Exhibit 99.1
|
| Imperial Tobacco Group PLC |
|
| Annual Report and Accounts 2006 |
Building on our success
The Group at a Glance
Imperial Tobacco is the world’s fourth largest international tobacco company, which manufactures, markets and sells a comprehensive range of cigarettes, tobaccos, rolling papers and tubes.
|
| Overview |
| Our Brands |
|
|
|
|
|
Group |
| Imperial Tobacco products are available in over 130 countries worldwide. Our geographic and product diversity provides business resilience and a strong platform for future growth. |
| • Our key premium international cigarette brand Davidoff has a strong foothold in Asia and a growing presence in a number of markets worldwide. • West is our biggest selling cigarette brand with its major markets in Germany and in Central and Eastern Europe. • Complementing our cigarette portfolio we are world leaders in fine cut tobacco, papers and tubes with brands such as Golden Virginia, Drum and Rizla. |
|
|
|
|
|
United Kingdom |
| We have clear market leadership in the UK, which is a key profit centre for the Group, with strong positions in cigarette, fine cut tobacco and papers. |
| • Lambert & Butler has been the UK’s best selling cigarette for 8 consecutive years with Richmond the UK’s number two cigarette brand. • Golden Virginia is the UK’s leading fine cut tobacco brand. • UK key brands: |
|
|
|
|
|
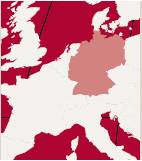
Germany |
| Germany is an important contributor to our overall results. Our cigarette market share is growing and although trading conditions are challenging, our broad portfolio enables us to respond to changing consumer dynamics. |
| • Our cigarette brand JPS has been the main driver behind the growth in our cigarette share, with West a key brand in Germany in both cigarette and other tobacco products. • Germany key brands: |
|
|
|
|
|
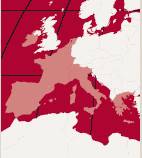
Rest of Western |
| Building on our leading position in fine cut tobacco and papers, we have growing cigarette shares in a number of markets in our Rest of Western Europe region, despite a highly competitive and regulated environment. |
| • Davidoff, West and JPS are performing strongly in the premium, mid and value segments across the region. • Rest of Western Europe key brands: |
|
|
|
|
|
Rest of |
| Our Rest of the World region is diverse with over 100 countries, with different dynamics, opportunities and challenges. We are growing our market shares and sales volumes in many markets across the region. |
| • Davidoff is growing across this region with line extensions in the Middle East, Asia and Eastern Europe and launches into Africa. • Rest of the World key brands: |
2006 Financial Performance
Revenue Less Duty | £3,162m |
|
|
Adjusted Profit from Operations | £1,356m |
Contributions to the Group |
| Revenue Less Duty |
| Adjusted Profit from Operations |
|
|
|
|
|
|
| £835m |
| £506m |
|
|
|
|
|
Contributions to the Group |
| Revenue Less Duty |
| Adjusted Profit from Operations |
|
|
|
|
|
|
| £584m |
| £274m |
|
|
|
|
|
Contributions to the Group |
| Revenue Less Duty |
| Adjusted Profit from Operations |
|
|
|
|
|
|
| £637m |
| £324m |
|
|
|
|
|
Contributions to the Group |
| Revenue Less Duty |
| Adjusted Profit from Operations |
|
|
|
|
|
|
|
|
|
|
|
| £1,106m |
| £252m |


Key Global Brands
Our key global brands of Davidoff, West, Drum, Golden Virginia and Rizla are complemented by a strong portfolio of regional and local brands such as Lambert & Butler, JPS, Horizon, Maxim, Excellence and Route 66.
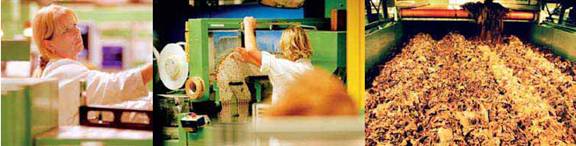
Manufacturing
Our 32 factories are focused on production quality, business simplification and optimising our cost base. We continue to increase productivity and reduce our unit costs.
Cigarette factories |
| 21 |
|
|
|
Other tobacco product factories |
| 8 |
|
|
|
Papers and tubes factories |
| 3 |
www.imperial-tobacco.com
Financial Highlights
(In £’s million) |
| 2006 |
| % change |
| 2005 |
|
Revenue |
| 11,676 |
| +4 | % | 11,229 |
|
Revenue less duty |
| 3,162 |
| +1 | % | 3,123 |
|
Profit from operations |
| 1,311 |
| +6 | % | 1,240 |
|
Adjusted profit from operations |
| 1,356 |
| +5 | % | 1,297 |
|
Profit before tax |
| 1,168 |
| +8 | % | 1,078 |
|
(In pence) |
| 2006 |
| % change |
| 2005 |
|
Basic earnings per share |
| 122.2 |
| +13 | % | 108.6 |
|
Adjusted earnings per share |
| 122.2 |
| +9 | % | 112.2 |
|
Diluted earnings per share |
| 121.6 |
| +12 | % | 108.1 |
|
Dividend per share |
| 62.0 |
| +11 | % | 56.0 |
|
Management believes that reporting adjusted measures provides a better comparison of business performance for the year and reflects the way in which the business is controlled. Accordingly, adjusted measures of profit from operations, net finance costs, profit before tax, taxation and earnings per share exclude, where applicable, restructuring costs, retirement benefit net finance income, fair value gains and losses on derivative financial instruments and related taxation effects. Reconciliations between adjusted and reported profit from operations, net finance costs and profit before tax are included within note 1 to the financial statements, adjusted and reported taxation in note 6, and adjusted and reported earnings per share in note 8. The term adjusted is not a defined term under International Financial Reporting Standards and may not be comparable with similarly titled measures reported by other companies.
Adjusted Earnings Per Share |
| Dividend Per Share |
| Adjusted Profit from |
| |
|
|
|
|
|
| |
122.2 | p | 62 | p | £ | 1,356 | m |
+9% on 2005 |
| +11% on 2005 |
| +5% on 2005 |
| |
Contents
| |
| |
| |
| |
| |
| |
| |
| |
| |
| |
| |
| |
| |
| |
| |
| |
| |
| |
|
|
| Statutory Reports |
| |
| |
| |
|
|
| Financial Statements |
| Independent Auditors’ Report to the Members of Imperial Tobacco Group PLC |
| |
| |
| Consolidated Statement of Recognised Income and Expense Consolidated Cash Flow Statement |
| |
| |
| |
| Independent Auditors’ Report to the Members of Imperial Tobacco Group PLC |
| |
| |
|
|
| Supplementary Information |
| |
| |
|
Davidoff
Davidoff is our key premium international cigarette brand.
1
Operating and Financial Review
Building on our success

“On the tenth anniversary of our listing on the London Stock Exchange, I am extremely pleased that the successful execution of our strategy has again delivered a strong set of results.”
Derek Bonham, Chairman
Earnings and Dividends
This year’s results build on our impressive track record, clearly demonstrating our consistent ability to create sustainable shareholder value.
Growing sales volumes, good brand performances, our ongoing focus on costs, and effective cash management have delivered an increase in adjusted earnings per share of 9 per cent to 122.2 pence. Basic earnings per share were 122.2 pence (2005: 108.6 pence).
The Board recommends a final dividend of 43.5 pence per share bringing the total dividend for the year to 62.0 pence, up 11 per cent on 2005 (2005: 56.0 pence).(1)
An Outstanding Track Record
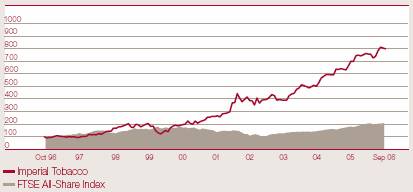
The last decade has been a wonderfully exciting time in the long history of Imperial Tobacco. Since listing in 1996, we have transformed a largely UK business into the world’s fourth largest international tobacco company. Total shareholder return over this period ranks us second amongst FTSE 100 companies. £100 invested in Imperial Tobacco in 1996 would have grown to almost £800 by 2006, over 6 times the return of the FTSE All-Share Index. The share price has risen from 329 pence(2) in 1996 to an all time high of 1,843 pence during this year. Adjusted earnings per share and dividends have both grown by a compound 15 per cent.
Since 1996, we have invested £5.2 billion in acquisitions which have enabled us to significantly increase our geographic footprint and enhance our product and brand portfolio. These acquisitions, combined with our underlying organic growth, have delivered significant returns to shareholders. Fundamental to our success has been our
(1) If approved, the dividend will be paid on 16 February 2007 to those shareholders on the register at close of business on 19 January 2007.
(2) Adjusted to reflect the bonus element of the two-for-five discounted rights issue in 2002.
2
focus on profitable top-line growth combined with a rigorous approach to controlling costs and effectively utilising the cash we generate.
An excellent management team, supported by a dedicated and highly skilled work force, has converted our plans into the tangible results we have consistently delivered.
Corporate Governance
Our dedication to delivering excellent results is matched by our commitment to maintaining high standards of corporate governance. We believe our reporting has always been open and transparent, and this year we have refined our approach to include the latest UK legislative requirements.
Board
In accordance with our corporate governance practices and as part of our ongoing evaluation of Board performance, we regularly review Board membership to ensure that we have the skills and expertise necessary to run our international business.
This year I was pleased to welcome Graham Blashill as Group Sales and Marketing Director, and Ken Burnett and Charles Knott as Non-Executive Directors. David Thursfield resigned as a Non-Executive Director in October last year. Simon Duffy and Sipko Huismans retired as Non-Executive Directors at the end of the 2006 Annual General Meeting, both having served nine years on the Board. I thank them most warmly.
I will shortly be retiring as Chairman and will be succeeded by Iain Napier, currently Joint Vice Chairman and Senior Independent Director. I have been pleased to work alongside Iain since his appointment to the Board in 2000, and wish him every success.
This is my last annual report and it has been a pleasure and a privilege to serve as your Chairman. Above all, it has been tremendously enjoyable, due to the friendship and dedicated support of all my Board colleagues over the years.
The Group is in good shape and in capable hands. I am confident that Imperial Tobacco will continue to achieve sustainable growth, creating value for its shareholders.
![]()
Derek Bonham
Chairman
Total Shareholder Return
Total shareholder return since our listing in 1996 ranks us second amongst FTSE 100 companies.
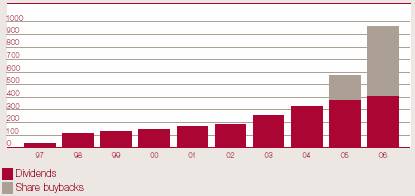
In the past ten years we have returned more than £2.8 billion to shareholders by way of dividends and share buybacks.
Total Shareholder Return (Index)
Cash Returned to Shareholders (£m)
3
Operating and Financial Review
Delivering our strategy

“We have again demonstrated the strength of our strategy and our organic growth credentials. Our brands and in-market performances and the commitment of our people have all contributed to another great year.”
Gareth Davis, Chief Executive
Performance Overview
Our success in 2006 has been reflected in a 7 per cent growth in our cigarette volumes and share gains across all our regions. In the UK, a good performance from our existing brand portfolio has been complemented by the successful national launch of Windsor Blue. In Germany, JPS has continued to grow strongly. In the Rest of Western Europe and Rest of the World regions, we have grown our shares in most of our markets.
Our key premium international cigarette brand Davidoff performed well, with global volumes up 6 per cent on last year to 14 billion cigarettes. In September 2006, we acquired the worldwide cigarette trademark for the brand, having been the long term licensee since the acquisition of Reemtsma in 2002. We have had considerable success with Davidoff cigarettes in the last four years and this acquisition will provide us with greater flexibility to develop the brand and accelerate its international growth.
In addition to our acquisition of the Davidoff cigarette trademark, we bought Gunnar Stenberg, a Norwegian distributor of tobacco products and accessories, in February 2006, extending our position in Scandinavia.
In our manufacturing operations, our cigarette unit costs reduced by 6 per cent reflecting excellent progress in our simplification and standardisation programmes. In July, to further improve operational efficiencies and our competitive position, we announced the closure of our other tobacco product factories in Liverpool and Lahr. The closure of the Treforest papers factory and the relocation of our
4
Central European cigarette production to Poland announced last year have now been completed.
In order to ensure the effective use of our cash we increased our rolling share buyback programme to an annual rate of around £600 million in February 2006. In our current financial year, we spent £556 million, including transaction costs, acquiring 32.5 million shares which are held as Treasury shares. The average price paid was £17.02. As at 30 September 2006, we held 46.0 million Treasury Shares representing 6.3 per cent of our issued share capital.
Our success is as much due to our people as it is to our products and brands. Our employees’ enthusiasm and commitment are great assets for Imperial Tobacco, ensuring we continue to deliver on our strategy and create value for our shareholders. My sincere thanks to them all for yet another great year.
Regulation
We have demonstrated our ability to successfully develop our business in highly regulated environments. Regulation continued to increase during the year in many markets in which we operate. We believe that we are well positioned to effectively manage regulatory challenges. We welcome constructive dialogue with governments and regulatory bodies in pursuit of sensible, practical and proportionate regulation.
Corporate Responsibility
In my introduction to our most recent Corporate Responsibility Review, I reiterated our commitment to corporate responsibility and our performance across many measured criteria has continued to improve. More detail on our progress is included onpages 32 to 35 of this report and on our website www.imperial-tobacco.com
Outlook
Looking ahead, we believe that we are in a strong position. Our widening geographic footprint combined with our broad product portfolio offers many opportunities to leverage and build brand equity, with long term sustainable growth prospects across the business.
Our unrelenting focus on cost and efficiency throughout every part of the business will continue. We remain committed to seeking value creating acquisitions that meet our established criteria. Our rolling share buyback programme is an effective use of our cash flow in the meantime.
Finally, I would like to thank my Chairman, Derek, for his guidance and wise counsel over the years. It has been a privilege to serve as his Chief Executive.

Gareth Davis
Chief Executive
2006 Highlights
��
Our success in 2006 has been reflected in a 7 per cent growth in our cigarette volumes and share gains across
all our regions.
• Drum and Golden Virginia continued to support our world leadership position in fine cut tobacco.
• Building on our considerable success with Davidoff cigarettes in recent years, we acquired the worldwide cigarette trademark in September 2006.
• In manufacturing, we reduced our cigarette unit costs by 6 per cent and made excellent progress in our simplification and standardisation programmes.
• We increased our rolling share buyback programme to an annual rate of around £600 million in February 2006, in order to ensure the effective use of our cash.
5
Operating and Financial Review
World Tobacco Market Context
In 2005(1) an estimated 3.5 trillion cigarettes (2004: 3.6 trillion cigarettes) were sold globally, excluding China. Against this background of relatively stable global cigarette consumption, the four largest international tobacco companies, Philip Morris, British American Tobacco, Japan Tobacco and Imperial Tobacco, have a share of around 64 per cent.
Whilst there are local variations, cigarettes are manufactured using two principal tobacco blends, Virginia blendand American blend, each accountingfor approximately half of the worldmarket. Virginia blend products arepredominant in the UK, Africa and mostAsian markets, including China andIndia. American blend products arepredominant in continental, Centraland Eastern Europe, the United Statesand Latin America. Fine cut tobacco ismanufactured using blends of lightand dark tobacco.
Alternatives to cigarettes and fine cut tobacco products include smokeless tobaccos, cigars and pipe tobacco.
Consumption
Some developed markets, including those within the EU, have experienced reduced duty-paid cigarette sales volumes due to significant excise-driven price increases, resulting in increased cross-border inflow and some reduced consumption. On the other hand, some developing markets such as those in Asia, Central and Eastern Europe are experiencing increases in cigarette consumption as a result of rising Gross Domestic Product.
In recent years, there has been a consumer trend towards international branded cigarettes at the expense of local brands. This is likely to continue with volumes of international premium brands remaining relatively stable whilst those in the mid and value price segments may continue to grow.
Duty Increases
In the EU, tax-driven price increases are stimulating growth in value cigarette brands and fine cut tobacco products as consumers downtrade. Governments continue to drive excise increases globally as a key instrument to reduce tobacco consumption.
Duty increases are generally passed on to the consumer. However, in some markets such as in the EU accession countries, which have derogation periods within which they must reach the EU minimum tax level, duty increases have been partly or wholly absorbed by tobacco manufacturers, which has the effect of reducing market profitability.
Regulation
Tobacco legislation and regulation continue to increase in speed, scope, scale and sophistication. For example, restrictions on smoking in public places and pictorial health warnings have been adopted in a number of markets.
The Framework Convention on Tobacco Control took effect on 27 February 2005 and by the end of September 2006 had been ratified by 140 countries, as well as the EU.
(1) Most recent year for which worldwide information is available.
6
Operating and Financial Review
Delivering shareholder value
Our Strategy
Our strategy is to create sustainable shareholder value by growing both organically and through acquisitions.
Our Strategic Objectives
We actively pursue three primary objectives which underpin our strategy:
• Sales development
• Cost optimisation and efficiency improvements
• Effective cash management
7
Building sales Growth
Our Five Key Brands

Brands
Our broad brand and product portfolio includes international cigarette brands such as Davidoff and West and strong regional brands such as JPS, Lambert & Butler, Richmond and Horizon. Complementing our cigarette portfolio is our world leadership in fine cut tobacco, papers and tubes with brands such as Golden Virginia, Drum and Rizla. Our brand strategy takes a portfolio approachresponsive to individual market dynamics and price segmentation. We believe there is considerable potential to leverage and build our brand equity.
Trade Marketing
As regulation increases and conventional direct communication between manufacturers and consumers is progressively withdrawn, effectiveness at the point of sale is vital. Our trade marketing objective is to ensure that our brands are available, have impact and are appealing to our consumers.
8

Graham Blashill
Group Sales and Marketing Director
“Sales and marketing excellence are essential to achieving profit growth. We continue to build our sales and trade marketing skills and share best practice to ensure our comprehensive portfolio of brands are available, have impact and are appealing to consumers globally.”
Market Opportunities
With sales in over 130 countries, we have a strong international profile. Our position in mature European markets is balanced by developing markets such as those in Asia and Eastern Europe. We see opportunities, both organic and acquisition led, to enhance and extend our existing operations in our Rest of Western Europe and Rest of the World regions, with the UK and Germany continuing to be key contributors to the overall results.
9
Driving productivity & cost efficiencies
Efficiency Improvements
A continual focus on reducing costs and improving efficiency supports our sales development.
We aim to optimise our manufacturing operations whilst maintaining sufficient flexibility to adapt to changing demand.
Simplification and Standardisation
Our focus on simplification and standardisation continues to deliver profit improvements.
Cost Optimisation
Throughout every aspect of Imperial Tobacco, our culture is focused on cost optimisation and value creation. This frees up funds for us to invest in top-line development.
10

David Cresswell
Manufacturing Director
“We are focused on manufacturing high quality products and simplifying and standardising our manufacturing operations, ensuring a fast and flexible response and delivering cost savings. Throughout every aspect of Imperial Tobacco, our culture is focused on cost optimisation and value creation.”

11
Effective cash management
10 Years of Acquisitions
|
|
|
|
|
|
|
|
1996 | 1997 | 1998 | 1999 | 2000 |
| 2001 | 2002 |
Imperial Tobacco | Rizla | Douwe Egbert Van Nelle | Australasia Acquisition | Mayfair Vending | EFKA Group Baelen Group | Tobaccor | Reemtsma |


12

Robert Dyrbus
Finance Director
“We look to ensure that the cash we generate is used efficiently, through acquisitions, organic investment and returning funds to our shareholders, adding to our value creation.”
|
|
|
2004 CTC Tube Company of Canada Imperial Tobacco acquired the business and assets of tubes manufacturer CTC Tube Company of Canada. | 2005 Skruf Imperial Tobacco invested in Skruf, a Swedish manufacturer of snus. | 2006 Davidoff Imperial Tobacco acquired the worldwide Davidoff cigarette trademark.
Gunnar Stenberg AS A Norwegian distributor of tobacco products and accessories, is acquired by Imperial Tobacco. |


10 Year EPS and Dividend Record

Value Creating Acquisitions
Since 1996, we have invested £5.2 billion in acquisitions which have delivered significant shareholder value. We are committed to continuing to expand our business through both acquisitions and organic investment opportunities. In order to maintain balance sheet efficiency while we assess such opportunities, we have an ongoing share buyback programme.
Our Share Buyback Programme
In order to ensure an effective use of our cash we have our rolling share buyback programme, at an annual rate of around £600 million.
Dividends
Our policy is progressive, growing dividends broadly in line with adjusted earnings per share with around a fifty per cent pay out ratio.
Effective Cash Conversion
We continue to be highly cash generative with an ongoing annual cash conversion rate of around 100 per cent. Our focus is on managing capital expenditure, working capital, tax efficiency and interest costs. Our objective is then to ensure the disciplined allocation of that cash to generate shareholder value.
13
Operating and Financial Review
Principal Risks and Uncertainties
Principal Risks and Uncertainties
A detailed assessment of strategic risks is undertaken by management and is embedded into our corporate planning process.
Each area of the business is required to formally review their principal areas of risk and uncertainty so that major risks are reviewed at all levels across the Group. This is an ongoing process, ensuring there are clear and consistent procedures for monitoring, updating and implementing appropriate controls to manage the identified risks. The Board acknowledges responsibility for the Group’s systems of internal control. More detailed information on the Group’s approach to risk management is found in the Corporate Governance Report.
We are subject to the same general risks and uncertainties as any other business, for example, the political stability in the countries in which we operate and source our raw materials, the impact of natural disasters and changes in general economic conditions including currency and interest rate fluctuations, and the impact of competition.
Outlined below is a description of the principal risks and uncertainties that are specific to, and may impact, our business. Not all these factors are within the Group’s control. There may be other risks and uncertainties which are unknown to the Group or which may not be material now but could turn out to be material in the future.
Regulation
The tobacco industry is subject to substantial and increasing regulation. For many years the trend has been towards an increasingly restrictive regulatory environment. In many of the markets in which we operate, there are regulatory restrictions affecting the manufacture, development, sale, distribution, marketing and advertising of tobacco products. Increased regulation, including the introduction of public place smoking bans, may have an adverse effect on the demand for our products.
Excise Duty
Increasing excise duties on tobacco products are likely to reduce the demand for tobacco products. Tobacco products are subject to excise duty which, in many of the markets in which we operate, represents a substantial percentage of the retail price and has been steadily increasing in recent years. Increasing levels of excise duty have encouraged consumers in affected markets to switch from premium price cigarettes to lower price cigarettes and fine cut tobacco. Given our strengthin lower priced cigarettes and our worldleading position in fine cut tobacco we are well positioned to benefit from downtrading caused by increased levels of duty.
However, substantial increases in excise duties and any significantly unfavourable change in the tax treatment of fine cut tobacco may have an adverse effect on the size of individual duty-paid markets for our products. Excise duty increases have also encouraged both legal and illegal cross-border trade from countries with lower levels of duty and the production of counterfeit tobacco products.
Within such an environment there is a risk that we may be subject to investigation by customs or other authorities. Although we have implemented procedures to detect and control illegal trading of our products, such procedures can provide only reasonable and not absolute assurance of detecting non-compliance by managing rather than eliminating risk.
Key Market Dependency
The continued organic growth of the business is underpinned by our key markets. Any material decline in the performance of these markets may impact our future profit development.
Competition Law
We have significant market positions in certain markets. As a result, we may be subject to investigation for alleged infringement of competition law in these markets, which could result in adverse regulatory action by relevant authorities, including the potential for monetary fines, and negative publicity. In 2003,we received an enquiry from the Office of Fair Trading (OFT) in the UK into an alleged infringement of UK competition law. Information relating to the operation of the UK tobacco supply chain was supplied to the OFT in October 2003 and again during April 2005. The OFT’s enquiry is ongoing. Further information is included in theCorporate Governance Report.
Litigation
We may incur substantial costs in connection with health-related litigation. Various tobacco litigation claims are pending against the Group. To date, no tobacco litigation claim brought against Imperial Tobacco has been successful and/or resulted in the recovery of damages. However, if any individual claim were to be successful, it may lead to further claims, which if successful may result in a significant liability for damages. Regardless of the outcome of pending litigation, the costs of defending such claims can be substantial and may not be fully recoverable.
14
Operating and Financial Review
Key Performance Indicators
Key performance indicators are the principal measures used by the Board to assess performance against our strategy. These are reviewed on a regular basis.
Total Shareholder Return
2006 Performance
Our total shareholder return was 14 per cent.
Total shareholder return is the total investment gain to shareholders, resulting from the movement in the share price and assuming dividends are immediately invested in shares.
Adjusted Earnings Per Share
2006 Performance
Adjusted earnings per share increased by 9 per cent to 122.2 pence.
Adjusted earnings per share is adjusted profit after tax attributable to the equity holders of the Company divided by the weighted average number of ordinary shares in issue during the period. This excludes shares held to satisfy employee share schemes and shares purchased by the Company and held as Treasury shares.
Adjusted Operating Margin
2006 Performance
Our adjusted operating margin increased to 42.9 per cent.
This represents the adjusted profit from operations divided by revenue less duty.
Cash Conversion Rate
2006 Performance
Our cash conversion rate in 2006 was 98 per cent.
Cash conversion is calculated as cash flow from operations before tax payments less net capital expenditure relating to property, plant, equipment and software as a percentage of adjusted profit from operations.
Cigarette Market Share
2006 Performance
In our two key markets, the UK and Germany, our cigarette market shares grew to 45.5 per cent and 20.7 per cent respectively. Detailed performances in other markets can be found in our regional overviews on pages 18 to 26.
We estimate market shares as the volume of our brands sold by retailers in the year as a percentage of total market volumes.(1)
Volumes
2006 Performance
In 2006 our cigarette volumes grew to 186.9 billion cigarettes. Our fine cut tobacco volumes were 25,500 tonnes.
Volumes represent the number of units sold in the year.
Productivity
2006 Performance
Productivity was up by 6 per cent, excluding our Lahr factory in Germany, which was impacted by the cessation of Singles production.
Productivity is measured as factory output divided by paid hours.
Total Shareholder Return |
|
|
|
14% |
|
| 2005: 40% |
|
|
Adjusted Earnings Per Share |
|
|
|
122.2p |
|
| 2005: 112.2p |
|
|
Adjusted Operating Margin |
|
|
|
42.9% |
|
| 2005: 41.5% |
|
|
Cash Conversion Rate |
|
|
|
98% |
|
| 2005: 101% |
|
|
Cigarette Market Share(1) |
|
|
|
UK |
|
45.5% |
|
| 2005: 44.5% |
Germany |
|
20.7% |
|
| 2005: 19.4% |
|
|
Volumes |
|
|
|
Cigarettes |
|
186.9bn |
|
| 2005: 175.2bn |
|
|
Fine Cut Tobacco |
|
25,500t |
|
| 2005: 26,600t |
|
|
Productivity |
|
|
|
up by 6%(2) |
|
| 2005: up by 15% |
(1) Imperial Tobacco estimates.
(2) Excluding our Lahr factory in Germany, which was impacted by the cessation of Singles production.
15

16
Operating and Financial Review
Successful year of growth
In 2006, revenue was £11,676 million compared to £11,229 million in 2005. Revenue less duty was £3,162 million (2005: £3,123 million).
Adjusted profit from operations was up 5 per cent to £1,356 million and Group adjusted operating margins were up to 42.9 per cent (2005: 41.5 per cent). Reported profit from operations grew 6 per cent to £1,311 million (2005: £1,240 million).
Growing volumes, combined with increased efficiencies across the business and continued effective cash management, delivered 9 per cent growth in adjusted earnings per share. Basic earnings per share increased by 13 per cent to 122.2 pence. (2005: 108.6 pence).
Group Operating Performance
|
| 2006 |
| 2005 |
|
|
| £m |
| £m |
|
Revenue less duty |
| 3,162 |
| 3,123 |
|
Adjusted profit from operations |
| 1,356 |
| 1,297 |
|
Adjusted operating margin |
| 42.9 | % | 41.5 | % |
Restructuring costs |
| (45 | ) | (57 | ) |
Profit from operations |
| 1,311 |
| 1,240 |
|
Regional Performance Analysis
|
| Revenue |
| Adjusted profit |
| Cigarette |
| Fine cut |
| ||||||||
|
| 2006 |
| 2005 |
| 2006 |
| 2005 |
| 2006 |
| 2005 |
| 2006 |
| 2005 |
|
|
| £m |
| £m |
| £m |
| £m |
| bn |
| bn |
| 000’s |
| 000’s |
|
UK |
| 835 |
| 800 |
| 506 |
| 468 |
| 23.4 |
| 23.9 |
| 2.1 |
| 2.1 |
|
Germany |
| 584 |
| 630 |
| 274 |
| 294 |
| 20.7 |
| 20.9 |
| 6.4 |
| 7.1 |
|
Rest of Western Europe |
| 637 |
| 644 |
| 324 |
| 326 |
| 20.1 |
| 17.7 |
| 15.1 |
| 15.6 |
|
Rest of the World |
| 1,106 |
| 1,049 |
| 252 |
| 209 |
| 122.7 |
| 112.7 |
| 1.9 |
| 1.8 |
|
Total |
| 3,162 |
| 3,123 |
| 1,356 |
| 1,297 |
| 186.9 |
| 175.2 |
| 25.5 |
| 26.6 |
|
Detail on our regional performance can be found on pages 18 to 26 of this report.
The financial statements for the year ended 30 September 2006 have been prepared using International Financial Reporting Standards (IFRS) as endorsed by the European Union. In November 2005, we restated our 2005 results which were originally reported under UK GAAP, in accordance with IFRS. For full details, visit the investor section of our website www.imperial-tobacco.com Subsequent to releasing our restated 2005 results, we have reclassified certain advertising and promotion expenditure and retirement benefit net financing income within our income statement. These changes do not impact the previously reported IFRS profit before tax for 2005. Full details of these changes are set out in note 30 to the financial statements.
17
Our strategy in the UK is to build on our market leadership position.
Performance Highlights
|
| 2006 |
| 2005 |
| ||
Revenue less duty |
| £ | 835 | m | £ | 800 | m |
Adjusted profit from operations |
| £ | 506 | m | £ | 468 | m |
Imperial Tobacco cigarette volumes |
| 23.4 | bn | 23.9 | bn | ||
Imperial Tobacco fine cut tobacco volumes |
| 2,100 | t | 2,100 | t | ||
Market Dynamics
• The UK is a mature market which has experienced moderate market declines in recent years. Imperial Tobacco is the market leader in cigarette, fine cut tobacco and rolling papers.
• The value and economy segments of the cigarette market are growing as consumers downtrade.
• The UK is a highly regulated environment with one of the highest rates of tobacco tax in the world.
• A ban on smoking in public places was implemented in Scotland in March 2006. Similar bans are due to take effect in both Wales and in Northern Ireland in April 2007 and in England during summer 2007.
|
| 2006(1) |
| 2005(1) |
|
Total market size cigarette volumes |
| 49.1 | bn | 50.8 | bn |
Total market size fine cut tobacco volumes |
| 3,250 | t | 3,050 | t |
Imperial Tobacco’s market share in cigarettes(2) |
| 45.5 | % | 44.5 | % |
Imperial Tobacco’s market share in fine cut tobacco |
| 65.3 | % | 66.3 | % |
(1) Imperial Tobacco estimates.
(2) Excludes Private Label.
18
Operating and Financial Review
United Kingdom
We grew our UK cigarette market share, further enhancing our market leading position.
Market Dynamics
We estimate that the UK cigarette market was down 3 per cent to 49.1 billion (2005: 50.8 billion) with consumer downtrading continuing. The value and economy sectors now account for over 40 per cent of the total UK cigarette market. The fine cut tobacco market grew to 3,250 tonnes (2005: 3,050 tonnes).
A ban on smoking in public places was introduced in Scotland in March 2006.
Our Performance
In the UK, revenue less duty rose 4 per cent to £835 million, with adjusted profit from operations up 8 per cent to £506 million.Cigarette volumes were down 2 per centto 23.4 billion. This profit performance reflects improvements in cigarette market share and the benefits of price increases which more than offset market volume declines and downtrading.
We delivered an excellent operational performance in the UK, growing our cigarette market share to 45.5 per cent (2005: 44.5 per cent). Windsor Blue,launched nationally in January 2006 in the economy sector, grew to 2.2 per cent market share in September. New variants Superkings and Smooth and the relaunch of the celebration packs grew the UK’s number one cigarette brand Lambert & Butler to 16.2 per cent share. The number two brand, Richmond, has benefited from a packaging improvement and continued to perform well with a market share of 15.5 per cent. Reflecting downtrading dynamics, our Regal, Embassy and Superkings brands remained under pressure.
We are the UK market leaders in fine cut tobacco, however our market share declined to 65.3 per cent (2005: 66.3 per cent) due to continued competitor activity.
• Lambert & Butler
Lambert & Butler is the UK’s best selling cigarette brand.
Key Brands
• New variants Superkings and Smooth and the relaunch of the celebration packs grew the market share of the UK’s number one cigarette brand, Lambert & Butler.
• Richmond, the UK’s number two brand has benefited from a packaging improvement.
• In January 2006 we launched Windsor Blue nationally in the economy sector. The brand grew to 2.2 per cent market share in September 2006.
• In the UK we are market leaders in fine cut tobacco with our brands Golden Virginiaand Drum.
Brand Performance: Cigarette |
| Market Share 2006(1) |
| Market Share 2005(1) |
|
Lambert & Butler |
| 16.2 | % | 16.0 | % |
Richmond |
| 15.5 | % | 14.7 | % |
|
|
|
|
|
|
Brand Performance: Fine Cut Tobacco |
| Market Share 2006(1) |
| Market Share 2005(1) |
|
Golden Virginia |
| 49.5 | % | 50.8 | % |
Drum |
| 15.8 | % | 15.5 | % |
(1) Imperial Tobacco estimates.
We won the Convenience Tracking Programme Best Supplier, as voted by Retailers in 2006. This is an accolade that recognises the effectiveness and commitment of our sales teams and support functions. We have won this award three times in the last four years.
Outlook
In the context of further regulation, we do not expect smoking bans in the UK to have significant long term effect on our business. We believe smokers will continue to choose to smoke regardless of regulations and our view is supported by experiences in other markets.
The diversity of our brand and product portfolio continues to provide further opportunities within a downtrading environment. This, along with our commitment to sales and marketing excellence and our focus on costs, efficiency and flexibility, ensures we have a strong platform from which we seek to deliver further improvements in profits.
19
Germany remains a key contributor to the overall results. Our strategy is to build on the momentum of our growing cigarette market share, with our broad portfolio enabling us to respond to changing consumer dynamics.
Performance Highlights
|
| 2006 |
| 2005 |
| ||
Revenue less duty(1) |
| £ | 584 | m | £ | 630 | m |
Adjusted profit from operations(1) |
| £ | 274 | m | £ | 294 | m |
Imperial Tobacco cigarette volumes |
| 20.7 | bn | 20.9 | bn | ||
Imperial Tobacco other tobacco product volumes (as cigarette equivalents) |
| 9.5 | bn | 10.4 | bn | ||
Market Dynamics
• The cigarette market has declined in Germany due to the impact of successive duty increases.
• Imperial Tobacco is the number two in cigarettes; with a leading position in other tobacco products.
• Consumers are downtrading, with the low price branded cigarette sector growing strongly.
• Production of Singles stopped in March due to a change in duty status of the product.
|
| 2006(2) |
| 2005(2) |
|
Total market size cigarettes |
| 92 | bn | 101 | bn |
Total market size other tobacco products (as cigarette equivalents) |
| 43 | bn | 43 | bn |
Imperial Tobacco’s market share in cigarettes |
| 20.7 | % | 19.4 | % |
Imperial Tobacco’s market share in other tobacco products (as cigarette equivalents) |
| 21.8 | % | 24.2 | % |
(1) The results from our Austrian operations are included in Germany region.
(2) Imperial Tobacco estimates, excluding Austria.
20
Operating and Financial Review
Germany
While trading conditions remain challenging in Germany, we have been pleased with the growth in our cigarette market share.
Market Dynamics
We estimate that the overall tobacco market in 2006 was down 6 per cent to 135 billion cigarette equivalents (2005: 144 billion).The cigarette market fell by 9 per cent to 92 billion cigarettes, (2005: 101 billion), following the further duty increase in September 2005. Other tobacco products were stable at 43 billion cigarette equivalents. The low price branded cigarette sector has continued to grow strongly as consumers downtrade, accounting for 11.4 per cent (2005: 5.6 per cent) of the market, with the Private Label sector continuing to decline to 13.4 per cent (2005: 15.9 per cent).
Production of Singles ceased in March 2006, following a ruling from the European Court of Justice which resulted in a change in the duty status of the product, although products remained on retailers shelves until September.
Regulatory developments include the bill to restrict tobacco advertising in Germany, which has reached the German parliamentand is expected to take effect during 2007. The debate on smoking in public places continues with several political initiatives taken at federal and state level. A voluntaryagreement with the hospitality association is currently in place.
Our Performance
In Germany, our revenue less duty decreased by 7 per cent to £584 million, with adjusted profit from operations down 7 per cent to £274 million. These resultsreflect the overall market volume decline, downtrading into value cigarette brands and the cessation of Singles products, partly offset by cigarette market share growth and cost efficiencies.
We grew our cigarette share to 20.7 per cent (2005: 19.4 per cent) driven by an excellent performance from JPS. Thebrand captured the majority of marketshare growth in the low price brandedcigarette segment, with market share upto 3.8 per cent (2005: 1.7 per cent).Increased downtrading in the mid-priced cigarette segment resulted in West share dropping to 8.2 per cent (2005: 8.5 per cent). In recent months, our limited edition West packs have delivered additional salesvolumes and the brand’s performancehas stabilised, with a number of further initiatives planned to strengthen the brand. Davidoff performed robustly in a downtrading environment with a stable market share of 1.1 per cent.
Our market share of other tobacco products was down to 21.8 per cent (2005: 24.2 per cent). Prior to the change in duty status of Singles there was increased competition in this market segment, with a resulting impact on our other tobacco products share. In anticipation of consumers migrating fromSingles, we launched West Single Tobacco in March and JPS Single Tobacco in May with encouraging initial results.
Outlook
Our primary focus for Germany continues to be in managing the migration of Singles consumers to our alternative products.We are monitoring developments and our strength in value cigarettes and other tobacco products means we are well positioned to manage consumer migration. In addition, we will continue to work on our cost base in order to remain competitive.
• West
West is our biggest selling cigarette brand.
Key Brands

• JPS continues to grow strongly. The brand has captured the majority of market share growth in the low price branded cigarette segment.
• Germany is a key market for our strategic cigarette brand West. With increased downtrading, market share of West was down, however our limited edition West packs have delivered additional sales volumes, with a number of further initiatives planned.
• Our highly profitable premium cigarette brand Davidoff performed robustly given marketdynamics in Germany.
• We have a leading position in other tobacco products with traditional fine cut tobacco products such as West and JPS and new make your own products such as our recentlylaunched West Single Tobacco.
Brand Performance: Cigarette |
| Market Share 2006(1) |
| Market Share 2005(1) |
|
West |
| 8.2 | % | 8.5 | % |
JPS |
| 3.8 | % | 1.7 | % |
Davidoff |
| 1.1 | % | 1.1 | % |
|
|
|
|
|
|
Brand Performance: Other Tobacco Products |
| Market Share 2006(1) |
| Market Share 2005(1) |
|
West |
| 7.6 | % | 11.5 | % |
JPS |
| 7.5 | % | 6.3 | % |
(1) Imperial Tobacco estimates, excluding Austria.
21
Our strategy in the Rest of Western Europe is to continue to grow our cigarette market shares and build on our regional leadership in fine cut tobacco, while ensuring our key brands are available to travelling consumers.
Performance Highlights
|
| 2006 |
| 2005 |
| ||
Revenue less duty |
| £ | 637 | m | £ | 644 | m |
Adjusted profit from operations |
| £ | 324 | m | £ | 326 | m |
Imperial Tobacco cigarette volumes |
| 20.1 | bn | 17.7 | bn | ||
Imperial Tobacco fine cut tobacco volumes |
| 15,100 | t | 15,600 | t | ||
Regional Dynamics
The mature markets in the Rest of Western Europe region are becoming more regulated. With increasing levels of duty, there is downtrading in the region in both cigarette and fine cut tobacco.
|
| 2006(1) |
| 2005(1) |
|
Regional market size: cigarette |
| 320 | bn | 329 | bn |
Regional market size: fine cut tobacco |
| 30,400 | t | 30,900 | t |
Imperial Tobacco Performance
|
| Cigarette |
| Fine Cut Tobacco |
| ||||
|
| Market Share(1) |
| Market Share(1) |
| Market Share(1) |
| Market Share(1) |
|
|
| 2006 |
| 2005 |
| 2006 |
| 2005 |
|
Netherlands |
| 8.9 | % | 4.9 | % | 51.1 | % | 51.1 | %(2) |
Belgium |
| 10.2 | % | 9.5 | % | 10.4 | % | 11.6 | % |
Italy |
| 1.5 | % | 1.6 | % | 54.1 | % | 57.4 | % |
Ireland |
| 26.2 | % | 26.2 | %(2) | 67.4 | % | 67.0 | % |
France |
| 3.6 | % | 3.3 | % | 28.0 | % | 29.0 | % |
Spain |
| 6.4 | % | 5.1 | % | 58.8 | % | 64.4 | % |
Greece |
| 8.4 | % | 7.0 | % | 45.2 | % | 46.2 | % |
(1) Imperial Tobacco estimates.
(2) Restated as AC Nielsen bases changed.
22
Operating and Financial Review
Rest of Western Europe
In the Rest of Western Europe our cigarette shares have continued to grow in the majority of markets, complementing our leading position in fine cut tobacco.
Regional Dynamics
We estimate that the annual regional cigarette market was down by 3 per cent with the annual regional fine cut tobacco market down 2 per cent. The value segments in both cigarette and fine cut tobacco have grown as a result of consumer downtrading and an increasinglycompetitive pricing environment.
Restrictions on smoking in public places were introduced in Spain and Belgium in January 2006, and debate on this issue continues in other markets across the region.
Our Performance
Our regional cigarette volumes have grown by 14 per cent with improvements in our market shares more than offsetting the market volume decline. Despite our good cigarette volume performance, adjusted profit from operations was broadly stable at £324 million, reflecting declines in travel retail, particularly in Spain, and an increasingly competitive fine cut tobacco market.
In the Netherlands, our cigarette market share grew to 8.9 per cent (2005: 4.9 per cent), driven by the strong growth of West and JPS. In January 2006, we entered into a distribution agreement with Altadis. Our fine cut tobacco market share remained stable at 51.1 per cent with Zilver and Evergreen benefiting from the downtrading dynamic.
In Belgium, our domestic cigarette share progressed to 10.2 per cent (2005: 9.5 per cent), driven by the growth of Route 66, and supported by the stabilisation of Bastos.
Following the introduction of restrictions on smoking in public places in Italy last year, the market decline is now slowing with anoverall estimated cigarette market decline of 5 per cent this year. Our cigarette share is slightly down at 1.5 per cent (2005: 1.6 percent), with minimum pricing, introduced by the Italian Government in August 2005,reducing our ability to develop our portfolio.
In Ireland, with the overall cigarette market size up slightly to an estimated 5.7 billion (2005: 5.6 billion), our cigarette market share was unchanged at 26.2 per cent with a strong performancefrom Superkings.
We grew our cigarette share in France to 3.6 per cent (2005: 3.3 per cent) due to the success of the JPS family. Wemaintained our position in the fine cut tobacco sector with a robust performance from the market leader Interval at14.9 per cent (2005: 15.1 per cent).Our overall fine cut tobacco share declined to 28.0 per cent (2005: 29.0 per cent).
In Spain, we made significant domestic progress with JPS growing our cigarette market share to 6.4 per cent (2005: 5.1 per cent). However, trading conditions remain challenging following excise tax increases in February 2006 which were mainly absorbed by tobacco manufacturers,reducing the estimated profitablilty of the market by more than 30 per cent.
In Greece, our cigarette market share progressed to 8.4 per cent (2005: 7.0 per cent) due to another strong performance from Davidoff in the premium segment, now up to 3.3 per cent (2005: 2.7 per cent), supported by West.
Outlook
We expect that further regulatory changes in the region will continue to cause moderate reductions in market sizes. France is likely to implement restrictions on smoking in public places next year and pictorial health warnings are planned to be introduced in Belgium early next year. We also expect the competitive and pricing environment to remain challenging in the near term.
We will focus on further improving our cigarette market shares and addressing the pressures on our fine cut tobacco business.We believe the breadth of our productportfolio continues to provide us with future opportunities for growth.
• JPS
JPS is our key brand in the low price branded cigarette segment.
Key Brands
• Our cigarette brands Davidoff, West and JPS performed strongly across the Rest of Western Europe in the premium, mid and value segments.
• Davidoff volumes up 15%
• West volumes up 32%
• JPS volumes up 82%
• In the Netherlands, the largest market for fine cut tobacco in the region, our value brands Zilver and Evergreen performed well, reflecting the regional downtrading trends.
• We grew our Rizla volumes across the region.
23

The Rest of the World is a diverse region, with over 100 countries with different dynamics, opportunities and challenges.
Performance Highlights
|
| 2006 |
| 2005 |
| ||
Revenue less duty |
| £ | 1,106 | m | £ | 1,049 | m |
Adjusted profit from operations |
| £ | 252 | m | £ | 209 | m |
Imperial Tobacco cigarette volumes |
| 122.7 | bn | 112.7 | bn | ||
Imperial Tobacco fine cut tobacco volumes |
| 1,900 | t | 1,800 | t | ||
Regional Dynamics
• We believe there are opportunities to continue to expand in this region in terms of brand portfolio and market presence.
• In Asia, we have a strong premium position in Taiwan, complemented by a growing presence in Vietnam and Laos.
• Our Australasia region contains the profitable developed markets of Australia and New Zealand where we have cigarette shares of over 17 per cent and a strong position in fine cut tobacco.
• We are growing market shares in Central Europe with our comprehensive brand portfolio and coverage.
• Our major markets in Eastern Europe are Russia and the Ukraine, complemented by a growing business in the Caucasus and Turkey.
• In Africa, we have a well established presence in the sub Saharan region with brands such as Excellence, and in the Middle East we have growing market shares with Davidoff.
Imperial Tobacco Performance
|
| Cigarette |
| Cigarette |
|
|
| Market Share 2006(1) |
| Market Share 2005(1) |
|
Taiwan |
| 11.1 | % | 11.4 | % |
Australia |
| 17.8 | % | 17.7 | % |
Poland |
| 16.1 | % | 15.5 | % |
Russia |
| 5.5 | % | 5.3 | % |
Ukraine |
| 19.0 | % | 18.9 | % |
(1) Imperial Tobacco estimates.
24
Operating and Financial Review
Rest of the World
Key Brands

• Davidoff is our premium cigarette brand and we grew volumes in the region by 6% to 11 billion cigarettes.
• Davidoff continues to grow rapidly in the Middle East, with volumes up over 30%, and it was launched into a number of African markets. We have extended the brand further with Davidoff Neon in Taiwan.
• In our Rest of the World region, we have a number of important regional and local brands.
• We are growing volumes in Eastern Europe with Classic and Maxim.
• In Africa Excellence is performing well.
• Poland is a key market for our Paramount cigarette brand.
• Horizon is our main cigarette brand in Australia.
In 2006, we delivered volume and cigarette share gains in many markets in the Rest of the World region.
Revenue less duty was up 5 per cent to £1,106 million and adjusted profit from operations was up 21 per cent to £252 million. These results reflect strong cigarette volume growth supported by continued investment in the region partially offset by the ongoing competitive challenges in Central Europe.
Asia
Overview
With rising GDP and increasing population, Asia is the world’s fastest growing economic region and represents 50 per cent of globalcigarette consumption. The regulatoryenvironment is mixed with some marketsin the process of adopting the recommendations of the Framework Convention on Tobacco Control.
We have a strong premium position in Taiwan and a growing presence in Vietnam and Laos. In China, we benefit from our positive collaboration with the StateTobacco Monopoly Administration and theYuxi Hongta Group. Our key brands in the region include Davidoff, Boss, Bastos and the ‘A’ brand family.
Our Performance
In Taiwan we launched the first king size Davidoff cigarette, Davidoff Neon, in December 2005, which has captured 0.5 per cent market share. Our volumes benefited as a result of a Boss packagingimprovement and the Davidoff Neon launch, however our overall market share was down slightly to 11.1 per cent (2005: 11.4 percent). In Vietnam, Bastos held market share at 10.3 per cent (2005: 10.2 per cent) while in Laos we delivered strong volume growth from the ‘A’ brand family.
Australasia
Overview
The mature markets of Australia and New Zealand are among the most highly regulated in the world, with pictorial health warnings in Australia and extensive restrictions on display and smoking in public places. However, we have demonstrated our ability to continue to grow our profit. Key brands include Horizon and Peter Stuyvesant in cigarettes and Drum and Champion in fine cut tobacco.
Our Performance
In Australia, our cigarette share was up slightly at 17.8 per cent (2005: 17.7 per cent) with a good performance from Peter Stuyvesant and Brandon. Our fine cut tobacco share was down to 62.0 per cent (2005: 63.4 per cent), due to increased
• Davidoff Neon
Davidoff Neon was launched in Taiwan in December 2005.
25
competitor activity. John Brandon also performed well in New Zealand, growingour market share to 17.6 per cent(2005: 17.0 per cent).
Central Europe
Overview
In Central Europe the trading environment continues to be challenging. Duty increases have taken place across the region, ascountries move further towards EU minimum excise rates, impacting volumes. We are well represented across the region with key markets including Poland, Hungary Slovenia, Slovakia and the Czech Republic. Our regional brands include Route 66, Golden Gate, Moon and Paramount. In Scandinavia, our acquisition of the Norwegian distributor of tobacco products, Gunnar Stenberg, in February 2006,and our investment in the Swedish snus company, Skruf, have provided a base from which to develop our business.
Our Performance
Across the region we have increased our cigarette market shares: Poland to 16.1 per cent (2005: 15.5 per cent), Hungary to 14.5 per cent (2005: 12.6 per cent) and the Czech Republic to 9.6 per cent (2005: 7.2 per cent), with growth driven by the performance of our value brands. We launched Davidoff, West and Paramount in both Sweden and Norway during the year.
Eastern Europe
Overview
Our Eastern Europe region is experiencing strong economic development and, while some restrictions are in place, our ability to communicate with consumers is significantlygreater than in the EU. Our establishedpositions in Russia and the Ukraine arecomplemented by a growing business in the Caucasus and in Turkey. Our key brands in the region include Davidoff, West, Maxim, Classic and Prima.
Our Performance
We grew volumes by 14 per cent across the region. In Russia, our market share was up to 5.5 per cent, (2005: 5.3 per cent) with a strong performance from Maxim.
To increase our retail coverage and improve efficiencies we formed a joint merchandising force with Altadis in February 2006. In the Ukraine our market share was stable at 19.0 per cent (2005: 18.9 per cent) and we continue to invest in our market leading brand Prima. In Turkey our market sharegrew to 1.4 per cent (2005: 0.4 per cent) with a good performance from Klasik.
Africa and the Middle East
Overview
We have an established presence with brands such as Excellence in the sub Saharan region of Africa, Good Look in Madagascar and Davidoff in the Middle East. Regulation is increasing with differing levels of restrictions in place or evolving in all markets. As the trading environment may be subject to political instability, the effective regional management of our operations is important to ensure continued supply and distribution.
Our Performance
We delivered market share improvements with the continued growth of Excellencein Côte d’Ivoire and Good Look in Madagascar. Following the decision to end the licensed manufacturing and distributionarrangements with British American Tobacco in West Africa, we have benefited from increased volumes and market shares. With the cessation of our manufacturing agreement with Phillip Morris, we are restructuring our operations in Senegal. We have recently launched Davidoff in Senegal, Gabon, Burkina Faso and Côte d’Ivoire and there are positive signs of development in all markets. Davidoff continued to grow strongly in the Middle East region with volumes up 31 per cent, notably in Saudi Arabia with Davidoff One.
United States
Overview
We have been monitoring developments in the United States for a considerable period of time and have been encouraged by therecent positive developments in the litigation landscape. As the second largest market in the world, representing 7 per cent of world cigarette volumes and a significantly higher percentage of world profit, the US offers great potential for the Group. We currently sell and distribute papers and tubes in theUS and have a basic infrastructure in place.
We recently applied for membership of the Master Settlement Agreement, which is a pre-requisite for our market entrance. Ourentry into this profitable market with tobacco products would be organically and without any historic liabilities.
Outlook
The Rest of the World is a diverse region with over 100 countries with different dynamics, opportunities and challenges. This year’s performance has demonstrated our ability to deliver organic growth in the region. We will continue to invest in our key markets, core brands and route to market to capitalise on our results to date. We see many opportunities to continue to develop our footprint in terms of brand portfolio and market presence.
26
Operating and Financial Review
Manufacturing

The drive for excellence across our manufacturing base continues. In 2006, we delivered significant cost savings further optimising our cost base and simplifying and standardising our business.
• Overall productivity was up by 6%(1).
• We simplified our product portfolio by reducing blends by 8% and ingredients by 10%.
• We have increased our ISO14001 accreditation to 19 locations.
Our Performance
We reduced our unit costs across the Group, including a further reduction in cigarette unit costs of 6 per cent. We increased our overall productivity by 6 per cent, (excluding our Lahr factory in Germanywhich was impacted by the cessation ofSingles production). We continued ourfocus on simplification across our product portfolio, reducing our blends, ingredients and stock keeping units.
As part of our ongoing review to improve operational efficiencies we announced a number of restructurings during the year. This included announcing the closure ofour factories in Liverpool in the UK and Lahr in Germany, the latter as a direct result of the change in tax status of Singles and unfiltered eco-cigarillos in Germany. Both facilities are due to be closed by March 2007. We completed the restructuring of part of our European cigarette operations, with our Central European cigarette production relocated from Germany to Poland and the closure in the UK of our Treforest papers factory as announced last year. A number of activities within central manufacturing support have also been consolidated.
We have continued our capital investment programme. This concentrates on harmonising cigarette pack formats in Europe and increasing capacity in line with growing sales volumes in Eastern Europe, particularly in Volgograd and Kiev. In addition, a significant machinery upgrade programme is in progress across our Africanfactories, utilising surplus machinery. This will deliver further improvements in efficiency and quality.
We have delivered further operational efficiencies through the use of standard systems and processes, which are reflected in our manufacturing performance indicators.
We continued our programme of ISO14001 accreditation with four locations certified during the year. A total of 59 per cent of our factories are now ISO14001 accredited.
Across our supply chain, we have focused on the competitiveness of our distribution network and the development of our planning process. Distribution has been reviewed and rationalised, providing greater flexibility and support, as well as delivering cost savings.
Outlook
Our objectives are focused on manufacturing quality products, on reducing complexity and on optimising our cost base. Our continuous process of review, should ensure our manufacturing footprint remains flexible and responsive in line with changing market requirements, delivering further efficiency improvements across all our manufacturing activities.
(1) Excluding our Lahr factory in Germany, which was impacted by the cessation of Singles production.
27
Operating and Financial Review
Strong financial performance
In 2006, adjusted profit from operations was up 5 per cent, to £1,356 million, as a result of our continuing sales development and efficiency gains. Reported profit from operations was £1,311 million, up by 6 per cent (2005: £1,240 million).
Restructuring Costs
Reported profit from operations was impacted by restructuring costs of £45 million (2005: £57 million). The 2006 costs relate to the announced closuresof our Lahr and Liverpool factories. Annual savings of around £4 million are expected in our 2007 financial year with additional annual savings of £7 million in our 2008 financial year.
Net Finance Costs
Reported net finance costs of £143 million (2005: £162 million) include retirement benefit net finance income of £46 million (2005: £22 million) and fair value losseson interest rate derivatives of £1 million (2005: not applicable). Eliminating these items, adjusted net finance costs totalled £188 million (2005: £184 million) givingadjusted interest cover of 7.2 times(2005: 7.0 times). The increase in adjusted net finance costs is due to a marginal increase in our average all-in cost of debt to 5.4 per cent (2005: 5.3 per cent). Our average adjusted net debt was stable during the year at £3.5 billion.
Profit Before Tax
Reported profit before tax increased by 8 per cent to £1,168 million (2005: £1,078 million).
Taxation
The tax charge for the year was £310 million (2005: £288 million), representing an effective tax rate of 26.5 per cent (2005: 26.7 per cent).
Earnings and Dividends
Adjusted earnings per share increased by 9 per cent to 122.2 pence (2005: 112.2 pence) and basic earnings per share increased by 13 per cent to 122.2 pence (2005: 108.6 pence).
We have proposed a final dividend of 43.5 pence such that the total dividend for the year is 62.0 pence, an increase of 11 per cent, just ahead of our adjustedearnings per share growth. This dividend will be paid on 16 February 2007 to those shareholders on the register at the close of business on 19 January 2007. Our dividend policy is progressive, growing dividendsbroadly in line with adjusted earnings per share, with around a 50 per cent payout ratio.
Acquisitions
In September 2006, we acquired the worldwide Davidoff cigarette trademark from Tchibo Holding AG for a cash consideration of €540 million (£368 million). We also acquired Gunnar Stenberg, a Norwegian distributor of tobacco products and accessories in February 2006 and paid the final instalment on the Tobaccor acquisition in December 2005.
Capital Expenditure
Gross capital expenditure in relation to property, plant, equipment and software was £82 million (2005: £102 million), reflecting a maintenance level of capital expenditure. Our net capital expenditure was £67 million (2005: £75 million) including proceeds on disposal of fixed assets of £15 million (2005: £27 million).
Financing
At the end of the year our reported net debt increased to £3.9 billion (2005: £3.3 billion). Eliminating the fair value of interest rate derivatives and accrued interest of £0.1 billion (2005: not applicable), our adjusted net debt was £3.8 billion (2005: £3.3 billion). A reconciliation of reported to adjusted net debt is included within note 28 to the financial statements. The increase in adjusted net debt is due to the acquisition of the Davidoff cigarette trademark and the level of the share buyback programme being greater than our free cash flow after dividends. Our cash conversion of 98 per cent (2005: 101 per cent) is in line with our target rate of around 100 per cent.
In April 2006 we agreed an increase in our core committed bank facility of €1.5 billion on existing terms. Following this increase our core committed bank facility totalled £2.5 billion.
28
Operating and Financial Review
Understanding our operating environment

“We have a long history of co-operation with authorities in the markets in which we operate and we remain committed to working constructively with governments and regulatory bodies worldwide.
We believe that sound, reasonable and practical regulation combined with well thought out voluntary agreements is the most effective way forward.”
Frank Rogerson, Corporate Affairs Director
SMOKING IN PUBLIC PLACES
Smoking in public places continues to be an important issue. A number of countries around the world including Ireland, Italy,Norway and New Zealand already havecomprehensive bans in place and othersare likely to follow in the future.
Our View
• Imperial Tobacco recognises that other people’s tobacco smoke can be unpleasant or annoying and can raise concerns leading to calls to ban smokingin the workplace. However, it is our view that the scientific evidence, taken as a whole, is insufficient to establish that other people’s tobacco smoke is a cause of any disease. We believe that concerns about smoking in public places can be resolved through common sense and courtesy and by introducing practical solutions such aswell-ventilated smoking and no-smokingareas into workplaces, restaurants, bars and other public places.
29
2006 Summary
• In January 2006, Spain introduced a public smoking ban for all hospitality venues that serve food or allow children on the premises, although bars and restaurants that are smaller than 100 square metres are exempt from the ban. Larger venues may provide a separate area for customers who wish to smoke. This was followed by a public smoking ban in Scotland which took effect in March 2006. In Scotland, smoking is no longer allowed inside any workplace including bars, pubs and restaurants. Similar regulations are scheduled to take effect in England, Wales and Northern Ireland in 2007.
The European Commission is expected to adopt a Green Paper on Smoke Free Environments later in 2006, to reflect comments received during the informal consultation period. Although the Commission does not have the competence to enact an EU-wide smoking ban, it seeks to encourage Member States to adopt minimum standards for smoke-free environments.
Our experiences in markets where severe smoking restrictions or bans are in place, supports our view on the impact of this legislation. Smokers will continue to choose to smoke; there may be an initial dip in consumption but this diminishes over time.
FRAMEWORK CONVENTION ON TOBACCO CONTROL (FCTC)
Adopted in May 2003, the World Health Organisation’s (WHO) Framework Convention on Tobacco Control (FCTC) is the first global tobacco treaty that seeks to regulate tobacco products in a number of areas including tobacco advertising, labelling, product testing and the submission of ingredient information, as well as product traceability. The FCTC also addresses tobacco taxation and calls for tightened legislation to clamp down on smuggling and illicit products.
Our View
• Imperial Tobacco respects the WHO’s overall objective that underpins the FCTC and would favour reasonable, practical regulation and self-regulatory initiatives. However, it is our belief that some of the FCTC provisions seek to go beyond reasonable objectives and impose a supranational regulatory regime covering a wide range of areas better addressed by national regulators, who are familiar with local conditions. Moreover, it gives the WHO authority to establish rules in areas well outside its core competence – areas that fall under the jurisdiction of other bodies such as the World Trade Organisation or the International Standards Organisation.
2006 Summary
• The Conference of Parties (all countries which have ratified the FCTC) held its first session in February 2006. During the meeting, participating parties agreed to draft two protocols (on illicit trade and on cross-border advertising) and two guidelines (on environmental tobacco smoke and on product regulation) to supplement the original text of the Convention. The draft protocols and guidelines are to be presented for discussion at the next session of the Conference of the Parties which is due to take place next year.
PICTORIAL HEALTH WARNINGS
Pictorial health warnings are mandatory in a number of countries including Canada and Brazil. A number of countries, around the world are considering the use of pictorial health warnings while others have decided against their use.
Our View
• We do not believe that pictorial health warnings are necessary. It is our view that such warnings are designed solely to shock and stigmatise smokers, and we disagree with their use. We believe that pictorial health warnings make no overall contribution to the public awareness of the risks associated with smoking, which are already well known. We believe that we are entitled to use our packaging to enable our consumers to distinguish our products from those of our competitors.
2006 Summary
• To date, eight countries worldwide require pictorial health warnings to be printed on packs whilst others are currently discussing the use of pictorial health warnings or have already introduced draft legislation. In March 2006, Australia introduced 14 rotating warnings to cover 30 per cent of the front and 90 per cent of the back of tobacco product packaging. In the European Union, Belgium is the only country that has already passed legislation and cigarette packs carrying the new warnings are expected to be on the shelves next year.
30
EXCISE DUTY
Cigarettes and other tobacco products are subject to excise duties, which generally represent a significant percentage of theretail price of the products. International disparities in the rates of excise duty imposed on tobacco products have created an environment that encourages the growth of smuggling, illegal cross-border trading and counterfeiting.
Our View
• We remain totally opposed to smuggling,illegal cross-border trading andcounterfeiting. We are committedto working with customs and exciseauthorities around the world to tacklesuch activities.
2006 Summary
• Although the level of duty increases inWestern European countries was lessmarked in 2006 than in the previousyear, Member States that joined the EUin May 2004 continue to implement duty increases as they move towards the minimum EU level.
We have continued to work with customs authorities in a number of countries around the world to counter the illegal trade in tobacco products and we have now signed Memoranda of Understanding (MoU) in a total of eleven countries. Discussions are progressing in a number of other countries. In March 2006, together with the other major UK tobacco manufacturers, we signed an industry MoU with HM Revenue & Customs that builds on the success of previous MoUs.
TOBACCO-RELATED LITIGATION
We are not facing any active tobacco-related litigation in the UK.
In the Republic of Ireland, the number of claims has fallen from 307 in 1997, to 11, ten of which are subject to pendingdismissal motions.
In Poland, we are currently facing two individual claims, one on appeal following a favourable judgment in March 2006. In February 2006, we received a favourable judgment in a case brought against us (and other tobacco companies) by a Health Association. The Association has not appealed against the judgment.
Despite threats to do so, no proceedings have been commenced against us in the Netherlands.
The only case against us in Australia was dismissed in February 2006. The claimant has not appealed.
To date, no judgment has been entered against Imperial Tobacco and no action has been settled in favour of a claimant in anytobacco-related litigation involving Imperial Tobacco or any of its subsidiaries. Imperial Tobacco has been advised by its lawyers that it has meritorious defences to the legal proceedings in which damages are sought for alleged smoking-related health effects and to threatened actions of a similar nature. Wewill continue to contest all such speculative litigation against us.
For more information
www.imperial-tobacco.com
31
Corporate Responsibility Highlights
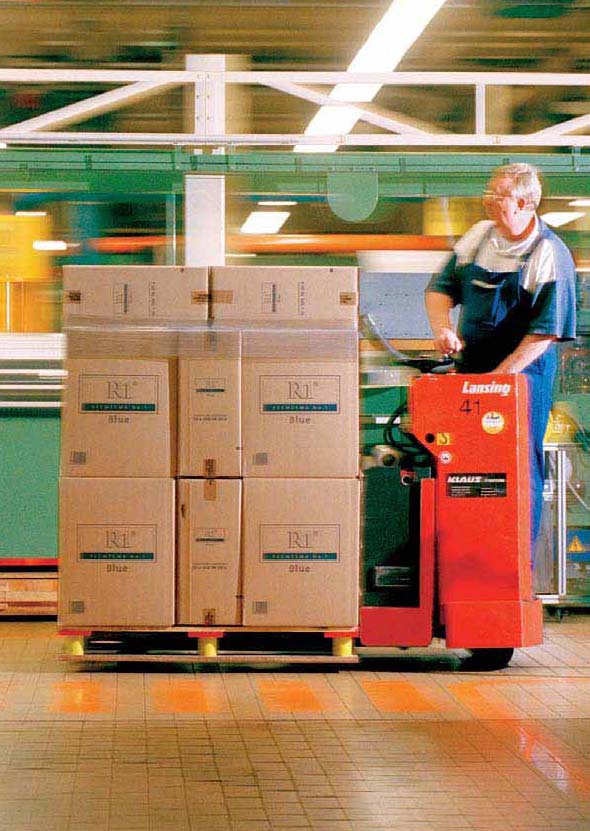
Achieved all environmental performance targets set for 2010 ahead of schedule.
• Energy consumption down(1) by 11 per cent.
• CO2 emissions down(1) by 20 per cent.
• Waste output down(2) by 3 per cent.
• Waste to landfill down(2) by 32 per cent.
• Water consumption down(1) by 12 per cent.
• Achieved ISO 14001 certification at 4 more manufacturing sites.
• Created significant partnerships with local NGOs, especially in the areas of the environment, malaria control and HIV/AIDS.
• Scored 73% (66% in 2005) in the SAM Research assessment for the Dow-Jones Sustainability Index 2006, against a sector average of 66% (the highest sector score was 79%).
• Named as 64th in the 2006 ‘Top 100 Companies That Count’ by the UK’s Business in the Community.
• Scored 90% in the Business in the Community Environment Index 2005 (83% in 2004), ranked 48/145.
• Rating agency SERM Index (Risk Management) has given us the second lowest risk rating compared with five other companies in our sector.
(1) Absolute values for financial year 2005 compared with 2001 base year.
(2) Absolute values for waste for financial year 2005 compared with 2004 base year.
32
Operating and Financial Review
Responsibility is at the heart of our business
Our Commitment
Our commitment to Corporate Responsibility is encapsulated in the following Group Policies which operate throughout the Group.
• Corporate Responsibility: to build a sustainable and profitable business while behaving responsibly.
• Non-Financial Reporting: to provide key stakeholders with appropriate non-financial information broadly in line with the Global Reporting Initiative and to co-operate with relevant investor evaluations and indices.
• Human Rights: to be guided on fundamental human rights by the Organisation for Economic Co-operation and Development guidelines for multinational enterprises (2000) and to support the International Labour Organisation’s core conventions.
• Occupational Health Safety and Environmental Management: to exercise responsible care for employees and others involved in our business activities; to minimise the adverse impact of our products, activities and services on the natural environment and, as a minimum standard, to comply with any relevant legislation within the territories in which we operate.
• Product Stewardship and Health: to understand our products; to assess prior to product manufacture the suitability of the materials used; and to ensure that developments in the science related to product stewardship and health are monitored, evaluated and appropriate actions are taken.
• Social Accountability: to conduct and report our business activities with integrity and to enter such stakeholder engagement as may assist us to be a good corporate citizen in the communities in which we operate.
• Community Investment: to support community activities in the geographical areas in which we operate, responding to local and significant international needs, and to encourage employee involvement in community and charitable activity.
These policies are in turn supported by a number of employment practices. The Group sets out for all employees the boundaries of acceptable business practice and the manner in which the activities of the Group are to be conducted. These policies cover, for example, anti-bribery, anti-corruption, anti-money laundering and whistleblowing. In this regard, our Values, Business Principles, Standard for Business Conduct and International Marketing Standards are key to governing responsible behaviour throughout the Group.
Product Stewardship and Health
We monitor the science relevant to our products, to ensure that appropriate investigations take place and that we anticipate and respond appropriately to developments. New products or processes are assessed, patented where necessary, evaluated and tested before commercial application. Prior to sale, any new product introductions into existing or new markets are checked to ensure regulatory compliance and to confirm the ingredients used meet our own high standards.
We have reviewed our standards of care which we routinely operate both for the assessment of ingredients used in our products and for our stewardship activities associated with leaf and smoke chemistry.
Employees
We aim to provide an environment which will attract, retain and motivate the best people, to ensure they can maximise their potential and share in the Group’s successes. During 2006 we continued to strengthen and develop our employment practices in support of our stated aim.
Investing in future leaders
We view leadership development and succession planning as essential for the sustainability of our business. We have committed significant investment into developing our managers and future leaders.
During 2006, we completed a further full cycle of our succession planning process. This process fulfils a number of goals, namely to identify critical management roles within the business; scope potential internal successors to those roles; select and validate prospective future leaders of the Group; and identify emerging talent within each function. The Imperial Leadership Programme (ILP) aims to develop current and future leaders of Imperial Tobacco.
“We are committed to behaving as a responsible corporate citizen in the communities in which we work and in society as a whole.”
Frank Rogerson, Corporate Affairs Director
33
Aligned to the succession planning process, ILP facilitates the development of leadership skills and competencies.
Learning and development
We place a strong emphasis on learning and development and create opportunities for our employees to develop both as individuals and as a team. The need for our people to adapt and extend their skills and knowledge in an ever-changing world is clearly important. A variety of locally based initiatives are in place to support the needs and circumstances of both the business and our employees.
Employee engagement
We aim to inform and involve employees in understanding our business objectives and local developments affecting their particular work environment. The promotion of good working relationships with employees, trade unions, works councils and other organisations has continued throughout the year.
Responsible restructuring
We, like many companies, operate in a highly competitive environment. Whilst we have continued to invest in incremental employment in some areas of our business, it has been necessary for us to take a number of restructuring decisions resulting in redundancies. During 2006, we closed our Treforest papers factory and announced the closure of our factories in Liverpool and Lahr. We have a track record of managing these situations in a fair and responsible manner, and remain committed to supporting our employees during any restructurings.
Occupational Health, Safety and Environment
We have a well-established policy for occupational health, safety and environmental (OHS&E) management and have made significant progress in these areas.
Occupational health and safety
The occupational health and safety (OHS) of our employees and those working with us, such as contractors, remains a high priority. Our Group lost time accident rate, for injuries resulting in more than three days absence from work, improved from 12.4 per 1,000 employees in 2004, to 11.6 in 2005. We are saddened to report the fatal shooting of one of our drivers at an illegal roadblock in Africa. There were no other fatalities during the year.
As part of our three-yearly programme, we commissioned independent OHS audits of a number of our European manufacturing facilities. The findings from our audits, together with analysis of our accident data for the 2005 financial year, have helped us to identify areas for improvement.
Environment
Good environmental management systems, designed to manage local impacts and sensitivities, are an essential component of our strategy.
We started our ISO14001 programme in 2001 and now have certified systems in 59 per cent of our manufacturing sites. In the last financial year, four of our factories have achieved certification; bringing the total to 19.
Over the last four years, we have improved the way we collect and report environmental data from our manufacturing facilities and main offices. During 2006 we implemented a new software platform for our non-financial performance indicators, including our environmental measures.
Our environmental performance indicators are showing decreasing trends in energy and water consumption, carbon dioxide emissions, waste and waste to landfill. Part of the decrease in absolute figures is as a result of factory closures. However, our relative indicators – expressed as per million cigarette equivalents – are also showing downward trends, an indication that our environmental management systems are improving our performance.
Our climate change strategy aims to reduce our direct impact by improving energy efficiency, and to reduce our indirect impacts by influencing our partners in the supply chain. We have achieved the ten per cent reduction target we set for carbon dioxide emissions, well ahead of the 2010 deadline of the Kyoto protocol.
Social Performance
We are committed to behaving as a responsible corporate citizen in the communities in which we operate and in society as a whole.
34
“Our Corporate Responsibility Review provides further insight, including performance data on what we see as our most important issues.”
Human rights
We recognise the importance of human rights across our operations and are aware that we operate in a number of countries where human rights may be an issue of concern. Our human rights policy commits us to support the International Labour Organisation core conventions on labour rights. These rights are covered in more detail in various Group employment policies. We regard equal opportunity and non-discrimination as essential aspects of all our employment practices.
Responsible sales and marketing
Our policy is to supply our products on a commercial basis only to approved customers and markets. A detailed product supply process is one way we help to ensure this. We thoroughly investigate product diversions and take appropriate action to mitigate the risk of any further diversion.
We believe that tobacco products are for adults. Our International Marketing Standards set out clear rules and principles to ensure that our advertising and promotional activities are directed only to adult smokers in all circumstances.
We are active in youth smoking prevention programmes in several parts of the world including the UK, Ireland and Hungary. Our involvement is through government-approved proof-of-age identity programmes, working in conjunction with independent bodies and trade associations.
Social responsibility in tobacco production
We continue to operate the Social Responsibility in Tobacco Production (SRiTP) programme in conjunction with our tobacco suppliers. SRiTP allows suppliers to understand their level of performance and make improvements where necessary. The programme covers Corporate Responsibility policy and management, health and safety and the socio-economic, agricultural and environmental impacts of growing and processing. During 2005, we introduced our suppliers to new SRiTP guidelines that now have more emphasis on biodiversity and the safety and environmental aspects of site vehicles.
We are committed to working with our suppliers to encourage their compliance with international standards on child labour. We are a Board member of the Eliminating Child Labour in Tobacco Foundation.
Community investment
During 2006, we committed £1.2 million to community investment worldwide. This does not include payments in kind, employee volunteering or management time.
One aim of our community investment activity is to benefit the local communities in which we operate. We have regional Community Investment Committees covering our operations in the UK, Germany, Africa, Asia and Australasia. In 2006, we created a committee for the Rest of Europe to support activities in around 30 countries, spreading from Ireland to Russia and from Scandinavia to Cyprus.
Our International Community Investment Committee aims to make a long term beneficial impact on significant global issues related to our business, by building long term partnerships with Non-Governmental Organisations (NGOs). Some international NGOs will not accept donations from tobacco companies, in the belief that it may damage their brand value or ability to raise funds from other sources. Although saddened by this, we respect their decision and are careful to avoid supporting causes which may be controversial in this regard.
We have formed several partnerships with NGOs engaged in innovative schemes that address poverty, water and sanitation, forest conservation, reforestation, biodiversity and sustainable development. These include ongoing projects in Uganda, Madagascar, Malawi and Mozambique.
Other new initiatives have focused on HIV/AIDS where we have partnerships at both global and local level. During 2006, we became a partner of a French NGO, which will help us to support employees and their communities in sub-Saharan Africa. We are also contributing to the global effort as new members of the Global Business Coalition on HIV/AIDS.
Following our donation to the Asian tsunami crisis, we have received repeated requests to respond to many other natural disasters. Rather than respond to individual disasters, we have decided to support a British rapid response charity for three years.
Independent verifier’s statement on corporate responsibility
The information and performance data in our 2005 and 2006 CR Reviews is verified by SGS United Kingdom Limited, using their Level One Sustainability Report Assurance protocols detailed in their Assurance Statement. These assurance protocols are based on the current best practice guidance provided by the Global Reporting Initiative and the AA1000 Assurance Standard. Their reports can be found in the CR Reviews and on our website.
For more information
www.imperial-tobacco.com
35


1. Derek Bonham
FCA, Aged 63
Chairman
Appointed Non-Executive Chairman on our London Stock Exchange Listing in 1996. Derek has a wide range of managerial and financial experience gained as a former Executive Chairman of The Energy Group PLC, a former Non-Executive Chairman of Cadbury Schweppes plc, Marconi plc, CamAxys Group plc and Songbird Estates plc and a former Deputy Chairman of Hanson PLC, having previously held a number of senior management and financial positions. He is also a former Non-Executive Director of TXU Corp (USA).
2. Gareth Davis
BA, Aged 56
Chief Executive
Appointed Chief Executive in 1996 Gareth led the successful demerger of the Company from Hanson PLC and its listings on the London and New York Stock Exchanges. With wide experience across all aspects of Imperial Tobacco’s business gained from over 30 years with the Company, he has played a key role in the development of both general strategy and the ongoing expansion programme. In 2003 he was appointed as a Non-Executive Director of Wolseley plc.
3. Robert Dyrbus
BSC, FCA, Aged 53
Finance Director
Appointed Finance Director of Imperial Tobacco Limited in 1989 Robert was one of the three-man Hanson team involved in the strategic reorganisation of the Group. He became Finance Director of the Group on demerger in 1996 and has since played an integral part in shaping the strategic direction of the Group. Previously he was financial controller with Hanson PLC, responsible for Imperial Tobacco and Ever Ready.
4. Graham Blashill
BSC, Aged 59
Group Sales and Marketing Director
Appointed to the Board in October 2005, Graham is responsible for the Group’s entire global sales and marketing activities across Europe, Asia Pacific, Africa and the Middle East, and Australia and New Zealand. He has worked for Imperial Tobacco for 38 years and during that time has held a number of senior sales and marketing positions, including Managing Director UK and Regional Director for Western Europe.
5. David Cresswell
C ENG, MIEE, Aged 61
Manufacturing Director
Joined Imperial Tobacco in 1961 and was appointed to the Board in June 2003. An electrical engineer by background, David has undertaken a number of senior management roles and has previously held the position of Managing Director for each of Imperial major operating divisions namely Cigarette, Rolling Paper and Roll Your Own Tobacco.
6. Frank Rogerson
BSC, PHD, Aged 53
Corporate Affairs Director
Appointed to the Board in June 2003, having joined Imperial Tobacco in 1977, Frank has held a number of senior management positions including Managing Director of Cigar and Roll Your Own Tobacco. Appointed Business Development Director in 2000, he was instrumental in negotiations for the acquisition of Reemtsma.
7. Iain Napier
FCMA, Aged 57
Joint Vice Chairman, Senior Independent Director, Chairman of the Remuneration Committee and a Member of the Audit Committee
Appointed a Non-Executive Director in 2000. Iain is currently Group Chief Executive of Taylor Woodrow plc. As a former main board Director of Bass PLC, he was Chief Executive of Bass Leisure and then Chief Executive of Bass Brewers and Bass International Brewers. Following the sale of the Bass bee business gained r business in f 2000, he became Vice President UK and Ireland for Interbrew SA until August 2001. He is also a former Non-Executive Director of BOC Group plc.
8. Anthony Alexander
FCA, Aged 68
Joint Vice Chairman
Appointed Vice Chairman on demerger. Anthony also serves as a Non-Executive Director of Platinum Investment Trust plc. He is a former Executive Director of Hanson PLC and as Chief Operating Officer he had responsibility for all their UK operating companies.
9. Ken Burnett
MA, MBA, PHD, Aged 54
Non-Executive Director
Appointed to the Board in April 2006, Ken was President, Asia Pacific of Allied Domecq from 1996 until its acquisition by Pernod Ricard in 2005. Prior to joining Allied Domecq, he held a number of senior management positions in the Asia Pacific region with Seagram, Interbrew and International Distillers & Vintners Ltd (now part of Diageo plc).
10. Colin Day
MBA, FCCA, Aged 51
Non-Executive Director, Chairman of the Audit Committee
Appointed a Non-Executive Director in July 2005. Colin is Group Finance Director of Reckitt Benckiser plc, having been appointed to its Board in September 2000. Prior to joining Reckitt Benckiser he was Group Finance Director of Aegis Group plc and previously held a number of senior finance positions with ABB Group plc and De La Rue Group plc. He is a Non-Executive Director of WPP Group PLC and a former Non-Executive Director of easyjet PLC.
11. Pierre Jungels
CBE (HON), C.ENG, PHD, Aged 62
Non-Executive Director and a Member of the Remuneration Committee and the Audit Committee
Appointed to the Board in August 2002. Pierre is Chairman of Oxford Catalyst Inc and a Director of Baker Hughes Inc. He has held numerous senior international positions within the oil industry with Shell International, Petrofina SA and British Gas PLC. He became CEO of Enterprise Oil in 1996, leading the business to substantial geographic and financial growth until his retirement in November 2001. He is Non-Executive Chairman of Offshore Hydrocarbon Mapping plc and Rockhopper Exploration PLC and a Non-Executive Director of Woodside Petroleum Ltd.
12. Charles Knott
FCMA, Aged 51
Non-Executive Director and a Member of the Remuneration Committee and the Audit Committee
Charles was appointed to the Board in April 2006. He is a Director of ICI plc and Chairman and Chief Executive of Quest International,ICI’s flavours and fragrances business based in the Netherlands. He was appointed to ICI’s Board in 2004. Charles was previously a long-term executive at National Starch, owned by Unilever until 1997, where he fulfilled a variety of international assignments.
13. Susan Murray
Aged 49
Non-Executive Director, Member of the Remuneration Committee and the Audit Committee
Appointed a Non-Executive Director in December 2004. Susan was a member of the Board of Littlewoods Limited from October 1998 until January 2004, latterly as Chief Executive of Littlewoods Stores Limited. Prior to joining Littlewoods she was worldwide President and Chief Executive of The Pierre Smirnoff Company, part of Diageo plc. She is a fellow of the Royal Society of Arts, a council member of the Advertising Standards Authority and a Non-Executive Director of Enterprise Inns Plc, SSL International PLC and Wm Morrison Supermarkets plc. She has also served asa Non-Executive Director of Aberdeen Asset Management PLC.
14. Matthew Phillips
LLB, Aged 36
Company Secretary
Appointed Company Secretary in October 2004, Matthew joined Imperial Tobacco’s legal department in 2000 having previously worked for the law firms Linklaters and Burges Salmon. He was closely involved in negotiations for Imperial Tobacco’s acquisitions of Tobaccor and Reemtsma.
37
Operating and Financial Review
The Chief Executive’s Committee is the senior management steering group for the Company. Comprised of the Chief Executive, the Executive Directors and the Company Secretary, the Regional Director, Western Europe, and the Group Human Resources Director (biographies below). The Committee is responsible for implementing Group strategy and monitoring the detailed performance of all aspects of the business.

1. Alison Cooper
BSC, ACA, Aged 40
Regional Director – Western Europe
Alison joined the Group in 1999 from PricewaterhouseCoopers, having worked with Imperial Tobacco over a number of years including in relation to acquisitions. Between 1999 and 2005, Alison held a number of senior finance roles and she is now responsible for all Sales and Marketing activities across the Rest of Western Europe region. She holds additional responsibility for strategic planning as part of the Chief Executive’s Committee.

2. Kathryn Brown
Aged 51
Group Human Resources Director
Kathryn joined Imperial Tobacco in 2002 from Somerfield PLC, where she was a member of the PLC Board. She has also held a number of senior operational consulting roles in change management in the FMCG sector. She is responsible for all aspects of human resource management across the Group.
38
The Directors submit their report together with the audited consolidated financial statements of the Group and the accounts of the Company for the year to 30 September 2006.
Business Review
The Group remains focused on its core business: the manufacture, marketing and sale of tobacco and tobacco-related products.
A review of the Group’s activities and future developments, which fulfils the requirements of the Business Review, including the financial performance during the year, key performance indicators and a description of the principal risks and uncertainties facing the Group, is included in the Operating and Financial Review section on pages 2 to 38. The purpose of the Annual Report is to provide information to the members of the Company. The Annual Report contains certain forward-looking statements with respect to the operations, performance and financial condition of the Group. By their nature, these statements involve uncertainties since future events and circumstances can cause actual results to differ materially from those anticipated. The forward-looking statements reflect knowledge and information available at the date of preparation of this Annual Report and the Company undertakes no obligation to update these forward-looking statements. Nothing in this Annual Report should be construed as a profit forecast.
The principal operating subsidiaries within the Group are shown on pages 125 and 126.
Financial results and dividends
The profit attributable to equity holders of the Company for the financial year was £851 million as shown in the consolidated income statement set out on page 68. Note 1 to the financial statements gives an analysis of revenue, duty, profit from operations and net assets.
The Directors have declared dividends as follows:
(In £’s million) |
| 2006 |
| 2005 |
|
Ordinary shares |
|
|
|
|
|
Interim paid, 18.5p per share (2005: 16.5p) |
| 127 |
| 120 |
|
Proposed final, 43.5p per share (2005: 39.5p) |
| 295 |
| 279 |
|
Total ordinary dividends, 62.0p (2005: 56.0p) |
| 422 |
| 399 |
|
The final dividend, if approved, will be paid on 16 February 2007 to shareholders whose names are on the Register of Members at the close of business on 19 January 2007. The associated ex dividend date is 17 January 2007. The interim dividend was paid on 4 August 2006 to shareholders on the register at the close of business on 7 July 2006.
Share capital
Details of the Company’s share capital are shown in note 20 to the financial statements. During the year the Company continued its share buyback programme purchasing 32,489,000 ordinary shares of 10 pence each in Imperial Tobacco Group PLC for a total cost of £556 million inclusive of expenses. The shares, representing 4.46 per cent of issued share capital and having an aggregate nominal value of £3,248,900, have not been cancelled but are held in a treasury shares reserve within the profit and loss account reserve and represent a deduction from equity shareholders’ funds.
Subsequent to the year end, as at 27 October 2006 the Company has purchased a further 1,665,000 ordinary shares of 10 pence each in Imperial Tobacco Group PLC for a cost of £30 million inclusive of expenses. These shares represent 0.2 per cent of issued share capital and have a nominal value of £166,500. These shares also have not been cancelled and are being held in the treasury share reserve.
At 27 October 2006 the Company had been notified that the following persons had interests in 3 per cent or more of the Company’s issued share capital.
|
| Number of |
| Percentage of |
|
|
| ordinary |
| issued |
|
|
| shares millions |
| share capital |
|
Franklin Resources, Inc |
| 22 |
| 3.00 |
|
Legal & General Investment Management Limited |
| 29 |
| 4.03 |
|
The Company has not received notification that any other person holds 3 per cent or more of the Company’s issued share capital.
The share interests of the Directors, their families and any connected persons are shown on page 57.
Board of Directors
Mr G L Blashill joined the Board as Sales and Marketing Director on 28 October 2005 and Mr C F Knott and Dr K M Burnett joined the Board on 19 April 2006 as Non-Executive Directors.
The Directors of the Company for the year to 30 September 2006 are shown on pages 36 and 37. Messrs A G L Alexander,
I J G Napier, D Cresswell and Dr F A Rogerson retire at the Annual General Meeting and being eligible, offer themselves for re-election. Mr C F Knott, and Dr K M Burnett, having been appointed during the year, retire at the Annual General Meeting and offer themselves for election.
Messrs S P Duffy and S Huismans retired from the Board following the Annual General Meeting on 31 January 2006 and
Mr D W Thursfield resigned from the Board on 28 October 2005.
39
Employees
The Group’s employment policies are designed to attract, retain, train and motivate the very best people, recognising that this can be achieved only through offering equal opportunities regardless of gender, race, religion, age or disability.
To ensure employees can share in our success, the Group offers competitive pay and benefit packages and, wherever possible, links rewards to individual and team performance. Employees are encouraged to build a stake in the Company through ownership of Imperial Tobacco Group PLC shares. A further opportunity to join the Sharesave Scheme was offered during the year and 77 per cent of eligible UK employees now participate. International employees were also offered a further opportunity to join the International Sharesave Plan and 32 per cent of eligible international employees now participate.
The Group is committed to providing an environment that encourages the continuous development of all its employees through skills enhancement and training programmes.
Using their own consultative and communication methods each of the Group’s businesses is encouraged to keep their employees informed on Group and individual business developments and to make its employees aware of the financial and economic factors affecting the performance of their employing company. To progress this aim further employee representatives are briefed on pan-European issues through a European Employee Forum.
Information concerning employees and their remuneration is given in note 4 to the accounts and in the Directors’ Remuneration Report.
Charitable and political donations
During the year the Group made charitable donations of £1.0m of which £0.7m was in respect of the UK (2005: £1.0m of which £0.3m was in respect of the UK), much of which was distributed through the Charities Aid Foundation in accordance with the Group’s charities policy.
No political donations or expenditure were made or incurred by the Company or its subsidiaries during the year (2005: Nil).
Creditor payment policy
The Company’s current policy concerning the payment of the majority of its trade creditors is to follow the CBI’s Prompt Payers Code (copies are available from the CBI, Centre Point, 103 New Oxford Street, London. WC1A 1DU). For other suppliers, the Company’s policy is to:
a) agree the terms of payment with those suppliers when agreeing the terms of each transaction;
b) ensure that those suppliers are made aware of the terms of payment by inclusion of the relevant terms in contracts; and
c) pay in accordance with its contractual and other legal obligations.
The payment policy applies to all payments to creditors for revenue and capital supplies of goods and services without exception. Wherever possible UK subsidiaries follow the same policy and international subsidiaries are encouraged to adopt similar policies, by applying local best practices.
The number of days’ purchases outstanding as at 30 September 2006 for Imperial Tobacco Group PLC was 30 days.
Research and development
The Group recognises the importance of investing in research and development, which brings innovative improvements to the Group, both in the products supplied to the consumer and in production and marketing techniques.
Auditors and disclosure of information to auditors
Each of the Directors in office as of the date of approval of this report confirms that:
• so far as they are aware, there is no relevant audit information (that is, information needed by the Company’s Auditors in connection with preparing their report) of which the Company’s Auditors are unaware; and
• they have each taken all the steps that he/she ought to have taken as a director in order to make himself/herself aware of any relevant audit information and to establish that the Company’s Auditors are aware of that information.
A resolution to reappoint PricewaterhouseCoopers LLP as Auditors to the Company will be proposed at the Annual General Meeting.
Annual General Meeting
Full details of the Annual General Meeting to be held on 30 January 2007, together with explanations of the resolutions to be proposed at the meeting, appear in the notice of meeting enclosed with this report.
By order of the Board
![]()
Matthew R Phillips
Company Secretary
31 October 2006
40
The Board of Directors (the Board) remains committed to maintaining high standards of corporate governance, which it sees as a cornerstone in managing the business affairs of the Group and a fundamental part of discharging its stewardship responsibilities.
Applicable Corporate Governance Provisions
Throughout the year under review and up to the date of approval of the Annual Report, the Group has complied with the governance rules and best practice provisions applying to UK listed companies as contained in section 1 of the Combined Code on Corporate Governance (the Code) which was introduced in 1998 and further revised during 2003 and 2006, although this latest revision is not anticipated to come into effect until the second quarter of 2007.
Since Imperial Tobacco Group PLC has securities registered with the US Securities and Exchange Commission (the SEC), the Group also complies with those provisions of the Sarbanes-Oxley Act of 2002 which are applicable to foreign large accelerated filers. In the light of this ongoing obligation, a programme of activity was put in place to enable the Group to meet the further requirements with regard to section 404 of the Sarbanes-Oxley Act, which are applicable for the first time in respect of the financial year ended 30 September 2006.
Corporate Governance Compliance
The Board recognises that it is accountable to shareholders for the Group’s standard of governance and this report, together with the Directors’ Remuneration Report, seeks to demonstrate how the principles of good governance, advocated by the Code, have been and continue to be applied in practice within the Group.
During the course of the financial year there has been continued rationalisation of the Group’s activities. Notwithstanding the ongoing organisational changes, the Board and its Audit Committee have continued to keep under review the Group’s entire system of internal control, encompassing both financial and operational controls, as well as compliance and risk management. Based on these reviews the Board is satisfied that an appropriate internal control framework is in place across the whole Group.
Throughout the Group, formal procedures, including well established and embedded internal controls, have been and continue to be maintained. Such procedures, together with continued regular formal reporting to the Audit Committee, have ensured the maintenance of a strong procedural framework for the ongoing identification, evaluation and management of the significant areas of risk to achievement of the Group’s strategic objectives.
As previously reported, certain investigations were initiated by German authorities in January 2003 into alleged foreign trading and related violations by a number of people, including Reemtsma employees during a period prior to its acquisition by the Group. A number of former and current employees have been interviewed and the German authorities have sought assistance from several other jurisdictions to obtain evidence. These investigations are continuing but in the course of 2005 parts of the investigations into certain of the individuals were terminated on terms agreed by the individuals with the authorities and settlement was made of any duty payable as a result of certain of the activities being investigated at no cost to the Group. In 2006, investigations against some of the other individuals were terminated for lack of evidence. Charges relating to smuggling have been brought in connection with one of the investigations against 18 individuals, one of whom is a former Reemtsma employee. The continuing investigations and any ensuing trials could take several years to be concluded. If employees are ultimately found to have committed offences, the authorities could impose penalties on Reemtsma for which the Group would seek recovery under arrangements made on the acquisition of the business.
A Board Committee established in 2003, under the Chairmanship of Mr A G L Alexander, remains in place to monitor the progress of the investigations and the Group’s responses on behalf of the Board. The German authorities’ investigations are based on alleged activities prior to the Group’s acquisition of Reemtsma and the Committee remains satisfied that, since the acquisition, the Group has not been involved in any activities of a nature similar to those alleged by the German authorities.
As previously reported, information was supplied by Imperial Tobacco and a number of other companies to the UK Office of Fair Trading (the OFT) in October 2003 in relation to an enquiry into the operations of the UK tobacco supply chain. Further information was supplied in April 2005 but to date no substantive response to any of the information submitted has been received from the OFT.
If the OFT were to decide that there are grounds for an infringement decision against the Group, it would issue a Statement of Objections setting out its preliminary findings and the basis for those findings. Imperial Tobacco would then have an opportunity to respond to these preliminary findings. If the OFT were subsequently to make an infringement finding, Imperial Tobacco would be able to appeal the OFT’s infringement decision to the Competition Appeal Tribunal. As at 27 October 2006, the OFT has not issued a Statement of Objections or publicly announced an intention to do so and as such the Board is unable to predict the outcome of this enquiry.
However, in the event that the OFT decides that a company has infringed UK competition law, it may impose a fine. The amount of the fine is calculated by reference to the turnover of the infringing company. The rules regarding the maximum amount of such a penalty changed on 1 May 2004. Before that date, the maximum amount of a fine was 10 per cent of a company’s UK turnover for up to three years. In the three years to 30 September 2003 our aggregate net UK turnover was £2,215 million. Under the revised rules, a fine may not exceed 10 per cent of a company’s worldwide turnover. However, the OFT’s guidelines state that where an infringement ended before 1 May 2004, the fine may not exceed the maximum penalty under the old rules. In either case, the applicable turnover on which the amount of a fine is based expressly excludes VAT and other taxes directly related to turnover, which we have been advised would also exclude duty. In addition, if the OFT were to make an infringement finding, it could issue orders prohibiting that activity in the future.
41
During the course of the year business reviews of the Group’s operations and reviews performed in preparation for conformance to section 404 of the Sarbanes-Oxley Act, have been performed as part of the Group Compliance Function’s programme of activity. This has highlighted a number of controls requiring minor remediation work which is being completed.
From reports to the Group Compliance Function by the business operations of any potential instances of fraud or accounting irregularity that may have occurred during the financial year, the Audit Committee concluded that neither individually nor collectively did they have a material impact on the results or performance of the Group for the financial year.
Board and Board Committees
Board Structure
The Board of Directors, which met seven times during the year (with two of the meetings having a duration of two days), currently comprises a Non-Executive Chairman, six independent Non-Executive Directors, one Non-Executive Director not classified, for the purposes of the Code, as independent when determining the composition of the Board or its Committees and five Executive Directors.
There is a clear separation of the roles of Chairman, Mr D C Bonham, and Chief Executive, Mr G Davis, to ensure an appropriate balance of power and authority. The Chairman is responsible for the leadership of the whole Board with the Chief Executive, in conjunction with the Chief Executive’s Committee, responsible for managing the Group and implementing the strategy and policies which have been set by the Board.
Mr I J G Napier is Joint Vice Chairman (alongside Mr A G L Alexander), Chairman designate and the recognised senior independent Non-Executive Director to whom any concerns can be conveyed by shareholders.
Following the 2006 Board evaluation and consideration of all other relevant factors contained in the Code and the NYSE Corporate Governance rules, the Board concluded at its meeting in September 2006 that all Non-Executive Directors continue to contribute effectively and constructively to Board debate, to challenge and question management objectively and robustly and at all times to have the best interests of the Group in mind and that, taking account of these factors, together with the other relevant factors contained in the Code and the NYSE Corporate Governance rules, all eight Non-Executive Directors (including the Chairman) remain independent for the purposes of the NYSE Corporate Governance rules and all seven Non-Executive Directors (excluding the Chairman as required by the Code) remain independent for the purposes of the Code.
However, recognising the general external focus under the Code on directors who have served in excess of nine years, the Company is no longer going to classify Mr A G L Alexander, for the purposes of the Code, as an independent Director when determining the composition of the Board and its Committees. For the time being Mr A G L Alexander will remain on the Board to ensure continuity at senior Board level pending Mr I J G Napier succeeding Mr D C Bonham as Chairman during 2007. Mr A G L Alexander is not a member of any of the Board Committees other than the Nominations Committee. In accordance with the Group’s policy, Mr A G L Alexander, having served in excess of nine years, will offer himself for re-election at the Company’s 2007 AGM. In addition, given his imminent change of role, Mr I J G Napier will also offer himself for re-election.
The Directors’ biographies, appearing on pages 36 and 37, demonstrate a detailed knowledge of the tobacco industry and the wider Fast Moving Consumer Goods sector together with a range of business and financial experience which is vital to the management of an expanding international company. The biographies also include details of their other major directorships.
Board Changes
During the year the Nominations Committee again reviewed the composition and balance of the Board. This review took into account not only the overall balance of skills, knowledge and experience of Board members but also of the wider provisions of the Code and the results of the annual evaluation of the performance of the Board, its Committees and individual Directors.
The Board performance evaluation in 2005 identified that, given the Group’s expansion within the Asia Pacific region, recruiting new Non-Executive Directors with international, and specifically Asian, experience would enhance the skill set of the Board. As a result the Nominations Committee produced two role profiles for an external search consultancy to identify suitable candidates. Subsequently Dr K M Burnett and Mr C F Knott joined the Board on 19 April 2006 as Non-Executive Directors having been identified as fitting the criteria.
As part of the ongoing review of the composition and balance of the Board it was announced, on 23 May 2006, that Mr I J G Napier would succeed Mr D C Bonham as Chairman during 2007. Prior to this appointment a role profile of the competences, experience and time commitment required by any potential candidate for the position of Chairman was produced by the Nominations Committee. It was determined by the Nominations Committee that Mr I J G Napier’s skills and experience so closely matched this profile that it was unlikely that a more suitable candidate would be found by conducting an external search or undertaking open advertising. During all discussions of the Chairman’s succession the Nominations Committee was chaired by Mr A G L Alexander and once Mr I J G Napier had been identified as a potential candidate he was excluded from all such discussions. As also announced on 23 May 2006,
Mr I J G Napier will cease to be a director of Taylor Woodrow plc by spring 2007.
On 28 October 2005 Mr G L Blashill was appointed to the Board as Group Sales and Marketing Director.
As reported last year, the Board accepted Mr D W Thursfield’s resignation with effect from 28 October 2005. Messrs S P Duffy and
S Huismans both retired from the Board following the conclusion of the 2006 AGM.
42
The opportunity exists for major shareholders to meet with new and existing Directors. Directors also made themselves available to meet shareholders after the formal business of the AGM had been completed.
Structure of the Board and Board Committees
|
|
|
| Audit |
| Remuneration |
| Nominations |
|
| Board |
| Committee |
| Committee |
| Committee |
Executive Directors |
|
|
|
|
|
|
|
|
G Davis |
| Member |
| — |
| — |
| — |
R Dyrbus |
| Member |
| — |
| — |
| — |
G L Blashill |
| Member |
| — |
| — |
| — |
D Cresswell |
| Member |
| — |
| — |
| — |
F A Rogerson |
| Member |
| — |
| — |
| — |
Non-Executive Directors |
|
|
|
|
|
|
|
|
D C Bonham |
| Chairman |
| — |
| — |
| Chairman |
I J G Napier |
|
|
|
|
|
|
|
|
Senior Independent Director |
| Joint Vice Chairman |
| Member |
| Chairman |
| Member |
A G L Alexander |
| Joint Vice Chairman |
| — |
| — |
| Member |
K M Burnett |
| Member |
| — |
| — |
| Member |
C R Day |
| Member |
| Chairman |
| — |
| Member |
P H Jungels |
| Member |
| Member |
| Member |
| Member |
C F Knott |
| Member |
| Member |
| Member |
| Member |
S E Murray |
| Member |
| Member |
| Member |
| Member |
Performance Evaluation
During the year, in accordance with the Code and with the assistance of an external consultant, the Board formally reviewed and evaluated its own performance, together with the performance of its Committees and individual Directors. These reviews were conducted by way of detailed questionnaires, completed by the Directors. A report on the performance of the Board as a whole and of the Board Committees was made to the Board at its meeting in September 2006. Feedback on individual Directors was discussed with the Chairman and this in turn was followed by private feedback meetings between the Chairman and each of the Directors.
In line with the provisions of the Code the performance of Mr I J G Napier was subjected to particularly rigorous review in light of him having served for six years. This review was conducted as part of the Chairman succession process.
In addition, an opportunity was taken at the Board meeting in September 2006 for Mr I J G Napier, the senior independent Non-Executive Director, to meet with the Non-Executive Directors as a group, without the Chairman present, to consider the performance of the Chairman. After also taking account of the views of the Executive Directors and the results of the Chairman’s formal performance evaluation, Mr I J G Napier held a private feedback meeting with the Chairman.
During the course of the year the Chairman additionally held meetings exclusively with the Non-Executive Directors to consider, amongst other things, the performance of the Executive Directors in the discharge of their duties.
Following these reviews the Board and its Committees are satisfied that they are operating and performing effectively and that, notwithstanding the ongoing Board refreshment, there remains a high degree of Board unity. No fundamental issues or training needs that require addressing were identified and the Board is also satisfied that each of the current Directors has sufficient time and commitment to contribute effectively to the Board and its Committees. Accordingly, the Board recommends that Messrs A G L Alexander, I J G Napier, D Cresswell, together with Dr F A Rogerson should stand for re-election, and Dr K M Burnett and Mr C F Knott should stand for election, at the 2007 AGM.
The key theme which emerged from the review related to the need to ensure the Board continues to maintain an appropriate balance between strategic matters and those relating to governance and the wider industry. The key themes of succession and the desirability of one or more additional Non-Executive Directors with international experience, specifically within the Asia region, identified in the 2005 evaluation were addressed during the year with the announcement of the appointment of Mr I J G Napier as Chairman Designate and the appointments of Dr K M Burnett and Mr C F Knott to the Board.
As reported last year, following the disclosure of individual Directors’ external commitments as part of the 2005 evaluation, the Board accepted that Mr D W Thursfield’s increasing level of external commitments was likely to have an adverse impact on his availability for Board and Committee matters. As a consequence, the Board accepted Mr D W Thursfield’s resignation with effect from 28 October 2005.
The Board plans to conduct evaluations on an annual basis and may employ alternative formats and approaches in future years.
Board Operations
The Board is the principal decision making forum of the Group and manages overall control of the Group’s affairs by the schedule of matters reserved for its decision contained in the Group’s Corporate Manual. These include, inter-alia, responsibility for the Group’s commercial strategy, the approval of financial statements and corporate plans, the overall corporate governance framework,
43
acquisitions and disposals, treasury, tax and risk management policies and appointment and removal of Directors and the Company Secretary.
The Company Secretary is responsible for advising the Board, through the Chairman, on all governance matters and for ensuring Board procedures are followed and applicable rules and regulations complied with.
All Directors are equally accountable in law for the proper stewardship of the Group’s affairs, with the Non-Executive Directors having a particular responsibility for ensuring that strategies proposed for the development of the business, resources and standards of conduct are critically reviewed using their independent judgement and experience. This ensures that the Board acts in the best long term interest of shareholders, takes account of the wider community of interest represented by employees, customers and suppliers and that environmental and ethical issues are fully integrated into the Group’s risk assessment processes.
During the year the principal matters considered by the Board included the Board changes detailed above, review of the strategy and operating results of the business, monitoring and if appropriate approval of major projects, for example the acquisition of the worldwide rights to the Davidoff cigarette trademark, approval of annual and medium term plans, return of capital to shareholders through share buybacks, feedback from results’ presentations to institutional shareholders, review of the Group’s non-financial reporting framework, consideration of the three-year occupational health safety and environment trends and priorities within the Group and review of Group funding arrangements, including the renewal of the Group’s European Medium Term Note programme. Actual results of the Group were reviewed at each Board meeting, with monthly reports, including detailed commentary and analysis, being provided in the intervening periods. This ensured that the Board was supplied with information on the progress of the business in a timely manner and that the Directors were properly briefed on issues arising at Board Meetings. All Board members receive reports from the chairmen of all Board Committees and receive copies of the Committees’ minutes.
The Non-Executive Directors also play a leading role in corporate accountability and governance through their membership of the Remuneration Committee, the Nominations Committee and the Audit Committee. The membership and remit of each Committee are considered below, together with a record of each Director’s attendance at Board and Board Committee meetings during the year. As part of the Group’s policy of annual review, the terms of reference for each of these Committees were reviewed during the year and are published on the Imperial Tobacco website www.imperial-tobacco.com. They are also available from the Company Secretary.
The Group has procedures in place to allow Directors to seek both independent professional advice, at the Group’s expense, and the advice and services of the Company Secretary in order to fulfil their duties. The Group maintains appropriate insurance cover in respect of Directors and Officers’ liabilities.
44
Chief Executive’s Committee
Over the financial year, the Chief Executive’s Committee, comprising the Executive Directors, the Regional Director – Western Europe, the Group Human Resources Director and the Company Secretary, met 12 times to ensure appropriate control and management of day-to-day business matters. Within the framework of the Chief Executive’s Committee, the Board delegates day-to-day and business control matters to the Chief Executive and the Chief Executive’s Committee who are responsible for implementing Group policy and monitoring the detailed performance of all aspects of the business. They have full power to act subject to the reserved powers and sanctioning limits laid down by the Board and the Group’s policy guidelines.
Between formal Board and Board Committee meetings, the Chairman and chairmen of the Board Committees communicate regularly with the Chief Executive and other members of the Chief Executive’s Committee.
Meetings of the Board, Board Committees and Shareholders
|
|
|
| Audit |
| Remuneration |
| Nominations |
| Annual General |
|
|
| Board |
| Committee |
| Committee |
| Committee |
| Meeting |
|
Total number of meetings in 2006 |
| 7 |
| 4 |
| 3 |
| 4 |
| 1 |
|
Number of meetings attended in 2006 |
|
|
|
|
|
|
|
|
|
|
|
Executive Directors |
|
|
|
|
|
|
|
|
|
|
|
Mr G Davis |
| 7/7 |
| — |
| — |
| 2/2 |
| 1/1 |
|
Mr R Dyrbus |
| 7/7 |
| — |
| — |
| — |
| 1/1 |
|
Mr G L Blashill(1) |
| 7/7 |
| — |
| — |
| — |
| 1/1 |
|
Mr D Cresswell |
| 7/7 |
| — |
| — |
| — |
| 1/1 |
|
Dr F A Rogerson |
| 7/7 |
| — |
| — |
| — |
| 1/1 |
|
Non-Executive Directors |
|
|
|
|
|
|
|
|
|
|
|
Mr D C Bonham |
| 6/6 |
| — |
| 1/1 |
| 3/3 |
| 1/1 |
|
Mr I J G Napier |
| 6/6 |
| 3/4 |
| 3/3 |
| 3/3 |
| 1/1 |
|
Mr A G L Alexander |
| 7/7 |
| 2/2 |
| — |
| 4/4 |
| 1/1 |
|
Dr K M Burnett(2) |
| 4/4 |
| — |
| — |
| 1/1 |
| — |
|
Mr C R Day(5) |
| 6/7 |
| 2/2 |
| — |
| 3/4 |
| 1/1 |
|
Mr S P Duffy(3) |
| 2/2 |
| 2/2 |
| — |
| 2/2 |
| 1/1 |
|
Mr S Huismans(3) |
| 2/2 |
| — |
| 1/1 |
| 2/2 |
| 1/1 |
|
Dr P H Jungels |
| 6/7 |
| 4/4 |
| 3/3 |
| 3/4 |
| 1/1 |
|
Mr C F Knott(2),(5) |
| 3/4 |
| — |
| — |
| 1/1 |
| — |
|
Ms S E Murray(5) |
| 7/7 |
| 2/2 |
| 2/2 |
| 4/4 |
| 1/1 |
|
Mr D W Thursfield(4) |
| 0/1 |
| — |
| 0/1 |
| 0/1 |
| — |
|
(1) Mr G L Blashill was appointed to the Board on 28 October 2005.
(2) Dr K M Burnett and Mr C F Knott were appointed to the Board on 19 April 2006.
(3) Messrs S P Duffy and S Huismans retired from the Board on 31 January 2006.
(4) Mr D W Thursfield resigned from the Board on 28 October 2005.
(5) Ms S E Murray was appointed to the Remuneration Committee and Audit Committee on 31 January 2006. Mr C F Knott was appointed to the Remuneration Committee and Audit Committee on 6 September 2006. Mr C R Day was appointed to the Audit Committee on 31 January 2006.
The maximum number of meetings for each individual Director is the number which they were eligible to attend.
Following the 2006 AGM Mr D C Bonham stepped down from the Remuneration Committee, Mr A G L Alexander stepped down from the Audit Committee and Mr G Davis stepped down from the Nominations Committee.
Remuneration Committee
The membership and responsibilities of the Remuneration Committee are contained in the Directors’ Remuneration Report which appears on page 52. The Remuneration Report, which has been approved by the Remuneration Committee and the Board and signed by the chairman of the Remuneration Committee, outlines remuneration strategy and policy, details of the Committee’s activities over the financial year and contains full details of Directors’ emoluments.
The performance of the Committee was evaluated as part of the Board performance evaluation process described above.
45
Nominations Committee
Membership
The Nominations Committee is comprised of all the Non-Executive Directors and meets on an as required basis. During the year the Committee met four times.
The members of the Committee during the year were:
• Mr D C Bonham (Chairman);
• Mr A G L Alexander (chaired committee during Chairman succession discussions);
• Mr I J G Napier;
• Dr K M Burnett (appointed 19 April 2006);
• Mr C R Day;
• Dr P H Jungels;
• Mr C F Knott (appointed 19 April 2006);
• Ms S E Murray;
• Mr G Davis (Chief Executive – stepped down from the Committee following the AGM on 31 January 2006);
• Mr S P Duffy (retired from the Board 31 January 2006);
• Mr S Huismans (retired from the Board 31 January 2006); and
• Mr D W Thursfield (resigned 28 October 2005).
Mr M R Phillips the Company Secretary acts as secretary to the Committee.
Responsibilities
The responsibilities of the Committee include the evaluation of the balance of skills, knowledge and experience on the Board, the development of role specifications, the formulation of succession plans and the making of recommendations to the Board with regard to the appointment of Directors.
In the financial year the Committee, after taking into account the Board evaluation and succession plans, produced role profiles for two new Non-Executive Directors and a successor to the Chairman, and following the identification of suitable candidates made a number of recommendations to the Board resulting in the appointments as detailed in the Board Changes section above.
Any Directors appointed by the Board must submit themselves for election by shareholders at the AGM following their appointment. Thereafter all Directors, in accordance with the Code, are subject to re-election at least every three years. Furthermore, it is the Company’s practice that any Non-Executive Director, including the Chairman, having been in post for nine years or more is subject to annual re-election. The performance of each Director is considered before recommending such re-election.
The performance of the Committee was evaluated as part of the Board performance evaluation process described above.
Induction and Training
Detailed training and briefing are provided to all Directors on appointment to the Board, taking into account their individual qualifications and experience.
Following his appointment Mr G L Blashill attended a programme at Henley Management College focusing on the roles and responsibilities of a listed PLC Board Director.
Dr K M Burnett and Mr C F Knott’s induction programmes included meetings with the Group’s Auditors, external lawyers, meetings with key Group personnel and site visits. These meetings included briefings on relevant corporate responsibility and corporate affairs issues, legal matters, product stewardship, occupational health and safety, environmental management, social impact, scientific and regulatory affairs and commercial risk management.
Ongoing training is made available to all Directors to meet their individual needs. Regular briefings are also provided to Directors on relevant issues such as legislation and regulation changes and corporate governance developments. During the year the Group’s external lawyers also briefed the Board on topical items of interest.
Structured training on leadership is also made available to members of the Group’s senior management team via the Imperial Leadership Programme.
The Audit and Remuneration Committees also received briefings from PricewaterhouseCoopers and Hewitt, Bacon and Woodrow respectively to ensure they remain up to date with current regulations and developments.
46
Audit Committee
Membership
The Audit Committee, consisting exclusively of independent Non-Executive Directors, met four times during the year and members’ attendance is set out in the table on page 45.
The members of the Committee during the year were:
• Mr C R Day (appointed and chairman 31 January 2006);
• Dr P H Jungels;
• Mr C F Knott (appointed 6 September 2006);
• Ms S E Murray (appointed 31 January 2006);
• Mr I J G Napier;
• Mr A G L Alexander (stepped down 31 January 2006); and
• Mr S P Duffy (chairman until retirement from the Board 31 January 2006).
Messrs C R Day, C F Knott and I J G Napier are qualified accountants and are therefore appropriately qualified to discharge the responsibilities that Audit Committee membership entails and are regarded as financial experts for the purposes of both the Code and section 407 of the Sarbanes-Oxley Act.
Mr M R Phillips the Company Secretary acts as secretary to the Committee.
Responsibilities
The Committee’s terms of reference cover the matters recommended by the Code and are published on the Imperial Tobacco website www.imperial-tobacco.com. During the year and up to the date of approval of the Annual Report the Committee worked with a structured agenda of matters focused to coincide with key events of the annual financial reporting cycle, together with standing items that the Committee is required to consider at each meeting. These responsibilities included, inter alia:
• monitoring internal control throughout the Group;
• approving the Group’s accounting policies;
• reviewing the interim and annual financial statements, together with the US filing on Form 20-F, prior to submission to the Board;
• reviewing the scope of the external Audit plan and the internal Group Compliance work plan;
• consideration of any related party matters;
• review of Auditor independence;
• consideration of and recommendations to the Board regarding the reappointment of the Auditors;
• review of non audit fees paid to the Auditors;
• review of the Going Concern statement prior to consideration by the Board;
• oversight and monitoring of the Group’s Public Interest Disclosure (Whistleblowing) policy; and
• review of risk management systems.
The performance of the Committee was evaluated as part of the Board performance evaluation process described above.
During the year the Head of Group Compliance provided the Committee with detailed reports to facilitate the regular monitoring and review of its activities and effectiveness including those in respect of the programme of activity in place to enable the Group to meet the requirements of section 404 of the Sarbanes-Oxley Act.
The Committee undertook its annual review of the scope and content of the risk assessment and compliance programme implemented by the Group Compliance Function and confirmed its approval. The Committee continually monitors and critically reviews the authority, effectiveness and level of resource allocated to the activity.
The Finance Director, the Group Financial Controller, the Head of Group Compliance, the Deputy Company Secretary and other financial management were invited to attend each meeting of the Committee and a standing item on each agenda allowed for the Head of Group Compliance to meet formally with the Committee, without any Executive Director or other manager being present, in line with the Code’s requirements.
In addition, the Group’s Auditors attended each meeting of the Committee during the year and, as a standing item on each agenda, met with the Committee members without the presence of any Executive Director or other manager, providing a direct line of communication between the Auditors and Non-Executive Directors.
Auditor Independence Policy
The Group regularly reviews its Auditor Independence Policy document, which provides clear definitions of services that the external Auditors can and cannot provide such that their independence and objectivity are not impaired. The policy also establishes a formal authorisation process, including the tendering and pre-approval by the Audit Committee for allowable non-audit work that they may perform and establishes guidelines for the recruitment of employees or former employees of the external Auditors. This policy is published on the Group’s website www.imperial-tobacco.com.
47
The Audit Committee also carried out bi-annual reviews of the remuneration received by the Auditors for audit services, audit related services and non-audit work with the aim of seeking to balance objectivity, value for money and compliance with this policy. The outcome of these reviews was not only that performance of the relevant non-audit work by the Auditors was the most cost-effective way of conducting the Group’s business but also that no conflict of interest existed between such audit and non-audit work. The fees for such non-audit work within the financial year were principally related to tax advisory work associated with the reorganisation of legal entities within the Group (including the review of work undertaken by other accounting firms prior to implementation), Sarbanes-Oxley section 404 compliance and assistance in preparing the Group for compliance with International Financial Reporting Standards, which became effective for the financial year ending 30 September 2006. In other situations, proposed assignments were subject to independent tendering with decisions taken on the basis of competence and cost-effectiveness.
Following a review during the year by the Audit Committee of the scope, efficiency and effectiveness of the audits performed by the Auditors it was agreed that the Group continues to receive an efficient, effective and independent audit service.
Internal control
The Board acknowledges responsibility for the Group’s system of internal control and for reviewing its effectiveness. The Audit Committee, on behalf of the Board, reviewed the effectiveness of the system in accordance with the guidance set out in the Code from information and regular reports provided by management, the internally independent Group Compliance Function and external Auditors. However, given the size and complexity of the Group’s operations, such a system can provide only reasonable and not absolute assurance of meeting internal control objectives by managing rather than eliminating risk and can only provide reasonable and not absolute assurance against material misstatement or loss.
The Board, either directly, or through the Audit Committee, regularly reviewed the effectiveness of the key procedures which have been established to provide internal control. It confirms that an ongoing process for identifying, evaluating and managing the Group’s significant risks operated throughout the year and up to the date of the approval of the Annual Report.
The Group has established control processes and procedures to ensure compliance with the best practice governance provisions as advocated by the Turnbull Guidance, and to comply with any relevant US governance and control provisions. The provisions of the Sarbanes-Oxley Act require US listed companies to adopt a generally accepted framework of control, advocating the “Internal Control-Integrated Framework” issued by the Committee of Sponsoring Organizations of the Treadway Commission (COSO) as appropriate. The Group considers its approach, methodology and actions in support of maintaining high standards of corporate governance satisfies the requirements of both the Turnbull guidance and COSO.
The following key features have operated to provide reassurance of both the reliability of information and the safeguarding of assets:
Risk assessment:
• The Group has clearly set out its strategic objectives as part of its medium term planning process. These objectives are incorporated as part of the annual planning cycle;
• A detailed assessment of strategic risks was undertaken by the Executive Directors as part of the medium term planning and annual and monthly forecasting reporting cycles;
• All areas of the business undertook risk-profiling exercises to formally review their principal areas of risk so that all major risks were reviewed at all levels across the Group. This formal system is based on the annual submission of risk assessment summaries from each of the business operations identifying their major areas of business risk, together with the controls embedded in the business processes to mitigate such risks. This review is ongoing throughout all business operations of the Group to ensure that there continues to be clear and consistent procedures for monitoring, updating and implementing appropriate controls to minimise the risk exposure so identified;
• The Audit Committee has delegated responsibility for considering Group-wide operational, financial and compliance risks on a regular basis. The Group Compliance Function formally reported at each Audit Committee meeting the outcome of its ongoing activities, including its programme of reviews relating to Sarbanes-Oxley compliance and any more general business reviews. These reports have supported the Audit Committee and the Board in assessing the effectiveness of internal controls within the business operations. In this way, the Audit Committee satisfied itself that the Group’s exposure to major business risks is minimised such that the levels of retained risk are acceptable to the Group; and
• A summary of the principal risks facing the business is included on page 14.
48
Control environment and control activities:
• The Group is organised on a functional basis with manufacturing, sales and marketing and central support functions each having their own management and control structures which satisfy the Group’s controls, accounting policies and regulatory responsibilities;
• The Board continually reviews the Group’s organisational structure to ensure that clearly defined lines of responsibility with appropriate delegation of authority and segregation of duties exist, with personnel of the necessary calibre in place to fulfil their roles. Such delegated authority ensures that decisions, significant either because of their value or impact on other parts of the Group, are taken at an appropriate level;
• The Board has formally adopted, and annually reviews, the schedule of matters of a strategic, financial, operational or compliance nature, which are required to be brought to it for decision;
• The Group has an established framework of policies and procedures laid down by the Board which personnel are expected to comply with. These cover key issues such as authorisation levels, segregation of duties, ethical compliance matters and legislation, physical and data security as well as regulatory, governance, and health, safety and environmental issues. This framework of policies and procedures, which has been developed and issued, with consistent communication throughout the Group, is reviewed and updated on a periodic basis to ensure it continues to provide the requisite control guidance and remains pertinent to the Group’s business activities;
• As part of the Group’s work for compliance with section 404 of the Sarbanes-Oxley Act during the year, further documentation and controls associated with establishing the structure of this framework have all been completed;
• A formal policy and arrangements for dealing in confidence with issues of genuine and significant concern raised by employees or others relating to perceived malpractice, improper business practices, management impropriety or other similar matters, whether financial or non-financial (commonly referred to as “Whistleblowing” arrangements) operates throughout the Group;
• The Group has an established and consistent methodology for ranking the level of risk from each of its business operations and identifying significant risk issues associated therewith. Appropriate strategies have been implemented to deal with each significant risk that has been identified, including not only internal controls but also other external measures such as insurance and dual sourcing of supplies;
• There are well-defined procedures for appraisal, approval, control and review of capital and strategic expenditure including acquisitions; and
• The Group’s treasury function operates within a well defined policy designed to control the Group’s financing arrangements and to minimise its exposure to interest rate and foreign exchange risks through treasury instruments.
Information and communication:
• Each area of the business produced detailed financial plans, prior to the start of the financial year, which were reviewed for robustness and realism; and
• A comprehensive system of controls, including regular periodic performance reviews for each area of the business, ensured that major variances against plan were promptly and thoroughly investigated. These reviews were conducted at a detailed level within each function and at a high level by the Chief Executive’s Committee.
The achievement of business objectives, both financial and non-financial, were assessed on a regular basis using a range of key performance indicators. These indicators are periodically reviewed to ensure that they remain relevant and reliable.
Monitoring:
• A range of procedures is used to review the risk profile and monitor the effective application of internal controls across the Group. These included independent reviews by the Group Compliance Function, together with self-assessment of risks and relevant controls. Furthermore both the senior operational and financial managers of each business and function annually certify that effective systems of internal control, in accordance with the Group’s policies and covering all business activities (both financial and non-financial), have been maintained within their area of responsibility;
• The Group Compliance Function’s responsibilities include reporting to the Audit Committee on the effectiveness of internal control systems, focusing on those areas of greatest perceived risk to the Group;
• Follow-up procedures ensure that there is an appropriate response to recommendations for any enhancement to risk controls as identified by the independent reviews of the Group Compliance Function; and
• As a consequence of its US listing, the Group is required to comply with the provisions of the Sarbanes-Oxley Act that apply to foreign large accelerated filers. Section 404 of the Sarbanes-Oxley Act is applicable for the Group for the first time in preparing the Form 20-F for the financial year ending 30 September 2006. Testing of year end controls is still ongoing at the date of publication.
The Audit Committee confirms it has reviewed and reported to the Board on the system of internal control for the financial year ended 30 September 2006, and up to the date of approval of the Annual Report, in accordance with the requirements of the Code and the Turnbull guidance. Through the procedural and reporting framework for monitoring business risks and controls, as set out above, and review of the Group’s financial statements, it is satisfied there is sufficient information to enable it to review the effectiveness of the Group’s system of internal control.
49
Disclosure Committee:
In line with recommendations issued by the US Securities and Exchange Commission and to meet corporate governance best practice in the UK, the Group has a Disclosure Committee comprising appropriate senior executives:
• The Company Secretary – chairman;
• Head of Group Compliance – co-ordinator;
• Senior Legal Counsel; and
• Group Financial Controller.
The Deputy Company Secretary acts as secretary to the Committee.
The External Auditors together with other senior management are invited to attend or to submit matters for the attention of the Committee.
The Committee, in accordance with its terms of reference, considered the significance of relevant information identified after due enquiry by its members both prior to each meeting and on an ongoing basis. The Committee reported on its evaluation of such information to the Chief Executive, Finance Director and, as appropriate, the Audit Committee to assist them in their evaluation of material issues for the purposes of any disclosure that may be required.
The terms of reference of the Disclosure Committee were reviewed during the year.
Going concern
The Directors are satisfied that the Group and Company has adequate resources to meet its operational needs for the foreseeable future and accordingly they continue to adopt the going concern basis in preparing the financial statements.
Pension fund
The Group’s main pension fund, the Imperial Tobacco Pension Fund, is not controlled by the Board but by Trustees, consisting of five nominees from the Company, one member chosen by employees and two by current and deferred pensioners. The Trustees look after the assets of the pension fund, which are held separately from those of the Group and are managed by independent fund managers. The pension fund assets can only be used in accordance with its rules and for no other purpose.
New York Stock Exchange corporate governance requirements
As a listed non-US issuer, the Group is required to comply with some of the New York Stock Exchange’s (NYSE) listing standards relating to the corporate governance practices of listed companies, being exempt from others.
However, there is an obligation to disclose any significant ways in which its corporate governance practices differ from those followed by US companies under the NYSE listing standards. At this time, the Group believes that it is in compliance, in all material respects, with the relevant NYSE listing standards. However, in respect of the NYSE standards relating to the composition of a Nomination/Corporate Governance Committee, it was the Group’s practice to include the Chief Executive, in addition to all of the Non-Executive Directors, on the Nominations Committee. However, he stepped down from the Committee with effect from the 2006 AGM.
Furthermore it is the Board, not the Nominations Committee, which develops, recommends and adopts the corporate governance principles to be applied throughout the Group. It should also be noted that the role of an internal audit department is incorporated within the general remit of the internally independent Group Compliance Function.
Communication with shareholders
Communication with all shareholders is given a high priority and a number of methods are used to promote greater understanding and dialogue with investment audiences. The Chairman, Chief Executive and Finance Director, together with feedback from external advisers, ensured that the views expressed at meetings with major shareholders were effectively communicated to the Board as a whole so that any issues or concerns were fully understood.
The Group’s Annual Review, a summary financial statement, provides shareholders with the material information concerning Imperial Tobacco Group in a form more readily assimilated than the full Annual Report and Accounts. Shareholders can also request the full Annual Report and Form 20-F. At the half year an Interim Report was published. All of these documents are available online through the Imperial Tobacco website www.imperial-tobacco.com, together with all announcements, investor presentations and share price information.
During the year shareholders were kept informed of the progress of the Group through trading statements and other announcements of significant developments through regulatory releases, which were also made available on other news services and on the Group’s website. There was regular dialogue with institutional shareholders and participation in sector conferences. This has been extended to ensure that major shareholders are given the opportunity to meet Non-Executive Directors, on appointment, and that the senior independent Non-Executive Director attends meetings with major investors, if so requested.
The Group regularly liaises with its major shareholders and their representative bodies on significant issues. The Group also met with Corporate Governance representatives of investors when requested.
Additionally, at the AGM, individual shareholders received presentations from the Chairman and Chief Executive on the Group’s performance and current business activities and were given the opportunity to question the Chairman and the chairmen of the Audit,
50
Remuneration and Nominations Committees and other Directors. In accordance with the Group’s practice the Annual Report and Accounts and Notice of the AGM were sent to shareholders more than 20 working days prior to the meeting.
All shareholders are offered the choice of receiving shareholder documentation, including the Annual Report, and submitting proxy votes either electronically or in paper format, including the ability to abstain if desired.
The Company indicates the level of proxy votes lodged in respect of each resolution proposed at its AGMs, together with the number of votes for and against each such resolution including details of abstentions. Subsequently the results are also published on the Company’s website.
Separate resolutions are proposed on each discrete subject, with all resolutions put to a poll, the results of which are announced, after the conclusion of the meeting, through a Regulatory Information Service release and on the Company’s website.
Statement of Directors’ responsibilities
Company law requires the Directors to prepare financial statements for each financial year which give a true and fair view of the state of affairs of the Company and the Group at the balance sheet date and of the profit or loss and the cash flows of the Group for that period.
The Directors consider that suitable accounting policies have been used. These have been applied consistently. They also confirm that reasonable judgements and estimates have been made in preparing the financial statements for the financial year ended 30 September 2006 and that applicable accounting standards have been followed.
The Directors are responsible for keeping proper accounting records that disclose with reasonable accuracy at any given time the financial position of the Company and the Group and enable them to ensure that the financial statements comply with the Companies Act 1985. They are also responsible for safeguarding the assets of the Company and the Group and hence for taking reasonable steps for the prevention and detection of fraud and other irregularities.
The Directors are also responsible for the maintenance and integrity of the Group’s website. Information published on the internet is accessible in many countries with different legal requirements. Legislation in the UK governing the preparation and dissemination of financial statements may differ from legislation in other jurisdictions.
Statement of Auditors’ responsibilities
Imperial Tobacco Group PLC’s Registered Auditors, PricewaterhouseCoopers LLP, are responsible for forming an independent opinion on the financial statements of the Group and on the financial statements of the Company as presented by the Directors, on other elements of the Annual Report and Accounts as required by legislation or regulation and for reporting their opinion to members. Their report is set out on page 67.
51
Directors’ Remuneration Report
This Report has been prepared by the Remuneration Committee in accordance with schedule 7A to the Companies Act 1985 and to meet the relevant requirements of the Listing Rules of the UK Listing Authority. In particular, it describes how the Board has applied the principles of good governance relating to Directors’ remuneration set out in the Combined Code on Corporate Governance (the Code).
The Companies Act 1985 requires the Auditors to report to the Company’s shareholders on the audited information within this Report and to state whether, in their opinion, those parts of the Report have been prepared in accordance with the Companies Act 1985. The Auditors’ opinion is set out on page 67 and those aspects of this Report which have been subject to audit have been clearly marked.
The Remuneration Committee, which met three times during the year and operates under clear written terms of reference (available on the Company’s website www.imperial-tobacco.com), confirms formally that it has been in compliance with the governance rules and best practice provisions relating to remuneration as set out in section 1 of the Code throughout the year.
Remuneration Committee
Membership
The Remuneration Committee is comprised exclusively of independent Non-Executive Directors who have no personal financial interest, other than as shareholders, in the matters to be decided.
The members of the Committee during the year were:
• Mr I J G Napier (chairman);
• Mr D C Bonham (who stepped down from the Committee following the Annual General Meeting (the AGM) on 31 January 2006);
• Mr S Huismans (who retired from the Board at the AGM);
• Dr P H Jungels;
• Mr C F Knott (appointed 6 September 2006);
• Ms S E Murray (appointed 31 January 2006); and
• Mr D W Thursfield (resigned 28 October 2005).
Mr G Davis (Chief Executive) and, since stepping down from the Committee, Mr D C Bonham (Board Chairman) are invited to attend to respond to questions raised by the Committee. Mr M R Phillips (Company Secretary) also attends meetings as secretary to the Committee. However, they are all specifically excluded from any matter concerning the details of their own remuneration.
Advisers to the Remuneration Committee
The Committee sets the remuneration package for each Executive Director and member of the Chief Executive’s Committee after taking advice principally from external sources, including remuneration consultants Hewitt Bacon & Woodrow Limited and Towers Perrin, both of whom are engaged by the Committee as required. Hewitt Bacon & Woodrow Limited also review the Group’s remuneration principles and practices against corporate governance best practice. Neither provide any other services for the Group.
Executive remuneration data provided by KPMG (engaged by the Committee as required and having provided tax and other consultancy services to the Group) and Towers Perrin have also been used to assist in benchmarking processes ensuring the consistent application of the executive remuneration policy.
Ms K A Brown (Group Human Resources Director) and Mr D P Cuthbert (Group Compensation and Benefits Manager) also provide internal support and advice to the Committee.
Solicitors Allen & Overy LLP have been retained by the Company to provide legal advice in respect of the Group’s share plans and to provide services to the Committee as and when required. The firm also provides other legal services to the Group as a whole.
The Company has appointed Alithos Limited to undertake Total Shareholder Return (TSR) calculations and provide advice on all TSR related matters. Alithos Limited provides no other services for the Group.
PricewaterhouseCoopers LLP, the Group’s Auditors, certify Earnings Per Share (EPS) calculations used in the Group’s share plans prior to awards vesting.
Responsibilities
The Board is ultimately responsible for the framework and cost of executive remuneration but has delegated to the Remuneration Committee, within its terms of reference, responsibility for the following activities:
• determination of the remuneration levels and conditions of service for Executive Directors, Chairman and members of the Chief Executive’s Committee;
• oversight of the overall policy for senior management remuneration;
• oversight of the Group’s employee share or cash-based incentive plans including approval of minor rule amendments, invitations and awards and the allocation or issue of shares or payments under any such plans; and
• approval of the form and content of the Directors’ Remuneration Report, prior to submission to the shareholders at the AGM.
52
During the year the most significant issues addressed by the Committee were:
• amendments to the share plan rules to take account of the Age Discrimination Act;
• review of executive pension arrangements following the recent pension reforms in the UK;
• annual review of the operation, performance conditions, vesting schedules, comparator groups and grant levels of awards under the Group’s share plans, to ensure that they remain appropriate in light of the Group’s current performance and prospects and aligned with the strategy and objectives of the Group;
• determination of bonus performance criteria and review of performance against the selected criteria prior to bonus payment; and
• oversight of the negotiations/administration of the agreed settlement with Mr B C Davidson.
The Committee’s approach is fully consistent with the Group’s overall remuneration strategy and philosophy that all employees should be competitively rewarded to attract and retain their valued skills in the business, as well as supporting corporate strategy, by directly aligning executive management reward with the Group’s strategic business goals.
Remuneration strategy
Imperial Tobacco Group PLC operates in a highly competitive, international environment. For the Group to continue to compete successfully it is essential that the level of remuneration and benefits offered achieves the objectives of attracting, developing, retaining and motivating the necessary high quality pool of talented employees at all levels across the Group. The Group therefore sets out to provide competitive remuneration to all its employees, appropriate to the business environment in the countries in which it operates. The Remuneration Committee maintains an overview of the remuneration policy for all employees, including arrangements for progression and succession planning.
The Group’s remuneration arrangements not only align with the Group’s fundamental values of fairness, competitiveness and equity but also support the Group’s corporate strategy, a significant contributor to its competitive advantage. The Group continues to relocate employees internationally to facilitate their development, and thus the Company’s pool of talent, and to achieve the optimum balance of experience within each of the Group’s subsidiaries. A cohesive reward structure across the Group is critical in ensuring that all employees can associate with, and strive for, the Group’s strategic goals. During the year this structure was consistently applied to all employees and communicated to ensure each element of the package is understood and the links to corporate performance recognised. To assist in this communication senior employees were issued with total reward statements.
The Group strives to align the interests of shareholders and employees at all levels by giving employees the opportunity and encouragement to build a shareholding in Imperial Tobacco Group PLC. Through a series of employee share plans the majority of employees of the Company and its subsidiaries have been offered participation in one or more equity-based plans with in excess of 42 per cent of the eligible population participating in one or more of those plans.
Executive remuneration policy
The Remuneration Committee determines the remuneration package for Executive Directors and members of the Chief Executive’s Committee. The package is designed to attract and retain high quality executives, induce loyalty and motivate them to achieve a high level of corporate performance in line with the best interests of shareholders, while not being excessive. The executive remuneration policy is set to provide base salary at around the median level of the comparator group, as set out below, while providing the Executive Directors and Chief Executive’s Committee members with the capacity to earn upper quartile total compensation on achievement of superior business performance.
The executive remuneration policy combines short term and long term rewards focusing on, and significantly weighted towards, performance-related elements that take into account individual, functional and corporate performance. The main components are base salary, annual cash bonus, share matching scheme (SMS), long term incentive plan (LTIP) and pension benefits. In the financial year to 30 September 2006, base salary typically represented around 28 per cent of total remuneration for the Chief Executive and Finance Director and around 37 per cent of total remuneration for the other Executive Directors with annual bonus and awards vesting under SMS and LTIP making up the balance.
53
Percentage of Total Remuneration
for the financial year to 30 September 2006
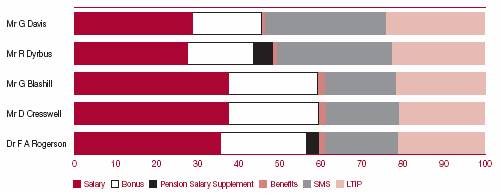
From the financial year ended September 2004, following a comprehensive remuneration review carried out during that year, more stringent performance criteria have been and continue to be applied to the performance-related elements, as detailed in the annual cash bonus and LTIP sections below and on page 57 both of which form part of this policy statement.
In September 2006 the Remuneration Committee reviewed the executive remuneration policy, including award policies, performance criteria, relevant comparator groups and vesting schedules. The Committee is satisfied that these remain appropriate and support the strategy and objectives of the Group, including the creation of shareholder value.
Key Elements of Directors Remuneration Package in the financial year to 30 September 2006
Element |
| Objective |
| Award level |
| Performance criteria |
| Performance period |
|
|
|
|
|
|
|
|
|
Base salary. |
| Reward high performing employees reflecting market value of role and individual’s skills and experience. |
| Median of FTSE 50 excluding companies in the Financial and Pharmaceutical sectors. |
| N/A. |
| N/A. |
|
|
|
|
|
|
|
|
|
Annual cash bonus. |
| Incentivise delivery of Group objectives. |
| Maximum percentage of base salary: |
| Group adjusted profit before tax and incremental financial performance (Group adjusted profit before tax, sales volume growth and gross margins.) |
| 1 year. |
|
|
|
|
|
|
|
|
|
Share matching scheme. |
| Incentivise delivery of improved Group adjusted EPS and align with interests of shareholders. |
| May elect to invest some or all of gross bonus in shares. These can be matched on a 1:1 basis. |
| Adjusted EPS growth. |
| 3 years. |
|
|
|
|
|
|
|
|
|
Long term incentive plan. |
| Incentivise long term delivery of TSR and adjusted EPS and align with interests of shareholders. |
| Percentage of base salary: |
| 3 elements – |
| 3 years. |
Base salary
Base salary is reviewed annually and is determined by the Remuneration Committee following detailed consideration of a number of factors including individual responsibilities, performance and external market data. It is set within a range around the market median of the comparator group to reflect the experience, responsibility, effectiveness and market value of the relevant executive. The comparator group of companies chosen remains the FTSE 50 excluding companies in the Financial and Pharmaceutical sectors. Base salary is the only element of the package used to determine pensionable earnings.
Annual cash bonus
For the financial year ended 30 September 2006 the potential maximum bonus was 100 per cent of base salary for the Chief Executive and Finance Director and 75 per cent for other Executive Directors. For all Executive Directors potential bonus, to a level representing 662/3 per cent of base salary, related to achievement of performance criteria based on Group adjusted profit before tax, set at the beginning of the financial year. The attainment of bonus in excess of this level was subject to achievement of additional stretching and incremental performance criteria relating to Group adjusted profit before tax, sales volume growth and gross margins. The specific targets are not, however, disclosed as they are considered to be commercially confidential.
54
Performance in the financial year has resulted in bonuses, as detailed in the table on page 56, being awarded to Executive Directors. These payments represented 58.0 per cent of base salary in respect of the Chief Executive and Finance Director and 58.0 per cent in respect of the other Executive Directors. Cash bonuses were also earned by other senior management for achieving relevant performance targets for the financial year to 30 September 2006.
For the financial year ending 30 September 2007 the Remuneration Committee has determined that the potential maximum bonus remains 100 per cent of base salary for the Chief Executive and Finance Director and 75 per cent for other Executive Directors. The performance criterion will, however, be changed to being based on adjusted Earnings Per Share growth as, given the Group’s current share buyback programme, adjusted Earnings Per Share reflects both the cost and benefit of the buyback programme, encouraging share buyback efficiency and further aligning Executives’ interests with those of shareholders.
No element of the bonus is guaranteed.
The Executive Directors may elect to invest up to the maximum of their gross bonus in the SMS as detailed on page 61.
Directors’ Emoluments for the Year Ended 30 September 2006 (audited)
|
| 2006 |
| 2005 |
|
|
| £’000 |
| £’000 |
|
Executive Directors |
|
|
|
|
|
Salary |
| 2,313 |
| 1,964 |
|
Benefits |
| 85 |
| 76 |
|
Pension Salary Supplement |
| 116 |
| — |
|
Bonus |
| 1,341 |
| 1,367 |
|
LTIP annual vesting(1) |
| 1,788 |
| 1,823 |
|
SMS vesting(2) |
| 1,669 |
| 1,650 |
|
|
| 7,312 |
| 6,880 |
|
Non-Executive Directors |
|
|
|
|
|
Fees |
| 700 |
| 601 |
|
Benefits |
| 5 |
| 7 |
|
Reemtsma Supervisory Boards |
| 7 |
| 22 |
|
|
| 712 |
| 630 |
|
Former Executive Directors |
|
|
|
|
|
Consultancy fees to former Executive Director |
| 106 |
| 100 |
|
Reemtsma Supervisory Boards |
| 22 |
| 22 |
|
Contractual settlement of former Executive Director |
| 702 |
| 305 |
|
LTIP vesting(1) |
| 360 |
| — |
|
SMS vesting(2) |
| 330 |
| — |
|
Benefits |
| — |
| 16 |
|
|
| 1,520 |
| 443 |
|
Fees of former Non-Executive Directors |
|
|
|
|
|
Reemtsma Supervisory Boards |
| 15 |
| — |
|
|
| 15 |
| — |
|
Total remuneration |
| 9,559 |
| 7,953 |
|
|
|
|
|
|
|
Chief Executive’s Committee |
|
|
|
|
|
Salary |
| 735 |
| 877 |
|
Benefits |
| 28 |
| 37 |
|
Bonus |
| 448 |
| 609 |
|
LTIP annual vesting(1) |
| 322 |
| 273 |
|
SMS annual vesting(2) |
| 197 |
| 307 |
|
|
| 1,730 |
| 2,103 |
|
(1) Value of LTIP shares vesting in the year, based on the closing share price on the day of exercise.
(2) Value of SMS shares vesting on maturity based on the closing share price on the day of vesting.
(3) The IFRS 2 charge to the Income Statement in respect of the share-based payments of the Executive Directors and the Chief Executive’s Committee members is £3.0m (2005 £2.6m).
55
Emoluments by individual Director (audited)
|
|
|
|
|
|
|
|
|
|
|
|
|
|
|
|
|
|
|
|
|
|
|
| Base |
|
|
|
|
|
|
|
|
|
|
| Pension |
|
|
|
|
|
|
|
|
|
|
|
|
| Salary/ |
|
|
| Base |
|
|
| Supervisory |
|
|
| Salary |
| Benefits in |
|
|
|
|
|
|
| Total |
| Total |
| Fees from |
|
|
| salary |
| Fees |
| Board fees |
| Bonus |
| Supplement(1) |
| kind(2) |
| Sub total |
| LTIP(3) |
| SMS(3) |
| 2006 |
| 2005 |
| 1/10/2006 |
|
|
| £’000 |
| £’000 |
| £’000 |
| £’000 |
| £’000 |
| £’000 |
| £’000 |
| £’000 |
| £’000 |
| £’000 |
| £’000 |
| £’000 |
|
Executive Directors |
|
|
|
|
|
|
|
|
|
|
|
|
|
|
|
|
|
|
|
|
|
|
|
|
|
Mr G Davis, Chief Executive |
| 780 |
| — |
| — |
| 452 |
| — |
| 21 |
| 1,253 |
| 793 |
| 654 |
| 2,700 |
| 2,720 |
| 835 |
|
Mr R Dyrbus, |
| 495 |
| — |
| — |
| 287 |
| 87 |
| 16 |
| 885 |
| 502 |
| 410 |
| 1,797 |
| 1,712 |
| 530 |
|
Mr G L Blashill(5), |
| 328 |
| — |
| — |
| 190 |
| — |
| 15 |
| 533 |
| 150 |
| 193 |
| 876 |
| — |
| 390 |
|
Mr D Cresswell, |
| 355 |
| — |
| — |
| 206 |
| — |
| 17 |
| 578 |
| 167 |
| 200 |
| 945 |
| 923 |
| 380 |
|
Dr F A Rogerson, |
| 355 |
| — |
| — |
| 206 |
| 29 |
| 16 |
| 606 |
| 176 |
| 212 |
| 994 |
| 945 |
| 380 |
|
Mr B C Davidson(10), |
| — |
| — |
| — |
| — |
| — |
| — |
| — |
| — |
| — |
| — |
| 580 |
| — |
|
|
| 2,313 |
| — |
| — |
| 1,341 |
| 116 |
| 85 |
| 3,855 |
| 1,788 |
| 1,669 |
| 7,312 |
| 6,880 |
| 2,515 |
|
Non-Executive Directors |
|
|
|
|
|
|
|
|
|
|
|
|
|
|
|
|
|
|
|
|
|
|
|
|
|
Mr D C Bonham, Chairman |
| — |
| 300 |
| — |
| — |
| — |
| 2 |
| 302 |
| — |
| — |
| 302 |
| 262 |
| 300 |
|
Mr I J G Napier, Joint Vice Chairman |
| — |
| 85 |
| — |
| — |
| — |
| — |
| 85 |
| — |
| — |
| 85 | (4) | 66 |
| 85 |
|
Mr A G L Alexander, Joint Vice Chairman |
| — |
| 75 |
| — |
| — |
| — |
| 3 |
| 78 |
| — |
| — |
| 78 |
| 80 |
| 75 |
|
Dr K M Burnett(6) |
| — |
| 21 |
| — |
| — |
| — |
| — |
| 21 |
| — |
| — |
| 21 |
| — |
| 50 |
|
Mr C R Day |
| — |
| 57 |
| — |
| — |
| — |
| — |
| 57 |
| — |
| — |
| 57 | (4) | 7 |
| 60 |
|
Mr S P Duffy(8) |
| — |
| 20 |
| — |
| — |
| — |
| — |
| 20 |
| — |
| — |
| 20 | (4) | 40 |
| N/A |
|
Mr S Huismans(8) |
| — |
| 17 |
| 7 |
| — |
| — |
| — |
| 24 |
| — |
| — |
| 24 |
| 62 |
| N/A |
|
Dr P H Jungels |
| — |
| 50 |
| — |
| — |
| — |
| — |
| 50 |
| — |
| — |
| 50 |
| 40 |
| 50 |
|
Mr C F Knott(6) |
| — |
| 21 |
| — |
| — |
| — |
| — |
| 21 |
| — |
| — |
| 21 |
| — |
| 50 |
|
Ms S E Murray |
| — |
| 50 |
| — |
| — |
| — |
| — |
| 50 |
| — |
| — |
| 50 |
| 33 |
| 50 |
|
Mr D W Thursfield(11) |
| — |
| 4 |
| — |
| — |
| — |
| — |
| 4 |
| — |
| — |
| 4 |
| 40 |
| N/A |
|
|
| — |
| 700 |
| 7 |
| — |
| — |
| 5 |
| 712 |
| — |
| — |
| 712 |
| 630 |
| 720 |
|
Former Directors |
|
|
|
|
|
|
|
|
|
|
|
|
|
|
| — |
| — |
|
|
|
|
|
|
|
Mr B C Davidson(10) |
| 702 |
| — |
| — |
| — |
| — |
| — |
| 702 |
| 360 |
| 330 |
| 1,392 |
| 77 |
|
|
|
Mr M A Häussler(7) |
| — |
| — |
| — |
| — |
| — |
| — |
| — |
| — |
| — |
| — |
| 244 |
|
|
|
Mr S Huismans(8) |
| — |
| — |
| 15 |
| — |
| — |
| — |
| 15 |
| — |
| — |
| 15 |
| — |
|
|
|
Mr S T Painter(9) |
| — |
| 106 |
| 22 |
| — |
| — |
| — |
| 128 |
| — |
| — |
| 128 |
| 122 |
|
|
|
|
| 702 |
| 106 |
| 37 |
| — |
| — |
| — |
| 845 |
| 360 |
| 330 |
| 1,535 |
| 443 |
|
|
|
|
| 3,015 |
| 806 |
| 44 |
| 1,341 |
| 116 |
| 90 |
| 5,412 |
| 2,148 |
| 1,999 |
| 9,559 |
| 7,953 |
|
|
|
(1) Further details are contained in the Executive Directors’ pension section on page 64.
(2) Benefits in kind principally include the provision of a company car and health insurance.
(3) LTIP and SMS represent the value of awards vesting and LTIP options exercised in the year both on annual vesting and under early leaver provisions.
(4) Includes payment in respect of chairmanship of Board Committees at an annual rate of £10,000.
(5) Mr G L Blashill was appointed to the Board on 28 October 2005.
(6) Dr K M Burnett and Mr C F Knott were appointed to the Board on 19 April 2006.
(7) Mr M A Häussler resigned from the Board on 9 July 2003 but remained an employee receiving his full contractual remuneration until his resignation from employment on 30 April 2005.
(8) Messrs S P Duffy and S Huismans retired from the Board on 31 January 2006. However, Mr S Huismans continues to receive fees in connection with his appointments to Supervisory Boards within the Reemtsma Group.
(9) Mr S T Painter retired from the Board on 31 May 2000 but receives fees on a consultancy basis and in connection with his appointments to Supervisory Boards within the Reemtsma Group.
(10) Mr B C Davidson resigned from the Board on 9 February 2005 and subsequently left the Company on 30 April 2005. Under the terms of his agreed settlement Mr B C Davidson received a payment of £702,000. This payment, which comprised base salary in lieu of notice plus other contractual payments, was subject to his duty to mitigate his loss and was paid in instalments, monthly in arrears. It was subject to Mr Davidson confirming to the Company, in writing, that he had not received emoluments from any other employment. In addition Mr B C Davidson’s company car was transferred to him and his rights under the LTIP and SMS vested on a time pro-rata basis to his date of leaving employment. This represented his contractual entitlement.
(11) Mr D W Thursfield resigned from the Board on 28 October 2005.
(12) No sums were paid to any Director by way of taxable expenses allowances.
56
Directors’ interests in shares (beneficial, family and any connected persons interests) (audited)
|
|
|
|
|
|
|
|
|
| Contingent rights to ordinary shares |
|
|
|
|
| ||
|
| Ordinary shares |
| Sharesave options |
| (LTIP and SMS shares) |
| Total interests |
| ||||||||
|
| 1/10/05(1) |
| 30/9/06(2) |
| 1/10/05(1) |
| 30/9/06(2) |
| 1/10/05(1) |
| 30/9/06(2) |
| 1/10/05(1) |
| 30/9/06(2) |
|
Executive Directors |
|
|
|
|
|
|
|
|
|
|
|
|
|
|
|
|
|
Mr G Davis |
| 319,181 |
| 330,289 |
| 1,979 |
| 1,979 |
| 250,036 |
| 291,791 |
| 571,196 |
| 624,059 |
|
Mr R Dyrbus |
| 206,703 |
| 213,944 |
| 1,049 |
| 776 |
| 158,527 |
| 170,047 |
| 366,279 |
| 384,767 |
|
Mr G L Blashill |
| 85,224 |
| 90,885 |
| 807 |
| 807 |
| 59,550 |
| 71,646 |
| 145,581 |
| 163,338 |
|
Mr D Cresswell |
| 89,861 |
| 89,894 |
| 2,008 |
| 2,008 |
| 91,567 |
| 104,650 |
| 183,436 |
| 196,552 |
|
Dr F A Rogerson |
| 84,093 |
| 88,831 |
| 2,008 |
| 2,008 |
| 93,274 |
| 105,080 |
| 179,375 |
| 195,919 |
|
Non-Executive Directors |
|
|
|
|
|
|
|
|
|
|
|
|
|
|
|
|
|
Mr D C Bonham |
| 124,600 |
| 124,600 |
| — |
| — |
| — |
| — |
| 124,600 |
| 124,600 |
|
Mr I J G Napier |
| 3,662 |
| 4,305 |
| — |
| — |
| — |
| — |
| 3,662 |
| 4,305 |
|
Mr A G L Alexander |
| 132,710 |
| 132,710 |
| — |
| — |
| — |
| — |
| 132,710 |
| 132,710 |
|
Dr K M Burnett |
| — |
| 134 |
| — |
| — |
| — |
| — |
| — |
| 134 |
|
Mr C R Day |
| 621 |
| 1,016 |
| — |
| — |
| — |
| — |
| 621 |
| 1,016 |
|
Mr S P Duffy |
| 8,825 |
| 8,825 |
| — |
| — |
| — |
| — |
| 8,825 |
| 8,825 |
|
Mr S Huismans |
| 5,820 |
| 5,820 |
| — |
| — |
| — |
| — |
| 5,820 |
| 5,820 |
|
Dr P H Jungels |
| 2,362 |
| 2,684 |
| — |
| — |
| — |
| — |
| 2,362 |
| 2,684 |
|
Mr C F Knott |
| — |
| 134 |
| — |
| — |
| — |
| — |
| — |
| 134 |
|
Ms S E Murray |
| 400 |
| 722 |
| — |
| — |
| — |
| — |
| 400 |
| 722 |
|
Mr D W Thursfield |
| 856 |
| 856 |
| — |
| — |
| — |
| — |
| 856 |
| 856 |
|
(1) Or date of appointment if later.
(2) Or date of resignation if earlier.
There have been no changes in these holdings since 30 September 2006.
Executive share retention
To ensure the interests of management are aligned with those of shareholders, Executive Directors and senior management are required to meet minimum shareholding guidelines. Over a period of five years from appointment they are required to build a holding in the Group’s shares to a current minimum value broadly equivalent to three times base salary for the Chief Executive and Finance Director and twice base salary in respect of the other Executive Directors. Other senior management are expected to invest at a level equivalent to between once and twice base salary, dependent upon grade. Failure to meet the minimum shareholding is taken into account when determining eligibility for future LTIP awards. All Executive Directors currently exceed their required shareholding.
Long Term Incentive Plan (LTIP)
Annual awards are made under the LTIP to Executive Directors and other senior management. These awards, which vest three years after grant, are subject to the satisfaction of performance criteria over a three year performance period. All grants are at the discretion of the Remuneration Committee and no employee has a right to receive any such grant.
Awards granted prior to November 2005 were equivalent to 75 per cent of basic salary for all Executive Directors and at a lower level for other senior management. Following a comprehensive remuneration review in 2004 and subsequent shareholder approval at the 2005 AGM, awards made in November 2005 were equivalent to 200 per cent of base salary for the Chief Executive, 150 per cent for the Finance Director and 100 per cent for the other Executive Directors with awards at a lower level for other senior management.
Current structure
The performance criteria for the November 2005 and proposed future awards are split into three elements as follows:
First element
50 per cent of the award with a performance criterion based on average growth in basic Earnings Per Share adjusted for certain items based on an agreed protocol, such as significant costs of restructuring (EPS). The adjustments are confirmed by the Auditors after adjusting for inflation over the period of the award. 12.5 per cent of this element (i.e. 6.25 per cent of the total award) vests if average annual EPS growth, after adjusting for UK inflation (Real Annual EPS Growth), equals three per cent and 100 per cent of this element (i.e. 50 per cent of the total award) vests if Real Annual EPS Growth equals or exceeds 10 per cent. Between these two points this element vests on a straight-line basis.
Second element
25 per cent of the award with a performance criterion based on Total Shareholder Return (TSR) relative to the FTSE 100 Index as described below.
57
The performance criterion for this element is based on a sliding scale depending on TSR achieved over the period of the award. No vesting of this element occurs unless the Company’s TSR ranks it in the top 50 of the companies constituting the FTSE 100 Index. At this performance threshold 30 per cent of this element (i.e. 7.5 per cent of the total award) vests. If the return ranks the Company in the top 25 of the Index, this element (i.e. 25 per cent of the total award) vests in full. Between these thresholds this element vests on a straight-line basis.
Third element
25 per cent of the award with a performance criterion based on TSR relative to a bespoke comparator group as described below.
The performance criterion for this element is also based on a sliding scale depending on TSR achieved over the period of the award. No vesting of this element occurs unless the Company’s TSR exceeds that of the bottom six companies constituting the comparator group comprising 12 tobacco and alcohol companies as detailed below. At this performance threshold, 30 per cent of this element (i.e. 7.5 per cent of the total award) vests. If the return ranks the Company in the top three of the comparator group, this element (i.e. 25 per cent of the total award) vests in full. Between these thresholds this element vests on a straight-line basis.
Altadis S A |
| Altria Group Inc |
| British American Tobacco PLC |
| Carlsberg A/S |
Diageo PLC |
| Gallaher Group PLC |
| Imperial Tobacco Group PLC |
| Interbrew SA |
Pernod Ricard SA |
| Reynolds American Inc |
| SABMiller PLC |
| Scottish & Newcastle PLC |
If one of the comparator group companies is acquired prior to the granting of an award a suitable replacement will be made. For any corporate actions affecting a comparator group company during an award period the intention would be to mirror the actions of a passive investor, e.g. for an equity bid the new shares offered in exchange for the original company would be held for the remainder of the award period.
The TSR calculations use share prices averaged over a period of three months to determine the initial and closing prices rather than those ruling on a single day. It is assumed that the cash flow of dividend payments is recognised on the date the shares are declared ex dividend. This method is considered to give a fairer and less volatile result as improved performance has to be sustained for several weeks before it effectively impacts on the TSR calculations. All share prices and dividend flows are converted to sterling on the applicable date to ensure that the calculations reflect the return achievable by a UK based investor.
The TSR calculations themselves are performed independently by Alithos Limited.
Each element operates independently and is capable of vesting regardless of the Company’s performance in respect of the other elements.
During the year the Remuneration Committee reviewed the performance criteria, award policy, comparator groups and vesting schedules for LTIP awards and decided that the three elements remain the most important measures that drive and measure sustainable improvement in shareholder value. The TSR criteria reflect comparative performance against the appropriate FTSE sector and the bespoke comparator group of companies. The EPS criterion reflects a key part of the Group’s strategy to create sustainable shareholder value.
Awards outstanding under the historic structure
For awards granted between December 2000 and November 2004, EPS growth was the sole performance criterion. This was seen as focusing on the financial performance of the business, over which Directors and senior management could exercise influence.
These awards vest on a sliding scale depending on average growth in basic Earnings Per Share adjusted under the terms of the protocol described above. The EPS calculations are confirmed by the Auditors. No vesting occurs unless the Company’s Real Annual EPS Growth exceeds three per cent. Full vesting occurs if Real Annual EPS Growth is equal to or exceeds 10 per cent. Between these two points the award vests on a straight-line basis.
In respect of the award which vested in November 2005, no vesting occurred unless Real Annual EPS Growth was positive and full vesting occurred if Real Annual EPS Growth was equal to or exceeded 10 per cent.
Vesting of awards
On vesting a participant is granted a “nil cost” option to acquire the relevant number of shares. The option may be exercised at any time up to the seventh anniversary of its date of grant.
There is no opportunity to re-test if any of the performance criteria are not achieved.
The Remuneration Committee has absolute discretion to vary, but not increase, the extent to which any awards vest to ensure they only vest, and at an appropriate level, if there has been an improvement in the underlying financial performance of the Company, including the maintenance of long term return on capital employed.
Under the LTIP Rules, in the event that Imperial Tobacco Group PLC is acquired, the relevant performance period would come to an end on the date of acquisition. Any outstanding awards would vest on a time pro-rata basis, subject to the achievement of the applicable performance criteria.
58
Award summary
Award Years |
| Award as Percentage of Base Salary |
| Performance Criteria |
1996 – 1999 |
| 75 for all Executive Directors |
| 100 per cent on TSR |
2000 – 2004 |
| 75 for all Executive Directors |
| 100 per cent on EPS |
2005 onwards |
| • 200 for Chief Executive; |
| • 50 per cent on EPS; |
|
| • 150 for Finance Director; |
| • 25 per cent on TSR against FTSE 100; |
|
| • 100 for other Executive Directors |
| • 25 per cent on TSR against comparator group |
Executive Directors’ conditional share awards under the Long Term Incentive Plan (audited)
|
|
|
|
|
|
|
|
|
|
|
|
|
|
|
|
|
|
|
| Performance |
|
|
|
|
|
|
|
|
| Market price |
|
|
|
|
| Market price |
| Amount |
|
|
| period |
|
|
| Balance at |
| Granted |
|
|
| at date of |
| Vested during |
| Market price at |
| at date of |
| realised on |
| Balance at |
| November– |
|
|
| 1/10/05(1) |
| during year |
| Date of grant |
| grant |
| year |
| date of vesting |
| exercise |
| exercise |
| 30/9/06 |
| November |
|
|
|
|
|
|
|
|
| £ |
|
|
| £ |
| £ |
| £’000 |
|
|
|
|
|
Mr G Davis |
| 46,923 |
| — |
| 25/11/02 |
| 9.59 |
| (46,923 | ) | 17.14 |
| 16.90 |
| 793 |
| — |
| 2002-2005 |
|
|
| 47,872 |
| — |
| 18/11/03 |
| 10.34 |
| — |
| — |
| — |
| — |
| 47,872 |
| 2003-2006 |
|
|
| 42,513 |
| — |
| 9/11/04 |
| 12.79 |
| — |
| — |
| — |
| — |
| 42,513 |
| 2004-2007 |
|
|
| — |
| 96,594 |
| 2/11/05 |
| 16.15 |
| — |
| — |
| — |
| — |
| 96,594 |
| 2005-2008 |
|
|
| 137,308 |
| 96,594 |
|
|
|
|
| (46,923 | ) |
|
|
|
|
|
| 186,979 |
|
|
|
Mr R Dyrbus |
| 29,718 |
| — |
| 25/11/02 |
| 9.59 |
| (29,718 | ) | 17.14 |
| 16.90 |
| 502 |
| — |
| 2002-2005 |
|
|
| 30,464 |
| — |
| 18/11/03 |
| 10.34 |
| — |
| — |
| — |
| — |
| 30,464 |
| 2003-2006 |
|
|
| 26,974 |
| — |
| 9/11/04 |
| 12.79 |
| — |
| — |
| — |
| — |
| 26,974 |
| 2004-2007 |
|
|
| — |
| 45,975 |
| 2/11/05 |
| 16.15 |
| — |
| — |
| — |
| — |
| 45,975 |
| 2005-2008 |
|
|
| 87,156 |
| 45,975 |
|
|
|
|
| (29,718 | ) |
|
|
|
|
|
| 103,413 |
|
|
|
Mr G L Blashill |
| 8,863 |
| — |
| 25/11/02 |
| 9.59 |
| (8,863 | ) | 17.14 |
| 16.90 |
| 150 |
| — |
| 2002-2005 |
|
|
| 9,912 |
| — |
| 18/11/03 |
| 10.34 |
| — |
| — |
| — |
| — |
| 9,912 |
| 2003-2006 |
|
|
| 8,600 |
| — |
| 9/11/04 |
| 12.79 |
| — |
| — |
| — |
| — |
| 8,600 |
| 2004-2007 |
|
|
| — |
| 21,981 |
| 2/11/05 |
| 16.15 |
| — |
| — |
| — |
| — |
| 21,981 |
| 2005-2008 |
|
|
| 27,375 |
| 21,981 |
|
|
|
|
| (8,863 | ) |
|
|
|
|
|
| 40,493 |
|
|
|
Mr D Cresswell |
| 9,906 |
| — |
| 25/11/02 |
| 9.59 |
| (9,906 | ) | 17.14 |
| 16.90 |
| 167 |
| — |
| 2002-2005 |
|
|
| 21,760 |
| — |
| 18/11/03 |
| 10.34 |
| — |
| — |
| — |
| — |
| 21,760 |
| 2003-2006 |
|
|
| 19,351 |
| — |
| 9/11/04 |
| 12.79 |
| — |
| — |
| — |
| — |
| 19,351 |
| 2004-2007 |
|
|
| — |
| 21,981 |
| 2/11/05 |
| 16.15 |
| — |
| — |
| — |
| — |
| 21,981 |
| 2005-2008 |
|
|
| 51,017 |
| 21,981 |
|
|
|
|
| (9,906 | ) |
|
|
|
|
|
| 63,092 |
|
|
|
Dr F A Rogerson |
| 10,427 |
| — |
| 25/11/02 |
| 9.59 |
| (10,427 | ) | 17.14 |
| 16.90 |
| 176 |
| — |
| 2002-2005 |
|
|
| 21,760 |
| — |
| 18/11/03 |
| 10.34 |
| — |
| — |
| — |
| — |
| 21,760 |
| 2003-2006 |
|
|
| 19,351 |
| — |
| 9/11/04 |
| 12.79 |
| — |
| — |
| — |
| — |
| 19,351 |
| 2004-2007 |
|
|
| — |
| 21,981 |
| 2/11/05 |
| 16.15 |
| — |
| — |
| — |
| — |
| 21,981 |
| 2005-2008 |
|
|
| 51,538 |
| 21,981 |
|
|
|
|
| (10,427 | ) |
|
|
|
|
|
| 63,092 |
|
|
|
(1) Or date of appointment if later.
There have been no changes in any Directors’ awards since 30 September 2006.
During the year, the November 2002 – November 2005 award vested in full. Real Annual EPS Growth over the period averaged 19.20 per cent, exceeding the average 10 per cent threshold at which the award maximised.
59
In respect of the November 2003 – November 2006 award, based on EPS to the end of the financial year, 100 per cent of the award will vest on 18 November 2006. For illustrative purposes only, the share price on 27 October 2006, being the latest practicable date prior to publication, was £18.54 valuing the awards as follows:
|
|
|
| Award vesting |
|
|
|
|
| Award lapsing |
| No. of shares over |
| Award vesting |
|
|
| No. of shares |
| which option granted |
| Illustrative value |
|
|
|
|
|
|
| £’000 |
|
Mr G Davis |
| — |
| 47,872 |
| 888 |
|
Mr R Dyrbus |
| — |
| 30,464 |
| 565 |
|
Mr G L Blashill |
| — |
| 9,912 |
| 184 |
|
Mr D Cresswell |
| — |
| 21,760 |
| 403 |
|
Dr F A Rogerson |
| — |
| 21,760 |
| 403 |
|
The value of any awards vesting could vary significantly from that shown due to share price movements.
The Remuneration Committee regards the November 2004 – November 2007 and the November 2005 – November 2008 awards to be too distant from maturity to be included in the value projected above.
However, in respect of the 2004 – 2007 award, the adjusted Real Average EPS Growth was 8.7 per cent in the performance period to the end of September 2006 and, therefore, if this performance were maintained over the relevant performance period, there would be partial vesting of 77.1 per cent of the award.
In respect of the 2005 – 2008 award, the first with the three part performance criteria, based upon interim measurement calculations prepared as at 30 September 2006 partial vesting of 38.6 per cent of the first element would occur if this performance were maintained over the relevant performance period. The second and third elements will lapse if the current performance is maintained over the relevant performance period.
The illustrative values based on the above share price and performance criteria are as follows;
|
| Potential awards vesting |
| ||||||
|
| November 2007 |
| November 2008 |
| ||||
|
| No. of shares |
| Illustrative value |
| No. of shares |
| Illustrative value |
|
|
|
|
| £’000 |
|
|
| £’000 |
|
|
|
|
|
|
|
|
|
|
|
Mr G Davis |
| 32,795 |
| 608 |
| 18,629 |
| 345 |
|
Mr R Dyrbus |
| 20,808 |
| 386 |
| 8,867 |
| 164 |
|
Mr G L Blashill |
| 6,634 |
| 123 |
| 4,239 |
| 79 |
|
Mr D Cresswell |
| 14,927 |
| 277 |
| 4,239 |
| 79 |
|
Dr F A Rogerson |
| 14,927 |
| 277 |
| 4,239 |
| 79 |
|
Evidence of the Group’s sustained performance on a TSR basis when compared with the FTSE 100 Index is set out below.

The FTSE 100 Index is seen to provide the most appropriate and widely recognised index for benchmarking the corporate performance of the Company, which is a constituent of that index and reflects the benchmark index used as an LTIP performance criterion.
60
Share Matching Scheme (SMS)
Annual scheme
Under the SMS the Remuneration Committee at its absolute discretion invites Executive Directors and the majority of the Group’s management to invest any proportion of their gross bonus in Imperial Tobacco Group PLC Ordinary Shares to be held by a nominee managed by the Employee Benefit Trust. Provided that the shares lodged are left with the nominee for three years and the participant remains an employee in the Group, they will be matched on a one for one basis.
However, in respect of investments made by Executive Directors under the SMS from their bonus paid in December 2003 and for future years, a performance criterion will be applied to the matched shares such that matching will only occur if the Group has achieved Real Average EPS Growth in excess of three per cent after adjusting for UK inflation over the three year retention period, being an indicator of sustained ongoing profit delivery. Achievement measurement is based on the same protocol as that applying to the LTIP. There is no opportunity to re-test if this performance criterion is not met. In setting the performance criterion for SMS awards, the Remuneration Committee decided that EPS reflects a key part of the Group’s strategy to create sustainable shareholder value. Under the scheme Rules, should Imperial Tobacco Group PLC be acquired, the performance period would come to an end on the date of acquisition. Any outstanding awards would vest on a time pro-rata basis, subject to the achievement of the applicable performance criterion.
Centenary scheme
To encourage employees to acquire and retain a shareholding, and to mark the centenary of the founding of The Imperial Tobacco Company (of Great Britain and Ireland) Limited, all employees of the Company and its wholly owned subsidiaries employed on 10 December 2001, the date of the centenary, were invited to purchase up to £3,000 worth of Imperial Tobacco Group PLC Ordinary Shares and lodge them with the Employee Benefit Trust or its nominee. Provided these shares are left with the Trust and the participant remains an employee in the Group, the shares will be matched on a sliding scale from 20 per cent for one year’s retention to a maximum of 100 per cent if they are retained for the full five years to 12 August 2007.
61
The Executive Directors’ rights to shares arising under both SMS schemes are set out below:
Executive Directors’ contingent rights to shares under the Share Matching Scheme (audited)
|
|
|
|
|
| Market price at |
|
|
| Market price at |
|
|
|
|
|
|
|
|
| Balance at |
| Contingent |
| date of grant |
| Vested |
| date of vesting |
| Amount realised |
| Balance at |
|
|
|
|
| 1/10/2005(1) |
| rights arising |
| 15/2/2006 |
| during year |
| 29/1/2006 |
| on vesting |
| 30/9/2006 |
| Expected vesting date |
|
|
|
|
|
|
| £ |
|
|
| £ |
| £’000 |
|
|
|
|
|
Mr G Davis |
| 39,614 |
| — |
| — |
| (39,614 | ) | 16.50 |
| 654 |
| — |
| January 2006 |
|
|
| 36,761 |
| — |
| — |
| — |
| — |
| — |
| 36,761 |
| January 2007 |
|
|
| 294 |
| — |
| — |
| — |
| — |
| — |
| 294 |
| August 2007 |
|
|
| 36,059 |
| — |
| — |
| — |
| — |
| — |
| 36,059 |
| January 2008 |
|
|
| — |
| 31,698 |
| 17.52 |
| — |
| — |
| — |
| 31,698 |
| February 2009 |
|
|
| 112,728 |
| 31,698 |
|
|
| (39,614 | ) |
|
|
|
| 104,812 |
|
|
|
Mr R Dyrbus |
| 24,848 |
| — |
| — |
| (24,848 | ) | 16.50 |
| 410 |
| — |
| January 2006 |
|
|
| 23,282 |
| — |
| — |
| — |
| — |
| — |
| 23,282 |
| January 2007 |
|
|
| 294 |
| — |
| — |
| — |
| — |
| — |
| 294 |
| August 2007 |
|
|
| 22,947 |
| — |
| — |
| — |
| — |
| — |
| 22,947 |
| January 2008 |
|
|
| — |
| 20,111 |
| 17.52 |
| — |
| — |
| — |
| 20,111 |
| February 2009 |
|
|
| 71,371 |
| 20,111 |
|
|
| (24,848 | ) |
|
|
|
| 66,634 |
|
|
|
Mr G L Blashill |
| 11,723 |
| — |
| — |
| (11,723 | ) | 16.50 |
| 193 |
| — |
| January 2006 |
|
|
| 10,947 |
| — |
| — |
| — |
| — |
| — |
| 10,947 |
| January 2007 |
|
|
| 294 |
| — |
| — |
| — |
| — |
| — |
| 294 |
| August 2007 |
|
|
| 9,211 |
| — |
| — |
| — |
| — |
| — |
| 9,211 |
| January 2008 |
|
|
| — |
| 10,701 |
| 17.52 |
| — |
| — |
| — |
| 10,701 |
| February 2009 |
|
|
| 32,175 |
| 10,701 |
|
|
| (11,723 | ) |
|
|
|
| 31,153 |
|
|
|
Mr D Cresswell |
| 12,101 |
| — |
| — |
| (12,101 | ) | 16.50 |
| 200 |
| — |
| January 2006 |
|
|
| 13,262 |
| — |
| — |
| — |
| — |
| — |
| 13,262 |
| January 2007 |
|
|
| 294 |
| — |
| — |
| — |
| — |
| — |
| 294 |
| August 2007 |
|
|
| 14,893 |
| — |
| — |
| — |
| — |
| — |
| 14,893 |
| January 2008 |
|
|
| — |
| 13,109 |
| 17.52 |
| — |
| — |
| — |
| 13,109 |
| February 2009 |
|
|
| 40,550 |
| 13,109 |
|
|
| (12,101 | ) |
|
|
|
| 41,558 |
|
|
|
Dr F A Rogerson |
| 12,857 |
| — |
| — |
| (12,857 | ) | 16.50 |
| 212 |
| — |
| January 2006 |
|
|
| 13,692 |
| — |
| — |
| — |
| — |
| — |
| 13,692 |
| January 2007 |
|
|
| 294 |
| — |
| — |
| — |
| — |
| — |
| 294 |
| August 2007 |
|
|
| 14,893 |
| — |
| — |
| — |
| — |
| — |
| 14,893 |
| January 2008 |
|
|
| — |
| 13,109 |
| 17.52 |
| — |
| — |
| — |
| 13,109 |
| February 2009 |
|
|
| 41,736 |
| 13,109 |
|
|
| (12,857 | ) |
|
|
|
| 41,988 |
|
|
|
(1) Or date of appointment if later.
There have been no changes in any Directors’ contingent rights since 30 September 2006.
During January 2006, annual bonuses earned in the financial year to 30 September 2002 and lodged under the SMS for a three-year period matured, providing matched shares for participants on a 1:1 basis.
In respect of annual bonuses earned in the financial year to 30 September 2005 and paid in December 2005, the Executive Directors elected, in February 2006, to invest their entire bonus in the form of Imperial Tobacco Group PLC Ordinary Shares under the SMS. These will be matched on a 1:1 basis provided they are left in the SMS for three years, the participant remains an employee in the Group and the Company has achieved in excess of 3 per cent Real Annual EPS Growth over the retention period. This performance criterion and the award policy and vesting schedules were reviewed by the Committee during the year and deemed to remain appropriate. These matching shares are shown within Contingent rights arising above.
It is anticipated that, in February 2007, the Executive Directors will again invest their entire bonus earned in the financial year to 30 September 2006 in the form of Imperial Tobacco Group PLC Ordinary Shares under the SMS.
Impact of IFRS on LTIP and SMS
The financial year ending 30 September 2006 is the first where the Company is required to account under International Financial Reporting Standards (IFRS). All performance criteria have been adjusted to ensure consistent measurement during the transition to IFRS.
62
Share options
The Company does not operate an executive share option scheme. However, Executive Directors are eligible (along with all employees of the Company and participating subsidiaries of the Group where possible) to participate in Imperial Tobacco Group PLC’s savings-related Sharesave Plan. Under this Plan options are granted, at a discount of up to 20 per cent to the closing mid-market price of an Imperial Tobacco Group PLC Ordinary Share on the London Stock Exchange on the day prior to invitation, to participants who have contracted to save up to £250 per month over a period of three or five years.
Executive Directors’ share options (audited)
|
|
|
| Granted |
| Exercised |
| Market price |
|
|
|
|
| Range of exercisable |
|
|
|
|
|
|
| Balance at |
| during |
| during the |
| at date of |
| Balance at |
| Exercise |
| dates of options held at |
| Gains on exercise(3) |
| ||
|
| 1/10/2005(1) |
| the year |
| year |
| exercise |
| 30/9/2006 |
| price |
| 30/9/2006(2) |
| during the year |
| 2005 |
|
|
|
|
|
|
|
|
| £ |
|
|
| £ |
|
|
| £’000 |
| £’000 |
|
Mr G Davis |
| 1,205 |
| — |
| — |
| — |
| 1,205 |
| 8.24 |
| 1/8/07 – 31/1/08 |
| — |
| — |
|
|
| 774 |
| — |
| — |
| — |
| 774 |
| 8.22 |
| 1/8/08 – 31/1/09 |
| — |
| — |
|
|
| 1,979 |
| — |
| — |
| — |
| 1,979 |
| — |
|
|
| — |
| — |
|
Mr R Dyrbus |
| 675 |
| — |
| (675 | ) | 17.41 |
| — |
| 8.22 |
| 1/8/06 – 31/1/07 |
| 6 |
| — |
|
|
| 374 |
| — |
| — |
| — |
| 374 |
| 10.08 |
| 1/8/07 – 31/1/08 |
| — |
| — |
|
|
| — |
| 402 |
| — |
| — |
| 402 |
| 13.95 |
| 1/8/09 – 31/1/10 |
| — |
| — |
|
|
| 1,049 |
| 402 |
| (675 | ) | — |
| 776 |
| — |
|
|
| 6 |
| — |
|
Mr G L Blashill |
| 807 |
| — |
| — |
| — |
| 807 |
| 11.73 |
| 1/8/08 – 31/1/09 |
| — |
| — |
|
|
| 807 |
| — |
| — |
| — |
| 807 |
| — |
|
|
| — |
| — |
|
Mr D Cresswell |
| 2,008 |
| — |
| — |
| — |
| 2,008 |
| 8.24 |
| 1/8/07 – 31/1/08 |
| — |
| — |
|
|
| 2,008 |
| — |
| — |
| — |
| 2,008 |
| — |
|
|
| — |
| — |
|
Dr F A Rogerson |
| 2,008 |
| — |
| — |
| — |
| 2,008 |
| 8.24 |
| 1/8/07 – 31/1/08 |
| — |
| — |
|
|
| 2,008 |
| — |
| — |
| — |
| 2,008 |
| — |
|
|
| — |
| — |
|
(1) Or date of appointment to the Board if later.
(2) Any option not exercised by the end of the range of exercisable dates will expire.
(3) Gains made on exercise, calculated as the difference between the exercise price and the market price on the date of exercise. Aggregate gains during the year were £6,203 (2005: nil).
There have been no changes in any Directors’ share options since 30 September 2006.
The Company’s middle market share price at the close of business on 29 September 2006, being the last trading day of the financial year, was £17.80 and the range of the middle market price during the year was £15.47 to £18.43.
Full details of the Directors’ share interests are available for inspection in the Register of Directors’ Interests at the Company’s registered office.
Award Dates
It is the Group’s policy to grant awards under all its employee share plans on predetermined dates based on an annual cycle.
Employee Benefit Trusts
The Imperial Tobacco Group Employee and Executive Benefit Trust (the Executive Trust) and the Imperial Tobacco Group PLC 2001 Employee Benefit Trust (the 2001 Trust) have been established to acquire Ordinary Shares in the Company, by subscription or purchase, from funds provided by the Group to satisfy rights to shares arising on the exercise of share options and on the vesting of the SMS and LTIP awards. As potential beneficiaries of the Executive Trust, each of the Executive Directors is deemed to have a contingent interest in the 905,542 Ordinary Shares of the Company held by that Trust at 30 September 2006.
Details of the shareholdings by the Employee Benefit Trusts are as follows:
|
|
|
|
|
|
|
|
|
| Shares under |
|
|
|
|
| Balance at |
| Purchased |
| Distributed |
| Balance at |
| Award at |
| Surplus / |
|
|
| 1/10/2005 |
| during year |
| during year |
| 30/9/2006 |
| 30/9/2006 |
| (Shortfall) |
|
Executive Trust |
| 929,837 |
| 259,735 |
| 284,030 |
| 905,542 |
| 886,994 |
| 18,548 |
|
2001 Trust |
| 2,096,700 |
| 3,102,009 |
| 1,857,908 |
| 3,340,801 |
| 4,711,099 |
| (1,370,298 | ) |
As at 30 September 2006, the Company also held 46,004,000 shares in Treasury which may be used to satisfy awards under the share plans.
63
Share plan flow rates
The Company’s policy has always been to satisfy all awards under its share plans from market purchased shares through the Trusts. The Trust Deeds and the Rules of all plans contain provisions limiting awards to five per cent in five years and 10 per cent in 10 years for all employee share plans with an additional restriction to five per cent in 10 years for executive plans. Currently an aggregate total of only 0.8 per cent of the Company’s issued share capital is subject to awards under all the Group’s executive and all employee share plans. In future the Trust may also be provided with shares held by the Company in Treasury in order to satisfy vesting awards.
Since demerger in 1996 the cumulative awards under all of the Company’s share plans totals under 3 per cent of its issued share capital. Following initial grants on demerger, subsequent annual grants have averaged 0.3 per cent of issued share capital.
Summary of current awards outstanding:
Limit on awards |
| Current awards (%) |
| Increase in awards during year (%) |
|
10% in 10 years |
| 2.9 |
| 0.3 |
|
5% in 5 years |
| 1.4 |
| 0.3 |
|
5% in 10 years (executive schemes) |
| 1.4 |
| 0.1 |
|
Executive Directors’ pensions
Post 6 April 2006 (‘A’ day) the Group’s UK pension policy, which applies to all current Executive Directors, provides the option to maintain membership of or join (new employees) the UK Imperial Tobacco Pension Fund or receive a salary supplement in lieu of membership of the Fund.
The Executive Directors are all members of the Imperial Tobacco Pension Fund, the principal defined benefit scheme operated by the Group. For members who joined prior to 1 April 2002 the fund is non-contributory with a normal retirement age of 60. The fund allows members to achieve the maximum pension of two-thirds of their salary at normal retirement age after 32 years’ service. Pension commutation to enable participants to receive a lump sum on retirement is permitted.
For death before retirement a capital sum equal to four times salary is payable together with a spouse’s pension of two-thirds of the member’s expected pension at retirement. For death in retirement, a spouse’s pension of two-thirds of the member’s pre-commutation pension is payable. Dependent children will also receive allowances.
Pensions increase annually by the lesser of 10 per cent and the increase in the Retail Prices Index, together with an option under the rules to surrender part of a pension in order for the annual increase to be in line with the increase in the Retail Prices Index to 15 per cent.
From 6 April 2006 a new tax regime was introduced by HM Revenue & Customs (HMRC) which abolished most of the detailed limits previously imposed on pension schemes and replaced them with a more simplified approach. Each member now has a Lifetime Allowance (LTA) initially set at £1.5 million and a new tax, called the recovery charge, is levied at retirement if the value of their pension benefit from all sources exceeds this amount. For any member whose total benefit value on 6 April 2006 exceeded the LTA, transitional arrangements allowed them to register the higher value so that they would not be subject to a large retrospective recovery charge. To qualify for this enhanced protection the member was required to opt out of fund membership as regards future service accrual in order to retain a final salary linked pension entitlement in respect of past service.
All Executive Directors earn benefits on the standard scale with a normal retirement age of 60. However, each of the current Executive Directors has opted out of fund membership as regards future service accrual as a result of registering for enhanced protection with HMRC. The detailed HMRC rules governing enhanced protection mean that it may not be permissible in some rare circumstances for the full final salary linked pension based on service up to 6 April 2006 to be paid from the fund. In this event an additional pension will be paid by the Company through an unfunded unapproved retirement benefit scheme (UURBS) so that the full accrued benefit may be provided.
Mr R Dyrbus and Dr F A Rogerson are in receipt of a salary supplement. The supplement is paid in lieu of future pension service and accrual. Each salary supplement was calculated by independent actuaries to provide an accumulation of benefit no greater than a total pension promise of two-thirds of final salary. These supplements were discounted for early payment and employers National Insurance contributions and are non-compensatory. The supplement for Mr R Dyrbus is 35 per cent of salary and for Dr F A Rogerson is 16.4 per cent of salary. These amounts are non pensionable payments.
The following table provides the information required by both the Listing Rules and schedule 7A to the Companies Act 1985 and gives details for each Director of:
• the annual accrued pension payable on retirement calculated as if he had left service at the year end (any potential UURBS entitlement is included);
• the increase in accrued pension during the year, excluding any increases for inflation in respect of the disclosure required under the Listing Rules; and
• the transfer value of the increase in accrued pension calculated in accordance with the actuarial guidance note GN11.
None of the Directors has made additional voluntary contributions.
64
Executive Directors’ Pension Disclosures (audited)
|
|
|
|
|
| Disclosures required under Directors’ Remuneration Report Regulations 2002 |
| Listing Rules |
| ||||||||||||||
|
|
|
|
|
| Accrued pension £’000 |
| Transfer value of accrued pension £’000 |
| Increase in |
|
|
| ||||||||||
|
|
|
|
|
|
|
|
|
|
|
|
|
| Increase |
|
|
|
|
| accrued |
|
|
|
|
|
|
| Pensionable |
|
|
|
|
|
|
|
|
| during the |
|
|
|
|
| pension (net |
| Transfer |
|
|
| Age at |
| service at |
|
|
| Increase |
|
|
|
|
| year net of |
|
|
|
|
| of inflation) |
| value of |
|
|
| 30/9/06 |
| 30/9/06 |
| At |
| during the |
| At |
| At |
| Director’s |
| Director’s |
|
|
| during the |
| increase (net |
|
|
| Years |
| Years |
| 1/10/05 |
| year |
| 30/9/06 |
| 1/10/05 |
| contributions |
| contribution |
| At 30/9/06 |
| year |
| of inflation) |
|
|
|
|
|
|
|
|
|
|
|
|
|
|
|
|
|
|
|
|
| £’000 |
| £’000 |
|
Mr G Davis |
| 56 |
| 34 |
| 483 |
| 37 |
| 520 |
| 7,225 |
| 1,699 |
| — |
| 8,924 |
| 26 |
| 446 |
|
Mr R Dyrbus |
| 53 |
| 24 |
| 228 |
| 22 |
| 250 |
| 2,808 |
| 838 |
| — |
| 3,646 |
| 18 |
| 257 |
|
Mr D Cresswell |
| 61 |
| 43 |
| 220 |
| 17 |
| 237 |
| 4,669 |
| 160 |
| — |
| 4,829 |
| 12 |
| 241 |
|
Dr F A Rogerson |
| 53 |
| 29 |
| 197 |
| 18 |
| 215 |
| 2,404 |
| 708 |
| — |
| 3,112 |
| 14 |
| 209 |
|
Mr G L Blashill |
| 59 |
| 38 |
| 183 |
| 53 |
| 236 |
| 3,498 |
| 1,398 |
| — |
| 4,896 |
| 45 |
| 941 |
|
The transfer values disclosed above do not represent a sum paid or payable to the individual Director. Instead they represent a potential liability of the pension scheme.
Benefits
The principal taxable benefits for Executive Directors are the provision of company cars and health insurance.
Remuneration from other Non-Executive Directorships
The Company recognises that external non-executive directorships are beneficial for both the Executive Director concerned and the Company. At the discretion of the Board, Executive Directors are permitted to retain fees received in respect of any such non-executive directorship. Each serving Executive Director is restricted to one external non-executive directorship and may not serve as chairman of a FTSE 100 company.
Mr G Davis serves on the Board of Wolseley PLC and currently receives fees of £65,000 per annum.
Executive Directors’ service agreements
The Group appoints Executive Directors under service agreements terminable by either party giving 52 weeks’ notice, as shown in the table below.
There are no predetermined provisions for compensation on termination (including following a change of control) within Executive Directors’ service agreements. However, the Group is unequivocally against rewards for failure. The circumstances of the termination and an individual’s duty and opportunity to mitigate loss are taken into account in every case. The Group’s policy is to stop or reduce compensatory payments to former Directors to the extent that they receive remuneration from other employment during the compensation period and that any such payments should be paid monthly in arrears.
Under the Rules of the LTIP and SMS, outstanding awards vest on termination for certain reasons, such as death, retirement, redundancy or on a change of control, on a time-related pro-rata basis subject to satisfaction of the relevant performance criteria. If, however, the termination of employment is for a reason other than one of those specified in the Rules an individual’s full award lapses.
Executive Directors’ Service Agreements
|
| Date of contract |
| Expiry date |
|
Executive Directors |
|
|
|
|
|
Mr G Davis |
| 21 August 1996 |
| Terminable on 52 weeks’ notice |
|
Mr R Dyrbus |
| 21 August 1996 |
| Terminable on 52 weeks’ notice |
|
Mr G L Blashill(1) |
| 28 October 2005 |
| Terminable on 52 weeks’ notice |
|
Mr D Cresswell |
| 30 May 2003 |
| Terminable on 52 weeks’ notice |
|
Dr F A Rogerson |
| 30 May 2003 |
| Terminable on 52 weeks’ notice |
|
(1) Mr G L Blashill was appointed to the Board on 28 October 2005.
Remuneration Policy for Non-Executive Directors Fees for Non-Executive Directors are determined by the Board as a whole with regard to market practice and within the restrictions contained in the Company’s Articles of Association. The remuneration of the Chairman is determined by the Board following recommendation from the Remuneration Committee. The Non-Executive Directors do not take part in discussions relating to their own remuneration. They receive no other material pay or benefits (with the exception of reimbursement of expenses incurred in connection with their directorship of the Company and provision of administrative support including the use of Company offices by the Chairman Mr D C Bonham and Joint Vice Chairman Mr A G L Alexander), do not participate in the Company’s share plans, bonus schemes or incentive plans and are not eligible for pension scheme membership.
To align further the interests of the Non-Executive Directors with those of shareholders, it was agreed that a proportion of their fees be applied, after tax, to purchase shares in Imperial Tobacco Group PLC. These shares are to be held by a nominee during the term of each Non-Executive Directorship. Exceptionally, in respect of Mr D C Bonham and Mr A G L Alexander, this requirement has been waived due to their continued level of investment, as detailed above.
65
Following his retirement from the Board in January 2006, Mr S Huismans remains a member of Supervisory Boards within the Reemtsma Group for which he received additional remuneration for fulfilling such non-executive roles.
Non-Executive Directors’ Letters of Appointment
The Non-Executive Directors do not have service agreements with the Company.
The terms of their appointments are reviewed annually. These terms were reviewed for all Non-Executive Directors and confirmed on 30 January 2006. The letters of appointment are available for viewing at the Company’s registered office during normal business hours and prior to and at the AGM. Under the terms of the Articles of Association of the Company, Non-Executive Directors stand for election at the first AGM following appointment and are subject to triennial re-election by shareholders and retire (subject to the provisions of the Companies Act 1985) at the AGM following their reaching 70 years of age. There are no provisions regarding notice periods in their letters of appointment which state that the Director will only receive payment until the date their appointment ends and therefore no compensation is payable on termination. The letters of appointment detail the time commitment expected of each Non-Executive Director.
Although there is no current maximum term of appointment for Non-Executive Directors, the Board is supportive of the best practice provisions contained in the Code. Messrs S P Duffy and S Huismans retired from the Board at the AGM in January 2006, having both been on the Board since demerger in 1996. However, where the Board considers a Non-Executive Director is making a particularly valuable contribution, they may be invited to remain on the Board in excess of nine years. In such instances the length of tenure of the Non-Executive Director would be relevant to the Company’s deliberations as to the independence of the Non-Executive Director and he/she would also be subject to annual re-election at the AGM. It is proposed that Mr A G L Alexander, who has also been on the Board since demerger in 1996, will continue to serve on the Board and will therefore offer himself for re-election at the 2007 AGM.
Remuneration arrangements for former Executive Directors
Mr S T Painter
Following his retirement in May 2000, Mr S T Painter entered into a consultancy agreement with Imperial Tobacco Limited, the Group’s principal operating company.
The agreement, as amended in October 2001 and May 2004, runs to March 2007. Under the terms of the agreement he provides consultancy services as required and receives fees at a day rate of £1,000 with a minimum fee based on 100 days service for each 12 month period ending on 30 June, and 67 days for the period 1 July 2006 to 6 March 2007. He is also entitled to reimbursement for the use of his car.
Mr S T Painter is also a member of Supervisory Boards within the Reemtsma Group for which he receives additional remuneration for fulfilling such non-executive roles.
Mr M A Häussler
Mr M A Häussler is currently in receipt of a retirement pension that has been reduced because it has been taken before he reached his normal retirement age. His service agreement with the Group provided that he would receive similar overall pension benefits to those that he would have received had he remained in the Reemtsma Cigarettenfabriken GmbH pension arrangement. This was a pension for life equivalent to 42 per cent of his fixed annual salary at age 63. For death in retirement, a spouse’s pension for life of 60 per cent of that amount would be payable. The pension is made up of three parts: one part of the pension is payable from the unfunded pension arrangement of Reemtsma Cigarettenfabriken GmbH, another part is payable from the separately funded Imperial Tobacco Pension Fund and the difference, which is not separately pre-funded, is paid by the Company. The pension payable under the Reemtsma arrangement and from the Imperial Tobacco Pension Fund may be increased annually in accordance with the Rules of those arrangements or as is required by law. In accordance with Mr M A Häussler’s pension agreement the unfunded UK company portion was increased in line with the Imperial Tobacco Pension Fund 2006 increase of 2.21 per cent, from £11,811.37 to £12,072.48 per annum.
For the Board

I J G Napier
Chairman of the Remuneration Committee
31 October 2006
66
to the members of Imperial Tobacco Group PLC
We have audited the Group financial statements of Imperial Tobacco Group PLC for the year ended 30 September 2006 which comprise the consolidated income statement, the consolidated balance sheet, the consolidated cash flow statement, the consolidated statement of recognised income and expense and the related notes. These Group financial statements have been prepared under the accounting policies set out therein.
We have reported separately on the parent company financial statements of Imperial Tobacco Group PLC for the year ended 30 September 2006 and on the information in the directors’ remuneration report that is described as having been audited.
Respective responsibilities of directors and auditors
The directors’ responsibilities for preparing the annual report and the Group financial statements in accordance with applicable law and International Financial Reporting Standards (“IFRS”) as adopted by the European Union are set out in the statement of directors’ responsibilities.
Our responsibility is to audit the Group financial statements in accordance with relevant legal and regulatory requirements and International Standards on Auditing (UK and Ireland). This report, including the opinion, has been prepared for and only for the Company’s members as a body in accordance with section 235 of the Companies Act 1985 and for no other purpose. We do not, in giving this opinion, accept or assume responsibility for any other purpose or to any other person to whom this report is shown or into whose hands it may come save where expressly agreed by our prior consent in writing.
We report to you our opinion as to whether the Group financial statements give a true and fair view and whether the Group financial statements have been properly prepared in accordance with the Companies Act 1985 and article 4 of the IAS regulation. We report to you whether, in our opinion the information given in the Report of the Directors is consistent with the Group financial statements. We also report to you if, in our opinion, we have not received all the information and explanations we require for our audit, or if information specified by law regarding directors’ remuneration and other transactions is not disclosed.
We review whether the corporate governance statement reflects the Company’s compliance with the nine provisions of the 2003 FRC combined code specified for our review by the listing rules of the Financial Services Authority, and we report if it does not. We are not required to consider whether the board’s statements on internal control cover all risks and controls, or form an opinion on the effectiveness of the Group’s corporate governance procedures or its risk and control procedures.
We read other information contained in the annual report and consider whether it is consistent with the audited Group financial statements. The other information comprises only the operating and financial review, the Report of the Directors, the corporate governance report and the unaudited parts of the remuneration report. We consider the implications for our report if we become aware of any apparent misstatements or material inconsistencies with the Group financial statements. Our responsibilities do not extend to any other information.
Basis of audit opinion
We conducted our audit in accordance with International Standards on Auditing (UK and Ireland) issued by the Auditing Practices Board. An audit includes examination, on a test basis, of evidence relevant to the amounts and disclosures in the Group financial statements. It also includes an assessment of the significant estimates and judgements made by the directors in the preparation of the Group financial statements, and of whether the accounting policies are appropriate to the Group’s circumstances, consistently applied and adequately disclosed.
We planned and performed our audit so as to obtain all the information and explanations which we considered necessary in order to provide us with sufficient evidence to give reasonable assurance that the Group financial statements are free from material misstatement, whether caused by fraud or other irregularity or error. In forming our opinion we also evaluated the overall adequacy of the presentation of information in the Group financial statements.
Opinion
In our opinion:
• the Group financial statements give a true and fair view, in accordance with IFRSs as adopted by the European Union, of the state of the Group’s affairs as at 30 September 2006 and of its profit and cash flows for the year then ended;
• the Group financial statements have been properly prepared in accordance with the Companies Act 1985 and article 4 of the IAS regulation; and
• the information given in the Directors’ Report is consistent with the Group financial statements.
![]()
PricewaterhouseCoopers LLP
Chartered Accountants and Registered Auditors
Bristol
31 October 2006
67
for the year ended 30 September 2006
|
|
|
| Year ended |
| Year ended |
| |
|
|
|
| 30 September |
| 30 September |
| |
(In £’s million) |
| Notes |
| 2006 |
| 2005 |
| |
Revenue |
| 1 |
| 11,676 |
| 11,229 |
| |
Duty |
| 1 |
| (8,514 | ) | (8,106 | ) | |
Raw materials and consumables used |
|
|
| (641 | ) | (651 | ) | |
Changes in inventories of finished goods and work in progress |
|
|
| (9 | ) | 3 |
| |
Employment costs |
| 4 |
| (468 | ) | (455 | ) | |
Depreciation and amortisation |
|
|
| (103 | ) | (97 | ) | |
Other operating charges |
|
|
| (630 | ) | (683 | ) | |
Profit from operations |
| 1 |
| 1,311 |
| 1,240 |
| |
Adjusted profit from operations |
|
|
| 1,356 |
| 1,297 |
| |
Restructuring costs |
| 3 |
| (45 | ) | (57 | ) | |
Investment income |
| 5 |
| 283 |
| 180 |
| |
Finance costs |
| 5 |
| (426 | ) | (342 | ) | |
Net finance costs |
| 5 |
| (143 | ) | (162 | ) | |
Adjusted net finance costs |
|
|
| (188 | ) | (184 | ) | |
Retirement benefits net financing income |
|
|
| 46 |
| 22 |
| |
Fair value gains and losses on derivative financial instruments |
|
|
| (1 | ) | n/a |
| |
Profit before taxation |
| 2 |
| 1,168 |
| 1,078 |
| |
Taxation |
| 6 |
| (310 | ) | (288 | ) | |
Profit for the year |
|
|
| 858 |
| 790 |
| |
Attributable to: |
|
|
|
|
|
|
| |
Equity holders of the Company |
|
|
| 851 |
| 784 |
| |
Minority interests |
|
|
| 7 |
| 6 |
| |
|
|
|
|
|
|
|
| |
Earnings per ordinary share | – Basic |
| 8 |
| 122.2 | p | 108.6p |
|
| – Diluted |
| 8 |
| 121.6 | p | 108.1p |
|
All activities derive from continuing operations.
68
at 30 September 2006
|
|
|
| 30 September |
| 30 September |
|
(In £’s million) |
| Notes |
| 2006 |
| 2005 |
|
Non-current assets |
|
|
|
|
|
|
|
Intangible assets |
| 9 |
| 3,910 |
| 3,554 |
|
Property, plant and equipment |
| 10 |
| 580 |
| 642 |
|
Investments in associates |
| 11 |
| 5 |
| 5 |
|
Retirement benefit assets |
| 18 |
| 397 |
| 259 |
|
Trade and other receivables |
| 13 |
| 19 |
| 4 |
|
Deferred tax assets |
| 17 |
| 71 |
| 62 |
|
|
|
|
| 4,982 |
| 4,526 |
|
Current assets |
|
|
|
|
|
|
|
Inventories |
| 12 |
| 789 |
| 857 |
|
Trade and other receivables |
| 13 |
| 1,067 |
| 1,012 |
|
Current tax assets |
| 6 |
| 13 |
| 44 |
|
Cash and cash equivalents |
| 14 |
| 263 |
| 256 |
|
Derivative financial instruments |
| 16 |
| 29 |
| — |
|
|
|
|
| 2,161 |
| 2,169 |
|
Total assets |
|
|
| 7,143 |
| 6,695 |
|
Current liabilities |
|
|
|
|
|
|
|
Borrowings |
| 16 |
| (1,122 | ) | (707 | ) |
Derivative financial instruments |
| 16 |
| (119 | ) | — |
|
Trade and other payables |
| 15 |
| (1,433 | ) | (1,528 | ) |
Current tax liabilities |
| 6 |
| (272 | ) | (235 | ) |
Provisions |
| 19 |
| (56 | ) | (50 | ) |
|
|
|
| (3,002 | ) | (2,520 | ) |
Non-current liabilities |
|
|
|
|
|
|
|
Borrowings |
| 16 |
| (2,930 | ) | (2,775 | ) |
Derivative financial instruments |
| 16 |
| — |
| (57 | ) |
Trade and other payables |
| 15 |
| (5 | ) | (11 | ) |
Deferred tax liabilities |
| 17 |
| (135 | ) | (133 | ) |
Retirement benefit liabilities |
| 18 |
| (434 | ) | (438 | ) |
Provisions |
| 19 |
| (39 | ) | (56 | ) |
|
|
|
| (3,543 | ) | (3,470 | ) |
Total liabilities |
|
|
| (6,545 | ) | (5,990 | ) |
Net assets |
|
|
| 598 |
| 705 |
|
|
|
|
|
|
|
|
|
Equity |
|
|
|
|
|
|
|
Share capital |
| 20 |
| 73 |
| 73 |
|
Share premium account |
| 22 |
| 964 |
| 964 |
|
Retained earnings |
| 22 |
| (423 | ) | (370 | ) |
Exchange translation reserve |
| 22 |
| (35 | ) | 19 |
|
Equity attributable to equity holders of the Company |
|
|
| 579 |
| 686 |
|
Minority interests |
| 23 |
| 19 |
| 19 |
|
Total equity |
|
|
| 598 |
| 705 |
|
The financial statements on pages 68 to 122 were approved by the Board of Directors on 31 October 2006 and signed on its behalf by:
|
|
Derek Bonham | Robert Dyrbus |
Chairman | Director |


69
Consolidated statement of recognised income and expense
for the year ended 30 September 2006
|
| Year ended |
| Year ended |
|
|
| 30 September |
| 30 September |
|
(In £’s million) |
| 2006 |
| 2005 |
|
Exchange movements |
| (54 | ) | 19 |
|
Actuarial gains on retirement benefits |
| 100 |
| 101 |
|
Deferred tax relating to actuarial gains on retirement benefits |
| (24 | ) | (34 | ) |
Deferred tax on other items taken directly to or transferred from equity |
| 7 |
| — |
|
Net income recognised directly in equity |
| 29 |
| 86 |
|
Profit for the year |
| 858 |
| 790 |
|
Total recognised income and expense for the year |
| 887 |
| 876 |
|
|
|
|
|
|
|
Attributable to: |
|
|
|
|
|
Equity holders of the Company |
| 880 |
| 870 |
|
Minority interests |
| 7 |
| 6 |
|
Total recognised income and expense for the year |
| 887 |
| 876 |
|
|
|
|
|
|
|
Adoption of IAS 39 attributable to: |
|
|
|
|
|
Equity holders of the Company |
| 6 |
|
|
|
Minority interests |
| — |
|
|
|
|
| 6 |
|
|
|
Consolidated cash flow statement
for the year ended 30 September 2006
|
|
|
| Year ended |
| Year ended |
|
|
|
|
| 30 September |
| 30 September |
|
(In £’s million) |
| Notes |
| 2006 |
| 2005 |
|
Cash flows from operating activities |
| 27 |
| 1,155 |
| 1,143 |
|
|
|
|
|
|
|
|
|
Cash flows from investing activities |
|
|
|
|
|
|
|
Interest received |
|
|
| 13 |
| 16 |
|
Purchase of property, plant and equipment |
|
|
| (75 | ) | (92 | ) |
Proceeds from sale of property, plant and equipment |
|
|
| 15 |
| 27 |
|
Purchase of intangible assets – trademarks |
|
|
| (368 | ) | — |
|
Purchase of intangible assets – software |
|
|
| (7 | ) | (10 | ) |
Purchase of subsidiary undertakings |
|
|
| (68 | ) | (6 | ) |
Net cash used in investing activities |
|
|
| (490 | ) | (65 | ) |
|
|
|
|
|
|
|
|
Cash flows from financing activities |
|
|
|
|
|
|
|
Interest paid |
|
|
| (199 | ) | (212 | ) |
Purchase of treasury shares |
|
|
| (556 | ) | (201 | ) |
Proceeds from sale of shares held under Employee Share Ownership Trusts |
|
|
| 7 |
| 3 |
|
Purchase of shares held under Employee Share Ownership Trusts |
|
|
| (55 | ) | (8 | ) |
Increase/(decrease) in borrowings |
|
|
| 561 |
| (374 | ) |
Dividends paid to minority interests |
|
|
| (7 | ) | (4 | ) |
Dividends paid to shareholders |
|
|
| (406 | ) | (373 | ) |
Net cash used in financing activities |
|
|
| (655 | ) | (1,169 | ) |
|
|
|
|
|
|
|
|
Net increase/(decrease) in cash and cash equivalents |
|
|
| 10 |
| (91 | ) |
|
|
|
|
|
|
|
|
Cash and cash equivalents at start of year |
|
|
| 256 |
| 339 |
|
Effect of foreign exchange rates |
|
|
| (4 | ) | 8 |
|
Adjustments relating to adoption of IAS 39 from 1 October 2005 |
|
|
| 1 |
| — |
|
Cash and cash equivalents at end of year |
|
|
| 263 |
| 256 |
|
70
Basis of preparation
The consolidated financial statements have been prepared in accordance with International Financial Reporting Standards and IFRIC interpretations as endorsed by the European Union (collectively “IFRS”) and with those parts of the Companies Act 1985 applicable to companies reporting under IFRS.
The 2006 financial statements are the Group’s first full year consolidated financial statements prepared under IFRS, with a transition date to IFRS of 1 October 2004. Consequently, the comparative figures for 2005 and the Group’s balance sheet as at 1 October 2004 have been restated to comply with IFRS, with the exception of IAS 32: “Financial instruments: Disclosure and Presentation” and
IAS 39: “Financial instruments: Recognition and Measurement” which have been applied from 1 October 2005. In addition, IFRS 1 on first time adoption allows certain exemptions from retrospective application of IFRS in the opening balance sheet for 2004. Where these have been used, they are explained in the relevant accounting policies below.
The financial statements have been prepared under the historical cost convention except as described in the accounting policies on financial instruments and retirement benefit schemes below.
The preparation of the consolidated financial statements requires management to make estimates and assumptions that affect the reported amounts of revenues and expenses during the period, assets and liabilities, and the disclosure of contingent liabilities at the date of the financial statements. The key estimates and assumptions are set out in the Critical Accounting Estimates and Judgements note on pages 76 to 77. Such estimates and assumptions are based on historical experience and various other factors that are believed to be reasonable in the circumstances and constitute management’s best judgement at the date of the financial statements. In the future, actual experience may deviate from these estimates and assumptions. This could affect future financial statements as the original estimates and assumptions are modified, as appropriate, in the year in which the circumstances change.
A summary of the more important Group accounting policies is set out below.
Basis of consolidation
The consolidated financial statements comprise Imperial Tobacco Group PLC (the Company) and its subsidiary undertakings.
Subsidiaries are those entities controlled by the Group. Control exists when the Group has the power to govern the financial and operating policies of an enterprise taking into account any potential voting rights. The financial statements of subsidiaries are included in the consolidated financial statements from the date that control commences until the date that control ceases.
The purchase method of accounting is used to account for the acquisition of subsidiaries. The cost of an acquisition is measured at the fair value of the consideration plus costs directly attributable to the acquisition. The excess of the cost of the acquisition over the Group’s share of the fair value of the net identifiable assets of the subsidiary acquired is recorded as goodwill.
Intragroup transactions, balances and unrealised gains on transactions between Group companies are eliminated; unrealised losses are also eliminated unless costs cannot be recovered. Where necessary, accounting policies of subsidiaries have been changed to ensure consistency with the policies adopted by the Group.
A list of the principal subsidiaries is included on pages 125 to 126.
Segmental reporting
A segment is a distinguishable component of the Group that is engaged in providing products or services within a particular economic environment.
The principal activity of the Group is the manufacture, marketing and sale of tobacco and tobacco-related products. The management structure is based on geographical regions. These geographical regions of UK, Germany, Rest of Western Europe and Rest of the World have been used as the primary reporting segments. The manufacture, marketing and sale of tobacco and tobacco-related products is a single integrated business and as a consequence, the Group has only one business segment and no secondary segment disclosure has been made. The central costs are allocated to segments on a consistent basis of revenue less duty.
The prices agreed between Group companies for intragroup sales of materials, manufactured goods, charges for royalties, commissions and fees are based on normal commercial practices which would apply between independent businesses.
Foreign currency
Items included in the financial statements of each Group company are measured using the currency of the primary economic environment in which the company operates (the functional currency).
The income and cash flow statements of non-sterling denominated Group companies are translated to sterling (the Group’s presentation currency) at average rates of exchange in each period. Assets and liabilities of these companies are translated at rates of exchange ruling at the balance sheet date. The differences between retained profits and losses translated at average and closing rates are taken to reserves, as are differences arising on the retranslation to sterling of non-sterling denominated net assets at the beginning of the year.
Any translation differences that have arisen since 1 October 2004 are presented as a separate component of equity. As permitted by IFRS 1, any differences prior to this date are not included in this separate component of equity.
71
Foreign currency transactions are initially recorded at the exchange rate ruling at the date of the transaction. Foreign exchange gains and losses resulting from the settlement of such transactions and from the translation at exchange rates ruling at the balance sheet date of monetary assets and liabilities denominated in foreign currencies are recognised in the income statement, except when deferred in equity as qualifying net investment hedges.
Revenue recognition
Revenue comprises the invoiced value for the sale of goods and services net of sales taxes, rebates and discounts. Revenue from the sale of goods is recognised when a Group company has delivered products to the customer, the customer has accepted the products and collectibility of the related receivables is reasonably assured. Sales of services which include fees for distributing third party products are recognised in the accounting period in which the services are rendered. Licence fees are recognised on an accruals basis in accordance with the substance of the relevant agreements.
Duty
In countries where duty is a production tax, duty is included in the income statement as an expense. Where duty is a sales tax, duty is deducted from revenue.
Taxes
Income tax on the profit or loss for the year comprises current and deferred tax.
Current tax is the expected tax payable on the taxable income for the year, using tax rates substantially enacted at the balance sheet date, and any adjustments to tax payable in respect of previous years.
Deferred tax is provided in full on temporary differences between the carrying amount of assets and liabilities in the financial statements and the tax base. Deferred tax assets are recognised only to the extent that it is probable that future taxable profits will be available against which the temporary differences can be utilised. Deferred tax assets and liabilities are not discounted. Deferred tax is determined using the tax rates that have been enacted or substantially enacted by the balance sheet date, and are expected to apply when the deferred tax liability is settled or the deferred tax asset is realised.
Deferred tax is provided on temporary differences arising on investments in subsidiaries (including overseas subsidiaries), except where the timing of the reversal of the temporary difference is controlled by the Group and it is probable that the temporary difference will not reverse in the foreseeable future.
Tax is recognised in the income statement, except where it relates to items recognised directly in equity, in which case it is recognised in equity.
Dividends
Final dividends are recognised as a liability in the Group’s financial statements in the period in which the dividends are approved by shareholders, while interim dividends are recognised in the period in which the dividends are paid.
Intangible assets – goodwill
Goodwill represents the excess of the cost of an acquisition over the Group’s share of the fair value of the net identifiable assets and liabilities acquired, both tangible and intangible. Goodwill arising on acquisitions made on or after 27 September 1998 is capitalised. Previously all goodwill was written off through equity in the period of acquisition. As permitted under IFRS 1 goodwill arising on acquisitions prior to 1 October 2004 is stated in accordance with UK GAAP and has not been remeasured on transition to IFRS. Goodwill is tested at least annually for impairment and carried at cost less accumulated impairment losses. Any impairment is recognised immediately in the income statement and cannot be subsequently reversed. Goodwill is allocated to groups of cash-generating units for the purpose of impairment testing. The allocation is made to those cash-generating units or groups of cash-generating units that are expected to benefit from the business combination in which the goodwill arose. Gains or losses on the disposal of a Group company are determined by comparing the proceeds with the carrying value of the Group company’s assets and liabilities including the carrying amount of related goodwill.
Goodwill previously written off directly to reserves under UK GAAP is not recycled to the income statement on the disposal of the subsidiary to which it relates.
Intangible assets – other
These consist mainly of acquired trademarks, licences and computer software which are carried at cost less accumulated amortisation and impairment. Trademarks include the Davidoff cigarette trademark which was acquired in September 2006. The Directors are of the opinion that this trademark has an indefinite life, based on the fact that Davidoff is an established international brand with global growth potential. Other trademarks, licences and computer software are amortised on a straight line basis over their useful lives. For trademarks and licences (other than Davidoff) the useful life does not exceed 20 years. Computer software is written off over a period that does not exceed five years.
72
Property, plant and equipment
Property, plant and equipment are shown in the balance sheet at historical cost less accumulated depreciation and impairment. Historical cost includes expenditure that is directly attributable to the acquisition of the items. Subsequent costs are included in the assets’ carrying amounts or recognised as a separate asset as appropriate only when it is probable that future economic benefits associated with them will flow to the Group and the cost of the item can be measured reliably. All other repairs and maintenance are charged to the income statement as incurred.
Land is not depreciated. Depreciation is provided so as to write off the initial cost of each asset to its residual value over its estimated useful life as follows:
| up to 50 years |
| (straight line) | |
Plant and equipment |
| 2 – 20 years |
| (straight line/reducing balance) |
Fixtures and motor vehicles |
| 2 – 14 years |
| (straight line) |
The assets’ residual values and useful lives are reviewed and, if appropriate, adjusted at each balance sheet date.
Gains and losses on disposals are determined by comparing proceeds with carrying amounts. These are included in the income statement.
Impairment of assets
Assets that are not subject to amortisation or depreciation are tested at least annually for impairment. Assets that are subject to amortisation or depreciation are reviewed for impairment whenever events or changes in circumstances indicate that the carrying amount may not be recoverable. An impairment loss is recognised in the income statement for the amount by which the carrying amount of the asset exceeds its recoverable amount. The recoverable amount is the higher of the fair value less costs to sell and the value in use. For the purpose of assessing impairment, assets are grouped at the lowest levels for which there are separately identifiable cash flows (cash-generating units).
Financial instruments (2006)
Financial assets and financial liabilities are recognised when the Group becomes a party to the contractual provisions of the relevant instrument. Financial assets are de-recognised when the rights to receive benefits have expired or been transferred, and the Group has transferred substantially all risks and rewards of ownership. Financial liabilities are de-recognised when the obligation is extinguished.
Non-derivative financial assets are classified as either receivables or cash and cash equivalents. They are stated at amortised cost using the effective interest method, subject to reduction for allowances for estimated irrecoverable amounts. A provision for impairment of receivables is established when there is objective evidence that the Group will not be able to collect all amounts due according to the original terms of those receivables. The amount of the provision is the difference between the asset’s carrying amount and the present value of estimated future cash flows, and is recognised in the income statement. For interest-bearing assets, the carrying value includes accrued interest receivable.
Cash and cash equivalents include cash in hand and deposits held on call, together with other short term highly liquid investments.
Non-derivative financial liabilities are stated at amortised cost using the effective interest method. For borrowings, the carrying value includes accrued interest payable, as well as unamortised issue costs. All borrowing costs are recognised in profit or loss in the period in which they are incurred.
The Group transacts derivative financial instruments to manage the underlying exposure to foreign exchange and interest rate risks. The Group does not transact derivative financial instruments for trading purposes. Derivative financial assets and liabilities are included in the balance sheet at fair value, which includes accrued interest receivable and payable where relevant. However, as the Group has decided not to hedge account for its derivative financial instruments (as permitted under IAS 39), changes in fair values are recognised in the income statement in the period in which they arise.
Financial instruments (2005)
As noted above, the Group has chosen to utilise the IFRS 1 exemption from the requirement to restate comparative information for IAS 32 and IAS 39. For the year ended 30 September 2005, financial instruments are accounted for in accordance with UK GAAP using the following policies.
Derivative financial instruments are used to manage exposure of foreign exchange and interest rate risks and are not used for trading purposes. Instruments qualify for hedge accounting where the underlying asset or liability has characteristics which can be directly related to the instrument transacted.
Interest differentials arising under interest rate swaps are taken to the income statement on an accruals basis and included within interest payable or receivable. Any premiums or discounts received or paid are amortised over the lives of the instruments.
The principal amounts due to be exchanged at maturity under cross currency swaps are revalued at the exchange rates ruling at the balance sheet date and included within derivative financial instruments.
Where forward foreign exchange contracts are used to hedge future transactions, gains and losses are not recognised until the transactions occur.
73
Inventories
Inventories are stated at the lower of cost and net realisable value. Cost is determined using the first-in, first-out (FIFO) method. The cost of finished goods and work in progress comprises raw materials, direct labour, other direct costs and related production overheads (based on normal operating capacity) but excludes borrowing costs. Net realisable value is the estimated selling price in the ordinary course of business, less the estimated costs of completion and selling expenses.
Leaf tobacco inventory which has an operating cycle that exceeds twelve months is classified as a current asset, consistent with recognised industry practice.
Provisions
A provision is recognised in the balance sheet when the Group has a legal or constructive obligation as a result of a past event, it is more likely than not that an outflow of resources will be required to settle that obligation, and a reliable estimate of the amount can be made.
A provision for restructuring is recognised when the Group has approved a detailed formal restructuring plan, and the restructuring has either commenced or has been publicly announced. Future operating losses are not provided for.
Where there are a number of similar obligations, the likelihood that an outflow will be required in settlement is determined by considering the class of obligations as a whole. A provision is recognised even if the likelihood of an outflow with respect to any one item included in the same class of obligations may be small.
Retirement benefit schemes
The Group operates a number of retirement benefit schemes for its employees, including both defined benefit and defined contribution schemes. The Group’s two principal schemes are defined benefit schemes and are operated by Imperial Tobacco Limited in the UK and Reemtsma Cigarettenfabriken GmbH in Germany. The UK scheme’s assets are held in trustee administered funds while the German scheme is unfunded.
Under a defined benefit scheme, the amount of retirement benefit that will be received by an employee is defined. The amount recognised in the balance sheet is the difference between the present value of the defined benefit obligation at the balance sheet date and the fair value of the scheme assets. The defined benefit obligation is calculated annually by independent actuaries using the projected unit credit method. The present value of the defined benefit obligation is determined by discounting the estimated future cash outflows.
Past service costs are recognised immediately in income, unless the changes to the pension plan are conditional on the employees remaining in service for a specified period of time (the vesting period). In this case, the past service costs are amortised on a straight line basis over the average vesting period. All actuarial gains and losses, including differences between actual and expected returns on assets and differences that arise as a result of changes in actuarial assumptions are recognised immediately in full in the statement of recognised income and expense for the period in which they arise.
For defined contribution schemes, the Group pays a defined contribution to the scheme; there are no further payment obligations once these contributions have been paid. Such contributions are recognised as an employee benefit expense when they are due. Any prepaid contributions are recognised as an asset to the extent that a cash refund or reduction in future payments is available.
The Group has taken advantage of the optional exemption under IFRS 1 to recognise all cumulative actuarial gains and losses with respect to employee retirement benefit schemes in the equity attributable to equity holders of the Company at 1 October 2004.
Share-based payments
The Group applies the requirements of IFRS 2 “Share-based payments” to equity-based employee compensation schemes in respect of awards granted after 7 November 2002 which remained unvested at 1 January 2005, the dates specified in IFRS 1.
The cost of employees’ services received in exchange for the grant of rights under equity-based employee compensation schemes is measured at the fair value of the equity instruments granted and is expensed over the vesting period. The total amount to be expensed over the vesting period is determined by reference to the fair value of the equity instruments granted, excluding the impact of any non-market vesting conditions (e.g. earnings per share). Non-market vesting conditions are included in assumptions about the number of equity instruments that are expected to become exercisable. At each balance sheet date, the Group revises its estimates of the number of equity instruments that are expected to become exercisable. It recognises the impact of the revision of original estimates, if any, in the income statement, with a corresponding adjustment to equity. The fair value is measured based on an appropriate valuation model, taking into account the terms and conditions upon which the equity instruments were granted.
In order to manage the related exposure, the Group buys the number of shares necessary to satisfy rights to shares arising under equity-based employee compensation schemes. On consolidation, these shares are accounted for as a deduction from equity attributable to the equity holders of the Company. No additional shares are issued as a result of the equity compensation plan. When the rights are exercised, equity is increased by the amount of the proceeds received.
74
Share capital
Ordinary shares are classified as equity.
Incremental costs directly attributable to the issue of new shares or options are shown in equity as a deduction, net of tax, from the proceeds.
Where any Group company purchases the Company’s equity share capital (treasury shares), the consideration paid, including any directly attributable incremental costs (net of income taxes), is deducted on consolidation from equity attributable to the equity holders of the Company until the shares are cancelled, reissued or disposed of. Where such shares are subsequently sold or reissued, any consideration received, net of any directly attributable incremental transaction costs and the related income tax effects, is included in equity attributable to the equity holders of the Company.
Initial adoption of IFRS
In restating its transition balance sheet at 1 October 2004, the Group elected to take the following exemptions under IFRS 1:
IFRS 2 “Share-based Payments” The Group elected to apply IFRS 2 only to equity-based employee compensation schemes in respect of awards granted after 7 November 2002 that remained unvested at 1 January 2005, the dates specified in IFRS 1.
IFRS 3 “Business Combinations” The Group elected not to apply IFRS 3 retrospectively to business combinations that took place prior to the date of transition. In the opening balance sheet, goodwill and other assets and liabilities acquired in previous transactions remain at the same carrying value as under UK GAAP.
IAS 19 “Employee Benefits” The Group has taken advantage of the optional exemption to recognise all cumulative actuarial gains and losses with respect to employee retirement benefit schemes in the equity attributable to the equity holders of the Company at
1 October 2004.
IAS 21 “The Effects of Changes in Foreign Exchange Rates” Cumulative exchange differences on retranslation of net investments in overseas subsidiaries, which are recognised separately in equity under IFRS are deemed to be nil at 1 October 2004.
IAS 32 “Financial instruments: Disclosure and Presentation” and IAS 39 “Financial instruments: Recognition and Measurement” and IAS 32 and IAS 39 have been applied from 1 October 2005.
Standards and Interpretations issued but not applied
At the date of approval of these financial statements, the following Standards and Interpretations which have not been applied in these financial statements, were issued but the application was not yet mandatory for the period:
IFRS 6 “Exploration for and Evaluation of Mineral Resources”
IFRS 7 “Financial instruments: Disclosures”; and the related amendment to IAS 1 on capital disclosures
IFRIC 4 “Determining whether an Arrangement contains a Lease”
IFRIC 5 “Rights to Interests Arising from Decommissioning, Restoration and Environmental Rehabilitation Funds”
IFRIC 7 “Applying the Restatement Approach under IAS 29 Financial Reporting in Hyperinflationary Economies”
IFRIC 8 “Scope of IFRS 2”
IFRIC 9 “Reassessment of Embedded Derivatives”
IFRIC 10 “Interim Financial Reporting and Impairment”
The Directors anticipate that the adoption of these Standards and Interpretations in future periods will have no material impact on the financial statements of the Group.
75
Critical accounting estimates and judgements
The Group makes estimates and assumptions regarding the future. Estimates and judgements are continually evaluated based on historical experience and other factors, including expectations of future events that are believed to be reasonable under the circumstances.
In the future, actual experience may deviate from these estimates and assumptions. The estimates and assumptions that have a significant risk of causing a material adjustment to the carrying amounts of assets and liabilities within the next financial year are discussed below.
Legal proceedings
In accordance with IFRS, the Group only recognises liabilities where there is a present obligation from a past event, a transfer of economic benefits is probable and the amount of costs of the transfer can be reliably estimated. In such instances a provision is calculated and recorded in the financial statements. In instances where these criteria are not met, a contingent liability may be disclosed in the notes to the financial statements.
A contingent liability arises when a possible obligation that arises from past events and whose existence will be confirmed only by the occurrence or non-occurrence of one or more uncertain future events not wholly within the control of the Group; or from a present obligation that arises from past events but is not recognised because it is not possible that an outflow of resources embodying economic benefits will be required to settle the obligation; or the amount of the obligation cannot be measured with sufficient reliability.
Realisation of any contingent liabilities not currently recognised or disclosed in the financial statements could have a material effect on the Group’s financial condition.
Application of these accounting principles to legal cases in which claimants are seeking damages for alleged smoking-related health effects is inherently difficult, given the complex nature of the facts and law involved. Deciding whether or not to provide for loss in connection with such claims requires the Group’s management to make determinations about various factual and legal matters beyond its control.
The Group reviews outstanding legal cases following developments in the legal proceedings and at each balance sheet date, in order to assess the need for provisions in its financial statements. Among the factors considered in making decisions on provisions are the nature of the litigation, claim or assessment, the legal processes and potential level of damages in the jurisdiction in which the litigation, claim or assessment has been brought, the progress of the case (including progress after the date of the financial statements but before those statements are issued), the opinions or views of legal counsel and other advisers, experience of similar cases and any decision of the Group’s management as to how it will respond to the litigation, claim or assessment.
To the extent that the Group’s determinations at any time do not reflect subsequent developments or the eventual outcome of any claim, its future financial statements may be materially affected, with an adverse impact upon the Group’s profit from operations, financial position and liquidity.
The Group is currently involved in a number of legal cases in which claimants are seeking damages for alleged smoking-related health effects. In the opinion of the Group’s lawyers, the Group has meritorious defences to these actions, all of which are being vigorously contested. Although it is not possible to predict the outcome of the pending litigation, the Directors believe that the pending actions will not have an adverse effect upon the revenue, profit or financial condition of the Group. Consequently, in respect of any such cases, the Group has not provided for any amounts in the consolidated financial statements. See note 26 to these financial statements.
Property, plant and equipment and intangible assets
Intangible assets (other than goodwill and the Davidoff cigarette trademark) and property, plant and equipment are amortised or depreciated over their useful lives. Useful lives are based on management’s estimates of the period that the assets will generate revenue, which are periodically reviewed for continued appropriateness. Due to the long lives of assets, changes to the estimates used can result in significant variations in the carrying value.
The Group assesses the impairment of property, plant and equipment and intangible assets subject to amortisation or depreciation whenever events or changes in circumstances indicate that the carrying value may not be recoverable. Factors considered important that could trigger an impairment review include the following:
• significant underperformance relative to historical or projected future operating results;
• significant changes in the manner of the use of the acquired assets or the strategy for the overall business; and
• significant negative industry or economic trends.
Additionally, goodwill arising on acquisitions and the Davidoff cigarette trademark are subject to impairment review. The Group’s management undertakes an impairment review of goodwill and the Davidoff cigarette trademark annually or more frequently if events or changes in circumstances indicate that the carrying value may not be recoverable. When it is determined that there is an indicator that the carrying value may not be recoverable, impairment is measured based on estimates of the fair values of the underlying assets of the cash-generating unit.
The complexity of the estimation process and issues related to the assumptions, risks and uncertainties inherent in the application of the Group’s accounting estimates in relation to property, plant and equipment and intangible assets affect the amounts reported
76
in the financial statements, especially the estimates of the expected useful economic lives and the carrying values of those assets. If business conditions were different, or if different assumptions were used in the application of this and other accounting estimates, it is likely that materially different amounts could be reported in the Group’s financial statements.
See notes 9 and 10 to these financial statements.
Retirement benefits
The costs, assets and liabilities of the defined benefit retirement schemes operating within the Group are determined using methods relying on actuarial estimates and assumptions. Details of the key assumptions are set out in note 18. The Group takes advice from independent actuaries relating to the appropriateness of the assumptions. It is important to note, however, that comparatively small changes in the assumptions used may have a significant effect on the income statement and balance sheet.
Income taxes
The Group is subject to income tax in numerous jurisdictions and significant judgement is required in determining the provision for tax. There are many transactions and calculations for which the ultimate tax determination is uncertain during the ordinary course of business. The Group recognises liabilities for anticipated tax issues based on estimates of the additional taxes that are likely to become due. Where the final tax outcome of these matters is different from the amounts that were initially recorded, such differences will impact the income tax and deferred tax provisions in the period in which such determination is made.
See note 6 to these financial statements.
77
Notes to the financial statements
1 Segmental information
The principal activity of the Group is the manufacture, marketing and sale of tobacco and tobacco-related products. The management structure is based on geographical regions. These geographical regions of UK, Germany, Rest of Western Europe and Rest of the World have been used as the primary reporting segments. The manufacture, marketing and sale of tobacco and tobacco-related products is a single integrated business and as a consequence, the Group has only one business segment and no secondary segment disclosure has been made. The central costs are allocated to segments on the basis of revenue less duty.
Geographical consolidated income statement by destination of sales
|
| 2006 |
| 2005 |
| ||||||||
(In £’s million) |
| Revenue |
| Duty |
| Profit from |
| Revenue |
| Duty |
| Profit from |
|
UK |
| 4,762 |
| 3,927 |
| 496 |
| 4,710 |
| 3,910 |
| 460 |
|
Germany |
| 2,707 |
| 2,123 |
| 243 |
| 2,630 |
| 2,000 |
| 265 |
|
Rest of Western Europe |
| 1,647 |
| 1,010 |
| 321 |
| 1,571 |
| 927 |
| 308 |
|
Rest of the World |
| 2,560 |
| 1,454 |
| 251 |
| 2,318 |
| 1,269 |
| 207 |
|
International |
| 6,914 |
| 4,587 |
| 815 |
| 6,519 |
| 4,196 |
| 780 |
|
|
| 11,676 |
| 8,514 |
| 1,311 |
| 11,229 |
| 8,106 |
| 1,240 |
|
Geographical reconciliation of profit from operations to adjusted profit from operations by destination of sales
2006
(In £’s million) |
| Adjusted profit |
| Restructuring |
| Fair value |
| Retirement |
| Profit from |
|
UK |
| 506 |
| (10 | ) | — |
| — |
| 496 |
|
Germany |
| 274 |
| (31 | ) | — |
| — |
| 243 |
|
Rest of Western Europe |
| 324 |
| (3 | ) | — |
| — |
| 321 |
|
Rest of the World |
| 252 |
| (1 | ) | — |
| — |
| 251 |
|
International |
| 850 |
| (35 | ) | — |
| — |
| 815 |
|
|
| 1,356 |
| (45 | ) | — |
| — |
| 1,311 |
|
|
| Adjusted |
|
|
|
|
|
|
| Reported |
|
Investment income |
| 13 |
| — |
| 82 |
| 188 |
| 283 |
|
Finance costs |
| (201 | ) | — |
| (83 | ) | (142 | ) | (426 | ) |
Profit before taxation |
| 1,168 |
| (45 | ) | (1 | ) | 46 |
| 1,168 |
|
2005
(In £’s million) |
| Adjusted profit |
| Restructuring |
| Fair value |
| Retirement |
| Profit from |
|
UK |
| 468 |
| (8 | ) | n/a |
| — |
| 460 |
|
Germany |
| 294 |
| (29 | ) | n/a |
| — |
| 265 |
|
Rest of Western Europe |
| 326 |
| (18 | ) | n/a |
| — |
| 308 |
|
Rest of the World |
| 209 |
| (2 | ) | n/a |
| — |
| 207 |
|
International |
| 829 |
| (49 | ) | n/a |
| — |
| 780 |
|
|
| 1,297 |
| (57 | ) | n/a |
| — |
| 1,240 |
|
|
| Adjusted |
|
|
|
|
|
|
| Reported |
|
Investment income |
| 22 |
| — |
| n/a |
| 158 |
| 180 |
|
Finance costs |
| (206 | ) | — |
| n/a |
| (136 | ) | (342 | ) |
Profit before taxation |
| 1,113 |
| (57 | ) | n/a |
| 22 |
| 1,078 |
|
78
Geographical analysis of other segment items
2006
|
| By location of business unit |
| By destination of sales |
| ||||||||
|
| Capital expenditure |
| Capital expenditure |
|
|
|
|
| ||||
(In £’s million) |
| Property, plant |
| Intangible |
| Property, plant |
| Intangible |
| Depreciation |
| Amortisation |
|
UK |
| 29 |
| 5 |
| 24 |
| 5 |
| 23 |
| 3 |
|
Germany |
| 16 |
| 369 |
| 14 |
| 29 |
| 22 |
| 2 |
|
Rest of Western Europe |
| 4 |
| — |
| 8 |
| 47 |
| 10 |
| 2 |
|
Rest of the World |
| 26 |
| 1 |
| 29 |
| 294 |
| 39 |
| 2 |
|
International |
| 46 |
| 370 |
| 51 |
| 370 |
| 71 |
| 6 |
|
|
| 75 |
| 375 |
| 75 |
| 375 |
| 94 |
| 9 |
|
2005
|
| By location of business unit |
| By destination of sales |
| ||||||||
|
| Capital expenditure |
| Capital expenditure |
|
|
|
|
| ||||
|
| Property, plant |
| Intangible |
| Property, plant |
| Intangible |
|
|
|
|
|
(In £’s million) |
| & equipment |
| assets |
| & equipment |
| assets |
| Depreciation |
| Amortisation |
|
UK |
| 23 |
| 3 |
| 25 |
| 3 |
| 20 |
| 3 |
|
Germany |
| 17 |
| 2 |
| 15 |
| 2 |
| 17 |
| 2 |
|
Rest of Western Europe |
| 5 |
| 1 |
| 5 |
| 1 |
| 8 |
| 8 |
|
Rest of the World |
| 47 |
| 4 |
| 47 |
| 4 |
| 37 |
| 2 |
|
International |
| 69 |
| 7 |
| 67 |
| 7 |
| 62 |
| 12 |
|
|
| 92 |
| 10 |
| 92 |
| 10 |
| 82 |
| 15 |
|
Geographical analysis of assets and liabilities by destination of sales
|
| 2006 |
| 2005 |
| ||||||||
(In £’s million) |
| Assets |
| Liabilities |
| Net Assets |
| Assets |
| Liabilities |
| Net Assets |
|
UK |
| 885 |
| (670 | ) | 215 |
| 836 |
| (650 | ) | 186 |
|
Germany |
| 1,666 |
| (311 | ) | 1,355 |
| 1,790 |
| (328 | ) | 1,462 |
|
Rest of Western Europe |
| 1,137 |
| (252 | ) | 885 |
| 1,088 |
| (312 | ) | 776 |
|
Rest of the World |
| 2,682 |
| (300 | ) | 2,382 |
| 2,360 |
| (355 | ) | 2,005 |
|
International |
| 5,485 |
| (863 | ) | 4,622 |
| 5,238 |
| (995 | ) | 4,243 |
|
|
| 6,370 |
| (1,533 | ) | 4,837 |
| 6,074 |
| (1,645 | ) | 4,429 |
|
Unallocated assets and liabilities: |
|
|
|
|
|
|
|
|
|
|
|
|
|
Cash and cash equivalents |
| 263 |
| — |
| 263 |
| 256 |
| — |
| 256 |
|
Borrowings |
| — |
| (4,052 | ) | (4,052 | ) | — |
| (3,482 | ) | (3,482 | ) |
Retirement benefit asset/(liability) |
| 397 |
| (434 | ) | (37 | ) | 259 |
| (438 | ) | (179 | ) |
Taxation |
| 84 |
| (407 | ) | (323 | ) | 106 |
| (368 | ) | (262 | ) |
Derivative financial instruments |
| 29 |
| (119 | ) | (90 | ) | — |
| (57 | ) | (57 | ) |
|
| 7,143 |
| (6,545 | ) | 598 |
| 6,695 |
| (5,990 | ) | 705 |
|
Geographical analysis of assets and liabilities by location of business unit
|
| 2006 |
| 2005 |
| ||||||||
(In £’s million) |
| Assets |
| Liabilities |
| Net Assets |
| Assets |
| Liabilities |
| Net Liabilities |
|
UK |
| 937 |
| (720 | ) | 217 |
| 910 |
| (743 | ) | 167 |
|
Germany |
| 2,027 |
| (320 | ) | 1,707 |
| 1,873 |
| (317 | ) | 1,556 |
|
Rest of Western Europe |
| 1,028 |
| (243 | ) | 785 |
| 1,049 |
| (297 | ) | 752 |
|
Rest of the World |
| 2,378 |
| (250 | ) | 2,128 |
| 2,242 |
| (288 | ) | 1,954 |
|
International |
| 5,433 |
| (813 | ) | 4,620 |
| 5,164 |
| (902 | ) | 4,262 |
|
|
| 6,370 |
| (1,533 | ) | 4,837 |
| 6,074 |
| (1,645 | ) | 4,429 |
|
79
Use of adjusted measures
Management believes that reporting adjusted measures provides a better comparison of business performance for the year and reflects the way in which the business is controlled. Accordingly, adjusted measures of profit from operations, net finance costs, profit before tax, taxation and earnings per share exclude, where applicable, restructuring costs, retirement benefit net financing income, fair value gains and losses on derivative financial instruments and related taxation effects. Reconciliations between adjusted and reported taxation are included in note 6 and between adjusted and reported earnings per share in note 8.
The term adjusted is not a defined term under IFRS and may not be comparable with similarly titled measures reported by other companies.
The principal adjustments made to reported profits are as follows:
Restructuring costs
These are significant one-off costs incurred in integrating acquired businesses and rationalisation initiatives.
Fair value gains and losses on derivative financial instruments
IAS 39 requires that all derivative financial instruments be recognised on the balance sheet at fair value, with changes in the fair value being recognised in the income statement unless the instrument qualifies for hedge accounting under IAS 39.
The Group hedges underlying exposures in an efficient, commercial and structured manner. However the strict hedging requirements of IAS 39 lead to some commercially effective hedge positions not qualifying for hedge accounting. As a result, the Group has decided not to apply hedge accounting as permitted under IAS 39 and we exclude fair value gains and losses on derivative financial instruments from adjusted measures where appropriate.
Retirement benefit net financing income
The expected return on plan assets and the interest on retirement benefit liabilities is included within net finance costs. Since these items do not impact cash flows and can be subject to significant volatility outside of management’s control they have been eliminated from adjusted measures of net finance costs, profit before tax and earnings per share.
2 Profit before taxation
Profit before taxation is stated after charging/(crediting):
(In £’s million) |
| 2006 |
| 2005 |
|
Operating lease charges: |
|
|
|
|
|
– plant and equipment |
| 2 |
| 1 |
|
– other assets |
| 10 |
| 11 |
|
Net foreign exchange gains |
| (18 | ) | (2 | ) |
Write-down of inventories |
| 3 |
| 1 |
|
Profit on sale of property, plant and equipment |
| — |
| (2 | ) |
Repairs and maintenance costs |
| 24 |
| 25 |
|
Impairment of trade receivables |
| (1 | ) | (3 | ) |
80
Analysis of fees payable to PricewaterhouseCoopers:
(In £’s million) |
| 2006 |
| 2005 |
|
Audit fees in respect of the audit of the accounts of the Company |
| 0.6 |
| 0.6 |
|
Audit fees in respect of the audit of the accounts of associates of the Company |
| 1.5 |
| 1.5 |
|
Fees for other services supplied pursuant to legislation |
| 1.6 |
| 1.1 |
|
|
| 3.7 |
| 3.2 |
|
Other services relating to taxation |
| 1.1 |
| 1.3 |
|
Services relating to corporate finance transactions |
| 0.1 |
| 0.4 |
|
|
| 4.9 |
| 4.9 |
|
Of the above fees £0.1m (2005: £nil) has been capitalised in the balance sheet.
It is the responsibility of the Board of Trustees of the Imperial Tobacco Pension Fund to appoint the auditors to the scheme. The Board of Trustees acts independently of Group management. The fees paid to PricewaterhouseCoopers in respect of the Imperial Tobacco Pension Fund were £23,500 (2005: £20,500).
3 Restructuring costs
(In £’s million) |
| 2006 |
| 2005 |
|
Employment related (mainly termination) |
| 23 |
| 36 |
|
Fixed asset write offs and impairment |
| 17 |
| 13 |
|
Other operating charges |
| 5 |
| 8 |
|
|
| 45 |
| 57 |
|
In 2006 restructuring costs were primarily in respect of the closure of our Liverpool and Lahr factories.
In 2005 restructuring costs were in respect of the closure of our tube factories in Plattsburgh and Montreal, the cigarette factory in Dublin, the rolling papers factory in Treforest and a significant headcount reduction at the Berlin cigarette factory.
4 Directors and employees
(In £’s million) |
| 2006 |
| 2005 |
|
Employment costs |
|
|
|
|
|
Wages and salaries |
| 340 |
| 340 |
|
Social security costs |
| 61 |
| 60 |
|
Pension costs (note 18) |
| 51 |
| 44 |
|
Share-based payments (note 21) |
| 16 |
| 11 |
|
|
| 468 |
| 455 |
|
Details of Directors’ emoluments and interests are provided within the Directors’ Remuneration Report on pages 52 to 66. These disclosures form part of the financial statements. The highest paid Director during the year was Mr G Davis and details of his emoluments are shown on pages 54 to 65.
Average number of persons employed by the Group by location during the year
(Number) |
| 2006 |
| 2005 |
|
UK |
| 2,425 |
| 2,535 |
|
Germany |
| 2,328 |
| 2,518 |
|
Rest of Western Europe |
| 1,443 |
| 1,380 |
|
Rest of the World |
| 8,290 |
| 8,477 |
|
International |
| 12,061 |
| 12,375 |
|
|
| 14,486 |
| 14,910 |
|
81
5 Net finance costs
(In £’s million) |
| 2006 |
| 2005 |
|
Interest on bank deposits |
| (13 | ) | (22 | ) |
Expected return on retirement benefit assets |
| (188 | ) | (158 | ) |
Fair value gains on derivative financial instruments |
| (82 | ) | n/a |
|
Investment income |
| (283 | ) | (180 | ) |
|
|
|
|
|
|
Interest on bank and other loans |
| 201 |
| 206 |
|
Interest on retirement benefit liabilities |
| 142 |
| 136 |
|
Fair value losses on derivative financial instruments |
| 83 |
| n/a |
|
Finance costs |
| 426 |
| 342 |
|
Net finance costs |
| 143 |
| 162 |
|
6 Taxation
Analysis of charge in the year
(In £’s million) |
| 2006 |
| 2005 |
|
Current tax |
|
|
|
|
|
UK corporation tax at 30% (2005: 30%) |
| 148 |
| 109 |
|
Overseas taxation |
| 164 |
| 199 |
|
Total current tax |
| 312 |
| 308 |
|
Deferred tax |
|
|
|
|
|
Origination and reversal of temporary differences |
| (2 | ) | (20 | ) |
Total tax charge |
| 310 |
| 288 |
|
Adjusted taxation
The table below shows the tax impact of the adjustments made to reported profit after taxation in order to arrive at the adjusted measure of earnings disclosed in note 8.
(In £’s million) |
| 2006 |
| 2005 |
|
Reported taxation |
| 310 |
| 288 |
|
Tax on restructuring costs |
| 16 |
| 15 |
|
Tax on retirement benefits net financing income |
| (16 | ) | (6 | ) |
Adjusted tax charge |
| 310 |
| 297 |
|
82
Factors affecting the current tax charge for the year
The tax on the Group’s profit before taxation differs from the theoretical amount that would arise using the UK corporation tax rate of 30% as follows:
(In £’s million) |
| 2006 |
| 2005 |
|
Profit before taxation |
| 1,168 |
| 1,078 |
|
Tax at the UK corporation tax rate of 30% (2005: 30%) |
| 350 |
| 323 |
|
Tax effects of: |
|
|
|
|
|
Differences in effective tax rates on overseas earnings |
| (24 | ) | (35 | ) |
Unrecognised deferred tax asset |
| 6 |
| — |
|
Items not deductible for tax purposes |
| 2 |
| 4 |
|
Adjustments in respect of prior periods |
| (24 | ) | (4 | ) |
Total tax charge |
| 310 |
| 288 |
|
Factors that may affect future tax charges
No deferred tax is recognised on the unremitted earnings of overseas subsidiaries as the Group is able to control the source and timing of future remittances. The Group currently has no plans to remit dividends which would result in a material tax cost.
Movement on current tax account
(In £’s million) |
| 2006 |
| 2005 |
|
As at 1 October |
| (191 | ) | (121 | ) |
Exchange movements |
| 1 |
| (9 | ) |
Charge to income statement |
| (312 | ) | (308 | ) |
Cash paid |
| 236 |
| 239 |
|
Other movements |
| 7 |
| 8 |
|
As at 30 September |
| (259 | ) | (191 | ) |
Analysis of current tax account
(In £’s million) |
| 2006 |
| 2005 |
|
Current tax assets |
| 13 |
| 44 |
|
Current tax liabilities |
| (272 | ) | (235 | ) |
|
| (259 | ) | (191 | ) |
7 Dividends
Amounts recognised as distributions to ordinary shareholders in the year:
(In £’s million) |
| 2006 |
| 2005 |
|
Final dividend for the year ended 30 September 2005 of 39.5p per share (2004: 35.0p) |
| 279 |
| 253 |
|
Interim dividend for the year ended 30 September 2006 of 18.5p per share (2005: 16.5p) |
| 127 |
| 120 |
|
|
| 406 |
| 373 |
|
A final dividend for the year ended 30 September 2006 of 43.5 pence per share has been proposed. This amounts to £295m based on the number of shares ranking for dividend at 30 September 2006. At the date of the year end, the shareholders had not yet approved the final dividend at the Annual General Meeting and therefore it is not included in the balance sheet as a liability.
83
8 Earnings per share
Basic earnings per share is based on the profit for the year attributable to the equity holders of the Company and the weighted average number of ordinary shares in issue during the year excluding shares held to satisfy the Group’s employee share schemes and shares purchased by the Company and held as treasury shares. Diluted earnings per share have been calculated by taking into account the weighted average number of shares that would be issued on conversion into ordinary shares of rights held under the employee share schemes.
(In £’s million) |
| 2006 |
| 2005 |
|
Earnings: basic and diluted |
| 851 |
| 784 |
|
(Numbers in millions) |
|
|
|
|
|
Weighted average number of shares: |
|
|
|
|
|
Shares for basic earnings per share |
| 696.3 |
| 721.6 |
|
Potentially dilutive share options |
| 3.3 |
| 3.4 |
|
Shares for diluted earnings per share |
| 699.6 |
| 725.0 |
|
(In pence) |
|
|
|
|
|
Basic earnings per share |
| 122.2 |
| 108.6 |
|
Diluted earnings per share |
| 121.6 |
| 108.1 |
|
As described in note 1 above, management believes that reporting adjusted measures, including adjusted earnings per share, provides a better comparison of business performance for the year and reflects the way in which the business is controlled. A reconciliation from reported earnings per share to adjusted earnings per share, and the earnings figures (net of tax) used in calculating them is as follows:
|
| 2006 |
| 2006 |
| 2005 |
| 2005 |
|
(In £’s million unless otherwise indicated) |
| EPS |
| Earnings |
| EPS |
| Earnings |
|
Reported basic |
| 122.2 | p | 851 |
| 108.6 | p | 784 |
|
Restructuring costs |
| 4.2 | p | 29 |
| 5.8 | p | 42 |
|
Retirement benefits net financing income |
| (4.3 | )p | (30 | ) | (2.2 | )p | (16 | ) |
Fair value gains and losses on derivative financial instruments |
| 0.1 | p | 1 |
| n/a |
| n/a |
|
Adjusted |
| 122.2 | p | 851 |
| 112.2 | p | 810 |
|
9 Intangible assets
|
|
|
| Trademarks |
|
|
|
|
|
(In £’s million) |
| Goodwill |
| & licences |
| Software |
| Total |
|
Cost |
|
|
|
|
|
|
|
|
|
As at 1 October 2005 |
| 3,930 |
| 149 |
| 29 |
| 4,108 |
|
Exchange movements |
| (15 | ) | (9 | ) | (1 | ) | (25 | ) |
Acquisitions (note 24) |
| 11 |
| — |
| — |
| 11 |
|
Additions |
| — |
| 368 |
| 7 |
| 375 |
|
Disposals |
| — |
| — |
| (1 | ) | (1 | ) |
As at 30 September 2006 |
| 3,926 |
| 508 |
| 34 |
| 4,468 |
|
Amortisation |
|
|
|
|
|
|
|
|
|
As at 1 October 2005 |
| 481 |
| 55 |
| 18 |
| 554 |
|
Exchange movements |
| (1 | ) | (3 | ) | — |
| (4 | ) |
Amortisation charge for the year |
| — |
| 6 |
| 3 |
| 9 |
|
Disposals |
| — |
| — |
| (1 | ) | (1 | ) |
As at 30 September 2006 |
| 480 |
| 58 |
| 20 |
| 558 |
|
|
|
|
|
|
|
|
|
|
|
Net book value |
|
|
|
|
|
|
|
|
|
As at 30 September 2006 |
| 3,446 |
| 450 |
| 14 |
| 3,910 |
|
As at 1 October 2005 |
| 3,449 |
| 94 |
| 11 |
| 3,554 |
|
84
2005
|
|
|
| Trademarks |
|
|
|
|
|
(In £’s million) |
| Goodwill |
| & licences |
| Software |
| Total |
|
Cost |
|
|
|
|
|
|
|
|
|
As at 1 October 2004 |
| 3,938 |
| 140 |
| 20 |
| 4,098 |
|
Exchange movements |
| (26 | ) | 9 |
| — |
| (17 | ) |
Acquisitions (note 24) |
| 18 |
| — |
| — |
| 18 |
|
Additions |
| — |
| — |
| 10 |
| 10 |
|
Disposals |
| — |
| — |
| (1 | ) | (1 | ) |
As at 30 September 2005 |
| 3,930 |
| 149 |
| 29 |
| 4,108 |
|
Amortisation |
|
|
|
|
|
|
|
|
|
As at 1 October 2004 |
| 486 |
| 45 |
| 11 |
| 542 |
|
Exchange movements |
| (5 | ) | 2 |
| — |
| (3 | ) |
Amortisation charge for the year |
| — |
| 8 |
| 7 |
| 15 |
|
As at 30 September 2005 |
| 481 |
| 55 |
| 18 |
| 554 |
|
Net book value |
|
|
|
|
|
|
|
|
|
As at 30 September 2005 |
| 3,449 |
| 94 |
| 11 |
| 3,554 |
|
As at 1 October 2004 |
| 3,452 |
| 95 |
| 9 |
| 3,556 |
|
Goodwill and intangible asset impairment review
Goodwill and intangible assets with indefinite lives are allocated to the Group’s cash-generating units (CGUs), which have been identified according to country of operation for distribution units, with manufacturing identified as a single separate unit. A summary of the carrying value of goodwill and intangible assets with indefinite lives, presented at CGU level is shown as follows:
|
| 2006 |
| 2005 |
| ||||
|
|
|
| Intangible |
|
|
| Intangible |
|
|
|
|
| assets with |
|
|
| assets with |
|
(In £’s million) |
| Goodwill |
| indefinite lives |
| Goodwill |
| indefinite lives |
|
UK |
| 42 |
| — |
| 40 |
| — |
|
Germany |
| 1,164 |
| 28 |
| 1,093 |
| — |
|
Rest of Western Europe |
| 345 |
| 47 |
| 377 |
| — |
|
Rest of the World |
| 1,549 |
| 293 |
| 1,592 |
| — |
|
Manufacturing |
| 346 |
| — |
| 347 |
| — |
|
|
| 3,446 |
| 368 |
| 3,449 |
| — |
|
The goodwill in Germany and the Rest of the World arose principally on the acquisition of Reemtsma in 2002.
The Group tests goodwill and intangible assets with indefinite lives for impairment annually, or more frequently if there are any indications that impairment may have arisen. The recoverable amount of a CGU is determined based on value-in-use calculations. The key assumptions for the value-in-use calculations are those regarding discount rates and the long term growth rates. The discount rate is based on the weighted average cost of capital, while growth rates are based on management’s experience and expectations and do not exceed the long term average growth rate for the area in which the CGU operates. These calculations use cash flow projections based on financial budgets approved by management, covering a three-year period. Cash flows beyond the three-year period are extrapolated using the estimated growth rates. The weighted average growth rates are consistent with forecasts and the discount rates are pre-tax.
No impairment charges were recognised in 2006 (2005: £nil).
|
| Growth rate(1) |
| Discount rate(2) |
|
UK |
| 3.4 | % | 9.3 | % |
Germany |
| 3.5 | % | 9.3 | % |
Rest of Western Europe |
| 5.1 | % | 9.3 | % |
Rest of the World |
| 7.2 | % | 9.3 | % |
(1) Weighted average growth rate used to extrapolate cash flows beyond the budget period.
(2) Pre-tax discount rate applied to the cash flow projections.
85
Acquisition of Davidoff cigarette trademark
On 5 September 2006, the Group acquired the worldwide Davidoff cigarette trademark for a cash consideration of £368m. The Group had been the long term licensee of the trademark following the acquisition of Reemtsma in 2002. Given the global growth potential of the brand, the Directors consider that the Davidoff cigarette trademark has an indefinite life and it is therefore not subject to amortisation. It is, however, subject to an annual impairment review under the requirements of IAS 36.
10 Property, plant and equipment
2006
|
|
|
| Plant and |
| Fixtures and |
|
|
|
(In £’s million) |
| Property |
| equipment |
| motor vehicles |
| Total |
|
Cost |
|
|
|
|
|
|
|
|
|
As at 1 October 2005 |
| 166 |
| 776 |
| 151 |
| 1,093 |
|
Exchange movements |
| (2 | ) | (14 | ) | (1 | ) | (17 | ) |
Reclassifications |
| — |
| (2 | ) | 2 |
| — |
|
Acquisitions (note 24) |
| — |
| 1 |
| 1 |
| 2 |
|
Additions |
| 2 |
| 52 |
| 21 |
| 75 |
|
Disposals |
| (9 | ) | (33 | ) | (15 | ) | (57 | ) |
As at 30 September 2006 |
| 157 |
| 780 |
| 159 |
| 1,096 |
|
Accumulated depreciation |
|
|
|
|
|
|
|
|
|
As at 1 October 2005 |
| 3 |
| 370 |
| 78 |
| 451 |
|
Exchange movements |
| — |
| (5 | ) | (1 | ) | (6 | ) |
Charge for the year |
| 6 |
| 67 |
| 21 |
| 94 |
|
Impairment |
| 6 |
| 10 |
| 1 |
| 17 |
|
Disposals |
| (3 | ) | (27 | ) | (10 | ) | (40 | ) |
As at 30 September 2006 |
| 12 |
| 415 |
| 89 |
| 516 |
|
Net book value |
|
|
|
|
|
|
|
|
|
As at 30 September 2006 |
| 145 |
| 365 |
| 70 |
| 580 |
|
As at 1 October 2005 |
| 163 |
| 406 |
| 73 |
| 642 |
|
2005
|
|
|
| Plant and |
| Fixtures and |
|
|
|
(In £’s million) |
| Property |
| equipment |
| motor vehicles |
| Total |
|
Cost |
|
|
|
|
|
|
|
|
|
As at 1 October 2004 |
| 189 |
| 751 |
| 129 |
| 1,069 |
|
Exchange movements |
| 4 |
| 12 |
| 2 |
| 18 |
|
Reclassifications |
| 6 |
| (8 | ) | 2 |
| — |
|
Additions |
| 2 |
| 69 |
| 21 |
| 92 |
|
Disposals |
| (35 | ) | (48 | ) | (3 | ) | (86 | ) |
As at 30 September 2005 |
| 166 |
| 776 |
| 151 |
| 1,093 |
|
Accumulated depreciation |
|
|
|
|
|
|
|
|
|
As at 1 October 2004 |
| 7 |
| 337 |
| 60 |
| 404 |
|
Exchange movements |
| 1 |
| 6 |
| 1 |
| 8 |
|
Reclassifications |
| — |
| (1 | ) | 1 |
| — |
|
Charge for the year |
| 7 |
| 59 |
| 16 |
| 82 |
|
Impairment |
| — |
| 13 |
| — |
| 13 |
|
Disposals |
| (12 | ) | (44 | ) | — |
| (56 | ) |
As at 30 September 2005 |
| 3 |
| 370 |
| 78 |
| 451 |
|
Net book value |
|
|
|
|
|
|
|
|
|
As at 30 September 2005 |
| 163 |
| 406 |
| 73 |
| 642 |
|
As at 1 October 2004 |
| 182 |
| 414 |
| 69 |
| 665 |
|
86
Land and buildings at net book value:
(In £’s million) |
| 2006 |
| 2005 |
|
Freehold |
| 133 |
| 151 |
|
Long leasehold |
| 12 |
| 12 |
|
|
| 145 |
| 163 |
|
Assets with a net book value of £1m (2005: £1m) are pledged as security for liabilities.
11 Investments in associates
(In £’s million) |
| 2006 |
| 2005 |
|
As at 1 October |
| 5 |
| 7 |
|
Impairments |
| — |
| (2 | ) |
As at 30 September |
| 5 |
| 5 |
|
None of the associates is considered to be significant to the Group.
12 Inventories
(In £’s million) |
| 2006 |
| 2005 |
|
Raw materials |
| 259 |
| 301 |
|
Work in progress |
| 14 |
| 16 |
|
Finished inventories |
| 410 |
| 407 |
|
Other inventories |
| 106 |
| 133 |
|
|
| 789 |
| 857 |
|
Other inventories comprise mainly duty-paid tax stamps.
It is generally recognised industry practice to classify leaf tobacco inventory as a current asset although part of such inventory, because of the duration of the processing cycle, ordinarily would not be consumed within one year. Leaf tobacco held within raw materials inventories at the balance sheet date will ordinarily be utilised within two years.
13 Trade and other receivables
|
| 2006 |
| 2005 |
| ||||
(In £’s million) |
| Current |
| Non-current |
| Current |
| Non-current |
|
Trade receivables |
| 1,012 |
| — |
| 966 |
| — |
|
Less: provision for impairment of receivables |
| (6 | ) | — |
| (7 | ) | — |
|
Net trade receivables |
| 1,006 |
| — |
| 959 |
| — |
|
Other receivables |
| 16 |
| 15 |
| 28 |
| 2 |
|
Prepayments and accrued income |
| 45 |
| 4 |
| 25 |
| 2 |
|
|
| 1,067 |
| 19 |
| 1,012 |
| 4 |
|
14 Cash and cash equivalents
(In £’s million) |
| 2006 |
| 2005 |
|
Cash at bank and in hand |
| 246 |
| 231 |
|
Short term deposits and other liquid assets |
| 17 |
| 25 |
|
|
| 263 |
| 256 |
|
87
15 Trade and other payables
|
| 2006 |
| 2005 |
| ||||
(In £’s million) |
| Current |
| Non-current |
| Current |
| Non-current |
|
Trade payables |
| 123 |
| — |
| 125 |
| — |
|
Other taxes, duties and social security contributions |
| 1,126 |
| — |
| 1,134 |
| — |
|
Deferred consideration |
| 8 |
| — |
| 55 |
| 8 |
|
Other payables |
| 70 |
| 1 |
| 49 |
| 2 |
|
Accruals and deferred income |
| 106 |
| 4 |
| 165 |
| 1 |
|
|
| 1,433 |
| 5 |
| 1,528 |
| 11 |
|
16 Borrowings and derivative financial instruments
2006 – IFRS disclosures
As explained in the Accounting policy notes, IAS 32 and IAS 39, which deal with financial instruments, are being applied from
1 October 2005. The following disclosures are included as at 30 September 2006 in order to meet the requirements of IAS 32.
(i) Management of financial risk
The Group operates a centralised treasury function, Group Treasury, that is responsible for the management of the financing risks of the Group, together with its financing and liquidity requirements. It does not operate as a profit centre, nor does it enter into speculative transactions, and is subject to policies and procedures approved by the Board. A treasury sub-committee oversees the operation of Group Treasury in accordance with the delegated authorities set out by the Board. The Group Treasurer reports on a regular basis to the Board, including provision of monthly treasury summaries and an annual review of strategy.
Accounting for derivative financial instruments and hedging activities
IAS 39 requires that all derivative financial instruments are recognised in the balance sheet at fair value, with changes in the fair value being recognised in the income statement unless the instrument satisfies the hedge accounting rules under IFRS. The hedge accounting rules under IFRS are considerably more restrictive than the requirements under UK GAAP and while the Group continues to hedge underlying exposures in an efficient, commercial and structured manner, the requirements of IAS 39 may lead to some commercially effective hedge positions not being effective for hedge accounting purposes. As a result, the Group has decided not to apply hedge accounting for its derivative financial instruments as permitted under IAS 39. The information contained in sections (ii) and (iii) below shows the underlying borrowing position before the effect of interest rate swaps or cross currency swaps. However, the Group does apply net investment hedging, designating certain borrowings as hedges of the net investment in the Group’s foreign operations. See section (v) for details.
Foreign exchange risk
The Group is exposed to movements in foreign exchange rates due to its commercial trading denominated in foreign currencies, the foreign currency borrowings (both pre and post cross currency swaps), the translation of the net assets of its foreign operations into the consolidated financial statements and foreign currency denominated costs.
In 2006, 74% of revenue less duty and 62% of profit from operations was in international markets. Certain sales in these markets are invoiced in currencies other than the functional currency of the selling company, in particular Taiwanese dollars. The Group uses foreign currency derivative instruments, such as forward foreign exchange contracts, to reduce exposure to the risk that these sales will be adversely affected by changes in exchange rates. As at 30 September 2006, there were £32m notional outstanding forward foreign exchange contracts.
The material foreign currency denominated costs include the purchase of tobacco leaf, which is sourced from various countries but purchased principally in US dollars, and packaging materials which are sourced from various countries and purchased in a number of currencies.
The Group issues debt in the market or markets that are most appropriate at the time of execution and uses derivative financial instruments, such as cross currency swaps, to change the debt into the desired currency.
The Group has foreign operations whose net assets are exposed to foreign currency translation risk when consolidated into the Group financial statements. A proportion of the currency exposure arising from the net assets of the Group’s foreign operations is managed through borrowings (post cross currency swaps) denominated in the relevant foreign currencies.
Interest rate risk
The Group is exposed to interest rate risk due to its borrowings and cash deposits. The most material risk is in respect of its borrowings.
Group Treasury monitors the Group’s borrowing levels using adjusted net debt which includes the fair value of the principal amounts due to be exchanged at maturity under cross currency swaps and excludes the fair value of interest rate derivatives and interest accruals.
88
As at 30 September 2006, approximately 21% of adjusted net debt was denominated in sterling and 79% in Euro. Accordingly, the Group’s financial results are currently exposed to gains or losses arising from fluctuations in sterling and Euro interest rates. In order to manage its interest rate risk on the borrowings, the Group separates the borrowing activities from its interest rate risk management decisions by issuing debt in the market or markets that are most appropriate at the time of execution and using derivative financial instruments, such as cross currency swaps and interest rate swaps, to change the debt into the desired currency and into floating interest rate shortly after issue. The Group then transacts interest rate swaps at other times for different notional amounts and different maturities to manage our exposure to interest rate risk. As at 30 September 2006, 51% of adjusted net debt was at a floating rate of interest and 49% was at a fixed rate of interest.
Credit risk
The Group is exposed to credit risk due to its trade receivables due from customers and cash deposits and financial instruments transacted with financial institutions.
The Group has some significant concentrations of credit risk from customers. However, the Group has implemented policies to ensure that sales of products are made to customers with an appropriate credit history and obtains guarantees or other means of credit support to reduce the risk where this is considered to be necessary.
The Group has no significant concentrations of credit risk from financial institutions. The Group has placed cash deposits and entered into derivative instruments with a diversified group of financial institutions with suitable credit ratings in order to manage its credit risk to any one financial institution.
Liquidity risk
The Group is exposed to liquidity risk arising from having insufficient funds available to enable it to meet the financing needs of the Group.
The Group actively maintains a mixture of long term and short term committed facilities that are designed to ensure that the Group has sufficient available funds for the forecast requirements of the Group. As at 30 September 2006 the Group had £504m of undrawn committed facilities, maturing in 2010.
As well as forecasting and monitoring the Group’s core liquidity needs, the Group Treasury function is in regular dialogue with subsidiary companies to ensure their liquidity needs are met.
Price risk
The Group is exposed to commodity price risk in that there may be fluctuations in the price of tobacco leaf.
As with other agricultural commodities, the price of tobacco leaf tends to be cyclical as supply and demand considerations influence tobacco plantings in those countries where tobacco is grown. Also, different regions may experience variations in weather patterns that may affect crop quality or supply and so lead to changes in price.
The Group seeks to reduce this price risk by sourcing tobacco leaf from a number of different countries, sourcing from various counterparties and by varying the levels of tobacco leaf held.
(ii) Borrowings
The Group’s borrowings as at 30 September 2006 are as follows:
(In £’s million) |
| 2006 |
|
Current borrowings |
|
|
|
Bank loans and overdrafts |
| 85 |
|
Capital market issuance: |
|
|
|
€1,500m 6.25% notes due 2007 |
| 1,037 |
|
Total current borrowings |
| 1,122 |
|
Non-current borrowings |
|
|
|
Bank loans |
| 2,041 |
|
Capital market issuance: |
|
|
|
US$600m 7.125% notes due 2009 |
| 322 |
|
£350m 6.875% notes due 2012 |
| 361 |
|
£200m 6.25% notes due 2018 |
| 206 |
|
Total non-current borrowings |
| 2,930 |
|
Total borrowings |
| 4,052 |
|
Current borrowings and non-current borrowings include interest payable of £20m and £22m respectively at 30 September 2006.
89
(iii) Currency analysis and effective interest rates of financial assets and financial liabilities
The currency denomination, the maturities and the effective interest rates of the Group’s financial assets and liabilities as at 30 September 2006 are as follows:
|
| Maturity |
|
|
|
|
| ||||||||||||||
|
| Less than |
| Between |
| Between |
| More than |
|
|
| Weighted |
| ||||||||
|
| 1 year |
| 1 and 2 years |
| 2 and 5 years |
| 5 years |
| Total |
| average |
| ||||||||
(In £’s million unless otherwise indicated) |
| £m |
| % |
| £m |
| % |
| £m |
| % |
| £m |
| % |
| £m |
| % |
|
Assets/(liabilities) (before the impact of cross currency swaps and interest rate swaps) |
|
|
|
|
|
|
|
|
|
|
|
|
|
|
|
|
|
|
|
|
|
Cash and cash equivalents |
|
|
|
|
|
|
|
|
|
|
|
|
|
|
|
|
|
|
|
|
|
Sterling |
| 67 |
| 4.3 |
|
|
|
|
|
|
|
|
|
|
|
|
| 67 |
| 4.3 |
|
Euro |
| 99 |
| 2.5 |
|
|
|
|
|
|
|
|
|
|
|
|
| 99 |
| 2.5 |
|
Other |
| 97 |
| 3.3 |
|
|
|
|
|
|
|
|
|
|
|
|
| 97 |
| 3.3 |
|
Total cash and cash equivalents |
| 263 |
|
|
|
|
|
|
|
|
|
|
|
|
|
|
| 263 |
|
|
|
Weighted average receivable interest rate (%) |
|
|
| 3.2 |
|
|
|
|
|
|
|
|
|
|
|
|
|
|
| 3.2 |
|
|
|
|
|
|
|
|
|
|
|
|
|
|
|
|
|
|
|
|
|
|
|
Trade receivables |
|
|
|
|
|
|
|
|
|
|
|
|
|
|
|
|
|
|
|
|
|
Sterling |
| 573 |
| — |
|
|
|
|
|
|
|
|
|
|
|
|
| 573 |
| — |
|
Euro |
| 256 |
| — |
|
|
|
|
|
|
|
|
|
|
|
|
| 256 |
| — |
|
Other |
| 183 |
| — |
|
|
|
|
|
|
|
|
|
|
|
|
| 183 |
| — |
|
Total trade receivables |
| 1,012 |
| — |
|
|
|
|
|
|
|
|
|
|
|
|
| 1,012 |
| — |
|
Trade payables |
|
|
|
|
|
|
|
|
|
|
|
|
|
|
|
|
|
|
|
|
|
Sterling |
| (37 | ) | — |
|
|
|
|
|
|
|
|
|
|
|
|
| (37 | ) | — |
|
Euro |
| (55 | ) | — |
|
|
|
|
|
|
|
|
|
|
|
|
| (55 | ) | — |
|
Other |
| (31 | ) | — |
|
|
|
|
|
|
|
|
|
|
|
|
| (31 | ) | — |
|
Total trade payables |
| (123 | ) | — |
|
|
|
|
|
|
|
|
|
|
|
|
| (123 | ) | — |
|
|
|
|
|
|
|
|
|
|
|
|
|
|
|
|
|
|
|
|
|
|
|
Borrowings |
|
|
|
|
|
|
|
|
|
|
|
|
|
|
|
|
|
|
|
|
|
By currency: |
|
|
|
|
|
|
|
|
|
|
|
|
|
|
|
|
|
|
|
|
|
Sterling |
| (24 | ) | 5.3 |
| — |
| — |
| (501 | ) | 5.3 |
| (567 | ) | 6.6 |
| (1,092 | ) | 6.0 |
|
Euro |
| (1,094 | ) | 6.2 |
| (1 | ) | 9.2 |
| (1,539 | ) | 3.5 |
| — |
| — |
| (2,634 | ) | 4.6 |
|
US dollars |
| (1 | ) | 5.8 |
| — |
| — |
| (322 | ) | 7.1 |
| — |
| — |
| (323 | ) | 7.1 |
|
Other |
| (3 | ) | 4.3 |
| — |
| — |
| — |
| — |
| — |
| — |
| (3 | ) | 4.3 |
|
Total borrowings |
| (1,122 | ) |
|
| (1 | ) |
|
| (2,362 | ) |
|
| (567 | ) |
|
| (4,052 | ) |
|
|
Weighted average payable interest rate (%) |
|
|
| 6.2 |
|
|
| 9.2 |
|
|
| 4.4 |
|
|
| 6.6 |
|
|
| 5.2 |
|
|
|
|
|
|
|
|
|
|
|
|
|
|
|
|
|
|
|
|
|
|
|
By class of instrument: |
|
|
|
|
|
|
|
|
|
|
|
|
|
|
|
|
|
|
|
|
|
Bank borrowings |
| (85 | ) | 4.8 |
| (1 | ) | 9.2 |
| (2,040 | ) | 3.9 |
| — |
| — |
| (2,126 | ) | 4.0 |
|
Capital market issuance |
| (1,037 | ) | 6.2 |
| — |
| — |
| (322 | ) | 7.1 |
| (567 | ) | 6.6 |
| (1,926 | ) | 6.5 |
|
Total borrowings |
| (1,122 | ) |
|
| (1 | ) |
|
| (2,362 | ) |
|
| (567 | ) |
|
| (4,052 | ) |
|
|
Weighted average payable interest rate (%) |
|
|
| 6.1 |
|
|
| 9.2 |
|
|
| 4.4 |
|
|
| 6.6 |
|
|
| 5.2 |
|
The effective interest rates shown in the table above have been calculated excluding the accrued interest balances.
The bank borrowings are floating rate liabilities. The majority bear interest at rates fixed in advance by reference to LIBOR in the case of sterling and to EURIBOR in the case of Euro borrowings. The capital market issuance in place at 30 September 2006 bears interest at a fixed rate until maturity.
The impact of interest rate swaps and cross currency swaps to manage the resultant interest rate risk arising is shown in section (iv) overleaf.
90
(iv) Derivative financial instruments
IAS 39 requires that all derivative financial instruments are recognised in the balance sheet at fair value, with changes in the fair value being recognised in the income statement unless the instrument satisfies the hedge accounting rules under IFRS. The hedge accounting rules under IFRS are considerably more restrictive than the requirements under UK GAAP and while the Group continues to hedge underlying exposures in an efficient, commercial and structured manner, the requirements of IAS 39 may lead to some commercially effective hedge positions not being effective for hedge accounting purposes. As a result, the Group has decided not to apply hedge accounting for its derivative financial instruments as permitted under IAS 39.
The Group separates the borrowing activities from its interest rate risk management decisions by issuing debt in the market or markets that are most appropriate at the time of execution and using derivative financial instruments, such as cross currency swaps and interest rate swaps, to change the debt into the desired currency and into floating interest rate shortly after issue. The Group then transacts interest rate swaps at other times for different notional amounts and different maturities to manage our exposure to interest rate risk.
The following table sets out the derivative financial instruments held by the Group as at 30 September 2006, and demonstrates the Group’s use of those derivative financial instruments to manage the Group’s foreign currency exchange rate and interest rate exposure. The table presents the nominal value of such instruments used to calculate the contractual payments under such contracts, analysed by maturity date, together with the related weighted average interest rate where relevant. Some of the interest rate swaps have embedded options and assumptions have been made based on market information and third party advice at 30 September 2006 to determine whether such options are likely to be exercised in order to determine the probable maturity date.
Debt is issued in the market or markets that are most appropriate at the time of execution
|
| Sterling equivalent at |
| Accounting year ending in |
| ||||||||||||
(In £’s million) |
| 30 Sept 2006 |
| 2007 |
| 2008 |
| 2009 |
| 2010 |
| 2011 |
| Thereafter |
| Total |
|
|
|
|
|
|
|
|
|
|
|
|
|
|
|
|
|
|
|
Capital market issuance |
|
|
|
|
|
|
|
|
|
|
|
|
|
|
|
|
|
€1,500m 6.25% notes due 2007 |
| 1,018 |
| 1,018 |
|
|
|
|
|
|
|
|
|
|
| 1,018 |
|
US$600m 7.125% notes due 2009 |
| 321 |
|
|
|
|
| 321 |
|
|
|
|
|
|
| 321 |
|
£350m 6.875% notes due 2012 |
| 350 |
|
|
|
|
|
|
|
|
|
|
| 350 |
| 350 |
|
£200m 6.25% notes due 2018 |
| 200 |
|
|
|
|
|
|
|
|
|
|
| 200 |
| 200 |
|
Interest accruals and discounts |
|
|
| 19 |
|
|
| 1 |
|
|
|
|
| 17 |
| 37 |
|
Total capital market issuance |
|
|
| 1,037 |
|
|
| 322 |
|
|
|
|
| 567 |
| 1,926 |
|
|
|
|
|
|
|
|
|
|
|
|
|
|
|
|
|
|
|
Bank loans and overdrafts, borrowed at LIBOR (or equivalent) plus a margin at the time of borrowing |
|
|
| 85 |
| 1 |
|
|
| 2,038 |
|
|
|
|
| 2,124 |
|
Interest accruals |
|
|
|
|
|
|
|
|
| 2 |
|
|
|
|
| 2 |
|
Total bank borrowings |
|
|
| 85 |
| 1 |
|
|
| 2,040 |
|
|
|
|
| 2,126 |
|
Total borrowings |
|
|
| 1,122 |
| 1 |
| 322 |
| 2,040 |
|
|
| 567 |
| 4,052 |
|
91
Derivative financial instruments are then transacted to change the debt issued into the desired currency and into floating rates of interest
|
| Accounting year ending in |
| Fair value as at |
| ||||||||||||||
(In £’s million unless otherwise indicated) |
| 2007 |
| 2008 |
| 2009 |
| 2010 |
| 2011 |
| Thereafter |
| Total |
| Asset |
| Liability |
|
Cross currency swaps |
|
|
|
|
|
|
|
|
|
|
|
|
|
|
|
|
|
|
|
Notional amount |
|
|
|
|
|
|
|
|
|
|
| 550 | (1) | 550 |
| 5 |
| 20 |
|
Sterling interest rate to receive (%) |
|
|
|
|
|
|
|
|
|
|
| 6.5 |
| 6.5 |
|
|
|
|
|
Interest margin over EURIBOR to pay (%) |
|
|
|
|
|
|
|
|
|
|
| 1.2 |
| 1.2 |
|
|
|
|
|
Notional amount |
|
|
|
|
| 321 | (1) |
|
|
|
|
|
| 321 |
|
|
| 45 |
|
US dollar interest rate to receive (%) |
|
|
|
|
| 7.1 |
|
|
|
|
|
|
| 7.1 |
|
|
|
|
|
Sterling interest margin over LIBOR to pay (%) |
|
|
|
|
| 1.3 |
|
|
|
|
|
|
| 1.3 |
|
|
|
|
|
|
|
|
|
|
|
|
|
|
|
|
|
|
|
|
|
|
|
|
|
Euro interest rate derivatives |
|
|
|
|
|
|
|
|
|
|
|
|
|
|
|
|
|
|
|
Interest rate swaps – pay variable, receive fixed: |
|
|
|
|
|
|
|
|
|
|
|
|
|
|
|
|
|
|
|
Notional amount |
| 1,018 |
|
|
|
|
|
|
|
|
|
|
| 1,018 |
| 10 |
|
|
|
Weighted average interest rate to receive (%) |
| 6.1 |
|
|
|
|
|
|
|
|
|
|
| 6.1 |
|
|
|
|
|
Weighted average margin over EURIBOR to pay (%) |
| 1.2 |
|
|
|
|
|
|
|
|
|
|
| 1.2 |
|
|
|
|
|
Derivative financial instruments are then transacted to create the desired interest rate risk
Sterling interest rate derivatives |
|
|
|
|
|
|
|
|
|
|
|
|
|
|
|
|
|
|
|
Interest rate swaps – pay fixed, receive variable: |
|
|
|
|
|
|
|
|
|
|
|
|
|
|
|
|
|
|
|
Notional amount |
| 50 |
| 140 | (2) |
|
|
|
| 50 | (3) | 185 | (4) | 425 |
|
|
| 16 |
|
Weighted average interest rate to pay (%) |
| 6.6 |
| 6.1 |
|
|
|
|
| 4.3 |
| 5.3 |
| 5.6 |
|
|
|
|
|
|
|
|
|
|
|
|
|
|
|
|
|
|
|
|
|
|
|
|
|
Euro interest rate derivatives |
|
|
|
|
|
|
|
|
|
|
|
|
|
|
|
|
|
|
|
Interest rate swaps – pay fixed, receive variable: |
|
|
|
|
|
|
|
|
|
|
|
|
|
|
|
|
|
|
|
Notional amount |
| 997 |
| 61 |
| 187 |
| 95 | (5) |
|
| 1,586 | (6) | 2,926 |
| 14 |
| 38 |
|
Weighted average interest rate to pay (%) |
| 4.8 |
| 3.1 |
| 5.1 |
| 3.7 |
|
|
| 3.9 |
| 4.3 |
|
|
|
|
|
|
|
|
|
|
|
|
|
|
|
|
|
|
|
|
|
|
|
|
|
Total fair value of derivative financial instruments as at 30 September 2006 |
|
|
|
|
|
|
|
|
|
|
|
|
|
|
| 29 |
| 119 |
|
Therefore, the overall effect of the interest rate swaps transacted as at 30 September 2006 that were live at this date is to convert £1,886m of borrowings into a fixed rate.
(1) Principal amounts under these cross currency swaps are exchanged at the start and maturity of these trades.
(2) The following trade is included within this balance:
£20m interest rate swap maturing in 2031 where the counterparty has the option to cancel every three months throughout the life of the trade. This trade is expected to be cancelled in March 2008.
(3) The following trade is included within this balance:
£50m interest rate swap maturing in 2041 where the counterparty has the option to cancel every five years throughout the life of the trade. This trade is expected to be cancelled in April 2011.
(4) The following trades are included within this balance:
£60m interest rate swap maturing in 2031 where the counterparty has the option to cancel every three months throughout the life of the trade. This trade is expected to be cancelled in June 2016.
£15m interest rate swap maturing in 2031 where the counterparty has the option to cancel every three months throughout the life of the trade. This trade is expected to be cancelled in April 2016.
£25m forward start five-year swaption starting October 2006 at 5.5% at the counterparty’s option.
92
(5) The following trade is included within this balance:
€140m forward start three-year interest rate swaps starting in March 2007.
(6) The following trades are included within this balance:
€200m forward start five-year and €250m forward ten-year interest rate swaps starting in March 2007.
€1189m forward start five-year and €220m forward start seven-year interest rate swaps starting in April 2007.
€125m forward start five-year interest rate swaps starting in April 2012.
(v) Hedge of net investments in foreign operations
Included in borrowings at 30 September 2006 were loans of €3,720m (before the effect of cross currency swaps) which have been designated as hedges of the net investment in the Group’s foreign operations and are being used to hedge the Group’s exposure to foreign exchange risk on these investments. Gains or losses on the retranslation of these borrowings are transferred to equity to offset any gains or losses on translation of the net investments in the subsidiaries.
(vi) Fair values of financial assets and financial liabilities
Set out below is a comparison by category of carrying amounts and fair values of all financial liabilities that are carried in the financial statements at amounts other than fair values.
The carrying amounts of cash and cash equivalents, trade and other receivables, trade and other payables, and derivative financial instruments are approximate to their fair value and so are excluded from the analysis below.
|
| Carrying |
|
|
|
(In £’s million) |
| amount |
| Fair value |
|
Current borrowings |
|
|
|
|
|
Sterling |
| 24 |
| 24 |
|
Euro |
| 1,094 |
| 1,129 |
|
US dollars |
| 1 |
| 1 |
|
Other |
| 3 |
| 3 |
|
Total current borrowings |
| 1,122 |
| 1,157 |
|
Non-current borrowings |
|
|
|
|
|
Sterling |
| 1,068 |
| 1,103 |
|
Euro |
| 1,540 |
| 1,540 |
|
US dollars |
| 322 |
| 332 |
|
Total non-current borrowings |
| 2,930 |
| 2,975 |
|
It is only the capital market issues contained within the table above that have a fair value different to the carrying value and this has been calculated by comparing the current trading levels of the capital market bonds to par.
2005 – UK GAAP disclosures
The Group has exercised the exemption under IFRS 1 to adopt IAS 32 and IAS 39 from 1 October 2005 and to record financial instruments in the comparative period on the UK GAAP basis.
The following table analyses the Group’s financial liabilities at the 2005 balance sheet date:
(In £’s million) |
| 2005 |
|
Amounts falling due within one year |
|
|
|
Bank loans and overdrafts |
| 25 |
|
Other loans |
| 682 |
|
|
| 707 |
|
Amounts falling due after more than one year |
|
|
|
Other loans – between one and two years |
| 1,021 |
|
Bank loans – between two and five years |
| 867 |
|
Other loans – between two and five years |
| 369 |
|
Other loans – after five years |
| 575 |
|
|
| 2,832 |
|
Total borrowings |
| 3,539 |
|
The borrowings total above includes £57m in relation to cross currency swaps that have been reclassified to derivative financial instruments on the face of the balance sheet in accordance with IAS 21 “The effects of changes in foreign exchange rates”.
93
The loans maturing after five years are the £200m sterling bond (which matures in December 2018) and the £350m sterling bond (which matures in June 2012).
(i) Interest rate risk profile of financial liabilities
The Group is exposed to fluctuations in interest rates on its borrowings and surplus cash. In order to manage interest rate risk, the Group maintains both fixed and floating rate debt and uses derivatives, including interest rate and cross currency swaps, to vary the mix.
The following table analyses the currency and interest composition of the Group’s financial liabilities at the balance sheet date.
|
|
|
|
|
| Fixed rate financial liabilities |
| ||||
|
|
|
|
|
|
|
|
|
| Weighted |
|
|
|
|
|
|
|
|
| Weighted |
| average period |
|
|
|
|
| Floating rate |
| Fixed rate |
| average |
| for which |
|
|
|
|
| financial |
| financial |
| interest rate |
| rate is fixed |
|
(In £’s million unless otherwise indicated) |
| Total |
| liabilities |
| liabilities |
| % |
| Years |
|
Sterling |
| 765 |
| 390 |
| 375 |
| 5.7 |
| 5.0 |
|
Euro |
| 2,634 |
| 1,094 |
| 1,540 |
| 4.5 |
| 3.0 |
|
Australian dollar |
| 115 |
| 85 |
| 30 |
| 4.7 |
| 0.5 |
|
US dollar |
| 15 |
| 15 |
| — |
| n/a |
| n/a |
|
Other |
| 10 |
| 9 |
| 1 |
| 9.1 |
| 2.0 |
|
|
| 3,539 |
| 1,593 |
| 1,946 |
| 4.7 |
| 3.3 |
|
The borrowings total above includes £57m in relation to cross currency swaps that have been reclassified to derivative financial instruments on the face of the balance sheet in accordance with IAS 21 “The effects of changes in foreign exchange rates”.
The floating rate financial liabilities comprise bank borrowings and capital market issuances (post-derivatives). The majority of bank borrowings bear interest at rates fixed in advance for periods of one month by reference to LIBOR in the case of sterling and three months in the case of Australian dollar borrowings and EURIBOR (in the case of Euro borrowings). The capital market issuance in place at the year end bears interest (post-interest and currency swaps) at rates fixed in advance for six months by reference to LIBOR (in the case of the US dollar bond) and for three months by reference to EURIBOR (in the case of the sterling and Euro bonds).
The figures shown in the tables above take into account various interest rate and currency swaps. Hence the US dollar denominated bond issued in 1999 is shown within the sterling balance, and the sterling bonds issued in 2002 and 2003 are shown in the Euro balance. The fixed rate financial liabilities do not take into account forward start swaps, which may become effective after the balance sheet date.
(ii) Currency risk disclosure
The Group is exposed to the translation of the results of overseas subsidiaries into sterling, as well as the impact of transactions in foreign currencies. On significant acquisitions of overseas companies, borrowings are raised in the local currency to minimise the translation risk. For translation risk, where necessary, forward foreign exchange deals are entered into to hedge a proportion of the forecast foreign currency cash flows. At 30 September 2005, £36.1m notional of forward foreign exchange deals were outstanding.
The tables below show the extent to which Group companies have monetary assets and liabilities in currencies other than their local currency at the balance sheet date:
Functional currency of Group operation
|
| Net foreign currency monetary assets/(liabilities) |
| ||||||||||
(In £’s million) |
| Sterling |
| Euro |
| US dollars |
| Australian dollars |
| Other |
| Total |
|
Sterling |
| — |
| 632 |
| (36 | ) | (94 | ) | (29 | ) | 473 |
|
Euro |
| (1 | ) | — |
| 25 |
| 11 |
| 66 |
| 101 |
|
Other |
| (11 | ) | (27 | ) | (54 | ) | — |
| 28 |
| (64 | ) |
|
| (12 | ) | 605 |
| (65 | ) | (83 | ) | 65 |
| 510 |
|
(iii) Borrowing facilities
The Group has various borrowing facilities available to it. The undrawn committed facilities which are all available at a floating rate, as at 30 September 2005 in respect of which all conditions precedent have been met at that date, were as follows:
(In £’s million) |
| 2005 |
|
Expiring within one year |
| 118 |
|
Expiring between two and five years |
| 598 |
|
|
| 716 |
|
In addition to the above committed facilities there are other uncommitted facilities available to the Group.
94
(iv) Fair values of derivative financial instruments
A comparison by category of the fair values and book values of the Group’s derivative financial instruments is set out below:
|
| Positive fair |
| Negative fair |
|
|
|
|
|
(In £’s million) |
| values |
| values |
| Fair value |
| Book value |
|
Derivative financial instruments held to manage the interest and currency profile |
|
|
|
|
|
|
|
|
|
Interest rate swaps and similar instruments |
| 62 |
| (116 | ) | (54 | ) | — |
|
Currency swaps |
| 10 |
| (28 | ) | (18 | ) | — |
|
The figures shown in the table above for derivative financial instruments have been derived from market information and third party advice as at 30 September 2005.
(v) Detailed analysis of financial assets and financial liabilities
The following table shows the financial assets and financial liabilities held by the Group, their maturities and weighted average interest rates as at 30 September 2005:
(In £’s million unless otherwise |
| Maturity date and weighted average interest rate |
|
|
|
|
| ||||||||||||||||||||||
indicated) |
| 2006 |
| % |
| 2007 |
| % |
| 2008 |
| % |
| 2009 |
| % |
| 2010 |
| % |
| Thereafter |
| % |
| Total |
| Fair value |
|
Assets/(liabilities) (all at floating rates after cross currency swaps before the effect of interest rate swaps) |
|
|
|
|
|
|
|
|
|
|
|
|
|
|
|
|
|
|
|
|
|
|
|
|
|
|
|
|
|
Cash deposits |
|
|
|
|
|
|
|
|
|
|
|
|
|
|
|
|
|
|
|
|
|
|
|
|
|
|
|
|
|
Sterling |
| 67 |
| 2.8 |
|
|
|
|
|
|
|
|
|
|
|
|
|
|
|
|
|
|
|
|
| 67 |
| 67 |
|
Euro |
| 98 |
| 1.5 |
|
|
|
|
|
|
|
|
|
|
|
|
|
|
|
|
|
|
|
|
| 98 |
| 98 |
|
Other |
| 91 |
| 3.4 |
|
|
|
|
|
|
|
|
|
|
|
|
|
|
|
|
|
|
|
|
| 91 |
| 91 |
|
Total cash deposits |
| 256 |
|
|
|
|
|
|
|
|
|
|
|
|
|
|
|
|
|
|
|
|
|
|
| 256 |
| 256 |
|
Weighted average receivable interest rate (%) |
|
|
| 2.5 |
|
|
|
|
|
|
|
|
|
|
|
|
|
|
|
|
|
|
|
|
| 2.5 |
|
|
|
Short term debt |
|
|
|
|
|
|
|
|
|
|
|
|
|
|
|
|
|
|
|
|
|
|
|
|
|
|
|
|
|
Sterling |
| (16 | ) | 5.3 |
|
|
|
|
|
|
|
|
|
|
|
|
|
|
|
|
|
|
|
|
| (16 | ) | (16 | ) |
Euro |
| (681 | ) | 3.4 |
|
|
|
|
|
|
|
|
|
|
|
|
|
|
|
|
|
|
|
|
| (681 | ) | (707 | ) |
Australian dollars |
| (1 | ) | 6.5 |
|
|
|
|
|
|
|
|
|
|
|
|
|
|
|
|
|
|
|
|
| (1 | ) | (1 | ) |
Other |
| (9 | ) | 0.9 |
|
|
|
|
|
|
|
|
|
|
|
|
|
|
|
|
|
|
|
|
| (9 | ) | (9 | ) |
Total short term debt |
| (707 | ) |
|
|
|
|
|
|
|
|
|
|
|
|
|
|
|
|
|
|
|
|
|
| (707 | ) | (733 | ) |
Long term debt |
|
|
|
|
|
|
|
|
|
|
|
|
|
|
|
|
|
|
|
|
|
|
|
|
|
|
|
|
|
Sterling |
|
|
|
|
|
|
|
|
|
|
|
|
| (369 | ) | 5.8 |
| (380 | ) | 5.0 |
|
|
|
|
| (749 | ) | (773 | ) |
Euro |
|
|
|
|
| (1,022 | ) | 3.4 |
|
|
|
|
|
|
|
|
| (356 | ) | 2.5 |
| (575 | ) | 3.4 |
| (1,953 | ) | (2,061 | ) |
Australian dollars |
|
|
|
|
|
|
|
|
|
|
|
|
|
|
|
|
| (114 | ) | 5.9 |
|
|
|
|
| (114 | ) | (114 | ) |
Other |
|
|
|
|
|
|
|
|
| (1 | ) | 9.1 |
|
|
|
|
| (15 | ) | 4.2 |
|
|
|
|
| (16 | ) | (16 | ) |
Total long term debt |
|
|
|
|
| (1,022 | ) |
|
| (1 | ) |
|
| (369 | ) |
|
| (865 | ) |
|
| (575 | ) |
|
| (2,832 | ) | (2,964 | ) |
Weighted average payable interest rate (%) |
|
|
| 3.4 |
|
|
| 3.4 |
|
|
| 9.1 |
|
|
| 5.8 |
|
|
| 4.1 |
|
|
| 3.4 |
| 3.8 |
|
|
|
The borrowings total above includes £57m in relation to cross currency swaps that have been reclassified to derivative financial instruments on the face of the balance sheet in accordance with IAS 21 “The effects of changes in foreign exchange rates”.
The cash deposits earn interest at floating rates of interest and comprise mainly short term money market deposits with a maturity date not exceeding one year.
Credit risks on the amounts due from counterparties, in relation to cash deposits and other financial instruments, are managed by limiting the aggregate amount of exposure to any one counterparty, based on their credit rating.
95
(vi) Hedges
|
| Gains |
| Losses |
|
(In £’s million) |
| 2005 |
| 2005 |
|
Unrecognised gains and losses on hedges at 1 October 2004 |
| 100 |
| (137 | ) |
Gains and losses arising in previous years recognised in the year |
| (9 | ) | 10 |
|
Gains and losses arising before the start of the year not recognised in the year |
| 91 |
| (127 | ) |
Gains and losses arising in the year not recognised in the year |
| (19 | ) | (17 | ) |
Unrecognised gains and losses on hedges at 30 September 2005 |
| 72 |
| (144 | ) |
Of which: |
|
|
|
|
|
Gains and losses expected to be recognised within one year |
| 19 |
| — |
|
Gains and losses expected to be recognised after one year |
| 53 |
| (144 | ) |
96
(vii) Derivative financial instruments
The following table sets out the derivative financial instruments held by the Group at 30 September 2005. The table presents the nominal value of such instruments used to calculate the contractual payments under such contracts, analysed by maturity date, together with the related weighted average interest rate where relevant. Some of the interest rate swaps have embedded options and assumptions have been made based on market information and third party advice at the balance sheet date to determine whether such options are likely to be exercised in order to determine the probable maturity date.
|
| Accounting year ending in |
|
|
|
|
| ||||||||||
(In £’s million unless otherwise indicated) |
| 2006 |
| 2007 |
| 2008 |
| 2009 |
| 2010 |
| Thereafter |
| Total |
| Fair Value |
|
Sterling interest rate derivatives |
|
|
|
|
|
|
|
|
|
|
|
|
|
|
|
|
|
Interest rate swaps – pay fixed, receive variable: |
|
|
|
|
|
|
|
|
|
|
|
|
|
|
|
|
|
Notional amount |
|
|
| 70 | (1) | 120 |
|
|
|
|
| 210 | (2) | 400 |
| (26 | ) |
Weighted average interest rate to pay (%) |
|
|
| 6.0 |
| 6.4 |
|
|
|
|
| 5.2 |
| 5.7 |
|
|
|
Euro interest rate derivatives |
|
|
|
|
|
|
|
|
|
|
|
|
|
|
|
|
|
Interest rate swaps – pay fixed, receive variable: |
|
|
|
|
|
|
|
|
|
|
|
|
|
|
|
|
|
Notional amount |
| 48 |
| 1,002 |
| 61 |
| 187 |
| 95 | (3) | 501 | (4) | 1,894 |
| (90 | ) |
Weighted average interest rate to pay (%) |
| 2.6 |
| 4.8 |
| 3.1 |
| 5.1 |
| 3.7 |
| 4.1 |
| 4.5 |
|
|
|
Interest rate swaps – pay variable, receive fixed: |
|
|
|
|
|
|
|
|
|
|
|
|
|
|
|
|
|
Notional amount |
| 682 |
| 1,022 |
|
|
|
|
|
|
|
|
| 1,704 |
| 62 |
|
Weighted average interest rate to receive (%) |
| 6.1 |
| 6.1 |
|
|
|
|
|
|
|
|
| 6.1 |
|
|
|
Weighted average margin over EURIBOR to pay (%) |
| 1.0 |
| 1.2 |
|
|
|
|
|
|
|
|
| 1.1 |
|
|
|
Caps purchased: |
|
|
|
|
|
|
|
|
|
|
|
|
|
|
|
|
|
Notional amount |
| 136 |
|
|
|
|
|
|
|
|
|
|
| 136 |
| — |
|
Weighted average strike price (%) |
| 5.5 |
|
|
|
|
|
|
|
|
|
|
| 5.5 |
|
|
|
Australian dollar interest rate derivatives |
|
|
|
|
|
|
|
|
|
|
|
|
|
|
|
|
|
Interest rate swaps – pay fixed, receive variable: |
|
|
|
|
|
|
|
|
|
|
|
|
|
|
|
|
|
Notional amount |
| 30 |
|
|
|
|
|
|
|
|
|
|
| 30 |
| — |
|
Weighted average interest rate to pay (%) |
| 4.7 |
|
|
|
|
|
|
|
|
|
|
| 4.7 |
|
|
|
Currency swaps |
|
|
|
|
|
|
|
|
|
|
|
|
|
|
|
|
|
Notional amount |
|
|
|
|
|
|
| 370 | (5) |
|
|
|
| 370 |
| (17 | ) |
US dollar interest rate to receive (%) |
|
|
|
|
|
|
| 7.1 |
|
|
|
|
| 7.1 |
|
|
|
Sterling interest margin over LIBOR to pay (%) |
|
|
|
|
|
|
| 1.3 |
|
|
|
|
| 1.3 |
|
|
|
Notional amount |
|
|
|
|
|
|
|
|
|
|
| 550 | (5) | 550 |
| (1 | ) |
Sterling interest rate to receive (%) |
|
|
|
|
|
|
|
|
|
|
| 6.5 |
| 6.5 |
|
|
|
Interest margin over EURIBOR to pay (%) |
|
|
|
|
|
|
|
|
|
|
| 1.2 |
| 1.2 |
|
|
|
97
The Group has entered into certain swap transactions with contractual maturities exceeding those of the underlying debt being hedged, in anticipation of there being additional floating rate debt when the existing debt matures.
(1) The following trade is included within this balance:
£20m swap maturing in 2031 where the counterparty has the option to cancel every three months throughout the life of the trade. This trade is expected to be cancelled in March 2007.
(2) The following trades are included within this balance:
£25m swap maturing in 2041 where the counterparty has the option to cancel every five years throughout the life of the trade and to double the notional amount to £50m in April 2006. This trade is expected to be cancelled in April 2011.
£40m swap maturing in 2031 where the counterparty has the option to cancel every three months throughout the life of the trade. This trade is expected to be cancelled in December 2015.
£15m swap maturing in 2031 where the counterparty has the option to cancel every three months throughout the life of the trade. This trade is expected to be cancelled in December 2016.
£20m swap maturing in 2031 where the counterparty has the option to cancel every three months throughout the life of the trade. This trade is expected to be cancelled in March 2017.
£25m forward start five-year swaption starting October 2006 at 5.5% at the counterparties’ option.
£50m swaps maturing in October 2006 at 5.5% with the counterparties’ option to extend for a further five years.
(3) The following trades are included within this balance:
€140m forward start three-year swaps starting March 2007.
(4) The following trades are included within this balance:
€130m forward start five-year swaps starting March 2007.
€250m forward start ten-year swaps starting March 2007.
(5) Principal amounts under these cross currency swaps are exchanged at the start and maturity of these trades.
17 Deferred tax assets/liabilities
Deferred tax assets and liabilities are offset only when there is a legally enforceable right to set off current tax assets against current tax liabilities and when the deferred income taxes relate to the same fiscal authority. The following amounts, determined after appropriate offsetting, are shown in the consolidated balance sheet.
(In £’s million) |
| 2006 |
| 2005 |
|
Deferred tax assets |
| 71 |
| 62 |
|
Deferred tax liabilities |
| (135 | ) | (133 | ) |
|
| (64 | ) | (71 | ) |
|
|
|
|
|
|
Deferred tax expected to be recovered within 12 months: |
|
|
|
|
|
|
|
|
|
|
|
(In £’s million) |
| 2006 |
| 2005 |
|
Deferred tax assets |
| 22 |
| 15 |
|
Deferred tax liabilities |
| (38 | ) | (2 | ) |
|
| (16 | ) | 13 |
|
98
Deferred tax assets
|
| Excess of |
|
|
|
|
|
|
|
|
|
|
| depreciation |
|
|
|
|
|
|
|
|
|
|
| over capital |
| Retirement |
| Fair value |
| Other temporary |
|
|
|
(In £’s million) |
| allowances |
| benefits |
| losses |
| differences |
| Total |
|
As at 1 October 2005 |
| — |
| 39 |
| — |
| 23 |
| 62 |
|
Credited/(charged) to income statement |
| 21 |
| (3 | ) | — |
| 3 |
| 21 |
|
Credited to equity |
| — |
| 4 |
| — |
| — |
| 4 |
|
Transfers |
| (44 | ) | 17 |
| — |
| 11 |
| (16 | ) |
As at 30 September 2006 |
| (23 | ) | 57 |
| — |
| 37 |
| 71 |
|
|
| Excess of |
|
|
|
|
|
|
|
|
|
|
| depreciation |
|
|
|
|
|
|
|
|
|
|
| over capital |
| Retirement |
| Fair value |
| Other temporary |
|
|
|
(In £’s million) |
| allowances |
| benefits |
| losses |
| differences |
| Total |
|
As at 1 October 2004 |
| 1 |
| 20 |
| — |
| 10 |
| 31 |
|
(Charged)/credited to income statement |
| (1 | ) | — |
| — |
| 13 |
| 12 |
|
Credited to equity |
| — |
| 19 |
| — |
| — |
| 19 |
|
As at 30 September 2005 |
| — |
| 39 |
| — |
| 23 |
| 62 |
|
Deferred tax liabilities
|
| Excess of |
|
|
|
|
|
|
|
|
|
|
| depreciation |
|
|
|
|
|
|
|
|
|
|
| over capital |
| Retirement |
| Fair value |
| Other temporary |
|
|
|
(In £’s million) |
| allowances |
| benefits |
| gains |
| differences |
| Total |
|
As at 30 September 2005 before IAS 39 transition |
| (72 | ) | (77 | ) | — |
| 16 |
| (133 | ) |
IAS 39 transition (note 30) |
| — |
| — |
| 22 |
| — |
| 22 |
|
As at 1 October 2005 after IAS 39 transition |
| (72 | ) | (77 | ) | 22 |
| 16 |
| (111 | ) |
Credited/(charged) to income statement |
| 1 |
| (8 | ) | — |
| (12 | ) | (19 | ) |
(Charged)/credited to equity |
| — |
| (28 | ) | — |
| 7 |
| (21 | ) |
Transfers |
| 44 |
| — |
| — |
| (28 | ) | 16 |
|
As at 30 September 2006 |
| (27 | ) | (113 | ) | 22 |
| (17 | ) | (135 | ) |
|
| Excess of |
|
|
|
|
|
|
|
|
|
|
| depreciation |
|
|
|
|
|
|
|
|
|
|
| over capital |
| Retirement |
| Fair value |
| Other temporary |
|
|
|
(In £’s million) |
| allowances |
| benefits |
| gains |
| differences |
| Total |
|
As at 1 October 2004 |
| (73 | ) | (24 | ) | — |
| 9 |
| (88 | ) |
Credited to income statement |
| 1 |
| — |
| — |
| 7 |
| 8 |
|
Charged to equity |
| — |
| (53 | ) | — |
| — |
| (53 | ) |
As at 30 September 2005 |
| (72 | ) | (77 | ) | — |
| 16 |
| (133 | ) |
Deferred tax assets are recognised for tax losses carried forward to the extent that the realisation of the related tax benefit through future taxable profits is probable. No deferred tax assets for tax losses have been recognised at 30 September 2006. Deferred tax assets of £13m as at 30 September 2006 (2005: £11m) have not been recognised due to the uncertainty of the utilisation of the underlying tax losses in certain jurisdictions.
99
18 Retirement benefit schemes
The Group operates a number of retirement benefit schemes for its employees, including both defined benefit and defined contribution schemes. The Group’s two principal schemes are defined benefit schemes and are operated by Imperial Tobacco Limited in the UK and Reemtsma Cigarettenfabriken GmbH in Germany. The UK scheme’s assets are held in trustee administered funds while the German scheme is unfunded.
The results of the most recent available actuarial valuations for the principal Group schemes (outside Germany) have been updated to 30 September 2006 by Watson Wyatt Limited, actuaries and consultants in order to determine the amounts to be included in the balance sheet and income statements.
Actuarial valuations of the pension liabilities of Reemtsma Holding GmbH & Co. KG, Reemtsma Cigarettenfabriken GmbH and Badische Tabakmanufaktur Roth-Händle GmbH pension schemes were undertaken by Russ, Dr Zimmerman und Partner at 30 September 2005 and 30 September 2006. These valuations quantified unfunded past service liabilities of £376m at 30 September 2005 and £401m at 30 September 2006, which have been recognised in the accounts, together with the other German unfunded schemes.
Amounts recognised in the income statement
(In £’s million) |
| 2006 |
| 2005 |
|
Defined benefit schemes: |
|
|
|
|
|
Current service cost |
| 43 |
| 38 |
|
Past service credit |
| — |
| (4 | ) |
Losses from special termination benefits |
| 4 |
| 14 |
|
Curtailment gain |
| — |
| (6 | ) |
Charges included in employment costs |
| 47 |
| 42 |
|
Interest cost |
| 142 |
| 147 |
|
Expected return on scheme assets |
| (188 | ) | (169 | ) |
Retirement benefit net financing income included in finance costs |
| (46 | ) | (22 | ) |
Total defined benefit scheme costs |
| 1 |
| 20 |
|
Defined benefit charges in profit from operations |
| 47 |
| 42 |
|
Defined contribution charges in profit from operations |
| 4 |
| 2 |
|
Total pension costs in profit from operations (note 4) |
| 51 |
| 44 |
|
100
Defined benefit schemes – amounts recognised in the balance sheet
(In £’s million) |
| 2006 |
| 2005 |
|
Present value of funded obligations |
| (2,665 | ) | (2,591 | ) |
Fair value of scheme assets |
| 3,035 |
| 2,828 |
|
|
| 370 |
| 237 |
|
Present value of unfunded obligations |
| (407 | ) | (416 | ) |
|
| (37 | ) | (179 | ) |
Reflected in the balance sheet as:
(In £’s million) |
| 2006 |
| 2005 |
|
Retirement benefit assets |
| 397 |
| 259 |
|
Retirement benefit liabilities |
| (434 | ) | (438 | ) |
|
| (37 | ) | (179 | ) |
Changes in the present value of the defined benefit obligation are as follows:
(In £’s million) |
| 2006 |
| 2005 |
| |
Defined benefit obligation as at 1 October |
| 3,007 |
| 2,744 |
| |
Current service cost |
| 43 |
| 38 |
| |
Past service credit |
| — |
| (4 | ) | |
Interest cost |
| 142 |
| 147 |
| |
Actuarial losses |
| 44 |
| 226 |
| |
Contributions by employees |
| 1 |
| 1 |
| |
Exchange differences |
| (5 | ) | (3 | ) | |
Benefits paid |
| (165 | ) | (161 | ) | |
Special termination benefits |
| 7 |
| 27 |
| |
Curtailments |
| (2 | ) | (8 | ) | |
As at 30 September |
| 3,072 |
| 3,007 |
| |
101
Defined benefit schemes – changes in the fair value of the scheme assets are as follows:
(In £’s million) |
| 2006 |
| 2005 |
|
As at 1 October |
| 2,828 |
| 2,445 |
|
Expected return |
| 188 |
| 169 |
|
Actuarial gains |
| 144 |
| 327 |
|
Contributions by employees |
| 1 |
| 1 |
|
Contributions by employer |
| 42 |
| 41 |
|
Exchange differences |
| (3 | ) | 6 |
|
Benefits paid |
| (165 | ) | (161 | ) |
As at 30 September |
| 3,035 |
| 2,828 |
|
The actual return on pension scheme assets was £332m (2005: £496m)
(In £’s million) |
| 2006 |
| 2005 |
|
Actuarial gains recognised in Statement of Recognised Income and Expense |
| (100 | ) | (101 | ) |
Cumulative actuarial gains recognised in Statement of Recognised Income and Expense |
| (201 | ) | (101 | ) |
Defined benefit schemes – principal actuarial assumptions used
2006
|
| UK |
| Germany |
| Other* |
|
Discount rate |
| 5.10 | % | 4.60 | % | 4.62 | % |
Expected return on scheme assets |
| 6.99 | % | n/a |
| 5.97 | % |
Future salary increases |
| 4.85 | % | 3.00 | % | 3.81 | % |
Future pension increases |
| 3.10 | % | 1.90 | % | 2.23 | % |
Inflation |
| 3.10 | % | 1.90 | % | 2.15 | % |
2005
|
| UK |
| Germany |
| Other* |
|
Discount rate |
| 5.00 | % | 4.30 | % | 4.29 | % |
Expected return on scheme assets |
| 6.89 | % | n/a |
| 5.12 | % |
Future salary increases |
| 4.55 | % | 2.85 | % | 3.57 | % |
Future pension increases |
| 2.80 | % | 1.60 | % | 1.89 | % |
Inflation |
| 2.80 | % | 1.60 | % | 2.09 | % |
* Values shown are the weighted averages of the rates used in the calculations for the schemes outside of the UK and Germany.
Assumptions regarding future mortality experience are set based on advice that uses published statistics and experience in each territory. The average life expectancy, in years, of a pensioner retiring at age 65 is as follows:
|
| UK |
| Germany |
| ||||
|
| Male |
| Female |
| Male |
| Female |
|
Life expectancy at age 65 (years): |
|
|
|
|
|
|
|
|
|
Member currently aged 65 |
| 18.4 |
| 19.9 |
| 17.7 |
| 21.8 |
|
Member currently aged 50 |
| 19.1 |
| 20.7 |
| 19.8 |
| 23.8 |
|
The major categories of scheme assets and their expected rates of return are as follows:
2006
|
| UK |
| Other* |
| ||||||||
|
| Expected return |
|
|
| Percentage of |
| Expected return |
|
|
| Percentage of |
|
|
| per annum |
|
|
| total assets |
| per annum |
|
|
| total assets |
|
(In £’s million unless otherwise indicated) |
| % |
| Fair value |
| % |
| % |
| Fair value |
| % |
|
Equities |
| 8.00 | % | 1,767 |
| 63.0 | % | 7.80 | % | 101 |
| 44.5 | % |
Bonds |
| 4.50 | % | 645 |
| 23.0 | % | 4.30 | % | 104 |
| 45.8 | % |
Property |
| 6.70 | % | 365 |
| 13.0 | % | — |
| — |
| — |
|
Other |
| 4.10 | % | 28 |
| 1.0 | % | 5.60 | % | 22 |
| 9.7 | % |
|
|
|
| 2,805 |
| 100.0 | % |
|
| 227 |
| 100.0 | % |
102
2005
|
| UK |
| Other* |
| ||||||||
|
| Expected return |
|
|
| Percentage of |
| Expected return |
|
|
| Percentage of |
|
|
| per annum |
|
|
| total assets |
| per annum |
|
|
| total assets |
|
(In £’s million unless otherwise indicated) |
| % |
| Fair value |
| % |
| % |
| Fair value |
| % |
|
Equities |
| 7.90 | % | 1,616 |
| 62.0 | % | 7.68 | % | 92 |
| 42.0 | % |
Bonds |
| 4.40 | % | 625 |
| 24.0 | % | 3.80 | % | 105 |
| 47.9 | % |
Property |
| 6.70 | % | 365 |
| 14.0 | % | — |
| 15 |
| 6.8 | % |
Other |
| 3.80 | % | — |
| — |
| 3.57 | % | 7 |
| 3.3 | % |
|
|
|
| 2,606 |
| 100.0 | % |
|
| 219 |
| 100.0 | % |
* Values shown are the weighted averages of the rates used in the calculations for the schemes outside of the UK and Germany. £3m (2005: £3m) of assets related to the German unfunded schemes are not shown separately.
The derivation of the overall expected return on assets reflects the actual asset allocation at the measurement date combined with an expected return for each asset class. The bond return is based on the prevailing return available on fixed interest gilts. The return on equities and property is based on a number of factors including:
the income yield at the measurement date;
the long term growth prospects for the economy in general;
the long term relationship between each asset class and bond returns; and
the movement in market indices since the previous measurement date.
Excluding any self investment in the JP Morgan held portfolio, approximately £7m of the assets held by the Imperial Tobacco Pension Fund are in respect of Imperial Tobacco Group PLC’s own financial instruments. None of this amount is known to relate to assets being used by Imperial Tobacco Group PLC.
History of the plans for the current and prior year is as follows:
(In £’s million) |
| 2006 |
| 2005 |
|
As at 30 September |
|
|
|
|
|
Present value of defined benefit obligations |
| 3,072 |
| 3,007 |
|
Fair value of total plan assets |
| 3,035 |
| 2,828 |
|
Net total deficit/(surplus) on plans |
| 37 |
| 179 |
|
Experience adjustments on total plan liabilities |
| — |
| (9 | ) |
Experience adjustments on total plan assets |
| 144 |
| 333 |
|
In accordance with the transitional provisions for the amendments to IAS 19 in December 2004, the disclosures above are determined prospectively from the 2005 reporting period.
The Group expects to contribute £16m to its funded defined benefit schemes in the year to 30 September 2007.
The main UK Group scheme is the Imperial Tobacco Pension Fund (“the ITPF”). An actuarial valuation of the ITPF (the triennial valuation, for funding purposes) was made at 31 March 2004 by Watson Wyatt Limited. The assumptions which had the most significant effect when valuing the ITPF’s liabilities were those relating to the rate of investment return on the ITPF's existing assets, the rates of increase in pay and pensions and estimated mortality rates. On the basis that the ITPF is continuing it was assumed that the future investment returns relative to market values at the valuation date would be 5.85% per annum and that pay and pension increases would average 4.5% and 2.75% respectively. The assets were brought into account at their market value.
At 31 March 2004 the market value of the assets of the ITPF was £2,248m. The total assets were sufficient to cover 108% of the benefits that had accrued to members for past service, after allowing for expected future pay increases. However, the assets were not sufficient to cover future service benefits for current members and, as a result of this deficiency, the Group recommenced payment of employer’s contributions during the 2004/2005 financial year at the level of £10m per year as set by the ITPF Actuary. The financial position of the ITPF and the level of contributions to be paid will be reviewed at the next actuarial valuation, which is expected to be carried out at 31 March 2007.
103
19 Provisions
(In £’s million) |
| Restructuring |
| Other |
| Total |
|
As at 1 October 2005 |
| 71 |
| 35 |
| 106 |
|
Additional provisions charged to income statement |
| 45 |
| 11 |
| 56 |
|
Amounts used |
| (53 | ) | (14 | ) | (67 | ) |
As at 30 September 2006 |
| 63 |
| 32 |
| 95 |
|
Analysed as:
(In £’s million) |
| 2006 |
| 2005 |
|
Current |
| 56 |
| 50 |
|
Non-current |
| 39 |
| 56 |
|
|
| 95 |
| 106 |
|
The restructuring provision relates to the factory closures announced in current and prior years. The provision will unwind over several years as termination payments are made over an extended number of years in a number of EU countries.
Other provisions principally relate to holiday pay, employee benefits and commercial legal claims. These liabilities are expected to crystallise within the next five years.
20 Share capital
(In £’s million) |
| 2006 |
| 2005 |
|
Authorised |
|
|
|
|
|
1,000,000,000 ordinary shares of 10p each |
| 100 |
| 100 |
|
Issued and fully paid |
|
|
|
|
|
729,200,921 ordinary shares of 10p each |
| 73 |
| 73 |
|
21 Share schemes
The Group recognised total expenses of £16m (2005: £11m) related to share-based payment transactions during the year (note 4).
During the period, the Group operated a number of share-based employee benefit schemes as follows:
International Sharesave Plan
Under the Plan the Board may offer options to purchase ordinary shares or American Depositary Shares (ADSs) in the Company to non-UK employees who enter into a savings contract. The price at which options may be offered varies depending on local laws, but for ordinary shares will not be less than 80% of the mid-market price of an Imperial Tobacco Group PLC share on the London Stock Exchange on the day prior to invitation. In respect of ADSs the price will not be less than 80% of the closing price on the New York Stock Exchange on the same day. Options may normally be exercised during the six months after expiry of the savings contract, three years after entering the Plan.
Under the UK Sharesave Scheme, which is part of the International Plan, the Board may offer options to purchase ordinary shares in the Company to UK employees who enter into an HM Revenue and Customs approved Save as You Earn (SAYE) savings contract. The options may normally be exercised during the six months after expiry of the SAYE contract, either three or five years after entering the Scheme.
Long Term Incentive Plan (LTIP)
Each year since demerger in 1996, annual awards have been made to Executive Directors and other senior executives under the LTIP. The awards, which vest three years after grant, are subject to the satisfaction of specified performance criteria, measured over a three-year performance period. All grants are at the absolute discretion of the Remuneration Committee, with no employee having the right to receive such a grant. Further information relating to the performance criteria and the terms of the scheme are set out in the Directors’ Remuneration Report.
In respect of the November 2002 – November 2005 award 100% of the award vested in full on 25 November 2005.
104
In respect of the November 2003 – November 2006 award, it is expected that 100% of the award will vest on 18 November 2006.
Share Matching Scheme
The Share Matching Scheme is designed to encourage employees to acquire and retain Imperial Tobacco Group PLC ordinary shares.
For Executive Directors and most of the Group’s management, individuals may elect to invest any proportion up to a maximum of 100% of their gross bonus in Imperial Tobacco Group PLC ordinary shares to be held by the Employee Benefit Trusts. Provided that the shares elected for are left in the Trusts for three years, and the individual remains in employment with the Group, the participant would receive the original shares plus additional shares. The matching ratio for bonuses is 1:1 to encourage Directors and managers to build a meaningful shareholding in the Group.
There was an initiative in 2002 to mark the centenary of the founding of The Imperial Tobacco Company (of Great Britain and Ireland) Limited. All employees of the Company and its wholly owned subsidiaries employed on 10 December 2001, the date of the centenary, were invited to purchase up to £3,000 worth of Imperial Tobacco Group PLC ordinary shares and lodge them with the Employee Benefit Trusts. Provided these shares are left in the Trusts, the lodged shares will be matched on a sliding scale from 20% for one year’s retention to a maximum of 100% if they are retained for five years.
Employee Share Ownership Trusts (ESOTs)
The Imperial Tobacco Group PLC Employee and Executive Benefit Trust and the Imperial Tobacco Group PLC 2001 Employee Benefit Trust (the Trusts) have been established to acquire ordinary shares in Imperial Tobacco Group PLC, by subscription or purchase, from funds provided by the Group to satisfy rights to shares arising on the exercise of share-based employee benefit schemes. At 30 September 2006, the Trusts held 4.2m (2005: 3.0m) ordinary shares with a nominal value of £424,697, all acquired in the open market at a cost of £65.3m (2005: £31.3m). The acquisition of shares by the Trusts has been financed by a gift of £19.2m and an interest-free loan of £110.8m. None of the ESOT shares has been allocated to employees or Directors as at 30 September 2006. All finance costs and administration expenses connected with the ESOTs are charged to the income statement as they accrue. The Trusts have waived their rights to dividends and the shares held by the Trusts are excluded from the calculation of basic earnings per share.
105
|
|
|
|
|
| Year from 1 October 2005 to 30 September 2006 |
| ||||||||||
|
|
|
| Balance |
| Balance |
| Options exercisable at |
| Exercised |
| Lapsed/ Cancelled |
|
|
| Options exercisable at |
|
|
|
|
| outstanding at 1 |
| start of year |
| start of year |
| in year |
| in year |
| Outstanding at |
| end of year |
|
Date of grant |
| Granted |
| October 2004 |
| (Number) |
| (Number) |
| (Number) |
| (Number) |
| end of year |
| (Number) |
|
Sharesave options |
|
|
|
|
|
|
|
|
|
|
|
|
|
|
|
|
|
UK |
|
|
|
|
|
|
|
|
|
|
|
|
|
|
|
|
|
19 June 1999 |
| 599,862 |
| 735 |
| — |
| — |
| — |
| — |
| — |
| — |
|
5 June 2000 |
| 1,203,945 |
| 340,855 |
| — |
| — |
| — |
| — |
| — |
| — |
|
7 June 2001 |
| 758,286 |
| 245,667 |
| 218,131 |
| — |
| (195,935 | ) | (8,031 | ) | 14,165 |
| 14,165 |
|
31 May 2002 |
| 820,132 |
| 676,315 |
| 331,730 |
| 15,961 |
| (18,072 | ) | (15,584 | ) | 298,074 |
| — |
|
4 June 2003 |
| 638,919 |
| 581,347 |
| 534,653 |
| — |
| (326,248 | ) | (15,482 | ) | 192,923 |
| 9,245 |
|
26 May 2004 |
| 423,863 |
| 419,525 |
| 391,384 |
| — |
| (7,063 | ) | (18,272 | ) | 366,049 |
| — |
|
23 May 2005 |
| 395,313 |
| — |
| 392,265 |
| — |
| (8,248 | ) | (11,964 | ) | 372,053 |
| — |
|
22 May 2006 |
| 322,347 |
| — |
| — |
| — |
| — |
| (3,677 | ) | 318,670 |
| — |
|
|
|
|
|
|
|
|
|
|
|
|
|
|
|
|
|
|
|
International |
|
|
|
|
|
|
|
|
|
|
|
|
|
|
|
|
|
7 June – 18 June 2001 |
| 64,388 |
| 2,626 |
| — |
| — |
| — |
| — |
| — |
| — |
|
18 June 2002 |
| 65,897 |
| 49,287 |
| 4,339 |
| 4,339 |
| (3,554 | ) | (785 | ) | — |
| — |
|
4 June – 17 June 2003 |
| 639,579 |
| 573,532 |
| 497,109 |
| — |
| (378,225 | ) | (2,582 | ) | 116,302 |
| 116,302 |
|
26 May – 4 June 2004 |
| 162,479 |
| 162,088 |
| 152,597 |
| — |
| (1,505 | ) | (12,804 | ) | 138,288 |
| — |
|
23 May – 1 June 2005 |
| 171,189 |
| — |
| 169,168 |
| — |
| (515 | ) | (9,531 | ) | 159,122 |
| — |
|
22 May – 1 June 2006 |
| 301,612 |
| — |
| — |
| — |
| — |
| (5,770 | ) | 295,842 |
| — |
|
|
|
|
|
|
|
|
|
|
|
|
|
|
|
|
|
|
|
US** |
|
|
|
|
|
|
|
|
|
|
|
|
|
|
|
|
|
18 June 2002 |
| 1,866 |
| 1,560 |
| — |
| — |
| — |
| — |
| — |
| — |
|
17 June 2003 |
| 7,028 |
| 7,028 |
| 7,028 |
| — |
| (6,062 | ) | (966 | ) | — |
| — |
|
4 June 2004 |
| 2,580 |
| 2,580 |
| 2,580 |
| — |
| — |
| — |
| 2,580 |
| — |
|
1 June 2005 |
| 5,818 |
| — |
| 5,818 |
| — |
| — |
| — |
| 5,818 |
| — |
|
1 June 2006 |
| 4,312 |
| — |
| — |
| — |
| — |
| — |
| 4,312 |
| — |
|
|
| 6,589,415 |
| 3,063,145 |
| 2,706,802 |
| 20,300 |
| (945,427 | ) | (105,448 | ) | 2,284,198 |
| 139,712 |
|
|
|
|
|
|
|
|
|
|
|
|
|
|
|
|
|
|
|
Conditional awards |
|
|
|
|
|
|
|
|
|
|
|
|
|
|
|
|
|
Share matching scheme |
|
|
|
|
|
|
|
|
|
|
|
|
|
|
|
|
|
12 August 2002 – Centenary Scheme |
| 231,941 |
| 199,217 |
| 181,972 |
| — |
| (12,476 | ) | (5,503 | ) | 163,993 |
| — |
|
29 January 2002 |
| 650,767 |
| 520,953 |
| — |
| — |
| — |
| — |
| — |
| — |
|
29 January 2003 |
| 762,883 |
| 681,267 |
| 573,009 |
| — |
| (558,704 | ) | (14,305 | ) | — |
| — |
|
29 January 2004 |
| 999,733 |
| 980,839 |
| 835,815 |
| — |
| (40,351 | ) | (48,677 | ) | 746,787 |
| — |
|
29 January 2005 |
| 832,855 |
| — |
| 797,971 |
| — |
| (17,452 | ) | (58,246 | ) | 722,273 |
| — |
|
15 February 2006 |
| 796,653 |
| — |
| — |
| — |
| (1,014 | ) | (17,486 | ) | 778,153 |
| — |
|
|
| 4,274,832 |
| 2,382,276 |
| 2,388,767 |
| — |
| (629,997 | ) | (144,217 | ) | 2,411,206 |
| — |
|
|
|
|
|
|
|
|
|
|
|
|
|
|
|
|
|
|
|
Long term incentive plan |
|
|
|
|
|
|
|
|
|
|
|
|
|
|
|
|
|
26 November 2001 |
| 384,376 |
| 309,963 |
| — |
| — |
| — |
| — |
| — |
| — |
|
25 November 2002 |
| 474,547 |
| 407,091 |
| 311,653 |
| — |
| (309,377 | ) | (2,276 | ) | — |
| — |
|
18 November 2003 |
| 481,180 |
| 471,222 |
| 378,193 |
| — |
| (23,325 | ) | (23,310 | ) | 331,558 |
| — |
|
9 November 2004 |
| 355,861 |
| — |
| 343,071 |
| — |
| (9,201 | ) | (31,004 | ) | 302,866 |
| — |
|
2 November 2005 |
| 390,512 |
| — |
| — |
| — |
| (160 | ) | (9,118 | ) | 381,234 |
| — |
|
|
| 2,086,476 |
| 1,188,276 |
| 1,032,917 |
| — |
| (342,063 | ) | (65,708 | ) | 1,015,658 |
| — |
|
Total options/awards |
| 12,950,723 |
| 6,633,697 |
| 6,128,486 |
| 20,300 |
| (1,917,487 | ) | (315,373 | ) | 5,711,062 |
| 139,712 |
|
** Granted as American Depositary Shares, each representing two ordinary shares and denominated in US dollars.
106
|
|
|
| Year from 1 October 2004 to 30 September 2005* |
| Year from 1 October 2005 to 30 September 2006* |
| |||||||||||||||||
Date of grant |
| Share price at |
| Exercise price of |
| Contractual life of |
| Exercise price of |
| Share price at |
| Exercise price of |
| Contractual life of |
| Exercise price of |
| Share price at |
| |||||
Sharesave options |
|
|
|
|
|
|
|
|
|
|
|
|
|
|
|
|
|
|
| |||||
UK |
|
|
|
|
|
|
|
|
|
|
|
|
|
|
|
|
|
|
| |||||
19 June 1999 |
| 6.25 |
| n/a |
| n/a |
| n/a |
| 13.81 |
| n/a |
| n/a |
| n/a |
| n/a |
| |||||
5 June 2000 |
| 4.68 |
| n/a |
| n/a |
| n/a |
| 15.09 |
| n/a |
| n/a |
| n/a |
| n/a |
| |||||
7 June 2001 |
| 6.58 |
| 4.83 |
| 15 |
| n/a |
| 13.39 |
| 4.83 |
| 3 |
| 4.83 |
| 17.44 |
| |||||
31 May 2002 |
| 11.55 |
| 8.24 |
| 26 |
| 8.24 |
| 14.75 |
| 8.24 |
| 15 |
| n/a |
| 17.00 |
| |||||
4 June 2003 |
| 10.79 |
| 8.22 |
| 25 |
| n/a |
| 14.46 |
| 8.22 |
| 26 |
| 8.22 |
| 18.01 |
| |||||
26 May 2004 |
| 12.29 |
| 10.08 |
| 37 |
| n/a |
| 14.90 |
| 10.08 |
| 25 |
| n/a |
| 17.15 |
| |||||
23 May 2005 |
| 14.79 |
| 11.73 |
| 48 |
| n/a |
| n/a |
| 11.73 |
| 36 |
| n/a |
| 17.99 |
| |||||
22 May 2006 |
| 16.38 |
| n/a |
| n/a |
| n/a |
| n/a |
| 13.95 |
| 48 |
| n/a |
| n/a |
| |||||
|
|
|
|
|
|
|
|
|
|
|
|
|
|
|
|
|
|
|
| |||||
International |
|
|
|
|
|
|
|
|
|
|
|
|
|
|
|
|
|
|
| |||||
7 June – 18 June 2001 |
| 6.58 – 6.66 |
| n/a |
| n/a |
| n/a |
| 13.13 |
| n/a |
| n/a |
| n/a |
| n/a |
| |||||
18 June 2002 |
| 10.91 |
| 8.34 |
| 4 |
| 8.34 |
| 15.19 |
| n/a |
| n/a |
| n/a |
| 16.97 |
| |||||
4 June – 17 June 2003 |
| 10.40 – 10.79 |
| 8.24 |
| 16 |
| n/a |
| 14.40 |
| 8.22 |
| 4 |
| 8.22 |
| 17.95 |
| |||||
26 May – 4 June 2004 |
| 12.24 –12.29 |
| 10.08 |
| 28 |
| n/a |
| 15.12 |
| 10.08 |
| 16 |
| n/a |
| 16.99 |
| |||||
23 May – 1 June 2005 |
| 14.79 – 15.01 |
| 11.74 |
| 40 |
| n/a |
| n/a |
| 11.74 |
| 28 |
| n/a |
| 17.20 |
| |||||
22 May – 1 June 2006 |
| 16.38 – 16.48 |
| n/a |
| n/a |
| n/a |
| n/a |
| 13.95 |
| 40 |
| n/a |
| n/a |
| |||||
|
|
|
|
|
|
|
|
|
|
|
|
|
|
|
|
|
|
|
| |||||
US** |
|
|
|
|
|
|
|
|
|
|
|
|
|
|
|
|
|
|
| |||||
18 June 2002 |
| $ | 16.22 |
| n/a |
| n/a |
| n/a |
| $ | 28.10 |
| n/a |
| n/a |
| n/a |
| n/a |
| |||
17 June 2003 |
| $ | 17.56 |
| $ | 12.14 |
| 16 |
| n/a |
| n/a |
| n/a |
| n/a |
| n/a |
| $ | 34.33 |
| ||
4 June 2004 |
| $ | 22.50 |
| $ | 17.92 |
| 28 |
| n/a |
| n/a |
| $ | 17.92 |
| 16 |
| n/a |
| n/a |
| ||
1 June 2005 |
| $ | 27.23 |
| $ | 22.49 |
| 40 |
| n/a |
| n/a |
| $ | 22.49 |
| 28 |
| n/a |
| n/a |
| ||
1 June 2006 |
| $ | 30.76 |
| n/a |
| n/a |
| n/a |
| n/a |
| $ | 24.92 |
| 40 |
| n/a |
| n/a |
| |||
Conditional awards |
|
|
|
|
|
|
|
|
|
Share matching scheme |
|
|
|
|
|
|
|
|
|
12 August 2002 – Centenary Scheme |
| 22 |
| 14.26 |
| 10 |
| 16.93 |
|
29 January 2002 |
| n/a |
| 13.90 |
| n/a |
| n/a |
|
29 January 2003 |
| 4 |
| 14.20 |
| n/a |
| 16.59 |
|
29 January 2004 |
| 16 |
| 14.31 |
| 4 |
| 16.90 |
|
29 January 2005 |
| 28 |
| 15.64 |
| 16 |
| 17.00 |
|
15 February 2006 |
| n/a |
| n/a |
| 29 |
| 16.81 |
|
|
|
|
|
|
|
|
|
|
|
Long term incentive plan |
|
|
|
|
|
|
|
|
|
26 November 2001 |
| n/a |
| 13.66 |
| n/a |
| n/a |
|
25 November 2002 |
| 2 |
| 14.05 |
| n/a |
| 16.89 |
|
18 November 2003 |
| 14 |
| 14.19 |
| 2 |
| 17.01 |
|
9 November 2004 |
| 25 |
| 14.94 |
| 13 |
| 16.95 |
|
2 November 2005 |
| n/a |
| n/a |
| 25 |
| 16.78 |
|
* | All measures in these columns are weighted averages. |
** | Granted as American Depositary Shares, each representing two ordinary shares and denominated in US dollars. |
107
The weighted average exercise prices of options granted, exercised and lapsed during the year were:
|
| 2006 |
| 2005 |
| ||
Granted |
| £ | 13.95 |
| £ | 11.74 |
|
Exercised |
| £ | 7.57 |
| £ | 6.10 |
|
Lapsed/cancelled |
| £ | 9.73 |
| £ | 8.59 |
|
Option pricing
For the purposes of valuing options to calculate the share-based payment charge, the Black-Scholes option pricing model has been used for all the share option and share matching schemes and for the Long Term Incentive Plans except for the LTIP granted in November 2005, where the Monte Carlo model was used.
A summary of the assumptions used in the Black-Scholes model for 2005 and 2006 is as follows:
|
| 2006 |
| 2005 |
| |||||||||||
|
| Sharesave |
| Share Match |
| Sharesave |
| Share Match |
| LTIP |
| |||||
Risk-free interest rate |
| 3.6 %– 5.5 | % | 4.2 | % | 3.5 %– 4.3 | % | 4.4 | % | 4.6 | % | |||||
Volatility |
| 16.0 %– 21.0 | % | 17.0 | % | 21.0 %– 24.0 | % | 23.0 | % | 23.0 | % | |||||
|
| 3 – 5 yrs + |
|
|
| 3 – 5 yrs + |
|
|
|
|
| |||||
Expected lives of options granted |
| 6 months |
| 3 yrs |
| 6 months |
| 3 yrs |
| 3 yrs |
| |||||
Dividend yield |
| 3.9 | % | 3.9 | % | 4.4 | % | 4.4 | % | 4.4 | % | |||||
Fair value |
| £ 3.46 – £4.33 |
| £ | 15.58 |
| £ 2.76 – £3.55 |
| £ | 12.30 |
| £ | 11.21 |
| ||
Share price used to determine exercise price |
| £ 16.69 – £17.44 |
| £ | 17.52 |
| £ 14.66 – £15.50 |
| £ | 14.02 |
| £ | 12.79 |
| ||
Exercise price |
| £ 13.35 – £13.95 |
| n/a |
| £ 11.73 – £12.40 |
| n/a |
| n/a |
| |||||
Volatility is determined based on the three or five year share price history (the time period being determined by the length of the scheme).
Market condition features were incorporated into the Monte Carlo model for the total shareholder return elements of the Long Term Incentive Plan, in determining fair value at grant date. Assumptions used in this model were as follows:
|
| 2006 |
|
Future Imperial Tobacco Group share price volatility |
| 16.0 | % |
Future Imperial Tobacco Group dividend yield |
| 3.8 | % |
Share price volatility of tobacco and alcohol comparator group |
| 16.0 – 30.0 | % |
Share price volatility FTSE 100 comparator group |
| 13.0 – 94.0 | % |
Correlation between Imperial Tobacco and the companies in the alcohol and tobacco comparator group |
| 23.0 | % |
Correlation between Imperial Tobacco and the companies in the FTSE 100 comparator group |
| 21.0 | % |
108
22 Changes in equity
|
|
|
|
|
|
|
|
|
| Equity |
|
|
|
|
|
|
|
|
|
|
| attributable |
|
|
|
|
|
|
|
|
| Exchange |
| to the equity |
|
|
|
|
|
|
| Retained |
| translation |
| holders of the |
|
(In £’s million) |
| Share capital |
| Share premium |
| earnings |
| reserve |
| Company |
|
As at 1 October 2004 |
| 73 |
| 964 |
| (656 | ) | — |
| 381 |
|
Profit for the year attributable to equity holders of the Company |
| — |
| — |
| 784 |
| — |
| 784 |
|
Actuarial gains on retirement benefits |
| — |
| — |
| 101 |
| — |
| 101 |
|
Deferred tax on actuarial gains and other items taken directly to reserves |
| — |
| — |
| (34 | ) | — |
| (34 | ) |
Exchange movements |
| — |
| — |
| — |
| 19 |
| 19 |
|
Movement in employee share schemes |
| — |
| — |
| 9 |
| — |
| 9 |
|
Increase in own shares held as treasury shares |
| — |
| — |
| (201 | ) | — |
| (201 | ) |
Dividends paid |
| — |
| — |
| (373 | ) | — |
| (373 | ) |
As at 30 September 2005 as previously reported |
| 73 |
| 964 |
| (370 | ) | 19 |
| 686 |
|
IAS 39 transition balance sheet adjustments |
| — |
| — |
| 6 |
| — |
| 6 |
|
As at 1 October 2005 following IAS 39 adjustments |
| 73 |
| 964 |
| (364 | ) | 19 |
| 692 |
|
Profit for the year attributable to equity holders of the Company |
| — |
| — |
| 851 |
| — |
| 851 |
|
Actuarial gains on retirement benefits |
| — |
| — |
| 100 |
| — |
| 100 |
|
Deferred tax on actuarial gains and other items taken directly to reserves |
| — |
| — |
| (17 | ) | — |
| (17 | ) |
Exchange movements |
| — |
| — |
| — |
| (54 | ) | (54 | ) |
Movement in employee share schemes |
| — |
| — |
| (31 | ) | — |
| (31 | ) |
Increase in own shares held as treasury shares |
| — |
| — |
| (556 | ) | — |
| (556 | ) |
Dividends paid |
| — |
| — |
| (406 | ) | — |
| (406 | ) |
As at 30 September 2006 |
| 73 |
| 964 |
| (423 | ) | (35 | ) | 579 |
|
Treasury shares
(In £’s million) |
| 2006 |
| 2005 |
|
As at 1 October |
| 201 |
| — |
|
Net investment in own shares in the year |
| 556 |
| 201 |
|
As at 30 September |
| 757 |
| 201 |
|
Details of the Group’s share buyback scheme may be found in note (vi) to the parent company financial statements.
Cumulative goodwill of £2,410m relating to acquisitions prior to 1998 was written off directly to reserves in line with the requirements of the accounting standards that were in force at the time.
109
23 Minority interests.
(In £’s million) |
| 2006 |
| 2005 |
|
As at 1 October |
| 19 |
| 18 |
|
Exchange movements |
| — |
| (1 | ) |
Share of net profit |
| 7 |
| 6 |
|
Dividends |
| (7 | ) | (4 | ) |
As at 30 September |
| 19 |
| 19 |
|
24 Acquisitions
During 2006, the Group acquired interests in a number of small businesses, including in February 2006 a 100% interest in Gunnar Stenberg AS, a tobacco and tobacco-related products sales and distribution company based in Norway.
The fair and book values of the net assets acquired were £2m, giving rise to goodwill of £11m.
Full IFRS 3 disclosures have not been presented as these acquisitions are not considered significant to the Group as a whole.
The acquisition of the worldwide Davidoff cigarette trademark announced in August 2006 has, in accordance with IFRS 3, not been treated as a business combination as the substance of the transaction is the purchase of an intangible asset. This is dealt with in note 9 Intangible Assets.
In December 2005 the Group made the final payment of deferred consideration in respect of the acquisition of Tobaccor S.A.
2005 acquisitions – Skruf Snus AB
During 2005 the Group acquired interests in a number of small businesses, including a 43% interest in Skruf Snus AB. The acquisition agreement relating to the 43% interest in Skruf Snus AB includes a commitment to acquire the remaining shares by mid 2009 and provides the Group with control of the operating and financial policies of Skruf Snus AB (including its dividend policy). Accordingly the acquisition is accounted for as a 100% subsidiary to reflect the substance of the transaction. The fair and book values of the net liabilities acquired were £4m, giving rise to goodwill of £18m.
25 Commitments
Capital commitments
(In £’s million) |
| 2006 |
| 2005 |
|
Contracted but not provided for: |
|
|
|
|
|
Property, plant and equipment |
| 30 |
| 6 |
|
Operating lease commitments
Total future minimum lease payments under non-cancellable operating leases consist of leases where payments fall due:
(In £’s million) |
| 2006 |
| 2005 |
|
Property |
|
|
|
|
|
Within one year |
| 5 |
| 7 |
|
Between one and five years |
| 14 |
| 19 |
|
Beyond five years |
| 10 |
| 13 |
|
|
| 29 |
| 39 |
|
(In £’s million) |
| 2006 |
| 2005 |
|
Plant and equipment (includes fixtures and motor vehicles) |
|
|
|
|
|
Within one year |
| 2 |
| 3 |
|
Between one and five years |
| 3 |
| 4 |
|
|
| 5 |
| 7 |
|
110
26 Legal proceedings
The Group is currently involved in a number of legal cases in which claimants are seeking damages for alleged smoking-related health effects. In the opinion of the Group’s lawyers, the Group has meritorious defences to the actions all of which are being vigorously contested. Although it is not possible to predict the outcome of the pending litigation, the Directors believe that the pending actions will not have a material adverse effect upon the results of the operations, cash flow or financial condition of the Group.
27 Reconciliation of cash flow from operating activities
(In £’s million) |
| 2006 |
| 2005 |
|
Profit for the year |
| 858 |
| 790 |
|
Adjustments for: |
|
|
|
|
|
Taxation |
| 310 |
| 288 |
|
Finance costs |
| 426 |
| 342 |
|
Investment income |
| (283 | ) | (180 | ) |
Depreciation, amortisation and impairment |
| 120 |
| 110 |
|
Movement in provisions |
| (11 | ) | 11 |
|
Operating cash flows before movements in working capital |
| 1,420 |
| 1,361 |
|
|
|
|
|
|
|
Decrease/(increase) in inventories |
| 59 |
| (10 | ) |
Increase in trade and other receivables |
| (99 | ) | (47 | ) |
Increase in trade and other payables |
| 11 |
| 78 |
|
Movement in working capital |
| (29 | ) | 21 |
|
Taxation paid |
| (236 | ) | (239 | ) |
Net cash flow from operating activities |
| 1,155 |
| 1,143 |
|
28 Analysis of net debt
The movements in cash and cash equivalents, borrowings and derivative financial instruments in the year were as follows:
|
| Net cash |
|
|
|
|
| Derivative |
|
|
|
|
| and cash |
| Short term |
| Long term |
| financial |
|
|
|
(In £’s million) |
| equivalents |
| borrowings |
| borrowings |
| instruments |
| Total |
|
As at 30 September 2005 before IAS 39 transition |
| 256 |
| (707 | ) | (2,775 | ) | (57 | ) | (3,283 | ) |
IAS 39 transition (note 30) |
| 1 |
| (1 | ) | (39 | ) | (15 | ) | (54 | ) |
As at 1 October 2005 after IAS 39 transition |
| 257 |
| (708 | ) | (2,814 | ) | (72 | ) | (3,337 | ) |
Cash flow |
| 10 |
| (415 | ) | (146 | ) | — |
| (551 | ) |
Accretion of interest |
| — |
| (19 | ) | 17 |
| — |
| (2 | ) |
Change in fair values |
| — |
| — |
| — |
| (18 | ) | (18 | ) |
Currency translation differences |
| (4 | ) | 20 |
| 13 |
| — |
| 29 |
|
As at 30 September 2006 |
| 263 |
| (1,122 | ) | (2,930 | ) | (90 | ) | (3,879 | ) |
Adjusted net debt
Management monitors the Group’s borrowing levels using adjusted net debt which excludes the fair value of interest rate derivative financial instruments and interest accruals.
(In £’s million) |
| 2006 |
| 2005 |
|
Net debt as reported |
| (3,879 | ) | (3,283 | ) |
Accrued interest |
| 41 |
| n/a |
|
Fair value of interest rate derivatives |
| 16 |
| n/a |
|
Adjusted net debt |
| (3,822 | ) | (3,283 | ) |
111
29 Reconciliation of cash flow to movement in net debt
(In £’s million) |
| 2006 |
| 2005 |
|
Increase/(decrease) in cash and cash equivalents |
| 10 |
| (91 | ) |
(Increase)/decrease in borrowings |
| (561 | ) | 374 |
|
Change in net debt resulting from cash flows |
| (551 | ) | 283 |
|
Currency movements |
| 29 |
| 22 |
|
Other non-cash movements including revaluation of derivative financial instruments |
| (20 | ) | — |
|
Movement in net debt during the year |
| (542 | ) | 305 |
|
Opening net debt |
| (3,283 | ) | (3,588 | ) |
Adjustments relating to adoption of IAS 39 from 1 October 2005 |
| (54 | ) | — |
|
Closing net debt |
| (3,879 | ) | (3,283 | ) |
30 Explanation of transition to IFRS
These financial statements for the year ended 30 September 2006 are the Group’s first consolidated financial statements prepared under IFRS. For all accounting periods prior to this, the Group prepared its financial statements under UK generally accepted accounting principles (“UK GAAP”).
In accordance with IFRS 1 (“First time adoption of IFRS”), certain disclosures relating to the transition to IFRS are given in this note. These disclosures are prepared under IFRS as set out in the “Basis of preparation” on page 71.
Cash flow statement
The format of the cash flow statement under IFRS has changed when compared with UK GAAP and explains the change in cash and cash equivalents rather than just cash. Although the format is different, the transition to IFRS had no impact on net cash flows so no reconciliation has been provided.
Reconciliation of income statement and equity from UK GAAP (as previously reported) to IFRS
Consolidated income statement for the year ended 30 September 2005
|
| UK GAAP |
| Advertising & |
|
|
|
|
|
|
|
|
| |
|
| (as previously |
| promotion |
| Post-employment |
|
|
| Share-based |
|
|
| |
(In £’s million) |
| reported) |
| expenses |
| benefits |
| Goodwill |
| payments |
| Restated – IFRS |
| |
Notes |
|
|
| 1 | ** | 2** |
| 3 |
| 6 |
|
|
| |
Revenue |
| 11,255 |
| (26 | ) |
|
|
|
|
|
| 11,229 |
| |
Duty |
| (8,106 | ) |
|
|
|
|
|
|
|
| (8,106 | ) | |
Profit from operations |
| 1,046 |
|
|
| (8 | ) | 198 |
| 4 |
| 1,240 |
| |
Investment income |
| 22 |
|
|
| 158 |
|
|
|
|
| 180 |
| |
Finance costs |
| (206 | ) |
|
| (136 | ) |
|
|
|
| (342 | ) | |
Profit before taxation |
| 862 |
|
|
| 14 |
| 198 |
| 4 |
| 1,078 |
| |
Taxation |
| (286 | ) |
|
| (2 | ) |
|
|
|
| (288 | ) | |
Profit after taxation |
| 576 |
|
|
| 12 |
| 198 |
| 4 |
| 790 |
| |
Attributable to: |
|
|
|
|
|
|
|
|
|
|
|
|
| |
Equity holders of the Company |
| 570 |
|
|
| 12 |
| 198 |
| 4 |
| 784 |
| |
Minority interests |
| 6 |
|
|
|
|
|
|
|
|
| 6 |
| |
|
|
|
|
|
|
|
|
|
|
|
|
|
| |
Earnings per ordinary share | – Basic |
| 79.0 | p |
|
| 1.6 | p | 27.4 | p | 0.6 | p | 108.6 | p |
| – Diluted |
| 78.6 | p |
|
| 1.6 | p | 27.3 | p | 0.6 | p | 108.1 | p |
112
Consolidated balance sheet at 30 September 2005
|
| UK GAAP in |
|
|
|
|
|
|
|
|
|
|
|
|
|
|
|
|
| IFRS format |
|
|
|
|
|
|
|
|
|
|
|
|
|
|
|
|
| (as previously |
| Post-employment |
|
|
|
|
|
|
| Financial |
|
|
|
|
|
(In £’s million) |
| reported) |
| benefits |
| Goodwill |
| Dividends |
| Income tax |
| instruments |
| Others |
| Restated – IFRS |
|
Notes |
|
|
| 2 |
| 3 |
| 5 |
| 7 |
| 10 |
| 4,6,8,9 |
|
|
|
Non-current assets |
|
|
|
|
|
|
|
|
|
|
|
|
|
|
|
|
|
Intangible assets |
| 3,345 |
|
|
| 198 |
|
|
|
|
|
|
| 11 |
| 3,554 |
|
Property, plant and equipment |
| 632 |
|
|
|
|
|
|
|
|
|
|
| 10 |
| 642 |
|
Investments in associates |
| 5 |
|
|
|
|
|
|
|
|
|
|
|
|
| 5 |
|
Retirement benefit assets |
| — |
| 259 |
|
|
|
|
|
|
|
|
|
|
| 259 |
|
Trade and other receivables |
| 53 |
| (49 | ) |
|
|
|
|
|
|
|
|
|
| 4 |
|
Deferred tax assets |
| 23 |
| 39 |
|
|
|
|
|
|
|
|
|
|
| 62 |
|
|
| 4,058 |
| 249 |
| 198 |
| — |
| — |
| — |
| 21 |
| 4,526 |
|
Current assets |
|
|
|
|
|
|
|
|
|
|
|
|
|
|
|
|
|
Inventories |
| 878 |
|
|
|
|
|
|
|
|
|
|
| (21 | ) | 857 |
|
Trade and other receivables |
| 1,022 |
| (10 | ) |
|
|
|
|
|
|
|
|
|
| 1,012 |
|
Current tax assets |
| 44 |
|
|
|
|
|
|
|
|
|
|
|
|
| 44 |
|
Cash and cash equivalents |
| 256 |
|
|
|
|
|
|
|
|
|
|
|
|
| 256 |
|
|
| 2,200 |
| (10 | ) | — |
| — |
| — |
| — |
| (21 | ) | 2,169 |
|
Current liabilities |
|
|
|
|
|
|
|
|
|
|
|
|
|
|
|
|
|
Borrowings |
| (707 | ) |
|
|
|
|
|
|
|
|
|
|
|
| (707 | ) |
Trade and other payables |
| (1,806 | ) | 278 |
|
|
|
|
|
|
|
|
|
|
| (1,528 | ) |
Current tax liabilities |
| (235 | ) |
|
|
|
|
|
|
|
|
|
|
|
| (235 | ) |
Provisions |
| (40 | ) |
|
|
|
|
|
|
|
|
|
| (10 | ) | (50 | ) |
|
| (2,788 | ) | — |
| — |
| 278 |
| — |
| — |
| (10 | ) | (2,520 | ) |
Non-current liabilities |
|
|
|
|
|
|
|
|
|
|
|
|
|
|
|
|
|
Borrowings |
| (2,832 | ) |
|
|
|
|
|
|
|
| 57 |
|
|
| (2,775 | ) |
Derivative financial instruments |
| — |
|
|
|
|
|
|
|
|
| (57 | ) |
|
| (57 | ) |
Trade and other payables |
| (11 | ) |
|
|
|
|
|
|
|
|
|
|
|
| (11 | ) |
Deferred tax liabilities |
| (43 | ) | (77 | ) |
|
|
|
| (13 | ) |
|
|
|
| (133 | ) |
Retirement benefit liabilities |
| (388 | ) | (50 | ) |
|
|
|
|
|
|
|
|
|
| (438 | ) |
Provisions |
| (56 | ) |
|
|
|
|
|
|
|
|
|
|
|
| (56 | ) |
|
| (3,330 | ) | (127 | ) | — |
| — |
| (13 | ) | — |
| — |
| (3,470 | ) |
Net assets |
| 140 |
| 112 |
| 198 |
| 278 |
| (13 | ) | — |
| (10 | ) | 705 |
|
|
|
|
|
|
|
|
|
|
|
|
|
|
|
|
|
|
|
Share capital |
| 73 |
|
|
|
|
|
|
|
|
|
|
|
|
| 73 |
|
Share premium account |
| 964 |
|
|
|
|
|
|
|
|
|
|
|
|
| 964 |
|
Reserves |
| (916 | ) | 79 |
| 198 |
| 25 |
|
|
|
|
| (1 | ) | (615 | ) |
IFRS reserve* |
| — |
| 33 |
| 253 |
|
|
| (13 | ) |
|
| (9 | ) | 264 |
|
Equity attributable to equity holders of the Company |
| 121 |
| 112 |
| 198 |
| 278 |
| (13 | ) | — |
| (10 | ) | 686 |
|
Equity minority interests |
| 19 |
|
|
|
|
|
|
|
|
|
|
|
|
| 19 |
|
Total equity |
| 140 |
| 112 |
| 198 |
| 278 |
| (13 | ) | — |
| (10 | ) | 705 |
|
113
Consolidated balance sheet at 1 October 2004
|
| UK GAAP in |
|
|
|
|
|
|
|
|
|
|
|
|
|
|
| IFRS format |
|
|
|
|
|
|
|
|
|
|
|
|
|
|
| (as previously |
| Post-employment |
|
|
|
|
| Financial |
|
|
|
|
|
(In £’s million) |
| reported) |
| benefits |
| Dividends |
| Income tax |
| instruments |
| Others |
| Restated – IFRS |
|
Notes |
|
|
| 2 |
| 5 |
| 7 |
| 10 |
| 4,6,8,9 |
|
|
|
Non-current assets |
|
|
|
|
|
|
|
|
|
|
|
|
|
|
|
Intangible assets |
| 3,547 |
|
|
|
|
|
|
|
|
| 9 |
| 3,556 |
|
Property, plant and equipment |
| 651 |
|
|
|
|
|
|
|
|
| 14 |
| 665 |
|
Investments in associates |
| 7 |
|
|
|
|
|
|
|
|
|
|
| 7 |
|
Retirement benefit assets |
| — |
| 80 |
|
|
|
|
|
|
|
|
| 80 |
|
Trade and other receivables |
| 2 |
|
|
|
|
|
|
|
|
|
|
| 2 |
|
Deferred tax assets |
| 11 |
| 20 |
|
|
|
|
|
|
|
|
| 31 |
|
|
| 4,218 |
| 100 |
| — |
| — |
| — |
| 23 |
| 4,341 |
|
Current assets |
|
|
|
|
|
|
|
|
|
|
|
|
|
|
|
Inventories |
| 864 |
|
|
|
|
|
|
|
|
| (23 | ) | 841 |
|
Trade and other receivables |
| 962 |
|
|
|
|
|
|
|
|
|
|
| 962 |
|
Current tax assets |
| 46 |
|
|
|
|
|
|
|
|
|
|
| 46 |
|
Cash and cash equivalents |
| 339 |
|
|
|
|
|
|
|
|
|
|
| 339 |
|
|
| 2,211 |
| — |
| — |
| — |
| — |
| (23 | ) | 2,188 |
|
Current liabilities |
|
|
|
|
|
|
|
|
|
|
|
|
|
|
|
Borrowings |
| (719 | ) |
|
|
|
|
|
|
|
|
|
| (719 | ) |
Trade and other payables |
| (1,670 | ) |
|
| 253 |
|
|
|
|
|
|
| (1,417 | ) |
Current tax liabilities |
| (167 | ) |
|
|
|
|
|
|
|
|
|
| (167 | ) |
Provisions |
| (40 | ) |
|
|
|
|
|
|
|
| (10 | ) | (50 | ) |
|
| (2,596 | ) | — |
| 253 |
| — |
| — |
| (10 | ) | (2,353 | ) |
Non-current liabilities |
|
|
|
|
|
|
|
|
|
|
|
|
|
|
|
Borrowings |
| (3,208 | ) |
|
|
|
|
|
| 77 |
|
|
| (3,131 | ) |
Derivative financial instruments |
| — |
|
|
|
|
|
|
| (77 | ) |
|
| (77 | ) |
Trade and other payables |
| (59 | ) |
|
|
|
|
|
|
|
|
|
| (59 | ) |
Deferred tax liabilities |
| (51 | ) | (24 | ) |
|
| (13 | ) |
|
|
|
| (88 | ) |
Retirement benefit liabilities |
| (340 | ) | (43 | ) |
|
|
|
|
|
|
|
| (383 | ) |
Provisions |
| (39 | ) |
|
|
|
|
|
|
|
|
|
| (39 | ) |
|
| (3,697 | ) | (67 | ) | — |
| (13 | ) | — |
| — |
| (3,777 | ) |
Net assets |
| 136 |
| 33 |
| 253 |
| (13 | ) | — |
| (10 | ) | 399 |
|
|
|
|
|
|
|
|
|
|
|
|
|
|
|
|
|
Share capital |
| 73 |
|
|
|
|
|
|
|
|
|
|
| 73 |
|
Share premium account |
| 964 |
|
|
|
|
|
|
|
|
|
|
| 964 |
|
Reserves |
| (919 | ) |
|
|
|
|
|
|
|
| (1 | ) | (920 | ) |
IFRS reserve* |
| — |
| 33 |
| 253 |
| (13 | ) |
|
| (9 | ) | 264 |
|
Equity attributable to equity holders of the Company |
| 118 |
| 33 |
| 253 |
| (13 | ) | — |
| (10 | ) | 381 |
|
Minority interests |
| 18 |
|
|
|
|
|
|
|
|
|
|
| 18 |
|
Total equity |
| 136 |
| 33 |
| 253 |
| (13 | ) | — |
| (10 | ) | 399 |
|
* The IFRS reserve is disclosed separately for illustrative purposes only and will be included within revenue reserves in subsequent periods.
** Subsequent to releasing the restated 2005 results, it was decided to reclassify certain advertising and promotion expenditure and net pension benefit financing income within the income statement. These changes do not affect the reported profit before tax. Full details of this change can be found in the interim report for the six months ended 31 March 2006, which is available from www.imperial-tobacco.com.
114
Explanatory notes
1. Advertising and promotion expenditure
Certain advertising and promotion expenditure that is linked to volumes sold (£26m) has been reclassified within our income statement and deducted from revenue rather than included in other operating charges. These changes did not impact the reported profit before tax.
2. Post-employment benefits
Under UK GAAP, the Group accounted for post-employment benefits under Statement of Standard Accounting Practice 24 “Accounting for Pension Costs” (SSAP 24), whereby the cost of providing pensions was charged to the profit and loss account over the service lives of employees. Any variances arising from actuarial valuations were charged or credited to profit over the estimated remaining service lives of the employees.
Under IFRS, the assets and liabilities of each defined benefit scheme are valued at each balance sheet date to produce, for each scheme, a net asset or liability for recognition on the balance sheet. Actuarial gains and losses are recognised in full in the statement of recognised income and expense in the period in which they arise. All other service and interest costs and the expected return on assets are recognised in the income statement. This treatment is in accordance with the amendment to IAS 19 issued by the IASB on 16 December 2004 and endorsed by the EU on 8 November 2005, and brings the methodology of IAS 19 substantially into line with Financial Reporting Standard 17 “Retirement Benefits” (FRS 17). This means that subject to presentation and minor valuations differences, the impacts are similar to those given in the FRS 17 disclosures provided under UK GAAP.
The impact on retained profit for the year ended 30 September 2005 is an increase of £14m, offset by £2m of related deferred tax.
3. Intangible assets – goodwill
Under UK GAAP, goodwill on the balance sheet was amortised over its useful economic life. Under IFRS 3, amortisation of goodwill is prohibited, instead it is subject to an impairment review which must be carried out at least annually and whenever there is an indicator of impairment.
Following the adoption of IFRS, the goodwill asset with a value as at 1 October 2004 of £3,452m will no longer be amortised. The results for the year ended 30 September 2005 were restated to reverse the goodwill amortisation charge of £198m that was recorded under UK GAAP in order to restate the goodwill to the 1 October 2004 valuation.
Impairment reviews carried out at 1 October 2004 and 30 September 2005 in accordance with IAS 36 “Impairment of Assets” identified no impairments.
4. Intangible assets – other
Under UK GAAP, all computer software was included within tangible fixed assets in the balance sheet, however, under IFRS only software integral to another fixed asset should be included in tangible fixed assets. Any separately identifiable software must be classified as an intangible asset. The charge to the income statement in respect of such software is classified as amortisation under IFRS rather than as depreciation under UK GAAP.
As at 1 October 2004 and 30 September 2005, £9m and £11m respectively of software was reallocated to intangible assets. A £7m charge for depreciation for the year ended 30 September 2005 has been reclassified as amortisation in respect of this software for the year ended 30 September 2005.
5. Proposed final dividends
Under UK GAAP, proposed final dividends were accrued as an adjusting post balance sheet event in the accounting period to which they related. Under IFRS dividends are recognised in the period in which they are approved. As a result, the proposed final dividend of £278m for the year ended 30 September 2005 included in the balance sheet and profit and loss account under UK GAAP is not recognised in the statements prepared under IFRS. Similarly, there is an adjustment to the opening balance sheet at 1 October 2004 of £253m representing the 2004 final dividend which is recognised in the income statement for the year ended 30 September 2005 under IFRS.
6. Share-based payments
Under UK GAAP, the Group recognised a charge to the profit and loss account for its share option schemes over the performance period based on the difference between the exercise price of the award and the share price at the date of grant (the intrinsic value). Under IFRS, the charge is based on the fair value of the share options awarded at the date of grant spread over the vesting period.
There is an adjustment to the opening balance sheet at 1 October 2004 of £1m between the profit and loss reserve and the IFRS transition reserve.
The impact of this change is to increase operating profit for the year ended 30 September 2005 by £4m, with the other side of the accounting entry being a debit to shareholders’ funds as a reserves movement. There is therefore no impact on net assets.
7. Tax
IAS 12 “Income Taxes” covers the accounting requirements for both current and deferred taxation. There is no difference in the current tax accounting requirements under IAS 12, compared with those of UK GAAP.
However there are differences in the requirements for accounting for deferred tax under IFRS rather than under UK GAAP. Under UK GAAP, deferred tax was recognised only on timing differences arising from the inclusion of gains and losses in tax assessments in periods that differed from those in which those gains and losses were included in the financial statements. Under IFRS, except for specific exemptions, deferred tax is recognised on temporary differences, which include timing differences, arising from the difference between the tax base and accounting base of balance sheet items.
The Group has made adjustments to the balance sheets at 1 October 2004 and 30 September 2005 as follows:
an adjustment of £7m to reflect deferred tax on fair value adjustments made to property valuations as a result of the Reemtsma acquisition;
a further adjustment of £6m in respect of deferred tax on gains rolled over into replacement assets.
Further adjustments to the deferred tax liability were made as a result of the adoption of the IFRS requirements for accounting for post-employment benefits (as outlined in 2 above).
8. Holiday pay accrual
When reporting under UK GAAP, the Group did not account for holiday pay accruals except where it was legally obliged to make a cash settlement. IAS 19 (“Employee benefits”) explicitly requires provision to be made for the cost of holiday entitlements not taken at the balance sheet date. The effect of this change of approach is to reduce net assets as at both 1 October 2004 and 30 September 2005 by £10m.
9. Spare parts
Under UK GAAP, all spare parts held for plant and machinery were held within inventories and expensed when used. Under IFRS, certain spare parts should be held within fixed assets and transferred to the relevant asset as required and subsequently depreciated accordingly. As at 1 October 2004 and 30 September 2005, spare parts valued at £23m and £21m respectively were reclassified from inventories to property, plant and equipment. This change had no effect on the income statement for the year ended 30 September 2005.
115
10. Financial instruments
The Group undertakes transactions in derivative financial instruments in order to manage the underlying exposure to foreign exchange and interest rate risks. Foreign currency borrowings are also used to hedge foreign exchange risk.
IAS 21 “The effects of changes in foreign exchange rates”
Under UK GAAP, where cross currency swaps are used to hedge exchange risk, the book value of the underlying debt reflects the effect of the swap. However, under IAS 21, the book value of such derivatives is shown separately on the balance sheet and the underlying debt is translated at the exchange rate ruling at the balance sheet date. As a result of this change, £57m was reallocated to derivative financial instruments in liabilities, reducing borrowings.
IAS 39 “Financial instruments: recognition and measurement”
Under UK GAAP, hedge accounting was applied to derivative financial instruments such that changes in the market value of the instrument were matched against changes in the value of the underlying hedged exposure. With the exception of cross currency swaps, the instruments were kept off-balance sheet with their impact disclosed in a note to the financial statements.
IAS 39 requires all derivatives to be recognised on the balance sheet at fair value, with changes in the fair value being recognised in the income statement unless the instrument satisfies the IFRS hedge accounting rules, which are much more restrictive than those under UK GAAP.
In preparing the comparative figures for 2005, the Group has chosen to utilise the IFRS 1 exemption from the requirement to restate comparative information for IAS 32 and IAS 39 on financial instruments. Therefore, in the preparation of its financial statements in accordance with IFRS for the year ended 30 September 2005, the Group has continued to apply the hedge accounting rules of UK GAAP.
Restatement of consolidated balance sheet to include IAS 32 and IAS 39 as at 1 October 2005
From 1 October 2005, the Group is required to account for its financial instruments in accordance with the measurement criteria of IAS 39 and has recognised transitional adjustments for the following at this date:
(a) The measurement of all derivative financial instruments at fair value;
(b) The reclassification of interest accruals to form part of the carrying value of the related cash or borrowings; and
(c) Deferred tax on adjustments (a) and (b).
Although the Group has taken the decision not to hedge account for its derivative financial instruments, it is deemed to have applied hedge accounting under UK GAAP until 30 September 2005 and discontinued hedge accounting prospectively thereafter. Detailed below is a reconciliation between the IFRS restated balance sheet at 30 September 2005 applying prior UK GAAP hedge accounting and the balance sheet after the adoption of IAS 32 and IAS 39. From 1 October 2005 all derivative financial instruments will continue to be recognised in the balance sheet at fair value with future gains and losses being recognised immediately in earnings.
116
|
|
|
|
|
|
|
| Restated IFRS |
|
|
|
|
|
|
| IAS 39 transition |
| including impact |
|
(In £’s million) |
| Notes |
| Restated IFRS |
| adjustments |
| of IAS 39 |
|
Non-current assets |
|
|
|
|
|
|
|
|
|
Intangible assets |
|
|
| 3,554 |
|
|
| 3,554 |
|
Property, plant and equipment |
|
|
| 642 |
|
|
| 642 |
|
Investments in associates |
|
|
| 5 |
|
|
| 5 |
|
Retirement benefit assets |
|
|
| 259 |
|
|
| 259 |
|
Trade and other receivables |
|
|
| 4 |
|
|
| 4 |
|
Deferred tax assets |
| (c) |
| 62 |
| 43 |
| 105 |
|
|
|
|
| 4,526 |
| 43 |
| 4,569 |
|
Current assets |
|
|
|
|
|
|
|
|
|
Inventories |
|
|
| 857 |
|
|
| 857 |
|
Trade and other receivables |
| (b) |
| 1,012 |
| (1 | ) | 1,011 |
|
Current tax assets |
|
|
| 44 |
|
|
| 44 |
|
Cash and cash equivalents |
| (b) |
| 256 |
| 1 |
| 257 |
|
Derivative financial instruments |
| (a) |
| — |
| 72 |
| 72 |
|
|
|
|
| 2,169 |
| 72 |
| 2,241 |
|
Current liabilities |
|
|
|
|
|
|
|
|
|
Borrowings |
| (b) |
| (707 | ) | (1 | ) | (708 | ) |
Derivative financial instruments |
| (a) |
| — |
| (144 | ) | (144 | ) |
Trade and other payables |
| (b) |
| (1,528 | ) | 40 |
| (1,488 | ) |
Current tax liabilities |
|
|
| (235 | ) |
|
| (235 | ) |
Provisions |
|
|
| (50 | ) |
|
| (50 | ) |
|
|
|
| (2,520 | ) | (105 | ) | (2,625 | ) |
Non-current liabilities |
|
|
|
|
|
|
|
|
|
Borrowings |
| (b) |
| (2,775 | ) | (39 | ) | (2,814 | ) |
Derivative financial instruments |
| (a) |
| (57 | ) | 57 |
| — |
|
Trade and other payables |
|
|
| (11 | ) |
|
| (11 | ) |
Deferred tax liabilities |
| (c) |
| (133 | ) | (22 | ) | (155 | ) |
Retirement benefit liabilities |
|
|
| (438 | ) |
|
| (438 | ) |
Provisions |
|
|
| (56 | ) |
|
| (56 | ) |
|
|
|
| (3,470 | ) | (4 | ) | (3,474 | ) |
|
|
|
|
|
|
|
|
|
|
Net assets |
|
|
| 705 |
| 6 |
| 711 |
|
|
|
|
|
|
|
|
|
|
|
Equity |
|
|
|
|
|
|
|
|
|
Share capital |
|
|
| 73 |
|
|
| 73 |
|
Share premium account |
|
|
| 964 |
|
|
| 964 |
|
Reserves |
| (a), (b), (c) |
| (351 | ) | 6 |
| (345 | ) |
Equity attributable to equity holders of the Company |
|
|
| 686 |
| 6 |
| 692 |
|
Minority interests |
|
|
| 19 |
|
|
| 19 |
|
Total equity |
|
|
| 705 |
| 6 |
| 711 |
|
117
to the members of Imperial Tobacco Group PLC
We have audited the parent company financial statements of Imperial Tobacco Group PLC for the year ended 30 September 2006 which comprise the balance sheet and the related notes. These parent company financial statements have been prepared under the accounting policies set out therein. We have also audited the information in the directors’ remuneration report that is described as having been audited.
We have reported separately on the Group financial statements of Imperial Tobacco Group PLC for the year ended 30 September 2006.
Respective responsibilities of directors and auditors
The directors’ responsibilities for preparing the annual report, the directors’ remuneration report and the parent company financial statements in accordance with applicable law and UK Accounting Standards (UK Generally Accepted Accounting Practice) are set out in the statement of directors’ responsibilities included within the Report of the Directors.
Our responsibility is to audit the parent company financial statements and the part of the directors’ remuneration report to be audited in accordance with relevant legal and regulatory requirements and International Standards on Auditing (UK and Ireland). This report, including the opinion, has been prepared for and only for the Company’s members as a body in accordance with section 235 of the Companies Act 1985 and for no other purpose. We do not, in giving this opinion, accept or assume responsibility for any other purpose or to any other person to whom this report is shown or into whose hands it may come save where expressly agreed by our prior consent in writing.
We report to you our opinion as to whether the parent company financial statements give a true and fair view and whether the parent company financial statements and the part of the directors’ remuneration report to be audited have been properly prepared in accordance with the Companies Act 1985. We also report to you whether, in our opinion, the Report of the Directors is consistent with the parent company financial statements, if the Company has not kept proper accounting records, if we have not received all the information and explanations we require for our audit, or if information specified by law regarding directors’ remuneration and other transactions is not disclosed.
We read other information contained in the annual report and consider whether it is consistent with the audited parent company financial statements. The other information comprises only the operating and financial review, the Report of the Directors, the corporate governance report and the unaudited parts of the remuneration report. We consider the implications for our report if we become aware of any apparent misstatements or material inconsistencies with the parent company financial statements. Our responsibilities do not extend to any other information.
Basis of audit opinion
We conducted our audit in accordance with International Standards on Auditing (UK and Ireland) issued by the Auditing Practices Board. An audit includes examination, on a test basis, of evidence relevant to the amounts and disclosures in the parent company financial statements and the part of the directors’ remuneration report to be audited. It also includes an assessment of the significant estimates and judgements made by the directors in the preparation of the parent company financial statements, and of whether the accounting policies are appropriate to the Company’s circumstances, consistently applied and adequately disclosed.
We planned and performed our audit so as to obtain all the information and explanations which we considered necessary in order to provide us with sufficient evidence to give reasonable assurance that the parent company financial statements and the part of the directors’ remuneration report to be audited are free from material misstatement, whether caused by fraud or other irregularity or error. In forming our opinion we also evaluated the overall adequacy of the presentation of information in the parent company financial statements and the part of the directors’ remuneration report to be audited.
Opinion
In our opinion:
• the parent company financial statements give a true and fair view, in accordance with UK Generally Accepted Accounting Practice, of the state of the Company’s affairs as at 30 September 2006;
• the parent company financial statements and the part of the directors’ remuneration report to be audited have been properly prepared in accordance with the Companies Act 1985; and
• the information given in the Directors’ Report is consistent with the parent company financial statements.
![]()
PricewaterhouseCoopers LLP
Chartered Accountants and Registered Auditors
Bristol
31 October 2006
118
Imperial Tobacco Group PLC balance sheet
at 30 September 2006
|
|
|
|
|
| Restated |
|
(In £’s million) |
| Notes |
| 2006 |
| 2005 |
|
Tangible fixed assets |
|
|
|
|
|
|
|
Investments |
| (ii) |
| 1,035 |
| 1,035 |
|
Current assets |
|
|
|
|
|
|
|
Debtors |
| (iii) |
| 1,053 |
| 748 |
|
Cash |
|
|
| — |
| 1 |
|
|
|
|
| 1,053 |
| 749 |
|
|
|
|
|
|
|
|
|
Creditors: amounts falling due within one year |
| (iv) |
| (454 | ) | (197 | ) |
Net current assets |
|
|
| 599 |
| 552 |
|
Total assets less current liabilities |
|
|
| 1,634 |
| 1,587 |
|
Net assets |
|
|
| 1,634 |
| 1,587 |
|
|
|
|
|
|
|
|
|
Capital and reserves |
|
|
|
|
|
|
|
Called up share capital |
| (v) |
| 73 |
| 73 |
|
Share premium account |
| (vi) |
| 964 |
| 964 |
|
Profit and loss account |
| (vi) |
| 597 |
| 550 |
|
Equity shareholders’ funds |
|
|
| 1,634 |
| 1,587 |
|
The financial statements on pages 119 to 122 were approved by the Board of Directors on 31 October 2006 and signed on its behalf by:
|
|
Derek Bonham | Robert Dyrbus |
Chairman | Director |

119
Notes to the Imperial Tobacco Group PLC balance sheet
Accounting policies
Basis of accounting
The financial statements have been prepared on the going concern basis in accordance with the historical cost convention, the Companies Act 1985 and UK Generally Accepted Accounting Principles.
The principal accounting policies are set out below.
Changes in accounting policy and presentation
Following the introduction of a number of new standards issued by the Accounting Standards Board which became effective during the year, the Company has made changes to its accounting policies, as follows:
The profit and loss account for the year ended 30 September 2005 and the balance sheet at 30 September 2005 have been restated following the adoption of FRS 21 “Events after the Balance Sheet Date”. Following adoption of the Standard final dividends payable and receivable are recognised as a liability or asset in the Company’s financial statements in the period in which the dividends are approved by shareholders, while interim dividends are recognised in the period in which dividends are paid.
The adoption of FRS 21 has resulted in an increase in income receivable from Group companies of £305m (2005: £800m). Shareholders’ funds have decreased by £27m at 1 October 2005 (2004: £852m) due to the write back of the dividend payment by the Company at 30 September 2005 and the change in the timing of recognising dividends receivable from Group companies (see note vii).
The adoption of FRS 26 “Financial Instruments: Measurement” had no impact on the Company’s profit or net assets.
The Company has applied the requirements of FRS 20 “Share-based payment” and has elected to adopt the exemption to apply FRS 20 only to awards made after 7 November 2002. Following adoption, equity-settled share-based payments are measured using their fair value at market date. However, as the Company has no employees, there is no effect on its financial statements in current or prior years.
Investments held as fixed assets
Investments held as fixed assets comprise the Company’s investment in subsidiaries and are shown at cost less any provision for impairment.
Dividends
Final dividends are recognised as a liability in the Group’s financial statements in the period in which the dividends are approved by shareholders, while interim dividends are recognised in the period in which the dividends are paid.
As permitted by section 230 of the Companies Act 1985, no separate profit and loss account has been presented for the Company. The Company has not presented a cash flow statement or provided details of related party transactions as permitted under FRS 1 (revised) “Cash flow statements” and FRS 8 “Related party disclosures” respectively. The Company has taken advantage of the exemption not to present FRS 25 disclosures in the notes to its individual financial statements as full equivalent disclosures are presented in the consolidated financial statements.
120
(i) Dividends
Amounts recognised as distributions to ordinary shareholders in the year:
|
|
|
| Restated* |
|
(In £’s million) |
| 2006 |
| 2005 |
|
Final dividend for the year ended 30 September 2005 of 39.5p per share (2004: 35.0p) |
| 279 |
| 253 |
|
Interim dividend for the year ended 30 September 2006 of 18.5p per share (2005: 16.5p) |
| 127 |
| 120 |
|
|
| 406 |
| 373 |
|
A final dividend for the year ended 30 September 2006 of 43.5 pence per share has been proposed. This amounts to £295m based on the number of shares ranking for dividend at 30 September 2006. At the date of the year end, the shareholders had not yet approved the final dividend at the Annual General Meeting and therefore it is not included in the balance sheet as a liability.
* See note (vi)
(ii) Investments held as fixed assets
(In £’s million) |
| 2006 |
| 2005 |
|
Cost of shares in Imperial Tobacco Holdings Limited |
| 1,035 |
| 1,035 |
|
A list of the principal subsidiaries of the Company is shown on pages 125 to 126.
(iii) Debtors: amounts falling due within one year
|
|
|
| Restated |
|
(In £’s million) |
| 2006 |
| 2005 |
|
Amounts owed by Group undertakings |
| 1,051 |
| 746 |
|
Other debtors and prepayments |
| 2 |
| 2 |
|
|
| 1,053 |
| 748 |
|
(iv) Creditors: amounts falling due within one year
|
|
|
| Restated |
|
(In £’s million) |
| 2006 |
| 2005 |
|
Bank overdrafts |
| 241 |
| — |
|
Amounts owed to Group undertakings |
| 213 |
| 195 |
|
Other creditors |
| — |
| 2 |
|
|
| 454 |
| 197 |
|
(v) Called up share capital
(In £’s million) |
| 2006 |
| 2005 |
|
Authorised |
|
|
|
|
|
1,000,000,000 ordinary shares of 10p each |
| 100 |
| 100 |
|
Issued and fully paid |
|
|
|
|
|
729,200,921 ordinary shares of 10p each |
| 73 |
| 73 |
|
121
(vi) Reserves
|
| Share |
| Restated |
|
|
| premium |
| Profit and |
|
(In £’s million) |
| account |
| loss account |
|
As at 1 October 2005 as previously stated |
| 964 |
| 577 |
|
Prior year adjustments (see accounting policies on page 120) |
| — |
| (27 | ) |
As at 1 October 2005 as restated |
| 964 |
| 550 |
|
Retained profit for the year |
| — |
| 603 |
|
Purchase of own shares |
| — |
| (556 | ) |
As at 30 September 2006 |
| 964 |
| 597 |
|
Profit for the year
As permitted by section 230(3) of the Companies Act 1985, the profit and loss account of the Company is not presented. The profit attributable to shareholders, dealt with in the financial statements of the Company, is £1,009m (2005 restated: £1,099m).
Purchase of treasury shares
During the year the Company continued its share buyback programme purchasing 32,489,000 ordinary shares in Imperial Tobacco Group PLC for a total cost of £556m including expenses. As at 30 September 2006 the total number of shares held in treasury is 46,004,000 representing 6.3% of the issued share capital. The total cost, including expenses, of shares held in treasury is £757m. The shares purchased to date have not been cancelled but are held in a treasury shares reserve and represent a deduction from equity shareholders’ funds (see note 22 to the Consolidated Financial Statements).
(vii) Reconciliation of movements in shareholders’ funds
|
|
|
| Restated |
|
(In £’s million) |
| 2006 |
| 2005 |
|
Profit on ordinary activities after taxation |
| 1,009 |
| 1,099 |
|
Dividends |
| (406 | ) | (373 | ) |
Payments for purchase of own shares |
| (556 | ) | (201 | ) |
Movement in equity shareholders’ funds |
| 47 |
| 525 |
|
Opening equity shareholders’ funds |
| 1,587 |
| 1,062 |
|
Closing equity shareholders’ funds |
| 1,634 |
| 1,587 |
|
(viii) Contingent liabilities
Imperial Tobacco Group PLC has guaranteed various borrowings and liabilities of certain UK and overseas subsidiary undertakings, including its Dutch and Irish subsidiaries. At 30 September 2006, the contingent liability totalled £4,205m (2005: £3,783m).
The guarantees include the Dutch subsidiaries which, in accordance with Book 2, Article 403 of The Netherlands Civil Code, do not file separate financial statements with the Chamber of Commerce. Under the same article, Imperial Tobacco Group PLC has issued declarations to assume any and all liability for any and all debts of the Dutch subsidiaries.
The guarantees also cover the Irish subsidiaries, all of which are included in the consolidated financial statements as at 30 September 2006. The Irish companies, namely John Player & Sons Limited, John Player Distributors Limited and Imperial Tobacco Mullingar have therefore availed themselves of the exemption provided by section 17 of the Irish Companies (Amendment) Act 1986 in respect of documents required to be attached to the annual returns for such companies.
(ix) Other information
Number of employees
The average number of employees during 2006 was nil (2005: nil).
Statutory audit fees
The expenses of the Company included statutory audit fees of £0.6m (2005: £0.6m).
122
Registered office
PO Box 244, Upton Road,
Bristol BS99 7UJ
+44 (0)117 963 6636
Registered in England and Wales No: 3236483
Registrars
Lloyds TSB Registrars,
The Causeway, Worthing,
West Sussex BN99 6DA
0870 241 3932
+44 (0)121 415 7009
(0870 600 3950 text phone for shareholders with hearing difficulties)
ADR depositary
Shareholder Services for ADR Holders
Citibank Shareholder Services
PO Box 43077
Providence, RI 02940-3077
USA
Toll-free number in the US: 1-877-CITI-ADR (877-248-4237)
email: citibank@shareholders-online.com
Stockbrokers
Hoare Govett Limited,
250 Bishopsgate,
London EC2M 4AA
+44 (0)20 7661 6556
Morgan Stanley & Co International Limited
20 Cabot Square
Canary Wharf
London E14 4QW
+44 (0)20 7425 8000
Auditors
PricewaterhouseCoopers LLP
Chartered Accountants and Registered Auditors
31 Great George Street,
Bristol BS1 5QD
Lawyers
Ashurst,
Broadwalk House,
5 Appold Street,
London EC2A 2HA
Allen & Overy,
One Bishops Square
London E1 6AO
Financial advisers
CitiGroup
Citigroup Centre,
33 Canada Square
Canary Wharf,
London E14 5LB
123
Financial Calendar and Dividends
Interim results are expected to be announced in May and the full year’s results in October.
The Annual General Meeting of the Company is to be held on 30 January 2007. The Notice of Meeting and explanatory notes about the resolutions to be proposed are set out in the circular enclosed with this report.
Dividends are generally paid in August and February. Payment of the 2006 final dividend, if approved, will be on 16 February 2007, to shareholders on the register on 19 January 2007. The associated ex dividend date is 17 January 2007.
Shareholders who do not currently mandate their dividends and who wish to do so should complete a mandate instruction form obtainable from Lloyds TSB Registrars at the address shown.
Share Dealing Service
A low cost, execution-only, postal dealing service for the purchase and sale of Imperial Tobacco Group PLC shares has been set up by Hoare Govett Limited. Commission is 1 per cent with a minimum charge of £15. For details please contact Hoare Govett Limited at the address shown. This service is restricted to UK residents only and transactions are limited to €15,000 (approximately £10,000). Hoare Govett Limited is authorised and regulated by the Financial Services Authority.
Individual Savings Account (ISA)
Investors in Imperial Tobacco Group PLC ordinary shares may take advantage of a low cost Individual Savings Account (ISA), dedicated to Imperial Tobacco Group shares and operated by Lloyds TSB Bank plc. Details of the ISA can be obtained from Lloyds TSB Registrars, ISA Team, The Causeway, Worthing, West Sussex BN99 6UY, tel: 0870 242 4244.
Dividend Reinvestment Plan (DRIP)
Imperial Tobacco Group PLC has set up a dividend reinvestment plan (DRIP) to enable shareholders to use their cash dividend to buy further shares in the market. Further information can be obtained from Lloyds TSB Registrars, PO Box 699, Worthing, West Sussex, BN99 6YY, tel: 0870 241 3018.
American Depositary Receipt Facility
Imperial Tobacco Group PLC ordinary shares are traded on the New York Stock Exchange in the form of American Depositary Shares (ADSs) using the symbol ITY. Each ADS represents two Imperial Tobacco Group PLC ordinary shares. The ADS facility is administered by Citibank N.A. and enquiries should be directed to them at the address shown.
International Direct Investment Program
Imperial Tobacco Group PLC ADSs have been included in the Citibank International Direct Investment Program which provides registered holders and interested investors with a convenient way to purchase and sell Imperial Tobacco Group PLC ADSs.
To obtain further information about the International Direct Investment Program, please call Citibank N.A., the administrator and sponsor, at 1-800-808 8010 (toll free in the USA).
Website
Information on Imperial Tobacco Group PLC is available on our website: www.imperial-tobacco.com.
Lloyds TSB Registrars also offer a range of shareholder information on-line. You can access information on your holdings, indicative share prices and dividend details and find practical help on transferring shares or updating your details at www.shareview.co.uk.
124
The principal wholly owned subsidiaries of the Group held throughout the year, all of which are unlisted are shown below:
Registered in England and Wales
Name |
| Principal activity |
Imperial Tobacco Limited |
| Manufacture, marketing and sale of tobacco products in the UK |
Imperial Tobacco Finance PLC |
| Finance company |
Imperial Tobacco Holdings Limited |
| Holding investments in subsidiary companies |
Imperial Tobacco International Limited |
| Export and marketing of tobacco products |
Sinclair Collis Limited |
| Cigarette vending in the UK |
Incorporated overseas
Name and country of incorporation |
| Principal activity |
Badische Tabakmanufaktur Roth-Händle GmbH, Germany |
| Manufacture of tobacco products in Germany |
Dunkerquoise des Blends S.A., France |
| Tobacco processing in France |
Ets. L. Lacroix Fils N.V. (Rizla Belgium N.V.), Belgium |
| Manufacture, marketing and sale of tobacco products in Belgium |
Gunnar Stenberg AS, Norway |
| Marketing and sale of tobacco products in Norway |
Imperial Tobacco (Asia) Pte. Ltd., Singapore |
| Marketing and sale of tobacco products in South East Asia |
Imperial Tobacco Australia Limited, Australia |
| Marketing and sale of tobacco products in Australia |
Imperial Tobacco CR s.r.o., Czech Republic |
| Marketing and sale of tobacco products in the Czech Republic |
Imperial Tobacco France S.A.S., France |
| Marketing of tobacco products in France |
Imperial Tobacco Hellas S.A., Greece |
| Marketing and sale of tobacco products in Greece |
Imperial Tobacco Italy Srl, Italy |
| Marketing of tobacco products in Italy |
Imperial Tobacco Magyarorszäg Dohänyforgalmazö Kft, Hungary |
| Marketing and sale of tobacco products in Hungary |
Imperial Tobacco Mullingar, Republic of Ireland |
| Manufacture of fine cut tobacco in the Republic of Ireland |
Imperial Tobacco New Zealand Limited, New Zealand |
| Manufacture, marketing and sale of tobacco products in |
Imperial Tobacco Overseas B.V., the Netherlands |
| Finance company |
Imperial Tobacco Sigara ve Tutunculuck Sanayi ve Ticaret A.S., Turkey |
| Marketing and sale of tobacco products in Turkey |
Imperial Tobacco Slovakia A.S., Slovak Republic |
| Manufacture, marketing and sale of tobacco products in the Slovak Republic |
Imperial Tobacco Tutun Urunleri Satis ve Pazarlama A.S., Turkey |
| Manufacture of tobacco products in Turkey |
John Player & Sons Limited, Republic of Ireland |
| Marketing and sale of tobacco products in the Republic of Ireland |
John Player S.A., Spain |
| Marketing and sale of tobacco products in Spain |
Reemtsma Cigarettenfabriken GmbH, Germany |
| Manufacture, marketing and sale of tobacco products in Germany and export of tobacco products |
Reemtsma International Asia Services Limited, China |
| Marketing of tobacco products in China |
Reemtsma Ukraine, Ukraine |
| Marketing and sale of tobacco products in Ukraine |
OOO Reemtsma Volga Tabakfabrik, Russia |
| Manufacture of tobacco products in Russia |
OOO Reemtsma, Russia |
| Marketing and sale of tobacco products in Russia |
Robert Burton Associates Limited, USA |
| Marketing and sale of rolling papers and tubes in the USA |
Tobaccor S.A.S., France |
| Holding investments in subsidiary companies |
Van Nelle Canada Limited, Canada |
| Manufacture of tubes and sale of tobacco products in Canada |
Van Nelle Tabak Nederland B.V., the Netherlands |
| Manufacture, marketing and sale of tobacco products in the Netherlands |
125
The principal partly owned subsidiaries of the Group, held throughout the year, are shown below. All are unlisted unless otherwise indicated:
Incorporated overseas
Name and country of incorporation |
| Principal activity |
| Percentage |
|
Imperial Tobacco Polska S.A., Poland |
| Manufacture, marketing and sale of tobacco products in Poland |
| 96.5 |
|
Reemtsma Kiev Tyutyunova Fabrika, Ukraine |
| Manufacture of cigarettes in Ukraine |
| 99.8 |
|
Reemtsma Kyrgyzstan OJSC, Kyrgyzstan |
| Manufacture, marketing and sale of tobacco products in Kyrgyzstan |
| 98.7 |
|
Skruf Snus AB, Sweden |
| Manufacture, marketing and sale of tobacco products in Sweden |
| 43.0 |
|
Société Ivoirienne des Tabacs S.A.(1), Côte d’Ivoire |
| Manufacture, marketing and sale of tobacco products in the Ivory Coast |
| 74.1 |
|
Tobacna Ljubljana d.o.o., Slovenia |
| Marketing and sale of tobacco products in Slovenia |
| 76.5 |
|
Tutunski Kombinat AD, Macedonia |
| Manufacture, marketing and sale of tobacco products in Macedonia |
| 99.1 |
|
(1) Listed on the Côte d’Ivoire Stock Exchange.
In addition, the Group also wholly owns the following partnership:
Name and country |
| Principal activity |
|
Imperial Tobacco (EFKA) GmbH & Co. KG, Germany Principal place of business: Industriestrasse 6, Postfach 1257, D-78636 Trossingen, Germany |
| Manufacture of tubes in Germany |
|
* The percentage of issued share capital held by immediate parent and the effective voting rights of the Group are the same, with the exception of Tobacna Ljubljana d.o.o. in which the Group holds a 99% interest.
The consolidated Group financial statements include all the subsidiary undertakings and entities shown above. With the exception of Imperial Tobacco Holdings Limited, which is wholly owned by the Company, none of the shares in the subsidiaries is held by the Company. A full list of subsidiaries is attached to the Annual Return of the Company.
126
A |
|
|
|
Accounting Policies |
| 71-75, 120 |
|
Acquisitions |
| 12-13, 28, 110 |
|
Africa |
| 26 |
|
American Depositary |
|
|
|
Receipts/Shares |
| 123-124 |
|
Annual General Meeting |
| 40, 124 |
|
Asia |
| 25 |
|
Audit Committee |
| 47 |
|
Auditor (Independent Auditor) |
|
|
|
Remuneration |
| 81 |
|
Report |
| 67, 118 |
|
Australia |
| 25 |
|
|
|
|
|
B |
|
|
|
Balance Sheets |
| 69, 119 |
|
Belgium |
| 23 |
|
Board Committees |
| 42-44 |
|
Board of Directors |
| 36-37 |
|
Burkina Faso |
| 26 |
|
Business Review |
| 39 |
|
|
|
|
|
C |
|
|
|
Capital Expenditure |
| 28 |
|
Cash Flow |
| 70 |
|
Cash Management |
| 12-13 |
|
Caucasus |
| 26 |
|
Chairman’s Statement |
| 2-3 |
|
Changes in Equity |
| 109 |
|
Chief Executive’s Committee |
| 38, 45 |
|
Chief Executive’s Review |
| 4-5 |
|
China |
| 25 |
|
Community Investment |
| 35 |
|
Contents |
| 1 |
|
Contingent Liabilities |
| 122 |
|
Corporate Governance Report |
| 41-51 |
|
Corporate Responsibility |
| 5, 32-35 |
|
Côte d’Ivoire |
| 26 |
|
Creditor Payment Policy |
| 40 |
|
Critical Accounting Estimates and Judgements |
| 76-77 |
|
Czech Republic |
| 26 |
|
|
|
|
|
D |
|
|
|
Debt |
| 88-98, 111-112 |
|
Directors |
|
|
|
Biographies |
| 37 |
|
Interests in Shares |
| 57 |
|
Remuneration |
| 52-66 |
|
Responsibilities |
| 51 |
|
Pensions |
| 64-66 |
|
Disclosure Committee |
| 50 |
|
Dividend Reinvestment Plan (DRIP) |
| 124 |
|
Dividends |
| 2, 28, 83, 124 |
|
Donations |
| 35, 40 |
|
|
|
|
|
E |
|
|
|
Earnings Per Share |
| 2, 28, 84 |
|
Employee Share Schemes |
| 104-108 |
|
Employees/Employment |
| 33, 40, 81 |
|
Excise Duty |
| 6, 31 |
|
|
|
|
|
F |
|
|
|
Financial Calendar |
| 124 |
|
Financial Highlights |
| IFC |
|
Financial Performance |
| 28 |
|
Financial Statements |
| 68-122 |
|
Financing |
| 28 |
|
Framework Convention on Tobacco Control |
| 6, 30 |
|
France |
| 23 |
|
|
|
|
|
G |
|
|
|
Gabon |
| 26 |
|
Germany |
| 20-21 |
|
Greece |
| 23 |
|
Group Performance |
| 17 |
|
|
|
|
|
H |
|
|
|
Health, Safety and Environment |
| 34 |
|
Hungary |
| 26 |
|
|
|
|
|
I |
|
|
|
Income Statements |
| 68, 122 |
|
Intangible Assets |
| 84-86 |
|
International Financial |
|
|
|
Reporting Standards |
| 112-117 |
|
Ireland |
| 23 |
|
Italy |
| 23 |
|
|
|
|
|
L |
|
|
|
Laos |
| 25 |
|
Litigation |
| 31 |
|
|
|
|
|
M |
|
|
|
Madagascar |
| 26 |
|
Manufacturing |
| 27 |
|
Master Settlement Agreement |
| 26 |
|
Middle East |
| 26 |
|
|
|
|
|
N |
|
|
|
Net Finance Costs |
| 28 |
|
Netherlands, the |
| 23 |
|
New Zealand |
| 26 |
|
Nominations Committee |
| 46 |
|
Norway |
| 26 |
|
Notes to the Financial Statements |
| 78-122 |
|
|
|
|
|
O |
|
|
|
Operating and Financial Review |
| 2-38 |
|
Operating Environment |
| 29-31 |
|
Outlook |
| 5, 19, 21, 23, 26 |
|
|
|
|
|
P |
|
|
|
Pension Fund |
| 50 |
|
Pictorial Health Warnings |
| 30 |
|
Productivity |
| 10-11 |
|
Profit Before Tax |
| 28 |
|
Poland |
| 26 |
|
Property, Plant and Equipment |
| 86-87 |
|
Provisions |
| 104 |
|
|
|
|
|
R |
|
|
|
Regional Performance Analysis |
| 17 |
|
Registrars |
| 123 |
|
Regulation |
| 5, 6 |
|
Remuneration Committee |
| 45, 52 |
|
Remuneration Report |
| 52-66 |
|
Report of the Directors |
| 39-40 |
|
Rest of the World Region |
| 24-26 |
|
Rest of Western Europe Region |
| 22-23 |
|
Restructuring Costs |
| 28, 81 |
|
Retirement Benefit Schemes |
| 100-103 |
|
Risk Assessment |
| 48 |
|
Risks and Uncertainties |
| 14 |
|
Russia |
| 26 |
|
|
|
|
|
S |
|
|
|
Sales Development |
| 8-9 |
|
Saudi Arabia |
| 26 |
|
Segmental Information |
| 78-80 |
|
Senegal |
| 26 |
|
Share Buybacks |
| 13, 109, 122 |
|
Share Capital |
| 39, 104 |
|
Shareholder Information |
| 123-124 |
|
Slovakia |
| 26 |
|
Slovenia |
| 26 |
|
Smoking in Public Places |
| 29 |
|
Spain |
| 23 |
|
Statement of Recognised |
|
|
|
Income and Expense |
| 70 |
|
Strategy |
| 7-13 |
|
Subsidiary Undertakings |
| 125-126 |
|
Sweden |
| 26 |
|
|
|
|
|
T |
|
|
|
Taiwan |
| 25 |
|
Taxation |
| 28, 82-83, 98-99 |
|
Tobacco Consumption |
| 6 |
|
Total Shareholder Return Index |
| 3 |
|
Turkey |
| 26 |
|
|
|
|
|
U |
|
|
|
Ukraine, the |
| 26 |
|
United Kingdom |
| 18-19 |
|
United States |
| 26 |
|
|
|
|
|
V |
|
|
|
Vietnam |
| 25 |
|
|
|
|
|
W |
|
|
|
World Tobacco Market Context |
| 6 |
|
127
Notes
This page is for notes and has been left blank intentionally.
128
Designed and produced by Black Sun Pic. Printed in England by Butler and Tanner. |
This Annual Report and Accounts is printed on Arctic the Volume. This paper is produced from 100% ECF (Elemental Chlorine Free) pulp that is fully recyclable. It has FSC (Forest Stewardship Council) certification and has been manufactured within a mill which is registered under the British and International Quality standard of BS EN ISO 9001-2000 and the environmental standard of BS EN ISO 14001-1996. |
129
Imperial Tobacco Group PLC
PO Box 244
Southville
Bristol BS99 7UJ
130