Table of Contents
Filed pursuant to Rule 424(b)(3)
Registration No. 333-125430
| Prospectus |
DAIICHI PHARMACEUTICAL CO., LTD. | SANKYO COMPANY, LIMITED | |
 |  | |
Joint Share Transfer of Shares of Daiichi Pharmaceutical Co., Ltd. and
Sankyo Company, Limited for Shares of Daiichi Sankyo Company, Limited
The boards of directors of Daiichi Pharmaceutical Co., Ltd. and Sankyo Company, Limited have agreed to a joint share transfer (kyoudo-kabushiki iten) under the Commercial Code of Japan pursuant to which all of the shares of Daiichi and Sankyo will be exchanged for shares of Daiichi Sankyo Company, Limited. On May 13, 2005, the two companies entered into a joint share transfer agreement setting forth the exchange ratio and other terms of the transaction. In the joint share transfer, Daiichi’s shareholders will receive 1.159 shares of Daiichi Sankyo common stock for each share of Daiichi common stock and Sankyo’s shareholders will receive one share of Daiichi Sankyo common stock for each share of Sankyo common stock. As a result, former shareholders of Daiichi will hold approximately 42.0% and former shareholders of Sankyo will hold approximately 58.0% of the outstanding common stock of Daiichi Sankyo after the joint share transfer. In addition, shareholders of Daiichi will receive ¥25 in cash per share of Daiichi and shareholders of Sankyo will receive ¥25 in cash per share of Sankyo from Daiichi Sankyo in the joint share transfer. Daiichi and Sankyo expect that, upon the closing of the transaction, the shares of Daiichi Sankyo will be listed on the First Sections of the Tokyo Stock Exchange, the Osaka Securities Exchange and the Nagoya Stock Exchange. The joint share transfer is subject to approval of the terms of the joint share transfer at each of the two companies’ general meetings of shareholders. Under the current schedule, the joint share transfer, if approved, will become effective on or around September 28, 2005.
The dates, times and places of the general meetings of shareholders are as follows:
For Daiichi shareholders: June 29, 2005 at 10:00 a.m. Daiichi Pharmaceutical Co., Ltd. Head Office 14-10, Nihonbashi 3-chome Chuo-ku, Tokyo 103-8234 Japan | For Sankyo shareholders: June 29, 2005 at 10:00 a.m. Sankyo Company, Limited Head Office 5-1, Nihonbashi Honcho 3-chome Chuo-ku, Tokyo 103-8426 Japan |
With respect to each company, shareholders of record of such company as of March 31, 2005 will be entitled to vote at that company’s general meeting. To attend and vote at the general meetings, shareholders of each of Daiichi and Sankyo must follow the procedures outlined in the convocation notice and the mail-in-ballot material which each of the companies will distribute to them.
The joint share transfer can only be completed if the terms of the joint share transfer are approved by the shareholders of each of Daiichi and Sankyo and several other conditions are satisfied. The additional conditions and other terms of the joint share transfer are more fully described in this prospectus. For a discussion of these conditions, please see “The Joint Share Transfer Agreement”.
This prospectus has been prepared for shareholders of Daiichi and Sankyo resident in the United States to provide them with detailed information in connection with the joint share transfer. It also provides important information about the shares of Daiichi Sankyo to be issued and delivered to such shareholders in connection with the joint share transfer. You are encouraged to read this prospectus in its entirety.
You should carefully consider therisk factors beginning on page 13 of this prospectus.
NEITHER DAIICHI NOR SANKYO IS ASKING FOR A PROXY AND YOU ARE REQUESTED NOT TO SEND A PROXY.
Neither the Securities and Exchange Commission nor any state securities commission has approved or disapproved of the securities to be issued in connection with the joint share transfer or determined if this prospectus is truthful or complete. Any representation to the contrary is a criminal offense.
This prospectus is dated June 6, 2005.
Table of Contents
REFERENCE TO ADDITIONAL INFORMATION
Neither Daiichi nor Sankyo has previously had a reporting obligation in the United States under the Securities Exchange Act of 1934. Following the date of this prospectus until the completion of the joint share transfer, Daiichi and Sankyo will be, and after the joint share transfer, Daiichi Sankyo will be subject to reporting obligations and any filings they make will be available via the website of the United States Securities and Exchange Commission, or SEC, atwww.sec.gov. You can also obtain any filed documents or other information which may be incorporated by reference herein regarding Daiichi or Sankyo without charge by written or oral request to:
Daiichi Pharmaceutical Co., Ltd. Corporate Communications Department 14-10, Nihonbashi 3-chome Chuo-ku, Tokyo 103-8234 Japan Telephone: (81-3) 3273-7107 | Sankyo Company, Limited Corporate Communications Department 5-1, Nihonbashi Honcho 3-chome Chuo-ku, Tokyo 103-8426 Japan Telephone: (81-3) 5255-7034 |
Please note that copies of documents provided to you will not include exhibits, unless the exhibits are specifically incorporated by reference into the documents or this prospectus.
In order to receive timely delivery of requested documents in advance of the general meetings of the companies, you should make your request no later than June 22, 2005, which is five business days before you must make a decision regarding the joint share transfer.
See “Where You Can Find More Information” on page 201.
Table of Contents
| Page | ||
Questions and Answers About the Joint Share Transfer and Voting Procedures for the General Meetings | 1 | |
| 6 | ||
| 13 | ||
| 23 | ||
| 24 | ||
| 26 | ||
Selected Unaudited Pro Forma Condensed Combined Financial Information | 28 | |
| 38 | ||
| 39 | ||
| 41 | ||
| 42 | ||
| 45 | ||
| 48 | ||
| 76 | ||
| 80 | ||
| 99 | ||
| 119 | ||
| 121 | ||
| 126 | ||
Daiichi Management’s Discussion and Analysis of Financial Condition and Results of Operations | 127 | |
Sankyo Management’s Discussion and Analysis of Financial Condition and Results of Operations | 150 | |
Directors and Management of Daiichi Sankyo Following the Joint Share Transfer | 172 | |
| 177 | ||
| 180 | ||
| 187 | ||
| 188 | ||
| 189 | ||
| 200 | ||
| 200 | ||
| 201 | ||
| F-1 | ||
Appendix A | – | English Translation of Joint Share Transfer Agreement | ||
Appendix B | – | English Translation of Fairness Opinion Delivered by Merrill Lynch Japan Securities Co., Ltd. | ||
Appendix C | – | English Translation of Fairness Opinion Delivered by Nomura Securities Co., Ltd. | ||
Appendix D | – | Press Release of Daiichi, dated April 27, 2005, announcing its unaudited Japanese GAAP results for the fiscal year ended March 31, 2005 | ||
Appendix E | – | Unaudited Reverse Reconciliation of Selected Financial Information of Daiichi | ||
Appendix F | – | Press Release of Sankyo, dated May 13, 2005, announcing its unaudited Japanese GAAP results for the fiscal year ended March 31, 2005 | ||
Appendix G | – | Unaudited Reverse Reconciliation of Selected Financial Information of Sankyo | ||
Appendix H | – | English translation of Articles 371, 355, 245-3 and 245-4 of the Commercial Code of Japan |
i
Table of Contents
(This page is intentionally left blank)
ii
Table of Contents
QUESTIONS AND ANSWERS ABOUT THE JOINT SHARE TRANSFER AND VOTING PROCEDURES FOR THE GENERAL MEETINGS
| Q1: | What am I being asked to vote on? |
| A1: | You are being asked to vote to approve the terms of a joint share transfer between Daiichi and Sankyo. |
| Q2: | What will I receive in the joint share transfer? |
| A2: | In the transaction, each share of Daiichi common stock will be exchanged for 1.159 shares of Daiichi Sankyo common stock and each share of Sankyo common stock will be exchanged for one share of Daiichi Sankyo common stock. The ratio at which each share of Daiichi or Sankyo common stock will be exchanged for shares of Daiichi Sankyo common stock is referred to as the exchange ratio. |
| Neither shareholders of Daiichi nor Sankyo will receive any fractional shares of Daiichi Sankyo common stock in the joint share transfer. Instead, the shares representing the aggregate of all such fractional shares will be sold in the Japanese market or sold to Daiichi Sankyo itself and the net cash proceeds from the sale will be distributed to the former holders of Daiichi and Sankyo fractional shares on a proportionate basis, with any fractional yen amounts to be rounded up. |
| In addition, in the joint share transfer, shareholders of Daiichi will receive ¥25 in cash per share of Daiichi and shareholders of Sankyo will receive ¥25 in cash per share of Sankyo from Daiichi Sankyo as a substitute for interim dividends otherwise payable by each of Daiichi and Sankyo. Instead of paying its interim dividends for the six-month period ending September 30, 2005 directly to the former shareholders of Daiichi and Sankyo, each of Daiichi and Sankyo will pay such interim dividends to Daiichi Sankyo, which will be the sole holder of record of Daiichi and Sankyo common stock as of September 30, 2005, subsequent to the closing of the joint share transfer. |
| Q3: | How will such shareholders of Daiichi and Sankyo that will hold fewer than 100 shares, or a “unit”, of Daiichi Sankyo shares be treated after the joint share transfer? |
| A3: | In its proposed articles of incorporation, Daiichi Sankyo will provide that 100 shares of its common stock will constitute one unit. Some holders of Daiichi or Sankyo shares may receive less than a unit of Daiichi Sankyo shares upon the joint share transfer. Stock certificates of shares constituting less than one unit will not be issued, but holders of such shares will be registered in Daiichi Sankyo’s register of shareholders. Any shares held by a holder with less than a unit of shares will not carry voting rights. A holder of less than a unit of Daiichi Sankyo shares may request Daiichi Sankyo to purchase such shares at their market value. In addition, Daiichi Sankyo’ articles of incorporation will provide that a holder of less than a unit of Daiichi Sankyo shares may request that Daiichi Sankyo sell to such holder such amount of shares which will, when added together with the shares constituting less than one unit, constitute one unit of shares, as long as Daiichi Sankyo has treasury stock to sell upon such request. |
| Q4: | How does the Daiichi board of directors recommend that Daiichi shareholders vote? |
| A4: | The Daiichi board of directors unanimously recommends approval of the terms of the joint share transfer. |
| Q5: | How does the Sankyo board of directors recommend that Sankyo shareholders vote? |
| A5: | The Sankyo board of directors unanimously recommends approval of the terms of the joint share transfer. |
| Q6: | What vote of Daiichi shareholders and what vote of Sankyo shareholders is required in connection with the transaction? |
| A6: | The affirmative vote of the holders of at least two-thirds of the voting rights of each |
1
Table of Contents
of Daiichi and Sankyo represented at the relevant general meeting of shareholders at which shareholders holding at least one-third of the total voting rights are present is required to approve the terms of the joint share transfer. With respect to each company, 100 shares constitute one voting right. Holders of Daiichi and Sankyo shares as of March 31, 2005 will be eligible to vote at the relevant annual general meeting of shareholders. |
| Daiichi intends to vote the approximately 0.61% of the outstanding shares of Sankyo it owns in favor of the transaction. Sankyo also intends to vote the approximately 1.07% of the outstanding shares of Daiichi it owns in favor of the transaction. |
| Q7: | What is the structure of the transaction? |
| A7: | In the transaction, all of the issued and outstanding shares of common stock of each of Daiichi and Sankyo will be exchanged for shares of Daiichi Sankyo common stock at the exchange ratio described in Q2 above. Daiichi and Sankyo expect that, upon the closing of the transaction, the shares of Daiichi Sankyo will be listed on the First Sections of the Tokyo Stock Exchange, the Osaka Securities Exchange and the Nagoya Stock Exchange. The former shareholders of Daiichi and Sankyo will be shareholders of Daiichi Sankyo, and each of Daiichi and Sankyo will be wholly-owned subsidiaries of Daiichi Sankyo. See “The Joint Share Transfer—General” beginning on page 48. |
| Q8: | Can the number of shares of Daiichi Sankyo common stock for which the shares of Daiichi or Sankyo common stock are exchanged change between now and the time the transaction is completed? |
| A8: | No. The exchange ratios are fixed and will not change even if the trading price of either the Daiichi or Sankyo common stock changes between now and the time the joint share transfer is completed. See “Risk Factors” beginning on page 13. |
| Q9: | How much of Daiichi Sankyo will Daiichi shareholders own? How much of Daiichi Sankyo will Sankyo shareholders own? |
| A9: | After the transaction, Daiichi shareholders will own approximately 42.0% and Sankyo shareholders will own approximately 58.0% of the shares of Daiichi Sankyo common stock (based on shares outstanding as of March 31, 2005). |
| Q10: | What are the Japanese tax consequences of the joint share transfer? |
| A10: | In the opinion of Nagashima Ohno & Tsunematsu, Japanese counsel to Daiichi on Japanese tax matters, and Mori Hamada & Matsumoto, Japanese counsel to Sankyo on Japanese tax matters, each of which is based on representations made by Daiichi and Sankyo and customary factual assumptions and subject to certain qualifications, the joint share transfer as contemplated herein will be a tax-free transaction for Japanese tax purposes, except with respect to any cash received from Daiichi Sankyo as a substitute for interim dividends and any cash received instead of fractional shares of Daiichi Sankyo common stock. Subject to such exceptions, Daiichi and Sankyo expect that a non-resident holder of either of their shares will recognize no gain for Japanese tax purposes upon the holder’s exchange of its shares for shares of Daiichi Sankyo common stock. See “Taxation – Japanese Tax Consequences” beginning on page 189. Each non-resident holder should, however, obtain advice of its own tax advisers for its tax status in each jurisdiction. |
| Q11: | What are the U.S. tax consequences of the joint share transfer? |
| A11: | The proper U.S. federal income tax treatment of the joint share transfer is uncertain. Unless Daiichi Sankyo notifies U.S. holders of Daiichi or Sankyo shares otherwise, it intends to take the position that the joint share transfer will be treated as a taxable exchange for U.S. federal income tax purposes. According to this position, a |
2
Table of Contents
U.S. holder will generally recognize taxable gain or loss measured by the difference between (i) the sum of (A) the fair market value (in U.S. dollars) of the Daiichi Sankyo shares received in exchange for Daiichi or Sankyo shares and (B) the amount of cash received in the joint share transfer and (ii) the tax basis of the Daiichi or Sankyo shares exchanged. Daiichi Sankyo undertakes, as soon as practicable after the form of the subsequent combination of Daiichi’s and Sankyo’s operations is chosen, to notify U.S. holders of Sankyo or Daiichi shares who participate in the joint share transfer whether the joint share transfer and the subsequent business combination, viewed as an integrated transaction, qualify as a tax-free “reorganization” with respect to Sankyo shareholders and (separately) with respect to Daiichi shareholders. However, such notification may not be made until shortly before the date of the subsequent integration of the prescription pharmaceutical operations of the companies as currently contemplated. Each U.S. shareholder of Daiichi or Sankyo is strongly urged to consult its own tax advisor concerning the U.S. federal income tax consequences of the transaction. See “Taxation—United States Tax Consequences” beginning on page 192. |
| Q12: | When do you expect the joint share transfer to be completed? |
| A12: | Daiichi and Sankyo expect to complete the joint share transfer promptly after the companies receive approval of each of their shareholders at their annual general meeting of shareholders and after the companies follow the procedures required by the Commercial Code of Japan and receive all required regulatory approvals. The companies currently anticipate closing on or around September 28, 2005. However, it is possible that factors outside the control of Daiichi and Sankyo could require Daiichi and Sankyo to complete the joint share transfer at a later time or not complete it at all. See “The Joint Share Transfer—Regulatory Matters” beginning on page 74. |
| Q13: | If I own Daiichi or Sankyo shares, how do I vote at that company’s general meeting of shareholders? |
| A13: | If you have 100 or more shares of Daiichi or Sankyo common stock, you will have a voting right with respect to each such unit of 100 shares of common stock. You may exercise voting rights by attending the general meeting of shareholders of the relevant company in person or by arranging to return the voting card distributed to you by that company. Completed voting cards must be received by the relevant company at least one day before the meeting. For this purpose, if you are not residing in Japan, you are encouraged to contact your standing proxy in Japan. |
| Each of Daiichi and Sankyo will distribute voting materials, including a mail-in voting card, to shareholders resident in Japan that will enable them to exercise their voting rights. For shareholders not resident in Japan, each of Daiichi and Sankyo will distribute voting materials to their standing proxies in Japan. Therefore, if you are a non-resident shareholder, you are encouraged to contact your standing proxy in Japan. |
| Q14: | How will shares represented by mail-in voting cards at the general meetings of shareholders be treated? |
| A14: | The voting cards used for the general meetings of shareholders will list the proposals to be voted on by shareholders at the general meetings, including approval of the terms of the joint share transfer. The voting cards will allow shareholders to indicate a “for” or “against” vote with respect to each proposal. In accordance with Japanese law and practice, each of Daiichi and Sankyo intends to count towards the quorum requirements for its general meeting of shareholders the shares represented by voting cards that are returned without indicating a “for” or “against” vote for any of the proposals, and count these voting cards as having voted “for” approval of the terms of the joint share transfer and the other proposals referred to in the voting cards. |
3
Table of Contents
| Q15: | May I change my vote after I have submitted a mail-in voting card? |
| A15: | Yes. If you want to change your previously returned voting card, you must attend the general meeting of shareholders personally or through another shareholder having voting rights, whom you appoint as your attorney-in-fact. By attending the meeting in person or having another shareholder entitled to vote your shares attend the meeting on your behalf, you will automatically revoke your mail-in voting card. |
| Q16: | If my shares are held in “street name” by my broker, will my broker vote them for me without instructions? |
| A16: | Whether your broker will vote your shares without your instructions depends on the terms and conditions of the agreement entered into by you and your broker. Therefore, you are encouraged to contact your broker directly to confirm the applicable voting procedure. |
| Q17: | Should I send in my share certificates now? |
| A17: | No. After the terms of the joint share transfer are approved at the general meetings of shareholders of Daiichi and Sankyo, your standing proxy in Japan will, on your behalf, receive written instructions from an exchange agent on how to exchange your Daiichi or Sankyo share certificates for Daiichi Sankyo share certificates. Please do not send your share certificates until your standing proxy in Japan contacts you. |
| Q18: | What if I cannot find my share certificate? |
| A18: | There will be a procedure for you to receive Daiichi Sankyo share certificates in the joint share transfer, even if you have lost one or more of your Daiichi or Sankyo share certificates. This procedure, however, may take time to complete. In order to ensure that you will be able to receive your Daiichi Sankyo share certificates quickly after thejoint share transfer is completed, if you cannot locate your share certificates after looking for them carefully, Daiichi urges its shareholders to contact Mizuho Trust & Banking Co., Ltd. at 2-1, Yaesu 1-chome, Chuo-ku, Tokyo 103-0028, Japan and Sankyo urges its shareholders to contact UFJ Trust Bank Limited at 4-3, Marunouchi, 1-chome, Chiyoda-ku, Tokyo 100-0005, Japan as soon as possible and follow the procedure for replacing your share certificates. |
| Q19: | How will trading in Daiichi and Sankyo shares be affected in connection with the completion of the joint share transfer? |
| A19: | Under the current schedule, Daiichi shares will be delisted from the Tokyo Stock Exchange and the Osaka Securities Exchange and Sankyo shares will be delisted from those exchanges and also from the Nagoya Stock Exchange, the Sapporo Securities Exchange and the Fukuoka Stock Exchange on or around September 21, 2005. The companies plan to take steps in order to list the shares of Daiichi Sankyo on the First Sections of the Tokyo Stock Exchange, the Osaka Securities Exchange and the Nagoya Stock Exchange upon the closing of the transaction. |
| Q20: | Will Daiichi and Sankyo shareholders receive dividends on common stock for the year ended March 31, 2005? |
| A20: | Each of Daiichi and Sankyo expects to pay dividends in late July or early August 2005 to holders of record of its common stock as of March 31, 2005, subject to approval at the annual general meetings of shareholders in June 2005. |
| Q21: | Will I receive interim dividends for the six-month period ending September 30, 2005? |
| A21: | You will not receive interim dividends from Daiichi or Sankyo for the six-month period ending September 30, 2005. Instead, you |
4
Table of Contents
will receive from Daiichi Sankyo in the joint share transfer a payment of ¥25 in cash per share of Daiichi if you are a Daiichi shareholder and ¥25 in cash per share of Sankyo if you are a Sankyo shareholder. The payment in each case is a substitute for interim dividends otherwise payable by each of Daiichi and Sankyo, respectively. Instead of paying its interim dividends for the six-month period ending September 30, 2005 directly to the former shareholders of Daiichi and Sankyo, each of Daiichi and Sankyo will pay such interim dividends to Daiichi Sankyo, which will be the sole holder of record of Daiichi and Sankyo common stock as of September 30, 2005, subsequent to the closing of the joint share transfer. |
| Q22: | How do the legal rights of Daiichi and Sankyo shares differ from those of Daiichi Sankyo shares? |
| A22: | There is no material difference between the legal rights of holders of Daiichi and Sankyo shares and the proposed legal rights of holders of Daiichi Sankyo shares. |
| Q23: | Who can help answer my questions? |
| A23: | For Daiichi shareholders, if you have questions about the joint share transfer, you should contact: |
Mr. Toshio Takahashi
Corporate Communications Department
Daiichi Pharmaceutical Co., Ltd.
14-10, Nihonbashi 3-chome
Chuo-ku, Tokyo 103-8234
Japan
Telephone: (81-3) 3273-7107
For Sankyo shareholders, if you have questions about the joint share transfer, you should contact:
Mr. Shigemichi Kondo
Corporate Communications Department
Sankyo Company, Limited
5-1, Nihonbashi Honcho 3-chome
Chuo-ku, Tokyo 103-8426
Japan
Telephone: (81-3) 5255-7034
5
Table of Contents
This summary highlights selected information from this prospectus. It does not contain all of the information that may be important to you. You should carefully read this entire prospectus and the other documents to which this document refers for a more complete understanding of the joint share transfer being considered at the general meetings of Daiichi and Sankyo shareholders.
| The Companies | ||
Daiichi Pharmaceutical Co., Ltd. 14-10, Nihonbashi 3-chome Chuo-ku, Tokyo 103-8234 Japan (81-3) 3272-0611 | Sankyo Company, Limited 5-1, Nihonbashi Honcho 3-chome Chuo-ku, Tokyo 103-8426 Japan (81-3) 5255-7111 | |
Daiichi and Sankyo are two of the largest pharmaceutical companies in Japan. According to a survey published by the Japan Pharmaceutical Manufacturers Association, for the six months ended September 30, 2004, Sankyo was the second largest Japanese pharmaceutical company and Daiichi was the sixth largest Japanese pharmaceutical company in terms of consolidated net sales in Japan. Each of Daiichi and Sankyo offers, by itself or through subsidiaries or licensees, a broad range of pharmaceutical and other products.
Daiichi is headquartered in Tokyo, Japan at the above address and, as of March 31, 2005, operated in Japan, the United States, Europe and other parts of the world. Daiichi’s main areas of research include infectious diseases, cardiovascular disorders, cancer, and asthma and allergies. For the six months ended September 30, 2004, Daiichi had net sales of ¥157.8 billion and net income of ¥16.1 billion. For the fiscal year ended March 31, 2004, Daiichi had net sales of ¥323.0 billion and net income of ¥30.7 billion.
Sankyo is headquartered in Tokyo, Japan at the above address and, as of March 31, 2005, operated in Japan, the United States, Europe and other countries and territories worldwide. Sankyo’s main areas of research include cardiovascular diseases, glucose metabolic disorders, immune/allergic disorders, bone/articular disorders, cancer and infectious diseases. Sankyo has a particular focus on the treatment of lifestyle-related diseases such as hyperlipidemia, hypertension and diabetes. For the six months ended September 30, 2004, Sankyo had net revenue of ¥294.1 billion and net income of ¥38.8 billion. For the fiscal year ended March 31, 2004, Sankyo had net revenue of ¥601.3 billion and net income of ¥38.2 billion.
The Joint Share Transfer
(page 48)
In the joint share transfer, each share of Daiichi common stock will be exchanged for 1.159 shares of common stock of Daiichi Sankyo, and each share of Sankyo common stock will be exchanged for one share of common stock of Daiichi Sankyo. As a result of the joint share transfer, each of Daiichi and Sankyo will be a wholly-owned subsidiary of Daiichi Sankyo, and the shareholders of each of Daiichi and Sankyo will be the shareholders of Daiichi Sankyo in proportion to the applicable exchange ratios.
Shareholders of Daiichi and Sankyo will not receive any fractional shares of common stock of Daiichi Sankyo in the joint share transfer. Instead, the shares representing the aggregate of all such fractional shares will be sold in the Japanese market or sold to Daiichi Sankyo itself and the net cash proceeds from the sale will be distributed to the former holders of Daiichi and Sankyo fractional shares on a proportionate basis, with any fractional yen amounts to be rounded up.
In addition, in the joint share transfer, shareholders of Daiichi will receive ¥25 in cash per share of Daiichi and shareholders of Sankyo will receive ¥25 in cash per share of Sankyo from Daiichi Sankyo as a substitute for
6
Table of Contents
interim dividends otherwise payable by each of Daiichi and Sankyo. Instead of paying its interim dividends for the six-month period ending September 30, 2005 directly to the former shareholders of Daiichi and Sankyo, each of Daiichi and Sankyo will pay such interim dividends to Daiichi Sankyo, which will be the sole holder of record of Daiichi and Sankyo common stock as of September 30, 2005, subsequent to the closing of the joint share transfer.
Reasons for the Joint Share Transfer
(page 50)
Daiichi and Sankyo are conducting the joint share transfer, and combining their management under a single holding company, Daiichi Sankyo, in an effort to realize the potential synergies available from integrating their pharmaceutical businesses. The pharmaceutical industry, both within Japan and globally, is in a period of consolidation. Daiichi and Sankyo believe a combined entity will enjoy significant advantages over their independent operations, in particular:
| • | greater potential to introduce major new products due to the complementary nature of the companies’ existing development pipelines and combined annual R&D expenditures of over ¥150 billion; |
| • | the critical mass necessary to enhance sales of existing products in Japan as well as to develop and market pharmaceutical products in key global markets; |
| • | expanded ability to pursue strategic options through acquisitions or other partnerships or collaborations resulting from the combined entity’s financial position and strength in the Japanese market; and |
| • | greater efficiency through the combination of existing operations, targeting annual cost savings of approximately ¥50 billion in the year ending March 31, 2008, primarily in domestic pharmaceutical operations, and the eventual disposal of non-pharmaceutical operations, any gains from which would be used to offset integration expenses. |
Daiichi and Sankyo believe the joint share transfer will improve their joint prospects for long-term growth and profitability in the increasingly competitive pharmaceutical industry and believe that this will in turn deliver greater returns to their shareholders.
Ongoing Challenges
Although the companies believe the proposed business combination will be beneficial, the pharmaceutical industry is highly competitive and Daiichi Sankyo will continue to face significant ongoing challenges, including:
| • | the planned lengthy integration process, expected to culminate in the merger of the two subsidiary companies into Daiichi Sankyo in or around April 2007, may divert management’s focus from other matters and there can be no assurance that targeted operational efficiencies will be achieved; |
| • | the combined entity will still be significantly smaller than the largest global pharmaceutical companies, which have a greater number of products, greater financial resources and more geographically diverse operations; |
| • | the combined entity may not be successful in expanding the direct development of new products in markets outside of Japan; and |
| • | an expected decrease in combined revenue in the near term due to the planned disposal of non-pharmaceutical operations and a potential negative impact of up to approximately ¥16 billion on operating income in the year ending March 31, 2008 attributable to cannibalization due to competing products and the potential loss of licensing rights. |
7
Table of Contents
The companies also believe the integration process will result in aggregate one-time costs of approximately ¥118 billion, most of which will be incurred prior to March 31, 2007 and consisting primarily of personnel-related items such as retirement incentive payments. You are also urged to consider carefully the matters described in the “Risk Factors” section of this prospectus in evaluating the benefits of the proposed joint share transfer and the business strategy of Daiichi Sankyo.
The Annual General Meetings of Shareholders
(page 42 and page 45)
When and Where. The Daiichi general meeting of shareholders will be held at 10:00 a.m., local time, on June 29, 2005 at Daiichi’s head office, 14-10, Nihonbashi 3-chome, Chuo-ku, Tokyo 103-8234, Japan, unless it is postponed or adjourned. The Sankyo general meeting of shareholders will be held at 10:00 a.m., local time, on June 29, 2005 at Sankyo’s head office, 5-1, Nihonbashi Honcho 3-chome, Chuo-ku, Tokyo 103-8426, Japan, unless it is postponed or adjourned.
Record Date; Voting Power. With respect to each company, shareholders of record of such company as of March 31, 2005 will be entitled to vote at that company’s meeting. To attend and vote at the respective shareholders’ meetings, shareholders of Daiichi and Sankyo must follow the procedures outlined in the convocation notice and the mail-in-ballot material which the companies will distribute to them. With respect to both Daiichi and Sankyo, shareholders who own at least 100 shares of such company’s common stock will have a voting right with respect to each such 100 shares of common stock.
Required Vote. The affirmative vote of the holders of at least two-thirds of the voting rights of each of Daiichi and Sankyo represented at the respective general meeting of shareholders is required to approve the terms of the joint share transfer. The quorum required for each of the general meetings is shareholders holding one-third of the total voting rights.
Based on the register of shareholders of Daiichi dated March 31, 2005, and the register of shareholders of Sankyo dated March 31, 2005, which in each case is the record date for determination of shareholders having voting rights at the applicable annual general shareholders’ meetings, approximately 0.07% of the outstanding shares of Daiichi that would be entitled to vote, and 0.04% of the outstanding shares of Sankyo that would be entitled to vote were held directly or indirectly by the directors and corporate auditors of those companies, respectively. The total number of shares outstanding as of that date was 268,404,023 in the case of Daiichi and 429,508,509 in the case of Sankyo.
Recommendation of the Boards of Directors of Daiichi and Sankyo with Respect to the Joint Share Transfer
(page 52 and page 53)
Daiichi Shareholders. The Daiichi board of directors has determined that the terms of the joint share transfer are advisable and in the best interests of Daiichi and its shareholders and unanimously recommends that the Daiichi shareholders vote to approve the joint share transfer.
Sankyo Shareholders. The Sankyo board of directors has determined that the terms of the joint share transfer are advisable and in the best interests of Sankyo and its shareholders and unanimously recommends that the Sankyo shareholders vote to approve the joint share transfer.
Factors Considered by the Boards of Daiichi and Sankyo. In determining whether to approve the joint share transfer, the boards of directors of each of Daiichi and Sankyo consulted with their respective senior managements and legal and financial advisors and considered the respective strategic, financial and other considerations referred to under “The Joint Share Transfer - Reasons for the Joint Share Transfer” beginning on page 50.
8
Table of Contents
Material Japanese Income Tax Consequences of the Joint Share Transfer
(page 189)
In the opinion of Nagashima Ohno & Tsunematsu, Japanese counsel to Daiichi on Japanese tax matters, and Mori Hamada & Matsumoto, Japanese counsel to Sankyo on Japanese tax matters, each of which is based on representations made by Daiichi and Sankyo and customary factual assumptions and subject to certain qualifications, the joint share transfer as contemplated herein will be a tax-free transaction for Japanese tax purposes, except with respect to any cash received from Daiichi Sankyo as a substitute for interim dividends and any cash received instead of fractional shares of Daiichi Sankyo common stock. Subject to such exceptions, Daiichi and Sankyo expect that a non-resident holder of either of their shares will recognize no gain for Japanese tax purposes upon the holder’s exchange of its shares for shares of Daiichi Sankyo common stock. Please see “Taxation-Japanese Tax Consequences” for a more detailed description of Japanese taxation matters. Each non-resident holder should, however, obtain advice of its own tax advisers for its tax status in each jurisdiction.
Material United States Federal Income Tax Consequences of the Joint Share Transfer
(page 192)
The proper U.S. federal income tax treatment of the joint share transfer is uncertain. Unless Daiichi Sankyo notifies U.S. holders of Daiichi or Sankyo shares otherwise, it intends to take the position that the joint share transfer will be treated as a taxable exchange for U.S. federal income tax purposes. According to this position, a U.S. holder will generally recognize taxable gain or loss measured by the difference between (i) the sum of (A) the fair market value (in U.S. dollars) of the Daiichi Sankyo shares received in exchange for Daiichi or Sankyo shares and (B) the amount of cash received in the joint share transfer and (ii) the tax basis of the Daiichi or Sankyo shares exchanged. Daiichi Sankyo undertakes, as soon as practicable after the form of the subsequent combination of Daiichi’s and Sankyo’s operations is chosen, to notify U.S. holders of Sankyo or Daiichi shares who participate in the joint share transfer whether the joint share transfer and the subsequent business combination, viewed as an integrated transaction, qualify as a tax-free “reorganization” with respect to Sankyo shareholders and (separately) with respect to Daiichi shareholders. However, such notification may not be made until shortly before the date of the subsequent integration of the prescription pharmaceutical operations of the companies as currently contemplated. Each U.S. shareholder of Daiichi or Sankyo is strongly urged to consult its own tax advisor concerning the U.S. federal income tax consequences of the transaction. See “Taxation—United States Tax Consequences” beginning on page 192.
Accounting Treatment
(page 73)
The joint share transfer will be accounted for by Daiichi Sankyo under the purchase method of accounting in accordance with U.S. GAAP. Based on the Daiichi exchange ratio of 1.159 Daiichi Sankyo shares for each share of common stock of Daiichi and the Sankyo exchange ratio of one Daiichi Sankyo share for each share of Sankyo common stock, as set forth in the joint share transfer agreement, after the closing of the joint share transfer, former Daiichi shareholders will own approximately 42.0% and former Sankyo shareholders will own approximately 58.0% of Daiichi Sankyo. Based on these projected ownership percentages, Sankyo is the accounting acquiror for financial reporting purposes. Under the purchase method of accounting, in accordance with Statement of Financial Accounting Standards No. 141, “Business Combinations”, Sankyo will record the tangible and intangible assets acquired and liabilities of Daiichi assumed at their fair values. Management of Daiichi Sankyo will be required to exercise significant judgments by making estimates and determining underlying assumptions in order to value such assets and liabilities. The fair values used to record each of the tangible and intangible assets and liabilities of Daiichi, and the resulting excess of the purchase price over the fair
9
Table of Contents
value of net assets acquired (goodwill) will have a material effect on the financial position and the results of operations of Daiichi Sankyo subsequent to the acquisition. The reported financial condition and results of operations of Daiichi Sankyo to be issued after the closing of the joint share transfer will reflect Daiichi’s balances and results from the date of the acquisition in addition to Sankyo’s balances and results. If a different set of fair values were to be used at the time of the acquisition, Daiichi Sankyo’s results of operations and financial position could differ materially. Following the completion of the joint share transfer, the earnings of Daiichi Sankyo will reflect purchase accounting adjustments, including in-process research and development write-offs and increased amortization and depreciation expense for acquired assets. In accordance with Statement of Financial Accounting Standard No. 142, “Goodwill and Other Intangible Assets”, goodwill will not be subject to amortization for financial reporting purposes but will be evaluated annually for impairment. Subsequent to the acquisition, if a reporting unit to which such goodwill is assigned reports a carrying amount in excess of its estimated fair value, an impairment charge is recognized for any excess of the carrying amount of that goodwill over its implied far value.
Regulatory Approvals
(page 74)
In general, the consummation of the joint share transfer and the establishment of Daiichi Sankyo will not require the approval or clearance of governmental authorities in Japan. In practice, Daiichi and Sankyo expect to consult with the Fair Trade Commission in Japan with regards to antitrust implications of the transaction. The consultation is expected to be completed successfully before the effective date of the joint share transfer. Daiichi Sankyo is also required to give formal notice to the Fair Trade Commission of Japan of the effectiveness of the joint share transfer within 30 days after the effective date thereof.
The Hart-Scott-Rodino Antitrust Improvements Act of 1976, or the HSR Act, prohibits Daiichi and Sankyo from completing the joint share transfer until each of them notifies and furnishes required information to the Antitrust Division of the U.S. Department of Justice and to the U.S. Federal Trade Commission and the required waiting period has expired or been earlier terminated. Daiichi and Sankyo expect to file a pre-transaction notification form under the Hart-Scott-Rodino Antitrust Improvements Act prior to their general meetings of shareholders.
Dissenters’ Rights of Appraisal
(page 74)
Under the Commercial Code of Japan, you may have opposition rights of appraisal in connection with the joint share transfer. Please see “The Joint Share Transfer – Dissenters’ Rights of Appraisal” for a complete discussion of these rights.
Conditions to the Joint Share Transfer
(page 78)
The respective obligations of each of Daiichi and Sankyo to effect the transaction are conditioned upon the satisfaction of the following conditions:
| • | Daiichi’s shareholders having approved the terms of the joint share transfer by the requisite vote at the annual general meeting of Daiichi shareholders; |
| • | Sankyo’s shareholders having approved the terms of the joint share transfer by the requisite vote at the annual general meeting of Sankyo shareholders; and |
10
Table of Contents
| • | all regulatory approvals and consents or other requirements necessary to effect the joint share transfer having been obtained or satisfied. |
An English translation of the joint share transfer agreement is attached as Appendix A to this document. Daiichi and Sankyo urge you to read the entire document because it is the legal document governing the joint share transfer.
Termination
(page 78)
Daiichi and Sankyo can mutually agree to terminate the joint share transfer agreement prior to the effective time of the joint share transfer. Also, either party may terminate the joint share transfer agreement at any time prior to the effective time of the joint share transfer without the consent of the other:
| • | upon the failure, after negotiation between the parties for a period of 30 days, to agree on a revised exchange ratio upon the discovery or occurrence of any event with respect to the other party which would have a significantly material adverse effect on the exchange ratio agreed in the joint share transfer agreement; |
| • | upon the failure of the shareholders of the other party to approve the terms of the joint share transfer at the annual general meeting of shareholders of such party; |
| • | if the other party materially breaches any representation or warranty and the breach would have a significantly material adverse effect on the exchange ratio; or |
| • | if the other party breaches any provision of the agreement and such breach is material, when such breach has not been remedied within two weeks after notification to the breaching party of such breach by the non-breaching party. |
The joint share transfer agreement may be terminated by either party if the joint share transfer shall not have taken effect by March 31, 2006 as a result of the failure of the parties, acting in good faith, to resolve any problems which may arise related to the completion of the joint share transfer under the anti-monopoly laws of Japan or other anti-trust laws of any applicable country after good faith consultation with regard to measures to resolve such problems.
Comparative Per Share Market Price Data
(page 39)
The shares of Daiichi common stock are listed on the First Sections of the Tokyo Stock Exchange and the Osaka Securities Exchange. The shares of Sankyo common stock are listed on the First Sections of the Tokyo Stock Exchange, the Osaka Securities Exchange and the Nagoya Stock Exchange, and on the Sapporo Securities Exchange and the Fukuoka Stock Exchange. The companies plan to take steps in order to list the shares of Daiichi Sankyo on the First Sections of the Tokyo Stock Exchange, the Osaka Securities Exchange and the Nagoya Stock Exchange upon the closing of the transaction. The following table sets forth the closing sale prices of Daiichi and Sankyo common stock as reported on the First Section of the Tokyo Stock Exchange on February 25, 2005, the last trading day before the public announcement of the joint share transfer by Daiichi and Sankyo,
11
Table of Contents
and June 3, 2005, the last practicable trading day before the distribution of this prospectus. The table also sets forth the implied equivalent value on these dates. Daiichi and Sankyo urge you to obtain current market quotations for both the Daiichi and Sankyo common stock.
| Daiichi Common Stock | Sankyo Common Stock | |||||||||||
| (historical) | (implied equivalent value) (1) | (historical) | (implied equivalent value) (2) | |||||||||
At February 25, 2005 | ¥ | 2,485 | ¥ | 2,839.55 | ¥ | 2,450 | ¥ | 2,450 | ||||
At June 3, 2005 | 2,445 | 2,834 | 2,175 | 2,175 | ||||||||
| (1) | The implied equivalent value per share of Daiichi is calculated by multiplying the closing price of Sankyo common stock on the Tokyo Stock Exchange by the Daiichi exchange ratio of 1.159:1. |
| (2) | The implied equivalent value per share of Sankyo is calculated by multiplying the closing price of Sankyo common stock on the Tokyo Stock Exchange by the Sankyo exchange ratio of 1:1. |
Each of Daiichi and Sankyo may from time to time repurchase shares of its common stock. Purchases will be made subject to market circumstances and applicable regulatory requirements.
As used in this prospectus, references to “Daiichi” are to Daiichi Pharmaceutical Co., Ltd. and references to “Sankyo” are to Sankyo Company, Limited. References to the “joint share transfer” are to the proposed joint share transfer between Daiichi and Sankyo, the terms of which are set out in the joint share transfer agreement dated May 13, 2005 between Daiichi and Sankyo, and references to “Daiichi Sankyo” are to Daiichi Sankyo Company, Limited, the company that will be established upon the joint share transfer. Unless the context otherwise requires, references in this prospectus to the financial results or business of “Daiichi” refer to those of Daiichi and its consolidated subsidiaries, references to the financial results or business of “Sankyo” refer to those of Sankyo and its consolidated subsidiaries, and references to the financial results or business of “Daiichi Sankyo” refer to those of Daiichi Sankyo and its consolidated subsidiaries, including Daiichi and Sankyo.
As used in this prospectus, “dollar” or “$” means the lawful currency of the United States of America, and “yen” or “¥” means the lawful currency of Japan.
As used in this prospectus, “U.S. GAAP” means accounting principles generally accepted in the United States, and “Japanese GAAP” means accounting principles generally accepted in Japan. The consolidated financial information contained in this prospectus has been presented in accordance with U.S. GAAP, except for certain specifically identified information which was prepared in accordance with Japanese GAAP. Unless otherwise stated or the context otherwise requires, all amounts in the financial statements contained in this prospectus are expressed in Japanese yen.
12
Table of Contents
In addition to the other information included or incorporated by reference into this prospectus, including the matters addressed under the caption “Cautionary Statement Concerning Forward-Looking Statements,” you should carefully consider the matters described below in evaluating the matters described in this prospectus before making a decision on the joint share transfer.
Risks Relating to the Joint Share Transfer
Daiichi and Sankyo may fail to realize the anticipated benefits of the joint share transfer due to the challenges of integrating their operations.
The success of the joint share transfer will depend, in part, on Daiichi Sankyo’s ability to realize the anticipated growth opportunities and cost savings from combining the businesses of Daiichi and Sankyo under Daiichi Sankyo. The joint transfer agreement calls for an ongoing integration process, including the combination of the prescription pharmaceutical operations of the two companies in or around April 2007. The lengthy period required for the merger and the preparation for it may divert management’s focus and resources from other strategic opportunities and from day-to-day operation matters during the integration process.
Daiichi and Sankyo expect to face significant challenges in integrating the organizations, business cultures, procedures and operations of Daiichi and Sankyo and also expect to incur integration costs of approximately ¥118 billion. If they are not able to successfully manage the integration process and create a unified business culture, the anticipated benefits of the joint share transfer and subsequent integration may not be realized fully or at all or may take longer to realize than expected.
The exchange ratio is fixed and will not be adjusted to reflect changes in the market values of Daiichi and Sankyo common stock; as a result, the value of Daiichi Sankyo common stock you receive in the transaction may be less than when you vote on the joint share transfer.
Upon the completion of the joint share transfer, each share of Daiichi common stock will be exchanged for 1.159 shares of Daiichi Sankyo common stock, and each share of Sankyo common stock will be exchanged for one share of Daiichi Sankyo common stock. The ratios at which Daiichi and Sankyo common stock will be exchanged for Daiichi Sankyo common stock are fixed, and will not be adjusted for changes in the market prices of either company’s common stock. Therefore, even if the relative market values of Daiichi or Sankyo common stock change, there will be no change in the number of shares of Daiichi Sankyo common stock which shareholders of those companies will receive in the joint share transfer.
Any change in the prices of either company’s common stock occurring prior to the effective date of the joint share transfer will affect the value that holders of Daiichi or Sankyo common stock receive in the transaction. The value of the Daiichi Sankyo common stock to be received in the joint share transfer (which will occur approximately three months after the general meetings of shareholders) may be higher or lower than the indicative value as of the date of this prospectus and/or as of the date of the general meetings of shareholders, depending on the then prevailing market prices of Daiichi and Sankyo common stock.
The share prices of Daiichi and Sankyo common stock are subject to the general price fluctuations in the market for publicly traded equity securities and have experienced significant volatility in the past. Stock price changes may result from a variety of factors that are beyond the control of Daiichi and Sankyo, including actual changes in, or investor perception of, Daiichi’s and Sankyo’s businesses, operations and prospects. Regulatory developments, as well as current or potential legal proceedings, and changes in general market and economic conditions may also affect the stock price of Daiichi or Sankyo.
You should obtain and review recent market quotations for Daiichi and Sankyo common stock before voting on the joint share transfer. There can be no assurances as to the future market prices of Daiichi and Sankyo common stock before the completion of the joint share transfer, nor of the market price of Daiichi Sankyo’s common stock at any time after the completion of the joint share transfer.
13
Table of Contents
The joint share transfer is subject to regulatory approvals and various conditions set forth in the joint share transfer agreement and, even though it may be approved by both sets of shareholders, the joint share transfer nonetheless may not be completed as scheduled or at all.
Under the joint share transfer agreement, the respective obligations of Daiichi and Sankyo to complete the joint share transfer are subject to a number of specified conditions, including obtaining or satisfying all regulatory approvals, permits, consents and requirements necessary for the consummation of the transaction. Regulatory authorities in Japan or elsewhere may seek to block or delay the joint share transfer, or may impose conditions that reduce the anticipated benefits of the joint share transfer or make it difficult to complete as planned. Shareholder approval of the joint share transfer will be subject to fulfillment of conditions imposed on the joint share transfer by Japanese regulatory authorities. Daiichi and Sankyo will be required to obtain further shareholder approval in the event that any of the conditions imposed by Japanese regulatory authorities materially alter any aspect of the joint share transfer as previously approved. In addition, Daiichi and Sankyo have the right to terminate the joint share transfer agreement at any time prior to the completion of the transaction, upon the parties’ mutual written consent. Either party may also terminate the joint share transfer agreement upon an unremedied breach of the agreement by the other party that has a material adverse effect on either party or the ability of either party to perform its obligations under the joint share transfer agreement. Accordingly, even if the terms of the joint share transfer are approved at the general meetings of shareholders of Daiichi and Sankyo, there is no assurance that the joint share transfer will ultimately be completed as scheduled or at all.
Significant costs will be incurred in the course of the joint share transfer and subsequent integration of the business operations of the two companies.
Daiichi and Sankyo expect to incur significant costs related to the joint share transfer and subsequent integration of the business operations of the two companies. Daiichi estimates that its transaction-related costs associated with the joint share transfer will amount to approximately ¥2.5 billion and Sankyo estimates that its transaction-related costs associated with the joint share transfer will amount to approximately ¥2.0 billion. These expenses include financial advisory, legal and accounting fees and expenses, severance/employee benefit-related expenses, filing fees, printing expenses and other related charges. Additionally, Daiichi and Sankyo may also incur significant costs in compensating dissenting shareholders who exercise their appraisal rights. Daiichi and Sankyo may also incur additional unanticipated expenses in connection with the joint share transfer and the integration of the operations, information systems, domestic and overseas branch office network and personnel of the two companies.
Uncertainties associated with the joint share transfer, or Daiichi Sankyo as a new owner, may damage Daiichi Sankyo’s relationships with customers and business partners of Daiichi and Sankyo and, in some cases, may result in the termination of existing joint venture and/or licensing agreements of Daiichi and Sankyo pursuant to change of control provisions.
Current customers and business partners of Daiichi or Sankyo may, in response to the announcement of the joint share transfer or to subsequent steps taken to integrate the pharmaceutical businesses of Daiichi and Sankyo, delay or defer decisions concerning their relationships with Daiichi or Sankyo because of uncertainties related to the joint share transfer, including that there can be no assurances that the joint share transfer will be consummated. The existence of competing products could contribute to these uncertainties. Sankyo’s product Ketek® competes with Daiichi’s leading product Cravit®. In addition, both companies market anti-allergy and anti-inflammatory agents in Japan, including Zyrtec® and Mobic® in the case of Daiichi and Alesion® and Loxonin® in the case of Sankyo. Any of these matters could have an adverse effect on Daiichi Sankyo’s business, results of operations or financial condition following the joint share transfer.
Each of Daiichi and Sankyo is currently party to joint venture, licensing and other agreements which permit the counterparties thereto to terminate such agreements upon a change of control of Daiichi or Sankyo, as
14
Table of Contents
applicable. Some of these agreements also limit Daiichi’s or Sankyo’s ability to research, develop and market competing products. If the relevant counterparties do not waive their rights under such agreements, including because they view the combined entity as a more direct competitor, the joint share transfer could result in the termination of joint ventures, licensing rights or otherwise adversely affect Daiichi Sankyo’s results of operations. Daiichi and Sankyo currently estimate the potential negative impact on annual operating income of Daiichi Sankyo due to factors such as cannibalization by competing products and loss of licensing rights could be as much as ¥16 billion in the year ending March 31, 2008. If that negative impact materializes, and Daiichi Sankyo is unable to achieve the positive synergies the companies have targeted, the results of operations of the combined entity will be negatively affected.
In connection with the completion of the joint share transfer, it will not be possible to trade shares of Daiichi, Sankyo or Daiichi Sankyo common stock during certain periods.
In connection with the joint share transfer, Daiichi and Sankyo shares will be delisted from the Tokyo Stock Exchange and the Osaka Securities Exchange and Sankyo shares will be delisted from those exchanges and also from the Nagoya Stock Exchange, the Sapporo Securities Exchange and the Fukuoka Stock Exchange. The delistings of Daiichi and Sankyo shares are expected to occur on or around September 21, 2005, about four trading days before September 28, 2005, the date Daiichi Sankyo shares are expected to be listed on the First Sections of the Tokyo Stock Exchange, the Osaka Securities Exchange and the Nagoya Stock Exchange. As a result, holders of Daiichi and Sankyo shares will not be able to trade those shares, or the Daiichi Sankyo shares they will be entitled to receive when the joint share transfer is completed, during the applicable gap in trading. Accordingly, these holders will be subject to the risk of not being able to liquidate their shares during a falling market, whether for Japanese equities generally or for Daiichi, Sankyo or Daiichi Sankyo shares in particular.
In addition, holders of Daiichi and Sankyo shares who choose to receive their Daiichi Sankyo shares in share certificate form are not expected to receive those share certificates until late November, 2005. As a result, these holders will not be able to trade their Daiichi Sankyo shares during this period following the completion of the joint share transfer, since they will not be able to deliver share certificates to settle those trades.
Risks Relating to the Business of Daiichi Sankyo
If Daiichi Sankyo is unable to successfully develop or commercialize new products, its results of operations will suffer.
The future results of operations of Daiichi Sankyo will depend to a significant extent upon its ability to successfully commercialize new products in a timely manner. There are numerous difficulties in developing and commercializing new pharmaceutical products, including:
| • | developing, testing and manufacturing products in compliance with regulatory standards in a timely manner; |
| • | receiving requisite regulatory approvals for such products in a timely manner; and |
| • | the availability on commercially reasonable terms of raw materials, including active pharmaceutical ingredients and other key ingredients. |
Developing and commercializing a new product is time consuming, costly and subject to numerous factors that may delay or prevent the development and commercialization of new products. Products currently in development by Daiichi or Sankyo, and products to be developed by Daiichi Sankyo in the future, may or may not receive the regulatory approvals necessary for marketing by Daiichi Sankyo or other third-party partners. This risk particularly exists with respect to the development of proprietary products because of the uncertainties, higher costs and lengthy timeframes associated with research and development of such products and the inherent unproven market acceptance of such products.
15
Table of Contents
If any of the products of Daiichi Sankyo, when acquired or developed and approved, cannot be successfully or timely commercialized, the combined entity’s results of operations could be adversely affected. No guarantee can be given that any investment made in developing products will be recouped, even if Daiichi Sankyo is successful in commercializing those products.
Daiichi Sankyo product candidates may not gain acceptance among physicians, patients and the medical community, thereby limiting potential to generate revenues.
Even if Daiichi Sankyo’s product candidates are approved for commercial sale by the Japanese Ministry of Labor, Health and Welfare, or the MLHW, the United States Federal Drug Administration, or the FDA, or other regulatory authorities, the degree of market acceptance of any approved product candidate by physicians, healthcare professionals and third-party payors and Daiichi Sankyo’s profitability and growth will depend on a number of factors, including:
| • | relative convenience and ease of administration; |
| • | the prevalence and severity of any adverse side effects; |
| • | availability of alternative treatments; |
| • | pricing and cost effectiveness, which may be subject to regulatory control; |
| • | the effectiveness of the sales and marketing strategy employed by Daiichi Sankyo and its business partners; and |
| • | Daiichi Sankyo’s ability to obtain sufficient third-party insurance coverage or reimbursement. |
If any product candidate that Daiichi Sankyo develops does not provide a treatment regimen that is as beneficial as the current standard of care or otherwise does not provide sufficient benefits to patients, that product likely will not achieve market acceptance.
If Daiichi Sankyo is unsuccessful in its efforts to increase direct involvement in the development and marketing of products outside Japan, its results of operations could suffer.
Although, historically, Daiichi and Sankyo have each conducted a substantial portion of its sales outside Japan by licensing its products to third-party pharmaceutical companies and through marketing partnerships, Daiichi and Sankyo have each recognized the strategic importance of increased direct involvement in the development and marketing of products in markets outside Japan. The companies expect that Daiichi Sankyo will continue to try to increase direct overseas development and marketing activities. Direct development and, if approval is received, marketing of products in overseas markets will entail significant initial expenditures by Daiichi Sankyo as compared to licensing to a third party and thus the corresponding risk of losing its entire investment if the product candidate is not successfully commercialized. Daiichi and Sankyo have historically had relatively limited operations in markets such as the United States and Europe when compared to the largest global pharmaceutical companies. Daiichi Sankyo will incur additional costs in building its presence in overseas markets, including increased headcount, particularly in the United States, and research and development expenditures, and it is uncertain if the anticipated long-term benefits, including its enjoyment of economies of scale, and the reach of its operations in major global markets, will materialize. If Daiichi Sankyo is unable to generate increased revenues through the direct development and marketing strategy, its results of operations could suffer.
If Daiichi Sankyo is unsuccessful in obtaining or renewing licenses from third parties or in entering into collaborative marketing arrangements, Daiichi Sankyo’s results of operations could suffer.
Each of Daiichi and Sankyo enters into a variety of licensing, co-marketing and co-promotional agreements in the conduct of its business and Daiichi Sankyo expects to use these and other methods to develop
16
Table of Contents
or commercialize products in the future. These arrangements typically involve other pharmaceutical companies as partners that may be competitors of Daiichi Sankyo in certain markets. Both companies sell numerous products in Japan pursuant to licenses from third parties, and Daiichi Sankyo may need to obtain or renew such licenses. If Daiichi Sankyo is unable to timely obtain or renew these licenses on commercially reasonable terms or to continue to secure similar licensing opportunities in the future, its results of operations may be adversely affected. Daiichi Sankyo’s results of operations may also suffer if counterparties to which Daiichi Sankyo grants licenses or marketing rights withdraw, or if the relevant products are not timely developed, approved or successfully commercialized by the licensees.
If Daiichi Sankyo is unable to adequately protect its technology or enforce its patents, its business could suffer.
The success of the products that Daiichi Sankyo develops will depend, in part, on the company’s ability to obtain patent protection for these products. The process of seeking patent protection can be long and expensive. Effective patent protection is unavailable or limited in some countries. Each of Daiichi and Sankyo currently has a number of Japanese, U.S. and foreign patents issued and pending. Neither Daiichi nor Sankyo can be sure that Daiichi Sankyo, Daiichi or Sankyo will receive patents for any of their pending patent applications. If the current and future patent applications are not approved or, if approved, if such patents are not upheld in a court of law, it may reduce Daiichi Sankyo’s ability to competitively exploit its patented products. Also, such patents may or may not provide competitive advantages for their respective products or they may be challenged or circumvented by competitors.
Daiichi and its U.S. licensee have had to bring suit in the United States to prevent a competitor from marketing a generic version of levofloxacin. Although the district court has enjoined the competitor from producing, importing or selling levofloxacin until Daiichi’s U.S. patent expires in 2010, Daiichi must still contest the ongoing appeal from that decision.
Once basic composition patents expire, Daiichi and Sankyo’s products generally become subject to increased competition. Daiichi’s compound patent for levofloxacin expires in 2006 in Japan, and the corresponding patents expire in 2010 in the United States and 2011 in Europe. Sankyo’s compound patent for pravastatin expired in 2002 in Japan and the corresponding patent in the United States, as extended by a six-month extension for pediatric exclusivity, expires in April 2006. Sankyo’s compound patent for olmesartan expires in February 2012 in Japan, April 2016 in the United States, February 2017 in Germany and Great Britain, and February 2012 in France.
Daiichi and Sankyo also rely on trade secrets and proprietary know-how that the companies seek to protect, in part, through confidentiality agreements with their partners, customers, employees and consultants. It is possible that these agreements will be breached or that they will not be enforceable in every instance, and that Daiichi Sankyo will not have adequate remedies for any such breach. It is also possible that trade secrets of Daiichi, Sankyo or Daiichi Sankyo will become known or independently developed by Daiichi Sankyo’s competitors. If Daiichi Sankyo is unable to adequately protect its technology or enforce its patents, its results of operations, financial condition and cash flows could suffer.
Third parties may claim that Daiichi, Sankyo or Daiichi Sankyo infringes their proprietary rights and may prevent Daiichi Sankyo from manufacturing and selling some of its products.
The manufacture, use and sale of new products that are the subject of conflicting patent rights have been the subject of substantial litigation in the pharmaceutical industry. These lawsuits relate to the validity and infringement of patents or proprietary rights of third parties. Daiichi Sankyo may have to defend against charges that it or Daiichi or Sankyo violated patents or proprietary rights of third parties. Litigation may be costly and time-consuming, and could divert the attention of management and technical personnel. In addition, if any of Daiichi Sankyo, Daiichi or Sankyo infringes on the rights of others, they could lose the right to develop or manufacture products or could be required to pay monetary damages or royalties to license proprietary rights from third parties, or even suspend production and marketing of the challenged products. If they fail to obtain a license where one is required, Daiichi Sankyo could be forced to suspend the production and marketing of the
17
Table of Contents
challenged products. Although the parties to patent and intellectual property disputes in the pharmaceutical industry have often settled their disputes through licensing or similar arrangements, the costs associated with these arrangements may be substantial and could include ongoing royalties. Furthermore, Daiichi Sankyo, Daiichi and Sankyo cannot be certain that the necessary licenses would be available on acceptable terms. As a result, an adverse determination in a judicial or administrative proceeding or failure to obtain necessary licenses could prevent Daiichi Sankyo from manufacturing and selling a number of products, which could harm its business, financial condition, results of operations and cash flows.
The highly regulated nature of the pharmaceutical industry subjects Daiichi Sankyo to uncertainty with respect to the initial and continued approval of its products, pricing of pharmaceuticals and potential sanctions for any compliance failures.
As a pharmaceutical company, Daiichi Sankyo’s activities will be subject to extensive governmental regulation. Typically, the primary thrusts of governmental inquiry and action are toward determining drug safety and effectiveness as well as controlling the prices of prescription drugs and the profits of prescription drug companies. In many jurisdictions, a company is required to obtain and maintain regulatory approvals to market or manufacture pharmaceutical products. For example, the European Union has adopted directives concerning the classification, labeling, advertising, wholesale distribution and approval for marketing of medicinal products for human use. In addition, acts of governments may affect the price or availability of raw materials needed for the development or manufacture of Daiichi Sankyo’s products. Daiichi Sankyo will also be subject to potential administrative actions. Such actions may include seizures of products and other civil and criminal sanctions. Daiichi Sankyo may incur significant cost and may be required to devote substantial time and resources to comply with applicable rules and regulations.
The design, development, manufacture and sale of pharmaceutical products involve the risk of product liability claims by consumers and other third parties, and insurance against such potential claims is expensive and may be difficult to obtain.
The design, development, manufacture and sale of pharmaceutical products involve an inherent risk of product liability claims and the associated adverse publicity. Unexpected side effects manifesting after the approval of a product could give rise to claims and even cause the withdrawal of regulatory approval. Insurance coverage is expensive and may be difficult to obtain, and may not be available in the future on acceptable terms, or at all. Although each of Daiichi and Sankyo currently maintains, and after the joint share transfer, Daiichi Sankyo will maintain, product liability insurance for its products in amounts believed to be commercially reasonable, if the coverage limits of these insurance policies are not adequate, a claim brought against Daiichi Sankyo, Daiichi and Sankyo, whether covered by insurance or not, could have a material adverse effect on Daiichi Sankyo’s results of operations, financial condition and cash flows.
The pharmaceutical industry is highly competitive.
Each of Daiichi and Sankyo faces, and expects that after the joint share transfer, Daiichi Sankyo will face, strong competition in its pharmaceutical business, both for prescription drugs and over-the-counter products. The intensely competitive environment requires an ongoing, extensive search for technological innovations and the ability to market products effectively, including the ability to communicate the effectiveness, safety and value of each company’s products to healthcare professionals in hospitals, private practice, group practices and managed care organizations. The companies’ competitors vary depending upon product categories, and within each product category, upon dosage strengths and drug-delivery systems. Based on pro forma total assets, annual revenues, and market capitalization, Daiichi Sankyo is smaller than certain of its competitors. Many competitors have a greater number of products on the market and have greater financial and other resources than Daiichi, Sankyo or Daiichi Sankyo. If Daiichi Sankyo directly competes with them for the same markets and/or products, their financial strength could prevent Daiichi Sankyo from capturing a profitable share of those markets. It is possible that developments by competitors will make Daiichi Sankyo’s products or technologies noncompetitive or obsolete.
18
Table of Contents
Daiichi Sankyo’s results of operations could be adversely affected by global efforts to control the prices of prescription drugs and healthcare costs generally.
Healthcare policy makers in Japan, the United States and other countries have identified controlling healthcare costs, and the prices of prescription drugs in particular, as an important long-term goal. In April 2003, Japan increased the share of medical costs borne by patients with employees’ health insurance to 30%. A manufacturer of pharmaceutical products in Japan must have a new pharmaceutical product listed on a National Health Insurance, or NHI, price list. The NHI price list provides rates for calculating the costs of pharmaceutical products used in medical services given under various public medical care insurance systems. Prices on the NHI price list are subject to revision, generally once every two years, on the basis of the actual prices at which the pharmaceutical products are purchased by medical institutions. The most recent price revision occurred in April 2004 with the result that each of Daiichi and Sankyo has been required to reduce the prices for its pharmaceutical products in Japan by an average of 5.2% and 6.7%, respectively. Please see “Governmental Regulation - Japanese Regulation – Price Regulation”. In December 2004, U.S. President Bush enacted Medicare reform measures, including a new prescription drug benefit and reforms intended to speed the approval process for generic drug equivalents to pharmaceutical products under patent. The effect of these measures, in addition to increasing competition in the market, may result in downward pressure on the prices of prescription drugs and other pharmaceutical products which could have an adverse impact on Daiichi Sankyo’s results of operations.
Daiichi Sankyo’s consolidated results of operations may be negatively impacted by foreign currency fluctuations.
A portion of the net revenues of each of Daiichi and Sankyo is originally earned in currencies other than Japanese yen, primarily U.S. dollars and euros. Daiichi Sankyo expects to continue to report its financial results in Japanese yen and to translate the revenues and expenses of Daiichi Sankyo denominated in non-Japanese currencies into Japanese yen. If the Japanese yen were to strengthen relative to non-Japanese currencies, the amount of net income reported in Daiichi Sankyo’s consolidated statement of operations from non-Japanese yen denominated business would decrease. Accordingly, if the Japanese yen were to strengthen significantly against the U.S. dollar, Daiichi Sankyo’s consolidated net income could be adversely affected.
The high and low exchange rates of Japanese yen for U.S. dollars, expressed in yen per $1.00 and based on the noon buying rate in the City of New York, were ¥120.55 and ¥104.18 for the year ended March 31, 2004 and ¥114.30 and ¥102.26 for the year ended March 31, 2005. The high and low exchange rates of Japanese yen for euros, expressed in yen per €1.00 and based on the average of buying and selling rates of telegraphic transfers from The Bank of Tokyo Mitsubishi, Ltd., were ¥141.61 and ¥126.49 for the year ended March 31, 2004 and ¥141.61 and ¥126.49 for the year ended March 31, 2005.
Daiichi Sankyo will be subject to stringent environmental regulations in Japan and abroad that may require additional expenditures or other compliance measures.
Daiichi Sankyo will be subject to a variety of laws and regulations in Japan and abroad relating to the use, storage, discharge and disposal of waste products and emissions from its manufacturing processes. For example, new environmental regulations regarding soil contamination went into effect in Japan in February 2003 to permit the government to order land owners to remove or remedy hazardous or toxic substances on or under their land. Please see “Governmental Regulation - Japanese Regulation – Other Regulations”. Although neither Daiichi nor Sankyo has suffered material environmental claims in the past, environmental claims or the failure to comply with any present or future regulations could adversely affect Daiichi Sankyo in various ways, including the imposition of damages, clean-up costs and fines, suspension of production, cessation of operations or a delay in disposition of unused property.
Production facilities of Daiichi and Sankyo are subject to damage or destruction as a result of earthquakes or other natural disasters.
The manufacturing facilities of Daiichi and Sankyo are concentrated in Japan and are therefore vulnerable to damage or interruption from natural disasters, particularly earthquakes. If an earthquake or other
19
Table of Contents
natural disaster were to strike the areas of Japan where the manufacturing facilities of Daiichi or Sankyo are located, such facilities could be damaged or destroyed, resulting in significant disruption in the manufacture or distribution of material products, decreased consumer confidence and substantial expenses to repair, reconstruct or replace the manufacturing facilities. Each of Daiichi and Sankyo has insurance policies covering damage suffered as the result of earthquakes and other natural disasters, in amounts that they believe are reasonably adequate to cover potential losses. However, even losses that are covered by insurance may be subject to challenge or delays in reimbursement.
Risks of Owning the Shares
Sales of Daiichi Sankyo shares by Daiichi and Sankyo may adversely affect the market price of Daiichi Sankyo shares.
In order to comply with the Commercial Code of Japan, Daiichi and Sankyo will need to dispose of the Daiichi Sankyo shares they will receive in the joint share transfer as holders of one another’s shares within a reasonable time after the joint share transfer. As of March 31, 2005, Daiichi held 2,602,000 shares of Sankyo common stock and Sankyo held 2,864,000 shares of Daiichi common stock. Based on the agreed exchange ratio, and assuming no change in such shareholding, Daiichi will own approximately 0.3% and Sankyo will own approximately 0.4% of the shares of common stock of Daiichi Sankyo immediately following the joint share transfer. These shares may be disposed of in market transactions through the Tokyo Stock Exchange or other securities exchanges on which Daiichi Sankyo’s shares will be listed, reacquired by Daiichi Sankyo through non-market share repurchases, or through other legally permissible methods. Although Daiichi and Sankyo intend to engage in orderly dispositions of their Daiichi Sankyo interests, any share dispositions may adversely affect prevailing market prices of Daiichi Sankyo shares.
Japan’s unit share system imposes restrictions on the rights of holders of shares of Daiichi Sankyo common stock that do not constitute a “unit”.
Pursuant to the Commercial Code of Japan and certain related legislation, the proposed articles of incorporation of Daiichi Sankyo provide that 100 shares of Daiichi Sankyo common stock will constitute one “unit”. The Commercial Code imposes significant restrictions and limitations on holders of shares that constitute less than one unit. In general, such holders do not have voting rights, and the transferability of such shares is significantly limited. Under the unit share system, holders of shares constituting less than one unit have the right to require the issuer to purchase their shares. In addition, Daiichi Sankyo’s articles of incorporation will provide that a holder of less than a unit of Daiichi Sankyo shares may request that Daiichi Sankyo sell to such holder such amount of shares which will, when added together with the shares constituting less than one unit, constitute one unit of shares, as long as Daiichi Sankyo has treasury stock to sell upon such request.
Rights of shareholders under Japanese law may be more limited than under the laws of other jurisdictions.
The articles of incorporation, Share Handling Regulations and Regulations of the Board of Directors of each company, and the Commercial Code of Japan, govern the affairs of Daiichi and Sankyo, and will govern the affairs of Daiichi Sankyo. Legal principles relating to such matters as the validity of corporate procedures, directors’ and officers’ fiduciary duties and shareholders’ rights may be different from those that would apply if any such company were a non-Japanese company. Shareholders’ rights under Japanese law may not be as extensive as shareholders’ rights under the laws of other countries or jurisdictions within the United States. You may have more difficulty in asserting your rights as a shareholder than you would as a shareholder of a corporation organized in another jurisdiction. In addition, Japanese courts may not be willing to enforce liabilities against Daiichi Sankyo in actions brought in Japan which are based upon the securities laws of the United States or any U.S. state.
20
Table of Contents
The U.S. federal income tax consequences of the joint share transfer are uncertain, and Daiichi Sankyo intends to take the position that the joint share transfer is a taxable exchange unless it notifies U.S. holders of shares in Daiichi or Sankyo otherwise.
The joint share transfer agreement between Daiichi and Sankyo contemplates the integration of the prescription pharmaceutical operations of the companies in or around April 2007. In light of this intention to pursue a subsequent business combination, the joint share transfer and the subsequent business combination may be treated for U.S. federal income tax purposes as forming a single integrated transaction. However, because the form of the subsequent business combination has not been chosen, the U.S. federal income tax consequences of the overall transaction cannot presently be determined. As soon as practicable after the form of the subsequent combination of Daiichi’s and Sankyo’s operations is chosen, Daiichi Sankyo intends to consider whether the joint share transfer and the subsequent business combination, viewed as an integrated transaction, qualify as a tax-free “reorganization” for U.S. federal income tax purposes with respect to Sankyo shareholders and (separately) with respect to Daiichi shareholders. Daiichi Sankyo also undertakes to notify U.S. holders of Sankyo or Daiichi shares who participate in the joint share transfer of its conclusion in this regard. Before such notification, however, Daiichi Sankyo intends to take the position that the joint share transfer is a taxable exchange. There can be no assurance that the Internal Revenue Service, or the IRS, or a court will agree with Daiichi Sankyo’s position. See “Taxation—United States Tax Consequences—The Joint Share Transfer” beginning on page 192. Each U.S. shareholder of Daiichi or Sankyo is strongly urged to consult its own tax advisor concerning the U.S. federal income tax consequences of the transaction and the proper reporting of the transaction on its tax return.
Even if the joint share transfer is to be treated as a step in an integrated transaction qualifying as a “reorganization” for U.S. federal income tax purposes with respect to Daiichi or Sankyo shareholders, Daiichi Sankyo may not be able to notify U.S. holders of this conclusion until 2007.
As soon as practicable after the form of the subsequent combination of Daiichi’s and Sankyo’s operations is chosen, Daiichi Sankyo intends to consider whether the joint share transfer and the subsequent business combination, viewed as an integrated transaction, qualify as a “reorganization” with respect to Sankyo shareholders and (separately) with respect to Daiichi shareholders. Daiichi Sankyo will also undertake to notify U.S. holders of Sankyo or Daiichi shares who participate in the joint share transfer of its conclusion in this regard. However, there can be no assurance that the IRS or a court will agree with Daiichi Sankyo’s position. Moreover, notification regarding Daiichi Sankyo’s position may not be made until shortly before the date of the subsequent integration of the prescription pharmaceutical operations of the companies as currently contemplated. See “Taxation—United States Tax Consequences” beginning on page 192. Each U.S. shareholder of Daiichi or Sankyo is strongly urged to consult its own tax advisor concerning the U.S. federal income tax consequences of corporate events relating to the companies subsequent to the joint share transfer and the proper reporting of the joint share transfer on its tax return.
U.S. holders of shares in Daiichi or Sankyo may be subject to adverse tax consequences if either Daiichi or Sankyo is or has been considered a passive foreign investment company, or a PFIC, for U.S. federal income tax purposes.
Under U.S. federal income tax law, a foreign corporation is classified as a PFIC for a given taxable year if either at least 75% of its gross income is passive income, or at least 50% of the value of its assets is attributable to assets that produce or are held for the production of passive income. Each of Daiichi and Sankyo believes that it has not been a PFIC for each of the years ended March 31, 2004 and 2005, although there can be no assurance in this regard. Neither Daiichi nor Sankyo has made a determination whether it has been a PFIC for fiscal years prior to 2004.
Specifically, based on the composition of its income and value of its assets (including goodwill), Daiichi believes that in the year ended March 31, 2004, (i) no more than 1% of its gross income was passive income and (ii) the average percentage of its assets, by value, which produce passive income or are held for the production of
21
Table of Contents
passive income was more than 40% but less than 50%. At this time, Daiichi is unable to determine the actual percentage of its passive income or passive assets in the year ended March 31, 2005. However, Daiichi believes that, for purposes of determining whether it was a PFIC in the year ended March 31, 2005, such percentages are similar to the corresponding percentages in the year before. Based on the composition of its income and value of its assets (including goodwill), Sankyo believes that for each of the years ended March 31, 2004 and 2005, (i) no more than 7% of its gross income was passive income and (ii) the average percentage of its assets, by value, which produce passive income or are held for the production of passive income was more than 40% but less than 50%. Neither Daiichi nor Sankyo can give assurance regarding to the above calculations, however, because of difficulties associated with determining the fair market value of their respective assets.
If Daiichi or Sankyo is or has been a PFIC, and if the joint share transfer is a taxable exchange for U.S. federal income tax purposes with respect to Daiichi or Sankyo’s U.S. shareholders (which is the position Daiichi Sankyo intends to take unless it notifies such U.S. holders otherwise), then such holders of Daiichi or Sankyo, as applicable, may be subject to adverse tax consequences. See “Taxation—United States Tax Consequences—Passive Foreign Investment Company” for further information.
A transaction that would otherwise qualify as a tax-free reorganization with respect to a shareholder will not so qualify if the acquired corporation is or was a PFIC, during the period in which such shareholder had held its stock, and the acquiring corporation is not a PFIC after the transaction. Under this rule, if either Daiichi or Sankyo is or has been a PFIC at any time, the exchange of Daiichi or Sankyo shares for Daiichi Sankyo shares may be deemed a taxable disposition of PFIC shares, even if the joint share transfer would otherwise be considered as forming a part of a tax-free reorganization for U.S. federal income tax purposes. A taxable disposition of PFIC shares may result in adverse tax consequences. See “Taxation—United States Tax Consequences—Passive Foreign Investment Company” for further information.
U.S. holders of Daiichi Sankyo shares will be subject to adverse tax consequences if it is considered a PFIC for U.S. federal income tax purposes.
Based on the projected composition of Daiichi Sankyo’s income and value of its assets, including goodwill, we do not believe that Daiichi Sankyo will be a PFIC for the current taxable year and we do not expect that it will become one in the future. However, PFIC status is a factual determination that is made annually. Accordingly, it is possible that Daiichi Sankyo may become a PFIC in the current or any future taxable year due to changes in valuation or composition of its assets. If Daiichi Sankyo were to be considered a PFIC, U.S. holders of Daiichi Sankyo shares would generally be subject to special rules and adverse tax consequences with respect to certain distributions made by Daiichi Sankyo and on any gain realized on the sale or other disposition of Daiichi Sankyo shares. Such U.S. holders might be subject to a greater U.S. tax liability than might otherwise apply and incur tax on amounts in advance of when U.S. federal income tax would otherwise be imposed. A U.S. holder of Daiichi Sankyo shares might be able to avoid these rules and consequences by making an election to mark its shares to market. See “Taxation—United States Tax Consequences—Passive Foreign Investment Company” for further information.
22
Table of Contents
CAUTIONARY STATEMENT CONCERNING FORWARD-LOOKING STATEMENTS
This prospectus contains forward-looking statements that are based on the current expectations, assumptions, estimates and projections of each of Daiichi and Sankyo about its business, its industry and markets. These forward-looking statements can be identified by the use of forward-looking terminology such as “may”, “will”, “expect”, “anticipate”, “estimate”, “plan” or similar words. These statements discuss future expectations, identify strategies, contain projections of results of operations or of each pre-transaction company’s financial condition, or state other forward-looking information. Known and unknown risks, uncertainties and other factors could cause the actual results to differ materially from those contained in any forward-looking statement. Daiichi and Sankyo cannot promise that their expectations expressed in these forward-looking statements will turn out to be correct. The actual results of each of Daiichi, Sankyo and Daiichi Sankyo could be materially different from and worse than those expectations. Important risks and factors that could cause the actual results of each of Daiichi, Sankyo and Daiichi Sankyo to be materially different from their expectations are set forth in “Risk Factors” and elsewhere in this prospectus. None of Daiichi, Sankyo or Daiichi Sankyo undertakes any obligation to update or release any revisions to these forward-looking statements to reflect events or circumstances after the date of this prospectus or to reflect the occurrence of unanticipated events, except as required by law.
23
Table of Contents
SELECTED HISTORICAL FINANCIAL DATA OF DAIICHI
The following selected historical financial data of Daiichi as of or for each of the two years ended March 31, 2003 and 2004 which are presented in accordance with U.S. GAAP have been derived from Daiichi’s consolidated financial statements, which have been audited by KPMG AZSA & Co., an independent registered public accounting firm, and which are included in this prospectus.
The following selected historical financial data of Daiichi as of or for each of the five years ended March 31, 2000, 2001, 2002, 2003, and 2004 that are identified as being in accordance with Japanese GAAP have been derived from Daiichi’s consolidated financial statements, which have been audited by KPMG AZSA & Co., an independent registered public accounting firm, and which are not included in this prospectus.
There are significant differences between U.S. GAAP and Japanese GAAP. As applicable to Daiichi, primary differences include differences in accounting for revenue recognition, impairment of long-lived assets, severance and retirement plans, business combinations, software development costs and compensated absence. Daiichi has included a reverse reconciliation from U.S. GAAP to Japanese GAAP of Daiichi’s shareholders’ equity and net income as of and for the year ended March 31, 2004, including a discussion of significant differences between Japanese GAAP and U.S. GAAP, in Appendix E of this prospectus for your reference, because Daiichi periodically publishes unaudited interim financial information prepared in accordance with Japanese GAAP.
The following historical financial data of Daiichi as of and for the six-month periods ended September 30, 2003 and September 30, 2004 have been derived from Daiichi’s unaudited interim condensed consolidated financial statements prepared in accordance with U.S. GAAP which include, in the opinion of Daiichi’s management, all adjustments, consisting of normal recurring adjustments, necessary to present fairly the results of operations and financial position of Daiichi for the periods and dates presented. The results of operations for an interim period are not necessarily indicative of the results for the full year or any other interim period.
The data presented below is only a summary and should be read in conjunction with the respective audited and unaudited consolidated financial statements of Daiichi, including the notes thereto. You should also read “Daiichi Management’s Discussion and Analysis of Financial Condition and Results of Operations” in this prospectus.
U.S. GAAP Selected Financial Data
| For the Year Ended March 31, | For the Six Months Ended September 30, | ||||||||||||
| 2003 | 2004 | 2003 | 2004 | ||||||||||
| (millions of yen except per share data and number of shares) | |||||||||||||
Income Statement Data: | |||||||||||||
Net sales | ¥ | 321,926 | ¥ | 322,977 | ¥ | 161,332 | ¥ | 157,765 | |||||
Cost of sales | 106,955 | 106,475 | 51,240 | 49,261 | |||||||||
Selling, general and administrative expenses | 106,859 | 107,869 | 54,022 | 54,494 | |||||||||
Research and development expenses | 55,505 | 59,718 | 29,495 | 30,098 | |||||||||
Operating income | 52,607 | 48,915 | 26,575 | 23,912 | |||||||||
Other (expenses) income | (4,549 | ) | 2,147 | 486 | 1,886 | ||||||||
Income before income taxes and minority interests | 48,058 | 51,062 | 27,061 | 25,798 | |||||||||
Net income | 25,601 | 30,736 | 16,855 | 16,143 | |||||||||
Per Share Data: | |||||||||||||
Net income, basic | ¥ | 92.25 | ¥ | 112.79 | ¥ | 61.80 | ¥ | 60.11 | |||||
Net income, diluted | 92.25 | 112.79 | 61.80 | 60.11 | |||||||||
Cash dividends per share | 30.00 | 30.00 | 15.00 | 15.00 | |||||||||
24
Table of Contents
As of March 31, 2003 | As of March 31, 2004 | As of September 30, 2004 | |||||||
| (millions of yen) | |||||||||
Balance Sheet Data: | |||||||||
Current assets | ¥ | 307,220 | ¥ | 291,643 | ¥ | 291,507 | |||
Total assets | 540,251 | 550,569 | 547,058 | ||||||
Current liabilities | 83,036 | 79,153 | 74,463 | ||||||
Total liabilities | 136,726 | 123,847 | 114,164 | ||||||
Total shareholders’ equity | 397,719 | 422,406 | 431,051 | ||||||
Number of shares as adjusted to reflect changes in capital | |||||||||
Authorized | 789,000,000 | 789,000,000 | 789,000,000 | ||||||
Outstanding | 275,209,858 | 269,700,226 | 268,420,559 | ||||||
Treasury stock | 11,243,377 | 16,753,009 | 18,032,676 | ||||||
Japanese GAAP Selected Financial Data
| As of or for the Year Ended March 31, | |||||||||||||||||||
| 2000 | 2001 | 2002 | 2003 | 2004 | |||||||||||||||
| (millions of yen except per share data and number of shares) | |||||||||||||||||||
Income Statement Data: | |||||||||||||||||||
Net sales | ¥ | 300,539 | ¥ | 317,072 | ¥ | 332,753 | ¥ | 322,011 | ¥ | 322,767 | |||||||||
Cost of sales | 108,091 | 109,984 | 112,515 | 106,904 | 103,474 | ||||||||||||||
Selling, general and administrative expenses | 97,274 | 103,322 | 108,746 | 109,093 | 114,129 | ||||||||||||||
Research and development expenses | 34,204 | 39,990 | 46,082 | 53,377 | 59,049 | ||||||||||||||
Operating income | 60,970 | 63,776 | 65,410 | 52,637 | 46,115 | ||||||||||||||
Other income (expenses) | (13,294 | ) | (10,244 | ) | (7,131 | ) | (16,353 | ) | 1,493 | ||||||||||
Income before income taxes and minority interests in net income of consolidated subsidiaries | 47,676 | 53,532 | 58,279 | 36,284 | 47,608 | ||||||||||||||
Net income | 24,065 | 28,463 | 31,375 | 13,567 | 26,662 | ||||||||||||||
Per Share Data: | |||||||||||||||||||
Net income, basic | ¥ | 87.69 | ¥ | 102.13 | ¥ | 110.18 | ¥ | 48.15 | ¥ | 97.25 | |||||||||
Net income, diluted | 83.69 | 99.44 | — | — | 97.23 | ||||||||||||||
Cash dividends per share | 20.00 | 24.00 | 28.00 | 30.00 | 30.00 | ||||||||||||||
Balance Sheet Data: | |||||||||||||||||||
Current assets | ¥ | 353,603 | ¥ | 322,386 | ¥ | 288,373 | ¥ | 289,155 | ¥ | 283,206 | |||||||||
Total assets | 505,288 | * | 553,376 | 525,511 | 512,384 | 521,809 | |||||||||||||
Current liabilities | 127,346 | 100,435 | 84,636 | 75,358 | 71,536 | ||||||||||||||
Total liabilities | 158,626 | 139,581 | 118,620 | 104,468 | 94,719 | ||||||||||||||
Total shareholders’ equity | 341,335 | * | 408,247 | 401,208 | 401,472 | 422,130 | |||||||||||||
Number of shares as adjusted to reflect changes in capital | |||||||||||||||||||
Authorized | 795,000,000 | 789,000,000 | 789,000,000 | 789,000,000 | 789,000,000 | ||||||||||||||
Issued | 269,457,826 | 286,453,235 | 286,453,235 | 286,453,235 | 286,453,235 | ||||||||||||||
Treasury stock | 3,013 | 4,379 | 10,059,367 | 11,243,377 | 16,753,009 | ||||||||||||||
| * | Effective April 1, 2000, Daiichi and its consolidated subsidiaries adopted a revised accounting standard for foreign currency translation. Under the revised accounting standard, a foreign currency translation adjustment is reported in minority interests and shareholders’ equity. The amounts for 2000, which were included in assets, have been reclassified to conform to the 2001 presentation. |
25
Table of Contents
SELECTED HISTORICAL FINANCIAL DATA OF SANKYO
The following selected historical financial data of Sankyo as of or for each of the two years ended March 31, 2003 and 2004 which are presented in accordance with U.S. GAAP have been derived from Sankyo’s consolidated financial statements, which have been audited by Ernst & Young ShinNihon, an independent registered public accounting firm, and which are included in this prospectus.
The following selected historical financial data of Sankyo as of or for each of the five years ended March 31, 2000, 2001, 2002, 2003, and 2004 that are identified as being in accordance with Japanese GAAP have been derived from Sankyo’s consolidated financial statements, which have been audited by Ernst & Young ShinNihon, an independent registered public accounting firm, and which are not included in this prospectus.
There are significant differences between U.S. GAAP and Japanese GAAP. As applicable to Sankyo, primary differences include difference in accounting for revenue recognition, impairment of long-lived assets, goodwill and other intangible assets and pensions. Sankyo has included a reverse reconciliation from U.S. GAAP to Japanese GAAP of Sankyo’s shareholders’ equity and net income as of and for the year ended March 31, 2004, including a discussion of significant differences between Japanese GAAP and U.S. GAAP, in Appendix G of this prospectus for your reference, because Sankyo periodically publishes unaudited interim financial information prepared in accordance with Japanese GAAP.
The following historical financial data of Sankyo as of and for the six-month periods ended September 30, 2003 and September 30, 2004 have been derived from Sankyo’s unaudited interim condensed consolidated financial statements prepared in accordance with U.S. GAAP which include, in the opinion of Sankyo’s management, all adjustments, consisting of normal recurring adjustments, necessary to present fairly the results of operations and financial position of Sankyo for the periods and dates presented. The results of operations for an interim period are not necessarily indicative of the results for the full year or any other interim period.
The data presented below is only a summary and should be read in conjunction with the respective audited and unaudited consolidated financial statements of Sankyo, including the notes thereto. You should also read “Sankyo Management’s Discussion and Analysis of Financial Condition and Results of Operations” in this prospectus.
U.S. GAAP Selected Financial Data
| For the Year Ended March 31, | For the Six Months Ended September 30, | ||||||||||||||
| 2003 | 2004 | 2003 | 2004 | ||||||||||||
| (millions of yen except per share data and number of shares) | |||||||||||||||
Income Statement Data: | |||||||||||||||
Net revenue | ¥ | 576,270 | ¥ | 601,273 | ¥ | 302,255 | ¥ | 294,063 | |||||||
Cost of sales | 233,067 | 228,839 | 113,972 | 109,042 | |||||||||||
Research and development | 84,453 | 93,597 | 39,716 | 39,588 | |||||||||||
Selling, general and administrative | 178,432 | 194,004 | 97,529 | 95,437 | |||||||||||
Gain on sale of property, plant and equipment, net | — | — | (1,106 | ) | (11,142 | ) | |||||||||
Operating income | 80,318 | 84,833 | 52,144 | 61,138 | |||||||||||
Other income (expenses) | (2,510 | ) | 488 | 796 | 1,542 | ||||||||||
Income before income taxes and minority interest | 77,808 | 85,321 | 52,940 | 62,680 | |||||||||||
Income from continuing operations | 34,941 | 44,410 | 29,169 | 38,744 | |||||||||||
Loss (gain) from discontinued operations | 90 | 6,199 | 4,245 | (43 | ) | ||||||||||
Net income | 34,851 | 38,211 | 24,924 | 38,787 | |||||||||||
Per Share Data: | |||||||||||||||
Basic net income per common share | ¥ | 78.97 | ¥ | 87.43 | ¥ | 56.73 | ¥ | 90.30 | |||||||
Diluted net income per common share | 78.97 | 87.42 | 56.73 | 90.27 | |||||||||||
Cash dividends declared | 25.00 | 30.00 | 12.50 | 15.00 | |||||||||||
26
Table of Contents
As of March 31, 2003 | As of March 31, 2004 | As of September 30, | |||||||
| (millions of yen) | |||||||||
Balance Sheet Data: | |||||||||
Current assets | ¥ | 556,910 | ¥ | 546,499 | ¥ | 589,902 | |||
Total assets | 933,350 | 940,004 | 965,676 | ||||||
Current liabilities | 173,335 | 173,637 | 170,837 | ||||||
Total liabilities | 276,394 | 262,960 | 261,745 | ||||||
Shareholders’ equity | 646,234 | 666,027 | 692,865 | ||||||
Number of shares as adjusted to reflect changes in capital | |||||||||
Authorized | 1,178,099,000 | 1,168,099,000 | 1,168,099,000 | ||||||
Outstanding | 439,326,264 | 429,542,651 | 429,530,609 | ||||||
Treasury stock | 10,172,501 | 9,956,114 | 9,968,156 | ||||||
Japanese GAAP Selected Financial Data
| As of or for the Year Ended March 31, | |||||||||||||||||||
| 2000 | 2001 | 2002 | 2003 | 2004 | |||||||||||||||
| (millions of yen except per share data and number of shares) | |||||||||||||||||||
Income Statement Data: | |||||||||||||||||||
Net sales | ¥ | 589,732 | ¥ | 545,072 | ¥ | 548,893 | ¥ | 569,927 | ¥ | 596,345 | |||||||||
Cost of sales | 234,784 | 222,989 | 221,442 | 228,754 | 221,653 | ||||||||||||||
Selling, general and administrative expenses | 147,803 | 155,534 | 165,191 | 174,673 | 192,417 | ||||||||||||||
Research and development | 64,432 | 78,759 | 81,610 | 86,662 | 86,720 | ||||||||||||||
Operating income | 142,711 | 87,789 | 80,649 | 79,838 | 95,555 | ||||||||||||||
Other income (expenses) | (49,895 | ) | (4,577 | ) | 74 | (7,483 | ) | (12,962 | ) | ||||||||||
Income before income taxes and minority interests | 92,817 | 83,213 | 80,724 | 72,354 | 82,592 | ||||||||||||||
Net income | 42,817 | 42,478 | 38,795 | 33,845 | 43,411 | ||||||||||||||
Per Share Data: | |||||||||||||||||||
Net income, basic | ¥ | 93.33 | ¥ | 93.27 | ¥ | 85.76 | ¥ | 75.85 | ¥ | 98.57 | |||||||||
Net income, diluted | 91.07 | — | — | — | 98.56 | ||||||||||||||
Cash dividends applicable to year | 24.50 | 24.50 | 25.00 | 25.00 | 30.00 | ||||||||||||||
Balance Sheet Data: | |||||||||||||||||||
Current assets | ¥ | 628,783 | ¥ | 568,277 | ¥ | 535,042 | ¥ | 546,039 | ¥ | 535,816 | |||||||||
Total assets | 921,662 | 964,902 | 916,305 | 915,792 | 927,244 | ||||||||||||||
Current liabilities | 217,345 | 202,173 | 165,275 | 154,985 | 154,758 | ||||||||||||||
Total liabilities | 297,332 | 288,392 | 255,677 | 248,703 | 235,806 | ||||||||||||||
Shareholders’ equity | 615,011 | 668,318 | 652,220 | 658,707 | 682,594 | ||||||||||||||
Number of shares as adjusted to reflect changes in capital | |||||||||||||||||||
Authorized | 1,200,000,000 | 1,190,089,000 | 1,178,099,000 | 1,178,099,000 | 1,168,099,000 | ||||||||||||||
Issued | 458,808,463 | 461,488,765 | 449,498,765 | 449,498,765 | 439,498,765 | ||||||||||||||
Treasury stock | 15,706 | 10,196 | 5,002,947 | 10,172,501 | 9,956,114 | ||||||||||||||
27
Table of Contents
SELECTED UNAUDITED PRO FORMA CONDENSED COMBINED
FINANCIAL INFORMATION
The unaudited pro forma condensed combined balance sheet presents the historical consolidated balance sheet of Sankyo and the historical consolidated balance sheet of Daiichi, both appearing elsewhere in this prospectus, and gives effect on a pro forma basis to the joint share transfer as if it had been consummated on September 30, 2004. The unaudited pro forma condensed combined statements of income present the historical consolidated statements of income of Sankyo and Daiichi, both appearing elsewhere in this prospectus, giving effect to the joint share transfer as if it had occurred on April 1 of each period presented. The historical consolidated financial information has been adjusted to give effect to the events that are directly attributable to the joint share transfer, factually supportable, and, with respect to the statements of income, expected to have a continuing impact on the combined results. You should read this information in conjunction with the:
| • | accompanying notes to the unaudited pro forma condensed combined financial information; |
| • | historical unaudited consolidated balance sheet and statement of income of Sankyo as of and for the six-month period ended September 30, 2004 included in this prospectus; |
| • | historical consolidated balance sheet and statement of income of Sankyo as of and for the year ended March 31, 2004 included in this prospectus; |
| • | historical unaudited consolidated balance sheet and statement of income of Daiichi as of and for the six-month period ended September 30, 2004 included in this prospectus; and |
| • | historical consolidated balance sheet and statement of income of Daiichi as of and for the year ended March 31, 2004 included in this prospectus. |
The unaudited pro forma condensed combined financial information has been presented for informational purposes only. The pro forma information is not necessarily indicative of what our financial position or results of operations actually would have been had the joint share transfer been completed at the dates indicated. In addition, the unaudited pro forma condensed combined financial information does not purport to project the future financial position or operating results of the combined company.
The unaudited pro forma condensed combined financial information has been prepared using the purchase method of accounting with Sankyo treated as the acquiror. Accordingly, Sankyo’s cost to acquire Daiichi will be allocated to the assets acquired and liabilities assumed based upon their estimated fair values as of the date of the transaction. The allocation is dependent upon certain valuations and other studies that have not progressed to a stage where there is sufficient information to make a definitive allocation. Accordingly, the pro forma purchase price adjustments are preliminary and may differ materially from the final purchase price allocation adjustments.
28
Table of Contents
UNAUDITED PRO FORMA CONDENSED COMBINED BALANCE SHEET
AS OF SEPTEMBER 30, 2004
| Sankyo | Daiichi | Pro forma adjustments | Pro forma combined | |||||||||||||
| (millions of yen) | ||||||||||||||||
ASSETS | ||||||||||||||||
Current assets: | ||||||||||||||||
Cash and cash equivalents | ¥ | 249,333 | ¥ | 73,123 | ¥ | (17,449 | )(j) | ¥ | 305,007 | |||||||
Short-term investments | 60,153 | 66,845 | 126,998 | |||||||||||||
Accounts receivable, less allowance for doubtful accounts | 147,527 | 83,166 | 230,693 | |||||||||||||
Inventories | 93,829 | 38,118 | 10,000 | (a) | 141,947 | |||||||||||
Deferred income taxes | 26,990 | 19,695 | 46,685 | |||||||||||||
Other current assets | 12,070 | 10,560 | 22,630 | |||||||||||||
Total current assets | 589,902 | 291,507 | (7,449 | ) | 873,960 | |||||||||||
Investments and advances | 109,848 | 103,800 | (11,496 | )(i) | 202,152 | |||||||||||
Property, plant and equipment, less accumulated depreciation | 216,238 | 106,618 | 33,000 | (a) | 355,856 | |||||||||||
Goodwill | 3,091 | 5,914 | 28,035 | (a) | 31,126 | |||||||||||
| (5,914 | )(f) | |||||||||||||||
Other intangibles, net | 25,145 | 24,217 | 338,000 | (a) | 382,243 | |||||||||||
| (5,119 | )(f) | |||||||||||||||
Other assets | 21,452 | 15,002 | 9,491 | (h) | 45,945 | |||||||||||
Total assets | ¥ | 965,676 | ¥ | 547,058 | ¥ | 378,548 | ¥ | 1,891,282 | ||||||||
LIABILITIES AND SHAREHOLDERS’ EQUITY | ||||||||||||||||
Short-term borrowings, including current portion of long term debt | ¥ | 17,946 | ¥ | 2,111 | ¥ | ¥ | 20,057 | |||||||||
Accounts payable | 48,826 | 29,632 | 78,458 | |||||||||||||
Accrued income taxes | 20,506 | 9,572 | 30,078 | |||||||||||||
Other current liabilities | 83,559 | 33,148 | 2,000 | (a) | 118,707 | |||||||||||
Total current liabilities | 170,837 | 74,463 | 2,000 | 247,300 | ||||||||||||
Long-term debt | 6,802 | 2,505 | 9,307 | |||||||||||||
Accrued pension and severance costs | 74,829 | 33,087 | 18,161 | (a) | 126,077 | |||||||||||
Other long-term liabilities | 9,277 | 4,109 | 156,210 | (a) | 169,596 | |||||||||||
Total noncurrent liabilities | 90,908 | 39,701 | 174,371 | 304,980 | ||||||||||||
Minority interests | 11,066 | 1,843 | 12,909 | |||||||||||||
Shareholders’ equity: | ||||||||||||||||
Common stock | 68,793 | 45,247 | (64,040 | )(d) | 50,000 | |||||||||||
Additional paid-in capital | 67,263 | 50,212 | 713,043 | (d) | 830,518 | |||||||||||
Retained earnings | 566,760 | 359,975 | (89,000 | )(a) | 446,659 | |||||||||||
| (371,392 | )(d) | |||||||||||||||
| (8,946 | )(f) | |||||||||||||||
| (10,738 | )(j) | |||||||||||||||
Accumulated other comprehensive income | 10,412 | 14,448 | (14,448 | )(d) | 10,412 | |||||||||||
Treasury stock, at cost | (20,363 | ) | (38,831 | ) | 59,194 | (d) | (11,496 | ) | ||||||||
| (11,496 | )(i) | |||||||||||||||
Total shareholders’ equity | 692,865 | 431,051 | 202,177 | 1,326,093 | ||||||||||||
Total liabilities and shareholders’ equity | ¥ | 965,676 | ¥ | 547,058 | ¥ | 378,548 | ¥ | 1,891,282 | ||||||||
The accompanying Notes are an integral part of the Unaudited Pro Forma Condensed Combined Financial Information.
29
Table of Contents
UNAUDITED PRO FORMA CONDENSED COMBINED STATEMENT OF INCOME
FOR THE SIX MONTHS ENDED SEPTEMBER 30, 2004
| Sankyo | Daiichi | Pro forma adjustments | Pro forma combined | ||||||||||||
| (millions of yen, except for per share data) | |||||||||||||||
Net revenue | ¥ | 294,063 | ¥ | 157,765 | ¥ | ¥ | 451,828 | ||||||||
Cost of sales | 109,042 | 49,261 | 19,000 | (b) | 176,801 | ||||||||||
| (502 | )(g) | ||||||||||||||
Research and development | 39,588 | 30,098 | (310 | )(f) | 69,376 | ||||||||||
Selling, general and administrative | 95,437 | 54,494 | (85 | )(e) | 149,790 | ||||||||||
| (56 | )(g) | ||||||||||||||
Gain on sale of property, plant and equipment, net | 11,142 | 11,142 | |||||||||||||
Other income (expenses), net | 1,542 | 1,886 | 3,428 | ||||||||||||
Income from continuing operations before income taxes and minority interests | 62,680 | 25,798 | (18,047 | ) | 70,431 | ||||||||||
Income taxes | 23,744 | 10,139 | (7,790 | )(c) | 26,446 | ||||||||||
| 353 | (h) | ||||||||||||||
Minority interests | 192 | (484 | ) | (292 | ) | ||||||||||
Income from continuing operations | ¥ | 38,744 | ¥ | 16,143 | ¥ | (10,610 | ) | ¥ | 44,277 | ||||||
Income from continuing operations per common share: | |||||||||||||||
- Basic | ¥ | 90.20 | ¥ | 60.11 | ¥ | 60.25 | |||||||||
- Diluted | 90.17 | 60.11 | 60.24 | ||||||||||||
Weighted average shares used to calculate earnings per common share amounts (Thousands of shares): | |||||||||||||||
- Basic | 429,537 | 268,549 | 36,778 | 734,864 | |||||||||||
- Diluted | 429,691 | 268,578 | 36,783 | 735,052 | |||||||||||
Cash dividends per share | ¥ | 17.50 | ¥ | 15.00 | |||||||||||
The accompanying Notes are an integral part of the Unaudited Pro Forma Condensed Combined Financial Information.
30
Table of Contents
UNAUDITED PRO FORMA CONDENSED COMBINED STATEMENT OF INCOME
FOR THE YEAR ENDED MARCH 31, 2004
| Sankyo | Daiichi | Pro forma adjustments | Pro forma combined | ||||||||||||
| (millions of yen, except for per share data) | |||||||||||||||
Net revenue | ¥ | 601,273 | ¥ | 322,977 | ¥ | ¥ | 924,250 | ||||||||
Cost of sales | 228,839 | 106,475 | 38,000 | (b) | 372,411 | ||||||||||
| (903 | )(g) | ||||||||||||||
Research and development | 93,597 | 59,718 | (620 | )(f) | 152,695 | ||||||||||
Selling, general and administrative | 194,004 | 107,869 | (161 | )(e) | 301,612 | ||||||||||
| (100 | )(g) | ||||||||||||||
Other income (expenses), net | 488 | 2,147 | 2,635 | ||||||||||||
Income from continuing operations before income taxes and minority interests | 85,321 | 51,062 | (36,216 | ) | 100,167 | ||||||||||
Income taxes | 40,397 | 21,812 | (15,580 | )(c) | 47,291 | ||||||||||
| 662 | (h) | ||||||||||||||
Minority interests | 514 | (1,486 | ) | (972 | ) | ||||||||||
Income from continuing operations | ¥ | 44,410 | ¥ | 30,736 | ¥ | (21,298 | ) | ¥ | 53,848 | ||||||
Income from continuing operations per common share: | |||||||||||||||
- Basic | ¥ | 101.61 | ¥ | 112.79 | ¥ | 72.09 | |||||||||
- Diluted | 101.60 | 112.79 | 72.08 | ||||||||||||
Weighted average shares used to calculate earnings per common share amounts (Thousands of shares): | |||||||||||||||
- Basic | 437,053 | 272,516 | 37,409 | 746,978 | |||||||||||
- Diluted | 437,099 | 272,516 | 37,409 | 747,024 | |||||||||||
Cash dividends per share | ¥ | 25.00 | ¥ | 30.00 | |||||||||||
The accompanying Notes are an integral part of the Unaudited Pro Forma Condensed Combined Financial Information.
31
Table of Contents
NOTES TO UNAUDITED PRO FORMA CONDENSED COMBINED FINANCIAL INFORMATION
| 1. | Description of Transaction and Basis of Presentation |
The boards of directors of Sankyo and Daiichi have resolved to approve the terms and conditions of the joint share transfer in order to integrate the management and businesses of the two companies under a single holding company to be known as Daiichi Sankyo Company, Limited, a joint stock corporation to be organized under the laws of Japan.
The joint share transfer will be accounted for by Daiichi Sankyo under the purchase method of accounting in accordance with U.S. GAAP. Based on the Daiichi exchange ratio of 1.159 Daiichi Sankyo shares for each share of common stock of Daiichi and the Sankyo exchange ratio of one Daiichi Sankyo share for each share of Sankyo common stock, as set forth in the joint share transfer agreement, after the closing of the joint share transfer, former Daiichi shareholders will own approximately 42.0% and former Sankyo shareholders will own approximately 58.0% of Daiichi Sankyo. Based on these projected ownership percentages, Sankyo is the accounting acquiror for financial reporting purposes. Under the purchase method of accounting, in accordance with Statement of Financial Accounting Standards No. 141, “Business Combinations”, Sankyo will record the tangible and intangible assets acquired and liabilities of Daiichi assumed at their fair values. Management of Daiichi Sankyo will be required to exercise significant judgments by making estimates and determining underlying assumptions in order to value such assets and liabilities. The fair values used to record each of the tangible and intangible assets and liabilities of Daiichi, and the resulting excess of the purchase price over the fair value of net assets acquired (goodwill) will have a material effect on the financial position and the results of operations of Daiichi Sankyo subsequent to the acquisition. The reported financial condition and results of operations of Daiichi Sankyo to be issued after the closing of the joint share transfer will reflect Daiichi’s balances and results from the date of the acquisition in addition to Sankyo’s balances and results. If a different set of fair values were to be used at the time of the acquisition, Daiichi Sankyo’s results of operations and financial position could differ materially. Following the completion of the joint share transfer, the earnings of Daiichi Sankyo will reflect purchase accounting adjustments, including in-process research and development write-offs and increased amortization and depreciation expense for acquired assets. In accordance with Statement of Financial Accounting Standard No. 142, “Goodwill and Other Intangible Assets”, goodwill will not be subject to amortization for financial reporting purposes but will be evaluated annually for impairment. Subsequent to the acquisition, if a reporting unit to which such goodwill is assigned reports a carrying amount in excess of its estimated fair value, an impairment charge is recognized for any excess of the carrying amount of that goodwill over its implied fair value.
| 2. | Purchase Price |
The following is a preliminary estimate of the purchase price for Daiichi:
| (millions of yen) | ||||||
Number of shares of Daiichi common stock outstanding as of September 30, 2004 (in thousands) | 268,421 | |||||
Exchange ratio | 1.159 | |||||
| 311,100 | ||||||
Multiplied by the average market price of Sankyo’s stock for the period beginning two days before and ending two days after February 25, 2005, the date of the announcement of the joint share transfer | ¥ | 2,393 | ¥ | 744,462 | ||
Estimated transaction costs | 2,000 | |||||
Estimated purchase price | ¥ | 746,462 | ||||
32
Table of Contents
For the purpose of this pro forma analysis, the above estimated purchase price has been allocated based on a preliminary estimate of the fair value of assets and liabilities to be acquired.
ESTIMATED PURCHASE PRICE: | (millions of yen) | |||
Book value of net assets acquired | ¥ | 431,051 | ||
Write-off of existing goodwill and other intangible assets (1) | (11,033 | ) | ||
Income tax effects | 2,087 | |||
Cash payment in connection with joint share transfer | (6,711 | ) | ||
Adjusted book value of net assets acquired | 415,394 | |||
Remaining allocation: | ||||
Increase in inventories to fair value | 10,000 | |||
Increase property plant and equipment to fair value | 33,000 | |||
Other intangibles at fair value (2) | 338,000 | |||
In-process research and development charge (3) | 89,000 | |||
Increase accrued pension and severance costs (4) | (18,161 | ) | ||
Income tax effects | (148,806 | ) | ||
Goodwill (5) | 28,035 | |||
Estimated purchase price | ¥ | 746,462 | ||
| (1) | Elimination of acquired goodwill and intangibles |
Please refer to Note 5, “Pro Forma Adjustments – (f) Elimination of previously acquired goodwill and intangibles”, immediately below.
| (2) | Other intangibles |
Other intangibles mainly represent completed technology and core technology, including patents.
There is insufficient information at this time to provide specifics with regard to intangible assets relating to individual products, trade names, licensing agreements and others as required under Statement of Financial Accounting Standards (“FAS”) No. 141, “Business Combinations”. A product-by-product valuation of Daiichi’s completed technologies also has not been performed. Instead, the ¥338,000 million intangibles included as part of the pro forma financial data was determined based upon what is known about the various products within Daiichi, estimated revenue and operating profits of those products and the companies’ own extensive experiences in the pharmaceutical industry.
If the final valuation, which is expected to be completed within six to twelve months from the completion of the joint share transfer, derives a different amount from the ¥338,000 million estimate, identifiable intangible assets will be adjusted to that amount.
| (3) | In-process research and development charge |
As required by Financial Accounting Standards Board Interpretation No. 4, “Applicability of FASB Statement No. 2 to Business Combinations Accounted for by the Purchase Method” (“FIN 4”), the purchase price allocated to in-process research and development will be immediately expensed.
There is insufficient information at this time to provide specifics with regard to individual in-process projects. There has been no full evaluation regarding any specifics of many of the in-process research and development projects and the range of possible outcomes. A compound-by-compound valuation of Daiichi’s in-process research and development has not been performed. Instead, the ¥89,000 million in-process research and development charge included as part of the pro forma financial data was estimated based upon what is known
33
Table of Contents
about the various products within the Daiichi pipeline indicated above and the market for such potential products, the companies’ general understanding of Daiichi’s procedures, the amount of money spent on such projects to date and the companies’ extensive experiences with R&D activities, including the probabilities of success of compounds in various stages of completion. However, no assurance can be given that a compound-by-compound valuation in accordance with FAS No. 141 will confirm the estimate. If the actual valuation, which is expected to be completed within six to twelve months from the completion of the joint share transfer, derives a different amount from the ¥89,000 million estimate, the estimated in-process research and development expense amount will be adjusted to that amount.
| (4) | Increase accrued pension and severance costs |
Please refer to Note 5, “Pro Forma Adjustments – (g) Recognition of unrecognized items under pension accounting”, immediately below.
| (5) | Goodwill |
In accordance with the requirements of FAS No. 142, “Goodwill and Other Intangible Assets”, the goodwill associated with the joint share transfer will not be amortized.
| 3. | Accounting Policies and Financial Statement Classifications |
Upon completion of the joint share transfer, Sankyo and Daiichi will review their accounting policies and financial statement classifications. As a result of that review, it may become necessary to make certain changes to Daiichi’s accounting policies to conform those accounting policies to those of Sankyo.
| 4. | Intercompany Transactions |
Transactions between Sankyo and Daiichi are primarily limited to those relating to research and development activities. Upon completion of the joint share transfer, transactions that occurred in connection with those activities would be considered intercompany transactions. However, such intercompany balances and transactions related to those activities would not be material.
| 5. | Pro Forma Adjustments |
Adjustments included in the column under the heading “Pro forma adjustments” primarily relate to the following:
| (a) | Allocation of the estimated purchase price- |
| The allocation of the estimated purchase price would be recorded to reflect the differences between the carrying value and the fair value of the assets acquired and liabilities assumed. In addition, accrual of Sankyo’s estimated transaction costs of ¥2,000 million would be recorded. To record the allocation of the estimated purchase price to reflect the difference between the book value and the fair value of net assets acquired, the following adjustments would be recorded: |
| • | inventories would be increased by ¥10,000 million, |
| • | property, plant and equipment would be increased by ¥33,000 million, |
| • | other intangibles would be increased by ¥338,000 million, |
| • | research and development expenses would be increased by ¥89,000 million (directly charged to retained earnings), |
| • | accrued pension and severance costs would be increased by ¥18,161 million (see the description at Note 5(g) below), |
| • | income tax effects would be by ¥148,806 million (see the description at Note 5(c)below), and |
| • | goodwill would be increased by ¥28,035 million. |
34
Table of Contents
| (b) | Amortization of other intangible assets- |
| As a result of the estimated purchase price allocation, other intangibles of ¥338,000 million were recorded (see Note 5(a) above), mainly consisting of completed technology amounting to ¥297 billion and patents amounting to ¥41 billion. Amortization expenses relating to the estimated value of the other intangible assets, which are being amortized over their various estimated useful lives, 9.7 years for completed technology and 5.3 years for patents, of approximately ¥19,000 million and ¥38,000 million would be recorded in the six-month period ended September 30, 2004, and the fiscal year ended March 31, 2004, respectively. Amortization of other intangibles is included in cost of sales as the intangibles relate to completed technology from which Daiichi and Sankyo derive revenue. |
| (c) | Tax effects of the purchase price allocation and amortization of other assets- |
| The tax effects of the purchase price allocation and amortization of other intangible assets discussed in (a) and (b) above have been recognized. The following adjustments were made: |
| • | increase in deferred tax liabilities included in other long-term liabilities by ¥156,210 million at September 30, 2004, |
| • | decreases in income tax expenses by ¥7,790 million for the six months ended September 30, 2004 and ¥15,580 million for the year ended March 31, 2004, respectively. |
| (d) | Adjustments for shareholders’ equity- |
| In accordance with the joint share transfer agreement, the treasury stock held by Sankyo (¥20,363 million) and the treasury stock held by Daiichi (¥38,831 million) would be eliminated by offsetting with retained earnings before the consummation of the joint share transfer in September 2005. |
| The historical balances of all accounts in Daiichi’s shareholders’ equity, which accounts consisted of common stock of ¥45,247 million, additional paid-in-capital of ¥50,212 million, retained earnings of ¥312,198 million (after elimination of treasury stock of ¥38,831 million and adjustments of previously acquired goodwill and intangible assets of ¥8,946 million) and accumulated other comprehensive income of ¥14,448 million, would be removed and the purchase price of Daiichi’s common stock (¥744,462 million) would be recorded as common stock (¥50,000 million) and additional paid-in capital (¥694,462 million), respectively. |
| The historical balance of Sankyo’s common stock (¥68,793 million) has been transferred to additional paid-in capital. |
| (e) | Fair value recognition provisions on stock-based compensation- |
| Sankyo accounts for stock-based compensation plans under the recognition and measurements principles of the Accounting Principles Board (“APB”) No. 25,Accounting for Stock Issued to Employees (“APB No. 25”), and related interpretations. Sankyo records compensation expenses for its stock option plan under variable plan accounting. Daiichi accounts for its stock-based compensation plans to directors and certain employees using the fair-value method prescribed by FAS No. 123, “Accounting for Stock-Based Compensation”. Had Daiichi applied the intrinsic value based method of APB No. 25 to account for stock-based employee compensation, the stock-based compensation expenses would have decreased by ¥85 million and ¥161 million, with no tax effects, in the six-month period ended September 30, 2004 and the fiscal year ended March 31, 2004, respectively. |
| (f) | Elimination of previously acquired goodwill and intangibles- |
| Applying FAS No. 141, “Accounting for Business Combination”,Daiichi’s previously acquired goodwill of ¥5,914 million and intangible assets of ¥5,119 million as of September 30, 2004 would be written off. These write-offs would be charged to retained earnings on a net of tax basis and, accordingly, retained earnings would decrease by ¥8,946 million. |
| The related amortization expenses included in “Research and development” would decrease by ¥310 million and ¥620 million in the six month period ended September 30, 2004 and the year ended March 31, 2004, respectively. |
35
Table of Contents
| (g) | Recognition of unrecognized items under pension accounting- |
| In accordance with FAS No. 141, “Accounting for Business Combination”,Daiichi’s unrecognized items of ¥18,161 million, which consisted of unrecognized actuarial loss of ¥18,848 million, unrecognized prior service costs of ¥(1,060) million and unrecognized transition obligation of ¥373 million, relating to its severance and retirement plans would be eliminated and recorded as accrued pension and severance expenses through the purchase price allocation. In this regard, net periodic pension costs included in the “Cost of sales” account would be decreased by ¥502 million and ¥903 million for the six month period ended September 30, 2004 and the year ended March 31, 2004, respectively, and those included in the “Selling, general and administrative” account would be decreased by ¥56 million and ¥100 million for the six month period ended September 30, 2004 and the year ended March 31, 2004, respectively. |
| (h) | Tax effects of pro forma adjustments- |
| The tax effects of the pro forma adjustments discussed in (e), (f) and (g) above have been recognized. The following adjustments were made: |
| • | increase in deferred income tax assets by ¥9,491 million at September 30, 2004, and |
| • | increases in income tax expenses by ¥353 million for the six months ended September 30, 2004 and ¥662 million for the year ended March 31, 2004, respectively. |
| (i) | Adjustments for treasury stock- |
| Sankyo shares of ¥6,063 million held by Daiichi and Daiichi shares of ¥5,433 million held by Sankyo, which are included in “Investments and advances” accounts on their historical financial statements as of September 30, 2004, will be exchanged for shares of Daiichi Sankyo Company, Limited upon completion of the joint share transfer. Accordingly, these shares, amounting to ¥11,496 million, have been reclassified from the “Investments and advances” account to the “Treasury stock, at cost” account. |
| (j) | Adjustments for cash payments to shareholders- |
| Shareholders of Sankyo will receive ¥25 in cash per share of Sankyo and shareholders of Daiichi will receive ¥25 in cash per share of Daiichi from Daiichi Sankyo in the joint share transfer. The estimated total amounts of these cash payments to be paid to Sankyo shareholders and Daiichi shareholders will amount to ¥10,738 million and ¥6,711 million, respectively, and related cash payments have been recorded in the pro forma balance sheet. |
The pro forma combined basic and diluted earnings per share for the respective periods presented are based on the combined basic and diluted weighted average shares of Sankyo and Daiichi. The historical basic and diluted weighted average shares of Daiichi were converted at the exchange ratio of 1.159 shares of Daiichi Sankyo common stock for each Daiichi common stock equivalent.
Daiichi and Sankyo have been developing a business plan for integrating the operations of the two companies. Based on their current discussions, one-time integration costs of ¥118 billion are expected to be incurred, primarily in the year ending March 31, 2007. Approximately 80% of those costs are expected to be personnel-related for items such as retirement incentive payments and costs associated with the transfer of personnel. The parties also expect to realize substantial cost savings, with targets of annual savings of ¥50 billion in the year ending March 31, 2008 increasing to ¥57 billion by the year ending March 31, 2010. These savings are expected to result primarily from reductions in both personnel expenses and other operational expenses in the companies’ domestic pharmaceutical operations. Although the current plan reflects management’s current
36
Table of Contents
expectations, there can be no assurance that these expectations will prove accurate. The companies’ integration plans will continue to be refined and detailed integration procedures, including the methods for ultimately combining the existing pharmaceutical operations of Daiichi and Sankyo and for disposing of other businesses have not yet been determined. Therefore, these integration costs and anticipated savings are not reflected in the unaudited pro forma financial information.
| 6. | Forward-Looking Statements |
The statements contained in this section may be deemed to be forward-looking statements within the meaning of Section 27A of the Securities Act. Forward-looking statements are typically identified by the words “believe”, “expect”, “anticipate”, “intend”, “estimate” and similar expressions. These forward-looking statements are based largely on management’s expectations and are subject to a number of uncertainties. Actual results could differ materially from these forward-looking statements. Neither Daiichi nor Sankyo Daiichi undertakes any obligation to update publicly or revise any forward-looking statements. For a more complete discussion of the risks and uncertainties which may affect such forward-looking statements, please refer to the sections entitled “Risk Factors” on page 13 and “Cautionary Statement Concerning Forward-Looking Statements” on page 23.
37
Table of Contents
SELECTED UNAUDITED PRO FORMA PER SHARE DATA
The following table sets forth certain historical unaudited pro forma information with respect to net income per share and dividends per share for the fiscal year ended March 31, 2004 and for the six months ended September 30, 2004 and net book value per share as of March 31, 2004 for Daiichi and Sankyo. The historical information for Daiichi and Sankyo has been prepared under U.S. GAAP. The information that follows should be read in conjunction with the unaudited pro forma condensed combined financial statements and notes thereto included elsewhere in this prospectus and the unaudited consolidated financial statements of each of Daiichi and Sankyo for the six months ended September 30, 2004, and the audited consolidated financial statements of each of Daiichi and Sankyo for the year ended March 31, 2004 included elsewhere in this prospectus.
The comparative pro forma per share data have been included for comparative purposes only and do not purport to be indicative of (a) the results of operations or financial position which actually would have been obtained if the joint share transfer had been completed at the beginning of the earliest period presented or as of the date indicated, or of (b) the results or financial position which may be obtained in the future.
| Historical | Pro Forma | Equivalent Pro Forma | ||||||||||
| Sankyo Company, Limited | Daiichi Pharmaceutical Co., Ltd. | Daiichi Sankyo Company, Limited | Daiichi Pharmaceutical Co., Ltd. | |||||||||
As of or for the Year ended March 31, 2004 | ||||||||||||
Net book value per share | ¥ | 1,550.55 | ¥ | 1,566.21 | ||||||||
Net dividends per share | 25.00 | 30.00 | ||||||||||
Income from continuing operations | 101.61 | 112.79 | ¥ | 72.09 | ¥ | 83.55 | ||||||
Income from continuing operations | 101.60 | 112.79 | 72.08 | 83.54 | ||||||||
As of or for the Six Months ended September 30, 2004 | ||||||||||||
Net book value per share | ¥ | 1,613.07 | ¥ | 1,605.88 | ¥ | 1,804.92 | ¥ | 2,091.91 | ||||
Net dividends per share | 17.50 | 15.00 | ||||||||||
Income from continuing operations | 90.20 | 60.11 | 60.25 | 69.83 | ||||||||
Income from continuing operations | 90.17 | 60.11 | 60.24 | 69.81 | ||||||||
38
Table of Contents
COMPARATIVE PER SHARE MARKET PRICE DATA
Daiichi’s common stock is listed on the First Sections of the Tokyo Stock Exchange and the Osaka Securities Exchange.
Sankyo’s common stock is listed on the First Sections of the Tokyo Stock Exchange, the Osaka Securities Exchange and the Nagoya Stock Exchange, and on the Sapporo Securities Exchange and Fukuoka Stock Exchange.
The following table sets forth, for the periods indicated, the reported high and low sales prices per share of Daiichi’s common stock and Sankyo’s common stock on the First Section of the Tokyo Stock Exchange. The following table also sets forth, for the periods indicated, the average daily trading volume of Daiichi’s common stock and Sankyo’s common stock on the First Section of the Tokyo Stock Exchange.
| Daiichi’s common stock | Sankyo’s common stock | |||||||||||||||
| Price per share | Average daily trading volume | Price per share | Average daily trading volume | |||||||||||||
| High | Low | High | Low | |||||||||||||
Fiscal Year ended/ending March 31, | ||||||||||||||||
2000 | ¥ | 1,994 | ¥ | 1,265 | 465,274 | ¥ | 3,310 | ¥ | 2,020 | 1,179,654 | ||||||
2001 | 3,590 | 1,570 | 813,281 | 3,000 | 2,265 | 1,118,069 | ||||||||||
2002 | 3,060 | 2,305 | 736,706 | 2,825 | 1,868 | 1,371,098 | ||||||||||
2003: | ||||||||||||||||
First quarter | 2,620 | 2,115 | 777,871 | 1,988 | 1,580 | 1,372,790 | ||||||||||
Second quarter | 2,340 | 1,759 | 814,741 | 1,711 | 1,421 | 1,241,847 | ||||||||||
Third quarter | 1,993 | 1,530 | 656,648 | 1,600 | 1,308 | 1,019,082 | ||||||||||
Fourth quarter | 1,776 | 1,540 | 641,333 | 1,691 | 1,438 | 929,400 | ||||||||||
2004: | ||||||||||||||||
First quarter | 1,720 | 1,350 | 1,006,206 | 1,733 | 1,349 | 1,558,235 | ||||||||||
Second quarter | 2,080 | 1,560 | 961,537 | 1,764 | 1,387 | 1,280,817 | ||||||||||
Third quarter | 1,937 | 1,650 | 731,915 | 2,085 | 1,603 | 1,446,280 | ||||||||||
Fourth Quarter | 2,110 | 1,767 | 867,120 | 2,485 | 2,020 | 1,076,998 | ||||||||||
2005: | ||||||||||||||||
First Quarter | 2,055 | 1,734 | 835,984 | 2,390 | 1,957 | 1,375,143 | ||||||||||
Second Quarter | 2,055 | 1,843 | 667,568 | 2,505 | 2,180 | 1,038,803 | ||||||||||
Third Quarter | 2,245 | 1,920 | 749,033 | 2,455 | 1,983 | 1,215,048 | ||||||||||
Fourth Quarter | 2,740 | 2,185 | 1,106,522 | 2,540 | 2,210 | 1,361,930 | ||||||||||
Previous Six Months | ||||||||||||||||
December 2004 | 2,245 | 1,959 | 757,619 | 2,320 | 1,983 | 1,437,543 | ||||||||||
January 2005 | 2,445 | 2,185 | 661,005 | 2,385 | 2,220 | 928,711 | ||||||||||
February 2005 | 2,740 | 2,340 | 960,958 | 2,540 | 2,250 | 1,356,332 | ||||||||||
March 2005 | 2,645 | 2,440 | 1,617,000 | 2,350 | 2,210 | 1,740,909 | ||||||||||
April 2005 | 2,560 | 2,300 | 1,122,895 | 2,280 | 2,080 | 1,394,605 | ||||||||||
May 2005 | 2,475 | 2,250 | 1,557,995 | 2,255 | 2,080 | 2,074,663 | ||||||||||
39
Table of Contents
The table below sets forth the closing sale prices of Daiichi common stock and Sankyo common stock as reported on the First Section of the Tokyo Stock Exchange on February 25, 2005, the last trading day before the public announcement of the joint share transfer by Daiichi and Sankyo, and June 3, 2005, the last practicable trading day before the distribution of this prospectus. The table also sets forth the equivalent pro forma sale price of Daiichi common stock and Sankyo common stock on these dates, as determined by multiplying the applicable reported sale price of Sankyo common stock by the exchange ratio of 1.159 (in the case of Daiichi) and 1 (in the case of Sankyo). We urge you to obtain current market quotations for both the Daiichi common stock and the Sankyo common stock.
| Daiichi Common Stock | Sankyo Common Stock | |||||||||||
| Historical | Equivalent | Historical | Equivalent | |||||||||
At February 25, 2005 | ¥ | 2,485 | ¥ | 2,839.55 | ¥ | 2,450 | ¥ | 2,450 | ||||
At June 3, 2005 | 2,445 | 2,834 | 2,175 | 2,175 | ||||||||
Dividend Information
The following table indicates year-end and interim dividends paid on Daiichi common stock and Sankyo common stock for each of the record dates indicated.
| Daiichi | Sankyo | ||||
September 30, 1999 | ¥ | 9 | ¥ 12.25 | ||
March 31, 2000 | 11 | 12.25 | |||
September 30, 2000 | 13 | 12.25 | |||
March 31, 2001 | 11 | 12.25 | |||
September 30, 2001 | 14 | 12.5 | |||
March 31, 2002 | 14 | 12.5 | |||
September 30, 2002 | 15 | 12.5 | |||
March 31, 2003 | 15 | 12.5 | |||
September 30, 2003 | 15 | 15 | |||
March 31, 2004 | 15 | 15 | |||
September 30, 2004 | 15 | 15 | |||
Consistent with past practice, each of Daiichi and Sankyo currently intends to pay an annual dividend to its respective shareholders of record as of March 31, 2005, subject to approvals at its respective annual general meetings.
Daiichi’s board of directors agreed on April 27, 2005 to recommend a year-end dividend of ¥25 per share, an increase from prior periods due to improved financial performance. Sankyo’s board of directors also determined on April 27, 2005 that it would recommend a year-end dividend of ¥25 per share, an increase from prior periods, due in part to the receipt of proceeds from the sale of a former manufacturing site.
Shareholders of Daiichi will receive in the joint share transfer ¥25 in cash per share of Daiichi and shareholders of Sankyo will receive ¥25 in cash per share of Sankyo from Daiichi Sankyo as a substitute for interim dividends otherwise payable by each of Daiichi and Sankyo. Instead of paying its interim dividends for the six-month period ending September 30, 2005 directly to the former shareholders of Daiichi and Sankyo, each of Daiichi and Sankyo will pay such interim dividends to Daiichi Sankyo, which will be the sole holder of record of Daiichi and Sankyo common stock as of September 30, 2005, subsequent to the closing of the joint share transfer.
Following the completion of the joint share transfer, the companies have announced that one of the targets of Daiichi Sankyo will be to provide a dividend yield of approximately 5% by the year ending March 31, 2010. The declaration and payment of future dividends by Daiichi Sankyo are, however, subject to future earnings, financial condition and other factors, including statutory and other restrictions with respect to the payment of dividends.
40
Table of Contents
Fluctuations in exchange rates between the Japanese yen and U.S. dollar and other currencies will affect the U.S. dollar and other currency equivalent of the yen price of Daiichi and Sankyo shares and the U.S. dollar amounts received on conversion of any cash dividends. The following tables show, for the periods and dates indicated, certain information regarding the U.S. dollar/Japanese yen exchange rate. The information is based on the noon buying rate in the City of New York. On June 3, 2005, the exchange rate was ¥107.84 per U.S.$1.00.
| �� High | Low | Average | Period-End | |||||||||
Year ended March 31, | ||||||||||||
2000 | ¥ | 124.45 | ¥ | 101.53 | ¥ | 111.35 | ¥ | 102.73 | ||||
2001 | 125.54 | 104.19 | 110.60 | 125.54 | ||||||||
2002 | 134.77 | 115.89 | 125.64 | 132.70 | ||||||||
2003 | 133.40 | 115.71 | 121.10 | 118.07 | ||||||||
2004 | 120.55 | 104.18 | 112.94 | 104.18 | ||||||||
2005 | 114.30 | 102.26 | 107.49 | 107.22 | ||||||||
December 2004 | 105.59 | 102.56 | 103.81 | 102.68 | ||||||||
January 2005 | 104.93 | 102.26 | 103.34 | 103.55 | ||||||||
February 2005 | 105.84 | 103.70 | 104.94 | 104.25 | ||||||||
March 2005 | 107.49 | 103.87 | 105.25 | 107.22 | ||||||||
April 2005 | 108.67 | 104.64 | 107.19 | 107.57 | ||||||||
May 2005 | 108.17 | 104.41 | 106.60 | 105.07 | ||||||||
June 2005 (through June 3) | 108.42 | 107.84 | 108.19 | 107.84 | ||||||||
41
Table of Contents
THE GENERAL MEETING OF DAIICHI SHAREHOLDERS
General; Date; Time and Place
Daiichi will distribute voting cards to its shareholders of record as of March 31, 2005 who have voting rights (or their standing proxies in Japan, as appropriate) for use at its annual general meeting of shareholders. This meeting is currently scheduled to be held at 10:00 a.m. on June 29, 2005 (Japan Time) at Daiichi’s head office, 14-10, Nihonbashi 3-chome, Chuo-ku, Tokyo 103-8234, Japan. Daiichi is distributing the voting cards together with the notice of convocation of the meeting and reference documents concerning the exercise of voting rights, by mail to its shareholders who have voting rights. For shareholders not resident in Japan, Daiichi will distribute the voting cards and notice of convocation to their standing proxies in Japan, who will then transmit those materials to the shareholders according to the terms of the respective proxy agreements.
The purpose of the annual general meeting of shareholders will be, among other things:
| • | to consider and to vote upon the approval of the terms of the joint share transfer, including: |
| o | the provisions of the articles of incorporation of Daiichi Sankyo; |
| o | the class and the number of shares to be issued upon the joint share transfer by Daiichi Sankyo, and matters concerning the allotment of shares to the shareholders of each of Daiichi and Sankyo; |
| o | the amount of stated capital, and matters concerning the additional paid-in capital, of Daiichi Sankyo; |
| o | the cancellation of treasury stock of Daiichi and Sankyo; |
| o | the treatment of stock subscription rights and stock acquisition rights (options and other stock rights to acquire shares of Daiichi or Sankyo); |
| o | the amount of cash to be paid by Daiichi Sankyo, as a substitute for interim dividends, to the shareholders of each of Daiichi and Sankyo; |
| o | the scheduled share transfer date; |
| o | the maximum amount (if any) of any dividends to be paid by each of Daiichi and Sankyo by the effective date of the joint share transfer; |
| o | the names of the directors and corporate auditors of Daiichi Sankyo; |
| o | the name of the independent registered public accounting firm of Daiichi Sankyo; |
| o | the maximum amount of remuneration for all directors of Daiichi Sankyo; |
| o | the maximum amount of remuneration for all corporate auditors of Daiichi Sankyo; |
| o | the intended joint incorporation of Daiichi Sankyo by Daiichi and Sankyo through the joint share transfer; and |
| • | to transact such other business related to such proposals as may properly come before the annual general meeting. |
Record Date; Voting Power
Only holders of shares of Daiichi common stock as of the close of business on March 31, 2005, which is the record date for the annual general meeting of shareholders, will be entitled to receive notice of and to vote at the annual general meeting of shareholders and any adjournments or postponements of the annual general meeting of shareholders. As of that date, there were 268,404,023 shares of Daiichi common stock outstanding.
42
Table of Contents
The Commercial Code of Japan and the articles of incorporation of Daiichi limit the exercise of voting rights by certain shareholders of Daiichi. For example, voting rights may not be exercised with respect to shares constituting less than one unit of 100 shares of common stock of Daiichi, nor may voting rights be exercised with respect to any shares of Daiichi which are owned by the company itself. Accordingly, you may vote at the annual general shareholders’ meeting only if you were registered as a holder of one or more “units” of 100 shares of common stock in the company’s register of shareholders as of the close of business on March 31, 2005. As of March 31, 2005, there were 268,043,800 outstanding shares of Daiichi common stock having voting rights. Each 100 shares of Daiichi common stock constituting one unit is entitled to one vote at the annual general shareholders’ meeting.
Required Vote; Quorum; How to Vote
Required Vote. The affirmative vote of the holders of two-thirds of the voting rights of Daiichi represented at the relevant general meeting of shareholders at which shareholders holding at least one-third of the total voting rights are present is required to approve the terms of the joint share transfer. As of the record date, there were 268,043,800 outstanding shares of Daiichi common stock having voting rights.
The obligation of Daiichi and Sankyo to consummate the joint share transfer is subject to, among other things, the condition that the Daiichi shareholders approve the terms of the joint share transfer. If Daiichi’s shareholders fail to approve the terms of the joint share transfer at the annual general shareholders’ meeting, Sankyo will have the right to terminate the joint share transfer agreement. See “The Joint Share Transfer Agreement—Termination” beginning on page 78.
Voting Interests of Sankyo and Daiichi. As of March 31, 2005, which is the record date for determining those shareholders eligible to vote at the annual general meeting of shareholders:
| • | Sankyo beneficially owned 2,864,000 shares of common stock of Daiichi as part of its investment portfolio, representing approximately 1.07% of Daiichi’s outstanding shares having voting rights as of that date; and |
| • | Daiichi beneficially owned 2,602,000 shares of common stock of Sankyo as part of its investment portfolio, representing approximately 0.61% of Sankyo’s outstanding shares having voting rights as of that date. |
As permitted by Japanese law, Sankyo and Daiichi intend to vote these shares in favor of the joint share transfer at the respective annual general meetings of shareholders.
Voting Interests of Directors and Corporate Auditors. As of March 31, 2005, directors and corporate auditors of Daiichi owned an aggregate of 184,271 shares of Daiichi common stock, representing approximately 0.07% of Daiichi’s outstanding shares having voting rights.
Quorum. The holders of one-third of the total voting rights of Daiichi on the record date must be present, either in person or by proxy, at the annual general meeting of shareholders or submit their mail-in voting cards to Daiichi at least one day before the meeting, to constitute a quorum.
How to Vote. Holders of shares of common stock entitled to exercise voting rights at the annual general meeting of shareholders may exercise their voting rights by using the voting card that will be distributed by mail to those holders or their standing proxies in Japan.
Voting cards will allow shareholders to indicate a “for” or “against” vote with respect to each proposal to be voted on at the meeting, including approval of the terms of the joint share transfer. The face of each voting card will state that if the voting card is returned without indicating a vote “for” or “against” any of the proposals referred to in the voting card, the shares represented by that voting card will be deemed to have voted in favor of those proposals.
43
Table of Contents
In accordance with applicable Japanese law and practice, Daiichi intends to:
| • | count towards the quorum requirements for its shareholders’ meeting any shares represented by voting cards that are returned to it without indicating a “for” or “against” vote for any of the proposals; and |
| • | count the shares represented by voting cards returned in this manner as votes in favor of approval of the terms of the joint share transfer and the other proposals referred to in the voting cards. |
Revocation
Any person who submits a voting card may revoke it by voting in person, or through another shareholder who has voting rights and who is appointed as that person’s attorney-in-fact, at the relevant general meeting of shareholders.
No Solicitation of Proxies, Consents or Authorizations
Daiichi’s management is not soliciting proxies, consents or authorizations with respect to the joint share transfer prior to the annual general meetings of shareholders. Daiichi will not solicit any separate form of proxy, consent or authorization from the mail-in voting cards distributed in accordance with the Commercial Code of Japan. Daiichi has, however, retained IR Japan, Inc. as its agent for the purpose of promoting domestic and overseas institutional shareholders’ approval of the transaction.
Questions About Voting Your Shares
If you have any questions about how to vote or direct a vote in respect of your Daiichi common stock, you may call Mr. Toshio Takahashi, Corporate Communications Department, at (81-3) 3273-7107.
44
Table of Contents
THE GENERAL MEETING OF SANKYO SHAREHOLDERS
General; Date; Time and Place
Sankyo will distribute voting cards to its shareholders of record as of March 31, 2005 who have voting rights (or their standing proxies in Japan, as appropriate) for use at its annual general meeting of shareholders. This meeting is currently scheduled to be held at 10:00 a.m. on June 29, 2005 (Japan Time) at Sankyo’s head office, 5-1, Nihonbashi Honcho 3-chome, Chuo-ku, Tokyo 103-8426, Japan. Sankyo is distributing the voting cards together with the notice of convocation of the meeting and reference documents concerning the exercise of voting rights, by mail to its shareholders who have voting rights. For shareholders not resident in Japan, Sankyo will distribute the voting cards and notice of convocation to their standing proxies in Japan, who will then transmit those materials to the shareholders according to the terms of the respective proxy agreements.
The purpose of the annual general meeting of shareholders will be, among other things:
| • | to consider and to vote upon the approval of the terms of the joint share transfer, including: |
| o | the provisions of the articles of incorporation of Daiichi Sankyo; |
| o | the class and the number of shares to be issued upon the joint share transfer by Daiichi Sankyo, and matters concerning the allotment of shares to the shareholders of each of Daiichi and Sankyo; |
| o | the amount of stated capital, and matters concerning the additional paid-in capital, of Daiichi Sankyo; |
| o | the cancellation of treasury stock of Daiichi and Sankyo; |
| o | the treatment of stock subscription rights and stock acquisition rights (options and other stock rights to acquire shares of Daiichi or Sankyo); |
| o | the amount of cash to be paid by Daiichi Sankyo, as a substitute for interim dividends, to the shareholders of each of Daiichi and Sankyo; |
| o | the scheduled share transfer date; |
| o | the maximum amount (if any) of any dividends to be paid by each of Daiichi and Sankyo by the effective date of the joint share transfer; |
| o | the names of the directors and corporate auditors of Daiichi Sankyo; |
| o | the name of the independent registered public accounting firm of Daiichi Sankyo; |
| o | the maximum amount of remuneration for all directors of Daiichi Sankyo; |
| o | the maximum amount of remuneration for all corporate auditors of Daiichi Sankyo; |
| o | the intended joint incorporation of Daiichi Sankyo by Daiichi and Sankyo through the joint share transfer; and |
| • | to transact such other business related to such proposals as may properly come before the annual general meeting. |
Record Date; Voting Power
Only holders of shares of Sankyo common stock as of the close of business on March 31, 2005, which is the record date for the annual general shareholders’ meeting, will be entitled to receive notice of and to vote at the annual general shareholders’ meeting and any adjournments or postponements of the annual general shareholders’ meeting. As of that date, there were 429,508,509 shares of Sankyo common stock outstanding.
45
Table of Contents
The Commercial Code of Japan and the articles of incorporation of Sankyo limit the exercise of voting rights by certain shareholders of Sankyo. For example, voting rights may not be exercised with respect to shares constituting less than one unit of 100 shares of common stock of Sankyo, nor may voting rights be exercised with respect to any shares of Sankyo which are owned by the company itself. Accordingly, you may vote at the annual general shareholders’ meeting only if you were registered as a holder of one or more “units” of 100 shares of common stock in the company’s register of shareholders as of the close of business on March 31, 2005. As of March 31, 2005, there were 428,814,400 outstanding shares of Sankyo common stock having voting rights. Each 100 shares of Sankyo common stock constituting one unit is entitled to one vote at the annual general shareholders’ meeting.
Required Vote; Quorum; How to Vote
Required Vote. The affirmative vote of the holders of two-thirds of the voting rights of Sankyo represented at the relevant general meeting of shareholders at which shareholders holding at least one-third of the total voting rights are present is required to approve the terms of the joint share transfer. As of the record date, there were 428,814,400 outstanding shares of Sankyo common stock having voting rights.
The obligation of Daiichi and Sankyo to consummate the joint share transfer is subject to, among other things, the condition that the Sankyo shareholders approve the terms of the joint share transfer. If Sankyo’s shareholders fail to approve the terms of the joint share transfer at the annual general shareholders’ meeting, Daiichi will have the right to terminate the joint share transfer agreement. See “The Joint Share Transfer Agreement—Termination” beginning on page 78.
Voting Interests of Sankyo and Daiichi. As of March 31, 2005, which is the record date for determining those shareholders eligible to vote at the annual general meeting of shareholders:
| • | Sankyo beneficially owned 2,864,000 shares of common stock of Daiichi as part of its investment portfolio, representing approximately 1.07% of Daiichi’s outstanding shares having voting rights as of that date; and |
| • | Daiichi beneficially owned 2,602,000 shares of common stock of Sankyo as part of its investment portfolio, representing approximately 0.61% of Sankyo’s outstanding shares having voting rights as of that date. |
As permitted by Japanese law, Sankyo and Daiichi intend to vote these shares in favor of the joint share transfer at the respective annual general meetings of shareholders.
Voting Interests of Directors and Corporate Auditors. As of March 31, 2005, directors and corporate auditors of Sankyo owned an aggregate of 192,517 shares of Sankyo common stock, representing approximately 0.04% of Sankyo’s outstanding shares having voting rights.
Quorum. The holders of one-third of the total voting rights of Sankyo on the record date must be present, either in person or by proxy, at the annual general shareholders’ meeting or submit their mail-in voting cards to Sankyo at least one day before the meeting, to constitute a quorum.
How to Vote. Holders of shares of common stock entitled to exercise voting rights at the annual general meeting of shareholders may exercise their voting rights by using the voting card that will be distributed by mail to those holders or their standing proxies in Japan.
Voting cards will allow shareholders to indicate a “for” or “against” vote with respect to each proposal to be voted on at the meeting, including approval of the terms of the joint share transfer. The face of each voting card will state that if the voting card is returned without indicating a vote “for” or “against” any of the proposals referred to in the voting card, the shares represented by that voting card will be deemed to have voted in favor of those proposals.
46
Table of Contents
In accordance with applicable Japanese law and practice, Sankyo intends to:
| • | count towards the quorum requirements for its shareholders’ meeting any shares represented by voting cards that are returned to it without indicating a “for” or “against” vote for any of the proposals; and |
| • | count the shares represented by voting cards returned in this manner as votes in favor of approval of the terms of the joint share transfer and the other proposals referred to in the voting cards. |
Revocation
Any person who submits a voting card may revoke it by voting in person, or through another shareholder who has voting rights and who is appointed as that person’s attorney-in-fact, at the relevant general meeting of shareholders.
No Solicitation of Proxies, Consents or Authorizations
Sankyo’s management is not soliciting proxies, consents or authorizations with respect to the joint share transfer prior to the annual general meetings of shareholders. Sankyo will not solicit any separate form of proxy, consent or authorization from the mail-in voting cards distributed in accordance with the Commercial Code of Japan. Sankyo has, however, retained IR Japan, Inc. as its agent for the purpose of promoting domestic and overseas shareholders’ approval of the transaction and Morrow & Co., Inc. as its agent for the purpose of promoting overseas shareholders’ approval of the transaction.
Questions About Voting Your Shares
If you have any questions about how to vote or direct a vote in respect of your Sankyo common stock, you may call Mr. Shigemichi Kondo, Corporate Communications Department, at (81-3) 5255-7034.
47
Table of Contents
This section of the prospectus describes material aspects of the proposed joint share transfer. The summary may not contain all of the information that is important to you. You should carefully read this entire prospectus for a more complete understanding of the joint share transfer.
General
The boards of directors of Daiichi and Sankyo have resolved to approve the terms and conditions of the joint share transfer in order to integrate the management and businesses of the two companies under a single holding company to be known as Daiichi Sankyo Company, Limited, a joint stock corporation to be organized under the laws of Japan. Under this plan, which is subject to the approval at the general shareholders’ meetings of Daiichi and Sankyo, all shares of Daiichi and Sankyo will be transferred to Daiichi Sankyo. The shareholders of Daiichi and Sankyo will become shareholders of Daiichi Sankyo by receiving an allotment of new shares issued by Daiichi Sankyo in a statutory joint share transfer pursuant to the Commercial Code of Japan. If the plan is approved at the general meetings of shareholders, and if the other conditions for completing the joint share transfer are satisfied, Daiichi Sankyo will be incorporated, and the joint share transfer will become effective, on or around September 28, 2005.
Daiichi Sankyo will be organized as a joint stock corporation under the laws of Japan. In accordance with the joint share transfer agreement, Daiichi Sankyo will have 2,800,000,000 authorized shares of common stock, stated capital of ¥50.0 billion, and additional paid-in capital in an amount to be determined at the time of the joint share transfer. In accordance with its articles of incorporation Daiichi Sankyo will have no more than fourteen directors and no more than four corporate auditors.
Holders of record of common stock of each of Daiichi and Sankyo having voting rights as of March 31, 2005 will receive a notice of convocation of the annual general meeting of shareholders of Daiichi or Sankyo, as applicable, including the voting materials that contain the terms and conditions of the joint share transfer. Shareholders of each company outside Japan will receive this notice through their standing proxies in Japan.
If the joint share transfer is approved at the general meetings of shareholders of Daiichi and Sankyo, each company will give public notice and notice to each shareholder (or pledgee) whose name is on its register of shareholders. The notice will request that shareholders submit their share certificates representing the company’s common stock within a specified time period not shorter than one month ending on September 27, 2005.
Each company will give receipts to those shareholders who submit their share certificates in a timely manner. If share certificates representing Daiichi and Sankyo common stock are deposited with the Japan Securities Depository Center, Inc. (or JASDEC) in the manner described under “Description of Daiichi Sankyo Common Stock”, those share certificates need not be submitted by each of the beneficial shareholders of the relevant company within the submission period.
Certificates representing shares of Daiichi Sankyo common stock will be distributed to former shareholders of Daiichi and Sankyo, or deposited with JASDEC, following completion of the joint share transfer.
Background of the Joint Share Transfer
Management of each of Daiichi and Sankyo closely monitors trends in the Japanese and global pharmaceutical industry. In recent periods, each company has faced similar challenges of competing against the growing influence of the largest global pharmaceutical companies and developing and launching new pharmaceutical products given the high risks and expenses involved. Within Japan, the companies have also seen the consolidation of competitors, including the merger of Yamanouchi Pharmaceutical Co., Ltd. and Fujisawa Pharmaceutical Co., Ltd. in April 2005.
48
Table of Contents
Each of Daiichi and Sankyo has independently undertaken initiatives to strengthen its ability to compete globally, including Daiichi’s formation of Daiichi Medical Research in the United States to streamline its development efforts and Sankyo’s strengthening of its overseas marketing network in connection with the global launch of olmesartan. Despite these efforts, however, each of Daiichi and Sankyo also has recognized the value of a larger scale of operations to increase investment and diversify risks in the lengthy and uncertain drug development process.
On July 15, 2004, the presidents of each of Daiichi and Sankyo met and exchanged initial thoughts on the possibility of joining their operations. In the meeting, they expressed similar views about their companies’ respective competitive positions in the global pharmaceutical industry and the potential benefits of an increased scale of operations and strengthened competitive position. Subsequently, on September 29, 2004, senior management of Daiichi and Sankyo initiated discussions of a possible business combination, and executed a confidentiality agreement. The discussions between Daiichi and Sankyo focused primarily on the complementary nature of their existing businesses and ways the two companies could cooperate with each other to offer products and services across a full range of pharmaceutical businesses.
On September 28, 2004, Sankyo retained Nomura Securities Co., Ltd. as its financial advisor. On September 30, 2004, Daiichi retained Merrill Lynch Japan Securities Co., Ltd. as its financial advisor. On October 13, 2004, the companies and their financial advisors held an initial kick-off meeting to discuss the proposed transaction. On each of November 5, 2004, November 22, 2004, December 7, 2004, December 17, 2004, January 12, 2005, January 28, 2005 and February 7, 2005, the companies and their financial advisors met to discuss their current operations, their current strategies, their vision for the operations and governance of a post-transaction combined company, and other potential terms and conditions of the proposed business combination. By the final meeting, the parties concluded that forming a new holding company through the conduct of a joint share transfer would better advance their strategic objectives than potential alternatives under Japanese law, such as a direct merger. Factors considered included the benefits of designating a unified management team to set overall strategy while minimizing unnecessary disruption in day-to-day activities.
From early December 2004 through early February 2005, Daiichi and Sankyo each conducted a limited due diligence review of the other, focusing primarily on development agreements and license agreements relating to the approximately top ten material products of the other. On behalf of Sankyo, legal review was conducted by Mori Hamada & Matsumoto, legal counsel to Sankyo, and an accounting due diligence review was conducted by Ernst & Young ShinNihon. On behalf of Daiichi, legal review was conducted by Nagashima Ohno & Tsunematsu, legal counsel to Daiichi, and an accounting due diligence review was conducted by KPMG AZSA & Co.
The presidents of each of Daiichi and Sankyo met to directly discuss the merits of the proposed transaction on February 15, 2005 and February 21, 2005 and they reached a non-binding agreement in principle on the exchange ratios for the proposed joint share transfer at their February 15, 2005 meeting. On February 24, 2005, Daiichi’s management committee met to discuss the proposed transaction, and agreed to put the matter before the full Daiichi board. On February 25, 2005, the board of directors of Daiichi met to consider the transaction. On February 25, 2005, the board of directors of Sankyo met with its management team and legal and financial advisors to consider the transaction. After discussions of the progress of negotiations to date and the potential benefits and operating strategies of a combined entity, each board approved an agreement-in-principle on the joint share transfer exchange ratios and the other basic terms of the joint share transfer, and authorized the execution of a memorandum of understanding with respect to the transaction. The two companies executed the memorandum of understanding, which was non-binding with respect to the overall transaction, on the same day. After the execution of the memorandum of understanding, the two companies announced on the same day that they had an agreement in principle to establish a new joint holding company, Daiichi Sankyo, through a joint share transfer on or around October 1, 2005, and to integrate the prescription pharmaceuticals businesses of Daiichi and Sankyo in or around April 2007. In making this announcement, the two companies indicated that completion of the proposed management integration plan was subject to the subsequent execution of a definitive joint share transfer agreement and obtaining all necessary approvals by the shareholders of Daiichi and Sankyo.
49
Table of Contents
From early March 2005 through mid April 2005, on behalf of Sankyo, Mori Hamada & Matsumoto conducted a confirmatory legal due diligence review of Daiichi and its domestic subsidiaries, and on behalf of Daiichi, Nagashima Ohno & Tsunematsu conducted a confirmatory legal due diligence review of Sankyo and its domestic subsidiaries. In each case, the review was conducted with respect to material contractual and litigation matters concerning such company’s prescription pharmaceutical business and over-the-counter pharmaceutical business disclosed to the other in accordance with standards that Sankyo and Daiichi reasonably believed sufficient to reveal any legal issues that could materially affect the exchange ratios of the shares of Daiichi Sankyo. In addition, Ernst & Young ShinNihon conducted an accounting due diligence review of Daiichi on behalf of Sankyo and KPMG AZSA & Co. conducted an accounting due diligence review of Sankyo on behalf of Daiichi.
On each of March 17, 2005, March 25, 2005, April 4, 2005, April 11, 2005, April 15, 2005, April 22, 2005 and April 28, 2005, a steering committee formed to discuss issues related to the integration of Daiichi and Sankyo, and comprised of representatives of management of each of Daiichi and Sankyo, met and considered, among other things, the operations of the business integration committees and the synergy targets and business plans discussed in more detail below under “—Reasons for the Joint Share Transfer.” In these meetings, the steering committee confirmed the earlier decision to structure the business combination as a joint share transfer to be followed by further integration of the pharmaceutical operations of the two companies. The steering committee concluded that this structure would allow the parties to combine their planning processes, including ultimate oversight of their clinical development programs, immediately upon completion of the joint share transfer. Moreover, although they recognized that a two-step process risked delays in realizing targeted savings and in establishing a unified business culture, the parties concluded that planning carefully for the operational level integration would be a more reliable way of achieving the targeted long-term benefits than a direct merger. The parties concluded a direct merger might result in confusion, harm employee morale and ultimately yield lesser cost savings if the immediate need to standardize business processes and information systems were allowed to supersede the overall business objectives.
On May 13, 2005, the board of directors of each of Daiichi and Sankyo held a special meeting to consider the proposed joint share transfer agreement. At Daiichi’s meeting, Merrill Lynch reviewed its financial analysis regarding the proposed exchange ratio with the board and provided the final draft of the opinion, the original signed version of which was delivered to the Daiichi board of directors by Merrill Lynch immediately after the Daiichi board of directors approved the joint share transfer agreement, to the effect that, as of the date of the opinion and based upon and subject to the assumptions, considerations and limitations in the opinion, the proposed exchange ratio was fair from a financial point of view to the holders of Daiichi common shares other than Sankyo and its subsidiaries and affiliates. Following further review and discussion among the members of the Daiichi board of directors, the board of directors voted unanimously to approve the terms of the joint share transfer and authorize the execution of the definitive joint share transfer agreement. At Sankyo’s meeting, Nomura Securities reviewed its financial analysis regarding the proposed exchange ratio with the board and rendered to the board of Sankyo their opinion that, as of that date and based on and subject to the considerations in their written opinion, the proposed exchange ratio was fair, from a financial point of view to holders of Sankyo common stock. Following further review and discussion among the members of the Sankyo board of directors, the board of directors voted unanimously to approve the terms of the joint share transfer and authorize the execution of the definitive joint share transfer agreement. The two companies executed the joint share transfer agreement on the same day.
Reasons for the Joint Share Transfer
Daiichi and Sankyo are conducting the joint share transfer, and combining their management under a single holding company, in an effort to realize the potential synergies available from integrating their pharmaceutical businesses. The overriding goal of the companies is to achieve a critical mass in terms of scale of operations to enable the combined entity to compete in the major global pharmaceutical markets. Enhanced
50
Table of Contents
competitiveness is intended to increase profitability and shareholder returns. Daiichi and Sankyo believe Daiichi Sankyo will:
| • | Accelerate investment in the most promising product candidates. Daiichi and Sankyo have similar R&D-based corporate cultures. Both companies share a common focus on priority research and development categories including cardiovascular, infectious diseases, glucose metabolic, bone disorders, immune disorders and anti-allergy. Integration will enable increased concentration of R&D budgets and help facilitate the development of a greater number of compounds within each treatment category. Improved depth and concentration within treatment categories will help facilitate the prioritization and selection of promising compounds, boosting both the effectiveness and the speed of development. Given the uncertainty and expense of the drug development process, it is imperative that development funding be allocated strategically. By combining their annual R&D spending of over ¥150 billion and centrally coordinating investment decisions to direct funds to the most promising candidates, Daiichi and Sankyo expect to maximize their potential to develop major products. They intend to implement this collaboration upon the establishment of Daiichi Sankyo through the formation of a new research and development management committee that will report directly to the president of the new holding company. |
| • | Expand on the companies’ existing sales and marketing organizations. The combined entity is expected to have the second-largest sales of any Japanese pharmaceutical company and to rank among the top 20 global pharmaceutical companies. By taking advantage of a greater ability to reach targeted customers, the companies believe Daiichi Sankyo can realize net revenue synergies by increasing aggregate sales of key existing products such as olmesartan over a five-year period when compared to their individual sales targets. By combining their existing initiatives to strengthen their marketing capabilities in the United States, Europe and Asia, Daiichi and Sankyo also believe Daiichi Sankyo will be able to expand its presence more rapidly and more efficiently. Daiichi Sankyo’s goal is to more than double its medical representatives in the United States in the next five years as part of increasing the proportion of overseas employees from a combined 31% as of March 2005 to approximately 42% by March 2010. |
| • | Enjoy broader corporate strategic options through expanded scale. Based on Daiichi Sankyo’s financial position and strength in the Japanese market, each of Daiichi and Sankyo believe that the new company will more easily be able to pursue and complete a broad range of strategic options, including through acquisitions or joint ventures. |
| • | Achieve greater efficiency through the combination of existing operations. The holding company structure will also enable Daiichi and Sankyo to consolidate responsibility for strategic planning for their businesses and for management control of their subsidiaries. The two companies also plan to consolidate their general operations, accounting, investor relations and other basic corporate functions at the holding company level. In addition, Daiichi Sankyo aims to: |
| • | realize annual net synergies of approximately ¥51 billion in the year ended March 31, 2008 increasing to approximately ¥74 billion in the year ending March 31, 2010. These will primarily consist of annual cost savings of approximately ¥50 billion in the year ending March 31, 2008 increasing to ¥57 billion in the year ending March 31, 2010 achieved primarily through reductions in general operating costs, including premises, marketing and information technology expenses, and personnel expenses associated with domestic pharmaceutical operations. Daiichi Sankyo expects to reduce total headcount in domestic pharmaceutical operations in Japan by approximately 1,800 employees by March 31, 2008. |
| • | dispose of non-pharmaceutical businesses by March 31, 2007 and also target the sale of assets not currently utilized in business operations. Daichi Sankyo would use any sales gains to offset integration expenses. |
51
Table of Contents
| • | Daiichi Sankyo intends to invest a portion of the expected annual synergies amounting to approximately ¥12 billion in the year ending March 31, 2008 increasing to approximately ¥18 billion in the year ending March 31, 2010 in additional research and development. After providing for such increased investment, Daiichi Sankyo’s target for operating income on a Japanese GAAP basis in the year ending March 31, 2010 is approximately ¥255 billion. |
The financial targets and other forward-looking information of Daiichi Sankyo were prepared for planning purposes and with reference to the Japanese GAAP historical financial statements of each of Daiichi and Sankyo based on the current expectations of individual business units of Daiichi and Sankyo. There can be no assurance that the assumptions made in preparing the forward-looking statements will prove accurate or that the forward-looking information would not be materially different had it been based on U.S. GAAP. For information concerning factors which may cause the future financial results of Daiichi Sankyo to vary materially from its targets, see “Risk Factors” and “Cautionary Statement Concerning Forward-Looking Statements.”
Determination of the Daiichi Board of Directors
On May 13, 2005 the board of directors of Daiichi unanimously determined to approve the joint share transfer agreement and related transactions as advisable and in the best interests of Daiichi and its shareholders. Over the course of negotiations leading up to this decision, the Daiichi board of directors consulted with management as well as financial and legal advisors. Throughout this process, the board of directors of Daiichi placed emphasis on securing a business combination offering long-term growth potential greater than it believes that Daiichi would likely achieve on a stand-alone basis. The Daiichi board believes that the combination with Sankyo meets this requirement.
With respect to long-term business potential, the board considered that:
| • | the development candidates and expertise of the two companies are largely complementary, creating the potential for valuable synergies, |
| • | a combined entity would have greater resources to increase development and marketing operations in major global markets and a larger product portfolio to justify and benefit from additional investment, and |
| • | the integration steering committee established by the two companies has developed plans for the realization of cost savings following a combination. |
At the time of approving the joint share transfer agreement, the board of Daiichi also considered the following factors as generally supporting its decision to enter into the joint share transfer agreement:
| • | its understanding of the businesses, operations, financial condition, earnings and prospects of both Daiichi and Sankyo (including the report of management of Daiichi on the results of their due diligence review of Sankyo and its subsidiaries); |
| • | its understanding of the current and prospective economy and market and industry environment in which Daiichi and Sankyo operate, including global, national and local economic conditions, and the changing competitive landscape for pharmaceutical companies in Japan, including the trend toward consolidation and increased market presence of global pharmaceutical companies; |
| • | the results of its analyses of the exchange ratio, prepared by Merrill Lynch, Daiichi’s financial advisor, which included the analysis of historical stock price, comparable companies analysis and discounted cash flow analysis and other methods deemed to be relevant by Merrill Lynch; |
52
Table of Contents
| • | the final draft of the opinion, the signed version of which was delivered to the Daiichi board of directors by Merrill Lynch immediately after the Daiichi board of directors approved the joint share transfer agreement, to the effect that, as of the date of the opinion and based upon and subject to the assumptions, considerations and limitations in the opinion, the proposed exchange ratio was fair from a financial point of view to the holders of Daiichi common shares other than Sankyo and its subsidiaries and affiliates; and |
| • | the complementary nature of the businesses of Daiichi and Sankyo and the potential synergies as noted above. |
The Daiichi board of directors also considered disadvantages and potential risks associated with the combination with Sankyo in connection with its deliberations regarding the joint share transfer agreement, including:
| • | the challenges of integrating the businesses, operations and workforces of the two companies and the risk of delays given the April 2007 target for final integration of their pharmaceutical operations, |
| • | the risk that anticipated cost savings and other expected synergies may not be achieved, |
| • | the relatively weak position of both companies in major global markets outside of Japan, |
| • | the costs that are expected to be incurred in connection with completing the combination, and |
| • | that the fixed exchange ratio would not be adjusted for subsequent changes in the market prices of the shares of Daiichi and Sankyo. |
In view of the wide variety of factors considered in connection with its evaluation of the joint share transfer agreement and the complexity of these matters, the Daiichi board did not find it useful, and did not attempt, to quantify, rank or otherwise assign relative weights to these factors. In considering the factors described above, individual members of the Daiichi board may have given different weight to different factors. The Daiichi board conducted an overall analysis of the factors described above, including discussions with management and the legal and financial advisors of Daiichi, and it considered the factors overall to be favorable to, and to support, its determination.
Determination of the Sankyo Board of Directors
The board of directors of Sankyo unanimously determined on May 13, 2005 to approve the joint share transfer agreement as in the best interests of Sankyo and its shareholders. During the negotiations leading up to this decision, the Sankyo board of directors consulted with members of Sankyo’s management as well as the financial and legal advisors retained by Sankyo. Throughout this process, the Sankyo board of directors placed emphasis on securing a business combination offering a potential for long-term growth that would be greater than Sankyo would enjoy on an independent basis. The Sankyo board believes that the proposed joint share transfer with Daiichi meets this requirement.
With respect to long-term business potential, the board considered that:
| • | the expertise, product development pipeline candidates of the two companies and domestic sales force, especially in Sankyo’s largest sales category centering on treatment of cardiovascular conditions, are largely complementary, creating the potential for valuable synergies, |
53
Table of Contents
| • | a combined entity would have greater resources to increase development and marketing operations in major global markets and a larger product portfolio to justify and benefit from additional investment, and |
| • | the integration steering committee established by the two groups has developed plans for the realization of cost savings following the combination. |
At the time that it determined to approve the joint share transfer agreement, the board of Sankyo also considered the following factors as generally supporting its decision to enter into the agreement:
| • | its understanding of the businesses, operations, financial condition, earnings and prospects of both Sankyo and Daiichi (including the report of management of Sankyo on the results of their due diligence review of Daiichi and its subsidiaries), |
| • | its understanding of the current and prospective economy, market and industry environment in which Sankyo and Daiichi operate, including global, national and local economic conditions, and the changing competitive landscape for pharmaceutical companies in Japan, including the trend toward consolidation and increased market presence of global pharmaceutical companies, |
| • | the opinion delivered to the Sankyo board of directors by Nomura Securities, Sankyo’s financial advisor, to the effect that, as of the date of the opinion and based upon and subject to the considerations set forth in the opinion, the proposed exchange ratio was fair from a financial point of view to the holders of Sankyo common stock, |
| • | the complementary nature of the businesses of Sankyo and Daiichi and the potential synergies as noted above, and |
| • | the agreement that Sankyo’s current CEO will become CEO of and take a leadership role in Daiichi Sankyo. |
The Sankyo board of directors also considered disadvantages and potential risks associated with the combination with Daiichi in connection with its deliberations regarding the joint share transfer agreement, including:
| • | the challenges of integrating the businesses, operations and workforces of the two groups and the risk of delays given the April 2007 target for final integration of their pharmaceutical operations, |
| • | the risk that expected synergies and anticipated cost savings may not be achieved, |
| • | some products of Sankyo and Daiichi may be competitive or subject to change of control or non-competition provisions, |
| • | the costs expected to be incurred in connection with completing the combination, and |
| • | that the fixed exchange ratio would not be adjusted for subsequent changes in the market prices of the shares of Sankyo and Daiichi. |
In light of the wide range of factors considered in connection with its evaluation of the joint share transfer agreement and the complexity of these matters, the Sankyo board did not find it useful, and did not attempt, to quantify, rank or otherwise assign relative weights to these factors. In considering the factors described above, individual members of the Sankyo board may have given different weight to different factors.
54
Table of Contents
The Sankyo board conducted an overall analysis of the factors described above, including discussions with Sankyo management and the legal and financial advisors retained by Sankyo, and considered the factors overall to be favorable to, and to support, its determination. The Sankyo board also relied on the experience and expertise of Nomura Securities for quantitative analyses of the financial terms of the combination. See “—Advice of Sankyo’s Financial Advisor” below.
Opinion of Daiichi’s Financial Advisor
Merrill Lynch Japan Securities Co., Ltd. has acted as financial advisor to Daiichi in connection with the joint share transfer and has assisted the board of directors of Daiichi in its examination of the fairness, from a financial point of view, of the exchange ratio to the holders of Daiichi common shares.
On May 13, 2005, Merrill Lynch delivered its written opinion in Japanese to the board of directors of Daiichi that, based upon and subject to the factors and assumptions set forth in its written opinion, matters considered and limits of review set forth therein, as of such date, the exchange ratio was fair, from a financial point of view, to the holders of Daiichi common shares other than Sankyo and its subsidiaries and affiliates.
The full text of an English translation of Merrill Lynch’s opinion, dated May 13, 2005, which contains many of the assumptions Merrill Lynch made, the matters it considered and the limitations on the review it undertook in connection with the delivery of its opinion, is included in Appendix B to this document and is incorporated by reference into this proxy statement. Merrill Lynch’s opinion is directed to the board of directors of Daiichi and addresses only the fairness of the exchange ratio from a financial point of view to the holders of Daiichi common shares other than Sankyo and its subsidiaries and affiliates. It does not address any other aspect of the joint share transfer and does not constitute a recommendation to any Daiichi shareholder as to how that shareholder should vote at the general meeting of the shareholders with respect to the proposed joint share transfer or any other matter. It also does not express any opinion as to either the price at which the common shares of Daiichi or the common shares of Sankyo will trade following the announcement of the definitive joint share transfer agreement or the price at which the common shares of the combined entity will trade following the consummation of the joint share transfer. In addition, Daiichi’s board of directors did not ask Merrill Lynch to address, and the opinion does not address, the fairness to, or any other consideration of, the holders of any class of securities, creditors or other constituencies of Daiichi other than the holders of the Daiichi common shares. The following summary of Merrill Lynch’s opinion set forth below is qualified in its entirety by reference to the full text of such opinion. The holders of Daiichi common shares are urged to read the Merrill Lynch opinion carefully and in its entirety.
In connection with its opinion, Merrill Lynch, among other things:
| • | reviewed certain publicly available business and financial information relating to Daiichi and Sankyo that Merrill Lynch deemed to be relevant; |
| • | reviewed certain information, including financial forecasts, relating to the businesses, earnings, cash flow, assets, liabilities, capital and prospects of Daiichi and Sankyo furnished to Merrill Lynch by the senior management of Daiichi and Sankyo, as well as the amount and timing of the cost savings, related expenses and synergies expected to result from the joint share transfer (the “Expected Synergies”) furnished to Merrill Lynch by the senior management of Daiichi and Sankyo; |
| • | conducted discussions with members of the senior management of Daiichi and Sankyo concerning the matters described above, as well as their respective businesses and prospects before and after giving effect to the joint share transfer and the Expected Synergies; |
55
Table of Contents
| • | reviewed the market prices and valuation multiples for the common shares of Daiichi and the common shares of Sankyo and compared them with those of certain publicly traded companies that Merrill Lynch deemed to be relevant; |
| • | reviewed the results of operations of Daiichi and Sankyo and compared them with those of certain publicly traded companies that Merrill Lynch deemed to be relevant; |
| • | compared the proposed financial terms of the joint share transfer with the financial terms of certain other transactions that Merrill Lynch deemed to be relevant; |
| • | participated in certain discussions and negotiations among representatives of Daiichi and Sankyo and their financial and legal advisors; |
| • | reviewed the potential pro forma impact of the joint share transfer; |
| • | reviewed the Memorandum of Understanding between Daiichi and Sankyo, dated February 25, 2005, and a draft of the definitive joint share transfer agreement, dated May 11, 2005; and |
| • | reviewed such other financial studies and analyses and took into account such other matters as Merrill Lynch deemed necessary, including its assessment of general economic, market and monetary conditions. |
In preparing its opinion, Merrill Lynch assumed and relied on the accuracy and completeness of all information supplied or otherwise made available to it, discussed with or reviewed by or for it, or publicly available, and Merrill Lynch did not assume any responsibility for independently verifying such information or undertake an independent evaluation or appraisal of any of the assets or liabilities of Daiichi or Sankyo or their subsidiaries and affiliates nor has it been furnished with any such evaluation or appraisal, nor did it evaluate the solvency or fair value of Daiichi or Sankyo or their subsidiaries and affiliates under any laws in any jurisdiction relating to bankruptcy, insolvency or similar matters. In addition, Merrill Lynch did not assume any obligation to conduct any physical inspection of the properties or facilities of Daiichi or Sankyo or their subsidiaries or affiliates.
With respect to the financial forecast information and the Expected Synergies furnished to or discussed with Merrill Lynch by Daiichi or Sankyo, Merrill Lynch assumed that they have been reasonably prepared and reflect the best currently available estimates and judgment of Daiichi’s or Sankyo’s senior management as to the expected future financial performance of Daiichi, Sankyo or their subsidiaries and affiliates, as the case may be, and the Expected Synergies.
With Daiichi’s consent, Merrill Lynch further assumed that the joint share transfer will be accounted for as a pooling of interests under generally accepted accounting principles in Japan, which differ in certain respects from accounting principles generally accepted in other countries, and that it will qualify as a tax-free reorganization for Japanese income tax and Japanese corporate tax purposes for both companies and their respective shareholders. Merrill Lynch’s opinion is based upon financial information in accordance with generally accepted accounting principles in Japan which is supplied or otherwise made available to Merrill Lynch, discussed with or reviewed by or for Merrill Lynch, or publicly available. Merrill Lynch has not reviewed any financial information prepared by Daiichi or Sankyo under generally accepted accounting principles in the United States and has not taken account of any differences between generally accepted accounting principles in Japan and those in the United States.
Merrill Lynch has also assumed that the final form of the joint share transfer agreement was substantially identical to the last draft reviewed by it.
56
Table of Contents
Merrill Lynch’s opinion was necessarily based upon market, economic and other conditions as they existed and can be evaluated on, and on the information made available to Merrill Lynch as of, the date of the opinion. Merrill Lynch assumed that in the course of obtaining the necessary regulatory or other consents or approvals (contractual or otherwise) for the joint share transfer, no restrictions, including any divestiture requirements or amendments or modifications, will be imposed that will have an adverse effect on the contemplated benefits of the joint share transfer.
In connection with the preparation of the opinion, Merrill Lynch was not authorized by Daiichi or the board of directors to solicit, nor did Merrill Lynch solicit, third party indications of interest for the acquisition of all or any part of Daiichi.
The summary set forth above and under “Financial Analyses Used By Daiichi’s Financial Advisor” does not purport to be a complete description of the analyses or data presented by Merrill Lynch. The preparation of a fairness opinion is a complex process and is not necessarily susceptible to partial analysis or summary description. Merrill Lynch believes that the summary set forth above and its analyses must be considered as a whole and that selecting portions thereof, without considering all of its analyses, could create an incomplete view of the processes underlying its analyses and opinion.
Merrill Lynch is acting as financial advisor to Daiichi in connection with the joint share transfer, and Daiichi has agreed to pay Merrill Lynch a fee for its services. Merrill Lynch was paid a significant portion of its fee prior to the date of its opinion, and another significant portion of the fee is contingent upon the consummation of the joint share transfer. In addition, Daiichi has agreed to indemnify Merrill Lynch for certain liabilities arising out of its engagement.
Daiichi retained Merrill Lynch as financial advisor in connection with the proposed joint share transfer based upon Merrill Lynch’s qualifications, experience, reputation and expertise. Merrill Lynch is an internationally recognized investment banking firm and advisory firm. Merrill Lynch, as part of its investment banking business, is continually engaged in the valuation of businesses and securities in connection with mergers and acquisitions, negotiated underwritings, competitive biddings, secondary distributions of listed and unlisted securities, private placements and valuations for corporate and other purposes. Merrill Lynch has, in the past, provided investment banking services including financing services to Daiichi and Sankyo and may continue to do so and has received, and may receive, fees for the rendering of such services. In addition, in the ordinary course of its business, Merrill Lynch may actively trade or hold the securities of Daiichi and/or Sankyo for its own account and for the accounts of customers and, accordingly, may at any time hold a long or short position in such securities. In addition, professionals in Merrill Lynch’s research department and other divisions may base their analyses and publications on different market and operating assumptions and on different valuations methodologies when compared to Merrill Lynch’s fairness opinion. As a result, the research reports and other publications prepared by them may contain entirely different results.
Financial Analyses Used by Daiichi’s Financial Advisor
The following is a summary of the material financial analyses presented by Merrill Lynch in Japanese to the board of directors of Daiichi on May 13, 2005 in connection with the joint share transfer. These analyses, as updated through May 11, 2005, also provided in substantial part the basis for its opinion. However, it does not purport to be a complete description of the analyses performed by Merrill Lynch or of its presentations to the board of directors of Daiichi. The following summary includes information presented in tabular format. In order to understand fully the financial analyses used by Merrill Lynch, these tables must be read together with the text of each summary. The tables alone do not constitute a complete description of the financial analyses. The following quantitative information, to the extent it is based on market data, is, except as otherwise indicated, based on market data as it existed at or prior to May 11, 2005 and is not necessarily indicative of current or future market conditions. All Institutional Brokers Estimate System (“IBES”) estimates used in the analyses described below are median estimates of research analysts compiled by IBES.
57
Table of Contents
The preparation of a fairness opinion is a complex analytical process involving various determinations as to the most appropriate and relevant methods of financial analyses and the application of those methods to the particular circumstances and, therefore, such an opinion is not readily susceptible to partial analysis or summary description. No company, business or transaction used in those analyses as a comparison is identical to Daiichi, Sankyo or the joint share transfer, nor is an evaluation of the results of those analyses entirely mathematical; rather, it involves complex considerations and judgments concerning financial and operating characteristics and other factors that could affect the transactions, public trading or other values of the companies, business segments or transactions being analyzed. The estimates contained in those analyses and the ranges of valuations resulting from any particular analysis are not necessarily indicative of actual results or values or predictive of future results or values, which may be significantly more or less favorable than those suggested by those analyses. In addition, analyses relating to the value of businesses or securities are not appraisals and may not reflect the prices at which businesses, companies or securities actually may be sold. Accordingly, these analyses and estimates are inherently subject to substantial uncertainty.
Merrill Lynch’s written presentation to the board of directors of Daiichi contains its assumptions concerning the joint share transfer, including (1) the financial and operating information, including financial forecasts relating to the businesses, earnings, cash flow, assets, liabilities, capital and prospects of Daiichi prepared by the senior management of Daiichi and furnished to Merrill Lynch by the senior management of Daiichi (the “Daiichi Estimates”) and (2) the financial and operating information, including financial forecasts relating to the businesses, earnings, cash flow, assets, liabilities, capital and prospects of Sankyo prepared by the senior management of Sankyo as adjusted by the senior management of Daiichi and furnished to Merrill Lynch by the senior management of Daiichi (the “Sankyo Estimates”) as well as (3) estimates of the amount and timing of the Expected Synergies prepared by the senior management of Daiichi and the senior management of Sankyo furnished to Merrill Lynch by the senior management of Daiichi (the “Estimated Synergies”). The Estimated Synergies include possible negative synergies in items such as sales and cost. With respect to the Daiichi Estimates, the Sankyo Estimates and the Estimated Synergies, Merrill Lynch assumed that they were reasonably prepared and reflect the best then available estimates and judgment of the senior management of Daiichi and Sankyo, as applicable, as to the expected future financial performance of Daiichi, Sankyo, as the case may be, and the Expected Synergies.
With Daiichi’s consent, Merrill Lynch further assumed that the joint share transfer will be accounted for as a pooling of interests under generally accepted accounting principles in Japan, which differ in certain respects from accounting principles generally accepted in other countries, and that it will qualify as a tax-free reorganization for Japanese income tax and Japanese corporate tax purposes for both companies and their respective shareholders. Merrill Lynch’s opinion is based upon financial information in accordance with generally accepted accounting principles in Japan which is supplied or otherwise made available to Merrill Lynch, discussed with or reviewed by or for Merrill Lynch, or publicly available. Merrill Lynch has not reviewed any financial information prepared by Daiichi or Sankyo under generally accepted accounting principles in the United States and has not taken account of any differences between generally accepted accounting principles in Japan and those in the United States.
In arriving at its opinion, Merrill Lynch made qualitative judgments as to the significance and relevance of each analysis and factor considered by it. Accordingly, Merrill Lynch believes that its analysis must be considered as a whole and that selecting portions of its analysis and factors, without considering all analysis and factors, could create an incomplete view of the processes underlying such analysis and its opinion. In its analysis, Merrill Lynch made numerous assumptions with respect to Daiichi, Sankyo, industry performance and regulatory environment, general business, economic, market and financial conditions, as well as other matters, many of which are beyond the control of Daiichi and involve the application of complex methodologies and educated judgment.
58
Table of Contents
The following is a summary of each of the material financial analyses performed by Merrill Lynch in connection with its opinion dated May 13, 2005.
Outstanding Shares of Daiichi and Sankyo
Merrill Lynch has assumed that Daiichi has 268.596 million common shares issued and outstanding on a fully diluted basis based on the number of common shares issued and outstanding as of March 31, 2005 and adjusted for treasury stock and stock options pursuant to the treasury stock method (the “Treasury Stock Method”) as of May 11, 2005 and Sankyo has 429.646 million common shares issued and outstanding on a fully diluted basis pursuant to the Treasury Stock Method as of May 11, 2005.
Daiichi Common Shares
Analysis of Historical Stock Price of Daiichi Common Shares
The per share closing price trading data for the previous day, one-week average, one-month average and three-months average for each of (1) February 19, 2005, which is the date on which the joint share transfer discussions with Sankyo were reported by Nihon Keizai Shinbun (the “Nikkei Newspaper”), (2) February 25, 2005, which is the date on which the memorandum of understanding was executed and announced and (3) May 13, 2005, which is the date that the definitive joint share transfer agreement was executed and announced, is summarized in the table below.
| Reference Date | |||||||||
| Alliance with Sankyo Reported by the Nikkei Newspaper (2/19/2005) | Announcement of Memorandum of Understanding (2/25/2005) | Announcement of Definitive Joint Share Transfer Agreement (5/13/2005)1 | |||||||
Previous Day | ¥ | 2,450 | ¥ | 2,475 | ¥ | 2,360 | |||
1 Week Average | ¥ | 2,429 | ¥ | 2,496 | ¥ | 2,380 | |||
1 Month Average | ¥ | 2,369 | ¥ | 2,415 | ¥ | 2,395 | |||
3 Months Average | ¥ | 2,214 | ¥ | 2,241 | ¥ | 2,477 | |||
1 Note that with respect to each reference to May 13, 2005 in this section “Financial Analyses Used by Daiichi’s Financial Advisor”, Merrill Lynch used data as of May 11, 2005 as the data on the day previous to May 13, 2005.
Comparable Companies Analysis
Merrill Lynch reviewed certain publicly available financial, operating and stock market information for certain pharmaceutical companies in Japan. These companies were:
| • | Takeda Pharmaceutical Co., Ltd. |
| • | Astellas Pharma Inc. |
| • | Eisai Co., Ltd. |
| • | Chugai Pharmaceutical Co., Ltd. |
| • | Ono Pharmaceutical Co., Ltd. |
| • | Shionogi & Co., Ltd. |
| • | Mitsubishi Pharma Corporation |
| • | Kyowa Hakko Kogyo Co., Ltd. |
| • | Tanabe Seiyaku Co., Ltd. |
| • | Dainippon Pharmaceutical Co., Ltd. |
| • | Kissei Pharmaceutical Co., Ltd. |
| • | Kyorin Pharmaceutical Co., Ltd. |
59
Table of Contents
For each of these companies, Merrill Lynch calculated the ratio of enterprise value on May 11, 2005 to EBITDA and the ratio of the closing share price on May 11, 2005 to earnings per share for the fiscal years ending March 31, 2006 and March 31, 2007 using IBES estimates (except in respect of Chugai, which operates on a fiscal year ending December 31, and for which Merrill Lynch used estimates for December 31, 2005 and December 31, 2006 in this analysis and each other analysis described in this section “Financial Analyses Used by Daiichi’s Financial Advisor”) and then derived ranges of implied valuations for Daiichi common shares.
| Multiple | Per Share Value | |||||||||
| Minimum | Maximum | Daiichi | ||||||||
Enterprise value to EBITDA multiple (March 31, 2006 Estimates) | 6.5x | 8.5x | ¥ | 2,063 | ¥ | 2,535 | ||||
Enterprise value to EBITDA multiple (March 31, 2007 Estimates) | 6.0x | 8.0x | ¥ | 2,066 | ¥ | 2,578 | ||||
Price-to-earnings multiple (March 31, 2006 Estimates) | 16.5x | 20.5x | ¥ | 1,858 | ¥ | 2,309 | ||||
Price-to-earnings multiple (March 31, 2007 Estimates) | 16.0x | 20.0x | ¥ | 1,957 | ¥ | 2,447 | ||||
By applying to Daiichi’s EBITDA for the fiscal year ending March 31, 2006, as provided in the Daiichi Estimates, a range of multiples from 6.5x to 8.5x derived from the comparable companies’ enterprise value to EBITDA multiples for the fiscal year ending March 31, 2006, Merrill Lynch derived an implied valuation per Daiichi common share of ¥2,063 to ¥2,535. By applying to Daiichi’s EBITDA for the fiscal year ending March 31, 2007, as provided in the Daiichi Estimates, a range of multiples from 6.0x to 8.0x derived from the comparable companies’ enterprise value to EBITDA multiples for the fiscal year ending March 31, 2007, Merrill Lynch derived an implied valuation per Daiichi common share of ¥2,066 to ¥2,578. By applying to Daiichi’s normalized earnings per share for the fiscal year ending March 31, 2006, a range of multiples from 16.5x to 20.5x derived from the comparable companies’ price-to-earnings multiples for the fiscal year ending March 31, 2006, Merrill Lynch derived an implied valuation per Daiichi common share of ¥1,858 to ¥2,309. By applying to Daiichi’s normalized earnings per share for the fiscal year ending March 31, 2007, a range of multiples from 16.0x to 20.0x derived from the comparable companies’ price-to-earnings multiples for the fiscal year ending March 31, 2007, Merrill Lynch derived an implied valuation per Daiichi common share of ¥1,957 to ¥2,447. Merrill Lynch calculated normalized earnings per share by dividing normalized net income, as provided in the Daiichi Estimates, by the number of shares outstanding, as calculated by the Treasury Stock Method as of May 11, 2005.
Comparable Transactions Analysis
Merrill Lynch reviewed certain publicly available financial and stock market information for comparable transactions in Japan. These transactions were:
| • | SSP Co., Ltd. /Nippon Boehringer Ingelheim Co., Ltd |
| • | Mitsubishi-Tokyo Pharmaceuticals, Inc./Welfide, Corp. |
| • | Chugai Pharmaceutical Co., Ltd./F. Hoffmann-La Roche Ltd. |
| • | Banyu Pharmaceutical Co., Ltd./Merck & Co., Inc. |
| • | Mitsubishi Pharma Corporation/Mitsubishi Chemical Corporation (tender offer announced November 2003) |
| • | Fujisawa Pharmaceutical Co., Ltd./Yamanouchi Pharmaceutical Co., Ltd. |
| • | Sumitomo Pharmaceuticals Co., Ltd./Dainippon Pharmaceutical Co., Ltd. |
| • | Mitsubishi Pharma Corporation/Mitsubishi Chemical Corporation (joint share transfer announced April 2005) |
60
Table of Contents
For each of these comparable transactions, Merrill Lynch calculated transaction value to EBITDA multiples for the latest 12-month periods preceding the announcements. Merrill Lynch also calculated price-to-earnings multiples by dividing offer value for the selected comparable transactions by net income of the target company for the latest 12-month periods preceding announcements. The following table presents the ranges of valuations per Daiichi common share implied by this analysis.
| Multiple | Per Share Value | |||||||||
| Minimum | Maximum | Daiichi | ||||||||
Transaction value to EBITDA (March 31, 2005 Actuals) | 9.0x | 12.0x | ¥ | 2,907 | ¥ | 3,699 | ||||
Price-to-earnings (March 31, 2005 Actuals) | 23.0x | 29.0x | ¥ | 3,036 | ¥ | 3,828 | ||||
By applying to Daiichi’s EBITDA for the fiscal year ending March 31, 2005 a range of multiples derived from the comparable transactions transaction value to EBITDA multiples from 9.0x to 12.0x of the target company for the latest 12-month periods preceding announcements, Merrill Lynch derived an implied valuation per Daiichi common share of ¥2,907 to ¥3,699. By applying to Daiichi’s normalized earnings per share for the fiscal year ending March 31, 2005 a range of multiples derived from the comparable transactions transaction value to price-to-earnings multiples of 23.0x to 29.0x of the target company for the latest 12-month periods preceding announcements, Merrill Lynch derived an implied valuation per Daiichi common share of ¥3,036 to ¥3,828.
Discounted Cash Flow Analysis
Merrill Lynch performed a discounted cash flow analysis to estimate a range of present values per Daiichi common share assuming Daiichi continued to operate as a stand-alone entity. This range was calculated by adding (1) the sum of the discounted net present value of the stream of Daiichi’s unlevered free cash flows over the next five years and (2) the discounted net present value of the terminal value, calculated both by applying a range of enterprise value to EBITDA multiples to Daiichi’s normalized EBITDA for the fiscal year ending March 31, 2010 and by applying a range of perpetual growth rates to Daiichi’s normalized unlevered free cash flow for the fiscal year ending March 31, 2010. Normalized EBITDA and normalized unlevered free cash flow were calculated by taking into account items, including changes in royalty revenue resulting from patent expiration, based on instructions from the senior management of Daiichi. Merrill Lynch applied enterprise value to EBITDA multiples ranging from 6.5x to 8.5x to Daiichi’s normalized EBITDA for the fiscal year ending March 31, 2010. Merrill Lynch applied perpetual growth rates ranging from -0.25% to 0.25% to Daiichi’s normalized unlevered free cash flow for the fiscal year ending March 31, 2010. Merrill Lynch used discount rates ranging from 4.0% to 6.0% in these calculations. For the purposes of such analysis, Merrill Lynch utilized the Daiichi Estimates for the period from the fiscal year ending March 31, 2006 to the fiscal year ending March 31, 2010. Based on this analysis, Merrill Lynch derived an implied valuation per Daiichi common share of ¥2,530 to ¥3,140 using the EBITDA multiple method and ¥3,042 to ¥4,587 using the perpetual growth method.
Sankyo Common Shares
Analysis of Historical Share Price of Sankyo Common Shares
The per share closing price trading data for the previous day, one-week average, one-month average and three-months average for each of (1) February 19, 2005, which is the date on which the joint share transfer discussions with Daiichi were reported by the Nikkei Newspaper, (2) February 25, 2005, which is the date on
61
Table of Contents
which the memorandum of understanding was executed and announced and (3) May 13, 2005, which is the date that the definitive joint share transfer agreement was executed and announced, is summarized in the table below.
| Reference Date | |||||||||
| Alliance with Daiichi Reported by the Nikkei Newspaper (2/19/2005) | Announcement (2/25/2005) | Announcement of Definitive Joint Share Transfer Agreement (5/13/2005) | |||||||
Previous Day | ¥ | 2,345 | ¥ | 2,400 | ¥ | 2,150 | |||
1 Week Average | ¥ | 2,339 | ¥ | 2,403 | ¥ | 2,163 | |||
1 Month Average | ¥ | 2,311 | ¥ | 2,337 | ¥ | 2,161 | |||
3 Months Average | ¥ | 2,219 | ¥ | 2,239 | ¥ | 2,258 | |||
Comparable Companies Analysis
Merrill Lynch reviewed certain publicly available financial, operating and stock market information for certain pharmaceutical companies in Japan. These companies were:
| • | Takeda Pharmaceutical Co., Ltd. |
| • | Astellas Pharma Inc. |
| • | Eisai Co., Ltd. |
| • | Chugai Pharmaceutical Co., Ltd. |
| • | Ono Pharmaceutical Co., Ltd. |
| • | Shionogi & Co., Ltd. |
| • | Mitsubishi Pharma Corporation |
| • | Kyowa Hakko Kogyo Co., Ltd. |
| • | Tanabe Seiyaku Co., Ltd. |
| • | Dainippon Pharmaceutical Co., Ltd. |
| • | Kissei Pharmaceutical Co., Ltd. |
| • | Kyorin Pharmaceutical Co., Ltd. |
For each of these companies, Merrill Lynch calculated the ratio of enterprise value on May 11, 2005 to EBITDA and the ratio of the closing share price on May 11, 2005 to earnings per share for the fiscal years ending March 31, 2006 and March 31, 2007 using IBES estimates and then derived ranges of implied valuations for Sankyo common shares.
| Multiple | Per Share Value | |||||||||
| Minimum | Maximum | Sankyo | ||||||||
Enterprise value to EBITDA multiple (March 31, 2006 Estimates) | 6.5x | 8.5x | ¥ | 2,055 | ¥ | 2,478 | ||||
Enterprise value to EBITDA multiple (March 31, 2007 Estimates) | 6.0x | 8.0x | ¥ | 1,585 | ¥ | 1,886 | ||||
Price-to-earnings multiple (March 31, 2006 Estimates) | 16.5x | 20.5x | ¥ | 1,420 | ¥ | 1,765 | ||||
Price-to-earnings multiple (March 31, 2007 Estimates) | 16.0x | 20.0x | ¥799 | ¥999 | ||||||
By applying to Sankyo’s EBITDA for the fiscal year ending March 31, 2006, as provided in the Sankyo Estimates, a range of multiples from 6.5x to 8.5x derived from the comparable companies’ enterprise value to
62
Table of Contents
EBITDA multiples for the fiscal year ending March 31, 2006, Merrill Lynch derived an implied valuation per Sankyo common share of ¥2,055 to ¥2,478. By applying to Sankyo’s EBITDA for the fiscal year ending March 31, 2007, as provided in the Sankyo Estimates, a range of multiples from 6.0x to 8.0x derived from the comparable companies’ enterprise value to EBITDA multiples for the fiscal year ending March 31, 2007, Merrill Lynch derived an implied valuation per Sankyo common share of ¥1,585 to ¥1,886. By applying to Sankyo’s normalized earnings per share for the fiscal year ending March 31, 2006, a range of multiples from 16.5x to 20.5x derived from the comparable companies’ price-to-earnings multiples for the fiscal year ending March 31, 2006, Merrill Lynch derived an implied valuation per Sankyo common share of ¥1,420 to ¥1,765. By applying to Sankyo’s normalized earnings per share for the fiscal year ending March 31, 2007, a range of multiples from 16.0x to 20.0x derived from the comparable companies’ price-to-earnings multiples for the fiscal year ending March 31, 2007, Merrill Lynch derived an implied valuation per Sankyo common share of ¥799 to ¥999. Merrill Lynch calculated normalized earnings per share by dividing normalized net income, as provided in the Sankyo Estimates, by the number of shares outstanding, as calculated by the Treasury Stock Method as of May 11, 2005.
Discounted Cash Flow Analysis
Merrill Lynch performed a discounted cash flow analysis to estimate a range of present values per Sankyo common share assuming Sankyo continued to operate as a stand-alone entity. This range was calculated by adding (1) the sum of the discounted present value of the stream of Sankyo’s unlevered free cash flows over the next five years and (2) the discounted net present value of the terminal value, calculated both by applying a range of enterprise value to EBITDA multiples to Sankyo’s normalized EBITDA for the fiscal year ending March 31, 2010 and by applying a range of perpetual growth rates to Sankyo’s normalized unlevered free cash flow for the fiscal year ending March 31, 2010. Merrill Lynch applied enterprise value to EBITDA multiples ranging from 6.5x to 8.5x to Sankyo’s normalized EBITDA for the fiscal year ending March 31, 2010. Merrill Lynch applied perpetual growth rates ranging from -0.25% to 0.25% to Sankyo’s normalized unlevered free cash flow for the fiscal year ending March 31, 2010. Merrill Lynch used discount rates ranging from 4.0% to 6.0% in these calculations. For the purposes of such analysis, Merrill Lynch utilized the Sankyo Estimates, for the period from the fiscal year ending March 31, 2006 to the fiscal year ending March 31, 2010. Based on this analysis, Merrill Lynch derived an implied valuation per Sankyo common share of ¥2,399 to ¥3,017 using the EBITDA multiple method and ¥2,782 to ¥4,243 using the perpetual growth method.
Analysis of the Exchange Ratio
Based on its analysis of the valuations per Daiichi common share and valuations per Sankyo common share, Merrill Lynch calculated implied exchange ratio ranges and the implied premium based on the exchange ratio of 1.159 shares of Daiichi Sankyo common shares per Daiichi common share and one share of Daiichi Sankyo common shares per Sankyo common share that Daiichi and Sankyo negotiated. Merrill Lynch also assessed the exchange ratio of 1.159 shares of Daiichi Sankyo common shares for each Daiichi common share using a pro forma earnings per share accretion/dilution analysis.
63
Table of Contents
Implied Exchange Ratio Based on Share Price
Merrill Lynch calculated implied exchange ratios based on historical share prices of Daiichi common shares and Sankyo common shares and compared these implied exchange ratio ranges with the exchange ratio of 1.159 shares of Daiichi Sankyo common shares per Daiichi common share and one share of Daiichi Sankyo common shares per Sankyo common share. The exchange ratios implied by the per share closing price trading data for the previous day, one-week average, one-month average and three-months average for February 19, 2005, which is the date on which the joint share transfer discussions with Sankyo were reported by the Nikkei Newspaper, is summarized in the table below.
| Alliance with Sankyo Reported by the Nikkei Newspaper 2/19/2005 | ||
Previous Day | 1.045 | |
1 Week Average | 1.038 | |
1 Month Average | 1.025 | |
3 Months Average | 0.998 |
Implied Exchange Ratio Based on Comparable Companies Analysis
Merrill Lynch calculated implied exchange ratios based on the implied valuations per Daiichi common share and per Sankyo common share derived by (a) applying to Daiichi’s and Sankyo’s EBITDA for the fiscal years ending March 31, 2006 and March 31, 2007, as provided in the Daiichi Estimates and the Sankyo Estimates, respectively, a range of multiples derived from the comparable companies’ enterprise value to EBITDA multiples for the fiscal years ending March 31, 2006 and March 31, 2007, respectively, and (b) applying to Daiichi’s and Sankyo’s normalized earnings per share for the fiscal years ending March 31, 2006 and March 31, 2007, a range of multiples derived from the comparable companies’ price-to-earnings multiples for the fiscal years ending March 31, 2006 and March 31, 2007. Merrill Lynch calculated normalized earnings per share by dividing normalized net income, as provided in the Daiichi Estimates and the Sankyo Estimates, by the number of shares outstanding, as calculated by the Treasury Stock Method as of May 11, 2005. See “Comparable Companies Analysis” above for each of Daiichi and Sankyo. Such implied exchange ratios are summarized in the table below:
| Multiple | Implied Exchange Ratio | |||||
| Minimum | Maximum | |||||
Enterprise value to EBITDA multiple (March 31, 2006 Estimates) | 6.5x | 8.5x | 1.004 to 1.023 | |||
Enterprise value to EBITDA multiple (March 31, 2007 Estimates) | 6.0x | 8.0x | 1.303 to 1.367 | |||
Price-to-earnings multiple (March 31, 2006 Estimates) | 16.5x | 20.5x | 1.308 | |||
Price-to-earnings multiple (March 31, 2007 Estimates) | 16.0x | 20.0x | 2.450 | |||
Implied Exchange Ratio Based on Discounted Cash Flow Analysis
Merrill Lynch calculated implied exchange ratios based the implied valuations per Daiichi common share and Sankyo common share derived by performing a discounted cash flow analysis to estimate a range of
64
Table of Contents
present values per Daiichi common share and Sankyo common share assuming Daiichi and Sankyo, respectively, continued to operate as a stand-alone entity. These ranges were calculated by adding (1) the sum of the discounted net present value of the stream of Daiichi’s and Sankyo’s, as applicable, unlevered free cash flows over the next five years and (2) the discounted net present value of the terminal value, calculated both by applying a range of enterprise value to EBITDA multiples to Daiichi’s and Sankyo’s, as applicable, normalized EBITDA for the fiscal year ending March 31, 2010 and by applying a range of perpetual growth rates to Daiichi’s and Sankyo’s, as applicable, normalized unlevered free cash flow for the fiscal year ending March 31, 2010. Merrill Lynch applied enterprise value to EBITDA multiples ranging from 6.5x to 8.5x to Daiichi’s and Sankyo’s, as applicable, normalized unlevered free cash flow for the fiscal year ending March 31, 2010. Merrill Lynch applied perpetual growth rates ranging from -0.25% to 0.25% to Daiichi’s and Sankyo’s, as applicable, normalized unlevered free cash flow for the fiscal year ending March 31, 2010. Merrill Lynch used discount rates ranging from 4.0% to 6.0% in these calculations. See “Discounted Cash Flow Analysis” above for each of Daiichi and Sankyo. For purposes of such analysis, Merrill Lynch utilized the Daiichi Estimates and the Sankyo Estimates for the period from the fiscal year ending March 31, 2006 to the fiscal year ending March 31, 2010. Such implied exchange ratios are summarized in the table below:
Multiple or Rate (as applicable) | Implied Exchange Ratio | |||||
| Minimum | Maximum | |||||
EBITDA multiple method | 6.5x | 8.5x | 1.041 to 1.054 | |||
Perpetual growth method | -0.25x | 0.25x | 1.081 to 1.093 | |||
Implied Premiums of the Exchange Ratio
Merrill Lynch calculated the implied premiums for the Daiichi common shares of the exchange ratio of 1.159 shares of Daiichi Sankyo common shares per Daiichi common share based on the historical share prices of Daiichi common shares and Sankyo common shares. The implied premiums were calculated by multiplying the closing price trading data for the previous day of Sankyo common shares by the exchange ratio of 1.159 shares of Daiichi Sankyo common shares per Daiichi common share and 1 share of Daiichi Sankyo common shares per Sankyo common share, and dividing by the per share closing price trading data for Daiichi common shares for the previous day, one-week average, one-month average and three-months average for each of (1) February 19, 2005, which is the date on which the joint share transfer discussions with Sankyo were reported by the Nikkei Newspaper, (2) February 25, 2005, which is the date on which the memorandum of understanding was executed and announced and (3) May 13, 2005, which is the date that the definitive joint share transfer agreement was executed and announced. Such implied premiums are summarized in the table below:
| Reference Date | |||||||||
| Alliance with Sankyo Reported by the Nikkei Newspaper (2/19/2005) | Announcement of Memorandum of Understanding (2/25/2005) | Announcement of Definitive Joint Share Transfer Agreement (5/13/2005) | |||||||
Previous Day | 10.9 | % | 12.4 | % | 5.6 | % | |||
1 Week Average | 11.9 | % | 11.4 | % | 4.7 | % | |||
1 Month Average | 14.7 | % | 15.2 | % | 4.0 | % | |||
3 Months Average | 22.8 | % | 24.1 | % | 0.6 | % | |||
Contribution Analysis
Merrill Lynch calculated Daiichi’s and Sankyo’s respective contribution to the combined entity using the following components of the Daiichi Estimates and the Sankyo Estimates for the fiscal years ending
65
Table of Contents
March 31, 2005 through March 31, 2010: sales, EBITDA and normalized net income. The results of this analysis are summarized in the table below:
| Total Contribution | ||||
| Daiichi | Sankyo | |||
Sales (March 31, 2005 Actual) | 35.9% | 64.1% | ||
Sales (March 31, 2006 Estimates) | 37.4% | 62.6% | ||
Sales (March 31, 2007 Estimates) | 39.8% | 60.2% | ||
Sales (March 31, 2008 Estimates) | 38.7% | 61.3% | ||
Sales (March 31, 2009 Estimates) | 37.6% | 62.4% | ||
Sales (March 31, 2010 Estimates) | 37.0% | 63.0% | ||
EBITDA (March 31, 2005 Actual) | 38.4% | 61.6% | ||
EBITDA (March 31, 2006 Estimates) | 41.1% | 58.9% | ||
EBITDA (March 31, 2007 Estimates) | 51.5% | 48.5% | ||
EBITDA (March 31, 2008 Estimates) | 41.9% | 58.1% | ||
EBITDA (March 31, 2009 Estimates) | 49.2% | 50.8% | ||
EBITDA (March 31, 2010 Estimates) | 42.5% | 57.5% | ||
Normalized Net Income (March 31, 2005 Actual) | 42.3% | 57.7% | ||
Normalized Net Income (March 31, 2006 Estimates) | 45.0% | 55.0% | ||
Normalized Net Income (March 31, 2007 Estimates) | 60.5% | 39.5% | ||
Normalized Net Income (March 31, 2008 Estimates) | 45.6% | 54.4% | ||
Normalized Net Income (March 31, 2009 Estimates) | 54.1% | 45.9% | ||
Normalized Net Income (March 31, 2010 Estimates) | 44.5% | 55.5% | ||
Pro Forma Earnings Per Share Accretion/Dilution Analysis
Merrill Lynch analyzed the financial impact of the joint share transfer on the normalized earnings per share for Daiichi and Sankyo common shares, using the after-tax normalized synergies included in the Estimated Synergies as well as Daiichi and Sankyo normalized net income for the fiscal year ending March 31, 2005 through the fiscal year ending March 31, 2010 as provided in the Daiichi Estimates and the Sankyo Estimates. Merrill Lynch calculated normalized earnings per share by dividing normalized net income, as provided in the Daiichi Estimates and the Sankyo Estimates, by the number of shares outstanding, as calculated by the Treasury Stock Method as of May 11, 2005.
This analysis indicated that with after-tax normalized synergies, the joint share transfer would be approximately 0.5% accretive to Sankyo’s normalized earnings per share for the fiscal year ending March 31, 2005, approximately 5.2% accretive to Sankyo’s normalized earnings per share for the fiscal year ending March 31, 2006, approximately 53.2% accretive to Sankyo’s normalized earnings per share for the fiscal year ending March 31, 2007, approximately 29.7% accretive to Sankyo’s normalized earnings per share for the fiscal year ending March 31, 2008, approximately 71.2% accretive to Sankyo’s normalized earnings per share for the fiscal year ending March 31, 2009 and approximately 30.1% accretive to Sankyo’s normalized earnings per share for the fiscal year ending March 31, 2010.
This analysis also indicated that with after-tax normalized synergies, the joint share transfer would be approximately 0.7% dilutive to Daiicihi’s normalized earnings per share for the fiscal year ending March 31, 2005, approximately 6.8% dilutive to Daiicihi’s normalized earnings per share for the fiscal year ending March 31, 2006, approximately 27.5% dilutive to Daiicihi’s normalized earnings per share for the fiscal year ending March 31, 2007, approximately 12.3% accretive to Daiicihi’s normalized earnings per share for the fiscal year ending March 31, 2008, approximately 5.1% accretive to Daiicihi’s normalized earnings per share for the fiscal year ending March 31, 2009 and approximately 17.4% accretive to Daiicihi’s normalized earnings per share for the fiscal year ending March 31, 2010.
66
Table of Contents
Opinion of Sankyo’s Financial Advisor
Nomura rendered its opinion to Sankyo’s board of directors that, as of May 13, 2005, and based upon and subject to the factors and assumptions set forth therein, the exchange ratio was fair from a financial point of view to the holders of Sankyo common stock.
The full text of the written opinion of Nomura, dated May 13, 2005, which sets forth assumptions made, procedures followed, matters considered and limitations on the review undertaken in connection with the opinion, is attached as Appendix C. Nomura provided its opinion only for the information of the board of directors of Sankyo in connection with its evaluation of the exchange ratio. The Nomura opinion does not constitute a recommendation as to how any holder of shares of Sankyo common stock should vote or act on any matter relating to the joint share transfer.
In connection with rendering the opinion described above and performing its related financial analyses, Nomura, among other things:
| • | reviewed and analyzed financial information, such as financial statements, contained in the annual securities reports and other disclosure materials, of Sankyo and Daiichi respectively; |
| • | reviewed and analyzed revenue and expenditure projections of each of Sankyo and Daiichi for each of the fiscal years ending March 31, 2006 through March 31, 2010 received from Sankyo; |
| • | reviewed and analyzed projections relating to integration synergies for each of the fiscal years ending March 31, 2006 through March 31, 2010 received from Sankyo; |
| • | reviewed and analyzed market share price and market trading activities for shares of both Sankyo common stock and Daiichi common stock; |
| • | reviewed and analyzed financial data and market share price comparisons of publicly held companies in businesses comparable to those of Sankyo and Daiichi; |
| • | reviewed a report, dated April 18, 2005, on legal due diligence performed by Mori Hamada & Matsumoto on Daiichi received from Sankyo; |
| • | reviewed a report, dated April 1, 2005, on accounting due diligence performed by Ernst & Young ShinNihon on Daiichi received from Sankyo; |
| • | interviewed the management of Sankyo with respect to the effect of the joint share transfer, including the status of the business and financial condition and the future revenue and expenditure projections of Sankyo and Daiichi and their integration synergies; |
| • | reviewed and analyzed a draft of the joint share transfer agreement; and |
| • | reviewed and analyzed such other facts received from Sankyo in response to Nomura’s request or obtained ourselves through Nomura’s general investigation as Nomura considered appropriate and necessary. |
Nomura assumed the accuracy and completeness of all public information reviewed by it and all financial and other information provided to it for purposes of rendering its opinion. Nomura did not verify or assume any responsibility to independently verify the accuracy or completeness of any such information. In addition, Nomura did not make any independent valuation, appraisal or assessment of any of the assets or
67
Table of Contents
liabilities (including derivatives, off-balance sheet assets and liabilities, and other contingent liabilities) of Sankyo, Daiichi or their affiliates, nor did Nomura make any request to a third party for any such appraisal or assessment. With respect to the financial forecasts and other forward-looking information on Sankyo and Daiichi provided to Nomura, Nomura assumed that such information was reasonably prepared by the managements of Sankyo and Daiichi on a basis reflecting the best currently available estimates and judgments of Sankyo and Daiichi and that the future financial condition of Daiichi Sankyo will be consistent with such forecasts. In preparing its opinion, Nomura relied on these forecasts and related materials without independent verification. Nomura assumed, without independent verification, that the joint share transfer will be carried out lawfully and validly in accordance with the terms set forth in the joint share transfer agreement and that the joint share transfer will not have any accounting or tax consequences different from the assumptions provided to it. In addition, Nomura assumed, without independent verification, that all governmental, regulatory or other consents and approvals necessary for the consummation of the joint share transfer will be obtained without any adverse effect on the contemplated benefits of the joint share transfer and that the joint share transfer will be consummated in accordance with the terms of the joint share transfer agreement, without waiver, modification or amendment of any material term or agreement therein. Nomura was not asked to provide, and did not provide, any opinion on any transaction other than the joint share transfer or on the relative merits of the joint share transfer as compared to any other transaction. Nomura was under no obligation to Sankyo or its board of directors to solicit indications of interest from any third party in connection with the joint share transfer, nor did Nomura make any such solicitations. Nomura’s opinion is not an expression of an opinion regarding the prices at which the common stock of Sankyo or Daiichi will or should be traded prior to the consummation of the joint share transfer or of the value or prices of common stock of Daiichi Sankyo to be issued to Sankyo’s shareholders. Nomura was not asked to provide, and did not provide, any opinion on any of the premises or assumptions upon which the determination of the exchange ratio was based or the underlying business decision of Sankyo to proceed with the joint share transfer.
The following is a summary of the material financial analyses delivered by Nomura to the board of directors of Sankyo in connection with rendering the opinion described above, but does not purport to be a complete description of the financial analyses performed by Nomura, nor does the order of analyses described represent relative importance or weight given to those analyses by Nomura.The summary includes information presented in tabular format. In order to fully understand the financial analyses, the tablesmust be read together with the full text of each summary. The tables alone do not constitute a complete description of Nomura’s financial analyses.Except as otherwise noted, the following quantitative information, to the extent that it is based on market data, is based on market data as it existed on or before May 13, 2005 and is not necessarily indicative of current market conditions.
Market Share Price Analysis. Nomura reviewed the average trading prices for the common stock of Sankyo and Daiichi and calculated an implied exchange ratio of 1.04 per share of Daiichi for the period from January 31, 2005, the first business day after Daiichi announced results for the fiscal quarter ended December 31, 2004 and revised forecasts, through February 18, 2005, the last business day before the transaction was reported in the press, and an implied exchange ratio of 1.11 per share of Daiichi for the period from February 28, 2005, the first business day after the announcement of the transaction, through May 10, 2005.
In addition, Nomura noted as references the implied exchange ratios per share of Daiichi for the following dates and periods:
| • | an implied exchange ratio of 1.04 for February 18, 2005; |
| • | an implied exchange ratio of 1.03 for the one-month period ended February 18, 2005; and |
| • | an implied exchange ratio of 1.00 for the three-month period ended February 18, 2005. |
68
Table of Contents
Discounted Cash Flow Analysis. Nomura performed a discounted cash flow analysis on Sankyo and Daiichi using Sankyo’s management projections. The projections provided by Sankyo incorporated projections with respect to synergies expected to result from the joint share transfer, including the effects of dis-synergies, such as costs and sales dis-synergies resulting from the joint share transfer. Nomura calculated illustrative exchange ratios per share of Daiichi using the net present value of projected free cash flows for Sankyo and Daiichi on both combined and stand-alone bases for the period from October 1, 2005 through March 31, 2010. In calculating the projected free cash flows for Sankyo and Daiichi on a combined basis, Nomura took into account the projections with respect to synergies provided to it by Sankyo. In making these calculations, Nomura used implied terminal values based on projections for the year ending March 31, 2010 and earnings before interest, taxes and depreciation and amortization, or EBITDA, multiples of 6.5x to 8.5x, and then discounted these values to implied present values using discount rates ranging from 6.0% to 8.0%. In addition, as instructed by Sankyo, in making these calculations, Nomura took into account expected changes in royalty revenues resulting from the expiration of patent protections of Daiichi Sankyo. The EBITDA multiple range selected was based on Nomura’s judgment with reference to public market multiples (see “—Comparable Companies Analysis” below). The discount rate range selected was based on Nomura’s judgment with reference to the weighted average cost of capital of Sankyo and Daiichi. Also based on Sankyo management’s projections, Nomura calculated illustrative exchange ratios using the net present value indications of free cash flows for Sankyo and Daiichi on both combined and stand-alone bases for the period from October 1, 2005 through March 31, 2010. In making these calculations, Nomura used implied terminal values based on projections for the fiscal year ending March 31, 2010 and perpetual growth rates ranging from -0.5% to 0.5%, and then discounted these values to implied present values using discounting rates ranging from 6.0% to 8.0%. The following table presents the results of this analysis:
| Illustrative Implied Exchange Ratios | ||||
| Ratio Range | ||||
Combined Company
| Perpetual Growth Model | 0.84 – 1.69 | ||
| Multiple Model | 0.91 – 1.45 | |||
Stand Alone
| Perpetual Growth Model | 0.70 – 1.31 | ||
| Multiple Model | 0.76 – 1.16 | |||
Comparable Companies Analysis. Nomura reviewed and compared certain financial information for Sankyo and Daiichi to corresponding financial information, ratios and public market multiples for the following publicly traded corporations in the pharmaceuticals industry:
| • | Takeda Pharmaceutical Company Limited |
| • | Astellas Pharma Inc. |
| • | Chugai Pharmaceutical Co., Ltd. |
| • | Eisai Co., Ltd. |
| • | Ono Pharmaceutical Co., Ltd. |
| • | Shionogi & Co., Ltd. |
| • | Tanabe Seiyaku Co., Ltd. |
| • | KYORIN Pharmaceutical Co., Ltd. |
| • | Kissei Pharmaceutical Co., Ltd. |
69
Table of Contents
Although none of the selected companies is directly comparable to Sankyo or Daiichi, the companies included were chosen because they are publicly traded companies with operations that for purposes of analysis may be considered similar to certain operations of Sankyo and Daiichi. Nomura also calculated the following financial multiples for the selected companies, Sankyo and Daiichi based on Institutional Brokers’ Estimate System estimates:
| • | levered market capitalization as a multiple of the projected twelve months EBITDA for the fiscal years ending March 31, 2006, March 31, 2007 and March 31, 2008; and |
| • | levered market capitalization as a multiple of the projected twelve months adjusted net income (recurring income times (1 – effective tax rate)) for the fiscal years ending March 31, 2006, March 31, 2007 and March 31, 2008. Where the effective tax rate was not disclosed in public filings, 41.0% was used as the effective tax rate. |
The results of these calculations are summarized as follows:
| EBITDA | Tax-adjusted net profits | |||||||||||
| 2005 | 2006 | 2007 | 2005 | 2006 | 2007 | |||||||
Multiple summary(1) | ||||||||||||
Mean | 8.2x | 7.6x | 6.9x | 21.4x | 19.1x | 16.9x | ||||||
Median | 7.7x | 7.5x | 6.6x | 18.4x | 18.6x | 17.2x | ||||||
| (1) | The multiple summary is based on the nine comparable companies listed above. |
As a result of this analysis, Nomura applied a multiple range of 6.5x to 8.5x for EBITDA and 18x to 20x for adjusted net income to calculate the following ranges of implied exchange ratios per share of Daiichi based on the projections of Sankyo management for EBITDA and adjusted net income for Sankyo and Daiichi:
| • | a range of ratios of 0.83 to 1.24, with a median of 1.02, based on projected EBITDA for the fiscal year period ending March 31, 2006; |
| • | a range of ratios of 1.12 to 1.64, with a median of 1.36, based on projected EBITDA for the fiscal year ending March 31, 2007; |
| • | a range of ratios of 1.19 to 1.47, with a median of 1.32, based on projected adjusted net income for the fiscal year ending March 31, 2006; and |
| • | a range of ratios of 2.19 to 2.70, with a median of 2.43, based on projected adjusted net income for the fiscal year ending March 31, 2007. |
Earnings Per Share Dilution Analysis. Nomura prepared analyses of the potential dilutive impact of the joint share transfer using earnings per share, or EPS, in order to determine the maximum exchange ratio per share of Daiichi which does not cause a decrease in Sankyo’s EPS through dilution. The analyses involved a comparison of the EPS of Sankyo common stock on a stand-alone basis to the projected EPS of the common stock of Daiichi Sankyo, as adjusted for certain potential synergy effects, as described in “–Discounted Cash Flow Analysis” above, and based on the pooling method of accounting, which Nomura was informed by Sankyo would be adopted by Sankyo and Daiichi for purposes of Japanese GAAP. For each of the fiscal years ending
70
Table of Contents
March 31, 2006 through March 31, 2010, Nomura prepared analyses based on EPS projections prepared by Sankyo management. The following summarizes the results:
| Sankyo Management Estimates | ||||||||||
| Fiscal year ending March 31, | ||||||||||
| 2006 | 2007 | 2008 | 2009 | 2010 | ||||||
Maximum ratio | 0.18 | -2.52 | 2.48 | 2.53 | 1.35 | |||||
Nomura noted in particular that the maximum exchange ratios per share of Daiichi not leading to EPS dilution were 2.48 for the fiscal year ending March 31, 2008, and 1.35 for the fiscal year ending March 31, 2010, based on EPS projections prepared by Sankyo management.
Contribution Analysis. Nomura calculated the implied exchange ratios with reference to the level of relative financial contribution of Sankyo and Daiichi to Daiichi Sankyo in terms of EBITDA and net income for Sankyo and Daiichi on a stand-alone basis resulting from the joint share transfer based on Sankyo management’s projections for the fiscal years ending March 31, 2006 through March 31, 2010. The relevant results of the analysis are as follows:
| Sankyo/Daiichi Contribution Level | ||||||
| Fiscal Year Ending March 31, | ||||||
| 2006 | 2007 | 2008 | ||||
EBITDA | 58%/42% | 47%/53% | 57%/43% | |||
Net Income | 67%/33% | 42%/58% | 50%/50% | |||
Exchange Ratios Based on Contribution Levels | ||||||
| Fiscal Year Ending March 31, | ||||||
| 2006 | 2007 | 2008 | ||||
EBITDA | 1.17 | 1.80 | 1.19 | |||
Net Income | 0.80 | 2.22 | 1.57 | |||
Nomura noted that the implied exchange ratios per share of Daiichi for EBITDA ranged from 1.17 to 1.80 and that the implied exchange ratios per share of Daiichi for net income ranged from 0.80 to 2.22.
The preparation of a fairness opinion is a complex process and is not necessarily susceptible to partial analysis or summary description. Nomura believes that the analyses must be considered as a whole, and that selecting portions of the analyses, or of the summary set forth above, could create an incomplete view of the processes underlying Nomura’s opinion. In arriving at its fairness determination, Nomura considered the results of all of its analyses on the basis of its experience and professional judgment and did not assign any specific weight to any factor or analysis. Moreover, the summary above does not purport to be a complete description of the analyses performed by Nomura in connection with the fairness opinion and is qualified in its entirety by reference to the written opinion of Nomura attached as Appendix C. No company used in the above analyses as a comparison is identical to Sankyo or Daiichi.
Nomura’s opinion is directed to Sankyo’s board of directors and addresses only the fairness, from a financial point of view, to the holders of Sankyo common stock of the exchange ratio. Nomura’s opinion to Sankyo’s board of directors was one of many factors taken into consideration by the Sankyo board of directors in making its determination to approve the joint share transfer. These analyses do not purport to be appraisals nor do they necessarily reflect the prices at which businesses or securities actually may be sold. Analyses based upon projections of future results are not necessarily indicative of actual future results, which may be significantly
71
Table of Contents
more or less favorable than suggested by these analyses. Because these analyses are inherently subject to uncertainty, being based upon numerous factors or events beyond the control of the parties or their respective advisors, none of Sankyo, Daiichi, Nomura or any other person assumes responsibility if future results are materially different from those projected. Nomura’s opinion was based on financial, economic, market and other conditions as they existed on the date of the opinion, and relies upon information available to Nomura as of the date of the opinion. Nomura had limited involvement in the negotiations in connection with the joint share transfer agreement or any other matters related to the joint stock transfer. Although Nomura’s opinion may be affected by changes in future conditions, Nomura did not assume any responsibility to modify, change or supplement its opinion.
Nomura is an internationally recognized investment banking firm that is regularly engaged in the valuation of businesses and their securities in connection with mergers and acquisitions. The board of directors of Sankyo selected Nomura as its financial advisor because Nomura has substantial experience in transactions similar to the joint share transfer. Nomura acted as financial advisor to Sankyo in connection with the joint share transfer and, pursuant to an agreement between Nomura and Sankyo, expects to receive from Sankyo a customary fee for its services, including a fee contingent on the consummation of the joint share transfer. In addition, Nomura will also expect to receive from Sankyo reimbursement of certain expenses incurred by Nomura and its affiliates. Sankyo also agreed pursuant to the agreement between Nomura and Sankyo to indemnify Nomura and its affiliates and their respective officers and employees against liabilities incurred in connection with Nomura’s rendering of its opinion to Sankyo, including liabilities under the securities laws. Nomura and its affiliates have provided in the past investment banking or other financial services to Sankyo, Daiichi or their affiliates for which Nomura received customary fees, including, without limitation, services during 2004 and 2005 in connection with Sankyo’s transfer of stock of its wholly-owned subsidiary, Nippon Daiya Valve Co., Ltd., to Seika Corporation. Nomura may in the future provide investment banking or other financial services to Sankyo, Daiichi or their affiliates, for which Nomura and its affiliates would expect to receive compensation. In the ordinary course of business, Nomura and its affiliates may from time to time also acquire, hold or sell certain equity, debt and other securities and various types of financial instruments, including derivatives, of Sankyo, Daiichi or their affiliates for Nomura’s own account or Nomura’s clients’ accounts.
Material Japanese Income Tax Consequences of the Joint Share Transfer
In the opinion of Nagashima Ohno & Tsunematsu, Japanese counsel to Daiichi on Japanese tax matters, and Mori Hamada & Matsumoto, Japanese counsel to Sankyo on Japanese tax matters, each of which is based on representations made by Daiichi and Sankyo and customary factual assumptions and subject to certain qualifications, the joint share transfer as contemplated herein will be a tax-free transaction for Japanese tax purposes, except with respect to any cash received from Daiichi Sankyo as a substitute for interim dividends and any cash received instead of fractional shares of Daiichi Sankyo common stock. Subject to such exceptions, Daiichi and Sankyo expect that a non-resident holder of either of their shares will recognize no gain for Japanese tax purposes upon the holder’s exchange of its shares for Daiichi Sankyo shares. Please see “Taxation—Japanese Tax Consequences” for a more detailed description of Japanese taxation matters. Each shareholder should, however, obtain advice of its own tax advisers with respect to its tax treatment in each jurisdiction.
Material U.S. Federal Income Tax Consequences of the Joint Share Transfer
Because (1) the joint share transfer agreement contemplates the integration of the prescription pharmaceutical operations of Daiichi and Sankyo in or around April 2007, (2) for U.S. federal income tax purposes, the joint share transfer and the subsequent business combination may be treated as forming a single integrated transaction, and (3) the form of the subsequent business combination has not been chosen, the proper U.S. federal income tax treatment of the joint share transfer is uncertain. Unless Daiichi Sankyo notifies U.S. holders of Daiichi or Sankyo shares otherwise, Daiichi Sankyo intends to take the position that the joint share transfer will be treated as a taxable exchange for U.S. federal income tax purposes. According to this position, a
72
Table of Contents
U.S. holder will generally recognize taxable gain or loss measured by the difference between (i) the sum of (A) the fair market value (in U.S. dollars) of the Daiichi Sankyo shares received in exchange for Daiichi or Sankyo shares and (B) the amount of cash received in the joint share transfer and (ii) the tax basis of the Daiichi or Sankyo shares exchanged. However, there can be no assurance that the IRS or a court will agree with Daiichi Sankyo’s position.
Daiichi Sankyo undertakes, as soon as practicable after the form of the subsequent combination of Daiichi’s and Sankyo’s operations is chosen, to notify U.S. holders of Sankyo or Daiichi shares who participate in the joint share transfer whether the joint share transfer and the subsequent business combination, viewed as an integrated transaction, qualify as a tax-free “reorganization” for U.S. federal income tax purposes with respect to Sankyo shareholders and (separately) with respect to Daiichi shareholders. However, such notification may not be made until shortly before the date of the subsequent integration of the prescription pharmaceutical operations of the companies as currently contemplated. Moreover, there can be no assurance that the IRS or a court will agree with Daiichi Sankyo’s position in this regard.
A Daiichi or Sankyo shareholder who exercises appraisal rights will recognize taxable capital gain or loss based upon the difference between the amount of cash received by such U.S. holder and the U.S. holder’s tax basis in the shares of Daiichi or Sankyo shares exchanged.
For a more detailed discussion, see “Taxation—United States Taxation—The Joint Share Transfer”. Each U.S. shareholder of Daiichi or Sankyo is strongly urged to consult its own tax advisor concerning the U.S. tax consequences of the transaction.
Anticipated Accounting Treatment
The joint share transfer will be accounted for by Daiichi Sankyo under the purchase method of accounting in accordance with U.S. GAAP. Based on the Daiichi exchange ratio of 1.159 Daiichi Sankyo shares for each share of common stock of Daiichi and the Sankyo exchange ratio of one Daiichi Sankyo share for each share of Sankyo common stock, as set forth in the joint share transfer agreement, after the closing of the joint share transfer, former Daiichi shareholders will own approximately 42.0% and former Sankyo shareholders will own approximately 58.0% of Daiichi Sankyo. Based on these projected ownership percentages, Sankyo is the accounting acquiror for financial reporting purposes. Under the purchase method of accounting, in accordance with Statement of Financial Accounting Standards No. 141, “Business Combinations”, Sankyo will record the tangible and intangible assets acquired and liabilities of Daiichi assumed at their fair values. Management of Daiichi Sankyo will be required to exercise significant judgments by making estimates and determining underlying assumptions in order to value such assets and liabilities. The fair values used to record each of the tangible and intangible assets and liabilities of Daiichi, and the resulting excess of the purchase price over the fair value of net assets acquired (goodwill) will have a material effect on the financial position and the results of operations of Daiichi Sankyo subsequent to the acquisition. The reported financial condition and results of operations of Daiichi Sankyo to be issued after the closing of the joint share transfer will reflect Daiichi’s balances and results from the date of the acquisition in addition to Sankyo’s balances and results. If a different set of fair values were to be used at the time of the acquisition, Daiichi Sankyo’s results of operations and financial position could differ materially. Following the completion of the joint share transfer, the earnings of Daiichi Sankyo will reflect purchase accounting adjustments, including in-process research and development write-offs and increased amortization and depreciation expense for acquired assets. In accordance with Statement of Financial Accounting Standard No. 142, “Goodwill and Other Intangible Assets”, goodwill will not be subject to amortization for financial reporting purposes but will be evaluated annually for impairment. Subsequent to the acquisition, if a reporting unit to which such goodwill is assigned reports a carrying amount in excess of its estimated fair value, an impairment charge is recognized for any excess of the carrying amount of that goodwill over its implied far value.
73
Table of Contents
Regulatory Matters
Japanese Regulatory Approvals
In general, the consummation of the joint share transfer and the establishment of Daiichi Sankyo will not require any approval or clearance of governmental authorities in Japan. However, in practice, Daiichi and Sankyo expect to consult with the Fair Trade Commission in Japan with regards to antitrust implications of the transaction. The consultation is expected to be completed successfully before the effective date of the joint share transfer. Moreover, Daiichi Sankyo is required to give formal notice to the Fair Trade Commission of Japan of the effectiveness of the joint share transfer within 30 days after the effective date thereof.
United States Antitrust Laws
Under the HSR Act, acquisitions of a sufficient size may not be consummated unless notification has been given and information has been furnished to the Antitrust Division of the U.S. Department of Justice and to the Federal Trade Commission and applicable waiting period requirements have been satisfied or early termination of the waiting period has been granted. The consummation of the joint share transfer is subject to the expiration or early termination of the waiting period under the HSR Act.
Daiichi and Sankyo expect to file with the Antitrust Division of the U.S. Department of Justice and the Federal Trade Commission, a Hart-Scott-Rodino Notification and Report Form with respect to the joint share transfer prior to their general meetings of shareholders. The waiting period under the HSR Act expires 30 days later.
In addition, any appropriate U.S. state or federal authority could take actions under U.S. state or federal antitrust laws seeking to stop completion of the joint share transfer, if applicable, and in certain circumstances, third parties could seek relief under U.S. state or federal antitrust laws.
Fees, Costs and Expenses
All expenses incurred in connection with the joint share transfer, the joint share transfer agreement and the transactions contemplated by the joint share transfer agreement will be paid by the party incurring those expenses, except that Daiichi and Sankyo have agreed to share equally certain fees, costs and expenses including, but not limited to, those related to preparing, printing and mailing this registration statement on Form F-4 and this prospectus, and the filing fees incurred pursuant to the requirements of the HSR Act.
Dissenters’ Rights of Appraisal
Any Daiichi or Sankyo shareholder who notifies the relevant company in writing prior to its general meeting of shareholders of his or her intention to oppose the joint share transfer, who votes against approval of the joint share transfer at the general meeting, and who complies with the other procedures contained in the Commercial Code of Japan, may demand that the relevant company purchase his or her shares of common stock at the fair value those shares would have had but for the resolution approving the joint share transfer. The failure of a shareholder to provide this notice prior to the general meeting, or to vote against approval of the joint share transfer at the general meeting, will in effect constitute a waiver of the shareholder’s right to demand that the relevant company purchase his or her shares of common stock at that value.
The demand referred to in the preceding paragraph must be made in writing within 20 days from the date the resolution approving the joint share transfer is adopted. It should state the class and the number of shares held by the shareholder. The Commercial Code of Japan does not require any other statement in the demand. Accordingly, the demand is legally valid if the holder’s estimate of the value of the subject shares is not included. If the value of the shares is agreed upon between the dissenting shareholder and the company, then the company is required to make payment of the agreed value within 90 days from the date of the resolution. If, within 60 days
74
Table of Contents
on which the resolution is adopted, the shareholder and the company do not agree on the value of the shares, the shareholder may within 30 days after the expiration of the 60-day period, file a petition with the Tokyo District Court for a determination of the value of shares. The company is also required to make payment of statutory interest on such value as determined by the court after the expiration of the 90-day period. The payment for shares of dissenting shareholders will be made in exchange for the relevant share certificate. The transfer of those shares will become effective upon payment.
Dissenter’s rights in the context of a joint share transfer involving two Japanese companies are set forth in Articles 371, 355, 245-3 and 245-4 of the Commercial Code of Japan. An English translation of these articles is included in this prospectus as Appendix H.
Stock Exchange Listing
The companies plan to take steps in order to list the shares of Daiichi Sankyo on the First Sections of the Tokyo Stock Exchange, the Osaka Securities Exchange and the Nagoya Stock Exchange upon the closing of the transaction.
Resale of Shares of Daiichi Sankyo Common Stock under U.S. Securities Laws
The exchange of shares of Daiichi and Sankyo common stock held by U.S. shareholders for shares of Daiichi Sankyo common stock in connection with the joint share transfer has been registered under the U.S. Securities Act. Accordingly, there will be no restrictions under the U.S. Securities Act on the resale or transfer of such shares by U.S. shareholders of Daiichi or Sankyo except for those shareholders, if any, who are deemed to be “affiliates” of Daiichi or Sankyo, respectively, as such term is used in Rule 144 and Rule 145 of the U.S. Securities Act. Persons who may be deemed to be affiliates of Daiichi or Sankyo generally include individuals who, or entities that, directly or indirectly control, or are controlled by or are under common control with Daiichi or Sankyo, as applicable. With respect to those shareholders who may be deemed to be affiliates of Daiichi or Sankyo, Rule 144 and Rule 145 place certain restrictions on the offer and sale within the United States or to U.S. persons of shares of Daiichi Sankyo common stock that may be received by them pursuant to the joint share transfer. This prospectus does not cover resales of shares of Daiichi Sankyo common stock received by any person who may be deemed to be an affiliate of Daiichi or Sankyo.
75
Table of Contents
THE JOINT SHARE TRANSFER AGREEMENT
The following is a summary of selected provisions of the joint share transfer agreement. While Daiichi and Sankyo believe this description covers the material terms of the joint share transfer agreement, it may not contain all the information that is important to you and is qualified in its entirety by reference to the joint share transfer agreement, the English translation of which is incorporated by reference in its entirety and attached to this prospectus as Appendix A. We urge you to read the English translation of the joint share transfer agreement in its entirety.
Structure of the Joint Share Transfer
In the joint share transfer, pursuant to the Commercial Code of Japan, Daiichi Sankyo will be newly established, and each share of Daiichi common stock will be exchanged for 1.159 shares of common stock of Daiichi Sankyo, and each share of Sankyo common stock will be exchanged for one share of common stock of Daiichi Sankyo. Initially, Daiichi Sankyo will have no shareholders other than the shareholders of Daiichi and Sankyo at the time of the transaction. As a result of the joint share transfer, each of Daiichi and Sankyo will be wholly-owned subsidiaries of Daiichi Sankyo, and the shareholders of each of Daiichi and Sankyo will be the shareholders of Daiichi Sankyo in proportion to the applicable exchange ratios.
Shareholders of Daiichi and Sankyo will not receive any fractional shares of common stock of Daiichi Sankyo in the joint share transfer. Instead, the shares representing the aggregate of all such fractional shares will be sold in the Japanese market or sold to Daiichi Sankyo itself and the net cash proceeds from the sale will be distributed to the former holders of Daiichi and Sankyo fractional shares on a proportionate basis, with any fractional yen amounts to be rounded up.
Pursuant to the Commercial Code of Japan, Daiichi and Sankyo may adjust the exchange ratio in the event of a stock split, stock dividend or other similar event in order to provide shareholders of Daiichi and Sankyo with the same economic effect as contemplated by the joint share transfer agreement prior to this type of event. Although the exchange ratios are fixed with no formula for adjustment due to subsequent changes, the joint share transfer agreement provides that the parties may adjust the exchange ratio upon the discovery or occurrence of an event that would have a significantly material adverse effect on the exchange ratio as agreed in the agreement.
In addition, in the joint share transfer, shareholders of Daiichi will receive ¥25 in cash per share of Daiichi and shareholders of Sankyo will receive ¥25 in cash per share of Sankyo from Daiichi Sankyo as a substitute for interim dividends otherwise payable by each of Daiichi and Sankyo.
Closing
Unless the parties agree otherwise, the closing of the joint share transfer will occur on September 28, 2005.
Effective Time of the Joint Share Transfer
The joint share transfer is scheduled to become effective on September 28, 2005, when the commercial registration of Daiichi Sankyo with the Legal Affairs Bureau in Tokyo, Japan becomes effective. On this effective date of the joint share transfer, all certificates representing shares of Daiichi and Sankyo will no longer be effective, and each holder of a certificate representing any of those shares will cease to have any rights with respect to them, except the right to receive shares of Daiichi Sankyo common stock, cash with respect to fractional shares and cash as a substitute for interim dividends, without interest. After the completion of the joint share transfer, former Daiichi shareholders will hold approximately 42.0% of the outstanding shares of Daiichi Sankyo common stock and former Sankyo shareholders will hold approximately 58.0%.
76
Table of Contents
Representations and Warranties
In the joint share transfer agreement, each of Daiichi and Sankyo represents to the other that all documents and information disclosed to the other party in the process of negotiating the memorandum of understanding and the joint share transfer agreement are, to the knowledge of its officers, directors, corporate auditors and employees who participated in such negotiation process, true and correct in all material respects as of the date of the agreement.
Covenants and Agreements
Subsequent Integration. Daiichi and Sankyo acknowledge in the joint share transfer agreement that they aim to integrate their prescription pharmaceutical operations in or around April 2007. The companies agree that they will negotiate to finalize the details of such integration following the joint share transfer. Daiichi and Sankyo have established an integration committee comprised of officers and employees of each of Daiichi and Sankyo, with primary responsibility for developing a plan for and implementing the integration, as well as for considering the treatment of the companies’ non-prescription pharmaceutical operations. The integration committee, in turn, has established task forces for various business functions through which Daiichi and Sankyo will exchange information and opinions to develop operational strategies.
Treasury Stock. During the period from August 1, 2005 to September 26, 2005, the boards of directors of each of Daiichi and Sankyo will approve the cancellation of all treasury stock held by them. From the time of such cancellation until the effective date of the joint share transfer, each of Daiichi and Sankyo will not intentionally purchase any of its own shares. This provision does not affect the shares of each company held by the other.
Options and Other Stock Rights. Each option or right to acquire shares of Daiichi or Sankyo outstanding on the date of the joint share transfer agreement shall be terminated by September 26, 2005 by cancelling such rights, having the holders surrender their rights, or other appropriate means.
No Solicitation for Employment. The joint share transfer agreement precludes each of Daiichi and Sankyo, directly or indirectly, from soliciting to hire any officer or employee of the other, other than in the ordinary course through the public posting of an employment advertisement, until the earlier of two years from the date of the agreement and the effective date of the joint share transfer.
No Poaching. The joint share transfer agreement precludes each of Daiichi and Sankyo from using confidential information disclosed in connection with the integration in order to solicit customers or counterparties of the other, until the earlier of two years from the date of the agreement and the effective date of the joint share transfer.
Public Announcements. Daiichi and Sankyo have agreed that neither shall make any press release or other public statement with regards to the integration except as agreed between themselves after discussion and negotiation, other than as may be required by applicable law or ordinance or the rules of any applicable securities exchange, and even in such case, to the extent possible in a form and content as agreed between them.
Indemnification. If either party shall breach the joint share transfer agreement or any representation or warranty included therein (not including the failure of the shareholders of such party to approve the terms of the joint share transfer), the non-breaching party will have the right to claim damages against the breaching party.
Fees and Expenses. Daiichi and Sankyo have agreed to pay all their own costs and expenses incurred in connection with the joint share transfer agreement and the transactions contemplated thereby. If the transaction is not completed due to the breach of the agreement by either Daiichi or Sankyo, the non-breaching party may require the breaching party to pay its reasonable costs and expenses incurred in connection therewith.
77
Table of Contents
Post-Closing Operations
Daiichi and Sankyo intend that upon the closing of the joint share transfer, the headquarters of Daiichi Sankyo will be located at the current headquarters of Sankyo at 5-1, Nihonbashi Honcho 3-chome, Chuo-ku, Tokyo 103-8426, Japan.
Daiichi Sankyo Post-Closing Governance Arrangements
Daiichi Sankyo will be initially established as a “corporate auditor”-style company under the Commercial Code of Japan, and as such, will have representative directors, each with the power to bind the company, as well as corporate auditors with the power to audit the management of the company by the directors. The articles of incorporation of Daiichi Sankyo will provide for up to fourteen directors and four corporate auditors. Pursuant to the joint share transfer agreement, immediately after the joint share transfer, the board of directors of Daiichi Sankyo will consist of ten directors, including two representative directors, and four corporate auditors. Of the ten directors, initially four will be outside directors. Of the four corporate auditors, initially two will be outside corporate auditors. See “Directors and Management of Daiichi Sankyo Following the Joint Share Transfer” beginning on page 172. The term of directors will commence from the date of registration of the joint share transfer with the Legal Affairs Bureau and will be as set forth in the articles of incorporation of Daiichi Sankyo. The parties have agreed in the joint share transfer agreement that initially the chief executive officer of Daiichi Sankyo will be Takashi Shoda.
Conditions to the Joint Share Transfer
The obligations of each of Daiichi and Sankyo to complete the joint share transfer are conditioned upon the following conditions being satisfied:
| • | Daiichi’s shareholders having approved the terms of the joint share transfer by the requisite vote at the annual general meeting of Daiichi shareholders; |
| • | Sankyo’s shareholders having approved the terms of the joint share transfer by the requisite vote at the annual general meeting of Sankyo shareholders; and |
| • | all regulatory approvals and consents or other requirements necessary to effect the joint share transfer having been obtained or satisfied. |
Pre-Closing Operations
During the period from the date of the joint share transfer agreement until the effectiveness of the joint share transfer, each of Daiichi and Sankyo will carry on its business, and will manage its assets with the standard of care of a diligent manager. Each of Daiichi and Sankyo has agreed that it will not, without the prior consent of the other party, engage in any act that may have a materially adverse effect on its financial condition, or on any of its rights or obligations.
Termination
The joint share transfer agreement may be terminated by either party at any time prior to the completion of the joint share transfer without the consent of the other:
| • | upon the failure, after negotiation between the parties for a period of 30 days, to agree on a revised exchange ratio upon the discovery or occurrence of any event with respect to the other party which would have a significantly material adverse effect on the exchange ratio agreed in the joint share transfer agreement; |
78
Table of Contents
| • | upon the failure of the shareholders of the other party to approve the terms of the joint share transfer at the annual general meeting of shareholders of such party; |
| • | if the other party materially breaches any representation or warranty and such breach would have a significantly material adverse effect on the exchange ratio; or |
| • | if the other party breaches any provision of the agreement and such breach is material, when such breach has not been remedied within two weeks after notification to the breaching party of such breach by the non-breaching party. |
The joint share transfer agreement may be terminated by either party if the joint share transfer shall not have taken effect by March 31, 2006 as a result of the failure of the parties, acting in good faith, to resolve any problems which may arise related to the completion of the joint share transfer under the anti-monopoly laws of Japan or other anti-trust laws of any applicable country after good faith consultation with regard to measures to resolve such problems.
Effect of Termination
If the joint share transfer agreement is terminated as described above, the agreement will be void, and there will be no liability or obligation of Daiichi or Sankyo or their respective officers and directors except as to prior breaches of the joint share transfer agreement, confidentiality, no solicitation, public announcement, fees and expenses as described above.
79
Table of Contents
Introduction
Daiichi is a joint stock corporation incorporated pursuant to the laws of Japan in 1918. Daiichi develops, manufactures and markets prescription drugs, diagnostics and radiopharmaceuticals, over-the-counter, or OTC, drugs, fine chemicals and other products. According to a survey published by the Japan Pharmaceuticals Manufacturers Association, for the six months ended September 30, 2004, Daiichi was the sixth largest pharmaceutical company in Japan in terms of consolidated net sales in Japan.
Daiichi’s registered office and principal executive offices are located at 14-10, Nihonbashi 3-chome, Chuo-ku, Tokyo 103-8234, Japan. Its telephone number is (81-3) 3272-0611. Daiichi’s agent in the United States, Daiichi Pharmaceutical Corporation, is located at 11 Philips Parkway, Montvale, New Jersey 07645-1810. Its telephone number is (201) 573-7000.
History and Development
Daiichi was originally founded in 1915 as Arsemin Shokai. In 1918, Arsemin Shokai was re-established as Daiichi. Daiichi conducts operations both at the parent company level and through 31 consolidated subsidiaries and 5 other affiliates in Japan, the United States, Europe and other parts of the world.
In 2002, Daiichi acquired 66% of the issued and outstanding shares of Suntory Pharma, Co., Ltd., a non-public pharmaceutical manufacturer in Japan spun-off as a subsidiary from Suntory Limited. The company was renamed Daiichi Suntory Pharma Co., Ltd., referred to herein as DSP, upon the acquisition by Daiichi. Daiichi had previously cooperated with Suntory on development projects for several years and made the acquisition to strengthen its research and development capabilities and development pipeline in the areas of cardiovascular disease, central nervous system illnesses and immunological disorders. Suntory continues to own the remaining 34% of DSP, although Daiichi has agreed to acquire the remaining shares from Suntory in December 2005 for approximately ¥10.0 billion.
In 2004, Daiichi established Daiichi Medical Research, Inc. in the United States to improve and coordinate the evaluation of drug candidates before they advance to the clinical trial stage. The establishment of Daiichi Medical Research is a key component in Daiichi’s efforts to improve the allocation of development resources and to establish a stronger independent development capability in markets outside of Japan, particularly the United States.
Daiichi has had its stock listed on the First Section of the Tokyo Stock Exchange since 1949 and on the First Section of the Osaka Securities Exchange since 1952.
Business Overview
Daiichi views the research, development, manufacture and sale of pharmaceuticals as its core business. Its other business segments are comprised of diagnostics, consumer healthcare, fine chemicals, and others, which includes animal drug products and certain service businesses.
80
Table of Contents
Consolidated net sales to customers per business segment and the percentage of each business segment’s net sales to customers out of total net sales for the two fiscal years ended March 31, 2003 and 2004 are shown in the following table. The information in the table is derived from Daiichi’s management reports which have been prepared based on Japanese GAAP.
| Year ended March 31, | ||||||||||||
| 2003 | 2004 | |||||||||||
| (millions of yen, except percentages) | ||||||||||||
| Net Sales (Customer) | Percentage of Total Net Sales (Customer) | Net Sales (Customer) | Percentage of Total Net Sales (Customer) | |||||||||
Pharmaceuticals | ¥ | 275,023 | 85.4 | % | ¥ | 276,908 | 85.8 | % | ||||
Diagnostics | 14,258 | 4.4 | % | 14,497 | 4.5 | % | ||||||
Consumer Healthcare | 9,620 | 3.0 | % | 8,774 | 2.7 | % | ||||||
Fine Chemicals | 15,793 | 4.9 | % | 15,117 | 4.7 | % | ||||||
Others | 7,317 | 2.3 | % | 7,471 | 2.3 | % | ||||||
Consolidated net sales per geographic segment prior to inter-segment eliminations and the percentage of each geographic segment’s net sales out of total net sales for the two fiscal years ended March 31, 2003 and 2004 are shown in the following table.
| Year ended March 31, | ||||||||||||
| 2003 | 2004 | |||||||||||
| (millions of yen, except percentages) | ||||||||||||
| Net Sales | Percentage of Total Net Sales | Net Sales | Percentage of Total Net Sales | |||||||||
Japan | ¥ | 305,214 | 91.1 | % | ¥ | 306,698 | 91.3 | % | ||||
Americas | 21,102 | 6.3 | % | 20,156 | 6.0 | % | ||||||
Europe | 4,338 | 1.3 | % | 3,902 | 1.2 | % | ||||||
Asia/Oceania | 4,300 | 1.3 | % | 5,320 | 1.6 | % | ||||||
Daiichi’s long-term vision is to become an R&D-driven global pharmaceutical company focused on the internal development of new products for distribution in the world’s major markets of Japan, North America, Europe and Asia, including China. Daiichi’s key medium-term strategies for establishing a strong base for this transformation include:
| • | Strengthening Daiichi’s global R&D system. Daiichi will concentrate on internal R&D efforts to advance promising candidates in its product development pipeline to approval in major markets. As a key step in increasing the efficiency of its internal R&D efforts, Daiichi established Daiichi Medical Research to facilitate the evaluation of all of Daiichi’s development candidates and coordinate the transition of the most promising into pivotal clinical trials. |
| • | Focusing on key therapeutic areas. Daiichi will concentrate its research and development investments in areas of existing expertise that also have potential to yield global products with high sales potential, including treatments for infectious diseases, cardiovascular conditions, and cancer. |
| • | Investing to expand U.S. operations. Daiichi will build on the existing operations of its U.S. sales subsidiary, Daiichi Pharmaceutical Corporation, to increase its direct marketing capabilities in the U.S. market, particularly with respect to specialist practitioners in Daiichi’s areas of clinical focus. |
81
Table of Contents
| • | Leveraging strong position in Japanese market. By combining its new internal development focus with its historic strength of operations in the Japanese market, Daiichi will seek to improve profitability through the successful launch of new products. |
| • | Concentrating on core pharmaceutical operations. Daiichi is reexamining its non-pharmaceutical operations, and expects to continue to concentrate management resources in pharmaceutical operations. From time to time, Daiichi reviews operations outside of the pharmaceutical area to determine their ongoing profitability potential, the impact of maintaining such operations on the efficient allocation of management resources, and other factors. In June 2004, Daiichi sold sales and distribution rights for veterinary and livestock feed products in Japan to Meiji Seika Co., Ltd. Going forward, Daiichi will focus further on its pharmaceutical operations. |
Daiichi believes these initiatives will position it for future growth and allow it to compete more effectively on a global basis.
Pharmaceuticals
The pharmaceuticals segment is Daiichi’s primary business and includes the development, manufacture and marketing of pharmaceutical products, particularly, prescription drugs and other pharmaceutical products. In the fiscal year ended March 31, 2004, 85.8% of Daiichi’s consolidated net sales were derived from this segment.
Products
The principal pharmaceutical products for which Daiichi holds the underlying patent rights are as follows:
| • | Cravit® (levofloxacin), an oral antibacterial new quinolone agent used to treat a broad range of infections, which is Daiichi’s largest selling product. The term “quinolone agent” refers to a class of compounds capable of destroying or inhibiting bacteria, fungi, protozoa or viruses that are capable of causing disease. New quinolone agents act to kill or inhibit bacteria, but have fewer negative side effects, including, among others, hypersensitivity to light and damage to the heart. Levofloxacin was developed by Daiichi and is sold in Japan by Daiichi and outside Japan through licensing agreements with Johnson & Johnson, Sanofi-Aventis and other third parties. Levofloxacin is patent-protected in Japan through 2006, the United States through 2010 and Europe through 2011. Levofloxacin’s known side effects include shock, convulsions and jaundice. The principal products which compete with levofloxacin include Taisho’s Ozex®, Kyorin’s Gatiflo® and Meiji Seika’s Sword®. Levofloxacin was launched in 1993. Sales of levofloxacin accounted for approximately 24.9% of net sales in the year ended March 31, 2004. According to data acquired by Daiichi from IMS Health Incorporated, an independent provider of information services to the pharmaceutical and health care industries, in calendar year 2004, the market for levofloxacin in Japan was approximately ¥69.8 billion, in the United States was approximately U.S.$2.5 billion and in Europe was €783 million. |
| • | Omnipaque®, a contrast media for X-ray imaging administered by intravenous injection. Contrast media such as Omnipaque® are absorbed to different degrees by different tissues in the body, helping physicians to more clearly differentiate tissues appearing in X-ray images. Omnipaque® has been used by more than 100 million patients worldwide. Its indications include a broad range of intravascular diagnostic procedures such as coronary angiography, spinal cord imaging, and body cavity procedures including shoulder and knee joints. Omnipaque® enjoys limited patent protection in Japan with respect to certain preparations only. Daiichi is the only holder of such patents in Japan. The trademark to Omnipaque® is owned by Amersham Health. Omnipaque®’s known side effects include shock, acute renal failure, convulsions, pulmonary edema and jaundice. The principal products which compete with Omnipaque® include Schering’s Iopamiron®, Eisai’s Iomeron®, Tyco Hearthcare’s Optiray® and Tanabe’s Proscope®. Omnipaque® was launched in 1987. Sales of Omnipaque® accounted for approximately 9.7% of net sales in the year ended March 31, 2004. According to data acquired by Daiichi from IMS Health, the market for Omnipaque® in Japan in calendar year 2004 was approximately ¥107.5 billion. |
82
Table of Contents
The principal pharmaceutical products for which Daiichi holds rights pursuant to licensing agreements are as follows:
| • | Panaldine®, an oral anti-platelet agent widely used in hospitals. Anti-platelet agents act to reduce blood clotting in arteries, veins, and the heart. Panaldine® is sold by Daiichi in Japan pursuant to a grant from Sanofi-Aventis of the exclusive right to market the product and to use associated trademarks. The Panaldine® grant continues for two year terms unless terminated by either party upon one year’s prior notice. Panaldine® no longer enjoys patent protection in Japan. Panaldine®’s known side effects include serious liver damage and agranulocytosis. The principal products which compete with Panaldine® include Ono Yakuhin’s Opalmon®, Otsuka’s Pletaal®, and Mitsubishi’s Anplag®. Panaldine® was launched in 1981. Sales of Panaldine® accounted for approximately 8.6% of net sales in the year ended March 31, 2004. According to data acquired by Daiichi from IMS Health, the market for Panaldine ® in Japan in calendar year 2004 was approximately ¥184.8 billion. |
| • | Mobic®, an oral non-steroidal anti-inflammatory agent, which is a medication that reduces inflammation but is not a steroid and so does not cause certain side effects associated with steroids. Daiichi has had exclusive marketing rights with respect to Mobic® in Japan since July 2004 pursuant to a grant of the exclusive right to market the product from Nippon Boehringer Ingelheim. The term of the grant extends through 2009 and is then automatically renewed for one year periods unless terminated by either party upon one year’s prior notice. Mobic® no longer enjoys patent protection in Japan. As part of its exclusive marketing rights, Daiichi was granted a royalty-free license to use appropriate trademarks. Mobic®’s known side effects include ulcers or stomach bleeding, asthma, and acute renal failure. The principal products which compete with Mobic® include Sankyo’s Loxonin®, Novartis’ Vortaren® and Nippon Shinyaku’s Hypen®. Mobic® was launched in 2001. Sales of Mobic® accounted for approximately 1.2% of net sales in the year ended March 31, 2004. According to data acquired by Daiichi from IMS Health, the market for Mobic in Japan in calendar year 2004 was approximately ¥93.5 billion. |
| • | Artist®, an orally administered long-acting beta-blocker for treating hypertension, angina, and chronic cardiac insufficiency. Beta-blockers are medications that slow heart rate, lower blood pressure, control angina and protect patients with prior heart attacks from future heart attacks. Artist ® is marketed by Daiichi in Japan under a license granted by Roche to use the Artist® trademark, which is valid for as long as Daiichi continues to market the product in Japan under that trademark. Artist® no longer enjoys patent protection in Japan. Artist®’s known side effects include adverse cardiovascular reactions, liver dysfunction and jaundice. The principal products which compete with Artist® include AstraZeneca’s Tenormin®, Tanabe’s Maintate® and Mitsuibishi’s Kerlong®. Artist® was launched in 1993. Sales of Artist® accounted for approximately 3.8% of net sales in the year ended March 31, 2004. According to data acquired by Daiichi from IMS Health, that the market for Artist® in Japan in calendar year 2004 was approximately ¥76.5 billion. |
| • | Zyrtec®, an oral anti-allergy medication sold by Daiichi in Japan pursuant to license from UCB Japan. The term of the license is through August 2007. Zyrtec® is patent-protected in Japan through 2007. Zyrtec®’s known side effects include shock, convulsion, liver disorder and jaundice. The principal products which compete with Zyrtec® include Boeringer and Sankyo’s Alesion®, Aventis’ Allegra® and Kyowa Hakko’s Allelock®. Zyrtec® was launched in 1998. Sales of Zyrtec ® accounted for approximately 2.7% of net sales in the year ended March 31, 2004. According to data acquired by Daiichi from IMS Health, the market for Zyrtec® in Japan in calendar year 2004 was approximately ¥145.5 billion. |
Aggregate sales of the above six highest-selling products accounted for 50.9% of net sales in the year ended March 31, 2004, including 24.9% attributable to levofloxacin.
83
Table of Contents
Marketing
Daiichi’s marketing activities include direct marketing, marketing of products manufactured by third parties through licensing-in arrangements, and licensing of Daiichi products to third parties for marketing by such entity.
Japan. In Japan, Daiichi has an extensive network of branch offices and over 1,200 medical representatives, through which it promotes its products to healthcare providers such as doctors, pharmacists, hospitals and government agencies. Medical representatives provide medical information on Daiichi’s products and explain the approved uses and advantages of Daiichi products to healthcare providers. Daiichi sells its products to multiple wholesalers who make direct sales to healthcare providers and also often engage in collaborative marketing efforts with Daiichi’s direct sales force.
Other Markets. In other markets, Daiichi has approximately 180 sales representatives in the United States and 140 in China. Historically, Daiichi has conducted the majority of its sales outside Japan by licensing its products to other pharmaceutical companies or through marketing partnerships. The most significant of these relationships is the license granted to Johnson & Johnson for sales of levofloxacin in the United States. These licensing arrangements typically generate revenue both through royalty fees and through the bulk sales of levofloxacin to the licensee.
With respect to sales to major customers, Daiichi’s sales to one major wholesaler accounted for approximately 11% of its sales for the period ended March 31, 2004. Related accounts receivable from the wholesaler were ¥9.0 million at March 31, 2004. There was no customer accounting for over 10% of net sales of Daiichi for the year ended March 31, 2003. Daiichi believes that it is now more likely for sales to individual wholesalers to account for more than 10% of its net sales due to recent consolidation trends in the Japanese pharmaceutical wholesaler industry.
Research and Development
Daiichi conducts rigorous and extensive research on processes, compounds and standards in order to identify and develop products which can successfully be brought to market either by Daiichi itself or through a third-party licensee. Daiichi supplements its internal research with an aggressive licensing and external alliance strategy focused on the entire spectrum of collaborations from early research to late-stage compounds, as well as new technologies.
Aiming to increase the efficiency of its investment in R&D, Daiichi established Daiichi Medical Research, Inc., a new company focused exclusively on R&D. This move is designed to facilitate the rigorous evaluation of drug candidate product concepts during the initial clinical research stages and thereby boost the efficiency of subsequent investment in development programs.
Daiichi is also seeking to significantly change its drug discovery operations, with particular focus on increasing the utilization of genomic drug discovery technologies, although Daiichi will require some time before it can harvest the fruits of its work in the form of genomic drugs that it can market itself. Daiichi’s research departments are proactively introducing new information technologies, such as technologies for the computerized prediction of protein interactions (through joint research with Celestar Lexico-Sciences, Inc.), structure-based drug design technologies for focusing in on promising compounds, and high-throughput screening for quickly reviewing the potentials of large compound libraries. Daiichi has augmented its investment in R&D aimed at obtaining drug discovery “seeds” and drug candidates. Daiichi has also absorbed the pharmaceutical business units of Snow Brand Milk Products Co., Ltd., and Suntory Limited, thereby obtaining expertise for research involving proteins and peptide synthesis, respectively, and positioning itself to identify promising new drug discovery targets among low-molecular-weight compounds as well as a wide range of other compounds.
Daiichi maintains development bases in the United States and the United Kingdom, and Daiichi has been working on various projects aimed at developing products overseas before developing them in Japan, with particular emphasis on antibacterial agents and anti-cancer drugs.
84
Table of Contents
For the fiscal year ended March 31, 2004, consolidated R&D expenses were ¥59.7 billion, constituting 18.5% of net sales.
Clinical Development Pipeline
The following describes the clinical development state of various compounds in Daiichi’s research and development pipeline as of April 30, 2005. The tables include all the compounds to which Daiichi has development rights that have progressed to clinical trials. Due to the uncertainties and difficulties of the drug development process, however, it is not unusual for compounds to be terminated as they pass through development, even after the initiation of clinical trials. Except as noted, for internally developed candidates in clinical trials, Daiichi has typically applied for or obtained composition patents in Japan and other major countries such as the U.S. and countries in the EU. Such patents are generally valid for 17 to 20 years, depending on the jurisdiction and the date when the original application was filed. In addition, in some circumstances, the companies may be granted extensions of up to five years on their patents. For licensed candidates, the licensor has typically obtained such patents and granted Daiichi exclusive development rights in the territories covered by the license subject to meeting specified development milestones. In light of the number of candidates under development and the uncertainties and difficulties of the drug development process, Daiichi does not consider that its business depends to a material extent upon rights to any one development compound licensed from a third party.
Anti-Infective Agents
| Compound | Origin | Indication (Effect/Mechanism) | Stage of Development | |||||
| Japan | U.S./EU | |||||||
| DU-6859a sitafloxacin | Daiichi | General bacterial infections (New quinolone) | Phase III (P-III) | |||||
Severe and drug-resistant bacterial infections (New quinolone) | Phase II (P-II) (U.S.) | |||||||
Act-HIB DF-098 | Aventis Pasteur | Haemophilus influenza type b vaccine for pediatric use (Vaccine) | Application (3/03) | |||||
DU-6859a sitafloxacin is a new quinolone antibiotic, which like previous quinolone agents, acts to kill or inhibit bacteria, but which has fewer negative side effects, including, among others, hypersensitivity to light and damage to the heart. DU-6859a sitafloxacin was discovered and developed internally by Daiichi and Daiichi holds patents in Japan and other major countries such as the U.S. and countries in the EU with respect to the compound, production process and specific methods of use. The primary indication for DU-6859a being developed in Japan, where the compound is in Phase III clinical trials, is general bacterial infections. In the United States, where the compound is in Phase II clinical trials, the indication in development is severe and drug- resistant bacterial infections. Daiichi expects to directly market products based on DU-6859a in Japan and the United States.
Act HIB DF-098 is a vaccine against haemophilus influenza type b for pediatric use. Haemophilus influenza is an invasive disease that usually strikes children under five years old, producing any of several clinical syndromes, including meningitis and pneumonia. Act HIB DF-098 is being developed jointly by Daiichi and Aventis Pasteur for marketing in Japan based on a compound originally discovered by Aventis Pasteur. Daiichi will conduct clinical trials in Japan and combine the results thereof with data provided by Aventis from clinical trials conducted by it outside of Japan. Daiichi submitted a new drug application in Japan in March 2003 and, based on its past experience, expects to launch in fiscal year 2006, though there can be no assurance that approval will be granted in the expected time frame, or at all. Daiichi does not have rights to market such products outside Japan.
85
Table of Contents
Anti-Cancer Agents
| Compound | Origin | Indication (Effect/Mechanism) | Stage of Development | |||||
| Japan | U.S./EU | |||||||
| DJ-927 | Daiichi | Expected for a wide range of cancers (taxane derivative) | Phase I (P-I) | P-II | ||||
Topotecin (irinotecan hydrochloride) | Yakult | Pancreatic cancer (topoisomerase I inhibitor) | Application (5/04) | |||||
DJ-927 is an anti-cancer agent discovered and developed internally which is expected to be effective against a wide range of cancers. DJ-927 is a derivative of taxane, a medication used to treat cancer by stopping cell division. The compound is currently in Phase I clinical trials in Japan and Phase II in the United States and Europe. Notably, the compound can be taken orally. Daiichi holds certain patents with respect to DJ-927 in Japan and other major countries such as the U.S. and countries in the EU and has also applied for other patents in those jurisdictions.
Topotecin (irinotecan hydrochloride) is an anti-cancer agent originally discovered by Yakult and currently marketed in Japan in relation to a number of cancers, including colorectal cancer, breast cancer, lung cancer and ovarian cancer. Topotecin is an inhibitor of topoisomerase I, which is a protein that is instrumental in promoting the growth of cancer cells. The compound is being developed jointly with Daiichi with respect to the additional indication of pancreatic cancer. Both Daiichi and Yakult share equally in the creation and execution of the plan of development of the compound, as well as the expenses incurred in connection therewith. Daiichi submitted a new drug application in Japan in May 2004 and, based on its past experience, expects approval in the fiscal year ending March 31, 2006, though there can be no assurance that approval will be granted in the expected time frame, or at all. Within Japan, Daiichi expects that products based on this compound will have no competitors for the pancreatic cancer indication.
Anti-Thrombotic and Cardiovascular Agents
| Compound | Origin | Indication (Effect/Mechanism) | Stage of Development | |||||
| Japan | U.S./EU | |||||||
Plavix® (clopidogrel) | Sanofi-Aventis | Cerebral infarction (anti-platelet agent) | Application (2/04) | |||||
Myocardial infarction (anti-platelet agent) | P-III | |||||||
DX-9065a | Daiichi | Unstable angina (specific factor Xa inhibitor) | P-II | P-II | ||||
DS-992 HGF DNA plasmid | AnGes MG | Peripheral arterial diseases (PAD) (vascular regeneration therapy) | P-III | P-II | ||||
| Ischemic heart diseases (IHD) (vascular regeneration therapy) | P-I preparation | P-I | ||||||
86
Table of Contents
Anti-thrombotic agents refer to agents used to treat blood clots. Cardiovascular agents refer to a broader range of compounds used in treating diseases related to the heart and blood vessels.
Plavix® (clopidogrel) is an anti-platelet agent based on a compound discovered by Sanofi-Aventis, and is under joint development between Sanofi-Aventis and Daiichi. Daiichi is primarily responsibility for creating and executing the development plan for the product. Development expenses are borne equally by both Daiichi and Sanofi-Aventis. A new drug application was submitted in Japan in February 2004 for use of the compound to treat cerebral infarctions, which is the death of, or damage to, a part of the brain caused by a sudden insufficiency of blood supply. Further, the compound is in Phase III clinical trials in Japan with respect to its use for treatment of heart attacks. Within Japan, Daiichi expects that products based on this compound will compete with aspirin and Pletaal® (cilostazol).
DX-9065a is a specific factor Xa inhibitor used to treat unstable angina. Unstable angina is a type of heart disease resulting in chest discomfort and pain resulting from the partial blockage of a coronary artery by blood clots. Unstable angina may eventually progress to a heart attack. Factor Xa inhibitors are medications that selectively block the formation of blood clots. The compound was discovered and is being developed internally by Daiichi. Daiichi holds patents in Japan and other major countries such as the U.S. and countries in the EU with respect to the compound and other patent rights (such as rights with respect to the production process and specific methods of use). The compound is in Phase II clinical trials in Japan, the United States and Europe.
DS-992 HGF DNA plasmid is used in blood vessel regeneration therapy for the treatment of peripheral arterial diseases, which are diseases in which artery wall linings gradually narrow and rough clots form in the arteries due to a build up of cholesterol or plaque. The compound was discovered by AnGes MG, which owns the underlying rights to the compound and is responsible for development thereof. Pursuant to an agreement, Daiichi has exclusive marketing rights in Japan, the U.S. and the EU. With respect to uses of the compound to treat peripheral arterial diseases, the compound is in Phase III clinical trials in Japan and Phase II clinical trials in the United States. With respect to its use to treat ischemic heart diseases, which are heart diseases caused by narrowing of the coronary arteries and decreased blood flow to the heart, the compound is in preparation for Phase I clinical trials in Japan, and is in Phase I clinical trials in the United States.
Other Agents
| Compound | Origin | Indication (Effect/Mechanism) | Stage of Development | |||||
| Japan | U.S./EU | |||||||
Sonazoid DD-723 | Amersham Health | Contrast media for the liver (ultrasound contrast media) | Application (5/04) | |||||
DL-404 (intrathecal baclofen) | Medtronic | Spasticity | Approved (4/05) | |||||
| KMD-3213 (silodosin) | Kissei Pharmaceutical Co., Ltd. | Dysuria associated with benign prostatic hyperplasia (selective alpha-1A blocker) | Application (6/04, Japan) P-I (China) | |||||
Feron DL-8234 (Interferon beta) | Toray Industries, Inc. | Hepatitis C liver cirrhosis | Application (2/05) | |||||
Sonazoid DD-723 is a contrast media used in ultrasound procedures related to the liver. Daiichi is jointly developing the product in Japan with its original discoverer, Amersham Health. Daiichi is responsible for preparing and conducting clinical trials, while Amersham Health will prepare application materials and conduct
87
Table of Contents
non-clinical trials, and provide clinical pharmaceutical materials. Patents relating to the compound and its uses are held by Amersham Health. The companies completed clinical trials and Daiichi submitted a new drug application in Japan in May 2004. Daiichi expects to directly market products based on Sonazoid DD-723 in Japan. Within Japan, Daiichi expects that products based on this compound will compete with Levovist®, launched by Japan Schering.
DL-404 (intrathecal baclofen) is used to treat spasticity, which is involuntary muscle tightness and stiffness occurring in people suffering from cerebral palsy or persons who have suffered head injuries. The compound was discovered by Medtronic and developed jointly with Daiichi. A new drug application for this compound was approved in April 2005. As the indication for the compound is rare, Daiichi requested orphan drug approval. The patent for the compound is held by Medtronic. Within Japan, Daiichi expects that products based on this compound will have no competitors.
KMD-3213 (silodosin) is a selective alpha-1A blocker, which is used to treat dysuria, a urinary dysfunction, associated with non-cancerous enlargement of the prostate, or benign prostatic hyperplasia. The term “alpha blocker” designates a medication that blocks the effects on muscles of impulses sent to those muscles by the body’s nervous system. Selective alpha-1A blockers are a class of alpha blockers that selectively affect only the muscle of the prostate connecting tissue but not those muscles that surround blood vessels. Daiichi is co-marketing the compound in Japan with Kissei Pharmaceutical Co., Ltd., which is the owner of the underlying patent rights. Both Daiichi and Kissei jointly created and are jointly executing the plan for development of the product, and will share the costs thereof equally. Daiichi also has been granted exclusive rights to market the product in China. A new drug application was filed in June 2004 in Japan. The compound is in Phase I clinical trials in China. Within Japan, Daiichi expects that products based on this compound will compete with Harnal® (tamsulosin), AVISHOT® (naftopidil) and Flivas® (naftopidil).
Feron DL-8234 (interferon beta) is a compound which already has approved indications, and is being further developed by Daiichi and Toray Industries, Inc., the owner of the patent, as a treatment for liver cirrhosis arising in connection with hepatitis C. Daiichi and Toray Industries submitted a new drug application in Japan in February 2005.
As shown above, three areas of particular focus for Daiichi are anti-infective, anti-cancer, and anti-thrombotic and cardiovascular products. In the latter, Daiichi has already submitted an application for Plavix® (clopidogrel), a next-generation anti-platelet agent. In other fields, subject to receipt of approval of such application by the MHLW, Daiichi also anticipates launching Sonazoid (DD-723), an ultrasound contrast media product, during the fiscal year ending March 31, 2006, and DL-404, a spasticity medication, and KMD-3213 (silodosin), a selective alpha-1A blocker, during the fiscal year ending March 31, 2006. Although Daiichi intends to launch each of Plavix®, Sonazoid, DL-404 and KMD-3213 during the fiscal year ending March 31, 2006 and believes these targets are reasonable based on its past experience, the launch of these products depends in each case upon approval of the pending drug application by the MHLW, and there can be no assurance that approval will be granted in the expected time frame, or at all.
88
Table of Contents
To expand its international sales, Daiichi is also evaluating additional potential candidates in its core areas through the efforts of Daiichi Medical Research. Information on some of these initiatives is shown below:
| Therapeutic Area | Indication (Effect/Mechanism) | Major Candidate | Dosage Form | Stage of Development | ||||||
| Japan | U.S./EU | |||||||||
| Anti-Infective | Antibacterial new quinolone agent for drug-resistant bacteria | DX-619 | Injection | P-I prep. | P-I | |||||
| Anti-Thrombotic and Cardio-vascular | Oral factor Xa inhibitors/ anticoagulant | DU-176b | Oral | P-I | P-II | |||||
| Anti-Allergy and Immune Diseases | VLA-4 inhibitor/anti-allergic agent | DW-908e | Oral | P-I prep. | P-I | |||||
| Anti-Thrombotic and Cardio-vascular | Anti-platelet agent | DZ-697b | Oral | P-I prep. | P-I prep. | |||||
In the anti-infective therapeutic area, Daiichi is focusing on antibacterial new quinolone agents for drug-resistant bacteria, such as DX-619. Daiichi has applied for patents in Japan and other major countries such as the U.S. and countries in the EU with respect to the compound and other patent rights (such as rights with respect to the production process and specific methods of use). DX-619 is currently in preparation for Phase I clinical trials in Japan and has entered Phase I clinical trials in the United States and Europe. Daiichi expects to directly market products based on DX-619 in Japan and the U.S. Both within and outside Japan, Daiichi expects that products based on this compound will compete with vancomycin, teicoplanin and linezolid.
In the anti-thrombotic and cardio-vascular therapeutic area, Daiichi is focusing on oral factor Xa inhibitors and anticoagulants, such as DU-176b.Anticoagulants are mediations that prevent blood from clotting. Factor Xa plays an important role in causing thrombosis, or blood clotting, which can result in strokes and other diseases resulting from insufficient blood flow. Factor Xa inhibitors are expected to prevent these diseases. Daiichi has applied for patents in Japan and other major countries such as the U.S. and countries in the EU with respect to the compound and other patent rights (such as rights with respect to the production process and specific methods of use). DU-176b is currently in Phase I clinical trials in Japan and Phase II clinical trials in the United States and Europe. Daiichi expects to directly market products based on DU-176b in Japan and the U.S. Both within and outside Japan, Daiichi expects that products based on this compound will compete with warfarin. In this therapeutic area, Daiichi has a new anti-platelet agent, DZ-697b. Daiichi discovered the compound and has applied for patents in Japan and other major countries such as the U.S. and countries in the EU with respect to the compound and other patent rights (such as rights with respect to the production process and specific methods of use). The compound is in preparation for Phase I. The expected indications and competitors are similar for Plavix®.
In the anti-allergy and immune diseases therapeutic area, Daiichi is focusing on VLA-4 inhibitors and anti-allergic agents such as DW-908e. VLA-4 inhibitors prevent the leakage of white blood cells from the circulatory system to allergy and inflammation sites following allergic reactions and other inflammation. Daiichi has applied for patents in Japan and other major countries such as the U.S. and countries in the EU with respect to the compound and other patent rights (such as rights with respect to the production process and specific methods of use). DW-908e is currently in preparation for Phase I clinical trials in Japan and has entered Phase I clinical trials in the United States and Europe. Daiichi expects to directly market products based on DW-908e in Japan and the U.S. Both within and outside Japan, Daiichi expects that products based on this compound will compete with montelukast and pranlukast.
89
Table of Contents
Candidates in development by Daiichi’s majority-owned subsidiary, Daiichi Suntory Pharma, represent an additional important component of the development pipeline, particularly in the areas of cardiovascular disease, central nervous system illnesses and immunological disorders. In light of the number of candidates under development and the uncertainties and difficulties of the drug development process, Daiichi does not consider that its business depends to a material extent upon rights to any one development compound licensed by Daiichi Suntory Pharma from a third party. The table below shows the development candidates of Daiichi Suntory Pharma:
| Compound | Origin | Indication (Effect/Mechanism) | Stage of Development | |||||
| Japan | U.S./EU | |||||||
Adenoscan® (SUN Y4001) | King Pharmaceutical Inc. | Contrast media of myocardium scintigraphy (adenosine) | Approved (4/05) | |||||
| SUN A0026 | Daiichi Suntory Pharma | Bacterial infection (antibiotic agent (penem- type)) | NDA preparation | |||||
SUN Y7017 (memantine hydrochloride) | Merz Pharma | Severe Alzheimer’s disease (NMDA receptor antagonist) | P-III preparation | |||||
Mild to moderate Alzheimer’s disease (NMDA receptor antagonist) | P-III | |||||||
| SUN 4936h | Daiichi Suntory Pharma | Acute heart failure (a-human atrial natriuretic peptide)) | Launched | P-II | ||||
| SUN N4057 | Daiichi Suntory Pharma | Acute ischemic stroke (serotonin (5-HT) 1A receptor agonist) | P-II | |||||
| SUN E3001 | Daiichi Suntory Pharma | Osteoporosis (human parathyroid hormone) | P-II | |||||
| SUN N8075 | Daiichi Suntory Pharma | Acute ischemic stroke (NA/Ca channel dual blocker) | P-I | |||||
| SUN E7001 | Daiichi Suntory Pharma | Diabetes mellitus (glucagon-like peptide-1(GLP-1)) | P-I | |||||
| SUN-0588 | Daiichi Suntory Pharma | Phenylketonuria | Launched | P-III | ||||
Adenoscan® (SUN Y4001) is a contrast media used in myocardium scintigraphy, which is a diagnostic technique used to produce a two-dimensional image of heart muscle using radioactive contrast media. Adenoscan ® an adenosine injection used in non-stress-based testing of patients whose condition makes them unable to undergo more rigorous stress-based procedures. Adenosine is a nucleic acid that is one of the building blocks of DNA. The compound is being developed in Japan by Daiichi Suntory Pharma pursuant to a license from King Pharmaceutical Inc. A new drug application for this compound was approved in April 2005. Daiichi expects to directly market Adenoscan® (SUN Y4001) in Japan. Within Japan, there is no launched product that competes with Adenoscan®.
SUN A0026 is a penem-type antibiotic agent used to treat bacterial infections. Unlike conventional penicillin-type antibiotics, which are based on natural substances synthesized by micro-organisms, penem-type
90
Table of Contents
antiobiotics are synthetically designed antibiotic compounds. The compound was discovered by Daiichi Suntory Pharma. Daiichi Suntory Pharma, and is being developed with respect to the U.S. by Replidyne, Inc. Daiichi Suntory Pharma applied for a patent in Japan and in other major countries including the U.S. and countries in the EU. Daiichi Suntory Pharma has granted the right to market the compound in the U.S. and the EU to Replidyne, Inc. Outside of Japan, Daiichi Suntory Pharma expects that products based on this compound will compete with oral ß-lactam antibiotics including Augmentin®. SUN A0026 is a prodrug, or a drug that undergoes biotransformation before exhibiting its pharmacological effects, of faropenem sodium, which was launched in Japan in 1997.
SUN Y7017 is an NMDA receptor antagonist used to treat Alzheimer’s disease. Receptor antagonists inhibit the normal functioning of receptors, which are sites on nerve cells that receive specific messages from the nervous system. NMDA receptor antagonists inhibit receptors located in the brain that necessary for several types of learning and memory. The compound was discovered by Merz Pharma and has been launched in the United States and the EU for treatment of severe Alzheimer’s disease. The compound is currently being developed by Daiichi Suntory Pharma in Japan for similar indications. The compound is currently in preparation for Phase-III clinical trials in Japan and is at the same time in Phase-III clinical trials in Japan with respect to its indication for use in treatment of mild to moderate cases of Alzheimer’s disease. Daiichi expects to directly market products based on SUN Y7017 in Japan. Within Japan, Daiichi expects that products based on this compound will compete with Aricept®.
SUN 4936h is an alpha-human atrial natriuretic peptide used to treat acute heart failure. Alpha-human atrial natriuretic peptide is a hormone secreted by the heart which acts on the kidney to promote urine production and the excretion of sodium by the kidneys. The compound is being developed by Daiichi Suntory Pharma and jointly, with respect to the United States, by Astellas US. Daiichi Suntory Pharma has patents with respect to the compound in Japan and in other major countries such as the U.S. and countries in the EU. The compound is currently in Phase II clinical trials in the United States. Daiichi is marketing the compound in Japan, and has granted the right to market it in the U.S. and the EU to Astellas US. Within Japan, Daiichi Suntory Pharma expects that products based on this compound will compete with diuretic agents and medications that increase blood flow such as furosemide. Outside of Japan, Daiichi expects that products based on this compound will compete with nesiritide.
SUN N4057 is a serotonin 1A receptor agonist used to treat acute ischemic stroke. Receptor agonists mimic a specific neurotransmitter, attaching to that transmitter’s receptor and thereby producing the same effect that the neurotransmitter usually produces. Medications are often designed as receptor agonists to treat disorders in which the original chemical that normally attaches to the neurotransmitter’s receptor is depleted or missing. The serotonin 1A receptor is a specific receptor related to serotonin, a neurotransmitter involved in pain disorders and emotional perceptions. In recent years, several serotonin 1A receptor agonists have been reported to show a tendency to protect the body’s nervous system against infarction, which is tissue death due to lack of oxygen-rich blood, in animal testing. SUN N4057, as a selective and potent serotonin 1A agonist, is expected to prevent neuronal death in the brain following ischemic stroke, which is a stroke caused by the blocking of an artery in the brain by a blood clot. The compound was discovered and is being developed by Daiichi Suntory Pharma. Daiichi Suntory Pharma applied for a patent with respect to the compound in Japan and in other major countries such as the U.S. and countries in the EU. The compound is currently in Phase II clinical trials in the United States and the EU. Daiichi expects to market products based on SUN N4057 directly in Japan, and through third-party licensees in the rest of the world. Within Japan, Daiichi expects that products based on this compound will compete with Radicut®. Outside of Japan, there are currently no launched products that compete with products based on this compound.
SUN E3001 is a human parathyroid hormone (1-34) used to treat osteoporosis. Human parathyroid hormone itself is a known compound. Human parathyroid hormone is a hormone synthesized and released by the parathyroid gland which controls the distribution of calcium and phosphate in the bones. Daiichi Suntory Pharma applied for a patent with respect to the compound-related intranasal formulation in Japan and in other major countries such as the U.S. and countries in the EU. Daiichi Suntory Pharma has granted Chugai Pharmaceutical Co. Ltd. worldwide rights to develop and market the formulation. The formulation is currently in Phase II clinical
91
Table of Contents
trials in Japan. Within Japan, Daiichi expects that products based on this formulation will compete with anti-osteoporosis drugs such as Fosamax® and Evista®. Outside of Japan, Daiichi Suntory Pharma expects that products based on this formulation will also compete with anti-osteoporosis drugs such as Forteo®, Fosamax® and Evista®.
SUN N8075 is a Na/Ca channel dual blocker with antioxidant actions used to treat acute ischemic stroke. Na/Ca channel blockers are drugs that prevent sodium and calcium ions, needed for muscle contraction, from entering the cells of certain muscles, including heart muscles. Antioxidant actions limit cellular damage caused by destructive fragments of oxygen that can be released when tissue is injured, such as during the progression of heart disease. The compound was discovered and is being developed by Daiichi Suntory Pharma and Taisho Seiyaku, which is responsible for all development expenses. Daiichi Suntory Pharma applied for a patent and other patent rights, such as synthetic methods, with respect to the compound in Japan and in other major countries such as the U.S. and countries in the EU. The compound is currently in Phase I clinical trials in the United States. Within Japan, Daiichi Suntory Pharma expects that products based on this compound will compete with Radicut®. Outside of Japan, there are currently no launched products that compete with products based on this compound.
SUN E7001 is a nasal powder spray of glucagon-like peptide 1(7-36) used to treat type II diabetes mellitus. A glucagon-like peptide is a protein fragment similar to glucagon, a protein secreted by the pancreas to stimulate the liver to produce glucose, a simple sugar that is the main source of energy for the body. Diabetes mellitus is a disease in which the body is unable to use sugar for growth and energy for daily activities. The compound was discovered by Suntory (now Daiichi Suntory Pharma) and is being co-developed by Daiichi Suntory Pharma with Sankyo. Daiichi Suntory Pharma applied for a patent with respect to the compound-related intranasal formulation in Japan and in other major countries such as the U.S. and countries in the EU. The compound is currently in Phase I clinical trials in Japan (which are being conducted by Sankyo). Daiichi Suntory Pharma is conducting non-clinical testing and is supplying the relevant pharmaceutical materials. Daiichi Suntory Pharma expects that products based on this compound will compete with glucagons-like peptide-1 derivatives and diabetic agents such as pioglitazone and rosiglitazone.
SUN-0588 (sapropterin) is used to treat mild to moderate phenylkotenuria, an inherited metabolic disease caused by a deficiency of the enzyme phenylalanine hydroxylase. Insufficient quantities or reduced activities of the enzyme result in elevated levels of phenylalanine in the blood, which can result in serious neurological damage. The compound was discovered by Daiichi Suntory Pharma and is sold in Japan by Maruho Co., Ltd. as Biopten®. The compound is being developed by BioMarin Pharmaceutical Inc. in the U.S. and is in Phase III clinical trials.
Patents
Patent portfolios developed for products introduced by Daiichi normally provide market exclusivity. Patents may cover products per se, pharmaceutical formulations, processes for or intermediates useful in the manufacture of products or the uses of products. Protection for individual products extends for varying periods in accordance with the date of grant and the legal life of patents in the various countries. The protection afforded, which may also vary from country to country, depends upon the type of patent and its scope of coverage.
In the U.S., the FDA Modernization Act of 1997 includes a pediatric exclusivity provision that may provide an additional six months of market exclusivity in the United States for indications of new or currently marketed drugs, if certain agreed upon pediatric studies are completed by the applicant. These exclusivity provisions were re-authorized until October 1, 2007 by the “Best Pharmaceuticals for Children Act” passed in January 2002. In general, Daiichi seeks extensions for all of its products under patent in Japan and in the United States.
While the expiration of a product patent can in some instances result in a loss of market exclusivity for the covered pharmaceutical product, market exclusivity can in some instances continue to be derived from:
| • | patents relating to processes and intermediates for the manufacture of the active ingredient of such product; |
92
Table of Contents
| • | patents relating to the use of such product; |
| • | patents relating to novel compositions and formulations; and |
| • | in the United States, regulatory exclusivity that may be available under federal law. |
The effect of product patent expiration on pharmaceutical products also depends upon many other factors such as the nature of the market and the position of the product in it, the growth of the market, the complexities and economics of the process for manufacture of the active ingredient of the product, and the requirements of new drug provisions of the Federal Food, Drug and Cosmetic Act in the United States or similar laws and regulations in other countries.
Daiichi’s experience has been that the expiration of basic patents typically leads to less competition from generic products in Japan as compared to other major markets, although there can be no assurance that this will continue to be the case. Among Daiichi’s leading products, Panaldine®, Mobic® and Artist® no longer enjoy any kind of patent protection in Japan. Omnipaque® enjoys limited patent protection in Japan with respect to certain preparations only. Levofloxacin is patent-protected in Japan through 2006, the United States through 2010, and Europe through 2011. Zyrtec®, whose patent is held by UCB Japan, is patent-protected in Japan through 2007. With respect to levofloxacin, Daiichi has the right but not the obligation to pursue patent infringement litigation, and if Daiichi chooses not to pursue such enforcement, third parties to whom Daiichi licenses the right to market levofloxacin also have such right. With respect to Zyrtec®, Daiichi has neither the right nor the obligation to pursue patent infringement litigation.
Worldwide, all of Daiichi’s important products are sold under trademarks that are considered in the aggregate to be of material importance. Trademark protection continues in some countries as long as used; in other countries, as long as registered. Registration is generally for fixed terms and can be renewed indefinitely.
Seasonality
Sales in Daiichi’s pharmaceutical segment are generally not subject to seasonal fluctuation.
Availability of Raw Materials
Generally, Daiichi develops and manufactures the active ingredients used in its products at its own facilities, limiting dependence on suppliers. Among Daiichi’s major products, the active ingredients for Omnipaque®, Panaldine®, Artist® and Coversyl® are sourced from third parties. Daiichi believes that, in the event it is unable to source any products or ingredients from any of its major suppliers, it could replace those products or substitute ingredients from other suppliers without great difficulty or significant increases in its cost of goods sold. Daiichi has not experienced, and does not expect, any difficulty in obtaining the material necessary for its operations.
Diagnostics
In its diagnostics segment, Daiichi conducts the discovery, development, manufacture, distribution and marketing of in vitro diagnostic and radiopharmaceutical products. Daiichi’s principal products in its diagnostics segment include a substance to measure cholesterol levels, influenza diagnostics and an in vivo radiopharmaceutical for brain imaging applications. In the fiscal year ended March 31, 2004, 4.5% of Daiichi’s external sales were derived from this segment.
Consumer Healthcare
In its consumer healthcare segment, Daiichi conducts the development, manufacture, distribution and marketing of over-the-counter drugs, primarily in Japan. The main products in the consumer healthcare segment include Karoyan®, a hair loss treatment product, Cystina C®, a vitamin C product, Patecs®, an anti-inflammatory analgesic, and other products. In the fiscal year ended March 31, 2004, 2.7% of Daiichi’s external sales were derived from this segment.
93
Table of Contents
Fine Chemicals
In its fine chemical segment, Daiichi develops, manufactures, distributes and markets fine chemicals and vitamins, including compounds and substances used in pharmaceutical and other products. The main products in the fine chemicals segment include intermediate substances used in the manufacture of levofloxacin by Daiichi’s pharmaceutical operations, and Pantenol® (pantothenic acid calcium). In the fiscal year ended March 31, 2004, 4.7% of Daiichi’s external sales were derived from this segment.
Other Businesses
Daiichi’s other businesses include the sale of animal drug products, real property management for Daiichi group companies, and distribution with respect to Daiichi group products. In the fiscal year ended March 31, 2004, 2.3% of Daiichi’s external sales were derived from this segment.
Daiichi is reexamining its non-pharmaceutical operations, and expects to continue to concentrate management resources in pharmaceutical operations. From time to time, Daiichi reviews operations outside of the pharmaceutical area to determine their ongoing profitability potential, the impact of maintaining such operations on the efficient allocation of management resources, and other factors. In June 2004, Daiichi sold sales and distribution rights for veterinary and livestock feed products in Japan in its other business segment to Meiji Seika Co., Ltd. Going forward, Daiichi will further focus on its pharmaceutical operations.
Organizational Structure
Daiichi is the parent entity of the Daiichi group, which is comprised of 31 consolidated subsidiaries and 5 other affiliates. The following is a description of Daiichi’s significant subsidiaries.
Daiichi Pure Chemicals Co., Ltd.
Daiichi Pure Chemical Co., Ltd. was incorporated in 1947 in Japan. Daiichi Pure Chemical Co., Ltd. is a manufacturer and distributor of chemicals, pharmaceuticals and diagnostic reagents. External sales by Daiichi Pure Chemical Co., Ltd. during the fiscal year ended March 31, 2004 constituted approximately 6.0% of total consolidated net sales of the Daiichi group for that period.
Saitama Daiichi Pharmaceutical Co., Ltd.
Saitama Daiichi Pharmaceutical Co., Ltd. was incorporated in 1963 in Japan. On April 1, 2004, Daiichi acquired the remaining 13.8% of Saitama Daiichi it did not previously own in a share exchange transaction with minority shareholders, and as a result, Saitama Daiichi became a wholly-owned subsidiary of Daiichi. The primary business of Saitama Daiichi Pharmaceutical Co. is the research, development, manufacturing, marketing, importing and exporting of pharmaceutical products. It currently manufactures poultices (bandages designed to reduce inflammation and soreness) and hair loss treatment products for Daiichi. Most of its sales are to other group companies. External sales by Saitama Daiichi Pharmaceutical Co., Ltd. during the fiscal year ended March 31, 2004 constituted approximately 0.01% of total consolidated net sales of the Daiichi group for that period.
Daiichi Suntory Pharma Co., Ltd.
Daiichi Suntory Pharma Co., Ltd. is a joint venture between Daiichi and Suntory, Ltd. Daiichi holds 66% of the equity of the company and Suntory holds the remainder. The predecessor entity to Daiichi Suntory Pharma Co., Ltd. started as the pharmaceutical division of Suntory, Ltd in 1979. At the end of 2002, the pharmaceutical division of Suntory, Ltd., was merged into Daiichi Suntory Pharma Co., Ltd., the joint venture company, with the aim of achieving greater success in creating new medical compounds and therapies. Daiichi Suntory Pharma Co., Ltd. has focused on the creation of innovative prescription drugs using new technologies, notably in biotechnology and peptide chemistry, as well as conventional chemical synthesis. It has successfully developed and brought to market original in-house drugs such as Sunrythm®, an anti-arrhythmic agent and
94
Table of Contents
HANP®, a human atrial natriuretic peptide for acute heart failure. External sales by Daiichi Suntory Pharma Co., Ltd. during the fiscal year ended March 31, 2004 constituted approximately 1.2% of total consolidated net sales of the Daiichi group for that period.
Daiichi Radioisotope Laboratories, Ltd.
Daiichi Radioisotope Laboratories Ltd. was founded in 1968 and has been a pioneer in Japan for diagnostic imaging with radioisotopes, or nuclear medicines. Daiichi Radioisotope Laboratories Ltd. is active in the discovery, development, manufacturing, marketing and distribution of a variety of diagnostic and therapeutic products with a particular focus on nuclear medicine. External sales by Daiichi Radioisotope Laboratories, Ltd. during the fiscal year ended March 31, 2004 constituted approximately 5.8% of total consolidated net sales of the Daiichi group for that period.
Daiichi Pharmaceutical Corporation
Daiichi Pharmaceutical Corporation was established as the U.S. sales and marketing subsidiary of Daiichi Pharmaceutical Co., Ltd. in 1982. External sales by Daiichi Pharmaceutical Corporation during the fiscal year ended March 31, 2004 constituted approximately 3.6% of total consolidated net sales of the Daiichi group for that period.
Daiichi Fine Chemical Co., Ltd.
Daiichi Fine Chemical Co., Ltd. was incorporated in Japan in 1951. In 2001, Daiichi unified its fine chemical operations in Daiichi Fine Chemical. External sales by Daiichi Fine Chemical Co., Ltd. during the fiscal year ended March 31, 2004 constituted approximately 2.3% of total consolidated net sales of the Daiichi group for that period.
Daiichi Medical Research, Inc.
As part of its efforts to improve its research and development capabilities, in April of 2004, Daiichi formed Daiichi Medical Research, Inc. in the United States to design and globally coordinate clinical trials.
Property, Plants and Equipment
The following table sets out certain information with respect to the main properties owned or leased by Daiichi as of April 1, 2005.
Facility Name | Location | Owned/leased (Square meters) | Principal products and function | |||
Daiichi | ||||||
Head Office | Tokyo, Japan | 915 | Business administration | |||
Takatsuki Facility | Osaka, Japan | 31,564 | Distribution center and preparation development | |||
Kanaya Facility | Shizuoka, Japan | 95,781 | Distribution center and preparation development | |||
Branch Offices (13 Offices)(1) | Tokyo and other locations throughout Japan | 36,533 | Sales | |||
Research and Development Center | Tokyo, Japan | 74,872 | Pharmaceutical research and development | |||
Higashi-Fuji Training Institute | Shizuoka, Japan | 35,983 | Pharmaceutical research | |||
Distribution Centers (3 Centers in addition to the Takatsuki and Kanaya Facilities) | Saitama, Sapporo and Kyushu, Japan | 51,416 | Distribution | |||
95
Table of Contents
Facility Name | Location | Owned/leased (Square meters) | Principal products and function | |||
Daiichi Pharmatec Co., Ltd. | ||||||
Osaka Factory(2) | Osaka, Japan | 34,311 | Pharmaceutical production | |||
Shizuoka Factory(2) | Shizuoka, Japan | 114,742 | Pharmaceutical production | |||
Akita Factory(2) | Akita, Japan | 258,043 | Pharmaceutical production | |||
Daiichi Pure Chemicals Co., Ltd.(3) | ||||||
Tsukuba Factory | Ibaraki, Japan | 56,851 | Pharmaceutical production | |||
Iwate Factory | Iwate, Japan | 461,135 | Pharmaceutical production and research | |||
Pharmaceutical Research Center | Ibaraki, Japan | 14,131 | Pharmaceutical production | |||
Daiichi Fine Chemicals Co., Ltd.(3) | ||||||
Main Factory(4) | Toyama, Japan | 206,429 | Pharmaceutical production and research | |||
Daiichi Radioisotope Laboratories, Ltd.(3) | ||||||
Chiba Office | Chiba, Japan | 62,090 | Pharmaceutical production and research | |||
Saitama Daiichi Pharmaceutical Co., Ltd.(3) | ||||||
Head Office / Kasukabe Factory | Saitama, Japan | 9,611 | Pharmaceutical production and research | |||
Hanyu Factory | Saitama, Japan | 16,680 | Pharmaceutical production | |||
Daiichi Suntory Pharma Co., Ltd.(3) | ||||||
Institute for Medical Research and Development/Chiyoda Pharma Factory (Gunma) | Gunma, Japan | 101,709 | Pharmaceutical production and research | |||
Research Center | Osaka, Japan | 3,550 | Pharmaceutical research | |||
Daiichi Pharmaceutical (Beijing) Co., Ltd.(3) | ||||||
Main factory(5) | Beijing, China | 47,800 | Pharmaceutical production | |||
(1) Daiichi leases eleven of the thirteen branch offices pursuant to standard lease agreements.
(2) Leased from Daiichi.
(3) The land, buildings and facilities of this entity are pledged to secure certain obligations thereof.
(4) Daiichi Fine Chemicals Co., Ltd. leases 2,526 square meters of land for a parking lot.
(5) Daiichi Pharmaceutical (Beijing) Co., Ltd. leases the land on which its main factory is located from the Chinese government.
96
Table of Contents
Except as otherwise noted in the table above and the footnotes thereto, Daiichi owns all of the properties identified therein and all properties owned by Daiichi are owned without significant encumbrances. As of March 31, 2004, the aggregate book value of the buildings and structures owned by Daiichi and its consolidated subsidiaries was ¥58.7 billion, and the aggregate book value of machinery and equipment owned was ¥31.7 billion. Daiichi leases other equipment that is used in its operations.
Daiichi reviews market needs and prospects from time to time and adjusts its capacity and utilization by opening, closing, expanding or downsizing production facilities accordingly. Daiichi believes that it is difficult and would require unreasonable effort to track the exact productive capacity and the extent of utilization of each of its manufacturing facilities with a reasonable degree of accuracy. Daiichi believes that its manufacturing facilities are generally all operating within normal operating capacity and not substantially below capacity.
The following table describes current or planned construction, expansion or improvement of Daiichi facilities:
Company | Property | Intended Facility Use | Investment amount, forecast (millions of yen) | Method of financing | Actual or estimated start date | Estimated completion date | ||||||||
| Total | Amount of expenditure already paid | |||||||||||||
Daiichi Radioisotope Laboratories, Ltd. | Chiba Factory | Production of raw materials | ¥3,778 | ¥681 | Internal financing | October 2003 | October 2005 | |||||||
Daiichi Radioisotope Laboratories, Ltd. | Chiba Factory | Equipment for production | ¥1,366 | ¥1,279 | Internal financing | March 2003 | March 2005 | |||||||
Daiichi Suntory Pharma Co., Ltd. | Institute for Medicinal Research and Development | New plant using biotechnology | ¥3,500 | ¥73 | Long-term debt from Daiichi | August 2003 | October 2005 | |||||||
New construction at Daiichi Radioisotope Laboratories’ Chiba factory, originally scheduled for completion in March 2005, will increase Daiichi’s production capacity of raw materials for non-radioactive diagnostic products. Construction of another, separate Chiba factory is intended to replace similar, outdated production facilities and to increase Daiichi’s production capacity for radioactive diagnostic products. In each case, the planned improvement are intended to meet rising demand for those products. The construction of Daiichi Suntory Pharma’s Institute for Medicinal Research and Development is intended to increase the company’s production capacity to permit a stable supply of HANP® and other new products.
Employees
As of March 31, 2005, on a consolidated basis, Daiichi had 7,333 employees, of which 6,210 were employed in Japan. Employees in Japan may join the Daiichi Labor Union, which has a union shop contract with Daiichi. Daiichi considers its labor relations to be excellent.
97
Table of Contents
Legal Proceedings
In December 2004, the United States District Court for the Northern District of West Virginia ruled in favor of Daiichi and its U.S. licensee, Ortho-McNeil Pharmaceutical, Inc., on their patent infringement action against generic drug manufacturer, Mylan Pharmaceuticals, Inc. The suit arose from the filing by Mylan of an Abbreviated New Drug Application, or ANDA filing, seeking FDA approval to release a generic version of Daiichi’s anti-infective levofloxacin, marketed under the brand name Levaquin®. The court rejected each of Mylan’s five separate invalidity and unenforceability defenses. As a result of the decision, Mylan is enjoined from producing, importing or selling levofloxacin until Daiichi’s U.S. patent expires in 2010. Mylan has filed a notice of appeal to the U.S. Court of Appeals for the Federal Circuit. The appeal is in its earliest stages.
In 1999, Daiichi reached agreement with the United States Department of Justice to a U.S.$25 million fine. Daiichi was charged by the Department of Justice with participating with other manufacturers of vitamins in an agreement to fix the price and allocate the volume of Vitamin B5 (CalPan) sold in the United States and elsewhere, beginning in January 1991 and continuing into February 1999, in violation of the Sherman Antitrust Act. On November 21, 2001, Daiichi received a decision from the European Commission which imposed a fine of approximately ¥2.7 billion on Daiichi in connection with the participation by Daiichi with other manufacturers of vitamins in conduct, including price fixing with respect to Vitamin B5 (CalPan) and allocating its sales volume, in violation of Article 81(1) of the European Community Treaty and Article 53 of the Agreement on the European Economic Area for the period from January 1991 to February 1999. Daiichi has lodged an appeal with the European Court of First Instance to reduce the amount of the fine imposed.
98
Table of Contents
Introduction
Sankyo was initially established pursuant to the laws of Japan in 1899. Sankyo researches, develops, manufactures and markets pharmaceuticals and other products. According to a survey published by the Japan Pharmaceutical Manufacturers Association, for the six months ended September 30, 2004, Sankyo was the second largest pharmaceutical company in Japan in terms of consolidated net revenue in Japan.
Sankyo’s registered office and principal executive offices are located at 5-1, Nihonbashi Honcho 3-chome, Chuo-ku, Tokyo 103-8426, Japan. Sankyo’s telephone number is (81-3) 5255-7111. Its agent in the United States, Sankyo Pharma Inc., is located at Two Hilton Court, Parsippany, New Jersey 07054. The telephone number of Sankyo’s agent in the United States is (973) 359-2600.
History and Development
Sankyo was initially founded in 1899 as Sankyo Shoten. In 1913, Sankyo was incorporated as a joint stock corporation. Sankyo operates both at the parent company level and through subsidiaries and other affiliates in Japan, the United States, Europe and other parts of the world.
In 1989, Sankyo launched Mevalotin® (pravastatin), an agent for lowering cholesterol that quickly became Sankyo’s leading product and remains one of the top selling prescription medications in Japan. Sankyo has continued to focus on treatments for lifestyle-related diseases, such as hyperlipidemia, hypertension and diabetes, and is increasingly focused on growing its overseas operations. In contrast with Mevalotin®, the overseas sales of which generally have taken the form of bulk exports of pravastatin (the generic name) for resale, Sankyo directly launched its latest major product, the antihypertension agent olmesartan (marketed under the brand names Olmetec® and Benicar®), in the United States, major European markets and Japan between 2002 and 2004.
Sankyo’s shares were initially listed on the First Section of the Tokyo Stock Exchange in 1949, and are currently listed on the First Sections of the Tokyo Stock Exchange, the Osaka Securities Exchange, and the Nagoya Stock Exchange, as well as the Sapporo Securities Exchange and the Fukuoka Stock Exchange.
Business Overview
Sankyo’s business segments are comprised of “pharmaceuticals” and “other”. Sankyo views its pharmaceuticals segment as its core business and its vision is concentrated on implementing strategies to bolster the operating base of its pharmaceutical operations.
Consolidated net sales to customers per business segment and the percentage of each business segment’s net sales to customers out of total net sales for the two fiscal years ended March 31, 2003 and 2004 are shown in the following table. The information in the table below is derived from Sankyo’s management reports, which have been prepared based on Japanese GAAP.
| Year ended March 31, | ||||||||||||
| 2003 | 2004 | |||||||||||
| (millions of yen, except percentages) | ||||||||||||
Net Sales (Customer) | Percentage of Total Net Sales (Customer) | Net Sales (Customer) | Percentage of Total Net Sales (Customer) | |||||||||
Pharmaceuticals | ¥ | 443,534 | 77.8 | % | ¥ | 466,734 | 78.3 | % | ||||
Others | 126,394 | 22.2 | % | 129,612 | 21.7 | % | ||||||
99
Table of Contents
Consolidated net sales per geographic segment prior to inter-segment eliminations and the percentage of each geographic segment’s net sales out of total net sales for the two fiscal years ended March 31, 2003 and 2004 are shown in the following table.
| Year ended March 31, | ||||||||||||
| 2003 | 2004 | |||||||||||
| (millions of yen, except percentages) | ||||||||||||
| Net Sales | Percentage of Total Net Sales | Net Sales | Percentage of Total Net Sales | |||||||||
Japan | ¥ | 497,676 | 86.4 | % | ¥ | 504,245 | 83.9 | % | ||||
North America | 48,986 | 8.5 | % | 60,781 | 10.1 | % | ||||||
Other Foreign Countries | 29,608 | 5.1 | % | 36,247 | 6.0 | % | ||||||
Key elements of Sankyo’s strategy include:
| • | Maximizing sales of olmesartan. In connection with the launch of olmesartan in the United States and Germany in 2002 and in Japan in 2004, Sankyo has been increasing the number of its medical representatives and also forming marketing alliances in additional markets to maximize global sales of the drug. These measures are meant to quickly establish olmesartan as a leading global product as well as to strengthen Sankyo’s sales and marketing capabilities for the future. |
| • | Reinforcing development pipeline management. Following a 2003 reform program to better integrate its global R&D efforts, Sankyo is working to focus its efforts on core therapeutic areas and to prioritize new drug candidates in order to expedite the development of those with greatest potential. Lifestyle-related diseases such as cardiovascular diseases and diabetes remain principal areas of research. |
| • | Improving management efficiency. In April 2004, Sankyo established a supply chain management division to improve procurement and production practices. At the headquarters level, Sankyo also reorganized to separate strategic planning functions from the general oversight of operations. These initiatives are in keeping with the wider reorganization of Sankyo’s operation into more clearly accountable units and the introduction of a company-wide performance-based remuneration system. The new framework should enable and incentivize individual units to make autonomous and timely decisions. |
| • | Reexamining non-pharmaceutical operations. In order to concentrate management resources in pharmaceutical operations, Sankyo has been restructuring its non-pharmaceutical businesses. In the fiscal year ended March 31, 2004, the company spun off its agrochemical business to Sankyo Agro Co., Ltd., and its special merchandise business to Sankyo Lifetech Co., Ltd., each of which are wholly-owned subsidiaries of Sankyo. In March 2004, Sankyo withdrew from the medical diagnostics business, which included diagnostic reagents and medical devices. In February 2005, Sankyo also announced plans to sell subsidiaries engaged in the production of valves, yeast and certain confectionary products, the impact of which is not expected to be material on Sankyo’s results of operations. Sankyo believes that these divestments permit management to focus more attention on its core pharmaceutical operations. |
100
Table of Contents
Pharmaceuticals
In its pharmaceuticals operations, Sankyo researches, develops, manufactures and markets pharmaceutical products, including prescription drugs and nonprescription drugs. In the fiscal year ended March 31, 2004, 78.3% of Sankyo’s consolidated net revenue was derived from this segment.
Products
Sankyo’s principal and recently approved pharmaceutical products for which it or a subsidiary holds the underlying patent rights are as follows:
| • | Mevalotin® (pravastatin), an orally administered antihyperlipidemic, or cholesterol lowering, agent, and Sankyo’s flagship product. Pravastatin was developed in-house by Sankyo and is marketed directly in Japan. Pravastatin is also sold in bulk to Bristol-Myers Squibb for distribution as Pravachol® in the United States, Europe and other markets pursuant to a non-exclusive license, and by Sankyo group companies in Europe and other markets. The term of the license granted to Bristol-Myers Squibb continues until the expiration of the relevant patent. Pravastatin no longer enjoys patent protection in Japan, while the patent with respect to pravastatin in the United States is due to expire in April 2006. Pravastatin’s known side effects include rash, diarrhea and stomach discomfort. The principal product which competes with pravastatin is Lipitor®, sold by Pfizer and Astellas Pharma. Pravastatin was launched in 1989 in Japan and globally in 1991. Sales of Mevalotin® accounted for approximately 34.2% of net revenue in the year ended March 31, 2004. According to data acquired by Sankyo from IMS Health, Incorporated, an independent provider of information services to the pharmaceutical and health care industries, the market for pravastatin in the fiscal year ended March 31, 2004 was approximately ¥290 billion in Japan, and was U.S.$15 billion in the U.S. and €4.1 billion in Europe (Germany, France, the United Kingdom, Spain and Italy) in the calendar year ended December 31, 2004. |
| • | Olmesartan, an orally administered anti-hypertension agent marketed in the United States under the brand name Benicar® and in Europe and Japan under the brand name Olmetec®. Olmesartan was the first product for which Sankyo and its group companies oversaw R&D, production and sales on a global basis. Sankyo has expanded sales of olmesartan through selective use of co-promotion and co-marketing arrangements with third parties. Olmesartan’s known side effects include lightheadedness and dizziness. The principal products which compete with olmesartan include Novartis’s Diovan®. Sankyo launched Benicar® in the United States in May 2002 and Olmetec® in Germany in October 2002 and Japan in May 2004. Full-fledged global expansion of the product began in 2004. Sales of olmesartan accounted for approximately 2.7% of net revenue in the year ended March 31, 2004. According to data acquired by Sankyo from IMS Health, in the fiscal year ended March 31, 2004 the market for olmesartan in Japan was approximately ¥260 billion, and was approximately U.S.$4.2 billion in the United States, and €2.4 billion in Europe (Germany, France, the United Kingdom, Spain and Italy) in the calendar year ended December 31, 2004. |
| • | Loxonin® (loxoprofen), an orally administered non-steroidal analgesic and anti-inflammatory agent developed in-house by Sankyo and distributed directly in Japan and other markets, and through its subsidiaries and third party distributors in, South America and other markets. Loxoprofen no longer enjoys any kind of patent protection. Loxonin®’s known side effects include stomach discomfort, edema and rash. The principal product which competes with Loxonin® is Novartis’s Voltaren®. Loxonin® was launched in 1986 in Japan. Sales of Loxonin® accounted for approximately 4.6% of net revenue in the year ended March 31, 2004. According to data acquired by Sankyo from IMS Health, the market for Loxonin® in the fiscal year ended March 31, 2004 in Japan was approximately ¥83 billion and was approximately U.S.$49 million in China in the calendar year ended December 31, 2004. |
| • | Banan® (cefpodoxime), an oral antibiotic agent developed by Sankyo, distributed directly in Japan by Sankyo, and distributed outside Japan through its subsidiaries and third party licensees. Patent protection has expired in the United States with respect to cefpodoxime. The patent for cefpodoxime will expire in August 2005 in France and Germany, September 2005 in the United |
101
Table of Contents
Kingdom, and with respect to certain indications, September 2005 in Japan. Banan®’s known side effects include upset stomach, nausea and headache. The principal competing product of Banan® is Shionogi’s Flomox®. Banan® was launched in Japan in 1989, in Europe in 1991, and in the United States in 1992. Sales of Banan® accounted for approximately 2.2% of net revenue in the year ended March 31, 2004. According to data acquired by Sankyo from IMS Health, for the year ended March 31, 2004, the market for Banan® in Japan was approximately ¥114 billion, and was approximately U.S.$920 million in the United States, and €490 million in Europe (Germany, France, the United Kingdom, Spain and Italy) in the calendar year ended December 31, 2004. |
| • | Acecol®, an orally administered antihypertension agent developed by Sankyo and distributed directly by Sankyo in Japan. Acecol®’s known side effects include upset stomach, nausea and headache. The patent for Acecol® in Japan is valid through October 2008. The principal products which compete with Acecol® include Banyu Pharmaceutical’s Renivace®. Acecol® was launched in 1994. Sales of Acecol® accounted for approximately 2.0% of net revenue in the year ended March 31, 2004. According to data acquired by Sankyo from IMS Health, the market for Acecol® in Japan in the fiscal year ended March 31, 2004 was approximately ¥102 billion. |
Principal pharmaceutical products for which Sankyo holds marketing and other rights pursuant to licensing agreements are set forth below. Due to their relatively small individual contribution to Sankyo’s net revenue, Sankyo does not consider that its business depends to a material extent upon rights to any one pharmaceutical product it licenses from a third party.
| • | Venofer®, a drug for the treatment of iron deficiency anemia administered through intravenous injection, and marketed by Sankyo’s consolidated subsidiary Luitpold Pharmaceuticals, Inc. in the United States. Patent protection has expired in the United States with respect to the basic compound of Venofer®. Venofer®’s known side effects include low blood pressure, cramps and nausea. The principal product which competes with Venofer® is Watson Pharmaceutical’s Ferrlecit®. Sales of Venofer® accounted for approximately 2.8% of net revenue in the year ended March 31, 2004. Venofer® was launched in the United States in 2000. According to data acquired by Sankyo from IMS Health, the market for Venofer ® in the United States in the calendar year ended December 31, 2004 was approximately U.S.$440 million. |
| • | Kremezin®, an orally administered treatment for chronic renal failure developed by Kureha Chemical Industries and distributed directly by Sankyo, and promoted jointly with Sanwa Kagaku Kenkyusho Co., Ltd., in Japan. Kremezin®’s known side effects include constipation and anorexia. Sankyo believes that there are no products which compete with Kremezin® in Japan. Kureha has granted to Sankyo an exclusive license to sell the product in Japan. The term of Sankyo’s license continues for successive one year periods unless terminated in advance by either Sankyo or Kureha upon six months prior notice. Kremezin® no longer enjoys patent protection in Japan. Kremezin® was launched in Japan in 1991. Sales of Kremezin® accounted for approximately 2.2% of net revenue in the year ended March 31, 2004. According to data acquired by Sankyo from IMS Health, the market for Kremezin® in Japan in the fiscal year ended March 31, 2004 was approximately ¥14.5 billion. |
| • | WelChol®, an antihyperlipidemic agent for lowering cholesterol developed in collaboration with GelTex Pharmaceuticals, Inc. (now Genzyme) and marketed by Sankyo Pharma Inc. pursuant to license from Genzyme in the United States. WelChol® is administered orally, and its known side effects include gas, constipation, and upset stomach. The principal products which compete with WelChol® in the United States include generic cholestyramine. Genzyme has granted to Sankyo Pharma Inc. an exclusive, irrevocable right to manufacture and sell WelChol® in the United States in exchange for royalty payments calculated with reference to actual sales. The term of Sankyo’s license continues until the termination of patent rights with respect to the product. WelChol® was launched in the United States in 2000. Sales of WelChol® accounted for approximately 2.3% of net revenue in the year ended March 31, 2004. According to data acquired by Sankyo from IMS Health, the market for WelChol® in the United States in the portion of the calendar year through July 31, 2004 was approximately U.S.$2.4 billion. |
102
Table of Contents
| • | Zantac®, an H2 antagonist which inhibits gastric acids and is used for the treatment of ulcers. Zantac® is marketed by Sankyo in Japan under license from GlaxoSmithKline. Zantac® is administered orally or by intravenous injection, and its known side effects include elevated liver enzymes and nausea. The principal products which compete with Zantac® in Japan include Astellas Pharma’s Gaster®. GlaxoSmithKline has granted to Sankyo the right to sell Zantac® in Japan. The term of Sankyo’s license continues for successive one year periods unless terminated in advance by either Sankyo or GlaxoSmithKline upon six months prior notice. Zantac® no longer enjoys patent protection in Japan. Zantac® was launched in Japan in 1984. Sales of Zantac® accounted for approximately 1.6% of net revenue in the year ended March 31, 2004. According to data acquired by Sankyo from IMS Health, the market for Zantac® in Japan in the fiscal year ended March 31, 2004 was approximately ¥150 billion. |
The foregoing nine highest-selling products accounted for approximately 54.7% of net revenue in the year ended March 31, 2004, including 34.2% attributable to Mevalotin®.
Marketing
Sankyo’s marketing activities include direct marketing, marketing of products manufactured by third parties through licensing-in arrangements, and licensing of Sankyo products to third parties for marketing by such entities. The largest portion of Sankyo’s products is marketed directly by Sankyo’s Japanese and global group companies.
Japan. In Japan, Sankyo has an extensive salesforce that promotes products to healthcare providers such as doctors, pharmacists, hospitals and government agencies. As of September 30, 2004, Sankyo had approximately 1,285 medical representatives in Japan and was adding additional representatives to increase sales of olmesartan following its launch. Sankyo sells its products to multiple wholesalers who make direct sales to healthcare providers and also often engage in collaborative marketing efforts with Sankyo’s direct sales force. In addition to marketing its own products, Sankyo also enters into co-promotion agreements with other manufacturers. For example,
| • | in April 2003 Sankyo agreed with Sanwa Kagaku Kenkyusho Co., Ltd. to co-promote Kremezin®, a treatment for chronic renal failure in Japan. Previously, although Sankyo had marketed Kremezin ® independently, the company sought to strengthen its distribution through this co-promotion arrangement. |
| • | in March 2002 and December 2003, Sankyo agreed with Kowa Company, Ltd. to jointly sell, and with Sanwa Kagaku Kenkyusho Co., Ltd. to co-promote Olmetec® in Japan in an effort to efficiently increase the distribution coverage of this product. |
Sankyo does not consider that its business depends to a material extent upon these agreements or any one co-marketing arrangement.
Overseas Markets. Particularly in connection with the launch of olmesartan beginning in 2002, Sankyo has increased its marketing network in key markets in the United States and Europe. In the United States, as of September 30, 2004, Sankyo had approximately 530 medical representatives organized into six branches to give nationwide coverage. Their primary focus is olmesartan (marketed as Benicar®), which is also being co-promoted by Forest Laboratories Inc. In Europe, Sankyo’s subsidiaries had approximately 800 medical representatives as of September 30, 2004 to promote olmesartan and other products and directly handle sales of olmesartan in the United Kingdom, Germany and France. In addition, Sankyo has a variety of co-marketing and co-promotion arrangements in markets such as France and Spain. To maximize the speed of olmesartan’s worldwide launch, Sankyo also granted an exclusive sales and co-promotion license to Pfizer, Inc. covering Australia, New Zealand and certain markets in Southeast Asia and Latin America.
With respect to sales to major customers, Sankyo recorded sales to Bristol-Myers Squibb Company of ¥61.2 billion, or 10.6% of total sales in the year ended March 31, 2003, and ¥92.6 billion, constituting 15.4% of total sales in the year ended March 31, 2004. These sales consisted primarily of bulk sales of pravastatin to Bristol-Myers, a licensee of the product for distribution in the United States, Europe and other markets.
103
Table of Contents
Sankyo manufactures products in its own facilities in Japan, the United States, Germany, France, China, Venezuela and Brazil. In addition, Sankyo outsources manufacturing of Welchol® tablets for the United States, and ingredients for a single product in Italy, to third parties.
Research and Development
Sankyo places great importance on the research and development of new pharmaceutical products. Sankyo has concentrated its management resources on identifying new world-class drugs which are drugs that Sankyo believes have the potential for or have demonstrated success in establishing consistent sales in multiple markets throughout the world and bringing them to market as quickly as possible, focusing on six key fields: cardiovascular disease, glucose metabolic disorders, immune/allergic disorders, bone/articular disorders, cancer and infectious diseases. To date, pravastatin, olmesartan and the other principal products owned by Sankyo have demonstrated success in establishing consistent sales in various markets throughout the world. In October 2003, Sankyo implemented a major organizational reform focused on integrating its global R&D organization. This reform was leveraged off a previous R&D restructuring program that Sankyo launched in July 2002. Sankyo expects the realignments made to help prioritize compounds in the pipeline and expedite decision making so as to facilitate the rapid development of innovative new drugs.
For the fiscal year ended March 31, 2004, consolidated R&D expenses were ¥93.6 billion, constituting 15.6% of net revenue. Sankyo’s principal global development products include:
| • | CS-505 (Phase II/III (U.S. and Europe); Phase I preparations (Japan)), an antiarteriosclerotic agent; and |
| • | CS-011 (Phase II (U.S.); Phase I preparations (Japan)), an antidiabetic agent. |
In addition to products developed directly, Sankyo also often partners with other pharmaceutical or research companies for the development of pharmaceutical products. In June 2001, Sankyo entered into a licensing agreement with Eli Lilly and Company to partner in the promotion and marketing of CS-747, a treatment for ischemic diseases being jointly developed with Eli Lilly in countries other than Japan. Ischemic diseases are diseases caused by insufficient blood flow. CS-747 is currently in Phase III clinical trials in the U.S. and Europe and Phase I clinical trials in Japan. Products in development with other companies also include CS-917 (Phase II (U.S.)), an antidiabetic agent acquired through collaboration with Metabasis Therapeutics, Inc. This product is currently in Phase IIb testing in the United States.
104
Table of Contents
Clinical Development Pipeline
The following describes the clinical development state of various compounds in Sankyo’s research and development pipeline as of April 30, 2005. The tables include all the compounds to which Sankyo has development rights that have progressed to clinical trials. Due to the uncertainties and difficulties of the drug development process, however, it is not unusual for compounds to be terminated as they pass through development, even after the initiation of clinical trials. Except as noted, for internally developed candidates in clinical trials, Sankyo has typically applied for or obtained composition patents in Japan and other major countries such as the U.S. and countries in the EU. Such patents generally expire 17 years after grant, or 20 years from the filing date of the application, depending on the jurisdiction and the date when the original application was filed. In addition, in some circumstances, the companies may be granted patent term extensions of up to five years. For licensed candidates, the licensor has typically obtained such patents and granted Sankyo exclusive development rights in the territories covered by the license subject to meeting specified development milestones. In light of the number of candidates under development and the uncertainties and difficulties of the drug development process, Sankyo does not consider that its business depends to a material extent upon rights to any one development compound licensed from a third party.
Cardiovascular Diseases
| Compound | Origin | Indication (Effect/Mechanism) | Stage of Development | |||||
| Japan | U.S./EU | |||||||
CS-866 | Sankyo | Antihypertension (ARB, olmesartan) | Launched (5/04) | Launched (5/02)(U.S.)
Launched (10/02)(EU) | ||||
Additional indication of diabetes-related kidney dysfunction, chronic glomerulonephritis, and microalbuminuria prevention | P-III | |||||||
Additional indication of chronic glomerulonephritis | P-III | |||||||
Prevention of microalbuminuria | EU: large-scale clinical trial (ROADMAP) | |||||||
CS-866AZ | Sankyo | Antihypertension | P-I | |||||
CS-866CMB | Sankyo | Antihypertension | P-I | Launched (9/03)(U.S.)
Application (9/03)(EU) | ||||
CS-505 | Sankyo, Kyoto Pharmaceutical | Antiarteriosclerotic disease (ACAT inhibitor) | P-I preparation | P-II/III | ||||
CS-747 | Sankyo, Ube Industries | Ischemic disease (antiplatelet) | P-I | P-III | ||||
CS-3030 | Sankyo | Deep vein thrombosis/ pulmonary embolism | Pre-clinical study | Pre-clinical study | ||||
105
Table of Contents
CS-866 is an angiotensin II (type 1 receptor) blocker (ARB), with one indication for the treatment of hypertension, or high blood pressure, and other indications under development for the treatment of diabetes-related kidney dysfunctions and chronic glomerulonephritis, a kidney disease in which the kidney’s filters become inflamed and scarred and slowly lose their ability to remove waste from the blood and produce urine. The angiotensin II (type 1 receptor) blockers (ARBs) are a group of pharmaceuticals which modulate the hormone system that helps regulate long-term blood pressure and blood volume in the body. Sankyo is also using the product in clinical trials to demonstrate its effectiveness in the prevention of microalbuminuria, a urinary dysfunction also associated with diabetes. The prevention study of microalbuminuria is called ROADMAP (Randomised Olmesartan And Diabetes MicroAlbuminuria Prevention). The compound was discovered and is being developed by Sankyo. In connection with its indication for the treatment of hypertension, the compound was launched in Japan in May 2004, in the United States in May 2002 and in the EU in October 2002 and is currently under development in a number of other countries such as China and Venezuela. In connection with its indication for the treatment of diabetes-related kidney dysfunction and chronic gomerulonephritis, the compound is currently in Phase III clinical trials in Japan. In connection with its indication for the prevention of microalbuminuria, CS-866 is currently in large-scale clinical trials in the EU. In connection with its indication for the treatment of hypertension, Sankyo directly markets products based on CS-866 in Japan, the United States and Europe, and has granted the right to market such products in Japan to Kowa and in Europe to Menarini. Both inside and outside of Japan, Sankyo expects that products based on this compound will compete with Novartis’s Diovan®.
CS-866AZ is a combination angiotensin II (type 1 receptor) blocker (ARB)and calcium channel blocker used to treat hypertension. The compound was discovered and is being developed by Sankyo. The compound is currently in Phase I clinical trials in Japan. Within Japan, Sankyo expects that products based on this compound will have no competitors.
CS-866CMB is a combination angiotensin II (type 1 receptor) blocker (ARB)and diuretic used to treat hypertension. Diuretics are substances that increase the flow of urine from the body and are used to treat high blood pressure and fluid retention by increasing the elimination of salt and water from the kidneys. The compound was discovered and is being developed by Sankyo. The compound is currently in Phase I clinical trials in Japan. In September 2003, the compound was launched in the United States. Also, in September 2003, Sankyo submitted a new drug application for the compound in the EU, and based on its past experience, Sankyo expects approval of the EU drug application in the second quarter of 2005, though there can be no assurance that approval will be granted in the expected time frame, or at all. Sankyo expects to directly market products based on CS-866CMB in Japan, the United States and Europe, and has granted the right to market such products in Europe to Menarini. Within Japan, Sankyo expects that products based on this compound will have no competitors. Outside of Japan, Sankyo expects that products based on this compound will compete with Novartis’s Diovan HCT®.
CS-505 is an ACAT inhibitor used to treat arteriosclerotic disease. ACAT (Acyl-CoA Cholesterol Acyl Transferase) is an enzyme that plays a major role in the formation of lesions in artery walls, the absorption of dietary cholesterol, and the synthesis of lipoproteins, compounds of protein that carry fats and fat-like substances in the blood. CS-505 is an ACAT inhibitor and directly inhibits the progression of arteriosclerosis, a disease in which the walls of the arteries become thick and hard, without reducing cholesterol level. The compound was discovered by Sankyo and Kyoto Pharmaceutical and is being developed by Sankyo. The compound is currently in preparation for Phase I clinical trials in Japan and in Phase II/III clinical trials in the United States and the EU. Phase II/III is a term used by Sankyo to describe trials which are conducted like Phase II trials, but for which the results are used as the basis for new drug applications, as in Phase III trials. Sankyo expects to file a new drug application for CS-505 based on the results of the Phase II trials, but it is possible that the FDA may require additional clinical trials subsequent to such application. Sankyo expects to directly market products based on CS-505 in Japan, the United States and Europe. Both within and outside of Japan, Sankyo expects that products based on this compound will have no competitors.
CS-747 is an anti-platelet agent used to treat ischemic diseases, diseases relating to dysfunction in blood supply and flow. The compound was discovered by Sankyo and Ube Industries and is being developed by
106
Table of Contents
Sankyo in Japan. The compound is being co-developed by Sankyo and Eli Lilly in the United States and the EU. Eli Lilly, in collaboration with Sankyo, is responsible for regulatory submissions in the U.S. and the rest of the world excluding Japan. The companies are sharing development costs equally. The compound is currently in Phase I clinical trials in Japan and Phase III clinical trials in the United States and the EU. Sankyo expects to directly market products based on CS-747 in Japan, the United States and the United Kingdom, and has granted the right to market such products in the United States and Europe to Eli Lilly and Company. Eli Lilly has exclusive worldwide rights to develop and market CS-747, except in Japan and certain Middle Eastern countries. Sankyo and Eli Lilly will co-promote the product in the U.S. and certain countries in the EU, whereas in other countries Sankyo and Eli Lilly will co-market the product. Within Japan, Sankyo expects that products based on this compound will compete with Daiichi Pharmaceutical’s Panaldine® and Plavix®. Outside of Japan, Sankyo expects that products based on this compound will compete with Sanofi-Aventis’s Plavix®.
CS-3030 is an oral direct Factor Xa inhibitor used to treat deep vein thrombosis, or blood clots, and pulmonary embolism. Factor Xa inhibitors are medications that selectively block the formation of blood clots. The compound was discovered by Sankyo and is being developed by Sankyo in Japan, the United States and the EU Sankyo expects to directly market products based on CS-3030 in Japan, the United States and Europe. Both within and outside of Japan, Sankyo currently expects that products based on this compound will have no oral factor Xa inhibitor competitors.
Glucose Metabolic Disorders
| Compound | Origin | Indication (Effect/Mechanism) | Stage of Development | |||||
| Japan | U.S./EU | |||||||
CS-011 | Sankyo | Antidiabetic (glitazone agent) | P-I preparation | P-II | ||||
CS-917 | Sankyo, Metabasis Therapeutics, Inc. | Antidiabetic (gluconeogenesis inhibitor) | P-II | |||||
SNK-860 (fidarestat) | Sanwa Kagaku Kenkyusho | Diabetic neuropathy (aldose reductase inhibitor) | P-III preparation | |||||
WelChol® | Genzyme Corporation | Antidiabetic | P-III | |||||
CS-872 | Daiichi Suntory Pharma | Antidiabetic (rhGLP-1 nasal spray) | P-I | |||||
CS-011 is a glitazone agent used to treat diabetes. Glitazone agents are members of a class of diabetes medications called thiazolidinediones, which act against insulin resistance by making muscle cells more sensitive to insulin. The compound was discovered and is being developed by Sankyo. The compound is currently in preparation for Phase I clinical trials in Japan and is in Phase II clinical trials in the United States. Sankyo expects to directly market products based on CS-011 in Japan, the United States and the EU. Both within and outside of Japan, Sankyo expects that products based on this compound will compete with Takeda Pharmaceutical’s Actos®.
CS-917 is a gluconeogenesis inhibitor used to treat diabetes. Gluconeogenesis inhibitors suppress glucose production by the liver. The compound was discovered by Sankyo and Metabasis Therapeutics, Inc. and is being developed by Sankyo in the United States and the EU. Sankyo is responsible for development of CS-917 in Japan, the United States and the EU. The compound is currently in Phase II clinical trials in the United States, although some Phase I clinical trials of the compound are also ongoing at this time. Recently, one Phase I and two Phase II clinical trials were halted due to two serious adverse events that occurred in a clinical trial
107
Table of Contents
combining CS-917 with the marketed diabetes treatment metformin. One Phase I clinical trial of CS-917 is continuing and one or more Phase I clinical trials may be initiated soon to further evaluate the product candidate. The continuing Phase I clinical trial does not combine CS-917 with metformin. In parallel with this activity, Sankyo is evaluating the next steps to be taken in this program. Sankyo expects to directly market products based on CS-917 in Japan, the United States and the EU, and Metabasis has the option to co-promote the product in North America. Sankyo expects that products based on this compound will have no competitors outside of Japan.
SNK-860 (fidarestat) is an aldose reductase inhibitor used to treat diabetic neuropathy. Diabetic neuropathy is deterioration in the spinal cord and its nerves due to diabetes. Aldose reductase inhibitors prevent or slow the action of aldose reductase, an enzyme involved in changing glucose in the body into sorbitol, a sugar alcohol which can only be absorbed by the body at a slow rate and which contributes to diabetic neuropathy. The compound was discovered by Sanwa Kagaku Kenkyusho and is being co-developed by Sanwa Kagaku and N.K. Curex in Japan and by Sankyo and Sanwa Kagaku in the United States and the EU. Sanwa conducted Phase I and Phase II studies in the U.S., and Sankyo conducted additional Phase II-b studies in the U.S. in consultation with Sanwa. The compound is currently in preparation for Phase III clinical trials to be conducted by Sankyo in the United States and the EU in consultation with Sanwa. Sankyo expects to directly market products based on SNK-860 in the United States and the EU. Sankyo expects that products based on this compound will have no competitors outside of Japan.
WelChol® is a bile acid sequestrant approved for marketing in the United States for treatment of high blood cholesterol which is now being studied by Sankyo Pharma Inc. for the treatment of diabetes. Bile acid sequestrants bind with bile acids in the intestine and carry them out of the body, thus preventing their reabsorption from the digestive system. Preventing the reabsorption of bile acids causes the body to use more cholesterol to make more bile acids, resulting in lower overall levels of cholesterol in the body. The compound was discovered by Genzyme Corporation and was launched in 2000 as an antihyperlidimic agent. Currently, WelChol® is being developed by SPI in the United States for use in treating diabetes. The compound is currently in Phase III clinical trials in the United States. Sankyo expects to directly market products based on WelChol® for use in treating diabetes in the United States. Sankyo expects that products based on this compound for use in treating diabetes will compete with generic cholestyramine.
CS-872 is a nasal powder spray of glucogon-like peptide 1(7-36) used to treat type II diabetes mellitus. The compound was discovered by Suntory (now Daiichi Suntory Pharma) and is being co-developed by Sankyo with Daiichi Suntory Pharma. Sankyo is currently conducting Phase I clinical trials in Japan. Sankyo expects to directly market products based on CS-872 in Japan. Sankyo expects that products based on this compound will have no competitors inside Japan.
Bone/Articular Disorders
| Compound | Origin | Indication (Effect/Mechanism) | Stage of Development | |||||
| Japan | U.S./EU | |||||||
CS-706 | Sankyo | Anti-inflammatory and analgesic (COX-2 inhibitor) | P-II | |||||
OCIF | Sankyo | Osteoporosis | Pre-clinical study | Pre-clinical study | ||||
LX-A | Sankyo | Anti-inflammatory and analgesic (loxoprofen patch) | Application (6/03) | |||||
CS-600G | Sankyo | Anti-inflammatory and analgesic (loxoprofen gel) | P-III preparation | |||||
108
Table of Contents
CS-706 is a COX-2 inhibitor used as an anti-inflammatory and an analgesic. COX-2 inhibitors are non-steroid anti-inflammatory drugs that specifically inhibit the effect of an enzyme known as cyclooxygenase-2 (COX-2), which is an enzyme that makes hormone-like substances in the body that cause inflammation, pain and fever. Analgesics are medications that relieve pain. The compound was discovered by and is being developed by Sankyo. The compound is currently in Phase II clinical trials in the United States. Sankyo expects to directly market products based on CS-706 in Japan. Sankyo expects that products based on this compound will compete with Pfizer’s Celebrex® outside of Japan.
OCIF is a secreted protein used to treat osteoporosis. The compound was discovered by and is being developed by Sankyo. The compound is currently in pre-clinical study. Sankyo expects to directly market products based on OCIF in Japan, the U.S. and the EU. Both within and outside of Japan, Sankyo expects that products based on this compound will have no competitors.
LX-A is a loxoprofen patch used as an anti-inflammatory and an analgesic. Loxoprofen is a non-steroid anti-inflammatory drug. The compound was discovered by Sankyo and is being co-developed by Sankyo with Lead Chemical, which has primary responsibility for regulatory submissions in Japan. Sankyo filed a new drug application in Japan in June 2003 and expects approval in 2006, based on its past experience, though there can be no assurance that approval will be granted in the expected time frame, or at all. Sankyo expects to directly market products based on LX-A in Japan. Sankyo expects that products based on this compound will compete with Hisamitsu Pharmaceutical’s Mohrus® within Japan.
CS-600-G is a loxoprofen gel used as an anti-inflammatory and an analgesic. The compound was discovered by Sankyo and is being formulated by Toko Pharmaceutical. The compound is currently in preparation for Phase III clinical trials in Japan. Sankyo expects to directly market products based on CS-600-G in Japan. Sankyo expects that products based on this compound will compete with Novartis’s Voltaren Gel® inside Japan.
Immune/Allergic Disorders
| Indication | Stage of Development | |||||||
| Compound | Origin | (Effect/Mechanism) | Japan | U.S./EU | ||||
IGE025 (Xolair) | Novartis | Bronchial asthma, allergic rhinitis (anti-lgE antibody) | P-III | |||||
| CS-003/ CS- 003 inhalation | Sankyo | COPD/asthma (neurokinin receptor antagonist) | P-II/Pre-clinical study | |||||
| CS-712 | Sankyo | Cedar pollen pollenosis (oral immune desensitization) | P-II | |||||
| CS-0777 | Sankyo | Auto-immune disease (immunosuppressant) | Pre-clinical study | Pre-clinical study | ||||
IGE025 (Xolair) is an anti-lgE antibody used to treat bronchial asthma and allergic rhinitis. Bronchial asthma is a disease in which there is a widespread narrowing of the airways in the lungs, varying of short periods of time. Allergic rhinitis is an allergic reaction with symptoms similar to a chronic cold. An anti-lgE antibody is a medication that suppresses particular antibodies secreted by the immune system in response to an infection. The compound was discovered by Novartis and is being co-developed in Japan by Sankyo with Novartis Pharma K.K., which has primary responsibility for regulatory submisssions in Japan. The compound was launched in the
109
Table of Contents
United States in 2003. The compound is currently in Phase III clinical trials in Japan. Sankyo expects that products based on this compound will have no competitors inside Japan.
CS-003 and CS-003 inhalation are neurokinin receptor antagonists used to treat chronic obstructive pulmonary disease (“COPD”) and asthma. Neurokinin receptor antagonists inhibit the normal functioning of neurokinin receptors, which are receptors involved in the constriction of air passages in the lungs. Chronic obstructive pulmonary disease is a general term for disease characterized by long-term or permanent narrowing of the small airways of the lungs. The compounds were discovered by and are being developed by Sankyo. CS-003 is currently in Phase II clinical trials in the EU and CS-003 inhalation is currently in pre-clinical study. CS-003 and CS-003 inhalation will be offered to prospective licensing partners for further development and marketing.
CS-712 is an oral immune desensitization agent used to treat cedar pollen pollenosis. Immune desensitization agents suppress the normal functioning of the immune system. Cedar pollen pollenosis is an allergic reaction to the pollen of cedar trees, which are widespread in Japan. The compound was discovered by Sankyo and is being developed by Sankyo together with technical collaboration from Hayashibara Biochemical Laboratories. The compound is currently in Phase II clinical trials in Japan. Sankyo expects to directly market products based on CS-712 in Japan. Sankyo expects that products based on this compound will have no competitors inside Japan.
CS-0777 is an oral immunosuppressant used to treat rheumatoid arthritis, psoriasis, multiple sclerosis and the prevention of organ transplantation-graft rejection. Immunosuppressants act to reduce or halt the body’s immune responses. The compound was discovered by and is being developed by Sankyo. The compound is currently in pre-clinical study in Japan, the United States and the EU. Currently, Sankyo expects to directly market products based on CS-0777 in Japan. Sankyo expects that products based on this compound will have no competitors inside Japan.
Cancer
| Indication | Stage of Development | |||||||
| Compound | Origin | (Effect/Mechanism) | Japan | U.S./EU | ||||
CS-1008 | Sankyo, University of Alabama | Antineoplastic antibody (anti-DR5 antibody) | P-I preparation | |||||
CS-7017 | Sankyo | Antineoplastic (PPARg activator) | Pre-clinical study | Pre-clinical study | ||||
CS-1008 is an anti-DR5 antibody that is used as an antineoplastic antibody in the treatment of cancer. Antineoplastic antibodies are medications that prevent, kill or block the growth or spread of neoplastic cells, or cancer cells. The compound was discovered by Sankyo and the University of Alabama and is being developed by Sankyo. The compound is currently in preparation for Phase-I clinical trials in the United States. Sankyo expects to directly market products based on CS-1008 in Japan, the United States and the EU. Sankyo expects that products based on this compound will have no competitors outside of Japan.
CS-7017 is a PPARg activator that is used as an antineoplastic in the treatment of cancer. PPARg activators are drugs that activate types of proteins that are intimately connected to cellular metabolism and are generally used in the treatment of diabetes. There is a correlation between PPARg activation and inhibition of cell formation. The compound was discovered by and is being developed by Sankyo. The compound is currently in pre-clinical study. Sankyo expects to directly market products based on CS-7017 in Japan, the United States and the EU. Both inside and outside of Japan, Sankyo expects that products based on this compound for use in the treatment of cancer will have no competitors.
110
Table of Contents
Infectious Diseases
| Indication | Stage of Development | |||||||
| Compound | Origin | (Effect/Mechanism) | Japan | U.S./EU | ||||
CS-758 | Sankyo | Azole antifungal | P-I | |||||
CS-023 | Sankyo | Carbapenem antibacterial | P-I | P-II | ||||
CS-8958 | Sankyo | Anti-influenza | P-I preparation | |||||
CS-3955 | Kureha Chemical Industry | Agent to treat HIV infection (CXCR4 antagonist) | Pre-clinical study | Pre-clinical study | ||||
CS-758 is an azole antifungal agent. Azole antifungal agents are used to treat serious fungus infections that may occur in different parts of the body. The compound was discovered by and is being developed by Sankyo. The compound is currently in Phase-I clinical trials in the United States. Sankyo expects to directly market products based on CS-758 in Japan. CS-758 will be offered to prospective licensing partners for further development and marketing in the United States and the EU. Sankyo expects that products based on this compound will compete with Pfizer’s Diflucan® outside of Japan.
CS-023 is a carbapenem antibacterial agent. Carbapenem antibacterial agents are antibiotic drugs derived from the organism Streptomyces cattleya. The compound was discovered by and is being developed by Sankyo. The compound is currently in Phase I clinical trials in Japan and in Phase II clinical trials in the United States and the EU. Sankyo expects to directly market products based on CS-023 in Japan and has granted the right to market such products in the United States and the EU to F.Hoffman-La Roche Ltd. Within Japan, Sankyo expects that products based on this compound will compete with Banyu Pharmaceutical’s Tienem®. Outside of Japan, Sankyo expects that products based on this compound will compete with Merck’s Primaxin®.
CS-8958 is used to treat influenza. The compound was discovered by and is being developed by Sankyo. Sankyo plans collaborative clinical trials with Biota for proof of concept study. The compound is currently being prepared for Phase I clinical trials. CS-8958 will be offered to prospective licensing partners for further development and marketing. Sankyo expects that products based on this compound will compete with GlaxoSmithKline’s Relenza® outside of Japan.
CS-3955 is a CXCR4 antagonist agent used to treat HIV infection. CXCR4 is a second receptor for HIV entry into human cells. CS-3955 inhibits the binding between HIV and CXCR4. The compound was discovered by Kureha Chemical Industry and is being co-developed by Sankyo and Kureha Chemical Industry. The compound is currently in pre-clinical study. Sankyo is seeking a licensee to further develop and market the compound. Both inside and outside of Japan, Sankyo expects that products based on this compound will have no competitors.
111
Table of Contents
Other
| Indication | Stage of Development | |||||||
| Compound | Origin | (Effect/Mechanism) | Japan | U.S./EU | ||||
CS-419K | Sankyo | Vitamin (rapid preparation kit of Multamin ®, an intravenous hyperalimentation) | To be filed | |||||
CS-1401E | Janssen | Pain relief during anesthesia (fentanyl citrate’s additional dosage and dose regimen for infants) | P-III | |||||
CS-088 (DE-092) | Sankyo | Antiglaucoma (angiotensin II (type 1 receptor) blocker (ARB)) | P-II | P-II | ||||
CS-801 | Watson Pharmaceuticals | Antiurinary incontinence (oxybutynin patch) | P-III | |||||
CS-419K is a vitamin product consisting of a rapid preparation kit of Multamin®, an intravenous hyperalimentation. Intravenous hyperalimentation is the supply of nutrients to the body through injection. Multamin® was discovered by Sankyo and was launched in Japan in 1990. Currently, CS-419K is being co-developed in Japan by Sankyo with Ajinomoto Pharma in connection with a rapid preparation kit of Multamin ®. Sankyo intends to submit a new drug application in Japan with respect to the compound in 2005. Sankyo expects that Ajinomoto will directly market products based on CS-419K in Japan. Sankyo expects that products based on this compound will compete with Terumo’s Vitaject® inside Japan.
CS-1401E is a pain relief agent for use during the application of anesthesia. The compound known as Fentanest® (fentanyl) was discovered by Janssen and was launched in 1972 in Japan. CS1401E is currently being developed for additional dosage and dose regimen for infants pursuant to an investigator-initiated clinical trial in collaboration with Sankyo. The compound is currently in Phase III clinical trials in Japan. Sankyo expects to directly market products based on CS-1401E in Japan. Sankyo expects that products based on this compound for use as a pain reliever for infants will have no competitors inside Japan.
CS-088 (DE-092) is an angiotensin II (type 1 receptor) blocker (ARB) used to treat glaucoma. The angiotensin II (type 1 receptor) blockers (ARBs) are a group of pharmaceuticals which modulate the hormone system that helps regulate long-term blood pressure and blood volume in the body. The compound was discovered by Sankyo and is being co-developed by Sankyo with Santen Pharmaceuticals for use as an eye-drop. Sankyo conducted Phase I trials in Japan, and Santen Pharmaceuticals is currently conducting further clinical trials in Japan, the U.S. and the EU. The compound is currently in Phase II clinical trials in Japan and the United States. Sankyo has granted the right to market such products in Japan, the United States and the EU to Santen, although Sankyo retains the option to co-market such products in Japan. Both inside and outside of Japan, Sankyo expects that products based on this compound for use in treating glaucoma will have no competitors.
CS-801 is an oxybutynin patch used to treat urinary incontinence. Oxybutynin is a drug that helps to decrease muscle spasms of the bladder. The compound was discovered by Watson Pharmaceuticals and is under development by Sankyo in Japan and by Watson Pharmaceuticals in the United States and the EU. The compound was launched in the United States in 2003 and was approved in Canada and the EU in 2004. The
112
Table of Contents
compound is currently in Phase III clinical trials in Japan. Sankyo expects to directly market products based on CS-801 in Japan. Sankyo expects that products based on this compound in patch form will have no competitors inside Japan.
Patents
Patent portfolios developed for products introduced by Sankyo normally provide market exclusivity. In Japan, a compound patent is in effect for olmesartan. Compound patents are in effect for pravastatin and olmesartan in the United States.
Patent protection is considered, in the aggregate, to be of material importance in Sankyo’s marketing of human health products in Japan, the United States and in most major foreign markets. Patents may cover products per se, pharmaceutical formulations, processes for or intermediates useful in the manufacture of products or the uses of products. Protection for individual products extends for varying periods in accordance with the date of grant and the legal life of patents in the various countries. The protection afforded, which may also vary from country to country, depends upon the type of patent and its scope of coverage.
Among Sankyo’s leading products, the compound patent for pravastatin expired in Japan in 2002. Sankyo’s compound patent for pravastatin in the United States, as extended by pediatric exclusivity, expires in April 2006. The compound patent with respect to olmesartan expires in February 2012 in Japan, April 2016 in the United States, February 2017 in Germany and Great Britain, and February 2012 in France. Loxonin®, Zantac® and Kremezin® no longer have patent protection in Japan. In the United States, the compound patent for Venofer® has expired, and patent protection for Banan® has expired. Patent protection with respect to WelChol® continues through December 2014. Patent protection with respect to Banan® in Japan expired in part in August 2004 and continues in part through September 2005, depending on the indication. With respect to Acecor®, the patent expires in October 2008. Sankyo generally has the right, but not the obligation, to pursue patent infringement litigation with respect to patents that it owns. Sankyo typically has the right to pursue patent infringement litigation with respect to products licensed from third parties if the owner of the patent chooses not to pursue litigation on its own. With respect to WelChol®, Sankyo has the first right, although not the obligation, to pursue such action in the United States. If Sankyo does not exercise its right, Genzyme has the right, but not the obligation, to pursue litigation.
Pursuant to the exclusivity provisions of the “Best Pharmaceuticals for Children Act”, the FDA granted an additional six months of market exclusivity in the United States to pravastatin from October 2005 until April 2006. In general, Sankyo seeks available extensions for all of its products under patent in Japan and in the United States.
While the expiration of a product patent can in some instances result in a loss of market exclusivity for the covered pharmaceutical product, market exclusivity can in some instances continue to be derived from:
| • | patents relating to processes and intermediates for the manufacture of the active ingredient of such product; |
| • | patents relating to the use of such product; |
| • | patents relating to novel compositions and formulations; and |
| • | in the United States, regulatory exclusivity that may be available under federal law. |
The effect of product patent expiration on pharmaceutical products also depends upon many other factors such as the nature of the market and the position of the product in it, the growth of the market, the complexities and economics of the process for manufacture of the active ingredient of the product and the requirements of laws and regulations. In Sankyo’s experience, in the Japanese market, generic versions of products do not gain as significant a share of the Japanese market as elsewhere upon the expiration of the relevant patent.
113
Table of Contents
Worldwide, all of Sankyo’s important products are sold under trademarks that are considered in the aggregate to be of material importance. Trademark protection continues in some countries as long as used; in other countries, as long as registered. Registration is generally for fixed terms and can be renewed indefinitely.
Seasonality
Sales in Sankyo’s pharmaceutical segment are generally not subject to seasonal fluctuation.
Availability of Raw Materials
Generally, Sankyo develops and manufactures the active ingredients used in its products at its own facilities, limiting dependency on suppliers. Sankyo believes that, in the event it is unable to source any products or ingredients from any of its major suppliers, it could replace those products or substitute ingredients from other suppliers without great difficulty or significant increases in its cost of goods sold.
Other Businesses
The main products in Sankyo’s other operations include food products; additives and agrochemical products such as insecticides, fungicides and herbicides; chemical products; veterinary drugs, feed and others. Approximately 22.2% of Sankyo’s external net sales were derived from this segment in the fiscal year ended March 31, 2003, and approximately 21.7% of Sankyo’s external net sales were derived from this segment in the fiscal year ended March 31, 2004. Each product group accounts for less than 10% of Sankyo’s consolidated net revenues.
Sankyo’s principal products in this segment are:
| • | Milbemycin®, a drug to prevent heartworm disease for animal use; and |
| • | Tachigaren®, an agricultural fungicide. |
Sankyo’s operations in its other businesses segment are conducted primarily in Japan, with limited sales in the United States, Europe and Asia. Sankyo markets its products in this segment through various channels including directly to customers, through wholesalers and through licensees. In connection with its other businesses, Sankyo owns certain patents and has rights to others through licensing or other contractual arrangements. Although many of Sankyo’s other business operations are not subject to material governmental regulation, in any case, Sankyo believes that it is in material compliance with all applicable legal and regulatory requirements.
Sales in this segment are generally not subject to seasonal fluctuation.
Generally, Sankyo develops and manufactures the active ingredients used in products categorized in its other businesses segment, limiting dependency on suppliers. Sankyo believes that, in the event it is unable to source any products or ingredients from any of its major suppliers, it could replace those products or substitute ingredients from other suppliers without great difficulty or significant increases in its cost of goods sold.
Sankyo is re-examining its non-pharmaceutical operations, and expects to continue to concentrate management resources in its pharmaceutical operations. In the fiscal year ended March 31, 2004, the company spun off its agrochemical business to Sankyo Agro Co., Ltd., and its special merchandise business to Sankyo Lifetech Co., Ltd. Each of these companies is a wholly-owned subsidiary of Sankyo. In March 2004, Sankyo withdrew from the medical diagnostics business, which included diagnostic reagents and medical devices. In February 2005, Sankyo also announced plans to sell subsidiaries engaged in the production of valves, yeast and certain confectionary products, the impact of which is not expected to be material on Sankyo’s results of operations.
114
Table of Contents
Organizational Structure
Sankyo is the parent entity of the Sankyo group, which was comprised of 51 subsidiaries and three affiliates as of September 2004. The following is a description of Sankyo’s significant subsidiaries.
Sankyo Pharma Inc.
Sankyo Pharma Inc. was incorporated in Delaware in 1996. Sankyo Pharma Inc. is the primary entity through which Sankyo conducts marketing and R&D operations in the United States. In 2000, Sankyo Pharma Inc. consolidated Sankyo U.S.A. Corporation, a wholly-owned subsidiary of Sankyo incorporated by Sankyo in 1985 to conduct new drug development operations in the United States. Also in 2000, Sankyo Pharma Inc. bought out Warner-Lambert’s share of Sankyo Parke Davis, a U.S. marketing and promotion joint venture, integrating its operations with Sankyo Pharma’s development division and Sankyo Pharma’s research institute. External sales by Sankyo Pharma Inc. during the fiscal year ended March 31, 2004 constituted 4.5% of total consolidated net sales of the Sankyo group for that period.
Sankyo Pharma GmbH
Sankyo established Sankyo Europe GmbH as its new drug development entity in Europe in 1985. Sankyo entered into a partnership with Luitpold-Werk GmbH & Co. KG in Germany in 1990. In 1991, Sankyo acquired all of the equity of Luitpold-Werk and renamed the company Sankyo Pharma GmbH in 1997. In 2002, Sankyo Europe GmbH was merged into Sankyo Pharma GmbH. Sankyo Pharma GmbH, a wholly-owned subsidiary, is the entity through which Sankyo primarily conducts marketing and development operations in Europe. Sankyo Pharma GmbH has subsidiaries in 11 European countries. External sales by Sankyo Pharma GmbH during the fiscal year ended March 31, 2004 constituted 4.7% of total consolidated net sales of the Sankyo group for that period.
Luitpold Pharmaceuticals, Inc.
In 1991, Sankyo acquired all of Luitpold-Werk, including its U.S. subsidiary Luitpold Pharmaceuticals, Inc. Through Luitpold, a wholly-owned subsidiary of Sankyo Pharma Inc. Sankyo continues to market pharmaceuticals and veterinary drugs which are within Luitpold’s traditional area of expertise, such as the treatment of iron deficiency anemia with Venofer®. External sales by Luitpold Pharmaceuticals, Inc. during the fiscal year ended March 31, 2004 constituted 5.6% of total consolidated net sales of the Sankyo group for that period.
Property, Plants and Equipment
The following table sets out certain information with respect to the main properties owned and/or leased by Sankyo and its consolidated subsidiaries as of March 31, 2004.
Facility Name | Location | Owned/leased (Square meters) | Principal products and | |||
Sankyo (1) | ||||||
Head Office | Tokyo, Japan | 2,167 | Business administration | |||
Branch Offices (11 locations) | Tokyo and other locations within Japan | 13,822 | Sales | |||
Shinagawa R&D Center | Tokyo, Japan | 79,121 | Pharmaceutical research and development | |||
Hiratsuka Factory | Kanagawa, Japan | 248,827 | Pharmaceutical research and production | |||
115
Table of Contents
Facility Name | Location | Owned/leased (Square meters) | Principal products and | |||
Onahama Factory | Fukushima, Japan | 327,457 | Pharmaceutical research and production | |||
Odawara Factory | Kanagawa, Japan | 67,270 | Pharmaceutical production | |||
Osaka Factory | Osaka, Japan | 24,943 | Pharmaceutical production | |||
Distribution Centers (5 locations) | Saitama and other locations within Japan | 64,894 | Distribution | |||
Wakodo Co., Ltd.(2) | ||||||
Tokyo Factory | Tokyo, Japan | 22,204 | Food research and production | |||
Tochigi Factory | Tochigi, Japan | 84,609 | Food production | |||
Fuji Flour Milling Co., Ltd. | ||||||
Head Factory(3) | Shizuoka, Japan | 30,376 | Food production and administration | |||
Sankyo Organic Chemicals Co., Ltd. | ||||||
Odawara Factory(4) | Kanagawa, Japan | 65,793 | Pharmaceutical production | |||
Nippon Nyukazai Co., Ltd.(5) | ||||||
Kashima Factory | Ibaraki, Japan | 54,577 | Fine chemical production | |||
Kawasaki Factory | Kanagawa, Japan | 29,809 | Fine chemical research and production | |||
Sankyo Chemicals Industry, Ltd. | ||||||
Hiratsuka Factory | Kanagawa, Japan | 59,479 | Fine chemical research and production | |||
Hokkai Sankyo Co., Ltd. | ||||||
Main Factory | Hokkaido, Japan | 108,287 | Agrochemical production and administration | |||
Kyushu Sankyo Co., Ltd.(6) | ||||||
Main Factory | Saga, Japan | 37,166 | Agrochemical production and administration | |||
Sankyo Pharma GmbH(7) | ||||||
Pfaffenhofen Factory | Bavaria, Germany | 73,827 | Pharmaceutical production | |||
Luitpold Pharmaceuticals, Inc. | ||||||
Main Factory | New York, U.S.A. | 64,750 | Pharmaceutical production and administration | |||
| (1) | Sankyo leases a portion of its Tokyo head office and 11 branch offices. The aggregate annual lease obligations are ¥391 million and ¥408 million, respectively. |
| (2) | Wakodo Co., Ltd. leases a portion of the land, equivalent to 8,713 square meters, on which its Tochigi Factory rests. Annual lease obligations equal ¥3 million. |
116
Table of Contents
| (3) | Fuji Flour Milling Co., Ltd.’s head factory is subject to a security interest securing outstanding debt obligations of that company with an outstanding balance in the amount of ¥2.5 billion at March 31, 2004. |
| (4) | Sankyo Organic Chemicals Co., Ltd’s Odawara factory is subject to a security interest securing outstanding debt obligations of that company with an outstanding balance in the amount of ¥0.9 million at March 31, 2004. |
| (5) | Nippon Nyukazai Co., Ltd. leases its Kawasaki Factory from Sankyo Company, Limited. |
| (6) | Kyushu Sankyo Co., Ltd. leases the building, a portion of other structures on the property and a portion of the land on which the building sits from Sankyo’s consolidated subsidiary Sankyo Agro Co., Ltd. |
| (7) | Sankyo Pharma GmbH leases the building, a portion of the production and delivery equipment therein, and the land from Sankyo’s consolidated subsidiary Sankyo Grundstücks GmbH. |
Except as otherwise noted in the table above and the footnotes thereto, Sankyo owns all of the properties identified therein and all properties owned by Sankyo are owned without significant encumbrances. As of March 31, 2004, the aggregate book value of buildings owned by Sankyo was ¥109.7 billion, and the aggregate book value of machinery and equipment owned was ¥52.8 billion. Sankyo leases other equipment that is used in its operations.
Sankyo reviews market needs and prospects from time to time and adjusts its capacity and utilization by opening, closing, expanding or downsizing production facilities accordingly. Sankyo believes it is difficult and would require unreasonable effort to track the exact productive capacity and the extent of utilization of each of its manufacturing facilities with a reasonable degree of accuracy. Sankyo believes that its manufacturing facilities are generally all operating within normal operating capacity and not substantially below capacity.
The following table describes current or planned construction, expansion or improvement of Sankyo facilities:
Company | Property | Intended Facility Use | Investment amount, (millions of yen) | Method of financing | Actual or estimated start date | Estimated completion date | |||||||||
| Total | Amount of expenditure already paid | ||||||||||||||
Sankyo | Shinagawa R&D Center | Research facilities | ¥ | 1,130 | — | Internal financing | February 2005 | April 2006 | |||||||
| Medicinal Safety Research Laboratories | Research Facilities | 1,400 | — | Internal financing | November 2003 | June 2005 | |||||||||
| Onahama Factory | Production facilities | 3,500 | — | Internal financing | September 2004 | September 2005 | |||||||||
Sankyo intends to relocate part of its biological research operations to new laboratories under construction at the new Shinagawa Research and Development Center. In connection with this new construction, Sankyo will also upgrade a portion of its research facilities. Sankyo is building research and quarantine facilities for animals at its Medicinal Safety Research Laboratories to facilitate safety testing of its compounds. New construction at the existing site of Sankyo’s Onahama Factory is intended to position this facility as one of Sankyo’s primary facilities for the production of raw materials. This new construction will expand Sankyo’s production capabilities with respect to a number of compounds, increasing its ability to adapt to changes in demand.
117
Table of Contents
Employees
As of March 31, 2005, Sankyo had 11,444 employees on a consolidated basis, of which 8,275 were employed in Japan. Employees in Japan may join the Sankyo Workers Union, which has a union shop contract with Sankyo. Sankyo employees in Germany may join the Sankyo Works Council. Sankyo considers its labor relations to be excellent. During 2004, Sankyo extended a performance-based remuneration system to cover all parent company employees in Japan. The new system is designed to focus employees on specific targets in keeping with Sankyo’s overall initiatives to improve accountability and define strategic objectives.
Legal Proceedings
In the United States, numerous lawsuits seeking damages and other compensation were brought against Warner-Lambert Company and other pharmaceutical companies by patients who took the diabetes drug Rezulin, which had been sold until March 2000 using a compound with the generic name “troglitazone” supplied by Sankyo. A U.S. subsidiary of Sankyo, Sankyo Pharma Inc., was named as a defendant in a small portion of these cases, and it is defending those cases in cooperation with Warner-Lambert. In these cases, the compensation demanded from all defendants includes claims for both compensatory and punitive damages. In connection with the costs and damages to be borne by Sankyo and its subsidiaries, there is a provision in the license agreement with Warner-Lambert indemnifying Sankyo and its subsidiaries.
118
Table of Contents
The process of developing pharmaceutical products for commercialization is complex, costly and time-consuming. Although details vary from country to country, in general, identification of targets for new drugs and development of new pharmaceutical products takes 10 to 15 years. Only a small fraction of compounds that enter clinical trials result in commercially viable products.
Generally, the first two to three years of discovering a new drug are spent searching for compounds that may be suitable candidates for development. When a compound is found to be effective in treating a certain condition, a patent application is submitted.
The next three to five years are generally spent continuing animal testing to make detailed determinations as to the compound’s efficacy and safety, how it is metabolized in animal testing and other characteristics. The proportion of compounds that pass this phase in relation to those that enter this phase is very low.
The next set of procedures generally takes three to seven years. For those compounds that pass the animal testing process, the development company then commences the human clinical study process. This process is time-consuming and the cost of conducting clinical studies represents a large portion of research and development expenses.
Preparing a marketing authorization application, known as a New Drug Application, involves considerable data collection, verification, analysis and expense. There can be no assurance that approval from the relevant health authority will be granted at all or in a timely manner, even if approval for the same compound has been received in another market. The approval process is affected by a number of factors, primarily the efficacy, risks and benefits demonstrated in clinical trials as well as the severity of the disease and the availability of alternative treatments. The relevant health authorities may reject a New Drug Application if the regulatory criteria are not satisfied. In addition, the authorities may require additional testing or information.
The three phases of human clinical studies, which may overlap, are:
Phase I Clinical Studies | The drug candidate is tested on healthy human volunteers for safety, adverse effects, dosage, tolerance, absorption, metabolism, excretion and other elements of clinical pharmacology. | |
Phase II Clinical Studies | Efficacy and safety are tested and evaluated on a limited number of patients to assess the efficacy of the compound for a specific indication, to determine dose tolerance, dosing interval and the optimal dose range as well as to gather additional information relating to safety and potential adverse events or adverse drug reactions. | |
Phase III Clinical Studies | A large number of patients are treated with the drug candidate in order to demonstrate efficacy and safety in an expanded patient population at geographically-dispersed study sites in order to determine the overall risk-benefit balance of the compound and to provide an adequate basis for product labeling. The primary method used to confirm results is to compare the drug candidate with a standard treatment or a placebo. | |
Of these three phases, Phase III requires the largest expenditures and thus the decision to proceed with Phase III testing is a critical business decision in the drug development process.
For those drug candidates that pass Phase III clinical studies, a New Drug Application is submitted to the relevant governmental authorities for approval and subsequent launch of the drug. In Japan it generally takes
119
Table of Contents
approximately one to two years for the review process to be completed. If the application is approved, unless the drug is marketed outside of the public medical care insurance systems, an official drug price for the pharmaceutical product is negotiated with the Japanese government. Drug candidates must also go through a similar approval process in the United States and Europe, although the U.S. regulatory authority does not set prices for approved drugs.
Even after initial health authority approval has been obtained, further studies, including post-marketing studies, may be required to provide additional data regarding safety of the pharmaceutical product. The regulatory authorities require post-marketing surveillance to monitor any serious adverse events or adverse drug reactions. Results of post-marketing programs may limit or prohibit the further marketing of the products.
120
Table of Contents
The pharmaceutical industry operates in a highly controlled regulatory environment. There are stringent regulations relating to analytical, toxicological and clinical standards and protocols for testing of pharmaceuticals, as well as regulation covering research, development and manufacturing procedures. In addition, in many markets, marketing and pricing strategies are subject to national legislation, and regulatory authorities have administrative powers such as forcing product recalls and suspending manufacturing.
All major drug markets set high standards for technical appraisal which can result in a lengthy approval process. Historically, different requirements by different countries’ regulatory authorities have influenced the submission of applications. However, recent years have shown a gradual trend towards harmonization of standards among the EU, Japan and the United States. This allows pharmaceutical companies to use international guidelines for new product developments accepted in the three regions, which avoids duplication of non-clinical and clinical studies and enables companies to use the same basis for submissions to each of the regulatory authorities.
Japanese Regulation
The pharmaceutical businesses of Daiichi and Sankyo are subject to various Japanese laws and regulations. The principal laws and regulations applicable to businesses of Daiichi and Sankyo are briefly described below.
| • | Pharmaceutical Affairs Law |
Manufacturers and importers of pharmaceuticals and quasi-pharmaceuticals in Japan, such as Daiichi and Sankyo, are subject to the supervision of the Ministry of Health, Labor and Welfare (the “MHLW”), primarily under the Pharmaceutical Affairs Law (law No. 145 of 1960, as amended). The discussion of the Pharmaceutical Affairs Law below reflects certain amendments to the Pharmaceutical Affairs Law which became effective on April 1, 2005. The Minister of Health, Labor and Welfare, referred to as the Minister, may delegate certain powers mentioned below to prefectural governors.
Under amendments to the Pharmaceutical Affairs Law which became effective on April 1, 2005 and the ministerial ordinances and guidelines thereunder, a manufacturer or importer of prescription pharmaceuticals, nonprescription pharmaceuticals or quasi-pharmaceuticals, as the case may be, is required to obtain from the Minister a renewable five-year sales license, in order to conduct the business of selling, or providing prescription pharmaceuticals, nonprescription pharmaceuticals or quasi-pharmaceuticals, as the case may be, that are manufactured (or outsourced to a third party for manufacturing) by the manufacturer or imported by the importer. However, an outsourced contract manufacturer or subcontractor is not required to obtain such sales license. Daiichi has filed a pre-application to obtain such sales license in accordance with the amendments to the Pharmaceutical Affairs Law. Sankyo filed an application in anticipation of the amendments to the Pharmaceutical Affairs Law and such licenses were granted upon the enforcement of such amendments. The Minister has the power not to grant the license (i) if the methods of quality control of pharmaceuticals or quasi-pharmaceuticals, as the case may be, are not in conformity with the standards known as the Good Quality Practices (GQP) stipulated by the ministerial ordinance of the MHLW, (ii) if the methods of post-sales safety control of pharmaceuticals or quasi-pharmaceuticals, as the case may be, after the sales of them are not in conformity with the standards known as the Good Vigilance Practices (GVP) stipulated by the ministerial ordinance of the MHLW or (iii) if such manufacturer or importer falls under certain disqualifying provisions of the Pharmaceutical Affairs Law. The manufacturer or importer who obtained the sales license must appoint a general manufacturing and sales supervisor in order to supervise the product quality control and post-sales safety control. The manufacturer or importer must also comply with various other items stipulated by the ministerial ordinances of the MHLW in the process of conducting the licensed business.
Until the amendments to the Pharmaceutical Affairs Law took effect on April 1, 2005, manufacturers could not outsource all of their manufacturing operations. However, the amendments to the Pharmaceutical Affairs Law permit manufacturers to outsource their entire manufacturing operations. Manufacturers that
121
Table of Contents
outsource their entire manufacturing operations are required to obtain the above-mentioned sales license in order to sell or provide their products, but are not required to obtain the manufacturing license mentioned below.
A manufacturer of pharmaceuticals or quasi-pharmaceuticals, as the case may be, in order to manufacture such products, is also required to obtain from the Minister or a prefectural governor on behalf of the Minister a renewable five-year manufacturing license for each factory, which is classified in accordance with the ministerial ordinance of the MHLW. The Minister has the power not to grant a license (i) if the structure or facilities of the factory manufacturing pharmaceuticals or quasi-pharmaceuticals, as the case may be, is not in conformity with the standards stipulated by the ministerial ordinance of the MHLW or (ii) if such manufacturer falls under certain disqualifying provisions of the Pharmaceutical Affairs Law.
In addition, a manufacturer or importer of pharmaceuticals or quasi-pharmaceuticals, as the case may be, is required under the Pharmaceutical Affairs Law to obtain product approval from the Minister for sales of each new kind of pharmaceutical product or quasi-pharmaceutical product (other than those specified by the Minister), respectively, that is manufactured (or outsourced to a third party for manufacturing) by the manufacturer or imported by the importer. An approval shall not be granted (i) if the manufacturer or importer does not have a sales license to distribute prescription pharmaceuticals, nonprescription pharmaceuticals or quasi-pharmaceuticals, as the case may be, as set out above, (ii) if a factory manufacturing the product does not have a license to manufacture the relevant type of pharmaceuticals or quasi-pharmaceuticals, as the case may be, as set out above, (iii) if, as a result of a review of, among other things, the name, ingredients, quantities, synthesis, dosage, administration, method of use, indications, performance and side effects of the product, the relevant pharmaceutical or quasi-pharmaceutical is not recognized to have efficacy and effects specified in the application, or it has harmful side effects which outweigh its positive benefits, or it falls under the cases prescribed by the ministerial ordinances of the MHLW as not being appropriate as a pharmaceutical or quasi-pharmaceutical, as the case may be or (iv) if the methods of manufacturing control or quality control used in the factory manufacturing pharmaceuticals or quasi-pharmaceuticals, as the case may be, is not in conformity with the standards known as the Good Manufacturing Practices (GMP) stipulated by the ministerial ordinances of the MHLW. An application for approval must be accompanied by the data of results of clinical trials and other pertinent data. If the pharmaceutical product under application is of a type designated by ministerial ordinance of the MHLW, the accompanying data mentioned above must be obtained in compliance with the standards established by the Minister, such as the Good Laboratory Practices (GLP) or the Good Clinical Practices (GCP) stipulated by the ministerial ordinances of the MHLW. GLP are the standards for non-clinical safety studies on pharmaceuticals which provide the standards for the organization and operation of testing institutions, as well as for buildings and facilities for toxicity studies. GCP are the standards for clinical safety studies on pharmaceuticals which provide the standards for planning, implementation and supervision of clinical trials. An application for the approval must be made through Pharmaceuticals and Medical Devices Agency (PMDA), an incorporated administrative agency, which actually implements an approval review of pharmaceutical and quasi-pharmaceutical products as set out above.
Any manufacturer or importer that obtained product approval for distribution of new kinds of pharmaceutical products as described in the immediately preceding paragraph must have such pharmaceutical products re-examined by the Minister through PMDA after a period ranging from four to ten years (depending on each type of product) from the product approval if the pharmaceutical product is an innovative pharmaceutical product designated by the Minister. Typically, this reexamination is made in the sixth year after receipt of such approval. The reexamination is made by reconfirming whether the pharmaceutical products do not fall under any of the conditions for denying product approval which are described in (iii) of the immediately preceding paragraph. An application for reexamination must be accompanied by the data of results of drug usage and other pertinent data. In addition, if the pharmaceutical product in question is a new type of pharmaceutical product designated by ministerial ordinance of the MHLW, the accompanying data mentioned above must be obtained pursuant to GLP, GCP and standards known as Good Post-marketing Study Practices (GPSP). The manufacturer or importer that obtained the product approval is also required to investigate, among other things, the results of drug usage and to periodically report to the Minister pursuant to the Pharmaceutical Affairs Law and the ministerial ordinance of the MHLW.
122
Table of Contents
In addition, pharmaceutical products will be subject to re-evaluation by the Minister if the Minister so designates in consultation with Pharmaceutical Affairs and Food Sanitation Council (PAFSC) and makes a public notice about the re-evaluation. In that event, the re-evaluation is made by reconfirming whether the pharmaceutical products do not fall under any of the conditions for denying manufacturing approval in the same way as the reexamination described above.
If any manufacturer or importer which obtained a sales license as mentioned above becomes aware of a serious alleged side effect or infection from its products of a type prescribed by ministerial ordinance of the MHLW, the manufacturer or importer must report to the Minister in accordance with the ministerial ordinance of the MHLW within 15 days or 30 days depending on the seriousness of the side effect or infection and whether such side effect or infection was previously known to the manufacturer or importer. In addition, under the GVP, any manufacturer or importer who obtained a product license as mentioned above must examine the post-sales safety of the products for a six-month period from their release in order to promptly detect any harmful side effect or infection.
The Pharmaceutical Affairs Law also provides for special regulations applicable to pharmaceutical products made of biological raw materials, such as recombinant human serum albumin. These regulations impose various obligations on manufacturers and other persons in relation to manufacturing facilities, explanation to patients, labeling on products, record-keeping and reporting to the Minister.
Furthermore, under the Pharmaceutical Affairs Law, the Minister or a prefectural governor may take various measures to supervise manufacturers or importers of pharmaceuticals or quasi- pharmaceuticals. For example, the Minister or a prefectural governor may require licensed manufacturers or importers of pharmaceuticals or quasi- pharmaceuticals to submit reports, and carry out inspections at their factories or offices, if deemed necessary to monitor their compliance with the laws and regulations. The Minister has authority to order licensed manufacturers or importers to suspend temporarily the selling, leasing or providing of the pharmaceuticals or quasi- pharmaceuticals, in order to prevent risks, or increases in risks, to the public health. Also, the Minister may revoke or suspend a license or approval granted to a manufacturer or importer under certain limited circumstances such as violation of laws relating to pharmaceuticals.
Consummation of the joint share transfer and establishment of Daiichi Sankyo do not require the approval or clearance of governmental authorities in Japan, including the approval of the Minister under the Pharmaceutical Affairs Law. As of the date hereof, the Pharmaceutical Affairs Law provides no specific regulation applicable to a holding company of manufacturers or importers of pharmaceuticals or quasi-pharmaceuticals. No licenses or approvals held by Daiichi or Sankyo under the Pharmaceutical Affairs Law will be affected by the consummation of the joint share transfer. If Daiichi or Sankyo are subsequently merged into another company, including Daiichi Sankyo, and if such company does not hold the sales licenses mentioned above, and Daiichi or Sankyo, as the case may be, are not the surviving entity, such company will be required to obtain a new sales license.
| • | Price Regulation |
In Japan, public medical insurance systems cover virtually the entire Japanese population. The public medical insurance system, however, is not applicable to any pharmaceutical product which is not listed on a National Health Insurance, or NHI, price list published by the Minister. To sell a pharmaceutical product in Japan, a manufacturer or an importer of pharmaceutical products must first have a new pharmaceutical product listed on the NHI price list for coverage under the public medical care insurance systems. Most prescription pharmaceutical products are used in medical services under the public medical insurance systems. The NHI price list provides rates for calculating the costs of pharmaceutical products used in medical services which may be charged to insurers, such as the national government, local government and health insurance societies, under the public medical insurance systems.
When a new pharmaceutical product is listed on the NHI price list, the price of the pharmaceutical product is determined either by daily price comparison of comparable pharmaceutical products with necessary adjustments
123
Table of Contents
for innovativeness, usefulness or size of the market, or, in the absence of comparable pharmaceutical products, by the cost calculation method, after consideration of the opinion of the manufacturer. Prices on the price list are subject to revision, generally once every two years, on the basis of the actual prices at which the pharmaceutical products are purchased by medical institutions. To date, various methods, including a formula intended to accurately reflect the actual market prices, have been used. The most recent price revision occurred in April 2004. Most of the pharmaceutical products of Daiichi and Sankyo are subject to the price revision described above.
| • | Other Regulations |
Manufacturing operations of Daiichi and Sankyo use many chemicals and gases and the companies are therefore subject to a variety of governmental regulations relating to the use, storage, discharge, and disposal of such chemicals, gases and other emissions and wastes. Additionally, Daiichi and Sankyo are subject to a wide variety of laws and regulations as well as industry standards relating to energy and resource conservation, recycling, global warming, pollution prevention, and environmental health and safety. Among these laws are the Atmospheric Contamination Prevention Law (law No. 97 of 1968, as amended), the Water Quality Pollution Prevention Law (law No. 138 of 1970, as amended), the Wastes Disposal and Public Cleaning Law (law No. 137 of 1970, as amended), the Resource Recycling Law (law No. 48 of 1991, as amended), the Basic Law for Establishing a Recycling-based Society (law No. 110 of 2000, as amended), and the Soil Contamination Control Law (law No. 53 of 2002). Consistent with quality control principles, each of Daiichi and Sankyo has established proactive environmental policies with respect to the handling of such chemicals, gases, emissions and waste disposals from its manufacturing operations. Each of Daiichi and Sankyo received and maintained ISO14001 Certification for most of its factories, laboratories and other principal business divisions. Each of Daiichi and Sankyo also regularly conducts environmental audits of its facilities and has an environmental risk management system, environmental management teams, information systems, education and training programs, and environmental assessment procedures for new processes.
In addition to the foregoing, Daiichi and Sankyo are subject to other laws and regulations in Japan applicable to pharmaceutical companies, including with respect to the possession and handling of regulated pharmaceutical substances.
United States Regulation
In the United States, of particular importance is the Food and Drug Administration, or FDA, which administers requirements covering the testing, approval, safety, effectiveness, manufacturing, labeling and marketing of prescription pharmaceuticals. In many cases, the FDA requirements have increased the amount of time and money necessary to develop new products and bring them to market in the United States. In 1997, the Food and Drug Administration Modernization Act was passed and was the culmination of a comprehensive legislative reform effort designed to streamline regulatory procedures within the FDA and to improve the regulation of drugs, medical devices and food. The legislation was principally designed to ensure the timely availability of safe and effective drugs and biologics by expediting the pre-market review process for new products. A key provision of the legislation is the re-authorization of the Prescription Drug User Fee Act of 1992, which permits the continued collection of user fees from prescription drug manufacturers to augment FDA resources earmarked for the review of human drug applications. This helps provide the resources necessary to ensure the prompt approval of safe and effective new drugs.
In the United States, the government made significant progress in expanding healthcare access by enacting the Medicare Prescription Drug, Improvement and Modernization Act of 2003, which was signed into law in December 2003. This statute adds prescription drug coverage to Medicare beginning in 2006 and a voluntary drug discount card for Medicare beneficiaries effective in June 2004.
In addressing cost containment outside of Medicare, each of Daiichi and Sankyo has made a continuing effort to demonstrate that its medicines can help save costs in overall patient healthcare. In addition, pricing flexibility across each company’s product portfolio has encouraged growing use of its medicines and mitigated the effects of increasing cost pressures.
124
Table of Contents
For many years, the pharmaceutical industry in the United States has been under federal and state oversight with the approval process for new drugs, drug safety, advertising and promotion, drug purchasing and reimbursement programs and formularies variously under review. Each of Daiichi and Sankyo believes that it will continue to be able to conduct its operations, including the introduction of new drugs to the market, in this regulatory environment.
Also, federal and state governments have pursued methods to directly reduce the cost of drugs and vaccines for which they pay. Initiatives in some states seek rebates beyond the minimum required by Medicaid legislation, and in some cases for patients beyond those who are eligible for Medicaid.
Regulation in Other Jurisdictions
Outside Japan and the United States, each of Daiichi and Sankyo encounters similar regulatory and legislative issues in most of the countries where it does business. There, too, the primary thrust of governmental inquiry and action is toward determining drug safety and effectiveness as well as controlling the prices of prescription drugs and the profits of prescription drug companies. The EU has adopted directives concerning the classification, labeling, advertising, wholesale distribution and approval for marketing of medicinal products for human use. The policies and procedures of each of Daiichi and Sankyo are already consistent with the substance of these directives. Consequently, each believes that these directives will not have any material effect on their business.
Each of Daiichi and Sankyo is subject to the jurisdiction of various regulatory agencies and is, therefore, subject to potential administrative actions. Such actions may include seizures of products and other civil and criminal sanctions. Under certain circumstances, Daiichi or Sankyo, as the case may be, may on its own deem it advisable to initiate product recalls.
In addition, certain countries within the EU, recognizing the economic importance of the research-based pharmaceutical industry and the value of innovative medicines to society, are working with industry representatives and the European Commission on proposals to complete the “Single Market” in pharmaceuticals and improve the competitive climate through a variety of means including market deregulation.
125
Table of Contents
Japan’s pharmaceutical industry, like the global pharmaceutical industry, is becoming increasingly competitive. Healthcare policy makers in Japan, the United States and other countries have identified controlling healthcare costs, and the prices of prescription drugs in particular, as an important long-term goal. In April 2003, Japan increased the share of medical costs borne by patients with employees’ health insurance to 30%. In December 2004, U.S. President Bush signed a bill designed to reform Medicare, including reforms intended to speed the approval process for generic drug equivalents to pharmaceutical products under patent. It is expected that competition in the global pharmaceutical industry based on price and cost control will intensify.
Also, in recent years, the global pharmaceutical industry has undergone industry-wide reorganization. Competitors of Daiichi and Sankyo, both in Japan and worldwide, have announced or completed mergers. For example, in 2004, two of Japan’s largest pharmaceutical companies, Yamanouchi Pharmaceutical Co., Ltd. and Fujisawa Pharmaceutical Co., Ltd., announced a merger which closed in April 2005. Combined companies may be more efficient in bringing successful products to market through their research and development pipeline, may have additional marketing clout, and may enjoy other marginal benefits.
As a result, Daiichi and Sankyo expect that they, and after the joint share transfer, Daiichi Sankyo, will face competition not only from policy-driven market forces and existing competitors, but also from large companies resulting from the merger of existing competitors.
Daiichi and Sankyo believe that the Japanese market is dominated by no fewer than ten firms, with competition for market share among such firms being fairly intense. Daiichi and Sankyo believe that no company enjoys a share of the Japanese market for prescription drugs (as determined by net sales) greater than the approximately 7.3% of total net sales in Japan held by industry leader Takeda Pharmaceutical Company Limited. Daiichi believes that it holds approximately 3.5%, and Sankyo believes that it holds approximately 4.5% of the Japanese market. In the global market, Daiichi and Sankyo believe that no company holds more than the 7% of the global pharmaceutical market held by Pfizer.
126
Table of Contents
DAIICHI MANAGEMENT’S DISCUSSION AND ANALYSIS OF FINANCIAL
CONDITION AND RESULTS OF OPERATIONS
You should read the following discussion and analysis of Daiichi’s financial condition and results of operations together with its consolidated financial statements included in this document. The following discussion is based on Daiichi’s consolidated financial statements, which have been prepared in accordance with U.S. GAAP.
Overview
Daiichi operates primarily in the domestic and international pharmaceutical industry. In its domestic and international pharmaceutical business, Daiichi develops, manufactures, and markets, both directly and through third-party licensees or distributors, pharmaceutical products and also manufacturers and markets pharmaceutical products licensed from competing pharmaceutical companies.
Daiichi was the sixth largest pharmaceutical company in Japan by consolidated net sales for the six months ended September 30, 2004 according to a survey published by the Japan Pharmaceutical Manufacturers Association. Daiichi’s best selling drug has been Cravit®, an anti-infective drug used to fight infections. Cravit ®’s generic name is levofloxacin and it is sold by Daiichi and through licensees in 119 countries.
In recent years, competition has increased in the pharmaceutical industry. The marketplace is becoming increasingly borderless, with global mega-companies resulting from mergers of former competitors operating in many markets around the world, including Japan. Policymakers in Japan and in other countries in recent periods have taken steps to control healthcare costs, including the cost of prescription drugs. In April 2003, the Japanese National Health Insurance increased the share of medical costs borne by patients with employees’ health insurance to 30%. In addition, in April 2004, the Japanese National Health Insurance cut drug reimbursement prices by an average of 5.2%, which affected Daiichi’s revenues from pharmaceutical products.
Amid these difficult market conditions, Daiichi has committed to strengthening its research and development capabilities to develop and commercialize innovative new products more rapidly. Daiichi currently has more than 20 candidates in its R&D pipeline in the anti-infective, anti-cancer, anti-thrombotic and cardiovascular and other therapeutic areas. Daiichi has also redoubled its marketing efforts to promote appropriate drug use by providing physicians with information related to drug efficacy and safety in an attempt to expand the markets for its existing products.
On December 27, 2002, Daiichi acquired 66% of the issued and outstanding shares of Suntory Pharma, Co., Ltd. for total cash consideration of ¥20.1 billion including direct acquisition costs. The acquired company was a non-public pharmaceutical manufacturer in Japan, spun-off as a subsidiary of Suntory Limited and renamed Daiichi Suntory Pharma Co., Ltd. upon acquisition by Daiichi. The acquisition was accounted for by the purchase method and resulted in a one-time charge of ¥0.9 billion for in-process research and development as well as the recognition of ¥6.2 billion in identifiable intangible assets, which are being amortized over 10 years. Daiichi Suntory Pharma contributed ¥0.7 billion to consolidated net sales in the year ended March 31, 2003 and ¥3.9 billion in the year ended March 31, 2004. Daiichi has agreed to acquire the remaining 34% of Daiichi Suntory Pharma in December 2005 for approximately ¥10 billion.
In June 2004, Daiichi sold its sales and distribution rights for veterinary and livestock feed products in Japan to Meiji Seika Co., Ltd. Such sale is consistent with Daiichi’s goal of becoming a focused pharmaceutical company.
Factors Affecting Daiichi’s Financial Results
Net Sales
The financial results of Daiichi’s pharmaceutical business are the most important factor in determining its overall financial results. Daiichi’s pharmaceutical business accounted for 85.4% of its net sales for the year
127
Table of Contents
ended March 31, 2003 and 85.8% of its net sales for the year ended March 31, 2004. Net sales includes sales of products developed and manufactured by Daiichi as well as those licensed from competing pharmaceutical companies and manufactured and distributed in Japan by Daiichi, and revenues or royalties in connection with the sales of products manufactured by Daiichi and sold by third parties through licensing-out or distribution arrangements.
Sales Price. Daiichi considers the impact on consumer demand and on operating margins of prices of competitors, and general economic conditions when it sets the prices of its pharmaceutical products in each of the markets in which it operates. In addition, the price of pharmaceutical products is also affected in many markets by governmental regulation.
| • | Government regulation. In Japan and many other markets in which Daiichi operates, the government has the authority to set prices for prescription drugs, especially in the context of sales reimbursed by national health insurance programs. In Japan, for example, pharmaceutical companies, including Daiichi, are required to list new pharmaceutical products on a National Health Insurance price list published by the Minister of Health, Labor and Welfare in connection with the public medical insurance programs. Prices of pharmaceutical products so listed are determined by comparison to comparable products, with necessary adjustments for innovativeness, usefulness and/or size of the markets, or in the absence of comparable products, by the cost calculation method. Prices on the National Health Insurance price list are subject to revision, generally once every two years, on the basis of the actual prices at which the pharmaceutical products are purchased by medical institutions. The most recent price revision occurred in April 2004 with the result that Daiichi was required to reduce the prices for its pharmaceutical products in Japan by an average of 5.2%. Unlike the United States, governments in countries with national health programs often have similar price control systems. |
| Government policy in many countries, including Japan and the United States, has emphasized, and managed care organizations and other large customers continue to seek, discounts on pharmaceutical products. In Japan, recent governmental legislation has emphasized the use of generic drugs in an effort to control costs. In the U.S., recent enactment of U.S. Medicare legislation regarding prescription drug benefits for Medicare beneficiaries expands access to medicines that patients need. While expanded access may potentially result in increased sales of Daiichi’s products, such increases may be offset by increased pricing pressures due to the enhanced purchasing power of the private sector providers that will negotiate on behalf of Medicare beneficiaries. |
| • | Competition. Daiichi considers domestic and international competitive conditions, including the prices of competing products, in setting and revising prices for its products. Price competition may not only impact the sales price but also sales promotion expenses. |
| • | General economic conditions. Economic conditions in the various markets in which Daiichi operates also affect pricing. In addition, volatility and changing economic conditions in any significant target market outside Japan may impact Daiichi’s overseas operations. |
Sales Volume. Daiichi’s sales volume in each market in which it operates depends on a number of factors, including the availability of new products which address a public medical need, availability of generic alternatives, prices of products, including as may be affected by governmental regulation, demographics of the market, level of marketing activities, and general economic conditions.
| • | Research and development of new products. As patent protection for pharmaceutical products terminates and innovative products are constantly developed and introduced by competitors, competition from competing products increases and accordingly, projected revenues for a given product decrease. In order to ensure sustained revenue growth, pharmaceutical companies must be able to research, develop and market innovative, new products. To this end, a robust R&D pipeline |
128
Table of Contents
is essential. Daiichi’s R&D efforts focus primarily on three therapeutic areas: anti-infective, anti-cancer and anti-thrombotic and cardiovascular. Daiichi currently has more than 20 compounds in various phases of its R&D pipeline. In addition, Daiichi has made it a strategic goal to integrate its R&D efforts during the initial clinical research stages in Japan, the United States and Europe, so that promising drug compounds can be identified and submitted for subsequent clinical testing more rapidly. To this end, Daiichi recently established Daiichi Medical Research, Inc. (DMR) in the United States to apply global standards to rigorously evaluate drug candidates before they advance to the pivotal clinical trial state. |
| • | Patent protection; Competition from generics. Intellectual property legal protections and remedies are also a significant factor in Daiichi’s business. Many of its products have a composition-of-matter or compound patent and may also have secondary patents. Secondary patents can include additional composition-of-matter patents, processes for making the compound or additional indications or uses. During the patent period, Daiichi may receive revenues due to its control over rights to sell the product under patent. Once the patent protection period is finished, however, generic pharmaceutical manufacturers can produce similar products and sell those products for a lower price. |
| Some of Daiichi’s products face competition in the form of new competitor products or generic drugs, which treat similar diseases or indications. Daiichi has at times been able to limit the impact of generic competition, particularly in Japan, by highlighting the proven track record of safety and efficacy of its products, as well as through successful marketing campaigns. |
| • | Government regulation. The price of Daiichi products affects the volume of purchases made by consumers. In addition to the factors described above, governmental action may affect the price or amount which consumers are required to pay for prescription drugs. For example, in April 2003, in an effort to control health care costs, the Japanese National Health Insurance raised the co-payment for medical expenses, including prescription drugs in connection with the national health insurance program, to 30%, thereby effectively raising the cost of drugs. |
| • | Level of marketing activities. The level of marketing activities influences market share and sales volume. Marketing is particularly important for the introduction of new products, and to create brand loyalty in anticipation of competition with generic equivalents. |
Costs and Expenses
Research and development expenses. Research and development of new innovative pharmaceutical products is essential to continued positive operating results. Daiichi spends significantly on research and development expenses. Its pharmaceutical research expenses are mainly for its own research activities, collaboration and co-development with outside research institutions domestically and internationally and the development of potential products in pre-clinical and clinical studies. In the most recent fiscal year, Daiichi’s R&D expenditures increased by 7.6% to ¥59.7 billion, reflecting the consolidation of Daiichi Suntory Pharma for the full period as well as a rise in overseas R&D expenses. In the most recent fiscal year, the ratio of total R&D expenses to net sales increased by 1.3% to 18.5%.
Marketing expenses. Daiichi spends significantly on sales and marketing. Expenses relate primarily to sales and marketing with respect to pharmaceutical and other products, including advertising costs related to such products. Daiichi has also announced its intention to increase its medical sales representatives in Japan from 1,200 to 1,400 professionals. Over the longer term, Daiichi expects to increase its sales and marketing expenditures overseas, particularly in the United States, in keeping with a strategic shift away from out-licensing to greater direct developments and sales in major markets.
Raw material costs. Daiichi incurs costs to acquire raw materials or intermediates for its pharmaceutical products, and to a lesser degree, for products in its other businesses.
129
Table of Contents
Licensing Arrangements
Daiichi is a party to numerous license agreements relating to both development candidates and currently approved products. Daiichi both licenses in development candidates and products from patent owners, primarily for development or sale in the Japanese market, and licenses out candidates and products for which it owns the patent rights. The terms of these licensing agreements and the timing of the payments thereunder affect Daiichi’s results of operations.
With respect to the in-licensing of products that are in development, Daiichi typically will pay an upfront fee and/or payments upon the achievement of certain milestones, including advancement to successive stages of clinical trials or approval of a new drug application. The level of such milestone payments typically varies depending on the progress of development, the likelihood of successfully bringing a compound to market, the size of the potential market and other factors. Such one-time payments totaled approximately ¥1.1 billion for the fiscal year ended March 31, 2003, including ¥1.0 billion with respect to DS-992 HGF DNA plasmid (HGF), approximately ¥0.4 billion for the fiscal year ended March 31, 2004, including ¥0.3 billion with respect to HGF, and approximately ¥0.8 billion for the six months ended September 30, 2004, including ¥0.3 billion with respect to KMD-3213 and ¥0.3 billion with respect to HGF.
For products Daiichi has licensed from third parties and markets in Japan, Daiichi generally pays royalties of between 1% and 5% of sales, depending on the product, levels of sales and terms of the particular agreement. For products for which patent rights have expired, Daiichi may continue to pay royalties at reduced levels to secure continued use of the relevant trademark in Japan. Royalty payments made by Daiichi under such license agreements totaled approximately ¥1.4 billion for the fiscal year ended March 31, 2003, including approximately ¥0.6 billion and ¥0.3 billion for Artist® and Coversyl®, respectively, approximately ¥2.1 billion for the fiscal year ended March 31, 2004, including ¥1.1 billion, ¥0.3 billion and ¥.02 billion for HANP®, Artist® and Coversyl®, respectively, and approximately ¥1.1 billion for the six months ended September 30, 2004, including approximately ¥0.6 billion, ¥0.2 billion and ¥0.1 billion for HANP®, Artist® and Coversyl®, respectively.
For products Daiichi licenses to third parties, Daiichi typically receives royalties of between 5% and 10% of sales, depending on the product, the markets involved and the level of sales. Royalty payments received by Daiichi under such license agreements totaled approximately ¥17.1 billion for the fiscal year ended March 31, 2003, approximately ¥17.3 billion for the fiscal year ended March 31, 2004, and approximately ¥7.3 billion for the six months ended September 30, 2004. Royalty payments from various licensees of levofloxacin were by far the most important item, constituting approximately 80% of all royalties received in the year ended March 31, 2003, 85% in the year ended March 31, 2004 and 93% in the six months ended September 30, 2004.
Retirement and Severance Benefit Related Expenses
Retirement and severance benefit related expenses constitute one of the largest of Daiichi’s long-term liabilities. As of March 31, 2002, Daiichi and certain of its domestic subsidiaries had various defined benefit pension plans covering substantially all of their employees. These plans include the domestic employee’s pension fund plan, or EPF, and a tax qualified pension plan. These plans are funded in conformity with governmental regulations which basically require an employer to contribute the unfunded benefit over 20 years. Daiichi also has an unfunded lump-sum severance payment plan.
Employees of Japanese companies are compulsorily included in the Welfare Pension Insurance Scheme operated by the government. Employers are legally required to deduct employees’ welfare pension insurance contributions from their payroll and to pay them to the government together with the employers’ own contributions. For companies that have established Employees’ Pension Funds on their own that meet certain legal requirements, it is possible to transfer a part of their welfare pension insurance contributions (referred to as the “substitutional portion” of the government’s Welfare Pension Insurance Scheme) to their own Employees’ Pension Fund with the permission and under the supervision of the government. Based on the newly enacted
130
Table of Contents
Defined Benefit Corporate Pension Law, Daiichi decided to restructure its Employees’ Pension Fund and was permitted by the Minister of Health, Labor and Welfare on January 26, 2004 to be released from their future obligation for payments for the substitutional portion of the Welfare Pension Insurance Scheme. Pension assets for the substitutional portion maintained by the Employees’ Pension Fund relating to past employee service are to be transferred back to the government’s scheme pursuant to government approval received in January 2005.
The amount of pension assets for the substitutional portion maintained by the Employees’ Pension Funds that is to be transferred back to the government’s scheme in the future was estimated to be ¥20.6 billion as at March 31, 2004. The separation process will be accounted for at the time of the completion of the transfer.
Daiichi had ¥46.0 billion of total accrued pension and severance costs at March 31, 2003 and ¥38.1 billion at March 31, 2004.
Depreciation and Amortization
Daiichi has intangible assets, primarily sales and distribution rights, developed technology, and patents and trademarks for pharmaceutical products, subject to amortization generally over 10 years. Aggregate amortization expense of other intangible assets was ¥3.2 billion in the year ended March 31, 2004. Depreciation of property, plant and equipment is primarily computed using the declining-balance method over estimated useful lives ranging from 38 to 50 years for buildings and from 4 to 8 years for machinery and equipment.
Foreign Currency Fluctuations
Foreign currency fluctuations may have a positive or negative effect on Daiichi’s results of operations. In general, a strong yen negatively affects the translation of operating results into Japanese yen due to the negative impact on translations from U.S. dollars or other applicable currency into Japanese yen as a result of the consolidation of the accounts of Daiichi’s overseas subsidiaries and exports of Daiichi’s products to the United States and other countries as sales in those currencies amount to less when translated into Japanese yen. Daiichi estimates that a one yen per dollar change in exchange rates has an impact of approximately ¥400 million on annual net sales.
Investment Securities
Daiichi invests in debt and equity securities for liquidity management, investment and strategic purposes. As of March 31, 2004, Daiichi held ¥179.3 billion of investment securities. This included ¥117.8 billion of available-for-sale and held-to-maturity debt securities, of which ¥71.2 billion, including money management funds, matured within one year. Longer-term debt securities principally included investment grade corporate debt securities stated at amortized cost. Daiichi also held ¥57.8 billion of marketable equity securities as of March 31, 2004, primarily shares of listed Japanese companies.
Daiichi accounts for marketable securities in accordance with SFAS No. 115, “Accounting for Certain Investments in Debt and Equity Securities”, which requires all investment in debt securities and marketable equity securities to be classified as either trading, held-to-maturity or available-for-sale securities. Held-to-maturity securities are stated at amortized cost adjusted for the amortization or accretion of premiums or discounts. Available-for-sale securities are stated at fair value with unrealized gains and losses excluded from earnings and are reported as a separate component of accumulated other comprehensive income, net of applicable taxes, until realized. Realized gains or losses on the sale of such securities are determined based on the moving-average-cost. Daiichi owns no investments that are considered to be trading securities.
Held-to-maturity or available-for-sale securities are reduced to fair market value by a charge to income for other than temporary declines in value. Factors considered in assessing whether an indication of other than temporary impairment exists with respect to available-for-sale securities include: length of time and extent of
131
Table of Contents
decline, financial condition and near term prospects of the issuer and intent and ability of Daiichi to retain its investments for a period of time sufficient to allow for any anticipated recovery in market value. For debt securities classified as held to maturity, Daiichi evaluates the cost basis of a held-to-maturity security for possible impairment by taking into consideration the financial condition, business prospects and credit worthiness of the issuer. The published credit ratings of investee companies that are “BB” or lower are considered an indication of other than temporary impairment.
Litigation Related Costs
Like other pharmaceutical companies, Daiichi incurs costs for litigation related to patent disputes, product liability and other causes of action. In 1999, Daiichi reached agreement with the United States Department of Justice to a U.S.$25 million fine regarding a violation of U.S. antitrust laws in connection with the sale of calcium pantothenate during the period from 1991 to 1998. On November 21, 2001, Daiichi received a decision from the European Commission which imposed a fine of approximately ¥2.7 billion on Daiichi in connection with its transactions involving calcium pantothenate. Daiichi has lodged an appeal with the European Court of First Instance to reduce the amount of the fine imposed. In connection with the foregoing, a number of civil complaints including class-action lawsuits have been filed against Daiichi. Daiichi has settled the majority of those complaints to date, resulting in aggregate settlement payments of approximately ¥7.5 billion.
Critical Accounting Policies
The preparation of the consolidated financial statements of Daiichi in conformity with U.S. GAAP requires management to make estimates and assumptions that affect the reported amounts of assets and liabilities and the disclosure of contingent assets and liabilities at the date of the financial statements, as well as the reported amounts of revenues and expenses during the reporting period. By their nature, these estimates and assumptions are subject to an inherent degree of uncertainty, and are based on Daiichi’s historical experience, terms of existing contracts, Daiichi’s observance of trends in the industry, information provided by its customers and information available from other outside sources, as appropriate. For a summary of the significant accounting policies, including the critical accounting policies discussed below, please refer to Note 1 to Daiichi’s consolidated financial statements included in this prospectus.
Revenue Recognition
Daiichi believes that revenue recognition is critical for its financial statements because net income is directly affected by the timing of revenue recognition. Daiichi generates revenue principally through the sale of pharmaceutical products. Generally, Daiichi recognizes revenue when products are delivered to the customer and the customer takes ownership and assumes risk of loss, collection of the relevant receivable is probable, persuasive evidence of an arrangement exists and the sales price is fixed or determinable, which occur upon receipt by the purchaser.
Daiichi offers volume-based discounts to customers based mainly on the cumulative level of the customers’ purchases from Daiichi and sell-through by the wholesalers to end-users. These programs are accounted for in accordance with EITF Issue 01-9, “Accounting for Consideration Given by a Vendor to a Customer (including a Reseller of a Vendor’s product)”. Daiichi records volume discounts as a reduction of sales at the time the related sales are recognized. Estimates of expected sales discounts are evaluated and adjusted periodically based on actual sales transactions and forecasts for the balance of the incentive period. Volume-based discounts are offered to customers on purchases they make during a discreet promotional period which typically lasts three months in duration. All purchases made by customers during the promotional three-month period qualify for such discounts provided the customer reaches the required level of purchases. The percentage discount a customer may earn is predetermined by a progressive discount table agreed to by the parties as evidenced in the contractual sale agreement.
Daiichi accrues a rebate at each period-end by multiplying its accounts receivable balance due from the respective customer, net of estimated returns, by an estimated discount percentage. The estimated discount
132
Table of Contents
percentage is an average ratio of the discount earned by the customer, as determined by the progressive discount table, based on their estimated purchases to be made during the promotional volume-based discount period.
Volume-based discount promotional programs based on a wholesaler’s sell-through vary in length from one to six months. An estimated accrual for discounts earned by the wholesaler is recognized at each period-end by applying a discount percentage to the wholesaler’s on-hand inventory, less estimated returns. The estimated discount percentage is a ratio of total estimated discount amounts to be earned for the program periods by the wholesalers as a percentage of the estimated sell-through amounts that result in the estimated discounts.
In estimating future purchase and sell-through amounts by the wholesaler to the customer, Daiichi bases such estimates principally on historical sales levels of the wholesaler and a trend of end-customer prescription demand in the market. These estimates are validated through continued discussions with the wholesalers’ sales representatives.
A roll forward of balances of accrued volume discounts as well as provision for sales returns is as follows:
| (millions of yen) | ||||||||
| Volume discounts | ||||||||
| Based on customers’ purchase | Based on customers’ sell-through | Total discount | Sales returns | |||||
Balance as of March 31, 2002 | 875 | 561 | 1,436 | 504 | ||||
Current provision for the year: | ||||||||
Related to current year sales | 9,967 | 9,858 | 19,825 | 1,657 | ||||
Related to previous year sales | -188 | -273 | -461 | 60 | ||||
Actual credits for the year: | ||||||||
Related to current year sales | -9,209 | -9,441 | -18,650 | -1,172 | ||||
Related to previous year sales | -687 | -288 | -975 | -564 | ||||
Balance as of March 31, 2003 | 758 | 417 | 1,175 | 485 | ||||
Current provision for the year: | ||||||||
Related to current year sales | 9,751 | 10,658 | 20,409 | 1,590 | ||||
Related to previous year sales | 2 | 7 | 9 | -62 | ||||
Actual credits for the year: | ||||||||
Related to current year sales | -9,060 | -10,250 | -19,310 | -1,098 | ||||
Related to previous year sales | -760 | -424 | -1,184 | -423 | ||||
Balance as of March 31, 2004 | 691 | 408 | 1,099 | 492 | ||||
Since Daiichi’s volume discount promotional programs are typically short in duration (i.e. one to six months), a potential change in the estimated future purchase and sell-through level of the wholesalers and end customers would not have a material effect on the amount of accruals at the balance sheet dates. The effect that changes in estimated volume discounts had on Daiichi’s results of operations was less than 1% of pre-tax income for both of the years ended March 31, 2003 and 2004. The amount of volume-based discounts as a percentage of gross sales remained relatively consistent, and was 5.6% and 5.9% for the years ended March 31, 2003 and 2004, respectively. Had the volume discount percentage increased by 1%, the balance of accrued volume discounts would have been ¥236 million and ¥231 million higher than the amount recorded in the consolidated financial statements at March 31, 2003 and 2004, respectively. Daiichi does not ship products to wholesalers as a result of incentives or in excess of the wholesalers’ normal inventory levels. Wholesalers typically maintain less than 30 days’ inventory on hand.
The provision for sales returns principally relates to healthcare products and is provided at each period-end using the combined accounts receivable and notes receivable balances and an estimated sales return percentage. The estimated sales return percentage is a ratio of historical returns by product line during the last
133
Table of Contents
three-year period divided by historical sales in the same period. In estimating product returns, Daiichi also considers such factors as end-user demand and seasonality of the products, products’ market position relative to competitors’ and, if any, other specific events or factors which may have an effect on a product return trend. However, those variables have generally had an insignificant bearing on the period-end provision. Sales returns as a percentage of gross sales has historically been insignificant and was approximately 0.5% and 0.4% for the years ended March 31, 2003 and 2004, respectively.
Daiichi receives royalties from pharmaceutical companies and certain other third parties for the use of certain patents and trade names. Royalties are determined based on the number of products sold at predetermined royalty rates. Royalties and license fees are recognized in revenue on an accrual basis as earned.
Pension Accounting
Daiichi believes that pension accounting is critical for its financial statements because assumptions used to estimate pension benefit obligations and pension expenses can have a significant effect on its operating results and financial condition.
The determination of Daiichi’s benefit obligation and net periodic expense with respect to its pension liability is dependent upon the selection of certain assumptions used by actuaries and management in calculating such amounts. Those assumptions are described in Note 10, “Severance and Retirement Plans”, to Daiichi’s consolidated financial statements and include, among others, the discount rate, expected long-term rate of return on plan assets and rates of increase in compensation. In accordance with U.S. GAAP, actual results that differ from Daiichi’s assumptions are accumulated and amortized over future periods and therefore generally affect Daiichi’s recognized expense and recorded obligation in such future periods. While Daiichi believes that its assumptions are appropriate, significant differences in its actual experience or significant changes in its assumptions may materially affect Daiichi’s pension obligation and future expense.
In preparing its consolidated financial statements for fiscal year 2004, Daiichi estimated a discount rate for the measurement of projected benefit obligations of 2.0% and an expected long-term rate of return of 3.0% on plan assets. In determining the discount rate, Daiichi looks to rates of return on high-quality fixed-income investments currently available during the period to maturity of the pension benefits. The discount rate of 2.0% used for the projected benefit obligations at March 31, 2004 represents a 0.5% decline from the 2003 rate of 2.5%. Holding all other assumptions constant, the effect of this 0.5% decrease in the discount rate assumption is an increase in the projected benefit obligations at March 31, 2004 of approximately ¥10.1 billion. Daiichi established the expected long-term rate of return on plan assets based on management’s expectations in respect of the long-term returns of various plan asset categories in which it invests. Management developed expectations with respect to each plan asset category based on actual historical returns and its current expectations for future returns. Pursuant to the Contributed Benefit Pension Plan Law, Daiichi will return the substitutional portion of its Employee Pension Fund (EPF) to the government in May 2005.
The process of separating the substitutional portion of the EPF from the corporate portion occurs in four phases, as described below, and a company must complete all parts of the separation process. Essentially, once a company obtains Phase 2 approval, it must complete the entire separation process.
Phase 1: An employer submits an application to the Japanese government for an exemption from the obligation to pay benefits forfuture employee service related to the substitutional portion. As a prerequisite to submitting that application, the representative of the employees covered by the plan must agree to the separation.
Phase 2: The employer receives from the Japanese government formal approval of exemption from the obligation to pay benefits related tofuture employee service under the substitutional portion. Once that approval is obtained, the employer begins to submit Japanese Pension Insurance program, or JPI, payments directly to the government.
134
Table of Contents
Phase 3: After obtaining approval of exemption from the obligation to pay benefits related to future employee service, the employermust submit a second application for separation of the remaining substitutional portion (that is, the benefit obligation related topast services).
Phase 4: The Japanese government will grant the employer final approval of separation. Upon obtaining that approval, the remaining benefit obligation of the substitutional portion related to past services, together with the related government-specified portion of the plan assets of the EPF, will be transferred to JPI.
Physical transfer of the substitutional portion of the EPF fund to the Japanese government occurs after Phase 4 approval. On February 1, 2004, Daiichi received Phase 2 approval, an exemption from its obligation to contribute to the substitutional portion of its EPF, for future employee services from the Ministry of Health, Labor and Welfare. In January 2005, Daiichi received Phase 4 approval, an exemption from the Japanese government from its obligation to contribute to the substitutional portion of its EPF relating to past employee services. Under U.S. GAAP, Daiichi is expected to recognize a gain from the return of the substitutional portion at the time of physical transfer to the Japanese government in accordance with EITF No. 03-02, “Accounting for the Transfer to the Japanese Government of the Substitutional Portion of Employee Pension Fund Liabilities”.
In the substitutional portion of its employee pension fund liabilities, management exercised judgment and developed estimates, such as the discount rate and expected long-term rate of return, which judgment and estimates could materially affect the Company’s results of operations and financial conditions, as the determination of gain from the return will be based on such estimates.
Management estimated an effect of returning of the substitutional portion of EPF, calculated based on information available as of March 31, 2004, in accordance with U.S. GAAP, as a gain of ¥13.6 billion. The discount rate and expected long-term rate of return used to arrive at such estimate were 2.0% and 3.0%, respectively. The potential effects on the estimated gain due to changes in these assumptions are as follows:
| Millions of yen | |||
Estimated gain on return of the substitutional portion | ¥ | 13,595 | |
Expected long-term rate of return: | |||
+0.5% | 116 | ||
-0.5% | -116 | ||
Discount rate: | |||
+0.5% | 246 | ||
-0.5% | -270 | ||
Impairment of Long-Lived Assets and Goodwill
Daiichi periodically reviews the carrying value of its goodwill for impairment. This review is made at the reporting unit level and consists of two steps. First, Daiichi determines the estimated fair value of a reporting unit and compares it to its carrying amount including allocated goodwill. Second, if the carrying amount of a reporting unit exceeds its estimated fair value, an impairment loss is recognized for any excess of the carrying amount of the reporting unit’s goodwill over the implied fair value of that goodwill. In determining the estimated fair value of a reporting unit, Daiichi typically utilizes the “income approach”, which employs discounting of the projected future net cash flows using an appropriate discount rate that reflects the risk factors associated with the cash flow streams. Such determination requires significant estimates and assumptions by Daiichi, as the calculation is dependent on the projected future net cash flows which are affected by economic conditions related to the industries in which the reporting unit operates. A decline in the estimated fair value of a reporting unit could result in an impairment charge to goodwill, which could have a material adverse impact on Daiichi’s financial condition and results of operations.
Daiichi reviews its tangible long-lived assets and acquired intangible assets with a definite life for impairment whenever events or changes in circumstances indicate that the carrying amount of an asset may not
135
Table of Contents
be recoverable. Recoverability of assets to be held and used is measured by a comparison of the carrying amount of an asset to the estimated undiscounted future cash flows expected to be generated by the asset. If the carrying amount of an asset exceeds its estimated future cash flows, an impairment charge is recognized by the amount by which the carrying amount of the asset exceeds the fair value of the asset. Fair value is determined by independent third party appraisal, projected discounted cash flow or other valuation techniques as appropriate. The determination of the future cash flows and the fair value of an asset involves estimates and assumptions as to future operating results, all of which are affected by economic conditions related to the industries in which those assets operate. Inaccurate estimates could have a material adverse impact on Daiichi’s financial condition and results of operations. Assets to be disposed of would be separately presented in the balance sheet and reported at the lower of the carrying amount or fair value less costs to sell, and are no longer depreciated.
In July 2003, Daiichi made a decision to withdraw from research and development of a specific product. As a result, Daiichi recorded an impairment charge of ¥44 million, as a component of selling, general and administrative expenses, in its pharmaceuticals segment for the year ended March 31, 2004. This impairment charge reduced the carrying value of related manufacturing equipment to its estimated fair value of zero as Daiichi determined there was no future need for this research and development manufacturing equipment and there was no suitable alternative use for the equipment.
Income Taxes
In the ordinary course of Daiichi’s business, there are many transactions where the ultimate tax determination is uncertain. Also, tax exposures can involve complex issues and may require an extended period to resolve. As part of the process of preparing its consolidated financial statements, Daiichi is required to estimate its income taxes in each of the jurisdictions in which it operates. This process involves estimating current tax exposures in each jurisdiction including the impact, if any, of additional taxes resulting from tax examinations and making judgments regarding the recoverability of deferred tax assets. The recoverability of deferred tax assets ultimately depends on the existence of sufficient taxable income of an appropriate character and Daiichi records a valuation allowance to reduce its deferred tax assets to an amount that is more likely than not to be recoverable. A change in the ability of Daiichi’s operations to continue to generate future taxable income could affect its ability to recover deferred tax assets and requires re-assessment of the valuation allowance requirement. Such changes, if significant, could have a material impact on Daiichi’s effective tax rate, results of operations and cash flows.
Contingencies
In the normal course of business, Daiichi is subject to various contingencies such as liabilities from product-specific and general legal proceedings, environmental liabilities connected with its sites, and tax litigations. In accordance with SFAS No. 5, “Accounting for Contingencies”, Daiichi records accruals for such contingencies when it is probable that a liability has been incurred and the amount of loss can be reasonably estimated. Daiichi considers many factors in making these assessments, including past history, scientific evidence and the specifics of each matter, which involve significant judgments as to future outcomes for which a high degree of uncertainty is inherent.
Business Acquisitions
Daiichi accounts for acquired businesses using the purchase method of accounting, which requires that the assets acquired and liabilities assumed be recorded at the date of acquisition at their respective fair values. The judgments made in determining the estimated fair value assigned to each class of assets acquired, as well as asset lives, can materially impact net income of the periods subsequent to the acquisition through depreciation and amortization, and in certain instances by impairment charges, if the asset is significantly overvalued. For in-process research and development (IPRD) acquired, the estimated fair value assigned can materially impact net income of the period of acquisition as IPRD is required to be expensed upon acquisition.
136
Table of Contents
In determining the estimated fair value for intangible assets, including acquired IPRD, Daiichi typically utilizes the income approach, which employs discounting of the projected future net cash flow using an appropriate discount rate that reflects the risk factors associated with the cash flow streams. Some of the more significant estimates and assumptions inherent in the income approach or other methods include the projected future cash flows (including timing), the expected costs to develop IPRD into commercially viable products and estimates of cash flows from the projects when completed, and the discount rate reflecting the risks inherent in the future cash flows.
Determining the useful life of an intangible asset also requires judgment as different types of intangible assets will have different useful lives and certain assets may even be considered to have indefinite useful lives. Generally, the useful life of the right associated with a pharmaceutical product’s exclusive patent will be finite and will result in amortization expense being recorded over a determinable period, while the useful life associated with a brand that is expected to retain a distinct market identity could be considered to be indefinite.
All of these judgments and estimates can significantly impact net income.
Recently Issued Accounting Pronouncements
Inventory Costs
In November 2004, the FASB issued SFAS No. 151, “Inventory Costs-an amendment of ARB No. 43”. This Statement amends the guidance in ARB No. 43, Chapter 4, Inventory Pricing, to clarify the accounting for abnormal amounts of idle facility expense, freight, handling costs, and wasted material (spoilage). Paragraph 5 of ARB 43, Chapter 4, previously stated that “…under some circumstances, items such as idle facility expense, excessive spoilage, double freight, and rehandling costs may be so abnormal as to require treatment as current period charges…” This Statement requires that those items be recognized as current-period charges regardless of whether they meet the criterion of “so abnormal.” In addition, this Statement requires that allocation of fixed production overhead to the costs of conversion be based on the normal capacity of the production facilities. This Statement is effective for inventory costs incurred during annual periods beginning after June 15, 2005. Daiichi does not expect the adoption of this Statement will have a material effect on its consolidated financial statements.
Accounting for Share-Based Payments
In December 2004, the FASB revised FAS No. 123 to require expense recognition for share-based payments. This Statement, which requires companies to recognize in the income statement the grant-date fair value of stock options and other equity-based compensation issued to employees, is effective for most public companies’ interim or annual periods beginning after June 15, 2005. An effect of the adoption of this Statement on Daiichi’s consolidated results of operations and financial position is under evaluation and has not been determined yet.
Results of Operations
The following table sets forth a summary of Daiichi’s results of operations for the fiscal years ended March 31, 2003 and 2004 and the six months ended September 30, 2003 and 2004:
Fiscal year ended March 31, | Six months ended September 30, | ||||||||||||
| 2003 | 2004 | 2003 | 2004 | ||||||||||
| (millions of yen) | |||||||||||||
Net sales | ¥ | 321,926 | ¥ | 322,977 | ¥ | 161,332 | ¥ | 157,765 | |||||
Cost of sales | 106,955 | 106,475 | 51,240 | 49,261 | |||||||||
Selling, general and administrative expenses | 106,859 | 107,869 | 54,022 | 54,494 | |||||||||
Research and development expenses | 55,505 | 59,718 | 29,495 | 30,098 | |||||||||
Operating income | 52,607 | 48,915 | 26,575 | 23,912 | |||||||||
Other income (expenses) | (4,549 | ) | 2,147 | 486 | 1,886 | ||||||||
Income before income taxes and minority interests | 48,058 | 51,062 | 27,061 | 25,798 | |||||||||
Income Taxes | 22,634 | 21,812 | 10,743 | 10,139 | |||||||||
Minority Interests, net of tax | 177 | 1,486 | 537 | 484 | |||||||||
Net income | 25,601 | 30,736 | 16,855 | 16,143 | |||||||||
137
Table of Contents
Six Months Ended September 30, 2004 Compared to Six Months Ended September 30, 2003
Net Sales
Net sales for the six-month period ended September 30, 2004 decreased ¥3.6 billion, or 2.2% from the same interim period in fiscal 2003, to ¥157.8 billion. The decrease was due in part to a decrease of ¥1.1 billion associated with the sale of Daiichi’s veterinary and livestock feed products business and a decrease of approximately ¥1.6 billion in overseas sales reflecting a weaker U.S. dollar, despite a slight increase in domestic sales of pharmaceutical products.
Cost of Sales
The cost of sales for the six-month period ended September 30, 2004 decreased ¥2.0 billion, or 3.9% from the same interim period in fiscal 2003, to ¥49.3 billion. The decrease was due primarily to savings achieved in the manufacturing processes of precursors to levofloxacin, and the transfer during the period of Daiichi’s veterinary and livestock feed products business, which had relatively high costs of sales.
Selling, General and Administrative Expenses
Selling, general and administrative expenses for the six-month period ended September 30, 2004 increased ¥0.5 billion, or 0.9% from the same interim period in fiscal 2003, to ¥54.5 billion. The increase was due primarily to an increase of ¥0.4 billion in advertising expenses for healthcare products, primarily Karoyan Gush, a new hair growth formula launched in June 2004.
Research and Development
Research and development costs for the six-month period ended September 30, 2004 increased ¥0.6 billion, or 2.0%, as compared to the same interim period in fiscal 2003, to ¥30.1 billion. Cost reductions of approximately ¥0.6 billion associated with the completion of clinical trials of Plavix® were offset by increased domestic and overseas R&D expenses of approximately ¥0.6 billion related to antibiotics and HGF genetic plasmids, ¥0.4 billion in connection with ongoing trials by Daiichi Suntory Pharma, and approximately ¥0.1 billion in connection with the establishment of Daiichi Medical Research.
Operating Income
For the foregoing reasons, operating income for the six-month period ended September 30, 2004 declined ¥2.7 billion, or 10.0% from the same interim period in fiscal 2003, to ¥23.9 billion.
Other Income
Other income for the six-month period ended September 30, 2004 increased ¥1.4 billion, or 288.1% from the corresponding period in the prior year, to ¥1.9 billion. The increase was due primarily to foreign currency exchange gains resulting from the effect of a weaker yen during the period on dollar-denominated payments received as compared to a stronger yen during the same period in the previous year, higher dividend income, and gains recognized in connection with the transfer of sales and distribution rights related to veterinary and livestock feed products, all of which offset a loss on valuation of investment securities reflecting weak stock market conditions during the period.
Income Before Income Taxes and Minority Interests
As a result of the foregoing, income before income taxes and minority interests for the six-month period ended September 30, 2004 was ¥25.8 billion, a decrease of 4.7% from the same period in the previous fiscal year.
138
Table of Contents
Income Taxes
Income taxes for the six months ended September 30, 2004 decreased by ¥0.6 billion as compared to the corresponding period in the prior year as a result of a decrease in income before income taxes and minority interests. The effective tax rates for the six months ended September 30, 2003 and 2004 were 39.7% and 39.3%, respectively. The downward trend in effective tax rates was primarily due to the impact of a change in the applicable tax rates effective for the year beginning on April 1, 2004.
Net Income
As a result of the overall decline in net sales, net income for the six-month period ended September 30, 2004 decreased ¥0.7 billion, or 4.2% from the same period in fiscal 2003, to ¥16.1 billion. The net profit margin fell 0.2%, to 10.2%, and the return on shareholders’ equity fell 0.3%, to 3.7%.
Fiscal Year Ended March 31, 2004 Compared to Fiscal Year Ended March 31, 2003
Net Sales
Consolidated net sales for the fiscal year ended March 31, 2004 were ¥323.0 billion, up 0.3% from the previous fiscal year. Sales in the core pharmaceutical business segment grew slightly, to ¥276.9 billion, and accounted for 85.8% of net sales, 0.4% more than in the previous fiscal year.
Domestic sales increased ¥4.8 billion, or 1.9% from the previous fiscal year, to ¥256.3 billion. In the domestic prescription drug market, Daiichi’s marketing programs for the anti-platelet agent Panaldine® continued to emphasize the proactive provision of appropriate drug use information, but sales of that product declined. However, sales increases were seen for such mainstay products as the leading broad-spectrum oral antibacterial agent Cravit® (levofloxacin), the long-acting beta-blocker Artist®, and the anti-arrhythmic agent Sunrythm®. In addition, Daiichi Suntory Pharma Co., Ltd., which became a consolidated subsidiary in January 2003, made its first full-year contribution to consolidated performance, contributing ¥3.9 billion to consolidated net sales, compared with ¥0.7 billion in the previous year, thereby offsetting other declines.
Overseas sales decreased ¥3.8 billion, or 5.3% from the previous fiscal year, to ¥66.6 billion, and accounted for 20.6% of consolidated net sales, 1.2% less than in the previous fiscal year due in part to the impact of reduced bulk sales of levofloxacin to overseas licensees and a weaker yen.
Costs of Sales
The cost of sales for the fiscal year ended March 31, 2004 decreased ¥0.5 billion, or 0.4% from the previous fiscal year, to ¥106.5 billion, which was equal to 33.0% of consolidated net sales, 0.2% less than in the previous year.
Research and Development Expenses
During the fiscal year ended March 31, 2004, total R&D expenses increased by ¥4.2 billion, or 7.6%, to ¥59.7 billion, reflecting primarily the consolidation of Daiichi Suntory Pharma for the full period, and the start of such development programs as the full-scale Phase III development program for Memantine for the indication of mild to moderate cases of Alzheimer’s disease, partly offset by a decrease in R&D expenses related to genomic research and other R&D activities in areas at the end of their natural research cycle. The ratio of total R&D expenses to net sales increased by 1.3%, to 18.5%.
Selling, General and Administrative Expenses
Selling, general, and administrative expenses increased by ¥1.0 billion, or 0.9%, from the previous fiscal year, to ¥107.9 billion. The increase stemmed largely from litigation costs associated with Daiichi’s patent litigation in the United States.
139
Table of Contents
Operating Income
As a result of the foregoing, operating income for the fiscal year ended March 31, 2004 fell by 7.0% compared to the previous fiscal year, to ¥48.9 billion. This decrease primarily reflected rises in expenses related to R&D programs.
Other Income (Expenses)
Other income for the fiscal year ended March 31, 2004 was ¥2.1 billion as compared to other expenses of ¥4.5 billion in the prior year. The largest factor behind the improvement was the shift from a ¥5.6 billion loss on valuation of investment securities that reflected weak stock market conditions in the year ended March 31, 2003 to gains on investment securities of ¥1.6 billion in the year ended March 31, 2004.
Income Before Income Taxes and Minority Interests
As a result of the improvement in other income, income before income taxes and minority interests for the fiscal year ended March 31, 2004 was ¥51.1 billion, an increase of 6.3% from the previous fiscal year.
Income Taxes
Income taxes for the year ended March 31, 2004 decreased by ¥822 million as compared to the year ended March 31, 2003, despite the ¥3.0 billion increase in income before income taxes and minority interests, due primarily to a decrease in the effective tax rate. The effective tax rates for the years ended March 31, 2003 and 2004 were 47.1% and 42.7%, respectively. The lower tax rate for the year ended March 31, 2004 was primarily due to an increase in tax credits for research and development expenses.
Net Income
As a result of the improvement in other income more than offsetting the decline in operating income, and after minority interest in net losses of ¥1.5 billion, primarily with respect to Daiichi Suntory Pharma, net income for the fiscal year ended March 31, 2004 increased ¥5.1 billion, or 20.1% from the previous fiscal year, to ¥30.7 billion. The net profit margin rose 1.5%, to 9.5%, and the return on shareholders’ equity was to 7.3%.
Segment Information
Under SFAS No. 131, “Disclosures about Segments of an Enterprise and Related Information”, operating segments are defined as components of an enterprise about which separate financial information is available that is regularly evaluated by the chief operating decision maker in deciding how to allocate resources and in assessing performance. The operating segments are managed separately as each segment represents a strategic business unit that offers different products and serves different markets.
Daiichi operates on a worldwide basis principally with the following five business segments:
| • | Pharmaceuticals – The pharmaceuticals segment primarily consists of treatments for infectious and respiratory diseases, cardiovascular diseases, allergies, central nervous system disorders, cancer, dermatological disorders, gastrointestinal disorders, and in vivo imaging agents. |
| • | Diagnostics – The diagnostics segment primarily consist of in vitro diagnostics. |
| • | Consumer Healthcare – The consumer healthcare segment includes self-medications for hair growth, inflammatory analgesic, skin care, allergies, upper respiratory health, and gastrointestinal health. |
140
Table of Contents
| • | Fine Chemicals – The fine chemicals segment consists of fine chemical products and raw materials of pharmaceutical products. |
| • | Others – Others include veterinary and livestock feed products, service businesses such as real estate and travel agency. |
Daiichi’s management primarily evaluates the performance of business segments based on operating income reported under Japanese GAAP. The discussion below is based on Japanese GAAP operating income. A reconciliation of these segment results to operating income under U.S. GAAP is given in Note 13 to Daiichi’s unaudited semi-annual financial statements and Note 16 to Daiichi’s audited annual financial statements included herein.
Six Months Ended September 30, 2004 Compared to Six Months Ended September 30, 2003
The following table summarizes sales and operating income (loss) by business segments which are the primary measures used by Daiichi’s chief operating decision makers to measure Daiichi’s operating results and to measure segment profitability and performance. This information is derived from Daiichi’s management reports which have been prepared based on Japanese GAAP.
Six months ended September 30, 2003 | Pharma- ceuticals | Diagnostics | Consumer Healthcare | Fine Chemicals | Others | Corporate and Eliminations | Consolidated | |||||||||||||||||
| (millions of yen) | ||||||||||||||||||||||||
Net sales: | ||||||||||||||||||||||||
Customers | ¥ | 140,203 | ¥ | 6,954 | ¥ | 4,218 | ¥ | 7,188 | ¥ | 3,743 | ¥ | — | ¥ | 162,306 | ||||||||||
Inter-segment | 726 | 3 | — | 3,281 | 688 | (4,698 | ) | — | ||||||||||||||||
Total | 140,929 | 6,957 | 4,218 | 10,469 | 4,431 | (4,698 | ) | 162,306 | ||||||||||||||||
Operating expenses | 111,187 | 6,516 | 5,506 | 10,776 | 4,134 | (2,254 | ) | 135,865 | ||||||||||||||||
Operating income (loss) | ¥ | 29,742 | ¥ | 441 | ¥ | (1,288 | ) | ¥ | (307 | ) | ¥ | 297 | ¥ | (2,444 | ) | ¥ | 26,411 | |||||||
Six months ended September 30, 2004 | Pharma- ceuticals | Diagnostics | Consumer Healthcare | Fine Chemicals | Others | Corporate and Eliminations | Consolidated | |||||||||||||||||
| (millions of yen) | ||||||||||||||||||||||||
Net sales: | ||||||||||||||||||||||||
Customers | ¥ | 136,350 | ¥ | 7,284 | ¥ | 5,649 | ¥ | 7,329 | ¥ | 2,527 | ¥ | — | ¥ | 159,139 | ||||||||||
Inter-segment | 640 | 20 | — | 2,956 | 731 | (4,347 | ) | — | ||||||||||||||||
Total | 136,990 | 7,304 | 5,649 | 10,285 | 3,258 | (4,347 | ) | 159,139 | ||||||||||||||||
Operating expenses | 110,461 | 6,689 | 5,525 | 10,501 | 2,954 | (2,011 | ) | 134,119 | ||||||||||||||||
Operating income (loss) | ¥ | 26,529 | ¥ | 615 | ¥ | 124 | ¥ | (216 | ) | ¥ | 304 | ¥ | (2,336 | ) | ¥ | 25,020 | ||||||||
Inter-segment revenues primarily consist of sales of raw materials for prescription drugs from the fine chemicals segment to the pharmaceuticals segment. Corporate and eliminations primarily consists of administrative expenses of Daiichi and eliminations of inter-segment sales and profits on inventories.
Pharmaceuticals
Overall, prior to elimination of inter-segment transactions, pharmaceutical sales declined by 2.8% to ¥137.0 billion in the six months ended September 30, 2004 compared with the six months ended September 30, 2003. In the domestic prescription drug market, the downward effects of revisions of the prices of pharmaceutical products by the NHI were offset by increased revenues from the sales of Mobic® (for which the company became the sole distributor as of July 2004) and Artist®. However, overseas sales decreased by ¥4.1 billion due to decreased sales of Floxin Otic and other exports, and unfavorable currency exchange fluctuations.
Operating income for the segment declined by 10.8% to ¥26.5 billion due to lower sales and higher selling, general and administrative and R&D expenses.
141
Table of Contents
Diagnostics
Although market conditions remained harsh, strong sales were recorded for such products as mainstay cholesterol measuring agents. As a result, sales grew 5.0% to ¥7.3 billion compared to the six-month period ending September 30, 2003. Operating income for the segment increased by 39.5% to ¥0.6 billion as a result of the increasing revenues.
Consumer Healthcare
Benefiting from increased sales of Karoyan Gush, the consumer healthcare segment saw its net sales increase by 33.9% to ¥5.6 billion. Largely as a result thereof, the segment’s operating income increased to ¥124 million.
Fine Chemicals
Sales of fine chemical products decreased 1.8% to ¥10.3 billion in the six-month period ended September 30, 2004 compared to the same six-month period in the previous fiscal year. While sales to third parties of products such as Pantenol (pantothenic acid calcium) were flat as compared to the previous period, there was a decrease in inter-segment sales of raw materials for pharmaceutical products associated with changes in the production process for levofloxacin. The fine chemicals segment incurred an operating loss of ¥216 million compared to an operating loss of ¥307 million in the previous fiscal year. The reduced loss, despite a decline in sales, was due to successful efforts by Daiichi Fine Chemical to control production costs.
Others
As a result of the transfer of the veterinary and livestock feed products business in June 2004, segment sales decreased 26.5%, to ¥3.3 billion. Operating income for the segment increased, however, by 2.4% from ¥297 million to ¥304 million.
Fiscal Year Ended March 31, 2004 Compared to Fiscal Year Ended March 31, 2003
The following table summarizes sales and operating income (loss) by business segments which are the primary measures used by Daiichi’s chief operating decision makers to measure Daiichi’s operating results and to measure segment profitability and performance. This information is derived from Daiichi’s management reports which have been prepared based on Japanese GAAP.
Year ended March 31, 2003 | Pharma- ceuticals | Diagnostics | Consumer Healthcare | Fine Chemicals | Others | Corporate and Eliminations | Consolidated | |||||||||||||||||
| (millions of yen) | ||||||||||||||||||||||||
Net sales: | ||||||||||||||||||||||||
Customers | ¥ | 275,023 | ¥ | 14,258 | ¥ | 9,620 | ¥ | 15,793 | ¥ | 7,317 | ¥ | — | ¥ | 322,011 | ||||||||||
Inter-segment | 1,051 | 27 | — | 9,210 | 1,332 | (11,620 | ) | — | ||||||||||||||||
Total | 276,074 | 14,285 | 9,620 | 25,003 | 8,649 | (11,620 | ) | 322,011 | ||||||||||||||||
Operating expenses | 218,623 | 13,083 | 10,452 | 24,110 | 8,387 | (5,280 | ) | 269,375 | ||||||||||||||||
Operating income (loss) | ¥ | 57,451 | ¥ | 1,202 | ¥ | (832 | ) | ¥ | 893 | ¥ | 262 | ¥ | (6,340 | ) | ¥ | 52,636 | ||||||||
Year ended March 31, 2004 | Pharma- ceuticals | Diagnostics | Consumer Healthcare | Fine Chemicals | Others | Corporate and Eliminations | Consolidated | |||||||||||||||||
| (millions of yen) | ||||||||||||||||||||||||
Net sales: | ||||||||||||||||||||||||
Customers | ¥ | 276,908 | ¥ | 14,497 | ¥ | 8,774 | ¥ | 15,117 | ¥ | 7,471 | ¥ | — | ¥ | 322,767 | ||||||||||
Inter-segment | 1,338 | 26 | — | 6,592 | 1,373 | (9,379 | ) | — | ||||||||||||||||
Total | 278,296 | 14,523 | 8,774 | 21,709 | 8,844 | (9,379 | ) | 322,767 | ||||||||||||||||
Operating expenses | 226,193 | 13,592 | 10,911 | 21,816 | 8,285 | (4,145 | ) | 276,652 | ||||||||||||||||
Operating income (loss) | ¥ | 52,103 | ¥ | 931 | ¥ | (2,137 | ) | ¥ | (107 | ) | ¥ | 559 | ¥ | (5,234 | ) | ¥ | 46,115 | |||||||
142
Table of Contents
Inter-segment revenues primarily consist of sales of raw materials for prescription drugs from the fine chemicals segment to the pharmaceuticals segment. Corporate and eliminations primarily consists of administrative expenses of Daiichi and eliminations of inter-segment sales and profits on inventories.
Pharmaceuticals
Overall, pharmaceutical sales were largely unchanged in the year ended March 31, 2004 from the previous fiscal year ended March 31, 2003, despite Daiichi Suntory Pharma making its first full-year contribution to Daiichi’s consolidated sales. Prior to inter-segment eliminations, net sales increased 0.8% to ¥278.3 billion. In the domestic prescription drug market, sales of HANP®, a product developed by Daiichi Suntory Pharma and for which Daiichi acquired sole distribution rights in April 2003, contributed ¥6.0 billion and sales of Cravit® (levofloxacin), Artist®, and the anti-arrhythmic agent Sunrythm® increased, while sales of Panaldine® declined. Domestic increases were offset by declines in overseas sales attributable to unfavorable currency exchange rate fluctuations and decreased exports of levofloxacin as licensees sought to reduce inventories.
Operating income for the segment declined by 9.3% to ¥52.1 billion in large part due to increased research and development expenses, primarily as a result of the acquisition by Daiichi of Daiichi Suntory Pharma.
Diagnostics
Although market conditions remained harsh, strong sales were recorded for mainstay cholesterol measuring agents and other products. As a result, sales grew 1.7%, to ¥14.5 billion. Operating income for the segment declined by 22.5% to ¥931 million in large part due to expenses incurred in connection with the implementation of new information systems by Daiichi.
Consumer Healthcare
Although sales of the recently launched vitamin C product Cystina C grew smoothly, declines in sales of such mainstay products as Karoyan ApogeecaS hair-growth accelerator and Patecs anti-inflammatory analgesic poultices caused OTC drug sales to fall 8.8%, to ¥8.8 billion. In February 2004, Daiichi obtained permission to market a new hair growth-promoting product, which was launched on June 7, 2004. Operating losses for the segment increased from ¥0.8 billion to ¥2.1 billion as a result of the lower sales volume for the Karoyan series of products and increased advertising expenses in connection with Cystina C.
Fine Chemicals
Sales of fine chemical products decreased 13.2%, to ¥21.7 billion, reflecting drops in sales of such products as Pantenol (pantothenic acid calcium) and vitamin B complex, as well as a ¥2.7 billion reduction in inter-segment sales of raw materials for Cravit® resulting from a change in production processes at the parent company level. Operating losses in the fine chemicals segment were ¥0.1 billion compared to operating income of ¥0.9 billion in the prior year due to the impact of changes to the Cravit® production methods and related inventory adjustments as well as reduced prices for vitamin products.
Others
Sales of animal vaccines decreased, but smooth growth was sustained in sales of such products as the ofloxacin antibacterial agent Tarivid For Animals. Thus, segment sales increased 2.3%, to ¥8.8 billion. As a result of the foregoing as well as a reduction in operating expenses from certain service businesses, operating income for the segment also increased from ¥0.3 billion to ¥0.6 billion.
143
Table of Contents
Geographic Information
Fiscal Year Ended March 31, 2004 Compared to Fiscal Year Ended March 31, 2003
For the purpose of presenting its operations in geographic areas below, Daiichi attributes revenues from external customers to individual countries in each area based on where products are sold and services are provided, and attributes assets based on where assets are located. Information by geographic segment is based upon U.S. GAAP.
Year ended March 31, 2003 | Japan | Americas | Europe | Asia/ Oceania | Total | Eliminations | Consolidated | |||||||||||||||
| (millions of yen) | ||||||||||||||||||||||
Net sales: | ||||||||||||||||||||||
Total | ¥ | 305,214 | ¥ | 21,102 | ¥ | 4,338 | ¥ | 4,300 | ¥ | 334,954 | ¥ | (13,028 | ) | ¥ | 321,926 | |||||||
Long-lived assets | 142,528 | 961 | 53 | 5,601 | 149,143 | — | 149,143 | |||||||||||||||
Year ended March 31, 2004 | Japan | Americas | Europe | Asia/ Oceania | Total | Eliminations | Consolidated | |||||||||||||||
| (millions of yen) | ||||||||||||||||||||||
Net sales: | ||||||||||||||||||||||
Total | ¥ | 306,698 | ¥ | 20,156 | ¥ | 3,902 | ¥ | 5,320 | ¥ | 336,076 | ¥ | (13,099 | ) | ¥ | 322,977 | |||||||
Long-lived assets | 137,579 | 914 | 39 | 4,648 | 143,180 | — | 143,180 | |||||||||||||||
Financial Condition
September 30, 2004 Compared to March 31, 2004
Daiichi’s total assets at September 30, 2004, amounted to ¥547.1 billion, a decrease of ¥3.5 billion, or 0.6% compared to March 31, 2004. Total current assets decreased slightly to ¥291.5 billion, from ¥291.6 billion at March 31, 2004.
Total liabilities for Daiichi at September 30, 2004 amounted to ¥114.2 billion, down ¥9.7 billion, or 7.8%, from March 31, 2004. Total current liabilities decreased to ¥74.5 billion from ¥79.2 billion, reflecting primarily a decrease in accounts payable. Long-term liabilities decreased ¥5.0 billion, or 11.2%, to ¥39.7 billion, primarily due to a decrease in accrued pension and severance costs related to increased contributions to Daiichi’s pension fund.
Total shareholders’ equity for Daiichi rose 2.0%, or ¥8.6 billion, to ¥431.1 billion. A ¥12.1 billion increase in retained earnings was partly offset by the impact of the acquisition of treasury stock in the amount of ¥2.4 billion.
March 31, 2004 Compared to March 31, 2003
Daiichi’s total assets at March 31, 2004, amounted to ¥550.6 billion, an increase of ¥10.3 billion, or 1.9% compared to March 31, 2003. Total current assets fell ¥15.6 billion compared to March 31, 2003, owing mainly to decreases in inventories, trade notes and accounts receivable, and cash. The reduction in inventories reflected Daiichi’s successful promotion of supply-chain management (SCM) systems. Cash and trade notes and accounts receivable also decreased, as a portion of excess funds were shifted to longer-term investments. Reflecting gains amid positive securities market trends, investment securities increased ¥41.4 billion, and this rise was the principal reason for the increase in total assets.
Total liabilities at March 31, 2004 amounted to ¥123.8 billion, down ¥12.9 billion, or 9.4%, from the previous year-end. Total current liabilities fell ¥3.9 billion, or 4.7%, while long-term liabilities dropped ¥9.0 billion, or 16.8%. Principal factors bringing down current liabilities included a ¥1.6 billion drop in income taxes payable owing to R&D expense-related tax exemptions as well as a ¥2.8 billion reduction in trade notes and accounts payable that reflected the effect of SCM systems. The main factor decreasing long-term liabilities was a ¥7.9 billion drop in employees’ severance and retirement benefits.
144
Table of Contents
Total shareholders’ equity for Daiichi rose 6.2%, or ¥24.7 billion, to ¥422.4 billion in the fiscal year ended March 31, 2004. A ¥22.5 billion increase in retained earnings and a ¥13.5 billion advance in net unrealized holding gains on securities reflected in other accumulated comprehensive income more than offset increased acquisition of treasury stock in the amount of ¥10.2 billion.
As a result of the decrease in total liabilities and increase in shareholders’ equity, the shareholders’ equity ratio was up 3.1% at the fiscal year-end, to 76.7%. In addition, the current ratio declined 0.02 points from 3.70:1 to 3.68:1.
Cash Flows
Six Months Ended September 30, 2004 Compared to Six Months Ended September 30, 2003
Net cash provided by operating activities for the six-month period ended September 30, 2004 decreased ¥6.4 billion, to ¥19.7 billion. The decrease was attributable to slightly lower net income for the period and the large contribution to net cash provided by operating activities in the six months ended September 30, 2003 from reductions in trade receivables and inventories associated with Daiichi’s supply-chain management reforms. During the six months ended September 30, 2004, Daiichi maintained the lower levels of trade receivables and inventories achieved through those reforms in the prior year.
Net cash used in investing activities during the period totaled ¥3.3 billion, as compared to ¥4.8 billion in the same period in fiscal 2003. Capital expenditures increased slightly, but proceeds from the sale and maturities of investment securities exceeded new purchases by approximately ¥6.3 billion as Daiichi shifted to short-term investments in light of market conditions.
Net cash used in financing activities for the period totaled ¥9.5 billion, a decrease of ¥0.2 billion compared to the same period in fiscal 2003. Daiichi maintained a stable dividend policy and also conducted similar levels of share buybacks in both periods.
As a result, cash and cash equivalents at the end of the six-month period ended September 30, 2004 amounted to ¥73.1 billion, a decrease of ¥8.6 billion from the six-month period ended September 30, 2003.
Year Ended March 31, 2004 Compared to Year Ended March 31, 2003
Net cash provided by operating activities for the fiscal year ended March 31, 2004 increased ¥20.5 billion, to ¥52.4 billion. The increase was attributable to reductions in trade receivables and inventories associated with Daiichi’s supply-chain management reforms as Daiichi shifted its business relationships with wholesalers to a quarterly cycle from a semi-annual basis.
Net cash used in investing activities during the fiscal year ended March 31, 2004 totaled ¥35.7 billion, compared to ¥3.5 billion of net cash provided by investing activities in the previous fiscal year. Despite the absence of such outflows as the ¥19.4 billion used to acquire shares in Daiichi Suntory Pharma during the previous fiscal year, payments for purchases of investment securities grew by ¥62.7 billion as Daiichi sought to shift its financing stance to longer-term instruments to increase fiscal safety and efficiency.
Net cash used in financing activities for the fiscal year ended March 31, 2004 totaled ¥20.8 billion, up ¥4.6 billion from the previous fiscal year. This principally reflected Daiichi’s acquisition of a total of 5.5 million shares of treasury stock during April 2003 and March 2004.
As a result, cash and cash equivalents at the end of the fiscal year ended March 31, 2004 amounted to ¥66.0 billion, down ¥4.3 billion.
Dividends
While it emphasizes the allocation of earnings to shareholders, Daiichi makes decisions on the appropriation of earnings based on a comprehensive consideration of how to maximize shareholder benefits by
145
Table of Contents
both disbursing dividends and maintaining sufficient internal reserves to fund future business expansion. Daiichi also gives due attention to flexibly responding in a timely manner to opportunities to maximize shareholder benefits through such other means as the repurchase and retirement of its own shares.
Plans call for using internal reserves to promote Daiichi’s evolution into a global R&D-driven pharmaceutical company through investments aimed at strengthening leading-edge R&D programs, augmenting the product development pipeline, creating corporate alliances, and building a solid foundation for international operations.
In line with this basic policy, Daiichi maintained the level of cash dividends applicable to the fiscal year ended March 31, 2004 at ¥30 per share, unchanged from the level in the previous fiscal year. Daiichi’s dividend payout ratio decreased 4.3 percentage points, to 29.3%, while the ratio of dividends to equity declined 0.2 percentage points, to 2.0%. Continuing from the previous fiscal year, Daiichi helped increase shareholder benefits by repurchasing 5.5 million of its own outstanding shares.
Liquidity and Capital Resources
Liquidity
Daiichi seeks to manage its capital resources and liquidity to provide adequate funds for current and future financial obligations. Daiichi derives the funds it requires to meet its capital requirements principally from cash flow provided by operations. At March 31, 2004, Daiichi also had unused committed credit lines of ¥30 billion available for borrowing.
In its manufacturing and sales of pharmaceutical products, Daiichi requires operating capital mainly to purchase materials required for production and to conduct research and development, as well as to respond to cash flow fluctuations related to changes in inventory levels and payment cycles of receivables from distributors. Daiichi further requires funds for capital expenditures, mainly to upgrade, rationalize and renew production facilities. Daiichi also requires funds for financial expenditures, primarily to pay dividends and to repurchase treasury stock.
Borrowings
Long Term Borrowings
| Millions of yen | ||||||||
| 2003 | 2004 | |||||||
Secured loans from Development Bank of Japan, due serially through 2006 with interest rate of 2.15% | ¥ | 52 | ¥ | 35 | ||||
Unsecured loans from commercial banks, due serially through 2016 with interest rates ranging from 5.9% to 6.15% | 9 | 7 | ||||||
Capital lease obligation with interest rates ranging from 0.82% to 3.95% | 4,392 | 4,644 | ||||||
Total long-term indebtedness | 4,453 | 4,686 | ||||||
Less: current portion | (1,726 | ) | (2,036 | ) | ||||
Long-term indebtedness, non-current portion | ¥ | 2,727 | ¥ | 2,650 | ||||
Generally, Daiichi’s long-term loans have a maturity of two to twelve years, and accrue interest on a fixed rate basis. At March 31, 2004, the weighted average rate of Daiichi’s long-term loans from banks was 3.23%. As is customary in Japan, bank loans are made under general agreements which provide that under certain circumstances, security and guarantees for present and future indebtedness will be given upon request of the bank, and that the bank shall have the right, as the obligations become due, or in the event of their default, to offset cash deposits against such obligations due to the bank. At March 31, 2004, Daiichi had capital lease obligations of ¥4.6 billion with interest rates ranging from 0.82% to 3.95%.
146
Table of Contents
The aggregate future annual maturities of Daiichi’s long-term debt as of March 31, 2004 are as follows:
Year ending March 31, | (millions of yen) | ||
2005 | ¥ | 2,036 | |
2006 | 1,440 | ||
2007 | 776 | ||
2008 | 337 | ||
2009 | 92 | ||
Thereafter | 5 | ||
Total long-term borrowings | ¥ | 4,686 | |
At March 31, 2004, Daiichi’s secured loans were secured by certain assets with a net book value of ¥1.7 billion.
Short Term Borrowings
Daiichi had unused committed lines of credit available for immediate borrowings with certain financial institutions amounting to ¥30 billion at March 31, 2003 and 2004. The aggregate commitment fee paid for such credit line agreements for the years ended March 31, 2003 and 2004 amounted to ¥45 million and ¥40 million, respectively.
Working Capital
Daiichi’s working capital needs are primarily for operating expenses, including research and development, manufacturing expenses, employee expenses, advertising, rent, and property, building and equipment maintenance. Daiichi leases machinery and other equipment principally pursuant to capital leases. Total future minimum lease payments under such leases at March 31, 2004 are approximately ¥2.5 billion within one year and ¥3.7 billion for over one year.
On April 6, 2004, Daiichi announced a plan of reorganization in which certain employees were legally terminated and rehired by a newly established wholly-owned subsidiary, Daiichi Pharmatech Co., Ltd. In this connection, termination benefits of ¥7.3 billion were paid to those affected employees in March 2005. Daiichi covered this payment with operating cash flows.
Payment of Dividends and Stock Repurchase
Payments of dividends and stock repurchases also require cash outlays, which may fluctuate in accordance with Daiichi’s results of operation and financial conditions. In the year ended March 31, 2004, Daiichi repurchased, net of sales of fractional shares, 5.5 million shares of its common stock for an aggregate price of ¥10.2 billion, and purchased an additional 2.1 million shares between April 1, 2004 and April 20, 2004 for an aggregate price of ¥4.2 billion.
Capital Expenditures
Capital expenditures for the years ended March 31, 2003 and 2004 were ¥13.8 billion and ¥16.6 billion, respectively, consisting principally of expenditures related to production facilities in Daiichi and its domestic subsidiaries’ manufacturing plants.
Impact of Foreign Currency Fluctuations
Some portion of Daiichi’s business is conducted in currency other than yen, primarily in U.S. dollars and euros, and primarily in connection with the marketing and sale of pharmaceutical products in countries other than Japan. Non-Japan sales accounted for approximately ¥70.4 billion of total net sales, or 21.9%, for the fiscal year ended March 31, 2003 and approximately ¥66.6 billion, or 20.6% of total net sales for the fiscal year ended March 31, 2004.
147
Table of Contents
Daiichi uses foreign exchange forward contracts with terms ranging up to six months to reduce its exposure to short-term movements in the exchange rates applicable to firm funding commitments denominated in currencies other than Japanese yen. The aggregate notional amounts of derivative financial instruments outstanding at March 31, 2003 and 2004 were as follows:
| Millions of yen | ||||||
| 2003 | 2004 | |||||
Forward exchange contracts: | ||||||
To sell foreign currencies | ¥ | 2,810 | ¥ | 1,097 | ||
Off-Balance Sheet Arrangements
Daiichi does not presently have any material off-balance sheet transactions.
Contractual Obligations
As of March 31, 2004, Daiichi’s contractual obligations were as follows:
| Payments due by period (millions of yen) | |||||||||||||||
Contractual Obligation | Total | Less than 1 year | 1 – 3 years | 3-5 years | More than 5 years | ||||||||||
Long-Term Debt Obligations | ¥ | 42 | ¥ | 18 | ¥ | 19 | ¥ | 2 | ¥ | 3 | |||||
Capital Lease Obligations | 4,644 | 2,018 | 2,197 | 427 | 2 | ||||||||||
Operating Lease Obligations | 1,465 | 462 | 655 | 348 | — | ||||||||||
Research and Development Expense Obligations | |||||||||||||||
- unconditional | 1,028 | 346 | 535 | 147 | — | ||||||||||
- potential milestone payments | 9,909 | 900 | 2,669 | 2,591 | 3,749 | ||||||||||
Purchase Obligations | 23,458 | 10,009 | 13,449 | — | — | ||||||||||
Total | ¥ | 40,545 | ¥ | 13,752 | ¥ | 19,524 | ¥ | 3,515 | ¥ | 3,754 | |||||
Purchase obligations consists primarily of Daiichi’s obligation to acquire the remaining 34% of the issued and outstanding shares of Daiichi Suntory Pharma, construction of manufacturing facilities and certain purchase orders. Research and development expense obligations include payment obligations in connection with various research and development projects based upon the achievement of certain milestones or other specified conditions. The amount of contractual obligations shown in the table above can be expected to change materially over time as new contracts are initiated and existing contracts are terminated or modified.
Quantitative and Qualitative Disclosures about Market Risk
Daiichi is exposed to market risks primarily from changes in foreign currency exchange rates and changes in the value of its investment securities. In order to manage these risks that arise in the normal course of business, Daiichi enters into various hedging transactions pursuant to its policies and procedures covering such areas as counterparty exposure and hedging practices. Daiichi does not hold or issue derivative financial instruments for trading purposes or to generate income.
Daiichi regularly assesses these market risks based on the policies and procedures established to protect against adverse effects of these risks and other potential exposures, primarily by reference to the market value of the financial instruments. As a result of the latest assessment, Daiichi does not anticipate any material losses in these areas for the fiscal year ended March 31, 2004, and there were no material quantitative changes in market risk exposure at March 31, 2004 as compared to March 31, 2003. In the normal course of business, Daiichi also faces risks that are either non-financial or non-quantifiable. Such risks principally include credit risk and legal risk, and are not represented in the tables below.
148
Table of Contents
Foreign Currency Risk
In the ordinary course of business, Daiichi uses foreign exchange forward contracts to manage the effects of foreign currency exchange risk on monetary assets and liabilities denominated in foreign currencies. Contracts with respect to operating activities generally have maturities of less than six months.
The table below provides information about Daiichi’s material derivative financial instruments that are sensitive to foreign currency exchange rates. The table below relating to foreign exchange forward contracts presents the notional amounts, weighted-average exchange rates and estimated fair value. These notional amounts generally are used to calculate the contractual payments to be exchanged under the contracts.
Foreign Exchange Forward Contracts (Year ended March 31, 2004)
| Year Ended March 31, 2004 | ||||||||
Average contractual rates | Contract amounts (Millions of yen) | Estimated fair value (Millions of yen) | ||||||
U.S.$/¥ | 105.99 | ¥ | 938 | ¥ | 12 | |||
EUR/¥ | 133.20 | 125 | 4 | |||||
THB/¥ | 2.67 | 34 | — | |||||
Interest Rate Risk
Daiichi invests in a variety of debt securities, consisting primarily of investments in interest-bearing securities with financial institutions, money management funds, and investments in trust and highly liquid debt securities of corporations. As a matter of policy, Daiichi limits the amount of credit exposure to any one issuer.
Investments in both fixed rate and floating rate interest earning products carry a degree of interest rate risk. Fixed rate securities may have their fair market value adversely impacted due to a rise in interest rates, while floating rate securities may produce less income than predicted if interest rates fall. Due in part to these factors, Daiichi’s income from investments may decrease in the future. However, most of these fixed rate securities are classified in held-to-maturity securities and Daiichi has the intent and ability to retain its investment for a period of time sufficient to allow for any anticipated recovery in market value. Also, since debt securities included in available-for-sale securities are highly liquid and short-term financial instruments, the effect of interest rate change on the fair value of these debt securities is considered to be relatively immaterial.
The cost of debt securities classified as available-for-sale securities and held-to-maturity securities as of March 31, 2004 was ¥28.3 billion and ¥87.6 billion, respectively, and the maturities as of March 31, 2004 were as follows:
Millions of yen For the Year ended March 31, 2004 | ||||||
| Cost | Fair Value | |||||
Due within one year | ¥ | 70,049 | ¥ | 71,204 | ||
Due after one year through five years | 23,526 | 23,605 | ||||
Due after five through ten years | 14,373 | 15,071 | ||||
Due after ten years | 8,000 | 8,000 | ||||
Total | ¥ | 115,948 | ¥ | 117,880 | ||
Equity Securities Price Risk
Daiichi has marketable equity securities which are subject to equity price risk arising from changes in their market prices. These consist of listed Japanese equity securities held for strategic business purposes, none of which are classified as trading securities. As of March 31, 2004, Daiichi held marketable equity securities with an acquisition cost of ¥26.3 billion and fair value of ¥57.8 billion. The potential change in the fair value of these investments, assuming a 10% change in prices, would be approximately ¥5.8 billion as of March 31, 2004.
149
Table of Contents
SANKYO MANAGEMENT’S DISCUSSION AND ANALYSIS OF FINANCIAL
CONDITION AND RESULTS OF OPERATIONS
You should read the following discussion and analysis of Sankyo’s financial condition and results of operations together with its consolidated financial statements included in this document. The following discussion is based on Sankyo’s consolidated financial statements, which have been prepared in accordance with U.S. GAAP.
Overview
Sankyo operates primarily in the domestic and international pharmaceutical business, and secondarily in other markets including food and agrochemicals. In its pharmaceutical business, Sankyo researches, develops, manufactures and markets, both directly and through third-party licensees, prescription pharmaceutical products and over-the-counter drugs. Sankyo also sells pharmaceutical products developed or produced by third parties through licensing or distribution arrangements.
The global pharmaceutical industry has been marked by increasing competition. The marketplace is becoming increasingly borderless, with global mega-companies resulting from mergers of former competitors, operating in many markets around the world, including Japan. Sankyo was the second largest pharmaceutical company in Japan by consolidated net sales in the six months ended September 30, 2004. In recent years, Sankyo’s net revenues steadily increased due largely to the increase in bulk exports of Sankyo’s flagship product, pravastatin (marketed as Mevalotin® in Japan), an antihyperlipidemia drug, to the United States and other markets outside Japan, and the company’s success in minimizing the impact of generic competition in the Japanese market. However, in the six months ended September 30, 2004, net sales overall declined as compared to the same period ended September 30, 2003. While sales of olmesartan (an antihypertension drug marketed as Benicar® in the United States and Olmetec® in Japan and Europe) increased during the period, the increase was more than offset by the global decline in sales of Mevalotin® during the period.
The decline in sales of Mevalotin® can be attributed in part to the trend among policymakers in Japan and in other countries to control healthcare costs, including the cost of prescription drugs. In April 2003, the Japanese National Health Insurance increased co-payments for medical costs, including prescription drugs. In addition, in April 2004, the Japanese National Health Insurance cut drug reimbursement prices by an average of 5.2%, which has contributed to a slight decline in revenue for Sankyo. Sankyo expects that net revenues of Mevalotin® will continue to decline due to the foregoing trends as well as the expiration of the company’s patent for pravastatin in April 2006 in the United States.
Sankyo recognizes that to remain competitive, it must have a steady stream of successful products, and it must be more directly involved in the development, production and marketing of these products, both in Japan and in other important global markets. In the evolving global pharmaceutical industry, the profit margin derived from sales of products licensed from third parties will not be sufficient to compete against mega-firms that have advantages of economies of scale. As a result, Sankyo is increasing the number of products for which it oversees R&D, production and sales in both Japan and other markets. Sankyo has over 20 compounds in its R&D pipeline in six key areas: cardiovascular diseases, glucose metabolic disorders, bone/articular disorders, immune/allergic disorders, cancer and infectious diseases. The first major example of a product developed and launched internationally by Sankyo is olmesartan, which, as marketed under the brand name Benicar® in the United States by the company’s wholly-owned subsidiary Sankyo Pharma Inc., had captured more than a 10% share of new prescriptions for angiotensin II (type 1 receptor) blocker (ARB) products in the United States only two years after its introduction there in 2002.
In an effort to enable Sankyo group’s management to focus on Sankyo’s pharmaceuticals business, Sankyo undertook certain restructuring efforts during the fiscal years ending March 31, 2003 and 2004, such as bolstering its R&D program and global sales structure, and streamlining management through business reorganization. In particular, Sankyo introduced an Enterprise Resource Planning system in April 2003 to
150
Table of Contents
integrate core processes, allowing for more streamlined operations and the rationalization of personnel. In connection with these activities, Sankyo recorded charges in cost of sales of approximately ¥1.4 billion and ¥463 million in the fiscal years ended March 31, 2003 and 2004, respectively. In addition to the foregoing, Sankyo recorded charges in selling, general and administrative expenses of ¥1.6 billion and ¥3.0 billion for the fiscal years ended March 31, 2003 and 2004, respectively, in connection with implementation of early retirement programs in its pharmaceuticals segment.
On December 23, 2003, Sankyo’s U.S. subsidiary, Sankyo Pharma Inc., and Cygnus Inc. agreed to terminate the exclusive license granted by Cygnus to Sankyo to market GlucoWatch®, a glucose monitoring device that is worn like a watch. Losses related to Cygnus have been reported in Sankyo’s ¥6.2 billion of loss from discontinued operations for the year ended March 31, 2004. As part of the termination agreement, Sankyo paid a U.S.$30 million settlement fee to Cygnus and transferred title to all GlucoWatch® products to Cygnus. Sankyo also incurred the following special charges in connection with the termination: the write-off of a nonrefundable license fee with a carrying amount of ¥2.4 billion, and the write-off of a ¥1.0 billion receivable from Cygnus. The total loss from discontinued operations included a write-off of inventory of ¥2.4 billion, recorded on December 23, 2003 and was offset in part by related income tax benefits.
Factors Affecting Financial Results
Net Revenue
The financial results of Sankyo’s pharmaceutical business are the most important factor in determining Sankyo’s overall financial results. Sankyo’s pharmaceutical business accounted for 77.8% of its net revenues for the year ended March 31, 2003 and 78.3% of its net revenues for the year ended March 31, 2004. Net revenues of the company’s overseas pharmaceutical business are affected by exchange rates as sales in such overseas markets are made in the local currency and then translated into Japanese yen.
Net revenues also include revenues from sales of products manufactured by competing pharmaceutical companies imported into Japan for which Sankyo serves as distributor or licensee, as well as revenues from sales of products manufactured by Sankyo and sold by third parties through licensing-out or distribution arrangements. Gross margins from sales of such products are relatively small as Sankyo’s function is limited to participation in distribution, or production, as the case may be. Sankyo expects that greater control of each stage of development and marketing of products would increase revenues from the sale of such products.
Sales Price. Sankyo considers the impact on consumer demand and on operating margins of prices of competitors and general economic conditions when it sets the prices of its pharmaceutical products in each of the markets in which it operates. In addition, the price of pharmaceutical products is also affected in many markets by governmental regulation.
| • | Government regulation. In Japan and many other markets in which Sankyo operates, the government has the authority to set prices for prescription drugs, especially in the context of sales reimbursed from national health programs. In Japan, for example, pharmaceutical companies, including Sankyo, are required to list new pharmaceutical products on a National Health Insurance price list published by the Ministry of Health, Labor and Welfare in connection with the public medical insurance programs. Prices of pharmaceutical products so listed are determined by comparison to comparable products, or in the absence of comparable products, by the cost calculation method. Prices on the National Health Insurance price list are subject to revision, generally once every two years, on the basis of the actual prices at which the pharmaceutical products are purchased by medical institutions. The most recent price revision occurred in April 2004 with the result that Sankyo was required to reduce the prices for its pharmaceutical products in Japan by an average of 6.7%. Governments in other countries with similar national health programs, which does not include the United States, have similar price control systems. |
151
Table of Contents
| Government policy in many countries, including Japan and the United States, has emphasized, and managed care organizations and other large customers continue to seek, discounts on pharmaceutical products. In Japan, recent governmental legislation has emphasized the use of generic drugs in an effort to control costs. In the U.S., recent enactment of U.S. Medicare legislation regarding prescription drug benefits for Medicare beneficiaries expands access to medicines that patients need. While expanded access may potentially result in increased sales of Sankyo’s products, such increases may be offset by increased pricing pressures due to the enhanced purchasing power of the private sector providers that will negotiate on behalf of Medicare beneficiaries. |
| • | Competition. Sankyo considers competitive conditions, including the prices of competing products, in setting and revising prices for its products. Price competition may not only impact the sales price but also sales promotion expenses. |
| • | General economic conditions. Economic conditions in the various markets in which Sankyo operates also affect pricing. In addition, volatility and changing economic conditions in any significant target market outside Japan may impact the company’s overseas operations. |
Sales Volume. Sankyo’s sales volume in each market in which it operates depends on a number of factors, including the availability of new products which address a public medical need, availability of generic alternatives, prices of products, including as may be affected by governmental regulation, demographics of the market, level of marketing activities, and general economic conditions.
| • | Research and development of new products. As patent protection for pharmaceutical products terminates, and competition from generic rivals increases, projected revenues for a given product decrease. In order to ensure sustained revenue growth, pharmaceutical companies must develop and market innovative, new products. Sankyo focuses on six key areas of research: cardiovascular diseases, glucose metabolic disorders, bone/articular disorders, immune/allergic disorders, cancer and infectious diseases. The company currently has more than 20 compounds in various phases of its R&D pipeline. In addition, Sankyo has undertaken reform of its global R&D organization with the goal of prioritizing drugs in its pipeline and expediting decision making so as to facilitate the rapid development of innovative new drugs. |
| In addition to products in its own pipeline, Sankyo also markets products developed by third parties. Similarly, Sankyo enters into distribution arrangements with third parties to market products developed by it primarily in markets that Sankyo is not directly active. However, Sankyo has identified as a strategic goal increasing its direct involvement in the marketing of products developed by it in such markets. |
| • | Patent protection; Competition from generics. Intellectual property legal protections and remedies are also a significant factor in Sankyo’s business. Many of Sankyo’s products have a composition-of-matter or compound patent and may also have secondary patents. Secondary patents can include additional composition-of-matter patents, processes for making the compound or additional indications or uses. During the patent period, Sankyo may receive revenues due to its control over rights to sell the product under patent. Once the patent protection period is finished, however, generic pharmaceutical manufacturers can produce similar products and sell those products for a lower price. |
| Some of Sankyo’s products face competition in the form of new competitor products or generic drugs, which treat similar diseases or indications. Sankyo tries to limit the impact of generic competition, particularly in Japan, by highlighting the proven track record of safety and efficacy of its products, as well as through successful marketing campaigns. |
152
Table of Contents
| • | Government regulation. The price of Sankyo products affects the volume of purchases made by consumers. In addition to the factors described above, governmental action may affect the price or amount which consumers are required to pay for prescription drugs. For example, in April 2003, in an effort to control health care costs, the Japanese government raised the co-payment for prescription drugs in connection with the national health insurance program to 30%, thereby effectively raising the cost of drugs. |
| • | Level of marketing activities. The level of marketing activities influences market share and sales volume. Marketing is particularly important for the introduction of new products, and to create brand loyalty in anticipation of competition with generic equivalents. |
Costs and Expenses
Research and development expenses. Research and development of new innovative pharmaceutical products is essential to continued positive operating results. Sankyo spends significantly on research and development expenses primarily in its pharmaceutical segment, and to a lesser degree in other company businesses. Sankyo’s pharmaceutical research and development expenses are mainly for its own research activities, collaboration and co-development with outside research institutions domestically and internationally and the development of potential products in pre-clinical and clinical studies. Sankyo’s research and development costs also include fees paid to third parties for the right to commercialize products under licensing arrangements.
Marketing expenses. Sankyo spends significantly on sales and marketing. Expenses relate primarily to sales and marketing of pharmaceutical products, primarily costs associated with medical representatives and advertising costs, as well as products in Sankyo’s other businesses. Launches of new products, especially outside of Japan, require Sankyo to incur substantial sales and marketing expenses.
Raw material costs. Sankyo incurs costs to acquire raw materials for its pharmaceutical products, and to a lesser degree, for products in its other businesses.
Licensing Arrangements
Sankyo is a party to numerous license agreements relating to both development candidates and currently approved products. Sankyo both licenses in development candidates and products from patent owners, primarily for development or sale in the Japanese market, and licenses out candidates and products for which it owns the patent rights. The terms of these licensing agreements and the timing of the payments thereunder affect Sankyo’s results of operations.
With respect to the in-licensing of products that are in development, Sankyo typically will pay an upfront fee and/or payments upon the achievement of certain milestones, including advancement to successive stages of clinical trials or approval of a new drug application. The level of such milestone payments typically varies depending on the progress of development, the likelihood of successfully bringing a compound to market, the size of the potential market and other factors. Such one-time payments totaled approximately ¥4.3 billion for the fiscal year ended March 31, 2003, consisting primarily of payments with respect to Fidarestat® and CS-917, approximately ¥8.4 billion for the fiscal year ended March 31, 2004, consisting primarily of payments with respect to Ketek®, and approximately ¥30 million for the six months ended September 30, 2004. During such periods, Sankyo received one-time payments totaling approximately ¥0.3 billion, ¥2.2 billion (primarily related to CS-758 and CS-023) and ¥1.4 billion (primarily from Diethelm Keller Siber Hegner International AG), respectively.
For products Sankyo has licensed from third parties and markets in Japan, Sankyo generally pays royalties of between 2% and 10% of sales, depending on the product, levels of sales and terms of the particular
153
Table of Contents
agreement. For products for which patent rights have expired, Sankyo may continue to pay royalties at reduced levels to secure continued use of the relevant trademark in Japan. Royalty payments made by Sankyo under such license agreements totaled approximately ¥2.6 billion for the fiscal year ended March 31, 2003, approximately ¥2.5 billion for the fiscal year ended March 31, 2004, and approximately ¥1.4 billion for the six months ended September 30, 2004, in each case, primarily to Genzyme with respect to WelChol®.
For products Sankyo licenses to third parties, Sankyo typically receives royalties of between 2.5% and 10% of sales, depending on the product, the markets involved and the level of sales. Royalty payments received by Sankyo under such license agreements totaled approximately ¥2.7 billion for the fiscal year ended March 31, 2003, approximately ¥2.4 billion for the fiscal year ended March 31, 2004, and approximately ¥1.0 billion for the six months ended September 30, 2004. Royalty payments from various licensees of Banan® accounted for 46.8%, 49.6% and 54.4% of all royalty payments received in the fiscal year ended March 31, 2003, the fiscal year ended March 31, 2004 and the six months ended September 30, 2004, respectively. With respect to pravastatin, while that product accounted for the largest portion of Sankyo’s pharmaceutical product sales, it only accounted for a relatively small portion of royalty payments. The remaining revenues were derived from sales to Bristol-Myers Squibb pursuant to an exclusive supply agreement.
Retirement and Severance Benefit Related Expenses
Retirement and severance benefit related expenses are a significant component of selling, general and administrative expenses. Sankyo and most of its domestic subsidiaries have non-contributory unfunded defined benefit lump-sum indemnity plans and/or contributory funded defined benefit pension plans. In addition, certain overseas subsidiaries have defined benefit pension plans or severance indemnity plans covering substantially all of their employees under which the cost of benefits is currently invested or accrued. Sankyo had ¥84.1 billion of accrued pension and severance costs at March 31, 2003 and ¥74.5 billion at March 31, 2004.
Depreciation and Amortization
Depreciation and amortization is a significant component of both cost of sales and selling, general and administrative expenses. Unless Sankyo makes any major acquisitions, the company expects depreciation and amortization levels to decline in coming years.
Foreign Currency Fluctuations
Foreign currency fluctuations may have a positive or negative effect on Sankyo’s results of operations. In general, a strong yen negatively affects the translation of operating results into Japanese yen due to the negative impact on translations from U.S. dollars or other applicable currency into Japanese yen as a result of the consolidation of the accounts of Sankyo’s overseas subsidiaries as sales in those currencies amount to less when translated into Japanese yen.
Critical Accounting Policies
The consolidated financial statements of Sankyo are prepared in conformity with accounting principles generally accepted in the United States of America. The preparation of these financial statements requires the use of estimates, judgments and assumptions that affect the reported amounts of assets and liabilities at the date of the financial statements and the reported amounts of revenues and expenses during the periods presented. On an ongoing basis, Sankyo evaluates its estimates, which are based on historical experience and on various other assumptions that are believed to be reasonable under the circumstances. The results of these evaluations form the basis for making judgments about the carrying values of assets and liabilities and the reported amounts of expenses that are not readily apparent from other sources. Actual results may differ from these estimates under different assumptions. Sankyo considers an accounting policy to be critical if it is important to its financial condition and results of operations, and requires significant judgments and estimates on the part of management in its application. Sankyo believes that the following represent the critical accounting policies of the company.
154
Table of Contents
Investments
Sankyo’s investments are comprised of debt and equity securities carried at fair value or cost, or accounted for using the equity method of accounting. If it has been determined that an investment has sustained an other-than-temporary decline in its value, the investment is written down to its fair value by a charge to income. Sankyo regularly evaluates its investment portfolio to identify other-than-temporary impairments of individual securities. Factors that are considered by Sankyo in determining whether an other-than-temporary decline in value has occurred include: the length of time and extent to which the market value of the securities has been less than its original cost, the financial condition, operating results, business plans and estimated future cash flows of the issuers of the securities, other specific factors affecting the market value, deterioration of credit condition of the issuers, sovereign risk, and ability to retain the investment for a period of time sufficient to allow for the anticipated recovery in market value.
In evaluating the factors for available-for-securities whose fair value are readily determinable, Sankyo management presumes a decline in value to be other-than-temporary if the fair value of the securities is below its original cost for an extended period (generally a period of up to six months). This criteria is employed as a threshold to identify securities which may have a decline in value that is other-than-temporary. The presumption of an other-than-temporary impairment in such cases may be overcome if there is evidence to support that the decline is temporary in nature due to the existence of other factors which overcome the duration or magnitude of the decline. On the other hand, there may be a case where impairment losses are recognized when the decline in the fair value of the securities is not significant or such decline has not existed for an extended period of time, as a result of considering specific factors which may indicate the decline in the fair value is other-than-temporary.
The assessment of whether a decline in the value of an investment is other-than-temporary often requires management judgment based on evaluating relevant factors. Those factors include business plans and future cash flows of the issuer of the security, the regulatory, economic or technological environment of the issuer of the security, and the general market condition of either the geographic area or the industry in which the issuer of the security operates. Accordingly, it is possible that investments in Sankyo’s portfolio that have had a decline in value that are currently believed to be temporary may be determined to be other-than-temporary in the future based on Sankyo’s evaluation of additional information such as continued poor operating results, future broad decline in value of worldwide equity markets or circumstances in market interest rate fluctuations. As a result, unrecognized losses recorded for investments may be recognized into income in future periods.
Estimated Useful Lives and Impairments of Long-Lived Assets
Sankyo estimates the useful lives of property, plant and equipment and certain other intangibles with finite useful lives in order to determine the amount of depreciation and amortization expense to be recorded during any reporting period. Sankyo’s total depreciation and amortization expenses in the fiscal years ended March 31, 2003 and 2004 were ¥26.1 billion and ¥26.8 billion, respectively. The useful lives are estimated at the time the assets are acquired and are based on historical experience with similar assets as well as anticipated technological or other changes. If technological changes were to occur more rapidly than anticipated or in a different form than anticipated, the useful lives assigned to these assets may need to be shortened, resulting in the recognition of increased depreciation and amortization expense in future periods. Alternatively, these types of technological changes or possible declines in demand for the related products could result in the recognition of an impairment charge to reflect the write-down in value of the assets. Sankyo also reviews for impairment whenever events or changes in circumstances indicate that the carrying amount may not be recoverable. If the total of the expected future undiscounted cash flow is less than the carrying amount of the asset, a loss is recognized for the difference between the fair value and carrying value of the asset.
Sankyo management believes that its estimates of future cash flows and fair value are reasonable. However, changes in estimates resulting in lower future cash flows and fair value due to unforeseeable changes in business assumptions could negatively affect the valuations of those long-lived assets.
155
Table of Contents
Goodwill
In accordance with the provisions of Statement of Financial Accounting Standards No. 142, Sankyo does not amortize goodwill, but tests it for impairment at least annually using a two-step process that begins with an estimation of the fair value of a reporting unit and more frequently if an event occurs or circumstances change that would more likely than not reduce the fair value below its carrying amount. The determinants used for the fair value measurement include management’s estimate of the reporting unit’s continuing ability to generate income from operations and cash flows in future periods.
Sankyo management believes that its estimates of future cash flows and fair value are reasonable. However, changes in estimates resulting in lower future cash flows and fair value due to unforeseeable changes in business assumptions could negatively affect the valuations, which may result in Sankyo recognizing impairment charges for goodwill in the future. As of March 31, 2004, a 10% decrease in the fair value of each of Sankyo’s reporting units would not have resulted in an impairment charge.
Employees’ Severance Payments
The total costs for employees’ severance payments and pension plans represented approximately 1.5% of Sankyo’s total costs and expenses for the fiscal years ended March 31, 2003 and 2004. The amounts recognized in the consolidated financial statements related to employees’ severance payments and pension plans are determined on an actuarial basis utilizing certain assumptions in the calculation of such amounts. The assumptions used in determining net periodic costs and liabilities for severance payments and pension plans include the expected long-term rate of return on plan assets, discount rate, rate of increase in compensation levels, average remaining years of service, and other factors. Specifically, the expected long-term rate of return on assets and the discount rate are two critical assumptions. Assumptions are evaluated at least annually, and events may occur or circumstances change that may have a significant effect on the critical assumptions. In accordance with U.S. GAAP, actual results that differ from the assumptions are accumulated and amortized over future periods, thereby reducing the year-to-year volatility in pension expenses. As of March 31, 2004, the total amount of unrecognized net actuarial loss was ¥1.4 billion. The entire amount of unrecognized net actuarial loss will be amortized over the average remaining years of employee service of approximately 15 years. That amortization will increase future pension costs.
For the fiscal years ended March 31, 2003 and 2004, Sankyo used expected long-term rates of return on pension plan assets of 2.5 % and 1.7%, respectively. In determining the expected long-term rate of return on pension plan assets, Sankyo considers the current and projected asset allocations, as well as expected long-term investment returns and risks for each category of the plan assets based on Sankyo’s analysis of historical results. The projected allocation of the plan assets is developed in consideration of the expected long-term investment returns for each category of the plan assets. Approximately 35.0%, 34.0%, 8.0%, 21.0% and 2.0% of the plan assets will be allocated to domestic bonds, domestic stocks, international bonds, international stocks and other financial instruments, respectively, to moderate the level of volatility in pension plan asset returns and reduce risks. As of March 31, 2004, the actual allocation of assets was generally consistent with the projected allocation stated above. The actual returns for fiscal 2003 and fiscal 2004 were approximately –10% (loss) and 13% (gain), respectively. The actual returns on pension plan assets may vary in future periods, depending on market conditions. The market-related value of plan assets is measured using fair values on the plan measurement date.
Another critical assumption is the discount rate used in the annual actuarial valuation of the pension benefit obligations. Sankyo mainly used weighted average discount rates of 2.5% and 1.7% for the fiscal years ended March 31, 2003 and 2004, respectively. In determining the appropriate discount rate, Sankyo considers available information about the current yield on high-quality fixed-income securities that are currently available and are expected to be available during the period corresponding to the expected duration of the pension benefit obligations.
156
Table of Contents
The following table illustrates the sensitivity to changes in the discount rate and the expected return on pension plan assets, while holding all other assumptions constant, for Sankyo’s pension plans as of March 31, 2004.
Change in Assumption | Change in Pension Benefit Obligations | Change in Pre- Tax Pension Expenses | Change in Equity (Net of Tax) | |||
| (in billions) | ||||||
50 basis point increase / decrease in discount rate | – / + ¥4.2 | – / + ¥0.4 | + / – ¥0.2 | |||
50 basis point increase / decrease in expected return on assets | – | – / + ¥0.1 | – | |||
Revenue Recognition
Sankyo generates revenue principally from sales of pharmaceutical and other products. Revenue from those sales transactions is recognized upon delivery, which is considered to have occurred when the customer has taken title to the products, and risks and rewards of ownership have been substantially transferred to the customer. In the case of arrangements where title to delivered products passes through distributors, but the substance of the transaction is that of a consignment, Sankyo recognizes revenue when distributors sell the product to end users. In the case of sales made to buyers where the price is not considered fixed or determinable or cash collection is not reasonably assured at the time of delivery, Sankyo recognizes revenue when cash is collected from customers.
Sankyo generally accepts sales returns from customers if the reasons and conditions are considered reasonable in the light of those defined in the sales agreement. Sankyo also provides customers sales rebates and incentives based on the conditions agreed with the customers in line with Sankyo’s sales promotional strategies. For accounting purposes, these sales returns, rebates and incentives are treated as reductions in revenue as incurred and the related accruals are recorded at the end of each fiscal period.
Accruals for the sales returns are calculated based on such factors as historical experience of loss on sales returns, estimated product remaining shelf lives and extent of sales subject to sales returns. In addition, Sankyo considers certain information from external sources such as market data for pharmaceutical products, wholesaler inventory levels and others in reviewing the factors to determine the accruals for sales returns. The weighted-average estimated sales return ratios (only for sales subject to sales returns) in recording accruals for the fiscal years ended March 31, 2003 and 2004 were 3.8% and 4.6%, respectively, and the estimated weighted-average product remaining shelf lives considered in recording accruals were approximately 19.1 months and 19.3 months for the fiscal years ended March 31, 2003 and 2004, respectively. However, those factors applicable to the future periods could differ because of changes in historical experience of sales returns or estimated product remaining shelf lives and other circumstances in future periods. If the sales return ratio were to increase to 6.0% or if the estimated product remaining shelf lives were to be extended to 26 months, accrual for sales returns at March 31, 2004 would increase by approximately ¥1.4 billion or ¥1.6 billion, respectively.
Accruals for customer rebates and incentives are recorded based on the conditions agreed by customers and Sankyo’s sales promotional strategies. Accordingly, Sankyo does not anticipate any significant differences between accruals and actual payments for such sales reductions. Sales rebates and incentives are offered to customers based mainly on the volume of the customer’s purchases from Sankyo and sell-through by the wholesalers to end-users. Sankyo also considers its sales promotional strategies specific to each customer in determining the level of sales rebates and incentives. Conditions for the sales rebates and incentives are predetermined by the parties and evidenced in the relevant sales agreement. The level of sales rebates and incentives as a percentage of total revenue (after reduction of sales returns) remained relatively consistent, and was 9.0 % for the year ended March 31, 2003 and 9.4% for the year ended March 31, 2004. Since Sankyo’s sales rebates and incentives arrangements are typically short in duration (i.e. one to six months), the substantial portion of such rebates and incentives are fixed and settled in a short-term period within each fiscal year. Accordingly, the accruals for the sales rebates and incentives to be recorded at the end of each fiscal year are relatively
157
Table of Contents
insignificant as compared to the amounts actually settled and recorded as reductions in revenue for each fiscal year. If the level of sales rebates and incentives as a percentage of total revenue had increased by 1%, the balance of accrued sales rebates and incentives at March 31, 2004 would increase by approximately ¥0.6 billion.
The following table shows the changes in accruals for sales returns, customer rebates and incentives for the fiscal years ended March 31, 2003 and 2004:
| Accrual for product returns | Accrual for rebates and incentives | Total | ||||
| (billions of yen) | ||||||
Balance as of March 31, 2002 | 5.5 | 4.7 | 10.2 | |||
-Current provision related to sales made in the current period | 3.0 | 57.0 | 60.0 | |||
-Current provision related to sales made in prior periods | (0.3) | (0.1) | (0.4) | |||
-Actual returns or credits in the current period related to sales made in the current period | (0.2) | (51.3) | (51.5) | |||
-Actual returns or credits in the current period related to sales made in prior periods | (3.0) | (4.6) | (7.6) | |||
Balance as of March 31, 2003 | 5.0 | 5.7 | 10.7 | |||
-Current provision related to sales made in the current period | 3.3 | 62.1 | 65.4 | |||
-Current provision related to sales made in prior periods | 0.8 | 0.1 | 0.9 | |||
-Actual returns or credits in the current period related to sales made in the current period | (0.4) | (56.1) | (56.5) | |||
-Actual returns or credits in the current period related to sales made in prior periods | (4.0) | (5.8) | (9.8) | |||
Balance as of March 31, 2004 | 4.7 | 6.0 | 10.7 | |||
Income Taxes
Sankyo records deferred tax assets and liabilities using the effective tax rate for the effect of temporary differences between the book and tax bases of assets and liabilities. If the effective tax rate were to change, Sankyo would adjust its deferred tax assets and liabilities, through the provision for income taxes in the period of change, to reflect the effective tax rate expected to be in effect when the deferred tax items reverse. A one-percentage point change in the statutory tax rate would increase or decrease income tax expense by approximately ¥1.0 billion. Sankyo records a valuation allowance on deferred tax assets to reflect the expected future tax benefits to be realized. In determining the appropriate valuation allowance, Sankyo takes into account the level of expected future taxable income and available tax planning strategies. If future taxable income is lower than expected or if expected tax planning strategies are not available as anticipated, Sankyo may record an additional valuation allowance through income tax expense in the period such determination is made. At March 31, 2004, Sankyo had gross deferred tax assets of ¥93.6 billion, against which it had provided a valuation allowance of ¥23.5 billion.
Recently Issued Accounting Pronouncements
Accounting for Share-Based Payments
In December 2004, the Financial Accounting Standards Board, or FASB, revised FAS No. 123 (“FAS 123R”) to require expense recognition for share-based payments. This Statement shall be effective for interim or annual periods beginning after June 15, 2005. The adoption of FAS 123R is not expected to have a material impact on Sankyo’s results of operations and financial position.
158
Table of Contents
Inventory Costs
In December 2004, the FASB issued FAS No. 151, “Inventory Costs”. This Statement amends the guidance in Accounting Research Bulletin No. 43, Chapter 4, “Inventory Pricing”, to clarify the accounting for abnormal amounts of idle facility expense, freight, handling costs, and wasted material. The provisions of this Statement shall be effective for inventory costs incurred during fiscal years beginning after June 15, 2005. The adoption of FAS 151 is not expected to have a material impact on Sankyo’s results of operations and financial position.
Accounting for Exchanges of Non-Monetary Assets
In December 2004, the FASB issued FAS No. 153, “Accounting for Exchanges of Non-Monetary Assets”. This Statement addresses financial accounting and reporting for exchange transactions of non-monetary assets on a fair value basis. This Statement shall be effective for fiscal years beginning after June 15, 2005. The adoption of FAS 153 is not expected to have a material impact on Sankyo’s results of operations and financial position.
Results of Operations
The following table sets forth a summary of Sankyo’s results of operations for the fiscal years ended March 31, 2003 and 2004 and the six months ended September 30, 2003 and 2004:
| Fiscal year ended March 31, | Six months ended September 30, | ||||||||||||||
| 2003 | 2004 | 2003 | 2004 | ||||||||||||
| (in millions) | |||||||||||||||
Net revenue | ¥ | 576,270 | ¥ | 601,273 | ¥ | 302,255 | ¥ | 294,063 | |||||||
Costs and expenses | |||||||||||||||
Cost of sales | 233,067 | 228,839 | 113,972 | 109,042 | |||||||||||
Research and development | 84,453 | 93,597 | 39,716 | 39,588 | |||||||||||
Selling, general and administrative | 178,432 | 194,004 | 97,529 | 95,437 | |||||||||||
Gain on sale of property, plant and equipment, net | — | — | (1,106 | ) | (11,142 | ) | |||||||||
Operating income | 80,318 | 84,833 | 52,144 | 61,138 | |||||||||||
Other income (expenses) | (2,510 | ) | 488 | 796 | 1,542 | ||||||||||
Income before income taxes and minority interest | 77,808 | 85,321 | 52,940 | 62,680 | |||||||||||
Income taxes | |||||||||||||||
Current | 44,621 | 38,447 | 22,932 | 20,196 | |||||||||||
Deferred | (2,116 | ) | 1,950 | 766 | 3,548 | ||||||||||
Income from continuing operations before minority interest | 35,303 | 44,924 | 29,242 | 38,936 | |||||||||||
Minority interests in income of consolidated subsidiaries | 362 | 514 | 73 | 192 | |||||||||||
Income from continuing operations | 34,941 | 44,410 | 29,169 | 38,744 | |||||||||||
Loss (gain) from discontinued operations | 90 | 6,199 | 4,245 | (43 | ) | ||||||||||
Net income | 34,851 | 38,211 | 24,924 | 38,787 | |||||||||||
Six Months Ended September 30, 2004 Compared to Six Months Ended September 30, 2003
Net Revenue
Net revenue for the six month period ended September 30, 2004 decreased ¥8.2 billion, or 2.7%, from the same interim period in fiscal 2003, to ¥294.1 billion. Overall sales of Sankyo’s flagship antihyperlipidemic Mevalotin® declined by approximately ¥18.7 billion, or 17.1%, as compared to the six month period in the previous year, due largely to the impact in Japan of revisions of National Health Insurance drug prices and intense competition. Sales of olmesartan, an antihypertension agent that is marketed in the United States as Benicar®, and in Europe and Japan as Olmetec®, expanded in each of those markets. Additionally, sales of other Sankyo products generally grew in these markets.
159
Table of Contents
In Japan, sales of Mevalotin® declined by approximately ¥11.7 billion due to the impact of revisions of National Health Insurance drug prices and intense competition. In May 2004, Sankyo introduced Olmetec®, achieving domestic revenues of ¥4.5 billion in the period since the product’s introduction. Also during the six month period, Sankyo increased promotional efforts with respect to Calblock® (azelnidpine), addressing market demand in the antihypertension drug field.
In the United States, sales of the anti-hypertension drug olmesartan, marketed as Benicar®, which was introduced in that country by Sankyo Pharma Inc. in May 2002, expanded smoothly. In Europe, Sankyo Pharma GmbH Group expanded sales of Olmetec® to include the United Kingdom, France and other European countries, in addition to Germany, where the product was first introduced in October 2002. Together with sales in the United States of Benicar HCT®, a fixed combination of the active ingredient of Benicar® (olmesartan medoxomil) and hydrochlorothiazide, during the six months ended September 30, 2004, overseas revenues related to olmesartan increased by approximately ¥9.6 billion, or 157.4%, to ¥15.7 billion as compared to the six months ended September 30, 2003.
With respect to overseas sales of other products, in the United States, sales of Venofer®, an anti-anemia agent registered by Luitpold Pharmaceuticals, Inc., a U.S. wholly-owned subsidiary of Sankyo Pharma Inc. also contributed to the increase in revenue. In Europe, sales of anti-hypertension agents Lopresor® (metoprorol) and Lomir® (isradipine), introduced from Novartis AG, also grew.
During the period, Sankyo withdrew from its medical diagnostics business, which had net revenues of ¥4.2 billion in the six months ended September 30 2003.
In the over-the-counter product area, overall results improved with total sales of approximately ¥9.9 billion, a 21.7% increase from the prior period, led primarily by sales of the athlete’s foot medication Lamisil AT®, an OTC product containing a medically active drug ingredient licensed from Novartis Pharma K.K. in Japan in February 2004, and which formerly required a prescription.
In other businesses, Sankyo’s subsidiary Wakodo Co., Ltd. reported growth in sales of powdered milk for infants, following a redesign of the product packaging and an associated marketing campaign carried out in the latter half of the previous fiscal year. Another subsidiary, Nippon Nyukazai Co., Ltd., reported an increase in sales of glycol products.
Cost of Sales
The cost of sales for the six-month period ended September 30, 2004 decreased ¥4.9 billion, or 4.3% from the same interim period in fiscal 2003, to ¥109.0 billion. The decrease was due primarily to the combined impacts of the decreased sales of Mevalotin®, the withdrawal from the medical diagnostics business, and the effects of Sankyo’s ongoing cost reduction efforts, including headcount reductions. Cost of sales as a percentage of revenue slightly decreased to 37.1% during the six-month period ended September 30, 2004, as compared to 37.7% during the six months ended September 30, 2003.
Research and Development
Research and development costs for the six months ended September 30, 2004 decreased ¥0.1 billion, or 0.3% from the previous fiscal year, to ¥39.6 billion as there were no significant changes in research and development activities during the period as compared to the previous comparable period. Research and development costs as a percentage of revenue also slightly increased to 13.5% during the six month period ended September 30, 2004 from 13.1% in the same interim period in the previous year.
Selling, General and Administrative Expense
Selling, general and administrative expenses for the six month period ended September 30, 2004 decreased by ¥2.1 billion, or 2.1% to ¥95.4 billion compared with the corresponding interim period in the previous year. This decrease was a result of the impacts of headcount reductions in Japan in connection with the
160
Table of Contents
spin-off of Sankyo Agro Co., Ltd. and Sankyo Lifetech Co., Ltd., and the decrease in IT-related expenses, partially offset by an increase in sales promotional expenses in North America and Japan related to the launch of olmesartan in Japan and the expansion of sales of the product in North America.
Gain on Sale of Property, Plant and Equipment, Net
Gain on sale of property, plant and equipment, net, for the six months ended September 30, 2004 increased by ¥10.0 billion, or 907.4% to ¥11.1 billion. In connection with Sankyo’s decision to ally itself with a yeast manufacturer in Japan, and to reorganize its health care products operations, Sankyo closed its yeast manufacturing plant in Tanashi, Japan, integrated its health care products plant into its Hiratsuka, Japan plant, and closed its health care products plant in Mishima, Japan. In the six months ended September 30, 2004, Sankyo recognized gains in connection with the sale of land at these closed plants.
Operating Income
Operating income for the six-month period ended September 30, 2004 increased by ¥9.0 billion, or 17.2% to ¥61.1 billion from the same interim period in fiscal 2003. Despite decreases in net revenue due to reduced sales of Mevalotin®, reduced costs of sales coupled with reduced selling, general and administrative expenses and gains in connection with the restructuring of its health care products operations and certain non-pharmaceutical businesses resulted in the increase in operating income.
Other Income
Other income for the six-month period ended September 30, 2004 increased by 93.7% to ¥1.5 billion as compared to the same interim period in fiscal 2003. Increases in interest and dividends income arising from investment securities held by Sankyo, a shift from a ¥233 million foreign exchange loss to a ¥56 million gain resulting from the effect of a weaker yen on dollar-denominated payments received, and a shift from ¥468 million of net other expenses to ¥74 million of net other income, reflecting an increase in rent revenue and a decrease of other miscellaneous expenses, offset approximately ¥600 million of net losses on marketable securities.
Income Before Income Taxes and Minority Interest
As a result of the increases in operating income and other income, income before income taxes and minority interests for the six-month period ended September 30, 2004 was ¥62.7 billion, an increase of 18.4% from the same period in the previous fiscal year.
Income Taxes
Provision for income taxes slightly increased to ¥23.7 billion during the six month period ended September 30, 2004. However, the effective tax rate for the period ended September 30, 2004 decreased to 37.9% from 44.8% for the same interim period in the previous year due mainly to utilization of a portion of net operating loss carry-forwards for certain subsidiaries in North America as their operations became profitable.
Income from Continuing Operations
Income from continuing operations increased by 32.8% to ¥38.7 billion in the six months ended September 30, 2004 due to the lower effective tax rate as described above and increases in operating income and other income.
Loss from Discontinued Operations
Sankyo recorded a gain from discontinued operations, net of tax, of ¥43 million in the six month period ended September 30, 2004 as compared to a loss of ¥4.2 billion in the same interim period in the previous year. The loss in the prior period related to the termination of a distribution agreement with Cygnus related to GlucoWatch®.
161
Table of Contents
Net Income
As a result of the increase in income from continuing operations in the six months ended September 30, 2004, and the impact of a ¥4.2 billion loss from discontinued operations during the six-month period ended September 30, 2003, net income for the six-month period ended September 30, 2004 increased ¥13.9 billion, or 55.6% from the same period in fiscal 2003, to ¥38.8 billion. The net profit margin rose 5.0%, to 13.2%.
Year Ended March 31, 2004 Compared to Year Ended March 31, 2003
Net Revenue
Net revenue for the fiscal year ended March 31, 2004 rose ¥25.0 billion, or 4.3%, from the previous fiscal year, to ¥601.3 billion.
Net revenues rose as a result of the strong overseas performance of Sankyo’s flagship product Mevalotin ® (pravastatin) for which overall net sales rose 12.7% during the fiscal year ended March 31, 2004. Robust sales of pravastatin are mainly attributable to an increase in high-dose usage of the drug in the United States where it is sold as Pravachol®, a substantial increase in bulk exports of the product, and Sankyo’s success in keeping the impact of generic competition in the Japanese market to a minimum. In addition, during the year ended March 31, 2004, an increase in net sales of approximately ¥12.5 billion of the anti-hypertension agent olmesartan from the fiscal year ended March 31, 2003 during which the product was launched in the United States (under the brand name Benicar®) and in Europe (as Olmetec®), as well as a 31.5% expansion in sales of Venofer®, a drug for the treatment of anemia, to ¥17.1 billion in the year ended March 31, 2004, contributed to an increase in revenue. Product returns, sales rebates and incentives are treated as reductions from gross revenue in determining net revenue for each period. Provisions for these revenue reductions for the fiscal year ended March 31, 2004 increased by approximately ¥6.7 billion as compared to those in previous fiscal year, primarily due to increased competition in the market for pharmaceutical products.
Sales in Japan of pharmaceuticals were down despite the launches of the antihypertension agent Calblock® in May 2003, the antihyperlipidemic agent Livalo® in September 2003, and the oral ketolide Ketek® in December 2003, as sales of Sankyo’s mainstay product Mevalotin® (pravastatin) declined by approximately ¥8.9 billion in Japan due to such factors as the introduction of generic versions of the drug in July 2003 and intensifying competition.
Outside of Japan, bulk exports of pravastatin rose, spurred by robust sales of the drug by Sankyo’s licensee Bristol-Myers Squibb Company in all of the countries where it sells the product as well as expanded sales of the drug in high-dose formulations in the United States. Sales of olmesartan and Venofer® also grew in these markets.
With respect to over-the-counter products, intense price competition resulted in generally sluggish sales. Total sales of OTC products were ¥17.8 billion, a 11.3% decrease from the prior year. Towards the end of the period, in February 2004, Sankyo launched the Lamisil AT® series of products for the treatment of athlete’s foot and ringworm, licensed-in from Novartis Pharma K.K.
In other businesses, for the fiscal year ended March 31, 2004, Wakodo Co., Ltd., saw an increase in sales of dried milk for infants, and Fuji Flour Milling Co. Ltd. saw a rise in sales of flour and fish feed. In Sankyo’s agrochemical business, despite cool summer weather and long spells of rain, Sankyo increased sales of agrochemical products sold pursuant to manufacturing outsourcing arrangements with third parties.
Costs of Sales
The cost of sales for the fiscal year ended March 31, 2004 decreased ¥4.2 billion, or 1.8% from the previous fiscal year, to ¥228.8 billion. The decrease in the cost of sales was the result of a ¥2.5 billion decrease
162
Table of Contents
attributable to changes in the sales product mix, reflecting the increased sales of lower cost products such as Mevalotin®, olmesartan and Venofer® and decreased sales of higher cost products purchased from other companies, as well as a ¥2.0 billion decrease attributable to Sankyo’s ongoing cost reduction efforts, including the closing of manufacturing plants in Tanashi, Japan, Mishima, Japan and Yasugawa, Japan, the integration of operations into other existing factories of the company, and related headcount reduction. These decreases were partially offset by an increase of approximately ¥300 million, primarily attributable to an increase in the cost of sales of certain Sankyo subsidiaries.
Research and Development Expenses
Research and development costs for the fiscal year ended March 31, 2004 increased ¥9.1 billion, or 10.8% from the previous fiscal year, to ¥93.6 billion. The increase was due primarily to fees in the amount of ¥7.2 billion paid to third parties for the right to commercialize products under licensing arrangements. Sankyo’s efforts include continued development of products in the company’s R&D pipeline as well as structural improvements, such as the establishment in April 2003 of facilities to manufacture new drugs currently in the development pipeline and the November 2003 addition of new research areas in existing company properties.
Selling, General and Administrative Expenses
Selling, general and administrative expenses for the fiscal year ended March 31, 2004 increased ¥15.6 billion, or 8.7% from the previous fiscal year, to ¥194.0 billion. The increase stemmed largely from the enhancement of overseas subsidiaries’ sales and marketing forces to maximize sales of olmesartan and costs related to business reforms and the realignment of functions within the Sankyo group. In addition, during the period, advertising expenses decreased ¥2.0 billion, or 12.3%, to ¥14.6 billion, largely as a result of higher advertising costs associated with the global marketing of olmesartan in the prior year, offset in part by the launch of Benicar HCT® in the United States and Olmetec® in new markets in Europe. During the fiscal year ended March 31, 2004, Sankyo also recorded a restructuring charge of ¥3.0 billion in connection with the implementation of early retirement programs for employees in Sankyo’s pharmaceuticals segment, compared with a charge of ¥1.6 billion during the fiscal year ended March 31, 2003.
Operating Income
Operating income for the fiscal year ended March 31, 2004 increased ¥4.5 billion, or 5.6% from the previous fiscal year, to ¥84.8 billion. While selling, general and administrative expenses and research and development expenses increased, operating income increased due to an increase in net revenues due to strong sales of Mevalotin® and other products and a related major improvement in the cost of sales ratio resulting from the favorable effects of adjustments to the portfolio of products sold. These decreases were partially offset by a rise in research and development and selling, general and administrative expenses described above.
Other Income (Expenses)
Other income (expenses) for the fiscal year ended March 31, 2004 increased ¥3.0 billion from other expense of ¥2.5 billion in the previous fiscal year to ¥0.5 billion in other income. The increase was due primarily to ¥0.7 billion of net recognized gains on marketable securities held by Sankyo as compared to net realized losses of ¥4.2 billion recorded in the previous fiscal year primarily with respect to shares of Japanese banks, partially offset by an increase in miscellaneous expenses.
Income Before Income Taxes and Minority Interest
As a result of the increases in operating income and other income resulting from improvements in cost of sales and stronger equity markets, income before income taxes and minority interest increased ¥7.5 billion, or 9.7%, from the previous fiscal year, to ¥85.3 billion for the fiscal year ended March 31, 2004.
163
Table of Contents
Income Taxes
Provision for income taxes decreased by ¥2.1 billion during the fiscal year ended March 31, 2004 as compared with the prior year as a result of an increase in tax credits relating to research and development costs and IT-related investments. The effective tax rate for the fiscal year ended March 31, 2004 decreased to 47.3% from 54.6% for the prior fiscal year due mainly to increased tax credits.
Income from Continuing Operations
Income from continuing operations for the fiscal year ended March 31, 2004 was ¥44.4 billion, an increase of 27.1% from the previous fiscal year as provision for income taxes decreased by ¥2.1 billion during the period.
Loss from Discontinued Operations
Loss from discontinued operations increased to ¥6.2 billion in the fiscal year ended March 31, 2004, from ¥0.1 billion in the previous fiscal year. The increase was due primarily to losses arising from the termination in December 2003 of the distribution agreement with Cygnus related to GlucoWatch®.
Net Income
As a result of the foregoing, net income for the fiscal year ended March 31, 2004 increased ¥3.4 billion, or 9.6%, to ¥38.2 billion. The net profit margin rose 0.4%, to 6.4%, and the return on shareholders’ equity grew 0.4%, to 5.8%.
Segment Information
Under FAS No. 131, “Disclosures about Segments of an Enterprise and Related Information”, operating segments are defined as components of an enterprise about which separate financial information is available that is regularly evaluated by the chief operating decision maker in deciding how to allocate resources and in assessing performance. The operating segments are managed separately as each segment represents a strategic business unit that offers different products and serves different markets. Sankyo’s business segments are pharmaceutical and other. The major portions of Sankyo’s operations on a worldwide basis are derived from the pharmaceuticals segment.
Sankyo’s management primarily evaluates the performance of business segments based on operating income reported under Japanese GAAP. The discussion below is based on Japanese GAAP operating income.
164
Table of Contents
The following tables present certain information regarding Sankyo’s operating segments as of and for the six months ended September 30, 2003 and 2004, and as of and for the years ended March 31, 2003 and 2004:
Six Months Ended September 30, 2004 Compared to Six Months Ended September 30, 2003
Six months ended September 30, 2003 | Pharma- ceuticals | Other | Total | Inter-segment elimination | Consolidated Total | ||||||
| (millions of yen) | |||||||||||
Revenue from external customers | 236,519 | 59,952 | 296,471 | — | 296,471 | ||||||
Revenue from other operating segment | 796 | 1,653 | 2,449 | (2,449 | ) | 0 | |||||
Segment profit or loss | 49,716 | 929 | 50,645 | 403 | 51,048 | ||||||
Six months ended September 30, 2004 | Pharma- ceuticals | Other | Total | Inter-segment elimination | Consolidated Total | ||||||
| (millions of yen) | |||||||||||
Revenue from external customers | 228,128 | 61,860 | 289,988 | — | 289,988 | ||||||
Revenue from other operating segment | 525 | 890 | 1,415 | (1,415 | ) | 0 | |||||
Segment profit or loss | 46,648 | 2,112 | 48,760 | 399 | 49,159 | ||||||
Notes:
“Other” consists of Sankyo’s food products, additives and agrochemical products businesses.
“Inter-segment elimination” primarily consists of eliminations of inter-segment transactions, as well as certain general administrative expenses of Sankyo that are not otherwise attributed to any particular business segment.
Pharmaceuticals
Revenues in the pharmaceuticals segment from external customers for the six month period ended September 30, 2004 decreased ¥8.4 billion, or 3.5% from the same interim period in fiscal 2003, to ¥228.1 as increases in sales of olmesartan were offset by declines in sales of Mevalotin®. Operating profit decreased ¥3.1 billion or 6.2% compared to the six month period ended September 30, 2003 as total revenues decreased by ¥8.4 billion, partly offset by reduced costs of sales and reduced selling, general and administrative expenses.
Other
Revenues in the “other” segment from external customers for the six month period ended September 30, 2004 increased ¥1.9 billion, or 3.2% from the same interim period in fiscal 2003, to ¥61.9 billion, due to increases in sales of powdered milk and glycol products, partially offset by a decrease in sales of agrochemical products. Operating profit increased ¥1.2 billion to ¥2.1 billion, or 127.3% compared to the six month period ended September 30, 2003, due mainly to a ¥1.9 billion increase in revenue. The impact of the increased cost of sales corresponding to the increased sales was largely offset by the impacts of the discontinuation of certain higher cost products and continued cost reduction efforts, including headcount reduction.
Fiscal Year Ended March 31, 2004 Compared to Fiscal Year Ended March 31, 2003
Fiscal year ended March 31, 2003 | Pharma- ceuticals | Other | Total | Inter-segment elimination | Consolidated Total | ||||||
| (millions of yen) | |||||||||||
Revenue from external customers | 443,534 | 126,394 | 569,928 | — | 569,928 | ||||||
Revenue from other operating segment | 319 | 2,524 | 2,843 | (2,843 | ) | 0 | |||||
Segment profit or loss | 77,934 | 1,898 | 79,832 | 6 | 79,838 |
Fiscal year ended March 31, 2004 | Pharma- ceuticals | Other | Total | Inter-segment elimination | Consolidated Total | ||||||
| (millions of yen) | |||||||||||
Revenue from external customers | 466,734 | 129,612 | 596,346 | — | 596,346 | ||||||
Revenue from other operating segment | 1,288 | 3,171 | 4,459 | (4,459 | ) | 0 | |||||
Segment profit or loss | 89,114 | 5,506 | 94,620 | 935 | 95,555 |
Notes:
“Other” consists of Sankyo’s food products, additives and agrochemical products businesses.
“Inter-segment elimination” primarily consists of eliminations of inter-segment transactions, as well as certain general administrative expenses of Sankyo that are not otherwise attributed to any particular business segment.
165
Table of Contents
Pharmaceuticals
Revenues in the pharmaceuticals segment for the fiscal year ended March 31, 2004 increased ¥23.2 billion, or 5.2% from the previous fiscal year, to ¥466.7 billion due to strong sales of Mevalotin® and the successful introduction of olmesartan in various markets during the year. Operating profit increased ¥11.2 billion or 14.3% compared to the previous fiscal year. This increase was due to the net impact of the ¥23.2 billion increase in revenue and the increase in costs and expenses by ¥12.0 billion, reflecting the improvement in the cost of sales ratio resulting from the favorable effects of changes in the sales product mix and continuing cost reduction efforts.
Other
Revenues in the “other” segment for the fiscal year ended March 31, 2004 rose ¥3.2 billion, or 2.5% from the previous fiscal year to ¥129.6 billion. Operating profit increased by ¥3.6 billion or 190.1% compared to the previous fiscal year. Despite intensifying market conditions, results were positively influenced by sales of dried milk products, flour and fish feed, and increased sales of agrochemical products sold pursuant to manufacturing outsourcing arrangements with third parties.
Geographic Information
The following tables present certain information regarding Sankyo’s operations by geographic areas as of and for the years ended March 31, 2003 and 2004.
As of and for the year ended March 31, 2003:
| Japan | North America | Other foreign countries | Inter-segment Elimination/ Unallocated Amount | Total | |||||||
| (millions of yen) | |||||||||||
Revenues | |||||||||||
External customers | 497,676 | 48,986 | 29,608 | — | 576,270 | ||||||
Inter-segment | 3,821 | 2,726 | 1,222 | (7,769 | ) | — | |||||
Total revenue | 501,497 | 51,712 | 30,830 | (7,769 | ) | 576,270 | |||||
Long-lived assets | 198,423 | 3,319 | 10,638 | — | 212,380 | ||||||
As of and for the year ended March 31, 2004:
| Japan | North America | Other foreign countries | Inter-segment Elimination/ Unallocated Amount | Total | |||||||
| (millions of yen) | |||||||||||
Revenues | |||||||||||
External customers | 504,245 | 60,781 | 36,247 | — | 601,273 | ||||||
Inter-segment | 7,830 | 3,220 | 2,730 | (13,780 | ) | — | |||||
Total revenue | 512,075 | 64,001 | 38,977 | (13,780 | ) | 601,273 | |||||
Long-lived assets | 194,994 | 3,382 | 11,424 | — | 209,800 | ||||||
Revenue from external customers for the fiscal year ended March 31, 2004 increased by 1.3% in Japan, 24.1% in North America and 22.4% in all other markets compared with the prior fiscal year.
166
Table of Contents
Financial Condition
Sankyo and its consolidated subsidiaries’ total assets at September 30, 2004 amounted to ¥965.7 billion, an increase of ¥25.7 billion, or 2.7%, compared to March 31, 2004, which was an increase of ¥6.7 billion or 0.7% compared to March 31, 2003. Total current assets at September 30, 2004 increased ¥43.4 billion to ¥589.9 billion from March 31, 2004, due primarily to an increase in cash and cash equivalents. Total current assets at March 31, 2004 fell ¥10.4 billion to ¥546.5 billion from March 31, 2003, due primarily to a decrease in cash and cash equivalents.
Total liabilities for the Sankyo Group at September 30, 2004 amounted to ¥261.7 billion compared to ¥263.0 billion at March 31, 2004. Total liabilities at March 31, 2004 amounted to ¥263.0 billion, down ¥13.4 billion, or 4.9%, from the previous year-end. At September 30, 2004, current liabilities had decreased to ¥170.8 billion from ¥173.6 billion at March 31, 2004, reflecting primarily decreases in short-term borrowings and other payable and accrued expenses, partially offset by an increase in accrued income taxes. At March 31, 2004, current liabilities had increased slightly to ¥173.6 billion from ¥173.3 billion at March 31, 2003. An increase in other payable and accrued expenses was offset by a decrease in trade notes and accounts payable and accrued income taxes. At September 30, 2004, long-term liabilities were largely unchanged compared to March 31, 2004, with an increase of ¥1.6 billion, or 1.8%, to ¥90.9 billion. At March 31, 2004, long-term liabilities had decreased ¥13.7 billion, or 13.3%, to ¥89.3 billion from levels at March 31, 2003, primarily due to a decrease in accrued pension and severance costs, reflecting an increase in the fair value of plan assets in the company’s employees’ retirement and severance benefit plan and a decrease in the company’s projected benefit obligation due to a change in actuarial assumptions.
At September 30, 2004, total shareholders’ equity for Sankyo and its consolidated subsidiaries rose 4.0%, or ¥26.8 billion, to ¥692.9 billion from levels at March 31, 2004. A ¥31.3 billion increase in retained earnings was partly offset by a decrease in accumulated other comprehensive income resulting from a decrease in unrealized gains on securities. At March 31, 2004, total shareholders’ equity for the Sankyo Group rose 3.1%, or ¥19.8 billion, from levels at March 31, 2003, to ¥666.0 billion, due primarily to a ¥9.1 billion increase in retained earnings and a ¥12.2 billion increase in accumulated other comprehensive income, reflecting an increase in unrealized gains on securities partially offset by an increase in treasury stock.
As a result of the decrease in total liabilities and increase in shareholders’ equity, at September 30, 2004, the shareholders’ equity ratio was up 0.8% as compared to March 31, 2004, to 71.7%. At March 31, 2003, the shareholders’ equity ratio was up 1.7% as compared to March 31, 2004, to 70.9%.
Cash Flows
Six Months Ended September 30, 2004 Compared to Six Months Ended September 30, 2003
Net cash provided by operating activities for the six month period ended September 30, 2004 increased ¥6.7 billion, to ¥59.1 billion. This increase is primarily attributable to an increase in net income for the period and decreases in cash invested in working capital resulting mainly from an increase in accrued income taxes, partially offset by an adjustment for a gain on sales of property, plant and equipment. Cash proceeds from these transactions were included in the cash flows from investing activities as discussed below.
Net cash provided by investing activities during the six month period ended September 30, 2004 totaled ¥1.2 billion, as compared to a ¥4.8 billion outflow in the same period in fiscal 2003. The increase was due largely to an increase in proceeds from sales of property, plant and equipment relating to the closure of two manufacturing facilities in Japan and the sale of the associated real estate, partially offset by a net decrease in cash inflow associated with transactions in marketable securities and other securities investments.
Net cash used in financing activities for the six month period ended September 30, 2004 totaled ¥12.7 billion, up ¥1.7 billion from the same period in fiscal 2003. This principally reflected an increase in dividends
167
Table of Contents
paid as the dividend per share paid in the six months ended September 30, 2004 increased to ¥7.6 billion, or approximately 33.3%, from ¥5.7 billion in the corresponding period in 2003.
As a result, cash and cash equivalents at the end of the six month period ended September 30, 2004 amounted to ¥249.3 billion, a decrease of ¥1.2 billion from the six month period ended September 30, 2003.
Year Ended March 31, 2004 Compared to Year Ended March 31, 2003
Net cash provided by operating activities for the fiscal year ended March 31, 2004 decreased ¥5.5 billion, to ¥65.4 billion. This decrease is primarily attributable to an increase in payments of retirement and severance benefits, partially offset by a ¥3.4 billion increase in net income. The decreases in cash flows from changes in trade receivables, inventories and accrued income taxes were mostly offset by increases in cash flows from changes in other current liabilities.
Net cash used in investing activities during the fiscal year ended March 31, 2004 totaled ¥40.6 billion, as compared to a ¥2.3 billion inflow in the previous fiscal year. The increase was due largely to a ¥9.9 billion increase in additions to property, plant and equipment and a ¥32.1 billion net decrease in cash inflow associated with transactions in marketable securities and other securities investments.
Net cash used in financing activities for the fiscal year ended March 31, 2004 totaled ¥35.7 billion, up ¥8.9 billion from the previous fiscal year. This principally reflected an increase by ¥11.7 billion in Sankyo’s acquisition of treasury stock as compared with the previous fiscal year.
As a result, cash and cash equivalents at the end of the fiscal year ended March 31, 2004 amounted to ¥201.7 billion, a decrease of ¥11.8 billion from the previous fiscal year end.
Liquidity and Capital Resources
Liquidity
Sankyo seeks to manage its capital resources and liquidity to provide adequate funds for current and future financial obligations. Sankyo derives the funds it requires to meet its capital requirements principally from cash flow provided by operations and borrowings from financial institutions.
Sankyo’s principal capital and liquidity needs are for research and development expenses, general working capital and funds for payment of dividends, income taxes and stock repurchases, as well as capital expenditures to finance the growth of its business.
168
Table of Contents
Borrowings
Long Term Borrowings
All of Sankyo’s ¥9.9 billion of total long-term borrowings at March 31, 2004, including the current portion thereof, were from loans, principally from Japanese banks and other financial institutions, and capital lease obligations. Generally, Sankyo’s long-term loans have a maturity of two to fifteen years, and accrue interest on a floating rate basis (or on a fixed rate basis accompanied by an interest rate swap agreement). At March 31, 2004, the weighted-average rate of Sankyo’s long-term loans from banks and other financial institutions was 1.60%. As is customary in Japan, bank loans are made under general agreements which provide that under certain circumstances, security and guarantees for present and future indebtedness will be given upon request of the bank, and that the bank shall have the right, as the obligations become due, or in the event of their default, to offset cash deposits against such obligations due to the bank. The aggregate future annual maturities of long-term debt and lease obligations from banks and other financial institutions as of March 31, 2004 were as follows:
Year ending March 31, | (in millions) | ||
2005 | ¥ | 3,650 | |
2006 | 2,528 | ||
2007 | 1,274 | ||
2008 | 677 | ||
2009 | 470 | ||
After five years | 1,263 | ||
Total long-term borrowings: | ¥ | 9,862 | |
Short Term Borrowings
Sankyo also uses banks and other financial institutions for short-term loans. Sankyo’s short-term loans are comprised mainly of bank loans with fixed contractual interest rates ranging from 0.73% to 1.06% as of March 31, 2003 and from 0.75% to 0.86% as of March 31, 2004, and guarantee deposits received. The weighted-average contractual rates with respect to Sankyo’s bank loans were 1.00% at March 31, 2003 and 0.84% at March 31, 2004, and with respect to its guarantee deposits received were 2.47% at March 31, 2003 and 2.42% at March 31, 2004. The bank loans have terms ranging from 3 months to 12 months and are usually renewed at maturity subject to renegotiation of interest rates and other factors. Sankyo pledges some of its tangible assets and securities as collateral for these loans. At March 31, 2004, Sankyo had unused lines of credit for short-term financing arrangements which totaled ¥30 billion. These lines of credit have commitment fee requirements.
At March 31, 2003 and 2004, short-term borrowings were ¥17.0 billion and ¥17.6 billion, respectively.
As of March 31, 2004, Sankyo had pledged as collateral for short-term and long-term borrowings with banks and other financial institutions the following assets: property, plant and equipment carried at approximately ¥4.7 billion and securities with a book value of ¥462 million.
Working Capital
Sankyo’s working capital needs are primarily for operating expenses, including research and development, manufacturing expenses, employee expenses, advertising, rent, and property, building and equipment maintenance. In addition, Sankyo leases machinery and other equipment pursuant to capital leases. Total future minimum lease payments under such capital leases at March 31, 2004 were approximately ¥1.8 billion within one year, and ¥1.6 billion for over one year.
Payment of Dividends and Stock Repurchase
Payments of dividends and stock repurchases also require cash outlays, which may fluctuate in accordance with Sankyo’s results of operation and financial conditions. In the year ended March 31, 2004,
169
Table of Contents
Sankyo repurchased on the open market 9.764 million shares of its common stock for an aggregate price of ¥20.0 billion. Based on a resolution passed at the annual general meeting of Sankyo’s shareholders in June 2004, Sankyo amended its articles of incorporation to authorize the board of directors to purchase Sankyo stock at any time to facilitate proactive equity management in response to changes in the business environment.
Capital Expenditures
Capital expenditures for the years ended March 31, 2003 and 2004 were ¥16.5 billion and ¥26.5 billion, respectively, consisting principally of expenditures related to facilities for manufacturing and research and development activities.
Impact of Foreign Currency Fluctuations
Some portion of Sankyo’s business is conducted in currency other than yen, principally in U.S. dollars and euros, primarily the marketing and sale of pharmaceutical products in countries other than Japan. Non-Japan sales accounted for approximately ¥158.4 billion of total revenues, or 27.5%, for the fiscal year ended March 31, 2004, and approximately ¥209.4 billion of total net revenues, or 34.8%, for the fiscal year ended March 31, 2003. Sankyo seeks to manage its exposure to the risk of fluctuations in foreign currency exchange rates primarily by using forward exchange contracts, currency options and other derivatives. Sankyo also seeks to control currency exposure by holding offsetting foreign currency positions in order to reduce the risk of loss from currency fluctuations.
Dividends
While it emphasizes the allocation of earnings to shareholders, Sankyo makes decisions on the appropriation of earnings based on a comprehensive consideration of how to maximize shareholder benefits by both disbursing dividends and maintaining sufficient internal reserves to fund future business expansion. Sankyo also gives due attention to flexibly responding in a timely manner to opportunities to maximize shareholder benefits through such other means as the repurchase and retirement of its own shares.
During fiscal year 2004, Sankyo added a special dividend of ¥2.50 to its standard interim dividend of ¥10.00 per share, for a total interim dividend of ¥12.50 per share. During fiscal year 2004, Sankyo also added a special dividend of ¥7.50 to its standard year-end dividend of ¥10.00 per share, for a total year-end dividend of ¥17.50 per share, which resulted in a total dividend for the year of ¥30.00 per share. This increased the dividend payout ratio to 23.4%, and the dividend to shareholders’ equity ratio to 1.8% on a non-consolidated basis. Looking ahead, Sankyo will continue its policy of providing stable and consistent dividends to shareholders.
Off-Balance Sheet Arrangements
Sankyo does not presently have any material off-balance sheet transactions.
170
Table of Contents
Contractual Obligations
As of March 31, 2004, Sankyo’s contractual obligations were as follows:
| Payments due by period | |||||||||||||||
| (in millions of yen) | |||||||||||||||
Contractual Obligation | Total | Less than 1 year | 1 –3 years | 3-5 years | More than 5 years | ||||||||||
Long-Term Debt Obligations, including Capital (Finance) Lease Obligations | ¥ | 9,862 | ¥ | 3,650 | ¥ | 3,802 | ¥ | 1,147 | ¥ | 1,263 | |||||
Operating Lease Obligations | 5,015 | 1,071 | 1,641 | 907 | 1,396 | ||||||||||
Research and Development Expense Obligations | 5,847 | 700 | 2,837 | 665 | 1,645 | ||||||||||
Purchase Obligations | 40,599 | 18,425 | 12,010 | 10,164 | — | ||||||||||
Total | ¥ | 61,323 | ¥ | 23,846 | ¥ | 20,290 | ¥ | 12,883 | ¥ | 4,304 | |||||
Quantitative and Qualitative Disclosures about Market Risk
Sankyo is exposed to market risk from changes in foreign currency exchange rates, interest rates and equity security markets. In order to manage the risk arising from changes in foreign exchange rates and interest rates, Sankyo enters into certain derivative financial instruments. Disclosure concerning Sankyo’s derivative financial instruments is included in Note 16 to Sankyo’s consolidated financial statements.
Sankyo monitors and manages these financial exposures as an integral part of its overall risk management program, which recognize the unpredictability of financial markets and seeks to reduce the potential adverse effect on Sankyo’s operating results.
The financial instruments to be included in the market risk analysis consist of Sankyo’s cash and cash equivalents, time deposits, marketable securities, short-term and long-term debt and all derivative financial instruments. Sankyo’s portfolio of derivative financial instruments consists of foreign exchange forward contracts and interest rate swap agreements. The aggregate nominal amounts of foreign exchange forward contracts as of March 31, 2003 and 2004 were ¥309 million and ¥529 million, respectively, and those of interest rate swap agreements as of March 31, 2003 and 2004 were ¥1.5 billion and ¥1.2 billion, respectively. Trade accounts receivables and payables are not included in this analysis as their carrying amounts approximate fair value.
As discussed in the preceding paragraph and Note 16 to Sankyo’s consolidated financial statements, Sankyo does not have significant market sensitive instruments with significant exposure to market risk, except for the marketable equity securities for equity price risk discussed in the following paragraph.
Sankyo holds investments in various available-for-sale securities which are subject to price risk. The fair values of available-for-sale securities as of March 31, 2003 and 2004 were ¥37.9 billion and ¥67.1 billion, respectively. The potential change in fair value of these investments, assuming a 10% change in price, would be approximately ¥3.8 billion as of March 31, 2003 and ¥6.7 billion as of March 31, 2004.
171
Table of Contents
DIRECTORS AND MANAGEMENT OF DAIICHI SANKYO
FOLLOWING THE JOINT SHARE TRANSFER
The following provides information about those individuals who are expected to serve in general capacities indicated for Daiichi Sankyo, including members of Daiichi’s or Sankyo’s current board of directors and management.
From Daiichi
Name | Proposed Position at Daiichi Sankyo | Date of Birth | Number of Daiichi Shares Owned as of March 31, 2005 | Percentage Ownership | |||||
Kiyoshi Morita | Chairman and Representative Director | March 29, 1939 | 24,675 | 0.009 | % | ||||
Hiroyuki Nagasako | Director | May 17, 1939 | 13,720 | 0.005 | % | ||||
Tsutomu Une | Director | December 11, 1947 | 3,600 | 0.001 | % | ||||
Atsuo Inoue | Corporate Auditor | April 11, 1940 | 13,860 | 0.005 | % | ||||
Koukei Higuchi | Corporate Auditor | March 14, 1936 | 0 | — | |||||
Kiyoshi Moritajoined Daiichi Pharmaceutical Co., Ltd. in April 1962. Until 1991, Mr. Morita served in various positions within Daiichi, including General Manager of Medical Sales & Market Information Department and General Manager of Marketing & Sales Administration Department. In June 1991, Mr. Morita was elected to the Board of Directors of Daiichi. In June 1997, Mr. Morita became Representative Director/Senior Managing Director, Administration Pharmaceutical Marketing – Domestic. In June 1999, Mr. Morita was elected President and representative director of Daiichi and in June 2003, was further appointed as Chief Executive Officer. Mr. Morita is a Standing Director of the Japan Pharmaceutical Manufacturers Association, President and Chief Executive Officer of the Pharmaceutical Manufacturers’ Association of Tokyo, and Executive Director of the Japan Business Federation.
Hiroyuki Nagasako joined Daiichi Pharmaceutical Co., Ltd. in April 1962. Mr. Nagasako was elected to the Board of Directors in 1991. In 1999, Mr. Nagasako became Representative Director/Senior Managing Director to assume responsibility in corporate planning, administration, public relations and finance. Mr. Nagasako was elected Executive Vice President and director in June 2003.
Tsutomu Une joined Daiichi Pharmaceutical Co., Ltd. in April 1970. Mr. Une was elected to the Board of Directors in 1999 and has been leading Daiichi’s global business development, intellectual property and corporate R&D strategy as Managing Director.
Atsuo Inouejoined Daiichi Pharmaceutical Co., Ltd. in April 1965. In 1991, Mr. Inoue was appointed as General Manager of International Medical Development Department for Daiichi. From such time until 1999, Mr. Inoue served in various positions within Daiichi, including General Manager of Global Medical Planning Department and General Manager of International Division. Mr. Inoue was first elected to the board of directors of Daiichi in June 1995. In June 1999, Mr. Inoue was elected Managing Director.
Koukei Higuchijoined Tokio Marine and Fire Insurance Co., Ltd. in April 1960 and was first elected to that company’s board of directors in June 1989. Mr. Higuchi has served as president and chairman of Tokio Marine, having been elected to the latter position in June 2001, after serving as Managing Director and Senior Managing Director. In June 2003, Mr. Higuchi was appointed as Senior Corporate Advisor to Tokio Marine. Mr. Higuchi has served as corporate auditor of Daiichi since June 2004.
172
Table of Contents
As of March 31, 2005, the individuals listed above held options issued by Daiichi as listed below (other than Mr. Higuchi who holds no Daiichi options). Each option granted in July 2000 and 2001, when 1,000 shares constituted one full unit of shares of Daiichi, gives the holder the right to purchase 1,000 shares of common stock of Daiichi. Each option granted in July 2002, 2003 and 2004 gives the holder the right to purchase 100 shares of common stock of Daiichi. In each case, the exercise price is per share of Daiichi common stock. As of March 31, 2005, none of the options listed below had been exercised. In each case, the options are exercisable commencing approximately two years after the date of grant and ending eight years thereafter.
Grantee | Date of Grant | Number | Exercise Price | ||||
Kiyoshi Morita | July 2000 | 40 | ¥ | 2,755 | |||
| July 2001 | 40 | ¥ | 3,030 | ||||
| July 2002 | 400 | ¥ | 2,338 | ||||
| July 2003 | 400 | ¥ | 1,633 | ||||
| July 2004 | 400 | ¥ | 1,993 | ||||
Hiroyuki Nagasako | July 2000 | 20 | ¥ | 2,755 | |||
| July 2001 | 20 | ¥ | 3,030 | ||||
| July 2002 | 200 | ¥ | 2,338 | ||||
| July 2003 | 300 | ¥ | 1,633 | ||||
| July 2004 | 300 | ¥ | 1,993 | ||||
Tsutomu Une | July 2000 | 10 | ¥ | 2,755 | |||
| July 2001 | 10 | ¥ | 3,030 | ||||
| July 2002 | 100 | ¥ | 2,338 | ||||
| July 2003 | 150 | ¥ | 1,633 | ||||
| July 2004 | 150 | ¥ | 1,993 | ||||
Atsuo Inoue | July 2000 | 15 | ¥ | 2,755 | |||
| July 2001 | 15 | ¥ | 3,030 | ||||
| July 2002 | 150 | ¥ | 2,338 | ||||
| July 2003 | 150 | ¥ | 1,633 | ||||
| July 2004 | 150 | ¥ | 1,993 | ||||
On May 25, 2005, the board of directors of Daiichi resolved to shorten the exercise periods of all options granted to its directors and employees, including the options set out above, subject to the consent of each of the grantees and on the condition that the terms and conditions of the joint share transfer are approved at each of the general meetings of shareholders of Daiichi and Sankyo. As a result, the exercise periods will end on August 31, 2005. With respect to options granted in July 2004, the exercise periods of which have not yet started, such exercise periods will be accelerated subject to the above-mentioned conditions and, as a result, will start at the end of June and end on August 31, 2005. Upon the termination of the exercise periods at August 31, 2005, all options will be nullified and of no further force and effect.
The aggregate compensation, including bonuses but excluding the July 2004 stock option awards described in the immediately preceding paragraph, paid by Daiichi to those of its directors and corporate auditors listed above during the year ended March 31, 2005 was ¥226 million.
As of March 31, 2005, the Daiichi individuals listed above owned, in the aggregate, less than 1% of the aggregate amount of outstanding shares of Daiichi common stock and none of the Daiichi individuals listed above owned any shares of Sankyo common stock.
173
Table of Contents
From Sankyo
Name | Proposed Position at Daiichi Sankyo | Date of Birth | Number of Sankyo Shares Owned as of March 31, 2005 | Percentage Ownership | ||||
Takashi Shoda | President, CEO and Representative Director | June 21, 1948 | 12,000 | 0.003% | ||||
Hideho Kawamura | Director | January 9, 1941 | 19,100 | 0.004% | ||||
Yasuhiro Ikegami | Director | December 24, 1939 | 12,200 | 0.003% | ||||
Kunio Nihira | Director | April 6, 1933 | 4,500 | 0.001% | ||||
Katsuyuki Sugita | Director | October 13, 1942 | 1,700 | 0.0004% | ||||
Kozo Wada | Corporate Auditor | January 6, 1939 | 14,871 | 0.003% | ||||
Kaoru Shimada | Corporate Auditor | March 16, 1934 | 2,110 | 0.0005% | ||||
Takashi Shodajoined Sankyo Company, Limited in April 1972 after graduating from the Pharmacy Faculty of the University of Tokyo. In 1999, Mr. Shoda was appointed as Director, Department of Europe. From such time until 2001, Mr. Shoda served in various positions within Sankyo, including General Manager, International Pharmaceutical Division and Director, International Business Development Department. In June 2001, Mr. Shoda was elected to the board of directors of Sankyo. In June 2003, Mr. Shoda became President and Representative Director.
Hideho Kawamurajoined Sankyo Company, Limited in April 1963. In June 1995, Mr. Kawamura was elected to the board of directors of Sankyo and in June 2002, Mr. Kawamura became Executive Vice President and Representative Director. Mr. Kawamura has served Sankyo in various positions, including as Director of Corporate Planning Department and Director of Purchasing Department.
Yasuhiro Ikegamijoined Sankyo Company, Limited in April 1962. In June 2001, Mr. Ikegami was elected to the board of directors of Sankyo and in June 2003, Mr. Ikegami became Executive Vice President and Representative Director. Mr. Ikegami has served Sankyo in various positions, including as head of the Pharmaceutical Operations Planning Department.
Kunio Nihirajoined the National Police Agency in April 1957, rising to Chief of Police Administration in June 1989, and then, in December 1990, to Tokyo Metropolitan Police Commissioner. In June 1999, Mr. Nihira became the Chairman of the Japan Automobile Federation. Since June 2003, Mr. Nihira has sat on the board of directors of Sankyo Company, Limited.
Katsuyuki Sugitajoined the Nihon Kangyo Bank in April 1966. In June 1994, Mr. Sugita was elected as Director, General Manager, Administration of the bank (then called the Dai-Ichi Kangyo Bank Ltd.). Mr. Sugita was elected president and representative director of the Dai-Ichi Kangyo Bank in June 1997. In September 2000, Mr. Sugita became president of Mizuho Holdings, Inc. upon the merger of Dai-Ichi Kangyo Bank and two other banks. In June 2002, Mr. Sugita was named honorary advisor to Mizuho Financial Group, Inc. Since June 2003, Mr. Sugita has served as a director of Sankyo Company, Limited.
Kozo Wadajoined Sankyo Company, Limited in April 1962. In July 1989, Mr. Wada became Vice Director of the Accounting Department. In June 1991, Mr. Wada became the Director of Sankyo’s Audit Department. Since June 1998, Mr. Wada has served as a corporate auditor of Sankyo.
Kaoru Shimadaentered the medical faculty of the University of Tokyo in April 1960. In April 1972, Mr. Shimada became director of the microbiology department at Tokyo Welfare Institute Hospital. Starting
174
Table of Contents
in August 1984, Mr. Shimada was a professor for Infectious Diseases, Institute of Medical Science, The University of Tokyo. From April 1991, Mr. Shimada was Director of Research Hospital, The Institute of Medical Science, The University of Tokyo. From April 1996, Mr. Shimada was Director of the Tokyo Senbai Hospital. Since June 2003, Mr. Shimada has acted as a corporate auditor of Sankyo.
As of March 31, 2005, the Sankyo individuals listed above held, in the aggregate, options issued by Sankyo as listed below (other than Mr. Wada and Mr. Shimada who hold no options). Each option gives the holder the right to purchase 100 shares of common stock of Sankyo and the exercise price is per share of Sankyo common stock. As of March 31, 2005, none of the options listed below had been exercised. In each case, the options are exercisable for a period of ten years commencing on the month immediately following the date of grant.
Grantee | Date of Grant | Number | Exercise Price | ||||
Takashi Shoda | June 2002 | 140 | ¥ | 1,823 | |||
| June 2003 | 320 | ¥ | 1,519 | ||||
| June 2004 | 320 | ¥ | 2,365 | ||||
Hideho Kawamura | June 2002 | 160 | ¥ | 1,823 | |||
| June 2003 | 160 | ¥ | 1,519 | ||||
| June 2004 | 160 | ¥ | 2,365 | ||||
Yasuhiro Ikegami | June 2002 | 150 | ¥ | 1,823 | |||
| June 2003 | 150 | ¥ | 1,519 | ||||
| June 2004 | 160 | ¥ | 2,365 | ||||
Kunio Nihira | June 2002 | 0 | ¥ | 1,823 | |||
| June 2003 | 80 | ¥ | 1,519 | ||||
| June 2004 | 80 | ¥ | 2,365 | ||||
Katsuyuki Sugita | June 2003 | 80 | ¥ | 1,519 | |||
| June 2004 | 80 | ¥ | 2,365 | ||||
The aggregate compensation, including bonuses but excluding the June 2004 stock option awards described in the immediately preceding paragraph, paid by Sankyo to those individuals listed above during the year ended March 31, 2005 was ¥275.1 million.
As of March 31, 2005, the Sankyo individuals listed above owned, in the aggregate, less than 1% of the aggregate amount of outstanding shares of Sankyo common stock and none of the Sankyo individuals listed above owned any shares of Daiichi common stock.
Additional Outside Directors
Name | Position | Date of Birth | Number of Daiichi or Sankyo Shares Owned as of March 31, 2005 | Percentage Ownership | ||||
Yoshifumi Nishikawa | Director | August 3, 1938 | 0 | — | ||||
Jotaro Yabe | Director | January 8, 1939 | 0 | — | ||||
Yoshifumi Nishikawabegan his career at Sumitomo Banking Corporation in April 1961, and was first elected as a director of that company in June 1986. Mr. Nishikawa was elected as Managing Director in June 1989 and later, in November 1991, was elected as Senior Managing Director. In June 1997, Mr. Nishikawa
175
Table of Contents
was appointed as president of Sumitomo Banking Corporation, after serving as vice-president for approximately one year. Mr. Nishikawa was elected as president of Sumitomo Mitsui Banking Corporation in April 2001 and president and director of Sumitomo Mitsui Financial Group, Inc. in December 2002. Mr. Nishikawa is expected to be appointed as special advisor to Sumitomo Mitsui Banking Corporation in June 2005. Also, in June 2005, Mr. Nishikawa is expected to stand for election to the board of directors of Daiichi.
Jotaro Yabebegan his career at the Fair Trade Commission in Japan in 1963. From June 1991 to June 1996, Mr. Yabe was the head of various divisions with the commission, including those related to economic affairs and investigations. In June 1996, Mr. Yabe became Investigation Commissioner of the Commission, and in June 1997, Mr. Yabe became Secretary General thereof. Mr. Yabe retired from the Fair Trade Commission in 1998.
As of March 31, 2005, neither Mr. Nishikawa nor Mr. Yabe held any options issued by either Daiichi or Sankyo. Neither Mr. Nishikawa nor Mr. Yabe received any compensation from Daiichi or Sankyo during the year ended March 31, 2005.
176
Table of Contents
Daiichi
The following is information regarding shareholders of record as of March 31, 2005 that hold 5% or more of Daiichi’s outstanding common stock:
Name | Number of Daiichi (thousands of shares) | Percentage of Outstanding Daiichi Shares Owned as of March 31, 2005 | |||
Trust & Custody Services Bank, Ltd. | 20,030 | 7.46 | % | ||
Japan Trustee Service Bank, Ltd. | 19,168 | 7.14 | % | ||
Nippon Life Insurance Company | 14,225 | 5.30 | % |
| Notes: |
| 1. Daiichi understands that Trust & Custody Services Bank, Ltd. is not the beneficial owner of Daiichi’s common stock. Daiichi shares held by Trust & Custody Services Bank, Ltd. include approximately 7,331,000 shares held in a trust account at Mizuho Trust & Banking Co., Ltd. for the benefit of Mizuho Corporate Bank, Ltd. retirement plans. Other Daiichi shares held by Trust & Custody Services Bank, Ltd. are also held in other trust accounts, each of which accounts for less than 5% of Daiichi’s outstanding common stock. |
| 2. Daiichi understands that Japan Trustee Service Bank, Ltd. is not the beneficial owner of Daiichi’s common stock. Daiichi shares held by Japan Trustee Service Bank, Ltd. are held in several trust accounts, each of which accounts for less than 5% of Daiichi’s outstanding common stock. Daiichi does not know the identity of the beneficiaries of these trust accounts. |
| 3. Daiichi received from Brandes Investment Partners LLC a Substantial Shareholding Report dated January 15, 2004 under the Securities and Exchange Law of Japan to the effect that such entity holds approximately 14,826,000 shares of Daiichi common stock as of December 31, 2003. Daiichi was unable to confirm such shareholding as of March 31, 2005. |
| 4. Figures provided for number of Daiichi shares owned as of March 31, 2005 include shares that may be acquired within 60 days of such date. |
During the fiscal year ended March 31, 2003, Japan Trustee Service Bank, Ltd. increased its ownership in Daiichi by 4,018,000 shares and Nippon Life Insurance Company decreased its ownership by 332,000 shares. Trust & Custody Services Bank, Ltd. was not reported on Daiichi’s annual securities report filed with the Kanto Local Finance Bureau in Japan as a major shareholder for the fiscal year ended March 31, 2002.
During the fiscal year ended March 31, 2004, Trust & Custody Services Bank, Ltd. decreased its ownership in Daiichi by 1,978,000 shares, Japan Trustee Service Bank, Ltd. increased its ownership in Daiichi by 8,775,000 shares, and Nippon Life Insurance Company increased its ownership by 300,000 shares.
During the fiscal year ended March 31, 2005, Trust & Custody Services Bank, Ltd. decreased its ownership in Daiichi by 409,000 shares, Japan Trustee Service Bank, Ltd. decreased its ownership in Daiichi by 4,112,000 shares, and Nippon Life Insurance Company decreased its ownership by 174,000 shares.
The major shareholders of Daiichi do not have different voting rights from any other common shareholder of Daiichi. 66.63% of Daiichi’s common stock, held by 18,896 shareholders of record, were held in Japan as of March 31, 2005. To its knowledge, Daiichi is not owned or controlled by another corporation, any foreign government or any other natural or legal person, either severally or jointly. There are no arrangements known to Daiichi the operation of which may result in a change of control of the company.
177
Table of Contents
Sankyo
The following is information regarding shareholders of record as of March 31, 2005 that hold 5% or more of Sankyo’s outstanding common stock:
Name | Number of Sankyo (thousands of shares) | Percentage of Outstanding Sankyo Shares Owned as of March 31, 2005 | |||
The Master Trust Bank of Japan, Ltd. | 46,514 | 10.83 | % | ||
Japan Trustee Service Bank, Ltd. | 36,070 | 8.40 | % | ||
Nippon Life Insurance Company | 26,126 | 6.08 | % |
| Notes: |
| 1. Sankyo understands that The Master Trust Bank of Japan, Ltd. is not the beneficial owner of Sankyo’s common stock. Sankyo shares held by The Master Trust Bank of Japan, Ltd. are held in several trust accounts. Sankyo does not know the identity of the beneficiaries of these trust accounts. |
| 2. Sankyo understands that Japan Trustee Service Bank, Ltd. is not the beneficial owner of Sankyo’s common stock. Sankyo shares held by Japan Trustee Service Bank, Ltd. are held in several trust accounts. Sankyo does not know the identity of the beneficiaries of these trust accounts. |
| 3. Sankyo received from Barclays Global Investors Trust Bank an amendment to a Substantial Shareholding Report dated April 13, 2004 to the effect that such entity holds 24,578,000 shares of Sankyo common stock. Sankyo was unable to confirm such shareholding as of March 31, 2005. |
| 4. Figures provided for number of Sankyo shares owned as of March 31, 2005 include shares that may be acquired within 60 days of such date. |
During the fiscal year ended March 31, 2003, Japan Trustee Service Bank, Ltd. increased its ownership in Sankyo by 2,387,000 shares, and Nippon Life Insurance Company decreased its ownership in Sankyo by 2,344,000 shares. The Master Trust Bank of Japan, Ltd. was not reported on Sankyo’s annual securities report filed with the Kanto Local Finance Bureau in Japan as a major shareholder for the fiscal year ended March 31, 2002.
During the fiscal year ended March 31, 2004, The Master Trust Bank of Japan, Ltd. increased its ownership in Sankyo by 20,027,000 shares, and Japan Trustee Service Bank, Ltd. decreased its ownership by 4,351,000 shares. There was no change in the share ownership of Nippon Life Insurance Company during the fiscal year ended March 31, 2004.
During the fiscal year ended March 31, 2005, The Master Trust Bank of Japan, Ltd. increased its ownership in Sankyo by 2,632,000 shares, Japan Trustee Service Bank, Ltd. increased its ownership in Sankyo by 11,962,000 shares, and Nippon Life Insurance increased its ownership in Sankyo by 207,000 shares.
The major shareholders of Sankyo do not have different voting rights from any other common shareholder of Sankyo. 69.6% of Sankyo’s common stock, held by 39,536 shareholders of record, were held in Japan as of March 31, 2005. To its knowledge, Sankyo is not owned or controlled by another corporation, any foreign government or any other natural or legal person, either severally or jointly. There are no arrangements known to Sankyo the operation of which may result in a change of control of the company.
Daiichi Sankyo
Based on the information as of March 31, 2005 about the ten largest shareholders of record of each of Daiichi and Sankyo, which is the latest such information publicly disclosed in Japan, if the record ownership by those shareholders remained unchanged through the date of the joint share transfer, the following would be
178
Table of Contents
information regarding shareholders that would hold 5% or more of Daiichi Sankyo’s outstanding common stock immediately after the joint share transfer:
Name | Number of Shares of (thousands of shares) | Percentage of Outstanding Shares of Daiichi Sankyo following the Joint Share Transfer | |||
Japan Trustee Service Bank, Ltd. | 58,287 | 7.93 | % | ||
The Master Trust Bank of Japan, Ltd. | 57,817 | 7.87 | % | ||
Nippon Life Insurance Company | 42,614 | 5.80 | % |
179
Table of Contents
DESCRIPTION OF DAIICHI SANKYO COMMON STOCK
The following is a summary description of common stock of Daiichi Sankyo, which does not purport to be complete and is qualified in its entirety by reference to the detailed provisions of the proposed articles of incorporation, Regulations of Board of Directors and Share Handling Regulations of Daiichi Sankyo.
General
The authorized capital of Daiichi Sankyo will, immediately after the closing of the joint share transfer, consist of 2,800,000,000 shares of common stock with no par value. Of this number, it is anticipated that there will be 740,588,771 issued and outstanding shares of common stock, assuming that no stock options of Daiichi or Sankyo will be exercised prior to September 28, 2005, that each of Daiichi and Sankyo cancels all of the treasury stock that it owned as of March 31, 2005 and that neither Daiichi nor Sankyo acquires or disposes of its own shares after March 31, 2005. It is anticipated that at the time of the completion of the joint share transfer, no shares of Daiichi Sankyo will be held by Daiichi Sankyo. However, as of March 31, 2005, Daiichi held 2,602,000 shares of Sankyo common stock and Sankyo held 2,864,000 shares of Daiichi common stock. Assuming no change in such shareholdings, all of these shares held by Daiichi and Sankyo will be exchanged for shares of Daiichi Sankyo common stock in the joint share transfer. Further, at the time of completion of the joint share transfer, all Daiichi Sankyo’s outstanding shares will be fully paid and non-assessable.
Under the Commercial Code of Japan, the transfer of shares of a joint stock corporation is effected by delivery of share certificates unless its articles of incorporation provide that it shall not issue any share certificates. In order to assert shareholders’ rights against Daiichi Sankyo, the transferee must have its name and address registered on Daiichi Sankyo’s register of shareholders. For this purpose, shareholders will be required to file their names, addresses and seals with the transfer agent of Daiichi Sankyo. Foreign shareholders may file specimen signatures in lieu of seals. Non-resident shareholders are required to appoint a standing proxy in Japan or provide a mailing address in Japan. Japanese securities firms and commercial banks customarily act as standing proxy and provide related services for standard fees.
The transfer agent of Daiichi Sankyo is expected to be UFJ Trust Bank Limited as from on or around September 28, 2005.
The central clearing system of share certificates pursuant to the Law Concerning Central Clearing of Share Certificates and Other Securities in Japan will apply to the Daiichi Sankyo shares. Pursuant to this system, a holder of Daiichi Sankyo shares will be able to choose, at his or her discretion, to participate in this system. All certificates of Daiichi Sankyo shares elected to be put into this system are deposited with JASDEC (through a participating institution having a clearing account with JASDEC, if the holder is not such a participating institution) and all such shares will be registered in the name of JASDEC on Daiichi Sankyo’s register of shareholders. Each participating shareholder will, in turn, be registered in the register of beneficial shareholders of Daiichi Sankyo and generally treated in the same way as shareholders registered on Daiichi Sankyo’s register of shareholders. In connection with the transfer of shares held under this system, entry of any share transfer in the book maintained by JASDEC for participating institutions and/or the book maintained by each participating institution for its customers shall have the same effect as delivery of share certificates.
In June 2004, a law was promulgated to establish a new central clearing system for shares of listed companies and to eliminate the issuance and use of certificates for such shares. The relevant part of the law will come into effect within five years of the date of promulgation. On the effective date, a new central clearing system will be established and the shares of all Japanese companies listed on any Japanese stock exchange, including the Daiichi Sankyo shares following the listing of such shares on the applicable stock exchanges in Japan, will be subject to the new central clearing system. On the same day, all existing share certificates for shares of all Japanese companies listed on any Japanese stock exchange, including Daiichi Sankyo shares, will become null and void and the transfer of such shares will be effected through entry in the books maintained under the new central clearing system.
Dividends
Following approval by the shareholders at an annual general meeting of shareholders, annual dividends may be distributed in cash to shareholders, beneficial shareholders or registered pledgees of record as at March 31
180
Table of Contents
in each year in proportion to the number of Daiichi Sankyo shares held by such persons. Additionally, Daiichi Sankyo may, by resolution of its board of directors, make interim dividend payments in cash to shareholders, beneficial shareholders or registered pledgees of record as at September 30 in each year. Under the proposed form of articles of incorporation of Daiichi Sankyo, the company would not be obligated to pay any dividends unclaimed for a period of three years after the date on which they first become payable.
The Commercial Code provides that, until the sum of its legal reserve and its additional paid-in capital is at least one-quarter of its stated capital, Daiichi Sankyo must set aside in its legal reserve an amount equal to:
| (i) | at least one-tenth of any amount paid out by Daiichi Sankyo as an appropriation of retained earnings (including any payment by way of annual dividends and bonuses to directors and corporate auditors); and |
| (ii) | an amount equal to one-tenth of any interim dividends. |
Daiichi Sankyo may distribute profits by way of annual dividends out of the excess of its net assets as shown on its non-consolidated balance sheet as of the last day of the immediately preceding fiscal year over the aggregate of:
| (i) | its stated capital; |
| (ii) | its additional paid-in capital; |
| (iii) | its accumulated legal reserve; |
| (iv) | the legal reserve to be set aside in respect of the dividend concerned and any other proposed payment by way of appropriation of retained earnings; and |
| (v) | such other amounts as may be set out in an ordinance of the Ministry of Justice of Japan. |
Daiichi Sankyo may pay interim dividends out of the excess of its net assets as shown on its non-consolidated balance sheet as of the last day of the preceding fiscal year, over:
| (a) | the aggregate of the amounts stated in (i) through (iv) above; |
| (b) | the legal reserve to be set aside in respect of such interim dividends; |
| (c) | any amount subsequently paid by way of appropriation of retained earnings; |
| (d) | any amount subsequently transferred from retained earnings to stated capital; |
| (e) | if Daiichi Sankyo has been authorized, pursuant to a resolution of an annual general meeting of shareholders or the Board of Directors, to purchase Daiichi Sankyo shares (see “—Acquisition by Daiichi Sankyo of Daiichi Sankyo Shares”), the total amount of the purchase price of such Daiichi Sankyo shares to be paid by Daiichi Sankyo; and |
| (f) | such other amounts as may be set out in an ordinance of the Ministry of Justice of Japan, |
provided that, (a) if Daiichi Sankyo reduces the amount of its stated capital, additional paid-in capital or accumulated legal reserve after the end of the preceding fiscal year, the amount so reduced, less the amount paid to shareholders upon such reduction and certain other amounts, and (b) such other amounts as are set out in an ordinance of the Ministry of Justice of Japan, will be added to the amount distributable as interim dividends as described above. Daiichi Sankyo may not pay any interim dividends where there is a risk that at the end of the fiscal year net assets might be less than the aggregate of the amounts referred to in (i) through (v) above.
181
Table of Contents
In Japan, the ex-dividend date and the record date for dividends precede the date of determination of the amount of the dividends to be paid. The market price of the Daiichi Sankyo shares generally becomes ex-dividend on the third business day prior to the record date.
Capital and Reserves
The entire amount of the issue price of new shares is required to be accounted for as stated capital, although Daiichi Sankyo may, by resolution of the board of directors, account for an amount not exceeding one-half of such issue price as additional paid-in capital. Daiichi Sankyo may at any time transfer the whole or any part of its additional paid-in capital and legal reserve to stated capital by resolution of the board of directors. The whole or any part of retained earnings which may be distributed as annual dividends may also be transferred to stated capital by resolution of an annual general meeting of shareholders.
Daiichi Sankyo may reduce its additional paid-in capital and/or legal reserve in order to cover a deficiency in its stated capital by resolution of an annual general meeting of shareholders. Daiichi Sankyo may also reduce its additional paid-in capital and/or legal reserve by resolution of a general meeting of shareholders, provided that, following such reduction, the aggregate of its additional paid-in capital and legal reserve may not be less than one-quarter of Daiichi Sankyo’s stated capital. Daiichi Sankyo may reduce its stated capital by a special resolution of a general meeting of shareholders (see “—Voting Rights”).
Stock Splits
Daiichi Sankyo may at any time split its outstanding shares into a greater number of shares by resolution of the board of directors. When a stock split is to be made, so long as Daiichi Sankyo has only one class of outstanding shares, Daiichi Sankyo may increase the number of the authorized shares in the same ratio as that of such stock split by amending its articles of incorporation, which amendment may be effected by resolution of the board of directors without approval by shareholders.
Generally, shareholders do not need to exchange existing share certificates for new certificates following a stock split. Certificates representing the additional shares resulting from the stock split will be issued to shareholders. Prior to any stock split, Daiichi Sankyo must give public notice of the stock split, specifying the record date therefor, not less than two weeks prior to such record date. In addition, promptly after the effective date of the stock split, Daiichi Sankyo must give notice to each shareholder as well as each registered pledgee as to the number of shares to which such shareholder or registered pledgee is entitled.
Unit Share System
The articles of incorporation of Daiichi Sankyo will provide that 100 shares constitute one “unit” of shares. Under the Commercial Code of Japan, Daiichi Sankyo’s board of directors will be permitted to reduce the number of shares that will constitute a unit, or abolish the unit share system entirely, by amending the articles of incorporation without shareholder approval. The number of shares constituting a unit may not exceed the lesser of 1,000 shares and one-two hundredth (1/200) of the number of all issued shares.
Under the unit share system, shareholders have one voting right for each unit of shares they hold except as stated in “—Voting Rights”. Any number of shares less than a full unit will carry no voting rights. For calculation of a quorum for various voting purposes, Daiichi Sankyo will exclude the aggregate number of shares representing less than one unit from the number of voting rights.
The articles of incorporation of Daiichi Sankyo will provide that, in general, no share certificates will be issued with respect to any shares constituting less than one unit. As the transfer of shares normally requires delivery of the relevant share certificates, any fraction of a unit for which no share certificates are issued will not be transferable. Except as otherwise described above, holders of shares constituting less than one unit will generally have all the rights granted to shareholders under the Commercial Code.
182
Table of Contents
A holder of shares constituting less than a full unit will be able to require Daiichi Sankyo to purchase those shares at their market value in accordance with the provisions of Daiichi Sankyo’s Share Handling Regulations.
Daiichi Sankyo’s articles of incorporation will provide that a holder of shares constituting less than one unit may request that Daiichi Sankyo sell to such holder such amount of shares which will, when added together with the shares constituting less than one unit, constitute one unit of shares, in accordance with the provisions of Daiichi Sankyo’s Share Handling Regulations.
General Meetings of Shareholders
The annual general meeting of shareholders will be held in June of each year. In addition, Daiichi Sankyo may hold an extraordinary general meeting of shareholders whenever necessary. Notice of a shareholders’ meeting stating the place, the time and the purpose thereof must be given to each shareholder having voting rights (or, in the case of a non-resident shareholder, to its standing proxy or mailing address in Japan) at least two weeks prior to the date set for the meeting. Such notice may be given to shareholders by electronic means, subject to the consent of the relevant shareholders. The record date set for the annual general meeting of shareholders is March 31.
Voting Rights
A holder of shares constituting one or more units is entitled to one vote for each unit of shares, except that neither Daiichi Sankyo, nor a corporate shareholder of which Daiichi Sankyo directly or indirectly holds more than one-quarter of the total voting rights, has voting rights in respect of Daiichi Sankyo shares held thereby. Except as otherwise provided by law or in Daiichi Sankyo’s articles of incorporation, a resolution can be adopted at a general meeting of shareholders by the holder of a majority of the total number of voting rights represented at the meeting. The quorum for election of directors and corporate auditors is one-third of the total number of voting rights. Daiichi Sankyo’s shareholders will not be entitled to cumulative voting in the election of directors. Shareholders of Daiichi Sankyo may cast their votes in writing. Shareholders may also exercise their voting rights through proxies, provided that the proxies are, in general, also holders of Daiichi Sankyo shares with voting rights. Shareholders may also exercise their voting rights by electronic means if the board of directors decides to permit such method of exercising voting rights.
The Commercial Code and the proposed articles of incorporation of Daiichi Sankyo provide that certain important matters shall be approved by a “special resolution” of a general meeting of shareholders. The quorum for such meeting is one-third of the total number of voting rights. Approval of at least two-thirds of the voting rights represented at the meeting is required for passage of a special resolution. Such matters include:
| • | any amendment to the articles of incorporation (except amendments that the board of directors is authorized to make under the Commercial Code as described in “—Stock Splits” and “—Unit Share System”); |
| • | the reduction of stated capital; |
| • | the removal of a director or corporate auditor; |
| • | the dissolution, merger or consolidation of Daiichi Sankyo requiring shareholders’ approval; |
| • | the establishment of a 100% parent-subsidiary relationship by way of a share transfer or share exchange requiring shareholders’ approval; |
| • | the transfer of the whole or a substantial part of its business; |
183
Table of Contents
| • | the taking over of the whole of the business of another company requiring shareholders’ approval; |
| • | a corporate split requiring shareholders’ approval; |
| • | any consolidation of Daiichi Sankyo shares; |
| • | any purchase of Daiichi Sankyo shares by Daiichi Sankyo from a specific shareholder other than a subsidiary of Daiichi Sankyo; |
| • | the issue of Daiichi Sankyo shares to persons other than existing shareholders at a “specially favorable” price; and |
| • | the issue of stock acquisition rights (including those incorporated in bonds with stock acquisition rights) to persons other than the existing shareholders under “specially favorable” conditions. |
Liquidation Rights
In the event of a liquidation of Daiichi Sankyo, the assets remaining after payment of all debts, liquidation expenses and taxes will be distributed among the shareholders in proportion to the respective number of shares held thereby.
Subscription Rights
Holders of Daiichi Sankyo shares have no pre-emptive rights. Authorized but unissued shares may be issued at such times and upon such terms as the board of directors determines, subject to the limitations as to the issue of new shares at a “specially favorable” price mentioned in “—Voting Rights” above. The board of directors may, however, determine that shareholders be given subscription rights with respect to new shares. In that case, such subscription rights must be given on uniform terms to all shareholders as of a record date upon not less than two weeks’ prior public notice. Each of the shareholders to whom such rights are given must also be given at least two weeks’ prior notice of the date on which such rights expire.
Stock Acquisition Rights
Daiichi Sankyo may issue stock acquisition rights (shinkabu yoyakuken) or bonds with stock acquisition rights (shinkabu yoyakuken-tsuki shasai) in relation to which the stock acquisition rights are undetachable. Except where the issue would be on “specially favorable” terms, the issue of stock acquisition rights or bonds with stock acquisition rights may be authorized by a resolution of the board of directors. Subject to the terms and conditions thereof, holders of stock acquisition rights may acquire a prescribed number of Daiichi Sankyo shares by exercising their stock acquisition rights and paying the exercise price at any time during the exercise period thereof. Upon exercise of stock acquisition rights, Daiichi Sankyo will be obligated to either issue the relevant number of new shares or transfer the necessary number of existing shares held by it as treasury stock to the holder. The rights which inhere in stock acquisition rights attached to bonds are substantially similar to those accorded to stock acquisition rights not attached to bonds. However, if so determined by the board of directors at the time of its resolution authorizing the issue of the relevant bonds with stock acquisition rights, upon exercise of the stock acquisition rights, their exercise price will be deemed to have been paid by the holder thereof to Daiichi Sankyo in lieu of Daiichi Sankyo redeeming the relevant bonds.
Record Date
March 31 is the record date for the payment of annual dividends and the determination of shareholders entitled to vote at the annual general meeting of shareholders. September 30 is the record date for the payment of interim dividends. In addition, by resolution of the board of directors and upon at least two weeks’ prior public notice, Daiichi Sankyo may at any time set a record date in order to determine the shareholders who are entitled to certain rights pertaining to Daiichi Sankyo shares.
184
Table of Contents
Reports to Shareholders
Daiichi Sankyo will furnish to its shareholders notices of shareholders’ meetings, annual business reports, including financial statements, and notices of resolutions adopted at shareholders’ meetings, in each case in Japanese.
Acquisition by Daiichi Sankyo of Daiichi Sankyo Shares
Daiichi Sankyo may acquire Daiichi Sankyo shares (i) by way of purchase on any Japanese stock exchange on which Daiichi Sankyo shares are listed, or by way of tender offer (in either case pursuant to an ordinary resolution of an annual general meeting of shareholders), (ii) by way of purchase from a specific shareholder other than a subsidiary of Daiichi Sankyo (pursuant to a special resolution of an annual general meeting of shareholders), or (iii) by way of purchase from a subsidiary of Daiichi Sankyo (pursuant to a resolution of the board of directors). In the case of (ii) above, any other shareholder may make a request directly to a Representative Director, five days prior to the relevant annual general meeting of shareholders, to include such shareholder as a seller in the proposed purchase.
The proposed articles of incorporation of Daiichi Sankyo also permit Daiichi Sankyo to purchase its own shares pursuant to a resolution of the board of directors. If Daiichi Sankyo purchases its own shares pursuant to authorization of the board of directors, the reason for the purchase, as well as the class, number and aggregate purchase price of the Daiichi Sankyo shares in question must be reported to shareholders at the next annual general meeting of shareholders to be held immediately after such purchase.
Any acquisition of Daiichi Sankyo shares by the company must satisfy certain requirements. In the case of a purchase pursuant to a resolution of the general meeting of shareholders described in (i) and (ii) above, the total amount of the purchase price may not exceed the amount of the retained earnings available for annual dividend payments after taking into account any reduction of the stated capital, additional paid-in capital or legal reserve (if such reduction is authorized by a resolution of the relevant general meeting of shareholders) less the sum of the amount to be paid by way of appropriation of retained earnings and the amount of retained earnings to be transferred to the stated capital in respect of the relevant fiscal year pursuant to a resolution of such general meeting of shareholders. In the case of a purchase pursuant to a resolution of the board of directors described in (iii) above and in the preceding paragraph, the total amount of the purchase price may not exceed the amount distributable as interim dividends, as described in “—Dividends”, less the amount of the interim dividend Daiichi Sankyo actually paid (see “—Dividends”). However, if it is anticipated that the net assets, as stated on its non-consolidated balance sheet at the end of the fiscal year, will be less than the aggregate amount of items described in (i) through (v) in “—Dividends” above, Daiichi Sankyo may not purchase its own shares. Daiichi Sankyo may hold its shares acquired in compliance with the provisions of the Commercial Code, and may generally dispose of or cancel such shares by a resolution of the board of directors.
Sale by Daiichi Sankyo of Shares held by Shareholders whose Location is Unknown
Daiichi Sankyo is not required to send a notice to a shareholder if a notice to such shareholder is not received at the registered address of the shareholder in Daiichi Sankyo’s register of shareholders or at the address otherwise notified to Daiichi Sankyo over a five year period.
In addition, Daiichi Sankyo may sell or otherwise dispose of shares if (i) notices to the shareholder are not received at the registered address of the shareholder in Daiichi Sankyo’s register of shareholders or at the address otherwise notified to Daiichi Sankyo for a continuous period of five years or more and (ii) the shareholder fails to receive dividends on the shares at the address registered in Daiichi Sankyo’s register of shareholders or at the address otherwise notified to Daiichi Sankyo for a continuous period of five years or more. Generally, Daiichi Sankyo may sell or otherwise dispose of such shares at the then market price of the shares, pursuant to a resolution of the board of directors and after giving at least three months’ prior public notice and
185
Table of Contents
individual notices to the shareholder, the non-representative co-owner(s) of the shareholder (i.e. the person(s) other than the person who was appointed as the representative of the co-owners and entitled to exercise the rights attaching to the shares) and registered pledges. The company must hold or deposit the proceeds for the shareholder.
Expected Amendments to the Commercial Code
A bill to modernize and make overall amendments to the Commercial Code by replacing the current provisions with regard to corporations with a new “Company Law” was submitted to the National Diet of Japan, or the Diet, on March 22, 2005. The proposed Company Law is expected to be enacted during the first half of 2005 and to come into effect within eighteen months thereafter. The proposed legislation is subject to discussion at and approval by the Diet, but currently it is expected that the new law will take effect in April 2006. The effects of the new law would include, among other things, the following:
| • | Dividends. Daiichi Sankyo would be able to distribute annual and semi-annual dividends pursuant to a resolution of the board of directors if its articles of incorporation so provide and certain other requirements are met. In principle, dividends would be distributable in kind as well as in cash, but distribution in kind may require the approval of a general meeting of shareholders. The amount distributable to shareholders under the current provisions of the Commercial Code would not be amended under the new law, but the amount distributable to shareholders would be affected by changes in certain accounting items during the period commencing after the final settlement of accounts, usually at March 31,and continuing until the payment of the relevant annual or semi-annual dividends, as the case may be. Under the new law, Daiichi Sankyo would also be allowed to make distributions to shareholders in addition to annual and semi-annual dividends at any time. Additionally, Daiichi Sankyo would be allowed to close its books at any time during the fiscal year and prepare extraordinary accounting documents subject to an audit by an independent registered public accounting firm, in order to calculate and disclose to shareholders its financial situation and to reflect profits and losses during the fiscal year. |
| • | Capital and Reserves. The transfer of additional paid-in capital and legal reserve to stated capital would require an ordinary resolution of the general meeting of shareholders, which is not required under the current provisions of the Commercial Code. On the other hand, Daiichi Sankyo would be able to reduce the amount of its stated capital by a majority resolution passed at the annual general meeting of shareholders, notwithstanding that a reduction of stated capital generally requires a special resolution of the general meeting of shareholders, provided that such reduction of stated capital would not create distributable surplus amount. The current limitations on the amount that a company may reduce stated capital, additional paid-in capital and legal reserve will be abolished. |
| • | Acquisition by Daiichi Sankyo of Daiichi Sankyo Shares. The acquisition by Daiichi Sankyo of Daiichi Sankyo shares at a price not exceeding the then-market price would no longer trigger the right of other shareholders to have their shares included in such acquisition. The current restrictions on the sources of funds that may be used by Daiichi Sankyo to acquire its own shares would be integrated into the same restrictions on the sources of funds that may be used for annual and semi-annual dividends. These integrated restrictions would be applicable to any distribution of assets to the shareholders with certain exceptions. |
186
Table of Contents
Japanese Foreign Exchange Controls
The Foreign Exchange and Foreign Trade Law of Japan, as amended, and the cabinet orders and ministerial ordinances thereunder, collectively known as the Foreign Exchange Regulations, set forth, among other things, regulations relating to the receipt by non-residents of Japan of payment with respect to shares to be issued by Daiichi Sankyo and the acquisition and holding of shares by non-residents of Japan and foreign investors, both as defined below. In general, the Foreign Exchange Regulations as currently in effect do not affect transactions between exchange non-residents of Japan to purchase or sell Daiichi Sankyo shares outside Japan for non-Japanese currencies.
Exchange non-residents of Japan are individuals who are not resident in Japan and corporations whose principal offices are located outside Japan. Generally, the branches and offices of non-resident corporations which are located in Japan are regarded as residents of Japan while the branches and offices of Japanese corporations located outside Japan are regarded as non-residents of Japan.
Foreign investors are (i) individuals not resident in Japan, (ii) corporations which are organized under the laws of foreign countries or whose principal offices are located outside Japan and (iii) corporations organized in Japan not less than 50% of the voting rights of which are directly or indirectly held by (i) and/or (ii), or a majority of the directors or officers (or directors or officers having the power of representation) of which are non-resident individuals.
In general, the acquisition of shares of a Japanese company listed on any Japanese stock exchange or traded on the over-the-counter market in Japan by a non-resident of Japan from an exchange resident of Japan may be made without any restriction, except as mentioned below. However, a report by the relevant exchange resident of Japan to the Minister of Finance must be filed following the transfer of shares to the exchange non-resident of Japan, unless the consideration for such transfer is ¥100 million or less or such transfer is made through a bank, securities company or financial futures trader as licensed under the relevant Japanese laws.
If a foreign investor acquires shares of a Japanese company listed on a Japanese stock exchange or traded on an over-the-counter market in Japan and as a result of such acquisition (regardless of the person from or through whom it acquires the shares), aggregated with existing holdings (if any), the foreign investor directly or indirectly holds 10% or more of the issued shares of the relevant company, the foreign investor is, in general, required to report such acquisition to the Minister of Finance and any other competent Ministers within 15 days from and including the date of such acquisition. In certain exceptional cases, a prior notification is required in respect of such an acquisition.
Under the Foreign Exchange Regulations, dividends paid on, and the proceeds of sales in Japan of, Daiichi Sankyo shares held by exchange non-residents may in general be converted into any foreign currency and repatriated abroad. The acquisition of Daiichi Sankyo shares by exchange non-residents by way of stock split is not subject to any of the foregoing notification or reporting requirements.
Reporting of Substantial Shareholdings
The Securities and Exchange Law requires any person who has become, beneficially and solely or jointly, a holder of more than 5% of the total issued voting shares of capital stock of a company listed on any Japanese stock exchange or whose shares are traded on the over-the-counter market to file a report concerning such shareholdings with the director-general of the competent Local Finance Bureau of the Ministry of Finance within five business days. A similar report must also be made if the percentage of such holding subsequently increases or decreases 1% or more or if any change occurs in material matters set out in reports previously filed. For this purpose, voting shares issuable or transferable to such person upon his or her exchange of exchangeable securities, conversion of convertible securities or exercise of warrants or stock acquisition rights (including those incorporated in bonds with stock acquisition rights) are taken into account in determining both the size of his or her holding and the issuer’s total issued share capital. In general, copies of any reports must also be furnished to the company and to all Japanese stock exchanges on which the shares are listed or, in the case of shares traded on the over-the-counter market, the relevant securities dealers association.
187
Table of Contents
COMPARISON OF SHAREHOLDERS’ RIGHTS
Each of Daiichi and Sankyo is, and Daiichi Sankyo will be, a joint stock company organized under the laws of Japan, and the common stock of each of Daiichi and Sankyo is, and of Daiichi Sankyo will be, listed on the First Section of the Tokyo Stock Exchange and regional stock exchanges in Japan. In addition, the description of the attributes of shares of common stock in the articles of incorporation of each of Daiichi and Sankyo, and the expected articles of incorporation of Daiichi Sankyo, are substantially similar. As a result, there are no material differences in the legal rights of holders of Daiichi Sankyo common stock as compared to either Daiichi common stock or Sankyo common stock.
188
Table of Contents
You are urged to consult your own tax advisor regarding the United States federal, state and local and the Japanese and other tax consequences of the joint share transfer and of owning and disposing of Daiichi Sankyo shares in your particular circumstances. |
Japanese Tax Consequences
Following is a summary of the principal Japanese tax consequences of the joint share transfer and the ownership and disposition of Daiichi Sankyo shares to non-resident individuals of Japan or non-Japanese corporations without a permanent establishment in Japan which hold Daiichi or Sankyo shares. The statements regarding Japanese tax laws set out below are based on the laws in force and interpreted by the Japanese taxation authorities as of the date hereof and are subject to changes in the applicable Japanese laws or tax treaties, conventions or agreements or in the interpretation thereof after that date. This summary is not exhaustive of all possible tax considerations which may apply to a particular shareholder and shareholders are urged to consult their own tax advisors as to the overall tax consequences of the joint share transfer and the ownership and disposition of Daiichi Sankyo shares, including specifically the tax consequences under Japanese law, the laws of the jurisdiction of which they are resident, and any tax treaty, convention or agreement between Japan and their country of residence.
A “non-resident holder” means a holder of Daiichi shares, Sankyo shares or Daiichi Sankyo shares, as the case may be, who is a non-resident individual of Japan or a non-Japanese corporation without a permanent establishment in Japan.
The Joint Share Transfer
In the opinion of Nagashima Ohno & Tsunematsu, Japanese counsel to Daiichi on Japanese tax matters, and Mori Hamada & Matsumoto, Japanese counsel to Sankyo on Japanese tax matters, which in each case is based on certain representations made by Daiichi and Sankyo, and customary factual assumptions and subject to certain limited exceptions and certain qualifications, (i) shareholders of Daiichi or Sankyo will not recognize any income, gains or losses for Japanese tax purposes with respect to Daiichi Sankyo shares received in exchange for Daiichi or Sankyo shares, (ii) as more fully described below, the cash payments to be received by shareholders of each of Daiichi and Sankyo from Daiichi Sankyo as a substitute for interim dividends otherwise payable by each of Daiichi and Sankyo should be treated, for purposes of Japanese income taxation, as dividends from Daiichi or Sankyo, as the case may be, and subject to Japanese income taxes as such, and (iii) with respect to any cash received in lieu of fractional shares of Daiichi Sankyo common stock upon the joint share transfer, such cash shall be deemed to be sales proceeds for such fractional shares and, consequently, shareholders of Daiichi or Sankyo will recognize capital gains or losses for Japanese tax purposes depending on their respective tax basis for the Daiichi or Sankyo shares exchanged for such fractional shares. However, non-resident holders of Daiichi or Sankyo shares (including those who are U.S. residents fully entitled to the treaty benefits) will not be subject to Japanese income taxation with respect to such gains, if any.
In the joint share transfer, in exchange for their Daiichi or Sankyo shares, shareholders of Daiichi or Sankyo will receive Daiichi Sankyo shares and a cash payment from Daiichi Sankyo as a substitute for interim dividends otherwise payable by each of Daiichi and Sankyo. No other cash or other assets will be paid or given to shareholders of Daiichi or Sankyo, except that if any shareholder of Daiichi or Sankyo is entitled to receive cash in lieu of any fractional shares of Daiichi Sankyo common stock resulting from the joint share transfer, such shareholder will receive cash in lieu of such fractional shares. The Daiichi Sankyo shares representing the aggregate of all such fractional shares will be sold in the Japanese market or sold to Daiichi Sankyo itself and the net cash proceeds from the sale will be distributed to such shareholders on a proportionate basis, with any fractional yen amounts to be rounded up.
189
Table of Contents
The representations upon which the above opinion is based include, among others, a representation by each of Daiichi and Sankyo that:
| • | upon effectiveness of the joint share transfer Daiichi Sankyo will book (i) each share of Daiichi at a price not more than the amount obtained by dividing the net asset book value of Daiichi for Japanese tax purposes by the total issued shares of Daiichi as of the time immediately before the effective date of the joint share transfer and (ii) each share of Sankyo at a price not more than the amount obtained by dividing the net asset book value of Sankyo for Japanese tax purposes by the total issued shares of Sankyo as of the time immediately before the effective date of the joint share transfer; and |
| • | (i) the aggregate value of Daiichi Sankyo shares allotted to shareholders of Daiichi in exchange for Daiichi shares will represent 95% or more of the total of the said aggregate value of Daiichi Sankyo shares and the aggregate of any cash or other assets given to shareholders of Daiichi in the joint share transfer and (ii) the aggregate value of Daiichi Sankyo shares allotted to shareholders of Sankyo in exchange for Sankyo shares will represent 95% or more of the total of the said aggregate value of Daiichi Sankyo shares and the aggregate of any cash or other assets given to shareholders of Sankyo in the joint share transfer. |
The opinion described above is subject to the qualification, among others, that the amount of the per share cash payments described above contemplated to be paid to shareholders of each of Daiichi and Sankyo is paid pursuant to the terms of the joint share transfer agreement as an amount as a substitute for interim cash dividends for the six-month period ending September 30, 2005, and that each such amount is not more than the amount which each of Daiichi and Sankyo would have paid to its respective shareholders had Daiichi and Sankyo not agreed to implement the joint share transfer.
There are no statutory provisions in the Japanese income tax laws which explicitly address the tax treatment of any cash payment to be made upon a share transfer as a substitute for dividends (or interim dividends, as the case may be). Nevertheless, it is generally understood to be the practice of the Japanese tax authorities that any such cash payment to be made upon a share transfer as a substitute for dividends will be treated as dividends, so long as the economic substance of cash payment is dividends. Based on such practice, the cash payments to be paid to a non-resident holder of Daiichi or Sankyo shares should be treated as dividends and subject to Japanese withholding tax in the same manner and at the same rate as applicable to dividends to be paid on Daiichi Sankyo shares, as referred to below. However, the language of the relevant tax law is not necessarily clear whether the withholding tax rate to be applied to such cash payments would be the 7% rate applicable to dividends paid with respect to shares traded on qualified stock exchanges or over-the-counter markets, or 20% applicable to dividends paid with respect to any other shares since Daiichi shares and Sankyo shares will have been delisted for procedural reason as more fully described in item 19 of “Questions And Answers About the Joint Share Transfer and Voting Procedures for the General Meetings” of this prospectus at the time when the shareholders who are entitled to receive such cash payment are determined. If such cash payment fails to be qualified as being treated as dividends for any reason, a portion of Daiichi or Sankyo shares, as the case may be, corresponding to all or a portion of such cash payment will be deemed to have been sold, and consequently, shareholders of Daiichi or Sankyo, as the case may be, receiving such cash payment will recognize capital gains or losses, to a certain extent, for Japanese tax purposes depending on the respective tax basis of their shares. However, in such case, non-resident holders of Daiichi or Sankyo shares (including those who are U.S. residents fully entitled to the treaty benefits) will not be subject to Japanese income taxation with respect to such gains, if any.
Ownership and Disposition of Daiichi Sankyo Shares
Subject to any applicable income tax treaty as discussed below, a non-resident holder of Daiichi Sankyo shares will be subject to Japanese withholding tax on dividends paid by Daiichi Sankyo unless some special exemption is applicable to such non-resident holder under Japanese income tax law, and Daiichi Sankyo will withhold such tax upon payment of dividends. Stock splits are not subject to Japanese income tax or corporation tax.
190
Table of Contents
Under Japanese tax law, the rate of Japanese withholding tax applicable to dividends paid by Daiichi Sankyo to non-resident holders of its shares is, in principle, 20%. However, with respect to dividends paid on shares issued by a Japanese corporation and traded on any qualified stock exchange or over-the-counter market (such as Daiichi Sankyo shares following the listing of such shares on the Tokyo Stock Exchange) to any shareholders who are non-resident holders, except for any individual shareholder who holds 5% or more of the total issued shares of the relevant Japanese corporation, the aforementioned 20% withholding tax rate is reduced to (i) 7% for dividends due and payable on or before March 31, 2008, and (ii) 15% for dividends due and payable on or after April 1, 2008. Accordingly, so long as Daiichi Sankyo shares remain listed following their listing on the Tokyo Stock Exchange, the above-mentioned reduced withholding tax rate will be applied with respect to dividends to be paid on Daiichi Sankyo shares to any non-resident holder (other than those who are individuals holding 5% or more of the total Daiichi Sankyo issued shares).
As at the date hereof, Japan has income tax treaties, conventions or agreements which generally provide that the rate of withholding tax for non-resident holders who are portfolio investors shall not exceed 15% with,inter alia, Australia, Belgium, Canada, Denmark, Finland, France, Germany, Ireland, Italy, Luxembourg, the Netherlands, New Zealand, Norway, Singapore, Spain, Sweden, Switzerland and the United Kingdom. In the case of the Convention Between the Government of Japan and the Government of the United States for the Avoidance of Double Taxation and the Prevention of Fiscal Evasion with Respect to Taxes on Income, referred to herein as the Treaty, a maximum withholding tax rate of 10% rather than a rate of 15% will be generally applicable to dividends declared by Daiichi Sankyo and paid to non-resident holders of Daiichi Sankyo shares who are U.S. resident portfolio investors, and dividends declared by Daiichi Sankyo and paid to pension funds which are qualified U.S. residents eligible for treaty benefits will be exempt from Japanese income taxation by way of withholding or otherwise unless such dividends are derived from the carrying on of a business, directly or indirectly, by such pension funds. For purposes of this paragraph, a portfolio investor means a shareholder who holds less than 10% of the voting shares of Daiichi Sankyo. Whether a non-resident holder of Daiichi Sankyo shares qualifies for the full benefits of the Treaty depends on such non-resident holder’s individual circumstances and on whether such non-resident holder satisfies a number of conditions, including conditions specified in Article 22 (with respect to limitation of benefits) of the Treaty. Likewise, whether a non-resident holder of Daiichi Sankyo shares qualifies for the full benefits of any other treaty depends on such non-resident holder’s individual circumstances and on whether such non-resident holder satisfies a number of conditions specified in the relevant treaty. If you are a non-resident holder of Daiichi Sankyo shares, you are urged to consult your own tax advisor regarding whether you are a resident of any jurisdiction for purposes of any treaty (including the Treaty), and whether you qualify for the full benefits of such treaty.
A non-resident holder of Daiichi Sankyo shares who will be entitled, under an applicable income tax treaty, to a reduced rate of, or exemption from, Japanese withholding tax below the rate otherwise applicable under Japanese tax law referred to in item (i) or (ii) above, as the case may be, with respect to the dividends to be paid by Daiichi Sankyo on its shares is required to submit an Application Form for Income Tax Convention Regarding Relief from Japanese Income Tax on Dividends in advance through Daiichi Sankyo to the relevant Japanese tax authority before payment of dividends. A non-resident holder of Daiichi Sankyo shares who is entitled, under any applicable tax treaty, to a reduced rate of Japanese withholding tax below the rate otherwise applicable under Japanese tax law mentioned above, or to an exemption from Japanese withholding tax, as the case may be, but fails to submit the required application in advance will be entitled to claim the refund of withholding taxes withheld in excess of the rate under an applicable tax treaty (if such non-resident holder is entitled to a reduced treaty rate under the applicable tax treaty) or the full amount of tax withheld (if such non-resident holder is entitled to an exemption under the applicable tax treaty), as the case may be, from the relevant Japanese tax authority. Daiichi Sankyo does not assume any responsibility to ensure withholding at the reduced treaty rate, or exemption therefrom, for shareholders who would be eligible under an applicable tax treaty but who do not follow the required procedures as stated above.
Gains derived from the sale of Daiichi Sankyo shares outside Japan by a non-resident holder of Daiichi Sankyo shares, who is a portfolio investor, will not be subject to Japanese income tax or corporation tax. For
191
Table of Contents
purposes of this paragraph, a non-resident holder of Daiichi Sankyo shares is a portfolio investor if, subject to a certain limited exception, such non-resident holder holds, when aggregated with such non-resident holder’s related persons’ holdings of Daiichi Sankyo shares, less than 25% of the total issued Daiichi Sankyo shares at all times during a three-year period preceding the end of the fiscal year in which such non-resident holder disposes of Daiichi Sankyo shares and derives gains therefrom. A non-resident holder is urged to consult its own tax advisor regarding whether it will be subject to Japanese income tax or corporation tax with respect to gains derived by it from the sale of Daiichi Sankyo shares. If such non-resident holder is a U.S. resident eligible for treaty benefits under the Treaty, such non-resident holder will be exempt, by virtue of the Treaty, from Japanese income tax and corporation tax with respect to gains derived from the sale of Daiichi Sankyo shares held by such non-resident holder regardless of whether or not such non-resident holder is a portfolio investor. Whether such U.S. resident qualifies for the full benefits of the Treaty depends on such U.S. resident’s individual circumstances and on whether such U.S. resident satisfies a number of conditions, including conditions specified in Article 22 (with respect to limitation of benefits) of the Treaty.
Japanese inheritance tax or gift tax at progressive rates may be payable by an individual, wherever resident, who has acquired Daiichi Sankyo shares as legatee, heir or donee even if the individual is not a Japanese resident. Whether or not any Japanese inheritance tax or gift tax will become payable by such individual depends on the individual circumstances, including,inter alia, whether such individual is eligible for various allowances and deductions in calculating the tax base of the Japanese inheritance tax or gift tax. An individual who has acquired Daiichi Sankyo shares as legatee, heir or donee is urged to consult with his or her own tax advisor regarding whether any Japanese inheritance tax or gift tax will be payable.
United States Tax Consequences
The following summary sets forth the material U.S. federal income tax consequences of the joint share transfer to holders of Daiichi or Sankyo shares, and describes the material U.S. federal income tax consequences of holding Daiichi Sankyo shares. This summary, to the extent it states matters of law or legal conclusions and subject to the qualifications and exceptions stated herein, represents the opinion of Simpson Thacher & Bartlett LLP, U.S. tax counsel to the companies. The discussion is applicable to you if you are a U.S. holder (as defined below) and you have held either Daiichi shares or Sankyo shares as capital assets within the meaning of section 1221 of the U.S. Internal Revenue Code of 1986, as amended (the “Code”), and will hold Daiichi Sankyo shares as capital assets.
Except where noted, this summary does not deal with holders that are subject to special rules, such as the following:
| • | dealers in securities or currencies; |
| • | traders in securities that elect to use a mark-to-market method of accounting for their securities holdings; |
| • | persons liable for the alternative minimum tax; |
| • | financial institutions; |
| • | tax-exempt entities; |
| • | insurance companies; |
| • | persons holding Daiichi, Sankyo, or Daiichi Sankyo shares as part of a hedging, integrated, conversion or constructive sale transaction or a straddle; |
| • | persons owning (directly or indirectly) 10% or more of the voting shares of Daiichi or Sankyo; |
192
Table of Contents
| • | persons owning (directly or indirectly) 5% or more of either the total voting power or the total value of the shares of Daiichi Sankyo; or |
| • | persons whose “functional currency” is not the U.S. dollar. |
In addition, the following discussion is based on the provisions of the Code, and regulations, rulings and judicial decisions issued under the Code at the date of this prospectus. These authorities may be repealed, revoked or modified so as to result in U.S. federal income tax consequences different from those discussed below. None of Daiichi, Sankyo, or Daiichi Sankyo has requested a ruling from the U.S. Internal Revenue Service (the “IRS”) with respect to any of the U.S. federal income tax consequences of the joint share transfer and, as a result, there can be no assurance that the IRS will not disagree with or challenge any of the conclusions described below, or that such conclusions, if challenged, will be upheld by a court.
This summary does not contain a detailed description of all the U.S. federal income tax consequences to you in light of your particular circumstances and does not address the effects of any state, local or non-U.S. tax laws (or other U.S. federal tax consequences, such as U.S. federal estate or gift tax consequences). You are urged to consult your own tax advisor concerning the U.S. federal income tax consequences of the joint share transfer and the ownership or disposition of Daiichi Sankyo shares in light of your particular situation, as well as any consequences arising under the laws of any other taxing jurisdiction.
You are a “U.S. holder” if you are a beneficial holder of Daiichi, Sankyo, or Daiichi Sankyo shares and if you are for U.S. federal income tax purposes:
| • | an individual who is a citizen or resident of the United States; |
| • | a corporation (or other entity treated as a corporation) created or organized in or under the laws of the United States or any political subdivision thereof; |
| • | an estate, the income of which is subject to U.S. federal income taxation regardless of its source; or |
| • | a trust (i) that is subject to the supervision of a court within the United States and one or more United States persons have the authority to control any substantial decisions of the trust or (ii) that has a valid election in effect under applicable Treasury Regulations to be treated as a United States person. |
If a partnership holds either Daiichi or Sankyo shares or will hold Daiichi Sankyo shares, the tax treatment of a partner will generally depend upon the status of the partner and the activities of the partnership. If you are a partner of a partnership holding the shares just described, you should consult your tax advisor.
The Joint Share Transfer
Treatment of the Joint Share Transfer
The proper U.S. federal income tax treatment of the joint share transfer is uncertain and depends on future events that cannot be presently known. Simpson Thacher & Bartlett LLP therefore expresses no opinion as to the U.S. federal income tax consequences of the joint share transfer.
The joint share transfer agreement between Daiichi and Sankyo contemplates the integration of the prescription pharmaceutical operations of the companies in or around April 2007. In light of this intention to pursue a subsequent business combination, the joint share transfer and the subsequent business combination may be treated for U.S. federal income tax purposes as forming a single integrated transaction. However, because the form of the subsequent business combination has not been chosen, the U.S. federal income tax consequences of the overall transaction (of which the joint share transfer represents only the first step) cannot presently be determined.
Unless Daiichi Sankyo gives notice to U.S. holders of Daiichi or Sankyo shares pursuant to its undertaking described below, Daiichi Sankyo intends to take the position that the joint share transfer will be treated as a taxable exchange for U.S. federal income tax purposes. As a result, a U.S. holder will generally
193
Table of Contents
recognize taxable gain or loss measured by the difference between (i) the sum of (A) the fair market value (in U.S. dollars) of the Daiichi Sankyo shares received in exchange for Daiichi or Sankyo shares and (B) the amount of cash received (including cash received from Daiichi Sankyo in lieu of interim cash dividends for the six-month period ending September 30, 2005 which each of Daiichi and Sankyo would have paid to its respective shareholders had Daiichi and Sankyo not agreed to implement the joint share transfer, as well as cash received in lieu of fractional shares) in the joint share transfer and (ii) the tax basis of the Daiichi or Sankyo shares exchanged. See “The Joint Share Transfer—Taxation of Capital Gains” below. However, there can be no assurance that the IRS or a court will agree with Daiichi Sankyo’s position.
Depending on the form of the contemplated subsequent combination of Daiichi’s and Sankyo’s operations, it is possible that the integrated transaction comprising the joint share transfer and the subsequent business combination may qualify as a “reorganization” for U.S. federal income tax purposes with respect to holders (prior to the joint share transfer) of Sankyo shares, or with respect to both holders (prior to the joint share transfer) of Sankyo shares and of Daiichi shares. Therefore, Daiichi Sankyo intends to consider, as soon as practicable after the form of the subsequent combination of Daiichi’s and Sankyo’s operations is chosen, whether the joint share transfer and the subsequent business combination, viewed as an integrated transaction, qualify as a “reorganization” with respect to Sankyo shareholders and (separately) with respect to Daiichi shareholders. Daiichi Sankyo will also undertake to notify both U.S. holders of Sankyo shares and of Daiichi shares who participate in the joint share transfer of the position it intends to take regarding whether “reorganization” treatment applies as soon as is practicable. However, there can be no assurance that the IRS or a court will agree with Daiichi Sankyo’s position. Moreover, notification regarding Daiichi Sankyo’s position may not be made until shortly before the date of the subsequent integration of the prescription pharmaceutical operations of the companies as currently contemplated. Unless Daiichi Sankyo notifies U.S. holders that, with respect to the Sankyo or Daiichi shares surrendered in the joint share transfer, it intends to take the position that the joint share transfer forms a part of an integrated transaction that qualifies as a “reorganization” for U.S. federal income tax purposes, Daiichi Sankyo shall take the position that the joint share transfer is a taxable exchange, with consequences as described above.
If the integrated transaction comprising the joint share transfer and the subsequent business combination of Daiichi and Sankyo qualifies as a “reorganization” for U.S. federal income tax purposes with respect to a U.S. holder of Daiichi or Sankyo shares, and if Daiichi Sankyo notifies such holder to that effect, then, subject to the discussion under “Passive Foreign Investment Company” below, the material U.S. federal income tax consequences to such holder of the joint share transfer will be as follows:
| • | gain (but not loss) will be recognized on the exchange of Daiichi shares or Sankyo shares (as applicable) for shares of Daiichi Sankyo pursuant to the joint share transfer to the extent of cash received in the joint share transfer; |
| • | the gain (if any) realized on the exchange will equal the excess (if any) of (i) the sum of (A) the fair market value (in U.S. dollars) of the Daiichi Sankyo shares received in exchange for Daiichi or Sankyo shares and (B) the amount of cash received (including cash received from Daiichi Sankyo in lieu of interim cash dividends for the six-month period ending September 30, 2005 which each of Daiichi and Sankyo would have paid to its respective shareholders had Daiichi and Sankyo not agreed to implement the joint share transfer, as well as cash received in lieu of fractional shares) in the joint share transfer over (ii) the tax basis of the Daiichi or Sankyo shares exchanged; |
| • | the aggregate tax basis of Daiichi Sankyo shares received by the holder in exchange for Daiichi or Sankyo shares (as applicable) will equal the aggregate tax basis of the U.S. holder’s Daiichi or Sankyo shares (as applicable) exchanged in the joint share transfer, increased by the amount of gain recognized on the exchange; |
| • | the holding period of the shares of Daiichi Sankyo received in the joint share transfer will include the holding period of the Daiichi or Sankyo shares (as applicable) exchanged for the Daiichi Sankyo shares; and |
194
Table of Contents
| • | if the holder acquired different blocks of Daiichi or Sankyo shares (as applicable) at different times and at different prices, the basis and holding period of the shares of Daiichi Sankyo the holder receives in the joint share transfer will be determined separately with respect to each block of the Daiichi or Sankyo shares (as applicable) exchanged for the Daiichi Sankyo shares and the stock of Daiichi Sankyo received by the holder will be allocated pro rata to each such block of stock. |
U.S. holders are urged to consult their own tax advisors regarding the treatment of the joint share transfer for U.S. federal income tax purposes.
Taxation of Capital Gains
A Daiichi or Sankyo shareholder who exercises appraisal rights will recognize taxable capital gain or loss based upon the difference between the amount of cash received by such holder and the holder’s tax basis in the shares of Daiichi or Sankyo shares exchanged.
Subject to the discussion under “Passive Foreign Investment Company” below, gain or loss recognized by a U.S. holder of Daiichi or Sankyo shares upon the joint share transfer or upon the exercise of dissenter’s appraisal rights will constitute capital gain or loss and will constitute long-term capital gain or loss if the U.S. holder’s holding period is greater than 12 months as of the date of the joint share transfer. See “Ownership and Disposition of Daiichi Sankyo Shares – Taxation of Capital Gains” below. The computation of a U.S. holder’s holding period of Daiichi or Sankyo shares is a complex matter and must take into account factors such as offsetting positions which such U.S. holder may have taken with respect with such shares. U.S. holders are urged to consult their own tax advisors regarding the computation of their holding periods with respect to Daiichi or Sankyo shares.
Any gain realized by a U.S. holder will be treated as U.S. source income for U.S. foreign tax credit purposes. Therefore, a U.S. holder may not be able to utilize foreign tax credits in respect of Japanese withholding taxes imposed on cash payments made to such U.S. holder unless such holder has other foreign source income in the appropriate class for U.S. foreign tax credit purposes.
Ownership and Disposition of Daiichi Sankyo Shares
The following discussion is applicable to you if (i) you are a resident of the United States for purposes of the current tax treaty between the United States and Japan (the “Treaty”), (ii) your holding of Daiichi Sankyo shares is not, for purposes of the Treaty, effectively connected with a permanent establishment in Japan, and (iii) you otherwise qualify for the full benefits of the Treaty. Whether you satisfy these requirements and thus qualify for the full benefits of the Treaty depends on your individual circumstances and on whether you satisfy a number of conditions, including conditions specified in Article 22 (with respect to limitation of benefits) of the Treaty. You are urged to consult your own tax advisor regarding whether you are a resident of the United States for purposes of the Treaty, whether your holding of Daiichi Sankyo shares is, for purposes of the Treaty, effectively connected with a permanent establishment in Japan, and whether you qualify for the full benefits of the Treaty.
Taxation of Dividends
Subject to the discussion under “Passive Foreign Investment Company” below, the gross amount of dividends paid to you with respect to Daiichi Sankyo shares, including amounts withheld to reflect Japanese withholding taxes, will be treated as dividend income to you, to the extent paid out of Daiichi Sankyo’s current or accumulated earnings and profits, as determined under U.S. federal income tax principles. This income will be includable in your gross income on the day you actually or constructively receive it. These dividends will not be eligible for the dividends received deduction allowed to corporations under the Code. To the extent amounts paid with respect to Daiichi Sankyo shares were to exceed Daiichi Sankyo’s current and accumulated earnings and
195
Table of Contents
profits, those amounts would not be dividends but would instead be treated first as a tax-free return of capital reducing a U.S. holder’s basis in the Daiichi Sankyo shares until such basis is reduced to zero, and then as gain from the sale of the Daiichi Sankyo shares.
With respect to individual U.S. holders, for taxable years beginning before January 1, 2009, certain dividends paid by a qualified foreign corporation and received by such holders may be subject to reduced rates of taxation. A qualified foreign corporation includes a foreign corporation that is eligible for the benefits of an income tax treaty with the United States that meets certain requirements. The U.S. Treasury Department has determined that the Treaty meets these requirements. In addition, it is expected that Daiichi Sankyo will be eligible for the benefits of the Treaty. However, individuals who do not hold Daiichi Sankyo shares for at least 61 days during the 121 day period beginning 60 days before the date on which such shares becomes ex-dividend (during which minimum holding period they are not protected from the risk of loss) or that elect to treat the dividends as “investment income” pursuant to Section 163(d)(4) of the Code will not be eligible for the reduced rates of taxation. In addition, the rate reduction will not apply to dividends if the recipient of a dividend is obligated to make related payments with respect to positions in substantially similar or related property. This disallowance applies even if the minimum holding period has been met. U.S. holders should consult their own tax advisors regarding the application of the foregoing rules to their particular circumstances.
The amount of any dividend paid in yen will equal the U.S. dollar value of the yen received calculated by reference to the exchange rate in effect on the date the dividend is received by the U.S. holder regardless of whether the yen are converted into U.S. dollars. If the yen received as a dividend is not converted into U.S. dollars on the date of receipt, a U.S. holder will have a basis in the yen equal to its U.S. dollar value on the date of receipt. Any gain or loss realized on a subsequent conversion or other disposition of the yen will be treated as ordinary income or loss.
Subject to certain limitations, Japanese tax on dividends withheld at a rate not in excess of the rate prescribed by the Treaty will be treated as foreign taxes eligible for credit or deduction against your U.S. federal income tax liability. See “—Japanese Taxation” for a discussion of the Japanese withholding tax and, if applicable, how to obtain the reduced withholding tax rate. Special rules apply in determining the foreign tax credit limitation with respect to dividends that are subject to the reduced rates. The decision to claim either a credit or a deduction must be made each year, and will apply to all foreign taxes paid by you to any foreign country with respect to that year. Dividends paid on Daiichi Sankyo shares will be treated as income from sources outside the United States and will generally constitute “passive income.” A U.S. holder may not be able to derive effective U.S. foreign tax credit benefits in respect of Japanese withholding taxes imposed on payments on Daiichi Sankyo shares that are not treated as dividend income for U.S. federal income tax purposes unless the holder has other foreign source income in the appropriate class for foreign tax credit purposes. In addition, in certain circumstances foreign tax credits will not be allowed for a U.S. holder that has held Daiichi Sankyo shares for less than a specified minimum period during which it is not protected from risk of loss or is obligated to make payments related to the dividends. The rules relating to the determination of the U.S. foreign tax credit are complex and U.S. holders should consult their tax advisors to determine whether and to what extent a credit would be available.
Taxation of Capital Gains
For U.S. federal income tax purposes, subject to the discussion under “Passive Foreign Investment Company” below, you will recognize taxable gain or loss on any taxable sale or exchange of Daiichi Sankyo shares in an amount equal to the difference between the amount realized for the Daiichi Sankyo shares and your basis in the Daiichi Sankyo shares. The gain or loss will be capital gain or loss. Capital gains of individuals derived with respect to capital assets held for more than one year that are recognized in taxable years beginning before January 1, 2009 are generally taxed as a maximum rate of 15%. The deductibility of capital losses is subject to limitations. Any gain or loss recognized by you will generally be treated as U.S. source gain or loss.
196
Table of Contents
Passive Foreign Investment Company
Each of Daiichi and Sankyo, based on the projected composition of its income and value of its assets (including goodwill), believes that it has not been a passive foreign investment company (“PFIC”) for fiscal years 2004 and 2005, although there can be no assurance in this regard. Neither Daiichi nor Sankyo has made a determination whether it has been a PFIC for fiscal years prior to 2004. If the joint share transfer is treated as a taxable exchange and if either Daiichi or Sankyo is or has been a PFIC at any time during the period in which a U.S. holder held its stock, the exchange of Daiichi or Sankyo shares for Daiichi Sankyo shares will be subject to special rules relating to the disposition of shares in a PFIC described below, which may result in adverse tax consequences to such U.S. holder.
A transaction that would otherwise qualify as a tax-free reorganization with respect to a shareholder will not so qualify if the acquired corporation is or has been a PFIC during the period in which such shareholder held its stock, and the acquiring corporation is not a PFIC after the transaction. Under this rule, if either Daiichi or Sankyo is or has been a PFIC during a U.S. holder’s holding period, the exchange of Daiichi or Sankyo shares for Daiichi Sankyo shares may be deemed a taxable disposition by such U.S. holder, even if such U.S. holder should otherwise be notified by Daiichi Sankyo that the joint share transfer forms a part of an integrated transaction that is treated as a “reorganization” for U.S. federal income tax purposes with respect to such holder. In such case, the U.S. holder would be required to recognize gain, but would not be permitted to recognize loss, on the exchange for U.S. federal income tax purposes. In addition, any gain from such a taxable exchange of PFIC shares would be subject to special rules relating to the disposition of shares in a PFIC described below, which could result in adverse tax consequences to U.S. holders. U.S. holders of shares in Daiichi or Sankyo are strongly urged to consult their U.S. tax advisors regarding the tax consequences of the joint share transfer if either Daiichi or Sankyo is or has been a PFIC. Because the determination of PFIC status is a factual matter, the companies’ U.S. tax counsel expresses no opinion with respect to the companies’ beliefs contained in the preceding paragraph or with respect to either company’s status under the PFIC rules.
Daiichi Sankyo, based on the projected composition of its income and value of its assets, believes that it will not be a PFIC for the current taxable year, nor does it expect to become a PFIC in the future, although there can be no assurance in this regard. However, PFIC status requires a factual determination that is made annually. Accordingly, it is possible that Daiichi Sankyo may become a PFIC in the current or any future taxable year due to changes in valuation or composition of its assets or income. Because the determination of PFIC status is a factual matter, the companies’ U.S. tax counsel expresses no opinion with respect to Daiichi Sankyo’s belief and expectation contained in this paragraph.
Subject to special rules that apply to certain circumstances and certain exceptions, any one of Daiichi, Sankyo, and Daiichi Sankyo (a “Relevant Company”) would be considered a PFIC for any taxable year if either:
| • | at least 75% of its gross income is passive income; or |
| • | at least 50% of the value of its assets is attributable to assets that produce or are held for the production of passive income. |
The 50% of value test is based on the average of the value of a Relevant Company’s assets for each quarter during the taxable year. If a Relevant Company owns at least 25% by value of another company’s stock, the Relevant Company will be treated, for purposes of the PFIC rules, as owning a proportionate share of the assets and receiving a proportionate share of the income of that company.
If Daiichi Sankyo is a PFIC for any taxable year during which you hold its shares, you will be subject to special tax rules with respect to any “excess distribution” that you receive and any gain you realize from the sale or other disposition (including a pledge) of Daiichi Sankyo shares. These special tax rules generally will apply to you even if Daiichi Sankyo ceases to be a PFIC in future years. Distributions you receive in a taxable year that
197
Table of Contents
are greater than 125% of the average annual distributions you received during the shorter of the three preceding taxable years or your holding period for the Daiichi Sankyo shares will be treated as excess distributions. Under these special tax rules:
| • | the excess distribution or gain will be allocated ratably over your holding period for the shares; |
| • | the amount allocated to the current taxable year, and any taxable year prior to the first taxable year in which Daiichi Sankyo becomes a PFIC, will be treated as ordinary income; and |
| • | the amount allocated to each other year will be subject to tax at the highest applicable tax rate in effect for that year, and the interest charge generally applicable to underpayments of tax will be imposed on the resulting tax attributable to each such year. |
Special rules apply for calculating the amount of the foreign tax credit with respect to excess distributions by a PFIC.
Alternatively, you could make a mark-to-market election provided that Daiichi Sankyo shares are regularly traded on a “qualified exchange or other market” for PFIC purposes. We expect Daiichi Sankyo shares to be listed on the Tokyo Stock Exchange following the joint share transfer. Under applicable regulations, in order to be treated as a qualified exchange or other market, a foreign exchange must meet certain trading, listing, financial disclosure and other requirements. We believe that the Tokyo Stock Exchange meets such requirements. In addition, for Daiichi Sankyo shares to be considered regularly traded, such shares must be traded in more thande minimis quantities on at least 15 days during each calendar quarter. No assurance can be given, therefore, that Daiichi Sankyo shares will be considered regularly traded for these purposes. You should consult your tax advisor as to whether the mark-to market election is available if Daiichi Sankyo were to be treated as a PFIC in any taxable year.
A U.S. holder that makes a valid mark-to-market election in the first year in which Daiichi Sankyo is a PFIC will not be subject to the special tax rules described above. Instead, subject to special rules that apply to certain circumstances and certain exceptions, such holder will include in each year as ordinary income, rather than capital gain, the excess, if any, of the fair market value of its Daiichi Sankyo shares at the end of the year over its adjusted basis in such shares and will be permitted an ordinary loss in respect of the excess, if any, of its adjusted basis in such shares over their fair market value at the end of the year, but only to the extent of the net amount previously included in income as a result of the mark-to-market election. These amounts of ordinary income will not be eligible for the favorable tax rates applicable to qualified dividend income or long-term capital gains described above. An electing U.S. holder’s basis in Daiichi Sankyo shares will be adjusted to reflect any such income or loss amounts. Any gain on the sale of Daiichi Sankyo shares will be ordinary income, and any loss on such sale will be ordinary loss to the extent of the previously included net mark-to-market gain and thereafter capital loss.
If you make a mark-to-market election, it will be effective for the taxable year for which the election is made and all subsequent taxable years unless Daiichi Sankyo shares are no longer regularly traded on a qualified exchange or other market or the IRS consents to the revocation of the election. Under proposed U.S. Treasury regulations, mark-to-market inclusions and deductions will be suspended during taxable years in which Daiichi Sankyo is not a PFIC but will resume if Daiichi Sankyo becomes a PFIC again. You are urged to consult your tax advisors about the availability of the mark-to-market election and whether making the election would be advisable in your particular circumstances.
If you hold Daiichi Sankyo shares in any year in which Daiichi Sankyo is classified as a PFIC, you would be required to file IRS Form 8621.
Notwithstanding any elections made regarding Daiichi Sankyo shares, U.S. holders who are individuals will not be eligible for reduced rates of taxation on any payment received from Daiichi Sankyo prior to January
198
Table of Contents
1, 2009 that are characterized as dividends for U.S. federal income tax purposes if Daiichi Sankyo is a PFIC in the taxable year in which such dividends are paid or in the preceding taxable year. You should consult your tax advisor concerning the determination of Daiichi Sankyo’s PFIC status and the U.S. federal income tax consequences of holding Daiichi Sankyo shares if Daiichi Sankyo is considered a PFIC in any taxable year.
Information Reporting and Backup Withholding
In general, information reporting requirements will apply to (i) any cash payments you receive in the joint share transfer, (ii) dividends in respect of the Daiichi Sankyo shares, and (iii) the proceeds received on the sale, exchange or redemption of Daiichi Sankyo shares paid within the United States, and, in some cases, outside of the United States, to you unless you are an exempt recipient, such as a corporation. In addition, backup withholding tax may apply to those amounts if you fail to provide an accurate taxpayer identification number or fail either to report dividends required to be shown on your U.S. federal income tax returns or make certain certifications. The amount of any backup withholding from a payment to you will be allowed as a credit against your U.S. federal income tax liability, provided you furnish the required information to the IRS.
199
Table of Contents
The consolidated financial statements and schedule of Daiichi Pharmaceutical Co., Ltd. as of March 31, 2003 and 2004, and for each of the years in the two-year period ended March 31, 2004 have been included herein in reliance upon the report of KPMG AZSA & Co., independent registered public accounting firm, appearing elsewhere herein and upon the authority of said firm as experts in accounting and auditing.
The consolidated financial statements of Sankyo at March 31, 2003 and 2004, and for each of the years then ended, appearing in this Prospectus and Registration Statement have been audited by Ernst & Young ShinNihon, independent registered public accounting firm, as set forth in their report thereon appearing elsewhere herein, and are included in reliance upon such report given on the authority of such firm as experts in accounting and auditing.
The legality of the Daiichi Sankyo common stock offered hereby will be passed upon for Daiichi by Nagashima Ohno & Tsunematsu and for Sankyo by Mori Hamada & Matsumoto. Simpson Thacher & Bartlett LLP, counsel to Daiichi Sankyo, has consented to the inclusion of its opinion under the heading “Taxation—United States Tax Consequences.”
200
Table of Contents
WHERE YOU CAN FIND MORE INFORMATION
Each of Daiichi and Sankyo is a “foreign private issuer” and, under the rules adopted under the Exchange Act, is exempt from some of the requirements of that Act, including the proxy and information provisions of Section 14 of the Exchange Act and the reporting and liability provisions applicable to officers, directors and significant shareholders under Section 16 of the Exchange Act.
Neither Daiichi nor Sankyo has previously had a reporting obligation in the United States under the Securities Exchange Act of 1934. Following the date of this prospectus until the completion of the joint share transfer, Daiichi and Sankyo will be, and following the completion of the joint share transfer, Daiichi Sankyo will be, subject to reporting obligations and any filings they make will be available via the website of the United States Securities and Exchange Commission, or SEC, at www.sec.gov. You may also read and copy any reports, statements or other information filed by Daiichi, Sankyo and, after the joint share transfer, Daiichi Sankyo at the SEC’s Public Reference Room at 100 F Street, N.E., Washington, D.C. 20549. Please call the SEC at 1-800-SEC-0330 for further information on the operation of the Public Reference Room.
You may also obtain copies of this information by mail from the Public Reference Section of the SEC, 450 Fifth Street, N.W., Room 1024, Washington, D.C. 20549, at prescribed rates, or from commercial document retrieval services.
The SEC maintains a website that contains filings by reporting companies, including those filed by Daiichi, Sankyo and, after the joint share transfer, Daiichi Sankyo, at http://www.sec.gov. You may also access the SEC filings and obtain other information about Daiichi and Sankyo through the websites maintained by each of them, which are www.daiichipharm.co.jp/english/ and www.sankyo.co.jp/english/, respectively. The information contained in those websites is not incorporated by reference into this prospectus.
Each of Daiichi and Sankyo files, and following the completion of the joint share transfer, Daiichi Sankyo will file, annual and semi-annual securities reports and other reports, in Japanese, under the Securities Exchange Law of Japan with the applicable local finance bureau in Japan.
After the joint share transfer, Daiichi Sankyo will furnish to you the same annual business reports, in Japanese, including financial statements, that each of Daiichi and Sankyo currently furnishes to its shareholders, unless you notify Daiichi Sankyo of your desire not to receive these reports, as well as proxy statements and related materials for annual and extraordinary general meetings of shareholders.
Neither Daiichi nor Sankyo has authorized anyone to give any information or make any representation about the joint share transfer that is different from, or in addition to, that contained in this prospectus or in any of the materials that are incorporated by reference into this prospectus. Therefore, if anyone does give you information of this sort, you should not rely on it. If you are in a jurisdiction where offers to exchange or sell, or solicitations of offers to exchange or purchase, the securities offered by this prospectus are unlawful, or if you are a person to whom it is unlawful to direct these types of activities, then the offer presented in this prospectus does not extend to you. The information contained in this prospectus speaks only as of the date of this document unless the information specifically indicates that another date applies.
201
Table of Contents
F-1
Table of Contents
(This page is intentionally left blank)
F-2
Table of Contents
Report of Independent Registered Public Accounting Firm
The Board of Directors and Shareholders
Daiichi Pharmaceutical Co., Ltd:
We have audited the consolidated financial statements of Daiichi Pharmaceutical Co., Ltd. (a Japanese corporation) and subsidiaries as listed in the accompanying index. In connection with our audits of the consolidated financial statements, we also have audited the financial statement schedule as listed in the accompanying index. These consolidated financial statements and financial statement schedule are the responsibility of the Company’s management. Our responsibility is to express an opinion on these consolidated financial statements and financial statement schedule based on our audits.
We conducted our audits in accordance with the standards of the Public Company Accounting Oversight Board (United States). Those standards require that we plan and perform the audit to obtain reasonable assurance about whether the financial statements are free of material misstatement. An audit includes examining, on a test basis, evidence supporting the amounts and disclosures in the financial statements. An audit also includes assessing the accounting principles used and significant estimates made by management, as well as evaluating the overall financial statement presentation. We believe that our audits provide a reasonable basis for our opinion.
In our opinion, the consolidated financial statements referred to above present fairly, in all material respects, the financial position of Daiichi Pharmaceutical Co., Ltd. and subsidiaries as of March 31, 2003 and 2004, and the results of their operations and their cash flows for each of the years in the two-year period ended March 31, 2004, in conformity with U.S. generally accepted accounting principles. Also in our opinion, the related financial statement schedule, when considered in relation to the basic consolidated financial statements taken as a whole, presents fairly, in all material respects, the information set forth therein.
/s/ KPMG AZSA & Co.
Tokyo, Japan
February 28, 2005
F-3
Table of Contents
DAIICHI PHARMACEUTICAL CO., LTD. AND SUBSIDIARIES
CONSOLIDATED BALANCE SHEETS
March 31, 2003 and 2004
| Millions of Yen | ||||||||
ASSETS | 2003 | 2004 | ||||||
Current assets: | ||||||||
Cash and cash equivalents | ¥ | 70,266 | ¥ | 65,998 | ||||
Time deposits | 279 | 2,513 | ||||||
Investment securities | 72,203 | 73,421 | ||||||
Trade receivables— | ||||||||
Notes | 10,016 | 9,052 | ||||||
Accounts | 80,265 | 74,866 | ||||||
Less – allowance for doubtful receivables | (317 | ) | (256 | ) | ||||
Inventories | 45,614 | 37,682 | ||||||
Deferred income taxes, net | 17,115 | 18,441 | ||||||
Other current assets | 11,779 | 9,926 | ||||||
Total current assets | 307,220 | 291,643 | ||||||
Property, plant and equipment, at cost: | ||||||||
Land | 17,163 | 17,044 | ||||||
Buildings | 141,230 | 142,656 | ||||||
Machinery and equipment | 157,516 | 161,939 | ||||||
Construction in progress | 946 | 1,221 | ||||||
| 316,855 | 322,860 | |||||||
Less – accumulated depreciation and amortization | (202,692 | ) | (214,221 | ) | ||||
| 114,163 | 108,639 | |||||||
Investment securities | 64,502 | 105,895 | ||||||
Investments in and advances to affiliates | 485 | 542 | ||||||
Goodwill | 5,914 | 5,914 | ||||||
Other intangible assets, net | 22,853 | 23,157 | ||||||
Deferred income taxes, net | 18,715 | 7,675 | ||||||
Lease deposits and other assets | 6,399 | 7,104 | ||||||
Total assets | ¥ | 540,251 | ¥ | 550,569 | ||||
F-4
Table of Contents
| Millions of Yen | ||||||||
LIABILITIES AND SHAREHOLDERS’ EQUITY | 2003 | 2004 | ||||||
Current liabilities: | ||||||||
Current maturities of long-term debt | ¥ | 1,726 | ¥ | 2,036 | ||||
Trade payables— | ||||||||
Notes | 1,477 | 52 | ||||||
Accounts | 33,196 | 31,778 | ||||||
Income taxes payable | 11,539 | 9,963 | ||||||
Accrued expenses | 31,553 | 32,234 | ||||||
Deposits received | 2,365 | 2,418 | ||||||
Other current liabilities | 1,180 | 672 | ||||||
Total current liabilities | 83,036 | 79,153 | ||||||
Long-term debt, less current maturities | 2,727 | 2,650 | ||||||
Accrued pension and severance costs | 45,998 | 38,140 | ||||||
Deferred income taxes | 3,479 | 2,657 | ||||||
Other noncurrent liabilities | 1,486 | 1,247 | ||||||
Total liabilities | 136,726 | 123,847 | ||||||
Minority interests | 5,806 | 4,316 | ||||||
Commitments and contingencies | ||||||||
Shareholders’ equity: | ||||||||
Common stock; | ||||||||
Authorized – 789,000,000 shares | ||||||||
Issued and outstanding – 286,453,235 shares and 275,209,858 shares in 2003 and 286,453,235 shares and 269,700,226 shares in 2004, respectively | 45,247 | 45,247 | ||||||
Additional paid-in capital | 49,797 | 49,958 | ||||||
Retained earnings | 325,359 | 347,877 | ||||||
Accumulated other comprehensive income | 3,502 | 15,724 | ||||||
Treasury stock at cost – 11,243,377 shares in 2003 and 16,753,009 shares in 2004 | (26,186 | ) | (36,400 | ) | ||||
Total shareholders’ equity | 397,719 | 422,406 | ||||||
Total liabilities and stockholders’ equity | ¥ | 540,251 | ¥ | 550,569 | ||||
The accompanying notes to consolidated financial statements are an integral part of these statements.
F-5
Table of Contents
DAIICHI PHARMACEUTICAL CO., LTD. AND SUBSIDIARIES
CONSOLIDATED STATEMENTS OF INCOME
For the Years Ended March 31, 2003 and 2004
| Millions of Yen | ||||||||
| 2003 | 2004 | |||||||
Net Sales | ¥ | 321,926 | ¥ | 322,977 | ||||
Cost and expense: | ||||||||
Cost of sales | 106,955 | 106,475 | ||||||
Selling, general and administrative expenses | 106,859 | 107,869 | ||||||
Research and development expense | 55,505 | 59,718 | ||||||
Operating income | 52,607 | 48,915 | ||||||
Other income (expense): | ||||||||
Interest and dividend income | 1,634 | 1,211 | ||||||
Interest expense | (223 | ) | (190 | ) | ||||
Foreign currency exchange loss, net | (401 | ) | (677 | ) | ||||
(Loss) gain on investment securities | (5,605 | ) | 1,554 | |||||
Equity in losses of affiliates | (172 | ) | (133 | ) | ||||
Other income, net | 218 | 382 | ||||||
Income before income taxes and minority interests | 48,058 | 51,062 | ||||||
Income taxes | 22,634 | 21,812 | ||||||
Minority interests, net of tax | 177 | 1,486 | ||||||
Net income | ¥ | 25,601 | ¥ | 30,736 | ||||
| Yen | ||||||||
| Per share of common stock: | 2003 | 2004 | ||||||
Basic: | ||||||||
Net income | ¥ | 92.25 | ¥ | 112.79 | ||||
Diluted: | ||||||||
Net income | 92.25 | 112.79 | ||||||
Cash dividends per share | 30.00 | 30.00 | ||||||
The accompanying notes to consolidated financial statements are an integral part of these statements.
F-6
Table of Contents
DAIICHI PHARMACEUTICAL CO., LTD. AND SUBSIDIARIES
CONSOLIDATED STATEMENTS OF SHAREHOLDERS’ EQUITY
AND COMPREHENSIVE INCOME
For the Years Ended March 31, 2003 and 2004
| Millions of Yen | ||||||||
| 2003 | 2004 | |||||||
Common stock: | ||||||||
Beginning balance | ¥ | 45,247 | ¥ | 45,247 | ||||
Ending balance | ¥ | 45,247 | ¥ | 45,247 | ||||
Additional paid-in capital: | ||||||||
Beginning balance | ¥ | 49,492 | ¥ | 49,797 | ||||
Stock option transactions | 305 | 161 | ||||||
Ending balance | ¥ | 49,797 | ¥ | 49,958 | ||||
Retained earnings: | ||||||||
Beginning balance | ¥ | 307,835 | ¥ | 325,359 | ||||
Net income for the year | 25,601 | 30,736 | ||||||
Dividends paid | (8,034 | ) | (8,218 | ) | ||||
Issuance of treasury stock in exchange for subsidiary’s stock; 1,331,886 | (43 | ) | — | |||||
Ending balance | ¥ | 325,359 | ¥ | 347,877 | ||||
Accumulated other comprehensive income: | ||||||||
Beginning balance | ¥ | 8,859 | ¥ | 3,502 | ||||
Other comprehensive (loss) income, net of tax | (5,357 | ) | 12,222 | |||||
Ending balance | ¥ | 3,502 | ¥ | 15,724 | ||||
Treasury stock: | ||||||||
Beginning balance | ¥ | (25,405 | ) | ¥ | (26,186 | ) | ||
Purchases of treasury stock; 2,515,896 shares in 2003 and 5,509,632 | (4,145 | ) | (10,214 | ) | ||||
Issuance of treasury stock in exchange for subsidiary’s stock; 1,331,886 | 3,364 | — | ||||||
Ending balance | ¥ | (26,186 | ) | ¥ | (36,400 | ) | ||
Comprehensive income: | ||||||||
Net income for the year | ¥ | 25,601 | ¥ | 30,736 | ||||
Other comprehensive (loss) income for the year, net of tax | (5,357 | ) | 12,222 | |||||
Total comprehensive income for the year | ¥ | 20,244 | ¥ | 42,958 | ||||
The accompanying notes to consolidated financial statements are an integral part of these statements.
F-7
Table of Contents
DAIICHI PHARMACEUTICAL CO., LTD. AND SUBSIDIARIES
CONSOLIDATED STATEMENTS OF CASH FLOWS
For the Years Ended March 31, 2003 and 2004
| Millions of Yen | ||||||||
| 2003 | 2004 | |||||||
CASH FLOWS FROM OPERATING ACTIVITIES: | ||||||||
Net income | ¥ | 25,601 | ¥ | 30,736 | ||||
Adjustments to reconcile net income to net cash provided by operating activities — | ||||||||
Depreciation and amortization | 19,801 | 20,365 | ||||||
Equity in losses of affiliates | 172 | 133 | ||||||
Deferred income taxes | (1,838 | ) | (150 | ) | ||||
Gain on disposals and sales of property, plant and equipment | (430 | ) | (404 | ) | ||||
Loss (gain) on investment securities | 5,605 | (1,554 | ) | |||||
Change in operating assets and liabilities, net of effects of acquisition — | ||||||||
Decrease in trade receivables | 154 | 6,111 | ||||||
Decrease in inventories | 399 | 7,616 | ||||||
Decrease in trade payables | (4,327 | ) | (3,076 | ) | ||||
Decrease in income taxes payable and accrued expenses | (3,426 | ) | (871 | ) | ||||
Decrease in accrued pension and severance costs | (7,874 | ) | (7,528 | ) | ||||
Other, net | (1,999 | ) | 999 | |||||
Net cash provided by operating activities | 31,838 | 52,377 | ||||||
CASH FLOWS FROM INVESTING ACTIVITIES: | ||||||||
Proceeds from sales of property, plant and equipment | 1,199 | 1,191 | ||||||
Capital expenditures | (13,207 | ) | (15,151 | ) | ||||
Payments for purchases of available-for-sale securities | (104,590 | ) | (145,267 | ) | ||||
Payments for purchases of held-to-maturity securities | (30,407 | ) | (52,428 | ) | ||||
Proceeds from sales and maturities of available-for-sale securities | 136,768 | 148,616 | ||||||
Proceeds from maturities of held-to-maturity securities | 28,090 | 31,482 | ||||||
Acquisition of new subsidiary, net of cash acquired | (19,445 | ) | — | |||||
Decrease (increase) in time deposits | 1,931 | (3,939 | ) | |||||
Advances to affiliates | (458 | ) | (37 | ) | ||||
Collections of advances to affiliates | 3,814 | 55 | ||||||
Other, net | (197 | ) | (176 | ) | ||||
Net cash provided by (used in) investing activities | 3,498 | (35,654 | ) | |||||
CASH FLOWS FROM FINANCING ACTIVITIES: | ||||||||
Repayments of long-term debt | (2,003 | ) | (2,332 | ) | ||||
Decrease in short-term borrowings, net | (1,993 | ) | — | |||||
Dividend payments | (8,034 | ) | (8,218 | ) | ||||
Payments for purchases of treasury stock | (4,144 | ) | (10,215 | ) | ||||
Other, net | (52 | ) | (18 | ) | ||||
Net cash used in financing activities | (16,226 | ) | (20,783 | ) | ||||
EFFECT OF EXCHANGE RATE CHANGES ON CASH AND CASH EQUIVALENTS | (511 | ) | (208 | ) | ||||
NET INCREASE (DECREASE) IN CASH AND CASH EQUIVALENTS | 18,599 | (4,268 | ) | |||||
CASH AND CASH EQUIVALENTS AT BEGINNING OF YEAR | 51,667 | 70,266 | ||||||
CASH AND CASH EQUIVALENTS AT END OF YEAR | ¥ | 70,266 | ¥ | 65,998 | ||||
The accompanying notes to consolidated financial statements are an integral part of these statements.
F-8
Table of Contents
Daiichi Pharmaceutical Co., Ltd. and Subsidiaries
Notes to Consolidated Financial Statements
| 1. Business | and Organization and Summary of Significant Accounting Policies |
Business and Organization
DAIICHI PHARMACEUTICAL CO., LTD. (“Daiichi”), a research-based pharmaceutical company, was originally incorporated under the laws of Japan in 1915 as Arsemin Shokai, and was renamed Daiichi in 1918. Daiichi and its subsidiaries (collectively the “Company”) develops, manufactures, and markets a diversified line of innovative products that contribute to better human health throughout the world.
The Company’s business segments are comprised of the following five segments: Pharmaceuticals, Diagnostics, Consumer Healthcare, Fine Chemicals, and Other. The pharmaceuticals segment primarily consists of treatments for infectious and respiratory diseases, cardiovascular diseases, allergies, central nervous system disorders, cancer, dermatological disorders, gastrointestinal disorders, and in vivo imaging agents. The diagnostics segment primarily consists of in vitro diagnostics. The consumer healthcare segment includes self medications for hair growth, inflammatory analgesic, skin care, allergies, upper respiratory health and gastrointestinal health. The fine chemicals segment consists of fine chemical products and raw materials of pharmaceutical products. Others include veterinary and livestock feed products, service businesses such as real estate and travel agency.
The Company conducts overseas business through subsidiaries located in 9 countries, including key countries such as the United States of America, United Kingdom, Germany and China. The manufacturing operations of the Company are conducted at plants in Japan, China and Taiwan.
The Company’s sales to one major wholesaler accounted for approximately 11% of the Company’s net sales for the year ended March 31, 2004, which were recorded principally in the pharmaceuticals segment. Related accounts receivable from the wholesaler totaled ¥9,024 million at March 31, 2004. There was no single customer accounting for in excess of 10% of the Company’s net sales for the year ended March 31, 2003.
Summary of Significant Accounting Policies
(1) Basis of Presentation
Daiichi and its domestic subsidiaries maintain their books and records in conformity with accounting principles and practices generally accepted in Japan (“Japanese GAAP”), and its foreign subsidiaries in conformity with those of the country of their domicile. The consolidated financial statements presented herein have been prepared in a manner and reflect certain adjustments which are necessary to conform them to accounting principles generally accepted in the United States of America (“U.S. GAAP”).
(2) Basis of Consolidation and Investments in Affiliated Companies
The accompanying consolidated financial statements include the accounts of Daiichi and all subsidiaries of which Daiichi directly or indirectly owns more than 50% of the voting shares and, accordingly, is able to exercise control. All significant intercompany balances, transactions and profits have been eliminated. The fiscal year end of Daiichi and the majority of its consolidated subsidiaries is March 31, while the fiscal year end of certain foreign subsidiaries is December 31. Results of these foreign subsidiaries have been included in the consolidated financial statements based on their fiscal year.
The Company’s investments in affiliated companies, in which the Company owns between 20% and 50% of voting shares and has the ability to exercise significant influence over operating and financial policies of the investee, are accounted for by the equity method. The Company’s net income includes the Company’s equity in the current net earnings or losses of such companies after the elimination of unrealized intercompany profits.
F-9
Table of Contents
Daiichi Pharmaceutical Co., Ltd. and Subsidiaries
Notes to Consolidated Financial Statements (continued)
On a continuous basis, but no less frequently than at the end of each semi-annual period, the Company evaluates the carrying amount of its ownership interests in investee companies for possible impairment. Factors considered in assessing whether an indication of other than temporary impairment exists include the achievement of business plan objectives and milestones including cash flow projections and the results of planned financing activities, the financial condition and prospects of each investee company, the fair value of the ownership interest relative to the carrying amount of the investment, the period of time the fair value of the ownership interest has been below the carrying amount of the investment and other relevant factors. Impairment to be recognized is measured based on the amount by which the carrying amount of the investment exceeds the fair value of the investment. Fair value is determined based on quoted market prices, projected discounted cash flows or other valuation techniques as appropriate.
In December 2003, the Financial Accounting Standards Board (“FASB”) issued FASB Interpretation (“FIN”) No. 46 (revised December 2003),Consolidation of Variable Interest Entities-an interpretation of ARB No. 51, which addresses how a business enterprise should evaluate whether it has a controlling financial interest in an entity through means other than voting rights and accordingly should consolidate the entity. FIN No. 46R replaces FIN No. 46, which was issued in January 2003. The adoption of FIN No. 46R did not have any impact on the Company’s financial position or results of operations as it presently does not have investments in variable interest entities.
(3) Cash and Cash Equivalents
Cash and cash equivalents consist of highly liquid investments with original maturities of less than three months, including certificates of deposit.
(4) Accounts Receivable
The allowance for doubtful receivables is the Company’s estimate of the amount of probable credit losses in the Company’s existing accounts receivable. The Company determines the allowance based upon historical write-off experience, adjusted to reflect current economic conditions, and specific customer collection issues, for which it is concluded all amounts due will not be fully recovered. The Company reviews its allowance for doubtful receivables on a quarterly basis. Past due balances over 90 days and over a specified amount are reviewed individually for collectibility. Account balances are charged off against the allowance after all means of collection have been exhausted and the potential for recovery is considered remote.
The Company offers cash discounts to certain customers who make cash payments on outstanding accounts receivable within a specified period. The Company records these cash discounts as a reduction of sales at the time of the related sales. The Company estimates the amount of cash discounts based on historical experience with customers.
(5) Investment securities
The Company accounts for marketable securities in accordance with Statement of Financial Accounting Standards (“SFAS”) No. 115,Accounting for Certain Investments in Debt and Equity Securitiesthat requires all investment in debt securities and marketable equity securities to be classified as either trading, held-to-maturity or available-for-sale securities. Held-to-maturity securities are stated at amortized cost adjusted for the amortization or accretion of premiums or discounts. Available-for-sale securities are stated at fair value with unrealized gains and losses excluded from earnings and such gains or losses are reported as a separate component of accumulated other comprehensive income, net of applicable taxes, until realized. Realized gains or losses on the sale of such securities are determined based on the moving-average cost. The Company owns no investments that are considered to be trading securities.
F-10
Table of Contents
Daiichi Pharmaceutical Co., Ltd. and Subsidiaries
Notes to Consolidated Financial Statements (continued)
Available-for-sale securities, which mature or are expected to be sold in one year, are classified as current assets. Held-to-maturity securities, which mature in one year are classified as current assets.
Held-to-maturity or available-for-sale securities are reduced to fair market value by a charge to income for other than temporary declines in value. Factors considered in assessing whether an indication of other than temporary impairment exists with respect to available-for-sale securities include: length of time and extent of decline, financial condition and near term prospects of issuer and intent and ability of the Company to retain its investments for a period of time sufficient to allow for any anticipated recovery in market value. For debt securities classified as held-to-maturity, the Company evaluates the cost basis of a held to maturity security for possible impairment by taking into consideration the financial condition, business prospects and credit worthiness of the issuer. The published credit ratings of investee companies that are “BB” or lower are considered an indication of other than temporary impairment.
(6) Inventories
Inventories are stated at the lower of cost or market, cost being determined principally by the weighted-average method.
(7) Property, Plant and Equipment
Property, plant and equipment are stated at cost. Depreciation is primarily computed using the declining-balance method over estimated useful lives ranging from 38 to 50 years for buildings and from 4 to 8 years for machinery and equipment.
The cost and accumulated depreciation and amortization applicable to assets retired are removed from the accounts and any resulting gain or loss is recognized. Betterments, renewals, and extraordinary repairs that extend the life of the asset are capitalized. Other maintenance and repair costs are expensed as incurred.
Depreciation expense for the years ended March 31, 2003 and 2004 amounted to ¥16,529 million and ¥17,147 million, respectively, which included amortization of capitalized lease equipment.
Certain leased machinery and equipment are accounted for as capital leases in accordance with SFAS No. 13 Accounting for Leases. The aggregated cost included in machinery and equipment and related accumulated amortization at March 31, 2003 and 2004 were as follows:
| Millions of Yen | ||||||||
| 2003 | 2004 | |||||||
Aggregate cost | ¥ | 8,502 | ¥ | 9,219 | ||||
Accumulated amortization | ¥ | (4,168 | ) | ¥ | (4,617 | ) | ||
The Company adopted the provisions of SFAS No. 143,Accounting for Asset Retirement Obligations, effective April 1, 2003. SFAS No. 143 requires the Company to record the fair value of an asset retirement obligation as a liability in the period in which it incurs a legal obligation associated with the retirement of tangible long-lived assets that result from the acquisition, construction, development, and/or normal use of the assets. The Company would also record a corresponding increase to the carrying amount of the related long-lived asset and depreciate that cost over the life of the asset. Subsequent to the initial measurement of the asset retirement obligation, the obligation would be adjusted at the end of each period to reflect the passage of time and changes in the estimated future cash flows underlying the initial fair value measurement. The adoption of SFAS No. 143 did not have a material effect on the Company’s consolidated financial statements.
F-11
Table of Contents
Daiichi Pharmaceutical Co., Ltd. and Subsidiaries
Notes to Consolidated Financial Statements (continued)
(8) Software for Internal Use
Under the provisions of Statement of Position (“SOP”) 98-1,Accounting for the Costs of Computer Software Developed or Obtained for Internal Use, the Company has capitalized costs associated with software systems for internal use, that have reached the application development stage and meet recoverability tests as capitalized computer software in the accompanying consolidated balance sheets. Such capitalized costs primarily include external direct costs utilized in developing or obtaining the applications. Capitalization of such costs ceases at the point in which the project is substantially complete and ready for its intended use. Costs capitalized are amortized on a straight-line basis over the estimated useful life of each application, principally over 5 years. The Company expenses costs incurred during the preliminary project stage which include costs for making strategic decisions about the project, and determining performance and system requirements. The Company also expenses costs incurred for internal-use software in the post-implementation stage such as training costs.
(9) Impairment or Disposal of Long-Lived Assets
The Company accounts for impairment of long-lived assets in accordance with the provisions of SFAS No. 144,Accounting for the Impairment or Disposal of Long-Lived Assets. Long-lived assets, such as property, plant and equipment, and purchased intangibles subject to amortization, are reviewed for impairment whenever events or changes in circumstances indicate that the carrying amount of an asset may not be recoverable. Recoverability of assets to be held and used is measured by a comparison of the carrying amount of an asset to estimated undiscounted future cash flows expected to be generated by the asset. If the carrying amount of an asset exceeds its estimated future cash flows, an impairment charge is recognized by the amount by which the carrying amount of the asset exceeds the fair value of the asset. Fair value is determined by independent third party appraisal, projected discounted cash flow or other valuation techniques as appropriate. Assets to be disposed of would be separately presented in the balance sheet and reported at the lower of the carrying amount or fair value less costs to sell, and are no longer depreciated. The assets and liabilities of a disposed group classified as held for sale would be presented separately in the appropriate asset and liability sections of the balance sheet.
(10) Goodwill and Other Intangible Assets
Goodwill represents the excess of costs over fair value of assets of businesses acquired. Pursuant to SFAS No. 142,Goodwill and Other Intangible Assets, goodwill and intangible assets acquired in a purchase business combination and determined to have an indefinite useful life are tested annually for impairment, and are tested for impairment more frequently if events and circumstances indicate that the asset might be impaired. An impairment loss is recognized to the extent that the carrying amount exceeds the asset’s fair value. For goodwill, this determination is made at the reporting unit level and consists of two steps. First, the Company determines the fair value of a reporting unit and compares it to its carrying amount including allocated goodwill. Second, if the carrying amount of a reporting unit exceeds its fair value, an impairment loss is recognized for any excess of the carrying amount of the reporting unit’s goodwill over the implied fair value of that goodwill. The implied fair value of goodwill is determined by allocating the fair value of the reporting unit in a manner similar to a purchase price allocation, in accordance with SFAS No. 141,Business Combinations. The residual fair value after this allocation is the implied fair value of the reporting unit goodwill. The Company performs its annual impairment test on each year-end date. The Company has determined its reporting units to be principally the same as its operating segments.
(11) Retirement Plans
The Company has various defined benefit pension plans which are accounted for in accordance with SFAS No. 87,Employers’ Accounting for Pensions.
F-12
Table of Contents
Daiichi Pharmaceutical Co., Ltd. and Subsidiaries
Notes to Consolidated Financial Statements (continued)
In December 2003, the FASB issued SFAS No. 132 (revised),Employers’ Disclosures about Pensions and Other Postretirement Benefits—an amendment of FASB Statements No. 87, 88 and 106. SFAS No. 132R prescribes employers’ disclosures about pension plans and other postretirement benefit plans; it does not change the measurement or recognition of those plans. The statement retains and revises the disclosure requirements contained in the original SFAS No. 132. It also requires additional disclosures about the assets, obligations, cash flows, and net periodic benefit cost of defined benefit pension plans and other postretirement benefit plans. The statement became effective for fiscal years ending after December 15, 2003. The Company’s disclosures in Note 10 incorporate the requirements of SFAS No. 132R.
Plan settlements and curtailments are accounted for in accordance with SFAS No. 88,Employers’ Accounting for Settlements and Curtailments of Defined Benefit Pension Plans and for Termination Benefits. The Company will apply the consensus of the Emerging Issues Task Force (“EITF”) Issue 03-02,Accounting for the Transfer to the Japanese Government of the Substitutional Portion of Employee Pension Fund Liabilitiesto its contemplated transfer of the substitutional portion of the employee benefit plan.
(12) Revenue Recognition
The Company recognizes revenue when products are delivered to the customer and the customer takes ownership and assumes risk of loss, collection of the relevant receivable is probable, persuasive evidence of an arrangement exists and the sales price is fixed or determinable, which occur upon receipt by the purchaser.
Daiichi offers volume-based discounts to certain customers. These programs are accounted for in accordance with the EITF Issue 01-9,Accounting for Consideration Given by a Vendor to a Customer (including a Reseller of Vendor’s product). Total volume-based discounts amounted to ¥19,364 million and ¥20,418 million, for the years ended March 31, 2003 and 2004, respectively. Volume-based discounts are determined based on the cumulative level of the customer’s purchases from the Company within a program during a period of six months or less. The Company records such volume-based discounts as a reduction of sales at the time the related sales are recognized. The Company estimates the cost of the volume-based discounts based on historical experience with similar volume discount programs. Estimates of expected sales discounts are evaluated and adjusted periodically based on actual sales transactions and forecasts for the balance of the incentive period. The Company also provides volume-based discounts to certain customers based on such customer’s sell-through of certain products purchased from the Company. These volume discounts are recognized as a reduction of sales estimated based on historical experience.
The Company receives royalties from pharmaceutical companies and certain other third parties for use of certain patents and trade names. Royalties are determined based on the number of products sold at the predetermined royalty rates. Royalties are recognized in revenue on an accrual basis as earned.
(13) Research and Development Expense
Research and development expenses (“R&D”) are expensed as incurred.
(14) Advertising Expenses
Advertising expenses are expensed as incurred and are included in the selling, general and administrative expense. Advertising expenses amounted to ¥3,919 million and ¥4,256 million for the years ended March 31, 2003 and 2004, respectively.
F-13
Table of Contents
Daiichi Pharmaceutical Co., Ltd. and Subsidiaries
Notes to Consolidated Financial Statements (continued)
(15) Stock-based Compensation
The Company accounts for its stock-based compensation plans to directors and certain employees using the fair-value-based method prescribed by SFAS No. 123,Accounting for Stock-Based Compensation.
(16) Income Taxes
Income taxes are accounted for under the asset and liability method. Deferred tax assets and liabilities are recognized for the future tax consequences attributable to differences between the financial statement carrying amounts of existing assets and liabilities and their respective tax bases and operating loss and tax credit carryforwards. Deferred tax assets and liabilities are measured using enacted tax rates expected to apply to taxable income in the years in which those temporary differences are expected to be recovered or settled. The effect on deferred tax assets and liabilities of a change in tax rates is recognized in income in the period that includes the enactment date.
(17) Translation of Foreign Currencies
Transactions denominated in foreign currencies are recorded using the exchange rates in effect as of the transaction dates. The related foreign currency asset and liability balances are translated based on exchange rates prevailing at each balance sheet date with the resulting gain (loss) currently charged to income.
Assets and liabilities of foreign subsidiaries are translated into Japanese yen, the Company’s functional and reporting currency, at the exchange rates in effect at the balance sheet date. Revenue and expense accounts are translated at average exchange rates during the current year. The resulting translation adjustments are included as a component of accumulated other comprehensive income.
(18) Earnings Per Share
Earnings per share (“EPS”) is presented in accordance with the provisions of SFAS No. 128,Earnings per Share. Under SFAS No. 128, basic EPS excludes dilution for potential common stock and is computed by dividing consolidated net income by the weighted-average number of common shares outstanding. Diluted EPS reflects the effect of potential dilution that could occur if securities or other contracts to issue common stock were exercised or converted into common stock. Diluted net income per share is calculated by dividing net income by the sum of the weighted-average number of shares plus additional shares that would be outstanding if potential dilutive shares had been issued.
(19) Use of Estimates
The preparation of the consolidated financial statements requires management of the Company to make a number of estimates and assumptions relating to the reported amount of assets and liabilities and the disclosure of contingent assets and liabilities at the date of the consolidated financial statements and the reported amounts of revenues and expenses during the period. Significant items subject to such estimates and assumptions include the carrying amount of property, plant and equipment, intangibles and goodwill, valuation allowances for doubtful receivables, inventories and deferred income tax assets, fair value of stock based compensation, and assets and obligations related to employee benefits. Actual results could differ from those estimates.
(20) Recent Accounting Pronouncements
In November 2004, the FASB issued SFAS No. 151,Inventory Costs-an amendment of ARB No. 43. This Statement amends the guidance in Accounting Research Bulletin (“ARB”) No. 43, Chapter 4,Inventory Pricing,
F-14
Table of Contents
Daiichi Pharmaceutical Co., Ltd. and Subsidiaries
Notes to Consolidated Financial Statements (continued)
to clarify the accounting for abnormal amounts of idle facility expense, freight, handling costs, and wasted material (spoilage). Paragraph 5 of ARB No. 43, Chapter 4, previously stated that “. . . under some circumstances, items such as idle facility expense, excessive spoilage, double freight, and rehandling costs may be so abnormal as to require treatment as current period charges. . . .” This Statement requires that those items be recognized as current-period charges regardless of whether they meet the criterion of “so abnormal.” In addition, this Statement requires that allocation of fixed production overheads to the costs of conversion be based on the normal capacity of the production facilities. This Statement is effective for inventory costs incurred during annual periods beginning after June 15, 2005. The Company does not expect the adoption of this Statement will have a material effect on its consolidated financial statements.
SFAS No. 123 (revised 2004),Share-Based Payment, was issued in December 2004. This Statement is a revision of SFAS No. 123,Accounting for Stock-Based Compensationand supersedes Accounting Principles Board (“APB”) Opinion No. 25,Accounting for Stock Issued to Employees, and its related implementation guidance. This Statement, which requires companies to recognize in the income statement the grant-date fair value of stock options and other equity-based compensation issued to employees, is effective for most public companies’ interim or annual periods beginning after June 15, 2005. The Company is currently evaluating the impact of adopting this Statement.
2. Acquisition
On December 27, 2002, the Company acquired 66% of the issued and outstanding shares of Suntory Pharma, Inc. for the total cash consideration of ¥20,067 million including direct acquisition costs. The acquired company was a non-public pharmaceutical manufacturer in Japan and a subsidiary of Suntory Co., Ltd. (“Suntory”) and renamed Daiichi Suntory Pharma Co., Ltd. (“DSP”) upon acquisition by the Company. The acquisition of DSP was made for the purpose of enhancing five product lines of the Company.
The Company used the purchase method of accounting to account for the acquisition of DSP and, accordingly, the purchase price has been allocated to the tangible and intangible net assets of DSP based on the estimated fair value of such net assets. The amount of consideration paid in excess of the estimated fair value of the net assets acquired of ¥5,914 million was recorded as goodwill. Management of the Company believes that the growth potential of DSP contributed to the purchase price that resulted in recognition of such goodwill. Assets, liabilities and operations of DSP have been included in the accompanying consolidated financial statements since the acquisition date.
The following table reflects the December 27, 2002 condensed balance sheet of DSP, as adjusted to give effect to the purchase method accounting adjustments:
| Millions of Yen | ||||
Cash, receivables and other assets | ¥ | 5,893 | ||
Property, plant and equipment | 7,384 | |||
Identifiable intangible assets | 6,204 | |||
In-process research and development | 858 | |||
Goodwill | 5,914 | |||
Liabilities | (6,186 | ) | ||
| ¥ | 20,067 | |||
Identifiable intangible assets of DSP include intangible assets related to acquired existing pharmaceutical products of ¥6,204 million, which are estimated to have a remaining useful life of 10 years. In-process research
F-15
Table of Contents
Daiichi Pharmaceutical Co., Ltd. and Subsidiaries
Notes to Consolidated Financial Statements (continued)
and development (“IPRD”) includes the value of products in the development stage that are not considered to have reached technological feasibility or to have alternative future use. Accordingly, IPRD of ¥858 million was charged to R&D expense in the consolidated statement of income upon consummation of the acquisition. Goodwill arising from the acquisition of DSP has all been allocated to the pharmaceuticals segment of the Company.
The following unaudited pro forma condensed consolidated results of operations for the Company are prepared assuming that the foregoing acquisition was completed as of the beginning of the respective period in which the acquisition occurred. This pro forma condensed consolidated financial information does not purport to represent what the Company’s results of operations would actually have been if such transaction had in fact occurred on such date. The pro forma adjustments are based upon available information and upon certain assumptions that management believes are reasonable.
Millions of Yen, except for per share data (unaudited) | |||
| 2003 | |||
Net sales | ¥ | 326,926 | |
Net income | 22,101 | ||
Basic and diluted net income per share | 79.63 | ||
In connection with the December 2002 acquisition of DSP, Daiichi has agreed to acquire the remaining 34% interests from Suntory in December 2005 for approximately ¥10,000 million.
3. Investments in and Advances to Affiliates
At March 31, 2003 and 2004, Daiichi held investments in the equity method affiliates as follows:
| Description of business | Acquisition date | Ownership % | |||||
Aventis Pasteur-Daiichi Vaccines Co., | R&D of Pharmaceuticals | April 1987 | 50.0 | % | |||
Sanofi-Synthelabo Daiichi | R&D of Pharmaceuticals | October 1989 | 49.0 | % | |||
Neo-Morgan Laboratory Inc. | R&D of Pharmaceuticals | November 2002 | 22.7 | % | |||
Vascular Craft Research Center Co., | R&D of Pharmaceuticals | March 1989 | 20.8 | % | |||
Fuji Sangyo Co., Ltd. | Nonlife Insurance Agent Business | January 1972 | 50.0 | % |
F-16
Table of Contents
Daiichi Pharmaceutical Co., Ltd. and Subsidiaries
Notes to Consolidated Financial Statements (continued)
Summarized combined financial information of the Company’s unconsolidated affiliates at March 31, 2003 and 2004 and for the years then ended was as follows:
| Millions of Yen | ||||||||
| 2003 | 2004 | |||||||
Combined financial position: | ||||||||
Property and equipment, net | ¥ | 5 | ¥ | 21 | ||||
Other assets, net | 331 | 332 | ||||||
Total assets | 336 | 353 | ||||||
Debt | 754 | 768 | ||||||
Other liabilities | 34 | 271 | ||||||
Shareholders’ deficit | (452 | ) | (686 | ) | ||||
Total liabilities and equity | ¥ | 336 | ¥ | 353 | ||||
Combined operations: | ||||||||
Sales | ¥ | 168 | ¥ | 184 | ||||
Cost of sales | 101 | 112 | ||||||
Selling, general and administrative expenses | 417 | 409 | ||||||
Operating loss | (350 | ) | (337 | ) | ||||
Interest expense, net | (3 | ) | (4 | ) | ||||
Other, net | 9 | (4 | ) | |||||
Net loss | ¥ | (344 | ) | ¥ | (345 | ) | ||
The Company enters into joint venture agreements with third parties to collaborate on certain product development initiatives. Non-controlling ownership interests acquired in investee companies are generally in the form of voting common stock through which the Company is able to exercise significant influence over the operations of the investee. The Company also provides from time to time financial liquidity to investees in the form of loans. These loans mainly carry a term of seven years and bear interest at a market rate. The loans are guaranteed as to repayment by the joint venture partners to the extent of their respective common stock ownership interests. The Company does not enter into commitments with its investee companies to provide funding or capital investment above and beyond the extent of its initial investment and funds advanced to date in the form of loans. Accordingly, the extent of the Company’s exposure due to non-performance by the investee company is limited to the then carrying value of its investment and the carrying value of loans not subject to guarantee.
The Company accounts for its investment in these joint venture agreements using the equity method of accounting. Equity in losses of the investee company is first recognized to the extent of the carrying value of the Company’s investment in common stock and then to reduce the carrying value of the loans to the extent not guaranteed.
The guaranteed portion of the loans are evaluated for recoverability by considering the financial position and credit worthiness of the guarantor.
F-17
Table of Contents
Daiichi Pharmaceutical Co., Ltd. and Subsidiaries
Notes to Consolidated Financial Statements (continued)
Investments in and advances to affiliates and cumulative equity losses were as follows:
| Millions of Yen | ||||||||||||||||||||
| Investments | Advances | |||||||||||||||||||
| Original Cost | Accumulated equity losses allocated to investments | Net Balance | Original Cost | Accumulated loans | Net Balance | |||||||||||||||
2003: | ||||||||||||||||||||
AvP-D VAC | ¥ | 300 | ¥ | (300 | ) | ¥ | — | ¥ | 702 | ¥ | (267 | ) | ¥ | 435 | ||||||
SDC | 49 | (49 | ) | — | 63 | (24 | ) | 39 | ||||||||||||
Other | 11 | — | 11 | — | — | — | ||||||||||||||
Total | ¥ | 360 | ¥ | (349 | ) | ¥ | 11 | ¥ | 765 | ¥ | (291 | ) | ¥ | 474 | ||||||
2004: | ||||||||||||||||||||
AvP-D VAC | ¥ | 300 | ¥ | (300 | ) | ¥ | — | ¥ | 830 | ¥ | (394 | ) | ¥ | 436 | ||||||
SDC | 49 | (49 | ) | — | 94 | (30 | ) | 64 | ||||||||||||
Other | 42 | — | 42 | — | — | — | ||||||||||||||
Total | ¥ | 391 | ¥ | (349) | ¥ | 42 | ¥ | 924 | ¥ | (424) | ¥ | 500 | ||||||||
4. Inventories
Inventories at March 31, 2003 and 2004 consisted of the following:
| Millions of Yen | ||||||
| 2003 | 2004 | |||||
Finished products | ¥ | 22,970 | ¥ | 18,367 | ||
Work in process | 12,570 | 11,912 | ||||
Raw materials and supplies | 10,074 | 7,403 | ||||
Total | ¥ | 45,614 | ¥ | 37,682 | ||
5. Investment securities
Marketable and non-marketable investment securities as of March 31, 2003 and 2004 were as follows:
| Millions of Yen | ||||||
| 2003 | 2004 | |||||
Available-for-sale securities | ¥ | 34,389 | ¥ | 30,179 | ||
Held-to-maturity securities | 37,814 | 43,242 | ||||
Short-term investment securities | ¥ | 72,203 | ¥ | 73,421 | ||
Available-for-sale securities | ¥ | 32,633 | ¥ | 57,813 | ||
Held-to-maturity securities | 28,112 | 44,406 | ||||
Other investments | 3,757 | 3,676 | ||||
Long-term investment securities | ¥ | 64,502 | ¥ | 105,895 | ||
Other investments consisted of non-marketable equity securities, which are carried at cost.
F-18
Table of Contents
Daiichi Pharmaceutical Co., Ltd. and Subsidiaries
Notes to Consolidated Financial Statements (continued)
The cost, gross unrealized holding gains, gross unrealized holding losses and fair value for such securities by major security type and class of security as of March 31, 2003 and 2004 were as follows:
| Millions of Yen | ||||||||||||||||||||||||
| 2003 | 2004 | |||||||||||||||||||||||
| Cost | Gross unrealized holding gains | Gross unrealized holding losses | Fair value | Cost | Gross unrealized holding gains | Gross unrealized holding losses | Fair value | |||||||||||||||||
Available-for-sale: | ||||||||||||||||||||||||
Debt securities | ||||||||||||||||||||||||
Money Management | ¥ | 18,668 | ¥ | — | ¥ | — | ¥ | 18,668 | ¥ | 24,396 | ¥ | — | ¥ | — | ¥ | 24,396 | ||||||||
Investment in trust | 13,256 | 37 | 7 | 13,286 | 3,784 | 1,865 | — | 5,649 | ||||||||||||||||
Other | 2,440 | — | 5 | 2,435 | 120 | 14 | — | 134 | ||||||||||||||||
Equity securities | 21,944 | 10,967 | 278 | 32,633 | 26,303 | 31,510 | — | 57,813 | ||||||||||||||||
Total | ¥ | 56,308 | ¥ | 11,004 | ¥ | 290 | ¥ | 67,022 | ¥ | 54,603 | ¥ | 33,389 | ¥ | — | ¥ | 87,992 | ||||||||
| Millions of Yen | ||||||||||||||||||||||||
| 2003 | 2004 | |||||||||||||||||||||||
| Cost | Gross unrealized holding gains | Gross unrealized holding losses | Fair value | Cost | Gross unrealized holding gains | Gross unrealized holding losses | Fair value | |||||||||||||||||
Held-to-maturity: | ||||||||||||||||||||||||
Debt securities | ||||||||||||||||||||||||
Japanese treasury | ¥ | 10 | ¥ | — | ¥ | — | ¥ | 10 | ¥ | 10 | ¥ | — | ¥ | — | ¥ | 10 | ||||||||
Corporate debt | 65,916 | 57 | 347 | 65,626 | 87,638 | 123 | 70 | 87,691 | ||||||||||||||||
Total | ¥ | 65,926 | ¥ | 57 | ¥ | 347 | ¥ | 65,636 | ¥ | 87,648 | ¥ | 123 | ¥ | 70 | ¥ | 87,701 | ||||||||
Gross realized gains on sales of marketable and non-marketable investment securities for the years ended March 31, 2003 and 2004 amounted to ¥0 million and ¥1,584 million, respectively, and gross realized loss, which included the gross realized loss considered other than temporary, for the years ended March 31, 2003 and 2004 amounted to ¥5,605 million and ¥30 million, respectively. The cost of the securities sold was computed based on the moving-average cost of all the shares of each such securities held at the time of sale. Proceeds from the sales and maturities of available-for-sale and held-to-maturity securities for the years ended March 31, 2003 and 2004 were ¥164,858 million and ¥180,098 million, respectively.
F-19
Table of Contents
Daiichi Pharmaceutical Co., Ltd. and Subsidiaries
Notes to Consolidated Financial Statements (continued)
Gross unrealized holding losses on available-for-sale and held-to-maturity securities, and the fair value of the related securities, aggregated by investment category and length of time that individual securities have been in a continuous unrealized loss position, at March 31, 2004 were as follows:
| Millions of Yen | |||||||||||||
| Less than 12 months | 12 months or longer | ||||||||||||
| Fair value | Gross unrealized holding losses | Fair value | Gross unrealized holding losses | ||||||||||
2004: Current: | |||||||||||||
Held-to-maturity: | |||||||||||||
Corporate debt securities | ¥ | 14,628 | ¥ | (6 | ) | ¥ | — | ¥ | — | ||||
Noncurrent: | |||||||||||||
Held-to-maturity: | |||||||||||||
Corporate debt securities | ¥ | 11,110 | ¥ | (64 | ) | ¥ | — | ¥ | — | ||||
Total | ¥ | 25,738 | ¥ | (70 | ) | ¥ | — | ¥ | — | ||||
Maturities of debt securities classified as available-for-sale and held-to-maturity were as follows at March 31, 2004:
| Millions of Yen | ||||||
| Cost | Fair value | |||||
Due within one year | ¥ | 70,049 | ¥ | 71,204 | ||
Due after one through five years | 23,526 | 23,605 | ||||
Due after five through ten years | 14,373 | 15,071 | ||||
Due after ten years | 8,000 | 8,000 | ||||
Total | ¥ | 115,948 | ¥ | 117,880 | ||
6. Goodwill and Other Intangible Assets
At the adoption of SFAS No. 142 on April 1, 2002, the Company completed its transitional impairment assessment for goodwill and other intangible assets based on their fair value. Based on management’s assessment of the circumstances, considering the findings of an independent appraiser, the Company concluded that there was no impairment in the carrying value of goodwill and intangible assets with an indefinite life.
At March 31, 2003 and 2004, the Company performed its annual assessment of goodwill and intangible assets with an indefinite life and concluded that there was no impairment in the carrying value of such assets.
The changes in the carrying amount of goodwill in the pharmaceuticals segment for the years ended March 31, 2003 and 2004 were as follows:
| Millions of Yen | |||
Balance at April 1, 2002 | ¥ | — | |
Effect of acquisition of DSP | 5,914 | ||
Balance at March 31, 2003 | 5,914 | ||
Balance at March 31, 2004 | ¥ | 5,914 | |
F-20
Table of Contents
Daiichi Pharmaceutical Co., Ltd. and Subsidiaries
Notes to Consolidated Financial Statements (continued)
The information for intangible assets subject to amortization and for intangible assets not subject to amortization was as follows:
| Millions of Yen | ||||||||||||||||||||
| 2003 | 2004 | |||||||||||||||||||
| Gross carrying amount | Accumulated amortization | Net carrying amount | Gross carrying amount | Accumulated amortization | Net carrying amount | |||||||||||||||
Other intangible assets subject to amortization: | ||||||||||||||||||||
Sales and distribution rights | ¥ | 3,574 | ¥ | (1,066 | ) | ¥ | 2,508 | ¥ | 5,003 | ¥ | (1,564 | ) | ¥ | 3,439 | ||||||
Developed technology | 6,204 | (155 | ) | 6,049 | 6,204 | (775 | ) | 5,429 | ||||||||||||
Patents/trademarks | 5,487 | (1,403 | ) | 4,084 | 5,340 | (1,792 | ) | 3,548 | ||||||||||||
Software | 6,975 | (1,863 | ) | 5,112 | 9,919 | (3,393 | ) | 6,526 | ||||||||||||
Others | 587 | (139 | ) | 448 | 487 | (100 | ) | 387 | ||||||||||||
Total | 22,827 | (4,626 | ) | 18,201 | 26,953 | (7,624 | ) | 19,329 | ||||||||||||
Other intangible assets not subject to amortization | 4,652 | 3,828 | ||||||||||||||||||
Total other intangible assets | ¥ | 22,853 | ¥ | 23,157 | ||||||||||||||||
Sales and distribution rights represent intangible assets related to various sales and distribution rights for pharmaceutical products acquired from the manufacturers of such products, and are being amortized over their respective contractual lives. The balance at March 31, 2004 primarily consisted of the exclusive distribution rights for Hamp, an acute heart failure agent, acquired in April 2003, and the distribution right for Mobic, a non-steroidal anti-inflammatory drug, launched in February 2001, both of which are being amortized over the contractual life of 10 years.
Developed technology represents intangible assets related to the acquisition of DSP in December 2002 which are being amortized over the estimated life of 10 years. (See note 2 )
Patents/trademarks primarily consist of a patent related to Evoxac, a muscarinic receptor agonist, acquired in September 2001, which is being amortized over the patent life of 11 years.
The aggregate amortization expense of other intangible assets subject to amortization for the year ended March 31, 2003 and 2004 was ¥3,272 million and ¥3,218 million. The future amortization expense for each of the five years relating to intangible assets currently recorded in the consolidated balance sheets was estimated to be the following at March 31, 2004:
| Millions of Yen | |||
Year ending March 31, | |||
2005 | ¥ | 3,653 | |
2006 | 3,107 | ||
2007 | 2,873 | ||
2008 | 2,111 | ||
2009 | 1,794 | ||
F-21
Table of Contents
Daiichi Pharmaceutical Co., Ltd. and Subsidiaries
Notes to Consolidated Financial Statements (continued)
7. Impairment or Disposal of Long-Lived Assets
In July 2002, the Company made a decision to and then did vacate one of its R&D facilities as part of the restructuring of its biomedical business. As a result, the Company recorded an impairment charge of ¥89 million, as a component of selling, general and administrative expenses, in the fine chemicals segment for the year ended March 31, 2003. This impairment charge reduced the carrying value of the building and land to its estimated fair value of ¥111 million, which principally represented the fair value of the land, as the Company determined there was no future need for this R&D facility and there was no suitable alternative use for the facility.
In July 2003, the Company made a decision to and then did withdraw from certain manufacturing activities. As a result, the Company recorded an impairment charge of ¥44 million, as a component of selling, general and administrative expenses, in the pharmaceuticals segment for the year ended March 31, 2004. This impairment charge reduced the carrying value of the related equipment to its estimated fair value of ¥0 million as the Company determined there was no future need for this manufacturing equipment and there was no suitable alternative use for the equipment.
8. Short-term Borrowings and Long-term Debt
a. Short-term Borrowings
The Company had unused committed lines of credit available for immediate borrowings with certain financial institutions amounting to ¥30,000 million at March 31, 2003 and 2004. The aggregate commitment fee paid for such credit line agreements for the years ended March 31, 2003 and 2004 amounted to ¥45 million and ¥40 million, respectively, which were included in interest expense.
b. Long-term Debt
A summary of long-term debt at March 31, 2003 and 2004 was as follows:
| Millions of Yen | ||||||||
| 2003 | 2004 | |||||||
Secured loans from Development Bank of Japan, due serially through 2006 with interest rate 2.15% | ¥ | 52 | ¥ | 35 | ||||
Unsecured loans from commercial banks, due serially through 2016 with interest rates ranging from 5.9% to 6.15% | 9 | 7 | ||||||
Capital lease obligations with interest rates ranging from 0.82% to 3.95% | 4,392 | 4,644 | ||||||
Total long-term debt | 4,453 | 4,686 | ||||||
Less: current maturities | (1,726 | ) | (2,036 | ) | ||||
Long-term debt, less current maturities | ¥ | 2,727 | ¥ | 2,650 | ||||
The aggregate annual maturities of long-term debt outstanding at March 31, 2004 were as follows:
| Millions of Yen | |||
Year ending March 31, | |||
2005 | ¥ | 2,036 | |
2006 | 1,440 | ||
2007 | 776 | ||
2008 | 337 | ||
2009 | 92 | ||
Thereafter | 5 | ||
Total | ¥ | 4,686 | |
F-22
Table of Contents
Daiichi Pharmaceutical Co., Ltd. and Subsidiaries
Notes to Consolidated Financial Statements (continued)
At March 31, 2004, the secured loans were secured by certain assets with a net book value of ¥1,742 million.
As is customary in Japan, bank loans are made under general agreements which provide that under certain circumstances, security and guarantees for present and future indebtedness will be given upon request of the bank, and that the bank shall the right, as the obligations become due, or in the event of their default, to offset cash deposits against such obligations due to the bank.
9. Income Taxes
Daiichi and its domestic subsidiaries are subject to a national corporate tax rate of 30% and a local income tax rate of 12%, net of national tax benefit, which in the aggregate result in a statutory income tax rate of approximately 41.8% for the years ended March 31, 2003 and 2004. On March 24, 2003, the Japanese Diet approved amendments to the Local Tax Law, which will reduce the standard tax rate for the income-based business tax, as well as add business tax based on corporate size, effective for the years beginning on or after April 1, 2004. Consequently, the statutory income tax rate will be reduced to approximately 40.8% effective for the years beginning on or after April 1, 2004. Deferred tax assets and liabilities related to temporary differences that were expected to reverse within the year ended March 31, 2003 and for years beginning on or after April 1, 2004 were provided under the statutory rate of 41.8% and 40.8%, respectively. Foreign subsidiaries are subject to taxes of countries in which they operate.
Income before income taxes and minority interest (“income before income taxes”) and income tax expense for the years ended March 31, 2003 and 2004 consisted of the following:
| Millions of Yen | ||||||||
| 2003 | 2004 | |||||||
Income before income taxes: | ||||||||
Japan | ¥ | 48,648 | ¥ | 52,686 | ||||
Foreign | (590 | ) | (1,624 | ) | ||||
| ¥ | 48,058 | ¥ | 51,062 | |||||
Income taxes —Current: | ||||||||
Japan | ¥ | 23,654 | ¥ | 21,856 | ||||
Foreign | 818 | 106 | ||||||
| ¥ | 24,472 | ¥ | 21,962 | |||||
Income taxes —Deferred: | ||||||||
Japan | ¥ | (1,672 | ) | ¥ | 256 | |||
Foreign | (166 | ) | (406 | ) | ||||
| ¥ | (1,838 | ) | ¥ | (150 | ) | |||
Income taxes —Total: | ||||||||
Japan | ¥ | 21,982 | ¥ | 22,112 | ||||
Foreign | 652 | (300 | ) | |||||
| ¥ | 22,634 | ¥ | 21,812 | |||||
F-23
Table of Contents
Daiichi Pharmaceutical Co., Ltd. and Subsidiaries
Notes to Consolidated Financial Statements (continued)
The significant components of income taxes for the years ended March 31, 2003 and 2004 were as follows:
| Millions of Yen | ||||||||
| 2003 | 2004 | |||||||
Provision for income taxes | ¥ | 22,634 | ¥ | 21,812 | ||||
Shareholders’ equity: | ||||||||
Net unrealized (losses) gains on available-for-sale securities | (1,338 | ) | 9,141 | |||||
Minimum pension liability adjustment | (1,474 | ) | (202 | ) | ||||
Total income taxes | ¥ | 19,822 | ¥ | 30,751 | ||||
Reconciliation of the differences between the statutory tax rates and the effective tax rates was as follows:
| 2003 | 2004 | |||||
Statutory tax rate | 41.8 | % | 41.8 | % | ||
Increase (reduction) in taxes resulting from: | ||||||
Non-deductible expenses | 5.0 | 4.5 | ||||
Tax credit for research and development expense | (1.0 | ) | (5.8 | ) | ||
Change in valuation allowance | (0.4 | ) | 0.6 | |||
Change in income tax rate | 0.5 | 1.4 | ||||
Other, net | 1.2 | 0.2 | ||||
Effective income tax rate | 47.1 | % | 42.7 | % | ||
The effects of temporary differences that give rise to deferred tax assets and liabilities at March 31, 2003 and 2004 were as follows:
| Millions of Yen | ||||||||
| 2003 | 2004 | |||||||
Deferred tax assets: | ||||||||
Intangible assets | ¥ | 5,765 | ¥ | 5,156 | ||||
Accrued expenses | 7,301 | 8,168 | ||||||
Accrued pension and severance costs | 13,613 | 11,863 | ||||||
R&D expense not deducted for tax | 6,282 | 6,837 | ||||||
Inventories | 1,627 | 2,332 | ||||||
Net operating loss carryforwards | 637 | 1,038 | ||||||
Property, plant and equipment | 3,540 | 3,665 | ||||||
Other | 6,132 | 6,230 | ||||||
Gross deferred tax assets | 44,897 | 45,289 | ||||||
Less valuation allowance | (1,118 | ) | (1,445 | ) | ||||
Total deferred tax assets | 43,779 | 43,844 | ||||||
Deferred tax liabilities: | ||||||||
Intangible assets | (2,451 | ) | (2,199 | ) | ||||
Property, plant and equipment | (3,427 | ) | (3,250 | ) | ||||
Investment securities | (4,362 | ) | (13,605 | ) | ||||
Other | (1,188 | ) | (1,331 | ) | ||||
Gross deferred tax liabilities | (11,428 | ) | (20,385 | ) | ||||
Net deferred tax assets | ¥ | 32,351 | ¥ | 23,459 | ||||
F-24
Table of Contents
Daiichi Pharmaceutical Co., Ltd. and Subsidiaries
Notes to Consolidated Financial Statements (continued)
Net deferred income tax assets are recorded in the consolidated balance sheets as follows:
| Millions of Yen | ||||||||
| 2003 | 2004 | |||||||
Deferred income tax assets: | ||||||||
Current assets | ¥ | 17,115 | ¥ | 18,441 | ||||
Noncurrent assets | 18,715 | 7,675 | ||||||
Noncurrent liabilities | (3,479 | ) | (2,657 | ) | ||||
| ¥ | 32,351 | ¥ | 23,459 | |||||
In assessing the realizability of deferred tax assets, management considers whether it is more likely than not that some portion or all of deferred tax assets will not be realized. The ultimate realization of deferred tax assets is dependent upon the generation of future taxable income during the periods in which those temporary differences become deductible. Management considers the scheduled reversal of deferred tax liabilities, projected future taxable income and tax planning strategies in making this assessment.
Based on the level of historical taxable income and projections for future taxable income over the periods in which the net deductible temporary differences are expected to reverse, management believes it is more likely than not that the Company will realize the benefits of the deferred tax assets, net of the existing valuation allowance, at March 31, 2004. The amount of the deferred tax asset considered realizable, however, could be reduced in the near term if estimates of future taxable income during the carryforward period are reduced. The net changes in the total valuation allowance for the years ended March 31, 2003 and 2004 were a decrease of ¥200 million and an increase of ¥327 million, respectively.
At March 31, 2004, no deferred tax liabilities were recognized for undistributed earnings of foreign subsidiaries aggregating ¥1,832 million, because the Company currently does not intend to repatriate such earnings and believes no material additional tax would result should they be repatriated to Daiichi.
At March 31, 2004, certain subsidiaries had net operating loss carryforwards aggregating approximately ¥3,667 million, which expire as follows:
| Year ending March 31, | Millions of Yen | ||
2005 | ¥ | 81 | |
2006 | 148 | ||
2007 | 217 | ||
2008 | 1,235 | ||
2009 | 528 | ||
2010-2024 | 1,422 | ||
Indefinite periods | 36 | ||
Total | ¥ | 3,667 | |
10. Severance and Retirement Plans
Daiichi and certain of its domestic subsidiaries have various defined benefit pension plans covering substantially all of their employees. These plans include the domestic employee’s pension fund (“EPF”) plan and a tax qualified pension plan. These plans are funded in conformity with governmental regulations which basically require an employer to contribute the unfunded benefit over 20 years. The Company also has an unfunded lump-sum severance payment plan.
F-25
Table of Contents
Daiichi Pharmaceutical Co., Ltd. and Subsidiaries
Notes to Consolidated Financial Statements (continued)
On April 1, 2002, the portion of the tax qualified pension plan applicable to retired employees, was settled through the purchase of non-participating annuity contracts. The remaining part of the plan, applicable to current employees, was combined with the EPF plan. As a result of this settlement, the related projected benefit obligations and plan assets were reduced by ¥5,944 million and ¥6,564 million, respectively, and a settlement loss of ¥620 million was recorded.
Net periodic cost of the Company’s plans for the years ended March 31, 2003 and 2004 consisted of as follows:
| Millions of Yen | ||||||||
| 2003 | 2004 | |||||||
Service cost–benefits earned during the year | ¥ | 3,740 | ¥ | 4,345 | ||||
Interest cost on projected benefit obligations | 2,818 | 2,680 | ||||||
Expected return on plan assets | (2,179 | ) | (1,559 | ) | ||||
Recognized actuarial loss | — | 330 | ||||||
Amortization of unrecognized prior service cost | — | (74 | ) | |||||
Amortization of transition obligations | 747 | 747 | ||||||
Settlement loss | 620 | — | ||||||
Net periodic cost | ¥ | 5,746 | ¥ | 6,469 | ||||
In accordance with the provision of SFAS No. 87, the Company has recorded a minimum pension liability of ¥8,146 million and ¥7,818 million at March 31, 2003 and 2004, respectively. This liability represents the excess of the accumulated benefit obligations over the fair value of plan assets and severance costs already recognized before recording the minimum pension liability. A corresponding amount was recognized as an intangible asset to the extent of the unrecognized prior year service cost plus transition obligation, and the balance was recorded as a component of accumulated other comprehensive income, net of tax.
F-26
Table of Contents
Daiichi Pharmaceutical Co., Ltd. and Subsidiaries
Notes to Consolidated Financial Statements (continued)
The reconciliation of beginning and ending balances of the benefit obligation and fair value of plan assets of the Company is as follows:
| Millions of Yen | ||||||||
| 2003 | 2004 | |||||||
Change in benefit obligation: | ||||||||
Benefit obligation, beginning of year | ¥ | 102,189 | ¥ | 108,839 | ||||
Service cost | 3,740 | 4,345 | ||||||
Interest cost | 2,818 | 2,680 | ||||||
Business combination | 1,811 | — | ||||||
Actuarial loss | 8,043 | 9,178 | ||||||
Prior service benefit | (1,170 | ) | — | |||||
Plan participants’ contribution | 576 | 551 | ||||||
Settlement | (5,944 | ) | — | |||||
Benefits paid | (3,224 | ) | (4,376 | ) | ||||
Benefit obligation, end of year | ¥ | 108,839 | ¥ | 121,217 | ||||
Change in plan assets: | ||||||||
Fair value of plan assets, beginning of year | ¥ | 59,773 | ¥ | 58,135 | ||||
Actual return on plan assets | (6,174 | ) | 6,792 | |||||
Employer contribution | 12,717 | 12,423 | ||||||
Plan participants’ contribution | 576 | 551 | ||||||
Settlement | (6,564 | ) | — | |||||
Benefits paid | (2,193 | ) | (3,056 | ) | ||||
Fair value of plan assets, end of year | 58,135 | 74,845 | ||||||
Funded status | (50,704 | ) | (46,372 | ) | ||||
Unrecognized actuarial loss | 15,460 | 19,070 | ||||||
Unrecognized prior service cost | (1,170 | ) | (1,096 | ) | ||||
Transition obligation | 1,494 | 747 | ||||||
Net amount recognized | ¥ | (34,920 | ) | ¥ | (27,651 | ) | ||
Amounts recognized in the consolidated balance sheets consist of: | ||||||||
Accrued pension and severance costs | ¥ | (43,066 | ) | ¥ | (35,469 | ) | ||
Intangible asset | 4,530 | 3,706 | ||||||
Accumulated other comprehensive income | 3,616 | 4,112 | ||||||
Net amount recognized | ¥ | (34,920 | ) | ¥ | (27,651 | ) | ||
Information for pension plans with an accumulated benefit obligation in excess of plan assets at March 31, 2003 and 2004 were as follows:
| Millions of Yen | ||||||
| 2003 | 2004 | |||||
Projected benefit obligation | ¥ | 108,839 | ¥ | 121,217 | ||
Accumulated benefit obligation | 95,778 | 106,671 | ||||
Fair value of plan assets | 58,135 | 74,845 | ||||
The measurement date used to determine pension benefit obligations was March 31.
F-27
Table of Contents
Daiichi Pharmaceutical Co., Ltd. and Subsidiaries
Notes to Consolidated Financial Statements (continued)
Weighted-average assumptions used to determine benefit obligations at March 31, 2003 and 2004 were as follows:
| 2003 | 2004 | |||||
Weighted-average assumptions: | ||||||
Discount rate | 2.5 | % | 2.0 | % | ||
Assumed rate of increase in future compensation levels | 4.7 | % | 4.7 | % |
Weighted-average assumptions used to determine net periodic pension cost for the years ended March 31, 2003 and 2004 were as follows:
| 2003 | 2004 | |||||
Weighted-average assumptions: | ||||||
Discount rate | 3.0 | % | 2.5 | % | ||
Assumed rate of increase in future compensation levels | 4.7 | % | 4.7 | % | ||
Expected long-term rate of return on plan assets | 4.5 | % | 3.0 | % |
Daiichi determines the expected long-term rate of return based on the expected long-term return of the various assets categories in which it invests. Daiichi considers the current expectations for future returns and the actual historical returns of each plan asset category.
The benefit plan weighted-average asset allocations for Daiichi and its domestic subsidiaries for the years ended March 31, 2003 and 2004 by asset category were as follows:
| Asset Category: | 2003 | 2004 | ||||
Equity securities | 41.5 | % | 28.7 | % | ||
Debt securities | 42.0 | % | 42.8 | % | ||
Life insurance company general accounts | 11.7 | % | 14.1 | % | ||
Cash and other investments | 4.8 | % | 14.4 | % | ||
| 100.0 | % | 100.0 | % | |||
Daiichi’s investment goals for the pension benefit plans are to ensure adequate plan assets to provide future payments of pension benefits to eligible participants. Daiichi addresses diversification by the use of domestic and international equity securities and domestic and international debt securities in order to secure stable return on plan assets subject to specific risk management policies. Daiichi evaluates the difference between expected return based on expected long-term rate of return on plan assets and actual return on invested plan assets on an annual basis. Daiichi revises the portfolio formulation based on the result of its annual assessment.
Daiichi and its domestic subsidiaries expect to contribute ¥9,406 million to their domestic defined benefit plans in the year ending March 31, 2005.
In addition to the defined benefit plan described in preceding paragraph, Daiichi and certain of its subsidiaries have accrued a liability for retirement benefits for their directors and corporate statutory auditors in the amount of ¥2,932 million and ¥2,671 million at March 31, 2003 and 2004, respectively, which is included in accrued pension and severance costs in the accompanying consolidated balance sheets.
Retirement benefits to directors and corporate statutory auditors of the Company are calculated based on a multiple of such directors’ and statutory auditors’ compensation in the year of retirement.
F-28
Table of Contents
Daiichi Pharmaceutical Co., Ltd. and Subsidiaries
Notes to Consolidated Financial Statements (continued)
Under the unfunded plans described in the preceding paragraph, the amounts required if all directors and corporate statutory auditors had voluntarily terminated their employment at each balance sheet date are fully accrued. The payments to directors and corporate statutory auditors are subject to shareholders’ approval.
The domestic EPF plan was comprised of (1) a corporate defined benefit portion established by Daiichi and (2) a substitutional portion based on benefits prescribed by the government (similar to social security benefits in the United Sates). Daiichi had been exempted from contributing to the Japanese Pension Insurance (“JPI”) program that would otherwise have been required if it had not elected to fund the government substitutional portion of the benefit through an EPF arrangement. The plan assets of the EPF were invested and managed as a single portfolio for the entire EPF and were not separately attributed to the substitutional and corporate portions. In June 2001, the Contributed Benefit Pension Plan law was newly enacted and permitted an employer to elect to transfer the entire substitutional portion benefit obligation from the EPF to the government together with a specified amount of plan assets pursuant to a government formula. After such transfer, the employer would be required to make periodic contributions to JPI, and the Japanese government would be responsible for all benefit payments. The corporate portion of the EPF would continue to exist exclusively as a corporate defined benefit pension plan.
Pursuant to the new law, Daiichi received an approval of exemption from the Minister of Health, Labor and Welfare, effective January 1, 2004, from the obligation for benefits related to future employee service with respect to the substitutional portion of its EPF. Daiichi received the government approval of exemption from the obligation for benefits related to past employee service in January 2005 with respect to the substitutional portion of its domestic contributory plan. Daiichi will account for the transfer in accordance with EITF 03-02. As specified in EITF 03-02, the entire separation process is to be accounted for at the time of completion of the transfer to the government of the substitutional portion of the benefit obligation and related plan assets as a settlement in accordance with SFAS No. 88. Accordingly, there has been no effect on the Company’s consolidated financial statements for the year ended March 31, 2004. The aggregate effect of this separation will be determined based on the Company’s pension benefit obligation at the time of completion of the transfer and the amount of plan assets required to be transferred.
11. Shareholders’ Equity
Dividends
The Japanese Commercial Code (the “Code”), as amended effective October 1, 2001, provides that an amount equal to at least 10% of cash dividends and other distributions from retained earnings paid by a company be appropriated as a legal reserve. No further appropriation is required when the total combined amount of a company’s legal reserve and additional paid-in capital equal 25% of common stock. Legal reserves included in retained earnings at March 31, 2003 and 2004 were ¥48,961 million, and are restricted from being used as dividend.
The amount of retained earnings available for dividends under the Code is based on the retained earnings in Daiichi’s non-consolidated financial statements prepared in accordance with Japanese GAAP and amounted to ¥322,685 million at March 31, 2004.
At the general shareholders’ meeting on June 29, 2004, a cash dividend (¥15 per share) on the common stock totaling ¥4,045 million was approved, and will be reflected in the consolidated financial statements for the year ending March 31, 2005.
Stock-based Compensation Plan
As of March 31, 2004, Daiichi maintained four share subscription rights plans (the “2000-2003 Plans”) for the purpose of granting stock options to the directors, corporate executive officers and selected employees of
F-29
Table of Contents
Daiichi Pharmaceutical Co., Ltd. and Subsidiaries
Notes to Consolidated Financial Statements (continued)
Daiichi, pursuant to the Code. Pursuant to these plans, all of which were approved by the board of directors and shareholders of Daiichi, Daiichi may grant subscription rights exercisable for an aggregate of up to 1,842,000 shares at an exercise price ranging from ¥1,633 to ¥3,030 per share. All subscription rights were granted with an exercise price above the market value of Daiichi’s common stock on the dates of grant, expire 10 years from the date of grant, and are exercisable after two years from the date of grant. None of the granted subscription rights have been exercised or have expired. Under the 2000-2003 Plans, the number of ordinary shares issuable will be adjusted for stock splits, reverse stock splits and certain other recapitalizations. No such adjustments have been made to date.
The Company uses the fair-value based method prescribed by SFAS No. 123 to account for the Company’s share subscription plans. The compensation cost is measured based on a fair value of such options on the grant dates and is recognized in earnings equally over the vesting period of two years. The following table summarizes information about stock option activity for the years ended March 31, 2003 and 2004:
| Shares | Weighted average exercise price | Weighted average remaining life | Exercise price | ||||||||||
| Low | High | ||||||||||||
Outstanding at March 31, 2002 | 1,001,000 | ¥ | 2,873 | 8.68 | ¥ | 2,755 | ¥ | 3,030 | |||||
Granted | 409,000 | 2,388 | 10.00 | 2,388 | 2,388 | ||||||||
Exercised | — | — | — | — | — | ||||||||
Canceled or Expired | — | — | — | — | — | ||||||||
Outstanding at March 31, 2003 | 1,410,000 | 2,718 | 8.14 | 2,388 | 3,030 | ||||||||
Granted | 432,000 | 1,633 | 10.00 | 1,633 | 1,633 | ||||||||
Exercised | — | — | — | — | — | ||||||||
Canceled or Expired | — | — | — | — | — | ||||||||
Outstanding at March 31, 2004 | 1,842,000 | ¥ | 2,464 | 7.63 | ¥ | 1,633 | ¥ | 3,030 | |||||
Exercisable at March 31, 2003 | 570,000 | ¥ | 2,755 | 7.25 | ¥ | 2,755 | ¥ | 2,755 | |||||
Exercisable at March 31, 2004 | 1,001,000 | 2,873 | 6.68 | 2,755 | 3,030 | ||||||||
The table below summarizes information concerning options outstanding under the plans at March 31, 2004:
| Outstanding | Exercisable | |||||||||||
Range of exercise prices | Shares | Weighted average remaining life | Weighted average exercise price | Shares | Weighted average exercise price | |||||||
¥1,000 – ¥1,999 | 432,000 | 9.25 | ¥ | 1,633 | — | ¥ | — | |||||
2,000 – 2,999 | 979,000 | 7.09 | 2,581 | 570,000 | 2,755 | |||||||
3,000 – 3,999 | 431,000 | 7.25 | 3,030 | 431,000 | 3,030 | |||||||
Total | 1,842,000 | 1,001,000 | ||||||||||
F-30
Table of Contents
Daiichi Pharmaceutical Co., Ltd. and Subsidiaries
Notes to Consolidated Financial Statements (continued)
Total compensation cost recognized in the consolidated statements of income was ¥306 million and ¥161 million, respectively, for the years ended March 31, 2003 and 2004. The weighted average grant-date fair value of options granted during the years ended March 31, 2003 and 2004, together with significant assumptions used to estimate such fair values were as follows:
| 2003 | 2004 | |||||
Weighted average fair value per share at grant date | ¥ | 530 | ¥ | 326 | ||
Expected life | 10 years | 10 years | ||||
Risk-free rate | 1.32% | 0.82% | ||||
Expected volatility | 24.67% | 24.64% | ||||
Expected dividend yield | 1.40% | 1.90% | ||||
Weighted-average grant-date fair values and weighted-average exercise prices for options granted during the years ended March 31, 2003 and 2004 whose exercise price exceeded the market price of the Company’s common stock on the grant date was as follows:
| 2003 | 2004 | |||||
Grant-date fair value | ¥ | 530 | ¥ | 326 | ||
Exercise price | ¥ | 2,338 | ¥ | 1,633 | ||
12. Comprehensive Income
Accumulated other comprehensive income at March 31, 2003 and 2004 was as follows:
| Millions of Yen | ||||||||
| 2003 | 2004 | |||||||
Foreign currency translation adjustments: | ||||||||
Balance, beginning of year | ¥ | 786 | ¥ | (569 | ) | |||
Adjustments for the year | (1,355 | ) | (955 | ) | ||||
Balance, end of year | ¥ | (569 | ) | ¥ | (1,524 | ) | ||
Net unrealized gains on available-for-sale securities: | ||||||||
Balance, beginning of year | ¥ | 8,073 | ¥ | 6,213 | ||||
Adjustments for the year | (1,860 | ) | 13,471 | |||||
Balance, end of year | ¥ | 6,213 | ¥ | 19,684 | ||||
Minimum pension liability adjustment: | ||||||||
Balance, beginning of year | ¥ | — | ¥ | (2,142 | ) | |||
Adjustments for the year | (2,142 | ) | (294 | ) | ||||
Balance, end of year | ¥ | (2,142 | ) | ¥ | (2,436 | ) | ||
Total accumulated other comprehensive income: | ||||||||
Balance, beginning of year | ¥ | 8,859 | ¥ | 3,502 | ||||
Adjustments for the year | (5,357 | ) | 12,222 | |||||
Balance, end of year | ¥ | 3,502 | ¥ | 15,724 | ||||
F-31
Table of Contents
Daiichi Pharmaceutical Co., Ltd. and Subsidiaries
Notes to Consolidated Financial Statements (continued)
Tax effects allocated to each component of other comprehensive income (loss) and adjustments were as follows:
| Millions of Yen | ||||||||||||
Pretax amount | Tax (expense) or benefit | Net of tax amount | ||||||||||
2003 | ||||||||||||
Foreign currency translation adjustments | ¥ | (1,355 | ) | ¥ | — | ¥ | (1,355 | ) | ||||
Net unrealized losses on available-for-sale securities: | ||||||||||||
Unrealized losses arising during the year | (8,802 | ) | 3,682 | (5,120 | ) | |||||||
Less: reclassification adjustment included in net income | 5,604 | (2,344 | ) | 3,260 | ||||||||
Net unrealized losses | (3,198 | ) | 1,338 | (1,860 | ) | |||||||
Minimum pension liability adjustment | (3,616 | ) | 1,474 | (2,142 | ) | |||||||
Other comprehensive income | ¥ | (8,169 | ) | ¥ | 2,812 | ¥ | (5,357 | ) | ||||
2004 | ||||||||||||
Foreign currency translation adjustments | ¥ | (955 | ) | ¥ | — | ¥ | (955 | ) | ||||
Net unrealized gains on available-for-sale securities: | ||||||||||||
Unrealized gains arising during the year | 24,166 | (9,775 | ) | 14,391 | ||||||||
Less: reclassification adjustment included in net income | (1,554 | ) | 634 | (920 | ) | |||||||
Net unrealized gains | 22,612 | (9,141 | ) | 13,471 | ||||||||
Minimum pension liability adjustment | (496 | ) | 202 | (294 | ) | |||||||
Other comprehensive income | ¥ | 21,161 | ¥ | (8,939 | ) | ¥ | 12,222 | |||||
13. Derivatives
The Company operates internationally and is exposed to foreign currency risks related to selling products and purchasing materials in currencies other than Japanese yen in foreign markets. Daiichi uses foreign exchange forward contracts and foreign currency options with terms up to 6 months to reduce its exposure in foreign currency risks. The aggregate notional amounts of foreign exchange forward contracts outstanding at March 31, 2003 and 2004 were as follows:
| Millions of Yen | ||||||
| 2003 | 2004 | |||||
Foreign exchange forward contracts: | ||||||
To sell foreign currencies | ¥ | 2,810 | ¥ | 1,097 | ||
Daiichi does not designate foreign exchange forward contracts as hedges. There were no outstanding foreign currency option contracts at March 31, 2003 and 2004.
Daiichi has certain debt securities with embedded derivatives. The changes in fair value of the embedded derivatives and the interest yield on the debt securities are not clearly and closely related. Accordingly, the embedded derivatives were separated from the host contracts and accounted for as separate derivative financial instruments and recorded on Daiichi’s balance sheets at fair value with the changes in fair value recorded immediately in earnings. Unrealized gains of ¥50 million and ¥165 million for the years ended March 31, 2003 and 2004, respectively, were recorded in earnings and included in other income, net. The debt securities host contracts are classified as held-to-maturity securities in accordance with SFAS No.115 and are stated at amortized cost. The carrying amounts of these debt host securities were ¥14,000 million as of March 31, 2003 and 2004.
F-32
Table of Contents
Daiichi Pharmaceutical Co., Ltd. and Subsidiaries
Notes to Consolidated Financial Statements (continued)
14. Fair Value of Financial Instruments
The Company estimates fair value of financial instruments based on the following methodologies:
Cash and cash equivalents, Time deposits, Trade receivables, Trade payables, Accrued expenses, Deposit received
The carrying amount approximates fair value because of the short maturity of these instruments.
Investment securities and other investments
The fair values of the Company’s investments in marketable securities are based on quoted market prices.
For investments in non-marketable securities for which there are no quoted market prices, a reasonable estimate of fair value can not be made without incurring excessive costs, accordingly, these investments are carried at cost.
Advances to affiliates
The carrying amount of advances to affiliates were determined to be reasonable estimates of their fair value because interest rates are based on floating rates, which could be repriced within short-term periods.
Long-term debt
The fair values of the Company’s long-term debt instruments are the present value of future cash flows associated with each instrument discounted using the Company’s current borrowing rate for similar debt instruments of comparable maturity.
Derivatives
The fair values of derivatives are used for purposes other than trading, are estimated by obtaining quotes from brokers.
Guarantees
Fair value of guarantee on employees’ housing loan is calculated based on the market price of guarantee cost which is applicable to the balance and periods of employees’ housing loan.
The estimated fair values of the Company’s financial instruments at March 31, 2003 and 2004 were as follows:
| Millions of Yen | ||||||||||||||||
| 2003 | 2004 | |||||||||||||||
| Carrying amount | Estimated fair value | Carrying amount | Estimated fair value | |||||||||||||
Nonderivatives: | ||||||||||||||||
Marketable and investment securities | ¥ | 136,705 | ¥ | 136,415 | ¥ | 179,316 | ¥ | 179,369 | ||||||||
Long-term debt, including current maturities | (4,635 | ) | (4,642 | ) | (4,685 | ) | (4,689 | ) | ||||||||
Derivatives: | ||||||||||||||||
Foreign exchange forward contracts: | ||||||||||||||||
Assets | 9 | 9 | 16 | 16 | ||||||||||||
Liabilities | (31 | ) | (31 | ) | — | — | ||||||||||
Equity indexed interest contracts | (694 | ) | (694 | ) | (529 | ) | (529 | ) | ||||||||
Guarantees | — | (44 | ) | — | (35 | ) | ||||||||||
F-33
Table of Contents
Daiichi Pharmaceutical Co., Ltd. and Subsidiaries
Notes to Consolidated Financial Statements (continued)
Limitations
Fair value estimates are made at a specific point in time, based on relevant market information and information about the financial instruments. These estimates are subjective in nature and involve uncertainties and matters of significant judgment and therefore cannot be determined with precision. Changes in assumptions could significantly affect the estimates.
15. Supplemental Disclosures to Consolidated Statements of Cash Flows
| Millions of Yen | |||||||
| 2003 | 2004 | ||||||
Cash paid during the year for: | |||||||
Interest | ¥ | 70 | ¥ | 57 | |||
Income taxes | 27,478 | 23,038 | |||||
Cash acquisitions of new subsidiary: | |||||||
Fair value of assets acquired, net of cash acquired | 24,813 | — | |||||
Liabilities assumed | (7,568 | ) | — | ||||
Goodwill | 5,914 | — | |||||
Minority interest | (3,714 | ) | — | ||||
Cash paid, net of cash acquired | 19,445 | — | |||||
Property acquired under capital leases during the year | 1,604 | 2,565 | |||||
16. Segment Information
Under SFAS No. 131,Disclosures about Segments of an Enterprise and Related Information, operating segments are defined as components of an enterprise about which separate financial information is available that is regularly evaluated by the chief operating decision maker in deciding how to allocate resources and in assessing performance.
c. Operations in Business Segments
The Company operates on a worldwide basis within the business segments as described in Note 1, Business and Organization.
The following table summarizes sales, operating income (loss), total assets, depreciation and amortization and capital expenditures by business segment which are the primary measures used by the Company’s chief operating decision maker to measure the Company’s operating results and to measure segment profitability and performance. This information is derived from the Company’s management reports which have been prepared based on Japanese GAAP.
Year Ended March 31, 2003 | Pharmaceuticals | Diagnostics | Consumer Healthcare | Fine Chemicals | Others | Corporate and Eliminations | Consolidated | ||||||||||||||||
| (Millions of Yen) | |||||||||||||||||||||||
Net sales: | |||||||||||||||||||||||
Customers | ¥ | 275,023 | ¥ | 14,258 | ¥ | 9,620 | ¥ | 15,793 | ¥ | 7,317 | ¥ | — | ¥ | 322,011 | |||||||||
Intersegment | 1,051 | 27 | — | 9,210 | 1,332 | (11,620 | ) | — | |||||||||||||||
Total | 276,074 | 14,285 | 9,620 | 25,003 | 8,649 | (11,620 | ) | 322,011 | |||||||||||||||
Operating expenses | 218,623 | 13,083 | 10,452 | 24,110 | 8,387 | (5,280 | ) | 269,375 | |||||||||||||||
Operating income (loss) | ¥ | 57,451 | ¥ | 1,202 | ¥ | (832 | ) | ¥ | 893 | ¥ | 262 | ¥ | (6,340 | ) | ¥ | 52,636 | |||||||
Assets | ¥ | 298,714 | ¥ | 11,339 | ¥ | 8,069 | ¥ | 29,198 | ¥ | 14,949 | ¥ | 150,115 | ¥ | 512,384 | |||||||||
Depreciation and amortization | 13,860 | 322 | 166 | 1,751 | 702 | 142 | 16,943 | ||||||||||||||||
Capital expenditures | 6,805 | 273 | 149 | 2,096 | 1,908 | 27 | 11,258 | ||||||||||||||||
F-34
Table of Contents
Daiichi Pharmaceutical Co., Ltd. and Subsidiaries
Notes to Consolidated Financial Statements (continued)
Year Ended March 31, 2004 | Pharmaceuticals | Diagnostics | Consumer Healthcare | Fine Chemicals | Others | Corporate and Eliminations | Consolidated | |||||||||||||||||
| (Millions of Yen) | ||||||||||||||||||||||||
Net sales: | ||||||||||||||||||||||||
Customers | ¥ | 276,908 | ¥ | 14,497 | ¥ | 8,774 | ¥ | 15,117 | ¥ | 7,471 | ¥ | — | ¥ | 322,767 | ||||||||||
Intersegment | 1,388 | 26 | — | 6,592 | 1,373 | (9,379 | ) | — | ||||||||||||||||
Total | 278,296 | 14,523 | 8,774 | 21,709 | 8,844 | (9,379 | ) | 322,767 | ||||||||||||||||
Operating expenses | 226,193 | 13,592 | 10,911 | 21,816 | 8,285 | (4,145 | ) | 276,652 | ||||||||||||||||
Operating | ¥ | 52,103 | ¥ | 931 | ¥ | (2,137 | ) | ¥ | (107 | ) | ¥ | 559 | ¥ | (5,234 | ) | ¥ | 46,115 | |||||||
Assets | ¥ | 265,546 | ¥ | 11,024 | ¥ | 6,110 | ¥ | 25,352 | ¥ | 14,803 | ¥ | 198,974 | ¥ | 521,809 | ||||||||||
Depreciation and | 14,282 | 322 | 151 | 1,777 | 761 | 73 | 17,366 | |||||||||||||||||
Capital expenditures | 10,209 | 366 | 113 | 533 | 1,027 | 66 | 12,314 | |||||||||||||||||
Intersegment sales primarily consist of sales of raw materials for prescription drugs from the fine chemicals segment to the pharmaceuticals segment and others. “Corporate and eliminations” primarily consists of administrative expenses of the Company, and eliminations of intersegment sales and profits on inventories.
Capital expenditures include expenditures for acquisitions of tangible and intangible long-lived assets used in operations of each segment, including those acquired in business combinations.
The tables that follow present reconciliations of segment operating revenues, operating expenses, operating income, assets and depreciation and amortization from the management reports information shown above, to U.S. GAAP amounts included in the accompanying consolidated financial statements.
| Millions of Yen | |||||||
Adjustments to reconcile segment net sales to U.S. GAAP net sales: | 2003 | 2004 | |||||
Segment net sales | ¥ | 322,011 | ¥ | 322,767 | |||
Revenue recognition (1) | (85 | ) | 210 | ||||
Consolidated net sales under U.S. GAAP | ¥ | 321,926 | ¥ | 322,977 | |||
| Millions of Yen | ||||||||
Adjustments to reconcile segment operating expenses to U.S. GAAP | 2003 | 2004 | ||||||
Segment operating expenses | ¥ | 269,375 | ¥ | 276,652 | ||||
Business combination (2) | 1,073 | 1,314 | ||||||
Impairment of long-lived assets (3) | (1,111 | ) | (1,551 | ) | ||||
Severance and retirement plans (4) | 246 | (1,524 | ) | |||||
Software development costs (5) | 75 | (366 | ) | |||||
Other | (339 | ) | (463 | ) | ||||
Consolidated operating expenses under U.S. GAAP | ¥ | 269,319 | ¥ | 274,062 | ||||
F-35
Table of Contents
Daiichi Pharmaceutical Co., Ltd. and Subsidiaries
Notes to Consolidated Financial Statements (continued)
| Millions of Yen | ||||||||
Adjustments to reconcile segment operating income to U.S. GAAP | 2003 | 2004 | ||||||
Segment operating income | ¥ | 52,636 | ¥ | 46,115 | ||||
Business combination (2) | (1,073 | ) | (1,314 | ) | ||||
Impairment of long-lived assets (3) | 1,111 | 1,551 | ||||||
Severance and retirement plans (4) | (246 | ) | 1,524 | |||||
Software development costs (5) | (75 | ) | 366 | |||||
Other | 254 | 673 | ||||||
Consolidated operating income under U.S. GAAP | ¥ | 52,607 | ¥ | 48,915 | ||||
| Millions of Yen | ||||||||
Adjustments to reconcile segment assets to U.S. GAAP total assets: | 2003 | 2004 | ||||||
Segment assets | ¥ | 512,384 | ¥ | 521,809 | ||||
Business combination (2) | 13,660 | 12,346 | ||||||
Impairment of long-lived assets (3) | (2,686 | ) | (1,415 | ) | ||||
Severance and retirement plans (4) | 10,116 | 8,873 | ||||||
Software development costs (5) | 2,907 | 3,124 | ||||||
Leases(6) | 4,346 | 4,615 | ||||||
Other | (476 | ) | 1,217 | |||||
Consolidated total assets under U.S. GAAP | ¥ | 540,251 | ¥ | 550,569 | ||||
| Millions of Yen | ||||||||
Adjustments to reconcile segment depreciation and amortization to U.S. | 2003 | 2004 | ||||||
Segment depreciation and amortization | ¥ | 16,943 | ¥ | 17,366 | ||||
Business combination (2) | 1,208 | 1,314 | ||||||
Impairment of long-lived assets (3) | (1,120 | ) | (1,551 | ) | ||||
Software development costs (5) | 1,078 | 1,352 | ||||||
Leases (6) | 1,953 | 2,194 | ||||||
Other | (261 | ) | (310 | ) | ||||
Consolidated depreciation and amortization under U.S. GAAP | ¥ | 19,801 | ¥ | 20,365 | ||||
| Millions of Yen | ||||||
Adjustments to reconcile segment capital expenditures to U.S. GAAP | 2003 | 2004 | ||||
Segment capital expenditures | ¥ | 11,258 | ¥ | 12,314 | ||
Software development costs (5) | 986 | 1,718 | ||||
Leases (6) | 1,600 | 2,565 | ||||
Consolidated capital expenditures under U.S. GAAP | ¥ | 13,844 | ¥ | 16,597 | ||
Explanations of the significant reconciling items are as follows:
1) Revenue recognition
Under U.S. GAAP, royalty income is accrued based on an estimated amount of royalty earned during the period. Under Japanese GAAP, royalty income is recognized as it is reported by a licensee.
F-36
Table of Contents
Daiichi Pharmaceutical Co., Ltd. and Subsidiaries
Notes to Consolidated Financial Statements (continued)
2) Business combination
Under U.S. GAAP, business combinations must be accounted for using the purchase method. The purchase price is allocated to the acquired tangible and identifiable intangible net assets based on their respective fair values. The excess amount over fair value of the net assets acquired is recorded as goodwill. Those tangible and identifiable intangible assets are depreciated or amortized over their useful lives unless the useful life is indefinite. Under Japanese GAAP, the entire excess of the cost over book values of the net assets acquired is recorded as goodwill and is amortized over a period determined by Daiichi.
3) Impairment of long-lived assets
Under U.S. GAAP, long-lived assets and certain identifiable intangibles are reviewed for impairment whenever events or changes in circumstances indicate that the carrying amount of an asset may not be recoverable. If the assets are considered to be impaired, an impairment to be recognized is measured by the amount by which the carrying amount of the assets exceeds the fair value of the assets. Under Japanese GAAP, an impairment of long-lived assets is recognized only in certain circumstances. Depreciation and amortization under U.S. GAAP become lower compared to the amounts recorded under Japanese GAAP in the periods subsequent to the recognition of an impairment loss.
4) Severance and retirement plans
Under both U.S. and Japanese GAAP, defined benefit plans are accounted for in a similar manner. However, certain adjustments are necessary due primarily to the difference in an amortization method of unrecognized actuarial gain and loss between U.S. and Japanese GAAP. In addition, under U.S. GAAP, a minimum pension liability is required to be recognized in shareholders’ equity to cover the amount, if any, of accumulated benefit obligations in excess of the fair value of pension plan assets.
5) Software development costs
Under U.S. GAAP, costs associated with developing software systems for internal use are capitalized, once they reach the application development stage and meet recoverability tests. Capitalized software costs are amortized over an estimated useful life of the software. Under Japanese GAAP, the Company expenses costs associated with such software development as incurred.
6) Leases
U.S. GAAP requires that leases that transfer essentially all of the risks and rewards of ownership in the leased assets from the lessor to the lessee be capitalized. Under Japanese GAAP, the Company accounts for a lease agreement as an operating lease unless the lease agreement contains an ownership transfer provision or a bargain purchase option. The lease payments are charged to income as incurred.
d. Operations in Geographic Areas (based upon U.S. GAAP)
Year Ended March 31, 2003 | Japan | Americas | Europe | Asia/ Oceania | Total | Eliminations | Consolidated | |||||||||||||||
| (Millions of Yen) | ||||||||||||||||||||||
Net sales | ¥ | 305,214 | ¥ | 21,102 | ¥ | 4,338 | ¥ | 4,300 | ¥ | 334,954 | ¥ | (13,028 | ) | ¥ | 321,926 | |||||||
Long-lived assets | 142,528 | 961 | 53 | 5,601 | 149,143 | — | 149,143 | |||||||||||||||
Year Ended March 31, 2004 | Japan | Americas | Europe | Asia/ Oceania | Total | Eliminations | Consolidated | |||||||||||||||
| (Millions of Yen) | ||||||||||||||||||||||
Net sales | ¥ | 306,698 | ¥ | 20,156 | ¥ | 3,902 | ¥ | 5,320 | ¥ | 336,076 | ¥ | (13,099 | ) | ¥ | 322,977 | |||||||
Long-lived assets | 137,579 | 914 | 39 | 4,648 | 143,180 | — | 143,180 | |||||||||||||||
F-37
Table of Contents
Daiichi Pharmaceutical Co., Ltd. and Subsidiaries
Notes to Consolidated Financial Statements (continued)
The Company’s long-lived assets consist of property, plant and equipment, goodwill, other intangible assets, lease deposits and certain other assets.
For the purpose of presenting its operations in geographic areas above, the Company attributes revenues from external customers to individual countries in each area based on where products are sold and services are provided, and attributes assets based on where assets are located.
17. Commitments and Contingencies
Guarantees
At March 31, 2004, Daiichi and certain of its domestic subsidiaries were contingently liable as guarantor for loans to employees in the amount of ¥3,326 million. Daiichi will be required to satisfy the outstanding loan commitments of certain employees in the event those employees are not able to fulfill their repayment obligation. Guarantee agreements were entered into prior to December 31, 2002.
Daiichi and certain of its domestic subsidiaries are contingently liable for trade notes receivable discounted with banks in the amount of ¥198 million in the event certain customers are not able to fulfill their payment obligation.
Operating Lease
The Company recognized rent expense of ¥6,007 million and ¥5,697 million under cancelable and noncancelable operating lease agreements for offices, office equipment and automobiles for the years ended March 31, 2003 and 2004, respectively.
The Company leases office facilities and equipment under various noncancelable operating lease agreements. Future minimum lease payments under noncancelable operating leases as of March 31, 2004 were as follows:
| Millions of Yen | |||
Year ending March 31, | |||
2005 | ¥ | 462 | |
2006 | 409 | ||
2007 | 246 | ||
2008 | 184 | ||
2009 | 164 | ||
Thereafter | — | ||
Total | ¥ | 1,465 | |
Legal Proceedings
In December 2004, the United States District Court for the Northern District of West Virginia ruled in favor of Daiichi and its U.S. licensee, Ortho-McNeil Pharmaceutical, Inc., on their patent infringement action against generic drug manufacturer, Mylan Pharmaceuticals, Inc. The suit arose from the filing by Mylan of an Abbreviated New Drug Application, or ANDA filing, seeking FDA approval to release a generic version of Daiichi’s anti-infective, levofloxacin, marketed under the brand name Levaquin®. The court rejected each of Mylan’s five separate invalidity and unenforceability defenses. As a result of the decision, Mylan is enjoined from producing, importing or selling levofloxacin until Daiichi’s U.S. patent expires in 2010. Mylan has filed a notice of appeal to the U.S. Court of Appeals for the Federal Circuit. The appeal is in its earliest stages.
F-38
Table of Contents
Daiichi Pharmaceutical Co., Ltd. and Subsidiaries
Notes to Consolidated Financial Statements (continued)
Daiichi and certain of its overseas subsidiaries have been involved in various legal proceedings, consisting mainly of anti-trust proceedings in connection with transactions involving principally calcium pantothenate (Vitamin B5) and Vitamin B6 in the United States of America, Canada, Europe and Korea. The anti-trust prosecutions were completed in the United States of America in October 1999, in Canada in March 2000, in Europe in November 2001 and Korea in April 2003, in which the Company was assessed total fines of approximately ¥5,583 million. The Company fully expensed these amounts prior to April 1, 2002. The Company is in the process of an appeal with the European Court of First Instance to reduce the approximately ¥2,700 million fine initially imposed by the European Commission.
In this connection, a number of civil complaints including class-action lawsuits have been filed against the Company. The Company has settled the majority of those complaints to date, resulting in aggregate settlement payments of approximately ¥7,500 million. Daiichi has accrued ¥436 million and ¥295 million as of March 31, 2003 and 2004, respectively, to settle the remaining civil proceedings, in which the Company’s portion of the plaintiffs’ damages claims was estimated to be at most approximately ¥430 million as of March 31, 2004.
The ultimate outcome of all remaining civil proceedings cannot reasonably be determined at this time. The Company believes, however, that resolution of the remaining civil proceedings will not have a material adverse effect, individually or in the aggregate, on the Company’s financial position or results of operations. The estimate of the potential impact from these legal proceedings could change materially in the near term as litigation is subject to inherent uncertainty.
Environmental Liabilities
Accruals for environmental matters are recorded when it is probable that a liability has been incurred and the amount of the liability can be reasonably estimated, based on current law and existing technologies. Daiichi had accrued ¥477 million at March 31, 2004, for environmental remediation and restoration costs related to its Osaka factory. The accrual will be adjusted as assessment and remediation efforts progress or as additional technical or legal information becomes available. The accruals are recorded at undiscounted amounts and are included in accrued expenses in the accompanying consolidated balance sheets. Daiichi had no accrual for environmental liabilities at March 31, 2003.
In light of the environmental regulations regarding soil contamination that went into effect in Japan in February 2003, Daiichi undertook an environmental study in August 2003 which revealed an existence of volatile organic compounds and arsenic concentrations in the soil and ground water at its Osaka factory. In February 2004, Daiichi started a remediation and restoration work including demolition and removal of certain structures, soil replacement and water cleaning beneath the Osaka factory. Such remediation is expected to be completed by 2006. The following is a summary of activities in the Company’s accrued obligations for the environmental matter for the years ended March 31, 2003 and 2004:
| Millions of Yen | |||||||
Environmental accrued obligations: | 2003 | 2004 | |||||
Balance at beginning of year | ¥ | — | ¥ | — | |||
Additional accruals | — | 480 | |||||
Charges against reserve | — | (3 | ) | ||||
Balance at ending of year | ¥ | — | ¥ | 477 | |||
Management is of opinion that the ultimate costs in excess of the amount accrued, if any, will not have a material adverse effect on the Company’s results of operations or financial position. However, it is reasonably possible that a change in the estimate will occur in the near term as inherent uncertainties exist in these estimates.
F-39
Table of Contents
Daiichi Pharmaceutical Co., Ltd. and Subsidiaries
Notes to Consolidated Financial Statements (continued)
Radioisotope Equipment and Facilities
One of Daiichi’s subsidiaries currently owns and operates radiation generating equipment called “Cyclotrons” to manufacture certain diagnostic drugs it markets. Under current regulations in Japan concerning prevention of radioactive hazards, the Company has no legal obligation to demolish and dispose of contaminated equipment and facilities after their useful lives. However, the Company will be required to maintain such facilities pursuant to the technical standards established by the regulations. The Company intends to keep its Cyclotrons and related facilities closed after their use for a sufficient period of time to allow the radioactive contamination to decrease to a normal level. Management has estimated such time periods range between ten to thirty years from the time a Cyclotron ceased its operation. The Company has not provided an accrual or an asset retirement obligation related to these Cyclotrons at March 31, 2003 and 2004 in the accompanying balance sheets. The Company believes the matter does not have a material effect on the Company’s future results of operations or financial position.
18. Net Income per Share
A reconciliation of the numerators and denominators of the basic and diluted net income per share computations is as follows:
| Millions of Yen | ||||||
| 2003 | 2004 | |||||
Net income available to common shareholders | ¥ | 25,601 | ¥ | 30,736 | ||
| Number of Shares (Thousand) | ||||||
| 2003 | 2004 | |||||
Weighted average common shares outstanding—basic | 277,536 | 272,516 | ||||
Dilutive effect of stock options | — | — | ||||
Weighted average common shares outstanding— diluted | 277,536 | 272,516 | ||||
| Yen | ||||||
| 2003 | 2004 | |||||
Net income per share: | ||||||
Basic | ¥ | 92.25 | ¥ | 112.79 | ||
Diluted | ¥ | 92.25 | ¥ | 112.79 | ||
19. Subsequent Events
One-time Retirement Payment
On April 6, 2004, Daiichi announced a plan of reorganization in which certain employees were legally terminated and rehired by a newly established wholly-owned subsidiary, Daiichi Pharmatech Co., Ltd. In this connection, termination benefits of ¥7,200 million will be paid-out to those affected employees in March 2005.
Transfer of Veterinary and Livestock Feed Products
In June 2004, the Company sold sales and distribution rights for veterinary and livestock feed products in Japan to Meiji Seika Co., Ltd. (“Meiji”), an unrelated third party, for ¥800 million. As a result, an approximately
F-40
Table of Contents
Daiichi Pharmaceutical Co., Ltd. and Subsidiaries
Notes to Consolidated Financial Statements (continued)
¥800 million gain on sale of sales and distribution rights was recognized in the year ending March 31, 2005. In this connection, the Company entered into a long-term product supply agreement with Meiji and continues its manufacturing of veterinary and livestock feed products at one of its domestic subsidiaries.
Stock Subscription Rights Plan
On June 29, 2004, Daiichi’s board of directors and shareholders approved a stock subscription rights plan providing for the grant of stock subscription rights exercisable for an aggregate of up to 356,000 shares of common stock of the Company at an exercise price of ¥1,993 per share to directors and certain employees of Daiichi (“2004 Plan”). Subscription rights for all 356,000 shares of common stock were granted under the 2004 Plan during the year ending March 31, 2005. Those subscription rights will become exercisable on July 1, 2006 and will expire on June 29, 2014.
The amount of compensation cost related to these subscription rights was ¥180 million based on the grant date fair value of ¥507, and will be recognized in earnings over the two-year period ending June 30, 2006.
Merger with Sankyo Company, Limited
On February 25, 2005, Daiichi and Sankyo Company, Limited entered into a Memorandum of Understanding setting forth, among other items, the structure of the joint transfer and the common stock exchange ratio. The Company and Sankyo Company, Limited expect to complete the joint transfer in October 2005.
F-41
Table of Contents
Schedule II. Valuation and Qualifying Accounts and Reserves
For the Two Years Ended March 31, 2004
| (Millions of Yen) | ||||||||||||||
| Additions | ||||||||||||||
Description | Balance at beginning of period | Charged to costs and expenses | Charged to other accounts | Deduction from reserves | Translation adjustment | Balance at end of period | ||||||||
For the year ended March 31, 2003: | ||||||||||||||
Allowance for doubtful receivables(1)- | (434 | ) | — | — | 117 | — | (317 | ) | ||||||
For the year ended March 31, 2004: | ||||||||||||||
Allowance for doubtful receivables(1)- | (317 | ) | — | — | 61 | — | (256 | ) | ||||||
Notes:
| (1) | See Note 1(d) to Consolidated Financial Statements. |
F-42
Table of Contents
(This page is intentionally left blank)
F-43
Table of Contents
DAIICHI PHARMACEUTICAL CO., LTD. AND SUBSIDIARIES
UNAUDITED CONSOLIDATED BALANCE SHEETS
March 31, 2004 and September 30, 2004
| Millions of Yen | ||||||||
ASSETS | March 31, 2004 | September 30, 2004 | ||||||
Current assets: | ||||||||
Cash and cash equivalents | ¥ | 65,998 | ¥ | 73,123 | ||||
Time deposits | 2,513 | 606 | ||||||
Investment securities | 73,421 | 66,239 | ||||||
Trade receivables — | ||||||||
Notes | 9,052 | 10,093 | ||||||
Accounts | 74,866 | 73,337 | ||||||
Less - allowance for doubtful receivables | (256 | ) | (264 | ) | ||||
Inventories | 37,682 | 38,118 | ||||||
Deferred income taxes, net | 18,441 | 19,695 | ||||||
Other current assets | 9,926 | 10,560 | ||||||
Total current assets | 291,643 | 291,507 | ||||||
Property, plant and equipment, at cost: | ||||||||
Land | 17,044 | 16,915 | ||||||
Buildings | 142,656 | 142,650 | ||||||
Machinery and equipment | 161,939 | 162,649 | ||||||
Construction in progress | 1,221 | 3,816 | ||||||
| 322,860 | 326,030 | |||||||
Less - accumulated depreciation and amortization | (214,221 | ) | (219,412 | ) | ||||
| 108,639 | 106,618 | |||||||
Investment securities | 105,895 | 102,588 | ||||||
Investments in and advances to affiliates | 542 | 1,212 | ||||||
Goodwill | 5,914 | 5,914 | ||||||
Other intangible assets, net | 23,157 | 24,217 | ||||||
Deferred income taxes, net | 7,675 | 7,935 | ||||||
Lease deposits and other assets | 7,104 | 7,067 | ||||||
Total assets | ¥ | 550,569 | ¥ | 547,058 | ||||
F-44
Table of Contents
| Millions of Yen | ||||||||
LIABILITIES AND SHAREHOLDERS’ EQUITY | March 31, 2004 | September 30, 2004 | ||||||
Current liabilities: | ||||||||
Current maturities of long-term debt | ¥ | 2,036 | ¥ | 2,111 | ||||
Trade payables — | ||||||||
Notes | 52 | 47 | ||||||
Accounts | 31,778 | 29,585 | ||||||
Income taxes payable | 9,963 | 9,572 | ||||||
Accrued expenses | 32,234 | 30,828 | ||||||
Deposits received | 2,418 | 1,790 | ||||||
Other current liabilities | 672 | 530 | ||||||
Total current liabilities | 79,153 | 74,463 | ||||||
Long-term debt, less current maturities | 2,650 | 2,505 | ||||||
Accrued pension and severance costs | 38,140 | 33,087 | ||||||
Deferred income taxes | 2,657 | 2,764 | ||||||
Other non current liabilities | 1,247 | 1,345 | ||||||
Total liabilities | 123,847 | 114,164 | ||||||
Minority interests | 4,316 | 1,843 | ||||||
Commitment and contingencies | ||||||||
Shareholders’ equity: | ||||||||
Common stock; | ||||||||
Authorized – 789,000,000 shares | ||||||||
Issued and outstanding – 286,453,235 shares and 269,700,226 shares at March 31, 2004 and 286,453,235 shares and 268,420,559 shares at September 30, 2004, respectively | 45,247 | 45,247 | ||||||
Additional paid-in capital | 49,958 | 50,212 | ||||||
Retained earnings | 347,877 | 359,975 | ||||||
Accumulated other comprehensive income | 15,724 | 14,448 | ||||||
Treasury stock at cost; 16,753,009 shares at March 31, 2004 and 18,032,676 shares at September 30, 2004 | (36,400 | ) | (38,831 | ) | ||||
Total shareholders’ equity | 422,406 | 431,051 | ||||||
Total liabilities and shareholders’ equity | ¥ | 550,569 | ¥ | 547,058 | ||||
The accompanying notes to condensed consolidated financial statements are an integral part of these statements.
F-45
Table of Contents
DAIICHI PHARMACEUTICAL CO., LTD. AND SUBSIDIARIES
UNAUDITED INTERIM CONDENSED CONSOLIDATED STATEMENTS OF INCOME
For the six months ended September 30, 2003 and 2004
| Millions of Yen | ||||||||
| 2003 | 2004 | |||||||
Net sales | ¥ | 161,332 | ¥ | 157,765 | ||||
Cost and expense: | ||||||||
Cost of sales | 51,240 | 49,261 | ||||||
Selling, general and administrative expenses | 54,022 | 54,494 | ||||||
Research and development expense | 29,495 | 30,098 | ||||||
Operating income | 26,575 | 23,912 | ||||||
Other income (expense): | ||||||||
Interest and dividend income | 622 | 832 | ||||||
Interest expense | (96 | ) | (92 | ) | ||||
Foreign currency exchange (loss) gain, net | (287 | ) | 510 | |||||
Gain (loss) on investment securities | 330 | (114 | ) | |||||
Equity in losses of affiliates | (61 | ) | (37 | ) | ||||
Other (expense) income, net | (22 | ) | 787 | |||||
Income before income taxes and minority interests | 27,061 | 25,798 | ||||||
Income taxes | 10,743 | 10,139 | ||||||
Minority interests, net of tax | 537 | 484 | ||||||
Net income | ¥ | 16,855 | ¥ | 16,143 | ||||
| Yen | ||||||||
Per share of common stock: | 2003 | 2004 | ||||||
Basic: | ||||||||
Net income | ¥ | 61.80 | ¥ | 60.11 | ||||
Diluted: | ||||||||
Net income | 61.80 | 60.11 | ||||||
Cash dividends per share | 15.00 | 15.00 | ||||||
The accompanying notes to condensed consolidated financial statements are an integral part of these statements.
F-46
Table of Contents
DAIICHI PHARMACEUTICAL CO., LTD. AND SUBSIDIARIES
UNAUDITED INTERIM CONDENSED CONSOLIDATED STATEMENTS OF SHAREHOLDERS’
EQUITY AND COMPREHENSIVE INCOME
For the six months ended September 30, 2003 and 2004
| Millions of Yen | ||||||||
| 2003 | 2004 | |||||||
Common stock: | ||||||||
Beginning balance | ¥ | 45,247 | ¥ | 45,247 | ||||
Ending balance | ¥ | 45,247 | ¥ | 45,247 | ||||
Additional paid-in capital: | ||||||||
Beginning balance | ¥ | 49,797 | ¥ | 49,958 | ||||
Stock option transactions | 113 | 85 | ||||||
Issuance of treasury stock in exchange for subsidiary’s stock; 826,560 shares in 2004 | — | 169 | ||||||
Ending balance | ¥ | 49,910 | ¥ | 50,212 | ||||
Retained earnings: | ||||||||
Beginning balance | ¥ | 325,359 | ¥ | 347,877 | ||||
Net income for the six months | 16,855 | 16,143 | ||||||
Dividends paid | (4,129 | ) | (4,045 | ) | ||||
Ending balance | ¥ | 338,085 | ¥ | 359,975 | ||||
Accumulated other comprehensive income: | ||||||||
Beginning balance | ¥ | 3,502 | ¥ | 15,724 | ||||
Other comprehensive income (loss), net of tax | 6,433 | (1,276 | ) | |||||
Ending balance | ¥ | 9,935 | ¥ | 14,448 | ||||
Treasury stock: | ||||||||
Beginning balance | ¥ | (26,186 | ) | ¥ | (36,400 | ) | ||
Purchase of treasury stock; 2,604,300 shares in 2003 and 2,106,227 shares in 2004 | (4,363 | ) | (4,227 | ) | ||||
Issuance of treasury stock in exchange for subsidiary’s stock; 826,560 shares in 2004 | — | 1,796 | ||||||
Ending balance | ¥ | (30,549 | ) | ¥ | (38,831 | ) | ||
Comprehensive income: | ||||||||
Net income for the six months | ¥ | 16,855 | ¥ | 16,143 | ||||
Other comprehensive income (loss) for the six months, net of tax | 6,433 | (1,276 | ) | |||||
Total comprehensive income for the six months | ¥ | 23,288 | ¥ | 14,867 | ||||
Other comprehensive income: | ||||||||
Foreign currency translation adjustments | ¥ | (143 | ) | ¥ | 155 | |||
Net unrealized gains on available-for-sale securities | 6,232 | (1,747 | ) | |||||
Minimum pension liability adjustment | 344 | 316 | ||||||
Total other comprehensive income (loss) for the six months, net of tax | ¥ | 6,433 | ¥ | (1,276 | ) | |||
The accompanying notes to condensed consolidated financial statements are an integral part of these statements.
F-47
Table of Contents
DAIICHI PHARMACEUTICAL CO., LTD. AND SUBSIDIARIES
UNAUDITED INTERIM CONDENSED CONSOLIDATED STATEMENTS OF CASH FLOWS
For the six months ended September 30, 2003 and 2004
| Millions of Yen | ||||||||
| 2003 | 2004 | |||||||
CASH FLOWS FROM OPERATING ACTIVITIES: | ||||||||
Net income | ¥ | 16,855 | ¥ | 16,143 | ||||
Adjustments to reconcile net income to net cash provided by operating activities - | ||||||||
Depreciation and amortization | 9,701 | 10,382 | ||||||
Equity in losses of affiliates | 61 | 37 | ||||||
Deferred income taxes | (760 | ) | (333 | ) | ||||
(Gain) loss on disposals and sales of property, plant and equipment | (90 | ) | 172 | |||||
(Gain) loss on investment securities | (328 | ) | 59 | |||||
Change in operating assets and liabilities, net of effects of acquisition - | ||||||||
Decrease in trade receivables | 5,621 | 607 | ||||||
Decrease (increase) in inventories | 2,986 | (323 | ) | |||||
Decrease in trade payables | (4,199 | ) | (1,500 | ) | ||||
Decrease in income taxes payable and accrued expenses and other | (1,524 | ) | (1,448 | ) | ||||
Decrease in accrued pension and severance costs | (4,032 | ) | (4,003 | ) | ||||
Other, net | 1,834 | (84 | ) | |||||
Net cash provided by operating activities | 26,125 | 19,709 | ||||||
CASH FLOWS FROM INVESTING ACTIVITIES: | ||||||||
Proceeds from sales of property, plant and equipment | 1,161 | 262 | ||||||
Capital expenditures | (7,325 | ) | (9,154 | ) | ||||
Payments for purchases of available-for-sale securities | (54,794 | ) | (63,015 | ) | ||||
Payments for purchases of held-to-maturity securities | (22,391 | ) | (26,044 | ) | ||||
Proceeds from sales and maturities of available-for-sale securities | 63,557 | 78,188 | ||||||
Proceeds from maturities of held-to-maturity securities | 14,913 | 17,198 | ||||||
Decrease in time deposits | 40 | 1,944 | ||||||
Advances in affiliates | (5 | ) | (802 | ) | ||||
Collections of advances in affiliates | 35 | 121 | ||||||
Other, net | (20 | ) | (1,977 | ) | ||||
Net cash used in investing activities | (4,829 | ) | (3,279 | ) | ||||
CASH FLOWS FROM FINANCING ACTIVITIES: | ||||||||
Repayments of long-term debt | (1,175 | ) | (1,168 | ) | ||||
Dividend payments | (4,129 | ) | (4,045 | ) | ||||
Payments for purchases of treasury stock | (4,363 | ) | (4,227 | ) | ||||
Other, net | (13 | ) | (14 | ) | ||||
Net cash used in financing activities | (9,680 | ) | (9,454 | ) | ||||
EFFECT OF EXCHANGE RATE CHANGES ON CASH AND CASH EQUIVALENTS | (155 | ) | 149 | |||||
NET INCREASE IN CASH AND CASH EQUIVALENTS | 11,461 | 7,125 | ||||||
CASH AND CASH EQUIVALENTS AT BEGINNING OF PERIOD | 70,266 | 65,998 | ||||||
CASH AND CASH EQUIVALENTS AT END OF PERIOD | ¥ | 81,727 | ¥ | 73,123 | ||||
SUPPLEMENTAL DISCLOSURES OF CASH FLOW INFORMATION: | ||||||||
Cash paid during the six months for | ||||||||
Interest | ¥ | 30 | ¥ | 29 | ||||
Income taxes | 12,659 | 10,615 | ||||||
Property acquired under capital leases | ¥ | 1,953 | ¥ | 1,098 | ||||
The accompanying notes to condensed consolidated financial statements are an integral part of these statements.
F-48
Table of Contents
DAIICHI PHARMACEUTICAL CO., LTD. AND SUBSIDIARIES
NOTES TO UNAUDITED INTERIM CONDENSED CONSOLIDATED FINANCIAL STATEMENTS
Basis of Presentation
The condensed consolidated financial statements included herein have been prepared by DAIICHI PHARMACEUTICAL CO., LTD. (“Daiichi”) and its subsidiaries (collectively the “Company”), without audit, pursuant to the rules and regulations of the Securities and Exchange Commission. Certain information and footnote disclosures normally included in financial statements prepared in accordance with accounting principals generally accepted in the United States (“U.S. GAAP”) have been condensed or omitted pursuant to such rules and regulations, although the Company believes that the disclosures are adequate to make the information presented not misleading. These condensed consolidated financial statements should be read in conjunction with annual consolidated financial statements and note thereto included in this prospectus.
The accompanying unaudited condensed consolidated financial statements contain all adjustments (consisting of only normal recurring items) which are, in the opinion of management, necessary to present fairly the financial position as of September 30, 2004 and the results of operations and cash flows for the six months ended September 30, 2003 and 2004. The results of operations for the six months ended September 30, 2004 are not necessary indicative of the results to be expected for the full year.
1. Recent Accounting Pronouncements
In November 2004, the Financial Accounting Standards Board (“FASB”) issued Statement of Financial Accounting Standards (“SFAS”) No. 151,Inventory Costs-an amendment of ARB No. 43. This Statement amends the guidance in Accounting Research Bulletin (“ARB”) No. 43, Chapter 4,Inventory Pricing, to clarify the accounting for abnormal amounts of idle facility expense, freight, handling costs, and wasted material (spoilage). Paragraph 5 of ARB No. 43, Chapter 4, previously stated that “. . . under some circumstances, items such as idle facility expense, excessive spoilage, double freight, and rehandling costs may be so abnormal as to require treatment as current period charges…” This Statement requires that those items be recognized as current-period charges regardless of whether they meet the criterion of “so abnormal.” In addition, this Statement requires that allocation of fixed production overheads to the costs of conversion be based on the normal capacity of the production facilities. This Statement is effective for inventory costs incurred during annual periods beginning after June 15, 2005. The Company does not expect the adoption of this Statement will have a material effect on its consolidated financial statements.
SFAS No. 123 (revised 2004),Share-Based Payment, was issued in December 2004. This Statement is a revision of SFAS No. 123,Accounting for Stock-Based Compensation and supersedes Accounting Principles Board (“APB”) Opinion No. 25,Accounting for Stock Issued to Employees, and its related implementation guidance. This Statement, which requires companies to recognize in the income statement the grant-date fair value of stock options and other equity-based compensation issued to employees, is effective for most public companies’ interim or annual periods beginning after June 15, 2005. The Company is currently evaluating the impact of adopting this Statement.
2. Use of Estimates
The preparation of the condensed consolidated financial statements requires management of the Company to make a number of estimates and assumptions relating to the reported amount of assets and liabilities and the disclosure of contingent assets and liabilities at the date of the condensed consolidated financial statements and the reported amounts of revenues and expenses during the period. Significant items subject to such estimates and assumptions include the carrying amount of property, plant and equipment, intangibles and goodwill; valuation allowances for doubtful receivables, inventories and deferred income tax assets; fair value of stock based compensation; and assets and obligations related to employee benefits. Actual results could differ from those estimates.
F-49
Table of Contents
Daiichi Pharmaceutical Co., Ltd. and Subsidiaries
Notes to Consolidated Financial Statements (continued)
3. Business Concentration
For the six months ended September 30, 2003, the Company’s sales to one major wholesaler accounted for approximately 11% of the Company’s net sales. Related accounts receivable from the wholesaler was ¥10,438 million at September 30, 2003. For the six months ended September 30, 2004, the Company’s sales to two major wholesalers accounted for approximately 26% of the Company’s net sales. Related accounts receivable from these wholesalers were ¥24,703 million at September 30, 2004. Business Concentrations for the two periods were recorded principally in the pharmaceuticals segment.
For the six months ended September 30, 2003 and 2004, approximately 92% and 94% of the Company’s net sales were recognized in Japan, respectively.
4. Transfer of Veterinary and Livestock Feed Products
In June 2004, the Company sold sales and distribution rights for veterinary and livestock feed products in Japan to Meiji Seika Co., Ltd. (“Meiji”), an unrelated third party, for ¥800 million. As a result, an approximately ¥800 million gain on sale of sales and distribution rights was recognized during the six months ending September 30, 2004 and has been included in other income in the accompanying condensed consolidated statement of income. In this connection, the Company entered into a long-term product supply agreement with Meiji and continues its manufacturing of veterinary and livestock feed products at one of its domestic subsidiaries.
5. Stock-based Compensation Plan
On June 29, 2004, Daiichi’s board of directors and shareholders approved a stock subscription rights plan pursuant to which Daiichi may grant of subscription rights exercisable for an aggregate of up to 356,000 shares of common stock of Daiichi at an exercise price of ¥1,993 per share to directors and certain employees of Daiichi (“2004 Plan”). Subscription rights for all 356,000 shares were granted under the 2004 Plan. Those subscription rights will become exercisable on July 1, 2006 and will expire on June 29, 2014. The amount of compensation cost related to these subscription rights was ¥180 million based on the grant date fair value of ¥507, and will be recognized in earnings over the vesting period, during the two-year period ending March 31, 2006.
Total compensation costs related to stock-based compensation recognized in income were ¥113 million and ¥85 million, respectively, for the six months ended September 30, 2003 and 2004. Weighted average grant-date fair value of options granted during the six months ended September 30, 2003 and 2004, together with significant assumptions used to estimate such fair values were as follows:
| 2003 | 2004 | |||||
Weighted average fair value per share at grant date | ¥ | 326 | ¥ | 507 | ||
Expected life | 10 years | 10 years | ||||
Risk-free rate | 0.820% | 1.780% | ||||
Expected volatility | 24.64% | 24.50% | ||||
Expected dividend yield | 1.90% | 1.50% | ||||
Weighted-average grant-date fair values of options and weighted-average exercise prices for options granted during the six months ended September 30, 2003 and 2004 whose exercise price exceeds the market price of the stock on the grant date were as follows:
| 2003 | 2004 | |||||
Grant-date fair value | ¥ | 326 | ¥ | 507 | ||
Exercise price | ¥ | 1,633 | ¥ | 1,993 | ||
F-50
Table of Contents
Daiichi Pharmaceutical Co., Ltd. and Subsidiaries
Notes to Consolidated Financial Statements (continued)
6. Commitments and Contingencies
Guarantees
At September 30, 2004, Daiichi and certain of its domestic subsidiaries were contingently liable as guarantor for loans to employees in the amount of ¥2,993 million. Daiichi will be required to satisfy the outstanding loan commitments of certain employees in the event those employees are not able to fulfill their repayment of obligation. Guarantee agreements were entered into prior to December 31, 2002.
Daiichi and certain of its domestic subsidiaries are contingently liable for trade notes receivable discounted with banks in the amount of ¥111 million in the event certain customers are not able to fulfill their payment obligation.
Legal Proceedings
In December 2004, the United States District Court for the Northern District of West Virginia ruled in favor of Daiichi and its U.S. licensee, Ortho-McNeil Pharmaceutical, Inc., on their patent infringement action against generic drug manufacturer, Mylan Pharmaceuticals, Inc. The suit arose from the filing by Mylan of an Abbreviated New Drug Application, or ANDA filing, seeking FDA approval to release a generic version of Daiichi’s anti-infective, levofloxacin, marketed under the brand name Levaquin®. The court rejected each of Mylan’s five separate invalidity and unenforceability defenses. As a result of the decision, Mylan is enjoined from producing, importing or selling levofloxacin until Daiichi’s U.S. patent expires in 2010. Mylan has filed a notice of appeal to the U.S. Court of Appeals for the Federal Circuit. The appeal is in its earliest stages.
Daiichi and certain of its overseas subsidiaries have been involved in various legal proceedings, consisting mainly of anti-trust proceedings in connection with transactions involving principally calcium pantothenate (Vitamin B5) and Vitamin B6 in the United States of America, Canada, Europe and Korea. Anti-trust prosecutions were completed in the United States of America in October 1999, in Canada in March 2000, in Europe in November 2001 and Korea in April 2003, in which the Company was assessed total fines of approximately ¥5,583 million. The Company fully expensed these amounts prior to April 1, 2002. The Company is in the process of an appeal with the European Court of First Instance to reduce the approximately ¥2,700 million fine initially imposed by the European Commission.
In this connection, a number of civil complaints including class-action lawsuits have been filed against the Company. The Company has settled the majority of those complaints to date, resulting in aggregate settlement payments of approximately ¥7,500 million. Daiichi has reserved ¥295 million and ¥315 million as of March 31, 2004 and September 30, 2004, respectively, to settle the remaining civil proceedings, in which the Company’s portion of the plaintiffs’ damages claims was estimated to be at most approximately ¥430 million as of September 30, 2004.
The ultimate outcome of all remaining civil proceedings cannot reasonably be determined at this time. The Company believes, however, that resolution of the remaining civil proceedings will not have a material adverse effect, individually or in the aggregate, on the Company’s financial position or results of operations. The estimate of the potential impact from these legal proceedings could change materially in the near term as litigation is subject to inherent uncertainty.
Environmental Liabilities
Accruals for environmental matters are recorded when it is probable that a liability has been incurred and the amount of the liability can be reasonably estimated, based on current law and existing technologies. Daiichi had
F-51
Table of Contents
Daiichi Pharmaceutical Co., Ltd. and Subsidiaries
Notes to Consolidated Financial Statements (continued)
accrued obligations of ¥477 million and ¥353 million at March 31, 2004 and September 30, 2004, respectively, for environmental remediation and restoration costs related to its Osaka factory. The accrual will be adjusted as assessment and remediation efforts progress or as additional technical or legal information becomes available. The accrual has been recorded at undiscounted amounts included in accrued expenses in the accompanying condensed consolidated balance sheet as of September 30, 2004.
In light of the environmental regulations regarding soil contamination that went into effect in Japan in February 2003, Daiichi undertook an environmental study in August 2003 which revealed an existence of volatile organic compounds and arsenic concentrations in the soil and ground water at its Osaka factory. In February 2004, Daiichi started remediation and restoration work including demolition and removal of certain structures, soil replacement and water cleaning beneath the Osaka factory. Such remediation is expected to be completed by 2006. The following is a summary of the activities in the Company’s accrued obligation for the environmental matter for the six months ended September 30, 2004:
Environmental accrued obligations: | Millions of Yen | |||
| 2004 | ||||
Balance at beginning of six months | ¥ | 477 | ||
Additional accruals | 25 | |||
Charges against reserve | (149 | ) | ||
Balance at ending of six months | ¥ | 353 | ||
Management is of opinion that the ultimate costs in excess of those accrued, if any, will not have a material adverse effect on the Company’s results of operations or financial position. However, it is reasonably possible that a change in the estimate will occur in the near term as inherent uncertainties exist in theses estimates.
Radioisotope Equipment and Facilities
One of Daiichi’s subsidiaries currently owns and operates radiation generating equipment called “Cyclotrons” to manufacture certain of diagnostic drugs it markets. Under current regulations in Japan concerning prevention of radioactive hazards, the Company has no legal obligation to demolish and dispose of contaminated equipment and facilities after their useful lives. However, the Company will be required to maintain such facilities pursuant to the technical standards established by the regulations. The Company intends to keep its Cyclotrons and related facilities closed after their use for a sufficient period of time to allow the radioactive contamination decrease to a normal level. Management has estimated such time periods range between ten to thirty years from the time a Cyclotron ceased its operation. The Company has not provided an accrual or an asset retirement obligation related to these Cyclotrons at March 31, 2004 and September 31, 2004 in the accompanying balance sheet. The Company believes the matter does not have a material effect on the Company’s future results of operations or financial position.
Other
In connection with the December 2002 acquisition of Daiichi Suntory Pharma Co., Ltd. (“DSP”), Daiichi has agreed to acquire the remaining 34% of the shares of DSP from Suntory Co., Ltd. in December 2005 for approximately ¥10,000 million.
F-52
Table of Contents
Daiichi Pharmaceutical Co., Ltd. and Subsidiaries
Notes to Consolidated Financial Statements (continued)
7. Inventories
Inventories at March 31, 2004 and September 30, 2004 consisted of the following:
| Millions of Yen | ||||||
| March | September | |||||
Finished products | ¥ | 18,367 | ¥ | 20,448 | ||
Work in process | 11,912 | 8,684 | ||||
Raw materials and supplies | 7,403 | 8,986 | ||||
Total | ¥ | 37,682 | ¥ | 38,118 | ||
8. Goodwill and Other Intangible Assets
Other intangible assets at March 31, 2004 and September 30, 2004 consisted of the following:
| Millions of Yen | ||||||||||||||||||||
| March 31, 2004 | September 30, 2004 | |||||||||||||||||||
| Gross carrying amount | Accumulated amortization | Net carrying amount | Gross carrying amount | Accumulated amortization | Net carrying amount | |||||||||||||||
Other intangible assets subject to amortization: | ||||||||||||||||||||
Sales and distribution rights | ¥ | 5,003 | ¥ | (1,564 | ) | ¥ | 3,439 | ¥ | 6,967 | ¥ | (1,971 | ) | ¥ | 4,996 | ||||||
Developed technology | 6,204 | (775 | ) | 5,429 | 6,204 | (1,085 | ) | 5,119 | ||||||||||||
Patents/trademarks | 5,340 | (1,792 | ) | 3,548 | 5,340 | (2,064 | ) | 3,276 | ||||||||||||
Software | 9,919 | (3,393 | ) | 6,526 | 11,197 | (4,071 | ) | 7,126 | ||||||||||||
Others | 487 | (100 | ) | 387 | 490 | (100 | ) | 390 | ||||||||||||
Total | 26,953 | (7,624 | ) | 19,329 | 30,198 | (9,291 | ) | 20,907 | ||||||||||||
Other intangible assets not subject to amortization | 3,828 | 3,310 | ||||||||||||||||||
Total other intangible assets | ¥ | 23,157 | ¥ | 24,217 | ||||||||||||||||
In July 2004, the Company acquired the exclusive sales and distribution right for Mobic, a non-steroidal anti-inflammatory drug, for the amount of ¥1,500 million, which are being amortized over the contractual life of 7 years.
The aggregate amortization expense of other intangible assets subject to amortization for the six months ended September 30, 2003 and 2004 was ¥1,579 million and ¥1,895 million, respectively.
The weighted-average amortization period as of September 30, 2004 was as follows:
| Period | ||
Sales and distribution rights | 8.8 yrs | |
Developmental technology | 10.0 yrs | |
Patents/trademarks | 10.6 yrs | |
Software | 5.0 yrs |
9. �� Impairment or Disposal of Long-Lived Assets
In February 2004, the Company made a decision to vacate one of its research and development (“R&D”) facilities as part of its facilities’ integration plan and vacated it in September 2004. As a result, the Company revised estimates to reflect the use of the facility over its shortened useful life of 7 months.
F-53
Table of Contents
Daiichi Pharmaceutical Co., Ltd. and Subsidiaries
Notes to Consolidated Financial Statements (continued)
The Company recorded an additional depreciation expense of ¥926 million, as a component of R&D expense and an impairment charge of ¥101 million, as a component of selling, general and administrative expenses in the Pharmaceuticals segment for the six months ended September 30, 2004. This impairment charge reduced the carrying amount of land related to the facility to its estimated fair value, as determined based on a quoted market price of the land.
10. Net Income per Share
A reconciliation of the numerators and denominators of the basic and diluted net income per share computations for the six months ended September 30, 2003 and 2004, respectively, is as follows:
| Millions of Yen | ||||||
| 2003 | 2004 | |||||
Net income available to common shareholders | ¥ | 16,855 | ¥ | 16,143 | ||
| Number of Shares (Thousand) | ||||
| 2003 | 2004 | |||
Weighted average common shares outstanding—basic | 272,750 | 268,549 | ||
Dilutive effect of stock options | — | 29 | ||
Weighted average common shares outstanding—diluted | 272,750 | 268,578 | ||
| Yen | ||||||
| 2003 | 2004 | |||||
Net income per share: | ||||||
Basic | ¥ | 61.80 | ¥ | 60.11 | ||
Diluted | ¥ | 61.80 | ¥ | 60.11 | ||
11. Severance and Retirement Plans
Net periodic cost of the Company’s plans for the six months ended September 30, 2003 and 2004 were as follows:
| Millions of Yen | ||||||||
| 2003 | 2004 | |||||||
Service cost–benefits earned during the period | ¥ | 2,173 | ¥ | 1,827 | ||||
Interest cost on projected benefit obligations | 1,340 | 1,212 | ||||||
Expected return on plan assets | (780 | ) | (1,123 | ) | ||||
Recognized actuarial loss | 165 | 221 | ||||||
Amortization of unrecognized prior service cost | (37 | ) | (37 | ) | ||||
Amortization of transition obligations | 374 | 374 | ||||||
Net periodic cost | ¥ | 3,235 | ¥ | 2,474 | ||||
The domestic employee’s pension fund (“EPF”) plan was composed of (1) a corporate defined benefit portion established by Daiichi and (2) a substituitonal portion based on benefits prescribed by the government (similar to social security benefits in the United Sates). Daiichi had been exempted from contributing to the Japanese Pension Insurance (“JPI”) program that would otherwise have been required if it had not elected to fund the government substituional portion of the benefit through an EPF arrangement. The plan assets of the EPF were invested and managed as a single portfolio for the entire EPF and were not separately attributed to the
F-54
Table of Contents
Daiichi Pharmaceutical Co., Ltd. and Subsidiaries
Notes to Consolidated Financial Statements (continued)
substitutional and corporate portions. In June 2001, the Contributed Benefit Pension Plan law was newly enacted and permitted an employer to elect to transfer the entire substitutional portion benefit obligation from the EPF to the government together with a specified amount of plan assets pursuant to a government formula. After such transfer, the employer would be required to make periodic contributions to JPI, and the Japanese government would be responsible for all benefit payments. The corporate portion of the EPF would continue to exist exclusively as a corporate defined benefit pension plan.
Pursuant to the new law, Daiichi received an approval of exemption from the Minister of Health, Labor and Welfare, effective January 1, 2004, from the obligation for benefits related to future employee service with respect to the substitutional portion of its EPF. Daiichi received the government approval of exemption from the obligation for benefits related to past employee service in January 2005 with respect to the substitutional portion of its domestic contributory plan. Daiichi will account for the transfer in accordance with Emerging Issues Task Force (“EITF”) Issue 03-02,Accounting for the Transfer to theJapanese Government of Substitutional Portion of Employee Pension Fund Liabilities. As specified in EITF 03-02, the entire separation process is to be accounted for at the time of completion of the transfer to the government of the substitutional portion of the benefit obligation and related plan assets as a settlement in accordance with SFAS No. 88,Employers’ Accounting for settlement and Curtailments of Defined Benefit Pension Plans and Termination benefits. Accordingly, there has been no effect on the Company’s condensed consolidated financial statements for the six months ended September 30, 2004. The aggregate effect of this separation will be determined based on the Company’s pension benefit obligation as of the transfer is completed and the amount of plan assets required to be transferred.
12. Segment Information
The following table summarizes sales and operating income (loss) by business segment which are the primary measures used by the Company’s chief operating decision maker to measure the Company’s operating results and to measure segment profitability and performance. This information is derived from the Company’s management reports which have been prepared based on accounting principles and practices generally accepted in Japan (“Japanese GAAP”).
Six months ended September 30, 2003 | Pharma- ceuticals | Diagnostics | Consumer Healthcare | Fine Chemicals | Others | Corporate and Eliminations | Consolidated | |||||||||||||||||
| (Millions of Yen) | ||||||||||||||||||||||||
Net sales: | ||||||||||||||||||||||||
Customers | ¥ | 140,203 | ¥ | 6,954 | ¥ | 4,218 | ¥ | 7,188 | ¥ | 3,743 | ¥ | — | ¥ | 162,306 | ||||||||||
Intersegment | 726 | 3 | — | 3,281 | 688 | (4,698 | ) | — | ||||||||||||||||
Total | 140,929 | 6,957 | 4,218 | 10,469 | 4,431 | (4,698 | ) | 162,306 | ||||||||||||||||
Operating expenses | 111,187 | 6,516 | 5,506 | 10,776 | 4,134 | (2,254 | ) | 135,865 | ||||||||||||||||
Operating income (loss) | ¥ | 29,742 | ¥ | 441 | ¥ | (1,288 | ) | ¥ | (307 | ) | ¥ | 297 | ¥ | (2,444 | ) | ¥ | 26,441 | |||||||
Six months ended September 30, 2004 | Pharma- ceuticals | Diagnostics | Consumer Healthcare | Fine Chemicals | Others | Corporate and Eliminations | Consolidated | ||||||||||||||||
| (Millions of Yen) | |||||||||||||||||||||||
Net sales: | |||||||||||||||||||||||
Customers | ¥ | 136,350 | ¥ | 7,284 | ¥ | 5,649 | ¥ | 7,329 | ¥ | 2,527 | ¥ | — | ¥ | 159,139 | |||||||||
Intersegment | 640 | 20 | — | 2,956 | 731 | (4,347 | ) | — | |||||||||||||||
Total | 136,990 | 7,304 | 5,649 | 10,285 | 3,258 | (4,347 | ) | 159,139 | |||||||||||||||
Operating expenses | 110,461 | 6,689 | 5,525 | 10,501 | 2,954 | (2,011 | ) | 134,119 | |||||||||||||||
Operating income (loss) | ¥ | 26,529 | ¥ | 615 | ¥ | 124 | ¥ | (216 | ) | ¥ | 304 | ¥ | (2,336 | ) | ¥ | 25,020 | |||||||
F-55
Table of Contents
Daiichi Pharmaceutical Co., Ltd. and Subsidiaries
Notes to Consolidated Financial Statements (continued)
Intersegment sales primarily consist of sales of raw materials for prescription drugs from the fine chemicals segment to the pharmaceuticals segment and others. “Corporate and eliminations” primarily consists of administrative expenses of the Company, and eliminations of intersegment sales and profits on inventories.
The tables that follow present reconciliations of segment net sales, operating expenses and operating income from managements report information shown above, to U.S. GAAP amounts included in the accompanying condensed consolidated financial statements.
| Millions of Yen | ||||||||
Adjustments to reconcile segment net sales to U.S. GAAP net sales: | Six months ended September 30, 2003 | Six months ended September 30, 2004 | ||||||
Segment net sales | ¥ | 162,306 | ¥ | 159,139 | ||||
Revenue recognition (1) | (974 | ) | (1,374 | ) | ||||
Consolidated net sales under U.S. GAAP | ¥ | 161,332 | ¥ | 157,765 | ||||
| Millions of Yen | ||||||||
Adjustments to reconcile segment operating expenses to U.S. GAAP operating expenses: | Six months ended September 30, 2003 | Six months ended September 30, 2004 | ||||||
Segment operating expenses | ¥ | 135,865 | ¥ | 134,119 | ||||
Business combination (2) | 656 | 501 | ||||||
Impairment of long-lived assets (3) | (236 | ) | 771 | |||||
Severance and retirement plans (4) | (861 | ) | (378 | ) | ||||
Software development costs (5) | 132 | (188 | ) | |||||
Other | (799 | ) | (972 | ) | ||||
Consolidated operating expenses under U.S. GAAP | ¥ | 134,757 | ¥ | 133,853 | ||||
| Millions of Yen | ||||||||
Adjustments to reconcile segment operating income to U.S. GAAP operating income: | Six months ended September 30, 2003 | Six months ended September 30, 2004 | ||||||
Segment operating income | ¥ | 26,441 | ¥ | 25,020 | ||||
Business combination (2) | (656 | ) | (501 | ) | ||||
Impairment of long-lived assets (3) | 236 | (771 | ) | |||||
Severance and retirement plans (4) | 861 | 378 | ||||||
Software development costs (5) | (132 | ) | 188 | |||||
Other | (175 | ) | (402 | ) | ||||
Consolidated operating income under U.S. GAAP | ¥ | 26,575 | ¥ | 23,912 | ||||
Explanations of the significant reconciling items are as follows:
1) Revenue recognition
Under U.S. GAAP, royalty income is accrued based on an estimated amount of royalty earned during the period. Under Japanese GAAP, royalty income is recognized as it is reported by a licensee.
F-56
Table of Contents
Daiichi Pharmaceutical Co., Ltd. and Subsidiaries
Notes to Consolidated Financial Statements (continued)
2) Business combination
Under U.S. GAAP, business combinations must be accounted for using the purchase method. The purchase price is allocated to the acquired tangible and identifiable intangible net assets based on their respective fair values. The excess amount over fair value of the net assets acquired is recorded as goodwill. Those tangible and identifiable intangible assets are depreciated or amortized over their useful lives unless the useful life is indefinite. Under Japanese GAAP, the entire excess of the cost over book values of the net assets acquired is recorded as goodwill and is amortized over a period determined by Daiichi.
3) Impairment of long-lived assets
Under U.S. GAAP, long-lived assets and certain identifiable intangibles are reviewed for impairment whenever events or changes in circumstances indicate that the carrying amount of an asset may not be recoverable. If the assets are considered to be impaired, an impairment to be recognized is measured by the amount by which the carrying amount of the assets exceeds the fair value of the assets. Under Japanese GAAP, an impairment of long-lived assets is recognized only in certain circumstances. Depreciation and amortization under U.S. GAAP become lower compared to the amounts recorded under Japanese GAAP in the periods subsequent to the recognition of an impairment loss.
4) Severance and retirement plans
Under both U.S. and Japanese GAAP, defined benefit plans are accounted for in a similar manner. However, certain adjustments are necessary due primarily to the difference in an amortization method of unrecognized actuarial gain and loss between U.S. and Japanese GAAP. In addition, under U.S. GAAP, a minimum pension liability is required to be recognized in shareholders’ equity to cover the amount, if any, of accumulated benefit obligations in excess of the fair value of pension plan assets.
5) Software development costs
Under U.S. GAAP, costs associated with developing software systems for internal use are capitalized, once they reach the application development stage and meet recoverability tests. Capitalized software costs are amortized over an estimated useful life of the software. Under Japanese GAAP, the Company expenses costs associated with such software development as incurred.
13. Subsequent Events
One-time Retirement Payment
On April 6, 2004, Daiichi announced a plan of reorganization in which certain employees were to be legally terminated and rehired by a newly established wholly-owned subsidiary, Daiichi Pharmatech Co., Ltd., effective March 31, 2005. The plan was finalized on September 29, 2004, including an identification of employees to be transferred and the terms of the termination benefits. In this connection, the estimated termination benefits of ¥7,200 million to be paid-out to those affected employees in March 2005 will be recognized ratable over the employees’ required future service period from October 2004 to March 2005. Accordingly, no expense associated with the one-time termination benefit was recorded as of September 30, 2004.
Merger with Sankyo Company, Limited
On February 25, 2005, Daiichi and Sankyo Company, Limited entered into a Memorandum of Understanding setting forth, among other items, the structure of the joint transfer and the common stock exchange ratio. The Company and Sankyo Company, Limited expect to complete the joint transfer in October 2005.
F-57
Table of Contents
(This page is intentionally left blank)
F-58
Table of Contents
Report of Independent Registered Public Accounting Firm
The Board of Directors and Shareholders of Sankyo Company, Limited
We have audited the accompanying consolidated balance sheets of Sankyo Company, Limited and subsidiaries as of March 31, 2003 and 2004, and the related consolidated statements of income, shareholders’ equity, and cash flows for each of the years then ended. These financial statements are the responsibility of the Company’s management. Our responsibility is to express an opinion on these financial statements based on our audits.
We conducted our audits in accordance with the standards of the Public Company Accounting Oversight Board (United States). Those standards require that we plan and perform the audit to obtain reasonable assurance about whether the financial statements are free of material misstatement. We were not engaged to perform an audit of the Company’s internal control over financial reporting. Our audit included consideration of internal control over financial reporting as a basis for designing audit procedures that are appropriate in the circumstances, but not for the purpose of expressing an opinion on the effectiveness of the Company’s internal control over financial reporting. Accordingly, we express no such opinion. An audit also includes examining, on a test basis, evidence supporting the amounts and disclosures in the financial statements, assessing the accounting principles used and significant estimates made by management, and evaluating the overall financial statement presentation. We believe that our audits provide a reasonable basis for our opinion.
In our opinion, the financial statements referred to above present fairly, in all material respects, the consolidated financial position of Sankyo Company, Limited and subsidiaries at March 31, 2003 and 2004, and the consolidated results of their operations and their cash flows for each of the years then ended in conformity with U.S. generally accepted accounting principles.
/s/ Ernst & Young ShinNihon
Tokyo, Japan
March 4, 2005
F-59
Table of Contents
CONSOLIDATED BALANCE SHEETS
As of March 31, 2003 and 2004
| Yen in millions | ||||||||
| 2003 | 2004 | |||||||
ASSETS | ||||||||
Current assets: | ||||||||
Cash and cash equivalents | ¥ | 213,556 | ¥ | 201,734 | ||||
Time deposits | 5,591 | 5,451 | ||||||
Marketable securities | 47,233 | 50,033 | ||||||
Notes receivable, trade | 27,171 | 12,617 | ||||||
Accounts receivable, trade | 130,473 | 141,714 | ||||||
Allowance for doubtful accounts | (927 | ) | (884 | ) | ||||
Inventories | 95,674 | 97,525 | ||||||
Deferred income taxes | 26,445 | 25,900 | ||||||
Other current assets | 11,694 | 12,409 | ||||||
Total current assets | 556,910 | 546,499 | ||||||
Investments and advances: | ||||||||
Marketable securities and other securities investments | 89,939 | 114,061 | ||||||
Affiliated companies | 1,287 | 1,985 | ||||||
Other | 14,636 | 13,139 | ||||||
| 105,862 | 129,185 | |||||||
Property, plant and equipment: | ||||||||
Land | 38,328 | 38,810 | ||||||
Buildings | 209,392 | 218,354 | ||||||
Machinery and equipment | 262,963 | 265,889 | ||||||
Construction in progress | 10,383 | 8,477 | ||||||
| 521,066 | 531,530 | |||||||
Less – Accumulated depreciation | (308,686 | ) | (321,730 | ) | ||||
| 212,380 | 209,800 | |||||||
Other assets: | ||||||||
Goodwill | 2,752 | 2,865 | ||||||
Other intangibles, net | 21,780 | 29,699 | ||||||
Deferred income taxes | 33,042 | 21,119 | ||||||
Other | 624 | 837 | ||||||
| 58,198 | 54,520 | |||||||
| ¥ | 933,350 | ¥ | 940,004 | |||||
The accompanying notes are an integral part of these statements.
F-60
Table of Contents
SANKYO COMPANY, LIMITED
CONSOLIDATED BALANCE SHEETS – (Continued)
As of March 31, 2003 and 2004
| Yen in millions | ||||||||
| 2003 | 2004 | |||||||
LIABILITIES AND SHAREHOLDERS’ EQUITY | ||||||||
Current liabilities: | ||||||||
Short-term borrowings | ¥ | 17,004 | ¥ | 17,636 | ||||
Current portion of long-term debt | 5,251 | 3,650 | ||||||
Notes and accounts payable, trade | 57,770 | 50,743 | ||||||
Other payable and accrued expenses | 43,269 | 58,299 | ||||||
Accrued compensation | 18,530 | 16,988 | ||||||
Accrued income taxes | 20,565 | 12,723 | ||||||
Other | 10,946 | 13,598 | ||||||
Total current liabilities | 173,335 | 173,637 | ||||||
Long-term liabilities: | ||||||||
Long-term debt | 8,920 | 6,212 | ||||||
Accrued pension and severance costs | 84,140 | 74,496 | ||||||
Other | 9,999 | 8,615 | ||||||
| 103,059 | 89,323 | |||||||
Minority interest in consolidated subsidiaries | 10,722 | 11,017 | ||||||
Commitments and contingent liabilities | ||||||||
Shareholders’ equity: | ||||||||
Common stock, no par value – 2003–Authorized 1,178,099,000 shares, issued 449,498,765 shares 2004–Authorized 1,168,099,000 shares, issued 439,498,765 shares | 68,793 | 68,793 | ||||||
Additional paid-in capital | 66,862 | 67,225 | ||||||
Retained earnings | 526,407 | 535,488 | ||||||
Accumulated other comprehensive income | 2,635 | 14,857 | ||||||
Treasury stock, at cost | (18,463 | ) | (20,336 | ) | ||||
| 646,234 | 666,027 | |||||||
| ¥ | 933,350 | ¥ | 940,004 | |||||
The accompanying notes are an integral part of these statements.
F-61
Table of Contents
CONSOLIDATED STATEMENTS OF INCOME
For the Years Ended March 31, 2003 and 2004
| Yen in millions | ||||||||
| 2003 | 2004 | |||||||
Net revenue | ¥ | 576,270 | ¥ | 601,273 | ||||
Costs and expenses: | ||||||||
Cost of sales | 233,067 | 228,839 | ||||||
Research and development | 84,453 | 93,597 | ||||||
Selling, general and administrative | 178,432 | 194,004 | ||||||
| 495,952 | 516,440 | |||||||
Operating income | 80,318 | 84,833 | ||||||
Other income (expenses): | ||||||||
Interest and dividends income | 2,163 | 1,792 | ||||||
Interest expense | (616 | ) | (466 | ) | ||||
Foreign exchange loss, net | (307 | ) | (45 | ) | ||||
Gain (loss) on marketable securities, net | (4,171 | ) | 743 | |||||
Other expenses, net | 421 | (1,536 | ) | |||||
| (2,510 | ) | 488 | ||||||
Income before income taxes and minority interest | 77,808 | 85,321 | ||||||
Income taxes: | ||||||||
Current | 44,621 | 38,447 | ||||||
Deferred | (2,116 | ) | 1,950 | |||||
| 42,505 | 40,397 | |||||||
Income from continuing operations before minority interest | 35,303 | 44,924 | ||||||
Minority interest in income of consolidated subsidiaries | 362 | 514 | ||||||
Income from continuing operations | 34,941 | 44,410 | ||||||
Discontinued operations: | ||||||||
Loss from operations of discontinued business | 149 | 10,332 | ||||||
Income tax benefit | (59 | ) | (4,133 | ) | ||||
Loss from discontinued operations | 90 | 6,199 | ||||||
Net income | ¥ | 34,851 | ¥ | 38,211 | ||||
The accompanying notes are an integral part of these statements.
F-62
Table of Contents
SANKYO COMPANY, LIMITED
CONSOLIDATED STATEMENTS OF INCOME (Continued)
For the Years Ended March 31, 2003 and 2004
| Yen | ||||||
| Per share amounts: | 2003 | 2004 | ||||
Continuing operations per common share | ||||||
– Basic | ¥ | 79.17 | ¥ | 101.61 | ||
– Diluted | 79.17 | 101.60 | ||||
Discontinued operations per common share | ||||||
– Basic | 0.20 | 14.18 | ||||
– Diluted | 0.20 | 14.18 | ||||
Net income per common share | ||||||
– Basic | 78.97 | 87.43 | ||||
– Diluted | 78.97 | 87.42 | ||||
Cash dividends | 25.00 | 25.00 | ||||
The accompanying notes are an integral part of these statements.
F-63
Table of Contents
CONSOLIDATED STATEMENTS OF SHAREHOLDERS’ EQUITY
Year ended March 31
| Yen in millions | ||||||||||||||||||||||
Common stock | Additional paid-in capital | Retained earnings | Accumulated other comprehensive income | Treasury stock, cost | Total | |||||||||||||||||
Balance at March 31, 2002 | ¥ | 68,793 | ¥ | 66,862 | ¥ | 502,604 | ¥ | 11,890 | ¥ | (10,181 | ) | ¥ | 639,968 | |||||||||
Comprehensive income: | ||||||||||||||||||||||
Net income | 34,851 | 34,851 | ||||||||||||||||||||
Other comprehensive income (loss), net of tax– | ||||||||||||||||||||||
Unrealized loss on securities, net of reclassification adjustment | (2,944 | ) | (2,944 | ) | ||||||||||||||||||
Minimum pension liability adjustment | (1,775 | ) | (1,775 | ) | ||||||||||||||||||
Foreign currency translation adjustments | (4,536 | ) | (4,536 | ) | ||||||||||||||||||
Total comprehensive income | 25,596 | |||||||||||||||||||||
Dividends paid | (11,048 | ) | (11,048 | ) | ||||||||||||||||||
Purchase of treasury stock | (8,282 | ) | (8,282 | ) | ||||||||||||||||||
Balance at March 31, 2003 | 68,793 | 66,862 | 526,407 | 2,635 | (18,463 | ) | 646,234 | |||||||||||||||
Comprehensive income: | ||||||||||||||||||||||
Net income | 38,211 | 38,211 | ||||||||||||||||||||
Other comprehensive income (loss), net of tax – | ||||||||||||||||||||||
Unrealized gains on securities, net of reclassification adjustment | 14,443 | 14,443 | ||||||||||||||||||||
Minimum pension liability adjustment | 1,238 | 1,238 | ||||||||||||||||||||
Foreign currency translation adjustments: | (3,459 | ) | (3,459 | ) | ||||||||||||||||||
Total comprehensive income | 50,433 | |||||||||||||||||||||
Compensation cost of variable stock option costs | 363 | 363 | ||||||||||||||||||||
Dividends paid | (10,983 | ) | (10,983 | ) | ||||||||||||||||||
Purchase of treasury stock | (20,020 | ) | (20,020 | ) | ||||||||||||||||||
Retirement of treasury stock | (18,147 | ) | 18,147 | — | ||||||||||||||||||
Balance at March 31, 2004 | ¥ | 68,793 | ¥ | 67,225 | ¥ | 535,488 | ¥ | 14,857 | ¥ | (20,336 | ) | ¥ | 666,027 | |||||||||
The accompanying notes are an integral part of these statements.
F-64
Table of Contents
CONSOLIDATED STATEMENTS OF CASH FLOWS
For the Years Ended March 31, 2003 and 2004
| Yen in millions | ||||||||
| 2003 | 2004 | |||||||
Cash flows from operating activities: | ||||||||
Net income | ¥ | 34,851 | ¥ | 38,211 | ||||
Adjustments to reconcile net income to net cash provided by operating activities – | ||||||||
Depreciation and amortization | 26,130 | 26,760 | ||||||
Accrual for pension and severance costs, less payments | (1,744 | ) | (7,220 | ) | ||||
(Gain) loss on sales of property, plant and equipment, net | 71 | (2,647 | ) | |||||
(Gain) loss in available-for-sale securities, net | 3,875 | (266 | ) | |||||
Deferred income taxes | (2,116 | ) | 1,950 | |||||
Changes in assets and liabilities: | ||||||||
Decrease in notes and accounts receivable, trade | 16,334 | 2,949 | ||||||
(Increase) decrease in inventories | 5,353 | (2,259 | ) | |||||
Decrease in notes and accounts payable, trade | (8,494 | ) | (6,692 | ) | ||||
Decrease in accrued income taxes | (2,298 | ) | (7,861 | ) | ||||
Decrease in other current assets | 3,646 | 268 | ||||||
Increase (decrease) in other current liabilities | (5,962 | ) | 19,892 | |||||
Other | 1,281 | 2,321 | ||||||
Net cash provided by operating activities | 70,927 | 65,406 | ||||||
Cash flows from investing activities: | ||||||||
Additions to property, plant and equipment | (16,530 | ) | (26,457 | ) | ||||
Proceeds from sales of property, plant and equipment | 1,286 | 4,493 | ||||||
Additions to intangible assets | (10,892 | ) | (15,158 | ) | ||||
Purchase of marketable securities and other securities investments | (46,285 | ) | (63,493 | ) | ||||
Proceeds from sales and maturities of marketable securities and securities investments | 74,076 | 59,203 | ||||||
Increase in time deposits | (10,900 | ) | (9,604 | ) | ||||
Decrease in time deposits | 11,832 | 9,763 | ||||||
Acquisition, net of cash acquired | (1,633 | ) | — | |||||
Other | 1,384 | 660 | ||||||
Net cash provided by (used in) investing activities | 2,338 | (40,593 | ) | |||||
Cash flows from financing activities: | ||||||||
Proceeds from issuance of long-term debt | 1,190 | 29 | ||||||
Repayments of long-term debt | (5,808 | ) | (5,331 | ) | ||||
Increase (decrease) in short-term borrowings | (2,629 | ) | 691 | |||||
Purchase of treasury stock | (8,282 | ) | (20,020 | ) | ||||
Dividends paid | (11,203 | ) | (11,112 | ) | ||||
Other | (115 | ) | — | |||||
Net cash used in financing activities | (26,847 | ) | (35,743 | ) | ||||
Effect of exchange rate changes on cash and cash equivalents | (1,164 | ) | (892 | ) | ||||
Net increase (decrease) in cash and cash equivalents | 45,254 | (11,822 | ) | |||||
Cash and cash equivalents at beginning of the fiscal year | 168,302 | 213,556 | ||||||
Cash and cash equivalents at end of the fiscal year | ¥ | 213,556 | ¥ | 201,734 | ||||
The accompanying notes are an integral part of these statements.
F-65
Table of Contents
SANKYO COMPANY, LIMITED
CONSOLIDATED STATEMENTS OF CASH FLOWS (Continued)
For the Years Ended March 31, 2003 and 2004
Supplemental data: | ||||||
Cash paid during the year for – | ||||||
Income taxes | ¥ | 46,396 | ¥ | 41,746 | ||
Interest | 617 | 465 | ||||
Non-cash investing and financing activities – | ||||||
Capital lease agreements | ¥ | 2,315 | ¥ | 827 | ||
The accompanying notes are an integral part of these statements
F-66
Table of Contents
NOTES TO CONSOLIDATED FINANCIAL STATEMENTS
1. Nature of operations
Sankyo Company, Limited (the “Company”) and its subsidiaries (collectively “Sankyo”) are primarily engaged in the research, development, manufacturing and marketing of pharmaceuticals, which include pravastatin, an antihyperlipidemic agent, and olmesartan, an antihypertensive agent, as well as other products including food products, additives, and agrochemical products. Research and development activities are performed primarily in Japan, the United States, and Germany. Manufacturing operations of pharmaceuticals are located primarily in Japan and Europe. Sankyo markets and distribute its products primarily in Japan, North America and Europe. Pravastatin (marketed as Mevalotin® in Japan) accounted for 32% and 34% of total consolidated sales for the years ended March 31, 2003 and 2004, respectively.
2. Summary of significant accounting policies
Sankyo Company, Limited and its subsidiaries in Japan maintain their records and prepare their financial statements in accordance with accounting principles generally accepted in Japan while its foreign subsidiaries maintain their records and prepare their financial statements in conformity with accounting principles generally accepted in the countries of their domiciles. Certain adjustments and reclassifications have been incorporated in the accompanying consolidated financial statements to conform with accounting principles generally accepted in the United States of America (“U.S. GAAP”). These adjustments were not recorded in the statutory books of account.
(1) Significant accounting policies:
Basis of consolidation and accounting for investments in affiliated companies —
The consolidated financial statements include the accounts of Sankyo Company, Limited and those of its majority-owned subsidiary companies. Certain foreign subsidiary results are reported in the consolidated financial statements using a December 31 year-end. There have been no significant transactions with such subsidiaries during the period from January 1 to March 31. All intercompany transactions and accounts are eliminated in consolidation.
Investments in affiliated companies in which Sankyo has significant influence, but which it does not control, are stated at cost plus equity in undistributed earnings. Consolidated net income includes Sankyo’s equity in current earnings or losses of such companies, after elimination of unrealized intercompany profits. If the value of an investment has declined and is judged to be other than temporary, the investment is written down to its fair value.
Use of estimates —
The preparation of consolidated financial statements in conformity with U.S. GAAP requires management to make estimates and assumptions that affect the amounts reported in the consolidated financial statements and accompanying notes. Actual results could differ from those estimates. The more significant estimates include: allowance for doubtful accounts, sales returns, impairment of long-lived assets, postretirement benefit costs and obligations and other than temporary losses on marketable securities.
Translation of foreign currencies —
All asset and liability accounts of foreign subsidiaries and affiliates are translated into Japanese yen at exchange rates in effect at the balance sheet date and all income and expense accounts are translated using average rates during the year. The resulting translation adjustments are accumulated as a component of accumulated other comprehensive income.
F-67
Table of Contents
Foreign currency receivables and payables are translated at appropriate year-end current rates and the resulting translation gains or losses are taken into income.
Cash and cash equivalents —
Cash and cash equivalents include all highly liquid investments, with original maturities of three months or less, that are readily convertible to known amounts of cash and are so near maturity that they present insignificant risk of changes in value because of changes in interest rates.
Allowance for doubtful accounts —
Allowance for doubtful accounts is the Company’s best estimate of the amount of probable credit losses in their existing receivables. The allowance is determined based on factors including, but not limited to, the Company’s historical collection experience adjusted for the effects of current economic environment, assessment of inherent risks, aging and financial performance of debtors. Account balances are charged off against the allowance after all means of collection have been exhausted and the potential for recovery is considered remote.
Marketable securities —
Marketable securities consist of debt and equity securities. Debt securities and equity securities designated as available-for-sale, whose fair values are readily determinable, are carried at fair value with unrealized gains or losses included as a component of accumulated other comprehensive income, net of applicable taxes. Debt securities that are expected to be held-to-maturity are carried at amortized cost. Individual securities classified as either available-for-sale or held-to-maturity are reduced to net realizable value by a charge to income for other than temporary declines in fair value. In determining if a decline in value is other than temporary, Sankyo considers the length of time and the extent to which the fair value has been less than the carrying value, the financial condition and prospects of the company and Sankyo’s ability and intent to retain its investment in the company for a period of time sufficient to allow any anticipated recovery in market value. Realized gains and losses are determined on the average cost method and are reflected in the statement of income.
Equity securities in non-public companies —
Equity securities in non-public companies are carried at cost as fair value is not readily determinable. If the value of a non-public equity investment is estimated to have declined and such decline is judged to be other than temporary, Sankyo recognizes the impairment of the investment and the carrying value is reduced to its fair value. Determination of impairment is based on the consideration of such factors as operating results, business plans and estimated future cash flows. Fair value is determined through the use of such methodologies as discounted cash flows, valuation of recent financings and comparable valuations of similar companies.
Inventories —
Inventories are valued at cost, not in excess of market, cost being determined on the “average cost” basis, except for the cost of finished products carried by certain subsidiary companies which is determined on the “first in, first out” (“FIFO”) basis.
Property, plant and equipment and depreciation —
Property, plant and equipment are stated at cost. Depreciation of property, plant and equipment except for certain buildings is primarily computed on the declining-balance method for Sankyo Company, Limited and Japanese subsidiaries, and on the straight-line method for foreign subsidiaries at rates based on
F-68
Table of Contents
estimated useful lives of the assets, principally, ranging from 2 years up to 60 years for buildings and from 2 years up to 17 years for machinery and equipment. Depreciation expenses for property, plant and equipment for the fiscal years ended March 31, 2003 and 2004 were ¥25,090 million and ¥23,022 million, respectively. Significant renewals and additions are capitalized at cost. Maintenance and repairs, and minor renewals and betterments are charged to income as incurred.
From the fiscal year beginning April 1, 2002, Sankyo adopted the Statement of Financial Accounting Standard (“FAS”) No. 143, Accounting for Asset Retirement Obligations (“FAS 143”). FAS 143 requires full recognition of asset retirement obligations on the balance sheet from the point in time at which a legal obligation exists. The obligation is required to be measured at fair value. The carrying value of the asset or assets to which the retirement obligation relates would be increased by an amount equal to the liability recognized. This amount is included in the depreciable base of the asset and charged to income over its life as depreciation.
Business combinations —
All business combinations are accounted for by the purchase method. The excess of the acquisition cost, over the underlying net equity of the business acquired is allocated to identifiable assets and liabilities based on fair values at the date of acquisition. The unassigned residual value of the excess of the cost over the underlying net assets acquired is recognized as goodwill.
Goodwill and other intangible assets —
Goodwill and certain other intangible assets that are determined to have an indefinite life are not amortized and are tested for impairment on an annual basis and between annual tests if an event occurs or circumstances change that would more likely than not reduce the fair value below its carrying amount. Fair value for those assets is generally determined using a discounted cash flow analysis.
Long-lived assets —
Sankyo periodically reviews the carrying value of its long-lived assets held and used, other than goodwill and intangible assets with indefinite lives, and assets to be disposed of, whenever events or changes in circumstances indicated that the carrying amount may not be recoverable. Long-lived assets to be held and used are reviewed for impairment by comparing the carrying value of the assets with their estimated future undiscounted cash flows. If it is determined that an impairment loss has occurred, the loss would be recognized during the period. The impairment loss would be calculated as the difference between asset carrying value and the present value of estimated net cash flows or comparable market values, giving consideration to recent operating performance. Long-lived assets that are to be disposed of other than by sale are considered held and used until they are disposed of. Long-lived assets that are to be disposed of by sale are reported at the lower of their carrying value or fair value less cost to sell. Reductions in carrying value are recognized in the period in which the long-lived assets are classified as held for sale.
Derivative financial instruments —
Sankyo employs derivative financial instruments, including forward foreign currency exchange contracts, and interest rate swap agreements to manage its exposure to fluctuations in foreign currency exchange rates and interest rates. Sankyo does not use derivatives for speculation or trading purposes. Sankyo recognizes all derivative instruments as assets or liabilities in the balance sheet and measures them at fair value. Changes in the fair value of derivatives are recorded each period in current earnings.
Product liability —
Accruals for product liability claims are recorded, on an undiscounted basis, when it is probable that a liability has been incurred and the amount of the liability can reasonably be estimated based on existing information. The accruals are adjusted periodically as additional information becomes available.
F-69
Table of Contents
Revenue recognition —
Revenue from sales of pharmaceutical and other products is recognized upon delivery which is considered to have occurred when the customer has taken title to the products, and risk and reward of ownership have been substantially transferred to the customer. In the case of arrangements where title to delivered products passes to distributors, but the substance of the transaction is that of a consignment, Sankyo recognizes revenue when distributors sell the products to end users. In the case of sales made to a buyer where the price is not considered fixed or determinable or cash collection is not reasonably assured at the time of delivery, Sankyo recognizes revenue when cash is collected from customers. Provisions for rebates, sales incentives, product returns and discounts to customers are provided for as reductions in determining sales in the same period the related sales are recognized based on the conditions agreed with the customers.
Milestone payments received for the rights to distribute pharmaceutical products developed by Sankyo are deferred and recognized as revenue over the terms of the distribution agreements beginning on the product launch date.
Research and development costs —
Research and development (“R&D”) costs are expensed as incurred. These expenses include the costs of Sankyo’s proprietary R&D efforts as well as costs incurred in connection with Sankyo’s third-party collaboration efforts. Milestone payments made by Sankyo to third parties under contracted R&D arrangements are expensed prior to regulatory approval. The milestone payments after obtaining regulatory approval are recorded as other intangible assets.
Shipping and handling costs —
Shipping and handling, warehousing and internal transfer costs for finished goods are included in selling and marketing expenses. Shipping and handling costs were 6,813 million yen and 6,742 million yen for the years ended March 31, 2003 and 2004, respectively.
Advertising expenses —
Advertising costs are expensed as incurred. Advertising costs were 16,595 million yen and 14,561 million yen for the years ended March 31, 2003 and 2004, respectively.
Income taxes —
The provision for income taxes is computed based on the pretax income included in the consolidated statements of income. The asset and liability approach is used to recognize deferred tax assets and liabilities for the expected future tax consequences of temporary differences between the carrying amounts and the tax bases of assets and liabilities. Valuation allowances are recorded to reduce deferred tax assets when it is more likely than not that a tax benefit will not be realized.
Net income per share —
Basic net income per common share is calculated by dividing net income by the weighted-average number of shares outstanding during the reported period. The calculation of diluted net income per common share is similar to the calculation of basic net income per share, except that the weighted-average number of shares outstanding include the additional dilution from the assumed exercise of dilutive stock options.
Stock-based compensation —
Sankyo accounts for the stock-based compensation plans under the recognition and measurements principles of the Accounting Principles Board (“APB”) Opinion No. 25, Accounting for Stock Issued to
F-70
Table of Contents
Employees (“APB 25”), and related interpretations. Sankyo records compensation expenses for its stock option plan under variable plan accounting. The following table illustrates the effect on net income and earnings per share if the company had applied the fair value recognition provisions of FAS No. 123, Accounting for Stock-Based Compensation (“FAS 123”), to stock-based employee compensation. See Note 13 to the consolidated financial statements for weighted-average assumptions used in the stock option pricing model.
| Yen in millions | ||||||||
For the year ended March 31 | ||||||||
| 2003 | 2004 | |||||||
Income from continuing operations: | ||||||||
As reported | ¥ | 34,941 | ¥ | 44,410 | ||||
Add: Total stock-based compensation expense recorded in the net income from continuing operations | — | 363 | ||||||
Deduct: Total stock-based compensation expense determined under fair value based method for all awards, net of related tax effects | (92 | ) | (104 | ) | ||||
Pro forma | ¥ | 34,849 | ¥ | 44,669 | ||||
Net income: | ||||||||
As reported | ¥ | 34,851 | ¥ | 38,211 | ||||
Add: Total stock-based compensation expense recorded in the net income from continuing operations | — | 363 | ||||||
Deduct: Total stock-based compensation expense determined under fair value based method for all awards, net of related tax effects | (92 | ) | (104 | ) | ||||
Pro forma | ¥ | 34,759 | ¥ | 38,470 | ||||
Per share amounts: | ||||||||
Income from continuing operations | ||||||||
— Basic As reported | ¥ | 79.17 | ¥ | 101.61 | ||||
Pro forma | 78.96 | 102.20 | ||||||
— Diluted As reported | ¥ | 79.17 | ¥ | 101.60 | ||||
Pro forma | 78.96 | 102.19 | ||||||
Net income | ||||||||
— Basic As reported | ¥ | 78.97 | ¥ | 87.43 | ||||
Pro forma | 78.76 | 88.02 | ||||||
— Diluted As reported | ¥ | 78.97 | ¥ | 87.42 | ||||
Pro forma | 78.76 | 88.01 | ||||||
(2) New accounting standards adopted:
Costs Associated with Exit or Disposal Activities —
In June 2002, the Financial Accounting Standards Board (“FASB”) issued FAS No. 146, Accounting for Costs Associated with Exit or Disposal Activities (“FAS 146”). FAS 146 requires that a liability for a cost associated with an exit or disposal activity be recognized when the liability is incurred. This statement nullifies EITF Issue No. 94-3, Liability Recognition for Certain Employee Termination Benefits and Other Costs to Exit an Activity (including Certain Costs Incurred in a Restructuring), which required that a liability for an exit cost be recognized upon the entity’s commitment to an exit plan. FAS 146 is effective for exit or disposal activities that are initiated after December 31, 2002. The adoption of FAS 146 did not have a material impact on Sankyo’s consolidated financial statements.
F-71
Table of Contents
Multiple element revenue arrangements —
In November 2002, the EITF reached consensus on Issue No. 00-21, Revenue Arrangements with Multiple Deliverables (“EITF 00-21”). EITF 00-21 address certain aspects of the accounting by a vendor for arrangements under which it will perform multiple revenue-generating activities. Sankyo adopted this consensus for revenue arrangements entered into in the period commencing July 1, 2003. The adoption of EITF 00-21 did not have a material impact on Sankyo’s consolidated financial statements.
Consolidation of variable interest entities —
In January 2003, the FASB issued FASB Interpretation (“FIN”) No. 46, Consolidation of Variable Interest Entities – an interpretation of ARB No. 51 and, in December 2003, the FASB revised FIN46 (“FIN 46R”). This interpretation provides guidance on identifying variable interest entities (“VIEs”) for which control is achieved through means other than voting rights and on how to determine when a company should consolidate the VIE. It is not limited to special purpose entities (“SPEs”) and will require more companies to consolidate entities with which they have contractual ownership, or other pecuniary interests that absorb a portion of that entity’s expected losses or receive a portion of the entity’s residual returns. The adoption of FIN 46 did not have a material impact on Sankyo’s consolidated financial statements for the year ended March 31, 2003 because of no VIEs exist. The December 2003 revision to FIN 46 deferred the effective date for VIEs created before February 1, 2003 that are not SPEs to January 1, 2004, for Sankyo in addition to providing certain scope exceptions. FIN 46R was effective October 1, 2003, for SPEs. The adoption of FIN 46R did not have a material impact on Sankyo’s consolidated financial statements.
Impairment of securities investments —
In November 2003, the EITF reached consensus on EITF Issue No. 03-1, The Meaning of Other-Than-Temporary Impairment and Its Application to Certain Investments (“EITF 03-1”). EITF 03-1 established additional disclosure requirements for each category of FAS No. 115 investments in a loss position. In March 2004, the EITF also reached a consensus on the additional accounting guidance for other-than-temporary impairments and its application to debt and equity investments. In accordance with the new disclosure requirements under EITF 03-1, Note 6 has been expanded to include certain additional information regarding Sankyo’s securities investments.
Employer’s disclosures about pensions and other postretirement benefits —
In December 2003, the FASB revised FAS No. 132, Employers’ Disclosures about Pensions and Other Postretirement Benefits (“FAS 132(R)”), effective for fiscal year ending after December 15, 2003. This revision added disclosures related to assets, obligations and cash flows relating to employee benefit plans. This statement does not change the standards for recognition or measurement of pension plans and other postretirement benefit plans as required by FAS No. 87, Employers’ Accounting for Pensions, FAS No. 88, Employers’ Accounting for Settlements and Curtailments of Defined Benefit Pension Plans for Termination Benefits and FAS No. 106, Employers’ Accounting for Postretirement Benefits Other Than Pensions. See Note 14 for disclosures required by FAS 132(R).
(3) Recent pronouncement:
Accounting for share-based payment —
In December 2004, the FASB revised FAS No. 123 (“FAS 123(R)”) to require expense recognition for share-based payments. This statement shall be effective as of the beginning of the first interim or annual reporting period that begins after June 15, 2005. The adoption of FAS 123(R) is not expected to have a material impact on Sankyo’s results of operations and financial position.
F-72
Table of Contents
Inventory cost —
In December 2004, the FASB issued FAS No. 151, Inventory Costs (“FAS 151”). This statement amends the guidance in Accounting Research Bulletin No. 43, Chapter 4, “Inventory Pricing”, to clarify the accounting for abnormal amounts of idle facility expense, freight, handling costs, and wasted material. The provisions of this statement shall be effective for inventory costs incurred during fiscal years beginning after June 15, 2005. The adoption of FAS 151 is not expected to have a material impact on Sankyo’s results of operations and financial position.
Accounting for exchanges of nonmonetary assets —
In December 2004, the FASB issued FAS No. 153, Accounting for Exchanges of Nonmonetary Assets (“FAS 153”). This statement addresses financial accounting and reporting for exchange transactions of nonmonetary assets on a fair value basis. This statement shall be effective for fiscal years beginning after June 15, 2005. The adoption of FAS 153 is not expected to have a material impact on Sankyo’s results of operations and financial position.
3. Inventories
Inventories comprise the following:
| Yen in millions | ||||||
| March 31 | ||||||
| 2003 | 2004 | |||||
Finished products | ¥ | 51,258 | ¥ | 49,272 | ||
Work in process | 24,450 | 28,937 | ||||
Raw materials and supplies | 19,966 | 19,316 | ||||
| ¥ | 95,674 | ¥ | 97,525 | |||
Finished goods include inventory consigned to others totaling 6,134 million yen and 6,034 million yen, at March 31, 2003 and 2004, respectively.
4. Allowance for doubtful accounts
An analysis of activity within the allowance for doubtful accounts relating to trade notes and accounts receivable for the years ended March 31, 2003 and 2004 is as follows:
| Yen in millions | ||||||||
| March 31 | ||||||||
| 2003 | 2004 | |||||||
Allowance for doubtful accounts at beginning of year | ¥ | 1,018 | ¥ | 927 | ||||
Provision for doubtful accounts | 60 | 16 | ||||||
Write-offs | (153 | ) | (5 | ) | ||||
Translation adjustments and other | 2 | (54 | ) | |||||
Allowance for doubtful accounts at end of year | ¥ | 927 | ¥ | 884 | ||||
F-73
Table of Contents
5. Related party transactions
Account balances and transactions with affiliated companies accounted for under the equity method are presented below:
| Yen in millions | ||||||
| March 31 | ||||||
| 2003 | 2004 | |||||
Accounts receivable, trade | ¥ | 1,044 | ¥ | 965 | ||
| Yen in millions | ||||||
| Year ended March 31 | ||||||
| 2003 | 2004 | |||||
Sales | ¥ | 3,226 | ¥ | 2,909 | ||
Purchases | ¥ | 5 | ¥ | 3 | ||
Dividends from affiliated companies accounted for under the equity method for the years ended March 31, 2003 and 2004 were 18 million yen and 14 million yen, respectively.
6. Marketable securities and other securities investments
Marketable securities and other securities investments both current and long-term include debt and equity securities of which the aggregate cost, gross unrealized gains and losses and fair value pertaining to available-for-sale securities and held-to-maturity securities are as follows:
| Yen in millions | ||||||||||||||||||||||||||
| March 31, 2003 | March 31, 2004 | |||||||||||||||||||||||||
| Cost | Gross unrealized gains | Gross unrealized losses | Fair value | Cost | Gross unrealized gains | Gross unrealized gains | Fair value | |||||||||||||||||||
Available-for-sale: | ||||||||||||||||||||||||||
Debt securities | ¥ | 1,050 | ¥ | 2 | ¥ | (2 | ) | ¥ | 1,050 | ¥ | — | ¥ | — | ¥ | — | ¥ | — | |||||||||
Equity securities | 14,467 | 24,222 | (784 | ) | 37,905 | 19,240 | 47,889 | (2 | ) | 67,127 | ||||||||||||||||
Held-to-maturity | ||||||||||||||||||||||||||
Securities | 82,582 | 214 | (476 | ) | 82,320 | 81,285 | 140 | (36 | ) | 81,389 | ||||||||||||||||
Total | ¥ | 98,099 | ¥ | 24,438 | ¥ | (1,262 | ) | ¥ | 121,275 | ¥ | 100,525 | ¥ | 48,029 | ¥ | (38 | ) | ¥ | 148,516 | ||||||||
At March 31, 2004, debt securities classified as held-to-maturity securities mainly consist of Japanese government and municipal bonds and corporate debt securities due within 5 years.
Proceeds from sales of available-for-sale securities were 76 million yen and 2,151 million yen for the years ended March 31, 2003 and 2004, respectively. Gross realized gains were 39 million yen and 821 million yen and gross realized losses were 4,942 million yen and 81 million yen for the years ended March 31, 2003 and 2004, respectively.
In the ordinary course of business, Sankyo maintains other current and long-term investment securities, including stock in non-public companies, commercial paper and investment trusts. The aggregate carrying amounts of these investments at March 31, 2003 and 2004, were 15,635 million yen and 15,682 million yen, respectively.
F-74
Table of Contents
The following table presents the gross unrealized losses on, and fair value of, Sankyo’s investment securities with unrealized losses, aggregated by investment category and the length of time that individual investment securities have been in a continuous unrealized loss position, at March 31, 2004.
| Yen in millions | ||||||||||||||||||
| Less than 12 months | 12 months or more | Total | ||||||||||||||||
Fair value | Unrealized losses | Fair value | Unrealized losses | Fair value | Unrealized losses | |||||||||||||
Available-for-sale: | ||||||||||||||||||
Equity securities | ¥ | 7 | ¥ | 0 | ¥ | 36 | ¥ | 2 | ¥ | 43 | ¥ | 2 | ||||||
Held-to-maturity Securities | 10,198 | 10 | 2,475 | 26 | 12,673 | 36 | ||||||||||||
Total | ¥ | 10,205 | ¥ | 10 | ¥ | 2,511 | ¥ | 28 | ¥ | 12,716 | ¥ | 38 | ||||||
In evaluating the factors for available-for-sale securities whose fair values are readily determinable, Sankyo presumes a decline in value to be other-than-temporary if the fair value of the security is below its original cost for an extended period of time (generally a period of up to six months). This criteria is employed as a threshold to identify securities which may have a decline in value that is other-than-temporary. The presumption of an other-than-temporary impairment in such cases may be overcome if there is evidence to support that the decline is temporary in nature due to the existence of other factors which overcome the duration or magnitude of the decline. On the other hand, there may be cases where impairment losses are recognized when such decline has not existed for an extended period of time, as a result of considering specific factors which may indicate the decline in the fair value is other-than-temporary.
At March 31, 2004, Sankyo determined that the decline in value for securities with unrealized losses shown in the above table is temporary in nature.
7. Leased assets
Sankyo leases certain assets under capital lease and operating lease agreements. An analysis of leased assets under capital leases is as follows:
| Yen in millions | ||||||||
| March 31 | ||||||||
Class of property | 2003 | 2004 | ||||||
Machinery and equipment | ¥ | 12,615 | ¥ | 11,042 | ||||
Other leased assets | 100 | 56 | ||||||
Accumulated amortization | (7,397 | ) | (7,919 | ) | ||||
| ¥ | 5,318 | ¥ | 3,179 | |||||
Amortization expense under capital leases for the years ended March 31, 2003 and 2004 were 2,842 million yen and 2,535 million yen, respectively.
F-75
Table of Contents
The following is a schedule by year of the future minimum lease payments under capital leases together with the present value of the net minimum lease payments as of March 31, 2004:
| Yen in millions | |||
Year ending March 31: | |||
2005 | ¥ | 1,822 | |
2006 | 1,049 | ||
2007 | 314 | ||
2008 | 131 | ||
2009 | 85 | ||
Later years | 20 | ||
Total minimum lease payments | 3,421 | ||
Less – Amount representing interest | 135 | ||
Present value of net minimum lease payments | 3,286 | ||
Less – Current obligations | 1,745 | ||
Long-term capital lease obligations | ¥ | 1,541 | |
Expense under operating leases for premises and machinery and equipment for the years ended March 31, 2003 and 2004 were 4,534 million yen and 4,957 million yen, respectively. The minimum rental payments required under operating leases that have initial or remaining noncancelable lease terms in excess of one year at March 31, 2004 are as follows:
| Yen in millions | |||
Year ending March 31: | |||
2005 | ¥ | 1,071 | |
2006 | 994 | ||
2007 | 647 | ||
2008 | 493 | ||
2009 | 414 | ||
Later years | 1,396 | ||
Total minimum future rentals | ¥ | 5,015 | |
8. Goodwill and intangible assets
Intangible assets with estimated useful life are amortized on a straight-line basis. The weighted average amortization periods for acquired patent rights, distribution rights and software are 5 years, 10 years and 5 years, respectively.
Intangible assets subject to amortization comprise the following:
| Yen in millions | ||||||||||||||
| March 31 | ||||||||||||||
| 2003 | 2004 | |||||||||||||
Gross carrying amount | Accumulated amortization | Gross carrying amount | Accumulated amortization | |||||||||||
Software for internal use | ¥ | 11,607 | ¥ | (530 | ) | ¥ | 12,080 | ¥ | (2,571 | ) | ||||
Distribution rights | 8,274 | (836 | ) | 18,997 | (1,675 | ) | ||||||||
Patent rights and others | 4,618 | (1,353 | ) | 4,527 | (1,659 | ) | ||||||||
Total | ¥ | 24,499 | ¥ | (2,719 | ) | ¥ | 35,604 | ¥ | (5,905 | ) | ||||
F-76
Table of Contents
The aggregate amortization expenses for intangible assets for the years ended March 31, 2003 and 2004 were 1,040 million yen and 3,738 million yen, respectively. The estimated aggregate amortization expense for intangible assets for the next five years is as follows:
| Yen in millions | |||
Year ending March 31: | |||
2005 | ¥ | 3,905 | |
2006 | 3,917 | ||
2007 | 3,917 | ||
2008 | 3,915 | ||
2009 | 1,490 | ||
The changes in the carrying amount of goodwill related to pharmaceuticals segment for the years ended March 31, 2003 and 2004 are as follows:
| Yen in millions | |||
| Pharmaceuticals | |||
Balance at March 31, 2002 | ¥ | 1,179 | |
Goodwill acquired during year | 1,492 | ||
Translation adjustments | 81 | ||
Balance at March 31, 2003 | 2,752 | ||
Translation adjustments | 113 | ||
Balance at March 31, 2004 | ¥ | 2,865 | |
During the years ended March 31, 2003 and 2004, Sankyo performed the annual impairment tests for goodwill and recorded no impairment losses in the Pharmaceuticals business. The fair value of that reporting unit was estimated principally using the expected present value of future cash flows.
9. Short-term borrowings and long-term debt
Short-term borrowings comprise the following:
| Yen in millions | ||||||
| March 31 | ||||||
| 2003 | 2004 | |||||
Secured loans, principally from banks: | ||||||
with weighted-average interest rate of 0.73% | ¥ | 2,270 | ¥ | — | ||
with weighted-average interest rate of 0.75% | — | 2,650 | ||||
Unsecured loans, principally from banks: | ||||||
with weighted-average interest rate of 1.06% | 9,259 | — | ||||
with weighted-average interest rate of 0.86% | — | 11,023 | ||||
Guarantee deposits received | ||||||
with weighted-average interest rate of 2.42% | 5,475 | 3,963 | ||||
| ¥ | 17,004 | ¥ | 17,636 | |||
At March 31, 2004, Sankyo had unused committed lines of credit amounting to 30,000 million yen. Such credit lines are subject to commitment fees.
F-77
Table of Contents
Long-term debt comprises the following:
| Yen in millions | ||||||
| March 31 | ||||||
| 2003 | 2004 | |||||
Secured loans, representing obligations principally to banks: | ||||||
Due 2003 to 2014 with interest ranging from 1.45% to 4.35% per annum | ¥ | 2,387 | ¥ | — | ||
Due 2004 to 2014 with interest ranging from 1.45% to 4.35% per annum | — | 1,564 | ||||
Unsecured loans, representing obligations principally to banks: | ||||||
Due 2003 to 2013 with interest ranging from 0.69% to 2.25% per annum | 6,739 | — | ||||
Due 2004 to 2013 with interest ranging from 0.69% to 2.25% per annum | — | 5,012 | ||||
Capital lease obligations: | ||||||
Due 2003 to 2013 with interest ranging from 1.1% to 1.5% per annum | 5,045 | — | ||||
Due 2004 to 2014 with interest ranging from 1.1% to 1.5% per annum | — | 3,286 | ||||
| 14,171 | 9,862 | |||||
Less – Portion due within one year | 5,251 | 3,650 | ||||
| ¥ | 8,920 | ¥ | 6,212 | |||
At March 31, 2004, property, plant and equipment with a book value of 4,685 million yen, and securities with a book value of 462 million yen were pledged as collateral for short-term borrowings and long-term secured loans, representing obligations principally to banks.
Annual maturities on long-term debt and lease obligations during the next five years are as follows:
| Yen in millions | |||
Year ending March 31: | |||
2005 | ¥ | 3,650 | |
2006 | 2,528 | ||
2007 | 1,274 | ||
2008 | 677 | ||
2009 | 470 | ||
Later years | 1,263 | ||
| ¥ | 9,862 | ||
As is customary in Japan, both short-term and long-term bank loans are made under general agreements which provide that security and guarantees for present and future indebtedness will be given upon request of the bank, and that the bank shall have the right to offset cash deposits against obligations that have become due or, in the event of default, against all obligations due to the bank.
10. Restructuring charges
As part of its effort to improve the performance of the various businesses, Sankyo has undertaken a number of restructuring initiatives within the Pharmaceuticals and other businesses. For the years ended March 31, 2003 and 2004, Sankyo recorded total restructuring charges of 3,006 million yen and 3,444 million yen, respectively.
Pharmaceuticals Segment
In an effort to improve the performance of the Pharmaceutical segment, Sankyo has undergone a number of restructuring efforts to reduce its operating costs. For the years ended March 31, 2003 and 2004, Sankyo
F-78
Table of Contents
recorded total restructuring charges of 1,770 million yen and 3,059 million yen, respectively, within the Pharmaceutical segment. Significant restructuring activities are the following:
Closing of Mishima-Plant in Japan —
For the purpose of building up health care equipment in the Hiratsuka plant, Sankyo made a decision in the third quarter of the year ended March 31, 2001, to integrate its health care plant into the Hiratsuka plant and close the Mishima-plant, a health care plant in Japan. During the year ended March 31, 2003, Sankyo recorded restructuring charges totaling 188 million yen, which consisted of the accelerated depreciation of equipment of 75 million yen due to shortening the remaining useful lives, employee termination benefits costs of 103 million yen and other costs of 10 million yen, including demolition costs. These charges were all recorded in cost of sales in the consolidated statements of income.
During the year ended March 31, 2004, Sankyo recorded net restructuring charges totaling 78 million yen, which represents disposal costs of equipment. This restructuring program was completed during end of the year ended March 31, 2004.
Retirement Programs —
In addition to the restructuring efforts discussed above, Sankyo has undergone several headcount reduction programs to further reduce operating costs in the Pharmaceuticals segment. As a result of these programs, Sankyo recorded restructuring charges totaling 1,582 million yen and 2,981 million yen for the years ended March 31, 2003 and 2004, respectively, and these charges were included in selling, general and administrative expense in the consolidated statements of income. These staff reductions were primarily achieved through the implementation of voluntary early retirement programs. The remaining liability balance as of March 31, 2004 was 65 million yen and will be paid during the year ending March 31, 2005.
Other Segment
Closing of two plants in Japan.
Tanashi-Plant
Due to a stagnation of demand in the business conditions of the yeast market, Sankyo made a decision in the second quarter of the year ended March 31, 2001, to enter an alliance with the Oriental Yeast Co., Ltd., and close the Tanashi yeast-plant in Japan. During the year ended March 31, 2003, Sankyo recorded restructuring charges totaling 305 million yen, which consisted of the accelerated depreciation of equipment of 248 million yen due to shortening the remaining useful lives, employee termination benefits costs of 48 million yen and other costs of 9 million yen, mainly demolition costs. These charges were all recorded in cost of sales in the consolidated statements of income.
During the year ended March 31, 2004, Sankyo recorded net restructuring charges totaling 384 million yen, which represents disposal costs of equipment. This restructuring program was completed by the end of the year ended March 31, 2004.
Yasugawa-Plant
Due to restructuring in the non-medical business, Sankyo made a decision at the Board of Director’s meeting in the third quarter of the year ended March 31, 2002, to integrate the agrichemicals business and close the Yasugawa-plant on March 31 2003. During the year ended March 31, 2003, Sankyo recorded restructuring charges totaling 931 million yen, which consisted of the accelerated depreciation of equipment of 619 million yen due to shortening the remaining useful lives, employee termination benefits costs of 287 million yen and other costs of 25 million yen including demolition costs. These charges were all recorded in cost of sales in the consolidated statements of income.
F-79
Table of Contents
During the year ended March 31, 2004, Sankyo recorded net restructuring charges totaling 1 million yen of disposal costs of equipment. This restructuring program was completed by March 31, 2004.
The following table displays the balance of the accrued restructuring charges recorded for the years ended March 31, 2003 and 2004.
| Yen in millions | ||||||||||||||||
| Employee termination benefits | Additional depreciation and disposal | Other associated costs | Total | |||||||||||||
Balance at March 31, 2002 | ¥ | 201 | ¥ | — | ¥ | — | ¥ | 201 | ||||||||
Restructuring costs | 2,020 | 942 | 44 | 3,006 | ||||||||||||
Non-cash charges | — | (942 | ) | — | (942 | ) | ||||||||||
Cash payments | (2,065 | ) | — | — | (2,065 | ) | ||||||||||
Balance at March 31, 2003 | 156 | — | 44 | 200 | ||||||||||||
Restructuring costs | 2,981 | — | 463 | 3,444 | ||||||||||||
Non-cash charges | — | — | — | — | ||||||||||||
Cash payments | (3,072 | ) | — | (369 | ) | (3,441 | ) | |||||||||
Balance at March 31, 2004 | ¥ | 65 | ¥ | — | ¥ | 138 | ¥ | 203 | ||||||||
11. Income taxes
Income before income taxes and income tax expense from continuing operations comprise the following:
| Yen in millions | ||||||||
| Year ended March 31 | ||||||||
| 2003 | 2004 | |||||||
Income (loss) before income taxes: | ||||||||
Sankyo Company, Limited and subsidiaries in Japan | ¥ | 79,498 | ¥ | 86,281 | ||||
Foreign subsidiaries | (1,690 | ) | (960 | ) | ||||
| ¥ | 77,808 | ¥ | 85,321 | |||||
Income taxes – Current: | ||||||||
Sankyo Company, Limited and subsidiaries in Japan | ¥ | 43,553 | ¥ | 32,904 | ||||
Foreign subsidiaries | 1,068 | 5,543 | ||||||
| ¥ | 44,621 | ¥ | 38,447 | |||||
Income taxes – Deferred: | ||||||||
Sankyo Company, Limited and subsidiaries in Japan | ¥ | (5,006 | ) | ¥ | 2,575 | |||
Foreign subsidiaries | 2,890 | (625 | ) | |||||
| ¥ | (2,116 | ) | ¥ | 1,950 | ||||
Sankyo is subjected to a number of different income taxes, which, in the aggregate, results in a statutory tax rate in Japan of approximately 41.9% in the fiscal years ended March 31, 2003 and 2004.
For the year ending March 31, 2005, a new size-based enterprise tax was introduced in place of the current enterprise tax. As a result, the statutory tax rate for the year ending March 31, 2005 is approximately 41% effective April 1, 2004. The newly enacted rate was used in calculating the future expected tax effects of temporary differences as of March 31, 2004. The effect of the changes in the tax rates on the balance of deferred tax assets and liabilities was insignificant.
F-80
Table of Contents
Reconciliation of the differences between the statutory tax rate and the effective income tax rate from continuing operations is as follows:
| Year ended March 31 | ||||||
| 2003 | 2004 | |||||
Statutory tax rate | 41.9 | % | 41.9 | % | ||
Increase (reduction) in taxes resulting from: | ||||||
Tax credits on IT investments | — | (1.5 | ) | |||
Tax credits on research and development costs | (1.9 | ) | (5.7 | ) | ||
Expenses not deductible for tax purposes | 6.1 | 5.3 | ||||
Change in valuation allowances | 5.9 | 6.6 | ||||
Effects of tax rate changes | 1.5 | — | ||||
Income not taxable | (0.5 | ) | (0.5 | ) | ||
Other | 1.6 | 1.2 | ||||
Effective income tax rate | 54.6 | % | 47.3 | % | ||
The significant components of deferred tax assets and liabilities are as follows:
| Yen in millions | ||||||||
| March 31 | ||||||||
| 2003 | 2004 | |||||||
Deferred tax assets: | ||||||||
Reserve for employee retirement and severance benefits | ¥ | 26,362 | ¥ | 25,154 | ||||
Operating loss carryforwards for tax purposes | 13,143 | 15,455 | ||||||
Prepaid research and development costs | 16,085 | 13,821 | ||||||
Accrued compensation | 6,039 | 6,820 | ||||||
Revenue | 6,872 | 6,146 | ||||||
Intangible assets | 5,189 | 6,629 | ||||||
Inventories | 4,265 | 4,913 | ||||||
Loss on investments in securities | 2,275 | 2,106 | ||||||
Co-promotion advertising | 2,085 | 1,699 | ||||||
Accrued enterprise taxes | 1,733 | 1,403 | ||||||
Other | 7,866 | 9,458 | ||||||
Gross deferred tax assets | 91,914 | 93,604 | ||||||
Less: Valuation allowance | (20,750 | ) | (23,500 | ) | ||||
Total deferred tax assets | 71,164 | 70,104 | ||||||
Deferred tax liabilities: | ||||||||
Unrealized gains on securities | (9,498 | ) | (19,360 | ) | ||||
Depreciation of property, plant and equipment | (4,935 | ) | (6,922 | ) | ||||
Other | (423 | ) | (230 | ) | ||||
Gross deferred tax liabilities | (14,856 | ) | (26,512 | ) | ||||
Net deferred tax assets | ¥ | 56,308 | ¥ | 43,592 | ||||
F-81
Table of Contents
The valuation allowance mainly relates to deferred tax assets of certain consolidated subsidiaries with operating loss carryforwards and tax credit carryforwards for tax purposes that are not expected to be realized. The net changes in the total valuation allowance for the years ended March 31, 2003 and 2004 consisted of the following:
| Yen in millions | ||||||||
| March 31 | ||||||||
| 2003 | 2004 | |||||||
Valuation allowances at beginning of year | ¥ | 16,343 | ¥ | 20,750 | ||||
Additions | 4,924 | 3,776 | ||||||
Deductions | (42 | ) | (534 | ) | ||||
Translation adjustments | (475 | ) | (492 | ) | ||||
Valuation allowances at end of year | ¥ | 20,750 | ¥ | 23,500 | ||||
Tax benefits which have been realized through utilization of operating loss carryforwards for the years ended March 31, 2003 and 2004 were approximately 4,083 million yen and 219 million yen, respectively.
Net deferred tax assets are included in the consolidated balance sheets as follows:
| Yen in millions | ||||||||
| March 31 | ||||||||
| 2003 | 2004 | |||||||
Current assets – Deferred income taxes | ¥ | 26,445 | ¥ | 25,900 | ||||
Other assets – Deferred income taxes | 33,042 | 21,119 | ||||||
Current liabilities – Other | (331 | ) | (530 | ) | ||||
Long-term liabilities – Other | (2,848 | ) | (2,897 | ) | ||||
Net deferred tax assets | ¥ | 56,308 | ¥ | 43,592 | ||||
At March 31, 2004, deferred income taxes have not been provided on undistributed earnings of foreign subsidiaries totaling 28,579 million yen. Earnings from foreign subsidiaries are expected to be reinvested indefinitely. Sankyo does not anticipate any significant tax consequences on possible future disposition of its investments in subsidiaries based on its tax planning strategies. The unrecognized deferred tax liabilities as of March 31, 2004 for such temporary differences amounted to 994 million yen.
Operating loss carryforwards for corporate income tax and local income tax purposes of certain consolidated subsidiaries in Japan at March 31, 2004 amounted to 965 million yen, which are available as an offset against future taxable income. Total available operating loss carryforwards of subsidiaries in Japan expire at various dates up to 7 years.
Operating loss carryforwards for tax purposes of certain foreign consolidated subsidiaries at March 31, 2004 amounted to 34,865 million yen. With the exception of 15,059 million yen with no expiration period, total available operating loss carryforwards expire at various dates primarily up to 19 years. Realization is dependent on such companies generating sufficient taxable income prior to expiration of the loss carryforwards and tax credit carryforwards. Although realization is not assured, management believes it is more likely than not that all of the deferred tax assets, less valuation allowance, will be realized. The amount of such net deferred tax assets considered realizable, however, could be changed in the near term if estimates of future taxable income during the carryforward period are changed.
F-82
Table of Contents
12. Shareholders’ equity
Changes in the number of shares of common stock issued have resulted in the following:
| Year ended March 31 | |||||
| 2003 | 2004 | ||||
Common stock issued | |||||
Balance at beginning of year | 449,498,765 | 449,498,765 | |||
Retirement | — | (10,000,000 | ) | ||
Balance at end of year | 449,498,765 | 439,498,765 | |||
The Japanese Commercial code provides that an amount equivalent to at least 10% of cash dividends and other distributions from retained earnings paid by the parent companies and its Japanese subsidiaries with respect to each fiscal period be appropriated to a legal reserve until the aggregate amount of additional paid-in capital and the legal reserve equals 25% of stated capital. The legal reserve is not available for cash dividends, but may be used to reduce a deficit or may be transferred to stated capital. Retained earnings included legal reserve of 13,777 million yen and 13,799 million yen at March 31, 2003 and 2004, respectively, and are restricted to be used as dividends.
The amount of statutory retained earnings of Sankyo Company, Limited available for dividends to shareholders as of March 31, 2004 was 528,532 million yen.
In accordance with customary practice in Japan, the appropriations are not accrued in the financial statements for the period to which they relate, but are recorded in the subsequent accounting period after shareholders’ approval has been obtained. Retained earnings at March 31, 2004 includes amounts representing final cash dividends of 7,517 million yen, 17.5 yen per share, which were approved at the shareholders’ meeting held on June 29, 2004. Retained earnings at March 31, 2004 includes 875 million yen relating to equity in undistributed earnings of companies accounted for by the equity method.
The Japanese Commercial Code allows the company to purchase treasury stock at any reason at any time by the resolution of the Board of Directors up to the limitation approved at the Shareholder’s Meeting. During the years ended March 31, 2003 and 2004, 5,000,000 shares and 9,764,400 shares of the Company’s common stock were repurchased from the market for aggregate amounts of 8,014 million yen and 19,986 million yen, respectively. For the year ended March 31, 2004, 10,000,000 shares of the Company’s common stock were retired at aggregate costs of 18,147 million yen. The entire repurchase cost of the retired shares was charged directly to retained earnings in accordance with the Japanese Commercial Code.
In fiscal year 1995, Sankyo Company, Limited made a free distribution of shares to its shareholders for which no accounting entry is required in Japan. Had the distributions been accounted for in a manner used by companies in the United States of America, 86,320 million yen would have been transferred from retained earnings to the appropriate capital accounts.
Under the Japanese Commercial Code, a stock dividend can be effected by an appropriation of retained earnings to the common stock account, followed by a free share distribution with respect to the amount appropriated by resolution of the Board of Directors’ meeting.
F-83
Table of Contents
Detailed components of accumulated other comprehensive income (loss) at March 31, 2003 and 2004 and the related changes, net of taxes, for the years ended March 31, 2003 and 2004 consist of the following:
| Yen in millions | ||||||||||||||||
Foreign currency translation adjustments | Unrealized gains (losses) on securities | Minimum pension liability adjustments | Accumulated other comprehensive income (loss) | |||||||||||||
Balances at March 31, 2002 | ¥ | (1,727 | ) | ¥ | 13,617 | ¥ | — | ¥ | 11,890 | |||||||
Other comprehensive income (loss) | (4,536 | ) | (2,944 | ) | (1,775 | ) | (9,255 | ) | ||||||||
Balances at March 31, 2003 | (6,263 | ) | 10,673 | (1,775 | ) | 2,635 | ||||||||||
Other comprehensive income (loss) | (3,459 | ) | 14,443 | 1,238 | 12,222 | |||||||||||
Balances at March 31, 2004 | ¥ | (9,722 | ) | ¥ | 25,116 | ¥ | (537 | ) | ¥ | 14,857 | ||||||
Tax effects allocated to each component of other comprehensive income for the years ended March 31, 2003 and 2004 are as follows:
| Yen in millions | ||||||||||||
Pre-tax amount | Tax expense (benefit) | Net-of-tax amount | ||||||||||
For the year ended March 31, 2003 | ||||||||||||
Foreign currency translation adjustments | ¥ | (4,536 | ) | ¥ | — | ¥ | (4,536 | ) | ||||
Unrealized losses on securities: | ||||||||||||
Unrealized holding gains (losses) arising for the year | (10,080 | ) | 4,589 | (5,491 | ) | |||||||
Less: reclassification adjustments for losses included in net income | 4,903 | (2,356 | ) | 2,547 | ||||||||
Minimum pension liability adjustments | (2,931 | ) | 1,156 | (1,775 | ) | |||||||
Other comprehensive income (loss) | ¥ | (12,644 | ) | ¥ | 3,389 | ¥ | (9,255 | ) | ||||
For the year ended March 31, 2004 | ||||||||||||
Foreign currency translation adjustments | ¥ | (3,459 | ) | ¥ | — | ¥ | (3,459 | ) | ||||
Unrealized gains on securities: | ||||||||||||
Unrealized holding gains (losses) arising for the year | 25,146 | (10,436 | ) | 14,710 | ||||||||
Less: reclassification adjustments for losses included in net income | (463 | ) | 196 | (267 | ) | |||||||
Minimum pension liability adjustments | 2,275 | (1,037 | ) | 1,238 | ||||||||
Other comprehensive income (loss) | ¥ | 23,499 | ¥ | (11,277 | ) | ¥ | 12,222 | |||||
13. Stock-based compensation
In June 2002, the Company’s shareholders approved a stock option plan for board members. In June 2003, the shareholders also approved another plan to include both board members and key employees. Each year, since the plans’ inception, the shareholders have approved the authorization for the grant of options for the purchase of Sankyo’s common stock. Authorized shares for each year that remain ungranted are unavailable for grant in future years. Stock options with a term of 10 years are granted with an exercise price equal to 1.05 times the average closing price of Sankyo’s common stock for the month previous to the grant unless the average closing price is less than the closing price of the day before the grant, in which case the closing price of the day before the grant will become the exercise price.
F-84
Table of Contents
The terms of the options are subject to adjustment if there is a share split or consolidation of shares, or in certain circumstances, if new shares are issued at a price less than the current quoted market price. As a result, the Plans are accounted for as variable plans.
No stock-based compensation cost was recognized in net income for the year ended March 31, 2003, as the options granted under those plans had an exercise price higher than the market value of the underlying common stock on the date of grant through March 31, 2003. Compensation cost of 363 million yen was recorded in the year ended March 31, 2004.
Subsequent to March 31, 2004, the shareholders approved the authorization of additional shares up to 376,000 shares for issuance under the Sankyo’s stock option plan for board members and key employees.
The following table summarizes Sankyo’s stock option activity:
| Yen | |||||||
| Number of shares | Weighted-average exercise price | Weighted-average life in years | |||||
Balances at March 31, 2002 | — | ¥ | — | — | |||
Granted | 244,000 | 1,823 | |||||
Exercised | — | — | |||||
Canceled | — | — | |||||
Balances at March 31, 2003 | 244,000 | 1,823 | 9.25 | ||||
Granted | 342,000 | 1,519 | |||||
Exercised | — | — | |||||
Canceled | — | — | |||||
Balances at March 31, 2004 | 586,000 | 1,646 | 8.83 | ||||
Exercisable at March 31, 2004 | 586,000 | ¥ | 1,646 | 8.83 | |||
The following table summarizes information for outstanding options exercisable at March 31, 2004:
| Outstanding | Exercisable | |||||||||||
Exercise price range | Number of shares | Weighted -average | Weighted -average | Number of shares | Weighted -average exercise price | |||||||
| Yen | Yen | Years | Yen | |||||||||
| ¥ 1,519 | 342,000 | ¥ | 1,519 | 9.25 | 342,000 | ¥ | 1,519 | |||||
| 1,823 | 244,000 | 1,823 | 8.25 | 244,000 | 1,823 | |||||||
| 586,000 | 1,646 | 8.83 | 586,000 | 1,646 | ||||||||
The weighted-average fair value per option at the date of grant for options granted during the years ended March 31, 2003 and 2004 was 376 yen and 304 yen, respectively. The fair value of options granted, which is amortized over the option vesting period in determining the pro forma impact in Note 2, is estimated on the date of grant using the Black-Scholes option pricing model with the following weighted-average assumptions:
| 2003 | 2004 | |||
Dividend rate | 1.53% | 1.74% | ||
Risk-free interest rate | 0.44% | 0.37% | ||
Expected volatility | 35.06% | 31.54% | ||
Expected holding period | 5 years | 5 years |
F-85
Table of Contents
In April 2002, Sankyo Pharma Inc. (“SPI”), a wholly-owned subsidiary in the United States, adopted a stock appreciation rights (SAR) plan as an incentive plan for selected employees, including officers. Under the terms of the plan, the employees can receive cash equal to the amount that the market price of the Company’s common stock exceeds the grant price (market price at time of grant) of the SAR. The SAR vests 50%, 25%, and 25%, at the second, third, and fourth anniversary of the grant date, respectively. As of December 31, 2003, none of the shares were exercisable. The SAR expires ten years after the grant date. The total number of SARs authorized and granted is 286,101 and 789,181 for the years ended December 31, 2002 and 2003, respectively.
The following table summarizes SAR activity:
| U.S. dollar | ||||||
| Number of SARs | Weighted-average exercise price | Weighted-average life in years | ||||
Balances at December 31, 2001 | — | — | — | |||
Granted | 286,101 | 14.63 | ||||
Exercised | — | — | ||||
Forfeited | — | — | ||||
Balances at December 31, 2002 | 286,101 | 14.63 | 9.25 | |||
Granted | 789,181 | 13.27 | ||||
Exercised | — | — | ||||
Forfeited | 95,314 | 13.73 | ||||
Balances at December 31, 2003 | 979,968 | 13.62 | 9.01 | |||
Exercisable at December 31, 2003 | — | — | — | |||
The following table summarizes information for SAR outstanding and SAR exercisable at December 31, 2003:
| Outstanding | Exercisable | |||||
| Exercise price range | Number of shares | Weighted- average remaining life | Number of shares | |||
| US dollar | Years | |||||
| $13.27 | 726,036 | 9.25 | — | |||
| 14.63 | 253,932 | 8.25 | — | |||
| 979,968 | — | |||||
In accordance with APB 25 and its related interpretations, the SARs compensation expense is measured as the excess of the quoted market price of the Company’s common stock over the SARs strike price, which is consistent with the accounting treatment prescribed for SAR plans in FAS 123. For the years ended March 31, 2003 and 2004, Sankyo recognized SARs compensation expense of 0 million yen and 211 million yen, respectively.
In order to offset the potential cash outflow for SAR as a result of increase in the Company’s stock price, SPI entered into a call option for the Company’s common stock. The option is for the same number of shares granted under the SAR in 2002 and matures in 2009. At the settlement date, SPI has the option to acquire the Company’s common stock equal to the grant price with the settlement of net cash or physical delivery of the Company’s stock. The premium paid for the call option in the year ended March 31, 2003 was 262 million yen and is included as investment and advances – other. Sankyo charged the changes in fair value of the call option to earnings. The fair value of the option as of December 31, 2003 was 250 million yen.
F-86
Table of Contents
On June 29, 2004, the shareholders approved a stock option plan to grant warrants for purchasing shares of the Company’s common stock to 9 board members and 21 corporate officers of the Company in accordance with articles 280-20 and 280-21 of the Japanese Commercial Code. Under the plan, a maximum of 376,000 shares were granted to the board members and corporate officers. The stock option price is determined, subject to adjustment, at the higher of the average final price of the Company’s common stock traded on the Tokyo Stock Exchange in the month prior to the date of the granting of the options multiplied by a factor of 1.05 or the corresponding final price on the day prior to the granting the options. As outlined in the Company’s stock option plan, this exercise price will be adjusted in accordance with a specific formula for stock splits or reverse stock splits. These stock options will become exercisable during the period from July 1, 2004 to June 30, 2014.
14. Employee benefit plans
Pension and severance plans –
On terminating employment, employees of the parent company and subsidiaries in Japan are entitled, under most circumstances, to lump-sum indemnities or pension payments as described below, based on lengths of service, current rates of pay and performances. Under normal circumstances, the minimum payment prior to retirement age is an amount based on voluntary retirement. Employees usually receive additional benefits on involuntary retirement, including retirement at the age limit.
The parent company and most subsidiaries in Japan have non-contributory unfunded defined benefit lump-sum indemnities plans and/or contributory funded defined benefit pension plans, under which the contributions are made by the companies and their employees. The pension benefits are determined based on years of service, current rates of pay and performance as stipulated in the internal regulations, and are payable, at the option of the retiring employee, as a monthly pension payment or in a lump-sum amount. The contributions to the plans are funded with several financial institutions in accordance with the applicable laws and regulations. These pension plan assets consist principally of investments in domestic and international bonds and stocks.
During the year ended March 31, 2004, the parent company revised its lump-sum indemnities plan for certain employees. Under the revised plan, the benefits are determined based on the accumulated credits earned in connection with employees’ length of service and performance up to the end of the period. Prior to the revision, the benefits were determined based on the length of service and current rate of pay. As a result of this revision, the projected benefit obligation under the lump-sum indemnities plan was reduced by approximately 305 million yen and this reduction is being treated as unrecognized prior service cost.
Certain foreign subsidiaries have defined benefit pension plans or severance indemnity plans covering substantially all of their employees under which the cost of benefits is currently funded or accrued. The benefits for these plans are based primarily on current rate of pay and lengths of service.
Sankyo uses a March 31 measurement date for the majority of its benefit plans.
F-87
Table of Contents
Information regarding Sankyo’s defined benefit plans is as follows:
| Yen in millions | ||||||||
| March 31 | ||||||||
| 2003 | 2004 | |||||||
Change in benefit obligation | ||||||||
Benefit obligation at beginning of year | ¥ | 99,321 | ¥ | 106,725 | ||||
Service cost | 5,999 | 5,652 | ||||||
Interest cost | 2,160 | 1,696 | ||||||
Plan participants’ contributions | 343 | 423 | ||||||
Plan amendments | — | (305 | ) | |||||
Actuarial loss (gain) | 7,975 | (5,978 | ) | |||||
Acquisition and other | 590 | 159 | ||||||
Benefits paid | (9,663 | ) | (12,601 | ) | ||||
Benefit obligation at end of year | 106,725 | 95,771 | ||||||
Change in plan assets | ||||||||
Fair value of plan assets at beginning of year | 15,860 | 15,010 | ||||||
Actual return on plan assets | (1,638 | ) | 2,014 | |||||
Acquisition and other | 5 | (9 | ) | |||||
Employer contributions | 1,322 | 3,703 | ||||||
Plan participants’ contributions | 343 | 423 | ||||||
Benefits paid | (882 | ) | (566 | ) | ||||
Fair value of plan assets at end of year | 15,010 | 20,575 | ||||||
Funded status | 91,715 | 75,196 | ||||||
Unrecognized actuarial loss | (10,185 | ) | (1,439 | ) | ||||
Unrecognized prior service costs | — | 297 | ||||||
Unrecognized net transition obligations | (321 | ) | (214 | ) | ||||
Net amount recognized | ¥ | 81,209 | ¥ | 73,840 | ||||
Amounts recognized in the consolidated balance sheets are comprised of the following:
| Yen in millions | ||||||||
| March 31 | ||||||||
| 2003 | 2004 | |||||||
Accrued pension and severance costs | ¥ | 84,140 | ¥ | 74,496 | ||||
Accumulated other comprehensive income | (2,931 | ) | (656 | ) | ||||
Net amount recognized | ¥ | 81,209 | ¥ | 73,840 | ||||
The accumulated benefit obligation for all defined benefit pension plans was 90,204 million yen and 84,015 million yen at March 31, 2003 and 2004, respectively.
F-88
Table of Contents
The projected benefit obligation, accumulated benefit obligation and fair value of plan assets for the pension plans which Sankyo has recognized the minimum pension liability were as follows:
| Yen in millions | ||||||
| March 31 | ||||||
| 2003 | 2004 | |||||
Projected benefit obligation | ¥ | 22,982 | ¥ | 23,845 | ||
Accumulated benefit obligation | 22,273 | 23,148 | ||||
Fair value of plan assets | 10,623 | 15,449 | ||||
Components of net periodic pension costs are as follows:
| Yen in millions | ||||||||
| Year ended March 31 | ||||||||
| 2003 | 2004 | |||||||
Service cost | ¥ | 5,999 | ¥ | 5,652 | ||||
Interest cost | 2,160 | 1,696 | ||||||
Expected return on plan assets | (320 | ) | (213 | ) | ||||
Amortization of prior service costs | — | (8 | ) | |||||
Recognized net actuarial loss | — | 691 | ||||||
Amortization of net transition obligation | 107 | 107 | ||||||
Net periodic pension cost | ¥ | 7,946 | ¥ | 7,925 | ||||
Changes in recognized net actuarial loss for the years ended March 31, 2003 and 2004 were primarily due to changes in estimates made for actuarial assumptions, primarily the discount rate, in addition to actual returns on plan assets during the year ended March 31, 2002 and 2003 being less than the expected return on plan assets used for those years. The actuarial gain or loss is deferred and is being amortized to pension costs over the average remaining service period of active employees of 15 years.
In addition to net periodic pension costs, Sankyo records additional minimum liabilities for plans where the accumulated benefit obligation exceeded the fair market value of plan assets and accrued pension and severance costs. Minimum pension liability adjustments included in other comprehensive income (loss) for the years ended March 31, 2003 and 2004 are as follows:
| Yen in millions | |||||||
| Year ended March 31 | |||||||
| 2003 | 2004 | ||||||
Minimum pension liability adjustments, included in other comprehensive income (loss) | ¥ | (1,775 | ) | ¥ | 1,238 | ||
Weighted-average assumptions used to determine benefit obligations as of March 31, 2003 and 2004 are as follows:
| March 31 | ||||||
| 2003 | 2004 | |||||
Discount rate | 1.7 | % | 2.5 | % | ||
Rate of compensation increase | 3.5 | % | 3.5 | % | ||
F-89
Table of Contents
Weighted-average assumptions used to determine net periodic pension costs for the years ended March 31, 2003 and 2004 are as follows:
| Year ended March 31 | ||||||
| 2003 | 2004 | |||||
Discount rate | 2.5 | % | 1.7 | % | ||
Expected return on plan assets | 2.5 | % | 1.7 | % | ||
Rate of compensation increase | 3.5 | % | 3.5 | % | ||
The expected rate of return on plan assets is determined considering several applicable factors including, compositions of plan assets held, assumed risks of asset management, historical return on plan assets, Sankyo’s principal policy for plan asset management, and forecasted market conditions.
Sankyo’s pension plan weighted-average asset allocations as of March 31, 2003 and 2004, by asset category are as follows:
| Plan assets at March 31 | ||||||
| 2003 | 2004 | |||||
Domestic bonds | 30.0 | % | 29.1 | % | ||
Domestic stocks | 36.2 | % | 33.7 | % | ||
International bonds | 9.3 | % | 8.1 | % | ||
International stocks | 19.7 | % | 22.0 | % | ||
Other | 4.8 | % | 7.1 | % | ||
Total | 100.0 | % | 100.0 | % | ||
Sankyo’s policy and objective for plan asset management is to maximize returns on plan assets to meet future benefit payments at a level of risk which Sankyo considers permissible. Asset allocations are determined based on Sankyo’s plan asset management guideline established to achieve the optimized asset compositions in terms of the long-term overall plan asset management. To determine individual investments, Sankyo performs advance assessments on certain factors including risks, transaction costs and liquidity of each potential investee under the evaluation. To measure results of the plan asset management, Sankyo establishes bench mark return rates for each individual investment, combines these individual bench mark rates based on the asset composition ratios within each asset category, and compares the combined rates with the corresponding actual return rates on each asset category.
Sankyo expects to contribute 2,228 million yen to its pension plans in the year ending March 31, 2005.
Certain foreign subsidiaries have defined contribution retirement plans, mainly 401(K) retirement plans in the United States, covering all of their employees. The contributions by those subsidiaries to the plans are based on employees’ contributions and annual compensation of employees. The expenses for the defined contribution retirement plans for the years ended March 31, 2003 and 2004 were 537 million yen and 613 million yen, respectively.
Certain domestic subsidiaries participate in multi-employer plans, which provide defined benefits to their eligible employees. Pension expenses for these plans accounted to 282 million yen and 360 million yen for the years ended March 31, 2003 and 2004.
In connection with Sankyo’s restructuring initiatives, the parent company closed its manufacturing facilities and offered early retirement programs to their employees only for a short period of time, and paid special termination benefits to the employees who accepted the offer. These benefits recognized as expenses when employees accepted the offer amounted to 2,020 million yen and 2,981 million yen, in the aggregate, for the years ended March 31, 2003 and 2004, respectively. (See Note 10 for detailed discussions.)
F-90
Table of Contents
15. Derivative financial instruments
Sankyo employs derivative financial instruments, including interest rate swap, coupon swap, foreign exchange forward contracts and stock price option agreement to manage its exposure to fluctuations in interest rates, foreign currency exchange rates and stock appreciation rights. Sankyo does not use derivatives for speculation or trading.
Sankyo enters into interest rate swap agreements mainly to convert its variable-rate debt to fixed-rate debt. Sankyo uses interest rate swap agreements in managing its exposure to interest rate fluctuations. Interest rate swap agreements are executed as either an integral part of specific debt transactions or on a portfolio basis.
For the years ended March 31, 2003 and 2004, Sankyo reported gains of 21 million yen and 22 million yen respectively, related to the change in fair values of interest rate swaps which are included in other income (expenses) in the accompanying consolidated statements of income. At March 31, 2003 and 2004, the aggregate notional amounts of interest rate swap agreements were 1,513 million yen pay fixed and 1,239 million yen pay fixed, respectively.
Sankyo enters into coupon swap and foreign exchange forward contracts agreements to manage its exposure to foreign currency exchange risk.
For the years ended March 31, 2003 and 2004, Sankyo reported losses of 31 million yen and 57 million yen respectively, related to the change in fair values of coupon swap and foreign exchange forward contracts which is included in other income (expenses), net in the accompanying consolidated statement of income.
The contracted amounts outstanding at March 31, 2004 were 529 million yen.
16. Other financial instruments
Sankyo has certain financial instruments, including financial assets and liabilities and off-balance sheet financial instruments which arose in the normal course of business. These financial instruments are executed with creditworthy financial institutions, and virtually all foreign currency contracts are denominated in U.S. dollars, euros and other currencies of major industrialized countries. Financial instruments involve, to varying degrees, market risk as instruments are subject to price fluctuations, and elements of credit risk in the event a counterparty should default. In the unlikely event the counterparties fail to meet the contractual terms of a foreign currency or an interest rate instrument, Sankyo’s risk is limited to the fair value of the instrument. Although Sankyo may be exposed to losses in the event of non-performance by counterparties on financial instruments, it does not anticipate significant losses due to the nature of its counterparties. Counterparties to Sankyo’s financial instruments represent, in general, international financial institutions. Additionally, Sankyo does not have a significant exposure to any individual counterparty. Based on the creditworthiness of these financial institutions, collateral is generally not required of the counterparties or of Sankyo. Sankyo believes that the overall credit risk related to its financial instruments is not significant.
F-91
Table of Contents
The estimated fair values of Sankyo’s financial instruments, excluding marketable securities and other securities investments and affiliated companies, are summarized as follows:
| Yen in millions | ||||||||
| March 31, 2003 | ||||||||
| Carrying amount | Estimated fair value | |||||||
Asset (Liability) | ||||||||
Cash and cash equivalents | ¥ | 213,556 | ¥ | 213,556 | ||||
Time deposits | 5,591 | 5,591 | ||||||
Short-term borrowings | (17,004 | ) | (17,004 | ) | ||||
Long-term debt including the current portion | (14,171 | ) | (13,746 | ) | ||||
Foreign exchange forward contracts and coupon swap agreements | 8 | 8 | ||||||
Interest rate swap agreements | (43 | ) | (43 | ) | ||||
| Yen in millions | ||||||||
| March 31, 2004 | ||||||||
| Carrying amount | Estimated fair value | |||||||
Asset (Liability) | ||||||||
Cash and cash equivalents | ¥ | 201,734 | ¥ | 201,734 | ||||
Time deposits | 5,451 | 5,451 | ||||||
Short-term borrowings | (17,636 | ) | (17,636 | ) | ||||
Long-term debt including the current portion | (9,862 | ) | (9,537 | ) | ||||
Foreign exchange forward contracts and coupon swap agreements | (49 | ) | (49 | ) | ||||
Interest rate swap agreements | (22 | ) | (22 | ) | ||||
Following are explanatory notes regarding the financial assets and liabilities other than derivative financial instruments.
Cash and cash equivalents, and time deposits -
In the normal course of business, substantially all cash and cash equivalents, and time deposits are highly liquid and are carried at amounts which approximate fair value.
Short-term borrowings and long-term debt -
The fair values of short-term borrowings and total long-term debt including the current portion were estimated based on the discounted amounts of future cash flows using Sankyo’s current incremental borrowing rates for similar liabilities.
17. Acquisition
In November 2002, Sankyo Pharma GmbH, a European holding company wholly owned by the Company, acquired 100 percent of the outstanding common shares of Laboratoires Pharmaceutiquies FORNET S.A.S. and two of its affiliated companies (hereinafter collectively referred as “Fornet”). The results of Fornet’s operations for the two months ended December 31, 2002 have been included in the consolidated financial statements of Sankyo for the year ended March 31, 2003. Fornet was a distributor of certain branded generic products in France. After the acquisition, Fornet started to distribute Sankyo products. In 2004 upon obtaining local government approval, Sankyo was able to begin penetrating a new market in Europe.
The aggregate purchase price, fully paid in cash, was 30,274 thousand euro which was translated to and reflected in the consolidated financial statements by 3,672 million yen out of which 1,971 million yen was to settle liabilities assumed. The purchase agreement contained a contingent payment clause for the performance of certain product sales. This did not result in any material subsequent adjustments.
F-92
Table of Contents
The following table summarizes the estimated fair values of the assets acquired and liabilities assumed at the date of acquisition:
| Yen in millions | |||
At October 31, 2002: | |||
Current assets | ¥ | 1,468 | |
Property, plant and equipment | 83 | ||
Intangible assets | 1,650 | ||
Goodwill | 1,492 | ||
Total assets acquired | 4,693 | ||
Current liabilities | 2,877 | ||
Long-term debt | 115 | ||
Total liabilities assumed | 2,992 | ||
Net assets acquired | ¥ | 1,701 | |
The 1,650 million yen of acquired intangible assets have a weighted-average useful life of approximately 7 years.
The 1,492 million yen of goodwill was fully assigned to the Pharmaceutical segment. None of this is deductible for tax purposes.
The following unaudited pro forma financial information reflects the consolidated results of operations of Sankyo as if the acquisition had taken place at the beginning of the year ended March 31, 2003. The pro forma financial information is not necessarily indicative of the results of operations as it would have been had the transaction been effected on the assumed date.
For the year ended March 31, 2003:
| Yen in millions | |||
Net sales | ¥ | 578,951 | |
Income from continuing operations | 34,704 | ||
Net income | 34,614 | ||
| Yen | |||
Per share information: | |||
Income from continuing operations | |||
- Basic | ¥ | 78.64 | |
- Diluted | 78.64 | ||
Net income | |||
- Basic | 78.43 | ||
- Diluted | 78.43 | ||
18. Discontinued Operations
On December 23, 2003, Sankyo and Cygnus reached an agreement that, among other things, Sankyo pay a $30 million (3,238 million yen) settlement fee to Cygnus and transfer title to all Gluco Watch products to Cygnus. The agreement nullifies the licensing agreement between Sankyo and Cygnus for Sankyo to exclusively sell and market Gluco Watch. The settlement fee was paid in 2003. Sankyo has agreed to provide certain distribution and customer services until the later of June 30, 2004 or notification by Cygnus. Sankyo has classified all losses related to Cygnus and the Gluco Watch operations as a discontinued operation. The before-tax loss from operations of Gluco Watch amounted to 149 million yen and 10,322 million yen and the after-tax loss from operations of Gluco Watch amounted to 90 million yen and 6,199 million yen for the years ended March 31, 2003 and 2004, respectively.
F-93
Table of Contents
A major element of the loss included a write off of inventory of 2,369 million yen recorded on December 23, 2003. As of March 31, 2003, the carrying amount of Gluco Watch inventory and prepayments for inventory amounted to approximately 1,940 million yen.
Sankyo had also previously paid a nonrefundable license fee to Cygnus of $25 million (2,698 million yen), which had been capitalized as an intangible asset and amortized over the estimated life of the agreement. On December 23, 2003 the carrying amount of this intangible asset, 2,398 million yen, was charged to earnings. As of March 31, 2003, the carrying value of the intangible asset was 2,856 million yen and related amortization expense for the year then ended was 149 million yen.
On December 23, 2003, a 975 million yen receivable from Cygnus was charged to the loss as well. Receivables from Cygnus as of March 31, 2003 were 861 million yen which were included in due from alliance partners.
As of March 31, 2004, Sankyo had unpaid selling and marketing expenses related to Gluco Watch in the amount of approximately 173 million yen, which is included in other payable and accrued expenses.
In addition to the settlement fee and special charges noted above, Sankyo included the loss from Gluco Watch operations of 148 million yen in 2003 and 1,352 million yen in 2004 respectively, in discontinued operations.
Sankyo also recorded a tax benefit of approximately 59 million yen and 4,133 million yen for the years ended March 31, 2003 and 2004, respectively.
19. Other commitments and contingencies, concentrations and factors that may affect future operations
Commitments outstanding at March 31, 2004 for the purchase of property, plant and equipment approximated 14,455 million yen. Sankyo has entered into two supply agreements for future minimum purchase of the licensed products. Future payments remaining under the agreements as of March 31, 2004 approximated 26,144 million yen. The payments are scheduled at 3,970 million yen in fiscal year 2005; 5,393 million yen in fiscal year 2006; 6,617 million yen in fiscal year 2007; 7,455 million yen in fiscal year 2008 and 2,709 million yen in fiscal year 2009. Of these amounts, payments of 3,608 million yen in fiscal year 2006; 4,359 million yen in fiscal year 2007 and 4,810 million yen in fiscal year 2008 are subject to renegotiation with the counterparty. Sankyo has entered into several R&D agreements with alliance partners whereby Sankyo is committed to pay milestone payments. Future payments remaining under the agreements as of March 31, 2004 approximated 5,847 million yen.
At March 31, 2004, contingent liabilities for guarantees of loans of Sankyo’s employees and certain investees which Sankyo accounts for under cost method amounted to approximately 539 million yen.
It is common practice in Japan for companies, in the ordinary course of business, to receive promissory notes for the settlement of trade accounts receivable and subsequently to discount such notes to banks. At March 31, 2003 and 2004, Sankyo was contingently liable for discounted trade notes receivable of 775 million yen and 526 million yen, respectively.
In the United States, numerous lawsuits seeking damages and other compensation were brought against Warner-Lambert Company and other pharmaceutical companies by patients who took the diabetes drug Rezulin, which had been sold until March 2000 using a compound whose generic name is “troglitazone” supplied by the Company. A U.S. subsidiary of the Company, Sankyo Pharma Inc., was named as defendant in a small portion of these cases, and it is defending these cases in cooperation with Warner-Lambert.
F-94
Table of Contents
In these cases, the compensation claimed by all plaintiffs includes claims for both compensatory and punitive damages. In some cases in which specific amounts are claimed, the amounts are hugely speculative (in other cases no specific amounts are claimed). In general, the amounts demanded in product liability litigation in the United States are not considered a reliable standard for forecasting the amount defendants may be required to pay in a judgment or settlement.
In connection with the cost, including damages, to be borne by the Company and its subsidiaries, there is a provision in the license agreement with Warner-Lambert indemnifying the Company and its subsidiaries.
Sankyo believes that it is in compliance in all material respects with applicable environmental laws and regulations. Sankyo has made, and intends to continue to make, necessary expenditures for compliance with applicable laws and regulations. Sankyo also is cleaning up environmental contamination from past industrial activities at certain sites. As a result, Sankyo is in various stages of voluntary investigation or remediation for sites where contamination might exist. While Sankyo cannot predict with certainty future capital expenditures or operating costs for environmental compliance, Sankyo does not believe it will have a material effect on its capital expenditures, earnings or competitive position.
20. Segment data
The operating segments reported below are the segments of Sankyo for which separate financial information is available and for which operating income/loss amounts are evaluated regularly by executive management in deciding how to allocate resources and in assessing performance. Sankyo management primarily evaluates the performance of business segments based on operating income reported under accounting principles generally accepted in Japan (“Japanese GAAP”). There are several differences between Japanese GAAP and U.S. GAAP. The principal differences that affect segment operating profit are accounting for pension and severance costs, revenue recognition and the scope of consolidation.
The major portions of Sankyo’s operations on a worldwide basis are derived from the Pharmaceuticals and Other business segments. The Pharmaceuticals segment researches, develops, manufactures, and markets pharmaceuticals, medical devices and diagnostics. The Other segment includes operations that manufacture and market food products, additives, and agrochemical products.
The following tables present certain Japanese GAAP information regarding Sankyo’s operating segments and operations by geographic areas as of and for the years ended March 31, 2003 and 2004:
Segment operating results and assets -
As of and for the year ended March 31, 2003:
| Yen in millions | |||||||||||||||||||||||
Pharma- ceuticals | Other | Corporate | Total | Inter- segment | US GAAP adjustments | Consolidated total | |||||||||||||||||
Revenue from external customers | ¥ | 443,534 | ¥ | 126,394 | ¥ | — | ¥ | 569,928 | ¥ | — | ¥ | 6,342 | ¥ | 576,270 | |||||||||
Revenue from other operating segment | 319 | 2,524 | — | 2,843 | (2,843 | ) | — | — | |||||||||||||||
Segment profit or loss | 77,934 | 1,898 | — | 79,832 | 6 | 480 | 80,318 | ||||||||||||||||
Depreciation and amortization | 21,418 | 4,396 | — | 25,814 | — | 316 | 26,130 | ||||||||||||||||
Segment assets | 459,500 | 119,036 | 337,326 | 915,862 | (70 | ) | 17,558 | 933,350 | |||||||||||||||
Expenditures for segment assets | 28,246 | 3,695 | — | 31,941 | — | (4,519 | ) | 27,422 | |||||||||||||||
F-95
Table of Contents
As of and for the year ended March 31, 2004:
| Yen in millions | |||||||||||||||||||||||
| Pharma- ceuticals | Other | Corporate | Total | Inter- segment | US GAAP adjustments | Consolidated total | |||||||||||||||||
Revenue from external customers | ¥ | 466,734 | ¥ | 129,612 | ¥ | — | ¥ | 596,346 | ¥ | — | ¥ | 4,927 | ¥ | 601,273 | |||||||||
Revenue from other operating segment | 1,288 | 3,171 | — | 4,459 | (4,459 | ) | — | — | |||||||||||||||
Segment profit or loss | 89,114 | 5,506 | — | 94,620 | 935 | (10,722 | ) | 84,833 | |||||||||||||||
Depreciation and amortization | 23,873 | 3,974 | — | 27,847 | — | (1,087 | ) | 26,760 | |||||||||||||||
Segment assets | 518,432 | 140,649 | 269,617 | 928,698 | (1,454 | ) | 12,760 | 940,004 | |||||||||||||||
Expenditures for segment assets | 42,395 | 4,961 | — | 47,356 | — | (5,741 | ) | 41,615 | |||||||||||||||
Sankyo evaluates performance based on segmental profit and loss, which consists of revenue less operating expenses. Those measurements are determined using the accounting principles generally accepted in Japan. Transfers between segments are made at amounts which Sankyo’s management believes arm’s length prices.
Enterprise-wide information:
Major customers–
Sankyo had sales to one customer of 61,230 million yen and 92,570 million yen during the years ended March 31, 2003 and 2004, respectively, within the “Pharmaceuticals” segment, that exceeded 10% of Sankyo’s net sales.
Geographic Information –
As of and for the year ended March 31, 2003:
| Yen in millions | ||||||||||||||||
| Japan | North America | Other foreign countries | Intersegment Elimination/ Amount | Total | ||||||||||||
Revenues | ||||||||||||||||
External customers | ¥ | 497,676 | ¥ | 48,986 | ¥ | 29,608 | ¥ | — | ¥ | 576,270 | ||||||
Inter-segment | 3,821 | 2,726 | 1,222 | (7,769 | ) | — | ||||||||||
Total revenue | ¥ | 501,497 | ¥ | 51,712 | ¥ | 30,830 | ¥ | (7,769 | ) | ¥ | 576,270 | |||||
Long-lived assets | ¥ | 198,423 | ¥ | 3,319 | ¥ | 10,638 | ¥ | — | ¥ | 212,380 | ||||||
As of and for the year ended March 31, 2004:
| Yen in millions | ||||||||||||||||
| Japan | North America | Other foreign countries | Intersegment Elimination/ Amount | Total | ||||||||||||
Revenues | ||||||||||||||||
External customers | ¥ | 504,245 | ¥ | 60,781 | ¥ | 36,247 | ¥ | — | ¥ | 601,273 | ||||||
Inter-segment | 7,830 | 3,220 | 2,730 | (13,780 | ) | — | ||||||||||
Total revenue | ¥ | 512,075 | ¥ | 64,001 | ¥ | 38,977 | ¥ | (13,780 | ) | ¥ | 601,273 | |||||
Long-lived assets | ¥ | 194,994 | ¥ | 3,382 | ¥ | 11,424 | ¥ | — | ¥ | 209,800 | ||||||
Revenues are attributed to geographies based on the country location of the parent company or the subsidiary that transacted the sale with the external customer.
There are no any individually material countries with respect to revenues, operating expenses, operating income and segment assets included in other foreign countries.
F-96
Table of Contents
21. Per share amounts
Reconciliations of the differences between basic and diluted net income per share for the years ended March 31, 2003 and 2004 are as follows:
| Yen in millions | Thousands of shares | Yen | ||||||
| Net income | Weighted average shares | Net income per share | ||||||
For the year ended March 31, 2003 | ||||||||
Continuing operations per common share | ||||||||
Basic | ¥ | 34,941 | 441,325 | ¥ | 79.17 | |||
Effect of diluted securities Assumed exercise of dilutive stock options | — | — | — | |||||
Diluted | ¥ | 34,941 | 441,325 | ¥ | 79.17 | |||
| Yen in millions | Thousands of shares | Yen | ||||||
| Net income | Weighted average shares | Net income per share | ||||||
Discontinued operations per common share | ||||||||
Basic | ¥ | 90 | 441,325 | ¥ | 0.20 | |||
Diluted | 90 | 441,325 | 0.20 | |||||
Net income per common share | ||||||||
Basic | ¥ | 34,851 | 441,325 | ¥ | 78.97 | |||
Diluted | 34,851 | 441,325 | 78.97 | |||||
For the year ended March 31, 2004 | ||||||||
Continuing operations per common share | ||||||||
Basic | ¥ | 44,410 | 437,053 | ¥ | 101.61 | |||
Effect of diluted securities Assumed exercise of dilutive stock options | — | 46 | — | |||||
Diluted | ¥ | 44,410 | 437,099 | ¥ | 101.60 | |||
Discontinued operations per common share | ||||||||
Basic | ¥ | 6,199 | 437,053 | ¥ | 14.18 | |||
Diluted | 6,199 | 437,099 | 14.18 | |||||
Net income per common share | ||||||||
Basic | ¥ | 38,211 | 437,053 | ¥ | 87.43 | |||
Diluted | 38,211 | 437,099 | 87.42 | |||||
Certain stock options were not included in the computation of diluted net income per share for the year ended March 31, 2003 because the options’ exercise prices were greater than the average market price per common share during the period.
F-97
Table of Contents
CONSOLIDATED BALANCE SHEETS
(Unaudited)
As of March 31, 2004 and September 30, 2004
| Yen in millions | ||||||||
| March 31, 2004 | September 30, 2004 | |||||||
ASSETS | ||||||||
Current assets: | ||||||||
Cash and cash equivalents | ¥ | 201,734 | ¥ | 249,333 | ||||
Time deposits | 5,451 | 6,000 | ||||||
Marketable securities | 50,033 | 54,153 | ||||||
Notes receivable, trade | 12,617 | 13,112 | ||||||
Accounts receivable, trade | 141,714 | 134,793 | ||||||
Allowance for doubtful accounts | (884 | ) | (378 | ) | ||||
Inventories | 97,525 | 93,829 | ||||||
Deferred income taxes | 25,900 | 26,990 | ||||||
Other current assets | 12,409 | 12,070 | ||||||
Total current assets | 546,499 | 589,902 | ||||||
Investments and advances: | ||||||||
Marketable securities and other securities investments | 114,061 | 95,041 | ||||||
Affiliated companies | 1,985 | 2,213 | ||||||
Other | 13,139 | 12,594 | ||||||
| 129,185 | 109,848 | |||||||
Property, plant and equipment: | ||||||||
Land | 38,810 | 40,461 | ||||||
Buildings | 218,354 | 218,274 | ||||||
Machinery and equipment | 265,889 | 263,416 | ||||||
Construction in progress | 8,477 | 17,062 | ||||||
| 531,530 | 539,213 | |||||||
Less – Accumulated depreciation | (321,730 | ) | (322,975 | ) | ||||
| 209,800 | 216,238 | |||||||
Other assets: | ||||||||
Goodwill | 2,865 | 3,091 | ||||||
Other intangibles, net | 29,699 | 25,145 | ||||||
Deferred income taxes | 21,119 | 19,365 | ||||||
Other | 837 | 2,087 | ||||||
| 54,520 | 49,688 | |||||||
| ¥ | 940,004 | ¥ | 965,676 | |||||
(Continued on following page)
The accompanying notes are an integral part of these statements.
F-98
Table of Contents
SANKYO COMPANY, LIMITED
CONSOLIDATED BALANCE SHEETS (Continued)
(Unaudited)
March 31, 2004 and September 30, 2004
| Yen in millions | ||||||||
| March 31, 2004 | September 30, 2004 | |||||||
LIABILITIES AND SHAREHOLDERS’ EQUITY | ||||||||
Current liabilities: | ||||||||
Short-term borrowings | ¥ | 17,636 | ¥ | 14,277 | ||||
Current portion of long-term debt | 3,650 | 3,669 | ||||||
Notes and accounts payable, trade | 50,743 | 48,826 | ||||||
Other payable and accrued expenses | 58,299 | 54,426 | ||||||
Accrued compensation | 16,988 | 16,356 | ||||||
Accrued income taxes | 12,723 | 20,506 | ||||||
Other | 13,598 | 12,777 | ||||||
Total current liabilities | 173,637 | 170,837 | ||||||
Long-term liabilities: | ||||||||
Long-term debt | 6,212 | 6,802 | ||||||
Accrued pension and severance costs | 74,496 | 74,829 | ||||||
Other | 8,615 | 9,277 | ||||||
| 89,323 | 90,908 | |||||||
Minority interest in consolidated subsidiaries | 11,017 | 11,066 | ||||||
Commitments and contingent liabilities | ||||||||
Shareholders’ equity: | ||||||||
Common stock, no par value — | 68,793 | 68,793 | ||||||
Additional paid-in capital | 67,225 | 67,263 | ||||||
Retained earnings | 535,488 | 566,760 | ||||||
Accumulated other comprehensive income | 14,857 | 10,412 | ||||||
Treasury stock, at cost | ||||||||
(March 31, 2004 – 9,956,114 shares, September 30, 2004 – 9,968,156 shares) | (20,336 | ) | (20,363 | ) | ||||
| 666,027 | 692,865 | |||||||
| ¥ | 940,004 | ¥ | 965,676 | |||||
The accompanying notes are an integral part of these statements.
F-99
Table of Contents
CONSOLIDATED STATEMENTS OF INCOME
(Unaudited)
For the six months ended September 30, 2003 and 2004
| Yen in millions | ||||||||
| Six-month period ended September 30, | ||||||||
| 2003 | 2004 | |||||||
Net revenue: | ¥ | 302,255 | ¥ | 294,063 | ||||
Costs and expenses: | ||||||||
Cost of sales | 113,972 | 109,042 | ||||||
Research and development | 39,716 | 39,588 | ||||||
Selling, general and administrative | 97,529 | 95,437 | ||||||
Gain on sale of property, plant and equipment, net | (1,106 | ) | (11,142 | ) | ||||
| 250,111 | 232,925 | |||||||
Operating income | 52,144 | 61,138 | ||||||
Other income (expenses): | ||||||||
Interest and dividends income | 1,120 | 1,637 | ||||||
Interest expenses | (261 | ) | (237 | ) | ||||
Foreign exchange gain (loss), net | (233 | ) | 56 | |||||
Gain on marketable securities, net | 638 | 12 | ||||||
Other income (expenses), net | (468 | ) | 74 | |||||
| 796 | 1,542 | |||||||
Income before income taxes and minority interest | 52,940 | 62,680 | ||||||
Income taxes: | ||||||||
Current | 22,932 | 20,196 | ||||||
Deferred | 766 | 3,548 | ||||||
| 23,698 | 23,744 | |||||||
Income from continuing operations before minority interest | 29,242 | 38,936 | ||||||
Minority interest in income of consolidated subsidiaries | 73 | 192 | ||||||
Income from continuing operations | 29,169 | 38,744 | ||||||
Discontinued operations: | ||||||||
Loss (gain) from operations of discontinued business | 7,075 | (72 | ) | |||||
Income tax expense (benefit) | (2,830 | ) | 29 | |||||
Loss (gain) from discontinued operations | 4,245 | (43 | ) | |||||
Net income | ¥ | 24,924 | ¥ | 38,787 | ||||
Per share amounts: | ||||||||
Continuing operations per common share | ||||||||
– Basic | ¥ | 66.39 | ¥ | 90.20 | ||||
– Diluted | 66.39 | 90.17 | ||||||
Discontinued operations loss (gain) per common share | ||||||||
– Basic | 9.66 | (0.10 | ) | |||||
– Diluted | 9.66 | (0.10 | ) | |||||
Net income per common share | ||||||||
– Basic | 56.73 | 90.30 | ||||||
– Diluted | 56.73 | 90.27 | ||||||
Cash dividends | 12.50 | 17.50 | ||||||
The accompanying notes are an integral part of these statements.
F-100
Table of Contents
CONSOLIDATED STATEMENTS OF CASH FLOWS (UNAUDITED)
For the six months ended September 30, 2003 and 2004
| Yen in millions | ||||||||
| Six-month period ended September 30, | ||||||||
| 2003 | 2004 | |||||||
Cash flows from operating activities: | ||||||||
Net income | ¥ | 24,924 | ¥ | 38,787 | ||||
Adjustments to reconcile net income to net cash provided by operating activities – | ||||||||
Depreciation and amortization | 12,871 | 13,518 | ||||||
Accrual for pension and severance costs, less payments | (2,231 | ) | 477 | |||||
Gain on sale of property, plant and equipment, net | (1,106 | ) | (11,142 | ) | ||||
Gain on available-for-sale securities, net | (376 | ) | (169 | ) | ||||
Deferred income taxes | 766 | 3,548 | ||||||
Changes in assets and liabilities: | ||||||||
Decrease in notes and accounts receivable, trade | 6,503 | 6,143 | ||||||
Decrease in inventories | 5,388 | 3,682 | ||||||
Decrease in other current assets | 1,326 | 2,134 | ||||||
Decrease in notes and accounts payable, trade | (7,234 | ) | (1,769 | ) | ||||
Increase (decrease) in accrued income taxes | (427 | ) | 7,794 | |||||
Increase (decrease) in other current liabilities | 12,030 | (5,708 | ) | |||||
Other | (74 | ) | 1,784 | |||||
Net cash provided by operating activities | 52,360 | 59,079 | ||||||
Cash flows from investing activities: | ||||||||
Additions to property, plant and equipment | (12,123 | ) | (16,146 | ) | ||||
Proceeds from sales of property, plant and equipment | 1,687 | 13,324 | ||||||
Additions to intangible assets | (4,661 | ) | (399 | ) | ||||
Purchase of marketable securities and other securities investments | (27,180 | ) | (37,010 | ) | ||||
Proceeds from sales and maturities of marketable securities and securities investments | 36,038 | 43,345 | ||||||
Increase in time deposits | (4,464 | ) | (5,773 | ) | ||||
Decrease in time deposits | 4,980 | 5,191 | ||||||
Proceeds from sales of investments in subsidiary, net | — | 527 | ||||||
Other | 902 | (1,880 | ) | |||||
Net cash provided by (used in) investing activities | (4,821 | ) | 1,179 | |||||
Cash flows from financing activities: | ||||||||
Proceeds from issuance of long-term debt | 16 | 12 | ||||||
Repayments of long-term debt | (3,862 | ) | (4,445 | ) | ||||
Increase (decrease) in short-term borrowings | (1,499 | ) | (660 | ) | ||||
Purchase of treasury stock | (13 | ) | (27 | ) | ||||
Dividends paid | (5,691 | ) | (7,580 | ) | ||||
Other | (10 | ) | (11 | ) | ||||
Net cash provided by (used in) financing activities | (11,059 | ) | (12,711 | ) | ||||
Effect of exchange rate changes on cash and cash equivalents | 453 | 52 | ||||||
Net increase (decrease) in cash and cash equivalents | 36,933 | 47,599 | ||||||
Cash and cash equivalents at beginning of the period | 213,556 | 201,734 | ||||||
Cash and cash equivalents at end of the period | ¥ | 250,489 | ¥ | 249,333 | ||||
Supplemental data: | ||||||||
Cash paid during the period | ||||||||
Income taxes | ¥ | 20,588 | ¥ | 11,596 | ||||
Interest | 187 | 186 | ||||||
Non-cash investing and financing activities – Obtaining assets by entering into capital lease | ¥ | 78 | ¥ | 4,101 | ||||
(Continued on following page)
F-101
Table of Contents
NOTES TO CONSOLIDATED FINANCIAL STATEMENTS
(Unaudited)
1. Basis of preparation
The accompanying interim condensed consolidated financial statements of Sankyo as of September 30, 2004 and for the six-month periods ended September 30, 2003 and 2004, respectively, have been prepared in accordance with accounting principles generally accepted in the United States. The interim condensed consolidated financial statements are unaudited but include all adjustments, consisting of only normal recurring adjustments, which the Company considers necessary for a fair presentation of the consolidated financial position at September 30, 2004, and the consolidated results of its operations and cash flows for the periods ended September 30, 2003 and 2004. Results for the six-months ended September 30, 2004 are not necessarily indicative of results that may be expected for the full year.
2. Earnings per share
Reconciliations of the differences between basic and diluted net income per share for the six-month periods ended September 30, 2003 and 2004 are as follows:
| Yen in millions | Thousands of shares | Yen | ||||||||
| Net income | Weighted average shares | Net income per share | ||||||||
For the six-month period ended September 30, 2003 | ||||||||||
Continuing operations per common share | ||||||||||
Basic | ¥ | 29,169 | 439,323 | ¥ | 66.39 | |||||
Effect of diluted securities | ||||||||||
Assumed exercise of dilutive stock options | — | — | — | |||||||
Diluted | ¥ | 29,169 | 439,323 | ¥ | 66.39 | |||||
Discontinued operations loss per common share | ||||||||||
Basic | ¥ | 4,245 | 439,323 | ¥ | 9.66 | |||||
Diluted | 4,245 | 439,323 | 9.66 | |||||||
Net income per common share | ||||||||||
Basic | ¥ | 24,924 | 439,323 | ¥ | 56.73 | |||||
Diluted | 24,924 | 439,323 | 56.73 | |||||||
For the six-month period ended September 30, 2004 | ||||||||||
Continuing operations per common share | ||||||||||
Basic | ¥ | 38,744 | 429,537 | ¥ | 90.20 | |||||
Effect of diluted securities | ||||||||||
Assumed exercise of dilutive stock options | — | 154 | — | |||||||
Diluted | ¥ | 38,744 | 429,691 | ¥ | 90.17 | |||||
Discontinued operations (gain) per common share | ||||||||||
Basic | ¥ | (43 | ) | 429,537 | ¥ | (0.10 | ) | |||
Diluted | (43 | ) | 429,691 | (0.10 | ) | |||||
Net income per common share | ||||||||||
Basic | ¥ | 38,787 | 437,053 | ¥ | 90.30 | |||||
Diluted | 38,787 | 437,099 | 90.27 | |||||||
F-102
Table of Contents
Certain stock options were not included in the computation of diluted net income per share for the six-month period ended September 30, 2003 because the options’ exercise prices were greater than the average market price per common share during the period.
3. Inventories
Inventories comprise the following:
| Yen in millions | ||||||
| March 31, 2004 | September 30, 2004 | |||||
Finished products | ¥ | 49,272 | ¥ | 46,437 | ||
Work in process | 28,937 | 27,537 | ||||
Raw materials and supplies | 19,316 | 19,855 | ||||
| ¥ | 97,525 | ¥ | 93,829 | |||
4. Employee benefit plans
Components of net periodic (benefit) cost for the six-month periods ended September 30, 2003 and 2004 are as follows:
| Yen in millions | ||||||||
| Six-month period ended September 30, | ||||||||
| 2003 | 2004 | |||||||
Service cost | ¥ | 2,868 | ¥ | 2,679 | ||||
Interest cost | 826 | 1,025 | ||||||
Expected return on plan assets | (103 | ) | (212 | ) | ||||
Recognized net actuarial loss | 320 | 41 | ||||||
Net periodic pension cost | ¥ | 3,911 | ¥ | 3,533 | ||||
5. Comprehensive income
Sankyo’s total comprehensive income (loss) for the six-month periods ended September 30, 2003 and 2004 was as follows:
| Yen in millions | |||||||
| Six-month period ended September 30, | |||||||
| 2003 | 2004 | ||||||
Net income | ¥ | 24,924 | ¥ | 38,787 | |||
Other comprehensive income (loss) | |||||||
Foreign currency translation adjustments | 1,580 | 736 | |||||
Unrealized gains (losses) on securities | 7,289 | (5,372 | ) | ||||
Minimum pension liability adjustment | 26 | 191 | |||||
Total comprehensive income | ¥ | 33,819 | ¥ | 34,342 | |||
6. Contingencies
Commitments outstanding at September 30, 2004 amounted for the purchase of property, plant and equipment and other assets approximated 11,593 million yen.
F-103
Table of Contents
At September 30, 2004, contingent liabilities for guarantees of loans of Sankyo’s employees and certain unconsolidated companies amounted to approximately 542 million yen.
It is common practice in Japan for companies, in the ordinary course of business, to receive promissory notes for the settlement of trade accounts receivable and subsequently to discount such notes to banks. At September 30, 2004, Sankyo was contingently liable for discounted trade notes receivable of 569 million yen. Discounted notes are accounted for as sales and removed from the balance sheets.
7. Segment information
The operating segments reported below are the segments of Sankyo for which separate financial information is available and for which operating income/loss amounts are evaluated regularly by executive management in deciding how to allocate resources and in assessing performance. Sankyo management primarily evaluates the performance of business segments based on operating income reported under accounting principles generally accepted in Japan (“Japanese GAAP”). There are several differences between Japanese GAAP and U.S. GAAP. The principal differences that affect segment operating profit are accounting for pension and severance costs, revenue recognition and scope of consolidation.
The major portions of Sankyo’s operations on a worldwide basis are derived from the Pharmaceuticals and Other business segments. The Pharmaceuticals segment researches, develops, manufactures, and markets pharmaceuticals, medical devices and diagnostics. The Other segment includes its operations that manufacture and market food products, additives, and agrochemical products.
The following tables present Japanese GAAP information regarding Sankyo’s operating segments and operations by geographic areas for the six-month periods ended September 30, 2003 and 2004:
Segment operating results and assets —
For the six-month period ended September 30, 2003:
| Yen in millions | ||||||||||||||||||||||
| Pharmaceuticals | Other | Corporate | Total | Intersegment elimination | US GAAP adjustments | Consolidated total | ||||||||||||||||
Revenue from external customers | ¥ | 236,519 | ¥ | 59,952 | ¥ | — | ¥ | 296,471 | ¥ | — | ¥ | 5,784 | ¥ | 302,255 | ||||||||
Revenue from other operating segment | 796 | 1,653 | — | 2,449 | (2,449 | ) | — | — | ||||||||||||||
Segment profit or loss | 49,716 | 929 | — | 50,645 | 403 | 1,096 | 52,144 | |||||||||||||||
For the six-month period ended September 30, 2004:
| Yen in millions | ||||||||||||||||||||||
| Pharmaceuticals | Other | Corporate | Total | Intersegment elimination | US GAAP adjustments | Consolidated total | ||||||||||||||||
Revenue from external customers | ¥ | 228,128 | ¥ | 61,860 | ¥ | — | ¥ | 289,988 | ¥ | — | ¥ | 4,075 | ¥ | 294,063 | ||||||||
Revenue from other operating segment | 525 | 890 | — | 1,415 | (1,415 | ) | — | — | ||||||||||||||
Segment profit or loss | 46,648 | 2,112 | — | 48,760 | 399 | 11,979 | 61,138 | |||||||||||||||
Sankyo evaluates performance based on segmental profit and loss, which consists of revenue less operating expenses. Those measurements are determined using the accounting principles generally accepted in Japan. Transfers between segments are made at amounts which Sankyo’s management believes arm’s length prices.
F-104
Table of Contents
APPENDIX A
ENGLISH TRANSLATION OF JOINT SHARE TRANSFER AGREEMENT DATED MAY 13, 2005
App. A-1
Table of Contents
[TRANSLATION]
BUSINESS INTEGRATION AGREEMENT
(JOINT SHARE TRANSFER AGREEMENT)
Daiichi Pharmaceutical Co., Ltd. (“Daiichi”) and Sankyo Company, Limited (“Sankyo”) (respectively referred to as a “Party” and collectively the “Parties”) hereby agree to a business integration of the Parties (the “Business Integration”) on the terms set forth below and execute this business integration agreement (this “Agreement”) on the date specified at the end hereof (the “Execution Date of this Agreement”).
PREAMBLE
| (1) | The Parties have succeeded in creating world-class innovations such as CRAVIT and MEVALOTIN and have greatly contributed to the welfare and health of human beings. |
| (2) | The Parties have determined to integrate their businesses with the intention of making a leap forward in a new dimension that is beyond the framework of an individual company to further enhance their corporate value and fulfill their mission as leading pharmaceutical companies in Japan continuously in the 21st century in circumstances where globalization and structural change in the business environment of the pharmaceutical industry are in progress. |
| (3) | The Parties reached an agreement on the fundamental matters concerning the Business Integration by consultation and negotiation on the business integration, and executed a Memorandum of Understanding (the “MOU”) as of February 25, 2005. |
| (4) | The Parties have reached a definitive agreement on the terms and conditions of the Business Integration after further and repeated consideration, consultation and negotiation thereon based on the MOU. |
Article 1 (Purpose of the Business Integration)
The Parties shall implement the Business Integration with the aim of forming a Japan based “global pharma-innovator company,” which continuously provides innovative products and services and is independently competitive in the world’s major markets in order to meet the unmet medical needs of patients and healthcare professionals.
Article 2 (Schemes and Schedules of the Business Integration)
The Business Integration shall be implemented through two phases – in the first phase, a joint holding company will be incorporated and in the second phase, the prescription pharmaceuticals businesses of the Parties under the control of the holding company will be integrated. The basic schemes and schedules of the Business Integration are generally as follows:
| (1) | The First Phase |
| The Parties shall establish a joint holding company (the “Holding Company”) which will become the parent company that wholly owns the Parties, and the Parties will become wholly owned subsidiaries of the Holding Company, by means of a joint share transfer [kyoudo-kabushiki iten] (the “Share Transfer”), as provided for in Article 364 of the Commercial Code. The scheduled share transfer date shall be September 28, 2005. Accompanying the Share Transfer, the Parties will be delisted and the Holding Company shall be newly listed. |
| (2) | The Second Phase |
The Parties plan to have their prescription pharmaceuticals businesses under the control of the Holding Company integrated into the Holding Company (the Holding Company, as it exists after such integration, shall be referred to herein as the “Integrated Company”) in or around April of 2007 and aim to achieve their expected effect of the integration by further enhancing their unity. For that |
App. A-2
Table of Contents
purpose, the Parties shall, promptly after the Share Transfer, further proceed with preparations for the integration described above through the Holding Company’s function to promote the Business Integration. Details of the schemes and schedules of the second phase of the Business Integration will be determined by consultation between the Parties hereafter. |
Article 3 (Considerations at the Integration Preparation Committee and the Functional Task Forces)
At the integration preparation committee organized in accordance with the MOU, the Parties shall separately consider placing the Parties’ over-the-counter pharmaceutical businesses under the control of the Integrated Company and the treatment of other non-pharmaceutical businesses. Within the functional task forces set up as a subcommittee of the integration preparation committee, the Parties shall disclose information and exchange opinions mutually concerning business strategies after the Business Integration, and mutually confirm their understanding of the major matters of business strategies etc. of the Holding Company.
Article 4 (Share Transfer)
The Parties shall jointly implement the Share Transfer upon obtaining the approval of a general meeting of shareholders of each Party, as prescribed in Article 7 hereof, in accordance with the following items.
| (1) | Corporate Name of the Holding Company, etc. |
| The corporate name of the Holding Company shall be “Daiichi Sankyo Kabushiki Kaisha” [in Japanese] and “DAIICHI SANKYO COMPANY, LIMITED” in English. The corporate name of the Integrated Company shall be considered separately, with alternatives including new corporate names that do not contain the corporate names of the Parties. The corporate names of domestic subsidiaries and overseas subsidiaries, which promote the prescription pharmaceuticals business, shall follow the treatment of the corporate name of the Integrated Company. |
| (2) | Provisions of the Articles of Incorporation of the Holding Company |
| The provisions of the articles of incorporation of the Holding Company shall be substantially in the form attached hereto as an Exhibit. |
| (3) | Type and Number of Shares to be Issued by the Holding Company |
| The type of shares to be issued by the Holding Company upon the Share Transfer shall be common stock and the number thereof shall be seven hundred seventy-one million, four hundred ninety-eight thousand, and sixty-four (771,498,064); provided, however, that, as such number of shares is calculated based on the total number of issued and outstanding shares of each Party as of March 31, 2005 (the “ Calculation Date”), if Daiichi and Sankyo cancel their treasury shares respectively in accordance with Item 5 of this Article and if either Party has newly issued shares of common stock upon exercise of stock subscription rights and stock acquisition rights issued by such Party, from the day immediately following the Calculation Date to the day immediately preceding the scheduled share transfer date, the number of shares to be issued upon the Share Transfer shall be the sum of (a) and (b) below with fractional shares less than one (1) share rounded downwards. |
| (a) | The total number of issued and outstanding shares of Daiichi as of the Calculation Date minus the number of treasury shares that Daiichi has canceled since the day immediately following the Calculation Date plus the number of shares of common stock of Daiichi newly issued after the day immediately following the Calculation Date upon exercise of stock subscription rights and stock acquisition rights issued by Daiichi, multiplied by one point one five nine (1.159). |
| (b) | The total number of issued and outstanding shares of Sankyo as of the Calculation Date minus the number of treasury shares that Sankyo has canceled since the day immediately following the Calculation Date plus the number of shares of common stock of Sankyo newly issued after the |
App. A-3
Table of Contents
day immediately following the Calculation Date upon exercise of stock acquisition rights issued by Sankyo. |
| (4) | Allotment of Shares to the Parties’ Shareholders |
| Upon the Share Transfer, the Holding Company shall allot the shares of the Holding Company to shareholders of each Party (including beneficial shareholders; the same shall apply hereinafter) whose names appear on the latest register of shareholders (including the register of beneficial shareholders; the same shall apply hereinafter) as of the day immediately preceding the scheduled share transfer date at the ratios set forth below (the “Exchange Ratios”), respectively. |
| (a) | Daiichi’s shareholders: |
| One point one five nine (1.159) shares of common stock of the Holding Company to one (1) share of common stock of Daiichi |
| (b) | Sankyo’s shareholders: |
| One (1) share of common stock of the Holding Company to one (1) share of common stock of Sankyo |
| (5) | Cancellation of Treasury Shares and Treatment of the Stock Subscription Rights and the Stock Acquisition Rights |
| Each Party shall hold a meeting of the Board of Directors during the period from August 1, 2005 to September 26, 2005, and cancel all of its own treasury shares owned at the time of the meeting on its own responsibility. Thereafter, each Party shall not purchase its own shares until the effective date of the Share Transfer except for cases in which shareholders exercise their statutory rights to sell their shares to the issuing company or other unavoidable cases. Each Party shall terminate all stock subscription rights and stock acquisition rights by September 26, 2005 that the Party has issued as of the Execution Date of this Agreement by means of canceling such rights, having the holders surrender such rights or taking other appropriate measures on its own responsibility. Each Party shall ensure that no stock acquisition rights or other options or rights to acquire shares of the Party are outstanding as of the effective date of the Share Transfer. If a Party makes any payment (irrespective of any form of payment, including, but not limited to, cancellation for payment and cancellation after purchase) to terminate the stock subscription rights and stock acquisition rights, the amount of such payment shall not exceed the amount of the value of such stock subscription rights and stock acquisition rights evaluated by reasonable measures. |
| (6) | Amount of Capital and Capital Reserve of the Holding Company |
(a) | Amount of capital: | fifty billion yen (JPY 50,000,000,000) | ||
(b) | Amount of capital reserve: | (i) the aggregate amount of existing net assets of the Parties as of the effective date of the Share Transfer less (ii) the aggregate amount of capital provided above and the amount to be paid for the Share Transfer provided for in Item 7 of this Article. |
| (7) | Amount to Be Paid for the Share Transfer [kabushikiiten koufukin] |
| Upon the Share Transfer, the Holding Company shall, within three (3) months after the scheduled share transfer date, make a payment of the amount to be paid for the Share Transfer, as specified below, as a substitute for interim dividends to be paid by each Party, to each Party’s shareholders and the registered pledgees whose names appear on the latest register of shareholders as of the day immediately preceding the scheduled share transfer date. |
| (a) | Daiichi’s shareholders and registered pledgees: |
| twenty-five (25) yen per one (1) share of common stock of Daiichi |
App. A-4
Table of Contents
| (b) | Sankyo’s shareholders and registered pledgees: |
| twenty-five (25) yen per one (1) share of common stock of Sankyo |
| (8) | The Scheduled Share Transfer Date |
| The scheduled share transfer date shall be September 28, 2005, and registration of incorporation of the Holding Company shall be made on the same day; provided, however, that the Parties may change such date, by consultation between the Parties, if necessary for the procedure of the Share Transfer or other reason. |
| (9) | The Maximum Amount of Dividends to be Made by the Effective Date of the Share Transfer |
| Each Party may make a payment of dividends, within the limits of the following amounts respectively, to its respective shareholders and registered pledgees whose names appear on the latest register of shareholders as of March 31, 2005. |
| (a) | Daiichi’s shareholders and registered pledgees: |
| twenty-five (25) yen per one (1) share of common stock of Daiichi; and six billion, seven hundred ten million, one hundred thousand, five hundred seventy-five (6,710,100,575) yen in total |
| (b) | Sankyo’s shareholders and registered pledgees: |
| twenty-five (25) yen per one (1) share of common stock of Sankyo; and ten billion, seven hundred thirty-seven million, seven hundred twelve thousand, seven hundred twenty-five (10,737,712,725) yen in total |
| (10) | Directors of the Holding Company |
| The nominees for Directors of the Holding Company at the time of incorporation shall be as provided in Article 5, Paragraph 2 hereof. |
| (11) | Corporate Auditors of the Holding Company |
| The nominees for Corporate Auditors of the Holding Company at the time of incorporation shall be as provided in Article 5, Paragraph 8 hereof. |
| (12) | Remuneration for Directors and Corporate Auditors of the Holding Company |
| The total amount of remuneration for Directors of the Holding Company shall be not more than four hundred fifty million (450,000,000) yen per fiscal year and that of Corporate Auditors shall be not more than one hundred twenty million (120,000,000) yen per fiscal year. |
| (13) | Accounting Auditor of the Holding Company |
| The nominee for accounting auditor of the Holding Company at the time of incorporation shall be KPMG AZSA & Co. |
| (14) | Implementation of a Joint Share Transfer |
| The Parties shall jointly incorporate the Holding Company by way of a share transfer as provided for in Article 364 of the Commercial Code; provided, however, that if either Party fails to obtain approval concerning the matters of the Share Transfer at a general meeting of its shareholders, as prescribed in Article 7 hereof, the other Party shall not implement the Share Transfer either. Each Party shall implement the Share Transfer upon the condition that regulatory approvals and other requirements of the relevant authorities, as provided for in the laws and ordinances of Japan and other countries, have been obtained and satisfied. |
Article 5 (Corporate Governance)
| 1. | The Holding Company shall, in principle, adopt the Corporate Auditor system and the Executive Officer system as a style of corporate governance. |
App. A-5
Table of Contents
| 2. | The nominees for Directors at the time of incorporation of the Holding Company shall be as below. The last four (4) nominees listed below shall be nominees for Outside Directors, as provided for in Article 188, Paragraph 2, Item 7-2 of the Commercial Code. |
Chairman of the Board and Representative Director:
Kiyoshi Morita (currently President and Representative Director of Daiichi)
President and Representative Director (CEO):
Takashi Shoda (currently President and Representative Director of Sankyo)
Director:
Hiroyuki Nagasako (currently Executive Vice President and Representative Director of Daiichi)
Director:
Hideho Kawamura (currently Executive Vice-President and Representative Director of Sankyo)
Director:
Yasuhiro Ikegami (currently Executive Vice-President and Representative Director of Sankyo)
Director:
Tsutomu Une (currently Managing Director of Daiichi)
(Outside) Director:
Kunio Nihira
(Outside) Director:
Yoshifumi Nishikawa
(Outside) Director:
Jotaro Yabe
(Outside) Director:
Katsuyuki Sugita
| 3. | The Chairman of the Board and Representative Director shall act as chairperson at the meetings of the Board of Directors of the Holding Company, and the President and Representative Director (CEO) shall act as chairperson at the meetings of the management committee. |
| 4. | The Board of Directors of the Holding Company shall determine important matters concerning management and operation of the Holding Company, in addition to the matters provided for in the laws and ordinances and Articles of Incorporation, and supervise the performance of duties by the Directors. |
| 5. | The President and Representative Director (CEO) shall determine matters concerning operation of the Holding Company other than the matters provided for in the immediately preceding Paragraph. |
| 6. | The President and Representative Director (CEO) shall have authority and responsibility concerning operation of the Holding Company. |
| 7. | The management committee of the Holding Company shall consist of the President and Representative Director (CEO) and Directors other than the Outside Directors. The President and Representative Director (CEO) may request Executive Officers or employees to attend meetings of the management committee. The management committee, as an advisory body of the President and Representative Director (CEO), shall consider matters concerning operation of the Holding Company including matters concerning business strategies of the DAIICHI SANKYO group and the Business Integration. |
App. A-6
Table of Contents
| 8. | The nominees for Corporate Auditors at the time of incorporation of the Holding Company shall be as below. The first two (2) nominees listed below shall be nominees for Full-Time Corporate Auditors as provided for in Article 18, Paragraph 2 of the Law for Special Exceptions to the Commercial Code concerning Audit, etc. of Joint-stock Companies [Kabushiki-Kaisha] and the last two (2) nominees listed below shall be nominees for Outside Corporate Auditors as provided for in Article 18, Paragraph 1 of the same law. |
(Full-Time) Corporate Auditor:
Kozo Wada (currently Full-Time Corporate Auditor of Sankyo)
(Full-Time) Corporate Auditor:
Atsuo Inoue (currently Managing Director of Daiichi)
(Outside) Corporate Auditor:
Kaoru Shimada (currently Outside Corporate Auditor of Sankyo)
(Outside) Corporate Auditor:
Koukei Higuchi (currently Outside Corporate Auditor of Daiichi)
| 9. | Executive Officers of the Holding Company at the time of its incorporation shall include the Chairman of the Board and Representative Director, the President and Representative Director (CEO) and several other persons, and the Parties shall determine by mutual consultation the nominees therefor and the businesses such officers will be in charge of. Executive Officers of the Holding Company thereafter shall include the Chairman of the Board and Representative Director, the President and Representative Director (CEO) and several other persons, and the nominees therefor and the businesses such officers will be in charge of shall be proposed to the Board of Directors by the President and Representative Director (CEO) and decided by the Board of Directors. |
| 10. | The term of office of Directors and Executive Officers shall be one (1) year and the term of office of Corporate Auditors shall be four (4) years pursuant to Article 273, Paragraph 1 of the Commercial Code; provided, however, that the term of office of Corporate Auditors at the time of the incorporation of the Holding Company shall be one (1) year pursuant to Article 273, Paragraph 2 of the Commercial Code. |
| 11. | The President and Representative Director (CEO) shall act as chairperson at general meetings of shareholders of the Holding Company and the Integrated Company and, if the President and Representative Director (CEO) is unable to so act, another representative director shall so act. |
Article 6 (Other Matters Concerning the Holding Company)
| 1. | The functions of the Holding Company at the time of its incorporation shall be to manage the business strategies of the Daiichi Sankyo group and to promote the Business Integration and other management functions (business management, accounting, IR, etc.). Any addition, change and others of the functions and organizations of the Holding Company thereafter shall be proposed to the Board of Directors by the President and Representative Director (CEO) and decided by the Board of Directors. |
| 2. | The headquarters of the Holding Company shall be located at 5-1, Nihonbashi Honcho 3-chome, Chuo-ku, Tokyo (the location of Sankyo’s headquarters). The headquarters of the Integrated Company shall be located at the same address. |
| 3. | The securities exchanges that the Holding Company’s share certificates are to be listed on shall be the Tokyo Stock Exchange, Osaka Securities Exchange and Nagoya Stock Exchange. |
| 4. | The stock transfer agent of the Holding Company shall be UFJ Trust Bank Limited. |
App. A-7
Table of Contents
Article 7 (Share Transfer General Shareholders’ Meeting)
1. Daiichi and Sankyo shall respectively hold a general meeting of shareholders on June 29, 2005 (the “Share Transfer General Shareholders’ Meeting”) and submit an agenda concerning the matters provided for in Article 4 hereof and other matters concerning the Share Transfer, and make a reasonable effort to obtain the approval of the shareholders with regard to such agenda; provided, however, that the Parties may, by consultation between the Parties, change such date on which the Share Transfer General Shareholders’ Meeting is to be held, if necessary for the procedure of the Share Transfer or other reasons.
2. The Parties shall, as the occasion demands, consult and confirm with each other in order to avoid errors or inconsistencies with regard to the procedures for and contents of approval to be requested at each Party’s Share Transfer General Shareholders’ Meeting.
3. If either Party fails to obtain the approval prescribed in Paragraph 1 of this Article at the Share Transfer General Shareholders’ Meeting, the Parties shall consult on measures thereafter in good faith.
Article 8 (Management of Corporate Assets etc.)
1. Each Party shall recognize that it is the common purpose of both Parties to smoothly complete the Business Integration, and shall carry on its business and manage its assets with the care of a good manager during the period from the execution of this Agreement until the effective date of the Share Transfer. If a Party plans to engage in any act that may have a materially adverse effect on its financial condition or its rights or obligations, such Party shall obtain the other Party’s consent in advance, except for those acts that have already been disclosed in writing to the other Party by the Execution Date of this Agreement.
2. The Parties shall jointly make preliminary consultation with the Fair Trade Commission of Japan concerning the Business Integration, as necessary, after consultation with each other, and if the Parties are advised that the Business Integration involves any issue under the Act Concerning Prohibition of Private Monopolization and Maintenance of Fair Trade (the “Anti-monopoly Act”) as a result of such consultation, the Parties shall consult on remedial measures therefor in good faith and shall cooperate in taking such measures. The expenses for taking such measures (including all losses caused by the divestiture of businesses, if such divestiture is necessary) shall be deemed as common expenses for the Business Integration and shall have no effect on the Exchange Ratios. The Parties shall make filings under the anti-trust laws of each applicable country including the Hart-Scott-Rodino Antitrust Improvements Act of the United States and EU competition law, as necessary, after consultation with each other, and take measures therefor in the same manner prescribed in the immediately preceding two (2) sentences.
Article 9 (Review of the Exchange Ratios)
If either Party is subject to either of the following events, the other Party may request such Party to review the Exchange Ratios prescribed in Article 4, Item 4 hereof. In such case, the Parties shall adjust the Exchange Ratios upon consultation in good faith between the Parties.
| (1) | After the execution of this Agreement, any matter which has a significantly material adverse effect on the Exchange Ratios is newly discovered. |
| (2) | After the execution of this Agreement, any matter which has a significantly material adverse effect on the Exchange Ratios occurs. |
Article 10 (Representations and Warranties)
Each Party represents and warrants to the other Party that all documents and information disclosed by the Party to such other Party in the process of consultation and agreement for the MOU and this Agreement are correct in all material respects as of the execution of this Agreement to the knowledge of the Officers (a general term for Directors, Corporate Auditors and Executive Officers; the same shall apply hereinafter) and employees of the Party who are involved in such process.
App. A-8
Table of Contents
Article 11 (Confidentiality)
| 1. | Each Party shall not disclose or leak to any third party, without the prior written consent of the other Party, any and all information which has been disclosed or will be disclosed hereafter by the other Party with respect to the Business Integration, or the contents of this Agreement (whether in oral or written form, via e-mail or by any other means) (collectively, “Confidential Information”) and shall not use such information for any purpose other than the purposes of the Business Integration, except for cases of disclosing such information in compliance with a confidentiality obligation equivalent to that provided for in this Article, to a minimum number of its Officers and employees (including Officers and employees of its subsidiaries), attorneys, public accountants, investment bankers and other external professionals, or being required to disclose such information pursuant to any relevant laws or ordinances or rules of securities exchanges of Japan or other countries; provided, however, that information corresponding to any of the following shall be excluded from Confidential Information: |
| (a) | Information that is publicly known at the time of receipt thereof or has become publicly known after receipt thereof without any cause that is attributable to the receiving Party; |
| (b) | Information that the receiving Party has already received at the time of receipt thereof; |
| (c) | Information that the receiving Party has obtained from a duly authorized third party legally and without any restriction of a confidentiality obligation; or |
| (d) | Information that the receiving Party has obtained independent of the Confidential Information. |
| 2. | Attorneys, public accountants, investment bankers and other external professionals to whom each Party may disclose the Confidential Information shall be restricted to those whom the Parties mutually agree to. |
| 3. | If this Agreement is terminated without the Business Integration being implemented, each Party shall promptly meet the request of the other Party for return or disposition of any material containing the Confidential Information of such other Party. |
| 4. | Obligations of each Party provided for in this Article shall remain in force during the term of this Agreement and for five (5) years thereafter. |
Article 12 (Prohibition of Solicitation)
| 1. | Unless otherwise agreed by the Parties, each Party shall not solicit to hire any Officers or employees of the other Party as Officers or employees of its own or its affiliates for two (2) years from the Execution Date of this Agreement; provided, however, that each Party shall not be prohibited from publicly posting employment advertisement in the ordinary course of its business. |
| 2. | Unless otherwise agreed by the Parties, each Party shall not use the Confidential Information to solicit customers or other counterparties of the other Party in order to obtain those customers or other counterparties as customers or counterparties of itself or its affiliates for two (2) years from the Execution Date of this Agreement. |
| 3. | Each Party’s obligations prescribed in the immediately preceding two (2) Paragraphs shall be terminated if and at the time the Share Transfer takes effect. |
Article 13 (Public Announcement)
Each Party shall not publicly announce the terms of the Business Integration under this Agreement without the prior consent of the other Party and shall determine the content, timing and method of press releases and other public announcements (the “Contents, etc. of the Public Announcement”) by mutual consultation with the other Party, except where a public announcement is required pursuant to relevant laws or ordinances or rules of securities exchanges of Japan or other countries. In such case, the Parties, to the extent possible, shall confirm the Contents, etc. of the Public Announcement in advance by consultation.
App. A-9
Table of Contents
Article 14 (Damages)
| 1. | If either Party breaches this Agreement (except for cases in which, even though such Party requested approval at its general meeting of shareholders concerning the matters of the Share Transfer in accordance with Article 7 hereof, such Party fails to obtain the approval at the general meeting of shareholders; the same shall apply hereinafter) or any representations or warranties prescribed in Article 10, the other Party has the right to claim damages against the breaching Party. |
| 2. | The Parties are fully aware that if either Party breaches this Agreement, the other Party is likely to face an imminent risk or incur significant damages, and understand without objection that, to avoid or retrieve such damages, the other Party needs to take forcible execution, civil preservation (including provisional attachment, provisional disposition pertaining to the subject-matter in dispute and provisional disposition in order to establish provisional status) and any other remedies in addition to the claim of damages provided for in the immediately preceding Paragraph. |
Article 15 (Termination of this Agreement)
| 1. | If any of the following events occurs to either Party, the other Party may terminate this Agreement by sending a written notice to such Party prior to the effectuation of the Share Transfer; provided, however, that this Paragraph shall not prevent the other Party that so terminates this Agreement from claming damages against the Party that is subject to such event because of breach of this Agreement. |
| (1) | Although such Party has been subject to either of the events prescribed in Article 9, Item 1 or 2 hereof, the Parties fail to agree on the change of the Exchange Ratios within a period of thirty (30) days after the commencement of consultation. |
| (2) | Such Party fails to obtain approval with respect to the matters of the Share Transfer at the Share Transfer General Shareholders’ Meeting even though such Party submitted the agenda to the meeting, or the Share Transfer General Shareholders’ Meeting is closed without such Party submitting the agenda to the meeting. |
| (3) | Representations and warranties of such Party set forth in Article 10 hereof are untrue in material respects and it is evident that such fact have a significantly material adverse effect on the Exchange Ratios. |
| (4) | Such Party breaches any provision of this Agreement and such breach is material and is not remedied within two (2) weeks after notification of such breach to the breaching Party by the other Party. |
| 2. | If the Share Transfer does not take effect by March 31, 2006, because the Parties could not resolve problems under the Anti-monopoly Act or other anti-trust laws of any applicable country, after good faith consultations with regard to the measures to resolve such problems in accordance with Article 8, Paragraph 2 hereof, each Party may terminate this Agreement by sending a written notification to the other Party. In this case, the terminating Party shall have no responsibility to the other Party for such termination. |
| 3. | If this Agreement is terminated, the Parties shall consult, in good faith, with regard to the measures to be taken thereafter. |
| 4. | The provisions of Articles 11 through 14, proviso of Paragraph 1 of this Article, the immediately preceding Paragraph and this Paragraph, and Articles 16 through 22 shall remain in force after the termination of this Agreement. |
App. A-10
Table of Contents
Article 16 (Notice)
Notices to be given pursuant to this Agreement shall be delivered by hand or sent by prepaid registered express mail to the following addresses for each Party. Such notices shall be deemed to have reached the other Party at the time of hand delivery or after three (3) business days following the day on which such notices are dispatched for mail delivery. The addresses of each Party may be changed by providing a notice to the other Party in accordance with the manner provided for in this Article.
| (a) | Notices to Daiichi to: |
14-10, Nihonbashi 3-chome, Chuo-ku, Tokyo, 103-8234
Daiichi Pharmaceutical Co., Ltd.
Attention: President and Representative Director Kiyoshi Morita
| (b) | Notices to Sankyo to: |
5-1, Nihonbashi Honcho 3-chome, Chuo-ku, Tokyo, 103-8426
Sankyo Company, Limited
Attention: President and Representative Director Takashi Shoda
Article 17 (Prohibition of Transfer of Rights and Obligations)
Each Party shall not sell or transfer to any third party all or any part of its rights or obligations under this Agreement without obtaining the prior written consent of the other Party.
Article 18 (Expenses)
Unless otherwise agreed by the Parties, each Party shall bear its own expenses incurred relating to the execution and performance of this Agreement; provided, however, that if either Party breaches this Agreement and the Business Integration is not implemented due to such breach, the other Party may claim against such Party for such expenses reasonably caused by such breach.
Article 19 (Entire Agreement)
This Agreement is the entire agreement of the Parties on the matters provided for herein and shall supersede any and all previous agreements between the Parties on such matters.
Article 20 (Governing Law)
This Agreement shall be governed by, and construed in accordance with, the laws of Japan.
Article 21 (Jurisdiction)
Any disputes relating to this Agreement shall be subject to the exclusive jurisdiction of the Tokyo District Court as the court of first instance.
Article 22 (Matters to be Consulted in Good Faith)
With respect to any matter not set forth in this Agreement or any uncertainties regarding the interpretation of any provision in this Agreement, the Parties shall, in good faith, consult and make efforts to settle such matters.
App. A-11
Table of Contents
IN WITNESS WHEREOF, the Parties prepare two (2) originals of this Agreement and affix their signatures hereon, each Party retains one (1) executed original hereof.
May 13, 2005
14-10, Nihonbashi 3-chome, Chuo-ku, Tokyo Daiichi Pharmaceutical Co., Ltd. President and Representative Director
/s/ Kiyoshi Morita | 5-1, Nihonbashi Honcho 3-chome, Chuo-ku, Tokyo Sankyo Company, Limited President and Representative Director
/s/ Takashi Shoda | |
Kiyoshi Morita | Takashi Shoda |
App. A-12
Table of Contents
[English Translation]
EXHIBIT
ARTICLES OF INCORPORATION
OF
DAIICHI SANKYO COMPANY, LIMITED
Chapter 1 General Rules
Article 1 (Corporate Name)
The corporate name of the Company shall be Daiichi Sankyo Kabushiki Kaisha and in English DAIICHI SANKYO COMPANY, LIMITED.
Article 2 (Purpose)
The business purposes of the Company shall be as follows:
| (1) | Manufacture, sale & purchase and export & import of drugs, quasi-drugs, medical devices such as equipments and instruments, medical supplies, dental materials and sanitary materials, veterinary drugs, cosmetics, agrochemicals, reagents, fragrant materials, dietary supplemental foods and beverages made from vitamins, minerals, enzymes and other materials, nursery foods, food additives, yeasts for bread, seasonings, livestock foods, livestock food additives, chemicals, industrial chemicals, radiopharmaceuticals and other kinds of chemicals; |
| (2) | Sale & purchase and export & import of foods and daily necessities; |
| (3) | Sale & purchase and export & import of products relating to those set forth in the foregoing clauses, and other machines and equipments; |
| (4) | Manufacture and wholesale of alcoholic liquor, refreshing beverage and drinking water; |
| (5) | Undertaking of test and research concerning safety of chemicals; |
| (6) | Sale & purchase, lease, management and brokerage of real estate; |
| (7) | Publishing business; |
| (8) | Motor vehicle carrier business; |
| (9) | Casualty insurance agency business and business relating to offering of life insurance; |
| (10) | Control and management of the business activities of the companies carrying out the businesses set forth in the foregoing clauses by owning the shares of such companies; and |
| (11) | Any business and investment incidental to or related with the foregoing clauses. |
Article 3 (Location of Principal Office)
The principal office of the Company shall be located in Chuo-ku, Tokyo.
Article 4 (Method of Public Notice)
Public notice of the Company shall be inserted in The Nihon Keizai Shinbun.
Chapter 2 Shares
Article 5 (Total Number of Shares)
The total number of shares authorized to be issued by the Company shall be two billion and eight hundred million (2,800,000,000). If shares are retired, the number of such shares shall be decreased.
Article 6 (Acquisition of Treasury Stock)
The Company may purchase treasury stock by resolution of the Board of Directors in accordance with Item 2, Paragraph 1, Article 211-3 of the Commercial Code.
App. A-13
Table of Contents
Article 7 (Number of Shares constituting One Unit)
The number of shares constituting one unit of the Company shall be one hundred (100).
Article 8 (Non Issuance of Share Certificates for Shares Less Than One Unit)
The Company shall not issue share certificates for any shares less than one unit (“Shares Less Than One Unit”). Provided, however, that if Share Handling Regulation provides otherwise, this Article shall not be applied.
Article 9 (Additional Purchase of Shares Less Than One Unit)
Shareholders who hold the Shares Less Than One Unit of the Company (including beneficial shareholders. Same shall apply hereinafter.) may request, as set forth in the Share Handling Regulations, the Company to sell the number of shares that will constitute one unit when combined with the Shares Less Than One Unit held by such shareholder.
Article 10 (Transfer Agent)
10.1 The Company shall have a transfer agent for its shares.
10.2 The transfer agent and its business place shall be determined by the resolution of the Board of Directors, and shall be placed for the public notice.
10.3 The register of shareholders and the register of beneficial shareholders of the Company (collectively, “Register of Shareholders, etc.”) and the register of lost-share-certificate shall be maintained at the business place of the transfer agent, and the Company shall have the transfer agent undertake, and the Company shall not undertake, all business relating to shares such as entry of name change of shareholders in the Register of Shareholders, etc., purchase and additional purchase of Shares Less Than One Unit, and procedures for invalidating share certificates.
Article 11 (Share Handling Regulation)
Matters relating to shares such as denominations of share certificates, entry of name change of shareholders in the Register of Shareholders, etc., purchase and additional purchase of Shares Less Than One Unit, and procedures for invalidating share certificates shall be governed by the Share Handling Regulation established by the resolution of the Board of Directors.
Article 12 (Record Date)
12.1 The Company shall deem the shareholders having voting rights who are registered or recorded on the final Register of Shareholders, etc., as of March 31 each year to be the shareholders eligible to exercise voting rights at the Ordinary General Meeting of Shareholders for the accounting period.
12.2 The Company may set a record date by the resolution of the Board of Directors upon giving prior public notice thereof for determination of the shareholders eligible to receive Interim Dividends provided for in Article 39 hereof or for other necessities.
Chapter 3 General Meeting of Shareholders
Article 13 (Convocation)
13.1 The Ordinary General Meeting of Shareholders shall be convened in June every year, and an Extraordinary General Meeting of Shareholders shall be convened at any time as necessary.
13.2 The General Meetings of Shareholders shall be held at the place where the principal office is located or other places in the wards within Tokyo.
Article 14 (Person to Convene and Chairperson)
A President and Representative Director shall convene the General Meeting of Shareholders pursuant to the resolution of the Board of Directors and act as chairperson thereof. If the President and Representative Director is unable to so act, one of the other Representative Directors shall act as chairperson pursuant to the resolution of the Board of Directors.
App. A-14
Table of Contents
Article 15 (Exercise of Voting Rights by Proxy)
15.1 Shareholders or their legal representative may appoint another shareholder having voting rights of the Company as their proxy and exercise their voting rights through the proxy. Provided, however, that the number of the proxy shall be limited to one (1).
15.2 In the event of Clause 15.1, the shareholders or the proxy must submit to the Company a document establishing power of representation for each General Meeting of Shareholders.
Article 16 (Method of Resolution)
16.1 Resolutions at the General Meeting of Shareholders shall be adopted by a majority of voting rights of shareholders present, unless otherwise provided by laws and ordinances or by these Articles of Incorporation.
16.2 For the special resolution provided for in Article 343 of the Commercial Code, shareholders representing at least one-third (1/3) of voting rights of all shareholders shall be present, and the special resolution shall be adopted by at least two-thirds (2/3) of the voting rights represented by such shareholders present.
Article 17 (Minutes of General Meeting of Shareholders)
The proceedings of the General Meeting of Shareholders shall be registered or recorded in the minutes with printed name and seal affixed or electronic signature affixed by the chairperson and Directors present, and the minutes shall be maintained at the Company.
Chapter 4 Director and Board of Directors
Article 18 (Number)
The number of Directors shall be fourteen (14) or less.
Article 19 (Election)
19.1 Directors shall be elected at the General Meeting of Shareholders.
19.2 Directors shall be elected by a majority of the voting rights represented by the shareholders present who shall have no less than one-third (1/3) of the voting rights of all shareholders at the General Meeting of Shareholders.
19.3 No cumulative voting shall be used for the resolution of the election of Directors.
Article 20 (Term of Office)
20.1 The term of office of each Director shall expire at the close of the Ordinary General Meeting of Shareholders held for the accounting period last to expire within one (1) year subsequent to his/her assumption of office.
20.2 The term of office of a Director who was appointed for increasing the number of Directors or filling a vacancy of the Director having retired from office before expiration of his/her office shall expire upon the expiration of the term of office of other Directors in service.
Article 21 (Convocation of the Board of Directors)
21.1 A notice to convene the Board of Directors shall be dispatched to each Director and Corporate Auditor at least three (3) days before the meeting date; provided, however, that such period may be shortened in cases of emergency.
21.2 A meeting of the Board of Directors may be held without the procedures of convocation, if consented to by all the Directors and Corporate Auditors.
Article 22 (Method of Resolution)
The resolution of the Board of Directors shall be adopted by majority of votes of Directors present who constitute majority in number of all Directors.
Article 23 (Authority of Board of Directors)
The Board of Directors of the Company shall determine administration of affairs of the Company and supervise the performance of duties by the Directors.
App. A-15
Table of Contents
Article 24 (Representative Director and Executive Director)
24.1 Directors to represent the Company shall be appointed by the resolution of the Board of Directors.
24.2 The Board of Directors may appoint Chairman, President, Executive Vice-president, Executive Managing Director and Managing Director.
Article 25 (Minutes of Board of Directors)
An outline of the course of proceedings at each Board of Directors’ meeting and results thereof shall be registered or recorded in the minutes with printed name and seal affixed or electronic signature affixed by Directors and Corporate Auditors present.
Article 26 (Release of Liability of Outside Directors)
The Company may enter into an agreement with an Outside Director for limitation of liabilities for damages due to acts set forth in Item 5, Paragraph 1, Article 266 of the Commercial Code in accordance with the provisions of Paragraph 19, Article 266 of the Commercial Code; provided, however, that the maximum amount of liabilities for damages under such agreement shall be as provided by laws and ordinances.
Article 27 (Regulation of the Board of Directors)
Matters other than those provided in this Chapter shall be governed by the Regulation of the Board of Directors established by the Board of Directors.
Chapter 5 Corporate Auditor and Board of Corporate Auditors
Article 28 (Number)
The number of Corporate Auditors shall be four (4) or less.
Article 29 (Election)
29.1 Corporate Auditors shall be elected at the General Meeting of Shareholders.
29.2 Corporate Auditors shall be elected by a majority of the voting rights represented by the shareholders present who shall have no less than one-third (1/3) of the voting rights of all shareholders at the General Meeting of Shareholders.
Article 30 (Supplemental Corporate Auditor)
30.1 The Company may elect a supplemental Corporate Auditor in advance at the Ordinary General Meeting of Shareholders to prepare for an event where the number of Corporate Auditors falls below the number required by laws and ordinances.
30.2 A supplemental Corporate Auditor shall be elected by a majority of the voting rights represented by the shareholders present who shall have no less than one-third (1/3) of the voting rights of all shareholders at the General Meeting of Shareholders.
30.3 Election of a supplemental Corporate Auditor provided for in Clause 30.1 shall be effective until the opening of the Ordinary General Meeting of Shareholders to be held immediately following such election.
Article 31 (Term of Office)
31.1 The term of office of each Corporate Auditor shall expire at the close of the Ordinary General Meeting of Shareholders held for the accounting period last to expire within four (4) years subsequent to his/her assumption of office.
31.2 The term of office of a Corporate Auditor who was appointed for filling a vacancy of the Corporate Auditor having retired from office before expiration of his/her office shall expire at the time of expiration of the term of office of the retired Corporate Auditor.
31.3 The term of office of a supplemental Corporate Auditor who was appointed in advance as provided for in Clause 30.1 shall expire at the time of expiration of the term of office of the retired Corporate Auditor.
App. A-16
Table of Contents
Article 32 (Convocation of the Board of Corporate Auditors)
32.1 A notice to convene the Board of Corporate Auditors shall be dispatched to each Corporate Auditor at least three (3) days before the meeting date; provided, however, that such period may be shortened in cases of emergency.
32.2 A meeting of the Board of Corporate Auditors may be held without the procedures of convocation, if consented to by all the Corporate Auditors.
Article 33 (Method of Resolution)
The resolution of the Board of Corporate Auditors shall be adopted by majority of votes of Corporate Auditors unless otherwise provided by laws and ordinances.
Article 34 (Minutes of Board of Corporate Auditors)
An outline of the course of proceedings at each Board of Corporate Auditors’ meeting and results thereof shall be registered or recorded in the minutes with printed name and seal affixed or electronic signature affixed by Corporate Auditors present.
Article 35 (Full-time Corporate Auditor)
Corporate Auditors shall by mutual agreement appoint Full-time Corporate Auditors from among themselves.
Article 36 (Regulation of Board of Corporate Auditors)
Matters other than those provided in this Chapter shall be governed by the Regulation of Board of Corporate Auditors established by the Board of Corporate Auditors.
Chapter 6 Accounts
Article 37 (Business Year and Settlement of Accounts)
37.1 The business year of the Company shall commence on April 1 every year and end on March 31 of the following year.
37.2 The accounts shall be settled at the final day of each business year.
Article 38 (Dividend)
The dividend shall be paid to shareholders or registered pledgees registered or recorded in the final Register of Shareholders, etc., as of the last day of each business year.
Article 39 (Interim Dividend)
The Company may declare distribution of money (“Interim Dividend”) provided for in Article 293-5 of the Commercial Code by the resolution of the Board of Directors to the shareholders and registered pledgees registered or recorded in the final Register of Shareholders, etc., as of September 30 every year.
Article 40 (Annulment Term)
The Company is exempted from liability for paying dividend and Interim Dividend if the same remains uncollected after three (3) years have elapsed from the first date on which such dividend and Interim Dividend became payable.
App. A-17
Table of Contents
Supplemental Provisions
Article 1 (Shares to be Issued upon Incorporation)
1.1 The Company shall be incorporated by way of share transfer pursuant to Article 364 of the Commercial Code.
1.2 The class of shares to be issued upon incorporation of the Company shall be common stock and the number of shares thereof shall be 771,498,064 shares.
1.3 Notwithstanding the immediately preceding paragraph, if Daiichi Pharmaceutical Co., Ltd. (“Daiichi”) and Sankyo Company, Limited (“Sankyo”) cancel their treasury shares respectively and if Daiichi and Sankyo have newly issued shares of common stock respectively upon exercise of stock subscription rights and stock acquisition rights respectively issued by Daiichi and Sankyo, from the day immediately following March 31, 2005 (the “Calculation Date”) to the day immediately preceding the scheduled share transfer date, the number of shares to be issued upon the Share Transfer shall be the sum of Items 1 and 2 below with fractional shares less than one (1) share rounded downwards.
| (1) | 286,453,235 minus the number of treasury shares that Daiichi has canceled since the day immediately following the Calculation Date plus the number of shares of common stock of Daiichi newly issued after the day immediately following the Calculation Date upon exercise of stock subscription rights and stock acquisition rights issued by Daiichi, multiplied by one point one five nine (1.159). |
| (2) | 439,498,765 minus the number of treasury shares that Sankyo has canceled since the day immediately following the Calculation Date plus the number of shares of common stock of Sankyo newly issued after the day immediately following the Calculation Date upon exercise of stock acquisition rights issued by Sankyo. |
Article 2 (First Business Year)
Notwithstanding the provisions of Clause 37, the first business year of the Company shall commence on the date of incorporation of the Company and end on March 31, 2006.
Article 3 (Term of Office of First Corporate Auditors)
Notwithstanding the provision of Clause 31.1, the term of office of first Corporate Auditors of the Company shall expire at the close of the Ordinary General Meeting of Shareholders held for the accounting period last to expire within one (1) year subsequent to his/her assumption of office.
App. A-18
Table of Contents
APPENDIX B
ENGLISH TRANSLATION OF FAIRNESS OPINION DELIVERED BY
MERRILL LYNCH JAPAN SECURITIES CO., LTD.
App. B-1
Table of Contents
Merrill Lynch Japan Securities Co., Ltd.
1-4-1 Nihonbashi
Chuo-ku, Tokyo 103-8230, Japan
[Translation]
May 13, 2005
Board of Directors
Daiichi Pharmaceutical Co., Ltd.
14-10, Nihonbashi 3 chome
Chuo-ku, Tokyo 103-8234, Japan
Members of the Board of Directors:
Daiichi Pharmaceutical Co., Ltd. (“Daiichi”) and Sankyo Company, Limited (“Sankyo”) propose to enter into a definitive joint share transfer agreement (the “Agreement”) as of May 13, 2005 pursuant to which Daiichi and Sankyo will jointly establish Daiichi Sankyo Company Limited (the “Holding Company”) as a parent company that owns one hundred percent of each of Daiichi and Sankyo through a share transfer (the “Joint Share Transfer”) in which each outstanding share of common stock of Daiichi (the “Daiichi Shares”) will be converted into the right to receive 1.159 shares of the common stock of the Holding Company (the “Holding Company Shares”) and each outstanding share of common stock of Sankyo (the “Sankyo Shares”) will be converted into the right to receive one Holding Company Share (the “Exchange Ratio”).
You have asked us whether, in our opinion, the Exchange Ratio is fair from a financial point of view to the holders of Daiichi Shares, other than Sankyo and its subsidiaries and affiliates (the “Related Companies”).
In arriving at the opinion set forth below, we have, among other things:
| (1) | Reviewed certain publicly available business and financial information relating to Daiichi and Sankyo that we deemed to be relevant; |
| (2) | Reviewed certain information, including financial forecasts, relating to the businesses, earnings, cash flow, assets, liabilities, capital and prospects of Daiichi and Sankyo furnished to us by the senior management of Daiichi and Sankyo, as well as the amount and timing of the cost savings, related expenses and synergies expected to result from the Joint Share Transfer (the “Expected Synergies”) furnished to us by the senior management of Daiichi and Sankyo; |
| (3) | Conducted discussions with members of the senior management of Daiichi and Sankyo concerning the matters described in clauses 1 and 2 above, as well as their respective businesses and prospects before and after giving effect to the Joint Share Transfer and the Expected Synergies; |
| (4) | Reviewed the market prices and valuation multiples for Daiichi Shares and Sankyo Shares and compared them with those of certain publicly traded companies that we deemed to be relevant; |
App. B-2
Table of Contents
| (5) | Reviewed the results of operations of Daiichi and Sankyo and compared them with those of certain publicly traded companies that we deemed to be relevant; |
| (6) | Compared the proposed financial terms of the Joint Share Transfer with the financial terms of certain other transactions that we deemed to be relevant; |
| (7) | Participated in certain discussions and negotiations among representatives of Daiichi and Sankyo and their financial and legal advisors; |
| (8) | Reviewed the potential pro forma impact of the Joint Share Transfer; |
| (9) | Reviewed the Memorandum of Understanding between Daiichi and Sankyo, dated February 25, 2005, and a draft of the Agreement, dated May 11, 2005; and |
| (10) | Reviewed such other financial studies and analyses and took into account such other matters as we deemed necessary, including our assessment of general economic, market and monetary conditions. |
In preparing our opinion, we have assumed and relied on the accuracy and completeness of all information supplied or otherwise made available to us, discussed with or reviewed by or for us, or publicly available, and we have not assumed any responsibility for independently verifying such information or undertaken an independent evaluation or appraisal of any of the assets or liabilities of Daiichi or Sankyo or their Related Companies or been furnished with any such evaluation or appraisal, nor have we evaluated the solvency or fair value of Daiichi or Sankyo or their Related Companies upon bankruptcy, insolvency or similar matters (“Bankruptcy”) under any laws in any jurisdictions relating to Bankruptcy. In addition, we have not assumed any obligation to conduct any physical inspection of the properties or facilities of Daiichi or Sankyo or their Related Companies. With respect to the financial forecast information and the Expected Synergies furnished to or discussed with us by Daiichi or Sankyo, we have assumed that they have been reasonably prepared and reflect the best currently available estimates and judgment of Daiichi’s or Sankyo’s management as to the expected future financial performance of Daiichi, Sankyo or the Related Companies, as the case may be, and the Expected Synergies. With Daiichi’s consent, We have further assumed that the Joint Share Transfer will be accounted for as a pooling of interests under generally accepted accounting principles in Japan (“Japanese GAAP”), which differ in certain respects from accounting principles generally accepted in other countries, and that it will qualify as a tax-free reorganization for Japanese income tax and Japanese corporate tax purposes for both companies and their respective shareholders. Our opinion is based upon financial information in accordance with Japanese GAAP which is supplied or otherwise made available to us, discussed with or reviewed by or for us, or publicly available. We have not reviewed any financial information prepared by Daiichi or Sankyo under generally accepted accounting principles in the United States (“US GAAP”) and have not taken account of any differences between Japanese GAAP and US GAAP. We have also assumed that the final form of the Agreement will be substantially identical to the last draft reviewed by us.
Our opinion is necessarily based upon market, economic and other conditions as they exist and can be evaluated on, and on the information made available to us as of, the date hereof. We have assumed that in the course of obtaining the necessary regulatory or other consents or approvals (contractual or otherwise) for the Joint Share Transfer, no restrictions, including any divestiture requirements or amendments or modifications, will be imposed that will have an adverse effect on the contemplated benefits of the Joint Share Transfer.
In connection with the preparation of this opinion, we have not been authorized by Daiichi or the Board of Directors to solicit, nor have we solicited, third-party indications of interest for the acquisition of all or any part of Daiichi.
We are acting as financial advisor to Daiichi in connection with the Joint Share Transfer, and Daiichi has agreed to pay us a fee for our services. We have been paid a significant portion of our fee prior to the date
App. B-3
Table of Contents
hereof, and a significant portion of the fee is contingent upon the consummation of the Joint Share Transfer. In addition, Daiichi has agreed to indemnify us for certain liabilities arising out of our engagement. We have, in the past, provided investment banking services including financing services to Daiichi and Sankyo and may continue to do so and have received, and may receive, fees for the rendering of such services. In addition, in the ordinary course of our business, we may actively trade or hold Daiichi Shares and other securities of Daiichi, as well as Sankyo Shares and other securities of Sankyo, for our own account and for the accounts of customers and, accordingly, may at any time hold a long or short position in such securities.
This opinion is for the use and benefit of the Board of Directors of Daiichi. If reference to this opinion is required by law or regulation in any jurisdictions other than Japan, or by the Board of Directors of Daiichi, to be made in a registration statement or a proxy statement, we will not unreasonably withhold our consent thereto so long as the full text of our opinion is reproduced therein and we approve in advance the text of any accompanying disclosure. Except as permitted by the preceding sentence, our opinion may not be reproduced, summarized, described or referred to or given to any person without our prior written consent. Our opinion does not address the merits of the underlying decision by Daiichi to engage in the Joint Share Transfer and does not constitute a recommendation to any shareholder as to how such shareholder should vote on the proposed Joint Share Transfer or any matter related thereto. In addition, you have not asked us to address, and this opinion does not address, the fairness to, or any other consideration of, the holders of any class of securities, creditors or other constituencies of Daiichi, other than the holders of Daiichi Shares.
We are not expressing any opinion herein as to either the price at which the Daiichi Shares or the Sankyo Shares will trade following the announcement of the Agreement or the price at which the Holding Company Shares will trade following consummation of the Joint Share Transfer.
On the basis of and subject to the foregoing, we are of the opinion that, as of the date hereof, the Exchange Ratio is fair from a financial point of view to the holders of Daiichi Shares, other than Sankyo and its Related Companies.
Very truly yours,
MERRILL LYNCH, JAPAN SECURITIES CO., LTD.
App. B-4
Table of Contents
APPENDIX C
ENGLISH TRANSLATION OF FAIRNESS OPINION DELIVERED BY
NOMURA SECURITIES CO., LTD.
App. C-1
Table of Contents
ENGLISH TRANSLATION OF OPINION DELIVERED IN JAPANESE
[Letterhead of Nomura Securities Co., Ltd.]
Personal and Confidential
May 13, 2005
Board of Directors
Sankyo Company, Limited
5-1, Nihonbashi Honcho 3-chome,
Chuo-ku, Tokyo 103-8426
Japan
Members of the Board:
In regards to the joint share transfer of Sankyo Company, Limited (“Sankyo”) and Daiichi Pharmaceutical Co., Ltd. (“Daiichi”) expected to occur on September 28, 2005 (the “Proposed Transaction”), you, Sankyo, have requested us, Nomura Securities Co., Ltd. (“Nomura”), to provide our opinion as to the fairness of the proposed share transfer ratio of common stock (the “Exchange Ratio”) set forth in the proposed draft joint share transfer agreement (the “Draft Agreement”) that is planned to be entered into by and between Sankyo and Daiichi on May 13, 2005.
In the Proposed Transaction, Sankyo and Daiichi will establish a joint holding company (the “Joint Holding Company”) by way of a share transfer and shareholders of each of Sankyo and Daiichi respectively will receive shares in the Joint Holding Company and as a result, Sankyo and Daiichi will each become a wholly-owned subsidiary of the Joint Holding Company.
The Exchange Ratio in the Proposed Transaction will be one share of the Joint Holding Company for each share of Sankyo and 1.159 shares of the Joint Holding Company for each share of Daiichi.
In preparing this opinion, we have, among other things:
(i) reviewed and analyzed financial information, such as financial statements, contained in the annual securities reports and other disclosure materials, of Sankyo and Daiichi respectively;
(ii) reviewed and analyzed revenue and expenditure projections of each of Sankyo and Daiichi for each of the fiscal years ending March 31, 2006 through March 31, 2010 received from Sankyo;
(iii) reviewed and analyzed projections relating to integration synergies for each of the fiscal years ending March 31, 2006 through March 31, 2010 received from Sankyo;
(iv) reviewed and analyzed market share price and market trading activities for shares of both Sankyo common stock and Daiichi common stock;
(v) reviewed and analyzed financial data and market share price comparisons of publicly held companies in businesses comparable to those of Sankyo and Daiichi;
(vi) reviewed a report, dated April 18, 2005, on legal due diligence performed by Mori Hamada & Matsumoto on Daiichi received from Sankyo;
App. C-2
Table of Contents
(vii) reviewed a report, dated April 1, 2005, on accounting due diligence performed by Ernst & Young ShinNihon on Daiichi received from Sankyo;
(viii) interviewed the management of Sankyo with respect to the effect of the Proposed Transaction, including the status of the business and financial condition and the future revenue and expenditure projections of Sankyo and Daiichi and their integration synergies;
(ix) reviewed and analyzed the Draft Agreement; and
(x) reviewed and analyzed such other facts received from Sankyo in response to our request or obtained ourselves through our general investigation as we considered appropriate and necessary.
Nomura has acted as financial advisor to Sankyo in connection with the Proposed Transaction and expects to receive from Sankyo a fee for its services, including a fee contingent on the consummation of the Proposed Transaction. In addition, Nomura will also expect to receive from Sankyo reimbursement of certain expenses incurred by Nomura and its affiliates. In rendering this opinion, the waiver and indemnity clauses specified in the agreement between Nomura and Sankyo are applicable. Nomura and its affiliates may have provided in the past and may in the future provide investment banking or other financial services to Sankyo, Daiichi or their affiliates, for which Nomura and its affiliates would expect to receive compensation. In the ordinary course of business, Nomura and its affiliates may from time to time also acquire, hold or sell certain equity, debt and other securities and various types of financial instruments, including derivatives, of Sankyo, Daiichi or their affiliates for Nomura’s own account or Nomura’s clients’ accounts.
This letter is not an expression of an opinion regarding the prices at which the common stock of Sankyo or Daiichi will or should be traded prior to the consummation of the Proposed Transaction or of the value or prices of common stock of the Joint Holding Company to be issued to Sankyo’s shareholders. The opinion expressed herein is provided only for the information of the Board of Directors of Sankyo in connection with its evaluation of the Exchange Ratio. We were not asked to provide, and do not provide herein, any opinion on any of the premises or assumptions upon which the determination of the Exchange Ratio was based or the underlying business decision of Sankyo to proceed with the Proposed Transaction. The opinion set forth in this letter does not constitute a recommendation as to how any holder of shares of Sankyo common stock should vote or act on any matter relating to the Proposed Transaction. Except as otherwise specifically permitted under the agreement between Sankyo and us, the opinion expressed herein may not be disclosed to any other person or used for any purpose other than as originally intended, and Sankyo may not disclose, refer to, transmit or use this letter, in whole or in part, without our prior consent.
We have assumed the accuracy and completeness of all public information reviewed by us and all financial and other information provided to us for purposes of rendering this opinion. We have not verified or assumed any responsibility to independently verify the accuracy or completeness of any such information. In addition, we have not made any independent valuation, appraisal or assessment of any of the assets or liabilities (including derivatives, off-balance sheet assets and liabilities, and other contingent liabilities) of Sankyo, Daiichi or their affiliates, nor have we made any request to a third party for any such appraisal or assessment. With respect to the financial forecasts and other forward-looking information on Sankyo and Daiichi provided to us, we have assumed that such information was reasonably prepared by the managements of Sankyo and Daiichi on a basis reflecting the best currently available estimates and judgments of Sankyo and Daiichi and that the future financial condition of the Joint Holding Company will be consistent with such forecasts. In preparing this opinion, we have relied on these forecasts and related materials without independent verification. We have assumed, without independent verification, that the Proposed Transaction will be carried out lawfully and validly in accordance with the terms set forth in the Draft Agreement and that the Proposed Transaction will not have any accounting or tax consequences different from the assumptions provided to us. In addition, we have assumed, without independent verification, that all governmental, regulatory or other consents and approvals necessary for the consummation of the Proposed Transaction will be obtained without any adverse effect on the contemplated
App. C-3
Table of Contents
benefits of the Proposed Transaction and that the Proposed Transaction will be consummated in accordance with the terms of the Draft Agreement, without waiver, modification or amendment of any material term or agreement therein. We were not asked to provide, and have not provided, any opinion on any transaction other than the Proposed Transaction or on the relative merits of the Proposed Transaction as compared to any other transaction. We are under no obligation to Sankyo or its Board of Directors to solicit indications of interest from any third party in connection with the Proposed Transaction, nor did we make any such solicitations.
Our opinion stated in this letter is based on financial, economic, market and other conditions as they exist on the date hereof, and relies upon information available to us as of the date hereof. We had limited involvement in the negotiations in connection with the Draft Agreement or any other matters related to the Proposed Transaction. Although our opinion stated in this letter may be affected by changes in future conditions, we do not assume any responsibility to modify, change or supplement this opinion in the future.
Based upon and subject to the foregoing, it is our opinion that, as of the date hereof, the Exchange Ratio is fair from a financial point of view to the holders of Sankyo common stock.
Nomura Securities Co., Ltd.
App. C-4
Table of Contents
APPENDIX D
PRESS RELEASE OF DAIICHI, DATED APRIL 27, 2005,
ANNOUNCING ITS UNAUDITED JAPANESE GAAP RESULTS FOR
THE FISCAL YEAR ENDED MARCH 31, 2005
App. D-1
Table of Contents
DAIICHI PHARMACEUTICAL CO., LTD.
Consolidated Financial Results
for Fiscal 2004
(The Fiscal Year Ended March 31, 2005)
This document has been prepared as a guide for non-Japanese investors and contains forward-looking statements that are based on management’s estimates, assumptions and projections at the time of publication. A number of factors could cause actual results to differ materially from expectations.
App. D-2
Table of Contents
Daiichi Pharmaceutical Co., Ltd.
FASF
April 27, 2005
Summary of Consolidated Financial Results (Consolidated)
for Fiscal Year 2004, Ended March 31, 2005
(English Translation of “Kessan Tanshin”)
Listed company name: Daiichi Pharmaceutical Co., Ltd.
Stock code number: 4505
Stock listings: Tokyo Stock Exchange, Osaka Securities Exchange
Head office: Tokyo, Japan
URL: http://www.daiichipharm.co.jp/
Representative: Mr. Kiyoshi Morita, President and CEO
Contact: Mr. Toshio Takahashi, General Manager, Corporate Communications Department
Telephone: (03) 3272-0611
Meeting of the Board of Directors held on: April 27, 2005
Application of U.S. GAAP: No
1. Financial results for the fiscal year (April 1, 2004—March 31, 2005)
(1) Consolidated Operating Results
(Figures less than ¥1 million, except per share amounts, have been omitted)
Net sales (% change from previous year) | Operating income (% change from previous year) | Ordinary income (% change from previous year) | ||||
| Millions of yen | Millions of yen | Millions of yen | ||||
Fiscal Year 2004 | 328,534 (1.8%) | 56,063 (21.6%) | 57,320 (22.7%) | |||
Fiscal Year 2003 | 322,767 (0.2%) | 46,114 (D12.4%) | 46,731 (D13.0%) |
| Net income (% change from previous year) | Basic net income per share | Diluted net income per share | Return on equity | Ratio of ordinary income to total assets | Ratio of ordinary income to net sales | |||||||
| Millions of yen | Yen | Yen | % | % | % | |||||||
Fiscal Year 2004 | 37,175 (39.4%) | 137.95 | 137.90 | 8.5 | 10.7 | 17.4 | ||||||
Fiscal Year 2003 | 26,661 (96.5%) | 97.25 | 97.23 | 6.5 | 9.0 | 14.5 |
Notes
| 1. | Investment income (loss) from affiliated companies accounted for using the equity accounting method: |
| For the year ended March 31, 2005D¥399 million |
| For the year ended March 31, 2004 ¥— million |
| 2. | Weighted -average number of common shares issued and outstanding during the year (consolidated): |
| For the year ended March 31, 2005 268,481,535 shares |
| For the year ended March 31, 2004 272,515,920 shares |
| 3. | Changes in method of accounting presentation: None |
| 4. | Percentages in parentheses under net sales, operating income, ordinary income, and net income indicate changes from the previous fiscal year. |
App. D-3
Table of Contents
| (2) | Consolidated Financial Position |
| Total assets | Shareholders’ equity | Shareholders’ equity ratio | Shareholders’ equity per share | |||||
| Millions of yen | Millions of yen | % | Yen | |||||
Fiscal Year 2004 | 546,555 | 448,563 | 82.1 | 1,670.71 | ||||
Fiscal Year 2003 | 521,808 | 422,130 | 80.9 | 1,564.59 |
Notes : Total common shares issued and outstanding at end of year (consolidated)
March 31, 2005: 268,404,023 shares
March 31, 2004: 269,700,226 shares
| (3) | Consolidated Cash Flows |
| Cash flows from operating activities | Cash flows from investing activities | Cash flows from financing activities | Cash and cash equivalents at year-end | |||||
| Millions of yen | Millions of yen | Millions of yen | Millions of yen | |||||
Fiscal Year 2004 | 35,571 | D21,989 | D12,369 | 91,571 | ||||
Fiscal Year 2003 | 47,505 | D27,419 | D18,470 | 90,346 |
| (4) | Notes regarding the scope of consolidation and application of the equity method of accounting |
Consolidated subsidiaries : | 31 | |
Non-consolidated subsidiaries accounted for under the equity method : | 0 | |
Affiliated companies accounted for under the equity method : | 2 |
| (5) | Changes in the scope of consolidation and application of the equity method of accounting |
Consolidated subsidiaries | ||
(increase) | 3 | |
(decrease) | 0 | |
Equity method affiliates | ||
(increase) | 2 | |
(decrease) | 0 |
2. Forecasts of Consolidated Results Fiscal Year 2005 (April 1, 2005—March 31, 2006)
| Net sales | Ordinary income | Net income | ||||
| Millions of yen | Millions of yen | Millions of yen | ||||
Interim 6-month period | 159,000 | 22,000 | 12,000 | |||
Full year | 333,000 | 52,000 | 18,000 |
| Reference: Forecasted basic net income per share for the year: ¥ 66.55 |
* Note: The forecast figures shown above are based on information that was available at the time of preparation and may contain some uncertainties. Actual performance and other factors may differ from these forecasts due to changes in circumstances and other developments. More information concerning these forecasts can be found in the attached Supplementary Information on page 16-17.
App. D-4
Table of Contents
1. State of the Group
The Company’s corporate Group comprises Daiichi Pharmaceutical Co., Ltd. (the parent Company), its 34 subsidiaries (including 31 consolidated subsidiaries and 3 unconsolidated subsidiaries), and 5 affiliated companies, for a total of 40 Group companies. The principal lines of business of Group companies, the positioning of principal companies within the Group, and the business and geographic segment to which each company belongs are shown below.
| Business Classification | Lines of Business | Principal Group Companies | ||||
| Pharmaceuticals | Japan | |||||
Prescription drugs | Daiichi Pharmaceutical Co., Ltd. | |||||
Daiichi Pure Chemicals Co., Ltd. | ||||||
Diagnostic and radiopharmaceuticals | Daiichi Radioisotope Laboratories, Ltd. | |||||
Daiichi Fine Chemical Co., Ltd. | ||||||
Saitama Daiichi Pharmaceutical Co., Ltd. | ||||||
Daiichi Suntory Pharma Co., Ltd. | ||||||
Daiichi Pharmatech Co., Ltd. | ||||||
OTC drugs | Tokyo Iyaku Shiki Co., Ltd. | |||||
Nishimura Shiki Co., Ltd. | ||||||
Animal drug products | Daiichi Butsuryu Co., Ltd. | |||||
D. P. C. Medical Co., Ltd. | ||||||
Kanto Daiichi Service Co., Ltd. | ||||||
Kansai Daiichi Service Co., Ltd. | ||||||
Daiichi Technos Co., Ltd. | ||||||
Daiichi Suntory Biomedical Research Ltd. | ||||||
Unconsolidated subsidiary: 2 company; affiliated companies: 4 | ||||||
Total 21 companies | ||||||
| Overseas | ||||||
Daiichi Pharma Holdings, Inc. | ||||||
Daiichi Pharmaceutical Corporation | ||||||
Daiichi Medical Research, Inc. | ||||||
Daiichi Pharmaceuticals UK Ltd. | ||||||
Daiichi Pharmaceutical (Beijing) Co., Ltd. | ||||||
Daiichi Pharmaceutical (China) Co., Ltd. | ||||||
Daiichi Pharmaceutical Asia Ltd. | ||||||
Daiichi Pharmaceutical Taiwan Ltd. | ||||||
Daiichi Pharmaceutical Korea Co., Ltd. | ||||||
Daiichi Pharmaceutical (Thailand) Ltd. | ||||||
Laboratoires Daiichi Sanofi–Synthelabo | ||||||
Daiichi Asubio Pharmaceuticals, Inc. | ||||||
Daiichi Asubio Holdings, Inc. | ||||||
Daiichi Asubio Medical Research Laboratories LLC | ||||||
Total 14 companies | ||||||
App. D-5
Table of Contents
| Business Classification | Lines of Business | Principal Group Companies | ||||
| Other Business | Japan | |||||
Fine chemical business | Daiichi Pure Chemicals Co., Ltd. | |||||
Daiichi Fine Chemical Co., Ltd. | ||||||
Daiichi Jisho Co., Ltd. | ||||||
Safety research | ||||||
business | Other affiliated company: 1 | |||||
Total 4 companies | ||||||
Other business | Overseas | |||||
Daiichi Fine Chemicals, Inc. | ||||||
Daiichi Fine Chemical Europe GmbH | ||||||
Unconsolidated subsidiary: 1 | ||||||
Total 3 companies | ||||||
Note
| 1. | The number of companies by business line includes those companies that are engaged in more than one business. |
| 2. | For the fiscal year under review, three newly-established companies have been included in the scope of consolidation: Daiichi Pharmaceutical Corporation, Daiichi Medical Research, Inc., and Daiichi Pharmatech Co., Ltd. |
| Also, please note that the former corporate name of Daiichi Pharmaceutical Corporation has been changed to Daiichi Pharma Holdings, Inc. as of April 1, 2004. |
| 3. | As of May 7, 2004, the corporate name of Suntory Pharmaceutical Inc. was changed to Daiichi Asubio Pharmaceuticals, Inc.; as of July 30, 2004, the corporate name of Suntory Pharmaceutical Holding Inc. was changed to Daiichi Asubio Holdings, Inc.; and, as of September 14, 2004, the corporate name of Suntory Pharmaceutical Research Laboratories LLC was changed to Daiichi Asubio Medical Research Laboratories LLC. |
App. D-6
Table of Contents
As of March 31, 2005
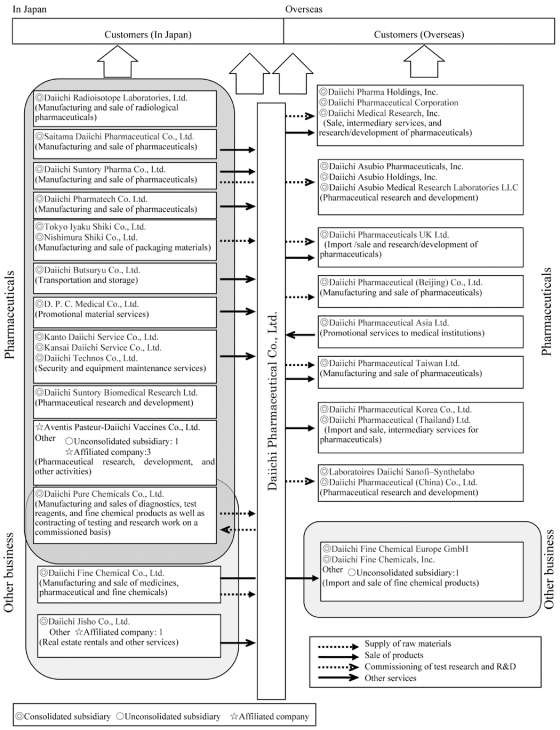
App. D-7
Table of Contents
2. Management Policy
1. Basic Policies
With its corporate slogan “Enriching the Quality of Life,” the Daiichi Pharmaceutical Co., Ltd. and its Group companies has adopted the philosophy of contributing to healthier and happier lives globally by developing innovative technologies and providing superior pharmaceutical products.
The Daiichi Group’s GLOBAL 10 long-term vision calls for the Group to become an “R&D-driven global pharmaceutical company” that develops products that meet global standards and provides them throughout the world. To realize this vision, the Group has made proceeded with diverse business reforms, and striven to improve its operations in a manner that accords with its social mission.
However, in view of such worldwide trends as progressive globalization and stepped-up cost-containment measures in the healthcare environment, we recognize that it is crucial to adopt a new corporate strategy that will enable us to build the stronger corporate foundation and management resources needed to overcome global competition.
Sharing in the recognition of the need for this strategy, Daiichi and Sankyo Co., Ltd., on February 25, signed a basic agreement calling for the establishment of a joint holding company to be called DAIICHI SANKYO COMPANY, LIMITED, with the target date for the company’s founding set at October 1, 2005, and the integration of their operations in the prescription drug business scheduled for April, 2007. The goal of integration is to realize the philosophy and vision jointly held by the two companies.
By maximizing synergies generated by the integration, the two companies are aiming to become the Japan-based “global pharma-innovator.” Having outstanding R&D and marketing capabilities competitive in the major world markets, this company will seek to “contribute to better human health throughout the world” on a still-higher level.
2. Basic Policy Regarding Distribution of Profits
Positioning the distribution of profits earned from business activities as one of its most important management tasks, Daiichi emphasizes the distribution of profits to shareholders in a manner that reflects corporate performance. The level of cash dividends is determined in line with this emphasis while reflecting the comprehensive consideration of such factors as the need to bolster internal reserves to build a foundation for corporate growth.
Regarding cash dividends, the Company seeks to maintain stable growth in cash dividends and in the dividend payout ratio while concurrently making flexible and timely moves to repurchase its outstanding shares with the goal of boosting income per share.
Regarding internal reserves, the Company plans to used them to fund such investments as those for engaging in leading-edge research, strengthening the product development pipeline, engaging in corporate alliances, and strengthening the foundations for international operations.
3. Policy Regarding the Reduction of the Basic Trading Unit of Shares
Aiming to increase the liquidity of its shares and expand its shareholder base, the Company reduced the trading unit size from 1,000 shares to 100 shares as of August 1, 2002.
4. Management Indicator Performance Goals
The Daiichi Group has set its lf consolidated net sales target at ¥345.0 billion for fiscal 2006. A new target and other goals are to be set in light of the basic agreement for integration with Sankyo Co., Ltd.
5. Medium- and Long-Term Strategies and Essential Tasks
Regarding overseas pharmaceutical markets, while the industrialized countries are making sustained efforts to reduce healthcare costs, marketing competition is becoming increasingly intense in the United States and other countries, and development competition in the search for breakthrough products involves the use of leading-edge technologies that are accompanied by increased R&D expenses. These and other factors are making the overseas operating environment more challenging.
App. D-8
Table of Contents
In Japan, growth in the pharmaceutical market is being slowed by healthcare system reform measures implemented against the backdrop of demographic graying, and the growing presence of overseas-based companies is contributing to an intensification of competition for market share.
Aiming to use new global development drug candidates to realize its corporate objectives, the Daiichi Group has designated the period through fiscal 2006 for reforms that will create the foundation required for achievement of its corporate objectives. Accordingly, it is taking measures to attain the following management goals.
(1) Expanding Global R&D Operations
Daiichi is giving strategic emphasis to the tasks of building a global R&D system able to create pharmaceutical products in line with global standards, continuously creating high-quality drug development candidates, and strengthening its system for evaluating drug development candidates in line with global standards and from both scientific and business perspectives.
Recognizing the need to transform conventional R&D operations in order to promote the smooth operation of a global R&D system, in October 2004 the Company established a new organizational system within an R&D Division designed to integrate R&D operations. Within the R&D Division system, the Company is working to promote progress in domestic and overseas R&D projects through functional collaboration between its Tokyo Research and Development Center and U.S.-based Daiichi Medical Research, Inc. Through this initiative, the Company is seeking to boost R&D productivity, integrate science and business, and firmly instill global thinking and action mechanisms.
Regarding drug discovery research, Daiichi has chosen for four therapeutic domains—infectious diseases, cancer, thrombosis and other cardiovascular diseases, and allergies and other immune system disorders. Research advances are being promoted by augmenting the quality and efficiency of drug discovery system’s performance. Competitively superior drug discovery technologies are being implemented by stepping up collaboration with leading-edge research institutions in Japan and overseas as well as with Daiichi Suntory Pharma Co., Ltd., and other Daiichi Group members.
In clinical development operations, Daiichi Medical Research now provides more-sophisticated drug candidate evaluation capabilities. Working in cooperation with the Daiichi Group’s other internal research facilities, the U.S.-based company is now undertaking comprehensive evaluation of a number of promising drug candidates—including such oral antithrombotic agents as DU-176b, an oral factor-Xa inhibitor ; such quinolone agents for treating drug-resistant infections as DX-619 ; such anti-allergy agents as DW-908e ; and the anticancer chemotherapeutic agent DJ-927. In preparation for the advance of these candidates to the proof-of-concept (POC) testing stage, the Company is creating systems for performing POC studies in line with global standards.
(2) Strengthening Domestic and Overseas Prescription Drug Business
Amid increasingly intense marketing competition, Daiichi has the policy of working to further reinforce the market positions of its domestic and overseas prescription drug businesses.
In the domestic prescription drug business, the Company is aiming to expand its current market share. To do this, it is striving to increase the number of prescriptions for established drugs—such asCravit, a broad-spectrum oral antibacterial agent;Artist, a long-acting beta-blocker;Sunrythm, an anti-arrhythmic agent; andHANP, an agent for treating acute cardiac insufficiency—while also expeditiously launching and developing the markets for drugs for which applications were already made—such asPlavix (clopidogrel sulfate), a new anti-platelet agent; and KMD-3213 (silodosin), an agent for treating dysuria. The Company is also strengthening its marketing operations aimed at the hospital market while taking steps to respond to such changes in the medical therapy environment as the creation of medical institution networks and the spread of diagnostic and therapeutic guidelines.
In the overseas prescription drug business, the Company is working to ensure that its licensee maintains the top share of the quinolone market in the United States, which is the largest export market for bulk shipments of its mainstay antibacterial agent levofloxacin, by working through the licensee to obtain approval for additional indications and taking other steps to expand sales of products containing levefloxacin in the United States.
App. D-9
Table of Contents
(3) Building a Resilient Corporate Structure by Resolutely Implementing Structural Reforms
To transform the entire Daiichi Group into an enterprise featuring high levels of profitability and management efficiency as well as strong overall competitiveness, the Company has established a task force, the Structural Reform Headquarters, that is working to
| 1) | consolidate functions within the Group and integrate and consolidate networks of research, manufacturing, and distribution facilities, |
| 2) | optimize the size of the Group’s workforce, and |
| 3) | restructure ancillary businesses. |
Particularly noteworthy among functional and facility consolidation measures was the establishment of Daiichi Pharmatech Co., Ltd., which began operating smoothly in April 2005. Created through the spin-off of three factories from the parent Company and subsequent integration of these factories with two Group manufacturing service companies, Daiichi Pharmatech is working to further increase manufacturing efficiency and strengthen cost-competitiveness.
Other noteworthy measures include the shift of the Tochigi Research Center’s protein research unit and Daiichi Fine Chemical’s drug discovery units to the Tokyo Research and Development Center, in October 2004 and April 2005, respectively. A decision has been made to increase distribution efficiency and cut costs by shifting the functions of distribution centers in Sapporo and Shizuoka to the Tokyo Distribution Center, and the Company is assiduously moving ahead with measures to prepare for the implementation of this decision.
To consolidate planning and administration functions, the Company is proceeding with the consolidation of Group companies’ accounting, personnel, remuneration, and IT units as well as with the introduction of enterprise resource planning (ERP) systems. The personnel and remuneration functions of major Group companies have already been consolidated in the Company’s Business Center facility.
Aiming to optimize the size of the Group’s workforce, steps were taken to hire additional staff to work for Daiichi Medical Research and as the parent Company’s Medical Representatives (sales representatives in the field) in domestic prescription drug marketing. In contrast, at many other Group companies such operational reform measures as those to reevaluate operations, consolidate functions, and introduce electronic information systems have enabled workforce right-sizing.
Regarding the reorganization of non-core businesses, the Company transferred its veterinary and livestock feed products business to Meiji Seika Kaisha, Ltd. This transfer was smoothly implemented in June 2004.
(4) Other Issues
With respect to manufacturing and technology, the Group is striving to upgrade its overall technological strength and thereby boost its cost-competitiveness and provide additional high-value-added products. At the same time, the Group is working to fortify its supply chain management initiative to ensure stable supplies, optimize inventory levels, and enhance its product quality assurance systems in line with global standards.
In the area of post-marketing-surveillance (PMS) and reliability assurance, the Company is taking various measures in accord with the complete implementation of Japan’s amended Pharmaceutical Affairs Law in April 2005, which calls for appropriate responses to new post-manufacturing/marketing safety administration standards and new regulatory responsibility definitions. Organizational restructuring responses include the October 2004 establishment and reorganization of functional units within the newly created and independent PMS Administration and Reliability Assurance Division.
Regarding environmental management, the Company recognizes the importance of conserving the global environment. In line with the Daiichi Environmental Charter, the Group has created an organizational framework for guiding environmental conservation activities, such as the proactive launch of various programs aimed at realizing a recycling-oriented society. These efforts will be made public in the fiscal 2004 edition of the Daiichi Environmental Report.
Regarding the issues associated with the alleged formation of a bulk vitamin marketing cartel, settlements were reached with all but a few relevant parties in the United States. In Europe, an appeal was filed in February 2002 in response to a notification of the levying of a fine received from the European Commission.
In the United States, Mylan Laboratories Inc. and other companies have filed applications for permission to manufacture generic versions of products containing of Daiichi’s mainstay product, levofloxacin. Having
App. D-10
Table of Contents
determined that such applications constitute attempts to infringe Daiichi’s patents, Daiichi and its licensee together filed suit against the Mylan Laboratories-led group in a federal district court, which decided in favor of Daiichi and the licensee in December 2004. However, the Mylan Laboratories-led group was dissatisfied with the decision and has appealed it. Daiichi intends to continue vigorously defending its intellectual property assets.
6. Basic Policy Regarding Corporate Governance and Implementation of Related Measures
(1) Basic Policy Regarding Corporate Governance
Recognizing that increasing shareholder value is an important management issue, Daiichi is working to strengthen its capabilities regarding legal compliance, highly transparent management, rapid and appropriate management decision-making, and supervisory systems.
(2) Implementation of Corporate Governance Related Measures
| 1) | Management and Administration Organization System for Decision-Making, Execution, and Supervisory Tasks and Other Corporate Governance Systems |
Held every month in principle are Board of Directors’ Meetings, where directors decide issues related to operational execution and the supervision of the execution of tasks by directors. Serving as a management council or executive board, Managing Directors’ Meetings are held once every week in principle, to discuss operational execution matters and to expedite and ensure the appropriateness of management decision-making. Currently there are no external directors.
Aiming to reinforce corporate governance with particular attention to such goals as increasing management transparency, strengthening decision-making capabilities, and establishing flexible and dynamic operational execution systems, changes will be made to appoint external directors and adopt single-year terms for directors upon approval at the coming 127th Ordinary General Meeting of Shareholders, and the Company is moving ahead with the introduction of an executive officer system and functional reevaluation of the Management Committee.
Directors’ remuneration is determined within a predetermined remuneration framework using a rational method that takes corporate performance into consideration.
Daiichi has adopted an auditor system. To promote the Company’s sound and sustained management, corporate auditors participate and express opinions at Board of Directors’ Meetings and Managing Directors’ Meetings as well as at other important meetings in accordance with regulations for Corporate Auditors’ Meetings and corporate auditor’s execution of duties. In addition, corporate auditors have the task of performing financial and operational audits for the Company and other Group companies. Corporate Auditors’ Meeting is currently composed of four members, including two external corporate auditors
Regarding internal control systems, Daiichi is strengthening its Internal Audit Department and other internal auditing units and also conducts audits of its compliance system, risk management system, and other internal control systems.
Daiichi has commissioned KPMG AZSA & CO. as its independent auditor, giving it the role of auditing the Company’s financial statements from an independent standpoint.
Daiichi Group companies make sustained efforts to ensure rigorous legal compliance and have instituted the “Daiichi Conduct Guidelines.” The Company has employee hot-lines and the Ethics Committee that include advisory lawyers and directors as members.
| 2) | External Directors’ and External Auditors’ Personal, Capital, Transactional, or Other Relationships of Vested Interest with the Company |
The external auditors have no vested interest in the Company.
| 3) | Measures Taken During the Past Year to Strengthen Corporate Governance |
To clarify the Group management staff roles of the Company’s planning and administration departments, these departments were reorganized as “corporate” departments, and Group management capabilities were strengthened.
To promote rigorous legal compliance and thorough awareness of the “Daiichi Conduct Guidelines” among all employees, measures were taken, including the organization of training seminars for each management stratum and the implementation of questionnaire-based surveys.
App. D-11
Table of Contents
Responding to the full implementation of Japan’s new Personal Information Protection Law in April 2005, the Company has instituted new policies, regulations, and handling standards related to personal information. It has also taken various measures to create a personal information protection system, including the establishment of the Personal Information Protection Committee to act as an operational administrative organ.
Daiichi is continuing efforts to ensure the timely disclosure of information related to changes in the Company’s situation as well as to ensure the transparency of the Company’s management processes.
Corporate Governance Framework
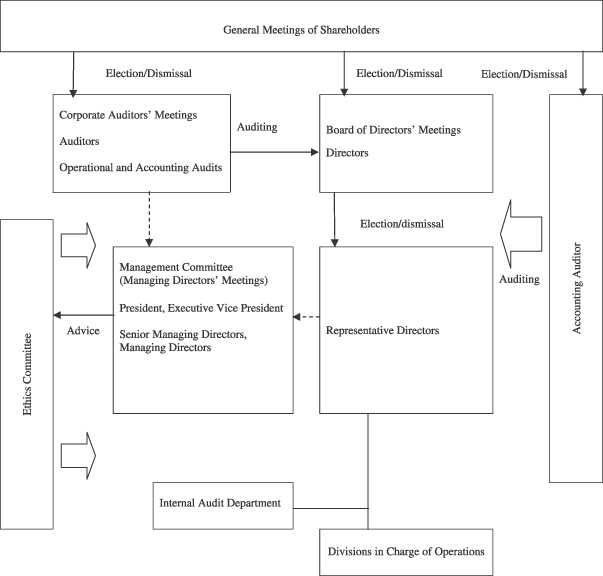
App. D-12
Table of Contents
3. Results of Operations and Financial Position
I. Results of Operations
1. Overview of Fiscal Year 2004
(Millions of Yen)
| Net sales | Operating income | Ordinary income | Net income | |||||
Fiscal Year 2003 | 322,767 | 46,114 | 46,731 | 26,661 | ||||
Fiscal Year 2004 | 328,534 | 56,063 | 57,320 | 37,175 | ||||
Change (%) | 1.8 | 21.6 | 22.7 | 39.4 |
(1) Overview of Performance during the Fiscal Year
During the year, overseas pharmaceutical markets were characterized by a further intensification of global competition centered on “global-mega” companies and associated with both new drug-related R&D and marketing activities. The Japanese pharmaceutical market was affected by changes in the healthcare systems—such as the growing scope of application of the comprehensive hospital therapy evaluation system and the conversion of national university hospitals and other national hospitals into independent corporations—and an average 4.2% reduction in National Health Insurance (NHI) drug reimbursement prices was implemented in April 2004.
Against this backdrop, the Daiichi Group worked to expand the markets for its products while emphasizing the promotion of appropriate drug use through the provision of information related to drug efficacy and safety. As a result, higher revenue from domestic sales of prescription drugs and a rise in bulk levofloxacin exports more than offset a revenue decline associated with the transfer of veterinary and livestock feed products business to another company. Consequently, net sales advanced 1.8% from the previous fiscal year, to ¥328,534 million. Reflecting the reduction in cost of sales as well as cost-cutting measures with respect to R&D expenses, operating income totaled ¥56,063 million, up 21.6% from the previous fiscal year, and double-digit growth was achieved in ordinary income, which amounted to ¥57,320 million, up 22.7% from the previous fiscal year. While ¥7.3 billion in extraordinary restructuring expenses associated with the spin-off of the parent Company’s manufacturing operations was recorded, this was more than offset by extraordinary gains of ¥11.7 billion on the return of the substitutional retirement portion of its Employee’s Pension Fund and ¥3.8 billion on the shift to a new retirement payment system. Thus, net income surged 39.4% from the previous fiscal year, to ¥37,175 million.
The share of consolidated net sales derived from overseas operations was 20.9%.
In light of this strong performance, the Company has decided to increase year-end cash dividends by ¥10 per share and disburse total year-end cash dividends of ¥25 per share. As ¥15 per share interim cash dividends have already been disbursed, cash dividends applicable to the fiscal year under review will total ¥40 per share.
The Company intends to keep emphasis on the distribution of profits to shareholders after the integration with Sankyo Co., Ltd. scheduled for October 2005.
(2) Overview of Performance by Business Segment
Business segment | (Millions of Yen) |
| Business segment | Net sales | Operating income | ||||||||||
| Fiscal 2003 | Fiscal 2004 | Increase (Decrease) | Fiscal 2003 | Fiscal 2004 | Increase (Decrease) | |||||||
| Pharmaceutical | 304,564 | 311,844 | 7,280 | 53,126 | 64,096 | 10,969 | ||||||
| Other | 18,203 | 16,689 | D1,513 | 65 | D78 | D144 | ||||||
| Subtotal | 322,767 | 328,534 | 5,766 | 53,192 | 64,017 | 10,824 | ||||||
| Eliminations | — | — | — | D7,077 | D7,953 | D876 | ||||||
| Consolidated | 322,767 | 328,534 | 5,766 | 46,114 | 56,063 | 9,948 | ||||||
Note: Sales are the value of sales to external customers.
App. D-13
Table of Contents
Pharmaceutical Business
<Prescription Drugs>
Although conditions in the domestic prescription drug market were negatively affected by the April 2004 revision of drug reimbursement prices, sales of the mainstay broad-spectrum oral antibacterial agentCravit were steady, and increased sales were recorded for such products asMobic, a nonsteroidal anti-inflammatory agent marketed in Japan exclusively by Daiichi since July 2004;Artist, a long-acting beta-blocker for treating high blood pressure, angina, and chronic cardiac insufficiency; andZyrtec, an anti-allergy agent. As a result, total domestic prescription drug sales advanced 1.9% from the previous fiscal year, to ¥205,859 million.
Overseas prescription drug sales were negatively affected by a decline in a U.S. subsidiary’s sales ofFLOXIN Otic, an antibacterial otic solution for treating ear infections, as well as by the appreciation of the yen. However, the completion of U.S. inventory adjustments for levofloxacin enabled a recovery in bulk sales of this product, and patent licensing royalty income grew. Thus, overseas sales of prescription drugs rose 6.2% from the previous fiscal year, to ¥61,318 million.
<Diagnostics and Radiopharmaceuticals>
Measures aimed at restraining medical costs kept market conditions challenging, and sales of such products as in vivo radiopharmaceuticals for cardiac imaging applications declined. However, strong sales of such in vitro diagnostics products as testing kits for influenza—which was prevalent in Japan during the year under and mainstay cholesterol measuring agents for export boosted total sales of diagnostics and radiopharmaceuticals products 2.1% from the previous fiscal year, to ¥32,923 million.
<OTC Drugs>
Karoyan Gush, a hair-growth accelerator launched in June 2004, made a significant contribution to performance during the year, and sales of such products asPatecs anti-inflammatory analgesic poultices and the vitamin C productCystina C were robust. Accordingly, OTC Drug sales advanced 16.3% from the previous fiscal year, to ¥10,199 million.
<Veterinary and Livestock Feed Products>
Reflecting the Company’s June 2004 transfer of its veterinary and livestock feed products business to Meiji Seika Kaisha, Ltd., segment sales dropped 59.1% from the previous fiscal year, to ¥1,544 million.
Other Businesses
Sales of fine chemical products decreased 10.6%, to ¥12,967 million, reflecting drops in sales of such products as calcium pantothenate to customers in North America and Europe. Total sales in the other businesses segment, which includes fine chemicals, declined 8.3%, to ¥16,689 million.
R&D Activities
By conducting research programs that enable the identification of additional drug target molecules and the acquisition of innovative new drug discovery “seeds,” Daiichi is seeking to continuously generate high-quality drug development candidates. Moreover, the Company is proactively undertaking POC testing programs coordinated by Daiichi Medical Research.
Regarding collaborative research initiatives, Daiichi is collaborating with the U.S.-based UCSF Cancer Research Institute and U.S.-based Rigel Pharmaceuticals Inc., in research aimed at developing molecularly-targeted anti-cancer agents and is conducting research related to genomic drug discovery with Japan-based Kazusa DNA Research Institute and Celestar Lexico-Sciences, Inc. All of these research programs are expected to facilitate new drug discovery.
Recognizing the importance of strategies for obtaining additional leading-edge technologies, Daiichi and MediBIC ALLIANCE jointly established a drug development venture investment fund in March 2005. The objectives of this fund are to facilitate the collection of information on drug discovery technologies as well as collaborative research activities.
With respect to drug development operations, Daiichi has applications pending in Japan forPlavix (clopidogrel sulfate), an antiplatelet agent;Sonazoid (DD-723), an ultrasonic contrast medium product; and
App. D-14
Table of Contents
KMD-3213 (silodosin), an agent for treating dysuria jointly developed with Kissei Pharmaceutical Co., Ltd. In addition, Aventis Pasteur-Daiichi Vaccines Co., Ltd. has an application pending in Japan forActHIB,the first haemophilus influenzae type b conjugate vaccine for pediatric use.
In May 2004, Daiichi submitted a supplemental application for the anticancer agentTopotecin (irinotecan hydrochloride), for the additional indication of pancreatic cancer. In February 2005, the Company submitted a supplemental application for the natural interferon beta agentFeron, for the additional indication of Hepatitis C -induced liver cirrhosis.
In April 2005, approval was received for the anti-spasticity agentGabalonIntrathecal Injection (continuous administration of baclofen into the intrathecal cavity) developed as an orphan drug (an agent for rare diseases). The agent is used with a programmable pump system, which was developed by Medtronic Japan Co., Ltd. and approval was given for the system in March 2005.
Also in April 2005, approval was received forAdenoscan(adenosine), an adjunctive agent for myocardial scintigraphy imaging for which the domestic application was submitted by Daiichi Suntory Pharma.
Daiichi decided to discontinue its participation in development for anticancer agent TZT-1027, licensed from TEIKOKU HORMONE MFG. CO., LTD., as a result of its reevaluation of development plans, aimed at and strategy of making selective and concentrated investments of R&D resources.
Other noteworthy products under development include DU-6859a (Gracevit, sitafloxacin), a quinolone antibacterial agent that was discovered and developed in-house, and HGF DNA plasmid, an agent for treating peripheral artery disease and ischemic heart disease for which exclusive marketing rights for Japan, the United States, and Europe have been obtained from AnGes MG, Inc.
Daiichi Suntory Pharma is proceeding with domestic clinical trials of (SUN Y7017 (memantine hydrochloride), an agent for treating Alzheimer’s disease.
Manufacturing and Technologies
Aiming to realize considerable reduction in cost of sales, the Daiichi Group has introduced a new levofloxacin manufacturing method involving a new synthesis technology. The switch to the new manufacturing method has been completed with respect to levofloxacin exported to the United States, which is the principal market for this product.
Daiichi Suntory Pharma began constructing a bio bulk manufacturing facility at its Chiyoda Pharma Factory that is designed to meet needs associated with growing sales ofHANP injectable 1000 as well as newly developed products. This facility is scheduled to be completed in October 2005.
Group-wide Initiatives
Daiichi has undertaken various reforms designed to increase the soundness and stability of its pension system. Along with completing the return of its Employees’ Welfare Pension Fund’s substitutional portion, the Company has undertaken fundamental reform aimed at unification of the pension plans of domestic Group companies. These companies have introduced new pension systems involving defined contributions and benefits.
Regarding moves to introduce and upgrade electronic information systems, the Company is been proceeding with the introduction of enterprise resource planning (ERP) systems at major domestic Group companies. Consolidated accounting, personnel, and remuneration systems have already been inaugurated and the Company is moving forward steadily with the introduction of supply-chain management systems.
2. Forecast for the current Fiscal Year
(Millions of Yen)
| Net sales | Operating income | Ordinary income | Net income | |||||
Fiscal Year 2004 results | 328,534 | 56,063 | 57,320 | 37,175 | ||||
Fiscal Year 2005 forecast | 333,000 | 53,000 | 52,000 | 18,000 | ||||
Change (%) | 1.4 | D5.5 | D9.3 | D51.6 |
App. D-15
Table of Contents
<Net Sales>
In the domestic prescription drug business, Daiichi projects that it will face a severe operating environment due to such factors as the increasing effect of government measures aimed at restraining medical costs and the rising market share of major global drug companies. Against this backdrop, the Company will concentrate its efforts on maintaining the top market share of its mainstay productCravit, as well as increasing sales of such major products for cardiovascular diseases asArtist,Sunrythm, andHANP. In addition, the Company anticipates the launch of new products during the latter half of the year such asPlavix will help increase net sales in the domestic prescription drug business.
In the overseas prescription drug business, the Company expects that revenues from its mainstay bulk exports of levofloxacin to the United States will continue to increase in light of the favorable growth in sales by its licensee. The Company is basing its projections on the premise that exchange rates during the fiscal year will be approximately US$1=¥105 and 1 Euro=¥130.
Rising sales are projected in OTC drug operations due to such factors as growing sales of the hair-growth acceleratorKaroyan Gush. Sales of diagnostics and radiopharmaceuticals, for which market conditions are severe, are expected to be approximately unchanged.
Consequently, net sales are projected to increase, albeit by a small margin.
<Profitability>
Having started operating Daiichi Pharmatech in April 2005, the Company is further stepping up its efforts to reduce the cost of sales, and it intends to place still greater emphasis on reducing non-strategic expenses. The Company is seeking to restrain R&D expenses by strengthening is capabilities for accurately evaluating drug candidates at early development stages and continuing to concentrate its operations in core therapeutic domains; nevertheless R&D expenses are projected to increase owing to the full-scale start of clinical trial programs in the United States and Europe for DU-176b, an oral factor-Xa inhibitor during the next fiscal year.
While the domestic and overseas operating environments are expected to be more challenging, the Company is doing its utmost to secure the profits required to fund the R&D programs needed to build new corporate growth paths, expeditiously realize the medium-to-long-term corporate growth capabilities that its R&D results make possible, and proceed steadily and quickly with such structural reform measures as those aimed at merging and eliminating certain distribution facilities. The Company plans to implement these strategies in a manner that maximizes the benefits of the upcoming business integration.
Based on the above projections, Daiichi anticipates that it will record higher sales but lower profits during fiscal 2005. Specifically, the Company is aiming to record ¥333.0 billion in consolidated net sales, ¥53.0 billion in operating income, and ¥52.0 billion in ordinary income. After accounting for the effect of converting Daiichi Suntory Pharma into a wholly owned subsidiary, net income is expected to amount to ¥18.0 billion.
App. D-16
Table of Contents
II. Financial Position
1. Overview of Changes in the Fiscal Year Under Review
<Assets, Liabilities, and Shareholders’ Equity>
At the end of the fiscal year, total assets amounted to ¥546.5 billion, up ¥24.7 billion from the previous fiscal year end. Total current assets were affected by a ¥13.4 billion rise in marketable securities, while long-term assets were affected by a ¥15.4 expense on prepaid pension liabilities that accompanied the return of the substitutional retirement portion of its Welfare Pension Fund.
Regarding liabilities, such factors as the introduction of a specified contribution pension system led to a ¥14.4 billion decrease in reserves for employees’ retirement benefits, and an accompanying ¥9.1 billion increase in deferred income taxes. Shareholders’ equity was affected by a ¥28.2 billion rise in retained earnings.
<Consolidated Cash Flows>
(Millions of Yen)
| Accounting Items | Fiscal Year 2003 | Fiscal Year 2004 | Increase (Decrease) | |||
Net cash provided by (used in) operating activities | 47,505 | 35,571 | D11,934 | |||
Net cash provided by (used in) investing activities | D27,419 | D21,989 | 5,430 | |||
Net cash provided by (used in) financing activities | D18,470 | D12,369 | 6,101 | |||
Effect of exchange rate changes on cash and cash equivalents | D207 | 12 | 220 | |||
Increase (decrease) in cash and cash equivalents | 1,407 | 1,225 | D182 | |||
Cash and cash equivalents at end of year | 90,346 | 91,571 | 1,225 |
Net cash provided by operating activities amounted to ¥35.6 billion, down ¥11.9 billion from the previous year. Although net income grew ¥17.1 billion, the decrease in net cash provided by operating activities reflected such factors as a decrease in reserves for employees’ retirement benefits as well as such factors increasing accounts receivable and a rise in royalty income.
Net cash used in investing activities totaled ¥22.0 billion, down ¥5.4 billion from the previous year. This decrease mainly reflected a drop in the acquisition of investment securities.
Net cash used in financing activities amounted to ¥12.4 billion, down ¥6.1 billion from the previous year. This decrease mainly reflected a drop in the acquisition of treasury stock.
As a result, total cash and cash equivalents at the end of year were ¥91.6 billion, up ¥1.2 billion from the previous fiscal year.
2. Projection of Changes in the Current Fiscal Year
In the next fiscal year, Daiichi projects that its net sales will increase by a small margin, but the Company also anticipates that profits will decline due to its proactive augmentation of R&D investment. Accordingly, the Company projects that the level of net cash provided by operating activities during the next fiscal year will be lower than that in the year under review.
Cash flows from investing activities are expected to be affected by higher spending accompanying the conversion of Daiichi Suntory Pharma into a wholly owned subsidiary, although the levels of cash used to acquire tangible fixed assets and of long-term funds under management are projected to remain approximately unchanged.
Cash flows from financing activities are projected to be affected by a rise in cash dividend payments.
In light of the above factors, the balance of cash and cash equivalents at the end of the next fiscal year is projected to decrease from the level at the end of the year under review.
App. D-17
Table of Contents
<Principal Financial Indicators>
| Fiscal Year 2002 | Fiscal Year 2003 | Fiscal Year 2004 | ||||
Shareholders’ equity ratio (%) | 78.4 | 80.9 | 82.1 | |||
Market capitalization ratio (%) | 85.3 | 104.4 | 123.3 | |||
Interest-bearing debt ratio (years) | 0.0 | 0.0 | 0.0 | |||
Interest coverage ratio (times) | 2,040.3 | 48,280.4 | 51,372.9 |
Notes:
| 1. | Shareholders’ equity ratio = total shareholders’ equity/total assets |
| 2. | Market capitalization ratio = total market value (Closing stock prices on balance sheet date x number of outstanding shares at the balance sheet date less the number of treasury shares)/ total assets |
| 3. | Interest-bearing debt ratio = interest-bearing debt/operating cash flow |
| 4. | Interest coverage ratio = operating cash flow/interest paid |
| 5. | All indicators are calculated based on consolidated figures. |
| 6. | Interest-bearing debt includes all consolidated balance sheets liability items on which interest is paid. |
| 7. | Operating cash flow equals the value of operating cash flows in the consolidated statements of cash flows less the value of “interest expense” and “corporate income taxes” (from the consolidated statements of income). |
| 8. | Interest expense equals the “interest expense” item list on the consolidated statements of cash flows. |
App. D-18
Table of Contents
III. Business Risk and Other Risks
With regard to business activities, financial accounting, and other items described in this report, issues that could potentially exert a large influence on investors’ decisions include those described below the following. Forward-looking statements are based on judgments made by the Group as of March 31, 2005.
(1) R&D Risks
The R&D of new drug development candidates entails large financial expenditures over lengthy time periods. If during those time periods, the expected efficacy of a drug under development cannot be confirmed, there is a possibility that the relevant R&D project will be terminated. Moreover, in the case of cooperative R&D activities in collaboration with other parties, such events as contract changes or annulments could cause a project to fail.
(2) Manufacturing and Procurement Risks
The Group manufactures products at its own factories using its own technologies, and it depends on specific suppliers for a portion of the products and materials used in the manufacture of certain products. Because of this, if for some reason manufacturing or procurement activities are delayed or halted, there is a possibility that such event would affect the Group’s profitability and financial situation.
The Group conducts manufacturing operations in accordance with regulations based on the Pharmaceutical Affairs Law; however, if a product quality problem requiring a product recall or similar event should occur, there is a possibility that it would affect the Group’s profitability and financial situation.
(3) Marketing Risks
In the case of such an event as the occurrence of an unanticipated side effect, the launch by other companies of products that compete in the same therapeutic domains as the Group’s products, or the launch of competing generic versions of the Group’s products after the expiration of relevant patents, there is a possibility that the Group’s sales could be adversely affected and therefore the Group’s profitability and financial situation could also be affected.
In the case of such an event as the expiration or annulment of marketing or technology out-licensing contracts or a change in the terms of such contracts, the Group’s profitability and financial situation could be affected.
Aggregate sales of Cravit,Panaldine, andOmnipaqueaccount for more than 40% of the Group’s consolidated net sales. If side effects or other factors that have the effect of decreasing sales of these products were to arise, there is a possibility that such an event would have a large influence on the Group’s profitability and financial situation.
(4) Legislative, Regulatory, and Government Administration Risks
Prescription drug products in Japan are subject to a variety of regulations and administrative procedures based on the Pharmaceutical Affairs Law. Moreover, trends in other government measures related to healthcare systems and health insurance systems, such as the biannual revision of National Health Insurance (NHI) drug reimbursement prices, may affect the Group’s profitability and financial situation. Similarly, drug-related operations are liable to be affected by diverse regulations in other countries.
(5) Intellectual Property Risks
If some of the Group’s business activities are alleged to infringe on the patent rights or other intellectual property rights of another party, there is a possibility that such activities might have to be discontinued or related litigation undertaken. On the other hand, if another party should infringe on the patent rights or other intellectual property rights of the Group, there is a possibility that related litigation might have to be undertaken to defend those rights. These possibilities could affect the Group’s profitability and financial situation.
(6) Environmental Risks
Chemical substances used in drug-related research and manufacturing processes include substances that can affect human health and natural ecosystems. Each of the Group’s facilities is implementing measures to prevent air and water pollution, shifting to the use, where possible, of substances with relatively small environmental
App. D-19
Table of Contents
impact, and making other environmental conservation efforts. However, in the unlikely case of a determination that it is determined that the Group’s activities have caused serious adverse environmental impact, there is a possibility that the Group’s profitability and financial situation could be affected.
(7) Litigation Risks
In addition to fair trade issues, the Group’s activities have the potential for other difficulties with regard to various other issues—such as drugs side effects, manufacturer’s liability issues, and labor issues—that could become the subject of litigation. There is a possibility that such litigation could affect the Group’s profitability and financial situation.
(8) Currency Exchange Risks
Most of the Group’s overseas sales transactions are conducted in foreign currencies. Moreover, the revenues and assets of overseas subsidiaries are translated into yen for inclusion in the Group’s consolidated accounting items. Because of these circumstances, there is a possibility that changes in currency exchange rates could affect the Group’s profitability and financial situation.
(9) Other Risks
In addition to risks already described, other types of risks that could affect the Group’s profitability and financial situation include those associated with the interruption of business activities due to earthquakes or other large-scale disasters, the interruption of computer system operations due to network viruses or other technical problems, fluctuations in stock prices and interest rates, and the emergence of uncollectible accounts receivable or loans that could follow the deterioration of transactional partners’ financial position or of the state of affairs in a relevant country.
App. D-20
Table of Contents
4. Consolidated Financial Statements
(1) Consolidated Balance Sheets
(Millions of yen)
Fiscal Year 2003 (As of March 31, 2004) | Fiscal Year 2004 (As of March 31, 2005) | Change | ||||||||||||||
| See Note | Amount | % | Amount | % | Amount | |||||||||||
ASSETS | ||||||||||||||||
I Current assets: | ||||||||||||||||
1. Cash and time deposits | 21,977 | 16,395 | ||||||||||||||
2. Trade notes and accounts receivable | 81,211 | 88,168 | ||||||||||||||
3. Investment securities | 94,124 | 107,514 | ||||||||||||||
4. Mortgage-backed securities | 20,000 | 20,000 | ||||||||||||||
5. Inventories | 39,145 | 40,486 | ||||||||||||||
6. Deferred tax assets | 16,111 | 13,826 | ||||||||||||||
7. Other current assets | 10,891 | 13,496 | ||||||||||||||
Allowance for doubtful accounts | D256 | D50 | ||||||||||||||
Total current assets | 283,205 | 54.27 | 299,836 | 54.86 | 16,631 | |||||||||||
II Non-current assets: | ||||||||||||||||
1. Property, plant and equipment: | ||||||||||||||||
(1) Buildings and structures | *1 | 141,605 | 141,983 | |||||||||||||
Less accumulated depreciation | 82,945 | 58,660 | 86,013 | 55,969 | ||||||||||||
(2) Machinery, equipment and vehicles | *1 | 113,440 | 112,430 | |||||||||||||
Less accumulated depreciation | 90,465 | 22,975 | 92,724 | 19,705 | ||||||||||||
(3) Land | *1 | 17,722 | 17,526 | |||||||||||||
(4) Construction in progress | 1,244 | 6,029 | ||||||||||||||
(5) Other fixed assets | *1 | 38,582 | 38,264 | |||||||||||||
Less accumulated depreciation | 31,899 | 6,683 | 31,892 | 6,372 | ||||||||||||
Total property, plant and equipment, net | 107,286 | 20.56 | 105,602 | 19.32 | D1,683 | |||||||||||
2. Intangible assets: | ||||||||||||||||
Other intangible assets, net | 7,564 | 6,796 | ||||||||||||||
Total intangible assets, net | 7,564 | 1.45 | 6,796 | 1.24 | D768 | |||||||||||
3. Investments and other assets: | ||||||||||||||||
(1) Investment securities | *2 | 112,077 | 105,461 | |||||||||||||
(2) Long-term loans | 924 | 763 | ||||||||||||||
(3) Prepaid pension costs | — | 15,493 | ||||||||||||||
(4) Deferred tax assets | 3,437 | 3,167 | ||||||||||||||
(5) Other assets | *2 | 7,375 | 9,756 | |||||||||||||
Allowance for doubtful accounts | D62 | D323 | ||||||||||||||
Total investments and other assets | 123,752 | 23.72 | 134,319 | 24.58 | 10,566 | |||||||||||
Total non-current assets | 238,603 | 45.73 | 246,718 | 45.14 | 8,115 | |||||||||||
Total assets | 521,808 | 100.00 | 546,555 | 100.00 | 24,746 | |||||||||||
App. D-21
Table of Contents
(Millions of yen)
Fiscal Year 2003 (As of March 31, 2004) | Fiscal Year 2004 (As of March 31, 2005) | Change | |||||||||||||||||||
| See Note | Amount | % | Amount | % | Amount | ||||||||||||||||
LIABILITIES | |||||||||||||||||||||
I Current liabilities: | |||||||||||||||||||||
1. Trade notes and accounts payable | 14,115 | 17,182 | |||||||||||||||||||
2. Short-term bank loans | *1 | 18 | 18 | ||||||||||||||||||
3. Income taxes payable | 9,962 | 8,401 | |||||||||||||||||||
4. Allowance for sales returns | 491 | 448 | |||||||||||||||||||
5. Allowance for sales discounts | 1,488 | 1,421 | |||||||||||||||||||
6. Accrued expenses and other current liabilities | 45,460 | 46,867 | |||||||||||||||||||
Total current liabilities | 71,536 | 13.71 | 74,339 | 13.60 | 2,803 | ||||||||||||||||
II Non-current liabilities: | |||||||||||||||||||||
1. Long-term debt | *1 | 23 | 5 | ||||||||||||||||||
2. Deferred tax liabilities | 679 | 9,791 | |||||||||||||||||||
3. Accrued retirement and severance costs | 19,090 | 4,754 | |||||||||||||||||||
4. Accrued directors’ retirement and severance costs | 2,670 | 2,200 | |||||||||||||||||||
5. Other non-current liabilities | 717 | 5,318 | |||||||||||||||||||
Total non-current liabilities | 23,182 | 4.44 | 22,070 | 4.04 | D1,112 | ||||||||||||||||
Total liabilities | 94,718 | 18.15 | 96,409 | 17.64 | 1,690 | ||||||||||||||||
MINORITY INTERESTS | |||||||||||||||||||||
Minority Interests | 4,959 | 0.95 | 1,582 | 0.29 | D3,377 | ||||||||||||||||
SHAREHOLDERS’ EQUITY | |||||||||||||||||||||
I Common stock | *4 | 45,246 | 8.67 | 45,246 | 8.28 | - | |||||||||||||||
II Additional paid-in-capital | 48,961 | 9.38 | 49,130 | 8.99 | 169 | ||||||||||||||||
III Retained earnings | 347,973 | 66.69 | 376,144 | 68.82 | 28,170 | ||||||||||||||||
IV Net unrealized gain on investment securities | 17,873 | 3.43 | 18,215 | 3.33 | 342 | ||||||||||||||||
V Foreign currency translation adjustments | D1,524 | D0.29 | D1,305 | D0.24 | 218 | ||||||||||||||||
VI Treasury stock at cost | *5 | D36,400 | D6.98 | D38,867 | D7.11 | D2,467 | |||||||||||||||
Total shareholders’ equity | 422,130 | 80.90 | 448,563 | 82.07 | 26,433 | ||||||||||||||||
Total liabilities, minority interests and shareholders’ equity | 521,808 | 100.00 | 546,555 | 100.00 | 24,746 | ||||||||||||||||
App. D-22
Table of Contents
(2) Consolidated Statements of Income
(Millions of yen)
| Fiscal Year 2003 (For the year ended March 31, 2004) | Fiscal Year 2004 (For the year ended March 31, 2005) | Change | ||||||||||||||
| See Note | Amount | % | Amount | % | Amount | |||||||||||
I Net sales | 322,767 | 100.00 | 328,534 | 100.00 | 5,766 | |||||||||||
II Cost of sales | *1 | 103,474 | 32.06 | 100,834 | 30.69 | D2,639 | ||||||||||
Gross profit | 219,293 | 67.94 | 227,699 | 69.31 | 8,406 | |||||||||||
III Selling, general and administrative: | ||||||||||||||||
1. Salaries and bonuses | 37,584 | 38,076 | ||||||||||||||
2. Retirement and severance costs | 4,828 | 3,429 | ||||||||||||||
3. Research and development expenses | *1 | 59,048 | 57,416 | |||||||||||||
4. Other | 71,716 | 173,178 | 53.65 | 72,713 | 171,636 | 52.24 | D1,541 | |||||||||
Operating income | 46,114 | 14.29 | 56,063 | 17.06 | 9,948 | |||||||||||
IV Non-operating income: | ||||||||||||||||
1. Interest income | 742 | 738 | ||||||||||||||
2. Dividend income | 469 | 735 | ||||||||||||||
3. Foreign exchange gains | - | 297 | ||||||||||||||
4. Other income | 1,168 | 2,380 | 0.74 | 1,023 | 2,795 | 0.85 | 415 | |||||||||
V Non-operating expenses: | ||||||||||||||||
1. Interest expense | 1 | 1 | ||||||||||||||
2. Loss on disposal and write-down of inventories | 682 | 626 | ||||||||||||||
3. Foreign exchange losses | 568 | — | ||||||||||||||
4. Equity in net losses of affiliated companies | — | 399 | ||||||||||||||
5. Other expenses | 511 | 1,764 | 0.55 | 510 | 1,538 | 0.47 | D225 | |||||||||
Ordinary income | 46,731 | 14.48 | 57,320 | 17.45 | 10,589 | |||||||||||
VI Extraordinary gains: | ||||||||||||||||
1. Realized gain on sale of investment securities | 1,331 | 283 | ||||||||||||||
2. Gain on sale of land | 881 | 384 | ||||||||||||||
3. Gain from the return of the substitutional portion of the employees’ pension fund to the government | — | 11,747 | ||||||||||||||
4. Gain from the transfer to the defined contribution pension plan | — | 3,769 | ||||||||||||||
5. Gain on sale of the veterinary and livestock feed product business | *2 | — | 800 | |||||||||||||
6. Reversal of allowance for doubtful accounts | 113 | 2,325 | 0.72 | — | 16,983 | 5.17 | 14,657 | |||||||||
VII Extraordinary losses: | ||||||||||||||||
1. Restructuring charge | *3 | — | 7,316 | |||||||||||||
2. Impairment of investment securities | 61 | 32 | ||||||||||||||
3. Loss on settlement of an employee pension fund plan | *4 | — | 381 | |||||||||||||
4. Loss on settlement of vitamin-related anti-trust litigations | *5 | — | 111 | |||||||||||||
5. Loss on disposal of fixed assets | *6 | 1,387 | 1,448 | 0.45 | 1,792 | 9,633 | 2.93 | 8,184 | ||||||||
Net income before income taxes and minority interests | 47,608 | 14.75 | 64,670 | 19.68 | 17,062 | |||||||||||
Income tax expense—current | 21,465 | 17,357 | ||||||||||||||
Income tax expense—deferred | 953 | 22,418 | 6.95 | 11,486 | 28,843 | 8.78 | 6,425 | |||||||||
Minority interests in net losses of subsidiaries | D1,472 | D0.46 | D1,348 | D0.41 | 124 | |||||||||||
Net income | 26,661 | 8.26 | 37,175 | 11.32 | 10,513 | |||||||||||
App. D-23
Table of Contents
(3) Consolidated Statements of Retained Earnings
(Millions of yen)
| Fiscal Year 2003 (For the year ended March 31, 2004) | | Fiscal Year 2004 (For the year ended March 31, 2005) | | Change | |||||||||||||
| See Note | Amount | Amount | Amount | ||||||||||||||
ADDITIONAL PAID-IN CAPITAL | |||||||||||||||||
I Additional paid-in capital, beginning of year | 48,961 | 48,961 | — | ||||||||||||||
II Increase in additional paid-in capital | |||||||||||||||||
1. Gain on reissuance of treasury stock | — | — | 169 | 169 | 169 | ||||||||||||
III. Additional paid-in capital, end of year | 48,961 | 49,130 | 169 | ||||||||||||||
RETAINED EARNINGS | |||||||||||||||||
I Retained earnings, beginning of year | 329,730 | 347,973 | 18,243 | ||||||||||||||
II Increase in retained earnings: | |||||||||||||||||
1. Net income | 26,661 | 26,661 | 37,175 | 37,175 | 10,513 | ||||||||||||
III Decrease in retained earnings: | |||||||||||||||||
1. Cash dividends | 8,217 | 8,071 | |||||||||||||||
2. Bonuses to directors | 201 | 160 | |||||||||||||||
3. Changes in scope of investments accounted for under the equity method | — | 8,418 | 772 | 9,004 | 586 | ||||||||||||
IV Retained earnings, end of year | 347,973 | 376,144 | 28,170 | ||||||||||||||
App. D-24
Table of Contents
(4) Consolidated Statements of Cash Flows
(Millions of yen)
| Fiscal Year 2003 (For the year ended March 31, 2004) | Fiscal Year 2004 (For the year ended March 31, 2005) | Change | ||||||
| See Note | Amount | Amount | Amount | |||||
I Cash flows from operating activities: | ||||||||
Net income before income taxes and minority interests | 47,608 | 64,670 | 17,062 | |||||
Depreciation | 17,366 | 15,946 | D1,419 | |||||
Amortization of goodwill | — | 3 | 3 | |||||
Decrease in accrued retirement and severance costs | D6,003 | D14,807 | D8,803 | |||||
Increase in prepaid pension costs | — | D15,493 | D15,493 | |||||
Interest and dividend income | D1,211 | D1,474 | D262 | |||||
Interest expense | 1 | 1 | 0 | |||||
Impairment of investment securities | 62 | 34 | D28 | |||||
Loss on disposal of fixed assets | 1,387 | 1,792 | 404 | |||||
Loss on fines, penalties and settlements | — | 111 | 111 | |||||
Equity in net losses of affiliated companies | — | 399 | 399 | |||||
Decrease (increase) in trade notes and accounts receivable | 7,382 | D6,793 | D14,175 | |||||
Decrease (increase) in inventories | 6,607 | D1,290 | D7,898 | |||||
Increase (decrease) in trade notes and accounts payable | D158 | 3,011 | 3,170 | |||||
Increase (decrease) in accrued expenses and other liabilities | D1,562 | 1,457 | 3,020 | |||||
Other, net | D2,136 | 5,803 | 7,940 | |||||
Subtotal | 69,344 | 53,373 | D15,970 | |||||
Interest and dividends received | 1,208 | 1,501 | 293 | |||||
Interest paid | D1 | D1 | 0 | |||||
Fines, penalties and settlements paid | D7 | D89 | D82 | |||||
Income taxes paid | D23,038 | D19,212 | 3,825 | |||||
Net cash provided by operating activities | 47,505 | 35,571 | D11,934 | |||||
II Cash flows from investing activities: | ||||||||
Purchases of time deposits | D4,088 | D7,800 | D3,712 | |||||
Proceeds from sale of time deposits | 150 | 8,267 | 8,117 | |||||
Purchases of investment securities | D22,368 | D26,601 | D4,233 | |||||
Proceeds from sale of investment securities | 21,682 | 25,210 | 3,527 | |||||
Acquisitions of property, plant and equipment | D11,213 | D10,753 | 459 | |||||
Acquisitions of intangible assets | D1,416 | D2,546 | D1,130 | |||||
Purchases of non-current investment securities | D35,798 | D24,443 | 11,354 | |||||
Proceeds from sale of non-current investment securities | 24,531 | 22,181 | D2,349 | |||||
Other, net | 1,102 | D5,500 | D6,602 | |||||
Net cash used in investing activities | D27,419 | D21,989 | 5,430 | |||||
III Cash flows from financing activities: | ||||||||
Repayment of long-term debt | D19 | D18 | 0 | |||||
Dividends paid | D8,217 | D8,071 | 145 | |||||
Purchases of treasury stock | D10,214 | D4,263 | 5,951 | |||||
Other, net | D19 | D15 | 3 | |||||
Net cash used in financing activities | D18,470 | D12,369 | 6,101 | |||||
IV Effect of exchange rate changes on cash and cash equivalents | D207 | 12 | 220 | |||||
V Net increase in cash and cash equivalents | 1,407 | 1,225 | D182 | |||||
VI Cash and cash equivalents, beginning of year | 88,938 | 90,346 | 1,407 | |||||
VII Cash and cash equivalents, end of year | 90,346 | 91,571 | 1,225 | |||||
App. D-25
Table of Contents
Basis of Presentation and Summary of Significant Accounting Policies
Fiscal Year 2003 (For the year ended March 31, 2004) |
1. Scope of consolidation (1) Consolidated subsidiaries: 28 Principal consolidated subsidiaries: In Japan Daiichi Pure Chemicals Co., Ltd. Daiichi Radioisotope Laboratories, Ltd. Daiichi Fine Chemical Co., Ltd. Saitama Daiichi Pharmaceutical Co., Ltd. Daiichi Suntory Pharma Co., Ltd.
Overseas Daiichi Pharmaceutical Corporation Daiichi Pharmaceutical (Beijing) Co., Ltd. Daiichi Pharmaceutical (China) Co., Ltd.
|
(2) Non-consolidated subsidiaries: 2 During the fiscal year, the Company excluded one newly established subsidiary from the scope of consolidation, and thereby increased the number of non-consolidated subsidiaries to two. Non-consolidated subsidiaries are small in size and are not material when measured by the amounts of assets, sales, net income (based on the Company’s ownership percentage), retained earnings (based on the Company’s ownership percentage), and other indicators. They have therefore been excluded from the scope of consolidation. |
| 2. Application of the Equity Method |
(1) –
|
(2) For the fiscal year, net income (based on the Company’s equity percentage), retained earnings (based on the Company’s equityownership percentage) and other indicators of the Company’s two non-consolidated subsidiaries and five of its 20%-50% owned affiliated companies (i.e. Aventis Pasteur-Daiichi Vaccine Co., Ltd. and 6 other companies) are not material or significant to the Company as a whole. Therefore, these companies have not been accounted for under the equity method but, rather, are rather reported in the Company’s investment account under the cost method. |
(3) –
|
Fiscal Year 2004 (For the year ended March 31, 2005) |
1. Scope of consolidation (1) Consolidated subsidiaries: 31 Principal consolidated subsidiaries: In Japan Daiichi Pure Chemicals Co., Ltd. Daiichi Radioisotope Laboratories, Ltd. Daiichi Fine Chemical Co., Ltd. Saitama Daiichi Pharmaceutical Co., Ltd. Daiichi Suntory Pharma Co., Ltd.
Overseas Daiichi Pharmaceutical Corporation Daiichi Medical Research, Inc. Daiichi Pharmaceutical (Beijing) Co., Ltd. Daiichi Pharmaceutical (China) Co., Ltd. |
For the fiscal year, three newly-established subsidiaries have been added to the scope of consolidation: Daiichi Pharmaceutical Corporation, Daiichi Medical Research, Inc., and Daiichi Pharmatech, Co., Ltd. Also, during the fiscal year, the former corporate name of Daiichi Pharmaceutical Corporation was changed to Daiichi Pharmaceutical Holdings, Inc. |
(2) Non-consolidated subsidiaries: 3 During the fiscal year, the Company excluded one newly established subsidiary from the scope of consolidation, and thereby increased the number of non-consolidated subsidiaries to three. Non-consolidated subsidiaries are small in size and are not material when measured by the amounts of assets, sales, net income (based on the Company’s ownership percentage), retained earnings (based on the Company’s ownership percentage), and other indicators. They have therefore been excluded from the scope of consolidation. |
| 2. Application of the Equity Method |
(1) Affiliated companies accounted for under the equity method: 2 Names of principal companies: Aventis Pasteur Daiichi Vaccine Co., Ltd., plus one other company. Since the significance of these affiliates to the consolidated financial statements has increased, they are been included in the scope of companies accounted for under the equity method beginning this fiscal year. |
(2) For the fiscal year, net income (based on the Company’s equity percentage), retained earnings (based on the Company’s equity percentage) and other indicators of the Company’s three non-consolidated subsidiaries and three of its 20%-50% owned affiliated companies are not material or significant to for the Company as a whole. Therefore, these companies have not been accounted for under the equity method but, rather, are reported in the Company’s investment accounts under the cost method.
|
(3) The equity method of accounting is applied on the basis of the affiliated companies’ fiscal years. One affiliated company has a fiscal year-end date that is different from the Company’s fiscal year-end. |
App. D-26
Table of Contents
Fiscal Year 2003
(For the year ended March 31, 2004)
3. Fiscal Year-end of Consolidated Subsidiaries
The fiscal year-end of the following consolidated subsidiaries is December 31: Daiichi Pharmaceutical (China) Co., Ltd.; Daiichi Pharmaceutical (Beijing) Co., Ltd.; Suntory Pharmaceutical Inc.; Suntory Pharmaceutical Holdings, Inc.; and Suntory Research Laboratories LLC.
In preparing the consolidated financial statements, the Company uses the financial statements of these companies as of their fiscal year-end. For major intervening transactions that occurred between the fiscal year-end of these companies and March 31, appropriate adjustments have been made in the consolidated financial statements.
4. Summary of Significant Accounting Policies
(1) Methods of Valuation of Significant Assets
Investment securities
Held-to-maturity securities: The Company reports held-to-maturity securities at an amortized cost using the straight-line method of amortization.
Available-for-sale securities
Securities with quoted market value:
The fair value method based on the quoted market value at the end of fiscal year (Unrealized holding gains/losses are reported in a component of stockholder’s equity, with costs of securities sold being calculated using the moving average method.)
Securities with no readily available market value:
Stated at cost based mainly on the moving- average method
‚ Inventories
Inventories are mainly stated at the lower of cost or market, with cost being determined by the average cost method.
(2) Depreciation and Amortization of Significant Depreciable Assets
Property, plant and equipment: The Company and its domestic consolidated subsidiaries account for depreciation of property, plant and equipment based on the declining balance method. Certain overseas consolidated subsidiaries account for depreciation of property, plant and equipment under the straight-line method. The ranges of useful lives are as follows:
Buildings and structures: 38 to 50 years
Machinery, equipment and vehicles: 4 to 7 years
Intangible assets and long-term prepaid assets: The Company accounts for amortization under the straight-line method
(3) Method of Accounting for Significant Allowances
Allowance for Doubtful Accounts
The Company covers the risk of credit losses from potential customer defaults by providing this allowance. For normal accounts, the allowance is computed on the basis of the historical default rates. For specific over-due accounts, the allowance is based on individual account-by-account estimates of the amounts that may not be recoverable.
Fiscal Year 2004
(For the year ended March 31, 2005)
3. Fiscal Year-end of Consolidated Subsidiaries
The fiscal year-end of the following consolidated subsidiaries is December 31: Daiichi Pharmaceutical (China) Co., Ltd.; Daiichi Pharmaceutical (Beijing) Co., Ltd.; Daiichi Asubio Pharmaceuticals, Inc. ; Daiichi Asubio Holdings, Inc. ; Daiichi Asubio Medical Research Laboratories LLC.
In preparing the consolidated financial statements, the Company uses the financial statements of these companies as of their fiscal year-end. For major intervening transactions that occurred between the fiscal year-end of these companies and March 31, appropriate adjustments have been made in the consolidated financial statements.
4. Summary of Significant Accounting Policies
(1) Methods of Valuation of Significant Assets
Investment Securities
Held-to-maturity securities: Same as for the previous year.
Available-for-sale securities
Securities with quoted market value:
Same as for the previous year
Securities with no readily available market value:
Same as for the previous year
‚ Inventories
Same as for the previous year
(2) Depreciation and Amortization of Significant Depreciable Assets
Properly, plant and equipment: Same as for the previous year
Intangible assets and long-term prepaid assets: Same as for the previous year
(3) Method of Accounting for Significant Allowances
Allowance for Doubtful Accounts
Same as for the previous year
App. D-27
Table of Contents
Fiscal Year 2003
(For the year ended March 31, 2004)
‚ Allowance for Sales Returns
To prepare for losses on potential returns of products after fiscal year-end, the Company provides for an amount equal to the sum of gross profits and inventory losses on such returned products, based on its estimates of possible sales returns.
For the fiscal year, the Company’s sales return provision in the amount of ¥6 million was included in cost of sales.
ƒ Allowance for Sales Discounts
To prepare for future sales discounts, the Company provides for this allowance calculated by multiplying an estimated sales discount percentage for the period by the amounts of accounts receivable from and inventories held by wholesalers at fiscal year-end.
„ Accrued Retirement and Severance Costs
To prepare for future payments of employee retirement and severance benefits, the Company provides for an accrual based on estimated projected benefit obligations and plan assets at the end of fiscal year. Prior service cost is amortized under the straight-line method over a period of 10 years, which is equal to or less than the estimated average remaining years of service of the eligible employees when the prior year service cost was incurred.
Actuarial gains and losses are amortized based on the straight-line method, beginning in the fiscal year following the year in which such gain or loss was initially measured, over a period of 10 years, which is equal to or less than the average remaining years of service of the eligible employees when the actuarial gain or loss occurred.
Supplemental Information
Accompanying the enactment of the Contributed Benefit Pension Law, the Company received an approval of exemption from the Minister of Health, Labor and Welfare, on January 26, 2004, from the obligation for pension payment liabilities related to future employee service with respect to the substitutional portion of its Employees’ Pension Fund.
As of fiscal year-end, the estimated amount to be returned (based the minimum reserve obligations) to the government was ¥20,557 million. Had such amount (based on the minimum reserve obligations) been returned at the end of this fiscal year, in accordance with the provisions of Article 44-2 of the “Practice Guidelines of Accounting for Retirement Benefits” (Interim Report) (Report No. 13 of the Accounting Systems Committee of the Japan Institute of Certified Public Accountants), a gain (extraordinary gain) from the return of the Employees’ Pension Fund amounting to ¥10,995 million would have been recorded.
Fiscal Year 2004
(For the year ended March 31, 2005)
‚ Allowance for Sales Returns
To prepare for losses on potential returns of products after fiscal year-end, the Company provides for an amount equal to the sum of gross profits and inventory losses on such returned products, based on its estimates of possible sales returns.
For the fiscal year, the Company’s reversal of sales return provision in the amount of ¥43 million was deducted from cost of sales.
ƒ Allowance for Sales Discounts
Same as for the previous fiscal year
„ Accrued Retirement and Severance Costs
To prepare for future payments of employee retirement and severance benefits, the Company provides for an accrual based on estimated projected benefit obligations and plan assets at the end of fiscal year.
Prior service cost is amortized under the straight-line method over a period of 10 years, which is equal to or less than the estimated average remaining years of service of the eligible employees when the prior service cost was incurred.
Actuarial gain and loss are amortized based on the straight-line method, beginning in the fiscal year following the year in which such gain or loss was initially measured, over a period of 10 years, which is equal to or less than the average remaining years of service of the eligible employees when the actuarial gain or loss occurred.
Supplementary Information
Accompanying the enactment of the Contribute Benefit Pension Law, the Company received an approval of exemption from the Minister of Health, Labour and Welfare, on January 1, 2005, from the obligation for pension payment liabilities related to past employee service with respect to the substitutional portion of its Employees’ Pension Fund.
For the fiscal year, as a result, the Company recognized an extraordinary gain of ¥11,747 million from the return of the substitutional portion of the employees’ pension fund to the government.
In addition, accompanying the enactment of the Defined Contribution Pension Plans Law, the Company and certain of its domestic consolidated subsidiaries transferred a portion of their lump-sum retirement benefit plans to a defined contribution pension plan, which was accounted for under the provisions of “Accounting for Transitions between Retirement Benefit Plans” (Corporate Accounting Guidelines No. 1).
This change in retirement benefit arrangement resulted in an extraordinary gain of ¥3,769 million for the fiscal year.
App. D-28
Table of Contents
Fiscal Year 2003
(For the year ended March 31, 2004)
… Director’s Retirement and Severance Benefits
To prepare for payments of directors’ retirement and severance benefits, the Company and its domestic consolidated subsidiaries provide for an amount equal to the total benefits that would have been payable at the end of fiscal year, in accordance with the internal guidelines, had all directors resigned voluntarily.
| (4) | Translation of Significant Assets and Liabilities Denominated in Foreign Currencies into Yen |
Receivables and payables denominated in foreign currencies are translated into yen at the exchange rates prevailing at the end of fiscal year, with translation gains or losses currently recognized in earnings. The assets and liabilities of overseas consolidated subsidiaries are translated into yen at the exchange rates prevailing at the balance sheet dates. Income and expenses are translated into yen at the average exchange rates prevailing over the fiscal year, with translation gains or losses recorded in minority interests and foreign currency translation adjustment in the shareholders’ equity section of the balance sheet.
| (5) | Accounting for Significant Lease Transactions |
Finance lease transactions are accounted for using the same method applied to operating lease transactions, with an exception for those finance leases in which the legal title of the underlying property is transferred from the lessor to the lessee.
| (6) | Significant Hedge Accounting Method |
(a) Hedge Accounting Method
The Company employs the deferral method of hedge accounting. Forward foreign exchange contracts that meet certain hedge criteria are accounted for as a hedge of underlying assets and liabilities.
(b) Hedging Instruments and Hedged Items
Hedging Instruments: Forward foreign exchange contracts and other
Hedged Items: Assets denominated in foreign currencies
(c) Hedge Policy
The Company hedges foreign exchange rate fluctuation risks in accordance with its internal policies.
(d) Method of Assessing Hedge Effectiveness
Based on its internal policies, the Company evaluates the effectiveness of hedges by examining the correlations between its hedging instruments and hedged items as a result of fluctuations of foreign currency exchange rates and confirms the effectiveness of its hedge relationship.
| (7) | Consumption Tax Accounting Method |
The tax-exclusion method is used to account for the national and local consumption taxes.
Fiscal Year 2004
(For the year ended March 31, 2005)
… Director’s Retirement and Severance Benefits
Same as for the previous fiscal year
| (4) | Translation of Significant Assets and Liabilities Denominated in Foreign Currencies into Yen |
Same as for the previous year
| (5) | Accounting for Significant Lease Transactions |
Same as for the previous year
| (6) | Significant Hedge Accounting Method |
(a) Hedge Accounting Method
Same as for the previous year
(b) Hedging Instruments and Hedged Items
Same as for the previous year
(c) Hedge Policy
Same as for the previous year
(d) Method for Assessing Hedge Effectiveness
Same as for the previous year
| (7) | Consumption Tax Accounting Method |
Same as for the previous year
App. D-29
Table of Contents
Fiscal Year 2003
(For the year ended March 31, 2004)
5. Valuation Method for Assets and Liabilities of Acquired in Business Combinations
All assets and liabilities of an acquired business that becomes a consolidated subsidiary are valued on a full fair value basis without taking into account minority interests’ share in such assets and liabilities.
6. Amortization of Goodwill
Goodwill recorded in the consolidated financial statements is generally amortized on a straight-line basis over a period of five years.
7. Appropriations of Retained Earnings
The consolidated statements of retained earnings are prepared based on the appropriations of retained earnings approved during the fiscal year.
8. Definition of Cash and Cash Equivalents in the Consolidated Statements of Cash Flows
Cash and cash equivalents in the consolidated statements of cash flows consists of the following: cash in hand, deposits that can be withdrawn upon demand, and highly liquid short-term investments that are readily convertible to cash with little risk of fluctuation in value, and that mature within three months from the dates of acquisition.
Fiscal Year 2004
(For the year ended March 31, 2005)
5. Valuation Method for Assets and Liabilities Acquired in Business Combinations
Same as for the previous year
6. Amortization of Goodwill
Same as for the previous year
7. Appropriations of Retained Earnings
Same as for the previous year
8. Definition of Cash and Cash Equivalents in the Consolidated Statements of Cash Flows
Same as for the previous year
App. D-30
Table of Contents
Notes to Consolidated Financial Statements
(Notes to Consolidated Balance Sheets)
Fiscal Year 2003
(As of March 31, 2004)
*1. Pledged assets and secured liabilities
Assets pledged as collateral and secured liabilities were as follows:
| (Millions of yen) | ||||
Pledged assets: | ||||
Buildings and structures | 463 | (463) | ||
Machinery, equipment and vehicles | 289 | (289) | ||
Land | 724 | (724) | ||
Other fixed assets | 27 | (27) | ||
Total | 1,505 | (1,505) | ||
Secured liabilities: | ||||
Short-term bank loans | 17 | (17) | ||
Long-term debt | 17 | (17) | ||
Figures in parentheses indicate factory foundation mortgaged assets and related secured borrowings that are included in the figures on the left.
*2. Amounts related to non-consolidated subsidiaries and affiliated companies were as follows:
| (Millions of yen) | ||
Investment securities | 438 |
3. Contingent Liabilities
| (1) | The Company guarantees the following debts and other obligations owed to financial institutions |
| (Millions of yen) | ||
Guarantees provided on employees’ housing loans, etc | 3,326 | |
(2) Trade export notes receivable discounted | 198 | |
*4. The Company’s common stock issued at the end of fiscal year was 286,453,235 shares.
*5. Treasury stock owned by the Company at the end of fiscal year was 16,753,009 shares of common stock.
6. Committed Lines of Credit
To facilitate the efficient raising of working capital, the Company maintains committed lines of credit with four financial institutions. The unused balance of credit lines under these commitments at fiscal year-end was as follows:
| (Millions of yen) | ||
Total amount of committed credit lines | 30,000 | |
Less amount borrowed against credit lines | — | |
Credit lines unused | 30,000 |
Fiscal Year 2004
(As of March 31, 2005)
*1. Pledged assets and secured liabilities
Assets pledged as collateral and secured liabilities were as follows:
| (Millions of yen) | |||||
Pledged assets: | |||||
Buildings and structures | 426 | (426 | ) | ||
Machinery, equipment and vehicles | 264 | (264 | ) | ||
Land | 724 | (724 | ) | ||
Other fixed assets | 26 | (26 | ) | ||
Total | 1,441 | (1,441 | ) | ||
Secured liabilities: | |||||
Short-term bank loans | 17 | (17 | ) | ||
Figures in parentheses indicate factory foundation mortgaged assets and related secured borrowings that are included in the figures on the left.
*2. Amounts related to non-consolidated subsidiaries and affiliated companies were as follows:
| (Millions of yen) | ||
Investment securities | 87 | |
Other assets (advances) | 600 |
3. Contingent Liabilities
| (1) | The Company guarantees the following debts and other obligations owed to financial institutions |
| (Millions of yen) | ||
Guarantees provided on employees’ housing loans, etc | 2,737 | |
Aventis Pasteur-Daiichi vaccines Co., Ltd. | 350 | |
(2) The trade export notes receivable discounted | 78 | |
*4. The Company’s common stock issued at the end of fiscal was 286,453,235 shares.
*5. Treasury stock owned by the Company at the end of fiscal year was 18,049,212 shares of common stock.
6. Commitment Lines
To facilitate the efficient raising of working capital, the Company maintains committed lines of credit with four financial institutions. The unused balance of credit lines under these commitments at fiscal year-end was as follows:
| (Millions of yen) | ||
Total amount of committed credit lines | 30,000 | |
Less amount borrowed against credit lines | — | |
Credit lines unused | 30,000 |
App. D-31
Table of Contents
(Notes to Consolidated Statements of Income)
Fiscal Year 2003
(For the year ended March 31, 2004)
*1. Research and development expenses included in selling, general and administrative expenses and manufacturing overhead costs were ¥60,720 million.
* 2. —
* 3. —
* 4. —
* 5. —
* 6. The breakdown of losses on sale of fixed assets was as follows:
| (Millions of yen) | ||
Buildings and structures | 552 | |
Machinery, equipment and vehicles | 673 | |
Other fixed assets | 160 |
Fiscal Year 2004
(For the year ended March 31, 2005)
*1. Research and development expenses included in selling, general and administrative expenses and manufacturing overhead costs were ¥58,605 million.
*2. A gain on sale of the veterinary and livestock feed product business was recognized as a result of sale of the domestic distribution rights and other intangibles related to its veterinary and livestock feed product business to a third-party.
*3. A restructuring charge was recorded for the one-time termination benefits provided to certain employees who were involuntarily transferred from the Company to a newly established wholly-owned subsidiary, Daiichi Pharmatech Co., Ltd.
*4. The loss on settlement of an employee pension fund represented a one-time payment made by a consolidated subsidiary to settle its participation in a multi-employer Employee Pension Fund plan.
*5. The loss on settlement of vitamin-related anti-trust litigations was related to a settlement of a part of the civil anti-trust class-action damage claims in connection with the Company’s vitamin transactions.
*6. The breakdown of losses on sale of fixed assets was as follows:
| (Millions of yen) | ||
Buildings and structures | 884 | |
Machinery, equipment and vehicles | 267 | |
Other fixed assets | 639 |
(Notes to Consolidated Statements of Cash Flows)
Fiscal Year 2003
(For the year ended March 31, 2004)
*Reconciliation of cash and cash equivalents at fiscal year-end with balance sheet accounts:
(As of March 31, 2004) (Millions of yen) | |||
Cash and time deposits | 21,977 | ||
| Less time deposits with maturities extending over three months | D | 2,513 | |
Add short-term investments with maturities within three months | 70,881 | ||
Cash and cash equivalents | 90,346 | ||
Fiscal Year 2004
(For the year ended March 31, 2005)
*Reconciliation of cash and cash equivalents at fiscal year-end with balance sheet accounts:
(As of March 31, 2005) (Millions of yen) | |||
Cash and time deposits | 16,395 | ||
| Less time deposits with maturities extending over three months | D | 579 | |
| Add short-term investments with maturities within three months | 75,755 | ||
Cash and cash equivalents | 91,571 | ||
App. D-32
Table of Contents
Proforma Lease Information
Fiscal Year 2003
(For the year ended March 31, 2004)
Finance lease transactions, excluding those that transfer the legal title to the leased property to the lessee
| (1) | Amounts representing the acquisition costs of the leased assets, accumulated amortization, and net book value, at the end of the fiscal year, had those leases been accounted for as capital leases |
(Millions of yen)
| Acquisition costs | Accumulated amortization | Net book value | ||||
Machinery, equipment and vehicles | 1,045 | 453 | 592 | |||
Other fixed assets | 9,930 | 5,936 | 3,994 | |||
Total | 10,976 | 6,389 | 4,586 |
| (2) | Amounts representing capital lease obligations, at the end of fiscal year, had those leases been accounted for as capital leases |
(Millions of yen)
Due within one year | 2,037 | |
Due after one year | 2,549 | |
Total | 4,586 |
| Note: | The Company included an interest component of the lease payments in the amounts representing each of the acquisition costs of the leased assets and the capital lease obligations, since the ratio of the lease obligations at the end of fiscal year to the net book value of capitalized leased assets at the end of fiscal year is low. |
| (3) | Comparison of lease expense recorded in the consolidated statements of income and the depreciation expense that would have been recorded, had those leases been accounted for as capital leases |
(Millions of yen)
Lease expense | 2,192 | |
Depreciation expense | 2,192 |
| (4) | Depreciation method for computing the amount representing depreciation expense |
The amount representing depreciation expense was computed as if the capitalized leased assets had been amortized on a straight-line basis over the lease terms with no residual value at the end of leases.
Fiscal Year 2004
(For the year ended March 31, 2005)
Finance lease transactions, excluding those that transfer the legal title to the leased property to the lessee
| (1) | Amounts representing to the acquisition costs of the leased assets, accumulated amortization, and net book value at the end of the fiscal year, had those leases been accounted for as capital leases |
(Millions of yen)
| Acquisition costs | Accumulated amortization | Net book value | ||||
Machinery, equipment and vehicles | 1,100 | 506 | 594 | |||
Other fixed assets | 9,711 | 6,232 | 3,478 | |||
Total | 10,811 | 6,738 | 4,073 |
| (2) | Amounts representing capital lease obligations, at the end of fiscal year, had those leases been accounted for as capital leases |
(Millions of yen)
Due within one year | 1,869 | |
Due after one year | 2,204 | |
Total | 4,073 |
| Note: Same | as for the previous year. |
| (3) | Comparison of lease expense recorded in the consolidated statements of income and the depreciation expense that would have been recorded, had those leases been accounted for as capital leases |
(Millions of yen)
Lease expense | 2,366 | |
Depreciation expense | 2,366 |
| (4) | Depreciation method for computing the amount representing depreciation expense |
Same as for the previous year
App. D-33
Table of Contents
(2) Investment Securities
1. Marketable Held-to-Maturity Securities | (Millions of yen) |
| Type of securities | Fiscal Year 2003 (As of March 31, 2004) | Fiscal Year 2004 (As of March 31, 2005) | ||||||||||||
| Carrying value | Market value | Difference | Carrying value | Market value | Difference | |||||||||
| Securities with market values greater than balance sheet carrying value | ||||||||||||||
(1) National and local government bonds | 9 | 9 | 0 | — | — | — | ||||||||
(2) Corporate bonds | 21,530 | 21,653 | 123 | 29,332 | 29,492 | 160 | ||||||||
(3) Other securities | — | — | — | — | — | — | ||||||||
Subtotal | 21,540 | 21,663 | 123 | 29,332 | 29,492 | 160 | ||||||||
| Securities with market values at or less than balance sheet carrying value | ||||||||||||||
(1) National and local government bonds | — | — | — | — | — | — | ||||||||
(2) Corporate bonds | 46,108 | 45,508 | D | 599 | 39,409 | 39,022 | D | 387 | ||||||
(3) Other securities | — | — | — | — | — | — | ||||||||
Subtotal | 46,108 | 45,508 | D | 599 | 39,409 | 39,022 | D | 387 | ||||||
Total | 67,648 | 67,171 | D | 476 | 68,742 | 68,514 | D | 227 | ||||||
2. Marketable Available-for-sale Securities | (Millions of yen) |
| Type of securities | Fiscal Year 2003 (As of March 31, 2004) | Fiscal Year 2004 (As of March 31, 2005) | ||||||||||||
| Acquisition cost | Carrying value | Difference | Acquisition cost | Carrying value | Difference | |||||||||
| Securities with balance sheet carrying values greater than acquisition cost | ||||||||||||||
(1) Equity securities | 27,486 | 57,733 | 30,247 | 26,285 | 56,955 | 30,669 | ||||||||
(2) Debt securities | ||||||||||||||
National and local government bonds | — | — | — | — | — | — | ||||||||
‚ Corporate bonds | 120 | 133 | 13 | 1,120 | 1,176 | 56 | ||||||||
ƒ Other securities | — | — | — | — | — | — | ||||||||
(3) Other | 2,310 | 2,731 | 420 | 2,412 | 2,859 | 446 | ||||||||
Subtotal | 29,916 | 60,598 | 30,681 | 29,818 | 60,990 | 31,172 | ||||||||
| Securities with balance sheet carrying values at or less than acquisition cost | ||||||||||||||
(1) Equity securities | 85 | 79 | D | 5 | 606 | 496 | D | 109 | ||||||
(2) Debt securities | ||||||||||||||
National and local government bonds | — | — | — | — | — | — | ||||||||
‚ Corporate bonds | — | — | — | — | — | — | ||||||||
ƒ Other securities | — | — | — | — | — | — | ||||||||
(3) Other | 3,405 | 2,918 | D | 486 | 3,260 | 2,840 | D | 419 | ||||||
Subtotal | 3,490 | 2,998 | D | 492 | 3,866 | 3,337 | D | 529 | ||||||
Total | 33,407 | 63,596 | 30,189 | 33,685 | 64,328 | 30,643 | ||||||||
| Notes: | Impairment losses for marketable available-for-sale securities are classified and computed as follows: |
| (1) | An impairment loss is generally recognized on securities whose market value has declined 50% or more from the acquisition cost as of the beginning of fiscal year. Exceptions are allowed when there were justifiable reasons. |
| (2) | For securities whose market value has declined more than 30% but less than 50% from the acquisition cost as of the beginning of fiscal year, after due consideration of the possibility of recovery in market value of individual securities, an impairment loss is recognized on those securities that are not judged likely to recover in value. |
| (3) | An impairment loss is not generally recognized on those securities whose market value has declined less than 30% from the acquisition cost as of the beginning of fiscal year. |
App. D-34
Table of Contents
3. Available- for- Sale Securities Sold during the Current Fiscal Year and the Prior Fiscal Year | (Millions of yen) | |||||||||
Fiscal Year 2003 (For the year ended March 31, 2004) | Fiscal Year 2004 (For the year ended March 31, 2005) | |||||||||
Amount of sale | Amount of gains | Amount of losses | Amount of sale | Amount of gains | Amount of losses | |||||
2,793 | 1,331 | — | 1,935 | 283 | 27 | |||||
4. Securities with No Readily Available Market Values and Their Carrying Value in the Consolidated Balance Sheets (Millions of yen)
Fiscal Year 2003 (As of March 31, 2004) | Fiscal Year 2004 (As of March 31, 2005) | ||||
| Carrying value | Carrying value | ||||
(1) Held-to-maturity securities | |||||
Certificates of deposit | — | 20,000 | |||
Commercial paper | 46,486 | 47,492 | |||
(2) Available-for-sale securities | |||||
MMF, FFF, and medium-term government bond funds | 24,395 | 8,263 | |||
Foreign fund securities | — | 1,000 | |||
Non-marketable equity securities, excluding OTC traded stocks | 2,636 | 2,061 | |||
Preferred securities | 1,000 | 1,000 |
5. Maturity Schedule of Available-for-Sale Securities with Maturity Dates and Held-to-Maturity Securities (Millions of yen)
Fiscal Year 2003 (As of March 31, 2004) | Fiscal Year 2004 (As of March 31, 2005) | |||||||||||||||||||||||
| Within one year | More than one to five years | More than five to 10 years | More than 10 years | Within one year | More than one to five years | More than five to 10 years | More than 10 years | |||||||||||||||||
1. Debt securities (1) National and local government bonds | 9 | — | — | — | — | — | — | — | ||||||||||||||||
(2) Corporate bonds | 23,232 | 23,406 | 13,000 | 8,000 | 31,758 | 22,983 | 14,000 | — | ||||||||||||||||
(3) Other | 46,486 | — | — | — | 67,492 | — | — | — | ||||||||||||||||
2. Other securities | — | 120 | 2,387 | — | — | 2,359 | — | — | ||||||||||||||||
Total | 69,728 | 23,526 | 15,387 | 8,000 | 99,250 | 25,342 | 14,000 | |||||||||||||||||
App. D-35
Table of Contents
(3) Derivative Transactions
Fiscal Year 2003 (For the year ended March 31, 2004)
1. Descriptions of Transactions
The Company does not currently use derivative instruments other than foreign currency forward contracts and currency options entered into for hedging purposes. Foreign currency forward contracts involve risks associated with fluctuations in foreign currency exchange rates. The counterparties to such transactions are all banking institutions with high credit ratings. Accordingly, the risk of nonperformance by counterparties on foreign currency forward contracts is considered virtually nonexistent.
Basic principles regarding the use of derivative instruments have been set by the Board of Directors, and the Company has established the internal policies specifying those officers with authority over derivative transactions and upper limits on such transactions. The Company’s Finance and Accounting Department is responsible for executing and maintaining controls over derivative transactions. The department periodically reports such transactions to the Board of Directors.
Under the Company’s internal policies, the effectiveness of the use of derivatives as a hedge is evaluated by examining the correlations between the hedging instruments and the hedged items due to fluctuations in foreign currency exchange rates.
2. Fair Value of Derivative Transactions
Not applicable, as the Company applies deferred hedge accounting. and Derivative transactions directly applied to foreign currency denominated assets are excluded from the disclosure requirements under the “Accounting Standards for Foreign Currency Denominated Transactions.”
Fiscal Year 2004 (For the year ended March 31, 2005)
1. Descriptions of Transactions
Same as for the previous year
2. Fair Value of Derivative Transactions
Same as for the previous year
(4) Retirement Benefit
1. Summary of the Company’s Retirement Benefits Arrangements
Previously, the Company had maintained: an Employees’ Pension Fund plan and a lump-sum retirement benefit plan, both of which were a defined benefit arrangements. However, on January 1, 2005, the Company received an approval of exemption from the Minister of Health, Labour and Welfare from the obligation for retirement benefit payments related to past employee service with respect to the government the substitutional portion of its Employees’ Pension Fund. In addition, domestic consolidated subsidiaries had previously maintained various defined benefit retirement arrangements including Tax Qualified Pension plans (adopted by 10 consolidated subsidiaries) and lump-sum retirement benefit plans.
Daiichi Pharmaceuticals Co., Ltd. and certain domestic group companies (10 consolidated subsidiaries), upon obtaining an approval of exemption from the obligation related to past employee service with respect to the substitutional portion of the Daiichi Pharmaceutical Employees’ Pension Fund, beginning on January 1, 2005, unified their retirement benefit arrangements. With an exception of certain lump-sum retirement benefit plans, the Company’s various retirement benefit arrangements haves been transformed into a single group arrangement comprising a Defined Benefit Corporate Pension plan and a Defined Contribution Pension plan.
Also, under certain circumstances, when employees retire or otherwise leave the Company, additional retirement benefits may be paid.
Please note that certain of the Group’s overseas consolidated subsidiaries also maintain defined benefit pension plans.
App. D-36
Table of Contents
2. Components of Retirement Benefit Obligations | (Millions of yen) |
Fiscal Year 2003 As of March 31, 2004 | Fiscal Year 2004 As of March 31, 2005 | |||||
a. Projected benefit obligations | D | 108,152 | D | 82,986 | ||
b. Fair value of pension plan assets | 74,845 | 83,197 | ||||
c. Under-funded projected benefit obligations (a+b) | D | 33,306 | 210 | |||
d. Unamortized transition obligations | — | — | ||||
e. Unrecognized actuarial loss | 18,520 | 8,965 | ||||
f. Unrecognized prior service cost (benefit) | D | 4,304 | 1,563 | |||
g. Net pension liabilities recognized in the consolidated balance sheets (c+d+e+f) | D | 19,090 | 10,739 | |||
h. Prepaid pension costs | — | 15,493 | ||||
i. Accrued retirement and severance costs (g-h) | D | 19,090 | D | 4,754 | ||
Notes:
1. The above figures include the substitutional portion of the Employees’ Pension Fund.
2. Certain of the Company’s subsidiaries use the vested benefit method in computing retirement and severance obligations.
3. The effects of the transfer of a portion of the lump-sum retirement benefit plans to a defined contribution pension plan was as follows:
| (Millions of yen) | |||
Decrease in projected benefit obligations | 11,779 | ||
Unrecognized actuarial loss | D | 1,334 | |
Unrecognized prior service benefit | 3,852 | ||
Decrease in accrued retirement and severance costs | 14,297 | ||
The transfer of plan assets to be transferred to the defined contribution pension plan amounted to ¥10,528 million. The transfer is scheduled to take place over the next four-year period. The amount of the plan assets not yet transferred was to ¥6,744 million at the end of this fiscal year, which is included in Other Payables (accrued expenses and other current liabilities and Long-term Payables (other non-current liabilities) in the accompanying consolidated balance sheets.
3. Employees’ Retirement and Severance Costs | (Millions of yen) |
| Fiscal Year 2003 (For the year ended March 31,2004) | Fiscal Year 2004 (For the year ended March 31,2005) | |||||
a. Service costs-benefits earned during the year | 4,158 | 3,463 | ||||
b. Interest cost | 2,668 | 2,381 | ||||
c. Expected return on plan assets | D | 1,559 | D | 1,994 | ||
d. Amortization of transition obligations | — | — | ||||
e. Amortization of actuarial loss | 2,977 | 2,156 | ||||
f. Amortization of prior service costs | D | 251 | D | 1,014 | ||
g. Net periodic retirement and severance costs (a+b+c+d+e+f) | 7,992 | 4,993 | ||||
h. Gain from the return of the substitutional portion of the Employees’ Pension Fund to the government | — | D | 11,747 | |||
i. Loss on settlement of an Employees’ Pension Fund plan | — | 381 | ||||
j. Gain from the transfer to the defined contribution pension plan | — | D | 3,769 | |||
k. Restructuring charge | — | 7,316 | ||||
l. Other | — | 199 | ||||
Total (g+h+i+j+k+l) | 7,992 | D | 2,625 | |||
Notes:
| 1. | Employee contributions to the Employees’ Pension Fund are excluded from the above figures. |
| 2. | Retirement and severance costs of consolidated subsidiaries that are computed under the vested benefit method are included in “a. Service costs-benefits earned during the year.” |
| 3. | The Restructuring charge was related to the payments of additional one-time termination benefits to the employees who were transferred to Daiichi Pharmatech Co., Ltd., which was established through a split-off of three domestic manufacturing plants of the Company. |
App. D-37
Table of Contents
| 4. | Other represented the Company’s contributions to the defined contribution pension plan and prepayments of retirement benefits to certain employees under the retirement benefit prepayment arrangement. |
4. Principal Assumptions for Computing Retirement Benefit Obligations
| Fiscal Year 2003 (As of March 31, 2004) | Fiscal Year 2004 (As of March 31, 2005) | |||
a. Method for inter-period allocation of expected retirement costs | Straight-line method | Same as for the previous year | ||
b. Discount rate | Mainly 2.5% | Same as for the previous year | ||
c. Expected return on plan assets | Mainly 3.0% | Same as for the previous year | ||
d. Amortization period of prior service costs | Mainly 10 years (amortized under the straight-line method over a period not exceeding the average remaining years of service of the eligible employees when such prior service cost was incurred) | Same as for the previous year | ||
e. Amortization period of actuarial gain and loss | Mainly 10 years (amortized beginning in the fiscal year following the year in which such actuarial gain or loss was first measured under the straight-line method over a period not exceeding the average remaining years of services of the eligible employees when the actuarial gain or loss occurred) | Same as for the previous year |
(5) Deferred Income Taxes
1. Principal Components of Deferred Tax Assets and Liabilities
(Millions of yen)
| Fiscal Year 2003 (As of March 31, 2004) | Fiscal Year 2004 (As of March 31, 2005) | |||||
Deferred tax assets: | ||||||
Depreciation | 9.528 | 11,163 | ||||
Advance payments (for contract research and development, etc.) | 6,791 | 5,435 | ||||
Accrued expenses | 4,282 | 4,544 | ||||
Payables to the defined contribution pension plan | -- | 2,626 | ||||
Accrued retirement and severance costs | 5,610 | 1,553 | ||||
Inventories (unrealized profit and valuation losses) | 1,701 | 1,290 | ||||
Impairment losses on investment securities | 1,326 | 776 | ||||
Enterprise taxes payable | 1,015 | 707 | ||||
Other | 5,835 | 7,635 | ||||
Subtotal | 36,092 | 35,731 | ||||
Valuation allowance | D | 2,518 | D | 6,637 | ||
Total deferred tax assets | 33,573 | 29,094 | ||||
Deferred tax liabilities: | ||||||
Unrealized gain on available-for-sale securities | D | 12,225 | D | 12,419 | ||
Prepaid pension costs | — | D | 6,866 | |||
Deferred gain on sale of fixed assets | D | 2,456 | D | 2,588 | ||
Reserve for additional depreciation | D | 23 | D | 17 | ||
Total deferred tax liabilities | D | 14,705 | D | 21,892 | ||
Net deferred tax assets | 18,868 | 7,202 | ||||
Note: Net deferred tax assets are included under the following balance sheet captions:
| Fiscal Year 2003 (As of March 31, 2004) | Fiscal Year 2004 (As of March 31, 2005) | |||||
Current assets-deferred tax assets | 16,111 | 13,826 | ||||
Non-current assets-deferred tax assets | 3,437 | 3,167 | ||||
Current liabilities-deferred tax liabilities | — | — | ||||
Non-current liabilities-deferred tax liabilities | D | 679 | D | 9,791 | ||
App. D-38
Table of Contents
2. Reconciliation between the statutory tax rate and the Company’s effective tax rates after application of deferred tax accounting
(%)
| Fiscal Year 2003 (As of March 31, 2004) | Fiscal Year 2004 (As of March 31, 2005) | |||||
Statutory tax rate | 41.8 | 40.5 | ||||
(Adjustments) | ||||||
Non-deductible permanent differences including entertainment and other expenses. | 4.2 | 3.2 | ||||
Deductible permanent differences including dividend received deductions and other items | D | 0.7 | D | 0.5 | ||
Per capita inhabitants’ taxes | 0.3 | 0.2 | ||||
Tax credit for research and development expenses | D | 6.2 | D | 4.2 | ||
Other | 7.7 | 5.4 | ||||
Effective tax rate | 47.1 | 44.6 | ||||
| (6) | Segment Information |
a. Information by Business Segment
Information by business segment on a consolidated basis for the most recent two fiscal years is as follows:
Fiscal Year 2003 (For the year ended March 31, 2004) | |||||||||||||||
| Pharmaceutical business (Millions of yen) | Other (Millions of yen) | Total (Millions of yen) | Eliminations and corporate (Millions of yen) | Consolidated (Millions of yen) | |||||||||||
I. Sales and operating income Net sales | |||||||||||||||
(1) Outside customers | 304,564 | 18,203 | 322,767 | — | 322,767 | ||||||||||
(2) Inter-segment | 1,301 | 2,452 | 3,753 | (3,753 | ) | — | |||||||||
Total sales | 305,865 | 20,655 | 326,521 | (3,753 | ) | 322,767 | |||||||||
Operating expenses | 252,738 | 20,590 | 273,328 | 3,323 | 276,652 | ||||||||||
Operating income | 53,126 | 65 | 53,192 | (7,077 | ) | 46,114 | |||||||||
II. Assets, depreciation, and capital expenditures | |||||||||||||||
Assets | 270,308 | 29,575 | 299,883 | 221,924 | 521,808 | ||||||||||
Depreciation | 15,550 | 1,743 | 17,293 | 72 | 17,366 | ||||||||||
Capital expenditures | 10,899 | 1,347 | 12,247 | 66 | 12,314 | ||||||||||
Notes:
| 1. | Method of classifying segments |
The business segments of the Company and its consolidated subsidiaries are the pharmaceutical business, which is the principal business of the Company, and other, which is businesses other than the pharmaceutical business.
| 2. | Principal products by business segment |
| Business segment | Principal products | |||
Pharmaceutical business | Pharmaceutical products, diagnostic and radiopharmaceutical products, over-the-counter drugs, and veterinary and livestock feed products | |||
| Fine chemicals | Bulk vitamins, chemical products, industrial chemicals and other | |||
Other | Safety testing and research | Contract research and development | ||
| Other | Real estate rental and other | |||
| 3. | Included in operating expenses under elimination and corporate was ¥6,975 million that could not be allocated to business segments. These expenses consisted mainly of the expenses of the administrative departments of the parent company. |
| 4. | Included in assets under elimination and corporate was ¥221,214 million in corporate assets. These assets were comprised mainly of excess working capital funds under management of the parent company (cash, short-term investments and other), long-term investments (investment securities) and assets used by the administrative departments of the parent company. |
App. D-39
Table of Contents
Fiscal Year 2004 (For the year ended March 31, 2005) | ||||||||||||||||
Pharmaceutical (Millions of yen) | Other (Millions of yen) | Total (Millions of yen) | Eliminations and (Millions of yen) | Consolidated (Millions of yen) | ||||||||||||
I. Sales and operating income Net sales | ||||||||||||||||
(1) Outside customers | 311,844 | 16,689 | 328,534 | — | 328,534 | |||||||||||
(2) Inter-segment | 73 | 2,783 | 2,857 | (2,857 | ) | — | ||||||||||
Total sales | 311,917 | 19,473 | 331,391 | (2,857 | ) | 328,534 | ||||||||||
Operating expenses | 247,821 | 19,552 | 267,373 | 5,096 | 272,470 | |||||||||||
Operating income | 64,096 | D | 78 | 64,017 | (7,953 | ) | 56,063 | |||||||||
II. Assets, depreciation, and capital expenditures | ||||||||||||||||
Assets | 288,227 | 28,768 | 316,996 | 229,529 | 546,525 | |||||||||||
Depreciation | 14,342 | 1,518 | 15,861 | 85 | 15,946 | |||||||||||
Capital expenditures | 12,937 | 1,747 | 14,684 | 113 | 14,798 | |||||||||||
Notes:
| 1. | Method of classifying segments |
The business segment of the Company and its consolidated subsidiaries are the pharmaceutical business, which is the principal business of the Company, and other, which is businesses other than the pharmaceutical business.
| 2. | Principal products by business segment |
| Business segment | Principal products | |||
Pharmaceutical business | Pharmaceutical products, diagnostic and radiopharmaceutical products, over-the-counter drugs, and veterinary and livestock feed products | |||
| Fine chemicals | Bulk vitamins, chemical products, industrial chemicals and other | |||
Other | Safety testing and research | Contract research and development | ||
| Other | Real estate rental and other | |||
| 3. | Included in operating expenses under elimination and corporate was ¥7,919 million that could not be allocated to business segments. These expenses consisted mainly of the expenses of the administrative departments of the parent company. |
| 4. | Included in assets under elimination and corporate was ¥231,328 million in corporate assets. These assets were comprised mainly of excess working capital funds under management of the parent company (cash, short-term investments and other), long-term investments (investment securities), and assets used by the administrative departments of the parent company. |
| b. | Information by Geographic Segment |
Fiscal Year 2003: Information by geographic segment has been omitted because more than 90% of total segment sales and segment assets were attributable to Japan.
Fiscal Year 2004: Same as for the previous fiscal year
c. Overseas Net Sales
Information about overseas net sales for the two most recent fiscal years is as follows:
| Fiscal Year 2003 | ||||||||
| Americas | Europe | Asia and other | Total | |||||
I Overseas net sales (millions of yen) | 45,157 | 12,403 | 8,602 | 66,163 | ||||
II Consolidated net sales (millions of yen) | 322,767 | |||||||
III Percentage of overseas net sales (%) | 14.0 | 3.8 | 2.7 | 20.5 | ||||
| Fiscal Year 2004 | ||||||||
| Americas | Europe | Asia and other | Total | |||||
I Overseas net sales (millions of yen) | 46,608 | 13,392 | 8,588 | 68,589 | ||||
II Consolidated net sales (millions of yen) | 328,534 | |||||||
III Percentage of overseas net sales (%) | 14.2 | 4.1 | 2.6 | 20.9 | ||||
App. D-40
Table of Contents
Notes:
1. Geographic areas are determined by geographic proximity.
2. Principal countries for each geographic area include the following:
(1) Americas: | United States | |
(2) Europe: | Germany, France, Italy | |
(3) Asia and other: | China, Taiwan, Korea |
3. Overseas net sales are defined as the net sales of the Company and its consolidated subsidiaries in countries or regions outside Japan.
(7) Transactions with related parties
Fiscal Year 2003 (For the year ended March 31, 2004)
None applicable
Fiscal Year 2004 (For the year ended March 31, 2005)
None applicable
Per Share Information
Fiscal Year 2003 (For the year ended March 31, 2004) | Fiscal Year 2004 (For the year ended March 31, 2005) | |||||
Net assets per share | ¥1,564.59 | Net assets per share | ¥1,670.71 | |||
Net income per share (basic) | ¥97.25 | Net income per share (basic) | ¥137.95 | |||
Net income per share (diluted) | ¥97.23 | Net income per share (diluted) | ¥137.90 | |||
Note: Calculations of basic and diluted net income per share were based on the following numerators and denominators:
Fiscal Year 2003 (For the year ended March 31, 2004) | Fiscal Year 2004: (For the year ended March 31, 2005) | ||||
Net income per share (basic): | |||||
Net income (millions of yen) | 26,661 | 37,175 | |||
| Amount not available for common shareholders (millions of yen) | 160 | 137 | |||
| (Including directors’ bonuses paid from net income of) (millions of yen) | (160) | (137 | ) | ||
| Net income available for dividends on common shares (millions of yen) | 26,501 | 37,037 | |||
Weighted-average number of common shares outstanding during the year (1,000 shares) | 272,515 | 268,481 | |||
Net income per share (diluted): | |||||
Additional dilutive common shares (1,000 shares) | 34 | 111 | |||
| (Including dilutive effect of stock options of) | (34) | (111 | ) | ||
| Descriptions of potentially dilutive common shares that were not included in the computation of diluted net income per share because of their anti-dilutive effect | Two share subscription right plans (related to 1,001 thousand shares) and one share purchase option plan (related to 4,090 units of options) | Same as for the previous year |
Subsequent Events
Fiscal Year 2003 (For the year ended March 31, 2004)
None applicable
Fiscal Year 2004 (For the year ended March 31, 2005)
None applicable
App. D-41
Table of Contents
5. Production, Orders and Sales
1. Production
(1) Production by business segment
(Millions of yen)
| Business segment | Fiscal Year 2003 (For the year ended March 31, 2004) | Fiscal Year 2004 (For the year ended March 31, 2005) | Change | ||||||||||||
| Amount | Percentage of total | Amount | Percentage of total | Amount | Percentage of change | ||||||||||
Pharmaceutical business | 247,567 | 95.7 | % | 272,132 | 95.9 | % | 24,564 | 9.9 | % | ||||||
Other | 11,072 | 4.3 | % | 11,519 | 4.1 | % | 446 | 4.0 | % | ||||||
Total | 258,640 | 100.0 | % | 283,651 | 100.0 | % | 25,011 | 9.7 | % | ||||||
Note: The above amounts are stated based on selling prices, exclusive of consumption tax.
(2) Procurement by business segment
(Millions of yen)
| Business segment | Fiscal Year 2003 (For the year ended | Fiscal Year 2004 (For the year ended | Change | ||||||||||||||
| Amount | Percentage of total | Amount | Percentage of total | Amount | Percentage of change | ||||||||||||
Pharmaceutical business | 30,067 | 91.9 | % | 32,015 | 93.2 | % | 1,948 | 6.5 | % | ||||||||
Other | 2,632 | 8.1 | % | 2,323 | 6.8 | % | D | 309 | D | 11.7 | % | ||||||
Total | 32,700 | 100.0 | % | 34,339 | 100.0 | % | 1,638 | 5.0 | % | ||||||||
Note: The above amounts are stated based on actual purchases, exclusive of consumption tax.
2. Orders
The Company manufactures products according to its production plans based not on advance orders for production but on estimated product demand.
3. Sales
(Millions of yen)
| Business segment | Fiscal Year 2003 (For the year ended March 31, 2004) | Fiscal Year 2004 (For the year ended March 31, 2005) | Change | ||||||||||||||||
| Amount | Percentage of total | Amount | Percentage of total | Amount | Percentage of change | ||||||||||||||
Pharmaceutical products | 259,766 | 85.3 | % | 267,177 | 85.7 | % | 7,411 | 2.9 | % | ||||||||||
Diagnostic and radiopharmaceuticals | 32,251 | 10.6 | % | 32,923 | 10.5 | % | 671 | 2.1 | % | ||||||||||
Over-the-counter drugs | 8,768 | 2.9 | % | 10,199 | 3.3 | % | 1,430 | 16.3 | % | ||||||||||
Veterinary and livestock feed products | 3,777 | 1.2 | % | 1,544 | 0.5 | % | D | 2,233 | D | 59.1 | % | ||||||||
| Pharmaceutical business | 304,564 | 94.4 | % | 311,844 | 94.9 | % | 7,280 | 2.4 | % | ||||||||||
| Other | 18,203 | 5.6 | % | 16,689 | 5.1 | % | D | 1,513 | D | 8.3 | % | ||||||||
| Total | 322,767 | 100.0 | % | 328,534 | 100.0 | % | 5,766 | 1.8 | % | ||||||||||
Note: The above amounts are stated exclusive of consumption tax.
App. D-42
Table of Contents
Daiichi Pharmaceutical Co., Ltd.
FASF
April 27, 2005
Summary of Non-Consolidated Financial Results
for Fiscal Year 2004, Ended March 31, 2005
(English Translation of “Kessan Tanshin”)
Listed company name: Daiichi Pharmaceutical Co., Ltd.
Stock code number: 4505
Stock listings: Tokyo Stock Exchange, Osaka Securities Exchange
Head office: Tokyo, Japan
URL: http://www.daiichipharm.co.jp/
Representative: Mr. Kiyoshi Morita, President and CEO
Contact: Mr. Toshio Takahashi, General Manager of Corporate Communications Department Telephone: (03)3272-0611
Meeting of the Board of Directors held on: April 27, 2005
Scheduled date for commencement of dividend payments: June 30, 2005
Adoption of the unit stock system: Yes (One unit equals 100 shares)
Interim dividend system: Yes
General shareholders meeting held on: June 29, 2005
1. Financial results for the fiscal year 2004 (April 1, 2004—March 31, 2005)
(1) Non-Consolidated Operating Results
(Figures less than ¥1 million, except per share amounts, have been omitted)
| Net sales (% change from previous year) | Operating income (% change from previous year) | Ordinary income (% change from previous year) | ||||||||||
| Millions of yen | Millions of yen | Millions of yen | ||||||||||
Fiscal Year 2004 | 259,912 | (2.5%) | 54,440 | (20.0%) | 56,322 | (21.1%) | ||||||
Fiscal Year 2003 | 253,486 | (D0.6%) | 45,353 | (D6.7%) | 46,527 | (D8.7%) | ||||||
| Net income (% change from previous year) | Basic net income per share | Diluted net income per share | Return on equity | Ratio of ordinary income to total assets | Ratio of ordinary income to net sales | |||||||
| Millions of yen | Yen | Yen | % | % | % | |||||||
Fiscal Year 2004 | 19,303 (D31.0%) | 71.53 | 71.50 | 4.7 | 11.3 | 21.7 | ||||||
Fiscal Year 2003 | 27,996 (138.6%) | 102.29 | 102.28 | 7.1 | 9.6 | 18.4 |
Notes
1. Weighted-average number of common shares issued and outstanding during the year
For the year ended March 31, 2005: 268,481,535 shares
For the year ended March 31, 2004: 272,515,920 shares
2. Changes in method of accounting and presentation: None
3. Percentages in parentheses under net sales, operating income, ordinary income, and net income indicate changes from the previous fiscal year.
App. D-43
Table of Contents
(2) Dividends
(Figures less than ¥1 million, except per share amounts, have been omitted)
| Dividends per share | Total dividends for the year | Payout ratio | Dividends as a percentage of total equity | |||||||||
| Interim | Year-end | |||||||||||
| Yen | Yen | Yen | Millions of yen | % | % | |||||||
Fiscal Year 2004 | 40.00 | 15.00 | 25.00 | 10,736 | 55.9 | 2.6 | ||||||
Fiscal Year 2003 | 30.00 | 15.00 | 15.00 | 8,134 | 29.3 | 2.0 | ||||||
(3) Non-Consolidated Financial Position
(Figures less than ¥1 million, except per share amounts, have been omitted)
| Total assets | Shareholders’ equity | Shareholders’ equity ratio | Shareholders’ equity per share | ||||||
| Millions of yen | Millions of yen | % | Yen | ||||||
Fiscal Year 2004 | 508,932 | 415,020 | 81.5 | % | 1,545.88 | ||||
Fiscal Year 2003 | 491,534 | 405,274 | 82.5 | % | 1,502.24 |
Notes 1. Total common shares issued at the end of fiscal year
March 31, 2005: 268,404,023 shares
March 31, 2004: 269,700,226 shares
2. Number of shares of treasury stock at the end of fiscal year
March 31, 2005: 18,049,212 shares
March 31, 2004: 16,753,009 shares
2. Forecasts of Non-Consolidated Operating Results
Fiscal Year 2005 (April 1, 2005—March 31, 2006)
| Net sales | Ordinary income | Net income | Cash dividends per share | |||||||||
| Interim | Year-end | |||||||||||
| Millions of yen | Millions of yen | Millions of yen | Yen | Yen | Yen | |||||||
Interim 6-month period | 126,000 | 24,000 | 14,000 | 25.00 | — | — | ||||||
Full-year | 262,000 | 54,000 | 33,000 | — | 25.00 | 50.00 | ||||||
Reference: Forecasted basic net income per share for the year: ¥122.58
| * | Note: The forecast figures shown above are based on information that was available at the time of preparation and may contain some uncertainties. Actual performance and other factors may differ from these forecasts due to changes in circumstances and other developments. More information concerning these forecasts can be found in the attached Supplemental Information on page 16~17. |
App. D-44
Table of Contents
6. Non-Consolidated Financial Statements
(1) Non-Consolidated Balance Sheets
(Millions of yen)
Fiscal Year 2003 (As of March 31, 2004) | Fiscal Year 2004 (As of March 31, 2005) | Change | ||||||||||||||
See Note | Amount | % | Amount | % | Amount | |||||||||||
ASEETS | ||||||||||||||||
I Current assets: | ||||||||||||||||
| 1. Cash and time deposits | 6,145 | 6,455 | ||||||||||||||
2. Trade notes receivable | 7,063 | 6,771 | ||||||||||||||
3. Accounts receivable | *4 | 59,218 | 63,046 | |||||||||||||
4. Investment securities | 94,080 | 107,514 | ||||||||||||||
5. Mortgage-backed securities | 20,000 | 20,000 | ||||||||||||||
6. Merchandises | 5,379 | 5,911 | ||||||||||||||
7. Products | 10,635 | 13,360 | ||||||||||||||
8. Semi-finished products | 4,942 | 4,816 | ||||||||||||||
9. Raw materials | 5,972 | 6,222 | ||||||||||||||
10. Work in process | 1,106 | 1,249 | ||||||||||||||
11. Prepaid expenses | 188 | 187 | ||||||||||||||
12. Deferred tax assets | 12,050 | 10,850 | ||||||||||||||
13. Short-term loans to affiliated companies | 9,825 | 9,715 | ||||||||||||||
14. Other receivables | 5,517 | 4,277 | ||||||||||||||
15. Other current assets | 2,616 | 8,806 | ||||||||||||||
Allowance for doubtful accounts | D200 | — | ||||||||||||||
Total current assets | 244,540 | 49.75 | 269,185 | 52.89 | 24,644 | |||||||||||
II Non-current assets: | ||||||||||||||||
1. Property, plant and equipment: | ||||||||||||||||
(1) Buildings | 86,478 | 86,374 | ||||||||||||||
Less accumulated depreciation | 50,314 | 36,164 | 52,523 | 33,851 | ||||||||||||
(2) Structures | 8,865 | 8,624 | ||||||||||||||
Less accumulated depreciation | 6,080 | 2,785 | 6,118 | 2,505 | ||||||||||||
(3) Machinery and equipment | 65,800 | 65,274 | ||||||||||||||
Less accumulated depreciation | 53,657 | 12,142 | 55,150 | 10,124 | ||||||||||||
(4) Vehicles and transportation equipment | 499 | 496 | ||||||||||||||
Less accumulated depreciation | 439 | 60 | 449 | 46 | ||||||||||||
(5) Furniture, tools and fixtures | 24,746 | 24,285 | ||||||||||||||
Less accumulated depreciation | 21,356 | 3,390 | 21,195 | 3,090 | ||||||||||||
(6) Land | 7,241 | 7,241 | ||||||||||||||
(7) Construction in progress | 368 | 1,273 | ||||||||||||||
Total property, plant and equipment, net | 62,152 | 12.64 | 58,133 | 11.42 | D4,018 | |||||||||||
2. Intangible assets : | ||||||||||||||||
(1) Sales and distribution rights | 1,761 | 2,921 | ||||||||||||||
(2) Patents | 4,781 | 2,975 | ||||||||||||||
(3) Real estate lease rights | 1 | 1 | ||||||||||||||
(4) Trademarks | 78 | 66 | ||||||||||||||
(5) Software | — | 1,873 | ||||||||||||||
(6) Other intangible assets | 882 | 75 | ||||||||||||||
Total intangible assets, net | 7,505 | 1.53 | 7,915 | 1.56 | 409 | |||||||||||
App. D-45
Table of Contents
(Millions of yen)
Fiscal Year 2003 (As of March 31, 2004) | Fiscal Year 2004 (As of March 31, 2005) | Change | |||||||||||||||||||||
| See Note | Amount | % | Amount | % | Amount | ||||||||||||||||||
3. Investments and other assets: | |||||||||||||||||||||||
(1) Investment securities | 107,693 | 104,045 | |||||||||||||||||||||
(2) Stock of affiliated companies | 50,463 | 52,748 | |||||||||||||||||||||
(3) Advances to affiliated companies | 7,862 | 8,685 | |||||||||||||||||||||
(4) Long-term loans | 4 | — | |||||||||||||||||||||
(5) Long-term loans to employees | 11 | 4 | |||||||||||||||||||||
(6) Long-term loans to affiliated companies | 5,744 | 5,651 | |||||||||||||||||||||
(7) Prepaid pension cost | — | 15,385 | |||||||||||||||||||||
(8) Deferred tax assets | 576 | — | |||||||||||||||||||||
(9) Other assets | 4,960 | 6,524 | |||||||||||||||||||||
Allowance for doubtful accounts | D10 | D676 | |||||||||||||||||||||
Allowance Reserve for investment losses | — | D18,671 | |||||||||||||||||||||
Total investments and other assets | 177,335 | 36.08 | 173,698 | 34.13 | D3,637 | ||||||||||||||||||
Total non-current assets | 246,993 | 50.25 | 239,747 | 47.11 | D7,246 | ||||||||||||||||||
Total assets | 491,534 | 100.00 | 508,932 | 100.00 | 17,398 | ||||||||||||||||||
LIABILITIES | |||||||||||||||||||||||
I Current liabilities: | |||||||||||||||||||||||
1. Accounts payable | *4 | 13,048 | 16,163 | ||||||||||||||||||||
2. Other payables | 11,492 | 10,660 | |||||||||||||||||||||
3. Accrued expenses | 18,044 | 19,445 | |||||||||||||||||||||
4. Income taxes payable | 8,165 | 7,023 | |||||||||||||||||||||
5. Consumption taxes payable | 1,262 | 502 | |||||||||||||||||||||
6. Advance receipts | 1,799 | 1,546 | |||||||||||||||||||||
7. Advances received from affiliated companies | *5 | 17,160 | 22,774 | ||||||||||||||||||||
8. Allowance for sales returns | 491 | 448 | |||||||||||||||||||||
9. Allowance for sales discounts | 1,448 | 1,421 | |||||||||||||||||||||
Total current liabilities | 72,953 | 14.84 | 79,985 | 15.72 | 7,032 | ||||||||||||||||||
App. D-46
Table of Contents
(Millions of yen)
Fiscal Year 2003 (As of March 31, 2004) | Fiscal Year 2004 (As of March 31, 2005) | Change | |||||||||||||||||||
See Note | Amount | % | Amount | % | Amount | ||||||||||||||||
II Non-current liabilities: | |||||||||||||||||||||
1. Long-term payables | — | 3,467 | |||||||||||||||||||
2. Deferred tax liabilities | — | 9,035 | |||||||||||||||||||
3. Accrued retirement and severance costs | 11,521 | 213 | |||||||||||||||||||
4. Accrued directors’ retirement and severance costs | 1,785 | 1,208 | |||||||||||||||||||
Total non-current liabilities | 13,306 | 2.71 | 13,926 | 2.74 | 619 | ||||||||||||||||
Total liabilities | 86,259 | 17.55 | 93,912 | 18.46 | 7,652 | ||||||||||||||||
SHAREHOLDERS’ EQUITY | |||||||||||||||||||||
I Common stock | *1 | 45,246 | 9.21 | 45,246 | 8.89 | — | |||||||||||||||
II Additional paid-in-capital: | |||||||||||||||||||||
1. Capital surplus | 48,961 | 48,961 | |||||||||||||||||||
2. Other capital surplus | |||||||||||||||||||||
(1) Gain on reissuance of treasury stock | — | 169 | |||||||||||||||||||
Total additional paid-in-capital | 48,961 | 9.96 | 49,130 | 9.65 | 169 | ||||||||||||||||
III Retained earnings: | |||||||||||||||||||||
1. Legally appropriated retained earnings | 7,599 | 7,599 | |||||||||||||||||||
2. Voluntary retained earnings reserve: | |||||||||||||||||||||
(1) Reserve for reduction in fixed asset (cost basis) | 2,599 | 2,591 | |||||||||||||||||||
(2) Special reserve | 286,762 | 306,762 | |||||||||||||||||||
3. Unappropriated retained earnings | 33,322 | 24,442 | |||||||||||||||||||
Total retained earnings | 330,284 | 67.19 | 341,395 | 67.08 | 11,111 | ||||||||||||||||
IV Net unrealized gain on investment securities | 17,182 | 3.50 | 18,115 | 3.56 | 933 | ||||||||||||||||
V Treasury stock at cost | *2 | D36,400 | D7.41 | D38,867 | D7.64 | D2,467 | |||||||||||||||
Total shareholders’ equity | 405,274 | 82.45 | 415,020 | 81.54 | 9,746 | ||||||||||||||||
Total liabilities, and shareholders’ equity | 491,534 | 100.00 | 508,932 | 100.00 | 17,398 | ||||||||||||||||
App. D-47
Table of Contents
(2) Non-Consolidated Statements of Income
(Millions of yen)
Fiscal Year 2003 (For the year ended March 31, 2004) | Fiscal Year 2004 (For the year ended March 31, 2005) | Change | ||||||||||||||||||||||
See Note | Amount | % | Amount | % | Amount | |||||||||||||||||||
I Net sales: | ||||||||||||||||||||||||
1. Sales of products | 174,411 | 175,635 | ||||||||||||||||||||||
2. Sales of merchandise | 58,613 | 62,981 | ||||||||||||||||||||||
3. Royalty income | 20,462 | 253,486 | 100.00 | 21,296 | 259,912 | 100.00 | 6,426 | |||||||||||||||||
| *1 | ||||||||||||||||||||||||
II Cost of sales: | *2 | |||||||||||||||||||||||
| *3 | ||||||||||||||||||||||||
1. Product and merchandise inventories, beginning of year | 21,530 | 16,014 | ||||||||||||||||||||||
2. Merchandises purchased during the year | 35,873 | 38,519 | ||||||||||||||||||||||
3. Costs of products manufactured during the year | 43,537 | 48,130 | ||||||||||||||||||||||
Subtotal | 100,942 | 102,663 | ||||||||||||||||||||||
4. Less amount transferred to other accounts | 1,514 | 1,343 | ||||||||||||||||||||||
5. Less product and merchandise inventories, end of year | 16,014 | 19,272 | ||||||||||||||||||||||
Total cost of sales | 17,528 | 83,414 | 32.91 | 20,615 | 82,047 | 31.57 | D1,366 | |||||||||||||||||
Gross profit on sales | 170,072 | 67.09 | 177,865 | 68.43 | 7,792 | |||||||||||||||||||
Reversal of provision for sales returns | 485 | 0.19 | 491 | 0.19 | 6 | |||||||||||||||||||
Provision for sales returns | 491 | 0.19 | 448 | 0.17 | D43 | |||||||||||||||||||
Gross profit | 170,066 | 67.09 | 177,908 | 68.45 | 7,841 | |||||||||||||||||||
III Selling, general and administrative: | *3 | |||||||||||||||||||||||
1. Shipping and storage expenses | 1,690 | 1,401 | ||||||||||||||||||||||
2. Advertising expenses | 3,508 | 3,686 | ||||||||||||||||||||||
3. Sales promotion expenses | 10,199 | 10,229 | ||||||||||||||||||||||
4. Royalty expense | 806 | 791 | ||||||||||||||||||||||
5. Salaries and bonuses | 24,542 | 25,395 | ||||||||||||||||||||||
6. Employee retirement and severance costs | 4,346 | 3,043 | ||||||||||||||||||||||
7. Welfare expenses | 3,777 | 3,831 | ||||||||||||||||||||||
8. Depreciation expense | 2,772 | 3,035 | ||||||||||||||||||||||
9. Rent expenses | 6,176 | 6,298 | ||||||||||||||||||||||
10. Travel and transportation expenses | 4,021 | 3,991 | ||||||||||||||||||||||
11. Research and development expenses | *1 | 44,311 | 42,698 | |||||||||||||||||||||
12. Other | 18,560 | 124,713 | 49.20 | 19,063 | 123,467 | 47.50 | D1,245 | |||||||||||||||||
Operating income | 45,353 | 17.89 | 54,440 | 20.95 | 9,087 | |||||||||||||||||||
App. D-48
Table of Contents
(Millions of yen)
Fiscal Year 2003 (For the year ended March 31, 2004) | Fiscal Year 2004 (For the year ended March 31, 2005) | Change | ||||||||||||||||||||||
See Note | Amount | % | Amount | % | Amount | |||||||||||||||||||
IV Non-operating income: | ||||||||||||||||||||||||
1. Interest income | 286 | 287 | ||||||||||||||||||||||
2. Interest income from investment securities | 486 | 505 | ||||||||||||||||||||||
3. Dividend income | 967 | 1,230 | ||||||||||||||||||||||
4. Foreign exchange gains | — | 357 | ||||||||||||||||||||||
5. Other income | 508 | 2,248 | 0.88 | 547 | 2,928 | 1.13 | 680 | |||||||||||||||||
V Non-operating expenses: | ||||||||||||||||||||||||
1. Loss on disposal and write-down of inventories | *2 | 623 | 384 | |||||||||||||||||||||
2. Foreign exchange losses | 200 | — | ||||||||||||||||||||||
3. Other expense | 250 | 1,074 | 0.42 | 661 | 1,046 | 0.40 | D28 | |||||||||||||||||
Ordinary income | 46,527 | 18.35 | 56,322 | 21.67 | 9,795 | |||||||||||||||||||
VI Extraordinary gains: | ||||||||||||||||||||||||
1. Gain from the return of the substitutional portion of the employees’ pension fund to the government | — | 11,747 | ||||||||||||||||||||||
2. Gain from the transfer to the defined contribution pension plan | — | 3,073 | ||||||||||||||||||||||
3. Gain on sale of the veterinary and livestock feed products business | *4 | — | 679 | |||||||||||||||||||||
4. Realized gain on sale of Investment securities | 1,322 | 20 | ||||||||||||||||||||||
5. Reversal of allowance for doubtful accounts | 70 | 1,392 | 0.55 | — | 15,520 | 5.97 | 14,128 | |||||||||||||||||
VII Extraordinary losses: | ||||||||||||||||||||||||
1. Provision for allowance for investment losses | — | 18,671 | ||||||||||||||||||||||
2. Restructuring charge | *5 | — | 7,042 | |||||||||||||||||||||
3. Loss on settlement of vitamin-related anti-trust litigations | *6 | — | 111 | |||||||||||||||||||||
4. Impairment of investment securities | 61 | 28 | ||||||||||||||||||||||
5. Loss on disposal of fixed assets | *7 | 1,081 | 1,143 | 0.45 | 1,124 | 26,978 | 10.38 | 25,835 | ||||||||||||||||
Net income before income taxes | 46,776 | 18.45 | 44,865 | 17.26 | D1,910 | |||||||||||||||||||
Income tax expense-current | 18,410 | 15,400 | ||||||||||||||||||||||
Income tax expense-deferred | 370 | 18,780 | 7.41 | 10,161 | 25,561 | 9.83 | 6,781 | |||||||||||||||||
Net income | 27,996 | 11.04 | 19,303 | 7.43 | D8,692 | |||||||||||||||||||
Unappropriated retained earnings, beginning of year | 9,415 | 9,165 | D249 | |||||||||||||||||||||
Less interim dividends | 4,089 | 4,026 | D62 | |||||||||||||||||||||
Unappropriated retained earnings, end of year | 33,322 | 24,442 | D8,879 | |||||||||||||||||||||
App. D-49
Table of Contents
(3) Proposal for Appropriations of Retained Earnings
(Millions of yen)
Fiscal Year 2003 Approved at Annual | Fiscal Year 2004 Approved at Annual | Change | ||||||||||||
| See Note | Amount | Amount | Amount | |||||||||||
I Unappropriated retained earnings, end of year | 33,332 | 24,442 | D8,879 | |||||||||||
II Reversal of voluntary retained earnings reserves: | ||||||||||||||
1. Reserve for reduction in fixed asset (cost basis) | 8 | — | ||||||||||||
2. Special reserve | — | 8 | 40,000 | 40,000 | 39,991 | |||||||||
| Total retained earnings available for appropriation | 33,330 | 64,442 | 31,111 | |||||||||||
II. Appropriations: | ||||||||||||||
1. Dividends | 4,045 | 6,710 | ||||||||||||
2. Directors’ bonuses | 120 | 100 | ||||||||||||
(Including corporate auditors’ bonuses of) | (20 | ) | (— | ) | ||||||||||
3. Voluntary retained earnings reserve: | ||||||||||||||
(1) Reserve for reduction in fixed asset (cost basis) | — | 48 | ||||||||||||
(2) Special reserve | 20,000 | 24,165 | — | 6,858 | D17,307 | |||||||||
IV Unappropriated retained earnings, carried-forward to the next fiscal year | 9,165 | 57,584 | 48,419 | |||||||||||
App. D-50
Table of Contents
Significant Accounting Policies
Fiscal Year 2003
(For the year ended March 31, 2004)
| 1. | Methods of Valuation of Investment Securities Held-to-maturity securities: |
| Stated | at amortized costs (straight-line method) |
Stocks of subsidiaries and affiliated companies: Accounted for at moving-average costs
| Available-for-sale | securities: |
| With quoted market value: Stated at quoted market value at the balance sheet dates (Unrealized holding gains or losses are reported as a component of shareholders’ equity. Realized gains or losses are computed using the moving-average cost method.) With no readily available market value: Accounted for at moving-average costs |
| 2. | Method of Valuation of Inventories: |
| Accounted for at the lower of cost or market, with cost being determined under the average cost method. |
| 3. | Methods of Depreciation and Amortization: |
Property, plant and equipment: Depreciation is computed using the declining-balance method.
| The | ranges of useful lives of principal assets are as follows: |
Buildings: | 38 to 50 years | |
Machinery and equipment: | 4 to 7 years |
Intangible assets: Amortization is computed using the straight-line method.
| 4. | Foreign Currency Translation: Foreign currency denominated assets and liabilities are converted into yen at the exchange rates prevailing on the balance sheet dates. Translation gains and losses are recognized currently in earnings. The foreign currency denominated assets that are hedged by specific foreign currency forward contracts are converted into yen based on the relevant contract rates. |
| 5. | Methods of Determining Significant Allowances: |
(1) Allowance for Doubtful Accounts:
The Company covers the risk of credit losses from potential customer defaults by providing this allowance. The allowance is estimated on the basis of historical default rates for normal accounts and individual account-by-account evaluation for specific over-due accounts.
(2) -----------------
(3) Allowance for Sales Return:
To prepare for losses from potential returns of products after fiscal year-end, the Company provides for an amount equal to the estimated gross profit and inventory losses on sales returns.
Fiscal Year 2004
(For the year ended March 31, 2005)
1. Methods of Valuation of Investment Securities
Held-to-maturity debt securities:
Same as for the previous year
Stock of subsidiaries and affiliated companies:
Same as for the previous year
Available-for-sale securities:
With available fair market value:
Same as for the previous year
With no readily available fair market value:
| Same | as for the previous year |
| 2. | Method of Valuation of Inventories: |
| Same | as for the previous year |
| 3. | Methods of Depreciation: |
| Property, | plant and equipment: |
| Same | as for the previous year |
| Intangible | assets: |
| Amortization | is computed using the straight-line method. Software that is expected to generate future revenues or to contribute to a future cost reduction is amortized over estimated number of years it will be used internally. |
| 4. | Foreign Currency Translation: |
| Same | as for the previous year |
| 5. | Methods off Determining Significant Allowances: |
(1) Allowance for Doubtful Accounts:
Same as for the previous year
(2) Allowance for Investment Losses:
To cover a potential decline in value of the investments in affiliated companies, the Company provides for an allowance based on the financial condition and future prospects for recovery of the affiliated companies.
(3) Allowance for Sales Return:
Same as for the previous year
App. D-51
Table of Contents
Fiscal Year 2003
(For the year ended March 31, 2004)
(4) Allowance for Sales Discounts:
To prepare for future sales discounts, the Company provides for an estimated amount of discounts calculated by multiplying the sales discount percentage for the period by the amounts of accounts receivable and the wholesaler’s inventories at the end of fiscal year.
(5) Accrued Retirement and Severance Costs
To prepare for future payments of retirement and severance benefits, the Company provides for an accrual based on estimated projected benefit obligations and plan assets at the end of fiscal year.
Prior service cost is amortized under the straight-line method over a period of 10 years, which is equal to or less than the estimated average remaining years of service of the eligible employees.
Actuarial gains and losses are amortized based on the straight-line method, beginning in the fiscal year following the year in which such gain or loss was initially measured, over a period of 10 years, which is equal to or less than the average remaining years of service of the eligible employees.
Supplemental Information
Accompanying the enactment of the Contributed Benefit Pension Law, the Company received an approval of exemption from the Minister of Health, Labor and Welfare, on January 26, 2004, from the obligation for pension payment liabilities related to future employee service with respect to the substitutional portion of its Employees’ Pension Fund.
As of fiscal year-end, the estimated amount to be returned (based on the minimum reserve obligations) was ¥20,557 million. Had such amount (based on the minimum reserve obligations) been returned at the end of this fiscal year, in accordance with the provisions of Article 44-2 of the “Practice Guidelines of Accounting for Retirement Benefits” (Interim Report) (Report No. 13 of the Accounting Systems Committee of the Japanese Institute of Certified Public Accountants), a gain (extraordinary gain) from the return of the Employee’ Pension Fund in the amount of ¥10,995 million would have been recorded.
(6) Directors’ Retirement and Severance Benefits
To prepare for payments of directors’ retirement and severance benefits, the Company and its domestic consolidated subsidiaries provide for an amount equal to the total benefits that would have been payable at the end of fiscal year, in accordance with internal guidelines, had all directors resigned voluntarily.
6. Accounting for Significant Lease Transactions
Finance lease transactions are accounted for using the same method applied to operating lease transactions, with an exception for those finance leases in which the legal title of the underlying property is transferred from the lessor to the lessee.
Fiscal Year 2004
(For the year ended March 31, 2004)
(4) Allowance for Sales Discounts:
Same as for the previous year
(5) Accrued Retirement and Severance Costs
To prepare for future payments of retirement and severance benefits, the Company provides for an accrual based on estimated projected benefit obligations and plan assets at the end of fiscal year.
Prior service cost is amortized under the straight-line method over a period of 10 years, which is equal to or less than the estimated average remaining years of service of the eligible employees.
Actuarial gains and losses are amortized based on the straight-line method, beginning in the fiscal year following the year in which such gain or loss was initially measured, over a period of 10 years, which is equal to or less than the average remaining years of service of the eligible employees.
Supplemental Information
Accompanying the enactment of the Contributed Benefit Pension Law, the Company received an approval of exemption from the Minister of Health, Labor and Welfare, on January 1, 2005, from the obligation for pension payment liabilities related to past employee service with respect to the substitutional portion of its Employees’ Pension Fund.
For the fiscal year, as a result, the Company recognized this an extraordinary gain of ¥11,747 million from the return of the substitutional portion of the employees’ pension fund to the government.
In addition, accompanying the enactment of the Defined Contribution Pension Plan Laws, the Company and certain of its domestic consolidated subsidiaries transferred a portion of their lump-sum retirement benefit plans to a defined contribution plan, which was accounted for under the provisions of “applied the Accounting Principles for Transitions among Retirement Benefit Plans” (Corporate Accounting Guidelines No. 1).
This change in retirement benefit arrangement resulted in an extraordinary gain of ¥3,073 million for the fiscal year.
(6) Directors’ Retirement and Severance Benefits
Same as for the previous year
6. Accounting for Important Lease Transactions
Same as for the previous year
App. D-52
Table of Contents
Fiscal Year 2003
(For the year ended March 31, 2004)
| 7. | Significant Hedge Accounting Method |
(a) Hedge Accounting Method
The Company employs the deferral method of hedge accounting. Forward foreign exchange contracts that meet certain hedge criteria are accounted for as a hedge of underlying assets and liabilities.
(b) Hedging Instruments and Hedged Items
Hedging Instruments: Foreign exchange forward contracts and other
Hedged Items:
Assets denominated in foreign currencies.
(c) Hedge Policy
The Company hedges foreign exchange rate fluctuation risks in accordance with its internal policies.
(d) Method of Assessing Hedge Effectiveness
Based on its internal policies, the Company evaluates the effectiveness of hedges by examining the correlations between its hedging instruments and hedged items as a result of fluctuations in foreign currency exchange rates and confirms the effectiveness of its hedge relationship.
| 8. | Other Significant Policies in Preparing the Financial Statements Accounting for Consumption Tax |
The tax-exclusion method is used to account for the national and local consumption taxes.
Fiscal Year 2004
(For the year ended March 31, 2004)
| 7. | Significant Hedge Accounting Method |
(a) Hedge Accounting Method
Same as for the previous year
(b) Hedging Instruments and Hedged Items
Same as for the previous year
(c) Hedging Policy
Same as for the previous year
(d) Methods for Assessing Hedge Effectiveness
Same as for the previous year
| 8. | Other Significant Policies in Preparing the Financial Statements |
Accounting for Consumption Tax
Same as for the previous year
App. D-53
Table of Contents
Notes to Financial Statements
(Notes to Balance Sheets)
Fiscal Year 2003
(As of March 31, 2004)
*1. Authorized shares: | 789,000,000 common shares | |
Issued shares: | 286,453,235 common shares |
*2. Treasury stock
Treasury stock owned by the Company at the end of fiscal year was 16,753,009 shares of common stock.
3. Contingent Liabilities
| (1) | The Company guarantees the following debts and other obligations owed to financial institutions |
| (Millions of yen) | |||
Guarantees provided for employees’ housing loans | 3,037 | ||
Suntory Pharmaceutical | 42 | ||
Research Laboratories LLC | (US$ | 400,000) | |
(2) Trade export notes receivable discounted | 198 | ||
| *4. | Assets and liabilities related to affiliated companies were as follows: |
| (Millions of yen | ) | ||
Accounts receivable | 1,235 | ||
Accounts payable | 5,470 |
| *5. | The Company holds the excess working capital of its subsidiaries |
6. Committed Lines of Credit
To facilitate the efficient raising of working capital, the Company maintains committed lines of credit with four financial institutions. The unused balance of credit lines under these commitments at fiscal year-end was as follows:
| (Millions of yen) | ||
Total amount of committed credit lines | 30,000 | |
Less amount borrowed against credit lines | — | |
Credit lines unused | 30,000 |
7. Limitations on Dividends
The increase in net assets of the Company, as a result of the mark-to-market adjustment to the assets specified in Article 124-3 of the Commercial Code of Japan, was ¥17,182 million
Fiscal Year 2004
(As of March 31, 2005)
*1. Authorized shares: | 789,000,000 common shares | |
Issued shares : | 286,453,235 common shares |
*2. Treasury stock
Treasury stock owned by the Company at the end of fiscal year was 18,049,212 shares of common stock.
3. Contingent Liabilities
| (1) | The Company guarantees certain debts and other obligations owed to financial institutions |
| (Millions of yen) | ||
Guarantees provided for employees’ (housing loans, etc) | 2,540 | |
Aventis Pasteur-Daiichi Vaccines Co., Ltd. | 350 | |
(2) Trade export notes receivable discounted | 78 | |
| *4. | Assets and liabilities of affiliated companies were as follows: |
| (Millions of yen) | ||
Accounts receivable | 831 | |
Accounts payable | 5,402 |
| *5. | Same as for the previous year |
6. Committed Lines of Credit
To facilitate the efficient raising of working capital, the Company maintains committed lines of credit with four financial institutions. The unused balance of credit lines under these commitments at fiscal year-end was as follows:
| (Millions of yen) | ||
Total amount of committed credit lines | 30,000 | |
Less amount borrowed against credit lines used | — | |
Credit lines unused | 30,000 |
7. Limitations on Dividends
The increase in the net assets of the Company, as a result of the mark-to-market adjustment to the assets specified in Article 124-3 of the Commercial Code of Japan, was ¥18,115 million.
App. D-54
Table of Contents
(Notes to Statements of Income)
Fiscal 2003
(For the year ended March 31,2004)
| *1. | Research and development expenses included in selling, general and administrative expenses and manufacturing overhead costs : |
¥45,983 million
| *2.(1) | Losses from application of the lower of cost or market method to inventories were accounted for at their net amount in non-operating expenses (loss on disposal and write-down of inventories) under the periodic reserve method. |
| (Millions of yen) | ||
Reversal of valuation losses | 351 | |
Provision for valuation losses | 414 | |
Net difference | 63 |
| (2) | The amount transferred to other accounts included expense items such as sales promotion and valuation losses. |
| *3. | The amount of procurement from affiliated companies included in cost of sales and selling, general and administrative expenses: |
¥35,019 million
| *4. | — |
| *5. | — |
| *6. | — |
| *7. | The breakdown of losses on sale of fixed assets was as follows: |
| (Millions of yen) | ||
Buildings | 319 | |
Machinery, and equipment | 628 | |
Furniture, tools and fixtures | 133 |
Fiscal Year 2004
(As of March 31, 2005)
| *1. | Research and development costs included under selling, general and administrative expenses and manufacturing overhead costs: |
¥43,886 million
| *2.(1) | Losses from application of the lower of cost or market method to inventories were accounted for at their net amount in non-operating expenses (loss on disposal and write-down of inventories) under the periodic reserve method. |
| (Millions of yen) | |||
Reversal of valuation losses | 414 | ||
Provision for reversal of evaluation losses | 277 | ||
Net difference | D | 137 | |
| (2) Same as for the previous year |
| *3. | The amount of procurement from affiliated companies included in cost of sale and selling, general and administrative expenses was: |
¥32,945 million
| *4. | A gain on sale of the veterinary and livestock feed product business was recognized as a result of sale of the domestic distribution rights and other intangibles related to its veterinary and livestock feed product business to a third-party. |
| *5. | A restructuring charge was recorded for the one-time termination benefits provided to certain employees who were involuntarily transferred from the Company to a newly established wholly- owned subsidiary, Daiichi Pharmatech Co., Ltd. |
| *6. | The Loss on settlement of vitamin-related anti-trust litigations was related to a settlement of a part of the civil anti-trust class-action damage claims in connection with the Company’s vitamin transactions. |
| *7. | The breakdown of losses on sales of fixed assets was as follows: |
| (Millions of yen) | ||
Buildings | 382 | |
Machinery, and equipment | 132 | |
Furniture, tools and fixtures | 610 |
App. D-55
Table of Contents
Proforma Lease Information
Fiscal Year 2003
(For the year ended March 31, 2004)
Finance lease transactions, excluding those that transfer the legal title to the leased property to the lessee
| (1) | Amounts representing the acquisition costs of the leased assets, accumulated depreciation, and net book value at the end of fiscal year, had those leases been accounted for as capital leases |
(Millions of yen)
| Acquisition costs | Accumulated depreciation | Net book value | ||||
| Vehicles and transportation equipment | 811 | 355 | 455 | |||
| Furniture, tools and fixtures fixtures equipment | 5,473 | 3,412 | 2,060 | |||
| Total | 6,284 | 3,768 | 2,516 |
| (2) | Amount representing the capital lease obligations, at the end of fiscal year, had those leases been accounted for as capital leases |
| (Millions of yen) | ||
Due within one year | 1,226 | |
Due after one year | 1,289 | |
Total | 2,516 |
Note: The Company included an interest component of the lease payments in the amounts representing each of the acquisition costs of the leased assets and the capital lease obligations, since the ratio of the lease obligations at the end of fiscal year to the net book value of capitalized lease assets at the end of fiscal year is low.
| (3) | Comparison of lease expense recorded in the statements of income and the depreciation expense, that would have been recorded, had those leases been accounted for as capital leases |
| (Millions of yen) | ||
Lease expense | 1,284 | |
Depreciation expense | 1,284 |
| (4) | Depreciation method for computing the amount representing depreciation expenses. |
| The amount representing depreciation expense was computed as if the capitalized lease assets had been amortized on a straight-line basis over the lease terms, with no residual at the end of leases. |
Fiscal Year 2004
(For the year ended March 31, 2005)
Finance lease transactions, excluding those that transfer the legal title to the leased item to the lessee
| (1) | Amounts representing the acquisition costs of the leased assets, accumulated depreciation, and net book value at the end of fiscal year, had those leases been accounted for as capital leases |
(Millions of yen)
Acquisition costs | Accumulated depreciation | Net book value | ||||
| Vehicles and transportation equipment | 843 | 395 | 447 | |||
| Furniture, tools and fixtures fixtures equipment | 5,057 | 3,607 | 1,449 | |||
Total | 5,900 | 4,002 | 1,897 |
| (2) | Amount representing the capital lease obligations, at the end of fiscal year, had those leases been accounted for as capital leases |
| (Millions of yen) | ||
Due within one year | 1,034 | |
Due after one year | 863 | |
Total | 1,897 |
| Note: | Same as for the previous year. |
| (3) | Comparison of lease expense recorded in the statement of income and the depreciation expense that would have been recorded, had those leases been accounted for as capital leases |
| (Millions of yen) | ||
Leasing fees payable | 1,399 | |
Amount corresponding to depreciation | 1,399 |
| (4) | Depreciation method for computing the amount representing depreciation expenses |
| Same as for the previous year |
(2) Investment Securities
* There was no quoted market value for stock of subsidiaries and affiliated companies for fiscal year 2003 (For the year ended March 31, 2004) or fiscal year 2004 (For the year ended March 31, 2005)
App. D-56
Table of Contents
(3) Deferred Income Taxes
1. Principal Components of Deferred Tax Assets and Liabilities
(Millions of yen)
| Fiscal Year 2003 (As of March 31, 2004) | Fiscal Year 2004 (As of March 31, 2005) | |||
Deferred tax assets: | ||||
Depreciation | 8,717 | 9,567 | ||
Allowance for investment losses on affiliated companies | — | 7,567 | ||
Advance payments (for contract research and development, etc.) | 5,283 | 3,468 | ||
Accrued expenses | 2,914 | 3,183 | ||
Payables to the defined contribution pension plan | — | 2,127 | ||
Impairment losses on investment securities | 1,100 | 1,005 | ||
Enterprise taxes payable | 867 | 578 | ||
Accrued retirement and severance costs | 3,494 | 86 | ||
Other | 3,744 | 3,706 | ||
Subtotal | 26,122 | 31,291 | ||
Valuation allowance | — | D8,510 | ||
Total deferred tax assets | 26,122 | 22,781 | ||
Deferred tax liabilities: | ||||
Unrealized gain on available-for-sale securities | D11,695 | D12,345 | ||
Deferred gain on sale of fixed assets | — | D6,822 | ||
Reserve for additional depreciation | D1,800 | D1,798 | ||
Total deferred tax liabilities | D13,496 | D20,967 | ||
Net deferred tax assets | 12,626 | 1,814 | ||
Note: Net deferred tax assets are included under the following balance sheet captions:
2. Reconciliation between the statutory tax rate and the Company’s effective tax rates after application of deferred tax accounting
(%)
| Fiscal Year 2003 (As of March 31, 2004) | Fiscal Year 2004 (As of March 31, 2005) | |||
Statutory tax rate | 41.8 | 40.5 | ||
(Adjustments) | ||||
Non-deductible permanent differences including entertainment and other expenses. | 3.9 | 3.8 | ||
| Deductible permanent differences including dividend received deductions and other items | D0.6 | D 0.7 | ||
Per capita inhabitants’ taxes | 0.2 | 0.2 | ||
Tax credit for research and development expenses | D5.9 | D5.5 | ||
Provision for valuation allowance | — | 19.0 | ||
Other | 0.7 | D0.3 | ||
Effective tax rate | 40.1 | 57.0 | ||
Per Share Information
Fiscal Year 2003 (For the year ended March 31, 2004) | Fiscal Year 2004 (For the year ended March 31, 2005) | |||||
Net assets per share | ¥1,502.24 | Net assets per share | ¥1,545.88 | |||
Net income per share (basic) | ¥102.29 | Net income per share (basic) | ¥71.53 | |||
Net income per share (diluted) | ¥102.28 | Net income per share (diluted) | ¥71.50 | |||
App. D-57
Table of Contents
Note: Calculations of basic and diluted net income per share are based on the following numerators and denominators:
Fiscal Year 2003 (For the year ended March 31, 2004) | Fiscal Year 2004: (For the year ended March 31, 2005) | |||
Net income per share (basic): | ||||
Net income (millions of yen) | 27,996 | 19,303 | ||
| Amount not available for common shareholders (millions of yen) | 120 | 100 | ||
| (Including directors’ bonuses paid from net income of) (millions of yen) | (120) | (100) | ||
| Net income available for dividends on common shares (millions of yen) | 27,876 | 19,203 | ||
| Weighted-average number of common shares outstanding during the year (1,000 shares) | 272,515 | 268,481 | ||
| Net income per share (diluted): | ||||
| Additional dilutive common shares (1,000 shares) | 34 | 111 | ||
| (Including dilutive effect of stock options of) | (34) | (111) | ||
| Descriptions of potentially dilutive common shares that were not included in the computation of diluted net income per share because of their anti-dilutive effect. | Two share subscription right plans (related to 1,001 thousand shares) and one share purchase option plan (related to 4,090 units of options). | Same as for the previous year |
Subsequent Events
Fiscal Year 2003 (For the year ended March 31, 2004)
None applicable
Fiscal Year 2004 (For the year ended March 31, 2005)
None applicable
App. D-58
Table of Contents
7. Proposed Changes in Membership of the Board of Directors
The following changes in executive management responsibilities are anticipated pending approval at the 127th Ordinary General Meeting of Shareholders scheduled to be held on June 29, 2005.
1. Changes in Representative Directors*
(1) Candidate for Election to Representative Director and Senior Managing Director
Kenichi Mizutani (Currently, Senior Managing Director)
(2) Representative Director Scheduled to Retire
Hiroyuki Nagasako (Currently, Representative Director and Executive Vice President)
*Representative Directors in Japanese corporations have designated fiduciary responsibilities
according to the Japanese Commercial Code.
2. Changes in Directors
(1) Candidates for Election to Board of Directors ~
External Director | Teijiro Furukawa (Previously, Deputy Chief Cabinet Secretary, Parliamentary Cabinet Office) [Note: Daiichi announced in a May 27, 2005 press release that it had changed one of its candidates for director from Teijiro Furukawa to Jotaro Yabe (Formerly, Secretary General, Fair Trade Commission of Japan).] | |
External Director | Yoshifumi Nishikawa (Currently, President and CEO of Sumitomo Mitsui Banking Corporation) | |
(2) Directors Scheduled to Retire
Hiroshi Yamamoto (Currently, Senior Managing Director)
Scheduled to become Representative Director and President of Daiichi Pharmatech Co., Ltd.
Atsuo Inoue (Currently, Managing Director)
Scheduled to become Advisor of the Company
Tomomi Chiba (Currently, Director responsible for Medical Information)
Scheduled to become Representative Director and President of D.P.C. Medical Co., Ltd.
Isao Hayakawa (Currently, Director responsible for Drug Discovery Research)
Scheduled to become General Manager responsible for the Drug Discovery Research Office and
Special Corporate Advisor.
Kyohei Nonose (Currently, Director and General Manager of Human Resources Department)
Scheduled to become Senior Corporate Officer
Kazunori Hirokawa (Currently, Director and General Manager of R&D Strategic Planning Department)
Scheduled to become Senior Corporate Officer
(3) Promotions of Directors
Senior Managing Director | Tadao Suzuki (Currently, Managing Director) | |
Managing Director | Ryuzo Takada (Currently, Director and General Manager of Marketing & Sales Administration Department) | |
App. D-59
Table of Contents
3. References
(1) Board of Directors after Changes | ||||
*President and CEO (Representative Director) | Kiyoshi Morita | |||
*Senior Managing Director (Representative Director) | Kenichi Mizutani | |||
*Senior Managing Director | Tadao Suzuki | |||
*Managing Director | Hidetoshi Imaizumi | |||
*Managing Director | Tsutomu Une | |||
*Managing Director | Ryuzo Takada | |||
*Director | Hiroshi Sugiyama | |||
*Director | Teruo Takayanagi | |||
*Director | Toru Kuroda | |||
*Director | Akira Nagano | |||
*Director | George Nakayama | |||
Director | Teijiro Furukawa | |||
| [Note: Daiichi announced in a May 27, 2005 press release that it had changed one of its candidates for director from Teijiro Furukawa to Jotaro Yabe.] | ||||
Director | Yoshifumi Nishikawa | |||
*Directors marked with asterisks are scheduled to serve concurrently as Corporate Officers.
| (2) Corporate Officers after Changes | ||
Senior Corporate Officer | Kyohei Nonose | |
Senior Corporate Officer | Kazunori Hirokawa | |
Corporate Officer | Toshiro Minotani | |
Corporate Officer | Koju Ogawa | |
Corporate Officer | Yusuke Yukimoto | |
Corporate Officer | Tadashi Horiuchi | |
Corporate Officer | Masatoshi Sakamoto | |
Corporate Officer | Osamu Goishihara | |
Corporate Officer | Shinsei Tamai | |
Corporate Officer | Yoichi Hara | |
Corporate Officer | Takao Sato | |
Corporate Officer | Koichi Masumura | |
Corporate Officer | Yuichi Kano | |
Corporate Officer | Toshio Takahashi | |
Corporate Officer | Manabu Sakai | |
Corporate Officer | Haruhisa Kubota |
App. D-60
Table of Contents
| (3) Profile of New Representative Director | ||
Position | Representative Director and Senior Managing Director | |
Name | Kenichi Mizutani | |
Date of birth | February 12, 1941 (64 years old) | |
Education | Graduated from The Faculty of Pharmaceutical Sciences of Nagoya City | |
University in March 1963 | ||
Work history | ||
April 1963 | Entered the Company | |
April 1990 | General Manager of Drug Marketing Department 2 | |
June 1995 | Director and General Manager of Tokyo Branch 1 | |
October 1998 | Director responsible for Medical Planning and Promotion | |
June 1999 | Managing Director | |
October 2002 | Senior Managing Director | |
App. D-61
Table of Contents
Filings with the U.S. SEC
Daiichi Pharmaceutical Co., Ltd. and Sankyo Company, Limited may file a registration statement on Form F-4 with the U.S. SEC in connection with the proposed business combination of Daiichi and Sankyo under a new holding company by way of a joint share transfer. The Form F-4 (if filed) will contain a prospectus and other documents. If a Form F-4 is filed and declared effective, Daiichi and Sankyo plan to mail the prospectus contained in the Form F-4 to their U.S. shareholders prior to the shareholders meetings at which the share exchange will be voted upon. The Form F-4 (if filed) and prospectus will contain important information about Daiichi and Sankyo, the joint share transfer and related matters. U.S. shareholders of Daiichi and Sankyo are urged to read the Form F-4, the prospectus and the other documents that may be filed with the U.S. SEC in connection with the joint share transfer carefully before they make any decision at the shareholders meeting with respect to the joint share transfer. The Form F-4 (if filed), the prospectus and all other documents filed with the U.S. SEC in connection with the joint share transfer will be available when filed, free of charge, on the U.S. SEC’s web site atwww.sec.gov. In addition, the prospectus and all other documents filed with the U.S. SEC in connection with the business combination will be made available to shareholders, free of charge, by calling, writing or e-mailing:
Sankyo Company, Limited | Daiichi Pharmaceutical Co., Ltd. | |
Mr. Shigemichi Kondo | Mr. Toshio Takahashi | |
Corporate Communications Department | Corporate Communications Department | |
3-5-1, Nihonbashi Honcho | 14-10 Nihonbashi, 3-chome | |
Chuo-ku, Tokyo 103-8426, Japan | Chuo-ku, Tokyo 103-8234, Japan | |
Telephone: 81-3-5255-7034 | Telephone: 81-3-3273-7107 | |
E-mail: shige-k@sankyo.co.jp | E-mail: andokb5o@daiichipharm.co.jp |
You may read and copy any reports and other information filed with, or submitted to, the U.S. SEC at the U.S. SEC’s public reference rooms at 100 F Street, N.E., Washington, D.C. 20549 or at the other public reference rooms in New York, New York and Chicago, Illinois. Please call the U.S. SEC at 1-800-SEC-0330 for further information on public reference rooms. Filings with the U.S. SEC also are available to the public from commercial document-retrieval services and at the web site maintained by the U.S. SEC at http//www.sec.gov.
Forward-Looking Statements
This communication contains forward-looking information and statements about Daiichi and Sankyo and their combined businesses after completion of the joint share transfer. Forward-looking statements are statements that are not historical facts. These statements include financial projections and estimates and their underlying assumptions, statements regarding plans, objectives and expectations with respect to future operations, products and services, and statements regarding future performance. Forward-looking statements are generally identified by the words “expect,” “anticipates,” “believes,” “intends,” “estimates” and similar expressions. Although the management of Daiichi and Sankyo believe that the expectations reflected in such forward-looking statements are reasonable, investors and holders of Daiichi and Sankyo securities are cautioned that forward-looking information and statements are subject to various risks and uncertainties, many of which are difficult to predict and generally beyond the control of Daiichi and Sankyo, that could cause actual results and developments to differ materially from those expressed in, or implied or projected by, the forward-looking information and statements. These risks and uncertainties include those discussed or identified in the public filings with the SEC and the local filings made by Daiichi and Sankyo, including those listed under “Cautionary Statement Concerning Forward-Looking Statements” and “Risk Factors” in the prospectus included in the registration statement on Form F-4 that Daiichi and Sankyo may file with the U.S. SEC. Other than as required by applicable law, neither Daiichi nor Sankyo undertakes any obligation to update or revise any forward-looking information or statements.
App. D-62
Table of Contents
APPENDIX E
UNAUDITED REVERSE RECONCILIATION OF SELECTED
FINANCIAL INFORMATION OF DAIICHI
App. E-1
Table of Contents
Daiichi has included unaudited consolidated financial statements as of or for the year ended March 31, 2005 prepared in accordance with Japanese GAAP in Appendix D of this prospectus. As the basis of the consolidated financial information included or incorporated by reference in this prospectus, which is presented under U.S. GAAP, is significantly different from Japanese GAAP in certain respects, Daiichi presents below a reverse reconciliation from U.S. GAAP to Japanese GAAP of its net income for the year ended March 31, 2004 and shareholders’ equity as of March 31, 2004.
| Unaudited | ||||||||
| Net Income for the year ended March 31, 2004 | Shareholders’ equity as of March 31, 2004 | |||||||
| (in millions) | ||||||||
Amounts reported in the consolidated financial statements under U.S. GAAP | ¥ | 30,736 | ¥ | 422,406 | ||||
Adjustments | ||||||||
1. Revenue recognition | ¥ | (373 | ) | ¥ | (3,204 | ) | ||
2. Impairment of long-lived assets | (2,147 | ) | 2,389 | |||||
3. Severance and retirement plans | (1,524 | ) | 12,673 | |||||
4. Business combination | 1,314 | (13,205 | ) | |||||
5. Software development costs | (366 | ) | (5,274 | ) | ||||
6. Compensated absence | (151 | ) | 5,266 | |||||
7. Other | (220 | ) | 6,350 | |||||
Total Japanese GAAP adjustments | (3,467 | ) | 4,995 | |||||
8. Income tax effect of Japanese GAAP adjustments | (607 | ) | (5,271 | ) | ||||
Effect of Japanese GAAP adjustments | (4,074 | ) | (276 | ) | ||||
Amounts determined in conformity with Japanese GAAP | ¥ | 26,662 | ¥ | 422,130 | ||||
| 1. | Revenue recognition |
Under U.S. GAAP, royalty income is accrued based on an estimated amount of royalty earned during the period. Under Japanese GAAP, royalty income is recognized as it is reported by a licensee.
| 2. | Impairment of long-lived assets |
Under U.S. GAAP, long-lived assets and certain identifiable intangibles are reviewed for impairment whenever events or changes in circumstances indicate that the carrying amount of an asset may not be recoverable. If the assets are considered to be impaired, an impairment to be recognized is measured by the amount by which the carrying amount of the assets exceeds the fair value of the assets. Under Japanese GAAP, an impairment of long-lived assets is recognized only in certain circumstances. Depreciation and amortization under U.S. GAAP become lower compared to the amounts recorded under Japanese GAAP in the periods subsequent to the recognition of an impairment loss.
| 3. | Severance and retirement plans |
Under both U.S. and Japanese GAAP, defined benefit plans are accounted for in a similar manner. However, certain adjustments are necessary due primarily to the differences in the amortization method of unrecognized actuarial gain and loss between Japan and U.S. GAAP. In addition, under U.S. GAAP, a minimum pension liability is required to be recognized in shareholders’ equity to cover the amount, if any, of accumulated benefit obligations in excess of the fair value of pension plan assets.
App. E-2
Table of Contents
| 4. | Business combination |
Under U.S. GAAP, business combinations must be accounted for using the purchase method. The purchase price is allocated to the acquired tangible and identifiable intangible net assets based on their respective fair values. The excess amount over fair value of the net assets acquired is recorded as goodwill. Those tangible and identifiable intangible assets are depreciated or amortized over their useful lives unless the useful life is indefinite. Under Japanese GAAP, the entire excess of the cost over book values of the net assets acquired is recorded as goodwill and is amortized over a period determined by Daiichi.
| 5. | Software development costs |
Under U.S. GAAP, costs associated with developing software systems for internal use are capitalized, once they reach the application development stage and meet recoverability tests. Capitalized software costs are amortized over an estimated useful life of the software. Under Japanese GAAP, Daiichi expenses costs associated with such software development as incurred.
| 6. | Compensated absence |
Under U.S. GAAP, Daiichi is required to accrue a liability for employees’ future compensation for certain compensated absences. Under Japanese GAAP, there is no established authoritative accounting standard that requires the recognition of a liability related to such compensated absences.
| 7. | Other |
Other includes items having a relatively small effect on net income and shareholders’ equity.
| 8. | Income tax effect of Japanese GAAP adjustments |
The effective tax rate on total Japanese GAAP adjustments does not necessarily equate to the effective tax rate of Daiichi, because certain Japanese GAAP adjustments, such as the amortization of goodwill are not deductible for tax purposes. In addition, Japanese GAAP does not require the recognition of certain identifiable intangible assets acquired in business combinations and, as a consequence, the related deferred tax liabilities. Accordingly, the need for a valuation allowance to reduce deferred tax assets to an amount deemed realizable under Japanese GAAP is determined absent of the reversing effect of such deferred tax liabilities that would otherwise be recognized and available for consideration under U.S. GAAP.
App. E-3
Table of Contents
APPENDIX F
PRESS RELEASE OF SANKYO, DATED MAY 13, 2005,
ANNOUNCING ITS UNAUDITED JAPANESE GAAP RESULTS FOR
THE FISCAL YEAR ENDED MARCH 31, 2005
App. F-1
Table of Contents
SANKYO CO., LTD.
Consolidated Financial Results
for Fiscal 2004
(The Fiscal Year Ended March 31, 2005)
This document has been prepared as a guide for non-Japanese investors and contains forward-looking statements that are based on managements’ estimates, assumptions and projections at the time of publication. A number of factors could cause actual results to differ materially from expectations.
App. F-2
Table of Contents
Consolidated Financial Results
for Fiscal 2004
(The Fiscal Year Ended March 31, 2005)
Sankyo Co., Ltd.
Listed exchanges: | Tokyo, Osaka, Nagoya, Fukuoka and Sapporo | |
Head office: | Tokyo, Japan | |
Stock code: | 4501 | |
Homepage: | http://www.sankyo.co.jp | |
Address: | 3-5-1 Nihonbashi Honcho, Chuo-ku Tokyo 103-8426, Japan | |
Meeting of Board of Directors for year-end closing: | May 13, 2005 | |
U.S. accounting standards: | Not adopted |
| 1. | Consolidated Financial Results for Fiscal 2004 |
(1) Consolidated Financial Results
| Net sales | Operating income | Recurring income | |||||||||||||
| (¥ Million) | % | (¥ Million) | % | (¥ Million) | % | ||||||||||
Fiscal 2004 | 587,830 | (1.4 | ) | 84,925 | (11.1 | ) | 82,506 | (12.2 | ) | ||||||
Fiscal 2003 | 596,345 | 4.6 | 95,555 | 19.7 | 93,975 | 17.1 | |||||||||
| Net income | Net income per share | Fully diluted net income per share | Return on equity (ROE) | |||||||
| (¥ Million) | % | (¥) | (¥) | (%) | ||||||
Fiscal 2004 | 48,282 | 11.2 | 111.78 | 111.74 | 6.9 | |||||
Fiscal 2003 | 43,411 | 28.3 | 98.57 | 98.56 | 6.5 | |||||
| Ratio of recurring income to total assets | Ratio of recurring income to net sales | |||
| (%) | (%) | |||
Fiscal 2004 | 8.7 | 14.0 | ||
Fiscal 2003 | 10.2 | 15.8 |
| Notes: 1. | Gain on investments in subsidiaries and affiliates accounted for by the equity method: |
Fiscal 2004: | None | |
Fiscal 2003: | None |
| 2. | Average number of outstanding shares (consolidated) during the period: |
Fiscal 2004: | 429,527,836 shares | |
Fiscal 2003: | 437,053,274 shares |
| 3. | Changes in accounting procedures: Yes |
| 4. | Percentages for net sales, operating income, recurring income and net income represent year-on-year changes. |
App. F-3
Table of Contents
(2) Consolidated Financial Position
| Total assets | Shareholders’ equity | Shareholders’ equity ratio | Shareholders’ share | |||||
| (¥ Million) | (¥ Million) | (%) | (¥) | |||||
Fiscal 2004 | 976,230 | 716,587 | 73.4 | 1,667.76 | ||||
Fiscal 2003 | 927,244 | 682,594 | 73.6 | 1,588.35 |
Notes: Outstanding shares (consolidated) at the end of the period:
Fiscal 2004: | 429,508,509 shares | |
Fiscal 2003: | 429,542,651 shares |
(3) Consolidated Cash Flows
Net cash (used in) operating activities | Net cash (used in) investing activities | Net cash (used in) financing activities | Cash and cash equivalents at the end of period | |||||||
| (¥ Million) | (¥ Million) | (¥ Million) | (¥ Million) | |||||||
Fiscal 2004 | 96,703 | (16,265 | ) | (12,716 | ) | 262,530 | ||||
Fiscal 2003 | 71,207 | (49,168 | ) | (31,657 | ) | 194,789 |
(4) Scope of Consolidation and Application of Equity Method:
Number of consolidated subsidiaries: | 37 | |
Number of non-consolidated subsidiaries accounted for by the equity method: | 0 | |
Number of affiliates accounted for by the equity method: | 0 |
(5) Changes in Scope of Consolidation and Application of Equity Method:
Consolidated subsidiaries: | (Newly included) | 0 | ||
| (Excluded) | 1 | |||
Companies accounted for by the equity method: | (Newly included) | 0 | ||
| (Excluded) | 0 |
2. Consolidated Results ‘Forecast for Fiscal 2005’
| Net sales | Recurring income | Net income | ||||
| (¥ Million) | (¥ Million) | (¥ Million) | ||||
Interim period of Fiscal 2005 | 279,000 | 36,000 | 23,000 | |||
Fiscal 2005 | 557,000 | 63,000 | 37,000 |
(Reference) Projected net income per share for Fiscal 2005: ¥85.52
The forecasts above have been based on the information available to management on the date of their announcement. The results could differ materially from these projections for a wide variety of reasons. For detailed information of ‘Forecast for Fiscal 2005’ please refer page 18,19 and 21 of the attached information.
App. F-4
Table of Contents
I. State of the Group
The Sankyo Group consists of Sankyo Co., Ltd. (the “Company”), its 51 subsidiaries, and its three affiliates, for a total of 55 companies. The group’s main operating activities consist of the manufacture and sales of pharmaceuticals, food products, agrochemicals, veterinary drugs and chemical products.
The following chart shows the organization of the Sankyo Group.
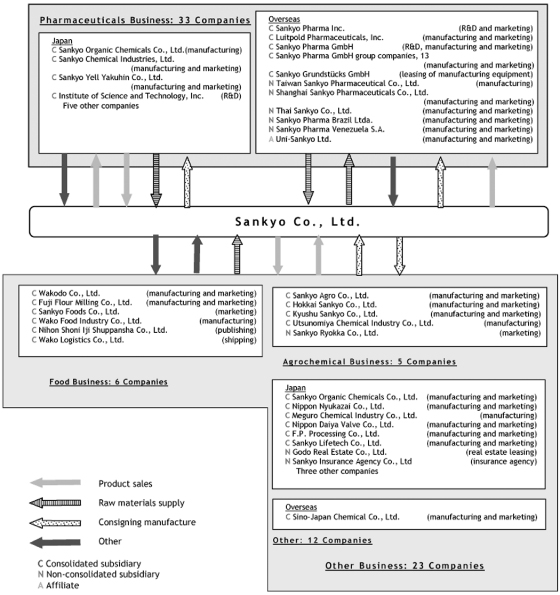
App. F-5
Table of Contents
Consolidated Subsidiaries
| Name | Location | Capital/ Investment (Million yen) | Major | Percentage (%) | Details of Relationship | |||||||||||||
Mutual | Capital Support | Operating | Facilities Leased by Sankyo | Other | ||||||||||||||
Wakodo Co., Ltd. | Chiyoda-ku, Tokyo | 2,918 | Food | 61.6 (0.7) | Yes | — | Sankyo purchases and markets products | — | — | |||||||||
Fuji Flour Milling Co., Ltd. | Shizuoka-shi | 500 | Food | 66.6 (0.4) | Yes | Facility-related capital | Sankyo purchases raw materials | Research facilities and warehouses | — | |||||||||
Sankyo Organic Chemicals Co., Ltd. | Takatsu-ku, Kawasaki-shi | 300 | Pharmaceu- ticals and other | 93.4 | Yes | — | Sankyo purchases raw materials and consigns manufacturing | Manufacturing facilities | — | |||||||||
Nippon Nyukazai Co., Ltd. | Chuo-ku, Tokyo | 300 | Other | 100.0 | Yes | Loan guarantees | Sankyo purchases raw materials | Land | — | |||||||||
Nippon Daiya Valve Co., Ltd. | Shinagawa-ku, Tokyo | 96 | Other | 100.0 | Yes | — | Sankyo purchases research and manufacturing facilities | Land and buildings | — | |||||||||
Sankyo Chemical Industries, Ltd. | Chuo-ku, Tokyo | 65 | Pharmaceu- ticals | 100.0 | Yes | Facility-related and working capital | Sankyo purchases raw materials and consigns manufacturing | — | — | |||||||||
Hokkai Sankyo Co., Ltd. | Kitahiroshima-shi | 52 | Agrochemi- cals | 96.2 | Yes | — | — | — | — | |||||||||
Kyushu Sankyo Co., Ltd. | Tosu-shi | 40 | Agrochemi- cals | 100.0 (100.0) | Yes | — | — | — | — | |||||||||
Meguro Chemical Industry Co., Ltd. | Meguro-ku, Tokyo | 40 | Other | 100.0 | Yes | — | Sankyo purchases materials and consigns manufacturing | Manufacturing facilities | — | |||||||||
Sankyo Foods Co., Ltd. | Chiyoda-ku, Tokyo | 20 | Food | 100.0 | Yes | — | Sankyo purchases raw materials | Offices | — | |||||||||
Utsunomiya Chemical Industry Co., Ltd. | Utsunomiya-shi | 20 | Agrochemi- cals | 100.0 (100.0) | Yes | Facility-related capital | — | — | — | |||||||||
F.P. Processing Co., Ltd. | Ikuno-ku, Osaka- shi | 30 | Other | 100.0 | Yes | Working capital | Sankyo purchases materials | — | — | |||||||||
Institute of Science and Technology, Inc. | Shinagawa-ku, Tokyo | 20 | Pharmaceu- ticals | 100.0 | Yes | — | Sankyo consigns pharmaceutical testing | Offices | — | |||||||||
Sankyo Yell Yakuhin Co., Ltd. | Chiyoda-ku, Tokyo | 96 | Pharmaceu- ticals | 100.0 | Yes | Facility-related and working capital | Sankyo purchases products | — | — | |||||||||
Nihon Shoni Iji Shuppansya Co., Ltd. | Shinjuku-ku, Tokyo | 20 | Food | 100.0 (100.0) | No | — | — | — | — | |||||||||
Wako Logistics Co., Ltd. | Chofu-shi | 21 | Food | 100.0 (100.0) | No | — | — | — | — | |||||||||
Wako Food Industry Co., Ltd. | Nagano-shi | 25 | Food | 100.0 (100.0) | Yes | — | — | — | — | |||||||||
Sankyo Agro Co., Ltd. | Bunkyo-ku, Tokyo | 350 | Agrochemi- cals | 100.0 | Yes | — | Sankyo conducts R&D for the company | Land, buildings and offices | — | |||||||||
Sankyo Lifetech Co., Ltd. | Bunkyo-ku, Tokyo | 300 | Other | 100.0 | Yes | — | Sankyo conducts R&D and manufacturing for the company | Offices | — | |||||||||
Sino-Japan Chemical Co., Ltd. | Taipei, Taiwan | 144 million NT$ | Other | 52.0 (3.4) | Yes | — | — | — | — | |||||||||
Sankyo Pharma Inc. | Parsippany, U.S. | 20.1 million U.S. dollars | Pharmaceu- ticals | 100.0 | Yes | Guarantee for liabilities relating to joint sales promotional contracts, office lease contracts and automotive lease contracts | Sankyo markets products and consigns pharmaceutical- related R&D | — | Sankyo provides pharmaceutical technology | |||||||||
Luitpold Pharmaceuticals, Inc. | Shirley, U.S. | 0.2 million U.S. dollars | Pharmaceu- ticals | 100.0 (100.0) | Yes | — | — | — | — | |||||||||
Sankyo Grundstücks GmbH | Munich, Germany | 5.1 million euros | Pharmaceu- ticals | 100.0 | No | — | — | — | — | |||||||||
Sankyo Pharma GmbH | Munich, Germany | 16.0 million euros | Pharmaceu- ticals | 100.0 | Yes | — | Sankyo markets raw materials and consigns manufacturing and pharmaceutical- related R&D | — | Sankyo provides pharmaceutical technology | |||||||||
Sankyo Pharma UK Ltd. | Amersham, UK | 19.5 million pounds | Pharmaceu- ticals | 100.0 (100.0) | No | — | — | — | — | |||||||||
Sankyo Pharma Espana S.A. | Madrid, Spain | 120 thousand euros | Pharmaceu- ticals | 100.0 (100.0) | No | — | — | — | — | |||||||||
Sankyo Pharma Italia S.p.A. | Rome, Italy | 120 thousand euros | Pharmaceu- ticals | 100.0 (100.0) | No | — | — | — | — | |||||||||
Sankyo Pharma Portugal Lda. | Porto Salvo, Portugal | 349 thousand euros | Pharmaceu- ticals | 100.0 (100.0) | No | — | — | — | — | |||||||||
Sankyo Pharmazeutika Austria GmbH | Vienna, Austria | 18 thousand euros | Pharmaceu- ticals | 100.0 (100.0) | No | — | — | — | — | |||||||||
Sankyo Pharma (Schweiz) AG | Thalwil, Switzerland | 3 million Swiss Francs | Pharmaceu- ticals | 100.0 (100.0) | No | — | — | — | — | |||||||||
Sankyo Pharma Nederland B.V. | Zwanenburg, the Netherlands | 18 thousand euros | Pharmaceu- ticals | 100.0 (100.0) | No | — | — | — | — | |||||||||
App. F-6
Table of Contents
| Name | Location | Capital/ Investment (Million yen) | Major | Percentage (%) | Details of Relationship | |||||||||||||
| Mutual Directors | Capital Support Provided by Sankyo | Operating Transactions | Facilities Leased by Sankyo | Other | ||||||||||||||
N.V. Sankyo Pharma Belgium S.A. | Louvain- La-Nueve, Belgium | 62 thousand euros | Pharmaceu- ticals | 100.0 (100.0) | No | — | — | — | — | |||||||||
Oy Sankyo Pharma Finland Ab | Helsinki, Finland | 25 thousand euros | Pharmaceu- ticals | 100.0 (100.0) | No | — | — | — | — | |||||||||
Sankyo Manufacturing France S.a.r.l. | Altkirch, France | 457 thousand euros | Pharmaceu- ticals | 100.0 (100.0) | No | — | — | — | — | |||||||||
Dignos-Chemie GmbH | Munich, Germany | 40 thousand euros | Pharmaceu- ticals | 100.0 (100.0) | No | — | — | — | — | |||||||||
Sankyo Pharma France S.A.S. | Neully-sur- Seine, France | 2,182 thousand euros | Pharmaceu- ticals | 100.0 (100.0) | No | — | — | — | — | |||||||||
Dismed AG | Zug, Switzerland | 100 thousand Swiss Francs | Pharmaceu- ticals | 100.0 (100.0) | No | — | — | — | — | |||||||||
Notes:
| 1. | The terms used in the ‘Major Operating Activities’ column are the same as those used in the business segment information section. |
| 2. | Those subsidiaries submitting notification or reports relating to securities (‘yukashoken todokedesho’ or ‘yukashoken hokokusyo’) are as follows: Wakodo Co., Ltd. and Fuji Flour Milling Co., Ltd. Both companies are listed, on the Tokyo and Nagoya Stock Exchanges, respectively. |
| 3. | Figures in parentheses under the ‘Percentage of Voting Rights Held’ column represent voting rights owned indirectly and have been included in the respective total. |
| 4. | Sankyo Trading Co., Ltd., which had been a consolidated subsidiary of the Company until the year ended March 31, 2004, has been excluded from the scope of consolidation effective the current period due to sale of the Company’s entire shares in this company. |
| 5. | The Company sold its entire shares of Nippon Daiya Valve Co., Ltd. in April 2005. |
| 6. | Kyushu Sankyo Co., Ltd. was integrated into Sankyo Agro Co., Ltd. and Utsunomiya Chemical Industry Co., Ltd. in April 2005. |
| 7. | Sankyo Foods Co., Ltd. decided that it would transfer its business in July 2005. |
App. F-7
Table of Contents
II. Management Policies
1. Basic Management Objective
The Sankyo Group’s business philosophy is to “contribute, as a company involved with human life, to healthy and full lives for people around the world by developing innovative pharmaceuticals that are highly appraised internationally.” This philosophy and a firm ethical vision are the foundations upon which the Group intends to fulfill its social mission.
Amid a challenging operating environment marked by intensifying competition in new drug development, the worldwide implementation of measures to curb medical expenses, and the emergence of truly global competition spurred by the increasingly borderless nature of the pharmaceutical market, Sankyo is pushing forward with various restructuring that aim to bolster competitiveness. In addition, on February 25, 2005, Sankyo and Daiichi Pharmaceutical Co., Ltd., entered into a basic agreement to integrate their businesses. This proactive management decision will facilitate the early achievement of Group sales of ¥1 trillion, an operating income ratio of 20% or more, and an ROE of 10% or more by fiscal 2010—targets set out in a management vision.
Sankyo will continue to conduct its business activities in line with its business philosophy to maintain the trust of its stakeholders-shareholders, customers, staff, and society.
2. Profit Distribution
Sankyo, having taken into consideration numerous factors including the Company’s future financial outlook, medium- to long-term financing needs, and financial structure, is working to maintain or enhance retained earnings. At the same time, the Company places considerable importance on distributing profits to shareholders. Sankyo will continue to provide stable dividends while taking a flexible and strategic approach to acquiring treasury stock. Retained earnings are primarily invested in new drug R&D and the globalization of the Group’s sales organization with the objective of boosting corporate value.
3. Reduction of Number of Shares of Common Stock per Unit
On August 1, 2002, Sankyo reduced the size of its stock unit from 1,000 shares to 100 shares of common stock in order to promote the wider circulation of the Company’s stock and expand its shareholder base. Going forward, Sankyo will strive to enhance information provision to individual investors.
4. Medium-to-Long-Term Management Strategies and Goals
Amid increasingly competitive conditions in Japan and overseas spurred by globalization and borderless markets, Sankyo continues to face a challenging operating environment over the medium term, compounded by intensified competition and competition from generic versions of the mainstay product Mevalotin®, an antihyperlipidemic agent, in Japan and the upcoming expiration of the patent for this drug in fiscal 2006 in the United States.
To promote its flexible and appropriate response to the changing global environment, Sankyo completely revamped its management team, including the selection of a new president, in June 2003, forging onward with business reforms under the new regime. In addition, on February 25, 2005, Sankyo and Daiichi entered into the aforementioned agreement to integrate their businesses. This proactive management decision will facilitate the early achievement of Group sales of ¥1 trillion, an operating income ratio of 20% or more, and an ROE of 10% or more by fiscal 2010—targets set out in the management vision.
5. Issues to be Addressed
(1) Realizing the Business Integration with Daiichi
On February 25, 2005, Sankyo concluded a basic agreement to integrate the businesses with Daiichi. On May 13, 2005, Sankyo and Daiichi signed a definitive agreement. Subject to approval at Sankyo’s 151st Ordinary General Shareholders Meeting to be held on June 29, 2005, the companies plan to establish the holding company DAIICHI SANKYO COMPANY, LTD., on September 28, 2005. In addition, Sankyo and Daiichi aim to complete the integration of their pharmaceutical operations under the operational holding company by April 2007. We aim to strengthen R&D capabilities, enhance the development pipeline, bolster domestic sales strength, achieve expanded corporate strategy options via increased scale, improve operational efficiency, and enhance human resources through the integration.
App. F-8
Table of Contents
(2) Maximizing Sales of the Antihypertensive Agent Olmesartan
Sales of Sankyo’s strategic global product olmesartan, an antihypertensive agent sold as Benicar® in the United States and Olmetec® in Japan and Europe, are showing steady growth. The product was first brought to market in the United States and Germany in 2002 and is currently offered in 27 countries around the world. Olmesartan was launched in Japan on May 11, 2004, and we expect its approval for long-term use to push sales even higher in 2005 and beyond. Sankyo is redoubling its efforts to maximize global sales of olmesartan making use of its own infrastructure and some alliances in sales and promotion.
(3) Reinforcement of the Development Pipeline Management
A robust development pipeline is crucial to emerging as a winner in the face of global competition. Sankyo established three global organizations in fiscal 2003 to bolster pipeline management.
| i) | The Global R&D Management Committee (GRDMC) makes decisions regarding investment and resource allocation within R&D units and prioritizes drugs in the pipeline. |
| ii) | The Global Licensing Committee (GLC) makes decisions regarding policies and strategies for such licensing matters as acquiring and leveraging the resources of other companies. |
| iii) | The Global Marketing Management Committee (GMMC) formulates strategies to extend the life cycles of products on the market and increase sales. |
These three committees all operate from a global perspective and gather at product strategy conferences to ensure that the Sankyo Group’s pipeline is optimized.
(4) Putting the Emphasis on Performance and Roles
In fiscal 2003, Sankyo introduced a new personnel system for managerial-level staff to motivate both the individual and the organization. This system clarifies the roles of employees and appropriately links performance to compensation. In October 2004, we expanded this personnel system to include all employees.
We also divided the Company into individual organizational units that are accountable for given functions, for example, marketing, R&D, or supply chain activities, and delegated responsibility and authority for operations in their particular areas to the units. This enables each unit to make autonomous decisions and take swift action. In addition, Sankyo introduced a performance management system to track unit performance to ensure that management resources are effectively invested in units.
(5) Strengthening Group Internal Functions
To heighten the competitiveness of the entire Sankyo Group, we are restructuring functions related to pharmaceutical operations. In April 2004, we established a Supply Chain Management Division to oversee procurement, production, and related functions. We also realigned headquarters functions, establishing a Corporate Division to handle strategic functions and a Business Operation Division to manage routine functions. These initiatives are designed to create an organization that is clearly partitioned by function and to thereby strengthen functions within the Group and enhance cost-competitiveness. In addition, Sankyo has outsourced its information system operations to Hitachi, Ltd., and will establish a joint company with the Hitachi Group for the provision of information system services.
(6) Reexamining Non-Pharmaceutical Operations
In order to concentrate management resources in pharmaceutical operations, we are restructuring our non-pharmaceutical businesses within the Group. In fiscal 2003, we spun off the Crop Protection Division and the Special Merchandise Division and moved forward with the realignment and consolidation of Group companies, withdrawing from operations handling such medical products as diagnostic reagents and medical devices. In addition, in fiscal 2004 Sankyo transferred the stock of Sankyo Trading Co., Ltd., and decided to sell its shares in the consolidated subsidiary Nippon Daiya Valve Co., Ltd., and transfer the business of Sankyo Foods Co., Ltd. Going forward, Sankyo will focus further on its pharmaceutical operations.
6. Corporate Governance
In the area of corporate governance, we have structured management to respond to changes in the business environment with greater speed and flexibility and maintain a focus on improving the environment to ensure the
App. F-9
Table of Contents
transparency of management and maintain the trust of our shareholders. In line with this policy, in June 2003, Sankyo reduced the number of Directors and introduced an Executive Officer System, clarifying Directors’ responsibilities in management decision-making and the auditing of business operations, and executive officers’ responsibilities in business operations as part of efforts to strengthen corporate governance.
(1) Improvement of Management
Sankyo’s Board of Directors is devoted to making decisions related to management strategies and other important issues as well as supervising business operations. To reinforce the supervisory functions of general executive operations, enhance transparency, and create a management framework better equipped to rapidly address global issues, Sankyo appointed one director from the Company’s U.S.-based subsidiary Sankyo Pharma Inc., and two directors from outside the Group to its Board of Directors.
In addition, four corporate auditors, including outside auditors, make up the Board of Corporate Auditors, which audits the legality and soundness of Sankyo’s operations.
(2) Introduction of Corporate Officer System
Corporate Officers are appointed by the Board to perform specific business operations for a period of one year under the supervision of a representative director. This system clarifies Directors’ responsibilities in connection with management decision making and the auditing of business operations and Corporate Officers’ responsibilities in connection with business operations. The executive officers appointed are individuals with outstanding professional skills in the areas of business for which they are responsible and are accorded a status equivalent to that of directors.
(3) Establishment of an Executive Appointment Nomination Committee and a Remuneration Committee
To enhance the transparency of management, Sankyo formed the Executive Appointment Nomination Committee and the Remuneration Committee as ad hoc units. The Executive Appointment Nomination Committee deliberates on matters related to the appointment and removal of Board members and corporate officers as well as promotions and reports its findings to the Board. The Remuneration Committee reviews and establishes individual compensation packages for Board members and corporate officers.
(4) Compliance
We introduced the Sankyo Compliance Program and are continuing to educate our directors and employees with the aim of ensuring strict compliance with laws and adherence to corporate ethics. In addition, Sankyo established the Environmental & Compliance Program Management Department in April 2004 as a part of efforts to reinforce the functions of headquarters. As a company involved with human life, we remain committed to maintaining high ethics and building a business culture that emphasizes the corporation’s social responsibilities.
7. Business Risks
Examples of the types of risks that may affect the performance of the Sankyo Group are as follows:
(1) Risks Associated with the Product Qualities and Side Effects
Unanticipated side effects, accidents, or changes in laws and regulations may result in the recall or discontinuation of products. Although every effort is made to ensure the reliability and quality of clinical trials, there is a chance that unanticipated side effects or incidents involving product contamination will arise.
(2) Risks Associated with Legal Regulations and Government Policies
Changes in Pharmaceutical Affairs Law regulations may result in a product no longer complying with regulations or the cancellation of manufacturing or sales approval. Such instances may require product recall or discontinuation, which may affect business performance.
In addition, the Company may be adversely affected by medical policy and health insurance system trends. The Sankyo Group sells pharmaceuticals throughout the world, and, as pharmaceutical prices are strongly influenced by the medical policies and health insurance systems of individual countries, these trends may affect business performance.
App. F-10
Table of Contents
(3) Risks Associated with Pharmaceutical R&D
There is a possibility that R&D will not proceed as planned, delaying the launch of potential new products. If a new drug candidate does not meet expectations in terms of efficacy or leaves doubt as to its safety in clinical trials, the development period may be extended or development may be delayed or discontinued and this may affect business performance.
(4) Risks Associated with Exchange Rate Fluctuations
The Company may be adversely affected by exchange rate fluctuations. The Sankyo Group is developing its business globally and is engaged in manufacturing, sales, importing and exporting. Therefore, exchange rate fluctuations may affect its business performance.
(5) Other Risks
Economic conditions in various countries, including inflation and interest rate fluctuations, may affect the Sankyo Group’s business performance.
A breakdown of law and order due to war or political upheaval may result in the destruction of or damage to business offices or may force the scaling down or withdrawal from certain businesses, which may affect business performance.
App. F-11
Table of Contents
III. Results of Operations and Financial Position
I. Results of Operations
1. Overview of Fiscal 2004
(¥ 100 Millions of yen)
| Net sales | Operating income | | Recurring income | | Net income | ||||||
Fiscal 2004 | 5,878 | 849 | 825 | 482 | |||||||
Fiscal 2003 | 5,963 | 955 | 939 | 434 | |||||||
Change (%) | (1.4 | ) | (11.1 | ) | (12.2 | ) | 11.2 |
(1) Overview of performance
During the fiscal year under review, the pharmaceutical industry was marked by intense change. Market conditions in Japan are becoming increasingly fierce as the government pushes forward with measures designed to curb medical expenses, including the promotion of generic drug use and the April 2004 national health insurance (NHI) drug price revisions. Overseas, pharmaceutical markets in Europe and the United States continue to expand; however, operating conditions are becoming ever more unpredictable as government plans to contain medical costs gradually take shape. Furthermore, globalization and borderless markets are contributing to an unprecedented pace of change in the business environment.
Against this backdrop, net sales for the fiscal year under review was down a slight 1.4% from the previous fiscal year, to ¥587.8 billion, operating income slid 11.1%, to ¥84.9 billion, and recurring income declined 12.2%, to ¥82.5 billion. Net income rose 11.2%, to ¥48.2 billion.
Sales of the antihypertensive agent olmesartan, which is offered in the United States as Benicar® and in Europe and Japan as Olmetec®, soared on the back of the drug’s strong performance in Europe and the United States and its May 2004 launch in Japan. Nevertheless, lower sales of the flagship antihyperlipidemic agent Mevalotin® and the withdrawal from medical products operations resulted in a decline in net sales. Operating income and ordinary income declined mainly as a result of lower sales and higher selling, general, and administrative expenses stemming from increased investment aimed at enhancing MR forces to maximize sales of olmesartan. Net income, however, rose due to a major increase in extraordinary profits primarily attributable to proceeds from the sale of land on the site of the Company’s former Tanashi Plant and an improvement in the corporate tax rate due to reduced losses at overseas subsidiaries, which more than countered the posting of an impairment loss resulting from the early application of asset impairment accounting as an extraordinary loss.
(2) Segment Information
Business Segments
(¥ 100 Millions of yen)
| Net sales | Operating income | |||||||||||||||||||
| Fiscal 2004 | Fiscal 2003 | Change | Change (%) | Fiscal 2004 | Fiscal 2003 | Change | Change (%) | |||||||||||||
Pharm. | 4,556 | 4,680 | (123 | ) | (2.6 | ) | 774 | 891 | (116 | ) | (13.0 | ) | ||||||||
Other | 1,348 | 1,327 | 20 | 1.6 | 65 | 55 | 10 | 19.6 | ||||||||||||
1) Pharmaceuticals
Sales in the pharmaceuticals segment totaled ¥455.6 billion, a 2.6% decline from the previous fiscal year, and operating income came to ¥77.4 billion, down 13.0%. Despite a strong showing from the antihypertensive agent olmesartan, encouraged by the drug’s May 2004 introduction under the trade name Olmetec®, sales of pharmaceuticals lost ground due to the withdrawal from the medical products business and a substantial decline in sales of the mainstay product Mevalotin®, an antihyperlipidemic agent, owing to the expiration of the patent
App. F-12
Table of Contents
for this agent in Europe, national health insurance (NHI) drug price revisions, and intensifying competition in Japan and overseas.
Overseas, sales of the antihypertensive agent Benicar® and the diuretic/olmesartan combination Benicar® HCT grew in the United States, thanks to the co-promotion efforts of Sankyo Pharma Inc. (SPI) and Forest Laboratories, Inc. In addition, Luitpold Pharmaceuticals Inc., saw a steady climb in sales of the antianemia agent Venofer®. In Europe, the Sankyo Pharma GmbH (SPG) Group recorded expanded sales of the antihypertensive agent Olmetec®, which the SPG Group has been successively launching throughout Europe, and steady sales of Lopresor® and Lomir®, antihypertensive drugs licensed in from Novartis Pharma Co., Ltd., throughout the fiscal year in France, Italy, Belgium, Switzerland, and Portugal.
Sales of health care products were up, thanks in part to the strong showing of Lamisil® AT, a switched OTC product for the treatment of athlete’s foot and ringworm licensed-in from Novartis Pharma Co., Ltd., in February 2004, in a lackluster market.
Operating income declined, mainly due to lower sales of Mevalotin® and a rise in selling, general and administrative expenses stemming from increased investments aimed at bolstering the sales of SPI and the SPG Group.
2) Other
Sales in this segment climbed 1.6% from the previous fiscal year, to ¥134.8 billion, and operating income jumped 19.6%, to ¥6.5 billion.
Although improved corporate earnings spurred growth in capital investment and consumer spending edged up, market conditions remained tough amid an uncertain economic outlook, skyrocketing oil prices, and increasingly fierce corporate competition. In this setting, Wakodo Co., Ltd., saw an expansion in sales of dried milk for infants and Nippon Nyukazai Co., Ltd., saw a rise in sales of glycol products. In addition, Sankyo Agro Co., Ltd., and Sankyo Lifetech Co., Ltd., which were established on April 1, 2003, following the spin-off of the Crop Protection Company and the Special Merchandise Company, recorded steady growth in sales.
Operating income rose as a result of ongoing efforts to improve operational efficiency through cost control and other measures. In addition, the Company transferred the stock of Sankyo Trading Co., Ltd., and entered into agreements to transfer the stock of Nippon Daiya Valve Co., Ltd., and the business of Sankyo Foods Co., Ltd., as part of initiatives to increase its focus on the pharmaceutical business.
Geographic Segments
(¥ 100 Millions of yen)
| Net sales | Operating income | |||||||||||||||||||||
| Fiscal 2004 | Fiscal 2003 | Change | Change (%) | Fiscal 2004 | Fiscal 2003 | Change | Change (%) | |||||||||||||||
Japan | 4,738 | 5,078 | (340 | ) | (6.7 | ) | 733 | 1,005 | (272 | ) | (27.1 | ) | ||||||||||
North America | 803 | 641 | 161 | 25.2 | 131 | 29 | 101 | 345.4 | ||||||||||||||
Other | 526 | 371 | 155 | 41.9 | (13 | ) | (62 | ) | 49 | |||||||||||||
1) Japan
Sales totaled ¥473.8 billion, down 6.7% from the previous fiscal year, and operating income was ¥73.3 billion, falling 27.1%.
A steady climb in sales of Olmetec® following the drug’s May 2004 launch in Japan were countered by the withdrawal from medical products operations and a marked decline in sales of Mevalotin®, resulting in an overall decrease in sales in Japan.
Lower sales and a rise in selling, general, and administrative expenses brought about by such factors as costs related to business reforms, the realignment of Group functions, and the upcoming business integration with Daiichi led to a substantial decline in operating income.
2) North America
Sales rose 25.2% from the previous fiscal year, to ¥80.3 billion, and operating income soared 345.4%, to ¥13.1 billion.
App. F-13
Table of Contents
Intensified competition caused sales of the antihyperlipidemic agent WelChol® at Sankyo Pharma Inc. to slip; however, those of Benicar® and Benicar® HCT were up. In addition, Luitpold Pharmaceuticals Inc., continued to see growth in sales of Venofer®.
Operating income rose dramatically, primarily owing to markedly higher net sales that countered an increase sales promotion costs and other selling, general, and administrative costs associated with sales expansion initiatives.
3) Other
Sales rose 41.9%, to ¥52.6 billion, and the operating loss shrank from ¥6.2 billion in the previous fiscal year, to ¥1.3 billion.
In Europe, the Sankyo Pharma GmbH (SPG) Group saw growth in sales of Olmetec®, Lopresor®, and Lomir®.
Although increased investment directed at bolstering sales forces and other factors led to higher selling, general, and administrative expenses, the operating loss was reduced, thanks to expanded sales.
( 3) Dividends
In the fiscal year under review, the Company paid an interim dividend of ¥15.00 per share. The Company also paid a year-end dividend of ¥25.00 per share, reflecting a ¥10.00 increase from initial projections in light of such factors as an increase in free cash flow due to the sale of land on the site of the Company’s former Tanashi Plant, resulting in a total dividend for the year of ¥40.00 per share.
This increased the dividend payout ratio to 45.9%, and the dividend to shareholders’ equity ratio to 2.4% on a non-consolidated basis.
2. R&D Activities
In the fiscal year under review, research and development costs amounted to ¥86.5 billion, or 14.7% of sales on a consolidated basis.
We have concentrated our management resources on creating and bringing new world-class drugs to market at the earliest possible date, focusing on six key research areas including cardiovascular disease.
As for R&D activities, Sankyo implemented major organizational reform focused on integrating its global R&D organization in October 2003. This reform was based on the successes of the R&D restructuring program that Sankyo launched in July 2002—the R&D ReDesign (RDRD) Project. Sankyo is working to leverage the realignments to achieve the RDRD Project goals of prioritizing drugs in the pipeline, expediting decision-making, and rapidly developing innovative new drugs.
Sankyo’s principal global development products include CS-747 [Phase III (U.S. and Europe); Phase I (Japan)], a treatment for ischemic disease being jointly developed with the Eli Lilly and Company; CS-505 [Phase II/III (U.S. and Europe); Phase I preparations (Japan)], an anti-arteriosclerotic agent being developed in-house; Fidarestat® [Phase III preparations (U.S. and Europe)], a diabetic neuropathy agent being jointly developed with Sanwa Kagaku Kenkyusho; CS-011 [Phase II (U.S. and Europe)], an antidiabetic agent being developed in-house; and CS-917 [Phase II (U.S. and Europe)], an antidiabetic agent being jointly developed with Metabasis.
Sankyo has given top priority to the development of two of these agents—CS-747 and CS-505. In August 2004, Sankyo presented results of Phase II trials of CS-747 (generic name: prasugrel) showing the agent to have a safety profile similar to that of the standard treatment clopidogrel at an European Society of Cardiology meeting in Munich, Germany. In addition, in March 2005, the Company presented data from early phase trials of CS-747 comparing the agent to clopidogrel at an American College of Cardiology meeting in Orlando, Florida. In these trials, CS-747 demonstrated more than ten times greater inhibition of platelet aggregation, quicker onset (more rapid effect), and more consistent action than clopidogrel. On the basis of results obtained to date, we are preparing to enter Phase III trials to demonstrate the superiority of CS-747 over clopidogrel. Turning to CS-505, three clinical trials of this agent are currently in progress. As a first-in-class treatment, CS-505 has great potential provided that these trials produce promising results.
In addition, Sankyo is focusing on the life cycle management of such products as olmesartan and Loxonin®.
App. F-14
Table of Contents
3. Overseas Deployment
As far as overseas activities are concerned, we have worked actively, considering the global development of the pharmaceuticals business, to select research, development, supply chain, and sales as our top-priority business issues. Above all, we are striving to maximize sales of the antihypertensive agent olmesartan, which is marketed in the United States as Benicar® and in Europe as Olmetec®.
In the United States, Sankyo Pharma Inc. (SPI) began selling Benicar® in May 2002 under a co-romotion agreement with Forest Laboratories, Inc., and, in September 2003, launched the diuretic/olmesartan combination Benicar® HCT. Sales of both these products are showing steady growth.
In Europe, the Sankyo Pharma GmbH (SPG) Group began selling Olmetec® in Germany in October 2002 and currently offers this product in all major European countries, including Britain, France, Spain, and Italy. Furthermore, SPG licensed-in the antihypertensive drugs Lopresor® and Lomir® from Novartis Pharma Co., Ltd., in November 2003. These products are already being sold in some European countries, and we hope to see synergistic effects for Olmetec® sales.
Sankyo aims to make the most of olmesartan not only in Europe and the United States but around the globe. Going forward, Shanghai Sankyo Pharmaceuticals Co., Ltd., Sankyo Pharma Brazil Ltda., and Sankyo Pharma Venezuela S.A., will begin preparing for the market introduction of olmesartan. In addition, Sankyo has selected Pfizer Inc. to co-promote the drug in thirteen other countries in Oceania, Asia, and Latin America and DaeWoong Pharma Co., Ltd., to handle it in the Republic of Korea. Olmesartan is currently available in 27 countries and is experiencing solid sales growth.
4. Outlook for Fiscal 2005
(¥ 100 Millions of yen)
| Net sales | Recurring income | Net income | |||||||
Fiscal 2005 | 5,570 | 630 | 370 | ||||||
Fiscal 2004 | 5,878 | 825 | 482 | ||||||
Change (%) | (5.2 | ) | (23.6 | ) | (23.4 | ) |
(1) Overview of performance
We anticipate operating conditions to remain challenging over the next year; however, the Group will continue to work to bolster its operating efficiency and proactively engage in business activities. Our forecast is that net sales will edge down 5.2%, to ¥557.0 billion, recurring income will decline 23.6%, to ¥63.0 billion, and net income will retreat 23.4%, to ¥37.0 billion.
Meanwhile, Nippon Daiya Valve Co., Ltd., the stock of which was transferred to Seika Corporation in April 2005, and Sankyo Foods Co., Ltd., the business of which is slated to be transferred to a joint venture with Oriental Yeast Co., Ltd., in July 2005, will be excluded from the scope of consolidation from fiscal 2005.
(2) Outlook by Segment
Business Segments
1) Pharmaceuticals
We forecast that net sales of pharmaceuticals will decline ¥26.0 billion.
Overseas, we anticipate a substantial decline in sales of bulk exports of the antihyperlipidemic agent Mevalotin® to Bristol-Myers Squibb Company due to expiration of the drug’s patent in Europe, competing products in the United States, and other factors. However, we predict that growth in sales of olmesartan, an antihypertensive agent sold in 27 countries, including major European countries and the United States, will lead to a sharp increase in overall sales.
In Japan, we expect to see sales of olmesartan soar with the lifting of restrictions on its period of use in May 2005. However, we anticipate a decline in revenues as a result of the conclusion of a joint sales agreement with Kirin Brewery Co., Ltd., for Espo®, a drug for the treatment of renal anemia, and Gran®, a drug for the treatment of leukopenia, at the end of March 2005 and fiercer competition of our flagship product Mevalotin®.
App. F-15
Table of Contents
We forecast that operating income will decline as a result of lower sales, and higher selling, general, and administrative expenses due to a rise in R&D and sales promotion costs.
2) Other
We forecast that net sales in this segment will decline approximately ¥5.0 billion due to the exclusion of Sankyo Foods Co., Ltd., and Nippon Daiya Valve Co., Ltd., from the scope of consolidation.
Although we anticipate a decline in sales, we expect operating income to remain at about the same level as in fiscal 2004.
Geographic Segments
1) Japan
Sales in this segment are expected to decline next year. We forecast that nonpharmaceutical sales will decrease approximately ¥5.0 billion and that sales of pharmaceuticals will contract to ¥38.0 billion or more, as reduced exports of the antihyperlipidemic agent Mevalotin® to Bristol-Myers Squibb Company and the conclusion of a joint sales agreement with Kirin Brewery Co., Ltd., for Espo® and Gran® outweigh expanded sales of the antihypertensive agent olmesartan.
We anticipate a decline in operating income, owing to substantially lower sales.
2) North America
Although sales of the antianemia agent Venofer® are projected to decline due to lowering of the drug’s reimbursement price, marked growth in those of the antihypertensive agent Benicar® and its diuretic combination Benicar® HCT are expected to bring about a ¥7.0 billion rise in the segment’s sales.
Operating income is forecast to lose ground due to a rise in sales promotion costs stemming from initiatives to boost Benicar® sales, which is expected to outweigh the increase in sales.
3) Other
We project a ¥1.0 billion increase in this segment’s sales as expanded sales of the antihypertensive agent olmesartan are expected to more than counter a decline in sales of the antihyperlipidemic agent Mevalotin® in Europe.
Although sales are forecast to rise, we expect operating income to decline as a result of higher personnel costs arising from efforts to bolster our global sales framework.
The exchange rates used for translation of revenues and expenses of overseas subsidiaries for fiscal 2004 are as follows:
1 US$ = ¥105.0
1 euro = ¥140.0
App. F-16
Table of Contents
II. Financial Position
1. Overview of Fiscal 2004
Cash Flow Analysis
(¥ 100 Millions of yen)
| Fiscal 2004 | Fiscal 2003 | Change | |||||||
Net cash provided by (used in) operating activities | 967 | 712 | 254 | ||||||
Net cash provided by (used in) investing activities | (162 | ) | (491 | ) | 329 | ||||
Net cash provided by (used in) financing activities | (127 | ) | (316 | ) | 189 | ||||
Effect of exchange rate changes on cash and cash equivalents | (1 | ) | (8 | ) | 7 | ||||
Net increase (decrease) in cash and cash equivalents | 675 | (105 | ) | 781 | |||||
Cash and cash equivalents at the end of period | 2,625 | 1,947 | 677 |
Cash and cash equivalents at the end of fiscal 2004 rose ¥67.7 billion from the previous fiscal year, to ¥262.5 billion. Contributing factors are summarized as follows:
Cash Flows from Operating Activities
Net cash provided by operating activities increased ¥25.4 billion from the corresponding amount for the previous fiscal year, to ¥96.7 billion. This is mainly a result of a ¥12.8 billion reduction in corporate tax payments, which offset a ¥4.9 billion decline in income before income taxes and minority interests that includes an impairment loss of ¥15.8 billion that does not affect cash flows.
Cash Flows from Investing Activities
Net cash used in investing activities declined ¥32.9 billion from the corresponding amount for the previous fiscal year, to ¥16.2 billion, largely as a result of a ¥19.9 billion reduction in expenditure of purchases of intangible fixed assets and a ¥10.2 billion increase in income from the sale of property, plant and equipment.
Cash Flows from Financing Activities
Cash used in financing activities declined ¥18.9 billion from the prior year, to ¥12.7 billion, primarily reflecting a ¥19.9 billion decrease in purchases of treasury stock.
Trends in key cash flow indicators are summarized as follows:
| Fiscal 2001 | Fiscal 2002 | Fiscal 2003 | Fiscal 2004 | |||||
Shareholders’ equity ratio (%) | 71.2 | 71.9 | 73.6 | 73.4 | ||||
Fair value shareholders’ equity ratio (%) | 94.2 | 75.3 | 104.9 | 99.4 | ||||
Debt redemption period (year) | 0.6 | 0.4 | 0.3 | 0.2 | ||||
Interest coverage ratio (%) | 77.1 | 157.5 | 212.4 | 269.8 |
Shareholders’ equity ratio: Shareholders’ equity/total assets
Fair value shareholders’ equity ratio: Total fair value of outstanding shares/total assets
Debt redemption period: Interest-bearing debt/cash flows from operating activities
Interest coverage ratio: Cash flows from operating activities/interest payments
Notes:
| 1. | All of the figures in the aforementioned indices were calculated on a consolidated basis. |
| 2. | The total fair value of outstanding shares was calculated by multiplying the closing stock price at the end of the fiscal year by the total number of outstanding shares at the end of the fiscal year (excluding treasury shares). |
App. F-17
Table of Contents
| 3. | Cash flows from operating activities represent net cash provided by operating activities in the consolidated statements of cash flows. Interest-bearing debt represents all liabilities subject to the payment of interest in the consolidated balance sheets. In addition, interest payments are reflected as “interest paid” in the consolidated statements of cash flows. |
2. Outlook for Fiscal 2004
Important issues that are likely to impact cash flows over the next year are as follows:
Cash Flows from Operating Activities
We project a ¥11.2 billion decline in net income and a reduction in cash flows from operating activities.
Cash Flows from Investing Activities
We expect a ¥10 billion decrease in income from the sale of tangible fixed assets as compared with fiscal 2004 in which the Company generated substantial income mainly from the sale of the former Tanashi Plant site. Purchases of tangible fixed assets are also anticipated to decline about a ¥9.0 billion.
Cash Flows from Financing Activities
We plan to increase dividend payments by approximately ¥7.5 billion as compared with the corresponding amount in the current fiscal year.
App. F-18
Table of Contents
IV. Consolidated Financial Statements
1. Consolidated Balance Sheets
(Millions of yen)
| As of March 31, 2004 | As of March 31, 2005 | Change | ||||||||||||||||
See Note: | Amount | % | Amount | % | Amount | |||||||||||||
ASSETS | ||||||||||||||||||
Current assets | ||||||||||||||||||
Cash and deposits | 156,660 | 175,960 | 19,299 | |||||||||||||||
Trade notes and accounts receivable | 170,468 | 162,442 | (8,026 | ) | ||||||||||||||
Marketable securities | 93,614 | 146,632 | 53,017 | |||||||||||||||
Inventories | 89,945 | 89,979 | 34 | |||||||||||||||
Deferred tax assets | 18,100 | 21,832 | 3,732 | |||||||||||||||
Other | 9,487 | 9,704 | 216 | |||||||||||||||
Allowance for doubtful accounts | (2,460 | ) | (483 | ) | 1,976 | |||||||||||||
Total current assets | 535,816 | 57.8 | 606,067 | 62.1 | 70,251 | |||||||||||||
Fixed assets | ||||||||||||||||||
Tangible fixed assets | 1 | |||||||||||||||||
Buildings and structures | 2,4 | 107,998 | 111,966 | 3,968 | ||||||||||||||
Machinery, equipment and vehicles | 2,4 | 36,172 | 31,831 | (4,341 | ) | |||||||||||||
Land | 4 | 29,933 | 30,655 | 721 | ||||||||||||||
Construction in progress | 8,687 | 10,005 | 1,317 | |||||||||||||||
Other | 2,4 | 11,735 | 11,980 | 245 | ||||||||||||||
Total tangible fixed assets | 194,527 | 21.0 | 196,439 | 20.1 | 1,912 | |||||||||||||
Intangible fixed assets | ||||||||||||||||||
Consolidation goodwill | 1,143 | 845 | (298 | ) | ||||||||||||||
Other | 41,891 | 24,181 | (17,710 | ) | ||||||||||||||
Total intangible fixed assets | 43,035 | 4.6 | 25,026 | 2.6 | (18,008 | ) | ||||||||||||
Investments and other assets | ||||||||||||||||||
Investment securities | 3,4 | 117,891 | 114,480 | (3,411 | ) | |||||||||||||
Long-term loans | 5,739 | 5,876 | 137 | |||||||||||||||
Deferred tax assets | 13,783 | 14,967 | 1,183 | |||||||||||||||
Other | 3 | 17,008 | 13,702 | (3,306 | ) | |||||||||||||
Allowance for doubtful accounts | (558 | ) | (329 | ) | 228 | |||||||||||||
Total investments and other assets | 153,865 | 16.6 | 148,696 | 15.2 | (5,168 | ) | ||||||||||||
Total fixed assets | 391,427 | 42.2 | 370,163 | 37.9 | (21,264 | ) | ||||||||||||
Total assets | 927,244 | 100.0 | 976,230 | 100.0 | 48,986 | |||||||||||||
App. F-19
Table of Contents
(Millions of yen)
| As of March 31, 2004 | As of March 31, 2005 | Change | |||||||||||||||
| See Note: | Amount | % | Amount | % | Amount | ||||||||||||
LIABILITIES | |||||||||||||||||
Current liabilities | |||||||||||||||||
Trade notes and accounts payable | 50,907 | 54,435 | 3,527 | ||||||||||||||
Short-term bank loans | 4 | 15,578 | 16,699 | 1,120 | |||||||||||||
Income taxes payable | 11,564 | 16,904 | 5,340 | ||||||||||||||
Deferred tax liabilities | 544 | 689 | 145 | ||||||||||||||
Accrued bonuses | 13,295 | 13,481 | 186 | ||||||||||||||
Allowance for sales returns | 461 | 476 | 15 | ||||||||||||||
Allowance for sales rebates | 1,004 | 1,022 | 18 | ||||||||||||||
Other | 61,402 | 70,002 | 8,599 | ||||||||||||||
Total current liabilities | 154,758 | 16.7 | 173,712 | 17.8 | 18,954 | ||||||||||||
Long-term liabilities | |||||||||||||||||
Long-term debt | 4 | 4,671 | 3,373 | (1,297 | ) | ||||||||||||
Deferred tax liabilities | 70 | 441 | 371 | ||||||||||||||
Retirement and severance benefits | 70,152 | 66,843 | (3,308 | ) | |||||||||||||
Directors’ retirement and severance benefits | 1,820 | 1,830 | 10 | ||||||||||||||
Other | 4,333 | 4,006 | (327 | ) | |||||||||||||
Total long-term liabilities | 81,048 | 8.7 | 76,495 | 7.8 | (4,552 | ) | |||||||||||
Total liabilities | 235,806 | 25.4 | 250,208 | 25.6 | 14,402 | ||||||||||||
MINORITY INTERESTS | |||||||||||||||||
Minority interests | 8,843 | 1.0 | 9,434 | 1.0 | 591 | ||||||||||||
SHAREHOLDERS’ EQUITY | |||||||||||||||||
Common stock | 8 | 68,793 | 7.4 | 68,793 | 7.0 | – | |||||||||||
Capital surplus | 66,862 | 7.2 | 66,862 | 6.8 | – | ||||||||||||
Retained earnings | 546,422 | 58.9 | 580,514 | 59.5 | 34,091 | ||||||||||||
Valuation difference on other securities | 27,920 | 3.0 | 27,857 | 2.9 | (63 | ) | |||||||||||
Translation adjustments | (7,068 | ) | (0.7 | ) | (7,026 | ) | (0.7 | ) | 41 | ||||||||
Treasury stock | 9 | (20,336 | ) | (2.2 | ) | (20,412 | ) | (2.1 | ) | (76 | ) | ||||||
Total shareholders’ equity | 682,594 | 73.6 | 716,587 | 73.4 | 33,993 | ||||||||||||
Total liabilities, minority interests and shareholders’ equity | 927,244 | 100.0 | 976,230 | 100.0 | 48,986 | ||||||||||||
App. F-20
Table of Contents
2. Consolidated Statements of Income
(Millions of yen)
| Fiscal 2003 | Fiscal 2004 | Change | |||||||||||||||||||
| See Note: | Amount | % | Amount | % | Amount | % | |||||||||||||||
Net sales | 596,345 | 100.0 | 587,830 | 100.0 | (8,515 | ) | (1.4 | ) | |||||||||||||
Cost of sales | 1 | 221,601 | 37.2 | 213,874 | 36.4 | (7,727 | ) | (3.5 | ) | ||||||||||||
Gross profit | 374,744 | 62.8 | 373,956 | 63.6 | (787 | ) | (0.2 | ) | |||||||||||||
Provision for sales returns | 51 | 0.0 | 15 | 0.0 | (36 | ) | |||||||||||||||
Adjusted gross profit | 374,692 | 62.8 | 373,940 | 63.6 | (751 | ) | (0.2 | ) | |||||||||||||
Selling, general and administrative expenses | 279,137 | 46.8 | 289,015 | 49.2 | 9,877 | 3.5 | |||||||||||||||
Advertising and promotional expenses | 47,842 | 51,738 | 3,896 | ||||||||||||||||||
Salaries and bonuses | 47,233 | 46,401 | (831 | ) | |||||||||||||||||
Provision for accrued bonuses | 7,330 | 8,282 | 951 | ||||||||||||||||||
Retirement and severance benefits | 3,979 | 3,976 | (3 | ) | |||||||||||||||||
Provision for directors’ retirement and severance benefits | 384 | 248 | (136 | ) | |||||||||||||||||
Provision for doubtful accounts | 83 | – | (83 | ) | |||||||||||||||||
Research and development costs | 1 | 86,720 | 86,551 | (169 | ) | ||||||||||||||||
Amortization of consolidation goodwill | 305 | 389 | 84 | ||||||||||||||||||
Other | 85,257 | 91,427 | 6,169 | ||||||||||||||||||
Operating income | 95,555 | 16.0 | 84,925 | 14.4 | (10,629 | ) | (11.1 | ) | |||||||||||||
Non-operating income | 5,122 | 0.9 | 6,425 | 1.1 | 1,302 | 25.4 | |||||||||||||||
Interest income | 1,060 | 1,178 | 117 | ||||||||||||||||||
Dividend income | 1,370 | 2,126 | 756 | ||||||||||||||||||
Amortization of consolidation goodwill | 2 | 11 | 8 | ||||||||||||||||||
Rent received | 785 | 889 | 104 | ||||||||||||||||||
Other | 1,904 | 2,219 | 315 | ||||||||||||||||||
Non-operating expenses | 6,701 | 1.1 | 8,844 | 1.5 | 2,142 | 32.0 | |||||||||||||||
Interest expense | 336 | 358 | 22 | ||||||||||||||||||
Loss on disposal of inventories | 2,995 | 3,983 | 987 | ||||||||||||||||||
Charitable donations | 1,173 | 737 | (436 | ) | |||||||||||||||||
Other | 2,195 | 3,765 | 1,569 | ||||||||||||||||||
Recurring income | 93,975 | 15.8 | 82,506 | 14.0 | (11,469 | ) | (12.2 | ) | |||||||||||||
App. F-21
Table of Contents
(Millions of yen)
| Fiscal 2003 | Fiscal 2004 | Change | |||||||||||||||||||
| See Note: | Amount | % | Amount | % | Amount | % | |||||||||||||||
Extraordinary income | 4,524 | 0.7 | 15,775 | 2.7 | 11,251 | ||||||||||||||||
Proceeds from sales of fixed assets | 2 | 4,127 | 12,179 | 8,052 | |||||||||||||||||
Reversal of allowance for doubtful accounts | – | 2,026 | 2,026 | ||||||||||||||||||
Proceeds from sales of investment securities | 111 | 983 | 872 | ||||||||||||||||||
Proceeds from sales of stock in affiliates | 285 | 544 | 258 | ||||||||||||||||||
Reversal of allowance for directors’ retirement and severance | – | 41 | 41 | ||||||||||||||||||
Extraordinary losses | 15,908 | 2.7 | 20,603 | 3.5 | 4,695 | ||||||||||||||||
Loss on disposal of fixed assets | 3 | 1,974 | 2,333 | 359 | |||||||||||||||||
Loss on impairment of fixed assets | 4 | – | 15,865 | 15,865 | |||||||||||||||||
Loss on valuation of investments in affiliates | – | 1,483 | 1,483 | ||||||||||||||||||
Additional retirement payment | 3,181 | 662 | (2,518 | ) | |||||||||||||||||
Loss on valuation of investments | – | 249 | 249 | ||||||||||||||||||
Loss on sale of investment securities | 77 | 5 | (71 | ) | |||||||||||||||||
Loss on valuation of investment securities | – | 4 | 4 | ||||||||||||||||||
Loss from termination of distribution agreement for GlucoWatch | 5 | 9,650 | – | (9,650 | ) | ||||||||||||||||
Loss on restructuring of plants | 6 | 1,024 | – | (1,024 | ) | ||||||||||||||||
Income before income taxes and minority interests | 82,592 | 13.8 | 77,678 | 13.2 | (4,914 | ) | (5.9 | ) | |||||||||||||
Income taxes | 33,110 | 5.5 | 33,224 | 5.7 | 113 | ||||||||||||||||
Income tax adjustment | 5,554 | 0.9 | (4,550 | ) | (0.8 | ) | (10,104 | ) | |||||||||||||
Minority interests | 515 | 0.1 | 722 | 0.1 | 206 | ||||||||||||||||
Net income | 43,411 | 7.3 | 48,282 | 8.2 | 4,870 | 11.2 | |||||||||||||||
App. F-22
Table of Contents
Consolidated Statements of Retained Earnings
(Millions of yen)
| Fiscal 2003 | Fiscal 2004 | Change | |||||||||||||||
| See Note: | Amount | Amount | Amount | ||||||||||||||
CAPITAL SURPLUS | |||||||||||||||||
Capital surplus at beginning of year | 66,862 | 66,862 | – | ||||||||||||||
Increase in capital surplus | – | – | – | ||||||||||||||
Decrease in capital surplus | – | – | – | ||||||||||||||
Capital surplus at end of year | 66,862 | 66,862 | – | ||||||||||||||
RETAINED EARNINGS | |||||||||||||||||
Retained earnings at beginning of year | 532,429 | 546,422 | 13,993 | ||||||||||||||
Increase in retained earnings | |||||||||||||||||
Net income | 43,411 | 48,282 | |||||||||||||||
Increase due to merger with a non-consolidated subsidiary | – | 117 | |||||||||||||||
Increase due to initial consolidation of subsidiaries | 80 | 43,492 | – | 48,399 | 4,907 | ||||||||||||
Decrease in retained earnings | |||||||||||||||||
Cash dividends | 10,983 | 13,959 | |||||||||||||||
Bonuses to directors | |||||||||||||||||
Bonuses to directors | 344 | 326 | |||||||||||||||
Bonuses to statutory auditors | 23 | 21 | |||||||||||||||
Elimination of treasury stock with earnings | 18,147 | 29,498 | – | 14,308 | (15,190 | ) | |||||||||||
Retained earnings at end of year | 546,422 | 580,514 | 34,091 | ||||||||||||||
App. F-23
Table of Contents
3. Consolidated Statements of Cash Flows
(Millions of yen)
| Fiscal 2003 | Fiscal 2004 | Change | |||||||||
| See Note: | Amount | Amount | Amount | ||||||||
Cash flows from operating activities: | |||||||||||
Income before income taxes and minority interests | 82,592 | 77,678 | (4,914 | ) | |||||||
Depreciation | 27,847 | 28,811 | 963 | ||||||||
Loss on impairment of fixed assets | – | 15,865 | 15,865 | ||||||||
Profit on sale of marketable and investment securities | (322 | ) | (1,064 | ) | (741 | ) | |||||
Loss on valuation of marketable and investment securities | 4 | 1,736 | 1,732 | ||||||||
Amortization of consolidation goodwill | 302 | 378 | 75 | ||||||||
Decrease in allowance for doubtful accounts | (348 | ) | (2,021 | ) | (1,673 | ) | |||||
Increase in retirement and severance benefits | (9,802 | ) | (3,498 | ) | 6,303 | ||||||
Increase in accrued bonuses | 1 | 224 | 222 | ||||||||
Interest and dividend income | (2,430 | ) | (3,304 | ) | (874 | ) | |||||
Interest expense | 336 | 358 | 22 | ||||||||
Gain on sale of fixed assets | (2,536 | ) | (10,731 | ) | (8,194 | ) | |||||
Decrease in trade receivables | 6,355 | 8,147 | 1,791 | ||||||||
Decrease (increase) in inventories | (3,885 | ) | 122 | 4,007 | |||||||
Increase (decrease) in trade payables | (6,528 | ) | 3,473 | 10,001 | |||||||
Other | 19,113 | 6,329 | (12,783 | ) | |||||||
Subtotal | 110,698 | 122,504 | 11,806 | ||||||||
Interest and dividends received | 2,590 | 3,407 | 817 | ||||||||
Interest paid | (335 | ) | (358 | ) | (23 | ) | |||||
Income taxes paid | (41,746 | ) | (28,851 | ) | 12,895 | ||||||
Net cash provided by operating activities | 71,207 | 96,703 | 25,495 | ||||||||
Cash flows from investing activities: | |||||||||||
Purchases of time deposits | (9,604 | ) | (7,889 | ) | 1,714 | ||||||
Refunds of time deposits upon maturity | 9,763 | 10,842 | 1,079 | ||||||||
Purchases of marketable securities | (40,572 | ) | (62,969 | ) | (22,397 | ) | |||||
Proceeds from sale and maturities of marketable securities | 58,103 | 77,786 | 19,683 | ||||||||
Purchases of tangible fixed assets | (26,457 | ) | (27,282 | ) | (825 | ) | |||||
Proceeds from sale of tangible fixed assets | 4,493 | 14,696 | 10,202 | ||||||||
Purchases of intangible fixed assets | (22,399 | ) | (2,439 | ) | 19,959 | ||||||
Purchases of investment securities | (22,779 | ) | (21,704 | ) | 1,075 | ||||||
Proceeds from sale of investment securities | 1,100 | 1,561 | 460 | ||||||||
Proceeds from sale of stock in a consolidated subsidiary | 2 | – | 527 | 527 | |||||||
Payment on loans receivable | (566 | ) | (904 | ) | (338 | ) | |||||
Proceeds from collection of loans | 1,067 | 1,342 | 274 | ||||||||
Other | (1,316 | ) | 169 | 1,486 | |||||||
Net cash used in investing activities | (49,168 | ) | (16,265 | ) | 32,902 | ||||||
App. F-24
Table of Contents
(Millions of yen)
| Fiscal 2003 | Fiscal 2004 | Change | |||||||||
| See Note: | Amount | Amount | Amount | ||||||||
Cash flows from financing activities: | |||||||||||
Net increase in short-term bank loans | 2,203 | 2,365 | 161 | ||||||||
Proceeds from long-term debt | 29 | 470 | 440 | ||||||||
Repayment of long-term debt | (2,757 | ) | (1,282 | ) | 1,475 | ||||||
Purchases of treasury stock | (20,020 | ) | (76 | ) | 19,943 | ||||||
Dividends paid to shareholders | (10,987 | ) | (13,960 | ) | (2,973 | ) | |||||
Dividends paid to minority interests | (126 | ) | (109 | ) | 17 | ||||||
Other | – | (123 | ) | (123 | ) | ||||||
Net cash used in financing activities | (31,657 | ) | (12,716 | ) | 18,940 | ||||||
Effect of exchange rate changes on cash and cash equivalents | (890 | ) | (123 | ) | 767 | ||||||
Net increase (decrease) in cash and cash equivalents | (10,509 | ) | 67,596 | 78,106 | |||||||
Cash and cash equivalents at beginning of year | 205,050 | 194,789 | (10,260 | ) | |||||||
Increase arising from inclusion in consolidation | 249 | – | (249 | ) | |||||||
Increase due to merger with non-consolidated subsidiary | – | 144 | 144 | ||||||||
Cash and cash equivalents at end of year | 194,789 | 262,530 | 67,740 |
Significant Items for the Preparation of the Consolidated Financial Statements
| 1. | Scope of Consolidation |
Consolidated subsidiaries: | 37 |
| The names of the consolidated subsidiaries are included in ‘1. State of the Group.’ |
| In addition, Sankyo Trading Co., Ltd., which had been a consolidated subsidiary of the Company until the year ended March 31, 2004, has been excluded from the scope of consolidation effective the current period due to sale of the Company’s entire shares in this company. |
Non-consolidated subsidiaries: | 14 |
| 2. | Application of the Equity Method |
Non-consolidated subsidiaries accounted for by the equity method: | None | |
Affiliated companies accounted for by the equity method: | None | |
Non-consolidated subsidiaries not accounted for by the equity method: | 14 | |
Affiliated companies not accounted for by the equity method: | 3 |
| 3. | Fiscal Year End of Consolidated Subsidiaries |
| The fiscal years for 18 of the Company’s overseas consolidated subsidiaries ended on December 31, 2004. Financial statements as of this date were used in the preparation of the consolidated financial statements. However, necessary adjustments were made in those cases where important transactions took place between this date and March 31, 2005. |
App. F-25
Table of Contents
| 4. | Accounting Principles and Methods |
| (1) | Principles and Methods of Valuation of Important Assets |
| Securities: |
Held-to-maturity securities
| Mainly the amortized cost method (straight-line method) |
Other securities
Securities with determinable market value:
| Mainly the market value method based on the market value at the end of the fiscal year. Valuation differences are dealt with by means of the direct capital influx method, with the cost of securities sold calculated by the moving average method. |
Securities without determinable market value:
| Mainly stated at cost based on the moving average method |
Derivatives: | Market value method | |
Inventories: | Mainly stated at cost by the weighted average method at the Company and its domestic consolidated subsidiaries. Mainly stated at the lower of cost or market by the weighted average method at the overseas consolidated subsidiaries. |
| (2) | Depreciation of Important Fixed Assets |
| Tangible Fixed Assets |
| The Company and its domestic consolidated subsidiaries account for property, plant and equipment by the declining balance method. However, buildings (excluding annexes) acquired since April 1, 1998, have been accounted for by the straight-line method. Overseas consolidated subsidiaries account for property, plant and equipment mainly by the straight-line method. The major useful lives are as follows: |
Buildings and structures: | 2~60 years | |
Machinery, equipment and vehicles: | 2~17 years |
| Intangible Fixed Assets |
| Computed by the straight-line method. Software for in-house use is amortized over the estimated useful lives (a five-year period) by the straight-line method. |
| (3) | Recording Methods for Important Allowances |
| Allowance for Doubtful Accounts |
| The Company and its consolidated subsidiaries cover the risk of credit losses by making additions to this allowance on the basis of the actual default rates for standard loans, and on an individual basis for loans considered unlikely to be repaid in full. |
| Accrued Bonuses |
| To prepare for accrued bonuses, the Company and the majority of its consolidated subsidiaries make provisions based on a portion of the estimated total amount payable for the fiscal year. |
| Allowance for Sales Returns |
| To prepare for sales return losses incurred after the end of the fiscal year, the Company and four of its domestic consolidated subsidiaries make the maximum possible provision calculated by the accounts receivable method as regulated by the Corporate Tax Law in Japan. |
| Allowance for Sales Rebates |
| To prepare for future sales rebates, the Company records an amount calculated by multiplying the sales rebate rate for the fiscal year by the wholesaler’s inventory amounts or the accounts receivable at the end of the fiscal year. |
| Retirement and Severance Benefits |
To prepare for retirement and severance benefits, the Company and its domestic consolidated subsidiaries make provisions for the amount based on projected benefit obligation and plan assets at the end of the fiscal |
App. F-26
Table of Contents
year. Provisions are made for six of the Company’s overseas consolidated subsidiaries in accordance with generally accepted accounting principles in the countries in question. |
| Prior service cost is amortized by the straight-line method over a set time period (five years), which is less than the estimated average remaining years of service of the eligible employees when the prior service cost was recognized. |
| At the Company itself, actuarial gain and loss are booked when they occur. At the domestic consolidated subsidiaries, the straight-line method is used to calculate an amount to be treated as an expense during the fiscal year after the gain or loss was initially recorded. This calculation is, in turn, based upon a set time period (five years) which is less than the average remaining years of service of the eligible employees when the actuarial gain or loss was recorded. |
| Directors’ Retirement and Severance Benefits |
| To prepare for directors’ retirement and severance benefits, the Company and its domestic consolidated subsidiaries make provisions for an amount based on the total benefits required to be paid at the end of the fiscal year in accordance with internal regulations. Two overseas consolidated subsidiaries make provisions for the amount generated by the end of the fiscal year. |
| (4) | Translation of Assets and Liabilities Denominated in Foreign Currencies into Yen |
| Receivables and payables denominated in foreign currencies are converted into yen at the rates of exchange in effect at the end of the fiscal year, with translation differences treated as gains or losses. The assets and liabilities of overseas consolidated subsidiaries are converted into yen at the rates of exchange in effect at their balance sheet dates. Profits and expenses are converted into yen at the average exchange rates in effect over the period in question, with translation differences recorded under translation adjustments in the minority interests and shareholders’ equity section of the balance sheets. |
| (5) | Accounting Methods Pertaining to Important Lease Transactions |
| The same accounting treatment applied to operating leases is used for financial leases, except for those where the legal title of the underlying property is transferred from the lessor to the lessee. |
| (6) | Important Hedge Accounting Methods |
| Hedge Accounting Methods |
| Deferral hedge accounting has been adopted. Forward foreign exchange contracts that meet the criteria are accounted for by the allocation method. Interest rate swaps that meet the criteria are accounted for by the special method, as regulated in the accounting standard, as if the interest rates of the interest rate swaps were originally applied to the underlying borrowings. |
| Hedge Methods and Hedge Accounts |
Hedge methods: | Forward foreign exchange contracts, interest rate swaps and call option on Sankyo’s common stock | |
Hedge accounts: | Accounts payable and receivable and anticipated transactions denominated in a foreign currency, loans and stock appreciation rights (SAR) |
| Hedge Policy |
| Certain consolidated subsidiaries hedge against foreign exchange rate fluctuation relating to imports and exports and interest rate risks relating to loans and fluctuations in stock prices relating to SAR. The Company and its consolidated subsidiaries do not enter into speculative derivative transactions. |
| Methods of Assessing Effectiveness of Hedges |
| Assessment of the effectiveness of hedges is conducted on the basis of the relationship between cumulative changes in the hedge methods and cumulative changes in the hedge accounts. However, with the important conditions for forward foreign exchange contracts transactions being identical, and interest rate swaps being handled by special methods, the effectiveness of the hedges is extremely high. Thus, an assessment of the effectiveness of these hedges has been omitted. |
App. F-27
Table of Contents
| (7) | Other Important Items Pertaining to the Consolidated Financial Statements |
| Consumption Tax Accounting Methods |
| Tax-excluded method has been applied. |
| 5. | Valuation Methods for Assets and Liabilities at Consolidated Subsidiaries |
| The total market value method is used to evaluate the assets and liabilities of consolidated subsidiaries. |
| 6. | Depreciation of Consolidation Goodwill |
| As a general rule, consolidation goodwill is depreciated over a period of five years. However, if the amount in question is minor, it is accounted for currently as a gain or loss. |
| 7. | Appropriation of Retained Earnings |
| The consolidated statements of retained earnings are based on the appropriation of retained earnings for the period in question. |
| 8. | Cash in the Consolidated Statements of Cash Flows |
| Cash (cash and cash equivalents) in the consolidated statements of cash flows consists of: cash in hand, deposits which can be withdrawn at any time, and short-term investments that are highly liquid, easily convertible into cash, have little risk of fluctuation in value, and which mature within three months of their dates of acquisition. |
Changes in Significant Items for the Preparation of the Consolidated Financial Statements
| (Accounting Standards for Impairment of Fixed Assets) |
| Effective April 1, 2004, the Sankyo Group has adopted accounting standards for impairment of fixed assets (“Opinion Concerning Establishment of Accounting Standards for Impairment of Fixed Assets” issued by the Business Accounting Council of Japan on August 9, 2002) and “Implementation Guidelines for Accounting Standards for Impairment of Fixed Assets” (Financial Accounting Standards Implementation Guidelines No. 6 issued by the Accounting Standards Board of Japan on October 31, 2003), since these standards and guidelines became applicable to the consolidated financial statements for the fiscal year ended March 31, 2004. The effect of this application was to decrease income before income taxes and minority interests by 15,865 million yen. |
| In accordance with the modification of the Regulations Concerning Consolidated Financial Statements, the accumulated impairment losses are directly deducted from the balances of related fixed assets. |
| The effect of this treatment on the segment information is described in “Segment Information.” |
Supplemental Information
| (Presentation of the “pro forma standard taxation” portion of enterprise tax in Consolidated Statements of Income) |
| In line with announcement of Practice Report No. 12 “Practical Treatment Concerning Presentation of Pro Forma Standard Taxation Portion of Enterprise Tax in Statements of Income” issued by the Accounting Standards Board of Japan on February 13, 2004, enterprise taxes levied in proportion to added value and capital, amounting to 971 million yen, were recognized as ‘Selling, general and administrative expenses’ effective this period under this report. |
| The effect of this treatment on the segment information is described in “Segment Information.” |
App. F-28
Table of Contents
Notes
Notes to the Consolidated Balance Sheets
Fiscal 2003
(As of March 31, 2004)
| 1) | Accumulated depreciation on tangible fixed assets equals 312,395 million yen. |
| 2) | Idle assets included under tangible fixed assets are as follows: |
(Millions of yen)
Buildings and structures | 1,988 | |
Machinery, equipment and vehicles | 866 | |
Other | 18 |
| 3) | Items relating to non-consolidated subsidiaries and affiliated companies are as follows: |
(Millions of yen)
Investment securities (stock) | 3,778 | |
Other assets under investments and other assets (capital provided) | 6,390 |
| 4) | Pledged assets and secured liabilities Assets serving as collateral and secured liabilities are as follows: |
Pledged assets | (Millions of yen) | ||||
Buildings and structures | 1,983 | (1,615 | ) | ||
Machinery, equipment and vehicles | 2,385 | (2,385 | ) | ||
Land | 277 | (56 | ) | ||
Other tangible fixed assets | 38 | (38 | ) | ||
Investment securities | 462 | (– | ) | ||
Total | 5,147 | (4,095 | ) | ||
Secured liabilities | (Millions of yen) | ||||
Short-term bank loans | 3,442 | (2,960 | ) | ||
Long-term debt | 925 | (422 | ) | ||
Total | 4,368 | (3,382 | ) | ||
Figures in parentheses indicate factory foundation mortgages and related obligations.
Fiscal 2004
(As of March 31, 2005)
| 1) | Accumulated depreciation on tangible fixed assets equals 322,172 million yen. |
| 2) | — |
| 3) | Items relating to non-consolidated subsidiaries and affiliated companies are as follows: |
(Millions of yen)
Investment securities (stock) | 1,801 | |
Other assets under investments and other assets (capital provided) | 6,598 |
| 4) | Pledged assets and secured liabilities Assets serving as collateral and secured liabilities are as follows: |
Pledged assets | (Millions of yen) | ||||
Buildings and structures | 1,912 | (1,562 | ) | ||
Machinery, equipment and | 2,087 | (2,087 | ) | ||
Land | 277 | (56 | ) | ||
Other tangible fixed assets | 33 | (33 | ) | ||
Investment securities | 415 | (– | ) | ||
Total | 4,727 | (3,740 | ) | ||
Secured liabilities | (Millions of yen) | ||||
Short-term bank loans | 3,314 | (2,931 | ) | ||
Long-term debt | 622 | (289 | ) | ||
Total | 3,936 | (3,221 | ) | ||
Figures in parentheses indicate factory foundation mortgages and related obligations.
App. F-29
Table of Contents
Fiscal 2003
(As of March 31, 2004)
| 5) | Contingencies |
| The debts and other obligations of non-consolidated companies and employees from financial institutions are guaranteed. A breakdown of these obligations is as follows: |
(Millions of yen)
Saudi Arabian-Japanese Pharmaceutical Co., Ltd. | 352 | |
One other company and employees | 186 | |
Total | 539 |
| 6) | The discounted balance of trade notes receivable equals 526 million yen. |
| 7) | Commitment line (loan framework) contracts |
| The Company maintains commitment line contracts with 15 financial institutions in order to allow the efficient procurement of working capital. The balance of loans not yet taken out under these contracts at fiscal year end was as follows: |
(Millions of yen)
Total commitments | 30,000 | |
Commitments used | – | |
Commitments unused | 30,000 |
| 8) | Outstanding common stock of the Company at the year end was 439,498,765 shares. |
| 9) | Treasury stock owned by the Company at the year end was 9,956,114 shares of common stock. |
Fiscal 2004
(As of March 31, 2005)
| 5) | Contingencies |
| (1) | The debts and other obligations of non-consolidated companies and employees from financial institutions are guaranteed. A breakdown of these obligations is as follows: |
(Millions of yen)
Saudi Arabian-Japanese Pharmaceutical Co., Ltd. | 366 | |
One other company and employees | 129 | |
Total | 496 |
| (2) | For purchased goods with the minimum volume purchase commitment, the Company is exposed to the risk of evaluation loss due to excess inventory. |
| 6) | The discounted balance of trade notes receivable equals 561 million yen. |
| 7) | Overdraft contracts and commitment line (Loan framework) contracts |
| The Company and its consolidated subsidiaries maintain overdraft contracts and commitment line contracts with 16 financial institutions and 15 financial institutions, respectively, in order to allow the efficient procurement of working capital. The balance of loans not yet taken out under these contracts at fiscal year end was as follows: |
(Millions of yen)
Overdraft limit and total commitments | 82,679 | |
Overdrafts and commitments used | 10,035 | |
Overdrafts and commitments unused | 72,643 |
| 8) | Outstanding common stock of the Company at the year end was 439,498,765 shares. |
| 9) | Treasury stock owned by the Company at the year end was 9,990,256 shares of common stock. |
App. F-30
Table of Contents
Notes to the Consolidated Statements of Income
Fiscal 2003
(Year Ended March 31, 2004)
| 1) | Research and development costs included under selling, general and administrative expenses and manufacturing expenses were 86,720 million yen. |
| 2) | Breakdown of proceeds from sales of fixed assets |
| (Millions of yen | ) | ||
Buildings and structures | 6 | ||
Machinery, equipment and vehicles | 9 | ||
Land | 4,110 | ||
Other tangible fixed assets | 1 |
| 3) | Breakdown of loss on disposal of fixed assets |
(Millions of yen) | ||
Buildings and structures | 719 | |
Machinery, equipment and vehicles | 277 | |
Land | 12 | |
Other tangible fixed assets | 192 | |
Other intangible fixed assets | 84 | |
In addition, expenses for disposal of fixed assets were 687 million yen.
Fiscal 2004
(Year Ended March 31, 2005)
| 1) | Research and development costs included under selling, general and administrative expenses and manufacturing expenses were 86,551 million yen. |
| 2) | Breakdown of proceeds from sales of fixed assets |
| (Millions of yen) | ||
Buildings and structures | 31 | |
Machinery, equipment and vehicles | 14 | |
Land | 12,133 | |
Other tangible fixed assets | 0 |
| 3) | Breakdown of loss on disposal of fixed assets |
| (Millions of yen) | ||
Buildings and structures | 455 | |
Machinery, equipment and vehicles | 332 | |
Land | 567 | |
Other tangible fixed assets | 133 | |
Other intangible fixed assets | 300 |
In addition, expenses for disposal of fixed assets were 545 million yen.
App. F-31
Table of Contents
Fiscal 2003
(Year Ended March 31, 2004)
| 4) | — |
Fiscal 2004
(Year Ended March 31, 2005)
| 4) | Impairment Loss |
| The Sankyo Group (the Company and its consolidated subsidiaries) categorizes its assets used for its business operation into groups (e.g., product group) about which separate financial information is regularly identified for the management accounting purpose, whereas the Sankyo Group individually categorizes lease assets and idle assets, which are not directly used for its business operation. |
| For the period of fiscal 2004, the Sankyo Group recorded impairment losses (15,865 million yen) on the following asset groups. |
| (1) | Assets used for its business operation |
| With respect to a distribution right of imported goods (13,059 million yen) in the pharmaceutical division, the Company recognized entire impairment loss for the distribution right as extraordinary loss because the Company expects to have negative cash flows from the imported goods due to a decrease in profitability resulting from their sluggish sales. |
| (2) | Lease assets and idle assets |
| Location | Function | Asset Type | Status | |||
Iwaki, Fukushima | Onahama Plant (manufacturing facilities of pharmaceuticals) | Buildings and structures Machinery, equipment and vehicles | Idle | |||
| Yasu, Shiga | Former Yasugawa Plant (manufacturing facilities of agrochemicals) | Buildings | Idle | |||
Shizuoka, etc., Shizuoka | Company dormitory land | Land | Idle |
There was no indication of impairment for the assets that are used for the operation of the Sankyo Group’s business. However, since the asset groups shown in the table above were idle and their expected use was uncertain in the foreseeable future, the Sankyo Group reduced their book values to the recoverable amounts and recorded such reduction as impairment loss of 2,806 million yen in extraordinary losses.
These impairment losses consisted of the loss for buildings and structures of 2,159 million yen, for machinery, equipment and vehicles of 525 million yen, for land of 112 million yen, and for other assets of 9 million yen.
The Sankyo Group measures the recoverable amount of such asset groups by net realizable value. More specifically, the Sankyo Group calculates the net realizable value of land based on the valuation amount for the real estate tax purpose, with reasonable adjustments made to it. As to buildings and machinery, equipment and vehicles, the Sankyo Group recognizes their net realizable value as five percent of their acquisition costs.
App. F-32
Table of Contents
Fiscal 2003
(Year Ended March 31, 2004)
| 5) | Breakdown of loss from termination of distribution agreement for GlucoWatch |
(Millions of yen)
Devaluation of inventories | 2,545 | |
Devaluation of distribution right | 2,577 | |
Devaluation of accounts receivable | 1,047 | |
Settlement payment made to an alliance partner | 3,479 |
| 6) | Breakdown of loss on restructuring of plants is as follows: |
(Millions of yen)
Loss on disposal of fixed assets | 1,024 |
Fiscal 2004
(Year Ended March 31, 2005)
| 5) | — |
| 6) | — |
App. F-33
Table of Contents
Notes to the Consolidated Statements of Cash Flows
Fiscal 2003
(Year Ended March 31, 2004)
| 1) | Reconciliation of cash and cash equivalents at fiscal year end and balance sheet items |
(Millions of yen)
Cash and deposits | 156,660 | ||
Marketable securities | 93,614 | ||
Time deposits with maturities of over three months | (5,451 | ) | |
Stocks and securities with maturities of over three months | (50,033 | ) | |
Cash and cash equivalents | 194,789 |
| 2) | — |
Fiscal 2004
(Year Ended March 31, 2005)
| 1) | Reconciliation of cash and cash equivalents at fiscal year end and balance sheet items |
(Millions of yen)
Cash and deposits | 175,960 | ||
Marketable securities | 146,632 | ||
Time deposits with maturities of over three months | (2,484 | ) | |
Stocks and securities with maturities of over three months | (57,577 | ) | |
Cash and cash equivalents | 262,530 |
| 2) | Breakdown of major assets and liabilities of consolidated subsidiaries that are no longer consolidated due to the sale of stock |
| The following are the breakdown of assets and liabilities of Sankyo Trading Co., Ltd, which is no longer consolidated due to sale of its stocks, and the reconciliation of the sales price of the stock and proceeds from the sale. |
(Millions of yen)
Current assets | 466 | ||
Fixed assets | 2,532 | ||
Current liabilities | (1,237 | ) | |
Fixed liabilities | (1,196 | ) | |
Other | (7 | ) | |
Proceeds from sale of stock in affiliate | 86 | ||
Amount of sale of stock in subsidiary | 644 | ||
Cash and cash equivalents in subsidiary | (116 | ) | |
Proceeds from sale of stock in subsidiary | 527 |
App. F-34
Table of Contents
Segment Information
| (1) | Business Segments |
(Millions of yen)
Fiscal 2003 | Pharmaceuticals | Other | Total | Eliminations & corporate | | Consolidated | |||||
Sales and operating income | |||||||||||
Sales | |||||||||||
(1) External sales | 466,733 | 129,612 | 596,345 | – | 596,345 | ||||||
(2) Inter-segment sales and transfers | 1,287 | 3,171 | 4,458 | (4,458 | ) | – | |||||
Total | 468,021 | 132,783 | 600,804 | (4,458 | ) | 596,345 | |||||
Operating expenses | 378,907 | 127,277 | 506,184 | (5,393 | ) | 500,790 | |||||
Operating income | 89,114 | 5,506 | 94,620 | 934 | 95,555 | ||||||
Assets, depreciation and capital expenditures Assets | 518,432 | 140,649 | 659,081 | 268,162 | 927,244 | ||||||
Depreciation | 23,873 | 3,974 | 27,847 | – | 27,847 | ||||||
Capital expenditures | 42,395 | 4,960 | 47,355 | – | 47,355 | ||||||
Fiscal 2004 | Pharmaceuticals | Other | Total | Eliminations & corporate | | Consolidated | |||||
Sales and operating income | |||||||||||
Sales | |||||||||||
(1) External sales | 454,710 | 133,120 | 587,830 | – | 587,830 | ||||||
(2) Inter-segment sales and transfers | 922 | 1,723 | 2,646 | (2,646 | ) | – | |||||
Total | 455,633 | 134,843 | 590,476 | (2,646 | ) | 587,830 | |||||
Operating expenses | 378,137 | 128,256 | 506,393 | (3,488 | ) | 502,904 | |||||
Operating income | 77,495 | 6,587 | 84,083 | 842 | 84,925 | ||||||
Assets, depreciation, impairment loss and capital expenditures Assets | 512,239 | 146,942 | 659,181 | 317,049 | 976,230 | ||||||
Depreciation | 25,633 | 3,177 | 28,811 | – | 28,811 | ||||||
Impairment loss | 15,853 | 11 | 15,865 | – | 15,865 | ||||||
Capital expenditures | 25,276 | 8,517 | 33,794 | – | 33,794 |
Notes:
| 1. | Business segmentation |
| Segmentation into ‘Pharmaceuticals’ and ‘Other’ is based on consideration of product type, market characteristics and other factors. |
| 2. | Main products in each business segment |
Business segments | Main products | |||
Pharmaceuticals | Ethical drugs and healthcare products | |||
Other | Food | Food products and additives | ||
| Agrochemicals | Insecticides, herbicides and fungicides | |||
| Other | Chemical products, veterinary drugs and bulbs | |||
| 3. | Out of the assets for the years ended March 31, 2004 and March 31, 2005, those corporate assets included under the category of “Eliminations & corporate” amounted to 269,616 million yen and 318,220 million yen, respectively. These amounts consisted mainly of surplus money (such as cash and marketable securities etc.) and long-term investment assets (investment securities) held at the parent company. |
| 4. | Depreciation includes the depreciation of tangible fixed assets, intangible fixed assets and long-term prepaid expenses. |
App. F-35
Table of Contents
| 5. | Capital expenditures include additions to tangible fixed assets, intangible fixed assets and long-term prepaid expenses. |
| 6. | As noted in “Changes in Significant Items for the Preparation of the Consolidated Financial Statements,” the Sankyo Group has adopted accounting standards for impairment of fixed assets for effective this period. |
| 7. | As noted in “Supplemental Information,” in line with announcement of “Practical Treatment Concerning Presentation of Pro Forma Standard Taxation Portion of Enterprise Tax in Statements of Income”, enterprise taxes levied in proportion to added value and capital are recognized as ‘Selling, general and administrative expenses’ in the amount of 814 million yen and 157 million yen for the Pharmaceuticals Business and the Other Business segments, respectively, effective this period under this report. |
(2)Geographic Segments
(Millions of yen)
Fiscal 2003 | Japan | North America | Other | Total | Eliminations & corporate | | Consolidated | |||||||
Sales and operating income | ||||||||||||||
Sales | ||||||||||||||
(1) External sales | 500,959 | 60,924 | 34,461 | 596,345 | – | 596,345 | ||||||||
(2) Inter-segment sales and transfers | 6,928 | 3,219 | 2,644 | 12,792 | (12,792 | ) | – | |||||||
Total | 507,887 | 64,143 | 37,106 | 609,138 | (12,792 | ) | 596,345 | |||||||
Operating expenses | 407,320 | 61,192 | 43,390 | 511,903 | (11,112 | ) | 500,790 | |||||||
Operating income (loss) | 100,567 | 2,950 | (6,283 | ) | 97,234 | (1,679 | ) | 95,555 | ||||||
Assets | 562,860 | 59,540 | 42,888 | 665,288 | 261,955 | 927,244 | ||||||||
Fiscal 2004 | Japan | North America | Other | Total | Eliminations & corporate | | Consolidated | |||||||
Sales and operating income | ||||||||||||||
Sales | ||||||||||||||
(1) External sales | 461,748 | 76,902 | 49,178 | 587,830 | – | 587,830 | ||||||||
(2) Inter-segment sales and transfers | 12,119 | 3,424 | 3,466 | 19,010 | (19,010 | ) | – | |||||||
Total | 473,867 | 80,327 | 52,645 | 606,841 | (19,010 | ) | 587,830 | |||||||
Operating expenses | 400,554 | 67,184 | 53,956 | 521,694 | (18,789 | ) | 502,904 | |||||||
Operating income (loss) | 73,313 | 13,143 | (1,310 | ) | 85,146 | (220 | ) | 84,925 | ||||||
Assets | 543,343 | 76,651 | 46,004 | 665,998 | 310,232 | 976,230 |
Notes:
| 1. | Geographic segmentation |
| Geographical | proximity is the basis for geographic segmentation. |
| 2. | Countries and areas included in regions other than Japan |
| North | America: U.S. |
| Other | areas: Germany, UK, France, Spain, Italy, Taiwan and others |
| 3. | Out of the assets for the years ended March 31, 2004 and March 31, 2005, those corporate assets included under the category of “Eliminations & corporate” amounted to 269,616 million yen and 318,220 million yen, respectively. These amounts consisted mainly of surplus money (such as cash and marketable securities etc.) and long-term investment assets (investment securities) held at the parent company. |
| 4. | As noted in “Changes in Significant Items for the Preparation of the Consolidated Financial Statements,” the Sankyo Group has adopted accounting standards for impairment of fixed assets for effective this period. |
App. F-36
Table of Contents
| 5. | As noted in “Supplemental Information,” in line with announcement of “Practical Treatment Concerning Presentation of Pro Forma Standard Taxation Portion of Enterprise Tax in Statements of Income”, enterprise taxes levied in proportion to added value and capital are recognized as ‘Selling, general and administrative expenses’ in the amount of 971 million yen for the Japan segment, effective this period under this report. This had no effect on the segment information in the North America and Other segments. |
(3)Overseas Sales
(Millions of yen)
Fiscal 2003 | North America | Europe | Other Areas | Total | ||||
Overseas sales | 116,968 | 80,008 | 12,428 | 209,404 | ||||
Consolidated net sales | 596,345 | |||||||
Ratio of overseas sales to consolidated net sales (%) | 19.6 | 13.4 | 2.1 | 35.1 | ||||
Fiscal 2004 | North America | Europe | Other Areas | Total | ||||
Overseas sales | 114,949 | 85,372 | 15,324 | 215,645 | ||||
Consolidated net sales | 587,830 | |||||||
Ratio of overseas sales to consolidated net sales (%) | 19.6 | 14.5 | 2.6 | 36.7 |
Notes:
| 1. | Geographic segmentation |
| Geographical proximity is the basis for geographic segmentation. |
| 2. | Countries and areas included in each region |
| North America: U.S., Canada |
| Europe: Germany, UK, Spain, Italy, Ireland, France, Switzerland and other countries |
| Other Areas: Asia, Middle East, Latin America and others |
| 3. | Overseas sales are sales of the Company and its consolidated subsidiaries which are transacted in countries or regions other than Japan. |
Lease Transactions
| Information on leases has not been presented because the Company discloses its information through EDINET (Electronic Disclosure for Investors’ NETwork). |
Transactions with Related Parties
| No applicable items. |
App. F-37
Table of Contents
Deferred Tax Accounting
Fiscal 2003
(As of March 31, 2004)
| 1) | Breakdown of deferred tax assets and deferred tax liabilities |
(Millions of yen)
Deferred tax assets | |||
Retirement and severance benefits | 24,313 | ||
Prepaid consignment research and co-development expenses | 13,821 | ||
Net operating loss carryforwards for income tax purposes | 13,736 | ||
Accrued employees’ bonuses | 5,277 | ||
Loss on valuation of inventories | 2,540 | ||
Loss on valuation of investment securities | 2,092 | ||
Excess depreciation of software | 2,001 | ||
Unrealized gain in inventories | 1,815 | ||
Milestone payment received for co-promotion agreement | 1,699 | ||
Accrued enterprise tax | 1,403 | ||
Other | 7,646 | ||
Subtotal | 76,348 | ||
Valuation allowance | (21,392 | ) | |
Total deferred tax assets | 54,955 | ||
Deferred tax liabilities | |||
Valuation difference on other securities | (19,360 | ) | |
Deferred gain on sale of property for income tax purposes | (2,349 | ) | |
Reserve for accelerated depreciation | (1,746 | ) | |
Other | (230 | ) | |
Total deferred tax liabilities | (23,686 | ) | |
Net deferred tax assets (liabilities) | 31,269 | ||
| Note: | Net deferred tax assets are included under the following balance sheet items: |
(Millions of yen)
Current assets – deferred tax assets | 18,100 | ||
Fixed assets – deferred tax assets | 13,783 | ||
Current liabilities – deferred tax liabilities | (544 | ) | |
Fixed liabilities – deferred tax liabilities | (70 | ) |
Fiscal 2004
(As of March 31, 2005)
| 1) | Breakdown of deferred tax assets and deferred tax liabilities |
(Millions of yen)
Deferred tax assets | |||
Retirement and severance benefits | 24,001 | ||
Prepaid consignment research and co-development expenses | 14,775 | ||
Net operating loss carryforwards for income tax purposes | 14,012 | ||
Impairment loss | 6,445 | ||
Accrued employees’ bonuses | 4,898 | ||
Loss on valuation of inventories | 3,350 | ||
Excess depreciation of software | 3,005 | ||
Depreciation | 2,476 | ||
Unrealized gain in inventories | 2,158 | ||
Loss on valuation of investment securities | 1,932 | ||
Milestone payment received for co-promotion agreement | 1,263 | ||
Accrued enterprise tax | 1,161 | ||
Other | 8,557 | ||
Subtotal | 88,040 | ||
Valuation allowance | (24,271 | ) | |
Total deferred tax assets | 63,769 | ||
Deferred tax liabilities | |||
Valuation difference on other securities | (19,264 | ) | |
Deferred gain on sale of property for income tax purposes | (5,954 | ) | |
Reserve for accelerated depreciation | (1,881 | ) | |
Other | (999 | ) | |
Total deferred tax liabilities | (28,100 | ) | |
Net deferred tax assets (liabilities) | 35,668 | ||
| Note: | Net deferred tax assets are included under the following balance sheet items: |
(Millions of yen)
Current assets – deferred tax assets | 21,832 | ||
Fixed assets – deferred tax assets | 14,967 | ||
Current liabilities – deferred tax liabilities | (689 | ) | |
Fixed liabilities – deferred tax liabilities | (441 | ) |
App. F-38
Table of Contents
Fiscal 2003
(As of March 31, 2004)
| 2) | Breakdown of the major reasons for the difference between the normal tax rate and the effective tax rate as a percentage of income before income taxes and minority interests |
Normal tax rate | 41.9 | % | |
(Reconciliation) | |||
Entertainment expenses and other items not deductible for income tax purposes | 5.3 | ||
Valuation allowance | 7.8 | ||
Dividend income and other items deductible for income tax purposes | (0.5 | ) | |
IT investment tax credit | (1.5 | ) | |
R&D expense tax credit | (5.8 | ) | |
Other | (0.4 | ) | |
Effective tax rate | 46.8 | ||
Fiscal 2004
(As of March 31, 2005)
| 2) | Breakdown of the major reasons for the difference between the normal tax rate and the effective tax rate as a percentage of income before income taxes and minority interests |
Normal tax rate | 40.6 | % | |
(Reconciliation) | |||
Entertainment expenses and other items not deductible for income tax purposes | 5.3 | ||
Valuation allowance | 3.3 | ||
IT investment tax credit | (0.4 | ) | |
Dividend income and other items deductible for income tax purposes | (1.0 | ) | |
R&D expense tax credit | (6.1 | ) | |
Effect of overseas subsidiaries’ effective tax rates | (6.6 | ) | |
Other | 1.8 | ||
Effective tax rate | 36.9 | ||
App. F-39
Table of Contents
Securities
Fiscal 2003 (as of March 31, 2004)
1. Traded Securities
No applicable items.
2. Held-to-Maturity Securities with Determinable Market Value
(Millions of yen)
| Type | Carrying amount | Market value | Difference | ||||||
| Securities whose market value exceeds their carrying value | (1) Government and local bonds (2) Corporate bonds (3) Other | 3,519 40,037 – | 3,523 40,172 – | 3 135 – | | ||||
Subtotal | 43,556 | 43,695 | 139 | ||||||
| Securities whose market value does not exceed their carrying value | (1) Government and local bonds (2) Corporate bonds (3) Other | 19,211 18,517 – | 19,211 18,481 – | – (35 – | ) | ||||
Subtotal | 37,728 | 37,692 | (35 | ) | |||||
Total | 81,285 | 81,388 | 103 | ||||||
3. Other Securities with Determinable Market Value
(Millions of yen)
| Type | Acquisition cost | Carrying amount | Difference | ||||||
| Securities whose carrying value exceeds their acquisition costs | (1) Stocks (2) Bonds a) Government and local bonds b) Corporate bonds c) Other (3) Other | 18,868 – – – 194 | 66,568 – – – 218 | 47,699 – – – 23 | | ||||
Subtotal | 19,063 | 66,786 | 47,723 | ||||||
| Securities whose carrying value does not exceed their acquisition costs | (1) Stocks (2) Bonds a) Government and local bonds b) Corporate bonds c) Other (3) Other | 1,488 – – – 2 | 1,258 – – – 2 | (230 – – – (0 | ) ) | ||||
Subtotal | 1,491 | 1,260 | (230 | ) | |||||
Total | 20,554 | 68,047 | 47,492 | ||||||
| Notes: | In cases where the market value of the securities in question dropped 30% or more from the acquisition costs, the securities were classified as having ‘fallen significantly.’ In cases where the securities’ market value dropped 50% or more, the securities were written off. In cases where the market value of securities dropped more than 30% but less than 50%, the likelihood of recovery was estimated on the basis of market value trends and the financial situation of the issuing companies. Write-offs were conducted in all cases other than those for which it was concluded that there was a chance of recovery. |
App. F-40
Table of Contents
| 4. | Other Securities Sold During Fiscal 2003 |
(Millions of yen)
| Amount sold | Total gain on sale | Total loss on sale | ||
| 712 | 111 | 77 |
| 5. | Major Securities without Determinable Market Value |
(Millions of yen)
| Carrying amount | ||
(1) Held-to-Maturity securities | ||
a) Commercial paper | 9,999 | |
b) Other | 10 | |
(2) Other securities | ||
a) Unlisted stocks (excluding stocks traded on the OTC market) | 13,317 | |
b) Money management funds, etc. | 35,062 | |
c) Other | 5 |
| 6. | Predicted Future Redemption of Other Securities with Maturity and Held-to-Maturity Securities |
(Millions of yen)
| Within one year | Between one and five | Between five and ten | Over ten years | |||||
(1) Bonds | ||||||||
a) Government and local bonds | 21,708 | 1,022 | – | – | ||||
b) Corporate bonds | 26,844 | 31,715 | – | – | ||||
c) Other | – | 10 | – | – | ||||
(2) Other | ||||||||
Commercial paper | 9,999 | – | – | – | ||||
Total | 58,552 | 32,748 | – | – |
Fiscal 2004 (as of March 31, 2005)
1. Traded Securities
No applicable items.
2. Held-to-Maturity Securities with Determinable Market Value
(Millions of yen)
| Type | Carrying amount | Market value | Difference | ||||||
| Securities whose market value exceeds their carrying value | (1) Government and local bonds | 1,002 | 1,002 | 0 | |||||
| (2) Corporate bonds | 39,237 | 39,382 | 144 | ||||||
| (3) Other | – | – | – | ||||||
| Subtotal | 40,239 | 40,384 | 145 | ||||||
| Securities whose market value does not exceed their carrying value | (1) Government and local bonds | 28,088 | 28,088 | – | |||||
| (2) Corporate bonds | 14,987 | 14,974 | (13 | ) | |||||
| (3) Other | – | – | – | ||||||
| Subtotal | 43,076 | 43,063 | (13 | ) | |||||
Total | 83,316 | 83,448 | 132 | ||||||
App. F-41
Table of Contents
3. Other Securities with Determinable Market Value
(Millions of yen)
| Type | Acquisition cost | Carrying amount | Difference | ||||||
| Securities whose carrying value exceeds their acquisition costs | (1) Stocks | 20,545 | 67,899 | 47,353 | |||||
| (2) Bonds | |||||||||
| a) Government and local bonds | – | – | – | ||||||
| b) Corporate bonds | – | – | – | ||||||
| c) Other | – | – | – | ||||||
| (3) Other | 220 | 229 | 8 | ||||||
| Subtotal | 20,766 | 68,128 | 47,362 | ||||||
| Securities whose carrying value does not exceed their acquisition costs | (1) Stocks | 7 | 7 | (0 | ) | ||||
| (2) Bonds | |||||||||
| a) Government and local bonds | – | – | – | ||||||
| b) Corporate bonds | – | – | – | ||||||
| c) Other | – | – | – | ||||||
| (3) Other | 2 | 2 | (0 | ) | |||||
| Subtotal | 9 | 9 | (0 | ) | |||||
Total | 20,776 | 68,137 | 47,361 | ||||||
| Notes: | In cases where the market value of the securities in question dropped 30% or more from the acquisition costs, the securities were classified as having ‘fallen significantly.’ In cases where the securities’ market value dropped 50% or more, the securities were written off. In cases where the market value of securities dropped more than 30% but less than 50%, the likelihood of recovery was estimated on the basis of market value trends and the financial situation of the issuing companies. Write-offs were conducted in all cases other than those for which it was concluded that there was a chance of recovery. |
4. Other Securities Sold During Fiscal 2004
(Millions of yen)
Amount sold | Total gain on sale | Total loss on sale | ||
| 1,184 | 983 | 5 |
5. Major Securities without Determinable Market Value
(Millions of yen)
| Carrying amount | ||
(1) Held-to-Maturity securities | ||
a) Commercial paper | 29,998 | |
b) Other | 10 | |
(2) Other securities | ||
a) Unlisted stocks (excluding stocks traded on the OTC market) | 14,416 | |
b) Money management funds, etc. | 60,848 | |
c) Other | 2,583 |
App. F-42
Table of Contents
| 6. | Predicted Future Redemption of Other Securities with Maturity and Held-to-Maturity Securities |
(Millions of yen)
| Within one year | Between one and five years | Between five and ten years | Over ten years | |||||
(1) Bonds | ||||||||
a) Government and local bonds | 29,077 | 13 | – | – | ||||
b) Corporate bonds | 26,707 | 27,517 | – | – | ||||
c) Other | – | 10 | – | – | ||||
(2) Other | ||||||||
Commercial paper | 29,998 | – | – | – | ||||
Total | 85,783 | 27,540 | – | – |
Derivative Transactions
Information on derivative transactions has not been presented because the Company discloses its information through EDINET (Electronic Disclosure for Investors’ NETwork).
Retirement and Severance Benefit
1. Summary of Retirement and Severance Benefit Systems Adopted
The Company has an unfunded retirement and severance plan and contributory pension plan as its defined benefit system.
The Company’s domestic consolidated subsidiaries have unfunded retirement and severance plans and certain domestic consolidated subsidiaries have contributory pension plans. Certain other domestic consolidated subsidiaries participate in a comprehensive establishment-type welfare pension fund system. Overseas consolidated subsidiaries adopt a defined benefit system or a defined contribution system.
Additional retirement payments not part of the numerical calculations in accordance with the retirement and severance benefit accounting standards are occasionally paid to employees upon retirement.
2. Retirement and Severance Benefit Obligation (Millions of yen)
| As of March 31, 2004 | As of March 31, 2005 | |||||
| (1) Projected benefit obligation (Note 1) | (89,999 | ) | (84,085 | ) | ||
| (2) Plan assets at fair value (Note 2) | 19,859 | 22,429 | ||||
(3) Projected benefit obligation in excess of plan assets (1)+(2) | (70,139 | ) | (61,656 | ) | ||
| (4) Unrecognized loss | 166 | 73 | ||||
| (5) Unrecognized prior service costs | (178 | ) | (5,260 | ) | ||
(6) Accrued retirement and severance benefits (3)+(4) + (5) | (70,152 | ) | (66,843 | ) |
| Notes: |
| 1. | Certain consolidated subsidiaries use the simplified method in calculating their retirement and severance benefit obligation. |
| 2. | In addition to the above, the plan assets in the comprehensive establishment-type welfare pension fund for which the amount of the plan assets applying to the companies’ contributions cannot be calculated reasonably totaled 5,197 million yen in fiscal 2003 and 7,923 million yen in fiscal 2004, respectively. This amount has not been included in the plan assets presented above. |
App. F-43
Table of Contents
3. Costs of Retirement and Severance Benefits
(Millions of yen)
| Fiscal 2003 | Fiscal 2004 | |||||
(1) Service cost for benefits earned (Notes 1 and 2) | 6,055 | 6,596 | ||||
(2) Interest expense on projected benefit obligation | 1,944 | 1,844 | ||||
(3) Estimated return on plan assets | (261 | ) | (392 | ) | ||
(4) Amortization of unrecognized actuarial gain or loss | (1,434 | ) | (426 | ) | ||
(5) Amortization of unrecognized prior service costs | (19 | ) | (603 | ) | ||
(6) Additional retirement payment (Note 3) | 3,740 | 693 | ||||
Total | 10,024 | 7,712 |
| Notes: |
| 1. | Costs of retirement and severance benefits at those consolidated subsidiaries which have adopted the simplified method are included under service cost for benefits earned. |
| 2. | Employees’ contributions to the comprehensive establishment-type welfare pension fund have been deducted. |
| 3. | Of this amount 3,181 million yen in fiscal 2003 and 662 million yen in fiscal 2004 have been included in extraordinary losses, respectively. |
4. Assumptions and Basis for the Calculation of Retirement and Severance Benefits
| Fiscal 2003 | Fiscal 2004 | |||
(1) Method of benefit attribution | “Benefit / years of service” approach | “Benefit / years of service” approach | ||
(2) Discount rate | 2.5% | 2.5% | ||
(3) Estimated rate of return on plan assets | 2.5% | 2.5% | ||
(4) Period of amortization of unrecognized actuarial gain or loss | Between one and five years | Between one and five years | ||
(5) Period of amortization of unrecognized prior service costs | five years | five years |
App. F-44
Table of Contents
V. Production, Orders and Sales
1. Production
| Production by business segment for fiscal 2004 is summarized as follows: |
| Business Segment | Production (Millions of yen) | Year-on-year changes (%) | ||
Pharmaceuticals | 317,646 | 102.7 | ||
Other | 77,752 | 103.2 | ||
Total | 395,399 | 102.8 |
Notes:
1. Production refers to the value of net sales and after eliminating inter segment sales.
2. The above amounts are stated exclusive of consumption tax.
2. Orders
| The Sankyo Group carries out production according to their own production plans, which are primarily based on their sales plans. Order production is carried out at certain subsidiaries; however, the balance of outstanding orders has not been included here as the relevant amounts were insignificant. |
3. Sales
| Sales by business segment for fiscal 2004 are as follows: |
| Business Segment | Sales (Millions of yen) | Year-on-year changes (%) | ||
Pharmaceuticals | 454,710 | 97.4 | ||
Other | 133,120 | 102.7 | ||
Total | 587,830 | 98.6 |
Notes:
1. Amounts represent sales to external customers.
2. Sales to major customers and percentage of total sales were as follows:
| Customers | Fiscal 2003 | Fiscal 2004 | ||||||
| (Millions of yen) | % | (Millions of yen) | % | |||||
Bristol-Myers Squibb Company | 93,923 | 15.7 | 72,074 | 12.3 | ||||
Alfresa Corporation | – | – | 64,985 | 11.1 | ||||
| 3. | The above amounts are stated exclusive of consumption tax. |
App. F-45
Table of Contents
Subsequent Events
[Signing of an agreement to integrate businesses by establishing a joint holding company with Daiichi Pharmaceutical Co., Ltd. (“Daiichi”)]
The Company signed an agreement to integrate its businesses with Daiichi through the resolution by the Board of Directors on May 13, 2005. The joint holding company, DAIICHI SANKYO COMPANY, LIMITED, will be established on September 28, 2005 through the approval at the 151st ordinary general shareholders’ meeting to be held on June 29, 2005.
1. Objectives of the Integration
In response to unsatisfied needs from patients and health care professionals, the Company and Daiichi (together, “Both Companies”) will integrate their businesses with an objective to pursue a Japan-based “global pharma-innovator,” who provides innovative products and services continuously and demonstrates a unique competitiveness in the international pharmaceutical market.
2. Business Integration Process
| (1) | A joint holding company will be established in the form of a fully-fledged parent company through stock transfer from Both Companies on September 28, 2005. As a result of the joint stock transfer, common stocks of Both Companies traded on the stock exchanges will be delisted and the new holding company will apply for listing. |
| (2) | The pharmaceutical businesses of Both Companies will be integrated into the joint holding company by April 2007. |
3. Profile of the joint holding company
Company name : Daiichi Sankyo Company, Limited
Headquarters : 3-5-1 Nihonbashi-honcho, Chuo-ku, Tokyo, Japan
Common stock : 50 billion yen
App. F-46
Table of Contents
Filings with the U.S. SEC
Daiichi Pharmaceutical Co., Ltd. and Sankyo Company, Limited may file a registration statement on Form F-4 with the U.S. SEC in connection with the proposed business combination of Daiichi and Sankyo under a new holding company by way of a joint share transfer. The Form F-4 (if filed) will contain a prospectus and other documents. If a Form F-4 is filed and declared effective, Daiichi and Sankyo plan to mail the prospectus contained in the Form F-4 to their U.S. shareholders prior to the shareholders meetings at which the share exchange will be voted upon. The Form F-4 (if filed) and prospectus will contain important information about Daiichi and Sankyo, the joint share transfer and related matters. U.S. shareholders of Daiichi and Sankyo are urged to read the Form F-4, the prospectus and the other documents that may be filed with the U.S. SEC in connection with the joint share transfer carefully before they make any decision at the shareholders meeting with respect to the joint share transfer. The Form F-4 (if filed), the prospectus and all other documents filed with the U.S. SEC in connection with the joint share transfer will be available when filed, free of charge, on the U.S. SEC’s web site atwww.sec.gov. In addition, the prospectus and all other documents filed with the U.S. SEC in connection with the business combination will be made available to shareholders, free of charge, by calling, writing or e-mailing:
Sankyo Company, Limited Mr. Shigemichi Kondo Corporate Communications Department 3-5-1, Nihonbashi Honcho Chuo-ku, Tokyo 103-8426, Japan Telephone: 81-3-5255-7034 E-mail:shige-k@sankyo.co.jp | Daiichi Pharmaceutical Co., Ltd. Mr. Toshio Takahashi Corporate Communications Department 14-10 Nihonbashi, 3-chome Chuo-ku, Tokyo 103-8234, Japan Telephone: 81-3-3273-7107 E-mail:andokb5o@daiichipharm.co.jp |
You may read and copy any reports and other information filed with, or submitted to, the U.S. SEC at the U.S. SEC’s public reference rooms at 100 F Street, N.E., Washington, D.C. 20549 or at the other public reference rooms in New York, New York and Chicago, Illinois. Please call the U.S. SEC at 1-800-SEC-0330 for further information on public reference rooms. Filings with the U.S. SEC also are available to the public from commercial document-retrieval services and at the web site maintained by the U.S. SEC at http//www.sec.gov.
Forward-Looking Statements
This communication contains forward-looking information and statements about Daiichi and Sankyo and their combined businesses after completion of the joint share transfer. Forward-looking statements are statements that are not historical facts. These statements include financial projections and estimates and their underlying assumptions, statements regarding plans, objectives and expectations with respect to future operations, products and services, and statements regarding future performance. Forward-looking statements are generally identified by the words “expect,” “anticipates,” “believes,” “intends,” “estimates” and similar expressions. Although the management of Daiichi and Sankyo believe that the expectations reflected in such forward-looking statements are reasonable, investors and holders of Daiichi and Sankyo securities are cautioned that forward-looking information and statements are subject to various risks and uncertainties, many of which are difficult to predict and generally beyond the control of Daiichi and Sankyo, that could cause actual results and developments to differ materially from those expressed in, or implied or projected by, the forward-looking information and statements. These risks and uncertainties include those discussed or identified in the public filings with the SEC and the local filings made by Daiichi and Sankyo, including those listed under “Cautionary Statement Concerning Forward-Looking Statements” and “Risk Factors” in the prospectus included in the registration statement on Form F-4 that Daiichi and Sankyo may file with the U.S. SEC. Other than as required by applicable law, neither Daiichi nor Sankyo undertakes any obligation to update or revise any forward-looking information or statements.
App. F-47
Table of Contents
APPENDIX G
UNAUDITED REVERSE RECONCILIATION OF SELECTED
FINANCIAL INFORMATION OF SANKYO
App. G-1
Table of Contents
Sankyo has included unaudited consolidated financial statements as of or for the year ended March 31, 2005 prepared in accordance with Japanese GAAP in Appendix F of this prospectus. As the basis of the consolidated financial information included or incorporated by reference in this prospectus, which is presented under U.S. GAAP, is significantly different from Japanese GAAP in certain respects, Sankyo presents below a reverse reconciliation from U.S. GAAP to Japanese GAAP of its net income for the year ended March 31, 2004 and shareholders’ equity as of March 31, 2004.
| Net income | (In millions of yen) Shareholders’ equity | |||||||
Amounts reported in the consolidated financial statements under U.S. GAAP | ¥ | 38,211 | ¥ | 666,027 | ||||
Adjustments: | ||||||||
1. Revenue recognition | (1,335 | ) | 14,473 | |||||
2. Impairment of long-lived assets | (351 | ) | 1,098 | |||||
3. Goodwill and other intangible assets | 5,358 | 10,327 | ||||||
4. Pensions | 1,900 | (86 | ) | |||||
5. Other | 2,027 | 3,078 | ||||||
Total Japanese GAAP adjustments | 7,599 | 28,890 | ||||||
Tax effect of above Japanese GAAP adjustments | (2,399 | ) | (12,323 | ) | ||||
Net effect of Japanese GAAP adjustments | 5,200 | 16,567 | ||||||
Amounts determined in conformity with Japanese GAAP | ¥ | 43,411 | ¥ | 682,594 | ||||
| 1. | Revenue recognition |
Staff Accounting Bulletin (“SAB”) 101 “Revenue Recognition in Financial Statements”, as amended by SAB 104, summarizes certain of the Securities and Exchange Commission (“SEC”) staff’s views regarding the basis of revenue recognition. Revenue should be recognized when all of the following criteria are met: (1) persuasive evidence of an arrangement exists, (2) delivery has occurred or services have been rendered, (3) the seller’s price to the buyer is fixed or determinable, and (4) collectibility is reasonably assured. For products which the buyer has a right to return, in accordance with Statement of Financial Accounting Standards (“SFAS”) No. 48, “Revenue Recognition When Rights of Return Exists”, revenue recognition for those products may be postponed or revenue and cost may be reduced to reflect estimated returns and expected costs or losses shall be accrued.
In Japan, the basis of revenue recognition includes, among others, delivery basis and acceptance basis. There is a business practice to accrue sales return reserves; however, there are no explicit provisions such as SAB 101 or SFAS No. 48.
| 2. | Impairment of long-lived assets |
Under U.S. GAAP, in accordance with SFAS No. 144, “Accounting for the Impairment or Disposal of Long-Lived Assets”, a review for impairment must be performed whenever events or circumstances indicate the carrying amount of long-lived assets may not be recoverable. If the review for impairment indicates that undiscounted future cash flows are less than the carrying amount of the assets, and the carrying amount of the assets may not be recoverable, the long-lived assets should be written down to their fair values. SFAS No. 144 also requires that long-lived assets to be disposed of by sale be measured at the lower of carrying amount or fair value less cost to sell. This Statement excludes from the definition of long-lived assets goodwill and other intangibles that are not amortized in accordance with SFAS No. 142, “Goodwill and Other Intangible Assets”.
App. G-2
Table of Contents
Historically, in Japan, no authoritative accounting standard existed for such impairment of long-lived assets, such as SFAS No. 144. In Japan, “Accounting Standard for Impairment of Fixed Assets”, which is similar to SFAS No. 144, was issued in August 2002 for the accounting of impairment of long-lived assets. It becomes effective for fiscal years beginning on or after April 1, 2005.
| 3. | Goodwill and intangible assets |
Under U.S. GAAP, the purchase method of accounting is required for business combinations and the cost of an acquisition, including the fair value of liabilities assumed, in excess of the fair value of tangible and identifiable intangible assets acquired on the acquisition date is recorded as goodwill. SFAS No. 142, “Goodwill and Other Intangible Assets”, requires that reporting units be identified for the purposes of allocating acquired tangible and intangible assets and liabilities as well as for impairment testing of goodwill and indefinite-lived intangible assets. In accordance with SFAS No. 142, goodwill and indefinite-lived intangible assets are not amortized, but an annual test for impairment is required.
In Japan, there is no specific guidance regarding the application of the purchase method of accounting in business combinations. Additionally, goodwill is amortized over a period of not more than 5 years, or charged to income. Goodwill resulting from consolidation is amortized over a period of not more than 20 years. Historically, no authoritative accounting standard existed for impairment of goodwill such as SFAS No. 142. In Japan, “Accounting Standard for Impairment of Fixed Assets”, will cover the accounting of impairment of goodwill and the intangible assets, effective for fiscal years beginning on or after April 1, 2005.
| 4. | Pensions |
Under U.S. GAAP, in accordance with SFAS No. 87, “Employers’ Accounting for Pensions”, pension cost represents service cost, interest cost, actual return on plan assets, amortization of prior service liability and other amounts. Any difference between net pension cost charged against income and the amount actually funded is recorded as accrued or prepaid pension cost. Pension benefit obligation is divided into Projected Benefit Obligation (“PBO”), which considers future salary increases, and Accumulated Benefit Obligation (“ABO”), which does not consider future salary increases. ABO is divided into a vested and non-vested benefit portion. A minimum liability is required to be recognized to cover the amount of ABO in excess of the fair value of plan assets. The unrecognized net obligation existing at the date of the initial application of SFAS No. 87 shall be amortized on a straight-line method basis over the average remaining service period of the employees.
In Japan, in accordance with “Accounting Standard for Retirement Benefits”, a similar accounting treatment is also required, however, neither the concept of ABO nor accounting treatment of a minimum liability exist in Japanese GAAP. In addition, the unrecognized net obligation existing at the date of the initial application of the standard can be charged to income in the period of the initial adoption.
| 5. | Other |
Other includes items having small effects on net income and shareholders’ equity as follows:
| • | Compensated absences: Under U.S. GAAP, an accrual for compensated absences is required. In Japan, there is no established authoritative accounting standard for accruing a liability related to compensated absences. |
| • | Gains on the disposition or exchange of fixed assets: Under U.S. GAAP, gains on the disposition or exchange of fixed assets are recognized when incurred. Under Japanese GAAP, some of gains on the disposition or exchange of fixed assets can be deferred to a later period. |
App. G-3
Table of Contents
| • | Scope of consolidation and equity method accounting: Under U.S. GAAP, basically, the company is required to consolidate all majority owned subsidiaries and apply the equity method to all investments in which the company holds 20-50% of the voting stock. Under Japanese GAAP, an insignificant majority owned subsidiary may not be consolidated and insignificant investments in which the company holds 20-50% of the voting stock may not be subject to equity method of accounting. |
| • | Directors’ bonuses: Under U.S. GAAP, bonuses to directors and corporate auditors are recorded as an expense when granted. Under Japanese GAAP, bonuses to directors and corporate auditors are directly debited to retained earnings. |
App. G-4
Table of Contents
APPENDIX H
ENGLISH TRANSLATION OF ARTICLES 371, 355, 245-3 AND 245-4 OF
THE COMMERCIAL CODE OF JAPAN
App. H-1
Table of Contents
Article 371
1. (Omitted)
2. The provisions of Articles 355 and 360 shall applymutatis mutandis to the case of share transfer.
Article 355
1. Any shareholder who has notified in writing to the company, prior to the general meeting of shareholders mentioned in Paragraph 1 of Article 353, of his/her intention to oppose the share exchange and has opposed approving the share exchange agreement at such general meeting, may demand that the company purchase his/her shares at the fair value which such shares would have had but for such resolution approving the share exchange agreement.
2. The provisions of Paragraph 2 of Article 245-2, Articles 245-3 and 245-4 shall applymutatis mutandis to the case mentioned in the preceding Paragraph.
Article 245-3
1. Such demand mentioned in the Paragraph 1 of the preceding Article(1) shall, within 20 days from the date on which the resolution was adopted, be made in writing by stating the class and the number of the shares.
2. The provisions of Paragraphs 2 and 3 of Article 204-2 shall applymutatis mutandis to such demand in writing mentioned in the Paragraph 1 of the preceding Article and the preceding Paragraph.
3. If the value of such shares is agreed upon between the dissenting shareholder and the company, the company shall make payment of the agreed value within 90 days from the date of such resolution.
4. If, within 60 days from the date of such resolution, the dissenting shareholder and the company do not agree on the value of shares, the dissenting shareholder may, within 30 days from the expiration of such 60-day period, file a petition with the court asking for a determination of the value of such shares.
5. The company shall also make payment of the statutory interest on such value as determined by the court after the expiration of the period mentioned in Paragraph 3 of this Article.
6. The payment of the price of shares shall be made in exchange for the share certificates. The transfer of the shares shall become effective upon the payment of the price therefor.
Article 245-4
The demand of a dissenting shareholder as provided for in Paragraph 1 of Article 245-2(2) shall be null and void when the company has abandoned the act mentioned in Paragraph 1 of Article 245(3). The same shall apply to the case where a dissenting shareholder has failed to file the petition mentioned in Paragraph 4 of the preceding Article within the period mentioned therein.
| (1) | For the purpose of interpreting Article 355, the ‘‘demand mentioned in the Paragraph 1 of the preceding Article’’ should be read to mean the ‘‘demand mentioned in Paragraph 1 of Article 355.’’ |
| (2) | For the purpose of interpreting Article 355, this ‘‘Paragraph 1 of Article 245-2’’ should be read to mean “Paragraph 1 of Article 355’’ |
| (3) | For the purpose of interpreting Article 355 which shall applymutatis mutandis to the case of share transfer, the ‘‘act mentioned in Paragraph 1 of Article 245’’ should be read to mean the ‘‘share transfer.’’ |
App. H-2