Table of Contents
Exhibit 99.1
Table of Contents
Table of Contents
Financial Highlights
Daiichi Pharmaceutical Co., Ltd. and Consolidated Subsidiaries
Years ended March 31
| Millions of yen | Thousands of U.S. dollars (Note) | |||||||||||
| 2005 | 2004 | 2005 | ||||||||||
For the Year: | ||||||||||||
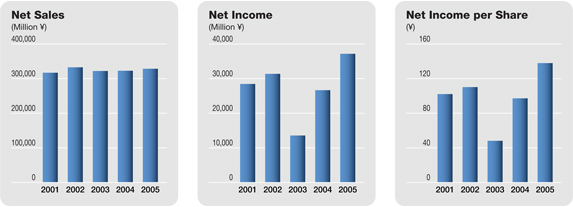
Net sales | ¥ | 328,534 | ¥ | 322,767 | $ | 3,059,261 | ||||||
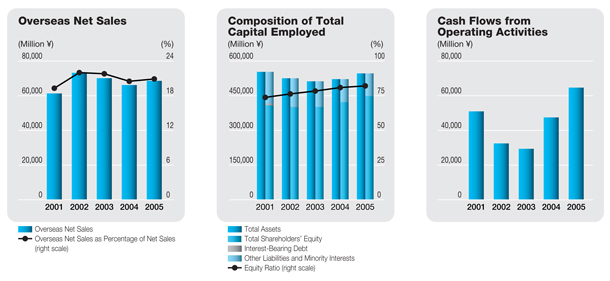
Overseas net sales | 68,589 | 66,164 | 638,691 | |||||||||
Percentage of net sales (%) | 20.9 | 20.5 | ||||||||||
Operating income | 56,064 | 46,115 | 522,060 | |||||||||
Net income | 37,175 | 26,662 | 346,168 | |||||||||
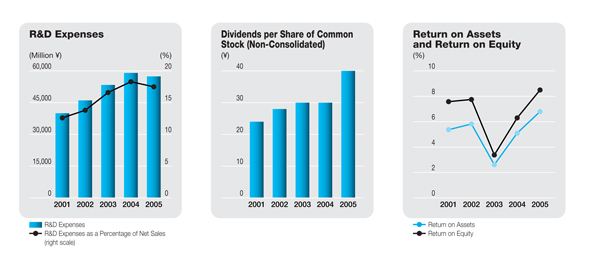
Research and development expenses | 57,417 | 59,049 | 534,659 | |||||||||
| [58,605 | ]* | [60,721 | ]* | [545,721 | ]* | |||||||
Percentage of net sales (%) | 17.5 | 18.3 | ||||||||||
Capital expenditures | 14,798 | 12,314 | 137,797 | |||||||||
Depreciation | 15,947 | 17,366 | 148,496 | |||||||||
At Year-End: | ||||||||||||
Total assets | 546,555 | 521,809 | 5,089,440 | |||||||||
Interest-bearing debt | 24 | 42 | 223 | |||||||||
Total shareholders’ equity | 448,563 | 422,130 | 4,176,953 | |||||||||
Per Share Data(yen and U.S. dollars): | ||||||||||||
Net income | ¥ | 137.95 | ¥ | 97.25 | $ | 1.285 | ||||||
Cash dividends applicable to the year | 40.00 | 30.00 | 0.372 | |||||||||
Note: U.S. dollar amounts in this annual report are translated from yen, for convenience only, at the rate of ¥107.39 to US$1.00.
| * | Total amount, including production R&D costs |
| 01 | ||
| 02 | ||
| 08 | ||
| 14 | ||
| 16 | ||
| 17 | ||
| 18 | ||
| 24 | ||
| 26 | ||
| 27 | ||
| 28 | ||
| 29 | ||
| 42 | ||
| 43 |
Note Regarding Forward-Looking Statements
This annual report contains statements concerning forecasts for Daiichi Pharmaceutical Co., Ltd., and Sankyo Co., Ltd., and their group companies. These statements are based on assumptions and judgments made with information available at the time of preparation, and as such are subject to existing and unforeseen risks, as well as uncertainties and other factors. Risks, uncertainties, and other factors may cause business performance, management actions, and financial results to differ from those presented in this report.
Table of Contents
| Daiichi Pharmaceutical Co., Ltd. | Annual Report 2005 |
Since its establishment in 1915, Daiichi Pharmaceutical Co., Ltd., has been guided by its commitment to provide valuable pharmaceuticals that help to enrich the quality of life. This commitment remains as strong as ever and is expressed through our pursuit of excellence in offering prescription drugs, diagnostic agents, OTC drugs, and fine chemicals.
Having earned a strong reputation in Japan, Daiichi is gaining increasing recognition abroad through its independent marketing network as well as through licensing tie-ups with renowned pharmaceutical manufacturers in other countries.
Daiichi has advanced steadily over the years by developing innovative pharmaceuticals that have a wealth of clinical and commercial potential. The Company is now sharpening the focus of its R&D programs to emphasize therapeutic areas that reflect both Daiichi’s strengths and patients’ needs.
01
Table of Contents
Bridges to the Future
The pharmaceutical industry’s operating environment is becoming increasingly harsh due to such worldwide trends as the progressive globalization of new drug development programs, a related rise in development costs, and government efforts to reduce healthcare costs. Moreover, these trends are causing a shift from an era in which the industry saw increasing disparities in corporate competitiveness to an era in which the relatively weak companies are being winnowed out. To augment its capabilities for overcoming global competition and sustaining its corporate development amid these trends, on May 13, 2005, Daiichi Pharmaceutical Co., Ltd., signed an agreement with Sankyo Co., Ltd., that calls for the integration of the two companies’ business operations. Plans call for establishing a joint holding company named DAIICHI SANKYO COMPANY, LIMITED, on September 28, 2005, and then progressively integrating the two companies’ operations, which are to be completely integrated by April 2007. By leveraging their strong presence in Japan and maximizing synergies generated by the integration, the two companies are aiming to become a Japan-based “global pharma-innovator” with the capabilities needed to “contribute to healthier and happier lives globally” on a still-higher level.
Overview of Results
During fiscal 2004, ended March 31, 2005, overseas pharmaceutical markets were characterized by a further intensification of global competition centered on “global-mega” companies and associated with both new drug-related R&D and marketing activities. The Japanese pharmaceutical market was affected by changes in the healthcare systems—such as the growing scope of application of the comprehensive hospital therapy evaluation system and the conversion of national university hospitals and other national hospitals into independent corporations—and an average 4.2% reduction in National Health Insurance (NHI) drug reimbursement prices was implemented in April 2004.
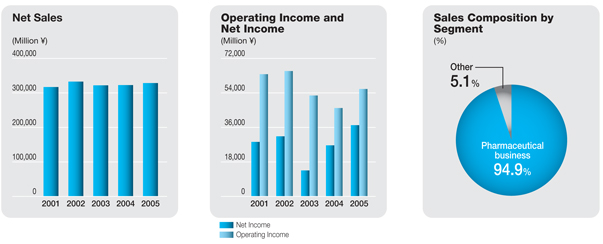
Against this backdrop, the Daiichi Group worked to expand the markets for its products while emphasizing the promotion of appropriate drug use. As a result of these efforts, a rise in revenue from domestic sales of prescription drugs and a rise in bulk exports of levofloxacin, consolidated net sales advanced 1.8% from the previous fiscal year, to ¥328,534 million. Profitability greatly improved—operating income totaled ¥56,064 million, up 21.6% from the previous fiscal year, and net income surged 39.4% from the previous fiscal year, to ¥37,175 million. The share of the Group’s consolidated net sales comprising overseas sales in total was 20.9%.
02
Table of Contents
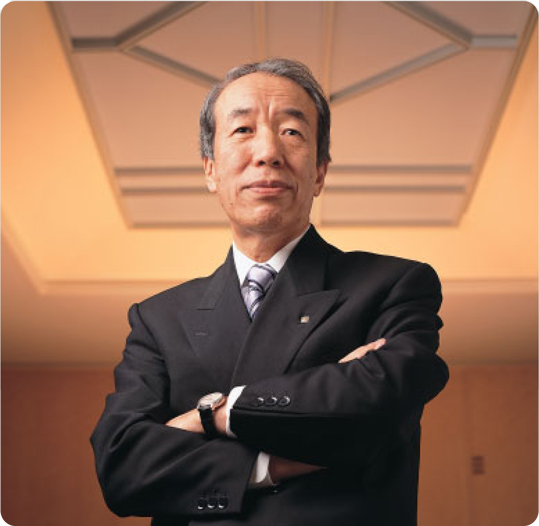
Kiyoshi Morita,
President and CEO
Our Structural Reforms
The Daiichi Group has been implementing its current program of concrete structural reform measures since the start of the fiscal year under review. It is continuing to implement these reforms with the goal of smoothly finishing the integration and creating a strong foundation for operations as “global pharma-innovator.”
| (1) | Expanding Global R&D Operations |
As a result of its April 2004 establishment of U.S.-based Daiichi Medical Research, Inc. (DMR) to evaluate global drug candidates and its October 2004 establishment of the R&D Division, Daiichi has integrated its research operations and development operations and created the organizational framework required to move ahead with R&D programs in line with global standards. The R&D Division is seeking to maintain progress in domestic and overseas R&D projects while promoting functional collaboration between the Tokyo Research and Development Center and DMR. Through this R&D structural reform initiative, the Company is seeking to boost R&D productivity and firmly instill global thinking and action mechanisms.
During the current fiscal year, we will comprehensively evaluate a number of promising drug candidates—including DU-176b, an oral factor-Xa inhibitor, and DJ-927, a taxane derivative anticancer chemotherapeutic agent—and make important decisions on whether to advance these candidates to the pivotal clinical trial stage. If the candidates are advanced, we will create global clinical development systems that ensure sufficient development capabilities with regard to programs’ quality, volume, and speed.
03
Table of Contents
Following the October 2005 establishment of DAIICHI SANKYO, we will work to unify the management of Daiichi’s and Sankyo’s product development pipelines. We will determine the methods of the unification process by September and unify the priority ratings for the two companies’ pipelines from October. Subsequent to the merger we will take steps to tighten the focuses of our global development operations and concentrate resources in strategically emphasized fields.
| (2) | Strengthening the Prescription Drug Business |
Amid increasingly intense marketing competition, Daiichi maintains a policy of working to further reinforce the strong market positions enjoyed of its prescription drugs.
In the domestic prescription drug business, the Company is aiming to expand its current overall market share. To do this, it is striving to increase the number of prescriptions for established drugs—such asCravit,a broad-spectrum oral antibacterial agent;Artist,a long-acting beta-blocker;Sunrythm,an anti-arrhythmic agent; andHANP,an agent for treating acute cardiac insufficiency—while expeditiously launching and developing the markets for drugs for which applications have already been made—such asPlavix(clopidogrel sulfate), a new anti-platelet agent; and KMD-3213 (silodosin), an agent for treating dysuria. The Company is also strengthening its marketing operations aimed at the hospital market while taking steps to respond to such changes in the medical therapy environment as the creation of medical institution networks and the spread of diagnostic and therapeutic guidelines.
04
Table of Contents
In the overseas prescription drug business, the Company is working to ensure that its licensee maintains the top share of the quinolone drug market in the United States, which is the largest export market for bulk shipments of its mainstay antibacterial agent levofloxacin, by working through Johnson & Johnson, the licensee, to obtain approval for additional indications and taking other steps to expand the market shares of products containing levofloxacin.
| (3) | Building a Resilient Corporate Structure by Resolutely Implementing Structural Reforms |
To transform the entire Daiichi Group into an enterprise featuring high levels of profitability and management efficiency as well as strong overall competitiveness, the Company has established a task force, the Structural Reform Headquarters, that is working to
| 1) | consolidate functions within the Group and integrate and consolidate networks of research and distribution facilities, |
| 2) | optimize the size of the Group’s workforce, and |
| 3) | restructure ancillary businesses. |
Particularly noteworthy among functional and facility consolidation measures was the shift of the Tochigi Research Center’s protein research unit and Daiichi Fine Chemical’s drug discovery units to the Tokyo Research and Development Center, in October 2004 and April 2005, respectively. Moreover, while we currently have five distribution bases, by March 31, 2007, we plan to consolidate distribution operations at just two bases, one in Tokyo and one in Osaka, thereby helping increase operational efficiency and reduce costs.
To consolidate planning and administration functions, the Company is proceeding with the introduction of enterprise resource planning (ERP) systems that promote the consolidation of Group companies’ accounting, remuneration, and IT units. The remuneration functions of major Group companies have already been consolidated in the Company’s Business Center facility.
Aiming to optimize the size of the Group’s workforce, steps were taken to hire additional staff to work for Daiichi Medical Research, Inc. and boost the number of the parent Company’s Medical Representatives in domestic prescription drug marketing to 1,400 by March 31, 2007, from the current level of 1,200. In contrast, at many other Group companies such operational reform measures as those to reevaluate operations, consolidate functions, and introduce electronic information systems have enabled workforce streamlining.
Regarding the reorganization of non-core businesses, the Group transferred its veterinary and livestock feed products business to Meiji Seika Kaisha, Ltd. This transfer was smoothly implemented in June 2004.
Another noteworthy move was the establishment of Daiichi Pharmatech, Co., Ltd., in April 2005 following the revision of Japan’s Pharmaceutical Affairs Law. Created through the spin-off of three factories from the parent Company, Daiichi Pharmatech is working to further increase manufacturing efficiency and strengthen cost-competitiveness.
05
Table of Contents
In fiscal 2004, we introduced new marketing systems that not only enable the unified management of customer data, marketing activity data, and other related data but that can be operated in coordination with product data management systems. These systems are expected to help increase the efficiency of information sharing throughout the company— particularly information sharing involving medical representatives. We intend to sustain our efforts to augment the Group’s operational efficiency.
Corporate Sustainability
The Daiichi Group is dedicated to its mission as a pharmaceutical company of promoting the use of superior drugs and thereby maximizing its contribution to the betterment of human health throughout the world. However, because the Group also recognizes its responsibility for the important task of maximizing shareholder value, it has been taking various steps to strengthen its corporate governance and compliance systems. With respect to corporate governance, we have made moves to increase management transparency and upgrade capabilities for expeditious and appropriate decision making. In particular, we have reduced the terms of directors from two years to one, introduced a corporate officer system and nominated outsidedirectors, and reevaluated the management council.
Regarding compliance, Daiichi Group companies have uniformly instituted the “Daiichi Conduct Guidelines” and are making sustained efforts to ensure rigorous legal compliance through such measures as the establishment of the Ethics Committee, which includes two outside lawyers as members, and the setting up of employee hot lines. Aiming to ensure that all Daiichi drug promotion activities are appropriate, we have also established the Daiichi Pharmaceutical Prescription Drug Promotion Code, which clearly describes the standards of behavior to which we expect our medical representatives to conform.
To augment our efforts in the area of personal information protection, we established the Daiichi Pharmaceutical Personal Information Protection Policy in April 2005 and have taken various measures to create a personal information protection system, including designating personal information protection managers at the parent Company and Group companies and establishing the Personal Information Protection Committee. At the same time, we have taken steps to ensure the maintenance of rigorous safety management standards and have implemented awareness-enhancement and educational programs for employees.
Regarding disclosure, we have earned a good reputation for the timely release of information-rich reports on financial performance and other relevant subjects. We are continuing to do our utmost to sustain a high level of management transparency and undertake other activities that enhance our corporate social responsibility performance.
06
Table of Contents
Business Integration of Daiichi and Sankyo
During the current fiscal year, Daiichi will mark the 90th anniversary of its founding and also begin a totally new era of corporate development due to the decision to integrate its operations with those of Sankyo, which was recently approved by our general meeting of shareholders.
The business integration is designed to create a Japan-based “global pharma-innovator” with “the creative power needed for revolutionary new drugs, the highest level of operational efficiency in the global pharmaceutical industry, a solid presence in the world’s principal markets, superior competitiveness in the Japanese market, and a high rate of growth in profitability.” By making optimal use of the distinctive strengths of both Daiichi and Sankyo, we intend to generate strong international competitiveness, and we are seeking to maximize the potential synergies between the two companies effectively in order to boost our integrated net sales and operating income to ¥932.0 billion and ¥255.0 billion, respectively, in the fiscal year ending March 31, 2010. I hope for the continued understanding and support of all stakeholders as we continue to strive to boost Daiichi’s corporate value.
July 2005
 |
| Kiyoshi Morita |
| President and CEO |
07
Table of Contents
Building Strong Bridges
Daiichi’s mission is to develop innovative technologies and distribute superior drugs that promote better human health worldwide.
During the current fiscal year Daiichi will celebrate the 90th anniversary of its founding as well as the beginning of a new stage in its corporate history in the wake of its agreement with Sankyo Co., Ltd., to cooperate in the September 28, 2005, establishment of a joint holding company to be named DAIICHI SANKYO COMPANY, LIMITED.
Integrating the operations of Daiichi and Sankyo will generate synergistic benefits that will enable the new company to overcome the challenges presented by global competition and make a still-greater contribution to human health throughout the world.
Daiichi’s Pipeline
Currently, Daiichi is focusing the bulk of its R&D resources on programs in four therapeutic domains—infectious diseases, thrombosis and other cardiovascular diseases, cancer, and allergies and other immune system disorders.
Regarding the domestic pipeline, in fiscal 2005, Daiichi has launchedAdenoscan,an adjunctive agent for myocardial scintigraphy imaging, and plans to launch such promising new products asPlavix,a new anti-platelet agent.
In fiscal 2006, Daiichi plans to launch KMD-3213 (silodosin), an agent for treating dysuria;ActHIB, Haemophilus influenzaetype b conjugate vaccine; and theGabalon Intrathecal Injectionsystem. It is possible that KMD-3213 and theGabalon Intrathecal Injectionsystem might be launched as early as some time during fiscal 2005.Memantine,an agent for treating Alzheimer’s disease, had previously scheduled for launch in Japan during fiscal 2006; however, the failure of efforts to use bridging with overseas data has necessitated the initiation of domestic Phase III trial programs and the scheduled launch date has been delayed to 2009 or later.
08
Table of Contents
DAIICHI SUNTORY PHARMA DEVELOPMENT PIPELINE
Development Code Number | Generic Name | Class or Application | Product Origin | Region | Development Stage | |||||
SUN Y4001 | adenosine | Diagnosis (coronary ischemia and angina) | King | Japan | Approval (05.04) | |||||
SUN A0026 | faropenem daloxate | Antibiotic agent (penem-type) | DSP | Overseas | Registration preparation | |||||
SUN Y7017 | memantine hydrochloride | Dementia of Alzheimer’s type (NMDA receptor antagonist) | Merz | Japan | (mild to moderate) P-III | |||||
| (severe) P-III preparation | ||||||||||
SUN 0588r | sapropterin hydrochloride (tetrahydro- biopterin) | BH4-responsive hyperphenylalaninemia | DSP | Overseas | P-III | |||||
SUN 4936h | carperitide | Acute heart failure (a-human atrial natriuretic peptide) | DSP | Overseas | P-II | |||||
SUN N4057 | — | Acute ischemic stroke (serotonin 1A receptor agonist) | DSP | Japan | — | |||||
| Overseas | P-II | |||||||||
SUN E3001 | human parathyroid hormone (hPTH) | Osteoporosis | DSP | Japan | P-II | |||||
| Overseas | — | |||||||||
SUN N8075 | — | Acute ischemic stroke (NA/Ca channel dual blocker) | DSP | Japan | — | |||||
| Overseas | P-I | |||||||||
SUN E7001 | glucagon-like peptide-1(GLP-1) | Diabetes mellitus | DSP | Japan | P-I | |||||
| Overseas | — | |||||||||
SUN 11031 | human ghrelin | Cachexia, Anorexia nervosa | DSP | Japan | P-I | |||||
| Overseas | IND preparation |
DAIICHI PHARMACEUTICAL R&D PIPELINE
Therapeutic Area | Development | Generic Name | Class or Application | Product Origin | Region | Development Stage | ||||||
Anti-infective | DU-6859a | sitafloxacin hydrate | Quinolone | DAIICHI | Japan | P-III | ||||||
| USA | P-II | |||||||||||
| DX-619 | — | Quinolone (Drug-resistant gram-positive bacteria infections) | DAIICHI | Japan | P-I preparation | |||||||
| USA/EU | P-I | |||||||||||
| ActHIB (DF-098) | Haemophilus influenzae type b conjugate vaccine | Haemophilus influenzae type b conjugate vaccine for pediatric use | AVENTIS PASTEUR-DAIICHI VACCINES (Sales Agreement) | Japan | Application (03.03) | |||||||
Anti-cancer | DJ-927 | — | Cancer chemotherapeutic (taxane deriv.) | DAIICHI | Japan | P-I | ||||||
| USA/EU | P-II | |||||||||||
| Topotecin (CPT-11*) | irinotecan hydrochloride | Cancer chemotherapeutic (camptothecin deriv.) pancreatic cancer | YAKULT | Japan | Application (04.05) | |||||||
Anti-thrombotic & Cardiovascular | Plavix (DV-7314) | clopidogrel sulfate | Anti-platelet agent | SANOFI-AVENTIS** | Japan | (cerebral infarction) Application (04.02) | ||||||
(myocardial infarction) P-III | ||||||||||||
| DX-9065a | — | Specific factor Xa inhibitor (anti-coagulant) | DAIICHI | Japan | P-II | |||||||
| USA/EU | P-II (USA) | |||||||||||
| DU-176b | — | Specific factor Xa inhibitor (anti-coagulant) | DAIICHI | Japan | P-I | |||||||
| USA/EU | P-II | |||||||||||
| DZ-697b | — | Anti-platelet agent | DAIICHI | Japan | P-I preparation | |||||||
| USA/EU | P-I preparation | |||||||||||
| HGF | hepatocyte growth factor DNA plasmid | Vascular regeneration therapy by HGF-DNA | ANGES MG (Sales Agreement) | Japan | (PAD) P-III (CAD) P-I preparation | |||||||
| USA/EU | (PAD) P-II (CAD) P-I | |||||||||||
Diagnostics | Sonazoid (DD-723) | — | Ultrasound contrast medium | AMERSHAM HEALTH | Japan | Application (04.05) | ||||||
Others | DL-404 | Intrathecal baclofen (ITB) | Intrathecal baclofen (ITB) therapy (Orphan Drug) | MEDTRONIC | Japan | Approval (05.04) | ||||||
| KMD-3213 | silodosin | Treatment of dysuria (selective alpha 1A blocker) | KISSEI | Japan | Application (04.06) | |||||||
| China | P-II | |||||||||||
| DW-908e | — | Anti-allergy agent (adhesive molecule VLA-4 inhibitor) | DAIICHI | Japan | P-I preparation | |||||||
| USA/EU | P-I | |||||||||||
| DL-8234* | interferon-ß | Hepatitis C liver cirrhosis/ Hepatitis C with ribavirin | TORAY | Japan | (Hepatitis C liver cirrhosis) Application (05.02) | |||||||
(Hepatitis C with ribavirin) P-III |
| * | Additional indication or usage |
| ** | Subsequent to the end of fiscal 2004, all commercial rights forPlavixin Japan were transferred from Daiichi and a jointly held partnership to Sanofi-Aventis. (July 5, 2005, News release) |
09
Table of Contents
In fiscal 2007, Daiichi is hoping to launch the new quinolone drug DU-6859a and HGF, a DNA plasmid for treating peripheral artery diseases. Having begun accelerating its registration of patients for domestic and overseas clinical trials for HGF, clinical trial in the United States has already finished registering 100 peripheral artery disease patients.
During fiscal 2007, Daiichi is also hoping to obtain approval for the additional indication of heart disease forPlavix,and patient registration for the related clinical trials has proceeded much faster than originally anticipated. In addition, we are planning to launch the dysuria treatment KMD-3213 (silodosin) in China in fiscal 2007.
From fiscal 2009 onward, Daiichi expects to launch new quinolone drugs for treating drug-resistant infections and oral Xa inhibitors, and our clinical trials of these products are proceeding very smoothly. In particular, we expect to complete the compilation of proof of concept (PoC) trial results for the oral Xa inhibitor DU-176b and start Phase IIb trials during 2005. DX-619, a new quinolone compound being developed for treating drug-resistant infections, is demonstrating high efficiency against various drug-resistant organisms, and it may become an important drug of last resort. Another promising candidate considered to have great potential as a successor drug toCravitupon the expiry of that drug’s U.S. patent in 2011 is scheduled to move ahead to Phase I trials in 2006. Regarding our oral anti-allergy agent VLA-4 inhibitor, we are suspending clinical trials due to safety issues of a compound with similar method of action and are working to confirm its safety through pre-clinical trials.
To augment the Daiichi Group’s competitiveness with respect to drug discovery, since 2000 Daiichi has proceeded with research facility reforms that have enabled the creation of high-quality drug discovery systems. The Group has reformed its global development system through measures that include the April 2004 establishment of U.S.-based DMR, which focuses exclusively on the development and accurate evaluation of drug candidates, and the October 2004 establishment of the R&D Division, which offers a seamless framework for all activities from the investigation of drug discovery “seeds” through the subsequent development and commercialization processes. Through these and other measures, the Company is striving to create systems for speeding up R&D programs and thoroughly evaluating drug candidates’ commercial potential at early development stages.
Regarding the business integration with Sankyo, the overlapping parts of the two companies’ R&D programs are in the fields of arteriosclerosis and thrombosis. The combination of Daiichi’s and Sankyo’s efforts will enable still-deeper research programs in these overlapping domains, and particular growth can be expected in the fields of thrombosis, diabetes, and hyperlipidemia. All of these fields are characterized by very high drug development costs, numerous competitors, and low success rates. However, by combining their resources and selecting the most promising from among both companies’ drug candidates, the two partners expect to develop products in all of the aforementioned fields that can be marketed in Japan, the United States, and Europe.
Plans call for building a structural framework for unifying the development pipelines of Daiichi and Sankyo by September 2005 and unifying the priority ratings for the two companies’ pipelines from October. Subsequently, the partners will progressively tighten the focuses of their global development operations and concentrate resources in strategically emphasized fields.
10
Table of Contents
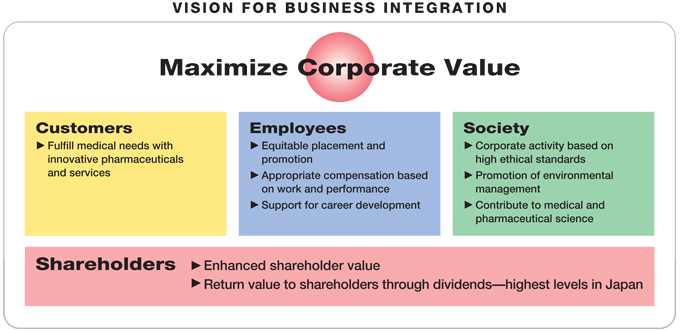
The Business Integration of Daiichi and Sankyo
| • | Business Integration Vision |
Daiichi and Sankyo have decided to integrate their operations with the goal of becoming a Japan-based “global pharma-innovator” with autonomous competitive strength in the world’s pharmaceutical markets and solid capabilities for sustaining a supply of innovative products and services that meet the needs of patients and medical professionals.
In particular, the integration is designed to maximize corporate value for the benefit of customers, employees, shareholders, and society at large by helping realize
| – | powerful drug discovery capabilities for creating innovative drugs, |
| – | the highest level of operational efficiency in the industry |
| – | a solid presence in the world’s markets, |
| – | superior competitive power in the Japanese market, and |
| – | rapid growth in profitability. |
11
Table of Contents
| • | Basic Corporate Strategies and Post-Integration Goals |
Plans call for establishing a solid profit base in Japan by consolidating pharmaceutical operations and then nurturing profit growth by expanding overseas operations centered on the United States. The rate of profit growth is expected to increase; in fiscal 2009, the integrated company is aiming for ¥932.0 billion in net sales and ¥255.0 billion in operating income, for a substantial operating income ratio of 27.4%. This high level of profitability is expected to create the funds required to meet the R&D expenses the new company will incur as a global pharma-innovator. To help maximize shareholder value, the integrated company will seek to maximize synergistic benefits that boost sales revenue and reduce costs in a manner that allows it to sustain its commitment to setting its dividend payout ratio at the highest level in the industry. The Company is aiming to have a dividend on equity ratio of 5% in fiscal 2009.
| • | Integration Effects |
While the business integration entails such potential dissynergies as those stemming from the overlap of the two companies’ product portfolios, plans call for generating synergistic benefits of a substantially greater magnitude and thereby providing a considerable boost to profitability. Specific measures aimed at generating synergistic benefits include the following.
| – | The integration is expected to boost annual consolidated operating income from prescription drug operations ¥56.0 billion by fiscal 2009. |
| – | Regarding cost synergies in prescription drug operations, the integration is expected to enable the reduction of procurement and outsourcing costs and the consolidation of facility networks in Japan and overseas. These and other cost cuts are projected to reduce annual consolidated operating costs ¥57.0 billion by fiscal 2009. |
| – | Regarding the size of the workforce in prescription drug operations, by fiscal 2009 the number of employees in prescription drug operations is projected to total 15,000, and the progressive expansion of overseas operations is expected to boost the overseas share of the workforce to above 40%. |
| – | Regarding sales synergies in prescription drug operations, by fiscal 2009 growth, primarily in sales of highly profitable in-house developed products, in Japan and overseas is projected to raise net sales and operating income ¥40.0 billion and ¥36.0 billion, respectively. |
12
Table of Contents
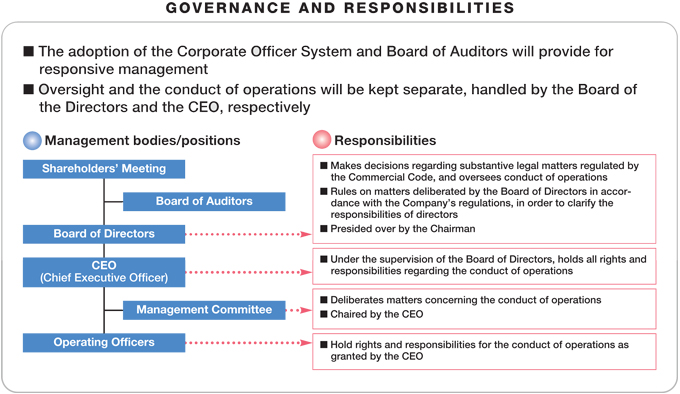
| • | Corporate Governance and Integration Schedule |
Regarding corporate governance for the joint holding company, plans call for establishing a board of auditors and adopting the corporate officer system to promote expeditious decision making and operational execution. While making sure to maximize the synergistic benefits of the business integration, the company will progressively move ahead with the actual integration of operations. Specific integration schedule items include the following.
| – | October 2005: Start of marketing collaboration in Japan; start of development pipeline unification |
| – | April 2006: Integration of marketing functions in the United States; integration of development functions in the United States and Europe; integration of OTC drug operations |
| – | March 2007: Completion of moves to spin off non-pharmaceutical operations as an autonomous unit outside the Group |
| – | April 2007: Completion of Group integration, completion of operational and information system integration, introduction of new personnel system |
Daiichi’s mission is to attain global competitiveness so that it can contribute to better human health throughout the world. The upcoming business integration is designed to create a company that can sustain innovation in line with global standards during the 21st century. This entails accelerating the Company’s evolution into a Japan-based “global pharma innovator.” Daiichi will retain its commitment to contributing to healthier and happier lives globally, and the business integration will facilitate the realization of this mission.
13
Table of Contents
Making a Difference

In line with the slogan “Enriching the Quality of Life,” Daiichi considers its primary corporate mission to be contributing to society through the provision of superior pharmaceutical products. In addition, the Company undertakes various types of corporate social responsibility (CSR) activities, such as those to promote rigorous standards of corporate ethics; help protect the environment; and support sports, arts, and other cultural activities as well as various other programs that help improve social welfare. These initiatives have been highly evaluated from a global perspective, and Daiichi has continued to be included in the FTSE4Good Index Series, which is a leading global socially responsible investment index.
Protecting the Environment
All Daiichi Group units are working concertedly to decrease energy and natural resource consumption while also reducing waste generation. In addition, the Company is progressing with the design of products that feature improved environment friendliness.
Among noteworthy environmental protection initiatives during the fiscal year under review, Daiichi introduced a calcium fluoride reuse system at its Akita Factory. The factory employs fluorine in its bulk powder manufacturing operations, generating calcium fluoride as a waste product. While the calcium fluoride was previously disposed of in landfills, from the fiscal year under review it is being supplied for use as a raw material for cement manufacturing. This system has the potential for reducing the volume of waste disposed of by the Tokyo Research and Development Center and Daiichi Pharmatech’s three factories by 70% during the current fiscal year.
Organic fluorine compounds | è | Sodium fluoride | è | Calcium fluoride (for reuse) | ||||
| (combustion) | (salt exchange, solid/liquid separation, purification) | |||||||
For more information on these and other environmental activities, please refer to Daiichi’s annual environmental reports, which it has published since fiscal 2001. These reports can be accessed via the Company’s website.
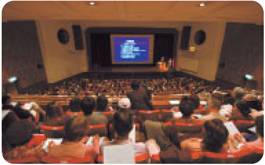
An event at the “Enriching the Quality of Life Health Forum” public lecture series
14
Table of Contents
A scene from Daiichi’s chemistry education programs for children
Contributing to Society
Aiming to make special contributions to society as a pharmaceutical manufacturer, Daiichi responded to the major December 2004 earthquake in the Gulf of Sumatra and associated tsunami by providing pharmaceutical products that help prevent the spread of infectious diseases. Working through its representative office in Jakarta, the Company donated 10,000 vials ofCravitinjectable and a considerable amount of orally administered ofloxacin (1,780 250mg tablets ofReskinand 12,000 200mg tablets ofDanoflox) to the local Tsunami Relief Medical Committee. The Company’s consolidated subsidiary in Thailand, Daiichi Pharmaceutical (Thailand) Ltd., (DPT), donated 5,000 100mg tablets ofCravitand 500 vials ofTarivid Otic Solutionto the Thai Red Cross. Additional financial donations to disaster relief programs were made by many employees in the parent Company and other Group companies.
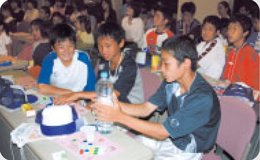
Regarding long-term programs, Daiichi has since 1997 organized a series of twice-yearly public lectures, the “Enriching the Quality of Life Health Forum,” that help promote greater health consciousness within the general populace. Since 1995, the Company has annually organized custom-designed chemistry education programs for children that involve easy-to-understand science lessons along with tours of its manufacturing and research facilities. In this way, the Company makes good use of its facilities to encourage young people to take greater interest in natural sciences while also contributing to local communities.

Shiki Theatre Company’s production of Phantom of the Opera
photo courtesy of Atsutoshi Shimosaka
Among its various activities for promoting the appreciation of art and culture, Daiichi has supported the Shiki Theatre Company musical and drama group for 20 years and the Mito Chamber Orchestra for 11 years. Both groups have been highly evaluated, and we are considering contributing to society through continued support for these groups in the future.
In connection with commemorating the 90th anniversary of its founding during the current fiscal year, Daiichi is planning to implement various special CSR activities that foster still-closer ties with communities near its facilities. These activities include the donation of ambulances to the local governments of the communities surrounding the Tokyo R&D Center and Daiichi Pharmatech’s factories in Osaka, Shizuoka, and Akita.
For more information on these activities, please take a look at Daiichi’s website.
Start of the Children’s Soccer Project!
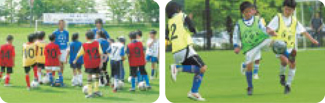
A soccer clinic
In the current fiscal year, Daiichi began a children’s soccer project as part of various activities designed to commemorate the 90th anniversary of the Company’s founding and is also designed to promote contributions to society involving the direct participation of employees.
Aimed at supporting the development of children’s soccer activities, the program will encompass
| 1. | Specially designed soccer clinics that include soccer classes for children taught by professional soccer players as well as health seminars for children’s parents/guardians taught by team doctors, |
| 2. | Special sponsorship of the 19th annual National Boys’ and Girls’ Grass Soccer Tournament, and |
| 3. | Sponsorship of the International Friendship Games. |
15
Table of Contents
(As of June 29, 2005)
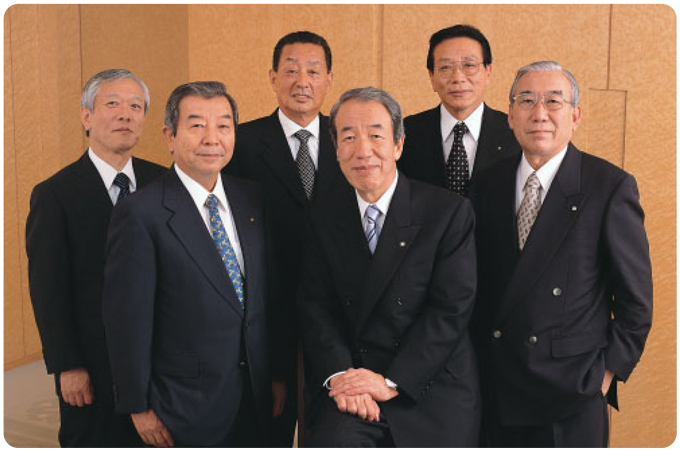
Back row (from left): | ||||
| Tsutomu Une, Ph.D. | Hidetoshi Imaizumi | Ryuzo Takada | ||
| Managing Director | Managing Director | Managing Director | ||
Front row: | ||||
| Kenichi Mizutani | Kiyoshi Morita | Tadao Suzuki, Ph.D. | ||
| Senior Managing Director | President and Chief Executive Officer | Senior Managing Director | ||
Kiyoshi Morita
President and Chief Executive Officer
(Representative Director)
Kenichi Mizutani
Senior Managing Director
(Representative Director)
Tadao Suzuki, Ph.D.
Senior Managing Director
Hidetoshi Imaizumi
Managing Director
Tsutomu Une, Ph.D.
Managing Director
Ryuzo Takada
Managing Director
Hiroshi Sugiyama
Board Director
Teruo Takayanagi, Ph.D.
Board Director
Toru Kuroda
Board Director
Akira Nagano
Board Director
George Nakayama
Board Director
Yoshifumi Nishikawa
Board Director
Jotaro Yabe
Board Director
Yutaka Hirata
Senior Corporate Auditor
Shigemi Oda
Corporate Auditor
Tadashi Takauji
Corporate Auditor
Koukei Higuchi
Corporate Auditor
16
Table of Contents
Daiichi Pharmaceutical Co., Ltd. and Consolidated Subsidiaries
Years ended March 31
| Millions of yen | ||||||||||||||||||||||||
| 2005 | 2004 | 2003 | 2002 | 2001 | 2000 | |||||||||||||||||||
Operating Results: | ||||||||||||||||||||||||
Net sales | ¥ | 328,534 | ¥ | 322,767 | ¥ | 322,011 | ¥ | 332,753 | ¥ | 317,072 | ¥ | 300,539 | ||||||||||||
Cost of sales | 100,834 | 103,474 | 106,904 | 112,515 | 109,984 | 108,091 | ||||||||||||||||||
Selling, general and administrative expenses | 114,219 | 114,129 | 109,093 | 108,746 | 103,322 | 97,274 | ||||||||||||||||||
Research and development expenses | 57,417 | 59,049 | 53,377 | 46,082 | 39,990 | 34,204 | ||||||||||||||||||
| [58,605 | ]* | [60,721 | ]* | [55,177 | ]* | [48,521 | ]* | [42,060 | ]* | [36,229 | ]* | |||||||||||||
Interest expense | 1 | 1 | 16 | 129 | 368 | 966 | ||||||||||||||||||
Income before income taxes and minority interests in net income of consolidated subsidiaries | 64,671 | 47,608 | 36,284 | 58,279 | 53,532 | 47,676 | ||||||||||||||||||
Net income | 37,175 | 26,662 | 13,567 | 31,375 | 28,463 | 24,065 | ||||||||||||||||||
Net income per share of common stock (yen) | ¥ | 137.95 | ¥ | 97.25 | ¥ | 48.15 | ¥ | 110.18 | ¥ | 102.13 | ¥ | 87.69 | ||||||||||||
Cash dividends paid | ¥ | 8,072 | ¥ | 8,218 | ¥ | 8,034 | ¥ | 7,161 | ¥ | 6,688 | ¥ | 4,958 | ||||||||||||
Financial Position: | ||||||||||||||||||||||||
Total current assets | ¥ | 299,837 | ¥ | 283,206 | ¥ | 289,155 | ¥ | 288,373 | ¥ | 322,386 | ¥ | 353,603 | ||||||||||||
Net property, plant and equipment | 105,603 | 107,286 | 112,422 | 109,925 | 108,582 | 108,097 | ||||||||||||||||||
Total assets | 546,555 | 521,809 | 512,384 | 525,511 | 553,376 | 505,288 | ** | |||||||||||||||||
Total current liabilities | 74,339 | 71,536 | 75,358 | 84,636 | 100,435 | 127,346 | ||||||||||||||||||
Total long-term liabilities | 22,071 | 23,183 | 29,111 | 33,984 | 39,146 | 31,280 | ||||||||||||||||||
Total shareholders’ equity | 448,563 | 422,130 | 401,472 | 401,208 | 408,247 | 341,335 | ** | |||||||||||||||||
Financial Ratios (%): | ||||||||||||||||||||||||
Pre-tax profit margin (Income before income taxes and minority interests in net income of consolidated subsidiaries to net sales) | 19.7 | % | 14.7 | % | 11.3 | % | 17.5 | % | 16.9 | % | 15.9 | % | ||||||||||||
Net profit margin (Net income to net sales) | 11.3 | 8.3 | 4.2 | 9.4 | 9.0 | 8.0 | ||||||||||||||||||
Return on shareholders’ equity (Net income to average shareholders’ equity) | 8.5 | 6.5 | 3.4 | 7.8 | 7.6 | 7.3 | ** | |||||||||||||||||
Shareholders’ equity to total assets | 82.1 | 80.9 | 78.4 | 76.3 | 73.8 | 67.6 | ** | |||||||||||||||||
Research and development expenses as a percentage of net sales | 17.5 | 18.3 | 16.6 | 13.8 | 12.6 | 11.4 | ||||||||||||||||||
Number of Employees | 7,333 | 7,379 | 7,428 | 7,060 | 6,958 | 6,944 | ||||||||||||||||||
| * | Total amount, including production R&D costs. |
| ** | Effective April 1, 2000, the Company and its consolidated subsidiaries adopted a revised accounting standard for foreign currency translation. Under the revised accounting standard, a foreign currency translation adjustment is reported in minority interests and shareholders’ equity. The amount for 2000, which was included in assets, has been reclassified to conform to the 2001 presentation. |
17
Table of Contents
Overview
During the year, overseas pharmaceutical markets were characterized by a further intensification of global competition centered on “global-mega” companies and associated with both new drug-related R&D and marketing activities. The Japanese pharmaceutical market was affected by changes in the healthcare systems—such as the growing scope of application of the comprehensive hospital therapy evaluation system and the conversion of national university hospitals and other national hospitals into independent corporations—and an average 4.2% reduction in National Health Insurance (NHI) drug reimbursement prices that was implemented in April 2004.
Against this backdrop, the Daiichi Group worked to expand the markets for its products while emphasizing the promotion of appropriate drug use through the provision of information related to drug efficacy and safety. As a result, higher revenue from domestic sales of prescription drugs and a rise in bulk levofloxacin (a quinolone antibiotic) exports more than offset a revenue decline associated with the transfer of veterinary and livestock feed products business to another company.
Consequently, net sales advanced 1.8% from the previous fiscal year, to ¥328.5 billion. Reflecting the reduction in cost of sales as well as cost-cutting measures with respect to R&D expenses, operating income totaled ¥56.1 billion, up 21.6% from the previous fiscal year. While a ¥7.3 billion extraordinary restructuring charge associated with the spin-off of the parent Company’s manufacturing operations was recorded, this was more than offset by an extraordinary gain of ¥11.7 billion on the release from the substitutional portion of the Employee’s Pension fund to the government and a ¥3.8 billion extraordinary gain on the transfer to the defined contribution pension plan. Thus, net income surged 39.4% from the previous fiscal year, to ¥37.2 billion.
Results of Operations
Net Sales
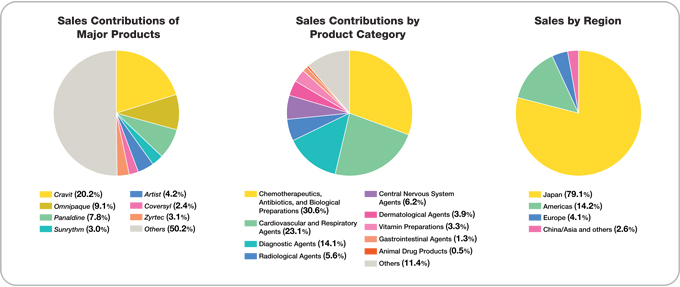
The consolidated net sales of the Daiichi Pharmaceutical Group during the period under review were ¥328.5 billion, up 1.8% from the previous fiscal year. Sales in the core prescription drugs business advanced 2.4%, to ¥311.8 billion, and accounted for 94.9% of net sales, 0.5 percentage point more than in the previous fiscal year. Overseas sales grew 3.7%, to ¥68.6 billion, and accounted for 20.9% of total net sales, up 0.4 percentage point.
A breakdown of performance by business segment follows.
Prescription Drugs
Although domestic prescription drug sales were negatively affected by the April 2004 revision of drug reimbursement prices, which reduced the domestic prices of the Company’s products by approximately 5%, sales of the mainstay broad-spectrum oral antibacterial agentCravitwere steady, and increased sales were recorded for such mainstay products asMobic,a nonsteroidal anti-inflammatory agent marketed in Japan exclusively by Daiichi since July 2004;Artist,a long-acting beta-blocker for treating high blood pressure, angina, and chronic cardiac insufficiency; andZyrtec,an anti-allergy agent. As a result, total domestic prescription drug sales advanced 1.9% from the previous fiscal year, to ¥205.9 billion.
Overseas prescription drug sales were negatively affected by a decline in a U.S. subsidiary’s sales ofFLOXIN Otic, an antibacterial otic solution for treating ear infections, as well as by the appreciation of the yen. However, the completion of U.S. inventory adjustments for levofloxacin enabled a recovery in bulk sales of this product, and patent licensing royalty income grew. Thus, overseas sales of prescription drugs rose 6.2% from the previous fiscal year, to ¥61.3 billion.
18
Table of Contents
Diagnostics and Radiopharmaceuticals
Measures aimed at restraining medical costs kept market conditions challenging, and sales of such products as in vivo radiopharmaceuticals for cardiac imaging applications declined. However, strong sales of such in vitro diagnostics products as testing kits for influenza—which was prevalent in Japan during the year under review and mainstay cholesterol measuring agents for export boosted total sales of diagnostics and radiopharmaceuticals products 2.1% from the previous fiscal year, to ¥32.9 billion.
OTC Drugs
Karoyan Gush, a hair-growth accelerator launched in June 2004, made a significant contribution to performance during the year, and sales of such products asPatecsanti-inflammatory analgesic poultices and the vitamin C productCystina Cwere robust.
Accordingly, OTC Drug sales advanced 16.3% from the previous fiscal year, to ¥10.2 billion.
Animal Drug Products
Reflecting the Company’s June 2004 transfer of its veterinary and livestock feed products business to Meiji Seika Kaisha, Ltd., segment sales dropped 59.1% from the previous fiscal year, to ¥1.5 billion.
Other Businesses
Sales of fine chemical products decreased 10.6%, to ¥13.0 billion, reflecting drops in sales of such products as calcium pantothenate to customers in North America and Europe. Total sales in the other businesses segment, which includes fine chemicals, declined 8.3%, to ¥16.7 billion.
Costs, Expenses, and Earnings
The cost of sales for the period under review decreased 2.6% from the previous fiscal year, to ¥100.8 billion. The gross profit ratio rose 1.4 percentage points, to 69.3%. Selling, general, and administrative (SG&A) expenses were ¥114.2 billion, edging up 0.1% from the previous fiscal year, and R&D expenses decreased 2.8%, to ¥57.4 billion. As a result, operating income surged 21.6%, to ¥56.1 billion. The Group’s concerted efforts to reduce the cost of sales boosted gross profit ¥8.4 billion and R&D expenses decreased ¥1.6 billion, as these expenses increased overseas but were down in Japan owing to the end of certain domestic R&D projects and to efficiency measures. Thus, operating income grew considerably and the ratio of operating income to net sales increased 2.8 percentage points to 17.1%,
Other income (expenses), net, improved from net income of ¥1.5 billion in the previous fiscal year to net income of ¥8.6 billion for the fiscal year under review. While a ¥7.3 billion extraordinary restructuring charge associated with the spin-off of the parent Company’s manufacturing operations was recorded, this was more than offset by an extraordinary gain of ¥11.7 billion on the release of the substitutional portion of the Employee’s Pension fund to the government and a ¥3.8 billion extraordinary gain on the transfer to the defined contribution pension plan.
As a result, income before income taxes and minority interests in net income of consolidated subsidiaries for the fiscal year under review was ¥64.7 billion, an increase of ¥17.1 billion from the previous fiscal year, and its value as a percentage of net sales increased 5.0 percentage points, to 19.7%.
19
Table of Contents
As a percentage of income before income taxes and minority interests in net income of consolidated subsidiaries, provision for income taxes, reflecting tax effect accounting, decreased 2.5 percentage points, from 47.1% to 44.6, a number relatively close to the 40.5% statutory rate.
As a result of the above, net income for the fiscal year under review surged 39.4%, to ¥37.2 billion, and the net profit margin rose 3.0 percentage points, to 11.3%. The return on shareholders’ equity improved 2.0 percentage points, to 8.5%.
Total R&D expenses (both research and development expenses and production R&D cost included in the cost of sales and SG&A expenses) amounted to ¥58.6 billion, down 3.5%. A rise in overseas R&D expenses due to the start of full-scale operations by DMR was more than offset by a decrease in domestic R&D expenses. The decrease in domestic R&D expenses reflected a peaking out of expenses associated withSonazoidandSilodosinfollowing the submission of applications for those products in February 2004 and May 2004, respectively, as well as measures to increase the efficiency of domestic exploratory clinical research following the start of operations by DMR. The ratio of total R&D expenses to net sales decreased 0.8 percentage points to 17.5%.
Financial Condition
At the end of the fiscal year, total assets amounted to ¥546.6 billion, up ¥24.7 billion, or 4.7%, from the previous fiscal year end. Total current assets grew ¥16.6 billion, to ¥299.8 billion. This reflected a ¥7.8 billion increase, to ¥123.9 billion, in liquidity on hand—including cash and time deposits along with marketable securities—and a ¥7.2 billion rise in trade notes and accounts receivable, net. Investments and long-term loans receivable decreased ¥7.0 billion; however, within other assets, other jumped ¥17.1 billion, mainly reflecting the recording of ¥15.5 billion in prepaid expenses associated with the shift to a defined contribution pension plan.
Total liabilities grew ¥1.7 billion, or 1.8%, to ¥96.4 billion. Current liabilities increased ¥2.8 billion, or 3.9%, to ¥74.3 billion, mainly owing to a ¥4.3 billion rise in trade notes and accounts payable. Long-term liabilities decreased ¥1.1 billion, or 4.8%, to ¥22.1 billion. This principally reflected a ¥14.3 billion drop in reserves for employees’ retirement benefits, to ¥4.8 billion, which more than compensated for a ¥9.1 billion increase in deferred income taxes, to ¥9.8 billion.
Total shareholders’ equity grew ¥26.4 billion, or 6.3%, to ¥448.6 billion. This mainly reflected a ¥28.2 billion rise in retained earnings, less a ¥2.5 billion rise in treasury stock.
As a result of the small increase in total liabilities and relatively large increase in shareholders’ equity, the shareholders’ equity ratio grew 1.2 percentage points in the fiscal year under review, to 82.1%. As the debt-to-equity ratio is approximately zero, the Company is effectively being managed without incurring debt. Moreover, the current ratio improved 7.4 percentage points, to 403.3%, and the ratio of net income to shareholders’ equity rose 2.0 percentage points, to 8.5%. Thus, considerable improvement was achieved in all principal financial ratios.
20
Table of Contents
Cash Flows
Net cash provided by operating activities for the fiscal year under review decreased ¥11.9 billion, to ¥35.6 billion, despite a ¥17.1 billion rise in income before income taxes and minority interests in net income of consolidated subsidiaries. The decrease reflected an ¥8.8 billion decrease in retirement benefits, a ¥15.5 billion increase in prepaid pension costs, a ¥6.8 billion decrease in trade receivables compared with a ¥7.4 billion increase in the previous fiscal year due to such factors as a rise in royalty income, and a ¥1.3 billion increase in inventories compared with a ¥6.6 billion decrease a year earlier.
Net cash used in investing activities during the fiscal year under review totaled ¥22.0 billion, down ¥5.4 billion from the previous fiscal year. This mainly resulted from a decrease in payments for purchases of investment securities.
Net cash used in financing activities for the fiscal year under review totaled ¥12.4 billion, down ¥6.1 billion from the previous fiscal year, largely because of a decrease in purchases of treasury stock.
As a result, cash and cash equivalents at the end of the fiscal year under review amounted to ¥91.6 billion, up ¥1.2 billion.
Dividends
Positioning the distribution of profits earned from business activities as one of its most important management tasks, Daiichi emphasizes distributing profits to shareholders in a manner that reflects corporate performance. The level of cash dividends is determined in line with this emphasis while reflecting the comprehensive consideration of such factors as the need to bolster internal reserves to build a foundation for corporate growth.
With regard to cash dividends, the Company seeks to maintain stable growth in cash dividends and in the dividend payout ratio while concurrently being flexible and timely in the repurchase of its own outstanding shares with the goal of boosting income per share. Turning to the use of internal reserves, the Company plans to use such reserves to fund investments aimed at realizing the goal of becoming a global pharma-innovator, including investments aimed at engaging in leading-edge research, strengthening the product development pipeline, engaging in corporate alliances, and strengthening the foundations for international operations.
Based on this policy, the Company decided to increase its year-end cash dividends ¥10 per share and disburse total year-end cash dividends of ¥25 per share. Including the ¥15 per share interim cash dividends, cash dividends applicable to the fiscal year under review thus totaled ¥40 per share. As a result, the dividend payout ratio for the parent Company on a non-consolidated basis rose 26.6 percentage points, to 55.9%, and ratio of dividends to shareholders’ equity increased 0.6 percentage point, to 2.6%. The dividend payout ratio on a consolidated basis rose was 29.0%, which the Company considers sufficient.
Forward-Looking Statement
Regarding overseas pharmaceutical markets, while industrialized countries are making sustained efforts to reduce healthcare costs, competition related to marketing is becoming increasingly intense in the United States and other countries, and development competition in the search for breakthrough products necessitates the use of leading-edge technologies that are accompanied by increased R&D expenses. These and other factors are making the overseas operating environment more challenging.
In Japan, growth in the pharmaceutical market is being slowed by healthcare system reform measures implemented against a backdrop of demographic graying, and the growing domestic market presence of companies whose home bases are overseas is contributing to an intensification of competition for market share.
Aiming to leverage new global development drug candidates to realize its corporate objectives, the Daiichi Group has designated the period through fiscal 2006 for reforms that will create the foundation required for achievement of these objectives. Accordingly, it is taking measures to attain such objectives as the expansion of global R&D activities, the strengthening of domestic and overseas prescription drug business, and the implementation of structural reforms that create a resiliently strong corporate structure.
The Company’s forecasts for the current fiscal year are as follows.
Net Sales
In the domestic prescription drug business, Daiichi projects that it will face a severe operating environment due to such factors as the increasing effect of government measures aimed at restraining medical costs and the rising market share of major global drug companies. Against this backdrop, the Company will concentrate its efforts on maintaining the top market share of its mainstay productCravit,as well as increasing sales of such major products for cardiovascular diseases asArtist, Sunrythm,andHANP.In addition, the Company anticipates that the launch of such new products during the latter half of the year asPlavixwill help increase domestic prescription drug sales.
In the overseas prescription drug business, the Company expects that revenues from its mainstay bulk exports of levofloxacin to the United States will continue to increase in light of the favorable growth in sales by its licensee. The Company is basing its projections on the premise that exchange rates during the fiscal year will be approximately US$1=¥105 and €1=¥130.
Rising sales are projected in OTC drug operations due to such factors as expanding sales of the hair-growth acceleratorKaroyan Gush.Sales of diagnostics and radiopharmaceuticals, for which market conditions are severe, are expected to be approximately unchanged.
Consequently, net sales are projected to increase, albeit by a small margin.
21
Table of Contents
Profitability
Having started operating Daiichi Pharmatech in April 2005, the Company is further stepping up its efforts to reduce the cost of sales, and it intends to place still greater emphasis on reducing non-strategic expenses. The Company is seeking to restrain R&D expenses by strengthening its capabilities for accurately evaluating drug candidates at early development stages and continuing to concentrate its operations in core therapeutic domains; nevertheless, R&D expenses are projected to increase approximately ¥10.0 billion owing to the full-scale start of clinical trials in the United States and Europe for DU-176b, an oral factor-Xa inhibitor, during the next fiscal year.
While the domestic and overseas operating environments are expected to be more challenging, the Company is doing its utmost to secure the profits required to fund the R&D programs needed to build new corporate growth paths, expeditiously realize the medium-to-long-term corporate growth capabilities that its R&D results make possible, and proceed steadily and quickly with such structural reform measures as those aimed at merging and eliminating certain distribution facilities. The Company plans to implement these strategies in a manner that maximizes the benefits of the upcoming business integration.
Based on the above projections, Daiichi anticipates that it will record higher sales but lower profits during the fiscal year ending March 31, 2006. Specifically, the Company is aiming to record ¥333.0 billion in consolidated net sales, ¥53.0 billion in operating income, and ¥52.0 billion in ordinary income. In view of an extraordinary loss of approximately ¥10.0 billion in goodwill in connection with the conversion of Daiichi Suntory Pharma into a wholly owned subsidiary, net income is expected to amount to ¥18.0 billion.
Note Regarding Forward-Looking Statements
This annual report contains statements concerning forecasts for Daiichi, Sankyo, and their group companies. These statements are based on assumptions and judgments made with information available at the time of preparation, and as such are subject to existing and unforeseen risks, as well as uncertainties and other factors. Risks, uncertainties, and other factors may cause business performance, management actions, and financial results to differ from those presented in this report.
Business Risk and Other Risks
With regard to business activities, financial accounting, and other items described in this report, issues that could potentially exert a large influence on investors’ decisions include those described below. Forward-looking statements are based on judgments made by the Group as of March 31, 2005.
(1) R&D Risks
The R&D of new drug development candidates entails large financial expenditures over lengthy time periods. If during those time periods, the expected efficacy of a drug under development cannot be confirmed, there is a possibility that the relevant R&D project will be terminated. Moreover, in the case of cooperative R&D activities in collaboration with other parties, such events as contract changes or annulments could cause a project to fail.
(2) Manufacturing and Procurement Risks
The Group manufactures products at its own factories using its own technologies, and it depends on specific suppliers for a portion of the products and materials used in the manufacture of certain products. Because of this, if for some reason manufacturing or procurement activities are delayed or halted, there is a possibility that such event would affect the Group’s profitability and financial situation.
The Group conducts manufacturing operations in accordance with regulations based on the Pharmaceutical Affairs Law; however, if a product quality problem requiring a product recall or similar event should occur, there is a possibility that it would affect the Group’s profitability and financial situation.
(3) Marketing Risks
In the case of such an event as the occurrence of an unanticipated side effect, the launch by other companies of products that compete in the same therapeutic domains as the Group’s products, or the launch of competing generic versions of the Group’s products after the expiration of relevant patents, there is a possibility that the Group’s sales could be adversely affected and therefore the Group’s profitability and financial situation could also be affected.
In the case of such an event as the expiration or annulment of marketing or technology out-licensing contracts or a change in the terms of such contracts, the Group’s profitability and financial situation could be affected.
Aggregate sales ofCravit, Panaldine,andOmnipaqueaccount for more than 40% of the Group’s consolidated net sales. If side effects or other factors that have the effect of decreasing sales of these products were to arise, there is a possibility that such an event would have a large influence on the Group’s profitability and financial situation.
22
Table of Contents
(4) Legislative, Regulatory, and Government Administration Risks
Prescription drug products in Japan are subject to a variety of regulations and administrative procedures based on the Pharmaceutical Affairs Law. Moreover, trends in other government measures related to healthcare systems and health insurance systems, such as the biannual revision of National Health Insurance (NHI) drug reimbursement prices, may affect the Group’s profitability and financial situation. Similarly, drug-related operations are liable to be affected by diverse regulations in other countries.
(5) Intellectual Property Risks
If some of the Group’s business activities are alleged to infringe on the patent rights or other intellectual property rights of another party, there is a possibility that such activities might have to be discontinued or related litigation undertaken. On the other hand, if another party should infringe on the patent rights or other intellectual property rights of the Group, there is a possibility that related litigation might have to be undertaken to defend those rights. These possibilities could affect the Group’s profitability and financial situation.
(6) Environmental Risks
Chemical substances used in drug-related research and manufacturing processes include substances that can affect human health and natural ecosystems. Each of the Group’s facilities is implementing measures to prevent air and water pollution, shifting to the use, where possible, of substances with relatively small environmental impact, and making other environmental conservation efforts. However, in the unlikely case of a determination that it is determined that the Group’s activities have caused serious adverse environmental impact, there is a possibility that the Group’s profitability and financial situation could be affected.
(7) Litigation Risks
In addition to fair trade issues, the Group’s activities have the potential for other difficulties with regard to various other issues—such as drug side effects, manufacturer’s liability issues, and labor issues—that could become the subject of litigation. There is a possibility that such litigation could affect the Group’s profitability and financial situation.
(8) Currency Exchange Risks
Most of the Group’s overseas sales transactions are conducted in foreign currencies. Moreover, the revenues and assets of overseas subsidiaries are translated into yen for inclusion in the Group’s consolidated accounting items. Because of these circumstances, there is a possibility that changes in currency exchange rates could affect the Group’s profitability and financial situation.
(9) Other Risks
In addition to risks already described, other types of risks that could affect the Group’s profitability and financial situation include those associated with the interruption of business activities due to earthquakes or other large-scale disasters, the interruption of computer system operations due to network viruses or other technical problems, fluctuations in stock prices and interest rates, and the emergence of uncollectable accounts receivable or loans that could follow the deterioration of transactional partners’ financial position or of the state of affairs in a relevant country.
23
Table of Contents
Daiichi Pharmaceutical Co., Ltd. and Consolidated Subsidiaries
March 31, 2005 and 2004
| Millions of yen | Thousands of U.S. dollars (Note 1) | |||||||||||
| 2005 | 2004 | 2005 | ||||||||||
ASSETS | ||||||||||||
Current Assets: | ||||||||||||
Cash and time deposits (Note 3) | ¥ | 16,395 | ¥ | 21,978 | $ | 152,668 | ||||||
Marketable securities (Notes 3 and 4) | 107,515 | 94,124 | 1,001,164 | |||||||||
Trade notes and accounts receivable, net of allowance of ¥51 million ($475 thousand) in 2005 and ¥256 million in 2004 | 88,117 | 80,956 | 820,533 | |||||||||
Inventories (Note 6) | 40,486 | 39,146 | 377,000 | |||||||||
Deferred income taxes (Note 9) | 13,827 | 16,111 | 128,755 | |||||||||
Other current assets | 33,497 | 30,891 | 311,918 | |||||||||
Total current assets | 299,837 | 283,206 | 2,792,038 | |||||||||
Investments and Long-Term Loans Receivable: | ||||||||||||
Investment securities (Note 4) | 105,461 | 112,077 | 982,037 | |||||||||
Long-term loans receivable, net of allowance of ¥323 million ($3,008 thousand) in 2005 and ¥62 million in 2004 | 440 | 863 | 4,097 | |||||||||
Total investments and long-term loans receivable | 105,901 | 112,940 | 986,134 | |||||||||
Property, Plant and Equipment(Note 8): | ||||||||||||
Land | 17,526 | 17,722 | 163,200 | |||||||||
Buildings | 141,984 | 141,606 | 1,322,134 | |||||||||
Machinery and equipment | 150,695 | 152,023 | 1,403,250 | |||||||||
Construction in progress | 6,029 | 1,245 | 56,141 | |||||||||
| 316,234 | 312,596 | 2,944,725 | ||||||||||
Accumulated depreciation | (210,631 | ) | (205,310 | ) | (1,961,365 | ) | ||||||
Net property, plant and equipment | 105,603 | 107,286 | 983,360 | |||||||||
Other Assets: | ||||||||||||
Deferred income taxes (Note 9) | 3,167 | 3,437 | 29,491 | |||||||||
Other | 32,047 | 14,940 | 298,417 | |||||||||
Total other assets | 35,214 | 18,377 | 327,908 | |||||||||
Total assets | ¥ | 546,555 | ¥ | 521,809 | $ | 5,089,440 | ||||||
See accompanying notes.
24
Table of Contents
| Millions of yen | Thousands of U.S. dollars (Note 1) | |||||||||||
| 2005 | 2004 | 2005 | ||||||||||
LIABILITIES AND SHAREHOLDERS’ EQUITY | ||||||||||||
Current Liabilities: | ||||||||||||
Long-term debt due within one year (Note 8) | ¥ | 18 | ¥ | 18 | $ | 168 | ||||||
Trade notes and accounts payable | 35,981 | 31,666 | 335,050 | |||||||||
Income taxes payable (Note 9) | 8,401 | 9,963 | 78,229 | |||||||||
Consumption tax payable | 966 | 1,720 | 8,995 | |||||||||
Accrued expenses | 26,311 | 25,078 | 245,004 | |||||||||
Other current liabilities | 2,662 | 3,091 | 24,788 | |||||||||
Total current liabilities | 74,339 | 71,536 | 692,234 | |||||||||
Long-Term Liabilities: | ||||||||||||
Long term debt (Note 8) | 6 | 24 | 56 | |||||||||
Employees’ severance and retirement benefits (Note 10) | 4,754 | 19,091 | 44,269 | |||||||||
Directors’ and corporate auditors’ retirement benefits | 2,201 | 2,671 | 20,495 | |||||||||
Deferred income taxes (Note 9) | 9,792 | 680 | 91,182 | |||||||||
Other long-term liabilities | 5,318 | 717 | 49,520 | |||||||||
Total long-term liabilities | 22,071 | 23,183 | 205,522 | |||||||||
Total liabilities | 96,410 | 94,719 | 897,756 | |||||||||
Minority Interests | 1,582 | 4,960 | 14,731 | |||||||||
Contingent Liabilities(Note 12) | ||||||||||||
Shareholders’ Equity(Note 11): | ||||||||||||
Common stock: | ||||||||||||
Authorized—789,000,000 shares in 2005 and 2004 Issued—286,453,235 shares in 2005 and 2004 | 45,247 | 45,247 | 421,333 | |||||||||
Capital surplus | 49,130 | 48,961 | 457,491 | |||||||||
Retained earnings | 376,144 | 347,973 | 3,502,598 | |||||||||
Net unrealized holding gains on securities | 18,215 | 17,873 | 169,615 | |||||||||
Foreign currency translation adjustment | (1,305 | ) | (1,524 | ) | (12,151 | ) | ||||||
| 487,431 | 458,530 | 4,538,886 | ||||||||||
Treasury stock, at cost | (38,868 | ) | (36,400 | ) | (361,933 | ) | ||||||
Total shareholders’ equity | 448,563 | 422,130 | 4,176,953 | |||||||||
Total liabilities, minority interests and shareholders’ equity | ¥ | 546,555 | ¥ | 521,809 | $ | 5,089,440 | ||||||
25
Table of Contents
Consolidated Statements of Income
Daiichi Pharmaceutical Co., Ltd. and Consolidated Subsidiaries
Years ended March 31, 2005, 2004 and 2003
| Millions of yen | Thousands of U.S. dollars (Note 1) | |||||||||||||||
| 2005 | 2004 | 2003 | 2005 | |||||||||||||
Net Sales(Note 13) | ¥ | 328,534 | ¥ | 322,767 | ¥ | 322,011 | $ | 3,059,261 | ||||||||
Costs and Expenses(Note 13): | ||||||||||||||||
Cost of sales | 100,834 | 103,474 | 106,904 | 938,951 | ||||||||||||
Selling, general and administrative expenses | 114,219 | 114,129 | 109,093 | 1,063,591 | ||||||||||||
Research and development expenses | 57,417 | 59,049 | 53,377 | 534,659 | ||||||||||||
| 272,470 | 276,652 | 269,374 | 2,537,201 | |||||||||||||
Operating Income(Note 13) | 56,064 | 46,115 | 52,637 | 522,060 | ||||||||||||
Other Income (Expenses): | ||||||||||||||||
Interest and dividend income | 1,474 | 1,211 | 1,634 | 13,726 | ||||||||||||
Interest expense | (1 | ) | (1 | ) | (16 | ) | (9 | ) | ||||||||
Gain on the release from the substitutional portion of the Employees’ Pension Fund to the government | 11,747 | — | — | 109,386 | ||||||||||||
Gain on the transfer to the defined contribution pension plan | 3,769 | — | — | 35,096 | ||||||||||||
Gain on sale of the business for the veterinary and livestock feed product | 800 | ��� | — | 7,449 | ||||||||||||
Lump-sum amortization of consolidation difference (Note 3) | — | — | (11,728 | ) | — | |||||||||||
Loss on devaluation of investment securities | (32 | ) | (61 | ) | (3,722 | ) | (298 | ) | ||||||||
Losses on bulk vitamin litigation | (111 | ) | — | (239 | ) | (1,034 | ) | |||||||||
Restructuring charge | (7,316 | ) | — | — | (68,126 | ) | ||||||||||
Loss on settlement of an Employees’ Pension Fund Plan | (381 | ) | — | — | (3,548 | ) | ||||||||||
Equity in net losses of affiliated companies | (400 | ) | — | — | (3,725 | ) | ||||||||||
Other, net | (942 | ) | 344 | (2,282 | ) | (8,770 | ) | |||||||||
| 8,607 | 1,493 | (16,353 | ) | 80,147 | ||||||||||||
Income before Income Taxes and Minority Interests in Net Income of Consolidated Subsidiaries | 64,671 | 47,608 | 36,284 | 602,207 | ||||||||||||
Income Taxes(Note 9): | ||||||||||||||||
Current | 17,358 | 21,465 | 24,680 | 161,635 | ||||||||||||
Deferred | 11,486 | 954 | (1,882 | ) | 106,956 | |||||||||||
Income before Minority Interests | 35,827 | 25,189 | 13,486 | 333,616 | ||||||||||||
Minority Interests in Net Income of Consolidated Subsidiaries | 1,348 | 1,473 | 81 | 12,552 | ||||||||||||
Net Income | ¥ | 37,175 | ¥ | 26,662 | ¥ | 13,567 | $ | 346,168 | ||||||||
| Yen | U.S. dollars (Note 1) | |||||||||||||||
Amounts per Share of Common Stock (Note 2): | ||||||||||||||||
Net income | ¥ | 137.95 | ¥ | 97.25 | ¥ | 48.15 | $ | 1.28 | ||||||||
Diluted net income | 137.90 | 97.23 | — | 1.28 | ||||||||||||
Cash dividends applicable to the year | 40.00 | 30.00 | 30.00 | 0.37 | ||||||||||||
See accompanying notes.
26
Table of Contents
Consolidated Statements of Shareholders’ Equity
Daiichi Pharmaceutical Co., Ltd. and Consolidated Subsidiaries
Years ended March 31, 2005, 2004 and 2003
| Number of shares of common stock (thousands) | Millions of yen | |||||||||||||||||||||||
| Common stock | Capital surplus | Retained earnings | Net unrealized holding gains on securities | Foreign currency translation adjustment | Treasury stock, at cost | |||||||||||||||||||
Balance at March 31, 2002 | 286,453 | ¥ | 45,247 | ¥ | 48,961 | ¥ | 324,428 | ¥ | 7,191 | ¥ | 786 | ¥ | (25,405 | ) | ||||||||||
Net income | — | — | — | 13,567 | — | — | — | |||||||||||||||||
Adjustment from translation of foreign currency financial statements | — | — | — | — | — | (1,355 | ) | — | ||||||||||||||||
Adjustment of net unrealized holding gains on securities | — | — | — | — | (2,902 | ) | — | — | ||||||||||||||||
Treasury stock | — | — | — | — | — | — | (781 | ) | ||||||||||||||||
Cash dividends paid (¥29.00 per share) | — | — | — | (8,034 | ) | — | — | — | ||||||||||||||||
Bonuses to directors and corporate auditors | — | — | — | (188 | ) | — | — | — | ||||||||||||||||
Loss on retirement of treasury stock | — | — | — | (43 | ) | — | — | — | ||||||||||||||||
Balance at March 31, 2003 | 286,453 | 45,247 | 48,961 | 329,730 | 4,289 | (569 | ) | (26,186 | ) | |||||||||||||||
Net income | — | — | — | 26,662 | — | — | — | |||||||||||||||||
Adjustment from translation of foreign currency financial statements | — | — | — | — | — | (955 | ) | — | ||||||||||||||||
Adjustment of net unrealized holding gains on securities | — | — | — | — | 13,584 | — | — | |||||||||||||||||
Treasury stock | — | — | — | — | — | — | (10,214 | ) | ||||||||||||||||
Cash dividends paid (¥30.00 per share) | — | — | — | (8,218 | ) | — | — | — | ||||||||||||||||
Bonuses to directors and corporate auditors | — | — | — | (201 | ) | — | — | — | ||||||||||||||||
Balance at March 31, 2004 | 286,453 | 45,247 | 48,961 | 347,973 | 17,873 | (1,524 | ) | (36,400 | ) | |||||||||||||||
Net income | — | — | — | 37,175 | — | — | — | |||||||||||||||||
Adjustment from translation of foreign currency financial statements | — | — | — | — | — | 219 | — | |||||||||||||||||
Adjustment of net unrealized holding gains on securities | — | — | — | — | 342 | — | — | |||||||||||||||||
Treasury stock | — | — | — | — | — | — | (2,468 | ) | ||||||||||||||||
Gain on disposal of treasury stock | — | — | 169 | — | — | — | — | |||||||||||||||||
Changes in scope of investments accounted for under the equity method | — | — | — | (772 | ) | — | — | — | ||||||||||||||||
Cash dividends paid (¥30.00 per share) | — | — | — | (8,072 | ) | — | — | — | ||||||||||||||||
Bonuses to directors and corporate auditors | — | — | — | (160 | ) | — | — | — | ||||||||||||||||
Balance at March 31, 2005 | 286,453 | ¥ | 45,247 | ¥ | 49,130 | ¥ | 376,144 | ¥ | 18,215 | ¥ | (1,305 | ) | ¥ | (38,868 | ) | |||||||||
| Thousands of U.S. dollars (Note 1) | |||||||||||||||||||||
| Common stock | Capital surplus | Retained earnings | Net unrealized holding gains on securities | Foreign currency translation adjustment | Treasury stock, at cost | ||||||||||||||||
Balance at March 31, 2004 | $ | 421,333 | $ | 455,918 | $ | 3,240,274 | $ | 166,431 | $ | (14,191 | ) | $ | (338,951 | ) | |||||||
Net income | — | — | 346,168 | — | — | — | |||||||||||||||
Adjustment from translation of foreign currency financial statements | — | — | — | — | 2,040 | — | |||||||||||||||
Adjustment of net unrealized holding gains on securities | — | — | — | 3,184 | — | — | |||||||||||||||
Treasury stock | — | — | — | — | — | (22,982 | ) | ||||||||||||||
Gain on disposal of treasury stock | — | 1,573 | — | — | — | — | |||||||||||||||
Changes in scope of investments accounted for under the equity method | — | — | (7,189 | ) | — | — | — | ||||||||||||||
Cash dividends paid ($0.28 per share) | — | — | (75,165 | ) | — | — | — | ||||||||||||||
Bonuses to directors and corporate auditors | — | — | (1,490 | ) | — | — | — | ||||||||||||||
Balance at March 31, 2005 | $ | 421,333 | $ | 457,491 | $ | 3,502,598 | $ | 169,615 | $ | (12,151 | ) | $ | (361,933 | ) | |||||||
See accompanying notes.
27
Table of Contents
Consolidated Statements of Cash Flows
Daiichi Pharmaceutical Co., Ltd. and Consolidated Subsidiaries
Years ended March 31, 2005, 2004 and 2003
| Millions of yen | Thousands of U.S. dollars (Note 1) | |||||||||||||||
| 2005 | 2004 | 2003 | 2005 | |||||||||||||
Cash Flows from Operating Activities: | ||||||||||||||||
Income before income taxes and minority interests in net income of consolidated subsidiaries | ¥ | 64,671 | ¥ | 47,608 | ¥ | 36,284 | $ | 602,207 | ||||||||
Adjustments to reconcile income before income taxes and minority interests to net cash provided by operating activities: | ||||||||||||||||
Depreciation | 15,947 | 17,366 | 16,943 | 148,496 | ||||||||||||
Interest and dividend income | (1,474 | ) | (1,211 | ) | (1,634 | ) | (13,726 | ) | ||||||||
Interest expense | 1 | 1 | 16 | 9 | ||||||||||||
Loss on disposal of property, plant and equipment | 1,792 | 1,388 | 1,489 | 16,687 | ||||||||||||
Loss on devaluation of investment securities | 34 | 63 | 3,724 | 317 | ||||||||||||
Losses on bulk vitamin litigation | 111 | — | 239 | 1,034 | ||||||||||||
Increase (decrease) in trade receivables | (6,793 | ) | 7,383 | 331 | (63,255 | ) | ||||||||||
Increase (decrease) in trade payables | 3,012 | (158 | ) | (4,903 | ) | 28,047 | ||||||||||
Increase (decrease) in accrued expenses | 1,458 | (1,562 | ) | (779 | ) | 13,577 | ||||||||||
Decrease (increase) in inventories | (1,291 | ) | 6,608 | 2,193 | (12,022 | ) | ||||||||||
Decrease in retirement benefits | (14,808 | ) | (6,004 | ) | (7,086 | ) | (137,890 | ) | ||||||||
Increase in prepaid pension costs | (15,494 | ) | — | — | (144,278 | ) | ||||||||||
Equity in net losses of affiliated companies | 400 | — | — | 3,725 | ||||||||||||
Amortization of consolidation differences | 4 | — | 11,849 | 37 | ||||||||||||
Other, net | 5,804 | (2,138 | ) | (3,173 | ) | 54,046 | ||||||||||
| 53,374 | 69,344 | 55,493 | 497,011 | |||||||||||||
Interest and dividend income received | 1,501 | 1,208 | 1,679 | 13,977 | ||||||||||||
Interest paid | (1 | ) | (2 | ) | (28 | ) | (9 | ) | ||||||||
Fines, penalties and settlement paid | (90 | ) | (7 | ) | (270 | ) | (838 | ) | ||||||||
Income taxes paid | (19,213 | ) | (23,038 | ) | (27,478 | ) | (178,909 | ) | ||||||||
Net cash provided by operating activities | 35,571 | 47,505 | 29,396 | 331,232 | ||||||||||||
Cash Flows from Investing Activities: | ||||||||||||||||
Payments for time deposits | (7,801 | ) | (4,089 | ) | (175 | ) | (72,642 | ) | ||||||||
Proceeds from time deposits | 8,267 | 150 | 306 | 76,981 | ||||||||||||
Payments for purchases of marketable securities | (26,602 | ) | (22,368 | ) | (21,345 | ) | (247,714 | ) | ||||||||
Proceeds from sale of marketable securities | 25,210 | 21,682 | 22,227 | 234,752 | ||||||||||||
Proceeds from sale of mortgage-backed securities | 8,000 | 3,500 | 1,400 | — | ||||||||||||
Payments for purchases of mortgage-backed securities | (8,000 | ) | (3,500 | ) | (1,300 | ) | — | |||||||||
Payments for purchases of property, plant and equipment | (10,754 | ) | (11,214 | ) | (12,095 | ) | (100,140 | ) | ||||||||
Payments for purchases of intangible assets | (2,547 | ) | (1,416 | ) | (128 | ) | (23,717 | ) | ||||||||
Proceeds from sales of investment securities | 22,182 | 24,531 | 26,830 | 206,556 | ||||||||||||
Payments for purchases of investment securities | (24,444 | ) | (35,798 | ) | (23,299 | ) | (227,619 | ) | ||||||||
Purchase of subsidiary net of cash acquired (Note 3) | — | — | (19,310 | ) | — | |||||||||||
Other, net | (5,501 | ) | 1,103 | 3,715 | (51,225 | ) | ||||||||||
Net cash used in investing activities | (21,990 | ) | (27,419 | ) | (23,174 | ) | (204,768 | ) | ||||||||
Cash Flows from Financing Activities: | ||||||||||||||||
Net decrease in bank loans | — | — | (1,994 | ) | — | |||||||||||
Repayments of long-term debt | (18 | ) | (19 | ) | (36 | ) | (168 | ) | ||||||||
Cash dividends paid | (8,072 | ) | (8,218 | ) | (8,034 | ) | (75,165 | ) | ||||||||
Purchases of treasury stock | (4,263 | ) | (10,215 | ) | (4,144 | ) | (39,696 | ) | ||||||||
Other, net | (16 | ) | (18 | ) | (51 | ) | (149 | ) | ||||||||
Net cash used in financing activities | (12,369 | ) | (18,470 | ) | (14,259 | ) | (115,178 | ) | ||||||||
Effect of Exchange Rate Changes on Cash and Cash Equivalents | 13 | (209 | ) | (511 | ) | 121 | ||||||||||
Net Increase (Decrease) in Cash and Cash Equivalents | 1,225 | 1,407 | (8,548 | ) | 11,407 | |||||||||||
Cash and Cash Equivalents at Beginning of Year | 90,346 | 88,939 | 97,487 | 841,289 | ||||||||||||
Cash and Cash Equivalents at End of Year (Note 3) | ¥ | 91,571 | ¥ | 90,346 | ¥ | 88,939 | $ | 852,696 | ||||||||
See accompanying notes.
28
Table of Contents
Notes to Consolidated Financial Statements
| 1 | Basis of Presenting Consolidated Financial Statements |
The accompanying consolidated financial statements have been prepared in accordance with the provisions set forth in the Japanese Securities and Exchange Law and its related accounting regulations, and in conformity with accounting principles generally accepted in Japan, which are different in certain respects as to application and disclosure requirements of International Financial Reporting Standards.
The accounts of overseas subsidiaries are based on their accounting records maintained in conformity with generally accepted accounting principles prevailing in the respective countries of domicile. The accompanying consolidated financial statements have been restructured and translated into English (with some expanded descriptions and the inclusion of consolidated statements of shareholders’ equity) from the consolidated financial statements of DAIICHI PHARMACEUTICAL CO., LTD. (the “Company”) prepared in accordance with Japanese GAAP and filed with the appropriate Local Finance Bureau of the Ministry of Finance as required by the Securities and Exchange Law. Some supplementary information included in the statutory Japanese-language consolidated financial statements, but not required for fair presentation, is not presented in the accompanying consolidated financial statements.
The translations of the Japanese yen amounts into U.S. dollars are included solely for the convenience of readers outside Japan, using the prevailing exchange rate at March 31, 2005, which was ¥107.39 to U.S.$1. The convenience translations should not be construed as representations that the Japanese yen amounts have been, could have been, or could in the future be, converted into U.S. dollars at this or any other rate of exchange.
| 2 | Summary of Significant Accounting Policies |
Consolidation
The consolidated financial statements include the accounts of the Company and its significant subsidiaries (the “Companies”). All significant intercompany balances, transactions and profits have been eliminated. In the elimination of investments in subsidiaries, the assets and liabilities of the subsidiaries, including the portion attributable to minority shareholders, are evaluated using the fair value at the time the Company acquired control. The consolidation difference between the cost of an investment and equity in its net assets at the date of acquisition is mainly amortized over five years. In the year ended March 31, 2003, the lump-sum amortization of the consolidation difference which resulted from the acquisition of Daiichi Suntory Pharma Co., Ltd. was charged to income.
Impairment of Fixed Assets
In the year ended March 31, 2005, the Companies did not adopt early the new accounting standard for the impairment of fixed assets (“Opinion Concerning Establishment of Accounting Standard for Impairment of Fixed Assets” issued by the Business Accounting Deliberation Council on August 9, 2002) and the implementation guidance for the accounting standard for the impairment of fixed assets (the Financial Accounting Standard Implementation Guidance No. 6 issued by the Accounting Standards Board of Japan on October 31, 2003). The Companies plan to adopt these standards effective April 1, 2005.
The Companies have begun their analyses of the possible impairment of fixed assets. The Companies can not currently estimate the effects of adoption of the new Standards because the Companies have not yet completed their analyses.
Equity Method
Investments in non-consolidated subsidiaries and affiliated companies (20%~50% owned and certain at least 15% but less than 20% owned) are accounted for using the equity method. Since the significance of Aventis Pasteur Daiichi Vaccine Co., Ltd., and one other company to the consolidated financial statements has increased, they are included in the scope of companies accounted for under the equity method from the year ended March 31, 2005.
Cash and Cash Equivalents and Cash Flow Statements
For the purpose of the consolidated statements of cash flows, the Companies classify cash on hand, readily available bank deposits and short-term, highly liquid investments with maturities of no more than three months at the time of purchase as cash and cash equivalents.
29
Table of Contents
Marketable Securities and Investment Securities
The Companies examine the intent of holding each security and classify those securities as (a) securities held for trading purposes (hereafter, “trading securities”), (b) debt securities intended to be held to maturity (hereafter, “held-to-maturity debt securities”), (c) equity securities issued by subsidiaries and affiliated companies and (d) all other securities that are not classified in any of the above categories (hereafter, “available-for-sale securities”).
Held-to-maturity debt securities are stated at amortized cost. Equity securities issued by subsidiaries and affiliated companies which are not consolidated or accounted for by the equity method are stated at the moving-average cost. Available-for-sale securities with available fair market value are stated at fair market value. Unrealized gains and unrealized losses on these securities are reported, net of applicable income taxes, as a separate component of shareholders’ equity. Realized gains or losses on the sale of such securities are computed using the moving-average cost. The Companies have no trading securities.
Debt securities with no readily available fair market value are stated at the amortized cost, net of the amount considered not collectible. Other securities with no readily available fair market value are stated principally at the moving-average cost.
If the market value of held-to-maturity debt securities, equity securities issued by subsidiaries and affiliated companies and available-for-sale securities declines significantly, such securities are stated at fair market value and the difference between fair market value and the carrying amount is recognized as loss in the period of the decline. If the fair market value of equity securities issued by subsidiaries and affiliated companies is not readily available, such securities should be written down to net asset value in the event net asset value significantly declines. Unrealized losses on these securities are reported in the statements of income.
Derivative Transactions
The Companies use forward foreign currency contracts as derivative financial instruments only for the purpose of mitigating future risks of fluctuation of foreign currency exchange rates with respect to foreign currency accounts. The derivative transactions are executed and managed by the Company’s Finance and Accounting Department in accordance with established policies. The Companies evaluate hedge effectiveness by comparing the cumulative changes in cash flows or the changes in fair value of hedged items and the corresponding changes in the hedging derivative instruments and in exchange rates on hedged items.
Inventories
Inventories are accounted for at the lower of cost or market, cost being determined principally by the weighted-average method.
Property, Plant and Equipment
Property, plant and equipment are stated at cost. Depreciation is computed using the declining-balance method at rates based on the estimated useful lives of respective assets, except that the straight-line method is adopted by certain overseas consolidated subsidiaries.
Retirement Benefits
Retirement benefits covering all employees are provided through the following two arrangements: an unfunded lump-sum benefit plan and a non-contributory funded pension plan. Upon retirement or termination of employment, employees are generally entitled to lump-sum or annuity payments based on their current rate of pay, length of service and cause of termination.
The Companies provide for the allowance for employees’ severance and retirement benefits at year-end based on the estimated amounts of projected benefit obligation and the fair value of the plan assets at the balance sheet date.
Actuarial gains or losses are recognized as income or expenses in equal amounts principally over 10 years commencing from the succeeding period.
Prior service costs are recognized as expenses in equal amounts principally over 10 years including the year in which such costs were incurred.
In April 2002, the Company partly closed its non-contributory funded pension plan and recorded write-offs of unrecognized actuarial differences and certain other items in accordance with Financial Standards Implementation Guideline No. 1, “Accounting for transfer between pension plans.”
30
Table of Contents
Employees of Japanese companies are compulsorily included in the Welfare Pension Insurance Scheme operated by the government. Employers are legally required to deduct employees’ welfare pension insurance contributions from their payroll and to pay them to the government together with the employers’ own contributions. For companies that have established Employees’ Pension Funds on their own that meet certain legal requirements, it is possible to transfer a part of their welfare pension insurance contributions (referred to as the “substitutional portion” of the government’s Welfare Pension Insurance Scheme) to their own Employees’ Pension Fund with the permission and under the supervision of the government.
Based on the enforcement of Defined Benefit Corporate Pension Law, the Company obtained approval from the Minister of Health, Labor and Welfare on January 1, 2005 for an exemption from the obligation of paying benefits for employees’ prior services relating to the substitutional portion of the government’s Welfare Pension Insurance Scheme. As a result, in the year ended March 31, 2005, the Company recognized gains on the release from the substitutional portion of the government’s Welfare Pension Insurance Scheme amounting to ¥11,747 million ($109,386 thousand).
Also, on January 1, 2005, the Company and 10 consolidated domestic subsidiaries transformed their retirement benefit plans, except for part of the lump-sum benefit plans, from the welfare pension plan, tax-qualified pension plans and lump-sum benefit plans to a defined-benefit corporate pension plan covering the group companies and defined-contribution pension plans. As a result, gains from transfer to the defined-contribution pension plan amounting to ¥3,769 million ($35,096 thousand) was recognized in the year ended March 31, 2005.
The transfer was accounted for in accordance with the Accounting Standards Implementation Guidance No. 1, “Accounting Treatment for the Transfer among the Retirement and Severance Benefit Plan,” issued by the Accounting Standards Board of Japan on January 31, 2002.
Retirement benefits to directors and corporate statutory auditors of the Company were calculated based on the established guidelines. Payment of such benefits is subject to approval at the shareholders’ meeting.
Bonuses to Directors and Corporate Statutory Auditors
Bonuses to directors and corporate statutory auditors, which are subject to approval at the shareholders’ meeting under the Japanese Commercial Code (the “Code”), are accounted for as an appropriation of retained earnings.
Research and Development
Research and development expenses are charged to income when incurred.
Foreign Currency Translation
Monetary assets and liabilities denominated in foreign currencies are translated into Japanese yen at the exchange rates prevailing at the balance sheet date with the resulting gain or loss included in the current statements of income.
Assets and liabilities of overseas subsidiaries are translated into Japanese yen at the exchange rates at the balance sheet dates of the overseas subsidiaries, shareholders’ equity accounts at historical rates and expenses and income at average rates of exchange during the year. The resulting foreign currency translation adjustment is reported in shareholders’ equity.
Accounting for Certain Lease Transactions
Finance leases which do not transfer ownership to lessees are accounted for in the same manner as operating leases under accounting principles generally accepted in Japan.
Amounts per Share
In computing net income per share of common stock, the average number of shares issued during each fiscal year has been used. For diluted net income per share, both net income and shares outstanding were adjusted to assume the conversion of convertible bonds. Diluted net income per share for the year ended March 31, 2003 was not shown since the Company had no securities with dilutive effect to net income per share.
Cash dividends per share represent actual amounts applicable to the respective years.
Effective from April 1, 2002, the Companies adopted the new accounting standard for earnings per share and its implementation guidance (the Accounting Standard No. 2, “Accounting Standard for Earnings Per Share” and the Accounting Standard Implementation Guidance No. 4, “Implementation Guidance on the Accounting Standard for Earnings Per Share,” issued by the Accounting Standards Board of Japan on September 25, 2002). The effect of adopting the new accounting standard on the consolidated statement of income for the year ended March 31, 2003, was immaterial.
31
Table of Contents
Treasury Stock and Reduction of Statutory Reserves
Effective from April 1, 2002, the Companies adopted the new accounting standard for treasury stock and reversal of statutory reserves (Accounting Standard No. 1, “Accounting Standard for Treasury Stock and Reversal of Legal Reserves,” issued by the Accounting Standards Board of Japan on February 21, 2002). The effect of adopting the new accounting standard on the consolidated statement of income for the year ended March 31, 2003, was immaterial.
Reclassification
Certain reclassifications have been made in the 2004 and 2003 financial statements to conform to the presentation for 2005.
| 3 | Cash and Cash Equivalents |
Cash and cash equivalents at March 31, 2005, 2004 and 2003 for the consolidated statements of cash flows consisted of the following:
| Millions of yen | Thousands of U.S. dollars | |||||||||||||||
| 2005 | 2004 | 2003 | 2005 | |||||||||||||
Cash and time deposits | ¥ | 16,395 | ¥ | 21,978 | ¥ | 27,562 | $ | 152,668 | ||||||||
Time deposits with maturities over three months | (579 | ) | (2,513 | ) | (279 | ) | (5,392 | ) | ||||||||
Marketable securities with maturities within three months | 75,755 | 70,881 | 61,656 | 705,420 | ||||||||||||
| ¥ | 91,571 | ¥ | 90,346 | ¥ | 88,939 | $ | 852,696 | |||||||||
In the year ended March 31, 2003, the Company newly consolidated Daiichi Suntory Pharma Co., Ltd. The amounts of assets and liabilities of Daiichi Suntory Pharma Co., Ltd. at the beginning of the consolidation period used for consolidation purposes and the acquisition cost of the investment were as follows:
| Millions of yen | ||||
Current assets | ¥ | 7,051 | ||
Non-current assets | 9,659 | |||
Consolidation difference | 11,728 | |||
Current liabilities | (2,468 | ) | ||
Long-term liabilities | (1,812 | ) | ||
Minority interests | (4,226 | ) | ||
Payment for purchase of the subsidiary | 19,932 | |||
Cash and cash equivalents owned by the subsidiary | (622 | ) | ||
Acquisition cost of investment | ¥ | 19,310 | ||
| 4 | Market Value Information for Securities |
(1)At March 31, 2005 and 2004, the acquisition costs, book values and fair values of securities with available fair values were as follows:
(a) Held-to-maturity debt securities
| Millions of yen | Thousands of U.S. dollars | ||||||||||
| 2005 | 2004 | 2005 | |||||||||
Securities with fair value exceeding book value: | |||||||||||
Book value | ¥ | 29,333 | ¥ | 21,540 | $ | 273,145 | |||||
Fair value | 29,493 | 21,663 | 274,635 | ||||||||
Difference | ¥ | 160 | ¥ | 123 | $ | 1,490 | |||||
Securities with fair value not exceeding book value: | |||||||||||
Book value | ¥ | 39,410 | ¥ | 46,108 | $ | 366,980 | |||||
Fair value | 39,022 | 45,509 | 363,367 | ||||||||
Difference | ¥ | (388 | ) | ¥ | 599 | $ | (3,613 | ) | |||
32
Table of Contents
(b) Available-for-sale securities with fair value
| Millions of yen | ||||||||||
| 2005 | ||||||||||
| Acquisition cost | Book value | Difference | ||||||||
Securities with book value (fair value) exceeding acquisition cost: | ||||||||||
Equity securities | ¥ | 26,286 | ¥ | 56,955 | ¥ | 30,669 | ||||
Bonds | 1,120 | 1,176 | 56 | |||||||
Others | 2,412 | 2,859 | 447 | |||||||
Total | ¥ | 29,818 | ¥ | 60,990 | ¥ | 31,172 | ||||
Securities with book value (fair value) not exceeding acquisition cost: | ||||||||||
Equity securities | ¥ | 606 | ¥ | 497 | ¥ | (109 | ) | |||
Bonds | — | — | — | |||||||
Others | 3,261 | 2,841 | (420 | ) | ||||||
Total | ¥ | 3,867 | ¥ | 3,338 | ¥ | (529 | ) | |||
| Millions of yen | ||||||||||
| 2004 | ||||||||||
| Acquisition cost | Book value | Difference | ||||||||
Securities with book value (fair value) exceeding acquisition cost: | ||||||||||
Equity securities | ¥ | 27,486 | ¥ | 57,734 | ¥ | 30,248 | ||||
Bonds | 120 | 134 | 14 | |||||||
Others | 2,311 | 2,731 | 420 | |||||||
Total | ¥ | 29,917 | ¥ | 60,599 | ¥ | 30,682 | ||||
Securities with book value (fair value) not exceeding acquisition cost: | ||||||||||
Equity securities | ¥ | 85 | ¥ | 80 | ¥ | (5 | ) | |||
Bonds | — | — | — | |||||||
Others | 3,405 | 2,918 | (487 | ) | ||||||
Total | ¥ | 3,490 | ¥ | 2,998 | ¥ | (492 | ) | |||
| Thousands of U.S. dollars | ||||||||||
| 2005 | ||||||||||
| Acquisition cost | Book value | Difference | ||||||||
Securities with book value (fair value) exceeding acquisition cost: | ||||||||||
Equity securities | $ | 244,771 | $ | 530,357 | $ | 285,586 | ||||
Bonds | 10,429 | 10,951 | 522 | |||||||
Others | 22,460 | 26,623 | 4,163 | |||||||
Total | $ | 277,660 | $ | 567,931 | $ | 290,271 | ||||
Securities with book value (fair value) not exceeding acquisition cost: | ||||||||||
Equity securities | $ | 5,643 | $ | 4,628 | $ | (1,015 | ) | |||
Bonds | — | — | — | |||||||
Others | 30,366 | 26,455 | (3,911 | ) | ||||||
Total | $ | 36,009 | $ | 31,083 | $ | (4,926 | ) | |||
The Companies recognized ¥32 million ($298 thousand) and ¥61 million as loss on devaluation of available-for-sale securities with available fair market value in the years ended at March 31, 2005 and 2004, respectively.
(2)At March 31, 2005 and 2004, book values of securities with no available fair values were as follows:
(a) Held-to-maturity debt securities
| Millions of yen | Thousands of U.S. dollars | ||||||||
| 2005 | 2004 | 2005 | |||||||
Certificates of deposit | ¥ | 20,000 | ¥ | — | $ | 186,237 | |||
Commercial paper | 47,492 | 46,486 | 442,239 | ||||||
33
Table of Contents
(b) Available-for-sale securities
| Millions of yen | Thousands of U.S. dollars | ||||||||
| 2005 | 2004 | 2005 | |||||||
Money management fund, free financial fund and medium-term government bond fund | ¥ | 8,264 | ¥ | 24,396 | $ | 76,953 | |||
Non-listed equity securities | 2,062 | 2,636 | 19,201 | ||||||
Others | 2,000 | 1,000 | 18,624 | ||||||
(3)At March 31, 2005 and 2004, available-for-sale securities with maturities and held-to-maturity debt securities were as follows:
| Millions of yen | |||||||||||||||
| 2005 | |||||||||||||||
Within one year | Over one year but within five years | Over five years but within ten years | Over ten years | Total | |||||||||||
Bonds: | |||||||||||||||
Government bonds | ¥ | — | ¥ | — | ¥ | — | ¥ | — | ¥ | — | |||||
Corporate bonds | 31,759 | 22,983 | 14,000 | — | 68,742 | ||||||||||
Others | 67,492 | — | — | — | 67,492 | ||||||||||
Others | — | 2,359 | — | — | 2,359 | ||||||||||
Total | ¥ | 99,251 | ¥ | 25,342 | ¥ | 14,000 | ¥ | — | ¥ | 138,593 | |||||
| Millions of yen | |||||||||||||||
| 2004 | |||||||||||||||
Within one year | Over one year but within five years | Over five years but within ten years | Over ten years | Total | |||||||||||
Bonds: | |||||||||||||||
Government bonds | ¥ | 10 | ¥ | — | ¥ | — | ¥ | — | ¥ | 10 | |||||
Corporate bonds | 23,232 | 23,406 | 13,000 | 8,000 | 67,638 | ||||||||||
Others | 46,486 | — | — | — | 46,486 | ||||||||||
Others | — | 120 | 2,387 | — | 2,507 | ||||||||||
Total | ¥ | 69,728 | ¥ | 23,526 | ¥ | 15,387 | ¥ | 8,000 | ¥ | 116,641 | |||||
| Thousands of U.S. dollars | |||||||||||||||
| 2005 | |||||||||||||||
Within one year | Over one year but within five years | Over five years but within ten years | Over ten years | Total | |||||||||||
Bonds: | |||||||||||||||
Government bonds | $ | — | $ | — | $ | — | $ | — | $ | — | |||||
Corporate bonds | 295,735 | 214,014 | 130,366 | — | 640,115 | ||||||||||
Others | 628,476 | — | — | — | 628,476 | ||||||||||
Others | — | 21,967 | — | — | 21,967 | ||||||||||
Total | $ | 924,211 | $ | 235,981 | $ | 130,366 | $ | — | $ | 1,290,558 | |||||
Available-for-sale securities sold during the year ended March 31, 2005 and 2004 were as follows:
| Millions of yen | Thousands of U.S. dollars | ||||||||||||||||||||||||
| 2005 | 2004 | 2005 | |||||||||||||||||||||||
Sales amount | Total gain | Total loss | Sales amount | Total gain | Total loss | Sales amount | Total gain | Total loss | |||||||||||||||||
| ¥ | 1,936 | ¥ | 283 | ¥ | 28 | ¥ | 2,794 | ¥ | 1,333 | ¥ | 1 | $ | 18,028 | $ | 2,635 | $ | 261 | ||||||||
34
Table of Contents
| 5 | Derivative Transactions |
Status of Derivative Transactions
The Companies utilize, at present, only forward foreign exchange contracts as derivative transactions in order to hedge foreign currency risks arising from normal business transactions. At the end of the year, the Company had forward foreign exchange contracts to sell U.S. dollars within the limit of export sales denominated in U.S. dollars and to sell U.S. dollars for hedging foreign currency denominated time deposits and the interest thereon.
The derivative transactions are made solely with highly rated financial institutions. Forward foreign exchange contracts relating to export transactions are subject to the approval of the General Manager of the Finance and Accounting Department after consulting with the related departments and are contracted by the Finance and Accounting Department, with the results then reported to the Board of Directors. Contracts relating to foreign currency denominated time deposits, etc., are, depending on their materiality, subject to a resolution of the Board of Directors or approval by the General Manager of the Finance and Accounting Department and are contracted by the Finance and Accounting Department, with the results then reported to the Board of Directors.
Market Value of Derivative Transactions
The Companies had no contracts of derivative transactions for other than hedging purposes outstanding at March 31, 2005 and 2004.
| 6 | Inventories |
Inventories at March 31, 2005 and 2004 consisted of the following:
| Millions of yen | Thousands of U.S. dollars | ||||||||
| 2005 | 2004 | 2005 | |||||||
Finished goods | ¥ | 22,394 | ¥ | 19,585 | $ | 208,530 | |||
Work in process and semi-finished products | 10,270 | 12,158 | 95,633 | ||||||
Raw materials and supplies | 7,822 | 7,403 | 72,837 | ||||||
| ¥ | 40,486 | ¥ | 39,146 | $ | 377,000 | ||||
| 7 | Lease Information |
A summary of assumed amounts of acquisition cost, accumulated depreciation and net book value at March 31, 2005 and 2004 were as follows:
| Millions of yen | Millions of yen | |||||||||||||||||||
| 2005 | 2004 | |||||||||||||||||||
Acquisition cost | Accumulated depreciation | Net book value | Acquisition cost | Accumulated depreciation | Net book value | |||||||||||||||
Machinery and equipment | ¥ | 10,812 | ¥ | (6,739 | ) | ¥ | 4,073 | ¥ | 10,976 | ¥ | (6,389 | ) | ¥ | 4,587 | ||||||
| Thousands of U.S. dollars | ||||||||||
| 2005 | ||||||||||
Acquisition cost | Accumulated depreciation | Net book value | ||||||||
Machinery and equipment | $ | 100,680 | $ | (62,753 | ) | $ | 37,927 | |||
Future lease payments at March 31, 2005 and 2004, inclusive of interest under such leases, were as follows:
| Millions of yen | Thousands of U.S. dollars | ||||||||
| 2005 | 2004 | 2005 | |||||||
Due within one year | ¥ | 1,869 | ¥ | 2,037 | $ | 17,404 | |||
Due after one year | 2,204 | 2,550 | 20,523 | ||||||
| ¥ | 4,073 | ¥ | 4,587 | $ | 37,927 | ||||
35
Table of Contents
Total expenses for finance leases which do not transfer ownership to lessees and assumed depreciation charges for the years ended March 31, 2005, 2004 and 2003 were as follows:
| Millions of yen | Thousands of U.S. dollars | |||||||||||
| 2005 | 2004 | 2003 | 2005 | |||||||||
Total expenses | ¥ | 2,367 | ¥ | 2,193 | ¥ | 2,081 | $ | 22,041 | ||||
Assumed depreciation charges | 2,367 | 2,193 | 2,081 | 22,041 | ||||||||
| 8 | Long-Term Debt |
Long-term debt at March 31, 2005 and 2004 consisted of the following:
| Millions of yen | Thousands of U.S. dollars | |||||||||||
| 2005 | 2004 | 2005 | ||||||||||
Secured loans principally from banks and insurance companies, with interest rates ranging from 2.2% to 6.2% | ¥ | 24 | ¥ | 42 | $ | 224 | ||||||
Less amount due within one year | (18 | ) | (18 | ) | (168 | ) | ||||||
| ¥ | 6 | ¥ | 24 | $ | 56 | |||||||
At March 31, 2005 and 2004, property, plant and equipment amounting to ¥1,442 million ($13,428 thousand) and ¥1,505 million were pledged as collateral for bank loans and long-term secured loans, respectively.
The annual maturities of long-term debt at March 31, 2005 were as follows:
Year ending March 31, | Millions of yen | Thousands of U.S. dollars | ||||
2006 | ¥ | 18 | $ | 169 | ||
2007 | 1 | 9 | ||||
2008 | 1 | 9 | ||||
2009 | 1 | 9 | ||||
Thereafter | 3 | 29 | ||||
| ¥ | 24 | $ | 224 | |||
| 9 | Income Taxes |
Taxes on income consist of corporation tax, inhabitants’ taxes and enterprise taxes. The aggregate statutory tax rate on income before income taxes and minority interests in net income of consolidated subsidiaries was approximately 40.5% for the year ended March 31, 2005, and 41.8% for the year ended March 31, 2004 and 2003, respectively.
The actual effective tax rates in the consolidated statements of income differ from the aggregate statutory tax rate principally because of the effect of expenses not deductible for tax purposes.
The following table summarizes the significant differences between the statutory tax rate and the Company’s effective tax rates for financial statement purposes for the years ended March 31, 2005, 2004 and 2003.
| 2005 | 2004 | 2003 | |||||||
Statutory tax rate | 40.5 | % | 41.8 | % | 41.8 | % | |||
Expenses not deductible for tax purposes | 2.7 | 3.5 | 5.1 | ||||||
Per capita inhabitants’ taxes | 0.2 | 0.3 | 0.4 | ||||||
Amortization of consolidation differences | — | — | 13.7 | ||||||
Adjustment of deferred tax assets due to change of income tax rate | — | — | 1.0 | ||||||
Tax deduction for research expenses | (4.2 | ) | (6.2 | ) | (1.4 | ) | |||
Other | 5.4 | 7.7 | 2.2 | ||||||
Effective tax rates | 44.6 | % | 47.1 | % | 62.8 | % | |||
36
Table of Contents
Significant components of the Company’s deferred tax assets and liabilities as of March 31, 2005 and 2004 were as follows:
| Millions of yen | Thousands of U.S. dollars | |||||||||||
| 2005 | 2004 | 2005 | ||||||||||
Deferred tax assets: | ||||||||||||
Retirement benefits and pension costs | ¥ | 1,553 | ¥ | 5,611 | $ | 14,461 | ||||||
Payable to the defined contribution pension plan | 2,626 | — | 24,453 | |||||||||
Depreciation | 11,163 | 9,528 | 103,948 | |||||||||
Research and development expenses | 5,435 | 6,792 | 50,610 | |||||||||
Accrued expenses | 4,545 | 4,282 | 42,322 | |||||||||
Inventories | 1,290 | 1,701 | 12,012 | |||||||||
Accrued enterprise taxes | 707 | 1,015 | 6,583 | |||||||||
Marketable securities and investments | 777 | 1,327 | 7,235 | |||||||||
Other | 7,636 | 5,836 | 71,107 | |||||||||
Valuation allowance | (6,638 | ) | (2,519 | ) | (61,812 | ) | ||||||
Total deferred tax assets | 29,094 | 33,573 | 270,919 | |||||||||
Deferred tax liabilities: | ||||||||||||
Net unrealized gains on securities | (12,420 | ) | (12,225 | ) | (115,653 | ) | ||||||
Prepaid pension costs | (6,866 | ) | — | (63,935 | ) | |||||||
Excess tax depreciation reserve | (2,588 | ) | (2,456 | ) | (24,099 | ) | ||||||
Other | (18 | ) | (24 | ) | (168 | ) | ||||||
Total deferred tax liabilities | (21,892 | ) | (14,705 | ) | (203,855 | ) | ||||||
Net deferred tax assets | ¥ | 7,202 | ¥ | 18,868 | $ | 67,064 | ||||||
Net deferred tax assets as of March 31, 2005 and 2004 were included in the following accounts of the consolidated balance sheets.
| Millions of yen | Thousands of U.S. dollars | ||||||||
| 2005 | 2004 | 2005 | |||||||
Deferred income taxes (assets): | |||||||||
Current | ¥ | 13,827 | ¥ | 16,111 | $ | 128,755 | |||
Non-current | 3,167 | 3,437 | 29,491 | ||||||
Deferred income taxes (liabilities): | |||||||||
Non-current | 9,792 | 680 | 91,182 | ||||||
| 10 | Retirement and Termination Benefits Plans |
The Companies adopted the new accounting standard for employees’ severance and retirement benefits, under which allowance and expenses for severance and retirement benefits are determined based on the amounts obtained by actuarial calculations.
Retirement benefits included in the liability section of the consolidated balance sheets as of March 31, 2005 and 2004 consisted of the following:
| Millions of yen | Thousands of U.S. dollars | |||||||||||
| 2005 | 2004 | 2005 | ||||||||||
Projected benefit obligation | ¥ | 83,245 | ¥ | 108,152 | $ | 775,165 | ||||||
Unrecognized prior service costs | (1,565 | ) | 4,305 | (14,573 | ) | |||||||
Unrecognized actuarial differences | (9,223 | ) | (18,521 | ) | (85,883 | ) | ||||||
Less fair value of pension assets | (83,197 | ) | (74,845 | ) | (774,718 | ) | ||||||
Prepaid pension costs | 15,494 | — | 144,278 | |||||||||
Employees’ severance and retirement benefits | ¥ | 4,754 | ¥ | 19,091 | $ | 44,269 | ||||||
37
Table of Contents
Due to the transfer from lump-sum benefit plans to the defined-contribution pension plans, employees’ severance and retirement benefits in the consolidated balance sheet as of March 31, 2005 decreased by ¥14,297 million ($133,132 thousand) as follows:
| Millions of yen | ||||
Decrease in projected benefit obligations | ¥ | 11,779 | ||
Unrecognized actuarial differences | (1,334 | ) | ||
Unrecognized prior service costs | 3,852 | |||
Decrease in provision for employees’ retirement benefits | ¥ | 14,297 | ||
Plan assets required to be transferred to the defined-contribution pension plans amounted to ¥10,528 million ($98,035 thousand), which is to be transferred in four years. The amount of plan assets yet to be transferred at March 31, 2005 amounting to ¥6,744 million ($62,799 thousand), is reflected in trade notes and accounts payable and other long-term liabilities in the consolidated balance sheet.
Included in selling, general and administrative expenses in the consolidated statements of income for the years ended March 31, 2005, 2004 and 2003 are employees’ severance and retirement benefit expenses consisting of the following:
| Millions of yen | Thousands of U.S. dollars | |||||||||||||||
| 2005 | 2004 | 2003 | 2005 | |||||||||||||
Service costs—benefits earned during the year | ¥ | 3,605 | ¥ | 4,158 | ¥ | 3,740 | $ | 33,569 | ||||||||
Interest costs on projected benefit obligation | 2,382 | 2,669 | 2,819 | 22,181 | ||||||||||||
Expected return on plan assets | (1,994 | ) | (1,560 | ) | (2,180 | ) | (18,568 | ) | ||||||||
Amortization of prior service costs | (267 | ) | (251 | ) | (204 | ) | (2,486 | ) | ||||||||
Amortization of actuarial differences | 2,073 | 2,977 | 1,325 | 19,303 | ||||||||||||
Other | 204 | — | — | 1,900 | ||||||||||||
Total | ¥ | 6,003 | ¥ | 7,933 | ¥ | 5,500 | $ | 55,899 | ||||||||
Included in other income (expenses) in the consolidated statements of income for the years ended March 31, 2005, 2004 and 2003 are the related income (expenses) of employees’ severance and retirement benefit consisting of the following:
| Millions of yen | Thousands of U.S. dollars | |||||||||||||
| 2005 | 2004 | 2003 | 2005 | |||||||||||
Costs of closing non-contributory pension plan | ¥ | — | ¥ | — | ¥ | 1,035 | $ | — | ||||||
Gain on the release from the substitutional portion of the Employees’ Pension Fund to the government | (11,747 | ) | — | — | (109,386 | ) | ||||||||
Loss on settlement of an Employees’ Pension Fund Plan | 381 | — | — | 3,548 | ||||||||||
Gain on the transfer to the defined contribution pension plan | (3,769 | ) | — | — | (35,096 | ) | ||||||||
Restructuring charge | 7,316 | — | — | 68,126 | ||||||||||
Total | ¥ | (7,819 | ) | ¥ | — | ¥ | 1,035 | $ | (72,808 | ) | ||||
The restructuring charge was related to the payments of additional one-time termination benefits to the employees who were transferred to Daiichi Pharmatech Co., Ltd., which was established through a split-off of three domestic manufacturing plants of the Company.
The discount rate for calculating projected benefit obligation used by the Companies were principally 2.5% and the rates of expected return on plan assets used by the Companies were principally 3.0% at March 31, 2005 and 2004.
| 11 | Shareholders’ Equity |
Under the Code, at least 50% of the issue price of new shares is required to be designated as common stock. The portion which is not transferred to common stock is determined by resolution of the Board of Directors. Proceeds not transferred to common stock are credited to additional paid-in capital, which is included in capital surplus.
Under the Code, certain amounts of retained earnings equal to at least 10% of cash dividends and bonuses to directors and corporate statutory auditors must be set aside as a legal earnings reserve until the total of the legal earnings reserve and additional paid-in capital equals 25% of common stock.
38
Table of Contents
The legal earnings reserve and additional paid-in capital may be used to eliminate or reduce a deficit by resolution of the shareholders’ meeting or may be capitalized by resolution of the Board of Directors. On condition that the total amount of the legal earnings reserve and additional paid-in capital remains equal to or exceeds 25% of common stock, they are available for distribution by the resolution of shareholders’ meeting.
The maximum amount that the Company can distribute as dividends is calculated based on the unconsolidated financial statements of the Company in accordance with the Code.
| 12 | Contingent Liabilities |
On March 31, 2005, the Company and its consolidated domestic subsidiaries were contingently liable as guarantors for loans of employees in the amount of ¥3,087 million ($28,746 thousand) and also contingently liable for trade notes receivable discounted with banks in the amount of ¥79 million ($736 thousand).
On November 21, 2001, the Company received a decision from the European Commission which imposed a fine of approximately ¥2,700 million (EU23,400 thousand) on the Company in connection with the Company’s transactions involving calcium pantothenate. The Company has lodged an appeal with the European Court of First Instance to reduce the amount of the fine imposed.
| 13 | Segment Information |
The Companies’ primary business activities consist mainly of the pharmaceutical business. Other includes various remaining businesses such as the fine chemicals business. Net sales, costs and expenses and operating income by segment of business activities for the years ended March 31, 2005, 2004 and 2003 were as follows:
| Millions of yen | ||||||||||||||
| 2005 | ||||||||||||||
| Pharmaceutical business | Other | Elimination and/or corporate | Consolidated | |||||||||||
I. Sales and operating income | ||||||||||||||
Net sales: | ||||||||||||||
Outside customers | ¥ | 311,845 | ¥ | 16,689 | ¥ | — | ¥ | 328,534 | ||||||
Intersegment | 73 | 2,784 | (2,857 | ) | — | |||||||||
Total sales | 311,918 | 19,473 | (2,857 | ) | 328,534 | |||||||||
Operating expenses | 247,822 | 19,551 | 5,097 | 272,470 | ||||||||||
Operating income (loss) | ¥ | 64,096 | ¥ | (78 | ) | ¥ | (7,954 | ) | ¥ | 56,064 | ||||
II. Identifiable assets | ¥ | 288,257 | ¥ | 28,769 | ¥ | 229,529 | ¥ | 546,555 | ||||||
Depreciation | 14,342 | 1,519 | 86 | 15,947 | ||||||||||
Capital expenditures | 12,937 | 1,747 | 114 | 14,798 | ||||||||||
| Millions of yen | |||||||||||||
| 2004 | |||||||||||||
| Pharmaceutical business | Other | Elimination and/or corporate | Consolidated | ||||||||||
I. Sales and operating income | |||||||||||||
Net sales: | |||||||||||||
Outside customers | ¥ | 304,564 | ¥ | 18,203 | ¥ | — | ¥ | 322,767 | |||||
Intersegment | 1,301 | 2,453 | (3,754 | ) | — | ||||||||
Total sales | 305,865 | 20,656 | (3,754 | ) | 322,767 | ||||||||
Operating expenses | 252,739 | 20,590 | 3,323 | 276,652 | |||||||||
Operating income | ¥ | 53,126 | ¥ | 66 | ¥ | (7,077 | ) | ¥ | 46,115 | ||||
II. Identifiable assets | ¥ | 270,308 | ¥ | 29,576 | ¥ | 221,925 | ¥ | 521,809 | |||||
Depreciation | 15,551 | 1,743 | 72 | 17,366 | |||||||||
Capital expenditures | 10,900 | 1,348 | 66 | 12,314 | |||||||||
39
Table of Contents
| Millions of yen | ||||||||||||||
| 2003 | ||||||||||||||
| Pharmaceutical business | Other | Elimination and/or corporate | Consolidated | |||||||||||
I. Sales and operating income | ||||||||||||||
Net sales: | ||||||||||||||
Outside customers | ¥ | 303,263 | ¥ | 18,748 | ¥ | — | ¥ | 322,011 | ||||||
Intersegment | 225 | 2,002 | (2,227 | ) | — | |||||||||
Total sales | 303,488 | 20,750 | (2,227 | ) | 322,011 | |||||||||
Operating expenses | 243,245 | 20,605 | 5,524 | 269,374 | ||||||||||
Operating income | ¥ | 60,243 | ¥ | 145 | ¥ | (7,751 | ) | ¥ | 52,637 | |||||
II. Identifiable assets | ¥ | 307,194 | ¥ | 31,873 | ¥ | 173,317 | ¥ | 512,384 | ||||||
Depreciation | 14,829 | 1,972 | 142 | 16,943 | ||||||||||
Capital expenditures | 8,865 | 2,366 | 27 | 11,258 | ||||||||||
| Thousands of U.S. dollars | ||||||||||||||
| 2005 | ||||||||||||||
| Pharmaceutical business | Other | Elimination and/or corporate | Consolidated | |||||||||||
I. Sales and operating income | ||||||||||||||
Net sales: | ||||||||||||||
Outside customers | $ | 2,903,855 | $ | 155,406 | $ | — | $ | 3,059,261 | ||||||
Intersegment | 680 | 25,924 | (26,604 | ) | — | |||||||||
Total sales | 2,904,535 | 181,330 | (26,604 | ) | 3,059,261 | |||||||||
Operating expenses | 2,307,682 | 182,057 | 47,462 | 2,537,201 | ||||||||||
Operating income (loss) | $ | 596,853 | $ | (727 | ) | $ | (74,066 | ) | $ | 522,060 | ||||
II. Identifiable assets | $ | 2,684,207 | $ | 267,892 | $ | 2,137,341 | $ | 5,089,440 | ||||||
Depreciation | 133,551 | 14,144 | 801 | 148,496 | ||||||||||
Capital expenditures | 120,467 | 16,268 | 1,062 | 137,797 | ||||||||||
Unallocable operating expenses, consisting primarily of the Companies’ expenses relating to general affairs, accounting and other departments, were ¥7,920 million ($73,750 thousand), ¥6,975 million and ¥7,797 million for the years ended March 31, 2005, 2004 and 2003, respectively, and were included in elimination and/or corporate. Corporate assets, consisting primarily of the Companies’ cash and marketable securities, investment securities and assets relating to the administration department, were ¥231,329 million ($2,154,102 thousand), ¥221,215 million and ¥175,016 million for the years ended March 31, 2005, 2004 and 2003, respectively, and were included in elimination and/or corporate.
Geographic segment information is not shown due to the total sales and the identifiable assets in Japan being more than 90% of consolidated amounts.
The Companies’ business activities overseas consist mainly of those in the Americas and in Europe. Other includes mainly Asia. A summary of overseas net sales by the Companies for the years ended March 31, 2005, 2004 and 2003 were as follows:
| Millions of yen | ||||||||||||||||
| 2005 | ||||||||||||||||
| Americas | Europe | Other | Total | |||||||||||||
I. Overseas net sales | ¥ | 46,608 | ¥ | 13,392 | ¥ | 8,589 | ¥ | 68,589 | ||||||||
II. Consolidated net sales | 328,534 | |||||||||||||||
III. Ratio of overseas net sales on a consolidated basis | 14.2 | % | 4.1 | % | 2.6 | % | 20.9 | % | ||||||||
| Millions of yen | ||||||||||||||||
| 2004 | ||||||||||||||||
| Americas | Europe | Other | Total | |||||||||||||
I. Overseas net sales | ¥ | 45,158 | ¥ | 12,404 | ¥ | 8,602 | ¥ | 66,164 | ||||||||
II. Consolidated net sales | 322,767 | |||||||||||||||
III. Ratio of overseas net sales on a consolidated basis | 14.0 | % | 3.8 | % | 2.7 | % | 20.5 | % | ||||||||
40
Table of Contents
| Millions of yen | ||||||||||||||||
| 2003 | ||||||||||||||||
| Americas | Europe | Other | Total | |||||||||||||
I. Overseas net sales | ¥ | 49,524 | ¥ | 12,503 | ¥ | 8,089 | ¥ | 70,116 | ||||||||
II. Consolidated net sales | 322,011 | |||||||||||||||
III. Ratio of overseas net sales on a consolidated basis | 15.4 | % | 3.9 | % | 2.5 | % | 21.8 | % | ||||||||
| Thousands of U.S. dollars | ||||||||||||||||
| 2005 | ||||||||||||||||
| Americas | Europe | Other | Total | |||||||||||||
I. Overseas net sales | $ | 434,007 | $ | 124,704 | $ | 79,980 | $ | 638,691 | ||||||||
II. Consolidated net sales | 3,059,261 | |||||||||||||||
| 14 | Subsequent Events |
A proposal calling for the establishment of a joint holding company (Daiichi Sankyo Co., Ltd.) with Sankyo Company, Limited (Sankyo) on September 28, 2005 and a definitive joint share transfer agreement were approved at the annual general meeting of shareholders of the Company held on June 29, 2005.
In the joint share transfer, each share of the Company’s common stock will be exchanged for 1.159 shares of common stock of Daiichi Sankyo, and each share of Sankyo’s common stock will be exchanged for one share of common stock of Daiichi Sankyo. As a result of the joint share transfer, the Company and Sankyo will be wholly owned subsidiaries of Daiichi Sankyo, and the shareholders of the Company and Sankyo will be the shareholders of Daiichi Sankyo in the proportion to the applicable exchange ratios.
In addition, under the joint share transfer, shareholders of the Company will receive ¥25 in cash per share of the Company and shareholders of Sankyo will receive ¥25 in cash per share of Sankyo from Daiichi Sankyo as a substitute for interim dividends otherwise payable to each shareholder of the Company and Sankyo. Instead of paying its interim dividends for the six-month period ending September 30, 2005 directly to the former shareholders of the Company and Sankyo, the Company and Sankyo will pay such interim dividends to Daiichi Sankyo, which will be the sole holders on record of the Company’s and Sankyo’s common stock as of September 30, 2005, subsequent to the closing of the joint share transfer.
The Company and Sankyo acknowledged in the joint share transfer agreement that they aim to integrate their prescription pharmaceutical operations in or around April 2007 and during the period from August 1, 2005 to September 26, 2005, the board of the directors of the Company and Sankyo will approve the cancellation of all treasury stock held by them. In addition, each option or right to acquire shares of the Company or Sankyo outstanding on the date of the joint share transfer agreement shall be terminated by September 26, 2005 by canceling such rights, having the holders surrender their rights, or other appropriate means.
The following appropriations of retained earnings on March 31, 2005 were approved at the annual general meeting of shareholders of the Company held on June 29, 2005.
| Millions of yen | Thousands of U.S. dollars | |||||
Year-end cash dividends of ¥25.00 ($0.23) per share | ¥ | 6,710 | $ | 62,483 | ||
Bonuses to directors | 100 | 931 | ||||
41
Table of Contents
To the Board of Directors of
DAIICHI PHARMACEUTICAL CO., LTD.
We have audited the accompanying consolidated balance sheets of DAIICHI PHARMACEUTICAL CO., LTD. and consolidated subsidiaries as of March 31, 2005 and 2004, and the related consolidated statements of income, shareholders’ equity and cash flows for each of the three years in the period ended March 31, 2005, expressed in Japanese yen. These consolidated financial statements are the responsibility of the Company’s management. Our responsibility is to independently express an opinion on these consolidated financial statements based on our audits.
We conducted our audits in accordance with auditing standards generally accepted in Japan. Those standards require that we plan and perform the audit to obtain reasonable assurance about whether the financial statements are free of material misstatement. An audit includes examining, on a test basis, evidence supporting the amounts and disclosures in the financial statements. An audit also includes assessing the accounting principles used and significant estimates made by management, as well as evaluating the overall financial statement presentation. We believe that our audits provide a reasonable basis for our opinion.
In our opinion, the consolidated financial statements referred to above present fairly, in all material respects, the consolidated financial position of DAIICHI PHARMACEUTICAL CO., LTD. and subsidiaries as of March 31, 2005 and 2004, and the consolidated results of their operations and their cash flows for each of the three years in the period ended March 31, 2005, in conformity with accounting principles generally accepted in Japan.
Without qualifying our opinion, we draw attention to Note 14 to the consolidated financial statements as a subsequent event, a proposal calling for the establishment of a joint holding company (Daiichi Sankyo Co., Ltd.) with Sankyo Co., Ltd. on September 28, 2005 and a definitive joint share transfer agreement were approved at the annual general meeting of shareholders of the Company held on June 29, 2005.
The U.S. dollar amounts in the accompanying consolidated financial statements with respect to the year ended March 31, 2005 are presented solely for convenience. Our audit also included the translation of yen amounts into U.S. dollar amounts and, in our opinion, such translation has been made on the basis described in Note 1 to the consolidated financial statements.
 |
Tokyo, Japan
June 29, 2005
42
Table of Contents
(As of March 31, 2005)
Head Office
14-10, Nihonbashi 3-chome
Chuo-ku, Tokyo 103-8234
Tel: 81-3-3272-0611
Fax: 81-3-3272-7348
http://www.daiichipharm.co.jp/
Regional Sales Offices
Sapporo, Sendai, Tokyo (metropolitan area), Chiba–Saitama, Yokohama, Tokyo (northern Kanto and outlying areas), Nagoya, Kyoto, Osaka, Kobe, Hiroshima, Takamatsu, Fukuoka
Research & Development Center
Tokyo
Overseas Office
JAKARTA OFFICE
15th Floor, Kyoei Prince Building,
Suite 1507, Jl. Jend., Sudirman Kav. 3-4
Jakarta 10220, Indonesia
Tel: 62-21-5724131
Fax: 62-21-5724132
Paid-in Capital
¥45,247 million
Common Stock
Authorized: 789,000,000 shares
Issued: 286,453,235 shares
Number of Shareholders: 16,887
Transfer Agent: Mizuho Trust & Banking Co., Ltd.
1-17-7, Saga
Koto-ku, Tokyo 135-8722
Stock Listings
Tokyo Stock Exchange
Osaka Securities Exchange
| Principal Shareholders | |||
Nippon Life Insurance Company | 4.97 | % | |
Japan Trustee Service Bank, Ltd. (Trust account) | 3.58 | % | |
The Master Trust Bank of Japan, Ltd. (Trust account) | 3.34 | % | |
Sumitomo Mitsui Banking Corporation | 2.98 | % | |
The Bank of Tokyo-Mitsubishi, Ltd. | 2.85 | % | |
Trust & Custody Services Bank, Ltd. | 2.56 | % | |
Tokio Marine and Nichido Fire Insurance Co., Ltd. | 2.43 | % | |
State Street Bank and Trust Company 505103 | 2.33 | % | |
Mitsui Sumitomo Insurance Co., Ltd. | 2.26 | % | |
Mellon Bank Treaty Clients Omnibus | 2.03 | % |
Independent Auditor
KPMC AZSA & CO.
Azsa Center Building
1-2, Tsukudo-cho
Shinjuku-ku, Tokyo 162-8551
| Number of Employees (Non-Consolidated) | ||
| (Based on theAnnual Securities Report) | ||
Administration | 362 | |
Sales & Marketing | 1,936 | |
Production & Technology | 678 | |
Research & Development | 823 | |
Total | 3,799 | |
43
Table of Contents
Consolidated Subsidiaries
(As of June 29, 2005)
Company Name | Principal Activities | Country | Established | Paid-in- Capital (thousands) | Equity Owned by Parent Company (%) | |||||
Daiichi Pure Chemicals Co., Ltd. | Manufacture and sale of pharmaceuticals and diagnostic reagents | Japan | 1947 | ¥1,275,250 | 100.0 | |||||
Daiichi Radioisotope Laboratories, Ltd. | Manufacture and sale of radiopharmaceuticals and radioisotope products | Japan | 1968 | ¥1,400,000 | 82.5 | |||||
Daiichi Pharmatech Co., Ltd. | Manufacture of pharmaceuticals | Japan | 2004 | ¥100,000 | 100.0 | |||||
Daiichi Fine Chemical Co., Ltd. (DFK) | Manufacture and sale of pharmaceuticals and fine chemicals | Japan | 1951 | ¥2,276,000 | 100.0 | |||||
Daiichi Fine Chemicals, Inc. | Sale of fine chemicals and related products | USA | 1995 | US$ 273 | DFK 100.0 | |||||
Daiichi Fine Chemical Europe GmbH | Sale of fine chemicals and related products | Germany | 1989 | EUR511 | DFK 100.0 | |||||
Saitama Daiichi Pharmaceutical Co., Ltd. | Manufacture and sale of pharmaceuticals | Japan | 1963 | ¥1,005,500 | 100.0 | |||||
Daiichi Suntory Pharma Co., Ltd. (DSP) | Research, development, manufacture, and marketing of pharmaceuticals | Japan | 2002 | ¥1,000,000 | 66.0 | |||||
Daiichi Asubio Pharmaceuticals, Inc. | Clinical development of pharmaceuticals | USA | 1999 | US$ 200 | DSP 100 | |||||
Daiichi Asubio Holdings, Inc. (ASBH) | Holding company of DAIAMED | USA | 1999 | US$ 6,000 | DSP 100.0 | |||||
Daiichi Asubio Medical Research Laboratories, LLC (DAIAMED) | Exploratory research of pharmaceuticals | USA | 2000 | US$ 3,000 | ASBH 100.0 | |||||
Daiichi Estate Co., Ltd. | Real estate and travel agency services | Japan | 1956 | ¥100,000 | 100.0 | |||||
Daiichi Butsuryu Co., Ltd. | Logistics services | Japan | 1965 | ¥50,000 | 100.0 | |||||
D. P. C. Medical Co., Ltd. | Supply and planning of sales promotional materials | Japan | 1995 | ¥50,000 | 100.0 | |||||
Tokyo Iyaku Shiki Co., Ltd. | Manufacture of packaging materials for pharmaceuticals | Japan | 1943 | ¥163,500 | 65.0 | |||||
Nishimura Shiki Co., Ltd. | Manufacture of packaging materials for pharmaceuticals | Japan | 1952 | ¥30,000 | 61.4 | |||||
Kanto Daiichi Service Co., Ltd. | Security and maintenance services | Japan | 1979 | ¥10,000 | 100.0 | |||||
Daiichi Pharma Holdings, Inc. (DPH) | Holding company of DPC and DMR | USA | 2004 | US$ 47,920 | 100.0 | |||||
Daiichi Pharmaceutical Corporation (DPC) | Sale of pharmaceuticals | USA | 1982 | US$ 37,871 | DPH 100.0 | |||||
Daiichi Medical Research, Inc. (DMR) | Clinical development of pharmaceuticals | USA | 2004 | US$ 4,530 | DPH 100.0 | |||||
Daiichi Pharmaceutical (Beijing) Co., Ltd. | Manufacture and sale of pharmaceuticals | China | 1998 | US$ 53,800 | 100.0 | |||||
Daiichi Pharmaceuticals UK Ltd. | Clinical development of pharmaceuticals | UK | 1993 | £400 | 100.0 | |||||
Daiichi Pharmaceutical (China) Co., Ltd. | Clinical development of pharmaceuticals | China | 1995 | US$ 10,000 | 100.0 | |||||
Daiichi Pharmaceutical Asia Ltd. | Sales promotional services for pharmaceuticals | Hong Kong | 1988 | HK$ 3,000 | 100.0 | |||||
Daiichi Pharmaceutical Taiwan Ltd. | Manufacture and sale of pharmaceuticals | Taiwan | 1963 | NT$ 80,000 | 100.0 | |||||
Daiichi Pharmaceutical Korea Co., Ltd. | Sale of pharmaceuticals | Korea | 1990 | W3,000,000 | 70.0 | |||||
Daiichi Pharmaceutical (Thailand) Ltd. | Sale of pharmaceuticals and fine chemicals | Thailand | 1994 | Baht10,000 | 100.0 | |||||
Laboratories Daiichi Sanofi–Aventis | Clinical development of pharmaceuticals | France | 1989 | EUR154 | 51.0 | |||||
44
Table of Contents

14-10, Nihonbashi 3-chome, Chuo-ku, Tokyo 103-8234, Japan
Tel: 81-3-3272-0611
http://www.daiichipharm.co.jp/