Pacific North West Capital Corp.
2010 TECHNICAL REPORT ON THE ROCK
AND ROLL PROPERTY
Liard Mining Division
NTS 104B/11
56o 43' North Latitude
131o 12' West Longitude
-prepared for-
PACIFIC NORTH WEST CAPITAL CORP.
2303 West 41st St.
Vancouver, BC
V6M 2A3
-prepared by-
Murray Jones, P.Geo.
EQUITY EXPLORATION CONSULTANTS LTD.
Suite 700, 700
West Pender Street
Vancouver, British Columbia, Canada, V6C 1G8
Allan Armitage, Ph.D., P.Geol.
Joe Campbell, P.Geo.
GEOVECTOR MANAGEMENT INC.
10 Green Street Suite 312
Ottawa, Ontario, Canada K2J 3Z6
February 23, 2011
1
TABLE OF CONTENTS
 |
2
LIST OF APPENDICES
LIST OF TABLES
LIST OF FIGURES
3
LIST OF PLATES
4
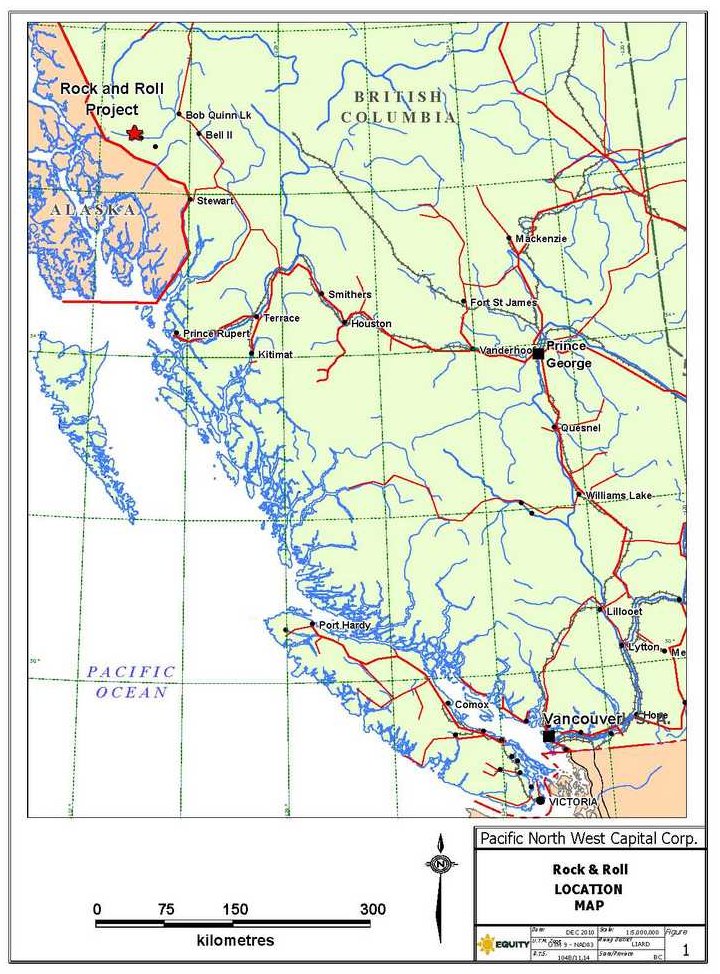
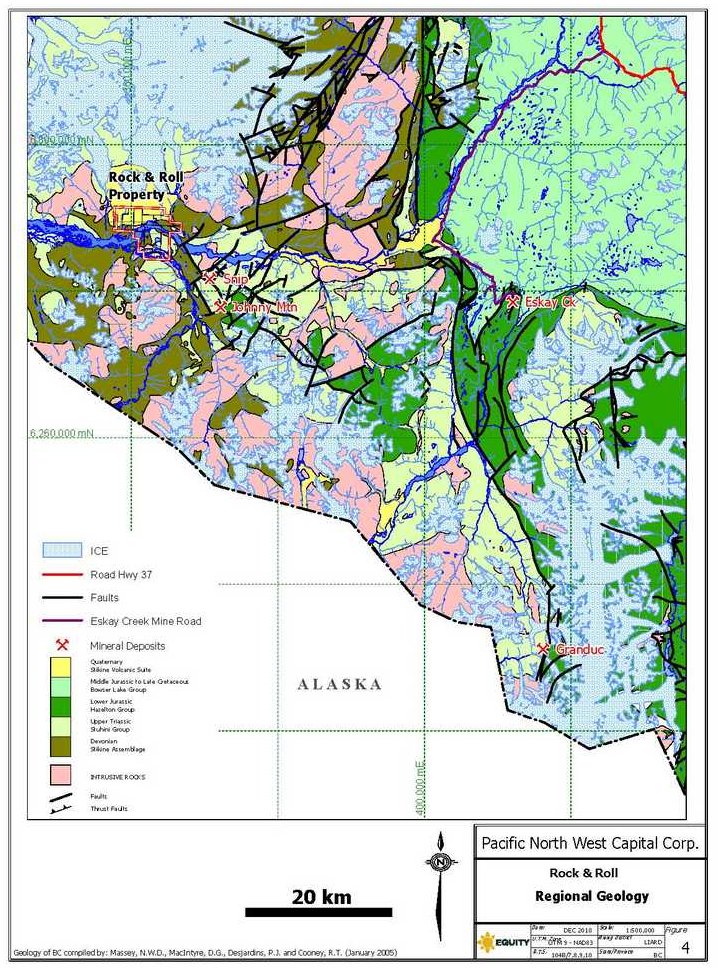
The Rock and Roll property (Figure 1) consists of eleven claims totalling 4243.81 hectares (42.4 km2) in the Iskut River valley of the Coast Mountains in northwestern British Columbia. The property is situated 9 kilometres downstream from the Bronson Creek airstrip and 70 kilometres downstream from the Bob Quinn airstrip, which is located on Highway 37. Pacific North West Capital Corp. (“PFN”) has an option to earn a 100% interest in the property from the current owners. The property lies within a belt of deformed mafic metavolcanic and metasedimentary rocks of the Paleozoic Stikine terrane and the Mesozoic Stuhini Group. The property hosts a massive sulphide deposit known as the Black Dog zone, plus a smaller zone known as the SRV Zone. The Black Dog zone is hosted by Mesozoic meta-argillite and siltstone units interspersed with mafic to intermediate tuff and flow volcanic rocks and sill and dyke intrusive units. Diamond drilling on the property between 1990 and 1997 outlined a historic resource, which is not compliant with N.I. 43- 101, calculated to be 675,000 tonnes at 1.75 g/t Au, 233.8 g/t Ag, 2.2% Zn, 0.5% Pb, 0.4% Cu (Dunning and Scott, 1997).
PFN contracted a time domain electro-magnetic and magnetic survey over the Rock and Roll property in late July-early August 2009. This survey looked deeper than previous geophysical surveys on the property and identified numerous conductors north and south of the Iskut River for eventual follow up. In late October 2009, PFN conducted a diamond drilling program on the Rock and Roll property. The program consisted of 539.81 metres of drilling in 5 holes on the Black Dog massive sulphide horizon. The diamond drilling tested the mineralized horizon with four holes within the historic, non-compliant resource on the Rock and Roll property in areas where drill hole density was low and successfully intersected massive sulphide mineralization in all holes. As well, one hole tested the northwestern fringe of the deposit where an electro-magnetic conductor was indicated by the 2009 airborne geophysical survey (Jones, 2009). The hole cut a diorite dyke or sill at the projection of the Black Dog horizon. A minor re-sampling (21 samples) program of the historic drill core from the property was done in 2009 and the results indicated a distinct bias to lower assay results for Ag and Au as compared to the results for the same intervals from the 1990-1991 drill program, which formed the basis for most of the historic resource (Becherer, 1997).
In September 2010, PFN conducted a drill core re-sampling program on historic core drilled in 1990-1997 intended to update the assay results in the Black Dog zone. A total of 509 samples, including standards and blanks, were taken from the mineralized horizons and, jointly with the 2009 drill results, represents 43 intersections of the mineralized horizons enabling a calculation of a N.I. 43-101 compliant resource for the mineralization on the Rock and Roll property (Table 1).
Table 1: Rock and Roll Indicated Mineral Resource Estimate
| Cut-off Grade | | Au g/t | Au | Ag g/t | Ag | Zn % | Zn | AuEq g/t | AuEq |
| (AuEq) | Tonnes | Grade | Ozs | Grade | M Ozs | Grade | M lbs | Grade | Ozs |
| (<0.1 g/)t | 2,323,914 | 0.63 | 47,447 | 77.3 | 5.772 | 0.88 | 21.659 | 2.91 | 217,165 |
| 0.3 g/t | 2,274,353 | 0.65 | 47,351 | 78.9 | 5.767 | 0.90 | 21.602 | 2.97 | 216,839 |
| 0.4 g/t | 2,233,002 | 0.66 | 47,267 | 80.2 | 5.757 | 0.91 | 21.491 | 3.01 | 216,383 |
| 0.5 g/t | 2,155,679 | 0.68 | 47,040 | 82.7 | 5.734 | 0.94 | 21.175 | 3.11 | 215,239 |
| 1.0 g/t | 1,750,810 | 0.80 | 44,816 | 98.5 | 5.544 | 1.09 | 19.049 | 3.65 | 205,360 |
| 5.0 g/t | 411,040 | 1.83 | 24,145 | 245.4 | 3.244 | 2.25 | 6.247 | 8.33 | 110,070 |
| 10.0 g/t | 120,312 | 2.42 | 9,360 | 370.0 | 1.431 | 3.09 | 2.112 | 11.79 | 45,618 |
At the same time, PFN conducted a geological mapping, prospecting, and rock and silt sampling program on the Rock and Roll property. This field work was focused southeast of the Black Dog zone and north of the Iskut River investigating conductors identified by the 2009 airborne geophysical survey. Results
5
of this field program have indicated the potential for the Black Dog horizon to extend across the Iskut River to the north half of the property and, possibly, south of Lost Lake.
At this point, exploration on the Rock and Roll property should focus on the discovery of additional massive sulphide resources outside the currently defined resources of the Black Dog zone. With this aim in mind, a $1.8 million comprehensive exploration program is outlined for the Rock and Roll property. This program includes geological and geochemical surveying along strike from the Black Dog zone and detailed interpretation of the 2009 airborne geophysical survey. A follow up drill program comprising 2500 metres in 10-12 drill holes is proposed to test both existing and newly developed targets for additional massive sulphide mineralization. This program should be accompanied by baseline environmental studies, initial metallurgical testing and community consultation.
Equity Exploration Consultants Ltd. (“Equity”) was contracted by PFN to explore the Rock and Roll property in northwest British Columbia, including an airborne geophysical survey and diamond drill programs in 2009 and a drill core re-sampling program on all available historic core from the property in 2010. GeoVector Management Inc. (“GeoVector”) was contracted to calculate mineral resources for the Black Dog and SRV mineralized zones based on the historic core re-sampling program and the drill program conducted by Equity on the property in 2009. Equity and GeoVector were requested to prepare recommendations for future exploration on the Rock and Roll property and to prepare a technical report on it in compliance with the requirements of NI 43-101.
Murray Jones (“Jones”) of Equity and both Dr. Alan Armitage (“Armitage”) and Joe Campbell (“Campbell”) of GeoVector are independent Qualified Persons. Jones wrote Sections 4-16 of the technical report and Armitage/Campbell wrote Sections 16-17. All authors collaborated on the remaining sections.
This technical report will be used by PFN in fulfillment of their continuing disclosure requirements. This report is based upon publicly-available assessment reports and unpublished reports and property data provided by PFN, as supplemented by publicly-available government maps and publications. A list of references used in the preparation of this report is provided in Appendix A (References). Jones personally supervised the diamond drill program on the property in October 2009 and a mapping and prospecting program in conjunction with the drill core re -sampling in September 2010. Armitage examined the property and the available core from September 18 to 20, 2010 and directed the 2010 drill core re-sampling program.
| 3.0 | RELIANCE ON OTHER EXPERTS |
The authors have relied on British Columbia’s Mineral Titles Online for information regarding ownership of tenure. PFN has provided documents outlining the terms of the option agreement between PFN and underlying vendors (Section 4). The underlying agreements on the Rock and Roll property are indicated by documents provided by Pamicon Developments Ltd. and Teck Resources Ltd. and no attempt has been made by the authors to ascertain the legal validity of these or any other agreements. The authors have not relied on a report, opinion or statement of an expert for other information concerning environmental, political or other issues.
| 4.0 | PROPERTY DESCRIPTION AND LOCATION |
The Rock and Roll property is situated in the lower Iskut River valley in northwestern BC, nine kilometres west of the Bronson Airstrip, and is centred at 50o 43' north latitude and 131o 12' west longitude (Figure 1).
The Rock and Roll property (Figure 2) consists of eleven contiguous MTO mineral claims for a total of 4243.81 hectares (10,486.3 acres) in the Liard Mining Division of British Columbia, as summarized in Table 2. Legal boundaries of the MTO claims are defined by map coordinates, forming a seamless grid. The claims
6
have not been surveyed. The Black Dog and SRV mineralized zones are located several hundred metres from the nearest property boundary.
Records of the British Columbia Minerals Branch indicate that the claims are held by Henry Awmack, Douglas Fulcher and First Fiscal Enterprises Ltd.. Separate documents show they are held in trust for Equity Pamicon Developments Ltd. (“Pamicon”) and First Fiscal Enterprises Ltd. (“First Fiscal”) . PFN has entered into an option agreement to earn a 100% interest in the claims, subject to an NSR, from the owners. Under the terms of the option agreement, PFN can earn a 100% interest in the property over a four year period by completing $2,000,000 in exploration expenditures, paying $130,000 and providing a total of 600,000 PFN shares to the vendors within four years. The vendors retain a 2% NSR on the property, 1% of which can be purchased for $3,000,000. There is an area of interest (“AOI”) extending 5 kilometres away from the core claims (507484, 599885 and 599886), in which any claims acquired by PFN become part of the Rock and Roll property.
Table 2: Claim Data, Rock and Roll Property
| Tenure Number | Recorded Owner | # of hectares | Expiry Date |
| 507484 | Fulcher | 799.24 | 2019/dec/31 |
| 599885 | Fulcher/First Fiscal | 337.51 | 2019/dec/31 |
| 599886 | Fulcher/First Fiscal | 248.58 | 2019/dec/31 |
| 601028 | Awmack | 248.51 | 2019/dec/31 |
| 611703 | Awmack | 408.28 | 2019/dec/31 |
| 611724 | Awmack | 426.05 | 2019/dec/31 |
| 611743 | Awmack | 355.02 | 2019/dec/31 |
| 611763 | Awmack | 283.93 | 2019/dec/31 |
| 611783 | Awmack | 408.73 | 2019/dec/31 |
| 611784 | Awmack | 284.20 | 2019/dec/31 |
| 611803 | Awmack | 443.76 | 2019/dec/31 |
| | | 4243.81 | |
The former Rock and Roll claims, except for the Rock 17 claim, are subject to a 3% net smelter return that can be purchased for $1,500,000 dollars payable to Prime Equities International Corporation. The Rock 17 claim is subject to a 15% net profits interest that can be purchased by payment of $1,500,000 to Prime Equities International Corporation. The Rock and Roll claims are currently subject to a Financing Agreement dated April 29th, 1991 between Teck and Eurus Resources Corp. that gives Teck the right to acquire a 50% interest in the claims by funding all the costs to bring the property to commercial production after a Preliminary Feasibility Report has been obtained. The Teck agreement expires on December 31, 2010.
Surface rights over the Rock and Roll property are owned by the Province of British Columbia. No roads exist on the property and no significant surface disturbance or any major environmental liabilities were noted during the authors’ field visits. The area overlying the Black Dog and SRV zones was clear -cut in 1991 to facilitate the placement and mobilization of diamond drills for close spaced drilling. This area has largely overgrown in the intervening time. Exploration permits must be obtained from the British Columbia Ministry of Energy, Mines and Petroleum Resources prior to carrying out further mechanized exploration on the property.
7
| 5.0 | ACCESSIBILITY, CLIMATE, LOCAL RESOURCES, INFRASTRUCTURE, PHYSIOGRAPHY |
The 1,600 metre long Bronson airstrip, which can accommodate Hercules aircraft, is located on the Iskut River flood- plain 9 kilometres upstream from the property. The nearest road is the Eskay Creek mine road that passes some 35 kilometres up the Iskut River valley. Direct access to the property must currently be gained by helicopter. A seasonal base is commonly maintained by helicopter charter companies at Bob Quinn airstrip, 75 km from the property on British Columbia provincial highway 37.
| | | 5.2 | Climate and Physiography |
The Rock and Roll property has a northern coastal climatic regime, with warm summers and moderate winters. Snowfall can be high with an accumulation of several metres during the winter. Fieldwork can be carried out during the summer and fall seasons and drilling has been done on the property almost year- round. The property is well- forested with hemlock, spruce and poplar. The Rock and Roll property covers ground of moderate relief in the Iskut valley, at the confluence of the Iskut and Craig Rivers. Elevations range from 55 metres on the Iskut River to 220 metres on the ridge top east of Lost Lake to 920 metres on the south slopes of Mt. Hoodoo. Rock outcrop covers about 5% of the Rock and Roll property area, but is close to surface in most areas.
| | | 5.3 | Local Resources and Infrastructure |
Local accommodation is available at the Bronson airstrip at Rivers West Lodge. The provincial hydro-electric power grid is currently being extended north along Highway 37 to Bob Quinn from Meziadin Junction. A 115 MW run-of-river hydro project has been proposed for the Iskut River canyon, located below the confluence of Forrest Kerr Creek with the Iskut River, about 35 kilometres upstream. The deep-sea port of Stewart, which has concentrate-loading facilities, is located 200 kilometres south of Bob Quinn on Highway 37. Highway 37 connects to the northern Trans-Canada Highway 16 at Kitwanga, approximately 300 kilometres south of Bob Quinn. Kitwanga is also the site of the nearest railway, connecting to the deep sea port of Prince Rupert 200 kilometres west. Terrace, located 100 kilometres west of Kitwanga, has an airport with several flights daily to Vancouver and other points. Labour, contractors, fuel and other supplies are available at Terrace and Smithers, both on Highway 16 and a national railway line, and at local communities such as Stewart, Iskut and Dease Lake.
The Rock & Roll area has been explored intermittently since the late 1800's by placer gold miners either en-route or leaving the Klondike gold fields near Dawson, Yukon. Rivers flowing through the Alaska Panhandle served as convenient access routes from the Pacific Ocean to the interior of British Columbia, Yukon, and Alaska, which ultimately led to the discovery of both gold and base metal mineralization on the Iskut and Unuk Rivers. The area around the Rock & Roll property saw little exploration activity until the 1950’s and the advent of helicopter-supported programs. Significant discoveries followed, including copper-rich deposits such as Granduc, Galore Creek and Shaft Creek and gold-rich deposits such as Johnny Mountain, Snip, and Eskay Creek.
Table 3 below summarizes all known exploration on the Rock and Roll property.
8
9

10
Table 3: Rock and Roll Exploration History
| Operator (Year) | Geochemistry | Geology | Geophysics | Drilling | Assessment Report
(Reference) |
| Northwest Gold Syndicate (1970) | orthophoto | | | AR #17209 (Todoruk and Ikona, 1988b) |
| | |
| New Alster Energy Ltd. (1988) | mapping | | | AR #17219 (Todoruk and Ikona, 1988a) |
| | rock, silt, soil |
| Cons. Bel Air Resources Ltd. (1988) | mapping,
line cutting | | | AR #18462 (Montgomery and Ikona, 1989) |
| | Rock, silt, soil |
Thios Resources Inc., Cons. Power
Gem Resource Corp. (1989) | mapping | | | AR #19566 (Pegg, 1989) |
| | Rock, silt, soil |
Eurus Resource Corp., Thios
Resources Inc.(1990) | mapping, line cutting,
110 mtrenching | VLF-EM,
mag
Airborne EM-
mag | 9 DDH,
(675 m) | AR #20884 (Montgomery et al, 1991)
AR#21670 (Dvorak, 1991) |
| | Rock, chips, soil |
Eurus Resource Corp., Thios
Resources Inc.(1991) | mapping,
petrography | HLEM, IP | 86 DDH
(10.526 m) | n.a. (Lloyd and Kornock, 1991) |
| | plugger soils, rocks |
Eurus Resource Corp., Thios
Resources Inc., Cons. Bel Air
Resource Corp. (1991) | mapping | HLEM | 5 DDH
(372.8 m) | n.a. |
| | plugger soils, rock |
Redstar Resource Corporation
(1997) | | | 10 DDH
(2409.0 m) | AR #25221 (Dunning and Scott, 1997) |
| | |
| Conquest Resources Ltd. (2004) | mapping | | | AR #27582 (Cohoon and Trebilcock, 2004) |
| | soils, rocks |
Pacific North West Capital Corp.
(2009) | mapping | airborne EM-mag (351.5 km) | 5 DDH
(539.8 m) | AR #27582 (Jones, 2009; Jones, 2010) |
| | rock |
Pacific North West Capital Corp.
(2010) | mapping | | | Internal company report |
| | silts, rocks, core
re-sampling |
The current Rock & Roll property covers the former Rock & Roll and Bornagain (Rob claims) properties, which were originally staked in 1988 on behalf of the Prime Resources Group (“Prime”). Preliminary assessment work was done on the Rock and Roll and Rob claims, including reconnaissance geological mapping and soils and silt sampling (Todoruk and Ikona, 1988a; Montgomery and Ikona, 1989; Pegg, 1989). From June to September 1990, exploration activities centered on line cutting, geochemical soil sampling (1313 soil samples at 25 and 12.5 metre spacing), geological mapping, prospecting, and ground geophysical surveys (Montgomery et al, 1991). These exploration activities led to the discovery of
11
polymetallic, silver-gold-zinc-lead-copper massive sulphide mineralization that became known as the Black Dog Zone. The polymetallic discovery was followed up with a trenching program totaling 110 metres. A 9-hole diamond drill program totaling 675 metres in October 1990 tested the continuity and extent of the sulphide mineralization over a strike length of 50 metres (Montgomery et al, 1991).
A larger exploration program was initiated in early 1991 to evaluate the Black Dog Zone. This program included an aggressive drilling program of 86 diamond drill holes for 10,526 metres and resulted in expansion of the Black Dog Zone and discovery of the parallel SRV Zone. Later in the year, geological mapping, geochemical soil sampling, ground geophysical programs were completed (Dunning and Scott, 1997). However, the 1991 exploration program was not submitted for assessment credit and no report covering the geological, geochemical and diamond drilling work has been located. A report documenting the ground geophysical work on the north half of the 150 Grid is available (Lloyd and Cornock, 1991).
Through 1990, a number of grids were cut across the Rock & Roll property that began with widely spaced, north-south trending baselines and cross- lines (Recon, 090 Grids). However, after the discovery of the Black Dog Zone, the 150 Grid was cut at an orientation of 330° with 100 metre cross-lines that were picketed at 50 metre intervals. A total of 74 line-kilometres were cut, facilitating geological mapping, geochemical soil sampling, and ground geophysical surveys. In 1991, survey control was established using the earlier 090 grid coordinates 34+00N and 24+00E as a start point with an assumed elevation of 115 metres above sea level (Dunning and Scott, 1997).
Geochemical soil sampling of the 150 Grid in 1990 covered an area from 30+00N to 55+00N (Montgomery et al, 1991). This work outlined several copper, zinc, and silver anomalies with an apparent trend that parallels the known stratigraphy and lithological contacts. The surface expression of the Black Dog Zone is readily apparent in the geochemical soil sample data, as well as in the ground geophysical data (Dunning and Scott, 1997). The Black Dog Zone is correlated with strong, multiple, overlapping geochemical anomalies for silver, copper, and zinc from lines 5000N to 5500N; whereas the SRV Zone has a much weaker signature with silver and zinc from lines 4500N to 5000N. Additional soil sampling on the 150 Grid south of 30+00N bringing the total to 1073 soil samples on the 150 Grid. As well, 1735 soil samples were taken using a man-portable mechanical overburden drill on the 150 Grid and North Grid (north of the Iskut River) in the late winter and spring of 1991. There are no reports documenting these geochemical programs and their location and results has been determined from field notes and assay certificates. The plugger soil samples have outlined a few weak anomalies on the north side of the Iskut and essentially refined the anomalies found by soil sampling on the 150 Grid.
Petrographic work by Vancouver Petrographics Ltd. in 1990 and 1991 further characterized the host sedimentary and mafic volcanic rocks, intrusions, and the various facies of the sulphide mineralization. A total of 30 samples were examined (Dunning and Scott, 1997).
Ground geophysical survey programs in 1990-91 included ground horizontal electromagnetic loop (“HLEM”), very low frequency (“VLF-EM”) electromagnetic and magnetic, and induced polarization (“IP”) methods (Forbes, 1991; Lloyd and Kornock, 1991). In all, the geophysical work indicated a large number of conductors along a north-south trend that corresponds with the geochemical soil sampling results; anomalies to the south and west remained open (Dunning and Scott, 1997). Aerodat successfully completed airborne frequency domain electro-magnetic and magnetic geophysical surveys in October-November, 1990. A total of 490 line kilometres were flown over the Rock & Roll property and 70 line kilometres over the Bornagain property (Dvorak, 1991a,b).
The geophysical surveys revealed an area of conductive stratigraphy that hosts the Black Dog Zone, with coincident high IP chargeability and low resistivity, stretching in a northwest direction from just east of Lost Lake to the north side of the Iskut River. Discontinuous conductors continue southeast of Lost Lake to the Phiz Property. Based on drill logs discovered in the abandoned Rock and Roll exploration camp, some of these conductors have been tested by diamond drilling, but generally by just one short drill hole. Other conductors identified on the Rock and Roll property have not been tested.
In 1996, Prime Equities International Corporation sold ownership of the Rock and Roll claims to the Forrest Syndicate, composed of the principles of Pamicon Developments Ltd. at the time. Subsequent to the
12

13
1991 exploration work, the ownership of the Rob claims was obtained by Douglas Fulcher (62.5%) and First Fiscal Enterprises Ltd. (37.5%) . The Forrest Syndicate and First Fiscal subsequently optioned the Rock and Roll and Rob claims to Redstar Resources Corporation (Redstar).
In 1997, Redstar conducted an additional 10 hole drill program for a total of 2203 metres, bringing the total drilling to 13,383 metres on the Rock and Roll property (Dunning and Scott, 1997), and submitted a total of 1004 drill core samples for analysis. The 1997 program extended the Black Dog zone down dip on Section 5250N and intersected the SRV zone in two holes on Section 4625N. Based on these positive results, Redstar commissioned a new resource estimate (Section 6.3)
In 2004, Conquest Resources Ltd. (“Conquest”) optioned the Rock and Roll property and conducted geological mapping and mobile metal ion (“MMI”) and conventional soil geochemical surveys, primarily on the southern portion of the property (Cohoon and Trebilcock, 2004) . A total of 735 MMI soil samples and 70 conventional B-horizon soil samples were taken. As well, 7 rock samples were collected from the property and 7 sections of core from the 1991-97 drilling were split and assayed. This work identified an MMI gold geochemical anomaly southwest of Lost Lake and anomalous zinc MMI geochemistry on the southeastern portion of the current property. Follow up was recommended but not carried out. Conquest relinquished their option later that year.
In July 2009, PFN signed an option agreement on the Rock and Roll property. From July 29 to August 2, 2009, Aeroquest Surveys flew an airborne time domain electro- magnetic and magnetic survey over the Rock and Roll property for PFN (Jones, 2009). This survey totalled 351.5 line kilometres using two different survey orientations to test for both northwest-southeast and east -west oriented conductors that were indicated in earlier surveys (Dvorak, 1991a, b). The survey defined a zone of very strong conductivity in the area of the Black Dog zone, including a possible extension of the conductive stratigraphy to the northwest across the Iskut River. Several other discrete conductors were detected on the property that have not been investigated.
The 2009 drill program consisted of 5 diamond drill holes, drilled from 4 set ups, for a total of 539.81 metres of NQ core. (Jones, 2010) . Blanks and duplicate samples were inserted into the sample stream at regular sample intervals. A total of 248 core samples and one rock sample were shipped to the ALS Chemex preparation facility in Terrace, BC.The first four holes were drilled within the extents of the Black Dog zone and intersected massive sulphide mineralization. The final hole was a step-out to the northwest to test an airborne and ground EM conductor on Section 5300N. Unfortunately the hole encountered a diorite dyke a the Black Dog horizon and did not intersect significant sulphide mineralization.
During the 2009 drill program, 21 samples of 1990-1991 core were re-split for analysis, reproducing sample intervals from the Black Dog horizon mineralization in 5 separate drill holes (Jones, 2010). These samples were analysed to test whether the historic assays would be acceptable for use in the calculation of a new mineral resource on the property. The results of the re-analysis at ALS Chemex Labs in North Vancouver, BC gave silver values averaging 30% lower and gold values averaging 14% lower than the reported results for the 1990-1991 analyses, completed by TSL Labs in Saskatoon, Saskatchewan. Results for copper, lead and zinc were comparable with the 1990-1991 results (Table 4).
A short program of geological mapping and prospecting was done southeast and northwest along strike from the Black Dog zone in 2010, intended to follow up several of the electro-magnetic conductors identified by the 2009 airborne geophysical survey. A total of 11 person/days were spent on the program and a total of 6 standard silt samples and 20 rock samples were taken. Although no significant metal values came from the rock samples, geological mapping identified stratigraphy similar to the Black dog horizon on the north side of the Iskut River. As well, strong silica alteration, similar to alteration associated with mineralization in the Black Dog horizon, was found both to the southeast and northwest.
Also in 2010, a comprehensive re-sampling program was completed on the 1990, 1991 and 1997 drill core stored at the Bronson Creek airstrip. For the 2010 sampling program, mineralized intervals were re-examined and their geology re-logged. Sample intervals were laid out to repeat the intervals used in the 1990-1997 drill programs, either on a one-to-one basis or on a composite interval basis. A total of 509
14
samples, including standards and blanks, were taken. A discussion of the quality control and quality assurance program is included in Section 14.
| | | 6.2 | Historical Mineral Resource Estimates |
In April 1991, Prime announced a preliminary geological resource for the Rock & Roll property of 580,608 tonnes (640,000 tons) grading 2.47 g/tonne (0.072 opt) gold, 336 g/tonne (9.80 opt) silver, 0.64% copper, 0.79% lead, and 3.08% zinc. It is important to note that the resource estimation was done in-house and predates National Instrument 43-101 guidelines. None of the assays from the in-house resource estimation were cut and no dilution factor was applied to the resource estimation for the Black Dog and SRV Zones. This resource estimate is not considered reliable, since it omits more recently drilled holes and has been superceded by the N. I. 43-101 compliant resource estimate presented in Section xx. It is not considered relevant, and is included for completeness only.
Table 4: Comparative 1990-91(TSL) vs 2009(ALS Minerals) Composite Assay Results, Black Dog Zone
| Drill Hole | From | To | Interval | Year | Au g/t | Ag g/t | Cu % | Pb | Zn % |
| RR90-004 | 28.18 | 30.78 | 2.58 | 2009 | 1.98 | 228.4 | 0.78 | 0.63 | 2.77 |
| | | | | 1990 | 2.13 | 268.7 | 0.76 | 0.61 | 2.79 |
| | | | | | | | | | |
| RR91-019 | 49.00 | 54.00 | 5.00 | 2009 | 0.47 | 112.8 | 0.13 | 0.71 | 2.25 |
| | | | | 1991 | 0.45 | 172.1 | 0.12 | 0.81 | 2.77 |
| including | 52.40 | 54.00 | 1.60 | 2009 | 1.07 | 264.8 | 0.20 | 1.84 | 5.89 |
| | | | | 1991 | 1.71 | 616.4 | 0.35 | 2.76 | 9.11 |
| | | | | | | | | | |
| RR91-024 | 54.00 | 58.00 | 4.00 | 2009 | 0.07 | 5.0 | 0.03 | 0.01 | 0.04 |
| | | | | 1991 | 0.05 | 7.5 | 0.04 | 0.02 | 0.05 |
| and | 58.00 | 59.30 | 1.30 | 2009 | 0.49 | 92.3 | 0.17 | 0.24 | 1.22 |
| | | | | 1991 | 0.41 | 76.1 | 0.14 | 0.18 | 0.86 |
| | | | | | | | | | |
| RR91-034 | 44.50 | 45.20 | 0.70 | 2009 | 8.49 | 1115.0 | 0.68 | 1.96 | 3.75 |
| | | | | 1991 | 10.97 | 1632.2 | 0.59 | 1.76 | 3.19 |
| | | | | | | | | | |
| RR91-044 | 83.80 | 88.00 | 4.20 | 2009 | 1.04 | 107.1 | 0.48 | 0.29 | 1.86 |
| | | | | 1991 | 1.43 | 155.3 | 0.45 | 0.32 | 2.01 |
| including | 83.80 | 86.00 | 2.20 | 2009 | 1.53 | 189.3 | 0.70 | 0.53 | 3.33 |
| | | | | 1991 | 2.33 | 280.4 | 0.65 | 0.59 | 3.58 |
| and | 86.00 | 88.00 | 2.00 | 2009 | 0.50 | 16.7 | 0.24 | 0.02 | 0.25 |
| | | | | 1991 | 0.45 | 17.7 | 0.24 | 0.03 | 0.29 |
Redstar commissioned a new resource estimate following the drill program in 1997. Becherer (1997) noted that the new resource estimation was assigned to the Indicated category using the criteria from the CIM 96 AD HOC Committee Report and National Policy 2-A Standards to assign categories to the known sulphide mineralization. However, it should be noted that the 1997 resource estimate also predates National Instrument 43-101. The 1997 resource estimation used the following parameters to interpret the mineral resource blocks:
| | (1) Horizontal distance along strike between resource blocks was set at 25 metres, the mid-point between sections. |
15
| | (2) On section and in the dip direction, the boundaries between resource blocks were defined as the halfway point between assay intersections. Where the assay intersections are open and not bounded by barren rock intercepts, blocks were assigned an equal and symmetrical dip projection deemed appropriate. |
| | (3) A cut-off of 2 metres was used to approximate the average true thickness of sulphide mineralization; noting that isolated intercepts less than 2 metres were discarded. |
| | (4) Assay grades were not cut and no dilution was applied to the calculation. |
| | (5) Minimum assay grade cut-offs were not applied. A geological model was used to outline the resource blocks. |
| | (6) An average specific gravity of 3.5 was applied to all blocks; noting that no formal specific gravity measurements were methodically taken during any of the diamond drilling programs. |
| | (7) Resource blocks were assigned to indicated resource category. |
| | (8) Both the Black Dog and SRV Zones were included in the resource estimation. |
Becherer (1997) estimated the mineral resource to contain 675,000 tonnes grading 1.75 g/tonne gold, 233.8 g/tonne silver, 0.40% copper, 0.50% lead, and 2.20% zinc. Becherer (1997) also estimated a near-surface, open-pit mineral resource of 200,000 tonnes grading 1.40 g/tonne gold, 270.20 g/tonne silver, 0.40% copper, 0.50% lead, and 2.00% zinc. This resource estimate is not considered reliable, since it omits more recently drilled holes and has been superceded by the N. I. 43-101 compliant resource estimate presented in Section xx . It is not considered relevant, and is included for completeness only.
| | The regional stratigraphy (Figure 4) is summarized well by Cohoon and Trebilcock (2004). |
The Rock and Roll Property lies within the Intermontane tectonic belt and the Stikinia terrain as illustrated in Figure 4. Anderson (1989) divided the Stikinia terrain in the Iskut River area into the four following tectono-stratigraphic assemblages, from oldest to youngest:
The Stikine Assemblage is Paleozoic in age; from Early Devonian and Mississipian to Permian. This group consists of metavolcanic and metasedimentary rocks, which include coralline limestone, chert, mafic to felsic volcanic and volcaniclastic rocks and argillite (Anderson, 1989; Britton et al., 1989). The Stuhini Group includes an assemblage of Triassic volcanosedimentary arc complexes that is composed of mafic intrusive rocks, polymictic conglomerate, basaltic to andesitic volcanic and sedimentary rocks, such as chert-limestone conglomerate, shale, argillite and limestone (Anderson and Thorkelson, 1990).
The most well known of the four assemblages in the Stikinia terrain is the Early to Mid-Jurrassic Hazelton Group. This group is composed of mafic to felsic volcanic and volcaniclastic rocks, conglomerate, argillite and mudstone sedimentary rocks (Anderson and Thorkelson, 1990). Grove (1986), Anderson and Thorkelson (1990) and Alldrick (1991) subdivided the Hazelton group into four formations; from oldest to youngest they are the Unuk River, Betty Creek, Mount Dilworth and Salmon River Formations. These groups have since been modified by Henderson et. al. (1992) and Nadaradju (1993) into the basal Jack, Betty Creek and Salmon River Formations.
The Bowser group is Mid to Late Jurassic in age and includes such basinal marine and non-marine rocks as conglomerate, siltstone, sandsonte and shale (Anderson, 1989). Anderson (1989) and Logan et. al. (1989) concluded that the Stikine assemblages first underwent an extensional event during the Mississippian then a contractional event between the Late Triassic and Early Permian. The Stuhini group experienced localised extension in the western areas of
16
the Intermontane belt. The events during the Jurassic and the resulting events on the Hazelton group are described as being contractional with lower greenschist to sub-greenschist metamorphism (Childe, 1996).
Table 5: Statigraphy of the Iskut River Area (after Anderson, 1989)
| Stratigraphy | Lithology | Remarks |
| | | |
| BOWSER GROUP | | |
| | | |
| Mid to Late Jurassic | conglomerate, siltstone, sandstone, shale | successor basin |
| | | |
| HAZELTON GROUP | | |
| | | |
| Early to Mid Jurassic | alkalic/calc-alkalic volcanic and intrusive rocks, plus sediments | contractional event?, Island arc rocks |
| | | |
| ---------------------------------------------- | Gradational to unconformable contact | --------------------------------------------- |
| STUHINI GROUP | | |
| | | |
| Late Triassic | intrusions; mafic to felsic volcanic rocks intrusions; mafic volcanic rocks in the east, bimodal in the west | extensional in western area |
| | | |
| | polymictic conglomerate; basaltic to andesitic volcanic rocks | no Triassic clasts; limestone clasts common |
| | | |
| Early Triassic | sedimentary rocks | |
| | | |
| ---------------------------------------------- | Unconformable contact | -------------------------------------------- |
| | | |
| STIKINE ASSEMBLAGE | | |
| | | |
| Permian | thin-bedded coralline to crystallineLimestone (over 1000 m thick) fossiliferous; intermediate flows and volcaniclastic rocks | volcanic units resemble Hazelton Group rocks |
| | | |
| Early Permian | argillite | |
| | | |
| ---------------------------------------------- | Unconformable contact | --------------------------------------------- |
| | | |
| Mississippian | siliceous turbidite, felsic lapilli tuff | extensional event |
| | | |
| | Mafic metavolcanic and metasedimentary rocks, | |
| | | |
| | upper coralline limestone and conglomerate | thick bedded |
| | | |
| | lower limestone with tuff layers crinoids, corals | commonly bioclastic, coarse |
| | | |
| ---------------------------------------------- | Unconformable contact | --------------------------------------------- |
| | | |
| Early Devonian | limestone; intermediate to felsic volcanic rocks | contractional events; rocks highly deformed |
The area of the Rock and Roll property has been intruded by intrusions of various ages. The Coast Plutonic Complex, forming the western boundary of the Stewart Complex, is generally characterized by felsic Tertiary plutons. Late Triassic and Early Jurassic plutonic styles suggest coeval and spatial relationships with surrounding Stuhini and Hazelton volcanic rocks via distinctive porphyritic dykes such as the Premier Porphyry. Tertiary Coast Complex plutons lack these dykes and volcanic equivalents.
17
18
Radiometric age dating in the Iskut River area from various mineral occurrences suggest a spatial and/or coeval relationship in the temporal framework between the Late Triassic to Early Jurassic metavolcanic rocks and intrusions; which has directly impacted upon exploration efforts. The massive sulphide deposits on the Rock & Roll property appear to be the oldest mineralization in the Iskut River area; however, no direct age dating has been done in the vicinity of the property (Dunning and Scott, 1997). The only age- related information on the Rock & Roll property is from Dean (1991), who noted that the Pb-isotopic signature of the sulphide mineralization at Rock & Roll is less radiogenic than the signature of the Eskay Creek gold-silver-rich VMS mine and therefore, probably Triassic in age.
Cenozoic-aged mafic volcanic flows and tuff associated with the Hoodoo Formation, Iskut Formation and Lava Fork Formation cap specific areas within the region.
The geology of the Rock and Roll property (Figure 5) is divided along a postulated thrust contact that runs north-northwest through the east side of Lost Lake. This fault separates Paleozoic rocks of the Stikine Assemblage to the west from Mesozoic Stuhini Group rocks to the east. Basalt flows of the Cenozoic Hoodoo Formation locally cover rocks of both groups north of the Iskut River. The Stikine Assemblage consists of interbedded limestone, intermediate volcanic rocks and fine grained sedimentary rocks. The Stuhini Group rocks consist of mafic to intermediate tuffs and flows, intercalated with fine grained sedimentary rocks, consisting of argillite, graphitic argillite and siltstone, siliceous siltstone and, locally, chert or siliceous tuff.
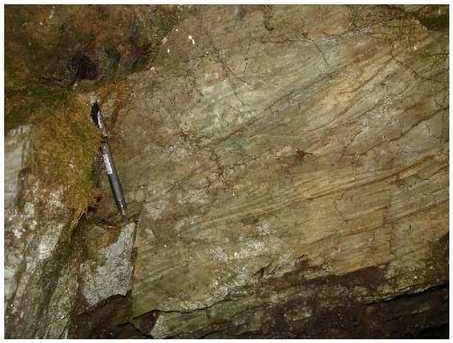
Plate 1: Laminated, very fine grained and weakly silicified, tuffaceous and silty layered rock lying east of the 150 Grid baseline, just south of the Iskut River. Minor folds are evident.
Just south of the Iskut River, a strongly graphitic argillite within the Stuhini Group hosts the Black Dog and SRV zones, which consist of massive to semi-massive pyrrhotite -pyrite-sphalerite and chalcopyrite in roughly compositional layering -parallel bands, plus wisps and stringers. The geological section in this area is disrupted by diorite intrusions that are primarily sub-parallel to the sedimentary rock layering but also cross cuts the stratigraphy at a high angle. In addition, the intense deformation present in the rocks may have resulted in some structural interleaving of argillite and diorite.
19

20
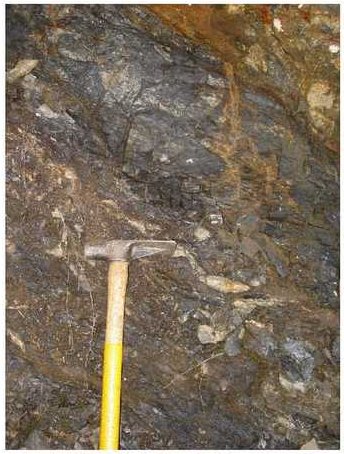
| Plate 2: | Photo of 4 metre chip sample locality (0.24 g/t Au, 14.7 g/t Ag, 498 ppm As, 656 ppm Cu, 571 ppm Pb and 1720 ppm Zn) on south bank of the Iskut River, just east of Baseline 3000E of the 150 Grid. Rock is graphitic argillite with disseminated pyrite, chalcopyrite and traces of sphalerite and galena and lies in the structural footwall stratigraphy to the main Black Dog horizon. |
Lying structurally below the Black Dog horizon there is a moderately thick section of siliceous sedimentary rocks, likely silicified siltstone and argillite, with possible chert. The contacts were not observed but exposures in the bluff near the Black Dog showing suggest that the section is >20 metres thick. In RR09-109, this unit contains disseminated sulphides, including pyrrhotite and sphalerite that appear to follow primary laminations in the rock. Other outcrops in the area, to the east of the Black Dog showing, indicate an additional section of very similar rocks that may also include tuffaceous layers (Plate 1). Previous drill holes to the east intersected dacite or rhyodacite within this section (RR91-070, Dunning and Scott, 1997). A graphitic, argillaceous horizon outcrops on the Iskut River, just east of the 150 Grid baseline, and it contains abundant pyrite and/or pyrrhotite plus traces of galena and sphalerite (Plate 2). There is limited exposure of the section immediately overlying the Black Dog Showing but it seems to be dominated by diorite intrusions and, possibly, intermediate tuffaceous and flow units.
Further west, the section is dominated by fine clastic sedimentary rocks and locally tuffaceous horizons. About 400 metres southwest of the Black Dog Showing, a possible thrust fault contact with the Paleozoic section is present, with the older rocks apparently thrust east over the Stuhini Group rocks.
21

| Plate 3: | Photo of contact zone between diorite above and argillite below at about 60 metres in RR09-106. Photo shows the fine to medium grained texture of the diorite and the effects of brecciation and shearing, including carbonaceous contamination near the argillite contact and increasing alteration intensity within the argillite section (lower right). |

| Plate 4: | Dark colouration due to carbonaceous contamination along crackle breccia fractures in diorite. Carbonaceous material likely originates from graphitic argillite/mudstone unit 25 centimetres below. Drill Hole RR09-107, at 32.70 metres. |
22
The rocks southeast and east of Lost Lake are dominated by a roughly 500 metre wide section of mafic to intermediate volcanic and intrusive rocks. These rocks strike southeast from the Black Dog area where interlayered argillite hosts massive sulphide mineralization. Weak to moderate epidote and chlorite alteration is common. There is also a significant component of iron carbonate alteration, characterized by bleaching and weak pyritization of the mafic rocks along with variable silicification and sericitization. Quartz-carbonate veinlets are common. Within the mafic section, several units of grey to black argillite, siltstone and mudstone occur in varying proportions. There may also be a tuffaceous component in these rocks. These rocks tend to be recessive and outcrop rarely. Several airborne geophysical conductors are located within the inferred projections of these rocks. The rocks tend to have well defined bedding and are commonly foliated. They are commonly phyllitic and contain weak to moderate carbonate alteration and quartz- calcite veinlets. Late iron carbonate occurs in fractures throughout the area. The argillite and mudstone are also commonly graphitic. Locally, intense silicification bleaches the rocks and masks primary textures and they may be described as chert. These rocks may also represent altered tuff, possibly originally intermediate to felsic in composition.
North of the Iskut River, the property covers the lower slopes of Mt. Hoodoo, which are largely inundated by Cenozoic Hoodoo basaltic lava flows. These lava flows do reach all the way to the Iskut River in numerous areas, leaving a few windows to the underlying Paleozoic and/or Mesozoic rocks below. The windows can be seen as magnetic low areas on the total field magnetic maps from the 2009 airborne geophysical survey (Jones, 2009). The basalt flows contain feldspar phenocrysts that are semi-translucent and get up to 1- 1.5 cm in size. These are especially visible in the massive portions of the flows. The flows have rubbly tops and there is evidence that they flowed over unconsolidated talus and/or colluvium.
The geology in this area consists of interlayered intermediate volcanic and argillite -siltstone units. The volcanic rocks are generally massive and fine to medium grained with no significant primary structures preserved. The argillite is commonly graphitic and contains rare, thin, pyritic lamina. Argillite-siltstone units are thinly bedded, grey to black, locally siliceous, and very deformed, commonly making identification of S0 or S1 difficult to impossible. Rare greywacke beds were tentatively identified. In general, the rocks are weakly to strongly iron carbonate altered with quartz-calcite and calcite stringers throughout. Very minor black limestone was noted in float but found in outcrop. Phyllitic intermediate to felsic volcanic rocks are also tentatively identified in a large outcrop low down near the river. This out crop includes strongly silicified units, including a limestone bed that is very hard but fizzes strongly with 10% hydro-chloric acid. The volcanic and sedimentary rocks are intruded by felsic dykes locally.
The Paleozoic and Mesozoic sedimentary and volcanic rocks are cut by intrusions of various ages. A series of north-south striking diorite dykes outcrop across the property. These rocks are medium-grained and moderately strained. Within the mineralized stratigraphy around the Black Dog horizon, diorite is very common and is generally strongly sheared and brecciated with dark colouration due to contamination/remobilization of carbonaceous material from the graphitic horizons (Plate 3 and 4). There are abundant feldspar crystals in the groundmass of this unit, occurring as laths and weakly glomeroporphyritic clusters. This diorite forms abundant narrow, strongly deformed and altered intervals within the sedimentary rocks, especially noticeable in proximity to the mineralized horizons.
A reddish- weathering feldspar porphyry unit forms dykes which cross-cut the stratigraphy. This unit is weakly deformed with little sign of penetrative deformation and is likely a later feature. This rock may be an offshoot from the Late Cretaceous to early Tertiary intrusions in the area.
There are a number of scattered outcrops of coarsely porphyritic, potassium feldspar porphyritic felsic dyke in this area. These outcrops indicate several of these late dykes occur but it is not a dominant rock type. The unit generally consists of coarsely crystalline potassium feldspar with a grey to white weathering groundmass. Locally, narrow, finer grained dykes are present characterized by creamy coloured feldspar phenocrysts.
23
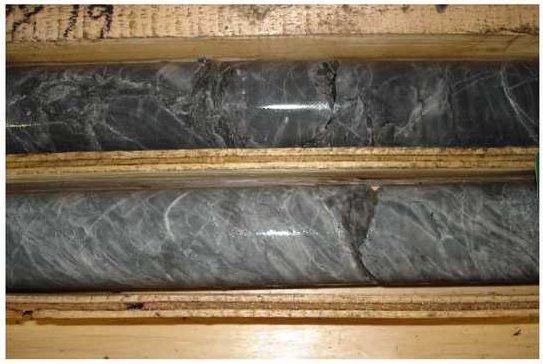
| Plate 5: | Strongly silicified and locally brecciated section of siltstone from drill hole RR09-109 at 105.4 metres. Sulphides may be present on fractures, in the breccia matrix or along layering in the host rock. |

| Plate 6: | Surface expression of the massive sulphide mineralization at the Black Dog Showing. Rusty rocks in foreground and background indicate sulphide mineralization, overlain here by an irregular diorite sill, seen primarily in the upper part of the photo.. Photo taken looking southeast. |
24
Overall, the stratigraphy strikes in a northwest-southeast direction but locally strikes north-south as well. The rocks are strongly deformed with evidence of at least two phases of tight folding, associated with strong shearing, particularly visible in the argillaceous sediments. Northeast-directed low-angle faulting (thrusting?) may have played a significant role in formation of the structural components of these rocks. This has resulted in moderate to steeply west dipping axial planes and flat fold hinges (Mihalynuk et al, 2010). As well, more or less east-west oriented fold hinges are seen, related to north-south compression of indeterminate age.
Alteration is not common overall although weak epidote and chlorite alteration is commonly present in the diorite. There is consistently silicification and brecciation of siltstone beds, normally in the footwall of the mineralized horizons (Plate 5). Sericite alteration is also present in footwall siltstone and tuffaceous sedimentary layers. Quartz-calcite veining is very common throughout the property and weak to moderate pervasive calcite alteration is present in both diorite and the sedimentary rocks.
The mineralization on the Rock and Roll property is dominated by the Black Dog and SRV massive sulphide horizons. The Black Dog horizon outcrops in a bluff between lines 5200N and 5300N (150 Grid) just south of the Iskut River (Plate 6) and is hosted by graphitic argillite to siltstone. The Black Dog showing consists of disseminated to massive pyrrhotite and pyrite with minor chalcopyrite and sphalerite lying along, and seemingly squeezed into, irregularities on, the contact with a large diorite sill or dyke. There are apparently two styles of mineralization associated with the Black Dog zone. Massive pyrrhotite with blebs and lenses of chalcopyrite and sphalerite forms the matrix to clasts of predominantly argillite with minor quartz, gypsum and diorite clasts mixed in locally. As well, massive pyrite-sphalerite forms finely laminated lenses locally, with minor pyrrhotite, galena and chalcopyrite. The Black Dog zone extends up to 650 metres to the southeast of the surface showing and similar mineralization occurs in at least three other horizons (or fold repeats) in the section. Diorite disrupts the mineralization and also hosts disseminated pyrrhotite-chalcopyrite mineralization along the length of the deposit.
No significant mineralization was observed in the Paleozoic/Mesozoic rocks north of the Iskut River other than the pyritic laminations in graphitic argillite. Two samples of graphitic argillite with thin pyritic laminations and pyrite in fractures returned slightly elevated values for silver, copper, zinc and antimony.
The Rock & Roll property hosts precious metal-rich volcanogenic massive sulphide (VMS) deposit that displays similarities to other precious metal-rich deposits such as Eskay Creek, Greens Creek, and other deposits in the Cordillera (Figure 4). VMS deposits are syn-volcanic accumulations of sulphide minerals that occur in geological environments characterized by submarine volcanic and sedimentary rocks. The VMS deposits are commonly spatially related to syn-volcanic faults, paleotopographic depressions, rhyolite domes, caldera rims and sub-volcanic intrusions, suggesting a genetic link to volcanic processes (Lydon, 1990).
Local examples of VMS deposits include the Eskay Creek deposit, 50 kilometres to the east-southeast, and the Granduc deposit, 80 kilometres southeast of the Rock and Roll property. Eskay Creek is hosted by mid-Jurassic aged Hazelton mafic to felsic volcanic and sedimentary rocks and is classified as a VMS- epithermal transition deposit (Alldrick, 1995). The Granduc deposit is classified as a Besshi type deposit (Hoy, 1995) and is hosted by strongly deformed mafic volcanic and sedimentary rocks near the contact between Upper Triassic rocks of the Stuhini Group and Lower to Middle Jurassic rocks of the Hazelton Group. Brief overviews of these VMS- genetic models are presented below. Examples of each deposit type are presented solely for comparative purposes and are not intended to characterize the mineralization at the Rock and Roll property.
VMS-epithermal transition deposits (also, subaqueous hot spring Au-Ag deposits) are characterized by the Eskay Creek deposit and are: precious metal-enriched, seafloor sulphide deposits. They primarily contain silver and gold plus copper, lead, zinc, arsenic, antimony, and mercury. They occur in volcanic arc settings, associated with near -surface sub-volcanic intrusions, where magmatic-dominated ore fluids are vented into a shallow aqueous environment (i.e. where a rift is propagating into continental crust). They are commonly hosted by felsic volcanic rocks with minor intercalated sedimentary layers along with pillow
25
basalts, coarse epiclastic debris flows, and assorted sub-volcanic feeder dykes. Their form is highly variable, from massive pods to finely laminated layers and epithermal style veins, with pyritic footwall zones of stringers or stockworks with massive chlorite to quartz-sericite to pervasive silica alteration. Sphalerite, arsenopyrite, tetrahedrite and various sulphosalts are the most common ore minerals. The Eskay Creek deposit had a pre-mining “geological reserve” of 4.3 Mt grading 28.8 g/t Au and 1027 g/t Ag and a “mining reserve” of 1.08 Mt grading 65.5 g/t Au, 2930 g/t Ag, 5.7% Zn, 0.77% Cu and 2.9% Pb (BC Minfile Number 104B 008).
Besshi deposits are typically associated with mafic volcanic rocks with intercalated fine grained, clastic sedimentary rocks. The deposits usually form fine to medium grained, thin, laterally extensive sheets of massive to layered pyrrhotite, chalcopyrite, sphalerite, pyrite and minor galena. They form in oceanic extensional environments and they may overlie platformal carbonate rocks. They form contemporaneously with their enclosing volcanic rocks and may be related to volcanic centres and/or syn-depositional faults. The deposits are generally dominated by copper and zinc with lesser silver and, commonly, cobalt. Gold, cobalt, molybdenum, and tin are produced as by-products and arsenic is commonly present. Manganese haloes provide exploration focus on a regional scale. Besshi deposits are highly variable in size and grade. The Granduc deposit (BC Minfile Number 104B 021) consists of a series of stacked, concordant massive sulphide lenses hosted in strongly deformed and metamorphosed mafic volcanic and fine grained clastic sedimentary rocks. The deposit contained pre-production “reserves” of 39.3 Mt grading 1.73% Cu, with minor gold and silver (BCMEMPR, Open File 1992-1). Elsewhere in British Columbia, the Goldstream deposit north of Revelstoke had a total resource of 1.8 Mt at 4.8% Cu, 3.1% Zn, and 20.6 g/t Ag whereas the world’s largest Besshi deposit, the Windy Craggy deposit in the Tatsenshini River area in the northwest corner of British Columbia, contains 297.4 Mt grading 1.38% Cu (including the NSB deposit at 138.3 Mt at 1.44% Cu, 0.22 g/t Au, 4.0 g/t Ag, 0.66% Co and 0.25% Zn) (Peter and Scott, 1999).
Note that all resource and reserve estimates presented in Section 8.0 are historical in nature, are not compliant with N.I. 43- 101, should not be relied upon and are relevant only for illustrative purposes to indicate the approximate tenor and size of the referred deposit types.
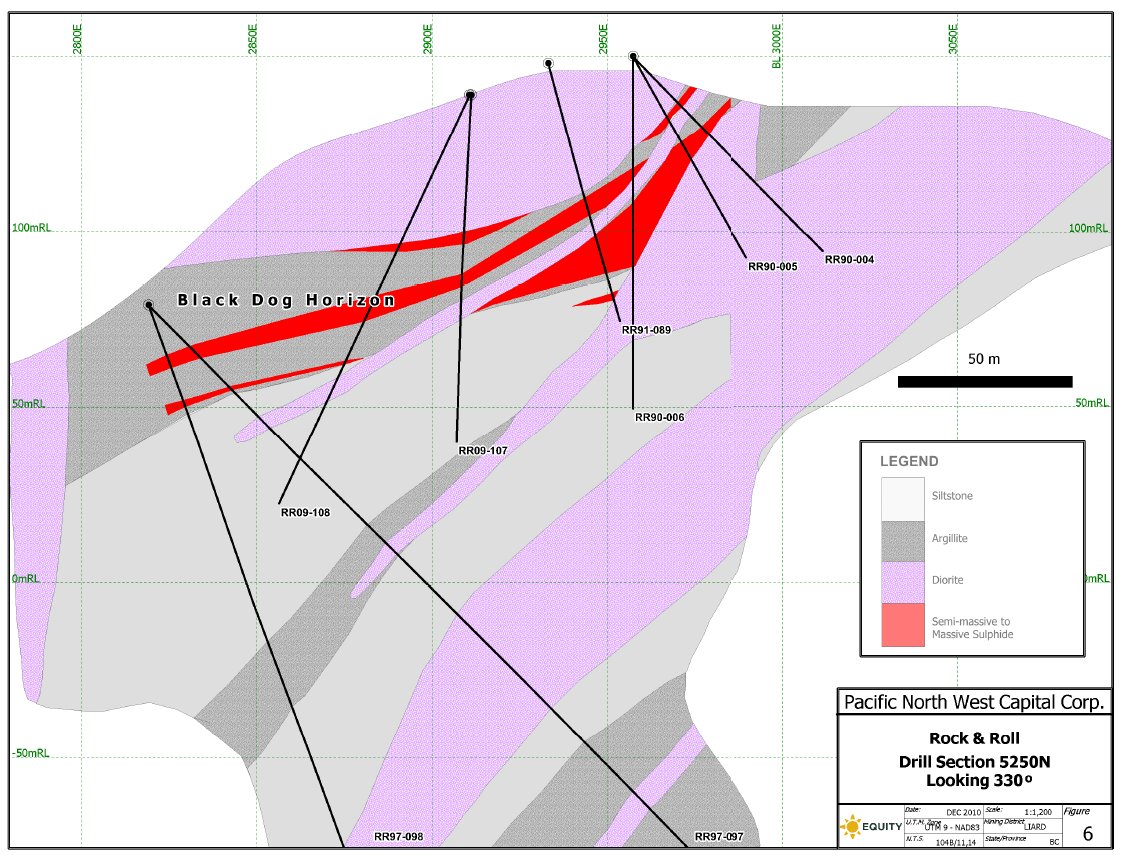
The mineralization on the Rock and Roll property is dominated by the Black Dog and SRV massive sulphide horizons. The Black Dog horizon outcrops in a bluff between lines 5200N and 5300N (150 Grid) just south of the Iskut River (Plate 6) and is hosted by graphitic argillite to siltstone (Figure 6). The Black Dog showing consists of disseminated to massive pyrrhotite and pyrite with minor chalcopyrite and sphalerite lying along, and seemingly squeezed into, irregularities on, the contact with a large diorite sill or dyke. From the Black Dog Showing, the Black Dog mineralized horizon, hosted by laminated and graphitic argillite about 25 metres thick, is traced in drill holes over approximately 550 metres south east along strike and can be traced down dip up to 175 metres (Section 5100N). Massive sulphide lenses occur within this horizon up to 10 metres thick. The zone seems to narrow to the south east and appears to pinch out near surface by section 4700N. Similar mineralization occurs in at least three other horizons (or fold repeats) in the section. The SRV Zone occurs at depth in several drill holes on sections 4700N to 4625N but has not been defined due to a lack of drilling in this area. Diorite disrupts the mineralization and also hosts disseminated pyrrhotite-chalcopyrite mineralization along the length of the deposit.
There are apparently two styles of mineralization associated with the Black Dog and SRV zones. Massive pyrrhotite with blebs and lenses of chalcopyrite and sphalerite forms the matrix to clasts of predominantly argillite with minor quartz, gypsum and diorite clasts mixed in locally (i.e. durchbewegung texture) (Plate 8) . As well, massive pyrite-sphalerite forms finely laminated lenses locally, with minor pyrrhotite, galena and chalcopyrite (Plate 7). Trace amounts of tetrahedrite and arsenopyrite have been logged in some of the higher grade sections. Primary textures have been noted in well preserved massive lenses, such as grain-size sorting and cross bedding (Foley, 1991). The mineralization has been strongly deformed and textures indicating rotation of clasts and disaggregation of lenses and dykes are common.
26

| Plate 7: | Section of laminated massive pyrite-sphalerite from 42.10 to 42.25 metres in RR09-107 (centre row). The faint layering in the massive sulphide is parallel to the bedding apparent in the host mudstone and siltstone unit |

| Plate 8: | Photo shows variable textures of mudstone-minor siltstone- quartz clast breccia with massive pyrrhotite-minor chalcopyrite-sphalerite matrix and distinct bands (beds?). Section occurs at around 41 m in RR09-107, immediately above the laminated massive sulphide in Plate 8. |
27
28
Dunning and Scott (1997) noted that given the complex structure of the Iskut River area, it is probable that the banding and/or bedding noted in the solid sulphide mineralization could be structurally induced.
The mineralized horizon is commonly underlain by a stringer/stockwork zone (Foley, 1991) often characterized silicification of the footwall. This silicification locally obliterates the primary textures of the host rocks, commonly siltstone or intermediate tuff. Stringery and wispy sulphides may be present where silicification is less pervasive and intense. Both calcite and Fe-carbonate are commonly present in the mineralization and host rocks.
PFN acquired an option on the Rock and Roll property in 2009. Since acquisition, PFN has carried out an airborne geophysical survey, digital compilation of much of the historic geological and geochemical data, targeted geological mapping and prospecting, extensive re-sampling of historic drill core amounting to 530 samples (including blanks, standards and duplicates) and cored and sampled 5 diamond drill holes (539.81 metres). The 2009 and 2010 programs were carried out under contract by Equity.
In 2009, Equity subcontracted Aeroquest Surveys of Toronto Ontario to carry out an airborne time domain electro-magnetic and magnetic geophysical survey over most of the Rock and Roll property (Jones, 2009) This survey totalled 351.5 line kilometres using two different survey orientations to test for both northwest- southeast and east-west oriented conductors that were indicated in earlier surveys (Dvorak, 1991a, b). The time domain system was chosen to test deeper and with better resolution than the existing frequency domain surveys flown in the late 1980’s and early 1990’s in the area.
The survey was successful in defining a broad zone of conductive rocks about a kilometre long in the area of the Black Dog and SRV zones and along strike to the northwest, across the Iskut River (Figure 3). As well, numerous, shorter conductors are present to the southeast along strike from the Black Dog and SRV zones. The response in the Black Dog area is very complex and reflects the shallow dip of the zone as well as the possible presence of multiple conductors including both massive sulphide mineralization and graphitic sedimentary horizons.
There are broad zones of conductivity associated with the Iskut and Craig River channels and these are assumed to reflect conductive clays and high water content in these areas. The Iskut River channel incorporates most of the southwest oriented conductors and these can be largely discounted as a result. As well, the conductive zone in Lost Lake shows a similar effect as the conductivity wanes at depth, and may be ascribed to conductive clays (Jan Klein, personal communication).
The magnetic survey shows different magnetic susceptibility to the north and south of the Iskut River. The magnetic patterns are much more erratic and, in general, susceptibilities are higher north of the river. This likely reflects the presence of the Cenozoic basalt lava flows and dykes(?) of the Hoodoo Formation, emanating from Mt. Hoodoo immediately north of the property. The magnetic response south of the Iskut River is more muted and shows more coherent patterns reflecting the known distribution and trends of the Paleozoic and Mesozoic rocks. The total magnetic field does indicate potential structures cross-cutting the host stratigraphy to the Black Dog and SRV zones, notably immediately north of the Black Dog showing.
The magnetic response of the rocks shows very little to characterize the mineralized stratigraphy of the Black Dog and SRV zones, despite the common presence of pyrrhotite. The position of the mineralization on the west flank of a magnetic high suggests that the mineralized stratigraphy may strike into the vicinity of the conductors to the southeast of the SRV zone that show similar magnetic characteristics.
PFN supported a short mapping program by the British Columbia geological survey (BCGS) on the Rock and Roll property in 2009 as part of a larger, on-going project to produce a map for the Iskut River
29
mapsheet (Mihalynuk et al, 2010). The results of the BCGS mapping coincides well with mapping by previous workers and sheds some light on the timing of the main intrusive events in the area. There are at least two diorite intrusions events evident by an early strongly deformed unit that broadly follows the structural pattern of the sedimentary and volcanic rocks in the area and a series of later, less deformed diorite units that cut roughly north -south through the stratigraphy. Both of these units cross cut the mineralization of the Black Dog horizon. This mapping also identified a felsic tuff marker horizon that is a good candidate for age dating.
In 2010, PFN contracted Equity Exploration Consultants Ltd. to do a 5-day program of geological mapping and prospecting, targeting conductors identified by the 2009 airborne survey. Mapping was done in two areas in 2010; southeast of Lost Lake and north of the Iskut River. There is evidence of Paleozoic and Mesozoic rocks in both of these areas. The results of this mapping program are discussed in Section 7.2 (Figure 5).
Mineralization was relatively sparse in the area southeast of Lost Lake. There is a wide area of moderate to strong iron carbonate alteration, with attendant bleaching and local silicification of the rocks, mostly present in the mafic to intermediate volcanic rocks. More interesting is the section of strongly silicified rocks in the section immediately east of drill hole BA91-003. The silicified rocks contain 1-5% disseminated pyrite and traces of chalcopyrite. Samples from this section returned elevated copper, molybdenum and arsenic from the silicified zone.
No significant mineralization was observed in the Paleozoic/Mesozoic rocks north of the Iskut River other than the pyritic laminations in graphitic argillite. Two samples of graphitic argillite with thin pyritic laminations and pyrite in fractures returned slightly elevated values for silver, copper, zinc and antimony.
In the course of the mapping and prospecting in 2009 and 2010, Equity collected 19 rock samples for gold and multi-element analysis (Figure 5). As well, 5 of these rocks were submitted for whole rock analysis. A total of 6 standard silt samples were also collected. These samples were analysed for a similar suite of elements as the rocks.
A sample of graphitic argillite collected during the 2009 mapping program from the south bank of the Iskut River 300 metres north of the Black Dog Showing, returned elevated values for several metals of interest (Mihalynuk et al, 2010; Jones, 2010). The sample contained 0.24 ppm Au, 14.7 ppm Ag, 496 ppm As, 656 ppm Cu, 571 ppm Pb, and 1720 ppm Zn. No significant analytical results were returned from the 2010 rock sampling.
With only 5 whole rock samples (including two from the 2009 drilling), conclusions are fairly limited. The samples were taken to help characterize some of the volcanic rocks on the property and in particular, to look for a range of composition in the volcanic rocks that might indicate a progression from mafic to felsic rocks and to provide some background on the affinity of the volcanic rocks. Both of these can play a significant role in identifying terranes prospective for VMS deposits. Whole rock sampling in the Black Dog zone area indicates mafic to intermediate or felsic volcanic rocks are present (Jones, 2010). Whole rock data also indicates the presence of felsic igneous rocks on the north side of the Iskut River where a sample of a feldspar porphyritic unit returned 322 ppm Zr. This rock is part of the deformed volcano-sedimentary package along strike from the Black Dog horizon.
Two of the six silt samples returned very highly anomalous results for arsenic (311 ppm As is the 99th percentile value for the BC government’s regional silt sample database for NTS 104B (Matysek et al, 1988)). One of these samples, taken north of the Iskut River, returned 581 ppm As and includes 4660 ppm Ba and 302 ppm Zn, which is the highest zinc value in the Rock and Roll silt sample survey (Figure 3). Another silt sample just east of Lost Lake returned 101 ppm As. An examination of the regional silt data did not show any elevation of these elements in the area, likely eliminating a lithological control on the geochemical response. The anomalous arsenic silt result north of the Iskut River may indicate potential for mineralization as the Black Dog horizon is zinc-rich and commonly contains up to 1% As.
30
There have been three main phases of diamond drilling on the Rock and Roll property; 1990-1991, 1997 and 2009 (Figure 7). The 2009 drill program was supervised by Equity Exploration Consultants Ltd. under contract to PFN. A table summarizing the drill holes and their survey data is included. (Table 5). Table 6 summarizes significant results from all the 2009 holes.
| | | 11.1 | Prime Resources Group, 1990-1991 |
In the period immediately following the discovery of the Black Dog Showing, Prime drilled 94 holes, totalling 11,063.2 metres in length, in the Black Dog and SRV zone area from Section 4450N to 5400N between November 1990 and September 1991. The first 9 holes, RR90-01 to RR90-09 (BQ size core), were drilled at 047° azimuth from three sites in the vicinity of the Black Dog Showing. The rest of these holes, RR91-10 to RR91-94A (BDBGM size core), were drilled on 150 Grid section lines at 060° (except RR91-090 at 240°) and ranged from 30.5 to 213.1 metres in length, averaging 117.5 metres. Diamond drilling along 50 metre sections resulted in the sulphide-bearing units being pierced on approximately 15 to 30 metre centres in the north part of the deposit, 20-60 metre centres south of 5000N (Becherer, 1997). The only survey data recorded for the 1990-1991 drill holes is acid test results. The collars for holes RR90-001 to RR91-086 were surveyed by transit and this data has been re-acquired in digital form from the surveyor.
The drill holes were sampled from top to bottom for the first 86 holes and all samples were analysed for gold and silver but only selected intervals were assayed for copper, lead and zinc. Following RR91 -086 sampling was confined to intervals of interest with a similar assay scheme except in holes RR91-091, 092 and 094A for which there are assay intervals recorded but no assay results. At this time it is unclear whether the assay results for these holes are missing or assaying was not done. The vast majority of samples were 1.0 metre in length with variations due to local geology and/or factors relating to core recovery or hole length. The samples were analysed at TSL Labratories in Saskatoon, Saskatchewan. Although a large number of original assay certificates are available recording a majority of the samples, none of the certificate cover-pages listing the analytical techniques, etc. are included.
The 1990-1991 drilling identified a mineralized horizon, the Black Dog horizon that contained semi-massive to massive sulphide mineralized lenses within a section of sulphidic mudstone, laminated argillite and minor siltstone. This section is strongly sheared and deformed as well as locally disrupted by variably altered and mineralized diorite intrusions. Nonetheless, the drilling outlined the Black Dog zone, a semi-continuous sulphidic body over a strike length of 550 metres, plus another sulphide horizon, the SRV zone, over approximately 75 metres, located 45 metres below the south end of the Black Dog Zone.
An additional 5 holes, BA91- 001 to 005, were drilled on the Bornagain property east and southeast of Lost Lake, also at 060°for a total of 372.8 metres. The only records existing for these holes are the original, hand-written drill logs. These drill logs record collar locations, azimuth and dip, assay intervals with core recovery and Rock Quality Index but no downhole survey data. Collars for three of these holes have been located in the field and their location verified with respect to the 150 Grid and also by handheld GPS device. The core from BA91-002, -003, and -004 are stored at the Rock and Roll campsite west of Lost Lake but have not been inspected. Assay results have not been located for these holes. The holes were apparently drilled to test a number of the airborne EM conductors identified in the area. Inspection of the drill logs indicates that minor pyrite+/-chalcopyrite mineralization was encountered associated with graphitic argillite in BA91-001 and BA91-002, associated with strongly silicified rocks containing disseminated pyrite and/or pyrrhotite. Silicified zones are reported in BA91-003 as well. This silicification is possibly the same type of alteration noted in the footwall to the Black Dog zone.
A drill log for one hole drilled north of the Iskut River has also been located. This hole, RRN91-001, was drilled at 360° to a depth of 121.3 metres to test an airborne EM conductor roughly along strike from the Black Dog horizon. The log records the grid location of the collar, azimuth and dip, assay intervals with core recovery and Rock Quality Index and one acid test result from the bottom of the hole. The collar location has been verified in the field and the location recorded by handheld GPS device. As with the Bornagain drill holes, no assay results have been located to date. The drill log records graphitic argillite, possibly explaining
31

32
the EM conductor, and minimal sulphide mineralization in the hole. Dunning (2004) mentions another drill hole north of the Iskut River but no record of this hole has been seen by this author.
| | | 11.2 | Redstar Resources Corporation, 1997 |
In 1997, a drill program was conducted by Pamicon Developments Limited on behalf of Redstar Resources Corporation (now Redstar Gold Corporation) (Dunning and Scott, 1997) . The 10 hole drill program, all at 060° azimuth, produced 2,409.0 metres of BQTW core from 6 drill set-ups with depths ranging from 178.9 to 334.7 metres. The collar locations were sited and surveyed using a compass and tight-chain along the existing grid with the down-hole deviation determined by standard acid test. Diamond drill core was logged for geological and geotechnical data and 1,004 samples from selected intervals were split and submitted for assay. The samples were submitted to Chemex Labs Ltd. (now ALS Minerals) for geochemical analysis. All samples were packaged in individual, twist-tied, and labelled sample bags that were shipped in labelled and sealed rice bags (Dunning and Scott, 1997). The core is stored at the Bronson Creek airstrip with other historic drill holes.
According to Dunning (2004), the rational for the 1997 diamond drilling program was threefold: (i) find extensions to known mineralization and evaluate stratigraphy below existing drilling in the Black Dog Zone; (ii) evaluate a coincident geochemical and geophysical anomaly on line 29+00N; and (iii) evaluate coincident geochemical and geophysical anomalies beneath the Paleozoic cover rocks along the western edge of the property. Of these objectives only the first and third were attempted. Redstar completed 5 holes (RR97-095, 096, - 099, -102, and -103) along strike to the north of the Black Dog horizon and 2 holes down dip from the Black Dog showing (RR91-097, -098). Only the down-dip holes encountered semi-massive to massive sulphide mineralization and returned significant assay results. The holes to the north did cut graphitic argillite with disseminated sulphides locally but assay results were generally non-economic.
Two drill holes were completed in the area of the SRV zone in 1997 (Dunning and Scott, 1997). Both holes intersected massive sulphide mineralization. Hole RR91- 100 hit mineralization at the same level as the SRV zone, intersecting 5.79 metres (5.0 metres true width) of near-massive sulphide mineralization grading 0.630 g/t gold, 59.46 g/t silver, 0.34% copper, 0.22% lead, and 0.98% zinc from 98.45 metres to 104.24 metres. RR97- 101 intersected 0.98 metres (approximate true width) of massive sulphide grading 1.59 g/t gold, 171.5 g/t silver, 0.40% copper, 0.86% lead, and 2.23% zinc (Dunning and Scott, 1997) from 64.0 to 64.98 metres. This intersection may represent SRV mineralization but could be interpreted to be at a higher stratigraphic interval. This sulphide zone is possibly cut off by a fault on its lower side.
The last hole of the 1997 program, RR97-104, was a step out to the west of the previous drilling in the Black Dog area in an attempt to evaluate the third objective above. The hole on Section 4500N was collared in limestone on the west side of the projected thrust placing Paleozoic rocks over the Mesozoic rocks hosting the Black Dog horizon. The hole passed through the limestone and into a section of mafic to intermediate volcanic rocks, dioritic intrusions and fine grained clastic sedimentary rocks such as argillite and siltstone; in short, very similar to the section hosting the Black Dog horizon. Several sections of strongly silicified sedimentary and, possibly, tuffaceous rocks were encountered lower in the hole that hosted trace to a few percent of disseminated and wispy pyrite, sphalerite and chalcopyrite (Dunning and Scott, 1997). The sulphides were commonly distributed along the primary fabric in the rock defined by the laminations or layering. This hole is significant for illustrating that there may be additional mineralized horizons on the property outside of the “along strike” focus of most of the exploration to date on the Rock and Roll property.
| | | 11.3 | Pacific North West Capital Corp., 2009 |
Following the 2009 airborne survey, PFN undertook a drill program on the Rock and Roll property (Jones, 2010). The diamond drill program (Plate 9) consisted of 5 NQ-size drill holes for a total of 539.81 metres, as outlined in Table 6. All holes were drilled on section, oriented 060° or 240°, consistent with the previous drilling on the Black Dog zone. Holes RR09- 105 to RR09-108 were drilled to intersect the Black Dog zone and in-fill gaps in the 1997 calculated resource (Becherer, 1997). The fifth hole, RR09- 109, was drilled outside of the historic resource area and was intended to intersect an electro-magnetic conductor that projects from the Black Dog zone to the northwest towards the Iskut River.
33
The drill hole collars were located by chain and compass from previous holes and 150 Grid stations that were found in the field. The collar locations were verified with a handheld GPS device. The first three holes were surveyed using a Reflex downhole survey instrument to obtain both dip and azimuth. However, the casing for the instrument was lost at the bottom of hole RR09-107 and a replacement was not available in time to survey the subsequent holes, RR09-108 and RR09-109, leaving those holes with no survey. The drill core was placed in 4- foot long wooden core boxes and flown from the property to the camp at the Bronson airstrip. The core was then logged for geology and geotechnical data, and photographed.
Table 6: 2009 Diamond Drilling Summary
| Drill Hole | UTM Northing
NAD 983 | UTM Easting
NAD 83 | Section | Coordinate | Azimuth | Dip | Depth m |
| RR09-105 | 6287908 | 363560 | 4850N | 2993E | 060° | -73° | 105.77 |
| RR09-106 | 6287953 | 363524 | 4900N | 2994E | 059° | -73° | 99.67 |
| RR09-107 | 6288212 | 363290 | 5240N | 2915E | 240° | -87° | 99.06 |
| RR09-108 | 6288212 | 363290 | 5240N | 2915E | 240° | -65° | 128.63 |
| RR09-109 | 6288180 | 363104 | 5300N | 2750E | 060° | -60° | 106.68 |
| | | | | | | Total | 539.81 |

Plate 9: Blackhawk Drilling JT2000 diamond drill at the collar for RR09-105, October 2009.
The four holes drilled in 2009 within the historic resource area intersected massive sulphide mineralization on the Black Dog horizon hosted within a strongly deformed section of mudstone and laminated argillite, interspersed with altered and deformed diorite. The mineralized horizon is characterized by graphitic slips and narrow beds(?) of gypsum locally. Diorite cuts the mineralization and is commonly brecciated or boudinaged by shearing, with irregular clasts and lenses within the argillaceous host rock. The massive sulphide mineralization consists of two main types: narrow intervals of massive laminated, bedding-
34
parallel pyrite- sphalerite with minor pyrrhotite, chalcopyrite and galena, and massive pyrrhotite as mudstone-breccia matrix and irregular bands with 1-5% chalcopyrite and lesser sphalerite as blebs, wisps and patches. Diorite, quartz-carbonate and gypsum breccia clasts are noted in the mudstone-breccia, as well. The clasts may contain fine wisps or lenses of sulphide and are commonly rotated and elongated. Both types of massive sulphide mineralization are generally conformable with layering in the host sedimentary rocks and likely represent syngenetic mineralization. There is high-grade gold and silver mineralization associated with both styles of mineralization, for instance in drill hole RR09 -107. Base metal values seem to be higher in the massive laminated pyrite-sphalerite mineralization but this is not true everywhere. Significant analytical results from the 2009 drill program are summarized in Table 7.
Table 7: 2009 Diamond Drilling, Significant Intercepts
| Drill Hole | From | To | Width m | True
Width m* | Au g/t | Ag g/t | Cu % | Pb % | Zn % |
| RR09-105 | 76.03 | 77.90 | 1.87 | 1.8 | 0.80 | 84.6 | 0.24 | 0.21 | 0.89 |
| incl. | 77.14 | 77.90 | 0.76 | 0.73 | 1.52 | 169.0 | 0.43 | 0.42 | 1.72 |
| | | | | | | | | | |
| RR09-106 | 62.26 | 63.01 | 0.75 | 0.72 | 0.97 | 178.0 | 0.60 | 0.63 | 4.23 |
| | | | | | | | | | |
| RR09-107 | 39.32 | 58.73 | 19.41 | 17.6 | 0.56 | 57.9 | 0.19 | 0.24 | 0.91 |
| incl. | 39.32 | 42.46 | 3.14 | 2.86 | 1.45 | 296.0 | 0.46 | 1.25 | 3.99 |
| or | 39.32 | 40.06 | 0.74 | 0.67 | 3.18 | 182.0 | 0.14 | 2.44 | 4.40 |
| and | 42.10 | 42.46 | 0.36 | 0.33 | 0.83 | 433.0 | 0.60 | 0.88 | 6.41 |
| | | | | | | | | | |
| RR09-108 | 46.88 | 85.59 | 38.71 | 31.5 | 0.28 | 18.32 | 0.13 | 0.05 | 0.72 |
| incl. | 52.03 | 58.10 | 6.07 | 4.92 | 0.31 | 12.9 | 0.10 | 0.06 | 1.11 |
| and | 65.22 | 69.23 | 4.41 | 3.57 | 0.40 | 25.2 | 0.28 | 0.06 | 1.32 |
| and | 69.32 | 75.71 | 6.39 | 5.18 | 0.55 | 37.9 | 0.20 | 0.08 | 0.95 |
| | | | | | | | | | |
| RR09-109 | 46.65 | 47.35 | 0.70 | 0.70 | 0.01 | 1.0 | 0.03 | 0.01 | 0.07 |
*True Width as interpreted from drill sections
| 12.0 | SAMPLING METHOD AND APPROACH |
Historic work performed by Prime and Redstar at Rock and Roll appears to conform to standard industry practice at the time. BQ (1990), BDBGM (1991) and BQTW (1997) size drill core were recovered during these diamond drilling programs at Rock and Roll. No blank, standard or duplicate samples were apparently submitted by the companies with the drill core samples from the 1990-1991 and 1997 programs.
The 2009 program conducted by PFN was supervised by Murray Jones, P.Geo. of Equity Exploration Consultants Ltd. (Jones, 2010). The diamond drilling was performed by Blackhawk Drilling Ltd. of Smithers, British Columbia. The core samples were placed in wooden core boxes at the drill site, with marker blocks indicating hole depth placed at the bottom of each sample run. The core boxes were delivered by helicopter to the camp at Bronson Creek at the end of each shift. Core recovery and rock quality designations (RQD) were measured, and then the cores were geologically logged and sample intervals were laid out by Murray Jones. Samples were marked by stapling the end portion of the tyvek assay tag at their boundary in the core box. The core was photographed before it was sampled. Blanks and duplicate samples were inserted into the sample stream at regular sample intervals. A total of 248 core samples and one rock sample were shipped to the ALS Minerals for analysis. In addition, 21 samples of 1990-1991 core were taken for comparative analyses.
Core recovery in 2009 was generally good (>95%) . The core samples are therefore representative of the rock units intersected by the drill holes. The 2009 drill holes were selectively sampled based on lithology and visual mineralization. Generally the sampling was concentrated within the mudstone and argillite units of the Black Dog Horizon including several shoulder samples adjacent to mineralized zones. The core sample intervals respected geological criteria.
35
Re-sampling of several intersections of the historic Rock and Roll core was also done in 2009. Sample intervals representing different tenor and mineralization types and generally distributed throughout the deposit, were retrieved from the core stacks at Bronson Creek. The original sample intervals were re-established from box labels and surviving core sample tags (where available) and repeated as closely as possible. The core was quartered using a diamond bladed saw and one quarter returned to the core box. A total of 21 samples from 5 different intersections of the Black Dog horizon were taken (Jones, 2010).
In 2010, the historic core sampling program was handled in the same way with respect to the sampling method and security. Following the direction of Armitage and under the supervision of Jones, as many intervals of the Black Dog and SRV zones as possible were recovered from the core stacks at Bronson Creek and sampled. The historic core was intact for almost all mineralized intervals. Core recovery was very good and the historic core was in very good shape for the most part allowing complete and representative sampling of the mineralized intervals. However, a few of the best mineralized intervals had apparently been removed by previous operators for display and other purposes and could not be re-sampled. There was also some loss of core over time due to spillage by previous handlers and some due to deterioration of the core boxes due to weathering. Where possible, core from rotted boxes was transferred to new boxes while maintaining the positioning of the core, core blocks and sample tags. As well, the box-end tags (from-to in metres) were transferred to the new boxes. The mineralized intervals were re-logged, including several metres outside the mineralization if possible, and new samples were laid out matching the historic sample intervals. Locally, where the old samples did not respect geological criteria, the new samples were taken to match the geological data while ensuring that the new samples were matched up to the old samples at some point i.e. ensuring a matching composite for assay comparisons. A total of 38 intervals of historic core from the Black Dog Zone and one interval of historic core from the SRV zone were re-sampled in 2009 and 2010.
| 13.0 | SAMPLE PREPARATION, ANALYSES AND SECURITY |
Neither of the 2009 or 2010 sampling programs was conducted by an officer, director, employee or associate of PFN. Jones is an employee of Equity Exploration Consultants Ltd., which is one of the underlying vendors of the property.
All samples were split in half lengthwise using a diamond blade core saw. One half of the core was returned to the core box for storage at the Bronson Creek airstrip, and an assay tag was stapled onto the core box at the top of the sample interval. The other half of the core was placed in a numbered plastic sample bag with the corresponding assay tag. The plastic sample bags were then sealed with plastic cable ties, and placed in rice sacks which were sealed with uniquely numbered plastic security ties. The sample numbers of the samples enclosed within each rice sack were written on the sack, and the sack containing the analytical instructions for each sample batch was marked. Jones supervised the core splitting and sampling during the 2009 program and, under the direction of Armitage, the 2010 program.
The sealed sample sacks were hand delivered to the ALS Minerals prep facility in Terrace, BC where they were inspected and no damage and or signs of tampering were reported. ALS Minerals is a Quality Systems (ISO 17025) and ISO 9001-2000 certified laboratory. Once crushed and pulverized in Terrace, sample pulps were shipped by ALS Minerals to their main analytical lab in North Vancouver, BC. All samples were analysed for Au by fire assay atomic absorption (ALS Minerals procedure Au-AA23) on a 30 g aliquot. As well, all samples were analysed for 35 elements by inductively coupled plasma-atomic emission spectroscopy (ALS Minerals procedure ME-ICP43). Samples that returned greater than 1.0 g/t Au in the initial run were re-analysed using a fire assay and gravimetric finish technique (ALS Minerals procedure Au -Gra21) on a 30 g aliquot. Samples that returned greater than 50 g/t Ag in the initial analysis were re-assayed using a fire assay and gravimetric finish technique (Ag-Gra21) on a 30 g aliquot. Initial assay overlimits (>10,000 ppm) for copper, lead and zinc were re-analysed using an ore grade assay technique (ALS Minerals procedure -OG46) using an aqua regia digestion and atomic emission spectroscopy finish).
|
36
| | | 13.1 | Quality Assurance and Control |
Blank (barren) samples were routinely inserted into the core sample stream during the 2009 (6) and the 2010 (32) drill programs. Commercially available dolomite stone was used as the blank material. Duplicate samples (8) were also routinely inserted into the core sample stream during PFN’s 2009 drill program. Review of the analytical results from the 2009 blanks samples indicates that all samples returned uniformly low values at or near the detection limits in all elements of interest. There were a significant number of blank samples that carried elevated values for elements of interest in 2010, possibly due to a much higher percentage of high grade samples. As much as 3% of the preceding sample’s metal concentration for copper, zinc and lead and as much as 1% carry over for gold and silver was noted.
Although the total duplicate samples examined in 2009 was not enough to warrant detailed statistical analysis, the results of original versus duplicate analyses showed very strong correlations for all elements of interest (Au, Ag, Cu, Pb, Zn, As, and Sb) (Jones, 2010). However for most elements of interest, this data is heavily biased with most analyses clustered near the origin and with one higher grade duplicate-pair.
Standard Reference Material (“SRM”) samples were inserted into the sample stream for the 2010 historic drill hole sampling program. A set of two SRMs were obtained from CDN Resource Laboratories Ltd. of Langley, BC, consisting of lower grade gold/higher grade silver (CDNME-7) and higher grade gold/moderate grade silver material (CDNME-11). These SRMs were inserted into the sample stream at a rate of at least one SRM per mineralized interval. A total of 44 SRMs were used in the 2010 program, or more than one for every ten samples. Two of the 44 SRMs failed the test for two standard deviation variance from the certified value for the element for the SRM.
Sample I985378 from Certificate TR10137308 showed greater than two standard deviations variance from the SRM (CDNME-7) for Au (higher), Pb, and Zn (both lower). A re-analysis of the pulps from the batch containing this SRM returned acceptable values for all elements of interest.
SRM sample J992690 from Certificate TR10137306 returned much lower than expected results for all metals in CDNME-7 except gold (i.e. all elements analysed by the ME-ICP41 procedure). Initial re -analysis of the pulps from this run by the ME-ICP41 method gave the same result. Subsequently, separate pulps were created from the sample rejects for 24 samples around the erroneous standard and these were re-analysed for all elements according original methods with the insertion of two new standards (one CDN-ME7, one CDN-ME11). The standards in this batch returned acceptable values for all elements of interest and the values for the elements of interest in the newly processed samples are taken as correct.
A consistent bias in copper values reported by the ME-ICP41 technique was also detected. The copper values given by the ICP method for SRMs are consistently about 10% higher than expected (Figure 8), lying just outside the two standard deviations acceptable range for the standard (ME-ICP7). Re-analysis of all samples returning copper values between 1000 and 10,000 ppm Cu including the SRM’s by the Cu-OG46 technique returned Cu values within acceptable limits for all SRMs. Consequently, the Cu-OG46 values were considered definitive.
| | Analysis of the QA/QC data led to the following conclusions: |
| • | There is no evidence of tampering with the samples between collection and the laboratory. |
| • | Blank samples returned values indicating low levels of contamination for various elements of interest in a significant number of the 2010 samples, likely due to high grade nature of most samples. This contamination, which consists of a carryover of <3% for Cu, Zn and Pb and <1% for Au, is not considered significant. |
| • | Review of standards indicates that all but two SRM samples were reported well within warning limits. Pulps from the batch containing the one of the failed SRM’s were re-analysed, with the reanalysed SRM giving an acceptable result. The second SRM and its associated batch of samples were re-analysed from both the pulp and reject material (including two new SRMs) before acceptable results were returned. The problem with the original SRM (sample J992690) ME-ICP41 analyses is unknown. |
37
| • | Copper values for SRMs revealed a bias towards higher values (by about 10%) for the ME-ICP41 method. This bias was not present with the Cu-OG46 assay method used with higher grade samples, so the range of Cu-OG46 analyses was extended down to samples reporting 1000 ppm Cu by ME-ICP41. |
The authors believe that sample preparation, security and analytical procedures were adequate in these programs. The 2009 and 2010 re-analysis results for Rock and Roll core samples are valid.
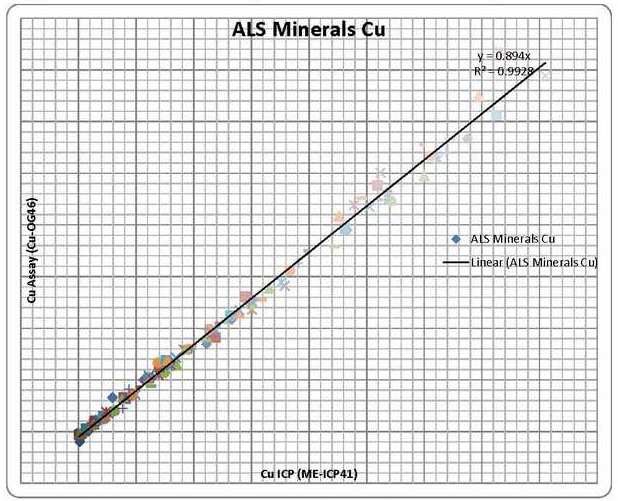
Figure 8: Graph showing comparative analyses for Cu by ME-ICP41 and Cu-OG46 for all samples returning between 1000 and 10000 ppm Cu for historic core sampling in 2010. Slope and correlation are indicated. The slope shows that the ICP method consistently reports about 10% greater than the assay results.
Drill hole collar locations for the 2009 drill program holes were positioned by hipchain-and-compass surveying from historic grid station and drill hole collar locations. In addition, the drill hole collar UTM coordinates were determined by handheld GPS surveying. Drill hole collar locations are marked in the field by wooden stakes inserted into the tops of the holes; the hole number is marked on aluminum tags attached to the stakes.
A number of the historic drill collars were also located in the field by Jones and surveyed by hand held GPS instrument. This data was then correlated with the existing transit survey data to derive NAD 83 UTM
38
coordinates for al holes. Thhe earlier traansit survey overlaid very well on thhe GPS measured positions for the historic collar locations prooviding confidence to extrapolate the UTM coordinates to the remainning historic holee collar locations within the Black Dog Horizon aarea.
Quality control measures and data verification procedures used during the 200 8 and 2009 exploration at t he Rock andd Roll Project are outlined in Section 13.1 above .
| | | 14.3 | Histooric Core Re-analysis |
The pri mary focus of both the 2009 and 2010 programs on the Rock and RRoll propertyy were data verification and upgrade. The 2009 drill results verified the pre sence of high grade Auu -Ag-Zn- Cu-Pb massive sulpphide mineralization associated with the Blackk Dog horizon (Jones, 2010). The limited re-sampling of historic core in 2009 indicated a stro ng correlatioon between assay results from the 1990-1991 , 1997 and 2009 drill programs. Howevver, there was an apparent bias towards higher silver and ggold values in the 1990-1991 results (Figure 9), which formed the bulk of the analytical data used in the historrical resource estimates (Jo nes, 2010). The 2010 re -sampling program wass intended too produce new assay results for as many of the historic intersecctions of the Black Dog and SRV mineralization as possibl e. In total, m ineralized i ntersections fromm 38 drill holes were re--sampled in 2010 and, along with the results of the 2009 re-sampling and drilling, new results for 44 mineralizzed intersections were used for the calculation oof the mineral resource contained in this report.
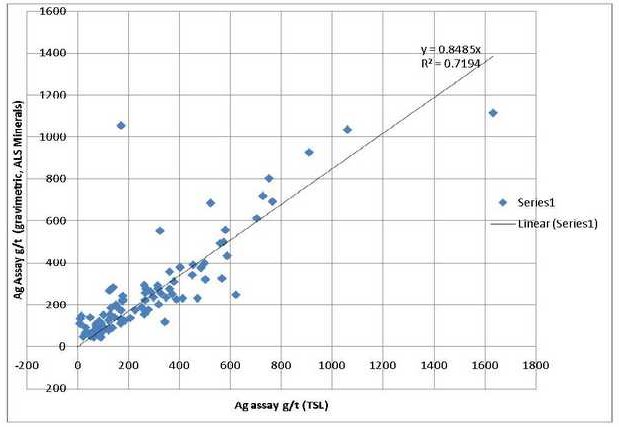
Figure 9: Graph of Ag assay by TSL in 1990-91 and in 2010 by ALS MMinerals (gravimetric finish, samples onlyy >50 g/t Ag) for the sam e sample intervals. There is a fair amount of scatter in the data but there is a clear trend to higher values in the TSL data, particularly below 600 pppm Ag. Slope indicates about a 15 % difference wheen passed through the grraph origin.
The 2009 and 2010 sampling programss, geologicaal mapping, quality assurance/qu ality control program and survey results have verified the data from the Rock and Roll properrty in so farr as the re-
39
sampling program has produced a data set sufficient for the calculation of a mineral resource for the Black Dog mineralized zone.
Jones personally supervised the diamond drill program on the property in October 2009 and a mapping and prospecting program in conjunction with the drill core re-sampling in September 2010. Armitage examined the property and the available core from September 18 to 20, 2010 and directed the 2010 drill core re-sampling program.
There is no information on adjacent properties necessary to make the technical report understandable and not misleading.
| 16.0 | MINERAL PROCESSING AND METALLURGICAL TESTING |
PFN has not carried out any metallurgical testwork on the Rock and Roll mineralization and there is no record of such work by previous operators.
| 17.0 | MINERAL RESOURCE AND MINERAL RESERVE ESTIMATES |
To complete this resource estimate GeoVector assessed the raw drill database and the available written reports, and the resource modeling data that was available from previous studies and internal resource reporting. Based on this review GeoVector formulated methodologies and geological models that reflected the deposit type and the data that is available to generate a resource estimate.
The Mineral Resource estimates discussed in this section are based on 109 diamond drill core holes. These holes were drilled and assayed in four campaigns, including 1990 (9 holes), 1991 (85 holes), 1997 (10 holes) and 2009 (5 holes).
Mineral Resources were estimated by Dr. Allan Armitage, P. Geol., and Mr. Joseph Campbell, B.Sc. (Hons.), P.Geo., both of GeoVector Management Inc. Dr. Armitage and Mr. Campbell are independent Qualified Persons as defined by NI 43-101. Practices consistent with CIM (2005) were applied to the generation of the resource estimate. There are no mineral reserves estimated for the Property at this time.
Inverse distances squared interpolation restricted to mineralized domains were used to estimate gold (grams/tonne Au), silver (grams/tonne Ag), copper (% Cu), lead (% lead) and zinc (% Zn) grades into the block models. Gold, silver, copper, lead and zinc content were combined into a gold equivalent value for resource reporting. Indicated Mineral Resources are reported in summary tables in Section 17.9 below, consistent with CIM definitions required by NI 43-101 (CIM, 2005).
| | | 17.1 | Drill File Preparation |
The assay database was looked at for errors, including overlaps and gapping in intervals, typographical errors in assay values, and supporting information on source of assay values, and finally a comparison of check assays, duplicates and metallic assays. Generally the database was in good shape, and after minor corrections no adjustments were required to assay values due to lab bias.
Variation in assay value and statistical distribution by drill campaign were small when compared spatially within the deposit, and any apparent variability was considered too small at the deposit scale to generate a significant resource bias. No adjustment to historical values used in the resource estimate (1990, 1991 and 1997) was required. Only those historical values from drill core intervals, which were not re-assayed in 2010, were used in the resource.
40
Verifications were also carried out on drill hole locations, down hole surveys, lithology, SG, trench data, and topography information. Minimal corrections were done to this information.
| | | 17.2 | Resource Modelling and Wireframing |
Working with the sub -populations made during the data verification stage, and examining their spatial distribution it became clear that generating geological controls based on rock type was not going to be possible with the current information available. No clear structural or stratigraphic controls to the mineralization have been confidently identified to allow even rudimentary geological sub-domains to be modeled.
It is recognized that the distribution of mineralization, and therefore the grade of mineralization at any given cut-off, would be enhanced by modeling geological controls. It is concluded that by completing more work in the field, coupled with review of the historical data, that defensible geological controls can be modeled for future resource estimates, and that this may have a positive impact on the resource grade for the overall deposit.
Figure 10: Isometric view looking north showing the Rock and Roll resource model, and drill holes.
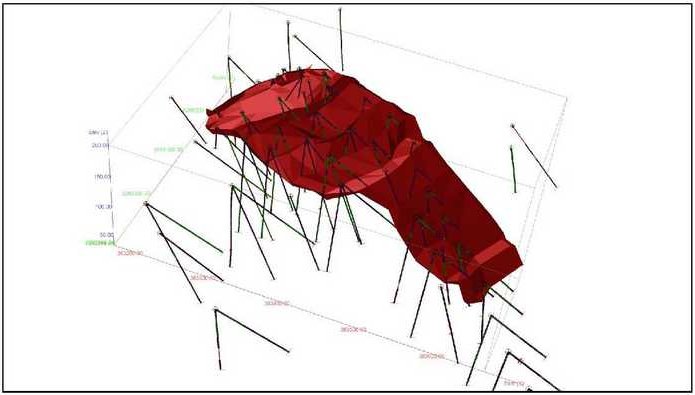
Failing to find good geological controls GeoVector reverted to a grade control model (Figure 10). This involved visually interpreting mineralized zones from cross sections using histograms of gold, silver and zinc values. Polygons of the mineralized intersections were made on each cross section and these were wireframed together to create a contiguous mineralized body. This modelling exercise provided broad controls of the dominant mineralizing direction. Once the model shape was accepted, a review of grade distribution within the model showed variable grade distribution between gold, silver and zinc. The mineralization however is contained within a single mineralized body which trends at 135 degrees and dips approximately 55 degrees southwest.
41
A total of 11,560 assays representing 14,100 meters of core were available to create the resource estimate. Average width of the samples was 1.01 meters, within a range of 0.10 meters to 19.5 meters. It was necessary to in -fill areas of the drill core with “zero” grade samples where no sampling had occurred. A summary of the drill hole assay database used for resource modeling is shown in Table 8.
Table 8: Summary of the drill hole assay data (length weighted)
| Variable | AU (g/t) | AG (g/t) | CU (%) | PB (%) | ZN (%) |
| Number of samples | 11561 | 11561 | 11561 | 11561 | 11561 |
| Minimum value | 0.00 | 0.40 | 0 | 0 | 0 |
| Maximum value | 36.18 | 1875.10 | 3.43 | 5.74 | 9.78 |
| Mean | 0.07 | 8.6 | 0.03 | 0.02 | 0.08 |
| Median | 0.02 | 1.7 | 0.00 | 0.00 | 0.00 |
| Variance | 0.22 | 3396.3 | 119.12 | 216.79 | 2418.63 |
| Standard Deviation | 0.47 | 58.3 | 0.11 | 0.15 | 0.49 |
| Coefficient of variation | 6.769 | 6.844 | 4.186 | 7.534 | 6.069 |
| 97.5 Percentile | 0.53 | 66.5 | 0.13 | 0.17 | 0.57 |
Of the total assay population only 5% of the assays were greater than 1.5 meters. On the basis of the assay sample size a nominal composite length of 1 meter was chosen. A total of 12,454 composites were created, of which 422 (3.0%) were partial composites ranging from 0.01 meters to 0.98 meters. The partial values had negligible impact on grade distribution of the composite population and they were included in the resource estimation.
Average grades of gold, silver, copper, lead and zinc were lower in the composite population, but this was mostly due to the included “zero” values.
Table 9: Summary of the drill hole composite data
| Variable | AU (g/t) | AG (g/t) | CU (%) | PB (%) | ZN (%) |
| Number of samples | 12454 | 12454 | 12454 | 12454 | 12454 |
| Minimum value | 0.00 | 0.40 | 0 | 0 | 0 |
| Maximum value | 36.18 | 1875.10 | 3.43 | 5.74 | 9.44 |
| Mean | 0.06 | 7.7 | 0.02 | 0.02 | 0.07 |
| Median | 0.02 | 1.7 | 0.00 | 0.00 | 0.00 |
| Variance | 0.19 | 2772.2 | 100.22 | 181.34 | 2048.02 |
| Standard Deviation | 0.44 | 52.7 | 0.10 | 0.13 | 0.45 |
| Coefficient of variation | 7.082 | 6.880 | 4.186 | 7.534 | 6.069 |
| 97.5 Percentile | 0.45 | 37.5 | 0.23 | 0.11 | 0.73 |
The composites were domained based on whether they intersected the ore model, and a total of 808 composite sample points occur within the resource model. These values were used to interpolate grade into their respective ore models.
42
No capping was carried out on the composite populations to limit high values. Descriptive statistics of the composited values for Au, Ag, Cu, Pb and Zn are shown in Table 10. Histograms of the data indicate a relatively log normal distribution of all metals with very few outliers within the database. Analyses of the spatial location of these samples and the sample values proximal to them led GeoVector to believe that the high values were legitimate parts of the population, and that the impact of including these high composite values uncut would be negligible to the overall resource estimate.
Table 10: Summary of the drill hole composite data within the resource model
| Variable | AU (g/t) | AG (g/t) | CU (%) | PB (%) | ZN (%) |
| Number of samples | 808 | 808 | 808 | 808 | 808 |
| Minimum value | 0.00 | 0.40 | 0 | 0 | 0 |
| Maximum value | 36.18 | 1875.1 | 3.43 | 5.74 | 9.44 |
| Mean | 0.61 | 80.7 | 0.22 | 0.21 | 0.91 |
| Median | 0.21 | 15.1 | 0.10 | 0.04 | 0.28 |
| Variance | 2.41 | 32486.4 | 874.12 | 2149.05 | 21218.50 |
| Standard Deviation | 1.55 | 180.2 | 0.30 | 0.46 | 1.46 |
| Coefficient of variation | 2.556 | 2.235 | 1.359 | 2.216 | 1.594 |
| 97.5 Percentile | 4.06 | 784.1 | 1.21 | 1.96 | 6.35 |
An empty block model area was created within NAD83 UTM space with an origin at 363150E, 6287850N, and an elevation of 210m above sea level (ASL) (Figure 11). Block size was designed to reflect the spatial distribution of the raw data – i.e. the hole spacing. The core of the deposit contains drill intersections that are on sections approximately 25 to 50 metres apart. The down dip spacing between holes is typically 20-30 metres up to 50 meters. It was decided to create blocks that were 5 x 5 x 2 metre in size in the X, Y and Z directions respectively. At this scale of the deposit this still provides a reasonable block size for discerning grade distribution, while still being large enough not to mislead when looking at higher cut-off grade distribution within the model. The model was intersected with surface topography and overburden models to exclude blocks, or portions of blocks, that extend above the bedrock surface.
A total of 41 drill core samples from 24 different drill holes were used to determine specific gravity of the mineralized material from the deposit. The minimum value was 2.73 and the maximum value was 3.83. The samples were collected from massive, semi-massive and disseminated mineralization, which is variably distributed throughout the deposit. Samples tend to show an increase in grade with an increase in SG values in rocks with an SG value above 2.85. Below an SG value of 2.85, rocks show variable grade distribution. The overall average specific gravity of all samples is 3.07. As a result of the variable distribution of mineralization styles, the 3.07 value was applied to all blocks within the block model.
43
Figure 11: Isometric view looking north showing the location and orientation of the block model and search ellipse used to interpolate the Rock and Roll resource.
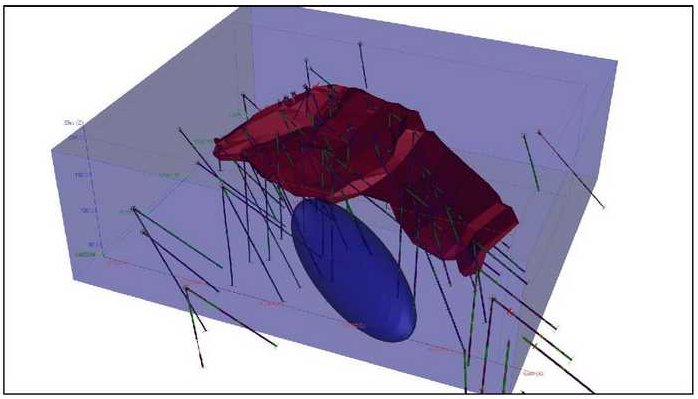
The primary aim of the interpolation was to fill all the blocks within the resource model with grade. Based on 3D semi-variography analysis of mineralized points within the resource model, the size of the search ellipse was set at 140 x 50 x 40 in the X, Y, Z direction respectively (Figure 11). The long axis is oriented at 310º to reflect the observed preferential long axis of the resource model. The short Y direction reflects the roughly 1/3 distance of the model in this direction relative to the longer axis. The dip axis of the search ellipse was set at -55° west to reflect the observed trend of the mineralization down dip.
To generate grade within the blocks inverse distance squared (ID2) was used. With the relatively high assay variability, particularly when recognizing the variable mineralization within the deposit, the minimal criteria for kriging methods were not considered to be met. The internal grade distribution within the model does not have a high confidence level, and therefore the entire resource estimate is categorized as Indicated.
The number of samples used to interpolate a block grade was set at a maximum of 12. Again, this was done to maximize the grade distribution of the blocks. The minimum amount of samples was set at 2, although very few blocks went down to this amount, and the majority of blocks had the maximum number of samples.
The volume of the block model compared to the wireframe model was essentially identical. The size of the search ellipse and the number of samples used to interpolate grade achieved the desired effect of filling the ore models, and very few blocks had zero grade interpolated into them.
44
Because ID2 interpolation was used the drill hole intersection grades would be expected to show good correlation with the modelled block grades. Visual checks of block grades against the raw data showed excellent correlation between block grades and drill intersections.
At a zero cut-off grade the cumulative total of all the models contain 2.32 Mt @ 0.63 g/t Au and 77.3 g/t Ag, 0.2 %Cu, 0.16 % Pb, and 0.42% Zn (Table 11). Visual checks of the block model grades against the drill hole intersections showed that, as expected, the grades in the blocks proximal to the drill holes were very similar to drill hole grades. Checks along the edges of the modeled resource, where drill hole information was distal and there were fewer points to model mineralization, showed that there were areas of spurious high or low grade blocks that are likely due to one or two data points being used in the interpolation. Comprehensive observations along 10 metre section lines did not indicate that, overall, there was any positive or negative bias to these blocks that would skew the global resource grade.
Simple statistical analysis was done of the composite grade distribution and trends against the distribution of the estimated block grades. When the distribution along Au Eq grade ranges for the resource block population is compared with the resource composite population both show a logarithmic distribution typical of precious metal deposits. The difference in distribution is a decrease in the lowest grade interval (00.10 g/t Au Eq) for the blocks in comparison to the composites, and a matching decrease in the high grade outlier population. This is due to the random distribution of both high and low grade within the Deposit, although this analysis is complicated by the disparate values of each metal used to generate the Au Eq.
Block grades are determined by multiple composites (most use twelve samples), and there are few blocks having enough low or high grade outliers of either metal to result in low or high grade Au Eq blocks. As noted above future modelling with better geological controls and possible different interpolation parameters for each metal has the potential to significantly change the spatial distribution of each metal and possibly increase the average grade of the deposit.
| | | 17.8 | Resource Classification |
The Mineral Resource estimate was classified in accordance with the CIM Definition Standards (2005). The classification of the Rock and Roll resource is based on the distribution of mineralization and the drill consistent and tight drill hole spacing. It is concluded that these controls for the Mineral Resource allows for high confidence in the modelled grade variance within the ore volumes. All material in this Mineral Resource estimate is therefore classified as Indicated.
The grade and tonnage estimates contained herein are classified as Indicated Resource given CIM definition Standards for Mineral Resources and Mineral Reserves (2005). As such, it is understood that:
| • | An ‘Indicated Mineral Resource’ is that part of a Mineral Resource for which quantity, grade or quality, densities, shape and physical characteristics can be estimated with a level of confidence sufficient to allow the appropriate application of technical and economic parameters, to support mine planning and evaluation of the economic viability of the deposit. The estimate is based on detailed and reliable exploration and testing information gathered through appropriate techniques from locations such as outcrops, trenches, pits, workings and drill holes that are spaced closely enough for geological and grade continuity to be reasonably assumed. |
Mineralization may be classified as an Indicated Mineral Resource by the Qualified Person when the nature, quality, quantity and distribution of data are such as to allow confident interpretation of the geological framework and to reasonably assume the continuity of mineralization. The Qualified Person must recognize the importance of the Indicated Mineral Resource category to the advancement of the feasibility of the project. An Indicated Mineral Resource estimate is of sufficient quality to support a Preliminary Feasibility Study which can serve as the basis for major development decisions.
45
Figure 12: Isometric view looking west showing the distribution of ore blocks, at 0 g/t Au Eq cut-off, within the Rock and Roll deposit

Review of the modelled blocsk at various cut-off grades indicates a contiquous ore body at the 0.50 g/t Au Eq cut-off grade (Figure 13). It is considered appropriate to report Indicated resources up to a 0.5 g/t Au cut-off grade. At this grade the Rock and Roll deposit contains 2.16 Mt at 0.68 g/t Au, 82.7 g/t Ag, 0.22% Cu, 0.22% Pb, and 0.94% Zn for contained 47,000 ounces gold, 5,734,000 ounces silver, 10.5 Mlb copper, 10.4 Mlb lead and 44.5 Mlb zinc (Table 9).
Table 11 contains tonnage and grade of gold and silver at various Au Eq cut-off grades. *AuEq grade is based $1,000.00/oz Au, $15,80/oz Ag, $2.92/lb Cu, $0.86/lb Pb and $0.86/lb Zn.
46
Table 11: Tonnages and Grades at Various AuEq Cut-off Grades
Cut-off Grade
(AuEq) | | Au (g/t) | Ag (g/t) |
| Tonnes | Grade | Ozs | Grade | Ozs |
| (<0.1 g/t) | 2,323,914 | 0.63 | 47,447 | 77.3 | 5,772,447 |
| 0.1 g/t | 2,313,908 | 0.64 | 47,439 | 77.6 | 5,771,665 |
| 0.2 g/t | 2,306,878 | 0.64 | 47,426 | 77.8 | 5,770,882 |
| 0.3 g/t | 2,274,353 | 0.65 | 47,351 | 78.9 | 5,766,679 |
| 0.4 g/t | 2,233,002 | 0.66 | 47,267 | 80.2 | 5,757,123 |
| 0.5 g/t | 2,155,679 | 0.68 | 47,040 | 82.7 | 5,734,445 |
| 1.0 g/t | 1,750,810 | 0.80 | 44,816 | 98.5 | 5,544,329 |
| 2.0 g/t | 1,062,074 | 1.10 | 37,735 | 142.5 | 4,865,715 |
| 5.0 g/t | 411,040 | 1.83 | 24,145 | 245.4 | 3,243,604 |
| 10 g/t | 120,312 | 2.42 | 9,360 | 370.0 | 1,431,457 |
| 20 g/t | 380 | 2.56 | 31 | 861.5 | 10,539 |
Cut-off Grade
(AuEq) | % Copper | % Lead | % Zinc | AuEq* (g/t) |
| Grade | Lbs | Grade | Lbs | Grade | Lbs | Grade | OZS |
| (<0.1 g/t) | 0.21 | 10,651,314 | 0.20 | 10,463,564 | 0.88 | 45,017,727 | 2.91 | 217,165 |
| 0.1 g/t | 0.21 | 10,650,819 | 0.21 | 10,463,379 | 0.88 | 45,017,117 | 2.92 | 217,143 |
| 0.2 g/t | 0.21 | 10,647,500 | 0.21 | 10,462,485 | 0.89 | 45,012,493 | 2.93 | 217,103 |
| 0.3 g/t | 0.21 | 10,622,387 | 0.21 | 10,458,203 | 0.90 | 44,959,790 | 2.97 | 216,839 |
| 0.4 g/t | 0.22 | 10,583,583 | 0.21 | 10,444,555 | 0.91 | 44,847,493 | 3.01 | 216,383 |
| 0.5 g/t | 0.22 | 10,500,833 | 0.22 | 10,399,960 | 0.94 | 44,522,995 | 3.11 | 215,239 |
| 1.0 g/t | 0.25 | 9,723,922 | 0.26 | 9,965,894 | 1.09 | 42,175,520 | 3.65 | 205,360 |
| 2.0 g/t | 0.32 | 7,489,082 | 0.37 | 8,567,229 | 1.48 | 34,648,655 | 5.08 | 173,396 |
| 5.0 g/t | 0.48 | 4,308,215 | 0.60 | 5,449,599 | 2.25 | 20,426,367 | 8.33 | 110,070 |
| 10 g/t | 0.59 | 1,566,943 | 0.91 | 2,416,873 | 3.09 | 8,199,986 | 11.79 | 45,618 |
| 20 g/t | 0.61 | 5,074 | 1.88 | 15,748 | 4.90 | 41,050 | 21.34 | 261 |
GeoVector and PFN do not know of any environmental, permitting, legal, title, taxation, socioeconomic, marketing or political issue that could materially affect the Mineral Resource Estimate. In addition GeoVector and PFN do not know of any mining, metallurgical, infrastructural or other relevant factors that could materially affect the Mineral Resource estimate.
47
| Figuure 13: | Isommetric view looking west showing the distribution of ore blocks, at 0.5 g/t AuEq cut-off, within the Rock and Roll deposit. |
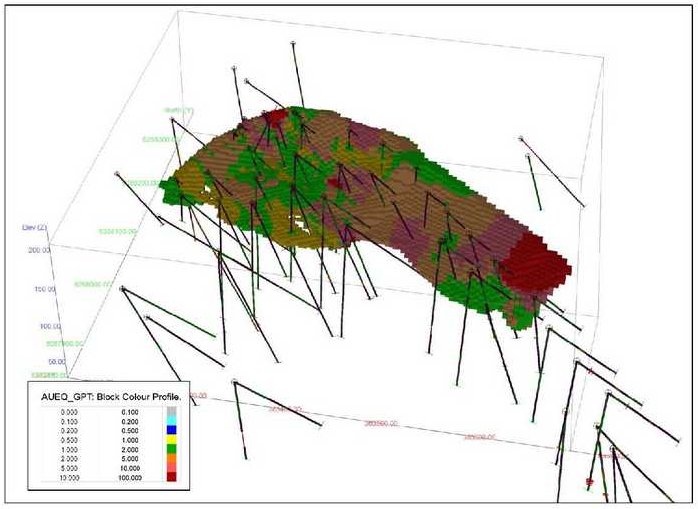
| 18.00 | OTHER RELEVANT DATA AND INFORMATION |
There is no other relevant data or information on necessary to make his technical report understandable and not misleading.
48
| 19.0 | INTERPRETATION AND CONCLUSIONS |
The Rock and Roll property hosts a Ag-Au-Zn-Cu-Pb deposit which has been partially delineated by 109 drill holes totalling 14,100 metres. Mineralization is hosted by graphitic argillite and siltstone representing a basin within a package of volcanic and sedimentary rocks that have been intruded by voluminous mafic to intermediate dykes. The Black Dog zone fits in with a broad group of submarine, volcanic associated Ag-Au-Zn-Cu massive sulphide deposits.
Whereas data density is adequate within the Black Dog horizon between section 5000 and 5400N to delineate the Black Dog deposit, down dip drilling has not been done south of 5000N, in particular around the SRV horizon, which remains open down dip and possibly along strike to north and south.
The 2010 re-sampling program of historic drill core has produced acceptable analytical data through the use of standard reference materials, which were not used in the previous drill programs. The discrepancy noted between Ag-Au values from the 1990-1991 program and the later drilling appears to be related to 1990-91 laboratory analyses as the results of the 2010 re-sampling program match the standards.
Airborne and ground EM conductors extend northwest of the current drill pattern and should be tested by additional drill holes. Drill hole targeting in this area would be assisted by additional interpretation of the airborne time domain EM data collected in 2009, particularly by modelling of potentially deeper EM conductors. The trend and distribution of the airborne conductors suggest that the conductive stratigraphy that hosts the Black Dog horizon may extend across the Iskut River channel to the southern slopes of Mt. Hoodoo. This interpretation is supported by the presence of sulphidic, graphitic argillite, deformed intermediate volcanic rocks and siltstone units, and silicified rocks similar .to the Black Dog horizon
Mineralization observed in the diamond drill holes on the Rock and Roll property may indicate several mineralized horizons within the larger stratigraphic section that hosts the Black Dog and SRV zones. The mineralized rock sample taken near the 150 Grid baseline at the south edge of the Iskut River channel (sample 458827, Plate 4) is an example of another mineralized horizon that lies outside the reach of most of the drill holes.
The 2009 and 2010 programs by PFN on the Rock and Roll Project have brought the project to the point of estimating a mineral resource compliant with N.I. 43-101, as presented in this technical report. The main objective going forward will be to expand that resource through the discovery of new mineralization. The work done by PFN, including compiling data that has not previously been available indicates that there is room to find more mineralization in several target areas. There is room to look down dip and along plunge of the Black Dog and SRV zones, particularly south of Section 5000N. As well, several conductors which extend north from the Black Dog showing have not been tested by diamond drilling. There are indications that there may be multiple mineralized horizons within the Black Dog stratigraphy. The recent airborne geophysical survey in conjunction with geological mapping has shown rocks located north of the Iskut River that have many similarities to the host rocks of the Black Dog zone.
Initial metallurgical testing, baseline environmental studies and a major diamond drilling program are recommended for the Black Dog zone. If core rejects from the 2009 program remain in suitable condition, suitable material should be used to carry out gravity, flotation and cyanidation testwork to determine the range of recoveries and metallurgical parameters that could be expected from the Black Dog zone. Otherwise, core from the 2011 exploration program could be used for the metallurgical testwork.
The relatively shallow dips of the stratigraphy make interpretation of the airborne geophysics difficult. Advanced geophysical modelling of the 2009 airborne data should be done to search for conductive stratigraphy under cover, particularly under and south of Lost Lake. This would involve several days time for a qualified geophysicist as well as rental of sophisticated software.
49
Additional detailed geological mapping in the areas southeast and northwest of the Black Dog Horizon and east and west of this section needs to be done to characterize the stratigraphy and determine the potential for additional mineralized horizons. Additional geological and geochemical survey work should be done north of the Iskut River both to examine the Paleozoic windows in detail and to determine if there are additional exposures present. This work would require three weeks of fly camp based surveying for a crew of four; a geologist, a prospector, and two samplers.
Following the initial field work and geophysical interpretation, diamond drilling should be done to evaluate existing and newly indicated targets. Drill hole RR09-109 did not adequately investigate the west margin of the conductive stratigraphy hosting the Black Dog horizon due to faulting and the presence of a large diorite dyke. The EM conductors in this area northwest of the Black Dog showing should be tested with a fence of holes to ensure the stratigraphy is properly characterized. This will require 1000 metres in 4 drill holes, keeping in mind that overburden depths may be substantial in this area.
There is some potential for extensions of the Black Dog mineralization down dip from the SRV zone, southeast of the current resource. Modelling of the Black Dog deposit and structural interpretation to identify potential in nearby areas i.e. down dip from current drilling on sections south of 5000N should be done to predict the possible position of additional mineralization. This drilling would be deeper than previous drilling in the area and will require 1000 metres in 3 or 4 holes.
Finally, some drilling should be done to test new targets and ideas stemming from the geophysical modelling, geological mapping and geochemical work This drilling is contingent on targets being generated and would amount to 500 metres in 2-4 holes. The number of holes will be dependent on factors such as the depth to geophysical targets.
This program is laid out in the estimated budget below.
A proposed budget for 2011 exploration at the Black Dog zone area is outlined below.
| Geological Mapping, Geophysical Interpretation | |
| North of Iskut R., southeast and south of Lost lake | 250,000 |
| Community Consultations | |
| First Nations consultations, permitting, etc. | 20,000 |
| Baseline Environmental Studies | |
| Weather station, water sampling, etc. | 30,000 |
| Diamond Drilling | |
| 2,500 m NQ diamond drilling (all in cost@$500/metre) | $1,250,000 |
| Preliminary Metallurgical Testing | |
| Metallurgical test, assays, report with petrographic studies | 13,000 |
| Sub-Total | $1,563,000 |
| Contingency(5%) | 78,200 |
| Administration(10%) | 158,800 |
| Total | $1,800,000 |
50
Respectfully submitted,
_____________________________
Murray Jones, M.Sc., P.Geo.
EQUITY EXPLORATION CONSULTANTS LTD.
_____________________________
Allan Armitage, Ph.D., P.Geol.
GEOVECTOR MANAGEMENT INC.
_____________________________
Joe Campbell, P.Geo.
GEOVECTOR MANAGEMENT INC.
February 23, 2011
Appendix A: References
REFERENCES
Alldrick, D.J., 1995. Subaqueous Hot Spring Au-Ag: in Selected British Columbia Mineral Deposit Profiles, Volume 1 – Metallics and Coal, Lefebure, D.V. and Ray, G.E., eds., British Columbia Ministry of Energy, Employment and investment, Open File 1995-20, pp. 55.58.
Alldrick, D.J., 1991. Geology and Ore Deposits of the Stewart Mining Camp, British Columbia; unpublished Ph.D. thesis, University of British Columbia, Vancouver, Canada, 347 p.
Anderson, R.G., 1989. A stratigraphic, plutonic and structural framework for the Iskut River map area, northwestern British Columbia; Geological Survey of Canada, Paper 89-1E, p. 145-154.
Anderson, R.G. and Thokelson, D.L., 1990. Mesozoic stratigraphy and setting for some mineral deposits in the Iskut River map area, northwestern British Columbia; Geological Survey of Canada Paper 89-1E, p. 131-140.
Becherer, M.P.E., 1997. Mineral Resource Estimate, Black Dog and SRV Zones, Rock and Roll Project, Red Star Resources Ltd., Company files
Britton, J.M., Webster, I.C.L., and Aldrick, D.J., 1989. Unuk map area (104B/7E7 8W710E); British Columbia Ministry of Energy, Mines and Petroleum Resources, Geological Fieldwork 1988, Paper 1989-1.
Childe, F., 1996. U-Pb geochronology of Nd and Pb isotope characteristics of the Au-Ag rich Eskay Creek volcanogenic massive sulphide deposit, British Columbia; Economic Geology, Vol. 91, p. 1201-1224.
Cohoon, G.A. and Trebilcock, D.A., 2005. Rock and Roll Project, Geology and Geochemical Surveys; British Columbia Ministry of Energy, Mines and Petroleum Resources, Assessment Report #27,582.
Dean, J.A. (1991a): Report to Prime Explorations Ltd on the Lead Isotopic Compositions of Further Samples from British Columbia. Unpublished company report from CSIRO, Sirtope Report SR164, Division of Exploration Geoscience, 7p.
Dunning, J.K., 2004. A summary report for the Rock and Roll property in the Liard Mining Division, British Columbia, Canada; SEDAR, Technical Report for Conquest Resources Ltd., dated May 14, 2004, 67p.
Dunning, J.K. and Scott, T.C., 1997. 1997 Diamond Drilling Assessment Report on the Rock and Roll mineral claims; British Columbia Ministry of Energy, Mines and Petroleum Resources, Assessment Report #25,221.
Dvorak, Z., 1991. Report on Combined Helicopterborne Magnetic, Electro-magnetic and VLF Survey, Rock and Roll Project, British Columbia; British Columbia Ministry of Energy, Mines and Petroleum Resources, Assessment Report #21,670.
Foley, D.J., 1991. The descriptive and genetic models used to conceptualize the Rock and Roll VMS deposit: Internal company memo.
Forbes, J.R. (1991): Fieldwork Summary Report on the Rock & Roll and Bornagain Properties. Unpublished report for Prime Equities Inc.
Grove, E.W., 1986. Geology and mineral deposits of the Unuk River-Salmon River-Anyox area; British Columbia Ministry of Energy, Mines and Petroleum Resources, Bulletin 63, 434 p.
Henderson, J.R., Kirkham, R.V., Henderson, M.N., Payne, J.G., Wright, T.O., and Wright, R.L.,1992. Stratigraphy and structure of the Sulphurets area, British Columbia; Geological Survey of Canada, Paper 92-lA, p.323-332.
Hoy, T., 1995. Besshi Massive Sulphide: in Selected British Columbia Mineral Deposit Profiles, Volume 1 – Metallics and Coal, Lefebure, D.V. and Ray, G.E., eds., Brtish Columbia Ministry of Energy, Employment and investment, Open File 1995-20, pp. 49-50.
Jones, M.I., 2009. 2009 Geophysical Report on the Rock and Roll Property; British Columbia Ministry of Energy, Mines and Petroleum Resources, Assessment Report #31,158.
Jones, M.I., 2010. 2009 Diamond Drilling Report on the Rock and Roll Property; British Columbia Ministry of Energy, Mines and Petroleum Resources, Assessment Report #31,370.
Lloyd, John, and Cornock, S. John A., 1991 A Summary Report of the 1991 Geophysical Surveys on the Rock'N'Roll Project, Liard Mining Division, Bronson Creek Area, British Columbia. For Eurus Resource Corp and Thios Resources Inc. Volume 1 of 2.
Logan, J.M., and Koyanagi, V.M., 1989. Geology and mineral deposits of the Galore Creek area, northwestern British Columbia (104G/3,4). British Columbia Ministry of Energy, Mines and Petroleum Resources, Geological Fieldwork 1988, Paper 1989-1.
Lydon, J.W. 1990. Volcanogenic massive sulphide deposits Part 1: A descriptive model; in Roberts, R.G. and Sheahan, P.A., eds., Ore Deposit Models, Geoscience Canada, Reprint Series 3, pp. 145-154.
Matysek, P.F.; Day, S.J.; Gravel, J.L.; and Jackaman, W., 1988. Iskut River, British Columbia: Geological Survey of Canada, Open File 1645.
Mihalynuk, M.G., Stier, T.J., Jones, M.I. and Johnston, S.T., 2010. Stratigraphic and structural setting of the Rock and Roll deposit, northwestern British Columbia (NTS 104B/11): British Columbia Ministry of Energy, Mines and Petroleum Resources, Geological Fieldwork 2009, Paper 2010-1, pp.718.
Montgomery, A.T., Todoruk, S.L. and Ikona, C.K., 1991. Assessment Report on the Rock and Roll Project; British Columbia Ministry of Energy, Mines and Petroleum Resources Assessment Report #20,884.
Montgomery, A.T. and Ikona, C.K., 1989. Geological Report on the Rob 17, 19, 20, 21 Mineral Claims; British Columbia Ministry of Energy, Mines and Petroleum Resources, Assessment Report #18462.
Nadaraju, G.T., 1993. Triassic-Jurassic biochronology of the eastern Iskut River map area, northwestern British Columbia. Unpublished M.Sc. thesis, Vancouver, Canada, University of British Columbia, 223p.
Pegg, R., 1989. Geological and Geochemical Report on the 1989 Exploration Program of the Rock and Roll property; British Columbia Ministry of Energy, Mines and Petroleum Resources, Assessment Report #19,566.
Peter, J.M. and Scott, S. D., 1999. Windy Craggy, northwestern British Columbia: The world’s largest Besshitype deposit; Reviews in Economic Geology, v. 8, pp. 261-295.
Todoruk, S.L. and Ikona, C.K., 1988a. Geological Report on the Rob 19, 20, 21 Mineral Claims; British Columbia Ministry of Energy, Mines and Petroleum Resources, Assessment Report #17,219.
Todoruk, S.L. and Ikona, C.K., 1988b. Geological Report on the Rob 17 & 18 and Win 1 & 2 Mineral Claims; British Columbia Ministry of Energy, Mines and Petroleum Resources, Assessment Report #17,209.
Appendix B: Geologists’ Certificates