UNITED STATES
SECURITIES AND EXCHANGE COMMISSION
Washington, D.C. 20549
FORM 20-F
[ ] Registration Statement Pursuant to Section 12(b) Or (g) of the Securities Exchange Act of 1934
or
[ X] Annual Report Pursuant to Section 13 or 15(d) of the Securities Exchange Act of 1934
For the Fiscal Year Ended APRIL 30, 2011
or
[ ] TRANSITION REPORT PURSUANT TO SECTION 13 OR 15 (D) OF THE SECURITIES EXCHANGE ACT OF 1934 or
[ ] SHELL COMPANY REPORT PURSUANT TO SECTION 13 OR 15(D) OF THE SECURITIES EXCHANGE ACT OF 1934
Date of event requiring this shell company report
For the transition period from ______________ to _________________
Commission File Number:0-29928
Pacific North West Capital Corp.
(Exact name of Registrant as specified in its Charter)
Not Applicable
(Translation of Registrant’s name into English)
British Columbia, Canada
(Jurisdiction of incorporation or organization)
2303 West 41st Avenue, Vancouver, British Columbia V6M 2A3
(Address of principal offices)
Harry Barr, President – info@pfncapital.com, telephone: (604) 685-1870,
facsimile: (604) 685-6550
(Name, telephone, email and/or facsimile number and address of company contact person)
Securities Registered or to be Registered Pursuant to Section 12 (b) of the Act.
| Title of Each Class | Name on Each Exchange On Which Registered |
| Not Applicable | Not Applicable |
Securities Registered or to be Registered Pursuant to Section 12(g) of the Act.
Common Shares Without Par Value
(Title of Class)
Exhibits Index is on page 89
Securities for which there is a reporting obligation pursuant to Section 15(d) of the Act.
None
(Title of Class)
Indicate the number of outstanding shares of each of the issuer’s classes of capital or common stock as of the close of the period covered by the annual report.
85,737,788
Indicate by check mark if the registrant is a well-known seasoned issuer, as defined in Rule 405 of the Securities Act.
Yes [ ] No [X]
If this report is an annual or transition report, indicate by check mark if the registrant is not required to file reports pursuant to Section 13 or 15(d) of the Securities Exchange Act of 1934.
Yes [ ] No [X]
Indicate by check mark whether the registrant (1) has filed all reports required to be filed by Section 13 or 15(d) of the Securities Exchange Act of 1934 during the preceding 12 months (or for such shorter period that the registrant was required to file such reports), and (2) has been subject to such filing requirements for the past 90 days.
Yes [X] No [ ]
Indicate by check mark whether the registrant has submitted electronically and posted on its corporate Web site, if any, every Interactive Data File required to be submitted and posted pursuant to Rule 405 of Regulation S-T (§232.405 of this chapter) during the preceding 12 months (or for such shorter period that the registrant was required to submit and post such files).
Yes [ ] No [X]
Indicate by check mark whether the registrant is a large accelerated filer, an accelerated filer, or a non-accelerated filer. See definition of “accelerated filer and large accelerated filer” in Rule 12b-2 of the Exchange Act.
Large accelerated filer [ ] Accelerated filer [ ] Non-accelerated filer [X]
Indicate by check mark which basis of accounting the registrant has used to prepare the financial statement included in this filing:
U.S. GAAP [ ] International Financial Reporting Standards as issued Other [X]
by the International Accounting Standards Board
If “Other” has been checked in response to the previous question, indicate by check mark which financial statement item the registrant has elected to follow.
[X] Item 17 [ ] Item 18
If this is an annual report, indicate by check mark whether the registrant is a shell company (as defined in Rule 12b‑2 of the Exchange Act.)
Yes [ ] No [X]
(APPLICABLE ONLY TO ISSUERS INVOLVED IN BANKRUPTCY PROCEEDINGS DURING THE PAST FIVE YEARS)
Indicate by check mark whether the registrant has filed all documents and reports required to be field in Sections 12, 13 or 15(d) of the Securities Exchange Act of 1934 subsequent to the distribution of securities under a plan confirmed by a court.
[ ] Yes [X] Not applicable
2
TABLE OF CONTENTS
| | | | | Page |
| General Information | |
| CAUTIONARY NOTE REGARDING FORWARD-LOOKING STATEMENTS | 5 |
| CAUTIONARY NOTE TO U.S. INVESTORS REGARDING RESERVE AND RESOURCE | 6 |
| ESTIMATES MEASUREMENT CONVERSION INFORMATION | 6 |
| Glossary of Mining Terms | 7 |
| Mineral Reserves - Definitions | 10 |
| PART I | |
| ITEM 1. | IDENTITY OF DIRECTORS, SENIOR MANAGEMENT AND ADVISORS | 11 |
| ITEM 2. | OFFER STATISTICS AND EXPECTED TIMETABLE | 11 |
| ITEM 3. | KEY INFORMATION | 11 |
| | A. Selected Financial Data | 10 |
| | B. Capitalization and Indebtedness | 13 |
| | C. Reasons for the Offer and Use of Proceeds | 13 |
| | D. Risk Factors | 13 |
| ITEM 4. | INFORMATION ON THE COMPANY | 17 |
| | A. History and Development of the Company | 17 |
| | B. Business Overview | 18 |
| | C. Organizational Structure | 18 |
| | D. Property, Plants, and Equipment | 18 |
| | | Ontario, Canada | 19 |
| | | I. River Valley Joint Venture Project | 19 |
| | | II. Sargesson Lake and Kelly-Davis Properties | 33 |
| | | III. West Timmins Nickel Project | 34 |
| | | IV. Raglan Hills (formerly South Renfrew) | 35 |
| | | V. Coldwell Properties | 36 |
| | | VI. Goodchild Property | 36 |
| | | VII. East Sudbury Property | 36 |
| | | VIII. Swayze Joint Venture | 37 |
| | | IX. North Duluth Property | 38 |
| | | Quebec, Canada | 38 |
| | | I. Glitter Lake Property | 38 |
| | | II. SOQUEM Taureau & Chenneville Projects | 39 |
| | | III. Fiedmont Property | 40 |
| | | IV Destiny Gold Project | 40 |
| | | Northwest Territories | 44 |
| | | I. Winter Lake | 44 |
| | | Saskatchewan Project | 44 |
| | | I. Nickel Plats Project | 44 |
| | | British Columbia | 45 |
| | | I Rock & Roll Property | 45 |
| | | Alaska>, USA | 49 |
| | | I. Union Bay Platinum Property | 49 |
| | | II. Kane Property | 49 |
| | | III. Tonsina Property | 50 |
| | | IV. Nixon Fork Project | 50 |
| ITEM 5. | OPERATING AND FINANCIAL REVIEW AND PROSPECTS | 50 |
| | | A. | Operating Results | 54 |
| | | | Twelve Months Ended April 30, 2011 Compared to Twelve Months Ended April 30, 2010 | 54 |
| | | | Twelve Months Ended April 30, 2010 Compared to Twelve Months Ended April 30, 2009 | 55 |
| | | | Twelve Months Ended April 30, 2009 Compared to Twelve Months Ended April 30, 2008 | 56 |
| | | B. | Liquidity and Capital Reserves | 57 |
| | | | Twelve Months Ended April 30, 2011 Compared to Twelve Months Ended April 30, 2010 | 57 |
| | | | Twelve Months Ended April 30, 2010 Compared to Twelve Months Ended April 30, 2009 | 57 |
| | | | Twelve Months Ended April 30, 2009 Compared to Twelve Months Ended April 30, 2008 | 59 |
| | | C. | Research and Development, Patents and Licenses, etc. | 58 |
| | | D. | Trend Information | 58 |
| | | E. | Off-Balance Sheet Arrangements | 58 |
| | | F. | Tabular Disclosure of Contractual Obligations | 58 |
| | | G. | Safe Harbour | 59 |
3
4
GENERAL INFORMATION
All references in this annual report on Form 20-F to the terms “we”, “our”, “us”, “the Company” and “PFN” refer to Pacific North West Capital Corp.
CAUTIONARY NOTE REGARDING FORWARD-LOOKING STATEMENTS
This annual report includes "forward-looking statements" within the meaning of Section 27A of the Securities Act and Section 21E of the Securities and Exchange Act of 1934, as amended (the "Exchange Act"). Any statements that express or involve discussions with respect to predictions, expectations, beliefs, plans, projections, objectives, assumptions or future events or performance (often, but not always, using words or phrases such as "expects" or "does not expect", "is expected", "anticipates" or "does not anticipate", "plans", "estimates" or "intends", or stating that certain actions, events or results "may", "could", "would", "might" or "will" be taken, occur or be achieved) are not statements of historical fact and may be "forward looking statements". Such statements are included, among other places in this Registration Statement, in the sections entitled "Management's Discussion and Analysis of Financial Condition and Results of Operations. Forward-looking statements are based on expectations, estimated and projections at the time the statements are made that involve a number of risks and uncertainties which could cause actual results or events to differ materially from those presently anticipated. These include, but are not limited to, the risks of mining industry (for example, operational risks of exploring for, developing and producing crude oil and natural gas, risks and uncertainties involving geology of mineral deposits, the uncertainty of reserve estimates and estimates relating to production volumes, cost and expense projections, potential cost overruns and health, safety and environmental risks), risks relating to the Company's properties (for example, lack of operating history and transportation), fluctuations in mineral prices and exchange rates and uncertainties resulting from potential delays or changes in plans with respect to exploration or development projects or capital expenditures (collectively "Cautionary Statements"). Although the Company believes that the expectations reflected in such forward-looking statements are reasonable, it can give no assurance that such expectations will prove to have been correct.
5
CAUTIONARY NOTE TO U.S. INVESTORS CONCERNING RESERVE AND RESOURCE ESTIMATES
The terms “mineral reserve”, “proven mineral reserve” and “probable mineral reserve” are Canadian mining terms as defined in accordance with Canadian National Instrument 43-101 – Standards of Disclosure for Mineral Projects (“NI 43-101”) and the Canadian Institute of Mining, Metallurgy and Petroleum (the “CIM”) - CIM Definition Standards on Mineral Resources and Mineral Reserves, adopted by the CIM Council, as amended. These definitions differ from the definitions in the United States Securities and Exchange Commission Industry Guide 7 (“SEC Industry Guide 7”) under the Securities Act of 1933, as amended. Under SEC Industry Guide 7 standards, a “final” or “bankable” feasibility study is required to report reserves, the three-year historical average price is used in any reserve or cash flow analysis to designate reserves and the primary environmental analysis or report must be filed with the appropriate governmental authority. Under SEC Industry Guide 7 standards, mineralization may not be classified as a “reserve” unless the determination has been made that the mineralization could be economically and legally produced or extracted at the time the reserve determination is made.
In addition, the terms “mineral resource”, “measured mineral resource”, “indicated mineral resource” and “inferred mineral resource” are defined in and required to be disclosed by NI 43-101; however, these terms are not defined terms under SEC Industry Guide 7 and are normally not permitted to be used in reports and registration statements filed with the United States Securities and Exchange Commission. Investors are cautioned not to assume that any part or all of mineral deposits in these categories will ever be converted into reserves or that they can be mined economically or legally. “Inferred mineral resources” have a great amount of uncertainty as to their existence, and great uncertainty as to their economic and legal feasibility. It cannot be assumed that all, or any part, of an inferred mineral resource will ever be upgraded to a higher category. Under Canadian rules, estimates of inferred mineral resources may not form the basis of feasibility or pre-feasibility studies, except in rare cases. Investors are cautioned not to assume that all or any part of an inferred mineral resource exists or that it can be economically or legally mined. Disclosure of “contained ounces” in a resource is permitted disclosure under Canadian regulations; however, the United States Securities and Exchange Commission normally only permits issuers to report mineralization that does not constitute “reserves” by Securities and Exchange Commission standards as in place tonnage and grade without reference to unit measures.
Accordingly, information contained in this annual report and the documents incorporated by reference herein contain descriptions of our mineral deposits that may not be comparable to similar information made public by U.S. companies subject to the reporting and disclosure requirements under the United States federal securities laws and the rules and regulations thereunder.
MEASUREMENT CONVERSION INFORMATION
In this Annual Report on Form 20-F, metric measures are used with respect to mineral properties described herein. For ease of reference, the following conversion factors are provided:
| 1 mile | = 1.609 kilometres | | 2,240 pounds | = 1 tonne |
| 1 yard | = 0.9144 metre | | 2,000 pounds/short ton | = 0.907 tonnes |
| 1 acre | = 0.405 hectare | | 1 troy ounce | = 31.103 grams |
6
GLOSSARY
The following are definitions of mining terms and certain other terms used in this Statement.
| Ag | Periodic symbol for Silver |
| | |
| Alto | Alto Ventures Ltd. |
| | |
| Anglo Platinum | Anglo American Platinum Corporation Limited |
| | |
| Au | Periodic symbol for Gold |
| | |
| assay | A chemical test performed on a sample of rocks or core to determine the amount of contained metals |
| | |
| assessment work | The amount of work, specified by mining law, that must be performed each year in order to retain legal control of mining claims |
| | |
| BHEM | Borehole electromagnetic induction geophysics |
| | |
| breccia | A rock in which angular fragments are surrounded by a mass of fine-grained minerals |
| | |
| Calista | Calista Corporation |
| | |
| CanAlaska | CanAlaska Uranium Ltd. |
| | |
| chalcopyrite | A sulphide mineral of Copper and Iron; an important ore mineral of Copper |
| | |
| channel sample | A sample from a small trench or channel, cut on a rock surface, usually about 5-10 cm wide and 2 cm deep, to provide accurate distribution of mineralization |
| | |
| chip sample | A method of sampling a rock exposure whereby a regular series of small chips of rock is broken off along a line across the face |
| | |
| CIM | Canadian Institute of Mining, Metallurgy, and Petroleum Standards on Mineral Resources and Mineral Reserves(see “Mineral Reserves – Definitions” below) |
| | |
| Cu | Periodic symbol for Copper |
| | |
| diabase | A common basic intrusive igneous rock usually occurring in dykes or sills |
| | |
| diamond drill | A rotary type of rock drill that cuts a core of rock that is recovered in long cylindrical sections, two cm or more in diameter |
| | |
| diorite | An intrusive igneous rock composed chiefly of plagioclase, hornblende, biotite or pyroxene |
| | |
| EM Survey | A geophysical survey method which measures the electromagnetic properties of rocks |
| | |
| Equity | Equity Exploration Consultants Ltd. |
| | |
| exploration | Prospecting, sampling, mapping, diamond drilling and other work involved in searching and defining or bodies |
| | |
| Feasibility Study | A detailed report showing the feasibility of placing a prospective ore body or deposit of the minerals within a mineral property into production, which report typically includes, inter alia, the specific portion or portions of the property that should be included, in a development block, conclusions and recommendations regarding any adjustments that should be made to the boundaries of a development block, a description of the work to be performed in order to develop the mineral resources within the development block and to construct a mine or mines and related facilities on the development block, the estimated capital and operating costs thereof, a proposed schedule for the timing of development and mine construction, and the information obtained and evaluations made in respect thereof |
|
7
| Freegold | Freegold Ventures Limited |
| | |
| FireRiver | Fire River Gold Corp. – a company trading on the TSX Venture Exchange and having purchased a 100% interest in the Nixon Fork Gold Mine, Alaska, from the Company |
| | |
| First Nickel | First Nickel Inc. - the Company’s joint venture partner on the Raglan Hills project |
| | |
| geophysical survey | The use of one or more geophysical techniques in geophysical exploration |
| | |
| GeoSim | GeoSim Services Inc., a mineral resource estimate consulting firm |
| | |
| GeoSim Report | “Revised Mineral Resources Estimate, Lismer’s North and Varley Areas (Incorporating VII Drilling), River Valley PGM Project, Ontario, for Pacific North West Capital Corp., dated May 2006” (the “GeoSim Report”) prepared by Ron Simpson, P.Geo., of GeoSim, and John Londry, then-Vice President of Exploration for the Company |
| | |
| Geovector | Geovector Management Inc. |
| | |
| gpt or g/t | Grams per tonne |
| | |
| grab samples | A sample of rock or sediment taken more or less indiscriminately at any place |
| | |
| granite | A coarse-grained intrusive igneous rock consisting of quartz, feldspar and mica |
| | |
| ha | Hectare - a unit for measuring an area of land equal to 10,000 square metres |
| | |
| Induced Polarization | A geophysical survey method which measures the conductivity properties of rocks |
| | |
| Kaymin | Kaymin Resources Limited, a wholly-owned subsidiary of Anglo Platinum |
| | |
| Kinbauri | Kinbauri Gold Corp. |
| | |
| km | A measure of distance known as a kilometre |
| | |
| Pb | Periodic symbol for lead |
| | |
| m | A measure of distance known as a metre |
| | |
| mineral | An inorganic substance having usually a definite chemical composition and, if formed under favourable conditions, having a certain characteristic atomic structure which is expressed in its crystalline form and other physical properties |
| | |
| mineralization | The concentration of metals and their chemical compounds within a body of rock |
| | |
| Ni | Periodic symbol for Nickel |
| | |
| Nickel | A hard white silver metallic chemical element |
| | |
| NI 43-101 | National Instrument 43-101,Standards of Disclosure for Mineral Projects – a Canadian instrument |
| | |
| NSR | Net Smelter Return Royalty |
| | |
| opt | Ounces per ton |
| | |
| ore | A natural aggregate of one or more minerals, which at a specified time and place, may be mined and sold at a profit, or which from some part may be profitably separated |
| | |
| oz | A measure of weight known as an ounce |
| | |
| Pd | Periodic symbol for Palladium |
| | |
| PGE | Platinum Group Elements |
8
| PGM | Platinum Group Metals |
| | |
| ppb | Parts per billion |
| | |
| ppm | Parts per million |
| | |
| Pt | Periodic symbol for Platinum |
| | |
| Rh | Periodic symbol for Rhodium |
| | |
| Rock & Roll Report | NI 43-101 compliant report on the Rock and Roll Property, entitled “2010 Technical Report on the Rock and Roll Property” by Murray Jones, P. Geo. of Equity, and Allan Armitage, Ph.D., P. Geol. and Joe Campbell, P.Geo., of Geovector, dated February 23, 2011 and filed on the Company’s Form 6-K for May 2011 |
| | |
| RVI | River Valley Intrusion |
| | |
| sample | A small portion of rock or mineralization taken so that the metal content can be determined by assaying |
| | |
| sampling | Selecting a fractional but representative part of a rock or mineralization for analysis |
| | |
| Stillwater | Stillwater Mining Company is engaged in the development, extraction, processing, smelting, refining, and marketing of palladium, platinum and associated metals from a geological formation in southern Montana known as the J-M Reef. This is the only known significant source of platinum group metals in the United States and one of the significant resources outside Russia and South Africa. Stillwater’s corporate office is located in Columbus, Montana. |
| | |
| strike | The bearing of a bed or layer of rock |
| | |
| ton | 2,000 pounds |
| | |
| tonne | A metric ton (2,204 pounds) |
| | |
| vein | A fissure, fault or crack in a rock filled by minerals that have traveled upwards from some deep source |
| | |
| Wardrop Report | NI 43-101 compliant “Technical Report and Resource Estimation of the DAC Deposit, Destiny Property, Québec” (the “Destiny Tech Report”) for Alto Ventures Ltd. and Pacific North West Capital Corp. dated March 1, 2011, by Todd McCracken, P.Geo.”, of Wardrop, filed on the Company’s Form 6-K for March 2011 |
| | |
| Wardrop | Wardrop - a Tetra Tech Company |
| | |
| Zn | Periodic symbol for Zinc |
| | |
| 3E | Pt+Pd+Au |
| | |
| 4E | Pt+Pd+Au+Rh |
9
Mineral Reserves – Definitions
| Indicated Mineral Resource | An Indicated Mineral Resource is part of a Mineral Resource for which quantity, grade or quality, densities, shape, and physical characteristics, can be estimated with a level of confidence sufficient to allow the appropriate application of technical and economic parameters, to support mine planning and evaluation of the economic viability of the deposit. The estimate is based on detailed and reliable exploration and testing information gathered through appropriate techniques from locations such as outcrops, trenches, pits, workings, and drill holes that are spaced closely enough for geological and grade continuity to be reasonably assumed. |
| | |
| Inferred Mineral Resource | An Inferred Mineral Resource is that part of a Mineral Resource for which quantity and grade or quality can be estimated on the basis of geological evidence and limited sampling and reasonably assumed, but not verified, geological and grade continuity. The estimate is based on limited information and sampling gathered through appropriate techniques from locations such as outcrops, trenches, pits, workings, and drill holes. |
| | |
| Measured Mineral Resource | A Measured Mineral Resource is part of a Mineral Resource for which quantity, grade or quality, densities, shape and physical characteristics are so well established that they can be estimated with confidence sufficient to allow the appropriate application of technical and economic parameters, to support production planning and evaluation of the economic viability of the deposit. The estimate is based on a detailed and reliable exploration, sampling and testing information gathered through appropriate techniques from locations such as outcrops, trenches, pits, workings, and drill holes that are spaced closely enough to confirm both geological and grade continuity. |
| | |
| Mineral Reserve | As defined by CIM, a Mineral Reserve is the economically mineable part of a Measured or Indicated Mineral Resource demonstrated by at least a Preliminary Feasibility Study. This Study must include adequate information on mining, processing, metallurgical, economic and other relevant factors that demonstrate, at the time of reporting, that economic extraction can be justified. A Mineral Reserve includes diluting materials and allowances for losses that may occur when the material is mined. |
| | |
| Mineral Resource | A Mineral Resource is a concentration or occurrence of diamonds, natural solid inorganic material, or natural solid fossilized organic material including base and precious metals, coal, and industrial minerals in or on the Earth’s crust in such form and quantity and of such a grade or quality that it has reasonable prospects for economic extraction. The location, quantity, grade, geological characteristics and continuity of a Mineral Resource are known, estimated or interpreted from specific geological evidence and knowledge. |
| | |
| Probable Mineral Reserve | A Probable Mineral Reserve is the economically mineable part of an Indicated and, in some circumstances, a Measured Mineral Resource demonstrated by at least a Preliminary Feasibility Study. This Study must include adequate information on mining, processing, metallurgical, economic, and other relevant factors that demonstrate, at the time of reporting, that economic extraction can be justified. |
| | |
| Proven Mineral Reserve | A Proven Mineral Reserve is the economically mineable part of a Measured Mineral Resource demonstrated by at least a Preliminary Feasibility Study. This Study must include adequate information on mining, processing, metallurgical, economic, and other relevant factors that demonstrate, at the time of reporting, that economic extraction is justified. |
| | |
| Qualified Person or QP | As defined by CIM, a “Qualified Person” means an individual who is an engineer or geoscientist with at least five years of experience in mineral exploration, mine development or operation or mineral project assessment, or any combination of these; has experience relevant to the subject matter of the mineral project and the technical report; and is a member or licensee in good standing of a professional association. |
10
PART I
ITEM 1. IDENTITY OF DIRECTORS, SENIOR MANAGEMENT AND ADVISORS
This Form 20F is being filed as an annual report under the Exchange Act and, as such, there is no requirement to provide any information under this item.
ITEM 2. OFFER STATISTICS AND EXPECTED TIMETABLE
This Form 20F is being filed as an annual report under the Exchange Act and, as such, there is no requirement to provide any information under this item.
ITEM 3. KEY INFORMATION
A. Selected Financial Data
Pacific North West Capital Corp. ("PFN" or the "Company") has a limited history of operations and has not generated any operating revenues. The following table sets forth, for the periods and the dates indicated, selected financial and operating data for the Company. This information should be read in conjunction with the Company's audited consolidated financial statements and notes thereto and "Management's Discussion and Analysis of Financial Condition and Results of Operations" included elsewhere herein. The selected financial data provided below are not necessarily indicative of the future results of operations or financial performance of the Company. To date the Company has not paid any dividends on its common shares and it does not expect to pay dividends in the foreseeable future.
The audited consolidated financial statements of the Company have been prepared in accordance with accounting principles generally accepted in Canada ("Canadian GAAP"). There are material differences between Canadian GAAP and the United States Generally Accepted Accounting Principles ("U.S. GAAP") as applied to the Company including disclosure items. For a comparison of these differences, refer to Note 15 to the April 30, 2011 Audited Consolidated Financial Statements.
Selected Financial Data
(In Canadian Dollars)
| | Year Ended April 2011 | Year Ended April 2010 | Year Ended April 2009 | Year Ended April 2008 | Year Ended April 2007 |
| | | | | | |
| Canadian GAAP | | | | | |
| | | | | | |
| Interest and other income | 52,293 | 52,616 | 222,252 | 314,082 | 147,301 |
| Project management fees | - | 6,680 | 25,628 | 297,622 | 49,209 |
| Net loss | 4,153,650 | 771,019 | 5,354,466 | 883,378 | 1,230,764 |
Loss per common share –
continuing operations | 0.06 | 0.06 | 0.09 | 0.02 | 0.03 |
Income per common share –
discontinued operation | - | 0.04 | - | - | - |
| Weighted Average No. Shares – Basic | 69,399,792 | 62,675,963 | 61,721,508 | 53,358,393 | 37,743,307 |
| Weighted Average No. Shares – Diluted | 69,399,792 | 62,954,534 | 61,721,508 | 53,358,393 | 37,743,307 |
11
Selected Financial Data continued
(In Canadian Dollars)
| | Year Ended April 2011 | Year Ended April 2010 | Year Ended April 2009 | Year Ended April 2008 | Year Ended April 2007 |
| | | | | | |
| Working capital | 8,686,132 | 7,249,616 | 5,418,885 | 10,088,901 | 4,298,776 |
| Mineral properties | 6,362,048 | 3,899,594 | 4,333,979 | 6,622,731 | 2,795,717 |
| Total assets | 15,575,641 | 11,353,054 | 15,095,336 | 17,087,029 | 7,315,871 |
| Capital stock | 30,276,368 | 25,170,802 | 24,779,281 | 25,677,015 | 16,906,926 |
| Dividends declared per share | - | - | - | - | - |
Selected Financial Data
(In Canadian Dollars)
| | Year Ended April 2011 | Year Ended April 2010 | Year Ended April 2009 | Year Ended April 2008 | Year Ended April 2007 |
| | | | | | |
| USGAAP | | | | | |
| | | | | | |
| Interest and other income | 52,293 | 52,616 | 222,252 | 314,082 | 147,301 |
| Project management fees | - | 6,680 | 25,628 | 297,622 | 49,209 |
| Net loss for period | 3,447,365 | 571,680 | 3,535,052 | 4,939,262 | 2,257,084 |
| Loss per common share | 0.05 | 0.01 | 0.05 | 0.09 | 0.06 |
| Weighted Average No. Shares | 69,399,792 | 62,675,963 | 61,721,508 | 53,358,393 | 37,743,307 |
| | | | | | |
| Working Capital | 8,608,818 | 7,249,616 | 5,418,885 | 8,031,041 | 3,567,904 |
| Mineral properties | 3,398,943 | 230,204 | 199,750 | 173,650 | - |
| Total assets | 12,612,536 | 7,683,664 | 10,961,107 | 10,464,298 | 4,520,154 |
| Capital stock | 31,877,709 | 26,849,457 | 26,192,436 | 25,677,015 | 16,906,926 |
| Dividends declared per share | - | - | - | - | - |
In this Annual Report on Form 20-F, unless otherwise specified, all monetary amounts are expressed in Canadian dollars. On July 22, 2011, the exchange rate, based on the noon buying rate published by the Bank of Canada, for the conversion of United States dollars into Canadian dollars (the “Noon Rate of Exchange”) was $0.9502.
The following table sets out the high and low exchange rates for each of the last six (s) months.
| | 2011 |
| | June | May | April | March | February | January |
| High for period | 0.9861 | 0.9809 | 0.9691 | 0.9918 | 0.9955 | 1.0022 |
| Low for period | 0.9643 | 0.9486 | 0.9486 | 0.9686 | 0.9739 | 0.9862 |
The following table sets out the average exchange rates for the five most recent financial years calculated by using the average of the Noon Rate of Exchange on the last day of each month during the period.
| | Year Ended April 30 |
| | 2011 | 2010 | 2009 | 2008 | 2007 |
| Average for the period | 1.0123 | 1.0721 | 1.1444 | 1.0225 | 1.1377 |
12
B. Capitalization and Indebtedness
This Form 20F is being filed as an annual report under the Exchange Act and, as such, there is no requirement to provide any information under this item.
C. Reasons for the Offer and Use of Proceeds
This Form 20F is being filed as an annual report under the Exchange Act and, as such, there is no requirement to provide any information under this item.
D. Risk Factors
As resource exploration is a speculative business, which is characterized by a number of significant risks including, among other things, unprofitable efforts resulting from the failure to discover mineral deposits. The marketability of minerals acquired or discovered by the Company may be affected by numerous factors which are beyond the control of the Company and which cannot be accurately predicted, such as market fluctuations, the proximity and capacity of milling facilities, mineral markets and processing equipment, and such other factors as government regulations, including regulations relating to royalties, allowable production, importing and exporting of minerals, and environmental protection, the combination of which factors may result in the Company not receiving an adequate return of investment capital.
To date, the Company’s properties have no proven commercially viable reserves and are currently at the exploration stage and as such prospective purchasers of the Company’s common shares should consider carefully, among other things, that the Company’s exploration of its properties involves significant risks. Our current Management while considerably experienced in managing exploration projects has limited production experience and as such is dependent upon the production expertise of our joint venture partners.
| | Mineral exploration involves a high degree of risk and few properties which are explored result in any discoveries of commercial bodies of mineralization or are ultimately developed into producing mines. The long-term profitability of the Company’s operations will be in part directly related to the cost and success of its exploration programs, which may be affected by a number of factors. |
| | Substantial expenditures are required to establish reserves through drilling, metallurgical processes to extract the metal from the ore and, in the case of new properties, to build the mining and processing facilities and infrastructure at any site chosen for mining. Minerals may not be discovered in sufficient quantities and grades to justify commercial operations or funds required for further expansion may not be obtained on a timely basis. All of the Company’s projects are currently in exploration stages. Estimates and mineral projects can also be affected by such factors as environmental permitting regulations and requirements, weather, environmental factors and unforeseen technical difficulties, as well as unusual or unexpected geological formations and work interruptions. In addition, the grade of ore ultimately mined may differ from that indicated by drilling results. |
| (ii) | Lack of Cash Flow and Non-Availability of Additional Funds |
| | The Company's properties are currently being explored or assessed for exploration and as a result, the Company has no source of operating cash flow. The Company has limited financial resources and, if additional funding were needed it may not be available to the Company on terms and conditions acceptable to it. Failure to obtain such additional financing could result in delay or indefinite postponement of further exploration and the possible, partial or total loss of the Company's interest in current properties. The Company presently has sufficient financial resources to undertake all of its currently planned exploration programs |
| | The exploration of any ore deposits found on the Company's exploration properties depends upon the Company's ability to obtain financing through debt financing, equity financing or other means. Failure to obtain additional financing on a timely basis could cause the Company to forfeit all or parts of its interests in some or all of its properties or joint ventures and reduce or terminate its operations. |
13
| | None of the Company's properties has commenced commercial production and the Company has no history of earnings or cash flow from its operations. As a result there can be no assurance that the Company will be able to develop any of its properties profitably or that its activities will generate positive cash flow. The Company has not declared or paid dividends on its common shares since incorporation and does not anticipate doing so in the foreseeable future. The only present source of funds available to the Company is through the sale of its common shares. Even if the results of exploration are encouraging, the Company may not have sufficient funds to conduct the further exploration that may be necessary to determine whether or not a commercially mineable deposit exists on any property. |
| (iii) | Operating Hazards and Risks |
| | Mineral exploration involves many risks, which even a combination of experience, knowledge and careful evaluation may not be able to overcome. Operations in which the Company has a direct or indirect interest will be subject to all the hazards and risks normally incidental to exploration, of PGMs and other metals, such as unusual or unexpected formations, cave-ins, pollution, all of which could result in work stoppages, damage to property, and possible environmental damage. The Company does have $10,000,000 commercial general liability insurance covering its operations. Payment of any liabilities in excess of its insurance could have a materially adverse effect upon the Company's financial condition. |
| | All of the properties in which the Company holds an interest are considered to be in the exploration stage only and do not contain a known body of commercial ore. |
| | Due to the large number and diverse legal nature of the mineral properties described herein, full investigation of legal title to each such property has not been carried out at this time. Much of the River Valley property was covered by the Temagami Land Caution and was not in fact open for staking and as such was closed for mineral exploration and development for twenty or more years. In June 1996, the Ontario Government passed legislation allowing the area open for staking mineral claims and on September 17, 1996, the area was re-opened for staking. The Company cannot be certain that native land claim issues may not arise. |
| | Many of the Company's properties may be subject to prior unregistered agreements of transfer or native land claims and title may be affected by undetected defects. The Company's properties consist of recorded mineral claims which have not been surveyed, and therefore the precise area and location of such claims is undefined. |
| | There is no guarantee that title to any claim will not be challenged or impugned. |
| (vi) | Uncertainty or Contestation of Contract Rights |
| | The Company owns or has the right to earn interests in properties under contract with a number of individuals and corporations. The Company has no control over whether these individuals or corporation have the full right to enter into an agreement and no control should any legal action be taken against the vendors of the properties. Should the Company not be able be meet its financial commitments to the vendor of a property this may result in the forfeiture of Company’s right to earn an interest in the property. |
| (vii) | Conflicts of Interest |
| | Harry Barr, Linda Holmes and John Londry, directors of the Company, are directors of other mineral resource companies and, to the extent that such other companies may participate in ventures in which the Company may participate, these directors of the Company may have a conflict of interest in negotiating and concluding terms respecting the extent of such participation. (See Item 6, Directors, Senior Management and Employees, A. Directors and Senior Management, for detailed disclosure regarding each of Messrs. Barr and Londry and Ms. Holmes and other mineral resource companies which with each is affiliated.) In the event that such a conflict of interest arises at a meeting of the directors of the Company, a director who has such a conflict will abstain from voting for or against the approval of such a participation or such terms. In appropriate cases the Company will establish a special committee of independent directors to review a matter in which several directors, or management, may have a conflict. From time to time several companies may participate in the acquisition, exploration and development of natural resource properties thereby allowing for their participating in larger programs, permitting involvement in a greater number of programs and reducing financial exposure in respect of any one program. It may also occur that a particular company will assign all or a portion of its interest in a particular program to another of these companies due to the financial position of the company making the assignment. In accordance with the laws of the Province of British Columbia, the directors of the Company are required to act honestly, in good faith and in the best interest of the Company. In determining whether the Company will participate in a particular program and the interest therein to be acquired by it, the directors will primarily consider the potential benefits to the Company, the degree of risk to which the Company may be exposed and its financial position at that time. Other than as indicated, the Company has no other procedures or mechanisms to deal with conflicts of interest. The Company is not aware of the existence of any conflict of interest as described herein |
14
| (viii) | Competition and Agreements with Other Parties |
| | The mineral resources industry is intensely competitive and the Company competes with many companies that have greater financial resources and technical facilities than itself. Significant competition exists for the limited number of mineral acquisition opportunities available in the Company's sphere of operations. As a result of this competition, the Company's ability to acquire additional attractive mining properties on terms it considers acceptable may be adversely affected. |
| | The Company may, in the future, be unable to meet its share of costs incurred under agreements to which it is a party and the Company may have its interests in the properties subject to such agreements reduced as a result. Furthermore, if other parties to such agreements do not meet their share of such costs, the Company may be unable to finance the costs required to complete the recommended programs. |
| (ix) | Fluctuating Mineral Prices |
| | The mining industry in general is intensely competitive and there is no assurance that, even if commercial quantities of mineral resources are developed, a profitable market will exist for the sale of same. Factors beyond the control of the Company may affect the marketability of any minerals discovered. Commodity prices may not remain at current levels and significant price movements over short periods of time may be affected by numerous factors beyond the control of the Company, including international economic and political trends, expectations of inflation, currency exchange fluctuations (specifically, the U.S. dollar relative to other currencies), interest rates and global or regional consumption patterns, and speculative activities. The effect of these factors on the price of minerals and therefore the economic viability of any of the Company's exploration projects cannot accurately be predicted. As the Company is in the exploration stage, the above factors have had no material impact on operations or income. |
| (x) | Shares Reserved for Future Issuance; Potential Dilution |
| | As of April 30, 2011, the Company had reserved 19,509,309 common shares for issuance upon the exercise of warrants, incentive stock options and performance shares. Such common shares represent a potential equity dilution of approximately 22.75% based upon the number of outstanding common shares at April 30, 2011, of 85,737,788. Furthermore, the Company may enter into commitments in the future which would require the issuance of additional common shares and may grant additional stock options and/or issue additional warrants. As at April 30, 2011, the Company had an unlimited number of authorized but unissued and unreserved common shares. Issuance of additional common shares would be subject to stock exchange regulatory approval and compliance with applicable securities legislation. The Company currently has no plans to issue common shares other than for the purposes of raising funds for property acquisition, property exploration and general working capital requirements which issuances would be subject to regulatory approval. |
15
| (xi) | Environmental Regulation |
| | All phases of the Company's operations in Canada are subject to environmental regulations. It is the Company's belief that if environmental legislation in Canada evolved and required stricter standards and enforcement, in conjunction with increased fines and penalties for non-compliance, including more stringent environmental assessments of proposed projects and a heightened degree of responsibility for companies and their officers, directors and employees, the cost of compliance therewith may substantially increase and thereby effect the Company's operations. |
| (xii) | Compliance with Applicable Laws and Regulations |
| | The current or future operations of the Company, including development activities and commencement of production on its properties, require permits from various governmental authorities and such operations are and will be subject to laws and regulations governing prospecting, development, mining, production, exports, taxes, labour standards, occupational health, waste disposal, toxic substances, land use, environmental protection, mine safety and other matters. Companies engaged in the development and operation of mines and related facilities generally experience increased costs, and delays in production and other schedules as a result of the need to comply with applicable laws, regulations and permits. There can be no assurance that approvals and permits required to commence production on its various properties will be obtained. Additional permits and studies, which may include environmental impact studies conducted before permits can be obtained, may be necessary prior to operation of the properties in which the Company has interests and the Company may not be able to obtain or maintain all necessary permits that may be required to commence construction, development or operation of mining facilities at these properties on terms which enable operations to be conducted at economically justifiable costs. |
| | The Company’s potential mining and processing operations and exploration activities are subject to various federal and state or provincial and municipal laws and by-laws governing land use, the protection of the environment, prospecting, development, production, exports, taxes, labour standards, occupational health, waste disposal, toxic substances, mine safety and other matters. Such operations and exploration activities are also subject to substantial regulation under these laws by governmental agencies and may require that the Company obtain permits from various governmental agencies. Permits that the Company may require for construction of mining facilities and conduct of mining operations may not be obtainable on reasonable terms. |
| | Failure to comply with applicable laws, regulations, and permitting requirements may result in enforcement actions thereunder, including orders issued by regulatory or judicial authorities causing operations to cease or be curtailed, and may include corrective measures requiring capital expenditures, installation of additional equipment, or remedial actions. Parties engaged in mining operations may be required to compensate those suffering loss or damage by reason of the mining activities and may have civil or criminal fines or penalties imposed for violations of applicable laws or regulations. |
| | Amendments to current laws, regulations and permits governing operations and activities of mining companies, or more stringent implementation thereof, could have a material adverse impact on the Company and cause increases in capital expenditures or production costs or reduction in levels of production at producing properties or abandonment or delays in advancement of new exploration properties. |
| (xiii) | Canadian Jurisdictional and Enforceability of Judgments, Risks |
| | The Company is a Canadian corporation and is governed in its conduct by the Laws of Canada. All of the Company’s directors are residents of Canada and all its assets are located in Canada and United States. Consequently, it may be difficult for U.S. investors to effect service of process within the United States upon the Company or upon such persons who are not residents of the United States, or to realize in the United States upon judgments of U.S. courts predicated upon civil liabilities under U.S. securities laws. A judgment of a U.S. court predicated solely upon such civil liabilities may be enforceable in Canada by a Canadian court if the U.S. court in which the judgment was obtained had jurisdiction, as determined by the Canadian court, in the matter. There is substantial doubt whether an original action could be brought successfully in Canada against any of such persons or the Company predicated solely upon such civil liabilities. |
16
| (xiv) | Adequate Labor and Dependence upon Key Personnel |
| | The Company will depend upon recruiting and maintaining other qualified personnel to staff its operations. The Company believes that such personnel currently are available at reasonable salaries and wages in the geographic areas in which the Company intends to operate. Such personnel may not always be available in the future. In addition, it cannot be predicted whether the labor staffing at any of the Company's projects will be unionized. The success of the operations and activities of the Company is dependent to a significant extent on the efforts and abilities of its management. The loss of services of any of its management could have a material adverse effect on the Company. |
| (xv) | Forward Looking Statements |
| | This document contains forward looking statements concerning the Company's operations, economic performance and financial condition, including in particular, the likelihood of the Company's success in operating as an independent company and developing and expanding its business. These statements are based upon a number of assumptions and estimates which are inherently subject to significant uncertainties and contingencies, many of which are beyond the control of the Company, and reflect future business decisions which are subject to change. Some of these assumptions inevitably will not materialize, and unanticipated events will occur which will affect the Company's future results. |
| | The Company has a history of losses and no revenues. |
| | The Company is a mineral exploration company without operations and has historically incurred losses. To date, the Company has not recorded any revenues from its operations nor has the Company commenced commercial production on any of its properties. The Company does not expect to receive revenues from operations in the foreseeable future, if at all. The Company expects to continue to incur losses unless and until such time as properties enter into commercial production and generate sufficient revenues to fund its continuing operations. Until such time, the Company will be dependent upon future financings in order to meet its capital requirements and continue its plan of operations. The Company cannot guarantee that it will obtain necessary future financing. The development of the Company’s properties will require the commitment of substantial resources to conduct the time-consuming exploration and development of properties. The amounts and timing of expenditures will depend on the progress of ongoing exploration, assessment and development, the results of consultants’ analyses and recommendations, the rate at which operating losses are incurred, the execution of any joint venture agreements with strategic partners, the Company’s acquisition of additional properties and other factors, many of which are beyond the Company’s control. The Company may never generate any revenues or achieve profitability. |
ITEM 4. INFORMATION OF THE COMPANY
A. History and Development of the Company
The Company was incorporated pursuant to the provisions of the Business Corporations Act (Alberta) on May 29, 1996. The Company amended its articles by certificate of amendment dated October 22, 1997 to remove the private company restrictions. On July 13, 2004 the Company continued out of the province of Alberta into the province of British Columbia pursuant to the Business Corporations Act (British Columbia).
The Company's registered and executive office is located at 2303 West 41st Avenue, Vancouver, British Columbia, Canada V6M 2A3, telephone (604) 685-1870, facsimile (604) 685-8045.
17
The Company is a reporting issuer in the provinces of Alberta, British Columbia and Ontario, Canada.
The Company’s common shares traded on the Toronto Venture Exchange from December 19, 1997 and on the Toronto Stock Exchange (“TSX”) from June 8, 2001, under the trading symbol “PFN”; on the Over-the-Counter Bulletin Board (“OTCBB”) since August 30, 2001 and the OTCQX™ since October 26, 2010 under the trading symbol “PAWEF”; and are included for trading on the Frankfurt Stock Exchange, Open Market, under the trading symbol “P7J.F”.
B. Business Overview
The Company is a mineral exploration company focused on the acquisition, exploration and development of platinum group metals (PGMs), precious and base metals minerals properties.
The Company has not determined whether these properties contain ore reserves that are economically recoverable and the Company is considered to be in the exploration stage.
Management's corporate philosophy is to be a project generator, explorer and project operator with the objective of optioning/joint venturing projects with major and junior mining companies through to production.
The Company’s primary project is the River Valley PGM project in Ontario.
Exploration on the property is generally not affected by seasonal change, with drill programs being carried out year round and surface bedrock exploration limited only by snow cover and spring thaw conditions. Exploration activities are dependent upon the availability of subcontractors, in particular drilling activities. These sub-contractors are generally available, however, may vary in price depending upon availability. The material effects of government regulations on the Company’s business are disclosed in Item 3 – Risk Factors.
The mineral resources industry is intensely competitive and the Company competes with many companies that have greater financial resources and technical facilities.
C. Organizational Structure

The Company owns 100% of Pacific North West Capital Corp. USA, and 99.98% of Pacific North West Capital de México, S.A. de C.V. in México (Mr. Harry Barr, President and CEO of the Company, owns 0.02%).
D. Property, Plants, and Equipment
PFN rents executive and administrative office space located at 2303 West 41st Avenue, Vancouver, British Columbia, V6M 2A3, Canada, for the sum of $17,043 per month.
18
Mineral Properties
None of the Company’s mineral exploration properties contain a known commercially mineable mineral deposit.
ONTARIO, CANADA
(I) River Valley PGM Project
The River Valley mineral claims are located in the Sudbury Region of Ontario. PFN optioned the River Valley claims following the discovery of highly anomalous PGM values in grab samples in the Dana Lake and Azen Creek areas. By an agreement dated January 15, 1999 and amended March 11, 1999 (collectively, the “Agreement”), the Company acquired a 100% interest in the River Valley claims from Bailey Resources Ltd., Luhta Resources Ltd. and Pardo Resources Ltd. by issuing 600,000 common shares of PFN and $265,000 in cash over four years. The River Valley claims are subject to a total 3% NSR, of which PFN can purchase up to 2% of the NSR from the vendors for $2,000,000.
On July 14, 1999, PFN entered into an unincorporated 50/50 joint venture agreement (“JV”) over the River Valley property with Kaymin whereby Kaymin was responsible for funding all exploration to completion of a feasibility study, which would give Kaymin an additional 10% interest. In addition, if Kaymin arranged financing for a mine, it would receive another 5% interest, for a total interest of 65%.
Kaymin continued to fund exploration under the terms of JV until 2007and invested over $22M in the exploration of the property; however, as a result of capital expenditure reductions during the global financial crisis in 2008, no new funds were allocated to the River Valley Project above and beyond the minimal holding costs.
By way of a Mineral Interest Assignment Agreement dated for reference December 13, 2010, as amended April 6, 2011 (“Assignment Agreement”), on April 7, 2011, PFN completed the purchase from Kaymin of Kaymin’s 50% interest in the River Valley claims, providing PFN with an undivided 100% interest in the River Valley PGM Project. Under the terms of the Assignment Agreement, Kaymin exchanged its 50% interest in the JV, for a 12% interest in PFN, based on the issued and outstanding common shares of PFN as of November 30, 2010 (67,643,008 common shares). The aggregate purchase price for the 50% interest in the River Valley PGM project was:
| | a. | 8,117,161 fully paid and non-assessable common shares of PFN (issued); and |
| | b. | three-year warrants exercisable to purchase 3,000,000 common shares of PFN at a price of $0.30 per common share. |
There are no other encumbrances on the River Valley PGM Project associated with the terms of the Assignment Agreement, after an 18-month early disposition period lapses, and there are no back-in rights or take-off agreements between PFN and Kaymin.
In addition to the River Valley claims, PFN holds various other properties that together comprise the River Valley Project as shown below:
| a) | Goldwright Property. By agreement dated June 30, 1998 and subsequently amended, the Company earned a 25% interest from Goldwright Explorations Inc. in certain mineral claims known as the Janes property, located in Janes Township, Sudbury Mining District, Ontario, by incurring in excess of $350,000 of exploration expenditures on the properties by May 31, 2001. Certain of these claims are subject to a 2% NSR. |
| b) | Washagami Lake Property. The Company entered into an option to purchase agreement dated February 23, 1999, as amended, whereby the Company could earn a 100% interest in 1 unpatented mining claim unit (16 ha) located in Janes Township, Sudbury Mining District, Ontario, immediately south of the Frontier property, by making cash payments of $28,200 (paid). On December 10, 2008, the claim was allowed to lapse. |
| c) | Razor Property. The Company acquired a 100% interest in certain mineral claims located in the Dana Township, Sudbury Mining District for a consideration of $30,000. The property is subject to a 2% NSR. |
19
| d) | Western Front Property. Under an agreement dated November 16, 2001, the Company earned a 70% interest in certain mineral claims from a company (the Optionor) that previously had certain directors in common. As consideration the Company paid $55,000 and issued 20,000 common shares to the Optionors. In addition, exploration expenditures of $50,000 were completed. The Company has the right to purchase an additional 30% interest in the property by paying $750,000 to the Optionor. The property is subject to a 3% NSR the first 1% of which the Company can purchase for $1,000,000 the second 1% can be purchased for $2,000,000. The Company and the Optionor will share the NSR buyout privileges in proportion to their respective interest. |
 | Location of the River Valley
PGM Property |
Property Location and Access
The River Valley claims, consisting of 226 claim units (1 claim unit = 16 ha), lie within Dana and Pardo Townships, and are located about 60 km northeast of the City of Sudbury, Ontario.
Claim Status
All the River Valley claims are in good standing at the time of writing. The River Valley claim block has been legally surveyed, and the final mining lease applications are being reviewed by the different Ontario government Ministries. The mining lease approvals are expected in 2011.
To the best of PFN’s knowledge there are no environmental or other liabilities associated with the River Valley Joint Venture claims.
All exploration to date has been carried out with appropriate work permits from the Ontario Ministry of Natural Resources. For the future exploration activities a more elaborate permit may be required, but to PFN’s knowledge there is no impediment to receiving one.
20
Claim list and anniversary dates - River Valley and River Valley Joint Venture Properties
| Township | Claim Number | Claim Due Date | Units |
| DANA | 1227988 | 2011-Oct-19 | 8 |
| DANA | 1227989 | 2011-Oct-19 | 8 |
| DANA | 1227990 | 2011-Oct-19 | 12 |
| DANA | 1227991 | 2011-Oct-19 | 10 |
| DANA | 1229216 | 2011-Oct-19 | 6 |
| DANA | 1229217 | 2011-Oct-19 | 16 |
| DANA | 1229218 | 2011-Oct-19 | 16 |
| DANA | 1229219 | 2012-Oct-19 | 12 |
| DANA | 1229220 | 2011-Oct-19 | 16 |
| DANA | 1229221 | 2011-Oct-19 | 16 |
| DANA | 1229222 | 2011-Oct-19 | 16 |
| DANA | 1229223 | 2011-Oct-19 | 12 |
| DANA | 1229224 | 2011-Oct-19 | 10 |
| DANA | 1229230 | 2011-Sep-21 | 16 |
| DANA | 1229231 | 2011-Sep-21 | 16 |
| DANA | 1229232 | 2011-Sep-21 | 14 |
| PARDO | 1229233 | 2011-Sep-21 | 16 |
| PARDO | 1229234 | 2011-Sep-21 | 6 |
| DANA | 1229542 | 2012-May-07 | 6 |
| DANA | 1230038 | 2012-May-07 | 12 |
| DANA | 1237228 | 2012-May-25 | 8 |
| DANA | 1237304 | 2012-Apr-13 | 12 |
| DANA | 1237305 | 2012-Apr-13 | 8 |
| PARDO | 1244332 | 2012-Jun-05 | 8 |
| DANA | 1244338 | 2012-Jun-14 | 6 |
| DANA | 1244427 | 2012-Jun-05 | 7 |
| DANA | 1244435 | 2012-Jun-05 | 4 |
| PARDO | 1244445 | 2012-Jun-05 | 8 |
| DANA | 1244444 | 2012-Jun-05 | 16 |
| JANES | 1235822 | 2012-Dec-10 | 12 |
| JANES | 1231107 | 2012-Dec-17 | 6 |
| JANES | 1235892 | 2012-Jan-04 | 16 |
| JANES | 1235893 | 2012-Jan-04 | 7 |
| JANES | 1235889 | 2012-Jan-04 | 16 |
| JANES | 1235891 | 2012-Jan-04 | 7 |
| JANES | 1235888 | 2012-Jan-06 | 12 |
| JANES | 1235896 | 2012-Jan-06 | 2 |
| JANES | 1235894 | 2012-Jan-06 | 9 |
| DANA | 1246498 | 2012-Jan-12 | 8 |
| MCWILLIAMS | 1229840 | 2012-Feb-12 | 9 |
| DANA | 1191268 | 2012-Oct-13 | 1 |
| DANA | 3010281 | 2012-Oct-29 | 1 |
| DANA | 3010282 | 2012-Oct-29 | 1 |
| DANA | 3004262 | 2011-Aug-29 | 2 |
| PARDO | 3017059 | 2011-Apr-08(1) | 16 |
| PARDO | 3017060 | 2011-Apr-08(1) | 16 |
| PARDO | 3017061 | 2011-Apr-08(1) | 16 |
| PARDO | 3017062 | 2011-Apr-08(1) | 16 |
| PARDO | 3017085 | 2011-Apr-08(1) | 16 |
| JANES | 1230271 | 2013-Jun-29 | 15 |
(1) Extensions to these dates have been applied for and are pending.
21
Climate and Local Resources
Climate is temperate, with four distinct seasons, typical of the Southern Shield, and moderated by the proximity to the Great Lakes. Other than over small lakes, drilling and geophysical surveys can be carried out year round from skidder roads. Drilling water is sufficient. Surface bedrock exploration can be done for about 7‑8 months of the year. An environmental base line study has not been necessary to date.
Infrastructure
Sudbury, a major mining and manufacturing city, can provide all of the infrastructure and technical needs for any exploration work.
Physiography
The property lies at a mean elevation of about 325 metres (m) ASL. Relief is moderate and typical of upland Precambrian Shield topography. The eastern part around Azen Creek is lower and marshy. Forest cover is mainly poplar with about 25-33% white pine regrowth.
Outcrop exposure on the property is limited to about 20% with the remaining areas covered mostly by a thin (<1 m) veneer of glacial till; locally gravel, outwash sand and silt reach 10’s of metres in thickness. Most of the area around the Dana Lake and Azen Creek areas has been logged within the past 10 years and new logging took place in the Azen Creek Area during the summer of 2000.
History and Previous Work
In 1973, the Province of Ontario placed more than 110 Townships in a withdrawn area referred to as the “Temagami Land Caution” – this region was excluded from any type of resource exploration and/or development until June 1996. The River Valley Property was covered by this withdrawn area and as a result, most of the River Valley Intrusion was never explored for its PGM-Cu-Ni potential.
The earliest recorded work on the River Valley property was by Kennco Explorations (Canada) Ltd. in 1968, at which time they conducted an airborne Mag-EM survey over Janes, Davis, Henry and Dana Townships.
Geological Setting
Regional Geology
The River Valley property is primarily underlain by rocks of the RVI, a large Paleoproterozoic intrusion that forms part of the Huronian-Nipissing Magmatic Province or the Huronian Metallogenic Province.
Local Geology
The RVI covers more than 100 square kilometres (km2) and lies adjacent to, and straddles, the Grenville Front within the Grenville Province and the Grenville Front Tectonic Zone (“GFTZ”). The GFTZ represents a complex zone, several km wide and consisting of generally southeast-dipping imbricate thrust faults. In the area of the River Valley property, the GFTZ is located along the westernmost edge of the claims where it is represented by a system of eastward-dipping (10-25°) thrust faults. This fault system separates the intrusive rocks of the RVI from younger sedimentary and intrusive rocks of the Huronian Supergroup (includes Nipissing Diabase). It is likely that intrusive rocks of the RVI interdigitated within Huronian rocks along the fault-bound western contact.
Within Pardo Township, a north-trending apophysis of the RVI appears to be in fault contact with older (Archean Superior Province) mylonitic granitic rocks. In Dana Township the western boundary is in fault contact with rocks of the Southern Province, and the eastern and northern boundaries are in igneous contact with Archean migmatite and paragneiss of the Superior Province. The eastern and northern boundaries were previously mapped as being in contact with rocks of the Grenville Province.
22
The RVI can be separated into two main areas on the basis of structural coherence and preservation of primary igneous features such as contacts and layering. The eastern part of the RVI, located primarily in Dana and Crerar Townships, is represented by the best preserved portions of the intrusion and as such the most prospective areas for discovery. PFN’s River Valley property covers about 40% of this area including about 10 km of highly prospective northern igneous contact. Further to the west, in Henry, Janes, Loughrin, Street and Awrey Townships, the geology of the western part of the RVI is complicated by the effects of Grenville metamorphism. In this area the rocks are attenuated, folded and structurally modified such that most of the primary features are absent.
Property Geology
The River Valley property as mapped by the Company, includes three main mineralized areas with anomalous PGM-Cu-Ni sulphide mineralization: the Dana Lake Area, Lismer’s Ridge, and Azen Creek Area.
The Dana Lake Area of the River Valley property lies within a north-trending portion of the River Valley Intrusion (RVI). This region of the RVI likely represents an offshoot of the main intrusive body and appears to be an up-thrust and rotated portion of the intrusion. In its current position, the Dana Lake Area represents a lower stratigraphic position in the intrusion that is now oriented sub-vertical relative to its original, near-horizontal position. The basal contact of the intrusion undulates in both the horizontal and vertical direction and this undulation is probably a primary igneous contact feature. However, the area has been structurally disturbed with evidence for dip-slip, strike-slip and rotational displacement on the centimetre to metre scale. Steeply dipping (>80°), decimetre- to metre-scale, modally layered rocks of the River Valley intrusion overly the contact-related, mineralized breccia unit and are truncated along the western edge of the intrusion by the Grenville Front Fault.
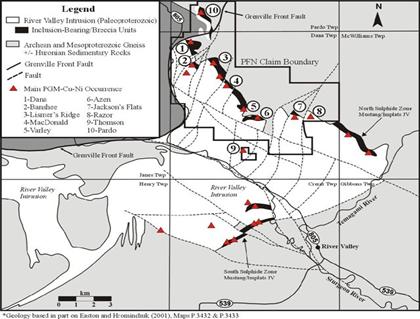 | Locations of mineralized
zones in the River Valley
Intrusion |
Mineralization
The River Valley project includes three main areas of PGM-Cu-Ni sulphide mineralization: Dana Lake Area, Lismer’s Ridge, and Azen Creek. Dana Lake, located within the northwest corner of the claim group, consists of 7 main areas from north to southThese seven zones of PGM-Cu-Ni mineralization extend intermittently over a strike length of >900 m. The first six are now combined as Dana North Zone and seventh as Dana South Zone. At Lismer’s Ridge, surface mineralization is intermittently exposed over a NW-SE strike length of greater than 800 m, where it occurs within a similar geological environment to the Dana Lake Area.
At the Azen Creek Area, located about 6 km southeast of the Dana Lake Area, breccia-hosted mineralization is exposed in outcrop, located about 200 m south of the intrusive contact. The mineralization at the Azen Creek Main showing represents a different style of mineralization than at Dana Lake Area or Lismer’s Ridge in the hanging wall in a setting akin to Mustang Minerals Ltd./Implats mineralization on the adjacent property to the south.
23
Exploration of the River Valley property from 1999 to 2001 has shown that PGM mineralization (Pt+Pd+Au±Rh) exceeding 200 ppb PGE occurs extensively within a sequence of felsic to mafic magmatic breccias and fragment-bearing units that have been intermittently exposed and drill-tested along a prospective +10 km long intrusive contact.
Joint Venture Exploration Programs (1999-2008)
Phase 1 Surface (July – December, 1999)
The Phase1 Surface program commenced on December 15, 1999 and included:
| | 1. | Establishing detailed and regional exploration grids |
| | 2. | Regional prospecting and sampling |
| | 3. | Grid prospecting and sampling |
| | 4. | Preliminary geological grid mapping (1:1000 scales) |
| | 5. | Stripping and cleaning of selected outcrop areas |
| | 6. | Detailed sampling (2.5 x 2.5 m grid) of cleaned outcrop areas |
| | 7. | Preliminary mapping (1:250 scale) of cleaned outcrop areas |
| | 8. | Orientation biogeochemical survey in area of South and Trench zones; and |
| | 9. | Orientation induced polarisation and ground magnetometer geophysical surveys. |
More than 2300 surface samples (27 grabs from regional prospecting, 392 grabs from grid prospecting, and 1636 samples from detailed sampling) were collected during the exploration program. Background was calculated to be 7 ppb Au, 25 ppb Pt, 23 ppb Pd, 1 ppb Rh, (57 ppb 4E), 82 ppm Cu and 137 ppm Ni; average ratios include 0.82 Pd:Pt and 0.81 Cu:Ni.
Regional prospecting led to the discovery of 2 new areas of highly anomalous PGM values:
| | 1. | Central Reef, located about 1.0 km northwest of the Azen Creek Area main showing (up to 10.38 g/t 4E, 2970 ppm Cu, 530 ppm Ni), |
| | 2. | East Reef, located about 2 km east of the Azen Creek Area main showing (up to 0.7 g/t 4E, 707 ppm Cu and 765 ppm Ni. |
The highest value from surface sampling was 12.11 g/t 4E, collected from a ridge several metres south of the Central Zone.
Detailed sampling of cleared outcrop areas returned highly anomalous average values from the 2.5m x 2.5m sample grid: all 1636 detailed samples averaged 958 ppb 4E; 632 samples from the South Zone averaged 975 ppb 4E; 99 samples from the Trench Zone averaged 1168 ppb 4E; and, 165 samples from the Central Zone averaged 1449 ppb 4E. The highest surface sample was 16.4 g/t 4E (South Zone).
Phase 1 Drilling (February – March, 2000)
The phase 1, 2000 m and 13 hole drilling program was completed between February 28and March 2000. The program concentrated on mineralization at the Dana Lake Area (claim S-1229230). A total of 1649 samples were taken from split drill core and sent to XRAL Laboratories in Rouyn-Noranda, Quebec for Pt-Pd-Au-Rh-Cu-Ni assay.
Drilling program was very successful and the highest drill samples was 10,206 ppb 4E (Au+ Pt+Pd+Rh) over 2.3 metres.
Phase 2 Drilling (June – July, 2000)
Phase 2 drilling concentrated on mineralization at the Dana Lake Area (claim S-1229230) where PGMs are associated with disseminated Cu-Ni sulphide mineralization that is hosted by mafic magmatic breccia which is proximal to the footwall contact. The Phase 2 program was designed to augment Phase 1 drilling, testing the down dip extension of surface mineralization and in-fill drilling of untested areas.
24
The Phase 2 program consisted of 2820.8m in 14 holes and was completed between June 12th and July 18th, 2000. Core logging and sampling was fully completed by October 15th; drill hole RV00-03 was extended 27.3 m. A total of 2177 samples (2158 from RV00-14 to 26 and 19 from RV00-03) were taken from split drill core and sent to XRAL Laboratories (Rouyn-Noranda, Quebec & Don Mills, Ontario) for Pt-Pd-Au, Rh and Cu-Ni assays. A total of 296 pulps were sent to Accurassay Laboratory in Thunder Bay for sample check assays.
Significant intervals were encountered in holes number DDH 15, 20 and 25 with 1143.2 ppb 4E over 39.10m, 2342.9 ppb 4E over 15.85 and 1948.2 ppb 4E over 11.10 meters respectively.
Phase 3 Drilling (September 2000)
Phase 3 drilling consisted of 10 drill holes at the Dana Lake Area (claim S-1229230) and 3 drill holes at Lismer’s Ridge (claims S-1229542 & S-1229216). In both areas, PGMs are associated with disseminated and bleb Cu-Ni sulphide mineralisation that is hosted by a heterolithic breccia which is proximal to the intrusive contact. The Phase 3 program was designed to augment Phases 1 & 2 drilling, testing the down dip extension of surface mineralisation and in-fill drilling of untested areas at the Dana Lake Area, and testing newly discovered surface mineralisation at Lismer’s Ridge.
The Phase 3 program (1958.50 m in 13 holes) was completed September 6 - 25, 2000; core logging and sampling was fully completed by October 30, 2000. A total of 1142 samples were collected from split drill core and assayed for Pt, Pd, Au, Cu and Ni at XRAL Laboratories (Rouyn-Noranda, Quebec & Don Mills, Ontario).
Significant intervals were encountered in holes number RV0028 and RV0036, with 1022.2 ppb 3E (Au+Pt+Pd) over 42.35m, including 1386.4 ppb 3E over 7.85m and 7215.8 ppb over 8.8m respectively.
Phase 2 Surfaces (March – October, 2000)
The Phase 2 program consisted of:
| | 3. | Regional mapping/prospecting and detailed mapping/sampling of newly-cleared areas. |
Detailed sampling produced a total of 2133 samples; 831 were collected from newly cleared areas in the Dana Lake Area (S-1229230); 1282 samples were collected from Lismer Ridge (S-1229542, S-1229216). Regional mapping and prospecting produced an additional 233 samples from regional work across the property.
Phase 4 Drilling (February – July 2001)
The Phase 4 program was separated into two time blocks, to accommodate for the changing weather conditions between seasons: February 1st to March 21, 2001 and May 14 - July 2001. Core logging and sampling was fully completed by August 31, 2001. A total of 10,529 samples from Dana and 7,501 from Lismer Ridge were collected from split drill core and assayed for Pt, Pd, Au, Cu and Ni at XRAL Laboratories (Rouyn-Noranda, Quebec & Don Mills, Ontario).
The highest value from drilling program was as follow:
3.7 g/t 3E over 71.4m including 9.6 g/t 3E over 4.2m in DL-08 drilled in Dana Lake Area and 4.71 g/t 3E over 18 metres including 13.2 g/t 3E over 5.2m and 28.14 g/t over 2m in hole number LR-02 drilled in Lismer Ridge Area.
At the completion of Phase 4 Drilling, an Independent Mineral Resource Study was carried out by Derry Michener Booth and Wahl (DMBW), which incorporated assay data from the 138 holes drilled to date on the property. The Report estimated an in situ resource at Dana Lake and Lismer Ridge totaling ~593,000 ounces (Pd+ Pt+ Au) at a 0.7 g/t cut-off in 12 million tonnes (measured + indicated + inferred). The report notes that “there is significant potential to increase resources on the property through further drilling both along strike from and down dip on the currently defined mineralized zones”.
25
Phase 3 Surface (June – September, 2001)
During the Phase 3 program a total of 1,111 samples were collected from the property with concentrations in the south eastern and western contact areas.
The highest value from surface sampling was 3.9 g/t 3E, collected from the Razor area.
Phase 5 Drilling (November, 2001 – August, 2002)
This Phase 5 program was completed in its entirety between November 17, 2001 and August 31, 2002; drilling was employed from November 22, 2001 to June 24, 2002 (Part 1: November 22, 2001 to March 3, 2002 and Part 2: April 21, 2002 to June 24, 2002).
A total of 22,319 core samples were collected consisting of 10,325 from Lismer Ridge, 10,289 from Dana South, and 1,705 from Banshee Lake. The core samples were collected from split drill core and assayed for Pt, Pd, Au, Cu and Ni at XRAL Laboratories, located in Rouyn-Noranda, Quebec and Don Mills, Ontario.
Highlights from Phase 5 Drilling: Dana Lake Area, River Valley Property (weighted averages).
| DDH | From | To | Int | Au | Pt | Pd | 3E* | 3E* | Pd:Pt |
| | m | m | m | ppb | ppb | ppb | ppb | g/t | |
| DL-55 | 198.00 | 215.50 | 17.50 | 162 | 942 | 3388 | 4492 | 4.49 | 3.6 |
| incl. | 210.50 | 212.85 | 2.35 | 221 | 1798 | 6001 | 8020 | 8.02 | 3.3 |
| DL-58 | 146.30 | 174.00 | 27.70 | 110 | 641 | 2147 | 2898 | 2.90 | 3.3 |
| incl. | 155.50 | 159.00 | 3.50 | 188 | 1256 | 4580 | 6024 | 6.02 | 3.6 |
| DL-59 | 192.00 | 200.00 | 8.00 | 101 | 734 | 2292 | 3127 | 3.13 | 3.1 |
| incl. | 193.00 | 197.00 | 4.00 | 136 | 1060 | 3433 | 4629 | 4.63 | 3.2 |
| DL-80 | 270.00 | 277.50 | 7.50 | 166 | 1319 | 4091 | 5576 | 5.58 | 3.1 |
| incl. | 271.00 | 274.00 | 3.00 | 208 | 1519 | 4810 | 6537 | 6.54 | 3.2 |
| DL-83 | 293.80 | 340.50 | 46.70 | 95 | 602 | 1913 | 2610 | 2.61 | 3.2 |
| incl. | 296.50 | 300.00 | 3.50 | 176 | 1778 | 5481 | 7435 | 7.44 | 3.1 |
Highlights from Phase 5 Drilling: Lismer Ridge Area, River Valley Property (weighted averages).
| DDH | From | To | Int | Au | Pt | Pd | 3E* | 3E* | Pd:Pt |
| | m | m | m | ppb | ppb | ppb | ppb | g/t | |
| LR-70 | 205.50 | 218.40 | 12.90 | 120 | 732 | 1794 | 2646 | 2.65 | 2.5 |
| incl. | 206.50 | 210.50 | 4.00 | 235 | 1691 | 3810 | 5736 | 5.74 | 2.3 |
| LR-72 | 69.50 | 71.00 | 1.50 | 34 | 2800 | 6330 | 9164 | 9.16 | 2.3 |
| - | 134.50 | 134.80 | 0.30 | 171 | 4930 | 8980 | 14081 | 14.08 | 1.8 |
Phase 4 Surface (October – December, 2002)
This program was completed on the River Valley property between October 15 and December 31, 2002, and included 1) regional geological mapping and sampling; 2) stripping, detailed mapping and sampling; 3) line cutting, and induced polarization and ground magnetometer geophysical surveys.
A total of 483 samples were collected; 395 grab samples from regional mapping and 88 samples from detailed sampling and mapping.
Of the 395 grab samples, 394 samples assayed from lower limit of detection to 250 ppb 3E (Pt, Pd, Au); 1 sample assayed between 251-500 ppb 3E, (Jackson’s Flats area - 12 ppb Au, 280 ppb Pt, 77 ppb Pd, 4.9 ppm Cu and 10 ppm Ni).
Of the 88 samples that were collected during detailed sampling, the highest value of PGM was 601 ppb Au, 2240 ppb Pt, 2950 ppb Pd, 2540 ppm Cu, and 76 ppm Ni. This sample was collected at the Banshee South trench.
26
Phase 6 Drilling (November 2002 – May 2004)
Phase 6 consisted of 44,131 metres in 208 holes:
- 70 drill holes at Dana Lake
- 15 holes at the Banshee Lake
- 41 drill holes at Lismer Ridge
- 7 holes at the MacDonald
- 32 holes at Varley
- 16 holes at Azen Creek
- 10 holes at Razor
- 13 holes at Jackson’s Flats
- 4 holes at Pardo
A total of 40,131 core samples were collected. The core samples were collected from sawed drill core and analyzed for Pt, Pd, Au, Cu and Ni as part of a 33 element ICP package at XRAL Laboratories, located in Rouyn-Noranda, Quebec and Don Mills, Ontario.
Phase 5 (July 2003)
Spectrem Air Ltd., based in Lanseria, South Africa, flew airborne mag, EM and radiometric surveys over the River Valley property.
Phase 6 Surface (May to October 2004)
The Phase 6 Surface consisted of extensive geological mapping of the eastern portion of the property along the northern contact and the interior of the River Valley Intrusive. The mapping successfully traced the mineralized Breccia Zone along the northern RVI-Archean contact from the south Varley area through to the Razor area. Assays values from the Breccia Zone were often highly anomalous, with maximum returned values of 4,114 ppb 3E (Pt+Pd+Au).
Untested, potential reef-type mineralization is interpreted to occur where the Marginal Leucogabbronorite Unit is interlayered within the Olivine Gabbronorite Zone near the base of the Layered Series on the south flank of the Turtle Creek Syncline in the South Jackson’s Flat West area. This interpretation is supported by a significant number of historic geochemical samples taken from this area, which returned Pt + Pd + Au values of greater than 100 ppb.
Mapping in the Azen-Spade Lake and South Azen areas has identified a new mineralized zone straddling the contact between the Layered Gabbronorite Zone and the Upper Leucogabbronorite/Anorthosite Unit. In the North Spade Lake, South Spade Lake and South Azen showing areas, significant PGE values (to 1696 ppb Au+Pt+Pd) have been returned from coarse-grained pyroxenite pegmatite layers and lenses interlayered with norite and gabbronorite near the top of the Layered Gabbronorite Zone and into the base of the overlying Upper Leucogabbronorite Unit. This mineralized zone is termed the “Transition Zone” and is a target for reef-type PGE ores in the Upper River Valley stratigraphy. The Thomson claims are now recognized as a potential Transition Zone target.
A Phase 7 exploration program was completed on the property during 2004 and mid 2005. The program completed 20,740 m of diamond drilling, metallurgical testing and the collection of a 40 tonne bulk sample for metallurgical testing on the Dana North and Dana South Zones. The budget was set at $3.0 million dollars.
In the Phase 7 program particular emphasis was placed on expanding targets identified by reconnaissance drilling, geophysics, and geological mapping especially along the northern contact of the intrusive. The known platinum, palladium mineralization has been identified within the contact breccia zone over a strike length in excess of 15 km. The mineral resource estimates have been primarily concentrated in the Dana Lake and Lismer’s Ridge Zones over a 3 km strike length.
In 2005-2006 (Phase 8), additional mapping and drilling was carried out. In 2006 and 2007 (Phase 9), further mapping and detailed sampling was completed.
27
In 2005 a $1.5 million budget (Phase 8) was approved by the joint venture. The program included the processing of the bulk sample at Anglo Platinum’s facilities in South Africa, and additional surface detailed mapping and geophysical work. A series of drill holes were completed at the end of 2005 to test geological interpretations for the mapping programs. A series of these drill holes located south of the Azen zone intercepted mineralized breccias and horizons within the River Valley Intrusive.
In 2006 the joint venture has authorized a further $1.1 million (phase 9) lease survey and mapping program to determine the controls on mineralization within the intrusive complex. At the end of 2009 it is expected that the JV will be in a position to receive a lease on the property from the Ontario Government.
Exploration programs completed on the property during 2007 were directed towards evaluating the potential of PGE mineralization within central portion of the River Valley Intrusive. The programs of prospecting, geological mapping, stripping, and channel sampling were designed to determine the continuity of indicated surface mineralization. The leasing process of the property continued. The budget was set at $525,000 dollars.
In 2008, a channel sampling program was completed in selected areas to allow comparison of grade estimates obtained using different sampling methods. A limited suite of samples were assayed by the Nickel Sulphide collection fire assay method for comparison with the lead collection fire assay method used in previous years, as well as to obtain better estimates of Osmium, Iridium, Rhodium and Ruthenium concentrations in the mineralization. In addition, a consulting geologist was contracted to review prior year’s exploration work to identify areas where additional work was needed.
In late 2008, Kaymin informed the Company that, due to the global economic downturn and concomitant drop in metal prices, Kaymin wished to temporarily suspend expenditures on the project other than those needed for normal maintenance of the property. As a result, the Company closed its Sudbury exploration office. A budget of $285,000 was apportioned to allow for compilation and archiving of data collected from the various phases of exploration and drilling, and to provide for property maintenance.
In 2008, a consulting geologist was engaged to review the work completed to date and recommend a future course of action. As part of this study, selected trench areas were re-sampled in detail to compare different sampling methods for consistency. A structural review was also completed.
A further $245,000 budget was approved for the project in 2009 to carry out reclamation work on the River Valley property. As of 28 February 2009, the process of archiving material, storing equipment, and shutting down operations in Sudbury was complete. Reclamation work was completed in August 2009.
An additional $150,000 budget was allocated to fund a detailed geochemical study of the River Valley mineralization was conducted by Dr. Reid Keays of Monash University, Melbourne, Australia. Dr. Keays is an expert in the geochemistry of Ni and PGM deposits. Re-sampling of selected River Valley drill holes was completed in January, 2009, and of the 336 samples were submitted to the Ontario Geoscience Laboratories for analytical work, 154 results have been received to date. In order to improve economy modelling of the deposit the study examined the full suite (Pt, Pd, Rh, osmium, iridium, and ruthenium) PGM content of the ore, and determined the relationship of Rh, iridium and ruthenium concentration from Pt and Pd. The results of the study are expected in late 2011.
Post JV Partnership (2011 Exploration Programs)
In April 2011 PFN commenced a $1,000,000 exploration program on its 100%- owned River Valley project. Phase IA, consisting of 3,724 m (15 holes) of drilling was completed on the Dana Lake area in late May 2011. The exploration program is utilizing one drill rig, which is systematically drilling off sections spaced at approximately 25m intervals through the +900m long, north-south trending Dana Lake deposit. Phase IA drilling confirmed the presence of significant PGM, associated with disseminated sulphide mineralization at the Dana North Area.
The target at Section 10350 was tested with one fence of four holes. Holes DN003-2011 and DN004-2011 of this fence showed extensive mineralization assaying 1.8 gt over 65 m (0.05 opt over 213.3 feet) and 2.8 gt 3E over 34 m (0.08 opt over 111.5 feet), respectively. The table below illustrates significant drill intervals in the first four holes.
28
All samples were assayed by SGS Laboratories. Assay results from mineralized core intersections are reported below.
Phase IA included the collection of approximately 60 line-km of 3D Induced Polarization ground geophysical data. These surveys have being conducted to generate additional drill targets and to enhance the targeting along a portion of the 9 km prospective horizon located at the contact of the River Valley Intrusion. PFN plans to expand the geophysical survey coverage and complete these surveys in four different phases to cover the prospective zones over the entire 9 Km strike length.
| Hole No. | From
(m) | To
(m) | Length of the Intersect
(m) | Length of the Intersect
(feet) | Pt
(gt) | Pt
(opt) | Pd
(gt) | Pd
(opt) | Au (gt) | 3E
(gt) | 3E
(opt) | Ni
(%) | Cu
(%) | Rh |
| DN001-2011 | 123 | 173 | 50 | 164.0 | 0.26 | 0.008 | 0.77 | 0.022 | 0.05 | 1.1 | 0.03 | 0.02 | 0.09 | Results
Pending |
| Including | 123 | 134 | 11 | 36.1 | 0.37 | 0.011 | 1.11 | 0.033 | 0.07 | 1.55 | 0.05 | 0.02 | 0.09 |
| Including | 141 | 153 | 12 | 39.4 | 0.31 | 0.009 | 0.90 | 0.026 | 0.05 | 1.26 | 0.04 | 0.02 | 0.11 |
| Including | 159 | 173 | 13 | 42.7 | 0.28 | 0.008 | 0.83 | 0.024 | 0.06 | 1.18 | 0.03 | 0.03 | 0.12 |
| DN002-2011 | 114 | 179 | 65 | 213.3 | 0.32 | 0.009 | 0.95 | 0.028 | 0.06 | 1.3 | 0.04 | 0.02 | 0.10 |
| Including | 146 | 158 | 12 | 39.4 | 0.43 | 0.013 | 1.30 | 0.038 | 0.08 | 1.82 | 0.05 | 0.03 | 0.14 |
| Including | 173 | 179 | 6 | 19.7 | 0.74 | 0.022 | 2.34 | 0.068 | 0.12 | 3.20 | 0.09 | 0.02 | 0.12 |
| DN003-2011 | 50 | 115 | 65 | 213.3 | 0.42 | 0.010 | 1.29 | 0.038 | 0.08 | 1.8 | 0.05 | 0.03 | 0.13 |
| Including | 50 | 59 | 9 | 29.5 | 0.98 | 0.029 | 3.09 | 0.090 | 0.18 | 4.25 | 0.12 | 0.03 | 0.22 |
| Including | 72 | 84 | 12 | 39.4 | 0.59 | 0.017 | 1.76 | 0.052 | 0.11 | 2.47 | 0.07 | 0.04 | 0.16 |
| DN004-2011 | 29 | 63 | 34 | 111.5 | 0.66 | 0.020 | 2.00 | 0.060 | 0.12 | 2.8 | 0.08 | 0.03 | 0.16 |
| Including | 29 | 40 | 11 | 36.1 | 1.12 | 0.033 | 3.40 | 0.099 | 0.18 | 4.71 | 0.14 | 0.04 | 0.24 |
| Including | 43 | 47 | 4 | 13.1 | 0.69 | 0.020 | 2.06 | 0.060 | 0.11 | 2.86 | 0.08 | 0.03 | 0.16 |
PFN plans to commence Phase IB Exploration during the summer 2011. The Phase IB exploration program will include:
- More than 80 line Km of 3D IP
- Approximately 3500 m drilling
- Initialization of environmental baseline studies
Drilling program will focus on three main objectives:
| | 1) | Testing deeper targets that were generated to follow the footwall mineralization down dip |
| | 2) | Testing near surface mineralized zones not yet fully evaluated |
| | 3) | Testing new drilling targets found outside of the contact by the geophysics survey (3D IP) |
The Phase IB drilling campaign will continue to build on the results from Phase IA and will include the addition of newly available airborne geophysical survey technology. The mineralized footprint at River Valley remains unconstrained in all directions; therefore, the program will also include on-going condemnation drilling to test the limits of the known mineralization.
2011 Quality Assurance and Quality Control (QA/QC)
All diamond drill core samples were submitted to SGS Laboratories, Toronto, Ontario and assayed for Pt, Pd, Au, Cu and Ni and a 33 element ICP suite. Concentrations of Pt-Pd-Au were determined using standard lead fire assay, followed by dissolution with acqua-regia, and measurement with an ICP (inductively coupled plasma) finish. Lower limited of detection (30 gram sample) are 1 ppb for Au and Pd and 10 ppb for Pt; upper limits are 10,000 ppb by ICP. Concentrations of Cu-Ni were determined by ICP methods with detection limit of 0.5 ppm for Cu and 1 ppm for Ni; upper limit for both Cu and Ni is 1 %.
One standard and one Blank were inserted every 40 samples into the sample stream. Duplicates were taken each twentieth sample. This practice continued throughout 2011 Phase IA drilling and included the preparation and insertion of new and necessary standards at the cut-off grade and at the mean grade of the deposits. All sample preparation has been conducted and directed on site by contract geologists and samplers hired by PFN.
29
Non-Reserve Mineral Resource Estimation – Mineral Deposits
SEE “CAUTIONARY NOTE TO U.S. INVESTORS CONCERNING RESERVE AND RESOURCE ESTIMATES” AND “MINERAL RESERVES – DEFINITIONS” ABOVE.
The terms “mineral resource”, “inferred mineral resource”, “indicated mineral resource” and “measured mineral resource” have the meanings ascribed to those terms by CIM.
The following italicized text was excerpted from a report entitled, “Revised Mineral Resource Estimate, Dana Lake and Lismer’s Ridge Deposits incorporating Phase VI Drilling, River Valley PGM Project, Ontario for Pacific North West Capital Corp”, dated June 10th, 2004, by Derry, Michener, Booth and Wahl Consultants Ltd. (“Derry, Michener, Booth and Wahl Report”), as filed on Form 20-F on August 9, 2004.
In March 2006 the mineral resources table was updated in the GeoSim Report, as filed on Form 6-K/A on June 6, 2006. Mr. Simpson was responsible for the calculation of the resource estimate in the Derry, Michener, Booth and Wahl Report. The GeoSim Report included all of the drill holes from the phase 7 program.
Cut-off Grade
The cut-off grade is the lowest grade of material that can be mined and processed considering all applicable costs, without incurring a loss or gaining a profit. In the subsequent summary of resources, the cut-off grade used for reporting block model statistics within mineralized zone constraints is a combined Pt+Pd grade. The resources within each zone are reported for cut-off grades of 0.7 g/t Pt+Pd and 1.0 g/t Pt+Pd. The lower cut-off grade of 0.7 g/t Pt+Pd is based on historical resource estimates for the Lac des Iles Mine, which is the only active Pt/Pd producer in Canada. In the resource estimates, no allowance has been made for the respective precious metal prices, or recoveries.
Measured Mineral Resource
A ‘Measured Mineral Resource’ is that part of a Mineral Resource for which quantity, grade or quality, densities, shape, physical characteristics are so well established that they can be estimated with confidence sufficient to allow the appropriate application of technical and economic parameters, to support production planning and evaluation of the economic viability of the deposit. The estimate is based on detailed and reliable exploration, sampling and testing information gathered through appropriate techniques from locations such as outcrops, trenches, pits, workings and drill holes that are spaced closely enough to confirm both geological and grade continuity.
Mineralization or other natural material of economic interest may be classified as a Measured Mineral Resource by the Qualified Person when the nature, quality, quantity and distribution of data are such that the tonnage and grade of the mineralization can be estimated to within close limits and that variation from the estimate would not significantly affect potential economic viability. This category requires a high level of confidence in, and understanding of, the geology and controls of the mineral deposit.
Indicated Mineral Resource
An ‘Indicated Mineral Resource’ is that part of a Mineral Resource for which quantity, grade or quality, densities, shape and physical characteristics, can be estimated with a level of confidence sufficient to allow the appropriate application of technical and economic parameters, to support mine planning and evaluation of the economic viability of the deposit. The estimate is based on detailed and reliable exploration and testing information gathered through appropriate techniques from locations such as outcrops, trenches, pits, workings and drill holes that are spaced closely enough for geological and grade continuity to be reasonably assumed.
Mineralization may be classified as an Indicated Mineral Resource by the Qualified Person when the nature, quality, quantity and distribution of data are such as to allow confident interpretation of the geological framework and to reasonably assume the continuity of mineralization. The Qualified Person must recognize the importance of the Indicated Mineral Resource category to the advancement of the feasibility of the project. An Indicated Mineral Resource estimate is of sufficient quality to support a Preliminary Feasibility Study which can serve as the basis for major development decisions.
30
Inferred Mineral Resource
An ‘Inferred Mineral Resource’ is that part of a Mineral Resource for which quantity and grade or quality can be estimated on the basis of geological evidence and limited sampling and reasonably assumed, but not verified, geological and grade continuity. The estimate is based on limited information and sampling gathered through appropriate techniques from locations such as outcrops, trenches, pits, workings and drill holes. Due to the uncertainty that may be attached to Inferred Mineral Resources, it cannot be assumed that all or any part of an Inferred Mineral Resource will be upgraded to an Indicated or Measured Mineral Resource as a result of continued exploration. Confidence in the estimate is insufficient to allow the meaningful application of technical and economic parameters or to enable an evaluation of economic viability worthy of public disclosure. Inferred Mineral Resources must be excluded from estimates forming the basis of feasibility or other economic studies.
Measured and Indicated Resources
The following is a summary of the March 2006 Measured and Indicated Resources update, prepared by GeoSim Services Inc.:
- Table 1: Measured and Indicated Resources of 30.5 million tonnes with grades of 0.97 g/t palladium (Pd) 0.34 g/t platinum (Pt) and 0.061g/t gold (Au), using a cut off grade of 0.7 g/t Pt+Pd
- Table 2: Higher Grade Measured and Indicated Resources of 19.3 million tonnes with grades of 1.18 g/t palladium (Pd) 0.39 g/t platinum (Pt) and 0.07 g/t gold (Au), using a cut off grade of 1.0 g/t Pt+Pd
| | Cautionary Note to US Investors concerning estimates of Measured and Indicated Resources: This section uses the terms “measured resources” and “indicated resources”. We advise US investors that while those terms are recognized and required by Canadian regulations, the US Securities and Exchange Commission does not recognize them. US investors are cautioned not to assume that any part or all of mineral deposits in these categories will ever be converted into reserves. |
2006 River Valley Updated Measured and Indicated Resource Estimate
(cut-off grade 0.70 g/t Pt+Pd)
| Measured Resources |
| DEPOSIT | Tonnes | Au | Pt | Pd | Cu | Ni | Pt+Pd | Au+Pt+Pd |
| | 000s | g/t | g/t | g/t | % | % | g/t | g/t |
| Dana North | 2,623 | 0.080 | 0.428 | 1.327 | 0.12 | 0.02 | 1.755 | 1.835 |
| Dana South | 1,496 | 0.100 | 0.625 | 2.122 | 0.16 | 0.03 | 2.747 | 2.847 |
| Lismer's Ridge | 4,411 | 0.062 | 0.357 | 0.982 | 0.10 | 0.02 | 1.339 | 1.401 |
| Lismer North | - | - | - | - | - | - | - | - |
| Varley | - | - | - | - | - | - | - | - |
| Total | 8,530 | 0.074 | 0.426 | 1.288 | 0.12 | 0.02 | 1.714 | 1.788 |
| Indicated Resources |
| DEPOSIT | Tonnes | Au | Pt | Pd | Cu | Ni | Pt+Pd | Au+Pt+Pd | | | 000's | g/t | g/t | g/t | % | % | g/t | g/t |
| Dana North | 5,881 | 0.054 | 0.278 | 0.777 | 0.09 | 0.02 | 1.055 | 1.109 |
| Dana South | 3,516 | 0.071 | 0.380 | 1.229 | 0.11 | 0.02 | 1.609 | 1.680 |
| Lismer's Ridge | 7,439 | 0.046 | 0.255 | 0.667 | 0.08 | 0.02 | 0.922 | 0.968 |
| Lismer North | 1,333 | 0.058 | 0.316 | 0.911 | 0.11 | 0.03 | 1.227 | 1.285 |
| Varley | 3,855 | 0.059 | 0.345 | 0.939 | 0.07 | 0.02 | 1.283 | 1.342 |
| Total | 22,024 | 0.055 | 0.300 | 0.848 | 0.09 | 0.02 | 1.149 | 1.204 |
31
| Measured + Indicated Resources |
| DEPOSIT | Tonnes | Au | Pt | Pd | Cu | Ni | Pt+Pd | Au+Pt+Pd |
| | 000's | g/t | g/t | g/t | % | % | g/t | g/t |
| Dana North | 8,504 | 0.062 | 0.324 | 0.947 | 0.10 | 0.02 | 1.271 | 1.333 |
| Dana South | 5,012 | 0.079 | 0.453 | 1.496 | 0.13 | 0.02 | 1.949 | 2.028 |
| Lismer's Ridge | 11,850 | 0.052 | 0.293 | 0.784 | 0.09 | 0.02 | 1.077 | 1.129 |
| Lismer North | 1,333 | 0.058 | 0.316 | 0.911 | 0.11 | 0.03 | 1.227 | 1.285 |
| Varley | 3,855 | 0.059 | 0.345 | 0.939 | 0.07 | 0.02 | 1.283 | 1.342 |
| Total | 30,554 | 0.061 | 0.335 | 0.971 | 0.10 | 0.02 | 1.306 | 1.367 |
2006 River Valley Updated Measured and Indicated Resource Estimate
(cut-off grade 1.0 g/t Pt+Pd)
| Measured Resource |
| DEPOSIT | Tonnes | Au | Pt | Pd | Cu | Ni | Pt+Pd | Au+Pt+Pd |
| | 000s | g/t | g/t | g/t | % | % | g/t | g/t |
| Dana North | 2,523 | 0.082 | 0.435 | 1.354 | 0.12 | 0.02 | 1.790 | 1.871 |
| Dana South | 1,495 | 0.100 | 0.626 | 2.122 | 0.16 | 0.03 | 2.748 | 2.848 |
| Lismer's Ridge | 3,976 | 0.064 | 0.368 | 1.018 | 0.10 | 0.02 | 1.385 | 1.449 |
| Lismer North | - | - | - | - | - | - | - | - |
| Varley | - | - | - | - | - | - | - | - |
| Total | 7,994 | 0.076 | 0.437 | 1.331 | 0.12 | 0.02 | 1.768 | 1.844 |
| Indicated Resource |
| DEPOSIT | Tonnes | Au | Pt | Pd | Cu | Ni | Pt+Pd | Au+Pt+Pd |
| | 000s | g/t | g/t | g/t | % | % | g/t | g/t |
| Dana North | 3,067 | 0.061 | 0.320 | 0.920 | 0.09 | 0.02 | 1.240 | 1.301 |
| Dana South | 3,304 | 0.072 | 0.389 | 1.266 | 0.11 | 0.02 | 1.655 | 1.727 |
| Lismer's Ridge | 2,140 | 0.054 | 0.302 | 0.824 | 0.09 | 0.02 | 1.127 | 1.180 |
| Lismer North | 716 | 0.071 | 0.394 | 1.183 | 0.13 | 0.03 | 1.577 | 1.648 |
| Varley | 2,082 | 0.075 | 0.448 | 1.224 | 0.09 | 0.02 | 1.671 | 1.747 |
| Total | 11,309 | 0.066 | 0.365 | 1.076 | 0.10 | 0.02 | 1.441 | 1.506 |
| Measured and Indicated Resource |
| DEPOSIT | Tonnes | Au | Pt | Pd | Cu | Ni | Pt+Pd | Au+Pt+Pd |
| | 000s | g/t | g/t | g/t | % | % | g/t | g/t |
| Dana North | 5,590 | 0.070 | 0.372 | 1.116 | 0.11 | 0.02 | 1.488 | 1.558 |
| Dana South | 4,800 | 0.080 | 0.463 | 1.533 | 0.13 | 0.02 | 1.995 | 2.076 |
| Lismer's Ridge | 6,116 | 0.060 | 0.345 | 0.950 | 0.10 | 0.02 | 1.295 | 1.356 |
| Lismer North | 716 | 0.071 | 0.394 | 1.183 | 0.13 | 0.03 | 1.577 | 1.648 |
| Varley | 2,082 | 0.076 | 0.448 | 1.224 | 0.08 | 0.02 | 1.672 | 1.747 |
| Total | 19,303 | 0.070 | 0.395 | 1.181 | 0.11 | 0.02 | 1.576 | 1.646 |
Inferred Resources
The following is a summary of the March 2006 inferred resource update, prepared by GeoSim Services Inc.:
- Table 3: Inferred Resource of 2.3 million tonnes with grades of 0.87g/t palladium (Pd), 0.31g/t platinum (Pt) and 0.05 g/t Gold (Au), using a cut off grade of 0.7 g/t Pt+Pd.
- Table 4: Higher Grade Inferred Resources 881,000 tonnes with grades of 1.36 g/t palladium (Pd), 0.46 g/t platinum (Pt) and 0.07 g/t Gold (Au), using a cut off grade of 1.0 g/t Pt+Pd.
32
| | Cautionary Note to US Investors concerning estimates of Inferred Resources. This section uses the terms “inferred resources”. We advise US investors while those terms are recognized and required by Canadian regulations, the US Securities and Exchange Commission does not recognize it. “Inferred resources” have a great amount of uncertainty as to their existence, and great uncertainty as to their economic and legal feasibility. It cannot be assumed that all or any part of an Inferred Mineral Resource will ever be upgraded to a higher category or will ever be converted into reserves. Under Canadian rules, estimates of Inferred Mineral Resources may not form the basis of feasibility or prefeasibility studies, except in rare cases. US investors are cautioned not to assume that part or all of an inferred resource exists, or is economically or legally minable. |
| Table 3: 2006 River Valley Updated Inferred Resource Estimate (cut-off grade 0.70 g/t Pt+Pd) |
| DEPOSIT | Tonnes | Au | Pt | Pd | Cu | Ni | Pt+Pd | Au+Pt+Pd |
| | 000's | g/t | g/t | g/t | % | % | g/t | g/t |
| Dana North | 41 | 0.035 | 0.209 | 0.559 | 0.07 | 0.02 | 0.769 | 0.803 |
| Dana South | 552 | 0.047 | 0.229 | 0.648 | 0.08 | 0.02 | 0.876 | 0.923 |
| Lismer's Ridge | 330 | 0.039 | 0.219 | 0.529 | 0.08 | 0.02 | 0.748 | 0.788 |
| Lismer North | 546 | 0.073 | 0.419 | 1.224 | 0.12 | 0.03 | 1.644 | 1.717 |
| Varley | 948 | 0.050 | 0.326 | 0.925 | 0.07 | 0.02 | 1.251 | 1.301 |
| Total | 2,389 | 0.053 | 0.309 | 0.873 | 0.09 | 0.02 | 1.182 | 1.235 |
| Table 4: 2006 River Valley Updated Inferred Resource Estimate (cut-off grade 1.0 g/t Pt+Pd) |
| DEPOSIT | Tonnes | Au | Pt | Pd | Cu | Ni | Pt+Pd | 3E |
| | 000s | g/t | g/t | g/t | % | % | g/t | g/t |
| Dana North | - | - | - | - | - | - | - | - |
| Dana South | 104 | 0.053 | 0.276 | 0.819 | 0.09 | 0.02 | 1.094 | 1.147 |
| Lismer's Ridge | - | - | - | - | - | - | - | - |
| Lismer North | 345 | 0.091 | 0.524 | 1.586 | 0.14 | 0.03 | 2.110 | 2.201 |
| Varley | 432 | 0.063 | 0.464 | 1.301 | 0.07 | 0.01 | 1.765 | 1.828 |
| Total | 881 | 0.073 | 0.465 | 1.356 | 0.10 | 0.02 | 1.821 | 1.894 |
The new resource estimates include results from the North Lismer and Varley zones not included in previous resource estimates.
Resource estimation was constrained by 3 dimensional solid models using Surpac© Vision software, developed from geological and analytical data. Block estimation was carried out by ordinary kriging and inverse distance to the third power using 2 m downhole composites. For the North Lismer model, one high outlier was capped at 3 g/5 Pt and 9 g/t Pd and for Varley, one high assay interval was capped at 10 g/t Pd prior to compositing.
The updated mineral resource estimate was completed by Ron Simpson of GeoSim Services Inc., in conjunction with John Londry, former VP Exploration of the Company. Resource block modeling was carried out by GeoSim Services Inc. based upon geological modeling conducted in-house by the Company, and incorporated all diamond drilling to March 31, 2005 (86,557 m of drilling and 422 drill holes).
(No allowance for the respective precious metal prices or recoveries has been made in the foregoing resource estimates).
(II) Sargesson Lake and Kelly-Davis Properties
Ownership
The Company acquired a 100% interest in certain mineral claims, known as the Sargesson and Kelly/Davis properties, located in the Janes, Davis and Kelly Townships, Sudbury Mining District, Ontario. As consideration, the Company paid $68,400 and incurred $30,000 in exploration expenditures.
The property is subject to a 2% NSR. The Company can purchase 1% of the NSR from the vendors for $400,000 and has the right of first refusal on the remaining 1% NSR.
33
(III) West Timmins Nickel Project
Ownership
By agreement dated October 28, 2004 as amended September 27, 2006 and April 7, 2008, the Company had the option to earn up to a 100% interest in the West Timmins Nickel Project, consisting of 1682 claim units (27,235 ha), from Xstrata Nickel (formerly Falconbridge Inc.).
Under the terms of the agreement PFN was required to spend $4 million over a five (5) year period in order to vest with a 100% interest in the Project. Xstrata would retain a 2 % NSR and could, under certain circumstances, back-in and earn up to a 65% interest by completing a feasibility study or spending $20 million on a feasibility study, whichever occurred first. Under the agreement PFN acted as Project Operator.
Minimum aggregate exploration expenditures of $4 million were to be completed by December 31, 2008. This commitment was extended to December 31, 2009 to complete additional exploration programs as follows:
| On or before December 31, 2005 | (completed) | $ | 750,000 |
| On or before December 31, 2006 | (completed) | $ | 1,500,000 |
| On or before December 31, 2007 | (completed) | $ | 2,500,000 |
| On or before December 31, 2009 | (3,077,592 incurred) | $ | 4,000,000 |
Location and Access
The property is located approximately 70 km west of the city of Timmins, Ontario and is within the townships of Belford, Griffin, Melrose, Montcalm, Nova, Strachan and Watson. The property is accessible by road travelling west from Timmins along Highway 101 for 5 km, then heading northwest for 56 km along the Mallette logging road.
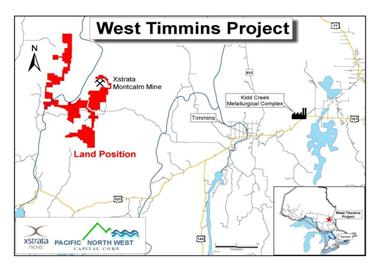 | Location of the West Timmins Project |
Exploration
The Company’s exploration activities on the West Timmins Nickel Project focused on nickel and associated metals. In addition to airborne geophysical surveys completed in late 2004, a detailed compilation of the historical work in the MFI was completed and has been used to help evaluate and prioritize conductors identified by the AeroTEM survey. In cooperation with Falconbridge, seven priority conductor anomalies have been identified based on geophysical responses, relation to the Montcalm deposit, geological settings and previous work over the conductors.
Follow up line cutting and EM surveys were initiated. Drill testing of the stronger geophysical and geochemical targets was carried out in early 2006. The most significant drill results were received in an area 5 km southwest of the Montcalm mine, where large zones of sulphide mineralization were intersected in an intrusive breccia. Trace nickel and copper mineralization was intersected in parts of the zone. PFN initiated a deep penetrating program of geophysical surveys to cover the extensive area between the successful drill holes and the mine area, and Xstrata agreed to continue the surveys on and over the mine on their property. The surveys were laid out to look for sulphide mineral zones at depth associated with magnetic anomalies identified from the AeroTEM survey.
34
A diamond drill program was completed in 2007 with no significant intersections. The drill program targeted geophysical and geochemical anomalies identified in previous work programs. Numerous additional airborne EM (AeroTEM), Pulse borehole EM, and geochemical anomalies in the Montcalm Intrusive Complex remain to be drill tested.
In a continuing effort to evaluate the Montcalm Intrusion, a deep penetrating UTEM survey was completed in September 2008. Although some geophysical anomalies were identified, interpretations suggest that the anomalies are unlikely to reflect mineralization.
On May 5, 2009, the Company terminated the option agreement with Xstrata Nickel on the West Timmins Property.
(IV) Raglan Hills (formerly South Renfrew)
Ownership
The Company staked 6 claims (1024 ha) in Raglan Township within the Raglan meta-gabbro mafic complex in June 2006.
The property covers at least one historical nickel copper showing within a sulphide zone that is approximately 155 m long and 6 to 15 m wide. Reconnaissance prospecting, sampling and geochemical soil programs have been initiated over the property, as well as the historical showing areas.
In 2007 the Company entered into a 50/50 joint venture agreement with First Nickel to evaluate the claims as well as their adjoining claims (1728 hectares) as one property. Expenditures and programs on the project were determined by an annual joint management committee meeting.
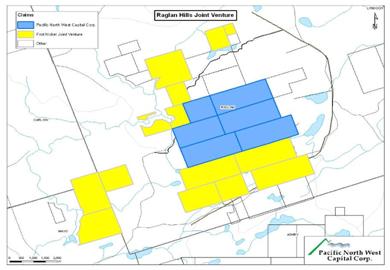 | PFN and First Nickel claims
forming the Raglan Hills joint
venture property |
In 2008 an airborne magnetic and electromagnetic survey was completed on the Raglan Hills property. This was followed by mapping and prospecting in the vicinity of anomalies generated by the airborne survey.
Due to the downturn in commodity prices, PFN informed First Nickel that it would not be participating in the funding of a 2009 exploration program and as a result the Company’s participating interest has been decreased. As per the joint venture agreement with First Nickel, the Company’s participating interest was converted to a 1.5% NSR over the Raglan Hills property.
35
(V) Coldwell Properties, Ontario
Ownership
In 2007, the Company acquired 91 mineral claims (20,254 ha) by staking in the Coldwell area near Marathon, Ontario. The claims cover parts of the Coldwell alkaline intrusive complex, which also hosts the Marathon PGM deposit.
 | PFN claims forming the Coldwell
property near Marathon, Ontario |
Airborne geophysical and lake bottom sediment surveys were completed in 2007. The goal of these surveys was to identify targets for follow-up ground evaluation in 2008. Prospecting and a soil geochemical survey were completed in 2008. This work did not identify any significant mineralization.
The Company allowed the Coldwell claims to lapse in July and August 2010.
(VI) Goodchild Property, Ontario
During the year ended April 30, 2009, the Company acquired 28 mineral claims (6640 ha) by staking in the north east of the Coldwell Area near Marathon, Ontario. These claims were incorporated into the Coldwell project as described in the preceeding section.
As with the Coldwell Project, the Company allowed the Goodchild claims to lapse in February 2010.
(VII) East Sudbury Property, Ontario
During the year ended April 30, 2009, the Company acquired 124 mineral claims (1,638 units – 26,208 hectares) by staking in the Sudbury area of Ontario.
PFN claims forming the East
Sudbury property near Sudbury,
Ontario |  |
36
A limited program of soil sampling and prospecting was completed on the East Sudbury property in 2008. In September 2009, the Company sold certain of the East Sudbury claims to Trueclaim Exploration Inc. for a 1.5% NSR and 50,000 Trueclaim Exploration Inc. shares.
In September 2009 the property was reduced from 128 claims to 60 claims and from then through December 2009 an additional 56 claims were lapsed. The Company allowed the balance of the claims remaining to lapse in August 2010.
(VIII) Swayze Joint Venture, Ontario
In 2007 the Company acquired claims by staking in Kenogaming Township (in the Swayze Greenstone Belt), Ontario. On February 12, 2008, the Company entered into a three-year joint venture agreement with Benton Resources Corp. to evaluate the claims that both parties held in the Swayze Greenstone Belt. It was proposed that the exploration budget over the three years would be $1,200,000 with the first year’s budget of $400,000. Total holdings in the Swayze area include 3 properties totaling 8,544 hectares.
Swayze joint venture claims
in the Swayze greenstone
belt of Ontario | 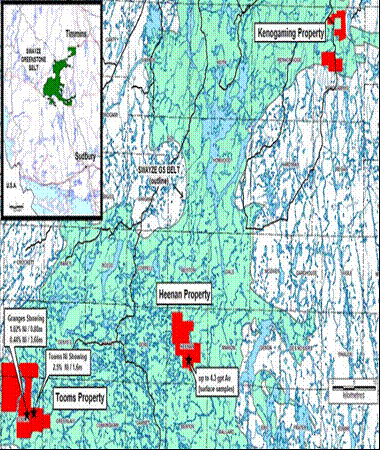 |
Any additional claims acquired in the Swayze Greenstone Belt would be included in the joint venture. Each company would participate in working the properties as a 50:50 joint venture. Expenditures and programs on the properties to be determined by an annual joint management committee meeting.
In 2008, and airborne survey was completed over claims in Tooms Township that form part of the Swayze joint venture property. In addition, prospecting and mapping were completed on the Tooms and Heenan Township properties. In late 2008, a small (500 m) drill program was completed on the Heenan Township property. This work did not identify significant mineralization.
On May 5, 2009 the joint venture was terminated. The Company allowed the Swayze claims to lapse in January 2010 and has no further plans for this project.
37
(IX) North Duluth Property, Ontario
In 2007 the Company acquired 10 mineral claims (81 units – 1296 hectares) in the Crystal Lake Area south of Thunder Bay, Ontario and completed an airborne magnetic-electromagnetic survey over the property. The survey did not identify any significant targets for follow-up work and in February 2009, the property was reduced to 8 claims. In February 2010, the remaining claims lapsed.
QUÉBEC, CANADA
(I) Glitter Lake Property, Québec, Canada
Ownership
By an agreement dated August 15, 2003, April 30, 2006 and further amended on April 1, 2008, with CanAlaska, a company that previously had certain directors in common, the Company acquired a 50% interest in certain mineral claims known as the Glitter Lake property, located in the province of Québec.
The Glitter Lake property consists of 63 unpatented mining claims totalling 1,008 hectares. The claims are owned 100% by PFN, and carry expiry dates of 24 June 2011 (extensions have been applied for). Work requirements are $750 per claim. The claims are situated along the trend of the gabbroic sill that hosts the Horden Lake Cu-Ni deposit and form two groups, one situated to the southwest of the Horden Lake property, the other to the northeast.
As consideration, the Company, at its option, must issue common shares, make payments and incur exploration expenditures as follows:
| | | | Payments | | Shares | | Exploration
Expenditures | |
| On or before 15 April 2003 | (completed) | $ | - | | - | $ | 50,000 | |
| Upon execution of agreement | (paid) | | 10,000 | | - | | - | |
| On or before 4 June 2004 | (issued) | | - | | 20,000 | | - | |
| On or before 15August 2004 | (paid) | | 15,000 | | - | | - | |
| On or before 28 May 2005 | (issued) | | - | | 20,000 | | - | |
| On or before 15August 2005 | (paid) | | 20,000 | | - | | - | |
| On or before 28 May 2006 | (issued) | | - | | 20,000 | | - | |
| On or before 15 April 2007 | (completed) | | - | | - | | 150,000 | |
| On or before 15 April 2009* | (14,953 paid) | | - | | - | | 200,000 | |
| On or before 15 April 2010* | | | - | | - | | 300,000 | |
| Total | | $ | 45,000 | | 60,000 | $ | 700,000 | |
* Extensions to these dates have been applied for and are pending.
Upon the Company having vested with a 50% interest by completing the aforementioned payments and obligations, the Company could elect within 45 days to increase its interest to 60% by completing a bankable feasibility study within 24 months. In the event the Company did not complete a bankable feasibility study within two years, the Company agreed to make cash payments in the amount of $50,000 per annum for each year the feasibility study was not completed. Upon vesting with a 60% interest, the Company could elect within 90 days to earn a 70% interest in the property by placing the property into commercial production within 2 years from the date of this election. In the event that the bankable feasibility study indicated an IRR in excess of 15%, the Company agreed to make annual cash payments of $50,000 to CanAlaska for each year the project is not placed into commercial production.
In the event that a major mining company elected to participate in the project before the Company vested with a 50% interest, the Company would issue common shares to the value of $100,000 to CanAlaska, within 15 days of the Company becoming vested, or pay such amount that would result in having the Company spent $1 million in exploration expenditures.
The property is subject to 1.5% NSR payable to a third party. The Company and CanAlaska will share the NSR buyout privileges in proportion to their respective interests.
In 2007 PFN and CanAlaska agreed to an extension of the option. A field program of sampling historical core stored on the property was also completed in 2007.
38
On January 30, 2009, the Company and CanAlaska signed an amendment to the option agreement whereby CanAlaska assigned a 100% ownership of the Glitter Lake property to the Company, in consideration of meeting CanAlaska’s office lease obligations until the end of the lease term in November 2010. This equates to a one-time cash payment of $83,601 dollars. CanAlaska retains a 0.05% NSR interest in the property along with the existing royalty agreement with the original prospectors of 1.5%. The original option agreement has thus been terminated.
The Glitter Lake Project is located in northeastern Quebec, approximately 135 km north –northeast of the town of Matagami. The property lies at the southwest end of a 40 km long, north east trending belt of metavolcanic and sedimentary rocks intruded by a gabbroic body. The exploration target is PGM mineralization associated with copper-nickel sulphide mineralization. The Glitter claims surround, and extend along strike from, the Horden Lake Copper-Nickel deposit, which hosts an indicated resource of 8.8Mt at 0.88% Cu and 0.21% Ni, and an inferred resource of 7.8Mt at 0.87% Cu and 0.25% Ni (Southampton Ventures Inc., Press Release, March 2, 2009).
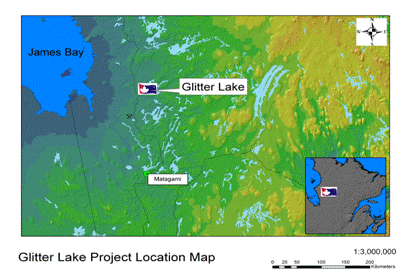
The principal exploration target on the Glitter Lake Property is remobilized magmatic Cu-Ni sulphide mineralization along the contact of the metagabroic intrusion that hosts the Horden Lake deposit. Of particular interest is the potential for relatively high-grade Cu mineralization that could be used to augment the high grade, but relatively low tonnage portion (indicated resource of 2.4 Mt at 1.37% Cu, 0.25% Ni, and inferred resource of 2.0 Mt at 1.34% Cu, 0.34% Ni) of the Horden Lake deposit.
A joint venture partner is being sought to further explore the Glitter Lake property.
(II) SOQUEM –Taureau & Chenneville Projects, Québec, Canada
On July 28, 2006 the Company signed a 50/50 Cooperation Agreement with SOQUEM Inc. ("SOQUEM") in order to conduct research on platinum properties in the southern portion of the Province of Québec, Canada, in a designated Area of Mutual Interest ("AMI"), with the objective of identifying viable properties for further exploration. PFN and SOQUEM would pool staffing and funding resources, and share all technical data pertaining to properties located within the AMI, with each party having equal representation of two members each on a technical committee, responsible for setting programs, budget and schedule. SOQUEM acted as Manager. The first exploration program agreed upon between the parties was budgeted at $250,000 and was completed by the end of 2006.
In the event that a viable property was identified, the parties would contribute jointly to all staking and acquisition costs, or, if one party elected to do so independently, would do so at its own expense. In that event, the other party was granted the right of first refusal to acquire a 50% interest in the property. Exercise of this right would result in the creation of a new joint venture agreement between the parties for the newly acquired property.
39
The 2006 program’s assay results (1.17gpt Pd, 0.14gpt Pt, 0.29gpt Au, 1.62% Cu, and 0.35% Ni) from the Taureau evaluations justified staking a mafic intrusive and the flying of an airborne EM survey. Several magnetic bodies with associated conductors were identified, and additional claims were acquired in these areas.
In 2007, work programs continued to evaluate mafic intrusives in the AMI. The conductor trends identified from the airborne survey in the Chenneville area were staked (254 mineral claims – 15,200 hectares) and evaluated. The Chenneville Project was initiated to follow-up on the PGE-Cu-Ni mineralization located in 2006. Additional follow-up ground work on the Taureau and Cheneville project areas was completed in 2009, culminating with a 500 m drill program on the Cheneville property. No significant mineralization was identified during the course of the foregoing investigations.
Both parties agreed to abandon the entire Chenneville property since the fieldwork did not give the significant results expected and the Company and Soquem agreed to terminate the Taureau and Chenneville joint venture in August 2009.
(III) Fiedmont Property, Val d’Or Québec
On December 16, 2008, the Company entered into an option agreement with Kinbauri whereby the Company could earn a 60% interest in 40 of Kinbauri’s 84 claims covering approximately 3,458 ha, known as the Fiedmont PGM property, subject to a 2% NSR held by the original vendors. The vendor’s NSR is subject to a 1.0%, $900,000 buyback, to earn a 60% interest.
Under the terms of the Agreement, the Company would pay Kinbauri an aggregate amount of $98,000, issue 150,000 common shares to Kinbauri and expend $400,000 on exploration prior to November 30, 2010 to earn its interest. The Company’s first year commitment was mandatory and included payment to Kinbauri of $38,000 (paid), issuance of 50,000 shares (issued, valued at $4,500), and expenditures of $150,000 (incurred) on exploration prior to November 30, 2009.
The property is situated approximately 15 km northeast of Val d’Or, Québec and is road accessible.
The Company completed an initial drill program targeting potential extensions of the known mineralization in March, 2009; however, no significant assays were returned
The option agreement with Kinbauri was terminated on October 13, 2009.
(IV) Destiny Gold Project, Québec
Ownership
On August 14, 2009, the Company entered into an option agreement with Alto Ventures Ltd. (“Alto”) to earn a 60% interest in the Destiny Gold Project (formerly the Despinassy Project) consisting of 175 mining claims totalling 7260 ha.
Under the terms of the Option Agreement with Alto, PFN will pay Alto $200,000 ($100,000 paid), provide Alto with 250,000 common shares of PFN (75,000 common shares issued), and complete a total of $3,500,000 in exploration expenditures over a four year period to earn a 60% interest in the Destiny Gold property. Subsequent to vesting of its interest, PFN will form a joint venture with Alto to further develop the project. Certain claims comprising the property are subject to underlying net smelter return royalties ranging from 1% to 3.5%, with varying buy-back provisions.
Location and Access
The Destiny Gold Project is located approximately 75 km north of Val d’Or in the Abitibi-Témiscamingue region of Québec. The property is road accessible, and excellent mining infrastructure and support facilities are available in nearby Val d’Or.
Geology
The Destiny Gold property is underlain by Archean metavolcanic and metasedimentary rocks of the Abitibi Greenstone Belt. A regional scale structure, the Despinassy shear zone, transects the property. High grade gold mineralization occurs in quartz veins and alteration zones associated with this structure. Mineralization has been identified in several locations along the Despinassy shear zone on the property over a strike distance of about 4 m.
40
Mineralization
The main area of mineralization, the DAC zone, occurs over a strike length of about 600 m. In this area, four to five identifiable intervals of quartz veining and shear-related alteration zones carry high-grade gold mineralization, with drill intersections ranging up to 178.5 g/t Au over a drill width of 1.0 m.
The DAC zone hosts a NI 43-101 compliant indicated resource of 166,863 tonnes grading 6.88 g/t Au (36,892 oz) and an inferred resource of 444,753 tonnes grading 4.46 g/t Au (63,839 oz) as calculated by W.A. Hubacheck Consultants Ltd. for Alto in “A Resource Estimate of the DAC Gold Deposit, Despinassy Twp., Val d’Or, Quebec,” dated January 9, 2007 (the “2007 Resource Estimate”), and incorporated into the Wardrop Report. The DAC zone is open along strike and at depth. The occurrence of high-grade mineralization at the Darla and 20 and 21 zones to the east clearly indicates that the mineralizing system occurs across a significant portion of the property.
Exploration
The Phase 1 program was completed on December 22, 2009 and consisted of 5,600 m of drilling in 14 holes. Results from the Phase I drilling program were very positive as they validated the deposit model and confirm continuity of gold mineralization between previous wide-spaced holes. Each of the holes targeting the DAC deposit intersected gold within multiple zones of shearing, strong alteration, quartz veins containing variable amounts of sulphides. Significant gold values were obtained in 100% of the holes drilled including high grade quartz veins containing up to 44.39 g/t Au and wide mineralized shear zones including 21.0 m averaging 1.39 g/t Au and another high grade quartz veins containing up to 16.43 g/t Au over 0.5 m (0.48 oz/ton) and averaging 0.51 g/t and 49.5 m averaging 0.36 g/t Au. Phase 1 confirmed the large size of the gold system at the DAC deposit.
The Phase II drilling program began January 26, 2010 and was completed in March 2010. The results from the Phase I and Phase II programs are incorporated into the extensive data base available for the Destiny project for the next stage of work, which may include diamond drilling. Drilling at the DAC Deposit continued to intersect multiple gold zones with high grade values over significant widths including DES10-137 which intersected 20.85 g/t Au over 1.1m within a vein zone that averages 8.46 g/t over 3.0m. This same hole intersected another gold zone containing 12.0 g/t Au over 0.5 m within a quartz-veined shear zone averaging 1.16 g/t Au over 6.6 m and a massive sulphide lens assaying 6.4% Zn over 1.0 m.
DES10-137 intersected a one metre-wide zone of zinc-rich massive sulphides that is believed to be part of the same sulphide horizon from which base metal values were reported. Company believes that the base metals are indications of an earlier copper-zinc-gold massive sulphide system that has been subsequently overprinted by the gold enriched shear zones that are host to the DAC Deposit.
Table of Significant Gold Assays
| Hole Number | From (m) | To (m) | With (m)
*downhole | Au (g/t) |
| DES09-128 | 315.0
458.1 | 318.6
458.6 | 3.6
0.5 | 1.37
2.99 |
| DES09-129 | 257.7
308.8
407.0 | 266.0
316.3
407.5 | 8.3
7.5
0.5 | 1.10
0.78
16.43 |
| Hole Number | From (m) | To (m) | With (m)
*downhole | Au (g/t) |
| DES09-130 | 299.2
305.5
354.4 | 312.6
306.7
374.2 | 13.4
1.2
19.8 | 0.7
6.02
0.53 |
| DES09-131 | 94.6
116.8
131.0 | 119.9
118.9
170.5 | 25.3
2.1
49.5 | 0.51
2.42
0.36 |
DES09-134 Includes | 124.8
256.9
259.6
316.7 | 135.3
266.7
260.6
332.8 | 10.5
9.8
1.0
16.1 | 0.41
0.53
2.54
0.28 |
DES09-135
Includes
Includes
Includes
Includes
Includes | 355.75
357.25
365.5
374.85
375.4
386.65
389.15
431.4
446.5
486.55
527.1
527.1 | 368.0
357.75
366.0
377.0
375.7
391.0
390.15
441.8
70.35
496.9
530.0
527.75 | 12.25
0.5
0.5
2.15
0.3
4.35
1.0
10.4
23.85
10.35
2.9
0.65 | 2.85
12.69
51.66
1.55
7.9
0.74
2.34
0.46
0.36
0.35
3.35
12.84 |
DES09-136
Includes | 451.0
460.9 | 463.3
461.5 | 12.3
1.6 | 0.9
3.59 |
DES09-137
Includes
Includes
Includes | 216.3
226.8
251.9
254.0
371.0
372.9 | 227.6
227.6
258.5
254.5
374.0
374.0 | 11.3
0.8
6.6
0.5
3.0
1.1 | 0.92
4.0
1.16
12.0
8.46
20.85 |
DES09-138
New Vein | 22.0
91.0 | 44.0
92.0 | 22.0
1.0 | 0.39
2.57 |
41
* Based on core angles and previous drilling, true widths are estimated at approximately 80 to 90% of the downhole lengths reported. Mineralized zones generally start at 0.1 g/t Au and assay averages may include minimal intervals of waste material. No top cuts of assays were used.
The results from the first 14 holes confirmed the continuity of gold mineralization between holes drilled previously, some of which were spaced from 100m to 200m apart.
The 2010 exploration program was completed in December 2010. A high resolution airborne magnetic survey was conducted along with BHEM surveys that were designed to target massive sulphide mineralization.
Three drill holes were completed and each had a specific objective with respect to defining controls on the mineralization at the Destiny Gold Project. These are summarized as (1) to test selected BHEM conductors and assess the association of areas of sulphide mineralization with gold mineralization, and (2) to test for shallow gold mineralization to the south of the DAC deposit where the high resolution magnetic survey identified magnetic signatures similar to the DAC deposit.
Previous drilling revealed massive sulphide mineralized lenses locally adjacent to the gold mineralization. The companies interpreted these sulphide lenses as important to the gold mineralizing system and completed BHEM surveys in certain drill holes to trace the extent of the massive sulphide mineralization and to help guide drilling at depth.
The 2010 program also included the completion of the Wardrop Report, which incorporated over 7,600 m of additional drilling that was completed on the deposit subsequent to the 2007 Resource Estimate, for an updated NI43-101 compliant report with a resource estimate.
Indicated and Inferred resources have been determined for the DAC deposit. The deposit is made up of narrow high-grade gold-bearing quartz veins occurring within five parallel alteration zones. These alteration zones carry gold at lower grades than the quartz veins but are significantly wider. The Wardrop Report indicates that the additional drilling has expanded the DAC Deposit and significantly increased the contained ounces of gold.
42
At a cut-off grade of 0.5 g/t Au and using the Inverse Distance Squared (ID2) estimation method, the five gold zones contain an Indicated Resource of about 10.8 million tonnes with an average grade of 1.05 g/t Au (364,000 contained ounces). In addition, the Inferred Resource totals 8.3 Mt with an average grade of 0.92 g/t Au (247,000 contained ounces). Table 2 summarises the Resource Estimate at the 0.5 g/t cut-off.
A cut off grade of 0.5 g/t Au was selected to tabulate the total resources based on the results of similar gold projects located in Ontario and Quebec. In addition, the following parameters were considered; 4:1 stripping ratio, operating costs of $14.30/tonne at 10,000 tonnes per day, long term gold price of $US973/troy ounce, $US to $Cdn conversion of 1.02 and gold recovery of 94%. The resources block considers the mineralization to start at approximately 15 m below surface down to a depth of 400m for the deepest zone (Zone 5).
Mineral Resources are not Mineral Reserves and by definition do not demonstrate economic viability.
DAC Resource Estimation Summary (using ID2 method)
| Class | Zone | Capping Grade (g/t) | Tonnes Above Capped Grade | Average Grade (g/t) | Average True Width (m) | Au Ounces |
| Indicated | 1 | 7.53 | 1,395,600 | 0.84 | 16 | 37,760 |
| | 2 | 19.63 | 2,942,700 | 1.19 | 30 | 112,644 |
| | 3 | 6.66 | 1,370,700 | 0.99 | 12 | 43,675 |
| | 4 | 10.80 | 3,542,600 | 1.06 | 21 | 121,221 |
| | 5 | 14.00 | 1,573,900 | 0.97 | 15 | 49,231 |
| | Total | | 10,825,500 | 1.05 | | 364,530 |
| Class | Zone | Capping Grade (g/t) | Tonnes Above Capped Grade | Average Grade (g/t) | Average True Width (m) | Au Ounces |
| Inferred | 1 | 7.53 | 971,900 | 0.70 | 16 | 21,724 |
| | 2 | 19.63 | 1,841,100 | 1.06 | 30 | 62,487 |
| | 3 | 6.66 | 725,500 | 0.93 | 12 | 21,759 |
| | 4 | 10.80 | 3,085,300 | 0.89 | 21 | 88,767 |
| | 5 | 14.00 | 1,706,600 | 0.96 | 15 | 52,854 |
| | Total | | 8,330,400 | 0.92 | | 247,590 |
Cut-off Sensitivities for the DAC Deposit Resource Estimate
| Class | ID2 Cut-off (Au g/t) | Tonnes | Average Grade (Au g/t) | Contained Ounces Au |
| Indicated | 0.2 | 24,275,300 | 0.65 | 509,960 |
| | 0.4 | 14,371,800 | 0.90 | 415,780 |
| | 0.5 | 10,825,500 | 1.05 | 364,530 |
| | 0.6 | 8,225,700 | 1.21 | 318,840 |
| | 0.8 | 5,359,200 | 1.48 | 255,370 |
| | 1.0 | 3,858,800 | 1.71 | 212,310 |
| | 1.5 | 1,820,100 | 2.26 | 132,490 |
| | 2.0 | 979,900 | 2.73 | 86,100 |
43
| Class | ID2 Cut-off (Au g/t) | Tonnes | Average Grade (Au g/t) | Contained Ounces Au |
| Inferred | 0.0 | 31,535,100 | 0.43 | 436,840 |
| | 0.2 | 22,541,600 | 0.55 | 401,190 |
| | 0.4 | 12,132,100 | 0.78 | 302,500 |
| | 0.5 | 8,330,400 | 0.92 | 247,590 |
| | 0.6 | 5,797,600 | 1.09 | 203,210 |
| | 0.8 | 3,534,600 | 1.35 | 153,420 |
| | 1.0 | 2,521,400 | 1.53 | 124,390 |
| | 1.5 | 1,133,600 | 1.93 | 70,360 |
| | 2.0 | 385,600 | 2.29 | 28,400 |
NORTHWEST TERRITORIES, CANADA
(I) Winter Lake
In 2007, the Company staked two separate blocks of claims, totaling 33 mineral claims of approximately 34,070 ha in the MacKay Lake area of the Northwest Territories. These claims cover geology similar to that where GGL Resources reported nickel values in a komatiitic environment.
No exploration work was completed on the property subsequent to staking, and the claims were allowed to lapse May 4, 2009 and reverted to the Crown.
SASKATCHEWAN, CANADA
(I) Nickel Plats Project
By agreement dated April 30, 2007, the Company can acquire, from Diamond Hunter Ltd. a 100% interest in the Gochager Lake property by completing $750,000 of exploration expenditures in three installments over a three year period, and by making cash payments of $90,000 in four installments in a two year period, and by issuing a total of 300,000 common shares over a three year period. Upon the Company vesting with 100% interest in the Nickel Plats property, the Optionor shall retain a 2% NSR. The Company shall have the right to purchase a 1% NSR from the Optionor for $750,000. The Company will make advanced royalty payments to the Optionor of $40,000 per year for a period of three years following completion of the initial option period. The Company, at its option, must issue common shares, make payments and incur exploration expenditures as follows:
| | | Payments | Shares | Exploration
Expenditures |
| Upon execution of agreement | (paid/issued) | $10,000 | 75,000 | $- |
| On or before 30 June 2007 | (paid) | 20,000 | - | - |
| On or before 30 April 2008 | (paid/issued/ completed) | 30,000 | 75,000 | 200,000 |
| On or before 30 April 2009 | re-negotiated | 30,000 | 75,000 | 250,000 |
| On or before 30 April 2010 | re-negotiated | - | 75,000 | 300,000 |
| On or before 30 April 2011 | re-negotiated | 40,000 | - | - |
| On or before 30 April 2012 | re-negotiated | 40,000 | - | - |
| On or before 30 April 2013 | re-negotiated | 40,000 | - | - |
| Total | | $210,000 | 300,000 | $750,000 |
44
By amendment dated March 30, 2009, the cash, share and advance royalty payment requirements of the Option Agreement were revised as follows:
| | | Payments | Shares | Exploration
Expenditures |
| Upon execution of agreement | (paid/issued) | $10,000 | 75,000 | $- |
| On or before 30 June 2007 | (paid) | 20,000 | - | - |
| On or before 30 April 2008 | (paid/issued) | 30,000 | 75,000 | - |
| On or before 30 April 2009 | (paid/issued) | 15,000 | 50,000 | - |
| On or before 30 April 2010 | (paid/issued) | 15,000 | 50,000 | - |
| On or before 30 April 2011 | (paid) | 20,000 | - | - |
| On or before 30 April 2012 | | 20,000 | - | - |
| On or before 30 April 2013 | | 20,000 | - | - |
| Total | | $150,000 | 250,000 | $- |
Approximately $678,609 in expenditures have been accrued by the Nickel Plats Project, thereby fulfilling all exploration expenditure requirements under the terms of the amended Option Agreement.
In 2007, the Nickel Plats project was evaluated, and a compilation was begun to understand the setting of the mineralization as well as develop an approach to test the known mineralization and other targets that were developed from the work. Five mineral claims (7,692 ha) were staked in the vicinity to expand to the property to include additional target areas.
A 2284 line km helicopter-borne VTEM (Versatile Time Domain Electromagnetic) geophysical survey was completed by Geotech Ltd over the Nickel Plats property in 2008, with a large number of anomalies identified, and limited re-sampling of historic drill core on the property was also completed.
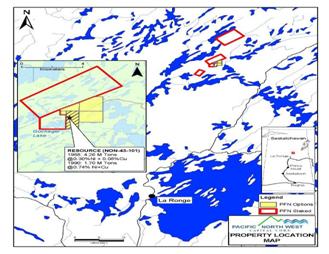 | Claim locations for the Nickel Plats
project, Saskatchewan. |
No exploration activity was undertaken on the project in 2009.
A joint venture partner is being sought to further explore the Nickel Plats project.
BRITISH COLUMBIA, CANADA
(I) Rock & Roll Property - Au-Ag-polymetallic project
Ownership
On July 28, 2009, the Company obtained an option from Misty Creek Ventures Ltd. (Misty Creek Ventures Ltd. was dissolved in January 2010 and its interest was transferred to Equity Exploration Consultants Ltd.), First Fiscal Enterprises Ltd. and Pamicon Developments Ltd. (collectively, the “Vendors”) on the Rock & Roll Property. Under the terms of the Agreement, the Company can earn a 100% interest in the property over a four-year period by completing $2,000,000 ($594,046 incurred) in exploration expenditures, paying the Vendors $130,000 and providing the Vendors with a total of 600,000 (100,000 shares issued) of the Company’s common shares. The Vendors retain a 2% NSR, of which 1% can be purchased for $3,000,000. The property is also subject to an underlying NSR of 3% and an underlying Net Profits Interest Royalty ("NPI") of 15%, both of which are payable to Prime Equities International Corporation, and both of which are purchasable by the Forrest Syndicate and/or heirs and assignees in their entirety for $1,500,000 each.
45
Location and Access
The Rock & Roll Property is located in the Liard Mining District approximately 9 km west of the Bronson airstrip and 37 km from the Eskay Creek Mine Road in northern British Columbia.
Geology and Mineralization
The Rock & Roll Property hosts precious metals rich in volcanogenic massive sulphide (VMS) mineralization in a volcano-sedimentary host rock package of Triassic age. As such, the mineralization shows similarities to the gold and silver rich mineralization of Barrick Gold’s past-producing Eskay Creek mine. Known mineralization on the Rock & Roll Property occurs in multiple stacked sulphide lenses in two zones, the Black Dog and SRV zones, over a strike length of approximately 950 m. A total of approximately 14,000 m of core drilling in 110 drill holes was completed on the property from 1991 to 1997. Only six drill holes tested the host stratigraphy outside of the known mineralization, but at least 5km of strike length of the prospective lithologies is present on the property. There is the potential for additional mineralization along strike and at depth, as historic drilling tested the known mineralization down to depths of only about 160 m.
Exploration
The 2009 exploration program included a 350 line km, AeroTem3, helicopter-borne magnetic/electromagnetic survey conducted by Aeroquest Limited and a drilling program consisting of a total of 540 m of core drilling completed in five holes. The first four holes were designed to test gaps in the historic drilling on the Black Dog Zone in order to establish the degree of continuity of the mineralization and to confirm the historic geological model. Each of the infill drill holes encountered the target mineralization, confirming the continuity of the sulphide lenses and the validity of previous geological interpretations. The table below illustrates selected assay results from this drill program. (Au and Ag in g/t. Cu, Pb and Zn in percent (%).
| Hole Number | From (m) | To (m) | Interval (m) | Au g/t | Ag g/t | Cu % | Pb% | Zn% |
| RR09-105 | 76.03 | 77.9 | 1.87 | 0.78 | 84.6 | 0.24 | 0.21 | 0.89 |
| including | 76.77 | 77.9 | 1.13 | 1.14 | 120.4 | 0.32 | 0.30 | 1.23 |
| RR09-106 | 62.26 | 64.3 | 2.04 | 0.40 | 72.2 | 0.27 | 0.24 | 1.63 |
| including | 62.26 | 63.01 | 0.75 | 0.90 | 177.7 | 0.60 | 0.63 | 4.23 |
| RR09-107 | 39.32 | 58.73 | 19.41 | 0.53 | 57.9 | 0.19 | 0.24 | 0.91 |
| including | 39.32 | 42.46 | 3.14 | 1.31 | 296.2 | 0.46 | 1.25 | 3.99 |
| RR09-108 | 46.88 | 85.59 | 38.71 | 0.28 | 18.3 | 0.13 | 0.05 | 0.72 |
| including | 62.74 | 75.71 | 12.97 | 0.40 | 28.0 | 0.21 | 0.06 | 1.07 |
| RR09-109 | No Significant Assays |
| | *Interval represents apparent thickness not true thickness |
The final drill hole of this program tested a strong electromagnetic anomaly that was thought to represent the westward continuation of the Black Dog Zone. Drilling at this location failed to return any significant assays.
Further investigations are required to test for a westward extension of the main zones of mineralization.
The 2009 work program on the property was also designed to provide an initial evaluation of the validity of historic assay data. A total of twenty-one samples from five different historic drill holes were obtained for comparison with the original assays. In most cases the samples were taken from the same core interval as the original samples.
46
Overall historic assay results have been confirmed, and the Company can now embark on a systematic re-sampling of historic core to provide a statistical comparison of the historic assay data with modern data. Commencement of the 2010 Rock and Roll exploration program was announced on September 27th 2010. This program primarily focused on continuation of re-sampling previous drill core, coupled by geological mapping/prospecting that investigated airborne geophysical survey conductors and geological and geochemical targets. The fieldwork was supported by further compilation of data from the 1990-97 programs and the incorporation of new geological interpretations formulating in conjunction with members of the British Columbia Geological Survey.
The Rock & Roll Report, commissioned by Alto and PFN, and filed on June 1, 2011 on the Company’s Form 6-K, included a new NI 43-101 compliant mineral resource estimate for the Black Dog Deposit. The resource estimate incorporated the mineralized zones of the historic drill core and the 540 m (1772 ft) of the five diamond drill holes that were completed by PFN in 2009/2010. Through this work, PFN significantly increased the resources contained within the Black dog deposit over the previous resource estimate, completed prior to the implementation of the NI 43-101 standards of disclosure.
The NI43-101 compliant mineral resource estimate in the “indicated” category consists of 2,155,679 tonnes grading 0.68 g/t Au (47,040 contained oz of Au), and 82.7 g/t Ag (5,734,445 contained oz of Ag) at a gold-equivalent cut-off grade of 0.5 g/t. The deposit also contains 0.22% Cu (10,500,833 lbs Cu), 0.22% Pb (10,399,960 lbs Pb), and 0.94% Zn (44,522,995 lbs Zn) or 3.11 g/t gold equivalent (AuEq) for an additional 215,239 oz of Au Eq at the 0.5 g/t AuEq cut-off. The AuEq grade is based on $1000/oz Au, $15.80/oz Ag, $2.92/lb Cu, $0.86/lb Pb and $0.86/lb Zn. Tables bellow give the mineral resource estimate for the Black Dog deposit at varying cut-off grades.
The Black Dog massive sulphide deposit is part of a larger area that includes the SRV Zone hosting precious metal-rich volcanogenic massive sulphide (VMS) mineralization. These occurrences display similarities to other precious metal-rich deposits such as Eskay Creek (50 km to the east-southeast), Greens Creek, and other deposits of the Canadian Cordillera. The mineralization on the Rock &Roll property is hosted by graphitic argillite to siltstone. The Black Dog and SRV zones are dominated by massive pyrrhotite with blebs and lenses of chalcopyrite and sphalerite. Massive pyrite-sphalerite forms finely laminated lenses locally, with minor pyrrhotite, galena and chalcopyrite.
Indicated Mineral Resources, consistent with CIM definitions required by NI43-101, are reported at various cut-off grades in Table 1 (for Au and Ag) and Table 2 (for Cu, Pb, Zn and gold equivalent values). Inverse distances squared interpolation restricted to mineralized domains were used to estimate gold (grams/tonne Au), silver (grams/tonne Ag), copper (% Cu), lead (% Pb), and zinc (% Zn) grades into the block models. Gold, silver, copper, lead and zinc content were combined into a gold equivalent value (using to the prices given above) for resource reporting.
A $1.8 million Phase I Program is recommended in the report for further exploration at the Black Dog zone which includes initial metallurgical testing, baseline environmental work and a major diamond drilling program. The relatively shallow dips of the stratigraphy and conductive cover material have hampered exploration efforts in the past. Diamond drilling is recommended to test the conductive horizons for new mineral occurrences and also to extend the known mineralization at the Black Dog and SRV zones that are open along strike and down dip.
47
Gold and Silver Indicated Mineral Resource Estimate at various gold-equivalent cut-off grades. Metallurgical recoveries and net smelter returns are assumed to be 100%

Copper, Lead, Zinc and gold equivalent Indicated Mineral Resource Estimate at various gold-equivalent cut-off grades
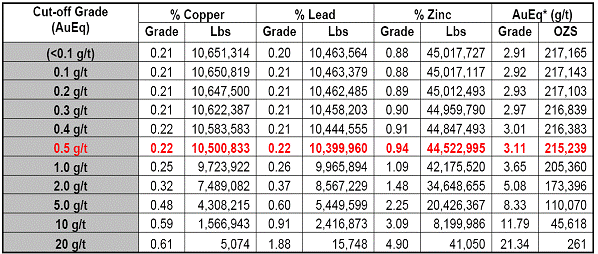
48
(I) Union Bay Platinum Property
The project is located 32 km west of Ketchikan, Alaska. The exploration target is an enriched platinum bearing zone within or peripheral to a dunite core.
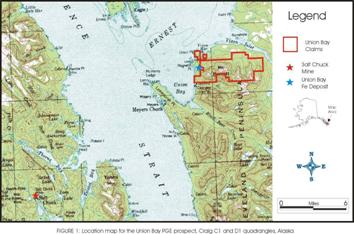 | Claim locations for the
Union Bay property, Alaska. |
By agreement dated October 1, 2002 and amended April 2, 2003 and February 4, 2004, the Company could acquire, from Freegold, a company that previously had certain directors and officers in common, an option to earn up to a 70% interest in the property.
In order to earn its 50% interest, the Company, purchased a private placement of $165,000 (2002), made cash payments, and issued common shares and incurred exploration expenditures as follows:
| | Payments | Shares | Exploration Expenditures |
| - Within 5 days from approval date(issued) | $- | 30,000 | $- |
| - On or before 1 July 2003(paid / incurred) | 20,000 | - | 30,000 |
| - On or before 30 January 2004(issued) | - | 30,000 | - |
| - On or before 1 July 2004(paid / incurred) | 20,000 | - | 30,000 |
| - On or before 1 July 2005(paid / incurred) | 30,000 | - | 340,000 |
| - On or before 1 July 2006(paid / incurred) | 30,000 | - | 600,000 |
| | $100,000 | 60,000 | $1,000,000 |
Following vesting with a 50% interest on July 1, 2006, the Company had the right to elect within 45 days to increase its interest to 60% by completing a feasibility study within 12 months of vesting with 50%. This election was not made.
As a term of the agreement the Company, upon vesting with 50%, issued 253,586 common shares at market value of $100,000 to Freegold. In a previous year, 134,538 common shares were issued, the value of which was accounted in the previous year.
By Memorandum of Agreement dated May 4, 2007, Freegold and the Company confirmed their 50/50 interest in the property, with the Company as Project Operator.
No programs were carried out during the past year and Freegold and the Company are seeking a joint venture partner to further develop this project.
(II) Kane Property, Alaska
On June 6, 2007, the Company entered into an option agreement with Stillwater whereby Stillwater could earn 50% of the first selected property by spending US$3.5 million and US$4.0 million on each subsequent selected property by December 31, 2011. In March 2008, Stillwater elected not to continue with exploration on the property in order to evaluate new ground in southeast Alaska.
49
The Company continues to maintain the Kane property’s mineral claims and a joint venture partner is being sought to further explore the property.
(III) Tonsina Property
The Tonsina property, presently defined, consists of 46 State of Alaska mining claims, known as the “Marc” claims 1-46 (ADL Nos. 610060 – 610105; which were staked in June 2006. These claims comprise a contiguous group of State of Alaska ¼ section claims covering approximately 29.78 sq. kilometers (744.62 hectares, or 7,360 acres), herein referred to as the “Tonsina property”. The claims are owned 100% by the Company.
The property is located in the Valdez quadrangle in southeast Alaska on state select land, located approximately 6 km south of the village of Tonsina and 110 km north of Valdez. The property covers prospective PGM mineralization within the Tonsina ultramafic intrusive complex. Access is relatively good with bush roads 6 km north to the Richardson Highway which connects Anchorage to Fairbanks. Helicopters are still required to reach the higher elevations.
Location of the Tonsina project, Alaska.
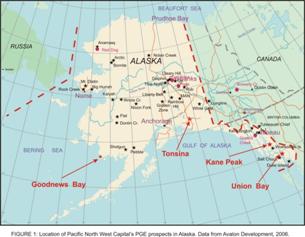
The 2007 exploration program identified significant PGM anomalies associated with a sulphide and chromite enriched layer in the Tonsina Ultramafic Complex. An induced polarization survey designed to test the extent of the mineralization was completed in the summer of 2008, and was followed by a ground magnetic survey and surface channel sampling. The results suggest that the zone of sulphide mineralization is continuous over a 300 m strike length. Future work will focus on determining the total strike extent of this zone, and identifying the best locations for drill testing of the mineralization.
A joint venture partner is being sought to further explore the project.
(IV) Nixon Fork Project, Alaska
By Letter Agreement (the “Agreement”) dated December 9, 2008 between the Company and St. Andrew Goldfields Ltd. (“SAG”), the Company was granted an option, exercisable until February 15, 2009, to acquire a 100% interest in SAG’s wholly-owned subsidiary Mystery Creek Resources Inc. (“MCR”). MCR’s assets include the Nixon Fork property, located 56 km northeast of McGrath, Alaska.
The Company paid US$100,000 upon signing the agreement dated 9 December 2008. The Company exercised the option by agreeing to pay a further US$400,000 of which US$100,000 was paid February 12, 2009, and the balance was paid in three equal installments on May 1, 2009, July 1, 2009 and September 1, 2009.
In June 2009, the Company granted Fire River Gold Corp. (“FAU”) an option to acquire all of the outstanding shares of MCR. FAU paid PFN US$50,000 on signing of the agreement. The sale of MCR to FAU was approved by PFN shareholders in August 2009. The shareholders of FAU approved the purchase of MCR in September 2009. FAU exercised the option by making further payments totaling US$450,000 and issuing a total of US$2.5 million in FAU shares at a deemed price of $0.45 per share for a total of 6,415,000 shares to the Company.
50
FAU issued to the Company 1,000,000 share purchase warrants entitling the Company to purchase 1,000,000 shares at an exercise price of $0.50 for a period of twenty-four months from the date of closing. FAU reimbursed all expenses incurred by the Company from May 1, 2009 until the finalization of this transaction for a total CDN$773,766.
ITEM 5: OPERATING AND FINANCIAL REVIEW AND PROSPECTS
Critical Accounting Estimates
The preparation of financial statements in conformity with GAAP requires management to make estimates and assumptions that affect the reported amounts of assets and liabilities and disclosure of contingent assets and liabilities at the date of the financial statements and the reported amounts of revenues and expenses during the reporting period. Significant estimates used in the preparation of these consolidated financial statements include, amongst other things, depreciation, determination of net recoverable value of assets, determination of fair value on taxes, and share compensation. These estimates are reviewed periodically (at least annually), and, as adjustments become necessary, they are reported in earnings in the period in which they become known.
A detailed summary of all of the Company’s significant accounting policies is included in Note 1 to the consolidated financial statements for the year ended April 30, 2011.
Financial Instruments - Recognition and Measurement
Section 3855 requires that all financial assets and financial liabilities be measured at fair value on initial recognition except for certain related party transaction. Financial instruments classified as held-for-trading are measured at fair value and unrealized gains and losses are included in the net income in the period in which they arise. The Company has historically measured these instruments at the lower of cost and market value and any unrealized gains or losses have been included in net income.
Comprehensive Income
Section 1530 introduces other comprehensive income (loss). Comprehensive income (loss) includes both net earnings (losses) and other comprehensive income. Other comprehensive income (loss) includes holding gains and losses on available-for-sale investments, gains and losses on certain derivative instruments and any foreign currency gains and losses relating to self-sustaining foreign operations where applicable, all of which are not included in the calculation of net earnings (loss) until realized. The only impact on the Company of adopting these new standards was the recognition of unrealized gains and losses on investments, which has been included as part of shareholders' equity under "Other Comprehensive Loss". As required by the prospective implementation of these new standards, the comparative financial statements have not been restated.
Financial Instruments and Other Instruments
The Company’s financial instruments consist of cash and cash equivalents, amounts receivable, available-for-sale securities, share purchase warrants and accounts payable. The fair value of these financial instruments, with the exception of available-for-sale and share purchase warrants, approximates their carrying value unless otherwise noted.
Credit Risk
Credit risk is the risk of an unexpected loss if a customer or counterparty to a financial instrument fails to meet its contractual obligations and arises primarily from the Company’s cash and cash equivalents and amounts receivable. The Company manages its credit risk relating to cash and cash equivalents by dealing with only with highly-rated financial institutions. As at April 30, 2011, amounts receivable was mainly comprised of Harmonized Sales Tax receivable of $184,818. As a result, credit risk is considered insignificant.
51
Liquidity Risk
Liquidity risk is the risk that the Company will not be able to meet its financial obligations as they fall due. The Company manages liquidity risk by continuously monitoring actual and projected cash flows and matching the maturity profile of financial assets and liabilities. As at April 30, 2011, the Company had $3,880,196 in cash and cash equivalents to settle current liabilities of $403,338 and, accordingly, liquidity risk is considered insignificant.
Currency Risk
The Company is exposed to currency risk to the extent of its acquisition and exploration expenditures on its US properties and African property. The Company’s expenditures will be negatively impacted if the US dollar increases versus the Canadian dollar.
The majority of the Company’s cash flows and financial assets and liabilities are denominated in Canadian dollars, which is the Company’s functional and reporting currency. Foreign currency risk is limited to the portion of the Company’s business transactions denominated in currencies other than the Canadian dollar. The Company has cash and cash equivalents held in US dollars.
The Company’s objective in managing its foreign currency risk is to minimize its net exposures to foreign currency cash flows by holding most of its cash and cash equivalents in Canadian dollars. The Company monitors and forecasts the values of net foreign currency cash flow and balance sheet exposures and from time to time could authorize the use of derivative financial instruments such as forward foreign exchange contracts to economically hedge a portion of foreign currency fluctuations.
The following table provides an indication of the Company’s significant foreign currency exposures during the years ended April 30, 2011 and 2010:
| | 2011 | 2010 |
| | | |
| Cash and cash equivalents | US$ 946,242 | US$ 732,412 |
The Company has not, to the date of these consolidated financial statements, entered into derivative instruments to offset the impact of foreign currency fluctuations.
Interest Risk
The Company’s interest rate risk is primarily related to the Company’s cash and cash equivalents for which amounts were invested at interest rates in effect at the time of investment. Changes in market interest rates affect the fair market value of the cash and cash equivalents. However, as these investments come to maturity within a short period of time, the impact would likely not be significant.
Commodity Price Risk
The Company is in the exploration stage and is not subject to commodity price risk.
International Financial Reporting Standards
In February 2008, the Canadian Accounting Standards Board (“AcSB”) confirmed that Canadian GAAP for publicly accountable enterprises would be replaced by IFRS for fiscal years beginning on or after January 1, 2011.
The Company commenced its IFRS conversion project in 2008 when it established a formal project governance structure, which included the Company’s Audit Committee and senior management. Overall project governance, management and support have been coordinated by the Company, with an independent external advisor engaged to assist in the IFRS conversion.
The Company’s approach to the conversion to IFRS includes three phases:
- Phase one, an initial general diagnostic of its accounting policies and Canadian GAAP relevant to its financial reporting requirements to determine the key differences and options with respect to acceptable accounting standards under IFRS.
52
Phase two, an in-depth analysis of the IFRS impact in those areas identified under phase one.
Phase three, the implementation of the conversion process, including the completion of the opening balance sheet as at May 1, 2010 together with related discussion and notes.
The following is a summary of key areas where accounting policies differ and where accounting policy decisions are necessary that will impact the Company’s reported financial position and results of operations:
Mineral properties – IFRS 6, “Exploration for and Evaluation of Mineral Resources” provides the Company with the option of expensing the exploration and evaluation costs as incurred, or deferring these costs until technical feasibility and commercial viability has been determined, at which point they are transferred to the development and production phase and allocated to specific projects. Under Canadian GAAP, exploration, evaluation and development costs are expensed as incurred. The existing accounting policy will be maintained.
Share-based payment – Under IFRS, stock-based compensation is amortized under the graded method only. In addition, the Company is required to update its value of options for each reporting period for expected forfeitures. Under Canadian GAAP, the Company recognizes stock-based compensation on straight-line method and updates the value of the options for forfeitures as they occur. The Company will record an IFRS income statement and balance sheet adjustment at May 1, 2010.
Impairment of assets – Under IFRS, impairment tests are generally carried out using the discounted future cash flows (one step test). Write-downs to net realizable values under an impairment test can be reversed if the conditions of impairment cease to exist. Under Canadian GAAP, impairment tests are generally done on the basis of undiscounted future cash flows and impairment loss is measured as the excess of the carrying value over the discounted future cash flows (two-step approach). Unlike IFRS, write-downs are permanent changes in the carrying value of assets and cannot be reversed. The Company’s financial statements will not be impacted on the changeover to IFRS based on the analysis of impairment indicators on transition. Nevertheless, in subsequent years, IFRS could generate more impairment write-downs than Canadian GAAP since it uses a one-step test.
Flow-through shares – Flow-through shares are a unique Canadian tax incentive which is the subject of specific guidance under Canadian GAAP. Under Canadian GAAP, the funds received are recorded as share capital at the time of issue. At the time of the filing of the renunciation of the qualifying flow-through expenditures to investors, the Company records a deferred tax liability with a charge directly to shareholders’ equity. Also under Canadian GAAP, the Company records any deferred tax recovery eligible to be recognized to offset the deferred tax charge to equity as a tax recovery in the statement of operations. IFRS does not contain explicit guidance pertaining to this tax incentive. Therefore, the Company has adopted a policy whereby the premium paid for flow-through shares in excess of the market value of the shares without the flow-through features at the time of issue is credited to other liabilities and recognized in income at the time the qualifying expenditures are made. The recognition of the deferred tax liability upon renunciation of the flow-through expenditures is recorded as income tax expensed in the period of renunciation.
The transition to IFRS requires the Company to apply IFRS 1, “First-Time Adoption of International Financial Reporting Standards” (“IFRS 1”) which details the requirements for preparing IFRS-compliance financial statements in the first reporting period after the date of transition. IFRS 1 provides entities adopting IFRS for the first time with a number of optional and mandatory exemptions in certain areas to the general requirement of full retrospective application of IFRS. Based on management’s analysis of the various accounting policy choices available, IFRS 1 elections relevant to the Company are as follows:
53
- Share-based payment – IFRS 1 allows an exemption to IFRS 2, “Share-based Payment” for equity instruments, such as the Company’s stock options, granted on or before 2 November 2002 or which vested before the transition date to IFRS. The Company will utilize this exemption upon adoption of IFRS.
- Property, plant and equipment – IFRS 1 allows the Company to elect to have fair value or revaluation amounts as the deemed cost of property, plant and equipment at the date of transition. In accordance with IFRS 1, the Company may elect to measure certain items of property, plant and equipment at their fair values at the date of transition. Any fair value adjustments and changes to the assessment of the related useful lives of the individual components of property, plant and equipment could impact the depreciation charges subsequent to the date of transition. The Company will not elect to utilize this transitional provision and will record property, plant and equipment at cost upon adoption of IFRS.
The Company is in the implementation stage. This stage involves finalizing accounting policy decisions, preparing the Company’s opening balance sheet as at May 1, 2010, preparing comparative financial statements and notes under IFRS for each quarterly period of 2010, and implementing system, processes, internal controls and training necessary. The quantification of the amounts that resulted from the differences between Canadian GAAP and IFRS relating to the key standards are based on management’s estimates and decisions, and currently being reviewed internally by the Board of Directors and by the Company’s external auditors.
A. Operating Results
The following discussion and analysis should be read in conjunction with the Company’s audited consolidated financial statements and related notes thereto included herein. The Company’s audited consolidated financial statements have been prepared in accordance with Canadian GAAP. Reference should be made to Note 15 of the audited consolidated financial statements for a discussion of the material differences from the amounts presented in Canadian GAAP to US GAAP.
The following table summarizes selected financial data for the Company for each of the three most recently completed financial years. The information set forth below was extracted from and should be read in conjunction with the audited consolidated financial statements, prepared in accordance with Canadian generally accepted accounting principles, and related notes.
| | Years Ended April 30 |
| | 2011 | 2010 | 2009 |
| Total revenues | $52,293 | $59,296 | $478,887 |
| General and administrative expenses | 1,526,478 | 1,789,601 | 2,647,547 |
| Mineral property cash costs incurred | 1,890,288 | 1,487,026 | 1,895,727 |
| Mineral property cash costs recovered | - | - | - |
Net income (loss) from continuing operations
- In total
- Basic and diluted loss per share |
(4,153,650)
(0.06) |
(3,551,664)
(0.06) |
(5,274,994)
(0.09) |
Net income (loss) from discontinued operation
- In total
- Basic and diluted loss per share |
-
- |
2,780,645
0.04 |
(79,472)
(0.00) |
| Totals assets | 15,575,641 | 11,353,054 | 15,095,336 |
| Total long term liabilities | Nil | Nil | Nil |
| Cash dividends declared | Nil | Nil | Nil |
Twelve Months Ended April 30, 2011 Compared to Twelve Months Ended April 30, 2010
Results of operations
The year ended April 30, 2011 resulted in loss from continuing operation of $4,153,650 which compares with a loss of $3,551,664, for the same period in 2010.
54
General and administrative expenses for the year ended April 30, 2011 were $1,526,478, a decrease of $263,123 over the same period in 2010. Shareholder relations and promotional activities undertaken by the Company, which included attendance at various trade shows, cost $192,814 for the year ended April 30, 2011 compared to $263,840 for the same period of 2010. Salaries and benefits decreased by $4,250 for a total of $182,782 compared to $187,032 in the previous year. An aggregate stock-based compensation of $68,650 was recorded as compared to $308,435 in the previous year. Stock-based compensation is broken down on the income statement according to the applicable expense category. Consulting fees for the year were $318,031 compared to $370,635 in the previous year. Travel and lodging costs of $78,155 were incurred during the year compared to $49,310 of the same period in 2010. All other general and administrative costs were relatively the same compared to the previous year. Interest and other income was $52,293, compared to $52,616 in the previous year. $1,734,953 unrealized gain on investment portfolio as a result of the fair value presentation required in the Canadian Institute of Chartered Accountants (“CICA”) Handbook Section 3855.
During the year ended April 30, 2011, the Company incurred mineral property cash costs of $1,890,288. The Company acquired the Rock & Roll property in British Columbia for acquisition costs of $40,000 and incurred exploration costs of $156,871 during the year. Also, the Company acquired the Destiny Gold property in Québec for acquisition costs of $30,500 and incurred $440,516 in exploration costs. In December 2010, as amended on April 6, 2011, the Company completed the purchase of Kaymin’s 50% interest in the River Valley claims, providing the Company with an undivided 100% interest in the River Valley PGM Project. The aggregate purchase price for the 50% interest in the River Valley PGM project was 8,117,161 common shares of the Company valued at $2,435,148 and 3,000,000 share purchase warrants exercisable at $0.30 per common share for three years valued at $675,570. The Company also incurred $902,055 in exploration costs related to the River Valley PGM Project. In January 2011, the Company entered into agreements with Somitra to acquire 100% interest in three properties located in Burkina Faso, Africa. The Company paid $75,000 on signing the agreement and incurred exploration costs of $111,693. The Company is now exploring these four properties and, consequently, has recorded a provision for write-down on all other properties in the amount of $2,549,552 during the year.
The Company is authorized to issue unlimited common shares without par value. As at April 30, 2011, there were 85,737,788 outstanding common shares compared to 67,543,008 outstanding common shares at April 30, 2010.
Events Subsequent to Year Ended April 30, 2011
On July 13, 2011, the Company completed the first tranche of a non-brokered private placement of 2,583,333 non flow-through units at $0.30 per unit, with each unit consisting of one fully paid and non-assessable common share in the capital of the Company and one-half of one share purchase warrant, each whole warrant entitling the holder thereof to purchase one additional common share of the Company for 18 months at an exercise of $0.40. A total of 4,332,141 flow-through units at $0.35 per unit were also placed in the first tranche closing. Each flow-through unit consists of one fully paid and non-assessable common share in the capital of the Company and one-half of one non-transferable share purchase warrant, each whole warrant entitling the holder thereof to purchase one additional non flow-through common share of the Company at $0.45 per share for a period of 18 months.
Twelve Months Ended April 30, 2010 Compared to Twelve Months Ended April 30, 2009
Results of operations
The year ended 30 April, 2010 resulted in loss from continuing operation of $3,551,664 which compares with a loss of $5,274,994, for the same period in 2009.
General and administrative expenses for the year ended April 30, 2010 were $1,789,601, a decrease of $857,946 over the same period in 2009. Shareholder relations and promotional activities undertaken by the Company, which included attendance at various trade shows, cost $263,840 for the year ended April 30, 2010 compared to $305,376 for the same period of 2009. Salaries and benefits decreased by $81,706 for a total of $187,032 compared to $268,738 in the previous year. An aggregate stock-based compensation of $308,435 was recorded as compared to $731,877 in the previous year. Stock-based compensation is broken down on the income statement according to the applicable expense category. Consulting fees for the year were $370,635 compared to $438,039 in the previous year. Travel and lodging costs of $49,310 were incurred during the year compared to $270,832 of the same period in 2009. All other general and administrative costs were relatively the same compared to the previous year. Interest and other income was $52,616, compared to $222,252 in the previous year. $314,026 unrealized gain on investment portfolio as a result of the fair value presentation required in the Canadian Institute of Chartered Accountants (“CICA”) Handbook Section 3855.
55
During the year ended April 30, 2010, the Company incurred mineral property cash costs of $1,487,026. The Company acquired the Rock & Roll property in British Columbia for acquisition costs of $14,500 and incurred exploration costs of $437,175 during the year. Also, the Company acquired the Destiny Gold property in Québec for acquisition costs of $43,454 and incurred $914,795 in exploration costs. In September 2009, the Company sold some of the East Sudbury claims in Ontario to Trueclaim Exploration Inc. for a 1.5% NSR and 50,000 shares valued at $7,500. Exploration costs of $33,204 were incurred on the Fiedmont property in Québec and cumulative costs of $236,889 were written off due to terminating the option agreement. Alaska exploration costs incurred on the Reconnaissance properties include the Kane, Tonsina and SE Alaska totaled $14,826 for cumulative expenditures of $508,084. Engineering, geological consulting and property fees of $16,624 were incurred on the Union Bay property, Alaska, for cumulative expenditures of $245,906. The joint venture agreements related to the West Timmins Nickel (Ontario) and the SOQUEM Taureau and SOQUEM Chenneville mineral properties (Québec) were terminated and written off during the current year. In addition, the Company has no further plans to pursue the Coldwell Project and the Swayze Joint Venture (Ontario) nor the Winter Lake mineral properties (Northwest Territories) and subsequently recorded a write-off on these properties.
As at April 30, 2010, there were 67,543,008 outstanding common shares compared to 61,858,008 outstanding common shares at April 30, 2009.
Twelve Months Ended April 30, 2009 Compared to Twelve Months Ended April 30, 2008
Results of operations
The year ended 30 April 2009 resulted in a net loss of $5,354,466 which compares with a loss of $883,378 for the same period in 2008.
General and administrative expenses for the year ended 30 April 2009 were $2,647,547, an increase of $2,091,920 over the same period in 2008. Shareholder relations and promotional activities undertaken by the Company, which included attendance at various trade shows, cost $305,376 for the year ended 30 April 2009 compared to $459,807 for the same period of 2008, a decrease of $154,431. Salaries and benefits increased by $51,758 for a total of $268,738 compared to $216,980 in the previous year due to the fact that wages of the Chief Financial Officer and Corporate Secretary are included in this period and not in last year’s. An aggregate stock-based compensation of $731,877 was recorded as compared to $259,900 in the previous year. Stock-based compensation is broken down on the income statement according to the applicable expense category. Consulting fees for the period were $438,039 compared to $317,600 in the previous year, an increase of $120,439 as several new projects were acquired in the previous year and some option agreements have been terminated in the current period. Travel and lodging costs of $270,832 were incurred during the year compared to $197,051 of the same period in 2008; an increase of $73,781 was due to cutting back in attendance of trade shows. All other general and administrative costs were lower compared to the previous year as no equity financing was made in the current period. Interest and other income was $222,252, compared to $314,082 in the previous year. $147,839 gain on sale of investment available-for-sale was the result of the sale of 305,188 shares of Freegold held as an investment available-for-sale and $743,866 unrealized loss on investment portfolio as a result of the fair value presentation required in the Canadian Institute of Chartered Accountants (“CICA”) Handbook Section 3855.
During the year ended 30 April 2009, the Company incurred mineral property cash costs of $1,895,727. An exploration program on the West Timmins Nickel Project cost $37,970 for cumulative expenditures of $3,131,937. Coldwell Project exploration cost $113,695 for a total of $992,786. Swayze Joint Venture Project acquisition and exploration cost $190,436 was incurred. $150,800 in project exploration costs were incurred in the East Sudbury and Marathon area. $227,939, was incurred with SOQUEM on the Quebec properties, $74,278 was incurred on the Glitter Lake Project. Staking cost of $42,500 and exploration cost of $161,186 were incurred in the Fiedmont Property in its initial year. $1,059,592 project exploration cost was incurred on Goodnews Bay Alaskan project while $1,135,000 cash was received from Stillwater.
56
As at April 30, 2009, there were 61,858,008 outstanding common shares compared to 61,658,008 outstanding common shares at April 30, 2008.
B. Liquidity and Capital Resources
The Company expects that its existing capital requirements arising from the evaluation of its existing mineral properties and fulfilling its exploration commitments will be met from the company's existing cash position.
The Company's future profitability is dependent on the successful definition of geological resources on its mining properties and the establishment of positive comprehensive feasibility studies on these geological resources. Upon completion of positive feasibility studies, the Company's success is dependent on the successful construction, financing and operation of a facility to extract the minerals from the geological resource located. The Company will continue to seek new mining opportunities. The Company presently has no producing properties, and the Company's material properties contain no known mineral reserves; the limited activities on such properties to date have been exploratory in nature. Except as disclosed herein, the Company does not possess reliable information concerning the history of previous operations including the names of previous operators, if any, on any of its properties.
Future profitability will also be affected by the level of taxes imposed by the jurisdiction in which the Company operates. Furthermore, the Company's operations may be affected by regulatory authorities in the jurisdictions in which the Company operates. The Company is not currently aware of any factors or current recommendations by the taxation or regulatory authorities in Canada that may have a material impact on the Company's operations.
Twelve Months Ended April 30, 2011 Compared to Twelve Months Ended April 30, 2010
During the year ended April 30, 2011, the Company’s working capital, defined as current assets less current liabilities, was $8,686,132 compared with working capital of $7,249,616 at April 30, 2010. The Company had no restricted cash included in working capital.
The Company’s total issued and outstanding common shares at April 30, 2011, was 85,737,788 common shares.
The Company had a portfolio of investments with a book value of $3,541,053 and a market value of $4,815,763 as at April 30, 2011.
Subsequent to year ended April 30, 2011, the Company completed the first tranche of a non-brokered private placement of 2,583,333 non flow-through units at $0.30 per unit, with each unit consisting of one fully paid and non-assessable common share in the capital of the Company and one-half of one share purchase warrant, each whole warrant entitling the holder thereof to purchase one additional common share of the Company for 18 months at an exercise of $0.40. A total of 4,332,141 flow-through units at $0.35 per unit were also placed in the first tranche closing. Each flow-through unit consists of one fully paid and non-assessable common share in the capital of the Company and one-half of one non-transferable share purchase warrant, each whole warrant entitling the holder thereof to purchase one additional non flow-through common share of the Company at $0.45 per share for a period of 18 months.
Twelve Months Ended April 30, 2010 Compared to Twelve Months Ended April 30, 2009
During the year ended April 30, 2010, the Company’s working capital, defined as current assets less current liabilities, was $7,249,616 compared with working capital of $5,418,885 at April 30, 2009. Flow-through funds of $567,771 had to be spent before December 31, 2010 on qualified Canadian mineral exploration and are included in working capital.
The Company’s total issued and outstanding common shares at April 30, 2010, was 67,543,008 common shares.
The Company had a portfolio of investments with a book value of $3,182,373 and a market value of $2,741,694 as at April 30, 2010.
57
Twelve Months Ended April 30, 2009 Compared to Twelve Months Ended April 30, 2008
At April 30, 2009, the Company’s working capital, defined as current assets less current liabilities, was $5,418,885 compared with working capital of $10,088,901 at April 30, 2008. Flow-through funds of $1,125,083 had to be spent before December 31, 2009 on qualified Canadian mineral exploration, and are included in working capital.
The Company’s total issued and outstanding common shares at April 30, 2009, was 61,858,008 common shares.
The Company had a portfolio of investments with a book value of $936,228 and a market value of $181,216 as at April 30, 2009.
C. Research and Development, Patents and Licenses, etc.
As the Company is a mineral exploration company with no research and development, the information required by this section is inapplicable.
D. Trend Information
As the Company is a mineral exploration company with no producing properties, the information required by this section is inapplicable.
E. Off-Balance Sheet Arrangements
The Company has no off-balance sheet arrangements.
F. Tabular Disclosure of Contractual Obligations
The following table sets out the Company’s contractual commitments as of the latest financial year ended April 30, 2011:
| Contractual Obligations(1) | Payments Due By Period | | | |
| | Total | Less than 1 yr | 1-3 yrs | 3-5 yrs | More than 5 yrs |
| Management Agreement(2) | $1,679,645 | $251,042 | $540,367 | $595,755 | $292,481 |
| Office Lease | 119,303 | 119,303 | - | - | - |
| Total | $1,798,948 | $370,345 | $540,367 | $595,755 | $292,481 |
| 1) | No mineral property payments or exploration expenditures are included in the above table as they are considered option payments solely exercisable at the option of the Company. |
| | |
| 2) | By agreement effective December 1, 2005 (“original agreement”) as amended December 1, 2008 and again on April 1, 2011, the Company entered into a five-year management agreement with a Company controlled by a director and Chairman. Compensation is $20,833 per month for the first year, with a 5% increase on each anniversary date plus benefits. The Chairman and director is also entitled to receive up to 20% of the stock options granted during the period that the agreement is in place. This agreement is automatically renewable for two-year periods. The Company may terminate the agreement at any time but will be responsible to pay the greater of the remaining amount under the contract or two years’ compensation. |
Some of the Company’s mineral properties are being acquired over time by option payments. It is at the Company’s option as to whether to continue with the acquisition of the mineral properties and to incur these option payments. Current details of option payments required in the future if the Company elects to maintain its interest are as follows:
| | Option Payments Due by Period |
Option Agreement
Obligations | Total | Less than
1 year | 2-3 years | 4-5 years | More than
5 years |
| Destiny Gold Project | $150,000 | $50,000 | $100,000 | $- | $- |
| Nickel Plats | $40,000 | $20,000 | $20,000 | - | - |
| Burkina Faso | $405,000 | $135,000 | $270,000 | - | - |
| Total | $595,000 | $205,000 | $390,000 | $- | $- |
58
G. Safe Harbor
The Company seeks safe harbor for our forward-looking statements contained in Items 5E and F. See the heading “Cautionary Note Regarding Forward-Looking Statements” above.
ITEM 6. DIRECTORS, SENIOR MANAGEMENT AND EMPLOYEES
A. Directors and Senior Management
The following table states the name, province or state, and country of residence of each of the directors and executive officers of the Company, the positions and offices presently held by them and the period or periods of time during which each has served as a director of the Company. The directors named below were elected or re-elected by the Company’s shareholders on August 25, 2010.
Name, Province and
Country of Residence | Age | Position in the Company | Period(s) as a Director of
the Company |
Harry Barr
Vancouver, BC
Canada | 56 | Director, President, CEO | since 1996 |
Linda Holmes(1)(2)
Summerland, BC
Canada | 61 | Director & Corporate Secretary | since September 2007 |
Dennis Hop (2)
Calgary, AB
Canada | 56 | Director | since October 2007 |
John Londry(1)
Stittsville, ON
Canada | 66 | Director | since February 2009 |
Jordan Point(1)(2)
Vancouver, BC
Canada | 48 | Director | since September 2007 |
Robert Guanzon
Richmond, BC
Canada | 47 | Chief Financial Officer | N/A |
John Oness Port
Coquitlam, BC
Canada | 64 | Vice President, Corporate Business Development | N/A |
| | (1) | Denotes member of Audit Committee. |
| | (2) | Denotes member of Compensation Committee. |
Business Experience, Function and Area of Experience for the Past Five Years
Harry Barr – President, Chairman, CEO and Director
Mr. Barr has been involved in the mining industry for over 25 years and has an extensive background in business management, corporate finance, and marketing.
Mr. Barr is currently President, CEO, Chairman and director of the Company and of Next Gen Metals Inc. (September 2009 to present); Director, Chairman and Acting CEO of El Niño Ventures Inc. (September 2009) and a director of Copper Reef Mining Corporation since June 3, 2011.
Mr. Barr previously served as President and Director of Fire River Gold Corp. (1997 – 2011); CEO of Fire River Gold Corp. (2007 – 2011); Chairman & COO of CanAlaska Uranium Ltd. (2004- 2007); Director of CanAlaska (1985-2007); Chairman of Freegold Ventures Limited (1999-2007); Director of Freegold Ventures Limited (1985–2007); CEO of El Niño Ventures Inc. (2003 – 2007); Chairman of El Niño Ventures Inc. (2006-2007); and Director of El Niño Ventures Inc. (1999–2007.
59
Linda Holmes – Director and Corporate Secretary
Ms. Holmes has been a Canadian and US securities compliance consultant to public companies, and companies desiring to go public, since 1994, and has been involved in the mineral resource industry for over 25 years.
Ms. Holmes is currently a director (since September 2007) and Corporate Secretary (since December 2009) of the Company; a director (since November 2007) of Fire River Gold Corp.; a director (since August 2009) and Corporate Secretary (since September 2009) of Next Gen Metals Inc.; and a director of El Niño Ventures Inc. (since May 2010).
Ms. Holmes has been a director and/or officer of, and/or consultant to, numerous public companies including: IGC Resources Inc. (director: 2003 –2009, Corporate Secretary: 2000 –2009); Copper Mesa Mining Corporation (formerly Ascendant Copper Corporation) (director: 2005 - 2007); Corporate Secretary and manager of compliance: 2005 –2009.
Dennis Hop - Director
Mr. Hop is a Certified Financial Planner (CFP) and has been involved in this specialty area since 1982. He is President of Hop Estate Planning Partners Ltd., a company specializing in creating consolidated financial and estate plans for high net worth families and private business owners.
Mr.Hop was a director of Breaker Energy Ltd. (2004 – 2009).
John Londry – Director
Mr. Londry received his BSc and MSc degrees in Geology from the University of Windsor. For over 35 years he has been active in the mineral exploration and mining industry. Mr. Londry’s considerable experience encompasses both grass roots and advanced stage exploration projects throughout Canada, the United States and South America. He has held senior positions with Camflo, Noranda Exploration, Hemlo Gold Mines and Battle Mountain Gold. Mr. Londry served as Vice President of Exploration (2004 – 2008) of PFN.
Mr. Londry has been a director of Next Gen Metals Inc. since January 12, 2011.
Jordan Point - Director
Mr. Point is the Executive Director of the First Nations Fisheries Council of British Columbia, an organization that acts at the intersection between the Federal department of Fisheries and Oceans, and the 203 First Nations in British Columbia. He works closely with the leads of the Assembly of First Nations, the First Nations Summit and the Union of BC Indian Chiefs (collectively known as the Leadership Council). Mr. Point is also a long-term elected Councillor with the Musqueam Indian Band, serving his local community since 1996, with portfolios as chair of the Finance Committee, Economic Development Committee and the Gateway construction initiative.
Mr. Point also served as a public servant for 15 years, and was a senior Program Manager with the Federal Government in Fisheries and Oceans, focused on Aboriginal Affairs, leading negotiations on annual allocations for salmon, and financial contribution agreements with First Nation Bands with interim assignments to the litigation case management unit and the treaty and Aboriginal Policy Unit for the Pacific Region.
Robert Guanzon – Chief Financial Officer
Mr. Guanzon is currently the Chief Financial Officer of the Company (2008 – present) and of Fire River Gold Corp (2009 to present). Prior to his appointment, Mr. Guanzon was the accountant for the Company (2007 – 2008). He was the accountant of RG properties Ltd. (1999 – 2007). Mr. Guanzon brings extensive experience to the Board in dealing in financial matters and corporate strategy.
John Oness – Vice President, Corporate Business Development
Mr. Oness has extensive experience and education in all aspects of corporate management with strengths in strategic planning, business development and investor relations for public companies.
60
Mr. Oness is a director and acting Chief Financial Officer of El Nino Ventures Inc. (2010 – present) and Vice-President, Corporate Business Development, of Next Gen Metals Inc. (2010 – present).
Mr. Oness has served as a director, executive and consultant to public companies in the resource and non-resource fields over a 20 year career. He was a director of Alix Resources Corp. (2007 – 2009) and of Sierra Geothermal Power Corp. (2004 – 2006).
Family Relationships
There are no family relationships between the directors and officers of the Company.
Other Relationships
Except as disclosed in Item 7B – Related Party Transactions, there are no arrangements or understandings between any major shareholder, customer, supplier or others, pursuant to which any of the above-named persons were selected as directors or members of senior management.
Conflicts of Interest
Other than as disclosed in Item 3D(vii) – Risk Factors, Conflicts of Interest, there are no existing or potential conflicts of interest among the Company, its directors, officers or promoters.
B. Compensation
The table below sets forth the compensation paid to or earned by the Company’s members of its administrative, supervisory or management bodies during the fiscal year ended April 30, 2011:
| Name | Year Ended Apr 30 | Salary(1)(2) ($) | Share-based awards ($) | Option-based awards ($) | Non-equity incentive plan compensation ($) | Pension value ($) | All Other Compensation ($) | Total Compensation ($) |
| Annual Incentive Plans | Long-term Incentive Plans |
Harry Barr
President, CEO &
Director | 2011 | 200,070 | Nil | 103,027 | Nil | Nil | Nil | 48,477(3) | 351,574 |
Robert Guanzon
CFO | 2011 | 53,555 | Nil | 26,282 | Nil | Nil | Nil | Nil | 79,837 |
Linda Holmes
Corporate Secretary | 2011 | 47,000 | Nil | 26,282 | Nil | Nil | Nil | Nil | 73,282 |
John Oness
(4) Vice President,
Corporate
Business
Development | 2011 | 27,500 | Nil | 108,108 | Nil | Nil | Nil | Nil | 135,608 |
Richard Goodwin
Vice President,
Engineering (5) | 2011 | 6,700 | Nil | Nil | Nil | Nil | Nil | Nil | 6,700 |
Anthony Kovacs
Vice President,
Exploration (6) | 2011 | 99,399 | Nil | 21,026 | Nil | Nil | Nil | Nil | 120,425 |
| | (1) | Mr. Barr’s salary is paid through CGR, pursuant to the terms of the management contract between the Company and CGR (as set forth below under the heading “Termination Benefits). |
| | (2) | Mr. Guanzon’s salary is paid pursuant to a contract with the Company, as set forth below under the heading “Termination Benefits. |
| | (3) | Pursuant to the terms of the management contract between the Company and CGR (as set forth below under the heading “Narrative Discussion”), during the year ended April 30, 2011, Mr. Barr received a bonus in the amount of $23,000; a benefit for the use of a leased vehicle (of which approximately 40% of its use was for personal use) of $12,229; and $13,248 for disability/critical illness and life insurance. |
| | (4) | Mr. Oness was appointed Vice President, Corporate Business Development, on December 3, 2010. |
| | (5) | Mr. Goodwin served as Vice President, Engineering, from January 4, 2010 to March 28, 2011. |
| | (6) | Mr. Kovacs resigned as Vice President, Exploration, effective May 21, 2011. |
61
Directors who are not members of the Company’s administrative, supervisory or management bodies are each entitled to receive an annual retainer fee of $6,000, an additional $500.00 per meeting for attending directors’ meetings, and may be reimbursed for actual expenses reasonably incurred in connection with the performance of their duties as directors.
Compensation paid to or earned by the Company’s directors who were not members of its administrative, supervisory or management bodies during the fiscal year ended April 30, 2011 was as follows:
Dennis Hop $7,000
John Londry $8,000
Jordan Point $8,000
Stock Options Granted During the Fiscal Year Ended April 30, 2011
The table below sets forth the stock options granted to the Company’s director and members of its administrative, supervisory or management bodies during the fiscal year ended April 30, 2011:
| Name | Options to purchase Common Shares | Exercise Price ($) | Date of Grant | Expiry Date |
Harry Barr
President, CEO &
Director | 490,000 | 0.30 | Feb 24/11 | Feb 24/16 |
Robert Guanzon
CFO | 125,000 | 0.30 | Feb 24/11 | Feb 24/16 |
Linda Holmes
Corporate Secretary | 125,000 | 0.30 | Feb 24/11 | Feb 24/16 |
John Oness
Vice President,
Corporate Business
Development | 100,000
300,000 | 0.25
0.30 | Feb 1/11
Feb 24/11 | Feb 1/16
Feb 24/16 |
Anthony Kovacs
Vice President,
Exploration | 100,000 | 0.30 | Feb 24/11 | Feb 24/16 |
Dennis Hop
Director | 100,000 | 0.30 | Feb 24/11 | Feb 24/16 |
John Londry
Director | 100,000 | 0.30 | Feb 24/11 | Feb 24/16 |
JordanPoint
Director | 100,000 | 0.30 | Feb 24/11 | Feb 24/16 |
C. Board Practices
Term of Office
An election of directors takes place at each annual meeting of shareholders and all the directors then in office retire but, if qualified, are eligible for re-election. A director retains office only until the election of his successor. The number of directors to be elected at such meeting is the number of directors then in office, unless the directors or the shareholders otherwise determine. The election is by ordinary resolution of shareholders. If an election of directors is not held at the proper time, the incumbent directors continue in office until their successors are elected. Our last annual general meeting was held on August 25, 2010.
Our articles also permit the directors to add additional directors to the board between annual general meetings as long as the number appointed does not exceed one-third of the number directors elected at the last annual general meeting. Individuals appointed as directors to fill casual vacancies created on the Board or added as additional directors hold office like any other director until the next annual general meeting at which time they may be re-elected or replaced.
Our officers are appointed by the directors at a meeting following each annual general meeting.
62
Termination Benefits
The Company did not have any contract with and director or member of the Company’s administrative, supervisory or management bodies, which provides benefits upon termination of employment, other than as set forth below:
Harry Barr is indirectly paid for his services as President, CEO and general corporate and management consultant to the Company through CGR, which company entered into a management agreement with the Company dated December 1, 2005, as amended December 1, 2008, and as further amended April 1, 2011 (the “Contract”), for a term of five years. Renewal of the Contract is automatic for subsequent two-year periods if not otherwise terminated. Pursuant to the terms of the Contract, CGR is paid an annual base fee of $250,000. CGR is entitled to receive additional bonuses, incentive fees, or other compensation at the discretion of the Board. Mr. Barr spends approximately 50% of his time on the Company’s business.
The base fee is reviewed every anniversary date with an annual increase negotiated between the parties; however if the parties cannot agree within 30 days to an amendment of the base fee, the base fee is subject to an automatic increase by the Cost of Living Index for the City of Vancouver, British Columbia, as published by the Canadian federal government or by 5%, whichever is greater. In addition, the Company pays for disability/critical illness insurance and life insurance for Mr. Barr, as well as for the cost of a leased vehicle up to a maximum of $1,200 per month. All reasonable expenses incurred by CGR on behalf of the Company will be reimbursed by the Company.
The Company may terminate the agreement at any time by paying to CGR the greater of (i) the aggregate remaining base fee for the unexpired remainder of the term of the Contract; or (ii) two annual base fees, each base fee multiplied by 24, plus one month of base fee for each year, or portion thereof, served with the Company plus a buy-out of any outstanding stock options at fair market value at the time of termination (the “Termination Fee”). The Termination Fee will be doubled in the event Mr. Barr is removed or not reappointed as an officer or Director of the Company without the consent of CGR, there is a change of control of the Board or the Company without the consent of CGR, or the agreement is terminated or repudiated by the Company without due and proper cause or otherwise not in compliance with its terms. The termination fee may be paid in whole or in part with common shares of the Company, at the election of CGR. In the event Mr. Barr is unable to provide adequate services to the Company as a result of disability or otherwise, the Company will fund a disability plan through CGR for a period of three years at 75% of the average base and incentive fees received for the two years preceding the cessation of services.
Committees
Audit Committee
The Company’s Audit Committee must be comprised of at least three directors, who are not employees, control persons or members of the management of the Company or any of its associates or affiliates. As of the date of this report, the following directors are members of the Audit Committee: Jordan Point, Chairman of the Audit Committee, Linda Holmes and John Londry. Ms. Holmes is a member of management, being the Corporate Secretary of the Company.
The Board of Directors of the Company, after each annual shareholder’s meeting must appoint or re-appoint an audit committee.
The Audit Committee:
- assists the Board in fulfilling its responsibilities for oversight of financial and accounting matters;
- recommends the auditors to be nominated and reviews the compensation of the auditors;
- is directly responsible for overseeing the work of the external auditors and pre-approves non-audit services;
- reviews the Company’s financial statements and related management’s discussion and analysis of financial and operating results; and
63
- establishes procedures for the receipt, retention and treatment of complaints regarding accounting, internal accounting controls or auditing matters.
The Audit Committee’s mandate requires that all of the members be financially literate and at least one member have accounting or related financial management expertise.
The mandate of the Committee empowers it to retain legal, accounting and other advisors.
Compensation Committee
As at April 30, 2011, the Compensation Committee was comprised of three directors: Dennis Hop, Chairman of the Compensation Committee, Jordan Point and Linda Holmes. The majority of the Compensation Committees is to be comprised of a majority of directors, who are not employees, control persons or members of the management of the Company or any of its associates or affiliates Ms. Holmes is a member of management, being the Corporate Secretary of the Company.
The primary purpose of the Compensation Committee is to:
- recommend levels of executive compensation that are competitive in order to attract, motivate and retain highly skilled and experienced executive officers;
- provide fair and competitive compensation;
- align the interest of management with those of shareholders and to reward corporate and individual performance;
- review executive compensation disclosure in public disclosure documents
The Compensation Committee does not have a formal compensation program with set benchmarks; however, the Compensation Committee does have an informal program which seeks to reward an executive officer’s current and future expected performance and the achievements of corporate milestones and align the interests of executive officers with the interests of the Company’s shareholders.
The Compensation Committee, when determining cash compensation to the President and CEO takes into consideration the extensive experience in the mining industry, responsibilities and duties as President and CEO, as well as personal risks and contributions to the Company’s success. The President and CEO receives a base cash compensation that the Company feels is in line with that paid by similar companies in North America; however no formal survey has been completed by the Compensation Committee or the Board in making such a determination.
D. Employees
During the fiscal year ended April 30, 2011, the Company had nine full-time employees, located in the Vancouver, British Columbia, Canada offices of the Company, involved in accounting, IT, investor relations and reception. Other services are carried out by consultants.
We do not currently have a collective bargaining arrangement with any labour union or association.
E. Share Ownership
The following table sets forth the share ownership of those individuals in Item 6.A, Directors and Senior Management, above and indicates the percentage of ownership for each based on the 93,733,262 common shares outstanding of the Company as at July 18, 2011. The voting rights attached to the common shares owned by our directors, officers and senior management do not differ from those voting rights attached to shares owned by people who are not directors, officers or senior management of the Company.
64
| | Stock Options | | | | |
| Name & Title | Number of securities underlying unexercised options (#) | Option exercise price ($) | Option expiration date | Number of securities underlying unexercised warrants (exercisable at $0.35/share until Mar 15/12) | Common Shares Beneficially Owned | Total number of securities and common shares underlying unexercised Stock Options and unexercised warrants | Percentage of Issued and Outstanding Common Shares |
Harry Barr
President & CEO
Director | 260,000(1)
490,000 (2)
340,000(3)
190,000(4)
240,000(5) | 0.25
0.30
0.25
0.25
0.60 | May 18/17
Feb 24/16
Nov 5/14
Apr 22/14
Feb 22/13 | 38,333 | 4,326,913(6) | 5,885,246 | 6.27% |
Robert Guanzon
CFO | 125,000
75,000
55,000 | 0.30
0.25
0.60 | Feb 24/16
Apr 22/14
Feb 22/13
| 8,333 | 35,291 | 298,624 | 0.32% |
Linda Holmes
Corporate
Secretary
Director | 100,000
125,000
80,000
70,000 | 0.25
0.30
0.25
0.60 | Oct 11/17
Feb 24/16
Apr 22/14
Feb 22/08
| 11,667 | 28,334 | 415,001 | 0.44% |
John Oness
Vice President,
Corporate Business Development | 300,000
300,000 | 0.25
0.30 | Feb 24/16
Feb 1/11 | 33,333 | 66,666 | 699,999 | 0.74% |
Dennis Hop
Director | 100,000
100,000
80,000
70,000 | 0.25
0.30
0.25
0.60 | Oct 29/17
Feb 24/16
Apr 22/14
Feb 22/13
| 5,000 | 640,000 | 975,000 | 1.04% |
John Londry
Director | 40,000
100,000
75,000
35,000
50,000 | 0.25
0.30
0.25
0.25
0.25 | May 18/17
Feb 24/16
Nov 5/14
Apr 22/14
Feb 22/13 | 5,000 | 15,714 | 320,714 | 0.34% |
JordanPoint
Director | 100,000
100,000
80,000
70,000 | 0.25
0.30
0.25
0.60 | Oct 11/17
Feb 24/16
Apr 22/14
Feb 22/13 | 5,000 | 10,000 | 365,000 | 0.39% |
| TOTAL | 3,750,000 | | | 106,666 | 5,122,918 | 8,959,584 | 9.56% |
| | (1) | Of this total 100,000 options are held by Mr. Barr; 80,000 are held by The Public Company Coach Inc and 80,000 are held by Canadian Gravity Recovery Inc. (“CGR”), both private companies wholly-owned by Mr. Barr. |
| | (3) | Of this total 170,000 options are held by Mr. Barr and 170,000 are held by CGR. |
| | (4) | These options are held by 293020 BC Ltd., a private company wholly-owned by Mr. Barr. |
| | (5) | Of this total, 120,000 options are held by Mr. Barr and 120,000 are held by CGR. |
| | (6) | Of this total, 1,336,313 common shares are held directly by Mr. Barr; 2,175,500 are held by 293020 BC Ltd.; 97,000 are held by 607767 BC Ltd., a private company wholly-owned by Mr. Barr; 718,100 are held by CGR. |
The stock options granted to directors have been granted at an exercise price at least equal to or greater than the closing price of the Company’s common shares on the TSX as at the date of grant. Options are typically granted for a period of five years and have a vesting period as determined by the Board.
65
As at July 18, 2011, our directors, officers and senior management held, as a group, directly or indirectly, an aggregate of 5,122,918 common shares; 2,650,000 options exercisable within 60 days and 106,666 warrants exercisable within 60 days.
Stock Option Grants
The stock option grants to directors, officers, other employees and consultants are determined by an assessment of the individual’s current and expected future performance, level of responsibilities, importance of the position held, contribution to the Company and previous option grants and exercise prices including:
- the remuneration paid to the individual as at the grant date in relation to the total remuneration payable by the Company to all of its directors, officers, employees and consultants as at the grant date;
- the length of time that each individual has been employed or engaged by the Company; and
- the quality of work performed by such director, officer, employee or consultant.
The fair value of stock options is estimated on the date of grant using the Black-Scholes pricing model. The following assumptions were used in the fair value calculation for options granted and/or vested during the year ended April 30, 2011:
| Risk-free interest rate | 2.57% |
| Options expected life | 4.9 years |
| Expected volatility | 117.12% |
| Expected dividend yield | Nil |
Description of Existing Incentive and Stock Compensation Plans
The Company has three existing incentive and stock compensation plans the 2004 Plan, the 2005 Plan and a Performance Share Plan (all as defined below), all of which have been previously approved by the shareholders of the Company and by the TSX. These plans are detailed below and are maintained separate and apart from each other.
| | (a) Following is a summary of the substantive terms of the 2004 Stock Option Plan: |
| | The Company’s 2004 stock option plan, as amended August 23, 2004 (the “2004 Plan”) provides that the aggregate number of shares of the Company that may be issued shall not exceed 6,324,200 shares. As at April 30, 2011, there are 2,410,366 stock options outstanding under the 2004 Plan which represents 2.81% of the Company’s 85,737,788 issued and outstanding shares. All allowable options have been granted under the 2004 Plan. The 2004 Plan shall remain in effect only until all outstanding options have been exercised, cancelled or have expired. |
| | If a participant ceases to be a director, officer, consultant or employee of the Company or ceases to be employed by the Company (other than by reason of disability, death or termination for cause), as the case may be, then the option granted shall expire on no later than the 90th day following the date that the option holder ceases to be a director, officer, consultant, or employee or ceases to be employed by the Company, subject to terms and conditions set out in the 2004 Plan. In the event of death of a participant, the option previously granted to him/her shall be exercisable only within the twelve months next succeeding such death. |
| | (b) Following is a summary of the substantive terms of the 2005 Plan: |
| | The Company’s 2005 Stock Option and Incentive Plan dated August 24, 2005 (the “2005 Plan”) provides that the aggregate number of shares of the Company that may be issued under the 2005 Plan shall not exceed 10% of the issued and outstanding capital of the Company, as such may be from time-to-time. As at April 30, 2011, of the 8,573,789 options allowable for grant under the 2005 Plan, options to purchase up to 5,632,634 common shares have been granted, representing 6.57% of the Company’s 85,737,788 issued and outstanding shares. |
| | Details of this plan are indicated below: |
66
| | 1. | The 2005 Plan is administered by the Board or by a committee appointed by the Board in accordance with terms of the 2005 Plan. |
| | 2. | The 2005 Plan shall terminate at 4:00PM of the next business day following March 31, 2015 (the “Termination Date”). No incentive under the 2005 Plan may be granted after the Termination Date, but the terms of an incentive agreement may extend beyond the Termination Date in accordance with the terms of the agreement but that no agreement may provide for a period in excess of ten years. |
| | 3. | Subject to the provisions of the 2005 Plan, the Board shall have the authority in its discretion to: (i) to grant Incentive Awards (as such term is defined under the 2005 Plan) to Participants (as such term is defined under the 2005 Plan); (ii) to determine, upon review of relevant information and in accordance with Section 2.16 of the 2005 Plan, the Fair Market Value (as such term is defined under the 2005 Plan) of the shares of the Company; (iii) to determine the exercise price per share of Incentive Awards (as such term is defined under the 2005 Plan) to be granted; (iv) to determine the number of common shares to be represented by each Incentive Award; (v) to determine the Participants to whom, and the time or times at which Incentive Awards shall be granted; (vi) to determine Management objectives; (vii) to interpret the 2005 Plan; (viii) to prescribe, amend and rescind rules and regulations relating to the 2005 Plan; (ix) to determine the terms and provisions of each Incentive Award granted (which need not be identical); (x) with the consent of the grantee thereof, to modify or amend Incentive Awards; (xi) to accelerate or defer (with the consent of the grantee) the exercise date of any Incentive Award; (xii) to authorize any person to execute on behalf of the Company any instrument required to effectuate the grant of an Incentive Award; (xiii) to accept or reject the election as to method of payment made by a grantee pursuant to Section 7.5 of the 2005 Plan; (xiv) to permit other Incentives to employ payment elections, such as net exercise, of Section 7.5 of the 2005 Plan; (xv) to create and implement new and innovative Incentives acceptable under law and policy and grant the same to eligible Participants and (xvi) to take all other acts and make all other determinations deemed necessary or advisable by the Board for the administration of the 2005 Plan. |
| | 4. | No individual may receive incentive grants exceeding 5% of issued and outstanding capital of the Company, unless specifically authorized by the Board and permitted by applicable laws and exchange policies. |
| | 5. | Unless otherwise provided in the option agreement, the term of each option shall be five (5) years from the date of grant. |
| | 6. | Payment for shares shall be paid by cash, in the form of currency or cheque or other cash equivalent acceptable to the Company, non-forfeitable, unrestricted or restricted common shares, which are already owed by the optionee and have an aggregate market reference value at the time of exercise that is equal to the option price or any other legal consideration that the Board may deem appropriate, including without limitation any form of consideration authorized pursuant to Section 7 of the 2005 Plan. |
| | 7. | The Board in its sole discretion may permit a cashless exercise of the option. In the event of a cashless exercise of the option, the Company shall issue the option holder the number of shares determined as follows: |
| | | X = Y (A-B) / A X = the number of shares to be issued to the option holder. Y = the number of shares with respect to which the option is being exercised. A = the market price of the common stock prior to the date of exercise. B = the exercise price |
| | 8. | The 2005 Plan may be amended by the Board at any time, without shareholder approval subject to the following amendments requiring shareholder approval, as required by law or TSX policies: an increase in the fixed percentage of shares subject to the 2005 Plan; and any change in the definition of Participant. |
67
| | 9. | The Board may make amendments such as repricing and extending non-insider options. If required by TSX policy to which the Company is subject, repricing or extension of Incentive Awards to insiders shall require shareholder approval. |
| | 10. | Subject to applicable laws and TSX policies, the Board may, in its discretion, assist any Participant in the exercise of awards under the 2005 Plan by authorizing the Company to provide a loan to the Participant (not to exceed the exercise price plus tax liability incurred in connection therewith), permitting the Participant to pay the exercise price in instalments, authorizing the Company to guarantee a loan obtained by the Participant from a third party, or granting a cash bonus to the Participant to enable the Participant to pay tax obligations arising from an award. Any such loans may be forgiven by the Company at the discretion of the Board. |
| | (c) | Previously Approved Performance Shares |
| | | In 2003 and 2004, the shareholders approved the issuance of an aggregate of 2,697,990 nominal value performance shares (1,116,940 in 2003; 1,581,050 in 2004). These performance shares are separate from any performance shares that may be issued under the 2005 Plan. |
| | | As at April 30, 2011, 750,000 of these performance shares have been issued and 300,000 performance shares that have been allotted are outstanding. As at July 18 2011, the 2,697,990 performance shares represent 3.15% of the Company’s issued and outstanding shares. |
| | | These performance shares have been and shall be issued at the discretion of the Board to such arm’s length parties as the Board considers desirable to attract to the Company due to their particular expertise, management experience, operations experience, financial capacity, industry profile or other such characteristics. Vesting provisions have been and may be imposed at the discretion of the Board at the date of issuance. The value of the performance shares shall be determined by the Board in its sole discretion at the date of issuance. The total number of performance shares granted to any one individual may not exceed 5% of the Company’s issued and outstanding shares at the date of issuance. |
ITEM 7. MAJOR SHAREHOLDERS
A. Major Shareholders
Based upon the Company’s review of the records maintained by Computershare Investor Services and insider reports filed with the System for Electronic Disclosure by Insiders (SEDI), as at July 18, 2011, the following shareholders beneficially owned, directly or indirectly, or exercised control or direction over, shares carrying more than 5% of the voting rights attached to all outstanding common shares of the Company:
| Shareholder Name And Address | Number Of Shares Held | Percentage Of Issued Shares |
CDS & Company
25 The Esplanade
Toronto, Ontario, M5E 1W5
Canada | 59,269,015(1) | 63.23% |
Kaymin Resources Limited(2)
2th Floor, 55 Marshall Street,
Johannesburg 2001
South Africa | 8,117,161 | 8.65% |
Pinetree Capital Ltd.
The Exchange Tower
130 King Street West, Suite 2500
Toronto, Ontario, M5X 1A9
Canada | 8,930,000) | 9.52% |
Stillwater Mining Company
1321 Discovery Drive
Billings, Montana 59102
USA | 5,750,692 | 6.14% |
68
| | (1) | CDS & Co. is a depository, the Company has no knowledge as to the beneficial ownership of these shares. |
| | (2) | Kaymin Resources Ltd. is a wholly-owned subsidiary of Anglo Platinum Limited of South Africa. |
As of July 18, 2011, Computershare Trust Company of Canada, our registrar and transfer agent, reported that we had 93,733,262 common shares issued and outstanding. Of those common shares, 72,869,476 common shares were registered to Canadian residents (97 shareholders); 9,384,625 common shares were registered to residents of the United States (21 shareholders); and 11,479,161 common shares were registered to residents of other foreign countries (8 shareholders).
To the best of our knowledge, we are not directly or indirectly owned or controlled by another corporation, by any foreign government or by any other natural or legal person.
There are no arrangements known to us, the operation of which may at a subsequent date result in a change in the control of our company.
The major shareholders do not have different voting rights from all shareholders.
B. Related Party Transactions
Other than as disclosed below or elsewhere in this annual report, to the best of our knowledge, there have been no material transactions or loans from the commencement of our 2011 fiscal year to the date of this annual report between our company and: (a) enterprises that directly or indirectly through one or more intermediaries, control or are controlled by, or are under common control with, the Company; (b) associates; (c) individuals owning, directly or indirectly, an interest in the voting power of the Company that gives them significant influence over the Company, and close members of any such individual's family; (d) key management personnel of the Company, including directors and senior management of the Company and close members of such individuals' families; and (e) enterprises in which a substantial interest in the voting power is owned, directly or indirectly, by any person described in (c) or (d) or over which such a person is able to exercise significant influence.
The Company's Board consists of Harry Barr, Dennis Hop, John Londry, Linda Holmes and Jordan Point. Harry Barr is the President and Chief Executive Officer, Linda Holmes is the Corporate Secretary and Robert Guanzon is the Chief Financial Officer. Richard Goodwin served as the Vice President of Engineering from January 4, 2010 to March 28, 2011 and Anthony Kovacs served as the Vice President of Exploration from January 5, 2010 to May 21, 2011.
The Company paid or accrued amounts to related parties as follows:
| | For the Year Ended April 30 |
| | 2011 | 2010 | 2009 |
| Management fees paid to Mr. Harry Barr(1) | - | 16,925 | 12,370 |
| Management fees paid to a company controlled by Mr. Harry Barr(1) | 200,071 | 172,773 | 202,602 |
| Consulting fees paid to a company controlled by Mr. Gregory Myers(2) | - | 3,916 | 135,000 |
| Engineering and consulting fees paid to Mr. Jonathon Findlay(3) | - | - | 61,807 |
| Consulting fees paid to a company controlled by Mr. John Londry(3) | 18,658 | 8,663 | 63,076 |
| Engineering and consulting fees paid to a company controlled by Mr. David Powers(4) | - | - | 123,641 |
| Engineering and consulting fees paid to Mr. Richard Goodwin(5) | 6,700 | 86,451 | - |
| Consulting fees paid to Mr. John Royall(6) | 7,500 | 16,000 | 26,125 |
| Consulting fees paid to a company controlled by Mr. Anthony Kovacs(7) | 99,399 | 38,983 | - |
| Consulting fees paid to Ms. Charlotte Brown(8) | - | 2,979 | - |
| Consulting fees paid to Ms. Linda Holmes(9) | 47,000 | 12,890 | - |
| Consulting fees paid to Mr. John Oness(10) | 45,000 | - | - |
| Management fees received from the River Valley Joint Venture | - | 6,680 | 12,176 |
| Director fees paid/accrued to Mr. Denny Hop | 7,000 | 7,000 | 8,000 |
| Director fees paid/accrued to Mr. John Londry | 8,000 | 8,000 | 1,750 |
| Director fees paid/accrued to Ms. Linda Holmes | - | - | 8,000 |
| Director fees paid/accrued to Mr. Jordan Point | 8,000 | 8,000 | 8,000 |
69
NOTES:
(1) President, Director and CEO of the Company
(2) Former Vice President of Business Development
(3) Former Vice President of Exploration
(4) Former Vice President of Project Development
(5) Former Vice President of Engineering
(6) Former Director of the Company
(7) Vice President of Exploration
(8) Former Corporate Secretary of the Company
(9) Corporate Secretary of the Company
(10) Vice President of Corporate Business Development
These transactions, occurring in the normal course of operations, are measured at the exchange amount which is the amount of consideration established and agreed to by the related parties.
C. Interests of Experts and Counsel
This Form 20F is being filed as an annual report under the Exchange Act and, as such, there is no requirement to provide any information under this section.
ITEM 8. FINANCIAL INFORMATION
A. Consolidated Statements and Other Financial Information
The consolidated financial statements of the Company and the accompanying notes have been prepared in accordance with generally accepted accounting principles in Canada (“Canadian GAAP”).
The consolidated financial statements for the year ended April 30, 2011 are prepared on a consolidated basis and include the accounts of the Company and its wholly owned US subsidiaries, Pacific North West Capital Corp. USA and Pacific North West Capital de México, S.A. de C.V. on the basis that the Company owned and effectively controlled a 100% interest in these companies.
This annual report contains the consolidated financial statements for the Company for the fiscal year ended April 30, 2011 which contains:
- Report of the Independent Auditor dated July 14, 2011
- Consolidated Balance Sheets for the fiscal years ended April 30, 2011 and 2010
- Consolidated Statements of Changes in Shareholders’ Equity for the fiscal years ended April 30, 2011, 2010 and 2009
- Consolidated Statements of Loss and Comprehensive Loss for the fiscal years ended April 30, 2011, 2010 and 2009
- Consolidated Statements of Cash Flows for the fiscal years ended April 30, 2011, 2010 and 2009
- Consolidated Schedules of Mineral Property Costs for the fiscal years ended April 30, 2011 and 2010
- Notes to Consolidated Financial Statements
70
Legal Proceedings and Regulatory Actions
During the fiscal year ended April 30, 2011, the Company was not and is not current a party to, nor is any of its property the subject of, any legal proceedings for which the outcome could have a material adverse affect on the Company, nor, to the Company’s knowledge, is the Company to be a party to any contemplated legal proceedings, the outcome of which could have a material adverse affect on the Company.
There have been no penalties or sanctions imposed against the Company by a court relating to securities
legislation or by a securities regulatory authority during the fiscal year ended April 30, 2011, or any other time that would likely be considered important to a reasonable investor making an investment decision in the Company, and the Company has not entered into any settlement agreements before a court relating to securities legislation or with a securities regulatory authority during the fiscal year ended April 30, 2011.
Dividend Distributions
Holders of our common shares are entitled to receive such dividends as may be declared from time to
time by the Board, in its discretion, out of funds legally available for that purpose. The Company has not, since the date of its incorporation, declared or paid any dividends on its common shares and does not currently intend to pay dividends. Earnings will be retained to finance further exploration.
B. Significant Changes
No significant change has occurred since the date of the annual audited consolidated financial statements included in this Annual Statement.
ITEM 9. THE OFFER AND LISTING
A. Offer and Listing Details
TSX Exchange – symbol “PFN”
The annual high and low market prices for the common shares of the Company on the TSX Exchange for each of the last five (5) completed financial years are as follows:
| Year Ended | High | Low |
| May 2010 – April 2011 | 0.36 | 0.08 |
| May 2009 – April 2010 | 0.245 | 0.08 |
| May 2008 – April 2009 | 0.35 | 0.05 |
| May 2007 – April 2008 | 0.770 | 0.280 |
| May 2006 – April 2007 | 0.500 | 0.270 |
The high and low market prices for the common shares of the Company on the TSX Exchange for each full financial quarter for the two (2) most recently completed full financial years are as follows:
| Year Ended | High | Low |
| April 30, 2011 1st Quarter ended July 2010 | 0.145 | 0.095 |
| 2nd Quarter ended October 2010 | 0.125 | 0.08 |
| 3rd Quarter ended January 2011 | 0.215 | 0.115 |
| 4th Quarter ended April 2011 | 0.36 | 0.16 |
| Year Ended | High | Low |
| April 30, 2010 | | |
| 1st Quarter ended July 2009 | 0.16 | 0.08 |
| 2nd Quarter ended October 2009 | 0.175 | 0.085 |
| 3rd Quarter ended January 2010 | 0.245 | 0.12 |
| 4th Quarter ended April 2010 | 0.185 | 0.125 |
71
The high and low market prices for the common shares of the Company on the TSX Exchange for the most recent six (6) months are as follows:
| Month Ended | High | Low |
| June 2011 | 0.37 | 0.27 |
| May 2011 | 0.375 | 0.25 |
| April 2011 | 0.36 | 0.27 |
| March 2011 | 0.315 | 0.225 |
| February 2011 | 0.36 | 0.16 |
| January 2011 | 0.215 | 0.12 |
The high and low market prices for the common shares of the Company on the TSX Exchange on the first trading day of each month in the most recent six months:
| Month Ended | High | Low |
| June 2011 | 0.36 | 0.34 |
| May 2011 | 0.35 | 0.345 |
| April 2011 | 0.305 | 0.285 |
| March 2011 | 0.285 | 0.275 |
| February 2011 | 0.225 | 0.18 |
| January 2011 | 0.13 | 0.12 |
On April 30, 2010 the closing sale price of the common shares on the TSX was $0.345 per share.
OTC Markets Group, Inc.’s OTC Bulletin Board (“OTCBB”) and OTCQX International (“OTCQX”)
Since August 31, 2001, the common shares of the Company have been quoted on the OTCBB under the symbol “PAWEF”. On October 26, 2010, the Company moved up to the OTCQX platform, the premier tier of the U.S. Over-the-Counter marketplace. The same symbol of PAWEF applies to the OTCQX.
The high and low market prices for the common shares of the Company for the five (5) most recent full financial years:
| Year Ended | High | Low |
| May 2010 – April 2011 May 2009 – April 2010 | 0.415 0.239 | 0.07 0.071 |
| May 2008 – April 2009 | 0.35 | 0.05 |
| May 2007 – April 2008 | 0.770 | 0.280 |
| May 2006 – April 2007 | 0.500 | 0.270 |
| May 2005 – April 2006 | 0.510 | 0.255 |
The high and low market prices for the common shares of the Company for each full financial quarter for the two (2) most recently completed financial years:
| Year Ended | High | Low |
| April 30, 2011 1st Quarter ended July 2010 | 0.15 | 0.07 |
| 2nd Quarter ended October 2010 | 0.139 | 0.775 |
| 3rd Quarter ended January 2011 | 0.1937 | 0.1108 |
| 4th Quarter ended April 2011 | 0.415 | 0.165 |
| Year Ended | High | Low |
| April 30, 2010 | | |
| 1st Quarter ended July 2009 | 0.129 | 0.071 |
| 2nd Quarter ended October 2009 | 0.169 | 0.08 |
| 3rd Quarter ended January 2010 | 0.239 | 0.116 |
| 4th Quarter ended April 2010 | 0.174 | 0.13 |
72
The high and low market prices for the common shares of the Company for the most recent six (6) months:
| Month Ended | High | Low |
| June 2011 | 0.3699 | 0.274 |
| May 2011 | 0.3799 | 0.271 |
| April 2011 | 0.415 | 0.278 |
| March 2011 | 0.3324 | 0.259 |
| February 2011 | 0.2599 | 0.165 |
| January 2011 | 0.1937 | 0.12 |
The high and low market prices for the common shares of the Company for the first trading day of each month in the most recent six months:
| Month Ended | High | Low |
| June 2011 | 0.356 | 0.356 |
| May 2011 | 0.3583 | 0.3583 |
| April 2011 | 0.3196 | 0.3196 |
| March 2011 | 0.296 | 0.2835 |
| February 2011 | 0.2201 | 0.189 |
| January 2011 | 0.141 | 0.13 |
On April 30, 2011 the closing sale price of the common shares on the OTCQX was $0.3664 per share.
B. Plan of Distribution
This Form 20F is being filed as an annual report under the Exchange Act and, as such, there is no requirement to provide any information under this section.
C. Markets
The Company’s common shares have traded on the TSX (and its predecessors, the Canadian Venture Exchange and the Vancouver Stock Exchange) since December 19, 1997 under the trade symbol “PFN”; the Company’s common shares have been quoted on the OTCBB from August 31, 2001 and on the OTCQX since October 26, 2010, under the trade symbol PAWEF; and on the Frankfurt Stock Exchange, Open Market under the symbol P7J.
D. Selling Shareholders
This Form 20F is being filed as an annual report under the Exchange Act and as such, there is no requirement to provide any information under this section.
E. Dilution
This Form 20F is being filed as an annual report under the Exchange Act and as such, there is no requirement to provide any information under this section.
F. Expense of the Issue
This Form 20F is being filed as an annual report under the Exchange Act and as such, there is no requirement to provide any information under this section.
ITEM 10. ADDITIONAL INFORMATION
A. Share Capital
This Form 20F is being filed as an annual report under the Exchange Act and as such, there is no requirement to provide any information under this section.
73
B. Memorandum and Articles of Association
Articles
The Company’s Articles of Association and Memorandum are registered with the British Columbia Registrar of Companies under corporation number C0699625. A copy of these Articles of Association and Memorandum were filed as an exhibit with the Company’s initial registration statement on Form 20‑F.
The Company was incorporated pursuant to the provisions of the Business Corporations Act (Alberta) on May 29, 1996. The Company amended its Articles by certificate of amendment dated October 22, 1997 to remove the private company restrictions. On July 13, 2004 the Company continued out of the Province of Alberta into the Province of British Columbia, and amended its Articles, pursuant to the Business Corporations Act (British Columbia) (“BCBCA”).
Objects and Purposes
Under the BCBCA we are permitted to conduct any lawful business that we are not restricted from conducting by our Articles, which does not contain any restriction on the business the Company may conduct.
Director’s Powers to Vote on a Proposal, Arrangement or Contract in which the Director is Materially Interested
The BCBCA requires that every director who is a party to, or who is a director or officers of, or has a material interest in, any person who is a party to, a material contract or transaction or a proposed material contract or transaction with the Company, must disclose in writing to the Company or request to have entered into the minutes of the meetings of directors, the nature and extent of his or her interest and must refrain from voting on the matter; however, the BCBCA states that:
| 1. | A director or senior officer of the Company does not hold a disclosable interest in a contract or transaction if: |
| | (a) | the situation that would otherwise constitute a disclosable interest arose before the coming into force of the BCBCA, or the interest was disclosed and approved under, or was not required to be disclosed under legislation that applied to the Company before the coming into effect of the BCBCA; |
| | (b) | both the Company and the other party to the contract or transaction are wholly-owned subsidiaries of the same corporation; |
| | (c) | the Company is a wholly-owned subsidiary of the other party to the contract or transaction; |
| | (d) | the other party to the contract or transaction is a wholly-owned subsidiary of the Company; or |
| | (e) | the director or senior officer is the sole shareholder of the Company or of a corporation of which the Company is a wholly-owned subsidiary; and |
| 2. | a director or senior officer of a company does not hold a disclosable interest in a contract or transaction merely because: |
| | (a) | the contract or transaction is an arrangement by way of security granted by the Company for money loaned to, or obligations undertaken by, the director or senior officer, or a person in whom the director or senior officer has a material interest, for the benefit of the company or an affiliate of the company, |
| | (b) | the contract or transaction relates to an indemnity or insurance, |
| | (c) | the contract or transaction relates to the remuneration of the director or senior officer in that person's capacity as director, officer, employee or agent of the company or of an affiliate of the company, |
74
| | (d) | the contract or transaction relates to a loan to the company, and the director or senior officer, or a person in whom the director or senior officer has a material interest, is or is to be a guarantor of some or all of the loan, or |
| | (e) | the contract or transaction has been or will be made with or for the benefit of a corporation that is affiliated with the Company and the director or senior officer is also a director or senior officer of that corporation or an affiliate of that corporation. |
Director’s Power, in the Absence of an Independent Quorum, to Vote Compensation to Themselves or any Members of their Body
The compensation of the directors is decided by the directors unless the Board of Directors requests approval of the compensation from the shareholders. If the issuance of compensation to the directors is decided by the directors, a quorum is the majority of the directors in office.
Indemnification of Directors
Under 15.1 of the Company’s Articles, the directors must cause the Company to indemnify its directors and former directors, and their respective heirs and personal or other legal representatives to the greatest extent permitted by the BCBCA. Under the BCBCA, the Company will be prohibited from paying an indemnity if:
| (a) | the party did not act honestly and in good faith with a view to the best interests of the Company; |
| (b) | the proceeding was not a civil proceeding and the party did not have reasonable grounds for believing that his or her conduct was lawful; and |
| (c) | the proceeding is brought against the party by the Company or an associated corporation. |
Borrowing Powers of Directors
Under 6.1 of the Company’s Articles, the directors may from time to time on behalf of the Company:
| (a) | borrow money in the manner and amount, on the security, from the sources and on the terms and conditions that they consider appropriate, |
| (b) | issued bonds, debentures and other debt obligations either outright or as security for any liability of obligation of the Company or any other person, |
| (c) | guarantee the repayment of money by any other person or the performance of any obligation of any other person, and |
| (d) | mortgage or charge, whether by way of specific or floating charge, or give other security on the whole or any part of the present and future undertaking of the Company. |
The borrowing powers may be varied by amendment to the Articles of the Company which requires approval of the shareholders of the Company by special resolution.
Retirement or Non-Retirement of Directors
There are no such provisions applicable to the Company under the Notice of Articles, Articles or the BCBCA nor does the Board have any mandatory retirement policy for directors.
Directors’ Share Ownership
A director of the Company is not required to hold any common shares in the capital of the Company as qualification for his/her office.
Rights, Preferences and Restrictions for each Class of Shares
Dividends
The Company’s Articles provide that holders of our common shares are entitled to receive such dividends as may be declared from time to time by the Board, in its discretion, out of funds legally available for that purpose. The Company has not, since the date of its incorporation, declared or paid any dividends on its common shares and does not currently intend to pay dividends. Any dividend declared by the directors may be made payable on such date as is fixed by the directors.
75
Rights
The Company has only one class of shares, common shares without par value. All of the common shares of the Company rank equally as to voting rights, participation in a distribution of the assets of the Company on a liquidation, dissolution or winding-up of the Company and the entitlement to dividends. The holders of the common shares are entitled to receive notice of all shareholder meetings and to attend and vote at such meetings. Each common share carries with it the right to one vote. The common shares do not have preemptive or conversion rights. In addition, there are no sinking fund or redemption provisions applicable to the common shares or any provisions discriminating against any existing or prospective holders of such securities as a result of a shareholder owning a substantial number of shares.
Directors do not currently stand for reelection at staggered intervals.
If there were profits realized by the Company, there is no right held by shareholders to share in the Company’s profits. There are no rights held by shareholders to share in any surplus in the event of liquidation; nor are they any redemption provisions, sinking fund provisions, liability to further capital calls by the Company or any provision discriminating against any existing or prospective holder of the Company’s securities as a result of such shareholder owing a substantial number of shares.
Changes to Rights
Under the BCBCA, the rights of shareholders may be changed only by the shareholders passing a special resolution approved by 2/3 of the votes cast at a special meeting of shareholders, the notice of which is accompanied by an information circular describing the proposed action and its effect on the shareholders.
Annual and General Meetings
The Board of Directors must call an annual general meeting once in each calendar year and not later than 15 months after the last such meeting. The Board may call an extraordinary general meeting at any time. Notice of such meetings must be accompanied by an information circular describing the proposed business to be dealt with and making disclosures as prescribed by statuteAdmission to such meetings is open to registered shareholders and their duly appointed proxies. Others may be admitted subject to the pleasure of the meeting.
No advance notice will be required to be published at a meeting where directors are to be elected. The Company must give shareholders not less than 21 days notice of any general meeting of the shareholders.
The Directors may fix in advance a date, which is no fewer than 35 days or no more than 60 days prior to the date of the meeting. All the holders of common shares as at that date are entitled to attend and vote at a general meeting.
A quorum for a meeting of shareholders of the Company is two persons who are, or who represent by proxy, shareholders who, in the aggregate, hold at least 1/20 (5%) of the issued shares entitled to be voted at the meeting.
The Company’s Notice of Articles and Articles contain no limitations on the rights of non-resident or foreign shareholders to hold or exercise rights on our shares. Except for the Investment Canada Act, which requires certain transactions to be approved by the Minister of Industry and/or the Minister of Canadian Heritage as being of net benefit to Canada before they may proceed, there is no limitation at law upon the right of a non-resident to hold shares in a Canadian company.
There are no provisions in the Company’s Notice of Articles and Articles that would have an effect of delaying, deferring or preventing a change in control and that would operate only with respect to a merger, acquisition or corporate restructuring involving the Company or any of its subsidiaries.
76
There is no provision in the Company’s Notice of Articles and Articles setting a threshold or requiring or governing disclosure of shareholder ownership above any level. Securities Acts, regulations and the policies and rules thereunder in the Provinces of British Columbia, Alberta and Ontario, where the Company is a reporting company, require any person holding or having beneficial ownership or control or direction of more than 10% of the Company’s issued shares to file insider and other reports disclosing such shareholdings.
C. Material Contracts
During the two years immediately preceding publication of this document, the Company entered into material contracts, other than contracts entered into in the ordinary course of business, as follows:
| 1. | In June 2009, the Company granted Fire River Gold Corp. (“FAU”) an option to acquire all of the outstanding shares of MCR. FAU paid PFN US$50,000 on signing of the agreement. The sale of MCR to FAU was approved by PFN shareholders in August 2009. The shareholders of FAU approved the purchase of MCR in September 2009. FAU exercised the option by making further payments totaling US$450,000 and issuing a total of US$2.5 million in FAU shares at a deemed price of $0.45 per share for a total of 6,415,000 shares to the Company. FAU issued to the Company 1,000,000 share purchase warrants entitling the Company to purchase 1,000,000 shares at an exercise price of $0.50 for a period of twenty-four months from the date of closing. |
| 2. | Option Agreement dated July 29, 2009, between the Company and Misty Creek Ventures Ltd, Pamicon Developments Ltd. and First Fiscal Enterprises Ltd. to earn a 100% interest in the Rock and Roll property in British Columbia over a four-year period by completing $2,000,000 in exploration expenditures, paying the Vendors $130,000 and providing the Vendors with a total of 600,000 PFN shares. The Vendors will retain a 2% NSR, of which 1% can be purchased for $3,000,000. The property is also subject to an underlying NSR of 3%, and an underlying net profits interest of 15%, both of which are payable to Prime Equities International Corporation, and both of which are purchasable in their entirety for $1,500,000 each. |
| 3. | Joint Venture Agreement dated August 14, 2009, between the Company and Alto Ventures Ltd. in respect of the Despinassy Property, Quebec (known as the “Destiny Gold property” by paying Alto $200,000, providing Alto with 250,000 common shares of PFN, and completing a total of $3,500,000 in exploration expenditures over a four year period to earn a 60% interest in the Destiny Gold property. Subsequent to vesting of its interest, PFN will form a joint venture with Alto to further develop the project. Certain claims comprising the property are subject to underlying net smelter return royalties ranging from 1% to 3.5%, with varying buy-back provisions. |
| 4. | Mineral Interest Assignment Agreement dated December 13, 2010 between Kaymin, Anglo Platinum and the Company, assigning Kaymin’s and Anglo Platinum’s 50% interest in the River Valley property to the Company Platinum’s, thus giving 100% ownership to the Company. |
| 5. | Amendment dated April 6, 2011 to the Mineral Interest Assignment Agreement dated December 13, 2010 (“Assignment Agreement”), between Kaymin, Anglo Platinum and the Company. Under the terms of the Assignment Agreement, Kaymin exchanged its 50% interest in the JV, for a 12% interest in PFN, based on the issued and outstanding common shares of PFN as of November 30, 2010 (67,643,008 common shares). The aggregate purchase price for the 50% interest in the River Valley PGM project was: |
| | a. | 8,117,161 fully paid and non-assessable common shares of PFN (issued); and |
| | b. | three-year warrants exercisable to purchase 3,000,000 common shares of PFN at a price of $0.30 per common share. |
D. Exchange Controls
There is no law or governmental decree or regulation in Canada that restricts the export or import of capital, or affects the remittance of dividends, interest or other payments to a non-resident holder of common shares, other than withholding tax requirements.
There is no limitation imposed by Canadian law or by the constituent documents of the Company on the right of a non-resident to hold or vote common shares, other than are provided in the Investment Canada Act (Canada). The following summarizes the material features of the Investment Canada Act (Canada).
77
The Investment Canada Act (Canada) requires certain "non-Canadian" individuals, governments, corporations or other entities who wish to acquire a "Canadian business" (as defined in the Investment Canada Act), or establish a "new Canadian business" (as defined in the Investment Canada Act) to file either a notification or an application for review with a governmental agency known as "Investment Canada". The Investment Canada Act requires that certain acquisitions of control by a Canadian business by a "non-Canadian" must be reviewed and approved by the Minister responsible for the Investment Canada Act on the basis that the Minister is satisfied that the acquisition is "likely to be of net benefit to Canada", having regard to criteria set forth in the Investment Canada Act. Only acquisitions of control are reviewable under the Investment Canada Act; however, the Investment Canada Act provides detailed rules for the determination of whether control has been acquired and, pursuant to those rules, the acquisition of one-third or more of the voting shares of a corporation may, in some circumstances, be considered to constitute an acquisition of control. Certain reviewable acquisitions of control may not be implemented before being approved by the Minister; if the Minister does not ultimately approve a reviewable acquisition which has been completed, the acquired Canadian business be divested. Failure to comply with the review provisions of the Investment Canada Act could result in, among other things, an injunction or a court order directing disposition of assets or shares.
E. Taxation
Material United States Federal Income Tax Consequences
The following is a general discussion of certain possible United States federal income tax consequences, under current law, generally applicable to a U.S. Holder (as hereinafter defined) of common shares of the Company. This discussion does not address all potentially relevant federal income tax matters and it does not address consequences peculiar to persons subject to special provisions of federal income tax law, such as those described below as excluded from the definition of a U.S. Holder. In addition, this discussion does not cover any state, local or foreign tax consequences. (See “Canadian Federal Income Tax Consequences” below).
The following discussion is based upon the sections of the Internal Revenue Code of 1986, as amended (the “Code”), Treasury Regulations, published Internal Revenue Service (“IRS”) rulings, published administrative positions of the IRS and court decisions that are currently applicable, any or all of which could be materially and adversely changed, possibly on a retroactive basis, at any time and which are subject to differing interpretations. This discussion does not consider the potential effects, both adverse and beneficial, of any recently proposed legislation, which, if enacted, could be applied, possibly on a retroactive basis, at any time. This discussion is for general information only and it is not intended to be, nor should it be construed to be, legal or tax advice to any holder or prospective holder of common shares of the Company and no opinion or representation with respect to United States federal income tax consequences to any such holder or prospective holder is made. Accordingly, holders and prospective holders of common shares of the Company should consult their own tax advisors about the federal, state, local, and foreign tax consequences of purchasing, owning and disposing of common shares of the Company.
U.S. Holders
As used herein, a “U.S. Holder” means a holder of common shares of the Company who is a citizen or individual resident of the United States, a corporation or partnership created or organized in or under the laws of the United Sates or of any political subdivision thereof, an estate whose income is taxable in the United States irrespective of source or a trust subject to the primary supervision of a court within the United States and control of a United States fiduciary as described in Section 7701(a)(30) of the Code. This summary does not address the tax consequences to, and U.S. Holder does not include, persons subject to specific provisions of federal income tax law, such as tax-exempt organizations, qualified retirement plans, individual retirement accounts and other tax-deferred accounts, financial institutions, insurance companies, real estate investment trusts, regulated investment companies, broker-dealers, nonresident alien individuals, or foreign corporations whose ownership of common shares of the Company is not effectively connected with conduct on a trade or a business in the United States, persons or entities that have a “functional currency” other than the U.S. dollar, shareholders who hold common shares as part of a straddle, hedging or a conversion transaction, and shareholders subject to the alternative minimum tax, and shareholders who acquired their common shares through the exercise of employee stock options or otherwise as compensation for services. This summary is limited to U.S. Holders who own common shares as capital assets. This summary does not address the consequences to a person or entity holding an interest in a shareholder or the consequences to a person of the ownership, exercise or disposition of any options, warrants or other rights to acquire common shares.
78
Distribution on Common Shares of the Company
U.S. Holders receiving dividend distributions (including constructive dividends) with respect to common shares of the Company are required to include in gross income for United States federal income tax purposes the gross amount of such distributions, equal to the U.S. dollar value of such distributions on the date of receipt (based on the exchange rate on such date), to the extent that the Company has current or accumulated earnings or profits, without reduction for any Canadian income tax withheld from such distributions. Such Canadian tax withheld may be credited, subject to certain limitations, against the U.S. Holder’s federal income tax liability or, alternatively, may be deducted in computing the U.S. Holder’s federal taxable income by those who itemize deductions. (See more detailed discussion at “Foreign Tax Credit” below.) To the extent that distributions exceed current or accumulated earnings and profits of the Company, they will be treated first as a return of capital up to the U.S. Holder’s adjusted basis in the common shares and thereafter as gain from the sale or exchange of the common shares. Preferential tax rates for long-term capital gains are applicable to a U.S. Holder, which is an individual, estate or trust. There are currently no preferential tax rates for long-term capital gains for a U.S. Holder, which is a corporation.
In the case of foreign currency received as a dividend that is not converted by the recipient into U.S. dollars on the date of receipt, a U.S. Holder will have a tax basis in the foreign currency equal to its U.S. dollar value on the date of receipt. Generally any gain or loss recognized upon a subsequent sale or other disposition of the foreign currency, including the exchange for U.S. dollars, will be ordinary income or loss. However, an individual whose realized gain does not exceed $200 will not recognize that gain, to the extent that there are no expenses associated with the transaction that meet the requirement for deductibility as a trade or business expense (other than travel expenses in connection with a business trip) or as an expense for the production of income.
Dividends paid on the common shares of the Company generally will not be eligible for the dividends received deduction provided to corporations receiving dividends from certain United States corporations. A U.S. Holder which is a corporation may, under certain circumstances, be entitled to a 70% (or 80%) deduction of the United States source portion of dividends received from the Company (unless the Company qualifies as a “foreign personal holding company” or a “passive foreign investment company,” as defined below) if such U.S. Holder owns common shares representing at least 10% (or 20%) of the voting power and value of the Company. The availability of this deduction is subject to several complex limitations that are beyond the scope of this discussion.
Information Reporting and Backup Withholding
Under current Treasury Regulations, dividends paid on the Company’s common shares, if any, generally will not be subject to information reporting and generally will not be subject to U.S. backup withholding tax. However, dividends and the proceeds from a sale of the Company’s common shares paid in the U.S. through a U.S. or U.S. related paying agent (including a broker) will be subject to U.S. information reporting requirements and may also be subject to the 30% U.S. backup withholding tax, unless the paying agent is furnished with a duly completed and signed Form W-9. Any amounts withheld under the U.S. backup withholding tax rules will be allowed as a refund or a credit against the U.S. Holder’s U.S. federal income tax liability, provided the required information is furnished to the IRS.
Foreign Tax Credit
A U.S. Holder who pays (or has withheld from distributions) Canadian income tax with respect to the ownership of common shares of the Company may be entitled, at the option of the U.S. Holder, to either receive a deduction or a tax credit for such foreign tax paid or withheld. Generally, it will be more advantageous to claim a credit because a credit reduces United States federal income taxes on a dollar-for-dollar basis, while a deduction merely reduces the taxpayer’s income subject to tax. This election is made on a year-by-year basis and applies to all foreign taxes paid by (or withheld from) the U.S. Holder during that year. There are significant and complex limitations which apply to the credit, among which is the general limitation that the credit cannot exceed the proportionate share of the U.S. Holder’s United States income tax liability that the U.S. Holder’s foreign source income bears to his or its worldwide taxable income. In the determination of the application of this limitation, the various items of income and deduction must be classified into foreign and domestic sources. Complex rules govern this classification process. In addition, this limitation is calculated separately with respect to specific classes of income such as “passive income”, “high withholding tax interest”, “financial services income”, “shipping income,” and certain other classifications of income. Dividends distributed by the Company will generally constitute “passive income” or, in the case of certain U.S. Holders, “financial services income” for these purposes. The availability of the foreign tax credit and the application of the limitations on the credit are fact specific, and U.S. Holders of common shares of the Company should consult their own tax advisors regarding their individual circumstances.
79
Disposition of Common Shares of the Company
A U.S. Holder will recognize gain or loss upon the sale of common shares of the Company equal to the difference, if any, between (i) the amount of cash plus the fair market value of any property received, and (ii) the shareholder’s tax basis in the common shares of the Company. Preferential tax rates apply to long-term capital gains of U.S. Holders which are individuals, estates or trusts. This gain or loss will be capital gain or loss if the common shares are a capital asset in the hands of the U.S. Holder, which will be long-term capital gain or loss if the common shares of the Company are held for more than one year. Deductions for net capital losses are subject to significant limitations. For U.S. Holders who are not corporations, any unused portion of such net capital loss may be carried over to be used in later tax years until such net capital loss is thereby exhausted. For U.S. Holders which are corporations (other than corporations subject to Subchapter S of the Code), an unused net capital loss may be carried back three years from the loss year and carried forward five years from the loss year to be offset against capital gains.
Currency Exchange Gains or Losses
U.S. Holders generally are required to calculate their taxable incomes in United States dollars. Accordingly, a U.S. Holder who purchases common shares of the Company with Canadian dollars will be required to determine the tax basis of such shares in United States dollars based on the exchange rate prevailing on the settlement date of the purchase (and may be required to recognize the unrealized gain or loss, if any, in the Canadian currency surrendered in the purchase transaction). Similarly, a U.S. Holder receiving dividends or sales proceeds from common shares of the Company in Canadian dollars will be required to compute the dividend income or the amount realized on the sale, as the case may be, in United States dollars based on the exchange rate prevailing at the time of receipt in the case of dividends and on the settlement date in the case of sales on an established securities exchange. Gain or loss, if any, recognized on a disposition of Canadian currency in connection with the described transaction generally will be treated as ordinary gain or loss.
Other Considerations
In the following circumstances, the above sections of this discussion may not describe the United States federal income tax consequences resulting from the holding and disposition of common shares:
Foreign Personal Holding Company
If at any time during a taxable year more than 50% of the total combined voting power or the total value of the Company’s outstanding common shares is owned, directly or indirectly, by five or fewer individuals who are citizens or residents of the United States and 60% or more of the Company’s gross income for such year was derived from certain passive sources (e.g., from dividends received from its subsidiaries), the Company may be treated as a “foreign personal holding company”. In that event, U.S. Holders that hold common shares would be required to include in gross income for such year their allocable portions of such passive income to the extent the Company does not actually distribute such income. The Company does not believe that it currently qualifies as a foreign personal holding company. However, there can be no assurance that the Company will not be considered a foreign personal holding company for the current or any future taxable year.
80
Foreign Investment Company
If 50% or more of the combined voting power or total value of the Company’s outstanding common shares are held, directly or indirectly, by citizens or residents of the United States, United States domestic partnerships or corporations, or estates or trusts other than foreign estates or trusts (as defined by the Code Section 7701(a)(31)), and the Company is found to be engaged primarily in the business of investing, reinvesting or trading in securities, commodities, or any interest therein, it is possible that the Company may be treated as a “foreign investment company” as defined in Section 1246 of the Code, causing all or part of any gain realized by a U.S. Holder selling or exchanging common shares to be treated as ordinary income rather than capital gain. The Company does not believe that it currently qualifies as a foreign investment company. However, there can be no assurance that the Company will not be considered a foreign investment company for the current or any future taxable year.
Passive Foreign Investment Company
The Code contains rules governing “passive foreign investment companies” (“PFIC”) which can have significant tax effects on U.S. Holders of foreign corporations. These rules do not apply to non-U.S. Holders. Section 1297 of the Code defines a PFIC as a corporation that is not formed in the United States and, for any taxable year, either (i) 75% or more of its gross income is “passive income”, which includes interest, dividends and certain rents and royalties or (ii) the average percentage, by fair market value (or, if the Company is not publicly traded and either is a controlled foreign corporation or makes an election, by adjusted tax basis), of its assets that produce or are held for the production of “passive income” is 50% or more. The Company believes that it qualified as a PFIC for the fiscal year ended April 30, 1997 and the fiscal years ended from April 30, 1998 through April 30, 2002 and April 30, 2006. There can be no assurance that the Company’s determination concerning its PFIC status will not be challenged by the IRS, or that it will be able to satisfy record keeping requirements which will be imposed on a qualified electing fund (“QEF”). Each U.S. Holder of the Company is urged to consult a tax advisor with respect to how the PFIC rules affect their tax situation.
A U.S. Holder who holds stock in a foreign corporation during any year in which such corporation qualifies as a PFIC is subject to United States federal income taxation under one of two alternative tax regimes at the election of each such U.S. Holder. The following is a discussion of such two alternative tax regimes applied to such U.S. Holders of the Company. In addition, special rules apply if a foreign corporation qualifies as both a PFIC and a “controlled foreign corporation” (as defined below) and a U.S. Holder owns, actually or constructively, 10% or more of the total combined voting power of classes of stock entitled to vote of such foreign corporation (See more detailed discussion at “Controlled Foreign Corporation” below).
A U.S. Holder who elects in a timely manner to treat the Company as a QEF (an “Electing U.S. Holder”) will be subject, under Section 1293 of the Code, to current federal income tax for any taxable year in which the Company qualifies as a PFIC on his pro rata share of the Company’s (i) “net capital gain” (the excess of net long-term capital gain over net short-term capital loss), which will be taxed as long-term capital gain to the Electing U.S. Holder and (ii) “ordinary earnings” (the excess of earnings and profits over net capital gain), which will be taxed as ordinary income to the Electing U.S. Holder, in each case, for the shareholder’s taxable year in which (or with which) the Company’s taxable year ends, regardless of whether such amounts are actually distributed.
The effective QEF election also allows the Electing U.S. Holder to (i) generally treat any gain realized on the disposition of his Company common shares (or deemed to be realized on the pledge of his shares) as capital gain; (ii) treat his share of the Company’s net capital gain, if any, as long-term capital gain instead of ordinary income; and (iii) either avoid interest charges resulting from PFIC status altogether, or make an annual election, subject to certain limitations, to defer payment of current taxes on his share of the Company’s annual realized net capital gain and ordinary earnings subject, however, to an interest charge. If the Electing U.S. Holder is not a corporation, such an interest charge would be treated as “personal interest” that is not deductible.
81
The procedure a U.S. Holder must comply with in making an effective QEF election will depend on whether the year of the election is the first year in the U.S. Holder’s holding period in which the Company is a PFIC. If the U.S. Holder makes a QEF election in such first year, i.e., a timely QEF election, then the U.S. Holder may make the QEF election by simply filing the appropriate documents at the time the U.S. Holder files his tax return for such first year. If, however, the Company qualified as a PFIC in a prior year, then in addition to filing documents, the U.S. Holder must elect to recognize under the rules of Section 1291 of the Code (discussed herein), any gain that he would otherwise recognize if the U.S. Holder sold his stock on the qualification date or if the Company is a controlled foreign corporation, the U.S. Holder’s pro rata share of the Company’s post-1986 earnings and profits as of the qualification date. The qualification date is the first day of the Company’s first tax year in which the Company qualified as a QEF with respect to such U.S. Holder. The elections to recognize such gain or earnings and profits can only be made if such U.S. Holder’s holding period for the common shares of the Company includes the qualification date. By electing to recognize such gain or earnings and profits, the U.S. Holder will be deemed to have made a timely QEF election. A U.S. Holder who made elections to recognize gain or earnings and profits after May 1, 1992 and before January 27, 1997 may, under certain circumstances, elect to change such U.S. Holder’s qualification date to the first day of the first QEF year. U.S. Holders are urged to consult a tax advisor regarding the availability of and procedure for electing to recognize gain or earnings and profits under the foregoing rules. In addition, special rules apply if a foreign corporation qualifies as both a PFIC and a “controlled foreign corporation (as defined below) and a U.S. Holder owns, actually or constructively, 10% or more of the total combined voting power of classes of stock entitled to vote of such foreign corporation. (See more detailed discussion at “Controlled Foreign Corporation” below).
If the Company is a PFIC for any taxable year during which a Non-Electing U.S. Holder holds Company common shares, then the Company will continue to be treated as a PFIC with respect to such Company common shares, even if it is no longer definitionally a PFIC. A Non-Electing U.S. Holder may terminate this deemed PFIC status by electing to recognize gain (which will be taxed under the rules discussed above for Non-Electing U.S. Holders) as if such Company common shares had been sold on the last day of the last taxable year for which it was a PFIC.
Effective for tax years of U.S. Holders beginning after December 31, 1997, U.S. Holders who hold (actually or constructively) marketable stock of a foreign corporation that qualifies as a PFIC, may annually elect to mark such stock to the market (a “mark-to-market election”). If such an election is made, such U.S. Holder will not be subject to the special taxation rules of Section 1291 discussed above. However, if the mark-to-market election is made by a Non-Electing U.S. Holder after the beginning of the holding period for the PFIC stock, then the Section 1291 rules will apply to certain dispositions of, distributions on and other amounts taxable with respect to the Company’s common shares. A U.S. Holder who makes the mark-to-market election will include in income for the taxable year for which the election was made an amount equal to the excess, if any, of the fair market value of the common shares of the Company as of the close of such tax year over such U.S. Holder’s adjusted basis in such common shares. In addition, the U.S. Holder is allowed a deduction for the lesser of (i) the excess, if any, of such U.S. Holder’s adjusted tax basis in common shares over the fair market value of such shares as of the close of the tax year, or (ii) the excess, if any, of (A) the mark-to-market gains for the common shares in the Company included by such U.S. Holder for prior tax years, including any amount which would have been included for any prior tax year but for the Section 1291 interest on tax deferral rules discussed above with respect to Non-Electing U.S. Holders, over (B) the mark-to-market losses for shares that were allowed as deductions for prior tax years. A U.S. Holder’s adjusted tax basis in the common shares of the Company will be adjusted to reflect the amount included in or deducted from income as a result of a mark-to-market election. A mark-to-market election applies to the taxable year in which the election is made and to each subsequent taxable year, unless the Company’s common shares cease to be marketable, as specifically defined, or the Secretary of the IRS consents to revocation of the election. Because the IRS has not established procedures for making a mark-to-market election, U.S. Holders should consult their tax advisor regarding the manner of making such an election.
82
Under Section 1291(f) of the Code, the IRS has issued Proposed Treasury Regulations that, subject to certain exceptions, would treat as taxable certain transfers of PFIC stock by Non-Electing U.S. Holders that are generally not otherwise taxed, such as gifts, exchanges pursuant to corporate reorganizations, and transfers at death. Generally, in such cases the basis of the Company common shares in the hands of the transferee and the basis of any property received in exchange for those common shares would be increased by the amount of gain recognized. Under the Proposed Treasury Regulations, an Electing U.S. Holder would not be taxed on certain transfers of PFIC stock, such as gifts, exchanges pursuant to corporate reorganizations, and transfers at death. The transferee’s basis in this case will depend on the manner of transfer. In a transfer at death, for example, the transferee’s basis is equal to (i) the fair market value of the Electing U.S. Holder’s common shares reduced by the U.S. Holder’s adjusted basis in these common shares at death. The specific tax effect to the U.S. Holder and the transferee may vary based on the manner in which the common shares are transferred. Each U.S. Holder of the Company is urged to consult a tax advisor with respect to how the PFIC rules affect their tax situation.
Certain special, generally adverse, rules will apply with respect to the Company common shares while the Company is a PFIC whether or not it is treated as a QEF. For example, under Section 1298(b)(6) of the Code, a U.S. Holder who uses PFIC stock as security for a loan (including a margin loan) will, except as may be provided in regulations, be treated as having made a taxable disposition of such shares.
If the Company is classified as a PFIC, U.S. Holders who do not make timely QEF Elections (as discussed above) will be subject to a number of special tax rules. For example, gains recognized on disposition of the Company stock or the receipt of an “excess distribution” from the Company is (i) treated as if it were ordinary income earned ratably on each day of the period the U.S. Holder owns shares of the Company at the highest marginal rate in effect during the period in which it was deemed included and (ii) subject to an interest charge as if the resulting tax had actually been due in such earlier year or years (An excess distribution is the amount of any distribution received by the U.S. Holder during the taxable year that exceeds 125% of the immediately preceding three year average of distributions received from the Company, subject to certain adjustments.) Proposed Regulations broadly define a disposition to include any transaction or event that constitutes an actual or deemed transfer of property for any purpose under the Code, including (but not limited to) a sale, exchange, gift, transfer at death, and the pledging of PFIC stock to secure a loan. If the tax described above is not imposed on transfer at death, the recipient of the PFIC stock receives a basis in the transferred stock equal to the lessor of the fair market value or the adjusted basis of the stock in the hands of the U.S. Holder immediately before death. Finally, the foregoing rules will continue to apply with respect to a U.S. Holder who held the stock of the Company while the Company met the definition of a PFIC even if the Company ceases to meet the definition of a PFIC.
Controlled Foreign Corporation
If more than 50% of the total combined voting power of all classes of shares entitled to vote or the total value of the shares of the Company is owned, actually or constructively, by citizens or residents of the United States, United States domestic partnerships and corporations or estates or trusts other than foreign estates or trusts (as defined by the Code Section 7701 (a)(31), each of which own, actually or constructively, 10% or more of the total combined voting power of all classes of shares of the Company (“United States Shareholder”), the Company could be treated as a controlled foreign corporation (“CFC”) under Subpart F of the Code. This classification would effect many complex results, one of which is the inclusion of certain income of a CFC which is subject to current U.S. tax. The United States generally taxes United States Shareholders of a CFC currently on their pro rata shares of the Subpart F income of the CFC. Such United States Shareholders are generally treated as having received a current distribution out of the CFC’s Subpart F income and are also subject to current U.S. tax on their pro rata shares of the CFC’s earnings invested in U.S. property. The foreign tax credit described above may reduce the U.S. tax on these amounts. In addition, under Section 1248 of the Code, gain from the sale or exchange of shares by a U.S. Holder of common shares of the Company which is or was a United States Shareholder at any time during the five-year period ending with the sale or exchange is treated as ordinary income to the extent of earnings and profits of the Company attributable to shares sold or exchanged. If a foreign corporation is both a PFIC and a CFC, the foreign corporation generally will not be treated as a PFIC with respect to United States shareholders of the CFC. This rule generally will be effective for taxable years of United States Shareholders beginning after 1997 and for taxable years of foreign corporations ending with or within such taxable years of United States Shareholders. Special rules apply to United States Shareholders who are subject to the special taxation rules under Section 1291 discussed above with respect to a PFIC. Because of the complexity of Subpart F, a more detailed review of these rules is outside the scope of this discussion. The Company does not believe that it currently qualifies as a CFC. However, there can be no assurance that the Company will not be considered a CFC for the current or any future taxable year.
83
Material Canadian Federal Income Tax Consequences
The summary below is restricted to the case of a holder (a “Holder”) of one or more common shares who for the purposes of the Income Tax Act (Canada) (the “Act”) is a non-resident of Canada, holds his common shares as capital property and deals at arm’s length with the Company.
The following is a general discussion of certain possible Canadian federal income tax consequences, under current law, generally applicable to a non-resident of Canada (as hereinafter defined) of common shares of the Company. This discussion does not address all potentially relevant federal income tax matters and it does not address consequences peculiar to persons subject to special provisions of federal income tax law, such as those described above as excluded from the definition of a U.S. Holder. In addition, this discussion does not cover any provincial, local or foreign tax consequences.
Dividends
A Holder will be subject to Canadian withholding tax (“Part XIII Tax”) equal to 25%, or such lower rate as may be available under an applicable tax treaty, of the gross amount of any dividend paid or deemed to be paid on his common shares. Under the 1995 Protocol amending the Canada-US Income Tax Convention (1980) (the “Treaty”) the rate of Part XIII Tax applicable to a dividend on common shares paid to a Holder who is a resident of the United States is, if the Holder is a company that beneficially owns at least 10% of the voting stock of the Company, 5% and in any other case, 15% of the gross amount of the dividend. The Company will be required to withhold the applicable amount of Part XIII Tax from each dividend so paid and remit the withheld amount directly to the Receiver General for Canada for the account of the Holder.
Capital Gains
A Holder who disposes of a common share, including by deemed disposition on death, will not be subject to Canadian tax on any capital gain (or capital loss) thereby realized unless the common share constituted “taxable Canadian property” as defined by the Act. Generally, a common share will not constitute taxable Canadian property of a Holder unless he held the common shares as capital property used by him carrying on a business (other than an insurance business) in Canada, or he or persons with whom he did not deal at arm’s-length alone or together held or held options to acquire, at any time within the five years preceding the disposition, 25% or more of the shares of any class of the capital stock of the Company.
A Holder who is resident of the United States and realizes a capital gain on disposition of a common share that was taxable Canadian property will nevertheless, by virtue of the Treaty, generally be exempt from Canadian tax thereon unless (a) more than 50% of the value of the common share is derived from, or forms an interest in, Canadian real estate, including Canadian mineral resource properties, (b) the common share formed part of the business property of a permanent establishment that the Holder has or had in Canada within the 12 months preceding disposition, or ( c) the Holder (i) was a resident of Canada at any time within the ten years immediately the disposition and for a total of 120 months during the 20 years, preceding the disposition, and (ii) owned the common share when he ceased to be a resident of Canada.
A Holder who is subject to Canadian tax in respect of a capital gain on disposition of a common share must include one-half of the capital gain (taxable capital gain) in computing his taxable income earned in Canada. This Holder may, subject to certain limitations, deduct one half of any capital loss (allowable capital loss) arising on disposition of taxable Canadian property from taxable capital gains realized in the year of disposition in respect of taxable Canadian property and, to the extent not so deductible, from such taxable capital gains of any of the three preceding years or any subsequent year.
84
F. Dividends and Paying Agents
This Form 20F is being filed as an annual report under the Exchange Act and as such, there is no requirement to provide any information under this section.
G. Statements by Experts
This Form 20F is being filed as an annual report under the Exchange Act and, as such, there is no requirement to provide any information under this section.
H. Documents on Display
Any documents referred to in this annual report may be inspected at the head office of the Company, 2303 West 41st Avenue, Vancouver, British Columbia V6M 2A3, during normal business hours.
The Company’s filings with the United States Securities and Exchange Commission (“SEC”), including exhibits filed with this Form 20-F, may be reviewed and copied at prescribed rates at the SEC’s public reference room located at 100 F Street N.E., Washington, D.C. 20549, or accessed through the SEC’s website at www.sec.gov/edgar.shtml. Further information on the public reference rooms may be obtained by calling the SEC at 1-800-SEC-0330.
The Company also files reports, statements and other information with the Canadian securities administrators and these can be accessed electronically at the System for Electronic Document Analysis and Retrieval’s website at www.sedar.com.
I. Subsidiary Information
There is no information relating to the Company’s subsidiaries, which must be provided in Canada, and which is not otherwise called for by the body of generally accepted accounting principles used in preparing the audited consolidated financial statements.
ITEM 11. QUANTITATIVE AND QUALITATIVE DISCLOSURE ABOUT MARKET RISK
The Company anticipates its primary market risk, if any, to be related to fluctuations in exchange rates. Exchange rate risk may arise if the Company is required to use different currencies for various aspects of its operations. At present, the functional currency for the Company is the Canadian dollar. Based on the Company’s overall exchange rate risk as at April 30, 2010, the Company believes that a ten percent change in exchange rates would not have a material adverse effect on its financial position, results of operations, or changes in financial position. The Company intends to monitor its exchange rate risk and take reasonable steps to reduce its exposure. The Company does not intend to purchase or sell derivative instruments for speculative purposes.
PART II
ITEM 12. DESCRIPTION OF SECURITIES OTHER THAN EQUITY SECURITIES
This Form 20F is being filed as an annual report under the Exchange Act and as such there is no requirement to provide information under this item.
ITEM 13. DEFAULTS, DIVIDEND ARREARAGES AND DELINQUENCIES
There has not been a material default in the payment of principal, interest, a sinking or purchase fund installment, or any other material default not cured within thirty days, relating to indebtedness of the Company of any of its significant subsidiaries. There are no payments of dividends by the Company in arrears, nor has there been any other material delinquency relating to any class of preference shares of the Company.
ITEM 14. MATERIAL MODIFICATIONS TO THE RIGHTS OF SECURITY HOLDERS AND USE OF PROCEEDS
Not Applicable
85
ITEM 15. CONTROLS AND PROCEDURES
Disclosure Controls and Procedures
At the end of the period covered by this report, an evaluation of the effectiveness of the design and operations of the Company’s “disclosure controls and procedures” (as defined in Rules 13a-15(e) and 15d-15(e) of the Exchange Act) was carried out by the Company’s principal executive officer and principal financial officer.
Based upon that evaluation, the Company’s principal executive officer and principal financial officer have concluded as of the end of the period covered by this report the Company’s disclosure controls and procedures were designed and are effective in providing reasonable assurance that:
- information required to be disclosed by the Company in reports that it files or submits under the Exchange Act is recorded, processed, summarized and reported within the time periods specified in Commission rules and forms, and
- material information required to be disclosed in our reports is accumulated and communicated to management, including the Company’s principal executive officer and principal financial officer, to allow timely decisions regarding required disclosures.
Management Report on Internal Control over Financial Reporting
Management is responsible for establishing and maintaining adequate internal control over financial reporting as defined in Rules 13a-15(e) under the Exchange Act. Our internal control over financial reporting is intended to provide reasonable assurance regarding the reliability of financial reporting and the preparation of financial statements for external purposes in accordance with U.S. GAAP. Our internal control over financial reporting includes those policies and procedures that:
- pertain to the maintenance of records that, in reasonable detail, accurately and fairly reflect the transactions and dispositions of our assets;
- provide reasonable assurance that transactions are recorded as necessary to permit preparation of financial statements in accordance with applicable GAAP, and that receipts and expenditures are being made only in accordance with authorizations of management and the Board of Directors; and
- provide reasonable assurance regarding prevention or timely detection of unauthorized acquisition, use or disposition of our assets that could have a material effect on the financial statements.
Under the supervision and with the participation of our management, including our Chief Executive Officer and our Chief Financial Officer, we have evaluated the effectiveness of internal control over financial reporting based on the framework and criteria established in Internal Control – Integrated Framework, issued by the Committee of Sponsoring Organizations of the Treadway Commission. The Company’s internal control over financial reporting was to provide reasonable assurance regarding the reliability of financial reporting and the preparation of financial statements in accordance with U.S. GAAP.
Based on this evaluation, management has concluded that as of April 30, 2011, the internal controls over financial reporting was effective.
All internal control systems, no matter how well designed, have inherent limitations. Therefore, even those systems determined to be effective can provide only reasonable assurance with respect to financial statement preparation and presentation.
The Company will continue to periodically review its disclosure controls and procedures and internal control over financial reporting and may make modifications from time to time as considered necessary or desirable
86
Changes in internal control over financial reporting
During the Company’s most recently completed financial year ended April 30, 2011, there were no changes in the Company’s internal control over financial reporting that have materially affected, or are reasonably likely to materially affect, our internal control over financial reporting.
Attestation report of the registered public accounting firm
This annual report does not include an attestation report of the Company’s registered public accounting firm regarding internal control over financial reporting. Management’s report was not subject to attestation by the Company’s registered public accounting firm pursuant to temporary rules of the Securities and Exchange Commission that permit the Company to provide only management’s report in this annual report.
ITEM 16. [Reserved]
ITEM 16A. AUDIT COMMITTEE FINANCIAL EXPERT
The Board of Directors has determined that Jordan Point, Chairman of the Audit Committee, meets the definition of an “audit committee financial expert” as defined in Item 16.A of Form 20F, is financially literate in accordance with Canadian national securities legislation, is independent in accordance with the standards of Director Independence set out under NI 52-110, and has an understanding of internal controls and procedures for financial reporting.
ITEM 16B: CODE OF ETHICS
The Company has adopted a Code of Business Conduct and Ethics that applies to the Company’s principal executive officer and principal financial officer, directors and employees. A copy of the Company’s Code of Business Conduct and Ethics, as amended June 28, 2010, is incorporated herein by reference and is posted on the Company’s website (www.pfncapitalcom) and under the Company’s profile on SEDAR at www.sedar.com and will be provided to any person without charge, upon request by mail but may also be made by telephone, facsimile or other electronic means of communication.
ITEM 16C. PRINCIPAL ACCOUNTANT FEES AND SERVICES
The following table discloses the aggregate fees billed for each of the last two (2) financial years for professional services rendered by the Company’s audit firm for various services. “Audit fees” are fees billed by the Company’s external auditors for services provided in auditing the Company’s annual consolidated financial statements for the subject year. “Audit-related fees” are fees not included in audit fees that are billed by the auditors for assurance and related services that are reasonably related to the performance of the audit or review of the Company’s consolidated financial statements. “Tax fees” are fees billed by the auditors for professional services rendered for tax compliance, tax advice and tax planning. “All other fees” are fees billed by the auditors for products and services not included in the foregoing categories.
The fees paid by the Company to its auditors for each of the last two fiscal years, by category, are as follows:
| Financial Year Ending | Audit Fees | Audit Related Fees | Tax Fees | All Other Fees |
| April 30, 2011 | $33,000 | $Nil | $4,000 | $Nil |
| April 30, 2010 | $33,000 | $Nil | $4,236 | $Nil |
From time to time, management of the Company recommends to and requests approval from the Audit Committee for non-audit services to be provided by the Company’s auditors. The Audit Committee routinely considers such requests at committee meetings, and if acceptable to a majority of the Audit Committee members, pre-approves such non-audit services by a resolution authorizing management to engage the Company’s auditors for such non-audit services, with set maximum dollar amount for each itemized service. During such deliberations, the Audit Committee assesses, among other factors, whether the services requested would be considered “prohibited services” as contemplated by the US Securities and Exchange Commission, and whether the services requested and the fees related to such services could impair the independence of the auditors.
87
ITEM 16D. EXEMPTIONS FROM THE LISTING STANDARDS FOR AUDIT COMMITTEES
Not Applicable
ITEM 16E. PURCHASE OF EQUITY SECURITIES BY THE ISSUER AND AFFILIATED PURCHASERS
None
88
PART III
ITEM 17. FINANCIAL STATEMENTS
Financial Statements Filed as Part of this Annual Report:
- Report of Independent Auditor dated July 14, 2011
- Consolidated Balance Sheets for the fiscal years ended April 30, 2011 and 2010.
- Consolidated Statements of Changes in Shareholders’ Equity for the fiscal years ended April 30, 2011, 2010 and 2009.
- Consolidated Statements of Loss and Comprehensive Loss for the fiscal years ended April 30, 2011, 2010 and 2009.
- Consolidated Statements of Cash Flows for the fiscal years ended April 30, 2011, 2010 and 2009.
- Consolidated Schedule of Mineral Property Costs for the fiscal years ended April 30, 2011 and 2010.
- Notes to consolidated financial statements for the fiscal years ended April 30, 2011 and 2010.

FORM 51-102F1
ANNUAL MANAGEMENT DISCUSSION AND ANALYSIS
FOR
PACIFIC NORTH WEST CAPITAL CORP.
FOR THE FISCAL YEAR ENDED 30 APRIL 2011
1
MANAGEMENT DISCUSSION AND ANALYSIS
The following discussion and analysis is Management’s assessment of the results and financial condition of Pacific North West Capital Corp. (the “Company” or “PFN”) for year ended 30 April 2011 and should be read in conjunction with the corresponding consolidated financial statements and the related notes. The date of this Management Discussion and Analysis is 18 July 2011. Additional information on the Company is available on SEDAR at www.sedar.com.
BUSINESS OF PACIFIC NORTH WEST CAPITAL CORP.
PFN is a mineral exploration company focused on the acquisition, exploration and development of platinum group metals (PGMs), precious and base metals properties. Management's corporate philosophy is to be a project generator, explorer and project operator with the objective of forming options and/or joint ventures with major mining companies through to production. PFN has begun the evaluation of several potential property acquisitions, including precious and base metal production opportunities. A wholly-owned US and Mexican subsidiary, Pacific North West Capital Corp. USA and Pacific North West Capital de México, S.A. de C.V., respectively, are being maintained for future acquisition.
FORWARD LOOKING STATEMENTS
Certain information included in this discussion may constitute forward-looking statements. Forward-looking statements are based on current expectations and entail various risks and uncertainties. These risks and uncertainties could cause or contribute to actual results that are materially different than those expressed or implied. The Company disclaims any obligation or intention to update or revise any forward-looking statement, whether as a result of new information, future events, or otherwise.
Project Overview:
ROCK & ROLL PROPERTY, BRITISH COLUMBIA
On 28 July 2009, the Company obtained an option from Misty Creek Ventures Ltd. (Misty Creek Ventures Ltd. was dissolved in January 2010 and its interest was transferred to Equity Exploration Consultants Ltd.), First Fiscal Enterprises Ltd. and Pamicon Developments Ltd. (collectively the “Vendors”) on the Rock & Roll property (the “Property”), located in the Liard Mining District approximately 9 km west of the Bronson airstrip and 37 kilometres (“km") from the Eskay Creek Mine Road in northern British Columbia. Under the terms of the Agreement, PFN can earn a 100% interest in the Property over a four year period by completing $2,000,000 in exploration expenditures, paying the Vendors $130,000 and providing the Vendors with a total of 600,000 PFN shares. The Vendors will retain a 2% net smelter return royalty (“NSR”), of which 1% can be purchased for $3,000,000. The Property is also subject to an underlying NSR of 2%, and an underlying NPI of 15%, both of which are payable to Prime Equities International Corporation, and both of which are purchasable in their entirety for $1,500,000 each.
The Rock & Roll Property hosts precious metals rich in volcanogenic massive sulphide (VMS) mineralization in a volcano-sedimentary host rock package of Triassic age. As such, the mineralization shows similarities to the gold and silver rich mineralization of Barrick Gold’s past-producing Eskay Creek mine. Known mineralization on the Rock & Roll Property occurs in multiple stacked sulphide lenses in two zones, the Black Dog and SRV zones, over a strike length of approximately 950 m. A total of approximately 14,000 m of core drilling in 110 drill holes was completed on the property from 1991 to 1997. Only six drill holes tested the host stratigraphy outside of the known mineralization, but at least 5km of strike length of the prospective lithologies is present on the property. There is the potential for additional mineralization along strike and at depth, as historic drilling tested the known mineralization down to depths of only about 160 m.
The 2009 exploration program included a 350 line km, AeroTem3, helicopter-borne magnetic/electromagnetic survey conducted by Aeroquest Limited and a drilling program consisting of a total of 540 m of core drilling completed in five holes. The first four holes were designed to test gaps in the historic drilling on the Black Dog Zone in order to establish the degree of continuity of the mineralization and to confirm the historic geological model. Each of the infill drill holes encountered the target mineralization, confirming the continuity of the sulphide lenses and the validity of previous geological interpretations. The table below illustrates selected assay results from this drill program. (gold (“Au”) and silver (“ Ag”) in grams per tonne (“g/t”). Copper (“Cu”), lead (“Pb”) and zinc (“Zn”) in percent (%).
2
Hole
Number | From
(m) | To
(m) | Interval
(m) | Au
g/t | Ag
g/t | Cu
% | Pb
% | Zn
% |
| RR09-105 | 76.03 | 77.9 | 1.87 | 0.78 | 84.6 | 0.24 | 0.21 | 0.89 |
| including | 76.77 | 77.9 | 1.13 | 1.14 | 120.4 | 0.32 | 0.30 | 1.23 |
| RR09-106 | 62.26 | 64.3 | 2.04 | 0.40 | 72.2 | 0.27 | 0.24 | 1.63 |
| including | 62.26 | 63.01 | 0.75 | 0.90 | 177.7 | 0.60 | 0.63 | 4.23 |
| RR09-107 | 39.32 | 58.73 | 19.41 | 0.53 | 57.9 | 0.19 | 0.24 | 0.91 |
| including | 39.32 | 42.46 | 3.14 | 1.31 | 296.2 | 0.46 | 1.25 | 3.99 |
| RR09-108 | 46.88 | 85.59 | 38.71 | 0.28 | 18.3 | 0.13 | 0.05 | 0.72 |
| including | 62.74 | 75.71 | 12.97 | 0.40 | 28.0 | 0.21 | 0.06 | 1.07 |
| RR09-109 | No Significant Assays |
| | *Interval represents apparent thickness not true thickness |
The final drill hole of this program tested a strong electromagnetic anomaly that was thought to represent the westward continuation of the Black Dog Zone. Drilling at this location failed to return any significant assays.
Further investigations are required to test for a westward extension of the main zones of mineralization.
The 2009 work program on the property was also designed to provide an initial evaluation of the validity of historic assay data. A total of twenty-one samples from five different historic drill holes were obtained for comparison with the original assays. In most cases the samples were taken from the same core interval as the original samples.
Overall historic assay results have been confirmed, and the Company can now embark on a systematic re-sampling of historic core to provide a statistical comparison of the historic assay data with modern data. Commencement of the 2010 Rock and Roll exploration program was announced on September 27th 2010. This program primarily focused on continuation of re-sampling previous drill core, coupled by geological mapping/prospecting that investigated airborne geophysical survey conductors and geological and geochemical targets. The fieldwork was supported by further compilation of data from the 1990-97 programs and the incorporation of new geological interpretations formulating in conjunction with members of the British Columbia Geological Survey.
The Rock & Roll Report, commissioned by Alto and PFN, and filed on 1 June 2011 on the Company’s Form 6-K, included a new NI 43-101 compliant mineral resource estimate for the Black Dog Deposit. The resource estimate incorporated the mineralized zones of the historic drill core and the 540 m (1772 ft) of the five diamond drill holes that were completed by PFN in 2009/2010. Through this work, PFN significantly increased the resources contained within the Black dog deposit over the previous resource estimate, completed prior to the implementation of the NI 43-101 standards of disclosure.
The NI43-101 compliant mineral resource estimate in the “indicated” category consists of 2,155,679 tonnes grading 0.68 g/t Au (47,040 contained oz of Au), and 82.7 g/t Ag (5,734,445 contained oz of Ag) at a gold-equivalent cut-off grade of 0.5 g/t. The deposit also contains 0.22% Cu (10,500,833 lbs Cu), 0.22% Pb (10,399,960 lbs Pb), and 0.94% Zn (44,522,995 lbs Zn) or 3.11 g/t gold equivalent (“AuEq”) for an additional 215,239 oz of Au Eq at the 0.5 g/t AuEq cut-off. The AuEq grade is based on $1000/oz Au, $15.80/oz Ag, $2.92/lb Cu, $0.86/lb Pb and $0.86/lb Zn. Tables bellow give the mineral resource estimate for the Black Dog deposit at varying cut-off grades.
3
The Black Dog massive sulphide deposit is part of a larger area that includes the SRV Zone hosting precious metal-rich volcanogenic massive sulphide (VMS) mineralization. These occurrences display similarities to other precious metal-rich deposits such as Eskay Creek (50 km to the east-southeast), Greens Creek, and other deposits of the Canadian Cordillera. The mineralization on the Rock &Roll property is hosted by graphitic argillite to siltstone. The Black Dog and SRV zones are dominated by massive pyrrhotite with blebs and lenses of chalcopyrite and sphalerite. Massive pyrite-sphalerite forms finely laminated lenses locally, with minor pyrrhotite, galena and chalcopyrite.
Indicated Mineral Resources, consistent with CIM definitions required by NI43-101, are reported at various cut-off grades in Table 1 (for Au and Ag) and Table 2 (for Cu, Pb, Zn and gold equivalent values). Inverse distances squared interpolation restricted to mineralized domains were used to estimate gold (grams/tonne Au), silver (grams/tonne Ag), copper (% Cu), lead (% Pb), and zinc (% Zn) grades into the block models. Gold, silver, copper, lead and zinc content were combined into a gold equivalent value (using to the prices given above) for resource reporting.
A $1.8 million Phase I Program is recommended in the report for further exploration at the Black Dog zone which includes initial metallurgical testing, baseline environmental work and a major diamond drilling program. The relatively shallow dips of the stratigraphy and conductive cover material have hampered exploration efforts in the past. Diamond drilling is recommended to test the conductive horizons for new mineral occurrences and also to extend the known mineralization at the Black Dog and SRV zones that are open along strike and down dip.
Gold and Silver Indicated Mineral Resource Estimate at various gold-equivalent cut-off grades. Metallurgical recoveries and net smelter returns are assumed to be 100%
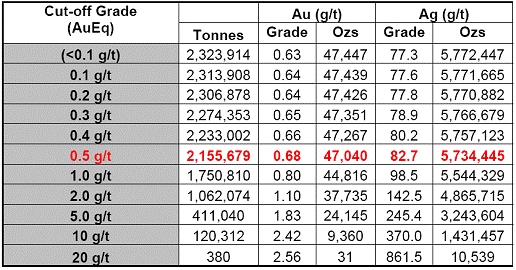
4
Copper, Lead, Zinc and gold equivalent Indicated Mineral Resource Estimate at various gold-equivalent cut-off grades

RIVER VALLEY, ONTARIO
The River Valley mineral claims are located in the Sudbury Region of Ontario. PFN optioned the River Valley claims following the discovery of highly anomalous PGM values in grab samples in the Dana Lake and Azen Creek areas. By an agreement dated 15 January 1999 and amended 11 March 1999 (collectively, the “Agreement”), the Company acquired a 100% interest in the River Valley claims from Bailey Resources Ltd., Luhta Resources Ltd. and Pardo Resources Ltd. by issuing 600,000 common shares of PFN and $265,000 cash (paid). The River Valley claims are subject to a total 3% NSR, of which PFN can purchase up to 2% of the NSR from the vendors for $2,000,000.
On 14 July 1999, PFN entered into an unincorporated 50/50 joint venture agreement (“JV”) over the River Valley property with Kaymin whereby Kaymin was responsible for funding all exploration to completion of a feasibility study, which would give Kaymin an additional 10% interest. In addition, if Kaymin arranged financing for a mine, it would receive another 5% interest, for a total interest of 65%.
Kaymin continued to fund exploration under the terms of JV until 2007and invested over $22M in the exploration of the property; however, as a result of capital expenditure reductions during the global financial crisis in 2008, no new funds were allocated to the River Valley Project above and beyond the minimal holding costs.
An additional $150,000 budget was allocated to fund a detailed geochemical study of the River Valley mineralization was conducted by Dr. Reid Keays of Monash University, Melbourne, Australia. Dr. Keays is an expert in the geochemistry of Ni and PGM deposits. Re-sampling of selected River Valley drill holes was completed in January, 2009, and of the 336 samples were submitted to the Ontario Geoscience Laboratories for analytical work, 154 results have been received to date. In order to improve economy modelling of the deposit the study examined the full suite (Pt, Pd, Rh, osmium, iridium, and ruthenium) PGM content of the ore, and determined the relationship of rhodium (“Rh”), iridium and ruthenium concentration from Pt and Pd. The results of the study are expected in late 2011.
Included in the River Valley PGM Project are the following:
| | i) | River Valley Property, Ontario |
| | By agreement dated 15 January 1999 and amended 11 March 1999, the Company acquired a 100% interest in 226 claim units, known as the River Valley Property, located in the Dana and Pardo Townships, Sudbury Mining District, Ontario. As consideration, the Company paid $265,000 and issued 600,000 common shares to the optionors. In addition, minimum annual exploration expenditures of $100,000 were completed. The property is subject to a 3% NSR. The Company, at its option, can purchase up to 2% of the NSR from the vendors for $2,000,000. |
5
| | ii) | Goldwright Property, Ontario |
| | By agreement dated 30 June 1998 and subsequently amended, the Company earned a 25% interest in certain mineral claims known as the Janes property, located in the Janes Township, Sudbury Mining District, Ontario. Certain claims are subject to a 2% NSR. |
| | iii) | Razor Property, Ontario |
| | The Company acquired a 100% interest in certain mineral claims located in the Dana Township, Sudbury Mining District, Ontario for consideration of $30,000. The property is subject to a 2% NSR. |
| | iv) | Western Front Property, Ontario |
| | By agreement dated 16 November 2001, the Company earned a 70% interest in certain mineral claims known as the Western Front property from a company (the “optionor”) with certain directors in common, for consideration of $55,000 and issuance of 20,000 shares. In addition, an exploration expenditure of $50,000 was completed. |
| | The Company has the right to purchase an additional 30% interest in the property by paying $750,000 to the optionor. |
| | The property is subject to a 3% NSR, the first 1% of which the Company can purchase for $1,000,000; the second 1% can be purchased for $2,000,000. The Company and the optionor will share the NSR buyout privileges in proportion to their respective interests. |
By way of a Mineral Interest Assignment Agreement dated for reference 13 December 2010, as amended on 6 April 2011 (“Assignment Agreement”), PFN completed the purchase from Kaymin of Kaymin’s 50% interest in the River Valley claims, providing PFN with an undivided 100% interest in the River Valley PGM Project. Under the terms of the Assignment Agreement, Kaymin exchanged its 50% interest in the JV, for a 12% interest in PFN, based on the issued and outstanding common shares of PFN as of 30 November 2010 (67,643,008 common shares). The aggregate purchase price for the 50% interest in the River Valley PGM project was:
| | a. | 8,117,161 fully paid and non-assessable common shares of PFN (issued); and |
| | | |
| | b. | three-year warrants exercisable to purchase 3,000,000 common shares of PFN at a price of $0.30 per common share (issued). |
Post JV Partnership (2011 Exploration Programs)
In April 2011 PFN commenced a $1,000,000 exploration program on its 100%- owned River Valley project. Phase IA, consisting of 3,724 m (15 holes) of drilling was completed on the Dana Lake area in late May 2011. The exploration program is utilizing one drill rig, which is systematically drilling off sections spaced at approximately 25m intervals through the +900m long, north-south trending Dana Lake deposit. Phase IA drilling confirmed the presence of significant PGM, associated with disseminated sulphide mineralization at the Dana North Area.
The target at Section 10350 was tested with one fence of four holes. Holes DN003-2011 and DN004-2011 of this fence showed extensive mineralization assaying 1.8 gt over 65 m (0.05 opt over 213.3 feet) and 2.8 gt 3E over 34 m (0.08 opt over 111.5 feet), respectively. The table below illustrates significant drill intervals in the first four holes.
All samples were assayed by SGS Laboratories. Assay results from mineralized core intersections are reported below.
Phase IA included the collection of approximately 60 line-km of 3D Induced Polarization ground geophysical data. These surveys have being conducted to generate additional drill targets and to enhance the targeting along a portion of the 9 km prospective horizon located at the contact of the River Valley Intrusion. PFN plans to expand the geophysical survey coverage and complete these surveys in four different phases to cover the prospective zones over the entire 9 Km strike length.
6
| Hole No. | From
(m) | To
(m) | Length of the Intersect
(m) | Length of the Intersect
(feet) | Pt
(gt) | Pt
(opt) | Pd
(gt) | Pd
(opt) | Au (gt) | 3E
(gt) | 3E
(opt) | Ni
(%) | Cu
(%) | Rh |
| DN001-2011 | 123 | 173 | 50 | 164.0 | 0.26 | 0.008 | 0.77 | 0.022 | 0.05 | 1.1 | 0.03 | 0.02 | 0.09 | Results Pending |
| Including | 123 | 134 | 11 | 36.1 | 0.37 | 0.011 | 1.11 | 0.033 | 0.07 | 1.55 | 0.05 | 0.02 | 0.09 |
| Including | 141 | 153 | 12 | 39.4 | 0.31 | 0.009 | 0.90 | 0.026 | 0.05 | 1.26 | 0.04 | 0.02 | 0.11 |
| Including | 159 | 173 | 13 | 42.7 | 0.28 | 0.008 | 0.83 | 0.024 | 0.06 | 1.18 | 0.03 | 0.03 | 0.12 |
| DN002-2011 | 114 | 179 | 65 | 213.3 | 0.32 | 0.009 | 0.95 | 0.028 | 0.06 | 1.3 | 0.04 | 0.02 | 0.10 |
| Including | 146 | 158 | 12 | 39.4 | 0.43 | 0.013 | 1.30 | 0.038 | 0.08 | 1.82 | 0.05 | 0.03 | 0.14 |
| Including | 173 | 179 | 6 | 19.7 | 0.74 | 0.022 | 2.34 | 0.068 | 0.12 | 3.20 | 0.09 | 0.02 | 0.12 |
| DN003-2011 | 50 | 115 | 65 | 213.3 | 0.42 | 0.010 | 1.29 | 0.038 | 0.08 | 1.8 | 0.05 | 0.03 | 0.13 |
| Including | 50 | 59 | 9 | 29.5 | 0.98 | 0.029 | 3.09 | 0.090 | 0.18 | 4.25 | 0.12 | 0.03 | 0.22 |
| Including | 72 | 84 | 12 | 39.4 | 0.59 | 0.017 | 1.76 | 0.052 | 0.11 | 2.47 | 0.07 | 0.04 | 0.16 |
| DN004-2011 | 29 | 63 | 34 | 111.5 | 0.66 | 0.020 | 2.00 | 0.060 | 0.12 | 2.8 | 0.08 | 0.03 | 0.16 |
| Including | 29 | 40 | 11 | 36.1 | 1.12 | 0.033 | 3.40 | 0.099 | 0.18 | 4.71 | 0.14 | 0.04 | 0.24 |
| Including | 43 | 47 | 4 | 13.1 | 0.69 | 0.020 | 2.06 | 0.060 | 0.11 | 2.86 | 0.08 | 0.03 | 0.16 |
PFN plans to commence Phase IB Exploration during the summer 2011. The Phase IB exploration program will include:
- More than 80 line Km of 3D IP
- Approximately 3500 m drilling
- Initialization of environmental baseline studies
Drilling program will focus on three main objectives:
| | 1) | Testing deeper targets that were generated to follow the footwall mineralization down dip |
| | 2) | Testing near surface mineralized zones not yet fully evaluated |
| | 3) | Testing new drilling targets found outside of the contact by the geophysics survey (3D IP) |
The Phase IB drilling campaign will continue to build on the results from Phase IA and will include the addition of newly available airborne geophysical survey technology. The mineralized footprint at River Valley remains unconstrained in all directions; therefore, the program will also include on-going condemnation drilling to test the limits of the known mineralization.
SARGESSON AND KELLY/DAVIS PROPERTIES, ONTARIO
The Company acquired a 100% interest in certain mineral claims, known as the Sargesson and Kelly/Davis properties, located in the Janes, Davis and Kelly Townships, Sudbury Mining District, Ontario. As consideration, the Company paid $68,400 and incurred $30,000 in exploration expenditures.
The property is subject to a 2% NSR. The Company can purchase 1% of the NSR from the vendors for $400,000 and has the right of first refusal on the remaining 1% NSR.
7
COLDWELL, ONTARIO
In 2007, the Company acquired 91 mineral claims (20,254 ha) by staking in the Coldwell area near Marathon, Ontario. The claims cover parts of the Coldwell alkaline intrusive complex, which also hosts the Marathon PGM deposit.
Airborne geophysical and lake bottom sediment surveys were completed in 2007. The goal of these surveys was to identify targets for follow-up ground evaluation in 2008. Prospecting and a soil geochemical survey were completed in 2008. This work did not identify any significant mineralization.
The Company allowed the Coldwell claims to lapse in July and August 2010.
GOODCHILD, ONTARIO
During the year ended 30 April 2009, the Company acquired 28 mineral claims (6640 ha) by staking in the north east of the Coldwell Area near Marathon, Ontario. These claims were incorporated into the Coldwell project as described in the preceeding section.
As with the Coldwell Project; the Company allowed the Goodchild claims to lapse in February 2010.
SWAYZE JOINT VENTURE, ONTARIO (OLD: NICKEL MUIR, ONTARIO)
In 2007 the Company acquired claims by staking in Kenogaming Township (in the Swayze Greenstone Belt), Ontario. On 12 February 2008, the Company entered into a three-year joint venture agreement with Benton Resources Corp. to evaluate the claims that both parties held in the Swayze Greenstone Belt. It was proposed that the exploration budget over the three years would be $1,200,000 with the first year’s budget of $400,000. Total holdings in the Swayze area include 3 properties totaling 8,544 hectares.
Any additional claims acquired in the Swayze Greenstone Belt would be included in the joint venture. Each company would participate in working the properties as a 50:50 joint venture. Expenditures and programs on the properties to be determined by an annual joint management committee meeting.
In 2008, and airborne survey was completed over claims in Tooms Township that form part of the Swayze joint venture property. In addition, prospecting and mapping were completed on the Tooms and Heenan Township properties. In late 2008, a small (500 m) drill program was completed on the Heenan Township property. This work did not identify significant mineralization.
On 5 May 2009, the joint venture was terminated. The Company allowed the Swayze claims to lapse in January 2010 and has no further plans for this project.
RAGLAN HILLS JOINT VENTURE, ONTARIO (OLD: SOUTH RENFREW, ONTARIO)
The Company staked 6 claims (1024 ha) in Raglan Township within the Raglan meta-gabbro mafic complex in June 2006.
The property covers at least one historical nickel copper showing within a sulphide zone that is approximately 155 m long and 6 to 15 m wide. Reconnaissance prospecting, sampling and geochemical soil programs have been initiated over the property, as well as the historical showing areas.
In 2007 the Company entered into a 50/50 joint venture agreement with First Nickel to evaluate the claims as well as their adjoining claims (1728 hectares) as one property. Expenditures and programs on the project were determined by an annual joint management committee meeting.
In 2008 an airborne magnetic and electromagnetic survey was completed on the Raglan Hills property. This was followed by mapping and prospecting in the vicinity of anomalies generated by the airborne survey.
Due to the downturn in commodity prices, PFN informed First Nickel that it would not be participating in the funding of a 2009 exploration program and as a result the Company’s participating interest has been decreased. As per the joint venture agreement with First Nickel, the Company’s participating interest was converted to a 1.5% NSR over the Raglan Hills property.
8
EAST SUDBURY, ONTARIO
During the year ended 30 April 2009, the Company acquired 124 mineral claims (1,638 units – 26,208 hectares) by staking in the Sudbury area of Ontario.
In September 2009, the Company entered into a purchase agreement with Trueclaim Exploration Ltd. (“Trueclaim”) whereby Trueclaim would purchase 100% ownership of certain claims that formed part of the East Sudbury property for a 1.5% NSR and 50,000 Trueclaim shares.
In September 2009 the property was reduced from 128 claims to 60 claims and from then through December 2009 an additional 56 claims were lapsed. The Company allowed the balance of the claims remaining to lapse in August 2010.
NORTH DULUTH, ONTARIO
In 2007 the Company acquired 10 mineral claims (81 units – 1296 hectares) in the Crystal Lake Area south of Thunder Bay, Ontario and completed an airborne magnetic-electromagnetic survey over the property. The survey did not identify any significant targets for follow-up work and in February 2009, the property was reduced to 8 claims.
In February 2010, the remaining claims lapsed.
GLITTER LAKE, QUÉBEC
The Company entered into an option agreement dated 15 August 2003, as amended 30 April 2006, with CanAlaska Uranium Ltd. (“CanAlaska”) whereby the Company could earn a 50% interest in the mineral claims knows as the “Glitter Lake Property”, located in Québec.
The Glitter Lake property consists of 63 unpatented mining claims totalling 1,008 hectares. The claims are owned 100% by PFN, and carry expiry dates of 24 June 2011. Work requirements are $750 per claim. The claims are situated along the trend of the gabbroic sill that hosts the Horden Lake Cu-Ni deposit and form two groups, one situated to the southwest of the Horden Lake property, the other to the northeast.
The Glitter Lake claims surround, and extend along strike from, the Horden Lake Copper-Nickel deposit, which hosts an indicated resource of 8.8 million tonnes (“Mt”) at 0.88% copper (“Cu”) and 0.21% Nickel (“N”)i, and an inferred resource of 7.8Mt at 0.87% Cu and 0.25% Ni (Southampton Ventures Inc., Press Release, March 2nd 2009).
The principal exploration target on the Glitter Lake Property is remobilized magmatic Cu-Ni sulphide mineralization along the contact of the metagabroic intrusion that hosts the Horden Lake deposit. Of particular interest is the potential for relatively high-grade Cu mineralization that could be used to augment the high grade, but relatively low tonnage portion (indicated resource of 2.4 Mt at 1.37% Cu, 0.25% Ni, and inferred resource of 2.0 Mt at 1.34% Cu, 0.34% Ni) of the Horden Lake deposit.
On 1 April 2008 the Company signed an amended agreement with CanAlaska whereby in order to maintain the option, a total of $200,000 was to be spent by 15 April 2009 with an additional $300,000 to be spent by 15 April 2010. PFN has completed exploration expenditures in the amount of $248,891 fulfilling its 2003 and 2007 exploration commitments.
On 30 January 2009, PFN and CanAlaska signed an amendment to the option agreement whereby CanAlaska has assigned a 100% interest in the Glitter Lake Property to PFN in consideration of PFN assuming CanAlaska’s remaining lease obligation of approximately $83,600 with respect to its Kerrisdale office location to the end of the lease term in November 2010. CanAlaska retains a 0.5% NSR interest in the property along with the existing royalty agreement with the original prospectors of 1.5%. The original option agreement has thus been terminated.
A joint venture partner is being sought to further explore the Glitter Lake Property.
FIEDMONT, QUÉBEC
On 16 December 2008, the Company entered into an option agreement with Kinbauri whereby the Company could earn a 60% interest in 40 of Kinbauri’s 84 claims covering approximately 3,458 ha, known as the Fiedmont PGM property, subject to a 2% NSR held by the original vendors. The vendor’s NSR is subject to a 1.0%, $900,000 buyback, to earn a 60% interest.
9
Under the terms of the Agreement, the Company would pay Kinbauri an aggregate amount of $98,000, issue 150,000 common shares to Kinbauri and expend $400,000 on exploration prior to 30 November 2010 to earn its interest. The Company’s first year commitment was mandatory and included payment to Kinbauri of $38,000 (paid), issuance of 50,000 shares (issued, valued at $4,500), and expenditures of $150,000 (incurred) on exploration prior to 30 November 2009.
The Fiedmont property hosts PGM mineralization in sulphide zones associated with the contacts of the intrusion. Showings have returned values grading up to 6 grams per tonne (“g/t”) Pt+Pd, and drill hole intersections include up to 1.5 g/t Pt+Pd over 5 meters (“m”). The property has seen very little work since its discovery in 2002. The Company completed an initial drill program targeting potential extensions of the known mineralization in March, 2009.
No significant assay results were obtained from the drilling program, and the option agreement was terminated in October of 2009.
SOQUEM –TAUREAU & CHENNEVILLE PROJECTS, QUÉBEC
On 28 July 2006 the Company signed a 50/50 Cooperation Agreement with SOQUEM Inc. ("SOQUEM") in order to conduct research on platinum properties in the southern portion of the Province of Québec, Canada, in a designated Area of Mutual Interest ("AMI"), with the objective of identifying viable properties for further exploration. PFN and SOQUEM would pool staffing and funding resources, and share all technical data pertaining to properties located within the AMI, with each party having equal representation of two members each on a technical committee, responsible for setting programs, budget and schedule. SOQUEM acted as Manager. The first exploration program agreed upon between the parties was budgeted at $250,000 and was completed by the end of 2006.
In the event that a viable property was identified, the parties would contribute jointly to all staking and acquisition costs, or, if one party elected to do so independently, would do so at its own expense. In that event, the other party was granted the right of first refusal to acquire a 50% interest in the property. Exercise of this right would result in the creation of a new joint venture agreement between the parties for the newly acquired property.
The 2006 program’s assay results (1.17gpt Pd, 0.14gpt Pt, 0.29gpt Au, 1.62% Cu, and 0.35% Ni) from the Taureau evaluations justified staking a mafic intrusive and the flying of an airborne EM survey. Several magnetic bodies with associated conductors were identified, and additional claims were acquired in these areas.
In 2007, work programs continued to evaluate mafic intrusives in the AMI. The conductor trends identified from the airborne survey in the Chenneville area were staked (254 mineral claims – 15,200 hectares) and evaluated. The Chenneville Project was initiated to follow-up on the PGE-Cu-Ni mineralization located in 2006. Additional follow-up ground work on the Taureau and Cheneville project areas was completed in 2009, culminating with a 500 m drill program on the Cheneville property. No significant mineralization was identified during the course of the foregoing investigations.
Both parties agreed to abandon the entire Chenneville property since the fieldwork did not give the significant results expected and the Company and Soquem agreed to terminate the Taureau and Chenneville joint venture in August 2009.
DESTINY GOLD PROPERTY, QUÉBEC
On 14 August 2009, the Company entered into an option agreement with Alto Ventures Ltd. (“Alto”) to acquire the Destiny Gold Project (formerly the Despinassy Project) consisting of 175 mining claims totalling 7260 ha.
Under the terms of the Option Agreement with Alto, PFN will pay Alto $200,000 ($100,000 paid), provide Alto with 250,000 common shares of PFN (75,000 common shares issued), and complete a total of $3,500,000 in exploration expenditures over a four year period to earn a 60% interest in the Destiny Gold property. Subsequent to vesting of its interest, PFN will form a joint venture with Alto to further develop the project. Certain claims comprising the property are subject to underlying net smelter return royalties ranging from 1% to 3.5%, with varying buy-back provisions.
10
The Destiny Gold Project is located approximately 75 km north of Val d’Or in the Abitibi-Témiscamingue region of Québec. The property is road accessible, and excellent mining infrastructure and support facilities are available in nearby Val d’Or.
The Destiny Gold property is underlain by Archean metavolcanic and metasedimentary rocks of the Abitibi Greenstone Belt. A regional scale structure, the Despinassy shear zone, transects the property. High grade gold mineralization occurs in quartz veins and alteration zones associated with this structure. Mineralization has been identified in several locations along the Despinassy shear zone on the property over a strike distance of about 4 km.
The main area of mineralization, the DAC zone, occurs over a strike length of about 600 m. In this area, four to five identifiable intervals of quartz veining and shear-related alteration zones carry high-grade gold mineralization, with drill intersections ranging up to 178.5 g/t Au over a drill width of 1.0 m.
The DAC zone hosts a NI 43-101 compliant indicated resource of 166,863 tonnes grading 6.88 g/t Au (36,892 oz) and an inferred resource of 444,753 tonnes grading 4.46 g/t Au (63,839 oz) as calculated by W.A. Hubacheck Consultants Ltd. in “A Resource Estimate of the DAC Gold Deposit, Despinassy Twp., Val d’Or, Quebec,” dated 9 January 2007, and incorporated into the NI 43-101 compliance “Technical Report and Resource Estimation of the DAC Deposit, Destiny Property, Québec” (the “Destiny Tech Report”) for Alto and PFN, dated 1 March 2011, by Todd McCracken, P.Geo. of Wardrop, a Tetra-Tech company (the,”Wardrop Report”). The Wardrop Report can be read in its entirety under PFN’s profile on SEDAR at www.sedar.com. The DAC zone is open along strike and at depth. The occurrence of high-grade mineralization at the Darla and 20 and 21 zones to the east clearly indicates that the mineralizing system occurs across a significant portion of the property.
The Phase 1 program was completed on 22 December 2009 and consisted of 5,600m of drilling in 14 holes. Results from the Phase I drilling program were very positive as they validated the deposit model and confirm continuity of gold mineralization between previous wide-spaced holes. Each of the holes targeting the DAC deposit intersected gold within multiple zones of shearing, strong alteration, quartz veins containing variable amounts of sulphides. Significant gold values were obtained in 100% of the holes drilled including high grade quartz veins containing up to 44.39 g/t Au and wide mineralized shear zones including 21.0 m averaging 1.39 g/t Au and another high grade quartz veins containing up to 16.43 g/t Au over 0.5 m (0.48 oz/ton) and averaging 0.51 g/t and 49.5 m averaging 0.36 g/t Au. Phase 1 confirmed the large size of the gold system at the DAC deposit.
The Phase II drilling program began 26 January 2010 and was completed in March 2010. The results from the Phase I and Phase II programs are incorporated into the extensive data base available for the Destiny project for the next stage of work, which may include diamond drilling. Drilling at the DAC Deposit continued to intersect multiple gold zones with high grade values over significant widths including DES10-137 which intersected 20.85 g/t Au over 1.1m within a vein zone that averages 8.46 g/t over 3.0m. This same hole intersected another gold zone containing 12.0 g/t Au over 0.5 m within a quartz-veined shear zone averaging 1.16 g/t Au over 6.6 m and a massive sulphide lens assaying 6.4% Zn over 1.0 m.
DES10-137 intersected a one metre wide zone of zinc-rich massive sulphides that is believed to be part of the same sulphide horizon from which base metal values were reported. Company believes that the base metals are indications of an earlier copper-zinc-gold massive sulphide system that has been subsequently overprinted by the gold enriched shear zones that are host to the DAC Deposit.
11
Table 1: Significant Gold Assays
| Hole Number | From (m) | To (m) | With (m) *downhole | Au (g/t) |
| DES09-128 | 315.0
458.1 | 318.6
458.6 | 3.6
0.5 | 1.37
2.99 |
| DES09-129 | 257.7
308.8
407.0 | 266.0
316.3
407.5 | 8.3
7.5
0.5 | 1.10
0.78
16.43 |
| DES09-130 | 299.2
305.5
354.4 | 312.6
306.7
374.2 | 13.4
1.2
19.8 | 0.7
6.02
0.53 |
| DES09-131 | 94.6
116.8
131.0 | 119.9
118.9
170.5 | 25.3
2.1
49.5 | 0.51
2.42
0.36 |
DES09-134
Includes | 124.8
256.9
259.6
316.7 | 135.3
266.7
260.6
332.8 | 10.5
9.8
1.0
16.1 | 0.41
0.53
2.54
0.28 |
DES09-135
Includes
Includes
Includes
Includes
Includes | 355.75
357.25
365.5
374.85
375.4
386.65
389.15
431.4
446.5
486.55
527.1
527.1 | 368.0
357.75
366.0
377.0
375.7
391.0
390.15
441.8
70.35
496.9
530.0
527.75 | 12.25
0.5
0.5
2.15
0.3
4.35
1.0
10.4
23.85
10.35
2.9
0.65 | 2.85
12.69
51.66
1.55
7.9
0.74
2.34
0.46
0.36
0.35
3.35
12.84 |
DES09-136
Includes | 451.0
460.9 | 463.3
461.5 | 12.3
1.6 | 0.9
3.59 |
DES09-137
Includes
Includes
Includes | 216.3
226.8 251.9
254.0 371.0
372.9 | 227.6
227.6
258.5
254.5
374.0
374.0 | 11.3
0.8
6.6
0.5
3.0
1.1 | 0.92
4.0
1.16
12.0
8.46
20.85 |
DES09-138
New Vein | 22.0
91.0 | 44.0
2.0 | 22.0
1.0 | 0.39
2.57 |
| * | Based on core angles and previous drilling, true widths are estimated at approximately 80 to 90% of the downhole lengths reported. Mineralized zones generally start at 0.1 g/t gold and assay averages may include minimal intervals of waste material. No top cuts of assays were used. |
The results from the first 14 holes were very positive as they confirm continuity of gold mineralization between holes drilled previously, some of which were spaced from 100m to 200m apart.
The 2010 Destiny exploration program was completed in December 2010. A high resolution airborne magnetic survey was conducted along with borehole electromagnetic (BHEM) surveys that were designed to target massive sulphide mineralization.
12
Three drill holes were completed and each had a specific objective with respect to defining controls on the mineralization at the Destiny Gold Project. These are summarized as (1) to test selected BHEM conductors and assess the association of areas of sulphide mineralization with gold mineralization, and (2) to test for shallow gold mineralization to the south of the DAC deposit where the high resolution magnetic survey identified magnetic signatures similar to the DAC deposit.
Previous drilling revealed massive sulphide mineralized lenses locally adjacent to the gold mineralization. The companies interpreted these sulphide lenses as important to the gold mineralizing system and completed BHEM surveys in certain drill holes to trace the extent of the massive sulphide mineralization and to help guide drilling at depth.
The 2010 program also included the completion of the Wardrop Report, which incorporated over 7,600 m of additional drilling that was completed on the deposit subsequent to the earlier NI43-101 compliant resource estimate calculated by W. A. Hubacheck Consultants Ltd., for an updated NI43-101 compliant report with a resource estimate.
Indicated and Inferred resources have been determined for the DAC deposit. The deposit is made up of narrow high-grade gold-bearing quartz veins occurring within five parallel alteration zones. These alteration zones carry gold at lower grades than the quartz veins but are significantly wider. The Wardrop Report indicates that the additional drilling has expanded the DAC Deposit and significantly increased the contained ounces of gold.
At a cut-off grade of 0.5 g/t Au and using the Inverse Distance Squared (ID2) estimation method, the five gold zones contain an Indicated Resource of about 10.8 million tonnes with an average grade of 1.05 g/t Au (364,000 contained ounces). In addition, the Inferred Resource totals 8.3 Mt with an average grade of 0.92 g/t Au (247,000 contained ounces). Table 2 summarises the Resource Estimate at the 0.5 g/t cut-off.
Table 2: DAC Resource Estimation Summary (using ID2 method)
| Class | Zone | Capping Grade (g/t) | Tonnes Above Capped Grade | Average Grade (g/t) | Average True Width (m) | Au Ounces |
| Indicated | 1 | 7.53 | 1,395,600 | 0.84 | 16 | 37,760 |
| | 2 | 19.63 | 2,942,700 | 1.19 | 30 | 112,644 |
| | 3 | 6.66 | 1,370,700 | 0.99 | 12 | 43,675 |
| | 4 | 10.80 | 3,542,600 | 1.06 | 21 | 121,221 |
| | 5 | 14.00 | 1,573,900 | 0.97 | 15 | 49,231 |
| | Total | | 10,825,500 | 1.05 | | 364,530 |
| Inferred | 1 | 7.53 | 971,900 | 0.70 | 16 | 21,724 |
| | 2 | 19.63 | 1,841,100 | 1.06 | 30 | 62,487 |
| | 3 | 6.66 | 725,500 | 0.93 | 12 | 21,759 |
| | 4 | 10.80 | 3,085,300 | 0.89 | 21 | 88,767 |
| | 5 | 14.00 | 1,706,600 | 0.96 | 15 | 52,854 |
| | Total | | 8,330,400 | 0.92 | | 247,590 |
13
Table 3: DAC Resource Estimation Summary (using ID2 method)
| Class | ID2 Cut-off (Au g/t) | Tonnes | Average Grade (Au g/t) | Contained Ounces Au |
| Indicated | 0.2 | 24,275,300 | 0.65 | 509,960 |
| | 0.4 | 14,371,800 | 0.90 | 415,780 |
| | 0.5 | 10,825,500 | 1.05 | 364,530 |
| | 0.6 | 8,225,700 | 1.21 | 318,840 |
| | 0.8 | 5,359,200 | 1.48 | 255,370 |
| | 1.0 | 3,858,800 | 1.71 | 212,310 |
| | 1.5 | 1,820,100 | 2.26 | 132,490 |
| | 2.0 | 979,900 | 2.73 | 86,100 |
| | | | | |
| Inferred | 0.2 | 22,541,600 | 0.55 | 401,190 |
| | 0.4 | 12,132,100 | 0.78 | 302,500 |
| | 0.5 | 8,330,400 | 0.92 | 247,590 |
| | 0.6 | 5,797,600 | 1.09 | 203,210 |
| | 0.8 | 3,534,600 | 1.35 | 153,420 |
| | 1.0 | 2,521,400 | 1.53 | 124,390 |
| | 1.5 | 1,133,600 | 1.93 | 70,360 |
| | 2.0 | 385,600 | 2.29 | 28,400 |
A cut off grade of 0.5 g/t Au was selected to tabulate the total resources based on the results of similar gold projects located in Ontario and Quebec. In addition, the following parameters were considered; 4:1 stripping ratio, operating costs of $14.30/tonne at 10,000 tonnes per day, long term gold price of $US973/troy ounce, $US to $CDN conversion of 1.02 and gold recovery of 94%. The resources block considers the mineralization to start at approximately 15 m below surface down to a depth of 400m for the deepest zone (Zone 5).
Mineral Resources are not Mineral Reserves and by definition do not demonstrate economic viability.
DAC Resource Estimation Summary (using ID2 method)
| Class | Zone | Capping Grade (g/t) | Tonnes Above Capped Grade | Average Grade (g/t) | Average True Width (m) | Au Ounces |
| Indicated | 1 | 7.53 | 1,395,600 | 0.84 | 16 | 37,760 |
| | 2 | 19.63 | 2,942,700 | 1.19 | 30 | 112,644 |
| | 3 | 6.66 | 1,370,700 | 0.99 | 12 | 43,675 |
| | 4 | 10.80 | 3,542,600 | 1.06 | 21 | 121,221 |
| | 5 | 14.00 | 1,573,900 | 0.97 | 15 | 49,231 |
| | Total | | 10,825,500 | 1.05 | | 364,530 |
14
| Class | Zone | Capping Grade (g/t) | Tonnes Above Capped Grade | Average Grade (g/t) | Average True Width (m) | Au Ounces |
| Inferred | 1 | 7.53 | 971,900 | 0.70 | 16 | 21,724 |
| | 2 | 19.63 | 1,841,100 | 1.06 | 30 | 62,487 |
| | 3 | 6.66 | 725,500 | 0.93 | 12 | 21,759 |
| | 4 | 10.80 | 3,085,300 | 0.89 | 21 | 88,767 |
| | 5 | 14.00 | 1,706,600 | 0.96 | 15 | 52,854 |
| | Total | | 8,330,400 | 0.92 | | 247,590 |
Cut-off Sensitivities for the DAC Deposit Resource Estimate
| Class | ID2 Cut-off (Au g/t) | Tonnes | Average Grade (Au g/t) | Contained Ounces Au |
| Indicated | 0.2 | 24,275,300 | 0.65 | 509,960 |
| | 0.4 | 14,371,800 | 0.90 | 415,780 |
| | 0.5 | 10,825,500 | 1.05 | 364,530 |
| | 0.6 | 8,225,700 | 1.21 | 318,840 |
| | 0.8 | 5,359,200 | 1.48 | 255,370 |
| | 1.0 | 3,858,800 | 1.71 | 212,310 |
| | 1.5 | 1,820,100 | 2.26 | 132,490 |
| | 2.0 | 979,900 | 2.73 | 86,100 |
| | | | | |
| Inferred | 0.0 | 31,535,100 | 0.43 | 436,840 |
| | 0.2 | 22,541,600 | 0.55 | 401,190 |
| | 0.4 | 12,132,100 | 0.78 | 302,500 |
| | 0.5 | 8,330,400 | 0.92 | 247,590 |
| | 0.6 | 5,797,600 | 1.09 | 203,210 |
| | 0.8 | 3,534,600 | 1.35 | 153,420 |
| | 1.0 | 2,521,400 | 1.53 | 124,390 |
| | 1.5 | 1,133,600 | 1.93 | 70,360 |
| | 2.0 | 385,600 | 2.29 | 28,400 |
15
NICKEL PLATS, SASKATCHEWAN
By agreement dated 30 April 2007, the Company optioned the Nickel Plats property from Diamond Hunter Ltd. (“Hunter”). The property is located approximately 50 km north of Laronge, Saskatchewan. The property covers a nickel (“Ni”)-Cu occurrence (historic resource of 1.7 million tonnes grading 0.74% combined nickel-copper) within a sulphide rich (pyrrhotite, chalcopyrite and pyrite) gabbro intrusion.
On 30 March 2009, the Company and Hunter signed an amendment to the terms agreement as follows:
| | | | Payments | Shares | | Exploration Expenditures |
| Upon execution of agreement | (paid/issued) | $ | 10,000 | 75,000 | $ | - |
| On or before 30 June 2007 | (paid) | | 20,000 | - | | - |
| On or before 30 April 2008 | (paid/issued) | | 30,000 | 75,000 | | - |
| On or before 30 April 2009 | (paid/issued) | | 15,000 | 50,000 | | - |
| On or before 30 April 2010 | (paid/issued) | | 15,000 | 50,000 | | - |
| On or before 30 April 2011 | (paid) | | 20,000 | - | | - |
| On or before 30 April 2012 | | | 20,000 | - | | - |
| On or before 30 April 2013 | | | 20,000 | - | | - |
| Total | | $ | 150,000 | 250,000 | $ | - |
Approximately $678,609 in expenditures have been accrued by the Nickel Plats Project, thereby fulfilling all exploration expenditure requirements under the terms of the amended Option Agreement.
In 2007, the Nickel Plats project was evaluated, and a compilation was begun to understand the setting of the mineralization as well as develop an approach to test the known mineralization and other targets that were developed from the work. Five mineral claims (7,692 ha) were staked in the vicinity to expand to the property to include additional target areas.
A 2284 line km helicopter-borne VTEM (Versatile Time Domain Electromagnetic) geophysical survey was completed by Geotech Ltd over the Nickel Plats property in 2008, with a large number of anomalies identified, and limited re-sampling of historic drill core on the property was also completed.
The Nickel Plats adjunct property is subject to a 2.0% NSR. The Company has the right to purchase a 1.0% NSR for $750,000.
No exploration activity was undertaken on the project in 2009.
A joint venture partner is being sought to further explore the Nickel Plats Project.
WINTER LAKE, NORTHWEST TERRITORIES, CANADA
In 2007, the Company staked two separate blocks of claims, totaling 33 mineral claims of approximately 34,070 ha in the MacKay Lake area of the Northwest Territories. These claims cover geology similar to that where GGL Resources reported nickel values in a komatiitic environment.
No exploration work was completed on the property subsequent to staking, and the claims were allowed to lapse May 4, 2009 and reverted to the Crown.
TONSINA PROPERTY, ALASKA
The Tonsina property, presently defined, consists of 46 State of Alaska mining claims, known as the “Marc” claims 1-46 (ADL Nos. 610060 – 610105; which were staked in June 2006. These claims comprise a contiguous group of State of Alaska ¼ section claims covering approximately 29.78 sq. kilometers (744.62 hectares, or 7,360 acres), herein referred to as the “Tonsina property”. The claims are owned 100% by the Company.
The property is located in the Valdez quadrangle in southeast Alaska on state select land, located approximately 6 km south of the village of Tonsina and 110 km north of Valdez. The property covers prospective PGM mineralization within the Tonsina ultramafic intrusive complex. Access is relatively good with bush roads 6 km north to the Richardson Highway which connects Anchorage to Fairbanks. Helicopters are still required to reach the higher elevations.
16
The 2007 exploration program identified significant PGM anomalies associated with a sulphide and chromite enriched layer in the Tonsina Ultramafic Complex. An induced polarization survey designed to test the extent of the mineralization was completed in the summer of 2008, and was followed by a ground magnetic survey and surface channel sampling. The results suggest that the zone of sulphide mineralization is continuous over a 300 m strike length. Future work will focus on determining the total strike extent of this zone, and identifying the best locations for drill testing of the mineralization.
A joint venture partner is being sought to further explore the project.
KANE PROPERTY, ALASKA
During a previous year, the Company acquired certain mineral claims by staking in Alaska. On 6 June 2007, the Company entered into an option agreement with Stillwater Mining Company (“Stillwater”) whereby Stillwater could earn 50% of the first selected property by spending US$3.5 million and US$4.0 million on each subsequent selected property by 31 December 2011. In March 2008, Stillwater elected not to continue with exploration on the property in order to evaluate new ground in southeast Alaska.
The Company continues to maintain the Kane property’s mineral claims and a joint venture partner is being sought to further explore the property.
UNION BAY, ALASKA
By agreement dated 1 October 2002 and amended 2 April 2003 and 4 February 2004, the Company could acquire, from Freegold, a company that previously had certain directors and officers in common, an option to earn up to a 70% interest in the property.
In order to earn its 50% interest, the Company, purchased a private placement of $165,000 (2002), made cash payments, and issued common shares and incurred exploration expenditures as follows:
| | | Payments | Shares | | | Exploration Expenditures |
| - Within 5 days from approval date(issued) | $ | - | 30,000 | | $ | - |
| - On or before 1 July 2003 paid / incurred) | | 20,000 | - | | | 30,000 |
| - On or before 30 January 2004(issued) | | - | 30,000 | | | - |
| - On or before 1 July 2004(paid / incurred) | | 20,000 | - | | | 30,000 |
| - On or before 1 July 2005(paid / incurred) | | 30,000 | - | | | 340,000 |
| - On or before 1 July 2006(paid / incurred) | | 30,000 | - | | | 600,000 |
| $ | 100,000 | 60,000 | | $ | 1,000,000 |
Following vesting with a 50% interest on 1July 2006, the Company had the right to elect within 45 days to increase its interest to 60% by completing a feasibility study within 12 months of vesting with 50%. This election was not made.
As a term of the agreement the Company, upon vesting with 50%, issued 253,586 common shares at market value of $100,000 to Freegold. In a previous year, 134,538 common shares were issued, the value of which was accounted in the previous year.
By Memorandum of Agreement dated 4 May 2007, Freegold and the Company confirmed their 50/50 interest in the property, with the Company as Project Operator.
No programs were carried out during the past year and Freegold and the Company are seeking a joint venture partner to further develop this project.
NIXON FORK PROPERTY, ALASKA
By Letter Agreement (the “Agreement”) dated 9 December 2008 between the Company and St. Andrew Goldfields Ltd. (“SAG”), the Company was granted an option, exercisable until 15 February 2009, to acquire a 100% interest in SAG’s wholly-owned subsidiary Mystery Creek Resources Inc. (“MCR”). MCR’s assets include the Nixon Fork property, located 56 km northeast of McGrath, Alaska.
17
The Company paid US$100,000 upon signing the agreement dated 9 December 2008. The Company exercised the option by agreeing to pay a further US$400,000 of which US$100,000 was paid 12 February 2009, and the balance was paid in three equal installments on 1 May 2009, 1 July 2009 and 1 September 2009.
The mine is located 56 km northeast of McGrath, Alaska. Work on the property began in late March 2009 and consisted of reopening the facilities that had been shut down in October of 2008. The facilities are in good condition and the camp is operational.
In June 2009, the Company granted Fire River Gold Corp. (“FAU”) an option to acquire all of the outstanding shares of MCR. FAU paid PFN US$50,000 on signing of the agreement. The sale of MCR to FAU was approved by PFN shareholders in August 2009. The shareholders of FAU approved the purchase of MCR in September 2009. FAU exercised the option by making further payments totalling US$450,000 and issuing a total of US$2.5 million in FAU shares at a deemed price of $0.45 per share for a total of 6,415,000 shares to the Company.
FAU also issued to PFN 1,000,000 share purchase warrants entitling PFN to purchase 1,000,000 shares of FAU at an exercise price of $0.50 until 2 October 2011, and reimbursed all expenses incurred by PFN from 1 May 2009 for a total of CDN$773,766.
BURKINA FASO GOLD PROJECT, AFRICA
In January, 2011, the Company entered into an option agreement with SOMITRA, a company incorporated in Burkina Faso, to acquire three gold permits, known as the Burkina Faso Gold Project, located in Burkina Faso, Western Africa. The project consists of three separate permits totaling 429 sq km.
Under the terms of the option agreement, PFN can earn a 100% interest in the properties over a three year period by paying SOMITRA US$480,000 and providing SOMITRA with a total of 450,000 PFN shares, or PFN may elect to pay the sum of US$135,000.
During the period of the agreement PFN can terminate the option agreement at any time as regards to one or several of the Permits.
SOMITRA will retain a 1% Net Smelter Return, NSR, with a buyout price of US$1,000,000 for any deposit OVER 1 million ounces and US$500,000 for any deposit UNDER 1 million ounces.
PFN’s Burkina Faso gold Projects lie within the Birimian Greenstone Belt of West Africa, one of the most prolific gold producing regions of the world. The Birimian Greenstone Belt consists of Lower Proterozoic age volcanic and sedimentary units intruded and surrounded by related plutonic rocks and has a long history of gold mining with industrial history beginning in Ghana at the end of the 19th century.
SELECTED ANNUAL INFORMATION
Unless otherwise noted, all currency amounts are stated in Canadian dollars. The following table summarizes selected financial data for PFN for each of the three most recently completed financial years. The information set forth below was extracted from and should be read in conjunction with the audited consolidated financial statements, prepared in accordance with Canadian generally accepted accounting principles (“GAAP”), and related notes.
| | Years Ended 30 April (audited) |
| | 2011 | 2010 | 2009 |
| Total revenues | $52,293 | $59,296 | $478,887 |
| General and administrative expenses | 1,526,478 | 1,789,601 | 2,647,547 |
| Mineral property cash costs incurred | 1,890,288 | 1,487,026 | 1,895,727 |
| Income (loss) before other items in total | (1,526,478) | (1,789,601) | (2,647,547) |
| Net income (loss) from continuing operations in total | (4,153,650) | (3,551,664) | (5,274,994) |
| Loss per share – Basic & fully diluted – continued operations | (0.06) | (0.06) | (0.09) |
| Loss per share – Basic & fully diluted – discontinued operation | - | 0.04 | - |
| Comprehensive loss per share – Basic & fully diluted | (0.03) | (0.01) | (0.10) |
| Totals assets | 15,575,641 | 11,353,054 | 15,095,336 |
| Total long term liabilities | Nil | Nil | Nil |
| Cash dividends declared | Nil | Nil | Nil |
18
SELECTED QUARTERLY FINANCIAL INFORMATION
The following selected financial information is derived from the unaudited interim consolidated financial statements of the Company prepared in accordance with GAAP.
| | | | For the Quarters Ended (unaudited) | | |
| | 30 Apr | 31 Jan. | 31 Oct. | 31 Jul. | 30 Apr. | 31 Jan. | 31 Oct. | 31 Jul. |
| | 2011 | 2011 | 2010 | 2010 | 2010 | 2010 | 2009 | 2009 |
| Total revenues | $35,017 | $5,222 | $5,748 | $6,306 | $12,151 | $6,028 | $13,582 | $27,481 |
| Net income(loss) | (3,148,155) | (146,461) | (329,068) | (529,966) | (1,843,147) | (626,573) | 2,221,965 | (523,264) |
| Net income(loss) per share | (0.05) | (0.00) | (0.01) | (0.01) | (0.03) | (0.01) | 0.04 | (0.01) |
| Total assets | 15,575,641 | 11,202,245 | 11,492,906 | 12,720,801 | 11,353,054 | 13,414,363 | 12,620,592 | 14,667,532 |
RESULTS OF OPERATIONS
The year ended 30 April 2011 resulted in a loss from continuing operations of $4,1,53,650 which compares with a loss of $3,551,664 for the same period in 2010. Mystery Creek Resources Inc. was sold in the previous year and reported an income on discontinued operation of $2,780,645. General and administrative expenses for the year ended 30 April 2011 were $1,526,478, a decrease of $263,123 over the same period in 2010. Shareholder relations and promotional activities undertaken by the Company, which included attendance at various trade shows, cost $192,814 for the period ended 30 April 2011 compared to $263,840 for the same period in 2010. Salaries and benefits slightly decreased to $182,782 compared to $187,032 in the previous year. An aggregate stock-based compensation of $68,650 was recorded as compared to $275,435 in the previous year. Stock-based compensation is broken down on the income statement according to the applicable expense category. Consulting fees for the year were $318,031 compared to $370,635 in the previous year. Corporate development for the year was $71,895 compared to $NIL in the previous year. Travel and lodging costs of $78,155 were incurred during the year, compared to $49,310 of the same period in 2010. All other general and administrative costs were relatively the same compared to the previous year. Interest and other income decreased to $52,293, compared to $52,616 in the previous year. $1,892,226 unrealized gain on investment portfolio as a result of the fair value presentation required in the Canadian Institute of Chartered Accountants (“CICA”) Handbook Section 3855 compared to $321,831 in the previous year.
During the year ended 30 April 2011, the Company incurred mineral property cash costs of $1,890,288 compared to $1,487,026 in the previous year.
LIQUIDITY AND CAPITAL RESOURCES
During the year ended 30 April 2011, the Company’s working capital, defined as current assets less current liabilities, was $8,686,132 compared with working capital of $7,249,616 as at 30 April 2010. The Company has total issued and outstanding of 85,737,788 shares as at 30 April 2011. The Company has a portfolio of investments with a book value of $3,541,053 and a market value of $4,815,763 as at 30 April 2011.
CONTRACTUAL COMMITMENTS
By agreement effective 1 December 2005, the Company entered into a five-year management agreement with a company controlled by a director and Chairman of the Company. Compensation is $7,350 per month for the first year, with a 5% increase on each anniversary date plus benefits. The Director and Chairman is also entitled to receive up to 20% of all stock options granted during the period that the agreement is in place. This agreement is automatically renewable for two-year periods. The Company may terminate the agreement at any time but will be responsible to pay the greater of the remaining amount under the contract or two years’ compensation.
By amended agreement effective 1 December 2008, the Company amended the 1 December 2005 agreement. The compensation under the original agreement was amended from $7,350 per month to $14,104 per month. The 5% increase under the original agreement was waived until 1 December 2009. All terms of the original agreement remained the same.
19
By amended agreement effective 1 April 2011, the Company amended the 1 December 2005 agreement as amended on 1 December 2008. The compensation under the amended agreement was further amended from $15,550 per month to $20,833 per month. The term of the amended agreement is for five years terminating on 31 March 2016. All terms of the original agreement remained the same.
| Year ended 30 April | 2012 | 2013 | 2014 | 2015 | 2016 | Total |
| Management agreement | $251,042 | $263,594 | $276,773 | $290,612 | $305,143 | $1,387,164 |
The Company has outstanding and future commitments under mineral property option agreements to pay cash and issue common shares of the Company.
The Company is committed under an operating lease with a Company for its office premises with the following minimum lease payments to the expiration of the lease on 30 November 2011.
| Year ended 30 April | 2012 | 2013 | 2014 | 2015 | 2016 | Total |
| Office lease * | $119,303 | $- | $- | $- | $- | $119,303 |
· In November 2008 the Company entered into an agreement with the former co-signor of the lease whereby the Company assumed their remaining lease obligation and received a lump sum amount of $126,845 which will then be applied to the end of the term.
OFF-BALANCE SHEET ARRANGEMENTS
The Company has no off-balance sheet arrangements.
CRITICAL ACCOUNTING ESTIMATES
The preparation of financial statements in conformity with GAAP requires management to make estimates and assumptions that affect the reported amounts of assets and liabilities and disclosure of contingent assets and liabilities at the date of the financial statements and the reported amounts of revenues and expenses during the reporting period. Significant estimates used in the preparation of these consolidated financial statements include, amongst other things, depreciation, determination of net recoverable value of assets, determination of fair value on taxes, and share compensation. These estimates are reviewed periodically (at least annually), and, as adjustments become necessary, they are reported in earnings in the period in which they become known.
A detailed summary of all of the Company’s significant accounting policies is included in Note 1 to the consolidated financial statements for the year ended 30 April 2011.
FINANCIAL INSTRUMENTS - RECOGNITION AND MEASUREMENT
Section 3855 requires that all financial assets and financial liabilities be measured at fair value on initial recognition except for certain related party transaction. Financial instruments classified as held-for-trading are measured at fair value and unrealized gains and losses are included in the net income in the period in which they arise. The Company has historically measured these instruments at the lower of cost and market value and any unrealized gains or losses have been included in net income.
COMPREHENSIVE INCOME
Section 1530 introduces other comprehensive income (loss). Comprehensive income (loss) includes both net earnings (losses) and other comprehensive income. Other comprehensive income (loss) includes holding gains and losses on available-for-sale investments, gains and losses on certain derivative instruments and any foreign currency gains and losses relating to self-sustaining foreign operations where applicable, all of which are not included in the calculation of net earnings (loss) until realized. The only impact on the Company of adopting these new standards was the recognition of unrealized gains and losses on investments, which has been included as part of shareholders' equity under "Other Comprehensive Loss". As required by the prospective implementation of these new standards, the comparative financial statements have not been restated.
20
FINANCIAL INSTRUMENTS AND OTHER INSTRUMENTS
The Company’s financial instruments consist of cash and cash equivalents, amounts receivable, advances and deposits, available-for-sale securities, share purchase warrants and accounts payable. Unless otherwise noted, it is management’s opinion that the Company is not exposed to significant interest, currency or credit risks arising from the financial instruments. The fair value of these financial instruments, with the exception of available-for-sale and share purchase warrants, approximates their carrying value unless otherwise noted. The Company is exposed to currency risk on its acquisition and exploration expenditures on its US properties since it has to convert Canadian dollars raised through equity financing in Canada to US dollars. The Company’s expenditures will be negatively impacted if the US dollar increases versus the Canadian dollar.
INTERNATIONAL FINANCIAL REPORTING STANDARDS
In February 2008, the Canadian Accounting Standards Board (“AcSB”) confirmed that Canadian GAAP for publicly accountable enterprises would be replaced by IFRS for fiscal years beginning on or after 1 January 2011.
The Company commenced its IFRS conversion project in 2008 when it established a formal project governance structure, which included the Company’s Audit Committee and senior management. Overall project governance, management and support have been coordinated by the Company, with an independent external advisor engaged to assist in the IFRS conversion.
The Company’s approach to the conversion to IFRS includes three phases:
- Phase one, an initial general diagnostic of its accounting policies and Canadian GAAP relevant to its financial reporting requirements to determine the key differences and options with respect to acceptable accounting standards under IFRS
- Phase two, an in-depth analysis of the IFRS impact in those areas identified under phase one.
- Phase three, the implementation of the conversion process, including the completion of the opening balance sheet as at 1 May 2010 together with related discussion and notes.
The following is a summary of key areas where accounting policies differ and where accounting policy decisions are necessary that will impact the Company’s reported financial position and results of operations:
- Mineral properties – IFRS 6, “Exploration for and Evaluation of Mineral Resources” provides the Company with the option of expensing the exploration and evaluation costs as incurred, or deferring these costs until technical feasibility and commercial viability has been determined, at which point they are transferred to the development and production phase and allocated to specific projects. Under Canadian GAAP, exploration, evaluation and development costs are expensed as incurred. The existing accounting policy will be maintained.
- Share-based payment – Under IFRS, stock-based compensation is amortized under the graded method only. In addition, the Company is required to update its value of options for each reporting period for expected forfeitures. Under Canadian GAAP, the Company recognizes stock-based compensation on straight-line method and updates the value of the options for forfeitures as they occur. The Company will record an IFRS income statement and balance sheet adjustment at 1 May 2010.
- Impairment of assets – Under IFRS, impairment tests are generally carried out using the discounted future cash flows (one step test). Write-downs to net realizable values under an impairment test can be reversed if the conditions of impairment cease to exist. Under Canadian GAAP, impairment tests are generally done on the basis of undiscounted future cash flows and impairment loss is measured as the excess of the carrying value over the discounted future cash flows (two-step approach). Unlike IFRS, write-downs are permanent changes in the carrying value of assets and cannot be reversed. The Company’s financial statements will not be impacted on the changeover to IFRS based on the analysis of impairment indicators on transition. Nevertheless, in subsequent years, IFRS could generate more impairment write-downs than Canadian GAAP since it uses a one-step test.
21
- Flow-through shares – Flow-through shares are a unique Canadian tax incentive which is the subject of specific guidance under Canadian GAAP. Under Canadian GAAP, the funds received are recorded as share capital at the time of issue. At the time of the filing of the renunciation of the qualifying flow-through expenditures to investors, the Company records a deferred tax liability with a charge directly to shareholders’ equity. Also under Canadian GAAP, the Company records any deferred tax recovery eligible to be recognized to offset the deferred tax charge to equity as a tax recovery in the statement of operations. IFRS does not contain explicit guidance pertaining to this tax incentive. Therefore, the Company has adopted a policy whereby the premium paid for flow-through shares in excess of the market value of the shares without the flow-through features at the time of issue is credited to other liabilities and recognized in income at the time the qualifying expenditures are made. The recognition of the deferred tax liability upon renunciation of the flow-through expenditures is recorded as income tax expensed in the period of renunciation.
The transition to IFRS requires the Company to apply IFRS 1, “First-Time Adoption of International Financial Reporting Standards” (“IFRS 1”) which details the requirements for preparing IFRS-compliance financial statements in the first reporting period after the date of transition. IFRS 1 provides entities adopting IFRS for the first time with a number of optional and mandatory exemptions in certain areas to the general requirement of full retrospective application of IFRS. Based on management’s analysis of the various accounting policy choices available, IFRS 1 elections relevant to the Company are as follows:
- Share-based payment – IFRS 1 allows an exemption to IFRS 2, “Share-based Payment” for equity instruments, such as the Company’s stock options, granted on or before 2 November 2002 or which vested before the transition date to IFRS. The Company will utilize this exemption upon adoption of IFRS.
- Property, plant and equipment – IFRS 1 allows the Company to elect to have fair value or revaluation amounts as the deemed cost of property, plant and equipment at the date of transition. In accordance with IFRS 1, the Company may elect to measure certain items of property, plant and equipment at their fair values at the date of transition. Any fair value adjustments and changes to the assessment of the related useful lives of the individual components of property, plant and equipment could impact the depreciation charges subsequent to the date of transition. The Company will not elect to utilize this transitional provision and will record property, plant and equipment at cost upon adoption of IFRS.
The Company is in the implementation stage. This stage involves finalizing accounting policy decisions, preparing the Company’s opening balance sheet as at 1 May 2010, preparing comparative financial statements and notes under IFRS for each quarterly period of 2010, and implementing system, processes, internal controls and training necessary. The quantification of the amounts that resulted from the differences between Canadian GAAP and IFRS relating to the key standards are based on management’s estimates and decisions, and currently being reviewed internally by the Board of Directors and by the Company’s external auditors.
RELATED PARTY TRANSACTIONS
During the year ended 30 April 2011, the following related party transactions took place:
| | a) | During the year, management fees of $200,070 (2010 - $189,698, 2009 - $214,972) were paid to a company controlled by a Director and Chairman. |
| | b) | During the year, engineering and consulting fees of $99,399 (2010 - $38,983, 2009 - $NIL) were paid to the Vice President of Exploration. |
| | c) | During the year, engineering and consulting fees of $6,700 (2010 - $86,451, 2009 - $NIL) were paid to the Vice President of Engineering. |
| | d) | During the year, consulting fees of $18,658 (2010 - $8,663, 2009 - $63,076) were paid to a company controlled by a Director. |
| | e) | During the year, consulting fees of $47,000 (2010 - $12,890, 2009 - $NIL) were paid to a Director and Corporate Secretary. |
22
| | f) | Effective 1 February 2005, each outside Director is entitled to receive $500 per month, $500 per directors meeting and $500 per committee meeting. During the period, $17,000 (2010 - $25,000) was paid/accrued to Directors. |
The above transactions, occurring in the normal course of operations, are measured at the exchange amount, which is the amount of consideration established and agreed to by the related parties.
OUTSTANDING SHARE DATA
The Company is authorized to issue unlimited common shares without par value. As at 30 April 2011, there were 85,737,788 outstanding common shares compared to 67,543,008 outstanding shares at 30 April 2010.
SHARE PURCHASE OPTIONS
Directors, officers, employees and contractors are granted options to purchase common shares under the Company stock option plan. The terms and outstanding balance are disclosed in the table below:
Number
outstanding
30 April 2010 | Granted | Exercised | Expired | Cancelled | Number outstanding 30 April 2011 | Exercise price per share | Expiry date |
| 718,000 | - | - | - | 15,000 | 703,000 | $0.25 | 5 November 2014 |
| 355,000 | - | - | - | 355,000 | - | $0.60 | 3 May 2010 |
| 100,000 | - | - | | - | 100,000 | $0.40 | 3 February 2011 |
| 82,500 | - | - | - | - | 82,500 | $0.40 | 19 April 2011 |
| 50,000 | - | - | - | - | 50,000 | $0.50 | 8 May 2011 |
| 20,000 | - | - | - | - | 20,000 | $0.50 | 19 May 2011 |
| 150,000 | - | - | - | - | 150,000 | $0.25 | 14 February 2017 |
| 680,000 | - | 35,000 | - | 50,000 | 595,000 | $0.25 | 18 May 2017 |
| 230,000 | - | - | - | - | 230,000 | $0.25 | 11 October 2017 |
| 130,000 | - | - | - | - | 130,000 | $0.25 | 29 October 2017 |
| 910,000 | - | - | - | - | 910,000 | $0.60 | 22 February 2013 |
| 100,000 | - | - | - | - | 100,000 | $0.50 | 11 June 2013 |
| 980,000 | - | 50,000 | - | - | 930,000 | $0.25 | 22 April 2014 |
| 125,000 | - | - | - | - | 125,000 | $0.25 | 15 July 2014 |
| 150,000 | - | - | - | - | 150,000 | $0.25 | 04 June 2015 |
| 150,000 | - | - | - | - | 150,000 | $0.40 | 04 June 2015 |
| 150,000 | - | - | - | - | 150,000 | $0.25 | 05 January 2015 |
| 150,000 | - | - | - | - | 150,000 | $0.50 | 05 January 2015 |
| 100,000 | - | - | - | - | 100,000 | $0.25 | 05 January 2015 |
| 100,000 | - | - | - | - | 100,000 | $0.50 | 05 January 2015 |
| - | 300,000 | - | - | - | 300,000 | $0.25 | 01 February 2016 |
| - | 3,100,000 | - | - | 75,000 | 3,025,000 | $0.30 | 24 February 2016 |
| - | 125,000 | - | - | - | 125,000 | $0.30 | 15 March 2014 |
| 5,430,500 | 3,525,000 | 85,000 | - | 420,000 | 8,450,500 | | |
PERFORMANCE SHARES
During the previous year, of the total of 2,697,990 performance shares reserved for issuance and exercisable at $0.01 per share, 750,000 performance shares have been exercised and issued and 300,000 performance shares were authorized for issuance to the new Vice President of Engineering. 1,647,990 remain available for issuance. At the discretion of the Board, these shares may be issued to such arm’s length parties as the Board considers desirable to attract consultants to the Company.
COMPENSATION OPTIONS
On 30 December 2009, 315,000 compensation options were issued as finder’s fees in connection with the non-brokered private placement of 5,360,000 units. Each compensation option entitles the holder thereof to acquire one unit at a price of $0.20 per unit until 30 December 2011. Each unit consists of one common share of the Company and one-half of one warrant, with each whole warrant entitling the holder thereof to acquire an additional common share at a price of $0.35 until 30 December 2010 and at a price of $0.45 until 30 December 2011.
23
DISCLOSURE CONTROLS AND PROCEDURES
Disclosure controls and procedures are designed to provide reasonable assurance that all relevant information is gathered and reported on a timely basis to senior management, so that appropriate decisions can be made regarding public disclosure. As at the end of the period covered by this management’s discussion and analysis, management has evaluated the effectiveness of the Company’s disclosure controls and procedures as required by Canadian securities laws.
Based on the evaluation of the disclosure controls performed to date, the Company is determined to strengthen internal controls over financial reporting. Management has engaged the services of an additional external accounting firm to obtain more specific and detailed advice as to increasing the effectiveness of the Company’s internal control.
INTERNAL CONTROLS AND PROCEDURES
Internal controls and procedures are designed to provide reasonable assurance regarding the reliability of financial reporting and the preparation of financial statements in accordance with the Canadian GAAP. As at the end of the year covered by this management’s discussion and analysis, management had designed and implemented internal controls and procedures as required by Canadian securities laws.
The Company has evaluated the design of its internal controls and procedures over financial reporting for the year ended 30 April 2011. All internal control systems, no matter how well designed, have inherent limitations. Therefore, even those systems determined to be effective can provide only reasonable assurance with respect to financial statement preparation and presentation. Management continues to review and refine its internal controls and procedures.
RISKS AND UNCERTAINTIES
The mineral industry is intensely competitive in all its phases. The Company competes with many other companies who have greater financial resources and experience. The market price of precious metals and other minerals is volatile and cannot be controlled. Exploration for minerals is a speculative venture.
There is no certainty that the money spent on exploration and development will result in the discovery of an economic ore body.
The Company’s activities outside of Canada make it subject to foreign currency fluctuations and this may materially affect its financial position and results.
The Company has limited financial resources, no source of operating cash flows and no assurances that sufficient funding, including adequate financing, will be available to conduct further exploration and development of its projects or to fulfill its obligations under the terms of any option or joint venture agreements. If the Company’s generative exploration programs are successful, additional funds will be required for development of one or more projects. Failure to obtain additional financing could result in the delay or indefinite postponement of further exploration and development or the possible loss of the Company’s properties.
OUTLOOK
The Company ended 30 April 2011 with a strong cash position that will enable it to continue its own acquisition and exploration effects in North America and other jurisdictions.
SUBSEQUENT EVENT
On 13 July 2011, the Company closed the first tranche of a non-brokered private placement of 2,583,333 non flow-through units at $0.30 per unit, with each unit consisting of one fully paid and non-assessable common share in the capital of the Company and one-half of one share purchase warrant, each whole warrant entitling the holder thereof to purchase one additional common share of the Company for 18 months at an exercise of $0.40. A total of 4,332,141 flow-through units at $0.35 per unit were also placed in the first tranche closing. Each flow-through unit consists of one fully paid and non-assessable common share in the capital of the Company and one-half of one share purchase warrant, each whole warrant entitling the holder thereof to purchase one additional non flow-through common share of the Company at $0.45 per share for a period of 18 months.
24
NEW PROJECT ACQUISITION PROGRAM
The current downturn in the metals market is providing an excellent opportunity to acquire high quality projects under excellent terms. Several properties located in Mexico, Central America, the United States, and Canada, are under review and the Company expects to complete new property acquisitions in the upcoming months. Several producing or near production properties with significant exploration potential are being evaluated, as are several drill-stage projects.
25
(An Exploration Stage Company)
CONSOLIDATED FINANCIAL STATEMENTS
30 April 2011 and 2010
(Expressed in Canadian Funds)
| JAMES STAFFORD | |
| | James Stafford, Inc.
Chartered Accountants
Suite 350 – 1111 Melville Street
Vancouver, British Columbia
Canada V6E 3V6
Telephone +1 604 669 0711
Facsimile +1 604 669 0754
www.jamesstafford.ca |
Independent Auditor’s Report
To the Shareholders of Pacific North West Capital Corp.
We have audited the accompanying consolidated financial statements of Pacific North West Capital Corp. (the “Company”), which comprise the consolidated balance sheets as at 30 April 2011 and 2010 and the consolidated statements of changes in shareholders’ equity, loss and comprehensive loss, and cash flows for each of the years in the three-year period ended 30 April 2011, and a summary of significant accounting policies and other explanatory information.
Management’s Responsibility for the Consolidated Financial Statements
Management is responsible for the preparation and fair presentation of these consolidated financial statements in accordance with Canadian generally accepted accounting principles, and for such internal control as management determines is necessary to enable the preparation of consolidated financial statements that are free from material misstatement, whether due to fraud or error.
Auditor’s Responsibility
Our responsibility is to express an opinion on these consolidated financial statements based on our audits. We conducted our audits in accordance with Canadian generally accepted auditing standards and the standards of the Public Company Accounting Oversight Board (United States). Those standards require that we comply with ethical requirements and plan and perform the audit to obtain reasonable assurance about whether the consolidated financial statements are free from material misstatement.
An audit involves performing procedures to obtain audit evidence about the amounts and disclosures in the consolidated financial statements. The procedures selected depend on the auditor’s judgment, including the assessment of the risks of material misstatement of the consolidated financial statements, whether due to fraud or error. In making those risk assessments, the auditor considers internal control relevant to the entity’s preparation and fair presentation of the consolidated financial statements in order to design audit procedures that are appropriate in the circumstances, but not for the purpose of expressing an opinion on the effectiveness of the entity’s internal control. An audit also includes evaluating the appropriateness of accounting policies used and the reasonableness of accounting estimates made by management, as well as evaluating the overall presentation of the consolidated financial statements.
We believe that the audit evidence we have obtained in our audits is sufficient and appropriate to provide a basis for our audit opinion.
Opinion
In our opinion, the consolidated financial statements present fairly, in all material respects, the financial position of the Company as at 30 April 2011 and 2010 and the results of its operations and its cash flows for each of the year in the three-year period ended 30 April 2011 in accordance with Canadian generally accepted accounting principles.
Chartered Accountants

Vancouver, Canada
14 July 2011
| Pacific North West Capital Corp. | Statement 1 |
| (An Exploration Stage Company) | |
| Consolidated Balance Sheets | |
| As at 30 April | |
| (Canadian Funds) | |
| | | | | | | |
| ASSETS | | 2011 | | | 2010 | |
| Current | | | | | | |
| Cash and cash equivalents(Note 3) | $ | 3,880,196 | | $ | 4,475,681 | |
| Amounts receivable | | 219,746 | | | 89,162 | |
| Prepaid expenses, advances and deposits | | 173,765 | | | 40,030 | |
| Investments(Note 4) | | 4,815,763 | | | 2,741,694 | |
| | | 9,089,470 | | | 7,346,567 | |
| | | | | | | |
| Mineral Property Costs- Statement 5(Note 5) | | 6,362,048 | | | 3,899,594 | |
| Property, Plant and Equipment(Note 6) | | 124,123 | | | 106,893 | |
| | $ | 15,575,641 | | $ | 11,353,054 | |
| | | | | | | |
| LIABILITIES | | | | | | |
| Current | | | | | | |
| Accounts payable and accrued liabilities | $ | 403,338 | | $ | 96,951 | |
| Commitments (Note 10) | | | | | | |
| Subsequent Event (Note 12) | | | | | | |
| | | | | | | |
| SHAREHOLDERS' EQUITY | | | | | | |
| Share Capital - Statement 2 (Note 8) | | | | | | |
| Authorized: | | | | | | |
| Unlimited number of common voting shares | | | | | | |
| Unlimited number of preferred voting shares | | | | | | |
| Issued and fully paid: | | | | | | |
| 85,737,788 (30 April 2010 – 67,543,008) common shares | | 30,276,368 | | | 25,170,802 | |
| Contributed Surplus | | 5,601,728 | | | 4,485,390 | |
| AccumulatedOther Comprehensive Loss | | 1,454,444 | | | (393,502 | ) |
| Deficit Accumulated During Exploration Stage | | (22,160,237 | ) | | (18,006,587 | ) |
| | | 15,172,303 | | | 11,256,103 | |
| | $ | 15,575,641 | | $ | 11,353,054 | |
ON BEHALF OF THE BOARD:
| “Harry Barr” | , | Director |
| | | |
| “Jordan Point ” | , | Director |
- See Accompanying Notes -
| Pacific North West Capital Corp. | Statement 2 |
| (An Exploration Stage Company) | |
| Consolidated Statements of Changes in Shareholders’ Equity | |
| | |
| (Canadian Funds) | |
| | |
| | | | | | | | | | | | | | | | | | | |
| | | | | | | | | | | | Other | | | | | | | |
| | | Common Shares | | | Contributed | | | Comprehensive | | | Accumulated | | | | |
| | | Number | | | Amount | | | Surplus | | | Income | | | Deficit | | | Total | |
| Balance – 30 April 2008 | | 61,658,008 | | $ | 25,677,015 | | $ | 3,075,349 | | $ | (11,146 | ) | $ | (11,881,102 | ) | $ | 16,860,116 | |
| Issuance of shares for: | | | | | | | | | | | | | | | | | | |
| - Properties | | 100,000 | | | 9,500 | | | – | | | – | | | – | | | 9,500 | |
| - Performance shares(Note 8e) | | 100,000 | | | 18,000 | | | (7,500 | ) | | – | | | – | | | 10,500 | |
| Share issuance costs | | – | | | (5,234 | ) | | – | | | – | | | – | | | (5,234 | ) |
| Stock-based compensation costs | | – | | | – | | | 722,377 | | | – | | | – | | | 722,377 | |
| Future income tax on flow-through | | – | | | (920,000 | ) | | – | | | – | | | – | | | (920,000 | ) |
| Unrealized loss on available-for-sale securities | | – | | | – | | | – | | | (596,027 | ) | | – | | | (596,027 | ) |
| Reclassification of gain on available-for-sale securities | | – | | | – | | | – | | | (147,839 | ) | | – | | | (147,839 | ) |
| Loss for the year | | – | | | – | | | – | | | – | | | (5,354,466 | ) | | (5,354,466 | ) |
| Balance – 30 April 2009 | | 61,858,008 | | $ | 24,779,281 | | $ | 3,790,226 | | $ | (755,012 | ) | $ | (17,235,568 | ) | $ | 10,578,927 | |
| Issuance of shares for: | | | | | | | | | | | | | | | | | | |
| - Private placements(Note 8a) | | 860,000 | | | 172,000 | | | – | | | – | | | – | | | 172,000 | |
| - F/T private placements(Note 8a) | | 4,500,000 | | | 900,000 | | | – | | | – | | | – | | | 900,000 | |
| - Properties(Note 8b) | | 125,000 | | | 14,750 | | | – | | | – | | | – | | | 14,750 | |
| - Performance shares(Note 8e) | | 200,000 | | | 25,000 | | | – | | | – | | | – | | | 25,000 | |
| - Value assigned to warrants (Note 8g) | | – | | | (367,403 | ) | | 367,403 | | | – | | | – | | | – | |
| Share issuance costs | | – | | | (87,326 | ) | | 42,326 | | | – | | | – | | | (45,000 | ) |
| Stock-based compensation costs | | – | | | – | | | 275,435 | | | – | | | – | | | 275,435 | |
| Performance shares allotted(Note 8e) | | – | | | – | | | 10,000 | | | – | | | – | | | 10,000 | |
| Future income tax on flow-through | | – | | | (265,500 | ) | | – | | | – | | | – | | | (265,500 | ) |
| Unrealized gain on available-for- sale securities | | – | | | – | | | – | | | 321,831 | | | – | | | 321,831 | |
| Reclassification of loss on available-for-sale securities | | – | | | – | | | – | | | 39,679 | | | – | | | 39,679 | |
| Net loss for the year | | – | | | – | | | – | | | – | | | (771,019 | ) | | (771,019 | ) |
| Balance – 30 April 2010 | | 67,543,008 | | $ | 25,170,802 | | $ | 4,485,390 | | $ | (393,502 | ) | $ | (18,006,587 | ) | $ | 11,256,103 | |
| Issuance of shares for: | | | | | | | | | | | | | | | | | | |
| - Private placements(Note 8a) | | 9,248,333 | | | 2,774,500 | | | - | | | - | | | - | | | 2,774,500 | |
| - F/T private placements(Note 8a) | | 644,286 | | | 225,500 | | | - | | | - | | | - | | | 225,500 | |
| - Properties(Note 8b) | | 100,000 | | | 11,000 | | | – | | | – | | | – | | | 11,000 | |
| - River Valley acquisition(Notes 5c, 8b and 8g) | | 8,117,161 | | | 2,435,148 | | | 675,570 | | | - | | | - | | | 3,110,718 | |
| - Exercise of stock option | | 85,000 | | | 21,250 | | | - | | | - | | | - | | | 21,250 | |
| - Value assigned to warrants(Note 8g) | | - | | | (331,618 | ) | | 331,618 | | | - | | | - | | | - | |
| Share issuance costs | | - | | | (30,214 | ) | | - | | | - | | | - | | | (30,214 | ) |
| Stock-based compensation costs(Note 8f) | | – | | | – | | | 68,650 | | | – | | | – | | | 68,650 | |
| Performance shares allotted(Note 8e) | | – | | | – | | | 40,500 | | | – | | | – | | | 40,500 | |
| Unrealized gain on available-for- sale securities | | – | | | – | | | – | | | 1,892,226 | | | – | | | 1,892,226 | |
| Reclassification of gain on available-for-sale securities | | – | | | – | | | – | | | (44,280 | ) | | – | | | (44,280 | ) |
| Net loss for the year | | – | | | – | | | – | | | – | | | (4,153,650 | ) | | (4,153,650 | ) |
| Balance – 30 April 2011 | | 85,737,788 | | $ | 30,276,368 | | $ | 5,601,728 | | $ | 1,454,444 | | $ | (22,160,237 | ) | $ | 15,172,303 | |
- See Accompanying Notes -
| Pacific North West Capital Corp. | Statement 3 |
| (An Exploration Stage Company) | |
| Consolidated Statements of Loss and Comprehensive Loss | |
| | |
| (Canadian Funds) | |
| | | Years Ended 30 April | |
| | | 2011 | | | 2010 | | | 2009 | |
| General and Administrative Expenses | | | | | | | | | |
| Consulting fees | $ | 318,031 | | $ | 370,635 | | $ | 438,039 | |
| Consulting fees - Stock compensation(Note 8f) | | 4,719 | | | 69,177 | | | 258,744 | |
| Corporate development | | 71,895 | | | - | | | - | |
| Investor & shareholder relations | | 192,814 | | | 263,840 | | | 305,376 | |
| Investor & shareholder relations - Stock compensation(Note 8f) | | - | | | 24,615 | | | 70,883 | |
| Travel, lodging & food | | 78,155 | | | 49,310 | | | 270,832 | |
| Management fees (Note 7a) | | 200,071 | | | 189,698 | | | 214,972 | |
| Director fees(Note 7f) | | 23,000 | | | 29,000 | | | 25,750 | |
| Director fees - Stock compensation(Note 8f) | | - | | | 57,000 | | | 243,757 | |
| Salaries & benefits | | 182,782 | | | 187,032 | | | 268,738 | |
| Salaries & benefits - Stock compensation(Note 8f) | | 63,931 | | | 122,693 | | | 148,993 | |
| Performance shares benefit(Note 8e) | | 40,500 | | | 34,950 | | | 9,500 | |
| Accounting & audit | | 23,500 | | | 32,576 | | | 48,922 | |
| Office | | 66,483 | | | 72,978 | | | 60,079 | |
| Transfer agent and regulatory fees | | 57,532 | | | 59,186 | | | 53,579 | |
| Rent | | 37,537 | | | 53,198 | | | 78,451 | |
| Telephone & utilities | | 16,638 | | | 19,357 | | | 25,631 | |
| Legal | | 43,087 | | | 21,622 | | | 6,523 | |
| Vehicle lease | | 12,229 | | | 12,552 | | | 13,935 | |
| Amortization | | 33,283 | | | 41,406 | | | 44,200 | |
| Insurance, licenses & fees | | 60,291 | | | 78,776 | | | 60,643 | |
| Loss Before the Following | | (1,526,478 | ) | | (1,789,601 | ) | | (2,647,547 | ) |
| Other Income (Expenses) | | | | | | | | | |
| Mineral property costs written off | | (2,549,552 | ) | | (1,898,539 | ) | | (4,025,189 | ) |
| Gain (loss) on sale of available-for-sale securities(Note 4) | | 44,280 | | | (39,679 | ) | | 147,839 | |
| Unrealized loss on share purchase warrants | | (112,993 | ) | | (47,484 | ) | | – | |
| Interest and other income | | 52,293 | | | 52,616 | | | 222,252 | |
| Project management fees | | - | | | 6,680 | | | 25,628 | |
| Foreign exchange, net | | (51,645 | ) | | (62,644 | ) | | 83,168 | |
| Interest and bank charges | | (9,555 | ) | | (38,513 | ) | | (1,145 | ) |
| | | (2,627,172 | ) | | (2,027,563 | ) | | (3,547,447 | ) |
| Loss Before Income Taxes | | (4,153,650 | ) | | (3,817,164 | ) | | (6,194,994 | ) |
| Future Income Tax Recovery(Note 9) | | - | | | 265,500 | | | 920,000 | |
| Loss From Continuing Operations | $ | (4,153,650 | ) | $ | (3,551,664 | ) | $ | (5,274,994 | ) |
| Gain (Loss) From Discontinued Operation(Note14) | $ | - | | $ | 2,780,645 | | $ | (79,472 | ) |
| Loss for the Year | $ | (4,153,650 | ) | $ | (771,019 | ) | $ | (5,354,466 | ) |
| Other Comprehensive Income (Loss) | | | | | | | | | |
| Unrealized gain (loss) on available-for-sale securities | | 1,892,226 | | | 321,831 | | | (596,027 | ) |
| Reclassification of (gain) loss on available-for-sale securities | | (44,280 | ) | | 39,679 | | | (147,839 | ) |
| Comprehensive Loss for the Year | $ | (2,305,704 | ) | $ | (409,509 | ) | $ | (6,098,332 | ) |
| Loss per Share - Basic and Fully Diluted | | | | | | | | | |
| Continuing Operations | $ | (0.06 | ) | $ | (0.06 | ) | $ | (0.09 | ) |
| Discontinued Operations | $ | - | | $ | 0.04 | | $ | (0.00 | ) |
| Weighted Average Number of Shares Outstanding | | | | | | | | | |
| Basic | | 69,399,792 | | | 62,675,963 | | | 61,721,508 | |
| Diluted | | 69,399,792 | | | 62,954,534 | | | 61,721,508 | |
- See Accompanying Notes -
| Pacific North West Capital Corp. | Statement 4 |
| (An Exploration Stage Company) | |
| Consolidated Statements of Cash Flows | |
| (Canadian Funds) | |
| | | Years Ended 30 April | |
| Cash Resources Provided By (Used In) | | 2011 | | | 2010 | | | 2009 | |
| Operating Activities | | | | | | | | | |
| Loss for the year | $ | (4,153,650 | ) | $ | (771,019 | ) | $ | (5,354,466 | ) |
| Items not affecting cash | | | | | | | | | |
| Mineral property costs written off | | 2,549,552 | | | 1,898,539 | | | 4,025,189 | |
| Stock-based compensation costs | | 68,650 | | | 275,435 | | | 722,377 | |
| (Gain) loss on sale of available-for-sale securities | | (44,280 | ) | | 39,679 | | | (147,839 | ) |
| Unrealized loss on share purchase warrants | | 112,993 | | | 47,484 | | | – | |
| Amortization | | 33,283 | | | 41,406 | | | 107,080 | |
| Consulting fees – performance shares issued/allotted | | 40,500 | | | 33,000 | | | 9,500 | |
| Other income received in shares | | (30,000 | ) | | – | | | – | |
| Future income tax recovery on flow-through shares | | – | | | (265,500 | ) | | (920,000 | ) |
| Foreign exchange gain | | – | | | – | | | (16,357 | ) |
| Accretion expense | | – | | | – | | | 66,632 | |
| Gain on disposition of discontinued operation | | – | | | (2,603,426 | ) | | – | |
| Amounts receivable | | (130,584 | ) | | (3,842 | ) | | 167,492 | |
| Prepaid expenses, advances and deposits | | (133,735 | ) | | 11,857 | | | 60,376 | |
| Accounts payable and accrued liabilities | | 306,387 | | | (57,479 | ) | | (93,260 | ) |
| | | (1,380,884 | ) | | (1,353,866 | ) | | (1,373,276 | ) |
| Investing Activities | | | | | | | | | |
| Business acquisition, net of cash received | | – | | | (220,330 | ) | | (338,280 | ) |
| Sale of available-for-sale securities | | 2,072,432 | | | 880,699 | | | 192,366 | |
| Purchase of property, plant and equipment | | (50,513 | ) | | (23,085 | ) | | (20,932 | ) |
| Purchase of available-for-sale securities | | (2,337,268 | ) | | (208,665 | ) | | (33,973 | ) |
| Mineral property costs | | (1,890,288 | ) | | (1,487,026 | ) | | (1,895,727 | ) |
| Net proceeds on sale of discontinued operation | | - | | | 343,534 | | | – | |
| | | (2,205,637 | ) | | (714,873 | ) | | (2,096,546 | ) |
| Financing Activities | | | | | | | | | |
| Share capital issued,net of issuance costs | | 2,991,036 | | | 1,029,000 | | | (4,234 | ) |
| | | | | | | | | | |
| Net Increase (Decrease) in Cash and Cash Equivalents | | (595,485 | ) | | (1,039,739 | ) | | (3,474,056 | ) |
| Cash and cash equivalents – Beginning of year | | 4,475,681 | | | 5,515,420 | | | 9,014,599 | |
| Cash and cash equivalents – Discontinued operation | | - | | | – | | | (25,123 | ) |
| Cash and Cash Equivalents - End of Year | $ | 3,880,196 | | $ | 4,475,681 | | $ | 5,515,420 | |
| | | | | | | | | | |
| Supplemental Disclosure of Non-Cash Investing and Financing Activities | | | | | | | | | |
| | | | | | | | | | |
| Exploration expenditures included in accounts payable | $ | - | | $ | 658 | | $ | 6,648 | |
| Shares issued for mineral properties | $ | 2,446,148 | | $ | 14,750 | | $ | 9,500 | |
| Share purchase warrants issued for mineral properties | $ | 675,570 | | $ | – | | $ | – | |
| Business acquisition costs included in accounts payable | $ | - | | $ | – | | $ | 259,870 | |
| Shares received for disposition of discontinued operation | $ | - | | $ | 2,694,300 | | $ | – | |
| Share purchase warrants received for disposition of discontinued operation | $ | - | | $ | 225,590 | | $ | – | |
- See Accompanying Notes -
| Pacific North West Capital Corp. | Statement 5 |
| (An Exploration Stage Company) | |
| Consolidated Schedules of Mineral Property Costs | |
| For the Years Ended 30 April | |
| Canadian Funds | |
| | | 2011 | | | | |
| | | Acquisition Costs | | | Exploration Costs | | | Total | | | 2010 Total | |
| British ColumbiaProperty: | | | | | | | | | | | | |
| BC Rock & Roll | | | | | | | | | | | | |
| Cash payments | $ | 40,000 | | $ | - | | $ | 40,000 | | $ | 10,000 | |
| Shares issued for properties | | 5,500 | | | - | | | 5,500 | | | 4,500 | |
| Drilling | | - | | | - | | | - | | | 254,910 | |
| Geophysical | | - | | | - | | | - | | | 93,169 | |
| Field expenses | | - | | | - | | | - | | | 33,290 | |
| Engineering and geological consulting | | - | | | 156,871 | | | 156,871 | | | 55,806 | |
| | | 45,500 | | | 156,871 | | | 202,371 | | | 451,675 | |
| Ontario Properties: | | | | | | | | | | | | |
| River Valley | | | | | | | | | | | | |
| Cash payments | | 79,270 | | | - | | | 79,270 | | | - | |
| Shares and warrants issued for properties | | 3,110,718 | | | - | | | 3,110,718 | | | - | |
| Engineering and geological consulting | | - | | | 902,055 | | | 902,055 | | | - | |
| | | 3,189,988 | | | 902,055 | | | 4,092,043 | | | - | |
| West Timmins Nickel | | | | | | | | | | | | |
| Engineering and geological consulting | | - | | | - | | | - | | | 2,250 | |
| Coldwell Project | | | | | | | | | | | | |
| Engineering and geological consulting | | - | | | - | | | - | | | 6,583 | |
| Swayze Joint Ventures | | | | | | | | | | | | |
| Engineering and geological consulting | | - | | | - | | | - | | | 1,173 | |
| Raglan Hills | | | | | | | | | | | | |
| Engineering and geological consulting | | - | | | - | | | - | | | 111 | |
| Ontario Project | | | | | | | | | | | | |
| Field expenses | | - | | | - | | | - | | | 735 | |
| Engineering and geological consulting | | - | | | - | | | - | | | 974 | |
| | | - | | | - | | | - | | | 1,709 | |
| East Sudbury Ontario | | | | | | | | | | | | |
| Engineering and geological consulting | | - | | | - | | | - | | | 864 | |
| Amounts recovered or received | | - | | | - | | | - | | | (38,280 | ) |
| | | - | | | - | | | - | | | (37,416 | ) |
| Quebec Properties: | | | | | | | | | | | | |
| SOQUEM – Taureau | | | | | | | | | | | | |
| Engineering and geological consulting | | - | | | - | | | - | | | 376 | |
| Glitter Lake | | | | | | | | | | | | |
| Cash payments | | 23,310 | | | - | | | 23,310 | | | - | |
| Field expenses | | - | | | - | | | - | | | 161 | |
| Quebec credit | | - | | | - | | | - | | | (14,462 | ) |
| Engineering and geological consulting | | - | | | - | | | - | | | 4,540 | |
| | | 23,310 | | | - | | | 23,310 | | | (9,761 | ) |
| Fiedmont | | | | | | | | | | | | |
| Field expenses | | - | | | - | | | - | | | 1,187 | |
| Quebec credit | | - | | | (47,535 | ) | | (47,535 | ) | | - | |
| Assay and geochemical | | - | | | - | | | - | | | 1,080 | |
| Drilling | | - | | | - | | | - | | | 14,778 | |
| Engineering and geological consulting | | - | | | 1,000 | | | 1,000 | | | 16,159 | |
| | | - | | | (46,535 | ) | | (46,535 | ) | | 33,204 | |
| | | | | | | | | | | | | |
| Balance Carried Forward | $ | 3,258,798 | | $ | 1,012,391 | | $ | 4,271,189 | | $ | 449,904 | |
- See Accompanying Notes -
| Pacific North West Capital Corp. |
| (An Exploration Stage Company) |
| Consolidated Schedules of Mineral Property Costs- continued |
| For the Years Ended 30 April |
| Canadian Funds |
| | | 2011 | | | | |
| | | Acquisition Costs | | | Exploration Costs | | | Total | | | 2010
Total | |
| Balance Forward | $ | 3,258,798 | | $ | 1,012,391 | | $ | 4,271,189 | | $ | 449,904 | |
| Quebec Properties – Continued: | | | | | | | | | | | | |
| Destiny Gold | | | | | | | | | | | | |
| Cash option payments | | 25,000 | | | - | | | 25,000 | | | 40,704 | |
| Shares issued for properties | | 5,500 | | | - | | | 5,500 | | | 2,750 | |
| Field expenses | | - | | | 2,174 | | | 2,174 | | | 5,341 | |
| Assays | | - | | | 9,640 | | | 9,640 | | | - | |
| Drilling | | - | | | - | | | - | | | 751,169 | |
| Engineering and geological consulting | | - | | | 428,702 | | | 428,702 | | | 158,285 | |
| | | 30,500 | | | 440,516 | | | 471,016 | | | 958,249 | |
| Saskatchewan Property: | | | | | | | | | | | | |
| Nickel Plats | | �� | | | | | | | | | | |
| Cash payments | | 20,000 | | | - | | | 20,000 | | | 15,000 | |
| Shares issued for property | | - | | | - | | | - | | | 7,500 | |
| Engineering and geological consulting | | - | | | - | | | - | | | 2,051 | |
| | | 20,000 | | | - | | | 20,000 | | | 24,551 | |
| Alaska Properties: | | | | | | | | | | | | |
| Reconnaissance (Kane, Tonsina, S.E. Alaska) | | | | | | | | | | | | |
| Property fees | | - | | | 17,080 | | | 17,080 | | | 12,005 | |
| Engineering and geological consulting | | - | | | 39,086 | | | 39,086 | | | 2,821 | |
| | | - | | | 56,166 | | | 56,166 | | | 14,826 | |
| Union Bay | | | | | | | | | | | | |
| Engineering and geological consulting | | - | | | 7,457 | | | 7,457 | | | 2,468 | |
| Property fees | | - | | | 12,643 | | | 12,643 | | | 14,156 | |
| Amounts recovered or received | | - | | | (13,158 | ) | | (13,158 | ) | | - | |
| | | - | | | 6,942 | | | 6,942 | | | 16,624 | |
| Africa Property: | | | | | | | | | | | | |
| Burkina Faso | | | | | | | | | | | | |
| Cash payments | | 75,000 | | | - | | | 75,000 | | | - | |
| Consulting & travel | | - | | | 111,693 | | | 111,693 | | | - | |
| | | 75,000 | | | 111,693 | | | 186,693 | | | - | |
| | | | | | | | | | | | | |
| Cost for the year | | 3,384,298 | | | 1,627,708 | | | 5,012,006 | | | 1,464,154 | |
| | | | | | | | | | | | | |
| Balance – Beginning of year | | 846,007 | | | 3,053,587 | | | 3,899,594 | | | 4,333,979 | |
| | | | | | | | | | | | | |
| Mineral property costs written off | | (831,362 | ) | | (1,718,190 | ) | | (2,549,552 | ) | | (1,898,539 | ) |
| | | | | | | | | | | | | |
| Balance – End of year | $ | 3,398,943 | | $ | 2,963,105 | | $ | 6,362,048 | | $ | 3,899,594 | |
- See Accompanying Notes -
Pacific North West Capital Corp.
(An Exploration Stage Company)
Notes to Consolidated Financial Statements
30 April 2011 and 2010
Canadian Funds |
| |
| 1. | Nature and Continuance of Operations and Significant Accounting Policies |
| | a) | Nature and Continuance of Operations |
| | Pacific North West Capital Corp. (the “Company”) was incorporated under the Business Corporations Act (Alberta) on 29 May 1996 and on 13 July 2004, the Company continued out of the Province of Alberta and into the Province of British Columbia. The Company is in the process of acquiring, exploring and developing Platinum Group Metals (“PGMs”), precious and base metals mineral properties. The Company will attempt to bring the properties to production, structure joint ventures with others, option or lease properties to third parties, or sell the properties outright. The Company has not determined whether these properties contain ore reserves that are economically recoverable and the Company is considered to be in the exploration stage. |
| | b) | Principles of Consolidation |
| | The consolidated financial statements of the Company and the accompanying notes have been prepared in accordance with generally accepted accounting principles in Canada (“Canadian GAAP”). |
| | Consolidated financial statements include the assets, liabilities and results of operations of all entities controlled by the Company. The effects of transactions between entities in the consolidated group are eliminated. Where control of an entity is obtained during a financial year, its results are included in the consolidated statements of loss and deficit from the date on which control commences. Where control of an entity ceases during a financial year, its results are included for that part of the year during which control exists. |
| | The consolidated financial statements for the year ended 30 April 2011 are prepared on a consolidated basis and include the accounts of the Company and its wholly owned US subsidiaries, Pacific North West Capital Corp. USA and Pacific North West Capital de México, S.A. de C.V. on the basis that the Company owned and effectively controlled a 100% interest in these companies. |
| | c) | Cash and Cash Equivalents |
| | For purposes of reporting cash flows, the Company considers cash and cash equivalents to include amounts held in banks and highly liquid investments with remaining maturities at point of purchase of 90 days or less. The Company places its cash and cash investments with institutions of high-credit worthiness. |
| | d) | Mineral Properties and Deferred Exploration Expenditures |
| | Direct costs related to the acquisition and exploration of mineral properties held or controlled by the Company are deferred on an individual property basis until the viability of a property is determined. Administration costs and general exploration costs are expensed as incurred. When a property is placed in commercial production, deferred costs will be depleted using the units-of-production method. Management of the Company periodically reviews the recoverability of the capitalized mineral properties. Management takes into consideration various information including, but not limited to, results of exploration activities conducted to date, estimated future metal prices, and reports and opinions of outside geologists, mine engineers and consultants. When it is determined that a project or property will be abandoned then the costs are written off, or if its carrying value has been impaired, then the mineral properties and deferred costs are written down to fair value. |
| | Although the Company has taken steps to verify title to mineral properties in which it has an interest, these procedures do not guarantee the Company's title. Such properties may be subject to prior agreements or transfers and title may be affected by undetected defects. |
Pacific North West Capital Corp.
(An Exploration Stage Company)
Notes to Consolidated Financial Statements
30 April 2011 and 2010
Canadian Funds |
| |
| 1. | Nature and Continuance of Operations and Significant Accounting Policies – Continued |
| | d) | Mineral Properties and Deferred Exploration Expenditures – Continued |
| | From time to time, the Company acquires or disposes of properties pursuant to the terms of option agreements. Options are exercisable entirely at the discretion of the optionee and, accordingly, are recorded as mineral property costs or recoveries when the payments are made or received. After costs are recovered, the balance of the payments received are recorded as a gain on option or disposition of mineral property. |
| | e) | Mineral Exploration Tax Credits (“METC”) |
| | The Company recognizes METC amounts and applies those amounts against exploration costs when the Company’s application for tax credits is approved by the Canada Revenue Agency. Assessments, if any, for taxes, penalties and interest are deducted from the tax credits when assessed. |
| | f) | Property, Plant and Equipment |
| | Property, plant and equipment is valued at cost less accumulated amortization. The Company provides amortization of furniture and office equipment and automotive equipment using the declining balance method at 20% and 30%, respectively. |
| | Income taxes are accounted for using the asset and liability method. Future taxes are recognized for the tax consequences of “temporary differences” by applying enacted or substantively enacted statutory tax rates applicable to future years to differences between the financial statement carrying amounts and tax basis of existing assets and liabilities. The effect on future taxes for a change in tax rates is recognized in income in the period that includes the date of enactment or substantive enactment. In addition, the method requires the recognition of future tax benefits to the extent that realization of such benefits is more likely than not. A valuation allowance is provided to the extent that it is more likely than not that future income tax assets will not be realized. |
| | h) | Foreign Currency Translation |
| | The Company's subsidiaries are integrated foreign operations and their results and financial position are translated into the Company’s functional currency, the Canadian dollar, using the temporal basis as follows: |
| | - Monetary assets and liabilities at year-end rates,
- All other assets and liabilities at historical rates, and
- Expense and exploration and development items at the average rate of exchange prevailing during the year.
|
| | Exchange gains and losses arising from these translations are reflected in income or expense in the period that they occur. |
| | i) | Stock-Based Compensation |
| | All stock-based awards made to employees and non-employees are measured and recognized using a fair value based method. For employees, the fair value of the options is measured at the date of the grant. For non-employees, the fair value of the options is measured on the earlier of the date at which the counterparty performance is complete or the date the performance commitment is reached or the date at which the equity instruments are granted if they are fully vested and non-forfeitable. For employees and non-employees, the fair value of the options is accrued and charged to operations, with the offsetting credit to contributed surplus, over the applicable vesting period. If and when the stock options are ultimately exercised, the applicable amounts of contributed surplus are transferred to share capital. |
Pacific North West Capital Corp.
(An Exploration Stage Company)
Notes to Consolidated Financial Statements
30 April 2011 and 2010
Canadian Funds |
| |
| 1. | Nature and Continuance of Operations and Significant Accounting Policies – Continued |
| | Basic earnings (loss) per share is computed by dividing income (loss) available to common shareholders by the weighted average number of common shares outstanding during the year. The computation of diluted earnings per share which assumes the conversion, exercise or contingent issuance of securities only when such conversion, exercise or issuance would have a dilutive effect on earnings per share. The dilutive effect of convertible securities is reflected in diluted earnings per share by application of the "if converted" method. In years in which a loss is incurred, the effect of potential issuances of shares under options and warrants would be anti-dilutive, and therefore basic and diluted loss per share are the same. |
| | k) | Management's Estimates |
| | The preparation of financial statements in conformity with Canadian GAAP requires management to make estimates and assumptions that affect the reported amounts of assets and liabilities and disclosure of contingent assets and liabilities at the dates of the financial statements and the reported amounts of revenues and expenses during the reported periods. Actual results could differ from those estimates. |
| | Canadian Income Tax Legislation permits an enterprise to issue securities referred to as flow-through shares, whereby the investor can claim the tax deductions arising from the renunciation of the related resource expenditures. When resource expenditures are renounced to the investors and the Company has reasonable assurance that the expenditures will be completed, future income tax liabilities are recognized with a corresponding reduction in share capital. |
| | If a Company has sufficient unused tax losses and deductions (“losses”) to offset all or part of the future income tax liabilities and no future income tax assets have been previously recognized on such losses, a portion of such unrecognized losses (losses multiplied by the effective corporate tax rate) is recorded as income up to the amount of the future income tax liability that was previously recognized on the renounced expenditures. |
| | m) | Financial Instrument Standards |
| | Financial assets and liabilities are initially recognized at fair value and are subsequently measured based on their classification as held-to-maturity, loans and receivables, available-for-sale or held-for-trading, as described below. The classification is not changed subsequent to initial recognition. |
| | Held-to-Maturity and Loans and Receivables |
| | Financial instruments that have a fixed maturity date, where the Company intends and has the ability to hold to maturity, are classified as held-to-maturity and measured at amortized cost using the effective interest rate method. Loans and receivables are measured at amortized cost using the effective interest method. Amounts receivable are classified as loans and receivables. |
| | Financial assets classified as available-for-sale are carried at fair value (where determinable based on market prices of actively traded securities) with changes in fair value recorded in other comprehensive income. Available-for-sale securities are written down to fair value through earnings whenever it is necessary to reflect an other-than-temporary impairment. Transaction costs that are directly attributable to the acquisition or issue of a financial asset or financial liability are added to its fair value. Shares held in other public companies are classified in this category. |
Pacific North West Capital Corp.
(An Exploration Stage Company)
Notes to Consolidated Financial Statements
30 April 2011 and 2010
Canadian Funds |
| |
| 1. | Nature and Continuance of Operations and Significant Accounting Policies – Continued |
| | m) | Financial Instrument Standards – Continued |
| | Financial assets and financial liabilities that are purchased and incurred with the intention of generating profits in the near term are classified as held-for-trading. These instruments are measured at fair value with the change in the fair value recognized in income. Share purchase warrants of other public companies are classified in this category. |
| | Derivatives and Hedge Accounting |
| | The Company has no derivative instruments that are designated and qualify as hedging items. |
| | Comprehensive income is composed of the Company’s earnings and other comprehensive income. Other comprehensive income includes unrealized gains and losses on available-for-sale securities, foreign currency translation gains and losses on the net investment in self-sustaining operations and changes in the fair market value of derivate instruments designated as cash flow hedges, all net of income taxes. Cumulative changes in other comprehensive income are included in accumulated other comprehensive income which is presented (if applicable) as a new category in shareholders’ equity. |
| | n) | International Financial Reporting Standards (“IFRS”) |
| | In February 2008, the Canadian Accounting Standards Board (“AcSB”) announced that 2011 is the changeover date for publicly-listed companies to use IFRS, replacing Canada’s own GAAP. The date is for interim and annual financial statements relating to fiscal years beginning on or after 1 January 2011. The transition date of 1 January 2011 will require the restatement for comparative purposes of amounts reported by the Company for the year ended 30 April 2011. Although IFRS uses a conceptual framework similar to Canadian GAAP, there are significant differences in recognition, measurement and disclosure. The Company has developed the framework of a plan for IFRS convergence and has started the implementation process. |
| | Certain comparative figures have been adjusted to conform to the current year’s presentation. |
| | The Company’s financial instruments consist of cash and cash equivalents, amounts receivable, available-for-sale securities, share purchase warrants and accounts payable. The fair value of these financial instruments, with the exception of available-for-sale securities and share purchase warrants, approximates their carrying values, due to their short-term maturity or capacity of prompt liquidation. |
| | Disclosure of a three-level hierarchy for fair value measurements based upon transparency of inputs to the valuation of financial instruments carried on the balance sheet at fair value is as follows: |
| | | | Fair Value Measurement | | | 30 April 2011 | | | 30 April 2010 | |
| | Available-for-sale securities(Note 4) | | Level 1 | | $ | 4,164,605 | | $ | 2,466,360 | |
| | Available-for-sale securities(Note 4) | | Level 2 | | | 225,000 | | | – | |
| | Share purchase warrants(Note 4) | | Level 2 | | | 426,158 | | | 275,334 | |
Pacific North West Capital Corp.
(An Exploration Stage Company)
Notes to Consolidated Financial Statements
30 April 2011 and 2010
Canadian Funds |
| |
| 2. | Financial Instruments – Continued |
| | The three levels are defined as follows: |
| | Level 1: | inputs to the valuation methodology are quoted prices (unadjusted) for identical assets or liabilities in active markets. |
| | Level 2: | inputs to the valuation methodology include quoted prices for similar assets and liabilities in active markets, and inputs that are observable for the asset or liability, either directly or indirectly, for substantially the full term of the financial instrument. |
| | Level 3: | inputs to the valuation methodology are unobservable and significant to the fair value measurement. |
| | Credit risk is the risk of an unexpected loss if a customer or counterparty to a financial instrument fails to meet its contractual obligations and arises primarily from the Company’s cash and cash equivalents and amounts receivable. The Company manages its credit risk relating to cash and cash equivalents by dealing with only with highly-rated financial institutions. As at 30 April 2011, amounts receivable was mainly comprised of Harmonized Sales Tax receivable of $184,818 (30 April 2010 - $10,433). As a result, credit risk is considered insignificant. |
| | Liquidity risk is the risk that the Company will not be able to meet its financial obligations as they fall due. The Company manages liquidity risk by continuously monitoring actual and projected cash flows and matching the maturity profile of financial assets and liabilities. As at 30 April 2011, the Company had $3,880,196 in cash and cash equivalents (30 April 2010 - $4,475,681) to settle current liabilities of $403,338 (30 April 2010 - $96,951) and, accordingly, liquidity risk is considered insignificant. |
| | The Company is exposed to currency risk to the extent of its acquisition and exploration expenditures on its US properties and African property. The Company’s expenditures will be negatively impacted if the US dollar increases versus the Canadian dollar. |
| | The majority of the Company’s cash flows and financial assets and liabilities are denominated in Canadian dollars, which is the Company’s functional and reporting currency. Foreign currency risk is limited to the portion of the Company’s business transactions denominated in currencies other than the Canadian dollar. The Company has cash and cash equivalents held in US dollars. |
| | The Company’s objective in managing its foreign currency risk is to minimize its net exposures to foreign currency cash flows by holding most of its cash and cash equivalents in Canadian dollars. The Company monitors and forecasts the values of net foreign currency cash flow and balance sheet exposures and from time to time could authorize the use of derivative financial instruments such as forward foreign exchange contracts to economically hedge a portion of foreign currency fluctuations. |
| | The following table provides an indication of the Company’s significant foreign currency exposures during the years ended 30 April 2011 and 2010: |
| | | 2011 | | 2010 |
| | | | | |
| | Cash and cash equivalents | US$ 946,242 | | US$ 732,412 |
| | The Company has not, to the date of these consolidated financial statements, entered into derivative instruments to offset the impact of foreign currency fluctuations. |
Pacific North West Capital Corp.
(An Exploration Stage Company)
Notes to Consolidated Financial Statements
30 April 2011 and 2010
Canadian Funds |
| |
| 2. | Financial Instruments – Continued |
| | The Company’s interest rate risk is primarily related to the Company’s cash and cash equivalents for which amounts were invested at interest rates in effect at the time of investment. Changes in market interest rates affect the fair market value of the cash and cash equivalents. However, as these investments come to maturity within a short period of time, the impact would likely not be significant. |
| | The Company is in the exploration stage and is not subject to commodity price risk. |
| 3. | Restricted Cash and Cash Equivalents |
| | A total of $Nil of the Company’s cash and cash equivalents at 30 April 2011 (2010 - $567,771) relates to proceeds from the issuance of flow-through shares and is restricted to future expenditures on Canadian mineral property operating expenditures. |
| | | 30 April 2011 | 30 April 2010 |
| | | Cost | Fair Value | Cost | Fair Value |
| | Fire River Gold Corp. (“FAU”)
5,363,000 (30 April 2010 – 4,647,500) common shares
2,487,500 (30 April 2010 – 1,000,000) share purchase
warrants. 1,000,000 warrants expire on 2 October 2011,
912,500 warrants expire on 5 November 2011, 325,000
warrants expire on 12 May 2012 and 250,000 warrants
expire on 24 June 2012 | $2,496,995 | $3,108,758 | $2,177,540 | $2,096,895 |
| | CanAlaska Uranium Ltd. (“CanAlaska”)
Nil (30 April 2010 – 68,600) common shares | - | - | 13,061 | 10,290 |
| | El Niño Ventures Inc. (“El Niño”)
5,789,142 (30 April 2010 – 1,429,071) common shares
4,142,856 (30 April 2010 – 1,428,571) share purchase
warrants. 1,428,571 warrants expire on 20 May 2011,
714,285 warrants expire on 29 September 2012 and
2,000,000 warrants expire on 5 October 2013 | 443,344 | 938,036 | 100,074 | 176,804 |
| | Next Gen Metals Inc. (“Next Gen”)
1,216,667 (30 April 2010 – 500,000) common shares
333,334 (30 April 2010 - Nil) share purchase warrants
expire on 3 February 2012 | 155,000 | 300,850 | 25,000 | 150,000 |
| | Foran Mining Corporation (“Foran”)
46,000 (30 April 2010 - 2,600,000) common shares | 19,714 | 44,620 | 282,100 | 78,000 |
| | Breakwater Ltd. (“Breakwater”)
Nil (30 April 2010 – 23,752) common shares | - | - | 422,108 | 102,135 |
| | Alto Ventures Ltd. ("Alto")
Nil (30 April 2010 - 549,000) common shares | - | - | 21,960 | 32,940 |
| | Other marketable securities | 426,000 | 423,499 | 140,530 | 94,630 |
| | | $3,541,053 | $4,815,763 | $3,182,373 | $2,741,694 |
| | The above investments have been accounted for using the fair value method. All investments represent less than a 5% ownership of the respective companies except for FAU which represents 7.96%. FAU, El Niño and Next Gen are companies that have certain directors in common with the Company. |
Pacific North West Capital Corp.
(An Exploration Stage Company)
Notes to Consolidated Financial Statements
30 April 2011 and 2010
Canadian Funds |
| |
| 4. | Investments – Continued |
| | During the year, the Company sold 2,674,500 common shares of FAU for proceeds of $1,347,547 resulting in a gain of $223,923. |
| | During the year, the Company sold 68,600 common shares of CVV for proceeds of $5,831 resulting in a loss of $6,894. |
| | During the year, the Company sold 604,000 common shares of Foran Mining Corp. for proceeds of $434,723 resulting in a gain of $172,423. |
| | During the year, the Company sold 549,000 common shares of Alto for proceeds of $38,559 resulting in a gain of $16,253. |
| | During the year, the Company sold 23,752 common shares of Breakwater for proceeds of $56,125 resulting in a loss of $368,992. |
| | During the year, the Company sold 529,500 common shares of other marketable securities for proceeds of $189,647 resulting in a gain of $7,567. |
| | During the year, the Company purchased 1,428,571 units at a purchase price of $0.07 and 2,000,000 units at a purchase price of $0.05 (30 April 2010 - 1,428,571) of El Niño. Each unit priced at $0.07 per unit consists of one common share and one-half of one non-transferable common share purchase warrant. Each unit priced at $0.05 per unit consists of common share and one non-transferable common share purchase warrant. Each common share purchase warrant entitles the holder to purchase one common share of El Nino at an exercise price of $0.10 per common share until 18 months and three years from the date of issuance, respectively. |
| | During the year, the Company purchased 1,825,000 units at a purchase price of $0.40 and 1,150,000 units at a purchase price of $0.45 (30 April 2010 - Nil) of FAU. Each unit consists of one common share and one-half of one non-transferable common share purchase warrant. Each common share purchase warrant entitles the holder to purchase one common share of FAU at an exercise price of $0.60 and $0.65 per common share until 18 months from the date of issuance, respectively. |
| | During the year, the Company purchased 666,667 units at a purchase price of $0.15 (30 April 2010 - Nil) of Next Gen. Each unit consists of one common share and one-half of one non-transferable common share purchase warrant. Each common share purchase warrant entitles the holder to purchase one common share of Next Gen at an exercise price of $0.25 per common share until 18 months from the date of issuance. |
| | During the year, the Company received 50,000 shares of Next Gen valued at $0.60 per share in relation to a finder’s fee payment. |
| | During the year ended 30 April 2010, the Company received 6,415,000 common shares and 1,000,000 share purchase warrants of FAU valued at $2,694,300 and $225,590 for the sale of MCR, respectively (Note 5r). Each share purchase warrant entitles the holder to purchase one common share of FAU at an exercise price of $0.50 per common share until 2 October 2011. |
Pacific North West Capital Corp.
(An Exploration Stage Company)
Notes to Consolidated Financial Statements
30 April 2011 and 2010
Canadian Funds |
| |
| 5. | Mineral Property Costs |
| | a) | Details are as follows: |
| | | Acquisition (Net of option payments received) | | | Exploration | | | Exploration Advances /Refunds | | | Write-off Mineral Property Costs | | | Total 30 April 2011 | | | Total 30 April 2010 | |
| British ColumbiaProperty | | | | | | | | | | | | | | | | | | |
| BC Rock & Roll | $ | 60,000 | | $ | 594,046 | | $ | - | | $ | - | | $ | 654,046 | | $ | 451,675 | |
| Ontario Properties | | | | | | | | | | | | | | | | | | |
| River Valley Joint Venture | | 3,189,989 | | | 5,955,154 | | | (5,053,099 | ) | | - | | | 4,092,044 | | | 1 | |
| Sargesson and Kelly/Davis | | 27,900 | | | 11,954 | | | - | | | (39,854 | ) | | - | | | 39,854 | |
| West Timmins Nickel | | 56,595 | | | 3,077,592 | | | - | | | (3,134,187 | ) | | - | | | - | |
| Coldwell Project | | 223,761 | | | 775,608 | | | - | | | (999,369 | ) | | - | | | - | |
| Swayze, Joint Venture (Nickel Muir) | | 80,572 | | | 205,774 | | | - | | | (286,346 | ) | | - | | | - | |
| Raglan Hills (South Renfrew) | | 13,517 | | | 148,151 | | | - | | | (161,668 | ) | | - | | | 16,167 | |
| East Sudbury | | 160,309 | | | 829,897 | | | (38,280 | ) | | (951,926 | ) | | - | | | 757,741 | |
| Goodchild | | - | | | 1,140 | | | - | | | (1,140 | ) | | - | | | 1,140 | |
| Walsh Township | | 36,400 | | | 38,643 | | | - | | | (75,043 | ) | | - | | | - | |
| North Duluth | | - | | | 3,038 | | | - | | | (3,038 | ) | | - | | | 3,038 | |
| Québec Properties | | | | | | | | | | | | | | | | | | |
| SOQUEM - Taureau | | - | | | 326,794 | | | - | | | (326,794 | ) | | - | | | - | |
| SOQUEM - Chenneville | | - | | | 206,618 | | | - | | | (206,618 | ) | | - | | | - | |
| Glitter Lake | | 103,910 | | | 293,932 | | | (135,402 | ) | | (262,440 | ) | | - | | | 239,130 | |
| Fiedmont | | 42,500 | | | 195,389 | | | (47,535 | ) | | (190,354 | ) | | - | | | - | |
| Destiny Gold | | 73,954 | | | 1,355,311 | | | - | | | - | | | 1,429,265 | | | 958,249 | |
| Nickel Plats, Saskatchewan | | 244,995 | | | 453,614 | | | - | | | (698,609 | ) | | - | | | 678,609 | |
| Winter Lake, Northwest Territories | | 52,250 | | | 2,704 | | | - | | | (54,954 | ) | | - | | | - | |
| Alaska Properties | | | | | | | | | | | | | | | | | | |
| Goodnews Bay | | 158,730 | | | 1,265,854 | | | (1,193,500 | ) | | (231,084 | ) | | - | | | - | |
| Reconnaissance (Kane, Tonsina, SE Alaska) | | 27,946 | | | 1,036,304 | | | (500,000 | ) | | (564,250 | ) | | - | | | 508,084 | |
| Union Bay | | 441,593 | | | 4,075,575 | | | (4,264,320 | ) | | (252,848 | ) | | - | | | 245,906 | |
| North Voisey, Labrador | | 46,081 | | | 9,671 | | | - | | | (55,752 | ) | | - | | | - | |
| Africa Property | | | | | | | | | | | | | | | | | | |
| Burkina Faso | | 75,000 | | | 111,693 | | | - | | | - | | | 186,693 | | | - | |
| | $ | 5,116,002 | | $ | 20,974,456 | | $ | (11,232,136 | ) | $ | (8,496,274 | ) | $ | 6,362,048 | | $ | 3,899,594 | |
Pacific North West Capital Corp.
(An Exploration Stage Company)
Notes to Consolidated Financial Statements
30 April 2011 and 2010
Canadian Funds |
| |
| 5. | Mineral Property Costs – Continued |
| | On 28 July 2009, the Company obtained an option from Misty Creek Ventures Ltd. (Misty Creek Ventures Ltd. was dissolved in January 2010 and its interest was transferred to Equity Exploration Consultants Ltd.), First Fiscal Enterprises Ltd. and Pamicon Developments Ltd. (collectively the “Vendors”) on the Rock & Roll property (the “Property”), located in the Liard Mining District approximately 9 km west of the Bronson airstrip and exploration camp in northern British Columbia. Under the terms of the Letter Agreement, the Company can earn a 100% interest in the Property over a four year period by completing $2,000,000 ($594,046 incurred) in exploration expenditures, paying the Vendors $130,000 and providing the Vendors with a total of 600,000 of the Company's shares (100,000 shares issued) (Note 8b). The Vendors will retain a 2% Net Smelter Return ("NSR"), of which 1% can be purchased for $3,000,000. The property is also subject to an underlying NSR of 3% and an underlying Net Profits Interest Royalty ("NPI") of 15%, both of which are payable to Prime Equities International Corporation, and both of which are purchasable by the Forrest Syndicate and/or heirs and assignees in their entirety for $1,500,000 each. |
| | c) | River Valley Farm-In and Joint Venture |
| | By agreement dated 14 July 1999, the Company granted to Kaymin Resources Limited (“Kaymin”), a wholly-owned subsidiary of Anglo Platinum Limited, an option to earn up to a 65% interest in the Company’s portion of certain properties, including the River Valley property, the Goldwright property, the Frontier property (these claims were allowed to lapse on 12 December 2006), the Washagami property (these claims were allowed to lapse on 10 December 2008), the Razor property and the Western Front property (Notes 5c(i)-5c(iv) respectively), in the Sudbury Region of Ontario. During a prior year, Kaymin elected to vest obtaining a 50% interest in the properties upon having paid the Company $300,000 (received in a prior year) and advanced and spent in excess of $4,000,000 for exploration on the properties. |
| | Kaymin continued to fund exploration under the terms of JV until 2007 and invested over $22M in the exploration of the property; however, as a result of capital expenditure reductions during the global financial crisis in 2008, no new funds were allocated to the River Valley Project above and beyond the minimal holding costs. |
| | By way of a Mineral Interest Assignment Agreement dated for reference 13 December 2010, as amended on 6 April 2011 (“Assignment Agreement”), the Company completed the purchase of Kaymin’s 50% interest in the River Valley claims, providing the Company with an undivided 100% interest in the River Valley PGM Project. Under the terms of the Assignment Agreement, Kaymin exchanged its 50% interest in the JV, for a 12% interest in the Company, based on the issued and outstanding common shares of the Company as of 30 November 2010 (67,543,008 common shares). The aggregate purchase price for the 50% interest in the River Valley PGM project was: |
| | - 8,117,161 fully paid and non-assessable common shares of the Company (issued) (Note 8b); and
- Three-year warrants exercisable to purchase 3,000,000 common shares of the Company at a price of $0.30 per common share (issued) (Notes 8b and 8g).
|
| | Included in accounts payable and accrued liabilities is $120,337 payable to Kaymin related to the cash received from the River Valley Joint Venture. |
| | | i) | River Valley Property, Ontario |
| | | By agreement dated 15 January 1999 and amended 11 March 1999, the Company acquired a 100% interest in 226 claim units, known as the River Valley Property, located in the Dana and Pardo Townships, Sudbury Mining District, Ontario. As consideration, the Company paid $265,000 and issued 600,000 common shares to the optionors. In addition, minimum annual exploration expenditures of $100,000 were completed. The property is subject to a 3% NSR. The Company, at its option, can purchase up to 2% of the NSR from the vendors for $2,000,000. |
Pacific North West Capital Corp.
(An Exploration Stage Company)
Notes to Consolidated Financial Statements
30 April 2011 and 2010
Canadian Funds |
| |
| 5. | Mineral Property Costs – Continued |
| | c) | River Valley Farm-In and Joint Venture – Continued |
| | ii) | Goldwright Property, Ontario |
| | By agreement dated 30 June 1998 and subsequently amended, the Company earned a 25% interest in certain mineral claims known as the Janes property, located in the Janes Township, Sudbury Mining District, Ontario. Certain claims are subject to a 2% NSR. |
| | iii) | Razor Property, Ontario |
| | The Company acquired a 100% interest in certain mineral claims located in the Dana Township, Sudbury Mining District, Ontario for consideration of $30,000. |
| | The property is subject to a 2% NSR. |
| | iv) | Western Front Property, Ontario |
| | By agreement dated 16 November 2001, the Company earned a 70% interest in certain mineral claims known as the Western Front property from a company (the “optionor”) with certain directors in common, for consideration of $55,000 and issuance of 20,000 shares. In addition, an exploration expenditure of $50,000 was completed. |
| | The Company has the right to purchase an additional 30% interest in the property by paying $750,000 to the optionor. |
| | The property is subject to a 3% NSR, the first 1% of which the Company can purchase for $1,000,000; the second 1% can be purchased for $2,000,000. The Company and the optionor will share the NSR buyout privileges in proportion to their respective interests. |
| | d) | Sargesson and Kelly/Davis Properties, Ontario |
| | The Company acquired a 100% interest in certain mineral claims, known as the Sargesson and Kelly/Davis properties, located in the Janes, Davis and Kelly Townships, Sudbury Mining District, Ontario. As consideration, the Company paid $68,400 and incurred $30,000 in exploration expenditures. |
| | The property is subject to a 2% NSR. The Company can purchase 1% of the NSR from the vendors for $400,000 and has the right of first refusal on the remaining 1% NSR. |
| | e) | Raglan Hills, Ontario (formerly: South Renfrew Property) |
| | In 2006, the Company acquired 6 claims by staking in Raglan Township, Ontario. In 2007, the Company entered into a 50:50 joint venture agreement with First Nickel Inc. (“First Nickel”) to evaluate the claims as well as their adjoining claims as one property. Due to the downturn in commodity prices, the Company elected to not contribute to the financial participation in 2009 and as a result, the Company’s participating interest has been decreased. As defined in the joint venture agreement, the Company’s participating interest has been converted to a 1.5% NSR over the Raglan Hills property and a provision for writedown of $145,501 has been recorded during a previous year, which represents a reduction in the Company’s participating interest by 90%. |
| | f) | Coldwell Properties, Ontario |
| | On 18 September 2007, the Company acquired 91 mineral claims by staking in the Coldwell Area near Marathon, Ontario. |
| | An exploration program of prospecting, lake-bottom sediment geochemical sampling, and an airborne EM and magnetic survey was initiated to evaluate the claims. Anomalies generated by these surveys were evaluated in a subsequent work program in the fall of 2008. No significant mineralization was identified during the course of this work. The Company allowed the Coldwell claims to lapse in July and August 2010. |
Pacific North West Capital Corp.
(An Exploration Stage Company)
Notes to Consolidated Financial Statements
30 April 2011 and 2010
Canadian Funds |
| |
| 5. | Mineral Property Costs – Continued |
| | g) | Goodchild Property, Ontario |
| | During the previous year, the Company acquired 28 mineral claims by staking in the Goodchild area of Ontario. The Goodchild property was incorporated into the Coldwell Project described in the preceding paragraph, and a portion of the 2008 Coldwell work program was directed at identifying mineralization on the Goodchild property. |
| | As with the Coldwell Project; the Company allowed the Goodchild claims to lapse in February 2010. |
| | h) | East Sudbury Property, Ontario |
| | In September 2009, the Company entered into a purchase agreement with Trueclaim Exploration Ltd. (“Trueclaim”) whereby Trueclaim would purchase 100% ownership of certain claims that formed part of the East Sudbury property for a 1.5% NSR and 50,000 Trueclaim shares. In September 2009 the property was reduced from 128 claims to 60 claims. |
| | In September 2009 the property was reduced from 128 claims to 60 claims and from then through December 2009 an additional 56 claims were lapsed. The Company allowed the balance of the claims remaining to lapse in August 2010. |
| | i) | Swayze Joint Venture, Ontario |
| | During a previous year, the Company acquired claims by staking in Kenogaming Township (in the Swayze Greenstone Belt), Ontario. In March 2008, the Company entered into a three-year, 50:50 joint venture agreement with Benton Resources Corp. (“Benton”) to evaluate the claims that both parties held in the Swayze Greenstone Belt. It is proposed that the exploration budget over the three years will be $1,200,000 with the first year’s budget of $400,000. |
| | During a previous year, the Company issued 10,000 common shares valued at $6,500 related to this property. |
| | On 5 May 2009, the joint venture was terminated. The Company allowed the Swayze claims to lapse in January 2010 and has no further plans for this project. |
| | j) | North Duluth Property, Ontario |
| | During a previous year, the Company spent $3,038 related to the acquisition of the 10 mineral claims in the Crystal Lake Area south of Thunder Bay, Ontario. |
| | On 25 February 2009, the property was reduced to 8 claims and in February 2010 the remaining claims lapsed. |
| | k) | Glitter Lake Property, Québec |
| | By agreement dated 15 August 2003, as amended on 30 April 2006, the Company can acquire, from CanAlaska Uranium Ltd. (“CanAlaska”), a company that previously had certain directors in common, a 50% interest in certain mineral claims known as the Glitter Lake property, located in the province of Québec. As consideration, the Company, at its option, must issue shares, make payments and incur exploration expenditures (the expenditure commitments for 2008 and 2009 have been extended to 2009 and 2010 as agreed to in an amendment dated 1 April 2008) as follows: |
Pacific North West Capital Corp.
(An Exploration Stage Company)
Notes to Consolidated Financial Statements
30 April 2011 and 2010
Canadian Funds |
| |
| 5. | Mineral Property Costs – Continued |
| | k) | Glitter Lake Property, Québec – Continued |
| | | | | Payments | | | Shares | | | Exploration Expenditures | |
| | On or before 15 April 2003 | (completed) | $ | - | | | - | | $ | 50,000 | |
| | Upon execution of agreement | (paid) | | 10,000 | | | - | | | - | |
| | On or before 4 June 2004 | (issued) | | - | | | 20,000 | | | - | |
| | On or before 15August 2004 | (paid) | | 15,000 | | | - | | | - | |
| | On or before 28 May 2005 | (issued) | | - | | | 20,000 | | | - | |
| | On or before 15August 2005 | (paid) | | 20,000 | | | - | | | - | |
| | On or before 28 May 2006 | (issued) | | - | | | 20,000 | | | - | |
| | On or before 15 April 2007 | (completed) | | - | | | - | | | 150,000 | |
| | On or before 15 April 2009 | (partially completed) | | - | | | - | | | 200,000 | |
| | On or before 15 April 2010 | (agreement terminated) | | - | | | - | | | 300,000 | |
| | Total | | $ | 45,000 | | | 60,000 | | $ | 700,000 | |
| | On 30 January 2009, the Company and CanAlaska signed an amendment to the option agreement whereby CanAlaska assigned a 100% interest in the Glitter Lake property to the Company in consideration of approximately $83,600 for CanAlaska’s remaining lease obligations with respect to the Company’s Kerrisdale office location to the end of the lease term in November 2010. CanAlaska retains a 0.5% NSR interest in the property. The original option agreement has thus been terminated. |
| | A joint venture partner is being sought to further explore the Glitter Lake property. |
| | l) | Fiedmont, Val d’Or, Québec |
| | On 16 December 2008, the Company entered into an Option Agreement (the “Agreement”) with Kinbauri Gold Corp. (“Kinbauri”) whereby the Company may earn a 60% interest in Kinbauri’s Fiedmont Property (“Fiedmont”) subject to a 2% NSR held by the original vendors; the vendor’s NSR is subject to a one percent, $900,000 buyback. |
| | Under the terms of the Agreement, the Company may pay Kinbauri an aggregate amount of $98,000, issue 150,000 common shares to Kinbauri, subject to regulatory hold periods and expend $400,000 on exploration prior to 30 November 2010 to earn its interest. The Company’s first year commitment is mandatory and includes payment to Kinbauri of $38,000 (paid), issuance of 50,000 shares (issued, valued at $4,500) and expenditures of $150,000 (incurred) on exploration prior to 30 Novembe2009. The Fiedmont property is located 30km north of Val d’Or, Québec, and is road accessible. The property consists of 84 claims (3,458 ha); 40 claims of which were staked in 2008. |
| | The Fiedmont option agreement was terminated on 13 October 2009. |
| | In September 2009, the Company announced that it had entered into an option agreement with Alto Ventures Ltd. ("Alto") on the Destiny Gold Project (formerly the Despinassy Project) located approximately 75 km north of Val d’Or in the Abitibi-Témiscamingue region of Québec (the "Alto Option Agreement). The property consists of 175 mining claims totalling 7,260 ha. Under the terms of the Alto Option Agreement, the Company will pay Alto $200,000, provide Alto with 250,000 common shares of the Company (Notes 8b and 10), and complete a cumulative total of $3,500,000 in exploration expenditures over a four year period, with minimum exploration expenditures of $1,400,000 to earn a 60% interest in the Destiny Gold property as follows: |
Pacific North West Capital Corp.
(An Exploration Stage Company)
Notes to Consolidated Financial Statements
30 April 2011 and 2010
Canadian Funds |
| |
| 5. | Mineral Property Costs – Continued |
| | m) | Destiny Gold Project – Continued |
| | | | | Payments | | | Shares | | | Minimum Exploration Expenditures | |
| | Upon execution of agreement | (paid/issued) | $ | 25,000 | | | 25,000 | | $ | - | |
| | On or before 31 December 2009 | (incurred) | | - | | | - | | | 300,000 | |
| | On or before 28 July 2010 | (paid/issued) | | 25,000 | | | 50,000 | | | - | |
| | On or before 31 December 2010 | (incurred) | | - | | | - | | | 300,000 | |
| | On or before 28 July 2011 | | | 50,000 | | | 75,000 | | | - | |
| | On or before 31 December 2011 | | | - | | | - | | | 400,000 | |
| | On or before 28 July 2012 | | | 50,000 | | | 100,000 | | | - | |
| | On or before 31 December 2012 | | | - | | | - | | | 400,000 | |
| | On or before 28 July 2013 | | | 50,000 | | | - | | | - | |
| | Total | | $ | 200,000 | | | 250,000 | | $ | 1,400,000 | |
| | Subsequent to vesting of its interest, the Company will form a joint venture with Alto to further develop the project. Certain claims comprising the property are subject to underlying net smelter return royalties ranging from 1% to 3.5%, with varying buy-back provisions. |
| | n) | Nickel Plats, Saskatchewan |
| | By agreement dated 30 April 2007, the Company can acquire, from Diamond Hunter Ltd. (“Hunter”), a 100% interest in certain mineral claims known as the Nickel Plats property, located in the province of Saskatchewan. |
| | On 30 March 2009, the Company and Hunter signed an amendment to the terms of the agreement as follows (Notes 8b and 10): |
| | | | | Payments | | | Shares | | | Exploration Expenditures | |
| | Upon execution of agreement | (paid/issued) | $ | 10,000 | | | 75,000 | | $ | - | |
| | On or before 30 June 2007 | (paid) | | 20,000 | | | - | | | - | |
| | On or before 30 April 2008 | (paid/issued) | | 30,000 | | | 75,000 | | | - | |
| | On or before 30 April 2009 | (paid/issued) | | 15,000 | | | 50,000 | | | - | |
| | On or before 30 April 2010 | (paid/issued) | | 15,000 | | | 50,000 | | | - | |
| | On or before 30 April 2011* | (paid) | | 20,000 | | | - | | | - | |
| | On or before 30 April 2012* | | | 20,000 | | | - | | | - | |
| | On or before 30 April 2013* | | | 20,000 | | | - | | | - | |
| | Total | | $ | 150,000 | | | 250,000 | | $ | - | |
| | * | The payments of $20,000 are Advanced Royalty Payments based on the price of nickel maintaining a minimum price of US$6.00/lb in the three months preceding each of the 4th, 5th and 6th anniversary of the agreement. In the case that the price of nickel does not maintain a minimum price of US$6.00/lb in the three months preceding each of the 4th, 5th and 6th anniversary of the agreement, the dollar amount of the Advanced Royalty Payments will be less than $20,000 on the 4th, 5th and 6th anniversary of the agreement and the actual dollar amount will be negotiated between Hunter and the Company at the time of the anniversary. |
| | An additional 100,000 shares may be issued upon vesting of 100% interest if the results of a feasibility studies are positive. |
| | The property is subject to a 2.0% NSR. The Company shall have the right to purchase a 1.0% NSR for $750,000. |
| | During a previous year, by agreement dated 16 May 2007, the Company can acquire for $10,000 (paid), from Hunter, a 100% interest in certain mineral claims known as the Nickel Plats adjunct property, located in the province of Saskatchewan. |
Pacific North West Capital Corp.
(An Exploration Stage Company)
Notes to Consolidated Financial Statements
30 April 2011 and 2010
Canadian Funds |
| |
| 5. | Mineral Property Costs – Continued |
| | n) | Nickel Plats, Saskatchewan – Continued |
| | The Nickel Plats adjunct property is subject to a 2.0% NSR. The Company shall have the right to purchase a 1.0% NSR for $750,000. |
| | A joint venture partner is being sought to further explore the Nickel Plats Project. |
| | o) | Tonsina Property, Alaska |
| | The Tonsina property, presently defined, consists of 46 State of Alaska mining claims, known as the “Marc” claims 1-46 (ADL Nos. 610060 – 610105) which were staked in June 2006. These claims comprise a contiguous group of State of Alaska ¼ section claims covering approximately 29.78 sq. kilometers (744.62 hectares, or 7,360 acres), herein referred to as the “Tonsina property”. The claims are owned 100% by the Company. |
| | A joint venture partner is being sought to further explore the project. |
| | During a previous year, the Company acquired certain mineral claims by staking in Alaska. On 6 June 2007, the Company entered into an option agreement with Stillwater pertaining to ongoing exploration on the property (the “Stillwater Option Agreement”). Under the terms of the Stillwater Option Agreement, Stillwater could elect to spend US$3.5 million to earn 50% of the first selected property and US$4.0 million on each subsequent selected property by 31 December 2011. |
| | In March 2008, Stillwater elected not to continue with exploration on the property in order to evaluate new ground in southeast Alaska. |
| | The Company continues to maintain the Kane property’s mineral claims and a joint venture partner is being sought to further explore the property. |
| | q) | Union Bay Property, Alaska |
| | By agreement dated 1 October 2002 and amended 2 April 2003 and 4 February 2004, the Company could acquire, from Freegold Ventures Limited (“Freegold”), a company that previously had certain directors and officers in common, an option to earn up to a 70% interest in the Union Bay Property. |
| | In order to earn its 50% interest, the Company purchased a private placement of $165,000 (2002) and made cash payments, issued shares and incurred exploration expenditures as follows: |
| | | | Payments | | | Shares | | | Exploration Expenditures | |
| | - Within 5 days from approval date(issued) | $ | - | | | 30,000 | | $ | - | |
| | - On or before 1 July 2003(paid/incurred) | | 20,000 | | | - | | | 30,000 | |
| | - On or before 30 January 2004(issued) | | - | | | 30,000 | | | - | |
| | - On or before 1 July 2004(paid/incurred) | | 20,000 | | | - | | | 30,000 | |
| | - On or before 1 July 2005(paid/incurred) | | 30,000 | | | - | | | 340,000 | |
| | - On or before 1 July 2006(paid/incurred) | | 30,000 | | | - | | | 600,000 | |
| | | $ | 100,000 | | | 60,000 | | $ | 1,000,000 | |
| | Following vesting with a 50% interest on 1 July 2006, the Company had the right to elect within 45 days to increase its interest to 60% by completing a feasibility study within 12 months of vesting with 50%. This election was not made. |
| | Under the terms of the agreement, the Company upon vesting with 50%, issued 253,586 shares at market value for $100,000 to Freegold. 134,538 shares were issued and accounted for in a previous year. |
Pacific North West Capital Corp.
(An Exploration Stage Company)
Notes to Consolidated Financial Statements
30 April 2011 and 2010
Canadian Funds |
| |
| 5. | Mineral Property Costs – Continued |
| | q) | Union Bay Property, Alaska – Continued |
| | By Memorandum of Agreement dated 4 May 2007, Freegold and the Company confirmed their 50:50% interest in the property. |
| | Freegold and the Company are seeking a joint venture partner to further develop this project. |
| | r) | Nixon Fork Property, Alaska |
| | On 12 February 2009, the Company acquired a 100% interest in the Nixon Fork Gold Mine through the purchase of Mystery Creek Resources, Inc. ("MCR") located 56 km northeast of McGrath, Alaska for a total consideration of US$500,000. The Company paid US$100,000 upon signing the agreement dated 9 December 2008. The Company exercised the option by agreeing to pay a further US$400,000 of which US$100,000 was paid 12 February 2009, and the balance is required to be paid in three equal instalments on 1 May 2009 (paid), 1 July 2009 (paid) and 1 September 2009 (paid). |
| | In June 2009, the Company granted FAU an option to acquire all of the outstanding shares of MCR. FAU paid US$50,000 on signing of the agreement. The sale of MCR to FAU was approved by the Company’s shareholders in August 2009. The shareholders of FAU approved the purchase of MCR in September 2009. FAU exercised the option by making further payments totaling US$450,000, and issuing a total of US$2.5 million in FAU shares at a deemed price of $0.45 per share for a total of 6,415,000 shares. FAU also issued to the Company 1,000,000 share purchase warrants entitling the Company to purchase 1,000,000 shares at an exercise price of $0.50 for a period of twenty-four months from the date of closing (Note 4) and reimbursed all expenses incurred by the Company from 1 May 2009 for a total of CDN$773,766. |
| | On 18 January 2011, the Company entered into agreements with Somitra to acquire 100% interest in the properties of Kangara, Kalempo and LHorosso. The Company can earn a 100% interest in the properties under the following terms of the agreements: |
| | - US$75,000 on signing of the agreements (paid);
- US$30,000 on six months following the signing of the agreements;
- US$105,000 on the first anniversary of the signing of the agreements;
- US$120,000 on the second anniversary of the signing of the agreements;
- US$150,000 on the third anniversary of the signing of the agreements; and
- After completion of transferring the claims, the Company is required to issue 450,000 common shares of the Company to Somitra or pay the sum of US$135,000.
|
| | Each property is subject to a 1.0% NSR with the buyout price of US$1,000,000 for any deposit over 1 million ounces and US$500,000 for any deposit under 1 million ounces. |
| 6. | Property, Plant and Equipment |
| | | | Cost | | | Accumulated Amortization | | | 30 April 2011 Net Book Value | |
| | Automotive equipment | $ | 122,947 | | $ | 66,018 | | $ | 56,929 | |
| | Furniture and office equipment | | 266,609 | | | 199,415 | | | 67,194 | |
| | | $ | 389,556 | | $ | 265,433 | | $ | 124,123 | |
Pacific North West Capital Corp.
(An Exploration Stage Company)
Notes to Consolidated Financial Statements
30 April 2011 and 2010
Canadian Funds |
| |
| 6. | Property, Plant and Equipment – Continued |
| | | | Cost | | | Accumulated Amortization | | | 30 April 2010 Net Book Value | |
| | Automotive equipment | $ | 86,470 | | $ | 55,240 | | $ | 31,230 | |
| | Furniture and office equipment | | 252,573 | | | 176,910 | | | 75,663 | |
| | | $ | 339,043 | | $ | 232,150 | | $ | 106,893 | |
| | During the year ended 30 April 2011, total additions to property, plant and equipment were $50,513 (30 April 2010 - $23,085). |
| 7. | Related Party Transactions |
| | Except as disclosed elsewhere in these consolidated financial statements, related party transactions are as follows: |
| | a) | During the year, management fees of $200,071 (2010 - $189,698, 2009 - $214,972) were paid to a company controlled by a director and Chairman. |
| | b) | During the year, engineering and consulting fees of $99,399 (2010 - $38,983, 2009 - $Nil) were paid to the Vice President of Exploration. |
| | c) | During the year, engineering and consulting fees of $6,700 (2010 - $86,451, 2009 - $Nil) were paid to the Vice President of Engineering. |
| | d) | During the year, consulting fees of $18,658 (2010 - $8,663, 2009 - $63,076) were paid to a company controlled by a director. |
| | e) | During the year, consulting fees of $47,000 (2010 - $12,890, 2009 - $Nil) were paid to a director and Corporate Secretary. |
| | f) | Effective 1 February 2005, each outside director is entitled to receive $500 per month, $500 per directors meeting and $500 per committee meeting. During the year, $23,000 (2010 - $25,000) was paid/accrued to directors. |
| | The above transactions, occurring in the normal course of operations, are measured at the exchange amount, which is the amount of consideration established and agreed to by the related parties. |
| | On 30 December 2009, the Company closed the non-brokered private placement of 5,360,000 units at a purchase price of $0.20 per unit for gross proceeds of up to $1,072,000, of which 4,500,000 units were issued as flow-through units to the Mineral Fields Group. Each unit consisted of one common share in the capital of the Company and one-half of one share purchase warrant, each whole warrant entitling the holder to purchase one additional common share of the Company for the period of two years at a price of $0.35 in the first year and at a price of $0.45 in the second year. |
| | In connection with this financing, the Company has paid an aggregate of $45,000 in cash and issued an aggregate of 315,000 compensation options valued at $42,326, as finder's fees (Note 8g). Each compensation option entitles the holder thereof to acquire one unit at a price of $0.20 per unit for a period of 24 months. Each unit is comprised of one common share and one-half of one warrant, with each whole warrant entitling the holder thereof to acquire an additional common share for a period of two years from the date of issue of the compensation options at a price of $0.35 during the first year of the exercise period and at a price of $0.45 during the second year of the exercise period. |
Pacific North West Capital Corp.
(An Exploration Stage Company)
Notes to Consolidated Financial Statements
30 April 2011 and 2010
Canadian Funds |
| |
| 8. | Share Capital – Continued |
| | a) | Private Placements – Continued |
| | On 15 March 2011, the Company closed the non-brokered private placement of 9,248,333 non flow-through units at $0.30 per unit, with each unit consisting of one fully paid and non-assessable common share in the capital of the Company and one-half of one non-transferable share purchase warrant, each whole warrant entitling the holder thereof to purchase one additional common share of the Company for one year at an exercise price of $0.35. A total of 644,286 flow-through units at $0.35 per unit were also placed. Each flow-through unit consists of one fully paid and non-assessable common share in the capital of the Company and one-half of one non-transferable share purchase warrant, each whole warrant entitling the holder thereof to purchase one additional non flow-through common share of the Company at $0.45 for a period of one year. The Company paid finder's fee of $24,775 in cash. |
| | During the previous year ended 30 April 2010, 50,000 shares at a deemed price of $0.09 per share were issued for the acquisition of the BC Rock & Roll project (Note 5b), 25,000 shares at a deemed price of $0.11 per share were issued for the acquisition of Destiny Gold project (Note 5m) and 50,000 shares at a price of $0.15 per share were issued for the acquisition of Saskatchewan Nickel Plats (Note 5n). |
| | During the year ended 30 April 2011, 50,000 shares at a deemed price of $0.11 per share were issued for the acquisition of the BC Rock & Roll project (Note 5b) and 50,000 shares at a deemed price of $0.11 per share were issued for the acquisition of Destiny Gold project (Note 5m). |
| | During the year ended 30 April 2011, the Company purchased the remaining 50% interest in the unincorporated joint venture of the River Valley Platinum Group Metals project from Anglo Platinum Limited through its wholly-owned subsidiary, Kaymin Resources Ltd., issuing 8,117,161 non-assessable common shares of the Company and three-year warrants to purchase up to 3,000,000 common shares of the Company at a price of $0.30 per common share (Notes 5c and 8g). |
| | Flow-through shares are shares issued by a company that incurs certain resource expenditures and then renounces them for Canadian tax purposes. This allows the expenditures to flow through to the subscriber for tax purposes. The subscribers may in turn claim the expenditure as a deduction on their personal or corporate tax returns. |
| | The total amount of funds raised through the flow-through shares must be spent on qualified mineral exploration. The use of proceeds from flow-through shares is restricted to certain Canadian Exploration Expenditures under Canadian Income Tax Legislation. |
| | d) | Exercise of Warrants and Options |
| | i) | During the year, no warrants were exercised (2010 – Nil). |
| | ii) | During the year, 85,000 units options were exercised at $0.25 (2010 – Nil). |
| | A total of 2,697,990 performance shares are reserved for issue. At the discretion of the Board, these shares may be issued to such arm’s length parties as the Board considers desirable to attract consultants to the Company. |
Pacific North West Capital Corp.
(An Exploration Stage Company)
Notes to Consolidated Financial Statements
30 April 2011 and 2010
Canadian Funds |
| |
| 8. | Share Capital – Continued |
| | e) | Performance Shares – Continued |
| | During a previous year, the Board authorized the issuance of up to 300,000 performance shares at an exercise price of $0.01 per share to attract a new officer to the Company. These shares were granted at the discretion of the Board as follows: |
| | Shares | Grant Date | |
| | 50,000 | 15 January 2004 | (issued) |
| | 50,000 | 30 June 2004 | (issued) |
| | 50,000 | 31 October 2004 | (issued) |
| | 50,000 | 28 February 2005 | (issued) |
| | 50,000 | 1 July 2005 | (issued) |
| | 50,000 | 1 December 2005 | (issued) |
| | 300,000 | | |
| | During a previous year, the Board authorized the issuance of up to 300,000 performance shares at an exercise price of $0.01 per share to attract a new officer to the Company. There shares were to be granted at the discretion of the Board as follows: |
| | Shares | Grant Date | |
| | 25,000 | 24 May 2005 | (issued) |
| | 25,000 | 24 November 2005 | (issued) |
| | 50,000 | 28 August 2006 | (issued) |
| | 50,000 | 28 February 2007 | (cancelled December 2006) |
| | 75,000 | 28 August 2007 | (cancelled December 2006) |
| | 75,000 | 28 February 2008 | (cancelled December 2006) |
| | 300,000 | | |
| | During a previous year, the Board authorized the issuance of up to 300,000 performance shares at an exercise price of $0.01 per share to attract a new Vice-President of Project Development to the Company. These shares were to be granted at the discretion of the Board as follows: |
| | Shares | Grant Date | |
| | 25,000 | 16 October 2007 | (issued) |
| | 25,000 | 16 January 2008 | (issued) |
| | 25,000 | 16 April 2008 | (issued) |
| | 25,000 | 16 July 2008 | (issued) |
| | 25,000 | 16 October 2008 | (issued) |
| | 25,000 | 16 January 2009 | (issued) |
| | 25,000 | 16 April 2009 | (cancelled March 2009) |
| | 25,000 | 16 July 2009 | (cancelled March 2009) |
| | 25,000 | 16 October 2009 | (cancelled March 2009) |
| | 25,000 | 16 January 2010 | (cancelled March 2009) |
| | 25,000 | 16 April 2010 | (cancelled March 2009) |
| | 25,000 | 16 July 2010 | (cancelled March 2009) |
| | 300,000 | | |
| | During the previous year, the Board authorized the issuance of up to 300,000 performance shares at an exercise price of $0.01 per share to attract a new Vice-President of Business Development to the Company. These shares were to be granted at the discretion of the Board as follows: |
| | Shares | Grant Date | |
| | 50,000 | 12 May 2009 | (issued *) |
| | 50,000 | 12 November 2009 | (issued **) |
| | 50,000 | 12 May 2010 | (cancelled December 2009) |
| | 50,000 | 12 November 2010 | (cancelled December 2009) |
| | 50,000 | 12 May 2011 | (cancelled December 2009) |
| | 50,000 | 12 November 2011 | (cancelled December 2009) |
| | 300,000 | | |
Pacific North West Capital Corp.
(An Exploration Stage Company)
Notes to Consolidated Financial Statements
30 April 2011 and 2010
Canadian Funds |
| |
| 8. | Share Capital – Continued |
| | e) | Performance Shares – Continued |
| | * | 50,000 performance shares were issued at $0.01 per share for total proceeds of $500. The fair market value of the performance shares at the date of the issuance was $6,000. The difference between the issue price and the fair market value ($5,500) was recorded in the accounts as stock-based compensation. The offsetting entry is to share capital. |
| | ** | 50,000 performance shares were issued at $0.01 per share for total proceeds of $500. The fair market value of the performance shares at the date of the issuance was $6,500. The difference between the issue price and the fair market value ($6,000) was recorded in the accounts as stock-based compensation. The offsetting entry is to share capital. |
| | During a previous year, the Board authorized the issuance of up to 300,000 performance shares at an exercise price of $0.01 per share to attract a new Vice-President of Exploration to the Company. These shares were to be granted at the discretion of the Board as follows: |
| | Shares | Grant Date | |
| | 50,000 | 12 May 2009 | (issued *) |
| | 50,000 | 12 November 2009 | (issued **) |
| | 50,000 | 12 May 2010 | (cancelled December 2009) |
| | 50,000 | 12 November 2010 | (cancelled December 2009) |
| | 50,000 | 12 May 2011 | (cancelled December 2009) |
| | 50,000 | 12 November 2011 | (cancelled December 2009) |
| | 300,000 | | |
| | * | 50,000 performance shares were issued at $0.01 per share for total proceeds of $500. The fair market value of the performance shares at the date of the issuance was $6,000. The difference between the issue price and the fair market value ($5,500) was recorded in the accounts as stock-based compensation. The offsetting entry is to share capital. |
| | ** | 50,000 performance shares were issued at $0.01 per share for total proceeds of $500. The fair market value of the performance shares at the date of the issuance was $6,500. The difference between the issue price and the fair market value ($6,000) was recorded in the accounts as stock-based compensation. The offsetting entry is to share capital. |
| | During the previous year, the Board authorized the issuance of up to 300,000 performance shares at an exercise price of $0.01 per share to attract a new Vice-President of Engineering to the Company. These shares are to be granted at the discretion of the Board as follows: |
| | Shares | Grant Date | |
| | 50,000 | 4 January 2010 | (allotted as at 30 April 2010*, cancelled) |
| | 50,000 | 4 June 2010 | (allotted as at 31 July 2010**, cancelled) |
| | 50,000 | 4 December 2010 | (allotted as at 31 January 2011***, cancelled) |
| | 50,000 | 4 June 2011 | (cancelled) |
| | 50,000 | 4 December 2011 | (cancelled) |
| | 50,000 | 4 June 2012 | (cancelled) |
| | 300,000 | | |
| | * | 50,000 performance shares were reserved for issuance at $0.01 per share during the year ended 30 April 2010. The fair market value of the performance shares at the date of allotment/accrual was $10,000 and was recorded in the accounts as stock-based compensation. The offsetting entry is to contributed surplus. |
| | ** | 50,000 performance shares were reserved for issuance at $0.01 per share during the year ended 30 April 2011. The fair market value of the performance shares at the date of allotment/accrual was $5,500 and was recorded in the accounts as stock-based compensation. The offsetting entry is to contributed surplus. |
| | ** | 50,000 performance shares were reserved for issuance at $0.01 per share during the year ended 30 April 2011. The fair market value of the performance shares at the date of allotment/accrual was $6,500 and was recorded in the accounts as stock-based compensation. The offsetting entry is to contributed surplus. |
Pacific North West Capital Corp.
(An Exploration Stage Company)
Notes to Consolidated Financial Statements
30 April 2011 and 2010
Canadian Funds |
| |
| 8. | Share Capital – Continued |
| | e) | Performance Shares – Continued |
| | During the current year, the Board authorized the issuance of up to 300,000 performance shares at an exercise price of $0.01 per share to the Vice-President of Corporate Business Development of the Company. These shares are to be granted at the discretion of the Board as follows: |
| | Shares | Grant Date | |
| | 150,000 | 1 February 2011 | (allotted as at 30 April 2011*) |
| | 75,000 | 1 August 2011 | |
| | 75,000 | 1 February 2012 | |
| | 300,000 | | |
| | * | 150,000 performance shares were reserved for issuance at $0.01 per share during the year ended 30 April 2011. The fair market value of the performance shares at the date of allotment/accrual was $28,500 and was recorded in the accounts as stock-based compensation. The offsetting entry is to contributed surplus. |
| | f) | Share Purchase Options |
| | A summary of the Company’s options at 30 April 2011 and the changes for the period are as follows: |
| | Number
outstanding
30 April
2010 | Granted | Exercised | Expired | Cancelled | Number outstanding 30 April 2011 | Exercise price per share | Expiry date |
| | 718,000 | - | - | - | 15,000 | 703,000 | $0.25 | 5 November 2014* |
| | 355,000 | - | - | - | 355,000 | - | $0.60 | 3 May 2010 |
| | 100,000 | - | - | - | - | 100,000 | $0.40 | 3 February 2011 |
| | 82,500 | - | - | - | - | 82,500 | $0.40 | 19 April 2011 |
| | 50,000 | - | - | - | - | 50,000 | $0.50 | 8 May 2011 |
| | 20,000 | - | - | - | - | 20,000 | $0.50 | 19 May 2011 |
| | 150,000 | - | - | - | - | 150,000 | $0.25 | 14 February 2017* |
| | 680,000 | - | 35,000 | - | 50,000 | 595,000 | $0.25 | 18 May 2017* |
| | 230,000 | - | - | - | - | 230,000 | $0.25 | 11 October 2017* |
| | 130,000 | - | - | - | - | 130,000 | $0.25 | 29 October 2017* |
| | 910,000 | - | - | - | - | 910,000 | $0.60 | 22 February 2013 |
| | 100,000 | - | - | - | - | 100,000 | $0.50 | 11 June 2013 |
| | 980,000 | - | 50,000 | - | - | 930,000 | $0.25 | 22 April 2014 |
| | 125,000 | - | - | - | - | 125,000 | $0.25 | 15 July 2014 |
| | 150,000 | - | - | - | - | 150,000 | $0.25 | 4 June 2015 |
| | 150,000 | - | - | - | - | 150,000 | $0.40 | 4 June 2015 |
| | 150,000 | - | - | - | - | 150,000 | $0.25 | 5 January 2015 |
| | 150,000 | - | - | - | - | 150,000 | $0.50 | 5 January 2015 |
| | 100,000 | - | - | - | - | 100,000 | $0.25 | 5 January 2015 |
| | 100,000 | - | - | - | - | 100,000 | $0.50 | 5 January 2015 |
| | - | 300,000 | - | - | - | 300,000 | $0.25 | 1 February 2016 |
| | - | 3,100,000 | - | - | - | 3,100,000 | $0.30 | 24 February 2016 |
| | - | 125,000 | - | - | - | 125,000 | $0.30 | 15 March 2014 |
| | 5,430,500 | 3,525,000 | 85,000 | - | 420,000 | 8,450,500 | | |
| | * | Amended and extended on 6 May 2009. |
Pacific North West Capital Corp.
(An Exploration Stage Company)
Notes to Consolidated Financial Statements
30 April 2011 and 2010
Canadian Funds |
| |
| 8. | Share Capital – Continued |
| | f) | Share Purchase Options – Continued |
| | During the year, the Company granted the following options and recognized the vested amount as follows: |
| | Grant Date | | Granted | | | Exercise Price | | | Fair Value | | | 30 April 2011 Vested Amount | |
| | 1 February 2011 | | 300,000 | | $ | 0.25 | | | 45,030 | | $ | 22,515 | |
| | 24 February 2011 | | 3,100,000 | | $ | 0.30 | | | 609,754 | | | - | |
| | 15 March 2011 | | 125,000 | | $ | 0.30 | | | 18,948 | | | - | |
| | | | 3,525,000 | | | | | $ | 673,732 | | $ | 22,515 | |
| | The total estimated fair value of the 3,525,000 options is $673,732, of which $22,515 has been recorded as stock-based compensation expenses for the year ended 30 April 2011. The offsetting entry is to contributed surplus. |
| | During prior years, the Company granted the following options and recognized the vested amount as follows: |
| | Grant Date | | Granted | | | Exercise Price | | | Fair Value | | | 30 April 2011 Vested Amount | |
| | 15 July 2009 | | 125,000 | | $ | 0.25 | | $ | 8,613 | | $ | 4,719 | |
| | 4 January 2010 | | 150,000 | | $ | 0.25 | | | 22,242 | | | 15,531 | |
| | 4 January 2010 | | 150,000 | | $ | 0.40 | | | 20,531 | | | - | |
| | 5 January 2010 | | 150,000 | | $ | 0.25 | | | 22,224 | | | 15,531 | |
| | 5 January 2010 | | 150,000 | | $ | 0.50 | | | 19,628 | | | - | |
| | 5 January 2010 | | 100,000 | | $ | 0.25 | | | 14,816 | | | 10,354 | |
| | 5 January 2010 | | 100,000 | | $ | 0.50 | | | 13,085 | | | - | |
| | | | 925,000 | | | | | $ | 121,139 | | $ | 46,135 | |
| | The total estimated fair value of the 925,000 options is $121,139, of which $46,135 has been recorded as stock-based compensation expenses for the year ended 30 April 2011. The offsetting entry is to contributed surplus. |
| | The fair value of each option grant is estimated on the date of grant using the Black-Scholes option-pricing model with the following weighted average assumptions: |
| | | | 2011 | | | 2010 | | | 2009 | |
| | Expected dividend yield | | 0.00% | | | 0.00% | | | 0.00% | |
| | Expected stock price volatility | | 117.12% | | | 113.98% | | | 92.55% | |
| | Risk-free interest rate | | 2.57% | | | 3.15% | | | 2.36% | |
| | Expected life of options | | 4.9 years | | | 5.0 years | | | 5.0 years | |
| | Option pricing models require the input of highly subjective assumptions including the expected price volatility. Changes in the subjective input assumptions can materially affect the fair value estimate, and therefore the existing models do not necessarily provide a reliable single measure of the fair value of the Company’s stock options. |
Pacific North West Capital Corp.
(An Exploration Stage Company)
Notes to Consolidated Financial Statements
30 April 2011 and 2010
Canadian Funds |
| |
| 8. | Share Capital – Continued |
| | f) | Share Purchase Options – Continued |
| | On 6 May 2009, the Company entered into an Amending Agreement with the holders of 1,923,000 existing options amending the exercise prices and extending the expiry dates: |
| | Grant Date | | Balance as at 6 May 2009 | | | Original Exercise Price | | | Amended Exercise Price | | | Original Expiry Date | | | Amended Expiry Date | |
| | 5 November 2004 | | 743,000 | | $ | 0.72 | | $ | 0.25 | | | 5 November 2009 | | | 5 November 2014 | |
| | 14 February 2007 | | 150,000 | | $ | 0.47 | | $ | 0.25 | | | 14 February 2012 | | | 14 February 2017 | |
| | 18 May 2007 | | 620,000 | | $ | 0.55 | | $ | 0.25 | | | 18 May 2012 | | | 18 May 2017 | |
| | 11 October 2007 | | 280,000 | | $ | 0.50 | | $ | 0.25 | | | 11 October 2012 | | | 11 October 2017 | |
| | 29 October 2007 | | 130,000 | | $ | 0.50 | | $ | 0.25 | | | 29 October 2012 | | | 29 October 2017 | |
| | | | 1,923,000 | | | | | | | | | | | | | |
| | The stock-based compensation expense related to this re-pricing of 1,923,000 stock options was $118,811. |
| | The following assumptions were used for the Black-Scholes valuation of stock options granted and re-priced during the period: |
| | | | 2011 | | | 2010 | | | 2009 | |
| | Expected dividend yield | | - | | | 0.00% | | | - | |
| | Expected stock price volatility | | - | | | 100.30% | | | - | |
| | Risk-free interest rate | | - | | | 2.24% | | | - | |
| | Expected life of options | | - | | | 7.13 years | | | - | |
| | Option pricing models require the input of highly subjective assumptions including the expected price volatility. Changes in the subjective input assumptions can materially affect the fair value estimate, and therefore the existing models do not necessarily provide a reliable single measure of the fair value of the Company’s stock options. |
| | g) | Share Purchase Warrants |
| | As at 30 April 2011, the following share purchase warrants were outstanding: |
| | Warrants | Exercise Price | Expiry Date |
| | 2,680,000 | $0.45 | 30 December 2011 |
| | 315,000 | $0.20 | 30 December 2011 |
| | 4,624,166 | $0.35 | 15 March 2012 |
| | 322,143 | $0.45 | 15 March 2012 |
| | 3,000,000 | $0.30 | 13 December 2013 |
| | 10,941,309 | | |
| | During the year ended 30 April 2011, 4,946,309 common share purchase warrants having a fair value of $331,618 were issued relating to private placements. |
| | During the year ended 30 April 2011, 3,000,000 common share purchase warrants having a fair value of $675,570 were issued relating to the purchase of the remaining 50% interest in the unincorporated joint venture of the River Valley Platinum Group Metals project from Anglo Platinum Limited through its wholly-owned subsidiary, Kaymin Resources Ltd. (Notes 5c and 8b). |
| | During the year ended 30 April 2010, 2,995,000 common share purchase warrants having a fair value of $409,729 were issued relating to private placements. |
Pacific North West Capital Corp.
(An Exploration Stage Company)
Notes to Consolidated Financial Statements
30 April 2011 and 2010
Canadian Funds |
| |
| 8. | Share Capital – Continued |
| | g) | Share Purchase Warrants – Continued |
| | The relative pro rata allocation of the fair value of the stock purchase warrants included in unit offerings is estimated on the date of issuance of the unit using the Black-Scholes warrant-pricing model with the following weighted average assumptions: |
| | | | 2011 | | | 2010 | | | 2009 | |
| | Average risk-free interest rate | | 1.83% | | | 1.42% | | | - | |
| | Expected dividend yield | | - | | | - | | | - | |
| | Expected stock price volatility | | 119.40% | | | 136.95% | | | - | |
| | Average expected warrant life | | 1.8 years | | | 2 years | | | - | |
| | Pricing models require the input of highly subjective assumptions including the expected stock price volatility. Changes in the subjective input assumptions can materially affect the fair value estimate, and therefore, the existing models do not necessarily provide a reliable single measure of the fair value of the Company’s share purchase warrants. |
| | a) | A reconciliation of income taxes at statutory rates with the reported taxes is as follows: |
| | | | 2011 | | | 2010 | |
| | | | | | | | |
| | Net loss for the year | $ | 4,153,650 | | $ | 3,817,164 | |
| | Canadian federal and provincial income tax rates | | 27.83% | | | 29.50% | |
| | | | | | | | |
| | Expected income tax (recovery) | $ | 1,156,099 | | $ | 1,126,063 | |
| | Permanent differences | | (47,258 | ) | | (469,093 | ) |
| | Change in prior year provision to actual | | (11,206 | ) | | (280,514 | ) |
| | Change in enacted tax rates | | (112,876 | ) | | (320,028 | ) |
| | Change in valuation allowance | | (984,759 | ) | | 209,072 | |
| | | | | | | | |
| | Total income tax recovery | $ | - | | $ | 265,500 | |
| | | | | | | | |
| | Represented by: | | | | | | |
| | Current income tax | $ | - | | $ | - | |
| | Future income tax recovery | $ | - | | $ | 265,500 | |
| | b) | The significant components of the Company's future income tax assets and liabilities are as follows: |
| | | | 2011 | | | 2010 | |
| | | | | | | | |
| | Future income tax assets (liabilities) | | | | | | |
| | Non-capital loss carry forwards | $ | 2,028,665 | | $ | 1,672,014 | |
| | Share issue costs | | 34,402 | | | 52,003 | |
| | Property, plant and equipment | | 67,955 | | | 59,634 | |
| | Mineral properties | | 286,452 | | | (350,936 | ) |
| | | | | | | | |
| | | | 2,417,474 | | | 1,432,715 | |
| | Valuation allowance | | (2,417,474 | ) | | (1,432,715 | ) |
| | | | | | | | |
| | Net future income tax assets | $ | - | | $ | - | |
Pacific North West Capital Corp.
(An Exploration Stage Company)
Notes to Consolidated Financial Statements
30 April 2011 and 2010
Canadian Funds |
| |
| 9. | Income Taxes – Continued |
| | The Company has non-capital losses for Canadian tax purposes of approximately $8,114,661 available to offset against taxable income in future years, which, if unutilized, will expire as follows: |
| | | | | |
| | | | | |
| | 2014 | $ | 701,754 | |
| | 2015 | | 684,375 | |
| | 2026 | | 851,782 | |
| | 2027 | | 1,271,389 | |
| | 2028 | | 1,336,195 | |
| | 2029 | | 1,530,437 | |
| | 2030 | | 267,302 | |
| | 2031 | | 1,471,427 | |
| | | | | |
| | Total | $ | 8,114,661 | |
| | Subject to certain restrictions, the Company also has resource exploration expenditures of approximately $7,507,855 available to reduce taxable income of future years. |
| | c) | Future Income Tax Recovery |
| | During the year, flow-through shares totalling $225,500 (2010 - $900,000, 2009 - $Nil) were issued, which funds are required to be spent on certain Qualifying Canadian Exploration Expenditures. Because the Company no longer has the ability to use the expenditures for tax purposes, the Company is required to record a future tax liability which is equal to the renunciation, times the corporation tax rate when expenditures are renounced. This amounted to $Nil (2010 - $265,500, 2009 - $920,000). However, because the Company has unused tax losses and resource pools in excess of the renunciation, the future tax liability becomes a future income tax recovery. |
| | a) | By agreement effective 1 December 2005, the Company entered into a five-year management agreement with a company controlled by a director and Chairman. Compensation is $7,350 per month for the first year, with a 5% increase on each anniversary date plus benefits. The Chairman and director is also entitled to receive up to 20% of all stock options granted during the period that the agreement is in place. This agreement is automatically renewable for two-year periods. The Company may terminate the agreement at any time but will be responsible to pay the greater of the remaining amount under the contract or two years’ compensation. |
| | By amended agreement effective 1 December 2008, the Company amended the 1 December 2005 agreement. The compensation under the original agreement was amended from $7,350 per month to $14,104 per month. The 5% increase under the original agreement was waived until 1 December 2009. All terms of the original agreement remained the same. |
| | By amended agreement effective 1 April 2011, the Company amended the 1 December 2005 agreement as amended on 1 December 2008. The compensation under the amended agreement was further amended from $15,550 per month to $20,833 per month. The term of the amended agreement is for five years terminating on 31 March 2016. All terms of the original agreement remained the same. |
| | Year ended 30 April | | 2012 | | | 2013 | | | 2014 | | | 2015 | | | 2016 | | | Total | |
| | Management agreement | $ | 251,042 | | $ | 263,594 | | $ | 276,773 | | $ | 290,612 | | $ | 305,143 | | $ | 1,387,164 | |
Pacific North West Capital Corp.
(An Exploration Stage Company)
Notes to Consolidated Financial Statements
30 April 2011 and 2010
Canadian Funds |
| |
| 10. | Commitments – Continued |
| | b) | The Company has outstanding and future commitments under mineral property option agreements to pay cash and issue common shares of the Company (Note 5). |
| | c) | By agreement dated 1 December 2006, the Company entered into a five-year lease for office premises with the following lease payments to the expiration of the lease on 30 November 2011: |
| | Year ended 30 April | | 2012 | | | 2013 | | | 2014 | | | 2015 | | | 2016 | | | Total | |
| | Office lease * | $ | 119,303 | | $ | - | | $ | - | | $ | - | | $ | - | | $ | 119,303 | |
| | * | In November 2008, the Company entered into an agreement with the former co-signor of the lease whereby the Company assumed their remaining lease obligation and received a lump sum amount of $126,845 which will be then applied to the end of the term. |
| | The capital structure of the Company consists of equity attributable to common shareholders, comprising of issued capital, contributed surplus, accumulated other comprehensive loss and deficit. The Company’s objectives when managing capital are to: (i) preserve capital, (ii) obtain the best available net return, and (iii) maintain liquidity. |
| | The Company manages the capital structure and makes adjustments to it in light of changes in economic condition and the risk characteristics of the underlying assets. To maintain or adjust the capital structure, the Company may attempt to issue new shares, issue new debt, acquire or dispose of assets or adjust the amount of cash and cash equivalents and investments. |
| | The Company’s policy is to invest its excess cash in highly liquid, fully guaranteed, bank sponsored instruments. |
| | There were no changes in the Company’s approach to capital management during the year ended 30 April 2011 compared to the year ended 30 April 2010. The Company is not subject to externally imposed capital requirements. |
| | The following event occurred during the period from the year ended 30 April 2011 to the date the consolidated financial statements were available to be issued on 14 July 2011: |
| | On 13 July 2011, the Company completed the first tranche of a non-brokered private placement of 2,583,333 non flow-through units at $0.30 per unit, with each unit consisting of one fully paid and non-assessable common share in the capital of the Company and one-half of one share purchase warrant, each whole warrant entitling the holder thereof to purchase one additional common share of the Company for 18 months at an exercise of $0.40. A total of 4,332,141 flow-through units at $0.35 per unit were also placed in the first tranche closing. Each flow-through unit consists of one fully paid and non-assessable common share in the capital of the Company and one-half of one share purchase warrant, each whole warrant entitling the holder thereof to purchase one additional non flow-through common share of the Company at $0.45 per share for a period of 18 months. |
Pacific North West Capital Corp.
(An Exploration Stage Company)
Notes to Consolidated Financial Statements
30 April 2011 and 2010
Canadian Funds |
| |
| 13. | Segmented Information |
| | Details on a geographic basis as at 30 April 2011 are as follows: |
| | | | USA | | | Canada | | | Africa | | | Total | |
| | Assets | $ | - | | $ | 15,388,948 | | $ | 186,693 | | $ | 15,575,641 | |
| | Mineral property costs | $ | - | | $ | 6,175,355 | | $ | 186,693 | | $ | 6,362,048 | |
| | Loss for the year | $ | (817,098) | | $ | (3,336,552 | ) | $ | - | | $ | (4,153,650 | ) |
| | Details on a geographic basis as at 30 April 2010 are as follows: |
| | | | USA | | | Canada | | | Africa | | | Total | |
| | Assets | $ | 753,990 | | $ | 10,599,064 | | $ | - | | $ | 11,353,054 | |
| | Mineral property costs | $ | 753,990 | | $ | 3,145,604 | | $ | - | | $ | 3,899,594 | |
| | Loss for the year | $ | - | | $ | (771,019 | ) | $ | - | | $ | (771,019 | ) |
| | Details on a geographic basis as at 30 April 2009 are as follows: |
| | | | USA | | | Canada | | | Africa | | | Total | |
| | Assets | $ | 5,755,418 | | $ | 9,339,918 | | $ | - | | $ | 15,095,336 | |
| | Mineral property costs | $ | 953,624 | | $ | 3,380,355 | | $ | - | | $ | 4,333,979 | |
| | Loss for the year | $ | (611 | ) | $ | (5,353,855 | ) | $ | - | | $ | (5,354,466 | ) |
| 14. | Discontinued Operation |
| | On 29 June 2009, the Company entered into an option agreement with FAU to sell all of the outstanding common shares of its wholly-owned subsidiary MCR which owns the Nixon Fork Gold Mine Project in Alaska. FAU paid US$50,000 on signing of the option agreement. Subsequently, FAU exercised the option by making further payments totalling US$450,000, and issuing a total of US$2.5 million in FAU shares at a deemed price of $0.45 per share for a total of 6,415,000 shares. FAU also issued 1,000,000 share purchase warrants entitling the Company to purchase 1,000,000 shares at an exercise price of $0.50 until 2 October 2011 (Note 4). FAU also refunded all expenses incurred by the Company from 1 May 2009 until the finalisation of this transaction on 22 September 2009 (Note 5r). |
| | The assets, liabilities and results of operations of MCR have been separately reported as discontinued operations in the consolidated balance sheets and statements of operations. Previously reported consolidated financial statements for the year ended 30 April 2009 have been revised to reflect this presentation. |
| | Income (loss) from discontinued operation is summarized as follows: |
| | | | 2011 | | | 2010 | |
| | Operating costs and expenses | | | | | | |
| | Foreign exchange gain | $ | - | | $ | (183,080 | ) |
| | Bank charges | | - | | | 317 | |
| | Legal | | - | | | 5,544 | |
| | | | | | | | |
| | Income (loss) for the year from discontinued operation | | - | | | 177,219 | |
| | | | | | | | |
| | Gain on disposition of discontinued operation | | - | | | 2,603,426 | |
| | Income (loss) from discontinued operation | $ | - | | $ | 2,780,645 | |
| | Included in the discontinued operation are tax loss carryforwards of approximately $Nil (2010 - $814,246, 2009 - $83,293) for which the Company has provided a full valuation allowance. |
Pacific North West Capital Corp.
(An Exploration Stage Company)
Notes to Consolidated Financial Statements
30 April 2011 and 2010
Canadian Funds |
| |
| 15. | Differences Between Canadian and United States Generally Accepted Accounting Principles (“GAAP”) |
| | Canadian GAAP vary in certain significant respects from the principles and practices generally accepted in the United States (“US GAAP”). The effect of the principal measurement differences on the Company’s consolidated financial statements is quantified below and described in the accompanying notes: |
| | a) | Securities and Exchange Commission (“SEC”) staff has interpreted US GAAP to require that mineral property exploration and land use costs must be expensed as incurred, until commercially mineable deposits are determined to exist within a particular property. Accordingly, for US GAAP purposes, for all periods presented, the Company has expensed all land use costs for mineral properties and deferred exploration costs, which have been incurred by the Company, for which commercially mineable revenues do not exist. Under Canadian GAAP, such costs have been deferred. For Canadian GAAP, cash flows relating to mineral property exploration and land use costs are reported as investing activities. For US GAAP, these costs would be characterized as operating activities. |
| | b) | US GAAP requires that the fair market value of contributed executive services be recorded as an expense, even when they are not paid. For the year ended 30 April 1998, the fair market value of contributed executive services of $98,000 was expensed for US GAAP purposes. |
| | c) | Under Canadian GAAP a premium to market on the issuance of flow-through shares would be recorded in share capital. For US GAAP purposes, the proceeds should be allocated between the offering of the shares and the sale of tax benefits when the shares are offered. The allocation is made based on the difference between the quoted price of the shares and the amount the investor pays for the flow-through shares. A future tax liability is recognized for the premium paid by the investors. For the years ended 30 April 2011, premium on the issuance of flow-through shares was $77,314 (2010 - $Nil, 2009 - $Nil). For the year ended 30 April 1998, the Company recorded a flow-through discount of $127,890. |
| | Under US GAAP, funds raised from the issuance of flow-through shares, which have not yet been disbursed on qualifying exploration expenditures, would be disclosed as restricted cash and excluded from current assets. Accordingly, cash and cash equivalents under US GAAP would be reduced by $Nil at 30 April 2011, $567,771 at 30 April 2010 and $1,125,083 at 30 April 2009. |
| | e) | The impact of the above differences between Canadian and United States GAAP on the reported assets of the Company is as follows: |
| | | | Years Ended 30 April | |
| | | | 2011 | | | 2010 | | | 2009 | |
| | Total assets as reported - Canadian GAAP | $ | 15,575,641 | | $ | 11,353,054 | | $ | 15,095,336 | |
| | Write-off of mineral exploration costs | | (2,963,105 | ) | | (3,669,390 | ) | | (4,134,229 | ) |
| | Total assets as reported - United States GAAP | $ | 12,612,536 | | $ | 7,683,664 | | $ | 10,961,107 | |
| | f) | The impact of the above differences between Canadian and United States GAAP on loss for the period is as follows: |
| | | | Years Ended 30 April | |
| | | | 2011 | | | 2010 | | | 2009 | |
| | Loss for the year as reported | $ | (4,153,650 | ) | $ | (771,019 | ) | $ | (5,354,466 | ) |
| | Recovery (write-off) of mineral exploration costs(Note 15a) | | 706,285 | | | 464,839 | | | 2,139,414 | |
| | Future tax recovery(Note 15c) | | - | | | (265,500 | ) | | (320,000 | ) |
| | Loss for the year in accordance with US GAAP | $ | (3,447,365 | ) | $ | (571,680 | ) | $ | (3,535,052 | ) |
| | Other comprehensive income (loss) | $ | 1,847,946 | | $ | 361,510 | | $ | (743,866 | ) |
| | Comprehensive loss for the year under US GAAP | $ | (1,599,419 | ) | $ | (210,170 | ) | $ | (4,278,918 | ) |
| | Loss per share for the year in accordance with US GAAP | $ | (0.05 | ) | $ | (0.01 | ) | $ | (0.05 | ) |
| | Comprehensive loss per share in accordance with US GAAP | $ | (0.02 | ) | $ | (0.01 | ) | $ | (0.07 | ) |
Pacific North West Capital Corp.
(An Exploration Stage Company)
Notes to Consolidated Financial Statements
30 April 2011 and 2010
Canadian Funds |
| |
| 15. | Differences Between Canadian and US GAAP – Continued |
| | g) | The impact of the above differences between Canadian and US GAAP on the deficit, as reported, is as follows: |
| | | | Years Ended 30 April | |
| | | | 2011 | | | 2010 | | | 2009 | |
| | Deficit as reported | $ | (22,160,237 | ) | $ | (18,006,587 | ) | $ | (17,235,568 | ) |
| | Flow-through discount(Note 15c) | | 127,890 | | | 127,890 | | | 127,890 | |
| | Write-off of mineral exploration costs(Note 15a) | | (2,963,105 | ) | | (3,669,390 | ) | | (4,134,229 | ) |
| | Future tax recovery(Note 15c) | | (1,678,655 | ) | | (1,678,655 | ) | | (1,413,155 | ) |
| | Deficit in accordance with US GAAP | $ | (26,674,107 | ) | $ | (23,226,742 | ) | $ | (22,655,062 | ) |
| | h) | The impact of the above differences between Canadian and US GAAP on the statement of changes in shareholders’ equity, as reported, is as follows: |
| | | Common Shares | | | Accumulated | | | Contributed | | | Accumulated Comprehensive | | | | |
| | | Number | | | Amount | | | Deficit | | | Surplus | | | Income | | | Total | |
| Shareholders’ equity balance as reported at 30 April 2009 | | 61,858,008 | | $ | 24,779,281 | | $ | (17,235,568 | ) | $ | 3,790,226 | | $ | (755,012 | ) | $ | 10,578,927 | |
| Flow-through discount(Note 15c) | | - | | | - | | | 127,890 | | | - | | | - | | | 127,890 | |
| Fair market value of contributed executive services(Note 15b) | | - | | | - | | | - | | | (98,000 | ) | | - | | | (98,000 | ) |
| Write-off of mineral exploration costs(Note 15a) | | - | | | - | | | (4,134,229 | ) | | - | | | - | | | (4,134,229 | ) |
| Future tax recovery(Note 15c) | | - | | | 1,413,155 | | | (1,413,155 | ) | | - | | | - | | | - | |
| Shareholders’ equity in accordance with US GAAP at 30 April 2009 | | 61,658,008 | | $ | 26,192,436 | | $ | (22,655,062 | ) | $ | 3,692,226 | | $ | (755,012 | ) | $ | 6,474,588 | |
| Shareholders’ equity balance as reported at 30 April 2010 | | 67,543,008 | | $ | 25,170,802 | | $ | (18,006,587 | ) | $ | 4,485,390 | | $ | (393,502 | ) | $ | 11,256,103 | |
| Flow-through discount(Note 15c) | | - | | | - | | | 127,890 | | | - | | | - | | | 127,890 | |
| Fair market value of contributed executive services(Note 15b) | | - | | | - | | | - | | | (98,000 | ) | | - | | | (98,000 | ) |
| Write-off of mineral exploration costs(Note 15a) | | - | | | - | | | (3,669,390 | ) | | - | | | - | | | (3,669,390 | ) |
| Future tax recovery(Note 15c) | | - | | | 1,678,655 | | | (1,678,655 | ) | | - | | | - | | | - | |
| Shareholders’ equity in accordance with US GAAP at 30 April 2010 | | 67,543,008 | | $ | 26,849,457 | | $ | (23,226,742 | ) | $ | 4,387,390 | | $ | (393,502 | ) | $ | 7,616,603 | |
Pacific North West Capital Corp.
(An Exploration Stage Company)
Notes to Consolidated Financial Statements
30 April 2011 and 2010
Canadian Funds |
| |
| 15. | Differences Between Canadian and US GAAP – Continued |
| | | Common Shares | | | Accumulated | | | Contributed | | | Accumulated Comprehensive | | | | |
| | | Number | | | Amount | | | Deficit | | | Surplus | | | Income | | | Total | |
| Shareholders’ equity balance as reported at 30 April 2011 | | 85,737,788 | | $ | 30,276,368 | | $ | (22,160,237 | ) | $ | 5,601,728 | | $ | 1,454,444 | | $ | 15,172,303 | |
| Flow-through discount(Note 15c) | | - | | | - | | | 127,890 | | | - | | | - | | | 127,890 | |
| Fair market value of contributed executive services(Note 15b) | | - | | | - | | | - | | | (98,000 | ) | | - | | | (98,000 | ) |
| Write-off of mineral exploration costs(Note 15a) | | - | | | - | | | (2,963,105 | ) | | - | | | - | | | (2,963,105 | ) |
| Future tax recovery(Note 15c) | | - | | | 1,678,655 | | | (1,678,655 | ) | | - | | | - | | | - | |
| Premium on flow-through shares(Note 15c) | | - | | | (77,314 | ) | | - | | | - | | | - | | | (77,314 | ) |
| Shareholders’ equity in accordance with US GAAP at 30 April 2011 | | 85,737,788 | | $ | 31,877,709 | | $ | (26,674,107 | ) | $ | 5,503,728 | | $ | 1,454,444 | | $ | 12,161,774 | |
| | i) | The impact of the above differences between Canadian and United States GAAP on the statement of cash flows, as reported, is as follows: |
| | | | Years Ended 30 April | |
| | | | 2011 | | | 2010 | | | 2009 | |
| | Cash used in operating activities under Canadian GAAP | $ | (1,380,884 | ) | $ | (2,323,610 | ) | $ | (1,573,837 | ) |
| | Mineral property exploration and development expenditures(Note 15a) | | (1,647,208 | ) | | (1,421,322 | ) | | (1,667,289 | ) |
| | Cash used in operating activities under US GAAP | $ | (3,028,092 | ) | $ | (3,744,932 | ) | $ | (3,241,126 | ) |
| | | | | | | | | | | |
| | Cash used in investing activities under Canadian GAAP | $ | (2,205,637 | ) | $ | 254,871 | | $ | (1,921,108 | ) |
| | Mineral property exploration and development expenditures(Note 15a) | | 1,647,208 | | | 1,421,322 | | | 1,667,289 | |
| | Flow-through funds not disbursed during the year(Note 15d) | | - | | | (567,771 | ) | | (1,125,083 | ) |
| | Flow-through funds realized from previous year(Note 15d) | | 567,771 | | | 1,125,083 | | | 2,057,860 | |
| | Cash used in investing activities under US GAAP | $ | 9,342 | | $ | 2,233,505 | | $ | 678,958 | |
| | | | | | | | | | | |
| | Cash generated by financing activities under Canadian and US GAAP | $ | 2,991,036 | | $ | 1,029,000 | | $ | (4,234 | ) |
| | | | | | | | | | | |
| | Cash and cash equivalents end of year under Canadian GAAP | $ | 3,880,196 | | $ | 4,475,681 | | $ | 5,515,420 | |
| | Restricted cash – Flow-through shares(Note 15d) | | - | | | (567,771 | ) | | (1,125,083 | ) |
| | Cash and cash equivalents end of year under US GAAP | $ | 3,880,196 | | $ | 3,907,910 | | $ | 4,390,337 | |
| 15. | Differences Between Canadian and US GAAP – Continued |
| | j) | New Accounting Pronouncements |
| | In December 2010, the Financial Accounting Standards Board (“FASB”) issued Accounting Standards Update (“ASU”) 2010-28, “Intangibles, Goodwill and Other”. The amendments in this ASU are effective for fiscal years, and interim periods within those years, beginning after 15 December 2010. The Company does not expect the provisions of ASU 2010-28 to have a material effect on the Company’s financial position, results of operations or cash flows. |
| | In December 2010, the FASB issued ASU 2010-29, “Business Combinations”. The amendments in this ASU are effective for fiscal years, and interim periods within those years, beginning after 15 December 2010. The Company does not expect the provisions of ASU 2010-29 to have a material effect on the Company’s financial position, results of operations or cash flows. |
| | In June 2011, the FASB issued ASU 2011-05, “Presentation of Comprehensive Income”. This update presents an entity with the option to present the total of comprehensive income, the components of net income, and the components of other comprehensive income either in a single continuous statement of comprehensive income or in two separate but consecutive statements. In both choices, an entity is required to present each component of net income along with total net income, each component of other comprehensive income along with a total for other comprehensive income, and a total amount for comprehensive income. This update eliminates the option to present the components of other comprehensive income as part of the statement of changes in stockholders' equity. The amendments in this update do not change the items that must be reported in other comprehensive income or when an item of other comprehensive income must be reclassified to net income. As ASU 2011-05 relates only to the presentation of Comprehensive Income, the Company does not expect that the adoption of this update will have a material effect on its financial statements. |
ITEM 18. FINANCIAL STATEMENTS
Refer to Item 17 – Financial Statements
ITEM 19. EXHIBITS
The following exhibits filed with, or incorporated into, this Form 20-F Annual Report for the fiscal year ended April 30, 2011:
| EXHIBIT # | |
| 1. | Articles of Incorporation | |
| 1.1 | Memorandum and By-laws dated May 29, 1996, as amended October 22, 1997, and Certificate of Incorporation as an Alberta corporation | (2) |
| 1.2 | Certificate of Continuation and Articles as a British Columbia Corporation dated July 13, 2004 | (7) |
| 4. | Material Contracts | |
| 4.1 | 2004 Stock Option Plan | (7) |
| 4.2 | 2005 Stock Option Plan | (7) |
| 4.3 | Farm-In Agreement dated July 14, 1999 on the River Valley property, Ontario, between the Company and Kaymin Resources Limited and Anglo Platinum Limited | (1) |
| 4.4 | Agreement between the Company and CanAlaska dated August 15, 2003, whereby the Company could acquire up to 70% of CanAlaska’s Glitter Lake Property in Québec | (3) |
| 4.5 | Agreement dated April 30, 2006, between the Company and CanAlaska, amending the August 15, 2003 agreement to acquire up to 70% of CanAlaska’s Glitter Lake Property | (7) |
| 4.6 | Agreement dated April 1, 2008, between the Company and CanAlaska, amending the August 15, 2003 agreement, as amended April 30, 2006, to acquire up to 70% of CanAlaska’s Glitter Lake Property | (7) |
| 4.7 | Agreement dated January 30, 2009, between the Company and CanAlaska, amending the August 15, 2003 agreement, as amended April 30, 2006, as amended April 1, 2008, assigning 100% ownership of the Glitter Lake Property to the Company | (7) |
89
| 4. | Material Contracts (continued) | |
| 4.8 | Joint Venture Agreement dated October 31, 2007, between the Company and First Nickel Inc. in respect of the Company acquiring the Southern Ontario Properties (known as the Raglan Hills Property) | (7) |
| 4.9 | Letter Agreement dated December 9, 2008 between the Company and St. Andrew Goldfields Ltd., (“SAG”) granting the Company an option to acquire a 100% interest in SAG’s wholly-owned subsidiary, Mystery Creek Resources, Inc. | (7) |
| 4.10 | Letter Agreement dated June 26, 2009, effective June 25, 2009, between the Company and Fire River Gold Corp. (“FAU”) granting FAU an option to acquire a 100% interest in the Company’s wholly-owned subsidiary, Mystery Creek Resources, Inc. | (7) |
| 4.11 | Agreement dated April 30, 2007 between the Company and Diamond Hunter Ltd. for the Company to acquire a 100% interest in the Nickel Plats Project (Gochager Lake property) | (7) |
| 4.12 | Agreement dated March 30, 2009, between the Company and Diamond Hunter Ltd., amending the terms of the Agreement dated April 30, 2007 covering the Gochager Lake property | (7) |
| 4.13 | Joint Venture Agreement dated August 14, 2009, between the Company and Alto Ventures Ltd. in respect of the Despinassy Property, Quebec (known as the Destiny Gold Property) | (7) |
| 4.14 | Letter Agreement dated July 28, 2009, between the Company and Misty Creek Ventures Ltd., Pamicon Developments Ltd. and First Fiscal Enterprises Ltd., granting the Company an option to earn a 100% interest in the Rock and Roll Property | (7) |
| 4.15 | Mineral Interest Assignment Agreement dated December 13, 2010 between Kaymin, Anglo Platinum and the Company, assigning Kaymin’s and Anglo Platinum’s 50% interest in the River Valley property to the Company | (9) |
| 4.16 | Amendment dated April 6, 2011 to the Mineral Interest Assignment Agreement dated December 13, 2010 between Kaymin, Anglo Platinum and the Company | (9) |
| 8. | List of Subsidiaries | |
| 8.1 | Pacific North West Capital Corp. USA, an Alaska corporation, incorporated May 27, 2003 | n/a |
| 8.2 | Pacific North West Capital de México, S.A. de C.V., a México company, incorporated January 20, 2009 | n/a |
| 11. | Code of Ethics | |
| 11.1 | Code of Business Conduct and Ethics | (6) |
| 12. | Certifications of Disclosure in Annual Report | |
| 12.1 | Certification of Chief Executive Officer pursuant to Section 302 of the Sarbanes-Oxley Act of 2002 | |
| 12.2 | Certification of Chief Financial Officer pursuant to Section 302 of the Sarbanes-Oxley Act of 2002 | |
| 12.3 | Certification of Chief Executive Officer pursuant to 18 U.S.C Section 1350, Adopted Pursuant to Section 906 of the Sarbanes-Oxley Act of 2002 | |
| 12.4 | Certification of Chief Financial Officer pursuant to 18 U.S.C Section 1350, Adopted Pursuant to Section 906 of the Sarbanes-Oxley Act of 2002 | |
90
| 12. | Certifications of Disclosure in Annual Report (continued) | |
| 12.5 | Certificate of Ethics for the Chief Executive Officer and the Chief Financial Officer | |
| 15. | Other | |
| 15.1 | Charter of the Audit Committee of the Board of Directors | (6) |
| 15.2 | Whistleblower Policy adopted by the Audit Committee on May 24, 2010 | (6) |
| 15.3 | Technical report entitled “Revised Mineral Resource Estimate, Dana Lake and Lismer’s Ridge Deposits incorporating Phase VI Drilling, River Valley PGM Project, Ontario for Pacific North West Capital Corp”, dated June 10th, 2004, by Derry, Michener, Booth and Wahl Consultants Ltd. (“Derry, Michener, Booth and Wahl Report”). | (4) |
| 15.4 | “Revised Mineral Resources Estimate, Lismer’s North and Varley Areas (Incorporating VII Drilling), River Valley PGM Project, Ontario, for Pacific North West Capital Corp., dated May 2006” (the “GeoSim Report”) prepared by Ron Simpson, P.Geo., of GeoSim, and John Londry. | (5) |
| 15.5 | NI 43-101 compliant “Technical Report and Resource Estimation of the DAC Deposit, Destiny Property, Québec” (the “Destiny Tech Report”) for Alto Ventures Ltd. and Pacific North West Capital Corp. dated March 1, 2011, by Todd McCracken, P.Geo.”, of Wardrop. | (8) |
| 15.6 | Consent of Independent Registered Public Accounting Firm dated July 26, 2011 | |
NOTES:
(1) Incorporated by reference from our Registration Statement on Form 20-F filed on paper September 17, 1999.
(2) Incorporated by reference from our Annual Report on Form 20-F filed on paper June 8, 2000.
(3) Incorporated by reference from our Annual Report on Form 20-F on October 24, 2003.
(4) Incorporated by reference from our Annual Report on Form 20-F on August 9, 2004.
(5) Incorporated by reference from our Form 6-K/A on June 6, 2006.
(6) Incorporated by reference from our Annual Report on Form 20-F filed on July 27, 2010.
(7) Incorporated by reference from our Annual Report, as Amended, on Form 20-F/A filed on March 7, 2011.
(8) Incorporated by reference from our Form 6-K for the month of March 2011 filed on April 4, 2011.
(9) Incorporated by reference from our Form 6-K for the month of April 2011 filed on April 29, 2011.
91
SIGNATURES
The Company hereby certifies that it meets all of the requirements for filing on Form 20-F and that it has duly caused and authorized the undersigned to sign this annual report on its behalf.
Dated: July 26, 2011
PACIFIC NORTH WEST CAPITAL CORP.
By: /s/ Harry Barr
_____________________________________________
Harry Barr
President & Chief Executive Officer
By: /s/ Robert Guanzon
_____________________________________________
Robert Guanzon, Chief Financial Officer