UNITED STATES
SECURITIES AND EXCHANGE COMMISSION
Washington, D.C. 20549
FORM N-CSR
Certified Shareholder Report of
Registered Management Investment Companies
Investment Company Act File Number: 811-09105
New World Fund, Inc.
(Exact Name of Registrant as Specified in Charter)
333 South Hope Street, 55th Floor
Los Angeles, California 90071
(Address of Principal Executive Offices)
Registrant's telephone number, including area code: (949) 975-5000
Date of fiscal year end: October 31
Date of reporting period: April 30, 2024
Brian C. Janssen
New World Fund, Inc.
6455 Irvine Center Drive
Irvine, California 92618
(Name and Address of Agent for Service)
ITEM 1 – Reports to Stockholders
New World Fund® Semi-annual report
for the six months ended
April 30, 2024 |  |

Capturing the
growth potential
of developing
economies
The Securities and Exchange Commission has adopted new regulations that will change the content and design of annual and semi-annual shareholder reports beginning in July 2024. Certain types of information, including investment portfolio and financial statements, will not be included in the shareholder reports but will be available online, delivered free of charge upon request, and filed on a semi-annual basis on Form N-CSR.
If you would like to receive shareholder reports and other communications from the fund electronically, you may update your mailing preferences with your financial intermediary or enroll in e-delivery at capitalgroup.com (for accounts held directly with the fund).
New World Fund seeks to provide you with long-term capital appreciation.
This fund is one of more than 40 offered by one of the nation’s largest mutual fund families, American Funds, from Capital Group. For over 90 years, Capital has invested with a long-term focus based on thorough research and attention to risk.
Fund results shown in this report, unless otherwise indicated, are for Class F-2 shares. Class A share results are shown at net asset value unless otherwise indicated. If a sales charge (maximum 5.75%) had been deducted from Class A shares, the results would have been lower. Results are for past periods and are not predictive of results for future periods. Current and future results may be lower or higher than those shown. Share prices and returns will vary, so investors may lose money. Investing for short periods makes losses more likely. For current information and month-end results, visit capitalgroup.com.
Here are the average annual total returns on a $1,000 investment for periods ended March 31, 2024 (the most recent calendar quarter-end):
| | | 1 year | | 5 years | | 10 years |
| | | | | | | | | | | | | |
| Class F-2 shares | | | 14.49 | % | | | 7.10 | % | | | 5.88 | % |
| Class A shares (reflecting 5.75% maximum sales charge) | | | 7.57 | | | | 5.53 | | | | 4.94 | |
For other share class results, visit capitalgroup.com and americanfundsretirement.com.
The total annual fund operating expense ratios were 0.68% for Class F-2 shares and 0.99% for Class A shares as of the prospectus dated January 1, 2024.
Investment results assume all distributions are reinvested and reflect applicable fees and expenses. When applicable, investment results reflect fee waivers and/or expense reimbursements, without which they would have been lower. Visit capitalgroup.com for more information.
Investing outside the United States may be subject to risks, such as currency fluctuations, periods of illiquidity, price volatility and political instability. These risks may be heightened in connection with investments in developing countries. Investing in smaller companies entails further risks. The return of principal for bond funds and for funds with significant underlying bond holdings is not guaranteed. Fund shares are subject to the same interest rate, inflation and credit risks associated with the underlying bond holdings. Lower rated bonds are subject to greater fluctuations in value and risk of loss of income and principal than higher rated bonds. Refer to the fund prospectus and the Risk Factors section of this report for more information on these and other risks associated with investing in the fund.
Investments are not FDIC-insured, nor are they deposits of or guaranteed by a bank or any other entity, so they may lose value.
Fellow investors:
Results for New World Fund for the periods ended April 30, 2024, are shown in the table below, as well as the results of the fund’s primary benchmark.
For additional information about the fund, its investment results, holdings and portfolio managers, visit capitalgroup.com/individual/investments/fund/NFFFX. You can also access information about Capital Group’s American Funds and read our insights about the markets, retirement, saving for college, investing fundamentals and more at capitalgroup.com.
Contents
Results at a glance
For periods ended April 30, 2024, with all distributions reinvested
| | | Cumulative total returns | | Average annual returns |
| | | 6 months | | 1 year | | 5 years | | 10 years | | Lifetime
(since Class A
inception
on 6/17/99) |
| | | | | | | | | | | | | | | | | | | | | |
| New World Fund (Class F-2 shares)1 | | | 16.30 | % | | | 11.20 | % | | | 6.25 | % | | | 5.69 | % | | | 7.79 | % |
| New World Fund (Class A shares) | | | 16.12 | | | | 10.86 | | | | 5.94 | | | | 5.38 | | | | 7.51 | |
| MSCI All Country World Index (ACWI)2 | | | 19.77 | | | | 17.46 | | | | 9.44 | | | | 8.19 | | | | 5.77 | |
Past results are not predictive of results in future periods.
| 1 | Class F-2 shares were first offered on August 1, 2008. Class F-2 share results prior to the date of first sale are hypothetical based on the results of the original share class of the fund without a sales charge, adjusted for typical estimated expenses. Please visit capitalgroup.com for more information on specific expense adjustments and the actual dates of first sale. |
| 2 | The MSCI All Country World Index (ACWI) is a free-float-adjusted market-capitalization-weighted index that is designed to measure equity market results in the global developed and emerging markets, consisting of more than 40 developed and emerging market country indexes. Results reflect dividends gross of withholding taxes through December 31, 2000, and dividends net of withholding taxes thereafter. This index is unmanaged, and its results include reinvested dividends and/or distributions but do not reflect the effect of sales charges, commissions, account fees, expenses or U.S. federal income taxes. Source: MSCI. The market indexes are unmanaged and, therefore, have no expenses. Investors cannot invest directly in an index. There have been periods when the fund has lagged the index. |
| Investment portfolio April 30, 2024 | unaudited |
| | |
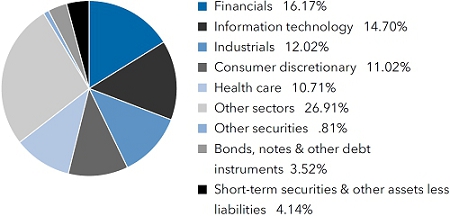
| Sector diversification | Percent of net assets |
| Country diversification by domicile | | | Percent of
net assets |
| United States | | | 22.22 | % |
| India | | | 13.57 | |
| Eurozone* | | | 13.18 | |
| China | | | 11.45 | |
| Brazil | | | 5.20 | |
| Taiwan | | | 3.56 | |
| Japan | | | 2.76 | |
| Mexico | | | 2.63 | |
| Indonesia | | | 2.59 | |
| Other countries | | | 18.70 | |
| Short-term securities & other assets less liabilities | | | 4.14 | |
| * | Countries using the euro as a common currency; those represented in the fund’s portfolio are Austria, Belgium, Finland, France, Germany, Greece, Italy, Luxembourg, the Netherlands and Spain. |
| Common stocks 91.53% | | Shares | | | Value
(000) | |
| Financials 16.17% | | | | | | | | |
| AIA Group, Ltd. | | | 77,544,355 | | | $ | 568,632 | |
| NU Holdings, Ltd. / Cayman Islands, Class A1 | | | 52,122,432 | | | | 566,050 | |
| Banco Bilbao Vizcaya Argentaria, SA | | | 50,033,909 | | | | 539,754 | |
| Bank Mandiri (Persero) Tbk PT | | | 1,193,176,111 | | | | 503,599 | |
| Mastercard, Inc., Class A | | | 902,936 | | | | 407,405 | |
| Bank Central Asia Tbk PT | | | 675,600,900 | | | | 404,962 | |
| PB Fintech, Ltd.1,2 | | | 26,558,966 | | | | 402,546 | |
| Kotak Mahindra Bank, Ltd. | | | 18,125,339 | | | | 349,811 | |
| Capitec Bank Holdings, Ltd. | | | 2,742,464 | | | | 339,389 | |
| HDFC Bank, Ltd. | | | 18,263,629 | | | | 332,695 | |
| Ping An Insurance (Group) Company of China, Ltd., Class H | | | 61,799,000 | | | | 281,778 | |
| Axis Bank, Ltd. | | | 18,809,728 | | | | 262,796 | |
| XP, Inc., Class A | | | 12,069,247 | | | | 247,058 | |
| ICICI Bank, Ltd. (ADR) | | | 4,339,430 | | | | 119,465 | |
| ICICI Bank, Ltd. | | | 8,313,851 | | | | 114,616 | |
| Visa, Inc., Class A | | | 806,768 | | | | 216,706 | |
| AU Small Finance Bank, Ltd. | | | 28,669,552 | | | | 216,285 | |
| Cholamandalam Investment and Finance Co., Ltd. | | | 14,361,320 | | | | 204,557 | |
| Eurobank Ergasias Services and Holdings SA1 | | | 93,205,464 | | | | 199,406 | |
| Grupo Financiero Banorte, SAB de CV, Series O | | | 19,964,547 | | | | 197,597 | |
| B3 SA - Brasil, Bolsa, Balcao | | | 91,926,468 | | | | 191,019 | |
| Shriram Finance, Ltd. | | | 5,515,839 | | | | 167,489 | |
| Bank Rakyat Indonesia (Persero) Tbk PT | | | 492,871,600 | | | | 148,639 | |
| Bank of Baroda | | | 42,566,663 | | | | 142,434 | |
| Erste Group Bank AG | | | 2,885,210 | | | | 134,391 | |
| Bank of the Philippine Islands | | | 60,462,985 | | | | 133,493 | |
| S&P Global, Inc. | | | 308,793 | | | | 128,405 | |
| Canara Bank | | | 17,070,176 | | | | 126,184 | |
| Bajaj Finserv, Ltd. | | | 6,158,519 | | | | 118,719 | |
| National Bank of Greece SA1 | | | 13,311,929 | | | | 107,080 | |
| Discovery, Ltd. | | | 15,939,974 | | | | 101,902 | |
| Hong Kong Exchanges and Clearing, Ltd. | | | 2,882,200 | | | | 91,560 | |
| Aon PLC, Class A | | | 278,269 | | | | 78,475 | |
| Akbank TAS | | | 42,493,744 | | | | 78,083 | |
| Edenred SA | | | 1,490,498 | | | | 70,635 | |
| BDO Unibank, Inc. | | | 25,042,710 | | | | 64,254 | |
| Alpha Services and Holdings SA1 | | | 37,673,000 | | | | 63,776 | |
| Commercial International Bank - Egypt (CIB) SAE (GDR) | | | 26,713,127 | | | | 39,609 | |
| Commercial International Bank - Egypt (CIB) SAE | | | 11,776,605 | | | | 17,696 | |
| China Merchants Bank Co., Ltd., Class H | | | 12,973,000 | | | | 56,618 | |
| Kaspi.kz JSC (ADR) | | | 475,705 | | | | 56,019 | |
| Max Financial Services, Ltd.1 | | | 4,346,000 | | | | 52,242 | |
| DBS Group Holdings, Ltd. | | | 2,023,181 | | | | 51,739 | |
| Common stocks (continued) | | Shares | | | Value
(000) | |
| Financials (continued) | | | | | | | | |
| Brookfield Corp., Class A | | | 1,218,800 | | | $ | 48,898 | |
| Moody’s Corp. | | | 118,550 | | | | 43,903 | |
| Jio Financial Services, Ltd.1 | | | 9,628,651 | | | | 43,405 | |
| Bajaj Finance, Ltd. | | | 480,400 | | | | 39,770 | |
| East Money Information Co., Ltd., Class A | | | 21,496,742 | | | | 38,721 | |
| Banco BTG Pactual SA, units | | | 5,942,307 | | | | 38,222 | |
| BNP Paribas SA | | | 475,235 | | | | 33,986 | |
| Emirates NBD Bank PJSC | | | 6,098,129 | | | | 28,191 | |
| PagSeguro Digital, Ltd., Class A1 | | | 2,136,500 | | | | 26,599 | |
| Bank of Ningbo Co., Ltd., Class A | | | 7,434,120 | | | | 23,546 | |
| Power Finance Corp., Ltd. | | | 4,292,926 | | | | 22,710 | |
| REC, Ltd.1 | | | 3,689,364 | | | | 22,418 | |
| Haci Ömer Sabanci Holding AS | | | 7,461,660 | | | | 21,219 | |
| China Construction Bank Corp., Class H | | | 30,590,500 | | | | 19,830 | |
| Société Générale | | | 598,543 | | | | 16,087 | |
| Prudential PLC | | | 1,741,000 | | | | 15,150 | |
| TISCO Financial Group PCL, foreign registered shares | | | 4,969,000 | | | | 12,988 | |
| China Pacific Insurance (Group) Co., Ltd., Class H | | | 4,440,800 | | | | 9,707 | |
| Moscow Exchange MICEX-RTS PJSC3 | | | 5,963,587 | | | | — | 4 |
| Sberbank of Russia PJSC3 | | | 38,486,552 | | | | — | 4 |
| | | | | | | | 9,200,918 | |
| | | | | | | | | |
| Information technology 14.70% | | | | | | | | |
| Taiwan Semiconductor Manufacturing Co., Ltd. | | | 74,991,816 | | | | 1,806,971 | |
| Taiwan Semiconductor Manufacturing Co., Ltd. (ADR) | | | 385,940 | | | | 53,005 | |
| Microsoft Corp. | | | 3,859,426 | | | | 1,502,590 | |
| Broadcom, Inc. | | | 611,333 | | | | 794,898 | |
| NVIDIA Corp. | | | 807,129 | | | | 697,376 | |
| ASML Holding NV | | | 645,045 | | | | 562,236 | |
| Samsung Electronics Co., Ltd. | | | 6,284,903 | | | | 347,857 | |
| Synopsys, Inc.1 | | | 566,856 | | | | 300,768 | |
| SAP SE | | | 1,380,912 | | | | 250,027 | |
| SAP SE (ADR) | | | 83,800 | | | | 15,185 | |
| Capgemini SE | | | 1,060,026 | | | | 222,707 | |
| SK hynix, Inc. | | | 1,748,624 | | | | 214,019 | |
| Keyence Corp. | | | 479,800 | | | | 212,530 | |
| ASM International NV | | | 297,043 | | | | 185,447 | |
| Tokyo Electron, Ltd. | | | 609,300 | | | | 133,794 | |
| Disco Corp. | | | 396,100 | | | | 112,184 | |
| Apple, Inc. | | | 436,148 | | | | 74,289 | |
| Wolfspeed, Inc.1,5 | | | 2,632,019 | | | | 71,144 | |
| Applied Materials, Inc. | | | 341,648 | | | | 67,868 | |
| EPAM Systems, Inc.1 | | | 279,747 | | | | 65,813 | |
| E Ink Holdings, Inc. | | | 10,120,000 | | | | 65,069 | |
| Coforge, Ltd. | | | 1,028,224 | | | | 62,205 | |
| Tata Consultancy Services, Ltd. | | | 1,332,961 | | | | 61,030 | |
| Nokia Corp. | | | 14,580,398 | | | | 53,053 | |
| MediaTek, Inc. | | | 1,701,130 | | | | 51,519 | |
| Advantech Co., Ltd. | | | 4,369,000 | | | | 50,847 | |
| TDK Corp. | | | 1,066,900 | | | | 47,095 | |
| ON Semiconductor Corp.1 | | | 620,000 | | | | 43,499 | |
| Micron Technology, Inc. | | | 342,491 | | | | 38,688 | |
| Trimble, Inc.1 | | | 616,650 | | | | 37,042 | |
| KLA Corp. | | | 52,902 | | | | 36,465 | |
| Accenture PLC, Class A | | | 105,601 | | | | 31,776 | |
| Intel Corp. | | | 843,400 | | | | 25,698 | |
| Xiamen Faratronic Co., Ltd., Class A | | | 1,747,959 | | | | 23,772 | |
| Hamamatsu Photonics KK | | | 580,900 | | | | 21,277 | |
| NICE, Ltd. (ADR)1,5 | | | 78,198 | | | | 17,478 | |
| Canva, Inc.1,3,6 | | | 10,572 | | | | 11,277 | |
| | | | | | | | 8,368,498 | |
| | | | | | | | | |
| Industrials 12.02% | | | | | | | | |
| Airbus SE, non-registered shares | | | 5,028,345 | | | | 826,349 | |
| Safran SA | | | 2,469,962 | | | | 534,086 | |
| International Container Terminal Services, Inc. | | | 83,748,170 | | | | 481,979 | |
| Larsen & Toubro, Ltd. | | | 7,168,173 | | | | 307,590 | |
| Copa Holdings, SA, Class A | | | 2,776,000 | | | | 265,108 | |
| Common stocks (continued) | | Shares | | | Value
(000) | |
| Industrials (continued) | | | | | | | | |
| Techtronic Industries Co., Ltd. | | | 18,977,000 | | | $ | 263,818 | |
| Grupo Aeroportuario del Pacífico, SAB de CV, Class B | | | 12,241,610 | | | | 222,969 | |
| Grupo Aeroportuario del Pacífico, SAB de CV, Class B (ADR) | | | 158,266 | | | | 28,777 | |
| General Electric Co. | | | 1,546,672 | | | | 250,282 | |
| Shenzhen Inovance Technology Co., Ltd., Class A | | | 26,749,086 | | | | 220,027 | |
| Rumo SA | | | 51,233,042 | | | | 198,910 | |
| Airports of Thailand PCL, foreign registered shares | | | 106,428,900 | | | | 186,121 | |
| Contemporary Amperex Technology Co., Ltd., Class A | | | 6,221,808 | | | | 174,376 | |
| Carrier Global Corp. | | | 2,760,919 | | | | 169,769 | |
| TransDigm Group, Inc. | | | 132,060 | | | | 164,815 | |
| Daikin Industries, Ltd. | | | 1,142,700 | | | | 155,086 | |
| IMCD NV | | | 1,022,199 | | | | 154,994 | |
| BAE Systems PLC | | | 8,725,852 | | | | 145,127 | |
| Grab Holdings, Ltd., Class A1 | | | 37,426,377 | | | | 130,992 | |
| Mitsui & Co., Ltd. | | | 2,339,000 | | | | 112,722 | |
| Zhejiang Sanhua Intelligent Controls Co., Ltd., Class A | | | 36,882,763 | | | | 111,363 | |
| Schneider Electric SE | | | 478,683 | | | | 109,017 | |
| Siemens AG | | | 539,722 | | | | 101,244 | |
| Caterpillar, Inc. | | | 282,000 | | | | 94,349 | |
| CCR SA, ordinary nominative shares | | | 38,705,218 | | | | 91,907 | |
| DSV A/S | | | 626,360 | | | | 89,160 | |
| InPost SA1 | | | 5,469,603 | | | | 88,162 | |
| ZTO Express (Cayman), Inc., Class A (ADR) | | | 4,080,981 | | | | 85,660 | |
| SMC Corp. | | | 156,600 | | | | 82,366 | |
| Jiangsu Hengli Hydraulic Co., Ltd., Class A | | | 10,793,539 | | | | 76,003 | |
| Wizz Air Holdings PLC1 | | | 2,499,388 | | | | 68,680 | |
| Boeing Co.1 | | | 406,162 | | | | 68,170 | |
| Weichai Power Co., Ltd., Class H1 | | | 17,040,000 | | | | 34,903 | |
| Weichai Power Co., Ltd., Class A1 | | | 13,502,748 | | | | 32,459 | |
| Astra International Tbk PT | | | 196,343,276 | | | | 62,022 | |
| Thales SA | | | 366,000 | | | | 61,559 | |
| Bharat Electronics, Ltd. | | | 21,376,195 | | | | 59,494 | |
| Ayala Corp. | | | 5,402,410 | | | | 57,392 | |
| Bureau Veritas SA | | | 1,743,229 | | | | 50,592 | |
| Leonardo SpA | | | 1,972,447 | | | | 45,421 | |
| Interpump Group SpA | | | 1,036,956 | | | | 45,168 | |
| SM Investments Corp. | | | 2,381,510 | | | | 39,037 | |
| Rolls-Royce Holdings PLC1 | | | 7,505,000 | | | | 38,598 | |
| Ingersoll-Rand, Inc. | | | 409,595 | | | | 38,223 | |
| MISUMI Group, Inc. | | | 2,162,789 | | | | 35,618 | |
| Shanghai International Airport Co., Ltd., Class A1 | | | 6,503,525 | | | | 33,775 | |
| Centre Testing International Group Co., Ltd. | | | 15,934,920 | | | | 27,613 | |
| Hitachi, Ltd. | | | 241,956 | | | | 22,280 | |
| GT Capital Holdings, Inc. | | | 1,919,580 | | | | 21,190 | |
| Epiroc AB, Class B | | | 1,249,425 | | | | 20,834 | |
| Embraer SA1 | | | 2,391,200 | | | | 15,358 | |
| Legrand SA | | | 142,852 | | | | 14,684 | |
| Haitian International Holdings, Ltd. | | | 3,351,000 | | | | 10,917 | |
| GE Vernova, Inc.1 | | | 40,781 | | | | 6,268 | |
| TELUS International (Cda), Inc., subordinate voting shares1 | | | 505,954 | | | | 4,255 | |
| | | | | | | | 6,837,638 | |
| | | | | | | | | |
| Consumer discretionary 11.02% | | | | | | | | |
| MercadoLibre, Inc.1 | | | 556,724 | | | | 812,093 | |
| LVMH Moët Hennessy-Louis Vuitton SE | | | 812,883 | | | | 654,352 | |
| Trip.com Group, Ltd. (ADR)1 | | | 9,890,197 | | | | 477,301 | |
| Trip.com Group, Ltd.1 | | | 438,400 | | | | 21,355 | |
| Midea Group Co., Ltd., Class A | | | 43,323,591 | | | | 417,041 | |
| Eicher Motors, Ltd. | | | 5,290,346 | | | | 290,446 | |
| Galaxy Entertainment Group, Ltd. | | | 50,773,000 | | | | 228,177 | |
| adidas AG | | | 932,284 | | | | 224,942 | |
| Meituan, Class B1 | | | 14,306,500 | | | | 197,056 | |
| Jumbo SA | | | 6,149,197 | | | | 190,627 | |
| Compagnie Financière Richemont SA, Class A | | | 1,289,616 | | | | 178,460 | |
| BYD Co., Ltd., Class A1 | | | 2,977,992 | | | | 89,269 | |
| BYD Co., Ltd., Class H | | | 2,986,000 | | | | 81,841 | |
| Titan Co., Ltd. | | | 3,676,360 | | | | 157,800 | |
| H World Group, Ltd. (ADR) | | | 4,246,560 | | | | 155,891 | |
| Common stocks (continued) | | Shares | | | Value
(000) | |
| Consumer discretionary (continued) | | | | | | | | |
| Maruti Suzuki India, Ltd. | | | 854,300 | | | $ | 130,670 | |
| Airbnb, Inc., Class A1 | | | 783,073 | | | | 124,172 | |
| Evolution AB | | | 1,085,047 | | | | 120,713 | |
| Hilton Worldwide Holdings, Inc. | | | 599,258 | | | | 118,222 | |
| Shenzhou International Group Holdings, Ltd. | | | 11,698,200 | | | | 115,831 | |
| Ferrari NV (EUR denominated) | | | 259,236 | | | | 106,892 | |
| YUM! Brands, Inc. | | | 743,902 | | | | 105,076 | |
| Hermès International | | | 40,523 | | | | 97,422 | |
| Tesla, Inc.1 | | | 509,369 | | | | 93,357 | |
| Industria de Diseño Textil, SA | | | 1,626,378 | | | | 73,868 | |
| Naspers, Ltd., Class N | | | 355,489 | | | | 68,032 | |
| Amadeus IT Group SA, Class A, non-registered shares | | | 1,040,241 | | | | 66,002 | |
| InterContinental Hotels Group PLC | | | 658,803 | | | | 64,192 | |
| Kering SA | | | 175,139 | | | | 60,441 | |
| China Tourism Group Duty Free Corp., Ltd., Class H5 | | | 6,712,640 | | | | 59,254 | |
| Li Ning Co., Ltd. | | | 21,484,000 | | | | 56,583 | |
| Sands China, Ltd.1 | | | 20,438,600 | | | | 48,420 | |
| Zhongsheng Group Holdings, Ltd. | | | 25,212,750 | | | | 46,161 | |
| NIKE, Inc., Class B | | | 498,634 | | | | 46,004 | |
| Suzuki Motor Corp. | | | 3,868,400 | | | | 45,004 | |
| Mahindra & Mahindra, Ltd. | | | 1,701,841 | | | | 43,762 | |
| Alibaba Group Holding, Ltd. | | | 2,912,000 | | | | 27,336 | |
| Alibaba Group Holding, Ltd. (ADR) | | | 187,800 | | | | 14,057 | |
| TVS Motor Co., Ltd. | | | 1,659,017 | | | | 40,825 | |
| Alsea, SAB de CV, Class A | | | 8,814,782 | | | | 36,925 | |
| Foschini Group, Ltd. (The) | | | 6,696,441 | | | | 35,248 | |
| Tube Investments of India, Ltd. | | | 702,883 | | | | 31,301 | |
| General Motors Co. | | | 693,940 | | | | 30,901 | |
| Stellantis NV | | | 1,330,360 | | | | 29,561 | |
| Melco Resorts & Entertainment, Ltd. (ADR)1 | | | 3,994,697 | | | | 26,125 | |
| Booking Holdings, Inc. | | | 6,660 | | | | 22,990 | |
| Renault SA | | | 462,500 | | | | 22,811 | |
| Shangri-La Asia, Ltd. | | | 32,362,000 | | | | 22,622 | |
| Magazine Luiza SA1 | | | 79,181,101 | | | | 20,738 | |
| Inchcape PLC | | | 1,815,116 | | | | 18,104 | |
| Cyrela Brazil Realty SA, ordinary nominative shares | | | 3,354,724 | | | | 13,115 | |
| Gree Electric Appliances, Inc. of Zhuhai, Class A | | | 2,060,692 | | | | 11,980 | |
| | | | | | | | 6,271,368 | |
| | | | | | | | | |
| Health care 10.71% | | | | | | | | |
| Novo Nordisk AS, Class B | | | 9,375,246 | | | | 1,204,864 | |
| Eli Lilly and Co. | | | 977,376 | | | | 763,428 | |
| Max Healthcare Institute, Ltd.2 | | | 52,921,713 | | | | 530,218 | |
| AstraZeneca PLC | | | 3,519,624 | | | | 529,928 | |
| Thermo Fisher Scientific, Inc. | | | 892,515 | | | | 507,591 | |
| Abbott Laboratories | | | 2,787,935 | | | | 295,438 | |
| Laurus Labs, Ltd.2 | | | 35,030,409 | | | | 188,041 | |
| BeiGene, Ltd. (ADR)1 | | | 1,155,057 | | | | 177,810 | |
| BeiGene, Ltd.1 | | | 693,600 | | | | 8,260 | |
| Jiangsu Hengrui Medicine Co., Ltd., Class A | | | 27,993,446 | | | | 178,510 | |
| EssilorLuxottica SA | | | 800,424 | | | | 171,175 | |
| Innovent Biologics, Inc.1 | | | 34,310,291 | | | | 165,546 | |
| Rede D’Or Sao Luiz SA | | | 30,452,589 | | | | 152,480 | |
| Danaher Corp. | | | 608,742 | | | | 150,128 | |
| Hypera SA, ordinary nominative shares | | | 16,646,484 | | | | 94,636 | |
| WuXi AppTec Co., Ltd., Class H5 | | | 14,433,283 | | | | 64,883 | |
| WuXi AppTec Co., Ltd., Class A | | | 2,907,577 | | | | 17,561 | |
| Revvity, Inc. | | | 800,621 | | | | 82,040 | |
| Mankind Pharma, Ltd.1 | | | 2,804,820 | | | | 79,273 | |
| Shenzhen Mindray Bio-Medical Electronics Co., Ltd., Class A | | | 1,726,481 | | | | 72,390 | |
| Aspen Pharmacare Holdings, Ltd. | | | 4,850,773 | | | | 57,809 | |
| OdontoPrev SA | | | 24,789,972 | | | | 57,050 | |
| Zoetis, Inc., Class A | | | 353,400 | | | | 56,275 | |
| Legend Biotech Corp. (ADR)1 | | | 1,284,073 | | | | 56,165 | |
| Straumann Holding AG | | | 392,136 | | | | 52,378 | |
| Zai Lab, Ltd. (ADR)1,5 | | | 2,659,797 | | | | 42,025 | |
| Teva Pharmaceutical Industries, Ltd. (ADR)1 | | | 2,979,500 | | | | 41,862 | |
| Align Technology, Inc.1 | | | 142,706 | | | | 40,297 | |
| Common stocks (continued) | | Shares | | | Value
(000) | |
| Health care (continued) | | | | | | | | |
| Siemens Healthineers AG | | | 643,000 | | | $ | 35,751 | |
| Shionogi & Co., Ltd. | | | 712,600 | | | | 33,306 | |
| Mettler-Toledo International, Inc.1 | | | 26,154 | | | | 32,162 | |
| Alcon, Inc. | | | 385,670 | | | | 29,615 | |
| Illumina, Inc.1 | | | 240,328 | | | | 29,572 | |
| Medtronic PLC | | | 268,000 | | | | 21,504 | |
| Asahi Intecc Co., Ltd. | | | 1,330,200 | | | | 19,548 | |
| Pfizer, Inc. | | | 683,400 | | | | 17,509 | |
| Angelalign Technology, Inc.5 | | | 1,530,000 | | | | 15,270 | |
| Lupin, Ltd.1 | | | 514,725 | | | | 10,152 | |
| WuXi Biologics (Cayman), Inc.1 | | | 4,766,000 | | | | 8,220 | |
| Shandong Pharmaceutical Glass Co., Ltd., Class A | | | 862,513 | | | | 3,358 | |
| CanSino Biologics, Inc., Class H1,5 | | | 832,000 | | | | 1,897 | |
| | | | | | | | 6,095,925 | |
| | | | | | | | | |
| Communication services 7.95% | | | | | | | | |
| Tencent Holdings, Ltd. | | | 23,150,540 | | | | 1,017,833 | |
| Meta Platforms, Inc., Class A | | | 1,832,243 | | | | 788,176 | |
| Alphabet, Inc., Class C | | | 2,472,573 | | | | 407,084 | |
| Alphabet, Inc., Class A | | | 1,864,165 | | | | 303,449 | |
| Bharti Airtel, Ltd. | | | 37,481,724 | | | | 593,306 | |
| Bharti Airtel, Ltd., interim shares | | | 1,085,032 | | | | 12,164 | |
| NetEase, Inc. | | | 12,996,500 | | | | 243,185 | |
| NetEase, Inc. (ADR) | | | 402,647 | | | | 37,636 | |
| MTN Group, Ltd.5 | | | 56,583,909 | | | | 270,022 | |
| Telkom Indonesia (Persero) Tbk PT, Class B | | | 975,732,600 | | | | 189,649 | |
| América Móvil, SAB de CV, Class B (ADR) | | | 9,093,308 | | | | 173,318 | |
| Telefónica, SA, non-registered shares | | | 30,129,668 | | | | 135,168 | |
| Netflix, Inc.1 | | | 175,417 | | | | 96,592 | |
| Vodafone Group PLC | | | 67,462,979 | | | | 56,978 | |
| Singapore Telecommunications, Ltd. | | | 31,724,000 | | | | 54,994 | |
| Indus Towers, Ltd.1 | | | 9,060,141 | | | | 38,186 | |
| Informa PLC | | | 3,210,083 | | | | 31,714 | |
| TIM SA | | | 8,342,582 | | | | 28,293 | |
| JCDecaux SE1 | | | 1,239,700 | | | | 25,914 | |
| Vodafone Idea, Ltd.1 | | | 95,565,786 | | | | 15,116 | |
| Saudi Telecom Co., non-registered shares | | | 702,602 | | | | 7,052 | |
| | | | | | | | 4,525,829 | |
| | | | | | | | | |
| Materials 6.80% | | | | | | | | |
| First Quantum Minerals, Ltd.2 | | | 45,674,103 | | | | 579,946 | |
| Freeport-McMoRan, Inc. | | | 10,940,184 | | | | 546,353 | |
| Linde PLC | | | 772,040 | | | | 340,439 | |
| Vale SA, ordinary nominative shares | | | 12,503,392 | | | | 152,397 | |
| Vale SA (ADR), ordinary nominative shares | | | 10,433,352 | | | | 126,974 | |
| Shin-Etsu Chemical Co., Ltd. | | | 4,844,800 | | | | 188,907 | |
| APL Apollo Tubes, Ltd. | | | 9,211,316 | | | | 171,886 | |
| Barrick Gold Corp. | | | 9,700,214 | | | | 161,412 | |
| Jindal Steel & Power, Ltd. | | | 13,068,837 | | | | 144,980 | |
| Sika AG | | | 490,056 | | | | 139,145 | |
| Albemarle Corp.5 | | | 1,064,809 | | | | 128,107 | |
| Amcor PLC (CDI) | | | 14,241,464 | | | | 127,158 | |
| Glencore PLC | | | 19,931,263 | | | | 116,075 | |
| Southern Copper Corp. | | | 809,517 | | | | 94,446 | |
| Givaudan SA | | | 21,422 | | | | 91,563 | |
| Gerdau SA (ADR) | | | 24,494,743 | | | | 85,242 | |
| Asian Paints, Ltd. | | | 2,390,786 | | | | 82,397 | |
| Tata Steel, Ltd. | | | 40,000,000 | | | | 78,609 | |
| Nutrien, Ltd. (CAD denominated) | | | 1,054,733 | | | | 55,615 | |
| Grupo México, SAB de CV, Series B | | | 8,725,300 | | | | 53,913 | |
| Wacker Chemie AG | | | 477,164 | | | | 51,221 | |
| CEMEX, SAB de CV (ADR), ordinary participation certificates, units1 | | | 5,912,576 | | | | 46,768 | |
| Loma Negra Compania Industrial Argentina SA (ADR)2 | | | 6,442,242 | | | | 45,998 | |
| Arkema SA | | | 373,575 | | | | 38,544 | |
| Shandong Sinocera Functional Material Co., Ltd., Class A | | | 13,621,850 | | | | 36,456 | |
| Fresnillo PLC | | | 4,590,946 | | | | 31,898 | |
| BASF SE | | | 534,774 | | | | 28,053 | |
| DSM-Firmenich AG | | | 249,156 | | | | 27,895 | |
| Common stocks (continued) | | Shares | | | Value
(000) | |
| Materials (continued) | | | | | | | | |
| Akzo Nobel NV | | | 392,741 | | | $ | 25,970 | |
| Antofagasta PLC | | | 780,109 | | | | 21,449 | |
| Zijin Mining Group Co., Ltd., Class H1 | | | 8,096,000 | | | | 17,768 | |
| OCI NV | | | 564,000 | | | | 15,230 | |
| Anhui Conch Cement Co., Ltd., Class H | | | 4,706,000 | | | | 10,912 | |
| Polymetal International PLC1 | | | 1,096,500 | | | | 3,871 | |
| Alrosa PJSC3 | | | 15,128,747 | | | | — | 4 |
| | | | | | | | 3,867,597 | |
| | | | | | | | | |
| Consumer staples 6.74% | | | | | | | | |
| Kweichow Moutai Co., Ltd., Class A | | | 2,340,901 | | | | 550,789 | |
| ITC, Ltd. | | | 77,325,738 | | | | 403,279 | |
| Nestlé SA | | | 2,926,244 | | | | 293,529 | |
| Varun Beverages, Ltd. | | | 14,988,215 | | | | 265,378 | |
| Arca Continental, SAB de CV | | | 18,852,228 | | | | 183,914 | |
| Ajinomoto Co., Inc. | | | 4,764,500 | | | | 176,733 | |
| Monster Beverage Corp.1 | | | 3,016,664 | | | | 161,241 | |
| Bunge Global SA | | | 1,573,000 | | | | 160,068 | |
| Constellation Brands, Inc., Class A | | | 555,668 | | | | 140,840 | |
| JBS SA | | | 28,083,188 | | | | 126,771 | |
| Kimberly-Clark de México, SAB de CV, Class A, ordinary participation certificates5 | | | 57,079,083 | | | | 118,818 | |
| Avenue Supermarts, Ltd.1 | | | 2,143,064 | | | | 118,234 | |
| Carlsberg A/S, Class B | | | 827,838 | | | | 111,610 | |
| Kao Corp. | | | 2,560,460 | | | | 105,696 | |
| KT&G Corp. | | | 1,531,012 | | | | 98,701 | |
| Budweiser Brewing Co., APAC, Ltd. | | | 70,052,800 | | | | 98,690 | |
| Anheuser-Busch InBev SA/NV | | | 1,562,971 | | | | 93,589 | |
| British American Tobacco PLC | | | 2,689,747 | | | | 78,833 | |
| Pernod Ricard SA | | | 500,893 | | | | 75,637 | |
| DINO POLSKA SA, non-registered shares1,5 | | | 684,000 | | | | 65,630 | |
| United Spirits, Ltd. | | | 4,325,033 | | | | 60,953 | |
| Uni-Charm Corp. | | | 1,848,100 | | | | 54,962 | |
| Philip Morris International, Inc. | | | 488,890 | | | | 46,415 | |
| L’Oréal SA, non-registered shares | | | 93,065 | | | | 43,473 | |
| WH Group, Ltd. | | | 49,409,500 | | | | 35,868 | |
| Mondelez International, Inc., Class A | | | 489,027 | | | | 35,180 | |
| Dabur India, Ltd. | | | 5,306,400 | | | | 32,267 | |
| Danone SA | | | 511,049 | | | | 31,958 | |
| Foshan Haitian Flavouring and Food Co., Ltd., Class A | | | 5,485,426 | | | | 29,707 | |
| Wuliangye Yibin Co., Ltd., Class A | | | 787,086 | | | | 16,263 | |
| JD Health International, Inc.1 | | | 3,232,850 | | | | 11,031 | |
| Reckitt Benckiser Group PLC | | | 188,372 | | | | 10,508 | |
| | | | | | | | 3,836,565 | |
| | | | | | | | | |
| Energy 2.69% | | | | | | | | |
| TotalEnergies SE | | | 6,682,063 | | | | 485,336 | |
| Reliance Industries, Ltd. | | | 10,193,574 | | | | 356,979 | |
| New Fortress Energy, Inc., Class A5 | | | 4,586,254 | | | | 120,160 | |
| Exxon Mobil Corp. | | | 931,511 | | | | 110,170 | |
| Schlumberger NV | | | 1,883,432 | | | | 89,425 | |
| Chevron Corp. | | | 547,795 | | | | 88,343 | |
| Cheniere Energy, Inc. | | | 501,000 | | | | 79,068 | |
| Saudi Arabian Oil Co.5 | | | 9,241,992 | | | | 74,193 | |
| Vista Energy, SAB de CV, Class A (ADR)1 | | | 1,103,775 | | | | 47,628 | |
| Shell PLC (GBP denominated) | | | 1,007,159 | | | | 35,892 | |
| Borr Drilling, Ltd. (NOK denominated) | | | 2,650,522 | | | | 14,046 | |
| Borr Drilling, Ltd.1,5 | | | 2,575,779 | | | | 13,651 | |
| INPEX Corp. | | | 711,500 | | | | 10,671 | |
| Petróleo Brasileiro SA (Petrobras) (ADR), ordinary nominative shares | | | 344,754 | | | | 5,850 | |
| Gazprom PJSC1,3 | | | 13,623,686 | | | | — | 4 |
| Rosneft Oil Co. PJSC3 | | | 8,335,580 | | | | — | 4 |
| | | | | | | | 1,531,412 | |
| | | | | | | | | |
| Real estate 1.68% | | | | | | | | |
| Macrotech Developers, Ltd. | | | 34,105,761 | | | | 503,852 | |
| Fibra Uno Administración REIT, SA de CV | | | 77,884,325 | | | | 111,797 | |
| China Resources Mixc Lifestyle Services, Ltd. | | | 29,153,200 | | | | 103,358 | |
| KE Holdings, Inc., Class A (ADR) | | | 5,753,581 | | | | 86,994 | |
| Common stocks (continued) | | Shares | | | Value
(000) | |
| Real estate (continued) | | | | | | | | |
| CK Asset Holdings, Ltd. | | | 15,623,500 | | | $ | 66,686 | |
| Longfor Group Holdings, Ltd.5 | | | 18,631,936 | | | | 27,969 | |
| ALLOS SA, ordinary nominative shares | | | 6,662,013 | | | | 26,789 | |
| American Tower Corp. REIT | | | 156,000 | | | | 26,763 | |
| Ayala Land, Inc. | | | 3,349,200 | | | | 1,661 | |
| | | | | | | | 955,869 | |
| | | | | | | | | |
| Utilities 1.05% | | | | | | | | |
| ENN Energy Holdings, Ltd. | | | 28,673,195 | | | | 246,713 | |
| Equatorial Energia SA, ordinary nominative shares | | | 30,678,119 | | | | 180,727 | |
| Engie SA | | | 4,370,343 | | | | 75,895 | |
| Power Grid Corporation of India, Ltd. | | | 19,504,644 | | | | 70,591 | |
| AES Corp. | | | 1,335,919 | | | | 23,913 | |
| | | | | | | | 597,839 | |
| | | | | | | | | |
| Total common stocks (cost: $37,578,122,000) | | | | | | | 52,089,458 | |
| | | | | | | | | |
| Preferred securities 0.75% | | | | | | | | |
| Financials 0.30% | | | | | | | | |
| Itaú Unibanco Holding SA (ADR), preferred nominative shares | | | 23,453,707 | | | | 141,895 | |
| Itaú Unibanco Holding SA, preferred nominative shares | | | 4,994,844 | | | | 30,165 | |
| | | | | | | | 172,060 | |
| | | | | | | | | |
| Consumer discretionary 0.20% | | | | | | | | |
| Dr. Ing. h.c. F. Porsche AG, nonvoting non-registered preferred shares | | | 1,217,343 | | | | 108,461 | |
| Getir BV, Series D, preferred shares1,3,6 | | | 103,205 | | | | 4,660 | |
| | | | | | | | 113,121 | |
| | | | | | | | | |
| Real estate 0.14% | | | | | | | | |
| QuintoAndar, Ltd., Series E, preference shares1,3,6 | | | 433,164 | | | | 63,407 | |
| QuintoAndar, Ltd., Series E-1, preference shares1,3,6 | | | 113,966 | | | | 16,682 | |
| | | | | | | | 80,089 | |
| | | | | | | | | |
| Information technology 0.11% | | | | | | | | |
| Samsung Electronics Co., Ltd., nonvoting preferred shares | | | 1,346,455 | | | | 63,100 | |
| Canva, Inc., Series A, noncumulative preferred shares1,3,6 | | | 925 | | | | 987 | |
| Canva, Inc., Series A-3, noncumulative preferred shares1,3,6 | | | 38 | | | | 41 | |
| Canva, Inc., Series A-4, noncumulative preferred shares1,3,6 | | | 3 | | | | 3 | |
| Canva, Inc., Series A-5, noncumulative preferred shares1,3,6 | | | 2 | | | | 2 | |
| | | | | | | | 64,133 | |
| | | | | | | | | |
| Total preferred securities (cost: $484,295,000) | | | | | | | 429,403 | |
| | | | | | | | | |
| Rights & warrants 0.05% | | | | | | | | |
| Consumer discretionary 0.03% | | | | | | | | |
| Midea Group Co., Ltd., warrants, expire 3/19/20251,7 | | | 1,934,670 | | | | 18,624 | |
| | | | | | | | | |
| Industrials 0.02% | | | | | | | | |
| Centre Testing International Group Co., Ltd., Class A, warrants, expire 3/28/20251,7 | | | 6,638,000 | | | | 11,503 | |
| | | | | | | | | |
| Total rights & warrants (cost: $28,223,000) | | | | | | | 30,127 | |
| | | | | | | | | |
| Convertible stocks 0.01% | | | | | | | | |
| Materials 0.01% | | | | | | | | |
| Albemarle Corp., Class A, cumulative convertible preferred depositary shares, 7.25% 3/1/2027 | | | 92,800 | | | | 5,092 | |
| | | | | | | | | |
| Total convertible stocks (cost: $4,651,000) | | | | | | | 5,092 | |
| Bonds, notes & other debt instruments 3.52% | | Principal amount
(000) | | | Value
(000) | |
| Bonds & notes of governments & government agencies outside the U.S. 3.09% | | | | | | | | |
| Abu Dhabi (Emirate of) 2.50% 9/30/20297 | | USD | 7,900 | | | $ | 6,956 | |
| Angola (Republic of) 8.00% 11/26/20297 | | | 13,202 | | | | 12,051 | |
| Angola (Republic of) 8.75% 4/14/20327 | | | 6,950 | | | | 6,304 | |
| Argentine Republic 1.00% 7/9/2029 | | | 3,656 | | | | 2,160 | |
| Argentine Republic 3.625% 7/9/2035 (4.125% on 7/9/2024)8 | | | 32,148 | | | | 14,829 | |
| Argentine Republic 4.25% 1/9/2038 (5.00% on 7/9/2024)8 | | | 10,333 | | | | 5,291 | |
| Argentine Republic 3.50% 7/9/2041 (4.875% on 7/9/2029)8 | | | 35,816 | | | | 15,729 | |
| Brazil (Federative Republic of) 10.00% 1/1/2025 | | BRL | 87,400 | | | | 16,766 | |
| Brazil (Federative Republic of) 10.00% 1/1/2027 | | | 147,000 | | | | 27,700 | |
| Brazil (Federative Republic of) 6.00% 5/15/20279 | | | 457,803 | | | | 87,685 | |
| Brazil (Federative Republic of) 10.00% 1/1/2029 | | | 148,700 | | | | 27,255 | |
| Brazil (Federative Republic of) 10.00% 1/1/2031 | | | 221,400 | | | | 39,500 | |
| Brazil (Federative Republic of) 10.00% 1/1/2033 | | | 230,890 | | | | 40,570 | |
| Brazil (Federative Republic of) 6.00% 8/15/20509 | | | 25,576 | | | | 4,803 | |
| Chile (Republic of) 6.00% 4/1/2033 | | CLP | 6,140,000 | | | | 6,401 | |
| Chile (Republic of) 5.30% 11/1/2037 | | | 7,520,000 | | | | 7,504 | |
| Chile (Republic of) 3.10% 5/7/2041 | | USD | 9,265 | | | | 6,515 | |
| China (People’s Republic of), Series INBK, 2.89% 11/18/2031 | | CNY | 456,940 | | | | 65,526 | |
| China (People’s Republic of), Series INBK, 3.72% 4/12/2051 | | | 407,410 | | | | 67,697 | |
| China (People’s Republic of), Series INBK, 3.12% 10/25/2052 | | | 162,200 | | | | 24,474 | |
| Colombia (Republic of) 3.00% 1/30/2030 | | USD | 511 | | | | 411 | |
| Colombia (Republic of) 3.25% 4/22/2032 | | | 11,800 | | | | 8,903 | |
| Colombia (Republic of) 5.625% 2/26/2044 | | | 2,209 | | | | 1,666 | |
| Colombia (Republic of) 5.00% 6/15/2045 | | | 7,251 | | | | 5,024 | |
| Colombia (Republic of) 5.20% 5/15/2049 | | | 3,955 | | | | 2,736 | |
| Colombia (Republic of), Series B, 7.00% 3/26/2031 | | COP | 26,634,000 | | | | 5,733 | |
| Colombia (Republic of), Series B, 13.25% 2/9/2033 | | | 96,648,900 | | | | 28,270 | |
| Colombia (Republic of), Series UVR, 3.75% 2/25/20379 | | | 130,200 | | | | 10,251 | |
| Colombia (Republic of), Series B, 9.25% 5/28/2042 | | | 65,483,300 | | | | 14,285 | |
| Cote d’Ivoire (Republic of) 4.875% 1/30/2032 | | EUR | 1,890 | | | | 1,687 | |
| Czech Republic 1.95% 7/30/2037 | | CZK | 300,160 | | | | 9,666 | |
| Dominican Republic 8.625% 4/20/20277 | | USD | 4,950 | | | | 5,109 | |
| Dominican Republic 6.00% 7/19/20287 | | | 4,360 | | | | 4,272 | |
| Dominican Republic 11.375% 7/6/2029 | | DOP | 195,700 | | | | 3,601 | |
| Dominican Republic 4.50% 1/30/20307 | | USD | 2,307 | | | | 2,069 | |
| Dominican Republic 13.625% 2/3/2033 | | DOP | 126,550 | | | | 2,585 | |
| Dominican Republic 6.00% 2/22/20337 | | USD | 3,295 | | | | 3,124 | |
| Dominican Republic 11.25% 9/15/2035 | | DOP | 146,650 | | | | 2,649 | |
| Dominican Republic 5.875% 1/30/20607 | | USD | 10,273 | | | | 8,399 | |
| Dominican Republic 5.875% 1/30/2060 | | | 18,230 | | | | 14,904 | |
| Egypt (Arab Republic of) 5.625% 4/16/2030 | | EUR | 1,615 | | | | 1,380 | |
| Egypt (Arab Republic of) 5.875% 2/16/20317 | | USD | 2,350 | | | | 1,838 | |
| Egypt (Arab Republic of) 7.625% 5/29/20327 | | | 7,060 | | | | 5,872 | |
| Egypt (Arab Republic of) 7.625% 5/29/2032 | | | 2,000 | | | | 1,664 | |
| Egypt (Arab Republic of) 8.50% 1/31/2047 | | | 5,010 | | | | 3,837 | |
| Egypt (Arab Republic of) 8.875% 5/29/2050 | | | 2,720 | | | | 2,146 | |
| Egypt (Arab Republic of) 8.75% 9/30/2051 | | | 7,240 | | | | 5,624 | |
| Egypt (Arab Republic of) 8.15% 11/20/20597 | | | 7,510 | | | | 5,473 | |
| Ethiopia (Federal Democratic Republic of) 6.625% 12/11/202410 | | | 6,800 | | | | 4,816 | |
| Gabonese Republic 7.00% 11/24/2031 | | | 7,500 | | | | 5,926 | |
| Georgia (Republic of) 2.75% 4/22/20267 | | | 4,995 | | | | 4,626 | |
| Ghana (Republic of) 7.75% 4/7/20297,10 | | | 15,000 | | | | 7,324 | |
| Ghana (Republic of) 8.125% 3/26/203210 | | | 16,010 | | | | 7,797 | |
| Honduras (Republic of) 6.25% 1/19/2027 | | | 14,463 | | | | 13,749 | |
| Honduras (Republic of) 5.625% 6/24/2030 | | | 6,669 | | | | 5,732 | |
| Honduras (Republic of) 5.625% 6/24/20307 | | | 5,600 | | | | 4,813 | |
| Hungary (Republic of) 6.25% 9/22/20327 | | | 6,200 | | | | 6,264 | |
| Hungary (Republic of), Series A, 6.75% 10/22/2028 | | HUF | 8,000,000 | | | | 21,447 | |
| India (Republic of) 7.32% 11/13/2030 | | INR | 640,000 | | | | 7,717 | |
| India (Republic of) 6.54% 1/17/2032 | | | 1,280,000 | | | | 14,766 | |
| India (Republic of) 7.18% 7/24/2037 | | | 720,000 | | | | 8,582 | |
| Indonesia (Republic of) 6.625% 2/17/2037 | | USD | 8,612 | | | | 9,396 | |
| Indonesia (Republic of), Series 95, 6.375% 8/15/2028 | | IDR | 803,649,000 | | | | 48,084 | |
| Indonesia (Republic of), Series 82, 7.00% 9/15/2030 | | | 200,000,000 | | | | 12,179 | |
| Indonesia (Republic of), Series 96, 7.00% 2/15/2033 | | | 418,880,000 | | | | 25,725 | |
| Indonesia (Republic of), Series 100, 6.625%, 2/15/2034 | | | 625,845,000 | | | | 36,881 | |
| Indonesia (Republic of), Series 98, 7.125% 6/15/2038 | | | 500,000,000 | | | | 30,578 | |
| Bonds, notes & other debt instruments (continued) | | Principal amount
(000) | | | Value
(000) | |
| Bonds & notes of governments & government agencies outside the U.S. (continued) | | | | | | | | |
| International Bank for Reconstruction and Development 6.05% 2/9/2029 | | INR | 153,500 | | | $ | 1,748 | |
| International Bank for Reconstruction and Development 6.75% 7/13/2029 | | | 446,600 | | | | 5,237 | |
| Kenya (Republic of) 6.875% 6/24/20247 | | USD | 205 | | | | 205 | |
| Malaysia (Federation of), Series 0119, 3.906% 7/15/2026 | | MYR | 49,000 | | | | 10,346 | |
| Malaysia (Federation of), Series 0219, 3.885% 8/15/2029 | | | 32,000 | | | | 6,735 | |
| Malaysia (Federation of), Series 0419, 3.828% 7/5/2034 | | | 66,000 | | | | 13,595 | |
| Malaysia (Federation of), Series 0418, 4.893% 6/8/2038 | | | 126,039 | | | | 28,586 | |
| Malaysia (Federation of), Series 0519, 3.757% 5/22/2040 | | | 33,761 | | | | 6,746 | |
| Malaysia (Federation of), Series 0519, 4.638% 11/15/2049 | | | 16,166 | | | | 3,581 | |
| Malaysia (Federation of), Series 0120, 4.065% 6/15/2050 | | | 77,400 | | | | 15,687 | |
| Malaysia (Federation of), Series 022, 5.357% 5/15/2052 | | | 15,534 | | | | 3,814 | |
| MFB Magyar Fejlesztesi Bank Zartkoruen Mukodo Reszvenytarsasag 6.50% 6/29/2028 | | USD | 14,500 | | | | 14,620 | |
| Mongolia (State of) 3.50% 7/7/2027 | | | 728 | | | | 649 | |
| Mongolia (State of) 8.65% 1/19/20287 | | | 4,951 | | | | 5,109 | |
| Mongolia (State of) 4.45% 7/7/2031 | | | 400 | | | | 332 | |
| Morocco (Kingdom of) 5.95% 3/8/20287 | | | 4,231 | | | | 4,208 | |
| Mozambique (Republic of) 9.00% 9/15/2031 | | | 9,800 | | | | 8,264 | |
| Nigeria (Republic of) 7.875% 2/16/2032 | | | 13,200 | | | | 11,586 | |
| Oman (Sultanate of) 5.625% 1/17/2028 | | | 7,200 | | | | 7,099 | |
| Oman (Sultanate of) 6.25% 1/25/20317 | | | 4,189 | | | | 4,237 | |
| Panama (Republic of) 3.75% 4/17/2026 | | | 4,590 | | | | 4,335 | |
| Panama (Republic of) 6.875% 1/31/2036 | | | 8,200 | | | | 7,742 | |
| Panama (Republic of) 4.50% 4/16/2050 | | | 4,525 | | | | 2,915 | |
| Panama (Republic of) 4.30% 4/29/2053 | | | 6,400 | | | | 3,953 | |
| Panama (Republic of) 6.853% 3/28/2054 | | | 9,000 | | | | 7,858 | |
| Panama (Republic of) 4.50% 1/19/2063 | | | 2,430 | | | | 1,490 | |
| Paraguay (Republic of) 4.70% 3/27/2027 | | | 5,500 | | | | 5,299 | |
| Paraguay (Republic of) 4.95% 4/28/2031 | | | 3,415 | | | | 3,212 | |
| Peru (Republic of) 3.00% 1/15/2034 | | | 5,715 | | | | 4,491 | |
| Peru (Republic of) 6.55% 3/14/2037 | | | 10,417 | | | | 10,804 | |
| Peru (Republic of) 5.625% 11/18/2050 | | | 1,240 | | | | 1,155 | |
| Peru (Republic of) 3.55% 3/10/2051 | | | 4,900 | | | | 3,296 | |
| Peru (Republic of) 2.78% 12/1/2060 | | | 10,795 | | | | 5,706 | |
| PETRONAS Capital, Ltd. 3.50% 4/21/20307 | | | 3,400 | | | | 3,054 | |
| PETRONAS Capital, Ltd. 4.55% 4/21/20507 | | | 3,400 | | | | 2,833 | |
| Philippines (Republic of) 3.95% 1/20/2040 | | | 11,700 | | | | 9,560 | |
| Poland (Republic of) 4.875% 10/4/2033 | | | 8,680 | | | | 8,293 | |
| Poland (Republic of), Series 0726, 2.50% 7/25/2026 | | PLN | 169,700 | | | | 39,411 | |
| Poland (Republic of), Series 1033, 6.00% 10/25/2033 | | | 148,000 | | | | 37,216 | |
| Qatar (State of) 4.50% 4/23/20287 | | USD | 13,400 | | | | 13,160 | |
| Qatar (State of) 3.75% 4/16/20307 | | | 6,200 | | | | 5,795 | |
| Romania 2.00% 1/28/2032 | | EUR | 18,275 | | | | 15,311 | |
| Romania 2.00% 4/14/2033 | | | 7,080 | | | | 5,703 | |
| Romania 6.375% 1/30/20347 | | USD | 7,448 | | | | 7,297 | |
| Romania 5.125% 6/15/20487 | | | 9,300 | | | | 7,592 | |
| Saudi Arabia (Kingdom of) 5.00% 1/16/2034 | | | 11,700 | | | | 11,280 | |
| Saudi Arabia (Kingdom of) 5.75% 1/16/2054 | | | 29,200 | | | | 27,375 | |
| Senegal (Republic of) 4.75% 3/13/2028 | | EUR | 13,200 | | | | 12,929 | |
| Senegal (Republic of) 5.375% 6/8/2037 | | | 715 | | | | 567 | |
| South Africa (Republic of) 5.875% 4/20/2032 | | USD | 8,700 | | | | 7,754 | |
| South Africa (Republic of), Series R-213, 7.00% 2/28/2031 | | ZAR | 881,900 | | | | 37,638 | |
| South Africa (Republic of), Series R-2032, 8.25% 3/31/2032 | | | 188,190 | | | | 8,323 | |
| South Africa (Republic of), Series R-2035, 8.875% 2/28/2035 | | | 859,200 | | | | 36,790 | |
| South Africa (Republic of), Series R-2040, 9.00% 1/31/2040 | | | 397,400 | | | | 15,781 | |
| Thailand (Kingdom of) 2.875% 12/17/2028 | | THB | 238,300 | | | | 6,506 | |
| Thailand (Kingdom of) 3.45% 6/17/2043 | | | 286,200 | | | | 7,884 | |
| Turkey (Republic of) 12.60% 10/1/2025 | | TRY | 659,300 | | | | 14,525 | |
| Turkey (Republic of) 17.30% 7/19/2028 | | | 707,500 | | | | 16,690 | |
| Turkey (Republic of) 5.875% 6/26/2031 | | USD | 12,630 | | | | 11,493 | |
| Ukraine 8.994% 2/1/202610 | | | 5,771 | | | | 1,854 | |
| Ukraine 7.75% 9/1/202910 | | | 28,014 | | | | 7,993 | |
| Ukraine 9.75% 11/1/203010 | | | 6,200 | | | | 1,909 | |
| Ukraine 7.375% 9/25/203410 | | | 29,200 | | | | 7,323 | |
| United Mexican States 3.75% 4/19/2071 | | | 10,285 | | | | 6,130 | |
| United Mexican States, Series M20, 8.50% 5/31/2029 | | MXN | 526,654 | | | | 28,861 | |
| United Mexican States, Series M, 7.75% 5/29/2031 | | | 1,575,849 | | | | 81,573 | |
| United Mexican States, Series M, 7.50% 5/26/2033 | | | 980,300 | | | | 48,836 | |
| Bonds, notes & other debt instruments (continued) | | Principal amount
(000) | | | Value
(000) | |
| Bonds & notes of governments & government agencies outside the U.S. (continued) | | | | | | | | |
| United Mexican States, Series M, 7.75% 11/23/2034 | | MXN | 274,000 | | | $ | 13,703 | |
| United Mexican States, Series M30, 8.50% 11/18/2038 | | | 369,000 | | | | 19,104 | |
| United Mexican States, Series MTN, 4.75% 3/8/2044 | | USD | 13,300 | | | | 10,548 | |
| United Mexican States, Series M, 8.00% 7/31/2053 | | MXN | 213,721 | | | | 10,124 | |
| Venezuela (Bolivarian Republic of) 8.25% 10/13/202410 | | USD | 2,827 | | | | 521 | |
| Venezuela (Bolivarian Republic of) 9.25% 5/7/202810 | | | 3,175 | | | | 629 | |
| Venezuela (Bolivarian Republic of) 7.00% 12/1/201810 | | | 870 | | | | 135 | |
| Venezuela (Bolivarian Republic of) 7.75% 10/13/201910 | | | 14,640 | | | | 2,524 | |
| Venezuela (Bolivarian Republic of) 6.00% 12/9/202010 | | | 12,912 | | | | 2,099 | |
| Venezuela (Bolivarian Republic of) 9.00% 5/7/202310 | | | 12,757 | | | | 2,517 | |
| Venezuela (Bolivarian Republic of) 7.00% 3/31/203810 | | | 1,448 | | | | 249 | |
| | | | | | | | 1,757,328 | |
| | | | | | | | | |
| Corporate bonds, notes & loans 0.43% | | | | | | | | |
| Utilities 0.08% | | | | | | | | |
| Aegea Finance SARL 9.00% 1/20/20317 | | | 5,210 | | | | 5,456 | |
| AES Panama Generation Holdings, SRL 4.375% 5/31/20307 | | | 3,422 | | | | 2,881 | |
| Empresas Publicas de Medellin ESP 4.25% 7/18/20297 | | | 2,062 | | | | 1,760 | |
| Empresas Publicas de Medellin ESP 4.25% 7/18/2029 | | | 445 | | | | 380 | |
| Empresas Publicas de Medellin ESP 4.375% 2/15/20317 | | | 3,679 | | | | 2,998 | |
| Eskom Holdings SOC, Ltd. 8.45% 8/10/2028 | | | 8,000 | | | | 7,895 | |
| Greenko Dutch BV 3.85% 3/29/20267 | | | 4,683 | | | | 4,378 | |
| State Grid Europe Development (2014) PLC 3.125% 4/7/2025 | | | 22,995 | | | | 22,477 | |
| | | | | | | | 48,225 | |
| | | | | | | | | |
| Communication services 0.06% | | | | | | | | |
| América Móvil, SAB de CV 10.125% 1/22/2029 | | MXN | 225,000 | | | | 12,753 | |
| América Móvil, SAB de CV 9.50% 1/27/2031 | | | 129,800 | | | | 7,085 | |
| Axiata SPV5 (Labuan), Ltd. 3.064% 8/19/2050 | | USD | 4,446 | | | | 2,805 | |
| PLDT, Inc. 2.50% 1/23/2031 | | | 2,590 | | | | 2,126 | |
| Tencent Holdings, Ltd. 3.975% 4/11/2029 | | | 6,300 | | | | 5,888 | |
| Tencent Holdings, Ltd. 3.24% 6/3/20507 | | | 7,100 | | | | 4,555 | |
| | | | | | | | 35,212 | |
| | | | | | | | | |
| Financials 0.06% | | | | | | | | |
| Bangkok Bank Public Co., Ltd. 3.733% 9/25/2034 (5-year UST Yield Curve Rate T Note Constant Maturity + 1.90% on 9/25/2029)8 | | | 7,517 | | | | 6,549 | |
| BBVA Bancomer, SA 8.45% 6/29/2038 (5-year UST Yield Curve Rate T Note Constant Maturity + 4.661% on 6/29/2033)7,8 | | | 5,200 | | | | 5,372 | |
| CMB International Leasing Management, Ltd. 2.75% 8/12/2030 | | | 7,385 | | | | 6,318 | |
| HDFC Bank, Ltd. 3.70% junior subordinated perpetual bonds (5-Year UST Yield Curve Rate T Note Constant Maturity + 2.925% on 2/25/2027)7,8 | | | 8,300 | | | | 7,690 | |
| HSBC Holdings PLC 6.332% 3/9/2044 (USD-SOFR + 2.65% on 3/9/2043)8 | | | 9,000 | | | | 9,208 | |
| | | | | | | | 35,137 | |
| | | | | | | | | |
| Materials 0.06% | | | | | | | | |
| Braskem Idesa SAPI 7.45% 11/15/2029 | | | 8,100 | | | | 6,403 | |
| Braskem Idesa SAPI 7.45% 11/15/20297 | | | 3,564 | | | | 2,817 | |
| Braskem Idesa SAPI 6.99% 2/20/20327 | | | 4,000 | | | | 3,007 | |
| Braskem Netherlands Finance BV 8.50% 1/12/20317 | | | 6,038 | | | | 6,142 | |
| CSN Resources SA 8.875% 12/5/20307 | | | 6,200 | | | | 6,221 | |
| Sasol Financing USA, LLC 5.50% 3/18/2031 | | | 9,400 | | | | 7,821 | |
| | | | | | | | 32,411 | |
| | | | | | | | | |
| Energy 0.05% | | | | | | | | |
| Oleoducto Central SA 4.00% 7/14/20277 | | | 3,450 | | | | 3,196 | |
| Petrobras Global Finance BV 6.85% 6/5/2115 | | | 4,340 | | | | 3,773 | |
| Petroleos Mexicanos 6.875% 8/4/2026 | | | 8,024 | | | | 7,793 | |
| Petroleos Mexicanos 6.49% 1/23/2027 | | | 6,488 | | | | 6,089 | |
| PTTEP Treasury Center Co., Ltd. 2.993% 1/15/2030 | | | 2,068 | | | | 1,806 | |
| Sinopec Group Overseas Development (2018), Ltd. 3.10% 1/8/20517 | | | 8,300 | | | | 5,590 | |
| | | | | | | | 28,247 | |
| Bonds, notes & other debt instruments (continued) | | Principal amount
(000) | | | Value
(000) | |
| Corporate bonds, notes & loans (continued) | | | | | | | | |
| Consumer discretionary 0.05% | | | | | | | | |
| Alibaba Group Holding, Ltd. 2.125% 2/9/2031 | | USD | 5,926 | | | $ | 4,793 | |
| Alibaba Group Holding, Ltd. 3.15% 2/9/2051 | | | 7,800 | | | | 4,887 | |
| Arcos Dorados BV 6.125% 5/27/2029 | | | 2,067 | | | | 2,034 | |
| Melco Resorts Finance, Ltd. 7.625% 4/17/20327 | | | 5,700 | | | | 5,584 | |
| MercadoLibre, Inc. 3.125% 1/14/2031 | | | 8,275 | | | | 6,794 | |
| Sands China, Ltd. 4.625% 6/18/2030 | | | 2,675 | | | | 2,410 | |
| | | | | | | | 26,502 | |
| | | | | | | | | |
| Industrials 0.03% | | | | | | | | |
| Empresa de Transporte de Pasajeros Metro SA 4.70% 5/7/20507 | | | 4,520 | | | | 3,607 | |
| IRB Infrastructure Developers, Ltd. 7.11% 3/11/20327 | | | 5,465 | | | | 5,406 | |
| Lima Metro Line 2 Finance, Ltd. 5.875% 7/5/20347 | | | 1,303 | | | | 1,260 | |
| Mexico City Airport Trust 4.25% 10/31/2026 | | | 6,200 | | | | 5,975 | |
| | | | | | | | 16,248 | |
| | | | | | | | | |
| Consumer staples 0.03% | | | | | | | | |
| MARB BondCo PLC 3.95% 1/29/20317 | | | 7,700 | | | | 6,183 | |
| MARB BondCo PLC 3.95% 1/29/2031 | | | 4,300 | | | | 3,453 | |
| NBM US Holdings, Inc. 6.625% 8/6/20296 | | | 6,150 | | | | 6,013 | |
| | | | | | | | 15,649 | |
| | | | | | | | | |
| Health care 0.01% | | | | | | | | |
| Rede D’Or Finance SARL 4.95% 1/17/2028 | | | 702 | | | | 660 | |
| Rede D’Or Finance SARL 4.50% 1/22/2030 | | | 6,323 | | | | 5,563 | |
| | | | | | | | 6,223 | |
| | | | | | | | | |
| Total corporate bonds, notes & loans | | | | | | | 243,854 | |
| | | | | | | | | |
| Total bonds, notes & other debt instruments (cost: $2,163,547,000) | | | | | | | 2,001,182 | |
| | | | | | | | | |
| Short-term securities 4.89% | | | Shares | | | | | |
| Money market investments 4.61% | | | | | | | | |
| Capital Group Central Cash Fund 5.37%2,11 | | | 26,221,321 | | | | 2,622,131 | |
| | | | | | | | | |
| Money market investments purchased with collateral from securities on loan 0.23% | | | | | | | | |
| Capital Group Central Cash Fund 5.37%2,11,12 | | | 675,267 | | | | 67,527 | |
| Invesco Short-Term Investments Trust – Government & Agency Portfolio, Institutional Class 5.23%11,12 | | | 11,013,823 | | | | 11,013 | |
| BlackRock Liquidity Funds – FedFund, Institutional Shares 5.18%11,12 | | | 8,000,000 | | | | 8,000 | |
| Dreyfus Treasury Obligations Cash Management, Institutional Shares 5.19%11,12 | | | 8,000,000 | | | | 8,000 | |
| Fidelity Investments Money Market Government Portfolio, Class I 5.20%11,12 | | | 8,000,000 | | | | 8,000 | |
| Goldman Sachs Financial Square Government Fund, Institutional Shares 5.21%11,12 | | | 8,000,000 | | | | 8,000 | |
| Morgan Stanley Institutional Liquidity Funds – Government Portfolio, Institutional Class 5.22%11,12 | | | 8,000,000 | | | | 8,000 | |
| RBC Funds Trust – U.S. Government Money Market Fund, RBC Institutional Class 1 5.25%11,12 | | | 8,000,000 | | | | 8,000 | |
| State Street Institutional U.S. Government Money Market Fund, Premier Class 5.25%11,12 | | | 8,000,000 | | | | 8,000 | |
| | | | | | | | | | | | 134,540 | |
| | | | | | | | | | | | | |
| | | Weighted
average yield
at acquisition | | | Principal amount
(000) | | | | |
| Bills & notes of governments & government agencies outside the U.S. 0.05% | | | | | | | | | | | | |
| Egypt (Arab Republic of) 3/18/2025 | | | 20.180 | % | | EGP | 800,000 | | | | 13,668 | |
| Nigeria (Republic of) 2/11/2025 | | | 18.000 | | | NGN | 1,403,815 | | | | 867 | |
| Nigeria (Republic of) 2/20/2025 | | | 17.782 | | | | 1,871,755 | | | | 1,156 | |
| Nigeria (Republic of) 2/25/2025 | | | 18.036 | | | | 5,700,647 | | | | 3,510 | |
| Short-term securities (continued) | | Weighted
average yield
at acquisition | | | Principal amount
(000) | | | Value
(000) | |
| Bills & notes of governments & government agencies outside the U.S. (continued) | | | | | | | | | | | | |
| Nigeria (Republic of) 3/6/2025 | | | 17.801 | % | | NGN | 6,400,320 | | | $ | 3,918 | |
| Nigeria (Republic of) 3/13/2025 | | | 17.900 | | | | 2,495,670 | | | | 1,521 | |
| Nigeria (Republic of) 3/27/2025 | | | 18.586 | | | | 3,638,793 | | | | 2,197 | |
| | | | | | | | | | | | 26,837 | |
| | | | | | | | | | | | | |
| Total short-term securities (cost: $2,783,185,000) | | | | | | 2,783,508 | |
| Total investment securities 100.75% (cost: $43,042,023,000) | | | | | | 57,338,770 | |
| Other assets less liabilities (0.75)% | | | | | | | | | | | (426,390 | ) |
| | | | | | | | | | | | | |
| Net assets 100.00% | | | | | | | | | | $ | 56,912,380 | |
Futures contracts
| Contracts | | Type | | Number of
contracts | | Expiration
date | | Notional
amount
(000) | | | Value and
unrealized
appreciation
(depreciation)
at 4/30/2024
(000) | |
| 2 Year U.S. Treasury Note Futures | | Long | | 670 | | 7/3/2024 | | | USD135,780 | | | $ | (1,345 | ) |
| 10 Year Euro-Bund Futures | | Short | | 158 | | 6/10/2024 | | | (21,934 | ) | | | 384 | |
| 30 Year Ultra U.S. Treasury Bond Futures | | Long | | 68 | | 6/28/2024 | | | 8,130 | | | | (443 | ) |
| | | | | | | | | | | | | $ | (1,404 | ) |
Forward currency contracts
| | | | | | | | | | | Unrealized | |
| | | | | | | | | | | appreciation | |
| Contract amount | | | | | | (depreciation) | |
| Currency purchased | | Currency sold | | | | Settlement | | at 4/30/2024 | |
| (000) | | (000) | | Counterparty | | date | | (000) | |
| TRY | | 489,000 | | USD | 14,637 | | Citibank | | 5/17/2024 | | | $ | 206 | |
| USD | | 36,219 | | EUR | 33,989 | | Morgan Stanley | | 5/20/2024 | | | | (85 | ) |
| USD | | 7,927 | | ZAR | 151,200 | | JPMorgan Chase | | 5/20/2024 | | | | (93 | ) |
| CZK | | 325,600 | | USD | 13,718 | | Barclays Bank PLC | | 5/22/2024 | | | | 97 | |
| HUF | | 7,800,000 | | USD | 21,066 | | Goldman Sachs | | 6/6/2024 | | | | 158 | |
| USD | | 86,646 | | MYR | 413,059 | | Standard Chartered Bank | | 6/7/2024 | | | | 257 | |
| CZK | | 292,740 | | USD | 12,947 | | Barclays Bank PLC | | 6/10/2024 | | | | (525 | ) |
| TRY | | 334,000 | | USD | 8,487 | | Barclays Bank PLC | | 9/23/2024 | | | | 293 | |
| | | | | | | | | | | | | $ | 308 | |
Investments in affiliates2
| | | Value at
11/1/2023
(000) | | | Additions
(000) | | | Reductions
(000) | | | Net
realized
gain (loss)
(000) | | | Net
unrealized
appreciation
(depreciation)
(000) | | | Value at
4/30/2024
(000) | | | Dividend
or interest
income
(000) | |
| Common stocks 3.07% | | | | | | | | | | | | | | | | | | | | | | | | | | | | |
| Financials 0.71% | | | | | | | | | | | | | | | | | | | | | | | | | | | | |
| PB Fintech, Ltd.1 | | $ | 14,916 | | | $ | 282,319 | | | $ | — | | | $ | — | | | $ | 105,311 | | | $ | 402,546 | | | $ | — | |
| Health care 1.26% | | | | | | | | | | | | | | | | | | | | | | | | | | | | |
| Max Healthcare Institute, Ltd. | | | 441,843 | | | | 110,385 | | | | 199,418 | | | | 39,177 | | | | 138,231 | | | | 530,218 | | | | — | |
| Laurus Labs, Ltd. | | | 141,536 | | | | 11,392 | | | | — | | | | — | | | | 35,113 | | | | 188,041 | | | | 156 | |
| | | | | | | | | | | | | | | | | | | | | | | | 718,259 | | | | | |
Investments in affiliates2 (continued)
| | | Value at
11/1/2023
(000) | | | Additions
(000) | | | Reductions
(000) | | | Net
realized
gain (loss)
(000) | | | Net
unrealized
appreciation
(depreciation)
(000) | | | Value at
4/30/2024
(000) | | | Dividend
or interest
income
(000) | |
| Materials 1.10% | | | | | | | | | | | | | | | | | | | | | | | | | | | | |
| First Quantum Minerals, Ltd. | | $ | 220,855 | | | $ | 247,571 | | | $ | — | | | $ | — | | | $ | 111,520 | | | $ | 579,946 | | | $ | — | |
| Loma Negra Compania Industrial Argentina SA (ADR) | | | 36,721 | | | | — | | | | — | | | | — | | | | 9,277 | | | | 45,998 | | | | 2,584 | |
| | | | | | | | | | | | | | | | | | | | | | | | 625,944 | | | | | |
| Total common stocks | | | | | | | | | | | | | | | | | | | | | | | 1,746,749 | | | | | |
| Short-term securities 4.73% | | | | | | | | | | | | | | | | | | | | | | | | | | | | |
| Money market investments 4.61% | | | | | | | | | | | | | | | | | | | | | | | | | | | | |
| Capital Group Central Cash Fund 5.37%11 | | | 2,598,930 | | | | 5,568,203 | | | | 5,545,158 | | | | 227 | | | | (71 | ) | | | 2,622,131 | | | | 72,615 | |
| Money market investments purchased with collateral from securities on loan 0.12% | | | | | | | | | | | | | | | | | | | | | | | | | | | | |
| Capital Group Central Cash Fund 5.37%11,12 | | | 43,724 | | | | 23,803 | 13 | | | | | | | | | | | | | | | 67,527 | | | | — | 14 |
| Total short-term securities | | | | | | | | | | | | | | | | | | | | | | | 2,689,658 | | | | | |
| Total 7.80% | | | | | | | | | | | | | | $ | 39,404 | | | $ | 399,381 | | | $ | 4,436,407 | | | $ | 75,355 | |
Restricted securities6
| | | Acquisition
date(s) | | Cost
(000) | | | Value
(000) | | | Percent
of net
assets | |
| QuintoAndar, Ltd., Series E, preference shares1,3 | | 5/26/2021 | | $ | 69,742 | | | $ | 63,407 | | | | .11 | % |
| QuintoAndar, Ltd., Series E-1, preference shares1,3 | | 12/20/2021 | | | 23,284 | | | | 16,682 | | | | .03 | |
| Canva, Inc.1,3 | | 8/26/2021-11/4/2021 | | | 18,022 | | | | 11,277 | | | | .02 | |
| Canva, Inc., Series A, noncumulative preferred shares1,3 | | 11/4/2021 | | | 1,577 | | | | 987 | | | | .00 | 15 |
| Canva, Inc., Series A-3, noncumulative preferred shares1,3 | | 11/4/2021 | | | 65 | | | | 41 | | | | .00 | 15 |
| Canva, Inc., Series A-4, noncumulative preferred shares1,3 | | 11/4/2021 | | | 5 | | | | 3 | | | | .00 | 15 |
| Canva, Inc., Series A-5, noncumulative preferred shares1,3 | | 11/4/2021 | | | 3 | | | | 2 | | | | .00 | 15 |
| NBM US Holdings, Inc. 6.625% 8/6/2029 | | 7/8/2022 | | | 5,959 | | | | 6,013 | | | | .01 | |
| Getir BV, Series D, preferred shares1,3 | | 5/27/2021 | | | 46,500 | | | | 4,660 | | | | .01 | |
| Total | | | | $ | 165,157 | | | $ | 103,072 | | | | .18 | % |
| | |
| 1 | Security did not produce income during the last 12 months. |
| 2 | Affiliate of the fund or part of the same “group of investment companies” as the fund, as defined under the Investment Company Act of 1940, as amended. |
| 3 | Value determined using significant unobservable inputs. |
| 4 | Amount less than one thousand. |
| 5 | All or a portion of this security was on loan. The total value of all such securities was $343,264,000, which represented .60% of the net assets of the fund. Refer to Note 5 for more information on securities lending. |
| 6 | Restricted security, other than Rule 144A securities or commercial paper issued pursuant to Section 4(a)(2) of the Securities Act of 1933. The total value of all such restricted securities was $103,072,000, which represented .18% of the net assets of the fund. |
| 7 | Acquired in a transaction exempt from registration under Rule 144A or, for commercial paper, Section 4(a)(2) of the Securities Act of 1933. May be resold in the U.S. in transactions exempt from registration, normally to qualified institutional buyers. The total value of all such securities was $252,213,000, which represented .44% of the net assets of the fund. |
| 8 | Step bond; coupon rate may change at a later date. |
| 9 | Index-linked bond whose principal amount moves with a government price index. |
| 10 | Scheduled interest and/or principal payment was not received. |
| 11 | Rate represents the seven-day yield at 4/30/2024. |
| 12 | Security purchased with cash collateral from securities on loan. Refer to Note 5 for more information on securities lending. |
| 13 | Represents net activity. Refer to Note 5 for more information on securities lending. |
| 14 | Dividend income is included with securities lending income in the fund’s statement of operations and is not shown in this table. |
| 15 | Amount less than .01%. |
Key to abbreviation(s)
ADR = American Depositary Receipts
BRL = Brazilian reais
CAD = Canadian dollars
CDI = CREST Depository Interest
CLP = Chilean pesos
CNY = Chinese yuan
COP = Colombian pesos
CZK = Czech korunas
DOP = Dominican pesos
EGP = Egyptian pounds
EUR = Euros
GBP = British pounds
GDR = Global Depositary Receipts
HUF = Hungarian forints
IDR = Indonesian rupiah
INR = Indian rupees
MXN = Mexican pesos
MYR = Malaysian ringgits
NGN = Nigerian naira
NOK = Norwegian kroner
PLN = Polish zloty
REIT = Real Estate Investment Trust
SOFR = Secured Overnight Financing Rate
THB = Thai baht
TRY = Turkish lira
USD = U.S. dollars
ZAR = South African rand
Refer to the notes to financial statements.
Financial statements
| Statement of assets and liabilities | unaudited |
| at April 30, 2024 | (dollars in thousands) |
| Assets: | | | | | | | | |
| Investment securities, at value (includes $343,264 of investment securities on loan): | | | | | | | | |
| Unaffiliated issuers (cost: $39,041,843) | | $ | 52,902,363 | | | | | |
| Affiliated issuers (cost: $4,000,180) | | | 4,436,407 | | | $ | 57,338,770 | |
| Cash | | | | | | | 19,024 | |
| Cash collateral pledged for futures contracts | | | | | | | 1,752 | |
| Cash collateral pledged for forward currency contracts | | | | | | | 230 | |
| Cash denominated in currencies other than U.S. dollars (cost: $133,299) | | | | | | | 133,171 | |
| Unrealized appreciation on open forward currency contracts | | | | | | | 1,011 | |
| Receivables for: | | | | | | | | |
| Sales of investments | | | 150,602 | | | | | |
| Sales of fund’s shares | | | 57,304 | | | | | |
| Dividends and interest | | | 114,115 | | | | | |
| Securities lending income | | | 9 | | | | | |
| Variation margin on futures contracts | | | 130 | | | | 322,160 | |
| | | | | | | | 57,816,118 | |
| Liabilities: | | | | | | | | |
| Collateral for securities on loan | | | | | | | 134,540 | |
| Unrealized depreciation on open forward currency contracts | | | | | | | 703 | |
| Payables for: | | | | | | | | |
| Purchases of investments | | | 414,599 | | | | | |
| Repurchases of fund’s shares | | | 47,790 | | | | | |
| Investment advisory services | | | 23,554 | | | | | |
| Services provided by related parties | | | 5,626 | | | | | |
| Directors’ deferred compensation | | | 3,409 | | | | | |
| Variation margin on futures contracts | | | 348 | | | | | |
| Non-U.S. taxes | | | 272,266 | | | | | |
| Other | | | 903 | | | | 768,495 | |
| Net assets at April 30, 2024 | | | | | | $ | 56,912,380 | |
| | | | | | | | | |
| Net assets consist of: | | | | | | | | |
| Capital paid in on shares of capital stock | | | | | | $ | 41,983,980 | |
| Total distributable earnings (accumulated loss) | | | | | | | 14,928,400 | |
| Net assets at April 30, 2024 | | | | | | $ | 56,912,380 | |
Refer to the notes to financial statements.
Financial statements (continued)
| Statement of assets and liabilities | unaudited |
| at April 30, 2024 (continued) | (dollars and shares in thousands, except per-share amounts) |
Total authorized capital stock — 2,000,000 shares,
$.01 par value (734,990 total shares outstanding)
| | | Net assets | | | Shares
outstanding | | | Net asset value
per share | |
| Class A | | $ | 12,864,672 | | | | 165,864 | | | $ | 77.56 | |
| Class C | | | 296,379 | | | | 4,012 | | | | 73.88 | |
| Class T | | | 14 | | | | — | * | | | 77.38 | |
| Class F-1 | | | 869,150 | | | | 11,284 | | | | 77.03 | |
| Class F-2 | | | 16,960,624 | | | | 219,267 | | | | 77.35 | |
| Class F-3 | | | 7,778,410 | | | | 100,193 | | | | 77.63 | |
| Class 529-A | | | 916,952 | | | | 11,948 | | | | 76.75 | |
| Class 529-C | | | 19,348 | | | | 261 | | | | 74.06 | |
| Class 529-E | | | 31,233 | | | | 411 | | | | 76.07 | |
| Class 529-T | | | 16 | | | | — | * | | | 77.38 | |
| Class 529-F-1 | | | 11 | | | | — | * | | | 76.47 | |
| Class 529-F-2 | | | 132,110 | | | | 1,705 | | | | 77.47 | |
| Class 529-F-3 | | | 12 | | | | — | * | | | 77.28 | |
| Class R-1 | | | 22,713 | | | | 307 | | | | 73.93 | |
| Class R-2 | | | 253,728 | | | | 3,431 | | | | 73.96 | |
| Class R-2E | | | 39,211 | | | | 516 | | | | 76.04 | |
| Class R-3 | | | 492,616 | | | | 6,468 | | | | 76.17 | |
| Class R-4 | | | 780,698 | | | | 10,135 | | | | 77.03 | |
| Class R-5E | | | 105,414 | | | | 1,375 | | | | 76.64 | |
| Class R-5 | | | 296,471 | | | | 3,808 | | | | 77.85 | |
| Class R-6 | | | 15,052,598 | | | | 194,005 | | | | 77.59 | |
| * | Amount less than one thousand. |
Refer to the notes to financial statements.
Financial statements (continued)
| Statement of operations | unaudited |
| for the six months ended April 30, 2024 | (dollars in thousands) |
| Investment income: | | | | | | |
| Income: | | | | | | |
| Dividends (net of non-U.S. taxes of $36,914; also includes $75,355 from affiliates) | | $ | 504,768 | | | | | |
| Interest from unaffiliated issuers (net of non-U.S. taxes of $534) | | | 77,056 | | | | | |
| Securities lending income (net of fees) | | | 1,101 | | | $ | 582,925 | |
| Fees and expenses*: | | | | | | | | |
| Investment advisory services | | | 137,405 | | | | | |
| Distribution services | | | 22,502 | | | | | |
| Transfer agent services | | | 22,975 | | | | | |
| Administrative services | | | 8,071 | | | | | |
| 529 plan services | | | 310 | | | | | |
| Reports to shareholders | | | 1,299 | | | | | |
| Registration statement and prospectus | | | 633 | | | | | |
| Directors’ compensation | | | 631 | | | | | |
| Auditing and legal | | | 73 | | | | | |
| Custodian | | | 4,222 | | | | | |
| State and local taxes | | | 1 | | | | | |
| Other | | | 547 | | | | 198,669 | |
| Net investment income | | | | | | | 384,256 | |
| | | | | | | | | |
| Net realized gain (loss) and unrealized appreciation (depreciation): | | | | | | | | |
| Net realized gain (loss) on: | | | | | | | | |
| Investments (net of non-U.S. taxes of $73,668): | | | | | | | | |
| Unaffiliated issuers | | | 868,454 | | | | | |
| Affiliated issuers | | | 39,404 | | | | | |
| Futures contracts | | | (786 | ) | | | | |
| Forward currency contracts | | | 2,311 | | | | | |
| Currency transactions | | | (2,567 | ) | | | 906,816 | |
| Net unrealized appreciation (depreciation) on: | | | | | | | | |
| Investments (net of non-U.S. taxes of $263,994): | | | | | | | | |
| Unaffiliated issuers | | | 6,144,248 | | | | | |
| Affiliated issuers | | | 399,381 | | | | | |
| Futures contracts | | | (3,839 | ) | | | | |
| Forward currency contracts | | | (1,490 | ) | | | | |
| Currency translations | | | (1,453 | ) | | | 6,536,847 | |
| Net realized gain (loss) and unrealized appreciation (depreciation) | | | | | | | 7,443,663 | |
| | | | | | | | | |
| Net increase (decrease) in net assets resulting from operations | | | | | | $ | 7,827,919 | |
| * | Additional information related to class-specific fees and expenses is included in the notes to financial statements. |
Refer to the notes to financial statements.
Financial statements (continued)
| Statements of changes in net assets | |
| | (dollars in thousands) |
| | | Six months ended
April 30,
2024* | | | Year ended
October 31,
2023 | |
| Operations: | | | | | | |
| Net investment income | | $ | 384,256 | | | $ | 694,417 | |
| Net realized gain (loss) | | | 906,816 | | | | 1,260,895 | |
| Net unrealized appreciation (depreciation) | | | 6,536,847 | | | | 2,678,806 | |
| Net increase (decrease) in net assets resulting from operations | | | 7,827,919 | | | | 4,634,118 | |
| | | | | | | | | |
| Distributions paid to shareholders | | | (1,413,453 | ) | | | (516,454 | ) |
| | | | | | | | | |
| Net capital share transactions | | | 2,763,124 | | | | 72,023 | |
| | | | | | | | | |
| Total increase (decrease) in net assets | | | 9,177,590 | | | | 4,189,687 | |
| | | | | | | | | |
| Net assets: | | | | | | | | |
| Beginning of period | | | 47,734,790 | | | | 43,545,103 | |
| End of period | | $ | 56,912,380 | | | $ | 47,734,790 | |
Refer to the notes to financial statements.
| Notes to financial statements | unaudited |
1. Organization
New World Fund, Inc. (the “fund”) is registered under the Investment Company Act of 1940, as amended (the “1940 Act”), as an open-end, diversified management investment company. The fund seeks long-term capital appreciation. Shareholders approved a proposal to reorganize the fund into a Delaware statutory trust. The reorganization may be completed in the next 12 months; however, the fund reserves the right to delay the implementation.
The fund has 21 share classes consisting of six retail share classes (Classes A, C, T, F-1, F-2 and F-3), seven 529 college savings plan share classes (Classes 529-A, 529-C, 529-E, 529-T, 529-F-1, 529-F-2 and 529-F-3) and eight retirement plan share classes (Classes R-1, R-2, R-2E, R-3, R-4, R-5E, R-5 and R-6). The 529 college savings plan share classes can be used to save for college education. The retirement plan share classes are generally offered only through eligible employer-sponsored retirement plans. The fund’s share classes are described further in the following table:
| Share class | | Initial sales charge | | Contingent deferred sales
charge upon redemption | | Conversion feature |
| Classes A and 529-A | | Up to 5.75% for Class A; up to 3.50% for Class 529-A | | None (except 1.00% for certain redemptions within 18 months of purchase without an initial sales charge) | | None |
| Classes C and 529-C | | None | | 1.00% for redemptions within one year of purchase | | Class C converts to Class A after eight years and Class 529-C converts to Class 529-A after five years |
| Class 529-E | | None | | None | | None |
| Classes T and 529-T* | | Up to 2.50% | | None | | None |
| Classes F-1, F-2, F-3, 529-F-1, 529-F-2 and 529-F-3 | | None | | None | | None |
| Classes R-1, R-2, R-2E, R-3, R-4, R-5E, R-5 and R-6 | | None | | None | | None |
| * | Class T and 529-T shares are not available for purchase. |
Holders of all share classes have equal pro rata rights to the assets, dividends and liquidation proceeds of the fund. Each share class has identical voting rights, except for the exclusive right to vote on matters affecting only its class. Share classes have different fees and expenses (“class-specific fees and expenses”), primarily due to different arrangements for distribution, transfer agent and administrative services. Differences in class-specific fees and expenses will result in differences in net investment income and, therefore, the payment of different per-share dividends by each share class.
2. Significant accounting policies
The fund is an investment company that applies the accounting and reporting guidance issued in Topic 946 by the U.S. Financial Accounting Standards Board. The fund’s financial statements have been prepared to comply with U.S. generally accepted accounting principles (“U.S. GAAP”). These principles require the fund’s investment adviser to make estimates and assumptions that affect reported amounts and disclosures. Actual results could differ from those estimates. Subsequent events, if any, have been evaluated through the date of issuance in the preparation of the financial statements. The fund follows the significant accounting policies described in this section, as well as the valuation policies described in the next section on valuation.
Security transactions and related investment income — Security transactions are recorded by the fund as of the date the trades are executed with brokers. Realized gains and losses from security transactions are determined based on the specific identified cost of the securities. In the event a security is purchased with a delayed payment date, the fund will segregate liquid assets sufficient to meet its payment obligations. Dividend income is recognized on the ex-dividend date and interest income is recognized on an accrual basis. Market discounts, premiums and original issue discounts on fixed-income securities are amortized daily over the expected life of the security.
Class allocations — Income, fees and expenses (other than class-specific fees and expenses), realized gains and losses and unrealized appreciation and depreciation are allocated daily among the various share classes based on their relative net assets. Class-specific fees and expenses, such as distribution, transfer agent and administrative services, are charged directly to the respective share class.
Distributions paid to shareholders — Income dividends and capital gain distributions are recorded on the ex-dividend date.
Currency translation — Assets and liabilities, including investment securities, denominated in currencies other than U.S. dollars are translated into U.S. dollars at the exchange rates supplied by one or more pricing vendors on the valuation date. Purchases and sales of investment securities and income and expenses are translated into U.S. dollars at the exchange rates on the dates of such transactions. The effects of changes in exchange rates on investment securities are included with the net realized gain or loss and net unrealized appreciation or depreciation on investments in the fund’s statement of operations. The realized gain or loss and unrealized appreciation or depreciation resulting from all other transactions denominated in currencies other than U.S. dollars are disclosed separately.
3. Valuation
Capital Research and Management Company (“CRMC”), the fund’s investment adviser, values the fund’s investments at fair value as defined by U.S. GAAP. The net asset value per share is calculated once daily as of the close of regular trading on the New York Stock Exchange, normally 4 p.m. New York time, each day the New York Stock Exchange is open.
Methods and inputs — The fund’s investment adviser uses the following methods and inputs to establish the fair value of the fund’s assets and liabilities. Use of particular methods and inputs may vary over time based on availability and relevance as market and economic conditions evolve.
Equity securities, including depositary receipts, are generally valued at the official closing price of, or the last reported sale price on, the exchange or market on which such securities are traded, as of the close of business on the day the securities are being valued or, lacking any sales, at the last available bid price. Prices for each security are taken from the principal exchange or market on which the security trades.
Fixed-income securities, including short-term securities, are generally valued at evaluated prices obtained from third-party pricing vendors. Vendors value such securities based on one or more of the inputs described in the following table. The table provides examples of inputs that are commonly relevant for valuing particular classes of fixed-income securities in which the fund is authorized to invest. However, these classifications are not exclusive, and any of the inputs may be used to value any other class of fixed-income security.
| Fixed-income class | | Examples of standard inputs |
| All | | Benchmark yields, transactions, bids, offers, quotations from dealers and trading systems, new issues, spreads and other relationships observed in the markets among comparable securities; and proprietary pricing models such as yield measures calculated using factors such as cash flows, financial or collateral performance and other reference data (collectively referred to as “standard inputs”) |
| Corporate bonds, notes & loans; convertible securities | | Standard inputs and underlying equity of the issuer |
| Bonds & notes of governments & government agencies | | Standard inputs and interest rate volatilities |
| Mortgage-backed; asset-backed obligations | | Standard inputs and cash flows, prepayment information, default rates, delinquency and loss assumptions, collateral characteristics, credit enhancements and specific deal information |
Securities with both fixed-income and equity characteristics, or equity securities traded principally among fixed-income dealers, are generally valued in the manner described for either equity or fixed-income securities, depending on which method is deemed most appropriate by the fund’s investment adviser. The Capital Group Central Cash Fund (“CCF”), a fund within the Capital Group Central Fund Series (“Central Funds”), is valued based upon a floating net asset value, which fluctuates with changes in the value of CCF’s portfolio securities. The underlying securities are valued based on the policies and procedures in CCF’s statement of additional information. Exchange-traded futures are generally valued at the official settlement price of the exchange or market on which such instruments are traded, as of the close of business on the day the futures are being valued. Forward currency contracts are valued based on the spot and forward exchange rates obtained from a third-party pricing vendor.
Securities and other assets for which representative market quotations are not readily available or are considered unreliable by the fund’s investment adviser are fair valued as determined in good faith under fair valuation guidelines adopted by the fund’s investment adviser and approved by the board of directors as further described. The investment adviser follows fair valuation guidelines, consistent with U.S. Securities and Exchange Commission rules and guidance, to consider relevant principles and factors when making fair value determinations. The investment adviser considers relevant indications of value that are reasonably and timely available to it in determining the fair value to be assigned to a particular security, such as the type and cost of the security, restrictions on resale of the security, relevant financial or business developments of the issuer, actively traded similar or related securities, dealer or broker quotes, conversion or exchange rights on the security, related corporate actions, significant events occurring after the close of trading in the
security, and changes in overall market conditions. In addition, the closing prices of equity securities that trade in markets outside U.S. time zones may be adjusted to reflect significant events that occur after the close of local trading but before the net asset value of each share class of the fund is determined. Fair valuations of investments that are not actively trading involve judgment and may differ materially from valuations that would have been used had greater market activity occurred.
Processes and structure — The fund’s board of directors has designated the fund’s investment adviser to make fair value determinations, subject to board oversight. The investment adviser has established a Joint Fair Valuation Committee (the “Committee”) to administer, implement and oversee the fair valuation process and to make fair value decisions. The Committee regularly reviews its own fair value decisions, as well as decisions made under its standing instructions to the investment adviser’s valuation team. The Committee reviews changes in fair value measurements from period to period, pricing vendor information and market data, and may, as deemed appropriate, update the fair valuation guidelines to better reflect the results of back testing and address new or evolving issues. Pricing decisions, processes and controls over security valuation are also subject to additional internal reviews facilitated by the investment adviser’s global risk management group. The Committee reports changes to the fair valuation guidelines to the board of directors. The fund’s board and audit committee also regularly review reports that describe fair value determinations and methods.
Classifications — The fund’s investment adviser classifies the fund’s assets and liabilities into three levels based on the inputs used to value the assets or liabilities. Level 1 values are based on quoted prices in active markets for identical securities. Level 2 values are based on significant observable market inputs, such as quoted prices for similar securities and quoted prices in inactive markets. Certain securities trading outside the U.S. may transfer between Level 1 and Level 2 due to valuation adjustments resulting from significant market movements following the close of local trading. Level 3 values are based on significant unobservable inputs that reflect the investment adviser’s determination of assumptions that market participants might reasonably use in valuing the securities. The valuation levels are not necessarily an indication of the risk or liquidity associated with the underlying investment. For example, U.S. government securities are reflected as Level 2 because the inputs used to determine fair value may not always be quoted prices in an active market. The following tables present the fund’s valuation levels as of April 30, 2024 (dollars in thousands):
| | | Investment securities | |
| | | Level 1 | | | Level 2 | | | Level 3 | | | Total | |
| Assets: | | | | | | | | | | | | | | | | |
| Common stocks: | | | | | | | | | | | | | | | | |
| Financials | | $ | 2,365,821 | | | $ | 6,835,097 | | | | — | * | | $ | 9,200,918 | |
| Information technology | | | 3,873,582 | | | | 4,483,639 | | | | 11,277 | | | | 8,368,498 | |
| Industrials | | | 1,835,812 | | | | 5,001,826 | | | | — | | | | 6,837,638 | |
| Consumer discretionary | | | 2,096,967 | | | | 4,174,401 | | | | — | | | | 6,271,368 | |
| Health care | | | 2,617,972 | | | | 3,477,953 | | | | — | | | | 6,095,925 | |
| Communication services | | | 1,834,548 | | | | 2,691,281 | | | | — | | | | 4,525,829 | |
| Materials | | | 2,421,481 | | | | 1,446,116 | | | | — | * | | | 3,867,597 | |
| Consumer staples | | | 973,247 | | | | 2,863,318 | | | | — | | | | 3,836,565 | |
| Energy | | | 554,295 | | | | 977,117 | | | | — | * | | | 1,531,412 | |
| Real estate | | | 252,343 | | | | 703,526 | | | | — | | | | 955,869 | |
| Utilities | | | 204,640 | | | | 393,199 | | | | — | | | | 597,839 | |
| Preferred securities | | | 172,060 | | | | 171,561 | | | | 85,782 | | | | 429,403 | |
| Rights & warrants | | | — | | | | 30,127 | | | | — | | | | 30,127 | |
| Convertible stocks | | | 5,092 | | | | — | | | | — | | | | 5,092 | |
| Bonds, notes & other debt instruments | | | — | | | | 2,001,182 | | | | — | | | | 2,001,182 | |
| Short-term securities | | | 2,756,671 | | | | 26,837 | | | | — | | | | 2,783,508 | |
| Total | | $ | 21,964,531 | | | $ | 35,277,180 | | | $ | 97,059 | | | $ | 57,338,770 | |
| | | | | | | | | | |
| | | Other investments† | |
| | | Level 1 | | | Level 2 | | | Level 3 | | | Total | |
| Assets: | | | | | | | | | | | | | | | | |
| Unrealized appreciation on futures contracts | | $ | 384 | | | $ | — | | | $ | — | | | $ | 384 | |
| Unrealized appreciation on open forward currency contracts | | | — | | | | 1,011 | | | | — | | | | 1,011 | |
| Liabilities: | | | | | | | | | | | | | | | | |
| Unrealized depreciation on futures contracts | | | (1,788 | ) | | | — | | | | — | | | | (1,788 | ) |
| Unrealized depreciation on open forward currency contracts | | | — | | | | (703 | ) | | | — | | | | (703 | ) |
| Total | | $ | (1,404 | ) | | $ | 308 | | | $ | — | | | $ | (1,096 | ) |
| | |
| * | Amount less than one thousand. |
| † | Futures contracts and forward currency contracts are not included in the fund’s investment portfolio. |
4. Risk factors
Investing in the fund may involve certain risks including, but not limited to, those described below.
Market conditions — The prices of, and the income generated by, the common stocks and other securities held by the fund may decline —sometimes rapidly or unpredictably — due to various factors, including events or conditions affecting the general economy or particular industries or companies; overall market changes; local, regional or global political, social or economic instability; governmental, governmental agency or central bank responses to economic conditions; changes in inflation rates; and currency exchange rate, interest rate and commodity price fluctuations.
Economies and financial markets throughout the world are highly interconnected. Economic, financial or political events, trading and tariff arrangements, wars, terrorism, cybersecurity events, natural disasters, public health emergencies (such as the spread of infectious disease), bank failures and other circumstances in one country or region, including actions taken by governmental or quasi-governmental authorities in response to any of the foregoing, could have impacts on global economies or markets. As a result, whether or not the fund invests in securities of issuers located in or with significant exposure to the countries affected, the value and liquidity of the fund’s investments may be negatively affected by developments in other countries and regions.
Issuer risks — The prices of, and the income generated by, securities held by the fund may decline in response to various factors directly related to the issuers of such securities, including reduced demand for an issuer’s goods or services, poor management performance, major litigation, investigations or other controversies related to the issuer, changes in the issuer’s financial condition or credit rating, changes in government regulations affecting the issuer or its competitive environment and strategic initiatives such as mergers, acquisitions or dispositions and the market response to any such initiatives. An individual security may also be affected by factors relating to the industry or sector of the issuer or the securities markets as a whole, and conversely an industry or sector or the securities markets may be affected by a change in financial condition or other event affecting a single issuer.
Investing in growth-oriented stocks — Growth-oriented common stocks and other equity-type securities (such as preferred stocks, convertible preferred stocks and convertible bonds) may involve larger price swings and greater potential for loss than other types of investments. These risks may be even greater in the case of smaller capitalization stocks.
Investing outside the U.S. — Securities of issuers domiciled outside the U.S., or with significant operations or revenues outside the U.S., and securities tied economically to countries outside the U.S., may lose value because of adverse political, social, economic or market developments (including social instability, regional conflicts, terrorism and war) in the countries or regions in which the issuers are domiciled, operate or generate revenue or to which the securities are tied economically. These securities may also lose value due to changes in foreign currency exchange rates against the U.S. dollar and/or currencies of other countries. Issuers of these securities may be more susceptible to actions of foreign governments, such as nationalization, currency blockage or the imposition of price controls, sanctions, or punitive taxes, each of which could adversely impact the value of these securities. Securities markets in certain countries may be more volatile and/or less liquid than those in the U.S. Investments outside the U.S. may also be subject to different regulatory, legal, accounting, auditing, financial reporting and recordkeeping requirements, and may be more difficult to value, than those in the U.S. In addition, the value of investments outside the U.S. may be reduced by foreign taxes, including foreign withholding taxes on interest and dividends. Further, there may be increased risks of delayed settlement of securities purchased or sold by the fund, which could impact the liquidity of the fund’s portfolio. The risks of investing outside the U.S. may be heightened in connection with investments in developing countries.
Investing in developing countries — Investing in countries with developing economies and/or markets may involve risks in addition to and greater than those generally associated with investing in developed countries. For instance, developing countries tend to have less developed political, economic and legal systems than those in developed countries. Accordingly, the governments of these countries may be less stable and more likely to intervene in the market economy, for example, by imposing capital controls, nationalizing a company or industry, placing restrictions on foreign ownership and on withdrawing sale proceeds of securities from the country, and/or imposing punitive taxes that could adversely affect the prices of securities. Information regarding issuers in developing countries may be limited, incomplete or inaccurate, and such issuers may not be subject to regulatory, accounting, auditing, and financial reporting and recordkeeping standards comparable to those to which issuers in developed countries are subject. The fund’s rights with respect to its investments in developing countries, if any, will generally be governed by local law, which may make it difficult or impossible for the fund to pursue legal remedies or to obtain and enforce judgments in local courts. In addition, the economies of these countries may be dependent on relatively few industries, may have limited access to capital and may be more susceptible to changes in local and global trade conditions and downturns in the world economy. Securities markets in these countries can also be relatively small and have substantially lower trading volumes. As a result, securities issued in these countries may be more volatile and less liquid, more vulnerable to market manipulation, and more difficult to value, than securities issued in countries with more developed economies and/or markets.
Less certainty with respect to security valuations may lead to additional challenges and risks in calculating the fund’s net asset value. Additionally, developing countries are more likely to experience problems with the clearing and settling of trades and the holding of securities by banks, agents and depositories that are less established than those in developed countries.
Investing in debt instruments — The prices of, and the income generated by, bonds and other debt securities held by the fund may be affected by factors such as the interest rates, maturities and credit quality of these securities.
Rising interest rates will generally cause the prices of bonds and other debt securities to fall. Also, when interest rates rise, issuers of debt securities which may be prepaid at any time, such as mortgage-or other asset-backed securities, are less likely to refinance existing debt securities, causing the average life of such securities to extend. A general change in interest rates may cause investors to sell debt securities on a large scale, which could also adversely affect the price and liquidity of debt securities and could also result in increased redemptions from the fund. Falling interest rates may cause an issuer to redeem, call or refinance a debt security before its stated maturity, which may result in the fund having to reinvest the proceeds in lower yielding securities. Longer maturity debt securities generally have greater sensitivity to changes in interest rates and may be subject to greater price fluctuations than shorter maturity debt securities.
Bonds and other debt securities are also subject to credit risk, which is the possibility that the credit strength of an issuer or guarantor will weaken or be perceived to be weaker, and/or an issuer of a debt security will fail to make timely payments of principal or interest and the security will go into default. Changes in actual or perceived creditworthiness may occur quickly. A downgrade or default affecting any of the fund’s securities could cause the value of the fund’s shares to decrease. Lower quality debt securities generally have higher rates of interest and may be subject to greater price fluctuations than higher quality debt securities. Credit risk is gauged, in part, by the credit ratings of the debt securities in which the fund invests. However, ratings are only the opinions of the rating agencies issuing them and are not guarantees as to credit quality or an evaluation of market risk. The fund’s investment adviser relies on its own credit analysts to research issuers and issues in assessing credit and default risks.
Investing in lower rated debt instruments — Lower rated bonds and other lower rated debt securities generally have higher rates of interest and involve greater risk of default or price declines due to changes in the issuer’s creditworthiness than those of higher quality debt securities. The market prices of these securities may fluctuate more than the prices of higher quality debt securities and may decline significantly in periods of general economic difficulty. These risks may be increased with respect to investments in junk bonds.
Liquidity risk — Certain fund holdings may be or may become difficult or impossible to sell, particularly during times of market turmoil. Liquidity may be impacted by the lack of an active market for a holding, legal or contractual restrictions on resale, or the reduced number and capacity of market participants to make a market in such holding. Market prices for less liquid or illiquid holdings may be volatile or difficult to determine, and reduced liquidity may have an adverse impact on the market price of such holdings. Additionally, the sale of less liquid or illiquid holdings may involve substantial delays (including delays in settlement) and additional costs and the fund may be unable to sell such holdings when necessary to meet its liquidity needs or to try to limit losses, or may be forced to sell at a loss.
Investing in small companies — Investing in smaller companies may pose additional risks. For example, it is often more difficult to value or dispose of small company stocks and more difficult to obtain information about smaller companies than about larger companies. Furthermore, smaller companies often have limited product lines, operating histories, markets and/or financial resources, may be dependent on one or a few key persons for management, and can be more susceptible to losses. Moreover, the prices of their stocks may be more volatile than stocks of larger, more established companies, particularly during times of market turmoil.
Management — The investment adviser to the fund actively manages the fund’s investments. Consequently, the fund is subject to the risk that the methods and analyses, including models, tools and data, employed by the investment adviser in this process may be flawed or incorrect and may not produce the desired results. This could cause the fund to lose value or its investment results to lag relevant benchmarks or other funds with similar objectives.
5. Certain investment techniques
Securities lending — The fund has entered into securities lending transactions in which the fund earns income by lending investment securities to brokers, dealers or other institutions. Each transaction involves three parties: the fund, acting as the lender of the securities, a borrower, and a lending agent that acts as an intermediary.
Securities lending transactions are entered into by the fund under a securities lending agent agreement with the lending agent. The lending agent facilitates the exchange of securities between the fund and approved borrowers, ensures that securities loans are properly coordinated and documented, marks-to-market the value of collateral daily, secures additional collateral from a borrower if it falls below preset terms, and may reinvest cash collateral on behalf of the fund according to agreed parameters. The lending agent provides indemnification to the fund against losses resulting from a borrower default. Although risk is mitigated by the collateral and indemnification, the fund could experience a delay in recovering its securities and a potential loss of income or value if a borrower fails to return securities, collateral investments decline in value or the lending agent fails to perform.
The borrower is required to post highly liquid assets, such as cash or U.S. government securities, as collateral for the loan in an amount at least equal to the value of the securities loaned. Investments made with cash collateral are recognized as assets in the fund’s investment portfolio. The same amount is recorded as a liability in the fund’s statement of assets and liabilities. While securities are on loan, the fund will continue to receive the equivalent of the interest, dividends or other distributions paid by the issuer, as well as a portion of the interest on the investment of the collateral. Additionally, although the fund does not have the right to vote on securities while they are on loan, the fund has a right to consent on corporate actions and a right to recall loaned securities to vote. A borrower is obligated to return loaned securities at the conclusion of a loan or, during the pendency of a loan, on demand from the fund.
As of April 30, 2024, the total value of securities on loan was $343,264,000, and the total value of collateral received was $365,603,000. Collateral received includes cash of $134,540,000 and U.S. government securities of $231,063,000. Investment securities purchased from cash collateral are disclosed in the fund’s investment portfolio as short-term securities. Securities received as collateral are not recognized as fund assets. The contractual maturity of cash collateral received under the securities lending agreement is classified as overnight and continuous.
Futures contracts — The fund has entered into futures contracts, which provide for the future sale by one party and purchase by another party of a specified amount of a specific financial instrument for a specified price, date, time and place designated at the time the contract is made. Futures contracts are used to strategically manage the fund’s interest rate sensitivity by increasing or decreasing the duration of the fund or a portion of the fund’s portfolio.
Upon entering into futures contracts, and to maintain the fund’s open positions in futures contracts, the fund is required to deposit with a futures broker, known as a futures commission merchant (“FCM”), in a segregated account in the name of the FCM an amount of cash, U.S. government securities or other liquid securities, known as initial margin. The margin required for a particular futures contract is set by the exchange on which the contract is traded to serve as collateral, and may be significantly modified from time to time by the exchange during the term of the contract.
On a daily basis, the fund pays or receives variation margin based on the increase or decrease in the value of the futures contracts and records variation margin on futures contracts in the statement of assets and liabilities. Futures contracts may involve a risk of loss in excess of the variation margin shown on the fund’s statement of assets and liabilities. The fund records realized gains or losses at the time the futures contract is closed or expires. Net realized gains or losses and net unrealized appreciation or depreciation from futures contracts are recorded in the fund’s statement of operations. The average month-end notional amount of futures contracts while held was $354,019,000.
Forward currency contracts — The fund has entered into forward currency contracts, which represent agreements to exchange currencies on specific future dates at predetermined rates. The fund’s investment adviser uses forward currency contracts to manage the fund’s exposure to changes in exchange rates. Upon entering into these contracts, risks may arise from the potential inability of counterparties to meet the terms of their contracts and from possible movements in exchange rates.
On a daily basis, the fund’s investment adviser values forward currency contracts and records unrealized appreciation or depreciation for open forward currency contracts in the fund’s statement of assets and liabilities. Realized gains or losses are recorded at the time the forward currency contract is closed or offset by another contract with the same broker for the same settlement date and currency.
Closed forward currency contracts that have not reached their settlement date are included in the respective receivables or payables for closed forward currency contracts in the fund’s statement of assets and liabilities. Net realized gains or losses from closed forward currency contracts and net unrealized appreciation or depreciation from open forward currency contracts are recorded in the fund’s statement of operations. The average month-end notional amount of open forward currency contracts while held was $213,970,000.
The following tables identify the location and fair value amounts on the fund’s statement of assets and liabilities and the effect on the fund’s statement of operations resulting from the fund’s use of futures contracts and forward currency contracts as of, or for the six months ended, April 30, 2024 (dollars in thousands):
| | | | | Assets | | | Liabilities | |
| Contracts | | Risk type | | Location on statement of
assets and liabilities | | Value | | | Location on statement of
assets and liabilities | | Value | |
| Futures | | Interest | | Unrealized appreciation* | | $ | 384 | | | Unrealized depreciation* | | $ | 1,788 | |
| Forward currency | | Currency | | Unrealized appreciation on open forward currency contracts | | | 1,011 | | | Unrealized depreciation on open forward currency contracts | | | 703 | |
| | | | | | | $ | 1,395 | | | | | $ | 2,491 | |
| | | | | | | | | | | | | | | |
| | | | | Net realized gain (loss) | | | Net unrealized appreciation (depreciation) | |
| Contracts | | Risk type | | Location on statement of operations | | Value | | | Location on statement of operations | | Value | |
| Futures | | Interest | | Net realized gain (loss) on futures contracts | | $ | (786 | ) | | Net unrealized appreciation (depreciation) on futures contracts | | $ | (3,839 | ) |
| Forward currency | | Currency | | Net realized gain (loss) on forward currency contracts | | | 2,311 | | | Net unrealized appreciation (depreciation) on forward currency contracts | | | (1,490 | ) |
| | | | | | | $ | 1,525 | | | | | $ | (5,329 | ) |
| | |
| * | Includes cumulative appreciation/depreciation on futures contracts as reported in the applicable table following the fund’s investment portfolio. Only current day’s variation margin is reported within the fund’s statement of assets and liabilities. |
Collateral — The fund receives or pledges highly liquid assets, such as cash or U.S. government securities, as collateral due to securities lending and its use of futures contracts and forward currency contracts. For securities lending, the fund receives collateral in exchange for lending investment securities. The lending agent may reinvest cash collateral from securities lending transactions according to agreed parameters. Cash collateral reinvested by the lending agent, if any, is disclosed in the fund’s investment portfolio. For futures contracts, the fund pledges collateral for initial and variation margin by contract. For forward currency contracts, the fund either receives or pledges collateral based on the net gain or loss on unsettled contracts by counterparty. The purpose of the collateral is to cover potential losses that could occur in the event that either party cannot meet its contractual obligation. Non-cash collateral pledged by the fund, if any, is disclosed in the fund’s investment portfolio, and cash collateral pledged by the fund, if any, is held in a segregated account with the fund’s custodian, which is reflected as pledged cash collateral in the fund’s statement of assets and liabilities.
Rights of offset — The fund has entered into enforceable master netting agreements with certain counterparties for forward currency contracts, where on any date amounts payable by each party to the other (in the same currency with respect to the same transaction) may be closed or offset by each party’s payment obligation. If an early termination date occurs under these agreements following an event of default or termination event, all obligations of each party to its counterparty are settled net through a single payment in a single currency (“close-out netting”). For financial reporting purposes, the fund does not offset financial assets and financial liabilities that are subject to these master netting arrangements in the statement of assets and liabilities.
The following table presents the fund’s forward currency contracts by counterparty that are subject to master netting agreements but that are not offset in the fund’s statement of assets and liabilities. The net amount column shows the impact of offsetting on the fund’s statement of assets and liabilities as of April 30, 2024, if close-out netting was exercised (dollars in thousands):
| | | Gross amounts
recognized in the | | | Gross amounts not offset in the
statement of assets and liabilities and
subject to a master netting agreement | | | | |
| Counterparty | | statement of assets
and liabilities | | | Available
to offset | | | Non-cash
collateral* | | | Cash
collateral* | | | Net
amount | |
| Assets: | | | | | | | | | | | | | | | | | | | | |
| Barclays Bank PLC | | $ | 390 | | | $ | (390 | ) | | $ | — | | | $ | — | | | $ | — | |
| Citibank | | | 206 | | | | — | | | | — | | | | — | | | | 206 | |
| Goldman Sachs | | | 158 | | | | — | | | | — | | | | (158 | ) | | | — | |
| Standard Chartered Bank | | | 257 | | | | — | | | | — | | | | — | | | | 257 | |
| Total | | $ | 1,011 | | | $ | (390 | ) | | $ | — | | | $ | (158 | ) | | $ | 463 | |
| Liabilities: | | | | | | | | | | | | | | | | | | | | |
| Barclays Bank PLC | | $ | 525 | | | $ | (390 | ) | | $ | — | | | $ | (135 | ) | | $ | — | |
| JPMorgan Chase | | | 93 | | | | — | | | | — | | | | (20 | ) | | | 73 | |
| Morgan Stanley | | | 85 | | | | — | | | | — | | | | (40 | ) | | | 45 | |
| Total | | $ | 703 | | | $ | (390 | ) | | $ | — | | | $ | (195 | ) | | $ | 118 | |
| | |
| * | Collateral is shown on a settlement basis. |
6. Taxation and distributions
Federal income taxation — The fund complies with the requirements under Subchapter M of the Internal Revenue Code applicable to regulated investment companies and intends to distribute substantially all of its net taxable income and net capital gains each year. The fund is not subject to income taxes to the extent such distributions are made. Therefore, no federal income tax provision is required.
As of and during the period ended April 30, 2024, the fund did not have a liability for any unrecognized tax benefits. The fund recognizes interest and penalties, if any, related to unrecognized tax benefits as income tax expense in the statement of operations. During the period, the fund did not incur any significant interest or penalties.
The fund’s tax returns are generally not subject to examination by federal, state and, if applicable, non-U.S. tax authorities after the expiration of each jurisdiction’s statute of limitations, which is typically three years after the date of filing but can be extended in certain jurisdictions.
Non-U.S. taxation — Dividend and interest income are recorded net of non-U.S. taxes paid. The fund may file withholding tax reclaims in certain jurisdictions to recover a portion of amounts previously withheld. As a result of rulings from European courts, the fund filed for additional reclaims related to prior years (“EU reclaims”). These reclaims are recorded when the amount is known and there are no significant uncertainties on collectability. Gains realized by the fund on the sale of securities in certain countries, if any, may be subject to non-U.S. taxes. The fund generally records an estimated deferred tax liability based on unrealized gains to provide for potential non-U.S. taxes payable upon the sale of these securities.
Distributions — Distributions determined on a tax basis may differ from net investment income and net realized gains for financial reporting purposes. These differences are due primarily to different treatment for items such as currency gains and losses; short-term capital gains and losses; capital losses related to sales of certain securities within 30 days of purchase; unrealized appreciation of certain investments in securities outside the U.S.; cost of investments sold and non-U.S. taxes on capital gains. The fiscal year in which amounts are distributed may differ from the year in which the net investment income and net realized gains are recorded by the fund for financial reporting purposes.
The components of distributable earnings on a tax basis are reported as of the fund’s most recent year-end. As of October 31, 2023, the components of distributable earnings on a tax basis were as follows (dollars in thousands):
| Undistributed ordinary income | | $ | 671,466 | |
| Undistributed long-term capital gains | | | 637,185 | |
As of April 30, 2024, the tax basis unrealized appreciation (depreciation) and cost of investments were as follows (dollars in thousands):
| Gross unrealized appreciation on investments | | $ | 16,598,437 | |
| Gross unrealized depreciation on investments | | | (2,508,407 | ) |
| Net unrealized appreciation (depreciation) on investments | | | 14,090,030 | |
| Cost of investments | | | 43,247,644 | |
Distributions paid were characterized for tax purposes as follows (dollars in thousands):
| | | Six months ended April 30, 2024 | | | Year ended October 31, 2023 | |
| Share class | | Ordinary
income | | | Long-term
capital gains | | | Total
distributions
paid | | | Ordinary
income | | | Long-term
capital gains | | | Total
distributions
paid | |
| Class A | | $ | 155,865 | | | $ | 153,467 | | | $ | 309,332 | | | $ | 104,575 | | | $ | — | | | $ | 104,575 | |
| Class C | | | 1,498 | | | | 3,975 | | | | 5,473 | | | | 52 | | | | — | | | | 52 | |
| Class T | | | — | * | | | — | * | | | — | * | | | — | * | | | — | | | | — | * |
| Class F-1 | | | 11,113 | | | | 10,844 | | | | 21,957 | | | | 7,789 | | | | — | | | | 7,789 | |
| Class F-2 | | | 249,174 | | | | 195,534 | | | | 444,708 | | | | 175,025 | | | | — | | | | 175,025 | |
| Class F-3 | | | 123,391 | | | | 90,678 | | | | 214,069 | | | | 86,351 | | | | — | | | | 86,351 | |
| Class 529-A | | | 11,029 | | | | 11,056 | | | | 22,085 | | | | 7,437 | | | | — | | | | 7,437 | |
| Class 529-C | | | 72 | | | | 264 | | | | 336 | | | | — | | | | — | | | | — | |
| Class 529-E | | | 324 | | | | 387 | | | | 711 | | | | 199 | | | | — | | | | 199 | |
| Class 529-T | | | — | * | | | — | * | | | — | * | | | — | * | | | — | | | | — | * |
| Class 529-F-1 | | | — | * | | | — | * | | | — | * | | | — | * | | | — | | | | — | * |
| Class 529-F-2 | | | 1,928 | | | | 1,508 | | | | 3,436 | | | | 1,318 | | | | — | | | | 1,318 | |
| Class 529-F-3 | | | — | * | | | — | * | | | — | * | | | — | * | | | — | | | | — | * |
| Class R-1 | | | 148 | | | | 288 | | | | 436 | | | | 54 | | | | — | | | | 54 | |
| Class R-2 | | | 1,640 | | | | 3,191 | | | | 4,831 | | | | 443 | | | | — | | | | 443 | |
| Class R-2E | | | 349 | | | | 456 | | | | 805 | | | | 145 | | | | — | | | | 145 | |
| Class R-3 | | | 5,087 | | | | 5,911 | | | | 10,998 | | | | 2,737 | | | | — | | | | 2,737 | |
| Class R-4 | | | 9,772 | | | | 9,062 | | | | 18,834 | | | | 6,910 | | | | — | | | | 6,910 | |
| Class R-5E | | | 1,507 | | | | 1,213 | | | | 2,720 | | | | 948 | | | | — | | | | 948 | |
| Class R-5 | | | 4,872 | | | | 3,692 | | | | 8,564 | | | | 3,412 | | | | — | | | | 3,412 | |
| Class R-6 | | | 198,477 | | | | 145,681 | | | | 344,158 | | | | 119,059 | | | | — | | | | 119,059 | |
| Total | | $ | 776,246 | | | $ | 637,207 | | | $ | 1,413,453 | | | $ | 516,454 | | | $ | — | | | $ | 516,454 | |
| | |
| * | Amount less than one thousand. |
7. Fees and transactions with related parties
CRMC, the fund’s investment adviser, is the parent company of American Funds Distributors®, Inc. (“AFD”), the principal underwriter of the fund’s shares, and American Funds Service Company® (“AFS”), the fund’s transfer agent. CRMC, AFD and AFS are considered related parties to the fund.
Investment advisory services — The fund has an investment advisory and service agreement with CRMC that provides for monthly fees accrued daily. These fees are based on a series of decreasing annual rates beginning with 0.850% on the first $500 million of daily net assets and decreasing to 0.474% on such assets in excess of $55 billion. For the six months ended April 30, 2024, the investment advisory services fees were $137,405,000, which were equivalent to an annualized rate of 0.511% of average daily net assets.
Class-specific fees and expenses — Expenses that are specific to individual share classes are accrued directly to the respective share class. The principal class-specific fees and expenses are further described below:
Distribution services — The fund has plans of distribution for all share classes, except Class F-2, F-3, 529-F-2, 529-F-3, R-5E, R-5 and R-6 shares. Under the plans, the board of directors approves certain categories of expenses that are used to finance activities primarily intended to sell fund shares and service existing accounts. The plans provide for payments, based on an annualized percentage of average daily net assets, ranging from 0.30% to 1.00% as noted in this section. In some cases, the board of directors has limited the amounts that may be paid to less than the maximum allowed by the plans. All share classes with a plan may use up to 0.25% of average daily net assets to pay service fees, or to compensate AFD for paying service fees, to firms that have entered into agreements with AFD to provide certain shareholder services. The remaining amounts available to be paid under each plan are paid to dealers to compensate them for their sales activities.
| | Share class | | Currently approved limits | | Plan limits |
| | Class A | | | 0.30 | % | | | 0.30 | % |
| | Class 529-A | | | 0.30 | | | | 0.50 | |
| | Classes C, 529-C and R-1 | | | 1.00 | | | | 1.00 | |
| | Class R-2 | | | 0.75 | | | | 1.00 | |
| | Class R-2E | | | 0.60 | | | | 0.85 | |
| | Classes 529-E and R-3 | | | 0.50 | | | | 0.75 | |
| | Classes T, F-1, 529-T, 529-F-1 and R-4 | | | 0.25 | | | | 0.50 | |
For Class A and 529-A shares, distribution-related expenses include the reimbursement of dealer and wholesaler commissions paid by AFD for certain shares sold without a sales charge. These share classes reimburse AFD for amounts billed within the prior 15 months but only to the extent that the overall annual expense limits are not exceeded. As of April 30, 2024, there were no unreimbursed expenses subject to reimbursement for Class A or 529-A shares.
Transfer agent services — The fund has a shareholder services agreement with AFS under which the fund compensates AFS for providing transfer agent services to each of the fund’s share classes. These services include recordkeeping, shareholder communications and transaction processing. Under this agreement, the fund also pays sub-transfer agency fees to AFS. These fees are paid by AFS to third parties for performing transfer agent services on behalf of fund shareholders.
Administrative services — The fund has an administrative services agreement with CRMC under which the fund compensates CRMC for providing administrative services to all share classes. Administrative services are provided by CRMC and its affiliates to help assist third parties providing non-distribution services to fund shareholders. These services include providing in-depth information on the fund and market developments that impact fund investments. Administrative services also include, but are not limited to, coordinating, monitoring and overseeing third parties that provide services to fund shareholders. The agreement provides the fund the ability to charge an administrative services fee at the annual rate of 0.05% of the average daily net assets attributable to each share class of the fund. Currently the fund pays CRMC an administrative services fee at the annual rate of 0.03% of the average daily net assets attributable to each share class of the fund for CRMC’s provision of administrative services.
529 plan services — Each 529 share class is subject to service fees to compensate the Virginia College Savings Plan (“Virginia529”) for its oversight and administration of the CollegeAmerica 529 college savings plan. The fees are based on the combined net assets invested in Class 529 and ABLE shares of the American Funds. Class ABLE shares are offered on other American Funds by Virginia529 through ABLEAmerica®, a tax-advantaged savings program for individuals with disabilities. Virginia529 is not considered a related party to the fund.
The quarterly fees are based on a series of decreasing annual rates beginning with 0.09% on the first $20 billion of the combined net assets invested in the American Funds and decreasing to 0.03% on such assets in excess of $75 billion. The fees for any given calendar quarter are accrued and calculated on the basis of the average net assets of Class 529 and ABLE shares of the American Funds for the last month of the prior calendar quarter. For the six months ended April 30, 2024, the 529 plan services fees were $310,000, which were equivalent to 0.057% of the average daily net assets of each 529 share class.
For the six months ended April 30, 2024, class-specific expenses under the agreements were as follows (dollars in thousands):
| | Share class | | Distribution
services | | Transfer agent
services | | Administrative
services | | 529 plan
services | |
| | Class A | | $15,416 | | $10,962 | | $1,899 | | Not applicable | |
| | Class C | | 1,520 | | 267 | | 46 | | Not applicable | |
| | Class T | | — | | — | * | — | * | Not applicable | |
| | Class F-1 | | 1,084 | | 636 | | 131 | | Not applicable | |
| | Class F-2 | | Not applicable | | 8,710 | | 2,444 | | Not applicable | |
| | Class F-3 | | Not applicable | | 72 | | 1,143 | | Not applicable | |
| | Class 529-A | | 1,006 | | 734 | | 135 | | $259 | |
| | Class 529-C | | 99 | | 17 | | 3 | | 6 | |
| | Class 529-E | | 76 | | 12 | | 5 | | 9 | |
| | Class 529-T | | — | | — | * | — | * | — | * |
| | Class 529-F-1 | | — | | — | * | — | * | — | * |
| | Class 529-F-2 | | Not applicable | | 37 | | 19 | | 36 | |
| | Class 529-F-3 | | Not applicable | | — | * | — | * | — | * |
| | Class R-1 | | 111 | | 12 | | 3 | | Not applicable | |
| | Class R-2 | | 937 | | 437 | | 37 | | Not applicable | |
| | Class R-2E | | 114 | | 39 | | 6 | | Not applicable | |
| | Class R-3 | | 1,193 | | 365 | | 72 | | Not applicable | |
| | Class R-4 | | 946 | | 387 | | 114 | | Not applicable | |
| | Class R-5E | | Not applicable | | 78 | | 15 | | Not applicable | |
| | Class R-5 | | Not applicable | | 83 | | 46 | | Not applicable | |
| | Class R-6 | | Not applicable | | 127 | | 1,953 | | Not applicable | |
| | Total class-specific expenses | | $22,502 | | $22,975 | | $8,071 | | $310 | |
| | | |
| | * | Amount less than one thousand. |
Directors’ deferred compensation — Directors who are unaffiliated with CRMC may elect to defer the cash payment of part or all of their compensation. These deferred amounts, which remain as liabilities of the fund, are treated as if invested in shares of the fund or other American Funds. These amounts represent general, unsecured liabilities of the fund and vary according to the total returns of the selected funds. Directors’ compensation of $631,000 in the fund’s statement of operations reflects $119,000 in current fees (either paid in cash or deferred) and a net increase of $512,000 in the value of the deferred amounts.
Affiliated officers and directors — Officers and certain directors of the fund are or may be considered to be affiliated with CRMC, AFD and AFS. No affiliated officers or directors received any compensation directly from the fund.
Investment in CCF — The fund holds shares of CCF, an institutional prime money market fund managed by CRMC. CCF invests in high-quality, short-term money market instruments. CCF is used as the primary investment vehicle for the fund’s short-term instruments. CCF shares are only available for purchase by CRMC, its affiliates, and other funds managed by CRMC or its affiliates, and are not available to the public. CRMC does not receive an investment advisory services fee from CCF.
Security transactions with related funds — The fund purchased investment securities from, and sold investment securities to, other funds managed by CRMC (or funds managed by certain affiliates of CRMC) under procedures adopted by the fund’s board of directors. The funds involved in such transactions are considered related by virtue of having a common investment adviser (or affiliated investment advisers), common directors and/or common officers. Each transaction was executed at the current market price of the security and no brokerage commissions or fees were paid in accordance with Rule 17a-7 of the 1940 Act. During the six months ended April 30, 2024, the fund engaged in such purchase and sale transactions with related funds in the amounts of $261,283,000 and $467,992,000, respectively, which generated $48,976,000 of net realized losses from such sales.
Interfund lending — Pursuant to an exemptive order issued by the SEC, the fund, along with other CRMC-managed funds (or funds managed by certain affiliates of CRMC), may participate in an interfund lending program. The program provides an alternate credit facility that permits the funds to lend or borrow cash for temporary purposes directly to or from one another, subject to the conditions of the exemptive order. The fund did not lend or borrow cash through the interfund lending program at any time during the six months ended April 30, 2024.
8. Committed line of credit
The fund participates with other funds managed by CRMC (or funds managed by certain affiliates of CRMC) in a $1.5 billion credit facility (the “line of credit”) to be utilized for temporary purposes to support shareholder redemptions. The fund has agreed to pay commitment fees on its pro-rata portion of the line of credit, which are reflected in other expenses in the fund’s statement of operations. The fund did not borrow on this line of credit at any time during the six months ended April 30, 2024.
9. Indemnifications
The fund’s organizational documents provide board members and officers with indemnification against certain liabilities or expenses in connection with the performance of their duties to the fund. In the normal course of business, the fund may also enter into contracts that provide general indemnifications. The fund’s maximum exposure under these arrangements is unknown since it is dependent on future claims that may be made against the fund. The risk of material loss from such claims is considered remote. Insurance policies are also available to the fund’s board members and officers.
10. Capital share transactions
Capital share transactions in the fund were as follows (dollars and shares in thousands):
| | | Sales* | | | Reinvestments of
distributions | | | Repurchases* | | | Net increase
(decrease) | |
| Share class | | Amount | | | Shares | | | Amount | | | Shares | | | Amount | | | Shares | | | Amount | | | Shares | |
| | | | | | | | | | | | | | | | | | | | | | | | | | | | | | | | | |
| Six months ended April 30, 2024 | | | | | | | | | | | | | | | | | | | | | | | | | | |
| | | | | | | | | | | | | | | | | | | | | | | | | | | | | | | | | |
| Class A | | $ | 303,266 | | | | 4,018 | | | $ | 304,076 | | | | 4,131 | | | $ | (898,836 | ) | | | (11,919 | ) | | $ | (291,494 | ) | | | (3,770 | ) |
| Class C | | | 14,965 | | | | 208 | | | | 5,456 | | | | 78 | | | | (56,084 | ) | | | (780 | ) | | | (35,663 | ) | | | (494 | ) |
| Class T | | | — | | | | — | | | | — | | | | — | | | | — | | | | — | | | | — | | | | — | |
| Class F-1 | | | 60,199 | | | | 806 | | | | 21,533 | | | | 295 | | | | (149,100 | ) | | | (1,996 | ) | | | (67,368 | ) | | | (895 | ) |
| Class F-2 | | | 1,803,020 | | | | 23,959 | | | | 432,550 | | | | 5,898 | | | | (1,831,893 | ) | | | (24,386 | ) | | | 403,677 | | | | 5,471 | |
| Class F-3 | | | 790,377 | | | | 10,494 | | | | 208,841 | | | | 2,838 | | | | (950,422 | ) | | | (12,557 | ) | | | 48,796 | | | | 775 | |
| Class 529-A | | | 34,151 | | | | 459 | | | | 22,074 | | | | 303 | | | | (75,256 | ) | | | (1,011 | ) | | | (19,031 | ) | | | (249 | ) |
| Class 529-C | | | 1,926 | | | | 27 | | | | 335 | | | | 4 | | | | (5,695 | ) | | | (79 | ) | | | (3,434 | ) | | | (48 | ) |
| Class 529-E | | | 849 | | | | 12 | | | | 709 | | | | 10 | | | | (2,931 | ) | | | (40 | ) | | | (1,373 | ) | | | (18 | ) |
| Class 529-T | | | — | | | | — | | | | — | † | | | — | † | | | — | | | | — | | | | — | † | | | — | † |
| Class 529-F-1 | | | — | | | | — | | | | — | † | | | — | † | | | — | | | | — | | | | — | † | | | — | † |
| Class 529-F-2 | | | 12,035 | | | | 160 | | | | 3,436 | | | | 47 | | | | (11,598 | ) | | | (154 | ) | | | 3,873 | | | | 53 | |
| Class 529-F-3 | | | — | | | | — | | | | — | † | | | — | † | | | — | | | | — | | | | — | † | | | — | † |
| Class R-1 | | | 1,917 | | | | 27 | | | | 434 | | | | 6 | | | | (3,213 | ) | | | (45 | ) | | | (862 | ) | | | (12 | ) |
| Class R-2 | | | 19,318 | | | | 268 | | | | 4,827 | | | | 69 | | | | (29,501 | ) | | | (408 | ) | | | (5,356 | ) | | | (71 | ) |
| Class R-2E | | | 5,405 | | | | 73 | | | | 805 | | | | 11 | | | | (5,258 | ) | | | (70 | ) | | | 952 | | | | 14 | |
| Class R-3 | | | 47,551 | | | | 640 | | | | 10,949 | | | | 151 | | | | (62,160 | ) | | | (838 | ) | | | (3,660 | ) | | | (47 | ) |
| Class R-4 | | | 84,477 | | | | 1,129 | | | | 18,847 | | | | 258 | | | | (89,173 | ) | | | (1,186 | ) | | | 14,151 | | | | 201 | |
| Class R-5E | | | 14,825 | | | | 199 | | | | 2,719 | | | | 36 | | | | (14,931 | ) | | | (201 | ) | | | 2,613 | | | | 34 | |
| Class R-5 | | | 32,096 | | | | 423 | | | | 8,530 | | | | 116 | | | | (58,979 | ) | | | (774 | ) | | | (18,353 | ) | | | (235 | ) |
| Class R-6 | | | 3,578,727 | | | | 47,350 | | | | 343,204 | | | | 4,667 | | | | (1,186,275 | ) | | | (15,392 | ) | | | 2,735,656 | | | | 36,625 | |
| Total net increase (decrease) | | $ | 6,805,104 | | | | 90,252 | | | $ | 1,389,325 | | | | 18,918 | | | $ | (5,431,305 | ) | | | (71,836 | ) | | $ | 2,763,124 | | | | 37,334 | |
Refer to the end of the table for footnotes.
| | | Sales* | | | Reinvestments of
distributions | | | Repurchases* | | | Net increase
(decrease) | |
| Share class | | Amount | | | Shares | | | Amount | | | Shares | | | Amount | | | Shares | | | Amount | | | Shares | |
| | | | | | | | | | | | | | | | | | | | | | | | | | | | | | | | | |
| Year ended October 31, 2023 | | | | | | | | | | | | | | | | | |
| | | | | | | | | | | | | | | | | | | | | | | | | | | | | | | | | |
| Class A | | $ | 631,333 | | | | 8,926 | | | $ | 102,574 | | | | 1,538 | | | $ | (1,519,189 | ) | | | (21,687 | ) | | $ | (785,282 | ) | | | (11,223 | ) |
| Class C | | | 31,222 | | | | 465 | | | | 52 | | | | 1 | | | | (108,462 | ) | | | (1,614 | ) | | | (77,188 | ) | | | (1,148 | ) |
| Class T | | | — | | | | — | | | | — | | | | — | | | | — | | | | — | | | | — | | | | — | |
| Class F-1 | | | 152,688 | | | | 2,183 | | | | 7,654 | | | | 116 | | | | (272,474 | ) | | | (3,873 | ) | | | (112,132 | ) | | | (1,574 | ) |
| Class F-2 | | | 3,845,710 | | | | 54,513 | | | | 170,371 | | | | 2,565 | | | | (5,071,724 | ) | | | (73,006 | ) | | | (1,055,643 | ) | | | (15,928 | ) |
| Class F-3 | | | 2,161,759 | | | | 31,362 | | | | 84,079 | | | | 1,262 | | | | (1,659,464 | ) | | | (23,575 | ) | | | 586,374 | | | | 9,049 | |
| Class 529-A | | | 64,013 | | | | 914 | | | | 7,435 | | | | 112 | | | | (131,886 | ) | | | (1,871 | ) | | | (60,438 | ) | | | (845 | ) |
| Class 529-C | | | 4,192 | | | | 62 | | | | — | | | | — | | | | (11,646 | ) | | | (173 | ) | | | (7,454 | ) | | | (111 | ) |
| Class 529-E | | | 2,096 | | | | 30 | | | | 199 | | | | 3 | | | | (5,083 | ) | | | (72 | ) | | | (2,788 | ) | | | (39 | ) |
| Class 529-T | | | — | | | | — | | | | — | † | | | — | † | | | — | | | | — | | | | — | † | | | — | † |
| Class 529-F-1 | | | — | | | | — | | | | — | † | | | — | † | | | — | | | | — | | | | — | † | | | — | † |
| Class 529-F-2 | | | 20,298 | | | | 288 | | | | 1,318 | | | | 20 | | | | (22,025 | ) | | | (309 | ) | | | (409 | ) | | | (1 | ) |
| Class 529-F-3 | | | — | | | | — | | | | — | † | | | — | † | | | — | | | | — | | | | — | † | | | — | † |
| Class R-1 | | | 3,028 | | | | 44 | | | | 53 | | | | 1 | | | | (4,706 | ) | | | (69 | ) | | | (1,625 | ) | | | (24 | ) |
| Class R-2 | | | 43,960 | | | | 652 | | | | 443 | | | | 7 | | | | (62,502 | ) | | | (929 | ) | | | (18,099 | ) | | | (270 | ) |
| Class R-2E | | | 10,168 | | | | 146 | | | | 145 | | | | 2 | | | | (7,184 | ) | | | (105 | ) | | | 3,129 | | | | 43 | |
| Class R-3 | | | 92,088 | | | | 1,320 | | | | 2,720 | | | | 41 | | | | (113,835 | ) | | | (1,642 | ) | | | (19,027 | ) | | | (281 | ) |
| Class R-4 | | | 132,199 | | | | 1,876 | | | | 6,909 | | | | 104 | | | | (203,059 | ) | | | (2,886 | ) | | | (63,951 | ) | | | (906 | ) |
| Class R-5E | | | 30,437 | | | | 440 | | | | 948 | | | | 15 | | | | (21,427 | ) | | | (306 | ) | | | 9,958 | | | | 149 | |
| Class R-5 | | | 77,282 | | | | 1,087 | | | | 3,398 | | | | 51 | | | | (76,953 | ) | | | (1,076 | ) | | | 3,727 | | | | 62 | |
| Class R-6 | | | 2,593,043 | | | | 36,396 | | | | 118,331 | | | | 1,776 | | | | (1,038,503 | ) | | | (14,728 | ) | | | 1,672,871 | | | | 23,444 | |
| Total net increase (decrease) | | $ | 9,895,516 | | | | 140,704 | | | $ | 506,629 | | | | 7,614 | | | $ | (10,330,122 | ) | | | (147,921 | ) | | $ | 72,023 | | | | 397 | |
| | |
| * | Includes exchanges between share classes of the fund. |
| † | Amount less than one thousand. |
11. Investment transactions
The fund engaged in purchases and sales of investment securities, excluding short-term securities and U.S. government obligations, if any, of $12,874,918,000 and $10,983,348,000, respectively, during the six months ended April 30, 2024.
Financial highlights
| | | | | | Income (loss) from investment operations1 | | | Dividends and distributions | | | | | | | | | | | | | | | | | | | |
| Year ended | | Net asset
value,
beginning
of year | | | Net
investment
income
(loss) | | | Net gains
(losses) on
securities
(both
realized and
unrealized) | | | Total from
investment
operations | | | Dividends
(from net
investment
income) | | | Distributions
(from capital
gains) | | | Total
dividends
and
distributions | | | Net asset
value,
end
of year | | | Total return2,3 | | | Net assets,
end of
year
(in millions) | | | Ratio of
expenses to
average net
assets before
reimburse-
ments4 | | | Ratio of
expenses to
average net
assets after
reimburse-
ments3,4 | | | Ratio of
net income
(loss) to
average
net assets3 | |
| Class A: | | | | | | | | | | | | | | | | | | | | | | | | | | | | | | | | | | | | | | | | | | | | | | | | | | | | |
| 4/30/20245,6 | | $ | 68.46 | | | $ | .44 | | | $ | 10.50 | | | $ | 10.94 | | | $ | (.93 | ) | | $ | (.91 | ) | | $ | (1.84 | ) | | $ | 77.56 | | | | 16.12 | %7 | | $ | 12,865 | | | | .98 | %8 | | | .98 | %8 | | | 1.17 | %8 |
| 10/31/2023 | | | 62.50 | | | | .83 | | | | 5.72 | | | | 6.55 | | | | (.59 | ) | | | — | | | | (.59 | ) | | | 68.46 | | | | 10.50 | | | | 11,612 | | | | 1.00 | | | | 1.00 | | | | 1.17 | |
| 10/31/2022 | | | 93.89 | | | | .69 | | | | (26.15 | ) | | | (25.46 | ) | | | (.37 | ) | | | (5.56 | ) | | | (5.93 | ) | | | 62.50 | | | | (28.73 | ) | | | 11,303 | | | | .96 | | | | .96 | | | | .93 | |
| 10/31/2021 | | | 73.88 | | | | .38 | | | | 19.72 | | | | 20.10 | | | | (.09 | ) | | | — | | | | (.09 | ) | | | 93.89 | | | | 27.20 | | | | 17,043 | | | | .96 | | | | .96 | | | | .42 | |
| 10/31/2020 | | | 69.13 | | | | .27 | | | | 7.06 | | | | 7.33 | | | | (.74 | ) | | | (1.84 | ) | | | (2.58 | ) | | | 73.88 | | | | 10.78 | | | | 13,341 | | | | 1.00 | | | | 1.00 | | | | .40 | |
| 10/31/2019 | | | 59.37 | | | | .69 | | | | 10.36 | | | | 11.05 | | | | (.58 | ) | | | (.71 | ) | | | (1.29 | ) | | | 69.13 | | | | 19.15 | | | | 12,964 | | | | 1.02 | | | | 1.02 | | | | 1.07 | |
| Class C: | | | | | | | | | | | | | | | | | | | | | | | | | | | | | | | | | | | | | | | | | | | | | | | | | | | | |
| 4/30/20245,6 | | | 64.99 | | | | .15 | | | | 9.99 | | | | 10.14 | | | | (.34 | ) | | | (.91 | ) | | | (1.25 | ) | | | 73.88 | | | | 15.71 | 7 | | | 296 | | | | 1.74 | 8 | | | 1.74 | 8 | | | .41 | 8 |
| 10/31/2023 | | | 59.27 | | | | .28 | | | | 5.45 | | | | 5.73 | | | | (.01 | ) | | | — | | | | (.01 | ) | | | 64.99 | | | | 9.67 | | | | 293 | | | | 1.75 | | | | 1.75 | | | | .41 | |
| 10/31/2022 | | | 89.61 | | | | .11 | | | | (24.89 | ) | | | (24.78 | ) | | | — | | | | (5.56 | ) | | | (5.56 | ) | | | 59.27 | | | | (29.28 | ) | | | 335 | | | | 1.72 | | | | 1.72 | | | | .15 | |
| 10/31/2021 | | | 70.96 | | | | (.29 | ) | | | 18.94 | | | | 18.65 | | | | — | | | | — | | | | — | | | | 89.61 | | | | 26.26 | | | | 598 | | | | 1.70 | | | | 1.70 | | | | (.33 | ) |
| 10/31/2020 | | | 66.46 | | | | (.22 | ) | | | 6.75 | | | | 6.53 | | | | (.19 | ) | | | (1.84 | ) | | | (2.03 | ) | | | 70.96 | | | | 9.98 | | | | 533 | | | | 1.74 | | | | 1.74 | | | | (.33 | ) |
| 10/31/2019 | | | 57.02 | | | | .19 | | | | 10.02 | | | | 10.21 | | | | (.06 | ) | | | (.71 | ) | | | (.77 | ) | | | 66.46 | | | | 18.21 | | | | 701 | | | | 1.79 | | | | 1.79 | | | | .30 | |
| Class T: | | | | | | | | | | | | | | | | | | | | | | | | | | | | | | | | | | | | | | | | | | | | | | | | | | | | |
| 4/30/20245,6 | | | 68.42 | | | | .53 | | | | 10.48 | | | | 11.01 | | | | (1.14 | ) | | | (.91 | ) | | | (2.05 | ) | | | 77.38 | | | | 16.27 | 7,9 | | | — | 10 | | | .70 | 8,9 | | | .70 | 8,9 | | | 1.41 | 8,9 |
| 10/31/2023 | | | 62.49 | | | | 1.01 | | | | 5.71 | | | | 6.72 | | | | (.79 | ) | | | — | | | | (.79 | ) | | | 68.42 | | | | 10.79 | 9 | | | — | 10 | | | .72 | 9 | | | .72 | 9 | | | 1.42 | 9 |
| 10/31/2022 | | | 93.87 | | | | .87 | | | | (26.11 | ) | | | (25.24 | ) | | | (.58 | ) | | | (5.56 | ) | | | (6.14 | ) | | | 62.49 | | | | (28.56 | )9 | | | — | 10 | | | .71 | 9 | | | .71 | 9 | | | 1.18 | 9 |
| 10/31/2021 | | | 73.86 | | | | .58 | | | | 19.69 | | | | 20.27 | | | | (.26 | ) | | | — | | | | (.26 | ) | | | 93.87 | | | | 27.47 | 9 | | | — | 10 | | | .74 | 9 | | | .74 | 9 | | | .63 | 9 |
| 10/31/2020 | | | 69.12 | | | | .43 | | | | 7.05 | | | | 7.48 | | | | (.90 | ) | | | (1.84 | ) | | | (2.74 | ) | | | 73.86 | | | | 11.05 | 9 | | | — | 10 | | | .76 | 9 | | | .76 | 9 | | | .62 | 9 |
| 10/31/2019 | | | 59.39 | | | | .82 | | | | 10.35 | | | | 11.17 | | | | (.73 | ) | | | (.71 | ) | | | (1.44 | ) | | | 69.12 | | | | 19.39 | 9 | | | — | 10 | | | .78 | 9 | | | .78 | 9 | | | 1.28 | 9 |
| Class F-1: | | | | | | | | | | | | | | | | | | | | | | | | | | | | | | | | | | | | | | | | | | | | | | | | | | | | |
| 4/30/20245,6 | | | 67.99 | | | | .44 | | | | 10.45 | | | | 10.89 | | | | (.94 | ) | | | (.91 | ) | | | (1.85 | ) | | | 77.03 | | | | 16.16 | 7 | | | 869 | | | | .96 | 8 | | | .96 | 8 | | | 1.19 | 8 |
| 10/31/2023 | | | 62.05 | | | | .85 | | | | 5.67 | | | | 6.52 | | | | (.58 | ) | | | — | | | | (.58 | ) | | | 67.99 | | | | 10.53 | | | | 828 | | | | .96 | | | | .96 | | | | 1.21 | |
| 10/31/2022 | | | 93.27 | | | | .67 | | | | (25.95 | ) | | | (25.28 | ) | | | (.38 | ) | | | (5.56 | ) | | | (5.94 | ) | | | 62.05 | | | | (28.74 | ) | | | 854 | | | | .96 | | | | .96 | | | | .91 | |
| 10/31/2021 | | | 73.39 | | | | .39 | | | | 19.58 | | | | 19.97 | | | | (.09 | ) | | | — | | | | (.09 | ) | | | 93.27 | | | | 27.22 | | | | 1,418 | | | | .95 | | | | .95 | | | | .43 | |
| 10/31/2020 | | | 68.68 | | | | .29 | | | | 7.01 | | | | 7.30 | | | | (.75 | ) | | | (1.84 | ) | | | (2.59 | ) | | | 73.39 | | | | 10.83 | | | | 1,097 | | | | .98 | | | | .98 | | | | .43 | |
| 10/31/2019 | | | 58.95 | | | | .69 | | | | 10.30 | | | | 10.99 | | | | (.55 | ) | | | (.71 | ) | | | (1.26 | ) | | | 68.68 | | | | 19.16 | | | | 1,177 | | | | 1.00 | | | | 1.00 | | | | 1.09 | |
| Class F-2: | | | | | | | | | | | | | | | | | | | | | | | | | | | | | | | | | | | | | | | | | | | | | | | | | | | | |
| 4/30/20245,6 | | | 68.39 | | | | .56 | | | | 10.47 | | | | 11.03 | | | | (1.16 | ) | | | (.91 | ) | | | (2.07 | ) | | | 77.35 | | | | 16.30 | 7 | | | 16,961 | | | | .67 | 8 | | | .67 | 8 | | | 1.49 | 8 |
| 10/31/2023 | | | 62.44 | | | | 1.05 | | | | 5.70 | | | | 6.75 | | | | (.80 | ) | | | — | | | | (.80 | ) | | | 68.39 | | | | 10.85 | | | | 14,620 | | | | .68 | | | | .68 | | | | 1.48 | |
| 10/31/2022 | | | 93.83 | | | | .90 | | | | (26.09 | ) | | | (25.19 | ) | | | (.64 | ) | | | (5.56 | ) | | | (6.20 | ) | | | 62.44 | | | | (28.52 | ) | | | 14,343 | | | | .68 | | | | .68 | | | | 1.22 | |
| 10/31/2021 | | | 73.81 | | | | .65 | | | | 19.68 | | | | 20.33 | | | | (.31 | ) | | | — | | | | (.31 | ) | | | 93.83 | | | | 27.55 | | | | 20,219 | | | | .67 | | | | .67 | | | | .72 | |
| 10/31/2020 | | | 69.06 | | | | .48 | | | | 7.05 | | | | 7.53 | | | | (.94 | ) | | | (1.84 | ) | | | (2.78 | ) | | | 73.81 | | | | 11.14 | | | | 14,085 | | | | .70 | | | | .70 | | | | .70 | |
| 10/31/2019 | | | 59.35 | | | | .88 | | | | 10.32 | | | | 11.20 | | | | (.78 | ) | | | (.71 | ) | | | (1.49 | ) | | | 69.06 | | | | 19.49 | | | | 12,291 | | | | .72 | | | | .72 | | | | 1.37 | |
| Class F-3: | | | | | | | | | | | | | | | | | | | | | | | | | | | | | | | | | | | | | | | | | | | | | | | | | | | | |
| 4/30/20245,6 | | | 68.67 | | | | .60 | | | | 10.51 | | | | 11.11 | | | | (1.24 | ) | | | (.91 | ) | | | (2.15 | ) | | | 77.63 | | | | 16.36 | 7 | | | 7,778 | | | | .57 | 8 | | | .57 | 8 | | | 1.60 | 8 |
| 10/31/2023 | | | 62.70 | | | | 1.13 | | | | 5.73 | | | | 6.86 | | | | (.89 | ) | | | — | | | | (.89 | ) | | | 68.67 | | | | 10.98 | | | | 6,827 | | | | .58 | | | | .58 | | | | 1.59 | |
| 10/31/2022 | | | 94.20 | | | | .99 | | | | (26.19 | ) | | | (25.20 | ) | | | (.74 | ) | | | (5.56 | ) | | | (6.30 | ) | | | 62.70 | | | | (28.45 | ) | | | 5,666 | | | | .57 | | | | .57 | | | | 1.34 | |
| 10/31/2021 | | | 74.08 | | | | .76 | | | | 19.74 | | | | 20.50 | | | | (.38 | ) | | | — | | | | (.38 | ) | | | 94.20 | | | | 27.70 | | | | 7,473 | | | | .57 | | | | .57 | | | | .83 | |
| 10/31/2020 | | | 69.30 | | | | .55 | | | | 7.08 | | | | 7.63 | | | | (1.01 | ) | | | (1.84 | ) | | | (2.85 | ) | | | 74.08 | | | | 11.25 | | | | 4,850 | | | | .60 | | | | .60 | | | | .81 | |
| 10/31/2019 | | | 59.54 | | | | .96 | | | | 10.34 | | | | 11.30 | | | | (.83 | ) | | | (.71 | ) | | | (1.54 | ) | | | 69.30 | | | | 19.62 | | | | 4,351 | | | | .62 | | | | .62 | | | | 1.48 | |
| Class 529-A: |
| 4/30/20245,6 | | | 67.75 | | | | .43 | | | | 10.39 | | | | 10.82 | | | | (.91 | ) | | | (.91 | ) | | | (1.82 | ) | | | 76.75 | | | | 16.12 | 7 | | | 917 | | | | 1.01 | 8 | | | 1.01 | 8 | | | 1.15 | 8 |
| 10/31/2023 | | | 61.86 | | | | .80 | | | | 5.66 | | | | 6.46 | | | | (.57 | ) | | | — | | | | (.57 | ) | | | 67.75 | | | | 10.48 | | | | 826 | | | | 1.02 | | | | 1.02 | | | | 1.14 | |
| 10/31/2022 | | | 93.01 | | | | .66 | | | | (25.89 | ) | | | (25.23 | ) | | | (.36 | ) | | | (5.56 | ) | | | (5.92 | ) | | | 61.86 | | | | (28.76 | ) | | | 807 | | | | .99 | | | | .99 | | | | .90 | |
| 10/31/2021 | | | 73.19 | | | | .36 | | | | 19.54 | | | | 19.90 | | | | (.08 | ) | | | — | | | | (.08 | ) | | | 93.01 | | | | 27.17 | | | | 1,205 | | | | .97 | | | | .97 | | | | .40 | |
| 10/31/2020 | | | 68.50 | | | | .25 | | | | 6.99 | | | | 7.24 | | | | (.71 | ) | | | (1.84 | ) | | | (2.55 | ) | | | 73.19 | | | | 10.77 | | | | 971 | | | | 1.02 | | | | 1.02 | | | | .37 | |
| 10/31/2019 | | | 58.83 | | | | .65 | | | | 10.28 | | | | 10.93 | | | | (.55 | ) | | | (.71 | ) | | | (1.26 | ) | | | 68.50 | | | | 19.08 | | | | 884 | | | | 1.06 | | | | 1.06 | | | | 1.03 | |
Refer to the end of the table for footnotes.
Financial highlights (continued)
| | | | | | Income (loss) from investment operations1 | | | Dividends and distributions | | | | | | | | | | | | | | | | | | | |
| Year ended | | Net asset
value,
beginning
of year | | | Net
investment
income
(loss) | | | Net gains
(losses) on
securities
(both
realized and
unrealized) | | | Total from
investment
operations | | | Dividends
(from net
investment
income) | | | Distributions
(from capital
gains) | | | Total
dividends
and
distributions | | | Net asset
value,
end
of year | | | Total return2,3 | | | Net assets,
end of
year
(in millions) | | | Ratio of
expenses to
average net
assets before
reimburse-
ments4 | | | Ratio of
expenses to
average net
assets after
reimburse-
ments3,4 | | | Ratio of
net income
(loss) to
average
net assets3 | |
| Class 529-C: | | | | | | | | | | | | | | | | | | | | | | | | | | | | | | | | | | | | | | | | | | | | | | | | | | | | |
| 4/30/20245,6 | | $ | 65.08 | | | $ | .13 | | | $ | 10.01 | | | $ | 10.14 | | | $ | (.25 | ) | | $ | (.91 | ) | | $ | (1.16 | ) | | $ | 74.06 | | | | 15.67 | %7 | | $ | 19 | | | | 1.77 | %8 | | | 1.77 | %8 | | | .37 | %8 |
| 10/31/2023 | | | 59.37 | | | | .24 | | | | 5.47 | | | | 5.71 | | | | — | | | | — | | | | — | | | | 65.08 | | | | 9.62 | | | | 20 | | | | 1.80 | | | | 1.80 | | | | .36 | |
| 10/31/2022 | | | 89.80 | | | | .07 | | | | (24.94 | ) | | | (24.87 | ) | | | — | | | | (5.56 | ) | | | (5.56 | ) | | | 59.37 | | | | (29.31 | ) | | | 25 | | | | 1.77 | | | | 1.77 | | | | .09 | |
| 10/31/2021 | | | 71.13 | | | | (.33 | ) | | | 19.00 | | | | 18.67 | | | | — | | | | — | | | | — | | | | 89.80 | | | | 26.23 | | | | 46 | | | | 1.73 | | | | 1.73 | | | | (.38 | ) |
| 10/31/2020 | | | 66.62 | | | | (.21 | ) | | | 6.73 | | | | 6.52 | | | | (.17 | ) | | | (1.84 | ) | | | (2.01 | ) | | | 71.13 | | | | 9.93 | | | | 47 | | | | 1.78 | | | | 1.78 | | | | (.32 | ) |
| 10/31/2019 | | | 57.14 | | | | .16 | | | | 10.06 | | | | 10.22 | | | | (.03 | ) | | | (.71 | ) | | | (.74 | ) | | | 66.62 | | | | 18.18 | | | | 117 | | | | 1.82 | | | | 1.82 | | | | .27 | |
| Class 529-E: | | | | | | | | | | | | | | | | | | | | | | | | | | | | | | | | | | | | | | | | | | | | | | | | | | | | |
| 4/30/20245,6 | | | 67.09 | | | | .35 | | | | 10.31 | | | | 10.66 | | | | (.77 | ) | | | (.91 | ) | | | (1.68 | ) | | | 76.07 | | | | 16.00 | 7 | | | 31 | | | | 1.20 | 8 | | | 1.20 | 8 | | | .96 | 8 |
| 10/31/2023 | | | 61.25 | | | | .66 | | | | 5.61 | | | | 6.27 | | | | (.43 | ) | | | — | | | | (.43 | ) | | | 67.09 | | | | 10.27 | | | | 29 | | | | 1.21 | | | | 1.21 | | | | .95 | |
| 10/31/2022 | | | 92.11 | | | | .51 | | | | (25.66 | ) | | | (25.15 | ) | | | (.15 | ) | | | (5.56 | ) | | | (5.71 | ) | | | 61.25 | | | | (28.90 | ) | | | 29 | | | | 1.19 | | | | 1.19 | | | | .70 | |
| 10/31/2021 | | | 72.57 | | | | .17 | | | | 19.37 | | | | 19.54 | | | | — | | | | — | | | | — | | | | 92.11 | | | | 26.93 | | | | 45 | | | | 1.18 | | | | 1.18 | | | | .19 | |
| 10/31/2020 | | | 67.94 | | | | .13 | | | | 6.92 | | | | 7.05 | | | | (.58 | ) | | | (1.84 | ) | | | (2.42 | ) | | | 72.57 | | | | 10.55 | | | | 38 | | | | 1.22 | | | | 1.22 | | | | .19 | |
| 10/31/2019 | | | 58.32 | | | | .53 | | | | 10.21 | | | | 10.74 | | | | (.41 | ) | | | (.71 | ) | | | (1.12 | ) | | | 67.94 | | | | 18.86 | | | | 38 | | | | 1.26 | | | | 1.26 | | | | .83 | |
| Class 529-T: | | | | | | | | | | | | | | | | | | | | | | | | | | | | | | | | | | | | | | | | | | | | | | | | | | | | |
| 4/30/20245,6 | | | 68.40 | | | | .51 | | | | 10.50 | | | | 11.01 | | | | (1.12 | ) | | | (.91 | ) | | | (2.03 | ) | | | 77.38 | | | | 16.26 | 7,9 | | | — | 10 | | | .77 | 8,9 | | | .77 | 8,9 | | | 1.37 | 8,9 |
| 10/31/2023 | | | 62.47 | | | | .98 | | | | 5.70 | | | | 6.68 | | | | (.75 | ) | | | — | | | | (.75 | ) | | | 68.40 | | | | 10.74 | 9 | | | — | 10 | | | .75 | 9 | | | .75 | 9 | | | 1.39 | 9 |
| 10/31/2022 | | | 93.83 | | | | .84 | | | | (26.10 | ) | | | (25.26 | ) | | | (.54 | ) | | | (5.56 | ) | | | (6.10 | ) | | | 62.47 | | | | (28.58 | )9 | | | — | 10 | | | .75 | 9 | | | .75 | 9 | | | 1.14 | 9 |
| 10/31/2021 | | | 73.84 | | | | .53 | | | | 19.69 | | | | 20.22 | | | | (.23 | ) | | | — | | | | (.23 | ) | | | 93.83 | | | | 27.43 | 9 | | | — | 10 | | | .78 | 9 | | | .78 | 9 | | | .59 | 9 |
| 10/31/2020 | | | 69.10 | | | | .40 | | | | 7.06 | | | | 7.46 | | | | (.88 | ) | | | (1.84 | ) | | | (2.72 | ) | | | 73.84 | | | | 11.00 | 9 | | | — | 10 | | | .79 | 9 | | | .79 | 9 | | | .59 | 9 |
| 10/31/2019 | | | 59.37 | | | | .79 | | | | 10.35 | | | | 11.14 | | | | (.70 | ) | | | (.71 | ) | | | (1.41 | ) | | | 69.10 | | | | 19.34 | 9 | | | — | 10 | | | .82 | 9 | | | .82 | 9 | | | 1.24 | 9 |
| Class 529-F-1: |
| 4/30/20245,6 | | | 67.61 | | | | .49 | | | | 10.37 | | | | 10.86 | | | | (1.09 | ) | | | (.91 | ) | | | (2.00 | ) | | | 76.47 | | | | 16.23 | 7,9 | | | — | 10 | | | .78 | 8,9 | | | .78 | 8,9 | | | 1.33 | 8,9 |
| 10/31/2023 | | | 61.77 | | | | .93 | | | | 5.65 | | | | 6.58 | | | | (.74 | ) | | | — | | | | (.74 | ) | | | 67.61 | | | | 10.68 | 9 | | | — | 10 | | | .79 | 9 | | | .79 | 9 | | | 1.33 | 9 |
| 10/31/2022 | | | 92.91 | | | | .81 | | | | (25.82 | ) | | | (25.01 | ) | | | (.57 | ) | | | (5.56 | ) | | | (6.13 | ) | | | 61.77 | | | | (28.60 | )9 | | | — | 10 | | | .78 | 9 | | | .78 | 9 | | | 1.11 | 9 |
| 10/31/2021 | | | 73.20 | | | | .55 | | | | 19.53 | | | | 20.08 | | | | (.37 | ) | | | — | | | | (.37 | ) | | | 92.91 | | | | 27.44 | 9 | | | — | 10 | | | .75 | 9 | | | .75 | 9 | | | .60 | 9 |
| 10/31/2020 | | | 68.51 | | | | .41 | | | | 6.98 | | | | 7.39 | | | | (.86 | ) | | | (1.84 | ) | | | (2.70 | ) | | | 73.20 | | | | 11.01 | 9 | | | — | 10 | | | .80 | 9 | | | .80 | 9 | | | .60 | 9 |
| 10/31/2019 | | | 58.90 | | | | .80 | | | | 10.25 | | | | 11.05 | | | | (.73 | ) | | | (.71 | ) | | | (1.44 | ) | | | 68.51 | | | | 19.36 | | | | 86 | | | | .84 | | | | .84 | | | | 1.25 | |
| Class 529-F-2: |
| 4/30/20245,6 | | | 68.49 | | | | .55 | | | | 10.51 | | | | 11.06 | | | | (1.17 | ) | | | (.91 | ) | | | (2.08 | ) | | | 77.47 | | | | 16.32 | 7 | | | 132 | | | | .68 | 8 | | | .68 | 8 | | | 1.48 | 8 |
| 10/31/2023 | | | 62.53 | | | | 1.05 | | | | 5.71 | | | | 6.76 | | | | (.80 | ) | | | — | | | | (.80 | ) | | | 68.49 | | | | 10.85 | | | | 113 | | | | .68 | | | | .68 | | | | 1.49 | |
| 10/31/2022 | | | 93.92 | | | | .90 | | | | (26.14 | ) | | | (25.24 | ) | | | (.59 | ) | | | (5.56 | ) | | | (6.15 | ) | | | 62.53 | | | | (28.54 | ) | | | 103 | | | | .69 | | | | .69 | | | | 1.21 | |
| 10/31/2021 | | | 73.88 | | | | .59 | | | | 19.69 | | | | 20.28 | | | | (.24 | ) | | | — | | | | (.24 | ) | | | 93.92 | | | | 27.48 | | | | 138 | | | | .74 | | | | .74 | | | | .65 | |
| 10/31/20205,11 | | | 73.88 | | | | — | | | | — | | | | — | | | | — | | | | — | | | | — | | | | 73.88 | | | | — | | | | 97 | | | | — | | | | — | | | | — | |
| Class 529-F-3: |
| 4/30/20245,6 | | | 68.35 | | | | .55 | | | | 10.48 | | | | 11.03 | | | | (1.19 | ) | | | (.91 | ) | | | (2.10 | ) | | | 77.28 | | | | 16.31 | 7 | | | — | 10 | | | .64 | 8 | | | .64 | 8 | | | 1.47 | 8 |
| 10/31/2023 | | | 62.44 | | | | 1.04 | | | | 5.71 | | | | 6.75 | | | | (.84 | ) | | | — | | | | (.84 | ) | | | 68.35 | | | | 10.84 | | | | — | 10 | | | .65 | | | | .65 | | | | 1.48 | |
| 10/31/2022 | | | 93.84 | | | | .92 | | | | (26.08 | ) | | | (25.16 | ) | | | (.68 | ) | | | (5.56 | ) | | | (6.24 | ) | | | 62.44 | | | | (28.50 | ) | | | — | 10 | | | .64 | | | | .64 | | | | 1.25 | |
| 10/31/2021 | | | 73.88 | | | | .67 | | | | 19.68 | | | | 20.35 | | | | (.39 | ) | | | — | | | | (.39 | ) | | | 93.84 | | | | 27.58 | | | | — | 10 | | | .67 | | | | .62 | | | | .73 | |
| 10/31/20205,11 | | | 73.88 | | | | — | | | | — | | | | — | | | | — | | | | — | | | | — | | | | 73.88 | | | | — | | | | — | 10 | | | — | | | | — | | | | — | |
| Class R-1: | | | | | | | | | | | | | | | | | | | | | | | | | | | | | | | | | | | | | | | | | | | | | | | | | | | | |
| 4/30/20245,6 | | | 65.13 | | | | .18 | | | | 10.00 | | | | 10.18 | | | | (.47 | ) | | | (.91 | ) | | | (1.38 | ) | | | 73.93 | | | | 15.74 | 7 | | | 23 | | | | 1.66 | 8 | | | 1.66 | 8 | | | .50 | 8 |
| 10/31/2023 | | | 59.48 | | | | .33 | | | | 5.48 | | | | 5.81 | | | | (.16 | ) | | | — | | | | (.16 | ) | | | 65.13 | | | | 9.77 | | | | 21 | | | | 1.67 | | | | 1.67 | | | | .49 | |
| 10/31/2022 | | | 89.83 | | | | .19 | | | | (24.98 | ) | | | (24.79 | ) | | | — | | | | (5.56 | ) | | | (5.56 | ) | | | 59.48 | | | | (29.21 | ) | | | 21 | | | | 1.63 | | | | 1.63 | | | | .26 | |
| 10/31/2021 | | | 71.14 | | | | (.28 | ) | | | 18.97 | | | | 18.69 | | | | — | | | | — | | | | — | | | | 89.83 | | | | 26.26 | | | | 29 | | | | 1.70 | | | | 1.70 | | | | (.32 | ) |
| 10/31/2020 | | | 66.65 | | | | (.24 | ) | | | 6.78 | | | | 6.54 | | | | (.21 | ) | | | (1.84 | ) | | | (2.05 | ) | | | 71.14 | | | | 9.96 | | | | 24 | | | | 1.77 | | | | 1.77 | | | | (.37 | ) |
| 10/31/2019 | | | 57.18 | | | | .19 | | | | 10.05 | | | | 10.24 | | | | (.06 | ) | | | (.71 | ) | | | (.77 | ) | | | 66.65 | | | | 18.23 | | | | 29 | | | | 1.78 | | | | 1.78 | | | | .31 | |
Refer to the end of the table for footnotes.
Financial highlights (continued)
| | | | | | Income (loss) from investment operations1 | | | Dividends and distributions | | | | | | | | | | | | | | | | | | | |
| Year ended | | Net asset
value,
beginning
of year | | | Net
investment
income
(loss) | | | Net gains
(losses) on
securities
(both
realized and
unrealized) | | | Total from
investment
operations | | | Dividends
(from net
investment
income) | | | Distributions
(from capital
gains) | | | Total
dividends
and
distributions | | | Net asset
value,
end
of year | | | Total return2,3 | | | Net assets,
end of
year
(in millions) | | | Ratio of
expenses to
average net
assets before
reimburse-
ments4 | | | Ratio of
expenses to
average net
assets after
reimburse-
ments3,4 | | | Ratio of
net income
(loss) to
average
net assets3 | |
| Class R-2: | | | | | | | | | | | | | | | | | | | | | | | | | | | | | | | | | | | | | | | | | | | | | | | | | | | | |
| 4/30/20245,6 | | $ | 65.16 | | | $ | .18 | | | $ | 10.00 | | | $ | 10.18 | | | $ | (.47 | ) | | $ | (.91 | ) | | $ | (1.38 | ) | | $ | 73.96 | | | | 15.73 | %7 | | $ | 254 | | | | 1.67 | %8 | | | 1.67 | %8 | | | .49 | %8 |
| 10/31/2023 | | | 59.47 | | | | .33 | | | | 5.48 | | | | 5.81 | | | | (.12 | ) | | | — | | | | (.12 | ) | | | 65.16 | | | | 9.77 | | | | 228 | | | | 1.67 | | | | 1.67 | | | | .49 | |
| 10/31/2022 | | | 89.85 | | | | .15 | | | | (24.97 | ) | | | (24.82 | ) | | | — | | | | (5.56 | ) | | | (5.56 | ) | | | 59.47 | | | | (29.24 | ) | | | 224 | | | | 1.67 | | | | 1.67 | | | | .21 | |
| 10/31/2021 | | | 71.13 | | | | (.26 | ) | | | 18.98 | | | | 18.72 | | | | — | | | | — | | | | — | | | | 89.85 | | | | 26.30 | | | | 341 | | | | 1.66 | | | | 1.66 | | | | (.29 | ) |
| 10/31/2020 | | | 66.67 | | | | (.20 | ) | | | 6.78 | | | | 6.58 | | | | (.28 | ) | | | (1.84 | ) | | | (2.12 | ) | | | 71.13 | | | | 10.03 | | | | 293 | | | | 1.70 | | | | 1.70 | | | | (.30 | ) |
| 10/31/2019 | | | 57.19 | | | | .23 | | | | 10.06 | | | | 10.29 | | | | (.10 | ) | | | (.71 | ) | | | (.81 | ) | | | 66.67 | | | | 18.32 | | | | 303 | | | | 1.72 | | | | 1.72 | | | | .37 | |
| Class R-2E: |
| 4/30/20245,6 | | | 67.07 | | | | .29 | | | | 10.29 | | | | 10.58 | | | | (.70 | ) | | | (.91 | ) | | | (1.61 | ) | | | 76.04 | | | | 15.91 | 7 | | | 39 | | | | 1.37 | 8 | | | 1.37 | 8 | | | .79 | 8 |
| 10/31/2023 | | | 61.22 | | | | .55 | | | | 5.61 | | | | 6.16 | | | | (.31 | ) | | | — | | | | (.31 | ) | | | 67.07 | | | | 10.08 | | | | 34 | | | | 1.38 | | | | 1.38 | | | | .79 | |
| 10/31/2022 | | | 92.06 | | | | .37 | | | | (25.65 | ) | | | (25.28 | ) | | | — | | | | (5.56 | ) | | | (5.56 | ) | | | 61.22 | | | | (29.03 | ) | | | 28 | | | | 1.38 | | | | 1.38 | | | | .51 | |
| 10/31/2021 | | | 72.67 | | | | — | 12 | | | 19.39 | | | | 19.39 | | | | — | | | | — | | | | — | | | | 92.06 | | | | 26.67 | | | | 42 | | | | 1.37 | | | | 1.37 | | | | — | 13 |
| 10/31/2020 | | | 68.10 | | | | — | 12 | | | 6.92 | | | | 6.92 | | | | (.51 | ) | | | (1.84 | ) | | | (2.35 | ) | | | 72.67 | | | | 10.34 | | | | 35 | | | | 1.41 | | | | 1.41 | | | | (.01 | ) |
| 10/31/2019 | | | 58.48 | | | | .42 | | | | 10.24 | | | | 10.66 | | | | (.33 | ) | | | (.71 | ) | | | (1.04 | ) | | | 68.10 | | | | 18.66 | | | | 33 | | | | 1.43 | | | | 1.43 | | | | .66 | |
| Class R-3: | | | | | | | | | | | | | | | | | | | | | | | | | | | | | | | | | | | | | | | | | | | | | | | | | | | | |
| 4/30/20245,6 | | | 67.20 | | | | .35 | | | | 10.32 | | | | 10.67 | | | | (.79 | ) | | | (.91 | ) | | | (1.70 | ) | | | 76.17 | | | | 16.01 | 7 | | | 493 | | | | 1.22 | 8 | | | 1.22 | 8 | | | .94 | 8 |
| 10/31/2023 | | | 61.34 | | | | .65 | | | | 5.62 | | | | 6.27 | | | | (.41 | ) | | | — | | | | (.41 | ) | | | 67.20 | | | | 10.26 | | | | 438 | | | | 1.22 | | | | 1.22 | | | | .94 | |
| 10/31/2022 | | | 92.20 | | | | .48 | | | | (25.67 | ) | | | (25.19 | ) | | | (.11 | ) | | | (5.56 | ) | | | (5.67 | ) | | | 61.34 | | | | (28.92 | ) | | | 417 | | | | 1.22 | | | | 1.22 | | | | .66 | |
| 10/31/2021 | | | 72.67 | | | | .13 | | | | 19.40 | | | | 19.53 | | | | — | | | | — | | | | — | | | | 92.20 | | | | 26.86 | | | | 644 | | | | 1.22 | | | | 1.22 | | | | .15 | |
| 10/31/2020 | | | 68.03 | | | | .10 | | | | 6.93 | | | | 7.03 | | | | (.55 | ) | | | (1.84 | ) | | | (2.39 | ) | | | 72.67 | | | | 10.51 | | | | 563 | | | | 1.26 | | | | 1.26 | | | | .14 | |
| 10/31/2019 | | | 58.39 | | | | .52 | | | | 10.21 | | | | 10.73 | | | | (.38 | ) | | | (.71 | ) | | | (1.09 | ) | | | 68.03 | | | | 18.83 | | | | 607 | | | | 1.28 | | | | 1.28 | | | | .82 | |
| Class R-4: | | | | | | | | | | | | | | | | | | | | | | | | | | | | | | | | | | | | | | | | | | | | | | | | | | | | |
| 4/30/20245,6 | | | 68.03 | | | | .46 | | | | 10.44 | | | | 10.90 | | | | (.99 | ) | | | (.91 | ) | | | (1.90 | ) | | | 77.03 | | | | 16.17 | 7 | | | 781 | | | | .92 | 8 | | | .92 | 8 | | | 1.24 | 8 |
| 10/31/2023 | | | 62.11 | | | | .87 | | | | 5.69 | | | | 6.56 | | | | (.64 | ) | | | — | | | | (.64 | ) | | | 68.03 | | | | 10.58 | | | | 676 | | | | .93 | | | | .93 | | | | 1.23 | |
| 10/31/2022 | | | 93.33 | | | | .72 | | | | (25.99 | ) | | | (25.27 | ) | | | (.39 | ) | | | (5.56 | ) | | | (5.95 | ) | | | 62.11 | | | | (28.70 | ) | | | 673 | | | | .92 | | | | .92 | | | | .98 | |
| 10/31/2021 | | | 73.44 | | | | .42 | | | | 19.59 | | | | 20.01 | | | | (.12 | ) | | | — | | | | (.12 | ) | | | 93.33 | | | | 27.26 | | | | 989 | | | | .92 | | | | .92 | | | | .46 | |
| 10/31/2020 | | | 68.72 | | | | .31 | | | | 7.01 | | | | 7.32 | | | | (.76 | ) | | | (1.84 | ) | | | (2.60 | ) | | | 73.44 | | | | 10.87 | | | | 759 | | | | .94 | | | | .94 | | | | .46 | |
| 10/31/2019 | | | 59.03 | | | | .72 | | | | 10.29 | | | | 11.01 | | | | (.61 | ) | | | (.71 | ) | | | (1.32 | ) | | | 68.72 | | | | 19.20 | | | | 836 | | | | .97 | | | | .97 | | | | 1.12 | |
| Class R-5E: |
| 4/30/20245,6 | | | 67.77 | | | | .53 | | | | 10.39 | | | | 10.92 | | | | (1.14 | ) | | | (.91 | ) | | | (2.05 | ) | | | 76.64 | | | | 16.29 | 7 | | | 105 | | | | .72 | 8 | | | .72 | 8 | | | 1.44 | 8 |
| 10/31/2023 | | | 61.88 | | | | 1.02 | | | | 5.65 | | | | 6.67 | | | | (.78 | ) | | | — | | | | (.78 | ) | | | 67.77 | | | | 10.80 | | | | 91 | | | | .73 | | | | .73 | | | | 1.45 | |
| 10/31/2022 | | | 93.07 | | | | .85 | | | | (25.86 | ) | | | (25.01 | ) | | | (.62 | ) | | | (5.56 | ) | | | (6.18 | ) | | | 61.88 | | | | (28.57 | ) | | | 74 | | | | .72 | | | | .72 | | | | 1.16 | |
| 10/31/2021 | | | 73.23 | | | | .63 | | | | 19.50 | | | | 20.13 | | | | (.29 | ) | | | — | | | | (.29 | ) | | | 93.07 | | | | 27.52 | | | | 102 | | | | .71 | | | | .71 | | | | .70 | |
| 10/31/2020 | | | 68.56 | | | | .44 | | | | 7.01 | | | | 7.45 | | | | (.94 | ) | | | (1.84 | ) | | | (2.78 | ) | | | 73.23 | | | | 11.08 | | | | 57 | | | | .74 | | | | .74 | | | | .66 | |
| 10/31/2019 | | | 58.94 | | | | .86 | | | | 10.25 | | | | 11.11 | | | | (.78 | ) | | | (.71 | ) | | | (1.49 | ) | | | 68.56 | | | | 19.46 | | | | 38 | | | | .76 | | | | .76 | | | | 1.34 | |
| Class R-5: | | | | | | | | | | | | | | | | | | | | | | | | | | | | | | | | | | | | | | | | | | | | | | | | | | | | |
| 4/30/20245,6 | | | 68.83 | | | | .58 | | | | 10.56 | | | | 11.14 | | | | (1.21 | ) | | | (.91 | ) | | | (2.12 | ) | | | 77.85 | | | | 16.35 | 7 | | | 296 | | | | .62 | 8 | | | .62 | 8 | | | 1.53 | 8 |
| 10/31/2023 | | | 62.85 | | | | 1.10 | | | | 5.73 | | | | 6.83 | | | | (.85 | ) | | | — | | | | (.85 | ) | | | 68.83 | | | | 10.90 | | | | 278 | | | | .63 | | | | .63 | | | | 1.54 | |
| 10/31/2022 | | | 94.40 | | | | .95 | | | | (26.25 | ) | | | (25.30 | ) | | | (.69 | ) | | | (5.56 | ) | | | (6.25 | ) | | | 62.85 | | | | (28.48 | ) | | | 250 | | | | .62 | | | | .62 | | | | 1.28 | |
| 10/31/2021 | | | 74.24 | | | | .70 | | | | 19.81 | | | | 20.51 | | | | (.35 | ) | | | — | | | | (.35 | ) | | | 94.40 | | | | 27.64 | | | | 378 | | | | .62 | | | | .62 | | | | .76 | |
| 10/31/2020 | | | 69.43 | | | | .52 | | | | 7.09 | | | | 7.61 | | | | (.96 | ) | | | (1.84 | ) | | | (2.80 | ) | | | 74.24 | | | | 11.20 | | | | 304 | | | | .64 | | | | .64 | | | | .76 | |
| 10/31/2019 | | | 59.67 | | | | .89 | | | | 10.40 | | | | 11.29 | | | | (.82 | ) | | | (.71 | ) | | | (1.53 | ) | | | 69.43 | | | | 19.57 | | | | 305 | | | | .67 | | | | .67 | | | | 1.40 | |
| Class R-6: | | | | | | | | | | | | | | | | | | | | | | | | | | | | | | | | | | | | | | | | | | | | | | | | | | | | |
| 4/30/20245,6 | | | 68.63 | | | | .60 | | | | 10.52 | | | | 11.12 | | | | (1.25 | ) | | | (.91 | ) | | | (2.16 | ) | | | 77.59 | | | | 16.38 | 7 | | | 15,053 | | | | .57 | 8 | | | .57 | 8 | | | 1.61 | 8 |
| 10/31/2023 | | | 62.67 | | | | 1.13 | | | | 5.72 | | | | 6.85 | | | | (.89 | ) | | | — | | | | (.89 | ) | | | 68.63 | | | | 10.97 | | | | 10,801 | | | | .58 | | | | .58 | | | | 1.59 | |
| 10/31/2022 | | | 94.15 | | | | .99 | | | | (26.17 | ) | | | (25.18 | ) | | | (.74 | ) | | | (5.56 | ) | | | (6.30 | ) | | | 62.67 | | | | (28.45 | ) | | | 8,393 | | | | .57 | | | | .57 | | | | 1.34 | |
| 10/31/2021 | | | 74.05 | | | | .73 | | | | 19.75 | | | | 20.48 | | | | (.38 | ) | | | — | | | | (.38 | ) | | | 94.15 | | | | 27.70 | | | | 10,326 | | | | .57 | | | | .57 | | | | .80 | |
| 10/31/2020 | | | 69.27 | | | | .56 | | | | 7.07 | | | | 7.63 | | | | (1.01 | ) | | | (1.84 | ) | | | (2.85 | ) | | | 74.05 | | | | 11.26 | | | | 8,255 | | | | .59 | | | | .59 | | | | .82 | |
| 10/31/2019 | | | 59.52 | | | | .95 | | | | 10.35 | | | | 11.30 | | | | (.84 | ) | | | (.71 | ) | | | (1.55 | ) | | | 69.27 | | | | 19.62 | | | | 7,010 | | | | .61 | | | | .61 | | | | 1.48 | |
Refer to the end of the table for footnotes.
Financial highlights (continued)
| | | Six months
ended
April 30, | | Year ended October 31, |
| | | 20245,6,7 | | 2023 | | 2022 | | 2021 | | 2020 | | 2019 |
| Portfolio turnover rate for all share classes14 | | 22% | | 32% | | 39% | | 32% | | 40% | | 37% |
| | |
| 1 | Based on average shares outstanding. |
| 2 | Total returns exclude any applicable sales charges, including contingent deferred sales charges. |
| 3 | This column reflects the impact, if any, of certain reimbursements from CRMC. During one of the years shown, CRMC reimbursed a portion of transfer agent services fees for Class 529-F-3 shares. |
| 4 | Ratios do not include expenses of any Central Funds. The fund indirectly bears its proportionate share of the expenses of any Central Funds. |
| 5 | Based on operations for a period that is less than a full year. |
| 6 | Unaudited. |
| 7 | Not annualized. |
| 8 | Annualized. |
| 9 | All or a significant portion of assets in this class consisted of seed capital invested by CRMC and/or its affiliates. Fees for distribution services are not charged or accrued on these seed capital assets. If such fees were paid by the fund on seed capital assets, fund expenses would have been higher and net income and total return would have been lower. |
| 10 | Amount less than $1 million. |
| 11 | Class 529-F-2 and 529-F-3 shares began investment operations on October 30, 2020. |
| 12 | Amount less than $.01. |
| 13 | Amount less than .01%. |
| 14 | Rates do not include the fund’s portfolio activity with respect to any Central Funds. |
Refer to the notes to financial statements.
As a fund shareholder, you incur two types of costs: (1) transaction costs, such as initial sales charges on purchase payments and contingent deferred sales charges on redemptions (loads), and (2) ongoing costs, including management fees, distribution and service (12b-1) fees, and other expenses. This example is intended to help you understand your ongoing costs (in dollars) of investing in the fund so you can compare these costs with the ongoing costs of investing in other mutual funds. The example is based on an investment of $1,000 invested at the beginning of the period and held for the entire six-month period (November 1, 2023, through April 30, 2024).
Actual expenses:
The first line of each share class in the table on the following page provides information about actual account values and actual expenses. You may use the information in this line, together with the amount you invested, to estimate the expenses that you paid over the period. Simply divide your account value by $1,000 (for example, an $8,600 account value divided by $1,000 = 8.6), then multiply the result by the number in the first line under the heading titled “Expenses paid during period” to estimate the expenses you paid on your account during this period.
Hypothetical example for comparison purposes:
The second line of each share class in the table on the following page provides information about hypothetical account values and hypothetical expenses based on the actual expense ratio for the share class and an assumed rate of return of 5.00% per year before expenses, which is not the actual return of the share class. The hypothetical account values and expenses may not be used to estimate the actual ending account balance or expenses you paid for the period. You may use this information to compare the ongoing costs of investing in the fund and other funds. To do so, compare this 5.00% hypothetical example with the 5.00% hypothetical examples that appear in the shareholder reports of the other funds.
Notes:
Retirement plan participants may be subject to certain fees charged by the plan sponsor, and Class F-1, F-2, F-3, 529-F-1, 529-F-2 and 529-F-3 shareholders may be subject to fees charged by financial intermediaries, typically ranging from 0.75% to 1.50% of assets annually depending on services offered. You can estimate the impact of these fees by adding the amount of the fees to the total estimated expenses you paid on your account during the period as calculated above. In addition, your ending account value would be lower by the amount of these fees.
Note that the expenses shown in the table on the following page are meant to highlight your ongoing costs only and do not reflect any transactional costs, such as sales charges (loads). Therefore, the second line of each share class in the table is useful in comparing ongoing costs only and will not help you determine the relative total costs of owning different funds. In addition, if these transactional costs were included, your costs would have been higher.
Expense example (continued)
| | | Beginning
account value
11/1/2023 | | | Ending
account value
4/30/2024 | | | Expenses paid
during period* | | | Annualized
expense ratio | |
| Class A – actual return | | $ | 1,000.00 | | | $ | 1,161.23 | | | $ | 5.27 | | | | .98 | % |
| Class A – assumed 5% return | | | 1,000.00 | | | | 1,019.99 | | | | 4.92 | | | | .98 | |
| Class C – actual return | | | 1,000.00 | | | | 1,157.11 | | | | 9.33 | | | | 1.74 | |
| Class C – assumed 5% return | | | 1,000.00 | | | | 1,016.21 | | | | 8.72 | | | | 1.74 | |
| Class T – actual return | | | 1,000.00 | | | | 1,162.71 | | | | 3.76 | | | | .70 | |
| Class T – assumed 5% return | | | 1,000.00 | | | | 1,021.38 | | | | 3.52 | | | | .70 | |
| Class F-1 – actual return | | | 1,000.00 | | | | 1,161.61 | | | | 5.16 | | | | .96 | |
| Class F-1 – assumed 5% return | | | 1,000.00 | | | | 1,020.09 | | | | 4.82 | | | | .96 | |
| Class F-2 – actual return | | | 1,000.00 | | | | 1,163.03 | | | | 3.60 | | | | .67 | |
| Class F-2 – assumed 5% return | | | 1,000.00 | | | | 1,021.53 | | | | 3.37 | | | | .67 | |
| Class F-3 – actual return | | | 1,000.00 | | | | 1,163.60 | | | | 3.07 | | | | .57 | |
| Class F-3 – assumed 5% return | | | 1,000.00 | | | | 1,022.03 | | | | 2.87 | | | | .57 | |
| Class 529-A – actual return | | | 1,000.00 | | | | 1,161.23 | | | | 5.43 | | | | 1.01 | |
| Class 529-A – assumed 5% return | | | 1,000.00 | | | | 1,019.84 | | | | 5.07 | | | | 1.01 | |
| Class 529-C – actual return | | | 1,000.00 | | | | 1,156.74 | | | | 9.49 | | | | 1.77 | |
| Class 529-C – assumed 5% return | | | 1,000.00 | | | | 1,016.06 | | | | 8.87 | | | | 1.77 | |
| Class 529-E – actual return | | | 1,000.00 | | | | 1,159.99 | | | | 6.44 | | | | 1.20 | |
| Class 529-E – assumed 5% return | | | 1,000.00 | | | | 1,018.90 | | | | 6.02 | | | | 1.20 | |
| Class 529-T – actual return | | | 1,000.00 | | | | 1,162.56 | | | | 4.14 | | | | .77 | |
| Class 529-T – assumed 5% return | | | 1,000.00 | | | | 1,021.03 | | | | 3.87 | | | | .77 | |
| Class 529-F-1 – actual return | | | 1,000.00 | | | | 1,162.34 | | | | 4.19 | | | | .78 | |
| Class 529-F-1 – assumed 5% return | | | 1,000.00 | | | | 1,020.98 | | | | 3.92 | | | | .78 | |
| Class 529-F-2 – actual return | | | 1,000.00 | | | | 1,163.21 | | | | 3.66 | | | | .68 | |
| Class 529-F-2 – assumed 5% return | | | 1,000.00 | | | | 1,021.48 | | | | 3.42 | | | | .68 | |
| Class 529-F-3 – actual return | | | 1,000.00 | | | | 1,163.14 | | | | 3.44 | | | | .64 | |
| Class 529-F-3 – assumed 5% return | | | 1,000.00 | | | | 1,021.68 | | | | 3.22 | | | | .64 | |
| Class R-1 – actual return | | | 1,000.00 | | | | 1,157.37 | | | | 8.90 | | | | 1.66 | |
| Class R-1 – assumed 5% return | | | 1,000.00 | | | | 1,016.61 | | | | 8.32 | | | | 1.66 | |
| Class R-2 – actual return | | | 1,000.00 | | | | 1,157.33 | | | | 8.96 | | | | 1.67 | |
| Class R-2 – assumed 5% return | | | 1,000.00 | | | | 1,016.56 | | | | 8.37 | | | | 1.67 | |
| Class R-2E – actual return | | | 1,000.00 | | | | 1,159.08 | | | | 7.35 | | | | 1.37 | |
| Class R-2E – assumed 5% return | | | 1,000.00 | | | | 1,018.05 | | | | 6.87 | | | | 1.37 | |
| Class R-3 – actual return | | | 1,000.00 | | | | 1,160.15 | | | | 6.55 | | | | 1.22 | |
| Class R-3 – assumed 5% return | | | 1,000.00 | | | | 1,018.80 | | | | 6.12 | | | | 1.22 | |
| Class R-4 – actual return | | | 1,000.00 | | | | 1,161.69 | | | | 4.94 | | | | .92 | |
| Class R-4 – assumed 5% return | | | 1,000.00 | | | | 1,020.29 | | | | 4.62 | | | | .92 | |
| Class R-5E – actual return | | | 1,000.00 | | | | 1,162.86 | | | | 3.87 | | | | .72 | |
| Class R-5E – assumed 5% return | | | 1,000.00 | | | | 1,021.28 | | | | 3.62 | | | | .72 | |
| Class R-5 – actual return | | | 1,000.00 | | | | 1,163.55 | | | | 3.34 | | | | .62 | |
| Class R-5 – assumed 5% return | | | 1,000.00 | | | | 1,021.78 | | | | 3.12 | | | | .62 | |
| Class R-6 – actual return | | | 1,000.00 | | | | 1,163.77 | | | | 3.07 | | | | .57 | |
| Class R-6 – assumed 5% return | | | 1,000.00 | | | | 1,022.03 | | | | 2.87 | | | | .57 | |
| | |
| * | The “expenses paid during period” are equal to the “annualized expense ratio,” multiplied by the average account value over the period, multiplied by the number of days in the period, and divided by 366 (to reflect the one-half year period). |
Approval of Investment Advisory and Service Agreement
The fund’s board has approved the continuation of the fund’s Investment Advisory and Service Agreement (the “agreement”) with Capital Research and Management Company (“CRMC”) through November 30, 2024. The board approved the agreement following the recommendation of the fund’s Contracts Committee (the “committee”), which is composed of all the fund’s independent board members. The board and the committee determined in the exercise of their business judgment that the fund’s advisory fee structure was fair and reasonable in relation to the services provided, and that approving the agreement was in the best interests of the fund and its shareholders.
In reaching this decision, the board and the committee took into account their interactions with CRMC and information furnished to them throughout the year and otherwise provided to them, as well as information prepared specifically in connection with their review of the agreement, and they were advised by their independent counsel with respect to the matters considered. They considered the following factors, among others, but did not identify any single issue or particular piece of information that, in isolation, was the controlling factor, and each board and committee member did not necessarily attribute the same weight to each factor.
1. Nature, extent and quality of services
The board and the committee considered the depth and quality of CRMC’s investment management process, including its global research capabilities; the experience, capability and integrity of its senior management and other personnel; the low turnover rates of its key personnel; the overall financial strength and stability of CRMC and the Capital Group organization; the resources and systems CRMC devotes to investment management (the manner in which the fund’s assets are managed, including liquidity management), financial, investment operations, compliance, trading, proxy voting, shareholder communications, and other services; and the ongoing evolution of CRMC’s organizational structure designed to maintain and strengthen these qualities. The board and the committee also considered the nature, extent and quality of administrative and shareholder services provided by CRMC to the fund under the agreement and other agreements, as well as the benefits to fund shareholders from investing in a fund that is part of a large family of funds. The board and the committee considered the risks assumed by CRMC in providing services to the fund, including operational, business, financial, reputational, regulatory and litigation risks. The board and the committee concluded that the nature, extent and quality of the services provided by CRMC have benefited and should continue to benefit the fund and its shareholders.
2. Investment results
The board and the committee considered the investment results of the fund in light of its objective. They compared the fund’s investment results with those of other funds (including funds that currently form the basis of the Lipper index for the category in which the fund is included), and data such as relevant market and fund indexes over various periods (including the fund’s lifetime) through March 31, 2023. They generally placed greater emphasis on investment results over longer term periods. On the basis of this evaluation and the board’s and the committee’s ongoing review of investment results, and considering the relative market conditions during certain reporting periods, the board and the committee concluded that the fund’s investment results have been satisfactory for renewal of the agreement, and that CRMC’s record in managing the fund indicated that its continued management should benefit the fund and its shareholders.
3. Advisory fees and total expenses
The board and the committee compared the advisory fees and total expense levels of the fund to those of other relevant funds. They observed that the fund’s advisory fees and expenses generally compared favorably to those of other similar funds included in the comparable Lipper category. The board and the committee also considered the breakpoint discounts in the fund’s advisory fee structure that reduce the level of fees charged by CRMC to the fund as fund assets increase. In addition, they reviewed information regarding the effective advisory fees charged to non-mutual fund clients by CRMC and its affiliates. They noted that, to the extent there were differences between the advisory fees paid by the fund and the advisory fees paid by those clients, the differences appropriately reflected the investment, operational, regulatory and market differences between advising the fund and the other clients. The board and the committee concluded that the fund’s cost structure was fair and reasonable in relation to the services provided, as well as in relation to the risks assumed by the adviser in sponsoring and managing the fund, and that the fund’s shareholders receive reasonable value in return for the advisory fees and other amounts paid to CRMC by the fund.
4. Ancillary benefits
The board and the committee considered a variety of other benefits that CRMC and its affiliates receive as a result of CRMC’s relationship with the fund and other American Funds, including fees for administrative services provided to certain share classes; fees paid to CRMC’s affiliated transfer agent; sales charges and distribution fees received and retained by the fund’s principal underwriter, an affiliate of CRMC; and possible ancillary benefits to CRMC and its institutional management affiliates in managing other investment vehicles. The board and the committee reviewed CRMC’s portfolio trading practices, noting that CRMC bears the cost of third-party research. The board and committee also noted that CRMC benefited from the use of commissions from portfolio transactions made on behalf of the fund to facilitate payment to certain broker-dealers for research to comply with regulatory requirements applicable to these firms, with all such amounts reimbursed by CRMC. The board and the committee took these ancillary benefits into account in evaluating the reasonableness of the advisory fees and other amounts paid to CRMC by the fund.
5. Adviser financial information
The board and the committee reviewed information regarding CRMC’s costs of providing services to the American Funds, including personnel, systems and resources of investment, compliance, trading, accounting and other administrative operations. They considered CRMC’s costs and related cost allocation methodology, as well as its track record of investing in technology, infrastructure and staff to maintain and expand services and capabilities, respond to industry and regulatory developments, and attract and retain qualified personnel. They noted information regarding the compensation structure for CRMC’s investment professionals. They reviewed information on the profitability of the investment adviser and its affiliates. The board and the committee also compared CRMC’s profitability and compensation data to the reported results and data of a number of large, publicly held investment management companies. The board and the committee noted the competitiveness and cyclicality of both the mutual fund industry and the capital markets, and the importance in that environment of CRMC’s long-term profitability for maintaining its independence, company culture and management continuity. They further considered the breakpoint discounts in the fund’s advisory fee structure and CRMC’s sharing of potential economies of scale, or efficiencies, through breakpoints and other fee reductions and costs voluntarily absorbed. The board and the committee concluded that the fund’s advisory fee structure reflected a reasonable sharing of benefits between CRMC and the fund’s shareholders.
| Liquidity Risk Management Program | unaudited |
The fund has adopted a liquidity risk management program (the “program”). The fund’s board has designated Capital Research and Management Company (“CRMC”) as the administrator of the program. Personnel of CRMC or its affiliates conduct the day-to-day operation of the program pursuant to policies and procedures administered by the Capital Group Liquidity Risk Management Committee.
Under the program, CRMC manages the fund’s liquidity risk, which is the risk that the fund could not meet shareholder redemption requests without significant dilution of remaining shareholders’ interests in the fund. This risk is managed by monitoring the degree of liquidity of the fund’s investments, limiting the amount of the fund’s illiquid investments, and utilizing various risk management tools and facilities available to the fund for meeting shareholder redemptions, among other means. CRMC’s process of determining the degree of liquidity of the fund’s investments is supported by one or more third-party liquidity assessment vendors.
The fund’s board reviewed a report prepared by CRMC regarding the operation and effectiveness of the program for the period October 1, 2022, through September 30, 2023. No significant liquidity events impacting the fund were noted in the report. In addition, CRMC provided its assessment that the program had been effective in managing the fund’s liquidity risk.
This page was intentionally left blank.
This page was intentionally left blank.
Office of the fund
333 South Hope Street
Los Angeles, CA 90071-1406
Investment adviser
Capital Research and Management Company
333 South Hope Street
Los Angeles, CA 90071-1406
Transfer agent for shareholder accounts
American Funds Service Company
(Write to the address nearest you.)
P.O. Box 6007
Indianapolis, IN 46206-6007
P.O. Box 2280
Norfolk, VA 23501-2280
Custodian of assets
JPMorgan Chase Bank
270 Park Avenue
New York, NY 10017-2070
Counsel
Dechert LLP
45 Fremont Street, 26th Floor
San Francisco, CA 94105-2223
Independent registered public accounting firm
Deloitte & Touche LLP
695 Town Center Drive
Suite 1000
Costa Mesa, CA 92626-7188
Principal underwriter
American Funds Distributors, Inc.
333 South Hope Street
Los Angeles, CA 90071-1406
Investors should carefully consider investment objectives, risks, charges and expenses. This and other important information is contained in the fund prospectus and summary prospectus, which can be obtained from your financial professional and should be read carefully before investing. You may also call American Funds Service Company (AFS) at (800) 421-4225 or visit the Capital Group website at capitalgroup.com.
“American Funds Proxy Voting Procedures and Principles” — which describes how we vote proxies relating to portfolio securities — is available on our website or upon request by calling AFS. The fund files its proxy voting record with the U.S. Securities and Exchange Commission (SEC) for the 12 months ended June 30 by August 31. The proxy voting record is available free of charge on the SEC website at sec.gov and on our website.
New World Fund files a complete list of its portfolio holdings with the SEC for the first and third quarters of each fiscal year on Form NPORT-P. The list of portfolio holdings is available free of charge on the SEC website and on our website.
This report is for the information of shareholders of New World Fund, but it also may be used as sales literature when preceded or accompanied by the current prospectus or summary prospectus, which gives details about charges, expenses, investment objectives and operating policies of the fund. If used as sales material after June 30, 2024, this report must be accompanied by an American Funds statistical update for the most recently completed calendar quarter.
MSCI has not approved, reviewed or produced this report, makes no express or implied warranties or representations and is not liable whatsoever for any data in the report. You may not redistribute the MSCI data or use it as a basis for other indices or investment products.
On or around July 1, 2024, American Funds Distributors, Inc. will be renamed Capital Client Group, Inc.
The Capital Advantage®
Since 1931, Capital Group, home of American Funds, has helped investors pursue long-term investment success. Our consistent approach — in combination with The Capital SystemTM — has resulted in superior outcomes.
Aligned with investor success
We base our decisions on a long-term perspective, which we believe aligns our goals with the interests of our clients. Our portfolio managers average 28 years of investment industry experience, including 22 years at our company, reflecting a career commitment to our long-term approach.1
The Capital System
The Capital System combines individual accountability with teamwork. Funds using The Capital System are divided into portions that are managed independently by investment professionals with diverse backgrounds, ages and investment approaches. An extensive global research effort is the backbone of our system.
American Funds’ superior outcomes
Equity-focused funds have beaten their Lipper peer indexes in 84% of 10-year periods and 97% of 20-year periods.2 Relative to their peers, our fixed income funds have helped investors achieve better diversification through attention to correlation between bonds and equities.3 Fund management fees have been among the lowest in the industry.4
| | 1 | Investment industry experience as of December 31, 2023. |
| | 2 | Based on Class F-2 share results for rolling monthly 10- and 20-year periods starting with the first 10- or 20-year period after each mutual fund’s inception through December 31, 2023. Periods covered are the shorter of the fund’s lifetime or since the comparable Lipper index inception date (except Capital Income Builder and SMALLCAP World Fund, for which the Lipper average was used). Expenses differ for each share class, so results will vary. Past results are not predictive of results in future periods. |
| | 3 | Based on Class F-2 share results as of December 31, 2023. Thirteen of the 18 fixed income American Funds that have been in existence for the three-year period showed a three-year correlation lower than their respective Morningstar peer group averages. S&P 500 Index was used as an equity market proxy. Correlation based on monthly total returns. Correlation is a statistical measure of how a security and an index move in relation to each other. A correlation ranges from -1 to 1. A positive correlation close to 1 implies that as one moved, either up or down, the other moved in “lockstep,” in the same direction. A negative correlation close to -1 indicates the two have moved in the opposite direction. |
| | 4 | On average, our mutual fund management fees were in the lowest quintile 55% of the time, based on the 20-year period ended December 31, 2023, versus comparable Lipper categories, excluding funds of funds. |
Class F-2 shares were first offered on August 1, 2008. Class F-2 share results prior to the date of first sale are hypothetical based on the results of the original share class of the fund without a sales charge, adjusted for typical estimated expenses. Results for certain funds with an inception date after August 1, 2008, also include hypothetical returns because those funds’ Class F-2 shares sold after the funds’ date of first offering. Refer to capitalgroup.com for more information on specific expense adjustments and the actual dates of first sale.
Capital Group manages equity assets through three investment groups. These groups make investment and proxy voting decisions independently. Fixed income investment professionals provide fixed income research and investment management across the Capital organization; however, for securities with equity characteristics, they act solely on behalf of one of the three equity investment groups.
All Capital Group trademarks mentioned are owned by The Capital Group Companies, Inc., an affiliated company or fund. All other company and product names mentioned are the property of their respective companies.

ITEM 2 – Code of Ethics
Not applicable for filing of semi-annual reports to shareholders.
ITEM 3 – Audit Committee Financial Expert
Not applicable for filing of semi-annual reports to shareholders.
ITEM 4 – Principal Accountant Fees and Services
Not applicable for filing of semi-annual reports to shareholders.
ITEM 5 – Audit Committee of Listed Registrants
Not applicable to this Registrant, insofar as the Registrant is not a listed issuer as defined in Rule 10A-3 under the Securities Exchange Act of 1934.
ITEM 6 – Schedule of Investments
Not applicable, insofar as the schedule is included as part of the report to shareholders filed under Item 1 of this Form.
ITEM 7 – Disclosure of Proxy Voting Policies and Procedures for Closed-End Management Investment Companies.
Not applicable to this Registrant, insofar as the Registrant is not a closed-end management investment company.
ITEM 8 – Portfolio Managers of Closed-End Management Investment Companies
Not applicable to this Registrant, insofar as the Registrant is not a closed-end management investment company.
ITEM 9 – Purchases of Equity Securities by Closed-End Management Investment Company and Affiliated Purchasers
Not applicable to this Registrant, insofar as the Registrant is not a closed-end management investment company.
ITEM 10 – Submission of Matters to a Vote of Security Holders
There have been no material changes to the procedures by which shareholders may recommend nominees to the Registrant’s board of directors since the Registrant last submitted a proxy statement to its shareholders. The procedures are as follows. The Registrant has a nominating and governance committee comprised solely of persons who are not considered ‘‘interested persons’’ of the Registrant within the meaning of the Investment Company Act of 1940, as amended. The committee periodically reviews such issues as the board’s composition, responsibilities, committees, compensation and other relevant issues, and recommends any appropriate changes to the full board of directors. While the committee normally is able to identify from its own resources an ample number of qualified candidates, it will consider shareholder suggestions of persons to be considered as nominees to fill future vacancies on the board. Such suggestions must be sent in writing to the nominating and governance committee of the Registrant, c/o the Registrant’s Secretary, and must be accompanied by complete biographical and occupational data on the prospective nominee, along with a written consent of the prospective nominee for consideration of his or her name by the nominating and governance committee.
ITEM 11 – Controls and Procedures
| (a) | The Registrant’s Principal Executive Officer and Principal Financial Officer have concluded, based on their evaluation of the Registrant’s disclosure controls and procedures (as such term is defined in Rule 30a-3 under the Investment Company Act of 1940), that such controls and procedures are adequate and reasonably designed to achieve the purposes described in paragraph (c) of such rule. |
| | |
| (b) | There were no changes in the Registrant’s internal controls over financial reporting (as defined in Rule 30a-3(d) under the Investment Company Act of 1940) that occurred during the Registrant’s semi-annual period covered by this report that has materially affected, or is reasonably likely to materially affect, the Registrant’s internal control over financial reporting. |
ITEM 12 – Disclosure of Securities Lending Activities for Closed-End Management Investment Companies
Not applicable to this Registrant, insofar as the Registrant is not a closed-end management investment company.
ITEM 13 – Exhibits
| (a)(1) | Not applicable for filing of semi-annual reports to shareholders. |
| | |
| (a)(2) | The certifications required by Rule 30a-2 of the Investment Company Act of 1940 and Sections 302 and 906 of the Sarbanes-Oxley Act of 2002 are attached as exhibits hereto. |
SIGNATURES
Pursuant to the requirements of the Securities Exchange Act of 1934 and the Investment Company Act of 1940, the Registrant has duly caused this report to be signed on its behalf by the undersigned, thereunto duly authorized.
| | NEW WORLD FUND, INC. |
| | |
| | By __/s/ Walter R. Burkley____________________ |
| | Walter R. Burkley, Principal Executive Officer |
| | |
| | Date: June 28, 2024 |
Pursuant to the requirements of the Securities Exchange Act of 1934 and the Investment Company Act of 1940, this report has been signed below by the following persons on behalf of the Registrant and in the capacities and on the dates indicated.
| By __/s/ Walter R. Burkley_________________ |
Walter R. Burkley, Principal Executive Officer |
| |
| Date: June 28, 2024 |
| By ___/s/ Brian C. Janssen __________ |
Brian C. Janssen, Treasurer and Principal Financial Officer |
| |
| Date: June 28, 2024 |