Exhibit 99.1
| This content is Confidential. QUARTERLY RESULTS 4Q24 Gerdau S.A. NEW HOT-ROLLED COIL MILL Ouro Branco Unit in Minas Gerais Videoconference February 20 (Thursday) 10:00 a.m. NY | 12:00 p.m. BRT CLICK HERE to access the videoconference RI.GERDAU.COM |

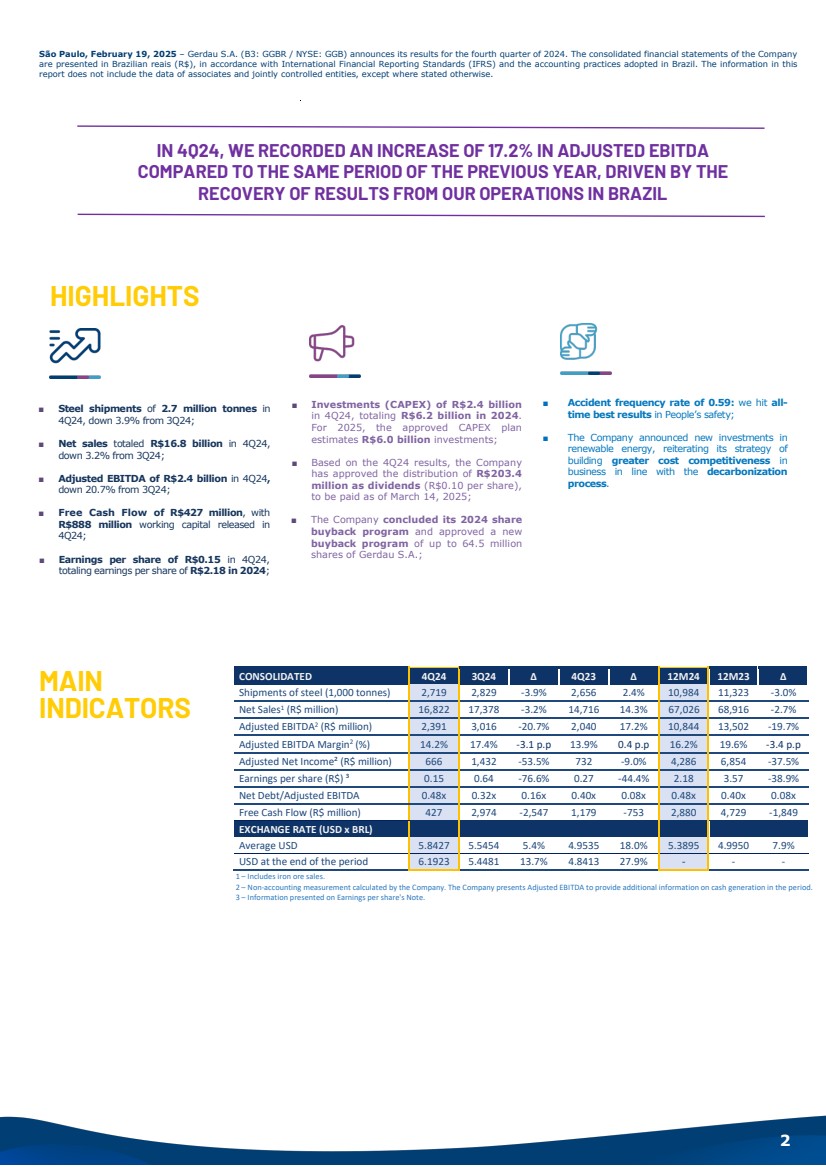
| 2 São Paulo, February 19, 2025 – Gerdau S.A. (B3: GGBR / NYSE: GGB) announces its results for the fourth quarter of 2024. The consolidated financial statements of the Company are presented in Brazilian reais (R$), in accordance with International Financial Reporting Standards (IFRS) and the accounting practices adopted in Brazil. The information in this report does not include the data of associates and jointly controlled entities, except where stated otherwise. IN 4Q24, WE RECORDED AN INCREASE OF 17.2% IN ADJUSTED EBITDA COMPARED TO THE SAME PERIOD OF THE PREVIOUS YEAR, DRIVEN BY THE RECOVERY OF RESULTS FROM OUR OPERATIONS IN BRAZIL HIGHLIGHTS MAIN INDICATORS 1 – Includes iron ore sales. 2 – Non-accounting measurement calculated by the Company. The Company presents Adjusted EBITDA to provide additional information on cash generation in the period. 3 – Information presented on Earnings per share's Note. CONSOLIDATED 4Q24 3Q24 ∆ 4Q23 ∆ 12M24 12M23 ∆ Shipments of steel (1,000 tonnes) 2,719 2,829 -3.9% 2,656 2.4% 10,984 11,323 -3.0% Net Sales1 (R$ million) 16,822 17,378 -3.2% 14,716 14.3% 67,026 68,916 -2.7% Adjusted EBITDA2 (R$ million) 2,391 3,016 -20.7% 2,040 17.2% 10,844 13,502 -19.7% Adjusted EBITDA Margin2 (%) 14.2% 17.4% -3.1 p.p 13.9% 0.4 p.p 16.2% 19.6% -3.4 p.p Adjusted Net Income² (R$ million) 666 1,432 -53.5% 732 -9.0% 4,286 6,854 -37.5% Earnings per share (R$) ³ 0.15 0.64 -76.6% 0.27 -44.4% 2.18 3.57 -38.9% Net Debt/Adjusted EBITDA 0.48x 0.32x 0.16x 0.40x 0.08x 0.48x 0.40x 0.08x Free Cash Flow (R$ million) 427 2,974 -2,547 1,179 -753 2,880 4,729 -1,849 EXCHANGE RATE (USD x BRL) Average USD 5.8427 5.5454 5.4% 4.9535 18.0% 5.3895 4.9950 7.9% USD at the end of the period 6.1923 5.4481 13.7% 4.8413 27.9% - - - ■ Steel shipments of 2.7 million tonnes in 4Q24, down 3.9% from 3Q24; ■ Net sales totaled R$16.8 billion in 4Q24, down 3.2% from 3Q24; ■ Adjusted EBITDA of R$2.4 billion in 4Q24, down 20.7% from 3Q24; ■ Free Cash Flow of R$427 million, with R$888 million working capital released in 4Q24; ■ Earnings per share of R$0.15 in 4Q24, totaling earnings per share of R$2.18 in 2024; ■ Accident frequency rate of 0.59: we hit all-time best results in People’s safety; ■ The Company announced new investments in renewable energy, reiterating its strategy of building greater cost competitiveness in business in line with the decarbonization process. ■ Investments (CAPEX) of R$2.4 billion in 4Q24, totaling R$6.2 billion in 2024. For 2025, the approved CAPEX plan estimates R$6.0 billion investments; ■ Based on the 4Q24 results, the Company has approved the distribution of R$203.4 million as dividends (R$0.10 per share), to be paid as of March 14, 2025; ■ The Company concluded its 2024 share buyback program and approved a new buyback program of up to 64.5 million shares of Gerdau S.A.; |
| Quarterly Results - 4Q24 Gerdau S.A. 3 MESSAGE FROM MANAGEMENT We ended 2024 with results that reflect our capacity for adaptation through collaborative work and a focus on common goals. Our safety indicators recorded all-time best results, reflecting our commitment to build healthy and safe environments for our employees and partners, day after day. This brings us closer to achieving our goal of becoming one of the safest, most profitable, respected, and relevant companies in the global steel chain. In terms of financial and operating results, we ended 4Q24 with an Adjusted EBITDA of R$2.4 billion, down 20.7% from 3Q24, mainly impacted by lower prices in the North America BD and volume decline due to the typical seasonality of the period. Year-over-year, the Adjusted EBITDA surged 17.2%, bolstered by improvement in performance and operating efficiency in Brazil. Our geographical diversification and operational flexibility once again proved capable of reducing the volatility of results in periods with more challenging dynamics. The Brazil BD ended 4Q24 with the best performance for a last quarter since 2021. Once again, we highlight the consolidation and delivery of initiatives to cut costs and expenses, as well as our assets optimization, which led to efficiency gains. We ended 4Q24 with consistent shipment volumes compared to 3Q24 and 4Q23. However, our domestic market volumes remain challenged by excessive inflow of imported steel in the country, which creates an environment of unfair competition for the local industry. On a positive note, our exports experienced a boost due to the Brazilian real devaluation. This contributed to a dilution in fixed costs and operating leverage during the period. At the North America BD, demand remained challenging due to seasonality and political uncertainties in the USA. This scenario put further pressure on steel prices for the main product lines throughout 4Q24, impacting the BD’s profitability. Despite the ongoing cautious market scenario, our order backlog has recovered to the 60-day level across all product lines, driven notably by the non-residential construction sector. Concerning the Special Steel BD, the lower shipment volume, which is due to the steeper seasonality of the period, and the higher costs resulting from scheduled maintenance shutdowns impacted the 4Q24 results. However, we highlight that 4Q24 was the second-best quarter since 2022 for operation in Brazil, reflecting the steady upturn of the automotive sector throughout the year, coupled with the consolidation of efficiency and competitiveness initiatives conducted at our industrial units in the country. In the USA, operating performance was impacted by the challenging price environment and lower demand. In the South America BD, 4Q24 results came in line with the previous quarter, driven by higher shipment volumes in Peru, which recorded the best level of deliveries since 1Q22, offsetting the lower demand for steel in Argentina due to the country's economic adjustment. Following our strategy of ensuring the long-term competitiveness of our operations, we ended 4Q24 with R$2.4 billion CAPEX, totaling R$6.2 billion in 2024. We remain committed to the execution of key strategic CAPEX projects. We reached 55% physical execution of new mining investments in Brazil, and we are on the verge of commencing operations with the new hot coil rolling line, which will deliver an investment in line with our strategy of focusing on higher value-added products for our customers. We are also expanding our self-production of renewable energy. This will be achieved through investments that will allow us to improve our costs and reduce our CO2 emissions. For 2025, we estimate a R$6.0 billion CAPEX, focused on modernization, enhancing environmental practices, and expanding our footprint in long, flat, and special steel in the Americas. Based on 4Q24 results, we approved the distribution of dividends in the amount of R$0.10 per share, totaling R$203.4 million. In 2024, approximately R$1.7 billion has been paid in dividends. In addition, in January 2025, we concluded the 2024 share buyback program with 69.8 million shares repurchased, nearly 3.4% of outstanding shares. Overall, Gerdau S.A. returned R$2.9 billion to shareholders in 2024. In accordance with our commitment to delivering value to our shareholders, on January 20, 2025, the Company's Board of Directors approved a new share buyback program of up to 63,000,000 preferred shares, representing nearly 5% of outstanding shares (GGBR4 and/or GGB), and up to 1,500,000 common shares, representing 10% of outstanding shares (GGBR3), with a 12-month term. With our history spanning 124 years, celebrated in January 2025, we remain committed to enhancing our competitiveness and contributing to a more sustainable global environment. Once again, we would like to thank our employees, customers, suppliers, partners, shareholders and other stakeholders for their trust and support in building our history and continuously creating value. THE MANAGEMENT “In 2024, we continued to implement our strategy of sustainable growth while maintaining our financial strength. We believe that both are essential if we are to continue to create value for our shareholders and other stakeholders.” Rafael Japur, Gerdau’s CFO and IRO. |

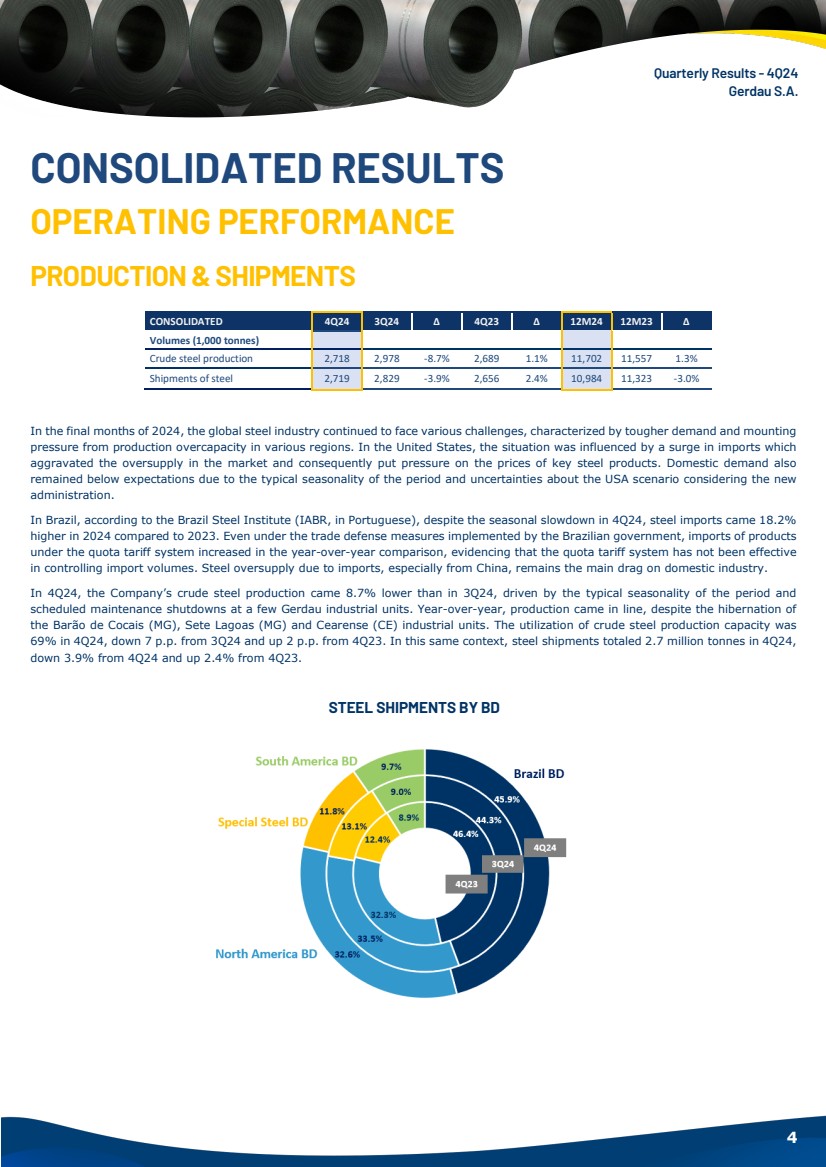
| Quarterly Results - 4Q24 Gerdau S.A. 4 CONSOLIDATED RESULTS OPERATING PERFORMANCE PRODUCTION & SHIPMENTS CONSOLIDATED 4Q24 3Q24 ∆ 4Q23 ∆ 12M24 12M23 ∆ Volumes (1,000 tonnes) Crude steel production 2,718 2,978 -8.7% 2,689 1.1% 11,702 11,557 1.3% Shipments of steel 2,719 2,829 -3.9% 2,656 2.4% 10,984 11,323 -3.0% In the final months of 2024, the global steel industry continued to face various challenges, characterized by tougher demand and mounting pressure from production overcapacity in various regions. In the United States, the situation was influenced by a surge in imports which aggravated the oversupply in the market and consequently put pressure on the prices of key steel products. Domestic demand also remained below expectations due to the typical seasonality of the period and uncertainties about the USA scenario considering the new administration. In Brazil, according to the Brazil Steel Institute (IABR, in Portuguese), despite the seasonal slowdown in 4Q24, steel imports came 18.2% higher in 2024 compared to 2023. Even under the trade defense measures implemented by the Brazilian government, imports of products under the quota tariff system increased in the year-over-year comparison, evidencing that the quota tariff system has not been effective in controlling import volumes. Steel oversupply due to imports, especially from China, remains the main drag on domestic industry. In 4Q24, the Company’s crude steel production came 8.7% lower than in 3Q24, driven by the typical seasonality of the period and scheduled maintenance shutdowns at a few Gerdau industrial units. Year-over-year, production came in line, despite the hibernation of the Barão de Cocais (MG), Sete Lagoas (MG) and Cearense (CE) industrial units. The utilization of crude steel production capacity was 69% in 4Q24, down 7 p.p. from 3Q24 and up 2 p.p. from 4Q23. In this same context, steel shipments totaled 2.7 million tonnes in 4Q24, down 3.9% from 4Q24 and up 2.4% from 4Q23. STEEL SHIPMENTS BY BD |
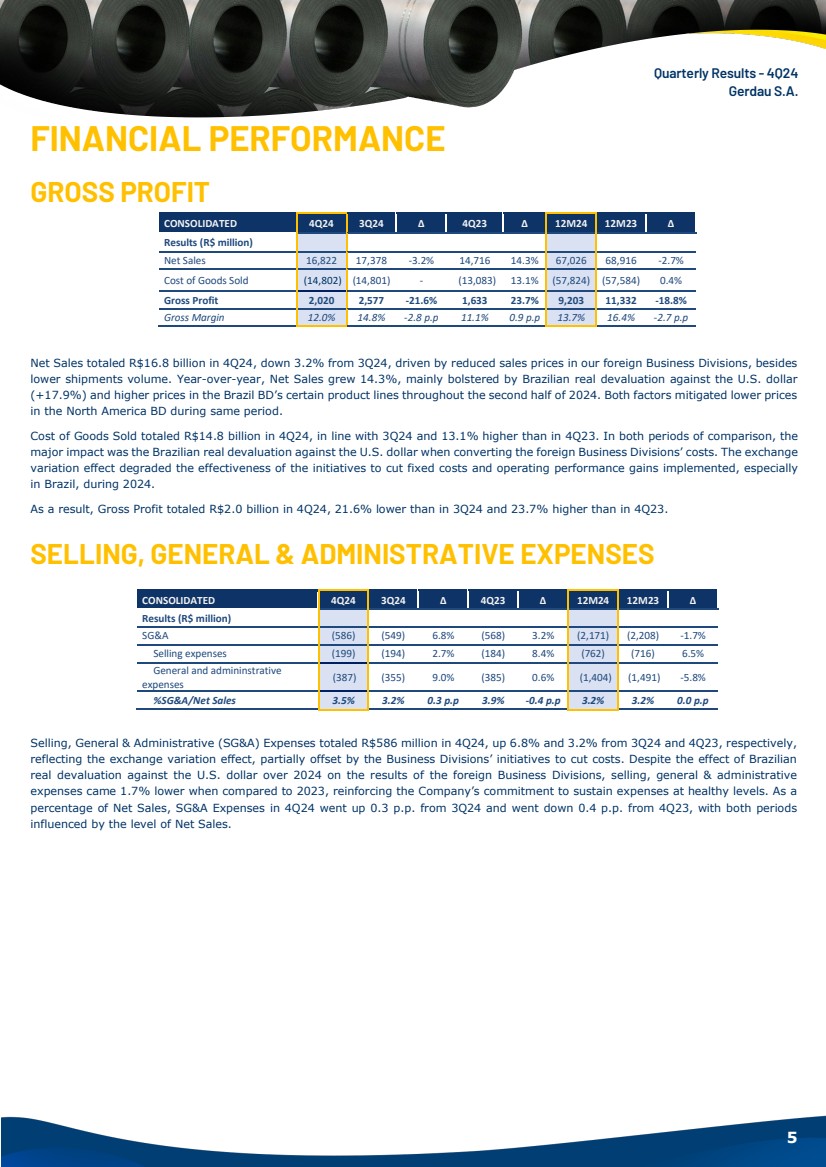
| Quarterly Results - 4Q24 Gerdau S.A. 5 FINANCIAL PERFORMANCE GROSS PROFIT Net Sales totaled R$16.8 billion in 4Q24, down 3.2% from 3Q24, driven by reduced sales prices in our foreign Business Divisions, besides lower shipments volume. Year-over-year, Net Sales grew 14.3%, mainly bolstered by Brazilian real devaluation against the U.S. dollar (+17.9%) and higher prices in the Brazil BD’s certain product lines throughout the second half of 2024. Both factors mitigated lower prices in the North America BD during same period. Cost of Goods Sold totaled R$14.8 billion in 4Q24, in line with 3Q24 and 13.1% higher than in 4Q23. In both periods of comparison, the major impact was the Brazilian real devaluation against the U.S. dollar when converting the foreign Business Divisions’ costs. The exchange variation effect degraded the effectiveness of the initiatives to cut fixed costs and operating performance gains implemented, especially in Brazil, during 2024. As a result, Gross Profit totaled R$2.0 billion in 4Q24, 21.6% lower than in 3Q24 and 23.7% higher than in 4Q23. SELLING, GENERAL & ADMINISTRATIVE EXPENSES Selling, General & Administrative (SG&A) Expenses totaled R$586 million in 4Q24, up 6.8% and 3.2% from 3Q24 and 4Q23, respectively, reflecting the exchange variation effect, partially offset by the Business Divisions’ initiatives to cut costs. Despite the effect of Brazilian real devaluation against the U.S. dollar over 2024 on the results of the foreign Business Divisions, selling, general & administrative expenses came 1.7% lower when compared to 2023, reinforcing the Company’s commitment to sustain expenses at healthy levels. As a percentage of Net Sales, SG&A Expenses in 4Q24 went up 0.3 p.p. from 3Q24 and went down 0.4 p.p. from 4Q23, with both periods influenced by the level of Net Sales. CONSOLIDATED 4Q24 3Q24 ∆ 4Q23 ∆ 12M24 12M23 ∆ Results (R$ million) Net Sales 16,822 17,378 -3.2% 14,716 14.3% 67,026 68,916 -2.7% Cost of Goods Sold (14,802) (14,801) - (13,083) 13.1% (57,824) (57,584) 0.4% Gross Profit 2,020 2,577 -21.6% 1,633 23.7% 9,203 11,332 -18.8% Gross Margin 12.0% 14.8% -2.8 p.p 11.1% 0.9 p.p 13.7% 16.4% -2.7 p.p CONSOLIDATED 4Q24 3Q24 ∆ 4Q23 ∆ 12M24 12M23 ∆ Results (R$ million) SG&A (586) (549) 6.8% (568) 3.2% (2,171) (2,208) -1.7% Selling expenses (199) (194) 2.7% (184) 8.4% (762) (716) 6.5% General and admininstrative expenses (387) (355) 9.0% (385) 0.6% (1,404) (1,491) -5.8% %SG&A/Net Sales 3.5% 3.2% 0.3 p.p 3.9% -0.4 p.p 3.2% 3.2% 0.0 p.p |
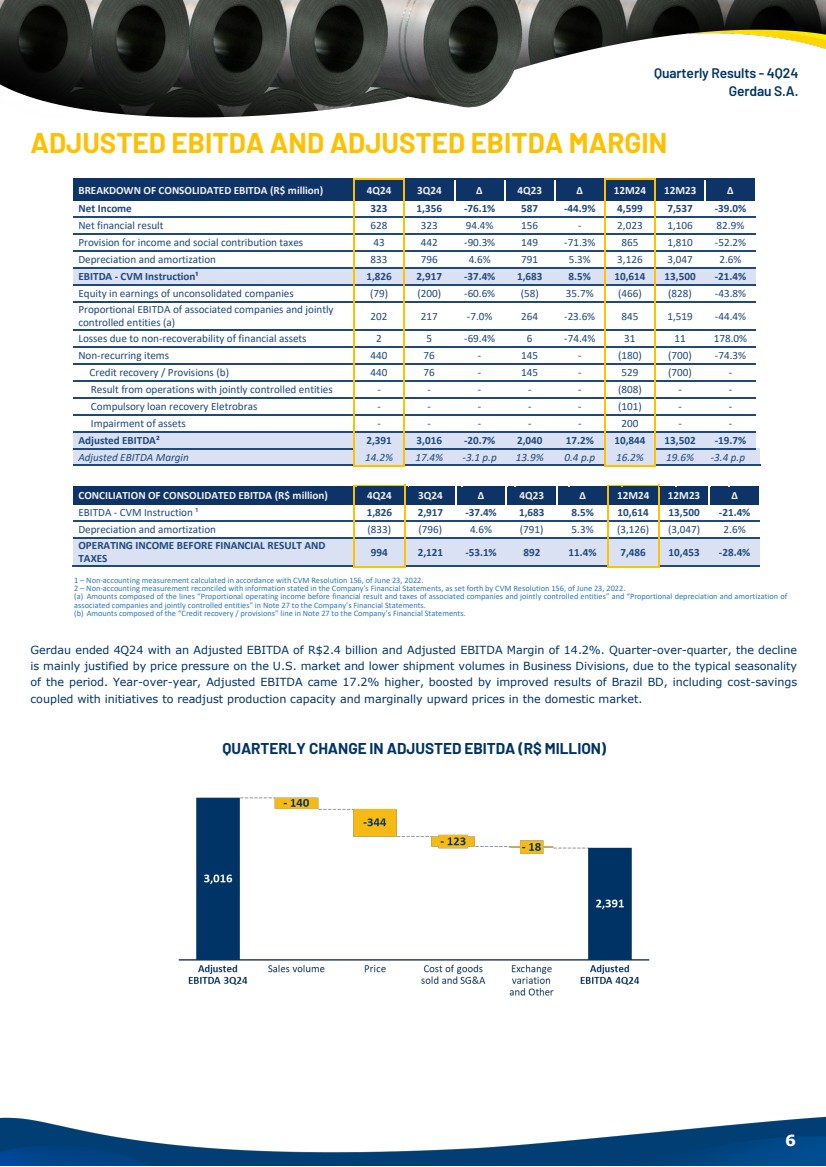
| Quarterly Results - 4Q24 Gerdau S.A. 6 ADJUSTED EBITDA AND ADJUSTED EBITDA MARGIN 1 – Non-accounting measurement calculated in accordance with CVM Resolution 156, of June 23, 2022. 2 – Non-accounting measurement reconciled with information stated in the Company's Financial Statements, as set forth by CVM Resolution 156, of June 23, 2022. (a) Amounts composed of the lines “Proportional operating income before financial result and taxes of associated companies and jointly controlled entities” and “Proportional depreciation and amortization of associated companies and jointly controlled entities" in Note 27 to the Company’s Financial Statements. (b) Amounts composed of the “Credit recovery / provisions” line in Note 27 to the Company’s Financial Statements. Gerdau ended 4Q24 with an Adjusted EBITDA of R$2.4 billion and Adjusted EBITDA Margin of 14.2%. Quarter-over-quarter, the decline is mainly justified by price pressure on the U.S. market and lower shipment volumes in Business Divisions, due to the typical seasonality of the period. Year-over-year, Adjusted EBITDA came 17.2% higher, boosted by improved results of Brazil BD, including cost-savings coupled with initiatives to readjust production capacity and marginally upward prices in the domestic market. QUARTERLY CHANGE IN ADJUSTED EBITDA (R$ MILLION) BREAKDOWN OF CONSOLIDATED EBITDA (R$ million) 4Q24 3Q24 ∆ 4Q23 ∆ 12M24 12M23 ∆ Net Income 323 1,356 -76.1% 587 -44.9% 4,599 7,537 -39.0% Net financial result 628 323 94.4% 156 - 2,023 1,106 82.9% Provision for income and social contribution taxes 43 442 -90.3% 149 -71.3% 865 1,810 -52.2% Depreciation and amortization 833 796 4.6% 791 5.3% 3,126 3,047 2.6% EBITDA - CVM Instruction¹ 1,826 2,917 -37.4% 1,683 8.5% 10,614 13,500 -21.4% Equity in earnings of unconsolidated companies (79) (200) -60.6% (58) 35.7% (466) (828) -43.8% Proportional EBITDA of associated companies and jointly controlled entities (a) 202 217 -7.0% 264 -23.6% 845 1,519 -44.4% Losses due to non-recoverability of financial assets 2 5 -69.4% 6 -74.4% 31 11 178.0% Non-recurring items 440 76 - 145 - (180) (700) -74.3% Credit recovery / Provisions (b) 440 76 - 145 - 529 (700) - Result from operations with jointly controlled entities - - - - - (808) - - Compulsory loan recovery Eletrobras - - - - - (101) - - Impairment of assets - - - - - 200 - - Adjusted EBITDA² 2,391 3,016 -20.7% 2,040 17.2% 10,844 13,502 -19.7% Adjusted EBITDA Margin 14.2% 17.4% -3.1 p.p 13.9% 0.4 p.p 16.2% 19.6% -3.4 p.p CONCILIATION OF CONSOLIDATED EBITDA (R$ million) 4Q24 3Q24 ∆ 4Q23 ∆ 12M24 12M23 ∆ EBITDA - CVM Instruction ¹ 1,826 2,917 -37.4% 1,683 8.5% 10,614 13,500 -21.4% Depreciation and amortization (833) (796) 4.6% (791) 5.3% (3,126) (3,047) 2.6% OPERATING INCOME BEFORE FINANCIAL RESULT AND TAXES 994 2,121 -53.1% 892 11.4% 7,486 10,453 -28.4% |
| Quarterly Results - 4Q24 Gerdau S.A. 7 ADJUSTED EBITDA (R$ MILLION) AND ADJUSTED EBITDA MARGIN (%) FINANCIAL RESULT CONSOLIDATED (R$ million) 4Q24 3Q24 ∆ 4Q23 ∆ 12M24 12M23 ∆ Financial Result (628) (323) 94.4% (156) - (2,023) (1,106) 82.9% Financial income 198 169 17.3% 202 -2.2% 726 903 -19.6% Financial expenses (434) (359) 20.7% (354) 22.5% (1,508) (1,397) 8.0% Tax credit update - - - - - - 253 - Exchange variation (USD x BRL) (114) 6 - 46 - (272) 48 - Exchange variation (other currencies) 81 (28) - (35) - 33 (206) - Inflation adjustments in Argentina (178) (133) 34.1% (12) - (826) (692) 19.3% Gains on financial instruments, net (180) 23 - (2) - (177) (15) - The Financial Result was negative R$628 million in 4Q24, primarily due to the effect of the Brazilian real devaluation against the U.S. dollar and other currencies in the countries where we operate and inflation adjustments to non-monetary items 1 of the subsidiaries in Argentina. 1 Non-monetary items are mostly made up of property, plant, and equipment and shareholders’ equity. |

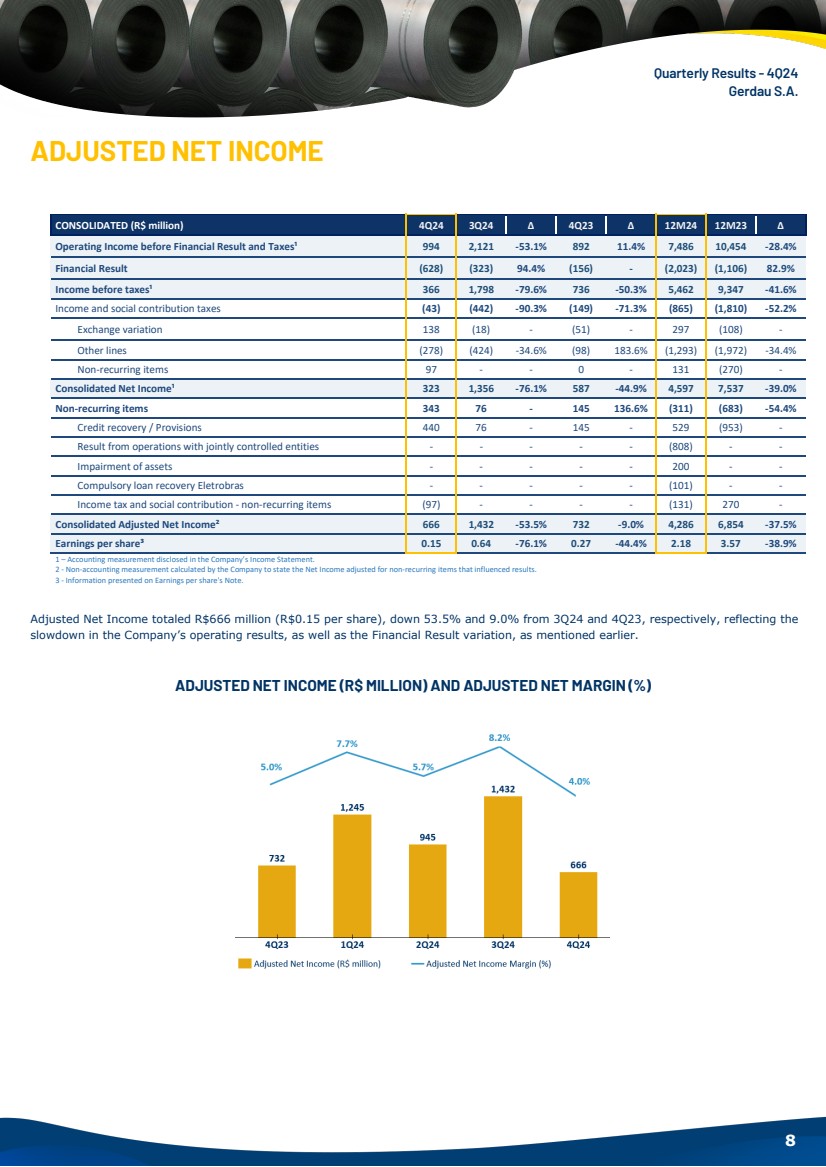
| Quarterly Results - 4Q24 Gerdau S.A. 8 ADJUSTED NET INCOME 1 – Accounting measurement disclosed in the Company’s Income Statement. 2 - Non-accounting measurement calculated by the Company to state the Net Income adjusted for non-recurring items that influenced results. 3 - Information presented on Earnings per share's Note. Adjusted Net Income totaled R$666 million (R$0.15 per share), down 53.5% and 9.0% from 3Q24 and 4Q23, respectively, reflecting the slowdown in the Company’s operating results, as well as the Financial Result variation, as mentioned earlier. ADJUSTED NET INCOME (R$ MILLION) AND ADJUSTED NET MARGIN (%) CONSOLIDATED (R$ million) 4Q24 3Q24 ∆ 4Q23 ∆ 12M24 12M23 ∆ Operating Income before Financial Result and Taxes¹ 994 2,121 -53.1% 892 11.4% 7,486 10,454 -28.4% Financial Result (628) (323) 94.4% (156) - (2,023) (1,106) 82.9% Income before taxes¹ 366 1,798 -79.6% 736 -50.3% 5,462 9,347 -41.6% Income and social contribution taxes (43) (442) -90.3% (149) -71.3% (865) (1,810) -52.2% Exchange variation 138 (18) - (51) - 297 (108) - Other lines (278) (424) -34.6% (98) 183.6% (1,293) (1,972) -34.4% Non-recurring items 97 - - 0 - 131 (270) - Consolidated Net Income¹ 323 1,356 -76.1% 587 -44.9% 4,597 7,537 -39.0% Non-recurring items 343 76 - 145 136.6% (311) (683) -54.4% Credit recovery / Provisions 440 76 - 145 - 529 (953) - Result from operations with jointly controlled entities - - - - - (808) - - Impairment of assets - - - - - 200 - - Compulsory loan recovery Eletrobras - - - - - (101) - - Income tax and social contribution - non-recurring items (97) - - - - (131) 270 - Consolidated Adjusted Net Income² 666 1,432 -53.5% 732 -9.0% 4,286 6,854 -37.5% Earnings per share³ 0.15 0.64 -76.1% 0.27 -44.4% 2.18 3.57 -38.9% |
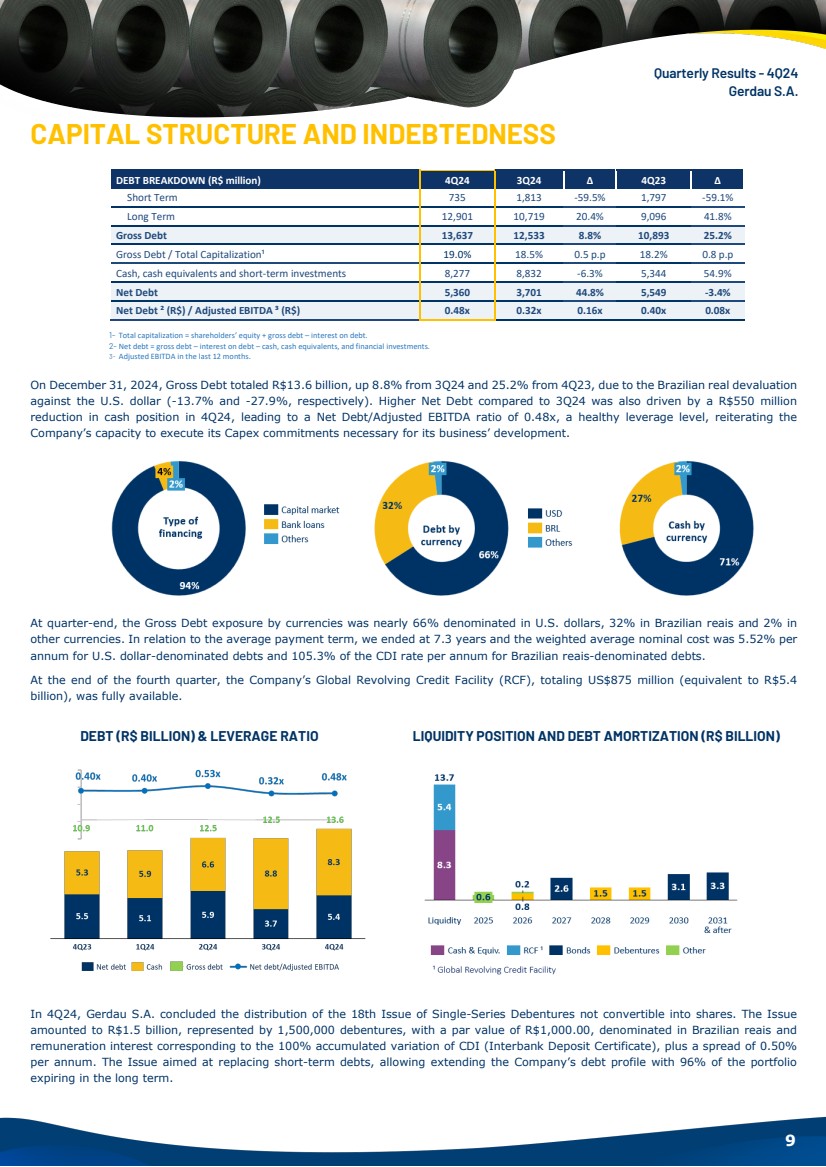
| Quarterly Results - 4Q24 Gerdau S.A. 9 CAPITAL STRUCTURE AND INDEBTEDNESS DEBT BREAKDOWN (R$ million) 4Q24 3Q24 ∆ 4Q23 ∆ Short Term 735 1,813 -59.5% 1,797 -59.1% Long Term 12,901 10,719 20.4% 9,096 41.8% Gross Debt 13,637 12,533 8.8% 10,893 25.2% Gross Debt / Total Capitalization¹ 19.0% 18.5% 0.5 p.p 18.2% 0.8 p.p Cash, cash equivalents and short-term investments 8,277 8,832 -6.3% 5,344 54.9% Net Debt 5,360 3,701 44.8% 5,549 -3.4% Net Debt ² (R$) / Adjusted EBITDA ³ (R$) 0.48x 0.32x 0.16x 0.40x 0.08x 1- Total capitalization = shareholders’ equity + gross debt – interest on debt. 2- Net debt = gross debt – interest on debt – cash, cash equivalents, and financial investments. 3- Adjusted EBITDA in the last 12 months. On December 31, 2024, Gross Debt totaled R$13.6 billion, up 8.8% from 3Q24 and 25.2% from 4Q23, due to the Brazilian real devaluation against the U.S. dollar (-13.7% and -27.9%, respectively). Higher Net Debt compared to 3Q24 was also driven by a R$550 million reduction in cash position in 4Q24, leading to a Net Debt/Adjusted EBITDA ratio of 0.48x, a healthy leverage level, reiterating the Company’s capacity to execute its Capex commitments necessary for its business’ development. At quarter-end, the Gross Debt exposure by currencies was nearly 66% denominated in U.S. dollars, 32% in Brazilian reais and 2% in other currencies. In relation to the average payment term, we ended at 7.3 years and the weighted average nominal cost was 5.52% per annum for U.S. dollar-denominated debts and 105.3% of the CDI rate per annum for Brazilian reais-denominated debts. At the end of the fourth quarter, the Company’s Global Revolving Credit Facility (RCF), totaling US$875 million (equivalent to R$5.4 billion), was fully available. DEBT (R$ BILLION) & LEVERAGE RATIO LIQUIDITY POSITION AND DEBT AMORTIZATION (R$ BILLION) In 4Q24, Gerdau S.A. concluded the distribution of the 18th Issue of Single-Series Debentures not convertible into shares. The Issue amounted to R$1.5 billion, represented by 1,500,000 debentures, with a par value of R$1,000.00, denominated in Brazilian reais and remuneration interest corresponding to the 100% accumulated variation of CDI (Interbank Deposit Certificate), plus a spread of 0.50% per annum. The Issue aimed at replacing short-term debts, allowing extending the Company’s debt profile with 96% of the portfolio expiring in the long term. |
| Quarterly Results - 4Q24 Gerdau S.A. 10 INVESTMENTS (CAPEX) CAPEX totaled nearly R$2.4 billion in 4Q24 and R$6.2 billion in 2024, of which 46% was allocated to Maintenance and 54% to Competitiveness, reiterating the Company’s strategy of enhancing the competitiveness of its operations, especially the Brazil and North America BDs, which already accounted for approximately 88% of CAPEX invested in 2024. Furthermore, we sustained the level of nearly R$1.5 billion investments with environmental returns and projects aimed at ensuring the safety of our personnel, thereby reinforcing our commitment to building an increasingly sustainable future. At Brazil BD, the investment in the project to expand flat steel rolling capacity, aiming at increasing the hot coil line by 250,000 tonnes/year, had its installations completed between November and December 2024, during the Company's scheduled shutdown. The investment is currently in the final testing phase, which will reach its full production capacity by the second half of 2025. Additionally, in 4Q24, the project to expand iron ore production capacity advanced as planned. The purchases and foundations phases of the project have been concluded, and the project is currently in the assembly phase. This investment is scheduled for completion in December 2025, making it possible to reach full production capacity of 5.5 million tonnes of iron ore/year in the second half of 2026. 2025 CAPEX PLAN On February 19, 2025, Gerdau S.A.’s Board of Directors approved its CAPEX2 plan for current year amounting to R$6.0 billion. This amount refers to Maintenance and Competitiveness CAPEX projects. i. Maintenance projects are associated with extending the useful life and implementing operational improvements of equipment to ensure optimal industrial units’ performance. ii. Competitiveness projects 3 are related to production growth, increased profitability, and industrial units’ modernization, based on bolstering sustainability practices, as well as the sustainable and economic development of the business. Out of total estimate for 2025, nearly R$1.6 billion are investments with environmental returns (expansion of forestry assets, upgrading and enhancing environmental controls, reducing greenhouse gas emissions and technological improvements) and projects aiming our employees’ safety. The Company reiterates that the execution of the CAPEX plan mentioned above will be contingent upon prevailing market conditions and the economic scenario of the countries in which it operates, as well as the sectors in which it is engaged. 2 The CAPEX plan does not include contributions made by Gerdau Next to other companies since, in accordance with international accounting standards (IFRS), only subsidiaries are consolidated in the Company's financial statements. 3 Competitiveness investments include Strategic CAPEX, as well as other investments for Gerdau's business divisions. |

| Quarterly Results - 4Q24 Gerdau S.A. 11 WORKING CAPITAL & CASH CONVERSION CYCLE At the end of 4Q24, Working Capital totaled R$16.0 billion. Despite the effect of exchange variation in the quarter (+13.7%), lower accounts receivable in most Business Divisions contributed to Working Capital remaining in line with 3Q24. Year-over-year, Working Capital came 12.4% higher mainly due to the exchange variation effect in the period (+27.9%). The Cash Conversion Cycle (Working Capital divided by Net Sales in the quarter) increased from 83 to 85 days, driven by lower Net Sales in 4Q24, down 3.2% quarter-over-quarter. Detailed information on Working Capital accounts is presented in Notes 5, 6, and 14 to the Financial Statements. FREE CASH FLOW Free Cash Flow was positive R$427 million in 4Q24, nearly R$2.5 billion lower than in 3Q24, primarily driven by a cash effect of approximately R$1.8 billion due to the court deposit received from the case related to the exclusion of ICMS tax from the PIS and COFINS tax base in 3Q24. Excluding this effect, quarter-over-quarter Free Cash Flow variation was nearly R$750 million, explained by i) a slowdown in the Company’s operating results; ii) half-yearly interest payments on bonds issued abroad; and iii) payment of agreement signed with CADE (Brazilian Antitrust Authority) on December 30, 2024, totaling R$256 million. However, these transactions were partially offset by the R$888 million working capital released in the period. 1- Includes the cash effect of customers, inventories, and suppliers accounts. 2- Includes the cash effect of income tax on the Company’s several subsidiaries, including the portion accrued in previous periods and due in the current period. 3- Includes the addition of R$2,396 million in CAPEX in 4Q24, deducted from R$529 million not disbursed in 2024. 4- Includes the payment of interest on loans and financing, and interest on lease. 5- Proportional EBITDA of the joint ventures net of dividends received from these joint ventures. 6- Disbursements for other intangible assets and lease payments. 7- Other changes include the Other Assets and Liabilities accounts. |

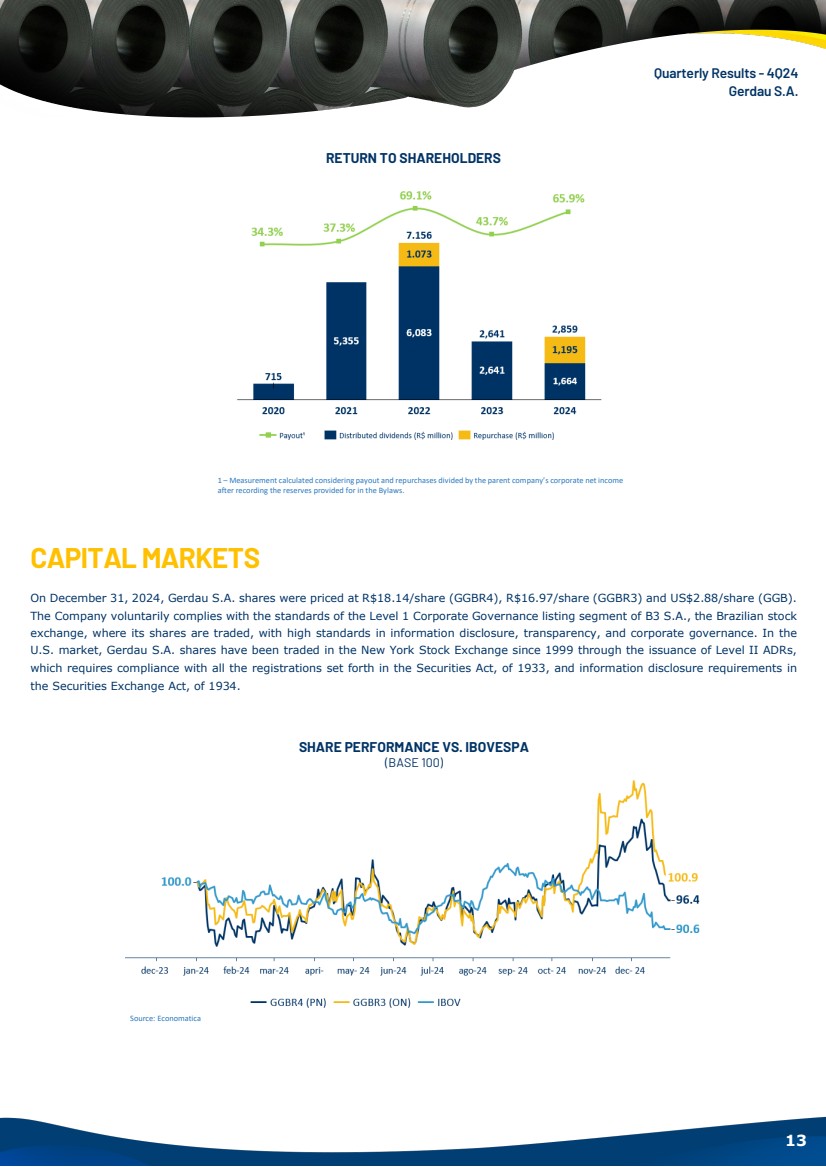
| Quarterly Results - 4Q24 Gerdau S.A. 12 RECONCILIATION OF FREE CASH FLOW WITH THE CASH FLOW STATEMENT 1 – Non-accounting measurement calculated by the Company to state Free Cash Flow. 2 – Accounting measurement disclosed in the Company’s Cash Flow Statement. RETURNTO SHAREHOLDERS DIVIDENDS On February 19, 2025, the Board of Directors of Gerdau S.A. approved the distribution of dividends in the amount of R$0.10 per share, equivalent to R$203.4 million. The payment will be made on March 14, 2025, based on shareholders of record on March 5, 2025, with ex-dividend date on March 6, 2025. The Company has maintained its policy of distributing the minimum amount of 30% of parent company Gerdau S.A.’s corporate annual Net Income after recording the reserves provided for in the Bylaws. SHARE BUYBACK PROGRAM As released in the Material Fact of January 20, 2025, the Company announced the conclusion of 100% of its “2024 Share Buyback Program”. Throughout the program, 1,767,911 common shares (GGBR3) were acquired at the average price of R$17.78/share and 68,000,000 preferred shares (GGBR4 and/or GGB) at the average price of R$18.89/share, corresponding to 3.4% of outstanding shares. In addition, during the program’s effectiveness period, the Company canceled a total of 1,767,911 common shares (GGBR3) and 54,000,000 preferred shares (GGBR4) issued by the Company, with no par value and without reducing the share capital. After the cancellation of shares, the Company’s share capital is now divided into 718,863,819 common shares and 1,333,848,730 non-par value preferred shares. Besides that, the Board of Directors approved a new buyback program of shares issued by Gerdau S.A., with a quantity to be acquired of up to 63,000,000 preferred shares, representing nearly 5% of preferred shares (GGBR4) and/or ADRs backed by outstanding preferred shares (GGB) and up to 1,500,000 common shares, representing 10% of outstanding common shares (GGBR3). Maintaining the consistency of return to shareholders and, through the payment of dividends in line with the policy and the execution of the buyback program, the Company distributed R$2.9 billion in 2024, or a payout of 65.9%. CONSOLIDATED (R$ million) 4Q24 3Q24 ∆ 4Q23 ∆ 12M24 12M23 ∆ Free Cash Flow¹ 427 2,974 (2,547) 1,179 (753) 2,878 4,729 (1,851) (+) Purchases of property, plant and equipment 1,867 1,658 209 1,540 327 5,779 5,209 570 (+) Additions in other intangibles 44 42 2 36 8 168 127 40 (+) Leasing payment 131 110 21 79 52 460 388 72 (-) Short-term investments (15) (324) 310 (1,536) 1,521 (925) (7,224) 6,299 (+) Proceeds from maturities and sales of short-term investments 332 1,368 (1,036) 2,314 (1,982) 3,021 7,909 (4,888) Net cash provided by operating activities² 2,787 5,828 (3,041) 3,613 (827) 11,380 11,139 242 |

| Quarterly Results - 4Q24 Gerdau S.A. 13 RETURN TO SHAREHOLDERS 1 – Measurement calculated considering payout and repurchases divided by the parent company’s corporate net income after recording the reserves provided for in the Bylaws. CAPITAL MARKETS On December 31, 2024, Gerdau S.A. shares were priced at R$18.14/share (GGBR4), R$16.97/share (GGBR3) and US$2.88/share (GGB). The Company voluntarily complies with the standards of the Level 1 Corporate Governance listing segment of B3 S.A., the Brazilian stock exchange, where its shares are traded, with high standards in information disclosure, transparency, and corporate governance. In the U.S. market, Gerdau S.A. shares have been traded in the New York Stock Exchange since 1999 through the issuance of Level II ADRs, which requires compliance with all the registrations set forth in the Securities Act, of 1933, and information disclosure requirements in the Securities Exchange Act, of 1934. SHARE PERFORMANCE VS. IBOVESPA (BASE 100) Source: Economatica |
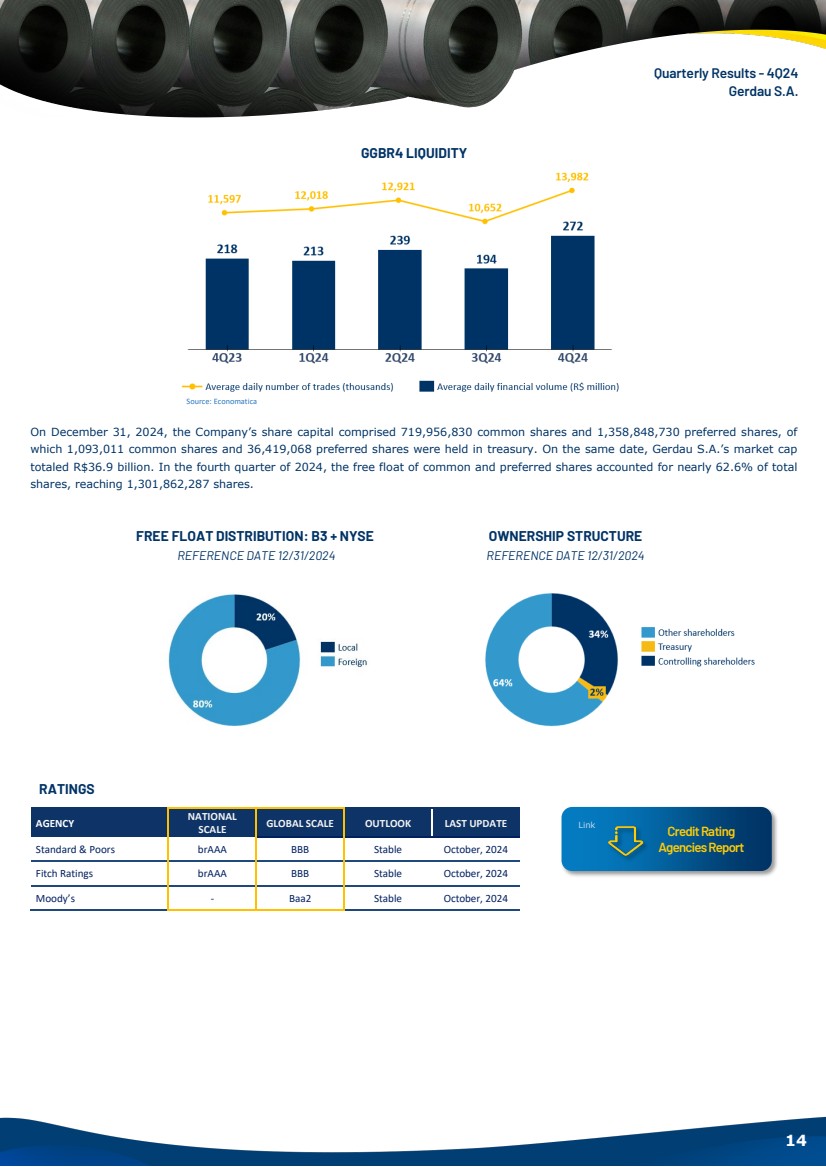
| Quarterly Results - 4Q24 Gerdau S.A. 14 GGBR4 LIQUIDITY Source: Economatica On December 31, 2024, the Company’s share capital comprised 719,956,830 common shares and 1,358,848,730 preferred shares, of which 1,093,011 common shares and 36,419,068 preferred shares were held in treasury. On the same date, Gerdau S.A.’s market cap totaled R$36.9 billion. In the fourth quarter of 2024, the free float of common and preferred shares accounted for nearly 62.6% of total shares, reaching 1,301,862,287 shares. FREE FLOAT DISTRIBUTION: B3 + NYSE REFERENCE DATE 12/31/2024 OWNERSHIP STRUCTURE REFERENCE DATE 12/31/2024 RATINGS AGENCY NATIONAL SCALE GLOBAL SCALE OUTLOOK LAST UPDATE Standard & Poors brAAA BBB Stable October, 2024 Fitch Ratings brAAA BBB Stable October, 2024 Moody’s - Baa2 Stable October, 2024 Credit Rating Agencies Report Link |
| Quarterly Results - 4Q24 Gerdau S.A. 15 PERFORMANCE BY BUSINESS DIVISION (BD) Gerdau presents its results through its Business Divisions (BD): BRAZIL BD — includes the operations in Brazil (except special steel) and the iron ore operation; NORTH AMERICA BD — includes all operations in North America (Canada and United States), except special steel, as well as the jointly controlled company in Mexico; SPECIAL STEEL BD — includes the special steel operations in Brazil and the United States, as well as the jointly controlled company in Brazil; SOUTH AMERICA BD — includes the operations in Argentina, Peru, and Uruguay. NET SALES (R$ MILLION) Modeling Guide Link Annual Report Link |

| Quarterly Results - 4Q24 Gerdau S.A. 16 ADJUSTED EBITDA 4 (R$ MILLION) and ADJUSTED EBITDA MARGIN (%) BRAZIL BD PRODUCTION & SHIPMENTS ∙ According to IABR data, apparent steel consumption in the Brazilian market fell by 9.9% in 4Q24 versus 3Q24, driven by the seasonal drop in imports in December. However, steel imports surged 18.2% in 2024 versus 2023. Considering the monthly average, imports of products covered by the quota tariff system went up 5.6% from June to December 2024 (quotas in force) compared to January to May 2024. The steel industry is in ongoing dialogue with the Brazilian government to identify effective measures that will reduce the inflow of imported steel in the country; ∙ At Brazil BD, lower crude steel production in 4Q24 versus 3Q24 was driven by scheduled maintenance shutdowns, mainly at Ouro Branco (preparation for the startup of the new hot-rolled coil mill). Year-over-year, the steel production growth, despite the hibernation of the Barão de Cocais, Sete Lagoas and Cearense industrial units in 2Q24, reinforces units’ higher occupation and productivity; ∙ In 4Q24, total shipments came in line with 3Q24 and 1.2% higher than in 4Q23, driven by exports growth that hit its highest level since 4Q19, offsetting the decline seen in the domestic market (-10.1%) and supporting the dilution of fixed costs and maintaining operating leverage. In the domestic market, long steel shipments grew by 6.3% year-over-year, bolstered by the improved performance of 4 Non-accounting measurement calculated by the Company. The Company states Adjusted EBITDA to provide additional information on cash generation in the period. The percentage of Adjusted EBITDA from business divisions is calculated considering the total Adjusted EBITDA of the four business divisions. BRAZIL BD 4Q24 3Q24 ∆ 4Q23 ∆ 12M24 12M23 ∆ Volumes (1,000 tonnes) Production of crude steel 1,312 1,442 -9.0% 1,224 7.2% 5,399 5,209 3.7% Shipments of steel 1,284 1,290 -0.5% 1,269 1.2% 5,059 5,150 -1.8% Domestic Market 952 1,059 -10.1% 964 -1.2% 4,090 4,155 -1.6% Exports 332 232 43.1% 305 8.8% 969 995 -2.6% Shipments of long steel 835 893 -6.5% 805 3.7% 3,359 3,369 -0.3% Domestic Market 603 686 -12.1% 567 6.3% 2,563 2,525 1.5% Exports 232 207 11.8% 237 -2.5% 796 844 -5.7% Shipments of flat steel 449 397 13.0% 464 -3.2% 1,700 1,782 -4.6% Domestic Market 349 373 -6.3% 397 -12.0% 1,527 1,630 -6.4% Exports 100 24 - 67 48.8% 173 151 14.5% |
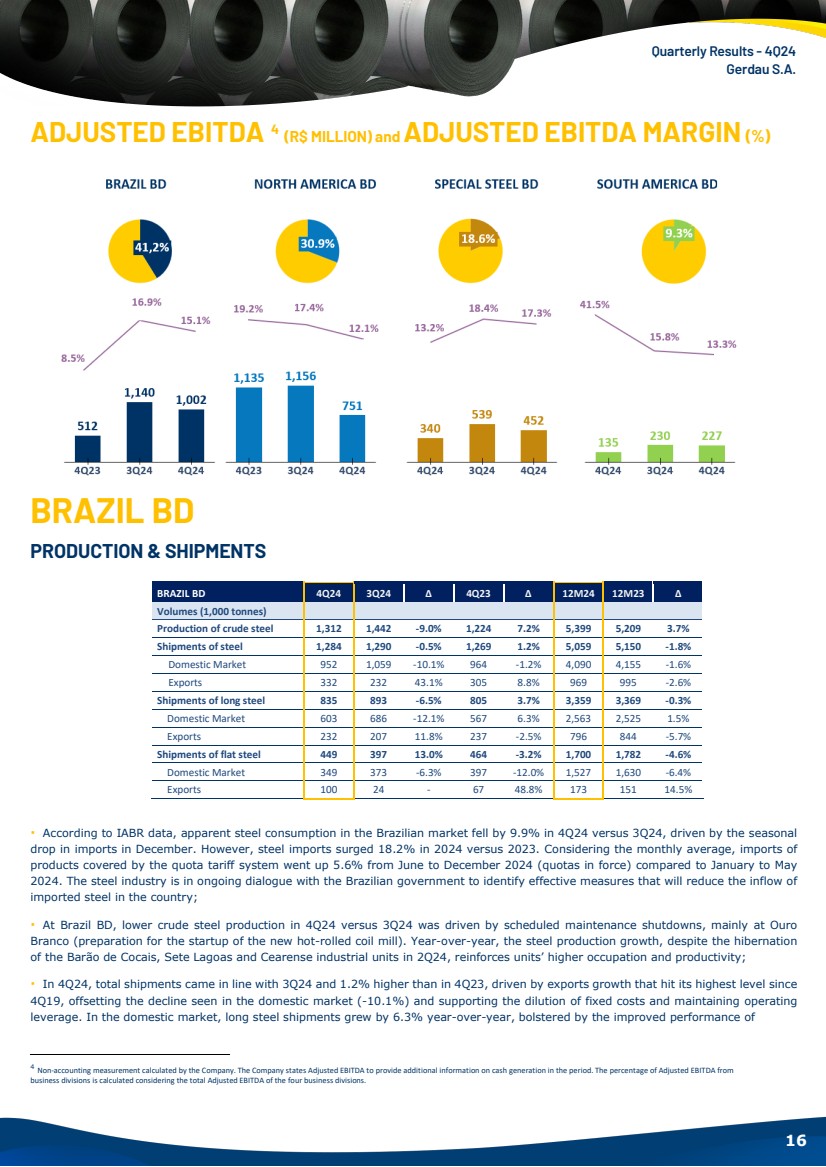
| Quarterly Results - 4Q24 Gerdau S.A. 17 demanding sectors such as civil construction and infrastructure. Conversely, flat steel shipments were impacted especially by the scheduled shutdown for the conclusion of the hot coil investment at the Ouro Branco industrial unit; ∙ In 4Q24, 211,000 tonnes of iron ore were sold to third parties and 1,096,000 tonnes were consumed internally. OPERATING RESULT 1 – Includes iron ore sales. 2 – Non-accounting measurement reconciled with information stated in Note 22 to the Company’s Financial Statements, as set forth by CVM Resolution 156, of June 23, 2022. ∙ In 4Q24, Net Sales per tonne came slightly lower than in 3Q24, on the back of greater share of exports in the quarter, neutralizing higher net sales per tonne in the domestic market (+2%). Year-over-year, Net Sales grew 10.1%, fueled by improved price scenario in the domestic market and the Brazilian real devaluation, benefiting exports profitability; ∙ In 4Q24, the cost of goods sold per tonne came in line with 3Q24 and 4Q23, mainly influenced by scheduled maintenance shutdowns, higher price and mix of some raw materials, such as pig iron and iron ore, which neutralized the savings from cost and expense reduction initiatives. In the second half of 2024, we realized gains from the announced cost-savings initiatives, amounting to nearly R$450 million. This achievement reaffirms our commitment to delivering the R$1.0 billion guidance and underscores our dedication to cost discipline and the ongoing pursuit of enhanced efficiency; ∙ The Adjusted EBITDA came 12.1% lower than in 3Q24, impacted mainly by the greater share of exports in the sales mix in the period, which carried lower margins. As a result, Brazil BD’s margin went down 1.8 p.p. It is worth noting that export margins benefited this quarter due to the more depreciated exchange scenario. The increase in Adjusted EBITDA and the Adjusted EBITDA Margin by 6.6 p.p. over 4Q23 reflects the improved operating results mentioned earlier. NORTH AMERICA BD PRODUCTION & SHIPMENTS ∙ In 4Q24, crude steel production was lower compared to both periods, due to scheduled maintenance shutdowns, mainly at the Midlothian industrial unit, on the back of the project progress to enhance the capacity; ∙ Shipment volume came lower than in the 3Q24 due to year-end typical seasonality and market uncertainties regarding demand and forward pricing. These factors are particularly relevant considering the recent change in leadership in the United States and its potential impact on the steel industry. Year-over-year, shipment volume grew 3.2%, reflecting the resilient demand arising from industrial investments linked to reshoring and IIJA (Infrastructure Investment and Jobs Act); ∙ During 4Q24, North America BD's order backlog returned to levels of approximately 60 days across all product lines. BRAZIL BD 4Q24 3Q24 ∆ 4Q23 ∆ 12M24 12M23 ∆ Results (R$ million) Net Sales¹ 6,647 6,738 -1.4% 6,034 10.1% 25,962 26,831 -3.2% Domestic Market 5,482 5,939 -7.7% 5,142 6.6% 22,674 23,437 -3.3% Exports 1,164 800 45.6% 892 30.5% 3,289 3,394 -3.1% Cost of Goods Sold (5,732) (5,757) -0.4% (5,726) 0.1% (23,222) (24,172) -3.9% Gross profit 914 981 -6.8% 308 196.6% 2,740 2,658 3.1% Gross margin (%) 13.8% 14.6% -0.8 p.p 5.1% 8.6 p.p 10.6% 9.9% 0.7 p.p Adjusted EBITDA² 1,002 1,140 -12.1% 512 95.8% 3,271 3,436 -4.8% Adjusted EBITDA Margin² (%) 15.1% 16.9% -1.8 p.p 8.5% 6.6 p.p 12.6% 12.8% -0.2 p.p NORTH AMERICA BD 4Q24 3Q24 ∆ 4Q23 ∆ 12M24 12M23 ∆ Volumes (1,000 tonnes) Production of crude steel 919 1,022 -10.1% 966 -4.9% 4,186 4,209 -0.5% Shipments of steel 914 976 -6.4% 885 3.2% 3,834 3,907 -1.9% |

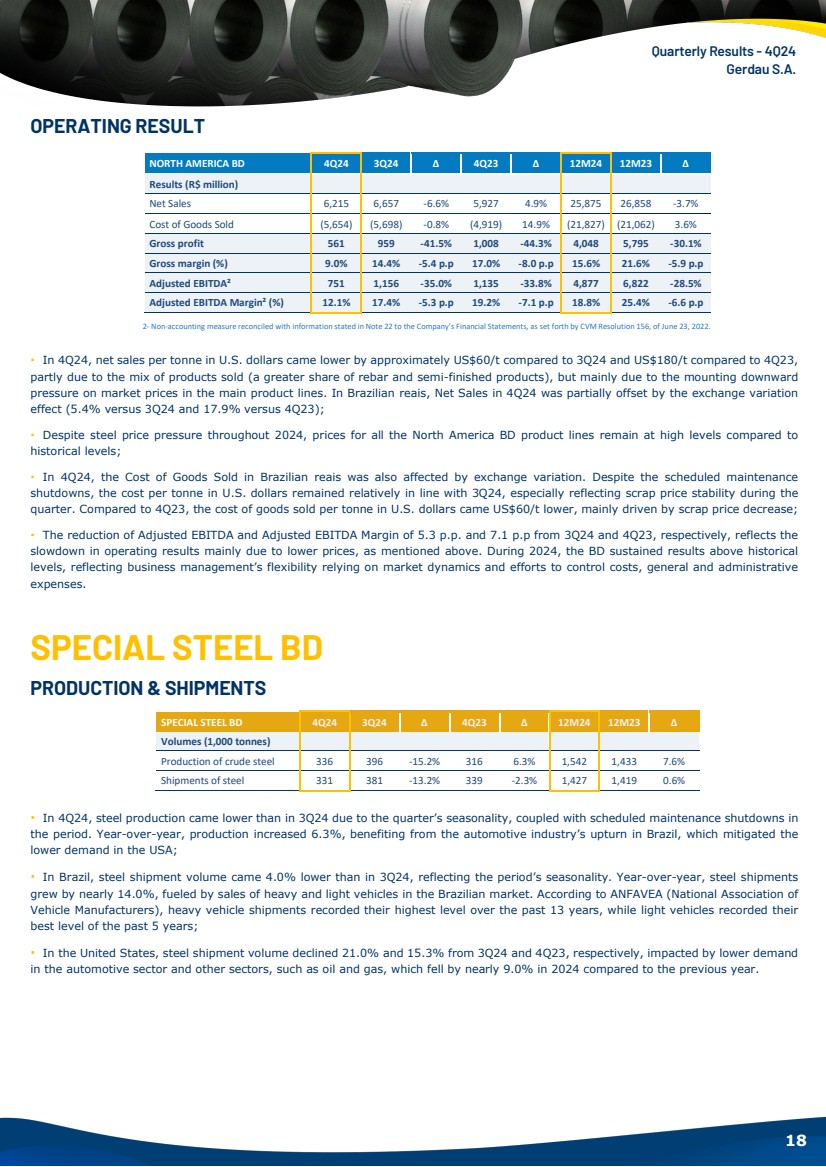
| Quarterly Results - 4Q24 Gerdau S.A. 18 OPERATING RESULT 2- Non-accounting measure reconciled with information stated in Note 22 to the Company’s Financial Statements, as set forth by CVM Resolution 156, of June 23, 2022. ∙ In 4Q24, net sales per tonne in U.S. dollars came lower by approximately US$60/t compared to 3Q24 and US$180/t compared to 4Q23, partly due to the mix of products sold (a greater share of rebar and semi-finished products), but mainly due to the mounting downward pressure on market prices in the main product lines. In Brazilian reais, Net Sales in 4Q24 was partially offset by the exchange variation effect (5.4% versus 3Q24 and 17.9% versus 4Q23); ∙ Despite steel price pressure throughout 2024, prices for all the North America BD product lines remain at high levels compared to historical levels; ∙ In 4Q24, the Cost of Goods Sold in Brazilian reais was also affected by exchange variation. Despite the scheduled maintenance shutdowns, the cost per tonne in U.S. dollars remained relatively in line with 3Q24, especially reflecting scrap price stability during the quarter. Compared to 4Q23, the cost of goods sold per tonne in U.S. dollars came US$60/t lower, mainly driven by scrap price decrease; ∙ The reduction of Adjusted EBITDA and Adjusted EBITDA Margin of 5.3 p.p. and 7.1 p.p from 3Q24 and 4Q23, respectively, reflects the slowdown in operating results mainly due to lower prices, as mentioned above. During 2024, the BD sustained results above historical levels, reflecting business management’s flexibility relying on market dynamics and efforts to control costs, general and administrative expenses. SPECIAL STEEL BD PRODUCTION & SHIPMENTS ∙ In 4Q24, steel production came lower than in 3Q24 due to the quarter’s seasonality, coupled with scheduled maintenance shutdowns in the period. Year-over-year, production increased 6.3%, benefiting from the automotive industry’s upturn in Brazil, which mitigated the lower demand in the USA; ∙ In Brazil, steel shipment volume came 4.0% lower than in 3Q24, reflecting the period’s seasonality. Year-over-year, steel shipments grew by nearly 14.0%, fueled by sales of heavy and light vehicles in the Brazilian market. According to ANFAVEA (National Association of Vehicle Manufacturers), heavy vehicle shipments recorded their highest level over the past 13 years, while light vehicles recorded their best level of the past 5 years; ∙ In the United States, steel shipment volume declined 21.0% and 15.3% from 3Q24 and 4Q23, respectively, impacted by lower demand in the automotive sector and other sectors, such as oil and gas, which fell by nearly 9.0% in 2024 compared to the previous year. NORTH AMERICA BD 4Q24 3Q24 ∆ 4Q23 ∆ 12M24 12M23 ∆ Results (R$ million) Net Sales 6,215 6,657 -6.6% 5,927 4.9% 25,875 26,858 -3.7% Cost of Goods Sold (5,654) (5,698) -0.8% (4,919) 14.9% (21,827) (21,062) 3.6% Gross profit 561 959 -41.5% 1,008 -44.3% 4,048 5,795 -30.1% Gross margin (%) 9.0% 14.4% -5.4 p.p 17.0% -8.0 p.p 15.6% 21.6% -5.9 p.p Adjusted EBITDA² 751 1,156 -35.0% 1,135 -33.8% 4,877 6,822 -28.5% Adjusted EBITDA Margin² (%) 12.1% 17.4% -5.3 p.p 19.2% -7.1 p.p 18.8% 25.4% -6.6 p.p SPECIAL STEEL BD 4Q24 3Q24 ∆ 4Q23 ∆ 12M24 12M23 ∆ Volumes (1,000 tonnes) Production of crude steel 336 396 -15.2% 316 6.3% 1,542 1,433 7.6% Shipments of steel 331 381 -13.2% 339 -2.3% 1,427 1,419 0.6% |
| Quarterly Results - 4Q24 Gerdau S.A. 19 OPERATING RESULT 2- Non-accounting measurement reconciled with information stated in Note 22 to the Company’s Financial Statements, as set forth by CVM Resolution 156, of June 23, 2022. ∙ In 4Q24, Net Sales went down 10.6% from 3Q24 driven by lower shipment volumes and a slight drop in net sales per tonne in the USA, partially offset by Brazilian real devaluation (+5.4%). Year-over-year, the BD’s net sales per tonne came 3.5% higher due to the exchange variation effect (+17.9%), which offset the more challenging special steel price scenario in 2024; ∙ The Cost of Goods Sold per tonne went up 5.0% in 4Q24 from 3Q24, on the back of scheduled maintenance shutdowns both in Brazil and in the USA. Year-over-year, in Brazil, the Cost of Goods Sold per tonne was approximately 14.0% lower, reflecting the consolidation of initiatives that bring greater competitiveness and profitability to the operation. In the North America BD, the exchange variation effect mitigated lower cost of goods sold per tonne, which went down 4.0% in 4Q24; ∙ Adjusted EBITDA and the Adjusted EBITDA Margin fell slightly compared to 3Q24, reflecting a decline in operating results in the United States, while in Brazil we recorded the 2nd best result of the year, despite the typical seasonality of the period. Year-over-year, both indicators grew mainly as a result of profitability gains from initiatives to enhance the Brazil BD’s industrial performance and cut costs, as explained earlier. SOUTH AMERICA BD PRODUCTION & SHIPMENTS 1- Includes resale of products imported from the Brazil BD. ∙ In 4Q24, compared to the weaker production base of the previous quarter, customer inventory levels favored the growth of steel production in Argentina; ∙ Steel shipments came 2.9% and 11.4% higher than in 3Q24 and 4Q23, driven by the operations in Peru, which recorded the best shipment level since 1Q22, reflecting the demand from execution of public works in the country. OPERATING RESULT 2- Non-accounting measurement reconciled with information stated in Note 22 to the Company’s Financial Statements, as set forth by CVM Resolution 156, of June 23, 2022. SPECIAL STEEL BD 4Q24 3Q24 ∆ 4Q23 ∆ 12M24 12M23 ∆ Results (R$ million) Net Sales 2,609 2,919 -10.6% 2,580 1.1% 10,990 11,385 -3.5% Cost of Goods Sold (2,257) (2,476) -8.9% (2,333) -3.3% (9,383) (9,688) -3.1% Gross profit 352 443 -20.6% 247 42.4% 1,607 1,698 -5.3% Gross margin (%) 13.5% 15.2% -1.7 p.p 9.6% 3.9 p.p 14.6% 14.9% -0.3 p.p Adjusted EBITDA² 452 539 -16.0% 340 33.2% 1,970 1,915 2.9% Adjusted EBITDA Margin² (%) 17.3% 18.4% -1.1 p.p 13.2% 4.2 p.p 17.9% 16.8% 1.1 p.p SOUTH AMERICA BD 4Q24 3Q24 ∆ 4Q23 ∆ 12M24 12M23 ∆ Volumes (1,000 tonnes) Production of crude steel 151 118 28.2% 182 -17.2% 575 705 -18.5% Shipments of steel¹ 271 263 2.9% 243 11.4% 1,010 1,125 -10.2% SOUTH AMERICA BD 4Q24 3Q24 ∆ 4Q23 ∆ 12M24 12M23 ∆ Results (R$ million) Net Sales 1,711 1,452 17.8% 326 - 5,759 5,118 12.5% Cost of Goods Sold (1,528) (1,250) 22.2% (303) - (4,931) (4,014) 22.8% Gross profit 183 202 -9.6% 23 - 828 1,104 -25.0% Gross margin (%) 10.7% 13.9% -3.2 p.p 7.0% 3.7 p.p 14.4% 21.6% -7.2 p.p Adjusted EBITDA² 227 230 -1.4% 135 67.7% 969 1,607 -39.7% Adjusted EBITDA Margin² (%) 13.3% 15.8% -2.6 p.p 41.5% -28.2 p.p 16.8% 31.4% -14.6 p.p |

| Quarterly Results - 4Q24 Gerdau S.A. 20 ∙ In 4Q24, Net Sales grew 17.8% over 3Q24, due to the exchange variation effect, which offset the steel price decline and a greater share of semi-finished products sold. We point out that in 4Q23, Argentina’s results were strongly impacted by the effects of inflation and currency devaluation, caused by economic measures announced by the government at the end of 2023; ∙ Cost of Goods Sold came 22.2% higher than in 3Q24 on the back of scheduled maintenance shutdowns, coupled with the exchange variation effect. In the year-over-year comparison, the result reflects the impacts already mentioned earlier; ∙ Adjusted EBITDA went down 1.4% from 3Q24, influenced by a slowdown in operating results. Year-over-year, the Adjusted EBITDA increase of 67.7% is due to the impacts on Argentina’s results during that period, besides the exchange effect. We highlight that in 4Q23, the South America BD’s Adjusted EBITDA included the proportional EBITDA of equity interest held in the Colombia and the Dominican Republic joint ventures recognized in that period 5. 5 The divestment of all equity interest in joint ventures Diaco S.A and Gerdau Metaldom Corp. was concluded in 1Q24. |
| Quarterly Results - 4Q24 Gerdau S.A. 21 APPENDICES ASSETS GERDAU S.A. CONSOLIDATED BALANCE SHEETS In thousands of Brazilian reais (R$) Consolidated December 31, 2024 December 31, 2023 CURRENT ASSETS Cash and cash equivalents 7,767,813 3,005,645 Short-term investments 509,030 2,338,097 Trade accounts receivable 5,176,958 4,875,394 Inventories 15,504,911 15,227,778 Tax credits 1,153,122 1,009,824 Income and social contribution taxes recoverable 914,395 986,068 Dividends receivable 125 1,036 Fair value of derivatives 16,921 766 Assets held for sale - 1,210,041 Other current assets 626,148 543,288 32,669,423 29,197,937 NON-CURRENT ASSETS Tax credits 1,744,387 1,916,100 Deferred income taxes 2,427,648 2,219,461 Judicial deposits 332,560 2,064,070 Other non-current assets 358,806 355,390 Prepaid pension cost 9,716 11,695 Fair value of derivatives 35,947 - Investments in associates and joint ventures 4,222,317 3,858,449 Goodwill 13,853,114 10,825,148 Leasing 1,168,694 1,182,654 Other Intangibles 400,567 373,710 Property, plant and equipment, net 29,591,314 22,880,530 54,145,070 45,687,207 TOTAL ASSETS 86,814,493 74,885,144 |

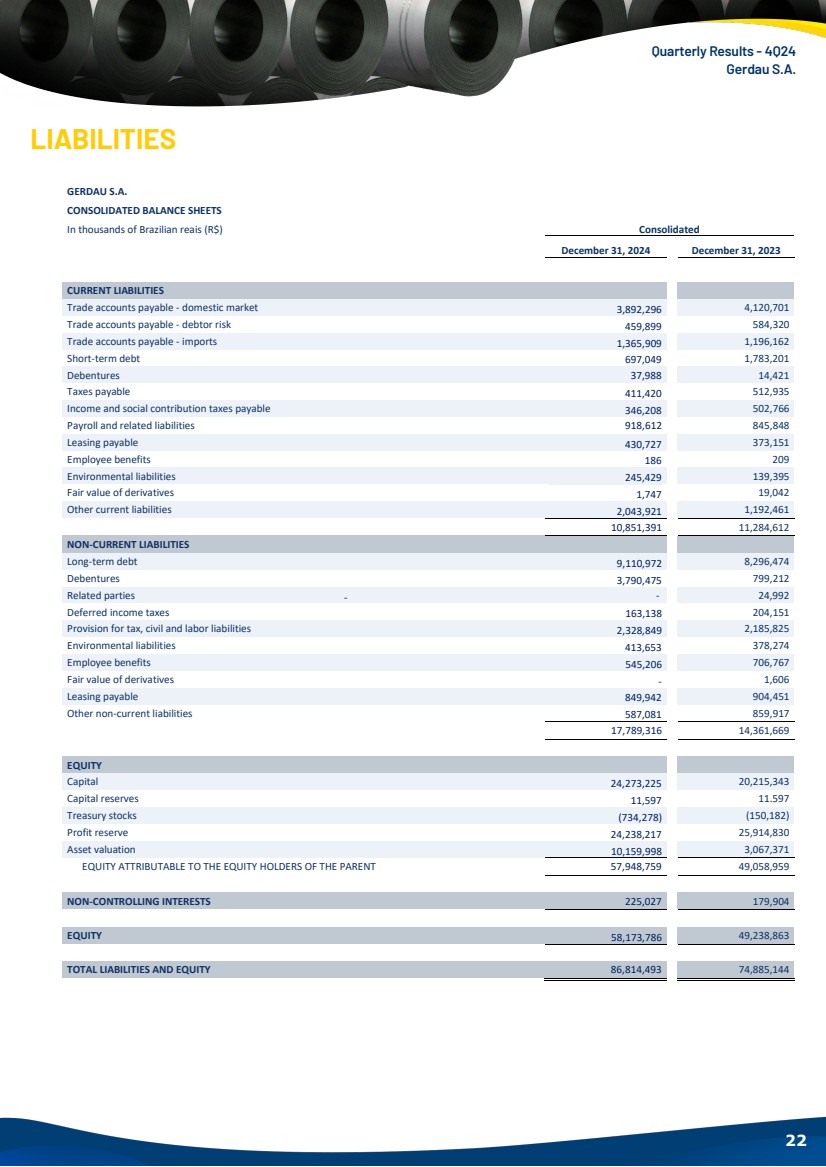
| Quarterly Results - 4Q24 Gerdau S.A. 22 LIABILITIES GERDAU S.A. CONSOLIDATED BALANCE SHEETS In thousands of Brazilian reais (R$) Consolidated December 31, 2024 December 31, 2023 CURRENT LIABILITIES Trade accounts payable - domestic market 3,892,296 4,120,701 Trade accounts payable - debtor risk 459,899 584,320 Trade accounts payable - imports 1,365,909 1,196,162 Short-term debt 697,049 1,783,201 Debentures 37,988 14,421 Taxes payable 411,420 512,935 Income and social contribution taxes payable 346,208 502,766 Payroll and related liabilities 918,612 845,848 Leasing payable 430,727 373,151 Employee benefits 186 209 Environmental liabilities 245,429 139,395 Fair value of derivatives 1,747 19,042 Other current liabilities 2,043,921 1,192,461 10,851,391 11,284,612 NON-CURRENT LIABILITIES Long-term debt 9,110,972 8,296,474 Debentures 3,790,475 799,212 Related parties - - 24,992 Deferred income taxes 163,138 204,151 Provision for tax, civil and labor liabilities 2,328,849 2,185,825 Environmental liabilities 413,653 378,274 Employee benefits 545,206 706,767 Fair value of derivatives - 1,606 Leasing payable 849,942 904,451 Other non-current liabilities 587,081 859,917 17,789,316 14,361,669 EQUITY Capital 24,273,225 20,215,343 Capital reserves 11,597 11.597 Treasury stocks (734,278) (150,182) Profit reserve 24,238,217 25,914,830 Asset valuation 10,159,998 3,067,371 EQUITY ATTRIBUTABLE TO THE EQUITY HOLDERS OF THE PARENT 57,948,759 49,058,959 NON-CONTROLLING INTERESTS 225,027 179,904 EQUITY 58,173,786 49,238,863 TOTAL LIABILITIES AND EQUITY 86,814,493 74,885,144 |
| Quarterly Results - 4Q24 Gerdau S.A. 23 INCOME STATEMENT GERDAU S.A. CONSOLIDATED INCOME STATEMENT In thousands of Brazilian reais (R$) Consolidated Consolidated For the three-month period ended Period ended December 31, 2024 December 31, 2023 2024 2023 NET SALES 16,822,544 14,715,516 67,026,656 68,916,447 Cost of sales (14,802,534) (13,082,750) (57,823,416) (57,583,992) GROSS PROFIT 2,020,010 1,632,766 9,203,240 11,332,455 Selling expenses (199,285) (183,761) (762,560) (716,195) General and administrative expenses (387,134) (384,621) (1,404,059) (1,491,441) Other operating income 50,696 82,081 306,426 1,033,506 Other operating expenses (567,742) (307,548) (999,002) (522,476) Compulsory loan recovery Eletrobras - - 100,860 - Result from operations with jointly controlled entities - - 808,367 - Reversal (Losses) Impairment of financial assets (1,536) (5,663) (30,910) (10,728) Impairment of assets - - (199,627) - Equity in earnings of unconsolidated companies 78,347 57,992 464,467 827,606 INCOME BEFORE FINANCIAL INCOME (EXPENSES) AND TAXES 993,356 891,246 7,487,202 10,452,727 Financial income 197,694 202,227 726,154 903,019 Financial expenses (433,931) (354,172) (1,508,339) (1,396,789) Exchange variations, net (211,162) (1,184) (1,064,401) (850,375) Tax credits monetary update - - - 253,002 Gains (Losses) on financial instruments, net (180,270) (2,409) (176,901) (14,979) INCOME BEFORE TAXES 365,687 735,708 5,463,715 9,346,605 Current (260,106) (268,477) (1,159,640) (1,810,459) Deferred 217,383 119,565 294,987 837 Income and social contribution taxes (42,723) (148,912) (864,653) (1,809,622) NET INCOME 322,964 586,796 4,599,062 7,536,983 (-) Credit recovery / Provisions 439,941 145,362 528,964 (699,854) (-) Compulsory loan recovery Eletrobras - - (100,860) - (-) Result from operations with jointly controlled entities - - (808,367) - (-) Impairment of assets - - 199,627 - (-) Tax credits monetary update - - - (253,002) (-/+) Income tax of extraordinary items (97,298) - (131,755) 270,456 (=) Total of extraordinary items 342,643 145,362 (312,391) (682,400) ADJUSTED NET INCOME* 665,607 732,158 4,286,671 6,854,583 1 - Adjusted net income is a non-accounting measurement prepared by the Company, reconciled with its financial statements, and consists of net income adjusted for non-recurring events that impacted net income |

| Quarterly Results - 4Q24 Gerdau S.A. 24 CASH FLOW Consolidated Consolidated GERDAU S.A. CONSOLIDATED STATEMENTS OF CASH FLOWS In thousands of Brazilian reais (R$) For the three-month period ended Year ended on December 31, 2024 December 31, 2023 2024 2023 Cash flows from operating activities Net income for the period 322,964 586,796 4,599,062 7,536,983 Adjustments to reconcile net income for the period to net cash provided by operating activities: Depreciation and amortization 832,866 790,836 3,126,247 3,047,212 Impairment of assets - - 199,627 - Equity in earnings of unconsolidated companies (78,347) (57,992) (464,467) (827,606) Exchange variation, net 211,162 1,184 1,064,401 850,375 Losses on derivative financial instruments, net 180,270 2,409 176,901 14,979 Post-employment benefits 57,201 45,713 257,359 235,977 Long-term incentive plans 37,870 35,178 152,414 157,979 Income tax 42,723 148,912 864,653 1,809,622 Losses on disposal of property, plant and equipment 7,969 1,315 45,859 27,525 Result from operations with jointly controlled entities - - (808,367) - Impairment of financial assets 1,536 5,663 30,910 10,728 Provision of tax, civil, labor and environmental liabilities, net 89,213 19,696 210,305 160,245 Tax credits recovery - - (100,860) (1,098,218) Interest income on short-term investments (68,738) (55,531) (274,291) (481,624) Interest expense on debt and debentures 219,822 209,142 796,933 840,069 Interest on loans with related parties 26,131 - 129,137 127,787 (Reversal) Provision for net realizable value adjustment in inventory, net 9,687 32,703 (33,137) 12,036 1,892,329 1,766,024 9,972,686 12,424,069 Changes in assets and liabilities Decrease (Increase) in trade accounts receivable 970,725 711,662 549,548 (294,509) Decrease in inventories 334,421 146,951 542,496 1,305,424 Decrease in trade accounts payable (417,646) 420,166 (1,192,990) (355,416) Decrease (Increase) in other assets 174,556 (6,742) 1,881,763 (107,171) Decrease (Increase) in other liabilities (299,650) 12,464 (407,073) (434,100) Dividends from associates and joint ventures 346,152 383,631 414,653 461,292 Purchases of short-term investments (14,566) (1,535,861) (924,686) (7,223,644) Proceeds from maturities and sales of short-term investments 331,932 2,313,824 3,020,432 7,908,990 Cash provided by operating activities 3,318,253 4,212,119 13,856,829 13,684,935 Interest paid on loans and financing (460,845) (399,634) (946,936) (858,301) Interest paid on lease liabilities (26,131) (49,155) (129,137) (127,787) Income and social contribution taxes paid (44,624) (150,028) (1,399,513) (1,560,137) Net cash provided by operating activities 2,786,653 3,613,302 11,381,243 11,138,710 Cash flows from investing activities Purchases of property, plant and equipment (1,867,115) (1,540,353) (5,778,381) (5,209,128) Proceeds from sales of property, plant and equipment, investments and other intangibles 33,952 30,325 1,559,697 40,661 Additions in other intangibles (44,402) (36,187) (168,036) (127,195) Repurchase of shares from jointly controlled entities - - - 47,006 Payment in the acquisition of company control (455,683) - (455,683) - Capital increase in joint ventures (90,878) (427,532) (191,947) (524,185) Net cash generated (applied) in investing activities (2,424,126) (1,973,747) (5,034,350) (5,772,841) Cash flows from financing activities Purchases of treasury shares (844,935) - (1,194,726) - Dividends and interest on capital paid (643,364) (828,256) (1,656,414) (2,683,328) Proceeds from loans and financing 1,820,964 117,914 3,918,019 1,776,684 Repayment of loans and financing (1,619,448) (138,073) (3,269,587) (2,830,684) Leasing payment (131,217) (79,383) (459,504) (388,202) Intercompany loans, net - (296) (24,992) 102 Net cash used by financing activities (1,418,000) (928,094) (2,687,204) (4,125,428) Exchange variation on cash and cash equivalents 749,182 (620,345) 1,102,479 (710,659) Increase (Decrease) in cash and cash equivalents (306,291) 91,116 4,762,168 529,782 Cash and cash equivalents at beginning of year 8,074,104 2,914,529 3,005,645 2,475,863 Cash and cash equivalents at end of the period 7,767,813 3,005,645 7,767,813 3,005,645 |

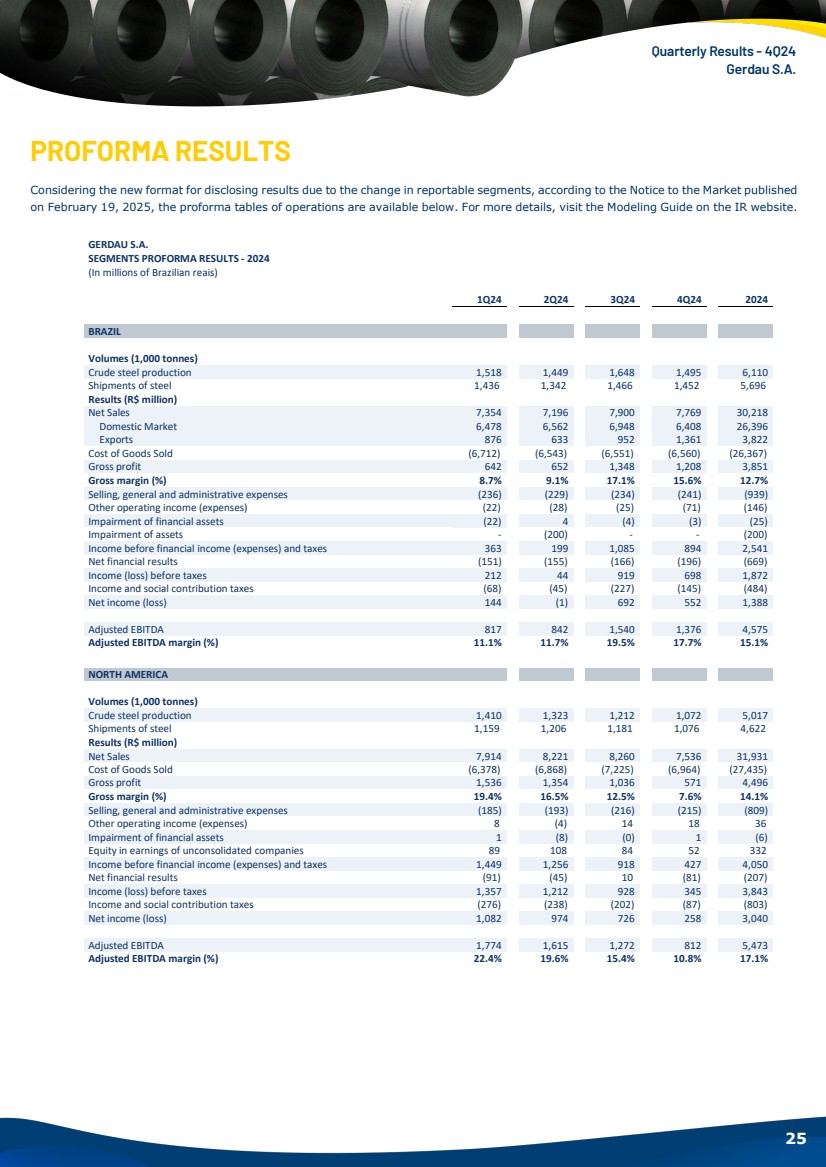
| Quarterly Results - 4Q24 Gerdau S.A. 25 PROFORMA RESULTS Considering the new format for disclosing results due to the change in reportable segments, according to the Notice to the Market published on February 19, 2025, the proforma tables of operations are available below. For more details, visit the Modeling Guide on the IR website. GERDAU S.A. SEGMENTS PROFORMA RESULTS - 2024 (In millions of Brazilian reais) 1Q24 2Q24 3Q24 4Q24 2024 BRAZIL Volumes (1,000 tonnes) Crude steel production 1,518 1,449 1,648 1,495 6,110 Shipments of steel 1,436 1,342 1,466 1,452 5,696 Results (R$ million) Net Sales 7,354 7,196 7,900 7,769 30,218 Domestic Market 6,478 6,562 6,948 6,408 26,396 Exports 876 633 952 1,361 3,822 Cost of Goods Sold (6,712) (6,543) (6,551) (6,560) (26,367) Gross profit 642 652 1,348 1,208 3,851 Gross margin (%) 8.7% 9.1% 17.1% 15.6% 12.7% Selling, general and administrative expenses (236) (229) (234) (241) (939) Other operating income (expenses) (22) (28) (25) (71) (146) Impairment of financial assets (22) 4 (4) (3) (25) Impairment of assets - (200) - - (200) Income before financial income (expenses) and taxes 363 199 1,085 894 2,541 Net financial results (151) (155) (166) (196) (669) Income (loss) before taxes 212 44 919 698 1,872 Income and social contribution taxes (68) (45) (227) (145) (484) Net income (loss) 144 (1) 692 552 1,388 Adjusted EBITDA 817 842 1,540 1,376 4,575 Adjusted EBITDA margin (%) 11.1% 11.7% 19.5% 17.7% 15.1% NORTH AMERICA Volumes (1,000 tonnes) Crude steel production 1,410 1,323 1,212 1,072 5,017 Shipments of steel 1,159 1,206 1,181 1,076 4,622 Results (R$ million) Net Sales 7,914 8,221 8,260 7,536 31,931 Cost of Goods Sold (6,378) (6,868) (7,225) (6,964) (27,435) Gross profit 1,536 1,354 1,036 571 4,496 Gross margin (%) 19.4% 16.5% 12.5% 7.6% 14.1% Selling, general and administrative expenses (185) (193) (216) (215) (809) Other operating income (expenses) 8 (4) 14 18 36 Impairment of financial assets 1 (8) (0) 1 (6) Equity in earnings of unconsolidated companies 89 108 84 52 332 Income before financial income (expenses) and taxes 1,449 1,256 918 427 4,050 Net financial results (91) (45) 10 (81) (207) Income (loss) before taxes 1,357 1,212 928 345 3,843 Income and social contribution taxes (276) (238) (202) (87) (803) Net income (loss) 1,082 974 726 258 3,040 Adjusted EBITDA 1,774 1,615 1,272 812 5,473 Adjusted EBITDA margin (%) 22.4% 19.6% 15.4% 10.8% 17.1% |
| Quarterly Results - 4Q24 Gerdau S.A. 26 GERDAU S.A. SEGMENTS PROFORMA RESULTS - 2024 (In millions of Brazilian reais) 1Q24 2Q24 3Q24 4Q24 2024 SOUTH AMERICA Volumes (1,000 tonnes) Crude steel production 162 144 118 151 575 Shipments of steel 227 249 263 271 1,010 Results (R$ million) Net Sales 1,191 1,405 1,452 1,711 5,759 Cost of Goods Sold (937) (1,215) (1,250) (1,528) (4,931) Gross profit 254 190 202 183 828 Gross margin (%) 21.3% 13.5% 13.9% 10.7% 14.4% Selling, general and administrative expenses (35) (41) (44) (56) (177) Other operating income (expenses) 9 2 1 1 12 Impairment of financial assets 1 0 (1) 0 0 Income before financial income (expenses) and taxes 227 151 158 127 664 Net financial results (321) (214) (208) (149) (893) Income (loss) before taxes (94) (64) (50) (22) (230) Income and social contribution taxes 30 27 13 22 91 Net income (loss) (63) (37) (37) (1) (138) Adjusted EBITDA 285 226 230 227 968 Adjusted EBITDA margin (%) 23.9% 16.1% 15.8% 13.3% 16.8% CONSOLIDATED Volumes (1,000 tonnes) Crude steel production 3,091 2,916 2,978 2,718 11,702 Shipments of steel 2,724 2,712 2,829 2,719 10,984 Results (R$ million) Net Sales 16,210 16,616 17,378 16,823 67,027 Cost of Goods Sold (13,791) (14,429) (14,801) (14,803) (57,823) Gross profit 2,420 2,187 2,577 2,020 9,203 Gross margin (%) 14.9% 13.2% 14.8% 12.0% 13.7% Selling, general and administrative expenses (501) (531) (549) (586) (2,167) Other operating income (expenses) (34) (41) (100) (517) (693) Impairment of financial assets (20) (4) (5) (2) (31) Recovery of Eletrobras compulsory loan - 101 - - 101 Result from operations with jointly controlled entities 808 - - - 808 Impairment of assets - (200) - - (200) Equity in earnings of unconsolidated companies 79 108 199 78 464 Income before financial income (expenses) and taxes 2,752 1,620 2,121 993 7,487 Net financial results (476) (597) (323) (628) (2,023) Income (loss) before taxes 2,277 1,023 1,799 366 5,464 Income and social contribution taxes (224) (156) (442) (43) (865) Net income (loss) 2,053 867 1,356 323 4,599 Adjusted EBITDA 2,815 2,624 3,016 2,388 10,843 Adjusted EBITDA margin (%) 17.4% 15.8% 17.4% 14.2% 16.2% |

| Quarterly Results - 4Q24 Gerdau S.A. 27 WHO WE ARE LARGEST BRAZILIAN STEEL PRODUCER With 124 years of history, Gerdau is Brazil’s largest producer of steel, a leading supplier of long steel in the Americas, and special steel globally. In Brazil, Gerdau also produces flat steel and iron ore for own consumption. In addition, it has a new business division, Gerdau Next, aiming at venturing into segments adjacent to steel. The Company is dedicated to empowering individuals to shape the future. With a global presence in multiple countries, it employs over 30,000 people directly and indirectly. Recognized as the largest recycler in Latin America, Gerdau utilizes scrap as a significant raw material, with nearly 70% of its steel production derived from scrap. Annually, it transforms more than 10 million tonnes of scrap into a diverse range of steel products. The Company is also the world's largest charcoal producer, with more than 250,000 hectares of forest base in the state of Minas Gerais. As a result of its sustainable production matrix, Gerdau currently has one of the lowest average greenhouse gases (CO₂e) emissions, at 0.91 tonnes of CO₂e per tonne of steel, which is approximately half the global average for the sector, of 1.91 tonnes of CO₂e per tonne of steel (Worldsteel). Gerdau shares are listed on the São Paulo (B3) and New York (NYSE) stock exchanges. For more information, visit the Investor Relations website: https://ri.gerdau.com/ |

| IR CONTACTS Investor Relations website: http://ri.gerdau.com/ IR e-mail: inform@gerdau.com ∙ Rafael Japur Vice President and Investor Relations Officer ∙ Mariana Velho Dutra IR Manager ∙ Ariana De Cesare ∙ Renata Albuquerque ∙ Gustavo Alves ∙ Arthur Alves Trovo ∙ Adriana Dias Costa PRESS: Press e-mail: atendimentogerdau.br@bcw-global.com |
