FORM 6-K
SECURITIES AND EXCHANGE COMMISSION
Washington, D.C. 20549
Report of Foreign Private Issuer
Pursuant to Rule 13s – 16 or 15d – 16 of
the Securities Exchange Act of 1934
For the month of June 2006
Acambis plc
(Translation of registrant’s name into English)
Peterhouse Technology Park
100 Fulbourn Road
Cambridge CB1 9PT
England
(address of principal executive offices)
(Indicate by check mark whether the registrant files or will file annual reports under cover of
Form 20-F or Form 40-F).
Forms 20-F ![]() Form 40-F
Form 40-F ![]()
(Indicate by check mark whether the registrant by furnishing the information contained in this Form is
also thereby furnishing the information to the Commission pursuant to Rule 12g3-2(b) under the
Securities Exchange Act of 1934).
Yes ![]() No
No 
(If “Yes” is marked, indicate below the file number assigned to the registrant in connection with
Rule 12g3-2(b): 82- ).
Enclosure:
Annual Report 2005
A future we can see
Preview
Annual Report 2005

| ||
| ||
| ||
| ||
| ||
| ||
| ||
|
‘We aim to make Acambis one of the world’s leading infectious disease companies. Whilst our current focus is on vaccines, we will consider the development of other biological products in due course. With the cash from our smallpox vaccine contracts, we have developed our infrastructure and increased the investment in our pipeline to generate long-term value for shareholders.
In “Preview”, we lay out our strategy for transforming Acambis into a fully integrated infectious disease company, one that invests in innovative new products to make a difference in the war against infectious diseases.
In “Review”, we report on our progress in 2005.’
ALAN SMITH, CHAIRMAN
About Acambis
Acambis is a biopharmaceutical company operating in the infectious disease arena, with a focus on developing new vaccines. We are headquartered in Cambridge, UK. The majority of our operations are based in the US, with R&D in Cambridge, MA, manufacturing in Canton, MA and Rockville, MD, and sales and marketing in Miami, FL. We are a UK public limited company with shares listed on the LSE since 1995 and on NASDAQ, in the form of ADRs, since 2001. We employ around 290 people.
About this Annual Report
This is the Annual Report for the year ended 31 December 2005. It contains the Annual Report and Financial Statements in accordance with UK regulations. The Annual Report on Form 20-F for the US SEC will be filed separately. References to the Group and Acambis throughout this document relate to Acambis plc and all of its subsidiary and associated undertakings. References to the Company are to Acambis plc, the ultimate holding company. For further information on Acambis, please visit our website at www.acambis.com
Cautionary statement regarding forward-looking statements
Under the safe harbour provisions of the US Private Securities Litigation Reform Act of 1995, the Company cautions investors that any forward-looking statements or projections made in this document are subject to risks and uncertainties that may cause actual results to differ materially from those projected. These forward-looking statements are based on estimates and assumptions made by the management of Acambis and are believed to be reasonable, though are inherently uncertain and difficult to predict. Actual results or experience could differ materially from the forward-looking statements. Factors that may affect the Group’s operations are discussed in the performance review and financial review and the corporate governance statement contained within this Annual Report and in documents as filed with the US SEC from time to time.
Definitions for abbreviations used throughout this document are provided on page 96.
1 |
We have a bold vision of the kind of company we want Acambis to be. This is our long-term, ambitious view of where we want to take the business over the next decade and beyond.
Our vision is to win the war against infectious disease.
Our mission is that, by providing innovative products to protect the world from the ravages of infectious disease, we will create a sustainable company that is focused on making a difference.
We are already helping to protect 200 million lives; there are 6.3 billion more to go...
2 | Strategic goals |
Today, infectious diseases cause 25% of deaths worldwide1. At Acambis, we aim to make a difference by turning scientific innovation into products that can save lives.
Healthcare products for combating infectious diseases range from vaccines and monoclonal antibodies to anti-bacterials, anti-virals and immunoglobulins. Commercially, the total ‘anti-infectives’ market is worth an estimated $50bn2, making it the third largest pharmaceutical market. Our immediate focus is on vaccines, which is the fastest-growing infectious disease sector.
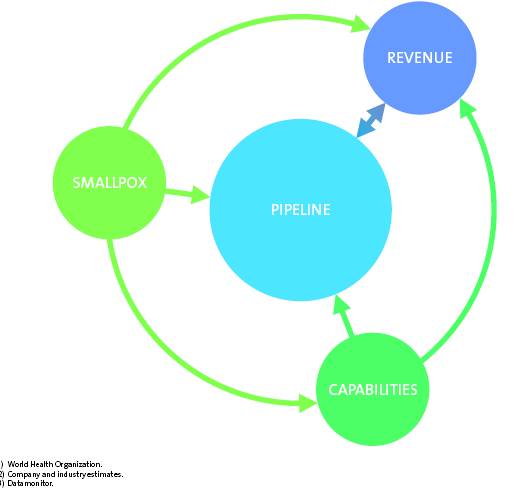
OUR STRATEGY
With the cash generated by our smallpox
franchise and Vivotif® sales, we are investing
in driving our pipeline forward and building
key capabilities to maximise long-term value.
3 | ||
| A clear, simple strategy | |
|
| |
| Four key drivers |
|
|
| |
| Why vaccines? |
|
|
|
‘Vaccines are back | WHY VACCINES? | ||
| GORDON CAMERON, CHIEF EXECUTIVE OFFICER | |||
|
| ||
| Vaccines used to be the ‘poor cousin’ of the pharmaceutical industry; low margin products made by local producers for cents per dose did little to encourage investment in vaccine innovation. In the 1980s and early 1990s, this situation was compounded by rising costs, increasing litigation and ever-more-burdensome regulatory requirements, which conspired to push companies out of the industry. Now, vaccines are being driven back to the top of the healthcare, pharmaceutical and political agenda. From biodefence to pandemic influenza, from hospital-acquired infections to emerging viruses and bacteria, vaccines are the front line of public health. And the statistics prove it: the prophylactic vaccine market has increased rapidly in recent years, reaching an estimated $8.5bn in 2004.3 Over the next decade, that market is expected to grow by a further 15% per annum, driven by three key factors: the launch of new vaccines; greater market penetration; and a paradigm shift around pricing. With new products expected to account for more than 50% of that growth and the groundwork on pricing already laid by the pharmaceutical companies, the potential for companies like Acambis is significant. |
| |

As part of our strategy to build Acambis into a company that can make a difference in the fight against infectious diseases, we have four key goals:
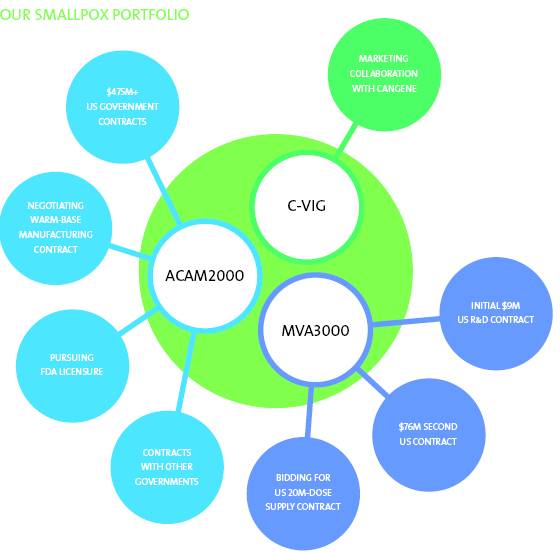
01 | MAXIMISE OUR SMALLPOX FRANCHISE We are the world leader in smallpox vaccines, having supplied more doses to more governments than any other company. By capitalising on our strengths, we aim to make the most of the opportunities available to us – warm-base manufacturing for the US, manufacturing ACAM2000 vaccine for other governments and MVA vaccine for the US – in order to generate funds to invest in our pipeline. |
| 02 | BUILD A BILLION DOLLAR PIPELINE Our pipeline is our principal asset for creating shareholder value. By delivering on what we have today – short- and medium-term projects with a range of commercial opportunities – we are establishing a sound base for our portfolio. By adding, over time, other products that offer significant commercial potential, we can turn today’s base into a billion dollar pipeline. | |
|
|
|
|
| |
03 | FULLY INTEGRATE FROM CONCEPT TO COMMERCIALISATION We want to generate as much value as possible from our pipeline. In time, we will develop, manufacture and sell our own products wherever we can create value by doing so. For now, profits from sales of Vivotif® are already contributing to our pipeline investment and our manufacturing assets are helping us to control our costs and timelines. We complement our strengths where necessary through partnerships with other companies. |
| 04 | INCREASE RECURRING REVENUE STREAMS The cost of developing new products is significant, as is investing in assets that can generate greater value in the long term, such as manufacturing. Our aim is to capitalise on all sources of funding available to us to supplement shareholder investment. In addition to bidding for smallpox contracts, we also aim to increase the size and diversity of our recurring revenue streams, particularly through using our sales and distribution infrastructure. |
4 | Strategic goals |
In the field of smallpox vaccines, Acambis is the world leader. We have supplied more doses of smallpox vaccine to more countries than any other company. We are also the only company to have supplied vaccine doses to the US Government’s Strategic National Stockpile, which it is continuing to build under Project Bioshield. This gives us an unrivalled track record. To maximise the revenues we can gain from our smallpox franchise, we are now targeting two principal opportunities: ACAM2000 warm-base manufacturing for the US Government and supply of MVA3000 to the US Government.
5 | ||
| Focused on two principal opportunities | |
|
| |
| Three related products |
|
|
| |
| The smallpox opportunity |
|
|
|
‘Significant support | THE SMALLPOX OPPORTUNITY | ||
| THOMAS MONATH, CHIEF SCIENTIFIC OFFICER | |||
|
| ||
| The environment for biodefence vaccines continues to be challenging, not least because concerns about pandemic influenza are creating competition for government funding. However, significant support still exists for smallpox preparedness efforts, as demonstrated in the US by the ongoing MVA procurement and the CDC entering negotiations on warm-base manufacturing. Speaking at a Congressional hearing in February 2005, Senator Ted Kennedy reflected: ‘America owes a debt of gratitude for what Acambis did in producing 180 million doses of vaccine to keep the nation safe from smallpox. I hope the Administration will build on this success by providing the funds needed to keep the production line for smallpox active.’ This sentiment was reinforced in May when the WHO announced it would hold a stockpile of five million doses of smallpox vaccine in Geneva, called on the world to pledge vaccines to a 200 million-dose ‘virtual’ stockpile and emphasised the need for the world to have warm-base manufacturing at two locations. For Acambis, licensure of ACAM2000 could be key, differentiating our vaccine and giving governments a higher level of confidence in the product. On MVA3000, our track record with both ACAM2000 and MVA3000 puts us in a very competitive position. |
| |

WARM-BASE MANUFACTURING
Having supplied more than 180 million doses of ACAM2000 to the US, our aim now is to meet its need to maintain a state of production readiness through annual production runs, known as ‘warm-base manufacturing’.
In 2005, the CDC confirmed to us its commitment to warm-base manufacturing and we aim to secure a contract in 2006. As part of this, we plan to transfer all manufacturing processes to our Canton, MA and Rockville, MD facilities, thereby providing the US Government with the security of production located entirely on US soil.
Warm-base manufacturing would produce doses of ACAM2000 each year for the Strategic National Stockpile. In future, it could also be used to maintain the stockpile, with production being increased, as required, to replace doses that expire. We hope to secure a contract later in 2006.
US GOVERNMENT MVA PROCUREMENT
Together with our partner, Baxter, we are bidding for a major contract to supply the US Government with doses of our MVA3000 attenuated smallpox vaccine. This vaccine is for the proportion of the population who could suffer adverse reactions to smallpox vaccines such as ACAM2000.
The US Government is looking for companies to supply up to 20 million doses of MVA vaccine for its Strategic National Stockpile. It also anticipates having an option for the US Government to procure up to a further 60 million doses of MVA. We submitted our proposal under the tender process in October 2005 and expect the US Government to make a decision around the end of the second quarter.
SALES OUTSIDE THE US
In addition to these two principal opportunities, we are continuing to pursue sales to other countries.
Outside the US, we have successfully competed for several government contracts but the majority have been for a small number of doses of ACAM2000.
In bidding for contracts, we have a clear advantage: the clinical data package we have generated for ACAM2000. We believe licensure of our vaccine would support future sales by differentiating ACAM2000.
While we continue to expect future sales to be at a relatively low level unless the environment changes significantly, we will ensure that we are positioned to take advantage of whatever opportunities exist.
6 | Strategic goals |
Our pipeline is our greatest asset and maximising its value is our primary goal. To do that, we want to develop, manufacture and market our proprietary products ourselves, wherever it is feasible for us to do so. This also gives us more control over the time it takes to bring our products to market.
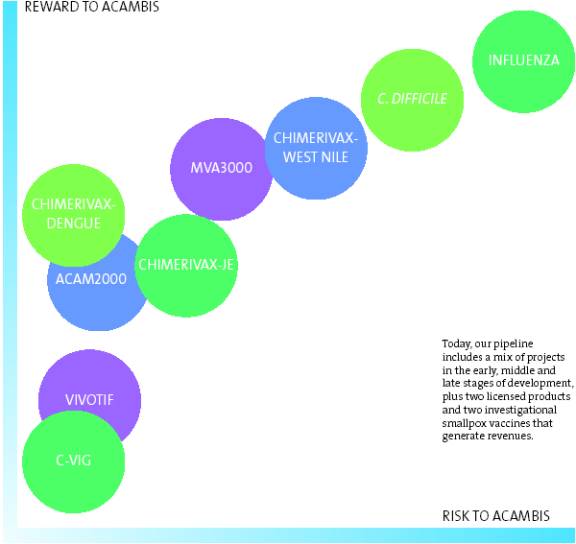
ACAMBIS’ PORTFOLIO
RISK/REWARD RATIO
7 | ||
| Towards a balanced pipeline | |
|
| |
| Addressing a regulatory environment |
|
|
| |
| Knowing what it takes |
|
|
|
|
|
|
|
|
| KNOWING WHAT IT TAKES |
|
| PHILIP BEDFORD, SENIOR VICE PRESIDENT, CLINICAL OPERATIONS AND REGULATORY AFFAIRS |
| |
| The ACAM2000 programme transformed Acambis, not only financially but also operationally, building both manufacturing operations to deliver more than 200 million doses of vaccine and clinical and regulatory teams to implement the largest and most rapid product development project we have yet undertaken. This experience has given us a better understanding of what it takes to develop and license a vaccine. In the last six years, we have conducted more than 40 clinical trials on multiple continents in over 15,000 subjects. We have also submitted two licence applications to the US FDA, giving us an invaluable insight into what is, arguably, the toughest regulatory regime in the world. We have also learned the importance of investing early, whether to establish the manufacturing process or to address regulatory questions through early-stage clinical trials, knowing that the more work we do up-front the greater our chance of success when we enter the expensive Phase 3 stage of clinical testing and submit licence applications. |
| |
‘We have an invaluable insight into the toughest regulatory regime in the world.’ |
|
| |
|
|
|

To achieve our vision, we want to build a billion dollar pipeline that delivers a flow of new licensed products and generates recurring revenues to fund our continued investment in innovation.
In addition, to create maximum long-term value for shareholders, we want to retain the rights to our products for as long as possible, wherever feasible.
Holding onto product rights is a long-term goal. For now, our recent success in progressing the projects in our pipeline and our need for more predictable cash-generation from recurring revenue streams means that we continue to make difficult decisions in prioritising our
efforts and resources. With our ChimeriVax-JE vaccine, for instance, we are focusing our initial commercial efforts on key endemic countries where we believe we can gain the greatest return and will stage our entry into other markets. Programmes may also need partners to supplement our existing capabilities if we are to be successful.
Our current pipeline is built around projects successfully transitioned from our research group and we will continue to add both in-house and external earlier-stage opportunities, particularly those of significant commercial value.
THE STAGES OF CLINICAL DEVELOPMENT | ||||||
Clinical testing is a lengthy and complex process that can vary significantly from product to product. Our ChimeriVax-JE vaccine, for instance, underwent seven different Phase 1 and Phase 2 trials before entering late-stage Phase 3 trials in 2005. Broadly, the US FDA defines the product development process for vaccines as follows: | ||||||
PHASE 1 Typically 20-100 subjects, this is the first time the product has been tested in humans. It aims to check that there are no serious side effects associated with the vaccine and generates initial data about the immune system’s response to the product. | PHASE 2 Typically 100-500 subjects, this explores the safety and immunogenicity profile in a larger number of subjects and investigates what effect different dose levels have on the immune system. | PHASE 3 Typically at least 3,000 subjects and possibly tens of thousands, this stage builds an extensive safety and immunogenicity database and tests vaccine efficacy through agreed endpoints.
| LICENCE APPLICATION Pre-clinical, clinical and manufacturing-related data are presented to support approval and the manufacturing facilities are inspected.
| |||
8 | Strategic goals |
We aim to make a difference by targeting unmet medical needs and developing next-generation products that provide improvements over existing products. Our pipeline of two licensed products and seven investigational vaccines targets viruses and bacteria that affect millions of people around the world every year. We also have other programmes at the research stage that will continue to feed new products into our development pipeline.
9 | ||
| Key proprietary programmes | |
|
| |
| Building a high-value portfolio |
|
|
| |
| New oppurtunities |
|
|
|
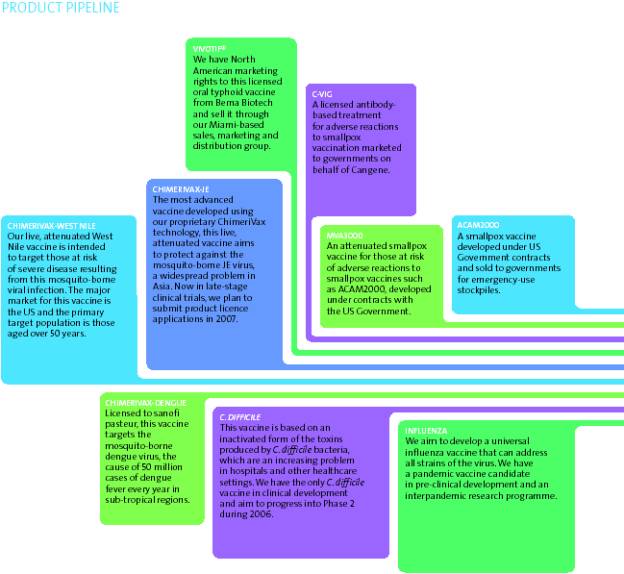
Our key proprietary programmes are our vaccines against JE,West Nile virus,
C. difficile and influenza.
CHIMERIVAX-JE
Use of current JE vaccines is limited by safety concerns and compliance difficulties with multiple-dose products. ChimeriVax-JE has been designed to have the ideal product profile: single-dose administration providing rapid immunity and long-lasting protection, a good safety profile and manufacturing compliant with FDA standards.
Such a vaccine suits both the endemic populations and travellers/military personnel visiting endemic regions. It makes childhood immunisation programmes more viable and facilitates short-notice vaccinations for travellers. We have already established an agreement with Bharat Biotech in India and will work with other partners not only to replace out-of-favour, first-generation products but also to expand the JE vaccine market.
C. DIFFICILE
C. difficile is emerging as the most significant hospital-acquired infection in the developed world. Reported annual numbers – 360,000 cases in the US, 44,000 in the UK – are believed to be underestimated and the severity, as well as the incidence, is increasing because of antibiotic resistance, an ageing population and the emergence of a more virulent strain.
The case for a C. difficile vaccine is a pharmaco-economic one: antibiotic treatment costs upwards of $3,600 per patient and 20% of those infected relapse when antibiotics are discontinued1. We are the only company with a C. difficile vaccine candidate in development.
CHIMERIVAX-WEST NILE
West Nile virus is endemic in the US and causes a spectrum of illness from fever through to polio-like paralysis and fatal encephalitis. There is no treatment and those at highest risk of severe disease are people aged over 50 years, which equates to 100 million people in the US.
Although several companies are developing West Nile vaccines, ours is the most advanced, having entered Phase 2 trials in 2005. Our vaccine was developed using the same ChimeriVax technology that was applied to our JE vaccine, which has been tested in more than 3,300 people, giving us a confidence in ChimeriVax-West Nile that has been borne out by our pre-clinical and Phase 1 results.
INFLUENZA
The market for influenza vaccines is huge: estimates suggest it will be worth $2bn a year by the end of the decade. It is dominated by the major vaccine players with first- or second-generation vaccines using either egg-based or cell-culture manufacture.
To compete in this field, we aim to revolutionise the market by developing the ‘holy grail’ of influenza vaccines: a product that can protect against all human strains of the virus. This ‘universal’ approach would make annual changes to the vaccine formulation unnecessary, provide longer-term immunity and support pandemic preparedness efforts through stockpiling.
PRE-CLINICAL |
| PHASE 1 |
| PHASE 2 |
| PHASE 3 |
| REGISTRATION |
| MARKETED |
| | ||||||||||
| ||||||||||
ACAM2000 is currently being sold to governments under an FDA IND application for emergency-use stockpiling.
1) Kyne et al., Clinical Infectious Diseases, 2002; 34: 346-353.
10 | Strategic goals |
Fully integrate from concept
to commercialisation
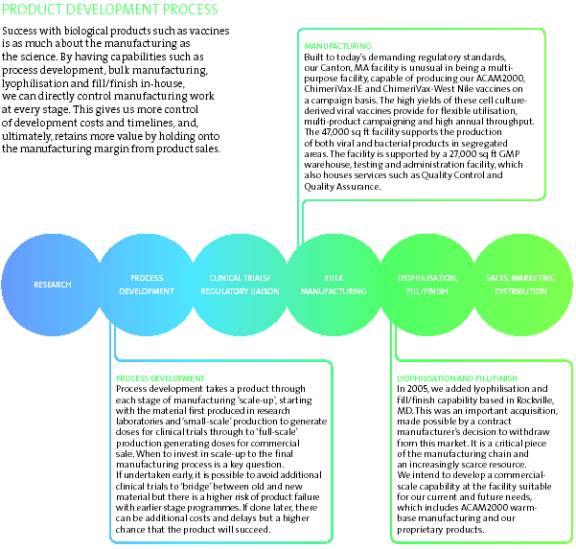
The process of developing a new vaccine is highly complex and involves many different capabilities. Over the long term, we plan to invest in our proprietary programmes ourselves, to establish the necessary in-house expertise and to build manufacturing and sales, marketing and distribution efforts, where appropriate, to ensure that we gain the maximum potential return on our investment.
11 | ||
| An increasingly scarce resource | |
|
| |
| Controlling cost and timelines |
|
|
| |
| investing to maximise value |
|
|
|
The most successful those products themselves.’ | INVESTING TO MAXIMISE VALUE | ||
| JOAN FUSCO, SENIOR VICE PRESIDENT, OPERATIONS | |||
|
| ||
| When looking at the success stories in our industry, the clearest lesson is that the most successful companies are those that develop and license products themselves, instead of out-licensing their proprietary programmes at an earlier stage to other companies. Like most biotechs, Acambis started life as a research and development company. Through our work on ACAM2000, we have built important additional capabilities, including highly trained teams to run our multinational clinical trials and to liaise with regulatory authorities. We have also added three important assets: a bulk manufacturing facility, a lyophilisation and fill/finish facility and a US-based sales, marketing and distribution organisation. Becoming fully integrated, such that we can develop, manufacture and sell our products ourselves, is a long-term goal. Today, we have a manufacturing capability that applies to some but not all of our products, and a sales and distribution group that targets a niche market in the US. As we grow, we aim to build the necessary expertise to capitalise on our assets. Over time, the needs of our existing and future pipeline will become increasingly complex, requiring different types and sizes of clinical trials in multiple countries, various manufacturing methods and a number of sales and distribution channels covering disparate regions of the world. When we put such capabilities in place and which ones we choose to develop in-house will depend upon the priority of a given project within our portfolio. The continuing success of our development programmes means that we are regularly faced with the challenge of prioritising our projects, deciding which we want to invest in ourselves and which should be partnered. Such partnerships can bring many and varied benefits to our programmes, including cash to invest in clinical trials, manufacturing capabilities beyond our own, geographic reach into countries where we have no presence or experience, or more extensive sales, marketing and distribution channels. Over time, as we increase our recurring revenue streams, our ability to retain more rights will also increase. For now, we continue to strike a balance between the financial resource associated with establishing and running such assets, our ability to make maximum use of such assets and the long-term benefits to be gained from holding onto product rights. |
| |
|
|
|
|

12 | Strategic goals |
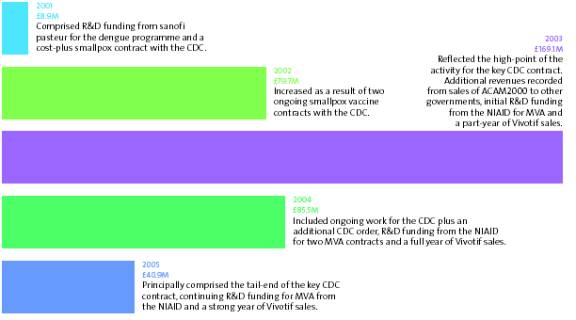
Our US Government ACAM2000 contract was a major revenue-generator for Acambis between 2002 and 2005. Now, we are exploiting two key assets – our smallpox franchise and our sales, marketing and distribution infrastructure – to bring in other sources of revenue and generate cash to invest in our long-term driver of future revenues, our pipeline.
FIVE-YEAR HISTORIC REVENUES
Five years ago, our revenues came from external R&D funding. The US Government smallpox vaccine contract we won in 2001 drove our revenues for the next three years. Our goal now is to supplement further government contracts with recurrent revenues from product sales.
13 | ||
| Funding our growth | |
|
| |
| Revenue-generating opportunities |
|
|
| |
| Building long-term value |
|
|
|
|
|
|
|
‘We have ambitions to grow Acambis into a sustainably profitable company.’ |
| FUNDING OUR GROWTH |
|
|
| ||
| DAVID LAWRENCE, CHIEF FINANCIAL OFFICER |
| |
| |||
| ACAM2000 transformed Acambis: before winning our US Government contract in November 2001, our revenues were minimal, driven primarily by funding from partners for our R&D activities. That contract provided a significant amount of capital for Acambis, giving us the opportunity to invest in driving forward our R&D pipeline and building capabilities that are critical to our success. We have ambitions to grow Acambis into a sustainably profitable company by developing innovative products. We also believe it is important to maximise the value of these products by manufacturing and marketing them ourselves, wherever possible. In the medium and long term, we aim to fund our investment through revenues generated by sales of products that are currently in development and from further products we add to the portfolio over time. The first of our proprietary products expected to reach the market is ChimeriVax-JE, for which we aim to submit licence applications in 2007. In the short term, our investment is likely to out-pace our revenues, so effective management of our cash continues to be a high priority. Inevitably, this means we have to strike a balance between short-term financial requirements and the long-term benefit of increasing value by developing, manufacturing and marketing products ourselves. Therefore, we are looking to maximise our potential revenue sources and will pursue partnering opportunities as appropriate. |
| |

Developing new vaccines is an expensive and time-consuming process. In 2006, we expect to invest up to £40-45m in R&D, a significant portion of which will fund the Phase 3 trials for our ChimeriVax-JE vaccine, reflecting the increased investment required as we progress our programmes into the later stages of development.
We aim, in due course, to sustain our R&D investment through recurring revenues generated by product sales, particularly those vaccines we currently have in development. Our nearest opportunity is ChimeriVax-JE, for which we plan to submit product licence applications in 2007, followed in later years by product licence applications for ChimeriVax-West Nile and our C. difficile vaccine. Early-stage projects are also being pursued to continue the flow of programmes into the pipeline.
Until our pipeline comes to fruition, we are looking to maximise our sources of revenue. To do this, we are principally addressing two broad approaches for increasing revenues.
First, the smallpox franchise continues to be a significant driver for potential revenues in the short term.
As highlighted on pages 4 and 5, we hope to win a US Government MVA stockpiling contract, to secure an ACAM2000 warm-base manufacturing contract with the US Government and to sell ACAM2000 to other governments. Of these, MVA could be a significant revenue generator and warm-base manufacturing could bring in useful recurring revenues over several years.
In addition, we are continuing to pursue opportunities to use certain assets to bring in additional revenues. In particular, there is potential to use our US sales, marketing and distribution infrastructure to sell other companies’ products. Our focus in this effort is licensed products or products close to licensure that might benefit from being sold through a highly targeted sales channel.
Although none of these opportunities would be sufficient in isolation, together they can help to carry us forward into a period when products currently in our development pipeline are expected to reach the market and generate revenues themselves.
‘To achieve our long-term vision for Acambis, we want to build a portfolio of vaccines and other infectious disease products that make a difference by helping millions of people and by generating significant revenues to support our investment in further innovative products. The product opportunities in our pipeline today could contribute useful recurring revenues from around 2008 to help to fund ongoing investment in our pipeline. As the pipeline progresses, we want to bring through programmes that have an increased impact in terms of both the numbers of people they reach and the size of the markets they address. In 2005, a key focus was on driving our pipeline programmes forward and our significant progress during the year has taken us much closer to achieving our goal.’ GORDON CAMERON, CHIEF EXECUTIVE OFFICER
|
|
|
|
| ||
| ||
| Review | |
| ||
| Annual Report 2005 | |
|
| |
|
| |


REVIEW OF 2005 |
| ||
| |||
| |||
| |||
| |||
| |||
| |||
| |||
| |||
| |||
|
| ||
| FINANCIALS: THE FACTS AND FIGURES |
| |
| |||
| |||
| |||
| |||
| |||
| |||
|
| ||
| GENERAL INFORMATION |
| |
| |||
| |||
| |||
|
|
|
17 | |
In our 2004 Annual Report, we set out our 10 strategic priorities for 2005.
Some we’ve completed, others we’re continuing to address in 2006...
|
|
|
| PROGRESS MADE IN 2005 | ||||
|
|
|
| 0% |
|
| 100% | |
01 |
| FILE THE ACAM2000 BLA WITH THE FDA |
|
|
|
|
| |
|
|
|
|
|
|
|
| |
02 |
| SECURE ACAM2000 US GOVERNMENT WARM-BASE MANUFACTURING CONTRACT |
|
|
|
|
| |
|
|
|
|
|
|
|
| |
03 |
| ACHIEVE YEAR-ON-YEAR GROWTH IN SALES OF ACAM2000 TO OTHER GOVERNMENTS |
|
|
|
|
| |
|
|
|
|
|
|
|
| |
04 |
| EXECUTE PLANNED ACTIVITIES UNDER OUR EXISTING US GOVERNMENT MVA CONTRACTS |
|
|
|
|
| |
|
|
|
|
|
|
|
| |
05 |
| IMPLEMENT STRATEGY TO WIN THE US GOVERNMENT’S MVA STOCKPILE CONTRACT |
|
|
|
|
| |
|
|
|
|
|
|
|
| |
06 |
| COMMENCE PHASE 3 TRIAL OF CHIMERIVAX-JE |
|
|
|
|
| |
|
|
|
|
|
|
|
| |
07 |
| COMMENCE PHASE 2 TRIAL OF CHIMERIVAX-WEST NILE |
|
|
|
|
| |
|
|
|
|
|
|
|
| |
08 |
| COMMENCE PHASE 1 TRIAL OF C. DIFFICILE |
|
|
|
|
| |
|
|
|
|
|
|
|
| |
09 |
| UTILISE OUR MANUFACTURING CAPACITY |
|
|
|
|
|
|
|
|
|
|
|
|
|
| |
10 |
| ADD PRODUCTS AND/OR LATE-STAGE PROJECTS TO OUR PORTFOLIO |
|
|
|
|
| |
18 | Chairman’s statement |
|
| |
Investing for growth, |
| |
|

As the operational highlights summary on page 17 illustrates, 2005 was a mixed year. We positioned 2005 as a year of investment aimed at building both our product portfolio and the infrastructure and capabilities. In both areas we had a very successful year.
However, the US Government warm-base manufacturing and MVA opportunities on which we expected decisions in 2005 have not yet crystallised and the start of litigation relating to MVA created a level of uncertainty around that opportunity. Together, these factors resulted in a disappointing share price performance in spite of our success in other areas.
REVIEW OF 2005
Our most notable achievement was the progression of each of our proprietary programmes into the next stage of development, including ChimeriVax-JE, which is now undergoing pivotal Phase 3 trials in Australia and the US. We also expanded the pipeline with the addition of an influenza vaccine programme.
Our capabilities were increased through the acquisition of a fill/finish facility in the US, which has given us the opportunity to bring in-house an increasingly scarce resource and to complete our manufacturing supply chain.
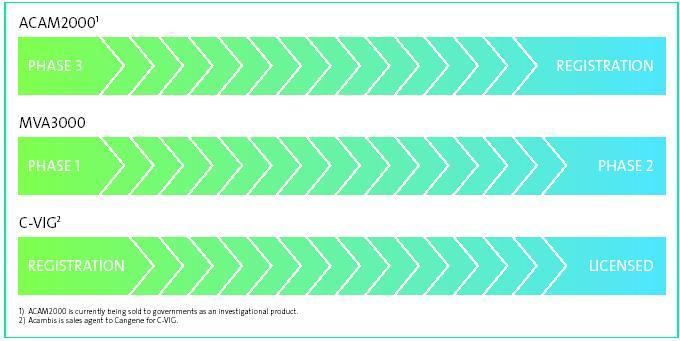
In addition to building our pipeline and capabilities, we have an ongoing aim to exploit our competitive strengths in the smallpox arena to gain as much value as possible from our franchise of products: ACAM2000, MVA3000 and C-VIG. We made good progress with our existing MVA3000 contract, including delivering 500,000 doses to the US Government, and, in April 2006, completed submission of a US licence application for ACAM2000.
We are currently in a litigation process relating to MVA as a result of complaints filed against us by Bavarian Nordic in the US in August 2005. A further suit was filed in Austria in February 2006. Bavarian Nordic alleges that we have used its trade secrets in the development of our MVA3000 vaccine and that we are infringing its patents. We strongly believe these allegations are without foundation and we are vigorously defending our position.
Our financial performance during 2005 was in line with our expectations. The guidance we gave at the beginning of the year was for £40m of predictable revenues and the actual performance was £40.9m. The fact that almost 60% of this revenue was recognised in the fourth quarter of the year highlights one of the principal challenges of predicting and relying on biodefence contract revenues and we continue to pursue opportunities to build more mainstream revenues. In this area, 2005 was a particularly good year for sales of Vivotif as we were able to capitalise on the competitor product’s lack of availability for part of the year to improve revenues and market share.
OUTLOOK FOR ACAMBIS
As one of the leading independent vaccine companies, Acambis is well placed within the sector. We further strengthened our pipeline by driving our development programmes forward in 2005 and have built a useful infrastructure to enable us to develop, manufacture and, in some markets, sell our vaccines.
Our investment in R&D delivered significant progress in 2005 and by continuing that strategy in 2006 we expect to see further good progress from our pipeline. Preliminary results from our ongoing Phase 3 trials of ChimeriVax-JE should be available later in 2006, at which point the
19
| PRIORITIES FOR 2006 |
|
|
| |
| Complete filing of ACAM2000 licence application with the FDA |
|
|
| |
| Secure ACAM2000 US Government warm-base manufacturing contract |
|
|
| |
| Secure MVA3000 US Government contract |
|
|
| |
| Complete MVA litigation process at the ITC |
|
|
| |
| Complete ChimeriVax-JE pivotal Phase 3 trials |
|
|
| |
| Commence ChimeriVax-JE Phase 2 paediatric trial in India |
|
|
| |
| Complete ChimeriVax-West Nile Phase 2 trial |
|
|
| |
| Commence C. difficile Phase 2 trial |
|
|
| |
|
|
|
Phase 2 paediatric trial in India will be ongoing. In addition, in the second half of the year we expect to see results from our Phase 2 trial of ChimeriVax-West Nile and aim to transition our C. difficile vaccine into Phase 2. Based on the fast-track status awarded to our ACAM2000 programme, we would hope to receive the FDA’s decision on our licence application before the end of 2006. Given this extensive clinical trial programme, we expect our investment in R&D to increase to around £40-45m in 2006. This includes a significant investment in the Phase 3 trials for ChimeriVax-JE.
We are confident that during 2006 we will also achieve greater clarity around our smallpox franchise. Based on indications from the CDC, we continue to expect to sign and initiate a US Government warm-base manufacturing contract for ACAM2000 and we also expect to receive a decision on the US MVA stockpiling tender process. In the MVA litigation process, the first of the US court cases is being heard in May at the ITC and a decision is expected in the second half of the year.
As in previous years, some of our revenues in 2006 will be more predictable than others, namely those from sales of Vivotif and existing ACAM2000 and MVA3000 contracts. We estimate that, depending upon the timing of activities for the existing smallpox contracts, our predictable revenues in 2006 will be £20-25m. We would expect the gross profit margin on these activities to be similar to that achieved in 2005. There is significant potential for additional revenues from contracts we are currently pursuing, particularly further ACAM2000 and MVA3000 US Government contracts.
BOARD CHANGES
Since our last Annual Report, we have seen two changes to the composition of the Board: the appointment of Dr Peter Fellner in February 2006 and the resignation of Michael Lytton in April 2006. We were delighted to welcome Peter to our Board given that he is one of the leading figures in the UK biotechnology industry. With his extensive knowledge and experience, we believe his insight and advice will be invaluable as we oversee the continued development of Acambis. Michael stood down following a period of five years on the Board. We thank Michael for the insight and advice he has brought to our Board discussions during that time.
I have been a member of Acambis’ Board for over 10 years and Chairman for more than seven of those years. Based on good corporate governance practices, I have decided that I will stand down from the Board and as Chairman of Acambis later in 2006. We will announce the appointment of my successor at that time.
Acambis is a very different company now from when I joined the Board and I am pleased to have played a part in its growth during that time. I am confident that it will continue to go from strength to strength and wish its Board and our shareholders every success.
ALAN SMITH, CHAIRMAN
20 | Performance review |
|
| |
Driving the pipeline forward |
| |
|

By driving our pipeline forward, generating revenues from our smallpox franchise and building in-house capabilities such as manufacturing and marketing, we aim to ensure Acambis is well placed to participate in our industry’s growth.
SMALLPOX FRANCHISE UPDATE
As part of our efforts to maximise our smallpox franchise, we are continuing to pursue two key US Government contracts. Negotiations are underway for an ACAM2000 warm-base manufacturing contract and we have submitted a tender for an MVA contract. We have also submitted a licence application to the FDA for ACAM2000, which could support other sales of this vaccine.
PROGRESS SINCE THE START OF 2005: OUR SMALLPOX FRANCHISE
21 | |
ACAM2000 |
|
|
Following a pre-BLA meeting with the FDA in November 2005, we started submission of our BLA for ACAM2000 in January 2006 and completed it in April. This is the culmination of over five years of work to provide the US Government with a next-generation, licensed smallpox vaccine. The submission included safety, tolerability and immunogenicity data obtained from clinical trials of ACAM2000 conducted in more than 3,800 subjects. Given ACAM2000’s fast-track status, we expect to receive the FDA’s decision on our application before the end of 2006. |
| Licence application submitted |
We are currently in negotiations with the US Government about a contract for us to provide warm-base manufacturing for ACAM2000 on a long-term basis. This is intended to maintain our facilities in a state of production readiness and, if necessary, to provide the US with ongoing surge capacity in smallpox vaccine production. In September 2005, we reported that the CDC had indicated to us that it would be proceeding with a warm-base manufacturing contract during US Government Fiscal Year 2006, which runs through to 30 September 2006. We are on track to achieve that timeline. We remain confident that there are further opportunities to sell ACAM2000 to other governments. Whilst we did not achieve any significant sales during 2005, discussions with various countries indicate that some are awaiting the outcome of the US product licence application process before proceeding with their procurement decisions. |
| Warm-base manufacturing contract negotiations underway |
|
|
|
MVA3000 |
|
|
During 2005, we made excellent progress on our existing contract with the US Government agency, the NIAID, including delivering 500,000 doses of our MVA vaccine, MVA3000, in December. We also initiated a Phase 2 safety and immunogenicity trial, enrolment for which is now complete. Together with our co-development partner, Baxter, we submitted our bid for a US Government stockpiling contract in October 2005. This was in response to an RFP issued by the Department of Health and Human Services. The RFP is for the manufacture of up to 20 million doses of MVA attenuated smallpox vaccine and advanced clinical testing up to and including obtaining a product licence. It also includes options for the purchase of up to 60 million additional doses of MVA and warm-base manufacturing over the longer term. The 500,000 doses we delivered in December were produced at the scale required for this stockpiling process. We believe that our strong track record with the US Government, our partnership with Baxter and our demonstrated ability to manufacture and deliver large quantities of both MVA3000 and ACAM2000 put us in a very strong competitive position. Based on indications received from the US Government, we expect the award of contract(s) to be made around the end of the second quarter of 2006. |
|
|
|
|
|
C-VIG |
|
|
During 2005, we helped Cangene to win its first major C-VIG contract outside the US. It was awarded a C$17m (c. £8.5m) contract in September to supply doses of its C-VIG product to the UK Government. As sales agent to Cangene, we receive a royalty on the sales achieved. C-VIG was licensed by the FDA in 2005. |
| UK contract secured in 2005 |
22 | Performance review |
MVA LITIGATION |
We are continuing vigorously to oppose any and all legal actions filed by BN with regard to MVA. |
BN has lodged complaints against us with the ITC, the District Court of Delaware and the Commercial Court in Vienna, Austria. BN’s legal actions include claims that relate to patents, trade secrets and misappropriation. We will present evidence that each of these allegations is without merit. |
• Patents: we have always believed and continue to believe that any patents awarded or pending do not restrict our freedom to operate in the field of MVA. We will present factual and expert evidence that: MVA-BN is not novel; the patent is unenforceable through lack of enablement; BN failed to provide the US Patent and Trademark Office with prior art related to its patent claims; and the patents rely on scant scientific evidence. |
• Trade secrets: we will present evidence that, in developing MVA3000, we have called upon our own experience, gained through the ACAM2000 programme, and the experience of our partners, including using established manufacturing practices. We have also used information gleaned from the many articles published on MVA over the last 30 years, including those from Dr Anton Mayr, who worked on the original development of MVA vaccines. In addition, key parameters for the programme were set by the NIAID, including dose level and dosing schedule. |
• Misappropriation: Dr Mayr provided an MVA strain to the NIH/NIAID. The NIAID then provided a version of that strain to Acambis for use as the basis of MVA3000. We will present evidence that Dr Mayr did not restrict the use of the MVA strain he provided to the NIH. We received the NIH MVA under a Material Transfer Agreement. The NIAID stated that ‘prior to distribution of the material NIAID determined that it is within its rights to transfer the material to other parties’. |
BN’s intent is clearly to disrupt and frustrate competition in the MVA procurement process, both in the US and elsewhere. We are, and always have been, very confident of our ability to counter BN’s allegations and will vigorously defend our freedom to compete for, and win, contracts under these important procurements. |

23 | |
RESEARCH AND DEVELOPMENT UPDATE |
|
|
Our aim for 2005 was to take each of our proprietary programmes into the next stage of development. In achieving this goal, we completed or initiated a total of 12 clinical trials, which is a significant achievement for a company of our size and stage of maturity. |
|
|
|
|
|
CHIMERIVAX-JE |
|
|
Our ChimeriVax-JE vaccine against the mosquito-borne JE virus is now undergoing pivotal Phase 3 testing. The two clinical trials, which are being conducted in multiple centres in Australia and the US, are testing the safety and efficacy of a single-dose regimen of ChimeriVax-JE in more than 2,800 subjects. The trials, which were initiated in November 2005, are progressing extremely well, with enrolment now complete. |
|
|
We are also undertaking a Phase 2 paediatric trial in India, where children are the primary target population for a JE vaccine. The paediatric data from this trial and a subsequent Phase 3 trial will supplement those generated in our ongoing Phase 3 trials and our previous Phase 1 and 2 studies to support licence applications for both the endemic regions and the travel market. We are targeting submissions of licence applications in both India and Australia in 2007. There is a large unmet public health need for a single-dose, convenient and affordable vaccine against JE, which could make it simpler, faster, easier and cheaper for healthcare providers to administer vaccines, particularly in regions where achieving compliance to multi-dose regimens can be difficult. An epidemic in northern India in 2005 resulted in 6,340 reported cases and more than 1,200 deaths, mostly of children. |
| Indian paediatric trial starting in 2006 |
India is one of our primary markets for ChimeriVax-JE and to support commercialisation of the vaccine in the region we established a collaboration with one of India’s leading biotechnology companies, Bharat Biotech, at the end of 2005. Under the partnership, Bharat Biotech will undertake end-stage fill/finish processing of ChimeriVax-JE at its facilities in India and will market and distribute the vaccine in India and neighbouring countries once the product is approved. We are currently pursuing the necessary import and export requirements with a view to completing technology transfer to Bharat Biotech in time to use material produced by Bharat Biotech in planned Phase 3 trials in India. We are also pursuing partnerships to target other endemic countries and the travellers’ market. |
|
|
|
|
|
CHIMERIVAX-WEST NILE |
|
|
We are continuing to lead the field in developing a human vaccine against the mosquito-borne West Nile virus, which is endemic in the US. Having become the first company to complete a Phase 1 trial, we were also the first to enter Phase 2 clinical testing. |
|
|
We initiated a Phase 2 trial in December 2005 to test our vaccine in more than 200 subjects in the US. The aim of the randomised, double-blind, placebo-controlled trial is to evaluate the safety, tolerability and immunogenicity of ChimeriVax-West Nile in healthy adults and elderly subjects. Having tested different dose levels in young adults, the optimal dose will be taken forward for testing in elderly subjects. Those aged 50 and above are likely to be the initial target population for a West Nile vaccine as they are most at risk of severe disease following infection. Recruitment for the healthy adults portion of the trial is now complete. In our Phase 1 safety and immunogenicity trial, results from which were announced in April 2005, of the subjects who received a single dose of ChimeriVax-West Nile, 96% in the high-dose group and 100% in the low-dose group developed high titres of West Nile-neutralising antibodies 28 days after vaccination. Intervet, which is the number one manufacturer of animal vaccines, is aiming to launch its West Nile veterinary vaccine in the US during the 2006 season. The West Nile virus is a particular problem for horses. Intervet’s vaccine was developed from the ChimeriVax technology licensed from Acambis and we will receive royalties from sales of the Intervet product. |
| First company into Phase 2 trials |
24 | Performance review |
CHIMERIVAX-DENGUE |
|
|
Following completion of the Phase 1 trial of a tetravalent formulation of our ChimeriVax-Dengue in the first quarter of 2005, the lead responsibility for further clinical testing and development passed during 2005 to SP, to whom we have licensed worldwide rights. Results from the trial showed seroconversion to all four dengue virus serotypes in the majority of subjects. SP has progressed the vaccine into Phase 2 clinical trials. |
| Partner sanofi pasteur progresses into Phase 2 |
|
|
|
C. DIFFICILE |
|
|
We have recently announced results from the first of two Phase 1 trials of our vaccine against C. difficile, a leading cause of hospital-acquired infections. In the 50-subject placebo-controlled trial in healthy adults, antibody responses were seen in all 37 subjects who received our vaccine. No subjects experienced unexpected or serious vaccine-related adverse events. Enrolment is now complete in a second Phase 1 trial designed to explore the safety, tolerability and immunogenicity of our vaccine in healthy elderly subjects at different dose levels. This is the first trial of our vaccine in one of the key target populations for the product. We aim to complete Phase 1 testing in the second half of the year and then to begin Phase 2 trials. |
| Encouraging results from first Phase 1 trial |
|
|
|
INFLUENZA |
|
|
During 2005, we initiated a programme to develop a universal influenza vaccine, which is seen as the “holy grail” of influenza protection. The aim of the programme is to develop a vaccine that can target all strains of influenza, removing the need for annual reformulations and annual vaccinations. To achieve this, we acquired a technology previously being developed by Apovia, a US-based biotechnology company, and established a research collaboration with VIB, a Belgian research institute. A major component of the new candidate(s) is M2e, the extracellular domain of the ion channel protein M2, which is specific to influenza ‘A’. Being highly conserved, M2e is intended to elicit protective immune responses against all strains of influenza ‘A’. While our ultimate goal is to develop a vaccine that is universally effective against all ‘A’ and ‘B’ strains of the influenza virus, which would be required for complete protection against seasonal influenza, we are also pursuing development of an ‘A’ strain candidate as this could be suitable as a vaccine against pandemic influenza. All previous pandemics have been caused by ‘A’ strains of the virus. With a vaccine that targets all ‘A’ strains, governments would be able to stockpile vaccine doses for use in the event of a pandemic instead of waiting for the appropriate strain to be identified before vaccine manufacture can be undertaken. Pre-clinical development of our pandemic vaccine candidate is ongoing and we aim to enter clinical trials in early 2007. Our longer term programme is currently at the research stage. |
| New project added to pipeline could be in clinical trials in 2007 |
|
|
|
VIVOTIF® |
|
|
Vivotif, the oral typhoid vaccine we sell in the US, had a strong year in 2005, with sales volumes 81% up over 2004. This was primarily as a result of our ability to capitalise on the competitor product’s lack of availability for part of the year. |
| Strong Vivotif sales growth |
|
|
|
ARILVAXTM |
|
|
Acambis has US sales and marketing rights to ARILVAX, a yellow fever vaccine that is owned and manufactured by Chiron. We are in ongoing discussions with Chiron and its new parent company, Novartis AG, to resolve a way forward for the ARILVAX programme. To date these have been constructive and we hope to conclude the discussions in the near future. |
|
|
|
|
|
GORDON CAMERON, CHIEF EXECUTIVE OFFICER |
|
|
25 | |
CORPORATE RESPONSIBILITY |
In 2005, we underwent our second annual audit by GoodCorporation, an independent CR verification organisation. We were able to demonstrate that improvement had been made during the year and were delighted to be awarded GoodCorporation membership for a second time. To achieve GoodCorporation membership, organisations are annually assessed and must meet minimum criteria on the existence and effectiveness of management practices in 62 areas. The requirements are practical and designed to ensure that CR is an integral part of everyday management. The verification report is based on site visits and interviews with all stakeholder groups.
ACAMBIS’ PERFORMANCE IN THE GOODCORPORATION AUDIT |
| 0 |
| 5 |
| 10 |
| 15 |
| 20 |
| 25 |
| 30 | |||
|
|
|
|
|
|
| |||||||||||
COMMENDATION |
|
|
|
|
|
|
|
|
|
|
|
|
| ||||
MERIT |
| ||||||||||||||||
OBSERVATION |
|
|
|
|
| ||||||||||||
MINOR NON-COMPLIANCES |
|
|
|
|
|
|
|
|
|
|
| ||||||
FAIL | 2005 | ||||||||||||||||
NOT APPLICABLE | 2004 | ||||||||||||||||
In 2005, the audit was extended to encompass our sales and distribution group in Miami, FL. During the year, we implemented several measures to address areas of improvement highlighted by GoodCorporation, including increased employee consultation, employee training on our grievance procedure and development of a bribery policy. In 2006, areas of continuing focus include environmental impact assessments and support for community projects, particularly those involving our employees. For more information, see our website, www.acambis.com.

RISK MANAGEMENT |
This report provides an update on risks highlighted last year and sets out key risks for 2006.
2005 REPORT
Two key risks for 2005 were that:
> The US Government MVA contract is for fewer doses, generates less revenue or materialises later than anticipated or that a contract is not awarded to Acambis at all; and
> The anticipated ACAM2000 warm-base manufacturing contract is delayed, is of less commercial value than anticipated or does not materialise.
Both of these contract awards are pending. To manage expectations during the year, we provided regular updates to investors and, for the first time, broke down our revenue guidance into ‘predictable’ and ‘unpredictable’ revenues to give greater clarity. Throughout the year, we continued to have regular dialogue with US Government personnel and ensured that we remained well positioned by delivering against MVA milestones and moving towards ACAM2000 licensure.
In addition, we highlighted two operational risks, namely that:
> The structural changes that have been implemented as we continue our transition from an R&D organisation into a fully integrated biopharmaceutical company are not successfully integrated; and
> There might be no or insufficient reward in marketing our products in development, that one or more of them fails in development or clinical trials, that development delays first-to-market advantage or that increasing costs negatively impact potential returns.
We continued to improve management practices, establishing a project management function and embedding the corporate planning process. We continue to balance our wish to be fully integrated with our current financial position.
Our annual planning includes a project and portfolio review, incorporating commercial strategies. We invested in progressing all our programmes into the next stage of development during 2005, maintaining
our lead in the West Nile arena and positioning ourselves as the only company with a C. difficile vaccine in development. To maximise the potential return for ChimeriVax-JE, we redefined the licensure strategy to focus on endemic markets.
MAJOR RISKS FOR 2006
Our key risks for 2006 are:
> That we are not awarded a contract under the US Government MVA procurement process or that the award is later than anticipated or for fewer doses;
> That we do not secure a US warm-base manufacturing contract for ACAM2000 or that the contract is later than anticipated or for fewer doses;
> That ACAM2000 is not licensed by the FDA;
> That we do not achieve an acceptable outcome from the MVA litigation process; or
> That one or more products in development fails to achieve the desired safety or efficacy outcomes.
26 | |
|
| |
| ||
|

INCOME STATEMENT HIGHLIGHTS |
| 2005 |
| 2004 |
|
| |||||
Revenue |
| 40.9 | 85.5 |
| |
Cost of sales |
| (27.6 | ) | (35.0 | ) |
| |||||
|
|
|
| ||
Gross profit |
| 13.3 | 50.5 |
| |
Research and development costs |
| (34.1 | ) | (29.3 | ) |
Sales and marketing costs |
| (2.6 | ) | (2.8 | ) |
Administrative costs |
| (7.7 | ) | (5.5 | ) |
Other operating income |
| 0.4 | 10.2 |
| |
|
Operating (loss)/profit |
| (30.7 | ) | 23.1 |
|
Net finance income |
| 3.0 |
| 3.9 |
|
|
|
|
|
|
|
|
|
|
|
|
|
Pre-tax (loss)/profit |
| (27.7 | ) | 27.0 | |
Taxation |
| 0.7 | (7.3 | ) | |
| |||||
(Loss)/profit after taxation |
| (27.0 | ) | 19.7 |
|
|
BALANCE SHEET HIGHLIGHTS |
| 2005 | 2004 |
| |
| |||||
|
|
|
| ||
Non-current assets |
| 39.8 | 40.5 |
| |
Current assets |
|
|
| ||
Cash and liquid investments |
| 68.0 | 101.8 |
| |
Inventory |
| 3.6 | 6.0 |
| |
Other current assets |
| 22.0 | 15.6 |
| |
| |||||
Liabilities |
|
|
| ||
Current liabilities |
| (46.8 | ) | (47.6 | ) |
Non-current liabilities |
| (3.6 | ) | (8.8 | ) |
| |||||
Net assets |
| 83.0 | 107.5 |
| |
|
27 | |
COMMENTARY REFLECTS THE 2005 NUMBERS, UNLESS OTHERWISE INDICATED
Revenue: This is in line with the predictable revenue guidance given throughout 2005. The main sources of revenue were: two MVA3000 contracts with the NIAID; fixed-price 155 million-dose ACAM2000 contract with the CDC; and product sales of Vivotif. Cost of sales: This decreased in line with revenues generated in the year. |
|
Gross profit: The change in margin reflects the mix of revenues recorded in the two years. During 2004, the gross margin was positively impacted by the reassessment and reduction of costs under the 155 million-dose contract following the decision to close out the two Phase 3 clinical trials early. Research and development costs: Expenditure on R&D increased as a result of the successful progression of projects into later stages of development. Some manufacturing costs are expensed to R&D as the facility is used for work on our R&D programmes. During 2005, we also started to incur operational costs for our fill/finish facility. Administrative costs: This includes costs and a provision, together totalling around £3m, in relation to the MVA litigation. In 2004, administrative costs included two exceptional items totalling £2.6m. Other operating income: During 2004, Baxter paid Acambis a £10.2m settlement for termination of a contract manufacturing agreement. |
|
Net finance income reduced as a result of lower cash. Interest was paid on the lease-financing facility put in place for the reactivation of our manufacturing plant in Canton, MA. |
|
Pre-tax (loss)/profit: The change compared with 2004 is primarily a result of changes to revenue, the gross profit margin and R&D costs. This is in line with management’s expectations. Taxation: The lower effective tax rate reflects the loss-making position, which led to the refund of certain taxes paid in previous profitable periods, and movements in deferred tax liabilities. |
|
Cash and liquid investments: The reduction is a result of increased investment in the R&D pipeline, together with the capital investments in the US R&D facility and the acquisition of a fill/finish capability. Inventory: This balance principally represents ACAM2000 and Vivotif stock. The reduction is partly a result of provisions made against ACAM2000 inventory during 2005. Other current assets: This includes an amount owing at the end of 2005 relating to the shipment of 500,000 doses of MVA3000 vaccine to the NIAID under the MVA3000 contract, which has been settled since the year-end. |
|
A proportion of this balance relates to accruals and deferred income arising under the ACAM2000 155 million-dose contract with the CDC. At 31 December 2005, deferred income relating to this contract was £2.0m (31 December 2004 – £16.5m). The deferred revenue balance will unwind during 2006 as the BLA submission process concludes. Accruals also include payment owing to Baxter for the production of 500,000 doses of MVA3000, which has been settled since the year-end. |
OTHER ITEMS |
SHORT-TERM BORROWINGS AND FINANCIAL LIABILITIES |
The combined balance of our US dollar-denominated financing facilities was £12.8m at 31 December 2005 (31 December 2004 – £13.0m). The balance on the lease-financing facility was £7.2m at 31 December 2005 (31 December 2004 – £9.4m). The balance on the overdraft facility at 31 December 2005 was £4.0m (31 December 2004 – £3.6m), the increase being attributable to exchange rate movements in the period. The remaining balance of £1.6m at 31 December 2005 (31 December 2004 – £nil) relates to the discounted value of the future payments for the Rockville fill/finish facility acquired earlier in 2005, payable between 2006 and 2017. |
|
INVESTING ACTIVITIES |
During 2005, we spent £1.7m (2004 – £0.8m) on the final payments for the BPC acquisition as a result of achieving higher sales of Vivotif. Capital expenditure in 2005 was £3.7m (2004 – £3.4m). Expenditure during the year related to the costs to redevelop and expand areas of our US R&D facility, as well as the acquisition of assets for our Rockville fill/finish facility, which was purchased in May 2005. |
DAVID LAWRENCE, CHIEF FINANCIAL OFFICER
28 | Chairman’s Board review |
|
| |||
Further strengthening our |
|
| ||
|
| |||
As in previous years, during 2005 we made a number of changes that further strengthened our governance of Acambis. Of note this year, we have reviewed composition of Board Committees and remuneration packages and initiated annual reports from each of our Board Committees.
BOARD EVALUATION AND COMMITTEE CHANGES
For the second year running, we appointed an external consultant to facilitate a formal evaluation of the Board. We again reviewed aspects such as Board size, composition and diversity.
As a result, we agreed to review the composition of our Board Committees. Alan Dalby stepped down from the Audit Committee in January 2006, in the light of his role as Chairman of the Remuneration Committee. In March 2006, we agreed that all Non-executive Directors should sit on the Remuneration Committee as there is an obvious link between management’s performance and remuneration. All Non-executive Directors will also continue to sit on the Nominations Committee.
BOARD TRAINING
As part of our ongoing efforts to ensure Board members are fully informed about key issues affecting Acambis and corporate governance matters, ad hoc presentations are provided to the Board. On governance, during 2005, updates were provided to the Board on corporate responsibility and the new Financial Services Authority Handbook, which came into effect in July 2005. We are introducing a structured programme of updates for the Board during 2006.
As per our commitment in last year’s Annual Report, this year, for those Directors who have professional qualifications, we have included an update within the ‘Biographies’ section on their continuing professional development.
REVIEW OF REMUNERATION PACKAGES
At the time of our last Annual Report, we advised that the Remuneration Committee was reviewing the structure of employee and management remuneration. We appointed Towers Perrin and The Hay Group to assist us with this work.
The purpose of this review was to ensure that we reward and motivate our Executive Directors and staff appropriately and provide the right mix of the four core elements of a remuneration package dependent on an employee’s position in the organisation. The four elements are base pay, benefits, learning and development, and work environment.
We are starting to implement specific changes from 2006. The first element is a new structure for long-term incentives, which is being proposed at the 2006 AGM. The details of this proposal are summarised on page 35.
REPORTS FROM BOARD COMMITTEES
For the first time, on pages 34 and 35 we have disclosed high-level reports from the three Committees of the Board – Audit, Nominations and Remuneration – covering the work each of them has performed during 2005 and thus far in 2006 to discharge their respective responsibilities.
29
BOARD CHANGES
Since the beginning of 2006, we have had two Non-executive Director changes to the Board: Michael Lytton has resigned and we have been joined by Dr Peter Fellner.
As I noted in my Chairman’s statement, I have now served 10 years on the Board of Acambis, seven of those as Chairman. This year, I will offer myself for re-election at the AGM, being required to retire by rotation in accordance with the Company’s Articles of Association, but I am planning to retire from the Board during the year. We will announce the appointment of my successor at that time.
ALAN SMITH, CHAIRMAN
| COMPLY OR EXPLAIN: COMPLIANCE WITH THE COMBINED CODE |
| ||
| The Combined Code (the code) was republished in July 2003 and restated in July 2005 by the Financial Reporting Council and incorporated the previous code (as published in 1998 by the Hampel Committee) and related guidance that had been issued since that date: the Turnbull Guidance on Internal Control; the Smith Guidance On Audit Committees; and various items of good practice guidance from the Higgs Report. The code has been applicable for reporting years beginning on or after 1 November 2003 and, therefore, was adopted by Acambis from our 2004 financial year. The overriding principle of the code is that companies must comply with it or explain why they have not. Our corporate governance statement is shown on pages 36 to 39 and provides details on our compliance with the code. The following section highlights the areas where we previously did not comply with the code and notes the progress we have made to address those areas: |
| ||
|
|
| ||
| CODE PROVISION |
| PROGRESS MADE SINCE PUBLICATION OF THE 2004 ANNUAL REPORT |
|
| B REMUNERATION B.2.1 A statement on whether remuneration consultants have any other connection with the Company should be available on the Company’s website. |
|
|
|
|
|
|
|
|
| C ACCOUNTABILITY AND AUDIT C.3.4 Arrangements should be in place for the reporting and management of concerns raised by staff about possible financial or other improprieties. |
| In November 2004, the Audit Committee approved a whistleblowing policy. The procedure was developed during 2005 and rolled out to the Group in early 2006. |
|
|
|
|
|
|
| DIRECTORS’ ATTENDANCE AT BOARD AND COMMITTEE MEETINGS DURING 20051 |
| ||||||||||||||||
| COMMITTEE/BOARD DIRECTOR |
| ALAN |
| GORDON |
| DAVID |
| DR THOMAS |
| DR RANDAL |
| ALAN |
| ROSS |
| MICHAEL |
|
|
|
|
|
|
|
|
|
|
| |||||||||
| BOARD |
| 8/8 |
| 8/8 |
| 8/8 |
| 8/8 |
| 8/8 |
| 6/8 |
| 8/8 |
| 8/8 |
|
| AUDIT COMMITTEE |
| N/A |
| N/A |
| N/A |
| N/A |
| 6/6 |
| 4/6 |
| 6/6 |
| 6/6 |
|
| REMUNERATION COMMITTEE |
| N/A |
| N/A |
| N/A |
| N/A |
| 2/2 |
| 1/2 |
| 2/2 |
| 2/2 |
|
| NOMINATIONS COMMITTEE6 |
| N/A |
| N/A |
| N/A |
| N/A |
| N/A |
| N/A |
| N/A |
| N/A |
|
| NOTES 1 Meetings include scheduled Board and Committee meetings. 2 Mr Smith is Chairman of both the Board and the Nominations Committee. 3 Mr Dalby is Chairman of the Remuneration Committee. 4 Mr Graham is Chairman of the Audit Committee. 5 Mr Lytton resigned from the Board on 11 April 2006. 6 No meetings of the Nominations Committee took place during the year.
|
| ||||||||||||||||
30 | Board of Directors’ biographies |
The Board is chaired by Alan Smith and has three Executive Directors. Together, they combine business acumen with scientific expertise to provide Acambis with a clear vision and direction that is firmly grounded in commercial realities.
|

1 ALAN SMITH †
Alan Smith, aged 61, a member of the Chartered Institute of Public Finance and Accountancy, joined the Board of Acambis on 3 November 1995 as a Non-executive Director and was appointed Non-executive Chairman on 20 May 1999. On appointment, Alan met the criteria for independence for Non-executive Directors; however, the independence test is not appropriate in relation to the role of Chairman to which he was subsequently appointed. He is also Chairman of the Nominations Committee. He was Group Managing Director of Anglian Water plc until December 1997 and is currently Chairman of Avlar Bioventures Limited, Chairman of Medical Device Innovations Limited and a Non-executive Director of CeNeS Pharmaceuticals plc. Mr Smith is participating in the Continuing Professional Development programme of the Chartered Institute of Public Finance and Accountancy.
2 GORDON CAMERON, OBE *
Gordon Cameron, aged 40, was appointed Chief Executive Officer on 23 February 2004. He was originally appointed to the Board on 1 March 1997 as Chief Financial Officer (formerly Finance Director), having joined Acambis in 1996 from the corporate finance department at N M Rothschild & Sons Limited where he had advised Acambis on its listing on the London Stock Exchange. From 31 March 2001 until his appointment as Chief Executive Officer, Gordon was additionally President of Acambis’ US division, Acambis Inc.. In 2004, he was appointed an Officer of the Order of the British Empire for services to the British biotechnology industry in the US.
Gordon was instrumental in Acambis’ winning and executing on the major smallpox vaccine supply and R&D contracts with the US Government. He combines considerable financial experience with the extensive industry knowledge he has developed during more than nine years with Acambis.
31
3 DAVID LAWRENCE * David Lawrence, aged 43, was appointed to the Board on 8 July 2004 from Chiron Vaccines, where he was Vice President of Finance. In his role at Chiron, David was responsible for all aspects of finance and accounting, and also for strategic planning and business development. In particular, he played a lead role in Chiron’s acquisition of PowderJect Pharmaceuticals plc and the subsequent disposal of various non-core assets/businesses. Prior to Chiron, the majority of David’s career had been spent with GlaxoSmithKline plc, which he joined in 1988. David has considerable industry knowledge and strong financial and management skills that, coupled with the experience he has gained through playing an active role in the rapid growth of Chiron, is invaluable in the management of Acambis’ continued growth. His responsibilities at Acambis include overseeing the finance function and corporate development. 4 DR THOMAS MONATH * Tom Monath, aged 65, a qualified medical doctor, joined Acambis in 1992 and was appointed to the Board as Chief Scientific Officer on 12 March 2002. Prior to joining Acambis, he worked as Colonel and Chief of the Virology Division of the US Army Medical Research Institute of Infectious Disease. During almost 20 years as Director of the CDC’s Division of Vector-Borne Infectious Diseases, he was instrumental in building the division into a key centre for research into arthropod-borne viruses such as yellow fever. Tom is responsible for the direction of Acambis’ programmes to develop vaccines against infectious diseases such as smallpox, JE, West Nile and C. difficile, and led the development of Acambis’ proprietary ChimeriVax technology. He served as a member of the US National Vaccine Advisory Committee. During his career, he has published more than 300 scientific papers and six books, including a seminal work on flaviviruses. Among other external positions, he is Adjunct Professor of Harvard School of Public Health. Dr Monath attends conferences and publishes papers and chapters with respect to maintaining his professional medical accreditation. |
| † Member of the Nominations Committee. * Member of the Executive Committee. ** Member of the Audit, Nominations and Remuneration Committees. *** Member of the Nominations and Remuneration Committees. | ||
| ||||
|
|
| ||
|
| ELIZABETH BROWN, COMPANY SECRETARY | ||
Elizabeth Brown, aged 34, was appointed Company Secretary on 1 July 2002. Elizabeth is a certified accountant and joined Acambis in 1996. In her core role as Vice President of Financial Management, Elizabeth is responsible for financial performance measurement, budgeting and long-term financial planning. In addition, Elizabeth has, in the last few years, overseen the development of Acambis’ risk management systems. | ||||
DIRECTORS’ INFORMATION The Directors who served during the year were: The usual business address of all the Directors, apart from Dr Thomas Monath, is Peterhouse Technology Park, 100 Fulbourn Road, Cambridge CB1 9PT, UK. Dr Monath’s usual business address is Acambis Inc., 38 Sidney Street, Cambridge, MA 02139, US. In accordance with the Company’s Articles of Association, Alan Smith and Alan Dalby will retire by rotation at this year’s AGM and, being eligible, offer themselves for re-election. In addition, Dr Peter Fellner, who has been appointed to the Board since the last AGM, offers himself for election at the AGM. | ||||

32 | Board of Director’s biographies |
Broad mix of industry expertise |
Our Non-executive Directors are a diverse group of individuals who provide a broad mix of expertise, drawn from several different industries. This includes not only sectors that are close to home – vaccines, biotech and pharmaceuticals – but also wider areas that can provide a different perspective on the issues faced by Acambis.
|

5 DR RANDAL CHASE ** Randal Chase, aged 56, was appointed to the Board of Acambis as a Non-executive Director on 1 October 2004. The Board considers Randal to be an independent Non-executive Director. Most recently, he was President of Shire Biologics, until its sale to ID Biomedical in 2004. Previously in his career, Randal was President of North American Vaccine and President of Aventis Pasteur Canada. He has a PhD in biochemistry from the University of British Columbia. Randal is currently a Director of Medicago Inc., a privately-held Canadian biopharmaceutical company, ConjuChem Inc., which is listed on the Toronto Stock Exchange, and Bioject Medical Technologies, Inc., and Executive Director and Chairman of Molecular Templates, Inc. 6 ALAN DALBY *** Alan Dalby, aged 69, became a Non-executive Director of Acambis on 1 May 1998. He is the Senior Independent Non-executive Director and Chairman of the Remuneration Committee. The Board considers Alan to be an independent Non-executive Director. Alan was previously an Executive Director of SmithKline, a predecessor company to GlaxoSmithKline plc, and retired from the role of Chairman of Reckitt Benckiser plc in 2001. He is a Director of Alteon, Inc., a US-based biotechnology company. 7 DR PETER FELLNER *** Peter Fellner, aged 62, was appointed to the Board of Acambis as a Non-executive Director on 6 February 2006. The Board considers Peter to be an independent Non-executive Director. Peter was Celltech Group plc’s Chief Executive Officer from 1990 to 2003 and Chairman from 2003 until its acquisition by the Belgian biopharmaceutical company, UCB SA, in 2004. Before Celltech, Peter was Chief Executive Officer of Roche UK from 1986 to 1990, having previously been Director of Roche UK Research Centre from 1984 to 1986. He is Chairman of Vernalis plc and Astex Therapeutics Limited, a Director of UCB SA, and a Non-executive Director of QinetiQ Group plc, Evotec AG and Bespak plc. He is also a Director of Oxford University’s technology transfer group, Isis Innovation Limited, and a Member of the UK’s Medical Research Council. |
|
33
8 ROSS GRAHAM ** Ross Graham, aged 58, was appointed to the Board of Acambis as a Non-executive Director on 25 March 2004. The Board considers him to be an independent Non-executive Director. He is Chairman of the Audit Committee and has been identified by the Board as having recent and relevant financial experience. Ross was most recently Corporate Development Director of Misys plc, which he joined as Finance Director in 1987 at the time of its flotation, and was appointed Corporate Development Director in 1998 with Board responsibility for corporate transactions and management of strategic alliances. He stepped down from Misys’ Board of Directors at the end of 2003 after more than 16 years. Prior to his career at Misys, Ross was a Partner with Arthur Young, a predecessor firm to Ernst & Young, where he qualified as a Chartered Accountant. He is also a Non-executive Director of Wolfson Microelectronics plc, Psion plc and Patientline plc, and Non-executive Chairman of Vecta Software Corporation Ltd. Mr Graham attends numerous courses and lectures on audit, financial, remuneration and non-executive related matters. |
| † Member of the Nominations Committee. * Member of the Executive Committee. ** Member of the Audit, Nominations and Remuneration Committees. *** Member of the Nominations and Remuneration Committees. | ||
| ||||
Our Executive Directors and two Senior Vice Presidents form our Executive Committee, which benefits from both wide-ranging and in-depth industry experience. | ||||
|
|
| ||
|
| DR PHILIP BEDFORD * | ||
Philip Bedford, aged 48, is Senior Vice President, Clinical Operations and Regulatory Affairs. A member of the Executive Committee, he joined Acambis in 1997 after spending 10 years with the predecessor companies to GlaxoSmithKline plc where he undertook a variety of project management and clinical development roles. Prior to joining industry, Philip obtained a PhD in tumour biology from the University of Manchester (UK), and undertook post-doctoral research into mechanisms of anti-tumour drug resistance in Heidelberg (Germany), Albany (NY, US) and London. | ||||

|
| DR JOAN FUSCO * | ||
Joan Fusco, aged 50, is Senior Vice President, Operations, with responsibility for manufacturing operations, process development, materials management, IT, project management and quality systems. A member of the Executive Committee, she joined Acambis in 2004 from Baxter where she was Vice President, Technical Affairs. Previously, she worked for North American Vaccine, Inc., which was acquired by Baxter in 2000. Joan has more than 18 years’ experience in the vaccine field. She obtained a PhD in microbiology from the University of Pittsburgh. | ||||
|
|
| ||

34 | |
This year, for the first time, we are presenting high-level reports from our three Board Committees – Audit, Nominations and Remuneration – covering the work each of them has performed during 2005 and thus far in 2006 to discharge their respective responsibilities. The remit of each of the Committees as delegated by the Board is laid out on pages 36 and 37.
|
|
|
|
|
| ROSS GRAHAM, CHAIRMAN OF THE AUDIT COMMITTEE |
|
|
| ||
| 2005 WAS A BUSY YEAR FOR THE AUDIT COMMITTEE, OVERSEEING IFRS, SOX PREPAREDNESS AND TAX STRATEGY |
| |
|
| ||
| The Audit Committee met six times during 2005 and has met twice already in 2006. During 2005, the Audit Committee’s agenda comprised regular items, such as the review of quarterly and full-year results, updates on our risk assessment work and the adoption of going concern basis. It also discussed more specific topics, such as progress towards achieving the Sarbanes-Oxley Act 2002, section 404 (SOX) attestation (required for the 2006 annual results), the requirement for an internal audit function and tax strategy. In early 2005, the Company reported its results for the first time under IFRS, restating 2004 comparator information. The Audit Committee oversaw the successful transition of reporting financial results under UK GAAP to IFRS, with external advice from Ernst & Young LLP. With respect to the requirement for an internal audit function, in May 2005 the Audit Committee agreed that the function should be formally established and a permanent position was filled in mid-2005. Previously, certain internal audit aspects were being addressed through the resource dedicated to ensuring internal controls were in place as required under SOX. During 2005, Ernst & Young LLP was formally appointed to assist us with our ongoing tax strategy to ensure that we are managing our business in a tax-efficient manner. Specifically, we are reviewing areas such as asset ownership, financing and foreign exchange exposures. MEMBERS OF THE AUDIT COMMITTEE: ROSS GRAHAM (CHAIRMAN), DR RANDAL CHASE, MICHAEL LYTTON (UNTIL HIS RESIGNATION ON 11 APRIL 2006) AND ALAN DALBY (STOOD DOWN FROM THE COMMITTEE ON 25 JANUARY 2006) |
| |
|
|
|
|

|
|
|
|
|
| ALAN SMITH, CHAIRMAN OF THE NOMINATIONS COMMITTEE |
|
|
| ||
| THE NOMINATIONS COMMITTEE’S WORK IN THE LAST YEAR CULMINATED IN THE RECOMMENDATION |
| |
|
| ||
| The Nominations Committee did not meet during 2005. It has met once in early 2006. During 2005, the Board initiated the search for an additional Non-executive Director. This search was conducted formally through the use of an external recruitment agency and culminated in the appointment of Dr Peter Fellner to the Board in February 2006. The process involved preparing a formal specification for the role, reviewing a short-list of candidates and conducting formal meetings with a number of potential candidates, before selecting Dr Fellner. MEMBERS OF THE NOMINATIONS COMMITTEE: ALAN SMITH (CHAIRMAN), DR RANDAL CHASE, ALAN DALBY, DR PETER FELLNER (APPOINTED TO COMMITTEE ON 22 MARCH 2006), ROSS GRAHAM AND MICHAEL LYTTON (UNTIL HIS RESIGNATION ON 11 APRIL 2006). |
| |
|
|
|
|

35
|
| ALAN DALBY, CHAIRMAN OF THE REMUNERATION COMMITTEE |
|
|
| ||
| DURING THE LAST YEAR THE REMUNERATION COMMITTEE HAS REVIEWED OUR LONG-TERM INCENTIVE SCHEMES AND FORMALISED SHARE OWNERSHIP GUIDELINES FOR EXECUTIVE DIRECTORS |
| |
|
| ||
| The Remuneration Committee met twice during 2005 and has met twice already in 2006. In addition to standard business items such as award of long-term incentives and remuneration reviews for Executive Directors and senior management, the Remuneration Committee has established a policy introducing formal Executive Directors’ share ownership guidelines and reviewed the composition of employee and management’s remuneration packages. In April 2006, the Remuneration Committee agreed to formalise share ownership guidelines for Executive Directors. The new policy encourages Executive Directors to build and maintain a shareholding at a level of around one times salary, recognising that fluctuations in the share price will cause the actual percentage to vary. In our 2004 Annual Report we reported that we had appointed Towers Perrin to assist us in reviewing the structure of employee and management remuneration to ensure that we reward and motivate our Executive Directors and staff appropriately. The review aimed to provide guidance to the Remuneration Committee on the optimal mix of the four core elements of a remuneration package according to an employee’s position in the organisation. The four elements are: base pay; benefits; learning and development; and work environment. We are starting to implement specific changes to remuneration packages from 2006. In late 2005, we appointed The Hay Group to assist us in reviewing our long-term incentives and to review Executive Directors’ remuneration packages. At this year’s AGM we are recommending a number of new schemes which will enable the Board to ensure that Executive Directors and senior employees are rewarded appropriately with long-term incentives. The new schemes are: • Deferred bonus plan: Annual maximum bonus percentage to be increased from 75% to 125% of salary but with 40% of any bonus to be deferred for three years in the form of Acambis shares. The deferral will be compulsory with no matching and will be lost on resignation or dismissal during the deferral period. • Share option scheme: Two new share option schemes are being proposed, the Acambis 2006 Approved Share Option Plan and the Acambis 2006 Unapproved Share Option Plan. • Use of stock settled share appreciation rights (SSSARs): SSSARs will provide equivalent awards to those of share options as the payments are directly linked to the increase in share price over the performance period. In normal circumstances, the net payment to the individual will be settled in Acambis shares. Performance conditions will be the same as for the share options. In addition, a recommendation will be made at the AGM to amend our dilution limit to allow for a 4.5% dilution over any three-year period whilst remaining within an overall 10% dilution limit over a 10-year period. The schemes are described fully in the Notice of AGM accompanying this Annual Report. The Remuneration Committee and the Board formally endorse these proposals. MEMBERS OF THE REMUNERATION COMMITTEE: ALAN DALBY (CHAIRMAN), DR RANDAL CHASE, DR PETER FELLNER (APPOINTED TO COMMITTEE 22 MARCH 2006), ROSS GRAHAM AND MICHAEL LYTTON (UNTIL HIS RESIGNATION ON 11 APRIL 2006) |
| |
|
|
|
|

36 |
The following statement describes the main principles of corporate governance and how they have been applied by Acambis.
COMPLIANCE WITH THE CODE OF BEST PRACTICE
Acambis has complied throughout the year with the provisions of the Code of Best Practice set out in Section 1 of the Combined Code published in July 2003 and restated in July 2005 by the Financial Reporting Council, except in those areas highlighted in the ‘comply or explain’ section presented on page 29.
STATEMENT OF APPLYING THE PRINCIPLES OF GOOD GOVERNANCE
Acambis has applied the Principles of Good Governance set out in Section 1 of the Combined Code by complying with the Code of Best Practice, as reported above. Further explanation of how the principles have been applied is set out below and, in relation to Directors’ remuneration, in the remuneration report.
THE BIA CODE OF BEST PRACTICE
Acambis, as a member of the BIA, has also complied with the principles in the BIA Code and maintains and develops procedures to support compliance with its specific provisions. The BIA Code was introduced in 1999, is obligatory for all BIA members, and includes principles and provisions relating to corporate governance matters, access to external advice, confidentiality, dealings in a company’s shares and standards of public announcements. It is intended to operate by reference to the particular circumstances of bioscience companies in support of the Combined Code.
THE BOARD AND COMMITTEES
BOARD OF DIRECTORS
The Board currently comprises the Chairman, three Executive Directors and four independent Non-executive Directors. It meets, in person, at least six times a year, with additional meetings as required. The Chairman also meets with just the Non-executive Directors, without the Executive Directors being present and the Non-executive Directors meet without the Chairman being present. The Board has identified Alan Dalby as the Senior Independent Director. During 2005, the Board met eight times. It oversees and approves Acambis’ business and commercial strategy, major transactions, financial statements and operating and capital expenditure budgets, and monitors progress. The information provided to the Board includes strategic and operational reviews, management accounting summaries and specific reports that provide details in respect of the ongoing running of the business. The Executive Directors are fully involved with the management of the Group’s strategic direction. A formal schedule of matters reserved for the Board exists and is available on the Company’s website. The Board is appraised of views of the investment community via biannual independent perception audits and weekly updates on analyst publications. All Directors have access to professional advice and training at the Company’s cost and to the services of the Company Secretary in the furtherance of their duties. The Board ensures that all newly appointed Directors receive a formal induction including, but not limited to, latest analyst reports, shareholder perception reports, Board and committee minutes, meetings with senior management and internal corporate literature. The Board delegates the day-to-day responsibility of managing the Group to a number of committees, details of which are set out below. Written terms of reference exist for the Audit, Remuneration and Nominations Committees. These were available during the year and are now published on the Company’s website.
AUDIT COMMITTEE
The Audit Committee currently consists of Ross Graham and Dr Randal Chase, who are both independent Non-executive Directors, and it is chaired by Ross Graham. It examines and reviews, on behalf of the Board, internal financial controls, financial and accounting policies and practices, the form and content of financial reports and statements, compliance with corporate governance best practice and the appointment and work of the external auditors. In 2005, the Company appointed Ernst & Young LLP to review the tax strategy for the Group. The Audit Committee reviews non-audit services provided by the external auditors on an ongoing basis to ensure that auditor objectivity and independence is safeguarded. In advance of any non-audit service engagements, the Audit Committee reviews whether objectivity and independence may be impaired and where appropriate engages alternative external accountants. The Audit Committee reviews the type of service and fee level in this respect. The policy to ensure that the external auditors
37
do not provide prohibited services was formalised in early 2005. The Audit Committee reports to the Board on these matters. The external auditors, PwC, have provided the Company written assurances under International Standard on Auditing (UK and Ireland) 260 ‘Communication of audit matters with those charged with governance’ and Independence Standards Board Standard No 1, ‘Independence Discussions with Audit Committees’, that they are independent accountants with respect to the Company, within the meaning of UK and SEC regulatory and professional requirements, and that the objectivity of the audit engagement partner and the audit staff is not impaired.
The CEO, the CFO and the external auditors may be in attendance at meetings. The Audit Committee meets, as a minimum, four times a year and at least once during the year without any Executive Directors present. During 2005, the Audit Committee met six times.
REMUNERATION COMMITTEE
The Remuneration Committee is made up of all of the independent Non-executive Directors and is chaired by Alan Dalby. It determines, on behalf of the Board, the Group’s policy for executive remuneration and the individual remuneration packages for the Executive Directors. The CEO may be in attendance at meetings, except when his own remuneration is being considered. The Committee met twice in 2005 and has access to professional advice in the furtherance of its duties. During 2005, the Remuneration Committee continued to work with Towers Perrin and also appointed The Hay Group to provide a Group-wide review of remuneration policy and strategy. Its report was considered during 2005. The remuneration report is set out on pages 40 to 49.
NOMINATIONS COMMITTEE
The Nominations Committee comprises the Chairman and all of the independent Non-executive Directors and is chaired by Alan Smith. It has responsibility for proposing to the Board any new appointments of both Executive and Non-executive Directors. The Chairman would not chair the Nominations Committee if it were dealing with the appointment of the successor to the Chairman. The Nominations Committee did not meet during 2005. The CEO may be in attendance at Nominations Committee meetings.
With respect to the process followed to appoint new Directors to the Board, it is the Nominations Committee’s policy to appoint an executive search agency to conduct an international search. The Board provides a role specification. Candidates are selected by the executive search agency, from which a shortlist is prepared. Interviews are conducted by Non-executive and Executive Directors as appropriate.
The Nominations Committee also reviews succession plans.
OPERATIONAL MANAGEMENT – EXECUTIVE COMMITTEE
The Board delegates operational management to an Executive Committee made up of the Executive Directors, the Senior Vice President, Clinical Operations and Regulatory Affairs and the Senior Vice President, Operations. It is chaired by the CEO, meets on a monthly basis and makes recommendations to the Board.
INTERNAL CONTROL
The Board has applied principle C.2 of the Combined Code by establishing a process for identifying, evaluating and managing the significant risks faced by the Group. This process has been in place since the start of 2000 and is in accordance with Internal Control: Guidance for Directors on the Combined Code published in September 1999. The Board is responsible for the Group’s system of internal control and for reviewing its effectiveness. Such a system manages rather than eliminates the risk of failure to achieve business objectives and can only provide reasonable and not absolute assurances against material misstatement or loss.
The Board regularly reviews the risks to which the business is exposed and the controls in place to mitigate those risks. It delegates the operational management of the business risk process to the Executive Directors. From 2005, the Operations Committee, which comprises senior operational managers, reports to the Executive Committee and has oversight of the day-to-day operational activities of Acambis, has been responsible for managing the risk reviews.
38 | Corporate governance statement |
In compliance with provision C.2.1 of the Combined Code, the Board reviews the effectiveness of the Group’s system of internal control. The Board’s monitoring covers all material controls, including financial, operational and compliance controls and risk management. It is based, principally, on reviewing reports from management to consider whether significant risks are identified, evaluated, managed and controlled and whether any significant weaknesses are promptly remedied or indicate a need for more extensive monitoring. The Board also receives, via the work performed by the Audit Committee, regular updates from the Company’s Auditors in this respect. The Board has also performed a specific assessment for the purpose of this Annual Report considering all significant aspects of internal control arising during the year. The Audit Committee reviewed and formalised the need to have an internal audit function during 2005, resulting in making a permanent appointment into this role during the year. The Audit Committee assists the Board in discharging its review responsibilities.
As of the date of this Annual Report, based on the assessment of the Board of Directors, there were no changes in the Group’s internal controls or in other factors that could significantly affect adversely these controls subsequent to the date of their evaluation.
RISK FACTORS
As with any business, there are risks and uncertainties relevant to Acambis’ business. These have been qualified by reference to factors that affect the majority of businesses, factors that are common to businesses in the biotechnology sector, factors common to businesses working in vaccines, and those specific to Acambis.
RISKS COMMON TO MOST BUSINESSES
THE FOLLOWING RISK FACTORS, WHILST PERTINENT TO ACAMBIS, ARE CONSIDERED TO BE COMMON TO MOST BUSINESSES
• | Failure to maintain legal and regulatory compliance |
• | New or revised accounting standards and rules causing a material adverse impact on reported financial results |
• | Failure to balance product portfolio against market projections and demands |
• | Increasing cost and decreasing availability of insurance |
• | Lack of control over external economic factors affecting business |
• | Political unrest, legal and regulatory changes or nationalisation in jurisdictions where a business operates |
• | Unforeseen events which would be classified as force majeure, e.g., fire, flood, loss of utilities |
• | Inability to trade as a going concern (e.g., through inaccurate forecasts, unexpected calls on reserves or significant increases in working capital) |
• | Impact of issues arising from reviews by tax authorities |
RISKS COMMON TO BIOTECH BUSINESSES
THE FOLLOWING RISK FACTORS, WHILST PERTINENT TO ACAMBIS, ARE CONSIDERED TO BE COMMON TO THE MAJORITY OF BIOTECHNOLOGY BUSINESSES
• | Recall or withdrawal of licensed products |
• | Failure of projects in development or clinical trial |
• | Inability to take any particular research project through to market due to safety and efficacy, regulatory approvals, manufacture, IP issues or lack of funds |
• | IP issues from challenges by others or lack of protection for own products |
• | High front-end costs associated with product development, which may have lead times to market of several years |
• | High product attrition rate, even after licensure |
• | Ethical issues, including in vivo testing and the conduct of clinical trials in humans |
• | Limited control over the type and cost of trial required to obtain licensure |
• | Insufficient funds for products or operations and consequent delay, reduction or elimination of some development programmes |
• | Negative impact of intense competition in areas in which the business is engaged |
• | Competitors who may have greater financial and human resources and more experience |
• | New research and discoveries that may render product candidates obsolete before they generate any income |
• | Competition for employees in the biotechnology sector that may lead to increased costs or decreased availability of staff |
• | Loss of key employees, which could delay or halt the development of products |
• | Some products may not be successfully commercialised without co-operation of collaborators |
39
RISKS COMMON TO VACCINE COMPANIES
THE FOLLOWING RISK FACTORS, WHILST PERTINENT TO ACAMBIS, ARE CONSIDERED TO BE COMMON TO THE MAJORITY OF COMPANIES WORKING IN THE VACCINE FIELD
• | Increasing demands of the vaccine regulatory environment, e.g., under the US FDA and EMEA, which could increase the cost of product development and also the time required |
• | Barriers to market such as inertia, doctor/patient attitudes and competitiveness in terms of product pricing and safety or efficacy profile |
• | Constraints on government and private healthcare budgets and drivers to reduce healthcare and insurance costs |
• | Legal factors, product liability claims, environmental concerns or patent disputes with competitors that could give rise to liabilities for which there may be no, limited or prohibitively expensive insurance coverage |
RISKS SPECIFIC TO ACAMBIS
THE FOLLOWING RISK FACTORS ARE CONSIDERED TO BE SPECIFIC TO ACAMBIS
• | Impact of regulatory issues arising from our listings in both the UK (LSE) and the US (NASDAQ) |
• | Inability to make the transition from primarily an R&D entity to a fully integrated infectious disease company |
• | No track record of having achieved registration of any product, although expertise does exist within the Group |
• | Reliance on the smallpox franchise and the US Government for the vast majority of our revenue |
• | Stocks of ACAM2000 smallpox vaccine held may become surplus to requirements |
• | Impact of fluctuations in the exchange rate with other currencies, particularly the US dollar |
• | Reliance on only one fully functional manufacturing facility, based in the US, which could be lost or damaged |
• | Lack of substantial recurrent revenue stream |
• | Outstanding IP litigation with BN on MVA |
• | Significant resources are required for ongoing investment in R&D pipeline |
This list should not be considered an exhaustive statement of all potential risks and uncertainties. Please refer to a fuller list of risk factors at www.acambis.com.
40 | |
The Principles of Good Governance relating to Directors’ remuneration are described below. The remuneration report relates to the 2005 financial year and subsequent years.
In accordance with the Directors’ Remuneration Report Regulations 2002, a resolution is being put to the Company’s shareholders at this year’s AGM (see page 93) to approve the Remuneration Committee’s report.
Those sections which our Auditors, PricewaterhouseCoopers LLP, have audited have been specifically identified within this report.
REMUNERATION COMMITTEE
The current members of the Remuneration Committee (the Committee) are Alan Dalby (Chairman), Ross Graham and Dr Randal Chase and, from 22 March 2006, Dr Peter Fellner. All members are Non-executive Directors of the Company. It is the view of the Board that the members of the Committee are fully independent. The remit of the Committee is to determine, on behalf of the Board, the remuneration and other benefits of all Executive Directors and senior management, including basic salary, benefits, pension contributions, bonus payments, share-based long-term incentives and service contracts. The terms of reference for the Committee were available throughout the year, and have been published on the Company’s website.
During 2005, The Hay Group (appointed by the Committee in 2005) and Towers Perrin (appointed in 2004), independent professional organisations specialising in providing advice on executive remuneration issues, employee share schemes and pensions, materially assisted the Committee. Their work is summarised on page 35, together with specific recommendations that will be put to the AGM this year to amend certain aspects of the long-term incentives offered. None of these organisations has any other links with the Company.
During 2005, the CEO, CFO and Company Secretary also materially assisted the Committee in its discussions, except in relation to their own remuneration.
Information on the remuneration of key management personnel is given in note 27 on page 86. Key management personnel are those persons having authority and responsibility for planning, directing and controlling the activities of the Group, directly and indirectly, including but not limited to, all Executive and Non-executive Directors.
POLICY ON EXECUTIVE DIRECTOR REMUNERATION
The Committee is aware that it must both attract and retain individuals of the highest calibre. Therefore, it aims to ensure that remuneration packages are competitive with comparable publicly listed companies and that they fairly and responsibly reward individuals for their contribution to the success of the Group, in order to align their interests with shareholders. The Committee considers it to be appropriate that a significant proportion of Directors’ remuneration is performance-related through an annual bonus scheme and longer term incentives, and the performance conditions attached to these components have been structured such that they are specific to Acambis.
COMPONENTS OF EXECUTIVE DIRECTORS’ REMUNERATION
BASIC SALARY AND BENEFITS
In determining the basic salary of each Director, the Committee takes into account, and intends to take into account in respect of future financial years, the individual’s responsibilities and any responsibility changes. Pay levels are set in the light of an independent assessment of market practices, by comparison with salary levels in a group of similar-sized biotechnology companies in the UK. For US-based Executive Directors, salary levels in companies of a size similar to Acambis Inc. are also reviewed. The Committee also takes into consideration the percentage increase awarded to all other employees when reviewing the Executive Director salary increases. Basic salaries for Executive Directors are reviewed annually. Benefits offered to all Executive Directors comprise private healthcare, life assurance, permanent health insurance and private telephone. In addition, Executive Directors may receive a car allowance. In the event that Executive Directors are required to relocate or are assigned outside their home office, certain travel or accommodation benefits may be provided, which the Committee will determine on a case-by-case basis.
41
ANNUAL BONUS
Bonuses are non-pensionable and based on a percentage of basic salary. The maximum annual bonus is 75% of basic salary, which can only be achieved for significantly outperforming budgeted targets.
Bonuses are paid at the discretion of the Committee in recognition of the Directors’ contributions to the success of the Group. Objectives are set that are considered to be both challenging and realistic. The performance metrics on which bonus payments are assessed are a mix of short-term financial, product development and business development targets. For 2005, the bonuses awarded to Executive Directors were determined following an evaluation of the Group’s performance against agreed objectives. Following termination, any bonuses paid are at the discretion of the Committee. Currently, bonuses can only be taken in the form of a cash payment. A recommendation is being put to the 2006 AGM to introduce a deferred bonus scheme (see page 35). The bonus awarded for the 2005 financial year was based on performance against certain of the strategic priorities, (numbers 1, 5, 6, 7 and 9 as shown on page 17), plus financial targets. An element of discretion was also applied.
LONG-TERM INCENTIVES
The Committee principally seeks to incentivise Executive Directors by offering participation in share-based long-term incentive schemes.
Executive Directors currently participate in grants of share options under the Acambis 1995 savings-related share option scheme, the Acambis 1996 Approved Share Option scheme, the Acambis 1999 Share Option Plan and in grants of performance shares under the Acambis Share Incentive Plan. These plans and the performance conditions that apply to awards under these plans are described in more detail below.
The Committee has established a policy that it believes is balanced whereby Executive Directors can receive an annual grant of options of up to one times basic salary per annum (granted in two half-yearly tranches) and an annual grant of performance shares of up to one times basic salary per annum.
At the beginning of 2004, the Committee reviewed the performance conditions applicable to share options and determined that there would be no retesting of performance conditions for options granted from 2004 onwards.
The Committee acknowledges that the performance conditions applicable to its long-term incentives are the same for share options and performance shares. The Board is recommending certain changes to its long-term incentives offered (as summarised on page 35), which will address this point.
The Committee acknowledges the importance of updating shareholders on the current performance of grants made to Executive Directors for share options and performance shares against pre-set conditions. This information is provided in the Directors’ remuneration section of this report.
Following the approval granted at the 2003 AGM to revise the dilution limits of issued ordinary share capital of the Company from time to time to 5% over a five-year period, to date the Company has, on average, remained within the 1% per annum limit agreed. A recommendation will be made at the 2006 AGM to amend this limit to allow for a 4.5% dilution over any three-year period whilst remaining within an overall 10% dilution limit over a 10-year period.
GENERAL PERFORMANCE CONDITIONS FOR LONG TERM INCENTIVES AWARDED CURRENTLY
Long-term incentive awards made currently are subject to performance conditions comparing Acambis’ TSR with that of a group of other companies within the industry, as detailed on page 48. The Committee has chosen this group as being the most appropriate for Acambis. As in 2004, during 2005 the Committee did consider including selected US biotechnology companies within the TSR comparator group and again concluded that they did not consider this appropriate given the Group is primarily compared to other UK-based biotechnology companies. The TSR condition seeks to align the interests of Executive Directors with the interests of shareholders by requiring superior relative TSR performance compared with other pharmaceutical and biotechnology companies before options can be exercised. The maximum allocation of shares would be achieved if Acambis were ranked in the upper quartile of the comparator group, being prorated down to a 30% allocation at a ranking at the median. No allocation will be made if Acambis’ ranking falls below the median. The performance condition is measured over a single three-year period.
42 | Remuneration report |
COMPONENTS OF EXECUTIVE DIRECTORS’ REMUNERATION (CONTINUED)
GENERAL PERFORMANCE CONDITIONS FOR LONG TERM INCENTIVES AWARDED CURRENTLY (CONTINUED)
For the purposes of the TSR calculation, the Company’s TSR will be averaged over the three months preceding the commencement of the period and the three months preceding a measurement date to ensure that results are not influenced by short-term volatility. TSR calculations are performed by an independent party.
Long-term incentive awards to Executive Directors made from 2003 are subject to an additional performance condition that requires the Committee to be satisfied that there has been improvement in the Company’s underlying financial performance over the relevant performance period.
A) SHARE OPTION SCHEMES
All Executive Directors are eligible to participate in the Company’s share option schemes.
The performance-linked share option schemes consist of an Inland Revenue-approved executive scheme and unapproved executive schemes. The grant of options under the current executive schemes (the ‘1996 Scheme’ and the ‘1999 Plan’ as defined below) is at the discretion of the Committee and their exercise is subject to the performance conditions detailed above. From 2004 there has been no retesting of performance conditions for new option grants beyond the single three-year testing period.
The Company also operates an Inland Revenue-approved savings-related scheme and an Employee Share Purchase Plan, which are available to all UK and US employees respectively, provided they enter into savings contracts.
B) LONG-TERM INCENTIVE SHARE PLAN
The Acambis LTIP has been established for Executive Directors and certain senior employees. The plan is designed to encourage participants to focus their efforts on longer-term growth in shareholder value and to encourage commitment to remain with the Acambis Group.
Long-term incentive awards are made, upon the recommendation of the Committee, by the Trustees of the Acambis Employees’ Trust (the Trust) and comprise performance shares, being a right to acquire, at no cost, a fixed maximum number of shares in the Company that are owned by the Trust. The right to acquire shares only vests after three years and is subject to a performance target, as described above. The Trust acquires shares to satisfy LTIP awards on the open market as required.
In 2003, the Committee reviewed the operation of that part of the LTIP that allowed participants to leave vested plan shares in the Trust in order to receive a grant of a further one matching share for each four plan shares deposited following those shares having been held by the Trust for a period of two years from vesting. As a result of this review, this aspect of the LTIP has not been operated for grants made since the start of 2004.
As the Company offers LTIPs, Executive Directors could be entitled to capitalised dividends and consequent adjustment of their overall package. As the Company does not currently pay dividends, this is not relevant at this time.
EXECUTIVE DIRECTORS’ SHARE OWNERSHIP GUIDELINES
The Committee encourages Executive Directors to build and maintain substantial interests in Acambis shares, thereby aligning their interests with other shareholders. During 2005, all Executive Directors increased their shareholdings in the Company. Until April 2006, the Committee had agreed not to introduce formal share ownership guidelines. In April 2006, the Remuneration Committee agreed to formalise share ownership guidelines for Executive Directors. The new policy encourages Directors to build and maintain a shareholding of 100% of salary, recognising that fluctuations in share price will cause the actual percentage to vary. It is envisaged that this shareholding will be built up over time through share purchases and through retaining a portion of net gains under the Company’s long-term incentive plans.
PENSION SCHEME
In the UK, the Company operates a self-administered, defined contribution, Inland Revenue-approved pension scheme for the Executive Directors. The Company contributes 18% of basic salary into this scheme on behalf of each Executive Director. No other benefits are pensionable. In the US, the Group offers a 401k Savings and Retirement Plan for all employees, including Executive Directors based in the US. Participants may contribute up to 15% of their annual compensation into the plan. The Company can make discretionary matching contributions, up to a maximum of 3% of basic salary. Pension costs for each Director are shown on page 45.
Changes to UK pensions legislation came into force in April 2006. As the Company operates defined contribution arrangements for its pension schemes, none of these changes significantly affects the Company.
43
DIRECTORS’ SERVICE CONTRACTS
Details of the service contracts of those who served as Directors during the year are:
|
|
|
|
Director | Contract date |
| Notice period |
Executive: |
|
|
|
Gordon Cameron | 1 March 1997 |
| 12 months |
David Lawrence | 8 July 2004 |
| 12 months |
Dr Thomas Monath1 | 12 March 2002 |
| 12 months |
Non-executive: |
|
|
|
Alan Smith1, 2 | 21 January 1998 |
| 3 months |
Dr Randal Chase | 1 October 2004 |
| 3 months |
Alan Dalby1, 2 | 25 March 1998 |
| 3 months |
Ross Graham | 25 March 2004 |
| 3 months |
Michael Lytton1, 3 | 12 March 2001 |
| 3 months |
NOTES
1 | The service contracts for these Directors were reviewed and updated in March 2005 to bring them in line with best practice. |
2 | Mr Smith and Mr Dalby will face re-election as Directors of the Company at the 2006 AGM, being Directors who are retiring by rotation in accordance with the Articles of Association of the Company. |
3 | Mr Lytton resigned from the Board on 11 April 2006. |
Dr Fellner was appointed to the Board on 6 February 2006 and will face re-election as a Director of the Company at the 2006 AGM, having been appointed to his role since the 2005 AGM.
All Executive Directors have rolling contracts with 12-month notice periods, in line with current best practice. On early termination of contract, an Executive Director would be entitled to basic salary and benefits for the notice period.
The Committee believes that, in the event of early termination of an Executive Director’s contract, it is appropriate to examine the specific circumstances of each case. Where appropriate, the Committee may agree to a phased payment of compensation over a fixed term. During this term, if the Executive Director were to find a new position the principle of mitigation would apply and payments would cease. The Committee does, however, reserve the right to make a payment in lieu of any period of notice.
The Board believes that it is in the Company’s best interest for Executive Directors to serve a minimum three-year term before retiring by rotation.
EXTERNAL APPOINTMENTS
The Committee recognises that Executive Directors may be invited to take up non-executive directorships or public service appointments and that these can broaden the experience and knowledge of the Director, from which the Company would benefit. Accordingly, subject to Board approval, they may accept non-executive appointments, as long as these are not likely to lead to a conflict of interest. They are also allowed to retain any fees paid under such appointments. During the year, none of the Executive Directors held other non-executive positions.
NON-EXECUTIVE DIRECTORS’ FEES AND TERMS
The Non-executive Directors’ fees are determined, and it is intended shall be determined in future financial years, by the Board on the basis of independent advice on current levels in similar businesses. Fees are reviewed periodically. Non-executive Directors are not eligible and do not participate in pensions, incentives, bonuses or any similar payments other than out-of-pocket travel and accommodation costs in connection with the performance of their duties. Non-executive Directors’ fees comprise a basic fee plus an additional fee for chairing a committee. Consideration is given to the time commitment required of Non-executive Directors when setting their fees. Non-executive Directors’ fees are not dependent on specific meeting attendance or linked to the number of hours of time spent on Group matters. Whilst there is no set time commitment specified in Non-executive Directors’ service contr acts, it is expected that they attend all relevant meetings. Under the terms of their contracts, Non-executive Directors do not take any part of their fees in the form of Acambis shares. Non-executive Directors are entitled to their fees during any notice period.
The Board believes that it is in the Company’s best interest for Non-executive Directors to serve a minimum three-year term before retiring by rotation. Typically, they are expected to serve two three-year terms, although they may be invited to continue in office for a further period.
44 | Remuneration report |
COMPONENTS OF EXECUTIVE DIRECTORS’ REMUNERATION (CONTINUED)
DIRECTORS’ INTERESTS IN SHARES (UNAUDITED)
The Directors who served during the year had the following beneficial interests in the shares of the Company:
| Number of | Number of |
Gordon Cameron1 | 283,442 | 278,442 |
Dr Randal Chase | 10,000 | – |
Alan Dalby | 5,000 | 5,000 |
Ross Graham | 6,128 | 6,128 |
David Lawrence2 | 800 | – |
Michael Lytton3 | 21,789 | 18,022 |
Dr Thomas Monath4 | 70,842 | 60,842 |
Alan Smith | 1,800 | 1,800 |
NOTES
1 | 40,885 of the shares owned by Mr Cameron are held in trust on his behalf by the Trustees of the Acambis Employees’ Trust (2004 – 35,885 shares). |
2 | Mr Lawrence holds 800 shares on behalf of certain family members (connected persons). |
3 | Mr Lytton resigned from the Board on 11 April 2006. |
4 | 10,000 of the shares owned by Dr Monath are held in trust on his behalf by the Trustees of the Acambis Employees’ Trust (2004 – Nil). |
Individually, each of the Directors beneficially owns less than 1% of the total issued share capital. As at 31 December 2005, the Directors had no interests in shares of any other Group company. On 24 March 2006, Mr Lawrence purchased 7,500 shares for himself and on behalf of certain family members and Dr Fellner (appointed to the Board on 6 February 2006) purchased 14,000 shares. Except for these purchases, there have been no changes in the interests of the current Directors in the share capital of the Company since 31 December 2005.
The Executive Directors also have an interest as potential beneficiaries in the 84,972 ordinary shares held at 21 April 2006 by the Trustees of the Acambis Employees’ Trust.
45
DIRECTORS’ REMUNERATION (AUDITED)
The total remuneration of the Directors for the year ended 31 December 2005 (shown below) comprised salaries, benefits, bonuses, pension contributions and Non-executive Director fees. During the year, no Directors waived emoluments (2004 – £nil). The remuneration received by each Director who served during the year was as follows:
Directors | Basic |
| Benefits9 |
| Bonus |
| Total |
| Total |
| Pension |
| Pension |
Executive: |
|
|
|
|
|
|
|
|
|
|
|
|
|
Gordon Cameron1 | 344 |
| 43 |
| 103 |
| 490 |
| 423 |
| 63 |
| 57 |
David Lawrence2 | 187 |
| 24 |
| 56 |
| 267 |
| 94 |
| 34 |
| 11 |
Nicolas Higgins3 | – |
| – |
| – |
| – |
| 474 |
| – |
| 33 |
Dr Thomas Monath4 | 179 |
| 8 |
| 51 |
| 238 |
| 212 |
| 4 |
| 3 |
Total | 710 |
| 75 |
| 210 |
| 995 |
| 1,203 |
| 101 |
| 104 |
Non-executive: |
|
|
|
|
|
|
|
|
|
|
|
|
|
Alan Smith | 70 |
| – |
| – |
| 70 |
| 70 |
| – |
| – |
Dr Randal Chase5 | 33 |
| – |
| – |
| 33 |
| 8 |
| – |
| – |
Alan Dalby | 37 |
| – |
| – |
| 37 |
| 37 |
| – |
| – |
Michael Lytton6 | 34 |
| – |
| – |
| 34 |
| 34 |
| – |
| – |
Ross Graham7 | 37 |
| – |
| – |
| 37 |
| 29 |
| – |
| – |
Victor Schmitt8 | – |
| – |
| – |
| – |
| – |
| – |
| – |
Total | 211 |
| – |
| – |
| 211 |
| 178 |
| – |
| – |
Total | 921 |
| 75 |
| 210 |
| 1,206 |
| 1,381 |
| 101 |
| 104 |
NOTES
1 | In 2005, Mr Cameron received a benefit valued at £15,000 (2004 – £22,000) in relation to the provision by the Group of accommodation and travel whilst he was located in the US. Total remuneration in 2005 includes $352,000 which Mr Cameron received in dollars, translated at an average exchange rate of £1: $1.821. (2004 – $511,000 translated at an average rate of £1: $1.832) as a result of him residing in the US for part of the year. Mr Cameron was appointed Chief Executive Officer in February 2004, and his remuneration during 2004 therefore represents a part year as Chief Financial Officer and a part year as Chief Executive Officer. |
2 | Remuneration paid to Mr Lawrence includes a benefit valued at £10,000 (2004 – £8,000) in relation to provision by the Group of travel costs and accommodation. Remuneration for 2004 relates to the period from 31 August 2004 being his employment start date. |
3 | Mr Higgins resigned from the Board on 31 December 2004. Amounts in 2004 represent remuneration paid up until the date of his resignation plus a payment of £240,000 (gross) as compensation for loss of office. |
4 | All of Dr Monath’s remuneration was paid in dollars and has been translated at an average exchange rate of £1: $1.821. |
5 | Dr Chase was appointed to the Board on 1 October 2004. Amounts in 2004 represent fees from the date of his appointment. |
6 | Mr Lytton resigned from the Board on 11 April 2006. |
7 | Mr Graham was appointed to the Board on 25 March 2004. Amounts in 2004 represent fees from the date of his appointment. |
8 | Mr Schmitt resigned from the Board on 21 January 2004. Under the terms of his appointment he did not receive fees. |
9 | Benefits offered to all Executive Directors comprise private healthcare, life assurance, permanent health insurance and private telephone. In addition, all Executive Directors, with the exception of Dr Monath, receive a car allowance. |
46 | Remuneration report |
COMPONENTS OF EXECUTIVE DIRECTORS’ REMUNERATION (CONTINUED)
DIRECTORS’ REMUNERATION (AUDITED) (CONTINUED)
The Directors who held office at 31 December 2005 hold options to acquire ordinary shares of the Company under the Acambis 1996 Approved Share Option Scheme (1996 Scheme), the Acambis 1995 Savings-Related Share Option Scheme (SAYE Scheme) and the Acambis 1999 Share Option Plan (1999 Plan) as follows:
Director |
| Scheme |
| 1 Jan |
| Granted |
| 31 Dec |
| Exercise |
| Earliest |
| Expiry |
| % performance |
| |
| ||||||||||||||||||
Gordon Cameron |
| 19961 |
| 17,685 |
| — |
| 17,685 |
| £1.70 |
| 20 Dec 99 |
| 20 Dec 06 |
| 100 | % | |
|
| 19992 |
| 13,911 |
| — |
| 13,911 |
| £3.33 |
| 31 Dec 04 |
| 31 Dec 11 |
| 100 | % | |
|
| 19992 |
| 30,545 |
| — |
| 30,545 |
| £3.04 |
| 26 Apr 05 |
| 26 Apr 12 |
| 53 | % | |
|
| 19992 |
| 39,116 |
| — |
| 39,116 |
| £2.33 |
| 26 Sep 05 |
| 26 Sep 12 |
| 61 | % | |
|
| 19993 |
| 27,469 |
| — |
| 27,469 |
| £3.23 |
| 14 May 06 |
| 14 May 13 |
| Nil |
| |
|
| 19993 |
| 32,561 |
| — |
| 32,561 |
| £2.76 |
| 19 Dec 06 |
| 19 Dec 13 |
| Nil |
| |
|
| 19994 |
| 43,350 |
| — |
| 43,350 |
| £3.46 |
| 24 Mar 07 |
| 12 Mar 14 |
| Nil |
| |
|
| 19994 |
| 60,440 |
| — |
| 60,440 |
| £2.73 |
| 12 Oct 07 |
| 12 Oct 14 |
| Nil |
| |
|
| 19994 |
| — |
| 78,538 |
| 78,538 |
| £2.19 |
| 31 May 08 |
| 31 May 15 |
| Nil |
| |
|
| 19994 |
| — |
| 68,525 |
| 68,525 |
| £2.51 |
| 12 Sep 08 |
| 12 Sep 15 |
| Nil |
| |
|
| SAYE5 |
| 5,250 |
| — |
| 5,250 |
| £1.80 |
| 01 Dec 05 |
| 01 Jun 06 |
| N/A |
| |
|
| SAYE5 |
| — |
| 4,651 |
| 4,651 |
| £2.01 |
| 01 Dec 08 |
| 31 May 09 |
| N/A |
| |
| ||||||||||||||||||
Total |
|
|
| 270,327 |
| 151,714 |
| 422,041 |
|
|
|
|
|
|
|
|
|
|
| ||||||||||||||||||
David Lawrence |
| 19964 |
| 10,989 |
| — |
| 10,989 |
| £2.73 |
| 12 Oct 07 |
| 12 Oct 14 |
| Nil |
| |
|
| 19994 |
| 117,216 |
| — |
| 117,216 |
| £2.73 |
| 12 Oct 07 |
| 12 Oct 14 |
| Nil |
| |
|
| 19994 |
| — |
| 42,808 |
| 42,808 |
| £2.19 |
| 31 May 08 |
| 31 May 15 |
| Nil |
| |
|
| 19994 |
| — |
| 37,350 |
| 37,350 |
| £2.51 |
| 12 Sep 08 |
| 12 Sep 15 |
| Nil |
| |
|
| SAYE5 |
| — |
| 4,651 |
| 4,651 |
| £2.01 |
| 01 Dec 08 |
| 31 May 09 |
| N/A |
| |
| ||||||||||||||||||
Total |
|
|
| 128,205 |
| 84,809 |
| 213,014 |
|
|
|
|
|
|
|
|
|
|
| ||||||||||||||||||
Dr Thomas Monath |
| 19992 |
| 30,403 |
| — |
| 30,403 |
| £3.04 |
| 26 Apr 05 |
| 26 Apr 12 |
| 53 | % | |
|
| 19992 |
| 38,575 |
| — |
| 38,575 |
| £2.33 |
| 26 Sep 05 |
| 26 Sep 12 |
| 61 | % | |
|
| 19993 |
| 26,993 |
| — |
| 26,993 |
| £3.23 |
| 14 May 06 |
| 14 May 13 |
| Nil |
| |
|
| 19993 |
| 30,752 |
| — |
| 30,752 |
| £2.76 |
| 19 Dec 06 |
| 19 Dec 13 |
| Nil |
| |
|
| 19994 |
| 23,470 |
| — |
| 23,470 |
| £3.46 |
| 24 Mar 07 |
| 24 Mar 14 |
| Nil |
| |
|
| 19994 |
| 31,834 |
| — |
| 31,834 |
| £2.73 |
| 12 Oct 07 |
| 12 Oct 14 |
| Nil |
| |
|
| 19994 |
| — |
| 40,709 |
| 40,709 |
| £2.19 |
| 31 May 08 |
| 31 May 15 |
| Nil |
| |
|
| 19994 |
| — |
| 35,995 |
| 35,995 |
| £2.51 |
| 12 Sep 08 |
| 12 Sep 15 |
| Nil |
| |
| ||||||||||||||||||
Total |
|
|
| 182,027 |
| 76,704 |
| 258,731 |
|
|
|
|
|
|
|
|
|
|
| ||||||||||||||||||
NOTES
1 | The performance condition for those options granted under the 1996 Scheme until the end of 2000 is that either: |
| a) | the percentage growth in the Company’s share price over the three years from the date of grant must exceed the percentage growth in the total return for the FTSE All-Share index over that three-year period; or |
| b) | the average percentage share price movements of the Company over each of the three years beginning on a date not earlier than the grant date and ending on the date of exercise must exceed the average movements in the FTSE All-Share Index over each of those three years. |
2 | The performance condition for those options granted under the 1999 Plan compares the Company’s TSR to the TSR of a chosen group of pharmaceutical and biotechnology companies over a three-year period. A median ranking must be achieved before any part of the option may be exercised (50% of the option) and an upper quartile ranking must be achieved for the option to vest in full. This condition, if not initially achieved in full, can be further measured over a four- or five-year period measured from the same fixed-base point. |
3 | The performance condition for these options granted under the 1999 Plan is the same as that outlined in note 2, except that only 30% of the option may be exercised if the Company achieves a median ranking. Performance can only be re-measured once over a four-year period and there is also a requirement before the option can be exercised for the Committee to be satisfied with the Company’s underlying financial performance over the performance period. |
4 | The performance condition for these options granted under the 1996 Scheme and the 1999 Plan is the same as that outlined in note 3, except that the performance is measured only once at the end of the three-year period. |
5 | No performance conditions apply to SAYE options. |
6 | Data in this column are intended to illustrate the percentage of the awards that would have vested at 31 December 2005 based on the performance conditions applying to those grants. Should the awards have vested at 31 December 2005, a time apportionment factor would also have applied based on the period of time from the date of award to 31 December 2005, where the full three years to vest had not been reached. These data are unaudited. |
47
DIRECTORS’ REMUNERATION (AUDITED) (CONTINUED)
All of these options were granted for nil consideration and are held over 10p ordinary shares in the Company. The market value of the options at the time of grant is as detailed in the ‘Exercise price’ column, with the exception of SAYE options which are granted at 20% below market value. The market price of shares at 31 December 2005 was 207.0p and the range during the year was 203.5p to 283.0p per share.
Further information on each of the Company’s share option schemes, including the number of options outstanding, exercise prices and exercise periods, is set out in note 25 to the financial statements.
LONG-TERM SHARE INCENTIVE PLAN (AUDITED)
Awards have been made to Executive Directors of the Company under the LTIP1as follows:
Directors |
| 1 Jan |
| Awarded |
| Vested |
| Lapsed |
| 31 Dec |
| Value |
| Award |
| Vesting |
| % performance |
|
| |||||||||||||||||||
Gordon Cameron |
| 59,366 | 2,3 | — |
| (20,600 | ) | (38,766 | ) | — |
| 45,320 |
| 22 Apr 02 |
| 22 Apr 05 |
| N/A |
|
|
| 54,939 | 2 | — |
| — |
| — |
| 54,939 |
| — |
| 14 May 03 |
| 14 May 06 |
| Nil |
|
|
| 86,704 | 4 | — |
| — |
| — |
| 86,704 |
| — |
| 24 Mar 04 |
| 24 Mar 07 |
| Nil |
|
|
| 8,971 | 5 | — |
| — |
| — |
| 8,971 |
| — |
| 05 Oct 04 |
| 05 Oct 06 |
| 100 | % |
|
| — |
| 1,250 | 6 | — |
| — |
| 1,250 |
| — |
| 27 May 05 |
| 27 May 07 |
| 100 | % |
|
| — |
| 157,077 | 4,7 | — |
| — |
| 157,077 |
| — |
| 31 May 05 |
| 31 May 08 |
| Nil |
|
| |||||||||||||||||||
Total |
| 209,980 |
| 158,327 |
| (20,600 | ) | (38,766 | ) | 308,941 |
| 45,320 |
|
|
|
|
|
|
|
| |||||||||||||||||||
David Lawrence |
| — |
| 85,616 | 4,7 | — |
| — |
| 85,616 |
| — |
| 31 May 05 |
| 31 May 08 |
| Nil |
|
| |||||||||||||||||||
Total |
|
|
| 85,616 |
| — |
| — |
| 85,616 |
|
|
|
|
|
|
|
|
|
| |||||||||||||||||||
Dr Thomas Monath |
| 59,090 | 2,3 | — |
| (20,504 | ) | (38,586 | ) | — |
| 45,109 |
| 22 Apr 02 |
| 22 Apr 05 |
| N/A |
|
|
| 53,987 | 2 | — |
| — |
| — |
| 53,987 |
| — |
| 14 May 03 |
| 14 May 06 |
| Nil |
|
|
| 46,943 | 4 | — |
| — |
| — |
| 46,943 |
| — |
| 24 Mar 04 |
| 24 Mar 07 |
| Nil |
|
|
| — |
| 2,500 | 8 | — |
| — |
| 2,500 |
| — |
| 27 May 05 |
| 27 May 07 |
| 100 | % |
|
| — |
| 81,418 | 4,7 | — |
| — |
| 81,418 |
| — |
| 31 May 05 |
| 31 May 08 |
| Nil |
|
| |||||||||||||||||||
Total |
| 160,020 |
| 83,918 |
| (20,504 | ) | (38,586 | ) | 184,848 |
| 45,109 |
|
|
|
|
|
|
|
|
NOTES
1 | The exercise price for all awards made under the LTIP is £1.00 in total for the exercise of any number of shares comprised in an award. All LTIP awards are held over ordinary 10p shares in the Company. |
2 | The performance condition for these awards compares the Company’s TSR to the TSR of a chosen group of pharmaceutical and biotechnology companies over a three-year period. A median ranking must be achieved before any part of the award may vest (30% of the award) and an upper quartile ranking must be achieved for the award to vest in full. After three years, vested plan shares may be left in the Trust and participants can then receive a grant of a further one matching share for each four plan shares so deposited. The matching shares will vest provided the participant remains employed and does not withdraw those plan shares for a further two years. The matching award component was not offered after 2003. |
3 | These awards were made on 22 April 2002, at which time the share price was 321.0p per share. On 22 April 2005, these awards vested, at which time the share price was 220.0p per share. Following the measurement of the performance condition, 34.7% of the award vested and the balance lapsed. These awards were exercised on 27 May 2005. |
4 | The performance condition for these awards compares the Company’s TSR to the TSR of a chosen group of pharmaceutical and biotechnology companies over a three-year period. A median ranking must be achieved before any part of the award may vest (30% of the award) and an upper quartile ranking must be achieved for the award to vest in full. |
5 | Following the exercise of an LTIP award on 5 October 2004, Mr Cameron elected to leave 35,885 of those plan shares with the Trust. Under the rules of the plan, Mr Cameron is entitled to receive an additional 8,971 shares, and matching share for each four plan shares so deposited so long as he retains those shares in the Trust for a period of two years from the date of award. |
6 | Following the exercise of an LTIP award on 27 May 2005, Mr Cameron elected to leave 5,000 of those plan shares with the Trust. Under the rules of the Plan, Mr Cameron is entitled to receive an additional 1,250 shares, one matching share for each four plan shares so deposited, so long as he retains those shares in the Trust for a period of two years from date of award. |
7 | These awards were made on 31 May 2005, at which time the share price was 217.75p per share. |
8 | Following the exercise of an LTIP award on 27 May 2005, Mr Monath elected to leave 10,000 of those plan shares with the Trust. Under the rules of the Plan, Mr Monath is entitled to receive an additional 2,500 shares, one matching share for each four plan shares so deposited, so long as he retains those shares in the Trust for a period of two years from date of award. |
9 | Data in this column are intended to illustrate the percentage of the awards that would have vested at 31 December 2005 based on the performance conditions applying to those awards. Should the awards have vested at 31 December 2005, a time apportionment factor would also have applied based on the period of time from the date of award to 31 December 2005, where the full three years to vest had not been reached. These data are unaudited. |
48 | Remuneration report |
COMPONENTS OF EXECUTIVE DIRECTORS’ REMUNERATION (CONTINUED)
GAINS MADE BY DIRECTORS ON SHARE OPTIONS AND LTIPS (AUDITED)
The table below shows gains made by individual Directors from the exercise of share options and LTIPs. The gains are calculated as at the exercise date, although the shares may have been retained.
|
| 2005 |
| 2004 |
Gordon Cameron |
| 45 |
| 740 |
Nicolas Higgins (resigned 31 December 2004) |
| — |
| 574 |
Dr Thomas Monath |
| 45 |
| 497 |
Total gains on share options and LTIPs |
| 90 |
| 1,811 |
ACAMBIS’TSR PERFORMANCE (UNAUDITED)
Acambis’ TSR performance is shown against a comparator group of all pharmaceutical and biotechnology companies listed on LSE and AIM with a market capitalisation greater than £60m but excluding Alliance UniChem Plc, AstraZeneca PLC, GSK plc and Shire Pharmaceuticals Group plc. This index has been chosen as Acambis is a constituent of this sector. These companies are:
AGI Therapeutics plc |
| Innovata plc |
Allergy Therapeutics Ltd |
| NeuTec Pharma PLC |
Alizyme plc |
| Oxford BioMedica plc |
Antisoma plc |
| Prostrakan Group plc |
Ardana plc |
| Protherics PLC |
ARK Therapeutics Group PLC |
| Sinclair Pharma plc |
Axis-Shield plc |
| SkyePharma PLC |
Cambridge Antibody Technology Group PLC |
| Vectura Group PLC |
Dechra Pharmaceuticals PLC |
| Vernalis Group plc |
Goldshield Group PLC |
| XTL Biopharmaceuticals Ltd |
GW Pharmaceuticals plc |
|
|
The following table details the five-year rebased TSR performance of Acambis and its chosen index.
|
| Acambis |
| Pharmaceuticals |
|
| |||||
31 December 2000 |
| 100 | % | 100 | % |
31 December 2001 |
| 339 | % | 55 | % |
31 December 2002 |
| 268 | % | 27 | % |
31 December 2003 |
| 295 | % | 41 | % |
31 December 2004 |
| 243 | % | 41 | % |
31 December 2005 |
| 200 | % | 44 | % |
|
49
ACAMBIS’TSR PERFORMANCE (UNAUDITED) (CONTINUED)
TOTAL SHAREHOLDER RETURN (TSR)
TSR REBASED TO 100
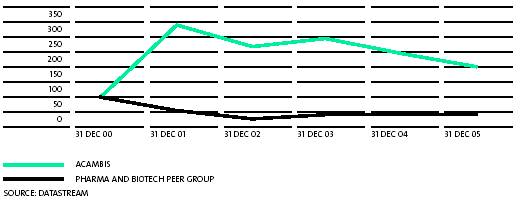
This graph illustrates the TSR performance (share price growth plus dividends paid) of Acambis compared to a ‘broad equity market index’ over the past five years, as required by legislation. Acambis’ TSR performance is shown against a peer group of pharmaceutical and biotechnology companies, comprising LSE- and AIM-listed companies with a market capitalisation of over £60m, excluding Alliance UniChem Plc, AstraZeneca plc, GSK plc and Shire Pharmaceuticals Group plc. This index has been chosen as the most appropriate form of ‘broad equity market index’ against which the Company’s performance should be graphed, as Acambis is a constituent of this sector.
On behalf of the Board
Alan Dalby
Non-executive Director and Chairman of the Remuneration Committee
9 May 2006
50 | |
The Directors’ report on the affairs of the Group is presented below. The Group financial statements and Auditors’ report for the year ended 31 December 2005 are presented within this document.
PRINCIPAL ACTIVITIES AND BUSINESS REVIEW
A review of the business and future developments of the Group is set out in the performance review. The principal activities of the Group are the research, development, manufacture and sale of vaccines to prevent and treat infectious diseases.
RESULTS AND DIVIDENDS
The loss for the year after taxation amounted to £27.0m (2004 – profit of £19.7m). The Directors do not recommend a final dividend for the year (2004 – £nil). In the year ended 31 December 2005, the Group generated revenues of £40.9m (2004 – £85.5m). Further details of the results for the year and future developments for the Group are set out in the financial review of 2005.
RESEARCH AND DEVELOPMENT
As discussed within the financial review, the Group incurred R&D costs of £34.1m (2004 – £29.3m) during the year, which have been written off to the income statement in accordance with the Group’s accounting policy.
DIRECTORS AND THEIR INTERESTS
The Directors who served during 2005 are shown in the Board review. The interests of the Directors in the Company’s shares and options to purchase shares in the Company are shown in the remuneration report. At 31 December 2005, the Directors held an aggregate 399,801 shares, representing 0.4% of the current issued capital. None of the Directors had an interest in a contract of significance to which the Company or any of its subsidiary undertakings was party during the year.
POLICY ON PAYMENT OF CREDITORS
It is the Group’s policy that payments to suppliers should be made in accordance with those terms and conditions agreed between the Group and its suppliers, provided that all trading terms and conditions have been met. At 31 December 2005, the Company had an average of nil days (2004 – 10 days) of purchases outstanding in trade creditors. At 31 December 2005, the Group had an average of 90 days (2004 – 46 days) of purchases outstanding in trade creditors.
PURCHASE OF OWN SHARES
During the year the Company purchased 100,000 ordinary shares with a nominal value of 10p each, for £0.2m. These represent less than 0.1% of allocated share capital. The shares were purchased for the ESOP Trust, to be used to satisfy awards under the LTIP.
CORPORATE RESPONSIBILITY
The Directors recognise the importance of corporate responsibility and, as a result, have included a report on Acambis’ current activities in this area in the performance review.
FINANCIAL RISK MANAGEMENT
As discussed in note 16, the main financial risks arising from the Group’s activities and involving the use of financial instruments are foreign currency risk, interest rate risk and liquidity risk.
51
POLITICAL AND CHARITABLE DONATIONS
During the year, the Group made charitable contributions amounting to £30,400 (2004 – £17,200). Of this total, £1,000 related to medical research (2004 – £3,200), £6,200 for the biotechnology – related education initiatives (2004 – £6,050), £nil to children’s charities (2004 – £350), £3,400 to local charities (2004 – £7,600), £11,900 to national charities (2004 – £nil) and £7,900 to international charities (2004 – £nil). No political donations were made during the year (2004 – £300). Employees participated in various charitable fundraising activities during the year in aid of local and national charities.
EMPLOYEES
Acambis seeks to involve its employees in its corporate objectives, plans and performance and in other relevant matters of interest to employees through various communication methods, including regular employee meetings. Employees of Acambis are not part of any labour unions. The Directors consider there to be a good relationship between employees and management. The Group is an equal opportunities employer and does not discriminate in the recruitment and promotion of staff, including applicants who are disabled. If an employee becomes disabled it is the policy, wherever practicable, to provide continued employment. All employees are encouraged to share in the growth of the Group, being eligible to participate in share option schemes.
HEALTH, SAFETY AND ENVIRONMENTAL ISSUES
The Group is committed to achieving high health, safety and environmental standards and aims for continuous improvement in health, safety and environmental performance. In the UK, Acambis is a member of the British Safety Council. In the US, Acambis contracts with Mount Auburn Hospital’s Occupational Health Service to provide medical surveillance, and prevention and treatment of work-related injuries and illnesses, including administering of appropriate immunisations. The Group has an excellent health and safety record. The Group seeks to minimise the environmental impact of its activities. Waste materials are recycled, where possible, and specialist disposal companies handle hazardous waste.
INTERNATIONAL FINANCIAL REPORTING STANDARDS
For the year ended 31 December 2005 the Group’s results are reported under IFRS in this Annual Report and under US GAAP when filing its annual Form 20-F with the US SEC. The Group has adopted IFRS from 1 January 2005. The financial information for 2004 has been restated under IFRS.
OTHER INFORMATION AND AGM
Information regarding the substantial shareholders of Acambis, this year’s AGM, the appointment of the Group’s Auditors and special business to be conducted at the AGM is contained within the shareholder information section of this document.
By order of the Board
Elizabeth Brown
Company Secretary
9 May 2006
52 | |
Company law requires the Directors to prepare financial statements for each financial year that give a true and fair view of the state of affairs of the Company and the Group and of the profit or loss of the Group for that period.
FINANCIAL STATEMENTS, INCLUDING ADOPTION OF GOING CONCERN BASIS
• | After making enquiries, the Directors have a reasonable expectation that the Company and the Group have adequate resources to continue in operational existence for the foreseeable future. For this reason, they continue to adopt the going concern basis in preparing the financial statements. |
• | In preparing the financial statements, the Directors are required to: |
| – | select suitable accounting policies and then apply them consistently; |
| – | make judgements and estimates that are reasonable and prudent; |
| – | state whether applicable accounting standards have been followed, subject to any material departures disclosed and explained in the financial statements; and |
| – | prepare the financial statements on the going concern basis unless it is inappropriate to presume that the Group will continue in business. |
• | The Directors are responsible for keeping proper accounting records that disclose with reasonable accuracy at any time the financial position of the Company and the Group and enable them to ensure that the financial statements comply with the Companies Act 1985. They are also responsible for safeguarding the assets of the Company and the Group and hence for taking reasonable steps for the prevention and detection of fraud and other irregularities. |
• | The Directors are responsible for the maintenance and integrity of the Group’s website. The Company notes that UK legislation governing the preparation and dissemination of financial information may differ from that in other jurisdictions. |
By order of the Board
Elizabeth Brown
Company Secretary
9 May 2006
53 | |
We have audited the Group and parent Company financial statements of Acambis plc for the year ended 31 December 2005 which comprise the consolidated income statement, the consolidated statement of recognised income and expenses, the consolidated and Company balance sheets, the consolidated and Company cash flow statements and the related notes. These financial statements have been prepared under the accounting policies set out therein. We have also audited the information in the Directors’ remuneration report that is described as having been audited.
RESPECTIVE RESPONSIBILITIES OF DIRECTORS AND AUDITORS
The Directors’ responsibilities for preparing the Annual Report, the Directors’ remuneration report and the financial statements in accordance with applicable law and IFRS as adopted by the European Union are set out in the statement of Directors’ responsibilities.
Our responsibility is to audit the financial statements and the part of the Directors’ remuneration report to be audited in accordance with relevant legal and regulatory requirements and International Standards on Auditing (UK and Ireland). This report, including the opinion, has been prepared for and only for the Company’s members as a body in accordance with Section 235 of the Companies Act 1985 and for no other purpose. We do not, in giving this opinion, accept or assume responsibility for any other purpose or to any other person to whom this report is shown or into whose hands it may come save where expressly agreed by our prior consent in writing.
We report to you our opinion as to whether the financial statements give a true and fair view and whether the financial statements and the part of the Directors’ remuneration report to be audited have been properly prepared in accordance with the Companies Act 1985 and Article 4 of the IAS Regulation. We also report to you if, in our opinion, the Directors’ report is not consistent with the financial statements, if the Company has not kept proper accounting records, if we have not received all the information and explanations we require for our audit or if information specified by law regarding Directors’ remuneration and other transactions is not disclosed.
We review whether the corporate governance statement reflects the Company’s compliance with the nine provisions of the 2003 FRC Combined Code specified for our review by the Listing Rules of the Financial Services Authority and we report if it does not. We are not required to consider whether the Board’s statements on internal control cover all risks and controls, or to form an opinion on the effectiveness of the Group’s corporate governance procedures or its risk and control procedures.
We read other information contained in the Annual Report and consider whether it is consistent with the audited financial statements. The other information comprises only the Directors’ report, the unaudited part of the remuneration report, the Chairman’s statement, the performance review, the financial review, the corporate governance statement, the preview section, operational highlights, the Chairman’s Board review, the summarised Group statements and the information contained in the borders from the consolidated income statement onwards. We consider the implications for our report if we become aware of any apparent misstatements or material inconsistencies with the financial statements. Our responsibilities do not extend to any other information.
BASIS OF AUDIT OPINION
We conducted our audit in accordance with International Standards on Auditing (UK and Ireland) issued by the Auditing Practices Board. An audit includes examination, on a test basis, of evidence relevant to the amounts and disclosures in the financial statements and the part of the Directors’ remuneration report to be audited. It also includes an assessment of the significant estimates and judgements made by the Directors in the preparation of the financial statements, and of whether the accounting policies are appropriate to the Group’s and Company’s circumstances, consistently applied and adequately disclosed.
We planned and performed our audit so as to obtain all the information and explanations that we considered necessary in order to provide us with sufficient evidence to give reasonable assurance that the financial statements and the part of the Directors’ remuneration report to be audited are free from material misstatement, whether caused by fraud or other irregularity or error. In forming our opinion we also evaluated the overall adequacy of the presentation of information in the financial statements and the part of the Directors’ remuneration report to be audited.
OPINION
In our opinion:
• | the Group financial statements give a true and fair view, in accordance with IFRS as adopted by the European Union, of the state of the Group’s affairs as at 31 December 2005 and of its loss and cash flows for the year then ended; |
• | the parent Company financial statements give a true and fair view, in accordance with IFRS as adopted by the European Union as applied in accordance with the provisions of the Companies Act 1985, of the state of the parent Company’s affairs as at 31 December 2005 and cash flows for the year then ended; and |
• | the financial statements and the part of the Directors’ remuneration report to be audited have been properly prepared in accordance with the Companies Act 1985 and Article 4 of the IAS Regulation. |
PricewaterhouseCoopers LLP
Chartered Accountants and Registered Auditors
Cambridge, UK
9 May 2006
54 | Consolidated income statement FOR THE YEAR ENDED 31 DECEMBER 2005 |
|
| Notes |
| 2005 |
| 2004 |
|
| |||||||
Revenue |
| 2 |
| 40.9 |
| 85.5 |
|
Cost of sales |
|
|
| (27.6 | ) | (35.0 | ) |
| |||||||
Gross profit |
|
|
| 13.3 |
| 50.5 |
|
A Research and development costs |
|
|
| (34.1 | ) | (29.3 | ) |
Sales and marketing costs |
|
|
| (2.6 | ) | (2.8 | ) |
B Administration costs (including costs relating to Canton plant impairment and restructuring costs) |
| 3 |
| (7.7 | ) | (5.5 | ) |
Other operating income – settlement of Canton agreement |
| 3 |
| – | 10.2 |
| |
Other operating income – fair value of shares received for grant of licence |
| 3 |
| 0.4 | – |
| |
| |||||||
Operating (loss)/profit |
| 4 |
| (30.7 | ) | 23.1 |
|
Finance income |
| 3 |
| 4.0 | 4.8 |
| |
Finance costs |
| 3 |
| (1.0 | ) | (0.9 | ) |
| |||||||
(Loss)/profit on ordinary activities before taxation |
|
|
| (27.7 | ) | 27.0 |
|
Taxation – UK |
| 5 |
| (1.7 | ) | (3.7 | ) |
Taxation – overseas |
| 5 |
| 2.4 | (3.6 | ) | |
| |||||||
(Loss)/profit on ordinary activities after taxation attributable to shareholders |
|
|
| (27.0 | ) | 19.7 |
|
| |||||||
Basic (loss)/earnings per ordinary share (in pence) |
| 6 |
| (25.2 | )p | 18.5 | p |
Diluted (loss)/earnings per ordinary share (in pence) |
| 6 |
| (25.2 | )p | 18.1 | p |
|
A statement of changes in equity is given in note 24.
The accompanying notes are an integral part of this consolidated income statement.
All amounts in 2005 and 2004 arise from continuing operations.
Consolidated statement of recognised income and expenses FOR THE YEAR ENDED 31 DECEMBER 2005 | |
|
| 2005 |
| 2004 |
|
| |||||
Retained (loss)/profit for the year | (27.0 | ) | 19.7 |
| |
Gain/(loss) on foreign currency exchange | 1.6 | (2.5 | ) | ||
Revaluation of available-for-sale investment (net of deferred tax) | 0.1 | – |
| ||
| |||||
Total (expense)/income recognised for the year |
| (25.3 | ) | 17.2 |
|
|
THE INFORMATION CONTAINED IN THIS BORDER HAS NOT BEEN AUDITED
|
|
|
| ||
A | RESEARCH AND DEVELOPMENT COSTS | B | ADMINISTRATION COSTS |
|
|
|
|
|
| ||
| R&D COSTS HAVE INCREASED AS WE HAVE SUCCESSFULLY PROGRESSED OUR PROJECTS INTO LATER STAGES OF DEVELOPMENT, INCLUDING STARTING PHASE 3 TRIALS FOR CHIMERIVAX-JE. |
| THESE INCLUDE COSTS AND A PROVISION, TOGETHER TOTALLING AROUND £3M, FOR THE MVA LITIGATION. |
|
|
Consolidated balance sheet AT 31 DECEMBER 2005 | 55 |
|
| Notes |
| 2005 |
| 2004 |
|
| |||||||
| Assets |
| ||||||
Non-current assets |
|
|
|
|
|
|
|
Goodwill |
| 8 |
| 14.9 |
| 15.4 |
|
Other intangible assets |
| 9 |
| 4.2 |
| 4.1 |
|
Property, plant and equipment |
| 10 |
| 19.8 |
| 18.5 |
|
Deferred tax asset |
| 5 |
| 0.3 |
| – |
|
Financial assets: available-for-sale investment |
| 12 |
| 0.6 |
| – |
|
Other non-current assets |
| 13 |
| – |
| 2.5 |
|
| |||||||
|
|
| 39.8 |
| 40.5 |
| |
| |||||||
| Current assets |
| ||||||
Inventory |
| 14 |
| 3.6 |
| 6.0 |
|
Current tax assets |
|
|
| 1.3 |
| 1.9 |
|
C Trade and other receivables |
| 15 |
| 20.6 |
| 13.7 |
|
Financial assets: derivative financial instruments |
| 16 |
| 0.1 |
| – |
|
Liquid investments |
| 16 |
| 18.8 |
| 20.8 |
|
Cash and cash equivalents |
| 17 |
| 49.2 |
| 81.0 |
|
| |||||||
|
|
| 93.6 |
| 123.4 |
| |
| |||||||
| Liabilities |
| ||||||
Current liabilities |
|
|
|
|
|
|
|
Financial liabilities: |
|
|
|
|
|
|
|
– short-term borrowings |
| 18 |
| (4.0 | ) | (3.6 | ) |
– short-term financial liabilities |
| 18 |
| (7.2 | ) | (3.1 | ) |
– derivative financial instruments |
| 16 |
| – |
| (0.1 | ) |
C Trade and other payables |
| 19 |
| (16.1 | ) | (8.3 | ) |
Accruals and deferred income |
|
|
| (14.1 | ) | (27.9 | ) |
Income tax payable |
|
|
| (3.1 | ) | (4.6 | ) |
Provisions |
| 20 |
| (2.3 | ) | – |
|
| |||||||
|
|
| (46.8 | ) | (47.6 | ) | |
| |||||||
Net current assets |
|
|
| 46.8 |
| 75.8 |
|
| |||||||
Non-current liabilities |
|
|
|
|
|
|
|
Investment in Joint Venture |
| 21 |
| (0.3 | ) | (0.3 | ) |
Long-term financial liabilities |
| 18 |
| (1.6 | ) | (6.3 | ) |
Other non-current liabilities |
| 22 |
| – |
| (0.5 | ) |
Deferred tax liabilities |
| 5 |
| (1.7 | ) | (1.7 | ) |
| |||||||
|
|
| (3.6 | ) | (8.8 | ) | |
| |||||||
Net assets |
|
|
| 83.0 |
| 107.5 |
|
| |||||||
Shareholders’ equity |
|
|
|
|
|
|
|
| |||||||
Share capital |
| 23 |
| 10.7 |
| 10.7 |
|
Share premium |
| 24 |
| 98.0 |
| 97.8 |
|
Other reserves |
| 24 |
| (0.9 | ) | (2.5 | ) |
Retained earnings |
| 24 |
| (24.8 | ) | 1.5 |
|
| |||||||
Total shareholders’ equity |
|
|
| 83.0 |
| 107.5 |
|
|
The financial statements on pages 54 to 91 were approved by the Board of Directors on 9 May 2006 and were signed on its behalf by David Lawrence, Chief Financial Officer.
C | TRADE AND OTHER RECEIVABLES AND PAYABLES |
| |
| IN DECEMBER 2005, ACAMBIS DELIVERED 500,000 DOSES OF |
| MVA3000 SMALLPOX VACCINE TO THE NIAID. AT 31 |
| DECEMBER 2005 A TRADE RECEIVABLE DUE FROM THE NIAID |
| AND A TRADE PAYABLE DUE TO BAXTER FOR THE |
| PRODUCTION OF THE DOSES WERE OUTSTANDING. THESE |
| AMOUNTS WERE BOTH SETTLED IN EARLY 2006. |
56 | Company balance sheet AT 31 DECEMBER 2005 |
A |
| Notes |
| 2005 |
| 2004 |
|
| |||||||
Assets |
|
|
| ||||
| Non-current assets |
| ||||||
Investments in subsidiaries |
| 11 |
| 15.9 |
| 15.5 |
|
Amounts owed by subsidiary undertakings |
|
|
| 29.2 |
| 26.1 |
|
Other non-current assets |
| 13 |
| – |
| 0.6 |
|
| |||||||
|
|
|
| 45.1 |
| 42.2 |
|
| |||||||
| Current assets | |||||||
Trade and other receivables |
| 15 |
| 2.5 |
| 1.2 |
|
Amounts owed by subsidiary undertakings |
|
|
| 17.6 |
| – |
|
Financial assets: derivative financial instruments |
| 16 |
| 0.1 |
| – |
|
Liquid investments |
| 16 |
| 18.8 |
| 17.8 |
|
Cash and cash equivalents |
| 17 |
| 42.5 |
| 70.3 |
|
| |||||||
|
|
|
| 81.5 |
| 89.3 |
|
| |||||||
Liabilities |
|
|
|
|
|
|
|
| Current liabilities | |||||||
Trade and other payables |
| 19 |
| – |
| (0.1 | ) |
Amounts owed to subsidiary undertakings |
|
|
| – |
| (16.0 | ) |
Accruals and deferred income |
|
|
| (1.1 | ) | (0.7 | ) |
Financial liabilities: derivative financial instruments |
| 16 |
| – |
| (0.1 | ) |
Income tax payable |
|
|
| (2.1 | ) | (1.1 | ) |
| |||||||
|
|
|
| (3.2 | ) | (18.0 | ) |
| |||||||
Net current assets |
|
|
| 78.3 |
| 71.3 |
|
| |||||||
Net assets |
|
|
| 123.4 |
| 113.5 |
|
| |||||||
Shareholders’ equity |
|
|
|
|
|
|
|
| |||||||
Share capital |
| 23 |
| 10.7 |
| 10.7 |
|
Share premium |
| 24 |
| 97.8 |
| 97.6 |
|
Retained earnings |
| 24 |
| 14.9 |
| 5.2 |
|
| |||||||
Total shareholders’ equity |
|
|
| 123.4 |
| 113.5 |
|
|
The financial statements on pages 54 to 91 were approved by the Board of Directors on 9 May 2006 and were signed on its behalf by David Lawrence, Chief Financial Officer.
THE INFORMATION CONTAINED IN THIS BORDER HAS NOT BEEN AUDITED
A | COMPANY BALANCE SHEET | ||
| |||
| THE COMPANY INFORMATION RELATES TO ACAMBIS PLC, THE | THE STRUCTURE OF THE PRINCIPAL COMPANIES IN THE GROUP | |
HOLDING COMPANY WHICH OWNS THE GROUP’S SUBSIDIARIES, | IS AS FOLLOWS: | ||
THE PRINCIPAL ONES BEING ACAMBIS RESEARCH LIMITED IN THE |
| ||
UK AND ACAMBIS INC. AND BPC IN THE US. THE COMPANY’S | |||
ACCOUNTS ARE CONSOLIDATED WITH THOSE OF THE SUBSIDIARIES | |||
TO PRODUCE THE GROUP’S ACCOUNTS. | |||
|
Consolidated cash flow statement FOR THE YEAR ENDED 31 DECEMBER 2005 | 57 |
|
| Notes |
| 2005 |
| 2004 |
|
| Operating activities |
|
| |||||
(Loss)/profit on ordinary activities before tax |
|
|
| (27.7 | ) | 27.0 |
|
Depreciation and amortisation | 5.3 |
| 6.3 |
| |||
Increase in working capital |
|
|
| (2.8 | ) | (51.1 | ) |
Other non-cash movements |
|
|
| (0.7 | ) | 2.6 |
|
Net finance costs |
|
|
| (3.0 | ) | (3.9 | ) |
Taxes paid |
|
|
| (0.4 | ) | (1.6 | ) |
| |||||||
Cash flows from operating activities |
|
|
| (29.3 | ) | (20.7 | ) |
| |||||||
Investing activities |
|
|
| ||||
Purchase of business operations |
|
|
| (1.7 | ) | (0.8 | ) |
Disposal of investments |
|
|
| – |
| 0.7 |
|
Purchase of intangibles |
|
|
| (0.4 | ) | – |
|
B Purchase of property, plant and equipment |
|
|
| (3.7 | ) | (3.4 | ) |
| |||||||
Cash flows used in investing activities |
|
|
| (5.8 | ) | (3.5 | ) |
| |||||||
Financing activities |
|
|
|
|
|
|
|
Interest element of finance lease payments |
|
|
| (0.6 | ) | (0.7 | ) |
Interest paid |
|
|
| (0.2 | ) | (0.1 | ) |
Interest received |
|
|
| 3.8 |
| 4.4 |
|
Proceeds from issues of shares |
|
|
| 0.2 |
| 1.9 |
|
Purchase of own shares |
| 24 |
| (0.2 | ) | – |
|
Capital element of finance lease payments |
|
|
| (3.3 | ) | (2.5 | ) |
Purchase of liquid investments |
|
|
| (34.8 | ) | (62.6 | ) |
Sale of liquid investments |
|
|
| 36.8 |
| 59.6 |
|
| |||||||
Cash flows from financing activities |
|
|
| 1.7 |
| – |
|
| |||||||
C Decrease in cash and cash equivalents |
|
|
| (33.4 | ) | (24.2 | ) |
Net foreign exchange difference |
|
|
| 1.6 |
| (2.2 | ) |
Cash and cash equivalents at 1 January |
| 17 |
| 81.0 |
| 107.4 |
|
| |||||||
Cash and cash equivalents at 31 December |
| 17 |
| 49.2 |
| 81.0 |
|
|
The accompanying notes are an integral part of this consolidated cash flow statement.
B | PURCHASE OF PROPERTY, PLANT AND EQUIPMENT | C | DECREASE IN CASH AND CASH EQUIVALENTS | |
IN 2005, WE REDEVELOPED AND EXPANDED AREAS OF OUR US | THE REDUCTION IN CASH DURING THE YEAR IS PRIMARILY | |||
R&D FACILITY AND ACQUIRED A FILL/FINISH CAPABILITY. | DUE TO INCREASED INVESTMENT IN THE R&D PIPELINE | |||
AND CAPITAL INVESTMENTS, AS REFERENCED IN NOTE B. |
58 | Company cash flow statement FOR THE YEAR ENDED 31 DECEMBER 2005 |
|
| Notes |
| 2005 |
| 2004 |
|
| |||||||
Operating activities |
|
|
|
|
|
|
|
Profit on ordinary activities before tax |
|
|
| 6.9 |
| 6.7 |
|
Increase in working capital |
|
|
| (33.0 | ) | (1.2 | ) |
Other non-cash movements |
|
|
| 3.6 |
| 3.7 |
|
Net finance costs |
|
|
| (6.3 | ) | (4.8 | ) |
Taxes paid |
|
|
| (1.7 | ) | (0.5 | ) |
| |||||||
Cash flows (used in)/from operating activities |
|
|
| (30.5 | ) | 3.9 |
|
Financing activities |
|
|
|
|
|
|
|
Interest received |
|
|
| 5.8 |
| 4.5 |
|
Proceeds from issues of shares |
|
|
| 0.2 |
| 1.9 |
|
Purchase of own shares | 24 | (0.2 | ) | – | |||
Purchase of liquid investments |
|
|
| (34.8 | ) | (33.8 | ) |
Sale of liquid investments |
|
|
| 33.8 |
| 27.0 |
|
| |||||||
Cash flows from/(used in) financing activities |
|
|
| 4.8 |
| (0.4 | ) |
| |||||||
|
|
|
|
|
|
|
|
(Decrease)/increase in cash and cash equivalents |
|
|
| (25.7 | ) | 3.5 |
|
Net foreign exchange difference |
|
|
| (2.1 | ) | (1.1 | ) |
Cash and cash equivalents at 1 January |
| 17 |
| 70.3 |
| 67.9 |
|
| |||||||
Cash and cash equivalents at 31 December |
| 17 |
| 42.5 |
| 70.3 |
|
|
The accompanying notes are an integral part of this Company cash flow statement.
THE INFORMATION CONTAINED IN THIS BORDER HAS NOT BEEN AUDITED
59 | |
A 1 ACCOUNTING POLICIES |
BASIS OF PREPARATION
The consolidated financial statements of Acambis plc have been prepared in accordance with IFRS and International Financial Reporting Interpretations Committee interpretations that have been adopted for use in the European Union and with those parts of the Companies Act 1985 applicable to companies reporting under IFRS. The consolidated financial statements have been prepared on a historical cost basis as modified by the revaluation of available-for-sale investments, except for derivative financial instruments which have been measured at fair value. The consolidated financial statements are presented in pounds sterling and all values are rounded to one decimal point of the nearest million (£m) except where otherwise indicated.
The preparation of financial statements in conformity with generally accepted accounting principles requires the use of estimates and assumptions that affect the reported amounts of assets and liabilities at the date of the financial statements and of revenues and expenses during the reporting period. Although these estimates are based on Management’s best knowledge of the amount, event or action, actual results may ultimately differ from those estimates.
CHANGE IN ACCOUNTING POLICY
The consolidated financial statements of Acambis plc have been prepared, for the first time, in accordance with IFRS. The effect of adoption of IFRS is described in note 28 of these financial statements. A summary of the more important Group accounting policies is set out below.
These accounting policies have been consistently applied in the preparation of these financial statements.
TRANSITIONAL PROVISIONS
The rules for first-time adopters of IFRS are set out in IFRS1 ‘First time adoption of IFRS’, which allows certain transitional provisions. Acambis has applied the exemption granted by IFRS1 to goodwill acquired before August 2003. The value of goodwill relating to the acquisition of Acambis Inc. in 1999 is frozen as at 1 January 2004, whilst that relating to the acquisition of BPC in August 2003 has been restated in accordance with IFRS3 ‘Business combinations’.
BASIS OF CONSOLIDATION
The Group financial statements include and consolidate the financial statements of Acambis plc and each of its subsidiary undertakings. Acquisitions made by the Group are accounted for under the acquisition method of accounting and the Group financial statements include the results of such subsidiaries from the relevant date of acquisition. Intra-Group transactions and profits are eliminated fully on consolidation.
REVENUE
Group revenue comprises the value of sales from products and income (excluding VAT and taxes, trade discounts and intra-Group transactions) derived from contract research fees and licence fees receivable from third parties in the normal course of business. Revenue from product sales is recognised when the risks and rewards of ownership have been transferred to the customer. The Group applies the criteria set out in IAS18 ‘Revenue’ in determining whether revenue may be recognised on bill and hold transactions entered into by the Group. Where the Group is required to undertake R&D activities and the fee is creditable against services provided by the Group, that revenue is deferred and recognised over the period over which the services are performed. Contract research fees are recognised in the accounting period in which the related work is carried out. Milestones receivable are recognised when they fall contractually due.
Profit is recognised on long-term contracts when the final outcome can be assessed with reasonable certainty by including turnover and related costs within the income statement as contract activity progresses. Turnover is recognised according to the extent of performance under the contract. In determining the degree of contractual performance, reference is made to the costs incurred in relation to the total estimated expected costs.
A | ACCOUNTING POLICIES |
|
|
| |
| 2005 IS THE FIRST YEAR FOR WHICH ACAMBIS IS REQUIRED | |
60 | Notes to the Group financial statements 31 DECEMBER 2005 |
1 ACCOUNTING POLICIES (CONTINUED)
REVENUE (CONTINUED)
The smallpox vaccine contract with the CDC, awarded to Acambis in November 2001, is a fixed-fee arrangement requiring the delivery of products as well as a concurrent R&D programme. This arrangement has been treated as a single long-term contract, whose elements have not been accounted for separately. Since IAS18 does not contain specific guidance on whether elements of a contract should be unbundled, the Group has continued to refer to the UK GAAP standard FRS5 ‘Substance of transaction’ Application Note G in evaluating its revenue recognition policy. The Group does not consider that the criteria for ‘unbundling’ of contracts as set out in FRS5 Application Note G have been met. Turnover and profits are recognised according to the extent of performance under the contract, as described above. Manufacturing costs in respect of this contract are deemed to be incurred when the risks and rewards of ownership have been transferred, as described above; R&D costs are recognised as incurred.
COST OF SALES
The Group has classified manufacturing costs and costs that are directly attributable to funded research and vaccine manufacture as cost of sales.
RESEARCH AND DEVELOPMENT COSTS
Research costs are expensed as incurred. Internally generated expenditure arising from development (or from the development phase of an internal project) is capitalised if, and only if, it satisfies all of six specified criteria in IAS38 ‘Intangible assets’. It is Management’s opinion that it is not possible to satisfy the requirement to demonstrate the technical feasibility of a project, and that it will generate probable future economic benefits, until final submission for regulatory approval has been obtained.
SHARE-BASED PAYMENT TRANSACTIONS
Employees (including Directors) of the Group may receive some remuneration in the form of share-based payment transactions, whereby employees render services in exchange for shares or rights over shares (equity-settled transactions).
The cost of equity-settled transactions with employees is measured by reference to the fair value at the date at which they are granted. Fair value is determined in conjunction with an external valuer, using a binomial option pricing model for the SAYE Scheme and the ESPP. The fair value of awards made under the 1996 Acambis Share Option Scheme (the 1996 Plan), the 1999 Acambis Share Option Plan (the 1999 Plan) and the LTIP is measured using a binomial option pricing model adjusted to reflect the TSR market-based performance condition. For all options and awards with a TSR market-based performance condition the pricing model used follows similar principles to the Monte Carlo approach to value the award and takes into account the fact that TSR vesting and share price performance are not independent.
The cost of equity-settled transactions is recognised, together with a corresponding increase in equity, over the year in which the performance conditions are fulfiled, ending on the date on which the relevant employees become fully entitled to the award (vesting date). The cumulative expense recognised for equity-settled transactions at each reporting date until the vesting date reflects the extent to which the vesting period has expired and the number of awards that, in the opinion of the Directors, will ultimately vest. The cost is allocated to R&D costs, sales and marketing costs and administration costs on the basis of headcount.
No expense is recognised for awards that do not ultimately vest, except for awards where vesting is conditional upon a market condition. These are treated as vesting, irrespective of whether or not the market condition is satisfied, provided that all other performance conditions are satisfied.
The dilutive effect of outstanding options is reflected as additional share dilution in the computation of earnings per share.
The Group has an employee share incentive plan and an employee share trust for the granting of non-transferable options to executives and senior employees. Shares in the Group held by the employee share trust are treated as treasury shares and presented in the balance sheet as a deduction from equity.
The Group has taken advantage of the transitional provisions of IFRS2 ‘Share based payments’ in respect of equity-settled awards and has applied IFRS2 only to equity-settled awards granted after 7 November 2002 that had not vested on 31 December 2004.
In the Company accounts, the granting of options to employees of subsidiaries is deemed a capital contribution.
TAXATION
The tax expense represents the sum of the tax currently payable and deferred tax, including UK corporation tax and foreign tax.
The tax currently payable is based on taxable profit for the year. Taxable profit differs from net profit as reported in the income statement because it excludes items of income or expense that are taxable or deductible in other years and it further excludes items that are never taxable or deductible. The Group’s liability for current tax is calculated using tax rates that have been enacted or substantively enacted by the balance sheet date.
61 |
1 ACCOUNTING POLICIES (CONTINUED) |
TAXATION (CONTINUED)
Deferred income tax is provided, using the liability method, on all temporary differences at the balance sheet date between the tax bases of assets and liabilities and their carrying amounts for financial reporting purposes.
Deferred income tax assets and liabilities are recognised for all deductible temporary differences, carry-forward of unused tax losses, to the extent that it is probable that taxable profit will be available against which the deductible temporary differences, carry-forward of unused tax losses can be utilised:
• | except where the deferred income tax asset or liability relating to the deductible temporary difference arises from the initial recognition of an asset or liability in a transaction that is not a business combination and, at the time of the transaction, affects neither the accounting profit nor taxable profit or loss; and |
• | in respect of deductible temporary differences associated with investments in subsidiaries, associates and interests in joint ventures, deferred tax assets or liabilities are only recognised to the extent that it is probable that the temporary differences will reverse in the foreseeable future and taxable profit will be available against which the temporary difference can be utilised. |
In the UK and the US, the Group is entitled to a tax deduction for the amount treated as compensation on exercise of certain employee share options under each jurisdiction’s tax rules. As explained under ‘Share-based payment transactions’ above, a compensation expense is recorded in the Group’s income statement over the period from the grant date to the vesting date of the relevant options. As there is a temporary difference between the accounting and tax bases, a deferred tax asset is recorded. The deferred tax asset arising is calculated by comparing the estimated amount of tax deduction to be obtained in the future (based on the Company’s share price at the balance sheet date) with the cumulative amount of the compensation expense recorded in the income statement. If the amount of estimated future tax deduction exceeds the cumulative amount of the remuneration expense at the statutory tax rate, the excess is recorded directly in equity, against the profit and loss reserve.
No compensation charge is recorded in respect of options granted before 7 November 2002 or in respect of those options which have been exercised or have lapsed before 31 December 2004. Nevertheless, tax deductions have arisen and will continue to arise on these options. The tax effects arising in relation to these options are recorded directly in equity, against the profit and loss reserve.
The carrying amount of deferred income tax assets is reviewed at each balance sheet date and reduced to the extent that it is no longer probable that sufficient taxable profit will be available to allow all or part of the deferred income tax asset to be utilised.
Deferred income tax assets and liabilities are measured at the tax rates that apply to the period when the asset is realised or the liability is settled, based on tax rates (and tax laws) that have been enacted or substantively enacted at the balance sheet date. Income tax relating to items recognised directly in equity is recognised in equity and not in the income statement.
GOODWILL
Goodwill on acquisition is initially measured at cost, being the excess of the cost of the business combination over the acquirer’s interest in the net fair value of the identifiable assets, liabilities and contingent liabilities. The fair value of the consideration is determined by applying appropriate discounts to contingent and deferred consideration, to the level where the Group considers those liabilities will be payable. Where the consideration for the acquisition of a business includes non-interest bearing cash payments due after more than one year, the liability is recorded at its present value, after applying a discount rate that approximates to that which a lender would typically require for a similar transaction, and taking into account the risk/likelihood of the payment being made.
Where revisions are made to the expected amounts of contingent consideration payable as a result of changes to estimates, such changes are accounted for at the date of the change in estimate.
Following initial recognition, goodwill is not amortised but is measured at cost less any accumulated impairment losses. Goodwill is reviewed for impairment annually or more frequently if events or changes in circumstances indicate that the carrying value may be impaired.
INTANGIBLE ASSETS
Separately identifiable intangible assets acquired are capitalised at cost and those acquired from a business acquisition are capitalised at fair value as at the date of acquisition. Following initial recognition, the cost model is applied. The useful lives of these intangible assets are assessed to be either finite or indefinite. Where amortisation is charged on assets with finite lives, this expense is taken to the income statement. In the case of assets acquired relating to BPC this is through the ‘Cost of sales’ line item.
62 | Notes to the Group financial statements 31 DECEMBER 2005 |
1. ACCOUNTING POLICIES (CONTINUED) |
|
INTANGIBLE ASSETS (CONTINUED)
Intangible assets are tested for impairment when a trigger event occurs. Useful lives are also examined on an annual basis and adjustments, where applicable, are made on a prospective basis. Useful lives are as follows:
Distribution contract – 88 months
Software assets – 3 years
R&D technology – Variable, depending on technology
PROPERTY, PLANT AND EQUIPMENT
Property, plant and equipment is stated at cost less accumulated depreciation and any impairment in value. Land is not depreciated. Depreciation is calculated on a straight-line basis over the estimated useful life of the asset as follows:
Freehold buildings – 39 years
Leasehold buildings – 15 years or term of lease if shorter
Laboratory and manufacturing equipment – 4 to 7 years
Office equipment – 3 to 5 years
The carrying values of property, plant and equipment are reviewed for impairment when events or changes in circumstances indicate the carrying value may not be recoverable. If any such indication exists and where the carrying values exceed the estimated recoverable amount, the assets or cash-generating units are written down to their recoverable amount. The recoverable amount of property, plant and equipment is the greater of net selling price and value in use. In assessing value in use, the estimated future cash flows are discounted to their present value using a pre-tax discount rate that reflects current market assessments of the time value of money and the risks specific to the asset. For an asset that does not generate largely independent cash inflows, the recoverable amount is determined for the cash-generating unit to which the asset belongs. Impairment losses are recognised in the income statement.
An item of property, plant and equipment is de-recognised upon disposal or when no future economic benefits are expected to arise from the continued use of the asset. Any gain or loss arising on de-recognition of the asset (calculated as the difference between the net disposal proceeds and the carrying amount of the item) is included in the income statement in the year the item is derecognised.
The Group does not capitalise interest charges on loans to fund the purchase of tangible fixed assets.
INVESTMENTS
Investments in subsidiaries are shown at cost less any provision for impairment. Available-for-sale investments are recorded at fair value. Unrealised holding gains and any temporary unrealised holding losses after the initial recognition are reflected through reserves, net of related taxes. Impairment losses and realised gains and losses are reported in the income statement.
RECOVERABLE AMOUNT OF NON-CURRENT ASSETS
At each reporting date, the Group assesses whether there is any indication that an asset may be impaired. Where an indicator of impairment exists, the Group makes a formal estimate of recoverable amount. Where the carrying amount of an asset exceeds its recoverable amount the asset is considered impaired and is written down to its recoverable amount. Recoverable amount is the higher of an asset’s or cash-generating unit’s fair value less costs to sell and its value in use and is determined for an individual asset, unless the asset does not generate cash inflows that are largely independent of those from other assets or groups of assets.
63 |
1. ACCOUNTING POLICIES (CONTINUED) |
INVENTORIES, EXCLUDING LONG-TERM CONTRACTS
Inventories are valued at the lower of cost and net realisable value.
Costs incurred in bringing each product to its present location and condition are accounted for as follows:
Raw materials | – | purchase cost on a first-in, first-out basis |
Finished goods and work in progress | – | cost of direct materials and labour and a proportion of manufacturing overheads based on normal operating capacity but excluding borrowing costs. |
Net realisable value is the estimated selling price in the ordinary course of business, less estimated costs of completion and the estimated costs necessary to make the sale.
FINANCIAL INSTRUMENTS
From time to time, the Group uses derivative financial instruments in the form of sterling and foreign currency contracts to hedge its risks associated with foreign currency fluctuations and those in the form of yield-enhancing deposits to maximise interest rates. Such derivative financial instruments are stated at fair value with movements in fair value recorded in the income statement. The fair value of forward exchange contracts is calculated by reference to current forward exchange rates for contracts with similar maturity profiles.
The Group makes certain deposits in foreign currencies for fixed terms (dual currency deposits) which, at the option of the bank, mature in that foreign currency or are converted to another currency at a pre-agreed exchange rate. The Group considers that such arrangements contain an embedded derivative element, which is separated from the host contract and accounted for as a derivative financial instrument under IAS39 ‘Recognition and measurement of financial instruments’. This is initially stated in the balance sheet at cost. After initial recognition, it is measured at fair value with movements in fair value recorded in the income statement. A gain or loss arising from a change in the fair value of a financial asset or financial liability classified as at fair value through the profit or loss is recognised in the income statements.
CASH AND CASH EQUIVALENTS
Cash and cash equivalents comprise cash at bank and in hand and short-term deposits with an original maturity of three months or less.
BORROWING COSTS
Borrowing costs are recognised as an expense when incurred.
ACCOUNTING FOR DERIVATIVE FINANCIAL INSTRUMENTS AND HEDGING ACTIVITIES
Derivatives are initially accounted and measured at fair value on the date a derivative contract is entered into and subsequently measured at fair value. The gain or loss on re-measurement is taken to the income statement except where the derivative is a designated cash-flow hedging instrument. The accounting treatment of derivatives classified as hedges depends on their designation, which occurs on the date on which a commitment to the derivative contract is made.
The Group designates derivatives as:
• | A hedge of the fair value of an asset or liability (fair value hedge); |
• | A hedge of the income/cost of a highly probable forecasted transaction or commitment (cash flow hedge); or |
• | A hedge of a net investment in a foreign entity. |
In order to qualify for hedge accounting, the Group is required to document in advance the relationship between the item being hedged and the hedging instrument. The Group is also required to document and demonstrate an assessment of the relationship between the hedged item and the hedging instrument, which shows that the hedge will be highly effective on an ongoing basis. This effectiveness testing is re-performed at each period end to ensure that the hedge remains highly effective.
Gains or losses on fair value hedges that are regarded as highly effective are recorded in the income statement with the gain or loss on the hedged item attributable to the hedged risk.
64 | Notes to the Group financial statements 31 DECEMBER 2005 |
1 ACCOUNTING POLICIES (CONTINUED)
ACCOUNTING FOR DERIVATIVE FINANCIAL INSTRUMENTS AND HEDGING ACTIVITIES (CONTINUED)
Gains or losses on cash flow hedges that are regarded as highly effective are recognised in equity. Where the forecast transaction results in a financial asset or liability only gains or losses previously recognised in equity are reclassified to profit or loss in the same period as the asset or liability affects profit or loss. Where the forecasted transaction or commitment results in a non-financial asset or liability, any gains or losses previously deferred in equity are included in the cost of the related asset or liability. If the forecasted transaction or commitment results in future income or expenditure, gains or losses deferred in equity are transferred to the income statement in the same period as the underlying income or expenditure. The ineffective portions of the gain or loss on the hedging instrument are recognised in profit or loss.
For the portion of hedges deemed ineffective or transactions that do not qualify for hedge accounting under IAS39, any change in assets or liabilities is recognised immediately in the income statement. Where a hedge no longer meets the effectiveness criteria, any gains or losses deferred in equity are only transferred to the income statement when the committed or forecasted transaction is recognised in the income statement. However, where an entity applied cash flow hedge accounting for a forecasted or committed transaction that is no longer expected to occur, then the cumulative gain or loss that has been recorded in equity is transferred to the income statement. When a hedging instrument expires or is sold, any cumulative gain or loss existing in equity at the time remains in equity and is recognised when the forecast transaction is ultimately recognised in the income statemen t.
LEASES
Finance leases, which transfer to the Group the risks and benefits incidental to ownership of the leased item, are capitalised at the inception of the lease at the fair value of the leased property or, if lower, at the present value of the minimum lease payments. Lease payments are apportioned between the finance charges and reduction of the lease liability so as to achieve a constant rate of interest on the remaining balance of the liability. Finance charges are charged directly against income.
Where the Group enters into transactions which meet the criteria for a sale and finance leaseback, the difference between the sale price of the asset and its previous carrying value is deferred and amortised over the lease term.
Capitalised leased assets are depreciated over the shorter of the estimated useful life of the asset or the lease term.
Leases where the lessor retains the risks and benefits of ownership of the asset are classified as operating leases. Operating lease payments are recognised as an expense in the income statement on a straight-line basis over the lease term.
PROVISIONS
Provisions are recognised when the Group has a present obligation (legal or constructive) as a result of a past event, it is probable that costs will be required to be incurred to settle the obligation and a reliable estimate can be made of the amount of the obligation.
FOREIGN CURRENCY AND TRANSLATION
Transactions denominated in foreign currencies are recorded in the functional currency of the Group entity at actual exchange rates as at the date of the transaction. Monetary assets and liabilities denominated in foreign currencies are translated at the rates ruling at the balance sheet date. All differences are taken to the income statement except where financing of a foreign subsidiary through long-term loans and deferred trading balances is intended to be as permanent as equity, such loans and inter-Company balances are treated as part of the net investment and, as such, any exchange differences arising are dealt with as adjustments to reserves.
Assets and liabilities of overseas subsidiary and joint venture undertakings are translated into sterling at rates of exchange ruling at the balance sheet date. The results and cash flows of overseas subsidiary and joint venture undertakings are translated into sterling using average rates of exchange. Exchange adjustments arising when the opening net assets and the profits for the year retained by overseas subsidiary and joint venture undertakings are translated into sterling are taken directly to equity. On disposal of a foreign entity, accumulated exchange differences are recognised in the income statement as a component of the gain or loss on disposal.
Goodwill and fair value adjustments arising on the acquisition of a foreign entity are treated as assets and liabilities of the acquiring company and are recorded at the exchange rate at the date of the transaction. The Group has taken advantage of the provisions under IFRS1, and does not have to apply this to acquisitions made before August 2003.
THE INFORMATION CONTAINED IN THIS BORDER HAS NOT BEEN AUDITED
| 65 |
1 ACCOUNTING POLICIES (CONTINUED)
ESOP TRUST
The Company recognises the assets and liabilities of the ESOP trust in its own accounts and shares held by the trust are recorded at cost as a deduction in arriving at shareholders’ funds until such time as the shares vest unconditionally to employees. The trust is a separately administered trust, funded by loans from the Company, whose assets comprise shares in the Company.
FUTURE PRONOUNCEMENTS
At the date of approval of these financial statements the following standards and interpretations which have not been applied in these financial statements were in issue but not yet effective:
• | an amendment to IAS21 ‘The effects of changes in foreign exchange rates’ in respect of an entity’s investment in foreign operations; |
• | an amendment to IAS1 ‘Presentation of financial statements’ requiring new disclosures about entities’ management of their capital resources; |
• | amendments to IAS39 and IFRS4 ‘Insurance contracts’ which clarify whether financial guarantees fall within the scope of IAS39 or IFRS4 and stipulate the measurement method to be applied to such guarantees; |
• | an amendment to IAS39 to permit hedge accounting for certain forecast intra-Group transactions; and |
• | a new accounting standard, IFRS7 ‘Financial instruments: Disclosures’. This standard replaces IAS30 ‘Disclosures in the financial statements of banks and similar institutions’ and the disclosure requirements in IAS32 ‘Financial instruments: disclosure and presentation’ and locates in one place all disclosures relating to financial instruments. The new requirements incorporate many of IAS32’s disclosures as well as additional qualitative and quantitative disclosures on the risks arising from financial instruments. |
The Directors believe the adoption of these standards and interpretations in the future periods will have no material impact on the financial statements when they come into effect for periods after 1 January 2006.
2 SEGMENTAL INFORMATION
The Group’s primary reporting format is business segments and its secondary format is geographic segments. At December 2005, the Group is organised on a worldwide basis in one business segment of vaccines, and into two geographical areas of Europe and North America. Transfer prices between segments are set on an arm’s length basis in a manner similar to transactions with third parties. The Group’s geographical segments are determined by location of operations.
GEOGRAPHICAL SEGMENT
The following table presents revenue and certain asset and capital expenditure information regarding the Group’s geographic segments.
|
|
|
| Europe |
|
|
| North America |
|
|
| Total Group |
|
| 2005 |
| 2004 |
| 2005 |
| 2004 |
| 2005 |
| 2004 |
A Revenue: |
|
|
|
|
|
|
|
|
|
|
|
|
Sales to external customers |
| 1.8 |
| 8.5 |
| 39.1 |
| 77.0 |
| 40.9 |
| 85.5 |
Other segment information: |
|
|
|
|
|
|
|
|
|
|
|
|
Total assets |
| 79.3 |
| 104.0 |
| 54.1 |
| 59.9 |
| 133.4 |
| 163.9 |
Total assets |
| 79.3 |
| 104.0 |
| 54.1 |
| 59.9 |
| 133.4 |
| 163.9 |
Capital additions: |
|
|
|
|
|
|
|
|
|
|
|
|
Tangible fixed assets |
| – |
| – |
| 5.2 |
| 3.1 |
| 5.2 |
| 3.1 |
Intangible assets |
| – |
| – |
| 0.6 |
| 0.2 |
| 0.6 |
| 0.2 |
The Company’s business is to invest in its subsidiaries and, therefore, it operates as a single segment.
A | 2005’S REVENUE BY TYPE (%) | |||||
| ||||||
|
| |||||
| ||||||
| 0 | 20 | 40 | 60 | 80 | 100 |
| ||||||
|
| ACAM2000 |
|
|
|
|
| ||||||
|
| MVA |
|
|
|
|
| ||||||
|
| VIVOTIF |
|
|
|
|
| ||||||
|
| VIG |
|
|
|
|
| ||||||
|
| OTHER |
|
|
|
|
| ||||||


66 | Notes to the Group financial statements 31 DECEMBER 2005 |
3 INCOME AND EXPENSES |
| ||||
In May 2005, the Group sold information and rights of a previous R&D project in exchange for shares, valued at £0.4m at the time. The shares are held on the balance sheet as a financial asset (see note 12).
In May 2004, the Group reached a c. £10.6m ($19m) agreement with Baxter to terminate the Canton manufacturing agreement under which Baxter was to place manufacturing orders at Acambis’ Canton facility. The first £5.1m ($9m) was received in May 2004 and the second instalment of £2.6m ($5m) was received in January 2005. The third and final instalment of £2.9m ($5m) was received in January 2006. The Group discounted future cash receipts and, as a result, recorded other operating income of £10.2m in 2004. In 2005 £0.2m (2004 – £0.2m) was recorded within finance income (see (iii) below), reflecting the staged payment nature of the agreement.
ii) ADMINISTRATION COSTS
|
| 2005 |
| 2004 |
|
| |||||
Administration costs |
| 7.7 |
| 2.9 |
|
Canton plant impairment |
| – |
| 1.9 |
|
Restructuring costs |
| – |
| 0.7 |
|
| |||||
Total administration costs |
| 7.7 |
| 5.5 |
|
|
iii) FINANCE INCOME
|
| 2005 |
| 2004 |
|
| |||||
A Unwinding of discounts in relation to deferred debtors |
| 0.2 |
| 0.2 |
|
Interest receivable |
| 3.8 |
| 4.6 |
|
| |||||
Total finance income |
| 4.0 |
| 4.8 |
|
|
iv) FINANCE COSTS
|
| 2005 |
| 2004 |
|
| |||||
On bank overdrafts |
| 0.2 |
| 0.1 |
|
Interest element of finance leases |
| 0.6 |
| 0.7 |
|
A Unwinding of discounts in relation to contingent and deferred consideration |
| 0.2 |
| 0.1 |
|
| |||||
Total finance costs |
| 1.0 |
| 0.9 |
|
|
v) STAFF COSTS
|
| 2005 |
| 2004 |
|
| |||||
Wages and salaries |
| 14.4 |
| 14.5 |
|
Social security costs |
| 1.1 |
| 1.4 |
|
Other pension and 401k costs |
| 0.4 |
| 0.4 |
|
Cost of share-based payments |
| 0.8 |
| 0.7 |
|
| |||||
Total employee benefits |
| 16.7 |
| 17.0 |
|
|
During 2004, a third-party company to which the Group provided administrative services paid a share of the Group’s administrative costs, including £0.2m for staff costs. This arrangement ceased in 2004 and these costs are included in the comparative figures shown above only.
THE INFORMATION CONTAINED IN THIS BORDER HAS NOT BEEN AUDITED
A | UNWINDING OF DISCOUNTS |
|
|
| DURING THE YEAR, THE GROUP HAD A DEBTOR DUE FROM BAXTER FOR THE CANTON SETTLEMENT, A BALANCE OWED IN RELATION TO CONSIDERATION FOR BPC AND A BALANCE OWED FOR THE ROCKVILLE ASSETS PURCHASED IN 2005. OWING TO THE FUTURE TIMING OF RECEIPT OR PAYMENT OF THESE AMOUNTS, THE BALANCES INCLUDED WITHIN DEBTORS AND CREDITORS RESPECTIVELY HAVE BEEN DISCOUNTED |
| TO THEIR PRESENT VALUE TO REFLECT THE TIME VALUE OF MONEY. OVER THE PERIOD TO SETTLEMENT, THESE BALANCES ARE INCREASED SO THAT THE FULL VALUE WILL BE RECORDED ON THE BALANCE SHEET WHEN THEY ARE RECEIVED OR PAID. THESE ADJUSTMENTS ARE RECORDED WITHIN INTEREST RECEIVABLE AND INTEREST PAYABLE. |
67
3 INCOME AND EXPENSES (CONTINUED)
v) STAFF COSTS (CONTINUED)
The average monthly number of employees during the year (including Executive Directors) was:
| UK | US | 2005 | 2004 |
Research and development | 8 | 93 | 101 | 118 |
Sales and marketing | 3 | 19 | 22 | 19 |
Manufacturing | – | 90 | 90 | 87 |
Administration | 19 | 43 | 62 | 65 |
| 30 | 245 | 275 | 289 |
At 31 December 2005, the Group had 285 employees (2004 – 270) and the Company had three employees, all of whom were Directors (2004 – four). The staff costs for the Company are shown in the remuneration report.
4 OPERATING (LOSS)/PROFIT
The following items are included in operating (loss)/profit:
| 2005 |
| 2004 |
Depreciation of fixed assets: |
|
|
|
– owned | 3.1 |
| 2.7 |
– held under finance leases | 1.9 |
| 1.9 |
B Cost of share-based payments (note 25) | 0.8 |
| 0.7 |
Amounts paid to the Group’s Auditors (see below) | 0.5 |
| 0.5 |
Operating lease charges for plant and equipment | 0.1 |
| 0.1 |
Operating lease charges for property | 2.2 |
| 1.8 |
Loss on disposal of fixed assets | 0.1 |
| 0.1 |
Repairs and maintenance costs for property,plant and equipment | 0.5 |
| 0.4 |
Exchange (loss)/gain on foreign currency borrowings | (0.4 | ) | 0.3 |
Cost of inventories recognised as expenses | 3.0 |
| 17.9 |
Amortisation of intangibles in cost of sales | 0.7 |
| 0.7 |
Amortisation of intangibles in operating expenses | 0.2 |
| 0.1 |
During the year the Group obtained the following services from the Group’s Auditors:
|
| 2005 |
| 2004 |
Audit services: |
|
|
|
|
– statutory audit |
| 0.2 |
| 0.1 |
– related regulatory reporting |
| 0.1 |
| 0.1 |
Tax services: |
|
|
|
|
– compliance services |
| 0.1 |
| 0.1 |
– advisory services |
| 0.1 |
| 0.2 |
|
| 0.5 |
| 0.5 |
The Company incurred £0.2m (2004 – £0.2m) of costs with the Group’s Auditors.
B | COST OF SHARE-BASED PAYMENTS |
|
|
|
|
| UNDER IFRS, AN ACCOUNTING CHARGE IS CALCULATED TO REFLECT THE VALUE OF SHARE OPTIONS GRANTED TO EMPLOYEES. THIS CHARGE IS ESTIMATED USING APPROPRIATE VALUATION MODELS AND IS DEPENDENT ON VARIOUS FACTORS AND ASSUMPTIONS, INCLUDING THE EXPECTED LIFE OF THE OPTION AND THE VOLATILITY OF THE COMPANY’S SHARE PRICE. |
|
|
|
|
68 | Notes to the Group financial statements 31 DECEMBER 2005 |
5 INCOME TAX
Tax is charged on profits made in the country where each Group company is based. Major components of income tax expense for the year are as follows:
Analysis of (credit)/charge in the consolidated income statement |
| 2005 |
| 2004 |
|
| |||||
Current income tax |
| (0.3 | ) | 4.2 |
|
Deferred taxation |
| (0.4 | ) | 3.1 |
|
| |||||
Income tax (benefit)/expense in the consolidated income statement |
| (0.7 | ) | 7.3 |
|
| |||||
Tax on items charged to equity |
|
|
|
|
|
| |||||
Current income tax credit on employee share schemes |
| – |
| (1.2 | ) |
Deferred tax on revaluation of available-for-sale investment |
| 0.1 |
| – |
|
| |||||
Income tax expense/(benefit) reported in equity |
| 0.1 |
| (1.2 | ) |
|
A reconciliation of income tax expense applicable to accounting profit before tax at the statutory income tax rate to total taxation for the Group is as follows:
|
| 2005 |
| 2004 |
|
| |||||
(Loss)/profit before tax |
| (27.7 | ) | 27.0 |
|
| |||||
At the standard rate of corporation tax in the UK of 30% (2004 – 30%) |
| (8.3 | ) | 8.1 |
|
Effects of: |
|
|
|
|
|
Utilisation of tax losses |
| (2.9 | ) | (3.6 | ) |
Losses carried forward |
| 13.7 |
| – |
|
Expenses not deductible for tax purposes |
| 0.2 |
| (1.1 | ) |
Adjustments in respect of foreign tax rates |
| (3.5 | ) | 0.2 |
|
Other timing differences |
| (0.5 | ) | 3.7 |
|
Adjustments to tax in respect of prior period |
| 0.6 |
| – |
|
| |||||
A Total taxation |
| (0.7 | ) | 7.3 |
|
|
B Movements in the deferred tax account are as follows:
|
| Deferred tax asset |
| Deferred tax liability |
| ||||
| |||||||||
|
| 2005 |
| 2004 |
| 2005 |
| 2004 |
|
| |||||||||
At 1 January |
| – |
| 2.1 |
| (1.7 | ) | (1.8 | ) |
Accelerated capital allowances |
| 0.3 |
| – |
| – |
| (2.7 | ) |
Short-term timing differences |
| – |
| – |
| – |
| 2.6 |
|
Exchange differences |
| – |
| – |
| 0.2 |
| 0.2 |
|
Available-for-sale investment |
| – |
| – |
| (0.2 | ) | – |
|
Tax losses |
| – |
| (2.1 | ) | – |
| – |
|
| |||||||||
At 31 December |
| 0.3 |
| – |
| (1.7 | ) | (1.7 | ) |
| |||||||||
The Company has no deferred tax balances.
No deferred tax is recognised on the unremitted earnings of overseas subsidiaries and joint ventures. The Directors have determined that, as earnings are continually reinvested by the Group, undistributed earnings of the subsidiaries and joint ventures will not be distributed in the foreseeable future.
Deferred tax assets and liabilities are only offset where there is a legally enforceable right of offset and there is an intention to settle the balances net. No balances have been offset in the current or previous years.
THE INFORMATION CONTAINED IN THIS BORDER HAS NOT BEEN AUDITED
A | TAXATION | B | DEFERRED TAXATION |
|
|
|
|
|
| ||
| AS THE GROUP IS LOSS-MAKING IN 2005, A TAX CREDIT HAS BEEN GENERATED, AND THE GROUP WILL BE ABLE TO CLAIM REFUNDS OF SOME TAXES PAID IN PREVIOUS PROFITABLE PERIODS. |
| A DEFERRED TAX LIABILITY ARISES UNDER IFRS ON THE ACQUISITION OF BPC IN 2003. THIS LIABILITY WILL UNWIND AS THE ASSOCIATED INTANGIBLE (SEE NOTE 9) IS AMORTISED. A DEFERRED TAX LIABILITY ALSO ARISES ON THE REVALUATION OF THE AVAILABLE-FOR-SALE INVESTMENT. |
|
|
69
5 INCOME TAX (CONTINUED)
UNRECOGNISED DEFERRED TAX ASSETS/(LIABILITIES)
|
| 2005 |
| 2004 |
|
| |||||
Tax losses |
| 7.9 |
| 0.6 |
|
R&D tax credit |
| 0.7 |
| – |
|
Short-term timing differences |
| (0.6 | ) | – |
|
Other |
| 0.4 |
| – |
|
| |||||
At 31 December |
| 8.4 |
| 0.6 |
|
|
Deferred tax assets have not been recognised in respect of tax losses because there is uncertainty in the probability that they will be recoverable in the foreseeable future.
6 EARNINGS PER ORDINARY SHARE (BASIC AND FULLY DILUTED)
Basic EPS is calculated by dividing the earnings attributable to ordinary shareholders by the weighted average number of ordinary shares in issue during the year, excluding those held in the employee share trust (see note 24), which are treated as cancelled until the shares vest unconditionally with the employees.
For fully diluted EPS, the weighted average number of ordinary shares in issue is adjusted to assume conversion of dilutive potential ordinary shares. The Group’s potentially dilutive securities consist of share options and performance shares.
For basic and diluted EPS, the weighted average numbers of shares used in the calculations are set out below:
|
| 2005 |
| 2004 |
| ||||
| |||||||||
|
| Earnings |
| Weighted |
| Earnings |
| Weighted |
|
| |||||||||
Basic EPS |
|
|
|
|
|
|
|
|
|
(Loss)/earnings attributable to ordinary shareholders |
| (27.0 | ) | 107,211,367 |
| 19.7 |
| 106,300,080 |
|
Effect of dilutive securities: |
|
|
|
|
|
|
|
|
|
Options |
| – |
| – |
| – |
| 2,349,309 |
|
| |||||||||
Adjusted (loss)/earnings |
| (27.0 | ) | 107,211,367 |
| 19.7 |
| 108,649,389 |
|
| |||||||||
|
| 2005 |
| 2004 |
|
| |||||
|
| Per share |
| Per share |
|
| |||||
Basic EPS |
|
|
|
|
|
(Loss)/earnings attributable to ordinary shareholders |
| (25.2 | ) | 18.5 |
|
Effect of dilutive securities: |
|
|
|
|
|
Options |
| – |
| (0.4 | ) |
| |||||
Diluted EPS |
| (25.2 | ) | 18.1 |
|
|
7 PARENT COMPANY RESULTS FOR THE YEAR
As permitted by Section 230 of the Companies Act 1985, a separate income statement for the Company is not presented. The Company’s profit for the year was £9.1m (2004 – £3.2m).
70 | Notes to the Group financial statements 31 DECEMBER 2005 |
8 GOODWILL |
|
| £m | |
| ||||
Cost | ||||
At 1 January 2005 |
|
| 21.0 | |
Adjustment to contingent consideration |
|
| (0.8 | ) |
A Exchange movement |
|
| 0.3 | |
| ||||
At 31 December 2005 | 20.5 | |||
Amortisation at 1 January and 31 December 2005 | 5.6 | |||
| ||||
Net book value at 31 December 2005 | 14.9 | |||
| ||||
Net book value at 31 December 2004 |
|
| 15.4 | |
|
Goodwill arose when Acambis Inc. was acquired in 1999 and when BPC was acquired in August 2003.
In 2003, the Group acquired BPC for $6.5m (£4.0m) cash, $2.0m (c. £1.1m) of deferred consideration and $3.2m (c. £1.8m) of contingent consideration. During 2005, deferred consideration of $1.6m (£0.9m) (2004 – $0.6m (£0.3m)) and contingent consideration of $1.5m (£0.8m) (2004 – $0.9m (£0.5m)) was paid.
During 2005, the conditions for the payment of the remainder of the contingent consideration were not met and $1.3m (£0.7m) (2004 – £nil) was deducted from the purchase price.
IMPAIRMENT TESTING OF GOODWILL
Goodwill acquired through business combinations has been allocated to the business as a whole. Acambis operates as a global business and does not have cash-generating units at a level lower than the Group as a whole.
During the year, the goodwill has been tested for impairment in accordance with IAS36 ‘Impairment of assets’. The recoverable value, which is the higher of the Group’s net selling price and its value in use, has been calculated based on the market capitalisation of the Group. No impairment charges were made.
9 OTHER INTANGIBLE ASSETS |
| Distribution |
| Software |
| R&D |
|
|
| ||||
|
| contract |
| assets |
| technology |
| Total |
| ||||
|
| £m |
| £m |
| £m |
| £m |
| ||||
| |||||||||||||
Cost | |||||||||||||
At 1 January 2005 |
|
| 4.7 |
|
| 0.6 |
|
| – |
|
| 5.3 |
|
Additions |
|
| – |
|
| 0.2 |
|
| 0.4 |
|
| 0.6 |
|
A Exchange movement |
|
| 0.5 |
|
| – |
|
| – |
|
| 0.5 |
|
| |||||||||||||
At 31 December 2005 | 5.2 | 0.8 | 0.4 | 6.4 | |||||||||
| |||||||||||||
Amortisation | |||||||||||||
At 1 January 2005 |
|
| 0.9 |
|
| 0.3 |
|
| – |
|
| 1.2 |
|
Charge for year |
|
| 0.7 |
|
| 0.2 |
|
| – |
|
| 0.9 |
|
A Exchange movement |
|
| 0.1 |
|
| – |
|
| – |
|
| 0.1 |
|
| |||||||||||||
At 31 December 2005 | 1.7 | 0.5 | – | 2.2 | |||||||||
| |||||||||||||
Net book value at 31 December 2005 | 3.5 | 0.3 | 0.4 | 4.2 | |||||||||
| |||||||||||||
|
|
| Distribution |
|
| Software |
|
| R&D |
|
|
|
|
|
|
| contract |
|
| assets |
|
| technology |
|
| Total |
|
|
|
| £m |
|
| £m |
|
| £m |
|
| £m |
|
| |||||||||||||
Cost |
|
|
|
|
|
|
|
|
|
|
|
|
|
At 1 January 2004 |
|
| 5.0 |
|
| 0.4 |
|
| – |
|
| 5.4 |
|
Additions |
|
| – |
|
| 0.2 |
|
| – |
|
| 0.2 |
|
Exchange movement |
|
| (0.3 | ) |
| – |
|
| – |
|
| (0.3 | ) |
| |||||||||||||
At 31 December 2004 |
|
| 4.7 |
|
| 0.6 |
|
| – |
|
| 5.3 |
|
| |||||||||||||
Amortisation |
|
|
|
|
|
|
|
|
|
|
|
|
|
At 1 January 2004 |
|
| 0.2 |
|
| 0.2 |
|
| – |
|
| 0.4 |
|
Charge for year |
|
| 0.7 |
|
| 0.1 |
|
| – |
|
| 0.8 |
|
| |||||||||||||
At 31 December 2004 |
|
| 0.9 |
|
| 0.3 |
|
| – |
|
| 1.2 |
|
| |||||||||||||
Net book value at 31 December 2004 |
|
| 3.8 |
|
| 0.3 |
|
| – |
|
| 4.1 |
|
|
THE INFORMATION CONTAINED IN THIS BORDER HAS NOT BEEN AUDITED
A | EXCHANGE MOVEMENT |
|
| ||
|
|
|
| ||
| DURING 2005, THE MONTHLY CLOSING US DOLLAR EXCHANGE RATE HAS FLUCTUATED BETWEEN 1.9199 AND 1.7168. THIS HAS GIVEN RISE TO AN EXCHANGE RATE MOVEMENT ON THE ASSETS LOCATED IN THE US, WHICH HAS AN IMPACT ON BOTH ASSET COST AND ACCUMULATED AMORTISATION AND DEPRECIATION. THE EXCHANGE DIFFERENCE RELATING TO AMORTISATION OF GOODWILL AND OTHER INTANGIBLE ASSETS IN 2004 IS TOO SMALL TO BE NOTED IN THE TABLES ABOVE. |
|
|
|
71 | ||
|
|
10 PROPERTY, PLANT AND EQUIPMENT
|
| Freehold |
| Short |
| Manufacturing |
|
|
|
| ||||||
|
| land and |
| leasehold |
| and laboratory |
| Office |
|
| ||||||
|
| buildings |
| improvements |
| equipment |
| equipment |
| Total | ||||||
|
| £m |
| £m |
| £m |
| £m |
| £m | ||||||
| ||||||||||||||||
Cost |
|
|
|
|
|
|
|
|
|
|
|
|
| |||
1 January 2005 |
|
| 0.6 |
|
| 20.4 |
|
| 6.8 |
|
| 2.6 |
| 30.4 | ||
Additions |
|
| – |
|
| 3.6 |
|
| 0.9 |
|
| 0.7 |
| 5.2 | ||
Disposals |
|
| – |
|
| – |
|
| – |
|
| (0.3 | ) | (0.3 | ) | |
A Exchange movement |
|
| – |
|
| 2.5 |
|
| 1.3 |
|
| 0.4 |
| 4.2 | ||
| ||||||||||||||||
At 31 December 2005 | 0.6 | 26.5 | 9.0 | 3.4 | 39.5 | |||||||||||
| ||||||||||||||||
Depreciation | ||||||||||||||||
At 1 January 2005 |
|
| – |
|
| 8.6 |
|
| 2.0 |
|
| 1.3 |
| 11.9 | ||
Charge for year |
|
| – |
|
| 3.1 |
|
| 1.2 |
|
| 0.7 |
| 5.0 | ||
Impairment |
|
| – |
|
| 0.9 |
|
| – |
|
| – |
| 0.9 | ||
Disposals |
|
| – |
|
| – |
|
| – |
|
| (0.2 | ) | (0.2 | ) | |
A Exchange movement |
|
| – |
|
| 1.1 |
|
| 0.7 |
|
| 0.3 |
| 2.1 | ||
| ||||||||||||||||
At 31 December 2005 | – | 13.7 | 3.9 | 2.1 | 19.7 | |||||||||||
| ||||||||||||||||
Net book value | ||||||||||||||||
At 31 December 2005 | 0.6 | 12.8 | 5.1 | 1.3 | 19.8 | |||||||||||
| ||||||||||||||||
Net book value of assets held under finance leases included above: |
|
|
|
|
|
|
|
|
|
|
|
|
| |||
At 1 January 2005 |
|
| – |
|
| 4.8 |
|
| 0.8 |
|
| – |
| 5.6 | ||
| ||||||||||||||||
At 31 December 2005 | – | 3.5 | 0.7 | – | 4.2 | |||||||||||
| ||||||||||||||||
|
|
| Freehold |
|
| Short |
|
| Manufacturing |
|
|
|
|
|
|
|
|
|
| land and |
|
| leasehold |
|
| and laboratory |
|
| Office |
|
|
|
|
|
|
| buildings |
|
| improvements |
|
| Equipment |
|
| equipment |
|
| Total |
|
|
|
| £m |
|
| £m |
|
| £m |
|
| £m |
|
| £m |
|
| ||||||||||||||||
Cost |
|
|
|
|
|
|
|
|
|
|
|
|
|
|
|
|
1 January 2004 |
|
| 0.6 |
|
| 20.3 |
|
| 8.4 |
|
| 2.1 |
|
| 31.4 |
|
Additions |
|
| – |
|
| 1.5 |
|
| 0.9 |
|
| 0.7 |
|
| 3.1 |
|
Disposals |
|
| – |
|
| (0.2 | ) |
| (1.8 | ) |
| – |
|
| (2.0 | ) |
Exchange movement |
|
| – |
|
| (1.2 | ) |
| (0.7 | ) |
| (0.2 | ) |
| (2.1 | ) |
| ||||||||||||||||
At 31 December 2004 |
|
| 0.6 |
|
| 20.4 |
|
| 6.8 |
|
| 2.6 |
|
| 30.4 |
|
| ||||||||||||||||
Depreciation |
|
|
|
|
|
|
|
|
|
|
|
|
|
|
|
|
At 1 January 2004 |
|
| – |
|
| 5.2 |
|
| 2.0 |
|
| 0.7 |
|
| 7.9 |
|
Charge for year |
|
| – |
|
| 2.5 |
|
| 1.4 |
|
| 0.7 |
|
| 4.6 |
|
Impairment |
|
| – |
|
| 1.8 |
|
| 0.1 |
|
| – |
|
| 1.9 |
|
Disposals |
|
| – |
|
| (0.3 | ) |
| (1.2 | ) |
| – |
|
| (1.5 | ) |
Exchange movement |
|
| – |
|
| (0.6 | ) |
| (0.3 | ) |
| (0.1 | ) |
| (1.0 | ) |
| ||||||||||||||||
At 31 December 2004 |
|
| – |
|
| 8.6 |
|
| 2.0 |
|
| 1.3 |
|
| 11.9 |
|
| ||||||||||||||||
Net book value |
|
|
|
|
|
|
|
|
|
|
|
|
|
|
|
|
At 1 January 2004 |
|
| 0.6 |
|
| 15.1 |
|
| 6.4 |
|
| 1.4 |
|
| 23.5 |
|
| ||||||||||||||||
At December 2004 |
|
| 0.6 |
|
| 11.8 |
|
| 4.8 |
|
| 1.3 |
|
| 18.5 |
|
|
The Company does not have any property, plant and equipment.
72 | Notes to the Group financial statements 31 DECEMBER 2005 |
11 SUBSIDIARIES AND JOINT VENTURES
INVESTMENT IN SUBSIDIARIES
|
|
|
| Company |
|
| 2005 |
| 2004 |
At 1 January |
| 15.5 |
| 15.1 |
A Deemed capital contribution |
| 0.4 |
| 0.4 |
At 31 December |
| 15.9 |
| 15.5 |
The consolidated financial statements include the financial statements of Acambis plc and the following subsidiaries:
Company name |
| Main business |
| Country of |
| Parent |
| % owned |
Acambis Research Limited |
| Corporate administration and sales |
| England and Wales |
| Acambis plc |
| 100 |
Acambis Inc. |
| R&D, sales and manufacturing |
| US |
| Acambis plc |
| 100 |
Berna Products Corporation |
| Sales, marketing and distribution |
| US |
| Acambis Inc. |
| 100 |
Smallpox Biosecurity Limited |
| Marketing |
| England and Wales |
| Acambis plc |
| 100 |
JOINT VENTURE
As described in note 21, the Group has an interest in a Joint Venture. Since May 1999, Acambis has performed a pre-agreed work programme on behalf of the Joint Venture. Costs incurred by the Group on behalf of the Joint Venture and corresponding turnover received from the Joint Venture have been included in the Group’s financial statements.
12 FINANCIAL ASSETS: AVAILABLE-FOR-SALE INVESTMENTS
|
|
|
| Group |
|
| |||||
| 2005 |
| 2004 |
| |
| |||||
At 1 January |
| – |
| – |
|
Additions |
| 0.4 |
| – |
|
Revaluation surplus transfer to equity (note 24) |
| 0.2 |
| – |
|
| |||||
At 31 December |
| 0.6 |
| – |
|
|
In May 2005, the Group sold information and rights of a previous R&D project to Cambridge Biostability Limited, an unquoted UK company, in exchange for 1,425,200 shares. The investment represents less than a 20% shareholding in that company.
The Company does not have any available-for-sale investments.
13 OTHER NON-CURRENT ASSETS
|
|
|
| Group |
|
|
| Company |
|
| |||||||||
|
| 2005 |
| 2004 |
| 2005 |
| 2004 |
|
| |||||||||
Prepayments and accrued income |
| – |
| 0.1 |
| – |
| – |
|
Settlement of Canton agreement |
| – |
| 2.4 |
| – |
| 0.6 |
|
| |||||||||
|
| – |
| 2.5 |
| – |
| 0.6 |
|
|
The discounted interest rate used to value the Canton settlement receivable was 8.0%.
THE INFORMATION CONTAINED IN THIS BORDER HAS NOT BEEN AUDITED
|
|
|
|
| |
A | DEEMED CAPITAL CONTRIBUTION |
|
|
|
|
|
|
|
|
| |
| THE GRANTING OF OPTIONS TO EMPLOYEES OF SUBSIDIARIES IS DEEMED A CAPITAL CONTRIBUTION AND THE COMPANY’S INVESTMENT IN THOSE SUBSIDIARIES IS INCREASED ACCORDINGLY. |
|
|
|
|
73
B 14 INVENTORY
|
|
|
| Group |
|
| |||||
|
| 2005 |
| 2004 |
|
| |||||
Raw materials |
| 0.4 |
| 0.4 |
|
Work in progress |
| 0.5 |
| 2.7 |
|
Finished goods |
| 2.7 |
| 2.9 |
|
| |||||
3.6 | 6.0 | ||||
The amount of inventory write-down recognised as an expense in 2005 was £3.3m (2004 – £0.8m). This expense is included in the cost of sales line.
At 31 December 2005 and 31 December 2004, the Company did not hold any inventory.
15 TRADE AND OTHER RECEIVABLES
|
|
|
| Group |
|
|
| Company |
|
| |||||||||
|
| 2005 |
| 2004 |
| 2005 |
| 2004 |
|
| |||||||||
C Trade receivables |
| 12.4 |
| 8.2 |
| – |
| – |
|
Other receivables |
| 0.5 |
| 0.7 |
| 0.5 |
| 0.2 |
|
Prepayments and accrued income |
| 4.8 |
| 2.2 |
| 0.3 |
| 0.4 |
|
Settlement of Canton agreement |
| 2.9 |
| 2.6 |
| 1.7 |
| 0.6 |
|
| |||||||||
| 20.6 |
| 13.7 |
| 2.5 |
| 1.2 |
| |
|
Trade receivables are non-interest-bearing and are generally on terms of 30 to 60 days. There was a provision against trade receivables of £0.1m at 31 December 2005 (2004 – £nil).
16 FINANCIAL INSTRUMENTS
The Group’s financial instruments comprise primarily cash and liquid resources, a finance lease facility, an overdraft facility, foreign currency contracts, short- and long-term debtors receivable under the Canton settlement and various items, such as trade debtors and trade creditors, which arise directly from its operations. The main purpose of these financial instruments is to provide working capital for the Group’s operations.
The main risks arising from the Group’s activities and involving the use of financial instruments are foreign currency risk, interest rate risk and liquidity risk. The Board reviews and agrees the Group’s objectives and policies for managing each of these risks. Details of the Group’s objectives and policies, both during the year and since the year-end, are set out below, along with numerical disclosures for each category of financial instrument. Except where indicated, these disclosures are indicative of the situation throughout the year.
FOREIGN CURRENCY RISK
The Group has subsidiaries that operate and trade in the US, with revenues, expenses and financing denominated principally in US dollars. Through these overseas operations, the Group is subject to foreign exchange risk, including the risk of fluctuations in the Group’s net investment in, and reported profits from, foreign subsidiaries when translated into sterling. In addition, the UK trading subsidiary enters into contracts in a variety of foreign currencies.
The Group had overall surplus cash funds throughout the year but had to determine in which currency to hold cash available for working capital and surplus funds. This was done with reference to anticipated future expenditure patterns and relative returns on funds held in different currencies. The Group’s current policy is to hold surplus funds in sterling over the long term, which currently achieves a higher interest rate return whilst mitigating the risk of fluctuations in the Group’s net assets, when reported in sterling.
From time to time, the Group makes use of forward contracts in order to reduce uncertainty over the sterling value of anticipated US dollar receipts, thereby reducing uncertainty over the level of the Group’s profits when reported in sterling. Typically, in 2005 the Group took out forward contracts for known significant foreign currency transactions only. There were no forward contracts outstanding at the year-end.
|
|
|
| ||
B | INVENTORY |
| C | TRADE RECEIVABLES |
|
|
|
|
| ||
| INVENTORY COMPRISES PRINCIPALLY ACAM2000 AND VIVOTIF VACCINES. |
|
| TRADE RECEIVABLES COMPRISES PRINCIPALLY THE BALANCE OWED FROM THE NIAID FOR THE SHIPMENT OF 500,000 DOSES OF MVA3000 VACCINE IN DECEMBER 2005. |
|
74 | Notes to the Group financial statements 31 DECEMBER 2005 |
16 FINANCIAL INSTRUMENTS (CONTINUED)
FOREIGN CURRENCY RISK (CONTINUED)
During the year, the Group also used dual currency deposits for both euro and US dollar deposits, allowing an enhanced interest rate to be earned, which may, at maturity, be converted into sterling or dollars at the banks’ discretion, at a rate previously agreed. The Group had no dual currency deposits outstanding at the year-end.
Where Group companies have monetary assets and liabilities denominated in currencies other than their functional currency, these balances are translated into that subsidiary’s functional currency. With the exception of gains and losses on those inter-Company balances that are considered to be ‘as permanent as equity’ and recorded in reserves, foreign exchange gains and losses arising are recorded immediately in the income statement. These amounts include sterling-denominated cash balances held in the US, US dollar- and euro-denominated balances held by the Company and a US dollar-denominated overdraft facility held by a UK subsidiary. In addition, the Group has other current assets and liabilities denominated in foreign currencies, which the Board does not consider to be significant.
LIQUIDITY RISK
The Board monitors the level of cash and liquid resources on a regular basis, and management monitors the level on a daily basis, to ensure that the Group has sufficient liquid funds to enable it to meet its commitments as they fall due. This is achieved through the production and review of cash forecasts, including sensitivity analyses. Approximately
60% of the Group’s cash and liquid resources are managed on a discretionary basis by a third party within strict parameters that have been set by the Board. The remainder is invested in managed funds or invested in bank deposits within the parameters set by the Board. These parameters include the requirement that the institutions used must have a minimum rating of Aa2 long-term or P-1 short-term, and a maximum investment with any one counter-party of £20m.
INTEREST RATE RISK
The Group finances its operations predominantly through cash and liquid resources generated through operating activities, from the issuance of equity shares, through finance leases and through an overdraft facility. It is the Group’s policy to invest surplus cash on deposit or in money market funds managed by professional money managers. The performance of the investments is reviewed by management on a regular basis to ensure that competitive rates of return are being achieved, subject to the Board’s requirement relating to the accessibility of funds and standing of financial institutions used. The Board reviews regularly the financing facilities available to the Group to ensure competitive rates of interest are being obtained. During the year, the Group invested in a cash deposit which accrues interest dependent on the sterling LIBOR rate. This deposit of £10.0m was outstanding at the year-end and was valued at £10.0m (2004 – deposit £ 5.8m, valued at £5.7m).
The following table sets out the carrying value by maturity, for each financial instrument that is exposed to interest rate risk.
|
|
|
|
| Group |
|
|
|
|
| Company |
| |
| |||||||||||||
2005 |
| Within |
| One–two |
| Total |
| Within |
| One–two |
| Total |
|
| |||||||||||||
Floating rate: |
|
|
|
|
|
|
|
|
|
|
|
|
|
Cash |
| 11.0 |
| – |
| 11.0 |
| 6.5 |
| – |
| 6.5 |
|
| |||||||||||||
Fixed rate: |
|
|
|
|
|
|
|
|
|
|
|
|
|
Short-term deposits |
| 38.2 |
| – |
| 38.2 |
| 36.0 |
| – |
| 36.0 |
|
Liquid investments |
| 8.8 |
| 10.0 |
| 18.8 |
| 8.8 |
| 10.0 |
| 18.8 |
|
Obligations under finance leases |
| (7.1 | ) | – |
| (7.1 | ) | – |
| – |
| – |
|
| |||||||||||||
2004 |
| Within |
| One–two |
| Total |
| Within |
| One–two |
| Total |
|
| |||||||||||||
Floating rate: |
|
|
|
|
|
|
|
|
|
|
|
|
|
Cash |
| 30.2 |
| – |
| 30.2 |
| 27.8 |
| – |
| 27.8 |
|
| |||||||||||||
Fixed rate |
|
|
|
|
|
|
|
|
|
|
|
|
|
Cash |
| 0.7 |
| – |
| 0.7 |
| 0.7 |
| – |
| 0.7 |
|
Short-term deposits |
| 50.1 |
| – |
| 50.1 |
| 41.8 |
| – |
| 41.8 |
|
Liquid investments |
| 20.8 |
| – |
| 20.8 |
| 17.8 |
| – |
| 17.8 |
|
Obligations under finance leases |
| (3.1 | ) | (6.3 | ) | (9.4 | ) | – |
| – |
| – |
|
|
75
16 FINANCIAL INSTRUMENTS (CONTINUED)
CREDIT RISK
The Group’s main customer is the US Government and therefore it assesses the credit risk as low. There are no other significant concentrations of credit risk.
FAIR VALUES OF FINANCIAL ASSETS AND FINANCIAL LIABILITIES
There is no material difference between the book values and fair values of the Group’s financial assets and liabilities as at 31 December 2005. Fair values have been calculated by discounting cash flows at prevailing interest rates.
|
| Group |
| Company |
| ||||
| |||||||||
|
| 2005 |
| 2004 |
| 2005 |
| 2004 |
|
| |||||||||
Assets: |
|
|
|
|
|
|
|
|
|
Foreign currency contracts |
| 0.1 |
| – |
| 0.1 |
| – |
|
| |||||||||
Liabilities: |
|
|
|
|
|
|
|
|
|
Foreign currency contracts |
| – |
| (0.1 | ) | – |
| (0.1 | ) |
| |||||||||
In accordance with IAS39, the Group has reviewed all contracts for embedded derivatives that are required to be separately accounted for if they do not meet certain requirements set out in the standard. This derivative is fair valued based on discounted future cash flows with gains and losses passing through the income statement as hedge accounting is not available.
The Group has an embedded derivative deposit which accrues interest dependent on UK LIBOR (the London inter-bank offered rate).
During the year, the Group also used dual currency deposits for both euro and US dollar deposits, allowing an enhanced interest rate to be earned, which may, at maturity, be converted into sterling or dollars at the banks’ discretion, at a rate previously agreed. The Group had no dual currency deposits outstanding at the year-end (2004 – none).
From time to time, the Group makes use of forward contracts in order to reduce uncertainty over the sterling value of anticipated US dollar receipts, thereby reducing uncertainty over the level of the Group’s profits when reported in sterling. Typically, in 2005 the Group took out forward contracts for known significant foreign currency only. The Group had no forward contracts outstanding at the year-end (2004 – a forward contract to sell dollars and buy sterling outstanding at the year-end).
17 CASH AND CASH EQUIVALENTS
|
| Group |
| Company | ||||
|
| 2005 |
| 2004 |
| 2005 |
| 2004 |
Cash |
| 11.0 |
| 30.9 |
| 6.5 |
| 28.5 |
Short-term deposits |
| 38.2 |
| 50.1 |
| 36.0 |
| 41.8 |
|
| 49.2 |
| 81.0 |
| 42.5 |
| 70.3 |
The weighted average interest rate received in the year was 3.9% for cash at bank. Short-term deposits are made for varying periods of between one day and three months, (the weighted average maturity being 14 days) and have earned interest at 4.7%.
The Group had cash and liquid resources of £68.0m at 31 December 2005 (2004 – £101.8m). Of this amount, deposits with an original maturity of more than three months of £18.8m (2004 – £20.8m) have been classified as liquid investments. The majority of these resources are invested in managed funds or on bank deposit, denominated in sterling, US dollars and euros. Approximately 16% of the Group’s cash and liquid resources is available for use with a day’s notice (2004 – 30%), with the remainder being invested on deposits of up to 18 months. The Group had £0.7m of restricted cash on deposit at the year-end (2004 – £0.4m).
76 | Notes to the Group financial statements 31 DECEMBER 2005 |
18 FINANCIAL LIABILITIES
|
| Group |
| Company | ||||
|
| 2005 |
| 2004 |
| 2005 |
| 2004 |
Current: |
|
|
|
|
|
|
|
|
Short-term borrowings |
| 4.0 |
| 3.6 |
| – |
| – |
Short-term financial liabilities – obligations under finance leases |
| 7.1 |
| 3.1 |
| – |
| – |
Other financial liabilities |
| 0.1 |
| – |
| – |
| – |
Derivative financial liabilities |
| – |
| 0.1 |
| – |
| – |
|
| 11.2 |
| 6.8 |
| – |
| – |
Non-current: |
|
|
|
|
|
|
|
|
Other financial liabilities |
| 1.6 |
| 6.3 |
| – |
| – |
SHORT-TERM BORROWINGS
Under the terms of the agreement between Acambis and Evans Vaccines Limited (a subsidiary of Chiron Corporation, which has been acquired by Novartis AG) given certain conditions the obligation under the bank overdraft facility of £4.0m (2004 – £3.6m) for part of the costs incurred on the ARILVAX project may be repayable within one year. The facility is underwritten by Chiron. Chiron has granted to Acambis 100% of the marketing rights to ARILVAX in the US, whilst retaining an option to buy back 50% of the profits from the US sales in return for refunding to Acambis the costs that Acambis has incurred on the ARILVAX programme. The overdraft facility was fully utilised at 31 December 2005 (2004 – fully utilised) and was renewed in January 2006 for a further year.
During the year, an exchange loss of £0.4m (2004 – gain of £0.3m) was recorded in the income statement, resulting from the revaluation of this US dollar-denominated facility.
OBLIGATIONS UNDER FINANCE LEASES
The Group has a $40m (c. £21m) finance lease facility. This was arranged through Baxter and was approved by shareholders in December 2001. In 2001, the Group drew down $18.6m (£14.0m) and has made no further draw-downs from the facility. The repayment schedule for the lease financing required that interest only was repaid in 2003 and capital and interest are repayable over 2004 to 2006. The Group had an option to repurchase all of the facility’s assets in December 2003, and on each anniversary thereafter, for the capital balance outstanding at that time, plus any accrued but unpaid interest due at the time, and a make-whole payment (discounted to present value) equal to the projected future interest stream payable to the end of the lease term.
In December 2001, the Group committed to a finance lease, repayable within five years, relating to the purchase and sale-and-leaseback of capital assets within the manufacturing plant.
OTHER FINANCIAL LIABILITIES
In May 2005, the Group purchased a fill/finish facility for c. £1.8m ($3m) upfront and a further c. £2.6m ($4.5m) in equal instalments between 2006 and 2017. The balance relating to the discounted value of future payments is £1.7m at 31 December 2005 (2004 – £nil). £0.1m is included in ‘current other financial liabilities’ (2004 – £nil), and £1.6m in ‘non-current other financial liabilities’ (2004 – £nil).
19 CURRENT LIABILITIES
TRADE AND OTHER PAYABLES
|
| Group |
| Company | ||||
|
| 2005 |
| 2004 |
| 2005 |
| 2004 |
A Trade payables |
| 16.0 |
| 5.8 |
| – |
| 0.1 |
Other taxation and social security |
| 0.1 |
| 0.1 |
| – |
| – |
Other payables |
| – |
| 0.7 |
| – |
| – |
Deferred and contingent consideration |
| – |
| 1.7 |
| – |
| – |
| 16.1 |
| 8.3 |
| – |
| 0.1 | |
THE INFORMATION CONTAINED IN THIS BORDER HAS NOT BEEN AUDITED
|
|
| |
A | TRADE PAYABLES |
|
|
|
|
| |
| THE INCREASE IN TRADE PAYABLES IS PRINCIPALLY ATTRIBUTABLE TO THE BALANCE OWED TO BAXTER FOR THE PRODUCTION OF 500,000 DOSES OF MVA3000. |
|
|
77
20 PROVISIONS
In August 2005 BN filed legal actions against Acambis in the US in relation to IP on its MVA smallpox vaccine. A further suit was filed in Austria in February 2006. BN alleges use of trade secrets, misappropriation and patent infringement. Acambis strongly believes these allegations are without foundation and is vigorously defending its position. A current provision of £2.3m (2004 – £nil) has been recognised in relation to future legal costs relating to the MVA litigation. The Company has no provisions.
21 INVESTMENT IN JOINT VENTURE
The Group has a 50% interest in the Pasteur Mérieux-OraVax joint venture (the Joint Venture), whose principal business is to develop, manufacture, market and sell immunotherapeutic and preventative vaccines against H. pylori infection in humans. The Joint Venture represents collaboration between two partnerships, Mérieux-OraVax SNC and OraVax-Mérieux Co., incorporated in Delaware, US. These partnerships were formed in March 1995 between the companies now known as Acambis Inc. and sanofi pasteur. The Joint Venture trades under the name of Pasteur Mérieux-OraVax and its accounting year-end is 31 December. The R&D budgets of the two partnerships are established by joint committees in which each of the parties has an equal participation and role. The parties pay approximately equal shares of the agreed budgets. The Joint Venture is being wound down.
The following information is given in respect of the Group’s share of the Joint Venture:
|
| 2005 |
| 2004 |
|
| |||||
Loss before tax |
| – |
| – |
|
| |||||
Current assets |
| 0.7 |
| 0.6 |
|
Liabilities due within one year |
| (1.0 | ) | (0.9 | ) |
| |||||
|
| (0.3 | ) | (0.3 | ) |
|
B Due to the nature of this Joint Venture as a collaboration between two partners, the following table provides an alternative analysis of the amounts shown above:
|
| 2005 |
| 2004 |
|
| |||||
Share of cumulative amounts invested by the partners |
| 17.0 |
| 15.2 |
|
Share of cumulative losses incurred by the Joint Venture |
| (17.3 | ) | (15.5 | ) |
| |||||
|
| (0.3 | ) | (0.3 | ) |
|
22 OTHER NON-CURRENT LIABILITIES
|
| Group |
| Company | ||||
|
| 2005 |
| 2004 |
| 2005 |
| 2004 |
Deferred and contingent consideration |
| – |
| 0.5 |
| – |
| – |
|
|
| |
B | JOINT VENTURE |
|
|
|
|
| |
| THE CUMULATIVE AMOUNTS INVESTED AND CUMULATIVE LOSSES OF THE JOINT VENTURE ARE DOLLAR-DENOMINATED AND THE MOVEMENT SHOWN IN STERLING IN THE YEAR IS PRINCIPALLY DUE TO FOREIGN CURRENCY FLUCTUATIONS. |
|
|
78 | Notes to the Group financial statements 31 DECEMBER 2005 |
23 CALLED-UP SHARE CAPITAL
GROUP AND COMPANY
|
|
|
| 2005 |
|
|
| 2004 |
|
|
| Number |
| £m |
| Number |
| £m |
|
Authorised shares of 10p each |
|
|
|
|
|
|
|
|
|
At 1 January and 31 December |
| 140,000,000 |
| 14.0 |
| 140,000,000 |
| 14.0 |
|
Allotted, called-up and fully paid ordinary shares of 10p each |
|
|
|
|
|
|
| ||
At 1 January |
| 107,219,329 |
| 10.7 |
| 105,637,848 |
| 10.6 |
|
Exercise of share options |
| 132,078 |
| – |
| 1,581,481 |
| 0.1 |
|
At 31 December |
| 107,351,407 |
| 10.7 |
| 107,219,329 |
| 10.7 |
|
All shares have equal voting rights.
As described in note 24, Acambis Employees Trustees Limited holds 84,972 shares, which will be used to satisfy awards made under the LTIP. Consideration received in 2005 through the exercise of share options amounted to £0.2m (2004 – £1.9m).
24 STATEMENT OF CHANGES IN EQUITY
GROUP
|
| Share |
| Share premium |
| Retained |
| Other |
| Total |
|
At 1 January 2005 |
| 10.7 |
| 97.8 |
| 1.5 |
| (2.5 | ) | 107.5 |
|
Gain on foreign currency exchange |
| – |
| – |
| – |
| 1.6 |
| 1.6 |
|
Total income and expense recognised directly in equity |
| – |
| – |
| – |
| 1.6 |
| 1.6 |
|
Loss for the year |
| – |
| – |
| (27.0 | ) | – |
| (27.0 | ) |
Total income and expense recognised |
| – |
| – |
| (27.0 | ) | 1.6 |
| (25.4 | ) |
Issue of new shares |
| – |
| 0.2 |
| – |
| – |
| 0.2 |
|
Purchase of treasury shares |
| – |
| – |
| (0.2 | ) | – |
| (0.2 | ) |
Revaluation of available-for-sale investment (net of deferred tax) |
| – |
| – |
| 0.1 |
| – |
| 0.1 |
|
Credit in respect of employee share schemes |
| – |
| – |
| 0.8 |
| – |
| 0.8 |
|
At 31 December 2005 |
| 10.7 |
| 98.0 |
| (24.8 | ) | (0.9 | ) | 83.0 |
|
GROUP
|
| Share |
| Share premium |
| Retained |
| Other |
| Total |
|
At 1 January 2004 |
| 10.6 |
| 96.0 |
| (20.1 | ) | – |
| 86.5 |
|
Loss on foreign currency exchange |
| – |
| – |
| – |
| (2.5 | ) | (2.5 | ) |
Deferred tax on share options |
| – |
| – |
| 1.2 |
| – |
| 1.2 |
|
Total income and expense recognised directly in equity |
| – |
| – |
| 1.2 |
| (2.5 | ) | (1.3 | ) |
Profit for the year |
| – |
| – |
| 19.7 |
| – |
| 19.7 |
|
Total income and expense recognised |
| – |
| – |
| 20.9 |
| (2.5 | ) | 18.4 |
|
Issue of new shares |
| 0.1 |
| 1.8 |
| – |
| – |
| 1.9 |
|
Credit in respect of employee share schemes |
| – |
| – |
| 0.7 |
| – |
| 0.7 |
|
At 31 December 2004 |
| 10.7 |
| 97.8 |
| 1.5 |
| (2.5 | ) | 107.5 |
|
The amount shown in ‘other reserves’ relates to foreign currency translation.
79 |
24 STATEMENT OF CHANGES IN EQUITY (CONTINUED)
COMPANY
|
| Share |
| Share premium |
| Retained |
| Total |
|
At 1 January 2005 |
| 10.7 |
| 97.6 |
| 5.2 |
| 113.5 |
|
Profit for the year |
| – |
| – |
| 9.1 |
| 9.1 |
|
Total income and expense recognised for the year |
| – |
| – |
| 9.1 |
| 9.1 |
|
Issue of new shares |
| – |
| 0.2 |
| – |
| 0.2 |
|
Purchase of treasury shares |
| – |
| – |
| (0.2 | ) | (0.2 | ) |
Credit in respect of employee share schemes |
| – |
| – |
| 0.4 |
| 0.4 |
|
Deemed capital contribution |
| – |
| – |
| 0.4 |
| 0.4 |
|
At 31 December 2005 |
| 10.7 |
| 97.8 |
| 14.9 |
| 123.4 |
|
COMPANY
|
| Share |
| Share premium |
| Retained |
| Total |
|
At 1 January 2004 |
| 10.6 |
| 95.8 |
| 1.0 |
| 107.4 |
|
Deferred tax on share option awards |
| – |
| – |
| 0.4 |
| 0.4 |
|
Total income and expense recognised directly in equity |
| – |
| – |
| 0.4 |
| 0.4 |
|
Profit for the year |
| – |
| – |
| 3.2 |
| 3.2 |
|
Total income and expense recognised for the year |
| – |
| – |
| 3.6 |
| 3.6 |
|
Issue of new shares |
| 0.1 |
| 1.8 |
| – |
| 1.9 |
|
Credit in respect of employee share schemes |
| – |
| – |
| 0.2 |
| 0.2 |
|
Deemed capital contribution |
| – |
| – |
| 0.4 |
| 0.4 |
|
At 31 December 2004 |
| 10.7 |
| 97.6 |
| 5.2 |
| 113.5 |
|
At 31 December 2005, Acambis Employees’ Trustees Limited held 84,972 (2004 – 62,190) ordinary shares in the Company with a total nominal value of £0.01m (2004 – £0.01m). The cost of these shares of £0.2m (2004 – £0.1m) is shown as a deduction to retained earnings. The total market value of these shares at 31 December 2005 is £0.2m (2004 – £0.2m). All shares held by the Trust have been allocated to long-term incentive awards and a charge has been made in respect of all of these awards. All costs relating to the administration of the Trust are included within the accounts of the Company as they arise.
25 SHARE-BASED PAYMENTS
SUMMARY OF SHARE SCHEMES IN OPERATION DURING THE YEAR
Acambis had the following share-based payment schemes in operation during the year.
1996 AND 1999 SCHEMES
The 1996 Scheme and the 1999 Plan involve the grant of market-value share options to participants. The options are subject to a market-based performance condition (Acambis’ TSR performance against a comparator group). The options granted have a maximum contractual life of 10 years with the exception of the 15 October 2005 and 28 October 2003 options granted to employees which have a maximum contractual life of four years. For all options granted after 1 January 2004 (to employees or Directors) performance is measured over three years and there is no retesting of the performance condition. Further information regarding the operation of the scheme can be found in the remuneration report.
80 | Notes to the Group financial statements 31 DECEMBER 2005 |
25 SHARE-BASED PAYMENTS (CONTINUED)
LTIP
The LTIP involves the grant of nil-cost share options to participants. The options are subject to a market-based performance condition (Acambis’ TSR performance against a comparator group). The options granted have a maximum contractual life of three years and six months. For all options granted under the LTIP performance is measured over three years and there is no retesting of the performance condition. Further information regarding the operation of the scheme can be found in the remuneration report.
SAYE SCHEME
The SAYE Scheme is based on a three-year monthly savings contract and eligible employees are granted share options with an exercise price of up to 20% below the share price when the invitation is issued. The options granted have a maximum contractual life of three years and six months. Vesting of the options is not subject to the achievement of a performance target.
ESPP
The ESPP is based on a two-year monthly savings contract and eligible employees are granted share options with an exercise price of up to a 15% discount to the share price at the time of invitation. The options granted have a maximum contractual life of two years and three months. Vesting of the options is not subject to the achievement of a performance target.
Options outstanding under all schemes are as follows:
Scheme |
| 1 January |
| Granted |
| Exercised |
| Lapsed |
| 31 December |
1996 |
| 233 |
| 36 |
| (10 | ) | (59 | ) | 200 |
1999 |
| 3,173 |
| 806 |
| (104 | ) | (342 | ) | 3,533 |
SAYE |
| 105 |
| 38 |
| (12 | ) | (50 | ) | 81 |
ESPP |
| 85 |
| 50 |
| – |
| (60 | ) | 75 |
1990 US1 |
| 121 |
| – |
| – |
| (107 | ) | 14 |
1995 US2 |
| 155 |
| – |
| – |
| (28 | ) | 127 |
Total |
| 3,872 |
| 930 |
| (126 | ) | (646 | ) | 4,030 |
Scheme |
| 1 January |
| Granted |
| Exercised |
| Lapsed |
| 31 December |
1995 |
| 5 |
| – |
| (5 | ) | – |
| – |
1996 |
| 318 |
| 70 |
| (113 | ) | (42 | ) | 233 |
1999 |
| 3,925 |
| 864 |
| (1,277 | ) | (339 | ) | 3,173 |
SAYE |
| 192 |
| 24 |
| (105 | ) | (6 | ) | 105 |
ESPP |
| 79 |
| 20 |
| – |
| (14 | ) | 85 |
1990 US1 |
| 167 |
| – |
| (46 | ) | – |
| 121 |
1995 US2 |
| 190 |
| – |
| (35 | ) | – |
| 155 |
Total |
| 4,876 |
| 978 |
| (1,581 | ) | (401 | ) | 3,872 |
NOTES
1 | The OraVax 1990 Stock Incentive Plan |
2 | The OraVax 1995 Stock Incentive Plan |
81
25 SHARE-BASED PAYMENTS (CONTINUED)
The following table shows outstanding options, divided into ranges to help assess the number and timing of additional shares that may be issued and the cash that may be received upon exercise of those options.
Year of grant |
| Weighted average |
| Period exercisable in |
| Number |
1996 |
| $26.02 |
| 1999-2006 |
| 30,547 |
1996 |
| £1.70 |
| 1999-2006 |
| 17,685 |
1997 |
| $4.89 |
| 2000-2007 |
| 105,443 |
1999 |
| $1.68 |
| 2002-2009 |
| 5,090 |
1999 |
| £0.36 |
| 2002-2009 |
| 85,434 |
2000 |
| £0.92 |
| 2003-2006 |
| 250,000 |
2000 |
| £0.96 |
| 2003-2010 |
| 3,600 |
2001 |
| £1.25 |
| 2004-2006 |
| 208,000 |
2001 |
| £3.33 |
| 2004-2006 |
| 19,520 |
2001 |
| £1.38 |
| 2004-2011 |
| 258,201 |
2002 |
| £2.46 |
| 2005-2006 |
| 237,152 |
2002 |
| £1.80 |
| 2005-2006 |
| 16,065 |
2002 |
| £2.62 |
| 2005-2012 |
| 363,419 |
2003 |
| £3.26 |
| 2006-2007 |
| 265,716 |
2003 |
| £2.74 |
| 2006-2007 |
| 8,346 |
2003 |
| £3.00 |
| 2006-2013 |
| 359,265 |
2004 |
| £2.65 |
| 2006 |
| 24,798 |
2004 |
| £2.81 |
| 2007-2008 |
| 377,340 |
2004 |
| £2.36 |
| 2007-2008 |
| 17,896 |
2004 |
| £2.91 |
| 2007-2014 |
| 462,949 |
2005 |
| £1.87 |
| 2007 |
| 50,652 |
2005 |
| £2.46 |
| 2008-2009 |
| 344,440 |
2005 |
| £2.01 |
| 2008-2009 |
| 38,414 |
2005 |
| £2.34 |
| 2008-2015 |
| 479,895 |
Total |
|
|
|
|
| 4,029,867 |
Whilst they have no present intention of utilising such authority, at the AGM to be held on 23 June 2006 the Directors will seek authority from the shareholders to allot shares up to an aggregate nominal value of £3,264,670 (32,646,703 ordinary shares of 10p each), being the unissued ordinary shares of the Company at 21 April 2006. Currently, the Directors have authority to allot shares up to an aggregate nominal value of £3,276,481.
The Group operates an Inland Revenue-approved SAYE scheme in the UK and an ESPP scheme in the US.
CHARGE IN THE INCOME STATEMENT
In accordance with the transitional provisions of IFRS2, Acambis has recognised an expense in respect of all grants under these plans made after 7 November 2002 which remained unvested at 31 December 2004. Acambis recognised a total expense of £0.8m in 2005 (2004 – £0.7m) in accordance with IFRS2.
82 | Notes to the Group financial statements 31 DECEMBER 2005 |
25 SHARE-BASED PAYMENTS (CONTINUED)
FINANCIAL DETAILS OF SHARE OPTIONS
Options were exercised on a regular basis during the year. The average share price during 2005 was £2.35.
The weighted average fair values for grants made in the year are as noted in the table below. Grants made to employees and Directors under the 1996 and 1999 Plans are shown separately since different inputs have been used for these grants.
Weighted average fair value |
| 2005 |
| 2004 |
1996 Plan (Employee grants) |
| 0.83 |
| 1.12 |
1996 Plan (Director grants) |
| N/A |
| 1.36 |
1999 Plan (Employee grants) |
| 0.68 |
| 1.03 |
1999 Plan (Director grants) |
| 0.84 |
| 1.19 |
LTIP |
| 1.41 |
| 2.37 |
ESPP |
| 0.62 |
| 1.36 |
SAYE |
| 0.88 |
| 1.16 |
The assumptions used in the calculation of the fair values in the above table are:
• | Expected volatility was based on the historical volatility of the Company’s share price: |
| – | over the three years prior to the grant date for employee grants under the 1996 and 1999 Plan and all grants under the SAYE Scheme and LTIP; |
| – | over the four years prior to the grant date for Director grants under the 1996 and 1999 Plan; and |
| – | over the two years prior to the grant date for all grants under the ESPP. |
• | A zero dividend yield assumption has been used in the calculation of these fair values. |
1996 PLAN, 1999 PLAN AND LTIP
The fair value of shares awarded under the 1996 Plan and 1999 Plan is calculated using a binomial option pricing model adjusted to reflect the TSR market-based performance condition. The awards were calculated using the following assumptions:
1996 PLAN (EMPLOYEE GRANTS) |
|
|
|
| 2005 |
| 2004 |
Weighted average share price (£) | 2.58 |
| 3.00 |
Weighted average exercise price (£) | 2.58 |
| 2.93 |
Weighted average volatility (%) | 41.4 |
| 51.1 |
Weighted average correlation (%) | 5.0 |
| 14.8 |
Weighted average expected life (years) | 3.5 |
| 3.5 |
Weighted average risk-free interest rate (%) | 4.6 |
| 4.7 |
1996 PLAN (DIRECTOR GRANTS) |
|
|
|
| 2005 |
| 2004 |
Weighted average share price (£) | N/A |
| 3.46 |
Weighted average exercise price (£) | N/A |
| 3.46 |
Weighted average volatility (%) | N/A |
| 53.6 |
Weighted average correlation (%) | N/A |
| 14.3 |
Weighted average expected life (years) | N/A |
| 4.00 |
Weighted average risk-free interest rate (%) | N/A |
| 4.6 |
83
25 SHARE-BASED PAYMENTS (CONTINUED)
1999 PLAN (EMPLOYEE GRANTS)
| 2005 |
| 2004 |
Weighted average share price (£) | 2.41 |
| 2.85 |
Weighted average exercise price (£) | 2.41 |
| 2.84 |
Weighted average volatility (%) | 36.9 |
| 50.2 |
Weighted average correlation (%) | 4.3 |
| 14.9 |
Weighted average expected life (years) | 3.1 |
| 3.5 |
Weighted average risk-free interest rate (%) | 4.3 |
| 4.7 |
1999 PLAN (DIRECTOR GRANTS) |
|
|
|
| 2005 |
| 2004 |
Weighted average share price (£) | 2.34 |
| 3.05 |
Weighted average exercise price (£) | 2.34 |
| 3.04 |
Weighted average volatility (%) | 47.9 |
| 52.0 |
Weighted average correlation (%) | 4.5 |
| 14.5 |
Weighted average expected life (years) | 4.0 |
| 3.7 |
Weighted average risk-free interest rate (%) | 4.3 |
| 4.7 |
LTIP
| 2005 |
| 2004 |
Weighted average share price (£) | 2.19 |
| 3.46 |
Weighted average exercise price (£) | – |
| – |
Weighted average volatility (%) | 40.8 |
| 53.3 |
Weighted average correlation (%) | 5.0 |
| 15.0 |
Weighted average expected life (years) | 3.0 |
| 3.0 |
Weighted average risk-free interest rate (%) | 4.3 |
| 4.5 |
The 1996 Plan, 1999 Plan and the LTIP have a TSR market-based performance condition, such that the Company’s TSR over the performance period will be compared with the TSR of the comparator companies on the date of grant. The maximum number of shares would vest if Acambis were ranked in the upper quartile of the comparator group, being prorated down to a 30% vesting at a ranking of the median. No shares vest if Acambis’ ranking falls below the median. The fair value of options under the 1996 Plan, 1999 Plan and LTIP has been adjusted to take into account this market-based performance condition using a pricing model based on expectations about volatility and the correlation of share price returns in the group of comparator companies and which incorporates into the valuation the interdependency between share price performance and TSR vesting.
ESPP AND SAYE GRANTS
The fair value of options granted under the ESPP and SAYE scheme are calculated using a binomial option pricing model with the following assumptions:
ESPP |
|
|
|
| 2005 |
| 2004 |
Weighted average share price (£) | 2.17 |
| 3.44 |
Weighted average exercise price (£) | 1.87 |
| 2.65 |
Weighted average volatility (%) | 32.4 |
| 44.8 |
Expected life (years) | 2.0 |
| 2.0 |
Weighted average risk-free interest rate (%) | 4.4 |
| 5.0 |
84 | Notes to the Group financial statements 31 DECEMBER 2005 |
25 SHARE-BASED PAYMENTS (CONTINUED)
SAYE
|
| 2005 |
| 2004 |
Weighted average share price (£) |
| 2.39 | 3.51 | |
Weighted average exercise price (£) |
| 2.01 | 2.74 | |
Weighted average volatility (%) |
| 34.7 | 55.2 | |
Expected life (years) |
| 3.3 | 3.3 | |
Risk-free interest rate (%) |
| 4.3 | 4.9 | |
FAIR VALUE OF OPTIONS GRANTED IN 2003
The charge under IFRS2 for the current period includes a charge for options granted under the above schemes during the year ended 31 December 2003 and the year ended 31 December 2002 with the following weighted average grant date fair values:
|
| 2003 |
| 2002 |
1996 Plan (Employee grants) |
| 1.25 |
| 1.11 |
1996 Plan (Director grants) |
| N/A |
| N/A |
1999 Plan (Employee grants) |
| 1.23 |
| 1.13 |
1999 Plan (Director grants) |
| 1.33 |
| N/A |
LTIP |
| 2.24 |
| N/A |
ESPP |
| 1.66 |
| N/A |
SAYE |
| 1.78 |
| N/A |
The fair values for the 2003 grants were calculated using the binomial model (adjusted for the TSR performance condition where relevant).
|
| 1996 Plan |
| 1996 Plan |
| 1999 Plan |
| 1999 Plan |
| LTIP |
| ESPP |
| SAYE |
Weighted average share price (£) |
| 3.34 |
| N/A |
| 3.21 |
| 2.94 |
| 3.23 |
| 3.72 |
| 3.51 |
Weighted average exercise price (£) |
| 3.34 |
| N/A |
| 3.17 |
| 2.94 |
| — |
| 3.08 |
| 2.74 |
Weighted average volatility (%) |
| 55.0 |
| N/A |
| 55.8 |
| 63.7 |
| 55.2 |
| 59.2 |
| 55.2 |
Weighted average expected life (years) |
| 3.2 |
| N/A |
| 3.3 |
| 4.0 |
| 3.0 |
| 2.0 |
| 3.3 |
Weighted average risk-free interest rate (%) |
| 4.5 |
| N/A |
| 4.4 |
| 4.4 |
| 3.8 |
| 3.4 |
| 4.9 |
The fair values for the 2002 grants were calculated using the binomial model (adjusted for the TSR performance condition where relevant).
|
| 1996 Plan |
| 1996 Plan |
| 1999 Plan |
| 1999 Plan |
| LTIP |
| ESPP |
| SAYE |
Weighted average share price (£) |
| 2.47 |
| N/A |
| 2.52 |
| N/A |
| N/A |
| N/A |
| N/A |
Weighted average exercise price (£) |
| 2.47 |
| N/A |
| 2.52 |
| N/A |
| N/A |
| N/A |
| N/A |
Weighted average volatility (%) |
| 66.8 |
| N/A |
| 66.7 |
| N/A |
| N/A |
| N/A |
| N/A |
Weighted average expected life (years) |
| 3.5 |
| N/A |
| 3.5 |
| N/A |
| N/A |
| N/A |
| N/A |
Weighted average risk-free interest rate (%) |
| 4.3 |
| N/A |
| 4.4 |
| N/A |
| N/A |
| N/A |
| N/A |
For the options granted under the 1996 Plan and 1999 Plan prior to 1 January 2004 where the TSR condition is retested at the end of year four (if not met at the end of year three) and/or at the end of year five (if not met at the end of year four), a three years and six months vesting period has been used to approximate the impact of the retesting condition on the fair value. This retesting condition applies to a limited number of option grants and does not apply to new option grants.
85 |
26 FINANCIAL COMMITMENTS
i) LEASE COMMITMENTS
The minimum lease payments under operating leases are as follows:
|
| Group | ||||||
|
| Land and buildings |
| Plant and machinery | ||||
|
| 2005 |
| 2004 |
| 2005 |
| 2004 |
Total commitments under operating lease: |
|
|
|
|
|
|
|
|
Due within one year |
| 2.3 |
| 1.7 |
| 0.1 |
| 0.1 |
Due within one to five years |
| 9.6 |
| 3.1 |
| 0.2 |
| 0.1 |
Due beyond five years |
| 8.2 |
| 7.7 |
| – |
| – |
|
| 20.1 |
| 12.5 |
| 0.3 |
| 0.2 |
|
| Company | ||||||
|
| Land and buildings |
| Plant and machinery | ||||
|
| 2005 |
| 2004 |
| 2005 |
| 2004 |
Total commitments under operating lease: |
|
|
|
|
|
|
|
|
Due within one year |
| 0.6 |
| 0.6 |
| – |
| – |
Due within one to five years |
| 2.3 |
| 2.3 |
| – |
| – |
Due beyond five years |
| 7.1 |
| 7.7 |
| – |
| – |
|
| 10.0 |
| 10.6 |
| – |
| – |
In March 2000, the Group entered into a sub-lease with Medivir UK Limited with respect to a part of the facility at Peterhouse Technology Park in the UK. In December 2003, this sub-lease was amended, such that 45% of the facility was rented to Medivir until November 2004. During 2004, Medivir contributed £0.2m in operating lease rentals relating to land and buildings (2005 – £nil).
ii) CAPITAL COMMITMENTS
At the end of the year, capital commitments contracted but not provided for were £0.1m (2004 – £0.2m).
iii) PENSION ARRANGEMENTS
The Group provides pension benefits to all full-time employees on a defined contribution basis. The Company operates a self-administered, Inland Revenue-approved pension scheme for UK Executive Directors. Other employees may operate private personal pension schemes. The normal age of retirement for UK staff is 65 years. In the US, the Group offers a ‘401k Savings and Retirement Plan’ for all employees, including Executive Directors. The Group pension cost (including 401k costs) for the year was £0.4m (2004 – £0.4m). At the year-end, the Group owed £0.2m (2004 – £0.2m) to the pension schemes. This amount is shown in the balance sheet under ‘accruals and deferred income’.
86 | Notes to the Group financial statements 31 DECEMBER 2005 |
27 RELATED PARTY TRANSACTIONS
For the year ended 31 December 2005, the Group has included turnover of £nil (2004 – £0.1m) in respect of costs incurred in performing services for the Joint Venture and a loss of £nil (2004 – £0.1m) within its Group financial statements. At 31 December 2005, the amounts the Group owed to the Joint Venture amounted to £0.4m (2004 – £0.3m).
Amounts owed by the Joint Venture to the Group at 31 December 2005 were £0.3m (2004 – £0.3m).
In 2005, the Company settled transactions on behalf of subsidiaries of £33.6m (2004 – nil). The inter-company balances outstanding at 31 December are detailed on the Company balance sheet. In 2005 the Company credited £3.6m to subsidiaries relating to management charges (2004 – charge of £22.7m) and charged £3.4m to subsidiaries relating to interest (2004 – £1.7m).
DIRECTORS’ REMUNERATION, INTERESTS AND TRANSACTIONS
Full disclosure of Directors’ remuneration, interests and transactions is given in that part of the remuneration report that is required to be audited. Aggregate gains made by Directors on the exercise of share options were £0.1m (2004 – £1.8m).
KEY MANAGEMENT COMPENSATION
The remuneration received by key management personnel, including the Directors, is as follows:
|
| 2005 |
| 2004 |
Salaries and short-term employee benefits |
| 1.6 |
| 1.5 |
Post-employment benefits |
| 0.1 |
| 0.1 |
Other long-term benefits |
| — |
| — |
Termination benefits |
| — |
| 0.2 |
Share-based payments |
| 0.3 |
| 0.2 |
|
| 2.0 |
| 2.0 |
Key management personnel are those persons having authority and responsibility for planning, directing and controlling the activities of the Group, directly or indirectly, including all Executive and Non-executive Directors. The number of key management personnel whose remuneration is included above is 11 (2004 – 12).
DIRECTORS’ INTERESTS
No Director or key management personnel had any disclosable related party transactions with the Group during the year.
28 RECONCILIATION OF EQUITY AND PROFIT UNDER UK GAAP TO IFRS
With effect from 1 January 2005, Acambis has prepared consolidated financial statements under IFRS. The comparative information for the year to 31 December 2004 that was previously reported under UK GAAP has been restated in accordance with IFRS. In order to understand the impact of transition to IFRS, this note provides reconciliations of certain information previously presented under UK GAAP to the amounts restated in accordance with IFRS.
EXPLANATORY NOTES
The notes below explain the impact that the adoption of IFRS has had on the Group’s consolidated results.
i) IFRS1 ‘FIRST TIME ADOPTION OF IFRS’
The Group has taken advantage of the following exemptions available under IFRS1:
• | To apply IFRS3 ‘Business combinations’ from August 2003; |
• | To treat all at cumulative translation differences on overseas subsidiaries as zero at the date of transition to IFRS; and |
• | Not to apply IFRS2 ‘Share based payments’ to awards made before 7 November 2002, and that had not vested at 31 December 2004. |
87 | |
28 RECONCILIATION OF EQUITY AND PROFIT UNDER UK GAAP TO IFRS (CONTINUED)
ii) IFRS3 ‘BUSINESS COMBINATIONS’
Under UK GAAP, the excess of consideration over the fair value of net assets acquired was recognised as goodwill, and amortised over its useful economic life. Under IFRS, intangible assets acquired in a business combination are recognised at their fair value subject to meeting the definition of an intangible asset as set out in IAS38 ‘Intangible assets’. The residual goodwill is not subject to amortisation, and is tested annually for impairment along with any other indefinite life assets in accordance with IAS36 ‘Impairment of assets’. Intangible assets acquired in a business combination are tested for impairment when there are indicators that the asset is impaired.
The adoption of IFRS3 has had the following impact:
• | Amortisation of goodwill for Acambis Inc. ceases from January 2004; |
• | Amortisation of goodwill for BPC ceases from August 2003; and |
• | The application of IFRS to the BPC acquisition in 2003 has resulted in the creation of an intangible asset and associated deferred tax liability and a reduction in the carrying amount of goodwill. |
iii) IFRS2 ‘SHARE-BASED PAYMENTS’
Acambis offers share options to employees as an employment benefit. Under UK GAAP, no accounting charge is made for share options issued at market value. Under IFRS, a fair value must be calculated and recognised as an expense over the vesting period, with a corresponding increase in equity. Deferred tax is recognised on share options where there is a temporary timing difference, which arises when the accounting book value and the tax book value of the options differ.
The charge previously made relating to UITF 17 (Revised 2003) ‘Employee Share Schemes’ has been reversed, as it is replaced by the IFRS2 charge. Deferred tax is calculated based on the expected tax deduction on exercise of the options compared to the accounting charge on grant of the option. Acambis has not provided for any increase in a deferred tax asset. Under IFRS, income tax relating to items recognised directly in equity is recognised in equity and not in the income statement, resulting in a movement between the tax charge under UK GAAP and equity under IFRS.
In the Company accounts, the granting of options to employees of subsidiaries is deemed a capital contribution.
iv) IAS38 ‘INTANGIBLE ASSETS’
IAS38 has had the following impact:
• | Capitalised software has been reclassified from ‘property plant and equipment’ to ‘intangible assets’; and |
• | Certain intangible assets acquired in a business are recognised at their value as described in explanatory note (ii). |
IAS38 also requires capitalisation of development costs incurred on an individual project if, and only if, specific criteria are met. Previously under UK GAAP, this was an alternative treatment. Management has reviewed these criteria and it is our opinion that it is not possible to satisfy the requirement to demonstrate the technical feasibility of a project, and that it will generate probable future economic benefits, until final submission for regulatory approval has been obtained. Therefore, the Group has not capitalised any internally generated development costs to date.
v) IAS12 ‘INCOME TAX’
Under IFRS deferred tax is recognised on taxable temporary differences arising between the tax base and the accounting base of balance sheet items. The scope of IAS12 is wider than the corresponding UK GAAP standards, and means that deferred tax is recognised on certain temporary differences that would not have given rise to deferred tax under UK GAAP. For Acambis, the main differences on adoption of IFRS arise in relation to intangible assets acquired in a business combination and share-based payments.
vi) IAS17 ‘LEASES’
Under IAS17, the presentation of the Canton finance lease facility differs from that under UK GAAP. Under IFRS the asset is restated to the net present value of the minimum lease payments, with a corresponding entry recorded as a lease creditor. This is unwound over the period of the lease.
88 | Notes to the Group financial statements 31 DECEMBER 2005 |
28 RECONCILIATION OF EQUITY AND PROFIT UNDER UK GAAP TO IFRS (CONTINUED)
vii) IAS21 ‘THE EFFECTS OF CHANGES IN FOREIGN EXCHANGE RATES’
Cumulative exchange differences arising on the retranslation of the Group’s overseas subsidiaries are reported as a separate component of equity under IFRS. There is no impact on the balance at transition as Acambis has taken advantage of the exemption available under IFRS1, as described above. The exchange differences on permanent-as-equity loans are recorded through the income statement in the Company’s accounts.
viii) IAS7 ‘CASH FLOW STATEMENT’
The following differences have arisen between the consolidated cash flow statement presented under UK GAAP, and the consolidated statement of cash flows prepared under IFRS:
• | Reclassification of certain liquid investments as cash and cash equivalents; and |
• | Reduction in the amounts disclosed as ‘purchases of liquid investments’ and ‘sale of liquid investments’. |
ix) IAS39 ‘RECOGNITION AND MEASUREMENT OF FINANCIAL INSTRUMENTS’
Under IFRS, derivative financial instruments are recorded at fair value, which has resulted in a net decrease in assets of £0.1m at 1 January 2005.
RECONCILIATION OF PROFIT FOR YEAR ENDED 31 DECEMBER 2004
|
|
|
|
|
|
|
| Group |
|
| |||||||||
|
| Note |
| UK GAAP |
| Adjustment |
| IFRS |
|
| |||||||||
Revenue |
|
|
| 85.5 |
| – |
| 85.5 |
|
Cost of sales |
| (ii | ) | (34.3 | ) | (0.7 | ) | (35.0 | ) |
| |||||||||
Gross profit |
|
|
| 51.2 |
| (0.7 | ) | 50.5 |
|
Research and development costs |
| (iii | ) | (28.9 | ) | (0.4 | ) | (29.3 | ) |
Sales and marketing costs |
| (iii | ) | (2.7 | ) | (0.1 | ) | (2.8 | ) |
Administration costs including costs relating to Canton plant |
|
|
|
|
|
|
|
|
|
impairment and restructuring costs |
| (i),(ii),(iii | ) | (7.7 | ) | 2.2 |
| (5.5 | ) |
Other operating income – settlement of Canton agreement |
|
|
| 10.2 |
| – |
| 10.2 |
|
| |||||||||
Operating profit |
|
|
| 22.1 |
| 1.0 |
| 23.1 |
|
Non-operating income |
|
|
| 0.2 |
| (0.2 | ) | – |
|
Finance income |
|
|
| 4.8 |
| – |
| 4.8 |
|
Finance costs |
|
|
| (0.9 | ) | – |
| (0.9 | ) |
| |||||||||
Profit before tax |
|
|
| 26.2 |
| 0.8 |
| 27.0 |
|
Taxation |
| (v | ) | (6.4 | ) | (0.9 | ) | (7.3 | ) |
| |||||||||
Profit for the year attributable to shareholders |
|
|
| 19.8 |
| (0.1 | ) | 19.7 |
|
| |||||||||
Earnings per ordinary share (basic) |
|
|
| 18.6p |
| (0.1 | )p | 18.5 | p |
Earnings per ordinary share (fully diluted) |
|
|
| 18.2p |
| (0.1 | )p | 18.1 | p |
|
RECONCILIATION OF PROFIT FOR YEAR ENDED 31 DECEMBER 2004
|
|
|
| Company |
| ||||
| |||||||||
|
|
|
| £m |
| ||||
| |||||||||
Profit for the Company under UK GAAP |
|
|
| 5.5 |
| ||||
IFRS2 share based payments | (iii | ) |
|
| 0.1 |
| |||
Tax effect of IFRS2 | (iii | ) |
|
| (0.4 | ) | |||
IAS39 financial liabilities | (ix | ) |
| (0.1 | ) | ||||
IAS21 foreign currency loss | (vii | ) |
| (1.9 | ) | ||||
| |||||||||
Retained profit under IFRS for 2004 |
|
|
| 3.2 |
| ||||
|
89 |
28 | RECONCILIATION OF EQUITY AND PROFIT UNDER UK GAAP TO IFRS (CONTINUED) |
RECONCILIATION OF EQUITY 31 DECEMBER 2004
|
|
|
|
|
|
|
| Group |
|
| |||||||||
|
| Note |
| UK GAAP |
| Adjustment |
| IFRS |
|
| |||||||||
Assets |
|
|
|
|
|
|
|
|
|
Non-current assets |
|
|
|
|
|
|
|
|
|
Goodwill |
| (ii | ) | 16.0 |
| (0.6 | ) | 15.4 |
|
Other intangible assets |
| (ii), (iv | ) | – |
| 4.1 |
| 4.1 |
|
Property, plant and equipment |
| (iv), (vi | ) | 17.5 |
| 1.0 |
| 18.5 |
|
Other non-current assets |
|
|
| 2.5 |
| – |
| 2.5 |
|
| |||||||||
|
|
|
| 36.0 |
| 4.5 |
| 40.5 |
|
| |||||||||
Current assets |
|
|
|
|
|
|
|
|
|
Inventory |
|
|
| 6.0 |
| – |
| 6.0 |
|
Trade and other receivables |
|
|
| 13.7 |
| – |
| 13.7 |
|
Current tax assets |
|
|
| 1.9 |
| – |
| 1.9 |
|
Liquid investments |
| (viii | ) | 70.9 |
| (50.1 | ) | 20.8 |
|
Cash and cash equivalents |
| (viii | ) | 30.9 |
| 50.1 |
| 81.0 |
|
| |||||||||
|
|
|
| 123.4 |
| – |
| 123.4 |
|
| |||||||||
|
|
|
|
|
|
|
|
|
|
Liabilities |
|
|
|
|
|
|
|
|
|
Current liabilities |
|
|
|
|
|
|
|
|
|
Interest-bearing loans and borrowings |
|
|
| (6.7 | ) | – |
| (6.7 | ) |
Trade and other payables |
|
|
| (8.3 | ) | – |
| (8.3 | ) |
Accruals and deferred income |
| (vi | ) | (26.6 | ) | (1.3 | ) | (27.9 | ) |
Derivative financial instruments |
| (ix | ) | – |
| (0.1 | ) | (0.1 | ) |
Income tax payable |
|
|
| (4.6 | ) | – |
| (4.6 | ) |
| |||||||||
|
|
|
| (46.2 | ) | (1.4 | ) | (47.6 | ) |
| |||||||||
Net current assets |
|
|
| 77.2 |
| (1.4 | ) | 75.8 |
|
| |||||||||
|
|
|
|
|
|
|
|
|
|
Non-current liabilities |
|
|
|
|
|
|
|
|
|
Investment in Joint Venture |
|
|
| (0.3 | ) | – |
| (0.3 | ) |
Long-term financial liabilities |
|
|
| (6.3 | ) | – |
| (6.3 | ) |
Other non-current liabilities |
|
|
| (0.5 | ) | – |
| (0.5 | ) |
Deferred income tax liabilities |
| (ii | ) | (0.1 | ) | (1.6 | ) | (1.7 | ) |
| |||||||||
|
|
|
| (7.2 | ) | (1.6 | ) | (8.8 | ) |
| |||||||||
Net assets |
|
|
| 106.0 |
| 1.5 |
| 107.5 |
|
| |||||||||
|
|
|
|
|
|
|
|
|
|
Shareholders’ equity |
|
|
|
|
|
|
|
|
|
| |||||||||
Share capital |
|
|
| 10.7 |
| – |
| 10.7 |
|
Share premium |
|
|
| 97.8 |
| – |
| 97.8 |
|
Other reserves |
| (vii | ) | – |
| (2.5 | ) | (2.5 | ) |
Retained earnings |
|
|
| (2.5 | ) | 4.0 |
| 1.5 |
|
| |||||||||
Total shareholders’ equity |
|
|
| 106.0 |
| 1.5 |
| 107.5 |
|
|
90 | Notes to the Group financial statements 31 DECEMBER 2005 |
28 | RECONCILIATION OF EQUITY AND PROFIT UNDER UK GAAP TO IFRS (CONTINUED) |
RECONCILIATION OF EQUITY AT 1 JANUARY 2004
|
|
|
|
|
|
|
| Group |
|
| |||||||||
|
| Note |
| UK GAAP |
| Adjustment |
| IFRS |
|
| |||||||||
Assets |
|
|
|
|
|
|
|
|
|
Non-current assets |
|
|
|
|
|
|
|
|
|
Goodwill |
| (ii | ) | 18.4 |
| (2.9 | ) | 15.5 |
|
Other intangible assets |
| (ii), (iv | ) | 0.8 |
| 4.9 |
| 5.7 |
|
Property, plant and equipment |
| (iv), (vi | ) | 21.0 |
| 2.6 |
| 23.6 |
|
Deferred tax assets |
|
|
| 2.1 |
| – |
| 2.1 |
|
Other non-current assets |
|
|
| 0.1 |
| – |
| 0.1 |
|
| |||||||||
|
|
|
| 42.4 |
| 4.6 |
| 47.0 |
|
| |||||||||
Current assets |
|
|
|
|
|
|
|
|
|
Inventory |
|
|
| 18.2 |
| – |
| 18.2 |
|
Trade and other receivables |
|
|
| 10.2 |
| – |
| 10.2 |
|
Liquid investments |
| (viii | ) | 62.0 |
| (44.2 | ) | 17.8 |
|
Cash and cash equivalents |
| (viii | ) | 63.2 |
| 44.2 |
| 107.4 |
|
| |||||||||
|
|
|
| 153.6 |
| – |
| 153.6 |
|
| |||||||||
|
|
|
|
|
|
|
|
|
|
Liabilities |
|
|
|
|
|
|
|
|
|
Current liabilities |
|
|
|
|
|
|
|
|
|
Trade and other payables |
|
|
| (15.4 | ) | – |
| (15.4 | ) |
Interest-bearing loans and borrowings |
|
|
| (6.9 | ) | – |
| (6.9 | ) |
Accruals and deferred income |
| (vi | ) | (74.3 | ) | (1.4 | ) | (75.7 | ) |
Income tax payable |
|
|
| (0.3 | ) | – |
| (0.3 | ) |
| |||||||||
|
|
|
| (96.9 | ) | (1.4 | ) | (98.3 | ) |
| |||||||||
Net current assets |
|
|
| 56.7 |
| (1.4 | ) | 55.3 |
|
| |||||||||
|
|
|
|
|
|
|
|
|
|
Non-current liabilities |
|
|
|
|
|
|
|
|
|
Investment in Joint Venture |
|
|
| (0.3 | ) | – |
| (0.3 | ) |
Long-term financial liabilities |
|
|
| (9.6 | ) | – |
| (9.6 | ) |
Accruals and deferred income |
| (vi | ) | (0.1 | ) | (1.4 | ) | (1.5 | ) |
Other non-current liabilities |
|
|
| (2.6 | ) | – |
| (2.6 | ) |
Deferred income tax liabilities |
| (ii | ) | – |
| (1.8 | ) | 1.8 | ) |
| |||||||||
|
|
|
| (12.6 | ) | (3.2 | ) | (15.8 | ) |
| |||||||||
Net assets |
|
|
| 86.5 |
| – |
| 86.5 |
|
| |||||||||
|
|
|
|
|
|
|
|
|
|
Shareholders’ equity |
|
|
|
|
|
|
|
|
|
| |||||||||
Share capital |
|
|
| 10.6 |
| – |
| 10.6 |
|
Share premium |
|
|
| 96.0 |
| – |
| 96.0 |
|
Retained earnings |
|
|
| (20.1 | ) | – |
| (20.1 | ) |
| |||||||||
Total shareholders’ equity |
|
|
| 86.5 |
| – |
| 86.5 |
|
|
91 |
28 | RECONCILIATION OF EQUITY AND PROFIT UNDER UK GAAP TO IFRS (CONTINUED) |
RECONCILIATION OF EQUITY AT 31 DECEMBER 2004
|
|
|
|
|
|
|
| Company |
|
|
| Note |
| UK GAAP |
| Adjustment |
| IFRS |
|
Non-current assets |
|
|
|
|
|
|
|
|
|
Investments in subsidiaries |
| (iii | ) | 15.0 |
| 0.5 |
| 15.5 |
|
Amounts owed by subsidiary undertaking |
|
|
| 26.1 |
| – |
| 26.1 |
|
Other non-current assets |
|
|
| 0.6 |
| – |
| 0.6 |
|
|
|
|
| 41.7 |
| 0.5 |
| 42.2 |
|
Current assets |
|
|
|
|
|
|
|
|
|
Trade and other receivables |
|
|
| 1.2 |
| – |
| 1.2 |
|
Liquid investments |
| (viii | ) | 53.9 |
| (36.1 | ) | 17.8 |
|
Cash and cash equivalents |
| (viii | ) | 34.2 |
| 36.1 |
| 70.3 |
|
|
|
|
| 89.3 |
| – |
| 89.3 |
|
Current liabilities |
|
|
|
|
|
|
|
|
|
Trade and other payables |
|
|
| (0.1 | ) | – |
| (0.1 | ) |
Amounts owed by subsidiary undertakings |
|
|
| (16.0 | ) | – |
| (16.0 | ) |
Accruals and deferred income |
|
|
| (0.7 | ) | – |
| (0.7 | ) |
Financial liabilities: derivative financial instruments |
| (ix | ) | – |
| (0.1 | ) | (0.1 | ) |
Income tax payable |
|
|
| (1.1 | ) | – |
| (1.1 | ) |
|
|
|
| (17.9 | ) | (0.1 | ) | (18.0 | ) |
Net current assets |
|
|
| 71.4 |
| (0.1 | ) | 71.3 |
|
Net assets |
|
|
| 113.1 |
| 0.4 |
| 113.5 |
|
|
|
|
|
|
|
|
|
|
|
Shareholders’ equity |
|
|
|
|
|
|
|
|
|
Share capital |
|
|
| 10.7 |
| – |
| 10.7 |
|
Share premium |
|
|
| 97.6 |
| – |
| 97.6 |
|
Retained earnings |
|
|
| 4.8 |
| 0.4 |
| 5.2 |
|
Total shareholders’ equity |
|
|
| 113.1 |
| 0.4 |
| 113.5 |
|
RECONCILIATION OF EQUITY AT 1 JANUARY 2004
|
|
|
|
|
|
|
| Company |
|
|
| Note |
| UK GAAP |
| Adjustment |
| IFRS |
|
Non-current assets |
|
|
|
|
|
|
|
|
|
Investments in subsidiaries |
| (iii | ) | 15.0 |
| 0.1 |
| 15.1 |
|
Amounts owed by subsidiary undertaking |
|
|
| 28.0 |
| – |
| 28.0 |
|
|
|
|
| 43.0 |
| 0.1 |
| 43.1 |
|
Current assets |
|
|
|
|
|
|
|
|
|
Liquid investments |
|
|
| 35.0 |
| (24.0 | ) | 11.0 |
|
Cash and cash equivalents |
|
|
| 43.9 |
| 24.0 |
| 67.9 |
|
|
|
|
| 78.9 |
| – |
| 78.9 |
|
Current liabilities |
|
|
|
|
|
|
|
|
|
Trade and other payables |
|
|
| (0.2 | ) | – |
| (0.2 | ) |
Amounts owed by subsidiary undertakings |
|
|
| (13.9 | ) | – |
| (13.9 | ) |
Accruals and deferred income |
|
|
| (0.5 | ) | – |
| (0.5 | ) |
|
|
| (14.6 | ) | – |
| (14.6 | ) | |
Net current assets |
|
|
| 64.3 |
| – |
| 64.3 |
|
Net assets |
|
|
| 107.3 |
| 0.1 |
| 107.4 |
|
|
|
|
|
|
|
|
|
|
|
Shareholders’equity |
|
|
|
|
|
|
|
|
|
Share capital |
|
|
| 10.6 |
| – |
| 10.6 |
|
Share premium |
|
|
| 95.8 |
| – |
| 95.8 |
|
Retained earnings |
|
|
| 0.9 |
| 0.1 |
| 1.0 |
|
Total shareholders’ equity |
|
|
| 107.3 |
| 0.1 |
| 107.4 |
|
92 |
SELECTED FINANCIAL INFORMATION
The following selected financial information for each of the fiscal years in the five-year period ended 31 December 2005 has been derived from Acambis’ audited Group financial statements.
The Group financial statements for the two-year period ended 31 December 2005 are included elsewhere in this Annual Report.
The results and balance sheet for 2004 have been restated to IFRS. UITF 38 and UITF 17 (revised) were not adopted in the 2001 and 2002 results. The previous results and balance sheets have not been restated for these new standards.
|
|
|
|
|
|
|
| Year ended 31 December |
| ||
| |||||||||||
|
| 2005 |
| 2004 |
| 2003 |
| 2002 |
| 2001 |
|
| |||||||||||
Statement of operations data: |
|
|
|
|
|
|
|
|
|
|
|
UK GAAP |
|
|
|
|
|
|
|
|
|
|
|
Turnover (revenues) |
| 40.9 |
| 85.5 |
| 169.1 |
| 79.7 |
| 8.9 |
|
Cost of sales |
| (27.6 | ) | (35.0 | ) | (98.4 | ) | (49.2 | ) | (5.1 | ) |
| |||||||||||
Gross profit |
| 13.3 |
| 50.5 |
| 70.7 |
| 30.5 |
| 3.8 |
|
Research and development costs |
| (34.1 | ) | (29.3 | ) | (19.9 | ) | (16.5 | ) | (13.0 | ) |
Sales and marketing costs |
| (2.6 | ) | (2.8 | ) | (1.3 | ) | – |
| – |
|
Administrative costs including costs relating to Canton plant impairment, restructuring costs and settlement of BTG agreement |
| (7.7 | ) | (5.5 | ) | (11.9 | ) | (4.3 | ) | (3.5 | ) |
Other operating income – settlement of Canton agreement |
| – |
| 10.2 |
| – |
| – |
| – |
|
– fair value of shares received for grant of licence |
| 0.4 |
| – |
| – |
| – |
| – |
|
| |||||||||||
Operating (loss)/profit |
| (30.7 | ) | 23.1 |
| 37.6 |
| 9.7 |
| (12.7 | ) |
Non-operating (expense)/income |
| – |
| – |
| 0.9 |
| 0.4 |
| (0.5 | ) |
Finance income |
| 4.0 |
| 4.8 |
| 2.1 |
| 0.7 |
| 0.9 |
|
Finance costs |
| (1.0 | ) | (0.9 | ) | (1.0 | ) | (1.2 | ) | (0.2 | ) |
| |||||||||||
(Loss)/profit before tax |
| (27.7 | ) | 27.0 |
| 39.6 |
| 9.6 |
| (12.5 | ) |
Taxation |
| 0.7 |
| (7.3 | ) | (3.9 | ) | – |
| 0.1 |
|
| |||||||||||
(Loss)/profit for the year attributable to equity holders of the parent |
| (27.0 | ) | 19.7 |
| 35.7 |
| 9.6 |
| (12.4 | ) |
| |||||||||||
(Loss)/earnings per ordinary share (basic) |
| (25.2 | )p | 18.5 | p | 34.5 | p | 10.0 | p | (13.7 | )p |
| |||||||||||
Basic number of shares – weighted average |
| 107,211,367 |
| 106,300,080 |
| 102,823,221 |
| 96,101,507 |
| 91,027,463 |
|
| |||||||||||
(Loss)/earnings per ordinary share (fully diluted) |
| (25.2 | )p | 18.1 | p | 34.0 | p | 9.7 | p | (13.7 | )p |
| |||||||||||
Fully diluted number of shares – weighted average |
| 107,211,367 |
| 108,649,389 |
| 104,393,147 |
| 98,976,882 |
| 91,027,463 |
|
| |||||||||||
|
|
|
|
|
|
|
| As at 31 December |
| ||
| |||||||||||
|
| 2005 |
| 2004 |
| 2003 |
| 2002 |
| 2001 |
|
| |||||||||||
Balance sheet data: |
|
|
|
|
|
|
|
|
|
|
|
Non-current assets |
| 39.8 |
| 40.5 |
| 40.3 |
| 39.6 |
| 35.0 |
|
Cash and liquid investments |
| 68.0 |
| 101.8 |
| 125.2 |
| 11.8 |
| 22.2 |
|
Current assets (excluding cash and liquid investments) |
| 25.6 |
| 21.6 |
| 30.5 |
| 102.4 |
| 7.6 |
|
Current liabilities |
| (46.8 | ) | (47.6 | ) | (96.9 | ) | (88.4 | ) | (16.6 | ) |
Non-current liabilities |
| (3.6 | ) | (8.8 | ) | (12.6 | ) | (19.1 | ) | (20.5 | ) |
Share capital |
| 10.7 |
| 10.7 |
| 10.6 |
| 9.9 |
| 9.3 |
|
Shareholders’ equity (net assets) |
| 83.0 |
| 107.5 |
| 86.5 |
| 46.3 |
| 27.7 |
|
| |||||||||||
Shareholder information | 93 |
SUBSTANTIAL SHAREHOLDINGS
The shareholdings in the table set out below represent the shareholdings amounting to 3% or more of the ordinary share capital of the Company that had been notified to the Company in accordance with sections 198 to 208 of the Companies Act 1985 at the time of publication of the 2004 and 2005 Annual Reports.
The figures in the column entitled ‘2004 Annual Report’ do not necessarily represent the current shareholdings or percentages held by the respective shareholders.
|
| As at 21 April 2006 |
| 2004 Annual Report |
| ||||
| |||||||||
|
| Number of |
| Percentage |
| Number of |
| Percentage |
|
| |||||||||
INVESCO Perpetual UK Investment Series1 |
| 20,410,000 |
| 19.01 | % | 18,385,000 |
| 17.14 | % |
F&C Asset Management plc |
| 10,646,451 |
| 9.92 | % | 10,646,451 |
| 9.93 | % |
Legal & General Investment Management Ltd |
| 6,467,972 |
| 6.03 | % | 6,467,972 |
| 6.03 | % |
The Goldman Sachs Group, Inc. |
| 4,258,375 |
| 3.97 | % | – |
| Nil | % |
Phylon Fund Limited |
| 3,922,000 |
| 3.65 | % | – |
| – |
|
HBOS plc |
| 3,260,033 |
| 3.04 | % | – |
| Nil | % |
Morley Fund Management Limited |
| – |
| Nil | % | 6,356,645 |
| 5.93 | % |
Fidelity Management & Research Company |
| – |
| Nil | % | 4,536,252 |
| 4.23 | % |
| |||||||||
NOTE
1 | The Amvescap Group, which includes Invesco Perpetual UK investment series, is Acambis’ single largest shareholder. Invesco’s holding for the purpose of disclosures under the rules governing the substantial acquisition of shares is 30,198,065 shares representing a 28.13% shareholding. |
As far as is known to the Directors, the Company is not directly or indirectly owned or controlled by another corporation or by any other government and the only shareholder directly or indirectly owning more than 10% of the Company is shown in the above table. All shareholders have the same voting rights.
ANALYSIS OF SHARE REGISTER AT 21 APRIL 2006
Shareholding |
| Number of |
| Percentage of |
| Number of |
| Percentage |
|
1-1,000 |
| 1,357 |
| 57.9 |
| 679,593 |
| 0.6 |
|
1,001-5,000 |
| 620 |
| 26.5 |
| 1,406,059 |
| 1.3 |
|
5,001-100,000 |
| 257 |
| 11.0 |
| 5,276,837 |
| 4.9 |
|
100,001-500,000 |
| 71 |
| 3.0 |
| 16,532,530 |
| 15.4 |
|
500,001-1,000,000 |
| 17 |
| 0.7 |
| 12,544,578 |
| 11.7 |
|
1,000,001 and over |
| 20 |
| 0.9 |
| 70,928,700 |
| 66.1 |
|
|
| 2,342 |
| 100.0 |
| 107,368,297 |
| 100.0 |
|
US record holders, including ADR holders, held approximately 9.8% of the issued share capital of ordinary 10p shares.
NATURE OF TRADING MARKET
COMPARATIVE MARKET PRICE INFORMATION
Acambis shares are traded on the LSE under the symbol ‘ACM’ and on the US NASDAQ National Market in the form of ADRs under the symbol ‘ACAM’.
The following tables set out the high and low closing mid-market prices for Acambis’ shares and close prices for ADRs:
|
|
|
| Shares |
|
|
| ADRs |
|
| |||||||||
| High |
| Low |
| High |
| Low |
| |
| |||||||||
Calendar year |
| Pence per ordinary share |
|
|
| Dollars per ADR |
| ||
| |||||||||
2001 |
| 353.0 |
| 103.5 |
| 10.22 |
| 3.33 |
|
2002 |
| 379.0 |
| 181.0 |
| 11.06 |
| 5.67 |
|
2003 |
| 396.0 |
| 207.5 |
| 12.85 |
| 6.40 |
|
2004 First quarter |
| 371.0 |
| 300.0 |
| 14.41 |
| 11.04 |
|
Second quarter |
| 364.0 |
| 300.0 |
| 13.63 |
| 10.55 |
|
Third quarter |
| 352.5 |
| 292.3 |
| 13.30 |
| 10.48 |
|
Fourth quarter |
| 300.0 |
| 244.3 |
| 10.70 |
| 9.46 |
|
2005 First quarter |
| 283.0 |
| 237.8 |
| 10.70 |
| 9.03 |
|
Second quarter |
| 240.8 |
| 212.0 |
| 9.22 |
| 7.93 |
|
Third quarter |
| 262.5 |
| 220.0 |
| 9.88 |
| 7.98 |
|
Fourth quarter |
| 240.0 |
| 203.5 |
| 8.66 |
| 7.15 |
|
| |||||||||
94 | Shareholder information (CONTINUED) |
|
|
|
| Shares |
|
|
| ADRs |
|
| |||||||||
|
| High |
| Low |
| High |
| Low |
|
| |||||||||
Calendar year |
| Pence per ordinary share |
| Dollars per ADR |
| ||||
| |||||||||
Monthly high and low prices (for the last full six months) are as follows: |
|
|
|
|
|
|
|
|
|
October 2005 |
| 240.0 |
| 212.0 |
| 8.66 |
| 7.61 |
|
November 2005 |
| 228.5 |
| 203.5 |
| 8.09 |
| 7.24 |
|
December 2005 |
| 214.3 |
| 205.8 |
| 7.74 |
| 7.15 |
|
January 2006 |
| 205.5 |
| 195.0 |
| 7.26 |
| 6.80 |
|
February 2006 |
| 229.3 |
| 197.5 |
| 7.94 |
| 6.81 |
|
March 2006 |
| 215.3 |
| 194.8 |
| 7.75 |
| 6.74 |
|
| |||||||||
As of 21 April 2006, the mid-market price of an Acambis share was 190.5p and the close price of an Acambis ADR was $6.85. The number of outstanding ordinary shares of 10p each at that date was 107,353,297.
COMPARATIVE DIVIDEND INFORMATION
Acambis has never paid any cash dividends on its shares and does not anticipate paying cash dividends for the foreseeable future.
ANNUAL GENERAL MEETING
The AGM of the Company will be held at 10.00 a.m. on 23 June 2006 at the offices of Morrison & Foerster MNP, CityPoint, One Ropemaker Street, London EC2Y 9AW. The Notice of AGM accompanies this Annual Report. In addition to the reappointment of PricewaterhouseCoopers LLP as Auditors authority in respect of special business is being sought:
• | to give the Company the authority to purchase up to 10% of its own issued ordinary shares at a price of not less than 10p per share and not more than 5% above the average of the middle market quotations of the Company’s shares as shown in the LSE Daily Official List for the five dealing days before the purchase is made. This authority shall expire at the conclusion of the Company’s next AGM or 15 months from the passing of this resolution, whichever is the earlier; |
• | to disapply the statutory pre-emption rights in respect of the allotment of new shares pursuant to rights issues or otherwise for cash up to an aggregate nominal value of £536,766, being 5% of the currently issued ordinary shares of the Company in accordance with the current guidelines of the Investment Committee of the Association of British Insurers and the National Association of Pension Funds. This authority shall expire at the conclusion of the Company’s next AGM or 15 months from the passing of this resolution, whichever is the earlier; and |
• | to make certain changes to Acambis’ long-term incentive schemes: a) subject to the approval of HM Revenues and Customs, introduce the Acambis 2006 Approved Share Option Plan; b) introduce the Acambis 2006 Unapproved Share Option Plan; and c) introduce the Acambis 2006 Deferred Bonus Plan. |
MEMORANDUM AND ARTICLES OF ASSOCIATION
A copy of both the Memorandum and Articles of Association of the Company has been filed with the Registrar of Companies. The Memorandum contains the fundamental provisions of the Company’s constitution. The Articles contain the rules for the internal management and control of the Company.
DOCUMENTS ON DISPLAY
Certain documents referred to in this Annual Report are available for inspection at the registered office of the Company.
95 | |
ACAMBIS PLC
COMPANY SECRETARY, REGISTERED OFFICE AND GROUP HEADQUARTERS
Registered number 2863682
ACAMBIS US OPERATIONS Berna Products Corporation SHAREHOLDER INFORMATION
LSE mnemonic – ACM Reuters reference – ACM.L
|
| ANALYST COVERAGE OF ACAMBIS
ANNOUNCEMENTS
CORPORATE ADVISERS
Bankers
The Registry
Auditors |
|
|
|
96 | |
The following abbreviations are used throughout this document:
ADR | American Depositary Receipt |
AGM | Annual General Meeting |
Baxter | Baxter International Inc. or subsidiaries thereof |
Bharat Biotech | Bharat Biotech International Limited |
BIA | BioIndustry Association |
BLA | Biologics License Application |
BN | Bavarian Nordic A/S |
BPC | Berna Products Corporation |
Cangene | Cangene Corporation |
CDC | US Centers for Disease Control and Prevention |
CEO | Chief Executive Officer |
CFO | Chief Financial Officer |
CR | Corporate responsibility |
EMEA | European Medicines Agency |
EPS | Earnings per Ordinary Share |
ESOP | Employee Share Ownership Plan |
ESPP | Employee Share Purchase Plan |
FDA | Food and Drug Administration |
FL | Florida |
GAAP | Generally Accepted Accounting Principles |
GMP | Good Manufacturing Practice |
GSK | GlaxoSmithKline |
IAS | International Accounting Standards |
IFRS | International Financial Reporting Standards |
IND | Investigational New Drug |
IP | Intellectual Property |
ITC | International Trade Commission |
JE | Japanese encephalitis |
LSE | London Stock Exchange |
LTIP | Long-term Share Incentive Plan |
MA | Massachusetts |
MD | Maryland |
MVA | Modified Vaccinia Ankara |
NIAID | National Institute of Allergy and Infectious Disease |
NIH | National Institutes of Health |
PwC | PricewaterhouseCoopers LLP |
R&D | Research and development |
RFP | Request for Proposals |
SAYE | Save As You Earn |
SEC | Securities and Exchange Commission |
SOX | Sarbanes-Oxley Act 2002 |
SP | sanofi pasteur |
SSSARs | Stock Settled Stock Appreciation Rights |
TSR | Total Share Return |
UITF | Urgent Issues Task Force |
VIB | Flanders Interuniversity Institute for Biotechnology |
VIG | Vaccinia Immune Globulin |
This Annual Report is printed on Era Silk and Evolve Business. Era Silk contains 50% fibres sourced and recycled in the UK. Evolve Business is made from 100% recycled office waste. Both papers remanufactured at ISO 14001 (environmental management) accredited mills. Designed and produced by Merchant in collaboration with Crescent Lodge. Printed by St Ives Westerham Press.
|
SIGNATURE
Pursuant to the requirements of the Securities Exchange Act of 1934, the registrant Peptide Therapeutics Group has duly caused this report to be signed on its behalf by the undersigned, thereunto duly authorized.
| Date: 14 June 2006 | ACAMBIS PLC | |
| By: | /s/ Lyndsay Wright | |
| Name: Lyndsay Wright | ||
| Title: Director of Communications |