SELECTED CONSOLIDATED FINANCIAL DATA
The summary information presented below under "Selected Balance Sheet Data" and "Selected Operations Data" for, and as of the end of, each of the years ended September 30 is derived from our audited consolidated financial statements. The following information is only a summary and you should read it in conjunction with our consolidated financial statements and notes beginning on page 38.
| | | September 30, | |
| | | 2008 | | 2007 | | 2006 | | 2005 | | 2004(1) | |
| | | (Dollars in thousands) | |
| Selected Balance Sheet Data: | | | | | | | | | | | |
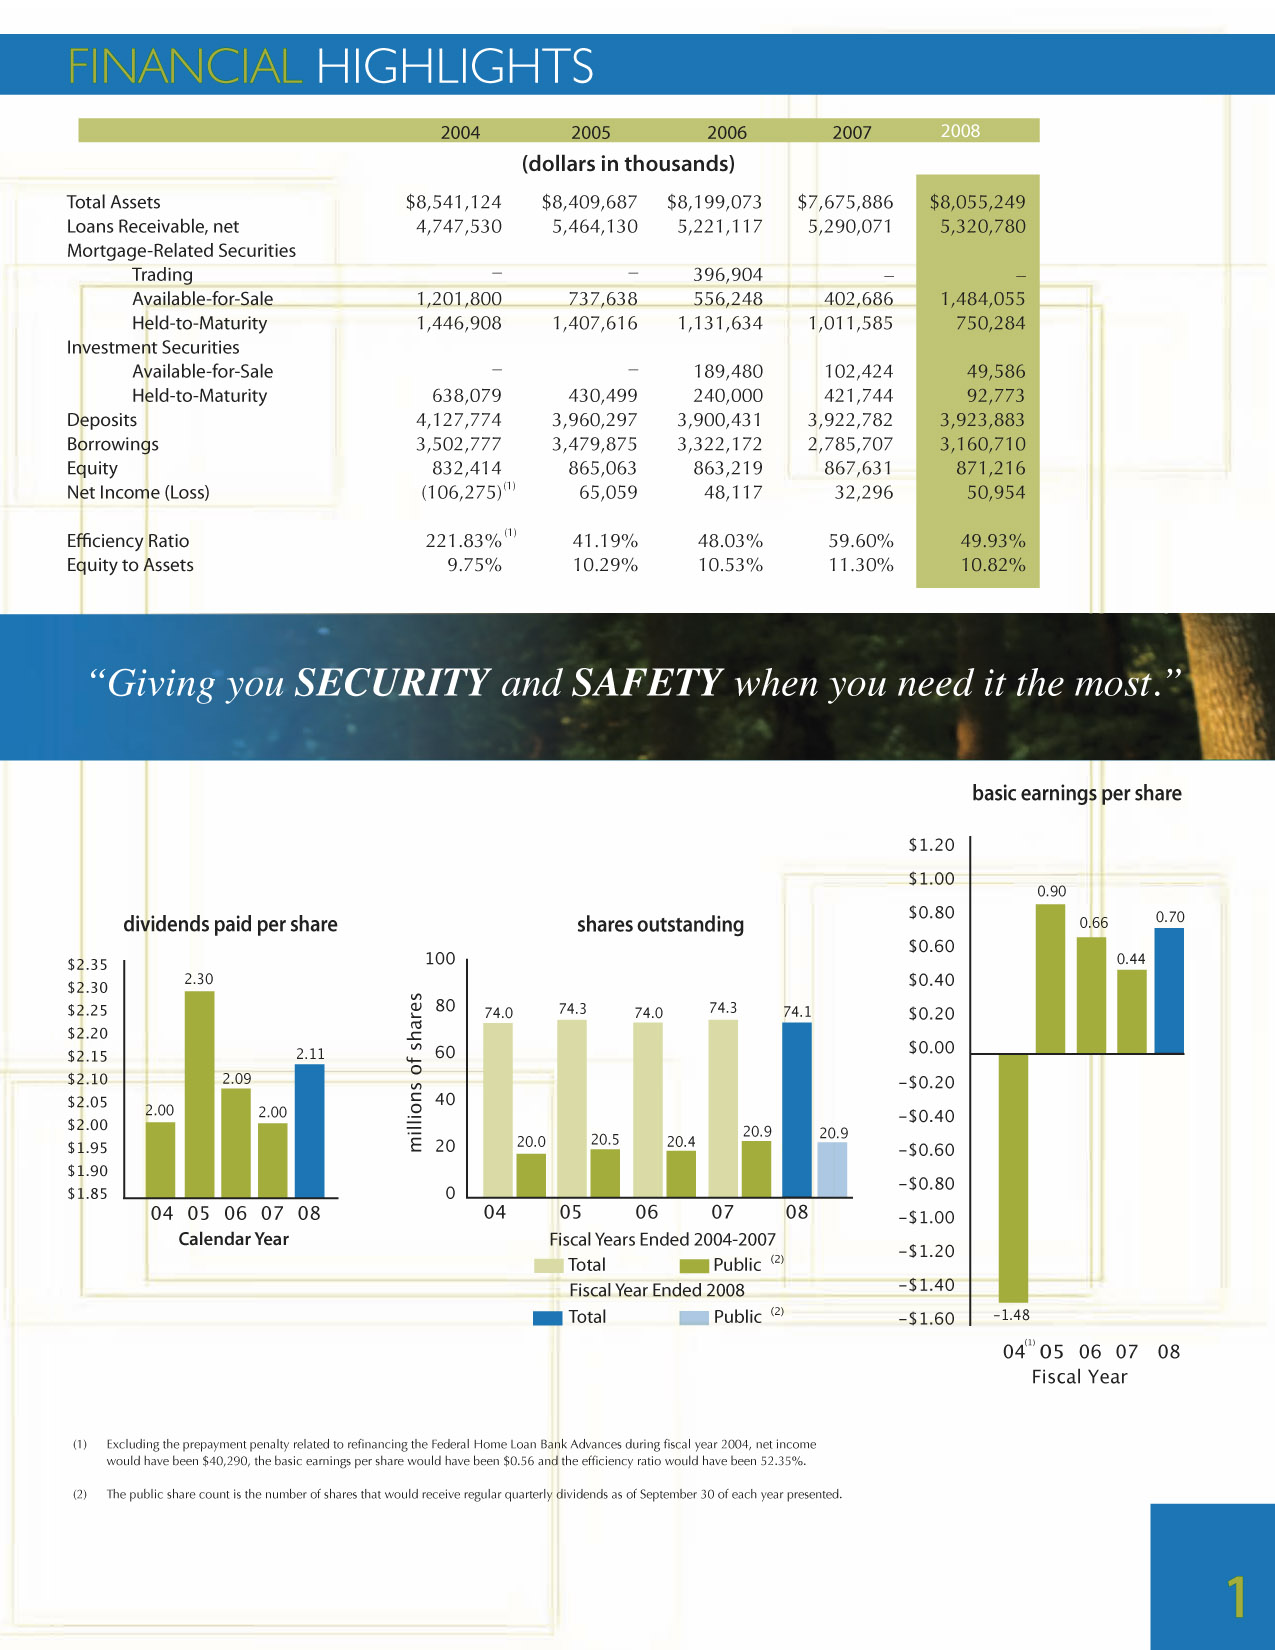
| Total assets | | $8,055,249 | | $7,675,886 | | $8,199,073 | | $8,409,687 | | $8,541,124 | |
| Loans receivable, net | | 5,320,780 | | 5,290,071 | | 5,221,117 | | 5,464,130 | | 4,747,530 | |
| Investment securities: | | | | | | | | | | | |
| Available-for-sale (“AFS”), at market value | | 49,586 | | 102,424 | | 189,480 | | -- | | -- | |
| Held-to-maturity (“HTM”), at cost | | 92,773 | | 421,744 | | 240,000 | | 430,499 | | 638,079 | |
| Mortgage-related securities (“MBS”): | | | | | | | | | | | |
| Trading, at market value | | -- | | -- | | 396,904 | | -- | | -- | |
| AFS, at market value | | 1,484,055 | | 402,686 | | 556,248 | | 737,638 | | 1,201,800 | |
| HTM, at cost | | 750,284 | | 1,011,585 | | 1,131,634 | | 1,407,616 | | 1,446,908 | |
| Capital stock of Federal Home Loan Bank (“FHLB”) | | 124,406 | | 139,661 | | 165,130 | | 182,259 | | 174,126 | |
| Deposits | | 3,923,883 | | 3,922,782 | | 3,900,431 | | 3,960,297 | | 4,127,774 | |
| Advances from FHLB | | 2,447,129 | | 2,732,183 | | 3,268,705 | | 3,426,465 | | 3,449,429 | |
| Other borrowings | | 713,581 | | 53,524 | | 53,467 | | 53,410 | | 53,348 | |
| Stockholders’ equity | | 871,216 | | 867,631 | | 863,219 | | 865,063 | | 832,414 | |
| | | | | | | | | | | | |
| | | | | | | | | | | | |
| | | | | | | | | | | | |
| | | Year Ended September 30, | |
| | | 2008 | | 2007 | | 2006 | | 2005 | | 2004(1) | |
| | | (Dollars and counts in thousands, except per share amounts) | |
| Selected Operations Data: | | | | | | | | | | | |
| Total interest and dividend income | | $ 410,806 | | $ 411,550 | | $ 410,928 | | $ 400,107 | | $ 384,833 | |
| Total interest expense | | 276,638 | | 305,110 | | 283,905 | | 244,201 | | 268,642 | |
| Net interest and dividend income | | 134,168 | | 106,440 | | 127,023 | | 155,906 | | 116,191 | |
| Provision (recovery) for loan losses | | 2,051 | | (225) | | 247 | | 215 | | 64 | |
| Net interest and dividend income after provision | | | | | | | | | | | |
| (recovery) for loan losses | | 132,117 | | 106,665 | | 126,776 | | 155,691 | | 116,127 | |
| Retail fees and charges | | 17,805 | | 16,120 | | 17,007 | | 16,029 | | 15,119 | |
| Other income | | 12,222 | | 7,846 | | 7,788 | | 7,286 | | 8,428 | |
| Total other income | | 30,027 | | 23,966 | | 24,795 | | 23,315 | | 23,547 | |
| Prepayment penalty on FHLB advances | | -- | | -- | | -- | | -- | | 236,109 | |
| Total other expenses | | 81,989 | | 77,725 | | 72,868 | | 73,631 | | 309,000 | |
| Income (loss) before income tax expense (benefit) | | 80,155 | | 52,906 | | 78,703 | | 105,375 | | (169,326) | |
| Income tax expense (benefit) | | 29,201 | | 20,610 | | 30,586 | | 40,316 | | (63,051) | |
| Net income (loss) | | 50,954 | | 32,296 | | 48,117 | | 65,059 | | (106,275) | |
| | | | | | | | | | | | |
| Basic earnings (loss) per share | | $ 0.70 | | $ 0.44 | | $ 0.66 | | $ 0.90 | | $ (1.48) | |
| Average shares outstanding | | 72,939 | | 72,849 | | 72,595 | | 72,506 | | 71,599 | |
| Diluted earnings (loss) per share | | $ 0.70 | | $ 0.44 | | $ 0.66 | | $ 0.89 | | $ (1.48) | |
| Average diluted shares outstanding | | 73,013 | | 72,970 | | 72,854 | | 73,082 | | 71,599 | |
| | | 2008 | | 2007 | | 2006 | | 2005 | | 2004(1) |
| Selected Performance and Financial Ratios | | | | | | | | | | |
| and Other Data: | | | | | | | | | | |
| Performance Ratios: | | | | | | | | | | |
| Return on average assets | | 0.65 | % | 0.41 | % | 0.58 | % | 0.77 | % | (1.25)% |
| Return on average equity | | 5.86 | | 3.72 | | 5.58 | | 7.62 | | (11.36) |
Dividends paid per public share(2) | | $ 2.00 | | $ 2.09 | | $ 2.30 | | $ 2.00 | | $ 2.81 |
| Dividend payout ratio | | 81.30 | % | 133.14 | % | 97.41 | % | 62.59 | % | n/a |
| Ratio of operating expense to | | | | | | | | | | |
| average total assets | | 1.04 | | 0.98 | | 0.88 | | 0.87 | | 3.64% |
| Efficiency ratio | | 49.93 | | 59.60 | | 48.03 | | 41.19 | | 221.83 |
| Ratio of average interest-earning assets | | | | | | | | | | |
| to average interest-bearing liabilities | | 1.12 | | 1.12 | | 1.11 | | 1.10 | | 1.12 |
| Interest rate spread information: | | | | | | | | | | |
| Average during period | | 1.35 | | 0.93 | | 1.19 | | 1.59 | | 1.05 |
| End of period | | 1.70 | | 0.89 | | 1.07 | | 1.46 | | 1.77 |
| Net interest margin | | 1.75 | | 1.36 | | 1.57 | | 1.87 | | 1.39 |
| Asset Quality Ratios: | | | | | | | | | | |
| Non-performing assets to total assets | | 0.23 | | 0.12 | | 0.10 | | 0.08 | | 0.12 |
| Non-performing loans to total loans | | 0.26 | | 0.14 | | 0.11 | | 0.09 | | 0.13 |
| Allowance for loan losses to | | | | | | | | | | |
| non-accruing loans | | 42.37 | | 56.87 | | 79.03 | | 89.14 | | 74.04 |
| Allowance for loan losses to | | | | | | | | | | |
| loans receivable, net | | 0.11 | | 0.08 | | 0.08 | | 0.08 | | 0.09 |
| Capital Ratios: | | | | | | | | | | |
| Equity to total assets at end of period | | 10.82 | | 11.30 | | 10.53 | | 10.29 | | 9.75 |
| Average equity to average assets | | 11.05 | | 10.91 | | 10.47 | | 10.05 | | 11.03 |
| | | | | | | | | | | |
| Regulatory Capital of Bank: | | | | | | | | | | |
| Core capital | | 10.0 | | 10.3 | | 9.5 | | 9.1 | | 8.8 |
| Tier I risk-based capital | | 23.1 | | 22.9 | | 22.6 | | 21.3 | | 21.6 |
| Total risk-based capital | | 23.0 | | 22.8 | | 22.5 | | 21.3 | | 21.6 |
| | | | | | | | | | | |
| Other Data: | | | | | | | | | | |
| Number of traditional offices | | 30 | | 29 | | 29 | | 29 | | 28 |
| Number of in-store offices | | 9 | | 9 | | 9 | | 8 | | 8 |
(1) During 2004, Capitol Federal Savings Bank refinanced $2.40 billion of its FHLB advances that were not hedged by interest rate swaps. In doing so, Capitol Federal Savings Bank incurred a $236.1 million prepayment penalty.
(2) For all years shown, Capitol Federal Savings Bank MHC, which owns a majority of the outstanding shares of Capitol Federal Financial common stock, waived its right to receive dividends paid on the common stock with the exception of the $0.50 per share dividend paid on 500,000 shares in February 2005. Public shares exclude shares held by Capitol Federal Savings Bank MHC, as well as unallocated shares held in the Capitol Federal Financial Employee Stock Ownership Plan (“ESOP”). See page 23 for additional information.
MANAGEMENT'S DISCUSSION AND ANALYSIS OF
FINANCIAL CONDITION AND RESULTS OF OPERATIONS
General Overview
Capitol Federal Financial (the “Company”) is the mid-tier holding company and the sole shareholder of Capitol Federal Savings Bank (the “Bank”). Capitol Federal Savings Bank MHC (“MHC”), a federally chartered mutual holding company, is the majority owner of the Company. MHC owns 52,192,817 shares of the 74,079,868 voting shares outstanding on September 30, 2008. The Company’s common stock is traded on the NASDAQ Stock Market LLC under the symbol “CFFN.” The Bank comprises almost all of the consolidated assets and liabilities of the Company and the Company is dependent primarily upon the performance of the Bank for the results of its operations. Because of this relationship, references to management actions, strategies and results of actions apply to both the Bank and the Company.
We may from time to time make written or oral "forward-looking statements", including statements contained in our filings with the Securities and Exchange Commission (“SEC”). These forward-looking statements may be included in this annual report to stockholders and in other communications by the Company, which are made in good faith by us pursuant to the "safe harbor" provisions of the Private Securities Litigation Reform Act of 1995.
These forward-looking statements include statements about our beliefs, plans, objectives, goals, expectations, anticipations, estimates and intentions that are subject to significant risks and uncertainties, and are subject to change based on various factors, some of which are beyond our control. The words "may", "could", "should", "would", "believe", "anticipate", "estimate", "expect", "intend", "plan" and similar expressions are intended to identify forward-looking statements. The following factors, among others, could cause our future results to differ materially from the plans, objectives, goals, expectations, anticipations, estimates and intentions expressed in the forward-looking statements:
| · | our ability to continue to maintain overhead costs at reasonable levels; |
| · | our ability to continue to originate a significant volume of one- to four-family mortgage loans in our market area; |
| · | our ability to acquire funds from or invest funds in wholesale or secondary markets; |
| · | the future earnings and capital levels of the Bank, which could affect the ability of the Company to pay dividends in accordance with its dividend policies; |
| · | fluctuations in deposit flows, loan demand, and/or real estate values, which may adversely affect our business; |
| · | the credit risks of lending and investing activities, including changes in the level and direction of loan delinquencies and write-offs and changes in estimates of the adequacy of the allowance for loan losses; |
| · | the strength of the U.S. economy in general and the strength of the local economies in which we conduct operations; |
| · | the effects of, and changes in, trade, monetary and fiscal policies and laws, including interest rate policies of the Board of Governors of the Federal Reserve System; |
| · | the effects of, and changes in, foreign and military policies of the United States Government; |
| · | inflation, interest rates, market and monetary fluctuations; |
| · | our ability to access cost-effective funding; |
| · | the timely development and acceptance of our new products and services and the perceived overall value of these products and services by users, including the features, pricing and quality compared to competitors' products and services; |
| · | the willingness of users to substitute competitors' products and services for our products and services; |
| · | our success in gaining regulatory approval of our products, services and branching locations, when required; |
| · | the impact of changes in financial services laws and regulations, including laws concerning taxes, banking, securities and insurance and the impact of other governmental initiatives affecting the financial services industry; |
| · | implementing business initiatives may be more difficult or expensive than anticipated; |
| · | acquisitions and dispositions; |
| · | changes in consumer spending and saving habits; and |
| · | our success at managing the risks involved in our business. |
This list of important factors is not exclusive. We do not undertake to update any forward-looking statement, whether written or oral, that may be made from time to time by or on behalf of the Company or the Bank.
The following discussion is intended to assist in understanding the financial condition and results of operations of the Company. The discussion includes comments relating to the Bank, since the Bank is wholly owned by the Company and comprises the majority of assets and is the principal source of income for the Company.
Executive Summary
The following summary should be read in conjunction with our Management’s Discussion and Analysis of Financial Condition and Results of Operations in its entirety.
Our principal business consists of attracting deposits from the general public and investing those funds primarily in permanent loans secured by first mortgages on owner-occupied, one- to four-family residences. We also originate consumer loans, loans secured by first mortgages on non-owner-occupied one- to four-family residences, permanent and construction loans secured by one- to four-family residences, commercial real estate loans, and multi-family real estate loans. While our primary business is the origination of one- to four-family mortgage loans funded through retail deposits, we also purchase whole loans and invest in certain investment securities and MBS, and use FHLB advances and repurchase agreements as additional funding sources.
The Company is significantly affected by prevailing economic conditions including federal monetary and fiscal policies and federal regulation of financial institutions. Deposit balances are influenced by a number of factors including interest rates paid on competing personal investment products, the level of personal income, and the personal rate of savings within our market areas. Lending activities are influenced by the demand for housing and other loans, changing loan underwriting guidelines, as well as interest rate pricing competition from other lending institutions. The primary sources of funds for lending activities include deposits, loan repayments, investment income, borrowings, and funds provided from operations.
The Company’s results of operations are primarily dependent on net interest income, which is the difference between the interest earned on loans, MBS, investment securities and cash, and the interest paid on deposits and borrowings. On a weekly basis, management reviews deposit flows, loan demand, cash levels, and changes in several market rates to assess all pricing strategies. We generally price our loan and deposit products based upon an analysis of our competition and changes in market rates. The Bank generally prices its first mortgage loan products based upon prices available in the secondary market if it were to sell them at prices near par. Generally, deposit pricing is based upon a survey of peers in the Bank’s market areas, and the need to attract funding and retain maturing deposits. The majority of our loans are fixed-rate products with maturities up to 30 years, while the majority of our deposits have maturity or reprice dates of less than two years.
In fiscal year 2008, the consequences of steep declines in credit quality and asset quality due largely to subprime lending and real estate devaluations were felt economy-wide, but predominantly in the financial services sector. Record levels of asset write-downs and credit losses were experienced by companies across the United States, leaving some companies in the financial services sector critically undercapitalized and without liquidity. The severity of these conditions is illustrated by the placement of the Federal National Mortgage Association (“FNMA”) and the Federal Home Loan Mortgage Corporation (“FHLMC”) into government conservatorships, the collapse of several large Wall Street firms, and the closing of a number of banks during the year by the Federal Deposit Insurance Corporation (“FDIC”). The Federal Open Market Committee of the Federal Reserve (“FOMC”) lowered the overnight lending rate 275 basis points during fiscal year 2008, from 4.75% to 2.00%. The Federal Reserve also provided emergency funding to struggling firms through a number of new term lending programs that accepted higher risk assets as collateral, in an effort to keep capital markets functioning. On October 3, 2008, the Emergency Economic Stabilization Act of 2008 (the “EESA”) was signed into law. The EESA is not expected to have a material impact on the Company’s future financial position, results of operations, cash flows, or liquidity.
The Bank continues to maintain access to liquidity in excess of forecasted needs by diversifying its funding sources and maintaining a strong retail oriented deposit portfolio. In addition, the investments of the Bank are government-agency backed securities which are highly liquid, which have not been credit impaired, compared to other classes of investments in recent months, and are available as collateral for additional borrowings or for sale if the need or unforeseen conditions warrant. See additional discussion regarding liquidity in the section entitled “Liquidity and Capital Resources.”
Subprime mortgage lending is not a market in which we participate. The loans we originate and purchase are fully documented and adhere to underwriting guidelines generally more restrictive than used by other lenders. See additional discussion of asset quality in Part I, Item 1 of the Annual Report on Form 10-K. While the subprime lending market essentially does not exist today, past practices have caused considerable strain in the credit markets from rising delinquencies, lower real estate valuations and liquidity pressures. This strain has resulted in tightened lending practices and negative impacts on many real estate markets, as well as negative perceptions of our business and industry. The continued decline in the real estate markets, as well as the overall economic environment, contributed to an increase in our non-performing loans during the year. Due to our level of geographic diversification, we are sheltered but not immune to negative consequences arising from overall economic weakness and, in particular, a sharp downturn in the housing industry nationally. Despite the increase in non-performing loans at September 30, 2008, our non-performing loans continue to remain at low levels relative to the size of our loan portfolio. We continue to closely monitor the local and national real estate markets and other factors related to risks inherent in our loan portfolio. Based on our evaluation of the quality of the loans in our residential loan portfolio, real estate markets, the
overall economic environment, and the increase in and composition of our delinquencies and non-performing loans, management determined a $2.1 million provision for loan losses was prudent and warranted for the year ended September 30, 2008.
Net income for the year ended September 30, 2008 was $51.0 million compared to $32.3 million for the year ended September 30, 2007. The $18.7 million increase in net income was primarily a result of a decrease in interest expense on FHLB advances and deposits. The decrease in interest expense on FHLB advances was a result of a decrease in the balance as maturing advances were not renewed in their entirety and a decrease in the weighted average rate due to the termination of $575.0 million of interest rate swap agreements during the first quarter. The decrease in interest expense on deposits was due to a decrease in the rate on the money market, certificate and savings portfolios due to the portfolios repricing to lower market rates.
During fiscal year 2008, we entered into $660.0 million of repurchase agreements as a means of expanding our funding sources and borrowed $825.0 million of FHLB advances, while $1.13 billion of FHLB advances matured. The amount of total borrowings is a function of balancing investment opportunities, liquidity requirements, and managing the interest rate sensitivity of the Bank. Management monitors the Bank’s investment opportunities and balances those opportunities with the cost of FHLB advances or other funding sources for various terms to maturity. During the year, management utilized some of the borrowings and cash flows from the investment securities portfolio to purchase MBS as the interest rate spreads were at attractive levels at certain points during the year when considering the related interest rate and credit risk exposure. Management intends to continue such transactions for the foreseeable future as long as interest rate spreads and the related interest rate and credit risk exposure are at acceptable levels. See additional discussion of interest rate risk in "Quantitative and Qualitative Disclosure About Market Risk."
The Bank opened one new branch in our Wichita market area in October 2008. The Bank has plans to open two additional branches in fiscal year 2009, located in our market area in south Johnson County, Kansas. The Bank has preliminary plans to open three additional branches in our market areas in Kansas City and Wichita by September 30, 2010.
Critical Accounting Policies
Our most critical accounting policies are the methodologies used to determine the allowance for loan losses and the other than temporary declines in the value of securities. These policies are important to the presentation of our financial condition and results of operations, involve a high degree of complexity, and require management to make difficult and subjective judgments that may require assumptions or estimates about highly uncertain matters. The use of different judgments, assumptions, and estimates could cause reported results to differ materially. These critical accounting policies and their application are reviewed at least annually by our audit committee and board of directors. The following is a description of our critical accounting policies and an explanation of the methods and assumptions underlying their application.
Allowance for Loan Losses. Management maintains an allowance for loan losses to absorb losses known and inherent in the loan portfolio based upon ongoing quarterly assessments of the loan portfolio. Our methodology for assessing the appropriateness of the allowance consists of several key elements, which includes a formula analysis for general valuation allowances, specific valuation allowances for identified problem loans and portfolio segments, and knowledge of economic conditions which may lead to credit risk concerns about the loan portfolio or segments of the loan portfolio.
All loans that are not impaired, as defined in Statement of Financial Accounting Standards (“SFAS”) No. 114, “Accounting by Creditors for Impairment of a Loan, an Amendment of Financial Accounting Standards Board (“FASB”) Statements No. 5 and 15” and No. 118 “Accounting by Creditors for Impairment of a Loan – Income Recognition and Disclosures, an Amendment of FASB Statement No. 114”, are included in a formula analysis, as permitted by SFAS No. 5, “Accounting for Contingencies”. Management uses the formula analysis to evaluate the adequacy of the general valuation allowance. Each quarter, the loan portfolio is segregated into categories in the formula analysis based upon certain risk characteristics such as loan type (one- to four-family, multi-family, etc.), interest payments (fixed-rate, adjustable-rate), loan source (originated or purchased), and payment status (i.e. current or number of days delinquent). Impaired loans and loans with known potential losses are excluded from the analysis and evaluated for specific valuation allowances. Potential loss factors are assigned to each category in the analysis based on management’s assessment of the potential risk inherent in each category. The greater the risks associated with a particular category, the higher the loss factor. Loss factors increase as individual loans become classified, delinquent, the foreclosure process begins or as economic conditions warrant. The loss factors are periodically reviewed by management for appropriateness giving consideration to historical loss experience, delinquency and non-performing loan trends, the results of foreclosed property transactions and the status of the local and national economies and housing markets, in order to ascertain that the loss factors cover probable and estimable losses inherent in the loan portfolio. Management’s evaluation of the inherent loss with respect to these conditions is subject to a higher degree of uncertainty because they are not identified with a specific problem loan or portfolio segments.
The amounts actually observed with respect to these losses can vary significantly from the estimated amounts. Our methodology permits adjustments to any loss factor used in the computation of the formula analysis in the event that, in management’s judgment, significant factors which affect the collectibility of the portfolio or any category of the
loan portfolio, as of the evaluation date, are not reflected in the current loss factors. By assessing the estimated losses inherent in our loan portfolio on a quarterly basis, we can adjust specific and inherent loss estimates based upon more current information.
During fiscal year 2008, the loss factors in our formula analysis were increased on certain purchased loans in our portfolio as a result of changes in the real estate markets, borrower credit attributes, economic environment, and composition of our delinquencies and non-performing loans. The increase in the loss factors was based on when the loan was originated, the lender from whom the loan was purchased, and changes in credit scores and loan-to-value (“LTV”) ratios since the time of origination. Since we rely primarily on the collateral securing a one-to four-family mortgage loan if the loan were to enter foreclosure, management believes the increase in the loss factor on these loans was necessary. The majority of our non-performing purchased loans were purchased from one nationwide lender. The Bank has discontinued purchasing loans from this nationwide lender. Management reviewed the pool of loans purchased from this nationwide lender and increased the loss factors on loans that met certain LTV and credit score criteria. Management also reviewed the pool of purchased loans from all other nationwide lenders and increased the loss factors, but to a lesser extent, on loans that met certain LTV and credit score criteria.
Specific valuation allowances are established in connection with individual loan reviews of specifically identified problem loans and the asset classification process, including the procedures for impairment recognition under SFAS No. 114 and SFAS No. 118. Such evaluations include a review of loans on which full collectibility is not reasonably assured, evaluation of the estimated fair value of the underlying collateral, and other factors that determine risk exposure to arrive at an adequate specific valuation allowance amount. Loans with an outstanding balance of $1.5 million or more are reviewed annually if secured by property in one of the following categories: multi-family (five or more units) property, unimproved land, other improved commercial property, acquisition and development of land projects, developed building lots, office building, single-use building, or retail building. Specific valuation allowances are established if the review determines a quantifiable impairment. If a loan is not impaired, it is included in the formula analysis.
Management reviews the appropriateness of the allowance for loan losses based upon its evaluation of then-existing economic and business conditions affecting our key lending areas. Other conditions management considers in determining the appropriateness of the allowance for loan losses include, but are not limited to, changes in our underwriting standards, credit quality trends (including changes in the balance and characteristics of non-performing loans expected to result from existing economic conditions), trends in collateral values, loan volumes and concentrations, and recent loss experience in particular segments of the portfolio as of the balance sheet date. Management also measures the impact these conditions were believed to have had on the collectibility of impaired loans.
Assessing the adequacy of the allowance for loan losses is inherently subjective. Actual results could differ from our estimates as a result of changes in economic or market conditions. Changes in estimates could result in a material change in the allowance for loan losses. In the opinion of management, the allowance for loan losses, when taken as a whole, is adequate to absorb reasonable estimated losses inherent in our loan portfolio. However, future adjustments may be necessary if portfolio performance or economic or market conditions differ substantially from the conditions that existed at the time of the initial determinations.
Securities Impairment. Management continually monitors the investment and mortgage-related security portfolios for impairment on a security by security basis. Many factors are considered in determining whether the impairment is deemed to be other-than-temporary, including, but not limited to, the nature of the investment, the length of time the security has had a market value less than the cost basis, the cause(s), severity of the loss, the intent and ability of the Bank to hold the security for a period of time sufficient for a substantial recovery of its investment, expectation of an anticipated recovery period, recent events specific to the issuer or industry including the issuer’s financial condition and current ability to make future payments in a timely manner, external credit ratings and recent downgrades in such ratings. If management deems the decline to be other-than-temporary, the carrying value of the security is adjusted and an impairment amount is recorded in the consolidated statements of income. Currently, all securities are rated investment grade, and there is a market for the securities. At September 30, 2008, no securities had been identified as other-than-temporarily impaired.
Recent Accounting Pronouncements. In September 2006, the FASB issued SFAS No. 157 “Fair Value Measurements.” SFAS No. 157 defines fair value, establishes a framework for measuring fair value, and expands disclosures regarding fair value measurements. The statement applies whenever other standards require or permit that assets or liabilities be measured at fair value. The statement does not require new fair value measurements, but rather provides a definition and framework for measuring fair value which will result in greater consistency and comparability among financial statements prepared under generally accepted accounting principles in the United States of America (“GAAP”). The statement is effective for financial statements issued for fiscal years beginning after November 15, 2007, which for the Company is October 1, 2008. The provisions are to be applied prospectively as of the beginning of the fiscal year in which the statement is initially applied, with certain exceptions. A transition adjustment, measured as the difference between the carrying amounts and the fair values of certain specific financial instruments at the date SFAS No. 157 is initially applied may be required. SFAS No. 157 will affect certain fair value disclosures, but is not expected to have a material impact on the Company’s financial condition or results of
operations. The portion of the Company’s assets and liabilities with fair values based on unobservable inputs is not significant.
In February 2007, FASB issued SFAS No. 159, “The Fair Value Option for Financial Assets and Financial Liabilities” which permits an entity to measure certain financial assets and financial liabilities at fair value. The objective of SFAS No. 159 is to improve financial reporting by allowing entities to mitigate volatility in reported earnings caused by the measurement of related assets and liabilities using different attributes, without having to apply complex hedge accounting provisions. The election for the fair value option is a one-time election for existing instruments and once fair value is elected for a particular instrument, that instrument is carried throughout the holding period at fair value. If elected, SFAS No. 159 is effective for fiscal years beginning after November 15, 2007, which for the Company is October 1, 2008. The Company has elected not to use the fair value option.
In November 2007, the SEC issued Staff Accounting Bulletin (“SAB”) 109, “Written Loan Commitments Recorded at Fair Value Through Earnings.” SAB 109 supersedes SAB 105, “Miscellaneous Accounting – Loan Commitments Accounted for as Derivative Instruments.” SAB 109 requires a company to include the value of the mortgage servicing asset in the estimated fair value of the commitments on loans to be sold. SAB 105 had stated that this treatment was inappropriate. The new guidance should be applied prospectively to commitments accounted for at fair value that are issued or modified in fiscal quarters beginning after December 15, 2007, which for the Company was January 1, 2008. The adoption of SAB 109 did not have a material impact on the Company’s financial statements.
In December 2007, the SEC codified SAB 110 as part of SAB Topic 14.D.2, “Share-Based Payment: Certain Assumptions Used in Valuation Methods – Expected Term.” SAB 110 permits companies, under certain circumstances, to continue to use the simplified method when calculating the expected term of “plain vanilla” share options. Originally, the simplified method was due to expire on December 31, 2007. A company may use the simplified method if it concludes that it is not reasonable to base its estimate of expected term on its experience with exercising historical share options. SAB 110 was effective for the Company on January 1, 2008. Management determined there was sufficient history of stock option exercises to develop an expected term based on historical experience so the simplified method will no longer be used to calculate expected term when stock options are granted. The adoption of SAB 110 did not have a material impact on the Company’s financial statements.
In December 2007, the FASB issued SFAS No. 141(R) “Business Combinations” and SFAS No. 160, “Noncontrolling Interests in Consolidated Financial Statements – an amendment of ARB No. 51.” These statements change the way companies account for business combinations and noncontrolling interests (minority interests in current GAAP) and continue the FASB’s push toward more fair value reporting in financial statements. These Statements should both be applied prospectively for fiscal years beginning on or after December 15, 2008, which for the Company is October 1, 2009. However, Statement No. 160 requires entities to apply the presentation and disclosure requirements retrospectively to comparative financial statements, if presented. Both Statements prohibit early adoption. Management is assessing the impact of the adoption of FASB Statements No. 141(R) and No. 160.
In March 2008, the FASB issued SFAS No. 161 “Disclosures about Derivative Instruments and Hedging Activities – an amendment of FAS 133.” SFAS No. 161 requires an entity with derivatives to describe how and why it uses derivative instruments, how derivative instruments and related hedged items are accounted for under SFAS No. 133 “Accounting for Derivative Instruments and Hedging Activities” and related interpretations, and how derivative instruments and related hedged items affect the entity's financial position, financial performance, and cash flows. SFAS No. 161 is effective for the Company beginning January 1, 2009. The Company's adoption of SFAS No. 161 is not expected to have a material impact on its financial condition or results of operations.
In May 2008, the FASB issued SFAS No. 162 “The Hierarchy of Generally Accepted Accounting Principles.” The purpose of SFAS No. 162 is to improve financial reporting by providing a consistent framework for determining what accounting principles should be applied when preparing GAAP financial statements. The FASB believes that issuing the GAAP hierarchy as an FASB standard, recategorizing the existing GAAP hierarchy into two levels of accounting literature (authoritative and nonauthoritative), and elevating the conceptual framework within the GAAP hierarchy are key objectives of achieving the FASB’s goal of improving the quality of accounting standards and the standard-setting process. SFAS No. 162 is effective 60 days following the SEC’s approval of Public Company Accounting Oversight Board (“PCAOB”) amendment to AU Section 411. The Company’s adoption of SFAS No. 162 is not expected to have a material impact on its financial condition or results of operations.
In June 2008, the FASB issued Staff Position (“FSP”) Emerging Issues Task Force (“EITF”) 03-6-1, “Determining Whether Instruments Granted in Share-Based Payment Transactions are Participating Securities,” which addresses whether instruments granted in share-based payment transactions are participating securities prior to vesting and, therefore, need to be included in the earnings allocation in computing EPS under the two-class method described in SFAS No. 128, “Earnings per Share.” EITF 03-6-1 states that unvested share-based payment awards that contain nonforfeitable rights to dividends or dividend equivalents are participating securities and shall be included in the computation of EPS pursuant to the two-class method. EITF 03-6-1 is effective for fiscal years beginning after December 15, 2008, and interim periods within those years, which for the Company is October 1, 2009. Early application is prohibited. The Company has not yet completed its assessment of the impact of EITF 03-6-1.
Management Strategy
Our strategy is to operate a retail-oriented financial institution dedicated to serving the needs of customers in our market areas. Our commitment is to provide the broadest possible access to home ownership through our mortgage lending programs and to offer a complete set of personal banking products and services. We strive to enhance stockholder value while maintaining a strong capital position. To achieve our strategy, we focus on the following:
| · | Portfolio Lending. We are one of the largest originators of one- to four-family mortgage loans in the state of Kansas. We have primarily originated these loans for our own portfolio, rather than for sale, and generally we service the loans we originate. We provide retail customers with alternatives for their borrowing needs by offering both fixed- and adjustable-rate products with various terms to maturity and pricing alternatives. We offer special programs to individuals who may be first time home buyers, have low or moderate incomes or may have certain credit risk concerns in order to maximize our ability to deliver home ownership opportunities. Through our strong relationships with real estate agents and marketing efforts which reflect our reputation and pricing, we attract mortgage loan business from walk-in customers, customers that apply online, and existing customers. We also purchase one- to four-family mortgage loans from correspondent lenders secured by property primarily located within our market areas and select market areas in Missouri and nationwide lenders. |
| · | Retail Financial Services. We offer a wide array of deposit products and retail services for our customers. These products include checking, savings, money market, certificates of deposit and retirement accounts. These products and services are provided through a branch network of 39 locations which includes traditional branch and retail store locations, our call center which operates on extended hours, telephone bill payment services and Internet-based transaction services. |
| · | Cost Control. We generally are very effective at controlling our costs of operations, outside of the expense portion of our employee benefit plans which are tied to the Company’s stock price. By using technology, we are able to centralize our lending and deposit support functions for efficient processing. Our retail orientation allows us to serve a broad range of customers through relatively few branch locations. Our average deposit base per traditional branch at September 30, 2008 and 2007 was over $119.5 million and $123.3 million, respectively. This large average deposit base helps to control costs. Our one- to four-family mortgage lending strategy, through effective management of credit risk, allows us to service a large portfolio of loans at efficient levels because it costs less to service a portfolio of performing loans. |
| · | Asset Quality. We utilize underwriting standards for our lending products that are designed to limit our exposure to credit risk, and have a portfolio of predominately one- to four-family mortgage loans which has resulted in minimal levels of delinquent and non-performing loans. At September 30, 2008, our ratio of non-performing assets to total assets was 0.23%, which continues to remain at low levels relative to the size of our loan portfolio. See additional discussion of asset quality in Part I, Item 1 of the Annual Report on Form 10-K. |
| · | Capital Position. Our policy has always been to protect the safety and soundness of the Bank through conservative credit and operational risk management, balance sheet strength, and sound operations. The end result of these activities is a capital ratio in excess of the well-capitalized standards set by the Office of Thrift Supervision (“OTS”). We believe that maintaining a strong capital position safeguards the long-term interests of the Bank, the Company and our stockholders. |
| · | Stockholder Value. We strive to enhance stockholder value while maintaining a strong capital position. We continue to provide returns to stockholders through our dividend payments. Total dividends declared and paid during fiscal year 2008 were $2.00 per share. In October 2008, the board of directors declared a $0.50 per share dividend which was paid on November 21, 2008 to holders of record on November 7, 2008. Due to MHC's waiver of dividends, the dividend of $0.50 per share was paid only on public shares. On November 10, 2008, the board of directors approved a special year end cash dividend of $0.11 per share which will be paid on December 5, 2008 to stockholders of record on November 21, 2008. The Company’s cash dividend payout policy is reviewed quarterly by management and the board of directors, and the ability to pay dividends under the policy depends upon a number of factors including the Company’s financial condition, results of operations, regulatory capital requirements of the Bank, other regulatory limitations on the Bank’s ability to make capital distributions to the Company and the continued waiver of dividends by MHC. It is management’s and the board of directors’ intention to continue to pay regular quarterly dividends of $0.50 per share for the foreseeable future and a special dividend each year, to the extent justified by earnings, under the Company’s stated special dividend formula. |
| · | Interest Rate Risk Management. Changes in interest rates are our primary market risk as our balance sheet is almost entirely comprised of interest-earning assets and interest-bearing liabilities. As such, fluctuations in interest rates have a significant impact not only upon our net income but also upon the cash flows related to those assets and liabilities and the market value of our assets and liabilities. To manage interest rate risk, the Asset and Liability Committee (“ALCO”) meets weekly to discuss and monitor the current interest rate environment compared to interest rates offered on our loan and deposit products. Additionally, ALCO meets once a month to review information regarding the sensitivity of our assets and liabilities to changes in rates. The members of ALCO are the Chairman, the Chief Executive Officer, the Chief Financial Officer (chair of |
| ALCO), the Executive Vice President for Corporate Services, the Chief Lending Officer, the Executive Vice President for Retail Operations and the Chief Investment Officer. |
| · | Liquidity Management. The Bank must manage its daily cash flows. Cash flow management is accomplished through establishing interest rates on loan and deposit products, investing cash flows not placed into mortgage loans, purchasing securities that meet the long term objectives of earnings, liquidity management and interest rate risk management and borrowing funds if cash flows are not sufficient to meet local loan demand or to leverage excess capital. Generally, management manages the Bank’s asset and liability portfolios, including the available-for-sale securities portfolio, as held-to-maturity portfolios. As such, changes in the balance or mix of products in these portfolios typically do not occur quickly, especially in a rising rate environment. Because of this, management looks at changes over a period of time to determine trends that can be changed through various strategies in our local markets, by the investments and mortgage loans we purchase or by borrowings we incur. |
Quantitative and Qualitative Disclosure about Market Risk
Asset and Liability Management and Market Risk
The rates of interest we earn on assets and pay on liabilities generally are established contractually for a period of time. Fluctuations in interest rates have a significant impact not only upon our net income, but also upon the cash flows of those assets and liabilities and the market value of our assets and liabilities. Our results of operations, like those of other financial institutions, are impacted by these changes in interest rates and the interest rate sensitivity of our interest-earning assets and interest-bearing liabilities. The risk associated with changes in interest rates on the earnings of the Bank and the market value of its financial assets and liabilities is known as interest rate risk. Interest rate risk is our most significant market risk and our ability to adapt to these changes is known as interest rate risk management.
Based upon management’s recommendations, the board of directors sets the asset and liability management policies of the Bank. These policies are implemented by ALCO. The purpose of ALCO is to communicate, coordinate and control asset and liability management consistent with the business plan and board-approved policies. ALCO sets goals for and monitors the volume and mix of assets and funding sources taking into account relative costs and spreads, interest rate sensitivity and liquidity needs. The objectives are to manage assets and funding sources to produce the highest profitability balanced against liquidity, capital adequacy and risk management objectives. At each monthly meeting, ALCO recommends appropriate strategy changes. The Chief Financial Officer, or his designee, is responsible for executing, reviewing and reporting on the results of the policy recommendations and strategies to the board of directors, generally on a monthly basis.
The ability to maximize net interest income is dependent largely upon the achievement of a positive interest rate spread that can be sustained despite fluctuations in prevailing interest rates. The asset and liability repricing gap is a measure of the difference between the amount of interest-earning assets and interest-bearing liabilities which either reprice or mature within a given period of time. The difference provides an indication of the extent to which an institution's interest rate spread will be affected by changes in interest rates. A gap is considered positive when the amount of interest-earning assets exceeds the amount of interest-bearing liabilities, maturing or repricing during the same period. A gap is considered negative when the amount of interest-bearing liabilities exceeds the amount of interest-earning assets maturing or repricing during the same period. Generally, during a period of rising interest rates, a negative gap within shorter repricing periods adversely affects net interest income, while a positive gap within shorter repricing periods results in an increase in net interest income. During a period of falling interest rates, the opposite would generally be true. As of September 30, 2008, the ratio of our one-year gap to total assets was 1.90%.
Management recognizes that dramatic changes in interest rates within a short period of time can cause an increase in our interest rate risk relative to the balance sheet. At times, ALCO may recommend increasing our interest rate risk position in an effort to increase our net interest margin, while maintaining compliance with established board limits for interest rate risk sensitivity. Management believes that maintaining and improving earnings is the best way to preserve a strong capital position. Management recognizes the need, in certain interest rate environments, to limit the Bank's exposure to changing interest rates and may implement strategies to reduce our interest rate risk which could, as a result, reduce earnings in the short-term. To minimize the potential for adverse effects of material and prolonged changes in interest rates on our results of operations, we have adopted asset and liability management policies to better balance the maturities and repricing terms of our interest-earning assets and interest-bearing liabilities based on existing local and national interest rates.
During periods of economic uncertainty, rising interest rates or extreme competition for loans, the Bank’s ability to originate or purchase loans may be adversely affected. In such situations, the Bank alternatively may invest its funds into investments or MBS. These alternate investments may have rates of interest lower than rates we could receive on loans, if we were able to originate or purchase them, potentially reducing the Bank’s interest income.
Qualitative Disclosure about Market Risk
For each period presented in the following table, the percentage change in the Bank’s estimated net interest income based on the indicated instantaneous, parallel and permanent change in interest rates are presented. The percentage change in each interest rate environment represents the difference between estimated net interest income in the 0 basis point interest rate environment (“base case”, assumes forward market and product interest rates implied by the yield curve are realized) and estimated net interest income in each alternative interest rate environment (assumes market and product interest rates have a parallel shift in rates across all maturities by the indicated change in rates). At September 30, 2008, the three-month Treasury bill yield was less than two percent, so the -200 basis point scenario is not presented. Estimations of net interest income used in preparing the table below are based upon the assumptions that the total composition of interest-earning assets and interest-bearing liabilities does not change materially and that any repricing of assets or liabilities occurs at anticipated product and market rates for the alternative rate environments as of the dates presented. The estimation of net interest income does not include any projected gain-on-sale related to the sale of loans or securities or the effect of the use of new interest rate swaps or income derived from non-interest income sources, but does include the use of different prepayment assumptions in the alternative interest rate environments. It is important to consider that the changes in estimated net interest income are for a cumulative four-quarter period. These do not reflect the earnings expectations of management.
| Percentage Change in Net Interest Income |
| Change | | | | |
| (in Basis Points) | | At September 30, |
in Interest Rates(1) | | 2008 | | 2007 |
| | | | | |
| -100 bp | | -0.67% | | 14.10% |
| 000 bp | | -- | | -- |
| +100 bp | | -2.20% | | -8.31% |
| +200 bp | | -5.08% | | -23.10% |
| +300 bp | | -8.62% | | -38.32% |
| | | | | |
| (1) | Assumes an instantaneous, permanent and parallel change in interest rates at all maturities. |
The primary driver for the decrease in the estimated net interest income in the increasing rate environments is the anticipated increase in the cost of interest-bearing liabilities in excess of increases in the yields on interest-earning assets. The increase in the cost of interest-bearing liabilities is primarily a result of the relatively short average maturity of the Bank’s certificate of deposit portfolio. The increase in the cost of interest-bearing liabilities is also due to anticipated increases in the cost of money market accounts. Increases in yield do not occur as quickly for interest-earning assets since changes in the rates on the mortgage loan and MBS portfolios happen at a slower pace, compared to the interest-bearing liabilities, because only the amount of cash flow received on the repayment of these portfolios is reinvested at the higher rates. Principal repayments on the mortgage loan and MBS portfolios decrease significantly in the rising rate scenario resulting in less cash flow being reinvested. In addition, caps on adjustable-rate mortgage products limit the increase in rates in these assets when rates rise.
The decrease in the sensitivity of estimated net interest income since September 30, 2007 in the increasing rate scenarios was primarily driven by rolling borrowings that matured during the year into longer-term borrowings. During the fiscal year, $525.0 million in borrowings that matured were rolled into fixed-rate borrowings with maturities of five years or longer. The Bank also terminated $575.0 million of interest rate swaps during the year. The interest rate swaps effectively converted long-term fixed-rate advances into adjustable-rate advances that repriced monthly. Once the swaps were terminated, the advances remained as long-term, fixed-rate liabilities that will not reprice in the upcoming year.
The decrease in the estimated net interest income if interest rates were to decrease 100 basis points is primarily the result of a higher amount of assets expected to reprice in the next 12 months (see gap table below) in the base case interest rate scenario. The amount of assets repricing will increase further in the down 100 scenario due to an increase in the anticipated cash flows from mortgage related assets due to lower interest rates.
The following table sets forth the percentage change in estimated market value of portfolio equity (“MVPE”) at each period presented based on the indicated instantaneous, parallel and permanent change in interest rates. The MVPE is defined as the net of the present value of the cash flows of an institution’s existing assets, liabilities and off-balance sheet instruments. The percentage change in each interest rate environment represents the difference between MVPE in the base case and MVPE in each alternative interest rate environment. At September 30, 2008, the three-month Treasury bill was less than two percent, so the -200 basis point scenario is not presented. The estimations of MVPE used in preparing the table below are based upon the assumptions that the total composition of interest-earning assets and interest-bearing liabilities does not change, that any repricing of assets or liabilities occurs at current product or market rates for the alternative rate environments as of the dates presented and that different
prepayment rates are used in each alternative interest rate environment. The estimated MVPE results from the valuation of cash flows from financial assets and liabilities over the anticipated lives of each for each interest rate environment. The table presents the effects of the change in interest rates on our assets and liabilities as they mature, repay or reprice, as shown by the change in the MVPE in changing interest rate environments.
| Percentage Change in MVPE | | |
| Change | | | | |
| (in Basis Points) | | At September 30, |
in Interest Rates(1) | | 2008 | | 2007 |
| | | | | |
| -100 bp | | 0.36% | | 4.77% |
| 000 bp | | -- | | -- |
| +100 bp | | -6.99% | | -13.05% |
| +200 bp | | -19.37% | | -29.99% |
| +300 bp | | -34.88% | | -49.00% |
| (1) | Assumes an instantaneous, permanent and parallel change in interest rates at all maturities. |
Changes in the estimated market values of our financial assets and liabilities drive changes in estimates of MVPE. The market value of shorter term-to-maturity financial instruments is less sensitive to changes in interest rates than the market value of longer term-to-maturity financial instruments. Because of this, our certificates of deposit (which have relatively short average lives) tend to display less sensitivity to changes in interest rates than do our mortgage-related assets (which have relatively long average lives). However, the average life expected on our mortgage-related assets varies under different interest rate environments because customers have the ability to prepay their mortgage loans. Prepayment assumptions change on mortgage-related assets under various interest rate environments because many customers with mortgage debt look to obtain financing at the lowest cost available. Generally, there is no penalty to prepay a mortgage loan we have originated or purchased. If rates decrease, the customer has an economic incentive to lower the cost of his mortgage (through a lower interest rate) with only the fees associated with the new mortgage or loan modification to obtain the lower cost mortgage. In a decreasing rate environment, prepayments increase and the average life of a mortgage shortens compared to higher rate environments. When interest rates increase, the economic incentive for customers to modify their mortgage debt is reduced, resulting in lower prepayment speed assumptions and longer average lives.
The Bank’s MVPE declines in the rising interest rate environments. As rates increase, the estimated fair values of the liabilities with short average lives do not respond to rates in the same manner as the longer maturity assets, such as our fixed-rate loans, which have longer average lives. The prepayment assumptions on the fixed-rate loans in particular, and all mortgage-related assets in general, anticipate prepayment rates in the increasing rate environments that would likely only be realized through normal changes in customers lives, such as divorce, death, job-related relocations, and other life changing events. The lower prepayment assumptions extend the expected average lives on these assets, relative to assumptions in the base case, thereby increasing their sensitivity to changes in interest rates. The net effect of these characteristics of short-lived liabilities and long-lived assets is to increase the sensitivity of the Bank to changes in interest rates the more rates increase.
The sensitivity of the Bank’s MVPE as of September 30, 2008 decreased from September 30, 2007. This was primarily due to lower interest rates at September 30, 2008 that resulted in shorter average lives of mortgage-related assets. In addition, the Bank extended the average lives of borrowings during the year. This was accomplished primarily by rolling borrowings that matured during the year into longer-term borrowings, and terminating $575.0 million of interest rate swaps.
The Bank’s measure of its MVPE sensitivity to declining interest rates indicates little change from the base case interest rate scenario at September 30, 2008. The increase in MVPE, if interest rates drop 100 basis points, is primarily driven by the short-term nature of our liabilities compared to the decrease in the expected lives of our assets, relative to the base case rate scenario, as a result of an assumed increase in prepayment speeds on mortgage-related assets, primarily our fixed-rate loan portfolio. Given the current composition of our loan portfolio and the current interest rate environment, it is likely that many of our customers would be economically enticed to refinance or modify their mortgage loans with a 100 basis point decline in rates compared to the base case scenario.
General assumptions used by management to evaluate the sensitivity of our financial performance to changes in interest rates presented in the tables above are utilized in, and set forth under, the gap table and related notes beginning on page 17. Although management finds these assumptions reasonable given the constraints described above, the interest rate sensitivity of our assets and liabilities and the estimated effects of changes in interest rates on our net interest income and MVPE indicated in the above tables could vary substantially if different assumptions were used or actual experience differs from these assumptions.
Gap Table: The gap table summarizes the anticipated maturities or repricing of our interest-earning assets and interest-bearing liabilities as of September 30, 2008, based on the information and assumptions set forth in the notes below.
| | Within Three Months | Three to Twelve Months | More Than One Year to Three Years | More Than Three Years to Five Years | Over Five Years | Total |
| | |
| | |
| Interest-earning assets: | (Dollars in thousands) |
Loans receivable(1) (2): | | | | | | |
| Mortgage loans: | | | | | | |
| Fixed | $ 152,551 | $ 553,997 | $ 1,119,251 | $ 602,752 | $ 1,267,965 | $ 3,696,516 |
| Adjustable | 122,267 | 632,992 | 611,785 | 74,679 | 6,094 | 1,447,817 |
| Other loans | 134,177 | 24,805 | 30,100 | 10,644 | 12,032 | 211,758 |
| Securities: | | | | | | |
Non-mortgage(3) | 17,629 | 2,892 | 14,238 | 50,896 | 58,818 | 144,473 |
Mortgage-related(4) | 209,348 | 688,368 | 608,284 | 287,046 | 448,773 | 2,241,819 |
| Other interest-earning assets | 70,401 | -- | -- | -- | -- | 70,401 |
| Total interest-earning assets | 706,373 | 1,903,054 | 2,383,658 | 1,026,017 | 1,793,682 | 7,812,784 |
| | | | | | | |
| Interest-bearing liabilities: | | | | | | |
| Deposits: | | | | | | |
Savings(5) | 121,872 | 7,189 | 16,927 | 13,397 | 72,718 | 232,103 |
Checking(5) | 9,698 | 32,406 | 74,714 | 72,771 | 210,872 | 400,461 |
Money market(5) | 34,906 | 96,269 | 177,626 | 138,515 | 325,007 | 772,323 |
| Certificates | 494,370 | 986,016 | 916,993 | 120,670 | 947 | 2,518,996 |
Borrowings(6) | 53,609 | 620,000 | 1,446,000 | 920,000 | 120,000 | 3,159,609 |
| Total interest-bearing liabilities | 714,455 | 1,741,880 | 2,632,260 | 1,265,353 | 729,544 | 7,083,492 |
| | | | | | | |
| Excess (deficiency) of interest-earning assets over | | | | | | |
| interest-bearing liabilities | $ (8,082) | $ 161,174 | $ (248,602) | $ (239,336) | $ 1,064,138 | $ 729,292 |
| | | | | | | |
| Cumulative excess (deficiency) of interest-earning | | | | | | |
| assets over interest-bearing liabilities | $ (8,082) | $ 153,092 | $ (95,510) | $ (334,846) | $ 729,292 | |
| | | | | | | |
| Cumulative excess (deficiency) of interest-earning | | | | | | |
| assets over interest-bearing liabilities as a | | | | | | |
| percent of total assets at September 30, 2008 | (0.10)% | 1.90% | (1.19)% | (4.16)% | 9.05% | |
| | | | | | | |
| Cumulative one-year gap at September 30, 2007 | | (11.57)% | | | | |
| | | | | | | |
| Cumulative one-year gap at September 30, 2006 | | (13.62)% | | | | |
(1) Adjustable-rate loans are included in the period in which the rate is next scheduled to adjust or in the period in which repayments are expected to occur, or prepayments are expected to be received, prior to their next rate adjustment, rather than in the period in which the loans are due. Fixed-rate loans are included in the periods in which they are scheduled to be repaid, based on scheduled amortization and prepayment assumptions.
(2) Balances have been reduced for non-performing loans, which totaled $13.7 million at September 30, 2008.
(3) Based on contractual maturities, terms to call date or pre-refunding dates as of September 30, 2008, and excludes the unrealized loss adjustment of $2.1 million on AFS investment securities.
(4) Reflects estimated prepayments of MBS in our portfolio, and excludes the unrealized loss adjustment of $7.5 million on AFS MBS.
(5) Although our checking, savings and money market accounts are subject to immediate withdrawal, management considers a substantial amount of such accounts to be core deposits having significantly longer effective maturities. The decay rates (the assumed rate at which the balance of existing accounts would decline) used on these accounts are based on assumptions developed from our actual experience with these accounts. If all of our checking, savings and money market accounts had been assumed to be subject to repricing within one year, interest-bearing liabilities which were estimated to mature or reprice within one year would have exceeded interest-earning assets with comparable characteristics by $949.5 million, for a cumulative one-year gap of (11.8)% of total assets.
(6) Borrowings exclude the $1.1 million deferred gain on the terminated interest rate swap agreements and $28 thousand of capitalized debt issuance costs on other borrowings.
The change in the one-year gap to positive 1.90% from a negative 11.57% from September 30, 2007 to September 30, 2008, respectively, occurred for two reasons. The first was a reduction of liabilities repricing in the upcoming year, caused primarily by the termination of $575.0 million of interest rate swaps hedging FHLB advances. These interest rate swaps effectively converted long-term fixed-rate advances to adjustable-rate advances that repriced monthly. Once the swaps were terminated the advances became long-term fixed-rate liabilities that will not reprice in the upcoming year. The Bank also had FHLB advances that matured and were extended. The second reason for the change in the one-year gap was the decrease in interest rates, which are expected to cause an increase in the projected cash flows in the upcoming year from mortgage loan prepayments. This results in shorter average lives and quicker repricing of assets than the September 30, 2007 projections.
The gap table summarizes the anticipated maturities or repricing of our interest-earning assets and interest-bearing liabilities as of September 30, 2008, based on the information and assumptions set forth in the notes above. Cash flow projections for mortgage loans and MBS are calculated based on current interest rates. Prepayment projections are subjective in nature, involve uncertainties and assumptions and, therefore, cannot be determined with a high degree of accuracy. Although certain assets and liabilities may have similar maturities or periods to repricing, they may react differently to changes in market interest rates. Assumptions may not reflect how actual yields and costs respond to market changes. The interest rates on certain types of assets and liabilities may fluctuate in advance of changes in market interest rates, while interest rates on other types of assets and liabilities may lag behind changes in market interest rates. Certain assets, such as adjustable-rate mortgage (“ARM”) loans, have features that restrict changes in interest rates on a short-term basis and over the life of the asset. In the event of a change in interest rates, prepayment and early withdrawal levels likely would deviate significantly from those assumed in calculating the gap table. For additional information regarding the impact of changes in interest rates, see the “Percentage Change in Net Interest Income” and “Percentage Change in MVPE” tables above.
Financial Condition
Total assets increased $379.4 million from $7.68 billion at September 30, 2007 to $8.06 billion at September 30, 2008. The increase in assets was primarily attributed to an increase in MBS of $820.1 million which was partially offset by a decrease in investment securities of $381.8 million. The increase in the MBS portfolio was a result of cash flows from the investment securities portfolio being reinvested into the MBS portfolio at a higher average yield, and funds from repurchase agreements being used to purchase MBS. The decrease in the investment securities portfolio was a result of calls and maturities that were not replaced in their entirety. The yields on MBS were more attractive than the yields on investment securities during the year due to the broad disruption in the mortgage market that led to a decrease in the demand for MBS from other market participants, resulting in higher yields on MBS relative to other investment alternatives.
Total liabilities increased $375.8 million from $6.81 billion at September 30, 2007 to $7.18 billion at September 30, 2008. The increase in liabilities was primarily a result of entering into $660.0 million of repurchase agreements, partially offset by a decrease in FHLB advances of $285.1 million. The repurchase agreements replaced certain maturing FHLB advances, as the rate and term offerings on the repurchase agreements were more favorable than other funding options on those dates. Additionally, funds from repurchase agreements were used to purchase MBS. The interest rate spreads between borrowing costs and investment options, at certain times during fiscal year 2008, were at levels above historical averages when considering the related interest rate and credit risk exposure. Management intends to continue to borrow funds to purchase securities when interest rate spreads are at acceptable levels. Management believes that such transactions, if completed, will contribute to improving the earnings of the Company and not create excessive interest rate or credit risk exposure.
Stockholders’ equity increased $3.6 million from $867.6 million at September 30, 2007 to $871.2 million at September 30, 2008.
Loans Receivable. The loan portfolio increased $30.7 million from $5.29 billion at September 30, 2007 to $5.32 billion at September 30, 2008. Loans purchased from nationwide lenders represented 14% of the loan portfolio at September 30, 2008 compared to 17% at September 30, 2007. As of September 30, 2008, the average balance of a purchased mortgage loan was approximately $350 thousand while the average balance of an originated mortgage loan was approximately $125 thousand.
The yield on our loan portfolio decreased 4 basis points from 5.73% at September 30, 2007 to 5.69% at September 30, 2008. The decrease in the yield was a result of a decrease in the rate on home equity loans tied to the Prime rate during the current fiscal year.
Included in the loan portfolio at September 30, 2008 were $336.7 million of interest-only loans, which were primarily purchased from nationwide lenders during fiscal year 2005. These loans do not typically require principal payments during their initial term, and primarily have initial interest-only terms of either five or ten years. At September 30, 2008, $327.3 million, or 97%, of these loans were still in their interest-only payment term. As of September 30, 2008, $142.3 million will begin to amortize principal within two years, $30.2 million will begin amortizing principal within two-to-five years, and the remaining $154.8 million will begin to amortize principal within five-to-ten years. Loans of this type generally are considered to be of greater risk to the lender because of the possibility that the borrower may default once principal payments are required. We attempt to mitigate the risk of interest-only loans by using prudent underwriting criteria. Interest-only loans we purchased had an average credit score greater than 700 and an average LTV ratio of 80% or less at the time of purchase.
The Bank’s underwriting guidelines have provided the Bank with loans of high quality and generally historically low delinquencies and low levels of non-performing assets compared to national levels. Of particular importance is the complete documentation required for each loan the Bank originates and purchases. This allows the Bank to make an informed credit decision based upon a thorough assessment of the borrower’s ability to repay the loan compared to underwriting methodologies that do not require full documentation. The continued decline in the real estate markets, as well as the overall economic environment, contributed to an increase in our non-performing loans during the year. The balance of our non-performing loans increased from $7.4 million at September 30, 2007 to $13.7 million at September 30, 2008. Our ratio of non-performing loans to total loans increased from 0.14% at September 30, 2007 to 0.26% at September 30, 2008. Despite the increase in non-performing loans at September 30, 2008, our non-performing loans continue to remain at low levels relative to the size of our loan portfolio. At September 30, 2008, our allowance for loan losses was $5.8 million or 0.11% of the total loan portfolio and 42% of total non-accruing loans. This compares with an allowance for loan losses of $4.2 million or 0.08% of the total loan portfolio and 57% of total non-accruing loans as of September 30, 2007. See additional discussion of asset quality in Part I, Item 1 of the Annual Report on Form 10-K.
During the fiscal year ended September 30, 2008, the rate on the Bank’s 30-year fixed-rate loans, with no points paid by the borrower, were approximately 220 basis points above the average 10-year Treasury rate, while the rate on the Bank’s 15-year fixed-rate loans were approximately 175 basis points above the average 10-year Treasury rate. The Bank’s loan pricing is benchmarked to the secondary market mortgage pricing.
The following tables summarize the activity in the loan portfolio for the periods indicated, excluding changes in undisbursed loan funds, unearned loans fees and deferred costs and allowance for loan losses. The weighted average contractual life of our mortgage loan portfolio was 23 years at both September 30, 2008 and 2007.
| | | For the Three Months Ended | |
| | | September 30, 2008 | | June 30, 2008 | | March 31, 2008 | | | December 31, 2007 | |
| | | Amount | | | Rate | | | Amount | | | Rate | | | Amount | | | Rate | | | Amount | | | Rate | |
| | | (Dollars in thousands) | |
| Beginning balance | | $ | 5,389,901 | | | | 5.63 | % | | $ | 5,352,278 | | | | 5.66 | % | | $ | 5,366,186 | | | | 5.71 | % | | $ | 5,346,626 | | | | 5.68 | % |
| Originations and refinances | | | | | | | | | | | | | | | | | | | | | | | | | | | | | | | | |
| Fixed | | | 140,565 | | | | 6.08 | | | | 213,098 | | | | 5.72 | | | | 167,003 | | | | 5.67 | | | | 131,345 | | | | 6.14 | |
| Adjustable | | | 45,333 | | | | 5.69 | | | | 47,641 | | | | 5.82 | | | | 32,596 | | | | 6.24 | | | | 43,254 | | | | 6.96 | |
| Purchases | | | | | | | | | | | | | | | | | | | | | | | | | | | | | | | | |
| Fixed | | | 7,309 | | | | 6.12 | | | | 18,209 | | | | 5.51 | | | | 10,191 | | | | 5.71 | | | | 12,086 | | | | 6.20 | |
| Adjustable | | | 17,225 | | | | 5.76 | | | | 14,509 | | | | 5.51 | | | | 20,322 | | | | 5.51 | | | | 19,780 | | | | 5.85 | |
| Repayments | | | (216,090 | ) | | | | | | | (254,784 | ) | | | | | | | (242,391 | ) | | | | | | | (185,913 | ) | | | | |
Other (1) | | | (4,398 | ) | | | | | | | (1,050 | ) | | | | | | | (1,629 | ) | | | | | | | (992 | ) | | | | |
| Ending balance | | $ | 5,379,845 | | | | 5.66 | % | | $ | 5,389,901 | | | | 5.63 | % | | $ | 5,352,278 | | | | 5.66 | % | | $ | 5,366,186 | | | | 5.71 | % |
| | | | | | | | | | | | | | | | | | | | | | | | | | | | | | | | | |
| | | For the Year Ended | | | | | | | | | | | | | | | | |
| | | 2008 | | 2007 | | | | | | | | | | | | | | | | |
| | | Amount | | | Rate | | | Amount | | | Rate | | | | | | | | | | | | | | | | | |
| | | (Dollars in thousands) | | | | | | | | | | | | | | | | |
| Beginning balance | | $ | 5,346,626 | | | | 5.68 | % | | $ | 5,257,473 | | | | 5.55 | % | | | | | | | | | | | | | | | | |
| Originations and refinances | | | | | | | | | | | | | | | | | | | | | | | | | | | | | | | | |
| Fixed | | | 652,011 | | | | 5.87 | | | | 612,066 | | | | 6.17 | | | | | | | | | | | | | | | | | |
| Adjustable | | | 168,824 | | | | 6.16 | | | | 191,384 | | | | 6.96 | | | | | | | | | | | | | | | | | |
| Purchases | | | | | | | | | | | | | | | | | | | | | | | | | | | | | | | | |
| Fixed | | | 47,795 | | | | 5.82 | | | | 53,094 | | | | 6.12 | | | | | | | | | | | | | | | | | |
| Adjustable | | | 71,836 | | | | 5.67 | | | | 91,241 | | | | 6.04 | | | | | | | | | | | | | | | | | |
| Repayments | | | (899,178 | ) | | | | | | | (855,980 | ) | | | | | | | | | | | | | | | | | | | | |
Other (1) | | | (8,069 | ) | | | | | | | (2,652 | ) | | | | | | | | | | | | | | | | | | | | |
| Ending balance | | $ | 5,379,845 | | | | 5.66 | % | | $ | 5,346,626 | | | | 5.68 | % | | | | | | | | | | | | | | | | |
| (1) | Amount consists of transfers to real-estate owned and net fees advanced. |
Mortgage-Related Securities. The balance of MBS increased $820.1 million from $1.41 billion at September 30, 2007 to $2.23 billion at September 30, 2008. The increase in the balance was a result of cash flows from the investment securities portfolio being reinvested into the MBS portfolio and funds from repurchase agreements being used to purchase MBS. Management primarily purchases MBS issued by U.S. Government sponsored enterprises or agencies.
The following tables provide a summary of the activity in our portfolio of MBS for the periods presented. The yields and weighted average life (“WAL”) for purchases are presented as recorded at the time of purchase. The yields for the beginning and ending balances are as of the period presented and are generally derived from recent prepayment activity on the securities in the portfolio as of the dates presented. The beginning and ending WAL is the estimated remaining maturity after projected prepayment speeds have been applied. The weighted average yield of the MBS portfolio increased between September 30, 2007 and September 30, 2008 due to the purchase of MBS with yields higher than the existing portfolio, the maturity and repayment of securities with lower yields, and adjustable-rate MBS resetting to higher coupons. The increase in the WAL at September 30, 2008 compared to September 30, 2007 was due to purchases of MBS with WALs greater than the existing portfolio. The WAL of the purchased securities increased further due to higher interest rates since the time of purchase. The WAL of the existing portfolio increased due to maturities and repayments of shorter securities during the year.
| | | For the Three Months Ended | |
| | | September 30, 2008 | | | June 30, 2008 | | | March 31, 2008 | | | December 31, 2007 | |
| | | Amount | | | Yield | | | WAL | | | Amount | | | Yield | | | WAL | | | Amount | | | Yield | | | WAL | | | Amount | | | Yield | | | WAL | |
| | | (Dollars in thousands) | |
| Beginning balance | | $ | 2,066,685 | | | | 4.76 | % | | | 4.32 | | | $ | 2,076,766 | | | | 4.70 | % | | | 4.88 | | | $ | 1,608,897 | | | | 4.66 | % | | | 4.41 | | | $ | 1,414,271 | | | | 4.46 | % | | | 4.04 | |
| Maturities and repayments | | | (112,777 | ) | | | | | | | | | | | (172,376 | ) | | | | | | | | | | | (119,682 | ) | | | | | | | | | | | (95,243 | ) | | | | | | | | |
Net amortization of premiums/ (discounts) | | | 23 | | | | | | | | | | | | (9 | ) | | | | | | | | | | | (426 | ) | | | | | | | | | | | (335 | ) | | | | | | | | |
| Purchases: | | | | | | | | | | | | | | | | | | | | | | | | | | | | | | | | | | | | | | | | | | | | | | | | |
| Fixed | | | 60,137 | | | | 5.03 | | | | 4.48 | | | | 129,614 | | | | 4.64 | | | | 4.56 | | | | 395,048 | | | | 4.90 | | | | 4.98 | | | | 200,382 | | | | 5.17 | | | | 3.98 | |
| Adjustable | | | 219,888 | | | | 4.99 | | | | 5.07 | | | | 50,443 | | | | 4.25 | | | | 4.04 | | | | 188,024 | | | | 4.71 | | | | 5.06 | | | | 86,819 | | | | 4.88 | | | | 4.68 | |
| Change in valuation on AFS securities | | | 383 | | | | | | | | | | | | (17,753 | ) | | | | | | | | | | | 4,905 | | | | | | | | | | | | 3,003 | | | | | | | | | |
| Ending balance | | $ | 2,234,339 | | | | 4.82 | % | | | 5.05 | | | $ | 2,066,685 | | | | 4.76 | % | | | 4.32 | | | $ | 2,076,766 | | | | 4.70 | % | | | 4.88 | | | $ | 1,608,897 | | | | 4.66 | % | | | 4.41 | |
| | | For the Year Ended | |
| | | 2008 | | | 2007 | |
| | | Amount | | | Yield | | | WAL | | | Amount | | | Yield | | | WAL | |
| | | (Dollars in thousands) | |
| Beginning balance | | $ | 1,414,271 | | | | 4.46 | % | | | 4.04 | | | $ | 2,084,786 | | | | 4.54 | % | | | 4.39 | |
| Maturities and repayments | | | (500,078 | ) | | | | | | | | | | | (494,746 | ) | | | | | | | | |
| Sale of securities, net of gains | | | -- | | | | | | | | | | | | (404,459 | ) | | | | | | | | |
| Net amortization of premiums/(discounts) | | | (747 | ) | | | | | | | | | | | (4,074 | ) | | | | | | | | |
| Purchases: | | | | | | | | | | | | | | | | | | | | | | | | |
| Fixed | | | 785,181 | | | | 4.94 | | | | 4.62 | | | | 75,285 | | | | 5.78 | | | | 4.74 | |
| Adjustable | | | 545,174 | | | | 4.81 | | | | 4.91 | | | | 152,807 | | | | 5.00 | | | | 5.45 | |
| Change in valuation on AFS securities | | | (9,462 | ) | | | | | | | | | | | 4,672 | | | | | | | | | |
| Ending balance | | $ | 2,234,339 | | | | 4.82 | % | | | 5.05 | | | $ | 1,414,271 | | | | 4.46 | % | | | 4.04 | |
Investment Securities. Investment securities, which consist primarily of U.S. government agency bonds (primarily issued by FNMA, FHLMC, or FHLB) and municipal investments, decreased $381.8 million from $524.2 million at September 30, 2007 to $142.4 million at September 30, 2008. The decrease in the balance was primarily a result of calls and maturities that were not reinvested in agency securities due to more attractive yields available on MBS. Included in our investment security portfolio at September 30, 2008 is $61.9 million of agency bonds issued by FNMA or FHLMC. The Bank does not hold any equity securities issued by FNMA or FHLMC.
The following tables provide a summary of the activity of investment securities for the periods presented. The yields for the beginning and ending balances are as of the periods presented. The decrease in the weighted average yield of the investment portfolio between September 30, 2007 and September 30, 2008 was attributed to purchases with lower yields than the portfolio and maturities and calls of securities with higher yields. The beginning and ending WAL represent the estimated remaining maturity of the securities after projected call dates have been considered, based upon market rates at each date presented. The increase in the WAL at September 30, 2008 compared to September 30, 2007 was due to issuers of callable securities in the portfolio exercising their option to call the security as well as the additional purchase of investment securities with WALs greater than the existing portfolio. The WAL of the purchased callable securities increased further due to higher interest rates since the time of purchase.
| | | For the Three Months Ended | |
| | | September 30, 2008 | | | June 30, 2008 | | | March 31, 2008 | | | December 31, 2007 | |
| | | Amount | | | Yield | | | WAL | | | Amount | | | Yield | | | WAL | | | Amount | | | Yield | | | WAL | | | Amount | | | Yield | | | WAL | |
| | | (Dollars in thousands) | |
| Beginning balance | | $ | 144,346 | | | | 3.94 | % | | | 4.45 | | | $ | 88,597 | | | | 4.48 | % | | | 2.78 | | | $ | 500,045 | | | | 4.14 | % | | | 0.67 | | | $ | 524,168 | | | | 4.52 | % | | | 1.66 | |
| Maturities and calls | | | (119 | ) | | | | | | | | | | | (4,009 | ) | | | | | | | | | | | (420,000 | ) | | | | | | | | | | | (189,890 | ) | | | | | | | | |
| Net amortization of premiums/(discounts) | | | (244 | ) | | | | | | | | | | | (204 | ) | | | | | | | | | | | 307 | | | | | | | | | | | | 171 | | | | | | | | | |
| Purchases | | | | | | | | | | | | | | | | | | | | | | | | | | | | | | | | | | | | | | | | | | | | | | | | |
| Fixed | | | -- | | | | -- | | | | -- | | | | 56,669 | | | | 3.12 | | | | 1.46 | | | | 8,253 | | | | 3.20 | | | | 5.67 | | | | 165,590 | | | | 4.28 | | | | 0.70 | |
| Adjustable | | | -- | | | | -- | | | | -- | | | | 3,874 | | | | 6.58 | | | | 28.98 | | | | -- | | | | -- | | | | -- | | | | -- | | | | -- | | | | -- | |
| Change in valuation on AFS securities | | | (1,624 | ) | | | | | | | | | | | (581 | ) | | | | | | | | | | | (8 | ) | | | | | | | | | | | 6 | | | | | | | | | |
| Ending balance | | $ | 142,359 | | | | 3.94 | % | | | 6.06 | | | $ | 144,346 | | | | 3.94 | % | | | 4.45 | | | $ | 88,597 | | | | 4.48 | % | | | 2.78 | | | $ | 500,045 | | | | 4.14 | % | | | 0.67 | |
| | | | | | | | | | | | | | | | | | | | | | | | | | | | | | | | | | | | | | | | | | | | | | | | | |
| | | For the Year Ended | | | | | | | | | | | | | | | | | | | | | | | | | |
| | | 2008 | | | 2007 | | | | | | | | | | | | | | | | | | | | | | | | | |
| | | Amount | | | Yield | | | WAL | | | Amount | | | Yield | | | WAL | | | | | | | | | | | | | | | | | | | | | | | | | |
| | | (Dollars in thousands) | | | | | | | | | | | | | | | | | | | | | | | | | |
| Beginning balance | | $ | 524,168 | | | | 4.52 | % | | | 1.66 | | | $ | 429,480 | | | | 4.46 | % | | | 2.63 | | | | | | | | | | | | | | | | | | | | | | | | | |
| Maturities and calls | | | (614,018 | ) | | | | | | | | | | | (600,490 | ) | | | | | | | | | | | | | | | | | | | | | | | | | | | | | | | | |
| Net amortization of premiums/(discounts) | | | 30 | | | | | | | | | | | | 4,251 | | | | | | | | | | | | | | | | | | | | | | | | | | | | | | | | | |
| Purchases | | | | | | | | | | | | | | | | | | | | | | | | | | | | | | | | | | | | | | | | | | | | | | | | |
| Fixed | | | 230,512 | | | | 3.96 | | | | 1.07 | | | | 691,039 | | | | 5.19 | | | | 0.88 | | | | | | | | | | | | | | | | | | | | | | | | | |
| Adjustable | | | 3,874 | | | | 6.58 | | | | 28.98 | | | | -- | | | | -- | | | | -- | | | | | | | | | | | | | | | | | | | | | | | | | |
| Change in valuation on AFS securities | | | (2,207 | ) | | | | | | | | | | | (112 | ) | | | | | | | | | | | | | | | | | | | | | | | | | | | | | | | | |
| Ending balance | | $ | 142,359 | | | | 3.94 | % | | | 6.06 | | | $ | 524,168 | | | | 4.52 | % | | | 1.66 | | | | | | | | | | | | | | | | | | | | | | | | | |
Liabilities. Liabilities increased from $6.81 billion at September 30, 2007 to $7.18 billion at September 30, 2008. The $374.1 million increase in liabilities was due primarily to entering into $660.0 million of repurchase agreements, partially offset by a decrease in FHLB advances of $285.1 million. The decrease in FHLB advances was due to $1.13 billion of maturing advances, of which only $825.0 million were renewed. Certain FHLB advances were replaced with repurchase agreements because rates and terms were more favorable than other funding options on those dates. The use of repurchase agreements also allows for the diversification of funding sources. Management will continue to monitor market conditions for funding opportunities that can be leveraged to improve earnings without creating undue interest rate or credit risk exposure.
The following table presents the amount, average rate and percentage of total deposits for checking, savings, money market and certificates for the periods presented.
| | | At | | At |
| | | September 30, 2008 | | September 30, 2007 |
| | | | | | Average | | % of | | | | | Average | | % of |
| | | Amount | | | Rate | | Total | | Amount | | | Rate | | Total |
| | | (Dollars in thousands) |
| Checking | | $ | 400,461 | | | | 0.21 | % | | | 10.21 | % | | $ | 394,109 | | | | 0.21 | % | | | 10.05 | % |
| Savings | | | 232,103 | | | | 1.51 | | | | 5.91 | | | | 237,148 | | | | 2.58 | | | | 6.04 | |
| Money market | | | 772,323 | | | | 1.48 | | | | 19.68 | | | | 790,277 | | | | 3.18 | | | | 20.15 | |
| Certificates | | | 2,518,996 | | | | 3.91 | | | | 64.20 | | | | 2,501,248 | | | | 4.77 | | | | 63.76 | |
| Total deposits | | $ | 3,923,883 | | | | 2.91 | % | | | 100.00 | % | | $ | 3,922,782 | | | | 3.86 | % | | | 100.00 | % |
At September 30, 2008, $180.6 million of the $2.52 billion in certificates were brokered deposits, compared to $193.0 million in brokered and public unit deposits at September 30, 2007. There were no public unit deposits at September 30, 2008 as management did not pursue public unit deposits. During the quarter ending December 31, 2008, $85.0 million of brokered deposits are scheduled to mature. Management will continue to monitor the wholesale deposit market for attractive opportunities to replace maturing deposits.
Stockholders’ Equity. Stockholders’ equity increased $3.6 million from $867.6 million at September 30, 2007 to $871.2 million at September 30, 2008. The increase was primarily a result of net income of $51.0 million and ESOP activity of $7.5 million, partially offset by dividends paid of $41.4 million, treasury stock purchases of $7.3 million and an increase in unrealized losses on AFS securities of $7.3 million.
Dividends from the Company are the only source of funds for MHC. It is expected that MHC will waive future dividends except to the extent they are needed to fund its continuing operations. The following table shows the number of shares eligible to receive dividends (“public shares”) because of the waiver of dividends by MHC at September 30, 2008. The unvested shares in the ESOP receive cash equal to the dividends paid on the public shares. The cash received is used to repay the annual debt obligation on the loan taken out by the ESOP from the Company at the time of the mutual-to-stock conversion of the Bank to purchase shares for the ESOP. These shares are held in trust for a future employee benefit, and are therefore excluded from the calculation of public shares.
| Total voting shares outstanding at September 30, 2007 | | 74,258,977 |
| Treasury stock acquisitions | | (225,042) |
| Recognition and Retention Plan (“RRP”) grants, net | | 10,000 |
| Options exercised, net | | 35,933 |
| Total voting shares outstanding at September 30, 2008 | | 74,079,868 |
| Unvested shares in ESOP | | (1,008,194) |
| Shares held by MHC | | (52,192,817) |
| Total shares eligible to receive dividends at September 30, 2008 (public shares) | 20,878,857 |
Weighted Average Yields and Rates: The following table presents the weighted average yields earned on loans, securities and other interest-earning assets, the weighted average rates paid on deposits, certificates and borrowings and the resultant interest rate spreads at the dates indicated. Yields on tax-exempt securities are not calculated on a tax-equivalent basis.
| | | At September 30, |
| | | 2008 | | 2007 | | 2006 | |
| | | | | | | | |
| Weighted average yield on: | | | | | | | |
| Loans receivable | | 5.69 | % | 5.73 | % | 5.64 | % |
| MBS | | 4.82 | | 4.46 | | 4.54 | |
| Investment securities | | 3.94 | | 4.52 | | 4.46 | |
| Capital stock of FHLB | | 4.73 | | 6.68 | | 6.24 | |
| Cash and cash equivalents | | 2.95 | | 4.94 | | 5.19 | |
| Combined weighted average yield on | | | | | | | |
| interest-earning assets | | 5.37 | | 5.41 | | 5.29 | |
| | | | | | | | |
| Weighted average rate paid on: | | | | | | | |
Savings deposits(1) | | 1.51 | | 2.58 | | 0.65 | |
| Checking deposits | | 0.21 | | 0.21 | | 0.21 | |
| Money market deposits | | 1.48 | | 3.18 | | 3.31 | |
| Certificates of deposit | | 3.91 | | 4.77 | | 4.35 | |
FHLB advances(2) | | 4.75 | | 5.39 | | 4.88 | |
| Other borrowings | | 4.09 | | 8.12 | | 8.28 | |
| Combined weighted average rate paid on | | | | | | | |
| interest-bearing liabilities | | 3.67 | | 4.52 | | 4.22 | |
| | | | | | | | |
| Net Interest Rate Spread | | 1.70 | % | 0.89 | % | 1.07 | % |
(1) The increase in the weighted average rate on savings deposits at September 30, 2007 compared to September 30, 2006 is due to the reclassification of variable-rate retirement certificates of deposit to savings during fiscal year 2007. The variable-rate retirement certificates of deposit did not have a stated maturity date as a result of changes required by the Bank’s new core information technology processing system.
(2) The September 30, 2008 rate includes the impact of the deferred gain associated with the interest rate swap termination during fiscal year 2008. The September 30, 2007 and 2006 rates include the impact of the interest rate swap agreements.
Average Balance Sheets: The following tables present certain information regarding our financial condition and net interest income for fiscal years 2008, 2007, and 2006, and for the quarters ended September 30, 2008 and June 30, 2008. The tables present the average yield on interest-earning assets and the average cost of interest-bearing liabilities for the periods indicated. We derived the yields and costs by dividing income or expense by the average balance of interest-earning assets or interest-bearing liabilities, respectively, for the periods shown. We derived average balances from daily balances over the periods indicated, except as noted. Interest income includes fees that we considered adjustments to yields. Yields on tax-exempt securities were not calculated on a tax-equivalent basis.
| | For the Fiscal Year Ended | |
| | September 30, 2008 | | September 30, 2007 | | September 30, 2006 | |
| | Average | | Interest | | | | Average | | Interest | | | | Average | | Interest | | | |
| | Outstanding | | Earned/ | | Yield/ | | Outstanding | | Earned/ | | Yield/ | | Outstanding | | Earned/ | | Yield/ | |
| | Balance | | Paid | | Rate | | Balance | | Paid | | Rate | | Balance | | Paid | | Rate | |
| Assets | | | | | | | (Dollars in thousands) | | | | | | | |
| Interest-earning assets: | | | | | | | | | | | | | | | | | | |
Loans receivable(1) | $ 5,099,147 | | $ 286,383 | | 5.62 | % | $ 5,022,178 | | $ 276,317 | | 5.50 | % | $ 5,314,972 | | $ 286,372 | | 5.39 | % |
| Other loans | 216,404 | | 15,637 | | 7.21 | | 222,000 | | 18,427 | | 8.30 | | 216,600 | | 17,450 | | 8.06 | |
| Total loans receivable, net | 5,315,551 | | 302,020 | | 5.68 | | 5,244,178 | | 294,744 | | 5.62 | | 5,531,572 | | 303,822 | | 5.49 | |
| MBS | 1,888,186 | | 88,395 | | 4.68 | | 1,605,901 | | 68,752 | | 4.28 | | 1,902,579 | | 75,806 | | 3.98 | |
Investment securities (2) | 242,426 | | 9,917 | | 4.09 | | 656,857 | | 30,849 | | 4.70 | | 405,329 | | 18,047 | | 4.45 | |
| Capital stock of FHLB | 129,216 | | 6,921 | | 5.36 | | 153,478 | | 10,017 | | 6.53 | | 174,094 | | 9,913 | | 5.69 | |
| Cash equivalents | 112,522 | | 3,553 | | 3.11 | | 138,756 | | 7,188 | | 5.11 | | 70,155 | | 3,340 | | 4.76 | |
| Total interest-earning assets | 7,687,901 | | 410,806 | | 5.34 | | 7,799,170 | | 411,550 | | 5.28 | | 8,083,729 | | 410,928 | | 5.08 | |
Other noninterest-earning assets(3) | 186,312 | | | | | | 153,949 | | | | | | 159,286 | | | | | |
| Total assets | $ 7,874,213 | | | | | | $ 7,953,119 | | | | | | $ 8,243,015 | | | | | |
| | | | | | | | | | | | | | | | | | | |
| Liabilities and stockholders' equity | | | | | | | | | | | | | | | | | | |
| Interest-bearing liabilities: | | | | | | | | | | | | | | | | | | |
Savings (4) | $ 230,818 | | 4,105 | | 1.77 | | $ 195,660 | | 4,952 | | 2.53 | | $ 114,234 | | 697 | | 0.61 | |
| Checking | 398,430 | | 819 | | 0.20 | | 396,454 | | 850 | | 0.21 | | 396,934 | | 857 | | 0.22 | |
| Money market | 804,612 | | 16,771 | | 2.08 | | 807,459 | | 26,566 | | 3.29 | | 845,233 | | 22,443 | | 2.66 | |
Certificates (4) | 2,507,036 | | 111,740 | | 4.44 | | 2,504,069 | | 114,911 | | 4.59 | | 2,555,952 | | 98,551 | | 3.86 | |
| Total deposits | 3,940,896 | | 133,435 | | 3.37 | | 3,903,642 | | 147,279 | | 3.77 | | 3,912,353 | | 122,548 | | 3.14 | |
FHLB advances(5) | 2,552,883 | | 125,748 | | 4.89 | | 3,009,538 | | 153,363 | | 5.03 | | 3,284,554 | | 157,197 | | 4.73 | |
| Other borrowings | 391,009 | | 17,455 | | 4.39 | | 53,493 | | 4,468 | | 8.24 | | 53,378 | | 4,160 | | 7.69 | |
| Total interest-bearing liabilities | 6,884,788 | | 276,638 | | 3.99 | | 6,966,673 | | 305,110 | | 4.35 | | 7,250,285 | | 283,905 | | 3.89 | |
Other noninterest-bearing liabilities(3) | 119,353 | | | | | | 118,445 | | | | | | 129,875 | | | | | |
Stockholders' equity(3) | 870,072 | | | | | | 868,001 | | | | | | 862,855 | | | | | |
| Total liabilities and stockholders' equity | $ 7,874,213 | | | | | | $ 7,953,119 | | | | | | $ 8,243,015 | | | | | |
| | | | | | | | | | | | | | | | | | | |
| Net interest income | | | $ 134,168 | | | | | | $ 106,440 | | | | | | $ 127,023 | | | |
| Net interest rate spread | | | | | 1.35 | % | | | | | 0.93 | % | | | | | 1.19 | % |
| Net earning assets | $ 803,113 | | | | | | $ 832,497 | | | | | | $ 833,444 | | | | | |
| Net interest margin | | | | | 1.75 | % | | | | | 1.36 | % | | | | | 1.57 | % |
| Ratio of interest-earning assets to | | | | | | | | | | | | | | | | | | |
| interest-bearing liabilities | | | | | 1.12 | | | | | | 1.12 | | | | | | 1.11 | |
| | For the Three Months Ended |
| | September 30, 2008 | | June 30, 2008 |
| | Average | | | | | Average | | | |
| | Outstanding | | Yield/ | | | Outstanding | | Yield/ | |
| | Balance | | Rate | | | Balance | | Rate | |
| Assets | (Dollars in thousands) |
| Interest-earning assets: | | | | | | | | | |
Loans receivable(1) | $ 5,328,776 | | 5.69 | % | | $ 5,316,794 | | 5.62 | % |
| MBS | 2,192,268 | | 4.77 | | | 2,107,757 | | 4.72 | |
Investment securities(2) | 144,718 | | 3.95 | | | 128,784 | | 4.03 | |
| Capital stock of FHLB | 124,365 | | 4.72 | | | 128,379 | | 4.71 | |
| Cash and cash equivalents | 59,351 | | 1.92 | | | 90,556 | | 2.03 | |
| Total interest-earning assets | 7,849,478 | | 5.36 | | | 7,772,270 | | 5.29 | |
Other noninterest-earning assets(3) | 151,695 | | | | | 187,701 | | | |
| Total assets | $ 8,001,173 | | | | | $ 7,959,971 | | | |
| | | | | | | | | | |
| Liabilities and stockholders' equity | | | | | | | | | |
| Interest-bearing liabilities: | | | | | | | | | |
| Deposits | $ 3,920,340 | | 2.94 | % | | $ 3,965,449 | | 3.15 | % |
FHLB advances(5) | 2,469,082 | | 4.73 | | | 2,547,450 | | 4.75 | |
| Borrowings, other | 638,463 | | 4.10 | | | 452,458 | | 4.09 | |
| Total interest-bearing liabilities | 7,027,885 | | 3.67 | | | 6,965,357 | | 3.80 | |
Other noninterest-bearing liabilities(3) | 103,332 | | | | | 122,747 | | | |
| Stockholders' equity | 869,956 | | | | | 871,867 | | | |
| Total liabilities and stockholders' equity | $ 8,001,173 | | | | | $ 7,959,971 | | | |
| | | | | | | | | | |
| Net interest rate spread | | | 1.68 | % | | | | 1.49 | % |
| Net interest-earning assets | $ 821,593 | | | | | $ 806,913 | | | |
| Net interest margin | | | 2.03 | % | | | | 1.89 | % |
| Ratio of interest-earning assets | | | | | | | | | |
| to interest-bearing liabilities | | | 1.12 | | | | | 1.12 | |
| | | | | | | | | | |
(1) Calculated net of undisbursed loan funds and unearned loan fees and deferred costs. Non-accruing loans are included in the loans receivable average balance at a yield of zero percent.
(2) Investment securities include tax-exempt securities with an average balance of $45.8 million and $11.1 million and interest income of $1.6 million and $405 thousand for fiscal years 2008 and 2007, respectively. No tax-exempt securities were held in fiscal year 2006. Investment securities include tax-exempt securities with an average balance of $55.0 million and $46.7 million and interest income of $486 thousand and $439 thousand for the quarters ended September 30, 2008 and June 30, 2008, respectively.
(3) Calculated using month end balances.
(4) Variable-rate retirement certificates of deposit were included in the Savings average balance and weighted average rate for a portion of fiscal year 2007 after the replacement of the Bank’s core information technology processing system, since they did not have a stated maturity date as a result of changes required by the Bank’s new core information technology processing system. Prior to the replacement of the Bank’s core information technology processing system, variable-rate retirement certificates of deposit were included in Certificates.
(5) The rate calculation includes net interest expense of $2.3 million, $13.6 million, and $8.6 million related to the interest rate swaps for fiscal years 2008, 2007 and 2006, respectively. There were no swaps outstanding during the quarter ended September 30, 2008. The rate calculation includes net interest expense of $122 thousand related to the interest rate swaps for the quarter ended June 30, 2008.
The increase in the net interest margin from the quarter ended June 30, 2008 to the quarter ended September 30, 2008 was primarily a result of a decrease in the average cost of interest-bearing liabilities, due largely to the maturity of certificates that were replaced at lower rates. The increase was also caused by a modest increase in the average yield on interest-earning assets due to increases in the yield on loans and MBS.
Rate/Volume Analysis: The table below presents the dollar amount of changes in interest income and interest expense for major components of interest-earning assets and interest-bearing liabilities, comparing fiscal years 2008 to 2007 and fiscal years 2007 to 2006. For each category of interest-earning assets and interest-bearing liabilities, information is provided on changes attributable to (1) changes in volume, which are changes in the average balance multiplied by the previous year’s average rate and (2) changes in rate, which are changes in the average rate multiplied by the average balance from the previous year. The net changes attributable to the combined impact of both rate and volume have been allocated proportionately to the changes due to volume and the changes due to rate.
| | | Year Ended September 30, | |
| | | 2008 vs. 2007 | | | 2007 vs. 2006 | |
| | | Increase (Decrease) Due to | | | Increase (Decrease) Due to | |
| | | Volume | | | Rate | | | Total | | | Volume | | | Rate | | | Total | |
| | | (Dollars in thousands) | |
| Interest-earning assets: | | | | | | | | | | | | | | | | | | |
| Loans receivable, net | | $ | 3,873 | | | $ | 3,403 | | | $ | 7,276 | | | $ | (15,565 | ) | | $ | 6,487 | | | $ | (9,078 | ) |
| MBS | | | 12,824 | | | | 6,819 | | | | 19,643 | | | | (12,451 | ) | | | 5,397 | | | | (7,054 | ) |
| Investment securities | | | (17,380 | ) | | | (3,552 | ) | | | (20,932 | ) | | | 11,763 | | | | 1,039 | | | | 12,802 | |
| Capital stock of FHLB | | | (1,451 | ) | | | (1,645 | ) | | | (3,096 | ) | | | (1,250 | ) | | | 1,354 | | | | 104 | |
| Cash equivalents | | | (1,182 | ) | | | (2,453 | ) | | | (3,635 | ) | | | 3,580 | | | | 268 | | | | 3,848 | |
| Total interest-earning assets | | $ | (3,316 | ) | | $ | 2,572 | | | $ | (744 | ) | | $ | (13,923 | ) | | $ | 14,545 | | | $ | 622 | |
| | | | | | | | | | | | | | | | | | | | | | | | | |
| Interest-bearing liabilities: | | | | | | | | | | | | | | | | | | | | | | | | |
Savings(1) | | $ | 802 | | | $ | (1,640 | ) | | $ | (838 | ) | | $ | 786 | | | $ | 3,475 | | | $ | 4,261 | |
| Checking | | | 4 | | | | (39 | ) | | | (35 | ) | | | (1 | ) | | | (39 | ) | | | (40 | ) |
| Money market | | | (90 | ) | | | (9,387 | ) | | | (9,477 | ) | | | (1,043 | ) | | | 5,125 | | | | 4,082 | |
Certificates(1) | | | 141 | | | | (3,635 | ) | | | (3,494 | ) | | | (2,025 | ) | | | 18,453 | | | | 16,428 | |
| FHLB advances | | | (23,533 | ) | | | (4,082 | ) | | | (27,615 | ) | | | (13,116 | ) | | | 9,281 | | | | (3,835 | ) |
| Other borrowings | | | 13,820 | | | | (833 | ) | | | 12,987 | | | | 13 | | | | 296 | | | | 309 | |
| Total interest-bearing liabilities | | $ | (8,856 | ) | | $ | (19,616 | ) | | $ | (28,472 | ) | | $ | (15,386 | ) | | $ | 36,591 | | | $ | 21,205 | |
| | | | | | | | | | | | | | | | | | | | | | | | | |
| Net change in net interest and dividend income | | $ | 5,540 | | | $ | 22,188 | | | $ | 27,728 | | | $ | 1,463 | | | $ | (22,046 | ) | | $ | (20,583 | ) |
(1) The increase in the volume and the rate in Savings in the 2007 vs 2006 comparison is related to the variable-rate retirement certificates of deposit that were reclassified to Savings from Certificates as the reclassified accounts did not have a stated maturity date as a result of changes required by the Bank’s new core information technology processing system. The change in volume and rate on the Savings would have been a decrease of $68 thousand and an increase of $33 thousand, respectively, excluding the variable-rate retirement certificates reclassified to Savings. The change in the volume and rate on Certificates would have been an increase of $1.6 million and $19.1 million, respectively, including the variable-rate retirement certificates reclassified to Savings.
Comparison of Results of Operations for the Years Ended September 30, 2008 and 2007
For fiscal year 2008, the Company recognized net income of $51.0 million compared to net income of $32.3 million in fiscal year 2007. The $18.7 million increase in net income was primarily a result of a $28.5 million decrease in interest expense and a $6.0 million increase in other income, partially offset by an $8.6 million increase in income tax expense, a $4.3 million increase in other expenses, and a $2.3 million increase in the provision for loan loss.
Total interest and dividend income for the current fiscal year was $410.8 million compared to $411.6 million in the prior fiscal year. Total interest expense for the current fiscal year was $276.6 million compared to $305.1 million in the prior fiscal year. Net interest margin, before provision for loan losses, was $134.2 million compared to $106.4 million in the prior fiscal year.
As a result of the flat or inverted yield curve during fiscal year 2007 and the relatively short term to reprice our liabilities compared to our assets, the Bank experienced net interest margin compression during fiscal year 2007. The steeper, more normalized yield curve during fiscal year 2008 has benefited the net interest margin, as short-term liabilities have repriced to lower interest rates while cash flows from the mortgage loan and MBS portfolios have been reinvested at rates comparable to that of the existing portfolio.
Interest income on loans receivable in the current fiscal year was $302.0 million compared to $294.7 million in the prior fiscal year. The $7.3 million increase in loan interest income was a result of a $71.4 million increase in the average balance of the loan portfolio between the two periods and an increase of 6 basis points in the weighted average yield of the loan portfolio to 5.68% for the current fiscal year. The increase in the weighted average yield can be attributed primarily to loans originated throughout the year at rates higher than the overall portfolio rate.
Interest income on government agency-backed MBS in the current fiscal year was $88.4 million compared to $68.8 million in the prior fiscal year. The $19.6 million increase in interest income was due to an increase of $282.3 million in the average balance of the portfolio and an increase of 40 basis points in the average yield to 4.68% for the current fiscal year. The increase in the average portfolio balance was due primarily to the utilization of cash available for investment and funds from borrowings to purchase MBS rather than other investment securities due to the more favorable yields available on MBS. The weighted average yield of the MBS portfolio increased between the two periods due to the purchase of MBS with yields higher than the existing portfolio, the maturity and repayment of MBS with lower yields, and adjustable-rate MBS resetting to higher coupons.
Interest income on investment securities in the current fiscal year was $9.9 million compared to $30.8 million in the prior fiscal year. The $20.9 million decrease in interest income was primarily a result of a decrease of $414.4 million in the average balance of the portfolio and, to a lesser extent, a 61 basis point decrease in the weighted average portfolio yield to 4.09% for the current fiscal year. The decrease in the average balance was a result of maturities and calls which were not reinvested into investment securities and were used, in part, to fund maturing FHLB advances and purchase higher yielding MBS during fiscal year 2008. The decrease in the weighted average yield of the portfolio was attributed to purchases with lower yields than the existing portfolio and maturities and calls of securities with higher yields.
Dividends on FHLB stock in the current fiscal year were $6.9 million compared to $10.0 million in the prior fiscal year. The $3.1 million decrease in dividend income was due to a 117 basis point decrease in the average yield to 5.36% for the current fiscal year and a $24.3 million decrease in the average balance. The dividend rate on FHLB stock correlates to the federal funds rate, which also decreased during the current fiscal year. The decrease in the average balance was due to the redemption of shares as the required number of shares held is based primarily upon the balance of outstanding FHLB advances, which decreased during the current fiscal year.
Interest income on cash and cash equivalents in the current fiscal year was $3.6 million compared to $7.2 million in the prior fiscal year. The $3.6 million decrease was a result of a 200 basis point decrease in the average yield to 3.11% for the current fiscal year due to a decrease in short-term market interest rates, and a decrease of $26.2 million in the average balance as cash was utilized to purchase MBS and fund maturing FHLB advances.
Interest expense on deposits in the current fiscal year was $133.4 million compared to $147.3 million in the prior fiscal year. The $13.9 million decrease in interest expense was primarily a result of a decrease in the rate on the money market, certificate and savings portfolios due to the portfolios repricing to lower market rates. During fiscal year 2007, the Bank increased the rates offered on its certificate of deposit portfolio, with an emphasis on the 19 month to 36 month maturity category, in order to remain competitive. As certificate of deposits matured during fiscal year 2008, the amounts retained rolled into lower rate certificate products.
Interest expense on FHLB advances in the current fiscal year was $125.7 million compared to $153.4 million in the prior fiscal year. The $27.7 million decrease in interest expense was primarily a result of a decrease of $456.7 million in the average balance due to maturing advances which were not renewed in their entirety and, to a lesser extent, a decrease of 14 basis points in the average rate to 4.89% for the current fiscal year as a result of the termination of the interest rate swaps. During the quarter ended December 31, 2007, management terminated interest rate swaps with a notional amount of $575.0 million. The remaining interest rate swap matured in May 2008. During the current fiscal year, interest expense related to the interest rate swaps was $2.3 million, compared to $13.6 million in the prior fiscal year.
Interest expense on other borrowings was $17.5 million compared to $4.5 million in the same period in the prior year. The $13.0 million increase was due to an increase in the average balance of other borrowings due to the Bank entering into $660.0 million of repurchase agreements during fiscal year 2008. Additional information about the repurchase agreements is included under “Liquidity and Capital Resources.”
During the current fiscal year, the Bank recorded a provision for loan losses of $2.1 million compared to a recovery for loan losses of $225 thousand in the prior fiscal year. Based on our evaluation of the issues regarding the real estate markets, the overall economic environment, and the increase in and composition of our delinquencies and non-performing loans, management determined a provision for loan losses was prudent and warranted for the current fiscal year. See additional discussion regarding the provision for loan losses in the sections entitled “Critical Accounting Policies – Allowance for Loan Losses” and “Asset Quality” in Part I, Item 1 of the Annual Report on Form 10-K.
Total other income increased $6.0 million to $30.0 million during the current fiscal year compared to $24.0 million for the prior fiscal year. The increase in other income was due primarily to increases in bank owned life insurance (“BOLI”) income, retail fees and other income, net. BOLI income was $2.3 million for the current fiscal year compared to $27 thousand in the prior fiscal year as the Bank’s BOLI purchase was made during the fourth quarter of fiscal year 2007. Retail fees increased $1.7 million due primarily to an increase in fees received on ATM and Visa check cards from increased volume and an increase in the interchange rate received on point-of-sale transactions. Other income, net increased $1.3 million due primarily to the redemption of shares received in the Visa, Inc. initial public offering. Total proceeds from the Visa redemption reported in other income, net were $992 thousand, offset by a liability accrual of $594 thousand, reported in other expense, net related to litigation involving Visa, Inc. for net proceeds of $398 thousand.
Total other expenses increased $4.3 million to $82.0 million during the current fiscal year compared to $77.7 million for the prior fiscal year. The increase was due primarily to an increase in salaries and employee benefits of $2.2 million and an increase in other expense, net of $2.1 million. The increase in salaries and employee benefits was due to an increase in costs associated with the short-term performance plan due to actual corporate performance exceeding targeted performance levels, salary increases, and the lack of capitalization of payroll expense in the current fiscal year, as salary costs related to the core conversion were capitalized in the prior fiscal year. The increase in other expense, net was due primarily to a liability accrual of $594 thousand related to litigation involving Visa, Inc., as mentioned above, $420 thousand related to real-estate owned write-downs, and a decrease in prior year miscellaneous expenses of approximately $1.0 million.
Income tax expense for the current fiscal year was $29.2 million compared to $20.6 million for the prior fiscal year. The increase in income tax expense was due to an increase in income, partially offset by a decrease in the effective tax rate for the fiscal year to 36.4%, compared to 39.0% for the prior fiscal year. The decrease in the effective tax rate between periods was a result of an increase in nontaxable income from municipal securities and BOLI, along with an increase in pre-tax income.
Comparison of Results of Operations for the Years Ended September 30, 2007 and 2006
For fiscal year 2007, the Company recognized net income of $32.3 million compared to net income of $48.1 million in fiscal year 2006. The $15.8 million decrease in net income was primarily a result of a $20.6 million decrease in net interest and dividend income and a $4.9 million increase in other expenses, offset by a $10.0 million decrease in income tax expense.
Net interest and dividend income in fiscal year 2007 was $106.4 million compared to $127.0 million in fiscal year 2006. The $20.6 million decrease between the two periods was a result of a $21.2 million increase in interest expense, which was partially offset by a $622 thousand increase in interest and dividend income. The increase in interest expense was mainly attributable to higher rates on the certificate of deposit and money market portfolios and the interest rate swaps which are all generally priced based upon short-term interest rates (two year and shorter maturities).
Interest income on loans receivable in fiscal year 2007 was $294.7 million compared to $303.8 million in fiscal year 2006. The $9.1 million decrease in loan interest income was primarily due to a $287.4 million decrease in the average balance of the portfolio primarily as a result of the loan swap transaction which took place at the end of fiscal year 2006. The weighted average yield of the loan portfolio for fiscal year 2007 increased 13 basis points to 5.62%, compared to 5.49% for fiscal year 2006. The increase in the yield was due primarily to fixed- and adjustable-rate mortgage loans originated at rates generally higher than the average yield on the existing loan portfolio and existing ARM loans in the portfolio repricing to higher rates.
Interest income on MBS in fiscal year 2007 was $68.8 million compared to $75.8 million in fiscal year 2006. The $7.0 million decrease in interest income was a result of a $296.7 million decrease in the average balance of the portfolio, which was partially offset by an increase in the weighted average yield of 30 basis points to 4.28% for fiscal year 2007. The decrease in the average balance was due to maturities and principal repayments during fiscal year 2007. The weighted average yield increased during fiscal year 2007 primarily due to adjustable-rate securities in the portfolio repricing to a higher rate, and partially due to the purchase of securities with weighted-average yields greater than the existing portfolio.
Interest income on investment securities in fiscal year 2007 was $30.8 million compared to $18.0 million in fiscal year 2006. The $12.8 million increase in interest income was primarily a result of a $251.5 million increase in the average balance of the portfolio and, to a lesser extent, a 24 basis point increase in the weighted average yield to 4.70% for fiscal year 2007. The increase in the average balance was a result of the purchase of securities. The funds to purchase the securities were primarily from the proceeds from the sale of the trading securities in the first quarter of fiscal year 2007. The increase in the weighted average yield of the portfolio was due to the purchase of securities with weighted average yields higher than the remaining portfolio.
Interest income on cash and cash equivalents in fiscal year 2007 was $7.2 million compared to $3.3 million in fiscal year 2006. The $3.9 million increase in interest income was primarily a result of an increase in the average balance and partially a result of an increase in the average yield. The average balance increased due to the timing of the repayment of maturing FHLB advances. The increase in the average yield was due to an increase in short-term interest rates between the two years.
Interest expense on deposits in fiscal year 2007 was $147.3 million compared to $122.5 million in fiscal year 2006. The $24.8 million increase was primarily a result of an increase in the average rate on the certificate of deposit and money market portfolios. The weighted average rate of the certificate of deposit portfolio for fiscal year 2007 was 4.59% compared to 3.86% for fiscal year 2006. The weighted average rate of the money market portfolio for fiscal year 2007 was 3.29% compared to 2.66% for fiscal year 2006. The Bank increased certain deposit rates in response to the general trend of increasing interest rates to remain competitive in its markets, which resulted in an increase in the weighted average rate of the certificate of deposit and money market portfolios.
Interest expense on FHLB advances in fiscal year 2007 was $153.4 million compared to $157.2 million in fiscal year 2006. The $3.8 million decrease in interest expense was a result of a decrease in the average FHLB balance, partially offset by an increase in the paying rate on the interest rate swaps. The average balance of FHLB advances decreased as a result of the repayment of $600.0 million of maturing FHLB advances during fiscal year 2007. The weighted average paying rate on the variable-rate interest rate swaps was 7.83% for fiscal year 2007 compared to 7.22% for the prior fiscal year. The 61 basis point increase was due to the increase in the one month LIBOR rate between the two periods.
During fiscal year 2007, the Bank recorded a recovery for loan losses of $225 thousand compared to a provision for loan losses of $247 thousand in fiscal year 2006. The recovery for loan losses in fiscal year 2007 was a result of adjustments to the risk assessments of certain categories of loans to better reflect the inherent risk of those categories. The adjustments to the risk assessments were based upon management’s continuous evaluation of the recent and historical loss experience of our loan portfolio, underwriting standards, credit quality trends, trends in collateral values, and economic and business conditions affecting our key lending areas.
Total other income decreased $829 thousand to $24.0 million during fiscal year 2007 compared to $24.8 million for fiscal year 2006. The decrease in other income was primarily due to a $1.1 million net gain on trading securities recorded in fiscal year 2006 with no such similar transaction occurring in fiscal year 2007, and a decrease in retail fees and charges of $887 thousand. The decreases were partially offset by a $691 thousand increase in loan fees and a $472 thousand other-than-temporary impairment on AFS securities in fiscal year 2006 with no such impairment amount recorded in fiscal year 2007. As previously indicated in our Form 10-K for the year ended September 30, 2006, we discontinued collection of fees for transactions originated electronically following the Bank’s core information technology processing system replacement. Fees charged for the processing of insufficient fund (“NSF”) transactions decreased due to fewer incidents of NSF. Fees generally charged to our customers relating to their usage of ATMs not owned by the Bank were not charged immediately following the core system replacement. In addition, waived fees increased due primarily to fees assessed to customers which were waived immediately following the core system replacement as customers were becoming accustomed to new interfaces. The waived fees and ATM service charges which were not charged are expected to be a one-time core system replacement-related incident. Loan fees increased primarily as a result of an increase in service fees on sold loans due to the servicing rights retained in the loan swap transaction.
Total other expenses increased $4.8 million to $77.7 million during fiscal year 2007 compared to $72.9 million for fiscal year 2006. The increase was due primarily to a $1.8 million increase in regulatory and other services, a $1.2 million increase in salaries and employee benefit expenses and a $710 thousand increase in office supplies and related expenses. The increase in regulatory and other services was due primarily to an increase in consulting fees related to compliance with Section 404 of the Sarbanes-Oxley Act of 2002 (“SOX 404”) and other professional services, as the Company’s internal control environment had to be completely re-documented under the Bank’s new core information technology processing systems. The $1.2 million increase in salaries and employee benefits was a result of an increase in payroll expense and related taxes largely attributed to overtime paid following the core system replacement for additional staffing required to address customer service issues, partially offset by capitalized payroll expense related to the core system replacement. The increase in office supplies and related expense was due primarily to an increase in stationery and postage due to conversion-related mailings and customer statement printing changes related to the core system replacement.
Income tax expense for fiscal year 2007 was $20.6 million compared to $30.6 million for fiscal year 2006. The decrease was primarily a result of a decrease in earnings in fiscal year 2007 compared to fiscal year 2006. The effective tax rate for fiscal year 2007 was 39.0% which was relatively unchanged from 38.9% in fiscal year 2006.
Liquidity and Capital Resources
Liquidity management is both a daily and long-term function of our business management. The Bank’s most available liquid assets, represented by cash and cash equivalents, available-for-sale mortgage-related and investment securities, and short-term investment securities, are a product of its operating, investing and financing activities. These marketable assets are all U.S. agency debt or pass-through securities maintaining the highest level of liquidity available in the market with substantial price stability. The Bank’s primary sources of funds are deposits, FHLB advances, other borrowings, repayments on and maturities of outstanding loans and MBS, other short-term investments, and funds provided from operations. While scheduled payments from the amortization of loans and MBS and payments on short-term investments are relatively predictable sources of funds, deposit flows and prepayments on loans and MBS are greatly influenced by general interest rates, economic conditions and competition and are less predictable sources of funds. To the extent possible, the Bank manages the cash flows of its loan and deposit portfolios by the rates it offers customers. Sources of funds are used primarily to meet ongoing operations, to pay maturing certificates of deposit and savings withdrawals, and to fund loan commitments. At September 30, 2008, $1.48 billion of the $2.52 billion in certificates of deposit were scheduled to mature within one year. Based on past experience and our pricing strategy, we expect a majority of these maturing deposits will renew, although no assurance can be given in this regard.
The Bank has paid competitive rates for its deposits while not “paying-up” in rates to grow its deposit base beyond the Bank’s need for funding. The Bank’s borrowings have been primarily used to invest in U.S. government agency securities in order to safely improve the earnings of the Bank while maintaining its capital ratios in excess of regulatory standards for well-capitalized financial institutions. In addition, the Bank’s focus on managing risk has provided it liquidity capacity by remaining below borrowing limits at FHLB and through the uncollateralized balance of its mortgage-related and investment securities available as collateral for borrowings.
The Bank has used FHLB advances to provide funds for lending and investment activities. FHLB lending guidelines set borrowing limits as part of their underwriting standards. At September 30, 2008, the Bank’s ratio of the face amount of advances to total assets, as reported to the OTS, was 30%. Our advances are secured by a blanket pledge of our loan portfolio, as collateral, supported by quarterly reporting to FHLB. Advances in excess of 40% of total assets, but not exceeding 55% of total assets, may be approved by the president of FHLB based upon a review of documentation supporting the use of the advances. Currently, the blanket pledge is sufficient collateral for the FHLB advances. It is possible that increases in our borrowings or decreases in our loan portfolio could require the Bank to pledge securities as collateral on the FHLB advances. The Bank’s policy allows borrowing from FHLB of up to 55% of total assets. The Bank utilizes other sources for liquidity, such as secondary market repurchase agreements and brokered deposits, but relies primarily on the FHLB advances.
During fiscal year 2008, the Bank entered into repurchase agreements totaling $660.0 million, or 8% of total assets. The agreements are treated as secured borrowings and are reported as a liability of the Company on a consolidated basis. The Bank has pledged securities with a market value of $742.7 million as collateral. At the maturity date of these borrowings, the pledged securities will be delivered back to the Bank. The Bank may enter into additional repurchase agreements as management deems appropriate. The Bank’s policy allows for repurchase agreements to total up to 15% of total assets.
In 2004, the Company issued $53.6 million in Junior Subordinated Deferrable Interest Debentures (“Debentures”) in connection with a trust preferred securities offering. The Company received, net, $52.0 million from the issuance of the Debentures and an investment of $1.6 million in Capitol Federal Financial Trust I (the “Trust”). The Company did not down-stream the proceeds to be used by the Bank for Tier 1 capital because the Bank already exceeded all regulatory requirements to be a well-capitalized institution. Instead, the Company deposited the proceeds into certificate accounts at the Bank to be used to further the Company’s general corporate and capital management strategies which could include the payment of dividends.
At September 30, 2008, cash and cash equivalents totaled $87.1 million, a decrease of $75.7 million from September 30, 2007. The decrease in cash was due to using funds to originate loans and purchase securities. The Bank maintains access to additional liquidity through its management of the level of borrowings from the FHLB and counterparties of repurchase agreements through the availability of high quality collateral for borrowings. At September 30, 2008, $1.57 billion of securities were eligible but unused for collateral. The Bank also has access to the brokered deposit market and considers this source of funding along with other sources when evaluating funding sources.
It is management’s and the board of directors’ intention to continue to pay regular quarterly dividends of $0.50 per share for the foreseeable future. MHC, which owns a majority of the outstanding shares of CFFN common stock, generally waives its right to receive dividends paid on the common stock. At September 30, 2008, Capitol Federal Financial, at the holding company level, had $104.5 million in cash and certificates of deposit at the Bank to be used to further the Company's general corporate and capital management strategies, which could include the payment of dividends.
The long-term ability of the Company to pay dividends to its stockholders is based primarily upon the ability of the Bank to make capital distributions to the Company. Under OTS safe harbor regulations, the Bank may distribute to the Company capital not exceeding net income for the current calendar year and the prior two calendar years. Due to lower earnings in prior periods compared to the timing of dividend payments by the Bank to the Company, the Bank cannot distribute capital to the Company unless it receives a waiver of the safe harbor regulation from the OTS during the current waiver period, which is expected to expire on December 31, 2008. Currently, the Bank has authorization from the OTS to distribute capital from the Bank to the Company through the quarter ending June 30, 2009. So long as the Bank continues to maintain excess capital, operate in a safe and sound manner, and comply with the interest rate risk management guidelines of the OTS, it is management’s belief the Bank will continue to receive waivers, as necessary, allowing it to distribute the net income of the Bank to the Company, although no assurance can be given in this regard.
On October 3, 2008, the EESA was signed into law. EESA authorizes the Treasury Department to purchase from financial institutions and their holding companies up to $700.00 billion in mortgage loans, MBS and certain other financial instruments, including debt and equity securities issued by financial institutions and their holding companies in a Troubled Asset Relief Program (“TARP”). The purpose of TARP is to restore confidence and stability to the U.S. banking system and to encourage financial institutions to increase their lending to customers and to each other. The Treasury Department has allocated $250.00 billion towards the TARP Capital Purchase Program (“CPP”). Under the CPP, Treasury will purchase debt or equity securities from participating institutions. Participants in the CPP are encouraged to expand their lending. Management believes the Company’s current capital position and sources of liquidity allow the Bank to continue to lend customers funds to purchase homes. Since expanding lending is the primary purpose of CPP, management and the board of directors believe the Company is already well positioned to meet the CPP’s objective and have decided not to participate in the CPP. The other provisions in the EESA are not expected to have a material impact on the Company’s future financial position, results of operations, cash flows, or liquidity.
Off-Balance Sheet Arrangements, Commitments and Contractual Obligations
The Company, in the normal course of business, makes commitments to buy or sell assets or to incur or fund liabilities. Commitments may include, but are not limited to:
| · | the origination, purchase, or sale of loans; |
| · | the purchase or sale of investments and MBS; |
| · | extensions of credit on home equity loans and construction loans; |
| · | terms and conditions of operating leases; and |
| · | funding withdrawals of certificate of deposits at maturity. |
In addition to its commitments of the types described above, at September 30, 2008 the Company’s off-balance sheet arrangements included its $1.6 million interest in the Trust, which in 2004 issued $52.0 million of variable rate cumulative trust preferred securities. In connection therewith, the Company issued $53.6 million of Debentures to the Trust.
The following table summarizes our contractual obligations and other material commitments as of September 30, 2008. The actual maturity of the Debentures may differ from scheduled maturity as the Debentures are callable at any time, in whole or in part, after April 7, 2009.
| | | Maturity Range | |
| | | | | | Less than | | | | 1 - 3 | | | | 3 - 5 | | | More than | |
| | | Total | | | 1 year | | | years | | | years | | | 5 years | |
| | | (Dollars in thousands) | |
| | | | | | | | | | | | | | | | | | |
| Operating leases | | $ | 10,452 | | | $ | 1,057 | | | $ | 1,644 | | | $ | 1,252 | | | $ | 6,499 | |
| | | | | | | | | | | | | | | | | | | | | |
| Certificates of Deposit | | $ | 2,518,996 | | | | 1,480,386 | | | | 916,993 | | | | 120,670 | | | | 947 | |
| Weighted average rate | | | 3.91 | % | | | 3.76 | % | | | 4.19 | % | | | 3.71 | % | | | 4.17 | % |
| | | | | | | | | | | | | | | | | | | | | |
| FHLB Advances | | $ | 2,446,000 | | | | 620,000 | | | | 1,201,000 | | | | 625,000 | | | | -- | |
| Weighted average rate | | | 4.77 | % | | | 4.27 | % | | | 5.46 | % | | | 3.95 | % | | | -- | % |
| | | | | | | | | | | | | | | | | | | | | |
| Repurchase Agreements | | $ | 660,000 | | | | -- | | | | 245,000 | | | �� | 295,000 | | | | 120,000 | |
| Weighted average rate | | | 3.97 | % | | | -- | % | | | 3.65 | % | | | 4.12 | % | | | 4.24 | % |
| | | | | | | | | | | | | | | | | | | | | |
| Debentures | | $ | 53,581 | | | | -- | | | | -- | | | | -- | | | | 53,581 | |
| Weighted average rate | | | 5.54 | % | | | -- | % | | | -- | % | | | -- | % | | | 5.54 | % |
| | | | | | | | | | | | | | | | | | | | | |
| Commitments to originate and | | | | | | | | | | | | | | | | | | | | |
| purchase mortgage loans | | $ | 269,240 | | | | 269,240 | | | | -- | | | | -- | | | | -- | |
| Weighted average rate | | | 5.51 | % | | | 5.51 | % | | | -- | % | | | -- | % | | | -- | % |
| | | | | | | | | | | | | | | | | | | | | |
| Commitments to fund unused home | | | | | | | | | | | | | | | | | | | | |
| equity lines of credit | | $ | 269,010 | | | | 269,010 | | | | -- | | | | -- | | | | -- | |
| Weighted average rate | | | 5.68 | % | | | 5.68 | % | | | -- | % | | | -- | % | | | -- | % |
| | | | | | | | | | | | | | | | | | | | | |
| Unadvanced portion of | | | | | | | | | | | | | | | | | | | | |
| construction loans | | $ | 43,186 | | | | 43,186 | | | | -- | | | | -- | | | | -- | |
Excluded from the table above are income tax liabilities of $2.4 million related to FASB Interpretation No. 48 (“FIN 48”). The amounts are excluded as management is unable to estimate the period of cash settlement as it is contingent on the statute of limitations expiring without examination by the respective taxing authority.
A percentage of commitments to originate mortgage loans are expected to expire unfunded, so the amounts reflected in the table above are not necessarily indicative of future liquidity requirements. Additionally, the Bank is not obligated to honor commitments to fund unused home equity lines of credit if a customer is delinquent or otherwise in violation of the loan agreement.
We anticipate we will continue to have sufficient funds, through repayments and maturities of loans and securities, deposits and borrowings, to meet our current commitments.
In December 2003, management entered into interest rate swap agreements with an aggregate notional amount of $800.0 million to modify the Bank’s interest rate risk profile by hedging certain FHLB advances. In December 2007, management terminated interest rate swap agreements with an aggregate notional amount of $575.0 million due to favorable economic market conditions. The interest rate swaps were scheduled to mature in fiscal year 2010. The net position at the time of termination was a gain of $1.7 million which is being deferred and recorded as a yield adjustment to the related advances over the remaining term to maturity of the advances. The termination of the interest rate swap agreements improved the interest rate risk profile of the Bank by extending the effective repricing frequency of the related advances from monthly to their stated maturity. The remaining interest rate swap agreement matured in May 2008.
In the normal course of business, the Company and its subsidiary are named defendants in various lawsuits and counter claims. In the opinion of management, after consultation with legal counsel, none of the currently pending suits are expected to have a materially adverse effect on the Company’s consolidated financial statements for the year ended September 30, 2008 or future periods.
Regulatory Capital
Consistent with management’s goals to operate a sound and profitable financial organization, we actively seek to maintain a “well capitalized” status in accordance with regulatory standards. Total equity for the Bank was $803.6 million at September 30, 2008, or 10.0% of total assets on that date. As of September 30, 2008, the Bank exceeded all capital requirements of the OTS. The following table presents the Bank’s regulatory capital ratios at September 30, 2008 based upon regulatory guidelines.
| | | | Regulatory |
| | | | Requirement |
| | Bank | | For "Well |
| | Ratios | | Capitalized” Status |
| Core capital | 10.0% | | 5.0% |
| Tier I risk-based capital | 23.1 | | 6.0 |
| Total risk-based capital | 23.0 | | 10.0 |
Stockholder Return Performance Presentation
The line graph below compares the cumulative total stockholder return on the Company’s common stock to the cumulative total return of a broad index of the Nasdaq Stock Market and a Hemscott Group savings and loan industry index (“S&L Index”) for the period September 30, 2003 through September 30, 2008. The information presented below assumes $100 invested on September 30, 2003 in the Company’s common stock and in each of the indices, and assumes the reinvestment of all dividends. Historical stock price performance is not necessarily indicative of future stock price performance.
| | 2003 | 2004 | 2005 | 2006 | 2007 | 2008 |
| CAPITOL FEDERAL FINANCIAL | 100.00 | 119.06 | 134.05 | 149.13 | 151.80 | 208.14 |
| S&L INDEX | 100.00 | 116.77 | 121.52 | 139.26 | 121.92 | 99.44 |
| NASDAQ MARKET INDEX | 100.00 | 106.02 | 120.61 | 127.77 | 152.68 | 118.28 |
MANAGEMENT’S REPORT ON INTERNAL CONTROL OVER FINANCIAL REPORTING
Management of the Company is responsible for establishing and maintaining adequate internal control over financial reporting (as defined in Rule 13a-15(e) and 15(d)-15(e) under the Securities Exchange Act of 1934, as amended, the “Act”). The Company’s internal control system is a process designed to provide reasonable assurance to the Company’s management and board of directors regarding the preparation and fair presentation of published financial statements.
The Company’s internal control over financial reporting includes policies and procedures that pertain to the maintenance of records that, in reasonable detail, accurately and fairly reflect transactions and dispositions of assets; provide reasonable assurances that transactions are recorded as necessary to permit preparation of financial statements in accordance with accounting principles generally accepted in the United States of America, and that receipts and expenditures are being made only in accordance with authorizations of management and the directors of the Company; and provide reasonable assurance regarding prevention or untimely detection of unauthorized acquisition, use or disposition of the Company’s assets that could have a material effect on the Company’s financial statements.
All internal control systems, no matter how well designed, have inherent limitations. Therefore, even those systems determined to be effective can provide only reasonable assurance with respect to financial reporting. Further, because of changes in conditions, the effectiveness of any system of internal control may vary over time. The design of any internal control system also factors in resource constraints and consideration for the benefit of the control relative to the cost of implementing the control. Because of these inherent limitations in any system of internal control, management cannot provide absolute assurance that all control issues and instances of fraud within the Company have been detected.
Management assessed the effectiveness of the Company’s internal control over financial reporting as of September 30, 2008. In making this assessment, management used the criteria set forth by the Committee of Sponsoring Organizations of the Treadway Commission in Internal Control-Integrated Framework. Management has concluded that the Company maintained an effective system of internal control over financial reporting based on these criteria as of September 30, 2008.
The Company’s independent registered public accounting firm, Deloitte & Touche LLP, who audited the consolidated financial statements included in the Company’s annual report, has issued an audit report on the Company’s internal control over financial reporting as of September 30, 2008 and it is included herein.
| John B. Dicus, President |
| and Chief Executive Officer |
| |
| |
| Kent G. Townsend, Executive Vice President |
| and Chief Financial Officer |
| |
REPORT OF INDEPENDENT REGISTERED PUBLIC ACCOUNTING FIRM
To the Board of Directors and Stockholders of
Capitol Federal Financial and Subsidiary
Topeka, Kansas
We have audited the internal control over financial reporting of Capitol Federal Financial and Subsidiary (the "Company") as of September 30, 2008, based on criteria established in Internal Control — Integrated Framework issued by the Committee of Sponsoring Organizations of the Treadway Commission. Because management’s assessment and our audit were conducted to meet the reporting requirements of Section 112 of the Federal Deposit Insurance Corporation Improvement Act (FDICIA), management’s assessment and our audit of the Company’s internal control over financial reporting included controls over the preparation of the schedules equivalent to the basic financial statements in accordance with the instructions for the Consolidated Financial Statements for Bank Holding Companies (Form FR Y-9C). The Company's management is responsible for maintaining effective internal control over financial reporting and for its assessment of the effectiveness of internal control over financial reporting, included in the accompanying Management’s Report on Internal Control over Financial Reporting. Our responsibility is to express an opinion on the Company's internal control over financial reporting based on our audit.
We conducted our audit in accordance with the standards of the Public Company Accounting Oversight Board (United States). Those standards require that we plan and perform the audit to obtain reasonable assurance about whether effective internal control over financial reporting was maintained in all material respects. Our audit included obtaining an understanding of internal control over financial reporting, assessing the risk that a material weakness exists, testing and evaluating the design and operating effectiveness of internal control based on the assessed risk, and performing such other procedures as we considered necessary in the circumstances. We believe that our audit provides a reasonable basis for our opinion.
A company's internal control over financial reporting is a process designed by, or under the supervision of, the company's principal executive and principal financial officers, or persons performing similar functions, and effected by the company's board of directors, management, and other personnel to provide reasonable assurance regarding the reliability of financial reporting and the preparation of financial statements for external purposes in accordance with generally accepted accounting principles. A company's internal control over financial reporting includes those policies and procedures that (1) pertain to the maintenance of records that, in reasonable detail, accurately and fairly reflect the transactions and dispositions of the assets of the company; (2) provide reasonable assurance that transactions are recorded as necessary to permit preparation of financial statements in accordance with generally accepted accounting principles, and that receipts and expenditures of the company are being made only in accordance with authorizations of management and directors of the company; and (3) provide reasonable assurance regarding prevention or timely detection of unauthorized acquisition, use, or disposition of the company's assets that could have a material effect on the financial statements.
Because of the inherent limitations of internal control over financial reporting, including the possibility of collusion or improper management override of controls, material misstatements due to error or fraud may not be prevented or detected on a timely basis. Also, projections of any evaluation of the effectiveness of the internal control over financial reporting to future periods are subject to the risk that the controls may become inadequate because of changes in conditions, or that the degree of compliance with the policies or procedures may deteriorate.
In our opinion, the Company maintained, in all material respects, effective internal control over financial reporting as of September 30, 2008 based on the criteria established in Internal Control — Integrated Framework issued by the Committee of Sponsoring Organizations of the Treadway Commission.
We have also audited, in accordance with the standards of the Public Company Accounting Oversight Board (United States), the consolidated financial statements as of and for the year ended September 30, 2008 of the Company and our report dated November 26, 2008 expressed an unqualified opinion on those financial statements.
Kansas City, Missouri
November 26, 2008
REPORT OF INDEPENDENT REGISTERED PUBLIC ACCOUNTING FIRM
To the Board of Directors and Stockholders of
Capitol Federal Financial and Subsidiary
Topeka, Kansas
We have audited the accompanying consolidated balance sheets of Capitol Federal Financial and Subsidiary (the “Company”) as of September 30, 2008 and 2007, and the related consolidated statements of income, stockholders' equity, and cash flows for each of the three years in the period ended September 30, 2008. These financial statements are the responsibility of the Company's management. Our responsibility is to express an opinion on these financial statements based on our audits.
We conducted our audits in accordance with the standards of the Public Company Accounting Oversight Board (United States). Those standards require that we plan and perform the audit to obtain reasonable assurance about whether the financial statements are free of material misstatement. An audit includes examining, on a test basis, evidence supporting the amounts and disclosures in the financial statements. An audit also includes assessing the accounting principles used and significant estimates made by management, as well as evaluating the overall financial statement presentation. We believe that our audits provide a reasonable basis for our opinion.
In our opinion, such consolidated financial statements present fairly, in all material respects, the financial position of Capitol Federal Financial and Subsidiary as of September 30, 2008 and 2007, and the results of their operations and their cash flows for each of the three years in the period ended September 30, 2008, in conformity with accounting principles generally accepted in the United States of America.
We have also audited, in accordance with the standards of the Public Company Accounting Oversight Board (United States), the Company's internal control over financial reporting as of September 30, 2008, based on the criteria established in Internal Control-Integrated Framework issued by the Committee of Sponsoring Organizations of the Treadway Commission and our report dated November 26, 2008 expressed an unqualified opinion on the Company's internal control over financial reporting.
Kansas City, Missouri
November 26, 2008
| CAPITOL FEDERAL FINANCIAL AND SUBSIDIARY | | | | |
| | | | | | | |
| CONSOLIDATED BALANCE SHEETS | | | | | | |
| SEPTEMBER 30, 2008 and 2007 (in thousands) | | | | | | |
| | | | | | | |
| | | | | | | |
| ASSETS | | 2008 | | | 2007 | |
| | | | | | | |
| CASH AND CASH EQUIVALENTS | | $ | 87,138 | | | $ | 162,791 | |
| | | | | | | | | |
| INVESTMENT SECURITIES: | | | | | | | | |
| Available-for-sale, at market (amortized cost of $51,700 and $102,331) | | | 49,586 | | | | 102,424 | |
| Held-to-maturity, at cost (market value of $92,211 and $418,940) | | | 92,773 | | | | 421,744 | |
| | | | | | | | | |
| MORTGAGE-RELATED SECURITIES: | | | | | | | | |
| Available-for-sale, at market value (amortized cost of $1,491,536 | | | | | | | | |
| and $400,705) | | | 1,484,055 | | | | 402,686 | |
| Held-to-maturity, at cost (market value of $743,764 and $995,415) | | | 750,284 | | | | 1,011,585 | |
| | | | | | | | | |
| LOANS RECEIVABLE HELD FOR SALE, at lower of amortized | | | | | | | | |
| cost or market | | | 997 | | | | 2,184 | |
| | | | | | | | | |
| LOANS RECEIVABLE, net (less allowance for loan losses of | | | | | | | | |
| $5,791 and $4,181) | | | 5,320,780 | | | | 5,290,071 | |
| | | | | | | | | |
| CAPITAL STOCK OF FEDERAL HOME LOAN BANK (“FHLB”), at cost | | | 124,406 | | | | 139,661 | |
| | | | | | | | | |
| ACCRUED INTEREST RECEIVABLE: | | | | | | | | |
| Investment securities | | | 1,890 | | | | 7,368 | |
| Mortgage-related securities | | | 10,909 | | | | 6,787 | |
| Loans receivable | | | 20,905 | | | | 21,714 | |
| | | | | | | | | |
| PREMISES AND EQUIPMENT, net | | | 29,874 | | | | 26,610 | |
| | | | | | | | | |
| REAL ESTATE OWNED, net | | | 5,146 | | | | 2,097 | |
| | | | | | | | | |
| INCOME TAXES RECEIVABLE, net | | | -- | | | | 6,620 | |
| | | | | | | | | |
| DEFERRED INCOME TAXES, net | | | -- | | | | 543 | |
| | | | | | | | | |
| OTHER ASSETS | | | 76,506 | | | | 71,001 | |
| | | | | | | | | |
| TOTAL ASSETS | | $ | 8,055,249 | | | $ | 7,675,886 | |
| | | | | | | | | |
| | | | | | | | | |
| . | | | | | | (Continued) | |
| CAPITOL FEDERAL FINANCIAL AND SUBSIDIARY | | | | |
| | | | | | | |
| CONSOLIDATED BALANCE SHEETS | | | | | | |
| SEPTEMBER 30, 2008 and 2007 (in thousands, except share amounts) | | | | | | |
| | | | | | | |
| | | | | | | |
| LIABILITIES AND STOCKHOLDERS’ EQUITY | | 2008 | | | 2007 | |
| | | | | | | |
| LIABILITIES: | | | | | | |
| Deposits | | $ | 3,923,883 | | | $ | 3,922,782 | |
| Advances from FHLB | | | 2,447,129 | | | | 2,732,183 | |
| Other borrowings | | | 713,581 | | | | 53,524 | |
| Advance payments by borrowers for taxes and insurance | | | 53,213 | | | | 51,109 | |
| Income taxes payable, net | | | 6,554 | | | | -- | |
| Deferred income taxes, net | | | 3,223 | | | | -- | |
| Accounts payable and accrued expenses | | | 36,450 | | | | 48,657 | |
| | | | | | | | | |
| Total liabilities | | | 7,184,033 | | | | 6,808,255 | |
| | | | | | | | | |
| COMMITMENTS AND CONTINGENCIES (NOTE 14) | | | | | | | | |
| | | | | | | | | |
| STOCKHOLDERS’ EQUITY: | | | | | | | | |
| Preferred stock, $.01 par value; 50,000,000 shares authorized, | | | | | | | | |
| no shares issued or outstanding | | | -- | | | | -- | |
| Common stock, $.01 par value; 450,000,000 shares authorized, | | | | | | | | |
| 91,512,287 shares issued; 74,079,868 and 74,258,977 shares | | | | | | | | |
| outstanding as of September 30, 2008 and 2007, respectively | | | 915 | | | | 915 | |
| Additional paid-in capital | | | 445,391 | | | | 438,964 | |
| Unearned compensation - Employee Stock Ownership Plan (“ESOP”) | | | (10,082 | ) | | | (12,098 | ) |
| Unearned compensation - Recognition and Retention Plan (“RRP”) | | | (553 | ) | | | (630 | ) |
| Retained earnings | | | 759,375 | | | | 750,186 | |
| Accumulated other comprehensive (loss) gain | | | (5,968 | ) | | | 1,287 | |
| | | | | | | | | |
| | | | 1,189,078 | | | | 1,178,624 | |
| | | | | | | | | |
| Treasury stock, 17,432,419 and 17,253,310 shares as of | | | | | | | | |
| September 30, 2008 and 2007, at cost | | | (317,862 | ) | | | (310,993 | ) |
| | | | | | | | | |
| Total stockholders’ equity | | | 871,216 | | | | 867,631 | |
| | | | | | | | | |
| TOTAL LIABILITIES AND STOCKHOLDERS’ EQUITY | | $ | 8,055,249 | | | $ | 7,675,886 | |
| | | | | | | | | |
| | | | | | | | | |
| See notes to consolidated financial statements. | | | | | | (Concluded) | |
| | | | | | | | | |
| CAPITOL FEDERAL FINANCIAL AND SUBSIDIARY | | | | | | | |
| | | | | | | | | | |
| CONSOLIDATED STATEMENTS OF INCOME | | | | | | | | | |
| YEARS ENDED SEPTEMBER 30, 2008, 2007, and 2006 (in thousands, except per share amounts) | |
| | | | | | | | | | |
| | | 2008 | | | 2007 | | | 2006 | |
| INTEREST AND DIVIDEND INCOME: | | | | | | | | | |
| Loans receivable | | $ | 302,020 | | | $ | 294,744 | | | $ | 303,822 | |
| Mortgage-related securities | | | 88,395 | | | | 68,752 | | | | 75,806 | |
| Investment securities | | | 9,917 | | | | 30,849 | | | | 18,047 | |
| Capital stock of FHLB | | | 6,921 | | | | 10,017 | | | | 9,913 | |
| Cash and cash equivalents | | | 3,553 | | | | 7,188 | | | | 3,340 | |
| Total interest and dividend income | | | 410,806 | | | | 411,550 | | | | 410,928 | |
| | | | | | | | | | | | | |
| INTEREST EXPENSE: | | | | | | | | | | | | |
| Deposits | | | 133,435 | | | | 147,279 | | | | 122,548 | |
| FHLB advances | | | 125,748 | | | | 153,363 | | | | 157,197 | |
| Other borrowings | | | 17,455 | | | | 4,468 | | | | 4,160 | |
| Total interest expense | | | 276,638 | | | | 305,110 | | | | 283,905 | |
| | | | | | | | | | | | | |
| NET INTEREST AND DIVIDEND INCOME | | | 134,168 | | | | 106,440 | | | | 127,023 | |
| | | | | | | | | | | | | |
| PROVISION (RECOVERY) FOR LOAN LOSSES | | | 2,051 | | | | (225 | ) | | | 247 | |
| | | | | | | | | | | | | |
| NET INTEREST AND DIVIDEND INCOME AFTER PROVISION | | | | | | | | | | | | |
| (RECOVERY) FOR LOAN LOSSES | | | 132,117 | | | | 106,665 | | | | 126,776 | |
| | | | | | | | | | | | | |
| OTHER INCOME: | | | | | | | | | | | | |
| Retail fees and charges | | | 17,805 | | | | 16,120 | | | | 17,007 | |
| Income from bank-owned life insurance (“BOLI”) | | | 2,323 | | | | 27 | | | | -- | |
| Loan fees | | | 2,325 | | | | 2,467 | | | | 1,776 | |
| Insurance commissions | | | 2,238 | | | | 2,059 | | | | 2,329 | |
| Gains on securities and loans receivable, net | | | 829 | | | | 75 | | | | 653 | |
| Other, net | | | 4,507 | | | | 3,218 | | | | 3,030 | |
| Total other income | | | 30,027 | | | | 23,966 | | | | 24,795 | |
| | | | | | | | | | | | | |
| OTHER EXPENSES: | | | | | | | | | | | | |
| Salaries and employee benefits | | | 43,498 | | | | 41,269 | | | | 40,026 | |
| Occupancy of premises | | | 13,957 | | | | 13,135 | | | | 12,970 | |
| Regulatory and outside services | | | 5,457 | | | | 7,078 | | | | 5,241 | |
| Deposit and loan transaction costs | | | 5,240 | | | | 4,709 | | | | 4,332 | |
| Advertising | | | 4,925 | | | | 4,317 | | | | 4,038 | |
| Office supplies and related expenses | | | 2,234 | | | | 2,913 | | | | 2,203 | |
| Federal insurance premium | | | 735 | | | | 490 | | | | 533 | |
| Other, net | | | 5,943 | | | | 3,814 | | | | 3,525 | |
| Total other expenses | | | 81,989 | | | | 77,725 | | | | 72,868 | |
| INCOME BEFORE INCOME TAX EXPENSE | | | 80,155 | | | | 52,906 | | | | 78,703 | |
| | | | | | | | | | | | | |
| INCOME TAX EXPENSE | | | 29,201 | | | | 20,610 | | | | 30,586 | |
| NET INCOME | | $ | 50,954 | | | $ | 32,296 | | | $ | 48,117 | |
| | | | | | | | | | | | | |
| Basic earnings per share | | $ | 0.70 | | | $ | 0.44 | | | $ | 0.66 | |
| Diluted earnings per share | | $ | 0.70 | | | $ | 0.44 | | | $ | 0.66 | |
| Dividends declared per public share | | $ | 2.00 | | | $ | 2.09 | | | $ | 2.30 | |
| | | | | | | | | | | | | |
| Basic weighted average common shares | | | 72,938,871 | | | | 72,849,095 | | | | 72,594,798 | |
| Diluted weighted average common shares | | | 73,012,666 | | | | 72,970,388 | | | | 72,853,691 | |
| | | | | | | | | | | | | |
| See notes to consolidated financial statements. | | | | | | | | | | | | |
| CAPITOL FEDERAL FINANCIAL AND SUBSIDIARY | | | | | | | | | | | | | | | | |
| | | | | | | | | | | | | | | | | | | | | | | | | | | | | | |
| CONSOLIDATED STATEMENTS OF STOCKHOLDERS’ EQUITY | | | | | | | | | | | | | | | | | | | | | | |
| YEARS ENDED SEPTEMBER 30, 2008, 2007, and 2006 | | | | | | | | | | | | | | | | | | | | | | | | | |
| (in thousands, except share amounts) | | | | | | | | | | | | | | | | | | | | | | | | | | | | |
| | | | | | | | | | | | | | | | | | | | | | | | | | | | | | | |
| | | | | | | | | | | | | | | | | | | | | | | | | | | | | | | |
| | | | | | | | | | | | | | | | | | | | | Accumulated | | | | | | | | | | |
| | | | | | | | | Additional | | | Unearned | | | Unearned | | | | | | Other | | | | | | | | | Total | |
| | | Common Stock | | | Paid-In | | | Compensation- | | | Compensation- | | | Retained | | | Comprehensive | | | Treasury Stock | | | Stockholders’ | |
| | | Shares | | | Amount | | | Capital | | | ESOP | | | RRP | | | Earnings | | | Gain (Loss) | | | Shares | | | Amount | | | Equity | |
| | | | | | | | | | | | | | | | | | | | | | | | | | | | | | | |
| Balance, October 1, 2005 | | | 91,512,287 | | | $ | 915 | | | $ | 421,903 | | | $ | (16,721 | ) | | $ | (539 | ) | | $ | 759,643 | | | $ | (3,769 | ) | | | 17,225,398 | | | $ | (296,369 | ) | | $ | 865,063 | |
| | | | | | | | | | | | | | | | | | | | | | | | | | | | | | | | | | | | | | | | | |
| Comprehensive income: | | | | | | | | | | | | | | | | | | | | | | | | | | | | | | | | | | | | | | | | |
| Net income for the year ended, | | | | | | | | | | | | | | | | | | | | | | | | | | | | | | | | | | | | | | | | |
| September 30, 2006 | | | | | | | | | | | | | | | | | | | | | | | 48,117 | | | | | | | | | | | | | | | | 48,117 | |
| Other comprehensive income - | | | | | | | | | | | | | | | | | | | | | | | | | | | | | | | | | | | | | | | | |
| Changes in unrealized gains/losses | | | | | | | | | | | | | | | | | | | | | | | | | | | | | | | | | | | | | |
| on securities available-for-sale | | | | | | | | | | | | | | | | | | | | | | | | | | | | | | | | | | | | | | | | |
| net of deferred income taxes | | | | | | | | | | | | | | | | | | | | | | | | | | | | | | | | | | | | | |
| of $1,360 | | | | | | | | | | | | | | | | | | | | | | | | 2,226 | | | | | | | | | | | | 2,226 | |
| Total comprehensive income | | | | | | | | | | | | | | | | | | | | | | | | | | | | | | | | | | | | | | | 50,343 | |
| | | | | | | | | | | | | | | | | | | | | | | | | | | | | | | | | | | | | | |
| ESOP activity, net | | | | | | | | | | | 4,741 | | | | 1,937 | | | | | | | | | | | | | | | | | | | | | | | | 6,678 | |
| RRP activity, net | | | | | | | | | | | 543 | | | | | | | | (286 | ) | | | | | | | | | | | (22,500 | ) | | | 208 | | | | 465 | |
| Stock based compensation -- | | | | | | | | | | | | | | | | | | | | | | | | | | | | | | | | | | | | | | | | |
| stock options and RRP | | | | | | | | | | | 375 | | | | | | | | | | | | | | | | | | | | | | | | | | | | 375 | |
| Acquisition of treasury stock | | | | | | | | | | | | | | | | | | | | | | | | | | | | | | | 508,551 | | | | (16,681 | ) | | | (16,681 | ) |
| Stock options exercised | | | | | | | | | | | 1,724 | | | | | | | | | | | | | | | | | | | | (231,092 | ) | | | 2,122 | | | | 3,846 | |
| Dividends on common stock to | | | | | | | | | | | | | | | | | | | | | | | | | | | | | | | | | | | | | |
| stockholders ($2.30 per public share) | | | | | | | | | | | | | | | | | | | | | | | (46,870 | ) | | | | | | | | | | | | | | | (46,870 | ) |
| BALANCE, September 30, 2006 | | | 91,512,287 | | | | 915 | | | | 429,286 | | | | (14,784 | ) | | | (825 | ) | | | 760,890 | | | | (1,543 | ) | | | 17,480,357 | | | | (310,720 | ) | | | 863,219 | |
| | | | | | | | | | | | | | | | | | | | | | | | | | | | | | | | | | | | | | | | | |
| See notes to consolidated financial statements. | | | | | | | | | | | | | | | | | | | | | | | | | | | | | | | | | | | (Continued) | |
| CAPITOL FEDERAL FINANCIAL AND SUBSIDIARY | | | | | | | | | | | |
| | | | | | | | | | | | | | | | | | | | | |
| CONSOLIDATED STATEMENTS OF STOCKHOLDERS’ EQUITY | | | | | | | | | | | | | | | |
| YEARS ENDED SEPTEMBER 30, 2008, 2007, and 2006 | | | | | | | | | | | | | | | | | |
| (in thousands, except share amounts) | | | | | | | | | | | | | | | | | | | |
| | | | | | | | | | | | | | | | | | | | | |
| | | | | | | | | | | | | | | | | | | |
| | | | | | | | | | | | | | Accumulated | | | | | | | |
| | | | | | Additional | | Unearned | | Unearned | | | | Other | | | | | | Total | |
| | Common Stock | | Paid-In | | Compensation- | | Compensation- | | Retained | | Comprehensive | Treasury Stock | | Stockholders’ | |
| | Shares | | Amount | | Capital | | ESOP | | RRP | | Earnings | | Gain (Loss) | | Shares | | Amount | | Equity | |
| Comprehensive income: | | | | | | | | | | | | | | | | | | | | |
| Net income for the year ended, | | | | | | | | | | | | | | | | | | | | |
| September 30, 2007 | | | | | | | | | | | 32,296 | | | | | | | | 32,296 | |
| Other comprehensive income - | | | | | | | | | | | | | | | | | | | | |
| Changes in unrealized gains/losses | | | | | | | | | | | | | | | | | | | | |
| on securities available-for-sale, | | | | | | | | | | | | | | | | | | | | |
| net of deferred income taxes | | | | | | | | | | | | | | | | | | | | |
| of $1,730 | | | | | | | | | | | | | 2,830 | | | | | | 2,830 | |
| Total comprehensive income | | �� | | | | | | | | | | | | | | | | | 35,126 | |
| | | | | | | | | | | | | | | | | | | | |
| ESOP activity, net | | | | | 5,497 | | 2,686 | | | | | | | | | | | | 8,183 | |
| RRP activity, net | | | | | 180 | | | | 195 | | | | | | (4,600) | | 42 | | 417 | |
| Stock based compensation – stock options | | | | | | | | | | | | | | | | | | | | |
| and RRP | | | | | 294 | | | | | | | | | | | | | | 294 | |
| Acquisition of treasury stock | | | | | | | | | | | | | | | 88,188 | | (3,198) | | (3,198) | |
| Stock options exercised | | | | | 3,707 | | | | | | | | | | (310,635) | | 2,883 | | 6,590 | |
| Dividends on common stock to | | | | | | | | | | | | | | | | | | | |
| stockholders ($2.09 per public share) | | | | | | | | | | | (43,000) | | | | | | | | (43,000) | |
| BALANCE, September 30, 2007 | 91,512,287 | | 915 | | 438,964 | | (12,098) | | (630) | | 750,186 | | 1,287 | | 17,253,310 | | (310,993) | | 867,631 | |
| | | | | | | | | | | | | | | | | | | | | |
| See notes to consolidated financial statements. | | | | | | | | | | | | | | | | | | (Continued) | |
| CAPITOL FEDERAL FINANCIAL AND SUBSIDIARY | | | | | | | | | | | |
| | | | | | | | | | | | | | | | | | | | | |
| CONSOLIDATED STATEMENTS OF STOCKHOLDERS’ EQUITY | | | | | | | | | | | | | | | |
| YEARS ENDED SEPTEMBER 30, 2008, 2007, and 2006 | | | | | | | | | | | | | | | | | |
| (in thousands, except share amounts) | | | | | | | | | | | | | | | | | | | |
| | | | | | | | | | | | | | | | | | | | | |
| | | | | | | | | | | | | | | | | | | |
| | | | | | | | | | | | | | Accumulated | | | | | | | |
| | | | | | Additional | | Unearned | | Unearned | | | | Other | | | | | | Total | |
| | Common Stock | | Paid-In | | Compensation- | | Compensation- | | Retained | | Comprehensive | Treasury Stock | | Stockholders’ | |
| | Shares | | Amount | | Capital | | ESOP | | RRP | | Earnings | | Gain (Loss) | | Shares | | Amount | | Equity | |
| Cumulative effect of Financial Accounting | | | | | | | | | | | | | | | | | | | | |
| Standards Board (“FASB”) Interpretation | | | | | | | | | | | | | | | | | | | | |
| No. 48 adoption | | | | | | | | | | | (339) | | | | | | | | (339) | |
| Net income for the year ended, | | | | | | | | | | | | | | | | | | | | |
| September 30, 2008 | | | | | | | | | | | 50,954 | | | | | | | | 50,954 | |
| Other comprehensive income - | | | | | | | | | | | | | | | | | | | | |
| Changes in unrealized gains/losses | | | | | | | | | | | | | | | | | | | |
| on securities available-for-sale, | | | | | | | | | | | | | | | | | | | | |
| net of deferred income taxes | | | | | | | | | | | | | | | | | | | |
| of $4,414 | | | | | | | | | | | | | (7,255) | | | | | | (7,255) | |
| Total comprehensive income | | | | | | | | | | | | | | | | | | | 43,699 | |
| | | | | | | | | | | | | | | | | | | | | |
| ESOP activity, net | | | | | 5,471 | | 2,016 | | | | | | | | | | | | 7,487 | |
| RRP activity, net | | | | | 238 | | | | 77 | | | | | | (10,000) | | 96 | | 411 | |
| Stock based compensation – stock | | | | | | | | | | | | | | | | | | | | |
| options and RRP | | | | | 323 | | | | | | | | | | | | | | 323 | |
| Acquisition of treasury stock | | | | | | | | | | | | | | | 225,042 | | (7,307) | | (7,307) | |
| Stock options exercised | | | | | 395 | | | | | | | | | | (35,933) | | 342 | | 737 | |
| Dividends on common stock to | | | | | | | | | | | | | | | | | | | |
| stockholders ($2.00 per public share) | | | | | | | | | | | (41,426) | | | | | | | | (41,426) | |
| BALANCE, September 30, 2008 | 91,512,287 | | $ 915 | | $ 445,391 | | $ (10,082) | | $ (553) | | $ 759,375 | | $ (5,968) | | 17,432,419 | | $ (317,862) | | $ 871,216 | |
| | | | | | | | | | | | | | | | | | | | | |
| See notes to consolidated financial statements. | | | | | | | | | | | | | | | | | | (Concluded) | |
| CAPITOL FEDERAL FINANCIAL AND SUBSIDIARY | | |
| | | | |
| CONSOLIDATED STATEMENTS OF CASH FLOWS | | | |
| YEARS ENDED SEPTEMBER 30, 2008, 2007, and 2006 (in thousands) |
| | | 2008 | | | 2007 | | | 2006 | |
| CASH FLOWS FROM OPERATING ACTIVITIES: | | | | | | | | | |
| Net income | | $ | 50,954 | | | $ | 32,296 | | | $ | 48,117 | |
| Adjustments to reconcile net income to net cash provided by | | | | | | | | | | | | |
| operating activities: | | | | | | | | | | | | |
| FHLB stock dividends | | | (6,921 | ) | | | (10,017 | ) | | | (9,913 | ) |
| Provision (recovery) for loan losses | | | 2,051 | | | | (225 | ) | | | 247 | |
| Originations of loans receivable held-for-sale | | | (47,062 | ) | | | (4,062 | ) | | | (4,408 | ) |
| Proceeds from sales of loans receivable held-for-sale | | | 48,444 | | | | 3,405 | | | | 4,907 | |
| Amortization and accretion of premiums and discounts on mortgage- | | | | | | | | | | | | |
| related and investment securities | | | 717 | | | | (177 | ) | | | 6,889 | |
| Principal collected on trading securities | | | -- | | | | 7,729 | | | | -- | |
| Proceeds from sale of trading securities | | | -- | | | | 389,209 | | | | -- | |
| Depreciation and amortization of premises and equipment | | | 5,428 | | | | 4,510 | | | | 3,845 | |
| Deferred gain on termination of interest rate swaps, net of amortization | | | 1,129 | | | | -- | | | | -- | |
| Common stock committed to be released for allocation - ESOP | | | 7,487 | | | | 7,513 | | | | 6,757 | |
| Stock based compensation - stock options and RRP | | | 722 | | | | 669 | | | | 826 | |
| Provision for deferred income taxes | | | 8,160 | | | | 18,714 | | | | 28,288 | |
| Other, net | | | (1,271 | ) | | | (648 | ) | | | (1,167 | ) |
| Changes in: | | | | | | | | | | | | |
| Accrued interest receivable | | | 2,165 | | | | 2,163 | | | | (1,132 | ) |
| Other assets | | | (4,871 | ) | | | 2,241 | | | | 1,172 | |
| Income taxes payable/receivable | | | 12,978 | | | | (1,239 | ) | | | (5,287 | ) |
| Accounts payable and accrued expenses | | | 1,610 | | | | (5,367 | ) | | | 2,123 | |
| Net cash provided by operating activities | | | 81,720 | | | | 446,714 | | | | 81,264 | |
| | | | | | | | | | | | | |
| CASH FLOWS FROM INVESTING ACTIVITIES: | | | | | | | | | | | | |
| Proceeds from maturities or calls of investment securities AFS | | | 99,810 | | | | 88,990 | | | | 10,000 | |
| Purchases of investment securities AFS | | | (49,248 | ) | | | (1,520 | ) | | | (199,143 | ) |
| Proceeds from maturities or calls of investment securities HTM | | | 514,208 | | | | 511,500 | | | | 190,510 | |
| Purchases of investment securities HTM | | | (185,138 | ) | | | (689,519 | ) | | | -- | |
| Principal collected on mortgage-related securities AFS | | | 233,225 | | | | 230,934 | | | | 288,970 | |
| Purchases of mortgage-related securities AFS | | | (1,324,872 | ) | | | (91,294 | ) | | | (110,123 | ) |
| Proceeds from sale of mortgage-related securities AFS | | | -- | | | | 15,237 | | | | -- | |
| Principal collected on mortgage-related securities HTM | | | 266,853 | | | | 256,083 | | | | 275,385 | |
| Purchases of mortgage-related securities HTM | | | (5,483 | ) | | | (136,798 | ) | | | (983 | ) |
| Proceeds from the redemption of capital stock of FHLB | | | 35,261 | | | | 38,287 | | | | 27,042 | |
| Purchases of capital stock of FHLB | | | (13,085 | ) | | | (2,801 | ) | | | -- | |
| Loan originations, net of principal collected | | | (92,656 | ) | | | (144,710 | ) | | | (94,347 | ) |
| Loan purchases, net of principal collected | | | 51,872 | | | | 71,399 | | | | (70,787 | ) |
| Purchase of BOLI | | | -- | | | | (50,000 | ) | | | -- | |
| Net deferred fee activity | | | 195 | | | | 574 | | | | 299 | |
| Purchases of premises and equipment | | | (8,721 | ) | | | (4,625 | ) | | | (7,444 | ) |
| Proceeds from sales of real estate owned | | | 5,197 | | | | 4,929 | | | | 4,767 | |
| Net cash (used in) provided by investing activities | | | (472,582 | ) | | | 96,666 | | | | 314,146 | |
| | | | | | | | | | | (Continued) | |
| CAPITOL FEDERAL FINANCIAL AND SUBSIDIARY | | | | | | | | | |
| | | | | | | | | | |
| CONSOLIDATED STATEMENTS OF CASH FLOWS | | | | | | | | | |
| YEARS ENDED SEPTEMBER 30, 2008, 2007, and 2006 (in thousands) | | | | | | | | | |
| | | | | | | | | | |
| | | | 2008 | | | | 2007 | | | | 2006 | |
| | | | | | | | | | | | | |
| CASH FLOWS FROM FINANCING ACTIVITIES: | | | | | | | | | |
| Dividends paid | | | (41,426 | ) | | | (43,000 | ) | | | (46,870 | ) |
| Dividends in excess of debt service cost of ESOP, net | | | -- | | | | 670 | | | | (79 | ) |
| Deposits, net of withdrawals | | | 1,101 | | | | 22,351 | | | | (59,866 | ) |
| Proceeds from advances/line of credit from FHLB | | | 834,700 | | | | 206,901 | | | | 675,100 | |
| Repayments on advances/line of credit from FHLB | | | (1,134,700 | ) | | | (756,901 | ) | | | (829,100 | ) |
| Proceeds from repurchase agreements | | | 660,000 | | | | -- | | | | -- | |
| Change in advance payments by borrowers for taxes and insurance | | | 2,104 | | | | 2,756 | | | | 2,916 | |
| Acquisitions of treasury stock | | | (7,307 | ) | | | (3,198 | ) | | | (16,681 | ) |
| Stock options exercised | | | 623 | | | | 3,942 | | | | 2,279 | |
| Excess tax benefits from stock options | | | 114 | | | | 2,648 | | | | 1,567 | |
| Net cash provided by (used in) financing activities | | | 315,209 | | | | (563,831 | ) | | | (270,734 | ) |
| | | | | | | | | | | | | |
| NET (DECREASE) INCREASE IN CASH AND CASH EQUIVALENTS | | | (75,653 | ) | | | (20,451 | ) | | | 124,676 | |
| | | | | | | | | | | | | |
| CASH AND CASH EQUIVALENTS: | | | | | | | | | | | | |
| Beginning of Period | | | 162,791 | | | | 183,242 | | | | 58,566 | |
| | | | | | | | | | | | | |
| End of Period | | $ | 87,138 | | | $ | 162,791 | | | $ | 183,242 | |
| | | | | | | | | | | | | |
| SUPPLEMENTAL DISCLOSURES OF CASH FLOW INFORMATION: | | | | | | | | | | | | |
| Income tax payments, net of refunds | | $ | 8,050 | | | $ | 711 | | | $ | 6,020 | |
| | | | | | | | | | | | | |
| Interest payments, net of interest credited to deposits of $134,545 | | | | | | | | | | | | |
| $143,383 and $112,386 | | $ | 140,774 | | | $ | 163,158 | | | $ | 170,317 | |
| | | | | | | | | | | | | |
| SUPPLEMENTAL DISCLOSURE OF NONCASH INVESTING | | | | | | | | | | | | |
| AND FINANCING ACTIVITIES: | | | | | | | | | | | | |
| Loans transferred to real estate owned | | $ | 8,159 | | | $ | 4,008 | | | $ | 4,996 | |
| | | | | | | | | | | | | |
| Loan swap with Federal Home Loan Mortgage Corporation, net | | $ | -- | | | $ | -- | | | $ | 402,701 | |
| | | | | | | | | | | | | |
| Market value change related to fair value hedge: | | | | | | | | | | | | |
| Interest rate swaps hedging FHLB advances | | $ | (13,817 | ) | | $ | (13,478 | ) | | $ | 3,760 | |
| | | | | | | | | | | | | |
| See notes to consolidated financial statements. | | | | | | | | | | (Concluded) | |
| | | | | | | | | | | | | |
CAPITOL FEDERAL FINANCIAL AND SUBSIDIARY
NOTES TO CONSOLIDATED FINANCIAL STATEMENTS
YEARS ENDED SEPTEMBER 30, 2008, 2007, and 2006
| 1. | SUMMARY OF SIGNIFICANT ACCOUNTING POLICIES |
Description of Business - Capitol Federal Financial (the “Company”) provides a full range of retail banking services through its wholly-owned subsidiary, Capitol Federal Savings Bank (the “Bank”) which has 30 traditional and nine in-store banking offices serving primarily the entire metropolitan areas of Topeka, Wichita, Lawrence, Manhattan, Emporia and Salina, Kansas and a portion of the metropolitan area of greater Kansas City. The Bank emphasizes mortgage lending, primarily originating and purchasing one- to four-family mortgage loans and providing personal retail financial services. The Bank is subject to competition from other financial institutions and other companies that provide financial services. The Company is subject to the regulations of the Office of Thrift Supervision (“OTS”) and the Federal Deposit Insurance Corporation (“FDIC”) and undergoes periodic examinations by those regulatory authorities.
The Bank has an expense sharing agreement with the Company that covers the reimbursement of certain expenses that are allocable to the Company. These expenses include compensation, rent for leased office space and general overhead expenses.
The Company’s ability to pay dividends is dependent, in part, upon its ability to obtain capital distributions from the Bank. The future dividend policy of the Company is subject to the discretion of the board of directors and will depend upon a number of factors, including the Company’s financial condition, results of operations, regulatory capital requirements of the Bank, other regulatory limitations on the Bank’s ability to make capital distributions to the Company and the continued waiver of dividends by Capitol Federal Savings Bank MHC ("MHC"). Holders of common stock will be entitled to receive dividends as and when declared by the board of directors of the Company out of funds legally available for that purpose.
Basis of Presentation - The Company is organized as a mid-tier holding company chartered as a federal savings and loan holding company. The Company owns 100% of the stock of the Bank. The Company is majority owned by MHC, a federally chartered mutual holding company. At September 30, 2008 MHC owned approximately 70% of the stock of the Company. The consolidated financial statements include the accounts of the Company and its wholly owned subsidiary, the Bank. The Bank has a wholly owned subsidiary, Capitol Funds, Inc. Capitol Funds, Inc. has a wholly owned subsidiary, Capitol Federal Mortgage Reinsurance Company. All intercompany accounts and transactions have been eliminated.
These consolidated financial statements have been prepared in conformity with accounting principles generally accepted in the United States of America (“GAAP”), and require management to make estimates and assumptions that affect the reported amounts of assets and liabilities and disclosure of contingent assets and liabilities at the date of the financial statements and the reported amounts of revenues and expenses during the reporting periods. Significant estimates include the allowance for loan losses, other-than-temporary declines in the fair value of securities and financial instruments. Actual results could differ from those estimates.
Cash and Cash Equivalents - Cash and cash equivalents include cash on hand and amounts due from banks. The Bank has acknowledged informal agreements with other banks where it maintains deposits. Under these agreements, service fees charged to the Bank are waived provided certain average compensating balances are maintained throughout each month. Federal Reserve Board (“FRB”) regulations require federally chartered savings banks to maintain non-interest-earning cash reserves against their transaction accounts. Required reserves must be maintained in the form of vault cash, a non-interest-bearing account at a Federal Reserve Bank, or a pass-through account as defined by the FRB. The Bank is in compliance with the FRB requirements. Effective October 9, 2008, as part of the Emergency Economic Stabilization Act of 2008 (the “EESA”), the Federal Reserve Bank may pay interest on balances held at the Federal Reserve Bank to satisfy reserve requirements and on balances held in excess of required reserve balances and clearing balances.
Securities - - Securities include mortgage-related and agency securities issued primarily by United States Government Sponsored Enterprises (“GSE”), United States Government agencies, including Federal National Mortgage Association (“FNMA”), Federal Home Loan Mortgage Corporation (“FHLMC”), Government National Mortgage Association (“GNMA”) and FHLB, and municipal bonds. Securities are classified as held-to-maturity, available-for-sale, or trading based on management’s intention on the date of purchase. Generally, classifications are made in response to liquidity needs, asset/liability management strategies, and the market interest rate environment at the time of purchase.
Securities that management has the intent and ability to hold to maturity are classified as held-to-maturity and reported at amortized cost. Such securities are adjusted for amortization of premiums and discounts which are recognized as adjustments to interest income over the life of the securities using the level-yield method.
Securities that management may sell if necessary for liquidity or asset management purposes are classified as available-for-sale and reported at fair value, with unrealized gains and losses reported as a component of accumulated other comprehensive income (loss) within stockholders’ equity, net of deferred income taxes. Premiums and discounts are recognized as adjustments to interest income over the life of the securities using the level-yield method. Gains or losses on the disposition of available-for-sale securities are recognized using the specific identification method. Estimated fair values of available-for-sale securities are based on one of three methods: 1) quoted market prices where available, 2) quoted market prices for similar instruments if quoted market prices are not available, and 3) unobservable data that represents the Bank’s assumptions about items that market participants would consider in determining fair value where no market data is available.
Securities that are purchased and held principally for resale in the near future are classified as trading securities and are reported at fair value, with unrealized gains and losses included in Gains on securities and loans receivable, net in the consolidated statements of income.
The Bank regularly monitors its securities portfolio for impairment on a security by security basis. The Bank considers many factors in determining whether the impairment is deemed to be other-than-temporary, including, but not limited to, the nature of the investment, the length of time the security has had a market value less than the cost basis, the cause(s), severity of the loss, the intent and ability of the Bank to hold the security for a period of time sufficient for a substantial recovery of its investment, expectation of an anticipated recovery period, recent events specific to the issuer or industry including the issuer’s financial condition and current ability to make future payments in a timely manner, external credit ratings and recent downgrades in such ratings. To the extent management determines a decline in value of held-to-maturity or available-for-sale security to be other-than-temporary, the Bank will adjust the carrying value and include such expense in Gains on securities and loans receivable, net in the consolidated statements of income.
On October 3, 2008, the EESA was signed into law. The EESA was a significant change in circumstances that occurred after September 30, 2008 and has not been considered in management's assessment of other-than-temporary impairment as of September 30, 2008.
Loans Receivable Held for Sale - Management designates certain loans receivable as held for sale as management does not intend to hold such loans to maturity or payoff. This decision is made prior to funding the loan. Accordingly, such loans are carried at the lower of amortized cost (outstanding principal adjusted for unamortized deferred loan fees, net of certain direct loan origination costs) or market value. Market values for such loans are determined based on sales commitments or dealer quotations. Gains or losses on such sales are recognized utilizing the specific identification method. Interest is included in interest income on loans receivable.
Loans Receivable - Loans receivable that management has the intent and ability to hold for the foreseeable future are carried at the amount of unpaid principal, net of allowance for loan losses, undisbursed loan funds, unamortized premiums and discounts, and deferred loan origination fees and costs. Net loan origination fees and costs, premiums and discounts are amortized as a yield adjustment to interest income using the level-yield method, adjusted for estimated prepayment speeds of the related loans when applicable. Interest on loans is credited to income as earned and accrued only if deemed collectible.
A loan is considered delinquent when payment has not been received within 30 days of its contractual due date. The accrual of income on loans is generally discontinued when interest or principal payments are 90 days in arrears or when the timely collection of such income is doubtful. A loan is considered impaired when, based upon current information and events, it is probable that the Bank will be unable to collect all amounts due, including principal and interest, according to the contractual terms of the loan agreement. Loans on which the accrual of income has been discontinued are designated as non-accrual loans and outstanding interest previously credited beyond 90 days is reversed. Management considers all non-accrual loans to be impaired loans. Interest income on impaired loans is recognized in the period collected unless the ultimate collection of principal is considered doubtful. A non-accrual loan is returned to accrual status when factors indicating doubtful collection no longer exist.
Allowance for Loan Losses - The allowance for loan losses represents management’s best estimate of the amount of known and inherent losses in the loan portfolio as of the balance sheet date. Management reviews the appropriateness of the allowance for loan losses based upon its evaluation of then-existing economic and business conditions impacting the Bank’s key lending areas. Other conditions management considers in determining the appropriateness of the allowance for loan losses include, but are not limited to, changes in the Bank’s underwriting standards, credit quality trends, trends in collateral values, loan volumes and concentrations, and recent loss experience in particular segments of the portfolio as of the balance sheet date.
The allowance for loan losses is comprised of both general valuation allowances and specific valuation allowances. Management maintains the allowance for loan losses through provisions for loan losses that are charged to income. Losses on loans are charged against the allowance for loan losses when the collection of loan principal is unlikely.
The Bank’s primary lending emphasis is the origination and purchase of one- to four-family first mortgage loans on residential properties and, to a lesser extent, second mortgage loans on one- to four-family residential properties resulting in a loan concentration in residential first mortgage loans. As a result of the Bank’s lending practices, the Bank also has a concentration of loans secured by real property located primarily in Kansas and Missouri. Based on the composition of the loan portfolio and the growth in the loan portfolio, management believes the primary risks inherent in the loan portfolio are increases in interest rates, a decline in the economy, employment conditions and a decline in real estate market values. Any one or a combination of these events may adversely affect the loan portfolio resulting in increased delinquencies, charge-offs and future loan loss provisions.
Each quarter management prepares an analysis which categorizes the entire loan portfolio by certain risk characteristics such as loan type (one- to four-family, multi-family, etc.), interest payments (fixed-rate, adjustable-rate), loan source (originated or purchased), and payment status (i.e., current or number of days delinquent). Management uses this analysis to evaluate the adequacy of the general valuation allowance. Loans with known potential losses are excluded from the analysis and evaluated for specific valuation allowances. Potential loss factors are assigned to each category in the analysis based on management’s assessment of the potential risk inherent in each category. These factors are periodically reviewed by management for appropriateness giving consideration to historical loss experience, delinquency and non-performing loan trends, the results of foreclosed property transactions, and the status of the local and national economies and housing markets, in order to ascertain that the loss factors cover probable and estimable losses inherent in the loan portfolio.
Loans in foreclosure and specifically identified problem loans are reviewed at least quarterly to determine if the loan is impaired and should have a specific valuation allowance established. Loans with an outstanding balance of $1.5 million or more are reviewed annually if secured by property in one of the following categories: multi-family (5 or more units) property, unimproved land, other improved commercial property, acquisition and development of land projects, developed building lots, office building, single-use building, or retail building. The primary considerations in establishing specific valuation allowances are the current estimated value of the loan’s underlying collateral and the loan's payment history. If a loan is not impaired, the loan is included in the general valuation allowance analysis.
Assessing the adequacy of the allowance for loan losses is inherently subjective. Actual results could differ from estimates as a result of changes in economic or market conditions. Changes in estimates could result in a material change in the allowance for loan losses. In the opinion of management, the allowance for loan losses, when taken as a whole, is adequate to absorb reasonable estimated losses inherent in the loan portfolio. However, future adjustments may be necessary if portfolio performance or economic or market conditions differ substantially from the conditions that existed at the time of the initial determinations.
Capital Stock of Federal Home Loan Bank - Capital Stock of FHLB Topeka is carried at cost. Dividends received on such stock are reflected as interest and dividend income in the consolidated statements of income.
Premises and Equipment - Land is carried at cost. Buildings, leasehold improvements and furniture, fixtures and equipment are carried at cost less accumulated depreciation and leasehold amortization. Buildings, furniture, fixtures and equipment are depreciated over their estimated useful lives using the straight-line or accelerated method. Leasehold improvements are amortized over the shorter of their estimated useful lives or the term of the respective leases. The costs for major improvements and renovations are capitalized, while maintenance, repairs and minor improvements are charged to operating expenses as incurred. Gains and losses on dispositions are recorded as other income or other expense as incurred.
Real Estate Owned (“REO”) - REO represents foreclosed assets held for sale and is initially recorded at the lower of cost or fair value less estimated disposal costs. Adjustments for estimated losses are charged to operations when any decline reduces the fair value to less than the carrying value. Costs and expenses related to major additions and improvements are capitalized while maintenance and repairs which do not improve or extend the lives of the respective assets are expensed. Gains and losses on the sale of REO are recognized upon disposition of the property. Periodically, the Bank will originate a loan for the purchase of an REO property. Gains on the sale under these circumstances are recognized to the extent allowable considering the adequacy of the down payment and other requirements. Losses are recognized immediately.
Income Taxes - The Company utilizes the asset and liability method of accounting for income taxes. Under this method, deferred income tax assets and liabilities are recognized for the tax consequences of temporary differences between the financial statement carrying amounts and the tax bases of existing assets and liabilities. The provision for deferred income taxes represents the change in deferred income tax assets and liabilities excluding the tax effects of the change in net unrealized gain (loss) on AFS securities and changes in the market value of vested RRP shares.
Deferred tax assets and liabilities are measured using enacted tax rates expected to apply to taxable income in the years in which those temporary differences are expected to be recovered or settled. The effect on deferred tax assets and liabilities of a change in tax rates is recognized in income in the period that includes the enactment date. Certain tax benefits attributable to stock options and restricted stock are credited to additional paid-in capital. The Company will record a valuation allowance to reduce its deferred income tax assets when there is uncertainty regarding the ability to realize their benefit.
The Company adopted FASB Interpretation (“FIN”) No. 48, “Accounting for Uncertainty in Income Taxes, an Interpretation of FASB Statement No. 109” on October 1, 2007. FIN No. 48 clarifies the accounting for uncertainty in income taxes recognized in an enterprise’s financial statements in accordance with Statement of Financial Accounting Standards (“SFAS”) No. 109, "Accounting for Income Taxes" and prescribes a recognition threshold and measurement attribute for the financial statement recognition and measurement of a tax position taken, or expected to be taken, in a tax return. Accruals of interest and penalties related to unrecognized tax benefits are recognized in income tax expense.
Employee Stock Ownership Plan - The ESOP is accounted for in accordance with the Statement of Position (“SOP”) 93-6, “Employer’s Accounting for Employee Stock Ownership Plans.” The funds borrowed by the ESOP from the Company to purchase the Company’s common stock are being repaid from the Bank’s contributions and dividends paid on unallocated ESOP shares. The shares pledged as collateral are reported as a reduction of stockholders’ equity at cost. As ESOP shares are committed to be released from collateral each quarter, the Company records compensation expense based on the average market price of the Company’s stock during the quarter. Additionally, the shares become outstanding for earnings per share computations once they are committed to be released.
Stock-based Compensation - At September 30, 2008, the Company had a Stock Option and Incentive Plan (the “Option Plan”) and a RRP. SFAS No. 123(R) “Share-Based Payment” requires companies to recognize all share-based payments which include stock options and restructured stock, in compensation expense over the service period of the share-based payment award. SFAS No. 123(R) establishes fair value as the measurement objective in accounting for share-based payment arrangements and requires all entities to apply a fair-value-based measurement method in accounting for share-based payment transactions with employees, except for equity instruments held by employee share ownership plans.
The Company adopted SFAS No. 123(R) on October 1, 2005, using the modified prospective method in which compensation cost is recognized over the service period for all awards granted subsequent to the Company’s adoption of SFAS No. 123(R), as well as, for the unvested portion of shares outstanding as of the Company’s adoption of SFAS No. 123(R). In accordance with the modified prospective method, results for prior periods have not been restated.
Borrowed Funds - The Bank enters into sales of securities under agreements to repurchase with selected brokers (“repurchase agreements”). These agreements are recorded as financing transactions as the Bank maintains effective control over the transferred securities. The dollar amount of the securities underlying the agreements continues to be carried in the Bank’s securities portfolio. The obligations to repurchase the securities are reported as a liability in the consolidated balance sheet. The securities underlying the agreements are delivered to the party with whom each transaction is executed. They agree to resell to the Bank the same securities at the maturity of the agreement. The Bank retains the right to substitute similar or like securities throughout the terms of the agreements. The collateral is subject to valuation at current market levels and the Bank may ask for the return of excess collateral or be required to post additional collateral due to market value changes.
The Bank has also obtained advances from FHLB. FHLB advances are secured by certain qualifying mortgage loans pursuant to a blanket collateral agreement with FHLB and all of the capital stock of FHLB owned by the Bank. Per the FHLB lending guidelines, total FHLB borrowings cannot exceed 40% of total Bank assets without pre-approval from the FHLB president.
The Bank is authorized to borrow from the Federal Reserve Bank’s “discount window.” Under the administration of the discount window revised January 9, 2003, an eligible institution need not exhaust other sources of funds before coming to the discount window, nor are there restrictions on the purposes for which the borrower can use primary credit. The Bank had no outstanding Federal Reserve Bank borrowings at September 30, 2008 or 2007.
Derivative Instruments - The Bank uses derivative instruments as a means of managing interest rate risk. Before entering into a derivative instrument, management formally documents its risk management objectives, strategy and the relationship between the hedging instruments and the hedged items. For those derivative instruments that are designated and qualify as hedging instruments, management designates the hedging instrument as either a fair value or cash flow hedge, based upon the exposure being hedged, in accordance with SFAS No. 133, “Accounting for Derivative Instruments and Hedging Activities,” as amended. Both at the inception of the hedge and on an ongoing basis, management evaluates the effectiveness of its hedging relationships in accordance with its risk management policy.
Interest rate swaps are derivative instruments the Bank has used as part of its interest rate risk management strategy. Interest rate swaps are contractual agreements between two parties to exchange interest payments, based on a common notional amount and maturity date. The interest rate swaps in effect as of September 30, 2007 and for a portion of the year during fiscal year 2008 were designated and qualified as fair value hedges under SFAS No. 133. The Bank assumed no ineffectiveness in the hedging relationship as all of the terms in the interest rate swap agreements matched the terms of the FHLB advances. The Bank accounted for the interest rate swaps agreements using the shortcut method, whereby any gain or loss in the fair value of the interest rate swaps was offset by the gain or loss on the hedged FHLB advances.
The Bank may enter into fixed commitments to originate and sell mortgage loans held for sale when the market conditions are appropriate or for risk management purposes, such as instances where holding the loans would increase interest rate or credit risk to levels above which management believes are appropriate for the Bank.
Pursuant to clarifying guidance, such commitments are considered derivative instruments under SFAS No. 133. The standard requires the recognition of all derivatives as either assets or liabilities on the balance sheet and measures those instruments at fair value. As of September 30, 2008 and 2007, there were no significant loan-related commitments that met the definition of derivatives or commitments to sell mortgage loans.
Comprehensive Income - Comprehensive income is comprised of net income and other comprehensive income. Other comprehensive income includes changes in unrealized gains and losses on securities available for sale, net of tax. Comprehensive income is presented in the consolidated statements of changes in stockholders’ equity.
Segment Information - SFAS No. 131, “Disclosures about Segments of an Enterprise and Related Information”, requires public companies to report certain financial information about significant revenue-producing segments of the business for which such information is available and utilized by the chief operating decision maker. As a community-oriented financial institution, substantially all of the Bank’s operations involve the delivery of loan and deposit products to customers. Management makes operating decisions and assesses performance based on an ongoing review of these community banking operations, which constitute our only operating segment for financial reporting purposes.
Earnings Per Share (“EPS”) - Basic EPS is computed by dividing income available to common stockholders by the weighted average number of shares outstanding for the period. Diluted EPS reflects the potential dilution that could occur if securities or other contracts to issue common stock (such as stock options) were exercised or resulted in the issuance of common stock. These potentially dilutive shares would then be included in the weighted average number of shares outstanding for the period using the treasury stock method. Shares issued and shares reacquired during any period are weighted for the portion of the period that they were outstanding.
In computing both basic and diluted EPS, the weighted average number of common shares outstanding includes the ESOP shares previously allocated to participants and shares committed to be released for allocation to participants and the RRP shares which have vested or have been allocated to participants. ESOP and RRP shares that have not been committed to be released or have not vested are excluded from the computation of basic and diluted EPS.
Recent Accounting Pronouncements - In September 2006, FASB issued SFAS No. 157 “Fair Value Measurements.” SFAS No. 157 defines fair value, establishes a framework for measuring fair value, and expands disclosures regarding fair value measurements. The statement applies whenever other standards require or permit that assets or liabilities be measured at fair value. The statement does not require new fair value measurements, but rather provides a definition and framework for measuring fair value which will result in greater consistency and comparability among financial statements prepared under GAAP. The statement is effective for financial statements issued for fiscal years beginning after November 15, 2007, which for the Company is October 1, 2008. The provisions are to be applied prospectively as of the beginning of the fiscal year in which the statement is initially applied, with certain exceptions. A transition adjustment, measured as the difference between the carrying amounts and the fair values of certain specific financial instruments at the date SFAS No. 157 is initially applied may be required. SFAS No. 157 will affect certain fair value disclosures, but is not expected to have a material impact on the Company’s financial condition or results of operations. The portion of the Company’s assets and liabilities with fair values based on unobservable inputs is not significant.
In February 2007, FASB issued SFAS No. 159, “The Fair Value Option for Financial Assets and Financial Liabilities” which permits an entity to measure certain financial assets and financial liabilities at fair value. The objective of SFAS No. 159 is to improve financial reporting by allowing entities to mitigate volatility in reported earnings caused by the measurement of related assets and liabilities using different attributes, without having to apply complex hedge accounting provisions. The election for the fair value option is a one-time election for existing instruments and once fair value is elected for a particular instrument, that instrument is carried throughout the holding period at fair value. If elected, SFAS No. 159 is effective for fiscal years beginning after November 15, 2007, which for the Company is October 1, 2008. The Company has elected not to use the fair value option.
In November 2007, the Securities and Exchange Commission (“SEC”) issued Staff Accounting Bulletin (“SAB”) 109, “Written Loan Commitments Recorded at Fair Value Through Earnings.” SAB 109 supersedes SAB 105, “Miscellaneous Accounting – Loan Commitments Accounted for as Derivative Instruments.” SAB 109 requires a company to include the value of the mortgage servicing right asset in the estimated fair value of the commitments on loans to be sold. SAB 105 had stated that this treatment was inappropriate. The new guidance should be applied prospectively to commitments accounted for at fair value that are issued or modified in fiscal quarters beginning after December 15, 2007, which for the Company was January 1, 2008. The adoption of SAB 109 did not have a material impact on the Company’s financial statements.
In December 2007, the SEC codified SAB 110 as part of SAB Topic 14.D.2, “Share-Based Payment: Certain Assumptions Used in Valuation Methods – Expected Term.” SAB 110 permits companies, under certain circumstances, to continue to use the simplified method when calculating the expected term of “plain vanilla” share options. Originally, the simplified method was due to expire on December 31, 2007. A company may use the simplified method if it concludes that it is not reasonable to base its estimate of expected term on its experience with exercising historical share options. SAB 110 was effective for the Company on January 1, 2008. Management determined there was sufficient history of stock option exercises to develop an expected term based on historical experience so the simplified method will no longer be used to calculate expected term when stock options are granted. The adoption of SAB 110 did not have a material impact on the Company’s financial statements.
In December 2007, the FASB issued SFAS No. 141(R) “Business Combinations” and SFAS No. 160, “Noncontrolling Interests in Consolidated Financial Statements – an amendment of ARB No. 51.” These statements change the way companies account for business combinations and noncontrolling interests (minority interests in current GAAP) and continue the FASB’s push toward more fair value reporting in financial statements. These Statements should both be applied prospectively for fiscal years beginning on or after December 15, 2008, which for the Company is October 1, 2009. However, SFAS No. 160 requires entities to apply the presentation and disclosure requirements retrospectively to comparative financial statements, if presented. Both Statements prohibit early adoption. The Company’s adoption of SFAS No. 141(R) and No. 160 are not expected to have a material impact on its financial condition or results of operations.
In March 2008, the FASB issued SFAS No. 161 “Disclosures about Derivative Instruments and Hedging Activities – an amendment of FAS 133”. SFAS 161 requires an entity with derivatives to describe how and why it uses derivative instruments, how derivative instruments and related hedged items are accounted for under SFAS 133 “Accounting for Derivative Instruments and Hedging Activities” and related interpretations, and how derivative instruments and related hedged items affect the entity's financial position, financial performance, and cash flows. SFAS No. 161 is effective for the Company beginning January 1, 2009. The Company's adoption of SFAS No. 161 is not expected to have a material impact on its financial condition or results of operations.
In May 2008, the FASB issued SFAS No. 162 “The Hierarchy of Generally Accepted Accounting Principles”. The purpose of SFAS No. 162 is to improve financial reporting by providing a consistent framework for determining what accounting principles should be applied when preparing GAAP financial statements. The FASB believes that issuing the GAAP hierarchy as a FASB standard, recategorizing the existing GAAP hierarchy into two levels of accounting literature (authoritative and nonauthoritative), and elevating the conceptual framework within the GAAP hierarchy are key objectives of achieving the FASB’s goal of improving the quality of accounting standards and the standard-setting process. SFAS No. 162 is effective 60 days following the SEC’s approval of Public Company Accounting Oversight Board (“PCAOB”) amendment to AU Section 411. The Company’s adoption of SFAS 162 No. is not expected to have a material impact on its financial condition, results of operations, cash flows or financial statement disclosures.
In June 2008, the FASB issued Staff Position (“FSP”) Emerging Issues Task Force (“EITF”) 03-6-1, “Determining Whether Instruments Granted in Share-Based Payment Transactions are Participating Securities,” which addresses whether instruments granted in share-based payment transactions are participating securities prior to vesting and, therefore, need to be included in the earnings allocation in computing EPS under the two-class method described in SFAS No. 128, “Earnings per Share.” EITF 03-6-1 states that unvested share-based payment awards that contain nonforfeitable rights to dividends or dividend equivalents are participating securities and shall be included in the computation of EPS pursuant to the two-class method. EITF 03-6-1 is effective for fiscal years beginning after December 15, 2008, and interim periods within those years, which for the Company is October 1, 2009. Early application is prohibited. The Company has not yet completed its assessment of the impact of EITF 03-6-1.
The following is a reconciliation of the numerators and denominators of the basic and diluted EPS calculations.
| | | 2008(1) | | | 2007(2) | | | 2006(3) | |
| | | (Dollars in thousands, except per share amounts) | |
| | | | | | | | | | |
| Net income | | $ | 50,954 | | | $ | 32,296 | | | $ | 48,117 | |
| | | | | | | | | | | | | |
| Average common shares outstanding | | | 72,862,705 | | | | 72,772,859 | | | | 72,518,562 | |
| Average committed ESOP shares outstanding | | | 76,166 | | | | 76,236 | | | | 76,236 | |
| | | | | | | | | | | | | |
| Total basic average common shares outstanding | | | 72,938,871 | | | | 72,849,095 | | | | 72,594,798 | |
| | | | | | | | | | | | | |
| Effect of dilutive RRP shares | | | 5,460 | | | | 5,902 | | | | 3,648 | |
| Effect of dilutive stock options | | | 68,335 | | | | 115,391 | | | | 255,245 | |
| | | | | | | | | | | | | |
| Total diluted average common shares outstanding | | | 73,012,666 | | | | 72,970,388 | | | | 72,853,691 | |
| | | | | | | | | | | | | |
| Net EPS | | | | | | | | | | | | |
| Basic | | $ | 0.70 | | | $ | 0.44 | | | $ | 0.66 | |
| Diluted | | $ | 0.70 | | | $ | 0.44 | | | $ | 0.66 | |
| (1) | Options to purchase 31,100 shares of common stock at a price of $38.77 per share were outstanding as of September 30, 2008 but were not included in the computation of diluted EPS because they were anti-dilutive for the year ended September 30, 2008. |
| (2) | Options to purchase 31,500 shares of common stock at a price of $38.77 per share were outstanding as of September 30, 2007 but were not included in the computation of diluted EPS because they were anti-dilutive for the year ended September 30, 2007. |
| (3) | Options to purchase 247,000 shares of common stock at prices between $32.48 per share and $36.19 per share were outstanding as of September 30, 2006 but were not included in the computation of diluted EPS because they were anti-dilutive for the year ended September 30, 2006. |
The following tables reflect the amortized cost, estimated market value, and gross unrealized gains and losses of available-for-sale and held-to-maturity investment securities at September 30, 2008 and 2007.
| | | September 30, 2008 | |
| | | | | | Gross | | | Gross | | | Estimated | |
| | | Amortized | | | Unrealized | | | Unrealized | | | Market | |
| | | Cost | | | Gains | | | Losses | | | Value | |
| | | (Dollars in thousands) | |
| Available-for-sale: | | | | | | | | | | | | |
| FNMA | | $ | 25,135 | | | $ | -- | | | $ | 601 | | | $ | 24,534 | |
| FHLB | | | 20,020 | | | | -- | | | | 366 | | | | 19,654 | |
| Municipal bonds | | | 2,686 | | | | 61 | | | | 4 | | | | 2,743 | |
| Trust preferred securities | | | 3,859 | | | | -- | | | | 1,204 | | | | 2,655 | |
| | | $ | 51,700 | | | $ | 61 | | | $ | 2,175 | | | $ | 49,586 | |
| | | | | | | | | | | | | | | | | |
| Held-to-maturity: | | | | | | | | | | | | | | | | |
| FHLMC | | $ | 37,397 | | | $ | 19 | | | $ | 647 | | | $ | 36,769 | |
| Municipal bonds | | | 55,376 | | | | 408 | | | | 342 | | | | 55,442 | |
| | | $ | 92,773 | | | $ | 427 | | | $ | 989 | | | $ | 92,211 | |
| | | | | | | | | | | | | | | | | |
| | | | | | | | | | | | | | | | | |
| | | September 30, 2007 | |
| | | | | | | Gross | | | Gross | | | Estimated | |
| | | Amortized | | | Unrealized | | | Unrealized | | | Market | |
| | | Cost | | | Gains | | | Losses | | | Value | |
| | | (Dollars in thousands) | |
| Available-for-sale: | | | | | | | | | | | | | | | | |
| FNMA | | $ | 22,423 | | | $ | 35 | | | $ | -- | | | $ | 22,458 | |
| FHLMC | | | 57,229 | | | | 39 | | | | -- | | | | 57,268 | |
| FHLB | | | 19,975 | | | | 4 | | | | -- | | | | 19,979 | |
| Municipal bonds | | | 2,704 | | | | 19 | | | | 4 | | | | 2,719 | |
| | | $ | 102,331 | | | $ | 97 | | | $ | 4 | | | $ | 102,424 | |
| | | | | | | | | | | | | | | | | |
| Held-to-maturity: | | | | | | | | | | | | | | | | |
| FNMA | | $ | 194,988 | | | $ | 36 | | | $ | 2,021 | | | $ | 193,003 | |
| FHLMC | | | 86,673 | | | | 84 | | | | 699 | | | | 86,058 | |
| FHLB | | | 119,770 | | | | 19 | | | | 252 | | | | 119,537 | |
| Municipal bonds | | | 20,313 | | | | 83 | | | | 54 | | | | 20,342 | |
| | | $ | 421,744 | | | $ | 222 | | | $ | 3,026 | | | $ | 418,940 | |
| | | | | | | | | | | | | | | | | |
| | | | | | | | | | | | | | | | | |
| | | | | | | | | | | | | | | | | |
The following tables summarize the estimated market value and gross unrealized losses of those investment securities on which an unrealized loss at September 30, 2008 and 2007 was reported and the continuous unrealized loss position for the twelve months prior to September 30, 2008 and 2007 or for a shorter period of time.
| | | September 30, 2008 | |
| | | Less Than 12 Months | | | 12 Months or Longer | | | Total | |
| | | Estimated | | | Gross | | | Estimated | | | Gross | | | Estimated | | | Gross | |
| | | Market | | | Unrealized | | | Market | | | Unrealized | | | Market | | | Unrealized | |
| | | Value | | | Losses | | | Value | | | Losses | | | Value | | | Losses | |
| | | (Dollars in thousands) | |
| Available-for-sale: | | | | | | | | | | | | | | | | | | |
| FNMA | | $ | 24,534 | | | $ | 601 | | | $ | -- | | | $ | -- | | | $ | 24,534 | | | $ | 601 | |
| FHLB | | | 19,655 | | | | 366 | | | | -- | | | | -- | | | | 19,655 | | | | 366 | |
| Municipal bonds | | | 491 | | | | 4 | | | | -- | | | | -- | | | | 491 | | | | 4 | |
| Trust preferred securities | | | 2,655 | | | | 1,204 | | | | -- | | �� | | -- | | | | 2,655 | | | | 1,204 | |
| | | $ | 47,335 | | | $ | 2,175 | | | $ | -- | | | $ | -- | | | $ | 47,335 | | | $ | 2,175 | |
| | | | | | | | | | | | | | | | | | | | | | | | | |
| Held-to-maturity: | | | | | | | | | | | | | | | | | | | | | | | | |
| FHLMC | | $ | 24,353 | | | $ | 647 | | | $ | -- | | | $ | -- | | | $ | 24,353 | | | $ | 647 | |
| Municipal bonds | | | 24,522 | | | | 342 | | | | -- | | | | -- | | | | 24,522 | | | | 342 | |
| | | $ | 48,875 | | | $ | 989 | | | $ | -- | | | $ | -- | | | $ | 48,875 | | | $ | 989 | |
| | | | |
| | | | |
| | | September 30, 2007 | |
| | | Less Than 12 Months | | | 12 Months or Longer | | | Total | |
| | | Estimated | | | Gross | | | Estimated | | | Gross | | | Estimated | | | Gross | |
| | | Market | | | Unrealized | | | Market | | | Unrealized | | | Market | | | Unrealized | |
| | | Value | | | Losses | | | Value | | | Losses | | | Value | | | Losses | |
| | | (Dollars in thousands) | |
| Available-for-sale: | | | | | | | | | | | | | | | | | | | | | | | | |
| Municipal bonds | | $ | 531 | | | $ | 4 | | | $ | -- | | | $ | -- | | | $ | 531 | | | $ | 4 | |
| | | | | | | | | | | | | | | | | | | | | | | | | |
| Held-to-maturity: | | | | | | | | | | | | | | | | | | | | | | | | |
| FNMA | | $ | -- | | | $ | -- | | | $ | 147,980 | | | $ | 2,021 | | | $ | 147,980 | | | $ | 2,021 | |
| FHLMC | | | 3,961 | | | | 6 | | | | 64,306 | | | | 693 | | | | 68,267 | | | | 699 | |
| FHLB | | | -- | | | | -- | | | | 24,748 | | | | 252 | | | | 24,748 | | | | 252 | |
| Municipal bonds | | | 6,441 | | | | 54 | | | | -- | | | | -- | | | | 6,441 | | | | 54 | |
| | | $ | 10,402 | | | $ | 60 | | | $ | 237,034 | | | $ | 2,966 | | | $ | 247,436 | | | $ | 3,026 | |
| | | | |
At September 30, 2008 and 2007, there were no securities and six securities, respectively, in a continuous unrealized loss position for more than 12 months. The unrealized losses are primarily a result of increases in interest rates from the time of purchase. In general, as interest rates rise, the fair value of fixed-rate securities will decrease; as interest rates fall, the fair value of fixed-rate securities will increase. Management generally views changes in fair value caused by changes in interest rates as temporary; therefore, these securities have not been classified as other-than-temporarily impaired. Additionally, the impairment is also considered temporary because scheduled coupon payments have been made, it is anticipated that the entire principal balance will be collected as scheduled, and management has the positive intent and ability to hold these securities to maturity or for a sufficient amount of time to recover the recorded principal. In addition, management has primarily purchased securities issued by U.S. Government sponsored enterprises or agencies.
The amortized cost and estimated market value of the investment securities by remaining contractual maturity, without consideration of call features or pre-refunding dates, as of September 30, 2008 are as follows:
| | | Available-for-Sale | | | Held-to-Maturity | | | Total | |
| | | | | | Estimated | | | | | | Estimated | | | | | | Estimated | |
| | | Amortized | | | Market | | | Amortized | | | Market | | | Amortized | | | Market | |
| | | Cost | | | Value | | | Cost | | | Value | | | Cost | | | Value | |
| | | (Dollars in thousands) | |
| | | | | | | | | | | | | | | | | | | |
| One year or less | | $ | -- | | | $ | -- | | | $ | 12,582 | | | $ | 12,603 | | | $ | 12,582 | | | $ | 12,603 | |
| One year through five years | | | 45,534 | | | | 44,575 | | | | 6,312 | | | | 6,408 | | | | 51,846 | | | | 50,983 | |
| Five years through ten years | | | 1,131 | | | | 1,131 | | | | 32,558 | | | | 32,373 | | | | 33,689 | | | | 33,504 | |
| Ten years and thereafter | | | 5,035 | | | | 3,880 | | | | 41,321 | | | | 40,827 | | | | 46,356 | | | | 44,707 | |
| | | $ | 51,700 | | | $ | 49,586 | | | $ | 92,773 | | | $ | 92,211 | | | $ | 144,473 | | | $ | 141,797 | |
Issuers of certain securities have the right to call obligations with or without prepayment penalties. As of September 30, 2008, the amortized cost of the securities in our portfolio which are callable or have pre-refunding dates within one year totaled $72.3 million.
All dispositions of investment securities during 2008, 2007, and 2006 were the result of maturities or calls.
| 4. | MORTGAGE-RELATED SECURITIES |
The following tables reflect the amortized cost, estimated market value, and gross unrealized gains and losses of available-for-sale and held-to-maturity mortgage-related securities at September 30, 2008 and 2007.
| | | September 30, 2008 | |
| | | | | | Gross | | | Gross | | | Estimated | |
| | | Amortized | | | Unrealized | | | Unrealized | | | Market | |
| | | Cost | | | Gains | | | Losses | | | Value | |
| | | (Dollars in thousands) | |
| Available-for-sale: | | | | | | | | | | | | |
| FNMA | | $ | 795,836 | | | $ | 1,047 | | | $ | 5,792 | | | $ | 791,091 | |
| FHLMC | | | 688,806 | | | | 2,893 | | | | 5,378 | | | | 686,321 | |
| Other | | | 6,894 | | | | -- | | | | 251 | | | | 6,643 | |
| | | $ | 1,491,536 | | | $ | 3,940 | | | $ | 11,421 | | | $ | 1,484,055 | |
| | | | | | | | | | | | | | | | | |
| Held-to-maturity: | | | | | | | | | | | | | | | | |
| FNMA | | $ | 359,134 | | | $ | 1,169 | | | $ | 3,212 | | | $ | 357,091 | |
| FHLMC | | | 387,614 | | | | 781 | | | | 5,413 | | | | 382,982 | |
| GNMA | | | 3,536 | | | | 155 | | | | -- | | | | 3,691 | |
| | | $ | 750,284 | | | $ | 2,105 | | | $ | 8,625 | | | $ | 743,764 | |
| | | | | | | | | | | | | | | | | |
| | | | |
| | | September 30, 2007 | |
| | | | | | | Gross | | | Gross | | | Estimated | |
| | | Amortized | | | Unrealized | | | Unrealized | | | Market | |
| | | Cost | | | Gains | | | Losses | | | Value | |
| | | (Dollars in thousands) | |
| Available-for-sale: | | | | | | | | | | | | | | | | |
| FNMA | | $ | 182,632 | | | $ | 915 | | | $ | 1,009 | | | $ | 182,538 | |
| FHLMC | | | 210,367 | | | | 2,369 | | | | 356 | | | | 212,380 | |
| Other | | | 7,706 | | | | 62 | | | | -- | | | | 7,768 | |
| | | $ | 400,705 | | | $ | 3,346 | | | $ | 1,365 | | | $ | 402,686 | |
| | | | | | | | | | | | | | | | | |
| Held-to-maturity: | | | | | | | | | | | | | | | | |
| FNMA | | $ | 469,853 | | | $ | 895 | | | $ | 7,435 | | | $ | 463,313 | |
| FHLMC | | | 537,476 | | | | 913 | | | | 10,665 | | | | 527,724 | |
| GNMA | | | 4,256 | | | | 122 | | | | -- | | | | 4,378 | |
| | | $ | 1,011,585 | | | $ | 1,930 | | | $ | 18,100 | | | $ | 995,415 | |
| | | | | | | | | | | | | | | | | |
The following tables summarize the estimated market value and gross unrealized losses of those securities on which an unrealized loss at September 30, 2008 and 2007 was reported and the continuous unrealized loss position for the twelve months prior to September 30, 2008 and 2007 or for a shorter period of time.
| | | September 30, 2008 | |
| | | Less Than 12 Months | | | 12 Months or Longer | | | Total | |
| | | Estimated | | | Gross | | | Estimated | | | Gross | | | Estimated | | | Gross | |
| | | Market | | | Unrealized | | | Market | | | Unrealized | | | Market | | | Unrealized | |
| | | Value | | | Losses | | | Value | | | Losses | | | Value | | | Losses | |
| | | (Dollars in thousands) | |
| Available-for-sale: | | | | | | | | | | | | | | | | | | |
| FNMA | | $ | 491,514 | | | $ | 4,908 | | | $ | 36,047 | | | $ | 884 | | | $ | 527,561 | | | $ | 5,792 | |
| FHLMC | | | 458,810 | | | | 5,032 | | | | 15,468 | | | | 346 | | | | 474,278 | | | | 5,378 | |
| Other | | | 6,644 | | | | 251 | | | | -- | | | | -- | | | | 6,644 | | | | 251 | |
| | | $ | 956,968 | | | $ | 10,191 | | | $ | 51,515 | | | $ | 1,230 | | | $ | 1,008,483 | | | $ | 11,421 | |
| | | | | | | | | | | | | | | | | | | | | | | | | |
| Held-to-maturity: | | | | | | | | | | | | | | | | | | | | | | | | |
| FNMA | | $ | 198,940 | | | $ | 2,110 | | | $ | 49,035 | | | $ | 1,102 | | | $ | 247,975 | | | $ | 3,212 | |
| FHLMC | | | 218,460 | | | | 2,894 | | | | 117,772 | | | | 2,519 | | | | 336,232 | | | | 5,413 | |
| | | $ | 417,400 | | | $ | 5,004 | | | $ | 166,807 | | | $ | 3,621 | | | $ | 584,207 | | | $ | 8,625 | |
| | | | | | | | | | | | | | | | | | | | | | | | | |
| | | | |
| | | September 30, 2007 | |
| | | Less Than 12 Months | | | 12 Months or Longer | | | Total | |
| | | Estimated | | | Gross | | | Estimated | | | Gross | | | Estimated | | | Gross | |
| | | Market | | | Unrealized | | | Market | | | Unrealized | | | Market | | | Unrealized | |
| | | Value | | | Losses | | | Value | | | Losses | | | Value | | | Losses | |
| | | (Dollars in thousands) | |
| Available-for-sale: | | | | | | | | | | | | | | | | | | | | | | | | |
| FNMA | | $ | 29,654 | | | $ | 104 | | | $ | 76,177 | | | $ | 905 | | | $ | 105,831 | | | $ | 1,009 | |
| FHLMC | | | 9,813 | | | | 46 | | | | 30,312 | | | | 310 | | | | 40,125 | | | | 356 | |
| | | $ | 39,467 | | | $ | 150 | | | $ | 106,489 | | | $ | 1,215 | | | $ | 145,956 | | | $ | 1,365 | |
| | | | | | | | | | | | | | | | | | | | | | | | | |
| Held-to-maturity: | | | | | | | | | | | | | | | | | | | | | | | | |
| FNMA | | $ | 33,920 | | | $ | 196 | | | $ | 309,506 | | | $ | 7,239 | | | $ | 343,426 | | | $ | 7,435 | |
| FHLMC | | | 3,200 | | | | 3 | | | | 424,831 | | | | 10,662 | | | | 428,031 | | | | 10,665 | |
| | | $ | 37,120 | | | $ | 199 | | | $ | 734,337 | | | $ | 17,901 | | | $ | 771,457 | | | $ | 18,100 | |
| | | | | | | | | | | | | | | | | | | | | | | | | |
At September 30, 2008 and 2007, a total of 93 securities and 112 securities, respectively, were in a continuous unrealized loss position for more than 12 months. The unrealized losses are primarily a result of an increase in yields on similar assets since the time of purchase. These securities have not been classified as other-than-temporarily impaired, except as noted below, as the scheduled principal and interest payments have been made, it is anticipated that the entire principal balance will be collected as scheduled, management believes the price variation is temporary in nature and management has the positive intent and ability to hold these securities to maturity or for a sufficient amount of time to recover the recorded principal. In addition, the Bank primarily purchases mortgage-related securities issued by U.S. Government sponsored enterprises or agencies.
During management’s review of the available-for-sale portfolio for the year ended September 30, 2006, securities were identified that management did not have the intent to hold until maturity or recovery of recorded principal primarily because their performance was below expectations set by the Bank’s Asset and Liability Committee. As a result of management’s decision to sell the securities, an other-than-temporary impairment of $472 thousand was recorded during the year ended September 30, 2006. The other-than-temporary impairment is included in Gains on securities and loans receivable, net in the consolidated statements of income. During fiscal year 2007, the aforementioned securities were sold, resulting in proceeds of $15.2 million, and a gross loss of $47 thousand. The gross loss is included in Gains on securities and loans receivable, net in the consolidated statements of income. There were no other-than-temporary impairments recorded for the years ended September 30, 2008 and 2007.
The amortized cost and estimated market value of mortgage-related securities by remaining contractual maturity as of September 30, 2008 are as follows:
| | | Available-for-Sale | | | Held-to-Maturity | | | Total | |
| | | | | | Estimated | | | | | | Estimated | | | | | | Estimated | |
| | | Amortized | | | Market | | | Amortized | | | Market | | | Amortized | | | Market | |
| | | Cost | | | Value | | | Cost | | | Value | | | Cost | | | Value | |
| | | (Dollars in thousands) | |
| | | | | | | | | | | | | | | | | | | |
| One year or less | | $ | 1,095 | | | $ | 1,109 | | | $ | -- | | | $ | -- | | | $ | 1,095 | | | $ | 1,109 | |
| Five years through ten years | | | 39,853 | | | | 40,102 | | | | 187,807 | | | | 185,292 | | | | 227,660 | | | | 225,394 | |
| Ten years and thereafter | | | 1,450,588 | | | | 1,442,844 | | | | 562,477 | | | | 558,472 | | | | 2,013,065 | | | | 2,001,316 | |
| | | $ | 1,491,536 | | | $ | 1,484,055 | | | $ | 750,284 | | | $ | 743,764 | | | $ | 2,241,820 | | | $ | 2,227,819 | |
Actual maturities of mortgage-related securities may differ from contractual maturities as borrowers have the right to prepay certain obligations, sometimes without penalties. Maturities of mortgage-related securities depend on the repayment characteristics and experience of the underlying financial instruments.
As of September 30, 2008, the Bank had pledged mortgage-related securities available-for-sale and held-to-maturity as collateral with an amortized cost of $803.8 million and an estimated market value of $800.9 million to the repurchase agreement counterparties, the Federal Reserve Bank, and the FHLB.
During the year ended September 30, 2007, proceeds from the sale of securities from the trading portfolio totaled $389.2 million resulting in gross realized gains of $2.8 million and gross realized losses of $1.7 million. The gross realized gains and losses are included in Gains on securities and loans receivable, net in the consolidated statements of income. All dispositions of mortgage-related securities during 2008 and 2006 were the result of principal repayments or maturities.
| | | 2008 | | | 2007 | |
| | | (Dollars in thousands) | |
| Mortgage loans: | | | | | | |
| Residential - one- to four-units | | $ | 5,026,358 | | | $ | 4,992,398 | |
| Multi-family and commercial | | | 56,081 | | | | 60,625 | |
| Construction and development | | | 85,178 | | | | 74,521 | |
| | | | 5,167,617 | | | | 5,127,544 | |
| Other loans: | | | | | | | | |
| Home equity, auto and other | | | 207,594 | | | | 213,833 | |
| Deposits | | | 4,634 | | | | 5,249 | |
| | | | 212,228 | | | | 219,082 | |
| | | | | | | | | |
| Less: | | | | | | | | |
| Undisbursed loan funds | | | 43,186 | | | | 42,481 | |
| Allowance for loan losses | | | 5,791 | | | | 4,181 | |
| Unearned loan fees and deferred costs | | | 10,088 | | | | 9,893 | |
| Loans receivable, net | | $ | 5,320,780 | | | $ | 5,290,071 | |
The Bank originated $975 thousand, $16.7 million, and $3.1 million of commercial real estate and business loans during the years ended September 30, 2008, 2007, and 2006, respectively.
The Bank is subject to numerous lending-related regulations. Under the Financial Institutions Reform, Recovery, and Enforcement Act, the Bank may not make real estate loans to one borrower in excess of the greater of 15% of its unimpaired capital and surplus or $500 thousand. As of September 30, 2008, the Bank was in compliance with this limitation.
Aggregate loans to executive officers, directors and their associates did not exceed 5% of stockholders’ equity as of September 30, 2008 and 2007. Such loans were made under terms and conditions substantially the same as loans made to parties not affiliated with the Bank.
As of September 30, 2008 and 2007, the Bank serviced loans for others aggregating approximately $623.0 million and $674.8 million, respectively. Such loans are not included in the accompanying consolidated balance sheets. Servicing loans for others generally consists of collecting mortgage payments, maintaining escrow accounts, disbursing payments to investors and foreclosure processing. Loan servicing income includes servicing fees withheld from investors and certain charges collected from borrowers, such as late payment fees. The Bank held borrowers’ escrow balances on loans serviced for others of $8.4 million and $9.2 million as of September 30, 2008 and 2007, respectively.
A summary of the activity in the allowance for loan losses is as follows:
| | | 2008 | | | 2007 | | | 2006 | |
| | | (Dollars in thousands) | |
| | | | | | | | | | |
| Balance, beginning of year | | $ | 4,181 | | | $ | 4,433 | | | $ | 4,598 | |
| Provision (recovery) charged to expense | | | 2,051 | | | | (225 | ) | | | 247 | |
| Losses charged against the allowance for loan losses | | | (441 | ) | | | (27 | ) | | | (132 | ) |
| Recoveries of loans previously charged against the | | | | | | | | | | | | |
| allowance for loan losses | | | -- | | | | -- | | | | 1 | |
| Allowance on loans in the loan swap transaction | | | -- | | | | -- | | | | (281 | ) |
| Balance, end of year | | $ | 5,791 | | | $ | 4,181 | | | $ | 4,433 | |
The following is a summary of information pertaining to impaired loans. Certain 2007 and 2006 impaired loan amounts have been adjusted for minor corrections.
| | | 2008 | | | 2007 | |
| | | (Dollars in thousands) | |
| | | | | | | |
| Impaired loans without a specific valuation allowance | | $ | 7,646 | | | $ | 2,923 | |
| Impaired loans with a specific valuation allowance | | | 6,020 | | | | 4,429 | |
| | | | | | | | | |
| | | $ | 13,666 | | | $ | 7,352 | |
| | | | | | | | | |
| Specific valuation allowance related to impaired loans | | $ | 758 | | | $ | 138 | |
| | | 2008 | | | 2007 | | | 2006 | |
| | | (Dollars in thousands) | |
| Average investment in impaired loans | | $ | 10,878 | | | $ | 6,606 | | | $ | 8,839 | |
| | | | | | | | | | | | | |
| Interest income recognized on impaired loans | | $ | 150 | | | $ | 111 | | | $ | 86 | |
| | | | | | | | | | | | | |
No additional principal is committed to be advanced in connection with impaired loans.
The Bank did not have significant troubled debt restructurings during fiscal years 2008, 2007 or 2006.
As of September 30, 2008, 2007, and 2006, loans totaling approximately $13.7 million, $7.4 million, and $5.6 million, respectively, were on nonaccrual status. Gross interest income would have increased by $178 thousand, $101 thousand, and $118 thousand for the years ended September 30, 2008, 2007, and 2006, respectively, if these nonaccrual status loans were not classified as such.
The decline in the real estate markets, as well as the overall economic environment, contributed to an increase in the balance of nonaccrual loans at September 30, 2008 compared to September 30, 2007 and 2006. Due to the Bank’s level of geographic diversification, the Bank is sheltered but not immune to negative consequences arising from overall economic weakness and, in particular, a sharp downturn in the housing industry nationally. Despite the increase in the balance of nonaccrual loans, the Bank’s balance of nonaccrual loans continue to remain at low levels relative to the size of the Bank’s loan portfolio.
| 6. | PREMISES AND EQUIPMENT, Net |
| | | 2008 | | | 2007 | |
| | | (Dollars in thousands) | |
| | | | | | | |
| Land | | $ | 7,618 | | | $ | 7,166 | |
| Building and improvements | | | 31,027 | | | | 27,330 | |
| Furniture, fixtures and equipment | | | 32,419 | | | | 30,155 | |
| | | | 71,064 | | | | 64,651 | |
| | | | | | | | | |
| Less accumulated depreciation | | | (41,190 | ) | | | (38,041 | ) |
| | | | | | | | | |
| | | $ | 29,874 | | | $ | 26,610 | |
Depreciation and amortization expense for the years ended September 30, 2008, 2007, and 2006 was $5.4 million, $4.5 million and $3.8 million, respectively.
The Bank has entered into non-cancelable operating lease agreements with respect to banking premises and equipment. It is expected that many agreements will be renewed at expiration in the normal course of business. Rental expense was $1.2 million, $1.1 million and $1.0 million for the years ended September 30, 2008, 2007, and 2006, respectively. Future minimum rental commitments, rounded to the nearest thousand, required under operating leases that have initial or remaining non-cancelable lease terms in excess of one year are as follows (dollars in thousands):
| 2009 | | $ | 1,057 | |
| 2010 | | | 890 | |
| 2011 | | | 754 | |
| 2012 | | | 671 | |
| 2013 | | | 581 | |
| Thereafter | | | 6,499 | |
| | | $ | 10,452 | |
| | | 2008 | | | 2007 | |
| | | | | | Weighted | | | | | | | | | Weighted | | | | |
| | | | | | Average | | | % of | | | | | | Average | | | % of | |
| | Amount | | | Rate | | | Total | | | Amount | | | Rate | | | Total | |
| | | (Dollars in thousands) | |
| Non-certificates: | | | | | | | | | | | | | | | | | | |
| Checking | | $ | 400,461 | | | | 0.21 | % | | | 10.21 | % | | $ | 394,109 | | | | 0.21 | % | | | 10.05 | % |
| Savings | | | 232,103 | | | | 1.51 | | | | 5.91 | | | | 237,148 | | | | 2.58 | | | | 6.04 | |
| Money market | | | 772,323 | | | | 1.48 | | | | 19.68 | | | | 790,277 | | | | 3.18 | | | | 20.15 | |
| Total non-certificates | | | 1,404,887 | | | | 1.12 | | | | 35.80 | | | | 1,421,534 | | | | 2.26 | | | | 36.24 | |
| | | | | | | | | | | | | | | | | | | | | | | | | |
| Certificates of deposit: | | | | | | | | | | | | | | | | | | | | | | | | |
| 0.00 – 0.99% | | | 114 | | | | 0.59 | | | | -- | | | | 134 | | | | 0.65 | | | | -- | |
| 1.00 – 1.99% | | | 7,426 | | | | 1.98 | | | | 0.19 | | | | -- | | | | -- | | | | -- | |
| 2.00 – 2.99% | | | 413,102 | | | | 2.78 | | | | 10.53 | | | | 35,815 | | | | 2.92 | | | | 0.91 | |
| 3.00 – 3.99% | | | 935,470 | | | | 3.39 | | | | 23.84 | | | | 225,162 | | | | 3.50 | | | | 5.74 | |
| 4.00 – 4.99% | | | 747,612 | | | | 4.52 | | | | 19.06 | | | | 746,707 | | | | 4.46 | | | | 19.04 | |
| 5.00 – 5.99% | | | 414,347 | | | | 5.17 | | | | 10.56 | | | | 1,489,706 | | | | 5.16 | | | | 37.98 | |
| 6.00 – 6.99% | | | 925 | | | | 6.47 | | | | 0.02 | | | | 3,724 | | | | 6.63 | | | | 0.09 | |
| Total certificates of deposit | | | 2,518,996 | | | | 3.91 | | | | 64.20 | | | | 2,501,248 | | | | 4.77 | | | | 63.76 | |
| | | | | | | | | | | | | | | | | | | | | | | | | |
| | | $ | 3,923,883 | | | | 2.91 | % | | | 100.00 | % | | $ | 3,922,782 | | | | 3.86 | % | | | 100.00 | % |
As of September 30, 2008, certificates of deposit mature as follows:
| | | Amount | | | Weighted Average Rate | |
| | | (Dollars in thousands) | |
| 2009 | | $ | 1,480,386 | | | | 3.76 | % |
| 2010 | | | 631,061 | | | | 4.26 | |
| 2011 | | | 285,932 | | | | 4.02 | |
| 2012 | | | 99,392 | | | | 3.69 | |
| 2013 | | | 21,278 | | | | 3.79 | |
| Thereafter | | | 947 | | | | 4.17 | |
| | | $ | 2,518,996 | | | | 3.91 | % |
The amount of noninterest-bearing deposits was $66.8 million and $65.6 million as of September 30, 2008 and 2007, respectively. Deposits in excess of $100 thousand ($250 thousand beginning October 3, 2008 until December 31, 2009, following the passage of the EESA) and IRA accounts in excess of $250 thousand may not be insured by the FDIC. The aggregate amount of deposit accounts in excess of $100 thousand was $996.7 million and $991.6 million as of September 30, 2008 and 2007, respectively. Certificates of deposit with a minimum denomination of $100 thousand were $686.3 million and $650.7 million as of September 30, 2008 and 2007, respectively. The aggregate amount of deposits that were reclassified as loans receivable was $296 thousand and $216 thousand as of September 30, 2008 and 2007, respectively.
At September 30, 2008, the Company’s borrowed funds consisted of FHLB advances and other borrowings. Included in other borrowings are repurchase agreements and Junior Subordinated Deferrable Interest Debentures (the “Debentures”).
FHLB Advances – FHLB advances at the periods ended are comprised of the following:
| | | 2008 | | | 2007 | |
| | | (Dollars in thousands) | |
| | | | | | | |
| Fixed-rate FHLB advances | | $ | 2,446,000 | | | $ | 2,746,000 | |
| Deferred gain on terminated interest rate swaps | | | 1,129 | | | | -- | |
| Fair value of interest rate swaps | | | -- | | | | (13,817 | ) |
| | | $ | 2,447,129 | | | $ | 2,732,183 | |
| | | | | | | | | |
| Weighted average interest rate on FHLB advances | | | 4.77 | % | | | 4.80 | % |
As of September 30, 2007, the Bank had interest rate swap agreements with an aggregate notional amount of $800.0 million. The Bank utilized the interest rate swaps to modify its interest rate risk profile. The Bank agreed to receive interest from counterparties at a fixed-rate matching the amounts paid by the Bank on the hedged FHLB advances and to pay interest at a variable rate indexed to the one month LIBOR rate plus a weighted average spread of 248 basis points during the term of the interest rate swaps and hedged FHLB advances. Net interest settlement with the counterparties was completed monthly. Interest expense on FHLB advances increased $2.3 million, $13.6 million and $8.6 million as a result of the interest rate swaps for the years ended September 30, 2008, 2007 and 2006. The aggregate fair value adjustment on the interest rate swaps represented a liability of $13.8 million as of September 30, 2007. As a result, the carrying amount of the FHLB advances as of September 30, 2007 was reduced by $13.8 million.
During the first quarter of fiscal year 2008, management terminated interest rate swap agreements with a notional amount of $575.0 million that were scheduled to mature during fiscal year 2010. As a result of the termination, the Bank received cash proceeds of $1.7 million and recorded a deferred gain for the proceeds. The gain will be amortized to interest expense on FHLB advances over the remaining life of the FHLB advances that were originally hedged by the terminated interest rate swap agreements. The Bank had no interest rate swap agreements outstanding at September 30, 2008 as the remaining interest rate swap agreement with a notional amount of $225.0 million matured in May 2008.
The FHLB advances are secured by certain qualifying mortgage loans pursuant to a blanket collateral agreement with the FHLB and all of the capital stock of FHLB owned by the Bank. Per the FHLB’s lending guidelines, total FHLB borrowings cannot exceed 40% of total Bank assets without the pre-approval of the FHLB president. At September 30, 2008, the Bank’s ratio of FHLB advances to total assets, as reported to the OTS, was 30%.
At September 30, 2008, the Company had access to a line of credit with the FHLB. In December 2008 the line of credit is expected to be renewed automatically by the FHLB for a one year period. At September 30, 2008, there were no borrowings on the FHLB line of credit. Any borrowings on the line of credit would be included in total FHLB borrowings in calculating the ratio of FHLB borrowings to total Bank assets, which generally could not exceed 40% of total Bank assets at September 30, 2008.
Other Borrowings –The following summarizes the components of other borrowings as of September 30, 2008 and 2007:
| | | 2008 | | | 2007 | |
| | | | | | Average | | | | | | Average | |
| | | Amount | | | Rate | | | Amount | | | Rate | |
| | | (Dollars in thousands) | |
| | | | | | | | | | | | | |
| Repurchase agreements | | $ | 660,000 | | | | 3.97 | % | | $ | -- | | | | -- | % |
| Debentures, net of capitalized debt issuance costs | | | 53,581 | | | | 5.54 | | | | 53,524 | | | | 8.12 | |
| | | $ | 713,581 | | | | 4.09 | % | | $ | 53,524 | | | | 8.12 | % |
Repurchase Agreements - During fiscal year 2008, the Bank entered into repurchase agreements totaling $660.0 million. Repurchase agreements are made at mutually agreed upon terms between counterparties and the Bank. The use of repurchase agreements allows for the diversification of funding sources and the use of securities that were not being leveraged as collateral. The Bank has pledged securities with a market value of $742.7 million at September 30, 2008 as collateral for the repurchase agreements.
Debentures - The Company has established a Delaware statutory trust, Capitol Federal Financial Trust I (the “Trust”), of which the Company owns 100% of the common securities, or slightly more than 3% of the Trust (“Trust Common Securities”). The Trust was formed for the purpose of issuing Company obligated mandatorily redeemable preferred securities (“Trust Preferred Securities”). Outside investors own 100% of the Trust Preferred Securities, or slightly less than 97% of the Trust. The Trust issued $53.6 million of Trust Preferred Securities. The Company purchased $1.6 million of the Trust Common Securities which are reported in Other Assets in the September 30, 2008 and 2007 consolidated balance sheet. When the Trust Preferred and Trust Common Securities were issued, the Trust used the proceeds to purchase a like amount of Debentures of the Company. The Debentures bear the same terms and interest rates as the Trust Preferred and Trust Common Securities. Interest is due quarterly in January, April, July and October until the maturity date of April 7, 2034. The interest rate, which resets at each interest payment, is based upon the three month LIBOR rate plus 275 basis points. Principal is due at maturity. The Debentures are callable, in part or whole, beginning on April 7, 2009, at par. Any such redemption of the Debentures by the Company will cause a redemption of a like amount of the Trust Preferred and Trust Common Securities by the Trust. The Company has guaranteed the obligations of the Trust. The Trust is not included in the consolidated financial statements of the Company in accordance with FIN No. 46R, “Consolidation of Variable Interest Entities, an interpretation of ARB No. 51.” The Debentures are the sole assets of the Trust. There are certain covenants of the Debentures that the Company is required to comply with. These covenants include a prohibition on cash dividends in the event of default or if the Company elects to defer the payment of interest on the Debentures, annual certifications to the Trust and other covenants related to the payment of interest and principal and maintenance of the Trust. The Company was in compliance with all covenants at September 30, 2008.
Maturity of Borrowed Funds – At September 30, 2008, the FHLB advances, repurchase agreements and Debentures mature as follows:
| | | FHLB | | | Repurchase | | | | | | Total | | | Weighted | |
| | | Advances | | | Agreements | | | Debentures | | | Borrowings | | | Average | |
| | | Amount | | | Amount | | | Amount | | | Amount | | | Rates | |
| | | (Dollars in thousands) | |
| 2009 | | $ | 620,000 | | | $ | -- | | | $ | -- | | | $ | 620,000 | | | | 4.27 | % |
| 2010 | | | 925,000 | | | | 45,000 | | | | -- | | | | 970,000 | | | | 5.52 | |
| 2011 | | | 276,000 | | | | 200,000 | | | | -- | | | | 476,000 | | | | 4.42 | |
| 2012 | | | 200,000 | | | | 150,000 | | | | -- | | | | 350,000 | | | | 4.24 | |
| 2013 | | | 425,000 | | | | 145,000 | | | | -- | | | | 570,000 | | | | 3.85 | |
| Thereafter | | | -- | | | | 120,000 | | | | 53,581 | | | | 173,581 | | | | 4.64 | |
| | | $ | 2,446,000 | | | $ | 660,000 | | | $ | 53,581 | | | $ | 3,159,581 | | | | 4.62 | % |
Of the $620.0 million FHLB advances maturing in fiscal year 2009, $300.0 million is due in the second quarter of fiscal year 2009 and $320.0 million is due in the fourth quarter of fiscal year 2009.
Income tax expense consists of the following:
| | | 2008 | | | 2007 | | | 2006 | |
| | | (Dollars in thousands) | |
| | | | | | | | | | |
| Current | | $ | 21,041 | | | $ | 1,896 | | | $ | 2,298 | |
| Deferred | | | 8,160 | | | | 18,714 | | | | 28,288 | |
| | | $ | 29,201 | | | $ | 20,610 | | | $ | 30,586 | |
Income tax expense has been provided at effective rates of 36.4%, 39.0% and 38.9% for the years ended September 30, 2008, 2007, and 2006, respectively. The differences between such effective rates and the statutory Federal income tax rate computed on income before income tax expense result from the following:
| | | 2008 | | | 2007 | | | 2006 | |
| | | Amount | | | % | | | Amount | | | % | | | Amount | | | % | |
| | | (Dollars in thousands) | |
| Federal income tax expense | | | | | | | | | | | | | | | | | | |
| computed at statutory Federal rate | | $ | 28,054 | | | | 35.0 | % | | $ | 18,517 | | | | 35.0 | % | | $ | 27,546 | | | | 35.0 | % |
| Increases in taxes resulting from: | | | | | | | | | | | | | | | | | | | | | | | | |
| State taxes, net of Federal tax effect | | | 2,122 | | | | 2.6 | | | | 1,719 | | | | 3.3 | | | | 2,335 | | | | 3.0 | |
| Other | | | (975 | ) | | | (1.2 | ) | | | 374 | | | | 0.7 | | | | 705 | | | | 0.9 | |
| | | $ | 29,201 | | | | 36.4 | % | | $ | 20,610 | | | | 39.0 | % | | $ | 30,586 | | | | 38.9 | % |
Deferred income tax expense results from temporary differences in the recognition of revenue and expenses for tax and financial statement purposes. The sources of these differences and the tax effect of each were as follows:
| | | 2008 | | | 2007 | | | 2006 | |
| | | (Dollars in thousands) | |
| | | | | | | | | | |
| FHLB prepayment penalty | | $ | 10,586 | | | $ | 21,225 | | | $ | 25,261 | |
| FHLB stock dividends | | | (1,901 | ) | | | (440 | ) | | | 1,214 | |
| Other, net | | | (525 | ) | | | (2,071 | ) | | | 1,813 | |
| | | $ | 8,160 | | | $ | 18,714 | | | $ | 28,288 | |
The components of the net deferred income tax (liabilities) assets as of September 30, 2008 and 2007 are as follows:
| | | 2008 | | | 2007 | |
| | | (Dollars in thousands) | |
| Deferred income tax assets: | | | | | | |
| FHLB prepayment penalty | | $ | 5,884 | | | $ | 16,470 | |
| Unrealized loss on AFS securities | | | 3,627 | | | | -- | |
| Salaries and employee benefits | | | 1,567 | | | | 1,048 | |
| ESOP compensation | | | 977 | | | | 1,024 | |
| Other | | | 2,285 | | | | 2,392 | |
| Gross deferred income tax assets | | | 14,340 | | | | 20,934 | |
| | | | | | | | | |
| Valuation allowance | | | (241 | ) | | | (231 | ) |
| Gross deferred income tax asset, net of valuation allowance | | | 14,099 | | | | 20,703 | |
| | | | | | | | | |
| | | | | | | | | |
| Deferred income tax liabilities: | | | | | | | | |
| FHLB stock dividends | | | 14,496 | | | | 16,397 | |
| Other | | | 2,826 | | | | 3,763 | |
| Gross deferred income tax liabilities | | | 17,322 | | | | 20,160 | |
| | | | | | | | | |
| Net deferred tax (liabilities) assets | | $ | (3,223 | ) | | $ | 543 | |
The Company assesses the available positive and negative evidence surrounding the recoverability of the deferred tax assets and applies its judgment in estimating the amount of valuation allowance necessary under the circumstances. As of September 30, 2008 and 2007, the Company recorded a $241 thousand and $231 thousand, respectively, valuation allowance on net operating losses that management believes will not be deductible for the foreseeable future on the Company’s consolidated Kansas corporate income tax return.
The Company adopted FASB FIN No. 48 “Accounting for Uncertainty in Income Taxes, an Interpretation of FASB Statement No. 109” on October 1, 2007. The interpretation clarifies the accounting for uncertainty in income taxes recognized in financial statements in accordance with SFAS No. 109, “Accounting for Income Taxes.” The interpretation prescribes a process by which the likelihood of a tax position is gauged based upon the technical merits of the position, and then a subsequent measurement relates the maximum benefit and the degree of likelihood to determine the amount of benefit to recognize in the financial statements.
As of October 1, 2007 (the date of adoption), the Company had unrecognized tax benefits of $3.8 million as a result of tax positions taken during prior periods, $531 thousand of which would affect the Company’s effective income tax rate if recognized. Of the total $3.8 million increase in liability for unrecognized tax positions, $339 thousand was accounted for as a decrease to the October 1, 2007 balance of retained earnings, and the remaining $3.5 million was accounted for as an increase to net deferred tax assets.
A reconciliation of the beginning and ending amounts of unrecognized tax benefits is as follows (dollars in thousands):
| Balance at October 1, 2007 | | $ | 3,773 | |
| Additions for tax positions of prior years | | | 130 | |
| Reductions for tax positions of prior years | | | ( 915 | ) |
| Lapse of statute of limitations | | | ( 579 | ) |
| Balance at September 30, 2008 | | $ | 2,409 | |
Included in the $2.4 million of unrecognized tax benefits at September 30, 2008 were accrued penalties and interest of $609 thousand. Estimated penalties and interest for the year ended September 30, 2008 was $81 thousand which are included in income tax expense in the consolidated statements of income. Interest income related to state and federal tax return refunds for the year ended September 30, 2008 was $235 thousand which is included in other income in the consolidated statements of income. We do not expect a material change in unrecognized tax benefits within the next twelve months.
The Company files income tax returns in the U.S. federal jurisdiction and the state of Kansas, as well as other states where it has nexus. In many cases, uncertain tax positions are related to tax years that remain subject to examination by the relevant taxing authorities. With few exceptions, the Company is no longer subject to U.S. federal and state examinations by tax authorities for fiscal years before 2005.
| 10. | EMPLOYEE BENEFIT PLANS |
The Company has a profit sharing plan and a Stock Ownership Plan (“ESOP”). The plans cover all employees with a minimum of one year of service, at least age 21, and at least 1,000 hours of employment each year.
Profit Sharing Plan – The profit sharing plan provides for two types of discretionary contributions. The first type is an optional Bank contribution, determined by the board of directors, between 0.0% and 5.0% of an eligible employee’s base compensation during the fiscal year. The second contribution may be between 0.5% and 10.0% of an eligible employee’s base compensation during the fiscal year if the employee matches 50.0% (on an after-tax basis) of the Bank’s second contribution. The profit sharing plan qualifies as a thrift and profit sharing plan for purposes of Internal Revenue Codes 401(a), 402, 412, and 417. Total profit sharing contributions amounted to $92 thousand, $80 thousand and $153 thousand for the years ended September 30, 2008, 2007, and 2006, respectively.
ESOP – The ESOP Trust acquired 3,024,574 shares of common stock in the Company’s initial public offering with proceeds from a loan from the Company. The Bank makes cash contributions to the ESOP on an annual basis sufficient to enable the ESOP to make the required loan payments to the Company.
The loan referenced above bears interest at a fixed-rate of 5.80% with interest payable annually and future principal and interest payable in five remaining fixed installments, as of September 30, 2008, of $3.0 million. Payments of $3.0 million consisting of principal of $2.1 million, $2.0 million and $1.9 million and interest of $900 thousand, $1.0 million and $1.1 million were made on September 30, 2008, 2007, and 2006, respectively. The loan is secured by the shares of Company stock purchased.
As the debt is repaid, 201,638 shares are released from collateral annually at September 30 and allocated to qualified employees based on the proportion of their qualifying compensation to total qualifying compensation. As ESOP shares are committed to be released from collateral, the Company records compensation expense. Compensation expense related to the ESOP was $7.5 million for each of the years ended September 30, 2008, 2007, and 2006. Dividends on unallocated ESOP shares are recorded as a reduction of debt, up to a total of $3.0 million.
During the year ended September 30, 2008 and 2007, the Bank paid $571 thousand and $41 thousand, respectively, of the ESOP debt payment because dividends on unallocated shares were insufficient to pay the scheduled debt payment as they had been in previous years. Dividends paid to participants on allocated ESOP shares were $2.9 million for the years ended September 30, 2008 and 2007.
Participants have the option to receive the dividends in cash or leave the dividend in the ESOP. Dividends are reinvested in Company stock for those participants who choose to leave their dividends in the ESOP or who do not make an election. The purchase of Company stock for reinvestment of dividends is made in the open market on or about the date of the cash disbursement to the participants who opt to take dividends in cash.
Shares may be withdrawn from the ESOP Trust due to retirement, termination or death of the participant. Following is a summary of shares held in the ESOP Trust as of September 30, 2008 and 2007:
| | | 2008 | | | 2007 | |
| (Dollars in thousands, except share amounts) | |
| | | | | | | |
| Allocated ESOP shares | | | 1,604,939 | | | | 1,529,881 | |
| Unreleased ESOP shares | | | 1,008,194 | | | | 1,209,832 | |
| Total ESOP shares | | | 2,613,133 | | | | 2,739,713 | |
| Fair value of unreleased ESOP shares | | $ | 44,693 | | | $ | 41,376 | |
| 11. | STOCK BASED COMPENSATION |
At September 30, 2008, the Company had an Option Plan and an RRP. SFAS No. 123(R) “Share-Based Payment” requires companies to recognize all share-based payments, which include stock options and restricted stock, in compensation expense over the service period of the share-based payment award. SFAS No. 123(R) establishes fair value as the measurement objective in accounting for share-based payment arrangements and requires all entities to apply a fair-value-based measurement method in accounting for share-based payment transactions with employees, except for equity instruments held by employee share ownership plans. The Company adopted SFAS No. 123(R) on October 1, 2005 using the modified prospective method in which compensation cost is recognized over the service period for all awards granted subsequent to the Company’s adoption of SFAS No. 123(R) as well as for the unvested portion of awards outstanding as of the Company’s adoption of SFAS No. 123(R).
Stock Option Plan – Pursuant to the Option Plan, 3,780,718 shares of common stock were reserved for issuance by the Company upon exercise of stock options granted to officers, directors and employees of the Company and the Bank from time to time under the Option Plan. The Company may issue both incentive and nonqualified stock options under the Option Plan. The incentive stock options expire in ten years and the nonqualified stock options expire fifteen years from the date of grant. The date on which the options are first exercisable is determined by the Stock Benefits Committee (“sub-committee”), a sub-committee of the Compensation Committee (“committee”) of the board of directors. The vesting period of the options generally ranges from three to five years. The option price is equal to the market value at the date of the grant as defined by the Option Plan. The purpose of the Option Plan is to provide additional incentive to certain officers, directors and key employees by facilitating their purchase of a stock interest in the Company. At September 30, 2008, the Company had 301,285 shares available for future grants under the Option Plan. The Option Plan expires in 2010. No additional grants may be made after expiration, but outstanding grants continue until they are individually exercised, forfeited, or expire.
The Option Plan is administered by the sub-committee, which selects the employees and non-employee directors to whom options are to be granted and the number of shares to be granted. The exercise price may be paid in cash, shares of the common stock, or a combination of both. The option price may not be less than 100% of the fair market value of the shares on the date of the grant. In the case of any employee who is granted an incentive stock option who owns more than 10% of the outstanding common stock at the time the option is granted, the option price may not be less than 110% of the fair market value of the shares on the date of the grant, and the option shall not be exercisable after the expiration of five years from the grant date. Historically, the Company has issued shares held in treasury upon the exercise of stock options.
The fair value of stock option grants is estimated on the date of the grant using the Black-Scholes option pricing model. The weighted average grant-date fair value of stock options granted during the fiscal years ended September 30, 2008, 2007, and 2006 was $3.20, $5.61 and $3.98 per share, respectively. Compensation expense attributable to stock options awards during the year ended September 30, 2008, 2007 and 2006 totaled $323 thousand ($205 thousand, net of tax), $294 thousand ($179 thousand, net of tax), and $375 thousand ($229 thousand, net of tax), respectively. The following weighted average assumptions were used for valuing stock option grants for the periods noted:
| | | 2008 | | | 2007 | | | 2006 | |
| | | | | | | | | | |
| Risk-free interest rate | | | 3.2 | % | | | 4.8 | % | | | 4.5 | % |
| Expected life (years) | | | 5 | | | | 6 | | | | 8 | |
| Expected volatility | | | 22 | % | | | 21 | % | | | 22 | % |
| Dividend yield | | | 6.2 | % | | | 5.2 | % | | | 6.1 | % |
| Estimated forfeitures | | | 3.0 | % | | | 6.2 | % | | | 0 | % |
The risk-free interest rate was determined using the yield available on the option grant date for a zero-coupon U.S. Treasury security with a term equivalent to the expected life of the option. Per SAB No. 110, the expected life for options granted during the year ended September 30, 2008 was based upon historical experience. The expected life for options granted during years ended 2007 and 2006 represents the period the option is expected to be outstanding and was determined by applying the simplified method as allowed by SAB No.107. The expected volatility was determined using historical volatilities based on historical stock prices. The dividend yield was determined based upon historical quarterly dividends and the Company’s stock price on the option grant date. Estimated forfeitures were determined based upon voluntary termination behavior and actual option forfeitures.
A summary of option activity for the years ended September 30, 2008, 2007, and 2006 follows:
| | | 2008 | | | 2007 | | | 2006 | |
| | | | | | Weighted | | | | | | Weighted | | | | | | Weighted | |
| | | | | | Average | | | | | | Average | | | | | | Average | |
| | | Number | | | Exercise | | | Number | | | Exercise | | | Number | | | Exercise | |
| | | of Options | | | Price | | | of Options | | | Price | | | of Options | | | Price | |
| | | | | | | | | | | | | | | | | | | |
| Options outstanding | | | | | | | | | | | | | | | | | | |
| at beginning of year | | | 382,855 | | | $ | 28.13 | | | | 668,457 | | | $ | 20.43 | | | | 789,749 | | | $ | 15.61 | |
| Granted | | | 56,500 | | | | 32.19 | | | | 34,000 | | | | 38.77 | | | | 112,000 | | | | 32.69 | |
| Forfeited | | | (100 | ) | | | 25.66 | | | | (8,967 | ) | | | 29.37 | | | | (2,200 | ) | | | 22.57 | |
| Exercised | | | (35,933 | ) | | | 17.34 | | | | (310,635 | ) | | | 12.69 | | | | (231,092 | ) | | | 9.87 | |
| Options outstanding | | | | | | | | | | | | | | | | | | | | | | | | |
| at end of year | | | 403,322 | | | $ | 29.66 | | | | 382,855 | | | $ | 28.13 | | | | 668,457 | | | $ | 20.43 | |
Shares issued upon the exercise of stock options are issued from treasury stock. The Company has an adequate number of treasury shares available for sale for future stock option exercises. During the years ended September 30, 2008, 2007 and 2006, the total pretax intrinsic value of stock options exercised was $755 thousand, $8.1 million and $5.3 million, respectively and the tax benefits realized from the exercise of stock options were $114 thousand, $2.6 million and $1.6 million, respectively. The fair value of stock options vested during the year ended September 30, 2008 was $281 thousand.
The following summarizes information about the stock options outstanding and exercisable as of September 30, 2008:
| | | Options Outstanding | |
| | | | | | Weighted | | | Weighted | | | | |
| | | | | | Average | | | Average | | | | |
| | | Number | | | Remaining | | | Exercise | | | Aggregate | |
| Exercise | | of Options | | | Contractual | | | Price per | | | Intrinsic | |
| Price | | Outstanding | | | Life (in years) | | | Share | | | Value | |
| | | (Dollars in thousands, except per share amounts) | |
| $9.22 | | | 64,431 | | | | 5.00 | | | $ | 9.22 | | | $ | 2,262 | |
| 14.03 - 19.68 | | | 6,091 | | | | 2.59 | | | | 17.52 | | | | 163 | |
| 25.66 – 28.78 | | | 3,500 | | | | 3.93 | | | | 27.00 | | | | 61 | |
| 30.19 - 38.77 | | | 329,300 | | | | 9.78 | | | | 33.91 | | | | 3,431 | |
| | | | 403,322 | | | | 8.85 | | | $ | 29.66 | | | $ | 5,917 | |
| | | Options Exercisable | |
| | | | | | Weighted | | | Weighted | | | | |
| | | | | | Average | | | Average | | | | |
| | | Number | | | Remaining | | | Exercise | | | Aggregate | |
| Exercise | | of Options | | | Contractual | | | Price per | | | Intrinsic | |
| Price | | Exercisable | | | Life (in years) | | | Share | | | Value | |
| | | (Dollars in thousands, except per share amounts) | |
| $9.22 | | | 64,431 | | | | 5.00 | | | $ | 9.22 | | | $ | 2,262 | |
| 14.03 - 19.68 | | | 6,091 | | | | 2.59 | | | | 17.52 | | | | 163 | |
| 25.66 - 28.78 | | | 3,500 | | | | 3.93 | | | | 27.00 | | | | 61 | |
| 30.19 - 38.77 | | | 193,800 | | | | 9.61 | | | | 34.03 | | | | 1,997 | |
| | | | 267,822 | | | | 8.27 | | | $ | 27.59 | | | $ | 4,483 | |
The aggregate intrinsic value in the preceding table represents the total pre-tax intrinsic value, based on the Company’s closing stock price of $44.33 as of September 30, 2008, which would have been received by the option holders had all option holders exercised their options as of that date. The total number of in-the-money options exercisable as of September 30, 2008 was 267,822.
As of September 30, 2008, the total future compensation cost related to non-vested stock options not yet recognized in the consolidated statements of income was $374 thousand and the weighted average period over which these awards are expected to be recognized was 2.1 years.
Recognition and Retention Plan – The objective of the RRP is to enable the Company and the Bank to retain personnel of experience and ability in key positions of responsibility. Employees and directors of the Bank are eligible to receive benefits under the RRP at the sole discretion of the sub-committee. The total number of shares originally eligible to be granted under the RRP was 1,512,287. At September 30, 2008, the Company had 165,987 shares available for future grants under the RRP. The RRP expires in 2010. No additional grants may be made after expiration, but outstanding grants continue until they are individually exercised, forfeited, or expire.
Compensation expense in the amount of the fair market value of the common stock at the date of the grant, as defined by the RRP, to the employee is recognized over the period during which the shares vest. Compensation expense attributable to RRP awards during the year ended September 30, 2008, 2007 and 2006 totaled $399 thousand ($253 thousand, net of tax), $375 thousand ($229 thousand, net of tax), and $451 thousand ($275 thousand, net of tax), respectively. A recipient of such restricted stock will be entitled to all voting and other stockholder rights (including the right to receive dividends on vested and non-vested shares), except that the shares, while restricted, may not be sold, pledged or otherwise disposed of and are required to be held in escrow by the Company. If a holder of such restricted stock terminates employment for reasons other than death or disability, the employee forfeits all rights to the non-vested shares under restriction. If the participant’s service terminates as a result of death, disability, or if a change in control of the Bank occurs, all restrictions expire and all non-vested shares become unrestricted. A summary of RRP share activity for the years September 30, 2008, 2007, and 2006 follows:
| | | 2008 | | | 2007 | | | 2006 | |
| | | | | | Weighted | | | | | | Weighted | | | | | | Weighted | |
| | | Number | | | Average | | | Number | | | Average | | | Number | | | Average | |
| | | of | | | Grant Date | | | of | | | Grant Date | | | of | | | Grant Date | |
| | | Shares | | | Fair Value | | | Shares | | | Fair Value | | | Shares | | | Fair Value | |
| Outstanding at beginning | | | | | | | | | | | | | | | | | | |
| of period | | | 24,300 | | | $ | 34.46 | | | | 30,800 | | | $ | 33.37 | | | | 18,800 | | | $ | 33.88 | |
| Granted | | | 10,000 | | | | 32.26 | | | | 5,000 | | | | 38.77 | | | | 22,500 | | | | 32.73 | |
| Vested | | | (11,100 | ) | | | 34.12 | | | | (11,100 | ) | | | 33.35 | | | | (10,500 | ) | | | 32.91 | |
| Forfeited | | | -- | | | | -- | | | | (400 | ) | | | 35.42 | | | | -- | | | | -- | |
| Outstanding at end of period | | | 23,200 | | | $ | 33.68 | | | | 24,300 | | | $ | 34.46 | | | | 30,800 | | | $ | 33.37 | |
The estimated forfeiture rate for the RRP shares granted during the year ended September 30, 2008, 2007 and 2006 was 0% based upon voluntary termination behavior and actual forfeitures. The fair value of RRP shares that vested during the years ended September 30, 2008, 2007, and 2006 totaled $379 thousand, $370 thousand and $346 thousand, respectively. As of September 30, 2008, there was $553 thousand of unrecognized compensation cost related to non-vested RRP shares to be recognized over a weighted average period of 2.2 years.
| 12. | PERFORMANCE BASED COMPENSATION |
The Company and the Bank have a short-term performance plan for all officers and a deferred incentive bonus plan for executive officers. The short-term performance plan has a component tied to Company performance and a component tied to individual participant performance. Individual performance criteria are established by executive management for eligible non-executive employees of the Bank; individual performances of executive officers are reviewed by the committee. Company performance criteria are approved by the committee. Short-term performance plan awards are granted based upon a performance review by the committee. The committee may exercise its discretion and reduce or not grant awards. The deferred incentive bonus plan is intended to operate in conjunction with the short-term performance plan. A participant of the deferred incentive bonus plan can elect to defer into an account between $2 thousand and 50% of the short-term performance plan award up to but not exceeding $100 thousand. The amount deferred receives a 50% employer match. The deferral period is three years. Earnings on the amount deferred by the executive and the employer match are tied to the performance of the Company’s common stock and cash dividends paid thereon during the deferral period. The total amount of short-term performance plan awards provided for the years ended September 30, 2008, 2007, and 2006, amounted to $2.1 million, $1.1 million and $1.1 million respectively, of which $165 thousand, $66 thousand and $125 thousand respectively, was deferred under the deferred incentive bonus plan. The deferrals and earnings on those deferrals will be paid in 2010, 2011, and 2012. During fiscal years 2008, 2007, and 2006 the amount expensed in conjunction with the earnings on the deferred amounts was $332 thousand, $82 thousand and $110 thousand, respectively.
| 13. | DEFERRED COMPENSATION |
The Bank has deferred compensation agreements with certain officers and retired officers whereby stipulated amounts will be paid to them over a period of 20 years upon their retirement or termination. Amounts accrued under these agreements aggregate $363 thousand and $492 thousand as of September 30, 2008 and 2007, respectively, and are accrued over the period of active employment and are funded by life insurance contracts.
| 14. | COMMITMENTS AND CONTINGENCIES |
The Bank had commitments outstanding to originate and purchase first and second mortgage loans as of September 30, 2008 and 2007 as follows:
| | | 2008 | | | 2007 | |
| | | (Dollars in thousands) | |
| | | | | | | |
| Originate fixed-rate | | $ | 105,419 | | | $ | 88,081 | |
| Originate adjustable-rate | | | 16,302 | | | | 23,737 | |
| Purchase fixed-rate | | | 14,366 | | | | 19,277 | |
| Purchase adjustable-rate | | | 133,153 | | | | 19,172 | |
| | | $ | 269,240 | | | $ | 150,267 | |
As of September 30, 2008 and 2007, there were no significant loan-related commitments that met the definition of derivatives or commitments to sell mortgage loans.
As of September 30, 2008, the Bank had commitments to originate non-mortgage loans approximating $72 thousand all of which were fixed-rate. As of September 30, 2007, the Bank had commitments to originate non-mortgage loans approximating $2.2 million of which approximately $158 thousand were fixed-rate and $2.1 million were variable rate commitments.
Commitments to originate mortgage and non-mortgage loans are agreements to lend to a customer as long as there is no violation of any condition established in the contract. Commitments generally have fixed expiration dates or other termination clauses and may require the payment of a rate lock fee. Some of the commitments are expected to expire without being fully drawn upon; therefore the amount of total commitments disclosed above does not necessarily represent future cash requirements. The Bank evaluates each customer’s creditworthiness on a case-by-case basis. The amount of collateral obtained, if considered necessary by the Bank, upon extension of credit is based on management’s credit evaluation of the customer.
As of September 30, 2008 and 2007, the Bank had approved but unadvanced home equity lines of credit of $269.0 million and $269.3 million, respectively. Approval of lines of credit is based upon underwriting standards that do not allow total borrowings, including existing mortgages and lines of credit, to exceed 100% of the estimated market value of the customer’s home.
| 15. | REGULATORY CAPITAL REQUIREMENTS |
The Bank is subject to various regulatory capital requirements administered by the federal banking agencies. Failure to meet minimum capital requirements can initiate certain mandatory, and possibly additional discretionary, actions by regulators that, if undertaken, could have a material effect on the Company’s financial statements. Under capital adequacy guidelines and the regulatory framework for prompt corrective action the Bank must meet specific capital guidelines that involve quantitative measures of the Bank’s assets, liabilities, and certain off-balance-sheet items as calculated under regulatory accounting practices. The Bank’s capital amounts and classifications are also subject to qualitative judgments by regulators about components, risk weightings, and other factors.
Quantitative measures that have been established by regulation to ensure capital adequacy require the Bank to maintain minimum capital amounts and ratios (set forth in the table below). The Bank’s primary regulatory agency, the OTS, requires that the Bank maintain minimum ratios of tangible capital (as defined in the regulations) of 1.5%, core capital (as defined) of 4%, and total risk-based capital (as defined) of 8%. The Bank also is subject to prompt corrective action capital requirement regulations set forth by the FDIC. The FDIC requires the Bank to maintain a minimum of Tier 1 total and core capital (as defined) to risk-weighted assets (as defined), and of core capital (as defined) to adjusted tangible assets (as defined). Management believes, as of September 30, 2008, that the Bank meets all capital adequacy requirements to which it is subject.
As of September 30, 2008 and 2007, the most recent guidelines from the OTS categorized the Bank as “well capitalized” under the regulatory framework for prompt corrective action. To be categorized as “well capitalized,” the Bank must maintain minimum total risk-based, Tier 1 risk-based, and Tier 1 leverage ratios as set forth in the following table. There are no conditions or events subsequent to September 30, 2008 that management believes changed the Bank’s category.
| | | | | | | | | | To Be Well |
| | | | | | | | | | Capitalized |
| | | | | | | | | | Under Prompt |
| | | | | | For Capital | Corrective Action |
| | Actual | | Adequacy Purposes | | Provisions |
| | Amount | | Ratio | | Amount | | Ratio | | Amount | | Ratio |
| | (Dollars in thousands) |
| As of September 30, 2008: | | | | | | | | | | | |
| Total capital (to risk weighted assets) | $ 801,886 | | 23.0 | % | $ 279,143 | | 8.0 | % | $ 348,929 | | 10.0% |
| Core capital (to adjusted tangible assets) | 806,708 | | 10.0 | | 323,192 | | 4.0 | | 403,990 | | 5.0 |
| Tangible capital (to tangible assets) | 806,708 | | 10.0 | | 121,197 | | 1.5 | | N/A | | N/A |
| Tier I capital (to risk weighted assets) | 806,708 | | 23.1 | | N/A | | N/A | | 209,357 | | 6.0 |
| | | | | | | | | | | | |
| As of September 30, 2007: | | | | | | | | | | | |
| Total capital (to risk weighted assets) | $ 784,725 | | 22.8 | % | $ 275,296 | | 8.0 | % | $ 344,120 | | 10.0% |
| Core capital (to adjusted tangible assets) | 788,621 | | 10.3 | | 307,799 | | 4.0 | | 384,749 | | 5.0 |
| Tangible capital (to tangible assets) | 788,621 | | 10.3 | | 115,425 | | 1.5 | | N/A | | N/A |
| Tier I capital (to risk weighted assets) | 788,621 | | 22.9 | | N/A | | N/A | | 206,472 | | 6.0 |
| | A reconciliation of the Bank’s equity under GAAP to regulatory capital amounts as of September 30, 2008 and 2007 is as follows: |
| | | 2008 | | | 2007 | |
| | | (Dollars in thousands) | |
| | | | | | | |
| Total equity as reported under GAAP | | $ | 803,643 | | | $ | 793,661 | |
| Unrealized losses (gains) on AFS securities | | | 5,968 | | | | (1,287 | ) |
| Other | | | (2,903 | ) | | | (3,753 | ) |
| Total tangible and core capital | | | 806,708 | | | | 788,621 | |
| Allowance for loan losses | | | 5,008 | | | | 4,164 | |
| Equity investments in low income housing tax credits | | | (9,830 | ) | | | (8,060 | ) |
| Total risk based capital | | $ | 801,886 | | | $ | 784,725 | |
Under OTS regulations, there are limitations on the amount of capital the Bank may distribute to the Company. Generally, this is limited to the earnings of the previous two calendar years and current year-to-date earnings. Currently, the Bank operates under an OTS-granted waiver to these regulations because of capital distributions from the Bank to the Company during the current waiver period, which is expected to expire on December 31, 2008. Currently, the Bank has authorization from the OTS to distribute capital from the Bank to the Company through the quarter ending June 30, 2009. So long as the Bank continues to maintain excess capital, operate in a safe and sound manner, and comply with the interest rate risk management guidelines of the OTS, it is management’s belief that the Bank will continue to receive waivers, as necessary, allowing it to distribute the net income of the Bank to the Company, although no assurance can be given in this regard.
| 16. | FAIR VALUE OF FINANCIAL INSTRUMENTS |
The Company determined estimated fair value amounts using available market information and a selection from a variety of valuation methodologies. However, considerable judgment is required to interpret market data to develop the estimates of fair value. Accordingly, the estimates presented are not necessarily indicative of the amount the Company could realize in a current market exchange. The use of different market assumptions and estimation methodologies may have a material effect on the estimated fair value amounts.
The estimated fair values of the Company’s financial instruments as of September 30, 2008 and 2007 are as follows:
| | | 2008 | | | 2007 | |
| | | | | | Estimated | | | | | | Estimated | |
| | | Carrying | | | Fair | | | Carrying | | | Fair | |
| | | Amount | | | Value | | | Amount | | | Value | |
| | | | | | (Dollars in thousands) | | | | |
| Assets: | | | | | | | | | | | | |
| Cash and cash equivalents | | $ | 87,138 | | | $ | 87,138 | | | $ | 162,791 | | | $ | 162,791 | |
| Investment securities: | | | | | | | | | | | | | | | | |
| Available-for-sale | | | 49,586 | | | | 49,586 | | | | 102,424 | | | | 102,424 | |
| Held-to-maturity | | | 92,773 | | | | 92,211 | | | | 421,744 | | | | 418,940 | |
| Mortgage-related securities: | | | | | | | | | | | | | | | | |
| Available-for-sale | | | 1,484,055 | | | | 1,484,055 | | | | 402,686 | | | | 402,686 | |
| Held-to-maturity | | | 750,284 | | | | 743,764 | | | | 1,011,585 | | | | 995,415 | |
| Loans receivable held-for-sale | | | 997 | | | | 997 | | | | 2,184 | | | | 2,184 | |
| Loans receivable | | | 5,320,780 | | | | 5,301,179 | | | | 5,290,071 | | | | 5,189,611 | |
| Capital stock of FHLB | | | 124,406 | | | | 124,406 | | | | 139,661 | | | | 139,661 | |
| Liabilities: | | | | | | | | | | | | | | | | |
| Deposits | | | 3,923,883 | | | | 3,934,188 | | | | 3,922,782 | | | | 3,925,810 | |
| Advances from FHLB | | | 2,447,129 | | | | 2,485,545 | | | | 2,732,183 | | | | 2,751,641 | |
| Other borrowings | | | 713,581 | | | | 716,951 | | | | 53,524 | | | | 54,451 | |
The following methods and assumptions were used to estimate the fair value of the financial instruments:
Cash and Cash Equivalents - The carrying amounts of cash and cash equivalents are reasonable estimates of their fair value.
Investment and Mortgage-Related Securities - Estimated fair values of investment and mortgage-related securities are based on one of three methods: 1) quoted market prices where available, 2) quoted market prices for similar instruments if quoted market prices are not available, 3) unobservable data that represents the Bank’s assumptions about items that market participants would consider in determining fair value where no market data is available.
Loans Receivable Held-for-Sale - Estimated fair values of loans receivable held for sale are determined based on sales commitments or dealer quotations.
Loans Receivable - Fair values are estimated for portfolios with similar financial characteristics. Loans are segregated by type, such as one- to four-family residential mortgages, multi-family residential mortgages, nonresidential and installment loans. Each loan category is further segmented into fixed and adjustable interest rate categories. Market pricing sources are used to approximate the estimated fair value of fixed and adjustable-rate one- to four-family residential mortgages. For all other loan categories, future cash flows are discounted using the current yield curve at which similar loans would be made to borrowers with similar credit ratings and for the same remaining maturity.
Capital Stock of FHLB - The carrying value of capital stock of FHLB approximates its fair value.
Deposits - The estimated fair value of demand deposits and savings accounts is the amount payable on demand at the reporting date. The estimated fair value of fixed-maturity certificates of deposit is estimated by discounting the future cash flows using the rates currently offered by the Bank for certificates of similar remaining maturities.
Advances from FHLB - The estimated fair value of advances from FHLB are determined by discounting the future cash flows of each advance using the LIBOR curve.
Other Borrowings – The Debentures have a variable rate structure. The Company can prepay the Debentures at a premium until April 2009, at which point the borrowings can be pre-paid at par. The estimated fair value of the repurchase agreements is determined by discounting the future cash flows of each agreement using the LIBOR curve.
The fair value estimates presented herein are based on pertinent information available to management as of September 30, 2008 and 2007. Although management is not aware of any factors that would significantly affect the estimated fair value amounts, such amounts have not been comprehensively revalued for purposes of these financial statements since that date. Therefore, current estimates of fair value may differ significantly from the amounts presented herein.
| 17. | SELECTED QUARTERLY FINANCIAL DATA (UNAUDITED) |
The following table presents summarized quarterly data for each of the years indicated for the Company.
| | | First Quarter | | | Second Quarter | | | Third Quarter | | | Fourth Quarter | | | Total | |
| | | | |
| | | (Dollars and counts in thousands, except per share amounts) | |
| | | | | | | | | | | | | | | | |
| 2008 | | | | | | | | | | | | | | | |
| Total interest and dividend income | | $ | 101,028 | | | $ | 101,816 | | | $ | 102,785 | | | $ | 105,177 | | | $ | 410,806 | |
| Net interest and dividend income | | | 26,627 | | | | 31,002 | | | | 36,681 | | | | 39,858 | | | | 134,168 | |
| Provision for loan losses | | | -- | | | | 119 | | | | 1,602 | | | | 330 | | | | 2,051 | |
| Net income | | | 9,113 | | | | 11,727 | | | | 14,355 | | | | 15,759 | | | | 50,954 | |
| Basic earnings per share | | | 0.12 | | | | 0.16 | | | | 0.20 | | | | 0.22 | | | | 0.70 | |
| Diluted earnings per share | | | 0.12 | | | | 0.16 | | | | 0.20 | | | | 0.22 | | | | 0.70 | |
| Dividends paid per public share | | | 0.50 | | | | 0.50 | | | | 0.50 | | | | 0.50 | | | | 2.00 | |
| Average number of shares outstanding | | | 72,956 | | | | 72,875 | | | | 72,933 | | | | 72,990 | | | | 72,939 | |
| | | | | | | | | | | | | | | | | | | | | |
| 2007 | | | | | | | | | | | | | | | | | | | | |
| Total interest and dividend income | | $ | 105,166 | | | $ | 104,573 | | | $ | 101,526 | | | $ | 100,285 | | | $ | 411,550 | |
| Net interest and dividend income | | | 27,827 | | | | 28,697 | | | | 25,816 | | | | 24,100 | | | | 106,440 | |
| (Recovery) Provision for loan losses | | | (280 | ) | | | 55 | | | | -- | | | | -- | | | | (225 | ) |
| Net income | | | 10,251 | | | | 8,456 | | | | 7,289 | | | | 6,300 | | | | 32,296 | |
| Basic earnings per share | | | 0.14 | | | | 0.12 | | | | 0.10 | | | | 0.08 | | | | 0.44 | |
| Diluted earnings per share | | | 0.14 | | | | 0.12 | | | | 0.10 | | | | 0.08 | | | | 0.44 | |
| Dividends paid per public share | | | 0.59 | | | | 0.50 | | | | 0.50 | | | | 0.50 | | | | 2.09 | |
| Average number of shares outstanding | | | 72,627 | | | | 72,812 | | | | 72,947 | | | | 73,011 | | | | 72,849 | |
| 18. | PARENT COMPANY FINANCIAL INFORMATION (PARENT COMPANY ONLY) |
The Company serves as the holding company for the Bank (see Note 1). The Company’s (parent company only) balance sheets as of September 30, 2008 and 2007, and the related statements of income and cash flows for each of the three years in the period ended September 30, 2008 are as follows:
| BALANCE SHEETS | | | | | | |
| SEPTEMBER 30, 2008 and 2007 | | | | | | |
| (in thousands, except share amounts) | | | | | | |
| | | 2008 | | | 2007 | |
| ASSETS | | | | | | |
| | | | | | | |
| Cash and cash equivalents | | $ | 44,508 | | | $ | 53,662 | |
| Investment in the Bank | | | 803,643 | | | | 793,661 | |
| Investment in certificates of deposit at the Bank | | | 60,000 | | | | 60,000 | |
| Note receivable - ESOP | | | 12,667 | | | | 14,799 | |
| Other assets | | | 4,621 | | | | 1,639 | |
| Income tax receivable | | | 67 | | | | -- | |
| TOTAL ASSETS | | $ | 925,506 | | | $ | 923,761 | |
| | | | | | | | | |
| LIABILITIES AND STOCKHOLDERS’ EQUITY | | | | | | | | |
| | | | | | | | | |
| LIABILITIES: | | | | | | | | |
| Income tax payable | | $ | -- | | | $ | 228 | |
| Accounts payable and accrued expenses | | | 709 | | | | 2,378 | |
| Other borrowings | | | 53,581 | | | | 53,524 | |
| Total liabilities | | | 54,290 | | | | 56,130 | |
| | | | | | | | | |
| STOCKHOLDERS’ EQUITY: | | | | | | | | |
| Preferred stock, $.01 par value; 50,000,000 shares authorized, | | | | | | | | |
| no shares issued or outstanding | | | -- | | | | -- | |
| Common stock, $.01 par value; 450,000,000 shares authorized, | | | | | | | | |
| 91,512,287 shares issued; 74,079,868 and 74,258,977 shares | | | | | | | | |
| outstanding as of September 30, 2008 and 2007, respectively | | | 915 | | | | 915 | |
| Additional paid-in capital | | | 445,391 | | | | 438,964 | |
| Unearned compensation - ESOP | | | (10,082 | ) | | | (12,098 | ) |
| Unearned compensation - RRP | | | (553 | ) | | | (630 | ) |
| Retained earnings | | | 759,375 | | | | 750,186 | |
| Accumulated other comprehensive (loss) gain | | | (5,968 | ) | | | 1,287 | |
| | | | 1,189,078 | | | | 1,178,624 | |
| Treasury stock 17,432,419 and 17,253,310 shares as of | | | | | | | | |
| September 30, 2008 and 2007, at cost | | | (317,862 | ) | | | (310,993 | ) |
| | | | | | | | | |
| Total stockholders’ equity | | | 871,216 | | | | 867,631 | |
| | | | | | | | | |
| TOTAL LIABILITIES AND STOCKHOLDERS’ EQUITY | | $ | 925,506 | | | $ | 923,761 | |
| STATEMENTS OF INCOME | | | | | | | | | |
| YEARS ENDED SEPTEMBER 30, 2008, 2007, and 2006 | | | | | | | | | |
| (in thousands) | | | | | | | | | |
| | | | | | | | | | |
| | | 2008 | | | 2007 | | | 2006 | |
| | | | | | | | | | |
| INTEREST AND DIVIDEND INCOME: | | | | | | | | | |
| Dividend income from the Bank | | $ | 41,511 | | | $ | 35,956 | | | $ | 38,414 | |
| Interest income from other investments | | | 4,683 | | | | 5,751 | | | | 5,174 | |
| Total interest and dividend income | | | 46,194 | | | | 41,707 | | | | 43,588 | |
| | | | | | | | | | | | | |
| INTEREST EXPENSE | | | 3,624 | | | | 4,468 | | | | 4,160 | |
| | | | | | | | | | | | | |
| NET INTEREST AND DIVIDEND INCOME | | | 42,570 | | | | 37,239 | | | | 39,428 | |
| | | | | | | | | | | | | |
| OTHER INCOME | | | 107 | | | | 132 | | | | 123 | |
| | | | | | | | | | | | | |
| OTHER EXPENSES: | | | | | | | | | | | | |
| Salaries and employee benefits | | | 975 | | | | 945 | | | | 960 | |
| Other, net | | | 380 | | | | 438 | | | | 512 | |
| Total other expenses | | | 1,355 | | | | 1,383 | | | | 1,472 | |
| | | | | | | | | | | | | |
| INCOME BEFORE INCOME TAX (BENEFIT) EXPENSE AND EQUITY | | | | | | | | | | | | |
| IN UNDISTRIBUTED EARNINGS OF SUBSIDIARY (EXCESS OF | | | | | | | | | | | | |
| DISTRIBUTION OVER) | | | 41,322 | | | | 35,988 | | | | 38,079 | |
| | | | | | | | | | | | | |
| INCOME TAX (BENEFIT) EXPENSE | | | (66 | ) | | | 11 | | | | (123 | ) |
| | | | | | | | | | | | | |
| INCOME BEFORE EQUITY IN UNDISTRIBUTED EARNINGS OF | | | | | | | | | | | | |
| SUBSIDIARY (EXCESS OF DISTRIBUTION OVER) | | | 41,388 | | | | 35,977 | | | | 38,202 | |
| | | | | | | | | | | | | |
| EQUITY IN UNDISTRIBUTED EARNINGS OF SUBSIDIARY | | | | | | | | | | | | |
| (EXCESS OF DISTRIBUTION OVER) | | | 9,566 | | | | (3,681 | ) | | | 9,915 | |
| | | | | | | | | | | | | |
| NET INCOME | | $ | 50,954 | | | $ | 32,296 | | | $ | 48,117 | |
| STATEMENTS OF CASH FLOWS | | | | | | | | | |
| YEARS ENDED SEPTEMBER 30, 2008, 2007, and 2006 | | | | | | | | | |
| (in thousands) | | | | | | | | | |
| | | | | | | | | | |
| | | 2008 | | | 2007 | | | 2006 | |
| CASH FLOWS FROM OPERATING ACTIVITIES: | | | | | | | | | |
| Net income | | $ | 50,954 | | | $ | 32,296 | | | $ | 48,117 | |
| Adjustments to reconcile net income to net cash provided by | | | | | | | | | | | | |
| operating activities: | | | | | | | | | | | | |
| Equity in excess of distribution over/(undistributed) | | | | | | | | | | | | |
| earnings of subsidiary | | | (9,566 | ) | | | 3,681 | | | | (9,915 | ) |
| Amortization of deferred debt issuance costs | | | 57 | | | | 57 | | | | 57 | |
| Other, net | | | 3 | | | | (5 | ) | | | (11 | ) |
| Changes in: | | | | | | | | | | | | |
| Other assets | | | (2,982 | ) | | | 33 | | | | (18 | ) |
| Income taxes receivable/payable | | | (295 | ) | | | 351 | | | | 47 | |
| Accounts payable and accrued expenses | | | (1,669 | ) | | | 1,321 | | | | (3,278 | ) |
| Net cash flows provided by operating activities | | | 36,502 | | | | 37,734 | | | | 34,999 | |
| | | | | | | | | | | | | |
| CASH FLOWS FROM INVESTING ACTIVITIES: | | | | | | | | | | | | |
| Principal collected on notes receivable from ESOP | | | 2,132 | | | | 2,016 | | | | 1,905 | |
| Net cash flows provided by investing activities | | | 2,132 | | | | 2,016 | | | | 1,905 | |
| | | | | | | | | | | | | |
| CASH FLOWS FROM FINANCING ACTIVITIES: | | | | | | | | | | | | |
| Payment from subsidiary for sale of treasury stock related to | | | | | | | | | | | | |
| RRP shares | | | 322 | | | | 180 | | | | 749 | |
| Dividends paid | | | (41,426 | ) | | | (43,000 | ) | | | (46,870 | ) |
| Acquisition of treasury stock | | | (7,307 | ) | | | (3,198 | ) | | | (16,681 | ) |
| Stock options exercised | | | 623 | | | | 3,942 | | | | 2,279 | |
| Net cash flows used in financing activities | | | (47,788 | ) | | | (42,076 | ) | | | (60,523 | ) |
| | | | | | | | | | | | | |
| NET DECREASE IN CASH AND CASH EQUIVALENTS | | | (9,154 | ) | | | (2,326 | ) | | | (23,619 | ) |
| | | | | | | | | | | | | |
| CASH AND CASH EQUIVALENTS: | | | | | | | | | | | | |
| Beginning of year | | | 53,662 | | | | 55,988 | | | | 79,607 | |
| | | | | | | | | | | | | |
| End of year | | $ | 44,508 | | | $ | 53,662 | | | $ | 55,988 | |
| | | | | | | | | | | | | |
| SUPPLEMENTAL DISCLOSURES OF CASH FLOW INFORMATION: | | | | | | | | | | | | |
| Interest payments | | $ | 3,929 | | | $ | 4,511 | | | $ | 3,915 | |
| | | | | | | | | | | | | |
| | | | | | | | | | | | | |