UNITED STATES
SECURITIES AND EXCHANGE COMMISSION
Washington, D.C. 20549
FORM N-CSR
CERTIFIED SHAREHOLDER REPORT OF REGISTERED MANAGEMENT INVESTMENT
COMPANIES
Investment Company Act file number 811-09123
The AMIDEX Funds, Inc.
(Exact name of registrant as specified in charter)
| 2621 Van Buren Ave Norristown, PA | 19403 |
| (Address of principal executive offices) | (Zip code) |
Matrix Capital Group, Inc.
630 Fitzwatertown Road
Building A, Second Floor
Willow Grove, PA 19090-1904
(Name and address of agent for service)
Registrant's telephone number, including area code: 610.666.1330
Date of fiscal year end: 05/31/2006
Date of reporting period: 05/31/2006
Form N-CSR is to be used by management investment companies to file reports with the Commission not later than 10 days after the transmission to stockholders of any report that is required to be transmitted to stockholders under Rule 30e-1 under the Investment Company Act of 1940 (17 CFR 270.30e-1). The Commission may use the information provided on Form N-CSR in its regulatory, disclosure review, inspection, and policymaking roles.
A registrant is required to disclose the information specified by Form N-CSR, and the Commission will make this information public. A registrant is not required to respond to the collection of information contained in Form N-CSR unless the Form displays a currently valid Office of Management and Budget ("OMB") control number. Please direct comments concerning the accuracy of the information collection burden estimate and any suggestions for reducing the burden to Secretary, Securities and Exchange Commission, 450 Fifth Street, NW, Washington, DC 20549-0609. The OMB has reviewed this collection of information under the clearance requirements of 44 U.S.C. ss. 3507.
| ITEM 1. | REPORTS TO SHAREHOLDERS |
The following is a copy of the annual report to shareholders for the period ended May 31, 2006 pursuant to rule 30e-1 under the Investment Company Act of 1940.
ANNUAL REPORT
May 31, 2006
AMIDEX
MUTUAL FUNDS
AMIDEX Funds, Inc.
c/o Matrix Capital Group, Inc.
630 Fitzwatertown Road
Building A, Second Floor
Willow Grove, PA 19090
| AMIDEX™ Funds, Inc. | ANNUAL REPORT |
President's Letter & Management's Discussion of Fund Performance
May 31, 2006
Dear AMIDEXTM Funds, Inc. Shareholder,
Enclosed please find the Annual Report for the AMIDEXTM Funds, Inc. for the fiscal year ended May 31, 2006.
The AMIDEXTM Funds enjoyed continuing improved performance during the last fiscal year. Our AMIDEX35TM Israel Mutual Fund benefited from Israel’s improved economic data, the election of the Kadima party headed by Ehud Olmert, the successor of Prime Minister Sharon, and the highlight of Israeli business news, the purchase of Iscar, a privately held metal company, by Warren Buffet. This was Mr. Buffet’s first investment in a foreign company, and created a lot of renewed interest in Israeli investment opportunities. For the 12-month period ending May 31, 2006, the AMIDEX35TM Israel Mutual Fund Class No Load, Class A and Class C returned 10.42%, 10.40% and 9.46%, respectively. For the same period, the S&P500 Total Return Index rose 8.64%. Since inception on June 8, 1999, the AMIDEX35TM Israel Mutual Fund Class NL had an annualized return of 2.37%. For the same period the S&P500 Index rose 1.05%. Since inception on November 19, 1999, the AMIDEX35TM Israel Mutual Fund Class A had an annualized return -0.72%. Since inception on May 19, 2000, the AMIDEX35TM Israel Mutual Fund Class C had an annualized return of -6.10%.
Portfolio Summary - The AMIDEX35™ Index tracks the largest Israeli companies traded either in Tel Aviv or New York, providing for the first time an accurate benchmark for Israel's equity universe. The AMIDEX35TM Israel Mutual Fund’s total industry holdings as of May 31, 2006 were as follows:
Israeli traded | |
| Banking & Insurance | 18.90% |
| Diversified Holdings | 12.49% |
| Chemicals | 8.02% |
| Telecommunications | 3.64% |
| Oil Companies | 1.93% |
| Food | 1.09% |
| | |
U.S. traded | |
| Computer Hardware/Software | 13.07% |
| Pharmaceuticals | 16.56% |
| Telecommunications | 17.35% |
| Semiconductors | 1.95% |
| Defense Equipment | 0.85% |
| Medical Products | 0.53% |
| Electronic Equipment | 1.04% |
| | |
Portfolio holdings are subject to change. Percentages are based on net assets of the Fund at May 31, 2006.
Our AMIDEXTM Cancer Innovations and Healthcare Mutual Fund rose 3.79% for the 12 month period ending May 31, 2006. Within the pharmaceutical industry, generic price competition has been increasingly severe as patents have expired. Meanwhile, the number of internally developed new products with potential for higher prices has continued to be meager. For the same period, the Russell 2000 Healthcare Index rose 11.53%. Since inception on November 1, 2001, the AMIDEXTM Cancer Innovations & Healthcare Mutual Fund had an annualized return of 2.33% as the Russell 2000 Healthcare Index rose 5.18% during the same period.
Portfolio Summary - The AMIDEXTM Cancer Innovations & Healthcare Index includes leading pharmaceutical, biotech and medical equipment companies focused on cancer detection and treatment. AMIDEXTM Cancer Innovations and Healthcare Mutual Fund’s total industry holdings as of May 31, 2006 were as follows:
| Pharmaceuticals | 42.62% |
| Biotechnology | 41.41% |
| Healthcare Products | 10.77% |
Portfolio holdings are subject to change. Percentages are based on total net assets of the Fund at May 31, 2006.
| AMIDEX™ Funds, Inc. | ANNUAL REPORT |
Our primary investment strategies and objectives remain unchanged. Our Funds are based on indices, and there has been no change in the underlying indices or portfolios, other than routine maintenance as outlined in the prospectuses.
We continue to believe in the merits of investing in our AMIDEX35TM Israel Mutual Fund and our AMIDEXTM Cancer Innovations & Healthcare Fund, and we remain committed to the index methodology as the best method of holding portfolios of stocks in our specialty niches. We encourage our investors to remain focused on the long-term prospects for the Funds, and to persevere through the uncertainties that still lie ahead.
Let's hope that the future brings comfort to those who are suffering, calm to regions too long plagued by violence, and security, both physical and economic, to all Americans.
Best regards,
Cliff Goldstein
President, AMIDEXTM Funds, Inc.
This report is intended for the Funds’ shareholders. It may not be distributed to prospective investors unless it is preceded or accompanied by the current Fund prospectus.
Past performance does not guarantee future results. An investor's return and principal value will fluctuate so that an investor's shares, when redeemed, may be more or less than their original cost. Current performance may be lower or higher than the performance data quoted.
Please call 215.830.8712 or visit the fund’s website http://www.amidex.com/fund.htm for current performance data. We advise you to consider the fund’s objectives, risks, charges and expenses carefully before investing. The prospectus contains this and other important information about the fund. Please read the prospectus carefully before you invest. The returns stated above do not take into consideration transaction charges such as sales loads or redemptions fees. If these fees were taken into consideration the returns would be lower.
The AMIDEX35™ Index is a market capitalization weighted index, consisting of the thirty five highest capitalized Israeli companies publicly traded on the TASE, NASDAQ, or NYSE. The AMIDEX35™ Index is not an investment product available for purchase.
The AMIDEXTM Cancer Innovations & Healthcare Index is an enhanced market capitalization weighted index, consisting of the 45 highest capitalized pharmaceutical, bio-tech and medical equipment companies publicly traded on U.S. exchanges. The AMIDEXTM Cancer Innovations & Healthcare Index is not an investment product available for purchase.
Information About Your Fund’s Expenses
As a shareholder of the Fund, you incur two types of costs: (1) transaction costs, including sales charges (loads) on purchase payments, reinvested dividends, or other distributions, redemption fees and exchange fees; and (2) ongoing costs, including management fees, distribution and service (12b-1) fees; and other Fund expenses. The example below is intended to help you understand your ongoing costs (in dollars) of investing in the Fund and to compare these costs with the ongoing costs of investing in other mutual funds.
The table below illustrates an example investment of $1,000 at the beginning of the period (November 30, 2005) and held for the entire period of 11/30/05 through 5/31/06. Please note however that this table is unaudited. This example is intended to help you understand your ongoing costs (in dollars) of investing in the Fund and to compare these costs with the ongoing costs of investing in other mutual funds.
| AMIDEX™ Funds, Inc. | ANNUAL REPORT |
Actual Expenses
The first section of the table provides information about actual account values and actual expenses (relating to the example $1,000 investment made on 11/30/05). You may use the information in this row, together with the amount you invested, to estimate the expenses that you paid over the period. Simply divide your account value by $1,000 (for example, an $8,600 account value divided by $1,000 = 8.6), then multiply the result by the number in the first row under the heading entitled “Expenses Paid During Period” to estimate the expenses you paid on your account during this period.
Hypothetical Example for Comparison Purposes
The second section of the table provides information about the hypothetical account values and hypothetical expenses based on the Fund’s actual expense ratio and an assumed rate of return of 5% per year before expenses, which is not the Fund’s actual return. The hypothetical account values and expenses may not be used to estimate the actual ending account balance or expenses you paid for the period. You may use this information to compare the ongoing costs of investing in the Fund and other funds. To do so, compare this 5% hypothetical example with the 5% hypothetical examples that appear in the shareholder reports of the other funds.
Please note that the expenses shown in the table are meant to highlight your ongoing costs only and do not reflect any transactional costs, such as sales charges (loads), redemption fees, or exchange fees. Therefore, the second section of the table is useful in comparing ongoing costs only, and will not help you determine the relative total costs of owning different funds. In addition, if these transactional costs were included, your costs would have been higher. For more information on transactional costs, please refer to the Funds’ prospectus.
Expenses and Value of a $1,000 Investment for the six months ended May 31, 2006 |
Actual Fund Return (in parentheses) | | Beginning Account Value 11/30/05 | | Ending Account Value 5/31/06 | | Expenses Paid During Period* | |
Amidex35TM Israel Mutual Fund No-Load Class (4.67%) | | $ | 1,000.00 | | $ | 1,046.70 | | $ | 17.40 | |
Amidex35TM Israel Mutual Fund Class A (4.64%) | | | 1,000.00 | | | 1,046.40 | | | 17.45 | |
Amidex35TM Israel Mutual Fund Class C (4.19%) | | | 1,000.00 | | | 1,041.90 | | | 21.23 | |
AmidexTM Cancer Innovations & Healthcare Fund Class A (-2.49%) | | | 1,000.00 | | | 975.10 | | | 24.57 | |
Hypothetical 5% Fund Return | | | Beginning Account Value 11/30/05 | | | Ending Account Value 5/31/06 | | | Expenses Paid During Period* | |
Amidex35TM Israel Mutual Fund No-Load Class | | $ | 1,000.00 | | $ | 1,007.93 | | $ | 17.07 | |
Amidex35TM Israel Mutual Fund Class A | | | 1,000.00 | | | 1,007.88 | | | 17.12 | |
Amidex35TM Israel Mutual Fund Class C | | | 1,000.00 | | | 1,004.14 | | | 20.84 | |
AmidexTM Cancer Innovations & Healthcare Fund Class A | | | 1,000.00 | | | 1,000.05 | | | 24.88 | |
*Expenses are equal to the Funds’ annualized expense ratios of 3.41%, 3.42% and 4.17% for the Amidex35TM Israel Mutual Fund No-Load Class, Class A and Class C shares, respectively; and 4.99% for the AmidexTM Cancer Innovations & Healthcare Fund Class A shares, multiplied by the average account value over the period, multiplied by 182/365 to reflect the one-half year period.
For more information on Fund expenses, please refer to the Funds’ prospectus, which can be obtained from your investment representative or by calling 888-876-3566. Please read it carefully before you invest or send money.
| AMIDEX™ Funds, Inc. | ANNUAL REPORT |
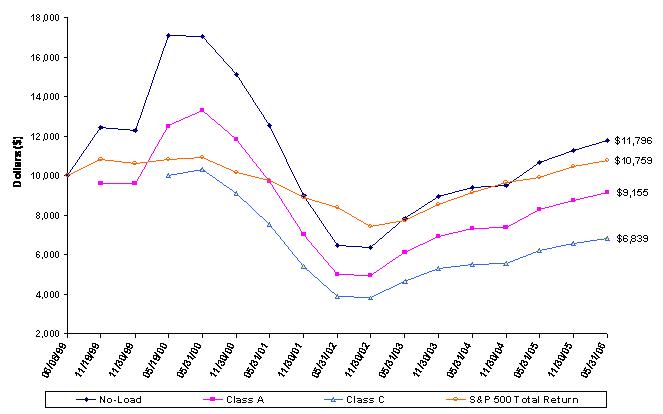
COMPARISON OF A $10,000 INVESTMENT IN THE
AMIDEX35TM ISRAEL MUTUAL FUND AND THE S&P 500 TOTAL RETURN INDEX
Average Annual Total Return
| | | | | |
| | | Commencement | | |
| | | of Operations | Five Years | One Year |
| | | through May 31, 2006 | ending May 31, 2006 | ending May 31, 2006 |
S&P 500 Total Return | 1.05% | 1.96% | 8.64% |
NoLoadClass(1) | | 2.37% | (1.24)% | 10.42% |
Class A(2) | With sales charge | (1.34)% | (2.08)% | 4.33% |
| Without sales charge | (0.72)% | (1.28)% | 10.40% |
Class C(3) | With contingent deferred sales charge | (6.10)% | (2.02)% | 8.37% |
| Without contingent deferred sales charge | (6.10)% | (2.02)% | 9.46% |
| | (1) | The AMIDEX35™ Israel Mutual Fund No-Load shares commenced operations on June 8, 1999. |
| | (2) | The AMIDEX35™ Israel Mutual Fund Class A shares commenced operations on November 19, 1999. |
| | (3) | The AMIDEX35™ Israel Mutual Fund Class C shares commenced operations on May 19, 2000. |
Past performance cannot guarantee future results. The investment return and principal value of an investment will fluctuate and, therefore, an investor’s shares, when redeemed, may be worth more or less than their original cost.
The above graph depicts the performance of the AMIDEX35™ Israel Mutual Fund versus the S&P 500 Total Return Index. The S&P 500 Total Return Index by Standard and Poor’s Corp. is a capitalization-weighted index comprising 500 issues listed on various exchanges, representing the performance of the stock market generally. Please note that indices do not take into account any fees and expenses of investing in the individual securities that they track, and individuals cannot invest directly in any index.
As with any fund, save an index fund, that commonly compares its performance to the S&P 500 Total Return Index, such a comparison may be said to be inappropriate because of the dissimilarity between the Fund’s investments and the securities comprising the index; so too with the AMIDEX35™ Israel Mutual Fund, which will not invest in certain securities comprising this index.
| AMIDEX™ Funds, Inc. | ANNUAL REPORT |
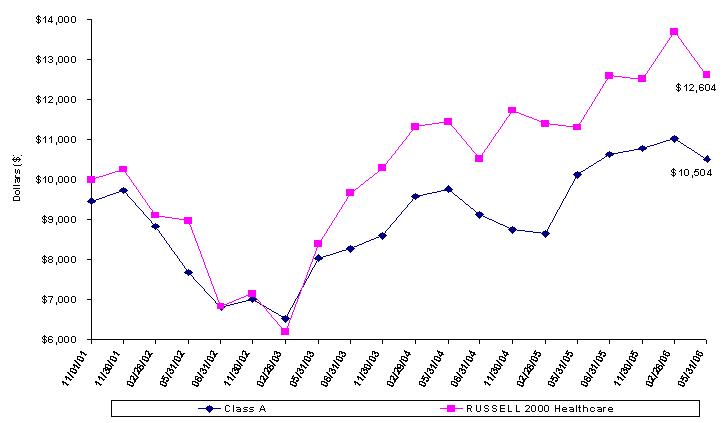
COMPARISON OF A $10,000 INVESTMENT IN THE
AMIDEXTM CANCER INNOVATIONS & HEALTHCARE FUND (1) AND THE RUSSELL 2000 HEALTHCARE INDEX
Average Annual Total Return
| | | | |
| | | Commencement | |
| | | of Operations | One Year |
| | | through May 31, 2006 | ending May 31, 2006 |
Russell 2000 Healthcare Index | 5.18% | 11.53% |
Class A(1) | With sales charge | 1.08% | (1.88)% |
| Without sales charge | 2.33% | 3.79% |
(1) The AMIDEX™ Cancer Innovations & Healthcare Fund Class A shares commenced operations on November 1, 2001.
Past performance cannot guarantee future results. The investment return and principal value of an investment will fluctuate and, therefore, an investor’s shares, when redeemed, may be worth more or less than their original cost.
The above graph depicts the performance of the AMIDEX™ Cancer Innovations & Healthcare Fund versus the Russell 2000 Health Care Index. The Russell 2000 Health Care Index is a capitalization-weighted index of companies involved in medical services or health care. Please note that indices do not take into account any fees and expenses of investing in the individual securities that they track, and individuals cannot invest directly in any index.
As with any fund, save an index fund, that commonly compares its performance to the Russell 2000 Health Care Index, such a comparison may be said to be inappropriate because of the dissimilarity between the Fund’s investments and the securities comprising the index; so too with the AMIDEX™ Cancer Innovations & Healthcare Fund, which will not invest in certain securities comprising this index.
| AMIDEX™ Funds, Inc. | ANNUAL REPORT |
AMIDEX35TM ISRAEL MUTUAL FUND |
SCHEDULE OF INVESTMENTS |
May 31, 2006 |
| | | Shares | | Value | |
ISRAEL - 46.07% | | | | | | | |
| | | | | | | | |
COMMON STOCK - 46.07% | | | | | | | |
| | | | | | | | |
Banking & Insurance - 18.90% | | | | | | | |
| Bank Hapoalim BM | | | 187,228 | | $ | 873,427 | |
| Bank Leumi Le-Israel BM | | | 173,116 | | | 649,903 | |
| Clal Insurance Enterprise Holdings Ltd. | | | 8,756 | | | 186,174 | |
| Israel Discount Bank Ltd. * | | | 147,810 | | | 274,868 | |
| Migdal Insurance Holdings Ltd. | | | 178,216 | | | 245,830 | |
| Mizrahi Tefahot Bank Ltd. * | | | 38,915 | | | 236,949 | |
| | | | | | | 2,467,151 | |
| | | | | | | | |
Chemicals - 8.02% | | | | | | | |
| Israel Chemicals Ltd. | | | 166,335 | | | 704,248 | |
| Makhteshim-Agan Industries Ltd. | | | 59,487 | | | 342,613 | |
| | | | | | | 1,046,861 | |
| | | | | | | | |
Diversified Holdings - 12.49% | | | | | | | |
| Africa Israel Investments Ltd. | | | 6,851 | | | 372,162 | |
| Clal Industries and Investments | | | 26,851 | | | 138,915 | |
| Discount Investment Corp. | | | 7,860 | | | 190,114 | |
| IDB Development Corp Ltd. | | | 8,629 | | | 286,171 | |
| IDB Holding Corp Ltd. | | | 6,490 | | | 176,922 | |
| Israel Corp Ltd. | | | 1,188 | | | 465,692 | |
| | | | | | | 1,629,976 | |
| | | | | | | | |
Food - 1.09% | | | | | | | |
| Osem Investment Ltd. | | | 16,670 | | | 142,006 | |
| | | | | | | | |
Oil Companies - 1.93% | | | | | | | |
| Delek Group Ltd. | | | 1,564 | | | 251,353 | |
| | | | | | | | |
Telecommunications - 3.64% | | | | | | | |
| Bezeq Israeli Telecommunication Corp. Ltd. | | | 387,390 | | | 475,266 | |
| | | | | | | | |
TOTAL COMMON STOCK (Cost $4,391,982) | | | | | | 6,012,613 | |
| | | | | | | | |
TOTAL ISRAEL (Cost $4,391,982) | | | | | | 6,012,613 | |
| | | | | | | | |
UNITED STATES - 52.41% | | | | | | | |
| | | | | | | | |
COMMON STOCK - 51.35% | | | | | | | |
| | | | Shares | | | Value | |
Computer Hardware/Software - 13.07% | | | | | | | |
| Check Point Software Technologies Ltd. * | | | 36,995 | | $ | 714,743 | |
| Electronics for Imaging, Inc.* | | | 8,428 | | | 197,468 | |
| Mercury Interactive Corp. * | | | 13,086 | | | 463,244 | |
| M-Systems Flash Disk Pioneers Ltd. * | | | 5,000 | | | 167,250 | |
| Verint Systems, Inc. * | | | 5,000 | | | 162,300 | |
| | | | | | | 1,705,005 | |
| | | | | | | | |
Defense Equipment - 0.85% | | | | | | | |
| Elbit Systems Ltd. | | | 4,198 | | | 110,869 | |
| | | | | | | | |
Electronics - 1.04% | | | | | | | |
| Orbotech Ltd. * | | | 5,382 | | | 135,196 | |
| | | | | | | | |
Medical Products - 0.53% | | | | | | | |
| Given Imaging Ltd. * | | | 4,010 | | | 69,614 | |
| | | | | | | | |
Pharmaceuticals - 16.56% | | | | | | | |
| Perrigo Co. | | | 1,204 | | | 20,251 | |
| Taro Pharmaceutical Industries Ltd. * | | | 6,000 | | | 72,360 | |
| Teva Pharmaceutical Industries Ltd. - ADR | | | 56,816 | | | 2,068,671 | |
| | | | | | | 2,161,282 | |
| | | | | | | | |
Semiconductors - 1.95% | | | | | | | |
| DSP Group, Inc. * | | | 4,705 | | | 123,695 | |
| Zoran Corp. * | | | 5,300 | | | 131,175 | |
| | | | | | | 254,870 | |
| | | | | | | | |
Telecommunications - 17.35% | | | | | | | |
| Alvarion Ltd. * | | | 7,000 | | | 50,820 | |
| Amdocs Ltd. * | | | 30,403 | | | 1,139,200 | |
| Comverse Technology, Inc. * | | | 28,377 | | | 639,050 | |
| ECI Telecom Ltd. * | | | 16,000 | | | 153,920 | |
| Partner Communications Co. Ltd. - ADR | | | 33,100 | | | 281,681 | |
| | | | | | | 2,264,671 | |
| | | | | | | | |
TOTAL COMMON STOCK (Cost $9,290,604) | | | | | | 6,701,507 | |
| | | | | | | | |
SHORT-TERM INVESTMENTS - 1.06% | | | | | | | |
First American Treasury Obligations Fund, 4.21% ** (Cost $138,321) | | | 138,321 | | | 138,321 | |
| | | | | | | | |
TOTAL UNITED STATES (Cost $9,428,925) | | | | | | 6,839,828 | |
| | | | | | | | |
| | | | | | Value | |
TOTAL INVESTMENTS (Cost $13,820,907) - 98.48% | | | | | $ | 12,852,441 | |
OTHER ASSETS IN EXCESS OF LIABILITIES, NET - 1.52% | | | | | | 198,278 | |
NET ASSETS - 100% | | | | | $ | 13,050,719 | |
| | | | | | | | |
* Non-income producing security.
** Rate shown represents the rate at May 31, 2006, is subject to change and resets daily.
ADR - American Depository Receipt
The accompanying notes are an integral part of these financial statements.
| AMIDEX™ Funds, Inc. | ANNUAL REPORT |
AMIDEXTM CANCER INNOVATIONS & HEALTHCARE FUND |
SCHEDULE OF INVESTMENTS |
May 31, 2006 |
| | | Shares | | Value | |
COMMON STOCK - 94.80% | | | | | | | |
| | | | | | | | |
Biotechnology - 41.41% | | | | | | | |
| Amgen, Inc. * | | | 325 | | $ | 21,967 | |
| Biogen Idec, Inc. * | | | 775 | | | 36,138 | |
| Celgene Corp. * | | | 1,400 | | | 58,030 | |
| Enzon Pharmaceuticals, Inc. * | | | 100 | | | 745 | |
| Genentech, Inc. * | | | 2,700 | | | 223,992 | |
| Genzyme Corp. * | | | 846 | | | 50,337 | |
| Human Genome Sciences, Inc. * | | | 600 | | | 6,576 | |
| Immunomedics, Inc. * | | | 100 | | | 278 | |
| Medimmune, Inc. * | | | 800 | | | 25,456 | |
| Millennium Pharmaceuticals, Inc. * | | | 900 | | | 7,704 | |
| Myriad Genetics, Inc. * | | | 100 | | | 2,611 | |
| PDL BioPharma, Inc. * | | | 500 | | | 10,125 | |
| Vertex Pharmaceuticals, Inc. * | | | 200 | | | 6,900 | |
| | | | | | | 450,859 | |
| | | | | | | | |
Healthcare Products - 10.77% | | | | | | | |
| Beckman Coulter, Inc. | | | 200 | | | 11,060 | |
| Cytyc Corp. * | | | 400 | | | 10,512 | |
| Johnson & Johnson | | | 1,200 | | | 72,264 | |
| Varian Medical Systems, Inc. * | | | 500 | | | 23,450 | |
| | | | | | | 117,286 | |
| | | | | | | | |
Pharmaceuticals - 42.62% | | | | | | | |
| Abbott Laboratories | | | 600 | | | 25,620 | |
| AstraZeneca Plc. - ADR | | | 800 | | | 42,352 | |
| Bristol-Myers Squibb Co. | | | 800 | | | 19,640 | |
| Cell Therapeutics, Inc. * | | | 100 | | | 141 | |
| Elan Corp Plc. - ADR * | | | 100 | | | 1,881 | |
| Eli Lilly & Co. | | | 400 | | | 20,656 | |
| Gilead Sciences, Inc. * | | | 1,700 | | | 97,461 | |
| GlaxoSmithKline Plc. - ADR | | | 1,200 | | | 66,360 | |
| ImClone Systems, Inc. * | | | 300 | | | 12,000 | |
| Medarex, Inc. * | | | 200 | | | 2,052 | |
| Merck & Co., Inc. | | | 900 | | | 29,961 | |
| Novartis AG - ADR | | | 950 | | | 52,706 | |
| Pfizer, Inc. | | | 2,250 | | | 53,235 | |
| QLT, Inc. * | | | 300 | | $ | 2,166 | |
| Schering-Plough Corp. | | | 600 | | | 11,436 | |
| Valeant Pharmaceuticals International | | | 200 | | | 3,440 | |
| Wyeth | | | 500 | | | 22,870 | |
| | | | | | | 463,977 | |
| | | | | | | | |
TOTAL COMMON STOCK (Cost $884,243) | | | | | | 1,032,122 | |
| | | | | | | | |
SHORT-TERM INVESTMENTS - 4.91% | | | | | | | |
| First American Government Obligations Fund, 4.54% ** | | | 471 | | | 471 | |
| First American Treasury Obligations Fund, 4.21% ** | | | 53,029 | | | 53,029 | |
TOTAL SHORT-TERM INVESTMENTS (Cost $53,500) | | | | | | 53,500 | |
| | | | | | | | |
TOTAL INVESTMENTS (Cost $937,743) - 99.71% | | | | | $ | 1,085,622 | |
OTHER ASSETS IN EXCESS OF LIABILITIES, NET - 0.29% | | | | | | 3,131 | |
NET ASSETS - 100% | | | | | $ | 1,088,753 | |
* Non-income producing security.
** Rate shown represents the rate at May 31, 2006, is subject to change and resets daily.
ADR - American Depository Receipt
The accompanying notes are an integral part of these financial statements.
| AMIDEX™ Funds, Inc. | ANNUAL REPORT |
STATEMENT OF ASSETS AND LIABILITIES - May 31, 2006 |
| | | AMIDEX35TM | |
| | | Israel Mutual Fund | |
Assets: | | | |
| Investments, at market (cost: $13,820,907) | | $ | 12,852,441 | |
| Receivables: | | | | |
| Dividends | | | 6,346 | |
| Interest | | | 636 | |
| Fund shares sold | | | 224,779 | |
| Investments sold | | | 13,557 | |
| Prepaid expenses | | | 30,618 | |
| Total assets | | | 13,128,377 | |
| | | | | |
Liabilities: | | | | |
| Payables: | | | | |
| Fund shares redeemed | | | 2,208 | |
| Investment advisory and administrative fees | | | 10,237 | |
| Fund accounting/transfer agency fees | | | 10,206 | |
| Distribution fees | | | 11,342 | |
| Other liabilities and accrued expenses | | | 43,665 | |
| Total liabilities | | | 77,658 | |
Net Assets | | $ | 13,050,719 | |
| | | | | |
Net Assets consist of: | | | | |
| Common stock | | $ | 124 | |
| Additional paid-in capital | | | 20,529,103 | |
| Accumulated realized loss on investments | | | (6,510,004 | ) |
| Net unrealized depreciation on investments | | | (968,504 | ) |
| | | | | |
| Total Net Assets (1,239,187 shares outstanding; 500,000,000 shares of $0.0001 par value | | | | |
authorized in the aggregate for both the AMIDEX35TM Israel Mutual Fund and the | | | | |
AMIDEXTM Cancer Innovations & Healthcare Fund) | | $ | 13,050,719 | |
| | | | | |
No-load class shares: | | | | |
Net Assets applicable to 807,128 shares outstanding | | $ | 9,408,839 | |
| Net Asset Value, and offering price per share | | $ | 11.66 | |
| | | | | |
| Redemption price per share No-load class * | | $ | 11.43 | |
| | | | | |
Class A shares: | | | | |
Net Assets applicable to 321,424 shares outstanding | | $ | 2,899,104 | |
| Net Asset Value and redemption price per share | | $ | 9.02 | |
| | | | | |
| Offering price per share Class A ** | | $ | 9.54 | |
| | | | | |
Class C shares: | | | | |
Net Assets applicable to 110,635 shares outstanding | | $ | 742,776 | |
| Net Asset Value and offering price per share | | $ | 6.71 | |
| | | | | |
| Redemption price per share Class C *** | | $ | 6.64 | |
* A redemption fee of 2.00% is imposed on redemptions occurring within 365 days of purchase. |
**A maximum sales charge of 5.50% is imposed on Class A shares. |
| *** A contingent deferred sales charge ("CDSC") of 1.00% is imposed in the event of certain redemption transactions within thirteen months following such investments. |
|
The accompanying notes are an integral part of these financial statements. |
| AMIDEX™ Funds, Inc. | ANNUAL REPORT |
STATEMENT OF ASSETS AND LIABILITIES - May 31, 2006 |
| | | AMIDEXTM Cancer | |
| | | | |
| | | Innovations | |
| | | & Healthcare Fund | |
Assets: | | | |
| Investments, at market (cost: $937,743) | | $ | 1,085,622 | |
| Receivables: | | | | |
| Dividends | | | 2,146 | |
| Interest | | | 218 | |
| Investments sold | | | 3,936 | |
| Prepaid expenses | | | 5,704 | |
| Total assets | | | 1,097,626 | |
| | | | | |
Liabilities: | | | | |
| Payables: | | | | |
| Investment advisory and administrative fees | | | 836 | |
| Fund accounting/transfer agency fees | | | 763 | |
| Distribution fees | | | 1,726 | |
| Other liabilities and accrued expenses | | | 5,548 | |
| Total liabilities | | | 8,873 | |
Net Assets | | $ | 1,088,753 | |
| | | | | |
Net Assets consist of: | | | | |
| Common stock | | $ | 10 | |
| Additional paid-in capital | | | 886,474 | |
| Accumulated realized gain on investments | | | 54,390 | |
| Net unrealized appreciation on investments | | | 147,879 | |
| | | | | |
| Total Net Assets (99,452 shares outstanding; 500,000,000 shares of $0.0001 par value | | | | |
authorized in the aggregate for both the AMIDEX35TM Israel Mutual Fund and the | | | | |
AMIDEXTM Cancer Innovations & Healthcare Fund) | | $ | 1,088,753 | |
| | | | | |
Class A shares: | | | | |
Net Assets applicable to 99,452 shares outstanding | | $ | 1,088,753 | |
| Net Asset Value and redemption price per share | | $ | 10.95 | |
| | | | | |
| Offering price per share Class A * | | $ | 11.59 | |
| | | | | | |
| *A maximum sales charge of 5.50% is imposed on Class A shares. |
| | | | | | |
The accompanying notes are an integral part of these financial statements. |
| AMIDEX™ Funds, Inc. | ANNUAL REPORT |
| | | AMIDEX35TM | |
| | | Israel Mutual Fund | |
| | | | |
| | | For the year ended | |
| | | May 31, 2006 | |
Investment income: | | | |
| Dividends (net of foreign withholding taxes of: $57,836) | | $ | 230,981 | |
| Interest | | | 6,490 | |
| Total investment income | | | 237,471 | |
| | | | | |
Expenses: | | | | |
| Investment advisory fees | | | 101,576 | |
| Distribution fees - No-load Class | | | 24,037 | |
| Distribution fees - Class A | | | 6,025 | |
| Distribution fees - Class C | | | 6,724 | |
| Accounting and transfer agent fees | | | 120,066 | |
| Audit fees | | | 32,022 | |
| Legal fees | | | 27,870 | |
| Registration fees | | | 24,081 | |
| Custody fees | | | 20,529 | |
| Out of pocket expenses | | | 19,604 | |
| Insurance fees | | | 16,634 | |
| Miscellaneous | | | 13,142 | |
| Administrative fees | | | 12,697 | |
| Printing fees | | | 7,473 | |
| Trustee fees | | | 3,662 | |
| Total expenses | | | 436,142 | |
| | | | | |
| Net investment loss | | | (198,671 | ) |
| | | | | |
Realized and unrealized gain on investments: | | | | |
| Net realized gain on investments | | | 401,028 | |
| Net change in unrealized depreciation on investments | | | 1,043,440 | |
| | | | 1,444,468 | |
| | | | | |
Net increase in net assets resulting from operations | | $ | 1,245,797 | |
The accompanying notes are an integral part of these financial statements.
| AMIDEX™ Funds, Inc. | ANNUAL REPORT |
| | | | |
| | | AMIDEXTM Cancer Innovations | |
| | | & Healthcare Fund | |
| | | | |
| | | For the year ended | |
| | | May 31, 2006 | |
| | | | |
Investment income: | | | |
| Dividends | | $ | 11,679 | |
| Interest | | | 3,506 | |
| Total investment income | | | 15,185 | |
| | | | | |
Expenses: | | | | |
| Investment advisory fees | | | 10,092 | |
| Distribution fees - Class A | | | 3,154 | |
| Accounting and transfer agent fees | | | 11,934 | |
| Registration fees | | | 8,039 | |
| Custody fees | | | 6,428 | |
| Out of pocket expenses | | | 4,574 | |
| Audit fees | | | 4,115 | |
| Legal fees | | | 2,600 | |
| Miscellaneous | | | 1,471 | |
| Insurance fees | | | 1,285 | |
| Administrative fees | | | 1,261 | |
| Printing fees | | | 995 | |
| Trustee fees | | | 364 | |
| Total expenses | | | 56,312 | |
| | | | | |
| Net investment loss | | | (41,127 | ) |
| | | | | |
Realized and unrealized gain on investments: | | | | |
| Net realized gain on investments | | | 58,127 | |
| Net change in unrealized appreciation on investments | | | 35,840 | |
| | | | 93,967 | |
| | | | | |
Net increase in net assets resulting from operations | | $ | 52,840 | |
The accompanying notes are an integral part of these financial statements.
| AMIDEX™ Funds, Inc. | ANNUAL REPORT |
STATEMENTS OF CHANGES IN NET ASSETS |
| | | AMIDEX35TM Israel Mutual Fund | |
| | | | | | |
| | | Year Ended | | Year Ended | |
| | | May 31, 2006 | | May 31, 2005 | |
Increase in Net Assets | | | | | |
| Operations: | | | | | |
| Net investment loss | | $ | (198,671 | ) | $ | (198,258 | ) |
| Net realized gain (loss) on investments | | | 401,028 | | | (1,877,586 | ) |
| Net change in unrealized depreciation on investments | | | 1,043,440 | | | 3,580,087 | |
| Net increase in net assets resulting from operations | | | 1,245,797 | | | 1,504,243 | |
| | | | | | | | |
| | | | | | | | |
| Decrease in net assets from Fund share transactions (Note 2) | | | (564,730 | ) | | (1,233,964 | ) |
| | | | | | | | |
| Total increase in net assets | | | 681,067 | | | 270,279 | |
| | | | | | | | |
Net Assets: | | | | | | | |
| Beginning of period | | | 12,369,652 | | | 12,099,373 | |
| End of period (including undistributed net investment income | | | | | | | |
| of $0 and $0, respectively) | | $ | 13,050,719 | | $ | 12,369,652 | |
The accompanying notes are an integral part of these financial statements.
| AMIDEX™ Funds, Inc. | ANNUAL REPORT |
STATEMENTS OF CHANGES IN NET ASSETS |
| | | AMIDEXTM Cancer Innovations & Healthcare Fund | |
| | | | | | |
| | | Year Ended | | Year Ended | |
| | | May 31, 2006 | | May 31, 2005 | |
Increase in Net Assets | | | | | |
| Operations: | | | | | |
| Net investment loss | | $ | (41,127 | ) | $ | (29,562 | ) |
| Net realized gain (loss) on investments | | | 58,127 | | | (1,618 | ) |
| Net change in unrealized appreciation on investments | | | 35,840 | | | 58,963 | |
| Net increase in net assets resulting from operations | | | 52,840 | | | 27,783 | |
| | | | | | | | |
| Distributions to Shareholders from: | | | | | | | |
| Net realized gain | | | - | | | (12,857 | ) |
| | | | | | | | |
| Decrease in net assets from Fund share transactions (Note 2) | | | (27,696 | ) | | (8,267 | ) |
| | | | | | | | |
| Total increase in net assets | | | 25,144 | | | 6,659 | |
| | | | | | | | |
Net Assets: | | | | | | | |
| Beginning of period | | | 1,063,609 | | | 1,056,950 | |
| End of period (including undistributed net investment income | | | | | | | |
| of $0 and $0, respectively) | | $ | 1,088,753 | | $ | 1,063,609 | |
The accompanying notes are an integral part of these financial statements.
| AMIDEX™ Funds, Inc. | ANNUAL REPORT |
FINANCIAL HIGHLIGHTS |
Per Share Data For a Share Outstanding Throughout Each Fiscal Year |
| | | AMIDEX35TM Israel Mutual Fund | |
| | | No-Load Class | |
| | | For the Year | | For the Year | | For the Year | | For the Year | | For the Year | |
| | | Ended | | Ended | | Ended | | Ended | | Ended | |
| | May 31, 2006 | | May 31, 2005 | | May 31, 2004 | | May 31, 2003 | | May 31, 2002 | |
| | | | | | | | | | | | |
Net Asset Value, Beginning of Period | | $ | 10.56 | | $ | 9.29 | | $ | 7.76 | | $ | 6.39 | | $ | 12.41 | |
| | | | | | | | | | | | | | | | | |
Investment Operations: | | | | | | | | | | | | | | | | |
Net investment loss (a) | | | (0.17 | ) | | (0.15 | ) | | (0.19 | ) | | (0.18 | ) | | (0.14 | ) |
| Net realized and unrealized gain (loss) on | | | | | | | | | | | | | | | | |
| investments | | | 1.27 | | | 1.42 | | | 1.72 | | | 1.55 | | | (5.88 | ) |
| Total from investment operations | | | 1.10 | | | 1.27 | | | 1.53 | | | 1.37 | | | (6.02 | ) |
| | | | | | | | | | | | | | | | | |
Paid in capital from redemption fees (b) | | | - | | | - | | | | | | | | | | |
| | | | | | | | | | | | | | | | | |
Net Asset Value, End of Period | | $ | 11.66 | | $ | 10.56 | | $ | 9.29 | | $ | 7.76 | | $ | 6.39 | |
| | | | | | | | | | | | | | | | | |
Total Return (c) | | | 10.42 | % | | 13.67 | % | | 19.72 | % | | 21.44 | % | | (48.51 | )% |
| | | | | | | | | | | | | | | | | |
Ratios/Supplemental Data | | | | | | | | | | | | | | | | |
| Net assets, end of period (in 000's) | | $ | 9,409 | | $ | 9,489 | | $ | 8,454 | | $ | 6,799 | | $ | 5,360 | |
| Ratio of expenses to average net assets: | | | 3.39 | % | | 3.53 | % | | 3.47 | % | | 3.53 | % | | 2.20 | % |
| Ratio of net investment loss to | | | | | | | | | | | | | | | | |
| average net assets: | | | (1.53 | )% | | (1.61 | )% | | (2.21 | )% | | (3.02 | )% | | (1.61 | )% |
| Portfolio turnover rate | | | 0.00 | % | | 10.39 | % | | 14.62 | % | | 8.72 | % | | 27.70 | % |
| | |
(a) | Net investment loss per share is based on average shares outstanding. |
(b) | Redemption fees resulted in less than $0.01 per share. |
(c) | Total return in the above table represents the rate that the investor would have earned or lost on an investment in the Fund assuming reinvestment of dividends. |
The accompanying notes are an integral part of these financial statements.
| AMIDEX™ Funds, Inc. | ANNUAL REPORT |
FINANCIAL HIGHLIGHTS |
Per Share Data For a Share Outstanding Throughout Each Fiscal Year |
| | | AMIDEX35TM Israel Mutual Fund | |
| | | Class A | |
| | | For the Year | | For the Year | | For the Year | | For the Year | | For the Year | |
| | | Ended | | Ended | | Ended | | Ended | | Ended | |
| | May 31, 2006 | | May 31, 2005 | | May 31, 2004 | | May 31, 2003 | | May 31, 2002 | |
Net Asset Value, Beginning of Period | | $ | 8.17 | | $ | 7.20 | | $ | 6.02 | | $ | 4.95 | | $ | 9.62 | |
| | | | | | | | | | | | | | | | | |
Investment Operations: | | | | | | | | | | | | | | | | |
Net investment loss (a) | | | (0.13 | ) | | (0.12 | ) | | (0.15 | ) | | (0.14 | ) | | (0.11 | ) |
| Net realized and unrealized gain (loss) on | | | | | | | | | | | | | | | | |
| investments | | | 0.98 | | | 1.09 | | | 1.33 | | | 1.21 | | | (4.56 | ) |
| Total from investment operations | | | 0.85 | | | 0.97 | | | 1.18 | | | 1.07 | | | (4.67 | ) |
| | | | | | | | | | | | | | | | | |
Net Asset Value, End of Period | | $ | 9.02 | | $ | 8.17 | | $ | 7.20 | | $ | 6.02 | | $ | 4.95 | |
| | | | | | | | | | | | | | | | | |
Total Return (b) | | | 10.40 | % | | 13.47 | % | | 19.60 | % | | 21.62 | % | | (48.54 | )% |
| | | | | | | | | | | | | | | | | |
Ratios/Supplemental Data | | | | | | | | | | | | | | | | |
| Net assets, end of period (in 000's) | | $ | 2,899 | | $ | 2,236 | | $ | 3,085 | | $ | 2,142 | | $ | 2,003 | |
| Ratio of expenses to average net assets: | | | 3.40 | % | | 3.50 | % | | 3.48 | % | | 3.47 | % | | 2.20 | % |
| Ratio of net investment loss to | | | | | | | | | | | | | | | | |
| average net assets: | | | (1.50 | )% | | (1.61 | )% | | (2.22 | )% | | (2.98 | )% | | (1.61 | )% |
| Portfolio turnover rate | | | 0.00 | % | | 10.39 | % | | 14.62 | % | | 8.72 | % | | 27.70 | % |
(a) | Net investment loss per share is based on average shares outstanding. |
(b) | Total return in the above table represents the rate that the investor would have earned or lost on an investment in the Fund assuming reinvestment of dividends. |
The accompanying notes are an integral part of these financial statements.
| AMIDEX™ Funds, Inc. | ANNUAL REPORT |
FINANCIAL HIGHLIGHTS |
Per Share Data For a Share Outstanding Throughout Each Fiscal Year |
| | | AMIDEX35TM Israel Mutual Fund | |
| | | Class C | |
| | | For the Year | | For the Year | | For the Year | | For the Year | | For the Year | |
| | | Ended | | Ended | | Ended | | Ended | | Ended | |
| | May 31, 2006 | | May 31, 2005 | | May 31, 2004 | | May 31, 2003 | | May 31, 2002 | |
| | | | | | | | | | | | |
Net Asset Value, Beginning of Period | | $ | 6.13 | | $ | 5.44 | | $ | 4.58 | | $ | 3.80 | | $ | 7.43 | |
| | | | | | | | | | | | | | | | | |
Investment Operations: | | | | | | | | | | | | | | | | |
Net investment loss (a) | | | (0.15 | ) | | (0.14 | ) | | (0.15 | ) | | (0.13 | ) | | (0.12 | ) |
| Net realized and unrealized gain (loss) on | | | | | | | | | | | | | | | | |
| investments | | | 0.73 | | | 0.83 | | | 1.01 | | | 0.91 | | | (3.51 | ) |
| Total from investment operations | | | 0.58 | | | 0.69 | | | 0.86 | | | 0.78 | | | (3.63 | ) |
| | | | | | | | | | | | | | | | | |
Net Asset Value, End of Period | | $ | 6.71 | | $ | 6.13 | | $ | 5.44 | | $ | 4.58 | | $ | 3.80 | |
| | | | | | | | | | | | | | | | | |
Total Return (b) | | | 9.46 | % | | 12.68 | % | | 18.78 | % | | 20.53 | % | | (48.86 | )% |
| | | | | | | | | | | | | | | | | |
Ratios/Supplemental Data | | | | | | | | | | | | | | | | |
| Net assets, end of period (in 000's) | | $ | 743 | | $ | 645 | | $ | 560 | | $ | 489 | | $ | 464 | |
| Ratio of expenses to average net assets: | | | 4.15 | % | | 4.29 | % | | 4.20 | % | | 4.22 | % | | 2.95 | % |
| Ratio of net investment loss to | | | | | | | | | | | | | | | | |
| average net assets: | �� | | (2.28 | )% | | (2.51 | )% | | (2.92 | )% | | (3.73 | )% | | (2.31 | )% |
| Portfolio turnover rate | | | 0.00 | % | | 10.39 | % | | 14.62 | % | | 8.72 | % | | 27.70 | % |
(a) | Net investment loss per share is based on average shares outstanding. |
(b) | Total return in the above table represents the rate that the investor would have earned or lost on an investment in the Fund assuming reinvestment of dividends. |
The accompanying notes are an integral part of these financial statements.
| AMIDEX™ Funds, Inc. | ANNUAL REPORT |
FINANCIAL HIGHLIGHTS |
Per Share Data For a Share Outstanding Throughout Each Fiscal Year |
| | | AMIDEXTM Cancer Innovations & Healthcare Fund | |
| | | Class A | |
| | | For the Year | | For the Year | | For the Year | | For the Year | | For the Period | |
| | | Ended | | Ended | | Ended | | Ended | | Ended | |
| | May 31, 2006 | | May 31, 2005 | | May 31, 2004 | | May 31, 2003 | | May 31, 20021 | |
| | | | | | | | | | | | | | | | | |
Net Asset Value, Beginning of Period | | $ | 10.55 | | $ | 10.32 | | $ | 8.50 | | $ | 8.12 | | $ | 10.00 | |
| | | | | | | | | | | | | | | | | |
Investment Operations: | | | | | | | | | | | | | | | | |
Net investment loss (a) | | | (0.36 | ) | | (0.32 | ) | | (0.34 | ) | | (0.16 | ) | | (0.02 | ) |
| Net realized and unrealized gain (loss) on | | | | | | | | | | | | | | | | |
| investments | | | 0.76 | | | 0.69 | | | 2.16 | | | 0.54 | | | (1.86 | ) |
| Total from investment operations | | | 0.40 | | | 0.37 | | | 1.82 | | | 0.38 | | | (1.88 | ) |
| | | | | | | | | | | | | | | | | |
Distributions: | | | | | | | | | | | | | | | | |
| From net realized capital gain | | | - | | | (0.14 | ) | | - | | | - | | | - | |
| Total distributions | | | - | | | (0.14 | ) | | - | | | - | | | - | |
| | | | | | | | | | | | | | | | | |
Net Asset Value, End of Period | | $ | 10.95 | | $ | 10.55 | | $ | 10.32 | | $ | 8.50 | | $ | 8.12 | |
| | | | | | | | | | | | | | | | | |
Total Return (b) | | | 3.79 | % | | 3.75 | % | | 21.41 | % | | 4.68 | % | | (18.80)%(c | ) |
| | | | | | | | | | | | | | | | | |
Ratios/Supplemental Data | | | | | | | | | | | | | | | | |
| Net assets, end of period (in 000's) | | $ | 1,089 | | $ | 1,064 | | $ | 1,057 | | $ | 946 | | $ | 1,023 | |
| Ratio of expenses to average net assets: | | | 4.46 | % | | 4.45 | % | | 4.56 | % | | 3.43 | % | | 1.24%(d | ) |
| Ratio of net investment loss to | | | | | | | | | | | | | | | | |
| average net assets: | | | (3.26 | )% | | (3.33 | )% | | (3.57 | )% | | (2.22 | )% | | (0.29)%(d | ) |
| Portfolio turnover rate | | | 12.42 | % | | 2.14 | % | | 0.00 | % | | 0.00 | % | | 0.00 | % |
1 | The AMIDEXTM Cancer Innovations & Healthcare Fund Class A shares commenced operations on November 1, 2001. |
(a) | Net investment loss per share is based on average shares outstanding. |
(b) | Total return in the above table represents the rate that the investor would have earned or lost on an investment in the Fund assuming reinvestment of dividends. |
(c) | Aggregate total return, not annualized. |
(d) | Annualized. |
The accompanying notes are an integral part of these financial statements.
| AMIDEX™ Funds, Inc. | ANNUAL REPORT |
NOTES TO THE FINANCIAL STATEMENTS
May 31, 2006
1. | ORGANIZATION AND SIGNIFICANT ACCOUNTING POLICIES |
AMIDEXTM Funds, Inc. (the “Company”) was incorporated under the laws of the state of Maryland on April 27, 1999, and currently consists of two active portfolios, the AMIDEX35TM Israel Mutual Fund, and the AMIDEXTM Cancer Innovations & Healthcare Fund (each a “Fund” and collectively the “Funds”). The Funds are non-diversified Funds. The Company is registered as an open-end management investment company under the Investment Company Act of 1940 (the “1940 Act”). The Funds were registered to offer four classes of shares, Class A, Class B, Class C and No-load class, with only the Class A, Class C and No-load shares currently being offered in the AMIDEX35 TM Israel Mutual Fund and only Class A shares being offered in the AMIDEXTM Cancer Innovations & Healthcare Fund. Each class differs as to sales and redemption charges, minimum investment amounts and ongoing fees. Income and realized/unrealized gains or losses are allocated to each class based on relative share balances. The Funds’ investment objectives are long term growth of capital. The AMIDEX35TM Israel Mutual Fund became effective with the SEC on April 27, 1999 and commenced operations on June 8, 1999. The AMIDEXTM Cancer Innovations & Healthcare Fund became effective with the SEC on August 1, 2001 and commenced operations on November 1, 2001.
The following is a summary of significant accounting policies consistently followed by the Funds. The policies are in conformity with accounting principles generally accepted in the United States of America.
a) Investment Valuation—A portfolio security listed or traded on an exchange in domestic or international markets is valued at the last reported sale price of the primary exchange on which it trades before the time when the fund values assets. Lacking any sales on the principal exchange that day, the security is valued at the mean between the last reported bid and ask prices, if available. Securities traded on more than one market are valued using the market identified as primary based on trading volume and activity. Equity securities traded on the NASDAQ National Market System are valued at the NASDAQ Official Closing Price. If there are no sales that day, such securities will be valued at the mean between the bid and ask quotation, if available. Other over-the-counter securities are valued at the last sale price, if published, or the mean between the last bid and ask quotation, if available. Debt securities with maturities of sixty days or less at the time of purchase are valued based on amortized cost. If market quotations are not readily available, or when the portfolio management team believes that a readily available market quotation or other valuation produced by the fund's valuation policies is not reliable, the fund values the assets at fair value using procedures established by the Board of Directors. The Board members have delegated pricing authority to the fair valuation committee of the adviser, for certain pricing issues, as defined in the valuation procedures. Events affecting the value of securities that occur between the time prices are established and the New York Stock Exchange closes are not reflected in the calculation of net asset value unless the fair valuation committee decides that the event would materially affect the net asset value. If the event would materially affect the fund's net asset value, the security will be fair valued by the fair valuation committee or, at its discretion, by an independent fair valuation vendor. At May 31, 2006, no securities were valued as determined by the Board of Directors.
b) Foreign Currency Translation—Portfolio securities and other assets and liabilities denominated in foreign currencies are translated into U.S. dollars based on the exchange rate of such currencies against U.S. dollars on the date of valuation. Purchases and sales of securities and income items denominated in foreign currencies are translated into U.S. dollars at the exchange rate in effect on the transaction date. The Fund does not separately report the effect of changes in foreign exchange rates from changes in market prices on securities held. Such changes are included in net realized and unrealized gain or loss from investments. Realized foreign exchange gains or losses arise from sales of foreign currencies, currency gains or losses realized between the trade and settlement dates on securities transactions and the difference between the recorded amounts of dividends, interest and foreign withholding taxes, and the U.S. dollar equivalent of the amounts actually received or paid. Net unrealized foreign exchange gains or losses arise from changes in foreign exchange rates on foreign currency denominated assets and liabilities other than investments in securities held at the end of the reporting period.
c) Federal Income Taxes—No provision for federal income taxes has been made since the AMIDEX35TM Israel Mutual Fund and the AMIDEXTM Cancer Innovations and Healthcare Fund have complied to date with sub-chapter M of the Internal Revenue Code applicable to regulated investment companies and intends to so comply in the future and to distribute all of its net investment income and realized capital gains to its shareholders.
| AMIDEX™ Funds, Inc. | ANNUAL REPORT |
May 31, 2006
1. ORGANIZATION AND SIGNIFICANT ACCOUNTING POLICIES (continued)
d) Distributions to Shareholders—Dividends from net investment income and distributions of net realized capital gains, if any, will be declared and paid at least annually. Income and capital gain distributions, which are determined in accordance with income tax regulations, are recorded on the ex-dividend date. Accounting principles generally accepted in the United States of America require that permanent financial reporting differences relating to shareholder distributions be reclassified to paid in capital or net realized gains. For the year ended May 31, 2006, net investment loss in the amount of $198,671 was reclassified to paid in capital for the AMIDEX35TM Israel Mutual Fund. Net investment loss in the amount of $2,119 was reclassified to short-term capital gain and $39,008 was reclassified to paid in capital for the AMIDEXTM Cancer Innovations & Healthcare Fund. These reclassifications have no affect on net assets.
e) Use of Estimates—The preparation of financial statements in conformity with accounting principles generally accepted in the United States of America requires management to make estimates and assumptions that affect the reported amounts of assets and liabilities and disclosure of contingent assets and liabilities at the date of the financial statements and the reported amounts of revenues and expenses during the reporting period. Actual results could differ from those estimates.
f) Other—Investment and shareholder transactions are recorded on trade date. The Funds determine the gain or loss realized from the investment transactions by comparing the original cost of the security lot sold with the net sales proceeds. Dividend income is recognized on the ex-dividend date or as soon as information is available to the Fund and interest income is recognized on an accrual basis. Withholding taxes on foreign dividends have been provided for in accordance with the Funds’ understanding of the applicable country’s tax rules and rates.
2. CAPITAL SHARE TRANSACTIONS
Transactions in shares of capital stock for the AMIDEX35TM Israel Mutual Fund for the year ended May 31, 2006 were as follows:
| | | No-load | |
| | | Shares | | Amount | |
| Sold | | | 96,476 | | $ | 1,082,037 | |
| Redeemed | | | (187,824 | ) | | (2,118,721 | ) |
| Net Decrease | | | (91,348 | ) | $ | (1,036,684 | ) |
| | | Class A | |
| | | Shares | | Amount | |
| Sold | | | 106,213 | | $ | 935,743 | |
| Redeemed | | | (58,341 | ) | | (503,191 | ) |
| Net Increase | | | 47,872 | | $ | 432,552 | |
| | | Class C | |
| | | Shares | | Amount | |
| Sold | | | 26,952 | | $ | 178,271 | |
| Redeemed | | | (21,467 | ) | | (138,869 | ) |
| Net Increase | | | 5,485 | | $ | 39,402 | |
Transactions in shares of the AMIDEXTM Cancer Innovations & Healthcare Fund for the year ended May 31, 2006 were as follows:
| | | Class A | |
| | | Shares | | Amount | |
| Sold | | | 59,866 | | $ | 643,250 | |
| Redeemed | | | (61,244 | ) | | (670,946 | ) |
| Net Decrease | | | (1,378 | ) | $ | (27,696 | ) |
| AMIDEX™ Funds, Inc. | ANNUAL REPORT |
May 31, 2006
2. CAPITAL SHARE TRANSACTIONS (continued)
Transactions in shares of capital stock for the AMIDEX35TM Israel Mutual Fund for the year ended May 31, 2005 were as follows:
| | | No-load | |
| | | Shares | | Amount | |
| Sold | | | 186,299 | | $ | 1,853,639 | |
| Redeemed | | | (197,707 | ) | | (1,888,411 | ) |
| Net Decrease | | | (11,408 | ) | $ | (34,772 | ) |
| | | Class A | |
| | | Shares | | Amount | |
| Sold | | | 206,935 | | $ | 1,590,869 | |
| Redeemed | | | (361,900 | ) | | (2,813,255 | ) |
| Net Decrease | | | (154,965 | ) | $ | (1,222,386 | ) |
| | | Class C | |
| | | Shares | | Amount | |
| Sold | | | 19,892 | | $ | 119,837 | |
| Redeemed | | | (17,840 | ) | | (96,643 | ) |
| Net Increase | | | 2,052 | | $ | 23,194 | |
Transactions in shares of the AMIDEXTM Cancer Innovations & Healthcare Fund for the year ended May 31, 2005 were as follows:
| | | Class A | |
| | | Shares | | Amount | |
| Sold | | | 27,275 | | $ | 269,502 | |
| Reinvested | | | 762 | | | 7,357 | |
| Redeemed | | | (29,581 | ) | | (285,126 | ) |
| Net Decrease | | | (1,544 | ) | $ | (8,267 | ) |
3. INVESTMENT TRANSACTIONS
For the year ended May 31, 2006, aggregate purchases and sales of investment securities (excluding short-term investments) for each Fund were as follows:
| | | Purchases | | Sales | |
AMIDEX35TM Israel Mutual Fund | | $ | - | | $ | 719,632 | |
AMIDEXTM Cancer Innovations & Healthcare Fund | | | 136,106 | | | 137,541 | |
There were no government securities purchased or sold during the period.
4. | ADVISORY FEES AND OTHER RELATED PARTY TRANSACTIONS |
Effective October 1, 2003, the Funds have entered into an Advisory Agreement with Index Investments, LLC (“II”) to provide investment management services to the Funds. II furnishes, at its own expense, office space to the Funds and all necessary office facilities, equipment and personnel for managing the assets of the Funds. II also pays all expenses of marketing shares of the Funds and related bookkeeping. Pursuant to the Advisory Agreement, II is entitled to receive a fee, calculated daily and payable monthly at the annual rate of 0.80% as applied to the Funds’ daily net assets. For the year ended May 31, 2006, the AMIDEX35TM Israel Mutual Fund incurred $101,576 of advisory fees, with $9,100 remaining payable at May 31, 2006. For the year ended May 31, 2006, the AMIDEXTM Cancer Innovations & Healthcare Fund incurred $10,092 of advisory fees, with $743 remaining payable at May 31, 2006.
| AMIDEX™ Funds, Inc. | ANNUAL REPORT |
May 31, 2006
4. ADVISORY FEES AND OTHER RELATED PARTY TRANSACTIONS (continued)
Effective October 1, 2003, the Funds have entered into an Administrative Services Agreement (“ASA”) with II to provide administrative services to the Funds. Pursuant to the ASA, II is entitled to receive a fee, calculated daily and payable monthly at the annual rate of 0.10% as applied to the Funds’ daily net assets. For the year ended May 31, 2006, the AMIDEX35TM Israel Mutual Fund incurred $12,697 of administrative fees, with $1,137 remaining payable at May 31, 2006. For the year ended May 31, 2006, the AMIDEXTM Cancer Innovations & Healthcare Fund incurred $1,261 of administrative fees, with $93 remaining payable at May 31, 2006.
One director of the Funds is also an Officer of II.
The Funds have entered into an Investment Company Services Agreement (“ICSA”) with Matrix Capital Group, Inc. (“Matrix”). Pursuant to the ICSA, Matrix will provide day-to-day operational services to the Funds including, but not limited to, accounting, administrative, transfer agent, dividend disbursement, registrar and record keeping services. For its services, Matrix receives $11,000 per month which is allocated to the Funds based on their respective average daily net assets. For the year ended May 31, 2006, Matrix earned $132,000, with $10,969 remaining payable at May 31, 2006.
For the year ended May 31, 2006, the AMIDEX35TM Israel Mutual Fund paid total portfolio commissions of $684 of which Matrix received portfolio commissions of $367 on trades that they entered on behalf of the AMIDEX35TM Israel Mutual Fund on instructions from II.
Certain Officers of the Funds are also employees of Matrix.
The Funds and II have entered into a Distribution Agreement with Matrix Capital Group, Inc. Pursuant to the Distribution Agreement, Matrix will provide distribution services to the Funds. Matrix serves as underwriter/distributor of the Funds. Pursuant to the Distribution Agreement, Matrix receives $20,000 per year from the Funds allocated based on their respective average daily net assets. Matrix also receives commissions from the sale of Class A Fund shares for which they are the broker of record. The allocated distribution fees are reduced by the amount of commissions received and the remainder is paid from the accruals pursuant to Rule 12b-1 under the Investment Company Act of 1940. For the year ended May 31, 2006, Matrix received net distribution fees of $13,516 and $249 from the AMIDEX35TM Israel Mutual Fund and the AMIDEXTM Cancer Innovations & Healthcare Fund, respectively. For the year ended May 31, 2006, Matrix received commissions from the sale of Fund shares of $2,270 and $3,965 from the AMIDEX35TM Israel Mutual Fund Class A and the AMIDEXTM Cancer Innovations & Healthcare Fund Class A, respectively.
A separate plan of distribution has been adopted pursuant to Rule 12b-1 under the Investment Company Act of 1940 for each class of shares. With respect to Class A and the No-load class of shares, the plan provides that the Funds may pay a servicing or Rule 12b-1 fee of up to 0.25% annually of the Funds' average net assets attributable to each class of shares, respectively, and up to 1.00% annually of the Funds’ average net assets attributable to Class C shares to persons or institutions for performing certain servicing functions for the Funds' shareholders. The distribution plans are compensation plans, which also allow the Funds to pay or reimburse expenditures in connection with sales, and promotional services related to distribution of the Funds' shares, including personal services provided to prospective and existing shareholders.
The distribution plans for the shares in the AMIDEX35TM Israel Mutual Fund Class A, the No-load class and Class C took effect November 19, 1999, June 8, 1999 and May 19, 2000, respectively. The distribution plan for the Class A shares in the AMIDEXTM Cancer Innovations & Healthcare Fund took effect November 1, 2001. For the year ended May 31, 2006, the AMIDEX35TM Israel Mutual Fund incurred $36,786 in 12b-1 fees with $11,342 remaining payable at May 31, 2006. For the year ended May 31, 2006, the AMIDEXTM Cancer Innovations & Healthcare Fund incurred $3,154 in 12b-1 fees with $1,726 remaining payable at May 31, 2006.
5. TAX MATTERS
The tax character of distributions paid for the year ended May 31, 2005 were as follows:
| | | 2005 | |
| | | Ordinary Income | | Capital Gains | |
AMIDEXTM Cancer Innovations & Healthcare Fund | | $ | - | | $ | 12,857 | |
| AMIDEX™ Funds, Inc. | ANNUAL REPORT |
May 31, 2006
5. TAX MATTERS (continued)
There were no distributions during the fiscal years ended May 31, 2006 and 2005 for the AMIDEX35TM Israel Mutual Fund and no distributions during the year ended May 31, 2006 for the AMIDEXTM Cancer Innovations & Healthcare Fund.
As of May 31, 2006, the Funds’ most recent fiscal year end, the components of distributable earnings on a tax basis were as follows:
| | | AMIDEX35TM Israel Mutual Fund | | AMIDEXTM Cancer Innovations & Healthcare Fund | |
| Cost of investments for tax purposes | | $ | 15,455,026 | | $ | 937,743 | |
| Unrealized Appreciation / (Depreciation): | | | | | | | |
| Gross Appreciation | | | 3,981,394 | | | 306,481 | |
| Gross Depreciation | | | (6,584,017 | ) | | (158,602 | ) |
| Net Unrealized Appreciation / (Depreciation) | | $ | (2,602,623 | ) | $ | 147,879 | |
| | | | | | | | |
| Undistributed Long-term Capital Gain | | | - | | | 54,390 | |
| Capital Loss Carryforwards | | | (4,875,787 | ) | | - | |
| Distributable Earnings, Net | | $ | (7,478,508 | ) | $ | 202,269 | |
The difference between book basis and tax-basis unrealized depreciation is attributable primarily to the tax deferral of losses on wash sales for the AMIDEX35TM Israel Mutual Fund.
As of May 31, 2006 the Funds had capital loss carryforwards available for federal income tax purposes as follows:
| | | AMIDEX35TM Israel Mutual Fund | | AMIDEXTM Cancer Innovations & Healthcare Fund | |
| Expiring in: 2010 | | $ | (1,795,267 | ) | $ | - | |
| Expiring in: 2011 | | $ | (100,824 | ) | $ | - | |
| Expiring in: 2012 | | $ | (1,246,393 | ) | $ | - | |
| Expiring in: 2013 | | $ | (323,400 | ) | $ | - | |
| Expiring in: 2014 | | $ | (1,409,903 | ) | $ | - | |
6. CONCENTRATION OF RISK
The AMIDEX35TM Israel Mutual Fund invests exclusively in common stock of Israeli companies. Investing in the companies from one geographic region may pose additional risks inherent to a region's economical and political situation.
A large portion of investments held by AMIDEX35TM Israel Mutual Fund are considered investments in the technology sector of the market. All investments in common stock held by AMIDEXTM Cancer Innovations & Healthcare Fund are identified as belonging to the healthcare sector of the market. Investing in a single market sector may be riskier than investing in a variety of market sectors.
7. BENEFICIAL OWNERSHIP
The beneficial ownership, either directly or indirectly, of more than 25% of the voting securities of a fund creates a presumption of control of the fund, under Section 2(a)(9) of the Investment Company Act of 1940. As of May 31, 2006, FTC & Co. held 45.54% of AMIDEX35TM Israel Mutual Fund Class A shares in an omnibus account for the sole benefit of their customers. As of May 31, 2006, Merrill Lynch Pierce, Fenner & Smith, Inc. held 65.61% of AMIDEX35TM Israel Mutual Fund Class C shares in an omnibus account for the sole benefit of their customers.
| AMIDEX™ Funds, Inc. | ANNUAL REPORT |
May 31, 2006
8. LITIGATION
On May 31, 2006, a lawsuit was filed against II, the Advisor, and certain officers/shareholders of II. The complaint was filed by previous shareholders of TransNations Investments, LLC, the Funds’ previous Investment Advisor. The complaint does not involve the AMIDEXTM Funds, Inc. or any of the current independent directors of the Funds. II believes that the pending lawsuit or settlement will not likely materially affect their ability to perform under their Advisory or Administrative Services Agreements with the Funds.
Additional Information (Unaudited)
The Funds file their complete schedules of portfolio holdings with the Securities and Exchange Commission (the “Commission”) for the first and third quarters of each fiscal year on Form N-Q. The Funds’ Forms N-Q are available on the Commissions website at http://www.sec.gov. The Funds’ Forms N-Q may be reviewed and copied at the Commission’s Public Reference Room in Washington, DC. Information on the operation of the Commission’s Public Reference Room may be obtained by calling 1-800-SEC-0330.
A description of the policies and procedures that the Funds use to determine how to vote proxies relating to portfolio securities is available without charge, upon request, by calling 888-876-3566; and on the Commissions website at http://www.sec.gov.
Information regarding how the Fund voted proxies relating to portfolio securities during the most recent 12-month period ended June 30, 2005 is available without charge, upon request, by calling 888-876-3566; and on the Commission’s website at http://www.sec.gov.
[Letterhead of Cohen Fund Audit Services]
To The Shareholders and
Board of Directors
AMIDEXTM Funds, Inc.
REPORT OF INDEPENDENT REGISTERED PUBLIC ACCOUNTING FIRM
We have audited the accompanying statements of assets and liabilities, including the schedules of investments, of AMIDEXTM Funds, Inc. (the “Funds”), comprising AMIDEX35TM Israel Mutual Fund and AMIDEXTM Cancer Innovations & Healthcare Fund as of May 31, 2006, and the related statements of operations for the year then ended and the statement of changes in net assets for each of the two years in the period then ended, and the financial highlights for each of the three years in the period then ended. These financial statements and financial highlights are the responsibility of the Funds’ management. Our responsibility is to express an opinion on these financial statements and financial highlights based on our audit. The financial highlights for the periods indicated prior to May 31, 2004 were audited by another independent accounting firm who expressed unqualified opinions on those statements and highlights.
We conducted our audits in accordance with the standards of the Public Company Accounting Oversight Board (United States). Those standards require that we plan and perform the audit to obtain reasonable assurance about whether the financial statements and financial highlights are free of material misstatement. An audit includes examining, on a test basis, evidence supporting the amounts and disclosures in the financial statements. Our procedures included confirmation of securities owned as of May 31, 2006, by correspondence with the Funds’ custodian and broker. An audit also includes assessing the accounting principles used and significant estimates made by management, as well as evaluating the overall financial statement presentation. We believe that our audits provide a reasonable basis for our opinion.
In our opinion, the financial statements and financial highlights referred to above present fairly, in all material respects, the financial positions of each of the portfolios constituting the AMIDEX TM Funds, Inc. as of May 31, 2006, the results of their operations for the year then ended, and the changes in their net assets for each of the two years in the period then ended, and their financial highlights for each of the three years in the period then ended, in conformity with accounting principles generally accepted in the United States of America.
/s/ Cohen Fund Audit Services
Cohen Fund Audit Services, Ltd.
(f.k.a. Cohen McCurdy, Ltd.)
Westlake, Ohio
July 24, 2006
DIRECTORS AND OFFICERS INFORMATION (Unaudited)
Name, Address and Age1 | Position(s) Held with The Company | Term of Office and Length of Time Served2 | Principal Occupation(s) During Past 5 Years | Number of Portfolios in Fund Complex Overseen by Director3 | Other Directorships Held by Director4 |
INDEPENDENT DIRECTORS | | | | | |
Eli Gabay, Esq. Age 47 | Director | October 2003 | Attorney, Solomon Sherman & Gabay, Philadelphia, PA | 2 | |
Erica Levi Age 28 | Director | October 2003 | Editor, Philadelphia Magazine; Editor Marion Publications | 2 | |
| | | | | | |
OFFICERS | | | | | |
Clifford A. Goldstein5 Age 47 | President and Director | 1999 | President, Index Investments, LLC, November 2002 to present; President, TransNations Investments, LLC, Managing Partner and Attorney with Weber, Goldstein, Greenberg, Gallagher, a general litigation firm, since 1991. | N/A | N/A |
Larry E. Beaver, Jr.6 630-A Fitzwatertown Road Willow Grove, PA 19090 Age 37 | Chief Accounting Officer | May 2003 | Director of Fund Accounting, Matrix Capital Group, February 2005 to present; Fund Accounting Manager, InCap Service Co., May 2003 to January 2005; Fund Accounting Supervisor, Declaration Group/InCap Service Co., October 2001 to April 2003; Fund Accounting Supervisor, PFPC, Inc., October 1999 to September 2001 | N/A | Treasurer, Commonwealth International Series Trust, since June 2003 |
________________________
1 | Each Director may be contacted by writing to the Director, c/o AMIDEXTM Funds, Inc., Chartwell Suites, 2621 Van Buren Avenue, Norristown, PA 19403. |
2 | Each Director holds office until he resigns, is removed or dies. The President and Chief Accounting Officer shall hold office for a one year term and until their respective successors are chosen and qualified, or until such officer dies or resigns. |
3 | The Fund Complex consists of the Company. The Company has two portfolios, the AMIDEX35 TM Israel Mutual Fund and the AMIDEXTM Cancer Innovations & Healthcare Fund. |
4 | Directorships of companies required to report to the Securities and Exchange Commission under the Securities Exchange Act of 1934 (i.e., “public companies”) or other investment companies registered under the 1940 Act. |
5 | Indicates an “interested person” as defined in the Investment Company Act of 1940. |
6 | The Company entered into an agreement related to its Distribution Plan with Matrix Capital Group. Larry E. Beaver, Jr. is Fund Accounting Manager at Matrix. |
a. The registrant has, as of the end of the period covered by this report, adopted a Code of Ethics that applies to the registrant’s principal executive officer, principal financial officer, principal accounting officer or controller, or persons performing similar functions, regardless of whether these individuals are employed by the registrant or a third party.
b. During the period covered by this report, there were no amendments to any provision of the Code of Ethics
c. During the period covered by this report, there were no waivers or implicit waivers of a provision of the Code of Ethics.
d. The registrant’s Code of Ethics is filed herewith.
| ITEM 3. | AUDIT COMMITTEE FINANCIAL EXPERT. |
The registrant’s Board of Directors has determined that Eli Gabay, a member of the Board of Directors is the Audit Committee financial expert. Mr. Gabay is independent under applicable rules.
| ITEM 4. | PRINCIPAL ACCOUNTANT FEES AND SERVICES. |
a. Audit Fees
The aggregate fees billed for each of the last two fiscal years for professional services rendered by a principal accountant for the audit of the registrant’s annual financial statements or services that are normally provided by the accountant in connection with statutory filings or engagements for those fiscal years were $34,010 for 2006 and $32,015 for 2005.
b. Audit related fees
There were no fees billed in each of the last two fiscal years for assurances and related services by the principal accountant that are reasonably related to the performance of the audit of the registrant’s financial statements and are not reported under paragraph (a) of this item.
c. Tax Fees
Set forth below are the aggregate fees billed in each of the last two fiscal years for professional services rendered by the principal accountant for tax compliance, tax advice and tax planning were for 2006 amounted to $3,070 and $2,330 for 2005.
The fees were for preparation of IRS Form 1120-RIC and Form 8613 (exercise tax). No tax services were provided to the registrant’s investment adviser.
d. All other fees
During the last two fiscal year end for products and services provided by the principal accountant, other than the services reported in paragraphs (a) through (c) billings for 2006 were $1,200 for auditor’s consent and $615 for the auditor’s review of the semi annual financial statement and for 2005 $1,282 for auditors’ consent and $750 for the auditor’s review of the semi annual financial statement
e (1) Audit Committee’s Pre-Approval Policies Registrant has adopted an audit committee charter to provide the Audit Committee with guidance. The audit committee consists of two independent members of the board of directors. The charter calls for receipt and review of the principal accountant’s written statement concerning independence,; dialogue concerning relationships or services to others (which involved all service providers including registrant’s custodian, investment adviser, transfer agent, fund accountants and administrator); and, prior to the board of directors selecting registrant’s auditor, review and assess services provided, fees charged and to be charged, and other relevant data. The audit committee charter contains, among other things, express provisions for selecting registrant’s auditor and for pre-approving all permitted non-audit services. With respect to auditor selection, the charter expressly states that the audit committee is to consider.
(a) the audit scope and plan to assure completeness and effectiveness of resources;
(b) the auditor’s formal written statement delineating relationship with registrant;
(c) the auditor’s relationship or service to others, which may impact objectivity or independence;
(d) rotations of audit partners; and
(e) fees or other compensation paid to the auditor
e(2) Percentage of services approved by the audit committee
| | Registrant | Adviser |
| Audit related Fees | 100% | not applicable |
| Tax fees | 100% | not applicable |
| All other fees | 100% | not applicable |
f. Not applicable. All work is performed by Cohen McCurdy Ltd’s principal employees.
g. Not applicable
h. Not applicable
| ITEM 5. | AUDIT COMMITTEE OF LISTED REGISTRANTS. |
Not applicable
| ITEM 6. | SCHEDULE OF INVESTMENT |
Included in annual report to shareholder filed under item 1 of this form.
| ITEM 7. | DISCLOSURE OF PROXY VOTING POLICIES AND PROCEDURES FOR CLOSED-END MANAGEMENT INVESTMENT COMPANIES. |
Not applicable Fund is an open-end management investment company
| ITEM 8. | PORTFOLIO MANAGERS OF CLOSED-END MANAGEMENT INVESTMENT COMPANIES |
Not applicable Fund is an open-end management investment company
| ITEM 9. | PURCHASES OF EQUITY SECURITIES BY CLOSED-END MANAGEMENT INVESTMENT COMPANY AND AFFILIATED PURCHASERS. |
Not applicable Fund is an open-end management investment company
| ITEM 10. | SUBMISSION OF MATTERS TO A VOTE OF SECURITY HOLDERS. |
Not applicable at this time.
| ITEM 11. | CONTROLS AND PROCEDURES. |
(a) The registrant’s principal executive office and principal financial officer has concluded that the registrant’s disclosure controls and procedures (as defined in rule 30a-2(c) under the Investment Company Act of 1940, as amended (the “1940 Act”)) are effective based on their evaluation of these controls and procedures as of a date within 90 days of the filing date of this document.
(b) There were so significant changes in the registrant’s internal controls or in other factors that could affect these controls subsequent to the date of their evaluation, including any corrective actions with regard to significant deficiencies and material weaknesses.
| | (1) | Certifications pursuant to Section 302 of the Sarbanes-Oxley Act of 2002 are filed herewith. |
| | (2) | Certifications pursuant to Section 906 of the Sarbanes-Oxley Act of 2002 are filed herewith. |
| | (3) | The AMIDEX Funds’ Code of Ethics for Principal Executive and Senior Officers is filed herewith. |
SIGNATURES
Pursuant to the requirements of the Securities Exchange Act of 1934 and the Investment Company Act of 1940, the registrant has duly caused this report to be signed on its behalf by the undersigned, thereunto duly authorized.
| | | |
| | The AMIDEX Funds, Inc. |
|
|
|
| Date: August 4, 2006 | By: | /s/ Clifford A. Goldstein |
| |
Clifford A. Goldstein, President |
Pursuant to the requirements of the Securities Exchange Act of 1934 and the Investment Company Act of 1940, this report has been signed below by the Following persons on behalf of the registrant and in the capacities and on the dates indicated.
| | | |
| Date: August 4, 2006 | By: | /s/ Clifford A. Goldstein |
| |
Clifford A. Goldstein, President |
| | |
| Date: August 4, 2006 | By: | /s/ Larry E. Beaver, Jr. |
| |
Larry E. Beaver, Jr., Treasurer |