Average Annual Total Return (Unaudited)
| | Ten Years Ended May 31, 2015 | Five Years Ended May 31, 2015 | One Year Ended May 31, 2015 |
| No Load Class | 4.28% | 2.86% | 6.74% |
| Class A | With sales charge | 3.61% | 1.65% | 0.84% |
| Without sales charge | 4.20% | 2.81% | 6.71% |
| Class C | With contingent deferred sales charge | 3.42% | 2.04% | 4.87% |
| Without contingent deferred sales charge | 3.42% | 2.04% | 5.93% |
| MSCI World Index | 7.44% | 13.58% | 6.35% |
| S&P 500 Total Return | 8.12% | 16.55% | 11.81% |
The performance information quoted in this annual report assumes the reinvestment of all dividend and capital gain distributions, if any, and represents past performance, which is not a guarantee of future results. The returns shown do not reflect taxes that a shareholder would pay on Fund distributions or on the redemption of Fund shares. The investment return and principal value of an investment will fluctuate and, therefore, an investor’s shares, when redeemed, may be worth more or less than their original cost.
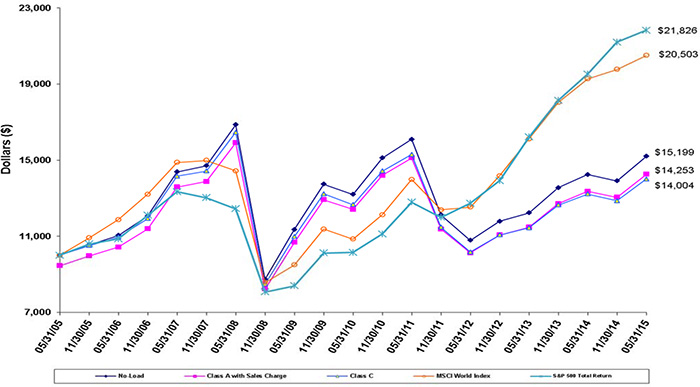
The above graph depicts the performance of the AMIDEX35™ Israel Mutual Fund versus the MSCI World Index and the S&P 500 Total Return Index. The MSCI World Index is a free float-adjusted market capitalization weighted index that is designed to measure the equity market performance of developed markets. The S&P 500 Total Return Index by Standard and Poor’s Corp. is a capitalization-weighted index comprising 500 issues listed on various exchanges, representing the performance of the stock market generally. Please note that indices do not take into account any fees and expenses of investing in the individual securities that they track and individuals cannot invest directly in any index.
Due to the bi-national, multi-sector and market capitalization range of the Fund, there aren’t adequate publically published benchmarks for comparison. As with any fund, save an index fund, that commonly compares its performance to the MSCI World Index and the S&P 500 Total Return Index, such a comparison may be said to be inappropriate because of the dissimilarity between the Fund’s investments and the securities comprising the indices; there may be little or no congruence between these indices and the AMIDEX35™ Israel Mutual Fund, which will not invest in certain securities comprising these indices.
AMIDEXTM Funds, Inc. | ANNUAL REPORT |
Information About Your Fund’s Expenses (Unaudited)
As a shareholder of the Fund, you incur two types of costs: (1) transaction costs, including sales charges (loads) on purchase payments, reinvested dividends, or other distributions, redemption fees and exchange fees; and (2) ongoing costs, including management fees, distribution and service (12b-1) fees; and other Fund expenses. The example below is intended to help you understand your ongoing costs (in dollars) of investing in the Fund and to compare these costs with the ongoing costs of investing in other mutual funds.
The table below illustrates an example investment of $1,000 at the beginning of the period (December 1, 2014) and held for the entire period of 12/01/14 through 05/31/15. This example is intended to help you understand your ongoing costs (in dollars) of investing in the Fund and to compare these costs with the ongoing costs of investing in other mutual funds.
Actual Expenses
The first section of the table provides information about actual account values and actual expenses (relating to the example $1,000 investment made on 12/01/14). You may use the information in this row, together with the amount you invested, to estimate the expenses that you paid over the period. Simply divide your account value by $1,000 (for example, an $8,600 account value divided by $1,000 = 8.6), then multiply the result by the number in the first row under the heading entitled “Expenses Paid During Period” to estimate the expenses you paid on your account during this period.
Hypothetical Example for Comparison Purposes
The second section of the table provides information about the hypothetical account values and hypothetical expenses based on the Fund’s actual expense ratio and an assumed rate of return of 5% per year before expenses, which is not the Fund’s actual return. The hypothetical account values and expenses may not be used to estimate the actual ending account balance or expenses you paid for the period. You may use this information to compare the ongoing costs of investing in the Fund and other funds. To do so, compare this 5% hypothetical example with the 5% hypothetical examples that appear in the shareholder reports of the other funds.
Please note that the expenses shown in the table are meant to highlight your ongoing costs only and do not reflect any transactional costs, such as sales charges (loads), redemption fees, or exchange fees. Therefore, the second section of the table is useful in comparing ongoing costs only, and will not help you determine the relative total costs of owning different funds. In addition, if these transactional costs were included, your costs would have been higher. For more information on transactional costs, please refer to the Fund’s prospectus.
| Expenses and Value of a $1,000 Investment for the six months ended May 31, 2015 |
| |
| Actual Fund Return (in parentheses) | Beginning
Account Value 12/01/14 | Ending
Account Value 05/31/15 | Expenses
Paid During
Period* |
Amidex35TM Israel Mutual Fund No-Load Class (+9.29%) | $1,000.00 | $1,092.90 | $17.90 |
Amidex35TM Israel Mutual Fund Class A (+9.28%) | 1,000.00 | 1,092.80 | 17.90 |
Amidex35TM Israel Mutual Fund Class C (+8.88%) | 1,000.00 | 1,088.80 | 21.77 |
AMIDEXTM Funds, Inc. | ANNUAL REPORT |
Information About Your Fund’s Expenses (Unaudited) (continued)
| Hypothetical 5% Fund Return | Beginning
Account Value 12/01/14 | Ending
Account Value 05/31/15 | Expenses
Paid During
Period* |
Amidex35TM Israel Mutual Fund No-Load Class | $1,000.00 | $1,007.83 | $17.17 |
Amidex35TM Israel Mutual Fund Class A | 1,000.00 | 1,007.83 | 17.17 |
Amidex35TM Israel Mutual Fund Class C | 1,000.00 | 1,004.09 | 20.89 |
| * | Expenses are equal to the Funds’ annualized expense ratios of 3.43%, 3.43% and 4.18% for the Amidex35TM Israel Mutual Fund No-Load Class, Class A and Class C shares, respectively, multiplied by the average account value over the period, multiplied by 182/365 to reflect the one-half year period. |
Total Fund operating expense ratios as stated in the current Fund prospectus dated September 30, 2014 were as follows: |
AMIDEX35TM Israel Mutual Fund Class No-Load | 3.37% |
AMIDEX35TM Israel Mutual Fund Class A | 3.37% |
AMIDEX35TM Israel Mutual Fund Class C | 4.12% |
Total Gross Operating Expenses (Annualized) for the fiscal year ended May 31, 2015 were 3.38% for the AMIDEX35TM Israel Mutual Fund Class No-Load shares, 3.38% for the AMIDEX35TM Israel Mutual Fund Class A shares and 4.13% for the AMIDEX35TM Israel Mutual Fund Class C shares. Please see the Information About Your Fund’s Expenses, the Financial Highlights and Notes to Financial Statements (Note 4) sections of this report for expense related disclosures during the fiscal year ended May 31, 2015. |
For more information on Fund expenses, please refer to the Fund’s prospectus, which can be obtained from your investment representative or by calling 1-888-876-3566. Please read it carefully before you invest or send money.
AMIDEXTM Funds, Inc.
AMIDEX35TM ISRAEL MUTUAL FUND
SCHEDULE OF INVESTMENTS
| May 31, 2015 | ANNUAL REPORT |
| | | Shares | | | Fair Value | |
| ISRAEL – 37.68% | | | | | | |
| | | | | | | |
| COMMON STOCK – 37.68% | | | | | | |
| | | | | | | |
| Banks- 12.41% | | | | | | |
| Bank Hapoalim BM | | | 110,528 | | | $ | 579,712 | |
| Bank Leumi Le-Israel BM * | | | 140,616 | | | | 549,690 | |
| First International Bank of Israel Ltd. | | | 10,000 | | | | 134,250 | |
| Israel Discount Bank Ltd. * | | | 115,810 | | | | 206,162 | |
| Mizrahi Tefahot Bank Ltd. * | | | 24,915 | | | | 283,371 | |
| | | | | | | | 1,753,185 | |
| Chemicals – 7.15% | | | | | | | | |
| Frutarom Industries Ltd. | | | 6,000 | | | | 235,635 | |
| Israel Chemicals Ltd. | | | 108,335 | | | | 774,781 | |
| | | | | | | | 1,010,416 | |
| Diversified Holdings – 3.96% | | | | | | | | |
| Delek Group Ltd. | | | 1,064 | | | | 307,346 | |
| Israel Corp. Ltd. | | | 708 | | | | 252,439 | |
| | | | | | | | 559,785 | |
| Food – 3.07% | | | | | | | | |
| Osem Investments Ltd. | | | 12,084 | | | | 244,340 | |
| Strauss Group Ltd. * | | | 11,200 | | | | 189,946 | |
| | | | | | | | 434,286 | |
| Insurance- 1.80% | | | | | | | | |
| Harel Insurance Investments & Financial Services Ltd. | | | 26,000 | | | | 113,461 | |
| Migdal Insurance & Financial Holdings Ltd. | | | 120,216 | | | | 140,859 | |
| | | | | | | | 254,320 | |
| Oil & Gas– 1.37% | | | | | | | | |
| Paz Oil Co. Ltd. | | | 1,300 | | | | 193,132 | |
| | | | | | | | | |
| Real Estate – 5.22% | | | | | | | | |
| Azrieli Group Ltd. | | | 12,000 | | | | 512,815 | |
| Gazit-Globe Ltd. | | | 18,000 | | | | 224,163 | |
| | | | | | | | 736,978 | |
| Telecommunications – 2.70% | | | | | | | | |
| Bezeq Israeli Telecommunication Corp. Ltd. | | | 227,390 | | | | 380,707 | |
| | | | | | | | | |
| TOTAL COMMON STOCK – ISRAEL (Cost $3,665,571) | | | | | | | 5,322,809 | |
| | | | | | | | | |
| TOTAL ISRAEL (Cost $3,665,571) | | | | | | | 5,322,809 | |
The accompanying notes are an integral part of these financial statements.
AMIDEXTM Funds, Inc.
AMIDEX35TM ISRAEL MUTUAL FUND
SCHEDULE OF INVESTMENTS
| May 31, 2015 | ANNUAL REPORT |
| | | Shares | | | Fair Value | |
| UNITED STATES – 62.40% | | | | | | |
| | | | | | | |
| COMMON STOCK – 59.47% | | | | | | |
| | | | | | | |
| Aerospace & Defense – 2.43% | | | | | | |
| Elbit Systems Ltd. | | | 4,698 | | | $ | 342,719 | |
| | | | | | | | | |
| Building Materials – 0.87% | | | | | | | | |
| Caesarstone Sdot-Yam Ltd. | | | 2,000 | | | | 123,640 | |
| | | | | | | | | |
| Computers – 0.92% | | | | | | | | |
| Electronics for Imaging, Inc. * | | | 3,000 | | | | 129,690 | |
| | | | | | | | | |
| Electric – 1.57% | | | | | | | | |
| Ormat Technologies, Inc. | | | 6,000 | | | | 222,600 | |
| | | | | | | | | |
| Pharmaceuticals – 27.32% | | | | | | | | |
| OPKO Health, Inc. * | | | 28,000 | | | | 495,040 | |
| Perrigo Co. PLC | | | 7,500 | | | | 1,427,250 | |
| Taro Pharmaceutical Industries Ltd. * | | | 3,400 | | | | 505,580 | |
| Teva Pharmaceutical Industries Ltd. - ADR | | | 23,816 | | | | 1,431,342 | |
| | | | | | | | 3,859,212 | |
| Semiconductors – 1.78% | | | | | | | | |
| Mellanox Technologies Ltd. * | | | 5,000 | | | | 251,600 | |
| | | | | | | | | |
| Software – 15.11% | | | | | | | | |
| Check Point Software Technologies Ltd. * | | | 14,395 | | | | 1,219,544 | |
| Imperva, Inc. * | | | 3,000 | | | | 182,430 | |
| VeriFone Systems, Inc. * | | | 10,000 | | | | 381,700 | |
| Verint Systems, Inc. * | | | 5,421 | | | | 350,576 | |
| | | | | | | | 2,134,250 | |
| Telecommunications – 9.10% | | | | | | | | |
| Amdocs Ltd. | | | 14,603 | | | | 800,975 | |
| Cellcom Israel Ltd. * | | | 11,200 | | | | 45,920 | |
| NICE Systems Ltd. - ADR | | | 7,000 | | | | 438,900 | |
| | | | | | | | 1,285,795 | |
| Wireless Telecommunication Services – 0.37% | | | | | | | | |
| Partner Communications Co. Ltd. – ADR * | | | 22,100 | | | | 51,935 | |
| TOTAL COMMON STOCK – UNITED STATES (Cost $5,350,611) | | | | | | | 8,401,441 | |
The accompanying notes are an integral part of these financial statements.
AMIDEXTM Funds, Inc.
AMIDEX35TM ISRAEL MUTUAL FUND
SCHEDULE OF INVESTMENTS
| May 31, 2015 | ANNUAL REPORT |
| | | Shares | | | Fair Value | |
| UNITED STATES – 62.40% (continued) | | | | | | |
| | | | | | | |
| PARTNERSHIPS – 1.15% | | | | | | |
| Oil & Gas – 1.15% | | | | | | |
| Alon USA Partners LP | | | 8,000 | | | $ | 162,880 | |
| TOTAL PARTNERSHIPS – UNITED STATES (Cost $94,530) | | | | | | | 162,880 | |
| | | | | | | | | |
| SHORT-TERM INVESTMENTS – 1.78% | | | | | | | | |
| Fidelity Institutional Money Market Fund, 0.05% ** (Cost $251,748) | | | 251,748 | | | | 251,748 | |
| | | | | | | | | |
| TOTAL UNITED STATES (Cost $5,696,889) | | | | | | | 8,816,069 | |
| | | | | | | | | |
| TOTAL INVESTMENTS (Cost $9,362,460) –100.08% | | | | | | $ | 14,138,878 | |
| LIABILITIES IN EXCESS OF OTHER ASSETS, NET – (0.08%) | | | | | | | (10,903 | ) |
| NET ASSETS - 100.00% | | | | | | $ | 14,127,975 | |
| * | Non-income producing security. |
| ** | Rate shown represents the 7 day yield as of May 31, 2015, is subject to change and resets daily. |
ADR - American Depository Receipt.
BM - Beeravon Mugbal (Limited).
LP - Limited Partnership.
PLC - Public Limited Company.
The accompanying notes are an integral part of these financial statements.
AMIDEXTM Funds, Inc. | ANNUAL REPORT |
STATEMENT OF ASSETS AND LIABILITIES – MAY 31, 2015
| | | AMIDEX35TM Israel Mutual Fund | |
| Assets: | | | |
| Investments, at fair value (cost: $9,362,460) | | $ | 14,138,878 | |
| Receivables: | | | | |
| Dividends | | | 12,432 | |
| Interest | | | 8 | |
| Prepaid expenses | | | 36,243 | |
| Total assets | | | 14,187,561 | |
| | | | | |
| Liabilities: | | | | |
| Payables: | | | | |
| Investment advisory and administrative fees | | | 10,547 | |
| Distribution fees | | | 7,317 | |
| Fund accounting and transfer agency fees | | | 10,250 | |
| Director fees | | | 667 | |
| Other liabilities and accrued expenses | | | 30,805 | |
| Total liabilities | | | 59,586 | |
| Net Assets | | $ | 14,127,975 | |
| | | | | |
| Net Assets consist of: | | | | |
| Common stock | | $ | 97 | |
| Additional paid-in capital | | | 12,477,835 | |
| Accumulated net investment loss | | | (120,456 | ) |
| Accumulated realized loss on investments | | | (3,004,319 | ) |
| Net unrealized appreciation on investments | | | 4,774,818 | |
| | | | | |
| Total Net Assets (974,297 shares outstanding; 500,000,000 shares of $0.0001 par value | | | | |
| authorized for the Fund) | | $ | 14,127,975 | |
| | | | | |
| No-load class shares: | | | | |
| Net Assets applicable to 723,543 shares outstanding | | $ | 11,577,870 | |
| Net Asset Value and offering price per share | | $ | 16.00 | |
| | | | | |
Minimum Redemption price per share No-load class 1 | | $ | 15.68 | |
| | | | | |
| Class A shares: | | | | |
| Net Assets applicable to 108,605 shares outstanding | | $ | 1,330,871 | |
| Net Asset Value and redemption price per share | | $ | 12.25 | |
| | | | | |
Maximum Offering price per share Class A 2 | | $ | 12.96 | |
| | | | | |
| Class C shares: | | | | |
| Net Assets applicable to 142,149 shares outstanding | | $ | 1,219,234 | |
| Net Asset Value and offering price per share | | $ | 8.58 | |
| | | | | |
Minimum Redemption price per share Class C 3 | | $ | 8.49 | |
| 1 | A redemption fee of 2.00% is imposed on redemptions occurring within 365 days of purchase. |
| 2 | A maximum sales charge of 5.50% is imposed on Class A shares. |
| 3 | A contingent deferred sales charge (“CDSC”) of 1.00% is imposed in the event of certain redemption transactions within thirteen months following such investments. |
The accompanying notes are an integral part of these financial statements.
AMIDEXTM Funds, Inc. | ANNUAL REPORT |
STATEMENT OF OPERATIONS
| | | AMIDEX35TM Israel Mutual Fund For the Year Ended May 31, 2015 | |
| Investment income: | | | |
| Dividends (net of foreign withholding taxes of $55,020) | | $ | 179,744 | |
| Interest | | | 23 | |
| Total investment income | | | 179,767 | |
| | | | | |
| Expenses: | | | | |
| Investment advisory fees | | | 108,004 | |
| Distribution fees - No-load Class | | | 27,866 | |
| Distribution fees - Class A | | | 3,249 | |
| Distribution fees - Class C | | | 10,545 | |
| Fund accounting and transfer agent fees | | | 123,000 | |
| Registration fees | | | 40,160 | |
| Legal fees | | | 23,630 | |
Custody fees (a) | | | 20,417 | |
| Audit fees | | | 20,900 | |
| Insurance fees | | | 18,221 | |
| Administrative fees | | | 13,500 | |
| Miscellaneous | | | 16,529 | |
| Out of pocket expenses | | | 8,645 | |
| Networking fees | | | 13,418 | |
| Printing fees | | | 6,277 | |
| Director fees | | | 5,167 | |
| Pricing fees | | | 4,417 | |
| Total expenses | | | 463,945 | |
| | | | | |
| Net investment loss | | | (284,177 | ) |
| | | | | |
| Realized and unrealized gain on investments and foreign currency transactions: | | | | |
| Net realized gain on investments and foreign currency transactions | | | 153,627 | |
| Net change in unrealized appreciation on investments and foreign currency transactions | | | 997,659 | |
| Net realized and unrealized gain on investments and foreign currency transactions | | | 1,151,286 | |
| | | | | |
| Net increase in net assets resulting from operations | | $ | 867,109 | |
| (a) | Includes interest credits of $41 |
The accompanying notes are an integral part of these financial statements.
AMIDEXTM Funds, Inc. | ANNUAL REPORT |
STATEMENTS OF CHANGES IN NET ASSETS
| | | AMIDEX35TM Israel Mutual Fund | |
| | | | |
| | | For the Year Ended May 31, 2015 | | | For the Year Ended May 31, 2014 | |
| Increase (decrease) in Net Assets | | | | | | |
| Operations: | | | | | | |
| Net investment loss | | $ | (284,177 | ) | | $ | (169,393 | ) |
| Net realized gain on investments and foreign currency transactions | | | 153,627 | | | | 519,642 | |
| Net change in unrealized appreciation on investments and foreign currency transactions | | | 997,659 | | | | 1,670,497 | |
| Net increase in net assets resulting from operations | | | 867,109 | | | | 2,020,746 | |
| | | | | | | | | |
| Decrease in net assets from Fund share transactions (Note 2) | | | (659,659 | ) | | | (666,363 | ) |
| | | | | | | | | |
| Total increase in net assets | | | 207,450 | | | | 1,354,383 | |
| | | | | | | | | |
| Net Assets: | | | | | | | | |
| Beginning of year | | | 13,920,525 | | | | 12,566,142 | |
| End of year | | $ | 14,127,975 | | | $ | 13,920,525 | |
| Accumulated net investment loss | | $ | (120,456 | ) | | $ | (65,548 | ) |
The accompanying notes are an integral part of these financial statements.
AMIDEXTM Funds, Inc. | ANNUAL REPORT |
FINANCIAL HIGHLIGHTS
Per Share Data For a Share Outstanding Throughout Each Fiscal Year
| | | AMIDEX35TM Israel Mutual Fund No-Load Class |
| | | |
| | | For the Year Ended May 31, 2015 | | | For the Year Ended May 31, 2014 | | | For the Year Ended May 31, 2013 | | | For the Year Ended May 31, 2012 | | | For the Year Ended May 31, 2011 | |
| | | | | | | | | | | | | | | | |
| Net Asset Value, Beginning of Year | | $ | 14.99 | | | $ | 12.87 | | | $ | 11.35 | | | $ | 16.94 | | | $ | 13.93 | |
| | | | | | | | | | | | | | | | | | | | | |
| Investment Operations: | | | | | | | | | | | | | | | | | | | | |
Net investment income (loss) (a) | | | (0.31 | ) | | | (0.17 | ) | | | (0.20 | ) | | | (0.10 | ) | | | 0.05 | |
| Net realized and unrealized gain (loss) on investments | | | 1.32 | | | | 2.29 | | | | 1.72 | | | | (5.50 | ) | | | 2.99 | |
| Total from investment operations | | | 1.01 | | | | 2.12 | | | | 1.52 | | | | (5.60 | ) | | | 3.04 | |
| | | | | | | | | | | | | | | | | | | | | |
| Distributions: | | | | | | | | | | | | | | | | | | | | |
| From net investment income | | | - | | | | - | | | | - | | | | - | | | | (0.05 | ) |
| Total distributions | | | - | | | | - | | | | - | | | | - | | | | (0.05 | ) |
| | | | | | | | | | | | | | | | | | | | | |
| Paid in capital from redemption fees | | | - | (c) | | | - | (c) | | | - | (c) | | | 0.01 | | | | 0.02 | |
| | | | | | | | | | | | | | | | | | | | | |
| Net Asset Value, End of Year | | $ | 16.00 | | | $ | 14.99 | | | $ | 12.87 | | | $ | 11.35 | | | $ | 16.94 | |
| | | | | | | | | | | | | | | | | | | | | |
Total Return (b) | | | 6.74 | % | | | 16.47 | % | | | 13.39 | % | | | (33.00 | )% | | | 21.93 | % |
| | | | | | | | | | | | | | | | | | | | | |
| Ratios/Supplemental Data | | | | | | | | | | | | | | | | | | | | |
| Net assets, end of year (in 000’s) | | $ | 11,578 | | | $ | 11,530 | | | $ | 10,415 | | | $ | 9,849 | | | $ | 15,821 | |
| Ratio of expenses to average net assets: | | | 3.38 | % | | | 3.37 | % | | | 3.47 | % | | | 3.02 | % | | | 2.62 | % |
| Ratio of net investment income (loss) to average net assets: | | | (2.05 | )% | | | (1.21 | )% | | | (1.63 | )% | | | (0.75 | )% | | | 0.31 | % |
| Portfolio turnover rate | | | 5.21 | % | | | 12.22 | % | | | 7.98 | % | | | 1.29 | % | | | 4.06 | % |
| (a) | Net investment income (loss) per share is based on average shares outstanding. |
| (b) | Total return in the above table represents the rate that the investor would have earned or lost on an investment in the Fund assuming reinvestment of dividends. |
| (c) | Redemption fees per share were less than $0.01 per share. |
The accompanying notes are an integral part of these financial statements.
AMIDEXTM Funds, Inc. | ANNUAL REPORT |
FINANCIAL HIGHLIGHTS
Per Share Data For a Share Outstanding Throughout Each Fiscal Year
| | AMIDEX35TM Israel Mutual Fund |
| | | Class A |
| | | |
| | | For the Year Ended May 31, 2015 | | | For the Year Ended May 31, 2014 | | | For the Year Ended May 31, 2013 | | | For the Year Ended May 31, 2012 | | | For the Year Ended May 31, 2011 | |
| | | | | | | | | | | | | | | | |
| Net Asset Value, Beginning of Year | | $ | 11.48 | | | $ | 9.86 | | | $ | 8.70 | | | $ | 12.99 | | | $ | 10.71 | |
| | | | | | | | | | | | | | | | | | | | | |
| Investment Operations: | | | | | | | | | | | | | | | | | | | | |
Net investment income (loss) (a) | | | (0.24 | ) | | | (0.13 | ) | | | (0.16 | ) | | | (0.08 | ) | | | 0.04 | |
| Net realized and unrealized gain (loss) on investments | | | 1.01 | | | | 1.75 | | | | 1.32 | | | | (4.21 | ) | | | 2.30 | |
| Total from investment operations | | | 0.77 | | | | 1.62 | | | | 1.16 | | | | (4.29 | ) | | | 2.34 | |
| | | | | | | | | | | | | | | | | | | | | |
| Distributions: | | | | | | | | | | | | | | | | | | | | |
| From net investment income | | | - | | | | - | | | | - | | | | - | | | | (0.06 | ) |
| Total distributions | | | - | | | | - | | | | - | | | | - | | | | (0.06 | ) |
| | | | | | | | | | | | | | | | | | | | | |
| Net Asset Value, End of Year | | $ | 12.25 | | | $ | 11.48 | | | $ | 9.86 | | | $ | 8.70 | | | $ | 12.99 | |
| | | | | | | | | | | | | | | | | | | | | |
Total Return (b) | | | 6.71 | % | | | 16.43 | % | | | 13.33 | % | | | (33.03 | )% | | | 21.81 | % |
| | | | | | | | | | | | | | | | | | | | | |
| Ratios/Supplemental Data | | | | | | | | | | | | | | | | | | | | |
| Net assets, end of year (in 000’s) | | $ | 1,331 | | | $ | 1,323 | | | $ | 1,158 | | | $ | 1,698 | | | $ | 3,833 | |
| Ratio of expenses to average net assets: | | | 3.38 | % | | | 3.37 | % | | | 3.47 | % | | | 3.02 | % | | | 2.62 | % |
| Ratio of net investment income (loss) to average net assets: | | | (2.05 | )% | | | (1.21 | )% | | | (1.63 | )% | | | (0.75 | )% | | | 0.30 | % |
| Portfolio turnover rate | | | 5.21 | % | | | 12.22 | % | | | 7.98 | % | | | 1.29 | % | | | 4.06 | % |
| (a) | Net investment income (loss) per share is based on average shares outstanding. |
| (b) | Total return in the above table represents the rate that the investor would have earned or lost on an investment in the Fund assuming reinvestment of dividends. |
The accompanying notes are an integral part of these financial statements.
AMIDEXTM Funds, Inc. | ANNUAL REPORT |
FINANCIAL HIGHLIGHTS
Per Share Data For a Share Outstanding Throughout Each Fiscal Year
| | | AMIDEX35TM Israel Mutual Fund Class C |
| | | |
| | For the Year Ended May 31, 2015 | | | For the Year Ended May 31, 2014 | | | For the Year Ended May 31, 2013 | | | For the Year Ended May 31, 2012 | | | For the Year Ended May 31, 2011 | |
| | | | | | | | | | | | | | | | |
| Net Asset Value, Beginning of Year | | $ | 8.10 | | | $ | 7.01 | | | $ | 6.23 | | | $ | 9.37 | | | $ | 7.76 | |
| | | | | | | | | | | | | | | | | | | | | |
| Investment Operations: | | | | | | | | | | | | | | | | | | | | |
Net investment loss (a) | | | (0.23 | ) | | | (0.15 | ) | | | (0.16 | ) | | | (0.11 | ) | | | (0.04 | ) |
| Net realized and unrealized gain (loss) on investments | | | 0.71 | | | | 1.24 | | | | 0.94 | | | | (3.03 | ) | | | 1.65 | |
| Total from investment operations | | | 0.48 | | | | 1.09 | | | | 0.78 | | | | (3.14 | ) | | | 1.61 | |
| | | | | | | | | | | | | | | | | | | | | |
| Net Asset Value, End of Year | | $ | 8.58 | | | $ | 8.10 | | | $ | 7.01 | | | $ | 6.23 | | | $ | 9.37 | |
| | | | | | | | | | | | | | | | | | | | | |
Total Return (b) | | | 5.93 | % | | | 15.55 | % | | | 12.52 | % | | | (33.51 | )% | | | 20.81 | % |
| | | | | | | | | | | | | | | | | | | | | |
| Ratios/Supplemental Data | | | | | | | | | | | | | | | | | | | | |
| Net assets, end of year (in 000’s) | | $ | 1,219 | | | $ | 1,068 | | | $ | 993 | | | $ | 1,003 | | | $ | 1,581 | |
| Ratio of expenses to average net assets: | | | 4.13 | % | | | 4.12 | % | | | 4.22 | % | | | 3.77 | % | | | 3.37 | % |
| Ratio of net investment loss to average net assets: | | | (2.80 | )% | | | (1.96 | )% | | | (2.38 | )% | | | (1.50 | )% | | | (0.47 | )% |
| Portfolio turnover rate | | | 5.21 | % | | | 12.22 | % | | | 7.98 | % | | | 1.29 | % | | | 4.06 | % |
| (a) | Net investment loss per share is based on average shares outstanding. |
| (b) | Total return in the above table represents the rate that the investor would have earned or lost on an investment in the Fund assuming reinvestment of dividends. |
The accompanying notes are an integral part of these financial statements.
AMIDEXTM Funds, Inc. | ANNUAL REPORT |
NOTES TO THE FINANCIAL STATEMENTS
May 31, 2015
| 1. | ORGANIZATION AND SIGNIFICANT ACCOUNTING POLICIES |
AMIDEXTM Funds, Inc. (the “Company”) was incorporated under the laws of the state of Maryland on April 27, 1999, and currently consists of one active portfolio, the AMIDEX35TM Israel Mutual Fund (the “Fund”). The Fund is a non-diversified Fund. As a non-diversified Fund, it may invest a significant portion of its assets in a small number of companies. The Company is registered as an open-end management investment company under the Investment Company Act of 1940 (the “1940 Act”). The Fund was registered to offer four classes of shares, Class A, Class B, Class C and No-load class, with only the Class A, Class C and No-load shares currently being offered in the AMIDEX35TM Israel Mutual Fund. Each class differs as to sales and redemption charges, minimum investment amounts and ongoing fees. Income and realized/unrealized gains or losses are allocated to each class based on relative share balances. The Fund’s investment objective is long term growth of capital. The Fund became effective with the SEC on April 27, 1999 and commenced operations on June 8, 1999. The Fund is an investment company and accordingly follows the investment company accounting and reporting guidance of the Financial Accounting Standards Board (FASB) Accounting Standard Codification Topic 946 “Financial Services—Investment Companies”.
The following is a summary of significant accounting policies consistently followed by the Fund. The policies are in conformity with accounting principles generally accepted in the United States of America (“GAAP”).
a) Investment Valuation - A portfolio security listed or traded on an exchange in domestic or international markets is valued at the last reported sale price of the primary exchange on which it trades before the time when the Fund values assets. Securities traded on more than one market are valued using the market identified as primary based on trading volume and activity. Equity securities traded on the NASDAQ National Market System are valued at the NASDAQ Official Closing Price. To the extent these securities are actively traded and valuation adjustments are not applied, they are categorized in level 1 of the fair value hierarchy described below. If there are no sales that day, such securities will be valued at the last bid price, if available. Other over-the-counter securities are valued at the last sale price, if published, or the last bid price, if available. Lacking any sales on the principal exchange that day, the security is valued at the last reported bid, if available and would be categorized as level 2. Debt securities with maturities of sixty days or less at the time of purchase are valued based on amortized cost which approximates fair value and would be categorized as level 2. Money market funds are valued at their asset value of $1.00 per share and are categorized as level 1. If market quotations are not readily available, or when the portfolio management team believes that a readily available market quotation or other valuation produced by the Fund’s valuation policies is not reliable, the Fund values the assets at fair value using procedures established by the Board of Directors. The Board members have delegated pricing authority to the fair valuation committee of the adviser, for certain pricing issues, as defined in the valuation procedures. Events affecting the value of securities that occur between the time prices are established and the New York Stock Exchange closes are not reflected in the calculation of net asset value unless the fair valuation committee decides that the event would materially affect the net asset value. If the event would materially affect the Fund’s net asset values, the security will be fair valued by the fair valuation committee or, at its discretion, by an independent fair valuation vendor. As of and during the year ended May 31, 2015, no securities were valued as determined by the Board of Directors.
In accordance with the authoritative guidance on fair value measurements and disclosure under GAAP, ASC 820, the Fund discloses fair value of its investments in a hierarchy that prioritizes the inputs to valuation techniques used to measure fair value. The objective of a fair value measurement is to determine the price that would be received to sell an asset or paid to transfer a liability in an orderly transaction between market participants at the measurement date (an exit price). Accordingly, the fair value hierarchy gives the highest priority to quoted prices (unadjusted) in active markets for identical assets or liabilities (Level 1) and the lowest priority to unobservable inputs (Level 3). The three levels of the fair value hierarchy under ASC 820 are described below:
Level 1 - Quoted prices in active markets for identical securities.
Level 2 - Other significant observable inputs (including quoted prices for similar securities, interest rates, prepayment speeds, credit risk, etc.).
Level 3 - Significant unobservable inputs (including the Fund’s own assumptions in determining the fair value of investments).
The inputs or methodology used for valuing securities are not an indication of the risk associated with investing in those securities.
AMIDEXTM Funds, Inc. | ANNUAL REPORT |
NOTES TO THE FINANCIAL STATEMENTS
May 31, 2015
| 1. | ORGANIZATION AND SIGNIFICANT ACCOUNTING POLICIES (continued) |
The following is a summary of the inputs used, as of May 31, 2015, in valuing the Fund’s investments carried at fair value:
Security Classification (a) | | | |
Level 1 | | | |
Common Stock - Israel (b) | | $ | 5,322,809 | |
Common Stock - United States (b) | | | 8,401,441 | |
Partnerships – United States (b) | | | 162,880 | |
| Short-Term Investments | | | 251,748 | |
| Total Level 1 | | $ | 14,138,878 | |
| | | | | |
Level 2 | | $ | - | |
| | | | | |
Level 3 | | $ | - | |
| | | | | |
| Total Investments | | $ | 14,138,878 | |
| (a) | As of and during the year ended May 31, 2015, the Fund held no securities that were considered to be “Level 3” securities (those valued using significant unobservable inputs). Therefore, a reconciliation of assets in which significant unobservable inputs (Level 3) were used in determining fair value is not applicable. |
| (b) | All common stocks and partnerships held in the Fund are Level 1 securities. For a detailed break-out of common stocks and partnerships by major industry classification, please refer to the Schedule of Investments. |
The Fund recognizes transfers, if any, between fair value hierarchy levels at the reporting period end. There were no transfers between levels as of May 31, 2015, from the valuation input levels used on May 31, 2014.
b) Foreign Currency Translation - Portfolio securities and other assets and liabilities denominated in foreign currencies are translated into U.S. dollars based on the exchange rate of such currencies against U.S. dollars on the date of valuation. Purchases and sales of securities and income items denominated in foreign currencies are translated into U.S. dollars at the exchange rate in effect on the transaction date. The Fund does not separately report the effect of changes in foreign exchange rates from changes in market prices on securities held. Such changes are included in net realized and unrealized gain or loss from investments. Realized foreign exchange gains or losses arise from sales of foreign currencies, currency gains or losses realized between the trade and settlement dates on securities transactions and the difference between the recorded amounts of dividends, interest and foreign withholding taxes, and the U.S. dollar equivalent of the amounts actually received or paid. Net unrealized foreign exchange gains or losses arise from changes in foreign exchange rates on foreign currency denominated assets and liabilities other than investments in securities held at the end of the reporting period.
c) Federal Income Taxes - No provision for federal income taxes has been made since the Fund has complied to date with sub-chapter M of the Internal Revenue Code applicable to regulated investment companies and intends to comply in the future and to distribute all of its net investment income and realized capital gains to its shareholders.
The Fund recognizes the tax benefits of uncertain tax positions only when the position is “more likely than not” to be sustained assuming examination by tax authorities. Management has reviewed the tax positions in the open tax years of 2012, 2013, 2014 and during the year ended May 31, 2015 and concluded that no liability for unrecognized tax benefits should be recorded related to uncertain tax positions taken in the above open tax years. The Fund identifies its major tax jurisdictions as U.S. Federal and Maryland. The Fund recognizes interest and penalties, if any, related to unrecognized tax benefits as income tax expense in the Statement of Operations. During the year ended May 31, 2015, the Fund did not incur any interest or penalties.
AMIDEXTM Funds, Inc. | ANNUAL REPORT |
NOTES TO THE FINANCIAL STATEMENTS
May 31, 2015
| 1. | ORGANIZATION AND SIGNIFICANT ACCOUNTING POLICIES (continued) |
d) Distributions to Shareholders - Dividends from net investment income and distributions of net realized capital gains, if any, will be declared and paid at least annually. Income and capital gain distributions, which are determined in accordance with income tax regulations, are recorded on the ex-dividend date. GAAP requires that permanent financial reporting differences relating to shareholder distributions be reclassified to paid-in capital or net realized gain.
e) Use of Estimates - The preparation of financial statements in conformity with GAAP requires management to make estimates and assumptions that affect the reported amounts of assets and liabilities and disclosure of contingent assets and liabilities at the date of the financial statements and the reported amounts of revenues and expenses during the reporting period. Actual results could differ from those estimates.
f) Redemption Fees and Sales Charges (loads) - Shareholders of the No-load shares that redeem shares within 365 days of purchase will be assessed a redemption fee of 2.00% of the amount redeemed. The redemption fee is paid directly to and retained by the Fund, and is designed to deter excessive short-term trading and to offset brokerage commissions, market impact and other costs that may be associated with short-term money movement in and out of the Fund. A maximum sales charge of 5.50% is imposed on Class A shares. Shareholders of the Class C shares are imposed a contingent deferred sales charge (“CDSC”) of 1.00% in the event of certain redemption transactions within thirteen months following such investments. The CDSC is paid directly to the Adviser to reimburse expenses incurred in providing distribution-related services to the Fund. For the year ended May 31, 2015, there were redemption fees of $984 paid to the Fund and CDSC fees of $1 paid to the Adviser.
g) Other - Investment and shareholder transactions are recorded on trade date. The Fund determines the gain or loss realized from the investment transactions by comparing the original cost of the security lot sold with the net sales proceeds. Dividend income is recognized on the ex-dividend date or as soon as information is available to the Fund and interest income is recognized on an accrual basis. Withholding taxes on foreign dividends have been provided for in accordance with the Fund’s understanding of the applicable country’s tax rules and rates.
| 2. | CAPITAL SHARE TRANSACTIONS |
Transactions in shares of capital stock for the Fund for the year ended May 31, 2015 were as follows:
| | | No-Load | |
| | | Shares | | | Amount | |
| Sold | | | 33,309 | | | $ | 505,560 | |
| Redeemed | | | (79,044 | ) | | | (1,183,494 | ) |
| Net Decrease | | | (45,735 | ) | | $ | (677,934 | ) |
| | | Class A | |
| | | Shares | | | Amount | |
| Sold | | | 12,223 | | | $ | 137,140 | |
| Redeemed | | | (18,884 | ) | | | (212,897 | ) |
| Net Decrease | | | (6,661 | ) | | $ | (75,757 | ) |
| | | Class C | |
| | | Shares | | | Amount | |
| Sold | | | 25,143 | | | $ | 214,443 | |
| Redeemed | | | (14,864 | ) | | | (120,411 | ) |
| Net Decrease | | | 10,279 | | | $ | 94,032 | |
AMIDEXTM Funds, Inc. | ANNUAL REPORT |
NOTES TO THE FINANCIAL STATEMENTS
May 31, 2015
| 2. | CAPITAL SHARE TRANSACTIONS (continued) |
Transactions in shares of capital stock for the Fund for the year ended May 31, 2014 were as follows:
| | | No-Load | |
| | | Shares | | | Amount | |
| Sold | | | 40,998 | | | $ | 580,872 | |
| Redeemed | | | (80,988 | ) | | | (1,136,714 | ) |
| Net Decrease | | | (39,990 | ) | | $ | (555,842 | ) |
| | | Class A | |
| | | Shares | | | Amount | |
| Sold | | | 18,348 | | | $ | 198,579 | |
| Redeemed | | | (20,581 | ) | | | (223,177 | ) |
| Net Decrease | | | (2,233 | ) | | $ | (24,598 | ) |
| | | Class C | |
| | | Shares | | | Amount | |
| Sold | | | 22,648 | | | $ | 171,792 | |
| Redeemed | | | (32,563 | ) | | | (257,715 | ) |
| Net Decrease | | | (9,915 | ) | | $ | (85,923 | ) |
| 3. | INVESTMENT TRANSACTIONS |
For the year ended May 31, 2015, aggregate purchases and sales of investment securities (excluding short-term investments) for the Fund were as follows:
| Purchases | Sales |
$ 697,830 | $ 1,608,231 |
There were no government securities purchased or sold during the year.
| 4. | ADVISORY FEES AND OTHER RELATED PARTY TRANSACTIONS |
Effective October 1, 2003, the Fund has entered into an Advisory Agreement with Index Investments, LLC (“II” or “Adviser”) to provide investment management services to the Fund. II furnishes, at its own expense, office space to the Fund and all necessary office facilities, equipment and personnel for managing the assets of the Fund. II also pays all expenses of marketing shares of the Fund and related bookkeeping. Pursuant to the Advisory Agreement, II is entitled to receive a fee, calculated daily and payable monthly at the annual rate of 0.80% as applied to the Fund’s daily net assets. For the year ended May 31, 2015, the Fund incurred $108,004 of advisory fees, with $9,347 remaining payable at May 31, 2015.
Effective October 1, 2003, the Fund has entered into an Administrative Services Agreement (“ASA”) with II to provide administrative services to the Fund. Pursuant to the ASA, II is entitled to receive a fee, calculated daily and payable monthly at the annual rate of 0.10% as applied to the Fund’s daily net assets. For the year ended May 31, 2015, the Fund incurred $13,500 of administrative fees, with $1,200 remaining payable at May 31, 2015.
One director of the Fund is also an Officer of II.
AMIDEXTM Funds, Inc. | ANNUAL REPORT |
NOTES TO THE FINANCIAL STATEMENTS
May 31, 2015
| 4. | ADVISORY FEES AND OTHER RELATED PARTY TRANSACTIONS (continued) |
The Fund has entered into an Investment Company Services Agreement (“ICSA”) with Matrix Capital Group, Inc. (“Matrix”). Pursuant to the ICSA, Matrix will provide day-to-day operational services to the Fund including, but not limited to, accounting, administrative, transfer agent, dividend disbursement, registrar and record keeping services. For its services, Matrix receives $10,250 per month. For the year ended May 31, 2015, Matrix earned $123,000 with $10,250 remaining payable at May 31, 2015 from the Fund.
Certain Officers of the Fund are also employees and officers of Matrix.
The Fund and II have entered into a Distribution Agreement with Matrix Capital Group, Inc. Pursuant to the Distribution Agreement, Matrix will provide distribution services to the Fund. Matrix serves as underwriter/distributor of the Fund. Pursuant to the Distribution Agreement, Matrix receives $20,000 per year from the Fund. Matrix also receives commissions from the sale of Class A Fund shares for which they are the broker of record. The allocated distribution fees are reduced by the amount of commissions received and the remainder is paid from the accruals pursuant to Rule 12b-1 under the Investment Company Act of 1940. For the year ended May 31, 2015, Matrix received net distribution fees of $19,295 from the Fund. For the year ended May 31, 2015, Matrix received commissions from the sale of Fund shares of $705 from the Class A shares.
A separate plan of distribution has been adopted pursuant to Rule 12b-1 under the Investment Company Act of 1940 for each class of shares. With respect to Class A and the No-load class of shares, the plan provides that the Fund may pay a servicing or Rule 12b-1 fee of up to 0.25% annually of the Fund’s average net assets attributable to each class of shares, respectively, and up to 1.00% annually of the Fund’s average net assets attributable to Class C shares to persons or institutions for performing certain servicing functions for the Fund’s shareholders. The distribution plan is a compensation plan, which also allows the Fund to pay or reimburse expenditures in connection with sales, and promotional services related to distribution of the Fund’s shares, including personal services provided to prospective and existing shareholders.
The distribution plans for the shares in the Class A, the No-load class and Class C shares took effect November 19, 1999, June 8, 1999 and May 19, 2000, respectively. For the year ended May 31, 2015, the Fund incurred $41,660 in 12b-1 fees with $7,317 remaining payable at May 31, 2015.
There were no distributions paid during the fiscal year ended May 31, 2015 or the fiscal year ended May 31, 2014.
For U.S. Federal income tax purposes, the cost of securities owned, gross unrealized appreciation, gross unrealized depreciation, and net unrealized appreciation (depreciation) of investments at May 31, 2015 were as follows:
| Cost | | Gross
Appreciation | | Gross
Depreciation | | Net Appreciation |
$ 9,737,779 | | $ 5,431,892 | | $ (1,030,789) | | $ 4,401,103 |
The difference between book basis and tax-basis unrealized appreciation (depreciation) is attributable primarily to the tax deferral of losses on wash sales and differing book/tax treatment of temporary book/tax differences due to the flow through income and deferred passive losses from limited partnerships for the Fund.
AMIDEXTM Funds, Inc. | ANNUAL REPORT |
NOTES TO THE FINANCIAL STATEMENTS
May 31, 2015
| 5. | TAX MATTERS (continued) |
The Fund’s distributable earnings on a tax basis are determined only at the end of each fiscal year. As of May 31, 2015, the Fund’s most recent fiscal year-end, the components of distributable earnings on a tax basis were as follows:
| Unrealized Appreciation | | $ | 4,401,103 | |
| Capital Loss Carryforwards | | | (2,630,623 | ) |
| Post-December Ordinary Losses | | | (120,437 | ) |
| Total Distributable Earnings, Net | | $ | 1,650,043 | |
The carryforward losses shown above differ from corresponding accumulated net investment loss and accumulated net realized gain (loss) figures reported in the statement of assets and liabilities due to differing temporary book/tax differences due to the tax deferral of wash sales.
Under current tax law, net capital losses realized after October 31st and net ordinary losses incurred after December 31 may be deferred and treated as occurring on the first day of the following fiscal year. The Fund’s carryforward losses, post-October losses and post-December losses are determined only at the end of each fiscal year. As of May 31, 2015, the Fund elected to defer net capital losses as indicated in the charts below.
| Post-October Losses | | Post-December Losses |
| Deferred | | Utilized | | Deferred | | Utilized |
| $ - | | $ - | | $ 120,437 | | $ 65,548 |
As of May 31, 2015, the Fund has capital loss carryforwards available for federal income tax purposes as follows:
| Expiring in: 2016 | | | | (652,905 | ) |
| 2017 | | | | (393,230 | ) |
| 2018 | | | | (51,633 | ) |
| No Expiration – Long-Term | | | | (1,532,855 | ) |
| | | | $ | (2,630,623 | ) |
At May 31, 2015, the Fund had available for federal income tax purposes unused capital loss carryforwards of $2,630,623, which are available for offset against future capital gains, the use of a portion of which is limited by IRS regulations. To the extent these loss carryforwards are used to offset future capital gains, it is probable that the amount offset will not be distributed to shareholders. Capital loss carryforwards in the amount of $1,009,874 expired during the year ended May 31, 2015.
Under the Regulated Investment Company Modernization Act of 2010 (the “Act”), net capital losses recognized after December 31, 2010, may be carried forward indefinitely, and their character is retained as short-term and/or long-term. Under the law in effect prior to the Act, pre-enactment net capital losses were carried forward for eight years and treated as short-term losses. As a transition rule, the Act requires that post-enactment net capital losses be utilized before pre-enactment net capital losses.
AMIDEXTM Funds, Inc. | ANNUAL REPORT |
NOTES TO THE FINANCIAL STATEMENTS
May 31, 2015
| 6. | RECLASS OF CAPITAL ACCOUNTS |
In accordance with accounting pronouncements, the Fund has recorded reclassifications in the capital accounts. These reclassifications have no impact on the net asset value of the Fund and are designed generally to present accumulated undistributed net investment income (loss) and accumulated realized gains/(losses) on a tax basis which is considered to be more informative to the shareholder. As of May 31, 2015, the Fund recorded reclassifications to increase (decrease) the capital accounts as follows:
Net Investment Loss | Paid-in
Capital | Accumulated
Capital Losses |
| $ 227,665 | $ (1,235,376) | $ 1,007,711 |
The Fund invests a majority of its assets in common stocks of Israeli companies. Investing in companies from one geographic region may pose additional risks inherent to a region’s economical and political situation.
A large portion of investments held by Fund are considered investments in the financial sector of the market. Investing in a single market sector may be riskier than investing in a variety of market sectors.
The beneficial ownership, either directly or indirectly, of more than 25% of the voting securities of a fund creates a presumption of control of the fund, under Section 2(a)(9) of the Investment Company Act of 1940. As of May 31, 2015, Merrill Lynch Pierce, Fenner & Smith, Inc. held 31.51% of the Fund’s Class A shares in omnibus accounts for the sole benefit of their customers. As of May 31, 2015, Merrill Lynch Pierce, Fenner & Smith, Inc. held 37.38% of the Fund’s Class C shares in an omnibus account for the sole benefit of their customers.
| 9. | COMMITMENTS AND CONTINGENCIES |
In the normal course of business, the Company may enter into contracts that may contain a variety of representations and warranties and provide general indemnifications. The Company’s maximum exposure under these arrangements is dependent on future claims that may be made against the Fund and, therefore, cannot be estimated; however, management considers the risk of loss from such claims to be remote.
| 10. | RECENT ACCOUNTING PROUNOUNCEMENTS |
In June 2014, the Financial Accounting Standards Board (“FASB”) issued Accounting Standards Update (“ASU”) No. 2014-11 Repurchase-to-Maturity Transactions, Repurchase Financings, and Disclosures. The amendments in this ASU require an entity to modify accounting for repurchase-to-maturity transactions and repurchase financing arrangements, as well as modify required disclosures for repurchase agreements, securities lending transactions, and repurchase-to-maturity transactions that are accounted for as secured borrowings. The guidance is effective for fiscal years beginning on or after December 15, 2014, and for interim periods within those fiscal years. Management is currently evaluating the impact these changes will have on the Fund’s financial statement disclosures.
Management has evaluated the impact of all subsequent events on the Fund through the date the financial statements were issued, and has determined that there were no subsequent events requiring recognition or disclosure in the financial statements.
REPORT OF INDEPENDENT REGISTERED PUBLIC ACCOUNTING FIRM
To the Shareholders and Board of Directors of
AMIDEXTM Funds, Inc.
We have audited the accompanying statement of assets and liabilities, including the schedule of investments, of AMIDEXTM Funds, Inc., comprising AMIDEX35TM Israel Mutual Fund (the “Fund”), as of May 31, 2015, and the related statement of operations for the year then ended, the statements of changes in net assets for each of the two years in the period then ended, and the financial highlights for each of the five years in the period then ended. These financial statements and financial highlights are the responsibility of the Fund’s management. Our responsibility is to express an opinion on these financial statements and financial highlights based on our audits.
We conducted our audits in accordance with the standards of the Public Company Accounting Oversight Board (United States). Those standards require that we plan and perform the audit to obtain reasonable assurance about whether the financial statements and financial highlights are free of material misstatement. An audit includes examining, on a test basis, evidence supporting the amounts and disclosures in the financial statements. Our procedures included confirmation of securities owned as of May 31, 2015, by correspondence with the custodian. An audit also includes assessing the accounting principles used and significant estimates made by management, as well as evaluating the overall financial statement presentation. We believe that our audits provide a reasonable basis for our opinion.
In our opinion, the financial statements and financial highlights referred to above present fairly, in all material respects, the financial position of AMIDEX35TM Israel Mutual Fund as of May 31, 2015, the results of its operations for the year then ended, the changes in its net assets for each of the two years in the period then ended, and the financial highlights for each of the five years in the period then ended, in conformity with accounting principles generally accepted in the United States of America.
COHEN FUND AUDIT SERVICES, LTD.
Cleveland, Ohio
July 29, 2015
AMIDEXTM Funds, Inc. | ANNUAL REPORT |
Additional Information (Unaudited)