UNITED STATES
SECURITIES AND EXCHANGE COMMISSION
Washington, D.C. 20549
FormN-CSR
CERTIFIED SHAREHOLDER REPORT OF REGISTERED
MANAGEMENT INVESTMENT COMPANIES
Investment Company Act File Number:811-09153
Eaton Vance Michigan Municipal Income Trust
(Exact Name of Registrant as Specified in Charter)
Two International Place, Boston, Massachusetts 02110
(Address of Principal Executive Offices)
Maureen A. Gemma
Two International Place, Boston, Massachusetts 02110
(Name and Address of Agent for Services)
(617)482-8260
(Registrant’s Telephone Number)
November 30
Date of Fiscal Year End
November 30, 2018
Date of Reporting Period
Item 1. Reports to Stockholders

Eaton Vance
Municipal Income Trusts
Annual Report
November 30, 2018
California (CEV) • Massachusetts (MMV) • Michigan (EMI) • New Jersey (EVJ)
New York (EVY) • Ohio (EVO) • Pennsylvania (EVP)
Important Note. Beginning on January 1, 2021, as permitted by regulations adopted by the Securities and Exchange Commission, paper copies of each Fund’s annual and semi-annual shareholder reports will no longer be sent by mail unless you specifically request paper copies of the reports. Instead, the reports will be made available on the Funds’ website (funds.eatonvance.com/closed-end-fund-and-term-trust-documents.php), and you will be notified by mail each time a report is posted and provided with a website address to access the report.
If you already elected to receive shareholder reports electronically, you will not be affected by this change and you need not take any action. If you hold shares at the Funds’ transfer agent, American Stock Transfer & Trust Company, LLC (“AST”), you may elect to receive shareholder reports and other communications from the Funds electronically by contacting AST. If you own your shares through a financial intermediary (such as a broker-dealer or bank), you must contact your financial intermediary to sign up.
You may elect to receive all future Fund shareholder reports in paper free of charge. If you hold shares at AST, you can inform AST that you wish to continue receiving paper copies of your shareholder reports by calling 1-866-439-6787. If you own these shares through a financial intermediary, you must contact your financial intermediary or follow instructions included with this disclosure, if applicable, to elect to continue to receive paper copies of your shareholder reports. Your election to receive reports in paper will apply to all funds held with AST or to all funds held through your financial intermediary, as applicable.

Commodity Futures Trading Commission Registration. Effective December 31, 2012, the Commodity Futures Trading Commission (“CFTC”) adopted certain regulatory changes that subject registered investment companies and advisers to regulation by the CFTC if a fund invests more than a prescribed level of its assets in certain CFTC-regulated instruments (including futures, certain options and swap agreements) or markets itself as providing investment exposure to such instruments. Each Fund has claimed an exclusion from the definition of the term “commodity pool operator” under the Commodity Exchange Act. Accordingly, neither the Funds nor the adviser with respect to the operation of the Funds is subject to CFTC regulation. Because of its management of other strategies, each Fund’s adviser is registered with the CFTC as a commodity pool operator and a commodity trading advisor.
Fund shares are not insured by the FDIC and are not deposits or other obligations of, or guaranteed by, any depository institution. Shares are subject to investment risks, including possible loss of principal invested.
Annual ReportNovember 30, 2018
Eaton Vance
Municipal Income Trusts
Table of Contents
| | | | |
Management’s Discussion of Fund Performance | | | 2 | |
| |
Performance and Fund Profile | | | | |
| |
| | | | |
California Municipal Income Trust | | | 4 | |
Massachusetts Municipal Income Trust | | | 5 | |
Michigan Municipal Income Trust | | | 6 | |
New Jersey Municipal Income Trust | | | 7 | |
New York Municipal Income Trust | | | 8 | |
Ohio Municipal Income Trust | | | 9 | |
Pennsylvania Municipal Income Trust | | | 10 | |
| |
| | | | |
| |
Endnotes and Additional Disclosures | | | 11 | |
| |
Financial Statements | | | 12 | |
| |
Report of Independent Registered Public Accounting Firm | | | 67 | |
| |
Federal Tax Information | | | 68 | |
| |
Dividend Reinvestment Plan | | | 69 | |
| |
Management and Organization | | | 71 | |
| |
Important Notices | | | 74 | |
Eaton Vance
Municipal Income Trusts
November 30, 2018
Management’s Discussion of Fund Performance1
Economic and Market Conditions
The fiscal year that began December 1, 2017, was characterized by a flattening of the municipal bond yield curve.7 Driven by four federal funds rate hikes by the U.S. Federal Reserve Board (the Fed) — starting in December 2017, and continuing in March, June, and September 2018 — rates generally rose across the entire U.S. Treasury yield curve, more so at the short end of the curve.
In the opening month of the period, the municipal market experienced considerable volatility after theGOP-controlled House and Senate passed new tax legislation. The most significant change to the municipal market was the elimination of an issuer’s ability to refinance debt prior to its call date through the issuance of advanced refunding bonds, which accounted for about 20% of new issuances over the previous decade. As a result, December 2017 witnessed the largestone-month issuance of new municipal debt, as issuers rushed to beat the December 31, 2017 deadline. Investors sold short maturity bonds to buynew-issue longer-maturity bonds in anticipation of lower supply going forward. The net result was a rise in prices on longer-term debt that drove a flattening of the yield curve in December 2017.
At the start of the new year, however, bond prices reversed direction. Signs of inflation, wage growth, and fears that new tax legislation might overheat the economy pushed short-term interest rates higher and longer-term bond prices lower. Upward pressure on short-term rates continued in March and June 2018 as the Fed delivered its first two rate hikes of the year. From April through the end of August 2018, fluctuating perceptions of geopolitical risk were a primary driver of rates at the long end of the curve. Investor sentiment toggled between concerns over a global trade war, optimism about economic growth, and uncertainties surrounding the strained relationship between the U.S. and North Korea.
In September 2018, the Fed hiked rates again and both U.S. Treasury and municipal rates rose across the curve. In October 2018, a strong U.S. employment report and easing concerns over Italy’s national budget continued the upward pressure on longer-term rates. In the final month of the period, however, longer-term rates declined after the Fed made dovish comments about the future direction of interest rates and the Democrats won a majority in the House of Representatives, decreasing the possibility of further tax cuts in 2019.
During the12-month period, the Bloomberg Barclays Municipal Bond Index (the Index),2 a broad measure of the asset class, returned 1.13% as coupon income modestly outweighed the
negative effects of falling bond prices. While rates forAAA-rated8 bonds rose across the yield curve, rate increases were greater at the shorter end of the curve.
On a total return basis, bonds with 15 years or less remaining to maturity generally outperformed bonds with 20 or more years to maturity. At the same time, lower-rated bonds generally outperformed higher-rated issues. Municipal bonds, in general, outperformed comparable U.S. Treasurys during the period, with the exception of the30-year area of the curve where municipals performed in line with U.S. Treasurys.
Fund Performance
For the fiscal year ended November 30, 2018, shares of the California, Massachusetts, Michigan, New York, Ohio, and Pennsylvania Trusts (the Funds) at net asset value (NAV) underperformed the 1.13% return of the Funds’ benchmark, the Index, while the New Jersey Trust at NAV outperformed the Index.
Each Fund’s overall strategy is to invest primarily in investment grade bonds of the Fund’s particular state. Management may hedge investments against the potential risk of volatility associated with the use of leverage and by investing in bonds at the long end of the yield curve using U.S. Treasury futures.
As a risk management tactic within each individual Fund, interest rate hedging is used to moderate performance on both the upside and downside of the market. During this period of declining municipal bond prices, the Funds’ Treasury futures hedge mitigated some of the price declines, and contributed modestly to performance relative to the unhedged Index for the New Jersey and Pennsylvania Funds. The California, Massachusetts, Michigan, New York, and Ohio Funds did not employ a hedging strategy during the period.
During the fiscal year ended November 30, 2018, management employed leverage through Residual Interest Bond financing,6 Auction Preferred Shares (APS) and Institutional MuniFund Term Preferred Shares (iMTP) to seek to enhance the Funds’tax-exempt income. In general, the use of leverage has the effect of achieving additional exposure to the municipal market, and magnifying a Fund’s exposure to its underlying investments in both up and down markets. During this period of rising rates and falling bond prices, the use of leverage amplified the relatively minor declines in the price of bonds owned by the Funds but also generated additionaltax-exempt income. As of November 30, 2018, the Funds had no APS and iMTP Shares outstanding.
See Endnotes and Additional Disclosures in this report.
Past performance is no guarantee of future results. Returns are historical and are calculated by determining the percentage change in net asset value (NAV) or market price (as applicable) with all distributions reinvested and include management fees and other expenses. Fund performance at market price will differ from its results at NAV due to factors such as changing perceptions about the Fund, market conditions, fluctuations in supply and demand for Fund shares, or changes in Fund distributions. Investment return and principal value will fluctuate so that shares, when sold, may be worth more or less than their original cost. Performance less than or equal to one year is cumulative. Performance is for the stated time period only; due to market volatility, current Fund performance may be lower or higher than the quoted return. For performance as of the most recentmonth-end, please refer to eatonvance.com.
Eaton Vance
Municipal Income Trusts
November 30, 2018
Management’s Discussion of Fund Performance — continued
State-specific Results
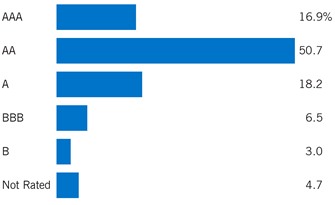
Eaton Vance California Municipal Income Trust shares at NAV returned –0.70%, underperforming the 1.13% return of the Index. Detractors from Fund performance versus the Index included leveraged investments used by the Fund, and security selections in the health care sector and general obligation (GO) bonds. In contrast, performance relative to the Index was helped by security selection inA-rated andBBB-rated bonds, security selection and an overweight position inzero-coupon bonds, and security selection in insured Puerto Rico bonds.
Returns were supported by the relatively strong performance of Puerto Rico’s debt structure during the period as ongoing bankruptcy negotiations signaled that bondholder recoveries may exceed initial expectations by the market. The Fund’s insured Puerto Rico holdings were insured by various municipal bond insurers. It should be noted that most uninsured bonds issued by the Commonwealth of Puerto Rico and its conduit issuers were no longer included in the Index. As Puerto Rico continued to deal with its ongoing fiscal crisis during the period, bonds issued by different legal entities were influenced by a number of factors, including monetary default. As the period ended, Puerto Rico continued to negotiate with creditors to address its current debt structure under the Puerto Rico Oversight, Management, and Economic Stability Act passed by the U.S. Congress.
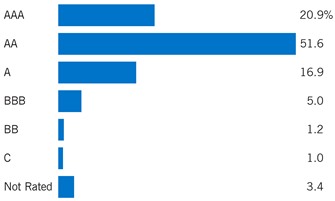
Eaton Vance Massachusetts Municipal Income Trust shares at NAV returned –0.82%, underperforming the 1.13% return of the Index. Leveraged investments used by the Fund, security selection in the education sector, and security selection inAA-rated bonds detracted from performance relative to the Index. During a period when lower-rated bonds outperformed higher-rated issues, an overweight inBBB-rated bonds and below contributed to performance versus the Index. Additional contributors to relative results included security selection and an overweight position in insured Puerto Rico bonds and holdings that were prerefunded during the period.
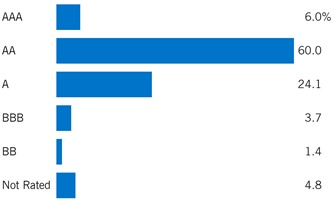
Eaton Vance Michigan Municipal Income Trust shares at NAV returned –0.20%, underperforming the 1.13% return of the Index. Detractors from performance relative to the Index included leveraged investments used by the Fund, an underweight inBBB-rated issues and security selection in the health care sector. In contrast, performance versus the Index was aided by an overweight position and security selection in insured Puerto Rico bonds, security selection in the water and sewer sector, and holdings that were prerefunded during the period.
Eaton Vance New Jersey Municipal Income Trust shares at NAV returned 1.53%, outperforming the 1.13% return of the Index. Security selection and an overweight position in insured and uninsured Puerto Rico bonds, security selection and an overweight position inBBB-rated bonds, and security selection inzero-coupon bonds all contributed to Fund performance versus the Index. Detractors from Fund performance relative to the Index included leveraged investments used by the Fund, security selection in state GO bonds, and security selection inAA-rated bonds.
Eaton Vance New York Municipal Income Trust shares at NAV returned –0.61%, underperforming the 1.13% return of the Index. Leveraged investments used by the Fund detracted from performance relative to the Index, as did security selection in the lease revenue/certificates of participation sector and security selection in 4.0% coupon bonds. Contributors to performance versus the Index included security selection in insured Puerto Rico bonds, an overweight position inBBB-rated bonds and below, and security selection in the housing sector.
Eaton Vance Ohio Municipal Income Trust shares at NAV returned –0.66%, underperforming the 1.13% return of the Index. Performance versus the Index was hurt by leveraged investments used by the Fund, security selection in local GO bonds, and an overweight and security selection inzero-coupon bonds. Contributors to results versus the Index included security selection and an overweight position in insured Puerto Rico bonds, security selection in the industrial development revenue sector, and security selection in the education sector.
Eaton Vance Pennsylvania Municipal Income Trust shares at NAV returned –0.05%, underperforming the 1.13% return of the Index. Leveraged investments used by the Fund, security selection in local GO bonds, and security selection inAAA-rated bonds all detracted from Fund performance versus the Index. Contributors to performance relative to the Index included security selection and an overweight position in insured Puerto Rico bonds, an overweight position in the health care sector, and holdings that were prerefunded during the period.
See Endnotes and Additional Disclosures in this report.
Past performance is no guarantee of future results. Returns are historical and are calculated by determining the percentage change in net asset value (NAV) or market price (as applicable) with all distributions reinvested and include management fees and other expenses. Fund performance at market price will differ from its results at NAV due to factors such as changing perceptions about the Fund, market conditions, fluctuations in supply and demand for Fund shares, or changes in Fund distributions. Investment return and principal value will fluctuate so that shares, when sold, may be worth more or less than their original cost. Performance less than or equal to one year is cumulative. Performance is for the stated time period only; due to market volatility, current Fund performance may be lower or higher than the quoted return. For performance as of the most recentmonth-end, please refer to eatonvance.com.
Eaton Vance
California Municipal Income Trust
November 30, 2018
Performance2,3
Portfolio Manager Craig R. Brandon, CFA
| | | | | | | | | | | | | | | | |
| % Average Annual Total Returns | | Inception Date | | | One Year | | | Five Years | | | Ten Years | |
Fund at NAV | | | 01/29/1999 | | | | –0.70 | % | | | 5.85 | % | | | 9.05 | % |
Fund at Market Price | | | — | | | | –4.76 | | | | 4.89 | | | | 8.01 | |
Bloomberg Barclays Municipal Bond Index | | | — | | | | 1.13 | % | | | 3.52 | % | | | 4.88 | % |
| | | | |
| | | | | | | | | | | | | | | | |
| % Premium/Discount to NAV4 | | | | | | | | | | | | |
| | | | | | | | | | | | | | | –15.99 | % |
| | | | |
| | | | | | | | | | | | | | | | |
| Distributions5 | | | | | | | | | | | | |
Total Distributions per share for the period | | | | | | | | | | | | | | $ | 0.465 | |
Distribution Rate at NAV | | | | | | | | | | | | | | | 3.85 | % |
Taxable-Equivalent Distribution Rate at NAV | | | | | | | | | | | | | | | 7.50 | % |
Distribution Rate at Market Price | | | | | | | | | | | | | | | 4.58 | % |
Taxable-Equivalent Distribution Rate at Market Price | | | | | | | | | | | | | | | 8.92 | % |
| | | | |
| | | | | | | | | | | | | | | | |
| % Total Leverage6 | | | | | | | | | | | | |
Residual Interest Bond (RIB) Financing | | | | | | | | | | | | | | | 38.72 | % |
Fund Profile
Credit Quality (% of total investments)8,9
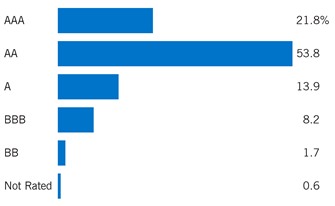
See Endnotes and Additional Disclosures in this report.
Past performance is no guarantee of future results. Returns are historical and are calculated by determining the percentage change in net asset value (NAV) or market price (as applicable) with all distributions reinvested and include management fees and other expenses. Fund performance at market price will differ from its results at NAV due to factors such as changing perceptions about the Fund, market conditions, fluctuations in supply and demand for Fund shares, or changes in Fund distributions. Investment return and principal value will fluctuate so that shares, when sold, may be worth more or less than their original cost. Performance less than or equal to one year is cumulative. Performance is for the stated time period only; due to market volatility, current Fund performance may be lower or higher than the quoted return. For performance as of the most recentmonth-end, please refer to eatonvance.com.
Eaton Vance
Massachusetts Municipal Income Trust
November 30, 2018
Performance2,3
Portfolio ManagerCraig R. Brandon, CFA
| | | | | | | | | | | | | | | | |
| % Average Annual Total Returns | | Inception Date | | | One Year | | | Five Years | | | Ten Years | |
Fund at NAV | | | 01/29/1999 | | | | –0.82 | % | | | 5.23 | % | | | 9.05 | % |
Fund at Market Price | | | — | | | | –4.33 | | | | 4.70 | | | | 8.67 | |
Bloomberg Barclays Municipal Bond Index | | | — | | | | 1.13 | % | | | 3.52 | % | | | 4.88 | % |
| | | | |
| | | | | | | | | | | | | | | | |
| % Premium/Discount to NAV4 | | | | | | | | | | | | |
| | | | | | | | | | | | | | | –15.00 | % |
| | | | |
| | | | | | | | | | | | | | | | |
| Distributions5 | | | | | | | | | | | | |
Total Distributions per share for the period | | | | | | | | | | | | | | $ | 0.466 | |
Distribution Rate at NAV | | | | | | | | | | | | | | | 3.27 | % |
Taxable-Equivalent Distribution Rate at NAV | | | | | | | | | | | | | | | 5.82 | % |
Distribution Rate at Market Price | | | | | | | | | | | | | | | 3.85 | % |
Taxable-Equivalent Distribution Rate at Market Price | | | | | | | | | | | | | | | 6.85 | % |
| | | | |
| | | | | | | | | | | | | | | | |
| % Total Leverage6 | | | | | | | | | | | | |
RIB Financing | | | | | | | | | | | | | | | 35.02 | % |
Fund Profile
Credit Quality (% of total investments)8,9
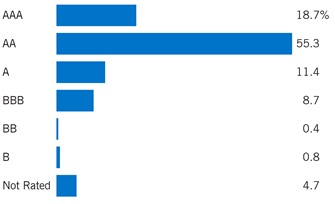
See Endnotes and Additional Disclosures in this report.
Past performance is no guarantee of future results. Returns are historical and are calculated by determining the percentage change in net asset value (NAV) or market price (as applicable) with all distributions reinvested and include management fees and other expenses. Fund performance at market price will differ from its results at NAV due to factors such as changing perceptions about the Fund, market conditions, fluctuations in supply and demand for Fund shares, or changes in Fund distributions. Investment return and principal value will fluctuate so that shares, when sold, may be worth more or less than their original cost. Performance less than or equal to one year is cumulative. Performance is for the stated time period only; due to market volatility, current Fund performance may be lower or higher than the quoted return. For performance as of the most recentmonth-end, please refer to eatonvance.com.
Eaton Vance
Michigan Municipal Income Trust
November 30, 2018
Performance2,3
Portfolio ManagerCynthia J. Clemson
| | | | | | | | | | | | | | | | |
| % Average Annual Total Returns | | Inception Date | | | One Year | | | Five Years | | | Ten Years | |
Fund at NAV | | | 01/29/1999 | | | | –0.20 | % | | | 6.76 | % | | | 8.62 | % |
Fund at Market Price | | | — | | | | –2.13 | | | | 6.91 | | | | 10.41 | |
Bloomberg Barclays Municipal Bond Index | | | — | | | | 1.13 | % | | | 3.52 | % | | | 4.88 | % |
| | | | |
| | | | | | | | | | | | | | | | |
| % Premium/Discount to NAV4 | | | | | | | | | | | | |
| | | | | | | | | | | | | | | –14.16 | % |
| | | | |
| | | | | | | | | | | | | | | | |
| Distributions5 | | | | | | | | | | | | |
Total Distributions per share for the period | | | | | | | | | | | | | | $ | 0.469 | |
Distribution Rate at NAV | | | | | | | | | | | | | | | 3.31 | % |
Taxable-Equivalent Distribution Rate at NAV | | | | | | | | | | | | | | | 5.84 | % |
Distribution Rate at Market Price | | | | | | | | | | | | | | | 3.85 | % |
Taxable-Equivalent Distribution Rate at Market Price | | | | | | | | | | | | | | | 6.79 | % |
| | | | |
| | | | | | | | | | | | | | | | |
| % Total Leverage6 | | | | | | | | | | | | |
RIB Financing | | | | | | | | | | | | | | | 38.68 | % |
Fund Profile
Credit Quality (% of total investments)8,9
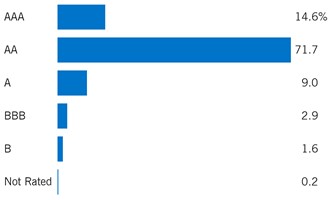
See Endnotes and Additional Disclosures in this report.
Past performance is no guarantee of future results. Returns are historical and are calculated by determining the percentage change in net asset value (NAV) or market price (as applicable) with all distributions reinvested and include management fees and other expenses. Fund performance at market price will differ from its results at NAV due to factors such as changing perceptions about the Fund, market conditions, fluctuations in supply and demand for Fund shares, or changes in Fund distributions. Investment return and principal value will fluctuate so that shares, when sold, may be worth more or less than their original cost. Performance less than or equal to one year is cumulative. Performance is for the stated time period only; due to market volatility, current Fund performance may be lower or higher than the quoted return. For performance as of the most recentmonth-end, please refer to eatonvance.com.
Eaton Vance
New Jersey Municipal Income Trust
November 30, 2018
Performance2,3
Portfolio ManagerAdam A. Weigold, CFA
| | | | | | | | | | | | | | | | |
| % Average Annual Total Returns | | Inception Date | | | One Year | | | Five Years | | | Ten Years | |
Fund at NAV | | | 01/29/1999 | | | | 1.53 | % | | | 5.58 | % | | | 9.68 | % |
Fund at Market Price | | | — | | | | –0.64 | | | | 4.76 | | | | 8.99 | |
Bloomberg Barclays Municipal Bond Index | | | — | | | | 1.13 | % | | | 3.52 | % | | | 4.88 | % |
| | | | |
| | | | | | | | | | | | | | | | |
| % Premium/Discount to NAV4 | | | | | | | | | | | | |
| | | | | | | | | | | | | | | –15.08 | % |
| | | | |
| | | | | | | | | | | | | | | | |
| Distributions5 | | | | | | | | | | | | |
Total Distributions per share for the period | | | | | | | | | | | | | | $ | 0.548 | |
Distribution Rate at NAV | | | | | | | | | | | | | | | 4.19 | % |
Taxable-Equivalent Distribution Rate at NAV | | | | | | | | | | | | | | | 7.78 | % |
Distribution Rate at Market Price | | | | | | | | | | | | | | | 4.93 | % |
Taxable-Equivalent Distribution Rate at Market Price | | | | | | | | | | | | | | | 9.15 | % |
| | | | |
| | | | | | | | | | | | | | | | |
| % Total Leverage6 | | | | | | | | | | | | |
RIB Financing | | | | | | | | | | | | | | | 35.29 | % |
Fund Profile
Credit Quality (% of total investments)8,9
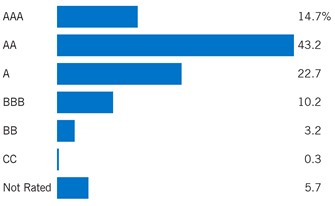
See Endnotes and Additional Disclosures in this report.
Past performance is no guarantee of future results. Returns are historical and are calculated by determining the percentage change in net asset value (NAV) or market price (as applicable) with all distributions reinvested and include management fees and other expenses. Fund performance at market price will differ from its results at NAV due to factors such as changing perceptions about the Fund, market conditions, fluctuations in supply and demand for Fund shares, or changes in Fund distributions. Investment return and principal value will fluctuate so that shares, when sold, may be worth more or less than their original cost. Performance less than or equal to one year is cumulative. Performance is for the stated time period only; due to market volatility, current Fund performance may be lower or higher than the quoted return. For performance as of the most recentmonth-end, please refer to eatonvance.com.
Eaton Vance
New York Municipal Income Trust
November 30, 2018
Performance2,3
Portfolio ManagerCraig R. Brandon, CFA
| | | | | | | | | | | | | | | | |
| % Average Annual Total Returns | | Inception Date | | | One Year | | | Five Years | | | Ten Years | |
Fund at NAV | | | 01/29/1999 | | | | –0.61 | % | | | 5.78 | % | | | 10.20 | % |
Fund at Market Price | | | — | | | | –6.42 | | | | 4.14 | | | | 10.18 | |
Bloomberg Barclays Municipal Bond Index | | | — | | | | 1.13 | % | | | 3.52 | % | | | 4.88 | % |
| | | | |
| | | | | | | | | | | | | | | | |
| % Premium/Discount to NAV4 | | | | | | | | | | | | |
| | | | | | | | | | | | | | | –15.63 | % |
| | | | |
| | | | | | | | | | | | | | | | |
| Distributions5 | | | | | | | | | | | | |
Total Distributions per share for the period | | | | | | | | | | | | | | $ | 0.580 | |
Distribution Rate at NAV | | | | | | | | | | | | | | | 3.85 | % |
Taxable-Equivalent Distribution Rate at NAV | | | | | | | | | | | | | | | 7.13 | % |
Distribution Rate at Market Price | | | | | | | | | | | | | | | 4.56 | % |
Taxable-Equivalent Distribution Rate at Market Price | | | | | | | | | | | | | | | 8.45 | % |
| | | | |
| | | | | | | | | | | | | | | | |
| % Total Leverage6 | | | | | | | | | | | | |
RIB Financing | | | | | | | | | | | | | | | 37.29 | % |
Fund Profile
Credit Quality (% of total investments)8,9
See Endnotes and Additional Disclosures in this report.
Past performance is no guarantee of future results. Returns are historical and are calculated by determining the percentage change in net asset value (NAV) or market price (as applicable) with all distributions reinvested and include management fees and other expenses. Fund performance at market price will differ from its results at NAV due to factors such as changing perceptions about the Fund, market conditions, fluctuations in supply and demand for Fund shares, or changes in Fund distributions. Investment return and principal value will fluctuate so that shares, when sold, may be worth more or less than their original cost. Performance less than or equal to one year is cumulative. Performance is for the stated time period only; due to market volatility, current Fund performance may be lower or higher than the quoted return. For performance as of the most recentmonth-end, please refer to eatonvance.com.
Eaton Vance
Ohio Municipal Income Trust
November 30, 2018
Performance2,3
Portfolio ManagerCynthia J. Clemson
| | | | | | | | | | | | | | | | |
| % Average Annual Total Returns | | Inception Date | | | One Year | | | Five Years | | | Ten Years | |
Fund at NAV | | | 01/29/1999 | | | | –0.66 | % | | | 5.87 | % | | | 8.91 | % |
Fund at Market Price | | | — | | | | –6.03 | | | | 5.16 | | | | 9.29 | |
Bloomberg Barclays Municipal Bond Index | | | — | | | | 1.13 | % | | | 3.52 | % | | | 4.88 | % |
| | | | |
| | | | | | | | | | | | | | | | |
| % Premium/Discount to NAV4 | | | | | | | | | | | | |
| | | | | | | | | | | | | | | –15.28 | % |
| | | | |
| | | | | | | | | | | | | | | | |
| Distributions5 | | | | | | | | | | | | |
Total Distributions per share for the period | | | | | | | | | | | | | | $ | 0.541 | |
Distribution Rate at NAV | | | | | | | | | | | | | | | 3.83 | % |
Taxable-Equivalent Distribution Rate at NAV | | | | | | | | | | | | | | | 6.81 | % |
Distribution Rate at Market Price | | | | | | | | | | | | | | | 4.52 | % |
Taxable-Equivalent Distribution Rate at Market Price | | | | | | | | | | | | | | | 8.04 | % |
| | | | |
| | | | | | | | | | | | | | | | |
| % Total Leverage6 | | | | | | | | | | | | |
RIB Financing | | | | | | | | | | | | | | | 36.25 | % |
Fund Profile
Credit Quality (% of total investments)8,9
See Endnotes and Additional Disclosures in this report.
Past performance is no guarantee of future results. Returns are historical and are calculated by determining the percentage change in net asset value (NAV) or market price (as applicable) with all distributions reinvested and include management fees and other expenses. Fund performance at market price will differ from its results at NAV due to factors such as changing perceptions about the Fund, market conditions, fluctuations in supply and demand for Fund shares, or changes in Fund distributions. Investment return and principal value will fluctuate so that shares, when sold, may be worth more or less than their original cost. Performance less than or equal to one year is cumulative. Performance is for the stated time period only; due to market volatility, current Fund performance may be lower or higher than the quoted return. For performance as of the most recentmonth-end, please refer to eatonvance.com.
Eaton Vance
Pennsylvania Municipal Income Trust
November 30, 2018
Performance2,3
Portfolio ManagerAdam A. Weigold, CFA
| | | | | | | | | | | | | | | | |
| % Average Annual Total Returns | | Inception Date | | | One Year | | | Five Years | | | Ten Years | |
Fund at NAV | | | 01/29/1999 | | | | –0.02 | % | | | 5.60 | % | | | 8.42 | % |
Fund at Market Price | | | — | | | | –5.06 | | | | 5.34 | | | | 7.41 | |
Bloomberg Barclays Municipal Bond Index | | | — | | | | 1.13 | % | | | 3.52 | % | | | 4.88 | % |
| | | | |
| | | | | | | | | | | | | | | | |
| % Premium/Discount to NAV4 | | | | | | | | | | | | |
| | | | | | | | | | | | | | | –15.28 | % |
| | | | |
| | | | | | | | | | | | | | | | |
| Distributions5 | | | | | | | | | | | | |
Total Distributions per share for the period | | | | | | | | | | | | | | $ | 0.505 | |
Distribution Rate at NAV | | | | | | | | | | | | | | | 3.90 | % |
Taxable-Equivalent Distribution Rate at NAV | | | | | | | | | | | | | | | 6.80 | % |
Distribution Rate at Market Price | | | | | | | | | | | | | | | 4.60 | % |
Taxable-Equivalent Distribution Rate at Market Price | | | | | | | | | | | | | | | 8.02 | % |
| | | | |
| | | | | | | | | | | | | | | | |
| % Total Leverage6 | | | | | | | | | | | | |
RIB Financing | | | | | | | | | | | | | | | 38.58 | % |
Fund Profile
Credit Quality (% of total investments)8,9
See Endnotes and Additional Disclosures in this report.
Past performance is no guarantee of future results. Returns are historical and are calculated by determining the percentage change in net asset value (NAV) or market price (as applicable) with all distributions reinvested and include management fees and other expenses. Fund performance at market price will differ from its results at NAV due to factors such as changing perceptions about the Fund, market conditions, fluctuations in supply and demand for Fund shares, or changes in Fund distributions. Investment return and principal value will fluctuate so that shares, when sold, may be worth more or less than their original cost. Performance less than or equal to one year is cumulative. Performance is for the stated time period only; due to market volatility, current Fund performance may be lower or higher than the quoted return. For performance as of the most recentmonth-end, please refer to eatonvance.com.
Eaton Vance
Municipal Income Trusts
November 30, 2018
Endnotes and Additional Disclosures
| 1 | The views expressed in this report are those of the portfolio manager(s) and are current only through the date stated at the top of this page. These views are subject to change at any time based upon market or other conditions, and Eaton Vance and the Fund(s) disclaim any responsibility to update such views. These views may not be relied upon as investment advice and, because investment decisions are based on many factors, may not be relied upon as an indication of trading intent on behalf of any Eaton Vance fund. This commentary may contain statements that are not historical facts, referred to as “forward looking statements.” The Fund’s actual future results may differ significantly from those stated in any forward looking statement, depending on factors such as changes in securities or financial markets or general economic conditions, the volume of sales and purchases of Fund shares, the continuation of investment advisory, administrative and service contracts, and other risks discussed from time to time in the Fund’s filings with the Securities and Exchange Commission. |
| 2 | Bloomberg Barclays Municipal Bond Index is an unmanaged index of municipal bonds traded in the U.S. Unless otherwise stated, index returns do not reflect the effect of any applicable sales charges, commissions, expenses, taxes or leverage, as applicable. It is not possible to invest directly in an index. |
| 3 | Performance results reflect the effects of leverage. Performance since inception for an index, if presented, is the performance since the Fund’s or oldest share class’ inception, as applicable. Included in the average annual total return at NAV for the five and ten year periods is the impact of the tender and repurchase of a portion of the Fund’s Auction Preferred Shares (APS) at 95.5% of the Fund’s APS per share liquidation preference. Had this transaction not occurred, the total return at NAV would be lower for the Fund. |
| 4 | The shares of the Fund often trade at a discount or premium from their net asset value. The discount or premium of the Fund may vary over time and may be higher or lower than what is quoted in this report. Forup-to-date premium/discount information, please refer to http://eatonvance.com/closedend. |
| 5 | The Distribution Rate is based on the Fund’s last regular distribution per share in the period (annualized) divided by the Fund’s NAV or market price at the end of the period. The Fund’s distributions may be comprised of amounts characterized for federal income tax purposes astax-exempt income, qualified andnon-qualified ordinary dividends, capital gains and nondividend distributions, also known as return of capital. The Fund will determine the federal income tax character of distributions paid to a shareholder after the end of the calendar year. This is reported on the IRS form1099-DIV and provided to the shareholder shortly after eachyear-end. For information about the tax character of distributions made in prior calendar years, please refer toPerformance-Tax Character of Distributions on the Fund’s webpage available at eatonvance.com. The Fund’s distributions are determined by the investment adviser based on its current assessment of the Fund’s long-term return potential. Fund distributions may be affected by numerous factors including changes in Fund performance, the cost of financing for Funds that employ leverage, portfolio holdings, realized and projected returns, and other factors. As portfolio and market conditions change, the rate of distributions paid by the Fund could change. Taxable-equivalent performance is based on the highest combined federal and state income tax rates, where applicable. Lower tax rates would result in lowertax-equivalent performance. Actual tax rates will vary depending on your income, exemptions and deductions. Rates do not include local taxes. |
| 6 | Fund employs RIB financing leverage. The leverage created by RIB investments provides an opportunity for increased income but, at the same time, creates special risks (including the likelihood of greater price volatility). The cost of leverage rises and falls with changes in short-term interest rates. See “Floating Rate Notes Issued in Conjunction with Securities Held” in the notes to the financial statements for more information about RIB financing. RIB leverage represents the amount of Floating Rate Notes outstanding at period end as a percentage of Fund net assets applicable to common shares plus Floating Rate Notes. The Fund may be required to maintain prescribed asset coverage for its leverage and may be required to reduce its leverage at an inopportune time. |
| 7 | Yield curve is a graphical representation of the yields offered by bonds of various maturities. The yield curve flattens when long-term rates fall and/or short-term rates increase, and the yield curve steepens when long-term rates increase and/or short-term rates fall. |
| 8 | Ratings are based on Moody’s Investors Service, Inc. (“Moody’s”), S&P Global Ratings (“S&P”) or Fitch Ratings (“Fitch”), as applicable. If securities are rated differently by the ratings agencies, the highest rating is applied. Ratings, which are subject to change, apply to the creditworthiness of the issuers of the underlying securities and not to the Fund or its shares. Credit ratings measure the quality of a bond based on the issuer’s creditworthiness, with ratings ranging from AAA, being the highest, to D, being the lowest based on S&P’s measures. Ratings of BBB or higher by S&P or Fitch (Baa or higher by Moody’s) are considered to be investment-grade quality. Credit ratings are based largely on the ratings agency’s analysis at the time of rating. The rating assigned to any particular security is not necessarily a reflection of the issuer’s current financial condition and does not necessarily reflect its assessment of the volatility of a security’s market value or of the liquidity of an investment in the security. Holdings designated as “Not Rated” (if any) are not rated by the national ratings agencies stated above. |
| 9 | The chart includes the municipal bonds held by a trust that issues residual interest bonds, consistent with the Portfolio of Investments. |
| | Fund profiles subject to change due to active management. |
| | Important Notice to Shareholders |
| | On April 26, 2018, the Boards of Trustees of the Eaton Vance Michigan Municipal Income Trust and Eaton Vance Municipal Income Trust have approved proposals to merge the Funds. |
| | As of the close of business on December 14, 2018, Eaton Vance Municipal Income Trust acquired the net assets of Eaton Vance Michigan Municipal Income Trust, pursuant to a plan of reorganization approved by the shareholders of Michigan Municipal Income Trust on November 15, 2018. |
| | On July 26, 2018, the Boards of Trustees of the following Funds approved the following mergers: Eaton Vance Massachusetts Municipal Income Trust, Eaton Vance New Jersey Municipal Income Trust, Eaton Vance Ohio Municipal Income Trust and Eaton Vance Pennsylvania Municipal Income Trust into Eaton Vance Municipal Income Trust. At Special Meetings of Shareholders held on December 20, 2018, shareholders of Massachusetts Municipal Income Trust, Ohio Municipal Income Trust and Pennsylvania Municipal Income Trust approved each merger into Eaton Vance Municipal Income Trust. Each merger is currently expected to be completed as of the close of business of the New York Stock Exchange on or about January 18, 2019, subject to the satisfaction of customary closing conditions. |
| | At a Special Meeting of Shareholders held on January 10, 2019, shareholders of New Jersey Municipal Income Trust approved the merger into Eaton Vance Municipal Income Trust. The merger is expected to be completed as of the close of business of the New York Stock Exchange on or about February 22, 2019, subject to the satisfaction of customary closing conditions. |
Eaton Vance
California Municipal Income Trust
November 30, 2018
Portfolio of Investments
| | | | | | | | |
| Tax-Exempt Municipal Securities — 152.6% | |
| Security | | Principal Amount (000’s omitted) | | | Value | |
|
| Education — 18.6% | |
California Educational Facilities Authority, (Harvey Mudd College), 5.25%, 12/1/31 | | $ | 195 | | | $ | 212,891 | |
California Educational Facilities Authority, (Harvey Mudd College), 5.25%, 12/1/36 | | | 330 | | | | 357,974 | |
California Educational Facilities Authority, (Loyola Marymount University), 5.00%, 10/1/30 | | | 745 | | | | 762,835 | |
California Educational Facilities Authority, (University of San Francisco), Prerefunded to 10/1/21, 6.125%, 10/1/36 | | | 115 | | | | 128,400 | |
California Municipal Finance Authority, (University of San Diego), 5.00%, 10/1/31 | | | 415 | | | | 445,610 | |
California Municipal Finance Authority, (University of San Diego), 5.00%, 10/1/35 | | | 285 | | | | 305,050 | |
California Municipal Finance Authority, (University of San Diego), 5.25%, 10/1/26 | | | 810 | | | | 877,797 | |
California Municipal Finance Authority, (University of San Diego), 5.25%, 10/1/27 | | | 850 | | | | 920,176 | |
California Municipal Finance Authority, (University of San Diego), 5.25%, 10/1/28 | | | 895 | | | | 967,862 | |
California State University, 5.00%, 11/1/41(1) | | | 6,275 | | | | 7,022,478 | |
University of California, 5.00%, 5/15/46(1) | | | 4,075 | | | | 4,521,987 | |
University of California, Prerefunded to 5/15/19, 5.25%, 5/15/39 | | | 205 | | | | 208,364 | |
University of California, Prerefunded to 5/15/19, 5.25%, 5/15/39 | | | 690 | | | | 701,323 | |
| | | | | | | $ | 17,432,747 | |
|
| Electric Utilities — 8.1% | |
Chula Vista, (San Diego Gas and Electric), 5.875%, 2/15/34 | | $ | 270 | | | $ | 273,953 | |
Los Angeles Department of Water and Power, 5.00%, 7/1/42(1) | | | 4,000 | | | | 4,531,720 | |
Northern California Power Agency, 5.25%, 8/1/24 | | | 1,500 | | | | 1,555,980 | |
Southern California Public Power Authority, (Tieton Hydropower), 5.00%, 7/1/35 | | | 680 | | | | 709,886 | |
Vernon, Electric System Revenue, 5.125%, 8/1/21 | | | 480 | | | | 488,793 | |
| | | | | | | $ | 7,560,332 | |
|
| Escrowed / Prerefunded — 4.4% | |
California, Prerefunded to 4/1/19, 6.00%, 4/1/38 | | $ | 265 | | | $ | 268,853 | |
California Educational Facilities Authority, (Claremont McKenna College), Prerefunded to 1/1/19, 5.00%, 1/1/39 | | | 3,135 | | | | 3,143,339 | |
California Educational Facilities Authority, (University of San Francisco), Prerefunded to 10/1/21, 6.125%, 10/1/36 | | | 120 | | | | 134,159 | |
| | | | | | | | |
| Security | | Principal Amount (000’s omitted) | | | Value | |
|
| Escrowed / Prerefunded (continued) | |
University of California, Prerefunded to 5/15/19, 5.25%, 5/15/39 | | $ | 355 | | | $ | 360,826 | |
Vernon, Electric System Revenue, Prerefunded to 8/1/19, 5.125%, 8/1/21 | | | 220 | | | | 224,994 | |
| | | | | | | $ | 4,132,171 | |
|
| General Obligations — 43.1% | |
Alameda City Unified School District, (Election of 2014), 5.00%, 8/1/42(1) | | $ | 3,325 | | | $ | 3,783,783 | |
California, 5.50%, 11/1/35 | | | 1,600 | | | | 1,703,040 | |
California, 6.00%, 4/1/38 | | | 485 | | | | 491,402 | |
Illinois, 5.00%, 12/1/35 | | | 2,000 | | | | 2,061,340 | |
La Canada Unified School District, (Election of 2017), 5.00%, 8/1/47(1) | | | 6,750 | | | | 7,747,042 | |
Long Beach Unified School District, (Election of 2008), 5.00%, 8/1/41(1) | | | 3,500 | | | | 3,951,325 | |
Oxnard Union High School District, (Election of 2018), 5.00%, 8/1/42(1) | | | 6,000 | | | | 6,734,640 | |
Palo Alto, (Election of 2008), 5.00%, 8/1/40 | | | 3,655 | | | | 3,833,803 | |
San Diego Unified School District, (Election of 2012), 5.00%, 7/1/47(1) | | | 6,000 | | | | 6,781,020 | |
Santa Clara County, (Election of 2008), Prerefunded to 8/1/19, 5.00%, 8/1/39(1) | | | 3,180 | | | | 3,250,660 | |
| | | | | | | $ | 40,338,055 | |
|
| Hospital — 26.0% | |
California Health Facilities Financing Authority, (Catholic Healthcare West), 5.25%, 3/1/27 | | $ | 1,000 | | | $ | 1,066,330 | |
California Health Facilities Financing Authority, (Catholic Healthcare West), 5.25%, 3/1/28 | | | 190 | | | | 202,688 | |
California Health Facilities Financing Authority, (City of Hope), 5.00%, 11/15/32 | | | 635 | | | | 692,201 | |
California Health Facilities Financing Authority, (City of Hope), 5.00%, 11/15/35 | | | 910 | | | | 988,770 | |
California Health Facilities Financing Authority, (Kaiser Permanente), 4.00%, 11/1/44(1) | | | 6,000 | | | | 6,130,620 | |
California Health Facilities Financing Authority, (Kaiser Permanente), 4.00%, 11/1/44 | | | 430 | | | | 439,361 | |
California Health Facilities Financing Authority, (St. Joseph Health System), 5.00%, 7/1/33 | | | 1,145 | | | | 1,260,233 | |
California Health Facilities Financing Authority, (St. Joseph Health System), 5.00%, 7/1/37 | | | 535 | | | | 585,301 | |
California Health Facilities Financing Authority, (Sutter Health), 5.00%, 11/15/46(1) | | | 6,000 | | | | 6,557,160 | |
California Public Finance Authority, (Henry Mayo Newhall Hospital), 5.00%, 10/15/37 | | | 500 | | | | 532,890 | |
| | | | |
| | 12 | | See Notes to Financial Statements. |
Eaton Vance
California Municipal Income Trust
November 30, 2018
Portfolio of Investments — continued
| | | | | | | | |
| Security | | Principal Amount (000’s omitted) | | | Value | |
|
| Hospital (continued) | |
California Public Finance Authority, (Henry Mayo Newhall Hospital), 5.00%, 10/15/47 | | $ | 1,000 | | | $ | 1,053,720 | |
California Public Finance Authority, (Sharp HealthCare), 5.00%, 8/1/47(1) | | | 3,750 | | | | 4,184,587 | |
California Statewide Communities Development Authority, (Methodist Hospital of Southern California), 5.00%, 1/1/48(2) | | | 600 | | | | 642,234 | |
| | | | | | | $ | 24,336,095 | |
|
| Insured – Escrowed / Prerefunded — 4.6% | |
Foothill/Eastern Transportation Corridor Agency, (AGC), (AGM), Escrowed to Maturity, 0.00%, 1/1/26 | | $ | 5,130 | | | $ | 4,297,042 | |
| | | | | | | $ | 4,297,042 | |
|
| Insured – General Obligations — 4.2% | |
Sweetwater Union High School District, (Election of 2000), (AGM), 0.00%, 8/1/25 | | $ | 4,720 | | | $ | 3,950,687 | |
| | | | | | | $ | 3,950,687 | |
|
| Insured – Transportation — 6.5% | |
Alameda Corridor Transportation Authority, (AMBAC), 0.00%, 10/1/29 | | $ | 5,000 | | | $ | 3,301,950 | |
Alameda Corridor Transportation Authority, (NPFG), 0.00%, 10/1/31 | | | 4,500 | | | | 2,790,810 | |
| | | | | | | $ | 6,092,760 | |
|
| Lease Revenue / Certificates of Participation — 1.1% | |
California Public Works Board, 5.00%, 11/1/38 | | $ | 915 | | | $ | 1,003,856 | |
| | | | | | | $ | 1,003,856 | |
|
| Other Revenue — 0.4% | |
California Infrastructure and Economic Development Bank, (Performing Arts Center of Los Angeles), 5.00%, 12/1/32 | | $ | 385 | | | $ | 385,886 | |
| | | | | | | $ | 385,886 | |
|
| Senior Living / Life Care — 1.6% | |
ABAG Finance Authority for Nonprofit Corporations, (Episcopal Senior Communities), 6.00%, 7/1/31 | | $ | 290 | | | $ | 312,817 | |
California Statewide Communities Development Authority, (Southern California Presbyterian Homes), 7.25%, 11/15/41(3) | | | 600 | | | | 625,464 | |
California Statewide Communities Development Authority, (The Redwoods, a Community of Seniors), 5.125%, 11/15/35 | | | 535 | | | | 594,498 | |
| | | | | | | $ | 1,532,779 | |
| | | | | | | | |
| Security | | Principal Amount (000’s omitted) | | | Value | |
|
| Special Tax Revenue — 8.2% | |
Aliso Viejo Community Facilities DistrictNo. 2005-01, Special Tax Revenue, (Glenwood at Aliso Viejo), 5.00%, 9/1/30 | | $ | 500 | | | $ | 556,675 | |
Los Angeles County Community Facilities District No. 3, (Valencia/Newhall Area), 5.00%, 9/1/23 | | | 480 | | | | 518,203 | |
Los Angeles County Community Facilities District No. 3, (Valencia/Newhall Area), 5.00%, 9/1/24 | | | 240 | | | | 258,902 | |
Los Angeles County Community Facilities District No. 3, (Valencia/Newhall Area), 5.00%, 9/1/25 | | | 335 | | | | 361,107 | |
Los Angeles County Community Facilities District No. 3, (Valencia/Newhall Area), 5.00%, 9/1/26 | | | 240 | | | | 258,434 | |
Los Angeles County Metropolitan Transportation Authority, Sales Tax Revenue, Green Bonds, 5.00%, 7/1/42(1) | | | 2,100 | | | | 2,396,058 | |
San Francisco Bay Area Rapid Transit District, Sales Tax Revenue, Prerefunded to 7/1/20, 5.00%, 7/1/28 | | | 2,400 | | | | 2,521,776 | |
South Orange County Public Financing Authority, Special Tax Revenue, (Ladera Ranch), 5.00%, 8/15/28 | | | 725 | | | | 784,929 | |
| | | | | | | $ | 7,656,084 | |
|
| Transportation — 10.5% | |
Bay Area Toll Authority, Toll Bridge Revenue, (San Francisco Bay Area), Prerefunded to 4/1/19, 5.25%, 4/1/29 | | $ | 1,000 | | | $ | 1,012,120 | |
California Municipal Finance Authority, (LINXS Automated People Mover), (AMT), 5.00%, 12/31/43 | | | 3,000 | | | | 3,224,820 | |
Los Angeles Department of Airports, (Los Angeles International Airport), 5.00%, 5/15/35(1) | | | 2,120 | | | | 2,209,549 | |
San Francisco City and County Airport Commission, (San Francisco International Airport), 5.00%, 5/1/35 | | | 2,760 | | | | 2,864,245 | |
San Joaquin Hills Transportation Corridor Agency, 5.00%, 1/15/34 | | | 500 | | | | 540,940 | |
| | | | | | | $ | 9,851,674 | |
|
| Water and Sewer — 15.3% | |
Rancho California Water District Financing Authority, 5.00%, 8/1/46(1) | | $ | 5,250 | | | $ | 5,906,722 | |
San Francisco City and County Public Utilities Commission, Water Revenue, Green Bonds, 5.00%, 11/1/45(1) | | | 6,000 | | | | 6,638,160 | |
San Mateo, Sewer Revenue, 5.00%, 8/1/36 | | | 1,700 | | | | 1,816,110 | |
| | | | | | | $ | 14,360,992 | |
| |
TotalTax-Exempt Municipal Securities — 152.6%
(identified cost $138,460,759) | | | $ | 142,931,160 | |
| | | | |
| | 13 | | See Notes to Financial Statements. |
Eaton Vance
California Municipal Income Trust
November 30, 2018
Portfolio of Investments — continued
| | | | | | | | |
| Taxable Municipal Securities — 8.7% | |
| Security | | Principal Amount (000’s omitted) | | | Value | |
|
| Education — 3.2% | |
California Educational Facilities Authority, (Loyola Marymount University), 4.842%, 10/1/48 | | $ | 3,000 | | | $ | 3,040,620 | |
| | | | | | | $ | 3,040,620 | |
|
| Hospital — 5.5% | |
California Statewide Communities Development Authority, (Loma Linda University Medical Center), 6.00%, 12/1/24 | | $ | 2,500 | | | $ | 2,617,525 | |
California Statewide Communities Development Authority, (Marin General Hospital), 4.821%, 8/1/45 | | | 2,500 | | | | 2,509,925 | |
| | | | | | | $ | 5,127,450 | |
| |
Total Taxable Municipal Securities — 8.7%
(identified cost $8,076,598) | | | $ | 8,168,070 | |
|
| Corporate Bonds & Notes — 1.1% | |
| Security | | Principal Amount (000’s omitted) | | | Value | |
|
| Other — 1.1% | |
Morongo Band of Mission Indians, 7.00%, 10/1/39(3) | | $ | 1,040 | | | $ | 1,044,170 | |
| | |
Total Corporate Bonds & Notes — 1.1%
(identified cost $1,040,000) | | | | | | $ | 1,044,170 | |
| | |
Total Investments — 162.4%
(identified cost $147,577,357) | | | | | | $ | 152,143,400 | |
| | |
Other Assets, Less Liabilities — (62.4)% | | | | | | $ | (58,448,048 | ) |
| |
Net Assets Applicable to Common Shares — 100.0% | | | $ | 93,695,352 | |
The percentage shown for each investment category in the Portfolio of Investments is based on net assets applicable to common shares.
The Trust invests primarily in debt securities issued by California municipalities. The ability of the issuers of the debt securities to meet their obligations may be affected by economic developments in a specific industry or municipality. In order to reduce the risk associated with such economic developments, at November 30, 2018, 9.4% of total investments are backed by bond insurance of various financial institutions and financial guaranty assurance agencies. The aggregate percentage insured by an individual financial institution or financial guaranty assurance agency ranged from 1.8% to 5.4% of total investments.
| (1) | Security represents the municipal bond held by a trust that issues residual interest bonds (see Note 1G). |
| (2) | When-issued security. |
| (3) | Security exempt from registration pursuant to Rule 144A under the Securities Act of 1933, as amended. These securities may be sold in certain transactions in reliance on an exemption from registration (normally to qualified institutional buyers). At November 30, 2018, the aggregate value of these securities is $1,669,634 or 1.8% of the Trust’s net assets applicable to common shares. |
Abbreviations:
| | | | |
| AGC | | – | | Assured Guaranty Corp. |
| AGM | | – | | Assured Guaranty Municipal Corp. |
| AMBAC | | – | | AMBAC Financial Group, Inc. |
| AMT | | – | | Interest earned from these securities may be considered a tax preference item for purposes of the Federal Alternative Minimum Tax. |
| NPFG | | – | | National Public Finance Guaranty Corp. |
| | | | |
| | 14 | | See Notes to Financial Statements. |
Eaton Vance
Massachusetts Municipal Income Trust
November 30, 2018
Portfolio of Investments
| | | | | | | | |
| Tax-Exempt Municipal Securities — 147.8% | |
| Security | | Principal
Amount
(000’s omitted) | | | Value | |
|
| Education — 41.7% | |
Massachusetts Development Finance Agency, (Boston College), 5.00%, 7/1/42(1) | | $ | 950 | | | $ | 1,067,952 | |
Massachusetts Development Finance Agency, (Harvard University), 5.00%, 7/15/33(1) | | | 4,500 | | | | 5,193,945 | |
Massachusetts Development Finance Agency, (Milton Academy), 5.00%, 9/1/35 | | | 1,080 | | | | 1,130,220 | |
Massachusetts Development Finance Agency, (Northeastern University), 5.00%, 3/1/33 | | | 770 | | | | 842,873 | |
Massachusetts Development Finance Agency, (Wentworth Institute of Technology), 5.00%, 10/1/37 | | | 1,000 | | | | 1,084,740 | |
Massachusetts Development Finance Agency, (Williams College), 5.00%, 7/1/46(1) | | | 3,000 | | | | 3,335,700 | |
Massachusetts Health and Educational Facilities Authority, (Berklee College of Music), 5.00%, 10/1/32 | | | 105 | | | | 105,261 | |
Massachusetts Health and Educational Facilities Authority, (Boston College), 5.50%, 6/1/35 | | | 1,640 | | | | 2,057,872 | |
Massachusetts Health and Educational Facilities Authority, (Northeastern University), 5.00%, 10/1/35 | | | 1,350 | | | | 1,410,237 | |
| | | | $ | 16,228,800 | |
|
| Escrowed / Prerefunded — 10.2% | |
Massachusetts Development Finance Agency, (Tufts Medical Center), Prerefunded to 1/1/21, 7.25%, 1/1/32 | | $ | 360 | | | $ | 396,979 | |
Massachusetts Development Finance Agency, (UMass Memorial), Prerefunded to 7/1/21, 5.50%, 7/1/31 | | | 525 | | | | 568,958 | |
Massachusetts Health and Educational Facilities Authority, (Baystate Medical Center, Inc.), Prerefunded to 7/1/19, 5.75%, 7/1/36 | | | 1,210 | | | | 1,237,406 | |
Massachusetts Health and Educational Facilities Authority, (Isabella Stewart Gardner Museum), Prerefunded to 5/1/19, 5.00%, 5/1/22 | | | 500 | | | | 506,365 | |
Massachusetts Health and Educational Facilities Authority, (Isabella Stewart Gardner Museum), Prerefunded to 5/1/19, 5.00%, 5/1/25 | | | 505 | | | | 511,429 | |
Newton, Prerefunded to 4/1/19, 5.00%, 4/1/36 | | | 750 | | | | 757,868 | |
| | | | $ | 3,979,005 | |
|
| General Obligations — 20.0% | |
Boston, 5.00%, 5/1/38(1) | | $ | 3,000 | | | $ | 3,477,930 | |
Danvers, 5.25%, 7/1/36 | | | 885 | | | | 948,056 | |
Illinois, 5.00%, 11/1/23 | | | 1,000 | | | | 1,053,240 | |
Plymouth, 5.00%, 5/1/31 | | | 345 | | | | 367,028 | |
Plymouth, 5.00%, 5/1/32 | | | 315 | | | | 334,962 | |
Wayland, 5.00%, 2/1/33 | | | 510 | | | | 539,040 | |
| | | | | | | | |
| Security | | Principal
Amount
(000’s omitted) | | | Value | |
|
| General Obligations (continued) | |
Wayland, 5.00%, 2/1/36 | | $ | 770 | | | $ | 812,504 | |
Winchester, 5.00%, 4/15/36 | | | 245 | | | | 259,778 | |
| | | | $ | 7,792,538 | |
|
| Hospital — 18.4% | |
Massachusetts Development Finance Agency, (Partners HealthCare System),
5.00%, 7/1/47(1) | | $ | 3,550 | | | $ | 3,855,229 | |
Massachusetts Development Finance Agency, (Tufts Medical Center), 7.25%, 1/1/32 | | | 240 | | | | 264,024 | |
Massachusetts Development Finance Agency, (UMass Memorial), 5.50%, 7/1/31 | | | 30 | | | | 31,977 | |
Massachusetts Health and Educational Facilities Authority, (Children’s Hospital), 5.25%, 12/1/39 | | | 500 | | | | 516,175 | |
Massachusetts Health and Educational Facilities Authority, (Dana-Farber Cancer Institute), 5.00%, 12/1/37 | | | 1,135 | | | | 1,137,962 | |
Massachusetts Health and Educational Facilities Authority, (Lowell General Hospital), 5.125%, 7/1/35 | | | 970 | | | | 1,004,930 | |
Massachusetts Health and Educational Facilities Authority, (Southcoast Health System), 5.00%, 7/1/29 | | | 350 | | | | 355,796 | |
| | | | $ | 7,166,093 | |
|
| Industrial Development Revenue — 1.3% | |
National Finance Authority, NH, (Covanta), 4.625%, 11/1/42(2) | | $ | 245 | | | $ | 233,243 | |
National Finance Authority, NH, (Covanta), (AMT), 4.875%, 11/1/42(2) | | | 270 | | | | 260,925 | |
| | | | $ | 494,168 | |
|
| Insured – Education — 7.6% | |
Massachusetts College Building Authority, (XLCA), 5.50%, 5/1/39 | | $ | 1,000 | | | $ | 1,269,940 | |
Massachusetts Development Finance Agency, (College of the Holy Cross), (AMBAC), 5.25%, 9/1/32(1) | | | 1,365 | | | | 1,693,023 | |
| | | | $ | 2,962,963 | |
|
| Insured – Electric Utilities — 1.5% | |
Puerto Rico Electric Power Authority, (NPFG), 5.25%, 7/1/29 | | $ | 550 | | | $ | 579,123 | |
| | | | $ | 579,123 | |
|
| Insured – Escrowed / Prerefunded — 0.9% | |
Massachusetts Health and Educational Facilities Authority, (Cape Cod Healthcare), (AGC), Prerefunded to 11/15/19, 5.00%, 11/15/25 | | $ | 335 | | | $ | 344,765 | |
| | | | $ | 344,765 | |
| | | | |
| | 15 | | See Notes to Financial Statements. |
Eaton Vance
Massachusetts Municipal Income Trust
November 30, 2018
Portfolio of Investments — continued
| | | | | | | | |
| Security | | Principal
Amount
(000’s omitted) | | | Value | |
|
| Insured – General Obligations — 3.2% | |
Massachusetts, (AMBAC), 5.50%, 8/1/30 | | $ | 1,000 | | | $ | 1,250,960 | |
| | | | $ | 1,250,960 | |
|
| Insured – Other Revenue — 2.0% | |
Massachusetts Development Finance Agency, (WGBH Educational Foundation), (AMBAC), 5.75%, 1/1/42 | | $ | 590 | | | $ | 763,731 | |
| | | | $ | 763,731 | |
|
| Insured – Special Tax Revenue — 3.2% | |
Massachusetts, Special Obligation, Dedicated Tax Revenue, (NPFG), 5.50%, 1/1/29 | | $ | 1,000 | | | $ | 1,229,650 | |
| | | | $ | 1,229,650 | |
|
| Insured – Transportation — 0.8% | |
Massachusetts Port Authority, (Bosfuel Project), (NPFG), (AMT), 5.00%, 7/1/32 | | $ | 315 | | | $ | 315,769 | |
| | | | $ | 315,769 | |
|
| Senior Living / Life Care — 2.4% | |
Massachusetts Development Finance Agency, (Carleton-Willard Village), 5.625%, 12/1/30 | | $ | 125 | | | $ | 128,442 | |
Massachusetts Development Finance Agency, (Linden Ponds, Inc.), 5.00%, 11/15/33(2) | | | 100 | | | | 102,519 | |
Massachusetts Development Finance Agency, (Linden Ponds, Inc.), 5.00%, 11/15/38(2) | | | 100 | | | | 100,934 | |
Massachusetts Development Finance Agency, (VOA Concord Assisted Living, Inc.), 5.125%, 11/1/27(2) | | | 135 | | | | 135,018 | |
Massachusetts Development Finance Agency, (VOA Concord Assisted Living, Inc.),
5.20%, 11/1/41(2) | | | 475 | | | | 461,966 | |
| | | | $ | 928,879 | |
|
| Special Tax Revenue — 20.3% | |
Massachusetts School Building Authority, Sales Tax Revenue, 5.00%, 11/15/46(1) | | $ | 4,100 | | | $ | 4,568,507 | |
Massachusetts, (Rail Enhancement and Accelerated Bridge Programs), 5.00%, 6/1/47(1) | | | 3,000 | | | | 3,353,790 | |
| | | | $ | 7,922,297 | |
|
| Transportation — 5.7% | |
Massachusetts Department of Transportation, (Metropolitan Highway System), 5.00%, 1/1/37 | | $ | 1,500 | | | $ | 1,539,510 | |
Massachusetts Port Authority, 5.00%, 7/1/34 | | | 670 | | | | 699,406 | |
| | | | $ | 2,238,916 | |
| | | | | | | | |
| Security | | Principal
Amount
(000’s omitted) | | | Value | |
|
| Water and Sewer — 8.6% | |
Massachusetts Water Resources Authority, Green Bonds, 5.00%, 8/1/40(1) | | $ | 3,000 | | | $ | 3,353,280 | |
| | | | $ | 3,353,280 | |
| |
TotalTax-Exempt Municipal Securities — 147.8%
(identified cost $55,957,878) | | | $ | 57,550,937 | |
|
| Taxable Municipal Securities — 1.9% | |
| Security | | Principal
Amount
(000’s omitted) | | | Value | |
|
| Student Loan — 1.9% | |
Massachusetts Educational Financing Authority, 4.70%, 1/1/30 | | $ | 710 | | | $ | 734,325 | |
| |
Total Taxable Municipal Securities — 1.9%
(identified cost $698,062) | | | $ | 734,325 | |
|
| Corporate Bonds & Notes — 2.0% | |
| Security | | Principal
Amount
(000’s omitted) | | | Value | |
|
| Hospital — 2.0% | |
Boston Medical Center Corp., 4.581%, 7/1/47 | | $ | 835 | | | $ | 788,118 | |
| |
Total Corporate Bonds & Notes — 2.0%
(identified cost $835,000) | | | $ | 788,118 | |
| |
Total Investments — 151.7%
(identified cost $57,490,940) | | | $ | 59,073,380 | |
| |
Other Assets, Less Liabilities — (51.7)% | | | $ | (20,122,496 | ) |
| |
Net Assets Applicable to Common Shares — 100.0% | | | $ | 38,950,884 | |
The percentage shown for each investment category in the Portfolio of Investments is based on net assets applicable to common shares.
The Trust invests primarily in debt securities issued by Massachusetts municipalities. The ability of the issuers of the debt securities to meet their obligations may be affected by economic developments in a specific industry or municipality. In order to reduce the risk associated with such economic developments, at November 30, 2018, 12.6% of total investments are backed by bond insurance of various financial institutions and financial guaranty assurance agencies. The aggregate percentage insured by an individual financial institution or financial guaranty assurance agency ranged from 0.6% to 6.3% of total investments.
| | | | |
| | 16 | | See Notes to Financial Statements. |
Eaton Vance
Massachusetts Municipal Income Trust
November 30, 2018
Portfolio of Investments — continued
| (1) | Security represents the municipal bond held by a trust that issues residual interest bonds (see Note 1G). |
| (2) | Security exempt from registration pursuant to Rule 144A under the Securities Act of 1933, as amended. These securities may be sold in certain transactions in reliance on an exemption from registration (normally to qualified institutional buyers). At November 30, 2018, the aggregate value of these securities is $1,294,605 or 3.3% of the Trust’s net assets applicable to common shares. |
Abbreviations:
| | | | |
| AGC | | – | | Assured Guaranty Corp. |
| AMBAC | | – | | AMBAC Financial Group, Inc. |
| AMT | | – | | Interest earned from these securities may be considered a tax preference item for purposes of the Federal Alternative Minimum Tax. |
| NPFG | | – | | National Public Finance Guaranty Corp. |
| XLCA | | – | | XL Capital Assurance, Inc. |
| | | | |
| | 17 | | See Notes to Financial Statements. |
Eaton Vance
Michigan Municipal Income Trust
November 30, 2018
Portfolio of Investments
| | | | | | | | |
| Tax-Exempt Investments — 160.1% | |
| Security | | Principal
Amount
(000’s omitted) | | | Value | |
|
| Bond Bank — 2.1% | |
Michigan Municipal Bond Authority, Prerefunded to 10/1/19, 5.00%, 10/1/29 | | $ | 600 | | | $ | 615,540 | |
| | | | $ | 615,540 | |
|
| Education — 9.6% | |
Michigan State University, 5.00%, 2/15/40 | | $ | 1,000 | | | $ | 1,032,430 | |
University of Michigan, 5.00%, 4/1/48(1) | | | 1,500 | | | | 1,702,185 | |
| | | | $ | 2,734,615 | |
|
| Electric Utilities — 4.7% | |
Lansing Board of Water and Light, 5.50%, 7/1/41 | | $ | 500 | | | $ | 538,895 | |
Michigan Public Power Agency, 5.00%, 1/1/43 | | | 775 | | | | 805,682 | |
| | | | $ | 1,344,577 | |
|
| Escrowed / Prerefunded — 7.7% | |
Comstock Park Public Schools, Prerefunded to 5/1/21, 5.25%, 5/1/33 | | $ | 80 | | | $ | 85,926 | |
Guam, Limited Obligation Bonds, Prerefunded to 12/1/19, 5.625%, 12/1/29 | | | 115 | | | | 119,200 | |
Guam, Limited Obligation Bonds, Prerefunded to 12/1/19, 5.75%, 12/1/34 | | | 125 | | | | 129,717 | |
Jenison Public Schools, Prerefunded to 5/1/21, 5.00%, 5/1/28 | | | 500 | | | | 535,335 | |
Jenison Public Schools, Prerefunded to 5/1/21, 5.00%, 5/1/30 | | | 500 | | | | 535,335 | |
Michigan, Prerefunded to 5/1/19, 5.50%, 11/1/25 | | | 270 | | | | 274,039 | |
Michigan Hospital Finance Authority, (MidMichigan Obligated Group), Prerefunded to 6/1/19, 6.125%, 6/1/39 | | | 500 | | | | 510,510 | |
| | | | $ | 2,190,062 | |
|
| General Obligations — 54.9% | |
Comstock Park Public Schools, 5.125%, 5/1/31 | | $ | 275 | | | $ | 293,004 | |
Comstock Park Public Schools, 5.25%, 5/1/33 | | | 140 | | | | 149,404 | |
Jackson Public Schools, 5.00%, 5/1/48(1) | | | 2,850 | | | | 3,135,057 | |
Kent County, 5.00%, 1/1/25 | | | 1,500 | | | | 1,503,705 | |
Kent County, (AMT), 5.00%, 1/1/28 | | | 1,000 | | | | 1,070,560 | |
Massachusetts, 5.00%, 9/1/38(1) | | | 2,500 | | | | 2,858,200 | |
Trenton Public Schools, 5.00%, 5/1/42(1) | | | 2,850 | | | | 3,170,540 | |
Walled Lake Consolidated School District, 5.00%, 5/1/34 | | | 365 | | | | 402,376 | |
Will County, IL, 5.00%, 11/15/45(1) | | | 2,850 | | | | 3,115,620 | |
| | | | $ | 15,698,466 | |
| | | | | | | | |
| Security | | Principal
Amount
(000’s omitted) | | | Value | |
|
| Hospital — 17.0% | |
Michigan Finance Authority, (Oakwood Obligated Group), 5.00%, 11/1/32 | | $ | 500 | | | $ | 541,570 | |
Michigan Finance Authority, (Trinity Health Credit Group), 5.00%, 12/1/42(1) | | | 2,850 | | | | 3,140,272 | |
Royal Oak Hospital Finance Authority, (William Beaumont Hospital), 5.00%, 9/1/39 | | | 130 | | | | 139,373 | |
Saginaw Hospital Finance Authority, (Covenant Medical Center, Inc.), 5.00%, 7/1/30 | | | 1,000 | | | | 1,038,420 | |
| | | | $ | 4,859,635 | |
|
| Industrial Development Revenue — 2.6% | |
Detroit Local Development Finance Authority, (Chrysler Corp.), 5.375%, 5/1/21 | | $ | 750 | | | $ | 746,445 | |
| | | | $ | 746,445 | |
|
| Insured – Electric Utilities — 3.8% | |
Puerto Rico Electric Power Authority, (NPFG), 5.25%, 7/1/29 | | $ | 630 | | | $ | 663,358 | |
Puerto Rico Electric Power Authority, (NPFG), 5.25%, 7/1/32 | | | 250 | | | | 261,478 | |
Puerto Rico Electric Power Authority, (NPFG), 5.25%, 7/1/34 | | | 155 | | | | 161,073 | |
| | | | $ | 1,085,909 | |
|
| Insured – Escrowed / Prerefunded — 3.5% | |
Grand Rapids, Water Supply System, (AGC), Prerefunded to 1/1/19, 5.10%, 1/1/39 | | $ | 1,000 | | | $ | 1,002,540 | |
| | | | $ | 1,002,540 | |
|
| Insured – General Obligations — 13.7% | |
Bay City Brownfield Redevelopment Authority, (BAM), 5.375%, 10/1/38 | | $ | 500 | | | $ | 548,980 | |
Byron Center Public Schools, (AGM), 3.75%, 5/1/26 | | | 150 | | | | 152,387 | |
Byron Center Public Schools, (AGM), 4.00%, 5/1/28 | | | 240 | | | | 243,002 | |
Detroit School District, (AGM), 5.25%, 5/1/32 | | | 300 | | | | 356,961 | |
Hartland Consolidated Schools, (AGM), 5.25%, 5/1/29 | | | 1,000 | | | | 1,066,920 | |
Livonia Public Schools, (AGM), 5.00%, 5/1/43 | | | 910 | | | | 994,521 | |
Westland Tax Increment Finance Authority, (BAM), 5.25%, 4/1/34 | | | 500 | | | | 543,565 | |
| | | | $ | 3,906,336 | |
|
| Insured – Transportation — 3.5% | |
Wayne County Airport Authority, (AGC), (AMT), 5.375%, 12/1/32 | | $ | 1,000 | | | $ | 1,000,970 | |
| | | | $ | 1,000,970 | |
| | | | |
| | 18 | | See Notes to Financial Statements. |
Eaton Vance
Michigan Municipal Income Trust
November 30, 2018
Portfolio of Investments — continued
| | | | | | | | |
| Security | | Principal
Amount
(000’s omitted) | | | Value | |
|
| Insured – Water and Sewer — 1.7% | |
Puerto Rico Aqueduct and Sewer Authority, (AGC), 5.00%, 7/1/28 | | $ | 475 | | | $ | 491,839 | |
| | | | $ | 491,839 | |
|
| Lease Revenue / Certificates of Participation — 10.9% | |
Michigan State Building Authority, 5.00%, 10/15/51(1) | | $ | 2,850 | | | $ | 3,105,873 | |
| | | | $ | 3,105,873 | |
|
| Water and Sewer — 24.4% | |
Dallas, Waterworks and Sewer System Revenue, 4.00%, 10/1/43(1) | | $ | 1,775 | | | $ | 1,798,927 | |
Detroit, Water Supply System, 5.25%, 7/1/41 | | | 750 | | | | 795,960 | |
Grand Rapids, Sanitary Sewer System Revenue, 5.00%, 1/1/48(1) | | | 2,500 | | | | 2,794,950 | |
Michigan Finance Authority, (Detroit Water and Sewerage Department), (AMT), 5.00%, 7/1/44 | | | 1,250 | | | | 1,316,537 | |
Port Huron, Water Supply System, 5.25%, 10/1/31 | | | 250 | | | | 268,010 | |
| | | | $ | 6,974,384 | |
| |
TotalTax-Exempt Investments — 160.1%
(identified cost $45,147,362) | | | $ | 45,757,191 | |
| |
Other Assets, Less Liabilities — (60.1)% | | | $ | (17,185,479 | ) |
| |
Net Assets Applicable to Common Shares — 100.0% | | | $ | 28,571,712 | |
The percentage shown for each investment category in the Portfolio of Investments is based on net assets applicable to common shares.
The Trust invests primarily in debt securities issued by Michigan municipalities. The ability of the issuers of the debt securities to meet their obligations may be affected by economic developments in a specific industry or municipality. In order to reduce the risk associated with such economic developments, at November 30, 2018, 16.4% of total investments are backed by bond insurance of various financial institutions and financial guaranty assurance agencies. The aggregate percentage insured by an individual financial institution or financial guaranty assurance agency ranged from 2.4% to 6.1% of total investments.
| (1) | Security represents the municipal bond held by a trust that issues residual interest bonds (see Note 1G). |
Abbreviations:
| | | | |
| AGC | | – | | Assured Guaranty Corp. |
| AGM | | – | | Assured Guaranty Municipal Corp. |
| AMT | | – | | Interest earned from these securities may be considered a tax preference item for purposes of the Federal Alternative Minimum Tax. |
| BAM | | – | | Build America Mutual Assurance Co. |
| NPFG | | – | | National Public Finance Guaranty Corp. |
| | | | |
| | 19 | | See Notes to Financial Statements. |
Eaton Vance
New Jersey Municipal Income Trust
November 30, 2018
Portfolio of Investments
| | | | | | | | |
| Tax-Exempt Municipal Securities — 147.3% | |
| Security | | Principal
Amount
(000’s omitted) | | | Value | |
|
| Education — 10.9% | |
New Jersey Educational Facilities Authority, (Princeton University), 5.00%, 7/1/29(1) | | $ | 2,825 | | | $ | 3,356,439 | |
New Jersey Educational Facilities Authority, (Princeton University), 5.00%, 7/1/31(1) | | | 1,875 | | | | 2,209,743 | |
New Jersey Educational Facilities Authority, (University of Medicine and Dentistry), Prerefunded to 6/1/19, 7.50%, 12/1/32 | | | 965 | | | | 991,750 | |
| | | | $ | 6,557,932 | |
|
| Escrowed / Prerefunded — 9.8% | |
Monmouth County Improvement Authority, Prerefunded to 1/15/21, 5.00%, 1/15/28 | | $ | 1,510 | | | $ | 1,604,889 | |
New Jersey Economic Development Authority, (School Facilities Construction), Prerefunded to 6/15/19, 5.25%, 12/15/33 | | | 105 | | | | 106,898 | |
New Jersey Economic Development Authority, (The Seeing Eye, Inc.), Prerefunded to 6/1/22, 5.00%, 6/1/32 | | | 250 | | | | 274,550 | |
New Jersey Educational Facilities Authority, (Kean University), Prerefunded to 9/1/19, 5.50%, 9/1/36 | | | 1,650 | | | | 1,694,600 | |
New Jersey Health Care Facilities Financing Authority, (Chilton Memorial Hospital), Prerefunded to 7/1/19, 5.75%, 7/1/39 | | | 915 | | | | 935,459 | |
New Jersey Health Care Facilities Financing Authority, (Palisades Medical Center), Prerefunded to 7/1/23, 5.25%, 7/1/31 | | | 205 | | | | 231,781 | |
New Jersey Health Care Facilities Financing Authority, (Robert Wood Johnson University Hospital), Prerefunded to 1/1/20, 5.00%, 7/1/31 | | | 1,000 | | | | 1,032,280 | |
| | | | $ | 5,880,457 | |
|
| General Obligations — 19.4% | |
Massachusetts, 5.00%, 9/1/38(1) | | $ | 4,000 | | | $ | 4,573,120 | |
Monmouth County Improvement Authority, 5.00%, 1/15/28 | | | 340 | | | | 360,281 | |
Monmouth County Improvement Authority, 5.00%, 1/15/30 | | | 340 | | | | 359,917 | |
Ocean County, 3.00%, 9/1/35 | | | 1,530 | | | | 1,452,429 | |
Ocean County, 3.00%, 9/1/36 | | | 625 | | | | 587,450 | |
Ocean County, 4.00%, 9/1/30(1) | | | 1,300 | | | | 1,426,061 | |
Ocean County, 5.00%, 9/1/28 | | | 10 | | | | 11,968 | |
Ocean County, 5.00%, 9/1/28(1) | | | 1,175 | | | | 1,406,181 | |
Ocean County, 5.00%, 9/1/29 | | | 20 | | | | 23,829 | |
Ocean County, 5.00%, 9/1/29(1) | | | 1,225 | | | | 1,459,551 | |
| | | | $ | 11,660,787 | |
|
| Hospital — 10.6% | |
Camden County Improvement Authority, (Cooper Health System), 5.75%, 2/15/42 | | $ | 650 | | | $ | 697,983 | |
| | | | | | | | |
| Security | | Principal
Amount
(000’s omitted) | | | Value | |
|
| Hospital (continued) | |
New Jersey Health Care Facilities Financing Authority, (AHS Hospital Corp.), 5.00%, 7/1/27 | | $ | 100 | | | $ | 100,255 | |
New Jersey Health Care Facilities Financing Authority, (Barnabas Health Obligated Group), 4.25%, 7/1/44 | | | 650 | | | | 656,565 | |
New Jersey Health Care Facilities Financing Authority, (Palisades Medical Center), Prerefunded to 7/1/23, 5.25%, 7/1/31 | | | 45 | | | | 50,774 | |
New Jersey Health Care Facilities Financing Authority, (Princeton HealthCare System), 5.00%, 7/1/39(1) | | | 3,425 | | | | 3,762,431 | |
New Jersey Health Care Facilities Financing Authority, (Virtua Health), 5.75%, 7/1/33 | | | 1,075 | | | | 1,098,758 | |
| | | | $ | 6,366,766 | |
|
| Industrial Development Revenue — 7.7% | |
Essex County Improvement Authority, (Covanta), (AMT), 5.25%, 7/1/45(2) | | $ | 1,085 | | | $ | 1,088,038 | |
New Jersey Economic Development Authority, (Continental Airlines), (AMT), 5.125%, 9/15/23 | | | 50 | | | | 53,551 | |
New Jersey Economic Development Authority, (Continental Airlines), (AMT), 5.25%, 9/15/29 | | | 135 | | | | 145,510 | |
New Jersey Economic Development Authority, (Continental Airlines), (AMT), 5.50%, 6/1/33 | | | 750 | | | | 820,567 | |
New Jersey Economic Development Authority, (New Jersey-American Water Co., Inc.), (AMT), 5.10%, 6/1/23 | | | 220 | | | | 228,331 | |
New Jersey Economic Development Authority, (New Jersey-American Water Co., Inc.), (AMT), 5.70%, 10/1/39 | | | 2,235 | | | | 2,289,713 | |
| | | | $ | 4,625,710 | |
|
| Insured – Electric Utilities — 2.1% | |
Puerto Rico Electric Power Authority, (NPFG), 5.25%, 7/1/29 | | $ | 135 | | | $ | 142,149 | |
Puerto Rico Electric Power Authority, (NPFG), 5.25%, 7/1/34 | | | 490 | | | | 509,198 | |
Puerto Rico Electric Power Authority, (NPFG), 5.25%, 7/1/35 | | | 595 | | | | 615,807 | |
| | | | $ | 1,267,154 | |
|
| Insured – General Obligations — 1.7% | |
Hudson County Improvement Authority, (Harrison Parking), (AGC), Prerefunded to 1/1/19, 5.25%, 1/1/39 | | $ | 1,015 | | | $ | 1,017,659 | |
| | | | $ | 1,017,659 | |
|
| Insured – Hospital — 2.3% | |
New Jersey Health Care Facilities Financing Authority, (Virtua Health), (AGC), 5.50%, 7/1/38 | | $ | 1,380 | | | $ | 1,407,738 | |
| | | | $ | 1,407,738 | |
| | | | |
| | 20 | | See Notes to Financial Statements. |
Eaton Vance
New Jersey Municipal Income Trust
November 30, 2018
Portfolio of Investments — continued
| | | | | | | | |
| Security | | Principal
Amount
(000’s omitted) | | | Value | |
|
| Insured – Lease Revenue / Certificates of Participation — 1.9% | |
New Jersey Economic Development Authority, (School Facilities Construction), (NPFG), 5.50%, 9/1/28 | | $ | 1,000 | | | $ | 1,175,390 | |
| | | | $ | 1,175,390 | |
|
| Insured – Special Tax Revenue — 11.3% | |
Garden State Preservation Trust, (AGM), 0.00%, 11/1/25 | | $ | 5,250 | | | $ | 4,294,290 | |
New Jersey Economic Development Authority, (Motor Vehicle Surcharges), (XLCA), 0.00%, 7/1/26 | | | 760 | | | | 582,608 | |
New Jersey Economic Development Authority, (Motor Vehicle Surcharges), (XLCA), 0.00%, 7/1/27 | | | 2,020 | | | | 1,477,590 | |
Puerto Rico Sales Tax Financing Corp., (NPFG), 0.00%, 8/1/45 | | | 2,020 | | | | 488,113 | |
| | | | $ | 6,842,601 | |
|
| Insured – Transportation — 7.4% | |
New Jersey Economic Development Authority, (The Goethals Bridge Replacement), (AGM), (AMT), 5.00%, 1/1/31 | | $ | 850 | | | $ | 917,405 | |
New Jersey Economic Development Authority, (The Goethals Bridge Replacement), (AGM), (AMT), 5.125%, 1/1/39 | | | 1,500 | | | | 1,602,330 | |
New Jersey Transportation Trust Fund Authority, (Transportation System), (AMBAC), 0.00%, 12/15/28 | | | 2,400 | | | | 1,591,128 | |
South Jersey Transportation Authority, (AGC), 5.50%, 11/1/33 | | | 315 | | | | 324,220 | |
| | | | $ | 4,435,083 | |
|
| Lease Revenue / Certificates of Participation — 2.3% | |
New Jersey Economic Development Authority, (School Facilities Construction), 5.25%, 12/15/33 | | $ | 995 | | | $ | 1,008,661 | |
New Jersey Economic Development Authority, (School Facilities Construction), Prerefunded to 6/15/19, 5.25%, 12/15/33 | | | 400 | | | | 407,232 | |
| | | | $ | 1,415,893 | |
|
| Senior Living / Life Care — 3.6% | |
New Jersey Economic Development Authority, (Cranes Mill, Inc.), 5.875%, 7/1/28 | | $ | 465 | | | $ | 465,614 | |
New Jersey Economic Development Authority, (Cranes Mill, Inc.), 6.00%, 7/1/38 | | | 770 | | | | 770,886 | |
New Jersey Economic Development Authority, (United Methodist Homes of New Jersey), 4.50%, 7/1/38 | | | 700 | | | | 701,127 | |
New Jersey Economic Development Authority, (United Methodist Homes of New Jersey), 5.00%, 7/1/29 | | | 215 | | | | 225,971 | |
| | | | $ | 2,163,598 | |
|
| Special Tax Revenue — 10.3% | |
New Jersey Economic Development Authority, (Newark Downtown District Management Corp.), 5.125%, 6/15/27 | | $ | 95 | | | $ | 95,051 | |
| | | | | | | | |
| Security | | Principal
Amount
(000’s omitted) | | | Value | |
|
| Special Tax Revenue (continued) | |
New Jersey Economic Development Authority, (Newark Downtown District Management Corp.), 5.125%, 6/15/37 | | $ | 175 | | | $ | 175,063 | |
New York State Urban Development Corp., Personal Income Tax Revenue, 4.00%, 3/15/45(1) | | | 5,600 | | | | 5,678,512 | |
Puerto Rico Sales Tax Financing Corp., 5.75%, 8/1/37(3) | | | 500 | | | | 241,250 | |
| | | | $ | 6,189,876 | |
|
| Student Loan — 1.3% | |
New Jersey Higher Education Student Assistance Authority, (AMT), 4.75%, 12/1/43 | | $ | 740 | | | $ | 767,299 | |
| | | | $ | 767,299 | |
|
| Transportation — 31.9% | |
Delaware River Joint Toll Bridge Commission of Pennsylvania and New Jersey, 5.00%, 7/1/37 | | $ | 5 | | | $ | 5,646 | |
Delaware River Joint Toll Bridge Commission of Pennsylvania and New Jersey,
5.00%, 7/1/37(1) | | | 1,825 | | | | 2,060,845 | |
Delaware River Joint Toll Bridge Commission of Pennsylvania and New Jersey, 5.00%, 7/1/47 | | | 15 | | | | 16,689 | |
Delaware River Joint Toll Bridge Commission of Pennsylvania and New Jersey,
5.00%, 7/1/47(1) | | | 5,300 | | | | 5,896,833 | |
Delaware River Port Authority of Pennsylvania and New Jersey, Prerefunded to 1/1/20, 5.00%, 1/1/40 | | | 1,080 | | | | 1,115,446 | |
New Jersey Economic Development Authority, (Port Newark Container Terminal, LLC), (AMT), 5.00%, 10/1/47 | | | 750 | | | | 787,050 | |
New Jersey Transportation Trust Fund Authority, (Transportation System), 5.50%, 6/15/31 | | | 1,100 | | | | 1,166,088 | |
New Jersey Transportation Trust Fund Authority, (Transportation System), 5.875%, 12/15/38 | | | 250 | | | | 250,303 | |
New Jersey Transportation Trust Fund Authority, (Transportation System), 6.00%, 12/15/38 | | | 530 | | | | 530,662 | |
Port Authority of New York and New Jersey, 5.00%, 10/15/42(1) | | | 6,250 | | | | 6,986,875 | |
South Jersey Transportation Authority, 5.00%, 11/1/39 | | | 400 | | | | 424,956 | |
| | | | $ | 19,241,393 | |
|
| Water and Sewer — 12.8% | |
Atlanta, GA, Water and Wastewater Revenue, 5.00%, 11/1/43(1) | | $ | 6,250 | | | $ | 7,053,812 | |
Sussex County Municipal Utilities Authority, 0.00%, 12/1/36 | | | 1,250 | | | | 656,675 | |
| | | | $ | 7,710,487 | |
| |
TotalTax-Exempt Municipal Securities — 147.3%
(identified cost $87,177,105) | | | $ | 88,725,823 | |
| | | | |
| | 21 | | See Notes to Financial Statements. |
Eaton Vance
New Jersey Municipal Income Trust
November 30, 2018
Portfolio of Investments — continued
| | | | | | | | |
| Taxable Municipal Securities — 4.5% | |
| Security | | Principal
Amount
(000’s omitted) | | | Value | |
|
| General Obligations — 3.1% | |
Atlantic City, 7.50%, 3/1/40 | | $ | 1,445 | | | $ | 1,861,059 | |
| | | | $ | 1,861,059 | |
|
| Transportation — 1.4% | |
New Jersey Transportation Trust Fund Authority, 5.754%, 12/15/28(4) | | $ | 750 | | | $ | 818,348 | |
| | | | $ | 818,348 | |
| |
Total Taxable Municipal Securities — 4.5%
(identified cost $2,288,550) | | | $ | 2,679,407 | |
| |
Total Investments — 151.8%
(identified cost $89,465,655) | | | $ | 91,405,230 | |
| |
Other Assets, Less Liabilities — (51.8)% | | | $ | (31,181,635 | ) |
| |
Net Assets Applicable to Common Shares — 100.0% | | | $ | 60,223,595 | |
The percentage shown for each investment category in the Portfolio of Investments is based on net assets applicable to common shares.
The Trust invests primarily in debt securities issued by New Jersey municipalities. The ability of the issuers of the debt securities to meet their obligations may be affected by economic developments in a specific industry or municipality. In order to reduce the risk associated with such economic developments, at November 30, 2018, 17.7% of total investments are backed by bond insurance of various financial institutions and financial guaranty assurance agencies. The aggregate percentage insured by an individual financial institution or financial guaranty assurance agency ranged from 1.7% to 7.5% of total investments.
| (1) | Security represents the municipal bond held by a trust that issues residual interest bonds (see Note 1G). |
| (2) | Security exempt from registration pursuant to Rule 144A under the Securities Act of 1933, as amended. These securities may be sold in certain transactions in reliance on an exemption from registration (normally to qualified institutional buyers). At November 30, 2018, the aggregate value of these securities is $1,088,038 or 1.8% of the Trust’s net assets applicable to common shares. |
| (3) | Issuer is in default with respect to interest payments. |
| (4) | Build America Bond. Represents taxable municipal obligation issued pursuant to the American Recovery and Reinvestment Act of 2009 or other legislation providing for the issuance of taxable municipal debt on which the issuer receives federal support. |
Abbreviations:
| | | | |
| AGC | | – | | Assured Guaranty Corp. |
| AGM | | – | | Assured Guaranty Municipal Corp. |
| AMBAC | | – | | AMBAC Financial Group, Inc. |
| AMT | | – | | Interest earned from these securities may be considered a tax preference item for purposes of the Federal Alternative Minimum Tax. |
| NPFG | | – | | National Public Finance Guaranty Corp. |
| XLCA | | – | | XL Capital Assurance, Inc. |
| | | | |
| | 22 | | See Notes to Financial Statements. |
Eaton Vance
New York Municipal Income Trust
November 30, 2018
Portfolio of Investments
| | | | | | | | |
| Tax-Exempt Investments — 152.4% | |
| Security | | Principal Amount
(000’s omitted) | | | Value | |
|
| Cogeneration — 2.3% | |
New York City Industrial Development Agency, (Brooklyn Navy Yard Cogeneration Partners, L.P.), (AMT), 5.65%, 10/1/28 | | $ | 500 | | | $ | 504,715 | |
New York City Industrial Development Agency, (Brooklyn Navy Yard Cogeneration Partners, L.P.), (AMT), 5.75%, 10/1/36 | | | 500 | | | | 504,715 | |
Suffolk County Industrial Development Agency, (Nissequogue Cogeneration Partners Facility), (AMT), 5.50%, 1/1/23 | | | 705 | | | | 705,092 | |
| | | | | | | $ | 1,714,522 | |
|
| Education — 29.0% | |
New York City Cultural Resources Trust, (The Juilliard School), 5.00%, 1/1/34 | | $ | 1,490 | | | $ | 1,493,710 | |
New York City Cultural Resources Trust, (The Juilliard School), 5.00%, 1/1/39 | | | 325 | | | | 325,809 | |
New York Dormitory Authority, (Brooklyn Law School), 5.75%, 7/1/33 | | | 510 | | | | 518,655 | |
New York Dormitory Authority, (Columbia University), 5.00%, 10/1/38(1) | | | 4,000 | | | | 4,632,280 | |
New York Dormitory Authority, (Columbia University), 5.00%, 10/1/41 | | | 725 | | | | 767,521 | |
New York Dormitory Authority, (Cornell University), 5.00%, 7/1/34 | | | 510 | | | | 518,813 | |
New York Dormitory Authority, (Cornell University), 5.00%, 7/1/39 | | | 2,000 | | | | 2,033,980 | |
New York Dormitory Authority, (Culinary Institute of America), 5.50%, 7/1/33 | | | 220 | | | | 243,245 | |
New York Dormitory Authority, (Fordham University), Prerefunded to 7/1/21, 5.50%, 7/1/36 | | | 1,000 | | | | 1,090,040 | |
New York Dormitory Authority, (New York University), 5.00%, 7/1/39(1) | | | 4,000 | | | | 4,550,760 | |
New York Dormitory Authority, (Skidmore College), 5.00%, 7/1/27 | | | 325 | | | | 346,391 | |
New York Dormitory Authority, (Skidmore College), 5.25%, 7/1/29 | | | 400 | | | | 429,540 | |
New York Dormitory Authority, (The New School), Prerefunded to 7/1/20, 5.50%, 7/1/40 | | | 2,000 | | | | 2,111,480 | |
Onondaga Civic Development Corp., (Le Moyne College), 5.20%, 7/1/29 | | | 280 | | | | 290,716 | |
Onondaga Civic Development Corp., (Le Moyne College), 5.375%, 7/1/40 | | | 735 | | | | 758,542 | |
Onondaga County Cultural Resources Trust, (Syracuse University), 5.00%, 12/1/38 | | | 1,205 | | | | 1,333,610 | |
| | | | | | | $ | 21,445,092 | |
|
| Electric Utilities — 10.3% | |
Long Island Power Authority, Electric System Revenue, Prerefunded to 5/1/19, 6.00%, 5/1/33 | | $ | 1,420 | | | $ | 1,444,594 | |
| | | | | | | | |
| Security | | Principal Amount
(000’s omitted) | | | Value | |
|
| Electric Utilities (continued) | |
Long Island Power Authority, Electric System Revenue, 5.00%, 9/1/37 | | $ | 1,500 | | | $ | 1,698,855 | |
Utility Debt Securitization Authority, 5.00%, 12/15/36(1) | | | 4,000 | | | | 4,503,680 | |
| | | | | | | $ | 7,647,129 | |
|
| Escrowed / Prerefunded — 5.6% | |
Brooklyn Arena Local Development Corp., (Barclays Center), Prerefunded to 1/15/20, 6.25%, 7/15/40 | | $ | 380 | | | $ | 398,685 | |
Metropolitan Transportation Authority, Dedicated Tax Revenue, Prerefunded to 11/15/19, 5.00%, 11/15/34 | | | 1,500 | | | | 1,545,585 | |
New York Dormitory Authority, (North Shore-Long Island Jewish Obligated Group), Prerefunded to 5/1/21, 5.00%, 5/1/32 | | | 1,000 | | | | 1,071,640 | |
Onondaga Civic Development Corp., (St. Joseph’s Hospital Health Center), Prerefunded to 7/1/22, 5.00%, 7/1/42 | | | 1,000 | | | | 1,100,810 | |
| | | | | | | $ | 4,116,720 | |
|
| General Obligations — 7.5% | |
Illinois, 5.00%, 10/1/33 | | $ | 1,300 | | | $ | 1,345,851 | |
New York, 5.00%, 2/15/34(1) | | | 4,000 | | | | 4,225,560 | |
| | | | | | | $ | 5,571,411 | |
|
| Hospital — 5.8% | |
Dutchess County Local Development Corp., (Health Quest Systems, Inc.), 5.75%, 7/1/30 | | $ | 130 | | | $ | 138,469 | |
Dutchess County Local Development Corp., (Health Quest Systems, Inc.), 5.75%, 7/1/40 | | | 960 | | | | 1,019,136 | |
Jefferson County Civic Facility Development Corp., (Samaritan Medical Center), 4.00%, 11/1/47 | | | 1,000 | | | | 937,910 | |
New York Dormitory Authority, (Mount Sinai Hospital), 5.00%, 7/1/26 | | | 1,000 | | | | 1,043,000 | |
Suffolk County Economic Development Corp., (Catholic Health Services of Long Island Obligated Group), 5.00%, 7/1/28 | | | 1,065 | | | | 1,129,401 | |
| | | | | | | $ | 4,267,916 | |
|
| Housing — 4.9% | |
New York Housing Finance Agency, 5.25%, 11/1/41 | | $ | 1,000 | | | $ | 1,011,110 | |
New York Housing Finance Agency, (FNMA), (AMT), 5.40%, 11/15/42 | | | 2,625 | | | | 2,627,835 | |
| | | | | | | $ | 3,638,945 | |
|
| Industrial Development Revenue — 4.9% | |
New York Liberty Development Corp., (Goldman Sachs Group, Inc.), 5.25%, 10/1/35 | | $ | 980 | | | $ | 1,181,302 | |
Niagara Area Development Corp., (Covanta), (AMT), 4.75%, 11/1/42(2) | | | 2,500 | | | | 2,406,525 | |
| | | | | | | $ | 3,587,827 | |
| | | | |
| | 23 | | See Notes to Financial Statements. |
Eaton Vance
New York Municipal Income Trust
November 30, 2018
Portfolio of Investments — continued
| | | | | | | | |
| Security | | Principal Amount
(000’s omitted) | | | Value | |
|
| Insured – Education — 2.1% | |
New York Dormitory Authority, (City University), (AMBAC), 5.50%, 7/1/35 | | $ | 1,250 | | | $ | 1,523,812 | |
| | | | | | | $ | 1,523,812 | |
|
| Insured – Electric Utilities — 1.9% | |
Long Island Power Authority, Electric System Revenue, (BHAC), Prerefunded to 4/1/19, 5.75%, 4/1/33 | | $ | 1,365 | | | $ | 1,382,977 | |
| | | | | | | $ | 1,382,977 | |
|
| Insured – Other Revenue — 5.4% | |
New York City Industrial Development Agency, (Yankee Stadium), (AGC), 0.00%, 3/1/31 | | $ | 2,645 | | | $ | 1,715,150 | |
New York City Industrial Development Agency, (Yankee Stadium), (AGC), 0.00%, 3/1/32 | | | 3,625 | | | | 2,245,434 | |
| | | | | | | $ | 3,960,584 | |
|
| Insured – Transportation — 3.0% | |
New York Transportation Development Corp., (LaGuardia Airport Terminal B Redevelopment), (AGM), (AMT), 4.00%, 7/1/37 | | $ | 1,000 | | | $ | 1,004,650 | |
New York Transportation Development Corp., (LaGuardia Airport Terminal B Redevelopment), (AGM), (AMT), 4.00%, 7/1/46 | | | 1,250 | | | | 1,232,087 | |
| | | | | | | $ | 2,236,737 | |
|
| Lease Revenue / Certificates of Participation — 13.9% | |
Hudson Yards Infrastructure Corp., 5.00%, 2/15/42(1) | | $ | 4,000 | | | $ | 4,445,240 | |
Monroe County Industrial Development Agency, (Rochester Schools Modernization), 5.00%, 5/1/31(1) | | | 5,000 | | | | 5,845,550 | |
| | | | | | | $ | 10,290,790 | |
|
| Other Revenue — 15.2% | |
Brooklyn Arena Local Development Corp., (Barclays Center), 0.00%, 7/15/31 | | $ | 3,120 | | | $ | 1,893,185 | |
New York City Transitional Finance Authority, (Building Aid), 5.00%, 7/15/37(1) | | | 5,200 | | | | 5,909,228 | |
New York Liberty Development Corp., (3 World Trade Center), 5.00%, 11/15/44(2) | | | 1,300 | | | | 1,328,795 | |
New York Liberty Development Corp., (7 World Trade Center), 5.00%, 3/15/44 | | | 2,000 | | | | 2,125,920 | |
| | | | | | | $ | 11,257,128 | |
|
| Senior Living / Life Care — 2.2% | |
New York Dormitory Authority, (Miriam Osborn Memorial Home Association), 5.00%, 7/1/42 | | $ | 120 | | | $ | 121,397 | |
Suffolk County Economic Development Corp., (Peconic Landing at Southold, Inc.), 6.00%, 12/1/40 | | | 905 | | | | 952,974 | |
| | | | | | | | |
| Security | | Principal Amount
(000’s omitted) | | | Value | |
|
| Senior Living / Life Care (continued) | |
Tompkins County Development Corp., (Kendal at Ithaca, Inc.), 4.00%, 7/1/34 | | $ | 100 | | | $ | 97,952 | |
Tompkins County Development Corp., (Kendal at Ithaca, Inc.), 4.25%, 7/1/32 | | | 230 | | | | 231,435 | |
Tompkins County Development Corp., (Kendal at Ithaca, Inc.), 4.50%, 7/1/42 | | | 230 | | | | 231,578 | |
| | | | | | | $ | 1,635,336 | |
|
| Special Tax Revenue — 20.0% | |
New York City Transitional Finance Authority, Future Tax Revenue, 5.50%, 11/1/35(1) | | $ | 1,185 | | | $ | 1,258,814 | |
New York City Transitional Finance Authority, Future Tax Revenue, Prerefunded to 11/1/20, 5.50%, 11/1/35(1) | | | 915 | | | | 974,649 | |
New York Dormitory Authority, Personal Income Tax Revenue, Prerefunded to 3/15/19, 5.25%, 3/15/38 | | | 1,000 | | | | 1,009,770 | |
New York Dormitory Authority, Sales Tax Revenue, 5.00%, 3/15/43(1) | | | 4,000 | | | | 4,495,360 | |
New York Thruway Authority, Fuel Tax Revenue, 5.00%, 4/1/30(1) | | | 6,000 | | | | 6,511,500 | |
Sales Tax Asset Receivable Corp., 4.00%, 10/15/32 | | | 485 | | | | 514,638 | |
| | | | | | | $ | 14,764,731 | |
|
| Transportation — 6.1% | |
Port Authority of New York and New Jersey, 5.00%, 10/15/36(1) | | $ | 4,000 | | | $ | 4,527,680 | |
| | | | | | | $ | 4,527,680 | |
|
| Water and Sewer — 12.3% | |
New York City Municipal Water Finance Authority, (Water and Sewer System), 5.00%, 6/15/46(1) | | $ | 4,000 | | | $ | 4,433,240 | |
Suffolk County Water Authority,
5.00%, 6/1/36(1) | | | 4,000 | | | | 4,663,720 | |
| | | | | | | $ | 9,096,960 | |
| |
TotalTax-Exempt Investments — 152.4%
(identified cost $108,702,615) | | | $ | 112,666,297 | |
|
| Corporate Bonds & Notes — 2.0% | |
| Security | | Principal
Amount
(000’s omitted) | | | Value | |
|
| Hospital — 2.0% | |
NYU Hospitals Center, 4.168%, 7/1/37 | | $ | 1,500 | | | $ | 1,459,742 | |
| |
Total Corporate Bonds & Notes — 2.0%
(identified cost $1,520,133) | | | $ | 1,459,742 | |
| | | | |
| | 24 | | See Notes to Financial Statements. |
Eaton Vance
New York Municipal Income Trust
November 30, 2018
Portfolio of Investments — continued
| | | | | | | | |
| Miscellaneous — 1.0% | |
| Security | | Units | | | Value | |
|
| Real Estate — 1.0% | |
CMS Liquidating Trust(2)(3)(4) | | | 257 | | | $ | 749,046 | |
| |
Total Miscellaneous — 1.0%
(identified cost $822,400) | | | $ | 749,046 | |
| |
Total Investments — 155.4%
(identified cost $111,045,148) | | | $ | 114,875,085 | |
| |
Other Assets, Less Liabilities — (55.4)% | | | $ | (40,936,212 | ) |
| |
Net Assets Applicable to Common Shares — 100.0% | | | $ | 73,938,873 | |
The percentage shown for each investment category in the Portfolio of Investments is based on net assets applicable to common shares.
The Trust invests primarily in debt securities issued by New York municipalities. The ability of the issuers of the debt securities to meet their obligations may be affected by economic developments in a specific industry or municipality. In order to reduce the risk associated with such economic developments, at November 30, 2018, 7.9% of total investments are backed by bond insurance of various financial institutions and financial guaranty assurance agencies. The aggregate percentage insured by an individual financial institution or financial guaranty assurance agency ranged from 1.2% to 3.4% of total investments.
| (1) | Security represents the municipal bond held by a trust that issues residual interest bonds (see Note 1G). |
| (2) | Security exempt from registration pursuant to Rule 144A under the Securities Act of 1933, as amended. These securities may be sold in certain transactions in reliance on an exemption from registration (normally to qualified institutional buyers). At November 30, 2018, the aggregate value of these securities is $4,484,366 or 6.1% of the Trust’s net assets applicable to common shares. |
| (3) | Non-income producing. |
| (4) | For fair value measurement disclosure purposes, security is categorized as Level 3 (see Note 10). |
Abbreviations:
| | | | |
| AGC | | – | | Assured Guaranty Corp. |
| AGM | | – | | Assured Guaranty Municipal Corp. |
| AMBAC | | – | | AMBAC Financial Group, Inc. |
| AMT | | – | | Interest earned from these securities may be considered a tax preference item for purposes of the Federal Alternative Minimum Tax. |
| BHAC | | – | | Berkshire Hathaway Assurance Corp. |
| FNMA | | – | | Federal National Mortgage Association |
| | | | |
| | 25 | | See Notes to Financial Statements. |
Eaton Vance
Ohio Municipal Income Trust
November 30, 2018
Portfolio of Investments
| | | | | | | | |
| Tax-Exempt Investments — 152.6% | |
| Security | | Principal Amount (000’s omitted) | | | Value | |
|
| Bond Bank — 1.7% | |
Rickenbacker Port Authority, (OASBO Expanded Asset Pooled Financing Program), 5.375%, 1/1/32 | | $ | 585 | | | $ | 663,068 | |
| | | | | | | $ | 663,068 | |
|
| Education — 4.4% | |
Ohio Higher Educational Facility Commission, (Kenyon College), 5.00%, 7/1/44 | | $ | 285 | | | $ | 296,759 | |
Ohio Higher Educational Facility Commission, (Kenyon College), 5.25%, 7/1/44 | | | 400 | | | | 418,040 | |
Ohio Higher Educational Facility Commission, (Oberlin College), 5.00%, 10/1/33 | | | 500 | | | | 549,305 | |
University of Cincinnati, 5.00%, 6/1/34 | | | 500 | | | | 525,135 | |
| | | | | | | $ | 1,789,239 | |
|
| Electric Utilities — 1.3% | |
Ohio Air Quality Development Authority, (Buckeye Power, Inc.), 6.00%, 12/1/40 | | $ | 500 | | | $ | 534,500 | |
| | | | | | | $ | 534,500 | |
|
| Escrowed / Prerefunded — 12.9% | |
Apollo Career Center Joint Vocational School District, Prerefunded to 12/1/21, 5.25%, 12/1/33 | | $ | 335 | | | $ | 366,259 | |
Guam, Limited Obligation Bonds, Prerefunded to 12/1/19, 5.625%, 12/1/29 | | | 155 | | | | 160,661 | |
Guam, Limited Obligation Bonds, Prerefunded to 12/1/19, 5.75%, 12/1/34 | | | 170 | | | | 176,416 | |
Hancock County, (Blanchard Valley Regional Health Center), Prerefunded to 6/1/21, 6.25%, 12/1/34 | | | 750 | | | | 825,368 | |
Montgomery County, (Catholic Health Initiatives), Prerefunded to 5/1/19, 5.50%, 5/1/34 | | | 175 | | | | 177,546 | |
Ohio Higher Educational Facility Commission, (Cleveland Clinic Health System), Prerefunded to 1/1/19, 5.50%, 1/1/39 | | | 1,000 | | | | 1,002,720 | |
Ohio Higher Educational Facility Commission, (Kenyon College), Prerefunded to 7/1/20, 5.00%, 7/1/44 | | | 155 | | | | 162,122 | |
Ohio Higher Educational Facility Commission, (Kenyon College), Prerefunded to 7/1/20, 5.25%, 7/1/44 | | | 850 | | | | 892,338 | |
Ohio Higher Educational Facility Commission, (Summa Health System), Prerefunded to 5/15/20, 5.75%, 11/15/40 | | | 350 | | | | 368,319 | |
Ohio State University, Escrowed to Maturity, 5.00%, 12/1/28 | | | 20 | | | | 24,200 | |
Symmes Township, Hamilton County, (Parkland Acquisition and Improvement), Prerefunded to 12/1/20, 5.25%, 12/1/37 | | | 1,000 | | | | 1,064,360 | |
| | | | | | | $ | 5,220,309 | |
| | | | | | | | |
| Security | | Principal Amount (000’s omitted) | | | Value | |
|
| General Obligations — 38.1% | |
Cleveland, 5.00%, 12/1/43(1) | | $ | 2,775 | | | $ | 3,094,458 | |
Forest Hills Local School District,
5.00%, 12/1/46(1) | | | 2,775 | | | | 3,061,297 | |
Ohio, 5.00%, 2/1/37(1) | | | 2,775 | | | | 3,107,250 | |
Upper Arlington City School District, 5.00%, 12/1/48(1) | | | 2,775 | | | | 3,114,216 | |
Will County, IL, 5.00%, 11/15/45(1) | | | 2,775 | | | | 3,033,630 | |
| | | | | | | $ | 15,410,851 | |
|
| Hospital — 21.9% | |
Allen County, (Mercy Health), 4.00%, 8/1/47(1) | | $ | 1,000 | | | $ | 976,790 | |
Butler County, (Kettering Health Network Obligated Group), 5.25%, 4/1/31 | | | 500 | | | | 528,450 | |
Franklin County, (Nationwide Children’s Hospital), Prerefunded to 11/1/19, 5.00%, 11/1/34 | | | 800 | | | | 821,632 | |
Franklin County, (Trinity Health Credit Group), 5.00%, 12/1/47(1) | | | 2,800 | | | | 3,069,248 | |
Hamilton County, (Cincinnati Children’s Hospital Medical Center), 5.00%, 5/15/34 | | | 250 | | | | 274,870 | |
Lucas County, (ProMedica Healthcare Obligated Group), 4.00%, 11/15/45 | | | 315 | | | | 275,414 | |
Middleburg Heights, (Southwest General Health Center), 5.25%, 8/1/36 | | | 500 | | | | 536,815 | |
Middleburg Heights, (Southwest General Health Center), 5.25%, 8/1/41 | | | 800 | | | | 857,408 | |
Montgomery County, (Catholic Health Initiatives), 5.50%, 5/1/34 | | | 325 | | | | 329,400 | |
Ohio Higher Educational Facility Commission, (Summa Health System), 5.75%, 11/15/40 | | | 205 | | | | 213,112 | |
Ohio Higher Educational Facility Commission, (University Hospitals Health System, Inc.), 5.00%, 1/15/27 | | | 565 | | | | 614,494 | |
Ohio Higher Educational Facility Commission, (University Hospitals Health System, Inc.), 5.00%, 1/15/29 | | | 165 | | | | 177,746 | |
Southeastern Ohio Port Authority, (Memorial Health System Obligated Group), 5.00%, 12/1/43 | | | 90 | | | | 90,202 | |
Southeastern Ohio Port Authority, (Memorial Health System Obligated Group), 5.50%, 12/1/43 | | | 80 | | | | 82,650 | |
| | | | | | | $ | 8,848,231 | |
|
| Housing — 2.5% | |
Ohio Housing Finance Agency, (GNMA, FNMA, FHLMC), 3.80%, 9/1/38 | | $ | 1,000 | | | $ | 1,001,430 | |
| | | | | | | $ | 1,001,430 | |
|
| Industrial Development Revenue — 1.4% | |
Cleveland, (Continental Airlines), (AMT), 5.375%, 9/15/27 | | $ | 555 | | | $ | 556,637 | |
| | | | | | | $ | 556,637 | |
| | | | |
| | 26 | | See Notes to Financial Statements. |
Eaton Vance
Ohio Municipal Income Trust
November 30, 2018
Portfolio of Investments — continued
| | | | | | | | |
| Security | | Principal Amount (000’s omitted) | | | Value | |
|
| Insured – Education — 1.9% | |
Hamilton County, (University Heights Community Urban Development Corp.), (AGM), 5.00%, 6/1/30 | | $ | 750 | | | $ | 779,978 | |
| | | | | | | $ | 779,978 | |
|
| Insured – Electric Utilities — 12.7% | |
Cleveland, Public Power System Revenue, (NPFG), 0.00%, 11/15/27 | | $ | 710 | | | $ | 522,808 | |
Cleveland, Public Power System Revenue, (NPFG), 0.00%, 11/15/38 | | | 2,000 | | | | 860,080 | |
Ohio Municipal Electric Generation Agency, (NPFG), 0.00%, 2/15/25 | | | 815 | | | | 676,841 | |
Ohio Municipal Electric Generation Agency, (NPFG), 0.00%, 2/15/26 | | | 3,000 | | | | 2,392,290 | |
Puerto Rico Electric Power Authority, (NPFG), 5.25%, 7/1/26 | | | 305 | | | | 321,693 | |
Puerto Rico Electric Power Authority, (NPFG), 5.25%, 7/1/29 | | | 200 | | | | 210,590 | |
Puerto Rico Electric Power Authority, (NPFG), 5.25%, 7/1/34 | | | 155 | | | | 161,073 | |
| | | | | | | $ | 5,145,375 | |
|
| Insured – Escrowed / Prerefunded — 4.0% | |
American Municipal Power-Ohio, Inc., (Prairie State Energy Campus), (AGC), Prerefunded to 2/15/19, 5.75%, 2/15/39 | | $ | 1,000 | | | $ | 1,007,900 | |
Brooklyn City School District, (AGM), Prerefunded to 12/1/20, 5.00%, 12/1/38 | | | 555 | | | | 587,462 | |
| | | | | | | $ | 1,595,362 | |
|
| Insured – General Obligations — 4.0% | |
Canal Winchester Local School District, (NPFG), 0.00%, 12/1/30 | | $ | 2,455 | | | $ | 1,625,136 | |
| | | | | | | $ | 1,625,136 | |
|
| Insured – Transportation — 9.2% | |
Cleveland, Airport System Revenue, (AGM), 5.00%, 1/1/30 | | $ | 600 | | | $ | 642,156 | |
Ohio, (Portsmouth Gateway Group, LLC), (AGM), (AMT), 5.00%, 12/31/39 | | | 140 | | | | 150,613 | |
Ohio Turnpike Commission, (NPFG), 5.50%, 2/15/24 | | | 1,000 | | | | 1,123,610 | |
Ohio Turnpike Commission, (NPFG), 5.50%, 2/15/26 | | | 1,000 | | | | 1,176,140 | |
Puerto Rico Highway and Transportation Authority, (AMBAC), 5.25%, 7/1/38 | | | 590 | | | | 629,902 | |
| | | | | | | $ | 3,722,421 | |
|
| Insured – Water and Sewer — 1.7% | |
Puerto Rico Aqueduct and Sewer Authority, (AGC), 5.00%, 7/1/28 | | $ | 665 | | | $ | 688,574 | |
| | | | | | | $ | 688,574 | |
| | | | | | | | |
| Security | | Principal Amount (000’s omitted) | | | Value | |
|
| Other Revenue — 2.2% | |
Riversouth Authority, (Lazarus Building Redevelopment), 5.75%, 12/1/27 | | $ | 875 | | | $ | 876,663 | |
| | | | | | | $ | 876,663 | |
|
| Senior Living / Life Care — 3.4% | |
Franklin County, (Friendship Village of Dublin), 5.00%, 11/15/44 | | $ | 650 | | | $ | 672,262 | |
Hamilton County, (Life Enriching Communities), 5.00%, 1/1/32 | | | 375 | | | | 386,543 | |
Warren County, (Otterbein Homes Obligated Group), 5.75%, 7/1/33 | | | 275 | | | | 306,350 | |
| | | | | | | $ | 1,365,155 | |
|
| Special Tax Revenue — 15.5% | |
Cleveland, Income Tax Revenue, 5.00%, 10/1/39(1) | | $ | 550 | | | $ | 616,061 | |
Cleveland, Income Tax Revenue, 5.00%, 10/1/43(1) | | | 2,200 | | | | 2,447,566 | |
Franklin County, Sales Tax Revenue, 5.00%, 6/1/38(1) | | | 1,400 | | | | 1,606,108 | |
Franklin County, Sales Tax Revenue, 5.00%, 6/1/43(1) | | | 1,400 | | | | 1,591,366 | |
| | | | | | | $ | 6,261,101 | |
| | |
| Water and Sewer — 13.8% | | | | | | |
Texas Water Development Board, 4.00%, 10/15/47(1) | | $ | 5,500 | | | $ | 5,565,285 | |
| | | | | | | $ | 5,565,285 | |
| |
TotalTax-Exempt Investments — 152.6%
(identified cost $59,893,715) | | | $ | 61,649,315 | |
| |
Other Assets, Less Liabilities — (52.6)% | | | $ | (21,243,564 | ) |
| |
Net Assets Applicable to Common Shares — 100.0% | | | $ | 40,405,751 | |
The percentage shown for each investment category in the Portfolio of Investments is based on net assets applicable to common shares.
The Trust invests primarily in debt securities issued by Ohio municipalities. The ability of the issuers of the debt securities to meet their obligations may be affected by economic developments in a specific industry or municipality. In order to reduce the risk associated with such economic developments, at November 30, 2018, 22.0% of total investments are backed by bond insurance of various financial institutions and financial guaranty assurance agencies. The aggregate percentage insured by an individual financial institution or financial guaranty assurance agency ranged from 1.0% to 14.7% of total investments.
| (1) | Security represents the municipal bond held by a trust that issues residual interest bonds (see Note 1G). |
| | | | |
| | 27 | | See Notes to Financial Statements. |
Eaton Vance
Ohio Municipal Income Trust
November 30, 2018
Portfolio of Investments — continued
Abbreviations:
| | | | |
| AGC | | – | | Assured Guaranty Corp. |
| AGM | | – | | Assured Guaranty Municipal Corp. |
| AMBAC | | – | | AMBAC Financial Group, Inc. |
| AMT | | – | | Interest earned from these securities may be considered a tax preference item for purposes of the Federal Alternative Minimum Tax. |
| FHLMC | | – | | Federal Home Loan Mortgage Corp. |
| FNMA | | – | | Federal National Mortgage Association |
| GNMA | | – | | Government National Mortgage Association |
| NPFG | | – | | National Public Finance Guaranty Corp. |
| | | | |
| | 28 | | See Notes to Financial Statements. |
Eaton Vance
Pennsylvania Municipal Income Trust
November 30, 2018
Portfolio of Investments
| | | | | | | | |
| Tax-Exempt Municipal Securities — 160.8% | |
| Security | | Principal
Amount
(000’s omitted) | | | Value | |
|
| Cogeneration — 0.3% | |
Northampton County Industrial Development Authority, (Northampton Generating), (AMT), 5.00%, 12/31/23(1) | | $ | 378 | | | $ | 113,437 | |
| | | | | | | $ | 113,437 | |
|
| Education — 25.1% | |
Bucks County Industrial Development Authority, (George School), 5.00%, 9/15/39 | | $ | 500 | | | $ | 510,385 | |
Northampton County General Purpose Authority, (Moravian College), 5.00%, 10/1/24 | | | 45 | | | | 50,081 | |
Northampton County General Purpose Authority, (Moravian College), 5.00%, 10/1/25 | | | 65 | | | | 72,966 | |
Northampton County General Purpose Authority, (Moravian College), 5.00%, 10/1/26 | | | 85 | | | | 95,576 | |
Northampton County General Purpose Authority, (Moravian College), 5.00%, 10/1/30 | | | 70 | | | | 76,678 | |
Pennsylvania State University, 5.00%, 9/1/42(2) | | | 3,250 | | | | 3,693,820 | |
State Public School Building Authority, (Northampton County Area Community College), 5.50%, 3/1/31 | | | 750 | | | | 799,230 | |
Swarthmore Borough Authority, (Swarthmore College), 5.00%, 9/15/38 | | | 250 | | | | 278,163 | |
Swarthmore Borough Authority, (Swarthmore College), 5.00%, 9/15/46(2) | | | 2,525 | | | | 2,885,620 | |
| | | | | | | $ | 8,462,519 | |
|
| Escrowed / Prerefunded — 18.8% | |
Allegheny County Higher Education Building Authority, (Duquesne University), Prerefunded to 3/1/21, 5.50%, 3/1/31 | | $ | 1,050 | | | $ | 1,128,697 | |
Cumberland County Municipal Authority, (Dickinson College), Prerefunded to 11/1/19, 5.00%, 11/1/39 | | | 1,200 | | | | 1,232,988 | |
Dauphin County General Authority, (Pinnacle Health System), Prerefunded to 6/1/19, 6.00%, 6/1/29 | | | 360 | | | | 367,348 | |
Northampton County General Purpose Authority, (Lehigh University), Prerefunded to 5/15/19, 5.00%, 11/15/39 | | | 500 | | | | 507,200 | |
Pennsylvania Higher Educational Facilities Authority, (Thomas Jefferson University), Prerefunded to 3/1/20, 5.00%, 3/1/40 | | | 625 | | | | 647,550 | |
Pennsylvania Turnpike Commission, Prerefunded to 6/1/19, 5.25%, 6/1/39 | | | 515 | | | | 523,631 | |
Pennsylvania Turnpike Commission, Prerefunded to 6/1/19, 5.25%, 6/1/39 | | | 420 | | | | 427,039 | |
Pennsylvania Turnpike Commission, Prerefunded to 6/1/19, 5.25%, 6/1/39 | | | 65 | | | | 66,089 | |
Pennsylvania Turnpike Commission, Prerefunded to 12/1/20, 5.35%, 12/1/30 | | | 385 | | | | 410,137 | |
Pennsylvania Turnpike Commission, Prerefunded to 12/1/20, 5.35%, 12/1/30 | | | 495 | | | | 527,319 | |
| | | | | | | | |
| Security | | Principal
Amount
(000’s omitted) | | | Value | |
|
| Escrowed / Prerefunded (continued) | |
Philadelphia, Gas Works Revenue, Prerefunded to 8/1/20, 5.25%, 8/1/40 | | $ | 235 | | | $ | 247,312 | |
South Fork Municipal Authority, (Conemaugh Health System), Prerefunded to 7/1/20, 5.50%, 7/1/29 | | | 250 | | | | 263,215 | |
| | | | | | | $ | 6,348,525 | |
|
| General Obligations — 40.6% | |
Allegheny County, 5.00%, 11/1/43(2) | | $ | 2,875 | | | $ | 3,210,398 | |
Chester County, 5.00%, 7/15/27 | | | 105 | | | | 106,975 | |
Delaware Valley Regional Finance Authority, 5.75%, 7/1/32 | | | 1,000 | | | | 1,245,140 | |
Pennsylvania, 5.00%, 3/1/32(2) | | | 2,250 | | | | 2,550,510 | |
Peters Township School District, 5.00%, 9/1/40(2) | | | 2,750 | | | | 3,078,240 | |
State College Area School District, 5.00%, 5/15/44(2) | | | 3,100 | | | | 3,492,522 | |
| | | | | | | $ | 13,683,785 | |
|
| Hospital — 23.5% | |
Allegheny County Hospital Development Authority, (University of Pittsburgh Medical Center), 5.50%, 8/15/34 | | $ | 500 | | | $ | 511,215 | |
Dauphin County General Authority, (Pinnacle Health System), 6.00%, 6/1/29 | | | 390 | | | | 397,063 | |
Lycoming County Authority, (Susquehanna Health System), 5.75%, 7/1/39 | | | 750 | | | | 766,620 | |
Northampton County General Purpose Authority, (Saint Luke’s Hospital), 5.50%, 8/15/33 | | | 250 | | | | 261,870 | |
Pennsylvania Higher Educational Facilities Authority, (University of Pennsylvania Health System), 4.00%, 8/15/42(2) | | | 5,250 | | | | 5,285,962 | |
Pennsylvania Higher Educational Facilities Authority, (UPMC Health System), 5.00%, 5/15/31 | | | 675 | | | | 701,251 | |
| | | | | | | $ | 7,923,981 | |
|
| Housing — 0.6% | |
East Hempfield Township Industrial Development Authority, (Student Services, Inc.), 5.00%, 7/1/39 | | $ | 175 | | | $ | 181,185 | |
| | | | | | | $ | 181,185 | |
|
| Industrial Development Revenue — 7.1% | |
Delaware County Industrial Development Authority, (Covanta), 5.00%, 7/1/43(3) | | $ | 750 | | | $ | 753,577 | |
Luzerne County Industrial Development Authority, (Pennsylvania-American Water Co.), 5.50%, 12/1/39 | | | 200 | | | | 206,020 | |
Pennsylvania Economic Development Financing Authority, (Pennsylvania-American Water Co.), 6.20%, 4/1/39 | | | 250 | | | | 253,168 | |
Pennsylvania Economic Development Financing Authority, (Procter & Gamble Paper Products Co.), (AMT), 5.375%, 3/1/31 | | | 1,000 | | | | 1,182,050 | |
| | | | | | | $ | 2,394,815 | |
| | | | |
| | 29 | | See Notes to Financial Statements. |
Eaton Vance
Pennsylvania Municipal Income Trust
November 30, 2018
Portfolio of Investments — continued
| | | | | | | | |
| Security | | Principal
Amount
(000’s omitted) | | | Value | |
|
| Insured – Electric Utilities — 3.3% | |
Puerto Rico Electric Power Authority, (NPFG), 5.25%, 7/1/34 | | $ | 1,080 | | | $ | 1,122,314 | |
| | | | | | | $ | 1,122,314 | |
|
| Insured – Escrowed / Prerefunded — 7.4% | |
Bucks County Water and Sewer Authority, (AGM), Prerefunded to 12/1/20, 5.00%, 12/1/35 | | $ | 500 | | | $ | 529,750 | |
Westmoreland Municipal Authority, (FGIC), Escrowed to Maturity, 0.00%, 8/15/19 | | | 2,000 | | | | 1,973,400 | |
| | | | | | | $ | 2,503,150 | |
|
| Insured – Hospital — 0.9% | |
Allegheny County Hospital Development Authority, (UPMC Health System), (NPFG), 6.00%, 7/1/24 | | $ | 250 | | | $ | 294,107 | |
| | | | | | | $ | 294,107 | |
|
| Insured – Lease Revenue / Certificates of Participation — 1.5% | |
Commonwealth Financing Authority, (AGC), 5.00%, 6/1/31 | | $ | 500 | | | $ | 506,460 | |
| | | | | | | $ | 506,460 | |
|
| Insured – Special Tax Revenue — 0.9% | |
Puerto Rico Sales Tax Financing Corp., (NPFG), 0.00%, 8/1/45 | | $ | 1,235 | | | $ | 298,425 | |
| | | | | | | $ | 298,425 | |
|
| Insured – Transportation — 8.9% | |
Philadelphia Parking Authority, (AMBAC), 5.25%, 2/15/29 | | $ | 1,005 | | | $ | 1,007,754 | |
Puerto Rico Highway and Transportation Authority, (AGC), 5.25%, 7/1/41 | | | 1,800 | | | | 1,980,612 | |
| | | | | | | $ | 2,988,366 | |
|
| Senior Living / Life Care — 0.3% | |
Lancaster Industrial Development Authority, (Garden Spot Village), 5.375%, 5/1/28 | | $ | 100 | | | $ | 107,426 | |
| | | | | | | $ | 107,426 | |
|
| Special Tax Revenue — 11.0% | |
Pennsylvania Turnpike Commission, Oil Franchise Tax Revenue, 5.25%, 12/1/44(2) | | $ | 3,250 | | | $ | 3,714,262 | |
| | | | | | | $ | 3,714,262 | |
|
| Transportation — 9.5% | |
Delaware River Joint Toll Bridge Commission of Pennsylvania and New Jersey, 5.00%, 7/1/47(2) | | $ | 1,225 | | | $ | 1,362,947 | |
| | | | | | | | |
| Security | | Principal
Amount
(000’s omitted) | | | Value | |
|
| Transportation (continued) | |
Delaware River Port Authority of Pennsylvania and New Jersey, Prerefunded to 1/1/20, 5.00%, 1/1/35 | | $ | 465 | | | $ | 480,261 | |
Delaware River Port Authority of Pennsylvania and New Jersey, Prerefunded to 1/1/20, 5.00%, 1/1/40 | | | 285 | | | | 294,354 | |
Pennsylvania Economic Development Financing Authority, (Amtrak), (AMT), 5.00%, 11/1/41 | | | 450 | | | | 475,286 | |
Pennsylvania Turnpike Commission, Prerefunded to 12/1/20, 5.35%, 12/1/30 | | | 550 | | | | 584,243 | |
| | | | | | | $ | 3,197,091 | |
|
| Utilities — 1.1% | |
Philadelphia, Gas Works Revenue, 5.25%, 8/1/40 | | $ | 365 | | | $ | 382,286 | |
| | | | | | | $ | 382,286 | |
| |
TotalTax-Exempt Municipal Securities — 160.8%
(identified cost $53,453,608) | | | $ | 54,222,134 | |
|
| Taxable Municipal Securities — 0.1% | |
| Security | | Principal
Amount
(000’s omitted) | | | Value | |
|
| Cogeneration — 0.1% | |
Northampton County Industrial Development Authority, (Northampton Generating), 5.00%, 12/31/23(1) | | $ | 69 | | | $ | 20,641 | |
| |
Total Taxable Municipal Securities — 0.1%
(identified cost $68,803) | | | $ | 20,641 | |
| |
Total Investments — 160.9%
(identified cost $53,522,411) | | | $ | 54,242,775 | |
| |
Other Assets, Less Liabilities — (60.9)% | | | $ | (20,529,517 | ) |
| |
Net Assets Applicable to Common Shares — 100.0% | | | $ | 33,713,258 | |
The percentage shown for each investment category in the Portfolio of Investments is based on net assets applicable to common shares.
The Trust invests primarily in debt securities issued by Pennsylvania municipalities. The ability of the issuers of the debt securities to meet their obligations may be affected by economic developments in a specific industry or municipality. In order to reduce the risk associated with such economic developments, at November 30, 2018, 14.2% of total investments are backed by bond insurance of various financial institutions and financial guaranty assurance agencies. The aggregate percentage insured by an individual financial institution or financial guaranty assurance agency ranged from 1.0% to 4.6% of total investments.
| | | | |
| | 30 | | See Notes to Financial Statements. |
Eaton Vance
Pennsylvania Municipal Income Trust
November 30, 2018
Portfolio of Investments — continued
| (1) | Represents apayment-in-kind security which may pay interest in additional principal at the issuer’s discretion. |
| (2) | Security represents the municipal bond held by a trust that issues residual interest bonds (see Note 1G). |
| (3) | Security exempt from registration pursuant to Rule 144A under the Securities Act of 1933, as amended. These securities may be sold in certain transactions in reliance on an exemption from registration (normally to qualified institutional buyers). At November 30, 2018, the aggregate value of these securities is $753,577 or 2.2% of the Trust’s net assets applicable to common shares. |
Abbreviations:
| | | | |
| AGC | | – | | Assured Guaranty Corp. |
| AGM | | – | | Assured Guaranty Municipal Corp. |
| AMBAC | | – | | AMBAC Financial Group, Inc. |
| AMT | | – | | Interest earned from these securities may be considered a tax preference item for purposes of the Federal Alternative Minimum Tax. |
| FGIC | | – | | Financial Guaranty Insurance Company |
| NPFG | | – | | National Public Finance Guaranty Corp. |
| | | | |
| | 31 | | See Notes to Financial Statements. |
Eaton Vance
Municipal Income Trusts
November 30, 2018
Statements of Assets and Liabilities
| | | | | | | | | | | | | | | | |
| | | November 30, 2018 | |
| Assets | | California Trust | | | Massachusetts Trust | | | Michigan Trust | | | New Jersey Trust | |
Investments — | | | | | | | | | | | | | | | | |
Identified cost | | $ | 147,577,357 | | | $ | 57,490,940 | | | $ | 45,147,362 | | | $ | 89,465,655 | |
Unrealized appreciation | | | 4,566,043 | | | | 1,582,440 | | | | 609,829 | | | | 1,939,575 | |
Investments, at value | | $ | 152,143,400 | | | $ | 59,073,380 | | | $ | 45,757,191 | | | $ | 91,405,230 | |
Cash | | $ | 182,744 | | | $ | 220,516 | | | $ | 462,967 | | | $ | 681,176 | |
Interest receivable | | | 1,553,332 | | | | 848,718 | | | | 536,469 | | | | 1,239,169 | |
Total assets | | $ | 153,879,476 | | | $ | 60,142,614 | | | $ | 46,756,627 | | | $ | 93,325,575 | |
|
| Liabilities | |
Payable for floating rate notes issued | | $ | 59,212,070 | | | $ | 20,995,015 | | | $ | 18,020,376 | | | $ | 32,845,195 | |
Payable for when-issued securities | | | 637,686 | | | | — | | | | — | | | | — | |
Payable to affiliates: | | | | | | | | | | | | | | | | |
Investment adviser fee | | | 49,295 | | | | 19,559 | | | | 15,054 | | | | 30,367 | |
Administration fee | | | 24,647 | | | | 9,780 | | | | 7,527 | | | | 15,184 | |
Trustees’ fees | | | 995 | | | | 467 | | | | 388 | | | | 788 | |
Interest expense and fees payable | | | 176,574 | | | | 106,818 | | | | 69,473 | | | | 136,344 | |
Accrued expenses | | | 82,857 | | | | 60,091 | | | | 72,097 | | | | 74,102 | |
Total liabilities | | $ | 60,184,124 | | | $ | 21,191,730 | | | $ | 18,184,915 | | | $ | 33,101,980 | |
Net assets applicable to common shares | | $ | 93,695,352 | | | $ | 38,950,884 | | | $ | 28,571,712 | | | $ | 60,223,595 | |
|
| Sources of Net Assets | |
Common shares, $0.01 par value, unlimited number of shares authorized | | $ | 71,336 | | | $ | 27,370 | | | $ | 20,130 | | | $ | 45,982 | |
Additionalpaid-in capital | | | 94,006,350 | | | | 38,439,922 | | | | 27,523,126 | | | | 62,788,648 | |
Distributable earnings (accumulated loss) | | | (382,334 | ) | | | 483,592 | | | | 1,028,456 | | | | (2,611,035 | ) |
Net assets applicable to common shares | | $ | 93,695,352 | | | $ | 38,950,884 | | | $ | 28,571,712 | | | $ | 60,223,595 | |
| | | | |
| Common Shares Outstanding | | | 7,133,575 | | | | 2,737,021 | | | | 2,012,994 | | | | 4,598,158 | |
|
| Net Asset Value Per Common Share | |
Net assets applicable to common shares ÷ common shares issued and outstanding | | $ | 13.13 | | | $ | 14.23 | | | $ | 14.19 | | | $ | 13.10 | |
| | | | |
| | 32 | | See Notes to Financial Statements. |
Eaton Vance
Municipal Income Trusts
November 30, 2018
Statements of Assets and Liabilities — continued
| | | | | | | | | | | | |
| | | November 30, 2018 | |
| Assets | | New York Trust | | | Ohio Trust | | | Pennsylvania Trust | |
Investments — | | | | | | | | | | | | |
Identified cost | | $ | 111,045,148 | | | $ | 59,893,715 | | | $ | 53,522,411 | |
Unrealized appreciation | | | 3,829,937 | | | | 1,755,600 | | | | 720,364 | |
Investments, at value | | $ | 114,875,085 | | | $ | 61,649,315 | | | $ | 54,242,775 | |
Cash | | $ | 759,774 | | | $ | — | | | $ | 100,915 | |
Interest receivable | | | 1,432,455 | | | | 904,078 | | | | 758,399 | |
Receivable for investments sold | | | 1,250,000 | | | | 1,065,000 | | | | — | |
Total assets | | $ | 118,317,314 | | | $ | 63,618,393 | | | $ | 55,102,089 | |
|
| Liabilities | |
Payable for floating rate notes issued | | $ | 43,994,395 | | | $ | 22,980,096 | | | $ | 21,179,968 | |
Due to custodian | | | — | | | | 4,364 | | | | — | |
Payable to affiliates: | | | | | | | | | | | | |
Investment adviser fee | | | 38,652 | | | | 20,673 | | | | 17,939 | |
Administration fee | | | 19,326 | | | | 10,337 | | | | 8,970 | |
Trustees’ fees | | | 865 | | | | 488 | | | | 414 | |
Interest expense and fees payable | | | 247,078 | | | | 134,940 | | | | 119,519 | |
Accrued expenses | | | 78,125 | | | | 61,744 | | | | 62,021 | |
Total liabilities | | $ | 44,378,441 | | | $ | 23,212,642 | | | $ | 21,388,831 | |
Net assets applicable to common shares | | $ | 73,938,873 | | | $ | 40,405,751 | | | $ | 33,713,258 | |
|
| Sources of Net Assets | |
Common shares, $0.01 par value, unlimited number of shares authorized | | $ | 54,758 | | | $ | 28,572 | | | $ | 26,010 | |
Additionalpaid-in capital | | | 74,258,180 | | | | 38,633,048 | | | | 35,706,432 | |
Distributable earnings (accumulated loss) | | | (374,065 | ) | | | 1,744,131 | | | | (2,019,184 | ) |
Net assets applicable to common shares | | $ | 73,938,873 | | | $ | 40,405,751 | | | $ | 33,713,258 | |
| | | |
| Common Shares Outstanding | | | 5,475,751 | | | | 2,857,157 | | | | 2,601,014 | |
|
| Net Asset Value Per Common Share | |
Net assets applicable to common shares ÷ common shares issued and outstanding | | $ | 13.50 | | | $ | 14.14 | | | $ | 12.96 | |
| | | | |
| | 33 | | See Notes to Financial Statements. |
Eaton Vance
Municipal Income Trusts
November 30, 2018
Statements of Operations
| | | | | | | | | | | | | | | | |
| | | Year Ended November 30, 2018 | |
| Investment Income | | California Trust | | | Massachusetts Trust | | | Michigan Trust | | | New Jersey Trust | |
Interest | | $ | 5,987,253 | | | $ | 2,373,604 | | | $ | 1,926,014 | | | $ | 4,194,503 | |
Total investment income | | $ | 5,987,253 | | | $ | 2,373,604 | | | $ | 1,926,014 | | | $ | 4,194,503 | |
|
| Expenses | |
Investment adviser fee | | $ | 739,406 | | | $ | 240,141 | | | $ | 233,063 | | | $ | 421,202 | |
Administration fee | | | 301,217 | | | | 120,070 | | | | 92,709 | | | | 195,235 | |
Trustees’ fees and expenses | | | 6,010 | | | | 2,770 | | | | 2,280 | | | | 4,510 | |
Custodian fee | | | 52,273 | | | | 32,979 | | | | 29,513 | | | | 39,183 | |
Transfer and dividend disbursing agent fees | | | 18,902 | | | | 19,557 | | | | 18,817 | | | | 18,992 | |
Legal and accounting services | | | 62,523 | | | | 60,029 | | | | 59,224 | | | | 75,322 | |
Printing and postage | | | 14,487 | | | | 8,765 | | | | 21,127 | | | | 11,411 | |
Interest expense and fees | | | 1,444,822 | | | | 536,237 | | | | 491,225 | | | | 1,007,815 | |
Miscellaneous | | | 30,422 | | | | 29,779 | | | | 33,192 | | | | 32,253 | |
Total expenses | | $ | 2,670,062 | | | $ | 1,050,327 | | | $ | 981,150 | | | $ | 1,805,923 | |
| | | | |
Net investment income | | $ | 3,317,191 | | | $ | 1,323,277 | | | $ | 944,864 | | | $ | 2,388,580 | |
|
| Realized and Unrealized Gain (Loss) | |
Net realized gain (loss) — | |
Investment transactions | | $ | 239,277 | | | $ | 729,864 | | | $ | 745,805 | | | $ | 555,816 | |
Extinguishment of debt | | | (118,948 | ) | | | (41,418 | ) | | | (37,384 | ) | | | (56,783 | ) |
Financial futures contracts | | | — | | | | — | | | | — | | | | 100,199 | |
Net realized gain | | $ | 120,329 | | | $ | 688,446 | | | $ | 708,421 | | | $ | 599,232 | |
Change in unrealized appreciation (depreciation) — | |
Investments | | $ | (4,851,375 | ) | | $ | (2,516,821 | ) | | $ | (1,840,496 | ) | | $ | (2,426,617 | ) |
Financial futures contracts | | | — | | | | — | | | | — | | | | (47,756 | ) |
Net change in unrealized appreciation (depreciation) | | $ | (4,851,375 | ) | | $ | (2,516,821 | ) | | $ | (1,840,496 | ) | | $ | (2,474,373 | ) |
| | | | |
Net realized and unrealized loss | | $ | (4,731,046 | ) | | $ | (1,828,375 | ) | | $ | (1,132,075 | ) | | $ | (1,875,141 | ) |
| | | | |
Distributions to auction preferred shareholders | | $ | (18,865 | ) | | $ | (20,197 | ) | | $ | (3,915 | ) | | $ | (27,962 | ) |
| | | | |
Net increase (decrease) in net assets from operations | | $ | (1,432,720 | ) | | $ | (525,295 | ) | | $ | (191,126 | ) | | $ | 485,477 | |
| | | | |
| | 34 | | See Notes to Financial Statements. |
Eaton Vance
Municipal Income Trusts
November 30, 2018
Statements of Operations — continued
| | | | | | | | | | | | |
| | | Year Ended November 30, 2018 | |
| Investment Income | | New York Trust | | | Ohio Trust | | | Pennsylvania Trust | |
Interest | | $ | 5,184,934 | | | $ | 2,661,648 | | | $ | 2,364,000 | |
Total investment income | | $ | 5,184,934 | | | $ | 2,661,648 | | | $ | 2,364,000 | |
|
| Expenses | |
Investment adviser fee | | $ | 475,882 | | | $ | 265,529 | | | $ | 283,262 | |
Administration fee | | | 237,941 | | | | 127,704 | | | | 109,647 | |
Trustees’ fees and expenses | | | 5,080 | | | | 2,903 | | | | 2,485 | |
Custodian fee | | | 45,122 | | | | 34,003 | | | | 31,997 | |
Transfer and dividend disbursing agent fees | | | 18,962 | | | | 18,892 | | | | 18,922 | |
Legal and accounting services | | | 68,175 | | | | 60,465 | | | | 57,293 | |
Printing and postage | | | 12,752 | | | | 9,609 | | | | 9,109 | |
Interest expense and fees | | | 1,169,473 | | | | 597,110 | | | | 515,383 | |
Miscellaneous | | | 34,863 | | | | 33,763 | | | | 31,779 | |
Total expenses | | $ | 2,068,250 | | | $ | 1,149,978 | | | $ | 1,059,877 | |
| | | |
Net investment income | | $ | 3,116,684 | | | $ | 1,511,670 | | | $ | 1,304,123 | |
|
| Realized and Unrealized Gain (Loss) | |
Net realized gain (loss) — | |
Investment transactions | | $ | 1,624,138 | | | $ | 1,016,037 | | | $ | 365,671 | |
Extinguishment of debt | | | (64,912 | ) | | | (44,811 | ) | | | (48,386 | ) |
Financial futures contracts | | | — | | | | — | | | | 33,400 | |
Net realized gain | | $ | 1,559,226 | | | $ | 971,226 | | | $ | 350,685 | |
Change in unrealized appreciation (depreciation) — | |
Investments | | $ | (5,562,057 | ) | | $ | (2,965,710 | ) | | $ | (1,805,560 | ) |
Financial futures contracts | | | — | | | | — | | | | (15,919 | ) |
Net change in unrealized appreciation (depreciation) | | $ | (5,562,057 | ) | | $ | (2,965,710 | ) | | $ | (1,821,479 | ) |
| | | |
Net realized and unrealized loss | | $ | (4,002,831 | ) | | $ | (1,994,484 | ) | | $ | (1,470,794 | ) |
| | | |
Distributions to auction preferred shareholders | | $ | (25,202 | ) | | $ | (25,693 | ) | | $ | (25,516 | ) |
| | | |
Net decrease in net assets from operations | | $ | (911,349 | ) | | $ | (508,507 | ) | | $ | (192,187 | ) |
| | | | |
| | 35 | | See Notes to Financial Statements. |
Eaton Vance
Municipal Income Trusts
November 30, 2018
Statements of Changes in Net Assets
| | | | | | | | | | | | | | | | |
| | | Year Ended November 30, 2018 | |
| Increase (Decrease) in Net Assets | | California Trust | | | Massachusetts Trust | | | Michigan Trust | | | New Jersey Trust | |
From operations — | |
Net investment income | | $ | 3,317,191 | | | $ | 1,323,277 | | | $ | 944,864 | | | $ | 2,388,580 | |
Net realized gain | | | 120,329 | | | | 688,446 | | | | 708,421 | | | | 599,232 | |
Net change in unrealized appreciation (depreciation) | | | (4,851,375 | ) | | | (2,516,821 | ) | | | (1,840,496 | ) | | | (2,474,373 | ) |
Distributions to auction preferred shareholders | | | (18,865 | ) | | | (20,197 | ) | | | (3,915 | ) | | | (27,962 | ) |
Net increase (decrease) in net assets from operations | | $ | (1,432,720 | ) | | $ | (525,295 | ) | | $ | (191,126 | ) | | $ | 485,477 | |
| | | | |
Distributions to common shareholders | | $ | (3,323,028 | ) | | $ | (1,274,357 | ) | | $ | (944,496 | ) | | $ | (2,521,630 | ) |
Capital share transactions — | |
Cost of shares repurchased (see Note 7) | | $ | (1,478,804 | ) | | $ | — | | | $ | — | | | $ | — | |
Net decrease in net assets from capital share transactions | | $ | (1,478,804 | ) | | $ | — | | | $ | — | | | $ | — | |
| | | | |
Net decrease in net assets | | $ | (6,234,552 | ) | | $ | (1,799,652 | ) | | $ | (1,135,622 | ) | | $ | (2,036,153 | ) |
|
| Net Assets Applicable to Common Shares | |
At beginning of year | | $ | 99,929,904 | | | $ | 40,750,536 | | | $ | 29,707,334 | | | $ | 62,259,748 | |
At end of year | | $ | 93,695,352 | | | $ | 38,950,884 | | | $ | 28,571,712 | | | $ | 60,223,595 | |
| | | | |
| | 36 | | See Notes to Financial Statements. |
Eaton Vance
Municipal Income Trusts
November 30, 2018
Statements of Changes in Net Assets — continued
| | | | | | | | | | | | |
| | | Year Ended November 30, 2018 | |
| Increase (Decrease) in Net Assets | | New York Trust | | | Ohio Trust | | | Pennsylvania Trust | |
From operations — | |
Net investment income | | $ | 3,116,684 | | | $ | 1,511,670 | | | $ | 1,304,123 | |
Net realized gain | | | 1,559,226 | | | | 971,226 | | | | 350,685 | |
Net change in unrealized appreciation (depreciation) | | | (5,562,057 | ) | | | (2,965,710 | ) | | | (1,821,479 | ) |
Distributions to auction preferred shareholders | | | (25,202 | ) | | | (25,693 | ) | | | (25,516 | ) |
Net decrease in net assets from operations | | $ | (911,349 | ) | | $ | (508,507 | ) | | $ | (192,187 | ) |
| | | |
Distributions to common shareholders | | $ | (3,175,388 | ) | | $ | (1,546,293 | ) | | $ | (1,314,032 | ) |
| | | |
Net decrease in net assets | | $ | (4,086,737 | ) | | $ | (2,054,800 | ) | | $ | (1,506,219 | ) |
|
| Net Assets Applicable to Common Shares | |
At beginning of year | | $ | 78,025,610 | | | $ | 42,460,551 | | | $ | 35,219,477 | |
At end of year | | $ | 73,938,873 | | | $ | 40,405,751 | | | $ | 33,713,258 | |
| | | | |
| | 37 | | See Notes to Financial Statements. |
Eaton Vance
Municipal Income Trusts
November 30, 2018
Statements of Changes in Net Assets — continued
| | | | | | | | | | | | | | | | |
| | | Year Ended November 30, 2017 | |
| Increase (Decrease) in Net Assets | | California Trust | | | Massachusetts Trust | | | Michigan Trust | | | New Jersey Trust | |
From operations — | |
Net investment income | | $ | 3,597,624 | | | $ | 1,485,231 | | | $ | 991,436 | | | $ | 2,633,258 | |
Net realized gain (loss) | | | (319,376 | ) | | | (225,791 | ) | | | 27,235 | | | | 150,172 | |
Net change in unrealized appreciation (depreciation) | | | 1,647,103 | | | | 1,097,369 | | | | 466,360 | | | | 321,139 | |
Distributions to auction preferred shareholders(1) | | | (40,183 | ) | | | (43,282 | ) | | | (8,726 | ) | | | (58,437 | ) |
Net increase in net assets from operations | | $ | 4,885,168 | | | $ | 2,313,527 | | | $ | 1,476,305 | | | $ | 3,046,132 | |
| | | | |
Distributions to common shareholders(1) | | $ | (3,588,113 | ) | | $ | (1,424,893 | ) | | $ | (977,711 | ) | | $ | (2,551,978 | ) |
| | | | |
Net increase in net assets | | $ | 1,297,055 | | | $ | 888,634 | | | $ | 498,594 | | | $ | 494,154 | |
|
| Net Assets Applicable to Common Shares | |
At beginning of year | | $ | 98,632,849 | | | $ | 39,861,902 | | | $ | 29,208,740 | | | $ | 61,765,594 | |
At end of year(2) | | $ | 99,929,904 | | | $ | 40,750,536 | | | $ | 29,707,334 | | | $ | 62,259,748 | |
| (1) | For the year ended November 30, 2017, the source of distributions was from net investment income. The current period presentation of distributions conforms with the Disclosure Update and Simplification Rule issued by the Securities and Exchange Commission, effective November 5, 2018. |
| (2) | Includes accumulated undistributed net investment income of $161,492, $195,711, $115,569 and $258,823, respectively, at November 30, 2017. The requirement to disclose the corresponding amounts as of November 30, 2018 was eliminated. |
| | | | |
| | 38 | | See Notes to Financial Statements. |
Eaton Vance
Municipal Income Trusts
November 30, 2018
Statements of Changes in Net Assets — continued
| | | | | | | | | | | | |
| | | Year Ended November 30, 2017 | |
| Increase (Decrease) in Net Assets | | New York Trust | | | Ohio Trust | | | Pennsylvania Trust | |
From operations — | |
Net investment income | | $ | 3,439,788 | | | $ | 1,647,178 | | | $ | 1,446,734 | |
Net realized gain (loss) | | | (141,063 | ) | | | 192,631 | | | | 1,347 | |
Net change in unrealized appreciation (depreciation) | | | 905,348 | | | | (97,951 | ) | | | (444,122 | ) |
Distributions to auction preferred shareholders(1) | | | (54,767 | ) | | | (57,593 | ) | | | (55,934 | ) |
Net increase in net assets from operations | | $ | 4,149,306 | | | $ | 1,684,265 | | | $ | 948,025 | |
| | | |
Distributions to common shareholders(1) | | $ | (3,313,377 | ) | | $ | (1,662,294 | ) | | $ | (1,344,984 | ) |
| | | |
Net increase (decrease) in net assets | | $ | 835,929 | | | $ | 21,971 | | | $ | (396,959 | ) |
|
| Net Assets Applicable to Common Shares | |
At beginning of year | | $ | 77,189,681 | | | $ | 42,438,580 | | | $ | 35,616,436 | |
At end of year(2) | | $ | 78,025,610 | | | $ | 42,460,551 | | | $ | 35,219,477 | |
| (1) | For the year ended November 30, 2017, the source of distributions was from net investment income. The current period presentation of distributions conforms with the Disclosure Update and Simplification Rule issued by the Securities and Exchange Commission, effective November 5, 2018. |
| (2) | Includes accumulated undistributed net investment income of $228,839, $204,040 and $132,428, respectively, at November 30, 2017. The requirement to disclose the corresponding amounts as of November 30, 2018 was eliminated. |
| | | | |
| | 39 | | See Notes to Financial Statements. |
Eaton Vance
Municipal Income Trusts
November 30, 2018
Statements of Cash Flows
| | | | | | | | | | | | | | | | |
| | | Year Ended November 30, 2018 | |
| Cash Flows From Operating Activities | | California Trust | | | Massachusetts Trust | | | Michigan Trust | | | New Jersey Trust | |
Net increase (decrease) in net assets from operations | | $ | (1,432,720 | ) | | $ | (525,295 | ) | | $ | (191,126 | ) | | $ | 485,477 | |
Distributions to auction preferred shareholders | | | 18,865 | | | | 20,197 | | | | 3,915 | | | | 27,962 | |
Net increase (decrease) in net assets from operations excluding distributions to auction preferred shareholders | | $ | (1,413,855 | ) | | $ | (505,098 | ) | | $ | (187,211 | ) | | $ | 513,439 | |
Adjustments to reconcile net increase (decrease) in net assets from operations to net cash provided by operating activities: | | | | | | | | | | | | | | | | |
Investments purchased | | | (198,096,155 | ) | | | (41,561,819 | ) | | | (26,414,186 | ) | | | (54,960,822 | ) |
Investments sold | | | 197,012,233 | | | | 41,370,725 | | | | 25,863,618 | | | | 61,257,214 | |
Net amortization/accretion of premium (discount) | | | 161,671 | | | | 307,251 | | | | 199,104 | | | | (90,663 | ) |
Amortization of deferred debt issuance costs | | | 238 | | | | — | | | | — | | | | — | |
Amortization of deferred offering costs on Institutional MuniFund Term Preferred Shares | | | 67,787 | | | | 35,112 | | | | 37,052 | | | | 61,426 | |
Decrease in deposits for derivatives collateral — financial futures contracts | | | — | | | | — | | | | — | | | | 81,000 | |
Decrease (increase) in interest receivable | | | 73,282 | | | | (80,176 | ) | | | (15,775 | ) | | | 227,463 | |
Decrease in receivable for variation margin on open financial futures contracts | | | — | | | | — | | | | — | | | | 14,063 | |
Decrease in payable to affiliate for investment adviser fee | | | (26,220 | ) | | | (843 | ) | | | (7,569 | ) | | | (17,680 | ) |
Decrease in payable to affiliate for administration fee | | | (1,393 | ) | | | (421 | ) | | | (274 | ) | | | (1,384 | ) |
Decrease in payable to affiliate for Trustees’ fees | | | (523 | ) | | | (176 | ) | | | (122 | ) | | | (204 | ) |
Increase in interest expense and fees payable | | | 158,932 | | | | 102,919 | | | | 69,473 | | | | 123,653 | |
Increase (decrease) in accrued expenses | | | (4,367 | ) | | | 2,199 | | | | 18,311 | | | | (461 | ) |
Net change in unrealized (appreciation) depreciation from investments | | | 4,851,375 | | | | 2,516,821 | | | | 1,840,496 | | | | 2,426,617 | |
Net realized gain from investments | | | (239,277 | ) | | | (729,864 | ) | | | (745,805 | ) | | | (555,816 | ) |
Net realized loss on extinguishment of debt | | | 118,948 | | | | 41,418 | | | | 37,384 | | | | 56,783 | |
Net cash provided by operating activities | | $ | 2,662,676 | | | $ | 1,498,048 | | | $ | 694,496 | | | $ | 9,134,628 | |
| | | | |
| Cash Flows From Financing Activities | | | | | | | | | | | | | | | | |
Repurchase of common shares | | $ | (1,478,804 | ) | | $ | — | | | $ | — | | | $ | — | |
Cash distributions paid to common shareholders | | | (3,323,028 | ) | | | (1,274,357 | ) | | | (944,496 | ) | | | (2,521,630 | ) |
Cash distributions paid to auction preferred shareholders | | | (19,261 | ) | | | (20,456 | ) | | | (3,919 | ) | | | (28,410 | ) |
Liquidation of auction preferred shares | | | (3,000,000 | ) | | | (3,250,000 | ) | | | (650,000 | ) | | | (4,425,000 | ) |
Liquidation of Institutional MuniFund Term Preferred Shares | | | (46,975,000 | ) | | | (16,800,000 | ) | | | (16,850,000 | ) | | | (29,000,000 | ) |
Proceeds from secured borrowings | | | 88,100,000 | | | | 20,080,000 | | | | 18,020,000 | | | | 32,840,000 | |
Repayment of secured borrowings | | | (36,240,000 | ) | | | — | | | | — | | | | (5,330,000 | ) |
Decrease in due to custodian | | | — | | | | (12,719 | ) | | | — | | | | — | |
Net cash used in financing activities | | $ | (2,936,093 | ) | | $ | (1,277,532 | ) | | $ | (428,415 | ) | | $ | (8,465,040 | ) |
| | | | |
Net increase (decrease) in cash | | $ | (273,417 | ) | | $ | 220,516 | | | $ | 266,081 | | | $ | 669,588 | |
| | | | |
Cash at beginning of year | | $ | 456,161 | | | $ | — | | | $ | 196,886 | | | $ | 11,588 | |
| | | | |
Cash at end of year | | $ | 182,744 | | | $ | 220,516 | | | $ | 462,967 | | | $ | 681,176 | |
| | | | |
| Supplemental disclosure of cash flow information: | | | | | | | | | | | | | | | | |
Cash paid for interest and fees on floating rate notes issued and Institutional MuniFund Term Preferred Shares | | $ | 1,217,865 | | | $ | 398,206 | | | $ | 384,700 | | | $ | 822,736 | |
| | | | |
| | 40 | | See Notes to Financial Statements. |
Eaton Vance
Municipal Income Trusts
November 30, 2018
Statements of Cash Flows — continued
| | | | | | | | | | | | |
| | | Year Ended November 30, 2018 | |
| Cash Flows From Operating Activities | | New York Trust | | | Ohio Trust | | | Pennsylvania Trust | |
Net decrease in net assets from operations | | $ | (911,349 | ) | | $ | (508,507 | ) | | $ | (192,187 | ) |
Distributions to auction preferred shareholders | | | 25,202 | | | | 25,693 | | | | 25,516 | |
Net decrease in net assets from operations excluding distributions to auction preferred shareholders | | $ | (886,147 | ) | | $ | (482,814 | ) | | $ | (166,671 | ) |
Adjustments to reconcile net decrease in net assets from operations to net cash provided by operating activities: | | | | | | | | | | | | |
Investments purchased | | | (70,274,997 | ) | | | (35,555,636 | ) | | | (33,969,750 | ) |
Investments sold | | | 75,907,973 | | | | 36,842,039 | | | | 33,275,170 | |
Net amortization/accretion of premium (discount) | | | 217,029 | | | | (6,916 | ) | | | 86,411 | |
Amortization of deferred offering costs on Institutional MuniFund Term Preferred Shares | | | 55,030 | | | | 37,987 | | | | 29,556 | |
Decrease in deposits for derivatives collateral — financial futures contracts | | | — | | | | — | | | | 27,000 | |
Decrease in interest receivable | | | 94,929 | | | | 38,707 | | | | 28,321 | |
Decrease in receivable for variation margin on open financial futures contracts | | | — | | | | — | | | | 4,688 | |
Decrease in payable to affiliate for investment adviser fee | | | (1,884 | ) | | | (10,984 | ) | | | (9,088 | ) |
Decrease in payable to affiliate for administration fee | | | (942 | ) | | | (579 | ) | | | (350 | ) |
Decrease in payable to affiliate for Trustees’ fees | | | (332 | ) | | | (199 | ) | | | (184 | ) |
Increase in interest expense and fees payable | | | 188,226 | | | | 126,734 | | | | 119,519 | |
Increase (decrease) in accrued expenses | | | (669 | ) | | | 2,846 | | | | 2,244 | |
Net change in unrealized (appreciation) depreciation from investments | | | 5,562,057 | | | | 2,965,710 | | | | 1,805,560 | |
Net realized gain from investments | | | (1,624,138 | ) | | | (1,016,037 | ) | | | (365,671 | ) |
Net realized loss on extinguishment of debt | | | 64,912 | | | | 44,811 | | | | 48,386 | |
Net cash provided by operating activities | | $ | 9,301,047 | | | $ | 2,985,669 | | | $ | 915,141 | |
| | | |
| Cash Flows From Financing Activities | | | | | | | | | | | | |
Cash distributions paid to common shareholders | | $ | (3,175,388 | ) | | $ | (1,546,293 | ) | | $ | (1,314,032 | ) |
Cash distributions paid to auction preferred shareholders | | | (26,435 | ) | | | (26,070 | ) | | | (25,851 | ) |
Liquidation of auction preferred shares | | | (4,125,000 | ) | | | (4,325,000 | ) | | | (4,200,000 | ) |
Liquidation of Institutional MuniFund Term Preferred Shares | | | (29,600,000 | ) | | | (18,400,000 | ) | | | (16,975,000 | ) |
Proceeds from secured borrowings | | | 33,760,000 | | | | 22,980,000 | | | | 21,180,000 | |
Repayment of secured borrowings | | | (5,995,000 | ) | | | (1,455,000 | ) | | | — | |
Decrease in due to custodian | | | — | | | | (213,306 | ) | | | — | |
Net cash used in financing activities | | $ | (9,161,823 | ) | | $ | (2,985,669 | ) | | $ | (1,334,883 | ) |
| | | |
Net increase (decrease) in cash | | $ | 139,224 | | | $ | — | | | $ | (419,742 | ) |
| | | |
Cash at beginning of year | | $ | 620,550 | | | $ | — | | | $ | 520,657 | |
| | | |
Cash at end of year | | $ | 759,774 | | | $ | — | | | $ | 100,915 | |
| | | |
| Supplemental disclosure of cash flow information: | | | | | | | | | | | | |
Cash paid for interest and fees on floating rate notes issued and Institutional MuniFund Term Preferred Shares | | $ | 926,217 | | | $ | 432,389 | | | $ | 366,308 | |
| | | | |
| | 41 | | See Notes to Financial Statements. |
Eaton Vance
Municipal Income Trusts
November 30, 2018
Financial Highlights
Selected data for a common share outstanding during the periods stated
| | | | | | | | | | | | | | | | | | | | |
| | | California Trust | |
| | | Year Ended November 30, | |
| | | 2018 | | | 2017 | | | 2016 | | | 2015 | | | 2014 | |
Net asset value — Beginning of year (Common shares) | | $ | 13.770 | | | $ | 13.600 | | | $ | 14.020 | | | $ | 14.080 | | | $ | 12.580 | |
| | | | | |
| Income (Loss) From Operations | | | | | | | | | | | | | | | | | | | | |
Net investment income(1) | | $ | 0.464 | | | $ | 0.496 | | | $ | 0.586 | | | $ | 0.737 | | | $ | 0.756 | |
Net realized and unrealized gain (loss) | | | (0.663 | ) | | | 0.175 | | | | (0.681 | ) | | | (0.057 | ) | | | 1.507 | |
Distributions to APS shareholders | | | | | | | | | | | | | | | | | | | | |
From net investment income(1) | | | (0.003 | ) | | | (0.006 | ) | | | (0.009 | ) | | | (0.009 | ) | | | (0.007 | ) |
Discount on redemption and repurchase of APS(1) | | | — | | | | — | | | | 0.291 | | | | — | | | | — | |
| | | | | |
Total income (loss) from operations | | $ | (0.202 | ) | | $ | 0.665 | | | $ | 0.187 | | | $ | 0.671 | | | $ | 2.256 | |
| | | | | |
| Less Distributions to Common Shareholders | | | | | | | | | | | | | | | | | | | | |
From net investment income | | $ | (0.465 | ) | | $ | (0.495 | ) | | $ | (0.607 | ) | | $ | (0.731 | ) | | $ | (0.757 | ) |
| | | | | |
Total distributions to common shareholders | | $ | (0.465 | ) | | $ | (0.495 | ) | | $ | (0.607 | ) | | $ | (0.731 | ) | | $ | (0.757 | ) |
| | | | | |
Anti-dilutive effect of share repurchase program (see Note 7)(1) | | $ | 0.027 | | | $ | — | | | $ | — | | | $ | — | | | $ | 0.001 | |
| | | | | |
Net asset value — End of year (Common shares) | | $ | 13.130 | | | $ | 13.770 | | | $ | 13.600 | | | $ | 14.020 | | | $ | 14.080 | |
| | | | | |
Market value — End of year (Common shares) | | $ | 11.030 | | | $ | 12.060 | | | $ | 12.260 | | | $ | 12.900 | | | $ | 12.670 | |
| | | | | |
Total Investment Return on Net Asset Value(2) | | | (0.70 | )% | | | 5.33 | % | | | 1.38 | %(3) | | | 5.28 | % | | | 19.06 | % |
| | | | | |
Total Investment Return on Market Value(2) | | | (4.76 | )% | | | 2.34 | % | | | (0.68 | )% | | | 7.65 | % | | | 21.86 | % |
| | | | |
| | 42 | | See Notes to Financial Statements. |
Eaton Vance
Municipal Income Trusts
November 30, 2018
Financial Highlights — continued
Selected data for a common share outstanding during the periods stated
| | | | | | | | | | | | | | | | | | | | |
| | | California Trust | |
| | | Year Ended November 30, | |
| Ratios/Supplemental Data | | 2018 | | | 2017 | | | 2016 | | | 2015 | | | 2014 | |
Net assets applicable to common shares, end of year (000’s omitted) | | $ | 93,695 | | | $ | 99,930 | | | $ | 98,633 | | | $ | 101,732 | | | $ | 102,129 | |
Ratios (as a percentage of average daily net assets applicable to common shares):(4)† | | | | | | | | | | | | | | | | | | | | |
Expenses excluding interest and fees(5) | | | 1.28 | % | | | 1.46 | % | | | 1.50 | % | | | 1.54 | % | | | 1.60 | % |
Interest and fee expense(6) | | | 1.50 | % | | | 1.32 | % | | | 0.87 | % | | | 0.08 | % | | | 0.09 | % |
Total expenses(5) | �� | | 2.78 | % | | | 2.78 | % | | | 2.37 | % | | | 1.62 | % | | | 1.69 | % |
Net investment income | | | 3.45 | % | | | 3.57 | % | | | 4.05 | % | | | 5.26 | % | | | 5.64 | % |
Portfolio Turnover | | | 129 | % | | | 19 | % | | | 12 | % | | | 9 | % | | | 11 | % |
Senior Securities: | | | | | | | | | | | | | | | | | | | | |
Total preferred shares outstanding | | | — | (7) | | | 1,999 | (8) | | | 1,999 | (8) | | | 1,999 | (8) | | | 1,999 | (8) |
Asset coverage per preferred share | | $ | — | (7) | | $ | 74,990 | (9) | | $ | 74,341 | (9) | | $ | 75,892 | (9) | | $ | 76,091 | (9) |
Involuntary liquidation preference per preferred share | | $ | — | (7) | | $ | 25,000 | (10) | | $ | 25,000 | (10) | | $ | 25,000 | (10) | | $ | 25,000 | (10) |
Approximate market value per preferred share | | $ | — | (7) | | $ | 25,000 | (10) | | $ | 25,000 | (10) | | $ | 25,000 | (10) | | $ | 25,000 | (10) |
| (1) | Computed using average common shares outstanding. |
| (2) | Returns are historical and are calculated by determining the percentage change in net asset value or market value with all distributions reinvested. Distributions are assumed to be reinvested at prices obtained under the Trust’s dividend reinvestment plan. |
| (3) | The total return based on net asset value reflects the impact of the tender and repurchase by the Trust of a portion of its APS at 95.5% of the per share liquidation preference. Absent this transaction, the total return based on net asset value would have been (0.80)%. |
| (4) | Ratios do not reflect the effect of dividend payments to APS shareholders. |
| (5) | Excludes the effect of custody fee credits, if any, of less than 0.005%. Effective September 1, 2015, custody fee credits, which were earned on cash deposit balances, were discontinued by the custodian. |
| (6) | Interest and fee expense relates to the liability for floating rate notes issued in conjunction with residual interest bond transactions (see Note 1G) and iMTP Shares issued to redeem a portion of the Trust’s APS (see Note 3). |
| (7) | As of November 30, 2018, the Trust had no APS and iMTP Shares outstanding (see Note 2 and Note 3). |
| (8) | Preferred shares represent iMTP Shares and APS as of November 30, 2017 and 2016 and APS as of November 30, 2015 and 2014. |
| (9) | Calculated by subtracting the Trust’s total liabilities (not including the preferred shares) from the Trust’s total assets, and dividing the result by the number of preferred shares outstanding. |
| (10) | Plus accumulated and unpaid dividends. |
| † | Ratios based on net assets applicable to common shares plus preferred shares (iMTP Shares and APS, as applicable) are presented below. Ratios do not reflect the effect of dividend payments to APS shareholders and exclude the effect of custody fee credits, if any. |
| | | | | | | | | | | | | | | | | | | | |
| | | Year Ended November 30, | |
| | | 2018 | | | 2017 | | | 2016 | | | 2015 | | | 2014 | |
Expenses excluding interest and fees | | | 0.97 | % | | | 0.98 | % | | | 1.01 | % | | | 1.04 | % | | | 1.06 | % |
Interest and fee expense | | | 1.16 | % | | | 0.88 | % | | | 0.59 | % | | | 0.05 | % | | | 0.06 | % |
Total expenses | | | 2.13 | % | | | 1.86 | % | | | 1.60 | % | | | 1.09 | % | | | 1.12 | % |
Net investment income | | | 2.65 | % | | | 2.39 | % | | | 2.74 | % | | | 3.53 | % | | | 3.73 | % |
| | | | |
| APS | | – | | Auction Preferred Shares |
| iMTP Shares | | – | | Institutional MuniFund Term Preferred Shares |
| | | | |
| | 43 | | See Notes to Financial Statements. |
Eaton Vance
Municipal Income Trusts
November 30, 2018
Financial Highlights — continued
Selected data for a common share outstanding during the periods stated
| | | | | | | | | | | | | | | | | | | | |
| | | Massachusetts Trust | |
| | | Year Ended November 30, | |
| | | 2018 | | | 2017 | | �� | 2016 | | | 2015 | | | 2014 | |
Net asset value — Beginning of year (Common shares) | | $ | 14.890 | | | $ | 14.560 | | | $ | 15.150 | | | $ | 15.140 | | | $ | 13.730 | |
| | | | | |
| Income (Loss) From Operations | | | | | | | | | | | | | | | | | | | | |
Net investment income(1) | | $ | 0.483 | | | $ | 0.543 | | | $ | 0.572 | | | $ | 0.710 | | | $ | 0.726 | |
Net realized and unrealized gain (loss) | | | (0.670 | ) | | | 0.324 | | | | (0.836 | ) | | | (0.008 | ) | | | 1.390 | |
Distributions to APS shareholders | | | | | | | | | | | | | | | | | | | | |
From net investment income(1) | | | (0.007 | ) | | | (0.016 | ) | | | (0.013 | ) | | | (0.010 | ) | | | (0.008 | ) |
Discount on redemption and repurchase of APS(1) | | | — | | | | — | | | | 0.276 | | | | — | | | | — | |
| | | | | |
Total income (loss) from operations | | $ | (0.194 | ) | | $ | 0.851 | | | $ | (0.001 | ) | | $ | 0.692 | | | $ | 2.108 | |
| | | | | |
| Less Distributions to Common Shareholders | | | | | | | | | | | | | | | | | | | | |
From net investment income | | $ | (0.466 | ) | | $ | (0.521 | ) | | $ | (0.589 | ) | | $ | (0.686 | ) | | $ | (0.703 | ) |
| | | | | |
Total distributions to common shareholders | | $ | (0.466 | ) | | $ | (0.521 | ) | | $ | (0.589 | ) | | $ | (0.686 | ) | | $ | (0.703 | ) |
| | | | | |
Anti-dilutive effect of share repurchase program (see Note 7)(1) | | $ | — | | | $ | — | | | $ | — | | | $ | 0.004 | | | $ | 0.005 | |
| | | | | |
Net asset value — End of year (Common shares) | | $ | 14.230 | | | $ | 14.890 | | | $ | 14.560 | | | $ | 15.150 | | | $ | 15.140 | |
| | | | | |
Market value — End of year (Common shares) | | $ | 12.100 | | | $ | 13.120 | | | $ | 13.330 | | | $ | 14.020 | | | $ | 13.310 | |
| | | | | |
Total Investment Return on Net Asset Value(2) | | | (0.82 | )% | | | 6.28 | % | | | 0.05 | %(3) | | | 5.21 | % | | | 16.30 | % |
| | | | | |
Total Investment Return on Market Value(2) | | | (4.33 | )% | | | 2.29 | % | | | (1.02 | )% | | | 10.75 | % | | | 17.27 | % |
| | | | |
| | 44 | | See Notes to Financial Statements. |
Eaton Vance
Municipal Income Trusts
November 30, 2018
Financial Highlights — continued
Selected data for a common share outstanding during the periods stated
| | | | | | | | | | | | | | | | | | | | |
| | | Massachusetts Trust | |
| | | Year Ended November 30, | |
| Ratios/Supplemental Data | | 2018 | | | 2017 | | | 2016 | | | 2015 | | | 2014 | |
Net assets applicable to common shares, end of year (000’s omitted) | | $ | 38,951 | | | $ | 40,751 | | | $ | 39,862 | | | $ | 41,478 | | | $ | 41,527 | |
Ratios (as a percentage of average daily net assets applicable to common shares):(4)† | | | | | | | | | | | | | | | | | | | | |
Expenses excluding interest and fees(5) | | | 1.29 | % | | | 1.33 | % | | | 1.59 | % | | | 1.62 | % | | | 1.68 | % |
Interest and fee expense(6) | | | 1.35 | % | | | 1.09 | % | | | 0.72 | % | | | 0.05 | % | | | 0.05 | % |
Total expenses(5) | | | 2.64 | % | | | 2.42 | % | | | 2.31 | % | | | 1.67 | % | | | 1.73 | % |
Net investment income | | | 3.32 | % | | | 3.63 | % | | | 3.66 | % | | | 4.70 | % | | | 4.96 | % |
Portfolio Turnover | | | 69 | % | | | 19 | % | | | 12 | % | | | 10 | % | | | 2 | % |
Senior Securities: | | | | | | | | | | | | | | | | | | | | |
Total preferred shares outstanding | | | — | (7) | | | 802 | (8) | | | 802 | (8) | | | 802 | (8) | | | 802 | (8) |
Asset coverage per preferred share | | $ | — | (7) | | $ | 75,811 | (9) | | $ | 74,703 | (9) | | $ | 76,719 | (9) | | $ | 76,780 | (9) |
Involuntary liquidation preference per preferred share | | $ | — | (7) | | $ | 25,000 | (10) | | $ | 25,000 | (10) | | $ | 25,000 | (10) | | $ | 25,000 | (10) |
Approximate market value per preferred share | | $ | — | (7) | | $ | 25,000 | (10) | | $ | 25,000 | (10) | | $ | 25,000 | (10) | | $ | 25,000 | (10) |
| (1) | Computed using average common shares outstanding. |
| (2) | Returns are historical and are calculated by determining the percentage change in net asset value or market value with all distributions reinvested. Distributions are assumed to be reinvested at prices obtained under the Trust’s dividend reinvestment plan. |
| (3) | The total return based on net asset value reflects the impact of the tender and repurchase by the Trust of a portion of its APS at 95.5% of the per share liquidation preference. Absent this transaction, the total return based on net asset value would have been (1.85)%. |
| (4) | Ratios do not reflect the effect of dividend payments to APS shareholders. |
| (5) | Excludes the effect of custody fee credits, if any, of less than 0.005%. Effective September 1, 2015, custody fee credits, which were earned on cash deposit balances, were discontinued by the custodian. |
| (6) | Interest and fee expense relates to the liability for floating rate notes issued in conjunction with residual interest bond transactions (see Note 1G) and iMTP Shares issued to redeem a portion of the Trust’s APS (see Note 3). |
| (7) | As of November 30, 2018, the Trust had no APS and iMTP Shares outstanding (see Note 2 and Note 3). |
| (8) | Preferred shares represent iMTP Shares and APS as of November 30, 2017 and 2016 and APS as of November 30, 2015 and 2014. |
| (9) | Calculated by subtracting the Trust’s total liabilities (not including the preferred shares) from the Trust’s total assets, and dividing the result by the number of preferred shares outstanding. |
| (10) | Plus accumulated and unpaid dividends. |
| † | Ratios based on net assets applicable to common shares plus preferred shares (iMTP Shares and APS, as applicable) are presented below. Ratios do not reflect the effect of dividend payments to APS shareholders and exclude the effect of custody fee credits, if any. |
| | | | | | | | | | | | | | | | | | | | |
| | | Year Ended November 30, | |
| | | 2018 | | | 2017 | | | 2016 | | | 2015 | | | 2014 | |
Expenses excluding interest and fees | | | 0.99 | % | | | 0.89 | % | | | 1.09 | % | | | 1.10 | % | | | 1.12 | % |
Interest and fee expense | | | 1.04 | % | | | 0.73 | % | | | 0.49 | % | | | 0.03 | % | | | 0.04 | % |
Total expenses | | | 2.03 | % | | | 1.62 | % | | | 1.58 | % | | | 1.13 | % | | | 1.16 | % |
Net investment income | | | 2.56 | % | | | 2.44 | % | | | 2.49 | % | | | 3.17 | % | | | 3.31 | % |
| | | | |
| APS | | – | | Auction Preferred Shares |
| iMTP Shares | | – | | Institutional MuniFund Term Preferred Shares |
| | | | |
| | 45 | | See Notes to Financial Statements. |
Eaton Vance
Municipal Income Trusts
November 30, 2018
Financial Highlights — continued
Selected data for a common share outstanding during the periods stated
| | | | | | | | | | | | | | | | | | | | |
| | | Michigan Trust | |
| | | Year Ended November 30, | |
| | | 2018 | | | 2017 | | | 2016 | | | 2015 | | | 2014 | |
Net asset value — Beginning of year (Common shares) | | $ | 14.760 | | | $ | 14.510 | | | $ | 14.740 | | | $ | 14.640 | | | $ | 12.910 | |
| | | | | |
| Income (Loss) From Operations | | | | | | | | | | | | | | | | | | | | |
Net investment income(1) | | $ | 0.469 | | | $ | 0.493 | | | $ | 0.580 | | | $ | 0.752 | | | $ | 0.730 | |
Net realized and unrealized gain (loss) | | | (0.568 | ) | | | 0.247 | | | | (0.556 | ) | | | 0.002 | | | | 1.685 | |
Distributions to APS shareholders | | | | | | | | | | | | | | | | | | | | |
From net investment income(1) | | | (0.002 | ) | | | (0.004 | ) | | | (0.010 | ) | | | (0.012 | ) | | | (0.009 | ) |
Discount on redemption and repurchase of APS(1) | | | — | | | | — | | | | 0.377 | | | | — | | | | — | |
| | | | | |
Total income (loss) from operations | | $ | (0.101 | ) | | $ | 0.736 | | | $ | 0.391 | | | $ | 0.742 | | | $ | 2.406 | |
| | | | | |
| Less Distributions to Common Shareholders | | | | | | | | | | | | | | | | | | | | |
From net investment income | | $ | (0.469 | ) | | $ | (0.486 | ) | | $ | (0.621 | ) | | $ | (0.709 | ) | | $ | (0.709 | ) |
| | | | | |
Total distributions to common shareholders | | $ | (0.469 | ) | | $ | (0.486 | ) | | $ | (0.621 | ) | | $ | (0.709 | ) | | $ | (0.709 | ) |
| | | | | |
Anti-dilutive effect of share repurchase program (see Note 7)(1) | | $ | — | | | $ | — | | | $ | — | | | $ | 0.067 | | | $ | 0.033 | |
| | | | | |
Net asset value — End of year (Common shares) | | $ | 14.190 | | | $ | 14.760 | | | $ | 14.510 | | | $ | 14.740 | | | $ | 14.640 | |
| | | | | |
Market value — End of year (Common shares) | | $ | 12.180 | | | $ | 12.920 | | | $ | 12.920 | | | $ | 12.730 | | | $ | 12.550 | |
| | | | | |
Total Investment Return on Net Asset Value(2) | | | (0.20 | )% | | | 5.51 | % | | | 2.98 | %(3) | | | 6.44 | % | | | 20.18 | % |
| | | | | |
Total Investment Return on Market Value(2) | | | (2.13 | )% | | | 3.72 | % | | | 6.21 | % | | | 7.19 | % | | | 20.91 | % |
| | | | |
| | 46 | | See Notes to Financial Statements. |
Eaton Vance
Municipal Income Trusts
November 30, 2018
Financial Highlights — continued
Selected data for a common share outstanding during the periods stated
| | | | | | | | | | | | | | | | | | | | |
| | | Michigan Trust | |
| | | Year Ended November 30, | |
| Ratios/Supplemental Data | | 2018 | | | 2017 | | | 2016 | | | 2015 | | | 2014 | |
Net assets applicable to common shares, end of year (000’s omitted) | | $ | 28,572 | | | $ | 29,707 | | | $ | 29,209 | | | $ | 29,677 | | | $ | 30,496 | |
Ratios (as a percentage of average daily net assets applicable to common shares):(4)† | | | | | | | | | | | | | | | | | | | | |
Expenses excluding interest and fees(5) | | | 1.68 | % | | | 1.78 | % | | | 1.81 | % | | | 1.77 | % | | | 1.87 | % |
Interest and fee expense | | | 1.68 | %(6) | | | 1.44 | %(7) | | | 0.94 | %(7) | | | — | | | | — | |
Total expenses(5) | | | 3.36 | % | | | 3.22 | % | | | 2.75 | % | | | 1.77 | % | | | 1.87 | % |
Net investment income | | | 3.24 | % | | | 3.32 | % | | | 3.78 | % | | | 5.12 | % | | | 5.24 | % |
Portfolio Turnover | | | 54 | % | | | 10 | % | | | 12 | % | | | 4 | % | | | 26 | % |
Senior Securities: | | | | | | | | | | | | | | | | | | | | |
Total preferred shares outstanding | | | — | (8) | | | 700 | (9) | | | 700 | (9) | | | 700 | (9) | | | 700 | (9) |
Asset coverage per preferred share | | $ | — | (8) | | $ | 67,439 | (10) | | $ | 66,727 | (10) | | $ | 67,396 | (10) | | $ | 68,566 | (10) |
Involuntary liquidation preference per preferred share | | $ | — | (8) | | $ | 25,000 | (11) | | $ | 25,000 | (11) | | $ | 25,000 | (11) | | $ | 25,000 | (11) |
Approximate market value per preferred share | | $ | — | (8) | | $ | 25,000 | (11) | | $ | 25,000 | (11) | | $ | 25,000 | (11) | | $ | 25,000 | (11) |
| (1) | Computed using average common shares outstanding. |
| (2) | Returns are historical and are calculated by determining the percentage change in net asset value or market value with all distributions reinvested. Distributions are assumed to be reinvested at prices obtained under the Trust’s dividend reinvestment plan. |
| (3) | The total return based on net asset value reflects the impact of the tender and repurchase by the Trust of a portion of its APS at 95.5% of the per share liquidation preference. Absent this transaction, the total return based on net asset value would have been 0.31%. |
| (4) | Ratios do not reflect the effect of dividend payments to APS shareholders. |
| (5) | Excludes the effect of custody fee credits, if any, of less than 0.005%. Effective September 1, 2015, custody fee credits, which were earned on cash deposit balances, were discontinued by the custodian. |
| (6) | Interest and fee expense relates to the liability for floating rate notes issued in conjunction with residual interest bond transactions (see Note 1G) and iMTP Shares issued to redeem a portion of the Trust’s APS (see Note 3). |
| (7) | Interest and fee expense relates to iMTP Shares issued to redeem a portion of the Trust’s APS (see Note 3). |
| (8) | As of November 30, 2018, the Trust had no APS and iMTP Shares outstanding (see Note 2 and Note 3). |
| (9) | Preferred shares represent iMTP Shares and APS as of November 30, 2017 and 2016 and APS as of November 30, 2015 and 2014. |
| (10) | Calculated by subtracting the Trust’s total liabilities (not including the preferred shares) from the Trust’s total assets, and dividing the result by the number of preferred shares outstanding. |
| (11) | Plus accumulated and unpaid dividends. |
| † | Ratios based on net assets applicable to common shares plus preferred shares (iMTP Shares and APS, as applicable) are presented below. Ratios do not reflect the effect of dividend payments to APS shareholders and exclude the effect of custody fee credits, if any. |
| | | | | | | | | | | | | | | | | | | | |
| | | Year Ended November 30, | |
| | | 2018 | | | 2017 | | | 2016 | | | 2015 | | | 2014 | |
Expenses excluding interest and fees | | | 1.19 | % | | | 1.12 | % | | | 1.16 | % | | | 1.11 | % | | | 1.17 | % |
Interest and fee expense | | | 1.20 | % | | | 0.91 | % | | | 0.60 | % | | | — | | | | — | |
Total expenses | | | 2.39 | % | | | 2.03 | % | | | 1.76 | % | | | 1.11 | % | | | 1.17 | % |
Net investment income | | | 2.30 | % | | | 2.09 | % | | | 2.41 | % | | | 3.23 | % | | | 3.29 | % |
| | | | |
| APS | | – | | Auction Preferred Shares |
| iMTP Shares | | – | | Institutional MuniFund Term Preferred Shares |
| | | | |
| | 47 | | See Notes to Financial Statements. |
Eaton Vance
Municipal Income Trusts
November 30, 2018
Financial Highlights — continued
Selected data for a common share outstanding during the periods stated
| | | | | | | | | | | | | | | | | | | | |
| | | New Jersey Trust | |
| | | Year Ended November 30, | |
| | | 2018 | | | 2017 | | | 2016 | | | 2015 | | | 2014 | |
Net asset value — Beginning of year (Common shares) | | $ | 13.540 | | | $ | 13.430 | | | $ | 13.800 | | | $ | 14.060 | | | $ | 12.960 | |
| | | | | |
| Income (Loss) From Operations | | | | | | | | | | | | | | | | | | | | |
Net investment income(1) | | $ | 0.519 | | | $ | 0.573 | | | $ | 0.635 | | | $ | 0.745 | | | $ | 0.748 | |
Net realized and unrealized gain (loss) | | | (0.405 | ) | | | 0.105 | | | | (0.637 | ) | | | (0.293 | ) | | | 1.098 | |
Distributions to APS shareholders | | | | | | | | | | | | | | | | | | | | |
From net investment income(1) | | | (0.006 | ) | | | (0.013 | ) | | | (0.012 | ) | | | (0.010 | ) | | | (0.008 | ) |
Discount on redemption and repurchase of APS(1) | | | — | | | | — | | | | 0.284 | | | | — | | | | — | |
| | | | | |
Total income from operations | | $ | 0.108 | | | $ | 0.665 | | | $ | 0.270 | | | $ | 0.442 | | | $ | 1.838 | |
| | | | | |
| Less Distributions to Common Shareholders | | | | | | | | | | | | | | | | | | | | |
From net investment income | | $ | (0.548 | ) | | $ | (0.555 | ) | | $ | (0.640 | ) | | $ | (0.728 | ) | | $ | (0.743 | ) |
| | | | | |
Total distributions to common shareholders | | $ | (0.548 | ) | | $ | (0.555 | ) | | $ | (0.640 | ) | | $ | (0.728 | ) | | $ | (0.743 | ) |
| | | | | |
Anti-dilutive effect of share repurchase program (see Note 7)(1) | | $ | — | | | $ | — | | | $ | — | | | $ | 0.026 | | | $ | 0.005 | |
| | | | | |
Net asset value — End of year (Common shares) | | $ | 13.100 | | | $ | 13.540 | | | $ | 13.430 | | | $ | 13.800 | | | $ | 14.060 | |
| | | | | |
Market value — End of year (Common shares) | | $ | 11.130 | | | $ | 11.750 | | | $ | 11.950 | | | $ | 12.320 | | | $ | 12.300 | |
| | | | | |
Total Investment Return on Net Asset Value(2) | | | 1.53 | % | | | 5.52 | % | | | 2.13 | %(3) | | | 4.08 | % | | | 15.20 | % |
| | | | | |
Total Investment Return on Market Value(2) | | | (0.64 | )% | | | 2.91 | % | | | 1.79 | % | | | 6.21 | % | | | 14.17 | % |
| | | | |
| | 48 | | See Notes to Financial Statements. |
Eaton Vance
Municipal Income Trusts
November 30, 2018
Financial Highlights — continued
Selected data for a common share outstanding during the periods stated
| | | | | | | | | | | | | | | | | | | | |
| | | New Jersey Trust | |
| | | Year Ended November 30, | |
| Ratios/Supplemental Data | | 2018 | | | 2017 | | | 2016 | | | 2015 | | | 2014 | |
Net assets applicable to common shares, end of year (000’s omitted) | | $ | 60,224 | | | $ | 62,260 | | | $ | 61,766 | | | $ | 63,445 | | | $ | 65,624 | |
Ratios (as a percentage of average daily net assets applicable to common shares):(4)† | | | | | | | | | | | | | | | | | | | | |
Expenses excluding interest and fees(5) | | | 1.30 | % | | | 1.58 | % | | | 1.60 | % | | | 1.60 | % | | | 1.64 | % |
Interest and fee expense(6) | | | 1.65 | % | | | 1.30 | % | | | 0.82 | % | | | 0.04 | % | | | 0.04 | % |
Total expenses(5) | | | 2.95 | % | | | 2.88 | % | | | 2.42 | % | | | 1.64 | % | | | 1.68 | % |
Net investment income | | | 3.90 | % | | | 4.20 | % | | | 4.46 | % | | | 5.36 | % | | | 5.47 | % |
Portfolio Turnover | | | 56 | % | | | 12 | % | | | 9 | % | | | 8 | % | | | 6 | % |
Senior Securities: | | | | | | | | | | | | | | | | | | | | |
Total preferred shares outstanding | | | — | (7) | | | 1,337 | (8) | | | 1,337 | (8) | | | 1,337 | (8) | | | 1,337 | (8) |
Asset coverage per preferred share | | $ | — | (7) | | $ | 71,567 | (9) | | $ | 71,197 | (9) | | $ | 72,453 | (9) | | $ | 74,083 | (9) |
Involuntary liquidation preference per preferred share | | $ | — | (7) | | $ | 25,000 | (10) | | $ | 25,000 | (10) | | $ | 25,000 | (10) | | $ | 25,000 | (10) |
Approximate market value per preferred share | | $ | — | (7) | | $ | 25,000 | (10) | | $ | 25,000 | (10) | | $ | 25,000 | (10) | | $ | 25,000 | (10) |
| (1) | Computed using average common shares outstanding. |
| (2) | Returns are historical and are calculated by determining the percentage change in net asset value or market value with all distributions reinvested. Distributions are assumed to be reinvested at prices obtained under the Trust’s dividend reinvestment plan. |
| (3) | The total return based on net asset value reflects the impact of the tender and repurchase by the Trust of a portion of its APS at 95.5% of the per share liquidation preference. Absent this transaction, the total return based on net asset value would have been (0.03)%. |
| (4) | Ratios do not reflect the effect of dividend payments to APS shareholders. |
| (5) | Excludes the effect of custody fee credits, if any, of less than 0.005%. Effective September 1, 2015, custody fee credits, which were earned on cash deposit balances, were discontinued by the custodian. |
| (6) | Interest and fee expense relates to the liability for floating rate notes issued in conjunction with residual interest bond transactions (see Note 1G) and iMTP Shares issued to redeem a portion of the Trust’s APS (see Note 3). |
| (7) | As of November 30, 2018, the Trust had no APS and iMTP Shares outstanding (see Note 2 and Note 3). |
| (8) | Preferred shares represent iMTP Shares and APS as of November 30, 2017 and 2016 and APS as of November 30, 2015 and 2014. |
| (9) | Calculated by subtracting the Trust’s total liabilities (not including the preferred shares) from the Trust’s total assets, and dividing the result by the number of preferred shares outstanding. |
| (10) | Plus accumulated and unpaid dividends. |
| † | Ratios based on net assets applicable to common shares plus preferred shares (iMTP Shares and APS, as applicable) are presented below. Ratios do not reflect the effect of dividend payments to APS shareholders and exclude the effect of custody fee credits, if any. |
| | | | | | | | | | | | | | | | | | | | |
| | | Year Ended November 30, | |
| | | 2018 | | | 2017 | | | 2016 | | | 2015 | | | 2014 | |
Expenses excluding interest and fees | | | 0.93 | % | | | 1.03 | % | | | 1.06 | % | | | 1.06 | % | | | 1.07 | % |
Interest and fee expense | | | 1.18 | % | | | 0.85 | % | | | 0.54 | % | | | 0.02 | % | | | 0.03 | % |
Total expenses | | | 2.11 | % | | | 1.88 | % | | | 1.60 | % | | | 1.08 | % | | | 1.10 | % |
Net investment income | | | 2.79 | % | | | 2.74 | % | | | 2.95 | % | | | 3.53 | % | | | 3.59 | % |
| | | | |
| APS | | – | | Auction Preferred Shares |
| iMTP Shares | | – | | Institutional MuniFund Term Preferred Shares |
| | | | |
| | 49 | | See Notes to Financial Statements. |
Eaton Vance
Municipal Income Trusts
November 30, 2018
Financial Highlights — continued
Selected data for a common share outstanding during the periods stated
| | | | | | | | | | | | | | | | | | | | |
| | | New York Trust | |
| | | Year Ended November 30, | |
| | | 2018 | | | 2017 | | | 2016 | | | 2015 | | | 2014 | |
Net asset value — Beginning of year (Common shares) | | $ | 14.250 | | | $ | 14.100 | | | $ | 14.520 | | | $ | 14.590 | | | $ | 13.260 | |
| | | | | |
| Income (Loss) From Operations | | | | | | | | | | | | | | | | | | | | |
Net investment income(1) | | $ | 0.569 | | | $ | 0.628 | | | $ | 0.665 | | | $ | 0.814 | | | $ | 0.840 | |
Net realized and unrealized gain (loss) | | | (0.734 | ) | | | 0.137 | | | | (0.651 | ) | | | (0.063 | ) | | | 1.359 | |
Distributions to APS shareholders | | | | | | | | | | | | | | | | | | | | |
From net investment income(1) | | | (0.005 | ) | | | (0.010 | ) | | | (0.010 | ) | | | (0.008 | ) | | | (0.007 | ) |
Discount on redemption and repurchase of APS(1) | | | — | | | | — | | | | 0.243 | | | | — | | | | — | |
| | | | | |
Total income (loss) from operations | | $ | (0.170 | ) | | $ | 0.755 | | | $ | 0.247 | | | $ | 0.743 | | | $ | 2.192 | |
| | | | | |
| Less Distributions to Common Shareholders | | | | | | | | | | | | | | | | | | | | |
From net investment income | | $ | (0.580 | ) | | $ | (0.605 | ) | | $ | (0.667 | ) | | $ | (0.813 | ) | | $ | (0.862 | ) |
| | | | | |
Total distributions to common shareholders | | $ | (0.580 | ) | | $ | (0.605 | ) | | $ | (0.667 | ) | | $ | (0.813 | ) | | $ | (0.862 | ) |
| | | | | |
Net asset value — End of year (Common shares) | | $ | 13.500 | | | $ | 14.250 | | | $ | 14.100 | | | $ | 14.520 | | | $ | 14.590 | |
| | | | | |
Market value — End of year (Common shares) | | $ | 11.390 | | | $ | 12.770 | | | $ | 13.040 | | | $ | 13.730 | | | $ | 13.730 | |
| | | | | |
Total Investment Return on Net Asset Value(2) | | | (0.61 | )% | | | 5.84 | % | | | 1.69 | %(3) | | | 5.63 | % | | | 17.25 | % |
| | | | | |
Total Investment Return on Market Value(2) | | | (6.42 | )% | | | 2.56 | % | | | (0.53 | )% | | | 6.13 | % | | | 20.92 | % |
| | | | |
| | 50 | | See Notes to Financial Statements. |
Eaton Vance
Municipal Income Trusts
November 30, 2018
Financial Highlights — continued
Selected data for a common share outstanding during the periods stated
| | | | | | | | | | | | | | | | | | | | |
| | | New York Trust | |
| | | Year Ended November 30, | |
| Ratios/Supplemental Data | | 2018 | | | 2017 | | | 2016 | | | 2015 | | | 2014 | |
Net assets applicable to common shares, end of year (000’s omitted) | | $ | 73,939 | | | $ | 78,026 | | | $ | 77,190 | | | $ | 79,518 | | | $ | 79,860 | |
Ratios (as a percentage of average daily net assets applicable to common shares):(4)† | | | | | | | | | | | | | | | | | | | | |
Expenses excluding interest and fees(5) | | | 1.19 | % | | | 1.37 | % | | | 1.52 | % | | | 1.53 | % | | | 1.60 | % |
Interest and fee expense(6) | | | 1.54 | % | | | 1.25 | % | | | 0.82 | % | | | 0.14 | % | | | 0.15 | % |
Total expenses(5) | | | 2.73 | % | | | 2.62 | % | | | 2.34 | % | | | 1.67 | % | | | 1.75 | % |
Net investment income | | | 4.11 | % | | | 4.37 | % | | | 4.43 | % | | | 5.60 | % | | | 5.96 | % |
Portfolio Turnover | | | 57 | % | | | 18 | % | | | 15 | % | | | 7 | % | | | 4 | % |
Senior Securities: | | | | | | | | | | | | | | | | | | | | |
Total preferred shares outstanding | | | — | (7) | | | 1,349 | (8) | | | 1,349 | (8) | | | 1,349 | (8) | | | 1,349 | (8) |
Asset coverage per preferred share | | $ | — | (7) | | $ | 82,841 | (9) | | $ | 82,220 | (9) | | $ | 83,946 | (9) | | $ | 84,200 | (9) |
Involuntary liquidation preference per preferred share | | $ | — | (7) | | $ | 25,000 | (10) | | $ | 25,000 | (10) | | $ | 25,000 | (10) | | $ | 25,000 | (10) |
Approximate market value per preferred share | | $ | — | (7) | | $ | 25,000 | (10) | | $ | 25,000 | (10) | | $ | 25,000 | (10) | | $ | 25,000 | (10) |
| (1) | Computed using average common shares outstanding. |
| (2) | Returns are historical and are calculated by determining the percentage change in net asset value or market value with all distributions reinvested. Distributions are assumed to be reinvested at prices obtained under the Trust’s dividend reinvestment plan. |
| (3) | The total return based on net asset value reflects the impact of the tender and repurchase by the Trust of a portion of its APS at 95.5% of the per share liquidation preference. Absent this transaction, the total return based on net asset value would have been (0.06)%. |
| (4) | Ratios do not reflect the effect of dividend payments to APS shareholders. |
| (5) | Excludes the effect of custody fee credits, if any, of less than 0.005%. Effective September 1, 2015, custody fee credits, which were earned on cash deposit balances, were discontinued by the custodian. |
| (6) | Interest and fee expense relates to the liability for floating rate notes issued in conjunction with residual interest bond transactions (see Note 1G) and iMTP Shares issued to redeem a portion of the Trust’s APS (see Note 3). |
| (7) | As of November 30, 2018, the Trust had no APS and iMTP Shares outstanding (see Note 2 and Note 3). |
| (8) | Preferred shares represent iMTP Shares and APS as of November 30, 2017 and 2016 and APS as of November 30, 2015 and 2014. |
| (9) | Calculated by subtracting the Trust’s total liabilities (not including the preferred shares) from the Trust’s total assets, and dividing the result by the number of preferred shares outstanding. |
| (10) | Plus accumulated and unpaid dividends. |
| † | Ratios based on net assets applicable to common shares plus preferred shares (iMTP Shares and APS, as applicable) are presented below. Ratios do not reflect the effect of dividend payments to APS shareholders and exclude the effect of custody fee credits, if any. |
| | | | | | | | | | | | | | | | | | | | |
| | | Year Ended November 30, | |
| | | 2018 | | | 2017 | | | 2016 | | | 2015 | | | 2014 | |
Expenses excluding interest and fees | | | 0.94 | % | | | 0.97 | % | | | 1.08 | % | | | 1.08 | % | | | 1.11 | % |
Interest and fee expense | | | 1.22 | % | | | 0.87 | % | | | 0.58 | % | | | 0.10 | % | | | 0.11 | % |
Total expenses | | | 2.16 | % | | | 1.84 | % | | | 1.66 | % | | | 1.18 | % | | | 1.22 | % |
Net investment income | | | 3.25 | % | | | 3.06 | % | | | 3.14 | % | | | 3.93 | % | | | 4.15 | % |
| | | | |
| APS | | – | | Auction Preferred Shares |
| iMTP Shares | | – | | Institutional MuniFund Term Preferred Shares |
| | | | |
| | 51 | | See Notes to Financial Statements. |
Eaton Vance
Municipal Income Trusts
November 30, 2018
Financial Highlights — continued
Selected data for a common share outstanding during the periods stated
| | | | | | | | | | | | | | | | | | | | |
| | | Ohio Trust | |
| | | Year Ended November 30, | |
| | | 2018 | | | 2017 | | | 2016 | | | 2015 | | | 2014 | |
Net asset value — Beginning of year (Common shares) | | $ | 14.860 | | | $ | 14.850 | | | $ | 15.210 | | | $ | 15.150 | | | $ | 13.510 | |
| | | | | |
| Income (Loss) From Operations | | | | | | | | | | | | | | | | | | | | |
Net investment income(1) | | $ | 0.529 | | | $ | 0.577 | | | $ | 0.650 | | | $ | 0.771 | | | $ | 0.775 | |
Net realized and unrealized gain (loss) | | | (0.699 | ) | | | 0.035 | | | | (0.593 | ) | | | 0.031 | | | | 1.605 | |
Distributions to APS shareholders | | | | | | | | | | | | | | | | | | | | |
From net investment income(1) | | | (0.009 | ) | | | (0.020 | ) | | | (0.016 | ) | | | (0.011 | ) | | | (0.009 | ) |
Discount on redemption and repurchase of APS(1) | | | — | | | | — | | | | 0.290 | | | | — | | | | — | |
| | | | | |
Total income (loss) from operations | | $ | (0.179 | ) | | $ | 0.592 | | | $ | 0.331 | | | $ | 0.791 | | | $ | 2.371 | |
| | | | | |
| Less Distributions to Common Shareholders | | | | | | | | | | | | | | | | | | | | |
From net investment income | | $ | (0.541 | ) | | $ | (0.582 | ) | | $ | (0.691 | ) | | $ | (0.731 | ) | | $ | (0.731 | ) |
| | | | | |
Total distributions to common shareholders | | $ | (0.541 | ) | | $ | (0.582 | ) | | $ | (0.691 | ) | | $ | (0.731 | ) | | $ | (0.731 | ) |
| | | | | |
Net asset value — End of year (Common shares) | | $ | 14.140 | | | $ | 14.860 | | | $ | 14.850 | | | $ | 15.210 | | | $ | 15.150 | |
| | | | | |
Market value — End of year (Common shares) | | $ | 11.980 | | | $ | 13.310 | | | $ | 13.580 | | | $ | 13.700 | | | $ | 13.620 | |
| | | | | |
Total Investment Return on Net Asset Value(2) | | | (0.66 | )% | | | 4.37 | % | | | 2.26 | %(3) | | | 5.91 | % | | | 18.49 | % |
| | | | | |
Total Investment Return on Market Value(2) | | | (6.03 | )% | | | 2.23 | % | | | 3.83 | % | | | 6.11 | % | | | 21.55 | % |
| | | | |
| | 52 | | See Notes to Financial Statements. |
Eaton Vance
Municipal Income Trusts
November 30, 2018
Financial Highlights — continued
Selected data for a common share outstanding during the periods stated
| | | | | | | | | | | | | | | | | | | | |
| | | Ohio Trust | |
| | | Year Ended November 30, | |
| Ratios/Supplemental Data | | 2018 | | | 2017 | | | 2016 | | | 2015 | | | 2014 | |
Net assets applicable to common shares, end of year (000’s omitted) | | $ | 40,406 | | | $ | 42,461 | | | $ | 42,439 | | | $ | 43,445 | | | $ | 43,287 | |
Ratios (as a percentage of average daily net assets applicable to common shares):(4)† | | | | | | | | | | | | | | | | | | | | |
Expenses excluding interest and fees(5) | | | 1.34 | % | | | 1.62 | % | | | 1.63 | % | | | 1.61 | % | | | 1.70 | % |
Interest and fee expense | | | 1.44 | %(6) | | | 1.15 | %(6) | | | 0.73 | %(6) | | | — | | | | — | |
Total expenses(5) | | | 2.78 | % | | | 2.77 | % | | | 2.36 | % | | | 1.61 | % | | | 1.70 | % |
Net investment income | | | 3.66 | % | | | 3.83 | % | | | 4.12 | % | | | 5.09 | % | | | 5.36 | % |
Portfolio Turnover | | | 55 | % | | | 8 | % | | | 5 | % | | | 1 | % | | | 9 | % |
Senior Securities: | | | | | | | | | | | | | | | | | | | | |
Total preferred shares outstanding | | | — | (7) | | | 909 | (8) | | | 909 | (8) | | | 909 | (8) | | | 909 | (8) |
Asset coverage per preferred share | | $ | — | (7) | | $ | 71,712 | (9) | | $ | 71,687 | (9) | | $ | 72,795 | (9) | | $ | 72,621 | (9) |
Involuntary liquidation preference per preferred share | | $ | — | (7) | | $ | 25,000 | (10) | | $ | 25,000 | (10) | | $ | 25,000 | (10) | | $ | 25,000 | (10) |
Approximate market value per preferred share | | $ | — | (7) | | $ | 25,000 | (10) | | $ | 25,000 | (10) | | $ | 25,000 | (10) | | $ | 25,000 | (10) |
| (1) | Computed using average common shares outstanding. |
| (2) | Returns are historical and are calculated by determining the percentage change in net asset value or market value with all distributions reinvested. Distributions are assumed to be reinvested at prices obtained under the Trust’s dividend reinvestment plan. |
| (3) | The total return based on net asset value reflects the impact of the tender and repurchase by the Trust of a portion of its APS at 95.5% of the per share liquidation preference. Absent this transaction, the total return based on net asset value would have been 0.27%. |
| (4) | Ratios do not reflect the effect of dividend payments to APS shareholders. |
| (5) | Excludes the effect of custody fee credits, if any, of less than 0.005%. Effective September 1, 2015, custody fee credits, which were earned on cash deposit balances, were discontinued by the custodian. |
| (6) | Interest and fee expense relates to the liability for floating rate notes issued in conjunction with residual interest bond transactions (see Note 1G) and iMTP Shares issued to redeem a portion of the Trust’s APS (see Note 3). |
| (7) | As of November 30, 2018, the Trust had no APS and iMTP Shares outstanding (see Note 2 and Note 3). |
| (8) | Preferred shares represent iMTP Shares and APS as of November 30, 2017 and 2016 and APS as of November 30, 2015 and 2014. |
| (9) | Calculated by subtracting the Trust’s total liabilities (not including the preferred shares) from the Trust’s total assets, and dividing the result by the number of preferred shares outstanding. |
| (10) | Plus accumulated and unpaid dividends. |
| † | Ratios based on net assets applicable to common shares plus preferred shares (iMTP Shares and APS, as applicable) are presented below. Ratios do not reflect the effect of dividend payments to APS shareholders and exclude the effect of custody fee credits, if any. |
| | | | | | | | | | | | | | | | | | | | |
| | | Year Ended November 30, | |
| | | 2018 | | | 2017 | | | 2016 | | | 2015 | | | 2014 | |
Expenses excluding interest and fees | | | 1.01 | % | | | 1.06 | % | | | 1.09 | % | | | 1.06 | % | | | 1.10 | % |
Interest and fee expense | | | 1.10 | % | | | 0.76 | % | | | 0.48 | % | | | — | | | | — | |
Total expenses | | | 2.11 | % | | | 1.82 | % | | | 1.57 | % | | | 1.06 | % | | | 1.10 | % |
Net investment income | | | 2.77 | % | | | 2.50 | % | | | 2.74 | % | | | 3.34 | % | | | 3.46 | % |
| | | | |
| APS | | – | | Auction Preferred Shares |
| iMTP Shares | | – | | Institutional MuniFund Term Preferred Shares |
| | | | |
| | 53 | | See Notes to Financial Statements. |
Eaton Vance
Municipal Income Trusts
November 30, 2018
Financial Highlights — continued
Selected data for a common share outstanding during the periods stated
| | | | | | | | | | | | | | | | | | | | |
| | | Pennsylvania Trust | |
| |
| | | Year Ended November 30, | |
| | | 2018 | | | 2017 | | | 2016 | | | 2015 | | | 2014 | |
| | | | | |
Net asset value — Beginning of year (Common shares) | | $ | 13.540 | | | $ | 13.690 | | | $ | 13.890 | | | $ | 13.910 | | | $ | 12.770 | |
| | | | | |
| Income (Loss) From Operations | | | | | | | | | | | | | | | | | | | | |
| | | | | |
Net investment income(1) | | $ | 0.501 | | | $ | 0.556 | | | $ | 0.621 | | | $ | 0.752 | | | $ | 0.755 | |
| | | | | |
Net realized and unrealized gain (loss) | | | (0.566 | ) | | | (0.167 | ) | | | (0.475 | ) | | | (0.099 | ) | | | 1.143 | |
| | | | | |
Distributions to APS shareholders | | | | | | | | | | | | | | | | | | | | |
| | | | | |
From net investment income(1) | | | (0.010 | ) | | | (0.022 | ) | | | (0.017 | ) | | | (0.011 | ) | | | (0.008 | ) |
| | | | | |
Discount on redemption and repurchase of APS(1) | | | — | | | | — | | | | 0.294 | | | | — | | | | — | |
| | | | | |
Total income (loss) from operations | | $ | (0.075 | ) | | $ | 0.367 | | | $ | 0.423 | | | $ | 0.642 | | | $ | 1.890 | |
| | | | | |
| Less Distributions to Common Shareholders | | | | | | | | | | | | | | | | | | | | |
| | | | | |
From net investment income | | $ | (0.505 | ) | | $ | (0.517 | ) | | $ | (0.623 | ) | | $ | (0.727 | ) | | $ | (0.764 | ) |
| | | | | |
Total distributions to common shareholders | | $ | (0.505 | ) | | $ | (0.517 | ) | | $ | (0.623 | ) | | $ | (0.727 | ) | | $ | (0.764 | ) |
| | | | | |
Anti-dilutive effect of share repurchase program (see Note 7)(1) | | $ | — | | | $ | — | | | $ | — | | | $ | 0.065 | | | $ | 0.014 | |
| | | | | |
Net asset value — End of year (Common shares) | | $ | 12.960 | | | $ | 13.540 | | | $ | 13.690 | | | $ | 13.890 | | | $ | 13.910 | |
| | | | | |
Market value — End of year (Common shares) | | $ | 10.980 | | | $ | 12.080 | | | $ | 12.280 | | | $ | 12.040 | | | $ | 12.050 | |
| | | | | |
Total Investment Return on Net Asset Value(2) | | | (0.02 | )% | | | 3.17 | % | | | 3.46 | %(3) | | | 6.02 | % | | | 16.07 | % |
| | | | | |
Total Investment Return on Market Value(2) | | | (5.06 | )% | | | 2.62 | % | | | 7.06 | % | | | 6.08 | % | | | 17.26 | % |
| | | | |
| | 54 | | See Notes to Financial Statements. |
Eaton Vance
Municipal Income Trusts
November 30, 2018
Financial Highlights — continued
Selected data for a common share outstanding during the periods stated
| | | | | | | | | | | | | | | | | | | | |
| | | Pennsylvania Trust | |
| | | Year Ended November 30, | |
| Ratios/Supplemental Data | | 2018 | | | 2017 | | | 2016 | | | 2015 | | | 2014 | |
Net assets applicable to common shares, end of year (000’s omitted) | | $ | 33,713 | | | $ | 35,219 | | | $ | 35,616 | | | $ | 36,126 | | | $ | 37,532 | |
Ratios (as a percentage of average daily net assets applicable to common shares):(4)† | | | | | | | | | | | | | | | | | | | | |
Expenses excluding interest and fees(5) | | | 1.58 | % | | | 1.73 | % | | | 1.77 | % | | | 1.76 | % | | | 1.79 | % |
Interest and fee expense(6) | | | 1.49 | % | | | 1.21 | % | | | 0.80 | % | | | 0.01 | % | | | 0.04 | % |
Total expenses(5) | | | 3.07 | % | | | 2.94 | % | | | 2.57 | % | | | 1.77 | % | | | 1.83 | % |
Net investment income | | | 3.78 | % | | | 4.04 | % | | | 4.34 | % | | | 5.42 | % | | | 5.61 | % |
Portfolio Turnover | | | 60 | % | | | 9 | % | | | 9 | % | | | 3 | % | | | 4 | % |
Senior Securities: | | | | | | | | | | | | | | | | | | | | |
Total preferred shares outstanding | | | — | (7) | | | 847 | (8) | | | 847 | (8) | | | 847 | (8) | | | 847 | (8) |
Asset coverage per preferred share | | $ | — | (7) | | $ | 66,582 | (9) | | $ | 67,050 | (9) | | $ | 67,653 | (9) | | $ | 69,312 | (9) |
Involuntary liquidation preference per preferred share | | $ | — | (7) | | $ | 25,000 | (10) | | $ | 25,000 | (10) | | $ | 25,000 | (10) | | $ | 25,000 | (10) |
Approximate market value per preferred share | | $ | — | (7) | | $ | 25,000 | (10) | | $ | 25,000 | (10) | | $ | 25,000 | (10) | | $ | 25,000 | (10) |
| (1) | Computed using average common shares outstanding. |
| (2) | Returns are historical and are calculated by determining the percentage change in net asset value or market value with all distributions reinvested. Distributions are assumed to be reinvested at prices obtained under the Trust’s dividend reinvestment plan. |
| (3) | The total return based on net asset value reflects the impact of the tender and repurchase by the Trust of a portion of its APS at 95.5% of the per share liquidation preference. Absent this transaction, the total return based on net asset value would have been 1.24%. |
| (4) | Ratios do not reflect the effect of dividend payments to APS shareholders. |
| (5) | Excludes the effect of custody fee credits, if any, of less than 0.005%. Effective September 1, 2015, custody fee credits, which were earned on cash deposit balances, were discontinued by the custodian. |
| (6) | Interest and fee expense relates to the liability for floating rate notes issued in conjunction with residual interest bond transactions (see Note 1G) and iMTP Shares issued to redeem a portion of the Trust’s APS (see Note 3). |
| (7) | As of November 30, 2018, the Trust had no APS and iMTP Shares outstanding (see Note 2 and Note 3). |
| (8) | Preferred shares represent iMTP Shares and APS as of November 30, 2017 and 2016 and APS as of November 30, 2015 and 2014. |
| (9) | Calculated by subtracting the Trust’s total liabilities (not including the preferred shares) from the Trust’s total assets, and dividing the result by the number of preferred shares outstanding. |
| (10) | Plus accumulated and unpaid dividends. |
| † | Ratios based on net assets applicable to common shares plus preferred shares (iMTP Shares and APS, as applicable) are presented below. Ratios do not reflect the effect of dividend payments to APS shareholders and exclude the effect of custody fee credits, if any. |
| | | | | | | | | | | | | | | | | | | | |
| | | Year Ended November 30, | |
| | | 2018 | | | 2017 | | | 2016 | | | 2015 | | | 2014 | |
Expenses excluding interest and fees | | | 1.19 | % | | | 1.09 | % | | | 1.13 | % | | | 1.11 | % | | | 1.14 | % |
Interest and fee expense | | | 1.12 | % | | | 0.76 | % | | | 0.51 | % | | | 0.01 | % | | | 0.02 | % |
Total expenses | | | 2.31 | % | | | 1.85 | % | | | 1.64 | % | | | 1.12 | % | | | 1.16 | % |
Net investment income | | | 2.85 | % | | | 2.54 | % | | | 2.77 | % | | | 3.44 | % | | | 3.55 | % |
| | | | |
| APS | | – | | Auction Preferred Shares |
| iMTP Shares | | – | | Institutional MuniFund Term Preferred Shares |
| | | | |
| | 55 | | See Notes to Financial Statements. |
Eaton Vance
Municipal Income Trusts
November 30, 2018
Notes to Financial Statements
1 Significant Accounting Policies
Eaton Vance California Municipal Income Trust (California Trust), Eaton Vance Massachusetts Municipal Income Trust (Massachusetts Trust), Eaton Vance Michigan Municipal Income Trust (Michigan Trust), Eaton Vance New Jersey Municipal Income Trust (New Jersey Trust), Eaton Vance New York Municipal Income Trust (New York Trust), Eaton Vance Ohio Municipal Income Trust (Ohio Trust) and Eaton Vance Pennsylvania Municipal Income Trust (Pennsylvania Trust), (each individually referred to as the Trust, and collectively, the Trusts), are Massachusetts business trusts registered under the Investment Company Act of 1940, as amended (the 1940 Act), asnon-diversified,closed-end management investment companies. The Trusts’ investment objective is to provide current income exempt from regular federal income tax and taxes in its specified state.
The following is a summary of significant accounting policies of the Trusts. The policies are in conformity with accounting principles generally accepted in the United States of America (U.S. GAAP). Each Trust is an investment company and follows accounting and reporting guidance in the Financial Accounting Standards Board (FASB) Accounting Standards Codification Topic 946.
A Investment Valuation — The following methodologies are used to determine the market value or fair value of investments.
Debt Obligations. Debt obligations are generally valued on the basis of valuations provided by third party pricing services, as derived from such services’ pricing models. Inputs to the models may include, but are not limited to, reported trades, executable bid and asked prices, broker/dealer quotations, prices or yields of securities with similar characteristics, interest rates, anticipated prepayments, benchmark curves or information pertaining to the issuer, as well as industry and economic events. The pricing services may use a matrix approach, which considers information regarding securities with similar characteristics to determine the valuation for a security. Short-term debt obligations purchased with a remaining maturity of sixty days or less for which a valuation from a third party pricing service is not readily available may be valued at amortized cost, which approximates fair value.
Derivatives. Financial futures contracts are valued at the closing settlement price established by the board of trade or exchange on which they are traded.
Fair Valuation. Investments for which valuations or market quotations are not readily available or are deemed unreliable are valued at fair value using methods determined in good faith by or at the direction of the Trustees of a Trust in a manner that fairly reflects the security’s value, or the amount that a Trust might reasonably expect to receive for the security upon its current sale in the ordinary course. Each such determination is based on a consideration of relevant factors, which are likely to vary from one pricing context to another. These factors may include, but are not limited to, the type of security, the existence of any contractual restrictions on the security’s disposition, the price and extent of public trading in similar securities of the issuer or of comparable companies or entities, quotations or relevant information obtained from broker/dealers or other market participants, information obtained from the issuer, analysts, and/or the appropriate stock exchange (for exchange-traded securities), an analysis of the company’s or entity’s financial condition, and an evaluation of the forces that influence the issuer and the market(s) in which the security is purchased and sold.
B Investment Transactions and Related Income — Investment transactions for financial statement purposes are accounted for on a trade date basis. Realized gains and losses on investments sold are determined on the basis of identified cost. Interest income is recorded on the basis of interest accrued, adjusted for amortization of premium or accretion of discount.
C Federal Taxes — Each Trust’s policy is to comply with the provisions of the Internal Revenue Code applicable to regulated investment companies and to distribute to shareholders each year substantially all of its taxable, if any, andtax-exempt net investment income, and all or substantially all of its net realized capital gains. Accordingly, no provision for federal income or excise tax is necessary. Each Trust intends to satisfy conditions which will enable it to designate distributions from the interest income generated by its investments innon-taxable municipal securities, which are exempt from regular federal income tax when received by each Trust, as exempt-interest dividends. The portion of such interest, if any, earned on private activity bonds issued after August 7, 1986, may be considered a tax preference item to shareholders.
As of November 30, 2018, the Trusts had no uncertain tax positions that would require financial statement recognition,de-recognition, or disclosure. Each Trust files a U.S. federal income tax return annually after its fiscalyear-end, which is subject to examination by the Internal Revenue Service for a period of three years from the date of filing.
D Legal Fees — Legal fees and other related expenses incurred as part of negotiations of the terms and requirement of capital infusions, or that are expected to result in the restructuring of, or a plan of reorganization for, an investment are recorded as realized losses. Ongoing expenditures to protect or enhance an investment are treated as operating expenses.
E Use of Estimates — The preparation of the financial statements in conformity with U.S. GAAP requires management to make estimates and assumptions that affect the reported amounts of assets and liabilities at the date of the financial statements and the reported amounts of income and expense during the reporting period. Actual results could differ from those estimates.
F Indemnifications — Under each Trust’s organizational documents, its officers and Trustees may be indemnified against certain liabilities and expenses arising out of the performance of their duties to each Trust. Under Massachusetts law, if certain conditions prevail, shareholders of a Massachusetts business trust (such as a Trust) could be deemed to have personal liability for the obligations of the Trust. However, each Trust’s Declaration of Trust contains an express disclaimer of liability on the part of Trust shareholders and theBy-laws provide that the Trust shall assume the defense on behalf of any Trust shareholders. Moreover, theBy-laws also provide for indemnification out of Trust property of any shareholder held personally liable solely by
Eaton Vance
Municipal Income Trusts
November 30, 2018
Notes to Financial Statements — continued
reason of being or having been a shareholder for all loss or expense arising from such liability. Additionally, in the normal course of business, each Trust enters into agreements with service providers that may contain indemnification clauses. Each Trust’s maximum exposure under these arrangements is unknown as this would involve future claims that may be made against each Trust that have not yet occurred.
G Floating Rate Notes Issued in Conjunction with Securities Held — The Trusts may invest in residual interest bonds, also referred to as inverse floating rate securities, whereby a Trust may sell a variable or fixed rate bond for cash to a Special-Purpose Vehicle (the SPV), (which is generally organized as a trust), while at the same time, buying a residual interest in the assets and cash flows of the SPV. The bond is deposited into the SPV with the same CUSIP number as the bond sold to the SPV by the Trust, and which may have been, but is not required to be, the bond purchased from the Trust (the Bond). The SPV also issues floating rate notes (Floating Rate Notes) which are sold to third-parties. The residual interest bond held by a Trust gives the Trust the right (1) to cause the holders of the Floating Rate Notes to generally tender their notes at par, and (2) to have the Bond held by the SPV transferred to the Trust, thereby terminating the SPV. Should the Trust exercise such right, it would generally pay the SPV the par amount due on the Floating Rate Notes and exchange the residual interest bond for the underlying Bond. Pursuant to generally accepted accounting principles for transfers and servicing of financial assets and extinguishment of liabilities, the Trusts account for the transaction described above as a secured borrowing by including the Bond in their Portfolio of Investments and the Floating Rate Notes (net of unamortized deferred debt issuance costs, if any) as a liability under the caption “Payable for floating rate notes issued” in their Statement of Assets and Liabilities. The Floating Rate Notes have interest rates that generally reset weekly and their holders have the option to tender their notes to the SPV for redemption at par at each reset date. Accordingly, the fair value of the payable for floating rate notes issued approximates its carrying value. If measured at fair value, the payable for floating rate notes would have been considered as Level 2 in the fair value hierarchy (see Note 10) at November 30, 2018. Interest expense related to a Trust’s liability with respect to Floating Rate Notes is recorded as incurred. The SPV may be terminated by the Trust, as noted above, or by the occurrence of certain termination events as defined in the trust agreement, such as a downgrade in the credit quality of the underlying Bond, bankruptcy of or payment failure by the issuer of the underlying Bond, the inability to remarket Floating Rate Notes that have been tendered due to insufficient buyers in the market, or the failure by the SPV to obtain renewal of the liquidity agreement under which liquidity support is provided for the Floating Rate Notes up to one year. Structuring fees paid to the liquidity provider upon the creation of an SPV are recorded as debt issuance costs and are being amortized as interest expense to the expected maturity of the related trust. Unamortized structuring fees related to a terminated SPV are recorded as a realized loss on extinguishment of debt. At November 30, 2018, the amounts of the Trusts’ Floating Rate Notes and related interest rates and collateral were as follows:
| | | | | | | | | | | | | | | | | | | | | | | | | | | | |
| | | California
Trust | | | Massachusetts
Trust | | | Michigan
Trust | | | New Jersey
Trust | | | New York
Trust | | | Ohio
Trust | | | Pennsylvania
Trust | |
| | | | | | | |
Floating Rate Notes Outstanding | | $ | 59,212,070 | | | $ | 20,995,015 | | | $ | 18,020,376 | | | $ | 32,845,195 | | | $ | 43,994,395 | | | $ | 22,980,096 | | | $ | 21,179,968 | |
| | | | | | | |
Interest Rate or Range of Interest Rates (%) | | | 1.62 - 1.74 | | | | 1.69 - 1.82 | | | | 1.69 - 1.81 | | | | 1.54 - 1.84 | | | | 1.69 - 1.72 | | | | 1.71 - 1.81 | | | | 1.68 - 1.84 | |
| | | | | | | |
Collateral for Floating Rate Notes Outstanding | | $ | 82,347,511 | | | $ | 29,899,356 | | | $ | 24,821,624 | | | $ | 45,870,403 | | | $ | 60,977,261 | | | $ | 31,283,275 | | | $ | 29,274,281 | |
For the year ended November 30, 2018, the Trusts’ average settled Floating Rate Notes outstanding and the average interest rate, including fees and amortization of deferred debt issuance costs, were as follows:
| | | | | | | | | | | | | | | | | | | | | | | | | | | | |
| | | California
Trust | | | Massachusetts
Trust | | | Michigan
Trust | | | New Jersey
Trust | | | New York
Trust | | | Ohio
Trust | | | Pennsylvania
Trust | |
| | | | | | | |
Average Floating Rate Notes Outstanding | | $ | 27,954,397 | | | $ | 9,073,507 | | | $ | 6,113,370 | | | $ | 12,745,425 | | | $ | 28,199,644 | | | $ | 10,558,644 | | | $ | 9,846,521 | |
| | | | | | | |
Average Interest Rate | | | 1.99 | % | | | 2.04 | % | | | 2.10 | % | | | 2.06 | % | | | 2.03 | % | | | 2.08 | % | | | 2.04 | % |
In certain circumstances, the Trusts may enter into shortfall and forbearance agreements with brokers by which a Trust agrees to reimburse the broker for the difference between the liquidation value of the Bond held by the SPV and the liquidation value of the Floating Rate Notes, as well as any shortfalls in interest cash flows. The Trusts had no shortfalls as of November 30, 2018.
The Trusts may also purchase residual interest bonds in a secondary market transaction without first owning the underlying bond. Such transactions are not required to be treated as secured borrowings. Shortfall agreements, if any, related to residual interest bonds purchased in a secondary market transaction are disclosed in the Portfolio of Investments.
The Trusts’ investment policies and restrictions expressly permit investments in residual interest bonds. Such bonds typically offer the potential for yields exceeding the yields available on fixed rate bonds with comparable credit quality and maturity. These securities tend to underperform the market for fixed
Eaton Vance
Municipal Income Trusts
November 30, 2018
Notes to Financial Statements — continued
rate bonds in a rising long-term interest rate environment, but tend to outperform the market for fixed rate bonds when long-term interest rates decline. The value and income of residual interest bonds are generally more volatile than that of a fixed rate bond. The Trusts’ investment policies do not allow the Trusts to borrow money except as permitted by the 1940 Act. Management believes that the Trusts’ restrictions on borrowing money and issuing senior securities (other than as specifically permitted) do not apply to Floating Rate Notes issued by the SPV and included as a liability in the Trusts’ Statement of Assets and Liabilities. As secured indebtedness issued by an SPV, Floating Rate Notes are distinct from the borrowings and senior securities to which the Trusts’ restrictions apply. Residual interest bonds held by the Trusts are securities exempt from registration under Rule 144A of the Securities Act of 1933.
H Financial Futures Contracts— Upon entering into a financial futures contract, a Trust is required to deposit with the broker, either in cash or securities, an amount equal to a certain percentage of the contract amount (initial margin). Subsequent payments, known as variation margin, are made or received by the Trust each business day, depending on the daily fluctuations in the value of the underlying security, and are recorded as unrealized gains or losses by the Trust. Gains (losses) are realized upon the expiration or closing of the financial futures contracts. Should market conditions change unexpectedly, the Trust may not achieve the anticipated benefits of the financial futures contracts and may realize a loss. Futures contracts have minimal counterparty risk as they are exchange traded and the clearinghouse for the exchange is substituted as the counterparty, guaranteeing counterparty performance.
I When-Issued Securities and Delayed Delivery Transactions — The Trusts may purchase or sell securities on a delayed delivery or when-issued basis. Payment and delivery may take place after the customary settlement period for that security. At the time the transaction is negotiated, the price of the security that will be delivered is fixed. The Trusts maintain cash and/or security positions for these commitments such that sufficient liquid assets will be available to make payments upon settlement. Securities purchased on a delayed delivery or when-issued basis aremarked-to-market daily and begin earning interest on settlement date. Losses may arise due to changes in the market value of the underlying securities or if the counterparty does not perform under the contract.
J Statement of Cash Flows — The cash amount shown in the Statement of Cash Flows of a Trust is the amount included in the Trust’s Statement of Assets and Liabilities and represents the unrestricted cash on hand at its custodian and does not include any short-term investments.
2 Auction Preferred Shares
Each Trust issued Auction Preferred Shares (APS) on March 1, 1999 in a public offering. Dividends on the APS, which accrued daily, were cumulative at rates which were reset every seven days by an auction, unless a special dividend period had been set. Beginning February 13, 2008 and consistent with the patterns in the broader market for auction-rate securities, the Trusts’ APS auctions were unsuccessful in clearing due to an imbalance of sell orders over bids to buy the APS. As a result, the dividend rates were reset to the maximum rate, which was 110% (150% for taxable distributions) of the greater of the 1) “AA” Financial Composite Commercial Paper Rate or 2) Taxable Equivalent of the Short-Term Municipal Obligation Rate on the date of the auction. The stated spread over the reference benchmark rate was determined based on the credit rating of the APS. On March 26, 2018, each Trust redeemed all of its outstanding APS at a liquidation price of $25,000 per share plus any accrued but unpaid APS dividends. Each Trust replaced its APS with residual interest bond financing (see Note 1G). Prior to the redemption of the APS, the Trusts paid an annual fee equivalent to 0.15% of the liquidation value of the APS to broker/dealers as a service fee if the auctions were unsuccessful; otherwise, the annual fee was 0.25%. At November 30, 2018, the Trusts had no APS outstanding.
During the year ended November 30, 2018, the number of APS redeemed and their redemption amount were as follows:
| | | | | | | | | | | | | | | | |
| | | California
Trust | | | Massachusetts
Trust | | | Michigan
Trust | | | New Jersey
Trust | |
| | | | |
APS Redeemed | | | 120 | | | | 130 | | | | 26 | | | | 177 | |
Redemption Amount | | $ | 3,000,000 | | | $ | 3,250,000 | | | $ | 650,000 | | | $ | 4,425,000 | |
| | | | | | | | | | | | |
| | | New York
Trust | | | Ohio
Trust | | | Pennsylvania
Trust | |
| | | |
APS Redeemed | | | 165 | | | | 173 | | | | 168 | |
Redemption Amount | | $ | 4,125,000 | | | $ | 4,325,000 | | | $ | 4,200,000 | |
There were no transactions in APS during the year ended November 30, 2017.
3 Institutional MuniFund Term Preferred Shares
On February 26, 2016, each Trust issued Institutional MuniFund Term Preferred Shares (iMTP Shares) in a private offering to finance a tender offer for its outstanding APS.
Eaton Vance
Municipal Income Trusts
November 30, 2018
Notes to Financial Statements — continued
The iMTP Shares were a form of preferred shares that represented stock of the Trusts. The iMTP Shares had a par value of $0.01 per share, a liquidation preference of $25,000 per share, and a mandatory redemption date of September 1, 2019, unless earlier redeemed or repurchased by a Trust. Dividends on the iMTP Shares were determined weekly based upon the Securities Industry and Financial Markets Association (SIFMA) Municipal Swap Index Rate plus a spread. Such spread to the SIFMA Municipal Swap Index Rate was determined based on the current credit rating of the iMTP Shares.
The iMTP Shares were subject to optional and mandatory redemption in certain circumstances. After February 28, 2017, the iMTP Shares were redeemable at the option of each Trust at a redemption price equal to $25,000 per share, plus accumulated and unpaid dividends and, on redemptions prior to March 1, 2018, plus an optional redemption premium. The iMTP Shares were also subject to mandatory redemption at a redemption price equal to $25,000 per share, plus accumulated and unpaid dividends (mandatory redemption price), if a Trust was in default for an extended period on its asset maintenance requirements with respect to its preferred shares. For so long as the iMTP Shares were outstanding, a Trust’s effective leverage ratio was not permitted to exceed 45%.
The holders of the iMTP Shares and common shares had equal voting rights of one vote per share except that the holders of the iMTP Shares were entitled to elect two Trustees of each Trust. If the dividends on the iMTP Shares remained unpaid in an amount equal to two full years’ dividends, the holders of the iMTP Shares had the right to elect a majority of each Trust’s Trustees.
During the year ended November 30, 2018, each Trust redeemed all of its iMTP Shares at a liquidation price of $25,000 per share plus any accrued but unpaid dividends. Each Trust replaced its iMTP Shares redeemed with residual interest bond financing (see Note 1G). The number of iMTP Shares redeemed and their redemption amount were as follows:
| | | | | | | | | | | | | | | | |
| | | California
Trust | | | Massachusetts
Trust | | | Michigan
Trust | | | New Jersey
Trust | |
| | | | |
Shares Redeemed | | | 1,879 | | | | 672 | | | | 674 | | | | 1,160 | |
Redemption Amount | | $ | 46,975,000 | | | $ | 16,800,000 | | | $ | 16,850,000 | | | $ | 29,000,000 | |
| | | | | | | | | | | | |
| | | New York
Trust | | | Ohio
Trust | | | Pennsylvania
Trust | |
| | | |
Shares Redeemed | | | 1,184 | | | | 736 | | | | 679 | |
Redemption Amount | | $ | 29,600,000 | | | $ | 18,400,000 | | | $ | 16,975,000 | |
Dividends accrued on iMTP Shares are treated as interest payments for financial reporting purposes and are included in interest expense and fees on the Statements of Operations. Costs incurred by each Trust in connection with its offering of iMTP Shares were capitalized as deferred offering costs and were being amortized to the mandatory redemption date of September 1, 2019. Unamortized deferred offerings costs on iMTP Shares which were redeemed in full by a Trust were recorded as realized loss on extinguishment of debt.
The average liquidation preference of the iMTP Shares during the year ended November 30, 2018 was as follows:
| | | | | | | | | | | | | | | | |
| | | California
Trust | | | Massachusetts
Trust | | | Michigan
Trust | | | New Jersey
Trust | |
| | | | |
Average Liquidation Preference of iMTP Shares | | $ | 28,024,315 | | | $ | 10,871,096 | | | $ | 11,592,534 | | | $ | 23,080,342 | |
| | | | | | | | | | | | |
| | | New York
Trust | | | Ohio
Trust | | | Pennsylvania
Trust | |
| | | |
Average Liquidation Preference of iMTP Shares | | $ | 18,652,055 | | | $ | 11,806,027 | | | $ | 9,962,671 | |
Eaton Vance
Municipal Income Trusts
November 30, 2018
Notes to Financial Statements — continued
4 Distributions to Shareholders and Income Tax Information
Each Trust intends to make monthly distributions of net investment income to common shareholders, after payment of any dividends on any outstanding APS and iMTP Shares during periods when APS and iMTP Shares were outstanding. In addition, at least annually, each Trust intends to distribute all or substantially all of its net realized capital gains (reduced by available capital loss carryforwards from prior years). Distributions to common shareholders are recorded on theex-dividend date. Distributions to APS shareholders were recorded daily and were payable at the end of each dividend period. The amount of dividends accrued (including capital gains, if any) to APS shareholders, average APS dividend rates, and dividend rate ranges for the year ended November 30, 2018 were as follows:
| | | | | | | | | | | | | | | | | | | | | | | | | | | | |
| | | California
Trust | | | Massachusetts
Trust | | | Michigan
Trust | | | New Jersey
Trust | | | New York
Trust | | | Ohio
Trust | | | Pennsylvania
Trust | |
| | | | | | | |
Dividends Accrued to APS Shareholders | | $ | 18,865 | | | $ | 20,197 | | | $ | 3,915 | | | $ | 27,962 | | | $ | 25,202 | | | $ | 25,693 | | | $ | 25,516 | |
Average APS Dividend Rates | | | 2.00 | % | | | 1.97 | % | | | 1.91 | % | | | 2.01 | % | | | 1.94 | % | | | 1.89 | % | | | 1.93 | % |
Dividend Rate Ranges (%) | | | 1.56 - 2.73 | | | | 1.57 - 2.73 | | | | 1.59 - 2.87 | | | | 1.56 - 2.73 | | | | 1.59 - 2.84 | | | | 1.59 - 2.59 | | | | 1.57 - 2.59 | |
Distributions to iMTP shareholders were recorded daily and were payable at the end of each dividend period. The amount of dividends accrued to iMTP shareholders and average iMTP dividend rates for the year ended November 30, 2018 were as follows:
| | | | | | | | | | | | | | | | |
| | | California
Trust | | | Massachusetts
Trust | | | Michigan
Trust | | | New Jersey
Trust | |
| | | | |
Dividends Accrued to iMTP Shareholders | | $ | 818,865 | | | $ | 315,601 | | | $ | 325,397 | | | $ | 675,657 | |
Average iMTP Dividend Rates | | | 2.92 | % | | | 2.90 | % | | | 2.81 | % | | | 2.93 | % |
| | | | | | | | | | | | |
| | | New York
Trust | | | Ohio
Trust | | | Pennsylvania
Trust | |
| | | |
Dividends Accrued to iMTP Shareholders | | $ | 528,719 | | | $ | 331,446 | | | $ | 280,063 | |
Average iMTP Dividend Rates | | | 2.83 | % | | | 2.81 | % | | | 2.81 | % |
Distributions to shareholders are determined in accordance with income tax regulations, which may differ from U.S. GAAP. As required by U.S. GAAP, only distributions in excess of tax basis earnings and profits are reported in the financial statements as a return of capital. Permanent differences between book and tax accounting relating to distributions are reclassified topaid-in capital. For tax purposes, distributions from short-term capital gains are considered to be from ordinary income.
The tax character of distributions declared, including distributions on iMTP Shares that are treated as interest expense for financial reporting purposes, for the years ended November 30, 2018 and November 30, 2017 was as follows:
| | | | | | | | | | | | | | | | | | | | | | | | | | | | |
| | | Year Ended November 30, 2018 | |
| | | California
Trust | | | Massachusetts
Trust | | | Michigan
Trust | | | New Jersey
Trust | | | New York
Trust | | | Ohio
Trust | | | Pennsylvania
Trust | |
| | | | | | | |
Tax-exempt income | | $ | 3,905,803 | | | $ | 1,530,524 | | | $ | 1,273,808 | | | $ | 3,105,269 | | | $ | 3,638,188 | | | $ | 1,903,432 | | | $ | 1,597,772 | |
Ordinary income | | $ | 254,955 | | | $ | 79,631 | | | $ | — | | | $ | 119,980 | | | $ | 91,121 | | | $ | — | | | $ | 21,839 | |
| | | | | | | |
| | | | | | | | | | | | | | | | | | | | | | | | | | | | |
Eaton Vance
Municipal Income Trusts
November 30, 2018
Notes to Financial Statements — continued
| | | | | | | | | | | | | | | | | | | | | | | | | | | | |
| | | Year Ended November 30, 2017 | |
| | | California Trust | | | Massachusetts
Trust | | | Michigan Trust | | | New Jersey Trust | | | New York Trust | | | Ohio Trust | | | Pennsylvania
Trust | |
| | | | | | | |
Tax-exempt income | | $ | 4,477,954 | | | $ | 1,786,608 | | | $ | 1,374,454 | | | $ | 3,114,672 | | | $ | 3,992,549 | | | $ | 2,146,103 | | | $ | 1,781,919 | |
Ordinary income | | $ | 242,309 | | | $ | 68,777 | | | $ | — | | | $ | 166,097 | | | $ | 54,213 | | | $ | — | | | $ | 7,708 | |
During the year ended November 30, 2018, the following amounts were reclassified due to expired capital loss carryforwards (except for Massachusetts Trust, Michigan Trust and Ohio Trust) and differences between book and tax accounting for deferred offering costs on iMTP Shares.
| | | | | | | | | | | | | | | | | | | | | | | | | | | | |
| | | California
Trust | | | Massachusetts
Trust | | | Michigan
Trust | | | New Jersey
Trust | | | New York
Trust | | | Ohio
Trust | | | Pennsylvania
Trust | |
|
Change in: | |
Paid-in capital | | $ | (468,024 | ) | | $ | (76,532 | ) | | $ | (74,436 | ) | | $ | (1,631,060 | ) | | $ | (791,871 | ) | | $ | (82,799 | ) | | $ | (407,469 | ) |
Distributable earnings (accumulated loss) | | $ | 468,024 | | | $ | 76,532 | | | $ | 74,436 | | | $ | 1,631,060 | | | $ | 791,871 | | | $ | 82,799 | | | $ | 407,469 | |
These reclassifications had no effect on the net assets or net asset value per share of the Trusts.
As of November 30, 2018, the components of distributable earnings (accumulated loss) on a tax basis were as follows:
| | | | | | | | | | | | | | | | | | | | | | | | | | | | |
| | | California
Trust | | | Massachusetts
Trust | | | Michigan
Trust | | | New Jersey
Trust | | | New York
Trust | | | Ohio
Trust | | | Pennsylvania
Trust | |
| | | | | | | |
Undistributedtax-exempt income | | $ | 201,395 | | | $ | 262,119 | | | $ | 142,644 | | | $ | 148,709 | | | $ | 204,339 | | | $ | 171,079 | | | $ | 134,496 | |
Undistributed long-term capital gains | | $ | — | | | $ | — | | | $ | 220,935 | | | $ | — | | | $ | — | | | $ | — | | | $ | — | |
Capital loss carryforwards and deferred capital losses | | $ | (5,299,748 | ) | | $ | (1,395,645 | ) | | $ | — | | | $ | (4,890,669 | ) | | $ | (4,446,670 | ) | | $ | (206,358 | ) | | $ | (2,882,311 | ) |
Net unrealized appreciation | | $ | 4,716,019 | | | $ | 1,617,118 | | | $ | 664,877 | | | $ | 2,130,925 | | | $ | 3,868,266 | | | $ | 1,779,410 | | | $ | 728,631 | |
At November 30, 2018, the following Trusts, for federal income tax purposes, had capital loss carryforwards and deferred capital losses which would reduce the respective Trust’s taxable income arising from future net realized gains on investment transactions, if any, to the extent permitted by the Internal Revenue Code, and thus would reduce the amount of distributions to shareholders, which would otherwise be necessary to relieve the Trusts of any liability for federal income or excise tax. Under tax regulations, capital losses incurred in taxable years beginning after December 2010 are considered deferred capital losses and are treated as arising on the first day of a Trust’s next taxable year, retaining the same short-term or long-term character as when originally deferred. Deferred capital losses are required to be used prior to capital loss carryforwards, which carry an expiration date. As a result of this ordering rule, capital loss carryforwards may be more likely to expire unused. The amounts and expiration dates of the capital loss carryforwards, whose character is short-term, and the amounts of the deferred capital losses are as follows:
| | | | | | | | | | | | | | | | | | | | | | | | | | | | |
| Expiration Date | | California
Trust | | | Massachusetts
Trust | | | Michigan
Trust | | | New Jersey
Trust | | | New York
Trust | | | Ohio
Trust | | | Pennsylvania
Trust | |
| | | | | | | |
November 30, 2019 | | $ | 5,299,748 | | | $ | 1,395,645 | | | $ | — | | | $ | 4,137,608 | | | $ | 3,607,489 | | | $ | 206,358 | | | $ | 1,724,760 | |
| | | | | | | |
Total capital loss carryforwards | | $ | 5,299,748 | | | $ | 1,395,645 | | | $ | — | | | $ | 4,137,608 | | | $ | 3,607,489 | | | $ | 206,358 | | | $ | 1,724,760 | |
| | | | | | | |
Deferred capital losses: | | | | | | | | | | | | | | | | | | | | | | | | | | | | |
Short-term | | $ | — | | | $ | — | | | $ | — | | | $ | 753,061 | | | $ | 839,181 | | | $ | — | | | $ | 351,947 | |
Long-term | | $ | — | | | $ | — | | | $ | — | | | $ | — | | | $ | — | | | $ | — | | | $ | 805,604 | |
Eaton Vance
Municipal Income Trusts
November 30, 2018
Notes to Financial Statements — continued
During the year ended November 30, 2018, capital loss carryforwards of $66,611, $384,436, $379,386 and $1,004,316 were utilized to offset net realized gains by the California Trust, Massachusetts Trust, Michigan Trust and Ohio Trust, respectively.
The cost and unrealized appreciation (depreciation) of investments of each Trust at November 30, 2018, as determined on a federal income tax basis, were as follows:
| | | | | | | | | | | | | | | | |
| | | California
Trust | | | Massachusetts
Trust | | | Michigan
Trust | | | New Jersey
Trust | |
| | | | |
Aggregate cost | | $ | 88,215,311 | | | $ | 36,461,247 | | | $ | 27,071,938 | | | $ | 56,429,110 | |
| | | | |
Gross unrealized appreciation | | $ | 5,371,820 | | | $ | 2,165,203 | | | $ | 1,071,843 | | | $ | 2,946,889 | |
Gross unrealized depreciation | | | (655,801 | ) | | | (548,085 | ) | | | (406,966 | ) | | | (815,964 | ) |
| | | | |
Net unrealized appreciation | | $ | 4,716,019 | | | $ | 1,617,118 | | | $ | 664,877 | | | $ | 2,130,925 | |
| | | | | | | | | | | | |
| | | New York
Trust | | | Ohio
Trust | | | Pennsylvania
Trust | |
| | | |
Aggregate cost | | $ | 67,012,424 | | | $ | 36,889,809 | | | $ | 32,334,176 | |
| | | |
Gross unrealized appreciation | | $ | 4,996,090 | | | $ | 2,486,874 | | | $ | 1,669,070 | |
Gross unrealized depreciation | | | (1,127,824 | ) | | | (707,464 | ) | | | (940,439 | ) |
| | | |
Net unrealized appreciation | | $ | 3,868,266 | | | $ | 1,779,410 | | | $ | 728,631 | |
5 Investment Adviser Fee and Other Transactions with Affiliates
The investment adviser fee is earned by Eaton Vance Management (EVM) as compensation for investment advisory services rendered to each Trust. Pursuant to the investment advisory agreements between the Trusts and EVM, the investment advisory fee payable by each Trust is 0.70% of the Trust’s average weekly gross assets and is payable monthly. Pursuant to a fee reduction agreement between each Trust and EVM that commenced on May 1, 2010, the annual investment adviser fee is reduced by 0.015% every May 1 thereafter for the next nineteen years. This annual fee reduction was accelerated for California Trust (effective June 1, 2018), Massachusetts Trust, New Jersey Trust (effective February 1, 2018), New York Trust, Michigan Trust (effective July 1, 2018), Ohio Trust (effective January 1, 2018) and Pennsylvania Trust (effective August 1, 2018), each of which is currently subject to an advisory fee of 0.40% of average weekly gross assets. The fee reductions cannot be terminated or reduced without the approval of a majority vote of the Trustees of the Trusts who are not interested persons of EVM or each Trust and by a vote of a majority of shareholders. Average weekly gross assets include the principal amount of any indebtedness for money borrowed, including debt securities issued by a Trust, and the amount of any outstanding preferred shares issued by the Trust. Pursuant to a fee reduction agreement with EVM, average weekly gross assets are calculated by adding to net assets the liquidation value of a Trust’s APS and iMTP Shares then outstanding and the amount payable by the Trust to floating rate note holders, such adjustment being limited to the value of the APS outstanding prior to any APS redemptions by the Trust. The administration fee is earned by EVM for administering the business affairs of each Trust and is computed at an annual rate of 0.20% of each Trust’s average weekly gross assets. For the year ended November 30, 2018, the investment adviser fees and administration fees were as follows:
| | | | | | | | | | | | | | | | |
| | | California
Trust | | | Massachusetts
Trust | | | Michigan
Trust | | | New Jersey
Trust | |
| | | | |
Investment Adviser Fee | | $ | 739,406 | | | $ | 240,141 | | | $ | 233,063 | | | $ | 421,202 | |
Administration Fee | | $ | 301,217 | | | $ | 120,070 | | | $ | 92,709 | | | $ | 195,235 | |
| | | | | | | | | | | | |
| | | New York
Trust | | | Ohio
Trust | | | Pennsylvania
Trust | |
| | | |
Investment Adviser Fee | | $ | 475,882 | | | $ | 265,529 | | | $ | 283,262 | |
Administration Fee | | $ | 237,941 | | | $ | 127,704 | | | $ | 109,647 | |
Eaton Vance
Municipal Income Trusts
November 30, 2018
Notes to Financial Statements — continued
Trustees and officers of the Trusts who are members of EVM’s organization receive remuneration for their services to the Trusts out of the investment adviser fee. Trustees of the Trusts who are not affiliated with EVM may elect to defer receipt of all or a percentage of their annual fees in accordance with the terms of the Trustees Deferred Compensation Plan. For the year ended November 30, 2018, no significant amounts have been deferred. Certain officers and Trustees of the Trusts are officers of EVM.
6 Purchases and Sales of Investments
Purchases and sales of investments, other than short-term obligations, for the year ended November 30, 2018 were as follows:
| | | | | | | | | | | | | | | | |
| | | California Trust | | | Massachusetts Trust | | | Michigan Trust | | | New Jersey Trust | |
| | | | |
Purchases | | $ | 198,733,841 | | | $ | 41,561,819 | | | $ | 26,414,186 | | | $ | 54,960,822 | |
Sales | | $ | 197,012,233 | | | $ | 41,370,725 | | | $ | 25,863,618 | | | $ | 61,257,214 | |
| | | | | | | | | | | | |
| | | New York Trust | | | Ohio Trust | | | Pennsylvania Trust | |
| | | |
Purchases | | $ | 70,274,997 | | | $ | 35,555,636 | | | $ | 33,395,860 | |
Sales | | $ | 76,507,973 | | | $ | 37,402,039 | | | $ | 33,275,170 | |
7 Common Shares of Beneficial Interest
The Trusts may issue common shares pursuant to their dividend reinvestment plans. There were no common shares issued by the Trusts for the years ended November 30, 2018 and November 30, 2017.
On November 11, 2013, the Boards of Trustees of the Trusts authorized the repurchase by each Trust of up to 10% of its then currently outstanding common shares in open-market transactions at a discount to net asset value (NAV). The repurchase program does not obligate the Trusts to purchase a specific amount of shares. During the year ended November 30, 2018, the California Trust repurchased 121,000 of its common shares under the share repurchase program at a cost, including brokerage commissions, of $1,478,804 and an average price per share of $12.22. The weighted average discount per share to NAV on these repurchases amounted to 11.81% for the year ended November 30, 2018.
There were no repurchases of common shares by the Trusts for the year ended November 30, 2017.
8 Overdraft Advances
Pursuant to the custodian agreement, State Street Bank and Trust Company (SSBT) may, in its discretion, advance funds to the Trusts to make properly authorized payments. When such payments result in an overdraft, the Trusts are obligated to repay SSBT at the current rate of interest charged by SSBT for secured loans (currently, the Federal Funds rate plus 2%). This obligation is payable on demand to SSBT. SSBT has a lien on a Trust’s assets to the extent of any overdraft. At November 30, 2018, the Ohio Trust had a payment due to SSBT pursuant to the foregoing arrangement of $4,364. Based on the short-term nature of these payments and the variable interest rate, the carrying value of the overdraft advances approximated its fair value at November 30, 2018. If measured at fair value, overdraft advances would have been considered as Level 2 in the fair value hierarchy (see Note 10) at November 30, 2018. The Trusts’ average overdraft advances during the year ended November 30, 2018 were not significant.
9 Financial Instruments
The Trusts may trade in financial instruments withoff-balance sheet risk in the normal course of their investing activities. These financial instruments may include financial futures contracts and may involve, to a varying degree, elements of risk in excess of the amounts recognized for financial statement purposes. The notional or contractual amounts of these instruments represent the investment a Trust has in particular classes of financial instruments and do not necessarily represent the amounts potentially subject to risk. The measurement of the risks associated with these instruments is meaningful only when all related and offsetting transactions are considered. At November 30, 2018, there were no obligations outstanding under these financial instruments.
Each Trust is subject to interest rate risk in the normal course of pursuing its investment objective. Because the Trusts hold fixed-rate bonds, the value of these bonds may decrease if interest rates rise. During the year ended November 30, 2018, the New Jersey Trust and Pennsylvania Trust entered into U.S. Treasury futures contracts to hedge against changes in interest rates.
Eaton Vance
Municipal Income Trusts
November 30, 2018
Notes to Financial Statements — continued
The effect of derivative instruments (not considered to be hedging instruments for accounting disclosure purposes) on the Statement of Operations and whose primary underlying risk exposure is interest rate risk for the year ended November 30, 2018 was as follows:
| | | | | | | | |
| | | New Jersey
Trust | | | Pennsylvania
Trust | |
| | |
Realized Gain (Loss) on Derivatives Recognized in Income | | $ | 100,199 | (1) | | $ | 33,400 | (1) |
Change in Unrealized Appreciation (Depreciation) on Derivatives Recognized in Income | | $ | (47,756 | )(2) | | $ | (15,919 | )(2) |
| (1) | Statement of Operations location: Net realized gain (loss) – Financial futures contracts. |
| (2) | Statement of Operations location: Change in unrealized appreciation (depreciation) – Financial futures contracts. |
The average notional cost of futures contracts outstanding during the year ended November 30, 2018, which is indicative of the volume of this derivative type, was approximately as follows:
| | | | | | | | |
| | | New Jersey Trust | | | Pennsylvania Trust | |
| | |
Average Notional Cost: | | | | | | | | |
Futures Contracts — Short | | $ | 708,000 | | | $ | 236,000 | |
10 Fair Value Measurements
Under generally accepted accounting principles for fair value measurements, a three-tier hierarchy to prioritize the assumptions, referred to as inputs, is used in valuation techniques to measure fair value. The three-tier hierarchy of inputs is summarized in the three broad levels listed below.
| • | | Level 1 – quoted prices in active markets for identical investments |
| • | | Level 2 – other significant observable inputs (including quoted prices for similar investments, interest rates, prepayment speeds, credit risk, etc.) |
| • | | Level 3 – significant unobservable inputs (including a fund’s own assumptions in determining the fair value of investments) |
In cases where the inputs used to measure fair value fall in different levels of the fair value hierarchy, the level disclosed is determined based on the lowest level input that is significant to the fair value measurement in its entirety. The inputs or methodology used for valuing securities are not necessarily an indication of the risk associated with investing in those securities.
At November 30, 2018, the hierarchy of inputs used in valuing the Trusts’ investments, which are carried at value, were as follows:
| | | | | | | | | | | | | | | | |
California Trust | | | | | | | | | | | | |
| Asset Description | | Level 1 | | | Level 2 | | | Level 3 | | | Total | |
| | | | |
Tax-Exempt Municipal Securities | | $ | — | | | $ | 142,931,160 | | | $ | — | | | $ | 142,931,160 | |
Taxable Municipal Securities | | | — | | | | 8,168,070 | | | | — | | | | 8,168,070 | |
Corporate Bonds & Notes | | | — | | | | 1,044,170 | | | | — | | | | 1,044,170 | |
| | | | |
Total Investments | | $ | — | | | $ | 152,143,400 | | | $ | — | | | $ | 152,143,400 | |
|
Massachusetts Trust | |
| Asset Description | | Level 1 | | | Level 2 | | | Level 3 | | | Total | |
| | | | |
Tax-Exempt Municipal Securities | | $ | — | | | $ | 57,550,937 | | | $ | — | | | $ | 57,550,937 | |
Taxable Municipal Securities | | | — | | | | 734,325 | | | | — | | | | 734,325 | |
Corporate Bonds & Notes | | | — | | | | 788,118 | | | | — | | | | 788,118 | |
| | | | |
Total Investments | | $ | — | | | $ | 59,073,380 | | | $ | — | | | $ | 59,073,380 | |
Eaton Vance
Municipal Income Trusts
November 30, 2018
Notes to Financial Statements — continued
| | | | | | | | | | | | | | | | |
Michigan Trust | | | | | | | | | | | | |
| Asset Description | | Level 1 | | | Level 2 | | | Level 3 | | | Total | |
| | | | |
Tax-Exempt Investments | | $ | — | | | $ | 45,757,191 | | | $ | — | | | $ | 45,757,191 | |
| | | | |
Total Investments | | $ | — | | | $ | 45,757,191 | | | $ | — | | | $ | 45,757,191 | |
| | | | |
New Jersey Trust | | | | | | | | | | | | |
| Asset Description | | Level 1 | | | Level 2 | | | Level 3 | | | Total | |
| | | | |
Tax-Exempt Municipal Securities | | $ | — | | | $ | 88,725,823 | | | $ | — | | | $ | 88,725,823 | |
Taxable Municipal Securities | | | — | | | | 2,679,407 | | | | — | | | | 2,679,407 | |
| | | | |
Total Investments | | $ | — | | | $ | 91,405,230 | | | $ | — | | | $ | 91,405,230 | |
| | | | |
New York Trust | | | | | | | | | | | | |
| Asset Description | | Level 1 | | | Level 2 | | | Level 3* | | | Total | |
| | | | |
Tax-Exempt Investments | | $ | — | | | $ | 112,666,297 | | | $ | — | | | $ | 112,666,297 | |
Corporate Bonds & Notes | | | — | | | | 1,459,742 | | | | — | | | | 1,459,742 | |
Miscellaneous | | | — | | | | — | | | | 749,046 | | | | 749,046 | |
| | | | |
Total Investments | | $ | — | | | $ | 114,126,039 | | | $ | 749,046 | | | $ | 114,875,085 | |
| | | | |
Ohio Trust | | | | | | | | | | | | |
| Asset Description | | Level 1 | | | Level 2 | | | Level 3 | | | Total | |
| | | | |
Tax-Exempt Investments | | $ | — | | | $ | 61,649,315 | | | $ | — | | | $ | 61,649,315 | |
| | | | |
Total Investments | | $ | — | | | $ | 61,649,315 | | | $ | — | | | $ | 61,649,315 | |
| | | | |
Pennsylvania Trust | | | | | | | | | | | | |
| Asset Description | | Level 1 | | | Level 2 | | | Level 3 | | | Total | |
| | | | |
Tax-Exempt Municipal Securities | | $ | — | | | $ | 54,222,134 | | | $ | — | | | $ | 54,222,134 | |
Taxable Municipal Securities | | | — | | | | 20,641 | | | | — | | | | 20,641 | |
| | | | |
Total Investments | | $ | — | | | $ | 54,242,775 | | | $ | — | | | $ | 54,242,775 | |
| * | None of the unobservable inputs for Level 3 assets, individually or collectively, had a material impact on the New York Trust. |
Level 3 investments held by the New York Trust at the beginning and/or end of the period in relation to net assets applicable to common shares were not significant and accordingly, a reconciliation of Level 3 assets for the year ended November 30, 2018 is not presented.
11 Agreements and Plans of Reorganization
In April 2018, the Trustees of Michigan Trust approved an Agreement and Plan of Reorganization whereby the common shares of Michigan Trust would, in effect, be exchanged for new common shares of Eaton Vance Municipal Income Trust with an equal aggregate net asset value. The Agreement and Plan of Reorganization was approved at a Special Meeting of Shareholders of Michigan Trust on November 15, 2018. The reorganization was completed on December 14, 2018.
Eaton Vance
Municipal Income Trusts
November 30, 2018
Notes to Financial Statements — continued
In July 2018, the Trustees of the following Trusts approved Agreements and Plans of Reorganization whereby the common shares of each Acquired Trust would, in effect, be exchanged for new common shares of the Acquiring Trust with an equal aggregate net asset value.
| | |
| Acquired Trusts | | Acquiring Trust |
| |
Massachusetts Trust | | Eaton Vance Municipal Income Trust |
| |
New Jersey Trust | | Eaton Vance Municipal Income Trust |
| |
Ohio Trust | | Eaton Vance Municipal Income Trust |
| |
Pennsylvania Trust | | Eaton Vance Municipal Income Trust |
The Agreements and Plans of Reorganization for Massachusetts Trust, Ohio Trust and Pennsylvania Trust were approved at a Special Meeting of Shareholders of the respective Acquired Trust on December 20, 2018. The reorganizations are expected to be completed on or about January 18, 2019.
The Agreement and Plan of Reorganization for New Jersey Trust was approved at a Special Meeting of Shareholders of New Jersey Trust on January 10, 2019. The reorganization is expected to be completed on or about February 22, 2019.
Eaton Vance
Municipal Income Trusts
November 30, 2018
Report of Independent Registered Public Accounting Firm
To the Trustees and Shareholders of Eaton Vance California Municipal Income Trust, Eaton Vance Massachusetts Municipal Income Trust, Eaton Vance Michigan Municipal Income Trust, Eaton Vance New Jersey Municipal Income Trust, Eaton Vance New York Municipal Income Trust, Eaton Vance Ohio Municipal Income Trust, and Eaton Vance Pennsylvania Municipal Income Trust:
Opinion on the Financial Statements and Financial Highlights
We have audited the accompanying statements of assets and liabilities of Eaton Vance California Municipal Income Trust, Eaton Vance Massachusetts Municipal Income Trust, Eaton Vance Michigan Municipal Income Trust, Eaton Vance New Jersey Municipal Income Trust, Eaton Vance New York Municipal Income Trust, Eaton Vance Ohio Municipal Income Trust, and Eaton Vance Pennsylvania Municipal Income Trust, (collectively, the “Trusts”), including the portfolios of investments, as of November 30, 2018, the related statements of operations and cash flows for the year then ended, the statements of changes in net assets for each of the two years in the period then ended, the financial highlights for each of the five years in the period then ended, and the related notes. In our opinion, the financial statements and financial highlights present fairly, in all material respects, the financial position of the Trusts as of November 30, 2018, and the results of their operations and cash flows for the year then ended, the changes in their net assets for each of the two years in the period then ended, and the financial highlights for each of the five years in the period then ended, in conformity with accounting principles generally accepted in the United States of America.
Basis for Opinion
These financial statements and financial highlights are the responsibility of the Trusts’ management. Our responsibility is to express an opinion on the Trusts’ financial statements and financial highlights based on our audits. We are a public accounting firm registered with the Public Company Accounting Oversight Board (United States) (PCAOB) and are required to be independent with respect to the Trusts in accordance with the U.S. federal securities laws and the applicable rules and regulations of the Securities and Exchange Commission and the PCAOB.
We conducted our audits in accordance with the standards of the PCAOB. Those standards require that we plan and perform the audit to obtain reasonable assurance about whether the financial statements and financial highlights are free of material misstatement, whether due to error or fraud. The Trusts are not required to have, nor were we engaged to perform, an audit of their internal control over financial reporting. As part of our audits we are required to obtain an understanding of internal control over financial reporting but not for the purpose of expressing an opinion on the effectiveness of the Trusts’ internal control over financial reporting. Accordingly, we express no such opinion.
Our audits included performing procedures to assess the risks of material misstatement of the financial statements and financial highlights, whether due to error or fraud, and performing procedures that respond to those risks. Such procedures included examining, on a test basis, evidence regarding the amounts and disclosures in the financial statements and financial highlights. Our audits also included evaluating the accounting principles used and significant estimates made by management, as well as evaluating the overall presentation of the financial statements and financial highlights. Our procedures included confirmation of securities owned as of November 30, 2018, by correspondence with the custodian and brokers; when replies were not received from brokers, we performed other auditing procedures. We believe that our audits provide a reasonable basis for our opinion.
Emphasis of Matter
We draw attention to Note 11 of the financial statements, which describes Agreements and Plans of Reorganization for certain of the Trusts. Our opinion is not modified in respect of this matter.
/s/ Deloitte & Touche LLP
Boston, Massachusetts
January 18, 2019
We have served as the auditor of one or more Eaton Vance investment companies since 1959.
Eaton Vance
Municipal Income Trusts
November 30, 2018
Federal Tax Information (Unaudited)
The Form1099-DIV you receive in February 2019 will show the tax status of all distributions paid to your account in calendar year 2018. Shareholders are advised to consult their own tax adviser with respect to the tax consequences of their investment in the Trusts. As required by the Internal Revenue Code and/or regulations, shareholders must be notified regarding exempt-interest dividends and capital gains dividends.
Exempt-Interest Dividends. For the fiscal year ended November 30, 2018, the Trusts designate the following percentages of distributions from net investment income as exempt-interest dividends:
| | | | |
California Municipal Income Trust | | | 93.87 | % |
Massachusetts Municipal Income Trust | | | 95.05 | % |
Michigan Municipal Income Trust | | | 100.00 | % |
New Jersey Municipal Income Trust | | | 96.28 | % |
New York Municipal Income Trust | | | 97.56 | % |
Ohio Municipal Income Trust | | | 100.00 | % |
Pennsylvania Municipal Income Trust | | | 98.65 | % |
Capital Gains Dividends. The Michigan Municipal Income Trust hereby designates as a capital gain dividend with respect to the taxable year ended November 30, 2018, $220,935 or, if subsequently determined to be different, the net capital gain of such year.
Eaton Vance
Municipal Income Trusts
November 30, 2018
Dividend Reinvestment Plan
Each Trust offers a dividend reinvestment plan (Plan) pursuant to which shareholders automatically have distributions reinvested in common shares (Shares) of the Trust unless they elect otherwise through their investment dealer. On the distribution payment date, if the NAV per Share is equal to or less than the market price per Share plus estimated brokerage commissions, then new Shares will be issued. The number of Shares shall be determined by the greater of the NAV per Share or 95% of the market price. Otherwise, Shares generally will be purchased on the open market by American Stock Transfer & Trust Company, LLC, the Plan agent (Agent). Distributions subject to income tax (if any) are taxable whether or not Shares are reinvested.
If your Shares are in the name of a brokerage firm, bank, or other nominee, you can ask the firm or nominee to participate in the Plan on your behalf. If the nominee does not offer the Plan, you will need to request that the Trust’s transfer agentre-register your Shares in your name or you will not be able to participate.
The Agent’s service fee for handling distributions will be paid by the Trust. Plan participants will be charged their pro rata share of brokerage commissions on all open-market purchases.
Plan participants may withdraw from the Plan at any time by writing to the Agent at the address noted on the following page. If you withdraw, you will receive Shares in your name for all Shares credited to your account under the Plan. If a participant elects by written notice to the Agent to sell part or all of his or her Shares and remit the proceeds, the Agent is authorized to deduct a $5.00 fee plus brokerage commissions from the proceeds.
If you wish to participate in the Plan and your Shares are held in your own name, you may complete the form on the following page and deliver it to the Agent. Any inquiries regarding the Plan can be directed to the Agent at1-866-439-6787.
Eaton Vance
Municipal Income Trusts
November 30, 2018
Application for Participation in Dividend Reinvestment Plan
This form is for shareholders who hold their common shares in their own names. If your common shares are held in the name of a brokerage firm, bank, or other nominee, you should contact your nominee to see if it will participate in the Plan on your behalf. If you wish to participate in the Plan, but your brokerage firm, bank, or nominee is unable to participate on your behalf, you should request that your common shares bere-registered in your own name which will enable your participation in the Plan.
The following authorization and appointment is given with the understanding that I may terminate it at any time by terminating my participation in the Plan as provided in the terms and conditions of the Plan.
Please print exact name on account
Shareholder signature Date
Shareholder signature Date
Please sign exactly as your common shares are registered. All persons whose names appear on the share certificate must sign.
YOU SHOULD NOT RETURN THIS FORM IF YOU WISH TO RECEIVE YOUR DISTRIBUTIONS IN CASH. THIS IS NOT A PROXY.
This authorization form, when signed, should be mailed to the following address:
Eaton Vance Municipal Income Trusts
c/o American Stock Transfer & Trust Company, LLC
P.O. Box 922
Wall Street Station
New York, NY 10269-0560
Eaton Vance
Municipal Income Trusts
November 30, 2018
Management and Organization
Fund Management. The Trustees of Eaton Vance California Municipal Income Trust (CEV), Eaton Vance Massachusetts Municipal Income Trust (MMV), Eaton Vance Michigan Municipal Income Trust (EMI), Eaton Vance New Jersey Municipal Income Trust (EVJ), Eaton Vance New York Municipal Income Trust (EVY), Eaton Vance Ohio Municipal Income Trust (EVO) and Eaton Vance Pennsylvania Municipal Income Trust (EVP) (collectively, the Trusts) are responsible for the overall management and supervision of the Trusts’ affairs. The Trustees and officers of the Trusts are listed below. Except as indicated, each individual has held the office shown or other offices in the same company for the last five years. The “Noninterested Trustees” consist of those Trustees who are not “interested persons” of the Trusts, as that term is defined under the 1940 Act. The business address of each Trustee and officer is Two International Place, Boston, Massachusetts 02110. As used below, “EVC” refers to Eaton Vance Corp., “EV” refers to Eaton Vance, Inc., “EVM” refers to Eaton Vance Management, “BMR” refers to Boston Management and Research and “EVD” refers to Eaton Vance Distributors, Inc. EVC and EV are the corporate parent and trustee, respectively, of EVM and BMR. EVD is a wholly-owned subsidiary of EVC. Each officer affiliated with Eaton Vance may hold a position with other Eaton Vance affiliates that is comparable to his or her position with EVM listed below. Each Trustee oversees 174 portfolios in the Eaton Vance Complex (including all master and feeder funds in a master feeder structure). Each officer serves as an officer of certain other Eaton Vance funds. Each Trustee serves for a three year term. Each officer serves until his or her successor is elected.
| | | | | | |
| Name and Year of Birth | | Position(s) with the Trusts | | Term Expiring; Trustee Since(1) | | Principal Occupation(s) and Directorships
During Past Five Years and Other Relevant Experience |
| Interested Trustee |
| | | |
Thomas E. Faust Jr. 1958 | | Class II Trustee | | Until 2019. Trustee since 2007. | | Chairman, Chief Executive Officer and President of EVC, Director and President of EV, Chief Executive Officer and President of EVM and BMR, and Director of EVD. Trustee and/or officer of 174 registered investment companies. Mr. Faust is an interested person because of his positions with EVM, BMR, EVD, EVC and EV, which are affiliates of the Trusts. Directorships in the Last Five Years.(2) Director of EVC and Hexavest Inc. (investment management firm). |
|
| Noninterested Trustees |
| | | |
Mark R. Fetting 1954 | | Class II Trustee | | Until 2019. Trustee since 2016. | | Private investor. Formerly held various positions at Legg Mason, Inc. (investment management firm) (2000-2012), including President, Chief Executive Officer, Director and Chairman (2008-2012), Senior Executive Vice President (2004-2008) and Executive Vice President (2001-2004). Formerly, President of Legg Mason family of funds (2001-2008). Formerly, Division President and Senior Officer of Prudential Financial Group, Inc. and related companies (investment management firm)(1991-2000). Directorships in the Last Five Years.None. |
| | | |
Cynthia E. Frost 1961 | | Class I Trustee | | Until 2021. Trustee since 2014. | | Private investor. Formerly, Chief Investment Officer of Brown University (university endowment) (2000-2012). Formerly, Portfolio Strategist for Duke Management Company (university endowment manager) (1995-2000). Formerly, Managing Director, Cambridge Associates (investment consulting company) (1989-1995). Formerly, Consultant, Bain and Company (management consulting firm)(1987-1989). Formerly, Senior Equity Analyst, BA Investment Management Company (1983-1985). Directorships in the Last Five Years.None. |
| | | |
George J. Gorman 1952 | | Class I Trustee(3) | | Until 2021. Trustee since 2014. | | Principal at George J. Gorman LLC (consulting firm). Formerly, Senior Partner at Ernst & Young LLP (a registered public accounting firm) (1974-2009). Directorships in the Last Five Years.Formerly, Trustee of the BofA Funds Series Trust (11 funds) (2011-2014) and of the Ashmore Funds (9 funds) (2010-2014). |
| | | |
Valerie A. Mosley 1960 | | Class I Trustee | | Until 2021. Trustee since 2014. | | Chairwoman and Chief Executive Officer of Valmo Ventures (a consulting and investment firm). Former Partner and Senior Vice President, Portfolio Manager and Investment Strategist at Wellington Management Company, LLP (investment management firm) (1992-2012). Former Chief Investment Officer, PG Corbin Asset Management (1990-1992). Formerly worked in institutional corporate bond sales at Kidder Peabody (1986-1990). Directorships in the Last Five Years.(2) Director of Envestnet, Inc. (provider of intelligent systems for wealth management and financial wellness) (since 2018). Director of Dynex Capital, Inc. (mortgage REIT) (since 2013). |
Eaton Vance
Municipal Income Trusts
November 30, 2018
Management and Organization — continued
| | | | | | |
| Name and Year of Birth | | Position(s) with the Trusts | | Term Expiring; Trustee Since(1) | | Principal Occupation(s) and Directorships
During Past Five Years and Other Relevant Experience |
| Noninterested Trustees (continued) |
| | | |
William H. Park 1947 | | Chairperson of the Board and Class III Trustee(3) | | Until 2020. Chairperson of the Board since 2016 and Trustee since 2003. | | Private investor. Formerly, Consultant (management and transactional)(2012-2014). Formerly, Chief Financial Officer, Aveon Group L.P. (investment management firm) (2010-2011). Formerly, Vice Chairman, Commercial Industrial Finance Corp. (specialty finance company) (2006-2010). Formerly, President and Chief Executive Officer, Prizm Capital Management, LLC (investment management firm)(2002-2005). Formerly, Executive Vice President and Chief Financial Officer, United Asset Management Corporation (investment management firm)(1982-2001). Formerly, Senior Manager, Price Waterhouse (now PricewaterhouseCoopers) (a registered public accounting firm) (1972-1981). Directorships in the Last Five Years.(2)None. |
| | | |
Helen Frame Peters 1948 | | Class III Trustee | | Until 2020. Trustee since 2008. | | Professor of Finance, Carroll School of Management, Boston College. Formerly, Dean, Carroll School of Management, Boston College (2000-2002). Formerly, Chief Investment Officer, Fixed Income, Scudder Kemper Investments (investment management firm) (1998-1999). Formerly, Chief Investment Officer, Equity and Fixed Income, Colonial Management Associates (investment management firm) (1991-1998). Directorships in the Last Five Years.(2) None. |
| | | |
Keith Quinton(4) 1958 | | Class III Trustee | | Until 2020. Trustee since 2018. | | Independent Investment Committee Member at New Hampshire Retirement System (since 2017). Advisory Committee member at Northfield Information Services, Inc. (risk management analytics provider) (since 2016). Formerly, Portfolio Manager and Senior Quantitative Analyst at Fidelity Investments (investment management firm) (2001-2014). Directorships in the Last Five Years. Director of New Hampshire Municipal Bond Bank (since 2016). |
| | | |
Marcus L. Smith(4) 1966 | | Class III Trustee | | Until 2020. Trustee since 2018. | | Member of Posse Boston Advisory Board (foundation) (since 2015); Trustee at University of Mount Union (since 2008). Formerly, Portfolio Manager at MFS Investment Management (investment management firm) (1994-2017). Directorships in the Last Five Years. Director of MSCI Inc. (global provider of investment decision support tools) (since 2017). Director of DCT Industrial Trust Inc. (logistics real estate company) (since 2017). |
| | | |
Susan J. Sutherland 1957 | | Class I Trustee | | Until 2021. Trustee since 2015. | | Private investor. Formerly, Associate, Counsel and Partner at Skadden, Arps, Slate, Meagher & Flom LLP (law firm) (1982-2013). Directorships in the Last Five Years.Formerly, Director of Montpelier Re Holdings Ltd. (global provider of customized insurance and reinsurance products)(2013-2015). |
| | | |
Scott E. Wennerholm 1959 | | Class II Trustee | | Until 2019. Trustee since 2016. | | Formerly, Trustee at Wheelock College (postsecondary institution) (2012-2018). Formerly, Consultant at GF Parish Group (executive recruiting firm) (2016-2017). Formerly, Chief Operating Officer and Executive Vice President at BNY Mellon Asset Management (investment management firm) (2005-2011). Formerly, Chief Operating Officer and Chief Financial Officer at Natixis Global Asset Management (investment management firm) (1997-2004). Formerly, Vice President at Fidelity Investments Institutional Services (investment management firm) (1994-1997). Directorships in the Last Five Years. None. |
| | | |
| | | | | | |
| Name and Year of Birth | | Position(s) with the Trusts | | Officer
Since(5) | | Principal Occupation(s) During Past Five Years |
| Principal Officers who are not Trustees |
| | | |
Payson F. Swaffield 1956 | | President | | 2003 | | Vice President and Chief Income Investment Officer of EVM and BMR. Also Vice President of Calvert Research and Management (“CRM”). |
| | | |
Maureen A. Gemma 1960 | | Vice President, Secretary and Chief Legal Officer | | 2005 | | Vice President of EVM and BMR. Also Vice President of CRM. |
Eaton Vance
Municipal Income Trusts
November 30, 2018
Management and Organization — continued
| | | | | | |
| Name and Year of Birth | | Position(s) with the Trusts | | Officer
Since(5) | | Principal Occupation(s) During Past Five Years |
| Principal Officers who are not Trustees (continued) |
| | | |
James F. Kirchner 1967 | | Treasurer | | 2007 | | Vice President of EVM and BMR. Also Vice President of CRM. |
| | | |
Richard F. Froio 1968 | | Chief Compliance Officer | | 2017 | | Vice President of EVM and BMR since 2017. Formerly, Deputy Chief Compliance Officer (Adviser/Funds) and Chief Compliance Officer (Distribution) at PIMCO(2012-2017) and Managing Director at BlackRock/Barclays Global Investors(2009-2012). |
| (1) | Year first appointed to serve as Trustee for a fund in the Eaton Vance family of funds. Each Trustee has served continuously since appointment unless indicated otherwise. Each Trustee holds office until the annual meeting for the year in which his or her term expires and until his or her successor is elected and qualified, subject to a prior death, resignation, retirement, disqualification or removal. |
| (2) | During their respective tenures, the Trustees (except for Mmes. Frost and Sutherland and Messrs. Fetting, Gorman, Quinton, Smith and Wennerholm) also served as Board members of one or more of the following funds (which operated in the years noted): eUnitsTM 2 Year U.S. Market Participation Trust: Upside to Cap / Buffered Downside (launched in 2012 and terminated in 2014); and eUnitsTM 2 Year U.S. Market Participation Trust II: Upside to Cap / Buffered Downside (launched in 2012 and terminated in 2014). However, Ms. Mosley did not serve as a Board member of eUnitsTM 2 Year U.S. Market Participation Trust: Upside to Cap / Buffered Downside (launched in 2012 and terminated in 2014). |
| (3) | Preferred Shares Trustee. |
| (4) | Messrs. Quinton and Smith began serving as Trustees effective October 1, 2018. |
| (5) | Year first elected to serve as officer of a fund in the Eaton Vance family of funds when the officer has served continuously. Otherwise, year of most recent election as an officer of a fund in the Eaton Vance family of funds. Titles may have changed since initial election. |
Eaton Vance Funds
IMPORTANT NOTICES
Privacy. The Eaton Vance organization is committed to ensuring your financial privacy. Each of the financial institutions identified below has in effect the following policy (“Privacy Policy”) with respect to nonpublic personal information about its customers:
| • | | Only such information received from you, through application forms or otherwise, and information about your Eaton Vance fund transactions will be collected. This may include information such as name, address, social security number, tax status, account balances and transactions. |
| • | | None of such information about you (or former customers) will be disclosed to anyone, except as permitted by law (which includes disclosure to employees necessary to service your account). In the normal course of servicing a customer’s account, Eaton Vance may share information with unaffiliated third parties that perform various required services such as transfer agents, custodians and broker-dealers. |
| • | | Policies and procedures (including physical, electronic and procedural safeguards) are in place that are designed to protect the confidentiality of such information. |
| • | | We reserve the right to change our Privacy Policy at any time upon proper notification to you. Customers may want to review our Privacy Policy periodically for changes by accessing the link on our homepage: www.eatonvance.com. |
Our pledge of privacy applies to the following entities within the Eaton Vance organization: the Eaton Vance Family of Funds, Eaton Vance Management, Eaton Vance Investment Counsel, Eaton Vance Distributors, Inc., Eaton Vance Trust Company, Eaton Vance Management (International) Limited, Eaton Vance Advisers International Ltd., Eaton Vance Management’s Real Estate Investment Group and Boston Management and Research. In addition, our Privacy Policy applies only to those Eaton Vance customers who are individuals and who have a direct relationship with us. If a customer’s account (i.e., fund shares) is held in the name of a third-party financial advisor/broker-dealer, it is likely that only such advisor’s privacy policies apply to the customer. This notice supersedes all previously issued privacy disclosures. For more information about Eaton Vance’s Privacy Policy, please call1-800-262-1122.
Delivery of Shareholder Documents. The Securities and Exchange Commission (SEC) permits funds to deliver only one copy of shareholder documents, including prospectuses, proxy statements and shareholder reports, to fund investors with multiple accounts at the same residential or post office box address. This practice is often called “householding” and it helps eliminate duplicate mailings to shareholders. American Stock Transfer & Trust Company, LLC (“AST”), theclosed-end funds transfer agent, or your financial advisor, may household the mailing of your documents indefinitely unless you instruct AST, or your financial advisor, otherwise. If you would prefer that your Eaton Vance documents not be householded, please contact AST or your financial advisor. Your instructions that householding not apply to delivery of your Eaton Vance documents will typically be effective within 30 days of receipt by AST or your financial advisor.
Portfolio Holdings. Each Eaton Vance Fund and its underlying Portfolio(s) (if applicable) will file a schedule of portfolio holdings on FormN-Q with the SEC for the first and third quarters of each fiscal year. The FormN-Q will be available on the Eaton Vance website at www.eatonvance.com, by calling Eaton Vance at1-800-262-1122 or in the EDGAR database on the SEC’s website at www.sec.gov. FormN-Q may also be reviewed and copied at the SEC’s public reference room in Washington, D.C. (call1-800-732-0330 for information on the operation of the public reference room).
Proxy Voting. From time to time, funds are required to vote proxies related to the securities held by the funds. The Eaton Vance Funds or their underlying Portfolios (if applicable) vote proxies according to a set of policies and procedures approved by the Funds’ and Portfolios’ Boards. You may obtain a description of these policies and procedures and information on how the Funds or Portfolios voted proxies relating to portfolio securities during the most recent12-month period ended June 30, without charge, upon request, by calling1-800-262-1122 and by accessing the SEC’s website at www.sec.gov.
Share Repurchase Program. The Funds’ Boards of Trustees have approved a share repurchase program authorizing each Fund to repurchase up to 10% of its outstanding common shares as of the approved date in open-market transactions at a discount to net asset value. The repurchase program does not obligate a Fund to purchase a specific amount of shares. The Funds’ repurchase activity, including the number of shares purchased, average price and average discount to net asset value, is disclosed in the Funds’ annual and semi-annual reports to shareholders.
Additional Notice to Shareholders. If applicable, a Fund may also redeem or purchase its outstanding preferred shares in order to maintain compliance with regulatory requirements, borrowing or rating agency requirements or for other purposes as it deems appropriate or necessary.
Closed-End Fund Information. Eaton Vanceclosed-end funds make fund performance data and certain information about portfolio characteristics available on the Eaton Vance website shortly after the end of each month. Other information about the funds is available on the website. The funds’ net asset value per share is readily accessible on the Eaton Vance website. Portfolio holdings for the most recentmonth-end are also posted to the website approximately 30 days following the end of the month. This information is available at www.eatonvance.com on the fund information pages under “Individual Investors —Closed-End Funds”.
This Page Intentionally Left Blank
This Page Intentionally Left Blank
Investment Adviser and Administrator
Eaton Vance Management
Two International Place
Boston, MA 02110
Custodian
State Street Bank and Trust Company
State Street Financial Center, One Lincoln Street
Boston, MA 02111
Transfer Agent
American Stock Transfer & Trust Company, LLC
6201 15th Avenue
Brooklyn, NY 11219
Independent Registered Public Accounting Firm
Deloitte & Touche LLP
200 Berkeley Street
Boston, MA 02116-5022
Fund Offices
Two International Place
Boston, MA 02110

147 11.30.18
Item 2. Code of Ethics
The registrant has adopted a code of ethics applicable to its Principal Executive Officer, Principal Financial Officer and Principal Accounting Officer. The registrant undertakes to provide a copy of such code of ethics to any person upon request, without charge, by calling1-800-262-1122. The registrant has not amended the code of ethics as described in FormN-CSR during the period covered by this report. The registrant has not granted any waiver, including an implicit waiver, from a provision of the code of ethics as described in FormN-CSR during the period covered by this report.
Item 3. Audit Committee Financial Expert
The registrant’s Board has designated George J. Gorman and William H. Park, each an independent trustee, as audit committee financial experts. Mr. Gorman is a certified public accountant who is the Principal at George J. Gorman LLC (a consulting firm). Previously, Mr. Gorman served in various capacities at Ernst & Young LLP (a registered public accounting firm), including as Senior Partner. Mr. Gorman also has experience serving as an independent trustee and audit committee financial expert of other mutual fund complexes. Mr. Park is a certified public accountant who is a private investor. Previously, he served as a consultant, as the Chief Financial Officer of Aveon Group, L.P. (an investment management firm), as the Vice Chairman of Commercial Industrial Finance Corp. (specialty finance company), as President and Chief Executive Officer of Prizm Capital Management, LLC (investment management firm), as Executive Vice President and Chief Financial Officer of United Asset Management Corporation (an institutional investment management firm) and as a Senior Manager at Price Waterhouse (now PricewaterhouseCoopers) (a registered public accounting firm).
Item 4. Principal Accountant Fees and Services
(a)-(d)
The following table presents the aggregate fees billed to the registrant for the registrant’s fiscal years ended November 30, 2017 and November 30, 2018 by the registrant’s principal accountant, Deloitte & Touche LLP (“D&T”), for professional services rendered for the audit of the registrant’s annual financial statements and fees billed for other services rendered by D&T during such periods.
| | | | | | | | |
Fiscal Years Ended | | 11/30/17 | | | 11/30/18 | |
Audit Fees | | $ | 27,330 | | | $ | 27,330 | |
Audit-Related Fees(1) | | $ | 0 | | | $ | 0 | |
Tax Fees(2) | | $ | 8,226 | | | $ | 8,226 | |
All Other Fees(3) | | $ | 0 | | | $ | 0 | |
| | | | | | | | |
Total | | $ | 35,556 | | | $ | 35,556 | |
| | | | | | | | |
| (1) | Audit-related fees consist of the aggregate fees billed for assurance and related services that are reasonably related to the performance of the audit of financial statements and are not reported under the category of audit fees. |
| (2) | Tax fees consist of the aggregate fees billed for professional services rendered by the principal accountant relating to tax compliance, tax advice, and tax planning and specifically include fees for tax return preparation and other related tax compliance/planning matters. |
| (3) | All other fees consist of the aggregate fees billed for products and services provided by the principal accountant other than audit, audit-related, and tax services. |
(e)(1) The registrant’s audit committee has adopted policies and procedures relating to thepre-approval of services provided by the registrant’s principal accountant (the“Pre-Approval Policies”). ThePre-Approval
Policies establish a framework intended to assist the audit committee in the proper discharge of itspre-approval responsibilities. As a general matter, thePre-Approval Policies (i) specify certain types of audit, audit-related, tax, and other services determined to bepre-approved by the audit committee; and (ii) delineate specific procedures governing the mechanics of thepre-approval process, including the approval and monitoring of audit andnon-audit service fees. Unless a service is specificallypre-approved under thePre-Approval Policies, it must be separatelypre-approved by the audit committee.
ThePre-Approval Policies and the types of audit andnon-audit servicespre-approved therein must be reviewed and ratified by the registrant’s audit committee at least annually. The registrant’s audit committee maintains full responsibility for the appointment, compensation, and oversight of the work of the registrant’s principal accountant.
(e)(2) No services described in paragraphs (b)-(d) above were approved by the registrant’s audit committee pursuant to the “de minimis exception” set forth in Rule2-01(c)(7)(i)(C) of RegulationS-X.
(f) Not applicable.
(g) The following table presents (i) the aggregatenon-audit fees (i.e., fees for audit-related, tax, and other services) billed to the registrant by D&T for the registrant’s fiscal years ended November 30, 2017 and November 30, 2018; and (ii) the aggregatenon-audit fees (i.e., fees for audit-related, tax, and other services) billed to the Eaton Vance organization by D&T for the same time periods.
| | | | | | | | |
Fiscal Years Ended | | 11/30/17 | | | 11/30/18 | |
Registrant | | $ | 8,226 | | | $ | 8,226 | |
Eaton Vance(1) | | $ | 148,018 | | | $ | 126,485 | |
| (1) | Eaton Vance Management, a subsidiary of Eaton Vance Corp., acts as the registrant’s investment adviser and administrator. |
(h) The registrant’s audit committee has considered whether the provision by the registrant’s principal accountant ofnon-audit services to the registrant’s investment adviser and any entity controlling, controlled by, or under common control with the adviser that provides ongoing services to the registrant that were notpre-approved pursuant to Rule2-01(c)(7)(ii) of RegulationS-X is compatible with maintaining the principal accountant’s independence.
Item 5. Audit Committee of Listed Registrants
The registrant has a separately-designated standing audit committee established in accordance with Section 3(a)(58)(A) of the Securities and Exchange Act of 1934, as amended. George J. Gorman (Chair), Valerie A. Mosley, William H. Park and Scott E. Wennerholm are the members of the registrant’s audit committee.
Item 6. Schedule of Investments
Please see schedule of investments contained in the Report to Stockholders included under Item 1 of this FormN-CSR.
Item 7. Disclosure of Proxy Voting Policies and Procedures forClosed-End Management Investment Companies
The Board of Trustees of the Trust has adopted a proxy voting policy and procedure (the “Fund Policy”), pursuant to which the Trustees have delegated proxy voting responsibility to the Fund’s investment adviser and adopted the investment adviser’s proxy voting policies and procedures (the “Policies”) which are described below. The Trustees will review the Fund’s proxy voting records from time to time and will annually consider approving the Policies for the upcoming year. In the event that a conflict of interest arises between the Fund’s shareholders and the investment adviser, the administrator, or any of their affiliates or any affiliate of the Fund, the investment adviser will generally refrain from voting the proxies related to the companies giving rise to such conflict until it consults with the Board’s Special Committee except as contemplated under the Fund Policy. The Board’s Special Committee will instruct the investment adviser on the appropriate course of action.
The Policies are designed to promote accountability of a company’s management to its shareholders and to align the interests of management with those shareholders. An independent proxy voting service (“Agent”), currently Institutional Shareholder Services, Inc., has been retained to assist in the voting of proxies through the provision of vote analysis, implementation and recordkeeping and disclosure services. The investment adviser will generally vote proxies through the Agent. The Agent is required to vote all proxies and/or refer them back to the investment adviser pursuant to the Policies. It is generally the policy of the investment adviser to vote in accordance with the recommendation of the Agent. The Agent shall refer to the investment adviser proxies relating to mergers and restructurings, and the disposition of assets, termination, liquidation and mergers contained in mutual fund proxies. The investment adviser will normally vote against anti-takeover measures and other proposals designed to limit the ability of shareholders to act on possible transactions, except in the case ofclosed-end management investment companies. The investment adviser generally supports management on social and environmental proposals. The investment adviser may abstain from voting from time to time where it determines that the costs associated with voting a proxy outweighs the benefits derived from exercising the right to vote or the economic effect on shareholders interests or the value of the portfolio holding is indeterminable or insignificant.
In addition, the investment adviser will monitor situations that may result in a conflict of interest between the Fund’s shareholders and the investment adviser, the administrator, or any of their affiliates or any affiliate of the Fund by maintaining a list of significant existing and prospective corporate clients. The investment adviser’s personnel responsible for reviewing and voting proxies on behalf of the Fund will report any proxy received or expected to be received from a company included on that list to the personnel of the investment adviser identified in the Policies. If such personnel expects to instruct the Agent to vote such proxies in a manner inconsistent with the guidelines of the Policies or the recommendation of the Agent, the personnel will consult with members of senior management of the investment adviser to determine if a material conflict of interests exists. If it is determined that a material conflict does exist, the investment adviser will seek instruction on how to vote from the Special Committee.
Information on how the Fund voted proxies relating to portfolio securities during the most recent 12 month period ended June 30 is available (1) without charge, upon request, by calling1-800-262-1122, and (2) on the Securities and Exchange Commission’s website athttp://www.sec.gov.
Item 8. Portfolio Managers ofClosed-End Management Investment Companies
Eaton Vance Management (“EVM” or “Eaton Vance”) is the investment adviser of the Funds. Craig R. Brandon, portfolio manager of Eaton Vance California Municipal Income Trust (“CEV”), Eaton Vance Massachusetts Municipal Income Trust (“MMV”) and Eaton Vance New York Municipal Income Trust (“EVY”), Cynthia J. Clemson, portfolio manager of Eaton Vance Michigan Municipal Income Trust (“EMI”) and Eaton Vance Ohio Municipal Income Trust (“EVO”), and Adam A. Weigold, portfolio manager of Eaton Vance New Jersey Municipal Income Trust (“EVJ”) and Eaton Vance Pennsylvania Municipal Income Trust (“EVP”), are responsible for the overall andday-to-day management of each Fund’s investments.
Mr. Brandon is a Vice President of EVM, has been a portfolio manager of CEV since January 2014, of MMV since February 2010, of EVY since November 2005, and isCo-Director of the Municipal Investments Group. Ms. Clemson is a Vice President of EVM, has been a portfolio manager of EMI and EVO since July 2015, and isCo-Director of the Municipal Investments Group. Mr. Weigold is a Vice President of EVM, has been a portfolio manager of EVJ since February 2010 and of EVP since October 2007. Messrs. Brandon and Weigold and Ms. Clemson have managed other Eaton Vance portfolios for more than five years. This information is provided as of the date of filing this report.
The following table shows, as of each Fund’s most recent fiscal year end, the number of accounts each portfolio manager managed in each of the listed categories and the total assets (in millions of dollars) in the accounts managed within each category. The table also shows the number of accounts with respect to which the advisory fee is based on the performance of the account, if any, and the total assets (in millions of dollars) in those accounts.
| | | | | | | | | | | | | | | | |
| | | Number of All
Accounts | | | Total Assets of
All Accounts | | | Number of
Accounts
Paying a
Performance Fee | | | Total Assets
of Accounts Paying
a Performance Fee | |
Craig R. Brandon | | | | | | | | | | | | | | | | |
Registered Investment Companies | | | 19 | | | $ | 5,389.2 | | | | 0 | | | $ | 0 | |
Other Pooled Investment Vehicles | | | 1 | | | $ | 56.7 | | | | 0 | | | $ | 0 | |
Other Accounts | | | 2 | | | $ | 100.7 | | | | 0 | | | $ | 0 | |
| | | | |
Cynthia J. Clemson | | | | | | | | | | | | | | | | |
Registered Investment Companies | | | 14 | | | $ | 3,582.3 | | | | 0 | | | $ | 0 | |
Other Pooled Investment Vehicles | | | 1 | | | $ | 56.7 | | | | 0 | | | $ | 0 | |
Other Accounts | | | 2 | | | $ | 100.7 | | | | 0 | | | $ | 0 | |
| | | | |
Adam A. Weigold | | | | | | | | | | | | | | | | |
Registered Investment Companies | | | 17 | | | $ | 3,796.9 | | | | 0 | | | $ | 0 | |
Other Pooled Investment Vehicles | | | 0 | | | $ | 0 | | | | 0 | | | $ | 0 | |
Other Accounts | | | 0 | | | $ | 0 | | | | 0 | | | $ | 0 | |
The following table shows the dollar range of Fund shares beneficially owned by each portfolio manager as of each Fund’s most recent fiscal year end.
| | |
Fund Name and Portfolio Manager | | Dollar Range of Equity Securities Beneficially Owned in the Fund |
California Municipal Income Trust | | |
Craig R. Brandon | | None |
| |
Massachusetts Municipal Income Trust | | |
Craig R. Brandon | | None |
| |
Michigan Municipal Income Trust | | |
Cynthia J. Clemson | | None |
| |
New Jersey Municipal Income Trust | | |
Adam A. Weigold | | None |
| |
New York Municipal Income Trust | | |
Craig R. Brandon | | None |
| |
Ohio Municipal Income Trust | | |
Cynthia J. Clemson | | None |
| |
Pennsylvania Municipal Income Trust | | |
Adam A. Weigold | | None |
Potential for Conflicts of Interest. It is possible that conflicts of interest may arise in connection with a portfolio manager’s management of the Fund’s investments on the one hand and the investments of other accounts for which a portfolio manager is responsible on the other. For example, a portfolio manager may have conflicts of interest in allocating management time, resources and investment opportunities among the Fund and other accounts he or she advises. In addition, due to differences in the investment strategies or restrictions between the Fund and the other accounts, the portfolio manager may take action with respect to another account that differs from the action taken with respect to the Fund. In some cases, another account managed by a portfolio manager may compensate the investment adviser based on the performance of the securities held by that account. The existence of such a performance based fee may create additional conflicts of interest for the portfolio manager in the allocation of management time, resources and investment opportunities. Whenever conflicts of interest arise, the portfolio manager will endeavor to exercise his or her discretion in a manner that he or she believes is equitable to all interested persons. EVM has adopted several policies and procedures designed to address these potential conflicts including a code of ethics and policies that govern the investment adviser’s trading practices, including among other things the aggregation and allocation of trades among clients, brokerage allocations, cross trades and best execution.
Compensation Structure for EVM
Compensation of EVM’s portfolio managers and other investment professionals has three primary components: (1) a base salary, (2) an annual cash bonus, (3) annualnon-cash compensation consisting of options to purchase shares of EVC nonvoting common stock and/or restricted shares of EVC nonvoting common stock that generally are subject to a vesting schedule and (4) (for equity portfolio managers) a Deferred Alpha Incentive Plan, which pays a deferred cash award tied to future excess returns in certain equity strategy portfolios. EVM’s investment professionals also receive certain retirement, insurance and other benefits that are broadly available to EVM’s employees. Compensation of EVM’s investment professionals is reviewed primarily on an annual basis. Cash bonuses, stock-based compensation awards, and adjustments in base salary are typically paid or put into effect at or shortly after the October 31st fiscal year end of EVC.
Method to Determine Compensation. EVM compensates its portfolio managers based primarily on the scale and complexity of their portfolio responsibilities and the total return performance of managed funds and accounts versus the benchmark(s) stated in the prospectus, as well as an appropriate peer group (as described below). In addition to rankings within peer groups of funds on the basis of absolute performance, consideration may also be given to relative risk-adjusted performance. Risk-adjusted performance measures include, but are not limited to, the Sharpe Ratio (Sharpe Ratio uses standard deviation and excess return to determine reward per unit of risk). Performance is normally based on periods ending on the September 30th preceding fiscal year end. Fund performance is normally evaluated primarily versus peer groups of funds as determined by Lipper Inc. and/or Morningstar, Inc. When a fund’s peer group as determined by Lipper or Morningstar is deemed by EVM’s management not to provide a fair comparison, performance may instead be evaluated primarily against a custom peer group or market index. In evaluating the performance of a fund and its manager, primary emphasis is normally placed on three-year performance, with secondary consideration of performance over longer and shorter periods. For funds that aretax-managed or otherwise have an objective ofafter-tax returns, performance is measured net of taxes. For other funds, performance is evaluated on apre-tax basis. For funds with an investment objective other than total return (such as current income), consideration will also be given to the fund’s success in achieving its objective. For managers responsible for multiple funds and accounts, investment performance is evaluated on an aggregate basis, based on averages or weighted averages among managed funds and accounts. Funds and accounts that have performance-based advisory fees are not accorded disproportionate weightings in measuring aggregate portfolio manager performance. A portion of the compensation payable to equity portfolio managers and investment professionals will be determined based on
the ability of one or more accounts managed by such manager to achieve a specified target average annual gross return over a three year period in excess of the account benchmark. The cash award to be payable at the end of the three year term will be established at the inception of the term and will be adjusted positively or negatively to the extent that the average annual gross return varies from the specified target return.
The compensation of portfolio managers with other job responsibilities (such as heading an investment group or providing analytical support to other portfolios) includes consideration of the scope of such responsibilities and the managers’ performance in meeting them.
EVM seeks to compensate portfolio managers commensurate with their responsibilities and performance, and competitive with other firms within the investment management industry. EVM participates in investment-industry compensation surveys and utilizes survey data as a factor in determining salary, bonus and stock-based compensation levels for portfolio managers and other investment professionals. Salaries, bonuses and stock-based compensation are also influenced by the operating performance of EVM and its parent company. The overall annual cash bonus pool is generally based on a substantially fixed percentage ofpre-bonus adjusted operating income. While the salaries of EVM’s portfolio managers are comparatively fixed, cash bonuses and stock-based compensation may fluctuate significantly from year to year, based on changes in manager performance and other factors as described herein. For a high performing portfolio manager, cash bonuses and stock-based compensation may represent a substantial portion of total compensation.
Item 9. Purchases of Equity Securities byClosed-End Management Investment Company and Affiliated Purchasers
No such purchases this period.
Item 10. Submission of Matters to a Vote of Security Holders
The Trust does not engage in securities lending.
Item 11. Controls and Procedures
(a) It is the conclusion of the registrant’s principal executive officer and principal financial officer that the effectiveness of the registrant’s current disclosure controls and procedures (such disclosure controls and procedures having been evaluated within 90 days of the date of this filing) provide reasonable assurance that the information required to be disclosed by the registrant has been recorded, processed, summarized and reported within the time period specified in the Commission’s rules and forms and that the information required to be disclosed by the registrant has been accumulated and communicated to the registrant’s principal executive officer and principal financial officer in order to allow timely decisions regarding required disclosure.
(b) There have been no changes in the registrant’s internal controls over financial reporting during the second fiscal quarter of the period covered by this report that has materially affected, or is reasonably likely to materially affect, the registrant’s internal control over financial reporting.
Item 12. Disclosure of Securities Lending Activities forClosed-End Management Investment Companies
Not applicable.
Item 13. Exhibits
| | |
| |
| (a)(1) | | Registrant’s Code of Ethics – Not applicable (please see Item 2). |
| |
| (a)(2)(i) | | Treasurer’s Section 302 certification. |
| |
| (a)(2)(ii) | | President’s Section 302 certification. |
| |
| (b) | | Combined Section 906 certification. |
Signatures
Pursuant to the requirements of the Securities Exchange Act of 1934 and the Investment Company Act of 1940, the registrant has duly caused this report to be signed on its behalf by the undersigned, thereunto duly authorized.
Eaton Vance Michigan Municipal Income Trust
| | |
| By: | | /s/ Payson F. Swaffield |
| | Payson F. Swaffield |
| | President |
| |
| Date: | | January 24, 2019 |
Pursuant to the requirements of the Securities Exchange Act of 1934 and the Investment Company Act of 1940, this report has been signed below by the following persons on behalf of the registrant and in the capacities and on the dates indicated.
| | |
| By: | | /s/ James F. Kirchner |
| | James F. Kirchner |
| | Treasurer |
| |
| Date: | | January 24, 2019 |
| |
| By: | | /s/ Payson F. Swaffield |
| | Payson F. Swaffield |
| | President |
| |
| Date: | | January 24, 2019 |