UNITED STATES
SECURITIES AND EXCHANGE COMMISSION
Washington, D.C. 20549
FormN-CSR
CERTIFIED SHAREHOLDER REPORT OF REGISTERED
MANAGEMENT INVESTMENT COMPANIES
Investment Company Act File Number:811-09157
Eaton Vance California Municipal Income Trust
(Exact Name of Registrant as Specified in Charter)
Two International Place, Boston, Massachusetts 02110
(Address of Principal Executive Offices)
Maureen A. Gemma
Two International Place, Boston, Massachusetts 02110
(Name and Address of Agent for Services)
(617)482-8260
(Registrant’s Telephone Number)
November 30
Date of Fiscal Year End
May 31, 2019
Date of Reporting Period
Item 1. Reports to Stockholders

Eaton Vance
Municipal Income Trusts
Semiannual Report
May 31, 2019
California (CEV) • New York (EVY)
Important Note. Beginning on January 1, 2021, as permitted by regulations adopted by the Securities and Exchange Commission, paper copies of each Fund’s annual and semi-annual shareholder reports will no longer be sent by mail unless you specifically request paper copies of the reports. Instead, the reports will be made available on the Funds’ website(funds.eatonvance.com/closed-end-fund-and-term-trust-documents.php), and you will be notified by mail each time a report is posted and provided with a website address to access the report.
If you already elected to receive shareholder reports electronically, you will not be affected by this change and you need not take any action. If you hold shares at the Funds’ transfer agent, American Stock Transfer & Trust Company, LLC (“AST”), you may elect to receive shareholder reports and other communications from the Funds electronically by contacting AST. If you own your shares through a financial intermediary (such as a broker-dealer or bank), you must contact your financial intermediary to sign up.
You may elect to receive all future Fund shareholder reports in paper free of charge. If you hold shares at AST, you can inform AST that you wish to continue receiving paper copies of your shareholder reports by calling1-866-439-6787. If you own these shares through a financial intermediary, you must contact your financial intermediary or follow instructions included with this disclosure, if applicable, to elect to continue to receive paper copies of your shareholder reports. Your election to receive reports in paper will apply to all funds held with AST or to all funds held through your financial intermediary, as applicable.

Commodity Futures Trading Commission Registration. Effective December 31, 2012, the Commodity Futures Trading Commission (“CFTC”) adopted certain regulatory changes that subject registered investment companies and advisers to regulation by the CFTC if a fund invests more than a prescribed level of its assets in certain CFTC-regulated instruments (including futures, certain options and swap agreements) or markets itself as providing investment exposure to such instruments. Each Fund has claimed an exclusion from the definition of the term “commodity pool operator” under the Commodity Exchange Act. Accordingly, neither the Funds nor the adviser with respect to the operation of the Funds is subject to CFTC regulation. Because of its management of other strategies, each Fund’s adviser is registered with the CFTC as a commodity pool operator and a commodity trading advisor.
Fund shares are not insured by the FDIC and are not deposits or other obligations of, or guaranteed by, any depository institution. Shares are subject to investment risks, including possible loss of principal invested.
Semiannual ReportMay 31, 2019
Eaton Vance
Municipal Income Trusts
Table of Contents
| | | | |
Performance and Fund Profile | | | | |
| |
| | | | |
California Municipal Income Trust | | | 2 | |
New York Municipal Income Trust | | | 3 | |
| |
| | | | |
| |
Endnotes and Additional Disclosures | | | 4 | |
| |
Financial Statements | | | 5 | |
| |
Annual Meeting of Shareholders | | | 25 | |
| |
Board of Trustees’ Contract Approval | | | 26 | |
| |
Officers and Trustees | | | 29 | |
| |
Important Notices | | | 30 | |
Eaton Vance
California Municipal Income Trust
May 31, 2019
Performance1,2
Portfolio Manager Craig R. Brandon, CFA
| | | | | | | | | | | | | | | | | | | | |
| % Average Annual Total Returns | | Inception Date | | | Six Months | | | One Year | | | Five Years | | | Ten Years | |
Fund at NAV | | | 01/29/1999 | | | | 9.73 | % | | | 8.16 | % | | | 5.34 | % | | | 7.77 | % |
Fund at Market Price | | | — | | | | 13.84 | | | | 11.85 | | | | 4.22 | | | | 6.98 | |
Bloomberg Barclays Municipal Bond Index | | | — | | | | 5.96 | % | | | 6.40 | % | | | 3.58 | % | | | 4.58 | % |
| | | | | |
| | | | | | | | | | | | | | | | | | | | |
| % Premium/Discount to NAV3 | | | | | | | | | | | | | | | |
| | | | | | | | | | | | | | | | | | | –12.85 | % |
| | | | | |
| | | | | | | | | | | | | | | | | | | | |
| Distributions4 | | | | | | | | | | | | | | | |
Total Distributions per share for the period | | | | | | | | | | | | | | | | | | $ | 0.263 | |
Distribution Rate at NAV | | | | | | | | | | | | | | | | | | | 3.80 | % |
Taxable-Equivalent Distribution Rate at NAV | | | | | | | | | | | | | | | | | | | 8.28 | % |
Distribution Rate at Market Price | | | | | | | | | | | | | | | | | | | 4.36 | % |
Taxable-Equivalent Distribution Rate at Market Price | | | | | | | | | | | | | | | | | | | 9.50 | % |
| | | | | |
| | | | | | | | | | | | | | | | | | | | |
| % Total Leverage5 | | | | | | | | | | | | | | | |
Residual Interest Bond (RIB) Financing | | | | | | | | | | | | | | | | | | | 37.07 | % |
Fund Profile
Credit Quality (% of total investments)6,7
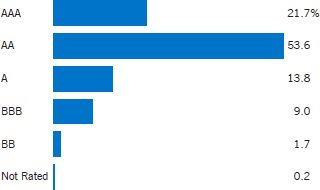
See Endnotes and Additional Disclosures in this report.
Past performance is no guarantee of future results. Returns are historical and are calculated by determining the percentage change in net asset value (NAV) or market price (as applicable) with all distributions reinvested and include management fees and other expenses. Fund performance at market price will differ from its results at NAV due to factors such as changing perceptions about the Fund, market conditions, fluctuations in supply and demand for Fund shares, or changes in Fund distributions. Investment return and principal value will fluctuate so that shares, when sold, may be worth more or less than their original cost. Performance less than or equal to one year is cumulative. Performance is for the stated time period only; due to market volatility, current Fund performance may be lower or higher than the quoted return. For performance as of the most recent month-end, please refer to eatonvance.com.
Eaton Vance
New York Municipal Income Trust
May 31, 2019
Performance1,2
Portfolio ManagerCraig R. Brandon, CFA
| | | | | | | | | | | | | | | | | | | | |
| % Average Annual Total Returns | | Inception Date | | | Six Months | | | One Year | | | Five Years | | | Ten Years | |
Fund at NAV | | | 01/29/1999 | | | | 10.24 | % | | | 9.00 | % | | | 5.46 | % | | | 8.18 | % |
Fund at Market Price | | | — | | | | 17.13 | | | | 11.41 | | | | 3.48 | | | | 6.45 | |
Bloomberg Barclays Municipal Bond Index | | | — | | | | 5.96 | % | | | 6.40 | % | | | 3.58 | % | | | 4.58 | % |
| | | | | |
| | | | | | | | | | | | | | | | | | | | |
| % Premium/Discount to NAV3 | | | | | | | | | | | | | | | |
| | | | | | | | | | | | | | | | | | | –10.36 | % |
| | | | | |
| | | | | | | | | | | | | | | | | | | | |
| Distributions4 | | | | | | | | | | | | | | | |
Total Distributions per share for the period | | | | | | | | | | | | | | | | | | $ | 0.260 | |
Distribution Rate at NAV | | | | | | | | | | | | | | | | | | | 3.57 | % |
Taxable-Equivalent Distribution Rate at NAV | | | | | | | | | | | | | | | | | | | 7.09 | % |
Distribution Rate at Market Price | | | | | | | | | | | | | | | | | | | 3.98 | % |
Taxable-Equivalent Distribution Rate at Market Price | | | | | | | | | | | | | | | | | | | 7.90 | % |
| | | | | |
| | | | | | | | | | | | | | | | | | | | |
| % Total Leverage5 | | | | | | | | | | | | | | | |
RIB Financing | | | | | | | | | | | | | | | | | | | 36.17 | % |
Fund Profile
Credit Quality (% of total investments)6,7
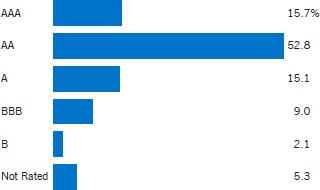
See Endnotes and Additional Disclosures in this report.
Past performance is no guarantee of future results. Returns are historical and are calculated by determining the percentage change in net asset value (NAV) or market price (as applicable) with all distributions reinvested and include management fees and other expenses. Fund performance at market price will differ from its results at NAV due to factors such as changing perceptions about the Fund, market conditions, fluctuations in supply and demand for Fund shares, or changes in Fund distributions. Investment return and principal value will fluctuate so that shares, when sold, may be worth more or less than their original cost. Performance less than or equal to one year is cumulative. Performance is for the stated time period only; due to market volatility, current Fund performance may be lower or higher than the quoted return. For performance as of the most recent month-end, please refer to eatonvance.com.
Eaton Vance
Municipal Income Trusts
May 31, 2019
Endnotes and Additional Disclosures
| 1 | Bloomberg Barclays Municipal Bond Index is an unmanaged index of municipal bonds traded in the U.S. Unless otherwise stated, index returns do not reflect the effect of any applicable sales charges, commissions, expenses, taxes or leverage, as applicable. It is not possible to invest directly in an index. |
| 2 | Performance results reflect the effects of leverage. Performance since inception for an index, if presented, is the performance since the Fund’s or oldest share class’ inception, as applicable. Included in the average annual total return at NAV for the five and ten year periods is the impact of the tender and repurchase of a portion of the Fund’s Auction Preferred Shares (APS) at 95.5% of the Fund’s APS per share liquidation preference. Had this transaction not occurred, the total return at NAV would be lower for the Fund. |
| 3 | The shares of the Fund often trade at a discount or premium from their net asset value. The discount or premium of the Fund may vary over time and may be higher or lower than what is quoted in this report. For up-to-date premium/discount information, please refer to http://eatonvance.com/closedend. |
| 4 | The Distribution Rate is based on the Fund’s last regular distribution per share in the period (annualized) divided by the Fund’s NAV or market price at the end of the period. The Fund’s distributions may be comprised of amounts characterized for federal income tax purposes as tax-exempt income, qualified and non-qualified ordinary dividends, capital gains and nondividend distributions, also known as return of capital. The Fund will determine the federal income tax character of distributions paid to a shareholder after the end of the calendar year. This is reported on the IRS form 1099-DIV and provided to the shareholder shortly after each year-end. For information about the tax character of distributions made in prior calendar years, please refer to Performance-Tax Character of Distributions on the Fund’s webpage available at eatonvance.com. The Fund’s distributions are determined by the investment adviser based on its current assessment of the Fund’s long-term return potential. Fund distributions may be affected by numerous factors including changes in Fund performance, the cost of financing for Funds that employ leverage, portfolio holdings, realized and projected returns, and other factors. As portfolio and market conditions change, the rate of distributions paid by the Fund could change. Taxable-equivalent performance is based on the highest combined federal and state income tax rates, where applicable. Lower tax rates would result in lower tax-equivalent performance. Actual tax rates will vary depending on your income, exemptions and deductions. Rates do not include local taxes. |
| 5 | Fund employs RIB financing. The leverage created by RIB investments provides an opportunity for increased income but, at the same time, creates special risks (including the likelihood of greater price volatility). The cost of leverage rises and falls with changes in short-term interest rates. See “Floating Rate Notes Issued in Conjunction with Securities Held” in the notes to the financial statements for more information about RIB financing. RIB leverage represents the amount of Floating Rate Notes outstanding at period end as a percentage of Fund net assets plus Floating Rate Notes. The Fund may be required to maintain prescribed asset coverage for its leverage and may be required to reduce its leverage at an inopportune time. |
| 6 | Ratings are based on Moody’s Investors Service, Inc. (“Moody’s”), S&P Global Ratings (“S&P”) or Fitch Ratings (“Fitch”), as applicable. If securities are rated differently by the ratings agencies, the highest rating is applied. Ratings, which are subject to change, apply to the creditworthiness of the issuers of the underlying securities and not to the Fund or its shares. Credit ratings measure the quality of a bond based on the issuer’s creditworthiness, with ratings ranging from AAA, being the highest, to D, being the lowest based on S&P’s measures. Ratings of BBB or higher by S&P or Fitch (Baa or higher by Moody’s) are considered to be investment-grade quality. Credit ratings are based largely on the ratings agency’s analysis at the time of rating. The rating assigned to any particular security is not necessarily a reflection of the issuer’s current financial condition and does not necessarily reflect its assessment of the volatility of a security’s market value or of the liquidity of an investment in the security. Holdings designated as “Not Rated” (if any) are not rated by the national ratings agencies stated above. |
| 7 | The chart includes the municipal bonds held by a trust that issues residual interest bonds, consistent with the Portfolio of Investments. |
| | Fund profiles subject to change due to active management. |
Eaton Vance
California Municipal Income Trust
May 31, 2019
Portfolio of Investments (Unaudited)
| | | | | | | | |
| Tax-Exempt Municipal Securities — 146.5% | |
| Security | | Principal
Amount
(000’s omitted) | | | Value | |
|
| Education — 16.9% | |
| | |
California Educational Facilities Authority, (Harvey Mudd College), 5.25%, 12/1/31 | | $ | 195 | | | $ | 213,195 | |
| | |
California Educational Facilities Authority, (Harvey Mudd College), 5.25%, 12/1/36 | | | 330 | | | | 358,760 | |
| | |
California Educational Facilities Authority, (Loyola Marymount University), 5.00%, 10/1/30 | | | 745 | | | | 755,154 | |
| | |
California Municipal Finance Authority, (University of San Diego), 5.00%, 10/1/31 | | | 415 | | | | 446,349 | |
| | |
California Municipal Finance Authority, (University of San Diego), 5.00%, 10/1/35 | | | 285 | | | | 306,629 | |
| | |
California Municipal Finance Authority, (University of San Diego), 5.25%, 10/1/26 | | | 810 | | | | 877,919 | |
| | |
California Municipal Finance Authority, (University of San Diego), 5.25%, 10/1/27 | | | 850 | | | | 920,456 | |
| | |
California Municipal Finance Authority, (University of San Diego), 5.25%, 10/1/28 | | | 895 | | | | 968,327 | |
| | |
California State University, 5.00%, 11/1/41(1) | | | 6,275 | | | | 7,372,937 | |
| | |
University of California, 5.00%, 5/15/46(1) | | | 4,075 | | | | 4,760,496 | |
| | |
| | | | | | | $ | 16,980,222 | |
|
| Electric Utilities — 7.8% | |
| | |
Chula Vista, (San Diego Gas and Electric), 5.875%, 2/15/34 | | $ | 270 | | | $ | 270,948 | |
| | |
Los Angeles Department of Water and Power, Power System Revenue, 5.00%, 7/1/42(1) | | | 4,000 | | | | 4,790,800 | |
| | |
Northern California Power Agency, 5.25%, 8/1/24 | | | 1,500 | | | | 1,536,885 | |
| | |
Southern California Public Power Authority, (Tieton Hydropower), 5.00%, 7/1/35 | | | 680 | | | | 704,602 | |
| | |
Vernon, Electric System Revenue, 5.125%, 8/1/21 | | | 480 | | | | 482,587 | |
| | |
| | | | | | | $ | 7,785,822 | |
|
| Escrowed / Prerefunded — 0.5% | |
| | |
California Educational Facilities Authority, (University of San Francisco), Prerefunded to 10/1/21, 6.125%, 10/1/36 | | $ | 120 | | | $ | 133,450 | |
| | |
California Educational Facilities Authority, (University of San Francisco), Prerefunded to 10/1/21, 6.125%, 10/1/36 | | | 115 | | | | 127,749 | |
| | |
Vernon, Electric System Revenue, Prerefunded to 8/1/19, 5.125%, 8/1/21 | | | 220 | | | | 221,322 | |
| | |
| | | | | | | $ | 482,521 | |
|
| General Obligations — 41.4% | |
| | |
Alameda City Unified School District, (Election of 2014), 5.00%, 8/1/42(1) | | $ | 3,325 | | | $ | 3,988,271 | |
| | |
California, 5.50%, 11/1/35 | | | 1,600 | | | | 1,690,832 | |
| | |
Illinois, 5.00%, 12/1/35 | | | 2,000 | | | | 2,230,420 | |
| | | | | | | | |
| Security | | Principal
Amount
(000’s omitted) | | | Value | |
|
| General Obligations (continued) | |
| | |
La Canada Unified School District, (Election of 2017), 5.00%, 8/1/47(1) | | $ | 6,750 | | | $ | 8,291,970 | |
| | |
Long Beach Unified School District, (Election of 2008), 5.00%, 8/1/41(1) | | | 3,500 | | | | 4,144,175 | |
| | |
Oxnard Union High School District, (Election of 2018), 5.00%, 8/1/42(1) | | | 6,000 | | | | 7,070,520 | |
| | |
Palo Alto, (Election of 2008), 5.00%, 8/1/40 | | | 3,655 | | | | 3,803,795 | |
| | |
San Diego Unified School District, (Election of 2012), 5.00%, 7/1/47(1) | | | 6,000 | | | | 7,135,560 | |
| | |
Santa Clara County, (Election of 2008), Prerefunded to 8/1/19, 5.00%, 8/1/39(1) | | | 3,180 | | | | 3,198,985 | |
| | |
| | | | | | | $ | 41,554,528 | |
|
| Hospital — 25.5% | |
| | |
California Health Facilities Financing Authority, (Catholic Healthcare West), 5.25%, 3/1/27 | | $ | 1,000 | | | $ | 1,062,300 | |
| | |
California Health Facilities Financing Authority, (Catholic Healthcare West), 5.25%, 3/1/28 | | | 190 | | | | 201,871 | |
| | |
California Health Facilities Financing Authority, (City of Hope), 5.00%, 11/15/32 | | | 635 | | | | 700,843 | |
| | |
California Health Facilities Financing Authority, (City of Hope), 5.00%, 11/15/35 | | | 910 | | | | 1,001,482 | |
| | |
California Health Facilities Financing Authority, (Kaiser Permanente), 4.00%, 11/1/44 | | | 430 | | | | 468,296 | |
| | |
California Health Facilities Financing Authority, (Kaiser Permanente), 4.00%, 11/1/44(1) | | | 6,000 | | | | 6,534,360 | |
| | |
California Health Facilities Financing Authority, (St. Joseph Health System), 5.00%, 7/1/33 | | | 1,145 | | | | 1,288,331 | |
| | |
California Health Facilities Financing Authority, (St. Joseph Health System), 5.00%, 7/1/37 | | | 535 | | | | 600,404 | |
| | |
California Health Facilities Financing Authority, (Sutter Health), 5.00%, 11/15/46(1) | | | 6,000 | | | | 6,992,400 | |
| | |
California Public Finance Authority, (Henry Mayo Newhall Hospital), 5.00%, 10/15/37 | | | 500 | | | | 562,220 | |
| | |
California Public Finance Authority, (Henry Mayo Newhall Hospital), 5.00%, 10/15/47 | | | 1,000 | | | | 1,108,780 | |
| | |
California Public Finance Authority, (Sharp HealthCare), 5.00%, 8/1/47(1) | | | 3,750 | | | | 4,434,600 | |
| | |
California Statewide Communities Development Authority, (Methodist Hospital of Southern California), 5.00%, 1/1/48 | | | 600 | | | | 692,304 | |
| | |
| | | | | | | $ | 25,648,191 | |
|
| Housing — 1.8% | |
| | |
California Department of Veterans Affairs, Home Purchase Revenue, 3.45%, 12/1/39 | | $ | 940 | | | $ | 981,642 | |
| | | | |
| | 5 | | See Notes to Financial Statements. |
Eaton Vance
California Municipal Income Trust
May 31, 2019
Portfolio of Investments (Unaudited) — continued
| | | | | | | | |
| Security | | Principal
Amount
(000’s omitted) | | | Value | |
|
| Housing (continued) | |
| | |
California Department of Veterans Affairs, Home Purchase Revenue, 3.60%, 12/1/43 | | $ | 830 | | | $ | 868,637 | |
| | |
| | | | | | | $ | 1,850,279 | |
|
| Insured – Escrowed / Prerefunded — 4.6% | |
| | |
Foothill/Eastern Transportation Corridor Agency, (AGC), (AGM), Escrowed to Maturity, 0.00%, 1/1/26 | | $ | 5,130 | | | $ | 4,607,663 | |
| | |
| | | | | | | $ | 4,607,663 | |
|
| Insured – General Obligations — 4.2% | |
| | |
Sweetwater Union High School District, (Election of 2000), (AGM), 0.00%, 8/1/25 | | $ | 4,720 | | | $ | 4,184,044 | |
| | |
| | | | | | | $ | 4,184,044 | |
|
| Insured – Transportation — 6.9% | |
| | |
Alameda Corridor Transportation Authority, (AMBAC), 0.00%, 10/1/29 | | $ | 5,000 | | | $ | 3,742,150 | |
| | |
Alameda Corridor Transportation Authority, (NPFG), 0.00%, 10/1/31 | | | 4,500 | | | | 3,154,185 | |
| | |
| | | | | | | $ | 6,896,335 | |
|
| Lease Revenue / Certificates of Participation — 1.0% | |
| | |
California Public Works Board, 5.00%, 11/1/38 | | $ | 915 | | | $ | 1,035,130 | |
| | |
| | | | | | | $ | 1,035,130 | |
|
| Other Revenue — 2.8% | |
| | |
California Infrastructure and Economic Development Bank, (Academy of Motion Picture Arts and Sciences Obligated Group), 4.00%, 11/1/45 | | $ | 2,350 | | | $ | 2,463,787 | |
| | |
California Infrastructure and Economic Development Bank, (Performing Arts Center of Los Angeles), 5.00%, 12/1/32 | | | 385 | | | | 386,016 | |
| | |
| | | | | | | $ | 2,849,803 | |
|
| Senior Living / Life Care — 1.5% | |
| | |
ABAG Finance Authority for Nonprofit Corporations, (Episcopal Senior Communities), 6.00%, 7/1/31 | | $ | 290 | | | $ | 314,000 | |
| | |
California Statewide Communities Development Authority, (Southern California Presbyterian Homes), 7.25%, 11/15/41(2) | | | 600 | | | | 614,430 | |
| | |
California Statewide Communities Development Authority, (The Redwoods, a Community of Seniors), 5.125%, 11/15/35 | | | 535 | | | | 608,900 | |
| | |
| | | | | | | $ | 1,537,330 | |
| | | | | | | | |
| Security | | Principal
Amount
(000’s omitted) | | | Value | |
|
| Special Tax Revenue — 7.8% | |
| | |
Aliso Viejo Community Facilities District No. 2005-01, Special Tax Revenue, (Glenwood at Aliso Viejo), 5.00%, 9/1/30 | | $ | 500 | | | $ | 566,540 | |
| | |
Los Angeles County Community Facilities District No. 3, (Valencia/Newhall Area), 5.00%, 9/1/23 | | | 480 | | | | 518,193 | |
| | |
Los Angeles County Community Facilities District No. 3, (Valencia/Newhall Area), 5.00%, 9/1/24 | | | 240 | | | | 258,876 | |
| | |
Los Angeles County Community Facilities District No. 3, (Valencia/Newhall Area), 5.00%, 9/1/25 | | | 335 | | | | 361,194 | |
| | |
Los Angeles County Community Facilities District No. 3, (Valencia/Newhall Area), 5.00%, 9/1/26 | | | 240 | | | | 258,490 | |
| | |
Los Angeles County Metropolitan Transportation Authority, Sales Tax Revenue, Green Bonds, 5.00%, 7/1/42(1) | | | 2,100 | | | | 2,528,883 | |
| | |
San Francisco Bay Area Rapid Transit District, Sales Tax Revenue, Prerefunded to 7/1/20, 5.00%, 7/1/28 | | | 2,400 | | | | 2,495,784 | |
| | |
South Orange County Public Financing Authority, Special Tax Revenue, (Ladera Ranch), 5.00%, 8/15/28 | | | 725 | | | | 792,766 | |
| | |
| | | | | | | $ | 7,780,726 | |
|
| Transportation — 9.0% | |
| | |
California Municipal Finance Authority, (LINXS Automated People Mover), (AMT), 5.00%, 12/31/43 | | $ | 3,000 | | | $ | 3,484,740 | |
| | |
Los Angeles Department of Airports, (Los Angeles International Airport), 5.00%, 5/15/35(1) | | | 2,120 | | | | 2,191,550 | |
| | |
San Francisco City and County Airport Commission, (San Francisco International Airport), 5.00%, 5/1/35 | | | 2,760 | | | | 2,841,696 | |
| | |
San Joaquin Hills Transportation Corridor Agency, 5.00%, 1/15/34 | | | 500 | | | | 568,220 | |
| | |
| | | | | | | $ | 9,086,206 | |
|
| Water and Sewer — 14.8% | |
| | |
Rancho California Water District Financing Authority, 5.00%, 8/1/46(1) | | $ | 5,250 | | | $ | 6,228,810 | |
| | |
San Francisco City and County Public Utilities Commission, Water Revenue, Green Bonds, 5.00%, 11/1/45(1) | | | 6,000 | | | | 6,854,220 | |
| | |
San Mateo, Sewer Revenue, 5.00%, 8/1/36 | | | 1,700 | | | | 1,817,572 | |
| | |
| | | | | | | $ | 14,900,602 | |
| |
Total Tax-Exempt Municipal Securities — 146.5%
(identified cost $136,465,441) | | | $ | 147,179,402 | |
| | | | |
| | 6 | | See Notes to Financial Statements. |
Eaton Vance
California Municipal Income Trust
May 31, 2019
Portfolio of Investments (Unaudited) — continued
| | | | | | | | |
| Taxable Municipal Securities — 8.6% | |
| Security | | Principal
Amount
(000’s omitted) | | | Value | |
|
| Education — 3.2% | |
| | |
California Educational Facilities Authority, (Loyola Marymount University), 4.842%, 10/1/48 | | $ | 3,000 | | | $ | 3,237,360 | |
| | |
| | | | | | | $ | 3,237,360 | |
|
| Hospital — 5.4% | |
| | |
California Statewide Communities Development Authority, (Loma Linda University Medical Center), 6.00%, 12/1/24 | | $ | 2,500 | | | $ | 2,689,200 | |
| | |
California Statewide Communities Development Authority, (Marin General Hospital), 4.821%, 8/1/45 | | | 2,500 | | | | 2,699,475 | |
| | |
| | | | | | | $ | 5,388,675 | |
| |
Total Taxable Municipal Securities — 8.6%
(identified cost $8,071,604) | | | $ | 8,626,035 | |
|
| Corporate Bonds & Notes — 1.1% | |
| Security | | Principal
Amount
(000’s omitted) | | | Value | |
|
| Other — 1.1% | |
| | |
Morongo Band of Mission Indians, 7.00%, 10/1/39(2) | | $ | 1,040 | | | $ | 1,134,609 | |
| |
Total Corporate Bonds & Notes — 1.1%
(identified cost $1,040,000) | | | $ | 1,134,609 | |
| |
Total Investments — 156.2%
(identified cost $145,577,045) | | | $ | 156,940,046 | |
| |
Other Assets, Less Liabilities — (56.2)% | | | $ | (56,460,390 | ) |
| |
Net Assets — 100.0% | | | $ | 100,479,656 | |
The percentage shown for each investment category in the Portfolio of Investments is based on net assets.
The Trust invests primarily in debt securities issued by California municipalities. The ability of the issuers of the debt securities to meet their obligations may be affected by economic developments in a specific industry or municipality. In order to reduce the risk associated with such economic developments, at May 31, 2019, 10.0% of total investments are backed by bond insurance of various financial institutions and financial guaranty assurance agencies. The aggregate percentage insured by an individual financial institution or financial guaranty assurance agency ranged from 2.0% to 5.6% of total investments.
| (1) | Security represents the municipal bond held by a trust that issues residual interest bonds (see Note 1G). |
| (2) | Security exempt from registration pursuant to Rule 144A under the Securities Act of 1933, as amended. These securities may be sold in certain transactions in reliance on an exemption from registration (normally to qualified institutional buyers). At May 31, 2019, the aggregate value of these securities is $1,749,039 or 1.7% of the Trust’s net assets. |
Abbreviations:
| | | | |
| | |
| AGC | | – | | Assured Guaranty Corp. |
| | |
| AGM | | – | | Assured Guaranty Municipal Corp. |
| | |
| AMBAC | | – | | AMBAC Financial Group, Inc. |
| | |
| AMT | | – | | Interest earned from these securities may be considered a tax preference item for purposes of the Federal Alternative Minimum Tax. |
| | |
| NPFG | | – | | National Public Finance Guarantee Corp. |
| | | | |
| | 7 | | See Notes to Financial Statements. |
Eaton Vance
New York Municipal Income Trust
May 31, 2019
Portfolio of Investments (Unaudited)
| | | | | | | | |
| Tax-Exempt Investments — 152.4% | |
| Security | | Principal
Amount
(000’s omitted) | | | Value | |
|
| Cogeneration — 0.7% | |
| | |
Suffolk County Industrial Development Agency, (Nissequogue Cogeneration Partners Facility), (AMT), 5.50%, 1/1/23 | | $ | 595 | | | $ | 595,351 | |
| | |
| | | | | | | $ | 595,351 | |
|
| Education — 25.6% | |
| | |
New York Dormitory Authority, (Brooklyn Law School), 5.75%, 7/1/33 | | $ | 510 | | | $ | 511,663 | |
| | |
New York Dormitory Authority, (Columbia University), 5.00%, 10/1/38(1) | | | 4,000 | | | | 4,937,320 | |
| | |
New York Dormitory Authority, (Columbia University), 5.00%, 10/1/41 | | | 725 | | | | 767,833 | |
| | |
New York Dormitory Authority, (Cornell University), 5.00%, 7/1/34 | | | 510 | | | | 511,398 | |
| | |
New York Dormitory Authority, (Cornell University), 5.00%, 7/1/39 | | | 2,000 | | | | 2,005,480 | |
| | |
New York Dormitory Authority, (Culinary Institute of America), 5.50%, 7/1/33 | | | 220 | | | | 249,803 | |
| | |
New York Dormitory Authority, (Fordham University), Prerefunded to 7/1/21, 5.50%, 7/1/36 | | | 1,000 | | | | 1,086,560 | |
| | |
New York Dormitory Authority, (New York University), 5.00%, 7/1/39(1) | | | 4,000 | | | | 4,922,680 | |
| | |
New York Dormitory Authority, (Skidmore College), 5.00%, 7/1/27 | | | 325 | | | | 347,100 | |
| | |
New York Dormitory Authority, (Skidmore College), 5.25%, 7/1/29 | | | 400 | | | | 428,996 | |
| | |
New York Dormitory Authority, (The New School), Prerefunded to 7/1/20, 5.50%, 7/1/40 | | | 2,000 | | | | 2,089,360 | |
| | |
Onondaga Civic Development Corp., (Le Moyne College), 5.20%, 7/1/29 | | | 280 | | | | 290,870 | |
| | |
Onondaga Civic Development Corp., (Le Moyne College), 5.375%, 7/1/40 | | | 735 | | | | 759,534 | |
| | |
Onondaga County Cultural Resources Trust, (Syracuse University), 5.00%, 12/1/38 | | | 1,205 | | | | 1,370,386 | |
| | |
| | | | | | | $ | 20,278,983 | |
|
| Electric Utilities — 6.0% | |
| | |
Utility Debt Securitization Authority, 5.00%, 12/15/36(1) | | $ | 4,000 | | | $ | 4,733,480 | |
| | |
| | | | | | | $ | 4,733,480 | |
|
| Escrowed / Prerefunded — 5.1% | |
| | |
Brooklyn Arena Local Development Corp., (Barclays Center), Prerefunded to 1/15/20, 6.25%, 7/15/40 | | $ | 380 | | | $ | 391,624 | |
| | |
Metropolitan Transportation Authority, Dedicated Tax Revenue, Prerefunded to 11/15/19, 5.00%, 11/15/34 | | | 1,500 | | | | 1,524,930 | |
| | | | | | | | |
| Security | | Principal
Amount
(000’s omitted) | | | Value | |
|
| Escrowed / Prerefunded (continued) | |
| | |
New York Dormitory Authority, (North Shore-Long Island Jewish Obligated Group), Prerefunded to 5/1/21, 5.00%, 5/1/32 | | $ | 1,000 | | | $ | 1,069,310 | |
| | |
Onondaga Civic Development Corp., (St. Joseph’s Hospital Health Center), Prerefunded to 7/1/22, 5.00%, 7/1/42 | | | 1,000 | | | | 1,107,970 | |
| | |
| | | | | | | $ | 4,093,834 | |
|
| General Obligations — 7.2% | |
| | |
Illinois, 5.00%, 10/1/33 | | $ | 1,300 | | | $ | 1,473,550 | |
| | |
New York, 5.00%, 2/15/34(1) | | | 4,000 | | | | 4,225,840 | |
| |
| | | | $ | 5,699,390 | |
|
| Hospital — 9.5% | |
| | |
Dutchess County Local Development Corp., (Health Quest Systems, Inc.), 5.75%, 7/1/30 | | $ | 130 | | | $ | 136,555 | |
| | |
Dutchess County Local Development Corp., (Health Quest Systems, Inc.), 5.75%, 7/1/40 | | | 960 | | | | 1,006,070 | |
| | |
Jefferson County Civic Facility Development Corp., (Samaritan Medical Center), 4.00%, 11/1/47 | | | 1,000 | | | | 1,019,120 | |
| | |
New York Dormitory Authority, (Catholic Health System Obligated Group), 4.00%, 7/1/45 | | | 2,960 | | | | 3,186,410 | |
| | |
New York Dormitory Authority, (Mount Sinai Hospital), 5.00%, 7/1/26 | | | 1,000 | | | | 1,035,960 | |
| | |
Suffolk County Economic Development Corp., (Catholic Health Services of Long Island Obligated Group), 5.00%, 7/1/28 | | | 1,065 | | | | 1,138,741 | |
| | |
| | | | | | | $ | 7,522,856 | |
|
| Housing — 3.3% | |
| | |
New York Housing Finance Agency, (FNMA), (AMT), 5.40%, 11/15/42 | | $ | 2,625 | | | $ | 2,629,620 | |
| | |
| | | | | | | $ | 2,629,620 | |
|
| Industrial Development Revenue — 4.9% | |
| | |
New York Liberty Development Corp., (Goldman Sachs Group, Inc.), 5.25%, 10/1/35 | | $ | 980 | | | $ | 1,291,630 | |
| | |
Niagara Area Development Corp., (Covanta), (AMT), 4.75%, 11/1/42(2) | | | 2,500 | | | | 2,580,225 | |
| | |
| | | | | | | $ | 3,871,855 | |
|
| Insured – Education — 2.1% | |
| | |
New York Dormitory Authority, (City University), (AMBAC), 5.50%, 7/1/35 | | $ | 1,250 | | | $ | 1,667,587 | |
| | |
| | | | | | | $ | 1,667,587 | |
| | | | |
| | 8 | | See Notes to Financial Statements. |
Eaton Vance
New York Municipal Income Trust
May 31, 2019
Portfolio of Investments (Unaudited) — continued
| | | | | | | | |
| Security | | Principal
Amount
(000’s omitted) | | | Value | |
|
| Insured – General Obligations — 4.0% | |
| | |
Nassau County, (AGM), 5.00%, 7/1/42 | | $ | 1,400 | | | $ | 1,679,706 | |
| | |
Nassau County, (AGM), 5.00%, 4/1/43 | | | 20 | | | | 24,274 | |
| | |
Nassau County, (AGM), 5.00%, 4/1/43(1) | | | 1,200 | | | | 1,456,428 | |
| | |
| | | | | | | $ | 3,160,408 | |
|
| Insured – Other Revenue — 5.6% | |
| | |
New York City Industrial Development Agency, (Yankee Stadium), (AGC), 0.00%, 3/1/31 | | $ | 2,645 | | | $ | 1,926,512 | |
| | |
New York City Industrial Development Agency, (Yankee Stadium), (AGC), 0.00%, 3/1/32 | | | 3,625 | | | | 2,535,978 | |
| | |
| | | | | | | $ | 4,462,490 | |
|
| Insured – Transportation — 9.1% | |
| | |
Metropolitan Transportation Authority, Green Bonds, (AGM), 4.00%, 11/15/46 | | $ | 2,000 | | | $ | 2,196,700 | |
| | |
New York Transportation Development Corp., (LaGuardia Airport Terminal B Redevelopment), (AGM), (AMT), 4.00%, 7/1/37 | | | 1,000 | | | | 1,057,050 | |
| | |
New York Transportation Development Corp., (LaGuardia Airport Terminal B Redevelopment), (AGM), (AMT), 4.00%, 7/1/41 | | | 2,500 | | | | 2,625,925 | |
| | |
New York Transportation Development Corp., (LaGuardia Airport Terminal B Redevelopment), (AGM), (AMT), 4.00%, 7/1/46 | | | 1,250 | | | | 1,308,900 | |
| | |
| | | | | | | $ | 7,188,575 | |
|
| Lease Revenue / Certificates of Participation — 16.0% | |
| | |
Hudson Yards Infrastructure Corp., 4.00%, 2/15/44 | | $ | 1,500 | | | $ | 1,628,445 | |
| | |
Hudson Yards Infrastructure Corp., 5.00%, 2/15/42(1) | | | 4,000 | | | | 4,731,000 | |
| | |
Monroe County Industrial Development Agency, (Rochester Schools Modernization), 5.00%, 5/1/31(1) | | | 5,000 | | | | 6,329,500 | |
| | |
| | | | | | | $ | 12,688,945 | |
|
| Other Revenue — 15.2% | |
| | |
Brooklyn Arena Local Development Corp., (Barclays Center), 0.00%, 7/15/31 | | $ | 3,120 | | | $ | 2,120,321 | |
| | |
New York City Transitional Finance Authority, (Building Aid), 5.00%, 7/15/37(1) | | | 5,200 | | | | 6,325,488 | |
| | |
New York Liberty Development Corp., (3 World Trade Center), 5.00%, 11/15/44(2) | | | 1,300 | | | | 1,421,537 | |
| | |
New York Liberty Development Corp., (7 World Trade Center), 5.00%, 3/15/44 | | | 2,000 | | | | 2,160,420 | |
| | |
| | | | | | | $ | 12,027,766 | |
|
| Senior Living / Life Care — 2.1% | |
| | |
New York Dormitory Authority, (Miriam Osborn Memorial Home Association), 5.00%, 7/1/42 | | $ | 120 | | | $ | 120,325 | |
| | | | | | | | |
| Security | | Principal
Amount
(000’s omitted) | | | Value | |
|
| Senior Living / Life Care (continued) | |
| | |
Suffolk County Economic Development Corp., (Peconic Landing at Southold, Inc.), 6.00%, 12/1/40 | | $ | 905 | | | $ | 950,141 | |
| | |
Tompkins County Development Corp., (Kendal at Ithaca, Inc.), 4.00%, 7/1/34 | | | 100 | | | | 101,367 | |
| | |
Tompkins County Development Corp., (Kendal at Ithaca, Inc.), 4.25%, 7/1/32 | | | 230 | | | | 236,682 | |
| | |
Tompkins County Development Corp., (Kendal at Ithaca, Inc.), 4.50%, 7/1/42 | | | 230 | | | | 236,895 | |
| | |
| | | | | | | $ | 1,645,410 | |
|
| Special Tax Revenue — 17.2% | |
| | |
New York City Transitional Finance Authority, Future Tax Revenue, 5.50%, 11/1/35(1) | | $ | 1,185 | | | $ | 1,250,898 | |
| | |
New York City Transitional Finance Authority, Future Tax Revenue, Prerefunded to 11/1/20, 5.50%, 11/1/35(1) | | | 915 | | | | 968,445 | |
| | |
New York Dormitory Authority, Sales Tax Revenue, 5.00%, 3/15/43(1) | | | 4,000 | | | | 4,815,640 | |
| | |
New York Thruway Authority, Fuel Tax Revenue, 5.00%, 4/1/30(1) | | | 6,000 | | | | 6,575,340 | |
| | |
| | | | | | | $ | 13,610,323 | |
|
| Transportation — 6.6% | |
| | |
Niagara Frontier Transportation Authority, (Buffalo Niagara International Airport), (AMT), 5.00%, 4/1/39 | | $ | 350 | | | $ | 412,895 | |
| | |
Port Authority of New York and New Jersey, 5.00%, 10/15/36(1) | | | 4,000 | | | | 4,838,800 | |
| | |
| | | | | | | $ | 5,251,695 | |
|
| Water and Sewer — 12.2% | |
| | |
New York City Municipal Water Finance Authority, (Water and Sewer System), 5.00%, 6/15/46(1) | | $ | 4,000 | | | $ | 4,680,000 | |
| | |
Suffolk County Water Authority, 5.00%, 6/1/36(1) | | | 4,000 | | | | 4,980,960 | |
| | |
| | | | | | | $ | 9,660,960 | |
| |
Total Tax-Exempt Investments — 152.4%
(identified cost $111,321,215) | | | $ | 120,789,528 | |
|
| Corporate Bonds & Notes — 2.0% | |
| Security | | Principal
Amount
(000’s omitted) | | | Value | |
|
| Hospital — 2.0% | |
| | |
NYU Hospitals Center, 4.168%, 7/1/37 | | $ | 1,500 | | | $ | 1,587,843 | |
| |
Total Corporate Bonds & Notes — 2.0%
(identified cost $1,519,764) | | | $ | 1,587,843 | |
| | | | |
| | 9 | | See Notes to Financial Statements. |
Eaton Vance
New York Municipal Income Trust
May 31, 2019
Portfolio of Investments (Unaudited) — continued
| | | | | | | | |
| Miscellaneous — 0.9% | |
| Security | | Units | | | Value | |
| | | | | | | | |
|
| Real Estate— 0.9% | |
| | |
CMS Liquidating Trust(2)(3)(4) | | | 257 | | | $ | 736,351 | |
| |
Total Miscellaneous — 0.9%
(identified cost $822,400) | | | $ | 736,351 | |
| |
Total Investments — 155.3%
(identified cost $113,663,379) | | | $ | 123,113,722 | |
| |
Other Assets, Less Liabilities — (55.3)% | | | $ | (43,833,065 | ) |
| |
Net Assets — 100.0% | | | $ | 79,280,657 | |
The percentage shown for each investment category in the Portfolio of Investments is based on net assets.
The Trust invests primarily in debt securities issued by New York municipalities. The ability of the issuers of the debt securities to meet their obligations may be affected by economic developments in a specific industry or municipality. In order to reduce the risk associated with such economic developments, at May 31, 2019, 13.4% of total investments are backed by bond insurance of various financial institutions and financial guaranty assurance agencies. The aggregate percentage insured by an individual financial institution or financial guaranty assurance agency ranged from 1.4% to 8.4% of total investments.
| (1) | Security represents the municipal bond held by a trust that issues residual interest bonds (see Note 1G). |
| (2) | Security exempt from registration pursuant to Rule 144A under the Securities Act of 1933, as amended. These securities may be sold in certain transactions in reliance on an exemption from registration (normally to qualified institutional buyers). At May 31, 2019, the aggregate value of these securities is $4,738,113 or 6.0% of the Trust’s net assets. |
| (3) | For fair value measurement disclosure purposes, security is categorized as Level 3 (see Note 6). |
| (4) | Non-income producing. |
Abbreviations:
| | | | |
| | |
| AGC | | – | | Assured Guaranty Corp. |
| | |
| AGM | | – | | Assured Guaranty Municipal Corp. |
| | |
| AMBAC | | – | | AMBAC Financial Group, Inc. |
| | |
| AMT | | – | | Interest earned from these securities may be considered a tax preference item for purposes of the Federal Alternative Minimum Tax. |
| | |
| FNMA | | – | | Federal National Mortgage Association |
| | | | |
| | 10 | | See Notes to Financial Statements. |
Eaton Vance
Municipal Income Trusts
May 31, 2019
Statements of Assets and Liabilities (Unaudited)
| | | | | | | | |
| | | May 31, 2019 | |
| Assets | | California Trust | | | New York Trust | |
| | |
Investments — | | | | | | | | |
| | |
Identified cost | | $ | 145,577,045 | | | $ | 113,663,379 | |
| | |
Unrealized appreciation | | | 11,363,001 | | | | 9,450,343 | |
| | |
Investments, at value | | $ | 156,940,046 | | | $ | 123,113,722 | |
| | |
Cash | | $ | 1,730,816 | | | $ | 188,530 | |
| | |
Interest receivable | | | 1,575,100 | | | | 1,445,403 | |
| | |
Total assets | | $ | 160,245,962 | | | $ | 124,747,655 | |
| | |
| Liabilities | | | | | | | | |
| | |
Payable for floating rate notes issued | | $ | 59,342,651 | | | $ | 45,040,896 | |
| | |
Payable for Trust shares repurchased | | | — | | | | 47,059 | |
| | |
Payable to affiliates: | | | | | | | | |
| | |
Investment adviser fee | | | 53,740 | | | | 41,652 | |
| | |
Administration fee | | | 26,870 | | | | 20,826 | |
| | |
Trustees’ fees | | | 1,525 | | | | 1,200 | |
| | |
Interest expense and fees payable | | | 296,291 | | | | 272,956 | |
| | |
Accrued expenses | | | 45,229 | | | | 42,409 | |
| | |
Total liabilities | | $ | 59,766,306 | | | $ | 45,466,998 | |
| | |
Net assets | | $ | 100,479,656 | | | $ | 79,280,657 | |
| | |
| Sources of Net Assets | | | | | | | | |
| | |
Common shares, $0.01 par value, unlimited number of shares authorized | | $ | 71,336 | | | $ | 54,428 | |
| | |
Additionalpaid-in capital | | | 94,006,350 | | | | 73,829,800 | |
| | |
Distributable earnings | | | 6,401,970 | | | | 5,396,429 | |
| | |
Net assets | | $ | 100,479,656 | | | $ | 79,280,657 | |
| | |
| Common Shares Outstanding | | | 7,133,575 | | | | 5,442,751 | |
| | |
| Net Asset Value Per Common Share | | | | | | | | |
| | |
Net assets ÷ common shares issued and outstanding | | $ | 14.09 | | | $ | 14.57 | |
| | | | |
| | 11 | | See Notes to Financial Statements. |
Eaton Vance
Municipal Income Trusts
May 31, 2019
Statements of Operations (Unaudited)
| | | | | | | | |
| | | Six Months Ended May 31, 2019 | |
| Investment Income | | California Trust | | | New York Trust | |
| | |
Interest | | $ | 3,029,768 | | | $ | 2,299,860 | |
| | |
Total investment income | | $ | 3,029,768 | | | $ | 2,299,860 | |
| | |
| Expenses | | | | | | | | |
| | |
Investment adviser fee | | $ | 309,699 | | | $ | 239,866 | |
| | |
Administration fee | | | 154,849 | | | | 119,933 | |
| | |
Trustees’ fees and expenses | | | 5,110 | | | | 3,932 | |
| | |
Custodian fee | | | 28,638 | | | | 24,537 | |
| | |
Transfer and dividend disbursing agent fees | | | 9,088 | | | | 9,126 | |
| | |
Legal and accounting services | | | 26,005 | | | | 23,634 | |
| | |
Printing and postage | | | 2,240 | | | | 2,219 | |
| | |
Interest expense and fees | | | 630,227 | | | | 481,535 | |
| | |
Miscellaneous | | | 11,532 | | | | 6,345 | |
| | |
Total expenses | | $ | 1,177,388 | | | $ | 911,127 | |
| | |
Net investment income | | $ | 1,852,380 | | | $ | 1,388,733 | |
| | |
| Realized and Unrealized Gain (Loss) | | | | | | | | |
| | |
Net realized gain (loss) — | | | | | | | | |
| | |
Investment transactions | | $ | 8,243 | | | $ | 183,955 | |
| | |
Net realized gain | | $ | 8,243 | | | $ | 183,955 | |
| | |
Change in unrealized appreciation (depreciation) — | | | | | | | | |
| | |
Investments | | $ | 6,796,958 | | | $ | 5,620,406 | |
| | |
Net change in unrealized appreciation (depreciation) | | $ | 6,796,958 | | | $ | 5,620,406 | |
| | |
Net realized and unrealized gain | | $ | 6,805,201 | | | $ | 5,804,361 | |
| | |
Net increase in net assets from operations | | $ | 8,657,581 | | | $ | 7,193,094 | |
| | | | |
| | 12 | | See Notes to Financial Statements. |
Eaton Vance
Municipal Income Trusts
May 31, 2019
Statements of Changes in Net Assets
| | | | | | | | |
| | | Six Months Ended May 31, 2019 (Unaudited) | |
| Increase (Decrease) in Net Assets | | California Trust | | | New York Trust | |
| | |
From operations — | | | | | | | | |
| | |
Net investment income | | $ | 1,852,380 | | | $ | 1,388,733 | |
| | |
Net realized gain | | | 8,243 | | | | 183,955 | |
| | |
Net change in unrealized appreciation (depreciation) | | | 6,796,958 | | | | 5,620,406 | |
| | |
Net increase in net assets from operations | | $ | 8,657,581 | | | $ | 7,193,094 | |
| | |
Distributions to common shareholders | | $ | (1,873,277 | ) | | $ | (1,422,600 | ) |
| | |
Capital share transactions — | | | | | | | | |
| | |
Cost of shares repurchased (see Note 5) | | $ | — | | | $ | (428,710 | ) |
| | |
Net decrease in net assets from capital share transactions | | $ | — | | | $ | (428,710 | ) |
| | |
Net increase in net assets | | $ | 6,784,304 | | | $ | 5,341,784 | |
| | |
| Net Assets | | | | | | | | |
| | |
At beginning of period | | $ | 93,695,352 | | | $ | 73,938,873 | |
| | |
At end of period | | $ | 100,479,656 | | | $ | 79,280,657 | |
| | | | |
| | 13 | | See Notes to Financial Statements. |
Eaton Vance
Municipal Income Trusts
May 31, 2019
Statements of Changes in Net Assets — continued
| | | | | | | | |
| | | Year Ended November 30, 2018 | |
| Increase (Decrease) in Net Assets | | California Trust | | | New York Trust | |
| | |
From operations — | | | | | | | | |
| | |
Net investment income | | $ | 3,317,191 | | | $ | 3,116,684 | |
| | |
Net realized gain | | | 120,329 | | | | 1,559,226 | |
| | |
Net change in unrealized appreciation (depreciation) | | | (4,851,375 | ) | | | (5,562,057 | ) |
| | |
Distributions to auction preferred shareholders | | | (18,865 | ) | | | (25,202 | ) |
| | |
Net decrease in net assets from operations | | $ | (1,432,720 | ) | | $ | (911,349 | ) |
| | |
Distributions to common shareholders | | $ | (3,323,028 | ) | | $ | (3,175,388 | ) |
| | |
Capital share transactions — | | | | | | | | |
| | |
Cost of shares repurchased (see Note 5) | | $ | (1,478,804 | ) | | $ | — | |
| | |
Net decrease in net assets from capital share transactions | | $ | (1,478,804 | ) | | $ | — | |
| | |
Net decrease in net assets | | $ | (6,234,552 | ) | | $ | (4,086,737 | ) |
| | |
| Net Assets | | | | | | | | |
| | |
At beginning of year | | $ | 99,929,904 | | | $ | 78,025,610 | |
| | |
At end of year | | $ | 93,695,352 | | | $ | 73,938,873 | |
| | | | |
| | 14 | | See Notes to Financial Statements. |
Eaton Vance
Municipal Income Trusts
May 31, 2019
Statements of Cash Flows (Unaudited)
| | | | | | | | |
| | | Six Months Ended May 31, 2019 | |
| Cash Flows From Operating Activities | | California Trust | | | New York Trust | |
| | |
Net increase in net assets from operations | | $ | 8,657,581 | | | $ | 7,193,094 | |
| | |
Adjustments to reconcile net increase in net assets from operations to net cash provided by operating activities: | | | | | | | | |
| | |
Investments purchased | | | (5,902,056 | ) | | | (23,742,443 | ) |
| | |
Investments sold | | | 7,269,235 | | | | 22,423,537 | |
| | |
Net amortization/accretion of premium (discount) | | | 134,271 | | | | 221,131 | |
| | |
Increase in interest receivable | | | (21,768 | ) | | | (12,948 | ) |
| | |
Increase in payable to affiliate for investment adviser fee | | | 4,445 | | | | 3,000 | |
| | |
Increase in payable to affiliate for administration fee | | | 2,223 | | | | 1,500 | |
| | |
Increase in payable to affiliate for Trustees’ fees | | | 530 | | | | 335 | |
| | |
Increase in interest expense and fees payable | | | 119,717 | | | | 25,878 | |
| | |
Decrease in accrued expenses | | | (37,628 | ) | | | (35,716 | ) |
| | |
Net change in unrealized (appreciation) depreciation from investments | | | (6,796,958 | ) | | | (5,620,406 | ) |
| | |
Net realized gain from investments | | | (8,243 | ) | | | (183,955 | ) |
| | |
Net cash provided by operating activities | | $ | 3,421,349 | | | $ | 273,007 | |
| | |
| Cash Flows From Financing Activities | | | | | | | | |
| | |
Repurchase of common shares | | $ | — | | | $ | (381,651 | ) |
| | |
Cash distributions paid to common shareholders | | | (1,873,277 | ) | | | (1,422,600 | ) |
| | |
Proceeds from secured borrowings | | | — | | | | 960,000 | |
| | |
Net cash used in financing activities | | $ | (1,873,277 | ) | | $ | (844,251 | ) |
| | |
Net increase (decrease) in cash | | $ | 1,548,072 | | | $ | (571,244 | ) |
| | |
Cash at beginning of period | | $ | 182,744 | | | $ | 759,774 | |
| | |
Cash at end of period | | $ | 1,730,816 | | | $ | 188,530 | |
| | |
| Supplemental disclosure of cash flow information: | | | | | | | | |
| | |
Cash paid for interest and fees | | $ | 510,510 | | | $ | 455,657 | |
| | | | |
| | 15 | | See Notes to Financial Statements. |
Eaton Vance
Municipal Income Trusts
May 31, 2019
Financial Highlights
Selected data for a common share outstanding during the periods stated
| | | | | | | | | | | | | | | | | | | | | | | | |
| | | California Trust | |
| | |
| | | Six Months Ended
May 31, 2019
(Unaudited) | | | Year Ended November 30, | |
| | | 2018 | | | 2017 | | | 2016 | | | 2015 | | | 2014 | |
| | | | | | | |
Net asset value — Beginning of period (Common shares) | | $ | 13.130 | | | $ | 13.770 | | | $ | 13.600 | | | $ | 14.020 | | | $ | 14.080 | | | $ | 12.580 | |
| | | | | | |
| Income (Loss) From Operations | | | | | | | | | | | | | | | | | | | | | | | | |
| | | | | | |
Net investment income(1) | | $ | 0.260 | | | $ | 0.464 | | | $ | 0.496 | | | $ | 0.586 | | | $ | 0.737 | | | $ | 0.756 | |
| | | | | | |
Net realized and unrealized gain (loss) | | | 0.963 | | | | (0.663 | ) | | | 0.175 | | | | (0.681 | ) | | | (0.057 | ) | | | 1.507 | |
| | | | | | |
Distributions to APS shareholders | | | | | | | | | | | | | | | | | | | | | | | | |
| | | | | | |
From net investment income(1) | | | — | | | | (0.003 | ) | | | (0.006 | ) | | | (0.009 | ) | | | (0.009 | ) | | | (0.007 | ) |
| | | | | | |
Discount on redemption and repurchase of APS(1) | | | — | | | | — | | | | — | | | | 0.291 | | | | — | | | | — | |
| | | | | | |
Total income (loss) from operations | | $ | 1.223 | | | $ | (0.202 | ) | | $ | 0.665 | | | $ | 0.187 | | | $ | 0.671 | | | $ | 2.256 | |
| | | | | | |
| Less Distributions to Common Shareholders | | | | | | | | | | | | | | | | | | | | | | | | |
| | | | | | |
From net investment income | | $ | (0.263 | ) | | $ | (0.465 | ) | | $ | (0.495 | ) | | $ | (0.607 | ) | | $ | (0.731 | ) | | $ | (0.757 | ) |
| | | | | | |
Total distributions to common shareholders | | $ | (0.263 | ) | | $ | (0.465 | ) | | $ | (0.495 | ) | | $ | (0.607 | ) | | $ | (0.731 | ) | | $ | (0.757 | ) |
| | | | | | |
Anti-dilutive effect of share repurchase program (see Note 5)(1) | | $ | — | | | $ | 0.027 | | | $ | — | | | $ | — | | | $ | — | | | $ | 0.001 | |
| | | | | | |
Net asset value — End of period (Common shares) | | $ | 14.090 | | | $ | 13.130 | | | $ | 13.770 | | | $ | 13.600 | | | $ | 14.020 | | | $ | 14.080 | |
| | | | | | |
Market value — End of period (Common shares) | | $ | 12.280 | | | $ | 11.030 | | | $ | 12.060 | | | $ | 12.260 | | | $ | 12.900 | | | $ | 12.670 | |
| | | | | | |
Total Investment Return on Net Asset Value(2) | | | 9.73 | %(3) | | | (0.70 | )% | | | 5.33 | % | | | 1.38 | %(4) | | | 5.28 | % | | | 19.06 | % |
| | | | | | |
Total Investment Return on Market Value(2) | | | 13.84 | %(3) | | | (4.76 | )% | | | 2.34 | % | | | (0.68 | )% | | | 7.65 | % | | | 21.86 | % |
| | | | | | |
| Ratios/Supplemental Data | | | | | | | | | | | | | | | | | | | | | | | | |
| | | | | | |
Net assets applicable to common shares, end of period (000’s omitted) | | $ | 100,480 | | | $ | 93,695 | | | $ | 99,930 | | | $ | 98,633 | | | $ | 101,732 | | | $ | 102,129 | |
| | | | | | |
Ratios (as a percentage of average daily net assets applicable to common shares):(5) | | | | | | | | | | | | | | | | | | | | | | | | |
| | | | | | |
Expenses excluding interest and fees(6) | | | 1.14 | %(7) | | | 1.28 | % | | | 1.46 | % | | | 1.50 | % | | | 1.54 | % | | | 1.60 | % |
| | | | | | |
Interest and fee expense(8) | | | 1.31 | %(7) | | | 1.50 | % | | | 1.32 | % | | | 0.87 | % | | | 0.08 | % | | | 0.09 | % |
| | | | | | |
Total expenses(6) | | | 2.45 | %(7) | | | 2.78 | % | | | 2.78 | % | | | 2.37 | % | | | 1.62 | % | | | 1.69 | % |
| | | | | | |
Net investment income | | | 3.85 | %(7) | | | 3.45 | % | | | 3.57 | % | | | 4.05 | % | | | 5.26 | % | | | 5.64 | % |
| | | | | | |
Portfolio Turnover | | | 3 | %(3) | | | 129 | % | | | 19 | % | | | 12 | % | | | 9 | % | | | 11 | % |
| | | | | | |
Senior Securities: | | | | | | | | | | | | | | | | | | | | | | | | |
| | | | | | |
Total preferred shares outstanding | | | — | | | | — | | | | 1,999 | (9) | | | 1,999 | (9) | | | 1,999 | (9) | | | 1,999 | (9) |
| | | | | | |
Asset coverage per preferred share | | $ | — | | | $ | — | | | $ | 74,990 | (10) | | $ | 74,341 | (10) | | $ | 75,892 | (10) | | $ | 76,091 | (10) |
| | | | | | |
Involuntary liquidation preference per preferred share | | $ | — | | | $ | — | | | $ | 25,000 | (11) | | $ | 25,000 | (11) | | $ | 25,000 | (11) | | $ | 25,000 | (11) |
| | | | | | |
Approximate market value per preferred share | | $ | — | | | $ | — | | | $ | 25,000 | (11) | | $ | 25,000 | (11) | | $ | 25,000 | (11) | | $ | 25,000 | (11) |
| (1) | Computed using average common shares outstanding. |
| (2) | Returns are historical and are calculated by determining the percentage change in net asset value or market value with all distributions reinvested. Distributions are assumed to be reinvested at prices obtained under the Trust’s dividend reinvestment plan. |
| (4) | The total return based on net asset value reflects the impact of the tender and repurchase by the Trust of a portion of its APS at 95.5% of the per share liquidation preference. Absent this transaction, the total return based on net asset value would have been (0.80)%. |
| (5) | Ratios do not reflect the effect of dividend payments to APS shareholders, if any. |
| | | | |
| | 16 | | See Notes to Financial Statements. |
Eaton Vance
Municipal Income Trusts
May 31, 2019
Financial Highlights — continued
| (6) | Excludes the effect of custody fee credits, if any, of less than 0.005%. Effective September 1, 2015, custody fee credits, which were earned on cash deposit balances, were discontinued by the custodian. |
| (8) | Interest and fee expense relates to the liability for floating rate notes issued in conjunction with residual interest bond transactions (see Note 1G) and/or iMTP Shares issued to redeem a portion of the Trust’s APS. As of November 30, 2018, the Trust had no APS and iMTP Shares outstanding. |
| (9) | Preferred shares represent iMTP Shares and APS as of November 30, 2017 and 2016 and APS as of November 30, 2015 and 2014. |
| (10) | Calculated by subtracting the Trust’s total liabilities (not including the preferred shares) from the Trust’s total assets, and dividing the result by the number of preferred shares outstanding. |
| (11) | Plus accumulated and unpaid dividends. |
| | | | |
| | |
| APS | | – | | Auction Preferred Shares |
| | |
| iMTP Shares | | – | | Institutional MuniFund Term Preferred Shares |
| | | | |
| | 17 | | See Notes to Financial Statements. |
Eaton Vance
Municipal Income Trusts
May 31, 2019
Financial Highlights — continued
Selected data for a common share outstanding during the periods stated
| | | | | | | | | | | | | | | | | | | | | | | | |
| | | New York Trust | |
| | |
| | | Six Months Ended
May 31, 2019
(Unaudited) | | | Year Ended November 30, | |
| | | 2018 | | | 2017 | | | 2016 | | | 2015 | | | 2014 | |
| | | | | | | |
Net asset value — Beginning of period (Common shares) | | $ | 13.500 | | | $ | 14.250 | | | $ | 14.100 | | | $ | 14.520 | | | $ | 14.590 | | | $ | 13.260 | |
| | | | | | |
| Income (Loss) From Operations | | | | | | | | | | | | | | | | | | | | | | | | |
| | | | | | |
Net investment income(1) | | $ | 0.254 | | | $ | 0.569 | | | $ | 0.628 | | | $ | 0.665 | | | $ | 0.814 | | | $ | 0.840 | |
| | | | | | |
Net realized and unrealized gain (loss) | | | 1.067 | | | | (0.734 | ) | | | 0.137 | | | | (0.651 | ) | | | (0.063 | ) | | | 1.359 | |
| | | | | | |
Distributions to APS shareholders | | | | | | | | | | | | | | | | | | | | | | | | |
| | | | | | |
From net investment income(1) | | | — | | | | (0.005 | ) | | | (0.010 | ) | | | (0.010 | ) | | | (0.008 | ) | | | (0.007 | ) |
| | | | | | |
Discount on redemption and repurchase of APS(1) | | | — | | | | — | | | | — | | | | 0.243 | | | | — | | | | — | |
| | | | | | |
Total income (loss) from operations | | $ | 1.321 | | | $ | (0.170 | ) | | $ | 0.755 | | | $ | 0.247 | | | $ | 0.743 | | | $ | 2.192 | |
| | | | | | |
| Less Distributions to Common Shareholders | | | | | | | | | | | | | | | | | | | | | | | | |
| | | | | | |
From net investment income | | $ | (0.260 | ) | | $ | (0.580 | ) | | $ | (0.605 | ) | | $ | (0.667 | ) | | $ | (0.813 | ) | | $ | (0.862 | ) |
| | | | | | |
Total distributions to common shareholders | | $ | (0.260 | ) | | $ | (0.580 | ) | | $ | (0.605 | ) | | $ | (0.667 | ) | | $ | (0.813 | ) | | $ | (0.862 | ) |
| | | | | | |
Anti-dilutive effect of share repurchase program (see Note 5)(1) | | $ | 0.009 | | | $ | — | | | $ | — | | | $ | — | | | $ | — | | | $ | — | |
| | | | | | |
Net asset value — End of period (Common shares) | | $ | 14.570 | | | $ | 13.500 | | | $ | 14.250 | | | $ | 14.100 | | | $ | 14.520 | | | $ | 14.590 | |
| | | | | | |
Market value — End of period (Common shares) | | $ | 13.060 | | | $ | 11.390 | | | $ | 12.770 | | | $ | 13.040 | | | $ | 13.730 | | | $ | 13.730 | |
| | | | | | |
Total Investment Return on Net Asset Value(2) | | | 10.24 | %(3) | | | (0.61 | )% | | | 5.84 | % | | | 1.69 | %(4) | | | 5.63 | % | | | 17.25 | % |
| | | | | | |
Total Investment Return on Market Value(2) | | | 17.13 | %(3) | | | (6.42 | )% | | | 2.56 | % | | | (0.53 | )% | | | 6.13 | % | | | 20.92 | % |
| | | | | | |
| Ratios/Supplemental Data | | | | | | | | | | | | | | | | | | | | | | | | |
| | | | | | |
Net assets applicable to common shares, end of period (000’s omitted) | | $ | 79,281 | | | $ | 73,939 | | | $ | 78,026 | | | $ | 77,190 | | | $ | 79,518 | | | $ | 79,860 | |
| | | | | | |
Ratios (as a percentage of average daily net assets applicable to common shares):(5) | | | | | | | | | | | | | | | | | | | | | | | | |
| | | | | | |
Expenses excluding interest and fees(6) | | | 1.13 | %(7) | | | 1.19 | % | | | 1.37 | % | | | 1.52 | % | | | 1.53 | % | | | 1.60 | % |
| | | | | | |
Interest and fee expense(8) | | | 1.26 | %(7) | | | 1.54 | % | | | 1.25 | % | | | 0.82 | % | | | 0.14 | % | | | 0.15 | % |
| | | | | | |
Total expenses(6) | | | 2.39 | %(7) | | | 2.73 | % | | | 2.62 | % | | | 2.34 | % | | | 1.67 | % | | | 1.75 | % |
| | | | | | |
Net investment income | | | 3.64 | %(7) | | | 4.11 | % | | | 4.37 | % | | | 4.43 | % | | | 5.60 | % | | | 5.96 | % |
| | | | | | |
Portfolio Turnover | | | 18 | %(3) | | | 57 | % | | | 18 | % | | | 15 | % | | | 7 | % | | | 4 | % |
| | | | | | |
Senior Securities: | | | | | | | | | | | | | | | | | | | | | | | | |
| | | | | | |
Total preferred shares outstanding | | | — | | | | — | | | | 1,349 | (9) | | | 1,349 | (9) | | | 1,349 | (9) | | | 1,349 | (9) |
| | | | | | |
Asset coverage per preferred share | | $ | — | | | $ | — | | | $ | 82,841 | (10) | | $ | 82,220 | (10) | | $ | 83,946 | (10) | | $ | 84,200 | (10) |
| | | | | | |
Involuntary liquidation preference per preferred share | | $ | — | | | $ | — | | | $ | 25,000 | (11) | | $ | 25,000 | (11) | | $ | 25,000 | (11) | | $ | 25,000 | (11) |
| | | | | | |
Approximate market value per preferred share | | $ | — | | | $ | — | | | $ | 25,000 | (11) | | $ | 25,000 | (11) | | $ | 25,000 | (11) | | $ | 25,000 | (11) |
| (1) | Computed using average common shares outstanding. |
| (2) | Returns are historical and are calculated by determining the percentage change in net asset value or market value with all distributions reinvested. Distributions are assumed to be reinvested at prices obtained under the Trust’s dividend reinvestment plan. |
| (4) | The total return based on net asset value reflects the impact of the tender and repurchase by the Trust of a portion of its APS at 95.5% of the per share liquidation preference. Absent this transaction, the total return based on net asset value would have been (0.06)%. |
| (5) | Ratios do not reflect the effect of dividend payments to APS shareholders, if any. |
| | | | |
| | 18 | | See Notes to Financial Statements. |
Eaton Vance
Municipal Income Trusts
May 31, 2019
Financial Highlights — continued
| (6) | Excludes the effect of custody fee credits, if any, of less than 0.005%. Effective September 1, 2015, custody fee credits, which were earned on cash deposit balances, were discontinued by the custodian. |
| (8) | Interest and fee expense relates to the liability for floating rate notes issued in conjunction with residual interest bond transactions (see Note 1G) and/or iMTP Shares issued to redeem a portion of the Trust’s APS. As of November 30, 2018, the Trust had no APS and iMTP Shares outstanding. |
| (9) | Preferred shares represent iMTP Shares and APS as of November 30, 2017 and 2016 and APS as of November 30, 2015 and 2014. |
| (10) | Calculated by subtracting the Trust’s total liabilities (not including the preferred shares) from the Trust’s total assets, and dividing the result by the number of preferred shares outstanding. |
| (11) | Plus accumulated and unpaid dividends. |
| | | | |
| | |
| APS | | – | | Auction Preferred Shares |
| | |
| iMTP Shares | | – | | Institutional MuniFund Term Preferred Shares |
| | | | |
| | 19 | | See Notes to Financial Statements. |
Eaton Vance
Municipal Income Trusts
May 31, 2019
Notes to Financial Statements (Unaudited)
1 Significant Accounting Policies
Eaton Vance California Municipal Income Trust (California Trust) and Eaton Vance New York Municipal Income Trust (New York Trust), (each individually referred to as the Trust, and collectively, the Trusts), are Massachusetts business trusts registered under the Investment Company Act of 1940, as amended (the 1940 Act), asnon-diversified,closed-end management investment companies. The Trusts’ investment objective is to provide current income exempt from regular federal income tax and taxes in its specified state.
The following is a summary of significant accounting policies of the Trusts. The policies are in conformity with accounting principles generally accepted in the United States of America (U.S. GAAP). Each Trust is an investment company and follows accounting and reporting guidance in the Financial Accounting Standards Board (FASB) Accounting Standards Codification Topic 946.
A Investment Valuation — The following methodologies are used to determine the market value or fair value of investments.
Debt Obligations.Debt obligations are generally valued on the basis of valuations provided by third party pricing services, as derived from such services’ pricing models. Inputs to the models may include, but are not limited to, reported trades, executable bid and ask prices, broker/dealer quotations, prices or yields of securities with similar characteristics, interest rates, anticipated prepayments, benchmark curves or information pertaining to the issuer, as well as industry and economic events. The pricing services may use a matrix approach, which considers information regarding securities with similar characteristics to determine the valuation for a security. Short-term debt obligations purchased with a remaining maturity of sixty days or less for which a valuation from a third party pricing service is not readily available may be valued at amortized cost, which approximates fair value.
Fair Valuation. Investments for which valuations or market quotations are not readily available or are deemed unreliable are valued at fair value using methods determined in good faith by or at the direction of the Trustees of a Trust in a manner that most fairly reflects the security’s “fair value”, which is the amount that the Trust might reasonably expect to receive for the security upon its current sale in the ordinary course. Each such determination is based on a consideration of relevant factors, which are likely to vary from one pricing context to another. These factors may include, but are not limited to, the type of security, the existence of any contractual restrictions on the security’s disposition, the price and extent of public trading in similar securities of the issuer or of comparable companies or entities, quotations or relevant information obtained from broker/dealers or other market participants, information obtained from the issuer, analysts, and/or the appropriate stock exchange (for exchange-traded securities), an analysis of the company’s or entity’s financial statements, and an evaluation of the forces that influence the issuer and the market(s) in which the security is purchased and sold.
B Investment Transactions and Related Income — Investment transactions for financial statement purposes are accounted for on a trade date basis. Realized gains and losses on investments sold are determined on the basis of identified cost. Interest income is recorded on the basis of interest accrued, adjusted for amortization of premium or accretion of discount.
C Federal Taxes — Each Trust’s policy is to comply with the provisions of the Internal Revenue Code applicable to regulated investment companies and to distribute to shareholders each year substantially all of its taxable, if any, andtax-exempt net investment income, and all or substantially all of its net realized capital gains. Accordingly, no provision for federal income or excise tax is necessary. Each Trust intends to satisfy conditions which will enable it to designate distributions from the interest income generated by its investments innon-taxable municipal securities, which are exempt from regular federal income tax when received by each Trust, as exempt-interest dividends. The portion of such interest, if any, earned on private activity bonds issued after August 7, 1986, may be considered a tax preference item to shareholders.
As of May 31, 2019, the Trusts had no uncertain tax positions that would require financial statement recognition,de-recognition, or disclosure. Each Trust files a U.S. federal income tax return annually after its fiscalyear-end, which is subject to examination by the Internal Revenue Service for a period of three years from the date of filing.
D Legal Fees — Legal fees and other related expenses incurred as part of negotiations of the terms and requirement of capital infusions, or that are expected to result in the restructuring of, or a plan of reorganization for, an investment are recorded as realized losses. Ongoing expenditures to protect or enhance an investment are treated as operating expenses.
E Use of Estimates — The preparation of the financial statements in conformity with U.S. GAAP requires management to make estimates and assumptions that affect the reported amounts of assets and liabilities at the date of the financial statements and the reported amounts of income and expense during the reporting period. Actual results could differ from those estimates.
F Indemnifications — Under each Trust’s organizational documents, its officers and Trustees may be indemnified against certain liabilities and expenses arising out of the performance of their duties to each Trust. Under Massachusetts law, if certain conditions prevail, shareholders of a Massachusetts business trust (such as a Trust) could be deemed to have personal liability for the obligations of the Trust. However, each Trust’s Declaration of Trust contains an express disclaimer of liability on the part of Trust shareholders and theBy-laws provide that the Trust shall assume, upon request by the shareholder, the defense on behalf of any Trust shareholders. Moreover, theBy-laws also provide for indemnification out of Trust property of any shareholder held personally liable solely by reason of being or having been a shareholder for all loss or expense arising from such liability. Additionally, in the normal course of business, each Trust enters into agreements with service providers that may contain indemnification clauses. Each Trust’s maximum exposure under these arrangements is unknown as this would involve future claims that may be made against each Trust that have not yet occurred.
G Floating Rate Notes Issued in Conjunction with Securities Held — The Trusts may invest in residual interest bonds, also referred to as inverse floating rate securities, whereby a Trust may sell a variable or fixed rate bond for cash to a Special-Purpose Vehicle (the SPV), (which is generally organized as a
Eaton Vance
Municipal Income Trusts
May 31, 2019
Notes to Financial Statements (Unaudited) — continued
trust), while at the same time, buying a residual interest in the assets and cash flows of the SPV. The bond is deposited into the SPV with the same CUSIP number as the bond sold to the SPV by the Trust, and which may have been, but is not required to be, the bond purchased from the Trust (the Bond). The SPV also issues floating rate notes (Floating Rate Notes) which are sold to third-parties. The residual interest bond held by a Trust gives the Trust the right (1) to cause the holders of the Floating Rate Notes to generally tender their notes at par, and (2) to have the Bond held by the SPV transferred to the Trust, thereby terminating the SPV. Should the Trust exercise such right, it would generally pay the SPV the par amount due on the Floating Rate Notes and exchange the residual interest bond for the underlying Bond. Pursuant to generally accepted accounting principles for transfers and servicing of financial assets and extinguishment of liabilities, the Trusts account for the transaction described above as a secured borrowing by including the Bond in their Portfolio of Investments and the Floating Rate Notes (net of unamortized deferred debt issuance costs, if any) as a liability under the caption “Payable for floating rate notes issued” in their Statement of Assets and Liabilities. The Floating Rate Notes have interest rates that generally reset weekly and their holders have the option to tender their notes to the SPV for redemption at par at each reset date. Accordingly, the fair value of the payable for floating rate notes issued approximates its carrying value. If measured at fair value, the payable for floating rate notes would have been considered as Level 2 in the fair value hierarchy (see Note 6) at May 31, 2019. Interest expense related to a Trust’s liability with respect to Floating Rate Notes is recorded as incurred. The SPV may be terminated by the Trust, as noted above, or by the occurrence of certain termination events as defined in the trust agreement, such as a downgrade in the credit quality of the underlying Bond, bankruptcy of or payment failure by the issuer of the underlying Bond, the inability to remarket Floating Rate Notes that have been tendered due to insufficient buyers in the market, or the failure by the SPV to obtain renewal of the liquidity agreement under which liquidity support is provided for the Floating Rate Notes up to one year. At May 31, 2019, the amounts of the Trusts’ Floating Rate Notes and related interest rates and collateral were as follows:
| | | | | | | | |
| | | California
Trust | | | New York
Trust | |
| | |
Floating Rate Notes Outstanding | | $ | 59,342,651 | | | $ | 45,040,896 | |
| | |
Interest Rate or Range of Interest Rates (%) | | | 1.36 - 1.54 | | | | 1.42 - 1.45 | |
| | |
Collateral for Floating Rate Notes Outstanding | | $ | 86,518,537 | | | $ | 65,771,819 | |
For the six months ended May 31, 2019, the Trusts’ average settled Floating Rate Notes outstanding and the average interest rate (annualized) including fees were as follows:
| | | | | | | | |
| | | California
Trust | | | New York
Trust | |
| | |
Average Floating Rate Notes Outstanding | | $ | 59,195,000 | | | $ | 44,101,593 | |
| | |
Average Interest Rate | | | 2.14 | % | | | 2.19 | % |
In certain circumstances, the Trusts may enter into shortfall and forbearance agreements with brokers by which a Trust agrees to reimburse the broker for the difference between the liquidation value of the Bond held by the SPV and the liquidation value of the Floating Rate Notes, as well as any shortfalls in interest cash flows. The Trusts had no shortfalls as of May 31, 2019.
The Trusts may also purchase residual interest bonds in a secondary market transaction without first owning the underlying bond. Such transactions are not required to be treated as secured borrowings. Shortfall agreements, if any, related to residual interest bonds purchased in a secondary market transaction are disclosed in the Portfolio of Investments.
The Trusts’ investment policies and restrictions expressly permit investments in residual interest bonds. Such bonds typically offer the potential for yields exceeding the yields available on fixed rate bonds with comparable credit quality and maturity. These securities tend to underperform the market for fixed rate bonds in a rising long-term interest rate environment, but tend to outperform the market for fixed rate bonds when long-term interest rates decline. The value and income of residual interest bonds are generally more volatile than that of a fixed rate bond. The Trusts’ investment policies do not allow the Trusts to borrow money except as permitted by the 1940 Act. Management believes that the Trusts’ restrictions on borrowing money and issuing senior securities (other than as specifically permitted) do not apply to Floating Rate Notes issued by the SPV and included as a liability in the Trusts’ Statement of Assets and Liabilities. As secured indebtedness issued by an SPV, Floating Rate Notes are distinct from the borrowings and senior securities to which the Trusts’ restrictions apply. Residual interest bonds held by the Trusts are securities exempt from registration under Rule 144A of the Securities Act of 1933.
H Interim Financial Statements — The interim financial statements relating to May 31, 2019 and for the six months then ended have not been audited by an independent registered public accounting firm, but in the opinion of the Trusts’ management, reflect all adjustments, consisting only of normal recurring adjustments, necessary for the fair presentation of the financial statements.
Eaton Vance
Municipal Income Trusts
May 31, 2019
Notes to Financial Statements (Unaudited) — continued
2 Distributions to Shareholders and Income Tax Information
Each Trust intends to make monthly distributions of net investment income to common shareholders. In addition, at least annually, each Trust intends to distribute all or substantially all of its net realized capital gains (reduced by available capital loss carryforwards from prior years). Distributions to shareholders are recorded on theex-dividend date. Distributions to shareholders are determined in accordance with income tax regulations, which may differ from U.S. GAAP. As required by U.S. GAAP, only distributions in excess of tax basis earnings and profits are reported in the financial statements as a return of capital. Permanent differences between book and tax accounting relating to distributions are reclassified topaid-in capital. For tax purposes, distributions from short-term capital gains are considered to be from ordinary income.
At November 30, 2018, the following Trusts, for federal income tax purposes, had capital loss carryforwards and deferred capital losses which would reduce the respective Trust’s taxable income arising from future net realized gains on investment transactions, if any, to the extent permitted by the Internal Revenue Code, and thus would reduce the amount of distributions to shareholders, which would otherwise be necessary to relieve the Trusts of any liability for federal income or excise tax. Under tax regulations, capital losses incurred in taxable years beginning after December 2010 are considered deferred capital losses and are treated as arising on the first day of a Trust’s next taxable year, retaining the same short-term or long-term character as when originally deferred. Deferred capital losses are required to be used prior to capital loss carryforwards, which carry an expiration date. As a result of this ordering rule, capital loss carryforwards may be more likely to expire unused. The amounts and expiration dates of the capital loss carryforwards, whose character is short-term, and the amounts of the deferred capital losses are as follows:
| | | | | | | | |
| Expiration Date | | California
Trust | | | New York
Trust | |
| | |
November 30, 2019 | | $ | 5,299,748 | | | $ | 3,607,489 | |
| | |
Total capital loss carryforwards | | $ | 5,299,748 | | | $ | 3,607,489 | |
| | |
Deferred capital losses: | | | | | | | | |
| | |
Short-term | | $ | — | | | $ | 839,181 | |
The cost and unrealized appreciation (depreciation) of investments of each Trust at May 31, 2019, as determined on a federal income tax basis, were as follows:
| | | | | | | | |
| | | California
Trust | | | New York
Trust | |
| | |
Aggregate cost | | $ | 86,220,256 | | | $ | 68,665,725 | |
| | |
Gross unrealized appreciation | | $ | 11,377,139 | | | $ | 9,493,150 | |
| | |
Gross unrealized depreciation | | | — | | | | (86,049 | ) |
| | |
Net unrealized appreciation | | $ | 11,377,139 | | | $ | 9,407,101 | |
3 Investment Adviser Fee and Other Transactions with Affiliates
The investment adviser fee is earned by Eaton Vance Management (EVM) as compensation for investment advisory services rendered to each Trust. Pursuant to the investment advisory agreements between the Trusts and EVM, the investment advisory fee payable by each Trust is 0.70% of the Trust’s average weekly gross assets and is payable monthly. Pursuant to a fee reduction agreement between each Trust and EVM that commenced on May 1, 2010, the annual investment adviser fee was reduced by 0.015% every May 1 thereafter for the next nineteen years. This annual fee reduction was accelerated for California Trust (effective June 1, 2018) and New York Trust (effective July 1, 2017), each of which is currently subject to an advisory fee of 0.40% of average weekly gross assets. The fee reductions cannot be terminated or reduced without the approval of a majority vote of the Trustees of the Trusts who are not interested persons of EVM or each Trust and by a vote of a majority of shareholders. Average weekly gross assets include the principal amount of any indebtedness for money borrowed, including debt securities issued by a Trust. Pursuant to a fee reduction agreement between each Trust and EVM, average weekly gross assets are calculated by adding to net assets the amount payable by the Trust to floating rate note holders, such adjustment being limited to the value of the Auction Preferred Shares (APS) outstanding prior to any APS redemptions by the Trust. The administration fee is earned by EVM for administering the business
Eaton Vance
Municipal Income Trusts
May 31, 2019
Notes to Financial Statements (Unaudited) — continued
affairs of each Trust and is computed at an annual rate of 0.20% of each Trust’s average weekly gross assets. For the six months ended May 31, 2019, the investment adviser fees and administration fees were as follows:
| | | | | | | | |
| | | California
Trust | | | New York
Trust | |
| | |
Investment Adviser Fee | | $ | 309,699 | | | $ | 239,866 | |
| | |
Administration Fee | | $ | 154,849 | | | $ | 119,933 | |
Trustees and officers of the Trusts who are members of EVM’s organization receive remuneration for their services to the Trusts out of the investment adviser fee. Trustees of the Trusts who are not affiliated with EVM may elect to defer receipt of all or a percentage of their annual fees in accordance with the terms of the Trustees Deferred Compensation Plan. For the six months ended May 31, 2019, no significant amounts have been deferred. Certain officers and Trustees of the Trusts are officers of EVM.
4 Purchases and Sales of Investments
Purchases and sales of investments, other than short-term obligations, for the six months ended May 31, 2019 were as follows:
| | | | | | | | |
| | | California
Trust | | | New York
Trust | |
| | |
Purchases | | $ | 5,264,370 | | | $ | 23,742,443 | |
| | |
Sales | | $ | 7,269,235 | | | $ | 21,173,537 | |
5 Common Shares of Beneficial Interest
The Trusts may issue common shares pursuant to their dividend reinvestment plans. There were no common shares issued by the Trusts for the six months ended May 31, 2019 and the year ended November 30, 2018.
In November 2013, the Board of Trustees initially approved a share repurchase program for the Trusts. Pursuant to the reauthorization of the share repurchase program by the Board of Trustees in March 2019, each Trust is authorized to repurchase up to 10% of its common shares outstanding as of the last day of the prior calendar year at market prices when shares are trading at a discount to net asset value (NAV). The repurchase program does not obligate the Trusts to purchase a specific amount of shares. During the six months ended May 31, 2019, the New York Trust repurchased 33,000 of its common shares under the share repurchase program at a cost, including brokerage commissions, of $428,710 and an average price per share of $12.99. The weighted average discount per share to NAV on these repurchases amounted to 10.21% for the six months ended May 31, 2019.
During the year ended November 30, 2018, the California Trust repurchased 121,000 of its common shares under the share repurchase program at a cost, including brokerage commissions, of $1,478,804 and an average price per share of $12.22. The weighted average discount per share to NAV on these repurchases amounted to 11.81% for the year ended November 30, 2018.
6 Fair Value Measurements
Under generally accepted accounting principles for fair value measurements, a three-tier hierarchy to prioritize the assumptions, referred to as inputs, is used in valuation techniques to measure fair value. The three-tier hierarchy of inputs is summarized in the three broad levels listed below.
| • | | Level 1 – quoted prices in active markets for identical investments |
| • | | Level 2 – other significant observable inputs (including quoted prices for similar investments, interest rates, prepayment speeds, credit risk, etc.) |
| • | | Level 3 – significant unobservable inputs (including a fund’s own assumptions in determining the fair value of investments) |
In cases where the inputs used to measure fair value fall in different levels of the fair value hierarchy, the level disclosed is determined based on the lowest level input that is significant to the fair value measurement in its entirety. The inputs or methodology used for valuing securities are not necessarily an indication of the risk associated with investing in those securities.
Eaton Vance
Municipal Income Trusts
May 31, 2019
Notes to Financial Statements (Unaudited) — continued
At May 31, 2019, the hierarchy of inputs used in valuing the Trusts’ investments, which are carried at value, were as follows:
| | | | | | | | | | | | | | | | |
California Trust | |
| Asset Description | | Level 1 | | | Level 2 | | | Level 3 | | | Total | |
| | | | |
Tax-Exempt Municipal Securities | | $ | — | | | $ | 147,179,402 | | | $ | — | | | $ | 147,179,402 | |
| | | | |
Taxable Municipal Securities | | | — | | | | 8,626,035 | | | | — | | | | 8,626,035 | |
| | | | |
Corporate Bonds & Notes | | | — | | | | 1,134,609 | | | | — | | | | 1,134,609 | |
| | | | |
Total Investments | | $ | — | | | $ | 156,940,046 | | | $ | — | | | $ | 156,940,046 | |
|
New York Trust | |
| Asset Description | | Level 1 | | | Level 2 | | | Level 3* | | | Total | |
| | | | |
Tax-Exempt Investments | | $ | — | | | $ | 120,789,528 | | | $ | — | | | $ | 120,789,528 | |
| | | | |
Corporate Bonds & Notes | | | — | | | | 1,587,843 | | | | — | | | | 1,587,843 | |
| | | | |
Miscellaneous | | | — | | | | — | | | | 736,351 | | | | 736,351 | |
| | | | |
Total Investments | | $ | — | | | $ | 122,377,371 | | | $ | 736,351 | | | $ | 123,113,722 | |
| * | None of the unobservable inputs for Level 3 assets, individually or collectively, had a material impact on the New York Trust. |
Level 3 investments held by the New York Trust at the beginning and/or end of the period in relation to net assets were not significant and accordingly, a reconciliation of Level 3 assets for the six months ended May 31, 2019 is not presented.
Eaton Vance
Municipal Income Trusts
May 31, 2019
Annual Meeting of Shareholders (Unaudited)
Each Trust held its Annual Meeting of Shareholders on April 18, 2019. The following action was taken by the shareholders:
Item 1. The election of Thomas E. Faust Jr., Mark R. Fetting and Scott E. Wennerholm as Class II Trustees of the Trust for a three-year term expiring in 2022.
| | | | | | | | | | | | |
| Trust | | Nominee for Class II Trustee: Thomas E. Faust Jr. | | | Nominee for Class II Trustee: Mark R. Fetting | | | Nominee for Class II Trustee: Scott E. Wennerholm | |
| | | |
California Trust | | | | | | | | | | | | |
| | | |
For | | | 5,551,781 | | | | 5,584,456 | | | | 5,342,121 | |
| | | |
Withheld | | | 1,122,305 | | | | 1,089,630 | | | | 1,331,965 | |
| | | |
New York Trust | | | | | | | | | | | | |
| | | |
For | | | 4,615,497 | | | | 4,615,497 | | | | 4,605,093 | |
| | | |
Withheld | | | 563,102 | | | | 563,102 | | | | 573,506 | |
Eaton Vance
Municipal Income Trusts
May 31, 2019
Board of Trustees’ Contract Approval
Overview of the Contract Review Process
The Investment Company Act of 1940, as amended (the “1940 Act”), provides, in substance, that the investment advisory agreement between a fund and its investment adviser will continue in effect fromyear-to-year only if its continuation is approved on an annual basis by a vote of the fund’s board of trustees, including a majority of the trustees who are not “interested persons” of the fund (“independent trustees”), cast in person at a meeting called for the purpose of considering such approval.
At a meeting held on April 24, 2019, the Boards of Trustees/Directors (collectively, the “Board”) of the registered investment companies advised by Eaton Vance Management or its affiliate, Boston Management and Research (the “Eaton Vance Funds”), including a majority of the independent trustees (the “Independent Trustees”), voted to approve the continuation of existing investment advisory andsub-advisory agreements for each of the Eaton Vance Funds for an additionalone-year period. In voting its approval, the Board relied upon the affirmative recommendation of its Contract Review Committee, which is a committee exclusively comprised of Independent Trustees. Prior to making its recommendation, the Contract Review Committee reviewed information furnished by the adviser andsub-adviser (where applicable) to each of the Eaton Vance Funds (including information specifically requested by the Board) for a series of meetings held between February and April 2019. Members of the Contract Review Committee also considered information received at prior meetings of the Board and its committees, to the extent such information was relevant to the Contract Review Committee’s annual evaluation of the investment advisory andsub-advisory agreements.
Among other things, the information the Board considered included the following (for funds that invest through one or more underlying portfolios, references to “each fund” in this section may include information that was considered at the portfolio-level):
Information about Fees, Performance and Expenses
| • | | A report from an independent data provider comparing advisory and related fees paid by each fund to such fees paid by comparable funds, as identified by the independent data provider (“comparable funds”); |
| • | | A report from an independent data provider comparing each fund’s total expense ratio (and its components) to those of comparable funds; |
| • | | A report from an independent data provider comparing the investment performance of each fund (including, where relevant, yield data, Sharpe ratios and information ratios) to the investment performance of comparable funds over various time periods; |
| • | | Data regarding investment performance relative to benchmark indices and, in certain instances, to customized groups of peer funds and blended indices identified by the adviser in consultation with the Portfolio Management Committee of the Board; |
| • | | Comparative information concerning the fees charged and services provided by the adviser andsub-adviser (where applicable) to each fund in managing other accounts (including mutual funds, other collective investment funds and institutional accounts) using investment strategies and techniques similar to those used in managing such fund(s), if any; |
| • | | Profitability analyses with respect to the adviser andsub-adviser (where applicable) to each of the funds; |
Information about Portfolio Management and Trading
| • | | Descriptions of the investment management services provided to each fund, as well as each of the funds’ investment strategies and policies; |
| • | | The procedures and processes used to determine the fair value of fund assets, when necessary, and actions taken to monitor and test the effectiveness of such procedures and processes; |
| • | | Information about the policies and practices of each fund’s adviser andsub-adviser (where applicable and in the context of asub-adviser with trading responsibilities) with respect to trading, including their processes for seeking best execution of portfolio transactions; |
| • | | Information about the allocation of brokerage transactions and the benefits, if any, received by the adviser andsub-adviser (where applicable and in the context of asub-adviser with trading responsibilities) to each fund as a result of brokerage allocation, including information concerning the acquisition of research through client commission arrangements and policies with respect to “soft dollars”; |
| • | | Data relating to the portfolio turnover rate of each fund; |
Information about each Adviser andSub-adviser
| • | | Reports detailing the financial results and condition of the adviser andsub-adviser (where applicable) to each fund; |
| • | | Information regarding the individual investment professionals whose responsibilities include portfolio management and investment research for the funds, and, for portfolio managers and certain other investment professionals, information relating to their responsibilities with respect to managing other mutual funds and investment accounts, if applicable; |
| • | | The Code of Ethics of the adviser and its affiliates and thesub-adviser (where applicable) of each fund, together with information relating to compliance with, and the administration of, such codes; |
| • | | Policies and procedures relating to proxy voting and the handling of corporate actions and class actions; |
| • | | Information concerning the resources devoted to compliance efforts undertaken by the adviser and its affiliates and thesub-adviser (where applicable) of each fund, if any, including descriptions of their various compliance programs and their record of compliance; |
| • | | Information concerning the business continuity and disaster recovery plans of the adviser and its affiliates and thesub-adviser (where applicable) of each fund, if any; |
Eaton Vance
Municipal Income Trusts
May 31, 2019
Board of Trustees’ Contract Approval — continued
| • | | A description of Eaton Vance Management’s and Boston Management and Research’s oversight ofsub-advisers, including with respect to regulatory and compliance issues, investment management and other matters; |
Other Relevant Information
| • | | Information concerning the nature, cost and character of the administrative and othernon-investment advisory services provided by Eaton Vance Management and its affiliates; |
| • | | Information concerning management of the relationship with the custodian, subcustodians and fund accountants by the adviser or administrator to each of the funds; and |
| • | | The terms of each investment advisory agreement. |
During the various meetings of the Board and its committees throughout the twelve months ended April 2019, the Trustees received information from portfolio managers and other investment professionals of the advisers andsub-advisers (where applicable) of the funds regarding investment and performance matters, and considered various investment and trading strategies used in pursuing the funds’ investment objectives. The Trustees also received information regarding risk management techniques employed in connection with the management of the funds. The Board and its Committees evaluated issues pertaining to industry and regulatory developments, compliance procedures, fund governance and other issues with respect to the funds, and received and participated in reports and presentations provided by Eaton Vance Management, Boston Management and Research and fundsub-advisers (as applicable), with respect to such matters. In addition to the formal meetings of the Board and its committees, the Independent Trustees held regular teleconferences to discuss, among other topics, matters relating to the continuation of investment advisory andsub-advisory agreements.
The Contract Review Committee was advised throughout the contract review process by Goodwin Procter LLP, independent legal counsel for the Independent Trustees. The members of the Contract Review Committee, with the advice of such counsel, exercised their own business judgment in determining the material factors to be considered in evaluating each investment advisory andsub-advisory agreement and the weight to be given to each such factor. The conclusions reached with respect to each investment advisory andsub-advisory agreement were based on a comprehensive evaluation of all the information provided and not any single factor. Moreover, each member of the Contract Review Committee may have placed varying emphasis on particular factors in reaching conclusions with respect to each investment advisory andsub-advisory agreement. In evaluating each investment advisory andsub-advisory agreement, including the fee structures and other terms contained in such agreements, the members of the Contract Review Committee were also informed by multiple years of analysis and discussion with the adviser andsub-adviser (where applicable) to each of the Eaton Vance Funds.
Results of the Process
Based on its consideration of the foregoing, and such other information as it deemed relevant, including the factors and conclusions described below, the Contract Review Committee concluded that the continuation of the investment advisory agreements between each of Eaton Vance California Municipal Income Trust and Eaton Vance New York Municipal Income Trust (together, the “Funds”) and Eaton Vance Management (the “Adviser”), including their respective fee structures, are in the interests of shareholders and, therefore, recommended to the Board approval of each agreement. Based on the recommendation of the Contract Review Committee, the Board, including a majority of the Independent Trustees, voted to approve continuation of the investment advisory agreement for each Fund.
Nature, Extent and Quality of Services
In considering whether to approve the investment advisory agreements for the Funds, the Board evaluated the nature, extent and quality of services provided to the Funds by the Adviser.
The Board considered the Adviser’s management capabilities and investment processes in light of the types of investments held by each Fund, including the education, experience and number of investment professionals and other personnel who provide portfolio management, investment research, and similar services to the Funds. In particular, the Board considered the abilities and experience of the Adviser’s investment professionals in analyzing factors such as credit risk, tax efficiency, and special considerations relevant to investing in municipal bonds. The Board considered the Adviser’s municipal bond team, which includes portfolio managers and credit specialists who provide services to the Funds. The Board also took into account the resources dedicated to portfolio management and other services, the compensation methods of the Adviser and other factors, including the reputation and resources of the Adviser to recruit and retain highly qualified research, advisory and supervisory investment professionals. In addition, the Board considered the time and attention devoted to the Eaton Vance Funds, including each Fund, by senior management, as well as the infrastructure, operational capabilities and support staff in place to assist in the portfolio management and operations of the Funds, including the provision of administrative services. The Board also considered the business-related and other risks to which the Adviser or its affiliates may be subject in managing each Fund.
The Board considered the compliance programs of the Adviser and relevant affiliates thereof. The Board considered compliance and reporting matters regarding, among other things, personal trading by investment professionals, disclosure of portfolio holdings, late trading, frequent trading, portfolio valuation, business continuity and the allocation of investment opportunities. The Board also considered the responses of the Adviser and its affiliates to requests in recent years from regulatory authorities, such as the Securities and Exchange Commission and the Financial Industry Regulatory Authority.
Eaton Vance
Municipal Income Trusts
May 31, 2019
Board of Trustees’ Contract Approval — continued
The Board considered shareholder and other administrative services provided or managed by Eaton Vance Management and its affiliates, including transfer agency and accounting services. The Board evaluated the benefits to shareholders of investing in a fund that is a part of a large fund complex offering exposure to a variety of asset classes and investment disciplines.
After consideration of the foregoing factors, among others, the Board concluded that the nature, extent and quality of services provided by the Adviser, taken as a whole, are appropriate and consistent with the terms of the investment advisory agreements.
Fund Performance
The Board compared each Fund’s investment performance to that of comparable funds and appropriate benchmark indices and assessed each Fund’s performance on the basis of total return and current income return. The Board’s review included comparative performance data with respect to each Fund for theone-, three-, five- andten-year periods ended September 30, 2018. In this regard, the Board noted that the performance of each Fund was lower than the median performance of such Fund’s peer group for the three-year period. The Board also noted that the performance of the Eaton Vance New York Municipal Income Trust was higher than its benchmark index for the three-year period, and that the performance of the Eaton Vance California Municipal Income Trust was lower than its benchmark index for the three-year period. The Board considered, among other things, the Adviser’s efforts to generate competitive levels oftax-exempt current income over time through investments that focus on higher quality municipal bonds that often have longer maturities. On the basis of the foregoing, the performance of each Fund over other periods and other relevant information provided by the Adviser in response to inquiries from the Contract Review Committee, the Board concluded that the performance of each Fund was satisfactory.
Management Fees and Expenses
The Board considered contractual fee rates payable by each Fund for advisory and administrative services (referred to collectively as “management fees”). As part of its review, the Board considered each Fund’s management fees and total expense ratio for theone-year period ended September 30, 2018, as compared to those of comparable funds, before and after giving effect to any undertaking to waive fees or reimburse expenses. The Board also considered certain Fund specific factors that had an impact on each Fund’s total expense ratio relative to comparable funds, as identified by management in response to inquiries from the Contract Review Committee. Additionally, the Board took into account the financial resources committed by the Adviser in structuring each Fund at the time of its initial public offering and the waiver of fees provided by the Adviser for the first five years of each Fund’s life. The Board also considered that, following discussions with the Contract Review Committee, the Adviser had implemented a series of permanent reductions in management fees beginning in May 2010, which had been fully implemented as of September 30, 2018.
After considering the foregoing information, and in light of the nature, extent and quality of the services provided by the Adviser, the Board concluded that the management fees charged for advisoryand related services are reasonable.
Profitability and“Fall-Out” Benefits
The Board considered the level of profits realized by the Adviser and relevant affiliates thereof in providing investment advisory and administrative services to each Fund and to all Eaton Vance Funds as a group. The Board considered the level of profits realized without regard to marketing support or other payments by the Adviser and its affiliates to third parties in respect of distribution services.
The Board concluded that, in light of the foregoing factors and the nature, extent and quality of the services rendered, the profits realized by the Adviser and its affiliates are deemed not to be excessive.
The Board also considered direct or indirectfall-out benefits received by the Adviser and its affiliates in connection with their respective relationships with the Funds, including the benefits of research services that may be available to the Adviser as a result of securities transactions effected for the Funds and other investment advisory clients.
Economies of Scale
In reviewing management fees and profitability, the Board also considered the extent to which the Adviser and its affiliates, on the one hand, and each Fund, on the other hand, can expect to realize benefits from economies of scale as the assets of each Fund increase. The Board acknowledged the difficulty in accurately measuring the benefits resulting from economies of scale, if any, with respect to the management of any specific fund or group of funds. The Board reviewed data summarizing the increases and decreases in the assets of each Fund and of all Eaton Vance Funds as a group over various time periods, and evaluated the extent to which the total expense ratio of each Fund and the profitability of the Adviser and its affiliates may have been affected by such increases or decreases. Based upon the foregoing, the Board concluded that each Fund currently shares in the benefits from economies of scale, if any, when they are realized by the Adviser. The Board also considered the fact that the Funds are not continuously offered and that the Funds’ assets are not expected to increase materially in the foreseeable future. Accordingly, the Board concluded that the implementation of breakpoints in the advisory fee schedules is not warranted at this time.
Eaton Vance
Municipal Income Trusts
May 31, 2019
Officers and Trustees
Officers
Payson F. Swaffield
President
Maureen A. Gemma
Vice President, Secretary and
Chief Legal Officer
James F. Kirchner
Treasurer
Richard F. Froio
Chief Compliance Officer
Trustees
William H. Park
Chairperson
Thomas E. Faust Jr.*
Mark R. Fetting
Cynthia E. Frost
George J. Gorman
Valerie A. Mosley
Helen Frame Peters
Keith Quinton(1)
Marcus L. Smith(1)
Susan J. Sutherland
Scott E. Wennerholm
| (1) | Messrs. Quinton and Smith began serving as Trustees effective October 1, 2018. |
Eaton Vance Funds
IMPORTANT NOTICES
Privacy. The Eaton Vance organization is committed to ensuring your financial privacy. Each of the financial institutions identified below has in effect the following policy (“Privacy Policy”) with respect to nonpublic personal information about its customers:
| • | | Only such information received from you, through application forms or otherwise, and information about your Eaton Vance fund transactions will be collected. This may include information such as name, address, social security number, tax status, account balances and transactions. |
| • | | None of such information about you (or former customers) will be disclosed to anyone, except as permitted by law (which includes disclosure to employees necessary to service your account). In the normal course of servicing a customer’s account, Eaton Vance may share information with unaffiliated third parties that perform various required services such as transfer agents, custodians and broker-dealers. |
| • | | Policies and procedures (including physical, electronic and procedural safeguards) are in place that are designed to protect the confidentiality of such information. |
| • | | We reserve the right to change our Privacy Policy at any time upon proper notification to you. Customers may want to review our Privacy Policy periodically for changes by accessing the link on our homepage: www.eatonvance.com. |
Our pledge of privacy applies to the following entities within the Eaton Vance organization: the Eaton Vance Family of Funds, Eaton Vance Management, Eaton Vance Investment Counsel, Eaton Vance Distributors, Inc., Eaton Vance Trust Company, Eaton Vance Management (International) Limited, Eaton Vance Advisers International Ltd., Eaton Vance Management’s Real Estate Investment Group and Boston Management and Research. In addition, our Privacy Policy applies only to those Eaton Vance customers who are individuals and who have a direct relationship with us. If a customer’s account (i.e., fund shares) is held in the name of a third-party financial advisor/broker-dealer, it is likely that only such advisor’s privacy policies apply to the customer. This notice supersedes all previously issued privacy disclosures. For more information about Eaton Vance’s Privacy Policy, please call1-800-262-1122.
Delivery of Shareholder Documents. The Securities and Exchange Commission (SEC) permits funds to deliver only one copy of shareholder documents, including prospectuses, proxy statements and shareholder reports, to fund investors with multiple accounts at the same residential or post office box address. This practice is often called “householding” and it helps eliminate duplicate mailings to shareholders. American Stock Transfer & Trust Company, LLC (“AST”), theclosed-end funds transfer agent, or your financial advisor, may household the mailing of your documents indefinitely unless you instruct AST, or your financial advisor, otherwise. If you would prefer that your Eaton Vance documents not be householded, please contact AST or your financial advisor. Your instructions that householding not apply to delivery of your Eaton Vance documents will typically be effective within 30 days of receipt by AST or your financial advisor.
Portfolio Holdings. Each Eaton Vance Fund and its underlying Portfolio(s) (if applicable) files a schedule of portfolio holdings on Part F toForm N-PORT with the SEC for the first and third quarters of each fiscal year. The FormN-PORT will be available on the Eaton Vance website at www.eatonvance.com, by calling Eaton Vance at1-800-262-1122 or in the EDGAR database on the SEC’s website at www.sec.gov.
Proxy Voting. From time to time, funds are required to vote proxies related to the securities held by the funds. The Eaton Vance Funds or their underlying Portfolios (if applicable) vote proxies according to a set of policies and procedures approved by the Funds’ and Portfolios’ Boards. You may obtain a description of these policies and procedures and information on how the Funds or Portfolios voted proxies relating to portfolio securities during the most recent12-month period ended June 30, without charge, upon request, by calling1-800-262-1122 and by accessing the SEC’s website at www.sec.gov.
Share Repurchase Program. The Funds’ Boards of Trustees have approved a share repurchase program authorizing each Fund to repurchase up to 10% of its common shares outstanding as of the last day of the prior calendar year in open-market transactions at a discount to net asset value. The repurchase program does not obligate a Fund to purchase a specific amount of shares. The Funds’ repurchase activity, including the number of shares purchased, average price and average discount to net asset value, is disclosed in the Funds’ annual and semi-annual reports to shareholders.
Additional Notice to Shareholders. If applicable, a Fund may also redeem or purchase its outstanding preferred shares in order to maintain compliance with regulatory requirements, borrowing or rating agency requirements or for other purposes as it deems appropriate or necessary.
Closed-End Fund Information. Eaton Vanceclosed-end funds make fund performance data and certain information about portfolio characteristics available on the Eaton Vance website shortly after the end of each month. Other information about the funds is available on the website. The funds’ net asset value per share is readily accessible on the Eaton Vance website. Portfolio holdings for the most recentmonth-end are also posted to the website approximately 30 days following the end of the month. This information is available at www.eatonvance.com on the fund information pages under “Individual Investors —Closed-End Funds”.
This Page Intentionally Left Blank
This Page Intentionally Left Blank
Investment Adviser and Administrator
Eaton Vance Management
Two International Place
Boston, MA 02110
Custodian
State Street Bank and Trust Company
State Street Financial Center, One Lincoln Street
Boston, MA 02111
Transfer Agent
American Stock Transfer & Trust Company, LLC
6201 15th Avenue
Brooklyn, NY 11219
Fund Offices
Two International Place
Boston, MA 02110

7694 5.31.19
Item 2. Code of Ethics
Not required in this filing.
Item 3. Audit Committee Financial Expert
Not required in this filing.
Item 4. Principal Accountant Fees and Services
Not required in this filing.
Item 5. Audit Committee of Listed Registrants
Not required in this filing.
Item 6. Schedule of Investments
Please see schedule of investments contained in the Report to Stockholders included under Item 1 of this FormN-CSR.
Item 7. Disclosure of Proxy Voting Policies and Procedures forClosed-End Management Investment Companies
Not required in this filing.
Item 8. Portfolio Managers ofClosed-End Management Investment Companies
Not required in this filing.
Item 9. Purchases of Equity Securities byClosed-End Management Investment Company and Affiliated Purchasers
No such purchases this period.
Item 10. Submission of Matters to a Vote of Security Holders
No material changes.
Item 11. Controls and Procedures
(a) It is the conclusion of the registrant’s principal executive officer and principal financial officer that the effectiveness of the registrant’s current disclosure controls and procedures (such disclosure controls and procedures having been evaluated within 90 days of the date of this filing) provide reasonable assurance that the information required to be disclosed by the registrant has been recorded, processed, summarized and reported within the time period specified in the Commission’s rules and forms and that the information required to be disclosed by the registrant has been accumulated and communicated to the registrant’s principal executive officer and principal financial officer in order to allow timely decisions regarding required disclosure.
(b) There have been no changes in the registrant’s internal controls over financial reporting during the second fiscal quarter of the period covered by this report that has materially affected, or is reasonably likely to materially affect, the registrant’s internal control over financial reporting.
Item 12. Disclosure of Securities Lending Activities forClosed-End Management Investment Companies
No activity to report for the registrant’s most recent fiscal year end.
Item 13. Exhibits
| | |
| |
| (a)(1) | | Registrant’s Code of Ethics – Not applicable (please see Item 2). |
| |
| (a)(2)(i) | | Treasurer’s Section 302 certification. |
| |
| (a)(2)(ii) | | President’s Section 302 certification. |
| |
| (b) | | Combined Section 906 certification. |
Signatures
Pursuant to the requirements of the Securities Exchange Act of 1934 and the Investment Company Act of 1940, the registrant has duly caused this report to be signed on its behalf by the undersigned, thereunto duly authorized.
Eaton Vance California Municipal Income Trust
| | |
| By: | | /s/ Payson F. Swaffield |
| | Payson F. Swaffield |
| | President |
| |
| Date: | | July 24, 2019 |
Pursuant to the requirements of the Securities Exchange Act of 1934 and the Investment Company Act of 1940, this report has been signed below by the following persons on behalf of the registrant and in the capacities and on the dates indicated.
| | |
| By: | | /s/ James F. Kirchner |
| | James F. Kirchner |
| | Treasurer |
| |
| Date: | | July 24, 2019 |
| |
| By: | | /s/ Payson F. Swaffield |
| | Payson F. Swaffield |
| | President |
| |
| Date: | | July 24, 2019 |