UNITED STATES
SECURITIES AND EXCHANGE COMMISSION
Washington, D.C. 20549
FORM N-CSR
CERTIFIED SHAREHOLDER REPORT OF REGISTERED
MANAGEMENT INVESTMENT COMPANIES
| Investment Company Act file number: 811-09195 |
| | | |
| |
| SA FUNDS – INVESTMENT TRUST |
| |
| (Exact name of registrant as specified in charter) |
| |
| 3055 Olin Avenue, Suite 2000, San Jose, California 95128 |
| |
| (Address of principal executive offices) (zip code) |
Christopher D. Stanley, Esq.
Chief Legal Officer
SA Funds – Investment Trust
3055 Olin Avenue, Suite 2000
San Jose, California 95128
(Name and address of agent for service)
Copy to:
R. Darrell Mounts, Esq.
K&L Gates LLP
1601 K Street, N.W.
Washington, DC 20006
Brian F. Link, Esq.
State Street Bank and Trust Company
Mail Code: JHT 1732
200 Clarendon Street
Boston, MA 02116
Registrant’s telephone number, including area code: 408-260-3100
Date of fiscal year end: June 30
Date of reporting period: December 31, 2011
Item 1. Report to Shareholders.
SEMI-ANNUAL REPORT
December 31, 2011 |
|
 |
TABLE OF CONTENTS
| | Page |
| Portfolios of Investments | | |
| SA U.S. Fixed Income Fund | | 1 |
| SA Global Fixed Income Fund | | 3 |
| SA U.S. Core Market Fund | | 6 |
| SA U.S. Value Fund | | 10 |
| SA U.S. Small Company Fund | | 13 |
| SA International Value Fund | | 17 |
| SA International Small Company Fund | | 19 |
| SA Emerging Markets Value Fund | | 20 |
| SA Real Estate Securities Fund | | 22 |
| Statements of Assets and Liabilities | | 24 |
| Statements of Operations | | 26 |
| Statements of Changes in Net Assets | | 28 |
| Financial Highlights | | 34 |
| Notes to Financial Statements | | 43 |
| Proxy Voting Policies and Procedures | | 55 |
| Quarterly Portfolio Schedule | | 55 |
| Semi-Annual Portfolio Schedule | | 55 |
| Trustees and Officers’ Information | | 55 |
| Understanding Your Fund’s Expenses | | 58 |
| Selected Financial Statements of DFA Investment Dimensions Group Inc. | | |
| & The DFA Investment Trust Company | | 62 |
SA U.S. Fixed Income Fund
PORTFOLIO OF INVESTMENTS –– AS OF DECEMBER 31, 2011 (Unaudited)
| FACE | | | | |
| AMOUNT | | VALUE† | |
| BONDS AND NOTES — 92.9% | | | | | | | |
| Australia — 1.9% | | | | | | | | |
| Westpac Banking Corp., | | | | | | | | |
| 2.100%, 8/02/13 | USD | | $ | 2,650,000 | | $ | 2,676,927 | |
| Westpac Banking Corp., | | | | | | | | |
| 2.250%, 11/19/12 | USD | | | 3,900,000 | | | 3,939,620 | |
| | | | | | | 6,616,547 | |
| Canada — 3.6% | | | | | | | | |
| Bank of Nova Scotia, | | | | | | | | |
| 2.250%, 1/22/13 | USD | | | 3,700,000 | | | 3,751,533 | |
| Ontario Electricity Financial Corp., | | | | | | | | |
| 7.450%, 3/31/13 | USD | | | 4,461,000 | | | 4,814,985 | |
| Province of Ontario Canada, | | | | | | | | |
| 4.375%, 2/15/13 | USD | | | 1,000,000 | | | 1,040,342 | |
| Royal Bank of Canada MTN, | | | | | | | | |
| 2.100%, 7/29/13 | USD | | | 3,000,000 | | | 3,046,731 | |
| | | | | | | 12,653,591 | |
| France — 1.0% | | | | | | | | |
| BNP Paribas / BNP Paribas US | | | | | | | | |
| MTN, 2.125%, 12/21/12 | USD | | | 3,400,000 | | | 3,312,997 | |
| | |
| Germany — 1.0% | | | | | | | | |
| Kreditanstalt fuer Wiederaufbau, | | | | | | | | |
| 1.875%, 1/14/13 | USD | | | 1,500,000 | | | 1,518,872 | |
| Landwirtschaftliche Rentenbank, | | | | | | | | |
| 3.250%, 3/15/13 | USD | | | 2,000,000 | | | 2,056,066 | |
| | | | | | | 3,574,938 | |
| Norway — 0.8% | | | | | | | | |
| Eksportfinans ASA, 1.875%, | | | | | | | | |
| 4/02/13 | USD | | | 3,000,000 | | | 2,829,357 | |
| | |
| Supranational — 1.5% | | | | | | | | |
| European Investment Bank, | | | | | | | | |
| 3.375%, 6/12/13 | USD | | | 5,000,000 | | | 5,156,395 | |
| | |
| United States — 83.1% | | | | | | | | |
| 3M Co. MTN, 4.375%, 8/15/13 | | | | 1,000,000 | | | 1,063,395 | |
| Bank of New York Mellon Corp. | | | | | | | | |
| (The), 5.125%, 8/27/13 | | | | 2,194,000 | | | 2,335,272 | |
| Bank of New York Mellon Corp. | | | | | | | | |
| (The) MTN, 4.500%, 4/01/13 | | | | 7,000,000 | | | 7,303,611 | |
| Berkshire Hathaway Finance Corp., | | | | | | | | |
| 5.000%, 8/15/13 | | | | 3,000,000 | | | 3,195,804 | |
| Berkshire Hathaway, Inc., 0.883%, | | | | | | | | |
| 2/11/13(a) | | | | 6,114,000 | | | 6,136,762 | |
| Berkshire Hathaway, Inc., 2.125%, | | | | | | | | |
| 2/11/13 | | | | 400,000 | | | 406,889 | |
| Federal Farm Credit Bank, 0.850%, | | | | | | | | |
| 4/15/13 | | | | 10,800,000 | | | 10,877,166 | |
| Federal Home Loan Banks, | | | | | | | | |
| 0.500%, 8/28/13 | | | | 8,500,000 | | | 8,519,006 | |
| Federal Home Loan Banks, | | | | | | | | |
| 1.000%, 3/27/13 | | | | 1,000,000 | | | 1,008,756 | |
| Federal Home Loan Banks, | | | | | | | | |
| 1.625%, 3/20/13 | | | | 250,000 | | | 254,057 | |
| Federal Home Loan Banks, | | | | | | | | |
| 1.625%, 6/14/13 | | | | 500,000 | | | 509,361 | |
| Federal Home Loan Banks, | | | | | | | | |
| 3.625%, 5/29/13 | | | | 9,300,000 | | | 9,730,776 | |
| Federal Home Loan Banks, | | | | | | | | |
| 5.125%, 8/14/13 | | | | 1,600,000 | | | 1,723,726 | |
| Federal Home Loan Mortgage | | | | | | | | |
| Corp., 0.375%, 10/30/13 | | | | 18,200,000 | | | 18,185,586 | |
| Federal Home Loan Mortgage | | | | | | | | |
| Corp., 0.375%, 11/27/13 | | | | 6,700,000 | | | 6,692,342 | |
| Federal Home Loan Mortgage | | | | | | | | |
| Corp., 0.500%, 10/15/13 | | | | 6,000,000 | | | 5,993,664 | |
| Federal Home Loan Mortgage | | | | | | | | |
| Corp., 0.750%, 3/28/13 | | | | 27,700,000 | | | 27,862,904 | |
| Federal Home Loan Mortgage | | | | | | | | |
| Corp., 1.625%, 4/15/13 | | | | 29,800,000 | | | 30,310,414 | |
| Federal Home Loan Mortgage | | | | | | | | |
| Corp., 3.500%, 5/29/13 | | | | 2,500,000 | | | 2,612,097 | |
| Federal Home Loan Mortgage | | | | | | | | |
| Corp., 3.750%, 6/28/13 | | | | 2,500,000 | | | 2,629,192 | |
| Federal Home Loan Mortgage | | | | | | | | |
| Corp., 4.125%, 9/27/13 | | | | 2,500,000 | | | 2,661,645 | |
| Federal Home Loan Mortgage | | | | | | | | |
| Corp., 4.500%, 7/15/13 | | | | 1,000,000 | | | 1,063,978 | |
| Federal National Mortgage | | | | | | | | |
| Association, 0.750%, 2/26/13 | | | | 23,050,000 | | | 23,185,327 | |
| Federal National Mortgage | | | | | | | | |
| Association, 0.750%, 12/18/13 | | | | 8,500,000 | | | 8,536,592 | |
| Federal National Mortgage | | | | | | | | |
| Association, 1.750%, 5/07/13 | | | | 9,900,000 | | | 10,089,021 | |
| Federal National Mortgage | | | | | | | | |
| Association, 2.875%, 12/11/13 | | | | 11,400,000 | | | 11,952,341 | |
| Federal National Mortgage | | | | | | | | |
| Association, 3.250%, 4/09/13 | | | | 11,400,000 | | | 11,841,077 | |
| Federal National Mortgage | | | | | | | | |
| Association, 3.875%, 7/12/13 | | | | 1,500,000 | | | 1,582,436 | |
| Federal National Mortgage | | | | | | | | |
| Association, 4.375%, 3/15/13 | | | | 5,900,000 | | | 6,190,935 | |
| General Electric Capital Corp., | | | | | | | | |
| 2.800%, 1/08/13 | | | | 1,900,000 | | | 1,936,585 | |
| General Electric Capital Corp., | | | | | | | | |
| 4.800%, 5/01/13 | | | | 2,500,000 | | | 2,618,050 | |
| General Electric Capital Corp., | | | | | | | | |
| 5.450%, 1/15/13 | | | | 1,713,000 | | | 1,792,701 | |
| General Electric Capital Corp. | | | | | | | | |
| MTN, Series A, | | | | | | | | |
| 5.400%, 9/20/13 | | | | 1,400,000 | | | 1,493,932 | |
| General Electric Capital Corp., | | | | | | | | |
| Series A, 0.410%, 3/20/13(a) | | | | 300,000 | | | 297,936 | |
| General Electric Co., | | | | | | | | |
| 5.000%, 2/01/13 | | | | 1,500,000 | | | 1,563,555 | |
| International Business Machines | | | | | | | | |
| Corp. (IBM), 2.100%, 5/06/13 | | | | 1,000,000 | | | 1,020,970 | |
| Johnson & Johnson, | | | | | | | | |
| 0.700%, 5/15/13 | | | | 4,000,000 | | | 4,025,804 | |
| JPMorgan Chase & Co., | | | | | | | | |
| 4.750%, 5/01/13 | | | | 1,200,000 | | | 1,254,904 | |
| JPMorgan Chase & Co. MTN, | | | | | | | | |
| 1.650%, 9/30/13 | | | | 8,750,000 | | | 8,816,596 | |
See notes to financial statements.
1
SA U.S. Fixed Income Fund
PORTFOLIO OF INVESTMENTS –– AS OF DECEMBER 31, 2011 (Unaudited) (Continued)
| FACE | | | | |
| AMOUNT | | VALUE† | |
| BONDS AND NOTES (Continued) | | | | |
| United States (Continued) | | | | | | |
| PepsiCo, Inc., | | | | | | |
| 0.524%, 5/10/13(a) | $ | 6,305,000 | | $ | 6,314,306 | |
| Private Export Funding Corp., | | | | | | |
| Series Y, 3.550%, 4/15/13 | | 3,055,000 | | | 3,178,947 | |
| Toyota Motor Credit Corp. MTN, | | | | | | |
| 1.900%, 12/05/12 | | 5,400,000 | | | 5,473,289 | |
| US Bancorp, 2.000%, 6/14/13 | | 5,232,000 | | | 5,319,249 | |
| Wal-Mart Stores, Inc., | | | | | | |
| 4.250%, 4/15/13 | | 2,353,000 | | | 2,468,085 | |
| Wal-Mart Stores, Inc., | | | | | | |
| 4.550%, 5/01/13 | | 7,000,000 | | | 7,390,586 | |
| Wells Fargo & Co., | | | | | | |
| 4.375%, 1/31/13 | | 3,100,000 | | | 3,204,699 | |
| Wells Fargo & Co., | | | | | | |
| 5.250%, 10/23/12 | | 6,069,000 | | | 6,283,133 | |
| | | | | 288,907,459 | |
| TOTAL BONDS AND NOTES | | | | | | |
| (Identified Cost $322,533,194) | | | | | 323,051,284 | |
| | |
| SHORT-TERM INVESTMENTS — 6.4% | | | | |
| Canada — 2.6% | | | | | | |
| Bank of Nova Scotia YCD, | | | | | | |
| 0.750%, 10/15/12 | | 5,000,000 | | | 5,014,550 | |
| Royal Bank of Canada MTN YCD, | | | | | | |
| 2.250%, 3/15/13 | | 4,000,000 | | | 4,056,896 | |
| | | | | 9,071,446 | |
| Finland — 2.6% | | | | | | |
| Nordea Bank YCD, | | | | | | |
| 1.023%, 4/05/13(a) | | 9,000,000 | | | 8,937,540 | |
| | |
| United States — 0.5% | | | | | | |
| EDF S.A. | | 1,600,000 | | | 1,599,340 | |
| | | | | 19,608,326 | |
| | |
| SHARES | | VALUE† | |
| United States — 0.7% | | | | | | |
| SSgA Government Money | | | | | | |
| Market Fund | | 1 | | | 1 | |
| SSgA Money Market Fund | | 2,478,472 | | | 2,478,472 | |
| | | | | 2,478,473 | |
| TOTAL SHORT-TERM INVESTMENTS | | | | | | |
| (Identified Cost $22,122,639) | | | | | 22,086,799 | |
| | |
| Total Investments — 99.3% | | | | | | |
| (Identified Cost $344,655,833)# | | | | | 345,138,083 | |
| Cash and Other Assets, Less | | | | | | |
| Liabilities — 0.7% | | | | | 2,547,512 | |
| Net Assets — 100.0% | | | | $ | 347,685,595 | |
| | | | | | |
| | † | | See Note 1. |
| | (a) | | Variable or Floating Rate Bond. Rate disclosed is as of December 31, 2011. |
| | # | | At December 31, 2011 the aggregate cost of investment securities for U.S. federal income tax purposes was $344,655,833. Net unrealized appreciation aggregated $482,250 of which $1,001,276 related to appreciated investment securities and $519,026 related to depreciated investment securities. |
Key to abbreviations:
MTN — Medium Term Note
USD — U.S. Dollar
YCD — Yankee Certificate of Deposits
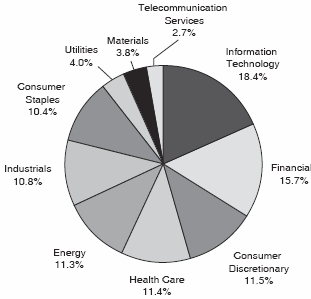
Portfolio Sectors
(% of portfolio market value)

See notes to financial statements.
2
SA Global Fixed Income Fund
PORTFOLIO OF INVESTMENTS — AS OF DECEMBER 31, 2011 (Unaudited)
| FACE | | | | |
| AMOUNT | | VALUE† | |
| BONDS AND NOTES — 97.9% | | | | | | |
| Australia — 5.8% | | | | | | | |
| Australia & New Zealand Banking | | | | | | | |
| Group, 4.375%, 5/24/12 | EUR | | 3,500,000 | | $ | 4,579,148 | |
| Suncorp-Metway Ltd., | | | | | | | |
| 4.000%, 1/16/14 | GBP | | 7,000,000 | | | 11,535,305 | |
| Westpac Banking Corp., | | | | | | | |
| 2.900%, 9/10/14 | USD | | 5,000,000 | | | 5,228,205 | |
| Westpac Banking Corp., | | | | | | | |
| 3.000%, 8/04/15(a) | USD | | 2,000,000 | | | 2,024,916 | |
| Westpac Banking Corp., | | | | | | | |
| 3.750%, 12/01/14 | CAD | | 6,000,000 | | | 5,991,755 | |
| Other Securities | | | 1,500,000 | | | 2,517,064 | |
| | | | | | 31,876,393 | |
| Austria — 2.0% | | | | | | | |
| Oesterreichische Kontrollbank | | | | | | | |
| AG, 1.750%, 10/05/15(a) | USD | | 3,000,000 | | | 2,987,736 | |
| Oesterreichische Kontrollbank | | | | | | | |
| AG, 2.000%, 6/03/16 | USD | | 8,000,000 | | | 7,982,136 | |
| | | | | | 10,969,872 | |
| Canada — 14.3% | | | | | | | |
| Bank of Nova Scotia, | | | | | | | |
| 3.400%, 1/22/15(a) | USD | | 5,000,000 | | | 5,255,690 | |
| Bank of Nova Scotia, | | | | | | | |
| 3.430%, 7/16/14 | CAD | | 2,000,000 | | | 2,042,739 | |
| Canada Housing Trust No 1, | | | | | | | |
| 2.750%, 12/15/14(b) | CAD | | 14,000,000 | | | 14,366,371 | |
| Province of Alberta Canada, | | | | | | | |
| 2.750%, 12/01/14 | CAD | | 13,800,000 | | | 14,136,889 | |
| Province of Ontario Canada, | | | | | | | |
| 4.100%, 6/16/14(a) | USD | | 9,800,000 | | | 10,536,627 | |
| Province of Ontario Canada, | | | | | | | |
| 5.125%, 11/21/12 | GBP | | 1,200,000 | | | 1,931,292 | |
| Royal Bank of Canada, | | | | | | | |
| 2.875%, 4/19/16(a) | USD | | 4,500,000 | | | 4,669,933 | |
| Royal Bank of Canada, | | | | | | | |
| 4.970%, 6/05/14 | CAD | | 6,000,000 | | | 6,339,121 | |
| Royal Bank of Canada, | | | | | | | |
| 5.060%, 7/17/13 | CAD | | 4,000,000 | | | 4,140,682 | |
| Toronto-Dominion Bank (The), | | | | | | | |
| 2.375%, 10/19/16(a) | USD | | 15,500,000 | | | 15,790,470 | |
| | | | | | 79,209,814 | |
| Finland — 1.5% | | | | | | | |
| Municipality Finance PLC, | | | | | | | |
| 2.375%, 5/16/16 | USD | | 4,000,000 | | | 4,129,592 | |
| Republic of Finland, | | | | | | | |
| 2.250%, 3/17/16 | USD | | 4,000,000 | | | 4,173,956 | |
| | | | | | 8,303,548 | |
| France — 11.3% | | | | | | | |
| Agence Francaise de | | | | | | | |
| Developpement, | | | | | | | |
| 4.875%, 10/30/13 | GBP | | 1,400,000 | | | 2,283,997 | |
| Agence Francaise de | | | | | | | |
| Developpement, | | | | | | | |
| 5.125%, 4/25/12 | EUR | | 7,670,000 | | | 10,061,926 | |
| Caisse d’Amortissement | | | | | | | |
| de la Dette Sociale, | | | | | | | |
| 2.250%, 12/07/15 | GBP | | 2,300,000 | | | 3,486,960 | |
| Caisse d’Amortissement | | | | | | | |
| de la Dette Sociale, | | | | | | | |
| 5.250%, 10/25/12 | EUR | | 7,250,000 | | | 9,694,889 | |
| Reseau Ferre de France, | | | | | | | |
| 2.375%, 12/23/15(a) | GBP | | 8,700,000 | | | 13,556,605 | |
| Societe Financement de | | | | | | | |
| l’Economie Francaise, | | | | | | | |
| 2.875%, 9/22/14 | USD | | 8,500,000 | | | 8,595,455 | |
| Total Capital SA, | | | | | | | |
| 5.500%, 1/29/13 | GBP | | 2,200,000 | | | 3,578,595 | |
| Total Capital SA, | | | | | | | |
| 5.625%, 1/25/12 | AUD | | 10,900,000 | | | 11,155,413 | |
| | | | | | 62,413,840 | |
| Germany — 8.8% | | | | | | | |
| Kreditanstalt fuer Wiederaufbau, | | | | | | | |
| 3.125%, 12/08/14 | GBP | | 1,000,000 | | | 1,635,630 | |
| Kreditanstalt fuer Wiederaufbau, | | | | | | | |
| 3.750%, 9/07/16 | GBP | | 2,600,000 | | | 4,395,492 | |
| Kreditanstalt fuer Wiederaufbau, | | | | | | | |
| 4.125%, 10/15/14(a) | USD | | 1,000,000 | | | 1,084,380 | |
| Kreditanstalt fuer Wiederaufbau, | | | | | | | |
| 4.625%, 10/12/12 | EUR | | 4,000,000 | | | 5,337,406 | |
| Kreditanstalt fuer Wiederaufbau, | | | | | | | |
| 5.500%, 12/07/15 | GBP | | 1,600,000 | | | 2,859,893 | |
| Landeskreditbank Baden- | | | | | | | |
| Wuerttemberg Foerderbank, | | | | | | | |
| 1.000%, 10/15/13 | USD | | 2,400,000 | | | 2,398,385 | |
| Landeskreditbank Baden- | | | | | | | |
| Wuerttemberg Foerderbank, | | | | | | | |
| 2.250%, 7/15/16 | USD | | 13,200,000 | | | 13,389,460 | |
| Landwirtschaftliche Rentenbank, | | | | | | | |
| 2.500%, 2/15/16(a) | USD | | 2,800,000 | | | 2,928,411 | |
| Landwirtschaftliche Rentenbank, | | | | | | | |
| 3.125%, 7/15/15 | USD | | 1,000,000 | | | 1,062,028 | |
| Landwirtschaftliche Rentenbank, | | | | | | | |
| 3.875%, 3/14/12 | EUR | | 4,800,000 | | | 6,256,044 | |
| NRW. Bank, 2.625%, 12/07/12 | GBP | | 3,000,000 | | | 4,715,183 | |
| Other Securities | | | 2,000,000 | | | 2,609,465 | |
| | | | | | 48,671,777 | |
| Japan — 0.2% | | | | | | | |
| Other Securities | | | 1,000,000 | | | 1,097,349 | |
| | |
| Netherlands — 8.7% | | | | | | | |
| Bank Nederlandse Gemeenten | | | | | | | |
| NV, 2.625%, 12/10/13 | GBP | | 2,200,000 | | | 3,481,563 | |
| Bank Nederlandse Gemeenten | | | | | | | |
| NV, 2.750%, 7/01/15 | USD | | 9,000,000 | | | 9,239,247 | |
| Bank Nederlandse Gemeenten | | | | | | | |
| NV, 4.750%, 4/22/13(a) | GBP | | 1,400,000 | | | 2,266,919 | |
| Nederlandse Waterschapsbank | | | | | | | |
| NV, 2.000%, 9/09/15 | USD | | 2,400,000 | | | 2,393,347 | |
| Nederlandse Waterschapsbank | | | | | | | |
| NV, 2.375%, 6/04/15 | EUR | | 8,100,000 | | | 10,682,530 | |
See notes to financial statements.
3
SA Global Fixed Income Fund
PORTFOLIO OF INVESTMENTS — AS OF DECEMBER 31, 2011 (Unaudited) (Continued)
| FACE | | | | |
| AMOUNT | | VALUE† | |
| BONDS AND NOTES (Continued) | | | | |
| Netherlands (Continued) | | | | | | | |
| Nederlandse Waterschapsbank | | | | | | | |
| NV, 3.000%, 3/17/15 | USD | | 1,000,000 | | $ | 1,030,661 | |
| NIBC Bank NV, | | | | | | | |
| 3.500%, 4/07/14 | EUR | | 3,000,000 | | | 4,074,070 | |
| Rabobank Nederland NV, | | | | | | | |
| 4.000%, 9/10/15 | GBP | | 9,000,000 | | | 14,638,867 | |
| | | | | | 47,807,204 | |
| New Zealand — 1.0% | | | | | | | |
| ASB Finance Ltd., | | | | | | | |
| 3.250%, 12/09/13 | GBP | | 3,700,000 | | | 5,772,101 | |
| | |
| Norway — 4.9% | | | | | | | |
| Eksportfinans ASA, | | | | | | | |
| 2.375%, 5/25/16(a) | USD | | 11,000,000 | | | 8,918,239 | |
| Eksportfinans ASA, | | | | | | | |
| 5.500%, 5/25/16(a) | USD | | 3,000,000 | | | 2,768,814 | |
| Kommunalbanken AS, | | | | | | | |
| 2.250%, 12/30/13(a) | GBP | | 1,700,000 | | | 2,695,212 | |
| Kommunalbanken AS, | | | | | | | |
| 2.375%, 1/19/16 | USD | | 7,500,000 | | | 7,641,960 | |
| Kommunalbanken AS, | | | | | | | |
| 2.875%, 10/27/14 | USD | | 4,780,000 | | | 4,947,769 | |
| | | | | | 26,971,994 | |
| Supranational — 15.9% | | | | | | | |
| African Development Bank, | | | | | | | |
| 3.000%, 5/27/14 | USD | | 12,000,000 | | | 12,661,692 | |
| Council of Europe Development | | | | | | | |
| Bank, 5.000%, 1/29/14 | USD | | 1,500,000 | | | 1,621,257 | |
| Council of Europe Development | | | | | | | |
| Bank, 5.500%, 1/18/12 | AUD | | 2,000,000 | | | 2,045,999 | |
| Eurofima, 4.250%, 2/04/14 | USD | | 7,600,000 | | | 8,007,580 | |
| Eurofima, 6.125%, 10/14/14 | GBP | | 1,000,000 | | | 1,747,083 | |
| European Bank for | | | | | | | |
| Reconstruction & Development, | | | | | | | |
| 0.500%, 1/30/15 | EUR | | 5,634,000 | | | 7,012,392 | |
| European Investment Bank, | | | | | | | |
| 2.750%, 3/23/15 | USD | | 2,000,000 | | | 2,079,096 | |
| European Investment Bank, | | | | | | | |
| 2.875%, 1/15/15 | USD | | 1,300,000 | | | 1,354,241 | |
| European Investment Bank, | | | | | | | |
| 3.000%, 12/07/15 | GBP | | 500,000 | | | 804,334 | |
| European Investment Bank, | | | | | | | |
| 4.500%, 1/14/13 | GBP | | 3,400,000 | | | 5,463,207 | |
| European Investment Bank, | | | | | | | |
| 6.250%, 4/15/14 | GBP | | 2,600,000 | | | 4,446,393 | |
| International Bank for | | | | | | | |
| Reconstruction & Development, | | | | | | | |
| 0.500%, 9/11/12 | AUD | | 9,000,000 | | | 8,970,838 | |
| International Bank for | | | | | | | |
| Reconstruction & Development, | | | | | | | |
| 5.375%, 1/15/14(a) | GBP | | 700,000 | | | 1,186,963 | |
| International Finance Facility | | | | | | | |
| for Immunisation, | | | | | | | |
| 3.375%, 5/15/14 | GBP | | 8,800,000 | | | 14,428,234 | |
| Nordic Investment Bank, | | | | | | | |
| 2.500%, 7/15/15(a) | USD | | 1,000,000 | | | 1,054,153 | |
| Nordic Investment Bank, | | | | | | | |
| 2.625%, 10/06/14(a) | USD | | 2,000,000 | | | 2,099,996 | |
| Nordic Investment Bank, | | | | | | | |
| 3.000%, 4/08/14(a) | EUR | | 5,000,000 | | | 6,741,356 | |
| Nordic Investment Bank, | | | | | | | |
| 5.750%, 12/16/14 | GBP | | 1,040,000 | | | 1,841,311 | |
| Other Securities | | | 3,622,000 | | | 4,509,709 | |
| | | | | | 88,075,834 | |
| Sweden — 3.7% | | | | | | | |
| Nordea Bank AB, | | | | | | | |
| 3.875%, 12/15/15 | GBP | | 4,100,000 | | | 6,626,914 | |
| Svensk Exportkredit AB, | | | | | | | |
| 2.125%, 7/13/16 | USD | | 3,000,000 | | | 2,977,170 | |
| Svensk Exportkredit AB, | | | | | | | |
| 3.250%, 9/16/14 | USD | | 10,400,000 | | | 10,751,780 | |
| | | | | | 20,355,864 | |
| United Kingdom — 2.9% | | | | | | | |
| United Kingdom Gilt, | | | | | | | |
| 2.250%, 3/07/14 | GBP | | 7,800,000 | | | 12,625,906 | |
| United Kingdom Gilt, | | | | | | | |
| 2.750%, 1/22/15 | GBP | | 1,000,000 | | | 1,660,949 | |
| Other Securities | | | 1,000,000 | | | 1,563,231 | |
| | | | | | 15,850,086 | |
| United States — 16.9% | | | | | | | |
| Bank of New York Mellon Corp. | | | | | | | |
| (The), 2.300%, 7/28/16 | USD | | 2,285,000 | | | 2,294,563 | |
| Bank of New York Mellon Corp. | | | | | | | |
| (The), 2.500%, 1/15/16 | USD | | 1,500,000 | | | 1,520,567 | |
| Bank of New York Mellon Corp. | | | | | | | |
| (The), 4.300%, 5/15/14(a) | USD | | 3,000,000 | | | 3,220,668 | |
| Bank of New York Mellon Corp. | | | | | | | |
| (The), 5.125%, 8/27/13 | USD | | 4,075,000 | | | 4,337,389 | |
| Berkshire Hathaway, Inc., | | | | | | | |
| 2.200%, 8/15/16(a) | USD | | 15,000,000 | | | 15,457,470 | |
| Federal National | | | | | | | |
| Mortgage Association, | | | | | | | |
| 2.500%, 5/15/14 | USD | | 2,700,000 | | | 2,819,572 | |
| General Electric Capital Corp., | | | | | | | |
| 1.875%, 9/16/13 | USD | | 4,000,000 | | | 4,050,960 | |
| General Electric Capital Corp., | | | | | | | |
| 2.250%, 11/09/15(a) | USD | | 10,520,000 | | | 10,576,734 | |
| Google, Inc., | | | | | | | |
| 2.125%, 5/19/16(a) | USD | | 14,454,000 | | | 15,045,356 | |
| Microsoft Corp., | | | | | | | |
| 2.950%, 6/01/14(a) | USD | | 6,500,000 | | | 6,908,811 | |
| Nestle Holdings, Inc., | | | | | | | |
| 2.125%, 3/12/14 | USD | | 6,000,000 | | | 6,197,514 | |
| Toyota Motor Credit Corp., | | | | | | | |
| 1.300%, 3/16/12 | JPY | | 700,000,000 | | | 9,103,656 | |
| Wal-Mart Stores, Inc., 2.250%, | | | | | | | |
| 7/08/15(a) | USD | | 1,000,000 | | | 1,043,974 | |
See notes to financial statements.
4
SA Global Fixed Income Fund
PORTFOLIO OF INVESTMENTS — AS OF DECEMBER 31, 2011 (Unaudited) (Continued)
| FACE | | | | |
| AMOUNT | | VALUE† | |
| BONDS AND NOTES (Continued) | | | | | |
| United States (Continued) | | | | | | | |
| Wal-Mart Stores, Inc., 2.800%, | | | | | | |
| 4/15/16(a) | USD | | 6,000,000 | | $ | 6,419,316 | |
| Wal-Mart Stores, Inc., 3.200%, | | | | | | |
| 5/15/14(a) | USD | | 2,000,000 | | | 2,113,400 | |
| Other Securities | | | 2,300,000 | | | 2,593,823 | |
| | | | | | 93,703,773 | |
| TOTAL BONDS AND NOTES | | | | | | |
| (Identified Cost $534,244,894) | | | | | 541,079,449 | |
| |
| SHARES | | VALUE† | |
| SHORT-TERM INVESTMENTS — 0.6% | | | | |
| United States — 0.6% | | | | | | | |
| SSgA Government Money | | | | | | | |
| Market Fund | | | 1 | | | 1 | |
| SSgA Money Market Fund | | | 3,542,181 | | | 3,542,181 | |
| | | | | | 3,542,182 | |
| TOTAL SHORT-TERM | | | | | | | |
| INVESTMENTS | | | | | | | |
| (Identified Cost $3,542,182) | | | | | 3,542,182 | |
| |
| COLLATERAL FOR SECURITIES ON LOAN — 15.6% | |
| Short-Term — 15.6% | | | | | | | |
| State Street Navigator Securities | | | | | | |
| Lending Prime Portfolio | | | 86,212,378 | | | 86,212,378 | |
| |
| TOTAL COLLATERAL FOR | | | | | | | |
| SECURITIES ON LOAN | | | | | | | |
| (Identified Cost $86,212,378) | | | | | 86,212,378 | |
| |
| Total Investments — 114.1% | | | | | | |
| (Identified Cost | | | | | | | |
| $623,999,454)# | | | | | | 630,834,009 | |
| Liabilities, Less Cash and Other | | | | | | |
| Assets — (14.1%) | | | | | | (77,815,475 | ) |
| |
| Net Assets — 100.0% | | | | | $ | 553,018,534 | |
| | | | | | | |
| | † | | See Note 1. |
| | (a) | | A portion or all of the security was held on loan. As of December 31, 2011, the market value of the securities on loan was $84,254,544. |
| | (b) | | 144A securities. Securities exempt from registration under Rule 144A of the Securities Act of 1933. These securities may be resold in transactions exempt from registration normally to qualified institutional buyers. |
| | # | | At December 31, 2011 the aggregate cost of investment securities for U.S. federal income tax purposes was $623,999,454. Net unrealized appreciation aggregated $6,834,555 of which $17,327,580 related to appreciated investment securities and $10,493,025 related to depreciated investment securities. |
Key to abbreviations:
AUD — Australian Dollar
CAD — Canadian Dollar
EUR — Euro Currency
GBP — British Pound
JPY — Japanese Yen
USD — U.S. Dollar
Ten Largest Industry Holdings as of December 31, 2011 (As a percentage of net assets):
| Industry | | Percentage | |
| Banks | 17.5 | % | |
| Supranational Organizations | 15.9 | % | |
| Financial | 10.6 | % | |
| Foreign Government/Agency-Germany | 8.8 | % | |
| Foreign Government/Agency-France | 8.6 | % | |
| Foreign Government/Agency-Canada | 7.4 | % | |
| Industrial | 6.8 | % | |
| Foreign Government/Agency-Netherlands | 6.0 | % | |
| Foreign Government/Agency-Norway | 4.9 | % | |
| Foreign Government/Agency-Austria | 4.1 | % | |
Country Weightings
(% of portfolio market value)

See notes to financial statements.
5
SA U.S. Core Market Fund
SUMMARY PORTFOLIO OF INVESTMENTS — AS OF DECEMBER 31, 2011 (Unaudited)
| SHARES | | VALUE† | |
| COMMON STOCKS — 95.6% | | | | | |
| Aerospace & Defense — 2.3% | | | | | |
| United Technologies Corp. | 24,568 | | $ | 1,795,675 | |
| Other Securities(a) | 122,087 | | | 7,301,958 | |
| | | | 9,097,633 | |
| Air Freight & Logistics — 0.7% | | | | | |
| Other Securities | 41,882 | | | 2,757,486 | |
| | | | 2,757,486 | |
| Airlines — 0.1% | | | | | |
| Other Securities(a) | 41,619 | | | 420,016 | |
| | | | 420,016 | |
| Auto Components — 0.4% | | | | | |
| Other Securities(a) | 48,728 | | | 1,517,248 | |
| | | | 1,517,248 | |
| Automobiles — 0.5% | | | | | |
| Other Securities(a) | 131,125 | | | 1,867,189 | |
| | | | 1,867,189 | |
| Beverages — 2.2% | | | | | |
| Coca-Cola Co. | 60,070 | | | 4,203,098 | |
| PepsiCo, Inc. | 44,450 | | | 2,949,257 | |
| Other Securities(a) | 34,296 | | | 1,426,246 | |
| | | | 8,578,601 | |
| Biotechnology — 1.5% | | | | | |
| Amgen, Inc. | 25,422 | | | 1,632,347 | |
| Other Securities(a) | 81,679 | | | 4,190,124 | |
| | | | 5,822,471 | |
| Building Products — 0.1% | | | | | |
| Other Securities(a) | 22,400 | | | 440,286 | |
| | | | 440,286 | |
| Capital Markets — 1.7% | | | | | |
| Other Securities(a) | 229,436 | | | 6,603,804 | |
| | | | 6,603,804 | |
| Chemicals — 2.3% | | | | | |
| Other Securities(a) | 174,423 | | | 8,806,028 | |
| | | | 8,806,028 | |
| Commercial Banks — 2.6% | | | | | |
| US Bancorp | 55,247 | | | 1,494,431 | |
| Wells Fargo & Co. | 144,516 | | | 3,982,861 | |
| Other Securities(a) | 280,721 | | | 4,736,177 | |
| | | | 10,213,469 | |
| Commercial Services & Supplies — 0.6% | | | | | |
| Other Securities(a) | 81,209 | | | 2,253,832 | |
| | | | 2,253,832 | |
| Communications Equipment — 2.0% | | | | | |
| Cisco Systems, Inc. | 156,421 | | | 2,828,092 | |
| QUALCOMM, Inc. | 47,120 | | | 2,577,464 | |
| Other Securities(a) | 92,861 | | | 2,246,164 | |
| | | | 7,651,720 | |
| Computers & Peripherals — 4.0% | | | | | |
| Apple, Inc.* | 26,957 | | | 10,917,585 | |
| Other Securities(a) | 209,600 | | | 4,751,585 | |
| | | | 15,669,170 | |
| Construction & Engineering — 0.2% | | | | | |
| Other Securities(a) | 30,403 | | | 939,346 | |
| | | | 939,346 | |
| Construction Materials — 0.1% | | | | | |
| Other Securities(a) | 4,491 | | | 219,993 | |
| | | | 219,993 | |
| Consumer Finance — 0.7% | | | | | |
| American Express Co. | 31,096 | | | 1,466,799 | |
| Other Securities(a) | 48,841 | | | 1,317,813 | |
| | | | 2,784,612 | |
| Containers & Packaging — 0.3% | | | | | |
| Other Securities(a) | 40,444 | | | 1,120,915 | |
| | | | 1,120,915 | |
| Distributors — 0.1% | | | | | |
| Other Securities | 9,505 | | | 423,018 | |
| | | | 423,018 | |
| Diversified Consumer Services — 0.2% | | | | | |
| Other Securities(a) | 31,269 | | | 857,397 | |
| | | | 857,397 | |
| Diversified Financial Services — 2.3% | | | | | |
| Bank of America Corp. | 284,250 | | | 1,580,430 | |
| Citigroup, Inc. | 81,861 | | | 2,153,763 | |
| JPMorgan Chase & Co. | 114,465 | | | 3,805,961 | |
| Other Securities(a) | 34,291 | | | 1,517,146 | |
| | | | 9,057,300 | |
| Diversified Telecommunication Services — 2.4% | | | | |
| AT&T, Inc. | 165,743 | | | 5,012,068 | |
| Verizon Communications, Inc. | 82,614 | | | 3,314,474 | |
| Other Securities(a) | 68,426 | | | 1,171,771 | |
| | | | 9,498,313 | |
| Electric Utilities — 2.0% | | | | | |
| Other Securities(a) | 204,555 | | | 7,693,790 | |
| | | | 7,693,790 | |
| Electrical Equipment — 0.7% | | | | | |
| Other Securities(a) | 59,669 | | | 2,711,349 | |
| | | | 2,711,349 | |
| Electronic Equipment, Instruments & Components — 0.6% | |
| Other Securities(a) | 98,458 | | | 2,141,479 | |
| | | | 2,141,479 | |
| Energy Equipment & Services — 2.1% | | | | | |
| Schlumberger Ltd. | 39,272 | | | 2,682,670 | |
| Other Securities(a) | 142,851 | | | 5,283,854 | |
| | | | 7,966,524 | |
See notes to financial statements.
6
SA U.S. Core Market Fund
SUMMARY PORTFOLIO OF INVESTMENTS — AS OF DECEMBER 31, 2011 (Unaudited) (Continued)
| SHARES | | VALUE† | |
| COMMON STOCKS (Continued) | | | | | |
| Food & Staples Retailing — 2.2% | | | | | |
| CVS Caremark Corp. | 38,129 | | $ | 1,554,901 | |
| Wal-Mart Stores, Inc. | 55,625 | | | 3,324,150 | |
| Other Securities(a) | 96,409 | | | 3,598,074 | |
| | | | 8,477,125 | |
| Food Products — 1.9% | | | | | |
| Kraft Foods, Inc., Class A | 48,271 | | | 1,803,405 | |
| Other Securities(a) | 152,894 | | | 5,597,233 | |
| | | | 7,400,638 | |
| Gas Utilities — 0.3% | | | | | |
| Other Securities(a) | 27,132 | | | 1,130,083 | |
| | | | 1,130,083 | |
| Health Care Equipment & Supplies — 1.7% | | | | | |
| Other Securities(a) | 180,463 | | | 6,743,901 | |
| | | | 6,743,901 | |
| Health Care Providers & Services — 2.2% | | | | | |
| UnitedHealth Group, Inc. | 31,050 | | | 1,573,614 | |
| Other Securities(a) | 164,939 | | | 6,915,338 | |
| | | | 8,488,952 | |
| Health Care Technology — 0.1% | | | | | |
| Other Securities(a) | 10,511 | | | 424,692 | |
| | | | 424,692 | |
| Hotels, Restaurants & Leisure — 2.2% | | | | | |
| McDonald’s Corp. | 30,328 | | | 3,042,808 | |
| Other Securities(a) | 141,595 | | | 5,369,095 | |
| | | | 8,411,903 | |
| Household Durables — 0.3% | | | | | |
| Other Securities(a) | 55,298 | | | 1,328,449 | |
| | | | 1,328,449 | |
| Household Products — 2.1% | | | | | |
| Procter & Gamble Co. | 79,505 | | | 5,303,778 | |
| Other Securities(a) | 36,202 | | | 2,740,337 | |
| | | | 8,044,115 | |
| Independent Power Producers & Energy Traders — 0.2% | | | | |
| Other Securities | 59,466 | | | 762,285 | |
| | | | 762,285 | |
| Industrial Conglomerates — 2.2% | | | | | |
| 3M Co. | 18,525 | | | 1,514,048 | |
| General Electric Co. | 306,628 | | | 5,491,707 | |
| Other Securities(a) | 31,764 | | | 1,491,128 | |
| | | | 8,496,883 | |
| Insurance — 3.7% | | | | | |
| Berkshire Hathaway, Inc., Class B* | 48,719 | | | 3,717,260 | |
| Other Securities(a) | 326,927 | | | 10,776,950 | |
| | | | 14,494,210 | |
| Internet & Catalog Retail — 0.8% | | | | | |
| Amazon.com, Inc.* | 10,649 | | | 1,843,342 | |
| Other Securities(a) | 24,467 | | | 1,128,726 | |
| | | | 2,972,068 | |
| Internet Software & Services — 1.9% | | | | | |
| Google, Inc., Class A* | 7,467 | | | 4,822,935 | |
| Other Securities(a) | 99,695 | | | 2,586,248 | |
| | | | 7,409,183 | |
| IT Services — 3.7% | | | | | |
| International Business Machines Corp. | 34,794 | | | 6,397,921 | |
| Visa, Inc., Class A | 15,100 | | | 1,533,103 | |
| Other Securities(a) | 155,432 | | | 6,485,943 | |
| | | | 14,416,967 | |
| Leisure Equipment & Products — 0.1% | | | | | |
| Other Securities(a) | 16,197 | | | 501,473 | |
| | | | 501,473 | |
| Life Sciences Tools & Services — 0.5% | | | | | |
| Other Securities(a) | 43,237 | | | 1,808,874 | |
| | | | 1,808,874 | |
| Machinery — 2.2% | | | | | |
| Caterpillar, Inc. | 18,400 | | | 1,667,040 | |
| Other Securities(a) | 145,398 | | | 6,966,029 | |
| | | | 8,633,069 | |
| Marine — 0.0% | | | | | |
| Other Securities(a) | 2,800 | | | 154,328 | |
| | | | 154,328 | |
| Media — 3.0% | | | | | |
| Comcast Corp., Class A | 60,616 | | | 1,437,205 | |
| Comcast Corp., Class A Special | 18,450 | | | 434,682 | |
| Walt Disney Co. | 47,492 | | | 1,780,950 | |
| Other Securities(a) | 345,977 | | | 8,120,867 | |
| | | | 11,773,704 | |
| Metals & Mining — 1.0% | | | | | |
| Other Securities(a) | 133,088 | | | 3,942,425 | |
| | | | 3,942,425 | |
| Multi-Utilities — 1.4% | | | | | |
| Other Securities(a) | 148,510 | | | 5,550,104 | |
| | | | 5,550,104 | |
| Multiline Retail — 0.8% | | | | | |
| Other Securities(a) | 69,397 | | | 3,056,650 | |
| | | | 3,056,650 | |
| Office Electronics — 0.1% | | | | | |
| Other Securities | 40,867 | | | 369,118 | |
| | | | 369,118 | |
| Oil, Gas & Consumable Fuels — 9.2% | | | | | |
| Chevron Corp. | 56,837 | | | 6,047,457 | |
| ConocoPhillips | 35,967 | | | 2,620,915 | |
| Exxon Mobil Corp. | 135,716 | | | 11,503,288 | |
| Occidental Petroleum Corp. | 22,983 | | | 2,153,507 | |
| Other Securities(a) | 346,762 | | | 13,244,961 | |
| | | | 35,570,128 | |
| Paper & Forest Products — 0.2% | | | | | |
| Other Securities(a) | 19,765 | | | 659,543 | |
| | | | 659,543 | |
See notes to financial statements.
7
SA U.S. Core Market Fund
SUMMARY PORTFOLIO OF INVESTMENTS — AS OF DECEMBER 31, 2011 (Unaudited) (Continued)
| | SHARES | | VALUE† | |
| COMMON STOCKS (Continued) | | | | | | |
| Personal Products — 0.2% | | | | | | |
| Other Securities(a) | | 20,988 | | $ | 860,223 | |
| | | | | 860,223 | |
| Pharmaceuticals — 5.4% | | | | | | |
| Abbott Laboratories | | 45,412 | | | 2,553,517 | |
| Bristol-Myers Squibb Co. | | 49,600 | | | 1,747,904 | |
| Johnson & Johnson | | 76,912 | | | 5,043,889 | |
| Merck & Co., Inc. | | 86,589 | | | 3,264,405 | |
| Pfizer, Inc. | | 216,572 | | | 4,686,618 | |
| Other Securities(a) | | 84,954 | | | 3,589,093 | |
| | | | | 20,885,426 | |
| Professional Services — 0.3% | | | | | | |
| Other Securities(a) | | 22,211 | | | 1,008,507 | |
| | | | | 1,008,507 | |
| Real Estate Investment Trusts (REITs) — 0.2% | | | | |
| Other Securities | | 11,207 | | | 672,532 | |
| | |
| Real Estate Management & Development — 0.1% | | | | |
| Other Securities(a) | | 15,300 | | | 285,950 | |
| | | | | 285,950 | |
| Road & Rail — 1.0% | | | | | | |
| Union Pacific Corp. | | 14,200 | | | 1,504,348 | |
| Other Securities(a) | | 68,357 | | | 2,254,121 | |
| | | | | 3,758,469 | |
| Semiconductors & Semiconductor Equipment — 2.5% | | | | |
| Intel Corp. | | 153,786 | | | 3,729,310 | |
| Other Securities(a) | | 333,422 | | | 5,916,478 | |
| | | | | 9,645,788 | |
| Software — 3.6% | | | | | | |
| Microsoft Corp. | | 219,659 | | | 5,702,348 | |
| Oracle Corp. | | 113,963 | | | 2,923,151 | |
| Other Securities(a) | | 190,175 | | | 5,364,137 | |
| | | | | 13,989,636 | |
| Specialty Retail — 2.3% | | | | | | |
| Home Depot, Inc. | | 43,721 | | | 1,838,031 | |
| Other Securities(a) | | 209,076 | | | 6,952,708 | |
| | | | | 8,790,739 | |
| Textiles, Apparel & Luxury Goods — 0.8% | | | | | | |
| Other Securities(a) | | 43,488 | | | 2,996,407 | |
| | | | | 2,996,407 | |
| Thrifts & Mortgage Finance — 0.1% | | | | | | |
| Other Securities(a) | | 49,574 | | | 536,096 | |
| | | | | 536,096 | |
| Tobacco — 1.8% | | | | | | |
| Altria Group, Inc. | | 61,022 | | | 1,809,303 | |
| Philip Morris International, Inc. | | 51,900 | | | 4,073,112 | |
| Other Securities(a) | | 16,993 | | | 958,535 | |
| | | | | 6,840,950 | |
| Trading Companies & Distributors — 0.3% | | | | | | |
| Other Securities(a) | | 16,885 | | | 1,010,558 | |
| | | | | | 1,010,558 | |
| Water Utilities — 0.1% | | | | | | |
| Other Securities(a) | | 8,934 | | | 245,064 | |
| | | | | 245,064 | |
| Wireless Telecommunication Services — 0.2% | | | | |
| Other Securities(a) | | 111,400 | | | 920,287 | |
| | | | | 920,287 | |
| TOTAL COMMON STOCKS | | | | | | |
| (Identified Cost $259,940,243) | | | | | 370,580,491 | |
| | | | | | | |
| PREFERRED STOCKS — 0.0% | | | | | | |
| Specialty Retail — 0.0% | | | | | | |
| Other Securities | | 53 | | | — | |
| TOTAL PREFERRED STOCKS | | | | | | |
| (Identified Cost $231) | | | | | — | |
| | |
| RIGHTS & WARRANTS* — 0.0% | | | | | | |
| Biotechnology — 0.0% | | | | | | |
| Other Securities | | 66 | | | 93 | |
| | |
| Hotels, Restaurants & Leisure — 0.0% | | | | | | |
| Other Securities | | 73 | | | 4 | |
| TOTAL RIGHTS & WARRANTS | | | | | | |
| (Identified Cost $350) | | | | | 97 | |
| | |
| MUTUAL FUNDS — 4.1% | | | | | | |
| Other — 4.1% | | | | | | |
| DFA U.S. Micro Cap Portfolio | | 1,205,567 | | | 15,937,606 | |
| TOTAL MUTUAL FUNDS | | | | | | |
| (Identified Cost $13,745,189) | | | | | 15,937,606 | |
| | |
| SHORT-TERM INVESTMENTS — 0.1% | | | | |
| Other — 0.1% | | | | | | |
| SSgA Government Money Market Fund | | 1 | | | 1 | |
| SSgA Money Market Fund | | 240,077 | | | 240,077 | |
| | | | | 240,078 | |
| TOTAL SHORT-TERM INVESTMENTS | | | | | | |
| (Identified Cost $240,078) | | | | | 240,078 | |
See notes to financial statements.
8
SA U.S. Core Market Fund
SUMMARY PORTFOLIO OF INVESTMENTS — AS OF DECEMBER 31, 2011 (Unaudited) (Continued)
| | SHARES | | VALUE† | |
| COLLATERAL FOR SECURITIES ON LOAN — 5.0% | | | | | |
| Short-Term — 5.0% | | | | | | | | |
| State Street Navigator Securities Lending | | | | | | | | |
| Prime Portfolio | | | 19,361,364 | | $ | 19,361,364 | | |
| | | | | | 19,361,364 | | |
| | | |
| TOTAL COLLATERAL FOR | | | | | | | | |
| SECURITIES ON LOAN | | | | | | | | |
| (Identified Cost $19,361,364) | | | | | | 19,361,364 | | |
| | | |
| Total Investments — 104.8% | | | | | | | | |
| (Identified Cost $293,287,455)# | | | | | | 406,119,636 | | |
| Liabilities, Less Cash and | | | | | | | | |
| Other Assets — (4.8%) | | | | | | (18,638,652 | ) | |
| Net Assets — 100.0% | | | | | $ | 387,480,984 | | |
| | † | | See Note 1. |
| | * | | Non-income producing security. |
| | (a) | | A portion or all of the security was held on loan. As of December 31, 2011, the market value of the securities on loan was $18,960,181. |
| | # | | At December 31, 2011 the aggregate cost of investment securities for U.S. federal income tax purposes was $293,287,455. Net unrealized appreciation aggregated $112,832,181 of which $131,552,096 related to appreciated investment securities and $18,719,915 related to depreciated investment securities. |
Key to abbreviations:
REIT — Real Estate Investment Trust
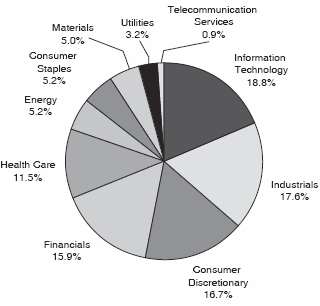
Portfolio Sectors
(% of portfolio market value)
See notes to financial statements.
9
SA U.S. Value Fund
SUMMARY PORTFOLIO OF INVESTMENTS — AS OF DECEMBER 31, 2011 (Unaudited)
| | SHARES | | VALUE† | |
| COMMON STOCKS — 100.0% | | | | | | |
| Aerospace & Defense — 1.3% | | | | | | |
| Northrop Grumman Corp.(a) | | 49,882 | | $ | 2,917,099 | |
| Other Securities | | 16,122 | | | 906,328 | |
| | | | | 3,823,427 | |
| Air Freight & Logistics — 0.0% | | | | | | |
| Other Securities | | 491 | | | 41,003 | |
| | |
| Airlines — 0.4% | | | | | | |
| Other Securities | | 126,100 | | | 1,079,416 | |
| | |
| Automobiles — 0.1% | | | | | | |
| Other Securities | | 12,955 | | | 262,598 | |
| | |
| Beverages — 1.1% | | | | | | |
| Other Securities | | 82,878 | | | 3,091,752 | |
| | | | | 3,091,752 | |
| Building Products — 0.3% | | | | | | |
| Other Securities | | 44,817 | | | 997,244 | |
| | | | | 997,244 | |
| Capital Markets — 0.8% | | | | | | |
| Morgan Stanley | | 105,967 | | | 1,603,281 | |
| Other Securities | | 48,157 | | | 752,373 | |
| | | | | 2,355,654 | |
| Chemicals — 0.4% | | | | | | |
| Other Securities | | 23,304 | | | 1,039,770 | |
| | | | | 1,039,770 | |
| Commercial Banks — 1.3% | | | | | | |
| SunTrust Banks, Inc. | | 81,987 | | | 1,451,170 | |
| Other Securities(a) | | 341,465 | | | 2,368,897 | |
| | | | | 3,820,067 | |
| Commercial Services & Supplies — 0.5% | | | | | | |
| Other Securities(a) | | 68,318 | | | 1,490,173 | |
| | | | | 1,490,173 | |
| Computers & Peripherals — 0.3% | | | | | | |
| Other Securities | | 33,272 | | | 971,822 | |
| | | | | 971,822 | |
| Construction & Engineering — 0.2% | | | | | | |
| Other Securities | | 25,704 | | | 723,454 | |
| | | | | 723,454 | |
| Construction Materials — 0.3% | | | | | | |
| Other Securities(a) | | 19,042 | | | 749,303 | |
| | |
| Consumer Finance — 1.1% | | | | | | |
| Capital One Financial Corp.(a) | | 74,533 | | | 3,152,000 | |
| | |
| Containers & Packaging — 0.1% | | | | | | |
| Other Securities | | 9,632 | | | 241,159 | |
| | | | | 241,159 | |
| Diversified Consumer Services — 0.0% | | | | | | |
| Other Securities | | 5,594 | | | 59,576 | |
| | |
| Diversified Financial Services — 5.3% | | | | | | |
| Bank of America Corp. | | 737,905 | | | 4,102,752 | |
| Citigroup, Inc. | | 258,694 | | | 6,806,239 | |
| CME Group, Inc. | | 10,093 | | | 2,459,361 | |
| Other Securities | | 66,392 | | | 1,959,974 | |
| | | | | 15,328,326 | |
| Diversified Telecommunication Services — 6.1% | | | | |
| AT&T, Inc. | | 419,977 | | | 12,700,104 | |
| CenturyLink, Inc. | | 62,251 | | | 2,315,737 | |
| Verizon Communications, Inc. | | 57,266 | | | 2,297,512 | |
| Other Securities(a) | | 41,385 | | | 213,133 | |
| | | | | 17,526,486 | |
| Electronic Equipment, Instruments & Components — 1.1% | |
| Other Securities | | 145,516 | | | 3,067,266 | |
| | | | | 3,067,266 | |
| Energy Equipment & Services — 2.9% | | | | | | |
| National Oilwell Varco, Inc. | | 55,555 | | | 3,777,184 | |
| Other Securities(a) | | 173,419 | | | 4,437,768 | |
| | | | | 8,214,952 | |
| Food & Staples Retailing — 3.3% | | | | | | |
| CVS Caremark Corp. | | 210,226 | | | 8,573,016 | |
| Other Securities(a) | | 38,038 | | | 800,320 | |
| | | | | 9,373,336 | |
| Food Products — 5.4% | | | | | | |
| Archer-Daniels-Midland Co. | | 96,578 | | | 2,762,131 | |
| J.M. Smucker Co. (The) | | 18,726 | | | 1,463,811 | |
| Kraft Foods, Inc., Class A | | 214,143 | | | 8,000,382 | |
| Other Securities | | 105,411 | | | 3,394,037 | |
| | | | | 15,620,361 | |
| Health Care Equipment & Supplies — 1.0% | | | | |
| Other Securities | | 257,921 | | | 2,746,961 | |
| | | | | 2,746,961 | |
| Health Care Providers & Services — 3.9% | | | | | | |
| Aetna, Inc. | | 66,065 | | | 2,787,282 | |
| Humana, Inc. | | 24,131 | | | 2,114,117 | |
| WellPoint, Inc. | | 77,407 | | | 5,128,214 | |
| Other Securities(a) | | 40,155 | | | 1,291,558 | |
| | | | | 11,321,171 | |
| Hotels, Restaurants & Leisure — 2.1% | | | | | | |
| Carnival Corp. | | 90,764 | | | 2,962,537 | |
| Other Securities(a) | | 157,746 | | | 3,093,737 | |
| | | | | | 6,056,274 | |
| Household Durables — 0.9% | | | | | | |
| Other Securities(a) | | 111,406 | | | 2,517,999 | |
| | | | | 2,517,999 | |
| Independent Power Producers & Energy Traders — 0.7% | |
| Other Securities | | 133,453 | | | 1,933,765 | |
| | | | | 1,933,765 | |
See notes to financial statements.
10
SA U.S. Value Fund
SUMMARY PORTFOLIO OF INVESTMENTS — AS OF DECEMBER 31, 2011 (Unaudited) (Continued)
| | SHARES | | VALUE† | |
| COMMON STOCKS (Continued) | | | | | | |
| Industrial Conglomerates — 4.7% | | | | | | |
| General Electric Co. | | 630,576 | | $ | 11,293,616 | |
| Tyco International Ltd. | | 46,192 | | | 2,157,628 | |
| | | | | 13,451,244 | |
| Insurance — 8.6% | | | | | | |
| Loews Corp. | | 72,979 | | | 2,747,659 | |
| MetLife, Inc. | | 149,973 | | | 4,676,158 | |
| Prudential Financial, Inc. | | 72,188 | | | 3,618,063 | |
| Other Securities(a) | | 559,885 | | | 13,607,312 | |
| | | | | 24,649,192 | |
| Internet & Catalog Retail — 0.6% | | | | | | |
| Liberty Media Corp. - Interactive, | | | | | | |
| Class A* | | 102,856 | | | 1,667,810 | |
| | | | | | | |
| Internet Software & Services — 0.6% | | | | | | |
| Other Securities | | 70,611 | | | 1,599,295 | |
| | | | | 1,599,295 | |
| IT Services — 0.6% | | | | | | |
| Other Securities | | 72,554 | | | 1,848,981 | |
| | | | | 1,848,981 | |
| Life Sciences Tools & Services — 1.1% | | | | | | |
| Thermo Fisher Scientific, Inc.* | | 65,998 | | | 2,967,930 | |
| Other Securities | | 13,459 | | | 312,276 | |
| | | | | 3,280,206 | |
| Machinery — 0.9% | | | | | | |
| Other Securities(a) | | 59,895 | | | 2,489,651 | |
| | | | | 2,489,651 | |
| Media — 11.0% | | | | | | |
| CBS Corp., Class A | | 8,400 | | | 232,512 | |
| CBS Corp., Class B | | 111,595 | | | 3,028,688 | |
| Comcast Corp., Class A | | 309,977 | | | 7,349,555 | |
| Comcast Corp., Class A Special | | 125,831 | | | 2,964,578 | |
| News Corp., Class A | | 295,411 | | | 5,270,132 | |
| News Corp., Class B | | 110,939 | | | 2,016,871 | |
| Time Warner Cable, Inc. | | 58,800 | | | 3,737,916 | |
| Time Warner, Inc. | | 167,231 | | | 6,043,728 | |
| Other Securities(a) | | 18,021 | | | 897,161 | |
| | | | | 31,541,141 | |
| Metals & Mining — 1.0% | | | | | | |
| Alcoa, Inc. | | 171,685 | | | 1,485,075 | |
| Other Securities(a) | | 51,275 | | | 1,365,379 | |
| | | | | 2,850,454 | |
| Multi-Utilities — 0.7% | | | | | | |
| Public Service Enterprise Group, Inc. | | 60,366 | | | 1,992,682 | |
| | | | | | | |
| Multiline Retail — 0.7% | | | | | | |
| Other Securities(a) | | 63,459 | | | 2,149,734 | |
| | | | | 2,149,734 | |
| Office Electronics — 0.3% | | | | | | |
| Other Securities | | 127,926 | | | 1,018,291 | |
| | |
| Oil, Gas & Consumable Fuels — 15.1% | | | | | | |
| Anadarko Petroleum Corp. | | 78,382 | | | 5,982,898 | |
| Apache Corp. | | 27,898 | | | 2,527,001 | |
| Chesapeake Energy Corp. | | 106,266 | | | 2,368,669 | |
| Chevron Corp. | | 32,820 | | | 3,492,048 | |
| ConocoPhillips | | 170,561 | | | 12,428,780 | |
| Devon Energy Corp. | | 28,781 | | | 1,784,422 | |
| Hess Corp. | | 47,336 | | | 2,688,685 | |
| Marathon Oil Corp. | | 115,078 | | | 3,368,333 | |
| Marathon Petroleum Corp. | | 57,539 | | | 1,915,473 | |
| Pioneer Natural Resources Co. | | 17,531 | | | 1,568,674 | |
| Valero Energy Corp. | | 91,951 | | | 1,935,569 | |
| Other Securities(a) | | 108,403 | | | 3,501,801 | |
| | | | | 43,562,353 | |
| Paper & Forest Products — 1.3% | | | | | | |
| International Paper Co. | | 74,679 | | | 2,210,499 | |
| Other Securities | | 35,567 | | | 1,402,999 | |
| | | | | 3,613,498 | |
| Pharmaceuticals — 3.9% | | | | | | |
| Pfizer, Inc. | | 510,809 | | | 11,053,907 | |
| Other Securities | | 5,290 | | | 175,379 | |
| | | | | 11,229,286 | |
| Road & Rail — 6.1% | | | | | | |
| CSX Corp. | | 196,515 | | | 4,138,606 | |
| Norfolk Southern Corp. | | 65,200 | | | 4,750,472 | |
| Union Pacific Corp. | | 74,089 | | | 7,848,989 | |
| Other Securities | | 33,703 | | | 788,489 | |
| | | | | 17,526,556 | |
| Semiconductors & Semiconductor Equipment — 0.2% | | | | |
| Other Securities | | 108,402 | | | 681,849 | |
| | |
| Software — 0.4% | | | | | | |
| Other Securities | | 83,074 | | | 1,023,472 | |
| | |
| Specialty Retail — 0.5% | | | | | | |
| Other Securities(a) | | 63,887 | | | 1,325,876 | |
| | | | | 1,325,876 | |
| Wireless Telecommunication Services — 0.8% | | | | |
| Other Securities(a) | | 540,781 | | | 2,308,695 | |
| | | | | 2,308,695 | |
| TOTAL COMMON STOCKS | | | | | | |
| (Identified Cost $273,807,828) | | | | | 287,415,581 | |
| | |
| PREFERRED STOCKS — 0.0% | | | | | | |
| Specialty Retail — 0.0% | | | | | | |
| Other Securities | | 854 | | | — | |
| TOTAL PREFERRED STOCKS | | | | | | |
| (Identified Cost $5,580) | | | | | — | |
See notes to financial statements.
11
SA U.S. Value Fund
SUMMARY PORTFOLIO OF INVESTMENTS — AS OF DECEMBER 31, 2011 (Unaudited) (Continued)
| | SHARES | | VALUE† | |
| SHORT-TERM INVESTMENTS — 0.0% | | | | | |
| Other — 0.0% | | | | | | | |
| SSgA Government | | | | | | | |
| Money Market Fund | | 1 | | $ | 1 | | |
| SSgA Money Market Fund | | 25 | | | 25 | | |
| | | | | 26 | | |
| TOTAL SHORT-TERM INVESTMENTS | | | | | | | |
| (Identified Cost $26) | | | | | 26 | | |
| | |
| COLLATERAL FOR SECURITIES ON LOAN — 5.3% | | |
| Short-Term — 5.3% | | | | | | | |
| State Street Navigator Securities | | | | | | | |
| Lending Prime Portfolio | | 15,365,753 | | | 15,365,753 | | |
| TOTAL COLLATERAL FOR | | | | | | | |
| SECURITIES ON LOAN | | | | | | | |
| (Identified Cost $15,365,753) | | | | | 15,365,753 | | |
| | |
| Total Investments — 105.3% | | | | | | | |
| (Identified Cost $289,179,187)# | | | | | 302,781,360 | | |
| Liabilities, Less Cash and | | | | | | | |
| Other Assets — (5.3%) | | | | | (15,271,950 | ) | |
| Net Assets — 100.0% | | | | $ | 287,509,410 | | |
| | † | | See Note 1. |
| | * | | Non-income producing security. |
| | (a) | | A portion or all of the security was held on loan. As of December 31, 2011, the market value of the securities on loan was $15,494,518. |
| | # | | At December 31, 2011 the aggregate cost of investment securities for U.S. federal income tax purposes was $289,179,187. Net unrealized appreciation aggregated $13,602,173 of which $59,603,160 related to appreciated investment securities and $46,000,987 related to depreciated investment securities. |
Portfolio Sectors
(% of portfolio market value)

See notes to financial statements.
12
SA U.S. Small Company Fund
SUMMARY PORTFOLIO OF INVESTMENTS — AS OF DECEMBER 31, 2011 (Unaudited)
| | SHARES | | VALUE† | |
| COMMON STOCKS — 100.1% | | | | | | |
| Aerospace & Defense — 2.0% | | | | | | |
| Hexcel Corp.* | | 21,236 | | $ | 514,124 | |
| Teledyne Technologies, Inc.* | | 8,099 | | | 444,230 | |
| Other Securities(a) | | 140,440 | | | 3,810,699 | |
| | | | | 4,769,053 | |
| Air Freight & Logistics — 0.5% | | | | | | |
| Other Securities(a) | | 63,289 | | | 1,117,515 | |
| | | | | 1,117,515 | |
| Airlines — 0.4% | | | | | | |
| Other Securities(a) | | 129,731 | | | 967,955 | |
| | | | | 967,955 | |
| Auto Components — 0.8% | | | | | | |
| Other Securities(a) | | 147,612 | | | 1,876,026 | |
| | | | | 1,876,026 | |
| Automobiles — 0.2% | | | | | | |
| Other Securities(a) | | 19,900 | | | 415,532 | |
| | | | | 415,532 | |
| Beverages — 0.3% | | | | | | |
| Other Securities(a) | | 55,607 | | | 764,947 | |
| | | | | 764,947 | |
| Biotechnology — 2.3% | | | | | | |
| Cubist Pharmaceuticals, Inc.(a)* | | 13,083 | | | 518,348 | |
| Other Securities(a) | | 586,001 | | | 4,985,365 | |
| | | | | 5,503,713 | |
| Building Products — 0.8% | | | | | | |
| Other Securities(a) | | 122,511 | | | 1,887,741 | |
| | | | | 1,887,741 | |
| Capital Markets — 1.1% | | | | | | |
| Other Securities(a) | | 265,777 | | | 2,667,814 | |
| | | | | 2,667,814 | |
| Chemicals — 2.1% | | | | | | |
| Other Securities(a) | | 251,743 | | | 4,962,227 | |
| | | | | 4,962,227 | |
| Commercial Banks — 6.7% | | | | | | |
| CapitalSource, Inc. | | 68,837 | | | 461,208 | |
| Investors Bancorp, Inc.* | | 34,155 | | | 460,409 | |
| Other Securities(a) | | 1,037,435 | | | 14,722,929 | |
| | | | | 15,644,546 | |
| Commercial Services & Supplies — 2.7% | | | | | | |
| Other Securities(a) | | 409,617 | | | 6,270,309 | |
| | | | | 6,270,309 | |
| Communications Equipment — 2.1% | | | | | | |
| InterDigital, Inc.(a) | | 11,222 | | | 488,943 | |
| Other Securities(a) | | 517,791 | | | 4,555,177 | |
| | | | | 5,044,120 | |
| Computers & Peripherals — 1.1% | | | | | | |
| Other Securities(a) | | 218,198 | | | 2,482,295 | |
| | | | | 2,482,295 | |
| Construction & Engineering — 0.9% | | | | | | |
| Other Securities(a) | | 140,890 | | | 2,134,578 | |
| | | | | 2,134,578 | |
| Construction Materials — 0.2% | | | | | | |
| Other Securities(a) | | 30,032 | | | 570,652 | |
| | | | | 570,652 | |
| Consumer Finance — 1.0% | | | | | | |
| Other Securities(a) | | 118,938 | | | 2,383,709 | |
| | | | | 2,383,709 | |
| Containers & Packaging — 0.3% | | | | | | |
| Other Securities(a) | | 114,149 | | | 649,790 | |
| | | | | 649,790 | |
| Distributors — 0.2% | | | | | | |
| Other Securities(a) | | 16,200 | | | 425,319 | |
| | | | | 425,319 | |
| Diversified Consumer Services — 1.5% | | | | | | |
| Other Securities(a) | | 195,812 | | | 3,425,879 | |
| | | | | 3,425,879 | |
| Diversified Financial Services — 0.4% | | | | | | |
| Other Securities(a) | | 62,320 | | | 845,611 | |
| | | | | 845,611 | |
| Diversified Telecommunication Services — 0.8% | | | | |
| Other Securities(a) | | 190,185 | | | 1,782,743 | |
| | | | | 1,782,743 | |
| Electric Utilities — 1.5% | | | | | | |
| Cleco Corp. | | 15,000 | | | 571,500 | |
| IDACORP, Inc. | | 10,600 | | | 449,546 | |
| Other Securities(a) | | 87,630 | | | 2,541,869 | |
| | | | | 3,562,915 | |
| Electrical Equipment — 1.5% | | | | | | |
| Generac Holdings, Inc.(a)* | | 15,486 | | | 434,073 | |
| II-VI, Inc.* | | 23,822 | | | 437,372 | |
| Other Securities(a) | | 149,810 | | | 2,620,796 | |
| | | | | 3,492,241 | |
See notes to financial statements.
13
SA U.S. Small Company Fund
SUMMARY PORTFOLIO OF INVESTMENTS — AS OF DECEMBER 31, 2011 (Unaudited) (Continued)
| | SHARES | | VALUE† | |
| COMMON STOCKS (Continued) | | | | | | |
| Electronic Equipment, Instruments & Components — 2.9% | |
| Other Securities(a) | | 463,370 | | $ | 6,852,893 | |
| | | | | 6,852,893 | |
| Energy Equipment & Services — 2.1% | | | | | | |
| Complete Production Services, Inc.* | | 15,113 | | | 507,192 | |
| Key Energy Services, Inc.* | | 30,901 | | | 478,038 | |
| Other Securities(a) | | 292,428 | | | 3,995,496 | |
| | | | | 4,980,726 | |
| Food & Staples Retailing — 1.4% | | | | | | |
| Casey’s General Stores, Inc. | | 12,174 | | | 627,083 | |
| PriceSmart, Inc. | | 6,250 | | | 434,937 | |
| Ruddick Corp.(a) | | 10,900 | | | 464,776 | |
| Other Securities(a) | | 93,625 | | | 1,655,156 | |
| | | | | 3,181,952 | |
| Food Products — 2.1% | | | | | | |
| Lancaster Colony Corp.(a) | | 7,600 | | | 526,984 | |
| TreeHouse Foods, Inc.(a)* | | 7,400 | | | 483,812 | |
| Other Securities(a) | | 243,913 | | | 3,927,809 | |
| | | | | 4,938,605 | |
| Gas Utilities — 0.8% | | | | | | |
| New Jersey Resources Corp.(a) | | 9,451 | | | 464,989 | |
| Other Securities(a) | | 30,543 | | | 1,398,359 | |
| | | | | 1,863,348 | |
| Health Care Equipment & Supplies — 3.2% | | | | |
| Thoratec Corp.* | | 17,008 | | | 570,788 | |
| Other Securities(a) | | 432,572 | | | 6,913,684 | |
| | | | | 7,484,472 | |
| Health Care Providers & Services — 3.4% | | | | | | |
| Magellan Health Services, Inc.* | | 11,300 | | | 559,011 | |
| PSS World Medical, Inc.(a)* | | 24,238 | | | 586,317 | |
| WellCare Health Plans, Inc.* | | 8,500 | | | 446,250 | |
| Other Securities(a) | | 402,695 | | | 6,428,006 | |
| | | | | 8,019,584 | |
| Health Care Technology — 0.6% | | | | | | |
| Quality Systems, Inc.(a) | | 20,036 | | | 741,132 | |
| Other Securities(a) | | 46,912 | | | 665,254 | |
| | | | | 1,406,386 | |
| Hotels, Restaurants & Leisure — 3.8% | | | | | | |
| Brinker International, Inc. | | 16,410 | | | 439,132 | |
| Domino’s Pizza, Inc.(a)* | | 16,189 | | | 549,617 | |
| Life Time Fitness, Inc.(a)* | | 9,707 | | | 453,802 | |
| Six Flags Entertainment Corp. | | 11,175 | | | 460,857 | |
| Other Securities(a) | | 438,945 | | | 6,928,261 | |
| | | | | 8,831,669 | |
| Household Durables — 0.9% | | | | | | |
| Other Securities(a) | | 209,919 | | | 2,078,384 | |
| | | | | 2,078,384 | |
| Household Products — 0.3% | | | | | | |
| Other Securities(a) | | 32,957 | | | 697,242 | |
| | | | | 697,242 | |
| Independent Power Producers & Energy Traders — 0.2% | |
| Other Securities(a) | | 64,338 | | | 562,052 | |
| | | | | 562,052 | |
| Industrial Conglomerates — 0.1% | | | | | | |
| Other Securities(a) | | 6,300 | | | 315,099 | |
| | | | | 315,099 | |
| Insurance — 4.4% | | | | | | |
| Delphi Financial Group, Inc., Class S | | 12,207 | | | 540,770 | |
| MBIA, Inc.(a)* | | 45,680 | | | 529,431 | |
| ProAssurance Corp. | | 6,055 | | | 483,310 | |
| Other Securities(a) | | 534,867 | | | 8,916,309 | |
| | | | | 10,469,820 | |
| Internet & Catalog Retail — 0.5% | | | | | | |
| HSN, Inc. | | 12,080 | | | 438,021 | |
| Other Securities(a) | | 87,858 | | | 634,288 | |
| | | | | 1,072,309 | |
| Internet Software & Services — 1.9% | | | | | | |
| Other Securities(a) | | 413,073 | | | 4,584,429 | |
| | | | | 4,584,429 | |
| IT Services — 2.7% | | | | | | |
| NeuStar, Inc., Class A* | | 14,088 | | | 481,387 | |
| Syntel, Inc.(a) | | 9,300 | | | 434,961 | |
| Wright Express Corp.(a)* | | 8,700 | | | 472,236 | |
| Other Securities(a) | | 327,330 | | | 4,854,662 | |
| | | | | 6,243,246 | |
| Leisure Equipment & Products — 0.4% | | | | | | |
| Other Securities(a) | | 93,248 | | | 918,735 | |
| | | | | 918,735 | |
| Life Sciences Tools & Services — 0.5% | | | | | | |
| Other Securities(a) | | 120,648 | | | 1,155,869 | |
| | | | | 1,155,869 | |
| Machinery — 3.5% | | | | | | |
| Robbins & Myers, Inc. | | 9,714 | | | 471,615 | |
| Other Securities(a) | | 383,081 | | | 7,875,430 | |
| | | | | 8,347,045 | |
| Marine — 0.2% | | | | | | |
| Other Securities(a) | | 45,473 | | | 462,546 | |
| | | | | 462,546 | |
| Media — 1.8% | | | | | | |
| Other Securities(a) | | 424,670 | | | 4,214,825 | |
| | | | | 4,214,825 | |
| Metals & Mining — 1.6% | | | | | | |
| Carpenter Technology Corp. | | 8,800 | | | 453,024 | |
| Other Securities(a) | | 297,621 | | | 3,319,217 | |
| | | | | 3,772,241 | |
See notes to financial statements.
14
SA U.S. Small Company Fund
SUMMARY PORTFOLIO OF INVESTMENTS — AS OF DECEMBER 31, 2011 (Unaudited) (Continued)
| | SHARES | | VALUE† | |
| COMMON STOCKS (Continued) | | | | | | |
| Multi-Utilities — 0.5% | | | | | | |
| Other Securities(a) | | 32,500 | | $ | 1,107,283 | |
| | | | | 1,107,283 | |
| Multiline Retail — 0.5% | | | | | | |
| Other Securities(a) | | 80,723 | | | 1,209,787 | |
| | | | | 1,209,787 | |
| Office Electronics — 0.1% | | | | | | |
| Other Securities | | 9,827 | | | 351,610 | |
| | |
| Oil, Gas & Consumable Fuels — 3.1% | | | | | | |
| Other Securities(a) | | 558,436 | | | 7,261,267 | |
| | | | | 7,261,267 | |
| Paper & Forest Products — 0.7% | | | | | | |
| Other Securities(a) | | 100,873 | | | 1,708,555 | |
| | | | | 1,708,555 | |
| Personal Products — 0.8% | | | | | | |
| Nu Skin Enterprises, Inc., Class A(a) | | 16,043 | | | 779,208 | |
| Other Securities(a) | | 74,384 | | | 1,092,991 | |
| | | | | 1,872,199 | |
| Pharmaceuticals — 1.5% | | | | | | |
| Questcor Pharmaceuticals, Inc.* | | 14,600 | | | 607,068 | |
| Viropharma, Inc.* | | 25,800 | | | 706,662 | |
| Other Securities(a) | | 181,207 | | | 2,304,713 | |
| | | | | 3,618,443 | |
| Professional Services — 2.0% | | | | | | |
| Acacia Research - Acacia | | | | | | |
| Technologies* | | 29,010 | | | 1,059,155 | |
| Other Securities(a) | | 222,432 | | | 3,691,764 | |
| | | | | 4,750,919 | |
| Real Estate Management & Development — 0.4% | | | | |
| Other Securities(a) | | 59,263 | | | 963,685 | |
| | | | | 963,685 | |
| Road & Rail — 1.5% | | | | | | |
| Old Dominion Freight Line, Inc.* | | 12,528 | | | 507,760 | |
| Other Securities(a) | | 161,477 | | | 3,130,308 | |
| | | | | 3,638,068 | |
| Semiconductors & Semiconductor Equipment — 4.2% | | | | |
| Other Securities(a) | | 993,384 | | | 9,861,861 | |
| | | | | 9,861,861 | |
| Software — 3.8% | | | | | | |
| Solarwinds, Inc.(a)* | | 15,895 | | | 444,265 | |
| Other Securities(a) | | 513,230 | | | 8,444,821 | |
| | | | | | 8,889,086 | |
| Specialty Retail — 4.8% | | | | | | |
| Aaron’s, Inc. | | 17,233 | | | 459,776 | |
| Cabela’s, Inc.(a)* | | 17,400 | | | 442,308 | |
| Pier 1 Imports, Inc.* | | 34,700 | | | 483,371 | |
| Rent-A-Center, Inc. | | 13,202 | | | 488,474 | |
| Other Securities(a) | | 628,890 | | | 9,332,122 | |
| | | | | 11,206,051 | |
| Textiles, Apparel & Luxury Goods — 1.5% | | | | | | |
| Carter’s, Inc.(a)* | | 14,200 | | | 565,302 | |
| Other Securities(a) | | 181,526 | | | 3,076,480 | |
| | | | | 3,641,782 | |
| Thrifts & Mortgage Finance — 1.8% | | | | | | |
| Capitol Federal Financial, Inc. | | 41,921 | | | 483,768 | |
| Other Securities(a) | | 423,749 | | | 3,825,600 | |
| | | | | 4,309,368 | |
| Tobacco — 0.3% | | | | | | |
| Other Securities(a) | | 69,937 | | | 677,762 | |
| | | | | | 677,762 | |
| Trading Companies & Distributors — 1.5% | | | | | | |
| GATX Corp.(a) | | 10,233 | | | 446,773 | |
| Other Securities(a) | | 145,047 | | | 2,976,387 | |
| | | | | 3,423,160 | |
| Water Utilities — 0.2% | | | | | | |
| Other Securities(a) | | 25,553 | | | 545,835 | |
| | | | | 545,835 | |
| Wireless Telecommunication Services — 0.2% | | | | |
| Other Securities(a) | | 30,397 | | | 357,972 | |
| | | | | 357,972 | |
| TOTAL COMMON STOCKS | | | | | | |
| (Identified Cost $233,688,193) | | | | | 235,495,400 | |
| | |
| RIGHTS & WARRANTS* — 0.0% | | | | | | |
| Biotechnology — 0.0% | | | | | | |
| Other Securities | | 4,900 | | | 6,860 | |
| | |
| Construction Materials — 0.0% | | | | | | |
| Other Securities(b) | | 670 | | | — | |
| | | | | — | |
| Hotels, Restaurants & Leisure — 0.0% | | | | | | |
| Other Securities | | 130 | | | 8 | |
| | |
| Oil, Gas & Consumable Fuels — 0.0% | | | | | | |
| Other Securities(a) | | 1,460 | | | 211 | |
| | |
| Pharmaceuticals — 0.0% | | | | | | |
| Other Securities(b)(c) | | 14,384 | | | — | |
| | | | | — | |
| Specialty Retail — 0.0% | | | | | | |
| Other Securities(b) | | 1,800 | | | — | |
| TOTAL RIGHTS & WARRANTS | | | | | | |
| (Identified Cost $111,630) | | | | | 7,079 | |
See notes to financial statements.
15
SA U.S. Small Company Fund
SUMMARY PORTFOLIO OF INVESTMENTS — AS OF DECEMBER 31, 2011 (Unaudited) (Continued)
| | FACE | | | | | |
| | AMOUNT | | VALUE† | |
| BONDS AND NOTES — 0.0% | | | | | | | |
| Capital Markets — 0.0% | | | | | | | |
| Other Securities | | 30 | | $ | 20 | | |
| TOTAL BONDS AND NOTES | | | | | | | |
| (Identified Cost $30) | | | | | 20 | | |
| | |
| | SHARES | | VALUE† | |
| SHORT-TERM INVESTMENTS — 0.0% | | | | | |
| Other — 0.0% | | | | | | | |
| SSgA Government | | | | | | | |
| Money Market Fund | | 1 | | | 1 | | |
| SSgA Money Market Fund | | 41 | | | 41 | | |
| | | | | 42 | | |
| TOTAL SHORT-TERM INVESTMENTS | | | | | | | |
| (Identified Cost $42) | | | | | 42 | | |
| | |
| COLLATERAL FOR SECURITIES ON LOAN — 34.3% | | |
| Short-Term — 34.3% | | | | | | | |
| State Street Navigator Securities | | | | | | | |
| Lending Prime Portfolio | | 80,520,088 | | | 80,520,088 | | |
| TOTAL COLLATERAL FOR | | | | | | | |
| SECURITIES ON LOAN | | | | | | | |
| (Identified Cost $80,520,088) | | | | | 80,520,088 | | |
| | |
| Total Investments — 134.4% | | | | | | | |
| (Identified Cost $314,319,983)# | | | | | 316,022,629 | | |
| Liabilities, Less Cash and | | | | | | | |
| Other Assets — (34.4%) | | | | | (80,837,259 | ) | |
| Net Assets — 100.0% | | | | $ | 235,185,370 | | |
| | † | | See Note 1. |
| | * | | Non-income producing security. |
| | (a) | | A portion or all of the security was held on loan. As of December 31, 2011, the market value of the securities on loan was $77,833,156. |
| | (b) | | Bankrupt security/delisted. |
| | (c) | | Contingent value rights based on future performance. |
| | # | | At December 31, 2011 the aggregate cost of investment securities for U.S. federal income tax purposes was $314,319,983. Net unrealized appreciation aggregated $1,578,221 of which $55,431,522 related to appreciated investment securities and $53,853,301 related to depreciated investment securities. |
Portfolio Sectors
(% of portfolio market value)
See notes to financial statements.
16
SA International Value Fund
SUMMARY PORTFOLIO OF INVESTMENTS — AS OF DECEMBER 31, 2011 (Unaudited)
| SHARES | | VALUE† | |
| COMMON STOCKS — 99.7% | | | | | |
| Australia — 5.2% | | | | | |
| Origin Energy Ltd. | 174,933 | | $ | 2,386,813 | |
| Wesfarmers Ltd. | 201,167 | | | 6,069,733 | |
| Other Securities(a) | 3,279,054 | | | 13,915,948 | |
| | | | 22,372,494 | |
| Austria — 0.1% | | | | | |
| Other Securities(a) | 30,328 | | | 616,676 | |
| | | | 616,676 | |
| Belgium — 1.0% | | | | | |
| Other Securities | 430,987 | | | 4,286,069 | |
| | | | 4,286,069 | |
| Canada — 12.9% | | | | | |
| EnCana Corp. | 153,451 | | | 2,845,339 | |
| Goldcorp, Inc. | 69,511 | | | 3,084,753 | |
| Kinross Gold Corp. | 203,700 | | | 2,325,429 | |
| Manulife Financial Corp.(a) | 320,899 | | | 3,417,673 | |
| Sun Life Financial, Inc.(a) | 125,037 | | | 2,319,705 | |
| Suncor Energy, Inc. | 247,864 | | | 7,148,215 | |
| Teck Resources Ltd.(a) | 104,620 | | | 3,687,759 | |
| Thomson Reuters Corp. | 106,534 | | | 2,847,530 | |
| TransCanada Corp.(a) | 138,613 | | | 6,058,834 | |
| Yamana Gold, Inc.(a) | 166,200 | | | 2,450,379 | |
| Other Securities(a) | 818,303 | | | 19,083,498 | |
| | | | | 55,269,114 | |
| Denmark — 1.3% | | | | | |
| Other Securities(a) | 186,580 | | | 5,619,638 | |
| | | | | 5,619,638 | |
| Finland — 0.7% | | | | | |
| Other Securities | 312,894 | | | 3,027,409 | |
| | | | | 3,027,409 | |
| France — 9.2% | | | | | |
| AXA SA | 198,619 | | | 2,582,195 | |
| Cie de Saint-Gobain | 76,505 | | | 2,937,328 | |
| France Telecom SA | 252,519 | | | 3,965,995 | |
| GDF Suez | 246,704 | | | 6,743,548 | |
| Vivendi | 288,783 | | | 6,323,977 | |
| Other Securities(a) | 839,673 | | | 16,895,670 | |
| | | | | 39,448,713 | |
| Germany — 8.1% | | | | | |
| Allianz SE | 34,938 | | | 3,342,101 | |
| Bayerische Motoren Werke AG | 71,775 | | | 4,808,236 | |
| Daimler AG | 127,622 | | | 5,602,730 | |
| Deutsche Bank AG | 29,867 | | | 1,137,821 | |
| Deutsche Bank AG | 41,677 | | | 1,577,891 | |
| Deutsche Telekom AG | 475,474 | | | 5,455,365 | |
| E.On AG | 249,404 | | | 5,380,930 | |
| Muenchener Rueckversicherungs AG | 18,030 | | | 2,211,723 | |
| Other Securities(a) | 356,110 | | | 5,400,250 | |
| | | | | 34,917,047 | |
| Greece — 0.1% | | | | | |
| Other Securities | 38,113 | | | 244,537 | |
| | | | | 244,537 | |
| Hong Kong — 1.3% | | | | | |
| Hutchison Whampoa Ltd. | 362,000 | | | 3,043,623 | |
| Other Securities | 1,319,948 | | | 2,595,774 | |
| | | | | 5,639,397 | |
| Ireland — 0.3% | | | | | |
| Other Securities(a) | 70,069 | | | 1,389,375 | |
| | | | | 1,389,375 | |
| Israel — 0.5% | | | | | |
| Other Securities | 462,783 | | | 2,346,238 | |
| | | | | 2,346,238 | |
| Italy — 0.9% | | | | | |
| Other Securities(a) | 2,134,955 | | | 4,044,301 | |
| | | | | 4,044,301 | |
| Japan — 21.4% | | | | | |
| FUJIFILM Holdings Corp. | 113,700 | | | 2,692,934 | |
| JX Holdings, Inc. | 446,500 | | | 2,697,447 | |
| Mitsubishi UFJ Financial Group, Inc. | 917,400 | | | 3,897,490 | |
| Mitsubishi UFJ Financial | | | | | |
| Group, Inc., ADR | 1,031,340 | | | 4,321,315 | |
| Panasonic Corp.(a) | 263,000 | | | 2,234,663 | |
| Sony Corp., ADR(a) | 212,565 | | | 3,834,673 | |
| Sumitomo Corp. | 207,400 | | | 2,807,728 | |
| Sumitomo Mitsui Financial Group, Inc. | 170,400 | | | 4,746,493 | |
| Toyota Motor Corp. | 105,300 | | | 3,509,088 | |
| Toyota Motor Corp., ADR | 50,471 | | | 3,337,647 | |
| Other Securities(a) | 9,402,772 | | | 57,806,659 | |
| | | | | 91,886,137 | |
| Netherlands — 2.6% | | | | | |
| Akzo Nobel NV | 49,506 | | | 2,393,773 | |
| Koninklijke Philips Electronics NV | 143,152 | | | 3,016,269 | |
| Other Securities | 485,310 | | | 5,763,193 | |
| | | | | 11,173,235 | |
| New Zealand — 0.1% | | | | | |
| Other Securities | 110,499 | | | 453,285 | |
| | |
| Norway — 0.9% | | | | | |
| Other Securities(a) | 936,022 | | | 4,054,832 | |
| | | | 4,054,832 | |
| Portugal — 0.1% | | | | | |
| Other Securities(a) | 308,765 | | | 208,289 | |
| | | | | 208,289 | |
| Singapore — 0.8% | | | | | |
| Other Securities(a) | 2,064,589 | | | 3,475,754 | |
| | | | | 3,475,754 | |
| Spain — 2.7% | | | | | |
| Banco Santander SA | 349,086 | | | 2,652,094 | |
| Repsol YPF SA(a) | 84,909 | | | 2,608,322 | |
| Other Securities(a) | 1,137,618 | | | 6,298,850 | |
| | | | | 11,559,266 | |
See notes to financial statements.
17
SA International Value Fund
SUMMARY PORTFOLIO OF INVESTMENTS — AS OF DECEMBER 31, 2011 (Unaudited) (Continued)
| SHARES | | VALUE† | |
| COMMON STOCKS (Continued) | | | | | |
| Sweden — 2.4% | | | | | | |
| Other Securities(a) | 1,031,305 | | $ | 10,171,626 | | |
| | | | 10,171,626 | | |
| Switzerland — 5.2% | | | | | | |
| Holcim Ltd.* | 63,904 | | | 3,418,690 | | |
| Swiss Re Ltd.* | 89,565 | | | 4,564,544 | | |
| Zurich Financial Services AG* | 24,930 | | | 5,639,971 | | |
| Other Securities | 236,350 | | | 8,603,446 | | |
| | | | | 22,226,651 | | |
| United Kingdom — 21.9% | | | | | | |
| BP PLC, ADR | 369,933 | | | 15,810,936 | | |
| Kingfisher PLC | 803,327 | | | 3,127,650 | | |
| Royal Dutch Shell PLC, ADR | 249,011 | | | 18,927,326 | | |
| Vodafone Group PLC, ADR | 6,835,685 | | | 18,991,700 | | |
| WM Morrison Supermarkets PLC | 611,503 | | | 3,097,805 | | |
| WPP PLC | 217,958 | | | 2,286,492 | | |
| Xstrata PLC | 395,500 | | | 6,006,989 | | |
| Other Securities(a) | 10,616,109 | | | 25,843,852 | | |
| | | | 94,092,750 | | |
| TOTAL COMMON STOCKS | | | | | | |
| (Identified Cost $443,543,773) | | | | 428,522,833 | | |
| | |
| PREFERRED STOCKS — 0.0% | | | | | | |
| Germany — 0.0% | | | | | | |
| Other Securities | 2,731 | | | 146,156 | | |
| TOTAL PREFERRED STOCKS | | | | | | |
| (Identified Cost $169,209) | | | | 146,156 | | |
| | |
| SHORT-TERM INVESTMENTS — 0.0% | | | | | |
| United States — 0.0% | | | | | | |
| SSgA Government Money | | | | | | |
| Market Fund | 1 | | | 1 | | |
| SSgA Money Market Fund | 57 | | | 57 | | |
| | | | 58 | | |
| TOTAL SHORT-TERM INVESTMENTS | | | | | | |
| (Identified Cost $58) | | | | 58 | | |
| | |
| COLLATERAL FOR SECURITIES ON LOAN — 15.0% | | |
| Short-Term — 15.0% | | | | | | |
| State Street Navigator Securities | | | | | | |
| Lending Prime Portfolio | 64,629,732 | | | 64,629,732 | | |
| TOTAL COLLATERAL FOR | | | | | | |
| SECURITIES ON LOAN | | | | | | |
| (Identified Cost $64,629,732) | | | | 64,629,732 | | |
| | |
| Total Investments — 114.7% | | | | | | |
| (Identified Cost $508,342,772)# | | | | 493,298,779 | | |
| Liabilities, Less Cash and Other | | | | | | |
| Assets — (14.7%) | | | | (63,289,387 | ) | |
| Net Assets — 100.0% | | | $ | 430,009,392 | | |
| | † | | See Note 1. |
| (a) | | A portion or all of the security was held on loan. As of December 31, 2011, the market value of the securities on loan was $62,499,430. |
| * | | Non-income producing security. |
| # | | At December 31, 2011 the aggregate cost of investment securities for U.S. federal income tax purposes was $508,342,772. Net unrealized depreciation aggregated $15,043,993 of which $48,675,654 related to appreciated investment securities and $63,719,647 related to depreciated investment securities. |
Key to abbreviations:
ADR — American Depository Receipt
Ten Largest Industry Holdings as of December 31, 2011
(As a percentage of net assets):
| Industry | | Percentage | |
| Oil, Gas & Consumable Fuels | 16.7 | % | |
| Commercial Banks | 11.2 | % | |
| Insurance | 8.6 | % | |
| Metals & Mining | 6.9 | % | |
| Automobiles | 4.9 | % | |
| Wireless Telecommunication Services | 4.8 | % | |
| Diversified Telecommunication Services | 4.6 | % | |
| Food & Staples Retailing | 3.9 | % | |
| Chemicals | 2.6 | % | |
| Household Durables | 2.5 | % | |
Country Weightings
(% of portfolio market value)

See notes to financial statements.
18
SA International Small Company Fund
PORTFOLIO OF INVESTMENTS — AS OF DECEMBER 31, 2011 (Unaudited)
| SHARES | | VALUE† | |
| MUTUAL FUNDS — 100.1% | | | | | | |
| Other — 100.1% | | | | | | |
| DFA International Small Company | | | | | | |
| Portfolio | 13,452,183 | | $ | 186,178,216 | | |
| TOTAL MUTUAL FUNDS | | | | | | |
| (Identified Cost $141,130,542) | | | | 186,178,216 | | |
| | |
| Total Investments — 100.1% | | | | | | |
| (Identified Cost $141,130,542)# | | | | 186,178,216 | | |
| Liabilities, Less Cash and | | | | | | |
| Other Assets — (0.1%) | | | | (256,870 | ) | |
| Net Assets — 100.0% | | | $ | 185,921,346 | | |
| | † | | See Note 1. |
| # | | At December 31, 2011 the aggregate cost of investment securities for U.S. federal income tax purposes was $141,130,542. Net unrealized appreciation aggregated $45,047,674, which related solely to appreciated investment securities. |
See notes to financial statements.
19
SA Emerging Markets Value Fund
SUMMARY PORTFOLIO OF INVESTMENTS — AS OF DECEMBER 31, 2011 (Unaudited)
| SHARES | | VALUE† | |
| COMMON STOCKS — 95.2% | | | | | |
| Brazil — 9.5% | | | | | |
| Banco Santander Brasil SA, ADR | 114,655 | | $ | 933,292 | |
| BM&FBOVESPA SA | 168,604 | | | 885,843 | |
| BR Malls Participacoes SA | 34,200 | | | 332,236 | |
| Gerdau SA, ADR | 98,782 | | | 771,487 | |
| JBS SA* | 94,584 | | | 308,308 | |
| Petroleo Brasileiro SA, ADR | 60,737 | | | 1,509,315 | |
| Other Securities | 223,707 | | | 1,679,535 | |
| | | | | 6,420,016 | |
| Chile — 2.2% | | | | | |
| Empresas CMPC SA | 133,020 | | | 488,807 | |
| Empresas COPEC SA | 28,567 | | | 383,001 | |
| Enersis SA, ADR | 29,100 | | | 513,033 | |
| Other Securities | 24,358 | | | 122,831 | |
| | | | 1,507,672 | |
| China — 15.7% | | | | | |
| Bank of China Ltd., H Shares | 4,654,902 | | | 1,720,131 | |
| Bank of Communications Co., Ltd., | | | | | |
| H Shares | 539,400 | | | 378,509 | |
| China Citic Bank Corp. Ltd., H Shares | 554,000 | | | 313,144 | |
| China Construction Bank Corp., H Shares | 1,505,810 | | | 1,050,845 | |
| China Petroleum & Chemical Corp. | 12,822 | | | 1,346,951 | |
| China Unicom Hong Kong Ltd., ADR | 38,409 | | | 811,582 | |
| Other Securities | 10,479,802 | | | 4,981,563 | |
| | | | | 10,602,725 | |
| Czech Republic — 0.3% | | | | | |
| Other Securities | 19,219 | | | 214,733 | |
| | | | | 214,733 | |
| Hungary — 0.2% | | | | | |
| Other Securities | 4,297 | | | 166,874 | |
| | | | | 166,874 | |
| India — 7.1% | | | | | |
| ICICI Bank Ltd., ADR | 32,610 | | | 861,882 | |
| Reliance Industries Ltd. | 39,139 | | | 510,823 | |
| Reliance Industries Ltd., GDR, (b) | 21,509 | | | 572,139 | |
| Other Securities | 1,303,779 | | | 2,879,523 | |
| | | | | 4,824,367 | |
| Indonesia — 3.0% | | | | | |
| Other Securities | 10,504,014 | | | 2,049,406 | |
| | | | | 2,049,406 | |
| Korea — 14.4% | | | | | |
| Hana Financial Group, Inc. | 13,580 | | | 419,070 | |
| Hyundai Motor Co. | 5,327 | | | 984,940 | |
| Hyundai Steel Co. | 3,820 | | | 317,339 | |
| KB Financial Group, Inc., ADR* | 23,644 | | | 741,003 | |
| LG Display Co., Ltd., ADR* | 30,316 | | | 319,227 | |
| LG Electronics, Inc. | 7,392 | | | 477,400 | |
| POSCO, ADR | 17,644 | | | 1,448,572 | |
| Samsung C&T Corp. | 5,831 | | | 344,697 | |
| Samsung SDI Co., Ltd. | 2,604 | | | 301,766 | |
| Shinhan Financial Group Co., Ltd., ADR* | 12,205 | | | 832,503 | |
| Other Securities | 185,632 | | | 3,549,352 | |
| | | | | 9,735,869 | |
| Malaysia — 3.9% | | | | | |
| AMMB Holdings Berhad | 201,687 | | | 378,561 | |
| Other Securities | 2,378,614 | | | 2,244,229 | |
| | | | | 2,622,790 | |
| Mexico — 6.3% | | | | | |
| Alfa SAB de CV-Class A | 31,400 | | | 342,224 | |
| Cemex SAB de CV, ADR* | 65,742 | | | 354,349 | |
| Embotelladoras Arca SAB de CV | 73,232 | | | 312,246 | |
| Fomento Economico Mexicano | | | | | |
| SAB de CV, ADR | 20,700 | | | 1,442,997 | |
| Grupo Financiero Banorte SAB de CV | 103,000 | | | 311,848 | |
| Other Securities | 433,224 | | | 1,470,536 | |
| | | | | 4,234,200 | |
| Philippines — 0.7% | | | | | |
| Other Securities | 2,226,019 | | | 475,584 | |
| | | | 475,584 | |
| Poland — 1.5% | | | | | |
| PGE SA | 54,527 | | | 327,086 | |
| Polski Koncern Naftowy Orlen* | 36,737 | | | 360,897 | |
| Other Securities | 110,242 | | | 301,143 | |
| | | | | 989,126 | |
| Russia — 5.3% | | | | | |
| Gazprom OAO, ADR | 237,661 | | | 2,534,982 | |
| Lukoil OAO, ADR | 14,376 | | | 761,209 | |
| Other Securities | 46,172 | | | 310,742 | |
| | | | 3,606,933 | |
| South Africa — 8.6% | | | | | |
| Gold Fields Ltd., ADR | 50,300 | | | 767,075 | |
| Harmony Gold Mining Co., Ltd., ADR | 30,300 | | | 352,692 | |
| Nedbank Group Ltd. | 20,163 | | | 362,170 | |
| Sanlam Ltd. | 214,984 | | | 768,318 | |
| Sasol Ltd., ADR | 9,800 | | | 464,520 | |
| Standard Bank Group Ltd. | 65,317 | | | 799,011 | |
| Steinhoff International Holdings Ltd.* | 137,280 | | | 390,793 | |
| Other Securities | 319,833 | | | 1,905,229 | |
| | | | | 5,809,808 | |
| Taiwan — 12.6% | | | | | |
| Chinatrust Financial Holding Co., Ltd. | 622,951 | | | 388,843 | |
| Mega Financial Holding Co., Ltd. | 777,240 | | | 518,519 | |
| United Microelectronics Corp. | 1,215,513 | | | 509,826 | |
| Other Securities | 13,466,774 | | | 7,114,515 | |
| | | | | 8,531,703 | |
| Thailand — 2.4% | | | | | |
| Bangkok Bank PCL, ADR | 99,000 | | | 481,664 | |
| Other Securities | 2,170,728 | | | 1,121,295 | |
| | | | 1,602,959 | |
See notes to financial statements.
20
SA Emerging Markets Value Fund
SUMMARY PORTFOLIO OF INVESTMENTS — AS OF DECEMBER 31, 2011 (Unaudited) (Continued)
| SHARES | | VALUE† | |
| COMMON STOCKS (Continued) | | | | | |
| Turkey — 1.5% | | | | | |
| Other Securities | 583,375 | | $ | 989,964 | |
| | | | 989,964 | |
| TOTAL COMMON STOCKS | | | | | |
| (Identified Cost $70,671,035) | | | | 64,384,729 | |
| | |
| PREFERRED STOCKS — 4.6% | | | | | |
| Brazil — 4.6% | | | | | |
| Petroleo Brasileiro SA, ADR | 77,403 | | | 1,818,197 | |
| Usinas Siderurgicas de Minas Gerais | | | | | |
| SA, PF A | 65,050 | | | 353,978 | |
| Other Securities | 136,511 | | | 938,378 | |
| | | | | 3,110,553 | |
| TOTAL PREFERRED STOCKS | | | | | |
| (Identified Cost $4,173,256) | | | | 3,110,553 | |
| | |
| SHORT-TERM INVESTMENTS — 0.0% | | | | |
| United States — 0.0% | | | | | |
| SSgA Government Money Market Fund | 1 | | | 1 | |
| SSgA Money Market Fund | 20 | | | 20 | |
| | | | | 21 | |
| TOTAL SHORT-TERM INVESTMENTS | | | | | |
| (Identified Cost $21) | | | | 21 | |
| | |
| Total Investments — 99.8% | | | | | |
| (Identified Cost $74,844,312)# | | | | 67,495,303 | |
| Cash and Other Assets, | | | | | |
| Less Liabilities — 0.2% | | | | 150,749 | |
| Net Assets — 100.0% | | | $ | 67,646,052 | |
| † | | See Note 1. |
| * | | Non-income producing security. |
| | # | | At December 31, 2011 the aggregate cost of investment securities for U.S. federal income tax purposes was $74,844,312. Net unrealized depreciation aggregated $7,349,009 of which $7,306,105 related to appreciated investment securities and $14,655,114 related to depreciated investment securities. |
| (b) | | 144A securities. Securities exempt from registration under Rule 144A of the Securities Act of 1933. These securities may be resold in transactions exempt from registration normally to qualified institutional buyers. |
Key to abbreviations:
ADR — American Depository Receipt
GDR — Global Depository Receipt
Ten Largest Industry Holdings as of December 31, 2011
(As a percentage of net assets):
| Industry | | Percentage | |
| Commercial Banks | 23.5 | % | |
| Oil, Gas & Consumable Fuels | 17.2 | % | |
| Metals & Mining | 9.9 | % | |
| Industrial Conglomerates | 3.8 | % | |
| Beverages | 3.5 | % | |
| Real Estate Management & Development | 3.2 | % | |
| Food Products | 2.8 | % | |
| Electronic Equipment, Instruments & Components | 2.5 | % | |
| Diversified Financial Services | 2.3 | % | |
| Automobiles | 2.2 | % | |
Country Weightings
(% of portfolio market value)

See notes to financial statements.
21
SA Real Estate Securities Fund
SUMMARY PORTFOLIO OF INVESTMENTS — AS OF DECEMBER 31, 2011 (Unaudited)
| SHARES | | VALUE† | |
| COMMON STOCKS — 99.4% | | | | | |
| Real Estate Investment Trusts (REITs) — 99.4% | | | | |
| Alexandria Real Estate Equities, Inc. | 13,826 | | $ | 953,579 | |
| American Campus Communities, Inc. | 15,413 | | | 646,729 | |
| Apartment Investment & | | | | | |
| Management Co. | 27,129 | | | 621,525 | |
| AvalonBay Communities, Inc. | 20,910 | | | 2,730,846 | |
| BioMed Realty Trust, Inc. | 29,836 | | | 539,435 | |
| Boston Properties, Inc. | 32,833 | | | 3,270,167 | |
| BRE Properties, Inc. | 16,502 | | | 833,021 | |
| Camden Property Trust | 15,652 | | | 974,180 | |
| CBL & Associates Properties, Inc. | 31,622 | | | 496,465 | |
| DDR Corp. | 50,375 | | | 613,064 | |
| Digital Realty Trust, Inc. | 22,213 | | | 1,480,941 | |
| Douglas Emmett, Inc. | 27,318 | | | 498,280 | |
| Duke Realty Corp. | 56,420 | | | 679,861 | |
| Entertainment Properties Trust | 10,577 | | | 462,321 | |
| Equity Lifestyle Properties, Inc. | 8,639 | | | 576,135 | |
| Equity Residential | 65,949 | | | 3,761,071 | |
| Essex Property Trust, Inc. | 7,481 | | | 1,051,155 | |
| Extra Space Storage, Inc. | 19,308 | | | 467,833 | |
| Federal Realty Investment Trust | 14,251 | | | 1,293,278 | |
| General Growth Properties, Inc. | 95,222 | | | 1,430,234 | |
| HCP, Inc. | 90,859 | | | 3,764,288 | |
| Health Care REIT, Inc. | 39,968 | | | 2,179,455 | |
| Highwoods Properties, Inc. | 16,361 | | | 485,431 | |
| Home Properties, Inc. | 10,723 | | | 617,323 | |
| Hospitality Properties Trust | 28,024 | | | 643,992 | |
| Host Hotels & Resorts, Inc. | 157,171 | | | 2,321,416 | |
| Kilroy Realty Corp. | 13,003 | | | 495,024 | |
| Kimco Realty Corp. | 91,026 | | | 1,478,262 | |
| LaSalle Hotel Properties | 18,751 | | | 453,962 | |
| Liberty Property Trust | 25,879 | | | 799,144 | |
| Mack-Cali Realty Corp.* | 19,600 | | | 523,124 | |
| Mid-America Apartment | | | | | |
| Communities, Inc. | 8,069 | | | 504,716 | |
| National Retail Properties, Inc. | 21,200 | | | 559,256 | |
| Omega Healthcare Investors, Inc. | 22,305 | | | 431,602 | |
| Piedmont Office Realty Trust, Inc., | | | | | |
| Class A | 38,406 | | | 654,438 | |
| Post Properties, Inc. | 11,085 | | | 484,636 | |
| Prologis, Inc. | 101,860 | | | 2,912,177 | |
| Public Storage | 32,353 | | | 4,350,184 | |
| Realty Income Corp. | 29,614 | | | 1,035,305 | |
| Regency Centers Corp. | 19,804 | | | 745,026 | |
| Senior Housing Properties Trust | 35,824 | | | 803,891 | |
| Simon Property Group, Inc. | 65,329 | | | 8,423,521 | |
| SL Green Realty Corp. | 19,652 | | | 1,309,609 | |
| Tanger Factory Outlet Centers | 19,324 | | | 566,580 | |
| Taubman Centers, Inc. | 12,538 | | | 778,610 | |
| The Macerich Co. | 29,378 | | | 1,486,527 | |
| UDR, Inc. | 48,055 | | | 1,206,180 | |
| Ventas, Inc. | 61,009 | | | 3,363,426 | |
| Vornado Realty Trust | 37,308 | | | 2,867,493 | |
| Weingarten Realty Investors | 25,900 | | | 565,138 | |
| Other Securities | 789,034 | | | 9,539,595 | |
| | | | | 79,729,451 | |
| TOTAL COMMON STOCKS | | | | | |
| (Identified Cost $65,885,768) | | | | 79,729,451 | |
| | |
| SHORT-TERM INVESTMENTS — 0.2% | | | | |
| United States — 0.2% | | | | | |
| SSgA Government Money Market Fund | 1 | | | 1 | |
| SSgA Money Market Fund | 152,019 | | | 152,019 | |
| | | | | 152,020 | |
| TOTAL SHORT-TERM INVESTMENTS | | | | | |
| (Identified Cost $152,020) | | | | 152,020 | |
| | |
| Total Investments — 99.6% | | | | | |
| (Identified Cost $66,037,788)# | | | | 79,881,471 | |
| Cash and Other Assets, | | | | | |
| Less Liabilities — 0.4% | | | | 356,862 | |
| Net Assets — 100.0% | | | $ | 80,238,333 | |
| | † | | See Note 1. |
| | * | | Non-income producing security. |
| | # | | At December 31, 2011 the aggregate cost of investment securities for U.S. federal income tax purposes was $66,037,788. Net unrealized appreciation aggregated $12,677,358 of which $16,234,009 related to appreciated investment securities and $3,556,651 related to depreciated investment securities. |
Key to abbreviations:
REIT — Real Estate Investment Trust
Portfolio Sectors
(% of portfolio market value)

See notes to financial statements.
22
(This page has been left blank intentionally.)
23
STATEMENTS OF ASSETS AND LIABILITIES — DECEMBER 31, 2011 (Unaudited)
| | SA | | SA | | | SA | |
| | U.S. Fixed | | Global Fixed | | | U.S. Core | |
| | Income Fund | | Income Fund | | | Market Fund | |
| ASSETS | | | | | | | | | | | | | |
| Investments in securities, at value | | $ | 345,138,083 | | | $ | 630,834,009 | | | $ | 406,119,636 | | |
| Cash | | | 612 | | | | 933 | | | | 11,271 | | |
| Foreign currency, at value | | | — | | | | 410,183 | | | | — | | |
| Receivable for investments sold | | | — | | | | — | | | | 21,895 | | |
| Dividends and interest receivable | | | 1,559,798 | | | | 6,380,667 | | | | 512,081 | | |
| Receivable for fund shares sold | | | 1,241,046 | | | | 1,070,750 | | | | 808,076 | | |
| Unrealized appreciation on foreign currency exchange contracts (Note 1) | | | — | | | | 2,230,457 | | | | — | | |
| Receivable due from the Adviser (Note 2) | | | 48,515 | | | | 666 | | | | 20,429 | | |
| Receivable for tax reclaims | | | — | | | | — | | | | 982 | | |
| ��Prepaid expenses | | | 1,895 | | | | 1,891 | | | | 1,885 | | |
| Other assets | | | 9,401 | | | | — | | | | — | | |
| Total Assets | | | 347,999,350 | | | | 640,929,556 | | | | 407,496,255 | | |
| | |
| LIABILITIES | | | | | | | | | | | | | |
| Payable for investments purchased | | | — | | | | — | | | | — | | |
| Payable for fund shares redeemed | | | 62,213 | | | | 269,948 | | | | 283,922 | | |
| Due to custodian bank | | | — | | | | — | | | | — | | |
| Collateral for securities on loan (Note 1) | | | — | | | | 86,212,378 | | | | 19,361,364 | | |
| Unrealized depreciation on foreign currency | | | | | | | | | | | | | |
| exchange contracts (Note 1) | | | — | | | | 1,005,380 | | | | — | | |
| Advisory fee payable (Note 2) | | | 73,452 | | | | 140,625 | | | | 179,082 | | |
| Sub-Advisory fee payable (Note 2) | | | 29,381 | | | | 23,438 | | | | 15,043 | | |
| Administration fee payable (Note 2) | | | 29,381 | | | | 46,875 | | | | 32,560 | | |
| Sub-Administration fee payable (Note 2) | | | 10,977 | | | | 18,971 | | | | 16,118 | | |
| Custody and accounting fees payable | | | 10,724 | | | | 22,188 | | | | 26,509 | | |
| Trustees' fees payable (Note 2) | | | 6,529 | | | | 6,529 | | | | 6,529 | | |
| Shareholder servicing fee payable (Note 2) | | | 73,452 | | | | 117,188 | | | | 81,401 | | |
| Transfer agent fee payable | | | 8,288 | | | | 13,880 | | | | 9,112 | | |
| Professional fees payable | | | 9,358 | | | | 19,674 | | | | — | | |
| Accrued expenses and other liabilities | | | — | | | | 13,948 | | | | 3,631 | | |
| Total Liabilities | | | 313,755 | | | | 87,911,022 | | | | 20,015,271 | | |
| | |
| NET ASSETS | | $ | 347,685,595 | | | $ | 553,018,534 | | | $ | 387,480,984 | | |
| NET ASSETS CONSIST OF: | | | | | | | | | | | | | |
| Capital paid in | | $ | 346,950,841 | | | $ | 533,487,830 | | | $ | 344,362,390 | | |
| Undistributed/(overdistributed) net investment income | | | (22,937 | ) | | | (2,122,669 | ) | | | 1,020,080 | | |
| Accumulated net realized gain/(loss) | | | 275,441 | | | | 13,744,756 | | | | (70,733,667 | ) | |
| Net unrealized appreciation/(depreciation) on: | | | | | | | | | | | | | |
| Investments | | | 482,250 | | | | 6,834,555 | | | | 112,832,181 | | |
| Foreign currency and forward currency transactions | | | — | | | | 1,074,062 | | | | — | | |
| | |
| NET ASSETS | | $ | 347,685,595 | | | $ | 553,018,534 | | | $ | 387,480,984 | | |
| | |
| Shares of beneficial interest outstanding | | | | | | | | | | | | | |
| ($0.01 par value, unlimited shares authorized) | | | 34,024,169 | | | | 55,380,081 | | | | 33,439,346 | | |
| Net asset value per share | | $ | 10.22 | | | $ | 9.99 | | | $ | 11.59 | | |
| Identified cost of investments | | $ | 344,655,833 | | | $ | 623,999,454 | | | $ | 293,287,455 | | |
| Cost of foreign currency | | $ | — | | | $ | 411,253 | | | $ | — | | |
See notes to financial statements.
24
| | SA | | SA U.S. | | SA International | | SA International | | SA | | SA | |
| | U.S. Value | | Small Company | | Value | | Small Company | | Emerging Markets | | Real Estate | |
| | | Fund | | Fund | | Fund | | Fund | | Value Fund | | Securities Fund | |
| | | | | | | | | | | | | | | | | | | | | | | | | | |
| | $ | 302,781,360 | | | $ | 316,022,629 | | | $ | 493,298,779 | | | $ | 186,178,216 | | | $ | 67,495,303 | | | $ | 79,881,471 | | |
| | | — | | | | — | | | | — | | | | — | | | | — | | | | 13,487 | | |
| | | — | | | | — | | | | 1,303,176 | | | | — | | | | 142,056 | | | | — | | |
| | | 778,666 | | | | 543,280 | | | | 816 | | | | 344,000 | | | | — | | | | — | | |
| | | 356,481 | | | | 149,255 | | | | 1,407,618 | | | | — | | | | 63,009 | | | | 262,801 | | |
| | | 499,145 | | | | 489,092 | | | | 454,120 | | | | 262,562 | | | | 199,780 | | | | 219,100 | | |
| | | — | | | | — | | | | — | | | | — | | | | — | | | | — | | |
| | | 22,453 | | | | 46,760 | | | | — | | | | 11,774 | | | | 40,685 | | | | 25,642 | | |
| | | 471 | | | | 175 | | | | 140,625 | | | | — | | | | 3,424 | | | | — | | |
| | | 1,885 | | | | 1,885 | | | | 1,885 | | | | 1,884 | | | | 1,896 | | | | 1,896 | | |
| | | 16,963 | | | | — | | | | — | | | | — | | | | — | | | | — | | |
| | | 304,457,424 | | | | 317,253,076 | | | | 496,607,019 | | | | 186,798,436 | | | | 67,946,153 | | | | 80,404,397 | | |
| | |
| | |
| | | | — | | | | 44,338 | | | | — | | | | — | | | | — | | | | — | | |
| | | 444,460 | | | | 309,506 | | | | 1,133,841 | | | | 310,409 | | | | 70,960 | | | | 51,106 | | |
| | | 833,458 | | | | 855,015 | | | | 281,335 | | | | 343,548 | | | | 29,141 | | | | — | | |
| | | 15,365,753 | | | | 80,520,088 | | | | 64,629,732 | | | | — | | | | — | | | | — | | |
| | |
| | | — | | | | — | | | | — | | | | — | | | | — | | | | — | | |
| | | 132,669 | | | | 109,072 | | | | 237,335 | | | | 102,561 | | | | 37,554 | | | | 36,155 | | |
| | | 24,122 | | | | 69,410 | | | | 73,026 | | | | — | | | | 28,888 | | | | 9,861 | | |
| | | 24,122 | | | | 19,831 | | | | 36,513 | | | | 15,779 | | | | 5,778 | | | | 6,574 | | |
| | | 13,109 | | | | 10,927 | | | | 21,827 | | | | 9,234 | | | | 3,521 | | | | 3,279 | | |
| | | 13,773 | | | | 25,360 | | | | 31,134 | | | | 4,934 | | | | 11,493 | | | | 5,912 | | |
| | | 6,529 | | | | 6,529 | | | | 6,529 | | | | 6,529 | | | | 6,529 | | | | 6,529 | | |
| | | 60,304 | | | | 49,578 | | | | 91,283 | | | | 39,447 | | | | 14,444 | | | | 16,434 | | |
| | | 14,423 | | | | 14,211 | | | | 14,952 | | | | 13,732 | | | | 13,367 | | | | 8,234 | | |
| | | — | | | | 20,183 | | | | 20,202 | | | | 18,199 | | | | 23,526 | | | | 20,206 | | |
| | | 15,292 | | | | 13,658 | | | | 19,918 | | | | 12,718 | | | | 54,900 | | | | 1,774 | | |
| | | 16,948,014 | | | | 82,067,706 | | | | 66,597,627 | | | | 877,090 | | | | 300,101 | | | | 166,064 | | |
| | | | |
| | $ | 287,509,410 | | | $ | 235,185,370 | | | $ | 430,009,392 | | | $ | 185,921,346 | | | $ | 67,646,052 | | | $ | 80,238,333 | | |
| | |
| | $ | 296,789,852 | | | $ | 231,622,730 | | | $ | 517,527,101 | | | $ | 170,293,962 | | | $ | 74,995,488 | | | $ | 74,833,289 | | |
| | | 16,194 | | | | 302,280 | | | | 3,041,921 | | | | 2,194,424 | | | | (22,145 | ) | | | 271,893 | | |
| | | (22,898,809 | ) | | | 1,557,706 | | | | (75,495,989 | ) | | | (31,614,714 | ) | | | 152,826 | | | | (8,710,532 | ) | |
| | |
| | | 13,602,173 | | | | 1,702,646 | | | | (15,043,993 | ) | | | 45,047,674 | | | | (7,349,009 | ) | | | 13,843,683 | | |
| | | | — | | | | 8 | | | | (19,648 | ) | | | — | | | | (131,108 | ) | | | — | | |
| | |
| | $ | 287,509,410 | | | $ | 235,185,370 | | | $ | 430,009,392 | | | $ | 185,921,346 | | | $ | 67,646,052 | | | $ | 80,238,333 | | |
| | |
| | |
| | | | 27,682,916 | | | | 14,989,625 | | | | 47,934,097 | | | | 12,741,089 | | | | 7,395,753 | | | | 10,788,905 | | |
| | $ | 10.39 | | | $ | 15.69 | | | $ | 8.97 | | | $ | 14.59 | | | $ | 9.15 | | | $ | 7.44 | | |
| | |
| | $ | 289,179,187 | | | $ | 314,319,983 | | | $ | 508,342,772 | | | $ | 141,130,542 | | | $ | 74,844,312 | | | $ | 66,037,788 | | |
| | | $ | — | | | $ | — | | | $ | 1,303,811 | | | $ | — | | | $ | 147,285 | | | $ | — | | |
25
STATEMENTS OF OPERATIONS—SIX MONTHS ENDED DECEMBER 31, 2011 (Unaudited)
| | SA U.S. | | SA Global | | SA U.S. | |
| | Fixed Income | | Fixed Income | | Core Market | |
| | Fund | | Fund | | Fund | |
| INVESTMENT INCOME | | | | | | | | | | | | |
| Income: | | | | | | | | | | | | |
| Dividends | | $ | — | | | $ | — | | $ | 3,903,154 | | |
| Interest (1) | | | 1,272,053 | | | | 8,052,361 | | | 56,686 | | |
| Other income | | | — | | | | — | | | 23,565 | | |
| Taxes withheld | | | — | | | | — | | | (216 | ) | |
| Total Income | | | 1,272,053 | | | | 8,052,361 | | | 3,983,189 | | |
| Expenses: | | | | | | | | | | | | |
| Advisory fees (Note 2) | | | 426,509 | | | | 847,794 | | | 1,058,560 | | |
| Sub-Advisory fees (Note 2) | | | 170,604 | | | | 141,299 | | | 88,919 | | |
| Shareholder Services fees (Note 2) | | | 426,509 | | | | 706,495 | | | 481,163 | | |
| Administration fees (Note 2) | | | 170,604 | | | | 282,598 | | | 192,465 | | |
| Deferred expense reimbursement (Note 2) | | | — | | | | 70,158 | | | — | | |
| Sub-Administration fees (Note 2) | | | 38,148 | | | | 64,274 | | | 45,962 | | |
| Trustees' fees and expenses (Note 2) | | | 10,904 | | | | 10,904 | | | 10,904 | | |
| Custody and accounting fees | | | 36,287 | | | | 76,797 | | | 68,167 | | |
| Transfer agent fees | | | 46,238 | | | | 66,125 | | | 64,118 | | |
| Professional fees | | | 52,509 | | | | 47,209 | | | 49,610 | | |
| Registration fees | | | 11,901 | | | | 10,357 | | | 10,106 | | |
| Other expenses | | | 18,548 | | | | 30,181 | | | 23,300 | | |
| Total expenses before waivers and reimbursements: | | | 1,408,761 | | | | 2,354,191 | | | 2,093,274 | | |
| Less: Fee waiver by Adviser (Note 2) | | | (299,771 | ) | | | (1,607 | ) | | (168,620 | ) | |
| Net expenses | | | 1,108,990 | | | | 2,352,584 | | | 1,924,654 | | |
| Net investment income | | | 163,063 | | | | 5,699,777 | | | 2,058,535 | | |
| | |
| NET REALIZED AND UNREALIZED GAIN (LOSS) ON INVESTMENTS | | | | | | | | | | | | |
| Realized gain (loss) on: | | | | | | | | | | | | |
| Investments | | | 408,618 | | | | 4,043,414 | | | 2,154,479 | | |
| Foreign currency and forward currency transactions | | | — | | | | 14,529,124 | | | (33 | ) | |
| Increase (decrease) in unrealized appreciation (depreciation) on: | | | | | | | | | | | | |
| Investments | | | (738,173 | ) | | | (22,166,162 | ) | | (25,624,893 | ) | |
| Foreign currency and forward currency transactions | | | — | | | | 250,197 | | | — | | |
| Net realized and unrealized loss on investments and | | | | | | | | | | | | |
| foreign currency transactions | | | (329,555 | ) | | | (3,343,427 | ) | | (23,470,447 | ) | |
| Net increase (decrease) in net assets resulting from operations | | $ | (166,492 | ) | | $ | 2,356,350 | | $ | (21,411,912 | ) | |
| (1) Interest income includes security lending income of: | | $ | — | | | $ | 81,131 | | $ | 56,656 | | |
See notes to financial statements.
26
| | SA U.S. | | SA U.S. | | SA International | | SA International | | SA | | SA | |
| | Value | | Small Company | | Value | | Small Company | | Emerging Markets | | Real Estate | |
| | Fund | | Fund | | Fund | | Fund | | Value Fund | | Securities Fund | |
| | |
| | |
| | $ | 3,170,122 | | | $ | 1,379,211 | | | $ | 6,451,347 | | | $ | 3,301,937 | | | $ | 969,369 | | | $ | 1,496,458 | | |
| | | 135,134 | | | | 307,132 | | | | 265,680 | | | | — | | | | 71 | | | | 9 | | |
| | | 13,556 | | | | 29,325 | | | | — | | | | — | | | | 18 | | | | 713 | | |
| | | (1,089 | ) | | | (1,336 | ) | | | (371,080 | ) | | | — | | | | (138,510 | ) | | | — | | |
| | | 3,317,723 | | | | 1,714,332 | | | | 6,345,947 | | | | 3,301,937 | | | | 830,948 | | | | 1,497,180 | | |
| | | | |
| | | 785,907 | | | | 647,190 | | | | 1,487,368 | | | | 654,439 | | | | 230,054 | | | | 208,737 | | |
| | | 142,892 | | | | 411,849 | | | | 457,652 | | | | — | | | | 176,964 | | | | 56,928 | | |
| | | 357,231 | | | | 294,177 | | | | 572,065 | | | | 251,707 | | | | 88,482 | | | | 94,880 | | |
| | | 142,892 | | | | 117,671 | | | | 228,826 | | | | 100,683 | | | | 35,393 | | | | 37,952 | | |
| | | — | | | | — | | | | — | | | | — | | | | — | | | | — | | |
| | | 35,178 | | | | 29,035 | | | | 57,740 | | | | 25,301 | | | | 9,128 | | | | 9,297 | | |
| | | 10,904 | | | | 10,904 | | | | 10,904 | | | | 10,904 | | | | 10,904 | | | | 10,904 | | |
| | | 41,730 | | | | 74,023 | | | | 101,469 | | | | 16,743 | | | | 82,119 | | | | 21,577 | | |
| | | 69,130 | | | | 67,655 | | | | 71,706 | | | | 66,646 | | | | 49,383 | | | | 46,179 | | |
| | | 49,574 | | | | 51,073 | | | | 51,093 | | | | 51,803 | | | | 51,996 | | | | 51,097 | | |
| | | 8,263 | | | | 7,915 | | | | 10,540 | | | | 7,890 | | | | 9,045 | | | | 8,855 | | |
| | | | 19,166 | | | | 15,872 | | | | 30,060 | | | | 12,942 | | | | 7,535 | | | | 5,724 | | |
| | | | 1,662,867 | | | | 1,727,364 | | | | 3,079,423 | | | | 1,199,058 | | | | 751,003 | | | | 552,130 | | |
| | | | (162,499 | ) | | | (315,312 | ) | | | — | | | | (91,545 | ) | | | (237,806 | ) | | | (172,609 | ) | |
| | | | 1,500,368 | | | | 1,412,052 | | | | 3,079,423 | | | | 1,107,513 | | | | 513,197 | | | | 379,521 | | |
| | | | 1,817,355 | | | | 302,280 | | | | 3,266,524 | | | | 2,194,424 | | | | 317,751 | | | | 1,117,659 | | |
| | | | |
| | | |
| | | |
| | | | 2,613,830 | | | | 1,954,430 | | | | (19,066,908 | ) | | | 3,661,837 | | | | 1,456,620 | | | | (374,231 | ) | |
| | | | (151 | ) | | | 377 | | | | (174,473 | ) | | | — | | | | (72,276 | ) | | | — | | |
| | | | | | | | | | | | | | | | | | | | | | | | | | |
| | | | (40,035,642 | ) | | | (28,530,866 | ) | | | (91,769,156 | ) | | | (49,602,728 | ) | | | (20,911,810 | ) | | | (1,994,125 | ) | |
| | | | — | | | | 8 | | | | (94,435 | ) | | | — | | | | 20,430 | | | | — | | |
| | | | |
| | | (37,421,963 | ) | | | (26,576,051 | ) | | | (111,104,972 | ) | | | (45,940,891 | ) | | | (19,507,036 | ) | | | (2,368,356 | ) | |
| | $ | (35,604,608 | ) | | $ | (26,273,771 | ) | | $ | (107,838,448 | ) | | $ | (43,746,467 | ) | | $ | (19,189,285 | ) | | $ | (1,250,697 | ) | |
| | $ | 135,123 | | | $ | 307,118 | | | $ | 264,749 | | | $ | — | | | $ | — | | | $ | — | | |
27
STATEMENTS OF CHANGES IN NET ASSETS
| SA U.S. Fixed Income Fund | |
| Six Months Ended | | | | | |
| 12/31/2011 | | Year Ended | |
| (Unaudited) | | 06/30/2011 | |
| INCREASE (DECREASE) IN NET ASSETS | | | | | | | | |
| Operations: | | | | | | | | |
| Net investment income | $ | 163,063 | | | $ | 662,549 | | |
| Net realized gain (loss) on investments and foreign currency transactions | | 408,618 | | | | 1,769,231 | | |
| Net increase (decrease) in unrealized appreciation (depreciation) | | (738,173 | ) | | | (158,334 | ) | |
| Net increase (decrease) in net assets from operations | | (166,492 | ) | | | 2,273,446 | | |
| | |
| Distributions to shareholders from: | | | | | | | | |
| Net investment income | | (187,387 | ) | | | (661,162 | ) | |
| Net realized gains | | (1,330,313 | ) | | | (1,740,510 | ) | |
| Total distributions | | (1,517,700 | ) | | | (2,401,672 | ) | |
| | |
| Share transactions | | | | | | | | |
| Proceeds from sale of shares | | 59,024,540 | | | | 130,806,529 | | |
| Value of distributions reinvested | | 1,467,896 | | | | 2,357,754 | | |
| Cost of shares redeemed | | (35,456,214 | ) | | | (40,010,129 | ) | |
| Total share transactions | | 25,036,222 | | | | 93,154,154 | | |
| Total increase (decrease) in net assets | | 23,352,030 | | | | 93,025,928 | | |
| | | | | | | | | |
| NET ASSETS | | | | | | | | |
| Beginning of period | | 324,333,565 | | | | 231,307,637 | | |
| End of period | $ | 347,685,595 | | | $ | 324,333,565 | | |
| | |
| Undistributed/(overdistributed) net investment income, end of period | $ | (22,937 | ) | | $ | 1,387 | | |
| CAPITAL SHARE TRANSACTIONS | | | | | | | | |
| Shares sold by subscription | | 5,747,563 | | | | 12,744,540 | | |
| Issued for distributions reinvested | | 143,585 | | | | 230,636 | | |
| Shares redeemed | | (3,453,798 | ) | | | (3,897,164 | ) | |
| Net increase (decrease) in fund shares | | 2,437,350 | | | | 9,078,012 | | |
See notes to financial statements.
28
| SA Global Fixed Income Fund | | SA U.S. Core Market Fund | |
| Six Months Ended | | | | | | Six Months Ended | | | | | |
| 12/31/2011 | | Year Ended | | 12/31/2011 | | Year Ended | |
| (Unaudited) | | 06/30/2011 | | (Unaudited) | | 06/30/2011 | |
| | |
| | |
| $ | 5,699,777 | | | $ | 11,761,654 | | | $ | 2,058,535 | | | $ | 3,566,340 | | |
| | 18,572,538 | | | | (26,214,649 | ) | | | 2,154,446 | | | | 7,565,611 | | |
| | (21,915,965 | ) | | | 25,080,963 | | | | (25,624,893 | ) | | | 89,456,597 | | |
| | 2,356,350 | | | | 10,627,968 | | | | (21,411,912 | ) | | | 100,588,548 | | |
| | |
| | |
| | (4,443,876 | ) | | | (20,092,211 | ) | | | (2,578,093 | ) | | | (4,471,661 | ) | |
| | — | | | | — | | | | — | | | | — | | |
| | (4,443,876 | ) | | | (20,092,211 | ) | | | (2,578,093 | ) | | | (4,471,661 | ) | |
| | |
| | |
| | 58,860,022 | | | | 156,244,385 | | | | 33,230,121 | | | | 65,358,389 | | |
| | 4,298,425 | | | | 19,536,038 | | | | 2,457,801 | | | | 4,256,599 | | |
| | (67,717,947 | ) | | | (79,024,374 | ) | | | (40,381,226 | ) | | | (74,170,277 | ) | |
| | (4,559,500 | ) | | | 96,756,049 | | | | (4,693,304 | ) | | | (4,555,289 | ) | |
| | (6,647,026 | ) | | | 87,291,806 | | | | (28,683,309 | ) | | | 91,561,598 | | |
| | | |
| | | |
| | 559,665,560 | | | | 472,373,754 | | | | 416,164,293 | | | | 324,602,695 | | |
| $ | 553,018,534 | | | $ | 559,665,560 | | | $ | 387,480,984 | | | $ | 416,164,293 | | |
| | |
| $ | (2,122,669 | ) | | $ | (3,378,570 | ) | | $ | 1,020,080 | | | $ | 1,539,638 | | |
| | |
| | 5,820,401 | | | | 15,583,009 | | | | 2,947,597 | | | | 5,709,765 | | |
| | 431,136 | | | | 1,951,123 | | | | 214,655 | | | | 370,139 | | |
| | (6,697,305 | ) | | | (7,835,412 | ) | | | (3,541,437 | ) | | | (6,515,704 | ) | |
| | (445,768 | ) | | | 9,698,720 | | | | (379,185 | ) | | | (435,800 | ) | |
29
STATEMENTS OF CHANGES IN NET ASSETS (Continued)
| SA U.S. Value Fund | |
| Six Months Ended | | | | | |
| 12/31/2011 | | Year Ended | |
| (Unaudited) | | 06/30/2011 | |
| INCREASE (DECREASE) IN NET ASSETS | | | | | | | | |
| Operations: | | | | | | | | |
| Net investment income | $ | 1,817,355 | | | $ | 3,209,257 | | |
| Net realized gain (loss) on investments and foreign currency transactions | | 2,613,679 | | | | 15,131,596 | | |
| Net increase (decrease) in unrealized appreciation (depreciation) | | (40,035,642 | ) | | | 66,739,136 | | |
| Net increase (decrease) in net assets from operations | | (35,604,608 | ) | | | 85,079,989 | | |
| | |
| Distributions to shareholders from: | | | | | | | | |
| Net investment income | | (2,875,897 | ) | | | (2,790,940 | ) | |
| Net realized gains | | — | | | | — | | |
| Total distributions | | (2,875,897 | ) | | | (2,790,940 | ) | |
| | |
| Share transactions | | | | | | | | |
| Proceeds from sale of shares | | 27,472,263 | | | | 58,016,731 | | |
| Value of distributions reinvested | | 2,751,412 | | | | 2,673,643 | | |
| Cost of shares redeemed | | (26,522,921 | ) | | | (60,363,186 | ) | |
| Total share transactions | | 3,700,754 | | | | 327,188 | | |
| Total increase (decrease) in net assets | | (34,779,751 | ) | | | 82,616,237 | | |
| | | | | | | | | |
| NET ASSETS | | | | | | | | |
| Beginning of period | | 322,289,161 | | | | 239,672,924 | | |
| End of period | $ | 287,509,410 | | | $ | 322,289,161 | | |
| | |
| Undistributed net investment income, end of period | $ | 16,194 | | | $ | 1,074,736 | | |
| CAPITAL SHARE TRANSACTIONS | | | | | | | | |
| Shares sold by subscription | | 2,683,198 | | | | 5,373,828 | | |
| Issued for distributions reinvested | | 271,075 | | | | 250,811 | | |
| Shares redeemed | | (2,568,006 | ) | | | (5,523,322 | ) | |
| Net increase (decrease) in fund shares | | 386,267 | | | | 101,317 | | |
See notes to financial statements.
30
| SA U.S. Small Company Fund | | SA International Value Fund | |
| Six Months Ended | | | | | | Six Months Ended | | | | | |
| 12/31/2011 | | Year Ended | | 12/31/2011 | | Year Ended | |
| | (Unaudited) | | 06/30/2011 | | (Unaudited) | | 06/30/2011 | |
| | |
| | |
| $ | 302,280 | | | $ | 426,461 | | | $ | 3,266,524 | | | $ | 10,790,216 | | |
| | 1,954,807 | | | | 15,701,742 | | | | (19,241,381 | ) | | | 31,086,900 | | |
| | | (28,530,858 | ) | | | 64,355,163 | | | | (91,863,591 | ) | | | 85,989,576 | | |
| | (26,273,771 | ) | | | 80,483,366 | | | | (107,838,448 | ) | | | 127,866,692 | | |
| | |
| | |
| | | — | | | | (610,760 | ) | | | (9,885,455 | ) | | | (8,897,384 | ) | |
| | (1,250,197 | ) | | | — | | | | — | | | | — | | |
| | (1,250,197 | ) | | | (610,760 | ) | | | (9,885,455 | ) | | | (8,897,384 | ) | |
| | |
| | |
| | 19,141,398 | | | | 43,918,508 | | | | 44,880,286 | | | | 91,701,841 | | |
| | 1,188,360 | | | | 583,377 | | | | 9,496,824 | | | | 8,551,929 | | |
| | (24,248,257 | ) | | | (61,907,723 | ) | | | (42,977,149 | ) | | | (103,160,286 | ) | |
| | (3,918,499 | ) | | | (17,405,838 | ) | | | 11,399,961 | | | | (2,906,516 | ) | |
| | (31,442,467 | ) | | | 62,466,768 | | | | (106,323,942 | ) | | | 116,062,792 | | |
| | | |
| | |
| | 266,627,837 | | | | 204,161,069 | | | | 536,333,334 | | | | 420,270,542 | | |
| $ | 235,185,370 | | | $ | 266,627,837 | | | $ | 430,009,392 | | | $ | 536,333,334 | | |
| | |
| $ | 302,280 | | | $ | — | | | $ | 3,041,921 | | | $ | 9,660,852 | | |
| | |
| | 1,251,578 | | | | 2,804,963 | | | | 4,663,038 | | | | 8,344,628 | | |
| | 76,128 | | | | 35,988 | | | | 1,077,960 | | | | 785,301 | | |
| | (1,564,885 | ) | | | (3,894,949 | ) | | | (4,442,662 | ) | | | (9,398,851 | ) | |
| | (237,179 | ) | | | (1,053,998 | ) | | | 1,298,336 | | | | (268,922 | ) | |
31
STATEMENTS OF CHANGES IN NET ASSETS (Continued)
| SA International Small Company Fund | |
| Six Months Ended | | | | | |
| 12/31/2011 | | Year Ended | |
| (Unaudited) | | 06/30/2011 | |
| INCREASE (DECREASE) IN NET ASSETS | | | | | | | | |
| Operations: | | | | | | | | |
| Net investment income | $ | 2,194,424 | | | $ | 3,391,130 | | |
| Net realized gain (loss) on investments and foreign currency transactions | | 3,661,837 | | | | 764,029 | | |
| Net increase (decrease) in unrealized appreciation (depreciation) | | (49,602,728 | ) | | | 56,843,371 | | |
| Net increase (decrease) in net assets from operations | | (43,746,467 | ) | | | 60,998,530 | | |
| | |
| Distributions to shareholders from: | | | | | | | | |
| Net investment income | | (2,370,316 | ) | | | (2,554,024 | ) | |
| Net realized gains | | — | | | | — | | |
| Total distributions | | (2,370,316 | ) | | | (2,554,024 | ) | |
| | |
| Share transactions | | | | | | | | |
| Proceeds from sale of shares | | 17,276,009 | | | | 37,866,446 | | |
| Value of distributions reinvested | | 2,258,132 | | | | 2,434,069 | | |
| Cost of shares redeemed | | (18,743,871 | ) | | | (41,682,737 | ) | |
| Total share transactions | | 790,270 | | | | (1,382,222 | ) | |
| Total increase (decrease) in net assets | | (45,326,513 | ) | | | 57,062,284 | | |
| | | | | | | | | |
| NET ASSETS | | | | | | | | |
| Beginning of period | | 231,247,859 | | | | 174,185,575 | | |
| End of period | $ | 185,921,346 | | | $ | 231,247,859 | | |
| | |
| Undistributed/(overdistributed) net investment income, end of period | $ | 2,194,424 | | | $ | 2,370,316 | | |
| CAPITAL SHARE TRANSACTIONS | | | | | | | | |
| Shares sold by subscription | | 1,094,080 | | | | 2,222,144 | | |
| Issued for distributions reinvested | | 156,380 | | | | 142,011 | | |
| Shares redeemed | | (1,182,646 | ) | | | (2,464,460 | ) | |
| Net increase (decrease) in fund shares | | 67,814 | | | | (100,305 | ) | |
See notes to financial statements.
32
| SA Emerging Markets Value Fund | | SA Real Estate Securities Fund | |
| Six Months Ended | | | | | | Six Months Ended | | | | | |
| 12/31/2011 | | Year Ended | | 12/31/2011 | | Year Ended | |
| (Unaudited) | | 06/30/2011 | | (Unaudited) | | 06/30/2011 | |
| | |
| | |
| $ | 317,751 | | | $ | 387,409 | | | $ | 1,117,659 | | | $ | 788,813 | | |
| | 1,384,344 | | | | 1,847,143 | | | | (374,231 | ) | | | (2,934,556 | ) | |
| | (20,891,380 | ) | | | 13,136,982 | | | | (1,994,125 | ) | | | 20,679,910 | | |
| | (19,189,285 | ) | | | 15,371,534 | | | | (1,250,697 | ) | | | 18,534,167 | | |
| | |
| | |
| | | (635,931 | ) | | | (253,509 | ) | | | (1,063,764 | ) | | | (1,436,108 | ) | |
| | (1,898,558 | ) | | | (1,191,663 | ) | | | — | | | | — | | |
| | (2,534,489 | ) | | | (1,445,172 | ) | | | (1,063,764 | ) | | | (1,436,108 | ) | |
| | |
| | |
| | 13,224,869 | | | | 20,590,900 | | | | 9,830,154 | | | | 19,258,866 | | |
| | 2,448,054 | | | | 1,423,998 | | | | 1,030,907 | | | | 1,409,854 | | |
| | (5,977,981 | ) | | | (15,784,782 | ) | | | (6,853,739 | ) | | | (13,219,175 | ) | |
| | 9,694,942 | | | | 6,230,116 | | | | 4,007,322 | | | | 7,449,545 | | |
| | (12,028,832 | ) | | | 20,156,478 | | | | 1,692,861 | | | | 24,547,604 | | |
| | | |
| | |
| | 79,674,884 | | | | 59,518,406 | | | | 78,545,472 | | | | 53,997,868 | | |
| $ | 67,646,052 | | | $ | 79,674,884 | | | $ | 80,238,333 | | | $ | 78,545,472 | | |
| | |
| $ | (22,145 | ) | | $ | 296,035 | | | $ | 271,893 | | | $ | 217,998 | | |
| | |
| | 1,274,439 | | | | 1,694,985 | | | | 1,370,738 | | | | 2,732,211 | | |
| | 272,916 | | | | 116,817 | | | | 140,642 | | | | 212,648 | | |
| | (575,808 | ) | | | (1,315,794 | ) | | | (952,204 | ) | | | (1,876,029 | ) | |
| | 971,547 | | | | 496,008 | | | | 559,176 | | | | 1,068,830 | | |
33
FINANCIAL HIGHLIGHTS
| | SA U.S. Fixed |
| | Income Fund |
| | Six Months Ended | | | | | | | | | | | | | | | | | | | | |
| | December 31, 2011 | | Year Ended | | Year Ended | | Year Ended | | Year Ended | | Year Ended |
| | (Unaudited) | | June 30, 2011 | | June 30, 2010 | | June 30, 2009 | | June 30, 2008 | | June 30, 2007* |
| Net Asset Value, Beginning of Period | | | $ | 10.27 | | | $ | 10.28 | | | $ | 10.27 | | | $ | 10.09 | | | $ | 10.11 | | | $ | 10.00 | |
| |
| Income from Investment Operations: | | | | | | | | | | | | | | | | | | | | | | |
| Net investment income (loss) | | | | (0.00 | )(4) | | | 0.02 | | | | 0.07 | | | | 0.21 | | | | 0.27 | | | | 0.06 | |
| Net realized and unrealized | | | | | | | | | | | | | | | | | | | | | | | | | |
| gain (loss) on investments | | | | (0.01 | ) | | | 0.06 | | | | 0.12 | | | | 0.18 | | | | 0.05 | | | | 0.05 | |
| Total from investment operations | | | | (0.01 | ) | | | 0.08 | | | | 0.19 | | | | 0.39 | | | | 0.32 | | | | 0.11 | |
| |
| Less Distributions: | | | | | | | | | | | | | | | | | | | | | | | | | |
| Dividends from net | | | | | | | | | | | | | | | | | | | | | | | | | |
| investment income | | | | (0.00 | )(4) | | | (0.02 | ) | | | (0.07 | ) | | | (0.21 | ) | | | (0.34 | ) | | | — | |
| Distributions from capital gains | | | | (0.04 | ) | | | (0.07 | ) | | | (0.11 | ) | | | — | | | | (0.00 | )(4) | | | — | |
| Total distributions | | | | (0.04 | ) | | | (0.09 | ) | | | (0.18 | ) | | | (0.21 | ) | | | (0.34 | ) | | | — | |
| |
| Net asset value, end of period | | | $ | 10.22 | | | $ | 10.27 | | | $ | 10.28 | | | $ | 10.27 | | | $ | 10.09 | | | $ | 10.11 | |
| |
| Total return (1) | | | | (0.05 | )% | | | 0.80 | % | | | 1.80 | % | | | 3.90 | % | | | 3.18 | % | | | 1.10 | % |
| Net assets, end of period (000s) | | | $ | 347,686 | | | $ | 324,334 | | | $ | 231,308 | | | $ | 162,975 | | | $ | 125,966 | | | $ | 37,226 | |
| Ratio of net expenses to | | | | | | | | | | | | | | | | | | | | | | | | | |
| average net assets (2) | | | | 0.65 | % | | | 0.65 | % | | | 0.65 | % | | | 0.65 | % | | | 0.65 | % | | | 0.65 | % |
| Ratio of gross expenses to | | | | | | | | | | | | | | | | | | | | | | | | | |
| average net assets (2)(3) | | | | 0.83 | % | | | 0.89 | % | | | 0.91 | % | | | 0.94 | % | | | 1.06 | % | | | 2.45 | % |
| Ratio of net investment income | | | | | | | | | | | | | | | | | | | | | | | | | |
| to average net assets (2) | | | | 0.10 | % | | | 0.24 | % | | | 0.66 | % | | | 2.05 | % | | | 3.05 | % | | | 4.56 | % |
| Portfolio turnover rate | | | | 39 | % | | | 92 | % | | | 104 | % | | | 46 | % | | | 0 | % | | | 0 | % |
| Without giving effect to the | | | | | | | | | | | | | | | | | | | | | | | | | |
| expense waiver described | | | | | | | | | | | | | | | | | | | | | | | | | |
| in Note 2 to the Financial | | | | | | | | | | | | | | | | | | | | | | | | | |
| Statements, net investment | | | | | | | | | | | | | | | | | | | | | | | | | |
| income (loss) per share | | | | | | | | | | | | | | | | | | | | | | | | | |
| would have been (3) | | | $ | (0.01 | ) | | $ | (0.00 | )(4) | | $ | 0.05 | | | $ | 0.18 | | | $ | 0.24 | | | $ | 0.04 | |
| * | | Fund commenced operations on April 2, 2007. |
| (1) | | Periods less than one year are not annualized. |
| (2) | | Annualized for periods less than one year. |
| (3) | | Gross expenses before waivers of expenses. |
| (4) | | Amount rounds to less than $(0.005) per share. |
See notes to financial statements.
34
FINANCIAL HIGHLIGHTS (Continued)
| | SA Global Fixed |
| | Income Fund |
| | Six Months Ended | | | | | | | | | | | | | | | | | | | | |
| | December 31, 2011 | | Year Ended | | Year Ended | | Year Ended | | Year Ended | | Year Ended |
| | (Unaudited) | | June 30, 2011 | | June 30, 2010 | | June 30, 2009 | | June 30, 2008 | | June 30, 2007 |
| Net Asset Value, Beginning of Period | | | $ | 10.03 | | | $ | 10.24 | | | $ | 9.93 | | | $ | 10.34 | | | $ | 10.30 | | | $ | 9.91 | |
| |
| Income from Investment Operations: | | | | | | | | | | | | | | | | | | | | | | | | | |
| Net investment income | | | | 0.10 | | | | 0.21 | | | | 0.25 | | | | 0.25 | | | | 0.26 | | | | 0.23 | |
| Net realized and unrealized | | | | | | | | | | | | | | | | | | | | | | | | | |
| gain (loss) on investments | | | | (0.06 | ) | | | — | | | | 0.25 | | | | 0.16 | | | | 0.02 | | | | 0.23 | |
| Total from investment operations | | | | 0.04 | | | | 0.21 | | | | 0.50 | | | | 0.41 | | | | 0.28 | | | | 0.46 | |
| |
| Less Distributions: | | | | | | | | | | | | | | | | | | | | | | | | | |
| Dividends from net | | | | | | | | | | | | | | | | | | | | | | | | | |
| investment income | | | | (0.08 | ) | | | (0.42 | ) | | | (0.19 | ) | | | (0.82 | ) | | | (0.24 | ) | | | (0.07 | ) |
| Total distributions | | | | (0.08 | ) | | | (0.42 | ) | | | (0.19 | ) | | | (0.82 | ) | | | (0.24 | ) | | | (0.07 | ) |
| |
| Net asset value, end of period | | | $ | 9.99 | | | $ | 10.03 | | | $ | 10.24 | | | $ | 9.93 | | | $ | 10.34 | | | $ | 10.30 | |
| |
| Total return (1) | | | | 0.41 | % | | | 2.12 | % | | | 5.02 | % | | | 4.04 | % | | | 2.77 | % | | | 4.60 | % |
| Net assets, end of period (000s) | | | $ | 553,019 | | | $ | 559,666 | | | $ | 472,374 | | | $ | 405,761 | | | $ | 601,370 | | | $ | 610,292 | |
| Ratio of net expenses to | | | | | | | | | | | | | | | | | | | | | | | | | |
| average net assets (2) | | | | 0.83 | % | | | 0.85 | % | | | 0.85 | % | | | 0.85 | % | | | 0.85 | % | | | 0.96 | % |
| Ratio of gross expenses to | | | | | | | | | | | | | | | | | | | | | | | | | |
| average net assets (2)(3) | | | | 0.83 | % | | | 1.15 | % | | | 1.17 | % | | | 1.16 | % | | | 1.14 | % | | | 1.23 | % |
| Ratio of net investment income | | | | | | | | | | | | | | | | | | | | | | | | | |
| to average net assets (2) | | | | 2.02 | % | | | 2.32 | % | | | 2.54 | % | | | 2.43 | % | | | 2.48 | % | | | 2.05 | % |
| Portfolio turnover rate | | | | 21 | % | | | 15 | % | | | 29 | % | | | 53 | % | | | 91 | % | | | 70 | % |
| Without giving effect to the expense | | | | | | | | | | | | | | | | | | | | | | | | | |
| waiver described in Note 2 | | | | | | | | | | | | | | | | | | | | | | | | | |
| to the Financial Statements, | | | | | | | | | | | | | | | | | | | | | | | | | |
| net investment income per | | | | | | | | | | | | | | | | | | | | | | | | | |
| share would have been (3) | | | $ | 0.10 | | | $ | 0.18 | | | $ | 0.22 | | | $ | 0.21 | | | $ | 0.23 | | | $ | 0.20 | |
| (1) | | Periods less than one year are not annualized. |
| (2) | | Annualized for periods less than one year. |
| (3) | | Gross expenses before waivers of expenses. |
See notes to financial statements.
35
FINANCIAL HIGHLIGHTS (Continued)
| | SA U.S. Core |
| | Market Fund |
| | Six Months Ended | | | | | | | | | | | | | | | | | | | | |
| | December 31, 2011 | | Year Ended | | Year Ended | | Year Ended | | Year Ended | | Year Ended |
| | (Unaudited) | | June 30, 2011 | | June 30, 2010 | | June 30, 2009 | | June 30, 2008 | | June 30, 2007 |
| Net Asset Value, Beginning of Period | | | $ | 12.31 | | | $ | 9.48 | | | $ | 8.42 | | | $ | 11.48 | | | $ | 13.56 | | | $ | 11.47 | |
| |
| Income from Investment Operations: | | | | | | | | | | | | | | | | | | | | | | |
| Net investment income | | | | 0.06 | | | | 0.11 | | | | 0.10 | | | | 0.16 | | | | 0.11 | | | | 0.10 | |
| Net realized and unrealized | | | | | | | | | | | | | | | | | | | | | | | | | |
| gain (loss) on investments | | | | (0.70 | ) | | | 2.85 | | | | 1.07 | | | | (3.08 | ) | | | (1.94 | ) | | | 2.08 | |
| Total from investment operations | | | | (0.64 | ) | | | 2.96 | | | | 1.17 | | | | (2.92 | ) | | | (1.83 | ) | | | 2.18 | |
| |
| Less Distributions: | | | | | | | | | | | | | | | | | | | | | | | | | |
| Dividends from net | | | | | | | | | | | | | | | | | | | | | | | | | |
| investment income | | | | (0.08 | ) | | | (0.13 | ) | | | (0.11 | ) | | | (0.11 | ) | | | (0.11 | ) | | | (0.09 | ) |
| Distributions from capital gains | | | | — | | | | — | | | | — | | | | (0.03 | ) | | | (0.14 | ) | | | — | |
| Total distributions | | | | (0.08 | ) | | | (0.13 | ) | | | (0.11 | ) | | | (0.14 | ) | | | (0.25 | ) | | | (0.09 | ) |
| |
| Net asset value, end of period | | | $ | 11.59 | | | $ | 12.31 | | | $ | 9.48 | | | $ | 8.42 | | | $ | 11.48 | | | $ | 13.56 | |
| |
| Total return (1) | | | | (5.21 | )% | | | 31.36 | % | | | 13.88 | % | | | (25.36 | )% | | | (13.70 | )% | | | 19.03 | % |
| Net assets, end of period (000s) | | | $ | 387,481 | | | $ | 416,164 | | | $ | 324,603 | | | $ | 299,711 | | | $ | 508,533 | | | $ | 624,833 | |
| Ratio of net expenses to | | | | | | | | | | | | | | | | | | | | | | | | | |
| average net assets (2) | | | | 1.00 | % | | | 1.00 | % | | | 1.00 | % | | | 1.00 | % | | | 1.00 | % | | | 1.06 | % |
| Ratio of gross expenses to | | | | | | | | | | | | | | | | | | | | | | | | | |
| average net assets (2)(3) | | | | 1.09 | % | | | 1.19 | % | | | 1.18 | % | | | 1.20 | % | | | 1.14 | % | | | 1.14 | % |
| Ratio of net investment income | | | | | | | | | | | | | | | | | | | | | | | | | |
| to average net assets (2) | | | | 1.07 | % | | | 0.93 | % | | | 0.95 | % | | | 1.50 | % | | | 0.91 | % | | | 0.81 | % |
| Portfolio turnover rate | | | | 3 | % | | | 9 | % | | | 6 | % | | | 7 | % | | | 2 | % | | | 2 | % |
| Without giving effect to the expense | | | | | | | | | | | | | | | | | | | | | | | | | |
| waiver described in Note 2 | | | | | | | | | | | | | | | | | | | | | | | | | |
| to the Financial Statements, | | | | | | | | | | | | | | | | | | | | | | | | | |
| net investment income per | | | | | | | | | | | | | | | | | | | | | | | | | |
| share would have been (3) | | | $ | 0.06 | | | $ | 0.09 | | | $ | 0.08 | | | $ | 0.14 | | | $ | 0.10 | | | $ | 0.09 | |
| (1) | | Periods less than one year are not annualized. |
| (2) | | Annualized for periods less than one year. |
| (3) | | Gross expenses before waivers of expenses. |
See notes to financial statements.
36
FINANCIAL HIGHLIGHTS (Continued)
| | SA U.S.
Value Fund |
| | Six Months Ended
December 31, 2011
(Unaudited) | | Year Ended
June 30, 2011 | | Year Ended
June 30, 2010 | | Year Ended
June 30, 2009 | | Year Ended
June 30, 2008 | | Year Ended
June 30, 2007 |
| Net Asset Value, Beginning of Period | | | $ | 11.81 | | | | $ | 8.81 | | | $ | 7.42 | | | $ | 11.25 | | | $ | 14.86 | | | $ | 13.27 | |
| |
| Income from Investment Operations: | | | | | | | | | | | | | | | | | | | | | | | |
| Net investment income | | | | 0.07 | | | | | 0.12 | | | | 0.06 | | | | 0.15 | | | | 0.10 | | | | 0.07 | |
| Net realized and unrealized | | | | | | | | | | | | | | | | | | | | | | | | | | |
| gain (loss) on investments | | | | (1.39 | ) | | | | 2.98 | | | | 1.42 | | | | (3.83 | ) | | | (3.33 | ) | | | 2.53 | |
| Total from investment operations | | | | (1.32 | ) | | | | 3.10 | | | | 1.48 | | | | (3.68 | ) | | | (3.23 | ) | | | 2.60 | |
| |
| Less Distributions: | | | | | | | | | | | | | | | | | | | | | | | | | | |
| Dividends from net | | | | | | | | | | | | | | | | | | | | | | | | | | |
| investment income | | | | (0.10 | ) | | | | (0.10 | ) | | | (0.09 | ) | | | (0.15 | ) | | | (0.07 | ) | | | (0.07 | ) |
| Distributions from capital gains | | | | — | | | | | — | | | | — | | | | — | | | | (0.31 | ) | | | (0.94 | ) |
| Total distributions | | | | (0.10 | ) | | | | (0.10 | ) | | | (0.09 | ) | | | (0.15 | ) | | | (0.38 | ) | | | (1.01 | ) |
| |
| Net asset value, end of period | | | $ | 10.39 | | | | $ | 11.81 | | | $ | 8.81 | | | $ | 7.42 | | | $ | 11.25 | | | $ | 14.86 | |
| |
| Total return (1) | | | | (11.12 | )% | | | | 35.33 | % | | | 19.92 | % | | | (32.68 | )% | | | (22.05 | )% | | | 20.33 | % |
| Net assets, end of period (000s) | | | $ | 287,509 | | | | $ | 322,289 | | | $ | 239,673 | | | $ | 200,695 | | | $ | 310,421 | | | $ | 373,545 | |
| Ratio of net expenses to | | | | | | | | | | | | | | | | | | | | | | | | | | |
| average net assets (2) | | | | 1.05 | % | | | | 1.05 | % | | | 1.05 | % | | | 1.05 | % | | | 1.05 | % | | | 1.11 | % |
| Ratio of gross expenses to | | | | | | | | | | | | | | | | | | | | | | | | | | |
| average net assets (2)(3) | | | | 1.16 | % | | | | 1.26 | % | | | 1.27 | % | | | 1.29 | % | | | 1.22 | % | | | 1.33 | % |
| Ratio of net investment income | | | | | | | | | | | | | | | | | | | | | | | | | | |
| to average net assets (2) | | | | 1.27 | % | | | | 1.09 | % | | | 0.67 | % | | | 1.82 | % | | | 0.82 | % | | | 0.47 | % |
| Portfolio turnover rate | | | | 5 | % | | | | 21 | % | | | 28 | % | | | 42 | % | | | 10 | % | | | 8 | % |
| Without giving effect to the expense | | | | | | | | | | | | | | | | | | | | | | | | | | |
| waiver described in Note 2 | | | | | | | | | | | | | | | | | | | | | | | | | | |
| to the Financial Statements, | | | | | | | | | | | | | | | | | | | | | | | | | | |
| net investment income per | | | | | | | | | | | | | | | | | | | | | | | | | | |
| share would have been (3) | | | $ | 0.06 | | | | $ | 0.09 | | | $ | 0.04 | | | $ | 0.13 | | | $ | 0.08 | | | $ | 0.04 | |
| (1) | Periods less than one year are not annualized. |
| (2) | Annualized for periods less than one year. |
| (3) | Gross expenses before waivers of expenses. |
See notes to financial statements.
37
FINANCIAL HIGHLIGHTS (Continued)
| | SA U.S.
Small Company Fund |
| | Six Months Ended
December 31, 2011
(Unaudited) | | Year Ended
June 30, 2011 | | Year Ended
June 30, 2010 | | Year Ended
June 30, 2009 | | Year Ended
June 30, 2008 | | Year Ended
June 30, 2007 |
| Net Asset Value, Beginning of Period | | | $ | 17.51 | | | | $ | 12.54 | | | $ | 10.26 | | | $ | 14.37 | | | $ | 20.15 | | | $ | 18.83 | |
| |
| Income from Investment Operations: | | | | | | | | | | | | | | | | | | | | | | | | | | |
| Net investment income (loss) | | | | 0.02 | | | | | 0.03 | | | | 0.00 | (4) | | | 0.09 | | | | 0.03 | | | | (0.01 | ) |
| Net realized and unrealized | | | | | | | | | | | | | | | | | | | | | | | | | | |
| gain (loss) on investments | | | | (1.76 | ) | | | | 4.98 | | | | 2.36 | | | | (3.41 | ) | | | (3.86 | ) | | | 2.88 | |
| Total from investment operations | | | | (1.74 | ) | | | | 5.01 | | | | 2.36 | | | | (3.32 | ) | | | (3.83 | ) | | | 2.87 | |
| |
| Less Distributions: | | | | | | | | | | | | | | | | | | | | | | | | | | |
| Dividends from net | | | | | | | | | | | | | | | | | | | | | | | | | | |
| investment income | | | | — | | | | | (0.04 | ) | | | (0.08 | ) | | | (0.03 | ) | | | — | | | | — | |
| Distributions from capital gains | | | | (0.08 | ) | | | | — | | | | — | | | | (0.76 | ) | | | (1.95 | ) | | | (1.55 | ) |
| Total distributions | | | | (0.08 | ) | | | | (0.04 | ) | | | (0.08 | ) | | | (0.79 | ) | | | (1.95 | ) | | | (1.55 | ) |
| |
| Net asset value, end of period | | | $ | 15.69 | | | | $ | 17.51 | | | $ | 12.54 | | | $ | 10.26 | | | $ | 14.37 | | | $ | 20.15 | |
| |
| Total return (1) | | | | (9.91 | )% | | | | 39.96 | % | | | 23.06 | % | | | (22.42 | )% | | | (20.15 | )% | | | 15.90 | % |
| Net assets, end of period (000s) | | | $ | 235,185 | | | | $ | 266,628 | | | $ | 204,161 | | | $ | 171,135 | | | $ | 260,892 | | | $ | 315,491 | |
| Ratio of net expenses to | | | | | | | | | | | | | | | | | | | | | | | | | | |
| average net assets (2) | | | | 1.20 | % | | | | 1.20 | % | | | 1.20 | % | | | 1.20 | % | | | 1.20 | % | | | 1.26 | % |
| Ratio of gross expenses to | | | | | | | | | | | | | | | | | | | | | | | | | | |
| average net assets (2)(3) | | | | 1.47 | % | | | | 1.56 | % | | | 1.57 | % | | | 1.61 | % | | | 1.51 | % | | | 1.53 | % |
| Ratio of net investment income | | | | | | | | | | | | | | | | | | | | | | | | | | |
| (loss) to average net assets (2) | | | | 0.26 | % | | | | 0.17 | % | | | 0.03 | % | | | 0.77 | % | | | 0.17 | % | | | (0.07 | )% |
| Portfolio turnover rate | | | | 8 | % | | | | 16 | % | | | 13 | % | | | 13 | % | | | 13 | % | | | 14 | % |
| Without giving effect to the expense | | | | | | | | | | | | | | | | | | | | | | | | | | |
| waiver described in Note 2 to | | | | | | | | | | | | | | | | | | | | | | | | | | |
| the Financial Statements, net | | | | | | | | | | | | | | | | | | | | | | | | | | |
| investment income (loss) per | | | | | | | | | | | | | | | | | | | | | | | | | | |
| share would have been (3) | | | $ | 0.00 | (4) | | | $ | (0.03 | ) | | $ | (0.04 | ) | | $ | 0.04 | | | $ | (0.02 | ) | | $ | (0.06 | ) |
| (1) | Periods less than one year are not annualized. |
| (2) | Annualized for periods less than one year. |
| (3) | Gross expenses before waivers of expenses. |
| (4) | Amount rounds to less than $0.005 per share. |
See notes to financial statements.
38
FINANCIAL HIGHLIGHTS (Continued)
| | SA International
Value Fund |
| | Six Months Ended
December 31, 2011
(Unaudited) | | Year Ended
June 30, 2011 | | Year Ended
June 30, 2010 | | Year Ended
June 30, 2009 | | Year Ended
June 30, 2008 | | Year Ended
June 30, 2007 |
| Net Asset Value, Beginning of Period | | | $ | 11.50 | | | | $ | 8.96 | | | $ | 8.51 | | | $ | 14.43 | | | $ | 19.79 | | | $ | 16.01 | |
| |
| Income from Investment Operations: | | | | | | | | | | | | | | | | | | | | | | | |
| Net investment income | | | | 0.07 | | | | | 0.23 | | | | 0.17 | | | | 0.23 | | | | 0.41 | | | | 0.38 | |
| Net realized and unrealized | | | | | | | | | | | | | | | | | | | | | | | | | | |
| gain (loss) on investments | | | | (2.39 | ) | | | | 2.50 | | | | 0.51 | | | | (4.91 | ) | | | (3.50 | ) | | | 5.07 | |
| Total from investment operations | | | | (2.32 | ) | | | | 2.73 | | | | 0.68 | | | | (4.68 | ) | | | (3.09 | ) | | | 5.45 | |
| |
| Less Distributions: | | | | | | | | | | | | | | | | | | | | | | | | | | |
| Dividends from net | | | | | | | | | | | | | | | | | | | | | | | | | | |
| investment income | | | | (0.21 | ) | | | | (0.19 | ) | | | (0.23 | ) | | | (0.37 | ) | | | (0.34 | ) | | | (0.31 | ) |
| Distributions from capital gains | | | | — | | | | | — | | | | — | | | | (0.87 | ) | | | (1.93 | ) | | | (1.36 | ) |
| Total distributions | | | | (0.21 | ) | | | | (0.19 | ) | | | (0.23 | ) | | | (1.24 | ) | | | (2.27 | ) | | | (1.67 | ) |
| |
| Net asset value, end of period | | | $ | 8.97 | | | | $ | 11.50 | | | $ | 8.96 | | | $ | 8.51 | | | $ | 14.43 | | | $ | 19.79 | |
| |
| Total return (1) | | | | (20.14 | )% | | | | 30.63 | % | | | 7.69 | % | | | (31.33 | )% | | | (17.01 | )% | | | 35.49 | % |
| Net assets, end of period (000s) | | | $ | 430,009 | | | | $ | 536,333 | | | $ | 420,271 | | | $ | 406,657 | | | $ | 632,869 | | | $ | 781,822 | |
| Ratio of net expenses to | | | | | | | | | | | | | | | | | | | | | | | | | | |
| average net assets (2) | | | | 1.35 | % | | | | 1.34 | % | | | 1.33 | % | | | 1.35 | % | | | 1.30 | % | | | 1.30 | % |
| Ratio of gross expenses to | | | | | | | | | | | | | | | | | | | | | | | | | | |
| average net assets (2)(3) | | | | 1.35 | % | | | | 1.34 | % | | | 1.33 | % | | | 1.35 | % | | | 1.30 | % | | | 1.42 | % |
| Ratio of net investment income | | | | | | | | | | | | | | | | | | | | | | | | | | |
| to average net assets (2) | | | | 1.43 | % | | | | 2.12 | % | | | 1.65 | % | | | 2.50 | % | | | 2.46 | % | | | 2.14 | % |
| Portfolio turnover rate | | | | 11 | % | | | | 25 | % | | | 20 | % | | | 27 | % | | | 20 | % | | | 18 | % |
| Without giving effect to the expense | | | | | | | | | | | | | | | | | | | | | | | | | | |
| waiver described in Note 2 | | | | | | | | | | | | | | | | | | | | | | | | | | |
| to the Financial Statements, | | | | | | | | | | | | | | | | | | | | | | | | | | |
| net investment income per | | | | | | | | | | | | | | | | | | | | | | | | | | |
| share would have been | | | $ | 0.07 | | | | $ | 0.23 | | | $ | 0.17 | | | $ | 0.23 | | | $ | 0.41 | | | $ | 0.36 | (3) |
| (1) | Periods less than one year are not annualized. |
| (2) | Annualized for periods less than one year. |
| (3) | Gross expenses before waivers of expenses. |
See notes to financial statements.
39
FINANCIAL HIGHLIGHTS (Continued)
| | SA International
Small Company Fund |
| | Six Months Ended
December 31, 2011
(Unaudited) | | Year Ended
June 30, 2011 | | Year Ended
June 30, 2010 | | Year Ended
June 30, 2009 | | Year Ended
June 30, 2008 | | Year Ended
June 30, 2007 |
| Net Asset Value, Beginning of Period | | | $ | 18.25 | | | | $ | 13.64 | | | $ | 12.29 | | | $ | 19.79 | | | $ | 24.61 | | | $ | 19.99 | |
| |
| Income from Investment Operations: | | | | | | | | | | | | | | | | | | | | | | | | | | |
| Net investment income | | | | 0.17 | | | | | 0.27 | | | | 0.12 | | | | 0.22 | | | | 0.28 | | | | 0.26 | |
| Net realized and unrealized | | | | | | | | | | | | | | | | | | | | | | | | | | |
| gain (loss) on investments | | | | (3.64 | ) | | | | 4.54 | | | | 1.43 | | | | (6.27 | ) | | | (4.04 | ) | | | 5.51 | |
| Total from investment operations | | | | (3.47 | ) | | | | 4.81 | | | | 1.55 | | | | (6.05 | ) | | | (3.76 | ) | | | 5.77 | |
| |
| Less Distributions: | | | | | | | | | | | | | | | | | | | | | | | | | | |
| Dividends from net | | | | | | | | | | | | | | | | | | | | | | | | | | |
| investment income | | | | (0.19 | ) | | | | (0.20 | ) | | | (0.20 | ) | | | (0.22 | ) | | | (0.33 | ) | | | (0.34 | ) |
| Distributions from capital gains | | | | — | | | | | — | | | | — | | | | (1.23 | ) | | | (0.73 | ) | | | (0.81 | ) |
| Total distributions | | | | (0.19 | ) | | | | (0.20 | ) | | | (0.20 | ) | | | (1.45 | ) | | | (1.06 | ) | | | (1.15 | ) |
| |
| Net asset value, end of period | | | $ | 14.59 | | | | $ | 18.25 | | | $ | 13.64 | | | $ | 12.29 | | | $ | 19.79 | | | $ | 24.61 | |
| |
| Total return (1) | | | | (19.55 | )% | | | | 35.39 | % | | | 12.56 | % | | | (29.10 | )% | | | (15.49 | )% | | | 29.64 | % |
| Net assets, end of period (000s) | | | $ | 185,921 | | | | $ | 231,248 | | | $ | 174,186 | | | $ | 156,285 | | | $ | 245,999 | | | $ | 282,516 | |
| Ratio of net expenses to | | | | | | | | | | | | | | | | | | | | | | | | | | |
| average net assets (2)† | | | | 1.10 | % | | | | 1.10 | % | | | 1.10 | % | | | 1.10 | % | | | 1.10 | % | | | 1.12 | % |
| Ratio of gross expenses to | | | | | | | | | | | | | | | | | | | | | | | | | | |
| average net assets (2)(3)† | | | | 1.19 | % | | | | 1.19 | % | | | 1.18 | % | | | 1.22 | % | | | 1.13 | % | | | 1.13 | % |
| Ratio of net investment income | | | | | | | | | | | | | | | | | | | | | | | | | | |
| to average net assets (2)† | | | | 2.18 | % | | | | 1.58 | % | | | 0.84 | % | | | 1.62 | % | | | 1.26 | % | | | 1.17 | % |
| Ratio of expenses to average | | | | | | | | | | | | | | | | | | | | | | | | | | |
| net assets for the DFA | | | | | | | | | | | | | | | | | | | | | | | | | | |
| Portfolio, (unaudited)(3)† | | | | | | | | | 0.55 | % | | | 0.55 | % | | | 0.57 | % | | | 0.55 | % | | | 0.55 | % |
| Ratio of expenses to average net | | | | | | | | | | | | | | | | | | | | | | | | | | |
| assets for the DFA Portfolio (4)† | | | | 0.55 | % | | | | 0.56 | % | | | 0.57 | % | | | 0.55 | % | | | 0.55 | % | | | 0.56 | % |
| Portfolio turnover rate | | | | N/A | | | | | N/A | | | | N/A | | | | N/A | | | | N/A | | | | N/A | |
| Without giving effect to the expense | | | | | | | | | | | | | | | | | | | | | | | | | | |
| waiver described in Note 2 | | | | | | | | | | | | | | | | | | | | | | | | | | |
| to the Financial Statements, | | | | | | | | | | | | | | | | | | | | | | | | | | |
| net investment income per | | | | | | | | | | | | | | | | | | | | | | | | | | |
| share would have been (5) | | | $ | 0.17 | | | | $ | 0.26 | | | $ | 0.11 | | | $ | 0.20 | | | $ | 0.27 | | | $ | 0.26 | |
| † | See Note 1. The DFA Portfolio expenses are not included in the stated expense information of the SA International Small Company Fund. The financial statements of the DFA Portfolio are included elsewhere in this report. |
| (1) | Periods less than one year are not annualized. |
| (2) | Annualized for periods less than one year. |
| (3) | The DFA Portfolio expense ratios are as of April 30, 2011, 2010, 2009, May 31, 2008 and 2007, respectively and are unaudited. |
| (4) | The DFA Portfolio expense ratios are for the fiscal years ended October 31, 2011, 2010, 2009, 2008, and November 30, 2007 and 2006, respectively. |
| (5) | Gross expenses before waivers of expenses. |
N/A Refer to the financial statements of the DFA Portfolio included elsewhere in this report. |
See notes to financial statements.
40
FINANCIAL HIGHLIGHTS (Continued)
| | SA Emerging
Markets Value Fund |
| | Six Months Ended
December 31, 2011
(Unaudited) | | Year Ended
June 30, 2011 | | Year Ended
June 30, 2010 | | Year Ended
June 30, 2009 | | Year Ended
June 30, 2008 | | Year Ended
June 30, 2007* |
| Net Asset Value, Beginning of Period | | | $ | 12.40 | | | | | $ | 10.04 | | | | | $ | 7.76 | | | | $ | 10.70 | | | $ | 11.33 | | | | $ | 10.00 | |
| |
| Income from Investment Operations: | |
| Net investment income | | | | 0.04 | | | | | | 0.06 | | | | | | 0.03 | | | | | 0.09 | | | | 0.13 | | | | | 0.02 | |
| Net realized and unrealized | | | | | | | | | | | | | | | | | | | | | | | | | | | | | | | |
| gain (loss) on investments | | | | (2.93 | ) | | | | | 2.54 | | | | | | 2.27 | | | | | (2.64 | ) | | | (0.67 | ) | | | | 1.31 | |
| Total from investment operations | | | | (2.89 | ) | | | | | 2.60 | | | | | | 2.30 | | | | | (2.55 | ) | | | (0.54 | ) | | | | 1.33 | |
| |
| Less Distributions: | | | | | | | | | | | | | | | | | | | | | | | | | | | | | | | |
| Dividends from net | | | | | | | | | | | | | | | | | | | | | | | | | | | | | | | |
| investment income | | | | (0.09 | ) | | | | | (0.04 | ) | | | | | (0.02 | ) | | | | (0.12 | ) | | | (0.09 | ) | | | | — | |
| Distributions from capital gains | | | | (0.27 | ) | | | | | (0.20 | ) | | | | | — | | | | | (0.27 | ) | | | — | | | | | — | |
| Total distributions | | | | (0.36 | ) | | | | | (0.24 | ) | | | | | (0.02 | ) | | | | (0.39 | ) | | | (0.09 | ) | | | | — | |
| |
| Net asset value, end of period | | | $ | 9.15 | | | | | $ | 12.40 | | | | | $ | 10.04 | | | | $ | 7.76 | | | $ | 10.70 | | | | $ | 11.33 | |
| |
| Total return (1) | | | | (23.34 | )% | | | | | 25.98 | % | | | | | 29.61 | % | | | | (22.48 | )% | | | (4.79 | )% | | | | 13.30 | % |
| Net assets, end of period (000s) | | | $ | 67,646 | | | | | $ | 79,675 | | | | | $ | 59,518 | | | | $ | 43,240 | | | $ | 44,269 | | | | $ | 20,742 | |
| Ratio of net expenses to | | | | | | | | | | | | | | | | | | | | | | | | | | | | | | | |
| average net assets (2) | | | | 1.45 | % | | | | | 1.45 | % | | | | | 1.45 | % | | | | 1.45 | % | | | 1.45 | % | | | | 1.45 | % |
| Ratio of gross expenses to | | | | | | | | | | | | | | | | | | | | | | | | | | | | | | | |
| average net assets (2)(3) | | | | 2.12 | % | | | | | 2.08 | % | | | | | 2.11 | % | | | | 2.44 | % | | | 2.44 | % | | | | 5.59 | % |
| Ratio of net investment income | | | | | | | | | | | | | | | | | | | | | | | | | | | | | | | |
| to average net assets (2) | | | | 0.90 | % | | | | | 0.53 | % | | | | | 0.34 | % | | | | 1.47 | % | | | 1.47 | % | | | | 1.52 | % |
| Portfolio turnover rate | | | | 5 | % | | | | | 14 | % | | | | | 25 | % | | | | 11 | % | | | 8 | % | | | | 0 | % |
| Without giving effect to the expense | | | | | | | | | | | | | | | | | | | | | | | | | | | | | | | |
| waiver described in Note 2 to | | | | | | | | | | | | | | | | | | | | | | | | | | | | | | | |
| the Financial Statements, net | | | | | | | | | | | | | | | | | | | | | | | | | | | | | | | |
| investment income (loss) per | | | | | | | | | | | | | | | | | | | | | | | | | | | | | | | |
| share would have been (3) | | | $ | 0.01 | | | | | $ | (0.01 | ) | | | | $ | (0.03 | ) | | | $ | 0.03 | | | $ | 0.04 | | | | $ | (0.04 | ) |
* | Fund commenced operations on April 2, 2007. |
| (1) | Periods less than one year are not annualized. |
| (2) | Annualized for periods less than one year. |
| (3) | Gross expenses before waivers of expenses. |
See notes to financial statements.
41
FINANCIAL HIGHLIGHTS (Continued)
| | SA Real Estate
Securities Fund |
| | Six Months Ended
December 31, 2011
(Unaudited) | | Year Ended
June 30, 2011 | | Year Ended
June 30, 2010 | | Year Ended
June 30, 2009 | | Year Ended
June 30, 2008 | | Year Ended
June 30, 2007* |
| Net Asset Value, Beginning of Period | | | $ | 7.68 | | | $ | 5.89 | | | $ | 3.92 | | | $ | 7.26 | | | $ | 8.93 | | | $ | 10.00 | |
| |
| Income from Investment Operations: |
| Net investment income | | | | 0.10 | | | | 0.08 | | | | 0.13 | | | | 0.13 | | | | 0.25 | | | | 0.03 | |
| Net realized and unrealized | | | | | | | | | | | | | | | | | | | | | | | | | |
| gain (loss) on investments | | | | (0.24 | ) | | | 1.86 | | | | 1.94 | | | | (3.28 | ) | | | (1.76 | ) | | | (1.10 | ) |
| Total from investment operations | | | | (0.14 | ) | | | 1.94 | | | | 2.07 | | | | (3.15 | ) | | | (1.51 | ) | | | (1.07 | ) |
| |
| Less Distributions: | | | | | | | | | | | | | | | | | | | | | | | | | |
| Dividends from net | | | | | | | | | | | | | | | | | | | | | | | | | |
| investment income | | | | (0.10 | ) | | | (0.15 | ) | | | (0.10 | ) | | | (0.12 | ) | | | (0.11 | ) | | | — | |
| Distributions from capital gains | | | | — | | | | — | | | | — | | | | (0.07 | ) | | | (0.05 | ) | | | — | |
| Total distributions | | | | (0.10 | ) | | | (0.15 | ) | | | (0.10 | ) | | | (0.19 | ) | | | (0.16 | ) | | | — | |
| |
| Net asset value, end of period | | | $ | 7.44 | | | $ | 7.68 | | | $ | 5.89 | | | $ | 3.92 | | | $ | 7.26 | | | $ | 8.93 | |
| |
| Total return (1) | | | | (1.80 | )% | | | 33.39 | % | | | 53.03 | % | | | (43.60 | )% | | | (16.94 | )% | | | (10.70 | )% |
| Net assets, end of period (000s) | | | $ | 80,238 | | | $ | 78,545 | | | $ | 53,998 | | | $ | 29,738 | | | $ | 36,660 | | | $ | 18,688 | |
| Ratio of net expenses to | | | | | | | | | | | | | | | | | | | | | | | | | |
| average net assets (2) | | | | 1.00 | % | | | 1.00 | % | | | 1.00 | % | | | 1.00 | % | | | 1.00 | % | | | 1.00 | % |
| Ratio of gross expenses to | | | | | | | | | | | | | | | | | | | | | | | | | |
| average net assets (2)(3) | | | | 1.45 | % | | | 1.61 | % | | | 1.67 | % | | | 2.02 | % | | | 1.99 | % | | | 4.78 | % |
| Ratio of net investment income | | | | | | | | | | | | | | | | | | | | | | | | | |
| to average net assets (2) | | | | 2.94 | % | | | 1.16 | % | | | 2.57 | % | | | 3.32 | % | | | 4.17 | % | | | 1.94 | % |
| Portfolio turnover rate | | | | 1 | % | | | 7 | % | | | 3 | % | | | 7 | % | | | 1 | % | | | 0 | % |
| Without giving effect to the expense | | | | | | | | | | | | | | | | | | | | | | | | | |
| waiver described in Note 2 to | | | | | | | | | | | | | | | | | | | | | | | | | |
| the Financial Statements, net | | | | | | | | | | | | | | | | | | | | | | | | | |
| investment income (loss) per | | | | | | | | | | | | | | | | | | | | | | | | | |
| share would have been (3) | | | $ | 0.09 | | | $ | 0.04 | | | $ | 0.09 | | | $ | 0.09 | | | $ | 0.19 | | | $ | (0.02 | ) |
* | Fund commenced operations on April 2, 2007. |
| (1) | Periods less than one year are not annualized. |
| (2) | Annualized for periods less than one year. |
| (3) | Gross expenses before waivers of expenses. |
See notes to financial statements.
42
SA FUNDS
NOTES TO FINANCIAL STATEMENTS — DECEMBER 31, 2011 (Unaudited)
1. Organization and Significant Accounting Policies
SA Funds — Investment Trust (the “Trust”) is a Delaware statutory trust that was organized on June 16, 1998. The Agreement and Declaration of Trust permits the Trust to offer separate portfolios (“Funds”) of shares of beneficial interest and different classes of shares of each Fund. The Trust is registered under the Investment Company Act of 1940 (the “1940 Act”), and currently offers the following nine Funds, each of which is a diversified mutual fund as defined in the 1940 Act.
SA U.S. Fixed Income Fund
SA Global Fixed Income Fund
SA U.S. Core Market Fund
SA U.S. Value Fund
SA U.S. Small Company Fund
SA International Value Fund
SA International Small Company Fund
SA Emerging Markets Value Fund
SA Real Estate Securities Fund
All of the Funds commenced investment operations on August 5, 1999, except SA Global Fixed Income Fund, which commenced operations on July 29, 1999, and SA U.S. Fixed Income Fund, SA Emerging Markets Value Fund, and SA Real Estate Securities Fund, which commenced operations on April 2, 2007.
Effective October 30, 2000, SA International Small Company Fund began investing substantially all of its assets in the International Small Company Portfolio (“DFA Portfolio”), a series of DFA Investment Dimensions Group Inc., an open-end management investment company. The DFA Portfolio has the same investment objective as SA International Small Company Fund and invests its assets in The Japanese Small Company Series, The Asia Pacific Small Company Series, The United Kingdom Small Company Series, The Continental Small Company Series and The Canadian Small Company Series, each a series of The DFA Investment Trust Company, an open-end management investment company. As of December 31, 2011, SA International Small Company Fund held approximately 3.41% of the DFA Portfolio. The performance of SA International Small Company Fund is directly affected by the performance of the DFA Portfolio. The financial statements of the DFA Portfolio are included elsewhere in this report and should be read in conjunction with the financial statements of SA International Small Company Fund. Prior to October 30, 2000, SA International Small Company Fund invested directly in each of the Series (and a relatively small amount in another series).
Use of Estimates — The preparation of financial statements in accordance with accounting principles generally accepted in the United States of America requires management to make estimates and assumptions that affect the reported amounts and disclosures in the financial statements. Actual results could differ from those estimates. The following summarizes the significant accounting policies of the Funds:
Security Valuation — Domestic equity securities listed on an exchange or stock market for which market quotations are readily available are valued according to the official closing price, if any, or at their last reported sale price on the exchange or stock market where the security is primarily traded, or in the absence of such reported price, at the mean between the most recent quoted bid and asked prices. Domestic equity securities traded on the over-the-counter markets are valued at the mean between the most recent quoted bid and asked prices in the absence of an official closing price or last reported sale price. Foreign equity securities traded on a foreign exchange or over-the-counter markets are valued at the most recent quoted bid price in the absence of an official closing price
43
SA FUNDS
NOTES TO FINANCIAL STATEMENTS — DECEMBER 31, 2011 (Unaudited) (Continued)
or last reported sale price. Foreign securities quoted in foreign currencies are translated into U.S. dollars at current rates. Bonds and other fixed income securities are valued based upon prices provided by independent pricing services or other reliable sources, including broker-dealers. Shares of registered open-end investment companies are valued at the investment company’s net asset value. Short-term investments purchased with an original or remaining maturity of sixty days or less are valued at amortized cost, which approximates market value. Securities for which market quotations are not readily available, or available quotations appear not to accurately reflect the current value of an investment, are valued at fair value as determined in good faith by a pricing committee (the “Pricing Committee”) appointed by the Board of Trustees of the Trust (the “Board”). Certain Funds hold securities traded in foreign markets. Foreign securities are valued at the latest market price in the foreign market. However, if events occurring after the close of the foreign market (but before the close of regular trading on the New York Stock Exchange) are believed to materially affect the value of those securities, such securities may be valued at fair value as determined in good faith by the Pricing Committee. Fair value pricing is based on subjective judgments, and it is possible that such pricing may vary significantly from the price actually received on a sale. Any determinations of fair value made by the Pricing Committee are presented to the Board for ratification.
Valuation of securities by the DFA Portfolio is discussed in the “Selected Financial Statements of DFA Investment Dimensions Group Inc. - Notes to Financial Statements,” and “Selected Financial Statements of the DFA Investment Trust Company – Notes to Financial Statements,” which are included elsewhere in this report.
Fair Value Measurement — The Funds adopted provisions surrounding fair value measurement which provides enhanced guidance for using fair value to measure assets and liabilities. The Funds value their investments based on a three-tier hierarchy of inputs that establishes classification of fair value measurements for disclosure purposes. The three-tier hierarchy of inputs is summarized in the three broad levels below.
Level 1 – quoted prices in active markets for identical investments.
Level 2 – significant observable inputs other than quoted prices within Level 1 (including quoted prices for similar investments, interest rates, yield curves, foreign exchange rates, put or call provisions, credit risk and default rates for similar securities).
Level 3 – significant unobservable inputs to the extent that observable inputs are not available (including the Pricing Committee’s own assumptions used to determine the fair value of investments).
The inputs or methodologies used for valuing securities are not necessarily an indication of the risk associated with investing in those securities.
44
SA FUNDS
NOTES TO FINANCIAL STATEMENTS — DECEMBER 31, 2011 (Unaudited) (Continued)
The tables below provide a summary of the inputs as of December 31, 2011 in valuing each Fund’s investments:
| | Investments in Securities | | | | | |
| Description | | | Unadjusted
Quoted Prices in
Active Markets for
Identical
Investments
(Level 1) | | Significant
Other
Observable
Inputs
(Level 2) | | Significant
Unobservable
Inputs
(Level 3) | | Balance as of
December 31, 2011
Total | |
| SA U.S. Fixed Income Fund | | | | | | | | | | | | | | | |
| Bonds and Notes | | $ | — | | $ | 323,051,284 | | | $ | — | | $ | 323,051,284 | | |
| Short-Term Investments | | | 18,029,903 | | | 4,056,896 | | | | — | | | 22,086,799 | | |
| Total Investments | | $ | 18,029,903 | | $ | 327,108,180 | | | $ | — | | $ | 345,138,083 | | |
| SA Global Fixed Income Fund | | | | | | | | | | | | | | | |
| Assets: | | | | | | | | | | | | | | | |
| Bonds and Notes | | $ | — | | $ | 541,079,449 | | | $ | — | | $ | 541,079,449 | | |
| Short-Term Investments | | | 3,542,182 | | | — | | | | — | | | 3,542,182 | | |
| Collateral for Securities on Loan | | | | | | | | | | | | | | | |
| Short-Term | | | 86,212,378 | | | — | | | | — | | | 86,212,378 | | |
| Forward Foreign Currency Contracts | | | — | | | 2,230,457 | | | | — | | | 2,230,457 | | |
| Total Investments | | $ | 89,754,560 | | $ | 543,309,906 | | | $ | — | | $ | 633,064,466 | | |
| Liabilities: | | | | | | | | | | | | | | | |
| Forward Foreign Currency Contracts | | $ | — | | $ | (1,005,380 | ) | | $ | — | | $ | (1,005,380 | ) | |
| SA U.S. Core Market Fund | | | | | | | | | | | | | | | |
| Common Stocks | | $ | 370,580,491 | | $ | — | | | $ | — | | $ | 370,580,491 | | |
| Preferred Stocks | | | — | | | — | † | | | — | | | — | | |
| Rights & Warrants | | | 93 | | | 4 | | | | — | | | 97 | | |
| Mutual Funds | | | 15,937,606 | | | — | | | | — | | | 15,937,606 | | |
| Short-Term Investments | | | 240,078 | | | — | | | | — | | | 240,078 | | |
| Collateral for Securities on Loan | | | | | | | | | | | | | | | |
| Short-Term | | | 19,361,364 | | | — | | | | — | | | 19,361,364 | | |
| Total Investments | | $ | 406,119,632 | | $ | 4 | | | $ | — | | $ | 406,119,636 | | |
| SA U.S. Value Fund | | | | | | | | | | | | | | | |
| Common Stocks | | $ | 287,415,581 | | $ | — | | | $ | — | | $ | 287,415,581 | | |
| Preferred Stocks | | | — | | | — | † | | | — | | | — | | |
| Short-Term Investments | | | 26 | | | — | | | | — | | | 26 | | |
| Collateral for Securities on Loan | | | | | | | | | | | | | | | |
| Short-Term | | | 15,365,753 | | | — | | | | — | | | 15,365,753 | | |
| Total Investments | | $ | 302,781,360 | | $ | — | | | $ | — | | $ | 302,781,360 | | |
45
SA FUNDS
NOTES TO FINANCIAL STATEMENTS — DECEMBER 31, 2011 (Unaudited) (Continued)
| | Investments in Securities | | | | |
| Description | | | Unadjusted
Quoted Prices in
Active Markets for
Identical
Investments
(Level 1) | | Significant
Other
Observable
Inputs
(Level 2) | | Significant
Unobservable
Inputs
(Level 3) | | Balance as of
December 31, 2011
Total | |
| SA U.S. Small Company Fund | | | | | | | | | | | | | |
| Common Stocks | | $ | 235,491,750 | | $ | 3,650 | | $ | — | | $ | 235,495,400 | |
| Rights & Warrants | | | 7,071 | | | 8 | | | — | | | 7,079 | |
| Bonds and Notes | | | — | | | 20 | | | — | | | 20 | |
| Short-Term Investments | | | 42 | | | — | | | — | | | 42 | |
Collateral for Securities on Loan
Short-Term | | | 80,520,088 | | | — | | | — | | | 80,520,088 | |
| Total Investments | | $ | 316,018,951 | | $ | 3,678 | | $ | — | | $ | 316,022,629 | |
| SA International Value Fund | | | | | | | | | | | | | |
| Common Stocks - Japan | | $ | 428,417,860 | | $ | 104,973 | | $ | — | | $ | 428,522,833 | |
| Preferred Stocks | | | 146,156 | | | — | | | — | | | 146,156 | |
| Short-Term Investments | | | 58 | | | — | | | — | | | 58 | |
Collateral for Securities on Loan
Short-Term | | | 64,629,732 | | | — | | | — | | | 64,629,732 | |
| Total Investments | | $ | 493,193,806 | | $ | 104,973 | | $ | — | | $ | 493,298,779 | |
| SA International Small Company Fund | | | | | | | | | | | | | |
| Mutual Funds | | $ | 186,178,216 | | $ | — | | $ | — | | $ | 186,178,216 | |
| Total Investments | | $ | 186,178,216 | | $ | — | | $ | — | | $ | 186,178,216 | |
| SA Emerging Markets Value Fund | | | | | | | | | | | | | |
| Common Stocks | | $ | 63,247,059 | | $ | 1,137,670 | | $ | — | | $ | 64,384,729 | |
| Preferred Stocks | | | 3,110,553 | | | — | | | — | | | 3,110,553 | |
| Short-Term Investments | | | 21 | | | — | | | — | | | 21 | |
| Total Investments | | $ | 66,357,633 | | $ | 1,137,670 | | $ | — | | $ | 67,495,303 | |
| SA Real Estate Securities Fund | | | | | | | | | | | | | |
| Common Stocks | | $ | 79,729,451 | | $ | — | | $ | — | | $ | 79,729,451 | |
| Short-Term Investments | | | 152,020 | | | — | | | — | | | 152,020 | |
| Total Investments | | $ | 79,881,471 | | $ | — | | $ | — | | $ | 79,881,471 | |
| | † | | Includes one or more securities which are valued at zero. |
Transfers between investment levels may occur as the markets fluctuate and/or the availability of data used in an investment’s valuation changes. There were no significant transfers into or out of Levels 1, 2, and 3 during the six months ended December 31, 2011.
In May 2011, the Financial Accounting Standards Board (“FASB”) issued Accounting Standards Update (“ASU”) 2011-04 Amendments to Achieve Common Fair Value Measurement and Disclosure Requirements in U.S. GAAP and International Financial Reporting Standards (“IFRS”). ASU 2011-04 is the result of the work of FASB and the International Accounting Standards Board to establish common requirements for measuring fair value and
46
SA FUNDS
NOTES TO FINANCIAL STATEMENTS — DECEMBER 31, 2011 (Unaudited) (Continued)
for disclosing information about fair value measurements, which are effective during interim and annual periods beginning after December 15, 2011. Management is currently evaluating the impact of the adoption of ASU 2011-04 on the Trust’s financial statements.
Repurchase Agreements — The Funds may agree to purchase securities from financial institutions such as member banks of the Federal Reserve System or any foreign bank or any domestic broker/dealer that is recognized as a reporting government securities dealer, subject to the seller’s agreement to repurchase them at an agreed-upon time and price. Dimensional Fund Advisors LP (the “Sub-Adviser”) will review and continuously monitor the creditworthiness of the seller under a repurchase agreement, and will require the seller to maintain liquid assets segregated on the books of the Fund or the Fund’s custodian in an amount that is greater than the repurchase price. Default by, or bankruptcy of, the seller would, however, expose a Fund to possible loss because of adverse market conditions or delays in connection with the disposition of underlying obligations except with respect to repurchase agreements secured by U.S. government securities.
Securities Lending — The Funds may lend any of their securities held by State Street Bank and Trust Company (“State Street”) as custodian to certain qualified broker-dealers, banks and other institutions, except those securities which LWI Financial Inc. (the “Adviser”) specifically identifies as not being available. Any gain or loss in the market price of the securities loaned that might occur and any interest or dividends declared during the term of the loan would accrue to the account of the Fund. Risks of delay in recovery of the securities or even loss of rights in the collateral may occur should the borrower of the securities fail financially. Risks may also arise to the extent that the value of the collateral decreases below the value of the securities loaned.
Upon entering into a securities lending transaction, a Fund receives cash or other securities as collateral in an amount equal to or exceeding 100% of the current market value of the loaned securities with respect to securities of the U.S. government or its agencies, 102% of the current market value of the loaned securities with respect to U.S. securities and 105% of the current market value of the loaned securities with respect to foreign securities. Any cash received as collateral is generally invested by State Street, acting in its capacity as securities lending agent (the “Agent”), in the State Street Navigator Securities Lending Prime Portfolio, which is a money market fund registered under the 1940 Act. A portion of the dividends received on the collateral is rebated to the borrower of the securities, and the remainder is split between the Agent and the Fund.
As of December 31, 2011, the following Funds had loaned securities, which were collateralized by short-term investments. The value of securities on loan and the value of the related collateral were as follows:
| | | | | | | | | | | Total | |
| | | | | | | | | | | Collateral | |
| | | | | Value of | | Value of | | (Including | |
| | Value of | | Cash | | Non-Cash | | Calculated | |
| Fund | | | Securities | | Collateral | | Collateral* | | Mark)† | |
| SA Global Fixed Income Fund | | $ | 84,254,544 | | $ | 86,212,378 | | $ | — | | $ | 86,038,493 | |
| SA U.S. Core Market Fund | | $ | 18,960,181 | | $ | 19,361,364 | | $ | 190,074 | | $ | 19,441,708 | |
| SA U.S. Value Fund | | $ | 15,494,518 | | $ | 15,365,753 | | $ | 598,419 | | $ | 15,868,430 | |
| SA U.S. Small Company Fund | | $ | 77,833,156 | | $ | 80,520,088 | | $ | 35,570 | | $ | 80,135,038 | |
| SA International Value Fund | | $ | 62,499,430 | | $ | 64,629,732 | | $ | 370,389 | | $ | 65,637,902 | |
* The Fund cannot repledge or resell this collateral. The non-cash collateral is comprised of U.S. government securities.
† Balances represent the-end-of-day mark-to-market of securities lending collateral that will be reflected by the Funds as of the next business day.
47
SA FUNDS
NOTES TO FINANCIAL STATEMENTS — DECEMBER 31, 2011 (Unaudited) (Continued)
Foreign Currency Translation and Foreign Investments — The books and records of the Funds are maintained in U.S. dollars. The value of securities, currencies and other assets and liabilities denominated in currencies other than U.S. dollars are translated into U.S. dollars based upon foreign currency exchange rates prevailing at the end of the period. Purchases and sales of investment securities are translated at contractual currency exchange rates established at the time of the trade. Income and expenses are translated at prevailing exchange rates on the respective dates of such transactions.
The results of operations resulting from changes in foreign exchange rates on investments are not reported separately from fluctuations arising from changes in market prices of securities held. All such fluctuations are included with net realized and unrealized gain or loss on investments.
Investing in securities of foreign companies and securities of foreign governments involves special risks and considerations not typically associated with investing in securities of U.S. companies and securities of the U.S. government. These risks include revaluation of currencies and the risk of appropriation. Moreover, the markets for securities of many foreign companies and foreign governments may be less liquid, and the prices of such securities may be more volatile than those of securities of comparable U.S. companies and the U.S. government.
Forward Foreign Currency Exchange Contracts — Each Fund that may invest in foreign securities may enter into forward foreign currency exchange contracts. A forward foreign currency exchange contract is an agreement between two parties to buy or sell currency at a set price on a future date. By entering into a forward contract for the purchase or sale for a fixed amount of dollars of the amount of foreign currency involved in all underlying security transactions, a Fund may be able to protect itself against a possible loss resulting from an adverse change in the relationship between the U.S. dollar and the applicable foreign currency during the period between the date the security is purchased or sold and the date on which payment is made or received.
The market value of the contract will fluctuate with changes in currency exchange rates. The contract is marked-to-market daily using the 12:00 PM Eastern Time pricing for the forward currency exchange rate, and the change in market value is recorded as unrealized appreciation (depreciation) on foreign currency transactions in the Fund’s Statement of Assets and Liabilities. When the contract is closed, realized gain or loss is recognized, which is equal to the difference between the value of the contract at the time it was opened and the value at the time it was closed, and recorded as realized gain (loss) on foreign currency transactions in the Fund’s Statement of Operations.
Forward foreign currency exchange contracts may involve risks from the potential inability of counterparties to meet the terms of their contracts and from unanticipated movements in the value of a foreign currency relative to the U.S. dollar.
At December 31, 2011, SA Global Fixed Income Fund had the following open forward foreign currency exchange contracts:
| | | | Local | | Aggregate | | | | | Unrealized | |
| | Delivery | | Currency | | Face | | Total | | Appreciation/ | |
| | Date | | Amount | | Amount | | Value | | (Depreciation) | |
| Australian Dollar (sell) | | 1/25/2012 | | 22,355,155 | | $ | 22,384,641 | | $ | 22,810,441 | | $ | (425,800 | ) | |
| Canadian Dollar (sell) | | 1/25/2012 | | 48,268,338 | | $ | 46,870,837 | | $ | 47,356,541 | | $ | (485,704 | ) | |
| Pound Sterling (sell) | | 1/25/2012 | | 88,245,201 | | $ | 138,281,730 | | $ | 137,020,087 | | $ | 1,261,643 | | |
| Euro Currency (sell) | | 1/25/2012 | | 52,727,078 | | $ | 69,219,581 | | $ | 68,250,766 | | $ | 968,815 | | |
| Japanese Yen (sell) | | 1/25/2012 | | 707,028,367 | | $ | 9,094,560 | | $ | 9,188,437 | | $ | (93,877 | ) | |
| | | | | | | | | | | | $ | 1,225,077 | | |
48
SA FUNDS
NOTES TO FINANCIAL STATEMENTS — DECEMBER 31, 2011 (Unaudited) (Continued)
The Funds have adopted provisions surrounding disclosures regarding derivative instruments and hedging activities. The following table, grouped into appropriate risk categories, discloses the amounts related to each Fund’s use of derivative instruments and hedging activities at December 31, 2011:
SA Global Fixed Income Fund
| | Asset Derivatives (1) | | | | | | | | |
| | | | | | | | | | |
| | Foreign | | | | | |
| | Exchange | | | | | |
| | Contracts Risk | | Total | |
| Forward Contracts | $ | 2,230,457 | | | $ | 2,230,457 | | |
| | | | | | | | | |
| Liability Derivatives (2) | | | | | | | | |
| | | | | | | | | |
| | Foreign | | | | | |
| | Exchange | | | | | |
| | Contracts Risk | | Total | |
| Forward Contracts | $ | (1,005,380 | ) | | $ | (1,005,380 | ) | |
(1) Statement of Assets and Liabilities location: Unrealized appreciation on foreign currency exchange contracts.
(2) Statement of Assets and Liabilities location: Unrealized depreciation on foreign currency exchange contracts.
Transactions in derivative instruments during the six months ended December 31, 2011, were as follows:
| | Realized Gain (Loss) (1) | | | | | | |
| | | | | | | |
| | Foreign | | | | |
| | Exchange | | | | |
| | Contracts Risk | | Total | |
| | Forward Contracts | $ | 240,107 | | $ | 240,107 | |
| | | | | | | |
| Change in Unrealized Appreciation (Depreciation) (2) | | | | | | |
| | | | | | | |
| | Foreign | | | | |
| | Exchange | | | | |
| | Contracts Risk | | Total | |
| Forward Contracts | $ | 439,310 | | $ | 439,310 | |
(1) Statement of Operations location: Realized gain (loss) on: Foreign currency transactions.
(2) Statement of Operations location: Increase (decrease) in unrealized appreciation/depreciation on: Foreign currency transactions
For the six months ended December 31, 2011, the average monthly principal amount of foreign currency exchange contracts was $296,191,758.
Investment Transactions, Income and Expenses — Investments in securities are accounted for as of trade date (the date the buy or sell is executed). Dividend income is recorded on the ex-dividend date. Interest income is recorded on an accrual basis and includes amortization of discounts and premiums based on the effective interest method. Gains and losses are determined on the identified cost basis, which is the same for U.S. federal income tax purposes.
49
SA FUNDS
NOTES TO FINANCIAL STATEMENTS — DECEMBER 31, 2011 (Unaudited) (Continued)
The Funds characterize distributions received from mutual fund investments on the Statement of Operations using the same characterization as the distribution received.
Expenses directly attributable to a specific Fund are charged to the respective Fund. Expenses that cannot be attributed to a particular Fund are apportioned among the Funds evenly or based on relative net assets.
Indemnifications — Under the Trust’s organizational documents, its officers and Trustees are indemnified against certain liabilities arising out of the performance of their duties to the Funds. The Trustees are also indemnified against certain liabilities pursuant to an Indemnity Agreement between the Trust and each Trustee. In addition, in the normal course of business the Trust enters into contracts that contain a variety of representations and warranties which provide general indemnifications. The Funds’ maximum exposures under these arrangements are unknown as this would involve potential future claims against the Funds that have not yet occurred. However, the Funds expect the risk of loss to be remote.
Federal Income Taxes — The Funds’ policy is to comply with the requirements of Subchapter M of the Internal Revenue Code that are applicable to regulated investment companies and to distribute substantially all of the Funds’ taxable income to their shareholders. Therefore, no income tax provision is required.
On December 22, 2010, The Regulated Investment Company Modernization Act of 2010 (the “Modernization Act”) was signed into law. The Modernization Act modifies several of the federal income and excise tax provisions related to Regulated Investment Companies (“RICs”). Under the Modernization Act, new capital losses may now be carried forward indefinitely, and retain the character of the original loss as compared with the pre-enactment law where capital losses could be carried forward for eight years, and carried forward as short-term losses, irrespective of the character of the original loss.
The Modernization Act contains simplified provisions aimed at preventing disqualification of a RIC for “inadvertent” failures of the asset diversification and/or qualifying income tests. Additionally, the Modernization Act repeals the preferential dividend rule for publicly offered RICs and repeals the 60-day designation requirement for certain types of pay-through income and gains while retaining the requirement that such dividends be reported by the RIC in written statements furnished to its shareholders.
The Modernization Act contains several provisions aimed at preserving the character of distributions made by a RIC during the portion of its taxable year ending after October 31 or December 31, reducing the circumstances under which a RIC might be required to file amended Forms 1099 to restate previously reported distributions.
Except for the simplified provisions related to RIC qualification, the Modernization Act is effective for taxable years beginning after December 22, 2010. The provisions related to RIC qualification are effective for taxable years for which the extended due date of the tax return is after December 22, 2010.
Management has analyzed the Funds’ tax positions, and has concluded that no liability for unrecognized tax benefits should be recorded with respect to uncertain tax positions taken on returns filed for open tax years (2009-2011), or expected to be taken in the Funds’ 2012 tax returns.
50
SA FUNDS
NOTES TO FINANCIAL STATEMENTS — DECEMBER 31, 2011 (Unaudited) (Continued)
Distributions to Shareholders — Each Fund, excluding SA Global Fixed Income Fund and SA U.S. Fixed Income Fund, declares and pays dividends from its net investment income annually. SA Global Fixed Income Fund and SA U.S. Fixed Income Fund declare and pay dividends from net investment income quarterly. All of the Funds declare and pay distributions from net realized capital gains, if any, at least annually.
SA Real Estate Securities Fund characterizes distributions received from real estate investment trust (“REIT”) investments based on information provided by the REITs into the following categories: ordinary income, long-term capital gains, and return of capital. If information is not available on a timely basis from the REITs, the characterization will be estimated based on available information, which may include the previous year’s allocation. If new or additional information becomes available from the REITs at a later date, a recharacterization will be made in the following year. The Fund records the amount recharacterized as dividend income as ordinary income, the amount recharacterized as long-term capital gain as realized gain in the Statement of Operations, and the amount recharacterized as a return of capital as a reduction to the cost of investments in the Statement of Assets and Liabilities and in the Portfolio of Investments. These recharacterizations are reflected in the accompanying financial statements.
Dividends to shareholders are recorded on the ex-dividend date. Income and capital gain distributions are determined in accordance with income tax regulations, which may differ from generally accepted accounting principles in the U.S. These differences are primarily due to differing treatments of income and gains on various investment securities held by the Funds, timing differences and differing characterizations of distributions made by the Funds. To the extent that distributions exceed net investment income and net capital gains for tax purposes, they are reported as distributions of paid-in capital. Permanent book and tax basis differences relating to shareholder distributions will result in reclassifications to paid-in capital. Undistributed net investment income and accumulated undistributed net realized gain (loss) on investments and foreign currency transactions may include temporary book and tax differences such as wash sales, net operating losses, and foreign currency transactions that will reverse in a subsequent period. During any particular year net realized gains from investment transactions, in excess of available capital loss carry forwards, would be taxable to the Funds if not distributed and, therefore, would be distributed to shareholders annually.
2. Agreements and Transactions with Affiliates
The Trust has an Investment Advisory and Administrative Services Agreement with the Adviser (the “Investment Advisory Agreement”) under which the Adviser manages the investments of, and provides administrative services to, each Fund. The Adviser is an indirect, wholly-owned subsidiary of Werba Reinhard, Inc., a U.S. company based in San Jose, California. Werba Reinhard, Inc. is controlled by Mr. Eli Reinhard through his sole ownership interest in Arcadia Loring Ward, LLC and Mr. Reinhard’s role as the sole trustee of nine trusts administered for the benefit
51
SA FUNDS
NOTES TO FINANCIAL STATEMENTS — DECEMBER 31, 2011 (Unaudited) (Continued)
of Mr. Reinhard’s family, each of which has an ownership interest in Werba Reinhard, Inc. Effective June 6, 2011, for the advisory services provided, the Adviser is entitled to a fee from each Fund computed daily and payable monthly as follows:
| Advisory | |
| Fund | | Fees | |
| SA U.S. Fixed Income Fund | 0.25 | % | |
| SA Global Fixed Income Fund | 0.30 | % | |
| SA U.S. Core Market Fund | 0.55 | % | |
| SA U.S. Value Fund | 0.55 | % | |
| SA U.S. Small Company Fund | 0.55 | % | |
| SA International Value Fund | 0.65 | % | |
| SA International Small Company Fund | 0.65 | % | |
| SA Emerging Markets Value Fund | 0.65 | % | |
| SA Real Estate Securities Fund | 0.55 | % | |
For the administrative services provided, the Adviser is entitled to a fee from each Fund computed daily and payable monthly at the annual rate of 0.10% of the average daily net assets of each Fund.
The Trust and the Adviser have jointly entered into an Investment Sub-Advisory Agreement with the Sub-Adviser (the “Sub-Advisory Agreement”). For the sub-advisory services provided, the Sub-Adviser is entitled to a fee from each Fund computed daily and payable monthly at an annual rate based on each Fund’s average daily net assets. SA International Small Company Fund will not pay a fee to the Sub-Adviser for its sub-advisory services for as long as it invests substantially all of its assets in the DFA Portfolio. However, the Sub-Adviser receives an administration fee from the DFA Portfolio and also receives advisory fees for providing advisory services to the funds in which the DFA Portfolio invests.
| Sub-Advisory | |
| Fund | | Fees | |
| SA U.S. Fixed Income Fund | 0.10 | % | |
| SA Global Fixed Income Fund | 0.05 | % | |
| SA U.S. Core Market Fund* | 0.05 | % | |
| SA U.S. Value Fund | 0.10 | % | |
| SA U.S. Small Company Fund | 0.35 | % | |
| SA International Value Fund | 0.20 | % | |
| SA Emerging Markets Value Fund | 0.50 | % | |
| SA Real Estate Securities Fund | 0.15 | % | |
* The Sub-Adviser will not receive any sub-advisory fee for its sub-advisory services to the SA U.S. Core Market Fund with respect to any assets of the SA U.S. Core Market Fund invested in the U.S. Micro Cap Portfolio of DFA Investment Dimensions Group Inc.
The Trust has a Shareholder Servicing Agreement with the Adviser. For the shareholder services provided the Adviser is entitled to a fee from each Fund computed daily and payable monthly at the annual rate of 0.25% of the average daily net assets of each Fund.
52
SA FUNDS
NOTES TO FINANCIAL STATEMENTS — DECEMBER 31, 2011 (Unaudited) (Continued)
The Adviser contractually agreed to waive its management fees and/or to reimburse expenses to the extent necessary to limit each Fund’s total operating expenses to the amounts shown in the table below. This agreement will remain in effect until October 28, 2021, at which time the agreement may be continued, modified or eliminated and net expenses will be adjusted as necessary. This agreement may only be terminated with the approval of the Trust’s Board.
| Expense | |
| Fund | | Limitation | |
| SA U.S. Fixed Income Fund | 0.65 | % | |
| SA Global Fixed Income Fund | 0.80 | % | |
| SA U.S. Core Market Fund | 1.00 | % | |
| SA U.S. Value Fund | 1.05 | % | |
| SA U.S. Small Company Fund | 1.20 | % | |
| SA International Value Fund | 1.35 | % | |
| SA International Small Company Fund | 1.10 | % | |
| SA Emerging Markets Value Fund | 1.45 | % | |
| SA Real Estate Securities Fund | 1.00 | % | |
Prior to October 28, 2011, the expense limitations for SA Global Fixed Income Fund and SA International Value Fund were 0.85% and 1.45%, respectively.
The Adviser may elect to recapture any amounts waived or reimbursed subject to the following conditions: (1) the Adviser must request reimbursement within three years from the end of the year in which the waiver/reimbursement is made, (2) the Board must approve the reimbursement, (3) reimbursement will be permitted if, and to the extent that, the relevant Fund does not exceed its operating expense limitation after giving effect to the reimbursement, and (4) the Adviser may not request or receive reimbursements for the reductions and waivers before payment of the relevant Fund’s operating expenses for the current fiscal year. During the six months ended December 31, 2011, the Adviser recaptured $70,158 from SA Global Fixed Income Fund pursuant to these conditions. As of December 31, 2011 the following amounts are subject to this recapture through June 30, 2012, June 30, 2013 and June 30, 2014, respectively.
| Expires | | Expires | | Expires | |
| Fund | | June 30, 2012 | | June 30, 2013 | | June 30, 2014 | |
| SA U.S. Fixed Income Fund | $ | 421,649 | | $ | 503,586 | | $ | 666,067 | |
| SA Global Fixed Income Fund | | 1,509,522 | | | 1,403,642 | | | 1,509,521 | |
| SA U.S. Core Market Fund | | 702,908 | | | 639,920 | | | 726,592 | |
| SA U.S. Value Fund | | 519,503 | | | 556,259 | | | 616,019 | |
| SA U.S. Small Company Fund | | 760,572 | | | 774,384 | | | 888,650 | |
| SA International Value Fund | | — | | | — | | | — | |
| SA International Small Company Fund | | 185,664 | | | 153,408 | | | 188,413 | |
| SA Emerging Markets Value Fund | | 332,353 | | | 378,982 | | | 463,663 | |
| SA Real Estate Securities Fund | | 294,575 | | | 318,162 | | | 417,871 | |
Trustees’ Fees and Expenses — For their services as Trustees, the Trustees of the Trust received an annual retainer fee of $75,000, as well as reimbursement for expenses incurred in connection with each meeting of the Board and its Committees. The Chairman of the Board received an additional $7,500 per year. Effective January 1, 2012, the annual retainer fee will be $80,000 and the Chairman of the Board will receive an additional $8,000 per year.
53
SA FUNDS
NOTES TO FINANCIAL STATEMENTS — DECEMBER 31, 2011 (Unaudited) (Continued)
Sub-Administration Fees—State Street serves as sub-administrator for the Trust, pursuant to a Sub-Administration Agreement with the Trust and the Adviser. During the period prior to September 1, 2011, for the sub-administrative services provided, State Street received a fee that was calculated daily and paid monthly at an annual rate based on the aggregate average daily net assets of the Trust as follows: 0.02% of the first $1.5 billion of net assets, plus 0.0175% of net assets over $1.5 billion. The fee was then allocated to each Fund based on the relative net assets of each Fund, subject to a minimum fee of $68,700 annually per Fund. In addition, State Street received $5,000 per Fund, per year except for the SA International Small Company Fund, for which State Street received $2,000 per year, for performing additional services related to the preparation of the Schedule of Investments on Form N-Q.
As of September 1, 2011, State Street receives a fee that is calculated daily and paid monthly at an annual rate based on the aggregate average daily net assets of the Trust as follows: 0.0175% of the first $1.5 billion of net assets, plus 0.015% of net assets over $1.5 billion. The fee is then allocated to each Fund based on the relative net assets of each Fund, subject to a minimum fee of $70,000 annually per Fund, except for SA International Small Company Fund, which is subject to a minimum fee of $50,000 annually.
3. Purchases and Sales of Securities
Excluding short-term investments, each Fund’s purchases and sales of securities for the six months ended December 31, 2011 were as follows:
| | Purchases | |
| | U.S. Government | | Other | |
| SA U.S. Fixed Income Fund | | | 76,016,944 | | | 62,380,357 | |
| SA Global Fixed Income Fund | | | — | | | 123,759,109 | |
| SA U.S. Core Market Fund | | | — | | | 12,562,389 | |
| SA U.S. Value Fund | | | — | | | 18,345,654 | |
| SA U.S. Small Company Fund | | | — | | | 19,729,035 | |
| SA International Value Fund | | | — | | | 60,797,688 | |
| SA International Small Company Fund | | | N/A | | | N/A | |
| SA Emerging Markets Value Fund | | | — | | | 11,762,779 | |
| SA Real Estate Securities Fund | | | — | | | 5,207,568 | |
| | | | | | | | |
| | Sales | |
| | U.S. Government | | Other | |
| SA U.S. Fixed Income Fund | | | 95,957,019 | | | 28,259,463 | |
| SA Global Fixed Income Fund | | | 8,519,963 | | | 106,611,785 | |
| SA U.S. Core Market Fund | | | — | | | 16,236,926 | |
| SA U.S. Value Fund | | | — | | | 15,363,104 | |
| SA U.S. Small Company Fund | | | — | | | 19,703,202 | |
| SA International Value Fund | | | — | | | 52,510,101 | |
| SA International Small Company Fund | | | N/A | | | N/A | |
| SA Emerging Markets Value Fund | | | — | | | 3,532,023 | |
| SA Real Estate Securities Fund | | | — | | | 941,972 | |
N/A — Refer to the financial statements of the DFA Portfolio, included elsewhere in this report.
4. Subsequent Events
Management has evaluated the possibility of subsequent events existing in the Funds’ financial statements through the date these financial statements were issued. Management has determined that there are no material events that would require disclosure in the Funds’ financial statements through this date.
54
SA FUNDS
ADDITIONAL INFORMATION (Unaudited)
Proxy Voting Policies and Procedures
The Sub-Adviser is responsible for exercising the voting rights associated with the securities purchased and/ or held by the Funds. A description of the policies and procedures that are used by the Sub-Adviser to vote proxies relating to the Funds’ portfolio securities is available without charge, upon request, by calling (800) 366-7266 and on the Securities and Exchange Commission’s website (“SEC”) at http://www.sec.gov. Information regarding how the Sub-Adviser voted these proxies during the most recent 12-month period ended June 30th is listed in the Trust’s Form N-PX, which is available after August 31st without charge, upon request, by calling the same number or visiting the SEC’s website at http://www.sec.gov.
Quarterly Portfolio Schedule
The Trust files a complete schedule of portfolio holdings for each Fund for the first and third quarters of each fiscal year on Form N-Q. The Trust’s Forms N-Q are available on the SEC’s website at http://www.sec.gov or may be reviewed and copied at the SEC’s Public Reference Room in Washington, D.C. Information on the operation of the Public Reference Room may be obtained by calling 1-800-SEC-0330. The Trust’s most recent Form N-Q is also available without charge, upon request, by calling (800) 366-7266.
Semi-Annual Portfolio Schedule
The Trust files a complete schedule of the portfolio holdings for each Fund for the second quarter of each fiscal year on Form N-CSR. The Trust’s Form N-CSR is available on the SEC’s website at http://www.sec.gov or may be reviewed and copied at the SEC’s Public Reference Room in Washington, D.C. Information on the operation of the Public Reference Room may be obtained by calling 1-800-SEC-0330. The Trust’s most recent Form N-CSR is also available without charge, upon request, by calling (800) 366-7266.
Trustees and Officers’ Information
Information regarding the Trustees and executive officers of the Trust is listed below. The Board governs each Fund and is responsible for protecting the interests of shareholders. The Trustees are experienced executives who meet periodically throughout the year to oversee each Fund’s activities, review contractual arrangements with companies that provide services to each Fund, and review each Fund’s performance. The Board of Trustees is comprised entirely of Trustees who are not “interested persons” of the Trust, as such term is defined under the 1940 Act (the “Independent Trustees”).
Those individuals listed in the table below whose names are marked with an asterisk (*) are interested persons of the Trust (as defined by the 1940 Act) by virtue of, among other considerations, their relationships with the Adviser, Loring Ward Securities Inc. (the “Distributor”) or their affiliated entities. Each Trustee and executive officer of the Trust oversees all Funds of the Trust.
55
SA FUNDS
ADDITIONAL INFORMATION (Unaudited) (Continued)
| | | | | | Number of | | |
| | Position(s) | | | | Portfolios in | | |
| | Held with | | Principal | | Fund Complex | | Other |
| Name, Address,(1) | | Trust and Length of | | Occupation(s) | | Overseen by | | Trusteeships/ |
| and Year of Birth | | Time Served(2) | | During Past 5 Years | | Trustee | | Directorships Held |
| Independent Trustees*: | | | | | | | | |
Bryan W. Brown
Year of Birth: 1945 | | Trustee
(since April 1999)
Chairman
(since December 2004) | | Self-Employed Management Consultant (financial and technological systems) (since 1992); Chief Financial Officer, Bioexpertise, Inc. (physician’s web-based continuing education) (since 2003); Chief Financial Officer, ONTHERIX, INC. (a pharmaceutical development company) (since 2008); Chief Financial Officer, PharmaGenias, Inc. (biotechnology and pharmaceutical clinical trial services) (2004-2008); Chief Financial Officer, DISK-IOPS (a patent licensing company in the life science industry) (2009-2011). | | 9 | | Director/Officer, Friends of the California Air & Space Center
(aviation museum) (1999-2010). |
| | | | | | | | |
Harold M. Shefrin
Year of Birth: 1948 | | Trustee
(since April 1999) | | Professor of Finance, Santa Clara University (since 1978). | | 9 | | Trustee, Litman Gregory Funds Trust (6 portfolios) (since February 2005). |
| | (1) | | The address of each Trustee is: LWI Financial Inc., 3055 Olin Ave., Suite 2000, San Jose, CA 95128. |
| | | | |
| (2) | | Each Trustee serves for the lifetime of the Trust or until he dies, resigns, or is removed. |
| | | | |
| * | | Prior to October 1, 2011, Mark Schimbor also served as an Independent Trustee. |
The Funds’ Statement of Additional Information includes additional information about the Trustees and is available, without charge, upon request, by calling 1-800-366-7266. It is also available on the Funds’ website at: http://sa-funds.net.
56
SA FUNDS
ADDITIONAL INFORMATION (Unaudited) (Continued)
Officers of the Trust
| | | Position(s) | | |
| | | Held with | | |
| Name, Address(1) | | Trust and Length of | | |
| and Year of Birth | | | Time Served(2) | | Principal Occupation(s) During Past 5 Years |
Alexander B. Potts*
Year of Birth: 1967 | | President and Chief Executive
Officer (since January 2009). | | President and Chief Executive Officer, LWI Financial Inc., Loring Ward Securities Inc. and Loring Ward Group Inc. (since January 2009); President and Chief Executive Officer, Werba Reinhard, Inc. (since January 2008); Consultant, Werba Reinhard, Inc. (2007); Executive Vice President and Chief Operating Officer, LWI Financial Inc. (2006-2007): |
| | | | | |
Michael R. Clinton*
Year of Birth: 1966 | | Chief Financial and Accounting
Officer and Treasurer (since
March 2009). | | Chief Operating Officer, Chief Financial Officer and Treasurer, LWI Financial Inc., Loring Ward Securities Inc. and Loring Ward Group Inc. (since March 2009); Chief Financial Officer and Treasurer, Werba Reinhard, Inc. (since March 2009); Vice President of Fund Administration, Charles Schwab Investment Management (2004- 2009). |
| | | | | |
Christopher D. Stanley*
Year of Birth: 1983 | | Vice President, Chief Legal
Officer, Chief Compliance
Officer and Anti-Money
Laundering Compliance Officer
(since April 2011). | | Vice President, General Counsel and Chief Legal Officer, LWI Financial Inc., Loring Ward Securities Inc. and Loring Ward Group Inc. (since April 2011); Chief Compliance Officer, Loring Ward Securities Inc. (since April 2011); Corporate Secretary and General Counsel, Werba Reinhard Inc. (since April 2011); Director of Compliance, LWI Financial Inc. and Loring Ward Securities Inc. (2009-2011); Legal Clerk, LWI Financial Inc. and Loring Ward Securities Inc. (2008-2009); Summer Associate, Bell, Rosenberg & Hughes LLP (2007). |
| | | | | |
Joni Clark*
Year of Birth: 1966 | | Vice President and Chief
Investment Officer
(since March 2010). | | Executive Vice President and Chief Investment Officer, LWI Financial Inc. (since June 2010); Chief Investment Strategist, LWI Financial Inc. (2007-2010); Investment Committee Member, LWI Financial Inc. (2003-2007); Senior Manager of Investment Services, Assante Global Advisors, Inc. and LWI Financial Inc. (2002-2007). |
| | | | | |
Marcy D. Tsagarakis*
Year of Birth: 1971 | | Secretary
(since June 2006). | | Vice President, Fund Administration, LWI Financial Inc. and Loring Ward Securities Inc. (since 2005). |
| | (1) | | The address of each officer is: LWI Financial Inc., 3055 Olin Ave., Suite 2000, San Jose, CA 95128. |
| | |
| | (2) | | The Trust’s officers are appointed annually by the Board, and each officer serves until he or she dies, resigns or is removed. |
57
SA FUNDS
ADDITIONAL INFORMATION (Unaudited) (Continued)
Understanding Your Fund’s Expenses
Shareholder Expense Example
As a mutual fund shareholder you incur ongoing costs including management fees, shareholder services fees, fees for administrative services and other Fund expenses. These costs are described in more detail in the Funds’ prospectus. The examples below are intended to help you understand your ongoing costs of investing in the Funds and help you compare these with the ongoing costs of investing in other mutual funds. The following examples are based on an investment of $1,000 made at the beginning of the six month period ended December 31, 2011 and held for the entire period.
Actual Expenses
The first line in each table below shows the actual account values and actual Fund expenses, based on the Fund’s actual performance during the period. You may use the information in this line, together with the amount you invested, to estimate the expenses you paid over the period. Simply divide your account value by $1,000 (for example, $8,600 account value divided by $1,000 = 8.6) then multiply the result by the number in the first line of the table for your Fund under the heading “Expenses Paid During Period” to estimate the expenses you paid over the period.
Hypothetical Example for Comparison Purposes
The second line in each table below provides information about hypothetical account values and hypothetical expenses based on the Fund’s actual expense ratio and an assumed rate of return of 5% per year before expenses, which is not the Fund’s actual return. Thus, you should not use the hypothetical account values and expenses to estimate the actual ending account balance or your expenses for the period. Rather, these figures are provided to enable you to compare the ongoing costs of investing in the Fund versus other funds. To do so, compare this 5% hypothetical example with the 5% hypothetical examples that appear in the shareholder reports of the other funds.
Please note that the expenses shown in the tables are meant to highlight your ongoing costs only and do not reflect any transaction costs, such as sales charges (loads), or redemption fees. Therefore, the second line of the table is useful in comparing ongoing costs only, and will not help you determine the relative total costs of investing in different funds. In addition, if these transaction costs were included, your costs would have been higher.
SA U.S. Fixed Income Fund
| | | | Beginning | | Ending | | Expenses Paid | |
| | | | Account Value | | Account Value | | During Period* | |
| | | 7/01/11 | | 12/31/11 | | 7/01/11-12/31/11 | |
| Actual | | $1,000.00 | | $ | 999.50 | | | $3.27 | |
| Hypothetical (5% return before expenses) | | $1,000.00 | | $ | 1,021.87 | | | $3.30 | |
| | * | Expenses are equal to the Fund’s annualized expense ratio of 0.65% multiplied by the average account value over the period, multiplied by 184/366 (to reflect the one-half year period). Such expenses are limited by agreement between the Fund and the Adviser and may be recovered by the Adviser under certain circumstances. |
| |
| | You can find additional information about the Fund’s expenses, including the expense limitation agreement, in the Notes to Financial Statements section of this report and in the Fund’s current prospectus. |
58
SA FUNDS
ADDITIONAL INFORMATION (Unaudited) (Continued)
SA Global Fixed Income Fund
| | | | Beginning | | Ending | | Expenses Paid | |
| | | Account Value | | Account Value | | During Period* | |
| | | 7/01/11 | | 12/31/11 | | 7/01/11-12/31/11 | |
| Actual | | $1,000.00 | | $1,004.10 | | $4.18 | |
| Hypothetical (5% return before expenses) | | $1,000.00 | | $1,020.96 | | $4.22 | |
| | * | Expenses are equal to the Fund’s annualized expense ratio of 0.83% multiplied by the average account value over the period, multiplied by 184/366 (to reflect the one-half year period). Such expenses are limited by agreement between the Fund and the Adviser and may be recovered by the Adviser under certain circumstances. |
| |
| | You can find additional information about the Fund’s expenses, including the expense limitation agreement, in the Notes to Financial Statements section of this report and in the Fund’s current prospectus. |
SA U.S. Core Market Fund
| | | | Beginning | | Ending | | Expenses Paid | |
| | | Account Value | | Account Value | | During Period* | |
| | | | 7/01/11 | | 12/31/11 | | 7/01/11-12/31/11 | |
| Actual | | $1,000.00 | | $ | 947.90 | | | $4.90 | |
| Hypothetical (5% return before expenses) | | $1,000.00 | | $ | 1,020.11 | | | $5.08 | |
| | * | Expenses are equal to the Fund’s annualized expense ratio of 1.00% multiplied by the average account value over the period, multiplied by 184/366 (to reflect the one-half year period). Such expenses are limited by agreement between the Fund and the Adviser and may be recovered by the Adviser under certain circumstances. |
| |
| | You can find additional information about the Fund’s expenses, including the expense limitation agreement, in the Notes to Financial Statements section of this report and in the Fund’s current prospectus. |
SA U.S. Value Fund
| | | | Beginning | | Ending | | Expenses Paid | |
| | | Account Value | | Account Value | | During Period* | |
| | | | 7/01/11 | | 12/31/11 | | 7/01/11-12/31/11 | |
| Actual | | $1,000.00 | | $ | 888.80 | | | $4.99 | |
| Hypothetical (5% return before expenses) | | $1,000.00 | | $ | 1,019.86 | | | $5.33 | |
| | * | Expenses are equal to the Fund’s annualized expense ratio of 1.05% multiplied by the average account value over the period, multiplied by 184/366 (to reflect the one-half year period). Such expenses are limited by agreement between the Fund and the Adviser and may be recovered by the Adviser under certain circumstances. |
| |
| | You can find additional information about the Fund’s expenses, including the expense limitation agreement, in the Notes to Financial Statements section of this report and in the Fund’s current prospectus. |
59
SA FUNDS
ADDITIONAL INFORMATION (Unaudited) (Continued)
SA U.S. Small Company Fund
| | | | Beginning | | Ending | | Expenses Paid | |
| | | Account Value | | Account Value | | During Period* | |
| | | 7/01/11 | | 12/31/11 | | 7/01/11-12/31/11 | |
| | Actual | | $1,000.00 | | $ | 900.90 | | | $5.73 | |
| Hypothetical (5% return before expenses) | | $1,000.00 | | $ | 1,019.10 | | | $6.09 | |
| | * | Expenses are equal to the Fund’s annualized expense ratio of 1.20% multiplied by the average account value over the period, multiplied by 184/366 (to reflect the one-half year period). Such expenses are limited by agreement between the Fund and the Adviser and may be recovered by the Adviser under certain circumstances. |
| |
| | You can find additional information about the Fund’s expenses, including the expense limitation agreement, in the Notes to Financial Statements section of this report and in the Fund’s current prospectus. |
SA International Value Fund
| | | | Beginning | | Ending | | Expenses Paid | |
| | | Account Value | | Account Value | | During Period* | |
| | | | 7/01/11 | | 12/31/11 | | 7/01/11-12/31/11 | |
| Actual | | $1,000.00 | | $ | 798.60 | | | $6.10 | |
| Hypothetical (5% return before expenses) | | $1,000.00 | | $ | 1,018.35 | | | $6.85 | |
| | * | Expenses are equal to the Fund’s annualized expense ratio of 1.35% multiplied by the average account value over the period, multiplied by 184/366 (to reflect the one-half year period). Such expenses are limited by agreement between the Fund and the Adviser and may be recovered by the Adviser under certain circumstances. |
| |
| | You can find additional information about the Fund’s expenses, including the expense limitation agreement, in the Notes to Financial Statements section of this report and in the Fund’s current prospectus. |
SA International Small Company
| | | | Beginning | | Ending | | Expenses Paid | |
| | | Account Value | | Account Value | | During Period* | |
| | | 7/01/11 | | 12/31/11 | | 7/01/11-12/31/11 | |
| Actual | | $1,000.00 | | $ | 804.50 | | | $4.99 | |
| Hypothetical (5% return before expenses) | | $1,000.00 | | $ | 1,019.61 | | | $5.58 | |
| | * | Expenses are equal to the Fund’s annualized expense ratio of 1.10% multiplied by the average account value over the period, multiplied by 184/366 (to reflect the one-half year period). Such expenses are limited by agreement between the Fund and the Adviser and may be recovered by the Adviser under certain circumstances. |
| |
| | You can find additional information about the Fund’s expenses, including the expense limitation agreement, in the Notes to Financial Statements section of this report and in the Fund’s current prospectus. |
| |
| | With respect to SA International Small Company Fund, the amounts set forth in the table reflect only those expenses incurred directly by the Fund. The expenses incurred by the DFA Portfolio and the underlying funds in which it invests are reflected in the valuation of the Fund’s investment in the DFA Portfolio. Because these expenses are passed indirectly, rather than directly, to the Fund, they are not reflected in the table. For the six months ended October 31, 2011, the total annual operating expenses of the DFA Portfolio was 0.55%. |
60
SA FUNDS
ADDITIONAL INFORMATION (Unaudited) (Continued)
SA Emerging Markets Value Fund
| | | | Beginning | | Ending | | Expenses Paid | |
| | | Account Value | | Account Value | | During Period* | |
| | | 7/01/11 | | 12/31/11 | | 7/01/11-12/31/11 | |
| | Actual | | $1,000.00 | | $ | 766.60 | | | $6.44 | |
| Hypothetical (5% return before expenses) | | $1,000.00 | | $ | 1,017.85 | | | $7.35 | |
| | * | Expenses are equal to the Fund’s annualized expense ratio of 1.45% multiplied by the average account value over the period, multiplied by 184/366 (to reflect the one-half year period). Such expenses are limited by agreement between the Fund and the Adviser and may be recovered by the Adviser under certain circumstances. |
| |
| | You can find additional information about the Fund’s expenses, including the expense limitation agreement, in the Notes to Financial Statements section of this report and in the Fund’s current prospectus. |
SA Real Estate Securities Fund
| | | | Beginning | | Ending | | Expenses Paid | |
| | | Account Value | | Account Value | | During Period* | |
| | | | 7/01/11 | | 12/31/11 | | 7/01/11-12/31/11 | |
| Actual | | $1,000.00 | | $ | 982.00 | | | $4.98 | |
| Hypothetical (5% return before expenses) | | $1,000.00 | | $ | 1,020.11 | | | $5.08 | |
| | * | Expenses are equal to the Fund’s annualized expense ratio of 1.00% multiplied by the average account value over the period, multiplied by 184/366 (to reflect the one-half year period). Such expenses are limited by agreement between the Fund and the Adviser and may be recovered by the Adviser under certain circumstances. |
| |
| | You can find additional information about the Fund’s expenses, including the expense limitation agreement, in the Notes to Financial Statements section of this report and in the Fund’s current prospectus. |
61
Selected Financial Statements of DFA Investment Dimensions Group Inc.
International Small Company Portfolio
TABLE OF CONTENTS
| Page |
| Definitions of Abbreviations and Footnotes | 63 |
| Disclosure of Fund Expenses — October 31, 2011 (Unaudited) | 64 |
| Disclosure of Portfolio Holdings — October 31, 2011 (Unaudited) | 65 |
| Schedule of Investments — December 31, 2011 (Unaudited) | 66 |
| Schedule of Investments — October 31, 2011 | 67 |
| Statement of Assets and Liabilities — December 31, 2011 (Unaudited) | 68 |
| Statement of Assets and Liabilities — October 31, 2011 | 69 |
| Statement of Operations | 70 |
| Statements of Changes in Net Assets | 71 |
| Financial Highlights | 72 |
| Notes to Financial Statements — October 31, 2011 | 73 |
| Report of Independent Registered Public Accounting Firm | 79 |
62
DFA INVESTMENT DIMENSIONS GROUP INC.
DEFINITIONS OF ABBREVIATIONS AND FOOTNOTES
Schedule of Investments/Summary Schedules of Portfolio Holdings
| Investment Abbreviations |
| | FNMA | | Federal National Mortgage Association |
| | P.L.C. | | Public Limited Company |
| | SA | | Special Assessment |
| |
| Investment Footnotes |
| | † | | See Note B to Financial Statements. |
| | †† | | Securities have generally been fair valued. See Note B to Financial Statements. |
| | ** | | Calculated as a percentage of total net assets. Percentages shown parenthetically next to the category headings have been calculated as a percentage of total investments. “Other Securities” are those securities that are not among the top 50 holdings of the Fund or do not represent more than 1.0% of the net assets of the Fund. Some of the individual securities within this category may include Total or Partial Securities on Loan and/or Non-Income Producing Securities. |
| | * | | Non-Income Producing Securities. |
| | # | | Total or Partial Securities on Loan. |
| | @ | | Security purchased with cash proceeds from Securities on Loan. |
| | § | | Affiliated Fund. |
| |
| Financial Highlights |
| | (A) | | Computed using average shares outstanding. |
| | (B) | | Annualized |
| | (C) | | Non-Annualized |
| | (D) | | Represents the combined ratios for the respective portfolio and its respective pro-rata share of its Master Fund Series. |
| | (E) | | Because of commencement of operations and related preliminary transaction costs, these ratios are not necessarily indicative of future ratios. |
| |
| All Statements, Schedules and Notes to Financial Statements. |
| | — | | Amounts designated as — are either zero or rounded to zero. |
| | SEC | | Securities and Exchange Commission |
| | (a) | | Commencement of Operations. |
63
DFA INVESTMENT DIMENSIONS GROUP INC.
INTERNATIONAL SMALL COMPANY PORTFOLIO
DISCLOSURE OF FUND EXPENSES
(Unaudited)
The following Expense Table is shown so that you can understand the impact of fees on your investment. All mutual funds have operating expenses. As a shareholder of the fund, you incur ongoing costs, which include costs for portfolio management, administrative services, and shareholder reports, among others. Operating expenses, legal and audit services, which are deducted from a fund’s gross income, directly reduce the investment return of the fund. A fund’s expenses are expressed as a percentage of its average net assets. This figure is known as the expense ratio. The following examples are intended to help you understand the ongoing costs, in dollars, of investing in the fund and to compare these costs with those of other mutual funds. The examples are based on an investment of $1,000 made at the beginning of the period shown and held for the entire period.
The Expense Table below illustrates your fund’s costs in two ways.
Actual Fund Return
This section helps you to estimate the actual expenses after fee waivers that you paid over the period. The “Ending Account Value” shown is derived from the fund’s actual return and “Expenses Paid During Period” reflect the dollar amount that would have been paid by an investor who started with $1,000 in the fund. You may use the information here, together with the amount you invested, to estimate the expenses that you paid over the period.
To do so, simply divide your account value by $1,000 (for example, a $7,500 account value divided by $1,000 = 7.5), then multiply the result by the number given for your fund under the heading “Expenses Paid During Period.”
Hypothetical Example for Comparison Purposes
This section is intended to help you compare your fund’s costs with those of other mutual funds. The hypothetical “Ending Account Value” and “Expenses Paid During Period” are derived from the fund’s actual expense ratio and an assumed 5% annual return before expenses. In this case, because the return used is not the fund’s actual return, the results do not apply to your investment. The example is useful in making comparisons because the SEC requires all mutual funds to calculate expenses based on a 5% annual return. You can assess your fund’s costs by comparing this hypothetical example with the hypothetical examples that appear in shareholder reports of other funds.
Please note that the expenses shown in the tables are meant to highlight and help you compare ongoing costs only and do not reflect any transactional costs, if applicable. The “Annualized Expense Ratio” represents the actual expenses for the six-month period indicated.
| | | | Six Months Ended October 31, 2011 | |
| EXPENSE TABLE | | | | | | | | | | |
| | |
| | Beginning | | Ending | | | | Expenses | |
| | Account | | Account | | Annualized | | Paid | |
| | Value | | Value | | Expense | | During | |
| | 05/01/11 | | 10/31/11 | | Ratio* | | Period* | |
| Actual Fund Return | | | | | | | | | | |
| Institutional Class Shares | | $1,000.00 | | $ | 825.23 | | 0.56% | | $2.58 | |
| Hypothetical 5% Annual Return | | | | | | | | | | |
| Institutional Class Shares | | $1,000.00 | | $ | 1,022.38 | | 0.56% | | $2.85 | |
____________________
| * | | Expenses are equal to the fund’s annualized expense ratio for the six-month period, multiplied by the average account value over the period, multiplied by the number of days in the most recent six-month period (184), then divided by the number of days in the year (365) to reflect the six-month period. The Portfolio is a Fund of Funds. The expenses shown reflect the direct expenses of the Fund of Funds and the indirect payment of the Fund of Fund’s portion of the expenses of its Master Funds (Affiliated Investment Companies). |
64
DFA INVESTMENT DIMENSIONS GROUP INC.
INTERNATIONAL SMALL COMPANY PORTFOLIO
DISCLOSURE OF PORTFOLIO HOLDINGS
(Unaudited)
The SEC requires that all Funds file a complete Schedule of Investments with the SEC for their first and third fiscal quarters on Form N-Q. For DFA Investment Dimensions Group Inc., this would be for the fiscal quarters ending January 31 and July 31. The Form N-Q filing must be made within 60 days of the end of the quarter. DFA Investment Dimensions Group Inc. filed its most recent Form N-Q with the SEC on September 28, 2011. It is available upon request, without charge, by calling collect: (512) 306-7400 or by mailing a request to Dimensional Fund Advisors LP, 6300 Bee Cave Road, Building One, Austin, Texas 78746, or by visiting the SEC’s website at http://www.sec.gov, or they may be reviewed and copied at the SEC’s Public Reference Room in Washington, D.C. (call 1-800-732-0330 for information on the operation of the Public Reference Room).
PORTFOLIO HOLDINGS
The SEC requires that all Funds present their categories of portfolio holdings in a table, chart or graph format in their annual and semi-annual shareholder reports, whether or not a Schedule of Investments is utilized. The following table, which presents portfolio holdings as a percent of total investments before short-term investments and collateral for loaned securities, is provided in compliance with such requirement. The categories shown below represent broad industry sectors. Each industry sector consists of one or more specific industry classifications.
The categories of industry classification for the Affiliated Investment Companies are represented in the Disclosure of Portfolio Holdings, which are included elsewhere within the report. Refer to the Summary Schedule of Portfolio Holdings for each of the underlying Master Funds’ holdings which reflect the investments by category or country.
| Affiliated Investment Companies | 100.0% | |
65
DFA INVESTMENT DIMENSIONS GROUP INC.
INTERNATIONAL SMALL COMPANY PORTFOLIO
SCHEDULE OF INVESTMENTS
December 31, 2011
(Unaudited)
| | Value† | |
| AFFILIATED INVESTMENT COMPANIES — (100.0%) | | | | |
| Investment in The Continental Small Company Series | | | | |
| of The DFA Investment Trust Company | | $ | 1,702,757,648 | |
| Investment in The Japanese Small Company Series | | | | |
| of The DFA Investment Trust Company | | | 1,324,964,361 | |
| Investment in The United Kingdom Small Company Series | | | | |
| of The DFA Investment Trust Company | | | 1,044,697,872 | |
| Investment in The Canadian Small Company Series | | | | |
| of The DFA Investment Trust Company | | | 697,396,132 | |
| Investment in The Asia Pacific Small Company Series | | | | |
| of The DFA Investment Trust Company | | | 681,321,082 | |
| TOTAL INVESTMENTS IN AFFILIATED | | | | |
| INVESTMENT COMPANIES (Cost $5,857,150,854) | | | 5,451,137,095 | |
| TOTAL INVESTMENTS — (100.0%) (Cost $5,857,150,854)^ | | $ | 5,451,137,095 | |
| ^ | | The cost for federal income tax purposes is $5,867,191,048. |
Summary of inputs used to value the Portfolio’s investments as of December 31, 2011 is as follows (See Security Valuation Note):
| | Valuation Inputs | |
| | Investment in | |
| | Securities | |
| | (Market Value) | |
| | Level 1 | | Level 2 | | Level 3 | | Total | |
| Affiliated Investment Companies | | $ | 5,451,137,095 | | — | | — | | $ | 5,451,137,095 | |
| TOTAL | | $ | 5,451,137,095 | | — | | — | | $ | 5,451,137,095 | |
See accompanying Notes to Financial Statements.
66
DFA INVESTMENT DIMENSIONS GROUP INC.
INTERNATIONAL SMALL COMPANY PORTFOLIO
SCHEDULE OF INVESTMENTS
October 31, 2011
| | Value† | |
| AFFILIATED INVESTMENT COMPANIES — (100.0%) | | | | |
| Investment in The Continental Small Company Series | | | | |
| of The DFA Investment Trust Company | | $ | 1,884,274,386 | |
| Investment in The Japanese Small Company Series | | | | |
| of The DFA Investment Trust Company | | | 1,339,627,823 | |
| Investment in The United Kingdom Small Company Series | | | | |
| of The DFA Investment Trust Company | | | 1,099,968,620 | |
| Investment in The Asia Pacific Small Company Series | | | | |
| of The DFA Investment Trust Company | | | 767,432,021 | |
| Investment in The Canadian Small Company Series | | | | |
| of The DFA Investment Trust Company | | | 736,260,868 | |
| TOTAL INVESTMENTS IN AFFILIATED | | | | |
| INVESTMENT COMPANIES (Cost $5,863,291,899) | | | 5,827,563,718 | |
| TOTAL INVESTMENTS — (100.0%) (Cost $5,863,291,899) | | $ | 5,827,563,718 | |
Summary of inputs used to value the Portfolio’s investments as of October 31, 2011 is as follows (See Security Valuation Note):
| | Valuation Inputs | |
| | Investment in | |
| | Securities | |
| | (Market Value) | |
| | Level 1 | | Level 2 | | Level 3 | | Total | |
| Affiliated Investment Companies | | $ | 5,827,563,718 | | — | | — | | $ | 5,827,563,718 | |
| TOTAL | | $ | 5,827,563,718 | | — | | — | | $ | 5,827,563,718 | |
See accompanying Notes to Financial Statements.
67
DFA INVESTMENT DIMENSIONS GROUP INC.
INTERNATIONAL SMALL COMPANY PORTFOLIO
STATEMENT OF ASSETS AND LIABILITIES
DECEMBER 31, 2011
(Unaudited)
(Amounts in thousands, except share and per share amounts)
| ASSETS: | | | | | |
| Investments in Affiliated Investment Companies at Value | | $ | 5,451,137 | | |
| Cash | | | 13,878 | | |
| Receivables: | | | | | |
| Prepaid Expenses and Other Assets | | | 42 | | |
| Total Assets | | | 5,465,057 | | |
| LIABILITIES: | | | | | |
| Payables: | | | | | |
| Due to Advisor | | | 1,937 | | |
| Accrued Expenses and Other Liabilities | | | 329 | | |
| Total Liabilities | | | 2,266 | | |
| NET ASSETS | | $ | 5,462,791 | | |
| NET ASSET VALUE, OFFERING AND REDEMPTION PRICE PER SHARE: | | | | | |
| Institutional Class Shares — based on net assets of $5,462,791 and shares outstanding | | | | | |
| of 394,736,656 | | $ | 13.84 | | |
| Investments in Affiliated Investment Companies at Cost | | $ | 5,857,151 | | |
| NET ASSETS CONSIST OF: | | | | | |
| Paid-In Capital | | $ | 5,899,787 | | |
| Undistributed Net Investment Income (Distributions in Excess of Net Investment Income) | | | (54,543 | ) | |
| Accumulated Net Realized Gain (Loss) | | | 23,617 | | |
| Net Unrealized Foreign Exchange Gain (Loss) | | | (56 | ) | |
| Net Unrealized Appreciation (Depreciation) | | | (406,014 | ) | |
| NET ASSETS | | $ | 5,462,791 | | |
See accompanying Notes to Financial Statements.
68
DFA INVESTMENT DIMENSIONS GROUP INC.
INTERNATIONAL SMALL COMPANY PORTFOLIO
STATEMENT OF ASSETS AND LIABILITIES
OCTOBER 31, 2011
(Amounts in thousands, except share and per share amounts)
| ASSETS: | | | | | |
| Investments in Affiliated Investment Companies at Value | | $ | 5,827,564 | | |
| Receivables: | | | | | |
| Affiliated Investment Companies Sold | | | 12,000 | | |
| Fund Shares Sold | | | 14,962 | | |
| Prepaid Expenses and Other Assets | | | 47 | | |
| Total Assets | | | 5,854,573 | | |
| LIABILITIES: | | | | | |
| Payables: | | | | | |
| Affiliated Investment Companies Purchased | | | 12,000 | | |
| Fund Shares Redeemed | | | 3,730 | | |
| Due to Advisor | | | 1,887 | | |
| Loan Payable | | | 2,643 | | |
| Accrued Expenses and Other Liabilities | | | 298 | | |
| Total Liabilities | | | 20,558 | | |
| NET ASSETS | | $ | 5,834,015 | | |
| NET ASSET VALUE, OFFERING AND REDEMPTION PRICE PER SHARE: | | | | | |
| Institutional Class Shares — based on net assets of $5,834,015 and shares outstanding | | | | | |
| of 383,664,864 | | $ | 15.21 | | |
| NUMBER OF SHARES AUTHORIZED | | | 1,500,000,000 | | |
| Investments in Affiliated Investment Companies at Cost | | $ | 5,863,292 | | |
| NET ASSETS CONSIST OF: | | | | | |
| Paid-In Capital | | $ | 5,763,382 | | |
| Undistributed Net Investment Income (Distributions in Excess of Net Investment Income) | | | 6,376 | | |
| Accumulated Net Realized Gain (Loss) | | | 99,876 | | |
| Net Unrealized Foreign Exchange Gain (Loss) | | | 109 | | |
| Net Unrealized Appreciation (Depreciation) | | | (35,728 | ) | |
| NET ASSETS | | $ | 5,834,015 | | |
See accompanying Notes to Financial Statements.
69
DFA INVESTMENT DIMENSIONS GROUP INC.
INTERNATIONAL SMALL COMPANY PORTFOLIO
STATEMENT OF OPERATIONS
FOR THE YEAR ENDED OCTOBER 31, 2011
(Amounts in thousands)
| Investment Income* | | | | | |
| Net Investment Income Received from | | | | | |
| Affiliated Investment Companies: | | | | | |
| Dividends (Net of Foreign Taxes Withheld of $12,592) | | $ | 166,353 | | |
| Interest | | | 41 | | |
| Income from Securities Lending | | | 14,413 | | |
| Expenses Allocated from Affiliated Investment Companies | | | (8,917 | ) | |
| Total Net Investment Income Received from | | | | | |
| Affiliated Investment Companies | | | 171,890 | | |
| | | | | | |
| Fund Investment Income | | | | | |
| Interest | | | 13 | | |
| Total Fund Investment Income | | | 13 | | |
| | | | | | |
| Fund Expenses | | | | | |
| Administrative Services Fees | | | 24,741 | | |
| Accounting & Transfer Agent Fees | | | 85 | | |
| Filing Fees | | | 160 | | |
| Shareholders’ Reports | | | 171 | | |
| Directors’/Trustees’ Fees & Expenses | | | 53 | | |
| Professional Fees | | | 65 | | |
| Other | | | 51 | | |
| Total Expenses | | | 25,326 | | |
| Net Investment Income (Loss) | | | 146,577 | | |
| Realized and Unrealized Gain (Loss)* | | | | | |
| Net Realized Gain (Loss) on: | | | | | |
| Investment Securities Sold | | | 205,897 | | |
| Futures | | | (271 | ) | |
| Foreign Currency Transactions | | | (103 | ) | |
| Change in Unrealized Appreciation (Depreciation) of: | | | | | |
| Investment Securities and Foreign Currency | | | (571,803 | ) | |
| Translation of Foreign Currency Denominated Amounts | | | (340 | ) | |
| Net Realized and Unrealized Gain (Loss) | | | (366,620 | ) | |
| Net Increase (Decrease) in Net Assets Resulting from Operations | | $ | (220,043 | ) | |
____________________
| * | | Investment Income and Realized and Unrealized Gain (Loss) were allocated from each Portfolio’s Master Fund (Affiliated Investment Companies). |
See accompanying Notes to Financial Statements.
70
DFA INVESTMENT DIMENSIONS GROUP INC.
INTERNATIONAL SMALL COMPANY PORTFOLIO
STATEMENTS OF CHANGES IN NET ASSETS
(Amounts in thousands)
| | Year | | Year | |
| | Ended | | Ended | |
| | Oct. 31, | | Oct. 31, | |
| | 2011 | | 2010 | |
| Increase (Decrease) in Net Assets | | | | | | | | | |
| Operations: | | | | | | | | | |
| Net Investment Income (Loss) | | $ | 146,577 | | | $ | 90,630 | | |
| Net Realized Gain (Loss) on: | | | | | | | | | |
| Investment Securities Sold | | | 205,897 | | | | 157,743 | | |
| Futures | | | (271 | ) | | | — | | |
| Foreign Currency Transactions | | | (103 | ) | | | 1,622 | | |
| Change in Unrealized Appreciation (Depreciation) of: | | | | | | | | | |
| Investment Securities and Foreign Currency | | | (571,803 | ) | | | 551,254 | | |
| Translation of Foreign Currency Denominated Amounts | | | (340 | ) | | | 210 | | |
| Net Increase (Decrease) in Net Assets Resulting from Operations | | | (220,043 | ) | | | 801,459 | | |
| Distributions From: | | | | | | | | | |
| Net Investment Income: | | | | | | | | | |
| Institutional Class Shares | | | (179,486 | ) | | | (84,604 | ) | |
| Total Distributions | | | (179,486 | ) | | | (84,604 | ) | |
| Capital Share Transactions (1): | | | | | | | | | |
| Shares Issued | | | 1,380,524 | | | | 1,099,327 | | |
| Shares Issued in Lieu of Cash Distributions | | | 171,227 | | | | 80,737 | | |
| Shares Redeemed | | | (829,801 | ) | | | (655,189 | ) | |
| Net Increase (Decrease) from Capital Share Transactions | | | 721,950 | | | | 524,875 | | |
| Total Increase (Decrease) in Net Assets | | | 322,421 | | | | 1,241,730 | | |
| | | | | | | | | | |
| Net Assets | | | | | | | | | |
| Beginning of Period | | | 5,511,594 | | | | 4,269,864 | | |
| End of Period | | $ | 5,834,015 | | | $ | 5,511,594 | | |
| | | | | | | | | | |
| (1) Shares Issued and Redeemed: | | | | | | | | | |
| Shares Issued | | | 81,929 | | | | 75,592 | | |
| Shares Issued in Lieu of Cash Distributions | | | 10,276 | | | | 5,955 | | |
| Shares Redeemed | | | (50,113 | ) | | | (45,123 | ) | |
| Net Increase (Decrease) from Shares Issued and Redeemed | | | 42,092 | | | | 36,424 | | |
| Undistributed Net Investment Income (Distributions in Excess of Net | | | | | | | | | |
| Investment Income) | | $ | 6,376 | | | $ | 31,973 | | |
See accompanying Notes to Financial Statements.
71
DFA INVESTMENT DIMENSIONS GROUP INC.
INTERNATIONAL SMALL COMPANY PORTFOLIO
FINANCIAL HIGHLIGHTS
(for a share outstanding throughout each period)
| | | | | | | | | | | | | | Period | | | | | | | | | |
| | Year | | Year | | Year | | Dec. 1, | | Year | | Year | |
| | Ended | | Ended | | Ended | | 2007 to | | Ended | | Ended | |
| | Oct. 31, | | Oct. 31, | | Oct. 31, | | Oct. 31, | | Nov. 30, | | Nov. 30, | |
| | 2011 | | 2010 | | 2009 | | 2008 | | 2007 | | 2006 | |
| Net Asset Value, Beginning of | | | | | | | | | | | | | | | | | | | | | | | | | |
| Period | | $ | 16.14 | | | $ | 13.99 | | | $ | 10.07 | | | $ | 20.80 | | | $ | 19.43 | | | $ | 16.19 | | |
| Income From Investment | | | | | | | | | | | | | | | | | | | | | | | | | |
| Operations | | | | | | | | | | | | | | | | | | | | | | | | | |
| Net Investment Income | | | | | | | | | | | | | | | | | | | | | | | | | |
| (Loss)(A) | | | 0.40 | | | | 0.28 | | | | 0.28 | | | | 0.44 | | | | 0.43 | | | | 0.36 | | |
| Net Gains (Losses) on | | | | | | | | | | | | | | | | | | | | | | | | | |
| Securities (Realized and | | | | | | | | | | | | | | | | | | | | | | | | | |
| Unrealized) | | | (0.83 | ) | | | 2.13 | | | | 3.91 | | | | (9.55 | ) | | | 2.07 | | | | 4.02 | | |
| Total From Investment | | | | | | | | | | | | | | | | | | | | | | | | | |
| Operations | | | (0.43 | ) | | | 2.41 | | | | 4.19 | | | | (9.11 | ) | | | 2.50 | | | | 4.38 | | |
| Less Distributions | | | | | | | | | | | | | | | | | | | | | | | | | |
| Net Investment Income | | | (0.50 | ) | | | (0.26 | ) | | | (0.27 | ) | | | (0.45 | ) | | | (0.46 | ) | | | (0.36 | ) | |
| Net Realized Gains | | | — | | | | — | | | | — | | | | (1.17 | ) | | | (0.67 | ) | | | (0.78 | ) | |
| Total Distributions | | | (0.50 | ) | | | (0.26 | ) | | | (0.27 | ) | | | (1.62 | ) | | | (1.13 | ) | | | (1.14 | ) | |
| Net Asset Value, End of | | | | | | | | | | | | | | | | | | | | | | | | | |
| Period | | $ | 15.21 | | | $ | 16.14 | | | $ | 13.99 | | | $ | 10.07 | | | $ | 20.80 | | | $ | 19.43 | | |
| Total Return | | | (2.92 | )% | | | 17.61 | % | | | 42.34 | % | | | (47.13 | )%(C) | | | 13.29 | % | | | 28.51 | % | |
| Net Assets, End of Period | | | | | | | | | | | | | | | | | | | | | | | | | |
| (thousands) | | $ | 5,834,015 | | | $ | 5,511,594 | | | $ | 4,269,864 | | | $ | 3,084,373 | | | $ | 5,597,209 | | | $ | 4,546,071 | | |
| Ratio of Expenses to Average | | | | | | | | | | | | | | | | | | | | | | | | | |
| Net Assets (D) | | | 0.55 | % | | | 0.56 | % | | | 0.57 | % | | | 0.55 | %(B) | | | 0.55 | % | | | 0.56 | % | |
| Ratio of Expenses to Average | | | | | | | | | | | | | | | | | | | | | | | | | |
| Net Assets (Excluding | | | | | | | | | | | | | | | | | | | | | | | | | |
| Waivers and Assumption | | | | | | | | | | | | | | | | | | | | | | | | | |
| of Expenses and/or | | | | | | | | | | | | | | | | | | | | | | | | | |
| Recovery of Previously | | | | | | | | | | | | | | | | | | | | | | | | | |
| Waived Fees) (D) | | | 0.55 | % | | | 0.56 | % | | | 0.57 | % | | | 0.55 | %(B) | | | 0.55 | % | | | 0.56 | % | |
| Ratio of Net Investment | | | | | | | | | | | | | | | | | | | | | | | | | |
| Income to Average | | | | | | | | | | | | | | | | | | | | | | | | | |
| Net Assets | | | 2.37 | % | | | 1.94 | % | | | 2.48 | % | | | 2.90 | %(B) | | | 2.03 | % | | | 2.04 | % | |
See page 63 for the Definitions of Abbreviations and Footnotes.
See accompanying Notes to Financial Statements.
72
DFA INVESTMENT DIMENSIONS GROUP INC.
NOTES TO FINANCIAL STATEMENTS
OCTOBER 31, 2011
A. Organization:
DFA Investment Dimensions Group Inc. (the “Fund”) is an open-end management investment company registered under the Investment Company Act of 1940, whose shares are generally offered to institutional investors, retirement plans and clients of registered investment advisors. The Fund consists of sixty operational portfolios and the International Small Company Portfolio ( the “Portfolio”) is included in this report.
The Portfolio is a Fund of Funds that invests in five series of The DFA Investment Trust Company (the “Master Funds”):
| | | | Percentage | |
| | | | Ownership | |
| Fund of Funds | | | Master Funds | | | at 10/31/11 | |
| International Small Company Portfolio | | The Japanese Small Company Series | | 89 | % | |
| | The Asia Pacific Small Company Series | | 85 | % | |
| | The United Kingdom Small Company Series | | 97 | % | |
| | The Continental Small Company Series | | 94 | % | |
| | The Canadian Small Company Series | | 100 | % | |
The financial statements of the Master Funds are included elsewhere in this report and should be read in conjunction with the financial statements of the Portfolio.
At a regular meeting of the Board of Directors/Trustees (the “Board”) on September 16, 2008, the Board voted to change the fiscal and tax year ends of the Portfolio from November 30 to October 31.
B. Significant Accounting Policies:
The following significant accounting policies are in conformity with accounting principles generally accepted in the United States of America. Such policies are consistently followed by the Fund in preparation of its financial statements. The preparation of financial statements in accordance with accounting principles generally accepted in the United States of America requires management to make estimates and assumptions that affect the reported amounts of assets and liabilities and disclosure of contingent assets and liabilities at the date of the financial statements and the reported amounts of increases and decreases in net assets from operations during the reporting period. Actual results could differ from those estimates and those differences could be material.
1. Security Valuation: The Portfolio utilizes a fair value hierarchy which prioritizes the inputs to valuation techniques used to measure fair value into three broad levels described below:
• Level 1 – quoted prices in active markets for identical securities
• Level 2 – other significant observable inputs (including quoted prices for similar securities, interest rates, prepayment speeds, credit risk, etc.)
• Level 3 – significant unobservable inputs (including the Portfolio’s own assumptions in determining the fair value of investments)
The Portfolio’s investments reflect proportionate interest in the net assets of its corresponding Master Fund. These valuations are classified as Level 1 in the hierarchy.
A summary of inputs used to value the Portfolio’s investments by each major security type is disclosed at the end of the Schedule of Investments. The inputs or methodology used for valuing securities are not necessarily an indication of the risk associated with investing in those securities.
The Portfolio did not have any significant transfers between Level 1 and Level 2 during the year ended October 31, 2011.
73
2. Deferred Compensation Plan: Each eligible Director of the Fund may elect participation in The Fee Deferral Plan for Independent Directors and Trustees (the “Plan”). Under the Plan, effective January 1, 2002, such Directors may defer payment of all or a portion of their total fees earned as a Director. These deferred amounts may be treated as though such amounts had been invested in shares of the following funds: U.S. Large Cap Value Portfolio; U.S. Core Equity 1 Portfolio; U.S. Core Equity 2 Portfolio; U.S. Vector Equity Portfolio; U.S. Micro Cap Portfolio; DFA International Value Portfolio; International Core Equity Portfolio; Emerging Markets Portfolio; Emerging Markets Core Equity Portfolio; and/or DFA Two-Year Global Fixed Income Portfolio. Contributions made under the Plan and the change in unrealized appreciation (depreciation) and income are included in Directors’/Trustees’ Fees & Expenses or Other Expenses.
Each Director has the option to receive their distribution of proceeds in one of the following methods: lump sum; annual installments over a period of agreed upon years; or quarterly installments over a period of agreed upon years. Each Director shall have the right in a notice of election to defer compensation (the “Notice”) to elect to defer the receipt of the Director’s deferred compensation until a date specified by such Director in the Notice, which date may not be sooner than the earlier of: (i) the first business day of January following the year in which such Director ceases to be a member of the Board of the Fund; and (ii) five years following the effective date of the Director’s first deferral election. If a Director who elects to defer fees fails to designate in the Notice a time or date as of which payment of the Director’s deferred fee account shall commence, payment of such amount shall commence as of the first business day of January following the year in which the Director ceases to be a member of the Board of the Fund (unless the Director files an amended Notice selecting a different distribution date). As of October 31, 2011, none of the Directors have requested or received a distribution of proceeds of a deferred fee account.
3. Other: Security transactions are accounted for as of the trade date. Costs used in determining realized gains and losses on the sale of investment securities/affiliated investment companies are on the basis of identified cost. Dividend income and distributions to shareholders are recorded on the ex-dividend date. Distributions received on securities and from the investment in affiliated investment companies that represent a return of capital or capital gain are recorded as a reduction of cost of investments or as a realized gain, respectively. The Portfolio estimates the character of distributions received that may be considered return of capital distributions. Interest income is recorded on an accrual basis. Discount and premium on debt securities purchased are amortized over the lives of the respective securities utilizing the effective interest method. Expenses directly attributable to a Portfolio are directly charged. Common expenses of the Fund or Portfolio are allocated using methods approved by the Board of Directors/Trustees, generally based on average net assets.
The Portfolio recognizes its pro-rata share of net investment income and realized and unrealized gains/losses on a daily basis, from its respective Master Funds, which are treated as partnerships for federal income tax purposes.
The Portfolio may be subject to taxes imposed by countries in which the Master Funds invest, with respect to their investments in issuers existing or operating in such countries. Such taxes are generally based on income earned or repatriated and capital gains realized on the sale of such investments. The Portfolio accrues such taxes when the related income or capital gains are earned by the Master Funds or throughout the holding period. Some countries require governmental approval for the repatriation of investment income, capital or the proceeds of sales earned by foreign investors. In addition, if there is a deterioration in a country’s balance of payments or for other reasons, a country may impose temporary restrictions on foreign capital remittances abroad.
C. Investment Advisor and Administrator:
Dimensional Fund Advisors LP (“Dimensional” or the “Advisor”) provides administrative services to the Portfolio, including supervision of services provided by others, providing information to shareholders and the Board of Directors/Trustees, and other administrative services.
For the year ended October 31, 2011, the Portfolio’s administrative services fees were accrued daily and paid monthly to the Advisor based on an effective annual rate of 0.40% of average daily net assets.
Pursuant to a Fee Waiver and Expense Assumption Agreement for the International Small Company Portfolio, the Advisor has contractually agreed to waive its administration fees and to assume the Portfolio’s other direct expenses to the extent necessary to limit the direct expenses of the Portfolio to 0.45% of its average net assets on an annualized basis. The Fee Waiver and Expense Assumption Agreement does not include the indirect expenses the Portfolio bears as a shareholder of the Master Funds. At any time that the direct expenses of the Portfolio are less than 0.45% of its average net assets on an annualized basis, the Advisor retains the right to recover any fees previously waived and/or expenses previously assumed
74
to the extent that such recovery will not cause the Portfolio’s direct expenses to exceed 0.45% of average net assets on an annualized basis. The International Small Company Portfolio is not obligated to reimburse the Advisor for fees previously waived or expenses previously assumed by the Advisor more than thirty-six months before the date of recovery. The Fee Waiver and Expense Assumption Agreement will remain in effect through February 28, 2012, and shall continue in effect from year to year thereafter unless terminated by the Fund or the Advisor. For the year ended October 31, 2011, there were no fees waived subject to future recovery by the Advisor.
The Advisor has contractually agreed to waive its administration fee and to assume the Portfolio’s other direct expenses (for International Small Company, not including expenses incurred through its investment in other investment companies) to the extent necessary to limit the direct expenses of the Portfolio to the rates listed above as a percentage of average net assets on an annualized basis. The Fee Waiver and Expense Assumption Agreement does not include the indirect expenses the Portfolio bears as a shareholder of its Master Funds. At any time that the direct expenses of the Portfolio are less than the rate listed above as a percentage of average net assets on an annualized basis, the Advisor retains the right to recover any fees previously waived and/or expenses previously assumed to the extent that such recovery will not cause the Portfolio’s direct expenses to exceed the applicable percentage of average net assets on an annualized basis, as listed above.
Fees Paid to Officers and Directors/Trustees:
Certain Officers and Directors/Trustees of the Advisor are also Officers and Directors/Trustees of the Fund; however, such Officers and Directors/Trustees (with the exception of the Chief Compliance Officer (“CCO”)) receive no compensation from the Fund. For the year ended October 31, 2011, the total related amounts paid by the Fund to the CCO were $221 (in thousands). The total related amounts paid by the Portfolio are included in Other Expenses on the Statement of Operations.
D. Deferred Compensation:
At October 31, 2011, the total liability for deferred compensation to Directors/Trustees was $120 (in thousands) and is included in Accrued Expenses and Other Liabilities on the Statement of Assets and Liabilities.
E. Federal Income Taxes:
The Portfolio has qualified and intends to continue to qualify as a regulated investment company under Subchapter M of the Internal Revenue Code for federal income tax purposes and to distribute substantially all of its taxable income and net capital gains to its shareholders. Accordingly, no provision has been made for federal income taxes.
Distributions from net investment income and net realized capital gains are determined in accordance with U.S. federal income tax regulations, which may differ from those amounts determined under accounting principles generally accepted in the United States of America. These book/tax differences are either temporary or permanent in nature. To the extent these differences are permanent, they are charged or credited to paid-in capital, undistributed net investment income or accumulated net realized gains, as appropriate, in the period that the differences arise. Accordingly, the following permanent differences as of October 31, 2011, primarily attributable to realized gains on securities considered to be “passive foreign investment companies” and the utilization of accumulated earnings and profits distributed to shareholders on redemptions of shares as part of the dividends paid deduction for income tax purposes and distribution redesignations, were reclassified to the following accounts.
These reclassifications had no effect on net assets or net asset value per share (amounts in thousands):
| | Increase | | Increase |
| | (Decrease) | | (Decrease) |
| Increase | | Undistributed | | Accumulated |
| (Decrease) | | Net Investment | | Net Realized |
| Paid-In Capital | | Income | | Gains (Losses) |
| $14,910 | | $7,312 | | $(22,222) |
75
The tax character of dividends and distributions declared and paid during the year ended October 31, 2010 and the year ended October 31, 2011 were as follows (amounts in thousands):
| | Net Investment | | | | | | | | | | | |
| | Income | | | | | | | | | | | |
| | and Short-Term | | Long-Term | | | | | | |
| | Capital Gains | | Capital Gains | | Total | |
| 2010 | | | $ | 84,604 | | | | | — | | | | $ | 84,604 | | |
| 2011 | | | | 188,546 | | | | $ | 5,851 | | | | | 194,397 | | |
At October 31, 2011, the Portfolio’s net investment income and short-term capital gains and long-term capital gains distributions designated for federal income tax purposes are due to the utilization of accumulated earnings and profits distributed to shareholders upon redemption of shares (amounts in thousands):
| Net Investment | | | | |
| Income | | | | |
| and Short-Term | | Long-Term | | |
| Capital Gains | | Capital Gains | | Total |
| $9,060 | | $5,851 | | $14,911 |
At October 31, 2011, the components of distributable earnings (accumulated losses) were as follows (amounts in thousands):
| Undistributed | | | | | | Total Net |
| Net Investment | | | | | | Distributable |
| Income and | | Undistributed | | Capital | | Earnings |
| Short-Term | | Long-Term | | Loss | | (Accumulated |
| Capital Gains | | Capital Gains | | Carryforward | | Losses) |
| $50,896 | | $108,303 | | — | | $159,199 |
For federal income tax purposes, the Fund measures its capital loss carryforwards annually at October 31, its fiscal year end. Capital loss carryforwards may be carried forward and applied against future capital gains. As of October 31, 2011, the Portfolio had no capital loss carryforwards to offset future realized capital gains.
During the year ended October 31, 2011, the Portfolio utilized capital loss carryforwards to offset realized capital gains for federal income tax purposes in the amount of $75,782 (amounts in thousands).
At October 31, 2011, the total cost and aggregate gross unrealized appreciation and (depreciation) of securities for federal income tax purposes were different from amounts reported for financial reporting purposes (amounts in thousands):
| | | | | | Net |
| | | | | | Unrealized |
| Federal | | Unrealized | | Unrealized | | Appreciation |
| Tax Cost | | Appreciation | | (Depreciation) | | (Depreciation) |
| $5,916,085 | | $1,047,515 | | $(1,136,036) | | $(88,521) |
The difference between book basis and tax-basis unrealized appreciation (depreciation) is primarily attributable to the tax deferral of losses on wash sales and on investments in passive foreign investment companies.
Accounting for Uncertainty in Income Taxes sets forth a minimum threshold for financial statement recognition of the benefit of a tax position taken or expected to be taken in a tax return. Management has analyzed the Portfolio’s tax positions and has concluded that no provision for income tax is required in the Portfolio’s financial statements. The Portfolio is not aware of any tax positions for which it is more likely than not that the total amounts of unrecognized tax benefits will significantly change in the next twelve months. The Portfolio’s federal tax returns for the prior three fiscal years remains subject to examination by the Internal Revenue Service.
76
F. Financial Instruments:
In accordance with the Portfolio’s investment objectives and policies, the Portfolio may invest, either directly or indirectly through its investment in its corresponding Master Funds, in certain financial instruments that have off-balance sheet risk in excess of the amounts recognized in the financial statements and concentrations of credit and market risk. These instruments and their significant corresponding risks are described below:
1. Repurchase Agreements: The Portfolio may purchase certain U.S. Government securities subject to the counterparty’s agreement to repurchase them at an agreed upon date and price. The counterparty will be required on a daily basis to maintain the value of the collateral subject to the agreement at not less than the repurchase price (including accrued interest). The agreements are conditioned upon the collateral being deposited under the Federal Reserve book-entry system with the Fund’s custodian or a third party sub-custodian. In the event of default or bankruptcy by the other party to the agreement, retention of the collateral may be subject to legal proceedings.
2. Foreign Market Risks: Investments in foreign markets may involve certain considerations and risks not typically associated with investments in U.S. companies, including the possibility of future political and economic developments and the level of foreign governmental supervision and regulation of foreign securities markets. These markets are generally smaller, less liquid and more volatile than the major securities markets in the United States of America. Consequently, acquisition and disposition of international securities held by the Master Funds may be inhibited.
G. Line of Credit:
The Fund, together with other Dimensional-advised portfolios, has entered into a $250 million unsecured discretionary line of credit effective June 22, 2011 with its domestic custodian bank. Each portfolio is permitted to borrow, subject to its investment limitations, up to a maximum of $250 million, as long as total borrowings under the line of credit do not exceed $250 million in the aggregate. Borrowings under the line of credit are charged interest at rates agreed to by the parties at the time of borrowing. Each portfolio is individually, and not jointly, liable for its particular advances under the line of credit. There is no commitment fee on the unused portion of the line of credit. The agreement for the discretionary line of credit may be terminated by either party at any time. The line of credit is scheduled to expire on June 22, 2012. There were no borrowings by the Portfolio under this line of credit during the year ended October 31, 2011.
The Fund, together with other Dimensional-advised portfolios, has also entered into an additional $500 million unsecured line of credit effective January 15, 2011 with its international custodian bank. Each portfolio is permitted to borrow, subject to its investment limitations, up to a maximum of $500 million, as long as total borrowings under the line of credit do not exceed $500 million in the aggregate. Each portfolio is individually, and not jointly, liable for its particular advances under the line of credit. Borrowings under the line of credit are charged interest at rates agreed to by the parties at the time of borrowing. There is no commitment fee on the unused portion of the line of credit. The agreement for the line of credit expires on January 13, 2012. The Fund, together with other Dimensional-advised portfolios, expects to enter into a new line of credit with substantially the same terms as its existing line of credit prior to its expiration.
For the year ended October 31, 2011, borrowings by the Portfolio under this line of credit were as follows (amounts in thousands, except percentages and days):
| Weighted | | Weighted | | Number of | | Interest | | Maximum Amount |
| Average | | Average | | Days | | Expense | | Borrowed During |
| Interest Rate | | Loan Balance | | Outstanding* | | Incurred | | the Period |
| 0.87% | | $6,458 | | 32 | | $5 | | $18,979 |
| * | | Number of Days Outstanding represents the total of single or consecutive days during the year ended October 31, 2011 that the Portfolio’s available line of credit was utilized. |
| |
| | There were no outstanding borrowings by the Portfolio under this line of credit as of October 31, 2011. |
77
H. Indemnitees; Contractual Obligations:
Under the Fund’s organizational documents, its officers and directors are indemnified against certain liabilities arising out of the performance of their duties to the Fund.
In the normal course of business, the Fund enters into contracts that contain a variety of representations and warranties which provide general indemnification. The Fund’s maximum exposure under these arrangements is unknown as this would involve future claims that may be made against the Fund and/or its affiliates that have not yet occurred. However, based on experience, the Fund expects the risk of loss to be remote.
I. Recently Issued Accounting Standards:
In January 2010, the Financial Accounting Standards Board (“FASB”) issued Accounting Standards Update (“ASU”) No. 2010-06 “Improving Disclosures about Fair Value Measurements.” ASU No. 2010-06 amends FASB Accounting Standards Codification Topic 820, Fair Value Measurements and Disclosures, to require additional disclosures in the roll forward of activity in Level 3 fair value measurements effective for interim and annual reporting periods beginning after December 15, 2010. Management is currently evaluating the impact ASU No. 2010-06 will have on its financial statement disclosures.
In May 2011, the FASB issued ASU No. 2011-04 “Amendments to Achieve Common Fair Value Measurement and Disclosure Requirements in U.S. Generally Accepted Accounting Principles (“GAAP”) and International Financial Reporting Standards (“IFRSs”).” ASU 2011-04 includes common requirements for measurement of and disclosure about fair value between U.S. GAAP and IFRSs. ASU 2011-04 will require reporting entities to disclose quantitative information about the unobservable inputs used in the fair value measurements categorized within Level 3 of the fair value hierarchy. In addition, ASU 2011-04 will require reporting entities to make disclosures about amounts and reasons for all transfers in and out of Level 1 and Level 2 fair value measurements. The new and revised disclosures are effective for interim and annual reporting periods beginning after December 15, 2011. At this time, management is evaluating the implications of ASU No. 2011-04 and its impact on the financial statements has not been determined.
Under the recently enacted Regulated Investment Company Modernization Act of 2010, Funds will be permitted to carry forward capital losses incurred in taxable years beginning after December 22, 2010 for an unlimited period. However, any losses incurred during those future taxable years will be required to be utilized prior to the losses incurred in pre-enactment taxable years. As a result of this ordering rule, pre-enactment capital loss carryforwards may be more likely to expire unused. Additionally, post-enactment capital losses that are carried forward will retain their character as either short-term or long-term capital losses rather than being considered all short-term as under previous law.
J. Other:
At October 31, 2011, there were two shareholders that held approximate 46% of outstanding shares of the Portfolio. One or more of the shareholders may be omnibus accounts, which typically hold shares for the benefit of several other underlying investors.
The Portfolio is subject to claims and suits that arise from time to time in the ordinary course of business (for example, in The Tribune Company Bankruptcy, certain creditors have filed actions against all shareholders of The Tribune Company who tendered shares when the Tribune Company went private in 2007 in a leveraged buy-out transaction, seeking the return of all proceeds received by the shareholders). Although management currently believes that resolving claims against us, individually or in aggregate, will not have a material adverse impact on our financial position, our results of operations, or our cash flows, these matters are subject to inherent uncertainties and management’s view of these matters may change in the future.
K. Subsequent Event Evaluations:
Management has evaluated the impact of all subsequent events on the Portfolio and has determined that there are no subsequent events requiring recognition or disclosure in the financial statements.
78
REPORT OF INDEPENDENT REGISTERED PUBLIC ACCOUNTING FIRM
To the Shareholders of International Small Company Portfolio and
Board of Directors of DFA Investment Dimensions Group Inc.:
In our opinion, the accompanying statement of assets and liabilities, including the schedule of investments, and the related statements of operations and of changes in net assets and the financial highlights present fairly, in all material respects, the financial position of International Small Company Portfolio (one of the portfolios constituting DFA Investment Dimensions Group Inc., hereafter referred to as the “Portfolio”) at October 31, 2011, the results of its operations, the changes in its net assets and the financial highlights for each of the periods indicated, in conformity with accounting principles generally accepted in the United States of America. These financial statements and financial highlights (hereafter referred to as “financial statements”) are the responsibility of the Portfolio’s management; our responsibility is to express an opinion on these financial statements based on our audits. We conducted our audits of these financial statements in accordance with the standards of the Public Company Accounting Oversight Board (United States). Those standards require that we plan and perform the audit to obtain reasonable assurance about whether the financial statements are free of material misstatement. An audit includes examining, on a test basis, evidence supporting the amounts and disclosures in the financial statements, assessing the accounting principles used and significant estimates made by management, and evaluating the overall financial statement presentation. We believe that our audits, which included confirmation of securities at October 31, 2011 by correspondence with the custodian, and the transfer agent of the investee funds, provide a reasonable basis for our opinion.
PricewaterhouseCoopers LLP
Philadelphia, Pennsylvania
December 22, 2011
79
Selected Financial Statements of The DFA Investment Trust Company
The Japanese Small Company Series
The Asia Pacific Small Company Series
The United Kingdom Small Company Series
The Continental Small Company Series
The Canadian Small Company Series
TABLE OF CONTENTS
| Page |
| Definitions of Abbreviations and Footnotes | 63 |
| | |
| Disclosure of Fund Expenses — October 31, 2011 (Unaudited) | 81 |
| | |
| Disclosure of Portfolio Holdings — October 31, 2011 (Unaudited) | 83 |
| | |
| Summary Schedules of Portfolio Holdings — December 31, 2011 (Unaudited) | 84 |
| The Japanese Small Company Series | 84 |
| The Asia Pacific Small Company Series | 87 |
| The United Kingdom Small Company Series | 90 |
| The Continental Small Company Series | 93 |
| The Canadian Small Company Series | 97 |
| | |
| Summary Schedules of Portfolio Holdings — October 31, 2011 | 100 |
| The Japanese Small Company Series | 100 |
| The Asia Pacific Small Company Series | 103 |
| The United Kingdom Small Company Series | 106 |
| The Continental Small Company Series | 109 |
| The Canadian Small Company Series | 113 |
| | |
| Statements of Assets and Liabilities — December 31, 2011 (Unaudited) | 116 |
| | |
| Statements of Assets and Liabilities — October 31, 2011 | 117 |
| | |
| Statements of Operations | 118 |
| | |
| Statements of Changes in Net Assets | 119 |
| | |
| Financial Highlights | 122 |
| | |
| Notes to Financial Statements — October 31, 2011 | 124 |
| | |
| Report of Independent Registered Public Accounting Firm | 132 |
| | |
| Fund Management — October 31, 2011 | 133 |
| | |
| Voting Proxies on Fund Portfolio Securities | 141 |
80
THE DFA INVESTMENT TRUST COMPANY
DISCLOSURE OF FUND EXPENSES
(Unaudited)
The following Expense Tables are shown so that you can understand the impact of fees on your investment. All mutual funds have operating expenses. As a shareholder of the fund, you incur ongoing costs, which include costs for portfolio management, administrative services, and shareholder reports, among others. Operating expenses, legal and audit services, which are deducted from a fund’s gross income, directly reduce the investment return of the fund. A fund’s expenses are expressed as a percentage of its average net assets. This figure is known as the expense ratio. The following examples are intended to help you understand the ongoing costs, in dollars, of investing in the fund and to compare these costs with those of other mutual funds. The examples are based on an investment of $1,000 made at the beginning of the period shown and held for the entire period.
The Expense Tables below illustrate your fund’s costs in two ways.
Actual Fund Return
This section helps you to estimate the actual expenses after fee waivers that you paid over the period. The “Ending Account Value” shown is derived from the fund’s actual return and “Expenses Paid During Period” reflect the dollar amount that would have been paid by an investor who started with $1,000 in the fund. You may use the information here, together with the amount you invested, to estimate the expenses that you paid over the period.
To do so, simply divide your account value by $1,000 (for example, a $7,500 account value divided by $1,000 = 7.5), then multiply the result by the number given for your fund under the heading “Expenses Paid During Period.”
Hypothetical Example for Comparison Purposes
This section is intended to help you compare your fund’s costs with those of other mutual funds. The hypothetical “Ending Account Value” and “Expenses Paid During Period” are derived from the fund’s actual expense ratio and an assumed 5% annual return before expenses. In this case, because the return used is not the fund’s actual return, the results do not apply to your investment. The example is useful in making comparisons because the SEC requires all mutual funds to calculate expenses based on a 5% annual return. You can assess your fund’s costs by comparing this hypothetical example with the hypothetical examples that appear in shareholder reports of other funds.
Please note that the expenses shown in the tables are meant to highlight and help you compare ongoing costs only and do not reflect any transactional costs, if applicable. The “Annualized Expense Ratio” represents the actual expenses for the six-month period indicated.
| | Six Months Ended October 31, 2011 | |
| |
| EXPENSE TABLES | | | | | | | | | | | |
| | Beginning | | Ending | | | | Expenses | |
| | Account | | Account | | Annualized | | Paid | |
| | Value | | Value | | Expense | | During | |
| | 05/01/11 | | 10/31/11 | | Ratio* | | Period* | |
| The Japanese Small Company Series | | | | | | | | | | | |
| Actual Fund Return | | $ | 1,000.00 | | $ | 984.11 | | 0.14% | | $0.70 | |
| Hypothetical 5% Annual Return | | $ | 1,000.00 | | $ | 1,024.50 | | 0.14% | | $0.71 | |
| | |
| The Asia Pacific Small Company Series | | | | | | | | | | | |
| Actual Fund Return | | $ | 1,000.00 | | $ | 834.53 | | 0.17% | | $0.79 | |
| Hypothetical 5% Annual Return | | $ | 1,000.00 | | $ | 1,024.35 | | 0.17% | | $0.87 | |
81
| Beginning | | Ending | | | | Expenses | |
| Account | | Account | | Annualized | | Paid | |
| Value | | Value | | Expense | | During | |
| 05/01/11 | | 10/31/11 | | Ratio* | | Period* | |
| The United Kingdom Small Company Series | | | | | | | | | | |
| Actual Fund Return | $ | 1,000.00 | | $ | 855.99 | | 0.13% | | $0.61 | |
| Hypothetical 5% Annual Return | $ | 1,000.00 | | $ | 1,024.55 | | 0.13% | | $0.66 | |
| | |
| The Continental Small Company Series | | | | | | | | | | |
| Actual Fund Return | $ | 1,000.00 | | $ | 741.64 | | 0.16% | | $0.70 | |
| Hypothetical 5% Annual Return | $ | 1,000.00 | | $ | 1,024.40 | | 0.16% | | $0.82 | |
| | |
| The Canadian Small Company Series | | | | | | | | | | |
| Actual Fund Return | $ | 1,000.00 | | $ | 799.14 | | 0.15% | | $0.68 | |
| Hypothetical 5% Annual Return | $ | 1,000.00 | | $ | 1,024.45 | | 0.15% | | $0.77 | |
____________________
| * | | Expenses are equal to the fund’s annualized expense ratio for the six-month period, multiplied by the average account value over the period, multiplied by the number of days in the most recent six-month period (184), then divided by the number of days in the year (365) to reflect the six-month period. |
82
DFA INVESTMENT TRUST COMPANY
DISCLOSURE OF PORTFOLIO HOLDINGS
(Unaudited)
The SEC requires that all Funds file a complete Schedule of Investments with the SEC for their first and third fiscal quarters on Form N-Q. For The DFA Investment Trust Company, this would be for the fiscal quarters ending January 31 and July 31. The Form N-Q filing must be made within 60 days of the end of the quarter. The DFA Investment Trust Company filed its most recent Form N-Q with the SEC on September 28, 2011. It is available upon request, without charge, by calling collect: (512) 306-7400 or by mailing a request to Dimensional Fund Advisors LP, 6300 Bee Cave Road, Building One, Austin, Texas 78746, or by visiting the SEC’s website at http://www.sec.gov, or they may be reviewed and copied at the SEC’s Public Reference Room in Washington, D.C. (call 1-800-732-0330 for information on the operation of the Public Reference Room).
SEC regulations permit a fund to include in its reports to shareholders a “Summary Schedule of Portfolio Holdings” in lieu of a full Schedule of Investments. The Summary Schedule of Portfolio Holdings reports the fund’s 50 largest holdings in unaffiliated issuers and any investments that exceed one percent of the fund’s net assets at the end of the reporting period. The amendments also require that the Summary Schedule of Portfolio Holdings identify each category of investments that are held.
The fund is required to file a complete Schedule of Investments with the SEC on Form N-CSR within ten days after mailing the annual and semi-annual reports to shareholders. It will be available upon request, without charge, by calling collect: (512) 306-7400 or by mailing a request to Dimensional Fund Advisors LP, 6300 Bee Cave Road, Building One, Austin, Texas 78746, or by visiting the SEC’s website at http://www.sec.gov, or they may be reviewed and copied at the SEC’s Public Reference Room in Washington, D.C. (call 1-800-732-0330 for information on the operation of the Public Reference Room).
PORTFOLIO HOLDINGS
The SEC requires that all Funds present their categories of portfolio holdings in a table, chart or graph format in their annual and semi-annual shareholder reports, whether or not a Schedule of Investments is utilized. The following table, which presents portfolio holdings as a percent of total investments before short-term investments and collateral for loaned securities, is provided in compliance with such requirement. The categories shown below represent broad industry sectors. Each industry sector consists of one or more specific industry classifications.
| INTERNATIONAL EQUITY PORTFOLIOS | | | | | | | | | | | | | | | | | | | | | | | | | | | | | | | | | | | |
| | | | | | | | | | | | | | | | | | | | | | | | | | | | | | | | | | | | | Real Estate | | | | | | | | | | | |
| | Consumer | | Consumer | | | | | | | | | | | | Health | | | | | | Information | | | | | | | Investment | | Telecommunication | | | | | | |
| | Discretionary | | Staples | | Energy | | Financials | | Care | | Industrials | | Technology | | Materials | | Trusts | | Services | | Utilities | | Other | | Total |
| The Japanese Small | | | | | | | | | | | | | | | | | | | | | | | | | | | | | | | | | | | | | | | | | | | | | | | | |
| Company Series | | | 23.1 | % | | | | 10.1 | % | | | | 1.0 | % | | | | 11.4 | % | | | 4.2% | | | 27.0 | % | | | 10.8 | % | | | 11.8 | % | | | — | | | — | | | | 0.6% | | — | | 100.0% |
| The Asia Pacific Small | | | | | | | | | | | | | | | | | | | | | | | | | | | | | | | | | | | | | | | | | | | | | | | | |
| Company Series | | | 22.5 | % | | | | 3.8 | % | | | | 6.8 | % | | | | 11.0 | % | | | 5.6% | | | 22.7 | % | | | 4.1 | % | | | 17.2 | % | | | — | | | 2.2 | % | | | 4.1% | | — | | 100.0% |
| The United Kingdom Small | | | | | | | | | | | | | | | | | | | | | | | | | | | | | | | | | | | | | | | | | | | | | | | | |
| Company Series | | | 22.7 | % | | | | 4.1 | % | | | | 4.7 | % | | | | 13.5 | % | | | 1.9% | | | 30.7 | % | | | 10.2 | % | | | 7.3 | % | | | — | | | 2.3 | % | | | 2.6% | | — | | 100.0% |
| The Continental Small | | | | | | | | | | | | | | | | | | | | | | | | | | | | | | | | | | | | | | | | | | | | | | | | |
| Company Series | | | 13.7 | % | | | | 7.8 | % | | | | 5.5 | % | | | | 17.8 | % | | | 8.8% | | | 25.2 | % | | | 9.7 | % | | | 8.0 | % | | | — | | | 1.3 | % | | | 2.2% | | — | | 100.0% |
| The Canadian Small | | | | | | | | | | | | | | | | | | | | | | | | | | | | | | | | | | | | | | | | | | | | | | | | |
| Company Series | | | 10.2 | % | | | | 3.1 | % | | | | 25.6 | % | | | | 7.3 | % | | | 2.0% | | | 9.0 | % | | | 5.6 | % | | | 34.3 | % | | �� | — | | | 0.3 | % | | | 2.6% | | — | | 100.0% |
83
THE JAPANESE SMALL COMPANY SERIES
SUMMARY SCHEDULE OF PORTFOLIO HOLDINGS
December 31, 2011
(Unaudited)
| | | | | | | | Percentage | |
| | | | Shares | | Value†† | | of Net Assets** | |
| COMMON STOCKS — (90.2%) | | | | | | | | | |
| Consumer Discretionary — (20.6%) | | | | | | | | | |
| Aoyama Trading Co., Ltd. | | 250,500 | | $ | 4,685,577 | | 0.3 | % | |
| Autobacs Seven Co., Ltd. | | 97,200 | | | 4,444,813 | | 0.3 | % | |
| * | Haseko Corp. | | 5,986,000 | | | 3,960,106 | | 0.3 | % | |
| Komeri Co., Ltd. | | 121,500 | | | 3,735,557 | | 0.2 | % | |
| Nifco, Inc. | | 193,300 | | | 5,372,196 | | 0.3 | % | |
| | Onward Holdings Co., Ltd. | | 532,000 | | | 3,896,398 | | 0.3 | % | |
| * | Pioneer Electronic Corp. | | 1,050,900 | | | 4,708,256 | | 0.3 | % | |
| Ryohin Keikaku Co., Ltd. | | 97,300 | | | 4,751,101 | | 0.3 | % | |
| Shimachu Co., Ltd. | | 191,900 | | | 4,394,614 | | 0.3 | % | |
| # | Shochiku Co., Ltd. | | 404,400 | | | 3,828,903 | | 0.2 | % | |
| SKY Perfect JSAT Holdings, Inc. | | 7,630 | | | 3,805,754 | | 0.2 | % | |
| Sumitomo Forestry Co., Ltd. | | 436,666 | | | 3,869,447 | | 0.3 | % | |
| Toyobo Co., Ltd. | | 3,220,000 | | | 4,330,410 | | 0.3 | % | |
| # | Zensho Co., Ltd. | | 298,400 | | | 4,021,357 | | 0.3 | % | |
| Other Securities | | | | | 288,869,044 | | 18.8 | % | |
| Total Consumer Discretionary | | | | | 348,673,533 | | 22.7 | % | |
| | |
| Consumer Staples — (9.4%) | | | | | | | | | |
| Nichirei Corp. | | 1,031,000 | | | 4,983,287 | | 0.3 | % | |
| Sugi Holdings Co., Ltd. | | 129,700 | | | 3,774,147 | | 0.3 | % | |
| Takara Holdings, Inc. | | 730,000 | | | 4,686,913 | | 0.3 | % | |
| Other Securities | | | | | 145,907,233 | | 9.5 | % | |
| Total Consumer Staples | | | | | 159,351,580 | | 10.4 | % | |
| | |
| Energy — (0.9%) | | | | | | | | | |
| Other Securities | | | | | 15,244,229 | | 1.0 | % | |
| | |
| Financials — (10.2%) | | | | | | | | | |
| Bank of Okinawa, Ltd. (The) | | 94,000 | | | 3,979,271 | | 0.2 | % | |
| Daishi Bank, Ltd. (The) | | 1,403,000 | | | 4,568,464 | | 0.3 | % | |
| Higo Bank, Ltd. (The) | | 663,000 | | | 3,739,868 | | 0.2 | % | |
| Hyakugo Bank, Ltd. (The) | | 1,045,609 | | | 4,134,014 | | 0.3 | % | |
| Hyakujishi Bank, Ltd. (The) | | 1,022,000 | | | 4,556,887 | | 0.3 | % | |
| Juroku Bank, Ltd. | | 1,337,000 | | | 4,357,179 | | 0.3 | % | |
| Kiyo Holdings, Inc. | | 2,635,900 | | | 4,103,204 | | 0.3 | % | |
| Musashino Bank, Ltd. | | 130,300 | | | 4,325,581 | | 0.3 | % | |
| Ogaki Kyoritsu Bank, Ltd. (The) | | 1,315,000 | | | 4,282,437 | | 0.3 | % | |
| San-in Godo Bank, Ltd. (The) | | 627,000 | | | 4,698,208 | | 0.3 | % | |
| Tokyo Tatemono Co., Ltd. | | 1,726,000 | | | 5,200,495 | | 0.3 | % | |
| Other Securities | | | | | 125,491,362 | | 8.2 | % | |
| Total Financials | | | | | 173,436,970 | | 11.3 | % | |
84
The Japanese Small Company Series
continued
| | | | | | | | Percentage | |
| | | | Shares | | Value†† | | of Net Assets** | |
| Health Care — (4.0%) | | | | | | | | | |
| Kaken Pharmaceutical Co., Ltd. | | 353,000 | | $ | 4,686,210 | | 0.3 | % | |
| # | Nihon Kohden Corp. | | 159,200 | | | 3,915,865 | | 0.3 | % | |
| Rohto Pharmaceutical Co., Ltd. | | 360,000 | | | 4,620,581 | | 0.3 | % | |
| # | Sawai Pharmaceutical Co., Ltd. | | 50,500 | | | 5,239,003 | | 0.3 | % | |
| Other Securities | | | | | 48,481,674 | | 3.2 | % | |
| Total Health Care | | | | | 66,943,333 | | 4.4 | % | |
| | |
| Industrials — (24.6%) | | | | | | | | | |
| COMSYS Holdings Corp. | | 378,300 | | | 3,967,301 | | 0.3 | % | |
| | Duskin Co., Ltd. | | 212,500 | | | 4,178,565 | | 0.3 | % | |
| # | Miura Co., Ltd. | | 137,600 | | | 3,875,611 | | 0.3 | % | |
| # | Mori Seiki Co., Ltd. | | 428,400 | | | 3,782,860 | | 0.2 | % | |
| OKUMA Corp. | | 586,000 | | | 3,731,709 | | 0.2 | % | |
| Sankyu, Inc. | | 1,049,000 | | | 3,952,045 | | 0.3 | % | |
| Takara Standard Co., Ltd. | | 501,000 | | | 3,786,757 | | 0.2 | % | |
| Other Securities | | | | | 389,701,899 | | 25.4 | % | |
| Total Industrials | | | | | 416,976,747 | | 27.2 | % | |
| | |
| Information Technology — (9.8%) | | | | | | | | | |
| # | Anritsu Corp. | | 458,000 | | | 5,029,089 | | 0.3 | % | |
| Capcom Co., Ltd. | | 205,600 | | | 4,861,819 | | 0.3 | % | |
| Horiba, Ltd. | | 160,950 | | | 4,828,595 | | 0.3 | % | |
| IT Holdings Corp. | | 357,401 | | | 4,278,832 | | 0.3 | % | |
| Net One Systems Co., Ltd. | | 1,984 | | | 5,400,355 | | 0.4 | % | |
| Other Securities | | | | | 142,430,093 | | 9.3 | % | |
| Total Information Technology | | | | | 166,828,783 | | 10.9 | % | |
| | |
| Materials — (10.2%) | | | | | | | | | |
| FP Corp. | | 61,200 | | | 3,965,084 | | 0.3 | % | |
| # | Hokuetsu Kishu Paper Co., Ltd. | | 862,199 | | | 5,789,984 | | 0.4 | % | |
| Sumitomo Osaka Cement Co., Ltd. | | 1,676,000 | | | 4,565,205 | | 0.3 | % | |
| Toagosei Co., Ltd. | | 1,096,000 | | | 4,483,673 | | 0.3 | % | |
| # | Tokai Carbon Co., Ltd. | | 825,000 | | | 4,468,390 | | 0.3 | % | |
| # | Tokuyama Corp. | | 1,202,000 | | | 3,812,193 | | 0.2 | % | |
| Other Securities | | | | | 146,553,037 | | 9.5 | % | |
| Total Materials | | | | | 173,637,566 | | 11.3 | % | |
| | |
| Utilities — (0.5%) | | | | | | | | | |
| Other Securities | | | | | 8,610,136 | | 0.5 | % | |
| TOTAL COMMON STOCKS | | | | | 1,529,702,877 | | 99.7 | % | |
| RIGHTS/WARRANTS — (0.0%) | | | | | | | | | |
| Other Securities | | | | | 25,542 | | 0.0 | % | |
85
The Japanese Small Company Series
continued
| | Shares/ | | | | | | | |
| | Face | | | | | Percentage | |
| | Amount | | Value† | | of Net Assets** | |
| | | (000) | | | | | | | |
| SECURITIES LENDING COLLATERAL — (9.8%) | | | | | | | | | |
| §@ | DFA Short Term Investment Fund | | 166,000,000 | | $ | 166,000,000 | | 10.8 | % | |
| @ | Repurchase Agreement, Deutsche Bank Securities, Inc. 0.08%, 01/03/12 | | | | | | | | | |
| (Collateralized by U.S. Treasury Note 1.375%, 09/30/18, | | | | | | | | | |
| valued at $667,386) to be repurchased at $654,306 | $ | 654 | | | 654,300 | | 0.1 | % | |
| TOTAL SECURITIES LENDING COLLATERAL | | | | | 166,654,300 | | 10.9 | % | |
| TOTAL INVESTMENTS — (100.0%) | | | | | | | | | |
| (Cost $1,832,235,713)^ | | | | $ | 1,696,382,719 | | 110.6 | % | |
____________________
| ^ | | The cost for federal income taxes is $1,833,532,699. |
Summary of inputs used to value the Series’ investments as of December 31, 2011 is as follows (See Security Valuation Note):
| | Valuation Inputs | |
| | Investment in | |
| | Securities | |
| | (Market Value) | |
| | Level 1 | | Level 2 | | Level 3 | | Total | |
| Common Stocks | | | | | | | | | | | | |
| Consumer Discretionary | | | — | | $ | 348,673,533 | | — | | $ | 348,673,533 | |
| Consumer Staples | | $ | 301,213 | | | 159,050,367 | | — | | | 159,351,580 | |
| Energy | | | — | | | 15,244,229 | | — | | | 15,244,229 | |
| Financials | | | — | | | 173,436,970 | | — | | | 173,436,970 | |
| Health Care | | | 2,495,050 | | | 64,448,283 | | — | | | 66,943,333 | |
| Industrials | | | 118,098 | | | 416,858,649 | | — | | | 416,976,747 | |
| Information Technology | | | — | | | 166,828,783 | | — | | | 166,828,783 | |
| Materials | | | — | | | 173,637,566 | | — | | | 173,637,566 | |
| Utilities | | | — | | | 8,610,136 | | — | | | 8,610,136 | |
| Rights/Warrants | | | — | | | 25,542 | | — | | | 25,542 | |
| Securities Lending Collateral | | | — | | | 166,654,300 | | — | | | 166,654,300 | |
| TOTAL | | $ | 2,914,361 | | $ | 1,693,468,358 | | — | | $ | 1,696,382,719 | |
See accompanying Notes to Financial Statements.
86
THE ASIA PACIFIC SMALL COMPANY SERIES
SUMMARY SCHEDULE OF PORTFOLIO HOLDINGS
December 31, 2011
(Unaudited)
| | | | | | | | | Percentage | |
| | | Shares | | Value†† | | of Net Assets** | |
| COMMON STOCKS — (83.2%) | | | | | | | | | |
| AUSTRALIA — (52.6%) | | | | | | | | | |
| Adelaide Brighton, Ltd. | | 1,927,272 | | $ | 5,693,709 | | 0.7 | % | |
| Ansell, Ltd. | | 503,479 | | | 7,475,505 | | 0.9 | % | |
| # | Aristocrat Leisure, Ltd. | | 1,897,825 | | | 4,262,477 | | 0.5 | % | |
| #* | Aurora Oil & Gas, Ltd. | | 1,265,748 | | | 4,387,027 | | 0.5 | % | |
| # | Australian Infrastructure Fund NL | | 3,166,751 | | | 6,232,048 | | 0.8 | % | |
| Beach Energy, Ltd. | | 4,828,492 | | | 6,084,689 | | 0.7 | % | |
| * | BlueScope Steel, Ltd. | | 10,743,876 | | | 4,431,884 | | 0.5 | % | |
| # | Boart Longyear Group | | 2,239,911 | | | 6,368,916 | | 0.8 | % | |
| Bradken, Ltd. | | 785,359 | | | 5,736,837 | | 0.7 | % | |
| Campbell Brothers, Ltd. | | 183,237 | | | 9,175,496 | | 1.1 | % | |
| # | carsales.com, Ltd. | | 961,726 | | | 4,687,260 | | 0.6 | % | |
| CSR, Ltd. | | 2,491,176 | | | 4,987,698 | | 0.6 | % | |
| # | David Jones, Ltd. | | 1,881,866 | | | 4,548,695 | | 0.5 | % | |
| #* | Downer EDI, Ltd. | | 1,768,446 | | | 5,772,439 | | 0.7 | % | |
| DUET Group, Ltd. | | 4,437,176 | | | 7,965,931 | | 1.0 | % | |
| # | DuluxGroup, Ltd. | | 1,538,157 | | | 4,532,941 | | 0.5 | % | |
| # | Envestra, Ltd. | | 5,142,027 | | | 3,752,254 | | 0.5 | % | |
| # | Goodman Fielder, Ltd. | | 8,296,037 | | | 3,673,797 | | 0.4 | % | |
| GrainCorp, Ltd. | | 759,612 | | | 6,078,950 | | 0.7 | % | |
| Iluka Resources, Ltd. | | 401,932 | | | 6,366,203 | | 0.8 | % | |
| # | Independence Group NL | | 1,024,848 | | | 3,959,817 | | 0.5 | % | |
| # | Invocare, Ltd. | | 572,622 | | | 4,509,447 | | 0.5 | % | |
| # | IOOF Holdings, Ltd. | | 989,055 | | | 5,164,887 | | 0.6 | % | |
| # | JB Hi-Fi, Ltd. | | 450,518 | | | 5,193,555 | | 0.6 | % | |
| Mineral Resources, Ltd. | | 388,955 | | | 4,376,479 | | 0.5 | % | |
| # | Monadelphous Group, Ltd. | | 319,624 | | | 6,571,746 | | 0.8 | % | |
| # | Myer Holdings, Ltd. | | 2,954,756 | | | 5,833,130 | | 0.7 | % | |
| # | Navitas, Ltd. | | 1,157,537 | | | 4,138,972 | | 0.5 | % | |
| #* | Paladin Energy, Ltd. | | 2,824,953 | | | 3,972,632 | | 0.5 | % | |
| * | PanAust, Ltd. | | 1,780,618 | | | 5,843,964 | | 0.7 | % | |
| # | Perpetual Trustees Australia, Ltd. | | 190,719 | | | 3,977,522 | | 0.5 | % | |
| #* | Perseus Mining, Ltd. | | 1,605,654 | | | 3,982,596 | | 0.5 | % | |
| # | Primary Health Care, Ltd. | | 1,960,174 | | | 6,168,563 | | 0.7 | % | |
| Reece Australia, Ltd. | | 238,457 | | | 4,476,495 | | 0.5 | % | |
| #* | Regis Resources, Ltd. | | 1,195,060 | | | 4,153,550 | | 0.5 | % | |
| # | SAI Global, Ltd. | | 1,064,331 | | | 4,901,978 | | 0.6 | % | |
| # | Seek, Ltd. | | 666,916 | | | 3,866,846 | | 0.5 | % | |
| Seven Group Holdings, Ltd. | | 544,133 | | | 3,939,065 | | 0.5 | % | |
| Spark Infrastructure Group, Ltd. | | 5,543,872 | | | 7,788,490 | | 0.9 | % | |
| #* | Sundance Resources, Ltd. | | 8,756,539 | | | 3,539,328 | | 0.4 | % | |
| # | Super Retail Group, Ltd. | | 1,268,454 | | | 6,882,737 | | 0.8 | % | |
| # | Transfield Services, Ltd. | | 1,880,286 | | | 4,164,576 | | 0.5 | % | |
| #* | Transpacific Industries Group, Ltd. | | 4,533,180 | | | 3,786,246 | | 0.5 | % | |
| Other Securities | | | | | 295,317,273 | | 35.6 | % | |
| TOTAL AUSTRALIA | | | | | 518,724,650 | | 62.4 | % | |
87
The Asia Pacific Small Company Series
continued
| | | | | | | | | Percentage | |
| | | Shares | | Value†† | | of Net Assets** | |
| HONG KONG — (15.4%) | | | | | | | | | | |
| | Giordano International, Ltd. | | | 7,162,000 | | $ | 5,164,890 | | 0.6 | % | |
| Other Securities | | | | | | 146,475,842 | | 17.7 | % | |
| TOTAL HONG KONG | | | | | | 151,640,732 | | 18.3 | % | |
| | |
| MALAYSIA — (0.0%) | | | | | | | | | | |
| Other Securities | | | | | | 4,069 | | 0.0 | % | |
| | |
| NEW ZEALAND — (5.9%) | | | | | | | | | | |
| Fisher & Paykel Healthcare Corp., Ltd. | | | 2,826,030 | | | 5,520,467 | | 0.6 | % | |
| Port of Tauranga, Ltd. | | | 528,322 | | | 4,090,750 | | 0.5 | % | |
| Ryman Healthcare, Ltd. | | | 1,673,055 | | | 3,525,028 | | 0.4 | % | |
| Sky City Entertainment Group, Ltd. | | | 3,025,486 | | | 8,083,163 | | 1.0 | % | |
| Sky Network Television, Ltd. | | | 991,419 | | | 4,091,030 | | 0.5 | % | |
| Other Securities | | | | | | 32,302,495 | | 3.9 | % | |
| TOTAL NEW ZEALAND | | | | | | 57,612,933 | | 6.9 | % | |
| | |
| SINGAPORE — (9.3%) | | | | | | | | | | |
| * | Biosensors International Group, Ltd. | | | 3,419,237 | | | 3,763,725 | | 0.5 | % | |
| Other Securities | | | | | | 88,326,855 | | 10.6 | % | |
| TOTAL SINGAPORE | | | | | | 92,090,580 | | 11.1 | % | |
| TOTAL COMMON STOCKS | | | | | | 820,072,964 | | 98.7 | % | |
| | |
| RIGHTS/WARRANTS — (0.0%) | | | | | | | | | | |
| AUSTRALIA — (0.0%) | | | | | | | | | | |
| Other Securities | | | | | | 8 | | 0.0 | % | |
| HONG KONG — (0.0%) | | | | | | | | | | |
| Other Securities | | | | | | 4,766 | | 0.0 | % | |
| SINGAPORE — (0.0%) | | | | | | | | | | |
| Other Securities | | | | | | 15,697 | | 0.0 | % | |
| TOTAL RIGHTS/WARRANTS | | | | | | 20,471 | | 0.0 | % | |
| | |
| | |
| | | Shares/ | | | | | | | |
| | | Face | | | | | | | |
| | | Amount | | Value† | | | | |
| | | (000) | | | | | | | |
| SECURITIES LENDING COLLATERAL — (16.8%) | | | | | | | | | | |
| §@ | DFA Short Term Investment Fund | | | 165,000,000 | | | 165,000,000 | | 19.9 | % | |
| @ | Repurchase Agreement, Deutsche Bank Securities, Inc. 0.08%, 01/03/12 | | | | | | | | | | |
| (Collateralized by U.S. Treasury Note 1.375%, 09/30/18, | | | | | | | | | | |
| valued at $866,063) to be repurchased at $849,089 | | $ | 849 | | | 849,081 | | 0.1 | % | |
| TOTAL SECURITIES LENDING COLLATERAL | | | | | | 165,849,081 | | 20.0 | % | |
| TOTAL INVESTMENTS — (100.0%) | | | | | | | | | | |
| (Cost $1,034,796,383)^ | | | | | $ | 985,942,516 | | 118.7 | % | |
____________________
| ^ | | The cost for federal income tax purposes is $1,038,719,321. |
88
The Asia Pacific Small Company Series
continued
Summary of inputs used to value the Series’ investments as of December 31, 2011 is as follows (See Security Valuation Note):
| | Valuation Inputs | |
| | Investment in | |
| | Securities | |
| | (Market Value) | |
| | Level 1 | | Level 2 | | Level 3 | | Total | |
| Common Stocks | | | | | | | | | | | | |
| Australia | | $ | 8,024,219 | | $ | 510,700,431 | | — | | $ | 518,724,650 | |
| Hong Kong | | | 293,612 | | | 151,347,120 | | — | | | 151,640,732 | |
| Malaysia | | | — | | | 4,069 | | — | | | 4,069 | |
| New Zealand | | | 85,075 | | | 57,527,858 | | — | | | 57,612,933 | |
| Singapore | | | 718,804 | | | 91,371,776 | | — | | | 92,090,580 | |
| Rights/Warrants | | | | | | | | | | | | |
| Australia | | | — | | | 8 | | — | | | 8 | |
| Hong Kong | | | 4,766 | | | — | | — | | | 4,766 | |
| Singapore | | | — | | | 15,697 | | — | | | 15,697 | |
| Securities Lending Collateral | | | — | | | 165,849,081 | | — | | | 165,849,081 | |
| TOTAL | | $ | 9,126,476 | | $ | 976,816,040 | | — | | $ | 985,942,516 | |
See accompanying Notes to Financial Statements.
89
THE UNITED KINGDOM SMALL COMPANY SERIES
SUMMARY SCHEDULE OF PORTFOLIO HOLDINGS
December 31, 2011
(Unaudited)
| | | | | | | | Percentage | |
| | | Shares | | Value†† | | of Net Assets** | |
| COMMON STOCKS — (99.1%) | | | | | | | | | |
| Consumer Discretionary — (22.1%) | | | | | | | | | |
| | Aegis Group P.L.C. | | 3,302,990 | | $ | 7,402,581 | | 0.7 | % | |
| * | Berkeley Group Holdings P.L.C. (The) | | 511,780 | | | 10,139,684 | | 0.9 | % | |
| GKN P.L.C. | | 3,414,280 | | | 9,695,522 | | 0.9 | % | |
| Greene King P.L.C. | | 1,421,372 | | | 10,748,766 | | 1.0 | % | |
| Inchcape P.L.C. | | 1,915,975 | | | 8,717,127 | | 0.8 | % | |
| Informa P.L.C. | | 2,292,105 | | | 12,851,263 | | 1.2 | % | |
| ITV P.L.C. | | 8,448,636 | | | 8,925,370 | | 0.8 | % | |
| Ladbrokes P.L.C. | | 3,578,739 | | | 7,218,497 | | 0.7 | % | |
| Persimmon P.L.C. | | 1,177,634 | | | 8,591,189 | | 0.8 | % | |
| Rightmove P.L.C. | | 378,372 | | | 7,310,653 | | 0.7 | % | |
| * | Taylor Wimpey P.L.C. | | 12,108,224 | | | 7,057,285 | | 0.7 | % | |
| William Hill P.L.C. | | 2,873,883 | | | 9,033,316 | | 0.8 | % | |
| Other Securities | | | | | 130,668,714 | | 12.2 | % | |
| Total Consumer Discretionary | | | | | 238,359,967 | | 22.2 | % | |
| | |
| Consumer Staples — (4.2%) | | | | | | | | | |
| PZ Cussons P.L.C. | | 1,287,639 | | | 6,999,863 | | 0.6 | % | |
| Tate & Lyle P.L.C. | | 1,074,000 | | | 11,741,438 | | 1.1 | % | |
| Other Securities | | | | | 26,811,738 | | 2.5 | % | |
| Total Consumer Staples | | | | | 45,553,039 | | 4.2 | % | |
| | |
| Energy — (4.7%) | | | | | | | | | |
| John Wood Group P.L.C. | | 1,034,385 | | | 10,288,678 | | 1.0 | % | |
| * | Premier Oil P.L.C. | | 1,778,192 | | | 10,013,866 | | 0.9 | % | |
| Other Securities | | | | | 30,589,539 | | 2.8 | % | |
| Total Energy | | | | | 50,892,083 | | 4.7 | % | |
| | |
| Financials — (13.0%) | | | | | | | | | |
| Aberdeen Asset Management P.L.C. | | 2,820,342 | | | 9,285,387 | | 0.9 | % | |
| Amlin P.L.C. | | 1,905,352 | | | 9,279,530 | | 0.9 | % | |
| Catlin Group, Ltd. | | 1,357,851 | | | 8,408,376 | | 0.8 | % | |
| Hiscox, Ltd. | | 1,562,751 | | | 9,050,013 | | 0.8 | % | |
| IG Group Holdings P.L.C. | | 1,317,769 | | | 9,752,922 | | 0.9 | % | |
| London Stock Exchange Group P.L.C. | | 579,642 | | | 7,128,631 | | 0.6 | % | |
| Provident Financial P.L.C. | | 499,581 | | | 7,301,768 | | 0.7 | % | |
| Other Securities | | | | | 79,469,396 | | 7.4 | % | |
| Total Financials | | | | | 139,676,023 | | 13.0 | % | |
| | |
| Health Care — (1.9%) | | | | | | | | | |
| Other Securities | | | | | 20,679,191 | | 1.9 | % | |
| | |
| Industrials — (30.7%) | | | | | | | | | |
| Ashtead Group P.L.C. | | 2,124,586 | | | 7,441,350 | | 0.7 | % | |
| Babcock International Group P.L.C. | | 1,446,405 | | | 16,501,362 | | 1.5 | % | |
| Balfour Beatty P.L.C. | | 2,828,972 | | | 11,628,302 | | 1.1 | % | |
| BBA Aviation P.L.C. | | 2,792,163 | | | 7,708,203 | | 0.7 | % | |
| Carillion P.L.C. | | 1,773,138 | | | 8,273,953 | | 0.8 | % | |
90
The United Kingdom Small Company Series
continued
| | | | | | | | Percentage | |
| | | Shares | | Value†† | | of Net Assets** | |
| Industrials — (Continued) | | | | | | | | | |
| | Charter International P.L.C. | | 664,438 | | $ | 9,741,359 | | 0.9 | % | |
| Cobham P.L.C. | | 3,090,004 | | | 8,798,519 | | 0.8 | % | |
| Cookson Group P.L.C. | | 1,135,834 | | | 8,964,334 | | 0.8 | % | |
| Firstgroup P.L.C. | | 1,789,126 | | | 9,376,858 | | 0.9 | % | |
| IMI P.L.C. | | 1,053,765 | | | 12,438,291 | | 1.2 | % | |
| Intertek Group P.L.C. | | 456,070 | | | 14,402,128 | | 1.3 | % | |
| Invensys P.L.C. | | 2,426,737 | | | 7,935,997 | | 0.7 | % | |
| Meggitt P.L.C. | | 2,465,596 | | | 13,496,107 | | 1.2 | % | |
| Melrose P.L.C. | | 1,583,124 | | | 8,356,075 | | 0.8 | % | |
| Michael Page International P.L.C. | | 1,310,832 | | | 7,101,476 | | 0.7 | % | |
| Rotork P.L.C. | | 366,679 | | | 10,977,031 | | 1.0 | % | |
| Spirax-Sarco Engineering P.L.C. | | 319,520 | | | 9,292,347 | | 0.9 | % | |
| Stagecoach Group P.L.C. | | 1,718,521 | | | 7,258,447 | | 0.7 | % | |
| Travis Perkins P.L.C. | | 922,110 | | | 11,379,408 | | 1.1 | % | |
| Other Securities | | | | | 139,593,408 | | 13.0 | % | |
| Total Industrials | | | | | 330,664,955 | | 30.8 | % | |
| | |
| Information Technology — (10.0%) | | | | | | | | | |
| Halma P.L.C. | | 1,541,075 | | | 7,904,969 | | 0.7 | % | |
| * | Imagination Technologies Group P.L.C. | | 961,901 | | | 8,200,427 | | 0.8 | % | |
| Spectris P.L.C. | | 515,234 | | | 10,295,072 | | 1.0 | % | |
| Other Securities | | | | | 80,610,962 | | 7.5 | % | |
| Total Information Technology | | | | | 107,011,430 | | 10.0 | % | |
| | |
| Materials — (7.3%) | | | | | | | | | |
| Croda International P.L.C. | | 520,183 | | | 14,562,102 | | 1.3 | % | |
| Mondi P.L.C. | | 1,231,343 | | | 8,697,714 | | 0.8 | % | |
| Other Securities | | | | | 55,536,946 | | 5.2 | % | |
| Total Materials | | | | | 78,796,762 | | 7.3 | % | |
| | |
| Telecommunication Services — (2.5%) | | | | | | | | | |
| Inmarsat P.L.C. | | 1,347,950 | | | 8,441,793 | | 0.8 | % | |
| Other Securities | | | | | 18,782,522 | | 1.7 | % | |
| Total Telecommunication Services | | | | | 27,224,315 | | 2.5 | % | |
| | |
| Utilities — (2.7%) | | | | | | | | | |
| Drax Group P.L.C. | | 1,479,700 | | | 12,514,618 | | 1.2 | % | |
| Pennon Group P.L.C. | | 1,445,401 | | | 16,006,243 | | 1.5 | % | |
| Other Securities | | | | | 244,163 | | 0.0 | % | |
| Total Utilities | | | | | 28,765,024 | | 2.7 | % | |
| TOTAL COMMON STOCKS | | | | | 1,067,622,789 | | 99.3 | % | |
| | |
| PREFERRED STOCKS — (0.0%) | | | | | | | | | |
| Consumer Staples — (0.0%) | | | | | | | | | |
| Other Securities | | | | | 9,292 | | 0.0 | % | |
| | | | | | | | | | |
| RIGHTS/WARRANTS — (0.0%) | | | | | | | | | |
| Other Securities | | | | | — | | 0.0 | % | |
91
The United Kingdom Small Company Series
continued
| | | Shares/ | | | | | | | |
| | Face | | | | | Percentage | |
| | Amount | | Value† | | of Net Assets** | |
| | (000) | | | | | | | |
| SECURITIES LENDING COLLATERAL — (0.9%) | | | | | | | | | |
| §@ | DFA Short Term Investment Fund | | 7,000,000 | | $ | 7,000,000 | | 0.7 | % | |
| @ | Repurchase Agreement, Deutsche Bank Securities, Inc. 0.08%, 01/03/12 | | | | | | | | | |
| (Collateralized by U.S. Treasury Note 1.375%, 09/30/18, | | | | | | | | | |
| valued at $2,235,983) to be repurchased at $2,192,159 | $ | 2,192 | | | 2,192,140 | | 0.2 | % | |
| TOTAL SECURITIES LENDING COLLATERAL | | | | | 9,192,140 | | 0.9 | % | |
| TOTAL INVESTMENTS — (100.0%) | | | | | | | | | |
| (Cost $1,118,700,276)^ | | | | $ | 1,076,824,221 | | 100.2 | % | |
____________________
| ^ | | The cost for federal income tax purposes is $1,123,288,705. |
Summary of inputs used to value the Series’ investments as of December 31, 2011 is as follows (See Security Valuation Note):
| | Valuation Inputs | |
| | Investment in | |
| | Securities | |
| | (Market Value) | |
| | Level 1 | | Level 2 | | Level 3 | | Total | |
| Common Stocks | | | | | | | | | | | | |
| Consumer Discretionary | | $ | 509,444 | | $ | 237,850,523 | | — | | $ | 238,359,967 | |
| Consumer Staples | | | 213,002 | | | 45,340,037 | | — | | | 45,553,039 | |
| Energy | | | — | | | 50,892,083 | | — | | | 50,892,083 | |
| Financials | | | 131,244 | | | 139,544,779 | | — | | | 139,676,023 | |
| Health Care | | | — | | | 20,679,191 | | — | | | 20,679,191 | |
| Industrials | | | 4,022 | | | 330,660,933 | | — | | | 330,664,955 | |
| Information Technology | | | — | | | 107,011,430 | | — | | | 107,011,430 | |
| Materials | | | 3,763,256 | | | 75,033,506 | | — | | | 78,796,762 | |
| Telecommunication Services | | | — | | | 27,224,315 | | — | | | 27,224,315 | |
| Utilities | | | — | | | 28,765,024 | | — | | | 28,765,024 | |
| Preferred Stocks | | | | | | | | | | | | |
| Consumer Staples | | | — | | | 9,292 | | — | | | 9,292 | |
| Rights/Warrants | | | — | | | — | | — | | | — | |
| Securities Lending Collateral | | | — | | | 9,192,140 | | — | | | 9,192,140 | |
| TOTAL | | $ | 4,620,968 | | $ | 1,072,203,253 | | — | | $ | 1,076,824,221 | |
See accompanying Notes to Financial Statements.
92
THE CONTINENTAL SMALL COMPANY SERIES
SUMMARY SCHEDULE OF PORTFOLIO HOLDINGS
December 31, 2011
(Unaudited)
| | | | | | | | | Percentage | |
| | | Shares | | Value†† | | of Net Assets** | |
| COMMON STOCKS — (83.6%) | | | | | | | | | |
| AUSTRIA — (1.9%) | | | | | | | | | |
| Other Securities | | | | $ | 42,058,345 | | 2.3 | % | |
| | |
| BELGIUM — (3.0%) | | | | | | | | | |
| Ackermans & van Haaren NV | | 94,712 | | | 7,040,950 | | 0.4 | % | |
| Other Securities | | | | | 57,545,828 | | 3.2 | % | |
| TOTAL BELGIUM | | | | | 64,586,778 | | 3.6 | % | |
| | | | | | | | | | |
| DENMARK — (2.7%) | | | | | | | | | |
| GN Store Nord A.S. | | 798,612 | | | 6,702,503 | | 0.4 | % | |
| * | Topdanmark A.S. | | 53,386 | | | 8,304,872 | | 0.5 | % | |
| Other Securities | | | | | 42,578,381 | | 2.3 | % | |
| TOTAL DENMARK | | | | | 57,585,756 | | 3.2 | % | |
| | |
| FINLAND — (5.5%) | | | | | | | | | |
| # | Elisa Oyj | | 494,801 | | | 10,302,204 | | 0.6 | % | |
| # | Orion Oyj Series B | | 337,043 | | | 6,548,837 | | 0.4 | % | |
| Outotec Oyj | | 133,044 | | | 6,230,991 | | 0.3 | % | |
| # | Yit Oyj | | 390,890 | | | 6,240,392 | | 0.3 | % | |
| Other Securities | | | | | 90,006,314 | | 5.0 | % | |
| TOTAL FINLAND | | | | | 119,328,738 | | 6.6 | % | |
| | |
| FRANCE — (9.6%) | | | | | | | | | |
| Arkema SA | | 130,795 | | | 9,190,786 | | 0.5 | % | |
| # | Neopost SA | | 91,985 | | | 6,185,863 | | 0.3 | % | |
| Nexans SA | | 131,823 | | | 6,807,411 | | 0.4 | % | |
| Remy Cointreau SA | | 82,777 | | | 6,638,753 | | 0.4 | % | |
| Societe BIC SA | | 74,331 | | | 6,575,875 | | 0.4 | % | |
| Valeo SA | | 196,323 | | | 7,769,667 | | 0.4 | % | |
| # | Zodiac Aerospace SA | | 89,170 | | | 7,532,929 | | 0.4 | % | |
| Other Securities | | | | | 156,206,995 | | 8.6 | % | |
| TOTAL FRANCE | | | | | 206,908,279 | | 11.4 | % | |
| | |
| GERMANY — (12.1%) | | | | | | | | | |
| * | Aareal Bank AG | | 423,110 | | | 7,633,993 | | 0.4 | % | |
| Aurubis AG | | 152,783 | | | 8,130,677 | | 0.5 | % | |
| Bilfinger Berger SE | | 125,406 | | | 10,677,964 | | 0.6 | % | |
| MTU Aero Engines Holding AG | | 142,908 | | | 9,124,965 | | 0.5 | % | |
| Rhoen-Klinikum AG | | 406,308 | | | 7,732,812 | | 0.4 | % | |
| #* | SGL Carbon SE | | 229,387 | | | 11,290,812 | | 0.6 | % | |
| # | Symrise AG | | 330,233 | | | 8,794,596 | | 0.5 | % | |
| Other Securities | | | | | 195,708,984 | | 10.8 | % | |
| TOTAL GERMANY | | | | | 259,094,803 | | 14.3 | % | |
93
The Continental Small Company Series
continued
| | | | | | | | | Percentage | |
| | | Shares | | Value†† | | of Net Assets** | |
| GREECE — (1.8%) | | | | | | | | | |
| Other Securities | | | | $ | 37,882,848 | | 2.1 | % | |
| | |
| IRELAND — (2.8%) | | | | | | | | | |
| DCC P.L.C. | | 308,989 | | | 7,296,468 | | 0.4 | % | |
| Dragon Oil P.L.C. | | 1,324,770 | | | 9,406,480 | | 0.5 | % | |
| Paddy Power P.L.C. | | 180,573 | | | 10,388,718 | | 0.6 | % | |
| Other Securities | | | | | 32,491,995 | | 1.8 | % | |
| TOTAL IRELAND | | | | | 59,583,661 | | 3.3 | % | |
| | |
| ISRAEL — (2.2%) | | | | | | | | | |
| Other Securities | | | | | 47,265,701 | | 2.6 | % | |
| | |
| ITALY — (6.7%) | | | | | | | | | |
| Banca Popolare di Sondrio Scarl | | 922,722 | | | 7,404,493 | | 0.4 | % | |
| Davide Campari - Milano SpA | | 990,609 | | | 6,584,272 | | 0.4 | % | |
| Prysmian SpA | | 653,038 | | | 8,068,757 | | 0.4 | % | |
| Other Securities | | | | | 122,596,572 | | 6.8 | % | |
| TOTAL ITALY | | | | | 144,654,094 | | 8.0 | % | |
| | |
| NETHERLANDS — (4.5%) | | | | | | | | | |
| Aalberts Industries NV | | 384,012 | | | 6,424,692 | | 0.4 | % | |
| # | Imtech NV | | 272,621 | | | 7,030,961 | | 0.4 | % | |
| Nutreco NV | | 145,366 | | | 9,546,244 | | 0.5 | % | |
| SBM Offshore NV | | 380,277 | | | 7,795,170 | | 0.4 | % | |
| Other Securities | | | | | 65,083,578 | | 3.6 | % | |
| TOTAL NETHERLANDS | | | | | 95,880,645 | | 5.3 | % | |
| | |
| NORWAY — (2.8%) | | | | | | | | | |
| Other Securities | | | | | 59,670,177 | | 3.3 | % | |
| | |
| PORTUGAL — (1.0%) | | | | | | | | | |
| Other Securities | | | | | 21,251,666 | | 1.2 | % | |
| | |
| SPAIN — (4.8%) | | | | | | | | | |
| # | Bankinter SA | | 1,006,147 | | | 6,156,407 | | 0.3 | % | |
| # | Bolsas y Mercados Espanoles SA | | 236,082 | | | 6,338,306 | | 0.4 | % | |
| Ebro Foods SA | | 340,839 | | | 6,312,169 | | 0.3 | % | |
| # | Viscofan SA | | 183,430 | | | 6,785,197 | | 0.4 | % | |
| Other Securities | | | | | 77,082,746 | | 4.3 | % | |
| TOTAL SPAIN | | | | | 102,674,825 | | 5.7 | % | |
| | |
| SWEDEN — (8.8%) | | | | | | | | | |
| Castellum AB | | 569,221 | | | 7,043,794 | | 0.4 | % | |
| Elekta AB Series B | | 255,842 | | | 11,062,417 | | 0.6 | % | |
| * | Lundin Petroleum AB | | 439,229 | | | 10,757,873 | | 0.6 | % | |
| Meda AB Series A | | 770,903 | | | 7,999,630 | | 0.4 | % | |
| Trelleborg AB Series B | | 928,357 | | | 8,022,870 | | 0.5 | % | |
| Other Securities | | | | | 144,988,392 | | 8.0 | % | |
| TOTAL SWEDEN | | | | | 189,874,976 | | 10.5 | % | |
94
The Continental Small Company Series
continued
| | | | | | | | Percentage | |
| | | Shares | | Value†† | | of Net Assets** | |
| SWITZERLAND — (13.4%) | | | | | | | | | | |
| Aryzta AG | | | 242,276 | | $ | 11,688,187 | | 0.6 | % | |
| Berner Kantonalbank AG | | | 23,232 | | | 6,163,467 | | 0.3 | % | |
| * | Clariant AG | | | 699,758 | | | 6,870,204 | | 0.4 | % | |
| # | Galenica Holding AG | | | 18,828 | | | 10,997,155 | | 0.6 | % | |
| GAM Holding AG | | | 780,910 | | | 8,456,882 | | 0.5 | % | |
| Helvetia Holding AG | | | 22,754 | | | 7,130,595 | | 0.4 | % | |
| Lonza Group AG | | | 146,907 | | | 8,656,139 | | 0.5 | % | |
| PSP Swiss Property AG | | | 148,327 | | | 12,399,222 | | 0.7 | % | |
| Sulzer AG | | | 64,067 | | | 6,822,251 | | 0.4 | % | |
| Swiss Life Holding AG | | | 94,071 | | | 8,615,819 | | 0.5 | % | |
| Other Securities | | | | | | 199,337,267 | | 11.0 | % | |
| TOTAL SWITZERLAND | | | | | | 287,137,188 | | 15.9 | % | |
| TOTAL COMMON STOCKS | | | | | | 1,795,438,480 | | 99.3 | % | |
| | | | | | | | | | | |
| RIGHTS/WARRANTS — (0.0%) | | | | | | | | | | |
| BELGIUM — (0.0%) | | | | | | | | | | |
| Other Securities | | | | | | 1,697 | | 0.0 | % | |
| | |
| ITALY — (0.0%) | | | | | | | | | | |
| Other Securities | | | | | | 25,890 | | 0.0 | % | |
| TOTAL RIGHTS/WARRANTS | | | | | | 27,587 | | 0.0 | % | |
| | |
| | | Shares/ | | | | | | | |
| | | Face | | | | | Percentage | |
| | | Amount | | Value† | | of Net Assets** | |
| | | (000) | | | | | | | |
| SECURITIES LENDING COLLATERAL — (16.4%) | | | | | | | | | | |
| §@ | DFA Short Term Investment Fund | | | 353,000,000 | | $ | 353,000,000 | | 19.5 | % | |
| @ | Repurchase Agreement, Deutsche Bank Securities, Inc. 0.08%, 01/03/12 | | | | | | | | | | |
| (Collateralized by U.S. Treasury Note 1.375%, 09/30/18, | | | | | | | | | | |
| valued at $172,911) to be repurchased at $169,523 | | $ | 170 | | | 169,521 | | 0.0 | % | |
| TOTAL SECURITIES LENDING COLLATERAL | | | | | | 353,169,521 | | 19.5 | % | |
| TOTAL INVESTMENTS — (100.0%) | | | | | | | | | | |
| (Cost $2,412,394,669)^ | | | | | $ | 2,148,635,588 | | 118.8 | % | |
____________________
| ^ | | The cost for federal income tax purposes is $2,413,711,366. |
95
The Continental Small Company Series
continued
Summary of inputs used to value the Series’ investments as of December 31, 2011 is as follows (See Security Valuation Note):
| | | | Valuation Inputs | |
| | | Investment in | |
| | | Securities | |
| | | (Market Value) | |
| | | Level 1 | | Level 2 | | Level 3 | | Total | |
| Common Stocks | | | | | | | | | | | | |
| Austria | | $ | 108,176 | | $ | 41,950,169 | | — | | $ | 42,058,345 | |
| Belgium | | | — | | | 64,586,778 | | — | | | 64,586,778 | |
| Denmark | | | 45,967 | | | 57,539,789 | | — | | | 57,585,756 | |
| Finland | | | — | | | 119,328,738 | | — | | | 119,328,738 | |
| France | | | 816,894 | | | 206,091,385 | | — | | | 206,908,279 | |
| Germany | | | 944,594 | | | 258,150,209 | | — | | | 259,094,803 | |
| Greece | | | 15,463 | | | 37,867,385 | | — | | | 37,882,848 | |
| Ireland | | | — | | | 59,583,661 | | — | | | 59,583,661 | |
| Israel | | | 1,785,252 | | | 45,480,449 | | — | | | 47,265,701 | |
| Italy | | | — | | | 144,654,094 | | — | | | 144,654,094 | |
| Netherlands | | | 528,632 | | | 95,352,013 | | — | | | 95,880,645 | |
| Norway | | | 173,723 | | | 59,496,454 | | — | | | 59,670,177 | |
| Portugal | | | 318,106 | | | 20,933,560 | | — | | | 21,251,666 | |
| Spain | | | — | | | 102,674,825 | | — | | | 102,674,825 | |
| Sweden | | | 7,042 | | | 189,867,934 | | — | | | 189,874,976 | |
| Switzerland | | | 1,064,706 | | | 286,072,482 | | — | | | 287,137,188 | |
| Rights/Warrants | | | | | | | | | | | | |
| Belgium | | | 357 | | | 1,340 | | — | | | 1,697 | |
| Italy | | | 25,876 | | | 14 | | — | | | 25,890 | |
| Securities Lending Collateral | | | — | | | 353,169,521 | | — | | | 353,169,521 | |
| TOTAL | | $ | 5,834,788 | | $ | 2,142,800,800 | | — | | $ | 2,148,635,588 | |
See accompanying Notes to Financial Statements.
96
THE CANADIAN SMALL COMPANY SERIES
SUMMARY SCHEDULE OF PORTFOLIO HOLDINGS
December 31, 2011
(Unaudited)
| | | | | | | | Percentage | |
| | | | Shares | | Value†† | | of Net Assets** | |
| COMMON STOCKS — (76.1%) | | | | | | | | | |
| Consumer Discretionary — (8.4%) | | | | | | | | | |
| Astral Media, Inc. Class A | | 195,947 | | $ | 6,826,168 | | 1.0 | % | |
| # | Cineplex, Inc. | | 197,159 | | | 4,977,599 | | 0.7 | % | |
| # | Corus Entertainment, Inc. Class B | | 295,300 | | | 5,948,030 | | 0.8 | % | |
| # | Dollarama, Inc. | | 197,346 | | | 8,620,267 | | 1.2 | % | |
| Groupe Aeroplan, Inc. | | 696,151 | | | 8,159,061 | | 1.2 | % | |
| #* | Imax Corp. | | 259,237 | | | 4,755,965 | | 0.7 | % | |
| RONA, Inc. | | 677,175 | | | 6,474,292 | | 0.9 | % | |
| Other Securities | | | | | 29,711,338 | | 4.3 | % | |
| Total Consumer Discretionary | | | | | 75,472,720 | | 10.8 | % | |
| | |
| Consumer Staples — (2.5%) | | | | | | | | | |
| Jean Coutu Group PJC, Inc. Class A (The) | | 400,161 | | | 5,008,150 | | 0.7 | % | |
| Other Securities | | | | | 17,955,705 | | 2.6 | % | |
| Total Consumer Staples | | | | | 22,963,855 | | 3.3 | % | |
| | |
| Energy — (19.7%) | | | | | | | | | |
| * | Advantage Oil & Gas, Ltd. | | 1,098,231 | | | 4,570,797 | | 0.7 | % | |
| # | AltaGas, Ltd. | | 276,864 | | | 8,653,104 | | 1.2 | % | |
| #* | Birchcliff Energy, Ltd. | | 355,600 | | | 4,747,151 | | 0.7 | % | |
| * | Celtic Exploration, Ltd. | | 269,000 | | | 6,038,802 | | 0.9 | % | |
| * | Crew Energy, Inc. | | 403,769 | | | 4,458,799 | | 0.6 | % | |
| * | Gran Tierra Energy, Inc. | | 969,291 | | | 4,681,140 | | 0.7 | % | |
| # | Keyera Corp. | | 92,981 | | | 4,563,485 | | 0.6 | % | |
| * | Legacy Oil & Gas, Inc. | | 476,295 | | | 4,899,702 | | 0.7 | % | |
| # | Mullen Group, Ltd. | | 274,057 | | | 5,286,106 | | 0.8 | % | |
| # | NAL Energy Corp. | | 542,913 | | | 4,199,415 | | 0.6 | % | |
| * | Paramount Resources, Ltd. Class A | | 136,127 | | | 5,678,918 | | 0.8 | % | |
| ShawCor, Ltd. Class A | | 222,500 | | | 6,307,534 | | 0.9 | % | |
| # | Trilogy Energy Corp. | | 191,610 | | | 7,066,295 | | 1.0 | % | |
| # | Veresen, Inc. | | 283,972 | | | 4,264,806 | | 0.6 | % | |
| Other Securities | | | | | 102,315,286 | | 14.7 | % | |
| Total Energy | | | | | 177,731,340 | | 25.5 | % | |
| | |
| Financials — (5.9%) | | | | | | | | | |
| # | AGF Management, Ltd. Class B | | 330,879 | | | 5,138,165 | | 0.8 | % | |
| # | Canadian Western Bank | | 266,672 | | | 6,753,509 | | 1.0 | % | |
| Home Capital Group, Inc. | | 120,600 | | | 5,812,476 | | 0.8 | % | |
| Laurentian Bank of Canada | | 92,400 | | | 4,338,152 | | 0.6 | % | |
| TMX Group, Inc. | | 231,476 | | | 9,472,623 | | 1.4 | % | |
| Other Securities | | | | | 21,833,016 | | 3.1 | % | |
| Total Financials | | | | | 53,347,941 | | 7.7 | % | |
| | |
| Health Care — (1.7%) | | | | | | | | | |
| Other Securities | | | | | 15,227,839 | | 2.2 | % | |
97
THE CANADIAN SMALL COMPANY SERIES
CONTINUED
| | | | | | | | | Percentage | |
| | | Shares | | Value†† | | of Net Assets** | |
| Industrials — (7.4%) | | | | | | | | | |
| Progressive Waste Solutions, Ltd. | | 209,167 | | $ | 4,091,974 | | 0.6 | % | |
| # | Ritchie Brothers Auctioneers, Inc. | | 244,637 | | | 5,379,012 | | 0.8 | % | |
| | Russel Metals, Inc. | | 243,400 | | | 5,356,592 | | 0.8 | % | |
| * | Stantec, Inc. | | 168,695 | | | 4,565,321 | | 0.6 | % | |
| Toromont Industries, Ltd. | | 282,567 | | | 5,913,451 | | 0.8 | % | |
| #* | Westport Innovations, Inc. | | 189,501 | | | 6,281,668 | | 0.9 | % | |
| Other Securities | | | | | 35,467,190 | | 5.1 | % | |
| Total Industrials | | | | | 67,055,208 | | 9.6 | % | |
| | |
| Information Technology — (3.4%) | | | | | | | | | |
| * | Celestica, Inc. | | 847,607 | | | 6,231,731 | | 0.9 | % | |
| MacDonald Dettweiler & Associates, Ltd. | | 111,753 | | | 5,165,594 | | 0.7 | % | |
| Other Securities | | | | | 19,583,216 | | 2.8 | % | |
| Total Information Technology | | | | | 30,980,541 | | 4.4 | % | |
| | |
| Materials — (24.1%) | | | | | | | | | |
| Alamos Gold, Inc. | | 423,220 | | | 7,290,808 | | 1.0 | % | |
| #* | AuRico Gold, Inc. | | 967,321 | | | 7,776,549 | | 1.1 | % | |
| * | Euro Goldfields, Ltd. | | 521,960 | | | 6,086,758 | | 0.9 | % | |
| #* | First Majestic Silver Corp. | | 354,783 | | | 5,982,991 | | 0.9 | % | |
| # | HudBay Minerals, Inc. | | 657,566 | | | 6,545,000 | | 0.9 | % | |
| # | Major Drilling Group International, Inc. | | 319,200 | | | 4,869,073 | | 0.7 | % | |
| Methanex Corp. | | 289,704 | | | 6,631,556 | | 1.0 | % | |
| #* | NovaGold Resources, Inc. | | 612,655 | | | 5,219,971 | | 0.7 | % | |
| * | Quadra FNX Mining, Ltd. | | 483,002 | | | 7,149,615 | | 1.0 | % | |
| * | SEMAFO, Inc. | | 922,285 | | | 5,975,049 | | 0.9 | % | |
| Sherritt International Corp. | | 1,571,926 | | | 8,424,752 | | 1.2 | % | |
| #* | Thompson Creek Metals Co., Inc. | | 610,028 | | | 4,263,460 | | 0.6 | % | |
| West Fraser Timber Co., Ltd. | | 131,316 | | | 5,336,424 | | 0.8 | % | |
| Other Securities | | | | | 135,487,160 | | 19.4 | % | |
| Total Materials | | | | | 217,039,166 | | 31.1 | % | |
| | |
| Telecommunication Services — (0.3%) | | | | | | | | | |
| Other Securities | | | | | 2,255,271 | | 0.3 | % | |
| Utilities — (2.7%) | | | | | | | | | |
| # | Just Energy Group, Inc. | | 507,878 | | | 5,713,160 | | 0.8 | % | |
| # | Northland Power, Inc. | | 249,185 | | | 4,385,656 | | 0.7 | % | |
| Other Securities | | | | | 14,064,863 | | 2.0 | % | |
| Total Utilities | | | | | 24,163,679 | | 3.5 | % | |
| | |
| TOTAL COMMON STOCKS | | | | | 686,237,560 | | 98.4 | % | |
| RIGHTS/WARRANTS — (0.0%) | | | | | | | | | |
| Other Securities | | | | | 25,994 | | 0.0 | % | |
98
THE CANADIAN SMALL COMPANY SERIES
CONTINUED
| | | Shares/ | | | | | | | |
| | | Face | | | | | Percentage | |
| | | Amount | | Value† | | of Net Assets** | |
| | | | (000) | | | | | | | |
| SECURITIES LENDING COLLATERAL — (23.9%) | | | | | | | | | | |
| §@ | DFA Short Term Investment Fund | | | 215,000,000 | | $ | 215,000,000 | | 30.8 | % | |
| @ | Repurchase Agreement, Deutsche Bank Securities, Inc. 0.08%, 01/03/12 | | | | | | | | | | |
| (Collateralized by U.S. Treasury Note 1.375%, 09/30/18, | | | | | | | | | | |
| | valued at $430,027) to be repurchased at $421,599 | | $ | 422 | | | 421,595 | | 0.1 | % | |
| TOTAL SECURITIES LENDING COLLATERAL | | | | | | 215,421,595 | | 30.9 | % | |
| TOTAL INVESTMENTS — (100.0%) | | | | | | | | | | |
| (Cost $967,169,070)^ | | | | | $ | 901,685,149 | | 129.3 | % | |
____________________
| ^ | | The cost for federal income tax purposes is $967,171,653. |
Summary of inputs used to value the Series’ investments as of December 31, 2011 is as follows (See Security Valuation Note):
| | Valuation Inputs | |
| | Investment in | |
| | Securities | |
| | (Market Value) | |
| | Level 1 | | Level 2 | | Level 3 | | Total | |
| Common Stocks | | | | | | | | | | | | |
| Consumer Discretionary | | $ | 75,472,720 | | | — | | — | | $ | 75,472,720 | |
| Consumer Staples | | | 22,963,855 | | | — | | — | | | 22,963,855 | |
| Energy | | | 177,731,340 | | | — | | — | | | 177,731,340 | |
| Financials | | | 53,347,941 | | | — | | — | | | 53,347,941 | |
| Health Care | | | 15,227,839 | | | — | | — | | | 15,227,839 | |
| Industrials | | | 67,055,208 | | | — | | — | | | 67,055,208 | |
| Information Technology | | | 30,980,541 | | | — | | — | | | 30,980,541 | |
| Materials | | | 217,039,166 | | | — | | — | | | 217,039,166 | |
| Telecommunication Services | | | 2,255,271 | | | — | | — | | | 2,255,271 | |
| Utilities | | | 24,163,679 | | | — | | — | | | 24,163,679 | |
| Rights/Warrants | | | 15,293 | | $ | 10,701 | | — | | | 25,994 | |
| Securities Lending Collateral | | | — | | | 215,421,595 | | — | | | 215,421,595 | |
| TOTAL | | $ | 686,252,853 | | $ | 215,432,296 | | — | | $ | 901,685,149 | |
| See accompanying Notes to Financial Statements. |
99
THE JAPANESE SMALL COMPANY SERIES
SUMMARY SCHEDULE OF PORTFOLIO HOLDINGS
October 31, 2011
| | | | | | | | Percentage | |
| | | | Shares | | Value†† | | of Net Assets** | |
| COMMON STOCKS — (89.2%) | | | | | | | | | |
| Consumer Discretionary — (20.6%) | | | | | | | | | |
| Aoyama Trading Co., Ltd. | | 250,500 | | $ | 3,957,036 | | 0.3 | % | |
| Autobacs Seven Co., Ltd. | | 97,200 | | | 4,450,886 | | 0.3 | % | |
| * | Haseko Corp. | | 5,986,000 | | | 3,763,301 | | 0.2 | % | |
| Komeri Co., Ltd. | | 121,500 | | | 3,827,963 | | 0.3 | % | |
| # | Nifco, Inc. | | 191,700 | | | 4,999,788 | | 0.3 | % | |
| #* | Pioneer Electronic Corp. | | 981,300 | | | 3,934,768 | | 0.3 | % | |
| Ryohin Keikaku Co., Ltd. | | 94,300 | | | 4,475,211 | | 0.3 | % | |
| Shimachu Co., Ltd. | | 187,000 | | | 4,033,239 | | 0.3 | % | |
| SKY Perfect JSAT Holdings, Inc. | | 7,630 | | | 3,708,231 | | 0.2 | % | |
| Sumitomo Forestry Co., Ltd. | | 436,666 | | | 3,778,511 | | 0.3 | % | |
| Toyobo Co., Ltd. | | 3,218,000 | | | 4,570,007 | | 0.3 | % | |
| # | Zensho Co., Ltd. | | 298,400 | | | 3,723,858 | | 0.2 | % | |
| Other Securities | | | | | 293,744,594 | | 19.5 | % | |
| Total Consumer Discretionary | | | | | 342,967,393 | | 22.8 | % | |
| | |
| Consumer Staples — (9.0%) | | | | | | | | | |
| Fuji Oil Co., Ltd. | | 258,900 | | | 3,674,846 | | 0.2 | % | |
| # | Megmilk Snow Brand Co., Ltd. | | 194,300 | | | 3,735,258 | | 0.3 | % | |
| Nichirei Corp. | | 1,019,000 | | | 4,522,962 | | 0.3 | % | |
| Takara Holdings, Inc. | | 714,000 | | | 4,219,127 | | 0.3 | % | |
| Other Securities | | | | | 134,068,275 | | 8.9 | % | |
| Total Consumer Staples | | | | | 150,220,468 | | 10.0 | % | |
| | |
| Energy — (0.9%) | | | | | | | | | |
| Other Securities | | | | | 15,515,236 | | 1.0 | % | |
| | |
| Financials — (10.1%) | | | | | | | | | |
| Bank of Okinawa, Ltd. (The) | | 92,500 | | | 3,692,807 | | 0.2 | % | |
| Century Tokyo Leasing Corp. | | 223,890 | | | 4,476,323 | | 0.3 | % | |
| Daishi Bank, Ltd. (The) | | 1,398,000 | | | 4,448,525 | | 0.3 | % | |
| Hyakugo Bank, Ltd. (The) | | 1,045,609 | | | 4,066,286 | | 0.3 | % | |
| Hyakujishi Bank, Ltd. (The) | | 1,022,000 | | | 3,913,596 | | 0.2 | % | |
| Juroku Bank, Ltd. | | 1,331,000 | | | 3,980,608 | | 0.3 | % | |
| Kiyo Holdings, Inc. | | 2,635,900 | | | 3,720,995 | | 0.2 | % | |
| Musashino Bank, Ltd. | | 130,300 | | | 4,143,571 | | 0.3 | % | |
| Ogaki Kyoritsu Bank, Ltd. (The) | | 1,315,000 | | | 4,076,621 | | 0.3 | % | |
| San-in Godo Bank, Ltd. (The) | | 592,000 | | | 4,303,496 | | 0.3 | % | |
| Tokyo Tatemono Co., Ltd. | | 1,552,000 | | | 4,870,859 | | 0.3 | % | |
| Other Securities | | | | | 123,207,469 | | 8.2 | % | |
| Total Financials | | | | | 168,901,156 | | 11.2 | % | |
| | |
| Health Care — (3.8%) | | | | | | | | | |
| Kaken Pharmaceutical Co., Ltd. | | 353,000 | | | 4,430,753 | | 0.3 | % | |
| KYORIN Holdings, Inc. | | 205,000 | | | 3,772,136 | | 0.3 | % | |
| # | Nihon Kohden Corp. | | 159,200 | | | 3,716,689 | | 0.2 | % | |
| Rohto Pharmaceutical Co., Ltd. | | 360,000 | | | 4,147,178 | | 0.3 | % | |
| # | Sawai Pharmaceutical Co., Ltd. | | 50,500 | | | 4,723,834 | | 0.3 | % | |
| Other Securities | | | | | 42,255,491 | | 2.8 | % | |
| Total Health Care | | | | | 63,046,081 | | 4.2 | % | |
100
THE JAPANESE SMALL COMPANY SERIES
CONTINUED
| | | | | | | | | Percentage | |
| | | | Shares | | Value†† | | of Net Assets** | |
| Industrials — (24.1%) | | | | | | | | | | |
| | Duskin Co., Ltd. | | | 212,500 | | $ | 4,129,397 | | 0.3 | % | |
| Hitachi Zosen Corp. | | | 2,951,000 | | | 3,989,842 | | 0.3 | % | |
| # | Miura Co., Ltd. | | | 137,600 | | | 3,691,708 | | 0.2 | % | |
| Nachi-Fujikoshi Corp. | | | 663,000 | | | 3,674,507 | | 0.2 | % | |
| OKUMA Corp. | | | 517,000 | | | 3,805,376 | | 0.3 | % | |
| OSG Corp. | | | 289,400 | | | 3,708,430 | | 0.2 | % | |
| Sankyu, Inc. | | | 969,000 | | | 3,836,727 | | 0.3 | % | |
| Other Securities | | | | | | 374,966,815 | | 24.9 | % | |
| Total Industrials | | | | | | 401,802,802 | | 26.7 | % | |
| | |
| Information Technology — (9.6%) | | | | | | | | | | |
| # | Anritsu Corp. | | | 458,000 | | | 5,178,398 | | 0.4 | % | |
| Capcom Co., Ltd. | | | 205,600 | | | 5,378,552 | | 0.4 | % | |
| Horiba, Ltd. | | | 160,950 | | | 5,105,623 | | 0.3 | % | |
| IT Holdings Corp. | | | 357,401 | | | 3,671,509 | | 0.3 | % | |
| Net One Systems Co., Ltd. | | | 1,984 | | | 5,160,385 | | 0.3 | % | |
| Other Securities | | | | | | 135,587,936 | | 9.0 | % | |
| Total Information Technology | | | | | | 160,082,403 | | 10.7 | % | |
| | |
| Materials — (10.6%) | | | | | | | | | | |
| FP Corp. | | | 61,200 | | | 3,896,208 | | 0.3 | % | |
| # | Hokuetsu Kishu Paper Co., Ltd. | | | 862,199 | | | 5,674,954 | | 0.4 | % | |
| # | Sumitomo Osaka Cement Co., Ltd. | | | 1,640,000 | | | 4,968,204 | | 0.3 | % | |
| Taiheiyo Cement Corp. | | | 2,664,000 | | | 5,175,243 | | 0.3 | % | |
| Toagosei Co., Ltd. | | | 1,096,000 | | | 4,895,489 | | 0.3 | % | |
| Tokai Carbon Co., Ltd. | | | 825,000 | | | 4,092,463 | | 0.3 | % | |
| Other Securities | | | | | | 147,158,740 | | 9.8 | % | |
| Total Materials | | | | | | 175,861,301 | | 11.7 | % | |
| | |
| Utilities — (0.5%) | | | | | | | | | | |
| Other Securities | | | | | | 8,117,479 | | 0.6 | % | |
| TOTAL COMMON STOCKS | | | | | | 1,486,514,319 | | 98.9 | % | |
| RIGHTS/WARRANTS — (0.0%) | | | | | | | | | | |
| Other Securities | | | | | | — | | 0.0 | % | |
| | |
| | | Shares/ | | | | | | | |
| | | Face | | | | | | | |
| | | Amount | | | | | | | |
| | | (000) | | Value† | | | | |
| SECURITIES LENDING COLLATERAL — (10.8%) | | | | | | | | | | |
| §@ | DFA Short Term Investment Fund | | | 179,334,778 | | | 179,334,778 | | 12.0 | % | |
| @ | Repurchase Agreement, Deutsche Bank Securities, Inc. 0.11%, 11/01/11 | | | | | | | | | | |
| (Collateralized by FNMA 3.500%, 11/01/31, | | | | | | | | | | |
| valued at $383,050) to be repurchased at $375,540 | | $ | 376 | | | 375,539 | | 0.0 | % | |
| TOTAL SECURITIES LENDING COLLATERAL | | | | | | 179,710,317 | | 12.0 | % | |
| TOTAL INVESTMENTS — (100.0%) | | | | | | | | | | |
| (Cost $1,814,743,819) | | | | | $ | 1,666,224,636 | | 110.9 | % | |
101
THE JAPANESE SMALL COMPANY SERIES
CONTINUED
Summary of inputs used to value the Series’ investments as of October 31, 2011 is as follows (See Security Valuation Note):
| | Valuation Inputs | |
| | Investment in | |
| | Securities | |
| | (Market Value) | |
| | Level 1 | | Level 2 | | Level 3 | | Total | |
| Common Stocks | | | | | | | | | | | | |
| Consumer Discretionary | | $ | 1,942,492 | | $ | 341,024,901 | | — | | $ | 342,967,393 | |
| Consumer Staples | | | 323,805 | | | 149,896,663 | | — | | | 150,220,468 | |
| Energy | | | — | | | 15,515,236 | | — | | | 15,515,236 | |
| Financials | | | — | | | 168,901,156 | | — | | | 168,901,156 | |
| Health Care | | | — | | | 63,046,081 | | — | | | 63,046,081 | |
| Industrials | | | 134,689 | | | 401,668,113 | | — | | | 401,802,802 | |
| Information Technology | | | — | | | 160,082,403 | | — | | | 160,082,403 | |
| Materials | | | — | | | 175,861,301 | | — | | | 175,861,301 | |
| Utilities | | | — | | | 8,117,479 | | — | | | 8,117,479 | |
| Rights/Warrants | | | — | | | — | | — | | | — | |
| Securities Lending Collateral | | | — | | | 179,710,317 | | — | | | 179,710,317 | |
| TOTAL | | $ | 2,400,986 | | $ | 1,663,823,650 | | — | | $ | 1,666,224,636 | |
See accompanying Notes to Financial Statements.
102
THE ASIA PACIFIC SMALL COMPANY SERIES
SUMMARY SCHEDULE OF PORTFOLIO HOLDINGS
October 31, 2011
| | | | | | | | Percentage | |
| | | | Shares | | Value†† | | of Net Assets** | |
| COMMON STOCKS — (82.0%) | | | | | | | | | |
| AUSTRALIA — (51.7%) | | | | | | | | | |
| Adelaide Brighton, Ltd. | | 1,927,272 | | $ | 5,766,974 | | 0.6 | % | |
| | Ansell, Ltd. | | 503,479 | | | 7,363,989 | | 0.8 | % | |
| # | APA Group, Ltd. | | 1,403,768 | | | 6,401,846 | | 0.7 | % | |
| # | Aristocrat Leisure, Ltd. | | 1,611,890 | | | 3,816,054 | | 0.4 | % | |
| # | Australian Infrastructure Fund NL | | 3,159,690 | | | 6,272,817 | | 0.7 | % | |
| Beach Energy, Ltd. | | 4,828,492 | | | 5,934,225 | | 0.7 | % | |
| Boart Longyear Group | | 1,792,094 | | | 6,100,440 | | 0.7 | % | |
| Bradken, Ltd. | | 708,039 | | | 5,710,618 | | 0.6 | % | |
| Campbell Brothers, Ltd. | | 261,443 | | | 12,585,834 | | 1.4 | % | |
| # | carsales.com, Ltd. | | 809,574 | | | 4,185,086 | | 0.5 | % | |
| Challenger, Ltd. | | 1,063,324 | | | 5,069,014 | | 0.6 | % | |
| CSR, Ltd. | | 2,025,158 | | | 5,158,339 | | 0.6 | % | |
| # | David Jones, Ltd. | | 1,783,074 | | | 6,294,519 | | 0.7 | % | |
| #* | Downer EDI, Ltd. | | 1,591,674 | | | 5,054,618 | | 0.6 | % | |
| DUET Group, Ltd. | | 4,437,176 | | | 7,732,961 | | 0.9 | % | |
| # | Flight Centre, Ltd. | | 192,954 | | | 4,006,413 | | 0.4 | % | |
| # | Goodman Fielder, Ltd. | | 8,233,537 | | | 4,788,349 | | 0.5 | % | |
| GrainCorp, Ltd. | | 693,457 | | | 5,712,269 | | 0.6 | % | |
| Iluka Resources, Ltd. | | 573,137 | | | 9,528,200 | | 1.0 | % | |
| # | Independence Group NL | | 892,724 | | | 4,935,443 | | 0.5 | % | |
| # | Invocare, Ltd. | | 572,622 | | | 4,172,041 | | 0.5 | % | |
| # | IOOF Holdings, Ltd. | | 989,055 | | | 6,550,695 | | 0.7 | % | |
| # | JB Hi-Fi, Ltd. | | 407,557 | | | 6,726,320 | | 0.7 | % | |
| # | Kingsgate Consolidated, Ltd. | | 560,879 | | | 4,421,985 | | 0.5 | % | |
| # | Medusa Mining, Ltd. | | 579,085 | | | 4,070,719 | | 0.4 | % | |
| Mineral Resources, Ltd. | | 419,678 | | | 4,920,651 | | 0.5 | % | |
| # | Monadelphous Group, Ltd. | | 318,887 | | | 6,064,967 | | 0.7 | % | |
| # | Mount Gibson Iron, Ltd. | | 2,962,399 | | | 4,738,207 | | 0.5 | % | |
| # | Myer Holdings, Ltd. | | 2,456,107 | | | 6,703,584 | | 0.7 | % | |
| # | Navitas, Ltd. | | 1,157,537 | | | 5,013,315 | | 0.6 | % | |
| * | PanAust, Ltd. | | 1,780,618 | | | 6,016,882 | | 0.7 | % | |
| # | Perpetual Trustees Australia, Ltd. | | 167,142 | | | 3,950,909 | | 0.4 | % | |
| #* | Perseus Mining, Ltd. | | 1,605,654 | | | 5,309,539 | | 0.6 | % | |
| # | Primary Health Care, Ltd. | | 1,866,288 | | | 6,495,676 | | 0.7 | % | |
| Reece Australia, Ltd. | | 238,457 | | | 4,689,436 | | 0.5 | % | |
| # | SAI Global, Ltd. | | 1,064,331 | | | 5,301,870 | | 0.6 | % | |
| # | Seek, Ltd. | | 666,916 | | | 4,323,680 | | 0.5 | % | |
| Seven Group Holdings, Ltd. | | 641,345 | | | 5,152,442 | | 0.6 | % | |
| # | Seven West Media, Ltd. | | 1,335,509 | | | 5,003,193 | | 0.6 | % | |
| Spark Infrastructure Group, Ltd. | | 4,783,165 | | | 6,094,155 | | 0.7 | % | |
| #* | Sundance Resources, Ltd. | | 8,756,539 | | | 3,955,560 | | 0.4 | % | |
| # | Super Retail Group, Ltd. | | 909,056 | | | 5,150,189 | | 0.6 | % | |
| # | Transfield Services, Ltd. | | 1,784,320 | | | 4,258,408 | | 0.5 | % | |
| UGL, Ltd. | | 332,576 | | | 4,601,399 | | 0.5 | % | |
| Other Securities | | | | | 315,932,663 | | 34.8 | % | |
| TOTAL AUSTRALIA | | | | | 562,036,493 | | 62.0 | % | |
103
THE ASIA PACIFIC SMALL COMPANY SERIES
CONTINUED
| | | | | | | | | Percentage | |
| | | | Shares | | Value†† | | of Net Assets** | |
| HONG KONG — (15.4%) | | | | | | | | | | |
| Giordano International, Ltd. | | | 7,162,000 | | $ | 5,374,945 | | 0.6 | % | |
| Other Securities | | | | | | 162,745,971 | | 17.9 | % | |
| TOTAL HONG KONG | | | | | | 168,120,916 | | 18.5 | % | |
| | | |
| MALAYSIA — (0.0%) | | | | | | | | | | |
| Other Securities | | | | | | 4,205 | | 0.0 | % | |
| | |
| NEW ZEALAND — (5.5%) | | | | | | | | | | |
| Fisher & Paykel Healthcare Corp., Ltd. | | | 2,659,497 | | | 4,946,589 | | 0.5 | % | |
| Port of Tauranga, Ltd. | | | 528,322 | | | 4,135,066 | | 0.5 | % | |
| Sky City Entertainment Group, Ltd. | | | 2,938,887 | | | 8,361,441 | | 0.9 | % | |
| Sky Network Television, Ltd. | | | 940,466 | | | 4,163,442 | | 0.5 | % | |
| Other Securities | | | | | | 38,013,153 | | 4.2 | % | |
| TOTAL NEW ZEALAND | | | | | | 59,619,691 | | 6.6 | % | |
| | |
| SINGAPORE — (9.4%) | | | | | | | | | | |
| * | Biosensors International Group, Ltd. | | | 3,419,237 | | | 3,811,638 | | 0.4 | % | |
| Other Securities | | | | | | 98,349,063 | | 10.9 | % | |
| TOTAL SINGAPORE | | | | | | 102,160,701 | | 11.3 | % | |
| TOTAL COMMON STOCKS | | | | | | 891,942,006 | | 98.4 | % | |
| | |
| RIGHTS/WARRANTS — (0.0%) | | | | | | | | | | |
| | |
| AUSTRALIA — (0.0%) | | | | | | | | | | |
| Other Securities | | | | | | 3,864 | | 0.0 | % | |
| | |
| HONG KONG — (0.0%) | | | | | | | | | | |
| Other Securities | | | | | | 40,990 | | 0.0 | % | |
| | |
| SINGAPORE — (0.0%) | | | | | | | | | | |
| Other Securities | | | | | | 79,161 | | 0.0 | % | |
| TOTAL RIGHTS/WARRANTS | | | | | | 124,015 | | 0.0 | % | |
| | |
| | | Shares/ | | | | | | | |
| | | Face | | | | | | | |
| | | Amount | | Value† | | | | |
| | | (000) | | | | | | | |
| SECURITIES LENDING COLLATERAL — (18.0%) | | | | | | | | | | |
| §@ | DFA Short Term Investment Fund | | | 194,946,384 | | | 194,946,384 | | 21.5 | % | |
| @ | Repurchase Agreement, Deutsche Bank Securities, Inc. 0.11%, 11/01/11 | | | | | | | | | | |
| (Collateralized by FNMA 3.500%, 11/01/31, | | | | | | | | | | |
| valued at $507,060) to be repurchased at $497,120 | | $ | 497 | | | 497,118 | | 0.0 | % | |
| TOTAL SECURITIES LENDING COLLATERAL | | | | | | 195,443,502 | | 21.5 | % | |
| TOTAL INVESTMENTS — (100.0%) | | | | | | | | | | |
| (Cost $1,048,582,657) | | | | | $ | 1,087,509,523 | | 119.9 | % | |
104
THE ASIA PACIFIC SMALL COMPANY SERIES
CONTINUED
Summary of inputs used to value the Series’ investments as of October 31, 2011 is as follows (See Security Valuation Note):
| | Valuation Inputs | |
| | Investment in | |
| | Securities | |
| | (Market Value) | |
| | Level 1 | | Level 2 | | Level 3 | | Total | |
| Common Stocks | | | | | | | | | | | | |
| Australia | | $ | 9,745,378 | | $ | 552,291,115 | | — | | $ | 562,036,493 | |
| Hong Kong | | | 431,272 | | | 167,689,644 | | — | | | 168,120,916 | |
| Malaysia | | | — | | | 4,205 | | — | | | 4,205 | |
| New Zealand | | | 84,538 | | | 59,535,153 | | — | | | 59,619,691 | |
| Singapore | | | 184,430 | | | 101,976,271 | | — | | | 102,160,701 | |
| Rights/Warrants | | | | | | | | | | | | |
| Australia | | | 22 | | | 3,842 | | — | | | 3,864 | |
| Hong Kong | | | 40,990 | | | — | | — | | | 40,990 | |
| Singapore | | | 62,935 | | | 16,226 | | — | | | 79,161 | |
| Securities Lending Collateral | | | — | | | 195,443,502 | | — | | | 195,443,502 | |
| TOTAL | | $ | 10,549,565 | | $ | 1,076,959,958 | | — | | $ | 1,087,509,523 | |
See accompanying Notes to Financial Statements.
105
THE UNITED KINGDOM SMALL COMPANY SERIES
SUMMARY SCHEDULE OF PORTFOLIO HOLDINGS
October 31, 2011
| | | | | | | Percentage | |
| | | | Shares | | Value†† | | of Net Assets** | |
| COMMON STOCKS — (99.5%) | | | | | | | | | |
| Consumer Discretionary — (22.6%) | | | | | | | | | |
| * | Berkeley Group Holdings P.L.C. (The) | | 511,780 | | $ | 10,262,607 | | 0.9 | % | |
| | GKN P.L.C. | | 3,414,280 | | | 10,379,451 | | 0.9 | % | |
| Greene King P.L.C. | | 1,421,372 | | | 10,248,985 | | 0.9 | % | |
| Inchcape P.L.C. | | 1,915,975 | | | 10,215,753 | | 0.9 | % | |
| Informa P.L.C. | | 2,227,041 | | | 12,932,542 | | 1.1 | % | |
| * | ITV P.L.C. | | 8,448,636 | | | 8,656,619 | | 0.8 | % | |
| Ladbrokes P.L.C. | | 3,578,739 | | | 7,926,071 | | 0.7 | % | |
| Millennium & Copthorne Hotels P.L.C. | | 1,048,561 | | | 7,496,839 | | 0.7 | % | |
| Persimmon P.L.C. | | 1,135,393 | | | 9,054,346 | | 0.8 | % | |
| Rightmove P.L.C. | | 378,372 | | | 7,916,679 | | 0.7 | % | |
| UBM P.L.C. | | 917,439 | | | 7,467,863 | | 0.6 | % | |
| William Hill P.L.C. | | 2,873,883 | | | 9,975,029 | | 0.9 | % | |
| Other Securities | | | | | 142,912,801 | | 12.6 | % | |
| Total Consumer Discretionary | | | | | 255,445,585 | | 22.5 | % | |
| | |
| Consumer Staples — (4.1%) | | | | | | | | | |
| PZ Cussons P.L.C. | | 1,287,639 | | | 7,603,992 | | 0.7 | % | |
| Tate & Lyle P.L.C. | | 1,074,000 | | | 11,236,585 | | 1.0 | % | |
| Other Securities | | | | | 27,383,039 | | 2.4 | % | |
| Total Consumer Staples | | | | | 46,223,616 | | 4.1 | % | |
| | |
| Energy — (4.7%) | | | | | | | | | |
| John Wood Group P.L.C. | | 1,034,385 | | | 10,241,235 | | 0.9 | % | |
| * | Premier Oil P.L.C. | | 1,778,192 | | | 10,468,183 | | 0.9 | % | |
| Other Securities | | | | | 32,447,704 | | 2.9 | % | |
| Total Energy | | | | | 53,157,122 | | 4.7 | % | |
| | |
| Financials — (13.4%) | | | | | | | | | |
| Aberdeen Asset Management P.L.C. | | 2,820,342 | | | 8,684,151 | | 0.8 | % | |
| Amlin P.L.C. | | 1,905,352 | | | 8,788,141 | | 0.8 | % | |
| Catlin Group, Ltd. | | 1,357,851 | | | 8,637,469 | | 0.8 | % | |
| Henderson Group P.L.C. | | 3,838,880 | | | 7,392,054 | | 0.7 | % | |
| Hiscox, Ltd. | | 1,562,751 | | | 9,550,834 | | 0.8 | % | |
| IG Group Holdings P.L.C. | | 1,317,769 | | | 9,826,558 | | 0.9 | % | |
| Jardine Lloyd Thompson Group P.L.C. | | 638,821 | | | 7,365,218 | | 0.6 | % | |
| London Stock Exchange Group P.L.C. | | 579,642 | | | 8,368,165 | | 0.7 | % | |
| Provident Financial P.L.C. | | 541,018 | | | 9,615,833 | | 0.8 | % | |
| Other Securities | | | | | 73,851,452 | | 6.5 | % | |
| Total Financials | | | | | 152,079,875 | | 13.4 | % | |
| | |
| Health Care — (1.9%) | | | | | | | | | |
| Other Securities | | | | | 21,928,906 | | 1.9 | % | |
| | |
| Industrials — (30.5%) | | | | | | | | | |
| Babcock International Group P.L.C. | | 1,446,405 | | | 16,346,634 | | 1.4 | % | |
| Balfour Beatty P.L.C. | | 2,828,972 | | | 11,412,635 | | 1.0 | % | |
| BBA Aviation P.L.C. | | 2,792,163 | | | 7,949,170 | | 0.7 | % | |
| Carillion P.L.C. | | 1,773,138 | | | 9,848,482 | | 0.9 | % | |
106
THE UNITED KINGDOM SMALL COMPANY SERIES
CONTINUED
| | | | | | | | Percentage | |
| | Shares | | Value†† | | of Net Assets** | |
| Industrials — (Continued) | | | | | | | | |
| Charter International P.L.C. | 664,438 | | $ | 9,570,201 | | 0.8 | % | |
| Cookson Group P.L.C. | 1,135,834 | | | 8,730,616 | | 0.8 | % | |
| Firstgroup P.L.C. | 1,763,210 | | | 9,443,194 | | 0.8 | % | |
| IMI P.L.C. | 1,053,765 | | | 13,887,888 | | 1.2 | % | |
| | Intertek Group P.L.C. | 506,207 | | | 16,690,015 | | 1.5 | % | |
| Invensys P.L.C. | 2,110,010 | | | 7,633,539 | | 0.7 | % | |
| Meggitt P.L.C. | 2,465,596 | | | 15,216,658 | | 1.3 | % | |
| Melrose P.L.C. | 1,583,124 | | | 8,361,271 | | 0.7 | % | |
| Michael Page International P.L.C. | 1,310,832 | | | 8,438,432 | | 0.8 | % | |
| * | Rentokil Initial P.L.C. | 6,753,492 | | | 7,788,542 | | 0.7 | % | |
| Rotork P.L.C. | 366,679 | | | 9,890,187 | | 0.9 | % | |
| Spirax-Sarco Engineering P.L.C. | 319,520 | | | 9,815,375 | | 0.9 | % | |
| Travis Perkins P.L.C. | 922,110 | | | 13,042,544 | | 1.2 | % | |
| Other Securities | | | | 161,405,297 | | 14.2 | % | |
| Total Industrials | | | | 345,470,680 | | 30.5 | % | |
| | |
| Information Technology — (10.1%) | | | | | | | | |
| Halma P.L.C. | 1,541,075 | | | 8,281,224 | | 0.7 | % | |
| Logica P.L.C. | 6,339,968 | | | 9,513,413 | | 0.8 | % | |
| * | Misys P.L.C. | 1,604,251 | | | 7,512,729 | | 0.7 | % | |
| Spectris P.L.C. | 515,234 | | | 10,526,946 | | 0.9 | % | |
| Other Securities | | | | 78,876,227 | | 7.0 | % | |
| Total Information Technology | | | | 114,710,539 | | 10.1 | % | |
| | |
| Materials — (7.3%) | | | | | | | | |
| Croda International P.L.C. | 520,183 | | | 14,624,049 | | 1.3 | % | |
| Mondi P.L.C. | 1,078,021 | | | 8,199,053 | | 0.7 | % | |
| Other Securities | | | | 59,734,196 | | 5.3 | % | |
| Total Materials | | | | 82,557,298 | | 7.3 | % | |
| | |
| Telecommunication Services — (2.3%) | | | | | | | | |
| Other Securities | | | | 25,819,992 | | 2.3 | % | |
| | | | | | | | | |
| Utilities — (2.6%) | | | | | | | | |
| Drax Group P.L.C. | 1,479,700 | | | 12,880,863 | | 1.2 | % | |
| Pennon Group P.L.C. | 1,445,401 | | | 16,146,166 | | 1.4 | % | |
| Other Securities | | | | 240,136 | | 0.0 | % | |
| Total Utilities | | | | 29,267,165 | | 2.6 | % | |
| TOTAL COMMON STOCKS | | | | 1,126,660,778 | | 99.4 | % | |
| | | | | | | | | |
| PREFERRED STOCKS — (0.0%) | | | | | | | | |
| Consumer Staples — (0.0%) | | | | | | | | |
| Other Securities | | | | 9,625 | | 0.0 | % | |
| | | | | | | | | |
| RIGHTS/WARRANTS — (0.0%) | | | | | | | | |
| Other Securities | | | | 9,536 | | 0.0 | % | |
107
THE UNITED KINGDOM SMALL COMPANY SERIES
CONTINUED
| Shares/ | | | | | | | |
| Face | | | | | Percentage | |
| Amount | | Value† | | of Net Assets** | |
| (000) | | | | | | | |
| SECURITIES LENDING COLLATERAL — (0.5%) | | | | | | | | | |
| §@DFA Short Term Investment Fund | | 3,124,051 | | $ | 3,124,051 | | 0.3 | % | |
| @Repurchase Agreement, Deutsche Bank Securities, Inc. 0.11%, 11/01/11 | | | | | | | | | |
| (Collateralized by FNMA 3.500%, 11/01/31, | | | | | | | | | |
| valued at $2,571,372) to be repurchased at $2,520,961 | $ | 2,521 | | | 2,520,953 | | 0.2 | % | |
| TOTAL SECURITIES LENDING COLLATERAL | | | | | 5,645,004 | | 0.5 | % | |
| | |
| TOTAL INVESTMENTS — (100.0%) | | | | | | | | | |
| (Cost $1,103,961,462) | | | | $ | 1,132,324,943 | | 99.9 | % | |
Summary of inputs used to value the Series’ investments as of October 31, 2011 is as follows (See Security Valuation Note):
| Valuation Inputs | |
| Investment in | |
| Securities | |
| (Market Value) | |
| Level 1 | | Level 2 | | Level 3 | | Total | |
| Common Stocks | | | | | | | | | | | |
| Consumer Discretionary | $ | 2,307,852 | | $ | 253,137,733 | | — | | $ | 255,445,585 | |
| Consumer Staples | | 291,174 | | | 45,932,442 | | — | | | 46,223,616 | |
| Energy | | — | | | 53,157,122 | | — | | | 53,157,122 | |
| Financials | | 3,845 | | | 152,076,030 | | — | | | 152,079,875 | |
| Health Care | | — | | | 21,928,906 | | — | | | 21,928,906 | |
| Industrials | | — | | | 345,470,680 | | — | | | 345,470,680 | |
| Information Technology | | — | | | 114,710,539 | | — | | | 114,710,539 | |
| Materials | | — | | | 82,557,298 | | — | | | 82,557,298 | |
| Telecommunication Services | | — | | | 25,819,992 | | — | | | 25,819,992 | |
| Utilities | | — | | | 29,267,165 | | — | | | 29,267,165 | |
| Preferred Stocks | | | | | | | | | | | |
| Consumer Staples | | — | | | 9,625 | | — | | | 9,625 | |
| Rights/Warrants | | — | | | 9,536 | | — | | | 9,536 | |
| Securities Lending Collateral | | — | | | 5,645,004 | | — | | | 5,645,004 | |
| TOTAL | $ | 2,602,871 | | $ | 1,129,722,072 | | — | | $ | 1,132,324,943 | |
See accompanying Notes to Financial Statements.
108
THE CONTINENTAL SMALL COMPANY SERIES
SUMMARY SCHEDULE OF PORTFOLIO HOLDINGS
October 31, 2011
| | | | | | | | Percentage | |
| | Shares | | Value†† | | of Net Assets** | |
| COMMON STOCKS — (86.7%) | | | | | | | | |
| AUSTRIA — (2.1%) | | | | | | | | |
| Other Securities | | | $ | 49,235,911 | | 2.5 | % | |
| | |
| BELGIUM — (2.9%) | | | | | | | | |
| Ackermans & van Haaren NV | 87,214 | | | 7,026,076 | | 0.4 | % | |
| * | D’ieteren SA | 129,060 | | | 7,344,614 | | 0.4 | % | |
| Other Securities | | | | 52,870,924 | | 2.6 | % | |
| TOTAL BELGIUM | | | | 67,241,614 | | 3.4 | % | |
| | |
| DENMARK — (2.6%) | | | | | | | | |
| * | Topdanmark A.S. | 53,386 | | | 8,789,962 | | 0.5 | % | |
| Other Securities | | | | 50,816,373 | | 2.5 | % | |
| TOTAL DENMARK | | | | 59,606,335 | | 3.0 | % | |
| | | |
| FINLAND — (5.8%) | | | | | | | | |
| # | Elisa Oyj | 494,801 | | | 10,431,808 | | 0.5 | % | |
| Orion Oyj Series B | 337,043 | | | 7,013,846 | | 0.4 | % | |
| Other Securities | | | | 115,966,780 | | 5.8 | % | |
| TOTAL FINLAND | | | | 133,412,434 | | 6.7 | % | |
| | |
| FRANCE — (10.1%) | | | | | | | | |
| * | Arkema SA | 139,427 | | | 9,475,335 | | 0.5 | % | |
| # | Neopost SA | 91,985 | | | 6,996,144 | | 0.4 | % | |
| # | Nexans SA | 131,823 | | | 8,292,007 | | 0.4 | % | |
| Remy Cointreau SA | 82,777 | | | 6,781,256 | | 0.3 | % | |
| Valeo SA | 229,231 | | | 11,506,324 | | 0.6 | % | |
| Zodiac Aerospace SA | 89,170 | | | 6,991,700 | | 0.3 | % | |
| Other Securities | | | | 183,063,235 | | 9.1 | % | |
| TOTAL FRANCE | | | | 233,106,001 | | 11.6 | % | |
| | |
| GERMANY — (12.8%) | | | | | | | | |
| * | Aareal Bank AG | 423,110 | | | 8,478,484 | | 0.4 | % | |
| Aurubis AG | 152,783 | | | 8,620,221 | | 0.4 | % | |
| Bilfinger Berger SE | 162,980 | | | 14,547,368 | | 0.7 | % | |
| MTU Aero Engines Holding AG | 176,697 | | | 11,832,506 | | 0.6 | % | |
| Rheinmetall AG | 126,352 | | | 6,700,932 | | 0.4 | % | |
| Rhoen-Klinikum AG | 406,308 | | | 8,107,235 | | 0.4 | % | |
| #* | SGL Carbon SE | 229,387 | | | 14,257,094 | | 0.7 | % | |
| Software AG | 192,899 | | | 7,988,782 | | 0.4 | % | |
| Symrise AG | 330,233 | | | 8,548,072 | | 0.4 | % | |
| Other Securities | | | | 204,125,996 | | 10.2 | % | |
| TOTAL GERMANY | | | | 293,206,690 | | 14.6 | % | |
| | |
| GREECE — (1.9%) | | | | | | | | |
| Other Securities | | | | 43,085,344 | | 2.2 | % | |
109
THE CONTINENTAL SMALL COMPANY SERIES
CONTINUED
| | | | | | | Percentage | |
| | | Shares | | Value†† | | of Net Assets** | |
| IRELAND — (2.9%) | | | | | | | | |
| DCC P.L.C. | 308,989 | | $ | 8,564,908 | | 0.4 | % | |
| Dragon Oil P.L.C. | 1,339,680 | | | 12,083,896 | | 0.6 | % | |
| Paddy Power P.L.C. | 180,573 | | | 9,997,277 | | 0.5 | % | |
| | Other Securities | | | | 35,360,315 | | 1.8 | % | |
| TOTAL IRELAND | | | | 66,006,396 | | 3.3 | % | |
| | |
| ISRAEL — (2.4%) | | | | | | | | |
| Other Securities | | | | 53,990,503 | | 2.7 | % | |
| | |
| ITALY — (7.1%) | | | | | | | | |
| # | Banca Popolare di Sondrio Scarl | 922,722 | | | 7,039,189 | | 0.4 | % | |
| Davide Campari - Milano SpA | 990,609 | | | 7,652,926 | | 0.4 | % | |
| Prysmian SpA | 653,038 | | | 9,872,100 | | 0.5 | % | |
| Other Securities | | | | 139,095,655 | | 6.9 | % | |
| TOTAL ITALY | | | | 163,659,870 | | 8.2 | % | |
| | |
| NETHERLANDS — (4.6%) | | | | | | | | |
| Aalberts Industries NV | 384,012 | | | 6,753,750 | | 0.3 | % | |
| # | Imtech NV | 272,621 | | | 8,053,728 | | 0.4 | % | |
| Nutreco NV | 145,366 | | | 9,658,003 | | 0.5 | % | |
| SBM Offshore NV | 563,703 | | | 12,385,902 | | 0.6 | % | |
| Other Securities | | | | 69,399,633 | | 3.5 | % | |
| TOTAL NETHERLANDS | | | | 106,251,016 | | 5.3 | % | |
| | |
| NORWAY — (2.8%) | | | | | | | | |
| Other Securities | | | | 64,920,076 | | 3.2 | % | |
| | |
| PORTUGAL — (0.9%) | | | | | | | | |
| Other Securities | | | | 20,190,809 | | 1.0 | % | |
| | |
| SPAIN — (5.4%) | | | | | | | | |
| # | Bolsas y Mercados Espanoles SA | 236,082 | | | 6,761,301 | | 0.3 | % | |
| Ebro Foods SA | 340,839 | | | 6,906,928 | | 0.4 | % | |
| #* | Grifols SA | 457,616 | | | 8,508,217 | | 0.4 | % | |
| Viscofan SA | 183,430 | | | 7,043,085 | | 0.4 | % | |
| Other Securities | | | | 94,355,215 | | 4.7 | % | |
| TOTAL SPAIN | | | | 123,574,746 | | 6.2 | % | |
| | |
| SWEDEN — (8.3%) | | | | | | | | |
| * | Castellum AB | 548,218 | | | 7,421,699 | | 0.4 | % | |
| Elekta AB Series B | 255,842 | | | 10,216,832 | | 0.5 | % | |
| * | Lundin Petroleum AB | 439,229 | | | 10,719,305 | | 0.5 | % | |
| * | Meda AB Series A | 750,311 | | | 7,635,753 | | 0.4 | % | |
| Trelleborg AB Series B | 928,357 | | | 7,858,668 | | 0.4 | % | |
| Other Securities | | | | 146,210,677 | | 7.3 | % | |
| TOTAL SWEDEN | | | | 190,062,934 | | 9.5 | % | |
110
THE CONTINENTAL SMALL COMPANY SERIES
CONTINUED
| | | | | | | | Percentage | |
| | | | Shares | | Value†† | | of Net Assets** | |
| SWITZERLAND — (14.1%) | | | | | | | | | |
| * | Aryzta AG | | 289,931 | | $ | 13,979,948 | | 0.7 | % | |
| Bank Sarasin & Cie AG Series B | | 182,505 | | | 6,937,974 | | 0.3 | % | |
| * | Clariant AG | | 699,758 | | | 7,577,735 | | 0.4 | % | |
| * | Dufry AG | | 65,162 | | | 6,975,452 | | 0.3 | % | |
| # | Galenica Holding AG | | 18,828 | | | 10,906,687 | | 0.5 | % | |
| GAM Holding AG | | 780,910 | | | 9,336,078 | | 0.5 | % | |
| | Helvetia Holding AG | | 22,754 | | | 8,313,855 | | 0.4 | % | |
| Lonza Group AG | | 140,493 | | | 9,345,357 | | 0.5 | % | |
| * | PSP Swiss Property AG | | 148,327 | | | 13,494,819 | | 0.7 | % | |
| * | Sulzer AG | | 64,067 | | | 7,466,988 | | 0.4 | % | |
| Swiss Life Holding AG | | 93,938 | | | 11,537,216 | | 0.6 | % | |
| Other Securities | | | | | 219,321,241 | | 10.9 | % | |
| TOTAL SWITZERLAND | | | | | 325,193,350 | | 16.2 | % | |
| TOTAL COMMON STOCKS | | | | | 1,992,744,029 | | 99.6 | % | |
| | | | | | | | | | |
| RIGHTS/WARRANTS — (0.1%) | | | | | | | | | |
| BELGIUM — (0.0%) | | | | | | | | | |
| Other Securities | | | | | 1,402 | | 0.0 | % | |
| | |
| ITALY — (0.1%) | | | | | | | | | |
| Other Securities | | | | | 1,667,926 | | 0.1 | % | |
| | |
| NORWAY — (0.0%) | | | | | | | | | |
| Other Securities | | | | | — | | 0.0 | % | |
| TOTAL RIGHTS/WARRANTS | | | | | 1,669,328 | | 0.1 | % | |
| | |
| | Shares/ | | | | | | | |
| | Face | | | | | | | |
| | Amount | | Value† | | | | |
| | (000) | | | | | | | |
| SECURITIES LENDING COLLATERAL — (13.2%) | | | | | | | | | |
| §@DFA Short Term Investment Fund | | 303,408,660 | | | 303,408,660 | | 15.1 | % | |
| @Repurchase Agreement, Deutsche Bank Securities, Inc. 0.11%, 11/01/11 | | | | | | | | | |
| (Collateralized by FNMA 3.500%, 11/01/31, | | | | | | | | | |
| valued at $1,237,089) to be repurchased at $1,212,836 | $ | 1,213 | | | 1,212,832 | | 0.1 | % | |
| TOTAL SECURITIES LENDING COLLATERAL | | | | | 304,621,492 | | 15.2 | % | |
| | | | | | | | | | |
| TOTAL INVESTMENTS — (100.0%) | | | | | | | | | |
| (Cost $2,351,668,120) | | | | $ | 2,299,034,849 | | 114.9 | % | |
111
THE CONTINENTAL SMALL COMPANY SERIES
CONTINUED
Summary of inputs used to value the Series’ investments as of October 31, 2011 is as follows (See Security Valuation Note):
| | Valuation Inputs | |
| | Investment in | |
| | Securities | |
| | | (Market Value) | |
| | Level 1 | | Level 2 | | Level 3 | | Total | |
| Common Stocks | | | | | | | | | | | |
| Austria | $ | 391,925 | | $ | 48,843,986 | | — | | $ | 49,235,911 | |
| Belgium | | 518,454 | | | 66,723,160 | | — | | | 67,241,614 | |
| Denmark | | 263,563 | | | 59,342,772 | | — | | | 59,606,335 | |
| Finland | | — | | | 133,412,434 | | — | | | 133,412,434 | |
| France | | 592,920 | | | 232,513,081 | | — | | | 233,106,001 | |
| | Germany | | 2,803,490 | | | 290,403,200 | | — | | | 293,206,690 | |
| Greece | | 140,819 | | | 42,944,525 | | — | | | 43,085,344 | |
| Ireland | | 38,612 | | | 65,967,784 | | — | | | 66,006,396 | |
| Israel | | 2,399,465 | | | 51,591,038 | | — | | | 53,990,503 | |
| Italy | | — | | | 163,659,870 | | — | | | 163,659,870 | |
| Netherlands | | 309,421 | | | 105,941,595 | | — | | | 106,251,016 | |
| Norway | | 901,048 | | | 64,019,028 | | — | | | 64,920,076 | |
| Portugal | | 492,951 | | | 19,697,858 | | — | | | 20,190,809 | |
| Spain | | 181,193 | | | 123,393,553 | | — | | | 123,574,746 | |
| Sweden | | 2,260,761 | | | 187,802,173 | | — | | | 190,062,934 | |
| Switzerland | | 339,294 | | | 324,854,056 | | — | | | 325,193,350 | |
| Rights/Warrants | | | | | | | | | | | |
| Belgium | | 355 | | | 1,047 | | — | | | 1,402 | |
| Italy | | 1,667,926 | | | — | | — | | | 1,667,926 | |
| Norway | | — | | | — | | — | | | — | |
| Securities Lending Collateral | | — | | | 304,621,492 | | — | | | 304,621,492 | |
| TOTAL | $ | 13,302,197 | | $ | 2,285,732,652 | | — | | $ | 2,299,034,849 | |
See accompanying Notes to Financial Statements.
112
THE CANADIAN SMALL COMPANY SERIES
SUMMARY SCHEDULE OF PORTFOLIO HOLDINGS
October 31, 2011
| | | | | | | Percentage | |
| | | Shares | | Value†† | | of Net Assets** | |
| COMMON STOCKS — (77.5%) | | | | | | | | |
| Consumer Discretionary — (7.9%) | | | | | | | | |
| Astral Media, Inc. Class A | 195,947 | | $ | 6,727,170 | | 0.9 | % | |
| # | Cineplex, Inc. | 191,278 | | | 5,079,637 | | 0.7 | % | |
| # | Corus Entertainment, Inc. Class B | 295,300 | | | 5,655,658 | | 0.8 | % | |
| # | Dollarama, Inc. | 197,346 | | | 7,428,565 | | 1.0 | % | |
| Groupe Aeroplan, Inc. | 696,151 | | | 8,017,872 | | 1.1 | % | |
| RONA, Inc. | 677,175 | | | 6,522,077 | | 0.9 | % | |
| | Other Securities | | | | 34,910,751 | | 4.7 | % | |
| Total Consumer Discretionary | | | | 74,341,730 | | 10.1 | % | |
| | |
| Consumer Staples — (2.4%) | | | | | | | | |
| Jean Coutu Group PJC, Inc. Class A (The) | 400,161 | | | 5,118,688 | | 0.7 | % | |
| Other Securities | | | | 17,452,446 | | 2.4 | % | |
| Total Consumer Staples | | | | 22,571,134 | | 3.1 | % | |
| | |
| Energy — (19.8%) | | | | | | | | |
| * | Advantage Oil & Gas, Ltd. | 1,098,231 | | | 5,828,585 | | 0.8 | % | |
| # | AltaGas, Ltd. | 276,864 | | | 8,169,120 | | 1.1 | % | |
| #* | Bankers Petroleum, Ltd. | 810,182 | | | 4,307,965 | | 0.6 | % | |
| #* | Birchcliff Energy, Ltd. | 355,600 | | | 5,394,203 | | 0.7 | % | |
| * | BlackPearl Resources, Inc. | 954,830 | | | 4,550,231 | | 0.6 | % | |
| * | Celtic Exploration, Ltd. | 269,000 | | | 6,663,266 | | 0.9 | % | |
| # | Daylight Energy, Ltd. | 739,288 | | | 7,305,730 | | 1.0 | % | |
| * | Gran Tierra Energy, Inc. | 969,291 | | | 5,941,678 | | 0.8 | % | |
| # | Keyera Corp. | 92,651 | | | 4,226,577 | | 0.6 | % | |
| # | Mullen Group, Ltd. | 274,057 | | | 5,507,260 | | 0.7 | % | |
| # | NAL Energy Corp. | 517,913 | | | 4,588,083 | | 0.6 | % | |
| * | Paramount Resources, Ltd. Class A | 136,127 | | | 4,953,425 | | 0.7 | % | |
| ShawCor, Ltd. Class A | 222,500 | | | 5,323,928 | | 0.7 | % | |
| # | Trilogy Energy Corp. | 191,610 | | | 6,528,293 | | 0.9 | % | |
| Other Securities | | | | 108,079,045 | | 14.7 | % | |
| Total Energy | | | | 187,367,389 | | 25.4 | % | |
| | |
| Financials — (5.6%) | | | | | | | | |
| # | AGF Management, Ltd. Class B | 330,879 | | | 5,304,687 | | 0.7 | % | |
| Canadian Western Bank | 255,372 | | | 7,301,833 | | 1.0 | % | |
| Home Capital Group, Inc. | 120,600 | | | 5,454,375 | | 0.7 | % | |
| Laurentian Bank of Canada | 92,400 | | | 4,262,405 | | 0.6 | % | |
| TMX Group, Inc. | 231,476 | | | 10,171,707 | | 1.4 | % | |
| Other Securities | | | | 20,797,284 | | 2.8 | % | |
| Total Financials | | | | 53,292,291 | | 7.2 | % | |
| | |
| Health Care — (1.6%) | | | | | | | | |
| Other Securities | | | | 14,813,008 | | 2.0 | % | |
| | |
| Industrials — (7.0%) | | | | | | | | |
| Progressive Waste Solutions, Ltd. | 209,167 | | | 4,406,829 | | 0.6 | % | |
| # | Ritchie Brothers Auctioneers, Inc. | 244,637 | | | 4,869,424 | | 0.7 | % | |
| Russel Metals, Inc. | 243,400 | | | 5,601,802 | | 0.8 | % | |
113
THE CANADIAN SMALL COMPANY SERIES
CONTINUED
| | | | | | | Percentage | |
| | | Shares | | Value†† | | of Net Assets** | |
| Industrials — (Continued) | | | | | | | | |
| Toromont Industries, Ltd. | 282,567 | | $ | 5,301,232 | | 0.7 | % | |
| #* | Westport Innovations, Inc. | 189,501 | | | 5,718,776 | | 0.8 | % | |
| Other Securities | | | | 40,046,544 | | 5.4 | % | |
| Total Industrials | | | | 65,944,607 | | 9.0 | % | |
| | | |
| Information Technology — (4.3%) | | | | | | | | |
| * | Celestica, Inc. | 847,607 | | | 7,032,566 | | 0.9 | % | |
| MacDonald Dettweiler & Associates, Ltd. | 111,753 | | | 5,023,980 | | 0.7 | % | |
| * | Open Text Corp. | 107,738 | | | 6,594,528 | | 0.9 | % | |
| Wi-Lan, Inc. | 666,819 | | | 4,963,930 | | 0.7 | % | |
| Other Securities | | | | 17,427,010 | | 2.4 | % | |
| Total Information Technology | | | | 41,042,014 | | 5.6 | % | |
| | |
| Materials — (26.6%) | | | | | | | | |
| Alamos Gold, Inc. | 423,220 | | | 7,833,869 | | 1.1 | % | |
| #* | AuRico Gold, Inc. | 967,320 | | | 9,365,074 | | 1.3 | % | |
| * | Detour Gold Corp. | 237,256 | | | 7,854,977 | | 1.1 | % | |
| * | Euro Goldfields, Ltd. | 521,960 | | | 5,875,487 | | 0.8 | % | |
| * | First Majestic Silver Corp. | 350,583 | | | 5,954,723 | | 0.8 | % | |
| # | HudBay Minerals, Inc. | 611,960 | | | 6,704,392 | | 0.9 | % | |
| Major Drilling Group International, Inc. | 319,200 | | | 4,268,810 | | 0.6 | % | |
| # | Methanex Corp. | 289,704 | | | 7,469,669 | | 1.0 | % | |
| #* | NovaGold Resources, Inc. | 612,655 | | | 5,624,071 | | 0.8 | % | |
| * | Quadra FNX Mining, Ltd. | 408,502 | | | 4,713,091 | | 0.6 | % | |
| #* | SEMAFO, Inc. | 905,185 | | | 6,947,244 | | 0.9 | % | |
| Sherritt International Corp. | 1,571,926 | | | 9,036,505 | | 1.2 | % | |
| # | Silvercorp Metals, Inc. | 620,630 | | | 5,771,999 | | 0.8 | % | |
| West Fraser Timber Co., Ltd. | 131,316 | | | 5,664,999 | | 0.8 | % | |
| Other Securities | | | | 157,883,063 | | 21.4 | % | |
| Total Materials | | | | 250,967,973 | | 34.1 | % | |
| | |
| Telecommunication Services — (0.3%) | | | | | | | | |
| Other Securities | | | | 2,467,484 | | 0.3 | % | |
| | |
| Utilities — (2.0%) | | | | | | | | |
| # | Just Energy Group, Inc. | 467,883 | | | 5,050,836 | | 0.7 | % | |
| Other Securities | | | | 13,927,682 | | 1.9 | % | |
| Total Utilities | | | | 18,978,518 | | 2.6 | % | |
| TOTAL COMMON STOCKS | | | | 731,786,148 | | 99.4 | % | |
| | |
| RIGHTS/WARRANTS — (0.0%) | | | | | | | | |
| Other Securities | | | | 43,371 | | 0.0 | % | |
114
THE CANADIAN SMALL COMPANY SERIES
CONTINUED
| Shares/ | | | | | | | |
| Face | | | | | Percentage | |
| Amount | | Value† | | of Net Assets** | |
| (000) | | | | | | | |
| SECURITIES LENDING COLLATERAL — (22.5%) | | | | | | | | | |
| §@DFA Short Term Investment Fund | | 210,374,890 | | $ | 210,374,890 | | 28.6 | % | |
| @Repurchase Agreement, Deutsche Bank Securities, Inc. 0.11%, 11/01/11 | | | | | | | | | |
| (Collateralized by FNMA 3.500%, 11/01/31, | | | | | | | | | |
| valued at $2,366,389) to be repurchased at $2,319,996 | $ | 2,320 | | | 2,319,989 | | 0.3 | % | |
| TOTAL SECURITIES LENDING COLLATERAL | | | | | 212,694,879 | | 28.9 | % | |
| | | | | | | | | | |
| TOTAL INVESTMENTS — (100.0%) | | | | | | | | | |
| (Cost $970,256,943) | | | | $ | 944,524,398 | | 128.3 | % | |
Summary of inputs used to value the Series’ investments as of October 31, 2011 is as follows (See Security Valuation Note):
| Valuation Inputs | |
| Investment in | |
| Securities | |
| (Market Value) | |
| Level 1 | | Level 2 | | Level 3 | | Total | |
| Common Stocks | | | | | | | | | | | |
| Consumer Discretionary | $ | 74,341,730 | | | — | | — | | $ | 74,341,730 | |
| Consumer Staples | | 22,571,134 | | | — | | — | | | 22,571,134 | |
| Energy | | 187,367,389 | | | — | | — | | | 187,367,389 | |
| Financials | | 53,292,291 | | | — | | — | | | 53,292,291 | |
| Health Care | | 14,813,008 | | | — | | — | | | 14,813,008 | |
| Industrials | | 65,944,607 | | | — | | — | | | 65,944,607 | |
| Information Technology | | 41,042,014 | | | — | | — | | | 41,042,014 | |
| Materials | | 250,967,973 | | | — | | — | | | 250,967,973 | |
| Telecommunication Services | | 2,467,484 | | | — | | — | | | 2,467,484 | |
| Utilities | | 18,978,518 | | | — | | — | | | 18,978,518 | |
| Rights/Warrants | | 32,434 | | $ | 10,937 | | — | | | 43,371 | |
| Securities Lending Collateral | | — | | | 212,694,879 | | — | | | 212,694,879 | |
| TOTAL | $ | 731,818,582 | | $ | 212,705,816 | | — | | $ | 944,524,398 | |
See accompanying Notes to Financial Statements.
115
THE DFA INVESTMENT TRUST COMPANY
STATEMENTS OF ASSETS AND LIABILITIES
DECEMBER 31, 2011
(Unaudited)
(Amounts in thousands)
| | The | | The | | The United | | The | | The | |
| | Japanese | | Asia Pacific | | Kingdom | | Continental | | Canadian | |
| | Small | | Small | | Small | | Small | | Small | |
| | Company | | Company | | Company | | Company | | Company | |
| | Series | | Series | | Series | | Series | | Series | |
| ASSETS: | | | | | | | | | | | | | | | | |
| Investments at Value (including $156,852, | | | | | | | | | | | | | | | | |
| $144,935, $8,627, $329,505 and $203,924 | | | | | | | | | | | | | | | | |
| of securities on loan, respectively) | | $ | 1,529,729 | | $ | 820,094 | | $ | 1,067,632 | | $ | 1,795,466 | | $ | 686,263 | |
| Collateral Received from Securities on | | | | | | | | | | | | | | | | |
| Loan at Value & Cost | | | 654 | | | 849 | | | 2,192 | | | 170 | | | 422 | |
| Affiliated Collateral Received from | | | | | | | | | | | | | | | | |
| Securities on Loan at Value & Cost | | | 166,000 | | | 165,000 | | | 7,000 | | | 353,000 | | | 215,000 | |
| Foreign Currencies at Value | | | 357 | | | 959 | | | 284 | | | 4,135 | | | 187 | |
| Cash | | | 2,479 | | | 7,198 | | | 4,958 | | | 11,420 | | | 1,257 | |
| Receivables: | | | | | | | | | | | | | | | | |
| Investment Securities Sold | | | — | | | 1,426 | | | 64 | | | 208 | | | 9,544 | |
| Dividends and Tax Reclaims | | | 1,894 | | | 1,505 | | | 3,270 | | | 2,176 | | | 1,601 | |
| Securities Lending Income | | | 159 | | | 224 | | | 18 | | | 550 | | | 165 | |
| Unrealized Gain on Foreign Currency | | | | | | | | | | | | | | | | |
| Contracts | | | — | | | 7 | | | 5 | | | 1 | | | — | |
| Prepaid Expenses and Other Assets | | | 3 | | | 2 | | | 2 | | | 5 | | | 2 | |
| Total Assets | | | 1,701,275 | | | 997,264 | | | 1,085,425 | | | 2,167,131 | | | 914,441 | |
| LIABILITIES: | | | | | | | | | | | | | | | | |
| Upon Return of Securities Loaned | | | 166,654 | | | 165,849 | | | 9,192 | | | 353,170 | | | 215,422 | |
| Investment Securities Purchased | | | — | | | 722 | | | 1,195 | | | 5,408 | | | 1,426 | |
| Due to Advisor | | | 134 | | | 75 | | | 94 | | | 160 | | | 61 | |
| Accrued Expenses and Other Liabilities | | | 90 | | | 74 | | | 53 | | | 308 | | | 135 | |
| Total Liabilities | | | 166,878 | | | 166,720 | | | 10,534 | | | 359,046 | | | 217,044 | |
| NET ASSETS | | $ | 1,534,397 | | $ | 830,544 | | $ | 1,074,891 | | $ | 1,808,085 | | $ | 697,397 | |
| Investments at Cost | | $ | 1,665,582 | | $ | 868,947 | | $ | 1,109,508 | | $ | 2,059,225 | | $ | 751,747 | |
| Foreign Currencies at Cost | | $ | 353 | | $ | 946 | | $ | 283 | | $ | 4,142 | | $ | 184 | |
See accompanying Notes to Financial Statements.
116
THE DFA INVESTMENT TRUST COMPANY
STATEMENTS OF ASSETS AND LIABILITIES
OCTOBER 31, 2011
(Amounts in thousands)
| The | | The | | The United | | The | | The | |
| Japanese | | Asia Pacific | | Kingdom | | Continental | | Canadian | |
| Small | | Small | | Small | | Small | | Small | |
| Company | | Company | | Company | | Company | | Company | |
| Series | | Series | | Series | | Series | | Series | |
| ASSETS: | | | | | | | | | | | | | | | |
| Investments at Value (including $168,689, | | | | | | | | | | | | | | | |
| $171,355, $5,273, $284,106 and $201,676 | | | | | | | | | | | | | | | |
| of securities on loan, respectively) | $ | 1,486,514 | | $ | 892,066 | | $ | 1,126,680 | | $ | 1,994,413 | | $ | 731,829 | |
| Collateral Received from Securities on | | | | | | | | | | | | | | | |
| Loan at Value & Cost | | 375 | | | 497 | | | 2,521 | | | 1,213 | | | 2,320 | |
| Affiliated Collateral Received from | | | | | | | | | | | | | | | |
| Securities on Loan at Value & Cost | | 179,335 | | | 194,946 | | | 3,124 | | | 303,409 | | | 210,375 | |
| Foreign Currencies at Value | | 113 | | | 10,013 | | | 15,561 | | | 180 | | | 101 | |
| Cash | | 416 | | | 545 | | | 198 | | | 851 | | | 692 | |
| Receivables: | | | | | | | | | | | | | | | |
| Investment Securities Sold | | — | | | 24 | | | — | | | 339 | | | 67 | |
| Dividends and Tax Reclaims | | 10,774 | | | 1,914 | | | 3,539 | | | 3,302 | | | 517 | |
| Securities Lending Income | | 168 | | | 213 | | | 13 | | | 472 | | | 184 | |
| Fund Shares Sold | | 5,055 | | | 3,000 | | | — | | | 3,000 | | | 3,000 | |
| Total Assets | | 1,682,750 | | | 1,103,218 | | | 1,151,636 | | | 2,307,179 | | | 949,085 | |
| LIABILITIES: | | | | | | | | | | | | | | | |
| Payables: | | | | | | | | | | | | | | | |
| Upon Return of Securities Loaned | | 179,710 | | | 195,443 | | | 5,645 | | | 304,622 | | | 212,695 | |
| Investment Securities Purchased | | — | | | 848 | | | — | | | 459 | | | 25 | |
| Fund Shares Redeemed | | — | | | 33 | | | 12,001 | | | 19 | | | — | |
| Due to Advisor | | 129 | | | 71 | | | 90 | | | 161 | | | 57 | |
| Unrealized Loss on Foreign Currency | | | | | | | | | | | | | | | |
| Contracts | | — | | | 12 | | | — | | | — | | | — | |
| Accrued Expenses and Other Liabilities | | 96 | | | 77 | | | 55 | | | 155 | | | 46 | |
| Total Liabilities | | 179,935 | | | 196,484 | | | 17,791 | | | 305,416 | | | 212,823 | |
| NET ASSETS | $ | 1,502,815 | | $ | 906,734 | | $ | 1,133,845 | | $ | 2,001,763 | | $ | 736,262 | |
| Investments at Cost | $ | 1,635,033 | | $ | 853,139 | | $ | 1,098,317 | | $ | 2,047,047 | | $ | 757,562 | |
| Foreign Currencies at Cost | $ | 115 | | $ | 9,776 | | $ | 15,576 | | $ | 181 | | $ | 100 | |
| | | | | | | | | | | | | | | |
See accompanying Notes to Financial Statements.
117
THE DFA INVESTMENT TRUST COMPANY
STATEMENTS OF OPERATIONS
FOR THE YEAR ENDED OCTOBER 31, 2011
(Amounts in thousands)
| The | | The | | The United | | The | | The | |
| Japanese | | Asia Pacific | | Kingdom | | Continental | | Canadian | |
| Small | | Small | | Small | | Small | | Small | |
| Company | | Company | | Company | | Company | | Company | |
| Series | | Series | | Series | | Series | | Series | |
| Investment Income | | | | | | | | | | | | | | | | | | | | |
| Dividends (Net of Foreign Taxes | | | | | | | | | | | | | | | | | | | | |
| Withheld of $2,246, $971, $13, $8,010 | | | | | | | | | | | | | | | | | | | | |
| and $2,212, respectively) | $ | 29,941 | | | $ | 36,085 | | | $ | 44,170 | | | $ | 56,938 | | | $ | 12,539 | | |
| Interest | | 5 | | | | 2 | | | | 3 | | | | 28 | | | | 5 | | |
| Income from Securities Lending | | 1,938 | | | | 2,502 | | | | 246 | | | | 8,288 | | | | 2,514 | | |
| Total Investment Income | | 31,884 | | | | 38,589 | | | | 44,419 | | | | 65,254 | | | | 15,058 | | |
| Expenses | | | | | | | | | | | | | | | | | | | | |
| Investment Advisory Services Fees | | 1,442 | | | | 979 | | | | 1,142 | | | | 2,274 | | | | 810 | | |
| Accounting & Transfer Agent Fees | | 159 | | | | 116 | | | | 131 | | | | 237 | | | | 100 | | |
| Custodian Fees | | 316 | | | | 454 | | | | 106 | | | | 779 | | | | 222 | | |
| Shareholders’ Reports | | 8 | | | | 6 | | | | 6 | | | | 13 | | | | 4 | | |
| Directors’/Trustees’ Fees & Expenses | | 12 | | | | 9 | | | | 10 | | | | 20 | | | | 7 | | |
| Professional Fees | | 33 | | | | 24 | | | | 27 | | | | 72 | | | | 19 | | |
| Other | | 19 | | | | 14 | | | | 14 | | | | 28 | | | | 6 | | |
| Total Expenses | | 1,989 | | | | 1,602 | | | | 1,436 | | | | 3,423 | | | | 1,168 | | |
| Fees Paid Indirectly | | (1 | ) | | | — | | | | (1 | ) | | | (1 | ) | | | — | | |
| Net Expenses | | 1,988 | | | | 1,602 | | | | 1,435 | | | | 3,422 | | | | 1,168 | | |
| Net Investment Income (Loss) | | 29,896 | | | | 36,987 | | | | 42,984 | | | | 61,832 | | | | 13,890 | | |
| Realized and Unrealized Gain (Loss) | | | | | | | | | | | | | | | | | | | | |
| Net Realized Gain (Loss) on: | | | | | | | | | | | | | | | | | | | | |
| Investment Securities Sold | | 17,637 | | | | 71,818 | | | | 18,980 | | | | 66,872 | | | | 38,405 | | |
| Futures | | — | | | | — | | | | — | | | | (287 | ) | | | — | | |
| Foreign Currency Transactions | | 93 | | | | 521 | | | | 33 | | | | (576 | ) | | | (110 | ) | |
| Change in Unrealized Appreciation | | | | | | | | | | | | | | | | | | | | |
| (Depreciation) of: | | | | | | | | | | | | | | | | | | | | |
| Investment Securities and Foreign Currency | | 66,983 | | | | (158,023 | ) | | | (66,130 | ) | | | (377,057 | ) | | | (68,747 | ) | |
| Translation of Foreign Currency | | | | | | | | | | | | | | | | | | | | |
| Denominated Amounts | | (598 | ) | | | 109 | | | | 53 | | | | 52 | | | | 4 | | |
| Net Realized and Unrealized | | | | | | | | | | | | | | | | | | | | |
| Gain (Loss) | | 84,115 | | | | (85,575 | ) | | | (47,064 | ) | | | (310,996 | ) | | | (30,448 | ) | |
| Net Increase (Decrease) in Net Assets | | | | | | | | | | | | | | | | | | | | |
| Resulting from Operations | $ | 114,011 | | | $ | (48,588 | ) | | $ | (4,080 | ) | | $ | (249,164 | ) | | $ | (16,558 | ) | |
| | | | | | | | | | | | | | | | | | | | |
See accompanying Notes to Financial Statements.
118
THE DFA INVESTMENT TRUST COMPANY
STATEMENTS OF CHANGES IN NET ASSETS
(Amounts in thousands)
| The Japanese | | | The Asia Pacific | |
| Small Company | | | Small Company | |
| Series | | | Series | |
| Year | | Year | | | Year | | Year | |
| Ended | | Ended | | | Ended | | Ended | |
| Oct. 31, | | Oct. 31, | | | Oct. 31, | | Oct. 31, | |
| 2011 | | 2010 | | | 2011 | | 2010 | |
| Increase (Decrease) in Net Assets | | | | | | | | | | | | | | | | | |
| Operations: | | | | | | | | | | | | | | | | | |
| Net Investment Income (Loss) | $ | 29,896 | | | $ | 23,032 | | | | $ | 36,987 | | | $ | 28,020 | | |
| Net Realized Gain (Loss) on: | | | | | | | | | | | | | | | | | |
| Investment Securities Sold | | 17,637 | | | | (15,709 | ) | | | | 71,818 | | | | 46,684 | | |
| Foreign Currency Transactions | | 93 | | | | 792 | | | | | 521 | | | | (20 | ) | |
| Change in Unrealized Appreciation | | | | | | | | | | | | | | | | | |
| (Depreciation) of: | | | | | | | | | | | | | | | | | |
| Investment Securities and Foreign Currency | | 66,983 | | | | (460 | ) | | | | (158,023 | ) | | | 129,509 | | |
| Translation of Foreign Currency | | | | | | | | | | | | | | | | | |
| Denominated Amounts | | (598 | ) | | | 315 | | | | | 109 | | | | (75 | ) | |
| Net Increase (Decrease) in Net Assets | | | | | | | | | | | | | | | | | |
| Resulting from Operations | | 114,011 | | | | 7,970 | | | | | (48,588 | ) | | | 204,118 | | |
| Transactions in Interest: | | | | | | | | | | | | | | | | | |
| Contributions | | 212,545 | | | | 61,990 | | | | | 80,765 | | | | 85,604 | | |
| Withdrawals | | (35,341 | ) | | | (41,396 | ) | | | | (60,581 | ) | | | (35,581 | ) | |
| Net Increase (Decrease) from | | | | | | | | | | | | | | | | | |
| Transactions in Interest | | 177,204 | | | | 20,594 | | | | | 20,184 | | | | 50,023 | | |
| Total Increase (Decrease) in Net Assets | | 291,215 | | | | 28,564 | | | | | (28,404 | ) | | | 254,141 | | |
| Net Assets | | | | | | | | | | | | | | | | | |
| Beginning of Period | | 1,211,600 | | | | 1,183,036 | | | | | 935,138 | | | | 680,997 | | |
| End of Period | $ | 1,502,815 | | | $ | 1,211,600 | | | | $ | 906,734 | | | $ | 935,138 | | |
| | | | | | | | | | | | | | | | | |
See accompanying Notes to Financial Statements.
119
THE DFA INVESTMENT TRUST COMPANY
STATEMENTS OF CHANGES IN NET ASSETS
(Amounts in thousands)
| The United Kingdom | | | The Continental | |
| Small Company | | | Small Company | |
| Series | | | Series | |
| Year | | Year | | | Year | | Year | |
| Ended | | Ended | | | Ended | | Ended | |
| Oct. 31, | | Oct. 31, | | | Oct. 31, | | Oct. 31, | |
| 2011 | | 2010 | | | | 2011 | | 2010 | |
| Increase (Decrease) in Net Assets | | | | | | | | | | | | | | | | | |
| Operations: | | | | | | | | | | | | | | | | | |
| Net Investment Income (Loss) | $ | 42,984 | | | $ | 24,392 | | | | $ | 61,832 | | | $ | 38,583 | | |
| Net Realized Gain (Loss) on: | | | | | | | | | | | | | | | | | |
| Investment Securities Sold | | 18,980 | | | | 35,525 | | | | | 66,872 | | | | 72,573 | | |
| Futures | | — | | | | — | | | | | (287 | ) | | | — | | |
| Foreign Currency Transactions | | 33 | | | | 126 | | | | | (576 | ) | | | 811 | | |
| Change in Unrealized Appreciation | | | | | | | | | | | | | | | | | |
| (Depreciation) of: | | | | | | | | | | | | | | | | | |
| Investment Securities and Foreign Currency | | (66,130 | ) | | | 152,112 | | | | | (377,057 | ) | | | 156,901 | | |
| Translation of Foreign Currency | | | | | | | | | | | | | | | | | |
| Denominated Amounts | | 53 | | | | (30 | ) | | | | 52 | | | | 30 | | |
| Net Increase (Decrease) in Net Assets | | | | | | | | | | | | | | | | | |
| Resulting from Operations | | (4,080 | ) | | | 212,125 | | | | | (249,164 | ) | | | 268,898 | | |
| Transactions in Interest: | | | | | | | | | | | | | | | | | |
| Contributions | | 125,970 | | | | 59,131 | | | | | 225,654 | | | | 199,653 | | |
| Withdrawals | | (24,739 | ) | | | (5,034 | ) | | | | (47,211 | ) | | | (26,959 | ) | |
| Net Increase (Decrease) from | | | | | | | | | | | | | | | | | |
| Transactions in Interest | | 101,231 | | | | 54,097 | | | | | 178,443 | | | | 172,694 | | |
| Total Increase (Decrease) in Net Assets | | 97,151 | | | | 266,222 | | | | | (70,721 | ) | | | 441,592 | | |
| Net Assets | | | | | | | | | | | | | | | | | |
| Beginning of Period | | 1,036,694 | | | | 770,472 | | | | | 2,072,484 | | | | 1,630,892 | | |
| End of Period | $ | 1,133,845 | | | $ | 1,036,694 | | | | $ | 2,001,763 | | | $ | 2,072,484 | | |
| | | | | | | | | | | | | | | | | |
See accompanying Notes to Financial Statements.
120
THE DFA INVESTMENT TRUST COMPANY
STATEMENTS OF CHANGES IN NET ASSETS
(Amounts in thousands)
| The Canadian | |
| Small Company | |
| Series | |
| Year | | Year | |
| Ended | | Ended | |
| Oct. 31, | | Oct. 31, | |
| 2011 | | 2010 | |
| Increase (Decrease) in Net Assets | | | | | | | | |
| Operations: | | | | | | | | |
| Net Investment Income (Loss) | $ | 13,890 | | | $ | 5,240 | | |
| Net Realized Gain (Loss) on: | | | | | | | | |
| Investment Securities Sold | | 38,405 | | | | 6,585 | | |
| Foreign Currency Transactions | | (110 | ) | | | 40 | | |
| Change in Unrealized Appreciation (Depreciation) of: | | | | | | | | |
| Investment Securities and Foreign Currency | | (68,747 | ) | | | 168,950 | | |
| Translation of Foreign Currency Denominated Amounts | | 4 | | | | (11 | ) | |
| Net Increase (Decrease) in Net Assets Resulting from Operations | | (16,558 | ) | | | 180,804 | | |
| Transactions in Interest: | | | | | | | | |
| Contributions | | 130,949 | | | | 117,737 | | |
| Withdrawals | | (41,851 | ) | | | — | | |
| Net Increase (Decrease) from Transactions in Interest | | 89,098 | | | | 117,737 | | |
| Total Increase (Decrease) in Net Assets | | 72,540 | | | | 298,541 | | |
| Net Assets | | | | | | | | |
| Beginning of Period | | 663,722 | | | | 365,181 | | |
| End of Period | $ | 736,262 | | | $ | 663,722 | | |
| | | | | | | | |
See accompanying Notes to Financial Statements.
121
THE DFA INVESTMENT TRUST COMPANY
FINANCIAL HIGHLIGHTS
| | The Japanese Small Company Series | | | The Asia Pacific Small Company Series |
| | | | | | | | | | | Period | | | | | | | | | | | | | | | | | | Period | | | | | | |
| | Year | | Year | | Year | | Dec. 1, | | Year | | Year | | | Year | | Year | | Year | | Dec. 1, | | Year | | Year |
| | Ended | | Ended | | Ended | | 2007 to | | Ended | | Ended | | | Ended | | Ended | | Ended | | 2007 to | | Ended | | Ended |
| | Oct. 31, | | Oct. 31, | | Oct. 31, | | Oct. 31, | | Nov. 30, | | Nov. 30, | | | Oct. 31, | | Oct. 31, | | Oct. 31, | | Oct. 31, | | Nov. 30, | | Nov. 30, |
| | 2011 | | 2010 | | 2009 | | 2008 | | 2007 | | 2006 | | | 2011 | | 2010 | | 2009 | | 2008 | | 2007 | | 2006 |
| Total Return | | 10.07 | % | | 0.72 | % | | 22.69 | % | | (26.87) | %(C) | | (1.16 | )% | | (2.28 | )% | | | (5.15 | )% | | 28.91 | % | | 84.98 | % | | (57.75) | %(C) | | 47.23 | % | | 38.26 | % |
| Net Assets, End of Period | | | | | | | | | | | | | | | | | | | | | | | | | | | | | | | | | | | | | |
| (thousands) | | $1,502,815 | | | $1,211,600 | | | $1,183,036 | | | $1,062,964 | | | $1,504,821 | | | $1,385,722 | | | | $906,734 | | | $935,138 | | | $680,997 | | | $441,237 | | | $1,205,154 | | | $749,627 | |
| Ratio of Expenses to Average | | | | | | | | | | | | | | | | | | | | | | | | | | | | | | | | | | | | | |
| Net Assets | | 0.14 | % | | 0.14 | % | | 0.15 | % | | 0.13 | %(B) | | 0.13 | % | | 0.14 | % | | | 0.16 | % | | 0.17 | % | | 0.18 | % | | 0.15 | %(B) | | 0.15 | % | | 0.17 | % |
| Ratio of Expenses to Average | | | | | | | | | | | | | | | | | | | | | | | | | | | | | | | | | | | | | |
| Net Assets (Excluding Fees | | | | | | | | | | | | | | | | | | | | | | | | | | | | | | | | | | | | | |
| Paid Indirectly) | | 0.14 | % | | 0.14 | % | | 0.15 | % | | 0.13 | %(B) | | 0.13 | % | | 0.14 | % | | | 0.16 | % | | 0.17 | % | | 0.18 | % | | 0.15 | %(B) | | 0.15 | % | | 0.17 | % |
| Ratio of Net Investment Income to | | | | | | | | | | | | | | | | | | | | | | | | | | | | | | | | | | | | | |
| Average Net Assets | | 2.07 | % | | 1.95 | % | | 2.15 | % | | 2.64 | %(B) | | 1.94 | % | | 1.68 | % | | | 3.78 | % | | 3.64 | % | | 4.00 | % | | 4.33 | %(B) | | 3.58 | % | | 4.19 | % |
| Portfolio Turnover Rate | | 5 | % | | 10 | % | | 7 | % | | 10 | %(C) | | 9 | % | | 9 | % | | | 17 | % | | 18 | % | | 23 | % | | 20 | %(C) | | 25 | % | | 14 | % |
| The United Kingdom Small Company Series | | | The Continental Small Company Series |
| | | | | | | | | | Period | | | | | | | | | | | | | | | | | | Period | | | | | | |
| Year | | Year | | Year | | Dec. 1, | | Year | | Year | | | Year | | Year | | Year | | Dec. 1, | | Year | | Year |
| Ended | | Ended | | Ended | | 2007 to | | Ended | | Ended | | | Ended | | Ended | | Ended | | 2007 to | | Ended | | Ended |
| Oct. 31, | | Oct. 31, | | Oct. 31, | | Oct. 31, | | Nov. 30, | | Nov. 30, | | | Oct. 31, | | Oct. 31, | | Oct. 31, | | Oct. 31, | | Nov. 30, | | Nov. 30, |
| 2011 | | 2010 | | 2009 | | 2008 | | 2007 | | 2006 | | | 2011 | | 2010 | | 2009 | | 2008 | | 2007 | | 2006 |
| Total Return | 0.20 | % | | 25.94 | % | | 43.51 | % | | (50.77) | %(C) | | 2.42 | % | | 44.80 | % | | | (10.75 | )% | | 15.37 | % | | 43.78 | % | | (49.66) | %(C) | | 17.49 | % | | 47.10 | % |
| Net Assets, End of Period | | | | | | | | | | | | | | | | | | | | | | | | | | | | | | | | | | | | |
| (thousands) | $1,133,845 | | | $1,036,694 | | | $770,472 | | | $555,390 | | | $1,158,580 | | | $1,117,826 | | | | $2,001,763 | | | $2,072,484 | | | $1,630,892 | | | $1,111,585 | | | $2,256,122 | | | $1,875,194 | |
| Ratio of Expenses to Average | | | | | | | | | | | | | | | | | | | | | | | | | | | | | | | | | | | | |
| Net Assets | 0.13 | % | | 0.13 | % | | 0.14 | % | | 0.12 | %(B) | | 0.12 | % | | 0.13 | % | | | 0.15 | % | | 0.15 | % | | 0.16 | % | | 0.14 | %(B) | | 0.14 | % | | 0.15 | % |
| Ratio of Expenses to Average | | | | | | | | | | | | | | | | | | | | | | | | | | | | | | | | | | | | |
| Net Assets (Excluding Fees | | | | | | | | | | | | | | | | | | | | | | | | | | | | | | | | | | | | |
| Paid Indirectly) | 0.13 | % | | 0.13 | % | | 0.14 | % | | 0.12 | %(B) | | 0.12 | % | | 0.13 | % | | | 0.15 | % | | 0.15 | % | | 0.16 | % | | 0.14 | %(B) | | 0.14 | % | | 0.15 | % |
| Ratio of Net Investment Income to | | | | | | | | | | | | | | | | | | | | | | | | | | | | | | | | | | | | |
| Average Net Assets | 3.76 | % | | 2.86 | % | | 4.02 | % | | 3.79 | %(B) | | 2.72 | % | | 2.70 | % | | | 2.72 | % | | 2.24 | % | | 2.93 | % | | 3.49 | %(B) | | 2.16 | % | | 2.27 | % |
| Portfolio Turnover Rate | 7 | % | | 15 | % | | 10 | % | | 25 | %(C) | | 12 | % | | 8 | % | | | 10 | % | | 12 | % | | 7 | % | | 18 | %(C) | | 12 | % | | 7 | % |
| See page 63 for the Definitions of Abbreviations and Footnotes. |
See accompanying Notes to Financial Statements.
122
THE DFA INVESTMENT TRUST COMPANY
FINANCIAL HIGHLIGHTS
| The Canadian Small Company Series |
| Year | | Year | | Year | | Period | | Period |
| Ended | | Ended | | Ended | | Dec. 1, 2007 | | April 2, 2007(a) |
| Oct. 31, | | Oct. 31, | | Oct. 31, | | to | | to |
| 2011 | | 2010 | | 2009 | | Oct. 31, 2008 | | Nov. 30, 2007 |
| Total Return | | 0.27 | % | | | 43.17 | % | | | 61.67 | % | | | (56.44) | %(C) | | | 10.20 | %(C) |
| Net Assets, End of Period (thousands) | $ | 736,262 | | | $ | 663,722 | | | $ | 365,181 | | | $ | 232,873 | | | $ | 213,529 | |
| Ratio of Expenses to Average Net Assets | | 0.14 | % | | | 0.15 | % | | | 0.17 | % | | | 0.18 | %(B) | | | 0.26 | %(B)(E) |
| Ratio of Expenses to Average Net Assets | | | | | | | | | | | | | | | | | | | |
| (Excluding Fees Paid Indirectly) | | 0.14 | % | | | 0.15 | % | | | 0.17 | % | | | 0.18 | %(B) | | | 0.26 | %(B)(E) |
| Ratio of Net Investment Income to Average Net Assets | | 1.72 | % | | | 1.05 | % | | | 1.37 | % | | | 0.97 | %(B) | | | 0.47 | %(B)(E) |
| Portfolio Turnover Rate | | 24 | % | | | 10 | % | | | 23 | % | | | 21 | %(C) | | | 6 | %(C) |
| See page 63 for the Definitions of Abbreviations and Footnotes. |
See accompanying Notes to Financial Statements.
123
THE DFA INVESTMENT TRUST COMPANY
NOTES TO FINANCIAL STATEMENTS
October 31, 2011
A. Organization:
The DFA Investment Trust Company (the “Trust”) is an open-end management investment company registered under the Investment Company Act of 1940. The Trust consists of eleven operational investment portfolios, of which five are included in this section of the report (collectively, the “Series”).
International Equity Portfolios
The Japanese Small Company Series
The Asia Pacific Small Company Series
The United Kingdom Small Company Series
The Continental Small Company Series
The Canadian Small Company Series
At a regular meeting of the Board of Directors/Trustees (the “Board”) on September 16, 2008, the Board voted to change the fiscal and tax year ends of the Series from November 30 to October 31.
B. Significant Accounting Policies:
The following significant accounting policies are in conformity with accounting principles generally accepted in the United States of America. Such policies are consistently followed by the Trust in preparation of its financial statements. The preparation of financial statements in accordance with accounting principles generally accepted in the United States of America requires management to make estimates and assumptions that affect the reported amounts of assets and liabilities and disclosure of contingent assets and liabilities at the date of the financial statements and the reported amounts of increases and decreases in net assets from operations during the reporting period. Actual results could differ from those estimates and those differences could be material.
1. Security Valuation: The Series utilizes a fair value hierarchy which prioritizes the inputs to valuation techniques used to measure fair value into three broad levels described below:
- Level 1 – quoted prices in active markets for identical securities
- Level 2 – other significant observable inputs (including quoted prices for similar securities, interest rates, prepayment speeds, credit risk, etc.)
- Level 3 – significant unobservable inputs (including the Series’ own assumptions in determining the fair value of investments)
Securities held by the Domestic Equity Portfolio and the International Equity Portfolios, including over-the-counter securities, are valued at the last quoted sale price of the day. Securities held by the Domestic Equity Portfolio and the International Equity Portfolios that are listed on Nasdaq are valued at the Nasdaq Official Closing Price (“NOCP”). If there is no last reported sale price or NOCP for the day, the Domestic Equity Portfolio and International Equity Portfolios value the securities at the mean of the most recent quoted bid and asked prices. Price information on listed securities is taken from the exchange where the security is primarily traded. Generally, securities issued by open-end investment companies are valued using their respective net asset values or public offering prices, as appropriate, for purchase orders placed at the close of the New York Stock Exchange (NYSE). These securities are generally categorized as Level 1 in the hierarchy.
Securities for which no market quotations are readily available (including restricted securities), or for which market quotations have become unreliable, are valued in good faith at fair value in accordance with procedures adopted by the Board of Directors/Trustees. These securities are generally categorized as Level 2 in the hierarchy. Fair value pricing may also be used if events that have a significant effect on the value of an investment (as determined in the discretion of the Investment
124
Committee of the Advisor) occur before the net asset value is calculated. When fair value pricing is used, the prices of securities used by the Domestic Equity Portfolios and International Equity Portfolios may differ from the quoted or published prices for the same securities on their primary markets or exchanges.
The International Equity Portfolios will also apply a fair value price in the circumstances described below. Generally, trading in foreign securities markets is completed each day at various times prior to the close of the NYSE. For example, trading in the Japanese securities markets is completed each day at the close of the Tokyo Stock Exchange (normally, 11:00 p.m. PT), which is fourteen hours prior to the close of the NYSE (normally, 1:00 p.m. PT) and the time that the net asset values of the International Equity Portfolios are computed. Due to the time differences between the closings of the relevant foreign securities exchanges and the time the International Equity Portfolios price their shares at the close of the NYSE, the International Equity Portfolios will fair value their foreign investments when it is determined that the market quotations for the foreign investments are either unreliable or not readily available. The fair value prices will attempt to reflect the impact of the U.S. financial markets’ perceptions and trading activities on the International Equity Portfolios’ foreign investments since the last closing prices of the foreign investments were calculated on their primary foreign securities markets or exchanges. For these purposes, the Board of Directors/Trustees of the Trust have determined that movements in relevant indices or other appropriate market indicators, after the close of the Tokyo Stock Exchange or the London Stock Exchange, demonstrate that market quotations may be unreliable. Fair valuation of portfolio securities may occur on a daily basis. The fair value pricing by the International Equity Portfolios utilizes data furnished by an independent pricing service (and that data draws upon, among other information, the market values of foreign investments). When an International Equity Portfolio uses fair value pricing, the values assigned to the International Equity Portfolio’s foreign investments may not be the quoted or published prices of the investments on their primary markets or exchanges. These securities are generally categorized as Level 2 in the hierarchy.
Futures contracts held by the Series are valued using the settlement price established each day on the exchange on which they are traded. These valuations are generally categorized as Level 1 in the hierarchy.
A summary of the inputs used to value the Series’ investments by each major security type, industry and/or country is disclosed at the end of the Summary Schedule of Portfolio Holdings. The inputs or methodology used for valuing securities are not necessarily an indication of the risk associated with investing in those securities.
The Series did not have any significant transfers between Level 1 and Level 2 during the year ended October 31, 2011.
2. Foreign Currency Translation: Securities and other assets and liabilities of the International Equity Portfolios, whose values are initially expressed in foreign currencies, are translated to U.S. dollars using the mean between the most recently quoted bid and asked prices for the U.S. dollar as quoted by generally recognized reliable sources. Dividend and interest income and certain expenses are translated to U.S. dollars at the rate of exchange on their respective accrual dates. Receivables and payables denominated in foreign currencies are marked to market daily based on daily exchange rates and exchange gains or losses are realized upon ultimate receipt or disbursement.
The International Equity Portfolios do not isolate the effect of fluctuations in foreign exchange rates from the effect of fluctuations in the market prices of securities held whether realized or unrealized.
Realized gains or losses on foreign currency transactions represent net foreign exchange gains or losses from the disposition of foreign currencies, currency gains or losses realized between the trade and settlement dates on securities transactions, and the difference between amounts of interest, dividends and foreign withholding taxes recorded on the books of the International Equity Portfolios and the U.S. dollar equivalent amounts actually received or paid.
3. Deferred Compensation Plan: Each eligible Trustee of the Trust may elect participation in The Fee Deferral Plan for Independent Directors and Trustees (the “Plan”). Under the Plan, effective January 1, 2002, such Trustees may defer payment of all or a portion of their total fees earned as a Trustee. These deferred amounts may be treated as though such amounts had been invested in shares of the following funds: U.S. Large Cap Value Portfolio; U.S. Core Equity 1 Portfolio; U.S. Core Equity 2 Portfolio; U.S. Vector Equity Portfolio; U.S. Micro Cap Portfolio; DFA International Value Portfolio; International Core Equity Portfolio; Emerging Markets Portfolio; Emerging Markets Core Equity Portfolio; and/or DFA Two-Year Global Fixed Income Portfolio. Contributions made under the Plan and the change in unrealized appreciation (depreciation) and income are included in Directors’/Trustees’ Fees & Expenses.
125
Each Trustee has the option to receive their distribution of proceeds in one of the following methods: lump sum; annual installments over a period of agreed upon years; or quarterly installments over a period of agreed upon years. Each Trustee shall have the right in a notice of election to defer compensation (the “Notice”) to elect to defer the receipt of the Trustee’s deferred compensation until a date specified by such Trustee in the Notice, which date may not be sooner than the earlier of: (i) the first business day of January following the year in which such Trustee ceases to be a member of the Board of the Fund; and (ii) five years following the effective date of the Trustee’s first deferral election. If a Trustee who elects to defer fees fails to designate in the Notice a time or date as of which payment of the Trustee’s deferred fee account shall commence, payment of such amount shall commence as of the first business day of January following the year in which the Trustee ceases to be a member of the Board of the Fund (unless the Trustee files an amended Notice selecting a different distribution date). As of October 31, 2011, none of the Trustees have requested or received a distribution of proceeds of a deferred fee account.
4. Other: Security transactions are accounted for as of the trade date. Costs used in determining realized gains and losses on the sale of investment securities are on the basis of identified cost. Dividend income and distributions to shareholders are recorded on the ex-dividend date. Distributions received on securities that represent a return of capital or capital gain are recorded as a reduction of cost of investments or as a realized gain, respectively. The Series estimate the character of distributions received that may be considered return of capital distributions. Interest income is recorded on an accrual basis. Discount and premium on securities purchased are amortized over the lives of the respective securities, utilizing the effective interest method. Expenses directly attributable to a Series are directly charged. Common expenses of the Trust or Series are allocated using methods approved by the Board of Directors/Trustees, generally based on average net assets.
The International Portfolios may be subject to taxes imposed by countries in which they invest, with respect to their investments in issuers existing or operating in such countries. Such taxes are generally based on income earned or repatriated and capital gains realized on the sale of such investments. The Series accrue such taxes when the related income or capital gains are earned or throughout the holding period. Some countries require governmental approval for the repatriation of investment income, capital or the proceeds of sales earned by foreign investors. In addition, if there is a deterioration in a country’s balance of payments or for other reasons, a country may impose temporary restrictions on foreign capital remittances abroad.
C. Investment Advisor:
Dimensional Fund Advisors LP (“Dimensional” or the “Advisor”) provides investment advisory services to the Trust. For the year ended October 31, 2011, the Series’ investment advisory services fees were accrued daily and paid monthly to the Advisor based on the following effective annual rates of average daily net assets:
| The Japanese Small Company Series | | 0.10% |
| The Asia Pacific Small Company Series | | 0.10% |
| The United Kingdom Small Company Series | | 0.10% |
| The Continental Small Company Series | | 0.10% |
| The Canadian Small Company Series | | 0.10% |
Earned Income Credit:
In addition, the Series have entered into arrangements with their custodian whereby net interest earned on uninvested cash balances was used to reduce a portion of each Series custody expenses. Custody expense in the accompanying financial statements is presented before reduction for credits. During the year ended October 31, 2011, expenses reduced were as follows (amounts in thousands):
| Fees Paid |
| Indirectly |
| The Japanese Small Company Series | | $ | 1 | |
| The Asia Pacific Small Company Series | | | — | |
| The United Kingdom Small Company Series | | | 1 | |
| The Continental Small Company Series | | | 1 | |
| The Canadian Small Company Series | | | — | |
126
Fees Paid to Officers and Directors/Trustees:
Certain Officers and Directors/Trustees of the Advisor are also Officers and Directors/Trustees of the Trust; however, such Officers and Directors/Trustees (with the exception of the Chief Compliance Officer (“CCO”)) receive no compensation from the Trust. For the year ended October 31, 2011, the total related amounts paid by the Trust to the CCO were $84 (in thousands). The total related amounts paid by each of the Series are included in Other Expenses on the Statement of Operations.
D. Deferred Compensation:
At October 31, 2011, the total liability for deferred compensation to Directors/Trustees is included in Accrued Expenses and Other Liabilities on the Statement of Assets and Liabilities as follows (amounts in thousands):
| The Japanese Small Company Series | | $ | 37 |
| The Asia Pacific Small Company Series | | | 18 |
| The United Kingdom Small Company Series | | | 21 |
| The Continental Small Company Series | | | 44 |
| The Canadian Small Company Series | | | 10 |
E. Purchases and Sales of Securities:
For the year ended October 31, 2011, the Series made the following purchases and sales of investment securities, other than short-term securities and U.S. government securities (amounts in thousands):
| | Purchases | | Sales | |
| The Japanese Small Company Series | | $ | 269,316 | | $ | 69,415 | |
| The Asia Pacific Small Company Series | | | 208,234 | | | 167,484 | |
| The United Kingdom Small Company Series | | | 223,610 | | | 82,231 | |
| The Continental Small Company Series | | | 456,167 | | | 215,427 | |
| The Canadian Small Company Series | | | 280,913 | | | 195,028 | |
There were no purchases or sales of long-term U.S. government securities.
F. Federal Income Taxes:
No provision for federal income taxes is required since the Series are treated as partnerships for Federal income tax purposes. Any net investment income and realized and unrealized gains and losses have been deemed to have been “passed down” to their respective partners.
At October 31, 2011, the total cost and aggregate gross unrealized appreciation and (depreciation) of securities for federal income tax purposes were different from amounts reported for financial reporting purposes (amounts in thousands):
| | | | | | | | | | | | | Net | |
| | | | | | | | | | | | | Unrealized | |
| | Federal Tax | | Unrealized | | Unrealized | | Appreciation | |
| | Cost | | Appreciation | | (Depreciation) | | (Depreciation) | |
| The Japanese Small Company Series | | $ | 1,819,229 | | $ | 164,477 | | | $ | (317,482 | ) | | $ | (153,005 | ) | |
| The Asia Pacific Small Company Series | | | 1,076,850 | | | 214,050 | | | | (203,391 | ) | | | 10,659 | | |
| The United Kingdom Small Company Series | | | 1,111,769 | | | 242,578 | | | | (222,022 | ) | | | 20,556 | | |
| The Continental Small Company Series | | | 2,356,891 | | | 455,824 | | | | (513,680 | ) | | | (57,856 | ) | |
| The Canadian Small Company Series | | | 984,551 | | | 118,412 | | | | (158,439 | ) | | | (40,027 | ) | |
The difference between book basis and tax-basis unrealized appreciation (depreciation) is primarily attributable to the tax deferral of losses on wash sales and on investments in passive foreign investment companies.
127
Accounting for Uncertainty in Income Taxes sets forth a minimum threshold for financial statement recognition of the benefit of a tax position taken or expected to be taken in a tax return. Management has analyzed each Series’ tax positions and has concluded that no provision for income tax is required in any Series’ financial statements. No Series is aware of any tax positions for which it is more likely than not that the total amounts of unrecognized tax benefits will significantly change in the next twelve months. Each of the Series’ federal tax returns for the prior three fiscal years remains subject to examination by the Internal Revenue Service.
G. Financial Instruments:
In accordance with the Series’ investment objectives and policies, the Series may invest in certain financial instruments that have off-balance sheet risk in excess of the amounts recognized in the financial statements and concentrations of credit and market risk. These instruments and their significant corresponding risks are described below:
1. Repurchase Agreements: The Series may purchase certain U.S. Government securities subject to the counterparty’s agreement to repurchase them at an agreed upon date and price. The counterparty will be required on a daily basis to maintain the value of the collateral subject to the agreement at not less than the repurchase price (including accrued interest). The agreements are conditioned upon the collateral being deposited under the Federal Reserve book-entry system with the Trust’s custodian or a third party sub-custodian. In the event of default or bankruptcy by the other party to the agreement, retention of the collateral may be subject to legal proceedings.
2. Foreign Markets Risks: Investments in foreign markets may involve certain consideration and risks not typically associated with investments in the United States of America, including the possibility of future political and economic developments and the level of foreign governmental supervision and regulation of foreign securities markets. These markets are generally smaller, less liquid and more volatile than the major securities markets in the United States of America. Consequently, acquisition and disposition of international securities by the Series may be inhibited.
Derivative Financial Instruments:
Disclosures on derivative instruments and hedging activities are intended to improve financial reporting for derivative instruments by enabling investors to understand how and why a fund uses derivatives, how derivatives are accounted for and how derivative instruments affect a fund’s results of operations and financial position. Summarized below are the specific types of derivative instruments used by the Series.
3. Futures Contracts: The Series may enter into futures contracts to gain market exposure on uninvested cash pending investment in securities or to maintain liquidity to pay redemptions. Upon entering into a futures contract, the Series deposits cash or pledges U.S. Government securities to a broker, equal to the minimum “initial margin” requirements of the exchange on which the contract is traded. Subsequent payments are received from or paid to the broker each day, based on the daily fluctuation in the market value of the contract. These receipts or payments are known as “variation margin” and are recorded daily by the Series as unrealized gains or losses until the contracts are closed. When the contracts are closed, the Series record a realized gain or loss, which is presented in the Statements of Operations as a net realized gain or loss on futures, equal to the difference between the value of the contract at the time it was opened and the value at the time it was closed.
Risks may arise upon entering into futures contracts from potential imperfect price correlations between the futures contracts and the underlying securities or indices, from the possibility of an illiquid secondary market for these instruments and from the possibility that the Series could lose more than the initial margin requirements. The Series entering into stock index futures are subject to equity price risk from those futures contracts. Counterparty credit risk related to exchange-traded futures is minimal because the exchange’s clearinghouse, as counterparty to all exchange-traded futures, guarantees the futures against default.
Additional disclosure on derivative instruments is required showing a summary by primary risk exposure of the derivatives instruments’ (i) location in the balance sheet and fair value at period end and (ii) the location in the Statements of Operations and the realized and change in unrealized gain or loss over the reporting period.
128
The following is a summary of the Series’ location and value of derivative instrument holdings on the Series’ Statements of Operations categorized by primary risk exposure for the year ended October 31, 2011 (amounts in thousands):
| | Location on the Statements | | Equity | |
| | of Operations | | Contracts | |
| The Continental Small Company Series* | | Net Realized Gain (Loss) on Futures | | $(287) | |
*As of October 31, 2011, there were no futures contracts outstanding. During the year ended October 31, 2011, the Series had limited activity in futures contracts.
H. Line of Credit:
The Trust, together with other Dimensional-advised portfolios, has entered into a $250 million unsecured discretionary line of credit effective June 22, 2011 with its domestic custodian bank. Each portfolio is permitted to borrow, subject to its investment limitations, up to a maximum of $250 million, as long as total borrowings under the line of credit do not exceed $250 million in the aggregate. Borrowings under the line of credit are charged interest at rates agreed upon by the parties at the time of borrowing. Each portfolio is individually, and not jointly, liable for its particular advances under the line of credit. There is no commitment fee on the unused portion of the line of credit. The agreement for the discretionary line of credit may be terminated by either party at any time. The line of credit is scheduled to expire on June 22, 2012. There were no borrowings by the Series under this line of credit during the year ended October 31, 2011.
The Trust, together with other Dimensional-advised portfolios, has also entered into an additional $500 million unsecured line of credit effective January 15, 2011 with its international custodian bank. Each portfolio is permitted to borrow, subject to its investment limitations, up to a maximum of $500 million, as long as total borrowings under the line of credit do not exceed $500 million in the aggregate. Each portfolio is individually, and not jointly, liable for its particular advances under the line of credit. Borrowings under the line of credit are charged interest at rates agreed to by the parties at the time of borrowing. There is no commitment fee on the unused portion of the line of credit. The agreement for the line of credit expires on January 13, 2012. The Trust, together with other Dimensional-advised portfolios, expects to enter into a new line of credit with substantially the same terms as its existing line of credit prior to its expiration.
For the year ended October 31, 2011, borrowings by the Series under this line of credit were as follows (amounts in thousands, except percentages and days):
| Weighted | | Weighted | | Number of | | Interest | | Maximum Amount | |
| Average | | Average | | Days | | Expense | | Borrowed During | |
| Interest Rate | | Loan Balance | | Outstanding* | | Incurred | | the Period | |
| The Japanese Small Company Series | 0.88% | | $625 | | | 16 | | | — | | | $4,628 | | |
| The Asia Pacific Small Company Series | 0.85% | | 446 | | | 51 | | $ | 1 | | | 2,968 | | |
| The United Kingdom Small Company Series | 0.91% | | 117 | | | 19 | | | — | | | 1,227 | | |
| The Continental Small Company Series | 0.83% | | 574 | | | 11 | | | — | | | 2,038 | | |
*Number of Days Outstanding represents the total of single or consecutive days during the year ended that each Series’ available line of credit was utilized.
There were no outstanding borrowings by the Series under this line of credit as of October 31, 2011.
129
I. Securities Lending:
As of October 31, 2011, some of the Series had securities on loan to brokers/dealers, for which each Series received cash collateral. Each Series invests the cash collateral, as described below, and records a liability for the return of the collateral, during the period the securities are on loan. Loans of securities are expected at all times to be secured by collateral equal to at least (i) 100% of the current market value of the loaned securities with respect to securities of the U.S. government or its agencies, (ii) 102% of the current market value of the loaned securities with respect to U.S. securities, and (iii) 105% of the current market value of the loaned securities with respect to foreign securities. However, daily market fluctuations could cause the Series’ collateral to be lower or higher than the expected thresholds. If this were to occur, the collateral would be adjusted the next business day to ensure adequate collateralization. In the event of default or bankruptcy by the other party to the agreement, realization and/or retention of the collateral may be subject to legal proceedings. If the borrower fails to return loaned securities, and cash collateral being maintained by the borrower is insufficient to cover the value of loaned securities and provided such collateral insufficiency is not the result of investment losses, the lending agent has agreed to pay the amount of the shortfall to the Series or, at the option of the lending agent, to replace the securities.
Subject to their stated investment policies, each Series will generally invest the cash collateral received for the loaned securities in The DFA Short Term Investment Fund (the “Money Market Series”), an affiliated registered money market fund advised by the Advisor for which the Advisor receives a management fee of 0.05% of the average daily net assets of the Money Market Series. Each Series also may invest the cash collateral received for the loaned securities in securities of the U.S. government or its agencies, repurchase agreements collateralized by securities of the U.S. government or its agencies, and affiliated and unaffiliated registered and unregistered money market funds. For purposes of this paragraph, agencies include both agency debentures and agency mortgage-backed securities. In addition, each Series will be able to terminate the loan at any time and will receive reasonable interest on the loan, as well as amounts equal to any dividends, interest or other distributions on the loaned securities. However, dividend income received from loaned securities may not be eligible to be taxed at qualified dividend income rates.
J. Indemnitees; Contractual Obligations:
Under the Trust’s organizational documents, its officers and directors are indemnified against certain liabilities arising out of the performance of their duties to the Trust.
In the normal course of business, the Trust enters into contracts that contain a variety of representations and warranties which provide general indemnification. The Trust’s maximum exposure under these arrangements is unknown as this would involve future claims that may be made against the Trust and/or its affiliates that have not yet occurred. However, based on experience, the Trust expects the risk of loss to be remote.
K. Recently Issued Accounting Standards:
In January 2010, the Financial Accounting Standards Board (“FASB”) issued Accounting Standards Update (“ASU”) No. 2010-06 “Improving Disclosures about Fair Value Measurements.” ASU No. 2010-06 amends FASB Accounting Standards Codification Topic 820, Fair Value Measurements and Disclosures, to require additional disclosures in the roll forward of activity in Level 3 fair value measurements effective for interim and annual reporting periods beginning after December 15, 2010. Management is currently evaluating the impact ASU No. 2010-06 will have on its financial statement disclosures.
In May 2011, the FASB issued ASU No. 2011-04 “Amendments to Achieve Common Fair Value Measurement and Disclosure Requirements in U.S. Generally Accepted Accounting Principles (“GAAP”) and International Financial Reporting Standards (“IFRSs”).” ASU 2011-04 includes common requirements for measurement of and disclosure about fair value between U.S. GAAP and IFRSs. ASU 2011-04 will require reporting entities to disclose quantitative information about the unobservable inputs used in the fair value measurements categorized within Level 3 of the fair value hierarchy. In addition, ASU 2011-04 will require reporting entities to make disclosures about amounts and reasons for all transfers in and out of Level 1 and Level 2 fair value measurements. The new and revised disclosures are effective for interim and annual reporting periods beginning after December 15, 2011. At this time, management is evaluating the implications of ASU No. 2011-04 and its impact on the financial statements has not been determined.
130
L. Other:
The Series are subject to claims and suits that arise from time to time in the ordinary course of business (for example, in The Tribune Company Bankruptcy, certain creditors have filed actions against all shareholders of The Tribune Company who tendered shares when the Tribune Company went private in 2007 in a leveraged buy-out transaction, seeking the return of all proceeds received by the shareholders). Although management currently believes that resolving claims against us, individually or in aggregate, will not have a material adverse impact on our financial position, our results of operations, or our cash flows, these matters are subject to inherent uncertainties and management’s view of these matters may change in the future.
M. Subsequent Event Evaluations:
Management has evaluated the impact of all subsequent events on the Series and has determined that there are no subsequent event requiring recognition or disclosure in the financial statements.
131
REPORT OF INDEPENDENT REGISTERED PUBLIC ACCOUNTING FIRM
To the Shareholders of the Series, as defined, and
Board of Trustees of The DFA Investment Trust Company:
In our opinion, the accompanying statements of assets and liabilities, including the summary schedules of portfolio holdings, and the related statements of operations and of changes in net assets and the financial highlights present fairly, in all material respects, the financial position of The Japanese Small Company Series, The Asia Pacific Small Company Series, The United Kingdom Small Company Series, The Continental Small Company Series and The Canadian Small Company Series (constituting portfolios within the DFA Investment Trust Company, hereafter referred to as the “Series”) at October 31, 2011, the results of each of their operations for the year then ended, the changes in each of their net assets and the financial highlights for each of the periods indicated, in conformity with accounting principles generally accepted in the United States of America. These financial statements and financial highlights (hereafter referred to as “financial statements”) are the responsibility of the Series’ management; our responsibility is to express an opinion on these financial statements based on our audits. We conducted our audits of these financial statements in accordance with the standards of the Public Company Accounting Oversight Board (United States). Those standards require that we plan and perform the audit to obtain reasonable assurance about whether the financial statements are free of material misstatement. An audit includes examining, on a test basis, evidence supporting the amounts and disclosures in the financial statements, assessing the accounting principles used and significant estimates made by management, and evaluating the overall financial statement presentation. We believe that our audits, which included confirmation of securities at October 31, 2011 by correspondence with the custodians, brokers and the transfer agent of the investee fund, provide a reasonable basis for our opinion.
PricewaterhouseCoopers LLP
Philadelphia, Pennsylvania
December 22, 2011
132
FUND MANAGEMENT
(Unaudited)
Trustees/Directors
Each Board of Trustees/Directors of The DFA Investment Trust Company Inc. (“DFAITC”), DFA Investment Dimensions Group Inc. (“DFAIDG”), Dimensional Investment Group Inc. (“DIG”) and Dimensional Emerging Markets Value Fund (“DEM”) (each, the “Fund” and collectively, the “Funds”) is responsible for establishing the Funds’ policies and for overseeing the management of the Funds. The Trustees/Directors of the Funds, including all of the disinterested Trustees/Directors, have adopted written procedures to monitor potential conflicts of interest that might develop between portfolios of the Funds (the “Feeder Portfolios”) that invest in certain series of DFAITC or DEM (the “Master Funds”).
Each Board has four standing committees, an Audit Committee, a Nominating Committee, a Portfolio Performance and Service Review Committee (the “Performance Committee”) and an Independent Review Committee (the “Review Committee”). The Audit Committee is comprised of George M. Constantinides, Roger G. Ibbotson and Abbie J. Smith. Each member of the Audit Committee is a disinterested Trustee/Director. The Audit Committee oversees the Fund’s accounting and financial reporting policies and practices, the Fund’s internal controls, the Fund’s financial statements and the independent audits thereof and performs other oversight functions as requested by the Board. The Audit Committee recommends the appointment of each Fund’s independent registered certified public accounting firm and also acts as a liaison between the Fund’s independent registered certified public accounting firm and the full Board. There were two Audit Committee meetings held during the fiscal year ended October 31, 2011.
Each Board’s Nominating Committee is comprised of George M. Constantinides, John P. Gould, Roger G. Ibbotson, Myron S. Scholes, Edward P. Lazear and Abbie J. Smith. Each member of the Nominating Committee is a disinterested Trustee/Director. The Nominating Committee for each Board makes recommendations for nominations of disinterested and interested members on the Board to the full Board. The Nominating Committee evaluates a candidate’s qualification for Board membership and the independence of such candidate from the Advisor and other principal service providers. There was one Nominating Committee meeting held for each Fund during the fiscal year ended October 31, 2011.
Each Board’s Performance Committee is comprised of George M. Constantinides, Roger G. Ibbotson, Abbie J. Smith, Edward P. Lazear, John P. Gould and Myron S. Scholes. Each member of the Performance Committee is a disinterested Trustee/Director. The Performance Committee regularly reviews and monitors the investment performance of the Fund’s series and reviews the performance of the Fund’s service providers. There were six Performance Committee meetings held during the fiscal year ended October 31, 2011.
Each Board’s Review Committee consists of both interested and disinterested Trustees/Directors. The Review Committee is comprised of John P. Gould, Edward P. Lazear, Myron S. Scholes and Eduardo A. Repetto. The Review Committee assists the Board in carrying out its fiduciary duties with respect to the oversight of the Fund and its performance. At the request of the Board or the Advisor, the Review Committee may (i) review the design of possible new series of the Fund, (ii) review performance of existing portfolios of the Fund and discuss and recommend possible enhancements to the portfolios’ investment strategies, (iii) review proposals by the Advisor to modify or enhance the investment strategies or policies of each portfolio, and (iv) consider issues relating to investment services for each portfolio of the Fund. The Review Committee was formed on December 17, 2010, and there were two Review Committee meetings held during the fiscal year ended October 31, 2011.
Certain biographical information for each disinterested Trustee/Director and each interested Trustee/Director of the Funds is set forth in the tables below, including a description of each Trustee/Director’s experience as a Trustee/ Director of the Funds and as a director or trustee of other funds, as well as other recent professional experience.
The statements of additional information (together, “SAI”) of the Funds include additional information about each Trustee/ Director. You may obtain copies of the SAI and prospectus of each Fund advised by Dimensional Fund Advisors LP by calling collect (512) 306-7400 or by mailing a request to Dimensional Fund Advisors LP, 6300 Bee Cave Road, Building One, Austin, Texas 78746. Prospectuses are also available at www.dimensional.com.
133
Name, Position
with the Fund,
Address and Age | Term of Office1 and
Length of Service | Portfolios within the
DFA Fund Complex2
Overseen | Principal Occupation(s) During Past 5 Years and
Other Directorships of Public Companies Held |
| Disinterested Trustees/Directors |
George M. Constantinides
Director of DFAIDG and DIG.
Trustee of DFAITC and DEM.
The University of Chicago
Booth School of Business
5807 S. Woodlawn Avenue
Chicago, IL 60637
Age: 64 | DFAITC - since 1993
DFAIDG - since 1983
DIG - since 1993
DEM - since 1993 | 94 portfolios in 4 investment companies | Leo Melamed Professor of Finance, The University of Chicago Booth School of Business. |
John P. Gould
Director of DFAIDG and DIG.
Trustee of DFAITC and DEM.
The University of Chicago
Booth School of Business
5807 S. Woodlawn Avenue
Chicago, IL 60637
Age: 72 | DFAITC - since 1993
DFAIDG - since 1986
DIG - since 1993
DEM - since 1993 | 94 portfolios in 4 investment
companies | Steven G. Rothmeier Distinguished Service Professor of Economics, The University of Chicago Booth School of Business (since 1965). Member and Chair, Competitive Markets Advisory Committee, Chicago Mercantile Exchange (futures trading exchange) (since 2004). Formerly, Director of UNext, Inc. (1999-2006). Trustee, Harbor Fund (registered investment company) (30 Portfolios) (since 1994). Formerly, Member of the Board of Milwaukee Mutual Insurance Company (1997-2010). |
Roger G. Ibbotson
Director of DFAIDG and DIG.
Trustee of DFAITC and DEM.
Yale School of Management
135 Prospect Street
New Haven, CT 06520-8200
Age: 68 | DFAITC - since 1993
DFAIDG - since 1981
DIG - since 1993
DEM - since 1993 | 94 portfolios in 4 investment
companies | Professor in Practice of Finance, Yale School of Management (since 1984). Chairman, CIO and Partner, Zebra Capital Management, LLC (hedge fund manager) (since 2001). Consultant to Morningstar, Inc. (since 2006). Formerly, Chairman, Ibbotson Associates, Inc., Chicago, IL (software data publishing and consulting) (1977-2006). Formerly, Director, BIRR Portfolio Analysis, Inc. (software products) (1990-2010). |
Edward P. Lazear
Director of DFAIDG and DIG.
Trustee of DFAITC and DEM.
Stanford University
Graduate School of Business
518 Memorial Way
Stanford, CA 94305-5015
Age: 63 | DFAITC - since 2010
DFAIDG - since 2010
DIG - since 2010
DEM - since 2010 | 94 portfolios in 4
investment companies | Morris Arnold Cox Senior Fellow, Hoover Institution (since 2002). Jack Steele Parker Professor of Human Resources Management and Economics, Graduate School of Business, Stanford University (since 1995). Cornerstone Research (expert testimony and economic and financial analysis) (since 2009). Formerly, Chairman of the President George W. Bush’s Council of Economic Advisers (2006-2009). Formerly, Council of Economic Advisors, State of California (2005-2006). Formerly, Commissioner, White House Panel on Tax Reform (2005). |
Myron S. Scholes
Director of DFAIDG and DIG.
Trustee of DFAITC and DEM.
c/o Dimensional Fund
Advisors, L.P.
6300 Bee Cave Road
Building 1
Austin, TX 78746
Age: 70 | DFAITC - since 1993
DFAIDG - since 1981
DIG - since 1993
DEM - since 1993 | 94 portfolios in 4
investment companies | Frank E. Buck Professor Emeritus of Finance, Stanford University (since 1981). Formerly, Chairman, Platinum Grove Asset Management, L.P. (hedge fund) (formerly, Oak Hill Platinum Partners) (1999-2009). Formerly, Managing Partner, Oak Hill Capital Management (private equity firm) (until 2004). Director, American Century Fund Complex (registered investment companies) (40 Portfolios) (since 1980). Formerly, Director, Chicago Mercantile Exchange (2001-2008). |
Abbie J. Smith
Director of DFAIDG and DIG.
Trustee of DFAITC and DEM.
The University of Chicago
Booth School of Business
5807 S. Woodlawn Avenue
Chicago, IL 60637
Age: 58 | DFAITC - since 2000
DFAIDG - since 2000
DIG - since 2000
DEM - since 2000 | 94 portfolios in 4
investment companies | Boris and Irene Stern Distinguished Service Professor of Accounting, The University of Chicago Booth School of Business (since 1980). Co-Director Investment Research, Fundamental Investment Advisors (hedge fund) (since 2008). Director, HNI Corporation (formerly known as HON Industries Inc.) (office furniture) (since 2000). Director, Ryder System Inc. (transportation, logistics and supply-chain management) (since 2003). Trustee, UBS Funds (3 investment companies within the fund complex) (52 portfolios) (since 2009). |
134
Name, Position
with the Fund,
Address and Age | Term of Office1 and
Length of Service | Portfolios within the
DFA Fund Complex2
Overseen | Principal Occupation(s) During Past 5 Years and
Other Directorships of Public Companies Held |
| Interested Trustees/Directors* |
David G. Booth Chairman,
Director, Co-Chief Executive
Officer and President of
DFAIDG and DIG.
Chairman, Trustee, Co-Chief
Executive Officer and
President of DFAITC and DEM.
6300 Bee Cave Road,
Building One
Austin, Texas 78746
Age: 64 | DFAITC - since 1993
DFAIDG - since 1981
DIG - since 1992
DEM - since 1993 | 94 portfolios in 4
investment companies | Chairman, Director/Trustee, President, and Co-Chief Executive Officer (since January 2010) of Dimensional Holdings Inc., Dimensional Fund Advisors LP, DFA Securities LLC, Dimensional Emerging Markets Value Fund, DFAIDG, Dimensional Investment Group Inc. and The DFA Investment Trust Company. Director of Dimensional Fund Advisors Ltd., Dimensional Funds PLC, Dimensional Funds II PLC, DFA Australia Limited and Dimensional Cayman Commodity Fund I Ltd. Chairman and President of Dimensional SmartNest LLC and Dimensional SmartNest (US) LLC. Chairman, Director and Co-Chief Executive Officer of Dimensional Fund Advisors Canada ULC. Limited Partner, Oak Hill Partners (since 2001) and VSC Investors, LLC (since 2007). Trustee, The University of Chicago. Trustee, University of Kansas Endowment Association. Formerly, Chief Executive Officer (until 2010) and Chief Investment Officer (2003-2007) of Dimensional Fund Advisors LP, DFA Securities LLC, Dimensional Emerging Markets Value Fund, DFAIDG, Dimensional Investment Group Inc., The DFA Investment Trust Company and Dimensional Holdings Inc. Formerly, Chief Investment Officer of Dimensional Fund Advisors Ltd. Formerly, President and Chief Investment Officer of DFA Australia Limited. Formerly, Director, SA Funds (registered investment company). |
Eduardo A. Repetto Director,
Co-Chief Executive Officer
and Chief Investment Officer
of DFAIDG and DIG. Trustee,
Co-Chief Executive Officer
and Chief Investment Officer
of DFAITC and DEM.
6300 Bee Cave Road,
Building One
Austin, TX 78746
Age: 44 | DFAITC - since 2009
DFAIDG - since 2009
DIG - since 2009
DEM - since 2009 | 94 portfolios in 4
investment companies | Co-Chief Executive Officer (since January 2010), Chief Investment Officer (since March 2007) and Director/Trustee of Dimensional Holdings Inc., Dimensional Fund Advisors LP, DFA Securities LLC, Dimensional Emerging Markets Value Fund, DFAIDG, Dimensional Investment Group Inc., The DFA Investment Trust Company and Dimensional Cayman Commodity Fund I Ltd. Co-Chief Executive Officer, President and Chief Investment Officer of Dimensional Fund Advisors Canada ULC. Chief Investment Officer, Vice President and Director of DFA Australia Limited. Director of Dimensional Fund Advisors Ltd., Dimensional Funds PLC and Dimensional Funds II PLC. Co-Chief Executive Officer of Dimensional SmartNest LLC and Dimensional SmartNest (US) LLC. Formerly, Vice President of Dimensional Holdings Inc., Dimensional Fund Advisors LP, DFA Securities LLC, Dimensional Emerging Markets Value Fund, DFAIDG, Dimensional Investment Group Inc., The DFA Investment Trust Company and Dimensional Fund Advisors Canada ULC. |
| 1 | | Each Trustee/Director holds office for an indefinite term until his or her successor is elected and qualified. |
| |
| 2 | | Each Trustee/Director is a director or trustee of each of the four registered investment companies within the DFA Fund Complex, which includes the Funds. |
| |
| | * | | Interested Trustees/Directors are described as such because they are deemed to be “interested persons,” as that term is defined under the Investment Company Act of 1940, as amended, due to their positions with Dimensional Fund Advisors LP. |
135
Officers
The name, age, information regarding positions with the Funds and the principal occupation for each officer of the Funds are set forth below. Each officer listed below holds the same office (except as otherwise noted) in the following entities: Dimensional Fund Advisors LP (prior to November 3, 2006, Dimensional Fund Advisors Inc.) (“Dimensional”), DFA Securities Inc., DFAIDG, DIG, DFAITC and DEM (collectively, the “DFA Entities”). The address of each officer is: Dimensional Fund Advisors LP, 6300 Bee Cave Road, Building One, Austin, Texas 78746, unless otherwise indicated.
Name, Position with the Fund
and Age | Term of Office1
and Length of
Service | Principal Occupation(s) During Past 5 Years |
| Officers |
April A. Aandal
Vice President, Global Business
Development
Age: 48 | Since 2008 | Vice President, Global Business Development of all the DFA Entities. Chief Learning Officer of Dimensional (September 2008-October 2011). Formerly, Regional Director of Dimensional (2004-2008). |
Darryl D. Avery
Vice President
Age: 45 | Since 2005 | Vice President of all the DFA Entities. |
Arthur H. Barlow
Vice President
Age: 55 | Since 1993 | Vice President of all the DFA Entities. Formerly, Vice President of DFA Australia Limited and Dimensional Fund Advisors Ltd. |
John T. Blood
Vice President
Age: 42 | Since 2011 | Vice President of all the DFA Entities. Regional Director for Dimensional (2010). Formerly, Chief Market Strategist at Commonwealth Financial (2007-2010); Director of Research at Commonwealth Financial (2000-2007). |
Scott A. Bosworth
Vice President
Age: 42 | Since 2007 | Vice President of all the DFA Entities. Regional Director of Dimensional (since November 1997). |
Valerie A. Brown
Vice President and Assistant
Secretary
Age: 44 | Since 2001 | Vice President and Assistant Secretary of all the DFA Entities, DFA Australia Limited, Dimensional Fund Advisors Ltd., Dimensional Fund Advisors Canada ULC (since 2003) and Dimensional Cayman Commodity Fund I Ltd. |
David P. Butler
Vice President
Age: 47 | Since 2007 | Vice President of all the DFA Entities. Head of Global Financial Services of Dimensional (since 2008). Formerly, Regional Director of Dimensional (January 1995 to January 2005). |
James G. Charles
Vice President
Age: 55 | Since 2011 | Vice President of all the DFA Entities. Regional Director for Dimensional (2008-2010). Formerly, Vice President, Client Portfolio Manager at American Century Investments (2001-2008). |
Joseph H. Chi
Vice President
Age: 45 | Since 2009 | Vice President of all the DFA Entities. Portfolio Manager for Dimensional (since October 2005). |
Stephen A. Clark
Vice President
Age: 39 | Since 2004 | Vice President of all the DFA Entities, DFA Australia Limited and Dimensional Fund Advisors Canada ULC. |
Robert P. Cornell
Vice President
Age: 62 | Since 2007 | Vice President of all the DFA Entities. Regional Director of Financial Services Group of Dimensional (since August 1993). |
George H. Crane
Vice President
Age: 56 | Since 2010 | Vice President of all the DFA Entities. Formerly, Senior Vice President and Managing Director at State Street Bank & Trust Company (2007-2008). Managing Director, Head of Investment Administration and Operations at State Street Research & Management Company (2002-2005). |
Christopher S. Crossan
Vice President and Global Chief
Compliance Officer
Age: 45 | Since 2004 | Vice President and Global Chief Compliance Officer of all the DFA Entities, DFA Australia Limited, Dimensional Fund Advisors Ltd., Dimensional SmartNest LLC and Dimensional SmartNest (US) LLC. Chief Compliance Officer of Dimensional Fund Advisors Canada ULC. |
136
Name, Position with the Fund
and Age | Term of Office1
and Length of
Service | Principal Occupation(s) During Past 5 Years |
James L. Davis
Vice President
Age: 54 | Since 1999 | Vice President of all the DFA Entities. Formerly, Vice President of DFA Australia Limited and Dimensional Fund Advisors Ltd. |
Robert T. Deere
Vice President
Age: 54 | Since 1994 | Vice President of all the DFA Entities, DFA Australia Limited and Dimensional Fund Advisors Canada ULC. |
Peter F. Dillard
Vice President
Age: 39 | Since 2010 | Vice President of all the DFA Entities. Research Associate for Dimensional (since August 2008). Formerly, Research Assistant for Dimensional (April 2006-August 2008). |
Robert W. Dintzner
Vice President and
Chief Communications Officer
Age: 41 | Since 2001 | Vice President of all the DFA Entities. Chief Communications Officer of Dimensional (since 2010). |
Richard A. Eustice
Vice President and Assistant
Secretary
Age: 46 | Since 1998 | Vice President and Assistant Secretary of all the DFA Entities and DFA Australia Limited. Chief Operating Officer of Dimensional Fund Advisors Ltd. (since July 2008). Formerly, Vice President of Dimensional Fund Advisors Ltd. |
Gretchen A. Flicker
Vice President
Age: 40 | Since 2004 | Vice President of all the DFA Entities. |
Jed S. Fogdall
Vice President
Age: 37 | Since 2008 | Vice President of all the DFA Entities. Portfolio Manager for Dimensional (since September 2004). |
Jeremy P. Freeman
Vice President
Age: 40 | Since 2009 | Vice President of all the DFA Entities. Senior Technology Manager for Dimensional (since June 2006). Formerly, Principal at AIM Investments/Amvescap PLC (now Invesco) (June 1998-June 2006). |
Mark R. Gochnour
Vice President
Age: 44 | Since 2007 | Vice President of all the DFA Entities. Regional Director of Dimensional. |
Henry F. Gray
Vice President
Age: 44 | Since 2000 | Vice President of all the DFA Entities. Formerly, Vice President of DFA Australia Limited. |
John T. Gray
Vice President
Age: 37 | Since 2007 | Vice President of all the DFA Entities. Formerly, Regional Director of Dimensional (January 2005 to February 2007). |
Joel H. Hefner
Vice President
Age: 43 | Since 2007 | Vice President of all the DFA Entities. Regional Director of Dimensional (since June 1998). |
Julie C. Henderson
Vice President and Fund Controller
Age: 37 | Since 2005 | Vice President and Fund Controller of all the DFA Entities and Dimensional Cayman Commodity Fund I Ltd. |
Kevin B. Hight
Vice President
Age: 43 | Since 2005 | Vice President of all the DFA Entities. |
Christine W. Ho
Vice President
Age: 43 | Since 2004 | Vice President of all the DFA Entities. |
Michael C. Horvath
Vice President
Age: 51 | Since 2011 | Vice President of all the DFA Entities. Formerly, Managing Director, Co-Head Global Consultant Relations at BlackRock (2004-2011). |
137
Name, Position with the Fund
and Age | Term of Office1
and Length of
Service | Principal Occupation(s) During Past 5 Years |
Jeff J. Jeon
Vice President
Age: 37 | Since 2004 | Vice President of all the DFA Entities and Dimensional Cayman Commodity Fund I Ltd. |
Patrick M. Keating
Vice President and Chief Operating Officer
Age: 56 | Since 2003 | Vice President of all the DFA Entities and Dimensional Cayman Commodity Fund I Ltd. and Chief Operating Officer of Dimensional and Dimensional Cayman Commodity Fund I Ltd. Director, Vice President and Chief Privacy Officer of Dimensional Fund Advisors Canada ULC. Director of DFA Australia Limited. |
David M. Kershner
Vice President
Age: 40 | Since 2010 | Vice President of all the DFA Entities. Portfolio Manager for Dimensional (since June 2004). |
Timothy R. Kohn
Vice President
Age: 40 | Since 2011 | Vice President of all the DFA Entities. Head of Defined Contribution Sales for Dimensional (since August 2010). Formerly, Chief DC Strategist, Barclays Global Investors (2005-2009). |
Joseph F. Kolerich
Vice President
Age: 39 | Since 2004 | Vice President of all the DFA Entities. |
Stephen W. Kurad
Vice President
Age: 42 | Since 2011 | Vice President of all the DFA Entities. Regional Director for Dimensional (2007-2010). |
Michael F. Lane
Vice President
Age: 44 | Since 2004 | Vice President of all the DFA Entities. |
Juliet Lee
Vice President
Age: 40 | Since 2005 | Vice President of all the DFA Entities. |
Marlena I. Lee
Vice President
Age: 30 | Since 2011 | Vice President of all the DFA Entities. Research Associate for Dimensional (July 2008-2010). |
Apollo D. Lupescu
Vice President
Age: 42 | Since 2009 | Vice President of all the DFA Entities. Regional Director for Dimensional (since February 2004). |
Kenneth M. Manell
Vice President
Age: 38 | Since 2010 | Vice President of all the DFA Entities and Dimensional Cayman Commodity Fund I Ltd. Counsel for Dimensional (since September 2006). Formerly, Assistant General Counsel at Castle & Cooke (January 2004-September 2006). |
Aaron M. Marcus
Vice President & Head of Global
Human Resources
Age: 41 | Since 2008 | Vice President and Head of Global Human Resources of Dimensional. Formerly, Global Head of Recruiting and Vice President of Goldman Sachs & Co. (June 2006 to January 2008), and Global Co-Head of HR of the Equities & FICC Division, and Vice President of Goldman Sachs & Co. (May 2005 to May 2006). |
David R. Martin
Vice President, Chief Financial Officer
and Treasurer
Age: 54 | Since 2007 | Vice President, Chief Financial Officer and Treasurer of all the DFA Entities. Director, Vice President, Chief Financial Officer and Treasurer of Dimensional Fund Advisors Ltd. and DFA Australia Limited. Chief Financial Officer, Treasurer, and Vice President of Dimensional Fund Advisors Canada ULC, Dimensional SmartNest LLC, Dimensional SmartNest (US) LLC and Dimensional Cayman Commidity Fund I Ltd. Director of Dimensional Funds PLC and Dimensional Funds II PLC. Formerly, Executive Vice President and Chief Financial Officer of Janus Capital Group Inc. (June 2005 to March 2007). |
138
Name, Position with the Fund
and Age | Term of Office1
and Length of
Service | Principal Occupation(s) During Past 5 Years |
Catherine L. Newell
Vice President and Secretary
Age: 47 | Vice President
since 1997
and Secretary
since 2000 | Vice President and Secretary of all the DFA Entities. Director, Vice President and Secretary of DFA Australia Limited and Dimensional Fund Advisors Ltd. (since February 2002, April 1997 and May 2002, respectively). Vice President and Secretary of Dimensional Fund Advisors Canada ULC (since June 2003), Dimensional SmartNest LLC, Dimensional SmartNest (US) LLC and Dimensional Cayman Commodity Fund I Ltd. Director, Dimensional Funds PLC and Dimensional Funds II PLC (since 2002 and 2006, respectively). Formerly, Assistant Secretary of all DFA Entities, DFA Australia Limited and Dimensional Fund Advisors Ltd. |
Christian A. Newton
Vice President
Age: 36 | Since 2009 | Vice President of all DFA Entities. Web Services Manager for Dimensional (since January 2008). Formerly, Design Manager of Dimensional (2005-2008). |
Pamela B. Noble
Vice President
Age: 47 | Since 2011 | Vice President of all the DFA Entities. Portfolio Manager for Dimensional (2008-2010). Formerly, Vice President and Portfolio Manager at USAA Investment Management Company (2001-2006). |
Carolyn L. O
Vice President
Age: 37 | Since 2010 | Vice President of all the DFA Entities and Dimensional Cayman Commodity Fund I Ltd. Deputy General Counsel, Funds (since 2011). Counsel for Dimensional (2007-2011). Formerly, Associate at K&L Gates LLP (January 2004-September 2007). |
Gerard K. O’Reilly
Vice President
Age: 34 | Since 2007 | Vice President of all the DFA Entities. Formerly, Research Associate of Dimensional (2004 to 2006). |
Daniel C. Ong
Vice President
Age: 37 | Since 2009 | Vice President of all the DFA Entities. Portfolio Manager for Dimensional (since July 2005). |
Kyle K. Ozaki
Vice President
Age: 33 | Since 2010 | Vice President of all the DFA Entities. Senior Compliance Officer for Dimensional (since January 2008). Formerly, Compliance Officer (February 2006-December 2007) and Compliance Analyst (August 2004-January 2006) for Dimensional. |
David A. Plecha
Vice President
Age: 50 | Since 1993 | Vice President of all the DFA Entities, DFA Australia Limited, Dimensional Fund Advisors Ltd. and Dimensional Fund Advisors Canada ULC. |
Allen Pu
Vice President
Age: 40 | Since 2011 | Vice President of all the DFA Entities. Portfolio Manager for Dimensional (July 2006-2010). |
Stephen A. Quance
Vice President
Age: 37 | Since 2011 | Vice President of all the DFA Entities. Portfolio Manager for Dimensional (October 2006-2010). |
Theodore W. Randall
Vice President
Age: 38 | Since 2008 | Vice President of all the DFA Entities. Formerly, Research Associate of Dimensional (2006-2008). Systems Developer of Dimensional (2001-2006). |
L. Jacobo Rodriguez
Vice President
Age: 40 | Since 2005 | Vice President of all the DFA Entities. |
Julie A. Saft
Vice President
Age: 52 | Since 2010 | Vice President of all the DFA Entities. Client Systems Manager for Dimensional (since July 2008). Formerly, Senior Manager at Vanguard (November 1997-July 2008). |
David E. Schneider
Vice President
Age: 65 | Since 2001 | Vice President of all the DFA Entities and Dimensional Fund Advisors Canada ULC. Head of Institutional Services of Dimensional. |
Walid A. Shinnawi
Vice President
Age: 49 | Since 2010 | Vice President of all the DFA Entities. Regional Director for Dimensional (since March 2006). Formerly, Senior Director at Moody’s KMV (1999-March 2006). |
139
Name, Position with the Fund
and Age | Term of Office1
and Length of
Service | Principal Occupation(s) During Past 5 Years |
Bruce A. Simmons
Vice President
Age: 46 | Since 2009 | Vice President of all the DFA Entities. Investment Operations Manager for Dimensional (since May 2007). Formerly, Vice President Client and Fund Reporting at Mellon Financial (September 2005-May 2007). |
Edward R. Simpson
Vice President
Age: 43 | Since 2007 | Vice President of all the DFA Entities. Regional Director of Dimensional (since December 2002). |
Bryce D. Skaff
Vice President
Age: 36 | Since 2007 | Vice President of all the DFA Entities. Formerly, Regional Director of Dimensional (December 1999 to January 2007). |
Andrew D. Smith
Vice President
Age: 43 | Since 2011 | Vice President of all the DFA Entities. Project Manager for Dimensional (2007-2010). Formerly, Business Analyst Manager, National Instruments (2003-2007). |
Grady M. Smith
Vice President
Age: 55 | Since 2004 | Vice President of all the DFA Entities and Dimensional Fund Advisors Canada ULC. |
Carl G. Snyder
Vice President
Age: 48 | Since 2000 | Vice President of all the DFA Entities. Formerly, Vice President of DFA Australia Limited. |
Lawrence R. Spieth
Vice President
Age: 63 | Since 2004 | Vice President of all the DFA Entities. |
Bradley G. Steiman
Vice President
Age: 38 | Since 2004 | Vice President of all the DFA Entities and Director and Vice President of Dimensional Fund Advisors Canada ULC. |
Robert C. Trotter
Vice President
Age: 53 | Since 2009 | Vice President of all the DFA Entities. Senior Manager, Technology for Dimensional (since March 2007). Formerly, Director of Technology at AMVESCAP (2002-2007). |
Karen E. Umland
Vice President
Age: 45 | Since 1997 | Vice President of all the DFA Entities, DFA Australia Limited, Dimensional Fund Advisors Ltd., and Dimensional Fund Advisors Canada ULC. |
Brian J. Walsh
Vice President
Age: 41 | Since 2009 | Vice President of all the DFA Entities. Portfolio Manager for Dimensional (since 2004). |
Weston J. Wellington
Vice President
Age: 60 | Since 1997 | Vice President of all the DFA Entities. Formerly, Vice President of DFA Australia Limited. |
Ryan J. Wiley
Vice President
Age: 35 | Since 2007 | Vice President of all the DFA Entities. Senior Trader of Dimensional. Formerly, Portfolio Manager (2006 to 2007) and Trader (2001 to 2006) for Dimensional. |
Paul E. Wise
Vice President
Age: 56 | Since 2005 | Vice President of all the DFA Entities. Chief Technology Officer for Dimensional (since 2004). |
John S. Wotowicz
Vice President
Age: 47 | Since 2010 | Vice President of all the DFA Entities. Formerly, Managing Director at Morgan Stanley (1999-2007). |
Joseph L. Young
Vice President
Age: 33 | Since 2011 | Vice President of all the DFA Entities. Regional Director for Dimensional (2005-2010). |
| | 1 | | Each officer holds office for an indefinite term at the pleasure of the Boards of Trustees/Directors and until his or her successor is elected and qualified. |
140
VOTING PROXIES ON FUND PORTFOLIO SECURITIES
A description of the policies and procedures that the Fund and the Trust use in voting proxies relating to securities held in the portfolios is available without charge, upon request, by calling collect: (512) 306-7400. Information regarding how the Advisor votes these proxies is available from the EDGAR database on the SEC’s website at http://www.sec.gov and from the Advisor’s website at http://www.dimensional.com and reflects the twelve-month period beginning July 1st and ending June 30th.
141
NOTICE TO SHAREHOLDERS
(Unaudited)
For shareholders that do not have an October 31, 2011 tax year end, this notice is for informational purposes only. For shareholders with an October 31, 2011 tax year end, please consult your tax advisor as to the pertinence of this notice. For the fiscal year November 1, 2010 to October 31, 2011, the Portfolio is designating the following items with regard to distributions paid during the fiscal year. All designations are based on financial information available as of the date of this annual report and, accordingly are subject to change. For each item, it is the intention of the Portfolio to designate the maximum amount permitted under the Internal Revenue Code and the regulations thereunder.
| | | | | | | | | | Qualifying For | | | | | | | | | | |
| | Net | | | | | | | | Corporate | | | | | | | | | | Qualifying |
| | Investment | | Short-Term | | Long-Term | | | | Dividends | | Qualifying | | Foreign | | Foreign | | Qualifying | | Short-Term |
| DFA Investment | | Income | | Capital Gain | | Capital Gain | | Total | | Received | | Dividend | | Tax | | Source | | Interest | | Capital |
| Dimensions Group Inc. | | | Distributions | | Distributions | | Distributions | | Distributions | | Deduction(1) | | Income(2) | | Credit(3) | | Income(4) | | Income(5) | | Gain(6) |
| International Small Company | | | | | | | | | | | | | | | | | | | | |
| Portfolio | | 97% | | — | | 3% | | 100% | | 100% | | 100% | | 3% | | 93% | | 100% | | 100% |
____________________
| (1) | | Qualifying dividends represent dividends which qualify for the corporate dividends received deduction and is reflected as a percentage of ordinary income distributions (the total of short-term capital gain and net investment income distributions). |
| (2) | | The percentage in this column represents the amount of “Qualifying Dividend Income” as created by the Jobs and Growth Tax Relief Reconciliation Act of 2003 and is reflected as a percentage of ordinary income distributions (the total of short-term capital gain and net investment income distributions). Please note that these percentages are designated only, refer to your 1099 for actual qualified dividend income. |
| (3) | | “Foreign Tax Credit” represents dividends which qualify for the foreign tax credit pass through and is reflected as a percentage of investment company taxable income. |
| (4) | | “Foreign Source Income” represents the portion of dividends derived from foreign sources, and is reflected as a percentage of investment company taxable income. |
| (5) | | The percentage in this column represents the amount of “Qualifying Interest Income” as created by The American Jobs Creation Act of 2004. The information is reflected as a percentage of ordinary income distributions (the total of short-term capital gain and net investment income distributions). |
| (6) | | The percentage in this column represents the amount of “Qualifying Short-Term Capital Gain” as created by The American Jobs Creation Act of 2004. The information is reflected as a percentage of ordinary income distributions (the total of short-term capital gain and net investment income distributions). |
142
(This page has been left blank intentionally.)
(This page has been left blank intentionally.)
(This page has been left blank intentionally.)
|
 |
| | PORTFOLIOS OF INVESTMENTS
SA U.S. FIXED INCOME FUND
SA GLOBAL FIXED INCOME FUND
SA U.S. CORE MARKET FUND
SA U.S. VALUE FUND
SA U.S. SMALL COMPANY FUND
SA INTERNATIONAL VALUE FUND
SA INTERNATIONAL SMALL COMPANY FUND
SA EMERGING MARKETS VALUE FUND
SA REAL ESTATE SECURITIES FUND LWI FINANCIAL INC.
3055 OLIN AVENUE, SUITE 2000 | SAN JOSE, CA 95128
800.366.7266 | SA-FUNDS.COM SA FUNDS ARE SPONSORED BY LWI FINANCIAL INC.
AND DISTRIBUTED BY LORING WARD SECURITIES INC.,
MEMBER FINRA/SIPC |
Item 2. Code of Ethics.
Not applicable.
Item 3. Audit Committee Financial Expert.
Not applicable.
Item 4. Principal Accountant Fees and Services.
Not applicable.
Item 5. Audit Committee of Listed Registrants.
Not applicable to the registrant.
Item 6. Schedule of Investments.
(a)
SA Global Fixed Income Fund
PORTFOLIO OF INVESTMENTS — AS OF DECEMBER 31, 2011 (Unaudited)
| FACE | | | |
| AMOUNT | | VALUE† | |
| BONDS AND NOTES — 97.9% | | | | |
| Australia — 5.8% | | | | | | | |
| | Australia & New Zealand | | | | | | | |
| Banking Group, 4.375%, | | | | | | | |
| 5/24/12 | EUR | | 3,500,000 | | $ | 4,579,148 | |
| National Australia Bank Ltd., | | | | | | | |
| 5.375%, 12/08/14 | GBP | | 1,500,000 | | | 2,517,064 | |
| Suncorp-Metway Ltd., 4.000%, | | | | | | | |
| 1/16/14 | GBP | | 7,000,000 | | | 11,535,305 | |
| | Westpac Banking Corp., 2.900%, | | | | | | | |
| 9/10/14 | USD | | 5,000,000 | | | 5,228,205 | |
| Westpac Banking Corp., 3.000%, | | | | | | | |
| 8/04/15(a) | USD | | 2,000,000 | | | 2,024,916 | |
| Westpac Banking Corp., 3.750%, | |
| 12/01/14 | CAD | | 6,000,000 | | | 5,991,755 | |
| | | | | | 31,876,393 | |
| Austria — 2.0% | | | | | | | |
| Oesterreichische Kontrollbank | | | | | | | |
| AG, 1.750%, 10/05/15(a) | USD | | 3,000,000 | | | 2,987,736 | |
| Oesterreichische Kontrollbank | |
| AG, 2.000%, 6/03/16 | USD | | 8,000,000 | | | 7,982,136 | |
| | | | | | 10,969,872 | |
| Canada — 14.3% | | | | | | | |
| Bank of Nova Scotia, 3.400%, | | | | | | | |
| 1/22/15(a) | USD | | 5,000,000 | | | 5,255,690 | |
| Bank of Nova Scotia, 3.430%, | | | | | | | |
| 7/16/14 | CAD | | 2,000,000 | | | 2,042,739 | |
| Canada Housing Trust No 1, | | | | | | | |
| 2.750%, 12/15/14(b) | CAD | | 14,000,000 | | | 14,366,371 | |
| Province of Alberta Canada, | | | | | | | |
| 2.750%, 12/01/14 | CAD | | 13,800,000 | | | 14,136,889 | |
| Province of Ontario Canada, | | | | | | | |
| 4.100%, 6/16/14(a) | USD | | 9,800,000 | | | 10,536,627 | |
| Province of Ontario Canada, | | | | | | | |
| 5.125%, 11/21/12 | GBP | | 1,200,000 | | | 1,931,292 | |
| Royal Bank of Canada, 2.875%, | | | | | | | |
| 4/19/16(a) | USD | | 4,500,000 | | | 4,669,933 | |
| Royal Bank of Canada, 4.970%, | | | | | | | |
| 6/05/14 | CAD | | 6,000,000 | | | 6,339,121 | |
| Royal Bank of Canada, 5.060%, | | | | | | | |
| 7/17/13 | CAD | | 4,000,000 | | | 4,140,682 | |
| Toronto-Dominion Bank (The), | |
| 2.375%, 10/19/16(a) | USD | | 15,500,000 | | | 15,790,470 | |
| | | | | | 79,209,814 | |
| Finland — 1.5% | | | | | | | |
| Municipality Finance PLC, | | | | | | | |
| 2.375%, 5/16/16 | USD | | 4,000,000 | | | 4,129,592 | |
| Republic of Finland, 2.250%, | |
| 3/17/16 | USD | | 4,000,000 | | | 4,173,956 | |
| | | | | | 8,303,548 | |
| France — 11.3% | | | | | | | |
| Agence Francaise de | | | | | | | |
| Developpement, 4.875%, | | | | | | | |
| 10/30/13 | GBP | | 1,400,000 | | | 2,283,997 | |
| Agence Francaise de | | | | | | | |
| Developpement, 5.125%, | | | | | | | |
| 4/25/12 | EUR | | 7,670,000 | | | 10,061,926 | |
| Caisse d'Amortissement de la | | | | | | | |
| Dette Sociale, 2.250%, | | | | | | | |
| 12/07/15 | GBP | | 2,300,000 | | | 3,486,960 | |
| Caisse d'Amortissement de la | | | | | | | |
| Dette Sociale, 5.250%, | | | | | | | |
| 10/25/12 | EUR | | 7,250,000 | | | 9,694,889 | |
| Reseau Ferre de France, 2.375%, | | | | | | | |
| 12/23/15(a) | GBP | | 8,700,000 | | | 13,556,605 | |
| Societe Financement de | | | | | | | |
| l'Economie Francaise, 2.875%, | | | | | | | |
| 9/22/14 | USD | | 8,500,000 | | | 8,595,455 | |
| Total Capital SA, 5.500%, | | | | | | | |
| 1/29/13 | GBP | | 2,200,000 | | | 3,578,595 | |
| Total Capital SA, 5.625%, | |
| 1/25/12 | AUD | | 10,900,000 | | | 11,155,413 | |
| | | | | | 62,413,840 | |
| Germany — 8.8% | | | | | | | |
| IKB Deutsche Industriebank AG, | | | | | | | |
| 2.125%, 9/10/12 | EUR | | 2,000,000 | | | 2,609,465 | |
| | Kreditanstalt fuer Wiederaufbau, | | | | | | | |
| | 3.125%, 12/08/14 | GBP | | 1,000,000 | | | 1,635,630 | |
| Kreditanstalt fuer Wiederaufbau, | | | | | | | |
| 3.750%, 9/07/16 | GBP | | 2,600,000 | | | 4,395,492 | |
| | Kreditanstalt fuer Wiederaufbau, | | | | | | | |
| | 4.125%, 10/15/14(a) | USD | | 1,000,000 | | | 1,084,380 | |
| Kreditanstalt fuer Wiederaufbau, | | | | | | | |
| 4.625%, 10/12/12 | EUR | | 4,000,000 | | | 5,337,406 | |
| | Kreditanstalt fuer Wiederaufbau, | | | | | | | |
| | 5.500%, 12/07/15 | GBP | | 1,600,000 | | | 2,859,893 | |
| Landeskreditbank Baden- | | | | | | | |
| Wuerttemberg Foerderbank, | | | | | | | |
| 1.000%, 10/15/13 | USD | | 2,400,000 | | | 2,398,385 | |
| | Landeskreditbank Baden- | | | | | | | |
| | Wuerttemberg Foerderbank, | | | | | | | |
| | 2.250%, 7/15/16 | USD | | 13,200,000 | | | 13,389,460 | |
| Landwirtschaftliche Rentenbank, | | | | | | | |
| 2.500%, 2/15/16(a) | USD | | 2,800,000 | | | 2,928,411 | |
| | Landwirtschaftliche Rentenbank, | | | | | | | |
| | 3.125%, 7/15/15 | USD | | 1,000,000 | | | 1,062,028 | |
| Landwirtschaftliche Rentenbank, | | | | | | | |
| 3.875%, 3/14/12 | EUR | | 4,800,000 | | | 6,256,044 | |
| | NRW. Bank, 2.625%, 12/07/12 | GBP | | 3,000,000 | | | 4,715,183 | |
| | | | | | 48,671,777 | |
| Japan — 0.2% | | | | | | | |
| | Development Bank of Japan, | | | | | | | |
| | 4.250%, 6/09/15 | USD | | 1,000,000 | | | 1,097,349 | |
| | | | | | | | |
| Netherlands — 8.7% | | | | | | | |
| | Bank Nederlandse Gemeenten | | | | | | | |
| | NV, 2.625%, 12/10/13 | GBP | | 2,200,000 | | | 3,481,563 | |
| | Bank Nederlandse Gemeenten | | | | | | | |
| | NV, 2.750%, 7/01/15 | USD | | 9,000,000 | | | 9,239,247 | |
| | Bank Nederlandse Gemeenten | | | | | | | |
| | NV, 4.750%, 4/22/13(a) | GBP | | 1,400,000 | | | 2,266,919 | |
| | Nederlandse Waterschapsbank | | | | | | | |
| | NV, 2.000%, 9/09/15 | USD | | 2,400,000 | | | 2,393,347 | |
| | Nederlandse Waterschapsbank | | | | | | | |
| | NV, 2.375%, 6/04/15 | EUR | | 8,100,000 | | | 10,682,530 | |
| | Nederlandse Waterschapsbank | | | | | | | |
| | NV, 3.000%, 3/17/15 | USD | | 1,000,000 | | | 1,030,661 | |
| | NIBC Bank NV, 3.500%, | | | | | | | |
| | 4/07/14 | EUR | | 3,000,000 | | | 4,074,070 | |
| | Rabobank Nederland NV, | |
| | 4.000%, 9/10/15 | GBP | | 9,000,000 | | | 14,638,867 | |
| | | | | | | | 47,807,204 | |
1
SA Global Fixed Income Fund
PORTFOLIO OF INVESTMENTS — AS OF DECEMBER 31, 2011 (Unaudited) (Continued)
| | | FACE | | | | |
| | AMOUNT | | VALUE† | |
| BONDS AND NOTES (Continued) | | | | | | |
| New Zealand — 1.0% | | | | | | | |
| ASB Finance Ltd., 3.250%, | | | | | | | |
| 12/09/13 | GBP | | 3,700,000 | | $ | 5,772,101 | |
| | | | | | | | |
| Norway — 4.9% | | | | | | | |
| Eksportfinans ASA, 2.375%, | | | | | | | |
| 5/25/16(a) | USD | | 11,000,000 | | | 8,918,239 | |
| Eksportfinans ASA, 5.500%, | | | | | | | |
| 5/25/16(a) | USD | | 3,000,000 | | | 2,768,814 | |
| Kommunalbanken AS, 2.250%, | | | | | | | |
| 12/30/13(a) | GBP | | 1,700,000 | | | 2,695,212 | |
| Kommunalbanken AS, 2.375%, | | | | | | | |
| 1/19/16 | USD | | 7,500,000 | | | 7,641,960 | |
| Kommunalbanken AS, 2.875%, | | | | | | | |
| 10/27/14 | USD | | 4,780,000 | | | 4,947,769 | |
| | | | | | 26,971,994 | |
| Supranational — 15.9% | | | | | | | |
| African Development Bank, | | | | | | | |
| 3.000%, 5/27/14 | USD | | 12,000,000 | | | 12,661,692 | |
| Asian Development Bank, | | | | | | | |
| 2.625%, 2/09/15 | USD | | 2,622,000 | | | 2,766,682 | |
| Council of Europe Development | | | | | | | |
| Bank, 5.000%, 1/29/14 | USD | | 1,500,000 | | | 1,621,257 | |
| Council of Europe Development | | | | | | | |
| | Bank, 5.500%, 1/18/12 | AUD | | 2,000,000 | | | 2,045,999 | |
| Eurofima, 4.250%, 2/04/14 | USD | | 7,600,000 | | | 8,007,580 | |
| Eurofima, 6.125%, 10/14/14 | GBP | | 1,000,000 | | | 1,747,083 | |
| European Bank for | | | | | | | |
| Reconstruction & | | | | | | | |
| Development, 0.500%, 1/30/15 | EUR | | 5,634,000 | | | 7,012,392 | |
| European Bank for | | | | | | | |
| Reconstruction and | | | | | | | |
| Development, 5.875%, 8/04/14 | GBP | | 1,000,000 | | | 1,743,027 | |
| European Investment Bank, | | | | | | | |
| 2.750%, 3/23/15 | USD | | 2,000,000 | | | 2,079,096 | |
| European Investment Bank, | | | | | | | |
| 2.875%, 1/15/15 | USD | | 1,300,000 | | | 1,354,241 | |
| European Investment Bank, | | | | | | | |
| 3.000%, 12/07/15 | GBP | | 500,000 | | | 804,334 | |
| European Investment Bank, | | | | | | | |
| 4.500%, 1/14/13 | GBP | | 3,400,000 | | | 5,463,207 | |
| European Investment Bank, | | | | | | | |
| 6.250%, 4/15/14 | GBP | | 2,600,000 | | | 4,446,393 | |
| International Bank for | | | | | | | |
| Reconstruction & | | | | | | | |
| Development, 0.500%, 9/11/12 | AUD | | 9,000,000 | | | 8,970,838 | |
| International Bank for | | | | | | | |
| Reconstruction & | | | | | | | |
| Development, 5.375%, | | | | | | | |
| 1/15/14(a) | GBP | | 700,000 | | | 1,186,963 | |
| International Finance Facility for | | | | | | | |
| Immunisation, 3.375%, | | | | | | | |
| 5/15/14 | GBP | | 8,800,000 | | | 14,428,234 | |
| Nordic Investment Bank, | | | | | | | |
| 2.500%, 7/15/15(a) | USD | | 1,000,000 | | | 1,054,153 | |
| Nordic Investment Bank, | | | | | | | |
| 2.625%, 10/06/14(a) | USD | | 2,000,000 | | | 2,099,996 | |
| Nordic Investment Bank, | | | | | | | |
| 3.000%, 4/08/14(a) | EUR | | 5,000,000 | | | 6,741,356 | |
| Nordic Investment Bank, | | | | | | | |
| 5.750%, 12/16/14 | GBP | | 1,040,000 | | | 1,841,311 | |
| | | | | | 88,075,834 | |
| Sweden — 3.7% | | | | | | | |
| Nordea Bank AB, 3.875%, | | | | | | | |
| 12/15/15 | GBP | | 4,100,000 | | | 6,626,914 | |
| Svensk Exportkredit AB, | | | | | | | |
| 2.125%, 7/13/16 | USD | | 3,000,000 | | | 2,977,170 | |
| Svensk Exportkredit AB, | | | | | | | |
| 3.250%, 9/16/14 | USD | | 10,400,000 | | | 10,751,780 | |
| | | | | | 20,355,864 | |
| United Kingdom — 2.9% | | | | | | | |
| Network Rail Infrastructure | | | | | | | |
| Finance PLC, 4.875%, 3/07/12 | GBP | | 1,000,000 | | | 1,563,231 | |
| United Kingdom Gilt, 2.250%, | | | | | | | |
| 3/07/14 | GBP | | 7,800,000 | | | 12,625,906 | |
| United Kingdom Gilt, 2.750%, | | | | | | | |
| 1/22/15 | GBP | | 1,000,000 | | | 1,660,949 | |
| | | | | | 15,850,086 | |
| United States — 16.9% | | | | | | | |
| Bank of New York Mellon Corp. | | | | | | | |
| (The), 2.300%, 7/28/16 | USD | | 2,285,000 | | | 2,294,563 | |
| Bank of New York Mellon Corp. | | | | | | | |
| (The), 2.500%, 1/15/16 | USD | | 1,500,000 | | | 1,520,567 | |
| Bank of New York Mellon Corp. | | | | | | | |
| (The), 4.300%, 5/15/14(a) | USD | | 3,000,000 | | | 3,220,668 | |
| Bank of New York Mellon Corp. | | | | | | | |
| (The), 5.125%, 8/27/13 | USD | | 4,075,000 | | | 4,337,389 | |
| Berkshire Hathaway, Inc., | | | | | | | |
| 2.200%, 8/15/16(a) | USD | | 15,000,000 | | | 15,457,470 | |
| Federal Home Loan Bank, | | | | | | | |
| 5.500%, 8/13/14 | USD | | 2,300,000 | | | 2,593,823 | |
| Federal National Mortgage | | | | | | | |
| Association, 2.500%, 5/15/14 | USD | | 2,700,000 | | | 2,819,572 | |
| General Electric Capital Corp., | | | | | | | |
| 1.875%, 9/16/13 | USD | | 4,000,000 | | | 4,050,960 | |
| General Electric Capital Corp., | | | | | | | |
| 2.250%, 11/09/15(a) | USD | | 10,520,000 | | | 10,576,734 | |
| Google, Inc., 2.125%, 5/19/16(a) | USD | | 14,454,000 | | | 15,045,356 | |
| Microsoft Corp., 2.950%, | | | | | | | |
| 6/01/14(a) | USD | | 6,500,000 | | | 6,908,811 | |
| Nestle Holdings, Inc., 2.125%, | | | | | | | |
| 3/12/14 | USD | | 6,000,000 | | | 6,197,514 | |
| Toyota Motor Credit Corp., | | | | | | | |
| 1.300%, 3/16/12 | JPY | | 700,000,000 | | | 9,103,656 | |
| Wal-Mart Stores, Inc., 2.250%, | | | | | | | |
| 7/08/15(a) | USD | | 1,000,000 | | | 1,043,974 | |
| Wal-Mart Stores, Inc., 2.800%, | | | | | | | |
| 4/15/16(a) | USD | | 6,000,000 | | | 6,419,316 | |
| Wal-Mart Stores, Inc., 3.200%, | | | | | | | |
| 5/15/14(a) | USD | | 2,000,000 | | | 2,113,400 | |
| | | | | | | 93,703,773 | |
| | TOTAL BONDS AND NOTES | | | | | | | |
| (Identified Cost $534,244,894) | | | | | | 541,079,449 | |
| | |
| | SHARES | | VALUE† | |
| SHORT-TERM INVESTMENTS — 0.6% | | | | | | | |
| United States — 0.6% | | | | | | | |
| SSgA Government Money Market Fund | | 1 | | | 1 | |
| SSgA Money Market Fund | | | 3,542,181 | | | 3,542,181 | |
| | | | | | | 3,542,182 | |
| TOTAL SHORT-TERM INVESTMENTS | | | | | | |
| (Identified Cost $3,542,182) | | | | | | 3,542,182 | |
2
SA Global Fixed Income Fund
PORTFOLIO OF INVESTMENTS — AS OF DECEMBER 31, 2011 (Unaudited) (Continued)
| | SHARES | | VALUE† | |
| COLLATERAL FOR SECURITIES ON LOAN — 15.6% | | | | |
| Short-Term — 15.6% | | | | | | |
| | State Street Navigator Securities | | | | | | |
| Lending Prime Portfolio | | 86,212,378 | | $ | 86,212,378 | |
| TOTAL COLLATERAL FOR SECURITIES ON LOAN | | | | |
| (Identified Cost $86,212,378) | | | | | 86,212,378 | |
| | | | | | | |
| Total Investments — 114.1% | | | | | | |
| (Identified Cost $623,999,454)# | | | | | 630,834,009 | |
| | Liabilities, Less Cash and Other Assets — (14.1%) | | | (77,815,475 | ) |
| Net Assets — 100.0% | | | | $ | 553,018,534 | |
| | † | | See Note 1. |
| (a) | | A portion or all of the security was held on loan. As of December 31, 2011, the market value of the securities on loan was $84,254,544. |
| (b) | | 144A securities. Securities exempt from registration under Rule 144A of the Securities Act of 1933. These securities may be resold in transactions exempt from registration normally to qualified institutional buyers. |
| # | | At December 31, 2011 the aggregate cost of investment securities for U.S. federal income tax purposes was $623,999,454. Net unrealized appreciation aggregated $6,834,555 of which $17,327,580 related to appreciated investment securities and $10,493,025 related to depreciated investment securities. |
Key to abbreviations:
AUD – Australian Dollar
CAD – Canadian Dollar
EUR – Euro Currency
GBP – British Pound
JPY – Japanese Yen
USD – U.S. Dollar
3
SA U.S. Core Market Fund
PORTFOLIO OF INVESTMENTS — AS OF DECEMBER 31, 2011 (Unaudited)
| | | | SHARES | | VALUE† | |
| COMMON STOCKS — 95.6% | | | | | | |
| Aerospace & Defense — 2.3% | | | | | | |
| Alliant Techsystems, Inc. | | 975 | | $ | 55,731 | |
| BE Aerospace, Inc.* | | 2,400 | | | 92,904 | |
| Boeing Co. | | 19,378 | | | 1,421,376 | |
| Cubic Corp. | | 500 | | | 21,795 | |
| Curtiss-Wright Corp. | | 1,576 | | | 55,680 | |
| Esterline Technologies Corp.* | | 900 | | | 50,373 | |
| Exelis, Inc. | | 5,089 | | | 46,056 | |
| General Dynamics Corp. | | 8,801 | | | 584,474 | |
| Goodrich Corp. | | 3,700 | | | 457,690 | |
| | HEICO Corp.(a) | | 375 | | | 21,930 | |
| HEICO Corp., Class A | | 625 | | | 24,594 | |
| Hexcel Corp.* | | 3,100 | | | 75,051 | |
| Honeywell International, Inc. | | 21,056 | | | 1,144,394 | |
| Huntington Ingalls Industries, Inc.(a)* | | 1,357 | | | 42,447 | |
| L-3 Communications Holdings, Inc. | | 3,100 | | | 206,708 | |
| Lockheed Martin Corp. | | 8,160 | | | 660,144 | |
| Moog, Inc., Class A* | | 1,100 | | | 48,323 | |
| Northrop Grumman Corp.(a) | | 7,153 | | | 418,307 | |
| Orbital Sciences Corp.* | | 300 | | | 4,359 | |
| Precision Castparts Corp. | | 4,224 | | | 696,073 | |
| Raytheon Co. | | 10,098 | | | 488,541 | |
| Rockwell Collins, Inc. | | 4,500 | | | 249,165 | |
| Spirit Aerosystems Holdings, Inc.* | | 2,700 | | | 56,106 | |
| Teledyne Technologies, Inc.* | | 900 | | | 49,365 | |
| Textron, Inc. | | 7,600 | | | 140,524 | |
| TransDigm Group, Inc.* | | 1,300 | | | 124,384 | |
| Triumph Group, Inc. | | 1,120 | | | 65,464 | |
| United Technologies Corp. | | 24,568 | | | 1,795,675 | |
| | | | | | 9,097,633 | |
| Air Freight & Logistics — 0.7% | | | | | | |
| | Atlas Air Worldwide Holdings, Inc.* | | 166 | | | 6,379 | |
| CH Robinson Worldwide, Inc. | | 4,700 | | | 327,966 | |
| | Expeditors International of Washington, Inc. | | 6,039 | | | 247,358 | |
| FedEx Corp. | | 8,626 | | | 720,357 | |
| | HUB Group, Inc., Class A* | | 900 | | | 29,187 | |
| United Parcel Service, Inc., Class B | | 19,051 | | | 1,394,343 | |
| | UTi Worldwide, Inc. | | 2,400 | | | 31,896 | |
| | | | | | 2,257,486 | |
| Airlines — 0.1% | | | | | | |
| Alaska Air Group, Inc.* | | 915 | | | 68,707 | |
| | Allegiant Travel Co.(a)* | | 300 | | | 16,002 | |
| Delta Air Lines, Inc.* | | 24,500 | | | 198,205 | |
| | JetBlue Airways Corp.(a)* | | 7,550 | | | 39,260 | |
| Southwest Airlines Co. | | 5,800 | | | 49,648 | |
| | United Continental Holdings, Inc.(a)* | | 2,554 | | | 48,194 | |
| | | | | | 420,016 | |
| Auto Components — 0.4% | | | | | | |
| Autoliv, Inc.(a) | | 2,300 | | | 123,027 | |
| | BorgWarner, Inc.* | | 3,154 | | | 201,036 | |
| Cooper Tire & Rubber Co.(a) | | 100 | | | 1,401 | |
| | Dana Holding Corp.* | | 4,000 | | | 48,600 | |
| Federal Mogul Corp.* | | 700 | | | 10,325 | |
| | Gentex Corp.(a) | | 3,900 | | | 115,401 | |
| Goodyear Tire & Rubber Co. (The)* | | 6,400 | | | 90,688 | |
| | Johnson Controls, Inc. | | 19,500 | | | 609,570 | |
| Lear Corp. | | 3,000 | | | 119,400 | |
| | Tenneco, Inc.(a)* | | 1,600 | | | 47,648 | |
| TRW Automotive Holdings Corp.* | | 3,074 | | | 100,212 | |
| | Visteon Corp.* | | 1,000 | | | 49,940 | |
| | | | | | 1,517,248 | |
| Automobiles — 0.5% | | | | | | |
| Ford Motor Co.* | | 99,140 | | | 1,066,746 | |
| | General Motors Co.* | | 22,000 | | | 445,940 | |
| Harley-Davidson, Inc. | | 6,900 | | | 268,203 | |
| | Tesla Motors, Inc.(a)* | | 1,485 | | | 42,412 | |
| Thor Industries, Inc.(a) | | 1,600 | | | 43,888 | |
| | | | | | | 1,867,189 | |
| Beverages — 2.2% | | | | | | |
| | Beam, Inc. | | 4,200 | | | 215,166 | |
| Boston Beer Co., Inc., Class A(a)* | | 300 | | | 32,568 | |
| | Brown-Forman Corp., Class B | | 2,400 | | | 193,224 | |
| Coca-Cola Co. | | 60,070 | | | 4,203,098 | |
| | Coca-Cola Enterprises, Inc. | | 9,100 | | | 234,598 | |
| Constellation Brands, Inc., Class A* | | 5,600 | | | 115,752 | |
| | Dr Pepper Snapple Group, Inc. | | 6,100 | | | 240,828 | |
| Hansen Natural Corp.* | | 2,200 | | | 202,708 | |
| | Molson Coors Brewing Co., Class B | | 4,396 | | | 191,402 | |
| PepsiCo, Inc. | | 44,450 | | | 2,949,257 | |
| | | | | | | 8,578,601 | |
| Biotechnology — 1.5% | | | | | | |
| | Alexion Pharmaceuticals, Inc.* | | 5,600 | | | 400,400 | |
| Alkermes PLC(a)* | | 3,279 | | | 56,923 | |
| | Amgen, Inc. | | 25,422 | | | 1,632,347 | |
| Biogen Idec, Inc.* | | 6,970 | | | 767,048 | |
| | BioMarin Pharmaceutical, Inc.* | | 3,200 | | | 110,016 | |
| Celgene Corp.* | | 13,025 | | | 880,490 | |
| | Cepheid, Inc.(a)* | | 1,400 | | | 48,174 | |
| Cubist Pharmaceuticals, Inc.(a)* | | 2,100 | | | 83,202 | |
| | Gilead Sciences, Inc.* | | 22,263 | | | 911,225 | |
| Incyte Corp. Ltd.(a)* | | 2,761 | | | 41,443 | |
| | InterMune, Inc.(a)* | | 1,500 | | | 18,900 | |
| Myriad Genetics, Inc.* | | 2,380 | | | 49,837 | |
| | Onyx Pharmaceuticals, Inc.* | | 1,900 | | | 83,505 | |
| Pharmasset, Inc.* | | 2,200 | | | 282,040 | |
| | Regeneron Pharmaceuticals, Inc.(a)* | | 2,300 | | | 127,489 | |
| Seattle Genetics, Inc.(a)* | | 2,487 | | | 41,570 | |
| | Theravance, Inc.(a)* | | 964 | | | 21,304 | |
| United Therapeutics Corp.* | | 1,600 | | | 75,600 | |
| | Vertex Pharmaceuticals, Inc.* | | 5,750 | | | 190,958 | |
| | | | | | 5,822,471 | |
| Building Products — 0.1% | | | | | | |
| A.O. Smith Corp. | | 1,050 | | | 42,126 | |
| Armstrong World Industries, Inc.(a)* | | 770 | | | 33,780 | |
| Fortune Brands Home & Security, Inc.(a)* | | 4,200 | | | 71,526 | |
| Lennox International, Inc.(a) | | 1,492 | | | 50,355 | |
| Masco Corp. | | 9,000 | | | 94,320 | |
| Owens Corning* | | 2,988 | | | 85,815 | |
| Simpson Manufacturing Co., Inc.(a) | | 1,400 | | | 47,124 | |
| USG Corp.(a)* | | 1,500 | | | 15,240 | |
| | | | | | 440,286 | |
| Capital Markets — 1.7% | | | | | | |
| Affiliated Managers Group, Inc.* | | 1,500 | | | 143,925 | |
| American Capital Ltd.* | | 8,700 | | | 58,551 | |
| Ameriprise Financial, Inc. | | 6,947 | | | 344,849 | |
| Bank of New York Mellon Corp. (The) | | 34,683 | | | 690,538 | |
| BGC Partners, Inc., Class A(a) | | 2,300 | | | 13,662 | |
| BlackRock, Inc. | | 2,800 | | | 499,072 | |
| Charles Schwab Corp. | | 28,835 | | | 324,682 | |
| Cohen & Steers, Inc.(a) | | 764 | | | 22,080 | |
| E*Trade Financial Corp.* | | 5,800 | | | 46,168 | |
| Eaton Vance Corp.(a) | | 3,600 | | | 85,104 | |
| Evercore Partners, Inc., Class A | | 700 | | | 18,634 | |
| Federated Investors, Inc., Class B(a) | | 2,300 | | | 34,845 | |
| Franklin Resources, Inc. | | 4,400 | | | 422,664 | |
4
SA U.S. Core Market Fund
PORTFOLIO OF INVESTMENTS — AS OF DECEMBER 31, 2011 (Unaudited) (Continued)
| | | | SHARES | | VALUE† | |
| COMMON STOCKS (Continued) | | | | | | |
| Capital Markets (Continued) | | | | | | |
| | Goldman Sachs Group, Inc. (The) | | 13,564 | | $ | 1,226,592 | |
| Greenhill & Co., Inc.(a) | | 600 | | | 21,822 | |
| | Invesco Ltd. | | 12,100 | | | 243,089 | |
| Janus Capital Group, Inc.(a) | | 4,300 | | | 27,133 | |
| | Jefferies Group, Inc. | | 3,600 | | | 49,500 | |
| Knight Capital Group, Inc., Class A(a)* | | 3,100 | | | 36,642 | |
| | Legg Mason, Inc. | | 4,200 | | | 101,010 | |
| Morgan Stanley | | 40,167 | | | 607,727 | |
| | Northern Trust Corp. | | 6,380 | | | 253,031 | |
| Raymond James Financial, Inc. | | 3,300 | | | 102,168 | |
| | SEI Investments Co. | | 3,800 | | | 65,930 | |
| State Street Corp. | | 14,140 | | | 569,983 | |
| | Stifel Financial Corp.* | | 1,200 | | | 38,460 | |
| T Rowe Price Group, Inc. | | 7,061 | | | 402,124 | |
| | TD Ameritrade Holding Corp. | | 6,478 | | | 101,381 | |
| Waddell & Reed Financial, Inc., Class A | | 2,117 | | | 52,438 | |
| | | | | | | 6,603,804 | |
| Chemicals — 2.3% | | | | | | |
| | A. Schulman, Inc.(a) | | 200 | | | 4,236 | |
| Air Products & Chemicals, Inc. | | 6,179 | | | 526,389 | |
| | Airgas, Inc. | | 2,200 | | | 171,776 | |
| Albemarle Corp. | | 2,581 | | | 132,947 | |
| | Ashland, Inc. | | 2,082 | | | 119,007 | |
| Balchem Corp.(a) | | 700 | | | 28,378 | |
| | Cabot Corp. | | 1,800 | | | 57,852 | |
| Celanese Corp., Series A | | 4,400 | | | 194,788 | |
| | CF Industries Holdings, Inc. | | 2,124 | | | 307,938 | |
| Chemtura Corp.* | | 650 | | | 7,371 | |
| | Cytec Industries, Inc. | | 1,600 | | | 71,440 | |
| Dow Chemical Co. (The) | | 33,613 | | | 966,710 | |
| | Eastman Chemical Co. | | 3,800 | | | 148,428 | |
| Ecolab, Inc. | | 8,699 | | | 502,889 | |
| | EI Du Pont de Nemours & Co. | | 26,334 | | | 1,205,570 | |
| FMC Corp. | | 2,100 | | | 180,684 | |
| | Georgia Gulf Corp.(a)* | | 100 | | | 1,949 | |
| H.B. Fuller Co. | | 1,500 | | | 34,665 | |
| Huntsman Corp. | | 5,900 | | | 59,000 | |
| Innophos Holdings, Inc. | | 600 | | | 29,136 | |
| International Flavors & Fragrances, Inc. | | 2,400 | | | 125,808 | |
| Intrepid Potash, Inc.(a)* | | 1,600 | | | 36,208 | |
| Kronos Worldwide, Inc.(a) | | 621 | | | 11,203 | |
| Minerals Technologies, Inc.(a) | | 600 | | | 33,918 | |
| Monsanto Co. | | 14,808 | | | 1,037,597 | |
| Mosaic Co. (The) | | 7,100 | | | 358,053 | |
| NewMarket Corp.(a) | | 400 | | | 79,244 | |
| Olin Corp.(a) | | 2,100 | | | 41,265 | |
| PolyOne Corp. | | 1,400 | | | 16,170 | |
| PPG Industries, Inc. | | 4,500 | | | 375,705 | |
| Praxair, Inc. | | 8,552 | | | 914,209 | |
| Rockwood Holdings, Inc.* | | 2,100 | | | 82,677 | |
| RPM International, Inc. | | 3,500 | | | 85,925 | |
| Scotts Miracle-Gro Co. (The), Class A(a) | | 1,300 | | | 60,697 | |
| Sensient Technologies Corp.(a) | | 1,400 | | | 53,060 | |
| Sherwin Williams Co. (The) | | 2,500 | | | 223,175 | |
| Sigma-Aldrich Corp. | | 3,500 | | | 218,610 | |
| Solutia, Inc.* | | 2,800 | | | 48,384 | |
| Valspar Corp.(a) | | 2,600 | | | 101,322 | |
| W.R. Grace & Co.* | | 2,044 | | | 93,860 | |
| Westlake Chemical Corp.(a) | | 1,436 | | | 57,785 | |
| | | | | | 8,806,028 | |
| Commercial Banks — 2.6% | | | | | | |
| Associated Banc-Corp. | | 4,819 | | | 53,828 | |
| Bank of Hawaii Corp.(a) | | 1,200 | | | 53,388 | |
| BB&T Corp. | | 20,011 | | | 503,677 | |
| BOK Financial Corp.(a) | | 696 | | | 38,231 | |
| CapitalSource, Inc. | | 8,300 | | | 55,610 | |
| Cathay General Bancorp(a) | | 1,300 | | | 19,409 | |
| Chemical Financial Corp.(a) | | 158 | | | 3,369 | |
| CIT Group, Inc.* | | 4,915 | | | 171,386 | |
| City National Corp.(a) | | 1,300 | | | 57,434 | |
| Comerica, Inc. | | 5,200 | | | 134,160 | |
| Commerce Bancshares, Inc. | | 2,399 | | | 91,450 | |
| Cullen/Frost Bankers, Inc.(a) | | 1,600 | | | 84,656 | |
| East West Bancorp, Inc. | | 3,900 | | | 77,025 | |
| Fifth Third Bancorp | | 26,307 | | | 334,625 | |
| First Financial Bankshares, Inc.(a) | | 900 | | | 30,087 | |
| First Horizon National Corp. | | 7,245 | | | 57,960 | |
| First Niagara Financial Group, Inc. | | 9,560 | | | 82,503 | |
| FirstMerit Corp.(a) | | 3,043 | | | 46,041 | |
| FNB Corp.(a) | | 1,851 | | | 20,935 | |
| Fulton Financial Corp. | | 6,667 | | | 65,403 | |
| Glacier Bancorp, Inc.(a) | | 275 | | | 3,308 | |
| Hancock Holding Co.(a) | | 2,100 | | | 67,137 | |
| Huntington Bancshares, Inc. | | 22,492 | | | 123,481 | |
| Iberiabank Corp.(a) | | 700 | | | 34,510 | |
| International Bancshares Corp.(a) | | 1,350 | | | 24,752 | |
| Investors Bancorp, Inc.(a)* | | 2,100 | | | 28,308 | |
| KeyCorp | | 24,200 | | | 186,098 | |
| M&T Bank Corp. | | 3,168 | | | 241,845 | |
| National Penn Bancshares, Inc.(a) | | 2,100 | | | 17,724 | |
| Old National Bancorp(a) | | 1,900 | | | 22,135 | |
| Pacific Capital Bancorp(a)* | | 400 | | | 11,296 | |
| PNC Financial Services Group, Inc. | | 15,405 | | | 888,406 | |
| Popular, Inc.* | | 14,572 | | | 20,255 | |
| PrivateBancorp, Inc.(a) | | 300 | | | 3,294 | |
| Prosperity Bancshares, Inc.(a) | | 1,500 | | | 60,525 | |
| Regions Financial Corp. | | 31,928 | | | 137,291 | |
| Signature Bank(a)* | | 1,400 | | | 83,986 | |
| SunTrust Banks, Inc. | | 15,536 | | | 274,987 | |
| SVB Financial Group(a)* | | 1,200 | | | 57,228 | |
| Synovus Financial Corp.(a) | | 1,700 | | | 2,397 | |
| TCF Financial Corp.(a) | | 4,000 | | | 41,280 | |
| Texas Capital Bancshares, Inc.* | | 727 | | | 22,254 | |
| Trustmark Corp.(a) | | 1,900 | | | 46,151 | |
| UMB Financial Corp.(a) | | 1,100 | | | 40,975 | |
| Umpqua Holdings Corp.(a) | | 3,100 | | | 38,409 | |
| United Bankshares, Inc.(a) | | 1,500 | | | 42,405 | |
| US Bancorp | | 55,247 | | | 1,494,431 | |
| Valley National Bancorp(a) | | 4,227 | | | 52,288 | |
| Webster Financial Corp. | | 1,710 | | | 34,867 | |
| Wells Fargo & Co. | | 144,516 | | | 3,982,861 | |
| WesBanco, Inc.(a) | | 100 | | | 1,947 | |
| Westamerica Bancorporation(a) | | 1,000 | | | 43,900 | |
| Wintrust Financial Corp.(a) | | 800 | | | 22,440 | |
| Zions Bancorporation(a) | | 4,860 | | | 79,121 | |
| | | | | | 10,213,469 | |
| Commercial Services & Supplies — 0.6% | | | | | | |
| ABM Industries, Inc.(a) | | 1,800 | | | 37,116 | |
| Avery Dennison Corp. | | 2,900 | | | 83,172 | |
| Brink's Co. (The) | | 1,200 | | | 32,256 | |
| Cintas Corp. | | 4,280 | | | 148,987 | |
| Clean Harbors, Inc.* | | 1,200 | | | 76,476 | |
| Copart, Inc.* | | 1,850 | | | 88,596 | |
| Corrections Corp. of America* | | 3,000 | | | 61,110 | |
| Covanta Holding Corp. | | 4,090 | | | 55,992 | |
| Deluxe Corp.(a) | | 1,100 | | | 25,036 | |
| EnergySolutions, Inc.(a)* | | 500 | | | 1,545 | |
5
SA U.S. Core Market Fund
PORTFOLIO OF INVESTMENTS — AS OF DECEMBER 31, 2011 (Unaudited) (Continued)
| | | | SHARES | | VALUE† | |
| COMMON STOCKS (Continued) | | | | | | |
| Commercial Services & Supplies (Continued) | | | | | | |
| Geo Group, Inc. (The)(a)* | | 1,700 | | $ | 28,475 | |
| Healthcare Services Group, Inc.(a) | | 1,795 | | | 31,754 | |
| Herman Miller, Inc.(a) | | 1,600 | | | 29,520 | |
| HNI Corp.(a) | | 500 | | | 13,050 | |
| Iron Mountain, Inc. | | 5,475 | | | 168,630 | |
| KAR Auction Services, Inc.* | | 617 | | | 8,330 | |
| Knoll, Inc.(a) | | 600 | | | 8,910 | |
| Mine Safety Appliances Co.(a) | | 1,100 | | | 36,432 | |
| NL Industries, Inc.(a) | | 320 | | | 4,150 | |
| Pitney Bowes, Inc.(a) | | 5,600 | | | 103,824 | |
| Portfolio Recovery Associates, Inc.(a)* | | 500 | | | 33,760 | |
| R.R. Donnelley & Sons Co.(a) | | 5,200 | | | 75,036 | |
| Republic Services, Inc. | | 8,585 | | | 236,517 | |
| Rollins, Inc.(a) | | 2,005 | | | 44,551 | |
| Steelcase, Inc., Class A | | 2,200 | | | 16,412 | |
| Stericycle, Inc.* | | 2,400 | | | 187,008 | |
| Tetra Tech, Inc.* | | 1,800 | | | 38,862 | |
| UniFirst Corp.(a) | | 477 | | | 27,065 | |
| United Stationers, Inc.(a) | | 1,000 | | | 32,560 | |
| Waste Connections, Inc.(a) | | 3,237 | | | 107,274 | |
| Waste Management, Inc.(a) | | 12,578 | | | 411,426 | |
| | | | | | 2,253,832 | |
| Communications Equipment — 2.0% | | | | | | |
| Acme Packet, Inc.(a)* | | 1,700 | | | 52,547 | |
| Adtran, Inc. | | 1,700 | | | 51,272 | |
| Arris Group, Inc.* | | 3,550 | | | 38,411 | |
| Aruba Networks, Inc.(a)* | | 2,700 | | | 50,004 | |
| Brocade Communications Systems, Inc.* | | 10,225 | | | 53,068 | |
| Cisco Systems, Inc. | | 156,421 | | | 2,828,092 | |
| EchoStar Corp., Class A* | | 1,380 | | | 28,897 | |
| F5 Networks, Inc.* | | 2,400 | | | 254,688 | |
| Finisar Corp.(a)* | | 1,900 | | | 31,816 | |
| Harmonic, Inc.(a)* | | 700 | | | 3,528 | |
| Harris Corp. | | 3,700 | | | 133,348 | |
| InterDigital, Inc.(a) | | 1,369 | | | 59,647 | |
| JDS Uniphase Corp.* | | 5,800 | | | 60,552 | |
| Juniper Networks, Inc.* | | 15,256 | | | 311,375 | |
| Loral Space & Communications, Inc.* | | 365 | | | 23,681 | |
| Motorola Mobility Holdings, Inc.* | | 8,283 | | | 321,380 | |
| Motorola Solutions, Inc. | | 9,179 | | | 424,896 | |
| Netgear, Inc.* | | 1,000 | | | 33,570 | |
| Plantronics, Inc.(a) | | 1,300 | | | 46,332 | |
| Polycom, Inc.* | | 4,800 | | | 78,240 | |
| QUALCOMM, Inc. | | 47,120 | | | 2,577,464 | |
| Riverbed Technology, Inc.* | | 4,100 | | | 96,350 | |
| Tellabs, Inc. | | 10,354 | | | 41,830 | |
| Viasat, Inc.(a)* | | 1,100 | | | 50,732 | |
| | | | | | 7,651,720 | |
| Computers & Peripherals — 4.0% | | | | | | |
| Apple, Inc.* | | 26,957 | | | 10,917,585 | |
| Dell, Inc.* | | 47,617 | | | 696,637 | |
| Diebold, Inc.(a) | | 2,100 | | | 63,147 | |
| Electronics for Imaging, Inc.* | | 100 | | | 1,425 | |
| EMC Corp.* | | 58,633 | | | 1,262,955 | |
| Hewlett-Packard Co. | | 56,450 | | | 1,454,152 | |
| Lexmark International, Inc., Class A | | 1,900 | | | 62,833 | |
| NCR Corp.* | | 4,400 | | | 72,424 | |
| NetApp, Inc.* | | 10,300 | | | 373,581 | |
| QLogic Corp.* | | 3,300 | | | 49,500 | |
| SanDisk Corp.* | | 6,600 | | | 324,786 | |
| Seagate Technology | | 11,900 | | | 195,160 | |
| Western Digital Corp.* | | 6,300 | | | 194,985 | |
| | | | | | 15,669,170 | |
| Construction & Engineering — 0.2% | | | | | | |
| Aecom Technology Corp.* | | 2,900 | | | 59,653 | |
| EMCOR Group, Inc.(a) | | 1,400 | | | 37,534 | |
| Fluor Corp. | | 5,100 | | | 256,275 | |
| Jacobs Engineering Group, Inc.* | | 3,693 | | | 149,862 | |
| KBR, Inc. | | 4,676 | | | 130,320 | |
| MasTec, Inc.(a)* | | 2,200 | | | 38,214 | |
| Quanta Services, Inc.* | | 5,834 | | | 125,664 | |
| Shaw Group, Inc. (The)* | | 2,400 | | | 64,560 | |
| URS Corp.* | | 2,200 | | | 77,264 | |
| | | | | | 939,346 | |
| Construction Materials — 0.1% | | | | | | |
| Martin Marietta Materials, Inc.(a) | | 1,200 | | | 90,492 | |
| Vulcan Materials Co.(a) | | 3,291 | | | 129,501 | |
| | | | | | 219,993 | |
| Consumer Finance — 0.7% | | | | | | |
| American Express Co. | | 31,096 | | | 1,466,799 | |
| Capital One Financial Corp. | | 13,241 | | | 559,962 | |
| Cash America International, Inc.(a) | | 700 | | | 32,641 | |
| Credit Acceptance Corp.(a)* | | 400 | | | 32,912 | |
| DFC Global Corp.* | | 800 | | | 14,448 | |
| Discover Financial Services | | 15,500 | | | 372,000 | |
| Ezcorp, Inc., Class A* | | 1,600 | | | 42,192 | |
| First Cash Financial Services, Inc.(a)* | | 547 | | | 19,194 | |
| Green Dot Corp., Class A* | | 600 | | | 18,732 | |
| Nelnet, Inc., Class A | | 600 | | | 14,682 | |
| SLM Corp. | | 14,653 | | | 196,350 | |
| World Acceptance Corp.* | | 200 | | | 14,700 | |
| | | | | | 2,784,612 | |
| Containers & Packaging — 0.3% | | | | | | |
| Aptargroup, Inc. | | 2,100 | | | 109,557 | |
| Ball Corp. | | 4,600 | | | 164,266 | |
| Bemis Co., Inc. | | 3,200 | | | 96,256 | |
| Crown Holdings, Inc.* | | 4,100 | | | 137,678 | |
| Graphic Packaging Holding Co.(a)* | | 5,578 | | | 23,762 | |
| Greif, Inc., Class A | | 600 | | | 27,330 | |
| Owens-Illinois, Inc.* | | 5,000 | | | 96,900 | |
| Packaging Corp. of America | | 2,800 | | | 70,672 | |
| Rock-Tenn Co., Class A | | 1,689 | | | 97,456 | |
| Sealed Air Corp. | | 3,900 | | | 67,119 | |
| Silgan Holdings, Inc. | | 1,277 | | | 49,343 | |
| Sonoco Products Co. | | 2,400 | | | 79,104 | |
| Temple-Inland, Inc. | | 3,200 | | | 101,472 | |
| | | | | | 1,120,915 | |
| Distributors — 0.1% | | | | | | |
| Genuine Parts Co. | | 4,405 | | | 269,586 | |
| LKQ Corp.* | | 3,900 | | | 117,312 | |
| Pool Corp. | | 1,200 | | | 36,120 | |
| | | | | | 423,018 | |
| Diversified Consumer Services — 0.2% | | | | | | |
| Apollo Group, Inc., Class A* | | 3,850 | | | 207,400 | |
| Bridgepoint Education, Inc.(a)* | | 1,500 | | | 34,500 | |
| Coinstar, Inc.(a)* | | 1,000 | | | 45,640 | |
| DeVry, Inc. | | 1,900 | | | 73,074 | |
| H&R Block, Inc.(a) | | 8,200 | | | 133,906 | |
| Hillenbrand, Inc.(a) | | 1,500 | | | 33,480 | |
| ITT Educational Services, Inc.(a)* | | 500 | | | 28,445 | |
| K12, Inc.* | | 582 | | | 10,441 | |
| Matthews International Corp., Class A(a) | | 700 | | | 22,001 | |
| Service Corp. International | | 7,500 | | | 79,875 | |
6
SA U.S. Core Market Fund
PORTFOLIO OF INVESTMENTS — AS OF DECEMBER 31, 2011 (Unaudited) (Continued)
| | | | SHARES | | VALUE† | |
| COMMON STOCKS (Continued) | | | | | | |
| Diversified Consumer Services (Continued) | | | | | | |
| Sotheby's, Class A(a) | | 1,900 | | $ | 54,207 | |
| Strayer Education, Inc.(a) | | 400 | | | 38,876 | |
| Weight Watchers International, Inc.(a) | | 1,737 | | | 95,552 | |
| | | | | | 857,397 | |
| Diversified Financial Services — 2.3% | | | | | | |
| Bank of America Corp. | | 284,250 | | | 1,580,430 | |
| CBOE Holdings, Inc. | | 2,300 | | | 59,478 | |
| Citigroup, Inc. | | 81,861 | | | 2,153,763 | |
| CME Group, Inc. | | 1,862 | | | 453,713 | |
| IntercontinentalExchange, Inc.* | | 2,100 | | | 253,155 | |
| JPMorgan Chase & Co. | | 114,465 | | | 3,805,961 | |
| Leucadia National Corp. | | 6,400 | | | 145,536 | |
| MarketAxess Holdings, Inc. | | 800 | | | 24,088 | |
| Moody's Corp.(a) | | 6,000 | | | 202,080 | |
| MSCI, Inc., Class A* | | 3,162 | | | 104,125 | |
| NASDAQ OMX Group, Inc. (The)* | | 3,400 | | | 83,334 | |
| NYSE Euronext | | 6,700 | | | 174,870 | |
| PHH Corp.(a)* | | 1,567 | | | 16,767 | |
| | | | | | 9,057,300 | |
| Diversified Telecommunication Services — 2.4% | | | | | | |
| AboveNet, Inc.* | | 700 | | | 45,507 | |
| AT&T, Inc. | | 165,743 | | | 5,012,068 | |
| CenturyLink, Inc. | | 18,113 | | | 673,804 | |
| Frontier Communications Corp.(a) | | 27,599 | | | 142,135 | |
| Level 3 Communications, Inc.(a)* | | 3,188 | | | 54,164 | |
| tw telecom, Inc.(a)* | | 4,600 | | | 89,148 | |
| Verizon Communications, Inc. | | 82,614 | | | 3,314,474 | |
| Windstream Corp.(a) | | 14,226 | | | 167,013 | |
| | | | | | 9,498,313 | |
| Electric Utilities — 2.0% | | | | | | |
| Allete, Inc.(a) | | 1,000 | | | 41,980 | |
| American Electric Power Co., Inc. | | 14,000 | | | 578,340 | |
| Cleco Corp.(a) | | 1,800 | | | 68,580 | |
| Duke Energy Corp. | | 39,056 | | | 859,232 | |
| Edison International | | 8,996 | | | 372,434 | |
| El Paso Electric Co. | | 1,200 | | | 41,568 | |
| Entergy Corp. | | 5,200 | | | 379,860 | |
| Exelon Corp. | | 19,209 | | | 833,094 | |
| FirstEnergy Corp. | | 12,001 | | | 531,644 | |
| Great Plains Energy, Inc.(a) | | 3,484 | | | 75,882 | |
| Hawaiian Electric Industries, Inc.(a) | | 2,800 | | | 74,144 | |
| IDACORP, Inc. | | 1,400 | | | 59,374 | |
| ITC Holdings Corp. | | 1,518 | | | 115,186 | |
| MGE Energy, Inc. | | 700 | | | 32,739 | |
| NextEra Energy, Inc. | | 11,200 | | | 681,856 | |
| Northeast Utilities | | 4,900 | | | 176,743 | |
| NV Energy, Inc. | | 7,100 | | | 116,085 | |
| Pepco Holdings, Inc. | | 6,200 | | | 125,860 | |
| Pinnacle West Capital Corp. | | 3,200 | | | 154,176 | |
| PNM Resources, Inc.(a) | | 2,100 | | | 38,283 | |
| Portland General Electric Co. | | 2,100 | | | 53,109 | |
| PPL Corp. | | 16,700 | | | 491,314 | |
| Progress Energy, Inc. | | 8,200 | | | 459,364 | |
| Southern Co. | | 24,958 | | | 1,155,306 | |
| UIL Holdings Corp.(a) | | 1,433 | | | 50,685 | |
| Unisource Energy Corp. | | 1,100 | | | 40,612 | |
| Westar Energy, Inc. | | 3,000 | | | 86,340 | |
| | | | | | 7,693,790 | |
| Electrical Equipment — 0.7% | | | | | | |
| Acuity Brands, Inc.(a) | | 1,000 | | | 53,000 | |
| AMETEK, Inc. | | 4,575 | | | 192,608 | |
| Babcock & Wilcox Co.* | | 2,750 | | | 66,385 | |
| Belden, Inc. | | 1,500 | | | 49,920 | |
| Brady Corp., Class A(a) | | 1,600 | | | 50,512 | |
| Cooper Industries PLC | | 4,600 | | | 249,090 | |
| Emerson Electric Co. | | 21,495 | | | 1,001,452 | |
| EnerSys(a)* | | 1,800 | | | 46,746 | |
| Franklin Electric Co., Inc.(a) | | 600 | | | 26,136 | |
| Generac Holdings, Inc.(a)* | | 1,500 | | | 42,045 | |
| General Cable Corp.(a)* | | 1,400 | | | 35,014 | |
| GrafTech International Ltd.* | | 3,700 | | | 50,505 | |
| Hubbell, Inc., Class B | | 1,505 | | | 100,624 | |
| II-VI, Inc.* | | 1,100 | | | 20,196 | |
| Polypore International, Inc.(a)* | | 1,200 | | | 52,788 | |
| Regal-Beloit Corp.(a) | | 1,100 | | | 56,067 | |
| Rockwell Automation, Inc. | | 4,144 | | | 304,045 | |
| Roper Industries, Inc. | | 2,800 | | | 243,236 | |
| Thomas & Betts Corp.* | | 1,300 | | | 70,980 | |
| | | | | | 2,711,349 | |
| Electronic Equipment, Instruments & Components — 0.6% | | | | |
| Amphenol Corp., Class A | | 4,803 | | | 218,008 | |
| Anixter International, Inc.* | | 800 | | | 47,712 | |
| Arrow Electronics, Inc.* | | 3,600 | | | 134,676 | |
| Avnet, Inc.* | | 4,722 | | | 146,807 | |
| AVX Corp. | | 1,314 | | | 16,767 | |
| Cognex Corp. | | 1,000 | | | 35,790 | |
| Coherent, Inc.(a)* | | 700 | | | 36,589 | |
| Corning, Inc. | | 44,844 | | | 582,075 | |
| Daktronics, Inc. | | 100 | | | 957 | |
| Dolby Laboratories, Inc.* | | 1,500 | | | 45,765 | |
| FEI Co.(a)* | | 800 | | | 32,624 | |
| FLIR Systems, Inc. | | 4,400 | | | 110,308 | |
| Ingram Micro, Inc., Class A* | | 4,200 | | | 76,398 | |
| IPG Photonics Corp.* | | 700 | | | 23,709 | |
| Itron, Inc.(a)* | | 1,000 | | | 35,770 | |
| Jabil Circuit, Inc. | | 5,800 | | | 114,028 | |
| Littelfuse, Inc.(a) | | 500 | | | 21,490 | |
| Molex, Inc. | | 2,000 | | | 39,560 | |
| Molex, Inc., Class A(a) | | 1,500 | | | 35,790 | |
| National Instruments Corp. | | 2,775 | | | 72,011 | |
| Plexus Corp.(a)* | | 800 | | | 21,904 | |
| Rofin-Sinar Technologies, Inc.(a)* | | 40 | | | 914 | |
| SYNNEX Corp.(a)* | | 312 | | | 9,503 | |
| Tech Data Corp.* | | 1,300 | | | 64,233 | |
| Trimble Navigation Ltd.* | | 3,514 | | | 152,508 | |
| Universal Display Corp.(a)* | | 604 | | | 22,161 | |
| Vishay Intertechnology, Inc.(a)* | | 4,830 | | | 43,422 | |
| | | | | | 2,141,479 | |
| Energy Equipment & Services — 2.1% | | | | | | |
| Atwood Oceanics, Inc.(a)* | | 1,800 | | | 71,622 | |
| Baker Hughes, Inc. | | 12,656 | | | 615,588 | |
| Bristow Group, Inc. | | 900 | | | 42,651 | |
| Cameron International Corp.* | | 7,199 | | | 354,119 | |
| CARBO Ceramics, Inc.(a) | | 600 | | | 73,998 | |
| Complete Production Services, Inc.* | | 2,400 | | | 80,544 | |
| Core Laboratories NV | | 211 | | | 24,043 | |
| Diamond Offshore Drilling, Inc. | | 2,000 | | | 110,520 | |
| Dresser-Rand Group, Inc.* | | 2,300 | | | 114,793 | |
| Dril-Quip, Inc.* | | 900 | | | 59,238 | |
| FMC Technologies, Inc.* | | 7,000 | | | 365,610 | |
| Gulfmark Offshore, Inc., Class A* | | 300 | | | 12,603 | |
| Halliburton Co. | | 26,240 | | | 905,542 | |
| Helix Energy Solutions Group, Inc.* | | 2,601 | | | 41,096 | |
| Helmerich & Payne, Inc. | | 3,200 | | | 186,752 | |
| Hornbeck Offshore Services, Inc.* | | 633 | | | 19,636 | |
7
SA U.S. Core Market Fund
PORTFOLIO OF INVESTMENTS — AS OF DECEMBER 31, 2011 (Unaudited) (Continued)
| | | | SHARES | | VALUE† | |
| COMMON STOCKS (Continued) | | | | | | |
| Energy Equipment & Services (Continued) | | | | | | |
| Key Energy Services, Inc.* | | 3,534 | | $ | 54,671 | |
| Lufkin Industries, Inc.(a) | | 800 | | | 53,848 | |
| McDermott International, Inc.* | | 6,400 | | | 73,664 | |
| Nabors Industries Ltd.* | | 8,100 | | | 140,454 | |
| National Oilwell Varco, Inc. | | 12,407 | | | 843,552 | |
| Oceaneering International, Inc. | | 3,200 | | | 147,616 | |
| Oil States International, Inc.* | | 1,400 | | | 106,918 | |
| Patterson-UTI Energy, Inc. | | 4,300 | | | 85,914 | |
| Rowan Cos, Inc.* | | 3,600 | | | 109,188 | |
| RPC, Inc. | | 1,087 | | | 19,838 | |
| Schlumberger Ltd. | | 39,272 | | | 2,682,670 | |
| SEACOR Holdings, Inc.* | | 700 | | | 62,272 | |
| Superior Energy Services, Inc.* | | 2,283 | | | 64,928 | |
| Tidewater, Inc.(a) | | 1,400 | | | 69,020 | |
| Unit Corp.* | | 1,300 | | | 60,320 | |
| Weatherford International Ltd.* | | 21,400 | | | 313,296 | |
| | | | | | 7,966,524 | |
| Food & Staples Retailing — 2.2% | | | | | | |
| Casey's General Stores, Inc. | | 1,300 | | | 66,963 | |
| Costco Wholesale Corp. | | 12,700 | | | 1,058,164 | |
| CVS Caremark Corp. | | 38,129 | | | 1,554,901 | |
| Kroger Co. | | 16,621 | | | 402,561 | |
| PriceSmart, Inc.(a) | | 700 | | | 48,713 | |
| Ruddick Corp.(a) | | 1,400 | | | 59,696 | |
| Safeway, Inc.(a) | | 10,235 | | | 215,344 | |
| SUPERVALU, Inc.(a) | | 5,075 | | | 41,209 | |
| Sysco Corp. | | 16,826 | | | 493,506 | |
| United Natural Foods, Inc.* | | 1,100 | | | 44,011 | |
| Wal-Mart Stores, Inc. | | 55,625 | | | 3,324,150 | |
| Walgreen Co. | | 25,552 | | | 844,749 | |
| Weis Markets, Inc.(a) | | 600 | | | 23,964 | |
| Whole Foods Market, Inc. | | 4,300 | | | 299,194 | |
| | | | | | 8,477,125 | |
| Food Products — 1.9% | | | | | | |
| Archer-Daniels-Midland Co. | | 19,277 | | | 551,322 | |
| B&G Foods, Inc.(a) | | 1,400 | | | 33,698 | |
| Bunge Ltd. | | 3,900 | | | 223,080 | |
| Campbell Soup Co.(a) | | 5,400 | | | 179,496 | |
| ConAgra Foods, Inc. | | 12,027 | | | 317,513 | |
| Corn Products International, Inc. | | 2,100 | | | 110,439 | |
| Darling International, Inc.(a)* | | 3,167 | | | 42,089 | |
| Dean Foods Co.* | | 5,184 | | | 58,061 | |
| Diamond Foods, Inc.(a) | | 600 | | | 19,362 | |
| Flowers Foods, Inc.(a) | | 3,105 | | | 58,933 | |
| Fresh Del Monte Produce, Inc. | | 1,100 | | | 27,511 | |
| General Mills, Inc. | | 18,637 | | | 753,121 | |
| Green Mountain Coffee Roasters, Inc.(a)* | | 3,700 | | | 165,945 | |
| Hain Celestial Group, Inc.(a)* | | 1,400 | | | 51,324 | |
| Hershey Co. (The) | | 4,600 | | | 284,188 | |
| HJ Heinz Co. | | 9,229 | | | 498,735 | |
| Hormel Foods Corp. | | 4,295 | | | 125,801 | |
| J&J Snack Foods Corp. | | 400 | | | 21,312 | |
| J.M. Smucker Co. (The) | | 3,329 | | | 260,228 | |
| Kellogg Co. | | 6,900 | | | 348,933 | |
| Kraft Foods, Inc., Class A | | 48,271 | | | 1,803,405 | |
| Lancaster Colony Corp.(a) | | 700 | | | 48,538 | |
| McCormick & Co., Inc. | | 3,500 | | | 176,470 | |
| Mead Johnson Nutrition Co. | | 6,000 | | | 412,380 | |
| Ralcorp Holdings, Inc.* | | 1,500 | | | 128,250 | |
| Sanderson Farms, Inc.(a) | | 400 | | | 20,052 | |
| Sara Lee Corp. | | 16,400 | | | 310,288 | |
| Smithfield Foods, Inc.* | | 4,200 | | | 101,976 | |
| Snyders-Lance, Inc.(a) | | 354 | | | 7,965 | |
| Tootsie Roll Industries, Inc.(a) | | 672 | | | 15,906 | |
| TreeHouse Foods, Inc.(a)* | | 1,116 | | | 72,964 | |
| Tyson Foods, Inc., Class A | | 8,302 | | | 171,353 | |
| | | | | | 7,400,638 | |
| Gas Utilities — 0.3% | | | | | | |
| AGL Resources, Inc. | | 3,357 | | | 141,867 | |
| Atmos Energy Corp. | | 2,600 | | | 86,710 | |
| Laclede Group, Inc. (The)(a) | | 700 | | | 28,329 | |
| National Fuel Gas Co. | | 2,000 | | | 111,160 | |
| New Jersey Resources Corp.(a) | | 1,150 | | | 56,580 | |
| Northwest Natural Gas Co.(a) | | 715 | | | 34,270 | |
| Oneok, Inc. | | 2,900 | | | 251,401 | |
| Piedmont Natural Gas Co., Inc.(a) | | 2,300 | | | 78,154 | |
| Questar Corp. | | 5,200 | | | 103,272 | |
| South Jersey Industries, Inc. | | 800 | | | 45,448 | |
| Southwest Gas Corp.(a) | | 1,000 | | | 42,490 | |
| UGI Corp. | | 3,010 | | | 88,494 | |
| WGL Holdings, Inc.(a) | | 1,400 | | | 61,908 | |
| | | | | | 1,130,083 | |
| Health Care Equipment & Supplies — 1.7% | | | | | | |
| Alere, Inc.* | | 2,200 | | | 50,798 | |
| Align Technology, Inc.* | | 1,900 | | | 45,077 | |
| Baxter International, Inc. | | 16,344 | | | 808,701 | |
| Becton Dickinson and Co. | | 6,116 | | | 456,987 | |
| Boston Scientific Corp.* | | 40,495 | | | 216,243 | |
| CareFusion Corp.* | | 5,900 | | | 149,919 | |
| Cooper Cos., Inc. (The) | | 1,446 | | | 101,972 | |
| Covidien PLC | | 13,470 | | | 606,285 | |
| CR Bard, Inc. | | 2,392 | | | 204,516 | |
| DENTSPLY International, Inc.(a) | | 3,734 | | | 130,653 | |
| Edwards Lifesciences Corp.* | | 3,200 | | | 226,240 | |
| Gen-Probe, Inc.* | | 1,400 | | | 82,768 | |
| Haemonetics Corp.(a)* | | 800 | | | 48,976 | |
| Hill-Rom Holdings, Inc. | | 1,606 | | | 54,106 | |
| Hologic, Inc.* | | 6,896 | | | 120,749 | |
| Idexx Laboratories, Inc.(a)* | | 1,600 | | | 123,136 | |
| Integra LifeSciences Holdings Corp.* | | 91 | | | 2,806 | |
| Intuitive Surgical, Inc.* | | 1,100 | | | 509,311 | |
| Invacare Corp.(a) | | 800 | | | 12,232 | |
| Masimo Corp.(a)* | | 401 | | | 7,493 | |
| Medtronic, Inc. | | 30,100 | | | 1,151,325 | |
| NuVasive, Inc.* | | 997 | | | 12,552 | |
| ResMed, Inc.* | | 4,200 | | | 106,680 | |
| Sirona Dental Systems, Inc.* | | 1,600 | | | 70,464 | |
| St. Jude Medical, Inc. | | 9,373 | | | 321,494 | |
| STERIS Corp.(a) | | 1,600 | | | 47,712 | |
| Stryker Corp. | | 8,200 | | | 407,622 | |
| Symmetry Medical, Inc.(a)* | | 200 | | | 1,598 | |
| Teleflex, Inc. | | 1,064 | | | 65,213 | |
| Thoratec Corp.* | | 1,658 | | | 55,642 | |
| Varian Medical Systems, Inc.(a)* | | 3,300 | | | 221,529 | |
| West Pharmaceutical Services, Inc.(a) | | 800 | | | 30,360 | |
| Zimmer Holdings, Inc.* | | 5,480 | | | 292,742 | |
| | | | | | 6,743,901 | |
| Health Care Providers & Services — 2.2% | | | | | | |
| Accretive Health, Inc.(a)* | | 1,200 | | | 27,576 | |
| Aetna, Inc. | | 10,700 | | | 451,433 | |
| Air Methods Corp.(a)* | | 300 | | | 25,335 | |
| AMERIGROUP Corp.(a)* | | 1,400 | | | 82,712 | |
| AmerisourceBergen Corp. | | 7,736 | | | 287,702 | |
| Brookdale Senior Living, Inc.* | | 2,500 | | | 43,475 | |
| Cardinal Health, Inc. | | 10,011 | | | 406,547 | |
| Catalyst Health Solutions, Inc.* | | 1,300 | | | 67,600 | |
8
SA U.S. Core Market Fund
PORTFOLIO OF INVESTMENTS — AS OF DECEMBER 31, 2011 (Unaudited) (Continued)
| | | | SHARES | | VALUE† | |
| COMMON STOCKS (Continued) | | | | | | |
| Health Care Providers & Services (Continued) | | | | | | |
| Centene Corp.* | | 1,800 | | $ | 71,262 | |
| Chemed Corp.(a) | | 700 | | | 35,847 | |
| CIGNA Corp. | | 7,600 | | | 319,200 | |
| Community Health Systems, Inc.* | | 2,200 | | | 38,390 | |
| Coventry Health Care, Inc.* | | 4,550 | | | 138,183 | |
| DaVita, Inc.* | | 2,700 | | | 204,687 | |
| Express Scripts, Inc.* | | 13,000 | | | 580,970 | |
| Health Management Associates, Inc., Class A* | | 6,472 | | | 47,699 | |
| Health Net, Inc.* | | 2,200 | | | 66,924 | |
| Healthsouth Corp.* | | 2,658 | | | 46,967 | |
| Healthspring, Inc.* | | 1,700 | | | 92,718 | |
| Henry Schein, Inc.(a)* | | 2,700 | | | 173,961 | |
| HMS Holdings Corp.(a)* | | 2,100 | | | 67,158 | |
| Humana, Inc. | | 5,100 | | | 446,811 | |
| Laboratory Corp. of America Holdings* | | 2,900 | | | 249,313 | |
| LifePoint Hospitals, Inc.(a)* | | 1,533 | | | 56,951 | |
| Lincare Holdings, Inc.(a) | | 3,150 | | | 80,986 | |
| Magellan Health Services, Inc.* | | 900 | | | 44,523 | |
| McKesson Corp. | | 7,000 | | | 545,370 | |
| Medco Health Solutions, Inc.* | | 9,912 | | | 554,081 | |
| Mednax, Inc.(a)* | | 1,400 | | | 100,814 | |
| Molina Healthcare, Inc.(a)* | | 200 | | | 4,466 | |
| Omnicare, Inc.(a) | | 3,300 | | | 113,685 | |
| Owens & Minor, Inc.(a) | | 1,650 | | | 45,853 | |
| Patterson Cos, Inc.(a) | | 2,515 | | | 74,243 | |
| PSS World Medical, Inc.(a)* | | 1,300 | | | 31,447 | |
| Quest Diagnostics, Inc. | | 4,415 | | | 256,335 | |
| Select Medical Holdings Corp.* | | 1,900 | | | 16,112 | |
| Team Health Holdings, Inc.(a)* | | 1,800 | | | 39,726 | |
| Tenet Healthcare Corp.* | | 12,500 | | | 64,125 | |
| UnitedHealth Group, Inc. | | 31,050 | | | 1,573,614 | |
| Universal American Corp. | | 1,252 | | | 15,913 | |
| Universal Health Services, Inc. | | 2,600 | | | 101,036 | |
| VCA Antech, Inc.(a)* | | 2,600 | | | 51,350 | |
| WellCare Health Plans, Inc.* | | 1,093 | | | 57,382 | |
| WellPoint, Inc. | | 10,392 | | | 688,470 | |
| | | | | | 8,488,952 | |
| Health Care Technology — 0.1% | | | | | | |
| Allscripts-Misys Healthcare Solutions, Inc.* | | 4,000 | | | 75,760 | |
| athenahealth, Inc.(a)* | | 911 | | | 44,748 | |
| Cerner Corp.* | | 4,000 | | | 245,000 | |
| Quality Systems, Inc.(a) | | 1,600 | | | 59,184 | |
| | | | | | 424,692 | |
| Hotels, Restaurants & Leisure — 2.2% | | | | | | |
| Bally Technologies, Inc.(a)* | | 1,600 | | | 63,296 | |
| BJ's Restaurants, Inc.(a)* | | 600 | | | 27,192 | |
| Bob Evans Farms, Inc. | | 500 | | | 16,770 | |
| Brinker International, Inc.(a) | | 2,650 | | | 70,914 | |
| Buffalo Wild Wings, Inc.(a)* | | 400 | | | 27,004 | |
| Carnival Corp. | | 13,100 | | | 427,584 | |
| Chipotle Mexican Grill, Inc.* | | 800 | | | 270,192 | |
| Choice Hotels International, Inc.(a) | | 700 | | | 26,635 | |
| Cracker Barrel Old Country Store, Inc. | | 500 | | | 25,205 | |
| Darden Restaurants, Inc.(a) | | 3,700 | | | 168,646 | |
| Domino's Pizza, Inc.* | | 1,790 | | | 60,770 | |
| Gaylord Entertainment Co.(a)* | | 1,200 | | | 28,968 | |
| Hyatt Hotels Corp., Class A(a)* | | 1,000 | | | 37,640 | |
| International Game Technology | | 8,500 | | | 146,200 | |
| International Speedway Corp., Class A | | 500 | | | 12,675 | |
| Jack in the Box, Inc.* | | 900 | | | 18,810 | |
| Las Vegas Sands Corp.* | | 10,300 | | | 440,119 | |
| Life Time Fitness, Inc.(a)* | | 1,300 | | | 60,775 | |
| Marriott International, Inc., Class A | | 7,510 | | | 219,067 | |
| Marriott Vacations Worldwide Corp.* | | 751 | | | 12,887 | |
| McDonald's Corp. | | 30,328 | | | 3,042,808 | |
| MGM Resorts International* | | 9,600 | | | 100,128 | |
| Orient-Express Hotels Ltd.(a)* | | 1,100 | | | 8,217 | |
| Panera Bread Co., Class A(a)* | | 900 | | | 127,305 | |
| Penn National Gaming, Inc.(a)* | | 2,100 | | | 79,947 | |
| Royal Caribbean Cruises Ltd.(a) | | 4,000 | | | 99,080 | |
| Six Flags Entertainment Corp.(a) | | 326 | | | 13,444 | |
| Starbucks Corp. | | 20,800 | | | 957,008 | |
| Starwood Hotels & Resorts Worldwide, Inc. | | 5,700 | | | 273,429 | |
| Texas Roadhouse, Inc., Class A(a) | | 1,354 | | | 20,175 | |
| The Cheesecake Factory, Inc.* | | 1,750 | | | 51,363 | |
| Vail Resorts, Inc.(a) | | 1,000 | | | 42,360 | |
| Wendy's Co. (The) | | 11,890 | | | 63,730 | |
| WMS Industries, Inc.(a)* | | 1,350 | | | 27,702 | |
| Wyndham Worldwide Corp. | | 4,660 | | | 176,288 | |
| Wynn Resorts Ltd. | | 3,464 | | | 382,737 | |
| Yum! Brands, Inc. | | 13,300 | | | 784,833 | |
| | | | | | 8,411,903 | |
| Household Durables — 0.3% | | | | | | |
| DR Horton, Inc. | | 8,800 | | | 110,968 | |
| Garmin Ltd.(a) | | 3,286 | | | 130,816 | |
| Harman International Industries, Inc. | | 1,900 | | | 72,276 | |
| Jarden Corp. | | 2,655 | | | 79,331 | |
| Kid Brands, Inc.* | | 100 | | | 316 | |
| Leggett & Platt, Inc. | | 4,300 | | | 99,072 | |
| Lennar Corp., Class A | | 4,200 | | | 82,530 | |
| Mohawk Industries, Inc.* | | 1,843 | | | 110,303 | |
| Newell Rubbermaid, Inc. | | 8,200 | | | 132,430 | |
| NVR, Inc.* | | 100 | | | 68,600 | |
| Pulte Homes, Inc.(a)* | | 9,847 | | | 62,135 | |
| Tempur-Pedic International, Inc.(a)* | | 1,800 | | | 94,554 | |
| Toll Brothers, Inc.* | | 4,500 | | | 91,890 | |
| Tupperware Brands Corp. | | 1,700 | | | 95,149 | |
| Whirlpool Corp.(a) | | 2,067 | | | 98,079 | |
| | | | | | 1,328,449 | |
| Household Products — 2.1% | | | | | | |
| Central Garden and Pet Co., Class A* | | 200 | | | 1,664 | |
| Church & Dwight Co., Inc.(a) | | 4,200 | | | 192,192 | |
| Clorox Co. | | 3,766 | | | 250,665 | |
| Colgate-Palmolive Co. | | 14,007 | | | 1,294,107 | |
| Energizer Holdings, Inc.* | | 1,900 | | | 147,212 | |
| Kimberly-Clark Corp. | | 11,312 | | | 832,111 | |
| Procter & Gamble Co. | | 79,505 | | | 5,303,778 | |
| Spectrum Brands Holdings, Inc.(a)* | | 817 | | | 22,386 | |
| | | | | | 8,044,115 | |
| Independent Power Producers & Energy Traders — 0.2% | | | | |
| AES Corp. (The)* | | 18,700 | | | 221,408 | |
| Calpine Corp.* | | 9,394 | | | 153,404 | |
| Constellation Energy Group, Inc. | | 5,400 | | | 214,218 | |
| GenOn Energy, Inc.* | | 19,172 | | | 50,039 | |
| NRG Energy, Inc.* | | 6,800 | | | 123,216 | |
| | | | | | 762,285 | |
| Industrial Conglomerates — 2.2% | | | | | | |
| 3M Co. | | 18,525 | | | 1,514,048 | |
| Carlisle Cos, Inc. | | 1,635 | | | 72,431 | |
| Danaher Corp. | | 16,277 | | | 765,670 | |
| General Electric Co. | | 306,628 | | | 5,491,707 | |
| Raven Industries, Inc.(a) | | 395 | | | 24,451 | |
| Tyco International Ltd. | | 13,457 | | | 628,576 | |
| | | | | | 8,496,883 | |
9
SA U.S. Core Market Fund
PORTFOLIO OF INVESTMENTS — AS OF DECEMBER 31, 2011 (Unaudited) (Continued)
| | | | SHARES | | VALUE† | |
| COMMON STOCKS (Continued) | | | | | | |
| Insurance — 3.7% | | | | | | |
| ACE Ltd. | | 9,480 | | $ | 664,738 | |
| Aflac, Inc. | | 13,236 | | | 572,589 | |
| Allied World Assurance Co., Holdings Ltd. | | 1,000 | | | 62,930 | |
| Allstate Corp. | | 14,943 | | | 409,588 | |
| Alterra Capital Holdings Ltd. | | 2,083 | | | 49,221 | |
| American Financial Group, Inc. | | 2,500 | | | 92,225 | |
| American International Group, Inc.* | | 3,400 | | | 78,880 | |
| American National Insurance Co. | | 466 | | | 34,032 | |
| Amtrust Financial Services, Inc.(a) | | 1,389 | | | 32,989 | |
| AON Corp. | | 8,385 | | | 392,418 | |
| Arch Capital Group Ltd.* | | 4,200 | | | 156,366 | |
| Arthur J Gallagher & Co. | | 3,200 | | | 107,008 | |
| Aspen Insurance Holdings Ltd. | | 2,100 | | | 55,650 | |
| Assurant, Inc. | | 2,800 | | | 114,968 | |
| Assured Guaranty Ltd. | | 4,400 | | | 57,816 | |
| Axis Capital Holdings Ltd. | | 3,400 | | | 108,664 | |
| Berkshire Hathaway, Inc., Class B* | | 48,719 | | | 3,717,260 | |
| Brown & Brown, Inc. | | 3,900 | | | 88,257 | |
| Chubb Corp. | | 8,007 | | | 554,245 | |
| Cincinnati Financial Corp.(a) | | 4,614 | | | 140,542 | |
| CNA Financial Corp. | | 7,300 | | | 195,275 | |
| CNO Financial Group, Inc.(a)* | | 6,200 | | | 39,122 | |
| Delphi Financial Group, Inc., Class S | | 1,675 | | | 74,202 | |
| Endurance Specialty Holdings Ltd. | | 1,200 | | | 45,900 | |
| Enstar Group Ltd.(a)* | | 300 | | | 29,460 | |
| Erie Indemnity Co., Class A | | 1,130 | | | 88,321 | |
| Everest Re Group Ltd. | | 1,400 | | | 117,726 | |
| FBL Financial Group, Inc., Class A(a) | | 100 | | | 3,402 | |
| Fidelity National Title Group, Inc., Class A | | 7,004 | | | 111,574 | |
| First American Financial Corp.(a) | | 3,300 | | | 41,811 | |
| Flagstone Reinsurance Holdings SA(a) | | 380 | | | 3,150 | |
| Genworth Financial, Inc., Class A* | | 12,500 | | | 81,875 | |
| Hanover Insurance Group, Inc. | | 1,100 | | | 38,445 | |
| Hartford Financial Services Group, Inc. | | 12,100 | | | 196,625 | |
| HCC Insurance Holdings, Inc. | | 3,400 | | | 93,500 | |
| Kemper Corp. | | 1,200 | | | 35,052 | |
| Lincoln National Corp. | | 8,333 | | | 161,827 | |
| Loews Corp. | | 9,359 | | | 352,366 | |
| Markel Corp.(a)* | | 211 | | | 87,495 | |
| Marsh & McLennan Cos, Inc. | | 15,400 | | | 486,948 | |
| MBIA, Inc.(a)* | | 3,900 | | | 45,201 | |
| Mercury General Corp. | | 800 | | | 36,496 | |
| MetLife, Inc. | | 29,890 | | | 931,970 | |
| Montpelier Re Holdings Ltd. | | 2,200 | | | 39,050 | |
| Old Republic International Corp.(a) | | 5,500 | | | 50,985 | |
| OneBeacon Insurance Group Ltd.(a) | | 300 | | | 4,617 | |
| PartnerRe Ltd. | | 2,000 | | | 128,420 | |
| Platinum Underwriters Holdings Ltd. | | 1,200 | | | 40,932 | |
| Primerica, Inc. | | 800 | | | 18,592 | |
| Principal Financial Group, Inc. | | 8,200 | | | 201,720 | |
| ProAssurance Corp. | | 900 | | | 71,838 | |
| Progressive Corp. (The) | | 17,300 | | | 337,523 | |
| Protective Life Corp. | | 2,200 | | | 49,632 | |
| Prudential Financial, Inc. | | 13,434 | | | 673,312 | |
| Reinsurance Group of America, Inc. | | 2,081 | | | 108,732 | |
| RenaissanceRe Holdings Ltd. | | 1,400 | | | 104,118 | |
| RLI Corp.(a) | | 500 | | | 36,430 | |
| StanCorp Financial Group, Inc.(a) | | 1,400 | | | 51,450 | |
| Symetra Financial Corp.(a) | | 1,300 | | | 11,791 | |
| Torchmark Corp. | | 3,100 | | | 134,509 | |
| Transatlantic Holdings, Inc. | | 1,500 | | | 82,095 | |
| Travelers Companies, Inc. (The) | | 11,928 | | | 705,780 | |
| UnumProvident Corp. | | 9,151 | | | 192,812 | |
| Validus Holdings Ltd. | | 1,687 | | | 53,141 | |
| White Mountains Insurance Group Ltd. | | 300 | | | 136,038 | |
| Willis Group Holdings PLC | | 4,700 | | | 182,360 | |
| WR Berkley Corp. | | 3,405 | | | 117,098 | |
| XL Group PLC | | 8,756 | | | 173,106 | |
| | | | | | 14,494,210 | |
| Internet & Catalog Retail — 0.8% | | | | | | |
| Amazon.com, Inc.* | | 10,649 | | | 1,843,342 | |
| Expedia, Inc.(a) | | 1,964 | | | 56,995 | |
| HSN, Inc. | | 900 | | | 32,634 | |
| Liberty Media Corp. - Interactive, Class A* | | 16,139 | | | 261,694 | |
| NetFlix, Inc.(a)* | | 1,500 | | | 103,935 | |
| Priceline.com, Inc.* | | 1,300 | | | 608,023 | |
| Shutterfly, Inc.(a)* | | 700 | | | 15,932 | |
| TripAdvisor, Inc.(a)* | | 1,964 | | | 49,513 | |
| | | | | | 2,972,068 | |
| Internet Software & Services — 1.9% | | | | | | |
| Akamai Technologies, Inc.* | | 5,154 | | | 166,371 | |
| Ancestry.com, Inc.(a)* | | 1,200 | | | 27,552 | |
| AOL, Inc.(a)* | | 3,127 | | | 47,218 | |
| DealerTrack Holdings, Inc.* | | 900 | | | 24,534 | |
| Digital River, Inc.* | | 500 | | | 7,510 | |
| eBay, Inc.* | | 33,800 | | | 1,025,154 | |
| Equinix, Inc.* | | 1,271 | | | 128,880 | |
| Google, Inc., Class A* | | 7,467 | | | 4,822,935 | |
| IAC/InterActiveCorp | | 2,753 | | | 117,278 | |
| j2 Global, Inc.(a) | | 1,500 | | | 42,210 | |
| Monster Worldwide, Inc.(a)* | | 2,500 | | | 19,825 | |
| QuinStreet, Inc.(a)* | | 189 | | | 1,769 | |
| Rackspace Hosting, Inc.* | | 2,900 | | | 124,729 | |
| Valueclick, Inc.(a)* | | 2,000 | | | 32,580 | |
| VeriSign, Inc. | | 4,900 | | | 175,028 | |
| VistaPrint NV(a)* | | 1,299 | | | 39,749 | |
| WebMD Health Corp.(a)* | | 1,400 | | | 52,570 | |
| Yahoo!, Inc.* | | 34,302 | | | 553,291 | |
| | | | | | 7,409,183 | |
| IT Services — 3.7% | | | | | | |
| Accenture PLC, Class A | | 18,900 | | | 1,006,047 | |
| Acxiom Corp.* | | 2,100 | | | 25,641 | |
| Alliance Data Systems Corp.* | | 1,500 | | | 155,760 | |
| Amdocs Ltd.* | | 5,030 | | | 143,506 | |
| Automatic Data Processing, Inc. | | 14,050 | | | 758,840 | |
| Broadridge Financial Solutions, Inc. | | 3,975 | | | 89,636 | |
| CACI International, Inc., Class A* | | 600 | | | 33,552 | |
| Cardtronics, Inc.* | | 900 | | | 24,354 | |
| Cognizant Technology Solutions Corp., Class A* | | 8,442 | | | 542,905 | |
| Computer Sciences Corp. | | 4,600 | | | 109,020 | |
| Convergys Corp.* | | 3,200 | | | 40,864 | |
| CoreLogic, Inc.* | | 2,308 | | | 29,842 | |
| DST Systems, Inc. | | 1,100 | | | 50,072 | |
| Fidelity National Information Services, Inc. | | 7,398 | | | 196,713 | |
| Fiserv, Inc.* | | 4,050 | | | 237,897 | |
| Gartner, Inc., Class A* | | 2,400 | | | 83,448 | |
| Genpact Ltd.* | | 5,590 | | | 83,571 | |
| Global Payments, Inc. | | 2,380 | | | 112,764 | |
| International Business Machines Corp. | | 34,794 | | | 6,397,921 | |
| Jack Henry & Associates, Inc.(a) | | 2,400 | | | 80,664 | |
| Lender Processing Services, Inc. | | 2,639 | | | 39,770 | |
| Mantech International Corp., Class A(a) | | 600 | | | 18,744 | |
| Mastercard, Inc., Class A | | 3,300 | | | 1,230,306 | |
| MAXIMUS, Inc. | | 800 | | | 33,080 | |
| MoneyGram International, Inc.(a)* | | 166 | | | 2,947 | |
| NeuStar, Inc., Class A* | | 1,900 | | | 64,923 | |
10
SA U.S. Core Market Fund
PORTFOLIO OF INVESTMENTS — AS OF DECEMBER 31, 2011 (Unaudited) (Continued)
| | | | SHARES | | VALUE† | |
| COMMON STOCKS (Continued) | | | | | | |
| IT Services (Continued) | | | | | | |
| Paychex, Inc. | | 9,250 | | $ | 278,517 | |
| SAIC, Inc.* | | 8,800 | | | 108,152 | |
| Sapient Corp. | | 4,000 | | | 50,400 | |
| Syntel, Inc.(a) | | 600 | | | 28,062 | |
| TeleTech Holdings, Inc.(a)* | | 1,200 | | | 19,440 | |
| Teradata Corp.* | | 4,900 | | | 237,699 | |
| Total System Services, Inc. | | 5,028 | | | 98,348 | |
| VeriFone Holdings, Inc.* | | 2,400 | | | 85,248 | |
| Visa, Inc., Class A | | 15,100 | | | 1,533,103 | |
| Western Union Co. (The) | | 17,826 | | | 325,503 | |
| Wright Express Corp.(a)* | | 1,100 | | | 59,708 | |
| | | | | | 14,416,967 | |
| Leisure Equipment & Products — 0.1% | | | | | | |
| Brunswick Corp.(a) | | 1,297 | | | 23,424 | |
| Hasbro, Inc. | | 3,300 | | | 105,237 | |
| Mattel, Inc. | | 9,800 | | | 272,048 | |
| Polaris Industries, Inc. | | 1,800 | | | 100,764 | |
| | | | | | 501,473 | |
| Life Sciences Tools & Services — 0.5% | | | | | | |
| Agilent Technologies, Inc.* | | 9,800 | | | 342,314 | |
| Bio-Rad Laboratories, Inc., Class A* | | 600 | | | 57,624 | |
| Bruker Corp.* | | 1,400 | | | 17,388 | |
| Charles River Laboratories International, Inc.* | | 1,088 | | | 29,735 | |
| Covance, Inc.(a)* | | 1,900 | | | 86,868 | |
| Illumina, Inc.(a)* | | 3,620 | | | 110,337 | |
| Life Technologies Corp.* | | 4,823 | | | 187,663 | |
| Mettler-Toledo International, Inc.* | | 900 | | | 132,939 | |
| Parexel International Corp.(a)* | | 1,600 | | | 33,184 | |
| PerkinElmer, Inc. | | 2,900 | | | 58,000 | |
| Techne Corp. | | 1,000 | | | 68,260 | |
| Thermo Fisher Scientific, Inc.* | | 11,106 | | | 499,437 | |
| Waters Corp.* | | 2,500 | | | 185,125 | |
| | | | | | 1,808,874 | |
| Machinery — 2.2% | | | | | | |
| Actuant Corp., Class A(a) | | 1,500 | | | 34,035 | |
| AGCO Corp.* | | 2,600 | | | 111,722 | |
| Barnes Group, Inc.(a) | | 1,800 | | | 43,398 | |
| Caterpillar, Inc. | | 18,400 | | | 1,667,040 | |
| Chart Industries, Inc.* | | 800 | | | 43,256 | |
| CLARCOR, Inc.(a) | | 1,300 | | | 64,987 | |
| CNH Global NV* | | 116 | | | 4,175 | |
| Colfax Corp.(a)* | | 700 | | | 19,936 | |
| Crane Co. | | 1,500 | | | 70,065 | |
| Cummins, Inc. | | 5,400 | | | 475,308 | |
| Deere & Co. | | 11,900 | | | 920,465 | |
| Donaldson Co., Inc.(a) | | 2,100 | | | 142,968 | |
| Dover Corp. | | 5,400 | | | 313,470 | |
| Eaton Corp. | | 9,323 | | | 405,830 | |
| Flowserve Corp. | | 1,600 | | | 158,912 | |
| Gardner Denver, Inc. | | 1,500 | | | 115,590 | |
| Graco, Inc. | | 1,550 | | | 63,380 | |
| Harsco Corp. | | 2,000 | | | 41,160 | |
| IDEX Corp. | | 2,100 | | | 77,931 | |
| Illinois Tool Works, Inc. | | 12,100 | | | 565,191 | |
| Ingersoll Rand PLC | | 9,311 | | | 283,706 | |
| ITT Corp. | | 2,544 | | | 49,176 | |
| Joy Global, Inc. | | 2,900 | | | 217,413 | |
| Kaydon Corp. | | 900 | | | 27,450 | |
| Kennametal, Inc. | | 2,100 | | | 76,692 | |
| Lincoln Electric Holdings, Inc. | | 2,600 | | | 101,712 | |
| Manitowoc Co., Inc. | | 3,300 | | | 30,327 | |
| Middleby Corp.(a)* | | 500 | | | 47,020 | |
| Mueller Industries, Inc.(a) | | 1,000 | | | 38,420 | |
| Navistar International Corp.* | | 2,000 | | | 75,760 | |
| Nordson Corp. | | 1,500 | | | 61,770 | |
| Oshkosh Corp.* | | 2,600 | | | 55,588 | |
| PACCAR, Inc. | | 9,309 | | | 348,808 | |
| Pall Corp. | | 3,200 | | | 182,880 | |
| Parker Hannifin Corp. | | 4,209 | | | 320,936 | |
| Pentair, Inc.(a) | | 2,700 | | | 89,883 | |
| Robbins & Myers, Inc. | | 700 | | | 33,985 | |
| Sauer-Danfoss, Inc.* | | 526 | | | 19,046 | |
| Snap-On, Inc. | | 1,600 | | | 80,992 | |
| SPX Corp. | | 1,400 | | | 84,378 | |
| Stanley Black & Decker, Inc. | | 4,622 | | | 312,447 | |
| Terex Corp.(a)* | | 2,600 | | | 35,126 | |
| Timken Co. | | 2,600 | | | 100,646 | |
| Toro Co.(a) | | 1,000 | | | 60,660 | |
| Trinity Industries, Inc. | | 2,400 | | | 72,144 | |
| Valmont Industries, Inc. | | 700 | | | 63,553 | |
| WABCO Holdings, Inc.* | | 1,899 | | | 82,417 | |
| Wabtec Corp. | | 1,400 | | | 97,930 | |
| Watts Water Technologies, Inc., Class A(a) | | 900 | | | 30,789 | |
| Woodward, Inc.(a) | | 2,000 | | | 81,860 | |
| Xylem, Inc. | | 5,089 | | | 130,736 | |
| | | | | | 8,633,069 | |
| Marine — 0.0% | | | | | | |
| Alexander & Baldwin, Inc. | | 1,200 | | | 48,984 | |
| Kirby Corp.(a)* | | 1,600 | | | 105,344 | |
| | | | | | 154,328 | |
| Media — 3.0% | | | | | | |
| AMC Networks, Inc., Class A* | | 1,725 | | | 64,826 | |
| Arbitron, Inc.(a) | | 800 | | | 27,528 | |
| Cablevision Systems Corp., Class A | | 6,100 | | | 86,742 | |
| CBS Corp., Class A | | 1,300 | | | 35,984 | |
| CBS Corp., Class B | | 17,351 | | | 470,906 | |
| Charter Communications, Inc.* | | 2,452 | | | 139,617 | |
| Cinemark Holdings, Inc.(a) | | 2,400 | | | 44,376 | |
| Clear Channel Outdoor Holdings, Inc., Class A* | | 231 | | | 2,899 | |
| Comcast Corp., Class A | | 60,616 | | | 1,437,205 | |
| Comcast Corp., Class A Special | | 18,450 | | | 434,682 | |
| CTC Media, Inc. | | 1,997 | | | 17,514 | |
| DIRECTV, Class A* | | 19,848 | | | 848,701 | |
| Discovery Communications, Inc., Class A* | | 4,020 | | | 164,699 | |
| Discovery Communications, Inc., Class C* | | 4,020 | | | 151,554 | |
| DISH Network Corp., Class A | | 6,200 | | | 176,576 | |
| DreamWorks Animation SKG, Inc., Class A(a)* | | 2,400 | | | 39,828 | |
| Gannett Co., Inc.(a) | | 6,000 | | | 80,220 | |
| Interpublic Group of Cos, Inc. | | 13,995 | | | 136,171 | |
| John Wiley & Sons, Inc., Class A | | 1,300 | | | 57,720 | |
| Lamar Advertising Co., Class A(a)* | | 1,800 | | | 49,500 | |
| Liberty Global, Inc., Series A* | | 4,195 | | | 172,121 | |
| Liberty Global, Inc., Series C* | | 3,573 | | | 141,205 | |
| Liberty Media Corp. - Liberty Capital, Class A* | | 3,482 | | | 271,770 | |
| Live Nation Entertainment, Inc.* | | 4,494 | | | 37,345 | |
| Madison Square Garden, Inc., Class A* | | 1,825 | | | 52,268 | |
| McGraw-Hill Companies, Inc. | | 8,886 | | | 399,603 | |
| Meredith Corp.(a) | | 900 | | | 29,385 | |
| Morningstar, Inc.(a) | | 700 | | | 41,615 | |
| New York Times Co. (The), Class A* | | 2,900 | | | 22,417 | |
| News Corp., Class A | | 49,644 | | | 885,649 | |
| News Corp., Class B | | 12,500 | | | 227,250 | |
11
SA U.S. Core Market Fund
PORTFOLIO OF INVESTMENTS — AS OF DECEMBER 31, 2011 (Unaudited) (Continued)
| | | | SHARES | | VALUE† | |
| COMMON STOCKS (Continued) | | | | | | |
| Media (Continued) | | | | | | |
| Omnicom Group, Inc. | | 7,900 | | $ | 352,182 | |
| Regal Entertainment Group, Class A | | 2,586 | | | 30,877 | |
| Scripps Networks Interactive, Inc., Class A | | 2,600 | | | 110,292 | |
| Sirius XM Radio, Inc.(a)* | | 82,643 | | | 150,410 | |
| Time Warner Cable, Inc. | | 9,271 | | | 589,358 | |
| Time Warner, Inc. | | 28,800 | | | 1,040,832 | |
| Valassis Communications, Inc.(a)* | | 1,200 | | | 23,076 | |
| Viacom, Inc., Class A(a) | | 1,600 | | | 85,328 | |
| Viacom, Inc., Class B | | 14,539 | | | 660,216 | |
| Virgin Media, Inc. | | 7,700 | | | 164,626 | |
| Walt Disney Co. | | 47,492 | | | 1,780,950 | |
| Washington Post Co. (The), Class B | | 100 | | | 37,681 | |
| | | | | | 11,773,704 | |
| Metals & Mining — 1.0% | | | | | | |
| Alcoa, Inc. | | 30,700 | | | 265,555 | |
| Allegheny Technologies, Inc. | | 2,400 | | | 114,720 | |
| Allied Nevada Gold Corp.(a)* | | 2,115 | | | 64,042 | |
| AMCOL International Corp.(a) | | 529 | | | 14,204 | |
| Carpenter Technology Corp. | | 1,300 | | | 66,924 | |
| Century Aluminum Co.(a)* | | 187 | | | 1,591 | |
| Cliffs Natural Resources, Inc. | | 4,187 | | | 261,059 | |
| Coeur d'Alene Mines Corp.* | | 2,464 | | | 59,481 | |
| Commercial Metals Co. | | 3,500 | | | 48,405 | |
| Compass Minerals International, Inc. | | 1,000 | | | 68,850 | |
| Freeport-McMoRan Copper & Gold, Inc., Class B | | 26,333 | | | 968,791 | |
| Globe Specialty Metals, Inc.(a) | | 1,087 | | | 14,555 | |
| Hecla Mining Co.(a) | | 5,900 | | | 30,857 | |
| Molycorp, Inc.(a)* | | 657 | | | 15,755 | |
| Newmont Mining Corp. | | 13,900 | | | 834,139 | |
| Nucor Corp. | | 9,194 | | | 363,806 | |
| Reliance Steel & Aluminum Co.(a) | | 2,000 | | | 97,380 | |
| Royal Gold, Inc. | | 1,500 | | | 101,145 | |
| Schnitzer Steel Industries, Inc., Class A | | 700 | | | 29,596 | |
| Southern Copper Corp. | | 4,437 | | | 133,909 | |
| Steel Dynamics, Inc. | | 5,800 | | | 76,270 | |
| Stillwater Mining Co.(a)* | | 3,300 | | | 34,518 | |
| Titanium Metals Corp.(a) | | 2,300 | | | 34,454 | |
| United States Steel Corp.(a) | | 3,923 | | | 103,803 | |
| Walter Industries, Inc. | | 1,775 | | | 107,494 | |
| Worthington Industries, Inc.(a) | | 1,900 | | | 31,122 | |
| | | | | | 3,942,425 | |
| Multi-Utilities — 1.4% | | | | | | |
| Alliant Energy Corp. | | 3,000 | | | 132,330 | |
| Ameren Corp. | | 7,000 | | | 231,910 | |
| Avista Corp.(a) | | 1,300 | | | 33,475 | |
| Black Hills Corp. | | 1,000 | | | 33,580 | |
| Centerpoint Energy, Inc. | | 11,950 | | | 240,075 | |
| CMS Energy Corp. | | 6,900 | | | 152,352 | |
| Consolidated Edison, Inc. | | 8,700 | | | 539,661 | |
| Dominion Resources, Inc. | | 16,700 | | | 886,436 | |
| DTE Energy Co. | | 4,900 | | | 266,805 | |
| Integrys Energy Group, Inc. | | 2,277 | | | 123,368 | |
| MDU Resources Group, Inc. | | 5,425 | | | 116,421 | |
| NiSource, Inc. | | 7,800 | | | 185,718 | |
| NorthWestern Corp. | | 1,000 | | | 35,790 | |
| NSTAR | | 2,800 | | | 131,488 | |
| OGE Energy Corp. | | 2,900 | | | 164,459 | |
| PG&E Corp. | | 11,858 | | | 488,787 | |
| Public Service Enterprise Group, Inc. | | 14,400 | | | 475,344 | |
| SCANA Corp. | | 3,400 | | | 153,204 | |
| Sempra Energy | | 6,600 | | | 363,000 | |
| TECO Energy, Inc. | | 5,800 | | | 111,012 | |
| Vectren Corp. | | 1,900 | | | 57,437 | |
| Wisconsin Energy Corp. | | 6,800 | | | 237,728 | |
| Xcel Energy, Inc. | | 14,100 | | | 389,724 | |
| | | | | | 5,550,104 | |
| Multiline Retail — 0.8% | | | | | | |
| 99 Cents Only Stores(a)* | | 1,800 | | | 39,510 | |
| Big Lots, Inc.* | | 2,200 | | | 83,072 | |
| Dillard's, Inc., Class A(a) | | 1,596 | | | 71,629 | |
| Dollar General Corp.* | | 3,800 | | | 156,332 | |
| Dollar Tree, Inc.* | | 3,602 | | | 299,362 | |
| Family Dollar Stores, Inc. | | 3,400 | | | 196,044 | |
| J.C. Penney Co., Inc. | | 4,700 | | | 165,205 | |
| Kohl's Corp. | | 7,610 | | | 375,554 | |
| Macy's, Inc. | | 12,300 | | | 395,814 | |
| Nordstrom, Inc. | | 5,000 | | | 248,550 | |
| Saks, Inc.(a)* | | 3,600 | | | 35,100 | |
| Sears Holdings Corp.(a)* | | 1,189 | | | 37,786 | |
| Target Corp. | | 18,600 | | | 952,692 | |
| | | | | | 3,056,650 | |
| Office Electronics — 0.1% | | | | | | |
| Xerox Corp. | | 39,292 | | | 312,764 | |
| Zebra Technologies Corp., Class A* | | 1,575 | | | 56,354 | |
| | | | | | 369,118 | |
| Oil, Gas & Consumable Fuels — 9.2% | | | | | | |
| Alpha Natural Resources, Inc.* | | 3,688 | | | 75,346 | |
| Anadarko Petroleum Corp. | | 14,400 | | | 1,099,152 | |
| Apache Corp. | | 10,875 | | | 985,057 | |
| Approach Resources, Inc.* | | 800 | | | 23,528 | |
| Arch Coal, Inc. | | 4,300 | | | 62,393 | |
| Berry Petroleum Co., Class A | | 1,600 | | | 67,232 | |
| Bill Barrett Corp.(a)* | | 1,500 | | | 51,105 | |
| Cabot Oil & Gas Corp. | | 3,000 | | | 227,700 | |
| Carrizo Oil & Gas, Inc.* | | 1,100 | | | 28,985 | |
| Chesapeake Energy Corp. | | 19,200 | | | 427,968 | |
| Chevron Corp. | | 56,837 | | | 6,047,457 | |
| Cimarex Energy Co. | | 2,410 | | | 149,179 | |
| Cloud Peak Energy, Inc.* | | 1,609 | | | 31,086 | |
| Cobalt International Energy, Inc.(a)* | | 3,164 | | | 49,105 | |
| Concho Resources, Inc.* | | 2,800 | | | 262,500 | |
| ConocoPhillips | | 35,967 | | | 2,620,915 | |
| Consol Energy, Inc. | | 6,600 | | | 242,220 | |
| Continental Resources, Inc.* | | 1,200 | | | 80,052 | |
| CVR Energy, Inc.* | | 1,522 | | | 28,507 | |
| Denbury Resources, Inc.* | | 11,108 | | | 167,731 | |
| Devon Energy Corp. | | 11,104 | | | 688,448 | |
| El Paso Corp. | | 22,433 | | | 596,045 | |
| Energen Corp. | | 2,100 | | | 105,000 | |
| EOG Resources, Inc. | | 7,800 | | | 768,378 | |
| EQT Corp. | | 4,200 | | | 230,118 | |
| EXCO Resources, Inc.(a) | | 3,600 | | | 37,620 | |
| Exxon Mobil Corp. | | 135,716 | | | 11,503,288 | |
| Forest Oil Corp.(a)* | | 3,371 | | | 45,677 | |
| Gulfport Energy Corp.(a)* | | 766 | | | 22,559 | |
| Hess Corp. | | 7,200 | | | 408,960 | |
| HollyFrontier Corp. | | 5,894 | | | 137,920 | |
| Kodiak Oil & Gas Corp.* | | 6,200 | | | 58,900 | |
| Marathon Oil Corp. | | 20,443 | | | 598,367 | |
| Marathon Petroleum Corp. | | 10,401 | | | 346,249 | |
| McMoRan Exploration Co.(a)* | | 2,587 | | | 37,641 | |
| Murphy Oil Corp. | | 5,400 | | | 300,996 | |
| Newfield Exploration Co.* | | 3,900 | | | 147,147 | |
| Noble Energy, Inc. | | 5,268 | | | 497,246 | |
| Northern Oil and Gas, Inc.(a)* | | 1,600 | | | 38,368 | |
12
SA U.S. Core Market Fund
PORTFOLIO OF INVESTMENTS — AS OF DECEMBER 31, 2011 (Unaudited) (Continued)
| | | | SHARES | | VALUE† | |
| COMMON STOCKS (Continued) | | | | | | |
| Oil, Gas & Consumable Fuels (Continued) | | | | | | |
| Oasis Petroleum, Inc.* | | 1,558 | | $ | 45,322 | |
| Occidental Petroleum Corp. | | 22,983 | | | 2,153,507 | |
| Peabody Energy Corp. | | 7,900 | | | 261,569 | |
| Pioneer Natural Resources Co. | | 3,002 | | | 268,619 | |
| Plains Exploration & Production Co.* | | 3,717 | | | 136,488 | |
| QEP Resources, Inc. | | 5,200 | | | 152,360 | |
| Quicksilver Resources, Inc.(a)* | | 2,008 | | | 13,474 | |
| Range Resources Corp. | | 4,700 | | | 291,118 | |
| Rosetta Resources, Inc.* | | 1,400 | | | 60,900 | |
| SandRidge Energy, Inc.(a)* | | 10,354 | | | 84,489 | |
| Ship Finance International Ltd.(a) | | 2,100 | | | 19,614 | |
| SM Energy Co. | | 1,900 | | | 138,890 | |
| Southern Union Co. | | 3,288 | | | 138,458 | |
| Southwestern Energy Co.* | | 10,000 | | | 319,400 | |
| Spectra Energy Corp. | | 18,778 | | | 577,423 | |
| Stone Energy Corp.(a)* | | 696 | | | 18,360 | |
| Sunoco, Inc. | | 3,200 | | | 131,264 | |
| Swift Energy Co.* | | 900 | | | 26,748 | |
| Teekay Corp.(a) | | 1,000 | | | 26,730 | |
| Tesoro Corp.* | | 3,900 | | | 91,104 | |
| Ultra Petroleum Corp.* | | 4,500 | | | 133,335 | |
| Valero Energy Corp. | | 16,318 | | | 343,494 | |
| W&T Offshore, Inc. | | 1,100 | | | 23,331 | |
| Western Refining, Inc.(a)* | | 2,000 | | | 26,580 | |
| Whiting Petroleum Corp.* | | 3,200 | | | 149,408 | |
| Williams Companies, Inc. | | 16,900 | | | 558,038 | |
| World Fuel Services Corp.(a) | | 2,000 | | | 83,960 | |
| | | | | | 35,570,128 | |
| Paper & Forest Products — 0.2% | | | | | | |
| Buckeye Technologies, Inc. | | 1,000 | | | 33,440 | |
| Domtar Corp. | | 1,000 | | | 79,960 | |
| International Paper Co. | | 11,925 | | | 352,980 | |
| MeadWestvaco Corp. | | 5,340 | | | 159,933 | |
| Schweitzer-Mauduit International, Inc.(a) | | 500 | | | 33,230 | |
| | | | | | 659,543 | |
| Personal Products — 0.2% | | | | | | |
| Avon Products, Inc. | | 12,500 | | | 218,375 | |
| Elizabeth Arden, Inc.(a)* | | 300 | | | 11,112 | |
| Estee Lauder Companies, Inc., Class A | | 3,500 | | | 393,120 | |
| Herbalife Ltd. | | 3,200 | | | 165,344 | |
| Nu Skin Enterprises, Inc., Class A(a) | | 1,488 | | | 72,272 | |
| | | | | | 860,223 | |
| Pharmaceuticals — 5.4% | | | | | | |
| Abbott Laboratories | | 45,412 | | | 2,553,517 | |
| Allergan, Inc. | | 8,900 | | | 780,886 | |
| Bristol-Myers Squibb Co. | | 49,600 | | | 1,747,904 | |
| Eli Lilly & Co. | | 28,900 | | | 1,201,084 | |
| Endo Pharmaceuticals Holdings, Inc.* | | 3,209 | | | 110,807 | |
| Forest Laboratories, Inc.* | | 8,100 | | | 245,106 | |
| Hospira, Inc.* | | 4,720 | | | 143,346 | |
| Impax Laboratories, Inc.(a)* | | 1,000 | | | 20,170 | |
| Jazz Pharmaceuticals, Inc.(a)* | | 1,100 | | | 42,493 | |
| Johnson & Johnson | | 76,912 | | | 5,043,889 | |
| Medicines Co. (The)* | | 1,500 | | | 27,960 | |
| Medicis Pharmaceutical Corp., Class A(a) | | 1,500 | | | 49,875 | |
| Merck & Co., Inc. | | 86,589 | | | 3,264,405 | |
| Mylan, Inc.* | | 12,025 | | | 258,057 | |
| Par Pharmaceutical Cos., Inc.* | | 900 | | | 29,457 | |
| Perrigo Co.(a) | | 2,500 | | | 243,250 | |
| Pfizer, Inc. | | 216,572 | | | 4,686,618 | |
| Questcor Pharmaceuticals, Inc.(a)* | | 1,600 | | | 66,528 | |
| Salix Pharmaceuticals Ltd.(a)* | | 1,500 | | | 71,775 | |
| Viropharma, Inc.(a)* | | 1,800 | | | 49,302 | |
| Warner Chilcott PLC, Class A* | | 2,100 | | | 31,773 | |
| Watson Pharmaceuticals, Inc.* | | 3,600 | | | 217,224 | |
| | | | | | 20,885,426 | |
| Professional Services — 0.3% | | | | | | |
| Acacia Research - Acacia Technologies* | | 1,200 | | | 43,812 | |
| Advisory Board Co. (The)* | | 500 | | | 37,105 | |
| Corporate Executive Board Co. (The)(a) | | 1,000 | | | 38,100 | |
| CoStar Group, Inc.(a)* | | 765 | | | 51,049 | |
| Dun & Bradstreet Corp. | | 1,500 | | | 112,245 | |
| Equifax, Inc. | | 3,389 | | | 131,290 | |
| FTI Consulting, Inc.(a)* | | 1,300 | | | 55,146 | |
| IHS, Inc., Class A* | | 1,300 | | | 112,008 | |
| Manpower, Inc. | | 2,400 | | | 85,800 | |
| Robert Half International, Inc.(a) | | 3,700 | | | 105,302 | |
| Towers Watson & Co., Class A | | 1,500 | | | 89,895 | |
| Verisk Analytics, Inc., Class A* | | 3,657 | | | 146,755 | |
| | | | | | 1,008,507 | |
| Real Estate Investment Trusts (REITs) — 0.2% | | | | | | |
| American Tower Corp., Class A | | 11,207 | | | 672,532 | |
| Real Estate Management & Development — 0.1% | | | | | | |
| Altisource Portfolio Solutions SA* | | 400 | | | 20,072 | |
| CBRE Group, Inc.* | | 8,400 | | | 127,848 | |
| Forest City Enterprises, Inc.* | | 3,000 | | | 35,460 | |
| Jones Lang LaSalle, Inc. | | 1,100 | | | 67,386 | |
| The St. Joe Co.(a)* | | 2,400 | | | 35,184 | |
| | | | | | 285,950 | |
| Road & Rail — 1.0% | | | | | | |
| AMERCO, Inc.(a) | | 300 | | | 26,520 | |
| Avis Budget Group, Inc.* | | 2,328 | | | 24,956 | |
| Con-way, Inc. | | 1,500 | | | 43,740 | |
| CSX Corp. | | 31,009 | | | 653,050 | |
| Genesee & Wyoming, Inc., Class A(a)* | | 1,300 | | | 78,754 | |
| Heartland Express, Inc.(a) | | 1,866 | | | 26,665 | |
| Hertz Global Holdings, Inc.* | | 7,400 | | | 86,728 | |
| JB Hunt Transport Services, Inc. | | 2,500 | | | 112,675 | |
| Kansas City Southern* | | 2,900 | | | 197,229 | |
| Knight Transportation, Inc.(a) | | 1,525 | | | 23,851 | |
| Landstar System, Inc. | | 1,200 | | | 57,504 | |
| Norfolk Southern Corp. | | 10,304 | | | 750,750 | |
| Old Dominion Freight Line, Inc.* | | 1,425 | | | 57,755 | |
| Ryder System, Inc. | | 1,600 | | | 85,024 | |
| Union Pacific Corp. | | 14,200 | | | 1,504,348 | |
| Werner Enterprises, Inc. | | 1,200 | | | 28,920 | |
| | | | | | 3,758,469 | |
| Semiconductors & Semiconductor Equipment — 2.5% | | | | |
| Advanced Micro Devices, Inc.* | | 16,400 | | | 88,560 | |
| Altera Corp. | | 9,300 | | | 345,030 | |
| Analog Devices, Inc. | | 8,600 | | | 307,708 | |
| Applied Materials, Inc. | | 38,300 | | | 410,193 | |
| Atmel Corp.* | | 12,900 | | | 104,490 | |
| Avago Technologies Ltd. | | 6,400 | | | 184,704 | |
| Broadcom Corp., Class A* | | 13,802 | | | 405,227 | |
| Cree, Inc.(a)* | | 2,900 | | | 63,916 | |
| Cymer, Inc.(a)* | | 700 | | | 34,832 | |
| Cypress Semiconductor Corp.* | | 4,600 | | | 77,694 | |
| Entegris, Inc.(a)* | | 3,200 | | | 27,920 | |
| Fairchild Semiconductor International, Inc.* | | 3,875 | | | 46,655 | |
| First Solar, Inc.(a)* | | 1,600 | | | 54,016 | |
| GT Advanced Technologies, Inc.(a)* | | 3,400 | | | 24,616 | |
| Hittite Microwave Corp.(a)* | | 800 | | | 39,504 | |
| Intel Corp. | | 153,786 | | | 3,729,310 | |
| International Rectifier Corp.* | | 1,500 | | | 29,130 | |
13
SA U.S. Core Market Fund
PORTFOLIO OF INVESTMENTS — AS OF DECEMBER 31, 2011 (Unaudited) (Continued)
| | | | SHARES | | VALUE† | |
| COMMON STOCKS (Continued) | | | | | | |
| Semiconductors & Semiconductor Equipment (Continued) | | | | | | |
| Intersil Corp., Class A | | 3,500 | | $ | 36,540 | |
| Kla-Tencor Corp. | | 4,900 | | | 236,425 | |
| Lam Research Corp.* | | 3,600 | | | 133,272 | |
| Linear Technology Corp. | | 6,200 | | | 186,186 | |
| LSI Corp.* | | 18,094 | | | 107,659 | |
| Marvell Technology Group Ltd.* | | 16,100 | | | 222,985 | |
| Maxim Integrated Products, Inc. | | 8,300 | | | 216,132 | |
| MEMC Electronic Materials, Inc.* | | 5,800 | | | 22,852 | |
| Microchip Technology, Inc. | | 5,350 | | | 195,971 | |
| Micron Technology, Inc.* | | 27,301 | | | 171,723 | |
| Microsemi Corp.* | | 2,900 | | | 48,575 | |
| MKS Instruments, Inc.(a) | | 1,300 | | | 36,166 | |
| Netlogic Microsystems, Inc.* | | 1,700 | | | 84,269 | |
| Novellus Systems, Inc.* | | 2,200 | | | 90,838 | |
| Nvidia Corp.* | | 16,500 | | | 228,690 | |
| ON Semiconductor Corp.* | | 11,830 | | | 91,328 | |
| PMC - Sierra, Inc.* | | 6,300 | | | 34,713 | |
| Power Integrations, Inc.(a) | | 300 | | | 9,948 | |
| RF Micro Devices, Inc.(a)* | | 7,000 | | | 37,800 | |
| Semtech Corp.* | | 1,800 | | | 44,676 | |
| Silicon Laboratories, Inc.(a)* | | 1,400 | | | 60,788 | |
| Skyworks Solutions, Inc.* | | 5,200 | | | 84,344 | |
| Spansion, Inc., Class A* | | 400 | | | 3,312 | |
| SunPower Corp.(a)* | | 268 | | | 1,670 | |
| Teradyne, Inc.* | | 6,000 | | | 81,780 | |
| Texas Instruments, Inc. | | 32,302 | | | 940,311 | |
| Veeco Instruments, Inc.(a)* | | 1,100 | | | 22,880 | |
| Xilinx, Inc. | | 7,500 | | | 240,450 | |
| | | | | | 9,645,788 | |
| Software — 3.6% | | | | | | |
| ACI Worldwide, Inc.* | | 600 | | | 17,184 | |
| Activision Blizzard, Inc. | | 14,188 | | | 174,796 | |
| Adobe Systems, Inc.* | | 14,008 | | | 396,006 | |
| Advent Software, Inc.(a)* | | 700 | | | 17,052 | |
| ANSYS, Inc.* | | 2,600 | | | 148,928 | |
| Ariba, Inc.* | | 2,300 | | | 64,584 | |
| Aspen Technology, Inc.* | | 2,400 | | | 41,640 | |
| Autodesk, Inc.* | | 6,300 | | | 191,079 | |
| Blackbaud, Inc. | | 992 | | | 27,478 | |
| BMC Software, Inc.* | | 5,000 | | | 163,900 | |
| CA, Inc. | | 11,676 | | | 236,030 | |
| Cadence Design Systems, Inc.* | | 7,100 | | | 73,840 | |
| Citrix Systems, Inc.* | | 5,179 | | | 314,469 | |
| Commvault Systems, Inc.* | | 960 | | | 41,011 | |
| Compuware Corp.* | | 5,600 | | | 46,592 | |
| Concur Technologies, Inc.(a)* | | 1,400 | | | 71,106 | |
| Electronic Arts, Inc.* | | 9,400 | | | 193,640 | |
| Factset Research Systems, Inc.(a) | | 1,250 | | | 109,100 | |
| Fair Isaac Corp. | | 1,450 | | | 51,968 | |
| Fortinet, Inc.* | | 2,600 | | | 56,706 | |
| Informatica Corp.* | | 3,000 | | | 110,790 | |
| Intuit, Inc. | | 8,100 | | | 425,979 | |
| JDA Software Group, Inc.* | | 800 | | | 25,912 | |
| Mentor Graphics Corp.(a)* | | 3,500 | | | 47,460 | |
| Micros Systems, Inc.* | | 2,300 | | | 107,134 | |
| Microsoft Corp. | | 219,659 | | | 5,702,348 | |
| MicroStrategy, Inc., Class A(a)* | | 200 | | | 21,664 | |
| NetSuite, Inc.(a)* | | 1,588 | | | 64,393 | |
| Nuance Communications, Inc.* | | 6,700 | | | 168,572 | |
| Oracle Corp. | | 113,963 | | | 2,923,151 | |
| Parametric Technology Corp.* | | 3,480 | | | 63,545 | |
| Progress Software Corp.(a)* | | 1,950 | | | 37,733 | |
| QLIK Technologies, Inc.* | | 1,545 | | | 37,389 | |
| Quest Software, Inc.* | | 2,100 | | | 39,060 | |
| RealPage, Inc.* | | 900 | | | 22,743 | |
| Red Hat, Inc.* | | 5,400 | | | 222,966 | |
| Rovi Corp.* | | 3,151 | | | 77,452 | |
| Salesforce.com, Inc.* | | 3,500 | | | 355,110 | |
| Solarwinds, Inc.(a)* | | 1,750 | | | 48,913 | |
| Solera Holdings, Inc. | | 1,984 | | | 88,367 | |
| SuccessFactors, Inc.* | | 2,100 | | | 83,727 | |
| Symantec Corp.* | | 21,592 | | | 337,915 | |
| Synopsys, Inc.* | | 4,200 | | | 114,240 | |
| Take-Two Interactive Software, Inc.* | | 2,150 | | | 29,133 | |
| Taleo Corp., Class A(a)* | | 257 | | | 9,943 | |
| TIBCO Software, Inc.* | | 6,000 | | | 143,460 | |
| TiVo, Inc.(a)* | | 2,872 | | | 25,762 | |
| Verint Systems, Inc.* | | 406 | | | 11,181 | |
| VMware, Inc.* | | 2,347 | | | 195,247 | |
| Websense, Inc.(a)* | | 600 | | | 11,238 | |
| | | | | | 13,989,636 | |
| Specialty Retail — 2.3% | | | | | | |
| Aaron's, Inc.(a) | | 2,250 | | | 60,030 | |
| Abercrombie & Fitch Co., Class A | | 2,500 | | | 122,100 | |
| Advance Auto Parts, Inc. | | 2,100 | | | 146,223 | |
| Aeropostale, Inc.(a)* | | 2,700 | | | 41,175 | |
| American Eagle Outfitters, Inc. | | 5,750 | | | 87,918 | |
| Ann, Inc.(a)* | | 1,550 | | | 38,409 | |
| Ascena Retail Group, Inc.* | | 2,000 | | | 59,440 | |
| AutoNation, Inc.(a)* | | 2,975 | | | 109,688 | |
| AutoZone, Inc.* | | 700 | | | 227,479 | |
| Bed Bath & Beyond, Inc.* | | 7,221 | | | 418,601 | |
| Best Buy Co., Inc.(a) | | 9,525 | | | 222,599 | |
| Buckle, Inc. (The)(a) | | 900 | | | 36,783 | |
| Cabela's, Inc.(a)* | | 1,100 | | | 27,962 | |
| Carmax, Inc.(a)* | | 6,346 | | | 193,426 | |
| Chico's FAS, Inc. | | 5,800 | | | 64,612 | |
| Childrens Place Retail Stores, Inc.(a)* | | 700 | | | 37,184 | |
| Dick's Sporting Goods, Inc.(a) | | 2,800 | | | 103,264 | |
| DSW, Inc., Class A(a) | | 700 | | | 30,947 | |
| Express, Inc.* | | 900 | | | 17,946 | |
| Finish Line Inc. (The), Class A(a) | | 1,500 | | | 28,928 | |
| Foot Locker, Inc. | | 4,100 | | | 97,744 | |
| GameStop Corp., Class A* | | 4,388 | | | 105,882 | |
| Gap, Inc. (The) | | 10,016 | | | 185,797 | |
| Genesco, Inc.(a)* | | 700 | | | 43,218 | |
| Group 1 Automotive, Inc.(a) | | 500 | | | 25,900 | |
| Guess?, Inc. | | 1,900 | | | 56,658 | |
| Hibbett Sports, Inc.* | | 700 | | | 31,626 | |
| Home Depot, Inc. | | 43,721 | | | 1,838,031 | |
| Jos. A. Bank Clothiers, Inc.* | | 750 | | | 36,570 | |
| Lowe's Cos, Inc. | | 36,070 | | | 915,457 | |
| Ltd. Brands, Inc. | | 7,980 | | | 321,993 | |
| Men's Wearhouse, Inc.(a) | | 1,750 | | | 56,718 | |
| Monro Muffler Brake, Inc.(a) | | 800 | | | 31,032 | |
| O'Reilly Automotive, Inc.* | | 3,900 | | | 311,805 | |
| Office Depot, Inc.(a)* | | 1,500 | | | 3,225 | |
| Orchard Supply Hardware Stores Corp., Class A* | | 53 | | | — | |
| Penske Auto Group, Inc.(a) | | 1,000 | | | 19,250 | |
| PetSmart, Inc. | | 3,400 | | | 174,386 | |
| Pier 1 Imports, Inc.* | | 3,200 | | | 44,576 | |
| RadioShack Corp.(a) | | 3,300 | | | 32,043 | |
| Rent-A-Center, Inc. | | 1,700 | | | 62,900 | |
| Ross Stores, Inc. | | 6,800 | | | 323,204 | |
| Sally Beauty Holdings, Inc.* | | 4,602 | | | 97,240 | |
| Select Comfort Corp.* | | 1,400 | | | 30,366 | |
14
SA U.S. Core Market Fund
PORTFOLIO OF INVESTMENTS — AS OF DECEMBER 31, 2011 (Unaudited) (Continued)
| | | | SHARES | | VALUE† | |
| COMMON STOCKS (Continued) | | | | | | |
| Specialty Retail (Continued) | | | | | | |
| Signet Jewelers Ltd. | | 2,400 | | $ | 105,504 | |
| Staples, Inc. | | 19,850 | | | 275,716 | |
| Tiffany & Co. | | 3,600 | | | 238,536 | |
| TJX Cos, Inc. | | 11,000 | | | 710,050 | |
| Tractor Supply Co. | | 2,800 | | | 196,420 | |
| Ulta Salon Cosmetics & Fragrance, Inc.* | | 1,600 | | | 103,872 | |
| Urban Outfitters, Inc.* | | 3,800 | | | 104,728 | |
| Vitamin Shoppe, Inc.(a)* | | 600 | | | 23,928 | |
| Williams-Sonoma, Inc. | | 2,900 | | | 111,650 | |
| | | | | | 8,790,739 | |
| Textiles, Apparel & Luxury Goods — 0.8% | | | | | | |
| Carter's, Inc.(a)* | | 1,400 | | | 55,734 | |
| Coach, Inc. | | 8,210 | | | 501,138 | |
| Columbia Sportswear Co.(a) | | 400 | | | 18,620 | |
| CROCS, Inc.(a)* | | 2,300 | | | 33,971 | |
| Deckers Outdoor Corp.* | | 1,200 | | | 90,684 | |
| Fossil, Inc.* | | 2,600 | | | 206,336 | |
| Hanesbrands, Inc.* | | 2,601 | | | 56,858 | |
| Iconix Brand Group, Inc.(a)* | | 1,472 | | | 23,979 | |
| Lululemon Athletica, Inc.* | | 1,800 | | | 83,988 | |
| NIKE, Inc., Class B | | 10,005 | | | 964,182 | |
| PVH Corp. | | 1,700 | | | 119,833 | |
| Ralph Lauren Corp. | | 2,000 | | | 276,160 | |
| Steven Madden Ltd.(a)* | | 1,200 | | | 41,400 | |
| Under Armour, Inc., Class A(a)* | | 1,100 | | | 78,969 | |
| VF Corp. | | 2,500 | | | 317,475 | |
| Warnaco Group, Inc. (The)(a)* | | 1,400 | | | 70,056 | |
| Wolverine World Wide, Inc. | | 1,600 | | | 57,024 | |
| | | | | | 2,996,407 | |
| Thrifts & Mortgage Finance — 0.1% | | | | | | |
| Capitol Federal Financial, Inc. | | 3,239 | | | 37,378 | |
| Hudson City Bancorp, Inc. | | 13,407 | | | 83,794 | |
| New York Community Bancorp, Inc.(a) | | 10,665 | | | 131,926 | |
| Northwest Bancshares, Inc.(a) | | 2,675 | | | 33,277 | |
| Ocwen Financial Corp.* | | 3,000 | | | 43,440 | |
| People's United Financial, Inc.(a) | | 11,010 | | | 141,478 | |
| TFS Financial Corp.* | | 2,631 | | | 23,574 | |
| Washington Federal, Inc. | | 2,947 | | | 41,229 | |
| | | | | | 536,096 | |
| Tobacco — 1.8% | | | | | | |
| Altria Group, Inc. | | 61,022 | | | 1,809,303 | |
| Lorillard, Inc. | | 4,100 | | | 467,400 | |
| Philip Morris International, Inc. | | 51,900 | | | 4,073,112 | |
| Reynolds American, Inc. | | 10,365 | | | 429,318 | |
| Universal Corp.(a) | | 600 | | | 27,576 | |
| Vector Group Ltd.(a) | | 1,928 | | | 34,241 | |
| | | | | | 6,840,950 | |
| Trading Companies & Distributors — 0.3% | | | | | | |
| Applied Industrial Technologies, Inc.(a) | | 964 | | | 33,904 | |
| Fastenal Co.(a) | | 7,800 | | | 340,158 | |
| GATX Corp.(a) | | 1,100 | | | 48,026 | |
| MSC Industrial Direct Co., Class A | | 1,400 | | | 100,170 | |
| Textainer Group Holdings Ltd.(a) | | 1,121 | | | 32,643 | |
| United Rentals, Inc.* | | 900 | | | 26,595 | |
| Watsco, Inc.(a) | | 800 | | | 52,528 | |
| WESCO International, Inc.(a)* | | 1,100 | | | 58,311 | |
| WW Grainger, Inc. | | 1,700 | | | 318,223 | |
| | | | | | 1,010,558 | |
| Water Utilities — 0.1% | | | | | | |
| American Water Works Co., Inc. | | 4,900 | | | 156,114 | |
| Aqua America, Inc.(a) | | 4,034 | | | 88,950 | |
| | | | | | 245,064 | |
| Wireless Telecommunication Services — 0.2% | | | | | | |
| Crown Castle International Corp.* | | 8,103 | | | 363,014 | |
| MetroPCS Communications, Inc.* | | 8,400 | | | 72,912 | |
| NII Holdings, Inc.* | | 4,600 | | | 97,980 | |
| SBA Communications Corp., Class A(a)* | | 2,900 | | | 124,584 | |
| Sprint Nextel Corp.* | | 85,067 | | | 199,057 | |
| Telephone & Data Systems, Inc.(a) | | 1,300 | | | 33,657 | |
| Telephone & Data Systems, Inc., Special Shares | | 800 | | | 19,048 | |
| United States Cellular Corp.(a)* | | 230 | | | 10,035 | |
| | | | | | 920,287 | |
| TOTAL COMMON STOCKS | | | | | | |
| (Identified Cost $259,940,243) | | | | | 370,580,491 | |
| | | | | | | |
| PREFERRED STOCKS — 0.0% | | | | | | |
| Specialty Retail — 0.0% | | | | | | |
| Orchard Supply Hardware Stores Corp., Series A* | | 53 | | | — | |
| TOTAL PREFERRED STOCKS | | | | | | |
| (Identified Cost $231) | | | | | — | |
| | | | | | | |
| RIGHTS & WARRANTS — 0.0% | | | | | | |
| Biotechnology — 0.0% | | | | | | |
| Celgene Corp., expires 12/31/2030* | | 66 | | | 93 | |
| Hotels, Restaurants & Leisure — 0.0% | | | | | | |
| Krispy Kreme Doughnuts, Inc., expires 3/2/2012* | | 73 | | | 4 | |
| TOTAL RIGHTS & WARRANTS | | | | | | |
| (Identified Cost $350) | | | | | 97 | |
| | | | | | | |
| MUTUAL FUNDS — 4.1% | | | | | | |
| Other — 4.1% | | | | | | |
| DFA U.S. Micro Cap Portfolio | | 1,205,567 | | | 15,937,606 | |
| TOTAL MUTUAL FUNDS | | | | | | |
| (Identified Cost $13,745,189) | | | | | 15,937,606 | |
| | | | | |
| SHORT-TERM INVESTMENTS — 0.1% | | | | |
| Other — 0.1% | | | | | | |
| SSgA Government Money Market Fund | | 1 | | | 1 | |
| SSgA Money Market Fund | | 240,077 | | | 240,077 | |
| | | | | | 240,078 | |
| TOTAL SHORT-TERM INVESTMENTS | | | | | | |
| (Identified Cost $240,078) | | | | | 240,078 | |
| | | | | |
| COLLATERAL FOR SECURITIES ON LOAN — 5.0% | | | | |
| Short-Term — 5.0% | | | | | | |
| State Street Navigator Securities Lending Prime Portfolio | | 19,361,364 | | | 19,361,364 | |
| | | | | | 19,361,364 | |
| TOTAL COLLATERAL FOR SECURITIES ON LOAN | | | | |
| (Identified Cost $19,361,364) | | | | | 19,361,364 | |
| | | | | | | |
| Total Investments — 104.8% | | | | | | |
| | (Identified Cost $293,287,455)# | | | | | 406,119,636 | |
| Liabilities, Less Cash and Other Assets — (4.8%) | | | (18,638,652 | ) |
| Net Assets — 100.0% | | | | $ | 387,480,984 | |
| † | | See Note 1. |
| * | | Non-income producing security. |
| (a) | | A portion or all of the security was held on loan. As of December 31, 2011, the market value of the securities on loan was $18,960,181. |
| # | | At December 31, 2011 the aggregate cost of investment securities for U.S. federal income tax purposes was $293,287,455. Net unrealized appreciation aggregated $112,832,181 of which $131,552,096 related to appreciated investment securities and $18,719,915 related to depreciated investment securities. |
Key to abbreviations:
REIT– Real Estate Investment Trust
15
SA U.S. Value Fund
PORTFOLIO OF INVESTMENTS — AS OF DECEMBER 31, 2011 (Unaudited)
| SHARES | | VALUE† | |
| COMMON STOCKS — 100.0% | | | | |
| Aerospace & Defense — 1.3% | | | | | |
| L-3 Communications Holdings, Inc. | 8,967 | | $ | 597,920 | |
| Northrop Grumman Corp.(a) | 49,882 | | | 2,917,099 | |
| Raytheon Co. | 5,892 | | | 285,055 | |
| Textron, Inc. | 1,263 | | | 23,353 | |
| | | | 3,823,427 | |
| Air Freight & Logistics — 0.0% | | | | | |
| FedEx Corp. | 491 | | | 41,003 | |
| | | | | | |
| Airlines — 0.4% | | | | | |
| Southwest Airlines Co. | 126,100 | | | 1,079,416 | |
| | | | | | |
| Automobiles — 0.1% | | | | | |
| General Motors Co.* | 12,955 | | | 262,598 | |
| | | | | | |
| Beverages — 1.1% | | | | | |
| Beam, Inc. | 24,799 | | | 1,270,453 | |
| Constellation Brands, Inc., Class A* | 30,934 | | | 639,406 | |
| Molson Coors Brewing Co., Class B | 27,145 | | | 1,181,893 | |
| | | | 3,091,752 | |
| Building Products — 0.3% | | | | | |
| Fortune Brands Home & Security, Inc.* | 24,799 | | | 422,327 | |
| Owens Corning* | 20,018 | | | 574,917 | |
| | | | 997,244 | |
| Capital Markets — 0.8% | | | | | |
| American Capital Ltd.* | 16,790 | | | 112,997 | |
| Bank of New York Mellon Corp. (The) | 1,000 | | | 19,910 | |
| E*Trade Financial Corp.* | 6,890 | | | 54,844 | |
| Legg Mason, Inc. | 23,477 | | | 564,622 | |
| Morgan Stanley | 105,967 | | | 1,603,281 | |
| | | | 2,355,654 | |
| Chemicals — 0.4% | | | | | |
| Ashland, Inc. | 14,733 | | | 842,138 | |
| Cytec Industries, Inc. | 1,824 | | | 81,442 | |
| Dow Chemical Co. (The) | 2,597 | | | 74,690 | |
| Huntsman Corp. | 4,150 | | | 41,500 | |
| | | | 1,039,770 | |
| Commercial Banks — 1.3% | | | | | |
| CIT Group, Inc.* | 5,752 | | | 200,572 | |
| KeyCorp | 126,159 | | | 970,163 | |
| Regions Financial Corp. | 184,756 | | | 794,451 | |
| SunTrust Banks, Inc. | 81,987 | | | 1,451,170 | |
| Zions Bancorporation(a) | 24,798 | | | 403,711 | |
| | | | 3,820,067 | |
| Commercial Services & Supplies — 0.5% | | | | | |
| Covanta Holding Corp. | 8,264 | | | 113,134 | |
| R.R. Donnelley & Sons Co.(a) | 21,147 | | | 305,151 | |
| Republic Services, Inc. | 38,907 | | | 1,071,888 | |
| | | | 1,490,173 | |
| Computers & Peripherals — 0.3% | | | | | |
| Hewlett-Packard Co. | 11,165 | | | 287,610 | |
| Western Digital Corp.* | 22,107 | | | 684,212 | |
| | | | 971,822 | |
| Construction & Engineering — 0.2% | | | | | |
| Aecom Technology Corp.* | 1,499 | | | 30,835 | |
| Quanta Services, Inc.* | 11,595 | | | 249,756 | |
| URS Corp.* | 12,610 | | | 442,863 | |
| | | | 723,454 | |
| Construction Materials — 0.3% | | | | | |
| Vulcan Materials Co.(a) | 19,042 | | | 749,303 | |
| | | | | | |
| Consumer Finance — 1.1% | | | | | |
| Capital One Financial Corp.(a) | 74,533 | | | 3,152,000 | |
| | | | | | |
| Containers & Packaging — 0.1% | | | | | |
| Rock-Tenn Co., Class A | 1,862 | | | 107,437 | |
| Sealed Air Corp. | 7,770 | | | 133,722 | |
| | | | 241,159 | |
| Diversified Consumer Services — 0.0% | | | | | |
| Service Corp. International | 5,594 | | | 59,576 | |
| | | | | | |
| Diversified Financial Services — 5.3% | | | | | |
| Bank of America Corp. | 737,905 | | | 4,102,752 | |
| Citigroup, Inc. | 258,694 | | | 6,806,239 | |
| CME Group, Inc. | 10,093 | | | 2,459,361 | |
| JPMorgan Chase & Co. | 38,067 | | | 1,265,728 | |
| NASDAQ OMX Group, Inc. (The)* | 28,325 | | | 694,246 | |
| | | | 15,328,326 | |
| Diversified Telecommunication Services — 6.1% | | | | | |
| AT&T, Inc. | 419,977 | | | 12,700,104 | |
| CenturyLink, Inc. | 62,251 | | | 2,315,737 | |
| Frontier Communications Corp.(a) | 41,385 | | | 213,133 | |
| Verizon Communications, Inc. | 57,266 | | | 2,297,512 | |
| | | | 17,526,486 | |
| Electronic Equipment, Instruments & Components — 1.1% | | | | |
| Arrow Electronics, Inc.* | 20,100 | | | 751,941 | |
| Avnet, Inc.* | 25,300 | | | 786,577 | |
| AVX Corp. | 8,790 | | | 112,161 | |
| Corning, Inc. | 61,354 | | | 796,375 | |
| Ingram Micro, Inc., Class A* | 27,569 | | | 501,480 | |
| Tech Data Corp.* | 2,403 | | | 118,732 | |
| | | | 3,067,266 | |
| Energy Equipment & Services — 2.9% | | | | | |
| Helmerich & Payne, Inc. | 17,367 | | | 1,013,538 | |
| Nabors Industries Ltd.* | 55,062 | | | 954,775 | |
| National Oilwell Varco, Inc. | 55,555 | | | 3,777,184 | |
| Noble Corp.* | 8,785 | | | 265,483 | |
| Patterson-UTI Energy, Inc. | 23,910 | | | 477,722 | |
| Rowan Cos, Inc.* | 19,250 | | | 583,852 | |
| Tidewater, Inc.(a) | 8,682 | | | 428,023 | |
| Transocean Ltd. | 4,396 | | | 168,762 | |
| Unit Corp.* | 600 | | | 27,840 | |
| Weatherford International Ltd.* | 35,367 | | | 517,773 | |
| | | | 8,214,952 | |
| Food & Staples Retailing — 3.3% | | | | | |
| CVS Caremark Corp. | 210,226 | | | 8,573,016 | |
| Safeway, Inc.(a) | 38,038 | | | 800,320 | |
| | | | 9,373,336 | |
| Food Products — 5.4% | | | | | |
| Archer-Daniels-Midland Co. | 96,578 | | | 2,762,131 | |
| Bunge Ltd. | 14,350 | | | 820,820 | |
| Corn Products International, Inc. | 5,606 | | | 294,820 | |
| J.M. Smucker Co. (The) | 18,726 | | | 1,463,811 | |
| Kraft Foods, Inc., Class A | 214,143 | | | 8,000,382 | |
| Ralcorp Holdings, Inc.* | 6,429 | | | 549,680 | |
| Smithfield Foods, Inc.* | 26,819 | | | 651,165 | |
| Tyson Foods, Inc., Class A | 52,207 | | | 1,077,552 | |
| | | | 15,620,361 | |
| Health Care Equipment & Supplies — 1.0% | | | | | |
| Alere, Inc.* | 7,560 | | | 174,560 | |
| Boston Scientific Corp.* | 178,496 | | | 953,169 | |
| CareFusion Corp.* | 29,859 | | | 758,717 | |
| Cooper Cos., Inc. (The) | 218 | | | 15,373 | |
| Hologic, Inc.* | 39,197 | | | 686,340 | |
| Teleflex, Inc. | 2,591 | | | 158,802 | |
| | | | 2,746,961 | |
16
SA U.S. Value Fund
PORTFOLIO OF INVESTMENTS — AS OF DECEMBER 31, 2011 (Unaudited) (Continued)
| SHARE | | VALUE† | |
| COMMON STOCKS (Continued) | | | | |
| Health Care Providers & Services — 3.9% | | | | | |
| Aetna, Inc. | 66,065 | | $ | 2,787,282 | |
| CIGNA Corp. | 117 | | | 4,914 | |
| Coventry Health Care, Inc.* | 22,712 | | | 689,763 | |
| Humana, Inc. | 24,131 | | | 2,114,117 | |
| Omnicare, Inc.(a) | 17,326 | | | 596,881 | |
| WellPoint, Inc. | 77,407 | | | 5,128,214 | |
| | | | 11,321,171 | |
| Hotels, Restaurants & Leisure — 2.1% | | | | | |
| Carnival Corp. | 90,764 | | | 2,962,537 | |
| Hyatt Hotels Corp., Class A(a)* | 314 | | | 11,819 | |
| MGM Resorts International* | 88,290 | | | 920,865 | |
| Penn National Gaming, Inc.(a)* | 5,567 | | | 211,935 | |
| Royal Caribbean Cruises Ltd.(a) | 34,910 | | | 864,721 | |
| Wyndham Worldwide Corp. | 28,665 | | | 1,084,397 | |
| | | | 6,056,274 | |
| Household Durables — 0.9% | | | | | |
| DR Horton, Inc.(a) | 42,255 | | | 532,836 | |
| Lennar Corp., Class A | 25,133 | | | 493,863 | |
| Mohawk Industries, Inc.* | 11,968 | | | 716,285 | |
| Toll Brothers, Inc.* | 27,590 | | | 563,388 | |
| Whirlpool Corp.(a) | 4,460 | | | 211,627 | |
| | | | 2,517,999 | |
| Independent Power Producers & Energy Traders — 0.7% | | | | |
| AES Corp. (The)* | 65,560 | | | 776,231 | |
| Calpine Corp.* | 40,607 | | | 663,112 | |
| NRG Energy, Inc.* | 27,286 | | | 494,422 | |
| | | | 1,933,765 | |
| Industrial Conglomerates — 4.7% | | | | | |
| General Electric Co. | 630,576 | | | 11,293,616 | |
| Tyco International Ltd. | 46,192 | | | 2,157,628 | |
| | | | 13,451,244 | |
| Insurance — 8.6% | | | | | |
| Allied World Assurance Co., Holdings Ltd. | 6,278 | | | 395,075 | |
| Allstate Corp. | 42,929 | | | 1,176,684 | |
| Alterra Capital Holdings Ltd.(a) | 1,399 | | | 33,058 | |
| American Financial Group, Inc. | 18,578 | | | 685,342 | |
| American International Group, Inc.* | 5,470 | | | 126,904 | |
| American National Insurance Co. | 3,889 | | | 284,014 | |
| Assurant, Inc. | 16,949 | | | 695,926 | |
| Axis Capital Holdings Ltd. | 20,253 | | | 647,286 | |
| CNA Financial Corp. | 45,652 | | | 1,221,191 | |
| Everest Re Group Ltd. | 7,352 | | | 618,230 | |
| Genworth Financial, Inc., Class A* | 74,443 | | | 487,602 | |
| Hartford Financial Services Group, Inc. | 70,673 | | | 1,148,436 | |
| Lincoln National Corp. | 52,189 | | | 1,013,510 | |
| Loews Corp. | 72,979 | | | 2,747,659 | |
| MetLife, Inc. | 149,973 | | | 4,676,158 | |
| Old Republic International Corp.(a) | 41,075 | | | 380,765 | |
| PartnerRe Ltd. | 5,060 | | | 324,903 | |
| Principal Financial Group, Inc. | 15,417 | | | 379,258 | |
| Prudential Financial, Inc. | 72,188 | | | 3,618,063 | |
| Reinsurance Group of America, Inc. | 12,042 | | | 629,194 | |
| Transatlantic Holdings, Inc. | 9,355 | | | 511,999 | |
| UnumProvident Corp. | 54,828 | | | 1,155,226 | |
| Validus Holdings Ltd. | 10,899 | | | 343,319 | |
| White Mountains Insurance Group Ltd. | 1,053 | | | 477,493 | |
| XL Group PLC | 44,102 | | | 871,897 | |
| | | | | 24,649,192 | |
| Internet & Catalog Retail — 0.6% | | | | | |
| Liberty Media Corp. - Interactive, Class A* | 102,856 | | | 1,667,810 | |
| | | | | | |
| Internet Software & Services — 0.6% | | | | | |
| IAC/InterActiveCorp | 17,391 | | | 740,857 | |
| Yahoo!, Inc.* | 53,220 | | | 858,438 | |
| | | | 1,599,295 | |
| IT Services — 0.6% | | | | | |
| Computer Sciences Corp. | 27,761 | | | 657,935 | |
| Fidelity National Information Services, Inc. | 44,793 | | | 1,191,046 | |
| | | | 1,848,981 | |
| Life Sciences Tools & Services — 1.1% | | | | | |
| Life Technologies Corp.* | 2,279 | | | 88,676 | |
| PerkinElmer, Inc. | 11,180 | | | 223,600 | |
| Thermo Fisher Scientific, Inc.* | 65,998 | | | 2,967,930 | |
| | | | 3,280,206 | |
| Machinery — 0.9% | | | | | |
| AGCO Corp.* | 5,847 | | | 251,246 | |
| Ingersoll Rand PLC | 27,796 | | | 846,944 | |
| Pentair, Inc.(a) | 11,168 | | | 371,783 | |
| Stanley Black & Decker, Inc. | 15,084 | | | 1,019,678 | |
| | | | 2,489,651 | |
| Media — 11.0% | | | | | |
| CBS Corp., Class A | 8,400 | | | 232,512 | |
| CBS Corp., Class B | 111,595 | | | 3,028,688 | |
| Clear Channel Outdoor Holdings, Inc., Class A* | 4,600 | | | 57,730 | |
| Comcast Corp., Class A | 309,977 | | | 7,349,555 | |
| Comcast Corp., Class A Special | 125,831 | | | 2,964,578 | |
| Gannett Co., Inc. | 7,910 | | | 105,757 | |
| Liberty Media Corp. - Liberty Capital, Class A* | 4,495 | | | 350,835 | |
| News Corp., Class A | 295,411 | | | 5,270,132 | |
| News Corp., Class B | 110,939 | | | 2,016,871 | |
| Time Warner Cable, Inc. | 58,800 | | | 3,737,916 | |
| Time Warner, Inc. | 167,231 | | | 6,043,728 | |
| Washington Post Co. (The), Class B(a) | 1,016 | | | 382,839 | |
| | | | 31,541,141 | |
| Metals & Mining — 1.0% | | | | | |
| Alcoa, Inc. | 171,685 | | | 1,485,075 | |
| Cliffs Natural Resources, Inc. | 2,241 | | | 139,726 | |
| Coeur d'Alene Mines Corp.* | 2,480 | | | 59,867 | |
| Nucor Corp. | 3,036 | | | 120,135 | |
| Reliance Steel & Aluminum Co.(a) | 12,193 | | | 593,677 | |
| Steel Dynamics, Inc. | 28,316 | | | 372,356 | |
| United States Steel Corp.(a) | 3,009 | | | 79,618 | |
| | | | 2,850,454 | |
| Multi-Utilities — 0.7% | | | | | |
| Public Service Enterprise Group, Inc. | 60,366 | | | 1,992,682 | |
| | | | | | |
| Multiline Retail — 0.7% | | | | | |
| Dillard's, Inc., Class A(a) | 945 | | | 42,412 | |
| J.C. Penney Co., Inc.(a) | 34,744 | | | 1,221,251 | |
| Macy's, Inc. | 8,851 | | | 284,825 | |
| Sears Holdings Corp.(a)* | 18,919 | | | 601,246 | |
| | | | 2,149,734 | |
| Office Electronics — 0.3% | | | | | |
| Xerox Corp. | 127,926 | | | 1,018,291 | |
| | | | | | |
| Oil, Gas & Consumable Fuels — 15.1% | | | | | |
| Anadarko Petroleum Corp. | 78,382 | | | 5,982,898 | |
| Apache Corp. | 27,898 | | | 2,527,001 | |
| Cabot Oil & Gas Corp. | 3,394 | | | 257,605 | |
| Chesapeake Energy Corp. | 106,266 | | | 2,368,669 | |
| Chevron Corp. | 32,820 | | | 3,492,048 | |
| ConocoPhillips | 170,561 | | | 12,428,780 | |
| Denbury Resources, Inc.* | 33,941 | | | 512,509 | |
17
SA U.S. Value Fund
PORTFOLIO OF INVESTMENTS — AS OF DECEMBER 31, 2011 (Unaudited) (Continued)
| SHARE | | VALUE† | |
| COMMON STOCKS (Continued) | | | |
| Oil, Gas & Consumable Fuels (Continued) | | | | | |
| Devon Energy Corp. | 28,781 | | $ | 1,784,422 | |
| Hess Corp. | 47,336 | | | 2,688,685 | |
| Marathon Oil Corp. | 115,078 | | | 3,368,333 | |
| Marathon Petroleum Corp. | 57,539 | | | 1,915,473 | |
| Murphy Oil Corp. | 17,723 | | | 987,880 | |
| Pioneer Natural Resources Co. | 17,531 | | | 1,568,674 | |
| Plains Exploration & Production Co.* | 22,622 | | | 830,680 | |
| QEP Resources, Inc. | 12,345 | | | 361,708 | |
| Sunoco, Inc. | 4,954 | | | 203,213 | |
| Tesoro Corp.(a)* | 11,940 | | | 278,918 | |
| Valero Energy Corp. | 91,951 | | | 1,935,569 | |
| Whiting Petroleum Corp.* | 1,484 | | | 69,288 | |
| | | | 43,562,353 | |
| Paper & Forest Products — 1.3% | | | | | |
| Domtar Corp. | 6,754 | | | 540,050 | |
| International Paper Co. | 74,679 | | | 2,210,499 | |
| MeadWestvaco Corp. | 28,813 | | | 862,949 | |
| | | | 3,613,498 | |
| Pharmaceuticals — 3.9% | | | | | |
| Endo Pharmaceuticals Holdings, Inc.* | 3,584 | | | 123,755 | |
| Forest Laboratories, Inc.* | 1,706 | | | 51,624 | |
| Pfizer, Inc. | 510,809 | | | 11,053,907 | |
| | | | 11,229,286 | |
| Road & Rail — 6.1% | | | | | |
| CSX Corp. | 196,515 | | | 4,138,606 | |
| Hertz Global Holdings, Inc.* | 24,203 | | | 283,659 | |
| Norfolk Southern Corp. | 65,200 | | | 4,750,472 | |
| Ryder System, Inc. | 9,500 | | | 504,830 | |
| Union Pacific Corp. | 74,089 | | | 7,848,989 | |
| | | | 17,526,556 | |
| Semiconductors & Semiconductor Equipment — 0.2% | | | | |
| Micron Technology, Inc.* | 108,402 | | | 681,849 | |
| | | | | | |
| Software — 0.4% | | | | | |
| Activision Blizzard, Inc. | 83,074 | | | 1,023,472 | |
| | | | | | |
| Specialty Retail — 0.5% | | | | | |
| Best Buy Co., Inc.(a) | 8,930 | | | 208,694 | |
| Foot Locker, Inc. | 19,383 | | | 462,091 | |
| GameStop Corp., Class A(a)* | 16,878 | | | 407,266 | |
| Orchard Supply Hardware Stores Corp., Class A* | 854 | | | — | |
| Staples, Inc. | 17,842 | | | 247,825 | |
| | | | 1,325,876 | |
| Wireless Telecommunication Services — 0.8% | | | | | |
| MetroPCS Communications, Inc.* | 48,793 | | | 423,523 | |
| NII Holdings, Inc.* | 2,772 | | | 59,044 | |
| Sprint Nextel Corp.* | 464,664 | | | 1,087,314 | |
| Telephone & Data Systems, Inc.(a) | 8,400 | | | 217,476 | |
| Telephone & Data Systems, Inc., Special Shares | 9,252 | | | 220,290 | |
| United States Cellular Corp.(a)* | 6,900 | | | 301,048 | |
| | | | 2,308,695 | |
| TOTAL COMMON STOCKS | | | | | |
| (Identified Cost $273,807,828) | | | | 287,415,581 | |
| | |
| PREFERRED STOCKS — 0.0% | | | | | |
| Specialty Retail — 0.0% | | | | | |
| Orchard Supply Hardware Stores Corp., Series A* | 854 | | | — | |
| TOTAL PREFERRED STOCKS | | | | | |
| (Identified Cost $5,580) | | | | — | |
| |
| SHORT-TERM INVESTMENTS — 0.0% | | | | |
| Other — 0.0% | | | | | |
| SSgA Government Money Market Fund | 1 | | | 1 | |
| SSgA Money Market Fund | 25 | | | 25 | |
| | | | | 26 | |
| TOTAL SHORT-TERM INVESTMENTS | | | | | |
| (Identified Cost $26) | | | | 26 | |
| |
| COLLATERAL FOR SECURITIES ON LOAN— 5.3% | | | | |
| Short-Term — 5.3% | | | | | |
| State Street Navigator Securities Lending Prime Portfolio | 15,365,753 | | | 15,365,753 | |
| TOTAL COLLATERAL FOR SECURITIES ON LOAN | | | | |
| (Identified Cost $15,365,753) | | | | 15,365,753 | |
| |
| Total Investments — 105.3% | | | | | |
| (Identified Cost $289,179,187)# | | | | 302,781,360 | |
| Liabilities, Less Cash and Other Assets — (5.3%) | | | (15,271,950 | ) |
| Net Assets — 100.0% | | | $ | 287,509,410 | |
| | † | | See Note 1. |
| | * | | Non-income producing security. |
| | (a) | | A portion or all of the security was held on loan. As of December 31, 2011, the market value of the securities on loan was $15,494,518. |
| | # | | At December 31, 2011 the aggregate cost of investment securities for U.S. federal income tax purposes was $289,179,187. Net unrealized appreciation aggregated $13,602,173 of which $59,603,160 related to appreciated investment securities and $46,000,987 related to depreciated investment securities. |
18
SA U.S. Small Company Fund
PORTFOLIO OF INVESTMENTS — AS OF DECEMBER 31, 2011 (Unaudited)
| | | | SHARES | | VALUE† | |
| COMMON STOCKS — 100.1% | | | | | | |
| Aerospace & Defense — 2.0% | | | | | | |
| AAR Corp. | | 9,000 | | $ | 172,530 | |
| Aerovironment, Inc.* | | 4,618 | | | 145,328 | |
| Alliant Techsystems, Inc. | | 1,421 | | | 81,224 | |
| Allied Defense Group, Inc. (The)(a)(b)* | | 1,000 | | | 3,150 | |
| American Science & Engineering, Inc. | | 2,000 | | | 136,220 | |
| Arotech Corp.(a)* | | 2,757 | | | 3,281 | |
| Astronics Corp.(a)* | | 1,851 | | | 66,284 | |
| Astronics Corp., Class B(a)* | | 185 | | | 6,706 | |
| | Ceradyne, Inc.* | | 5,525 | | | 147,960 | |
| CPI Aerostructures, Inc.* | | 1,342 | | | 15,769 | |
| Cubic Corp. | | 6,700 | | | 292,053 | |
| Curtiss-Wright Corp. | | 10,550 | | | 372,732 | |
| DigitalGlobe, Inc.(a)* | | 9,173 | | | 156,950 | |
| Ducommun, Inc. | | 2,055 | | | 26,201 | |
| Esterline Technologies Corp.* | | 6,669 | | | 373,264 | |
| GenCorp, Inc.(a)* | | 13,000 | | | 69,160 | |
| GeoEye, Inc.(a)* | | 4,700 | | | 104,434 | |
| HEICO Corp.(a) | | 3,655 | | | 213,744 | |
| HEICO Corp., Class A | | 4,875 | | | 191,831 | |
| Hexcel Corp.* | | 21,236 | | | 514,124 | |
| Huntington Ingalls Industries, Inc.* | | 289 | | | 9,040 | |
| Innovative Solutions & Support, Inc.* | | 4,950 | | | 17,028 | |
| Kratos Defense & Security Solutions, Inc.(a)* | | 6,518 | | | 38,912 | |
| LMI Aerospace, Inc.* | | 2,400 | | | 42,120 | |
| Moog, Inc., Class A(a)* | | 9,348 | | | 410,658 | |
| National Presto Industries, Inc.(a) | | 1,000 | | | 93,600 | |
| Orbital Sciences Corp.* | | 13,200 | | | 191,796 | |
| Sparton Corp.* | | 700 | | | 6,090 | |
| Sypris Solutions, Inc.* | | 4,000 | | | 15,880 | |
| Teledyne Technologies, Inc.* | | 8,099 | | | 444,230 | |
| Triumph Group, Inc. | | 6,959 | | | 406,754 | |
| | | | | | 4,769,053 | |
| Air Freight & Logistics — 0.5% | | | | | | |
| Air Transport Services Group, Inc.* | | 13,990 | | | 66,033 | |
| Atlas Air Worldwide Holdings, Inc.* | | 5,768 | | | 221,664 | |
| Forward Air Corp. | | 6,430 | | | 206,081 | |
| HUB Group, Inc., Class A* | | 8,300 | | | 269,169 | |
| Pacer International, Inc.* | | 5,200 | | | 27,820 | |
| Park-Ohio Holdings Corp.(a)* | | 3,058 | | | 54,555 | |
| UTi Worldwide, Inc. | | 19,667 | | | 261,374 | |
| XPO Logistics, Inc.(a)* | | 876 | | | 10,819 | |
| | | | | | 1,117,515 | |
| Airlines — 0.4% | | | | | | |
| Allegiant Travel Co.(a)* | | 4,800 | | | 256,032 | |
| ATA Holdings Corp.(b)* | | 600 | | | — | |
| Hawaiian Holdings, Inc.* | | 11,300 | | | 65,540 | |
| JetBlue Airways Corp.(a)* | | 48,131 | | | 250,281 | |
| Pinnacle Airlines Corp.(a)* | | 5,350 | | | 4,387 | |
| Republic Airways Holdings, Inc.(a)* | | 9,900 | | | 33,957 | |
| Skywest, Inc. | | 14,100 | | | 177,519 | |
| US Airways Group, Inc.(a)* | | 35,550 | | | 180,239 | |
| | | | | | 967,955 | |
| Auto Components — 0.8% | | | | | | |
| American Axle & Manufacturing Holdings, Inc.(a)* | | 16,600 | | | 164,174 | |
| Amerigon, Inc.(a)* | | 5,143 | | | 73,339 | |
| Cooper Tire & Rubber Co. | | 13,300 | | | 186,333 | |
| Dana Holding Corp.* | | 11,370 | | | 138,145 | |
| Dorman Products, Inc.(a)* | | 3,650 | | | 134,794 | |
| Drew Industries, Inc.(a)* | | 4,800 | | | 117,744 | |
| Exide Technologies(a)* | | 17,000 | | | 44,710 | |
| Federal Mogul Corp.* | | 15,600 | | | 230,100 | |
| Fuel Systems Solutions, Inc.* | | 4,600 | | | 75,854 | |
| Modine Manufacturing Co.* | | 10,100 | | | 95,546 | |
| Motorcar Parts of America, Inc.(a)* | | 2,441 | | | 18,308 | |
| Shiloh Industries, Inc.(a)* | | 3,600 | | | 30,168 | |
| Spartan Motors, Inc.(a) | | 6,900 | | | 33,189 | |
| Standard Motor Products, Inc. | | 4,420 | | | 88,621 | |
| Stoneridge, Inc.(a)* | | 6,100 | | | 51,423 | |
| Strattec Security Corp. | | 700 | | | 13,965 | |
| Superior Industries International, Inc.(a) | | 5,600 | | | 92,624 | |
| Tenneco, Inc.* | | 8,968 | | | 267,067 | |
| UQM Technologies, Inc.(a)* | | 5,620 | | | 7,756 | |
| Williams Controls, Inc.(a) | | 1,100 | | | 12,166 | |
| | | | | | 1,876,026 | |
| Automobiles — 0.2% | | | | | | |
| Thor Industries, Inc.(a) | | 13,400 | | | 367,562 | |
| Winnebago Industries(a)* | | 6,500 | | | 47,970 | |
| | | | | | 415,532 | |
| Beverages — 0.3% | | | | | | |
| Boston Beer Co., Inc., Class A(a)* | | 2,400 | | | 260,544 | |
| Central European Distribution Corp.* | | 3,257 | | | 14,249 | |
| Coca-Cola Bottling Co., Consolidated(a) | | 1,262 | | | 73,890 | |
| Craft Brewers Alliance, Inc.(a)* | | 3,511 | | | 21,136 | |
| Heckmann Corp.(a)* | | 29,185 | | | 194,080 | |
| MGP Ingredients, Inc.(a) | | 5,072 | | | 25,563 | |
| National Beverage Corp.(a)* | | 10,920 | | | 175,485 | |
| | | | | | 764,947 | |
| Biotechnology — 2.3% | | | | | | |
| Achillion Pharmaceuticals, Inc.(a)* | | 4,367 | | | 33,277 | |
| Affymax, Inc.(a)* | | 8,885 | | | 58,730 | |
| Alkermes PLC(a)* | | 23,333 | | | 405,061 | |
| Allos Therapeutics, Inc.(a)* | | 20,200 | | | 28,684 | |
| Alnylam Pharmaceuticals, Inc.(a)* | | 8,900 | | | 72,535 | |
| AMAG Pharmaceuticals, Inc.* | | 3,900 | | | 73,749 | |
| Anthera Pharmaceuticals, Inc.* | | 827 | | | 5,078 | |
| ARCA Biopharma, Inc.(a)* | | 600 | | | 594 | |
| Ardea Biosciences, Inc.* | | 319 | | | 5,362 | |
| Ariad Pharmaceuticals, Inc.* | | 26,550 | | | 325,237 | |
| Arqule, Inc.(a)* | | 13,750 | | | 77,550 | |
| Astex Pharmaceuticals, Inc.(a)* | | 17,300 | | | 32,697 | |
| AVEO Pharmaceuticals, Inc.(a)* | | 7,811 | | | 134,349 | |
| BioMimetic Therapeutics, Inc.(a)* | | 3,110 | | | 8,864 | |
| Celldex Therapeutics, Inc.* | | 5,757 | | | 14,968 | |
| Celsion Corp.(a)* | | 2,900 | | | 4,988 | |
| Cepheid, Inc.(a)* | | 7,548 | | | 259,727 | |
| Cleveland Biolabs, Inc.(a)* | | 1,100 | | | 3,146 | |
| Codexis, Inc.(a)* | | 7,350 | | | 38,955 | |
| Cubist Pharmaceuticals, Inc.(a)* | | 13,083 | | | 518,348 | |
| Curis, Inc.(a)* | | 13,600 | | | 63,648 | |
| Cytokinetics, Inc.* | | 13,046 | | | 12,524 | |
| Dusa Pharmaceuticals, Inc.* | | 2,809 | | | 12,303 | |
| Dynavax Technologies Corp.(a)* | | 9,900 | | | 32,868 | |
| Emergent Biosolutions, Inc.* | | 7,843 | | | 132,076 | |
| Enzon Pharmaceuticals, Inc.(a)* | | 13,152 | | | 88,118 | |
| Exelixis, Inc.(a)* | | 17,215 | | | 81,513 | |
| Genomic Health, Inc.* | | 6,042 | | | 153,406 | |
| Geron Corp.(a)* | | 16,604 | | | 24,574 | |
| GTx, Inc.(a)* | | 4,385 | | | 14,734 | |
| Halozyme Therapeutics, Inc.(a)* | | 4,869 | | | 46,304 | |
| iBio, Inc.(a)* | | 2,200 | | | 1,826 | |
| Idenix Pharmaceuticals, Inc.(a)* | | 10,038 | | | 74,733 | |
| Idera Pharmaceuticals, Inc.(a)* | | 4,700 | | | 4,982 | |
| Immunogen, Inc.(a)* | | 4,608 | | | 53,361 | |
| Immunomedics, Inc.(a)* | | 16,908 | | | 56,304 | |
19
SA U.S. Small Company Fund
PORTFOLIO OF INVESTMENTS — AS OF DECEMBER 31, 2011 (Unaudited) (Continued)
| | | | SHARES | | VALUE† | |
| COMMON STOCKS (Continued) | | | | | | |
| Biotechnology (Continued) | | | | | | |
| Incyte Corp. Ltd.(a)* | | 24,306 | | $ | 364,833 | |
| InterMune, Inc.* | | 7,926 | | | 99,868 | |
| Maxygen, Inc.(a)* | | 12,058 | | | 67,887 | |
| Micromet, Inc.(a)* | | 5,356 | | | 38,510 | |
| Molecular Insight Pharmaceuticals, Inc.(b)* | | 3,500 | | | — | |
| Momenta Pharmaceuticals, Inc.* | | 9,866 | | | 171,570 | |
| Myrexis, Inc.* | | 3,735 | | | 10,010 | |
| | Myriad Genetics, Inc.* | | 20,343 | | | 425,982 | |
| Nabi Biopharmaceuticals(a)* | | 26,243 | | | 49,337 | |
| Nanosphere, Inc.* | | 4,259 | | | 6,261 | |
| NPS Pharmaceuticals, Inc.* | | 1,232 | | | 8,119 | |
| OncoGenex Pharmaceutical, Inc.* | | 15 | | | 176 | |
| Oncothyreon, Inc.(a)* | | 2,942 | | | 22,300 | |
| Opko Health, Inc.(a)* | | 12,963 | | | 63,519 | |
| PDL BioPharma, Inc.(a) | | 29,347 | | | 181,951 | |
| Progenics Pharmaceuticals, Inc.(a)* | | 6,500 | | | 55,510 | |
| Repligen Corp.* | | 9,894 | | | 34,332 | |
| Rigel Pharmaceuticals, Inc.(a)* | | 14,741 | | | 116,306 | |
| Sangamo Biosciences, Inc.* | | 5,574 | | | 15,830 | |
| Sciclone Pharmaceuticals, Inc.(a)* | | 18,255 | | | 78,314 | |
| Seattle Genetics, Inc.(a)* | | 21,246 | | | 355,127 | |
| Spectrum Pharmaceuticals, Inc.* | | 12,000 | | | 175,560 | |
| StemCells, Inc.* | | 1,710 | | | 1,409 | |
| Synageva BioPharma Corp.(a)* | | 1,242 | | | 33,074 | |
| Synta Pharmaceuticals Corp.(a)* | | 4,121 | | | 19,245 | |
| Targacept, Inc.(a)* | | 1,758 | | | 9,792 | |
| Theravance, Inc.(a)* | | 6,159 | | | 136,114 | |
| Zalicus, Inc.(a)* | | 6,284 | | | 7,604 | |
| | | | | | 5,503,713 | |
| Building Products — 0.8% | | | | | | |
| A.O. Smith Corp.(a) | | 8,852 | | | 355,142 | |
| AAON, Inc.(a) | | 5,850 | | | 119,867 | |
| Ameresco, Inc., Class A(a)* | | 3,838 | | | 52,657 | |
| American Woodmark Corp. | | 3,200 | | | 43,712 | |
| Apogee Enterprises, Inc. | | 6,300 | | | 77,238 | |
| Builders FirstSource, Inc.(a)* | | 17,652 | | | 36,010 | |
| Gibraltar Industries, Inc.* | | 6,800 | | | 94,928 | |
| Griffon Corp.(a) | | 13,149 | | | 120,050 | |
| Insteel Industries, Inc.(a) | | 4,000 | | | 43,960 | |
| PGT, Inc.(a)* | | 3,525 | | | 3,878 | |
| Quanex Building Products Corp.(a) | | 7,625 | | | 114,528 | |
| Simpson Manufacturing Co., Inc.(a) | | 12,100 | | | 407,286 | |
| Trex Co., Inc.* | | 2,700 | | | 61,857 | |
| U.S. Home Systems, Inc.(a) | | 1,100 | | | 7,315 | |
| Universal Forest Products, Inc.(a) | | 4,200 | | | 129,654 | |
| USG Corp.(a)* | | 21,620 | | | 219,659 | |
| | | | | | 1,887,741 | |
| Capital Markets — 1.1% | | | | | | |
| Artio Global Investors, Inc. | | 9,194 | | | 44,867 | |
| BGC Partners, Inc., Class A(a) | | 20,262 | | | 120,356 | |
| Calamos Asset Management, Inc. | | 4,127 | | | 51,629 | |
| Cohen & Steers, Inc.(a) | | 9,306 | | | 268,943 | |
| Cowen Group, Inc., Class A(a)* | | 21,745 | | | 56,320 | |
| Duff & Phelps Corp., Class A | | 6,885 | | | 99,832 | |
| Edelman Financial Group, Inc.(a) | | 7,252 | | | 47,646 | |
| Epoch Holding Corp.(a) | | 4,574 | | | 101,680 | |
| Evercore Partners, Inc., Class A | | 5,419 | | | 144,254 | |
| Firstcity Financial Corp.(a)* | | 2,100 | | | 16,884 | |
| GAMCO Investors, Inc., Class A(a) | | 1,700 | | | 73,933 | |
| GFI Group, Inc.(a) | | 25,121 | | | 103,498 | |
| Gleacher & Co., Inc.(a)* | | 24,754 | | | 41,587 | |
| Harris & Harris Group, Inc.(a)* | | 7,000 | | | 24,220 | |
| HFF, Inc., Class A* | | 7,896 | | | 81,566 | |
| ICG Group, Inc.(a)* | | 8,600 | | | 66,392 | |
| Intl. FCStone, Inc.(a)* | | 3,884 | | | 91,546 | |
| Investment Technology Group, Inc.* | | 9,700 | | | 104,857 | |
| JMP Group, Inc. | | 3,620 | | | 25,883 | |
| KBW, Inc. | | 7,474 | | | 113,455 | |
| Knight Capital Group, Inc., Class A(a)* | | 23,916 | | | 282,687 | |
| MCG Capital Corp.(a) | | 16,757 | | | 66,860 | |
| Medallion Financial Corp.(a) | | 3,400 | | | 38,692 | |
| Oppenheimer Holdings, Inc., Class A(a) | | 2,133 | | | 34,341 | |
| Penson Worldwide, Inc.(a)* | | 3,979 | | | 4,616 | |
| Piper Jaffray Cos.* | | 4,324 | | | 87,345 | |
| Pzena Investment Management, Inc., Class A | | 794 | | | 3,438 | |
| Safeguard Scientifics, Inc.(a)* | | 3,700 | | | 58,423 | |
| Stifel Financial Corp.(a)* | | 8,617 | | | 276,175 | |
| SWS Group, Inc.(a) | | 5,901 | | | 40,540 | |
| Teton Advisors, Inc.(a) | | 25 | | | 500 | |
| Virtus Investment Partners, Inc.(a)* | | 905 | | | 68,789 | |
| Westwood Holdings Group, Inc.(a) | | 713 | | | 26,060 | |
| | | | | | 2,667,814 | |
| Chemicals — 2.1% | | | | | | |
| A. Schulman, Inc. | | 6,427 | | | 136,124 | |
| American Pacific Corp.* | | 1,000 | | | 7,630 | |
| American Vanguard Corp.(a) | | 6,233 | | | 83,148 | |
| Arabian American Development Co.* | | 2,400 | | | 20,352 | |
| Balchem Corp.(a) | | 6,525 | | | 264,524 | |
| Calgon Carbon Corp.* | | 14,175 | | | 222,689 | |
| Chase Corp. | | 700 | | | 9,730 | |
| Chemtura Corp.* | | 18,226 | | | 206,683 | |
| Core Molding Technologies, Inc.* | | 1,500 | | | 12,090 | |
| Cytec Industries, Inc. | | 2,329 | | | 103,990 | |
| Ferro Corp.* | | 19,000 | | | 92,910 | |
| Georgia Gulf Corp.(a)* | | 7,462 | | | 145,434 | |
| H.B. Fuller Co. | | 12,300 | | | 284,253 | |
| Hawkins, Inc.(a) | | 1,824 | | | 67,233 | |
| Innophos Holdings, Inc. | | 4,800 | | | 233,088 | |
| Innospec, Inc.* | | 5,100 | | | 143,157 | |
| Intrepid Potash, Inc.* | | 1,553 | | | 35,144 | |
| KMG Chemicals, Inc.(a) | | 2,500 | | | 43,175 | |
| Koppers Holdings, Inc. | | 4,400 | | | 151,184 | |
| Kraton Performance Polymers, Inc.* | | 6,774 | | | 137,512 | |
| Landec Corp.(a)* | | 10,074 | | | 55,609 | |
| LSB Industries, Inc.(a)* | | 5,556 | | | 155,735 | |
| Minerals Technologies, Inc. | | 4,400 | | | 248,732 | |
| NewMarket Corp.(a) | | 1,252 | | | 248,034 | |
| Olin Corp.(a) | | 17,277 | | | 339,493 | |
| OM Group, Inc.* | | 6,900 | | | 154,491 | |
| Omnova Solutions, Inc.(a)* | | 9,840 | | | 45,362 | |
| Penford Corp.* | | 3,648 | | | 18,568 | |
| PolyOne Corp. | | 20,800 | | | 240,240 | |
| Quaker Chemical Corp.(a) | | 2,260 | | | 87,891 | |
| Sensient Technologies Corp. | | 11,300 | | | 428,270 | |
| Spartech Corp.* | | 6,900 | | | 32,637 | |
| Stepan Co. | | 1,700 | | | 136,272 | |
| Tredegar Corp. | | 8,700 | | | 193,314 | |
| Valhi, Inc.(a) | | 548 | | | 33,138 | |
| Zep, Inc. | | 4,300 | | | 60,114 | |
| Zoltek Cos., Inc.(a)* | | 11,060 | | | 84,277 | |
| | | | | | 4,962,227 | |
| Commercial Banks — 6.7% | | | | | | |
| 1st Source Corp.(a) | | 5,867 | | | 148,611 | |
| 1st United Bancorp, Inc.* | | 5,096 | | | 28,283 | |
| Ameris Bancorp* | | 4,663 | | | 47,936 | |
20
SA U.S. Small Company Fund
PORTFOLIO OF INVESTMENTS — AS OF DECEMBER 31, 2011 (Unaudited) (Continued)
| | | | SHARES | | VALUE† | |
| COMMON STOCKS (Continued) | | | | | | |
| Commercial Banks (Continued) | | | | | | |
| AmeriServ Financial, Inc.(a)* | | 4,400 | | $ | 8,580 | |
| Arrow Financial Corp.(a) | | 2,544 | | | 59,631 | |
| Associated Banc-Corp. | | 7,347 | | | 82,066 | |
| Bancfirst Corp.(a) | | 3,000 | | | 112,620 | |
| Bancorp, Inc.(a)* | | 5,800 | | | 41,934 | |
| Bancorpsouth, Inc.(a) | | 18,401 | | | 202,779 | |
| BancTrust Financial Group, Inc.(a)* | | 3,390 | | | 4,204 | |
| Bank of Hawaii Corp. | | 2,432 | | | 108,200 | |
| | Bank of the Ozarks, Inc.(a) | | 8,000 | | | 237,040 | |
| Banner Corp. | | 3,197 | | | 54,829 | |
| BBCN Bancorp, Inc.* | | 15,614 | | | 147,552 | |
| Boston Private Financial Holdings, Inc. | | 18,225 | | | 144,706 | |
| Bryn Mawr Bank Corp.(a) | | 2,292 | | | 44,671 | |
| Camden National Corp.(a) | | 2,000 | | | 65,200 | |
| Capital City Bank Group, Inc.(a) | | 2,541 | | | 24,267 | |
| CapitalSource, Inc. | | 68,837 | | | 461,208 | |
| Cardinal Financial Corp. | | 6,692 | | | 71,872 | |
| Cathay General Bancorp(a) | | 17,255 | | | 257,617 | |
| Center Bancorp, Inc.(a) | | 3,180 | | | 31,069 | |
| Centerstate Banks of Florida, Inc. | | 4,385 | | | 29,029 | |
| Central Pacific Financial Corp.* | | 354 | | | 4,574 | |
| Chemical Financial Corp.(a) | | 5,576 | | | 118,880 | |
| Citizens Republic Bancorp, Inc.* | | 1,706 | | | 19,448 | |
| City Holding Co.(a) | | 6,502 | | | 220,353 | |
| CNB Financial Corp. | | 1,506 | | | 23,765 | |
| CoBiz Financial, Inc. | | 6,875 | | | 39,669 | |
| Colony Bankcorp, Inc.(a)* | | 1,100 | | | 2,486 | |
| Columbia Banking System, Inc.(a) | | 8,815 | | | 169,865 | |
| Community Bank System, Inc.(a) | | 8,319 | | | 231,268 | |
| Community Trust Bancorp, Inc.(a) | | 4,498 | | | 132,331 | |
| CVB Financial Corp. | | 26,555 | | | 266,347 | |
| Encore Bancshares, Inc.* | | 595 | | | 8,044 | |
| Enterprise Financial Services Corp.(a) | | 3,156 | | | 46,709 | |
| Fidelity Southern Corp. | | 100 | | | 608 | |
| Financial Institutions, Inc.(a) | | 3,105 | | | 50,115 | |
| First Bancorp(a) | | 3,400 | | | 37,910 | |
| First Busey Corp., Class A(a) | | 18,429 | | | 92,145 | |
| First Citizens BancShares, Inc. | | 200 | | | 34,998 | |
| First Commonwealth Financial Corp.(a) | | 24,031 | | | 126,403 | |
| First Community Bancshares, Inc. | | 3,311 | | | 41,321 | |
| First Financial Bancorp(a) | | 13,758 | | | 228,933 | |
| First Financial Bankshares, Inc.(a) | | 7,102 | | | 237,420 | |
| First Financial Corp.(a) | | 3,200 | | | 106,496 | |
| First Financial Service Corp.* | | 440 | | | 673 | |
| First Interstate Bancsystem, Inc.(a) | | 2,918 | | | 38,022 | |
| First Merchants Corp.(a) | | 5,902 | | | 49,990 | |
| First Midwest Bancorp, Inc. | | 15,686 | | | 158,899 | |
| First South Bancorp, Inc.* | | 1,100 | | | 3,520 | |
| FirstMerit Corp. | | 16,515 | | | 249,872 | |
| FNB Corp.(a) | | 31,775 | | | 359,375 | |
| Fulton Financial Corp. | | 43,949 | | | 431,140 | |
| German American Bancorp, Inc.(a) | | 2,400 | | | 43,656 | |
| Glacier Bancorp, Inc.(a) | | 16,091 | | | 193,575 | |
| Great Southern Bancorp, Inc. | | 3,025 | | | 71,360 | |
| Green Bankshares, Inc.* | | 2,220 | | | 2,797 | |
| Guaranty Bancorp* | | 11,800 | | | 17,346 | |
| Hanmi Financial Corp.* | | 1,162 | | | 8,599 | |
| Heartland Financial USA, Inc. | | 5,400 | | | 82,836 | |
| Heritage Commerce Corp.* | | 3,712 | | | 17,595 | |
| Heritage Financial Corp/WA(a) | | 1,186 | | | 14,896 | |
| Home Bancshares, Inc.(a) | | 7,169 | | | 185,749 | |
| Hudson Valley Holding Corp.(a) | | 3,598 | | | 76,350 | |
| Iberiabank Corp.(a) | | 7,535 | | | 371,475 | |
| Independent Bank Corp.(a) | | 4,384 | | | 119,639 | |
| International Bancshares Corp.(a) | | 15,200 | | | 278,692 | |
| Intervest Bancshares Corp.(a)* | | 1,400 | | | 3,822 | |
| Investors Bancorp, Inc.* | | 34,155 | | | 460,409 | |
| Lakeland Bancorp, Inc.(a) | | 5,539 | | | 47,746 | |
| Lakeland Financial Corp. | | 3,189 | | | 82,499 | |
| Macatawa Bank Corp.* | | 6,614 | | | 15,080 | |
| MainSource Financial Group, Inc. | | 4,530 | | | 40,000 | |
| MB Financial, Inc. | | 11,453 | | | 195,846 | |
| MBT Financial Corp.(a)* | | 7,300 | | | 7,738 | |
| Mercantile Bank Corp.* | | 1,265 | | | 12,397 | |
| Metro Bancorp, Inc.(a)* | | 4,280 | | | 35,866 | |
| Midsouth Bancorp, Inc.(a) | | 2,100 | | | 27,321 | |
| National Penn Bancshares, Inc.(a) | | 31,814 | | | 268,510 | |
| NBT Bancorp, Inc.(a) | | 7,860 | | | 173,942 | |
| New Century Bancorp, Inc.(a)* | | 200 | | | 400 | |
| NewBridge Bancorp* | | 3,549 | | | 13,735 | |
| Old National Bancorp | | 20,800 | | | 242,320 | |
| Old Second Bancorp, Inc.(a)* | | 3,268 | | | 4,346 | |
| OmniAmerican Bancorp, Inc.(a)* | | 1,604 | | | 25,183 | |
| Oriental Financial Group, Inc.(a) | | 9,336 | | | 113,059 | |
| Pacific Capital Bancorp(a)* | | 5,452 | | | 153,964 | |
| Pacific Continental Corp.(a) | | 3,047 | | | 26,966 | |
| Pacific Mercantile Bancorp(a)* | | 2,500 | | | 8,150 | |
| Pacific Premier Bancorp, Inc.* | | 300 | | | 1,902 | |
| PacWest Bancorp(a) | | 7,728 | | | 146,446 | |
| Park National Corp.(a) | | 3,450 | | | 224,457 | |
| Park Sterling Corp.* | | 1,725 | | | 7,038 | |
| Patriot National Bancorp, Inc.(a)* | | 500 | | | 875 | |
| Peapack Gladstone Financial Corp.(a) | | 1,312 | | | 14,091 | |
| Peoples Bancorp, Inc. | | 2,300 | | | 34,063 | |
| Pinnacle Financial Partners, Inc.(a)* | | 9,756 | | | 157,559 | |
| Preferred Bank/Los Angeles CA(a)* | | 593 | | | 4,447 | |
| PrivateBancorp, Inc.(a) | | 15,254 | | | 167,489 | |
| Prosperity Bancshares, Inc.(a) | | 7,725 | | | 311,704 | |
| Renasant Corp.(a) | | 5,000 | | | 75,000 | |
| Republic Bancorp, Inc., Class A | | 7,344 | | | 168,178 | |
| Republic First Bancorp, Inc.* | | 1,450 | | | 2,161 | |
| S&T Bancorp, Inc.(a) | | 10,071 | | | 196,888 | |
| S.Y. Bancorp, Inc.(a) | | 2,891 | | | 59,352 | |
| Sandy Spring Bancorp, Inc.(a) | | 6,300 | | | 110,565 | |
| SCBT Financial Corp.(a) | | 2,608 | | | 75,658 | |
| Seacoast Banking Corp. of Florida(a)* | | 4,572 | | | 6,949 | |
| Sierra Bancorp | | 2,100 | | | 18,480 | |
| Simmons First National Corp., Class A(a) | | 3,100 | | | 84,289 | |
| Southern Community Financial Corp.* | | 3,300 | | | 3,861 | |
| Southern Connecticut Bancorp, Inc.(a)* | | 200 | | | 390 | |
| Southside Bancshares, Inc.(a) | | 3,319 | | | 71,890 | |
| Southwest Bancorp, Inc.(a)* | | 3,700 | | | 22,052 | |
| State Bancorp, Inc.(a) | | 2,377 | | | 28,999 | |
| StellarOne Corp.(a) | | 4,223 | | | 48,058 | |
| Sterling Bancorp | | 6,040 | | | 52,186 | |
| Suffolk Bancorp* | | 2,200 | | | 23,738 | |
| Sun Bancorp, Inc* | | 6,759 | | | 16,357 | |
| Susquehanna Bancshares, Inc.(a) | | 35,145 | | | 294,515 | |
| SVB Financial Group* | | 8,675 | | | 413,711 | |
| Synovus Financial Corp.(a) | | 42,409 | | | 59,797 | |
| Taylor Capital Group, Inc.* | | 3,225 | | | 31,347 | |
| Texas Capital Bancshares, Inc.(a)* | | 8,100 | | | 247,941 | |
| TIB Financial Corp.* | | 114 | | | 1,023 | |
| Tompkins Financial Corp.(a) | | 2,420 | | | 93,194 | |
| Tower Bancorp, Inc. | | 2,234 | | | 63,758 | |
| TowneBank(a) | | 5,602 | | | 68,568 | |
| Trico Bancshares(a) | | 3,800 | | | 54,036 | |
| Trustmark Corp.(a) | | 13,700 | | | 332,773 | |
21
SA U.S. Small Company Fund
PORTFOLIO OF INVESTMENTS — AS OF DECEMBER 31, 2011 (Unaudited) (Continued)
| | | | SHARES | | VALUE† | |
| COMMON STOCKS (Continued) | | | | | | |
| Commercial Banks (Continued) | | | | | | |
| UMB Financial Corp.(a) | | 8,900 | | $ | 331,525 | |
| Umpqua Holdings Corp.(a) | | 22,906 | | | 283,805 | |
| Union First Market Bankshares Corp.(a) | | 4,860 | | | 64,589 | |
| United Bankshares, Inc.(a) | | 10,300 | | | 291,181 | |
| United Community Banks, Inc/GA(a)* | | 4,460 | | | 31,175 | |
| United Security Bancshares(a)* | | 882 | | | 1,932 | |
| Univest Corp. of Pennsylvania(a) | | 3,100 | | | 45,384 | |
| Valley National Bancorp(a) | | 4,500 | | | 55,665 | |
| | Virginia Commerce Bancorp(a)* | | 5,786 | | | 44,726 | |
| Washington Banking Co. | | 2,374 | | | 28,274 | |
| Washington Trust Bancorp, Inc.(a) | | 3,000 | | | 71,580 | |
| Webster Financial Corp. | | 18,456 | | | 376,318 | |
| WesBanco, Inc.(a) | | 5,363 | | | 104,418 | |
| West Bancorporation, Inc.(a) | | 5,350 | | | 51,253 | |
| West Coast Bancorp/OR* | | 3,519 | | | 54,896 | |
| Westamerica Bancorporation(a) | | 6,300 | | | 276,570 | |
| Western Alliance Bancorp* | | 16,297 | | | 101,530 | |
| Wilshire Bancorp, Inc.* | | 9,930 | | | 36,046 | |
| Wintrust Financial Corp.(a) | | 7,350 | | | 206,167 | |
| Yadkin Valley Financial Corp.* | | 1,400 | | | 2,380 | |
| | | | | | 15,644,546 | |
| Commercial Services & Supplies — 2.7% | | | | | | |
| ABM Industries, Inc.(a) | | 12,860 | | | 265,173 | |
| ACCO Brands Corp.* | | 13,050 | | | 125,933 | |
| Acorn Factor, Inc. | | 4,341 | | | 26,220 | |
| American Reprographics Co.* | | 10,300 | | | 47,277 | |
| Amrep Corp.* | | 1,500 | | | 9,840 | |
| Asset Acceptance Capital Corp.(a)* | | 6,900 | | | 26,979 | |
| Asta Funding, Inc. | | 2,600 | | | 20,748 | |
| Brink's Co. (The) | | 10,544 | | | 283,423 | |
| Casella Waste Systems, Inc., Class A(a)* | | 5,500 | | | 35,200 | |
| Ceco Environmental Corp.(a) | | 3,800 | | | 21,470 | |
| Cenveo, Inc.(a)* | | 4,900 | | | 16,660 | |
| Champion Industries, Inc.* | | 2,100 | | | 1,617 | |
| Command Security Corp.(a)* | | 4,300 | | | 7,052 | |
| Consolidated Graphics, Inc.* | | 2,500 | | | 120,700 | |
| Courier Corp. | | 1,857 | | | 21,783 | |
| Deluxe Corp.(a) | | 11,800 | | | 268,568 | |
| Encore Capital Group, Inc.* | | 6,000 | | | 127,560 | |
| EnergySolutions, Inc.* | | 19,070 | | | 58,926 | |
| EnerNOC, Inc.(a)* | | 4,955 | | | 53,861 | |
| Ennis, Inc. | | 5,800 | | | 77,314 | |
| Fuel Tech, Inc.(a)* | | 3,948 | | | 25,978 | |
| G&K Services, Inc., Class A | | 4,300 | | | 125,173 | |
| Geo Group, Inc. (The)* | | 13,910 | | | 232,992 | |
| Healthcare Services Group, Inc.(a) | | 22,639 | | | 400,484 | |
| Herman Miller, Inc.(a) | | 12,502 | | | 230,662 | |
| HNI Corp.(a) | | 10,511 | | | 274,337 | |
| Innerworkings, Inc.(a)* | | 10,529 | | | 98,025 | |
| Interface, Inc., Class A | | 9,293 | | | 107,241 | |
| Intersections, Inc. | | 4,100 | | | 45,469 | |
| KAR Auction Services, Inc.* | | 7,629 | | | 102,992 | |
| Kimball International, Inc., Class B(a) | | 4,900 | | | 24,843 | |
| Knoll, Inc. | | 11,450 | | | 170,032 | |
| Mcgrath Rentcorp | | 5,300 | | | 153,647 | |
| Metalico, Inc.(a)* | | 12,495 | | | 41,109 | |
| Mine Safety Appliances Co.(a) | | 8,100 | | | 268,272 | |
| Mobile Mini, Inc.(a)* | | 9,585 | | | 167,258 | |
| Multi-Color Corp.(a) | | 2,674 | | | 68,802 | |
| NL Industries, Inc.(a) | | 11,700 | | | 151,749 | |
| Portfolio Recovery Associates, Inc.(a)* | | 3,600 | | | 243,072 | |
| Quad/Graphics, Inc.(a) | | 556 | | | 7,973 | |
| Schawk, Inc.(a) | | 5,600 | | | 62,776 | |
| Standard Parking Corp.* | | 4,000 | | | 71,480 | |
| Standard Register Co. | | 5,600 | | | 13,048 | |
| Steelcase, Inc., Class A | | 18,044 | | | 134,608 | |
| SYKES Enterprises, Inc.* | | 11,326 | | | 177,365 | |
| Team, Inc.(a)* | | 4,200 | | | 124,950 | |
| Tetra Tech, Inc.* | | 13,589 | | | 293,387 | |
| TRC Cos., Inc.(a)* | | 7,000 | | | 42,070 | |
| UniFirst Corp. | | 3,000 | | | 170,220 | |
| United Stationers, Inc. | | 12,800 | | | 416,768 | |
| US Ecology, Inc.(a) | | 3,766 | | | 70,725 | |
| Versar, Inc.(a)* | | 2,000 | | | 6,300 | |
| Viad Corp. | | 4,500 | | | 78,660 | |
| Virco Manufacturing(a) | | 2,494 | | | 4,015 | |
| WCA Waste Corp.(a)* | | 7,300 | | | 47,523 | |
| | | | | | 6,270,309 | |
| Communications Equipment — 2.1% | | | | | | |
| Anaren, Inc.* | | 3,900 | | | 64,818 | |
| Arris Group, Inc.* | | 29,127 | | | 315,154 | |
| Aviat Networks, Inc.* | | 15,448 | | | 28,270 | |
| Aware, Inc.(a)* | | 4,900 | | | 14,798 | |
| Bel Fuse, Inc., Class B(a) | | 1,890 | | | 35,438 | |
| Black Box Corp. | | 3,700 | | | 103,748 | |
| Blue Coat Systems, Inc.(a)* | | 8,700 | | | 221,415 | |
| CalAmp Corp.* | | 5,179 | | | 22,011 | |
| Calix, Inc.(a)* | | 10,028 | | | 64,881 | |
| Communications Systems, Inc.(a) | | 1,418 | | | 19,937 | |
| Comtech Telecommunications Corp. | | 5,325 | | | 152,401 | |
| Digi International, Inc.(a)* | | 7,600 | | | 84,816 | |
| EchoStar Corp., Class A* | | 7,212 | | | 151,019 | |
| Emulex Corp.* | | 18,500 | | | 126,910 | |
| Extreme Networks(a)* | | 21,300 | | | 62,196 | |
| Finisar Corp.(a)* | | 11,402 | | | 190,926 | |
| Globecomm Systems, Inc.(a)* | | 8,052 | | | 110,151 | |
| Harmonic, Inc.* | | 27,125 | | | 136,710 | |
| Infinera Corp.(a)* | | 23,205 | | | 145,727 | |
| InterDigital, Inc.(a) | | 11,222 | | | 488,943 | |
| Ixia(a)* | | 12,858 | | | 135,138 | |
| KVH Industries, Inc.(a)* | | 3,300 | | | 25,674 | |
| Loral Space & Communications, Inc.* | | 4,100 | | | 266,008 | |
| Netgear, Inc.* | | 7,961 | | | 267,251 | |
| Network Engines, Inc.* | | 6,300 | | | 6,061 | |
| Network Equipment Technologies, Inc.(a)* | | 5,600 | | | 6,496 | |
| Numerex Corp., Class A(a)* | | 2,359 | | | 19,415 | |
| Oclaro, Inc.(a)* | | 10,126 | | | 28,555 | |
| Oplink Communications, Inc.* | | 4,200 | | | 69,174 | |
| Opnext, Inc.(a)* | | 13,882 | | | 11,214 | |
| Optical Cable Corp. | | 374 | | | 1,193 | |
| Orbcomm, Inc.(a)* | | 6,700 | | | 20,033 | |
| PC-Tel, Inc. | | 4,100 | | | 28,044 | |
| Performance Technologies, Inc.* | | 2,500 | | | 4,500 | |
| Plantronics, Inc.(a) | | 11,000 | | | 392,040 | |
| Relm Wireless Corp.(a)* | | 2,000 | | | 2,200 | |
| ShoreTel, Inc.(a)* | | 8,783 | | | 56,036 | |
| Sonus Networks, Inc.* | | 82,636 | | | 198,326 | |
| Sycamore Networks, Inc.(a)* | | 6,549 | | | 117,227 | |
| Symmetricom, Inc.(a)* | | 21,384 | | | 115,260 | |
| Tekelec(a)* | | 14,900 | | | 162,857 | |
| Tellabs, Inc. | | 16,571 | | | 66,947 | |
| Telular Corp. | | 4,597 | | | 34,478 | |
| Tessco Technologies, Inc. | | 1,000 | | | 13,820 | |
| UTStarcom Holdings Corp.(a)* | | 28,400 | | | 39,192 | |
| Viasat, Inc.(a)* | | 8,400 | | | 387,408 | |
22
SA U.S. Small Company Fund
PORTFOLIO OF INVESTMENTS — AS OF DECEMBER 31, 2011 (Unaudited) (Continued)
| | | | SHARES | | VALUE† | |
| COMMON STOCKS (Continued) | | | | | | |
| Communications Equipment (Continued) | | | | | | |
| Westell Technologies, Inc., Class A(a)* | | 13,200 | | $ | 29,304 | |
| | | | | | 5,044,120 | |
| Computers & Peripherals — 1.1% | | | | | | |
| 3D Systems Corp.(a)* | | 10,870 | | | 156,528 | |
| Astro-Med, Inc. | | 575 | | | 4,347 | |
| Avid Technology, Inc.(a)* | | 9,895 | | | 84,404 | |
| Concurrent Computer Corp.* | | 1,444 | | | 5,473 | |
| Cray, Inc.(a)* | | 6,539 | | | 42,307 | |
| Datalink Corp.* | | 3,145 | | | 25,978 | |
| | Dataram Corp.(a)* | | 1,799 | | | 1,457 | |
| Diebold, Inc. | | 14,312 | | | 430,362 | |
| Dot Hill Systems Corp.(a)* | | 17,585 | | | 23,388 | |
| Electronics for Imaging, Inc.* | | 11,600 | | | 165,300 | |
| Hauppauge Digital, Inc.* | | 2,400 | | | 1,440 | |
| Hutchinson Technology, Inc.(a)* | | 5,200 | | | 7,800 | |
| iGO, Inc.(a)* | | 4,686 | | | 3,617 | |
| Imation Corp.(a)* | | 7,297 | | | 41,812 | |
| Immersion Corp.* | | 3,300 | | | 17,094 | |
| Intermec, Inc.* | | 13,900 | | | 95,354 | |
| Interphase Corp.(a)* | | 1,200 | | | 5,424 | |
| Intevac, Inc.(a)* | | 4,883 | | | 36,134 | |
| Novatel Wireless, Inc.(a)* | | 6,800 | | | 21,284 | |
| Presstek, Inc.* | | 8,300 | | | 4,482 | |
| QLogic Corp.* | | 23,017 | | | 345,255 | |
| Qualstar Corp.* | | 3,000 | | | 5,700 | |
| Rimage Corp. | | 4,700 | | | 52,875 | |
| Silicon Graphics International Corp.(a)* | | 5,367 | | | 61,506 | |
| STEC, Inc.* | | 10,200 | | | 87,618 | |
| Stratasys, Inc.* | | 4,214 | | | 128,148 | |
| Super Micro Computer, Inc.(a)* | | 8,309 | | | 130,285 | |
| Synaptics, Inc.* | | 13,601 | | | 410,070 | |
| Transact Technologies, Inc.* | | 1,515 | | | 10,999 | |
| USA Technologies, Inc.(a)* | | 1,931 | | | 2,163 | |
| Video Display Corp.(a)* | | 1,990 | | | 12,099 | |
| Xyratex Ltd.(a) | | 4,624 | | | 61,592 | |
| | | | | | 2,482,295 | |
| Construction & Engineering — 0.9% | | | | | | |
| Aegion Corp.(a)* | | 7,800 | | | 119,652 | |
| Argan, Inc.(a) | | 1,102 | | | 16,761 | |
| Comfort Systems USA, Inc. | | 8,930 | | | 95,730 | |
| Dycom Industries, Inc.* | | 8,000 | | | 167,360 | |
| EMCOR Group, Inc. | | 15,424 | | | 413,517 | |
| Furmanite Corp.(a)* | | 8,080 | | | 50,985 | |
| Granite Construction, Inc.(a) | | 8,594 | | | 203,850 | |
| Great Lakes Dredge & Dock Corp. | | 12,897 | | | 71,707 | |
| Integrated Electrical Services, Inc.(a)* | | 2,998 | | | 5,756 | |
| Layne Christensen Co.(a)* | | 4,921 | | | 119,088 | |
| MasTec, Inc.(a)* | | 17,802 | | | 309,221 | |
| Michael Baker Corp.(a)* | | 1,700 | | | 33,337 | |
| MYR Group, Inc.* | | 4,000 | | | 76,560 | |
| Northwest Pipe Co.(a)* | | 2,100 | | | 48,006 | |
| Orion Marine Group, Inc.* | | 5,211 | | | 34,653 | |
| Pike Electric Corp.(a)* | | 7,600 | | | 54,644 | |
| Primoris Services Corp.(a) | | 10,341 | | | 154,391 | |
| Sterling Construction Co., Inc.* | | 3,741 | | | 40,291 | |
| Tutor Perini Corp.* | | 9,649 | | | 119,069 | |
| | | | | | 2,134,578 | |
| Construction Materials — 0.2% | | | | | | |
| Eagle Materials, Inc. | | 9,800 | | | 251,468 | |
| Headwaters, Inc.(a)* | | 12,353 | | | 27,423 | |
| Texas Industries, Inc. | | 6,200 | | | 190,836 | |
| United States Lime & Minerals, Inc.(a)* | | 1,679 | | | 100,925 | |
| | | | | | 570,652 | |
| Consumer Finance — 1.0% | | | | | | |
| Advance America Cash Advance Centers, Inc.(a) | | 16,711 | | | 149,564 | |
| Cash America International, Inc.(a) | | 6,500 | | | 303,095 | |
| CompuCredit Holdings Corp.(a)* | | 8,609 | | | 31,853 | |
| Consumer Portfolio Services, Inc.(a)* | | 10,500 | | | 9,450 | |
| Credit Acceptance Corp.(a)* | | 5,133 | | | 422,343 | |
| DFC Global Corp.* | | 10,498 | | | 189,594 | |
| Ezcorp, Inc., Class A* | | 11,029 | | | 290,835 | |
| First Cash Financial Services, Inc.* | | 7,400 | | | 259,666 | |
| First Marblehead Corp. (The)(a)* | | 18,037 | | | 21,103 | |
| Green Dot Corp., Class A* | | 6,285 | | | 196,218 | |
| Nelnet, Inc., Class A | | 9,000 | | | 220,230 | |
| QC Holdings, Inc. | | 5,600 | | | 22,512 | |
| World Acceptance Corp.(a)* | | 3,636 | | | 267,246 | |
| | | | | | 2,383,709 | |
| Containers & Packaging — 0.3% | | | | | | |
| AEP Industries, Inc.(a)* | | 1,000 | | | 28,150 | |
| Boise, Inc. | | 25,804 | | | 183,725 | |
| Graphic Packaging Holding Co.* | | 79,328 | | | 337,937 | |
| Myers Industries, Inc. | | 7,217 | | | 89,058 | |
| Northern Technologies International Corp.(a)* | | 800 | | | 10,920 | |
| | | | | | 649,790 | |
| Distributors — 0.2% | | | | | | |
| Core-Mark Holding Co., Inc.(a) | | 2,102 | | | 83,239 | |
| Pool Corp.(a) | | 10,298 | | | 309,970 | |
| VOXX International Corp.(a)* | | 3,800 | | | 32,110 | |
| | | | | | 425,319 | |
| Diversified Consumer Services — 1.5% | | | | | | |
| American Public Education, Inc.(a)* | | 4,715 | | | 204,065 | |
| Archipelago Learning, Inc.(a)* | | 6,048 | | | 58,484 | |
| Ascent Capital Group, Inc., Class A* | | 2,620 | | | 132,886 | |
| Bridgepoint Education, Inc.(a)* | | 13,163 | | | 302,749 | |
| Cambium Learning Group, Inc.(a)* | | 9,541 | | | 28,814 | |
| Capella Education Co.* | | 3,000 | | | 108,150 | |
| Career Education Corp.* | | 17,047 | | | 135,865 | |
| Carriage Services, Inc. | | 3,900 | | | 21,840 | |
| Coinstar, Inc.(a)* | | 6,400 | | | 292,096 | |
| Collectors Universe(a) | | 1,042 | | | 15,182 | |
| Corinthian Colleges, Inc.(a)* | | 14,137 | | | 30,677 | |
| CPI Corp.(a) | | 1,100 | | | 1,991 | |
| Grand Canyon Education, Inc.(a)* | | 9,783 | | | 156,137 | |
| Hillenbrand, Inc.(a) | | 15,646 | | | 349,219 | |
| ITT Educational Services, Inc.(a)* | | 6,143 | | | 349,475 | |
| K12, Inc.(a)* | | 7,906 | | | 141,834 | |
| Learning Tree International, Inc.(a)* | | 5,000 | | | 35,100 | |
| Lincoln Educational Services Corp. | | 5,874 | | | 46,405 | |
| Mac-Gray Corp.(a) | | 2,474 | | | 34,116 | |
| Matthews International Corp., Class A(a) | | 6,900 | | | 216,867 | |
| Regis Corp.(a) | | 12,625 | | | 208,944 | |
| School Specialty, Inc.(a)* | | 4,200 | | | 10,500 | |
| Spectrum Group International, Inc.* | | 7,402 | | | 18,505 | |
| Steiner Leisure Ltd.* | | 3,146 | | | 142,797 | |
| Stewart Enterprises, Inc., Class A(a) | | 18,000 | | | 103,680 | |
| Strayer Education, Inc.(a) | | 2,100 | | | 204,099 | |
| Universal Technical Institute, Inc.(a)* | | 5,900 | | | 75,402 | |
| | | | | | 3,425,879 | |
| Diversified Financial Services — 0.4% | | | | | | |
| Interactive Brokers Group, Inc., Class A | | 11,372 | | | 169,898 | |
| Life Partners Holdings, Inc. | | 3,125 | | | 20,188 | |
23
SA U.S. Small Company Fund
PORTFOLIO OF INVESTMENTS — AS OF DECEMBER 31, 2011 (Unaudited) (Continued)
| | | | SHARES | | VALUE† | |
| COMMON STOCKS (Continued) | | | | | | |
| Diversified Financial Services (Continued) | | | | | | |
| MarketAxess Holdings, Inc. | | 7,712 | | $ | 232,208 | |
| Marlin Business Services Corp.(a) | | 2,800 | | | 35,560 | |
| | MicroFinancial, Inc. | | 400 | | | 2,312 | |
| NewStar Financial, Inc.(a)* | | 13,144 | | | 133,674 | |
| PHH Corp.* | | 12,067 | | | 129,117 | |
| Pico Holdings, Inc.(a)* | | 4,200 | | | 86,436 | |
| Primus Guaranty Ltd.(a)* | | 3,700 | | | 18,130 | |
| Resource America, Inc. | | 3,800 | | | 18,088 | |
| | | | | | 845,611 | |
| Diversified Telecommunication Services — 0.8% | | | | | | |
| AboveNet, Inc.* | | 5,547 | | | 360,610 | |
| Atlantic Tele-Network, Inc.(a) | | 3,600 | | | 140,580 | |
| Cbeyond, Inc.* | | 6,100 | | | 48,861 | |
| Cincinnati Bell, Inc.(a)* | | 51,900 | | | 157,257 | |
| Cogent Communications Group, Inc.* | | 8,914 | | | 150,557 | |
| Consolidated Communications Holdings, Inc.(a) | | 7,482 | | | 142,532 | |
| General Communication, Inc., Class A* | | 16,861 | | | 165,069 | |
| HickoryTech Corp.(a) | | 4,037 | | | 44,730 | |
| IDT Corp., Class B(a) | | 4,900 | | | 45,962 | |
| Iridium Communications, Inc.(a)* | | 13,394 | | | 103,268 | |
| Lumos Networks Corp. | | 4,685 | | | 71,868 | |
| Neutral Tandem, Inc.(a)* | | 6,600 | | | 70,554 | |
| Premiere Global Services, Inc.* | | 13,860 | | | 117,394 | |
| Primus Telecommunications Group, Inc.(a)* | | 929 | | | 11,761 | |
| SureWest Communications | | 3,708 | | | 44,607 | |
| Vonage Holdings Corp.(a)* | | 36,070 | | | 88,372 | |
| Windstream Corp. | | 1,598 | | | 18,761 | |
| | | | | | 1,782,743 | |
| Electric Utilities — 1.5% | | | | | | |
| Allete, Inc.(a) | | 7,400 | | | 310,652 | |
| Central Vermont Public Service Corp. | | 2,500 | | | 87,750 | |
| Cleco Corp. | | 15,000 | | | 571,500 | |
| El Paso Electric Co. | | 11,500 | | | 398,360 | |
| Empire District Electric Co. | | 7,700 | | | 162,393 | |
| IDACORP, Inc. | | 10,600 | | | 449,546 | |
| MGE Energy, Inc.(a) | | 4,500 | | | 210,465 | |
| Otter Tail Corp.(a) | | 7,214 | | | 158,852 | |
| PNM Resources, Inc. | | 17,350 | | | 316,291 | |
| Portland General Electric Co. | | 14,100 | | | 356,589 | |
| UIL Holdings Corp.(a) | | 5,166 | | | 182,721 | |
| Unisource Energy Corp. | | 8,000 | | | 295,360 | |
| Unitil Corp.(a) | | 2,200 | | | 62,436 | |
| | | | | | 3,562,915 | |
| Electrical Equipment — 1.5% | | | | | | |
| A123 Systems, Inc.(a)* | | 23,121 | | | 37,225 | |
| Acuity Brands, Inc. | | 5,663 | | | 300,139 | |
| Allied Motion Technologies, Inc. | | 1,600 | | | 9,024 | |
| AZZ, Inc.(a) | | 2,700 | | | 122,688 | |
| Belden, Inc. | | 10,230 | | | 340,454 | |
| Brady Corp., Class A | | 11,473 | | | 362,203 | |
| Coleman Cable, Inc.* | | 2,781 | | | 24,195 | |
| Encore Wire Corp.(a) | | 5,200 | | | 134,680 | |
| Energy Focus, Inc.(a)* | | 2,200 | | | 440 | |
| EnerSys* | | 10,800 | | | 280,476 | |
| Franklin Electric Co., Inc. | | 5,300 | | | 230,868 | |
| Generac Holdings, Inc.(a)* | | 15,486 | | | 434,073 | |
| General Cable Corp.(a)* | | 10,934 | | | 273,459 | |
| Global Power Equipment Group, Inc.(a)* | | 3,290 | | | 78,137 | |
| Hoku Corp.(a)* | | 8,626 | | | 5,001 | |
| II-VI, Inc.* | | 23,822 | | | 437,372 | |
| LSI Industries, Inc. | | 4,900 | | | 29,400 | |
| Magnetek, Inc.(a)* | | 980 | | | 8,438 | |
| Ocean Power Technologies, Inc.(a)* | | 1,700 | | | 4,590 | |
| Orion Energy Systems, Inc.* | | 3,100 | | | 9,145 | |
| Powell Industries, Inc.(a)* | | 2,600 | | | 81,328 | |
| PowerSecure International, Inc.* | | 5,500 | | | 27,225 | |
| Preformed Line Products Co. | | 850 | | | 50,711 | |
| Regal-Beloit Corp.(a) | | 258 | | | 13,150 | |
| SatCon Technology Corp.(a)* | | 6,900 | | | 4,141 | |
| SL Industries, Inc.* | | 986 | | | 15,973 | |
| Steel Excel, Inc.* | | 2,972 | | | 71,328 | |
| Ultralife Corp.* | | 3,600 | | | 14,472 | |
| Vicor Corp.(a) | | 11,546 | | | 91,906 | |
| | | | | | 3,492,241 | |
| Electronic Equipment, Instruments & Components — 2.9% | | | | |
| ADDvantage Technologies Group, Inc.(a)* | | 2,400 | | | 5,136 | |
| Agilysys, Inc.(a)* | | 5,376 | | | 42,739 | |
| Anixter International, Inc.* | | 6,269 | | | 373,883 | |
| Badger Meter, Inc. | | 3,000 | | | 88,290 | |
| Benchmark Electronics, Inc.* | | 14,710 | | | 198,144 | |
| Brightpoint, Inc.* | | 19,839 | | | 213,468 | |
| Checkpoint Systems, Inc.* | | 8,500 | | | 92,990 | |
| Clearfield, Inc.* | | 1,600 | | | 12,176 | |
| Cognex Corp.(a) | | 9,000 | | | 322,110 | |
| Coherent, Inc.* | | 6,900 | | | 360,663 | |
| Comverge, Inc.(a)* | | 3,361 | | | 4,235 | |
| CTS Corp. | | 6,500 | | | 59,800 | |
| Daktronics, Inc.(a) | | 9,125 | | | 87,326 | |
| DDi Corp.(a) | | 5,736 | | | 53,517 | |
| Digital Theater Systems, Inc.(a)* | | 3,700 | | | 100,788 | |
| Echelon Corp.* | | 6,379 | | | 31,066 | |
| Electro Rent Corp. | | 6,482 | | | 111,166 | |
| Electro Scientific Industries, Inc.* | | 7,067 | | | 102,330 | |
| eMagin Corp.(a)* | | 3,154 | | | 11,670 | |
| Fabrinet(a)* | | 5,128 | | | 70,151 | |
| FARO Technologies, Inc.* | | 3,250 | | | 149,500 | |
| FEI Co.* | | 9,800 | | | 399,644 | |
| Frequency Electronics, Inc.* | | 1,400 | | | 10,724 | |
| GSI Group, Inc.* | | 8,322 | | | 85,134 | |
| GTSI Corp.(a)* | | 2,500 | | | 10,500 | |
| I.D. Systems, Inc.* | | 1,600 | | | 7,568 | |
| Identive Group, Inc.* | | 9,600 | | | 21,408 | |
| IEC Electronics Corp.(a)* | | 800 | | | 3,800 | |
| Insight Enterprises, Inc.* | | 10,250 | | | 156,722 | |
| Intelli-Check - Mobilisa, Inc.(a)* | | 3,500 | | | 2,975 | |
| IntriCon Corp.* | | 1,000 | | | 6,240 | |
| IPG Photonics Corp.* | | 3,943 | | | 133,549 | |
| Iteris, Inc.(a)* | | 7,798 | | | 10,137 | |
| Kemet Corp.* | | 7,336 | | | 51,719 | |
| KEY Tronic Corp.* | | 1,700 | | | 7,973 | |
| LeCroy Corp.* | | 5,920 | | | 49,787 | |
| Littelfuse, Inc.(a) | | 4,865 | | | 209,098 | |
| LoJack Corp.* | | 6,666 | | | 20,465 | |
| Maxwell Technologies, Inc.* | | 820 | | | 13,317 | |
| Measurement Specialties, Inc.* | | 3,300 | | | 92,268 | |
| Mercury Computer Systems, Inc.* | | 6,770 | | | 89,973 | |
| Methode Electronics, Inc., Class A | | 8,200 | | | 67,978 | |
| MTS Systems Corp. | | 3,800 | | | 154,850 | |
| Multi-Fineline Electronix, Inc.* | | 6,500 | | | 133,575 | |
| NAPCO Security Technologies, Inc.* | | 4,850 | | | 12,076 | |
| NetList, Inc.* | | 3,200 | | | 8,032 | |
| Newport Corp.* | | 8,200 | | | 111,602 | |
| OSI Systems, Inc.* | | 3,842 | | | 187,413 | |
| PAR Technology Corp.* | | 3,000 | | | 11,730 | |
| Park Electrochemical Corp.(a) | | 4,000 | | | 102,480 | |
| PC Connection, Inc.(a) | | 6,200 | | | 68,758 | |
24
SA U.S. Small Company Fund
PORTFOLIO OF INVESTMENTS — AS OF DECEMBER 31, 2011 (Unaudited) (Continued)
| | | | SHARES | | VALUE† | |
| COMMON STOCKS (Continued) | | | | | | |
| Electronic Equipment, Instruments & Components (Continued) | | | | |
| PC Mall, Inc.* | | 2,200 | | $ | 13,816 | |
| Perceptron, Inc.* | | 1,100 | | | 5,236 | |
| Planar Systems, Inc.(a)* | | 3,817 | | | 7,405 | |
| | Plexus Corp.(a)* | | 8,900 | | | 243,682 | |
| Power-One, Inc.* | | 23,462 | | | 91,736 | |
| Pulse Electronics Corp.(a) | | 9,000 | | | 25,200 | |
| Radisys Corp.(a)* | | 9,800 | | | 49,588 | |
| Remec, Inc.(b)* | | 4,693 | | | — | |
| Research Frontiers, Inc.(a)* | | 2,600 | | | 8,788 | |
| Richardson Electronics Ltd.(a) | | 2,700 | | | 33,183 | |
| Rofin-Sinar Technologies, Inc.* | | 7,200 | | | 164,520 | |
| Rogers Corp.* | | 3,900 | | | 143,754 | |
| Sanmina-SCI Corp.(a)* | | 17,544 | | | 163,335 | |
| Scansource, Inc.(a)* | | 5,700 | | | 205,200 | |
| SYNNEX Corp.(a)* | | 7,200 | | | 219,312 | |
| Tech Data Corp.* | | 402 | | | 19,863 | |
| TTM Technologies, Inc.(a)* | | 16,816 | | | 184,303 | |
| Ultimate Electrs, Inc.(b)* | | 1,600 | | | — | |
| Universal Display Corp.(a)* | | 4,188 | | | 153,658 | |
| Viasystems Group, Inc.(a)* | | 2,056 | | | 34,788 | |
| Vicon Industries, Inc.* | | 1,000 | | | 3,260 | |
| Vishay Intertechnology, Inc.(a)* | | 21,074 | | | 189,455 | |
| Vishay Precision Group, Inc.(a)* | | 2,771 | | | 44,281 | |
| Wireless Ronin Technologies, Inc.(a)* | | 2,168 | | | 2,602 | |
| X-Rite, Inc.(a)* | | 10,721 | | | 49,745 | |
| Zygo Corp.(a)* | | 3,600 | | | 63,540 | |
| | | | | | 6,852,893 | |
| Energy Equipment & Services — 2.1% | | | | | | |
| Basic Energy Services, Inc.(a)* | | 9,300 | | | 183,210 | |
| Bolt Technology Corp. | | 2,382 | | | 27,250 | |
| Bristow Group, Inc. | | 8,471 | | | 401,441 | |
| Cal Dive International, Inc.(a)* | | 19,390 | | | 43,627 | |
| Complete Production Services, Inc.* | | 15,113 | | | 507,192 | |
| Dawson Geophysical Co.* | | 1,100 | | | 43,483 | |
| ENGlobal Corp.(a)* | | 6,100 | | | 12,871 | |
| Exterran Holdings, Inc.* | | 11,723 | | | 106,679 | |
| Geokinetics, Inc.(a)* | | 3,853 | | | 8,284 | |
| Gulf Island Fabrication, Inc. | | 3,600 | | | 105,156 | |
| Gulfmark Offshore, Inc., Class A* | | 5,929 | | | 249,077 | |
| Helix Energy Solutions Group, Inc.* | | 26,225 | | | 414,355 | |
| Hercules Offshore, Inc.* | | 30,281 | | | 134,448 | |
| Hornbeck Offshore Services, Inc.* | | 7,200 | | | 223,344 | |
| ION Geophysical Corp.(a)* | | 27,183 | | | 166,632 | |
| Key Energy Services, Inc.* | | 30,901 | | | 478,038 | |
| Lufkin Industries, Inc.(a) | | 5,102 | | | 343,416 | |
| Matrix Service Co.* | | 5,900 | | | 55,696 | |
| Mitcham Industries, Inc.(a)* | | 2,601 | | | 56,806 | |
| Natural Gas Services Group, Inc.(a)* | | 2,500 | | | 36,150 | |
| Newpark Resources(a)* | | 19,900 | | | 189,050 | |
| OYO Geospace Corp.(a)* | | 1,000 | | | 77,330 | |
| Parker Drilling Co.* | | 28,039 | | | 201,040 | |
| PHI, Inc.(a)* | | 2,300 | | | 57,155 | |
| Pioneer Drilling Co.* | | 12,313 | | | 119,190 | |
| SEACOR Holdings, Inc.* | | 4,159 | | | 369,985 | |
| Tesco Corp.* | | 7,980 | | | 100,867 | |
| Tetra Technologies, Inc.* | | 16,850 | | | 157,379 | |
| TGC Industries, Inc.* | | 6,191 | | | 44,204 | |
| Union Drilling, Inc.(a)* | | 5,000 | | | 31,200 | |
| Willbros Group, Inc.(a)* | | 9,856 | | | 36,171 | |
| | | | | | 4,980,726 | |
| Food & Staples Retailing — 1.4% | | | | | | |
| Casey's General Stores, Inc. | | 12,174 | | | 627,083 | |
| Ingles Markets, Inc.(a) | | 2,600 | | | 39,156 | |
| Nash Finch Co. | | 2,253 | | | 65,968 | |
| PriceSmart, Inc. | | 6,250 | | | 434,937 | |
| Ruddick Corp.(a) | | 10,900 | | | 464,776 | |
| Spartan Stores, Inc.(a) | | 5,198 | | | 96,163 | |
| SUPERVALU, Inc.(a) | | 42,984 | | | 349,030 | |
| Susser Holdings Corp.* | | 4,500 | | | 101,790 | |
| The Andersons, Inc.(a) | | 4,100 | | | 179,006 | |
| The Pantry, Inc.* | | 5,100 | | | 61,047 | |
| United Natural Foods, Inc.* | | 10,300 | | | 412,103 | |
| Weis Markets, Inc.(a) | | 6,390 | | | 255,217 | |
| Winn-Dixie Stores, Inc.* | | 10,200 | | | 95,676 | |
| | | | | | 3,181,952 | |
| Food Products — 2.1% | | | | | | |
| Alico, Inc.(a) | | 1,300 | | | 25,181 | |
| B&G Foods, Inc.(a) | | 12,000 | | | 288,840 | |
| Bridgford Foods Corp.(a)* | | 101 | | | 986 | |
| Cagle's, Inc., Class A(a)* | | 1,200 | | | 58 | |
| Cal-Maine Foods, Inc. | | 5,100 | | | 186,507 | |
| Calavo Growers, Inc.(a) | | 5,041 | | | 129,453 | |
| Chiquita Brands International, Inc.(a)* | | 10,000 | | | 83,400 | |
| Coffee Holding Co., Inc.(a) | | 600 | | | 4,704 | |
| Darling International, Inc.* | | 28,400 | | | 377,436 | |
| Dean Foods Co.* | | 24,006 | | | 268,867 | |
| Diamond Foods, Inc.(a) | | 4,637 | | | 149,636 | |
| Dole Food Co., Inc.(a)* | | 18,855 | | | 163,096 | |
| Farmer Bros. Co.(a) | | 3,200 | | | 24,448 | |
| Fresh Del Monte Produce, Inc. | | 13,331 | | | 333,408 | |
| Hain Celestial Group, Inc.(a)* | | 10,979 | | | 402,490 | |
| Imperial Sugar Co.(a) | | 3,200 | | | 11,424 | |
| J&J Snack Foods Corp. | | 4,500 | | | 239,760 | |
| John B. Sanfilippo & Son, Inc.* | | 2,650 | | | 19,981 | |
| Lancaster Colony Corp.(a) | | 7,600 | | | 526,984 | |
| Lifeway Foods, Inc.(a)* | | 3,800 | | | 36,632 | |
| Limoneira Co.(a) | | 245 | | | 4,143 | |
| Omega Protein Corp.* | | 4,197 | | | 29,925 | |
| Overhill Farms, Inc.* | | 1,600 | | | 5,936 | |
| Pilgrims Pride Corp.(a)* | | 35,385 | | | 203,818 | |
| Rocky Mountain Chocolate Factory, Inc.(a) | | 1,260 | | | 10,760 | |
| Sanderson Farms, Inc. | | 4,600 | | | 230,598 | |
| Scheid Vineyards, Inc., Class A* | | 20 | | | 180 | |
| Seneca Foods Corp., Class A* | | 1,249 | | | 32,249 | |
| Smart Balance, Inc.(a)* | | 17,615 | | | 94,416 | |
| Snyders-Lance, Inc.(a) | | 15,840 | | | 356,400 | |
| Tootsie Roll Industries, Inc.(a) | | 9,002 | | | 213,077 | |
| TreeHouse Foods, Inc.(a)* | | 7,400 | | | 483,812 | |
| | | | | | 4,938,605 | |
| Gas Utilities — 0.8% | | | | | | |
| Chesapeake Utilities Corp.(a) | | 2,043 | | | 88,564 | |
| Delta Natural Gas Co., Inc.(a) | | 200 | | | 6,870 | |
| Gas Natural, Inc.(a) | | 300 | | | 3,423 | |
| Laclede Group, Inc. (The) | | 4,500 | | | 182,115 | |
| New Jersey Resources Corp.(a) | | 9,451 | | | 464,989 | |
| Northwest Natural Gas Co.(a) | | 6,800 | | | 325,924 | |
| RGC Resources, Inc.(a) | | 400 | | | 7,228 | |
| South Jersey Industries, Inc. | | 6,400 | | | 363,584 | |
| Southwest Gas Corp. | | 9,900 | | | 420,651 | |
| | | | | | 1,863,348 | |
| Health Care Equipment & Supplies — 3.2% | | | | | | |
| Abaxis, Inc.(a)* | | 2,970 | | | 82,180 | |
| ABIOMED, Inc.(a)* | | 8,588 | | | 158,620 | |
| Accuray, Inc.(a)* | | 17,223 | | | 72,853 | |
| Align Technology, Inc.* | | 17,775 | | | 421,712 | |
| Alphatec Holdings, Inc.* | | 14,824 | | | 25,497 | |
25
SA U.S. Small Company Fund
PORTFOLIO OF INVESTMENTS — AS OF DECEMBER 31, 2011 (Unaudited) (Continued)
| | | | SHARES | | VALUE† | |
| COMMON STOCKS (Continued) | | | | | | |
| Health Care Equipment & Supplies (Continued) | | | | | | |
| Analogic Corp. | | 3,000 | | $ | 171,960 | |
| Angiodynamics, Inc.* | | 6,163 | | | 91,274 | |
| Anika Therapeutics, Inc.* | | 4,100 | | | 40,180 | |
| Arthrocare Corp.(a)* | | 6,000 | | | 190,080 | |
| AtriCure, Inc.(a)* | | 2,740 | | | 30,414 | |
| Biolase Technology, Inc.(a)* | | 5,721 | | | 14,703 | |
| Bovie Medical Corp.* | | 4,900 | | | 10,388 | |
| Cantel Medical Corp. | | 3,950 | | | 110,323 | |
| Cardiovascular Systems, Inc.(a)* | | 672 | | | 6,619 | |
| CAS Medical Systems, Inc.(a)* | | 1,129 | | | 1,964 | |
| Cerus Corp.* | | 6,200 | | | 17,360 | |
| Conceptus, Inc.(a)* | | 12,100 | | | 152,944 | |
| Conmed Corp.(a)* | | 7,150 | | | 183,540 | |
| CryoLife, Inc.* | | 6,300 | | | 30,240 | |
| Cutera, Inc.* | | 4,899 | | | 36,498 | |
| Cyberonics, Inc.(a)* | | 6,200 | | | 207,700 | |
| Cynosure, Inc., Class A(a)* | | 1,412 | | | 16,605 | |
| Digirad Corp.* | | 2,100 | | | 4,116 | |
| DynaVox, Inc.(a)* | | 984 | | | 3,582 | |
| Endologix, Inc.(a)* | | 16,288 | | | 186,986 | |
| EnteroMedics, Inc.(a)* | | 125 | | | 213 | |
| Exactech, Inc.(a)* | | 2,535 | | | 41,751 | |
| Greatbatch, Inc.(a)* | | 7,881 | | | 174,170 | |
| Haemonetics Corp.* | | 5,900 | | | 361,198 | |
| Hill-Rom Holdings, Inc. | | 7,584 | | | 255,505 | |
| ICU Medical, Inc.(a)* | | 2,950 | | | 132,750 | |
| | Integra LifeSciences Holdings Corp.(a)* | | 6,543 | | | 201,721 | |
| Invacare Corp.(a) | | 9,357 | | | 143,069 | |
| Iridex Corp.* | | 1,000 | | | 3,740 | |
| IRIS International, Inc.* | | 4,200 | | | 39,270 | |
| Kensey Nash Corp.(a)* | | 2,900 | | | 55,651 | |
| LeMaitre Vascular, Inc.(a) | | 6,218 | | | 36,811 | |
| MAKO Surgical Corp.(a)* | | 2,340 | | | 58,991 | |
| Masimo Corp.* | | 9,492 | | | 177,358 | |
| Medical Action Industries, Inc.(a)* | | 4,450 | | | 23,274 | |
| Meridian Bioscience, Inc.(a) | | 4,708 | | | 88,699 | |
| Merit Medical Systems, Inc.* | | 15,874 | | | 212,394 | |
| Misonix, Inc.(a)* | | 2,200 | | | 4,488 | |
| Natus Medical, Inc.* | | 8,702 | | | 82,060 | |
| Neogen Corp.(a)* | | 4,517 | | | 138,401 | |
| Neurometrix, Inc.* | | 466 | | | 583 | |
| NuVasive, Inc.* | | 8,100 | | | 101,979 | |
| NxStage Medical, Inc.(a)* | | 883 | | | 15,700 | |
| OraSure Technologies, Inc.(a)* | | 11,100 | | | 101,121 | |
| Orthofix International NV* | | 3,489 | | | 122,917 | |
| Palomar Medical Technologies, Inc.(a)* | | 7,282 | | | 67,723 | |
| PhotoMedex, Inc.(a)* | | 258 | | | 3,328 | |
| Quidel Corp.(a)* | | 10,385 | | | 157,125 | |
| Retractable Technologies, Inc.(a)* | | 1,926 | | | 2,273 | |
| Rochester Medical Corp.* | | 1,500 | | | 12,435 | |
| Rockwell Medical Technologies, Inc.(a)* | | 2,600 | | | 22,022 | |
| RTI Biologics, Inc.* | | 11,039 | | | 49,013 | |
| Solta Medical, Inc.(a)* | | 10,131 | | | 31,811 | |
| SonoSite, Inc.(a)* | | 3,400 | | | 183,124 | |
| Spectranetics Corp.(a)* | | 7,200 | | | 51,984 | |
| Staar Surgical Co.(a)* | | 5,280 | | | 55,387 | |
| Stereotaxis, Inc.(a)* | | 3,941 | | | 3,246 | |
| STERIS Corp.(a) | | 11,903 | | | 354,947 | |
| SurModics, Inc.* | | 3,700 | | | 54,242 | |
| Symmetry Medical, Inc.* | | 11,100 | | | 88,689 | |
| Synovis Life Technologies, Inc.(a)* | | 2,484 | | | 69,130 | |
| Theragenics Corp.* | | 7,500 | | | 12,600 | |
| Thoratec Corp.* | | 17,008 | | | 570,788 | |
| TranS1, Inc.(a)* | | 2,263 | | | 4,232 | |
| Uroplasty, Inc.* | | 2,952 | | | 12,546 | |
| Vascular Solutions, Inc.(a)* | | 6,500 | | | 72,345 | |
| West Pharmaceutical Services, Inc.(a) | | 7,400 | | | 280,830 | |
| Wright Medical Group, Inc.(a)* | | 8,500 | | | 140,250 | |
| Young Innovations, Inc.(a) | | 1,900 | | | 56,297 | |
| Zoll Medical Corp.* | | 4,526 | | | 285,953 | |
| | | | | | 7,484,472 | |
| Health Care Providers & Services — 3.4% | | | | | | |
| Acadia Healthcare Co., Inc.* | | 1,075 | | | 10,718 | |
| Air Methods Corp.(a)* | | 3,348 | | | 282,739 | |
| Alliance HealthCare Services, Inc.(a)* | | 12,600 | | | 15,876 | |
| Almost Family, Inc.(a)* | | 1,100 | | | 18,238 | |
| Amedisys, Inc.(a)* | | 6,053 | | | 66,038 | |
| American Caresource Holdings, Inc.(a)* | | 600 | | | 241 | |
| American Dental Partners, Inc.(a)* | | 3,359 | | | 63,250 | |
| AMN Healthcare Services, Inc.(a)* | | 9,000 | | | 39,870 | |
| Amsurg Corp.* | | 7,750 | | | 201,810 | |
| Assisted Living Concepts, Inc., Class A(a) | | 4,248 | | | 63,253 | |
| Bio-Reference Labs, Inc.(a)* | | 5,243 | | | 85,304 | |
| BioScrip, Inc.(a)* | | 12,988 | | | 70,914 | |
| Capital Senior Living Corp.(a)* | | 9,398 | | | 74,620 | |
| CardioNet, Inc.* | | 3,237 | | | 7,672 | |
| Catalyst Health Solutions, Inc.* | | 3,351 | | | 174,252 | |
| Centene Corp.* | | 10,900 | | | 431,531 | |
| Chemed Corp.(a) | | 5,500 | | | 281,655 | |
| Chindex International, Inc.(a)* | | 2,640 | | | 22,493 | |
| Corvel Corp.* | | 2,550 | | | 131,860 | |
| Cross Country Healthcare, Inc.(a)* | | 6,900 | | | 38,295 | |
| Dynacq Healthcare, Inc.(a)* | | 1,300 | | | 1,417 | |
| Emeritus Corp.(a)* | | 9,685 | | | 169,584 | |
| Ensign Group, Inc. (The)(a) | | 4,200 | | | 102,900 | |
| Five Star Quality Care, Inc.* | | 12,800 | | | 38,400 | |
| Gentiva Health Services, Inc.* | | 6,500 | | | 43,875 | |
| Hanger Orthopedic Group, Inc.* | | 8,636 | | | 161,407 | |
| Healthsouth Corp.* | | 18,900 | | | 333,963 | |
| Healthways, Inc.(a)* | | 6,798 | | | 46,634 | |
| Integramed America, Inc.* | | 1,987 | | | 15,598 | |
| IPC The Hospitalist Co., Inc.(a)* | | 2,665 | | | 121,844 | |
| Kindred Healthcare, Inc.(a)* | | 11,383 | | | 133,978 | |
| Landauer, Inc.(a) | | 1,800 | | | 92,700 | |
| LCA-Vision, Inc.(a)* | | 5,917 | | | 17,159 | |
| LHC Group, Inc.(a)* | | 3,800 | | | 48,754 | |
| LifePoint Hospitals, Inc.(a)* | | 11,146 | | | 414,074 | |
| Magellan Health Services, Inc.* | | 11,300 | | | 559,011 | |
| Medcath Corp.* | | 3,122 | | | 22,759 | |
| MedQuist Holdings, Inc.(a)* | | 11,900 | | | 114,478 | |
| Metropolitan Health Networks, Inc.* | | 12,789 | | | 95,534 | |
| Molina Healthcare, Inc.(a)* | | 9,750 | | | 217,717 | |
| MWI Veterinary Supply, Inc.(a)* | | 2,292 | | | 152,280 | |
| National Healthcare Corp.(a) | | 3,000 | | | 125,700 | |
| Owens & Minor, Inc.(a) | | 12,204 | | | 339,149 | |
| PDI, Inc.* | | 3,600 | | | 23,220 | |
| PharMerica Corp.* | | 5,650 | | | 85,767 | |
| Providence Service Corp.(a)* | | 4,498 | | | 61,892 | |
| PSS World Medical, Inc.(a)* | | 24,238 | | | 586,317 | |
| Psychemedics Corp. | | 400 | | | 3,640 | |
| RadNet, Inc.(a)* | | 8,150 | | | 17,360 | |
| Select Medical Holdings Corp.(a)* | | 32,321 | | | 274,082 | |
| Skilled Healthcare Group, Inc., Class A(a)* | | 3,695 | | | 20,175 | |
| SRI/Surgical Express, Inc.(a)* | | 1,100 | | | 4,675 | |
| Sun Healthcare Group, Inc.* | | 4,743 | | | 18,403 | |
| Sunrise Senior Living, Inc.(a)* | | 11,840 | | | 76,723 | |
| Team Health Holdings, Inc.* | | 14,045 | | | 309,973 | |
| Triple-S Management Corp., Class B(a)* | | 4,035 | | | 80,781 | |
26
SA U.S. Small Company Fund
PORTFOLIO OF INVESTMENTS — AS OF DECEMBER 31, 2011 (Unaudited) (Continued)
| | | | SHARES | | VALUE† | |
| COMMON STOCKS (Continued) | | | | | | |
| Health Care Providers & Services (Continued) | | | | | | |
| U.S. Physical Therapy, Inc. | | 2,650 | | $ | 52,152 | |
| | Universal American Corp.(a) | | 16,273 | | | 206,830 | |
| VCA Antech, Inc.* | | 15,281 | | | 301,800 | |
| WellCare Health Plans, Inc.* | | 8,500 | | | 446,250 | |
| | | | | | 8,019,584 | |
| Health Care Technology — 0.6% | | | | | | |
| Arrhythmia Research Technology, Inc. | | 200 | | | 650 | |
| athenahealth, Inc.(a)* | | 1,168 | | | 57,372 | |
| Computer Programs & Systems, Inc. | | 1,836 | | | 93,838 | |
| HealthStream, Inc.* | | 6,062 | | | 111,844 | |
| MedAssets, Inc.* | | 12,409 | | | 114,783 | |
| Medidata Solutions, Inc.* | | 2,217 | | | 48,220 | |
| Merge Healthcare, Inc.* | | 12,632 | | | 61,265 | |
| Omnicell, Inc.* | | 7,300 | | | 120,596 | |
| Quality Systems, Inc.(a) | | 20,036 | | | 741,132 | |
| Simulations Plus, Inc.* | | 800 | | | 2,392 | |
| Transcend Services, Inc.(a)* | | 2,288 | | | 54,294 | |
| | | | | | 1,406,386 | |
| Hotels, Restaurants & Leisure — 3.8% | | | | | | |
| AFC Enterprises, Inc.* | | 6,349 | | | 93,330 | |
| Ambassadors Group, Inc.(a) | | 4,300 | | | 19,393 | |
| Ameristar Casinos, Inc. | | 9,200 | | | 159,068 | |
| Bally Technologies, Inc.* | | 4,108 | | | 162,512 | |
| Benihana, Inc., Class A(a)* | | 4,448 | | | 45,503 | |
| Biglari Holdings, Inc.(a)* | | 320 | | | 117,837 | |
| BJ's Restaurants, Inc.(a)* | | 8,000 | | | 362,560 | |
| Bluegreen Corp.(a)* | | 7,100 | | | 19,951 | |
| Bob Evans Farms, Inc.(a) | | 7,000 | | | 234,780 | |
| Boyd Gaming Corp.(a)* | | 16,663 | | | 124,306 | |
| Bravo Brio Restaurant Group, Inc.* | | 533 | | | 9,141 | |
| Brinker International, Inc. | | 16,410 | | | 439,132 | |
| Buffalo Wild Wings, Inc.(a)* | | 4,000 | | | 270,040 | |
| Caribou Coffee Co., Inc.(a)* | | 5,058 | | | 70,559 | |
| Carrols Restaurant Group, Inc.(a)* | | 8,600 | | | 99,502 | |
| CEC Entertainment, Inc. | | 5,150 | | | 177,417 | |
| Cheesecake Factory, Inc. (The)* | | 13,476 | | | 395,521 | |
| Choice Hotels International, Inc.(a) | | 787 | | | 29,945 | |
| Churchill Downs, Inc. | | 3,820 | | | 199,137 | |
| Cracker Barrel Old Country Store, Inc. | | 5,000 | | | 252,050 | |
| DineEquity, Inc.(a)* | | 3,900 | | | 164,619 | |
| Domino's Pizza, Inc.(a)* | | 16,189 | | | 549,617 | |
| Dover Downs Gaming & Entertainment, Inc. | | 3,400 | | | 7,276 | |
| Dover Motorsports, Inc.* | | 4,000 | | | 4,160 | |
| Einstein Noah Restaurant Group, Inc.(a) | | 3,600 | | | 56,952 | |
| Famous Dave's Of America, Inc.(a)* | | 2,145 | | | 22,265 | |
| Full House Resorts, Inc.* | | 4,300 | | | 11,309 | |
| Gaming Partners International Corp.(a) | | 1,300 | | | 8,060 | |
| Gaylord Entertainment Co.(a)* | | 10,022 | | | 241,931 | |
| Great Wolf Resorts, Inc.(a)* | | 8,725 | | | 25,302 | |
| International Speedway Corp., Class A | | 6,832 | | | 173,191 | |
| Interval Leisure Group, Inc.(a)* | | 15,989 | | | 217,610 | |
| Isle of Capri Casinos, Inc.* | | 8,287 | | | 38,700 | |
| J. Alexander's Corp.(a)* | | 800 | | | 5,000 | |
| Jack in the Box, Inc.* | | 14,400 | | | 300,960 | |
| Kona Grill, Inc.* | | 1,540 | | | 9,425 | |
| Krispy Kreme Doughnuts, Inc.(a)* | | 15,525 | | | 101,533 | |
| Lakes Entertainment, Inc.* | | 6,530 | | | 12,276 | |
| Life Time Fitness, Inc.(a)* | | 9,707 | | | 453,802 | |
| Luby's, Inc.(a)* | | 7,260 | | | 32,743 | |
| Marcus Corp. (The) | | 4,500 | | | 56,745 | |
| Monarch Casino & Resort, Inc.* | | 3,600 | | | 36,684 | |
| Morton's Restaurant Group, Inc.* | | 3,100 | | | 21,328 | |
| MTR Gaming Group, Inc.(a)* | | 6,300 | | | 11,781 | |
| Multimedia Games, Inc.* | | 6,030 | | | 47,878 | |
| Nathan's Famous, Inc.* | | 1,385 | | | 29,113 | |
| Nevada Gold & Casinos, Inc.* | | 1,712 | | | 1,969 | |
| O'Charleys, Inc.(a)* | | 4,820 | | | 26,462 | |
| Orient-Express Hotels Ltd.* | | 21,903 | | | 163,615 | |
| P.F. Chang's China Bistro, Inc. | | 5,870 | | | 181,442 | |
| Papa John's International, Inc.* | | 6,315 | | | 237,949 | |
| Peet's Coffee & Tea, Inc.* | | 2,900 | | | 181,772 | |
| Pinnacle Entertainment, Inc.* | | 13,499 | | | 137,150 | |
| PokerTek, Inc.* | | 500 | | | 475 | |
| Red Lion Hotels Corp.(a)* | | 4,500 | | | 31,185 | |
| Red Robin Gourmet Burgers, Inc.* | | 3,300 | | | 91,410 | |
| Rick's Cabaret International, Inc.(a)* | | 2,209 | | | 18,688 | |
| Ruby Tuesday, Inc.(a)* | | 14,262 | | | 98,408 | |
| Ruth's Hospitality Group, Inc.* | | 8,054 | | | 40,028 | |
| Scientific Games Corp., Class A* | | 18,781 | | | 182,176 | |
| Shuffle Master, Inc.* | | 11,762 | | | 137,851 | |
| Six Flags Entertainment Corp. | | 11,175 | | | 460,857 | |
| Sonic Corp.* | | 13,575 | | | 91,360 | |
| Speedway Motorsports, Inc.(a) | | 10,200 | | | 156,366 | |
| Texas Roadhouse, Inc., Class A(a) | | 15,300 | | | 227,970 | |
| Town Sports International Holdings, Inc.(a)* | | 8,000 | | | 58,800 | |
| Vail Resorts, Inc.(a) | | 8,330 | | | 352,859 | |
| Wendy's Co. (The) | | 5,771 | | | 30,933 | |
| | | | | | 8,831,669 | |
| Household Durables — 0.9% | | | | | | |
| American Greetings Corp., Class A(a) | | 9,420 | | | 117,844 | |
| Bassett Furniture Industries, Inc.(a) | | 2,600 | | | 19,474 | |
| Beazer Homes USA, Inc.(a)* | | 16,520 | | | 40,970 | |
| Blyth, Inc.(a) | | 2,000 | | | 113,600 | |
| California Coastal Communities, Inc.(b)* | | 1,800 | | | — | |
| Cavco Industries, Inc.* | | 1,100 | | | 44,066 | |
| CSS Industries, Inc.(a) | | 2,100 | | | 41,832 | |
| Dixie Group, Inc.(a)* | | 2,300 | | | 6,785 | |
| Emerson Radio Corp.(a)* | | 1,300 | | | 2,067 | |
| Ethan Allen Interiors, Inc.(a) | | 7,100 | | | 168,341 | |
| Furniture Brands International, Inc.(a)* | | 11,300 | | | 13,899 | |
| Helen of Troy Ltd.* | | 7,111 | | | 218,308 | |
| Hooker Furniture Corp.(a) | | 2,500 | | | 28,675 | |
| iRobot Corp.* | | 4,418 | | | 131,877 | |
| KB Home(a) | | 18,500 | | | 124,320 | |
| Kid Brands, Inc.* | | 5,342 | | | 16,881 | |
| La-Z-Boy, Inc.(a)* | | 11,200 | | | 133,280 | |
| Libbey, Inc.(a)* | | 4,108 | | | 52,336 | |
| Lifetime Brands, Inc.(a) | | 3,200 | | | 38,848 | |
| M.D.C. Holdings, Inc.(a) | | 11,867 | | | 209,215 | |
| M/I Homes, Inc.(a)* | | 3,928 | | | 37,709 | |
| Meritage Homes Corp.(a)* | | 6,706 | | | 155,512 | |
| Orleans Homebuilders, Inc.(b) | | 4,953 | | | — | |
| Ryland Group, Inc. | | 9,600 | | | 151,296 | |
| Sealy Corp.* | | 10,800 | | | 18,576 | |
| Skyline Corp.(a) | | 1,200 | | | 5,220 | |
| Standard Pacific Corp.(a)* | | 43,219 | | | 137,436 | |
| Stanley Furniture Co., Inc.(a)* | | 927 | | | 2,781 | |
| Universal Electronics, Inc.(a)* | | 2,800 | | | 47,236 | |
| | | | | | 2,078,384 | |
| Household Products — 0.3% | | | | | | |
| Central Garden and Pet Co.* | | 5,300 | | | 43,248 | |
| Central Garden and Pet Co., Class A(a)* | | 8,850 | | | 73,632 | |
| Spectrum Brands Holdings, Inc.(a)* | | 13,807 | | | 378,312 | |
27
SA U.S. Small Company Fund
PORTFOLIO OF INVESTMENTS — AS OF DECEMBER 31, 2011 (Unaudited) (Continued)
| | | | SHARES | | VALUE† | |
| COMMON STOCKS (Continued) | | | | | | |
| Household Products (Continued) | | | | | | |
| WD-40 Co.(a) | | 5,000 | | $ | 202,050 | |
| | | | | | 697,242 | |
| Independent Power Producers & Energy Traders — 0.2% | | | | |
| Atlantic Power Corp.(a)* | | 20,248 | | | 289,547 | |
| Dynegy, Inc.* | | 25,081 | | | 69,474 | |
| | Genie Energy Ltd.(a) | | 4,900 | | | 38,857 | |
| Ormat Technologies, Inc.(a) | | 8,635 | | | 155,689 | |
| Synthesis Energy Systems, Inc.(a)* | | 5,474 | | | 8,485 | |
| | | | | | 562,052 | |
| Industrial Conglomerates — 0.1% | | | | | | |
| Raven Industries, Inc.(a) | | 3,600 | | | 222,840 | |
| Standex International Corp. | | 2,700 | | | 92,259 | |
| | | | | | 315,099 | |
| Insurance — 4.4% | | | | | | |
| 21st Century Holding Co.(a)* | | 1,000 | | | 2,960 | |
| Affirmative Insurance Holdings, Inc.(a)* | | 3,262 | | | 1,761 | |
| American Equity Investment Life Holding Co.(a) | | 14,459 | | | 150,374 | |
| American Safety Insurance Holdings Ltd.* | | 1,683 | | | 36,605 | |
| Amerisafe, Inc.* | | 3,900 | | | 90,675 | |
| Amtrust Financial Services, Inc.(a) | | 14,064 | | | 334,020 | |
| Argo Group International Holdings Ltd. | | 6,959 | | | 201,533 | |
| Aspen Insurance Holdings Ltd. | | 12,227 | | | 324,015 | |
| Baldwin & Lyons, Inc., Class B(a) | | 1,818 | | | 39,632 | |
| Citizens, Inc., Class A(a)* | | 11,958 | | | 115,873 | |
| CNO Financial Group, Inc.* | | 60,833 | | | 383,856 | |
| Crawford & Co., Class A | | 10,528 | | | 42,849 | |
| Crawford & Co., Class B(a) | | 3,991 | | | 24,585 | |
| Delphi Financial Group, Inc., Class S | | 12,207 | | | 540,770 | |
| Donegal Group, Inc., Class A(a) | | 4,648 | | | 65,816 | |
| Eastern Insurance Holdings, Inc. | | 1,700 | | | 24,225 | |
| eHealth, Inc.* | | 4,659 | | | 68,487 | |
| EMC Insurance Group, Inc.(a) | | 3,800 | | | 78,166 | |
| Employers Holdings, Inc.(a) | | 8,742 | | | 158,143 | |
| Endurance Specialty Holdings Ltd. | | 8,174 | | | 312,655 | |
| Enstar Group Ltd.* | | 2,824 | | | 277,317 | |
| FBL Financial Group, Inc., Class A(a) | | 6,600 | | | 224,532 | |
| First Acceptance Corp.* | | 15,539 | | | 21,133 | |
| First American Financial Corp. | | 23,254 | | | 294,628 | |
| Flagstone Reinsurance Holdings SA(a) | | 16,257 | | | 134,771 | |
| Global Indemnity PLC* | | 3,524 | | | 69,881 | |
| Greenlight Capital Re Ltd., Class A* | | 7,603 | | | 179,963 | |
| Hallmark Financial Services(a)* | | 5,700 | | | 39,843 | |
| Hanover Insurance Group, Inc. | | 2,402 | | | 83,950 | |
| Harleysville Group, Inc.(a) | | 6,800 | | | 384,676 | |
| Hilltop Holdings, Inc.(a)* | | 11,048 | | | 93,356 | |
| Horace Mann Educators Corp. | | 9,010 | | | 123,527 | |
| Independence Holding Co.(a) | | 3,200 | | | 26,016 | |
| Infinity Property & Casualty Corp. | | 4,300 | | | 243,982 | |
| Kemper Corp. | | 13,679 | | | 399,564 | |
| Maiden Holdings Ltd. | | 14,533 | | | 127,309 | |
| MBIA, Inc.(a)* | | 45,680 | | | 529,431 | |
| Meadowbrook Insurance Group, Inc. | | 13,262 | | | 141,638 | |
| Montpelier Re Holdings Ltd.(a) | | 15,417 | | | 273,652 | |
| National Financial Partners Corp.(a)* | | 9,600 | | | 129,792 | |
| National Interstate Corp.(a) | | 4,200 | | | 103,614 | |
| Navigators Group, Inc.* | | 3,600 | | | 171,648 | |
| OneBeacon Insurance Group Ltd. | | 4,400 | | | 67,716 | |
| Platinum Underwriters Holdings Ltd. | | 7,812 | | | 266,467 | |
| Presidential Life Corp.(a) | | 5,600 | | | 55,944 | |
| Primerica, Inc. | | 15,395 | | | 357,780 | |
| ProAssurance Corp. | | 6,055 | | | 483,310 | |
| Protective Life Corp. | | 9,684 | | | 218,471 | |
| RLI Corp.(a) | | 5,800 | | | 422,588 | |
| Safety Insurance Group, Inc.(a) | | 3,900 | | | 157,872 | |
| SeaBright Insurance Holdings, Inc.(a) | | 4,800 | | | 36,720 | |
| Selective Insurance Group | | 13,800 | | | 244,674 | |
| StanCorp Financial Group, Inc.(a) | | 8,398 | | | 308,626 | |
| State Auto Financial Corp. | | 9,900 | | | 134,541 | |
| Stewart Information Services Corp.(a) | | 2,900 | | | 33,495 | |
| Symetra Financial Corp. | | 25,025 | | | 226,977 | |
| The Phoenix Companies, Inc.(a)* | | 21,698 | | | 36,453 | |
| Tower Group, Inc.(a) | | 8,548 | | | 172,413 | |
| Unico American Corp.(a)* | | 1,700 | | | 20,485 | |
| United Fire & Casualty Co. | | 6,100 | | | 123,098 | |
| Universal Insurance Holdings, Inc.(a) | | 8,650 | | | 30,967 | |
| | | | | | 10,469,820 | |
| Internet & Catalog Retail — 0.5% | | | | | | |
| 1-800-Flowers.com, Inc., Class A* | | 5,700 | | | 12,540 | |
| Blue Nile, Inc.(a)* | | 2,776 | | | 113,483 | |
| dELiA*s, Inc.(a)* | | 5,186 | | | 5,290 | |
| Gaiam, Inc., Class A* | | 2,400 | | | 7,776 | |
| Hollywood Media Corp.(a)* | | 10,017 | | | 12,722 | |
| HSN, Inc. | | 12,080 | | | 438,021 | |
| NutriSystem, Inc.(a) | | 5,687 | | | 73,533 | |
| Orbitz Worldwide, Inc.* | | 20,694 | | | 77,809 | |
| Overstock.com, Inc.(a)* | | 4,600 | | | 36,064 | |
| PetMed Express, Inc.(a) | | 8,500 | | | 88,230 | |
| Shutterfly, Inc.(a)* | | 6,894 | | | 156,907 | |
| US Auto Parts Network, Inc.(a)* | | 6,100 | | | 26,657 | |
| Valuevision Media, Inc., Class A(a)* | | 7,971 | | | 14,986 | |
| Vitacost.com, Inc.(a)* | | 1,333 | | | 8,291 | |
| | | | | | 1,072,309 | |
| Internet Software & Services — 1.9% | | | | | | |
| Ancestry.com, Inc.(a)* | | 11,385 | | | 261,400 | |
| AOL, Inc.(a)* | | 6,953 | | | 104,990 | |
| comScore, Inc.(a)* | | 4,067 | | | 86,220 | |
| Crexendo, Inc.(a) | | 1,100 | | | 3,113 | |
| DealerTrack Holdings, Inc.* | | 8,700 | | | 237,162 | |
| Dice Holdings, Inc.* | | 21,227 | | | 175,972 | |
| Digital River, Inc.* | | 8,400 | | | 126,168 | |
| Earthlink, Inc. | | 26,700 | | | 171,948 | |
| Envestnet, Inc.(a)* | | 5,029 | | | 60,147 | |
| Infospace, Inc.(a)* | | 7,800 | | | 85,722 | |
| Internap Network Services Corp.* | | 11,700 | | | 69,498 | |
| Ipass, Inc.* | | 14,400 | | | 20,016 | |
| j2 Global, Inc.(a) | | 9,900 | | | 278,586 | |
| Keynote Systems, Inc. | | 3,480 | | | 71,479 | |
| KIT Digital, Inc.(a)* | | 9,981 | | | 84,339 | |
| Limelight Networks, Inc.(a)* | | 21,264 | | | 62,941 | |
| Liquidity Services, Inc.(a)* | | 6,300 | | | 232,470 | |
| LogMeIn, Inc.(a)* | | 5,169 | | | 199,265 | |
| Looksmart Ltd.* | | 3,800 | | | 4,902 | |
| LoopNet, Inc.* | | 13,200 | | | 241,296 | |
| Marchex, Inc., Class B(a) | | 6,755 | | | 42,219 | |
| Market Leader, Inc.* | | 7,323 | | | 20,138 | |
| Move, Inc.* | | 8,625 | | | 54,510 | |
| NIC, Inc. | | 15,000 | | | 199,650 | |
| Onvia, Inc.(a)* | | 181 | | | 518 | |
| Perficient, Inc.* | | 7,000 | | | 70,070 | |
| QuinStreet, Inc.(a)* | | 9,301 | | | 87,057 | |
| RealNetworks, Inc.(a) | | 7,600 | | | 57,000 | |
| Reis, Inc.* | | 2,638 | | | 24,059 | |
| RightNow Technologies, Inc.(a)* | | 5,990 | | | 255,953 | |
| Saba Software, Inc.* | | 6,949 | | | 54,828 | |
| Soundbite Communications, Inc.(a)* | | 700 | | | 1,575 | |
28
SA U.S. Small Company Fund
PORTFOLIO OF INVESTMENTS — AS OF DECEMBER 31, 2011 (Unaudited) (Continued)
| | | | SHARES | | VALUE† | |
| COMMON STOCKS (Continued) | | | | | | |
| Internet Software & Services (Continued) | | | | | | |
| Spark Networks, Inc.(a)* | | 6,600 | | $ | 25,080 | |
| Stamps.com, Inc.(a)* | | 4,050 | | | 105,826 | |
| support.com, Inc.(a)* | | 11,250 | | | 25,312 | |
| | TechTarget, Inc.* | | 10,402 | | | 60,748 | |
| TheStreet.com, Inc. | | 7,200 | | | 12,096 | |
| Tower Automotive, Inc.(b)* | | 6,500 | | | — | |
| Travelzoo, Inc.(a)* | | 1,420 | | | 34,904 | |
| United Online, Inc.(a) | | 35,156 | | | 191,249 | |
| Valueclick, Inc.* | | 16,915 | | | 275,545 | |
| VistaPrint NV(a)* | | 6,478 | | | 198,227 | |
| Vocus, Inc.* | | 2,052 | | | 45,329 | |
| Web.com Group, Inc.* | | 6,313 | | | 72,284 | |
| XO Group, Inc.* | | 6,500 | | | 54,210 | |
| Zix Corp.(a)* | | 13,620 | | | 38,408 | |
| | | | | | 4,584,429 | |
| IT Services — 2.7% | | | | | | |
| Acxiom Corp.* | | 19,589 | | | 239,182 | |
| CACI International, Inc., Class A* | | 6,700 | | | 374,664 | |
| Cardtronics, Inc.* | | 10,264 | | | 277,744 | |
| Cass Information Systems, Inc.(a) | | 1,630 | | | 59,323 | |
| Ciber, Inc.* | | 14,781 | | | 57,055 | |
| Computer Task Group, Inc.(a)* | | 3,700 | | | 52,096 | |
| Convergys Corp.* | | 26,731 | | | 341,355 | |
| CoreLogic, Inc.* | | 8,341 | | | 107,849 | |
| CSG Systems International, Inc.* | | 10,600 | | | 155,926 | |
| Dynamics Research Corp.(a)* | | 2,200 | | | 24,948 | |
| Echo Global Logistics, Inc.* | | 4,751 | | | 76,729 | |
| Edgewater Technology, Inc.* | | 2,300 | | | 6,325 | |
| Euronet Worldwide, Inc.(a)* | | 11,400 | | | 210,672 | |
| ExlService Holdings, Inc.* | | 7,800 | | | 174,486 | |
| Forrester Research, Inc.* | | 8,761 | | | 297,348 | |
| Global Cash Access Holdings, Inc.* | | 21,692 | | | 96,529 | |
| Hackett Group, Inc.(a)* | | 8,900 | | | 33,286 | |
| Heartland Payment Systems, Inc. | | 9,197 | | | 224,039 | |
| iGate Corp.(a)* | | 12,677 | | | 199,409 | |
| Innodata Isogen, Inc.(a)* | | 5,684 | | | 22,395 | |
| INX, Inc.* | | 700 | | | 6,125 | |
| Lender Processing Services, Inc. | | 2,629 | | | 39,619 | |
| Mantech International Corp., Class A(a) | | 5,280 | | | 164,947 | |
| Mattersight Corp.(a)* | | 1,512 | | | 7,031 | |
| MAXIMUS, Inc. | | 8,800 | | | 363,880 | |
| ModusLink Global Solutions, Inc. | | 10,390 | | | 56,106 | |
| MoneyGram International, Inc.* | | 7,720 | | | 137,030 | |
| NCI, Inc., Class A(a)* | | 1,800 | | | 20,970 | |
| NeuStar, Inc., Class A* | | 14,088 | | | 481,387 | |
| Online Resources Corp.* | | 9,929 | | | 24,028 | |
| PRG-Schultz International, Inc.* | | 3,839 | | | 22,842 | |
| Rainmaker Systems, Inc.* | | 4,500 | | | 3,672 | |
| Sapient Corp.(a) | | 30,026 | | | 378,328 | |
| StarTek, Inc.* | | 3,323 | | | 6,380 | |
| Stream Global Services, Inc.* | | 300 | | | 993 | |
| Syntel, Inc.(a) | | 9,300 | | | 434,961 | |
| TeleTech Holdings, Inc.* | | 13,200 | | | 213,840 | |
| Tier Technologies, Inc., Class B* | | 3,900 | | | 17,004 | |
| TNS, Inc.* | | 4,841 | | | 85,782 | |
| Unisys Corp.(a)* | | 8,067 | | | 159,001 | |
| Virtusa Corp.(a)* | | 7,876 | | | 114,044 | |
| WPCS International, Inc.* | | 1,000 | | | 1,680 | |
| Wright Express Corp.(a)* | | 8,700 | | | 472,236 | |
| | | | | | 6,243,246 | |
| Leisure Equipment & Products — 0.4% | | | | | | |
| Aldila, Inc.(a)* | | 1,930 | | | 4,265 | |
| Arctic Cat, Inc.* | | 3,625 | | | 81,744 | |
| Black Diamond, Inc.(a)* | | 1,900 | | | 14,193 | |
| Brunswick Corp. | | 9,419 | | | 170,107 | |
| Callaway Golf Co.(a) | | 14,500 | | | 80,185 | |
| Cybex International, Inc.* | | 4,100 | | | 1,640 | |
| Escalade, Inc.(a) | | 1,950 | | | 8,658 | |
| Jakks Pacific, Inc.(a) | | 6,200 | | | 87,482 | |
| Johnson Outdoors, Inc., Class A(a)* | | 1,000 | | | 15,350 | |
| Leapfrog Enterprises, Inc.(a)* | | 10,056 | | | 56,213 | |
| Marine Products Corp.(a)* | | 10,020 | | | 49,699 | |
| Nautilus, Inc.(a)* | | 6,900 | | | 12,075 | |
| Smith & Wesson Holding Corp.* | | 12,562 | | | 54,771 | |
| Steinway Musical Instruments* | | 2,573 | | | 64,428 | |
| Sturm Ruger & Co., Inc. | | 6,513 | | | 217,925 | |
| | | | | | 918,735 | |
| Life Sciences Tools & Services — 0.5% | | | | | | |
| Affymetrix, Inc.(a)* | | 17,097 | | | 69,927 | |
| Albany Molecular Research, Inc.* | | 7,100 | | | 20,803 | |
| BioClinica, Inc.* | | 3,200 | | | 13,600 | |
| Cambrex Corp.* | | 7,100 | | | 50,978 | |
| Charles River Laboratories International, Inc.* | | 11,331 | | | 309,676 | |
| CombiMatrix Corp.(a)* | | 502 | | | 1,004 | |
| Enzo Biochem, Inc.(a)* | | 10,532 | | | 23,592 | |
| eResearchTechnology, Inc.(a)* | | 14,087 | | | 66,068 | |
| Furiex Pharmaceuticals, Inc.(a)* | | 2,517 | | | 42,059 | |
| Harvard Bioscience, Inc.* | | 10,123 | | | 39,176 | |
| Luminex Corp.(a)* | | 8,945 | | | 189,902 | |
| Medtox Scientific, Inc.* | | 3,300 | | | 46,365 | |
| Parexel International Corp.* | | 12,400 | | | 257,176 | |
| pSivida Corp.* | | 1,891 | | | 2,099 | |
| SeraCare Life Sciences, Inc.(a)* | | 3,373 | | | 10,288 | |
| Strategic Diagnostics, Inc.* | | 7,150 | | | 13,156 | |
| | | | | | 1,155,869 | |
| Machinery — 3.5% | | | | | | |
| Actuant Corp., Class A(a) | | 17,051 | | | 386,887 | |
| Adept Technology, Inc.(a)* | | 1,000 | | | 2,400 | |
| Alamo Group, Inc.(a) | | 2,600 | | | 70,018 | |
| Albany International Corp., Class A | | 6,000 | | | 138,720 | |
| Altra Holdings, Inc.(a)* | | 5,400 | | | 101,682 | |
| American Railcar Industries, Inc.* | | 5,900 | | | 141,187 | |
| Ampco-Pittsburgh Corp. | | 2,200 | | | 42,548 | |
| Astec Industries, Inc.* | | 5,264 | | | 169,553 | |
| Baldwin Technology Co., Class A* | | 2,900 | | | 2,613 | |
| Barnes Group, Inc.(a) | | 13,700 | | | 330,307 | |
| Blount International, Inc.(a)* | | 11,988 | | | 174,066 | |
| Briggs & Stratton Corp.(a) | | 11,900 | | | 184,331 | |
| Cascade Corp. | | 2,400 | | | 113,208 | |
| Chart Industries, Inc.* | | 6,734 | | | 364,107 | |
| CIRCOR International, Inc. | | 3,400 | | | 120,054 | |
| Colfax Corp.(a)* | | 10,063 | | | 286,594 | |
| Columbus McKinnon Corp.* | | 3,900 | | | 49,491 | |
| Commercial Vehicle Group, Inc.* | | 6,000 | | | 54,240 | |
| Douglas Dynamics, Inc.(a) | | 3,998 | | | 58,451 | |
| Dynamic Materials Corp. | | 2,800 | | | 55,384 | |
| Energy Recovery, Inc.(a)* | | 8,000 | | | 20,640 | |
| EnPro Industries, Inc.(a)* | | 4,600 | | | 151,708 | |
| ESCO Technologies, Inc. | | 5,700 | | | 164,046 | |
| Federal Signal Corp.(a) | | 12,928 | | | 53,651 | |
| Flanders Corp.(a)* | | 5,805 | | | 17,705 | |
| Flow International Corp.(a)* | | 10,779 | | | 37,727 | |
| FreightCar America, Inc.* | | 2,400 | | | 50,280 | |
| Graham Corp. | | 1,900 | | | 42,636 | |
| Greenbrier Cos., Inc.(a)* | | 6,166 | | | 149,710 | |
29
SA U.S. Small Company Fund
PORTFOLIO OF INVESTMENTS — AS OF DECEMBER 31, 2011 (Unaudited) (Continued)
| | | | SHARES | | VALUE† | |
| COMMON STOCKS (Continued) | | | | | | |
| Machinery (Continued) | | | | | | |
| Hardinge, Inc. | | 2,400 | | $ | 19,320 | |
| Hurco Cos., Inc.* | | 1,000 | | | 21,000 | |
| ITT Corp. | | 3,986 | | | 77,049 | |
| John Bean Technologies Corp. | | 6,469 | | | 99,429 | |
| Kadant, Inc.* | | 3,400 | | | 76,874 | |
| Kaydon Corp.(a) | | 7,475 | | | 227,988 | |
| Key Technology, Inc.* | | 1,100 | | | 14,234 | |
| | LB Foster Co., Class A | | 1,506 | | | 42,605 | |
| Lindsay Corp. | | 2,399 | | | 131,681 | |
| Lydall, Inc.(a)* | | 2,900 | | | 27,521 | |
| Manitex International, Inc.* | | 1,300 | | | 5,512 | |
| Manitowoc Co., Inc. | | 657 | | | 6,038 | |
| Meritor, Inc.* | | 17,207 | | | 91,541 | |
| Met-Pro Corp.(a) | | 4,417 | | | 39,930 | |
| Mfri, Inc.* | | 1,900 | | | 13,186 | |
| Middleby Corp.* | | 4,140 | | | 389,326 | |
| Miller Industries, Inc. | | 2,200 | | | 34,606 | |
| Mueller Industries, Inc. | | 8,775 | | | 337,136 | |
| Mueller Water Products, Inc., Class A(a) | | 41,091 | | | 100,262 | |
| NACCO Industries, Inc., Class A | | 1,000 | | | 89,220 | |
| NN, Inc.* | | 3,000 | | | 18,000 | |
| Omega Flex, Inc.(a)* | | 488 | | | 6,895 | |
| PMFG, Inc.(a)* | | 2,118 | | | 41,322 | |
| RBC Bearings, Inc.* | | 4,700 | | | 195,990 | |
| Robbins & Myers, Inc. | | 9,714 | | | 471,615 | |
| Sauer-Danfoss, Inc.* | | 10,900 | | | 394,689 | |
| Sun Hydraulics Corp. | | 5,700 | | | 133,551 | |
| Supreme Industries, Inc., Class A(a)* | | 1,197 | | | 3,004 | |
| Tecumseh Products Co., Class A(a)* | | 2,100 | | | 9,870 | |
| Tennant Co.(a) | | 3,939 | | | 153,109 | |
| The Gorman-Rupp Co.(a) | | 4,039 | | | 109,659 | |
| Titan International, Inc.(a) | | 8,474 | | | 164,904 | |
| Toro Co. | | 6,900 | | | 418,554 | |
| Trimas Corp.* | | 10,000 | | | 179,500 | |
| Trinity Industries, Inc. | | 11,028 | | | 331,502 | |
| Twin Disc, Inc.(a) | | 2,200 | | | 79,904 | |
| Watts Water Technologies, Inc., Class A(a) | | 7,500 | | | 256,575 | |
| | | | | | 8,347,045 | |
| Marine — 0.2% | | | | | | |
| Alexander & Baldwin, Inc. | | 8,689 | | | 354,685 | |
| Eagle Bulk Shipping, Inc.(a)* | | 10,600 | | | 9,986 | |
| Excel Maritime Carriers Ltd.(a)* | | 16,497 | | | 23,921 | |
| Genco Shipping & Trading Ltd.(a)* | | 8,977 | | | 60,684 | |
| International Shipholding Corp.(a) | | 710 | | | 13,270 | |
| | | | | | 462,546 | |
| Media — 1.8% | | | | | | |
| AH Belo Corp., Class A(a) | | 4,580 | | | 21,755 | |
| Arbitron, Inc. | | 6,200 | | | 213,342 | |
| Ballantyne of Omaha, Inc.(a)* | | 3,464 | | | 14,168 | |
| Beasley Broadcasting Group, Inc., Class A(a)* | | 1,657 | | | 5,236 | |
| Belo Corp., Class A(a) | | 21,359 | | | 134,562 | |
| Carmike Cinemas, Inc.(a)* | | 2,800 | | | 19,264 | |
| Central European Media Enterprises Ltd., Class A(a)* | | 8,503 | | | 55,440 | |
| Cinemark Holdings, Inc.(a) | | 10,930 | | | 202,096 | |
| Crown Media Holdings, Inc., Class A(a)* | | 17,800 | | | 21,538 | |
| Cumulus Media, Inc., Class A* | | 6,400 | | | 21,376 | |
| Digital Generation, Inc.* | | 5,472 | | | 65,226 | |
| DreamWorks Animation SKG, Inc., Class A(a)* | | 17,520 | | | 290,744 | |
| EDCI Holdings, Inc.(a) | | 1,485 | | | 7,536 | |
| Entercom Communications Corp., Class A(a)* | | 5,750 | | | 35,363 | |
| Entravision Communications Corp.(a) | | 100 | | | 156 | |
| EW Scripps Co., Class A(a)* | | 9,673 | | | 77,481 | |
| Fisher Communications, Inc.* | | 1,100 | | | 31,713 | |
| Gray Television, Inc.* | | 6,176 | | | 10,005 | |
| Harris Interactive, Inc.* | | 14,810 | | | 8,282 | |
| Harte-Hanks, Inc.(a) | | 20,583 | | | 187,099 | |
| Here Media, Inc.(b)* | | 499 | | | — | |
| Here Media, Inc., Special Shares(a)* | | 499 | | | 10 | |
| Journal Communications, Inc., Class A* | | 10,000 | | | 44,000 | |
| Knology, Inc.(a)* | | 13,068 | | | 185,566 | |
| Lin TV Corp., Class A* | | 6,700 | | | 28,341 | |
| Live Nation Entertainment, Inc.* | | 41,999 | | | 349,012 | |
| Madison Square Garden, Inc., Class A* | | 13,022 | | | 372,950 | |
| Martha Stewart Living Omnimedia, Class A(a) | | 5,600 | | | 24,640 | |
| McClatchy Co. (The), Class A(a)* | | 13,196 | | | 31,538 | |
| Media General, Inc., Class A(a)* | | 5,000 | | | 20,350 | |
| Meredith Corp.(a) | | 7,300 | | | 238,345 | |
| National CineMedia, Inc. | | 11,931 | | | 147,944 | |
| Navarre Corp.* | | 5,272 | | | 8,119 | |
| New Frontier Media, Inc.(a)* | | 7,900 | | | 8,216 | |
| New York Times Co. (The), Class A(a)* | | 31,959 | | | 247,043 | |
| Nexstar Broadcasting Group, Inc., Class A(a)* | | 2,098 | | | 16,448 | |
| Outdoor Channel Holdings, Inc.(a) | | 9,100 | | | 67,886 | |
| Radio One, Inc.(a)* | | 6,700 | | | 6,700 | |
| Regal Entertainment Group, Class A | | 26,218 | | | 313,043 | |
| Rentrak Corp.(a)* | | 1,900 | | | 27,132 | |
| Saga Communications, Inc.(a)* | | 837 | | | 31,287 | |
| Salem Communications Corp., Class A(a)* | | 3,500 | | | 8,995 | |
| Scholastic Corp. | | 8,100 | | | 242,757 | |
| Sinclair Broadcast Group, Inc., Class A | | 10,500 | | | 118,965 | |
| Valassis Communications, Inc.(a)* | | 10,800 | | | 207,684 | |
| World Wrestling Entertainment, Inc., Class A(a) | | 4,600 | | | 42,872 | |
| Xanadoo Co., Class A* | | 10 | | | 2,600 | |
| | | | | | 4,214,825 | |
| Metals & Mining — 1.6% | | | | | | |
| A.M. Castle & Co.(a)* | | 5,100 | | | 48,246 | |
| AK Steel Holding Corp.(a) | | 25,404 | | | 209,837 | |
| AMCOL International Corp.(a) | | 7,925 | | | 212,786 | |
| Carpenter Technology Corp. | | 8,800 | | | 453,024 | |
| Century Aluminum Co.(a)* | | 19,815 | | | 168,626 | |
| Commercial Metals Co. | | 24,935 | | | 344,851 | |
| Contango ORE, Inc.(a)* | | 350 | | | 4,725 | |
| Friedman Industries | | 700 | | | 7,315 | |
| General Moly, Inc.(a)* | | 18,758 | | | 57,962 | |
| Globe Specialty Metals, Inc.(a) | | 14,315 | | | 191,678 | |
| Haynes International, Inc. | | 2,200 | | | 120,120 | |
| Hecla Mining Co.(a) | | 59,121 | | | 309,203 | |
| Horsehead Holding Corp.(a)* | | 8,674 | | | 78,153 | |
| Kaiser Aluminum Corp.(a) | | 4,533 | | | 207,974 | |
| Materion Corp.* | | 4,600 | | | 111,688 | |
| Metals USA Holdings Corp.* | | 7,474 | | | 84,082 | |
| Mines Management, Inc.(a)* | | 8,088 | | | 16,176 | |
| Noranda Aluminum Holding Corp. | | 12,872 | | | 106,194 | |
| Olympic Steel, Inc.(a) | | 2,400 | | | 55,968 | |
| RTI International Metals, Inc.(a)* | | 6,300 | | | 146,223 | |
| Schnitzer Steel Industries, Inc., Class A | | 5,061 | | | 213,979 | |
| Solitario Exploration & Royalty Corp.(a)* | | 1,000 | | | 1,410 | |
| Stillwater Mining Co.(a)* | | 21,000 | | | 219,660 | |
| Universal Stainless & Alloy(a)* | | 1,400 | | | 52,304 | |
| US Gold Corp.(a)* | | 17,896 | | | 60,131 | |
30
SA U.S. Small Company Fund
PORTFOLIO OF INVESTMENTS — AS OF DECEMBER 31, 2011 (Unaudited) (Continued)
| | | | SHARES | | VALUE† | |
| COMMON STOCKS (Continued) | | | | | | |
| Metals & Mining (Continued) | | | | | | |
| Worthington Industries, Inc.(a) | | 17,700 | | $ | 289,926 | |
| | | | | | 3,772,241 | |
| Multi-Utilities — 0.5% | | | | | | |
| Avista Corp. | | 12,400 | | | 319,300 | |
| Black Hills Corp. | | 7,800 | | | 261,924 | |
| CH Energy Group, Inc.(a) | | 3,800 | | | 221,844 | |
| NorthWestern Corp. | | 8,500 | | | 304,215 | |
| | | | | | 1,107,283 | |
| Multiline Retail — 0.5% | | | | | | |
| | 99 Cents Only Stores* | | 14,600 | | | 320,470 | |
| Dillard's, Inc., Class A(a) | | 7,821 | | | 351,007 | |
| Duckwall-ALCO Stores, Inc.(a)* | | 200 | | | 1,670 | |
| Fred's, Inc. | | 8,987 | | | 131,030 | |
| Gordmans Stores, Inc.* | | 1,136 | | | 14,280 | |
| Saks, Inc.(a)* | | 35,876 | | | 349,791 | |
| The Bon-Ton Stores, Inc.(a) | | 2,700 | | | 9,099 | |
| Tuesday Morning Corp.(a)* | | 9,403 | | | 32,440 | |
| | | | | | 1,209,787 | |
| Office Electronics — 0.1% | | | | | | |
| Zebra Technologies Corp., Class A* | | 9,827 | | | 351,610 | |
| Oil, Gas & Consumable Fuels — 3.1% | | | | | | |
| Abraxas Petroleum Corp.(a)* | | 19,200 | | | 63,360 | |
| Adams Resources & Energy, Inc. | | 900 | | | 26,082 | |
| Alon USA Energy, Inc.(a) | | 10,500 | | | 91,455 | |
| Ante5, Inc.(a)* | | 2,059 | | | 1,750 | |
| Approach Resources, Inc.(a)* | | 7,841 | | | 230,604 | |
| Barnwell Industries, Inc.* | | 2,159 | | | 5,829 | |
| Bill Barrett Corp.(a)* | | 10,895 | | | 371,193 | |
| BPZ Resources, Inc.(a)* | | 25,439 | | | 72,247 | |
| Callon Petroleum Co.* | | 9,264 | | | 46,042 | |
| Carrizo Oil & Gas, Inc.* | | 9,054 | | | 238,573 | |
| Clayton Williams Energy, Inc.(a)* | | 2,100 | | | 159,348 | |
| Clean Energy Fuels Corp.(a)* | | 16,141 | | | 201,117 | |
| Cloud Peak Energy, Inc.* | | 15,189 | | | 293,451 | |
| Comstock Resources, Inc.(a)* | | 10,008 | | | 153,122 | |
| Contango Oil & Gas Co.* | | 3,500 | | | 203,630 | |
| CREDO Petroleum Corp.* | | 1,000 | | | 10,300 | |
| Crimson Exploration, Inc.(a)* | | 8,391 | | | 23,998 | |
| Crosstex Energy, Inc. | | 15,460 | | | 195,414 | |
| CVR Energy, Inc.* | | 21,682 | | | 406,104 | |
| Delek US Holdings, Inc. | | 12,078 | | | 137,810 | |
| DHT Holdings, Inc.(a) | | 10,378 | | | 7,680 | |
| Double Eagle Petroleum Co.(a)* | | 1,550 | | | 10,664 | |
| Endeavour International Corp.(a)* | | 7,372 | | | 64,063 | |
| Energy Partners Ltd.* | | 9,173 | | | 133,926 | |
| Evolution Petroleum Corp.* | | 6,400 | | | 51,520 | |
| FieldPoint Petroleum Corp.* | | 1,200 | | | 5,112 | |
| FX Energy, Inc.* | | 2,450 | | | 11,760 | |
| GeoPetro Resources Co.* | | 300 | | | 68 | |
| Georesources, Inc.* | | 5,555 | | | 162,817 | |
| GMX Resources, Inc.(a)* | | 11,876 | | | 14,845 | |
| Goodrich Petroleum Corp.(a)* | | 656 | | | 9,007 | |
| Green Plains Renewable Energy, Inc.* | | 7,838 | | | 76,499 | |
| Gulfport Energy Corp.(a)* | | 11,682 | | | 344,035 | |
| Harvest Natural Resources, Inc.(a)* | | 7,400 | | | 54,612 | |
| HKN, Inc.(a)* | | 4,194 | | | 8,933 | |
| HollyFrontier Corp. | | 12,362 | | | 289,271 | |
| Houston American Energy Corp.(a)* | | 6,452 | | | 78,650 | |
| James River Coal Co.(a)* | | 6,800 | | | 47,056 | |
| Northern Oil and Gas, Inc.(a)* | | 13,240 | | | 317,495 | |
| Overseas Shipholding Group, Inc.(a) | | 5,212 | | | 56,967 | |
| Panhandle Oil and Gas, Inc.(a) | | 900 | | | 29,529 | |
| Patriot Coal Corp.(a)* | | 19,200 | | | 162,624 | |
| Penn Virginia Corp.(a) | | 9,100 | | | 48,139 | |
| Petroleum Development Corp.(a)* | | 4,900 | | | 172,039 | |
| Petroquest Energy, Inc.(a)* | | 12,273 | | | 81,002 | |
| PostRock Energy Corp.* | | 1,342 | | | 3,771 | |
| Rex Energy Corp.(a)* | | 8,838 | | | 130,449 | |
| Rex Stores Corp.(a)* | | 1,575 | | | 34,823 | |
| Royale Energy, Inc.(a)* | | 1,600 | | | 7,328 | |
| SemGroup Corp.(a)* | | 8,201 | | | 213,718 | |
| Ship Finance International Ltd.(a) | | 16,513 | | | 154,231 | |
| Stone Energy Corp.* | | 10,059 | | | 265,356 | |
| Swift Energy Co.* | | 9,200 | | | 273,424 | |
| Teekay Corp.(a) | | 5,415 | | | 144,743 | |
| Toreador Resources Corp.(a)* | | 3,166 | | | 16,305 | |
| Triangle Petroleum Corp.(a)* | | 1,719 | | | 10,262 | |
| Uranium Energy Corp.(a)* | | 9,000 | | | 27,540 | |
| USEC, Inc.(a)* | | 24,000 | | | 27,360 | |
| Vaalco Energy, Inc.(a)* | | 13,164 | | | 79,511 | |
| Venoco, Inc.* | | 9,035 | | | 61,167 | |
| Voyager Oil & Gas, Inc.(a)* | | 2,059 | | | 5,292 | |
| W&T Offshore, Inc. | | 15,533 | | | 329,455 | |
| Warren Resources, Inc.(a)* | | 14,000 | | | 45,640 | |
| Western Refining, Inc.(a)* | | 19,043 | | | 253,081 | |
| Zion Oil & Gas, Inc.* | | 3,651 | | | 8,069 | |
| | | | | | 7,261,267 | |
| Paper & Forest Products — 0.7% | | | | | | |
| AbitibiBowater, Inc.(a)* | | 3,094 | | | 45,018 | |
| Buckeye Technologies, Inc. | | 10,000 | | | 334,400 | |
| Clearwater Paper Corp.(a)* | | 4,412 | | | 157,111 | |
| Deltic Timber Corp.(a) | | 2,800 | | | 169,092 | |
| Glatfelter | | 10,600 | | | 149,672 | |
| KapStone Paper and Packaging Corp.* | | 10,026 | | | 157,809 | |
| Louisiana-Pacific Corp.(a)* | | 32,984 | | | 266,181 | |
| Mercer International, Inc.* | | 9,357 | | | 57,078 | |
| Neenah Paper, Inc.(a) | | 3,300 | | | 73,656 | |
| Schweitzer-Mauduit International, Inc. | | 3,100 | | | 206,026 | |
| Wausau Paper Corp.(a) | | 11,200 | | | 92,512 | |
| | | | | | 1,708,555 | |
| Personal Products — 0.8% | | | | | | |
| CCA Industries, Inc. | | 556 | | | 2,635 | |
| Elizabeth Arden, Inc.* | | 10,900 | | | 403,736 | |
| Inter Parfums, Inc.(a) | | 6,746 | | | 104,968 | |
| Mannatech, Inc.* | | 7,700 | | | 3,157 | |
| Medifast, Inc.(a)* | | 3,300 | | | 45,276 | |
| Natural Alternatives International, Inc.(a)* | | 1,000 | | | 8,820 | |
| Natures Sunshine Products, Inc.* | | 2,700 | | | 41,904 | |
| Nu Skin Enterprises, Inc., Class A(a) | | 16,043 | | | 779,208 | |
| Nutraceutical International Corp.(a)* | | 2,300 | | | 26,036 | |
| Parlux Fragrances, Inc.(a)* | | 5,787 | | | 29,514 | |
| Physicians Formula Holdings, Inc.* | | 1,300 | | | 4,160 | |
| Prestige Brands Holdings, Inc.* | | 11,200 | | | 126,224 | |
| Reliv International, Inc. | | 3,500 | | | 4,550 | |
| Revlon, Inc., Class A(a)* | | 9,354 | | | 139,094 | |
| Schiff Nutrition International, Inc.(a)* | | 4,641 | | | 49,659 | |
| USANA Health Sciences, Inc.(a)* | | 3,400 | | | 103,258 | |
| | | | | | 1,872,199 | |
| Pharmaceuticals — 1.5% | | | | | | |
| Akorn, Inc.(a)* | | 20,100 | | | 223,512 | |
| AVANIR Pharmaceuticals, Inc., Class A(a)* | | 16,125 | | | 33,056 | |
| Columbia Laboratories, Inc.(a)* | | 10,900 | | | 27,250 | |
| Corcept Therapeutics, Inc.(a)* | | 4,500 | | | 15,390 | |
| Cumberland Pharmaceuticals, Inc.(a)* | | 5,912 | | | 31,807 | |
| Depomed, Inc.(a)* | | 11,500 | | | 59,570 | |
31
SA U.S. Small Company Fund
PORTFOLIO OF INVESTMENTS — AS OF DECEMBER 31, 2011 (Unaudited) (Continued)
| | | | SHARES | | VALUE† | |
| COMMON STOCKS (Continued) | | | | | | |
| Pharmaceuticals (Continued) | | | | | | |
| Emisphere Technologies, Inc.* | | 6,080 | | $ | 1,307 | |
| Hi-Tech Pharmacal Co., Inc.(a)* | | 2,678 | | | 104,147 | |
| Impax Laboratories, Inc.(a)* | | 14,300 | | | 288,431 | |
| Jazz Pharmaceuticals, Inc.(a)* | | 10,398 | | | 401,675 | |
| KV Pharmaceutical Co., Class A(a)* | | 7,700 | | | 10,780 | |
| Lannett Co., Inc.(a)* | | 4,650 | | | 20,553 | |
| Medicines Co. (The)* | | 13,500 | | | 251,640 | |
| Medicis Pharmaceutical Corp., Class A(a) | | 12,800 | | | 425,600 | |
| Obagi Medical Products, Inc.(a)* | | 3,200 | | | 32,512 | |
| | Pain Therapeutics, Inc.(a)* | | 5,500 | | | 20,900 | |
| Par Pharmaceutical Cos., Inc.* | | 7,800 | | | 255,294 | |
| Pozen, Inc.* | | 6,700 | | | 26,465 | |
| ProPhase Labs, Inc.(a)* | | 3,100 | | | 3,751 | |
| Questcor Pharmaceuticals, Inc.* | | 14,600 | | | 607,068 | |
| Repros Therapeutics, Inc.(a)* | | 700 | | | 3,374 | |
| Santarus, Inc.(a)* | | 500 | | | 1,655 | |
| Sucampo Pharmaceuticals, Inc., Class A(a)* | | 3,198 | | | 14,167 | |
| Transcept Pharmaceuticals, Inc.(a)* | | 4,028 | | | 31,539 | |
| Viropharma, Inc.* | | 25,800 | | | 706,662 | |
| XenoPort, Inc.* | | 5,338 | | | 20,338 | |
| | | | | | 3,618,443 | |
| Professional Services — 2.0% | | | | | | |
| Acacia Research - Acacia Technologies* | | 29,010 | | | 1,059,155 | |
| Advisory Board Co. (The)* | | 4,800 | | | 356,208 | |
| Barrett Business Services, Inc. | | 2,100 | | | 41,916 | |
| CBIZ, Inc.(a)* | | 15,700 | | | 95,927 | |
| CDI Corp. | | 3,800 | | | 52,478 | |
| Competitive Technologies, Inc.(a)* | | 1,800 | | | 2,268 | |
| Corporate Executive Board Co. (The) | | 6,893 | | | 262,623 | |
| CoStar Group, Inc.(a)* | | 3,755 | | | 250,571 | |
| CRA International, Inc.* | | 2,200 | | | 43,648 | |
| Dolan Media Co.(a)* | | 6,400 | | | 54,528 | |
| Exponent, Inc.* | | 2,610 | | | 119,982 | |
| Franklin Covey Co.(a)* | | 4,000 | | | 33,880 | |
| FTI Consulting, Inc.(a)* | | 9,847 | | | 417,710 | |
| GP Strategies Corp.(a)* | | 3,599 | | | 48,514 | |
| Heidrick & Struggles International, Inc. | | 3,700 | | | 79,698 | |
| Hill International, Inc.* | | 9,200 | | | 47,288 | |
| Hudson Highland Group, Inc.(a)* | | 7,871 | | | 37,702 | |
| Huron Consulting Group, Inc.* | | 4,651 | | | 180,180 | |
| ICF International, Inc.* | | 4,955 | | | 122,785 | |
| Insperity, Inc. | | 5,700 | | | 144,495 | |
| Kelly Services, Inc., Class A | | 8,211 | | | 112,326 | |
| Kforce, Inc.(a)* | | 10,079 | | | 124,274 | |
| Korn/Ferry International* | | 11,693 | | | 199,483 | |
| Luna Innovations, Inc.(a)* | | 1,600 | | | 2,776 | |
| Mastech Holdings, Inc.(a)* | | 849 | | | 3,167 | |
| Mistras Group, Inc.* | | 6,091 | | | 155,260 | |
| National Technical Systems, Inc.(a)* | | 1,400 | | | 8,750 | |
| Navigant Consulting, Inc.* | | 13,900 | | | 158,599 | |
| Odyssey Marine Exploration, Inc.(a)* | | 10,650 | | | 29,181 | |
| On Assignment, Inc.* | | 12,485 | | | 139,582 | |
| Pendrell Corp.* | | 9,861 | | | 25,244 | |
| RCM Technologies, Inc.(a)* | | 2,995 | | | 15,514 | |
| Resources Connection, Inc. | | 11,115 | | | 117,708 | |
| SmartPros Ltd.(a) | | 1,000 | | | 1,790 | |
| TrueBlue, Inc.* | | 11,123 | | | 154,387 | |
| Volt Information Sciences, Inc.(a)* | | 4,949 | | | 30,684 | |
| VSE Corp.(a) | | 850 | | | 20,638 | |
| | | | | | 4,750,919 | |
| Real Estate Management & Development — 0.4% | | | | | | |
| Altisource Portfolio Solutions SA* | | 5,967 | | | 299,424 | |
| Avatar Holdings, Inc.(a)* | | 2,054 | | | 14,748 | |
| Consolidated-Tomoka Land Co. | | 1,100 | | | 29,777 | |
| Forestar Group, Inc.* | | 8,034 | | | 121,554 | |
| Kennedy-Wilson Holdings, Inc.(a) | | 4,738 | | | 50,128 | |
| Maui Land & Pineapple Co., Inc.* | | 1,800 | | | 7,506 | |
| St. Joe Co. (The)(a)* | | 14,313 | | | 209,829 | |
| Tejon Ranch Co.* | | 8,031 | | | 196,599 | |
| Thomas Properties Group, Inc.(a) | | 8,716 | | | 29,024 | |
| ZipRealty, Inc.* | | 4,510 | | | 5,096 | |
| | | | | | 963,685 | |
| Road & Rail — 1.5% | | | | | | |
| AMERCO, Inc.(a) | | 4,600 | | | 406,640 | |
| Arkansas Best Corp. | | 5,700 | | | 109,839 | |
| Avis Budget Group, Inc.(a)* | | 21,901 | | | 234,779 | |
| Celadon Group, Inc. | | 5,010 | | | 59,168 | |
| Con-way, Inc. | | 13,191 | | | 384,650 | |
| Covenant Transportation Group, Inc., Class A(a)* | | 1,500 | | | 4,455 | |
| Dollar Thrifty Automotive Group, Inc.* | | 4,400 | | | 309,144 | |
| Frozen Food Express Industries* | | 5,100 | | | 6,579 | |
| Heartland Express, Inc.(a) | | 23,624 | | | 337,587 | |
| Knight Transportation, Inc.(a) | | 20,700 | | | 323,748 | |
| Marten Transport Ltd. | | 4,614 | | | 83,006 | |
| Old Dominion Freight Line, Inc.* | | 12,528 | | | 507,760 | |
| P.A.M. Transportation Services, Inc.* | | 3,196 | | | 30,362 | |
| Quality Distribution, Inc.* | | 6,100 | | | 68,625 | |
| RailAmerica, Inc.(a)* | | 11,142 | | | 165,904 | |
| Roadrunner Transportation Systems, Inc.* | | 4,624 | | | 65,337 | |
| Saia, Inc.(a)* | | 3,200 | | | 39,936 | |
| Universal Truckload Services, Inc.(a) | | 3,300 | | | 59,895 | |
| USA Truck, Inc.(a)* | | 1,900 | | | 14,687 | |
| Werner Enterprises, Inc. | | 17,675 | | | 425,967 | |
| | | | | | 3,638,068 | |
| Semiconductors & Semiconductor Equipment — 4.2% | | | | |
| Advanced Analogic Technologies, Inc.(a)* | | 9,300 | | | 53,754 | |
| Advanced Energy Industries, Inc.* | | 9,400 | | | 100,862 | |
| Aehr Test Systems* | | 900 | | | 468 | |
| Aetrium, Inc.* | | 2,200 | | | 1,606 | |
| Alpha & Omega Semiconductor Ltd.(a)* | | 3,174 | | | 23,202 | |
| Amkor Technology, Inc.(a)* | | 43,398 | | | 189,215 | |
| Amtech Systems, Inc.* | | 2,200 | | | 18,722 | |
| Anadigics, Inc.(a)* | | 14,200 | | | 31,098 | |
| Applied Micro Circuits Corp.* | | 14,675 | | | 98,616 | |
| ATMI, Inc.(a)* | | 7,200 | | | 144,216 | |
| AuthenTec, Inc.(a)* | | 8,622 | | | 27,677 | |
| Axcelis Technologies, Inc.(a)* | | 20,139 | | | 26,785 | |
| AXT, Inc.(a)* | | 12,200 | | | 50,874 | |
| Brooks Automation, Inc. | | 16,574 | | | 170,215 | |
| BTU International, Inc.* | | 2,100 | | | 5,460 | |
| Cabot Microelectronics Corp.(a)* | | 5,200 | | | 245,700 | |
| Cascade Microtech, Inc.(a)* | | 3,500 | | | 11,935 | |
| Cavium, Inc.(a)* | | 4,505 | | | 128,077 | |
| Ceva, Inc.(a)* | | 4,175 | | | 126,335 | |
| Cirrus Logic, Inc.(a)* | | 16,300 | | | 258,355 | |
| Cohu, Inc. | | 5,200 | | | 59,020 | |
| CSR PLC ADR* | | 2,173 | | | 24,837 | |
| Cyberoptics Corp.* | | 1,700 | | | 13,311 | |
| Cymer, Inc.(a)* | | 8,635 | | | 429,678 | |
| Diodes, Inc.(a)* | | 9,250 | | | 197,025 | |
| DSP Group, Inc.* | | 6,800 | | | 35,428 | |
| Entegris, Inc.* | | 32,288 | | | 281,713 | |
| Entropic Communications, Inc.* | | 13,401 | | | 68,479 | |
| Exar Corp.* | | 11,669 | | | 75,849 | |
| Fairchild Semiconductor International, Inc.* | | 26,822 | | | 322,937 | |
32
SA U.S. Small Company Fund
PORTFOLIO OF INVESTMENTS — AS OF DECEMBER 31, 2011 (Unaudited) (Continued)
| | | | SHARES | | VALUE† | |
| COMMON STOCKS (Continued) | | | | | | |
| Semiconductors & Semiconductor Equipment (Continued) | | | | | | |
| Formfactor, Inc.* | | 10,700 | | $ | 54,142 | |
| FSI International, Inc.(a)* | | 8,500 | | | 31,110 | |
| GigOptix, Inc.* | | 2,680 | | | 4,824 | |
| GSI Technology, Inc.(a)* | | 6,498 | | | 30,411 | |
| GT Advanced Technologies, Inc.(a)* | | 33,248 | | | 240,716 | |
| Hittite Microwave Corp.* | | 7,800 | | | 385,164 | |
| Ikanos Communications, Inc.* | | 9,200 | | | 7,452 | |
| Integrated Device Technology, Inc.* | | 33,300 | | | 181,818 | |
| Integrated Silicon Solution, Inc.(a)* | | 5,884 | | | 53,780 | |
| International Rectifier Corp.* | | 14,106 | | | 273,939 | |
| Intersil Corp., Class A | | 31,221 | | | 325,947 | |
| IXYS Corp.(a)* | | 7,000 | | | 75,810 | |
| Kopin Corp.(a)* | | 16,230 | | | 62,972 | |
| Kulicke & Soffa Industries, Inc.* | | 18,199 | | | 168,341 | |
| Lattice Semiconductor Corp.* | | 32,718 | | | 194,345 | |
| LTX-Credence Corp.(a)* | | 9,555 | | | 51,119 | |
| Mattson Technology, Inc.(a)* | | 14,200 | | | 19,596 | |
| MEMSIC, Inc.(a)* | | 1,209 | | | 3,228 | |
| Micrel, Inc. | | 15,500 | | | 156,705 | |
| Microsemi Corp.* | | 19,475 | | | 326,206 | |
| | Mindspeed Technologies, Inc.(a)* | | 6,180 | | | 28,304 | |
| MIPS Technologies, Inc., Class A(a)* | | 16,600 | | | 74,036 | |
| MKS Instruments, Inc. | | 12,552 | | | 349,197 | |
| Monolithic Power Systems, Inc.* | | 7,600 | | | 114,532 | |
| Nanometrics, Inc.(a)* | | 4,500 | | | 82,890 | |
| Netlogic Microsystems, Inc.* | | 293 | | | 14,524 | |
| Omnivision Technologies, Inc.(a)* | | 11,500 | | | 140,702 | |
| PDF Solutions, Inc.* | | 8,956 | | | 62,423 | |
| Pericom Semiconductor Corp.* | | 5,500 | | | 41,855 | |
| Photronics, Inc.* | | 11,917 | | | 72,455 | |
| Pixelworks, Inc.* | | 1,533 | | | 3,725 | |
| PLX Technology, Inc.(a)* | | 6,900 | | | 19,803 | |
| PMC - Sierra, Inc.* | | 49,083 | | | 270,447 | |
| Power Integrations, Inc.(a) | | 6,500 | | | 215,540 | |
| Ramtron International Corp.* | | 10,700 | | | 20,865 | |
| RF Micro Devices, Inc.(a)* | | 58,119 | | | 313,843 | |
| Rubicon Technology, Inc.* | | 4,400 | | | 41,316 | |
| Rudolph Technologies, Inc.(a)* | | 6,058 | | | 56,097 | |
| Semtech Corp.* | | 13,910 | | | 345,246 | |
| Sigma Designs, Inc.(a)* | | 6,309 | | | 37,854 | |
| Silicon Image, Inc.* | | 16,700 | | | 78,490 | |
| Silicon Laboratories, Inc.(a)* | | 9,015 | | | 391,431 | |
| Spansion, Inc., Class A(a)* | | 15,456 | | | 127,976 | |
| Spire Corp.* | | 1,100 | | | 682 | |
| Standard Microsystems Corp.* | | 5,000 | | | 128,850 | |
| STR Holdings, Inc.(a)* | | 7,400 | | | 60,902 | |
| SunPower Corp.(a)* | | 3,530 | | | 21,992 | |
| Supertex, Inc.(a)* | | 2,900 | | | 54,752 | |
| Tessera Technologies, Inc.* | | 11,500 | | | 192,625 | |
| TriQuint Semiconductor, Inc.* | | 32,800 | | | 159,736 | |
| Ultra Clean Holdings* | | 4,750 | | | 29,023 | |
| Ultratech, Inc.(a)* | | 5,300 | | | 130,221 | |
| Veeco Instruments, Inc.(a)* | | 8,400 | | | 174,720 | |
| Volterra Semiconductor Corp.(a)* | | 5,300 | | | 135,733 | |
| | | | | | 9,861,861 | |
| Software — 3.8% | | | | | | |
| Accelrys, Inc.* | | 13,277 | | | 89,221 | |
| ACI Worldwide, Inc.* | | 10,000 | | | 286,400 | |
| Actuate Corp.* | | 14,300 | | | 83,798 | |
| Advent Software, Inc.(a)* | | 12,200 | | | 297,192 | |
| American Software, Inc., Class A | | 5,100 | | | 48,195 | |
| AsiaInfo-Linkage, Inc.(a)* | | 15,273 | | | 118,366 | |
| Aspen Technology, Inc.* | | 23,092 | | | 400,646 | |
| Blackbaud, Inc. | | 12,954 | | | 358,826 | |
| Bottomline Technologies, Inc.* | | 7,055 | | | 163,464 | |
| Bsquare Corp.* | | 2,300 | | | 7,866 | |
| Commvault Systems, Inc.* | | 8,734 | | | 373,116 | |
| Compuware Corp.* | | 40,753 | | | 339,065 | |
| Convio, Inc.* | | 2,946 | | | 32,583 | |
| Deltek, Inc.(a)* | | 10,652 | | | 104,603 | |
| DemandTec, Inc.(a)* | | 584 | | | 7,691 | |
| Digimarc Corp.* | | 1,256 | | | 30,006 | |
| Ebix, Inc.(a) | | 9,036 | | | 199,696 | |
| EPIQ Systems, Inc.(a) | | 8,450 | | | 101,569 | |
| ePlus, Inc.(a)* | | 1,200 | | | 33,936 | |
| Fair Isaac Corp. | | 10,900 | | | 390,656 | |
| Gerber Scientific(a) | | 5,000 | | | — | |
| GSE Systems, Inc.(a)* | | 2,896 | | | 5,647 | |
| Guidance Software, Inc.(a)* | | 1,433 | | | 9,286 | |
| Interactive Intelligence Group* | | 3,800 | | | 87,096 | |
| JDA Software Group, Inc.* | | 9,553 | | | 309,422 | |
| Kenexa Corp.* | | 5,100 | | | 136,170 | |
| Manhattan Associates, Inc.* | | 5,462 | | | 221,102 | |
| Mentor Graphics Corp.* | | 24,100 | | | 326,796 | |
| MicroStrategy, Inc., Class A* | | 2,101 | | | 227,580 | |
| Monotype Imaging Holdings, Inc.* | | 7,120 | | | 111,001 | |
| NetScout Systems, Inc.* | | 9,285 | | | 163,416 | |
| Opnet Technologies, Inc.(a) | | 8,469 | | | 310,558 | |
| Pervasive Software, Inc.* | | 5,000 | | | 29,100 | |
| Progress Software Corp.* | | 13,950 | | | 269,932 | |
| PROS Holdings, Inc.(a)* | | 6,073 | | | 90,366 | |
| QAD, Inc., Class A(a)* | | 4,879 | | | 51,229 | |
| QAD, Inc., Class B(a)* | | 1,219 | | | 12,617 | |
| Quest Software, Inc.* | | 9,413 | | | 175,082 | |
| RealPage, Inc.* | | 1,534 | | | 38,764 | |
| Rosetta Stone, Inc.* | | 4,230 | | | 32,275 | |
| S1 Corp.(a)* | | 18,494 | | | 176,988 | |
| Scientific Learning Corp.(a)* | | 4,750 | | | 12,113 | |
| Seachange International, Inc.* | | 7,100 | | | 49,913 | |
| Smith Micro Software, Inc.(a)* | | 6,500 | | | 7,345 | |
| Solarwinds, Inc.(a)* | | 15,895 | | | 444,265 | |
| Sourcefire, Inc.(a)* | | 5,802 | | | 187,869 | |
| SRS Labs, Inc.* | | 3,700 | | | 21,275 | |
| SS&C Technologies Holdings, Inc.* | | 15,115 | | | 272,977 | |
| Synchronoss Technologies, Inc.* | | 2,822 | | | 85,253 | |
| Take-Two Interactive Software, Inc.* | | 17,890 | | | 242,409 | |
| Taleo Corp., Class A* | | 1,594 | | | 61,672 | |
| TeleCommunication Systems, Inc., Class A* | | 10,596 | | | 24,901 | |
| TeleNav, Inc.* | | 8,331 | | | 65,065 | |
| THQ, Inc.(a)* | | 14,250 | | | 10,830 | |
| TiVo, Inc.* | | 24,136 | | | 216,500 | |
| Tyler Technologies, Inc.(a)* | | 8,205 | | | 247,053 | |
| Ultimate Software Group, Inc.(a)* | | 3,395 | | | 221,082 | |
| Verint Systems, Inc.* | | 8,369 | | | 230,482 | |
| VirnetX Holding Corp.(a)* | | 3,418 | | | 85,347 | |
| Websense, Inc.(a)* | | 8,084 | | | 151,413 | |
| | | | | | 8,889,086 | |
| Specialty Retail — 4.8% | | | | | | |
| Aaron's, Inc. | | 17,233 | | | 459,776 | |
| Aeropostale, Inc.(a)* | | 6,275 | | | 95,694 | |
| America's Car-Mart, Inc.(a)* | | 2,516 | | | 98,577 | |
| Ann, Inc.* | | 12,800 | | | 317,184 | |
| Asbury Automotive Group, Inc.* | | 9,700 | | | 209,132 | |
| Ascena Retail Group, Inc.* | | 1,276 | | | 37,923 | |
| Barnes & Noble, Inc.(a)* | | 12,568 | | | 181,985 | |
| Bebe Stores, Inc.(a) | | 22,995 | | | 191,548 | |
| Big 5 Sporting Goods Corp.(a) | | 4,047 | | | 42,251 | |
33
SA U.S. Small Company Fund
PORTFOLIO OF INVESTMENTS — AS OF DECEMBER 31, 2011 (Unaudited) (Continued)
| | | | SHARES | | VALUE† | |
| COMMON STOCKS (Continued) | | | | | | |
| Specialty Retail (Continued) | | | | | | |
| Body Central Corp.* | | 261 | | $ | 6,515 | |
| Books-A-Million, Inc.(a) | | 3,928 | | | 9,388 | |
| Boyds Collection Ltd.(a),(b)* | | 10,600 | | | — | |
| Brown Shoe Co., Inc.(a) | | 9,550 | | | 84,995 | |
| Buckle, Inc. (The)(a) | | 9,375 | | | 383,156 | |
| Build-A-Bear Workshop, Inc.* | | 3,900 | | | 32,994 | |
| Cabela's, Inc.(a)* | | 17,400 | | | 442,308 | |
| Cache, Inc.* | | 3,300 | | | 20,427 | |
| Casual Male Retail Group, Inc.(a)* | | 8,925 | | | 30,523 | |
| Cato Corp. (The), Class A(a) | | 7,100 | | | 171,820 | |
| Charming Shoppes, Inc.* | | 24,814 | | | 121,589 | |
| Chico's FAS, Inc. | | 10,249 | | | 114,174 | |
| Childrens Place Retail Stores, Inc.(a)* | | 6,000 | | | 318,720 | |
| Christopher & Banks Corp.* | | 7,937 | | | 18,573 | |
| Citi Trends, Inc.* | | 3,000 | | | 26,340 | |
| Collective Brands, Inc.(a)* | | 13,100 | | | 188,247 | |
| Conn's, Inc.* | | 7,199 | | | 79,909 | |
| Cost Plus, Inc.(a)* | | 4,685 | | | 45,679 | |
| Destination Maternity Corp.(a) | | 2,800 | | | 46,816 | |
| DSW, Inc., Class A | | 7,973 | | | 352,486 | |
| Express, Inc.* | | 21,004 | | | 418,820 | |
| Finish Line Inc. (The), Class A | | 12,124 | | | 233,811 | |
| Friedmans, Inc., Class A(b) | | 1,600 | | | — | |
| Genesco, Inc.(a)* | | 5,569 | | | 343,830 | |
| Golfsmith International Holdings, Inc.(a)* | | 1,600 | | | 5,072 | |
| Group 1 Automotive, Inc.(a) | | 4,900 | | | 253,820 | |
| Haverty Furniture Cos., Inc.(a) | | 3,600 | | | 39,528 | |
| hhgregg, Inc.(a)* | | 9,379 | | | 135,527 | |
| Hibbett Sports, Inc.* | | 6,450 | | | 291,411 | |
| Hot Topic, Inc. | | 9,875 | | | 65,274 | |
| Jos. A. Bank Clothiers, Inc.(a)* | | 6,612 | | | 322,401 | |
| Kirkland's, Inc.(a)* | | 5,977 | | | 79,494 | |
| Lithia Motors, Inc., Class A | | 4,731 | | | 103,420 | |
| Lumber Liquidators Holdings, Inc.* | | 195 | | | 3,444 | |
| MarineMax, Inc.(a)* | | 4,100 | | | 26,732 | |
| Men's Wearhouse, Inc.(a) | | 11,601 | | | 375,988 | |
| Midas, Inc.* | | 3,000 | | | 25,770 | |
| Monro Muffler Brake, Inc.(a) | | 6,750 | | | 261,832 | |
| New York & Co., Inc.(a)* | | 11,900 | | | 31,654 | |
| Office Depot, Inc.* | | 60,988 | | | 131,124 | |
| OfficeMax, Inc.(a)* | | 17,831 | | | 80,953 | |
| Pacific Sunwear Of California(a)* | | 14,775 | | | 25,265 | |
| Penske Auto Group, Inc. | | 20,300 | | | 390,775 | |
| PEP Boys-Manny Moe & Jack(a) | | 11,700 | | | 128,700 | |
| Pier 1 Imports, Inc.* | | 34,700 | | | 483,371 | |
| RadioShack Corp.(a) | | 20,906 | | | 202,997 | |
| Rent-A-Center, Inc. | | 13,202 | | | 488,474 | |
| Rue21, Inc.(a)* | | 4,880 | | | 105,408 | |
| Sally Beauty Holdings, Inc.* | | 8,941 | | | 188,923 | |
| Select Comfort Corp.(a)* | | 12,269 | | | 266,115 | |
| Shoe Carnival, Inc.(a)* | | 2,240 | | | 57,568 | |
| Sonic Automotive, Inc., Class A(a) | | 8,327 | | | 123,323 | |
| Sport Chalet, Inc.* | | 800 | | | 1,312 | |
| Stage Stores, Inc.(a) | | 8,600 | | | 119,454 | |
| Stein Mart, Inc.(a)* | | 11,157 | | | 75,979 | |
| Systemax, Inc.(a)* | | 7,400 | | | 121,434 | |
| Talbots, Inc.(a)* | | 10,590 | | | 28,169 | |
| Tandy Leather Factory, Inc.* | | 2,200 | | | 10,736 | |
| Trans World Entertainment(a)* | | 5,400 | | | 13,608 | |
| Ulta Salon Cosmetics & Fragrance, Inc.* | | 6,477 | | | 420,487 | |
| Vitamin Shoppe, Inc.* | | 7,189 | | | 286,697 | |
| West Marine, Inc.(a)* | | 4,005 | | | 46,578 | |
| Wet Seal, Inc.(a)* | | 20,875 | | | 68,052 | |
| Zale Corp.(a)* | | 7,200 | | | 27,432 | |
| Zumiez, Inc.(a)* | | 6,000 | | | 166,560 | |
| | | | | | 11,206,051 | |
| Textiles, Apparel & Luxury Goods — 1.5% | | | | | | |
| Carter's, Inc.(a)* | | 14,200 | | | 565,302 | |
| Cherokee, Inc. | | 1,700 | | | 19,839 | |
| Columbia Sportswear Co.(a) | | 8,700 | | | 404,985 | |
| CROCS, Inc.* | | 22,600 | | | 333,802 | |
| Culp, Inc.* | | 2,400 | | | 20,448 | |
| Delta Apparel, Inc.(a)* | | 1,153 | | | 22,011 | |
| G-III Apparel Group Ltd.(a)* | | 3,500 | | | 87,185 | |
| Heelys, Inc.(a)* | | 2,200 | | | 4,070 | |
| Iconix Brand Group, Inc.(a)* | | 16,998 | | | 276,897 | |
| Jones Group, Inc. (The) | | 19,161 | | | 202,149 | |
| K-Swiss, Inc., Class A(a)* | | 5,700 | | | 16,644 | |
| Kenneth Cole Productions, Inc., Class A* | | 3,400 | | | 36,006 | |
| LaCrosse Footwear, Inc. | | 582 | | | 7,345 | |
| Lakeland Industries, Inc.* | | 440 | | | 4,070 | |
| Maidenform Brands, Inc.* | | 5,100 | | | 93,330 | |
| Movado Group, Inc. | | 4,000 | | | 72,680 | |
| Oxford Industries, Inc.(a) | | 4,374 | | | 197,355 | |
| Perry Ellis International, Inc.(a)* | | 3,000 | | | 42,660 | |
| Quiksilver, Inc.* | | 32,625 | | | 117,776 | |
| R.G. Barry Corp. | | 1,900 | | | 22,952 | |
| Rocky Brands, Inc.* | | 1,000 | | | 9,020 | |
| Skechers U.S.A., Inc., Class A(a)* | | 6,800 | | | 82,416 | |
| Steven Madden Ltd.* | | 10,860 | | | 374,670 | |
| Superior Uniform Group, Inc.(a) | | 1,100 | | | 13,673 | |
| Tandy Brands Accessories, Inc.* | | 1,300 | | | 1,274 | |
| True Religion Apparel, Inc.* | | 5,400 | | | 186,732 | |
| Unifi, Inc.(a)* | | 4,533 | | | 34,451 | |
| Wolverine World Wide, Inc. | | 11,000 | | | 392,040 | |
| | | | | | 3,641,782 | |
| Thrifts & Mortgage Finance — 1.8% | | | | | | |
| Astoria Financial Corp.(a) | | 21,700 | | | 184,233 | |
| Atlantic Coast Financial Corp.* | | 488 | | | 1,371 | |
| Bank Mutual Corp.(a) | | 8,663 | | | 27,548 | |
| BankFinancial Corp.(a) | | 4,900 | | | 27,048 | |
| Beneficial Mutual Bancorp, Inc.(a)* | | 16,344 | | | 136,636 | |
| Berkshire Hills Bancorp, Inc.(a) | | 4,442 | | | 98,568 | |
| BofI Holding, Inc.* | | 1,700 | | | 27,625 | |
| Brookline Bancorp, Inc.(a) | | 19,118 | | | 161,356 | |
| Cape Bancorp, Inc.(a)* | | 236 | | | 1,853 | |
| Capitol Federal Financial, Inc. | | 41,921 | | | 483,768 | |
| CFS Bancorp, Inc. | | 1,800 | | | 7,794 | |
| Charter Financial Corp.(a) | | 2,028 | | | 18,779 | |
| Citizens Community Bancorp, Inc.* | | 400 | | | 2,000 | |
| Citizens First Bancorp, Inc.* | | 1,800 | | | 13 | |
| Citizens South Banking Corp. | | 1,260 | | | 4,498 | |
| Clifton Savings Bancorp, Inc. | | 4,173 | | | 38,726 | |
| Dime Community Bancshares | | 10,050 | | | 126,630 | |
| Doral Financial Corp.(a)* | | 6,300 | | | 6,023 | |
| ESSA Bancorp, Inc.(a) | | 1,900 | | | 19,893 | |
| Federal Agricultural Mortgage Corp., Class C | | 1,400 | | | 25,228 | |
| First Defiance Financial Corp.(a) | | 1,100 | | | 16,049 | |
| First Federal Bancshares of Arkansas, Inc.* | | 397 | | | 1,715 | |
| First Federal of Northern Michigan Bancorp, Inc.* | | 300 | | | 858 | |
| First Financial Holdings, Inc.(a) | | 2,800 | | | 25,004 | |
| First Financial Northwest, Inc.(a)* | | 2,239 | | | 13,188 | |
| First Pactrust Bancorp, Inc. | | 1,673 | | | 17,148 | |
| First Place Financial Corp.(a)* | | 2,900 | | | 1,508 | |
| Flushing Financial Corp. | | 7,140 | | | 90,178 | |
34
SA U.S. Small Company Fund
PORTFOLIO OF INVESTMENTS — AS OF DECEMBER 31, 2011 (Unaudited) (Continued)
| | | | SHARES | | VALUE† | |
| COMMON STOCKS (Continued) | | | | | | |
| Thrifts & Mortgage Finance (Continued) | | | | | | |
| Fox Chase Bancorp, Inc.(a) | | 3,230 | | $ | 40,795 | |
| Hampden Bancorp, Inc.(a) | | 300 | | | 3,540 | |
| HF Financial Corp. | | 110 | | | 1,179 | |
| Home Bancorp, Inc.* | | 994 | | | 15,377 | |
| Home Federal Bancorp, Inc.(a) | | 4,062 | | | 42,245 | |
| HopFed Bancorp, Inc.(a) | | 415 | | | 2,698 | |
| | Kaiser Federal Financial Group, Inc. | | 2,068 | | | 26,512 | |
| Kearny Financial Corp.(a) | | 17,221 | | | 163,600 | |
| Meridian Interstate Bancorp, Inc.(a)* | | 3,210 | | | 39,965 | |
| MGIC Investment Corp.(a)* | | 44,075 | | | 164,400 | |
| New England Bancshares, Inc. | | 1,000 | | | 10,370 | |
| New Hampshire Thrift Bancshares, Inc.(a) | | 200 | | | 2,260 | |
| Northeast Community Bancorp, Inc.(a) | | 2,200 | | | 12,320 | |
| Northfield Bancorp, Inc.(a) | | 8,158 | | | 115,517 | |
| Northwest Bancshares, Inc. | | 27,000 | | | 335,880 | |
| OceanFirst Financial Corp.(a) | | 3,447 | | | 45,052 | |
| Ocwen Financial Corp.* | | 23,644 | | | 342,365 | |
| Oritani Financial Corp.(a) | | 12,152 | | | 155,181 | |
| Provident Financial Holdings, Inc. | | 1,000 | | | 9,340 | |
| Provident Financial Services, Inc.(a) | | 14,515 | | | 194,356 | |
| Provident New York Bancorp | | 10,000 | | | 66,400 | |
| Pulaski Financial Corp.(a) | | 2,040 | | | 14,504 | |
| Radian Group, Inc.(a) | | 27,036 | | | 63,264 | |
| Rainier Pacific Financial Group, Inc.* | | 700 | | | — | |
| Riverview Bancorp, Inc.* | | 2,760 | | | 6,541 | |
| Rockville Financial, Inc.(a) | | 7,084 | | | 73,390 | |
| Roma Financial Corp. | | 4,854 | | | 47,763 | |
| SI Financial Group, Inc. | | 2,065 | | | 20,340 | |
| Territorial Bancorp, Inc.(a) | | 2,302 | | | 45,465 | |
| Timberland Bancorp, Inc.* | | 2,600 | | | 10,010 | |
| Tree.com, Inc.(a)* | | 900 | | | 5,031 | |
| Trustco Bank Corp.(a) | | 17,234 | | | 96,683 | |
| United Financial Bancorp, Inc. | | 3,955 | | | 63,636 | |
| ViewPoint Financial Group(a) | | 8,008 | | | 104,184 | |
| Washington Federal, Inc. | | 23,270 | | | 325,547 | |
| Waterstone Financial, Inc.(a)* | | 6,900 | | | 13,248 | |
| Westfield Financial, Inc.(a) | | 5,000 | | | 36,800 | |
| WSFS Financial Corp. | | 789 | | | 28,372 | |
| | | | | | 4,309,368 | |
| Tobacco — 0.3% | | | | | | |
| Alliance One International, Inc.(a)* | | 20,000 | | | 54,400 | |
| Star Scientific, Inc.(a)* | | 27,050 | | | 58,969 | |
| Universal Corp.(a) | | 5,600 | | | 257,376 | |
| Vector Group Ltd.(a) | | 17,287 | | | 307,017 | |
| | | | | | 677,762 | |
| Trading Companies & Distributors — 1.5% | | | | | | |
| Aceto Corp.(a) | | 7,018 | | | 48,424 | |
| Aircastle Ltd. | | 15,000 | | | 190,800 | |
| Applied Industrial Technologies, Inc.(a) | | 9,834 | | | 345,862 | |
| Beacon Roofing Supply, Inc.(a)* | | 10,600 | | | 214,438 | |
| BlueLinx Holdings, Inc.(a)* | | 14,231 | | | 21,346 | |
| CAI International, Inc.* | | 3,585 | | | 55,424 | |
| DXP Enterprises, Inc.* | | 2,600 | | | 83,720 | |
| Empire Resources, Inc. | | 2,300 | | | 6,440 | |
| GATX Corp.(a) | | 10,233 | | | 446,773 | |
| H&E Equipment Services, Inc.* | | 8,700 | | | 116,754 | |
| Houston Wire & Cable Co.(a) | | 5,746 | | | 79,410 | |
| Interline Brands, Inc.* | | 6,600 | | | 102,762 | |
| Kaman Corp., Class A | | 5,778 | | | 157,855 | |
| KSW, Inc. | | 1,050 | | | 3,497 | |
| Lawson Products, Inc.(a) | | 1,575 | | | 24,302 | |
| RSC Holdings, Inc.(a)* | | 4,488 | | | 83,028 | |
| Rush Enterprises, Inc., Class A* | | 6,000 | | | 125,520 | |
| TAL International Group, Inc.(a) | | 7,400 | | | 213,046 | |
| Textainer Group Holdings Ltd.(a) | | 10,100 | | | 294,112 | |
| Titan Machinery, Inc.* | | 3,710 | | | 80,618 | |
| United Rentals, Inc.(a)* | | 12,532 | | | 370,321 | |
| Watsco, Inc.(a) | | 5,300 | | | 347,998 | |
| Willis Lease Finance Corp.(a)* | | 900 | | | 10,710 | |
| | | | | | 3,423,160 | |
| Water Utilities — 0.2% | | | | | | |
| American States Water Co.(a) | | 3,550 | | | 123,895 | |
| Artesian Resources Corp., Class A | | 1,300 | | | 24,479 | |
| California Water Service Group | | 8,600 | | | 157,036 | |
| Connecticut Water Service, Inc.(a) | | 1,900 | | | 51,547 | |
| Consolidated Water Co., Ltd.(a) | | 2,195 | | | 18,833 | |
| Middlesex Water Co.(a) | | 2,337 | | | 43,608 | |
| SJW Corp.(a) | | 4,400 | | | 104,016 | |
| York Water Co.(a) | | 1,271 | | | 22,421 | |
| | | | | | 545,835 | |
| Wireless Telecommunication Services — 0.2% | | | | | | |
| Leap Wireless International, Inc.(a)* | | 17,252 | | | 160,271 | |
| NTELOS Holdings Corp. | | 4,685 | | | 95,480 | |
| Shenandoah Telecommunications Co.(a) | | 4,460 | | | 46,741 | |
| USA Mobility, Inc. | | 4,000 | | | 55,480 | |
| | | | | | 357,972 | |
| TOTAL COMMON STOCKS | | | | | | |
| (Identified Cost $233,688,193) | | | | | 235,495,400 | |
| | | |
| RIGHTS & WARRANTS — 0.0% | | | | | | |
| Biotechnology — 0.0% | | | | | | |
| Celgene Corp., expires 12/31/2030* | | 4,900 | | | 6,860 | |
| Construction Materials — 0.0% | | | | | | |
| U.S. Concrete, Inc., Class A, expires 8/31/17(b)* | | 335 | | | — | |
| U.S. Concrete, Inc., expires 8/31/17(b)* | | 335 | | | — | |
| | | | | | — | |
| Hotels, Restaurants & Leisure — 0.0% | | | | | | |
| Krispy Kreme Doughnuts, Inc., expires 3/2/2012* | | 130 | | | 8 | |
| Oil, Gas & Consumable Fuels — 0.0% | | | | | | |
| Zion Oil & Gas, Inc., expires 7/26/12(a)* | | 1,460 | | | 211 | |
| Pharmaceuticals — 0.0% | | | | | | |
| FRD Acquisition Co.(c) | | 656 | | | — | |
| Fresenius Kabi Pharmaceuticals Holding, Inc., expires 6/30/11(b)(c)* | | 13,728 | | | — | |
| | | | | | — | |
| Specialty Retail — 0.0% | | | | | | |
| Ligand Pharmaceuticals, expires 12/31/11(b)* | | 1,800 | | | — | |
| TOTAL RIGHTS & WARRANTS | | | | | | |
| (Identified Cost $111,630) | | | | | 7,079 | |
| | |
| | | FACE | | | |
| | | AMOUNT | | VALUE† | |
| BONDS AND NOTES — 0.0% | | | | | | |
| Capital Markets — 0.0% | | | | | | |
| GAMCO Investors, Inc.* | | 30 | | | 20 | |
| TOTAL BONDS AND NOTES | | | | | | |
| (Identified Cost $30) | | | | | 20 | |
35
SA U.S. Small Company Fund
PORTFOLIO OF INVESTMENTS — AS OF DECEMBER 31, 2011 (Unaudited) (Continued)
| | | | SHARES | | VALUE† | |
| SHORT-TERM INVESTMENTS — 0.0% | | | | |
| Other — 0.0% | | | | | | |
| SSgA Government Money Market Fund | | 1 | | $ | 1 | |
| SSgA Money Market Fund | | 41 | | | 41 | |
| | | | | | 42 | |
| TOTAL SHORT-TERM INVESTMENTS | | | | | | |
| (Identified Cost $42) | | | | | 42 | |
| | | | | |
| COLLATERAL FOR SECURITIES ON LOAN — 34.3% | | | | |
| Short-Term — 34.3% | | | | | | |
| State Street Navigator Securities | | | | | | |
| Lending Prime Portfolio | | 80,520,088 | | | 80,520,088 | |
| TOTAL COLLATERAL FOR SECURITIES ON LOAN | | | | |
| (Identified Cost $80,520,088) | | | | | 80,520,088 | |
| | | | | | | |
| Total Investments — 134.4% | | | | | | |
| (Identified Cost $314,319,983)# | | | | | 316,022,629 | |
| Liabilities, Less Cash and Other Assets — (34.4%) | | | (80,837,259 | ) |
| Net Assets — 100.0% | | | | $ | 235,185,370 | |
| | † | | See Note 1. |
| * | | Non-income producing security. |
| (a) | | A portion or all of the security was held on loan. As of December 31, 2011, the market value of the securities on loan was $ 77,833,156. |
| (b) | | Bankrupt security/delisted. |
| (c) | | Contingent value rights based on future performance. |
| # | | At December 31, 2011 the aggregate cost of investment securities for U.S. federal income tax purposes was $314,319,983. Net unrealized appreciation aggregated $1,578,221 of which $55,431,522 related to appreciated investment securities and $53,853,301 related to depreciated investment securities. |
Key to abbreviations:
ADR– American Depository Receipt
36
SA International Value Fund
PORTFOLIO OF INVESTMENTS — AS OF DECEMBER 31, 2011 (Unaudited)
| | | | SHARES | | VALUE† | |
| COMMON STOCKS — 99.7% | | | | | | |
| Australia — 5.2% | | | | | | |
| Alumina Ltd. | | 256,850 | | $ | 292,918 | |
| Amcor Ltd. | | 137,883 | | | 1,016,803 | |
| Asciano Group | | 137,016 | | | 630,630 | |
| Bank of Queensland Ltd.(a) | | 69,547 | | | 519,980 | |
| Bendigo and Adelaide Bank Ltd. | | 80,715 | | | 662,919 | |
| BlueScope Steel Ltd.(a) | | 244,217 | | | 101,163 | |
| Boral Ltd.(a) | | 149,703 | | | 551,219 | |
| Caltex Australia Ltd. | | 54,126 | | | 651,588 | |
| Crown Ltd. | | 80,586 | | | 666,805 | |
| CSR Ltd.(a) | | 75,681 | | | 151,717 | |
| Downer EDI Ltd.* | | 14,976 | | | 49,016 | |
| Echo Entertainment Group Ltd.(a)* | | 116,617 | | | 428,201 | |
| Fairfax Media Ltd.(a) | | 358,477 | | | 263,988 | |
| Harvey Norman Holdings Ltd.(a) | | 35,795 | | | 67,181 | |
| Incitec Pivot Ltd. | | 240,274 | | | 764,290 | |
| Insurance Australia Group Ltd.(a) | | 46,828 | | | 142,729 | |
| Lend Lease Corp. Ltd. | | 35,726 | | | 261,630 | |
| Macquarie Group Ltd. | | 32,171 | | | 782,798 | |
| National Australia Bank Ltd. | | 5,777 | | | 138,028 | |
| OneSteel Ltd.(a) | | 91,574 | | | 65,563 | |
| Origin Energy Ltd. | | 174,933 | | | 2,386,813 | |
| OZ Minerals Ltd. | | 32,061 | | | 328,248 | |
| Primary Health Care Ltd. | | 48,970 | | | 154,267 | |
| Qantas Airways Ltd.* | | 197,873 | | | 295,482 | |
| Santos Ltd. | | 118,345 | | | 1,481,570 | |
| Seven Group Holdings Ltd. | | 1,538 | | | 11,137 | |
| Sims Metal Management Ltd.(a) | | 38,790 | | | 501,882 | |
| Suncorp Group Ltd. | | 216,476 | | | 1,855,430 | |
| TABCORP Holdings Ltd. | | 117,035 | | | 326,790 | |
| Tatts Group Ltd. | | 164,072 | | | 409,463 | |
| Toll Holdings Ltd.(a) | | 79,355 | | | 342,513 | |
| Wesfarmers Ltd. | | 201,167 | | | 6,069,733 | |
| | | | | | 22,372,494 | |
| Austria — 0.1% | | | | | | |
| Erste Group Bank AG | | 20,746 | | | 364,764 | |
| OMV AG | | 704 | | | 21,358 | |
| Raiffeisen Bank International AG(a) | | 8,878 | | | 230,554 | |
| | | | | | 616,676 | |
| Belgium — 1.0% | | | | | | |
| Delhaize Group | | 17,993 | | | 1,010,792 | |
| Fortis | | 349,625 | | | 543,003 | |
| KBC Groep NV | | 16,399 | | | 206,535 | |
| SA D'ieteren NV | | 2,077 | | | 91,585 | |
| Solvay SA | | 13,524 | | | 1,114,269 | |
| UCB SA | | 31,369 | | | 1,319,885 | |
| | | | | | 4,286,069 | |
| Canada — 12.9% | | | | | | |
| Astral Media, Inc., Class A | | 10,600 | | | 369,270 | |
| Bell Aliant, Inc. | | 200 | | | 5,613 | |
| Canadian Natural Resources Ltd. | | 20,800 | | | 778,915 | |
| Canadian Pacific Railway Ltd.(a) | | 17,375 | | | 1,176,980 | |
| Canadian Tire Corp., Ltd. | | 18,300 | | | 1,183,774 | |
| Canadian Utilities Ltd., Class A(a) | | 6,069 | | | 366,612 | |
| Empire Co., Ltd., Class A | | 7,800 | | | 452,572 | |
| EnCana Corp. | | 153,451 | | | 2,845,339 | |
| Enerplus Corp.(a) | | 31,795 | | | 806,774 | |
| Ensign Energy Services Inc. | | 16,271 | | | 259,538 | |
| Fairfax Financial Holdings Ltd. | | 2,700 | | | 1,158,211 | |
| George Weston Ltd.(a) | | 7,700 | | | 514,644 | |
| Goldcorp, Inc. | | 69,511 | | | 3,084,753 | |
| Groupe Aeroplan, Inc. | | 22,400 | | | 262,534 | |
| HudBay Minerals, Inc. | | 800 | | | 7,963 | |
| Husky Energy, Inc.(a) | | 50,950 | | | 1,227,801 | |
| Industrial Alliance Insurance & Financial | | | | | | |
| Services, Inc.(a) | | 18,285 | | | 471,865 | |
| Inmet Mining Corp.(a) | | 9,029 | | | 580,515 | |
| Kinross Gold Corp. | | 203,700 | | | 2,325,429 | |
| Loblaw Companies Ltd.(a) | | 14,200 | | | 536,359 | |
| Lundin Mining Corp.* | | 58,141 | | | 220,865 | |
| Magna International, Inc., Class A(a) | | 50,224 | | | 1,676,188 | |
| Manulife Financial Corp.(a) | | 320,899 | | | 3,417,673 | |
| New Gold, Inc.* | | 17,543 | | | 177,023 | |
| Nexen, Inc. | | 90,416 | | | 1,438,668 | |
| Pengrowth Energy Corp.(a) | | 39,727 | | | 419,595 | |
| Penn West Petroleum Ltd.(a) | | 58,024 | | | 1,149,943 | |
| Precision Drilling Corp.* | | 40,259 | | | 414,939 | |
| Progress Energy Resources Corp.(a) | | 1,293 | | | 16,804 | |
| Progressive Waste Solutions Ltd.(a) | | 4,734 | | | 92,612 | |
| Quadra FNX Mining Ltd.(a)* | | 28,500 | | | 421,870 | |
| Sun Life Financial, Inc.(a) | | 125,037 | | | 2,319,705 | |
| Suncor Energy, Inc. | | 247,864 | | | 7,148,215 | |
| Talisman Energy, Inc.(a) | | 52,300 | | | 666,360 | |
| Teck Resources Ltd.(a) | | 104,620 | | | 3,687,759 | |
| TELUS Corp. | | 17,542 | | | 940,854 | |
| Thomson Reuters Corp. | | 106,534 | | | 2,847,530 | |
| TransAlta Corp.(a) | | 32,569 | | | 672,000 | |
| TransCanada Corp.(a) | | 138,613 | | | 6,058,834 | |
| Uranium One, Inc.(a)* | | 16,700 | | | 35,408 | |
| Viterra, Inc. | | 55,057 | | | 580,429 | |
| Yamana Gold, Inc.(a) | | 166,200 | | | 2,450,379 | |
| | | | | | 55,269,114 | |
| Denmark — 1.3% | | | | | | |
| A P Moller - Maersk A/S, Class A | | 33 | | | 205,930 | |
| A P Moller - Maersk A/S, Class B | | 273 | | | 1,802,476 | |
| Carlsberg A/S | | 20,734 | | | 1,462,098 | |
| Danske Bank A/S* | | 117,152 | | | 1,488,036 | |
| H Lundbeck A/S | | 5,267 | | | 99,043 | |
| Jyske Bank A/S* | | 9,528 | | | 233,916 | |
| Rockwool International A/S | | 570 | | | 45,733 | |
| TDC A/S | | 26,693 | | | 214,072 | |
| Vestas Wind Systems A/S(a)* | | 6,330 | | | 68,334 | |
| | | | | | 5,619,638 | |
| Finland — 0.7% | | | | | | |
| Kesko Oyj | | 11,009 | | | 369,888 | |
| Neste Oil Oyj | | 18,872 | | | 190,638 | |
| Stora Enso Oyj, R Shares | | 129,420 | | | 775,199 | |
| UPM-Kymmene Oyj | | 153,593 | | | 1,691,684 | |
| | | | | | 3,027,409 | |
| France — 9.2% | | | | | | |
| Air France-KLM(a)* | | 27,263 | | | 140,188 | |
| Arkema | | 1,831 | | | 129,627 | |
| AXA SA | | 198,619 | | | 2,582,195 | |
| BNP Paribas SA | | 28,349 | | | 1,113,563 | |
| Bollore | | 14 | | | 2,745 | |
| Bouygues SA | | 4,657 | | | 146,735 | |
| Cap Gemini SA | | 19,799 | | | 618,712 | |
| Casino Guichard Perrachon SA | | 9,335 | | | 786,285 | |
| Cie de Saint-Gobain | | 76,505 | | | 2,937,328 | |
| Cie Generale de Geophysique-Veritas* | | 1,131 | | | 26,539 | |
| Cie Generale de Geophysique-Veritas, ADR(a)* | | 9,901 | | | 229,901 | |
| Ciments Francais SA | | 2,122 | | | 164,235 | |
| CNP Assurances | | 21,364 | | | 264,835 | |
| Compagnie Generele des Etablissements | | | | | | |
| Michelin, Class B, ADR | | 22,537 | | | 1,332,272 | |
| Credit Agricole SA | | 186,204 | | | 1,050,736 | |
37
SA International Value Fund
PORTFOLIO OF INVESTMENTS — AS OF DECEMBER 31, 2011 (Unaudited) (Continued)
| | | | SHARES | | VALUE† | |
| COMMON STOCKS (Continued) | | | | | | |
| France (Continued) | | | | | | |
| Credit Industriel et Commercial | | 509 | | $ | 66,207 | |
| EDF SA(a) | | 19,244 | | | 468,243 | |
| France Telecom SA | | 252,519 | | | 3,965,995 | |
| GDF Suez | | 246,704 | | | 6,743,548 | |
| Groupe Eurotunnel SA | | 42,022 | | | 286,076 | |
| Lafarge SA | | 38,431 | | | 1,350,920 | |
| Lagardere SCA | | 29,198 | | | 770,906 | |
| Natixis | | 161,411 | | | 406,114 | |
| Peugeot SA | | 25,314 | | | 396,756 | |
| PPR | | 11,860 | | | 1,698,456 | |
| Renault SA | | 35,128 | | | 1,218,447 | |
| Rexel SA | | 13,765 | | | 235,163 | |
| Sanofi | | 6,600 | | | 484,762 | |
| Sanofi-Aventis SA, ADR | | 43,199 | | | 1,578,491 | |
| SCOR | | 14,662 | | | 342,712 | |
| Societe Generale | | 59,624 | | | 1,327,682 | |
| Thales SA | | 427 | | | 13,485 | |
| Vallourec SA | | 3,772 | | | 244,877 | |
| Vivendi | | 288,783 | | | 6,323,977 | |
| | | | | | 39,448,713 | |
| Germany — 8.1% | | | | | | |
| Allianz SE | | 34,938 | | | 3,342,101 | |
| Bayerische Motoren Werke AG | | 71,775 | | | 4,808,236 | |
| Celesio AG | | 6,399 | | | 101,371 | |
| Commerzbank AG(a)* | | 188,056 | | | 317,139 | |
| Daimler AG | | 127,622 | | | 5,602,730 | |
| Deutsche Bank AG | | 29,867 | | | 1,137,821 | |
| Deutsche Bank AG | | 41,677 | | | 1,577,891 | |
| Deutsche Lufthansa AG | | 50,963 | | | 605,832 | |
| Deutsche Post AG | | 9,793 | | | 150,574 | |
| Deutsche Telekom AG | | 475,474 | | | 5,455,365 | |
| E.On AG | | 249,404 | | | 5,380,930 | |
| Fraport AG Frankfurt Airport Services Worldwide | | 523 | | | 25,722 | |
| Hannover Rueckversicherung AG | | 4,864 | | | 241,265 | |
| HeidelbergCement AG | | 14,250 | | | 604,748 | |
| Merck KGaA | | 8,461 | | | 843,529 | |
| Muenchener Rueckversicherungs AG | | 18,030 | | | 2,211,723 | |
| RWE AG | | 18,902 | | | 664,196 | |
| Salzgitter AG | | 3,794 | | | 189,688 | |
| Suedzucker AG | | 6,635 | | | 211,678 | |
| ThyssenKrupp AG | | 39,448 | | | 904,960 | |
| Volkswagen AG | | 4,022 | | | 539,548 | |
| | | | | | 34,917,047 | |
| Greece — 0.1% | | | | | | |
| Hellenic Petroleum SA | | 26,868 | | | 220,814 | |
| National Bank of Greece SA* | | 11,245 | | | 23,723 | |
| | | | | | 244,537 | |
| Hong Kong — 1.3% | | | | | | |
| Henderson Land Development Co., Ltd. | | 177,777 | | | 883,552 | |
| Hopewell Holdings Ltd. | | 77,000 | | | 196,897 | |
| Hutchison Whampoa Ltd. | | 362,000 | | | 3,043,623 | |
| New World Development Co., Ltd. | | 670,884 | | | 540,743 | |
| Orient Overseas International Ltd. | | 28,500 | | | 166,414 | |
| Sino Land Co., Ltd. | | 5,800 | | | 8,259 | |
| The Hongkong & Shanghai Hotels Ltd. | | 68,495 | | | 75,845 | |
| Tsim Sha Tsui Properties | | 58,492 | | | 146,859 | |
| Wheelock & Co., Ltd. | | 233,000 | | | 577,205 | |
| | | | | | 5,639,397 | |
| Ireland — 0.3% | | | | | | |
| CRH PLC | | 10,173 | | | 202,236 | |
| CRH PLC, ADR(a) | | 59,896 | | | 1,187,139 | |
| | | | | | 1,389,375 | |
| Israel — 0.5% | | | | | | |
| Bank Hapoalim B.M. | | 120,208 | | | 391,756 | |
| Bank Leumi Le-Israel | | 116,511 | | | 333,544 | |
| Bezeq Israeli Telecommunication Corp. Ltd. | | 26,406 | | | 48,378 | |
| Elbit Systems Ltd. | | 4,903 | | | 201,343 | |
| Israel Chemicals Ltd. | | 32,730 | | | 339,238 | |
| Israel Discount Bank Ltd., Series A* | | 138,248 | | | 185,007 | |
| NICE Systems Ltd.* | | 22,235 | | | 765,996 | |
| Paz Oil Co., Ltd. | | 569 | | | 69,053 | |
| Strauss Group Ltd. | | 973 | | | 11,923 | |
| | | | | | 2,346,238 | |
| Italy — 0.9% | | | | | | |
| Banca Monte dei Paschi di Siena SpA | | 162,299 | | | 52,913 | |
| Banco Popolare Scarl(a) | | 25,217 | | | 32,637 | |
| Fiat SpA(a) | | 77,417 | | | 355,699 | |
| Finmeccanica SpA(a) | | 61,153 | | | 226,203 | |
| Telecom Italia SpA | | 1,609,881 | | | 1,731,463 | |
| UniCredit SpA(a) | | 197,083 | | | 1,637,580 | |
| Unione di Banche Italiane SCPA(a) | | 1,905 | | | 7,806 | |
| | | | | | 4,044,301 | |
| Japan — 21.4% | | | | | | |
| Aeon Co., Ltd.(a) | | 107,200 | | | 1,472,137 | |
| Ajinomoto Co., Inc. | | 33,000 | | | 396,154 | |
| Alfresa Holdings Corp. | | 3,400 | | | 143,342 | |
| Amada Co., Ltd. | | 51,000 | | | 323,347 | |
| Aozora Bank Ltd.(a) | | 42,000 | | | 115,681 | |
| Asahi Kasei Corp. | | 76,000 | | | 458,153 | |
| Asatsu-DK, Inc.(a) | | 1,100 | | | 28,911 | |
| Bank of Kyoto Ltd.(a) | | 45,000 | | | 387,619 | |
| Bank of Yokohama Ltd. | | 45,000 | | | 212,810 | |
| Canon Marketing Japan, Inc. | | 8,000 | | | 93,543 | |
| Chiba Bank Ltd.(a) | | 56,000 | | | 360,868 | |
| Chugoku Bank Ltd. | | 24,000 | | | 334,572 | |
| Citizen Holdings Co., Ltd.(a) | | 68,900 | | | 400,134 | |
| Coca-Cola West Co., Ltd.(a) | | 7,200 | | | 124,880 | |
| COMSYS Holdings Corp. | | 9,000 | | | 94,478 | |
| Cosmo Oil Co., Ltd.(a) | | 111,000 | | | 310,056 | |
| Dai Nippon Printing Co., Ltd.(a) | | 119,000 | | | 1,144,082 | |
| Daicel Chemical Industries Ltd.(a) | | 45,000 | | | 274,198 | |
| Daishi Bank Ltd. | | 40,000 | | | 130,440 | |
| Daiwa Securities Group, Inc.(a) | | 131,000 | | | 408,471 | |
| Elpida Memory, Inc.(a)* | | 26,600 | | | 123,721 | |
| Fuji Heavy Industries Ltd. | | 79,000 | | | 477,264 | |
| Fuji Media Holdings, Inc. | | 84 | | | 127,359 | |
| FUJIFILM Holdings Corp. | | 113,700 | | | 2,692,934 | |
| Fujikura Ltd. | | 65,000 | | | 190,009 | |
| Fukuoka Financial Group, Inc. | | 153,000 | | | 642,055 | |
| Glory Ltd. | | 7,800 | | | 167,917 | |
| Gunma Bank Ltd. | | 55,000 | | | 302,261 | |
| H2O Retailing Corp.(a) | | 18,000 | | | 137,274 | |
| Hachijuni Bank Ltd.(a) | | 68,000 | | | 387,839 | |
| Hakuhodo DY Holdings, Inc.(a) | | 2,090 | | | 120,018 | |
| Hankyu Hanshin Holdings, Inc. | | 12,000 | | | 50,513 | |
| Higo Bank Ltd. | | 29,000 | | | 163,895 | |
| Hiroshima Bank Ltd.(a) | | 7,000 | | | 32,558 | |
| Hitachi Capital Corp. | | 4,800 | | | 66,540 | |
| Hitachi High-Technologies Corp. | | 9,800 | | | 212,628 | |
| Hokkoku Bank Ltd. | | 38,000 | | | 139,223 | |
| Hokuhoku Financial Group, Inc. | | 172,000 | | | 335,196 | |
| House Foods Corp.(a) | | 8,700 | | | 163,669 | |
| Hyakujushi Bank Ltd. | | 35,000 | | | 156,425 | |
| Idemitsu Kosan Co., Ltd.(a) | | 7,700 | | | 794,309 | |
38
SA International Value Fund
PORTFOLIO OF INVESTMENTS — AS OF DECEMBER 31, 2011 (Unaudited) (Continued)
| | | | SHARES | | VALUE† | |
| COMMON STOCKS (Continued) | | | | | | |
| Japan (Continued) | | | | | | |
| Inpex Corp. | | 218 | | $ | 1,373,652 | |
| Isetan Mitsukoshi Holdings Ltd.(a) | | 57,300 | | | 600,768 | |
| Iyo Bank Ltd.(a) | | 30,000 | | | 296,219 | |
| J Front Retailing Co., Ltd. | | 112,000 | | | 541,302 | |
| JFE Holdings, Inc. | | 46,000 | | | 833,104 | |
| Joyo Bank Ltd. | | 91,000 | | | 401,975 | |
| JS Group Corp. | | 31,800 | | | 609,393 | |
| JTEKT Corp. | | 22,500 | | | 221,288 | |
| Juroku Bank Ltd. | | 33,000 | | | 107,613 | |
| JX Holdings, Inc. | | 446,500 | | | 2,697,447 | |
| Kagoshima Bank Ltd. | | 22,000 | | | 154,346 | |
| Kajima Corp.(a) | | 88,000 | | | 269,819 | |
| Kamigumi Co., Ltd. | | 32,000 | | | 276,056 | |
| Kaneka Corp.(a) | | 55,000 | | | 292,971 | |
| Kawasaki Kisen Kaisha Ltd.(a) | | 49,000 | | | 88,489 | |
| Keiyo Bank | | 24,000 | | | 118,800 | |
| Kinden Corp. | | 34,000 | | | 287,125 | |
| Konica Minolta Holdings, Inc.(a) | | 24,500 | | | 182,708 | |
| Kyocera Corp. | | 10,300 | | | 828,336 | |
| Kyowa Hakko Kirin Co., Ltd.(a) | | 40,000 | | | 489,541 | |
| Marui Group Co., Ltd. | | 55,700 | | | 434,195 | |
| Mazda Motor Corp.(a)* | | 226,000 | | | 399,324 | |
| Mediceo Paltac Holdings Co., Ltd. | | 19,700 | | | 205,779 | |
| MEIJI Holdings Co., Ltd. | | 9,100 | | | 377,738 | |
| Mitsubishi Chemical Holdings Corp.(a) | | 91,000 | | | 501,286 | |
| Mitsubishi Corp. | | 89,800 | | | 1,814,200 | |
| Mitsubishi Gas Chemical Co., Inc. | | 62,000 | | | 343,952 | |
| Mitsubishi Heavy Industries Ltd.(a) | | 482,000 | | | 2,053,995 | |
| Mitsubishi Logistics Corp. | | 10,000 | | | 111,082 | |
| Mitsubishi Materials Corp. | | 181,000 | | | 491,477 | |
| Mitsubishi UFJ Financial Group, Inc. | | 917,400 | | | 3,897,490 | |
| Mitsubishi UFJ Financial Group, Inc., ADR | | 1,031,340 | | | 4,321,315 | |
| Mitsui & Co., Ltd. | | 18,800 | | | 292,368 | |
| Mitsui & Co., Ltd., ADR(a) | | 2,885 | | | 892,907 | |
| Mitsui Chemicals, Inc.(a) | | 126,000 | | | 384,695 | |
| Mitsui Engineering & Shipbuilding Co., Ltd.(a) | | 44,000 | | | 68,598 | |
| Mitsui OSK Lines Ltd.(a) | | 172,000 | | | 665,922 | |
| Mitsui Sumitomo Insurance Group Holdings, Inc. | | 64,900 | | | 1,202,383 | |
| Mizuho Financial Group, Inc. | | 34,100 | | | 46,075 | |
| Nagase & Co., Ltd. | | 24,000 | | | 261,608 | |
| Namco Bandai Holdings, Inc. | | 3,300 | | | 46,990 | |
| Nanto Bank Ltd. | | 1,000 | | | 5,535 | |
| NEC Corp.* | | 268,000 | | | 543,173 | |
| Nippon Electric Glass Co., Ltd.(a) | | 24,000 | | | 237,599 | |
| Nippon Express Co., Ltd. | | 132,000 | | | 514,486 | |
| Nippon Meat Packers, Inc. | | 27,067 | | | 336,184 | |
| Nippon Paper Group, Inc.(a) | | 14,200 | | | 309,939 | |
| Nippon Sheet Glass Co., Ltd. | | 159,000 | | | 297,467 | |
| Nippon Shokubai Co., Ltd.(a) | | 18,000 | | | 193,400 | |
| Nippon Steel Corp.(a) | | 544,000 | | | 1,356,996 | |
| Nippon Television Network Corp. | | 1,030 | | | 157,638 | |
| Nippon Yusen(a) | | 228,000 | | | 583,552 | |
| Nisshin Seifun Group, Inc. | | 30,000 | | | 363,648 | |
| Nisshin Steel Co., Ltd.(a) | | 160,000 | | | 245,290 | |
| Nisshinbo Holdings, Inc. | | 23,000 | | | 207,379 | |
| NOK Corp.(a) | | 16,200 | | | 278,454 | |
| Nomura Holdings, Inc. | | 358,300 | | | 1,084,629 | |
| NTN Corp. | | 32,000 | | | 128,881 | |
| Obayashi Corp.(a) | | 99,000 | | | 439,886 | |
| OJI Paper Co., Ltd.(a) | | 88,000 | | | 451,605 | |
| Onward Holdings Co., Ltd. | | 28,000 | | | 205,535 | |
| Panasonic Corp.(a) | | 263,000 | | | 2,234,663 | |
| Panasonic Corp., ADR(a) | | 98,061 | | | 822,732 | |
| Renesas Electronics Corp.(a)* | | 9,300 | | | 56,909 | |
| Rengo Co., Ltd. | | 18,000 | | | 125,581 | |
| Ricoh Co., Ltd.(a) | | 127,000 | | | 1,107,146 | |
| Rohm Co., Ltd. | | 14,400 | | | 671,638 | |
| San-In Godo Bank Ltd. | | 22,000 | | | 164,921 | |
| Sapporo Hokuyo Holdings, Inc. | | 32,000 | | | 114,746 | |
| SBI Holdings, Inc. | | 3,270 | | | 239,610 | |
| Seiko Epson Corp.(a) | | 28,000 | | | 372,145 | |
| Seino Holdings Corp. | | 23,000 | | | 178,394 | |
| Sekisui Chemical Co., Ltd. | | 52,000 | | | 428,998 | |
| Sekisui House Ltd. | | 158,000 | | | 1,402,027 | |
| Seven & I Holdings Co., Ltd. | | 13,800 | | | 384,578 | |
| Sharp Corp.(a) | | 182,000 | | | 1,591,347 | |
| Shiga Bank Ltd. | | 30,000 | | | 204,235 | |
| Shimizu Corp.(a) | | 90,000 | | | 377,680 | |
| Shinsei Bank Ltd. | | 193,000 | | | 200,598 | |
| Showa Denko KK(a) | | 214,000 | | | 433,727 | |
| Showa Shell Sekiyu KK(a) | | 29,700 | | | 200,264 | |
| SKY Perfect JSAT Holdings, Inc. | | 167 | | | 83,641 | |
| Sohgo Security Services Co., Ltd. | | 7,900 | | | 83,342 | |
| Sojitz Corp.(a) | | 149,700 | | | 231,445 | |
| Sony Corp., ADR(a) | | 212,565 | | | 3,834,673 | |
| Sumitomo Bakelite Co., Ltd.(a) | | 43,000 | | | 240,782 | |
| Sumitomo Corp. | | 207,400 | | | 2,807,728 | |
| Sumitomo Electric Industries Ltd. | | 144,800 | | | 1,576,490 | |
| Sumitomo Forestry Co., Ltd.(a) | | 28,200 | | | 249,136 | |
| Sumitomo Mitsui Financial Group, Inc. | | 170,400 | | | 4,746,493 | |
| Suzuken Co., Ltd.(a) | | 11,400 | | | 316,066 | |
| Suzuki Motor Corp. | | 24,500 | | | 506,743 | |
| Taisei Corp. | | 181,000 | | | 458,555 | |
| Takashimaya Co., Ltd.(a) | | 45,000 | | | 325,646 | |
| TDK Corp. | | 11,100 | | | 491,763 | |
| Teijin Ltd. | | 34,000 | | | 104,690 | |
| The 77 Bank Ltd. | | 60,000 | | | 258,802 | |
| The Nishi-Nippon City Bank Ltd. | | 89,000 | | | 255,541 | |
| The Yokohama Rubber Co., Ltd.(a) | | 28,000 | | | 157,152 | |
| Toda Corp. | | 30,000 | | | 109,133 | |
| TOKAI RIKA Co., Ltd. | | 5,900 | | | 90,374 | |
| Tokuyama Corp.(a) | | 46,000 | | | 146,421 | |
| Tokyo Broadcasting System Holdings, Inc. | | 6,900 | | | 88,749 | |
| Tokyo Steel Manufacturing Co., Ltd.(a) | | 16,100 | | | 130,942 | |
| Tokyo Tatemono Co., Ltd.(a)* | | 69,000 | | | 208,874 | |
| Toppan Printing Co., Ltd.(a) | | 163,000 | | | 1,198,623 | |
| Tosoh Corp.(a) | | 49,000 | | | 131,142 | |
| Toyo Seikan Kaisha Ltd. | | 52,200 | | | 712,096 | |
| Toyoda Gosei Co., Ltd. | | 2,000 | | | 31,883 | |
| Toyota Auto Body Co., Ltd. | | 7,000 | | | 104,973 | |
| Toyota Motor Corp. | | 105,300 | | | 3,509,088 | |
| Toyota Motor Corp., ADR | | 50,471 | | | 3,337,647 | |
| Toyota Tsusho Corp. | | 30,600 | | | 541,076 | |
| UNY Co., Ltd.(a) | | 39,000 | | | 351,137 | |
| Wacoal Holdings Corp.(a) | | 14,000 | | | 185,891 | |
| Yamaguchi Financial Group, Inc. | | 51,000 | | | 487,008 | |
| Yamaha Corp. | | 32,700 | | | 299,938 | |
| Yamato Kogyo Co., Ltd. | | 2,000 | | | 57,425 | |
| | | | | | 91,886,137 | |
| Netherlands — 2.6% | | | | | | |
| Aegon NV* | | 72,073 | | | 289,263 | |
| Akzo Nobel NV | | 49,506 | | | 2,393,773 | |
| ArcelorMittal | | 110,977 | | | 2,029,521 | |
| ArcelorMittal-NY Registered | | 29,788 | | | 541,844 | |
| Koninklijke DSM NV | | 31,703 | | | 1,470,984 | |
| Koninklijke Philips Electronics NV | | 143,152 | | | 3,016,269 | |
39
SA International Value Fund
PORTFOLIO OF INVESTMENTS — AS OF DECEMBER 31, 2011 (Unaudited) (Continued)
| | | | SHARES | | VALUE† | |
| COMMON STOCKS (Continued) | | | | | | |
| Netherlands (Continued) | | | | | | |
| STMicroelectronics NV | | 240,145 | | $ | 1,426,918 | |
| TNT Express NV | | 624 | | | 4,663 | |
| | | | | | 11,173,235 | |
| New Zealand — 0.1% | | | | | | |
| Contact Energy Ltd.* | | 110,499 | | | 453,285 | |
| | | | | | | | |
| Norway — 0.9% | | | | | | |
| Aker ASA, Series A | | 823 | | | 21,329 | |
| Archer Ltd.* | | 11,137 | | | 29,980 | |
| BW Offshore Ltd.(a) | | 11,203 | | | 17,701 | |
| DnB NOR ASA | | 69,771 | | | 683,029 | |
| Marine Harvest ASA(a) | | 309,194 | | | 133,689 | |
| Norsk Hydro ASA | | 267,912 | | | 1,242,612 | |
| Orkla ASA | | 165,896 | | | 1,238,496 | |
| Petroleum Geo-Services ASA* | | 29,174 | | | 319,259 | |
| Storebrand ASA | | 70,912 | | | 368,737 | |
| | | | | | 4,054,832 | |
| Portugal — 0.1% | | | | | | |
| Banco Comercial Portugues SA(a)* | | 210,790 | | | 37,103 | |
| Banco Espirito Santo SA(a) | | 97,975 | | | 171,186 | |
| | | | | | 208,289 | |
| Singapore — 0.8% | | | | | | |
| CapitaLand Ltd. | | 203,000 | | | 345,885 | |
| Fraser & Neave Ltd.(a) | | 106,500 | | | 509,078 | |
| Golden Agri-Resources Ltd. | | 1,188,000 | | | 654,886 | |
| Neptune Orient Lines Ltd.(a) | | 150,749 | | | 130,752 | |
| Overseas Union Enterprise Ltd. | | 64,000 | | | 103,620 | |
| Singapore Airlines Ltd.(a) | | 165,340 | | | 1,295,135 | |
| United Industrial Corp., Ltd. | | 171,000 | | | 359,917 | |
| Venture Corp., Ltd. | | 16,000 | | | 76,481 | |
| | | | | | 3,475,754 | |
| Spain — 2.7% | | | | | | |
| Acciona SA | | 8,496 | | | 733,760 | |
| Banco de Sabadell SA(a) | | 306,009 | | | 1,162,017 | |
| Banco Espanol de Credito SA(a) | | 13,917 | | | 67,095 | |
| Banco Popular Espanol SA(a) | | 281,788 | | | 1,283,759 | |
| Banco Santander SA | | 349,086 | | | 2,652,094 | |
| Bankinter SA(a) | | 6,575 | | | 40,421 | |
| Criteria Caixacorp SA(a) | | 210,490 | | | 1,033,860 | |
| EDP Renovaveis SA* | | 18,086 | | | 110,672 | |
| Gas Natural SDG SA | | 76,918 | | | 1,320,546 | |
| International Consolidated Airlines Group SA* | | 183,620 | | | 420,329 | |
| Mapfre SA(a) | | 18,659 | | | 59,287 | |
| Repsol YPF SA(a) | | 84,909 | | | 2,608,322 | |
| Sacyr Vallehermoso SA(a) | | 13,060 | | | 67,104 | |
| | | | | | 11,559,266 | |
| Sweden — 2.4% | | | | | | |
| Boliden AB | | 20,208 | | | 295,102 | |
| Holmen AB, B Shares | | 18,717 | | | 537,681 | |
| Meda AB, A Shares | | 6,846 | | | 71,225 | |
| Nordea Bank AB | | 247,277 | | | 1,913,311 | |
| Skandinaviska Enskilda Banken AB, Series A | | 230,385 | | | 1,342,062 | |
| SSAB Svenskt Stal AB, Series A(a) | | 42,025 | | | 370,357 | |
| SSAB Svenskt Stal AB, Series B | | 17,977 | | | 137,922 | |
| Svenska Cellulosa AB, Series A | | 922 | | | 13,518 | |
| Svenska Cellulosa AB, Series B | | 131,362 | | | 1,946,938 | |
| Swedbank AB, Class A | | 78,393 | | | 1,015,502 | |
| Tele2 AB, Class B | | 33,117 | | | 644,338 | |
| Telefonaktiebolaget LM Ericsson | | 144,362 | | | 1,476,752 | |
| Telefonaktiebolaget LM Ericsson, A Shares | | 334 | | | 3,375 | |
| TeliaSonera AB | | 59,380 | | | 403,543 | |
| | | | | | 10,171,626 | |
| Switzerland — 5.2% | | | | | | |
| Adecco SA* | | 32,604 | | | 1,365,876 | |
| Alpiq Holding AG | | 161 | | | 29,139 | |
| Aryzta AG | | 5,352 | | | 258,683 | |
| Baloise Holding AG | | 14,302 | | | 980,569 | |
| Banque Cantonale Vaudoise | | 335 | | | 162,721 | |
| Credit Suisse Group AG* | | 18,370 | | | 431,626 | |
| Givaudan SA* | | 1,372 | | | 1,307,293 | |
| Holcim Ltd.* | | 63,904 | | | 3,418,690 | |
| Lonza Group AG* | | 5,819 | | | 343,825 | |
| Novartis AG | | 14,519 | | | 830,051 | |
| Novartis AG | | 13,288 | | | 759,678 | |
| Sulzer AG | | 1,644 | | | 175,724 | |
| Swiss Life Holding AG* | | 5,342 | | | 491,375 | |
| Swiss Re Ltd.* | | 89,565 | | | 4,564,544 | |
| UBS AG* | | 123,242 | | | 1,466,886 | |
| Zurich Financial Services AG* | | 24,930 | | | 5,639,971 | |
| | | | | | 22,226,651 | |
| United Kingdom — 21.9% | | | | | | |
| Associated British Foods PLC | | 76,049 | | | 1,307,412 | |
| Aviva PLC | | 427,825 | | | 1,998,552 | |
| Barclays PLC | | 448,147 | | | 1,225,259 | |
| Barclays PLC, ADR(a) | | 122,013 | | | 1,340,923 | |
| BP PLC, ADR | | 369,933 | | | 15,810,936 | |
| Carnival PLC | | 36,295 | | | 1,195,194 | |
| Carnival PLC, ADR | | 24,609 | | | 812,510 | |
| Eurasian Natural Resources Corp. PLC | | 2,813 | | | 27,762 | |
| HSBC Holdings PLC | | 115,142 | | | 878,074 | |
| HSBC Holdings PLC, ADR(a) | | 448 | | | 17,069 | |
| International Power PLC | | 262,187 | | | 1,372,999 | |
| Investec PLC | | 71,730 | | | 377,635 | |
| J Sainsbury PLC | | 374,389 | | | 1,761,140 | |
| John Wood Group PLC | | 644 | | | 6,411 | |
| Kazakhmys PLC | | 42,677 | | | 614,391 | |
| Kingfisher PLC | | 803,327 | | | 3,127,650 | |
| Lloyds Banking Group PLC* | | 5,337,553 | | | 2,147,322 | |
| Lloyds Banking Group PLC, ADR*(a)* | | 19,015 | | | 29,854 | |
| Mondi PLC | | 36,769 | | | 259,815 | |
| Old Mutual PLC | | 870,234 | | | 1,831,246 | |
| Pearson PLC | | 11,184 | | | 210,162 | |
| Pearson PLC, ADR | | 75,300 | | | 1,420,911 | |
| Resolution Ltd. | | 165,216 | | | 645,043 | |
| Rexam PLC | | 232,302 | | | 1,272,779 | |
| Royal & Sun Alliance Insurance Group PLC | | 35,357 | | | 57,765 | |
| Royal Bank of Scotland Group PLC* | | 1,666,913 | | | 522,403 | |
| Royal Bank of Scotland Group PLC, ADR(a)* | | 26,038 | | | 165,862 | |
| Royal Dutch Shell PLC | | 37,989 | | | 1,447,784 | |
| Royal Dutch Shell PLC, A Shares | | 3,896 | | | 143,457 | |
| Royal Dutch Shell PLC, ADR | | 249,011 | | | 18,927,326 | |
| Vedanta Resources PLC(a) | | 2,183 | | | 34,411 | |
| Vodafone Group PLC(a) | | 58,988 | | | 1,653,434 | |
| Vodafone Group PLC, ADR | | 6,835,685 | | | 18,991,700 | |
| WM Morrison Supermarkets PLC | | 611,503 | | | 3,097,805 | |
| Wolseley PLC | | 32,204 | | | 1,066,273 | |
| WPP PLC | | 217,958 | | | 2,286,492 | |
| Xstrata PLC | | 395,500 | | | 6,006,989 | |
| | | | | | 94,092,750 | |
| TOTAL COMMON STOCKS | | | | | | |
| (Identified Cost $443,543,773) | | | | | 428,522,833 | |
40
SA International Value Fund
PORTFOLIO OF INVESTMENTS — AS OF DECEMBER 31, 2011 (Unaudited) (Continued)
| | | | SHARES | | VALUE† | |
| PREFERRED STOCKS — 0.0% | | | | | | |
| Germany — 0.0% | | | | | | |
| Porsche Automobil Holding SE | | 2,731 | | $ | 146,156 | |
| TOTAL PREFERRED STOCKS | | | | | | |
| (Identified Cost $169,209) | | | | | 146,156 | |
| | | | | |
| SHORT-TERM INVESTMENTS — 0.0% | | | | |
| United States — 0.0% | | | | | | |
| SSgA Government Money Market Fund | | 1 | | | 1 | |
| SSgA Money Market Fund | | 57 | | | 57 | |
| | | | | | 58 | |
| TOTAL SHORT-TERM INVESTMENTS | | | | | | |
| (Identified Cost $58) | | | | | 58 | |
| | |
| COLLATERAL FOR SECURITIES ON LOAN — 15.0% | |
| Short-Term — 15.0% | | | | | | |
| State Street Navigator Securities Lending | | | | | | |
| Prime Portfolio | | 64,629,732 | | | 64,629,732 | |
| TOTAL COLLATERAL FOR SECURITIES ON LOAN | | | | |
| (Identified Cost $64,629,732) | | | | | 64,629,732 | |
| | | | | | | |
| Total Investments — 114.7% | | | | | | |
| (Identified Cost $508,342,772)# | | | | | 493,298,779 | |
| Liabilities, Less Cash and Other Assets — (14.7%) | | | (63,289,387 | ) |
| | |
| Net Assets — 100.0% | | | | $ | 430,009,392 | |
| | † | | See Note 1. |
| (a) | | A portion or all of the security was held on loan. As of December 31, 2011, the market value of the securities on loan was $62,499,430. |
| * | | Non-income producing security |
| # | | At December 31, 2011 the aggregate cost of investment securities for U.S. federal income tax purposes was $508,342,772. Net unrealized depreciation aggregated $15,043,993 of which $48,675,654 related to appreciated investment securities and $63,719,647 related to depreciated investment securities. |
Key to abbreviations:
ADR – American Depository Receipt
41
SA Emerging Markets Value Fund
PORTFOLIO OF INVESTMENTS — AS OF DECEMBER 31, 2011 (Unaudited)
| | | | SHARES | | VALUE† | |
| COMMON STOCKS — 95.2% | | | | | | |
| Brazil — 9.5% | | | | | | |
| Banco Santander Brasil SA | | 6,200 | | $ | 49,726 | |
| Banco Santander Brasil SA, ADR | | 114,655 | | | 933,292 | |
| BM&FBOVESPA SA | | 168,604 | | | 885,843 | |
| BR Malls Participacoes SA | | 34,200 | | | 332,236 | |
| BRF - Brasil Foods SA | | 9,300 | | | 181,587 | |
| BRF - Brasil Foods SA, ADR | | 5,215 | | | 101,953 | |
| Brookfield Incorporacoes SA | | 27,100 | | | 71,918 | |
| Cosan SA Industria e Comercio | | 15,500 | | | 224,367 | |
| Fibria Celulose SA, ADR | | 35,799 | | | 278,158 | |
| Gafisa SA | | 31,894 | | | 146,712 | |
| Gerdau SA | | 6,900 | | | 45,316 | |
| Gerdau SA, ADR | | 98,782 | | | 771,487 | |
| Hypermarcas SA | | 15,400 | | | 70,178 | |
| JBS SA* | | 94,584 | | | 308,308 | |
| Magnesita Refratarios SA* | | 7,500 | | | 23,201 | |
| Marfrig Alimentos SA | | 18,499 | | | 84,697 | |
| MPX Energia SA* | | 4,200 | | | 104,705 | |
| Petroleo Brasileiro SA, ADR | | 60,737 | | | 1,509,315 | |
| Rossi Residencial SA | | 14,800 | | | 63,477 | |
| Usinas Siderurgicas de Minas Gerais SA | | 25,400 | | | 233,540 | |
| | | | | | 6,420,016 | |
| Chile — 2.2% | | | | | | |
| Cencosud SA | | 6,318 | | | 36,364 | |
| Cia General de Electricidad | | 18,040 | | | 86,467 | |
| Empresas CMPC SA | | 133,020 | | | 488,807 | |
| Empresas COPEC SA | | 28,567 | | | 383,001 | |
| Enersis SA, ADR | | 29,100 | | | 513,033 | |
| | | | | | 1,507,672 | |
| China — 15.7% | | | | | | |
| Agile Property Holdings Ltd. | | 85,859 | | | 76,942 | |
| Angang Steel Co., Ltd., H Shares | | 78,000 | | | 56,341 | |
| Bank of China Ltd., H Shares | | 4,654,902 | | | 1,720,131 | |
| Bank of Communications Co., Ltd., H Shares | | 539,400 | | | 378,509 | |
| Beijing Capital International Airport Co., Ltd., H Shares | | 132,000 | | | 66,284 | |
| Beijing Enterprises Holdings Ltd. | | 36,500 | | | 219,942 | |
| Chaoda Modern Agriculture Holdings Ltd. | | 62,354 | | | 8,831 | |
| China Agri-Industries Holdings Ltd. | | 77,000 | | | 58,494 | |
| China Citic Bank Corp. Ltd., H Shares | | 554,000 | | | 313,144 | |
| China Coal Energy Co. | | 243,000 | | | 262,192 | |
| China Communication Services Corp. Ltd., H Shares | | 118,000 | | | 52,873 | |
| China Communications Construction Co., Ltd. | | 323,000 | | | 252,857 | |
| China Construction Bank Corp., H Shares | | 1,505,810 | | | 1,050,845 | |
| China COSCO Holdings Co., Ltd., H Shares | | 141,000 | | | 69,169 | |
| China Dongxiang Group Co. | | 165,000 | | | 28,043 | |
| China Everbright Ltd. | | 72,000 | | | 112,543 | |
| China Lumena New Materials Corp. | | 224,000 | | | 41,532 | |
| China Merchants Holdings International Co., Ltd. | | 72,693 | | | 210,593 | |
| China Minsheng Banking Corp. Ltd., H Shares | | 281,000 | | | 243,857 | |
| China National Materials Co., Ltd., H Shares | | 18,000 | | | 6,397 | |
| China Petroleum & Chemical Corp. | | 12,822 | | | 1,346,951 | |
| China Railway Construction Corp. Ltd. | | 127,000 | | | 69,823 | |
| China Resources Land Ltd. | | 154,000 | | | 246,667 | |
| China Shipping Container Lines Co., Ltd., H Shares* | | 303,200 | | | 69,099 | |
| China Shipping Development Co., Ltd., H Shares | | 105,543 | | | 65,908 | |
| China Travel International Inv HK | | 208,000 | | | 35,084 | |
| China Unicom Hong Kong Ltd. | | 42,000 | | | 88,471 | |
| China Unicom Hong Kong Ltd., ADR | | 38,409 | | | 811,582 | |
| China Yurun Food Group Ltd. | | 9,000 | | | 11,820 | |
| China Zhongwang Holdings Ltd. | | 73,600 | | | 25,113 | |
| Citic Pacific Ltd. | | 126,000 | | | 227,126 | |
| Citic Resources Holdings Ltd.* | | 228,000 | | | 31,118 | |
| COSCO Pacific Ltd. | | 76,000 | | | 88,657 | |
| Country Garden Holdings Co. | | 143,000 | | | 53,579 | |
| Dalian Port PDA Co., Ltd., H Shares | | 128,000 | | | 31,149 | |
| Fosun International | | 163,500 | | | 84,207 | |
| Franshion Properties China Ltd. | | 238,000 | | | 45,660 | |
| Fushan International Energy Group Ltd. | | 188,000 | | | 63,178 | |
| Geely Automobile Holdings Ltd. | | 200,000 | | | 43,777 | |
| Glorious Property Holdings Ltd.* | | 228,000 | | | 40,218 | |
| Greentown China Holdings Ltd. | | 34,500 | | | 14,970 | |
| Guangshen Railway Co., Ltd., ADR | | 3,500 | | | 61,740 | |
| Guangzhou Automobile Group Co., Ltd., H Shares | | 140,870 | | | 117,534 | |
| Guangzhou R&F Properties Co., Ltd. | | 66,800 | | | 52,896 | |
| Harbin Power Equipment Co., Ltd. | | 54,000 | | | 46,932 | |
| Hidili Industry International Development Ltd. | | 60,000 | | | 17,768 | |
| Hopson Development Holdings Ltd. | | 68,000 | | | 35,460 | |
| Hunan Non-Ferrous Metal Corp. Ltd., H Shares* | | 96,000 | | | 28,059 | |
| Industrial & Commercial Bank of China | | 157,795 | | | 93,865 | |
| Kaisa Group Holdings Ltd.* | | 13,000 | | | 2,243 | |
| Kingboard Chemical Holdings Ltd. | | 40,500 | | | 119,676 | |
| Kingboard Laminates Holdings Ltd. | | 50,000 | | | 22,854 | |
| KWG Property Holding Ltd. | | 72,000 | | | 24,289 | |
| Lee & Man Paper Manufacturing Ltd. | | 76,000 | | | 24,464 | |
| Maanshan Iron & Steel, H Shares | | 128,000 | | | 41,037 | |
| Metallurgical Corp. of China Ltd., H Shares | | 131,000 | | | 30,023 | |
| New World China Land Ltd. | | 148,800 | | | 29,888 | |
| Nine Dragons Paper Holdings Ltd. | | 54,000 | | | 33,999 | |
| Poly Hong Kong Investments Ltd. | | 150,000 | | | 64,893 | |
| Semiconductor Manufacturing International Corp.* | | 994,000 | | | 47,994 | |
| Semiconductor Manufacturing International Corp., ADR* | | 7,700 | | | 18,095 | |
| Shanghai Industrial Holdings Ltd. | | 55,000 | | | 151,192 | |
| Shenzhen International Holdings | | 627,500 | | | 40,397 | |
| Shenzhen Investment Ltd. | | 108,000 | | | 19,329 | |
| Shimao Property Holdings Ltd. | | 130,500 | | | 110,898 | |
| Shougang Concord International Enterprises Co., Ltd. | | 264,000 | | | 15,636 | |
| Shui On Land Ltd. | | 230,281 | | | 69,974 | |
| Sino-Ocean Land Holdings Ltd. | | 228,434 | | | 105,885 | |
| Sinofert Holdings Ltd. | | 120,000 | | | 33,837 | |
| Sinotrans Ltd., H Shares | | 106,000 | | | 18,971 | |
| Sinotrans Shipping Ltd. | | 74,573 | | | 18,147 | |
| Sinotruk Hong Kong Ltd. | | 60,000 | | | 33,528 | |
| Skyworth Digital Holdings Ltd. | | 56,000 | | | 19,684 | |
| Soho China Ltd. | | 195,500 | | | 130,390 | |
| TCC International Holdings Ltd. | | 64,000 | | | 21,920 | |
| Tian An China Investment | | 10,000 | | | 5,112 | |
| Travelsky Technology Ltd., H Shares | | 118,500 | | | 61,641 | |
| Weiqiao Textile Co., H Shares | | 33,000 | | | 16,571 | |
| Xinjiang Xinxin Mining Industry Co., Ltd., H Shares | | 66,000 | | | 17,846 | |
| Yuexiu Property Co., Ltd. | | 515,800 | | | 74,382 | |
| | | | | | 10,602,725 | |
42
SA Emerging Markets Value Fund
PORTFOLIO OF INVESTMENTS — AS OF DECEMBER 31, 2011 (Unaudited) (Continued)
| | | | SHARES | | VALUE† | |
| COMMON STOCKS (Continued) | | | | | | |
| Czech Republic — 0.3% | | | | | | |
| Telefonica O2 Czech Republic AS | | 4,507 | | $ | 87,395 | |
| Unipetrol* | | 14,712 | | | 127,338 | |
| | | | | | 214,733 | |
| Hungary — 0.2% | | | | | | |
| Egis Gyogyszergyar Nyrt | | 1,851 | | | 134,549 | |
| OTP Bank Nyrt | | 2,446 | | | 32,325 | |
| | | | | | 166,874 | |
| India — 7.1% | | | | | | |
| Aditya Birla Nuvo Ltd. | | 2,706 | | | 37,723 | |
| Allahabad Bank Ltd. | | 1,836 | | | 3,959 | |
| Ambuja Cements Ltd. | | 9,569 | | | 28,146 | |
| Amtek Auto Ltd. | | 7,584 | | | 13,724 | |
| Arvind Ltd.* | | 11,397 | | | 14,250 | |
| Ashok Leyland Ltd. | | 66,000 | | | 28,523 | |
| Aurobindo Pharma Ltd. | | 5,739 | | | 9,207 | |
| Bajaj Finserv Ltd. | | 1,407 | | | 11,316 | |
| Bajaj Holdings and Investment Ltd. | | 1,407 | | | 18,044 | |
| Bank of Baroda | | 4,881 | | | 60,386 | |
| Bank of India | | 7,035 | | | 34,973 | |
| Bhushan Steel Ltd. | | 7,490 | | | 43,864 | |
| Bombay Rayon Fashions Ltd. | | 1,619 | | | 8,231 | |
| Cairn India Ltd.* | | 37,422 | | | 221,904 | |
| Canara Bank | | 5,493 | | | 37,754 | |
| Central Bank Of India | | 22,808 | | | 28,346 | |
| Corporation Bank | | 250 | | | 1,643 | |
| DLF Ltd. | | 29,868 | | | 103,066 | |
| Educomp Solutions Ltd. | | 5,729 | | | 20,713 | |
| EID Parry India Ltd. | | 7,288 | | | 26,075 | |
| Essar Ports Ltd.* | | 2,998 | | | 2,857 | |
| Essar Shipping Ltd.* | | 1,499 | | | 528 | |
| Federal Bank Ltd. | | 9,627 | | | 61,455 | |
| Gitanjali Gems Ltd. | | 6,654 | | | 37,746 | |
| HCL Infosystems Ltd. | | 6,893 | | | 5,049 | |
| Hexa Tradex Ltd.* | | 2,323 | | | 1,531 | |
| Hindalco Industries Ltd. | | 86,851 | | | 188,568 | |
| Housing Development & Infrastructure Ltd.* | | 8,468 | | | 8,547 | |
| ICICI Bank Ltd., ADR | | 32,610 | | | 861,882 | |
| IDBI Bank Ltd. | | 16,131 | | | 23,602 | |
| IFCI Ltd. | | 14,171 | | | 5,804 | |
| Indiabulls Financial Services Ltd. | | 1,875 | | | 4,839 | |
| Indiabulls Infra and Power Ltd. | | 3,507 | | | 511 | |
| Indiabulls Real Estate Ltd. | | 1,189 | | | 1,034 | |
| Indiabulls Wholesale Services Ltd.* | | 2,253 | | | 180 | |
| Indian Bank | | 12,173 | | | 42,326 | |
| Indian Hotels Co., Ltd. | | 19,676 | | | 20,082 | |
| Indian Overseas Bank | | 26,718 | | | 36,954 | |
| Infrastructure Development Finance Co., Ltd. | | 42,265 | | | 72,504 | |
| ING Vysya Bank Ltd. | | 6,545 | | | 35,249 | |
| Jaiprakash Associates Ltd. | | 65,004 | | | 64,202 | |
| Jammu & Kashmir Bank Ltd. | | 2,469 | | | 30,987 | |
| Jaypee Infratech Ltd. | | 42,410 | | | 31,146 | |
| Jindal Saw Ltd. | | 11,615 | | | 28,543 | |
| JSW Energy Ltd. | | 54,292 | | | 38,645 | |
| JSW Steel Ltd. | | 10,487 | | | 99,716 | |
| Mphasis Ltd. | | 2,597 | | | 14,637 | |
| National Aluminium Co., Ltd. | | 72,404 | | | 69,466 | |
| Oriental Bank Of Commerce | | 7,526 | | | 27,848 | |
| Patni Computer Systems Ltd., ADR* | | 3,300 | | | 53,691 | |
| Piramal Healthcare Ltd. | | 1,684 | | | 11,958 | |
| PTC India Ltd. | | 3,148 | | | 2,315 | |
| Reliance Capital Ltd. | | 8,971 | | | 39,673 | |
| Reliance Communications Ltd. | | 57,695 | | | 76,159 | |
| Reliance Industries Ltd. | | 39,139 | | | 510,823 | |
| Reliance Industries Ltd., GDR, (b) | | 21,509 | | | 572,139 | |
| Reliance Power Ltd.* | | 39,511 | | | 52,602 | |
| Rural Electrification Corp. Ltd. | | 11,303 | | | 32,863 | |
| Sesa Goa, Ltd. | | 15,374 | | | 47,478 | |
| Shipping Corp. of India Ltd. | | 13,851 | | | 12,572 | |
| Shree Renuka Sugars Ltd. | | 48,908 | | | 23,162 | |
| Sintex Industries Ltd. | | 22,565 | | | 26,812 | |
| State Bank of India Ltd. | | 1,500 | | | 45,843 | |
| State Bank of India Ltd., GDR | | 1,400 | | | 89,600 | |
| Steel Authority of India Ltd. | | 21,523 | | | 32,950 | |
| Sterlite Industries India Ltd., ADR | | 26,322 | | | 182,411 | |
| Suzlon Energy Ltd.* | | 48,515 | | | 16,536 | |
| Syndicate Bank | | 19,381 | | | 25,000 | |
| Tata Chemicals Ltd. | | 6,115 | | | 36,157 | |
| Tata Communications Ltd. | | 10,678 | | | 42,819 | |
| Tata Communications Ltd., ADR | | 1,300 | | | 10,348 | |
| Tata Steel Ltd., ADR | | 23,636 | | | 148,768 | |
| Tata Tea Ltd. | | 29,240 | | | 49,747 | |
| The Great Eastern Shipping Co., Ltd. | | 5,045 | | | 17,908 | |
| Union Bank Of India | | 6,100 | | | 19,677 | |
| Unitech Ltd.* | | 81,467 | | | 29,454 | |
| United Phosphorus Ltd. | | 11,000 | | | 26,358 | |
| Videocon Industries Ltd. | | 6,099 | | | 20,259 | |
| | | | | | 4,824,367 | |
| Indonesia — 3.0% | | | | | | |
| AKR Corporindo Tbk PT | | 127,500 | | | 42,535 | |
| Aneka Tambang Tbk PT | | 444,000 | | | 79,325 | |
| Bakrie and Brothers Tbk PT* | | 584,500 | | | 3,287 | |
| Bakrie Telecom Tbk PT* | | 845,500 | | | 24,244 | |
| Bank Tabungan Negara Tbk PT | | 55,500 | | | 7,406 | |
| Barito Pacific Tbk PT* | | 253,500 | | | 21,527 | |
| Bumi Serpong Damai Tbk PT | | 412,500 | | | 44,582 | |
| Ciputra Development Tbk PT | | 57,000 | | | 3,394 | |
| Gajah Tunggal Tbk PT | | 191,000 | | | 63,193 | |
| Holcim Indonesia Tbk PT | | 174,000 | | | 41,737 | |
| Indika Energy Tbk PT | | 92,000 | | | 22,068 | |
| Matahari Putra Prima Tbk PT | | 17,500 | | | 1,776 | |
| Media Nusantara Citra Tbk PT | | 176,000 | | | 25,427 | |
| PT Bank Danamon Indonesia Tbk | | 245,773 | | | 111,130 | |
| PT Bank Mandiri Tbk | | 237,500 | | | 176,799 | |
| PT Bank Negara Indonesia Persero Tbk | | 671,866 | | | 281,565 | |
| PT Bank Pan Indonesia Tbk* | | 1,140,000 | | | 98,064 | |
| PT Bumi Resources Tbk | | 725,500 | | | 174,024 | |
| PT Global Mediacom Tbk | | 533,500 | | | 58,248 | |
| PT Gudang Garam Tbk | | 14,500 | | | 99,225 | |
| PT Indah Kiat Pulp and Paper Corp., Tbk* | | 249,000 | | | 33,777 | |
| PT Indofood Sukses Makmur Tbk | | 536,500 | | | 272,170 | |
| PT International Nickel Indonesia Tbk | | 349,000 | | | 123,165 | |
| PT Lippo Karawaci Tbk | | 1,964,375 | | | 142,982 | |
| PT Medco Energi Internasional Tbk | | 276,000 | | | 73,813 | |
| Timah Tbk PT | | 130,000 | | | 23,943 | |
| | | | | | 2,049,406 | |
| Korea — 14.4% | | | | | | |
| BS Financial Group, Inc.* | | 8,140 | | | 78,079 | |
| CJ Corp.* | | 1,214 | | | 81,144 | |
| Daelim Industrial Co., Ltd. | | 1,996 | | | 155,591 | |
| Daewoo Engineering & Construction Co., Ltd.* | | 4,710 | | | 42,930 | |
| DGB Financial Group, Inc.* | | 5,580 | | | 62,484 | |
| Dongkuk Steel Mill Co., Ltd. | | 2,380 | | | 42,352 | |
| GS Engineering & Construction Corp. | | 477 | | | 38,135 | |
43
SA Emerging Markets Value Fund
PORTFOLIO OF INVESTMENTS — AS OF DECEMBER 31, 2011 (Unaudited) (Continued)
| | | | SHARES | | VALUE† | |
| COMMON STOCKS (Continued) | | | | | | |
| Korea (Continued) | | | | | | |
| GS Holdings Corp. | | 3,350 | | $ | 147,435 | |
| Hana Financial Group, Inc. | | 13,580 | | | 419,070 | |
| Hanjin Heavy Industries & Construction Co., Ltd.* | | 2,605 | | | 41,947 | |
| Hanjin Shipping Co., Ltd. | | 4,381 | | | 43,163 | |
| Hanwha Chem Corp. | | 6,220 | | | 132,823 | |
| Hanwha Corp. | | 2,710 | | | 77,983 | |
| Hyosung Corp. | | 1,982 | | | 92,218 | |
| Hyundai Development Co. | | 4,300 | | | 62,708 | |
| Hyundai Motor Co. | | 5,327 | | | 984,940 | |
| Hyundai Securities Co. | | 8,977 | | | 67,172 | |
| Hyundai Steel Co. | | 3,820 | | | 317,339 | |
| Industrial Bank of Korea | | 12,480 | | | 135,417 | |
| KB Financial Group, Inc., ADR* | | 23,644 | | | 741,003 | |
| KCC Corp. | | 487 | | | 120,693 | |
| Kolon Industries, Inc. | | 541 | | | 29,727 | |
| Korea Exchange Bank | | 20,440 | | | 130,411 | |
| Korea Express Co., Ltd.* | | 282 | | | 18,359 | |
| Korea Investment Holdings Co., Ltd. | | 3,470 | | | 109,492 | |
| Korea Life Insurance Co., Ltd. | | 9,130 | | | 58,648 | |
| LG Corp. | | 5,555 | | | 296,074 | |
| LG Display Co., Ltd., ADR* | | 30,316 | | | 319,227 | |
| LG Electronics, Inc. | | 7,392 | | | 477,400 | |
| LG Innotek Co., Ltd. | | 565 | | | 33,253 | |
| LG Uplus Corp. | | 20,310 | | | 130,464 | |
| Lotte Chilsung Beverage Co., Ltd. | | 40 | | | 50,868 | |
| Lotte Confectionery Co., Ltd. | | 54 | | | 80,016 | |
| Lotte Shopping Co., Ltd. | | 826 | | | 243,426 | |
| Mirae Asset Securities Co., Ltd. | | 1,180 | | | 32,317 | |
| Nong Shim Co., Ltd. | | 200 | | | 40,365 | |
| Pacific Corp. | | 369 | | | 81,680 | |
| Poongsan Corp. | | 630 | | | 14,328 | |
| POSCO, ADR | | 17,644 | | | 1,448,572 | |
| Samsung C&T Corp. | | 5,831 | | | 344,697 | |
| Samsung SDI Co., Ltd. | | 2,604 | | | 301,766 | |
| Shinhan Financial Group Co., Ltd. | | 4,080 | | | 140,781 | |
| Shinhan Financial Group Co., Ltd., ADR* | | 12,205 | | | 832,503 | |
| SK Holdings Co., Ltd. | | 2,008 | | | 210,910 | |
| SK Networks Co., Ltd. | | 6,830 | | | 59,881 | |
| STX Offshore & Shipbuilding Co., Ltd. | | 4,700 | | | 45,694 | |
| STX Pan Ocean Co., Ltd. | | 9,240 | | | 48,767 | |
| Taekwang Industrial Co., Ltd. | | 18 | | | 19,375 | |
| Tong Yang Securities, Inc. | | 1,000 | | | 3,780 | |
| Woori Finance Holdings Co., Ltd. | | 11,330 | | | 92,745 | |
| Woori Finance Holdings Co., Ltd., ADR* | | 3,675 | | | 89,743 | |
| Woori Investment & Securities Co., Ltd. | | 7,170 | | | 65,974 | |
| | | | | | 9,735,869 | |
| Malaysia — 3.9% | | | | | | |
| Affin Holdings Berhad | | 96,900 | | | 94,149 | |
| Alliance Financial Group Berhad | | 97,000 | | | 120,867 | |
| AMMB Holdings Berhad | | 201,687 | | | 378,561 | |
| Batu Kawan Berhad | | 18,800 | | | 103,548 | |
| Berjaya Corp. Berhad | | 244,700 | | | 73,719 | |
| Berjaya Land Berhad | | 215,200 | | | 64,492 | |
| Boustead Holdings Berhad | | 41,440 | | | 75,559 | |
| DRB-Hicom Berhad | | 44,100 | | | 28,380 | |
| Eastern & Oriental Bhd | | 46,300 | | | 20,448 | |
| Gamuda Berhad | | 50,000 | | | 53,470 | |
| Genting Malaysia Bhd | | 21,500 | | | 25,976 | |
| HAP Seng Consolidated Berhad | | 21,600 | | | 10,834 | |
| Hong Leong Financial Group Berhad | | 26,900 | | | 98,944 | |
| IGB Corp. Berhad | | 99,283 | | | 77,046 | |
| IJM Corp. Berhad | | 138,180 | | | 246,283 | |
| KLCC Property Holdings Berhad | | 72,000 | | | 71,546 | |
| KNM Group Bhd | | 81,900 | | | 25,578 | |
| Kulim Malaysia Berhad | | 30,000 | | | 39,937 | |
| Malaysian Airline System Bhd* | | 49,400 | | | 20,259 | |
| MISC Berhad | | 40,220 | | | 69,402 | |
| MMC Corp. Berhad | | 109,900 | | | 96,032 | |
| Oriental Holdings Berhad | | 36,360 | | | 61,479 | |
| OSK Holdings Berhad | | 81,500 | | | 45,763 | |
| Pharmaniaga Bhd* | | 720 | | | 1,174 | |
| Pos Malaysia Berhad | | 38,700 | | | 31,619 | |
| PPB Group Berhad | | 55,300 | | | 299,353 | |
| Proton Holdings Berhad | | 27,000 | | | 41,054 | |
| RHB Capital Berhad | | 48,711 | | | 114,940 | |
| Shell Refining Co., Federation of Malaya Berhad | | 8,600 | | | 24,905 | |
| TA Enterprise Berhad | | 92,600 | | | 17,381 | |
| TA Global Berhad | | 55,560 | | | 5,083 | |
| Time dotCom Bhd* | | 75,100 | | | 17,176 | |
| Tradewinds Malaysia Bhd | | 5,500 | | | 17,420 | |
| Wah Seong Corp. Bhd | | 3,500 | | | 2,285 | |
| WCT Bhd | | 21,600 | | | 16,217 | |
| YTL Corp. Berhad | | 282,540 | | | 131,911 | |
| | | | | | 2,622,790 | |
| Mexico — 6.3% | | | | | | |
| Alfa SAB de CV-Class A | | 31,400 | | | 342,224 | |
| Cemex SAB de CV, ADR* | | 65,742 | | | 354,349 | |
| Coca-Cola Femsa SAB de CV, ADR | | 3,000 | | | 285,630 | |
| Corp. GEO SAB de CV-Series B* | | 34,571 | | | 42,685 | |
| Desarrolladora Homex SAB de CV* | | 9,000 | | | 25,153 | |
| Embotelladoras Arca SAB de CV | | 73,232 | | | 312,246 | |
| Empresas ICA SAB de CV, ADR* | | 8,400 | | | 40,152 | |
| Fomento Economico Mexicano SAB de CV, ADR | | 20,700 | | | 1,442,997 | |
| Grupo Aeroportuario del Pacifico SAB de CV, ADR | | 5,200 | | | 175,552 | |
| Grupo Aeroportuario del Sureste SAB de CV, ADR | | 1,900 | | | 106,286 | |
| Grupo Carso SAB de CV-Ser A | | 47,917 | | | 116,027 | |
| Grupo Comercial Chedraui SA de CV | | 9,500 | | | 23,963 | |
| Grupo Financiero Banorte SAB de CV | | 103,000 | | | 311,848 | |
| Grupo Financiero Inbursa SA | | 74,100 | | | 136,362 | |
| Industrias CH SAB de CV- Ser B* | | 22,900 | | | 77,128 | |
| Inmuebles Carso SAB de CV* | | 47,917 | | | 36,020 | |
| Minera Frisco SAB de CV* | | 37,219 | | | 134,423 | |
| Organizacion Soriana SAB de CV- Class B* | | 94,800 | | | 229,278 | |
| Urbi Desarrollos Urbanos SAB DE CV* | | 36,800 | | | 41,877 | |
| | | | | | 4,234,200 | |
| Philippines — 0.7% | | | | | | |
| Megaworld Corp. | | 2,020,000 | | | 78,304 | |
| Metropolitan Bank & Trust | | 80,019 | | | 123,983 | |
| San Miguel Corp. | | 86,300 | | | 229,845 | |
| Universal Robina Corp. | | 39,700 | | | 43,452 | |
| | | | | | 475,584 | |
| Poland — 1.5% | | | | | | |
| Asseco Poland SA | | 5,875 | | | 82,572 | |
| Enea SA | | 7,208 | | | 37,598 | |
| Grupa Lotos SA* | | 10,150 | | | 68,533 | |
| Kredyt Bank SA | | 9,268 | | | 26,320 | |
| Netia SA* | | 10,000 | | | 15,359 | |
| Orbis SA* | | 677 | | | 7,436 | |
| PGE SA | | 54,527 | | | 327,086 | |
| Polimex Mostostal SA | | 38,014 | | | 18,287 | |
| Polski Koncern Naftowy Orlen* | | 36,737 | | | 360,897 | |
44
SA Emerging Markets Value Fund
PORTFOLIO OF INVESTMENTS — AS OF DECEMBER 31, 2011 (Unaudited) (Continued)
| | | | SHARES | | VALUE† | |
| COMMON STOCKS (Continued) | | | | | | |
| Poland (Continued) | | | | | | |
| Tauron Polska Energia SA | | 29,050 | | $ | 45,038 | |
| | | | | | 989,126 | |
| Russia — 5.3% | | | | | | |
| Gazprom OAO, ADR | | 237,661 | | | 2,534,982 | |
| Lukoil OAO, ADR | | 14,376 | | | 761,209 | |
| Magnitogorsk Iron & Steel Works, GDR | | 5,076 | | | 24,705 | |
| RusHydro, ADR | | 7,478 | | | 22,808 | |
| Surgutneftegaz, ADR | | 33,618 | | | 263,229 | |
| | | | | | 3,606,933 | |
| South Africa — 8.6% | | | | | | |
| ABSA Group Ltd. | | 13,962 | | | 243,869 | |
| Aeci Ltd. | | 6,832 | | | 69,940 | |
| African Rainbow Minerals Ltd. | | 5,732 | | | 121,420 | |
| ArcelorMittal South Africa Ltd. | | 16,923 | | | 143,769 | |
| Aveng Ltd. | | 21,904 | | | 89,542 | |
| Barloworld Ltd. | | 23,324 | | | 217,073 | |
| Caxton and CTP Publishers and Printers Ltd. | | 18,814 | | | 34,959 | |
| Daewoo Securities Co., Ltd. | | 3,497 | | | 31,570 | |
| DataTec Ltd. | | 6,000 | | | 30,399 | |
| Gold Fields Ltd., ADR | | 50,300 | | | 767,075 | |
| Grindrod Ltd. | | 15,332 | | | 26,590 | |
| Harmony Gold Mining Co., Ltd., ADR | | 30,300 | | | 352,692 | |
| Imperial Holdings Ltd. | | 9,604 | | | 146,929 | |
| Investec Ltd. | | 25,999 | | | 141,935 | |
| JD Group Ltd. | | 12,010 | | | 72,156 | |
| Liberty Holdings Ltd. | | 8,197 | | | 80,705 | |
| Medi-Clinic Corp. Ltd. | | 19,471 | | | 81,043 | |
| Mmi Holdings Ltd. | | 9,420 | | | 19,954 | |
| Mondi, Ltd. | | 8,490 | | | 60,263 | |
| Mpact, Ltd.* | | 10,541 | | | 19,574 | |
| Murray & Roberts Holdings Ltd.* | | 1,532 | | | 4,868 | |
| Nedbank Group Ltd. | | 20,163 | | | 362,170 | |
| Northam Platinum Ltd. | | 15,969 | | | 59,346 | |
| Sanlam Ltd. | | 214,984 | | | 768,318 | |
| Sappi Ltd., ADR* | | 44,820 | | | 128,185 | |
| Sasol Ltd., ADR | | 9,800 | | | 464,520 | |
| Standard Bank Group Ltd. | | 65,317 | | | 799,011 | |
| Steinhoff International Holdings Ltd.* | | 137,280 | | | 390,793 | |
| Telkom SA Ltd. | | 21,021 | | | 75,647 | |
| Tongaat Hulett Ltd. | | 439 | | | 5,493 | |
| | | | | | 5,809,808 | |
| Taiwan — 12.6% | | | | | | |
| Ability Enterprise Co., Ltd. | | 6,000 | | | 5,152 | |
| Acer, Inc. | | 211,000 | | | 244,595 | |
| Advanced Semiconductor Engineering, Inc. | | 13,388 | | | 11,452 | |
| Alpha Networks, Inc. | | 28,000 | | | 19,974 | |
| Altek Corp. | | 15,151 | | | 12,059 | |
| AmTRAN Technology Co., Ltd. | | 42,360 | | | 22,104 | |
| Asia Cement Corp. | | 128,795 | | | 144,623 | |
| Asia Optical Co., Inc.* | | 16,000 | | | 12,550 | |
| Asustek Computer, Inc. | | 22,950 | | | 163,338 | |
| AU Optronics Corp., ADR | | 68,934 | | | 297,795 | |
| BES Engineering Corp. | | 111,000 | | | 29,107 | |
| Capital Securities Corp. | | 156,661 | | | 54,067 | |
| Cathay Real Estate Development Co., Ltd. | | 100,000 | | | 34,182 | |
| Chang Hwa Commercial Bank | | 429,460 | | | 233,317 | |
| Cheng Loong Corp. | | 41,000 | | | 14,489 | |
| Cheng Uei Precision Industry Co., Ltd. | | 18,360 | | | 35,897 | |
| Chimei Innolux Corp.* | | 378,856 | | | 152,648 | |
| China Airlines Ltd. | | 103,000 | | | 44,902 | |
| China Development Financial Holding Corp. | | 878,468 | | | 248,637 | |
| China Manmade Fibers Corp.* | | 89,000 | | | 26,395 | |
| China Motor Corp. | | 39,195 | | | 35,598 | |
| China Petrochemical Development Corp. | | 7,952 | | | 7,078 | |
| China Synthetic Rubber Corp. | | 56,203 | | | 52,901 | |
| Chinatrust Financial Holding Co., Ltd. | | 622,951 | | | 388,843 | |
| Chung Hung Steel Corp. | | 48,000 | | | 13,950 | |
| CMC Magnetics Corp.* | | 165,000 | | | 27,247 | |
| Compal Electronics, Inc. | | 297,000 | | | 296,225 | |
| Compeq Manufacturing Co., Ltd.* | | 100,000 | | | 30,747 | |
| D-Link Corp. | | 41,000 | | | 27,691 | |
| E.Sun Financial Holding Co., Ltd. | | 322,650 | | | 139,060 | |
| Elitegroup Computer Systems Co., Ltd.* | | 39,610 | | | 8,307 | |
| Epistar Corp. | | 20,000 | | | 42,472 | |
| Evergreen International Storage & Transport Corp. | | 17,000 | | | 7,944 | |
| Evergreen Marine Corp. Taiwan Ltd. | | 105,599 | | | 53,359 | |
| Everlight Electronics Co., Ltd. | | 30,000 | | | 52,214 | |
| Far Eastern International Bank | | 69,205 | | | 25,713 | |
| First Financial Holding Co., Ltd. | | 427,074 | | | 250,357 | |
| Formosa Taffeta Co., Ltd. | | 67,000 | | | 62,068 | |
| Formosan Rubber Group, Inc. | | 23,000 | | | 13,711 | |
| Fubon Financial Holding Co., Ltd. | | 9,611 | | | 10,173 | |
| Getac Technology Corp. | | 45,000 | | | 21,029 | |
| Gigabyte Technology Co., Ltd. | | 27,000 | | | 18,904 | |
| Gintech Energy Corp. | | 1,049 | | | 1,131 | |
| Goldsun Development & Construction Co., Ltd. | | 66,953 | | | 23,107 | |
| Grand Pacific Petrochemical | | 99,000 | | | 42,505 | |
| Greatek Electronics, Inc. | | 41,000 | | | 32,498 | |
| HannStar Display Corp.* | | 309,000 | | | 16,022 | |
| Hey Song Corp. | | 26,000 | | | 21,639 | |
| Hua Nan Financial Holdings Co., Ltd. | | 319,482 | | | 172,513 | |
| Inotera Memories, Inc.* | | 104,000 | | | 17,174 | |
| Inventec Co., Ltd. | | 205,104 | | | 75,189 | |
| King Yuan Electronics Co., Ltd. | | 110,100 | | | 36,725 | |
| King's Town Bank* | | 46,000 | | | 25,902 | |
| Kinpo Electronics | | 122,000 | | | 25,384 | |
| Lien Hwa Industrial Corp. | | 62,829 | | | 36,416 | |
| LITE-ON IT Corp. | | 19,094 | | | 15,702 | |
| Lite-On Technology Corp. | | 171,780 | | | 193,457 | |
| Macronix International | | 343,017 | | | 137,075 | |
| Masterlink Securities Corp. | | 55,000 | | | 16,984 | |
| Mega Financial Holding Co., Ltd. | | 777,240 | | | 518,519 | |
| Micro-Star International Co., Ltd. | | 76,374 | | | 32,538 | |
| Mitac International | | 63,439 | | | 19,359 | |
| Nan Ya Printed Circuit Board Corp. | | 6,200 | | | 12,593 | |
| Neo Solar Power Corp. | | 17,000 | | | 10,696 | |
| Nien Hsing Textile Co., Ltd. | | 16,625 | | | 11,009 | |
| Pan-International Industrial | | 17,039 | | | 13,168 | |
| Pegatron Corp. | | 142,249 | | | 154,797 | |
| POU Chen Corp. | | 157,133 | | | 128,959 | |
| President Securities Corp. | | 56,945 | | | 26,894 | |
| Qisda Corp. | | 224,400 | | | 46,245 | |
| Radium Life Tech Co., Ltd. | | 26,502 | | | 18,468 | |
| Realtek Semiconductor Corp. | | 11,000 | | | 16,112 | |
| Ritek Corp.* | | 140,399 | | | 21,190 | |
| Sanyang Industry Co., Ltd. | | 55,573 | | | 30,192 | |
| Shihlin Electric & Engineering Corp. | | 17,000 | | | 17,966 | |
| Shin Kong Financial Holding Co., Ltd.* | | 364,849 | | | 103,385 | |
| Shinkong Synthetic Fibers Corp. | | 97,151 | | | 25,797 | |
| Silicon Integrated Systems Corp. | | 27,456 | | | 11,108 | |
| Siliconware Precision Industries Co., ADR | | 10,775 | | | 46,979 | |
| Sincere Navigation Corp. | | 27,000 | | | 22,649 | |
45
SA Emerging Markets Value Fund
PORTFOLIO OF INVESTMENTS — AS OF DECEMBER 31, 2011 (Unaudited) (Continued)
| | | | SHARES | | VALUE† | |
| COMMON STOCKS (Continued) | | | | | | |
| Taiwan (Continued) | | | | | | |
| SinoPac Financial Holdings Co., Ltd. | | 462,049 | | $ | 140,695 | |
| Sunplus Technology Co., Ltd. | | 20,999 | | | 6,914 | |
| TA Chen Stainless Pipe* | | 72,000 | | | 35,312 | |
| Ta Chong Bank Co., Ltd.* | | 136,800 | | | 31,897 | |
| Taichung Commercial Bank* | | 140,055 | | | 40,334 | |
| Tainan Spinning Co., Ltd. | | 58,833 | | | 19,819 | |
| Taishin Financial Holding Co., Ltd. | | 359,059 | | | 124,513 | |
| Taiwan Business Bank* | | 212,681 | | | 65,534 | |
| Taiwan Cement Corp. | | 245,772 | | | 284,092 | |
| Taiwan Cooperative Financial Holding* | | 337,562 | | | 202,901 | |
| Taiwan Glass Industrial Corp. | | 81,497 | | | 83,976 | |
| Tatung Co., Ltd.* | | 144,784 | | | 36,388 | |
| Teco Electric and Machinery Co., Ltd. | | 247,000 | | | 145,611 | |
| Ton Yi Industrial Corp. | | 61,950 | | | 28,644 | |
| Tong Yang Industry Co., Ltd. | | 37,450 | | | 40,197 | |
| Tung Ho Steel Enterprise Corp. | | 43,000 | | | 37,775 | |
| U-Ming Marine Transport Corp. | | 20,000 | | | 29,625 | |
| Unimicron Technology Corp. | | 97,000 | | | 114,046 | |
| Union Bank Of Taiwan* | | 22,000 | | | 7,193 | |
| United Microelectronics Corp. | | 1,215,513 | | | 509,826 | |
| UPC Technology Corp. | | 19,000 | | | 9,726 | |
| Walsin Lihwa Corp. | | 302,000 | | | 86,973 | |
| Walsin Technology Corp. | | 58,163 | | | 15,502 | |
| Wan Hai Lines Ltd. | | 76,650 | | | 37,086 | |
| Waterland Financial Holdings | | 176,304 | | | 58,809 | |
| Winbond Electronics Corp.* | | 311,000 | | | 43,139 | |
| Wintek Corp. | | 103,099 | | | 73,207 | |
| Wistron Corp. | | 77,000 | | | 97,525 | |
| Yageo Corp. | | 227,000 | | | 58,776 | |
| Yang Ming Marine Transport Corp. | | 117,365 | | | 46,901 | |
| Yieh Phui Enterprise | | 133,543 | | | 43,928 | |
| Young Fast Optoelectronics Co., Ltd. | | 5,000 | | | 10,271 | |
| Yuanta Financial Holding Co., Ltd.* | | 346,503 | | | 176,805 | |
| Yuen Foong Yu Paper Manufacturing Co., Ltd. | | 150,385 | | | 60,096 | |
| Yulon Motor Co., Ltd. | | 91,272 | | | 156,747 | |
| | | | | | 8,531,703 | |
| Thailand — 2.4% | | | | | | |
| Bangkok Bank PCL, ADR | | 99,000 | | | 481,664 | |
| Bangkok Expressway PCL | | 63,900 | | | 36,861 | |
| Bank of Ayudhya PCL | | 124,600 | | | 87,674 | |
| Delta Electronics Thai PCL | | 22,000 | | | 15,132 | |
| Esso Thailand PCL | | 97,600 | | | 33,410 | |
| IRPC PCL | | 901,900 | | | 116,632 | |
| Kiatnakin Bank PCL | | 33,300 | | | 33,775 | |
| Krung Thai Bank PCL | | 358,700 | | | 169,402 | |
| Precious Shipping PCL | | 58,400 | | | 29,987 | |
| PTT Global Chemical PCL* | | 86,228 | | | 166,717 | |
| Sri Trang Agro-Industry PCL | | 9,100 | | | 5,076 | |
| Thai Airways International PCL | | 41,400 | | | 26,244 | |
| Thai Oil PCL | | 57,600 | | | 106,802 | |
| Thai Plastic & Chemical PCL | | 75,800 | | | 70,875 | |
| Thanachart Capital PCL | | 81,200 | | | 68,846 | |
| Total Access Communication PCL | | 45,100 | | | 99,349 | |
| TPI Polene PCL | | 113,900 | | | 54,513 | |
| | | | | | 1,602,959 | |
| Turkey — 1.5% | | | | | | |
| Aksigorta AS* | | 14,835 | | | 12,769 | |
| Arcelik AS | | 20,351 | | | 65,768 | |
| Asya Katilim Bankasi AS* | | 9,747 | | | 8,184 | |
| Aygaz AS | | 4,982 | | | 23,256 | |
| Eregli Demir ve Celik Fabrikalari TAS | | 84,977 | | | 147,181 | |
| KOC Holding AS | | 61,514 | | | 184,501 | |
| Petkim Petrokimya Holding AS* | | 15,985 | | | 16,629 | |
| Sekerbank TAS | | 45,363 | | | 21,559 | |
| Tekfen Holding AS | | 23,735 | | | 66,928 | |
| Trakya Cam Sanayi AS | | 16,808 | | | 21,656 | |
| Turk Hava Yollari* | | 30,509 | | | 34,154 | |
| Turk Sise ve Cam Fabrikalari AS | | 53,209 | | | 80,077 | |
| Turkiye Is Bankasi | | 123,665 | | | 216,148 | |
| Turkiye Sinai Kalkinma Bankasi AS | | 28,595 | | | 27,632 | |
| Turkiye Vakiflar Bankasi TAO | | 49,100 | | | 63,522 | |
| | | | | | 989,964 | |
| TOTAL COMMON STOCKS | | | | | | |
| (Identified Cost $70,671,035) | | | | | 64,384,729 | |
| | |
| PREFERRED STOCKS — 4.6% | | | | | | |
| Brazil — 4.6% | | | | | | |
| Braskem SA, ADR | | 10,100 | | | 142,410 | |
| Cia Brasileira de Distribuicao Grupo Pao de Acucar, ADR | | 396 | | | 14,426 | |
| Gerdau SA | | 8,800 | | | 68,409 | |
| Klabin SA, PF | | 69,121 | | | 296,458 | |
| Petroleo Brasileiro SA | | 18,594 | | | 214,226 | |
| Petroleo Brasileiro SA, ADR | | 77,403 | | | 1,818,197 | |
| Suzano Papel e Celulose SA | | 24,800 | | | 89,614 | |
| Telemar Norte Leste SA, PR A | | 4,700 | | | 112,835 | |
| Usinas Siderurgicas de Minas Gerais SA, PF A | | 65,050 | | | 353,978 | |
| | | | | | 3,110,553 | |
| TOTAL PREFERRED STOCKS | | | | | | |
| (Identified Cost $4,173,256) | | | | | 3,110,553 | |
| | |
| SHORT-TERM INVESTMENTS — 0.0% | | | | | | |
| United States — 0.0% | | | | | | |
| SSgA Government Money Market Fund | | 1 | | | 1 | |
| SSgA Money Market Fund | | 20 | | | 20 | |
| | | | | | 21 | |
| TOTAL SHORT-TERM INVESTMENTS | | | | | | |
| (Identified Cost $21) | | | | | 21 | |
| | | | | | | |
| Total Investments — 99.8% | | | | | | |
| (Identified Cost $74,844,312)# | | | | | 67,495,303 | |
| Cash and Other Assets, Less Liabilities — 0.2% | | | | | 150,749 | |
| Net Assets — 100.0% | | | | $ | 67,646,052 | |
| † | | See Note 1. |
| * | | Non-income producing security. |
| # | | At December 31, 2011 the aggregate cost of investment securities for U.S federal income tax purposes was $74,844,312. Net unrealized depreciation aggregated $7,349,009 of which $7,306,109 related to appreciated investment securities and $14,655,118 related to depreciated investment securities. |
| (b) | | 144A securities. Securities exempt from registration under Rule 144A of the Securities Act of 1933. These securities may be resold in transactions exempt from registration normally to qualified institutional buyers. |
Key to abbreviations:
ADR– American Depository Receipt
GDR– Global Depository Receipt
46
SA Real Estate Securities Fund
PORTFOLIO OF INVESTMENTS — AS OF DECEMBER 31, 2011 (Unaudited)
| | | | SHARES | | VALUE† | |
| COMMON STOCKS — 99.4% | | | | | | |
| Real Estate Investment Trusts (REITs) — 99.4% | | | | |
| Acadia Realty Trust | | 9,122 | | $ | 183,717 | |
| Agree Realty Corp. | | 1,800 | | | 43,884 | |
| | Alexander's, Inc. | | 977 | | | 361,519 | |
| Alexandria Real Estate Equities, Inc. | | 13,826 | | | 953,579 | |
| American Campus Communities, Inc. | | 15,413 | | | 646,729 | |
| Apartment Investment & Management Co. | | 27,129 | | | 621,525 | |
| Ashford Hospitality Trust, Inc. | | 11,583 | | | 92,664 | |
| Associated Estates Realty Corp. | | 8,960 | | | 142,912 | |
| AvalonBay Communities, Inc. | | 20,910 | | | 2,730,846 | |
| BioMed Realty Trust, Inc. | | 29,836 | | | 539,435 | |
| Boston Properties, Inc. | | 32,833 | | | 3,270,167 | |
| Brandywine Realty Trust | | 30,194 | | | 286,843 | |
| BRE Properties, Inc. | | 16,502 | | | 833,021 | |
| Camden Property Trust | | 15,652 | | | 974,180 | |
| CapLease, Inc. | | 6,049 | | | 24,438 | |
| CBL & Associates Properties, Inc. | | 31,622 | | | 496,465 | |
| Cedar Shopping Centers, Inc. | | 13,325 | | | 57,431 | |
| Cogdell Spencer, Inc. | | 10,904 | | | 46,342 | |
| Colonial Properties Trust | | 18,453 | | | 384,930 | |
| CommonWealth REIT | | 18,134 | | | 301,750 | |
| Corporate Office Properties Trust | | 15,973 | | | 339,586 | |
| Cousins Properties, Inc. | | 21,935 | | | 140,603 | |
| CubeSmart | | 25,900 | | | 275,576 | |
| DCT Industrial Trust, Inc. | | 55,187 | | | 282,557 | |
| DDR Corp. | | 50,375 | | | 613,064 | |
| DiamondRock Hospitality Co. | | 38,052 | | | 366,821 | |
| Digital Realty Trust, Inc. | | 22,213 | | | 1,480,941 | |
| Douglas Emmett, Inc. | | 27,318 | | | 498,280 | |
| Duke Realty Corp. | | 56,420 | | | 679,861 | |
| DuPont Fabros Technology, Inc. | | 13,674 | | | 331,184 | |
| EastGroup Properties, Inc. | | 5,858 | | | 254,706 | |
| Education Realty Trust, Inc. | | 20,475 | | | 209,459 | |
| Entertainment Properties Trust | | 10,577 | | | 462,321 | |
| Equity Lifestyle Properties, Inc. | | 8,639 | | | 576,135 | |
| Equity One, Inc. | | 19,203 | | | 326,067 | |
| Equity Residential | | 65,949 | | | 3,761,071 | |
| Essex Property Trust, Inc. | | 7,481 | | | 1,051,155 | |
| Excel Trust, Inc. | | 5,342 | | | 64,104 | |
| Extra Space Storage, Inc. | | 19,308 | | | 467,833 | |
| Federal Realty Investment Trust | | 14,251 | | | 1,293,278 | |
| FelCor Lodging Trust, Inc.* | | 24,513 | | | 74,765 | |
| First Industrial Realty Trust, Inc.* | | 17,300 | | | 176,979 | |
| First Potomac Realty Trust | | 11,300 | | | 147,465 | |
| Franklin Street Properties Corp. | | 16,295 | | | 162,135 | |
| General Growth Properties, Inc. | | 95,222 | | | 1,430,234 | |
| Getty Realty Corp. | | 5,900 | | | 82,305 | |
| Gladstone Commercial Corp. | | 756 | | | 13,268 | |
| Glimcher Realty Trust | | 23,919 | | | 220,055 | |
| Government Properties Income Trust | | 8,387 | | | 189,127 | |
| HCP, Inc. | | 90,859 | | | 3,764,288 | |
| Health Care REIT, Inc. | | 39,968 | | | 2,179,455 | |
| Healthcare Realty Trust, Inc. | | 16,679 | | | 310,063 | |
| Hersha Hospitality Trust | | 34,973 | | | 170,668 | |
| Highwoods Properties, Inc. | | 16,361 | | | 485,431 | |
| Home Properties, Inc. | | 10,723 | | | 617,323 | |
| Hospitality Properties Trust | | 28,024 | | | 643,992 | |
| Host Hotels & Resorts, Inc. | | 157,171 | | | 2,321,416 | |
| Inland Real Estate Corp. | | 17,929 | | | 136,440 | |
| Investors Real Estate Trust | | 9,316 | | | 67,960 | |
| Kilroy Realty Corp. | | 13,003 | | | 495,024 | |
| Kimco Realty Corp. | | 91,026 | | | 1,478,262 | |
| Kite Realty Group Trust | | 12,812 | | | 57,782 | |
| LaSalle Hotel Properties | | 18,751 | | | 453,962 | |
| Lexington Realty Trust | | 31,614 | | | 236,789 | |
| Liberty Property Trust | | 25,879 | | | 799,144 | |
| LTC Properties, Inc. | | 5,345 | | | 164,947 | |
| Mack-Cali Realty Corp.* | | 19,600 | | | 523,124 | |
| Medical Properties Trust, Inc. | | 25,741 | | | 254,064 | |
| MHI Hospitality Corp. | | 100 | | | 238 | |
| Mid-America Apartment Communities, Inc. | | 8,069 | | | 504,716 | |
| Mission West Properties, Inc. | | 4,004 | | | 36,116 | |
| Monmouth Real Estate Investment Corp., Class A | | 6,321 | | | 57,837 | |
| MPG Office Trust, Inc.* | | 10,100 | | | 20,099 | |
| National Health Investors, Inc. | | 3,033 | | | 133,391 | |
| National Retail Properties, Inc. | | 21,200 | | | 559,256 | |
| Omega Healthcare Investors, Inc. | | 22,305 | | | 431,602 | |
| One Liberty Properties, Inc. | | 1,927 | | | 31,796 | |
| Parkway Properties, Inc. | | 5,400 | | | 53,244 | |
| Pennsylvania Real Estate Investment Trust | | 11,406 | | | 119,079 | |
| Piedmont Office Realty Trust, Inc., Class A | | 38,406 | | | 654,438 | |
| Post Properties, Inc. | | 11,085 | | | 484,636 | |
| Prologis, Inc. | | 101,860 | | | 2,912,177 | |
| PS Business Parks, Inc. | | 4,782 | | | 265,066 | |
| Public Storage | | 32,353 | | | 4,350,184 | |
| Ramco-Gershenson Properties Trust | | 7,438 | | | 73,116 | |
| Realty Income Corp. | | 29,614 | | | 1,035,305 | |
| Regency Centers Corp. | | 19,804 | | | 745,026 | |
| Retail Opportunity Investments Corp. | | 4,927 | | | 58,336 | |
| Sabra Healthcare REIT, Inc. | | 7,019 | | | 84,860 | |
| Saul Centers, Inc. | | 3,633 | | | 128,681 | |
| Senior Housing Properties Trust | | 35,824 | | | 803,891 | |
| Simon Property Group, Inc. | | 65,329 | | | 8,423,521 | |
| SL Green Realty Corp. | | 19,652 | | | 1,309,609 | |
| Sovran Self Storage, Inc. | | 6,100 | | | 260,287 | |
| Strategic Hotels & Resorts, Inc.* | | 35,891 | | | 192,735 | |
| Sun Communities, Inc. | | 4,300 | | | 157,079 | |
| Sunstone Hotel Investors, Inc.* | | 25,978 | | | 211,721 | |
| Supertel Hospitality, Inc.* | | 2,197 | | | 1,406 | |
| Tanger Factory Outlet Centers | | 19,324 | | | 566,580 | |
| Taubman Centers, Inc. | | 12,538 | | | 778,610 | |
| The Macerich Co. | | 29,378 | | | 1,486,527 | |
| UDR, Inc. | | 48,055 | | | 1,206,180 | |
| UMH Properties, Inc. | | 1,815 | | | 16,898 | |
| Universal Health Realty Income Trust | | 2,400 | | | 93,600 | |
| Urstadt Biddle Properties, Inc. | | 1,000 | | | 16,840 | |
| Urstadt Biddle Properties, Inc., Class A | | 4,000 | | | 72,320 | |
| Ventas, Inc. | | 61,009 | | | 3,363,426 | |
| Vornado Realty Trust | | 37,308 | | | 2,867,493 | |
| Washington Real Estate Investment Trust | | 14,850 | | | 406,148 | |
| Weingarten Realty Investors | | 25,900 | | | 565,138 | |
| Whitestone REIT, Class B | | 200 | | | 2,380 | |
| Winthrop Realty Trust | | 6,334 | | | 64,417 | |
| | | | | | 79,729,451 | |
| TOTAL COMMON STOCKS | | | | | | |
| (Identified Cost $65,885,768) | | | | | 79,729,451 | |
| | |
| SHORT-TERM INVESTMENTS — 0.2% | | | | | | |
| Other — 0.2% | | | | | | |
| SSgA Government Money Market Fund | | 1 | | | 1 | |
| SSgA Money Market Fund | | 152,019 | | | 152,019 | |
| | | | | | 152,020 | |
| TOTAL SHORT-TERM INVESTMENTS | | | | | | |
| (Identified Cost $152,020) | | | | | 152,020 | |
47
SA Real Estate Securities Fund
PORTFOLIO OF INVESTMENTS — AS OF DECEMBER 31, 2011 (Unaudited) (Continued)
| Total Investments — 99.6% | | | | |
| (Identified Cost $66,037,788)# | | | 79,881,471 | |
| | Cash and Other Assets, Less Liabilities — 0.4% | | | 356,862 | |
| Net Assets — 100.0% | | $ | 80,238,333 | |
| | † | | See Note 1. |
| * | | Non-income producing security. |
| # | | At December 31, 2011 the aggregate cost of investment securities for U.S. federal income tax purposes was $66,037,788. Net unrealized appreciation aggregated $12,677,358 of which $16,234,009 related to appreciated investment securities and $3,556,651 related to depreciated investment securities. |
Key to abbreviations:
REIT — Real Estate Investment Trust
48
DFA INVESTMENT DIMENSIONS GROUP INC.
THE DFA INVESTMENT TRUST COMPANY
DEFINITIONS OF ABBREVIATIONS AND FOOTNOTES
Schedule of Investments/Summary Schedules of Portfolio Holdings
| Investment Abbreviations |
| ADR | American Depositary Receipt |
| FNMA | Federal National Mortgage Association |
| GDR | Global Depository Receipt |
| P.L.C. | Public Limited Company |
| STRIP | Separate Trading of Registered Interest and Principal of Securities |
| | | |
| Investment Footnotes |
| † | See Note B to Financial Statements included elsewhere in the Semi-Annual Report. |
| †† | Securities have generally been fair valued. See Note B to Financial Statements included elsewhere in the Semi-Annual Report. |
| * | Non-Income Producing Securities. |
| # | Total or Partial Securities on Loan. |
| — | Amounts designated as — are either zero or rounded to zero. |
| @ | Security purchased with cash proceeds from Securities on Loan. |
| § | Affiliated Fund. |
| | | |
THE JAPANESE SMALL COMPANY SERIES
SCHEDULE OF INVESTMENTS
December 31, 2011
(Unaudited)
| | | | Shares | | Value†† | |
| COMMON STOCKS — (90.2%) | | | | | |
| Consumer Discretionary — (20.6%) | | | | | |
| # | | Accordia Golf Co., Ltd. | 4,489 | | $ | 3,248,574 | |
| | Aeon Fantasy Co., Ltd. | 57,832 | | | 937,572 | |
| | Ahresty Corp. | 24,200 | | | 115,026 | |
| # | | Aichi Machine Industry Co., Ltd. | 294,000 | | | 1,039,401 | |
| # | | Aigan Co., Ltd. | 96,200 | | | 450,659 | |
| | Aisan Industry Co., Ltd. | 132,800 | | | 1,029,317 | |
| # | | Akebono Brake Industry Co., Ltd. | 326,700 | | | 1,402,001 | |
| | Alpen Co., Ltd. | 70,600 | | | 1,240,776 | |
| | Alpha Corp. | 30,200 | | | 343,838 | |
| | Alpine Electronics, Inc. | 206,300 | | | 2,210,597 | |
| | Amiyaki Tei Co., Ltd. | 235 | | | 559,548 | |
| | Amuse, Inc. | 29,999 | | | 381,235 | |
| #* | | Anrakutei Co., Ltd. | 50,000 | | | 259,796 | |
| | AOI Advertising Promotion, Inc. | 39,000 | | | 204,962 | |
| | AOKI Holdings, Inc. | 97,100 | | | 1,582,559 | |
| | Aoyama Trading Co., Ltd. | 250,500 | | | 4,685,577 | |
| | Arc Land Sakamoto Co., Ltd. | 33,300 | | | 620,763 | |
| | Arnest One Corp. | 183,900 | | | 1,878,631 | |
| | Asahi Co., Ltd. | 38,800 | | | 829,651 | |
| #* | | ASAHI TEC Corp. | 1,772,000 | | | 738,089 | |
| # | | Asatsu-DK, Inc. | 120,400 | | | 3,155,320 | |
| * | | Ashimori Industry Co., Ltd. | 319,000 | | | 433,672 | |
| # | | ASKUL Corp. | 78,100 | | | 1,108,595 | |
| | Asti Corp. | 46,000 | | | 124,613 | |
| #* | | Atom Corp. | 170,700 | | | 640,518 | |
| | Atsugi Co., Ltd. | 750,000 | | | 894,978 | |
| | Autobacs Seven Co., Ltd. | 97,200 | | | 4,444,813 | |
| | Avex Group Holdings, Inc. | 152,900 | | | 1,952,921 | |
| | Belluna Co., Ltd. | 6,950 | | | 51,344 | |
| * | | Best Denki Co., Ltd. | 304,500 | | | 738,411 | |
| # | | Bic Camera, Inc. | 2,531 | | | 1,408,059 | |
| | Bookoff Corp. | 34,000 | | | 300,520 | |
| | Calsonic Kansei Corp. | 617,000 | | | 3,506,189 | |
| | Can Do Co., Ltd. | 297 | | | 320,760 | |
| * | | Carchs Holdings Co., Ltd. | 707,200 | | | 247,340 | |
| | Central Sports Co., Ltd. | 2,400 | | | 31,079 | |
| | Chiyoda Co., Ltd. | 120,900 | | | 2,142,787 | |
| | Chofu Seisakusho Co., Ltd. | 88,800 | | | 2,246,112 | |
| | Chori Co., Ltd. | 658,000 | | | 735,131 | |
| | Chuo Spring Co., Ltd. | 202,000 | | | 713,882 | |
| #* | | Clarion Co., Ltd. | 496,000 | | | 882,124 | |
| | Cleanup Corp. | 131,900 | | | 822,723 | |
| # | | Colowide Co., Ltd. | 213,950 | | | 1,492,549 | |
| | Corona Corp. | 76,200 | | | 1,197,731 | |
| | Cross Plus, Inc. | 22,000 | | | 231,768 | |
| | Daido Metal Co., Ltd. | 144,000 | | | 1,585,623 | |
| | Daidoh, Ltd. | 113,600 | | | 1,021,000 | |
| #* | | Daiei, Inc. (The) | 391,500 | | | 1,410,290 | |
| | Daikoku Denki Co., Ltd. | 36,900 | | | 349,161 | |
| | Daimaruenawin Co., Ltd. | 400 | | | 2,714 | |
| | Dainichi Co., Ltd. | 54,900 | | | 505,729 | |
| | Daisyo Corp. | 54,300 | | | 697,615 | |
| # | | DCM Holdings Co., Ltd. | 356,300 | | | 2,802,371 | |
| | Descente, Ltd. | 231,000 | | | 1,215,437 | |
| # | | Doshisha Co., Ltd. | 54,800 | | | 1,580,376 | |
| | Doutor Nichires Holdings Co., Ltd. | 140,986 | | | 1,852,167 | |
| | Dynic Corp. | 127,000 | | | 225,424 | |
| | Eagle Industry Co., Ltd. | 108,000 | | | 849,781 | |
1
THE JAPANESE SMALL COMPANY SERIES
CONTINUED
| | | | Shares | | Value†† | |
| Consumer Discretionary — (Continued) | | | | | |
| # | | Edion Corp. | 307,200 | | $ | 2,495,481 | |
| | Exedy Corp. | 120,600 | | | 3,462,476 | |
| | F&A Aqua Holdings, Inc. | 60,638 | | | 605,213 | |
| | FCC Co., Ltd. | 136,900 | | | 2,776,458 | |
| | Fine Sinter Co., Ltd. | 49,000 | | | 147,193 | |
| | Foster Electric Co., Ltd. | 86,500 | | | 1,233,423 | |
| | France Bed Holdings Co., Ltd. | 750,000 | | | 1,284,029 | |
| # | | F-Tech, Inc. | 20,300 | | | 227,896 | |
| # | | Fuji Co., Ltd. | 97,000 | | | 2,270,196 | |
| | Fuji Corp, Ltd. | 102,300 | | | 487,796 | |
| #* | | Fuji Kiko Co., Ltd. | 148,000 | | | 403,313 | |
| | Fuji Kyuko Co., Ltd. | 311,000 | | | 1,835,398 | |
| | Fuji Oozx, Inc. | 6,000 | | | 25,714 | |
| | Fujibo Holdings, Inc. | 271,000 | | | 550,556 | |
| | | Fujikura Rubber, Ltd. | 72,900 | | | 274,254 | |
| # | | Fujita Kanko, Inc. | 394,100 | | | 1,299,646 | |
| # | | Fujitsu General, Ltd. | 285,000 | | | 1,625,637 | |
| * | | FuKoKu Co., Ltd. | 500 | | | 4,395 | |
| # | | Funai Electric Co., Ltd. | 84,200 | | | 2,013,324 | |
| # | | Furukawa Battery Co., Ltd. | 71,000 | | | 311,205 | |
| | Futaba Industrial Co., Ltd. | 186,000 | | | 1,043,990 | |
| | G-7 Holdings, Inc. | 29,200 | | | 139,664 | |
| * | | Gajoen Kanko Co. | 37,000 | | | — | |
| | Gakken Holdings Co., Ltd. | 322,000 | | | 586,176 | |
| #* | | Genki Sushi Co., Ltd. | 19,400 | | | 240,532 | |
| # | | Geo Holdings Corp. | 1,394 | | | 1,442,762 | |
| | GLOBERIDE, Inc. | 463,000 | | | 535,969 | |
| | Goldwin, Inc. | 175,000 | | | 711,823 | |
| #* | | Gourmet Kineya Co., Ltd. | 87,000 | | | 473,298 | |
| * | | GSI Creos Corp. | 194,000 | | | 254,080 | |
| | Gulliver International Co., Ltd. | 24,330 | | | 996,481 | |
| | Gunze, Ltd. | 758,000 | | | 2,210,672 | |
| # | | H2O Retailing Corp. | 387,000 | | | 2,943,455 | |
| | Hagihara Industries, Inc. | 2,700 | | | 42,245 | |
| | Hakuyosha Co., Ltd. | 88,000 | | | 238,684 | |
| # | | Happinet Corp. | 72,200 | | | 660,066 | |
| * | | Hard Off Corp Co., Ltd. | 7,200 | | | 48,609 | |
| | Haruyama Trading Co., Ltd. | 47,900 | | | 238,919 | |
| * | | Haseko Corp. | 5,986,000 | | | 3,960,106 | |
| | Heiwa Corp. | 154,600 | | | 2,668,523 | |
| | Hiday Hidaka Corp. | 23,200 | | | 381,105 | |
| | Hikari Tsushin, Inc. | 95,800 | | | 2,379,826 | |
| | Himaraya Co., Ltd. | 35,900 | | | 243,236 | |
| | HIS Co., Ltd. | 101,800 | | | 2,901,179 | |
| # | | Honeys Co., Ltd. | 49,990 | | | 732,980 | |
| | Horipro, Inc. | 41,800 | | | 567,226 | |
| | I Metal Technology Co., Ltd. | 142,000 | | | 252,202 | |
| # | | Ichibanya Co., Ltd. | 21,800 | | | 637,136 | |
| | Ichikawa Co., Ltd. | 63,000 | | | 121,027 | |
| # | | Ichikoh Industries, Ltd. | 285,000 | | | 464,908 | |
| # | | Ikyu Corp. | 534 | | | 228,923 | |
| # | | Imasen Electric Industrial Co., Ltd. | 56,000 | | | 624,743 | |
| | Imperial Hotel, Ltd. | 10,950 | | | 257,577 | |
| #* | | Impress Holdings, Inc. | 110,400 | | | 145,986 | |
| | Intage, Inc. | 15,100 | | | 275,338 | |
| | Ishizuka Glass Co., Ltd. | 109,000 | | | 200,976 | |
| * | | Izuhakone Railway Co., Ltd. | 300 | | | 21,047 | |
| | Izumi Co., Ltd. | 102,500 | | | 1,693,880 | |
| * | | Izutsuya Co., Ltd. | 350,000 | | | 190,567 | |
| * | | Janome Sewing Machine Co., Ltd. | 402,000 | | | 275,891 | |
| | Japan Vilene Co., Ltd. | 139,000 | | | 589,766 | |
2
THE JAPANESE SMALL COMPANY SERIES
CONTINUED
| | | | Shares | | Value†† | |
| Consumer Discretionary — (Continued) | | | | | |
| | Japan Wool Textile Co., Ltd. (The) | 310,000 | | $ | 2,305,079 | |
| * | | Jeans Mate Corp. | 30,308 | | | 70,923 | |
| | Jidosha Buhin Kogyo Co., Ltd. | 79,000 | | | 417,466 | |
| #* | | Joban Kosan Co., Ltd. | 240,000 | | | 251,142 | |
| # | | Joshin Denki Co., Ltd. | 205,000 | | | 2,252,744 | |
| | Juntendo Co., Ltd. | 31,000 | | | 44,467 | |
| #* | | JVC Kenwood Holdings, Inc. | 481,530 | | | 1,657,097 | |
| | Kabuki-Za Co., Ltd. | 39,000 | | | 1,835,273 | |
| # | | Kadokawa Holdings, Inc. | 88,600 | | | 3,069,056 | |
| # | | Kanto Auto Works, Ltd. | 168,000 | | | 1,396,806 | |
| | Kappa Create Co., Ltd. | 53,100 | | | 1,256,125 | |
| | Kasai Kogyo Co., Ltd. | 118,000 | | | 593,419 | |
| # | | Kawai Musical Instruments Manufacturing Co., Ltd. | 297,000 | | | 550,747 | |
| | Keihin Corp. | 175,800 | | | 2,905,273 | |
| # | | Keiyo Co., Ltd. | 173,500 | | | 1,074,440 | |
| # | | Kentucky Fried Chicken Japan, Ltd. | 78,000 | | | 2,046,702 | |
| | Kimoto Co., Ltd. | 55,100 | | | 347,195 | |
| #* | | Kinki Nippon Tourist Co., Ltd. | 224,000 | | | 238,481 | |
| # | | Kinugawa Rubber Industrial Co., Ltd. | 198,000 | | | 1,738,098 | |
| # | | Kisoji Co., Ltd. | 85,300 | | | 1,588,831 | |
| | Kohnan Shoji Co., Ltd. | 101,800 | | | 1,666,676 | |
| # | | Kojima Co., Ltd. | 145,700 | | | 950,454 | |
| | Komatsu Seiren Co., Ltd. | 145,000 | | | 692,792 | |
| | Komeri Co., Ltd. | 121,500 | | | 3,735,557 | |
| | Konaka Co., Ltd. | 116,660 | | | 828,487 | |
| | Kourakuen Corp. | 19,400 | | | 298,835 | |
| | KU Holdings Co., Ltd. | 68,200 | | | 336,314 | |
| # | | Kura Corp. | 54,800 | | | 720,390 | |
| | Kurabo Industries, Ltd. | 1,067,000 | | | 2,022,251 | |
| | Kuraudia Co., Ltd. | 5,700 | | | 77,456 | |
| | Kuroganeya Co., Ltd. | 14,000 | | | 54,632 | |
| # | | KYB Co., Ltd. | 633,000 | | | 2,981,137 | |
| | Kyoritsu Maintenance Co., Ltd. | 46,160 | | | 853,508 | |
| | Kyoto Kimono Yuzen Co., Ltd. | 55,700 | | | 645,105 | |
| #* | | Laox Co., Ltd. | 423,000 | | | 159,090 | |
| | LEC, Inc. | 13,200 | | | 195,440 | |
| #* | | Look, Inc. | 159,000 | | | 425,158 | |
| | Mamiya-Op Co., Ltd. | 285,000 | | | 376,575 | |
| | Marche Corp. | 23,000 | | | 208,963 | |
| | Mars Engineering Corp. | 43,600 | | | 743,862 | |
| #* | | Maruei Department Store Co., Ltd. | 142,000 | | | 162,018 | |
| #* | | Maruzen CHI Holdings Co., Ltd. | 11,800 | | | 30,248 | |
| # | | Maruzen Co., Ltd. | 46,000 | | | 312,822 | |
| #* | | Matsuya Co., Ltd. | 158,400 | | | 896,501 | |
| | Matsuya Foods Co., Ltd. | 46,900 | | | 969,656 | |
| # | | Megane TOP Co., Ltd. | 79,700 | | | 916,103 | |
| | Meiko Network Japan Co., Ltd. | 26,300 | | | 236,250 | |
| | Meiwa Estate Co., Ltd. | 12,300 | | | 56,759 | |
| * | | Meiwa Industry Co., Ltd. | 29,000 | | | 50,072 | |
| | Mikuni Corp. | 108,000 | | | 201,050 | |
| * | | Misawa Homes Co., Ltd. | 109,100 | | | 877,809 | |
| | Mitsuba Corp. | 152,690 | | | 1,190,266 | |
| | Mitsui Home Co., Ltd. | 155,000 | | | 791,525 | |
| | Mizuno Corp. | 435,000 | | | 2,238,187 | |
| | MOS Food Services, Inc. | 115,300 | | | 2,296,119 | |
| | Mr Max Corp. | 119,000 | | | 502,066 | |
| | Murakami Corp. | 5,000 | | | 51,520 | |
| | Musashi Seimitsu Industry Co., Ltd. | 85,200 | | | 1,832,151 | |
| * | | Naigai Co., Ltd. | 2,643,000 | | | 1,610,325 | |
| * | | Nexyz Corp. | 1,920 | | | 46,558 | |
| | Nice Holdings, Inc. | 451,000 | | | 944,342 | |
3
THE JAPANESE SMALL COMPANY SERIES
CONTINUED
| | | | Shares | | Value†† | |
| Consumer Discretionary — (Continued) | | | | | |
| | Nidec Copal Corp. | 88,700 | | $ | 981,859 | |
| # | | Nidec Tosok Corp. | 109,300 | | | 1,295,218 | |
| | Nifco, Inc. | 193,300 | | | 5,372,196 | |
| | Nihon Eslead Corp. | 2,400 | | | 20,689 | |
| | Nihon Tokushu Toryo Co., Ltd. | 56,000 | | | 216,980 | |
| | Nikkato Corp. | 700 | | | 4,301 | |
| #* | | Nippon Columbia Co., Ltd. | 609,000 | | | 221,367 | |
| | Nippon Felt Co., Ltd. | 67,200 | | | 338,431 | |
| #* | | Nippon Piston Ring Co., Ltd. | 285,000 | | | 562,542 | |
| | Nippon Seiki Co., Ltd. | 169,400 | | | 1,834,307 | |
| | Nishimatsuya Chain Co., Ltd. | 234,700 | | | 1,811,948 | |
| | Nissan Shatai Co., Ltd. | 362,023 | | | 3,508,205 | |
| #* | | Nissan Tokyo Sales Holdings Co., Ltd. | 236,000 | | | 411,060 | |
| | Nissen Holdings Co., Ltd. | 181,591 | | | 809,442 | |
| | | Nissin Kogyo Co., Ltd. | 162,100 | | | 2,320,877 | |
| | Nittan Valve Co., Ltd. | 82,800 | | | 281,105 | |
| * | | Nitto Kako Co., Ltd. | 60,000 | | | 40,482 | |
| * | | Noritsu Koki Co., Ltd. | 101,700 | | | 455,089 | |
| | Omikenshi Co., Ltd. | 127,000 | | | 72,426 | |
| | Onward Holdings Co., Ltd. | 532,000 | | | 3,896,398 | |
| | Pacific Industrial Co., Ltd. | 184,000 | | | 884,062 | |
| # | | Pal Co., Ltd. | 14,200 | | | 549,282 | |
| * | | Paltac Corp. | 9,450 | | | 120,929 | |
| | PanaHome Corp. | 398,200 | | | 2,705,026 | |
| | Parco Co., Ltd. | 268,200 | | | 2,040,386 | |
| | Paris Miki Holdings, Inc. | 160,100 | | | 1,304,330 | |
| #* | | PIA Corp. | 26,700 | | | 274,586 | |
| | Piolax, Inc. | 44,500 | | | 971,498 | |
| * | | Pioneer Electronic Corp. | 1,050,900 | | | 4,708,256 | |
| | Plenus Co., Ltd. | 83,900 | | | 1,370,459 | |
| | Point, Inc. | 66,930 | | | 2,838,979 | |
| | Press Kogyo Co., Ltd. | 396,000 | | | 1,899,034 | |
| #* | | Renown, Inc. | 242,600 | | | 447,258 | |
| | RESORT SOLUTION Co., Ltd. | 180,000 | | | 337,556 | |
| | Resorttrust, Inc. | 139,408 | | | 2,058,328 | |
| | Rhythm Watch Co., Ltd. | 650,000 | | | 1,195,580 | |
| | Right On Co., Ltd. | 67,325 | | | 509,999 | |
| | Riken Corp. | 362,000 | | | 1,353,836 | |
| # | | Ringer Hut Co., Ltd. | 72,700 | | | 999,272 | |
| | Riso Kyoiku Co., Ltd. | 7,810 | | | 481,274 | |
| | Roland Corp. | 92,800 | | | 839,073 | |
| # | | Round One Corp. | 266,600 | | | 1,728,634 | |
| # | | Royal Holdings Co., Ltd. | 135,300 | | | 1,612,774 | |
| | Ryohin Keikaku Co., Ltd. | 97,300 | | | 4,751,101 | |
| #* | | Sagami Chain Co., Ltd. | 77,000 | | | 538,966 | |
| * | | Sagami Co., Ltd. | 225,000 | | | 239,517 | |
| | Saizeriya Co., Ltd. | 145,800 | | | 2,422,674 | |
| #* | | Sakai Ovex Co., Ltd. | 214,000 | | | 313,446 | |
| | SAN HOLDINGS, Inc. | 13,600 | | | 239,983 | |
| # | | Sanden Corp. | 497,000 | | | 1,491,289 | |
| # | | Sangetsu Co., Ltd. | 84,425 | | | 2,170,910 | |
| * | | Sanko Marketing Foods Co., Ltd. | 19 | | | 20,184 | |
| | Sankyo Seiko Co., Ltd. | 30,200 | | | 104,405 | |
| | Sanoh Industrial Co., Ltd. | 118,600 | | | 833,904 | |
| | Sanyo Housing Nagoya Co., Ltd. | 354 | | | 340,069 | |
| | Sanyo Shokai, Ltd. | 421,000 | | | 956,189 | |
| | Scroll Corp. | 77,900 | | | 274,189 | |
| | Seiko Holdings Corp. | 494,407 | | | 1,010,247 | |
| | Seiren Co., Ltd. | 223,900 | | | 1,309,233 | |
| # | | Senshukai Co., Ltd. | 165,200 | | | 1,109,300 | |
| * | | Seven Seas Holdings Co., Ltd. | 319,000 | | | 86,566 | |
4
THE JAPANESE SMALL COMPANY SERIES
CONTINUED
| | | | Shares | | Value†† | |
| Consumer Discretionary — (Continued) | | | | | |
| | Shikibo, Ltd. | 523,000 | | $ | 692,831 | |
| | Shimachu Co., Ltd. | 191,900 | | | 4,394,614 | |
| # | | Shimojima Co., Ltd. | 14,800 | | | 185,224 | |
| #* | | Shinyei Kaisha | 96,000 | | | 197,422 | |
| | Shiroki Corp. | 285,000 | | | 802,364 | |
| | Shobunsha Publications, Inc. | 339,400 | | | 2,543,707 | |
| # | | Shochiku Co., Ltd. | 404,400 | | | 3,828,903 | |
| | Shoei Co., Ltd. | 1,600 | | | 9,845 | |
| * | | Showa Corp. | 320,400 | | | 1,840,818 | |
| | SKY Perfect JSAT Holdings, Inc. | 7,630 | | | 3,805,754 | |
| | SNT Corp. | 101,800 | | | 438,226 | |
| | Soft99 Corp. | 70,600 | | | 419,941 | |
| | Sotoh Co., Ltd. | 49,700 | | | 460,349 | |
| | SPK Corp. | 16,800 | | | 286,191 | |
| | SRI Sports, Ltd. | 14,300 | | | 155,537 | |
| | St. Marc Holdings Co., Ltd. | 37,600 | | | 1,445,651 | |
| | Studio Alice Co., Ltd. | 35,400 | | | 552,353 | |
| # | | Suminoe Textile Co., Ltd. | 323,000 | | | 565,016 | |
| | | Sumitomo Forestry Co., Ltd. | 436,666 | | | 3,869,447 | |
| #* | | SxL Corp. | 493,000 | | | 1,153,115 | |
| | T. RAD Co., Ltd. | 268,000 | | | 883,496 | |
| # | | Tac Co., Ltd. | 15,400 | | | 32,571 | |
| # | | Tachikawa Corp. | 50,800 | | | 297,531 | |
| | Tachi-S Co., Ltd. | 112,840 | | | 1,964,771 | |
| # | | Tact Home Co., Ltd. | 281 | | | 228,776 | |
| | Taiho Kogyo Co., Ltd. | 92,800 | | | 803,122 | |
| | Takamatsu Construction Group Co., Ltd. | 90,500 | | | 1,433,937 | |
| | Taka-Q Co., Ltd. | 48,000 | | | 82,218 | |
| | Take & Give Needs Co., Ltd. | 2,219 | | | 134,860 | |
| | Takihyo Co., Ltd. | 19,000 | | | 102,239 | |
| | Tamron Co., Ltd. | 65,200 | | | 1,571,771 | |
| * | | TASAKI & Co., Ltd. | 498,000 | | | 303,507 | |
| | Taya Co., Ltd. | 5,000 | | | 42,782 | |
| # | | TBK Co., Ltd. | 78,000 | | | 370,331 | |
| * | | TDF Corp. | 11,000 | | | 18,871 | |
| | Teikoku Sen-I Co., Ltd. | 79,000 | | | 493,545 | |
| #* | | Ten Allied Co., Ltd. | 50,000 | | | 169,790 | |
| # | | T-GAIA Corp. | 735 | | | 1,364,015 | |
| | Tigers Polymer Corp. | 59,000 | | | 220,296 | |
| # | | Toabo Corp. | 130,000 | | | 91,144 | |
| | Toei Co., Ltd. | 290,000 | | | 1,371,728 | |
| * | | Tokai Kanko Co., Ltd. | 505,999 | | | 131,236 | |
| | Tokai Rika Co., Ltd. | 129,400 | | | 1,976,027 | |
| | Tokai Rubber Industries, Ltd. | 159,700 | | | 1,765,856 | |
| # | | Tokai Senko K.K. | 215,000 | | | 242,929 | |
| | Token Corp. | 24,380 | | | 822,430 | |
| * | | Tokyo Derica Co., Ltd. | 6,200 | | | 51,517 | |
| #* | | Tokyo Dome Corp. | 686,200 | | | 1,681,073 | |
| # | | Tokyo Individualized Educational Institute, Inc. | 93,100 | | | 166,299 | |
| | Tokyo Kaikan Co., Ltd. | 12,000 | | | 43,780 | |
| | Tokyo Soir Co., Ltd. | 49,000 | | | 116,014 | |
| # | | Tokyotokeiba Co., Ltd. | 828,000 | | | 1,126,739 | |
| # | | Tokyu Recreation Co., Ltd. | 77,000 | | | 470,853 | |
| # | | Tomy Co., Ltd. | 297,893 | | | 2,083,634 | |
| | Topre Corp. | 185,700 | | | 1,823,449 | |
| # | | Toridoll.corp. | 52,200 | | | 487,468 | |
| | Totenko Co., Ltd. | 57,000 | | | 83,487 | |
| # | | Touei Housing Corp. | 76,040 | | | 774,553 | |
| | Tow Co., Ltd. | 7,000 | | | 41,631 | |
| | Toyo Tire & Rubber Co., Ltd. | 775,000 | | | 1,754,484 | |
| | Toyobo Co., Ltd. | 3,220,000 | | | 4,330,410 | |
5
THE JAPANESE SMALL COMPANY SERIES
CONTINUED
| | | | Shares | | Value†† | |
| Consumer Discretionary — (Continued) | | | | | |
| | TPR CO., Ltd. | 103,500 | | $ | 1,208,649 | |
| | TS TECH CO., Ltd. | 191,600 | | | 3,013,819 | |
| * | | TSI Holdings Co., Ltd. | 292,895 | | | 1,444,458 | |
| * | | Tsukamoto Co., Ltd. | 52,000 | | | 56,484 | |
| | Tsutsumi Jewelry Co., Ltd. | 49,300 | | | 1,167,890 | |
| | TV Asahi Corp. | 326 | | | 537,142 | |
| | TV Tokyo Holdings Corp. | 9,000 | | | 119,053 | |
| | Umenohana Co., Ltd. | 18 | | | 37,853 | |
| | Unipres Corp. | 130,200 | | | 3,721,717 | |
| # | | United Arrows, Ltd. | 71,300 | | | 1,374,529 | |
| #* | | Unitika, Ltd. | 1,967,000 | | | 1,068,323 | |
| | U-Shin, Ltd. | 94,500 | | | 758,309 | |
| | Watabe Wedding Corp. | 29,500 | | | 271,551 | |
| # | | WATAMI Co., Ltd. | 104,500 | | | 2,489,980 | |
| | Xebio Co., Ltd. | 98,000 | | | 2,323,492 | |
| # | | Yamatane Corp. | 224,000 | | | 322,033 | |
| | Yellow Hat, Ltd. | 73,700 | | | 1,173,167 | |
| | Yomiuri Land Co., Ltd. | 225,000 | | | 708,532 | |
| | Yonex Co., Ltd. | 40,000 | | | 257,204 | |
| | Yorozu Corp. | 62,500 | | | 1,420,854 | |
| # | | Yoshinoya Holdings Co., Ltd. | 2,180 | | | 3,055,937 | |
| | Zenrin Co., Ltd. | 130,000 | | | 1,161,449 | |
| # | | Zensho Co., Ltd. | 298,400 | | | 4,021,357 | |
| Total Consumer Discretionary | | | | 348,673,533 | |
| | | |
| Consumer Staples — (9.4%) | | | | | |
| * | | Aderans Co., Ltd. | 120,250 | | | 1,542,654 | |
| * | | Aeon Hokkaido Corp. | 391,700 | | | 1,811,039 | |
| | Ahjikan Co., Ltd. | 10,500 | | | 105,982 | |
| | Ain Pharmaciez, Inc. | 39,900 | | | 1,920,044 | |
| | Arcs Co., Ltd. | 97,900 | | | 1,802,191 | |
| | Ariake Japan Co., Ltd. | 103,700 | | | 1,997,097 | |
| | Cawachi, Ltd. | 81,900 | | | 1,652,565 | |
| | Chubu Shiryo Co., Ltd. | 89,000 | | | 574,067 | |
| | Chuo Gyorui Co., Ltd. | 93,000 | | | 216,308 | |
| | Circle K Sunkus Co., Ltd. | 164,000 | | | 2,712,962 | |
| | Coca-Cola Central Japan Co., Ltd. | 111,200 | | | 1,416,064 | |
| | Cocokara fine, Inc. | 59,560 | | | 1,536,781 | |
| | Cosmos Pharmaceutical Corp. | 34,200 | | | 1,764,014 | |
| | CVS Bay Area, Inc. | 51,000 | | | 79,900 | |
| | Daikokutenbussan Co., Ltd. | 5,600 | | | 161,468 | |
| # | | Dr. Ci:Labo Co., Ltd. | 532 | | | 2,824,583 | |
| | Dydo Drinco, Inc. | 49,800 | | | 1,972,393 | |
| | Echo Trading Co., Ltd. | 11,000 | | | 100,884 | |
| | Ensuiko Sugar Refining Co., Ltd. | 102,000 | | | 226,687 | |
| | Ezaki Glico Co., Ltd. | 5,000 | | | 56,276 | |
| # | | Fancl Corp. | 157,800 | | | 2,150,149 | |
| #* | | First Baking Co., Ltd. | 183,000 | | | 196,833 | |
| | Fuji Oil Co., Ltd. | 258,900 | | | 3,696,972 | |
| | Fujicco Co., Ltd. | 116,600 | | | 1,446,118 | |
| #* | | Fujiya Co., Ltd. | 474,000 | | | 1,004,385 | |
| | Hagoromo Foods Corp. | 40,000 | | | 635,267 | |
| | Harashin Narus Holdings Co., Ltd. | 61,500 | | | 1,017,285 | |
| #* | | Hayashikane Sangyo Co., Ltd. | 299,000 | | | 248,012 | |
| # | | Heiwado Co., Ltd. | 152,800 | | | 1,961,414 | |
| # | | Hohsui Corp. | 120,000 | | | 157,938 | |
| | Hokkaido Coca-Cola Bottling Co., Ltd. | 87,000 | | | 428,135 | |
| | Hokuto Corp. | 106,700 | | | 2,326,760 | |
| | Inageya Co., Ltd. | 175,000 | | | 2,066,002 | |
| | Ito En, Ltd. | 80,800 | | | 1,388,310 | |
| | Itochu-Shokuhin Co., Ltd. | 27,400 | | | 972,105 | |
6
THE JAPANESE SMALL COMPANY SERIES
CONTINUED
| | | | Shares | | Value†† | |
| Consumer Staples — (Continued) | | | | | |
| # | | Itoham Foods, Inc. | 674,800 | | $ | 2,681,454 | |
| | Izumiya Co., Ltd. | 447,000 | | | 2,371,656 | |
| | J-Oil Mills, Inc. | 477,000 | | | 1,362,141 | |
| # | | Kameda Seika Co., Ltd. | 70,000 | | | 1,368,180 | |
| | Kasumi Co., Ltd. | 203,100 | | | 1,293,581 | |
| | Kato Sangyo Co., Ltd. | 109,300 | | | 2,105,437 | |
| # | | Key Coffee, Inc. | 79,000 | | | 1,424,687 | |
| | Kirindo Co., Ltd. | 28,300 | | | 185,443 | |
| | Kose Corp. | 107,000 | | | 2,672,979 | |
| | Kyodo Shiryo Co., Ltd. | 330,000 | | | 394,440 | |
| # | | Kyokuyo Co., Ltd. | 370,000 | | | 854,715 | |
| | Life Corp. | 183,400 | | | 3,328,899 | |
| # | | Lion Corp. | 82,000 | | | 483,733 | |
| | Mandom Corp. | 81,100 | | | 2,141,340 | |
| | Marudai Food Co., Ltd. | 465,000 | | | 1,704,828 | |
| # | | Maruetsu, Inc. (The) | 375,000 | | | 1,363,800 | |
| | Maruha Nichiro Holdings, Inc. | 1,719,069 | | | 3,166,080 | |
| * | | Maruya Co., Ltd. | 7,400 | | | 15,882 | |
| # | | Matsumotokiyoshi Holdings Co., Ltd. | 114,900 | | | 2,325,051 | |
| * | | Maxvalu Tohok Co., Ltd. | 18,200 | | | 163,759 | |
| | Maxvalu Tokai Co., Ltd. | 57,500 | | | 835,716 | |
| # | | Megmilk Snow Brand Co., Ltd. | 194,300 | | | 3,725,871 | |
| | Meito Sangyo Co., Ltd. | 53,600 | | | 689,096 | |
| | Mikuni Coca-Cola Bottling Co., Ltd. | 171,600 | | | 1,519,990 | |
| | Milbon Co., Ltd. | 49,014 | | | 1,504,051 | |
| | Ministop Co., Ltd. | 70,200 | | | 1,312,810 | |
| | Mitsubishi Shokuhin Co., Ltd. | 87,800 | | | 2,297,857 | |
| | Mitsui Sugar Co., Ltd. | 453,850 | | | 1,544,616 | |
| | Miyoshi Oil & Fat Co., Ltd. | 261,000 | | | 344,545 | |
| | Morinaga & Co., Ltd. | 933,000 | | | 2,193,291 | |
| | Morinaga Milk Industry Co., Ltd. | 886,000 | | | 3,420,645 | |
| | Morishita Jinton Co., Ltd. | 47,800 | | | 204,746 | |
| | Morozoff, Ltd. | 108,000 | | | 385,752 | |
| # | | Nagatanien Co., Ltd. | 115,000 | | | 1,298,795 | |
| | Nakamuraya Co., Ltd. | 203,000 | | | 1,001,142 | |
| #* | | Nichimo Co., Ltd. | 112,000 | | | 235,725 | |
| | Nichirei Corp. | 1,031,000 | | | 4,983,287 | |
| # | | Nihon Chouzai Co., Ltd. | 20,300 | | | 706,097 | |
| | Niitaka Co., Ltd. | 7,260 | | | 82,084 | |
| | Nippon Beet Sugar Manufacturing Co., Ltd. | 543,000 | | | 1,076,863 | |
| | Nippon Flour Mills Co., Ltd. | 557,000 | | | 2,461,256 | |
| #* | | Nippon Formula Feed Manufacturing Co., Ltd. | 267,000 | | | 380,995 | |
| | Nippon Suisan Kaisha, Ltd. | 936,700 | | | 3,207,396 | |
| | Nisshin Oillio Group, Ltd. (The) | 550,000 | | | 2,360,931 | |
| * | | Nissin Sugar Holdings Co., Ltd. | 14,900 | | | 301,213 | |
| | Nitto Fuji Flour Milling Co., Ltd. | 64,000 | | | 242,639 | |
| | Noevir Holdings Co., Ltd. | 6,800 | | | 74,979 | |
| | Oenon Holdings, Inc. | 247,000 | | | 576,811 | |
| # | | Oie Sangyo Co., Ltd. | 20,900 | | | 214,062 | |
| | Okuwa Co., Ltd. | 115,000 | | | 1,753,402 | |
| | Olympic Corp. | 64,900 | | | 607,072 | |
| | Pietro Co., Ltd. | 10,300 | | | 114,210 | |
| | Pigeon Corp. | 72,300 | | | 2,946,825 | |
| | Poplar Co., Ltd. | 25,760 | | | 156,785 | |
| | Prima Meat Packers, Ltd. | 671,000 | | | 1,097,241 | |
| # | | Riken Vitamin Co., Ltd. | 79,200 | | | 2,342,601 | |
| | Rock Field Co., Ltd. | 47,000 | | | 778,965 | |
| | S Foods, Inc. | 73,762 | | | 617,091 | |
| | Sakata Seed Corp. | 164,600 | | | 2,355,584 | |
| | San-A Co., Ltd. | 22,800 | | | 901,205 | |
| #* | | Sapporo Holdings, Ltd. | 758,000 | | | 2,858,361 | |
7
THE JAPANESE SMALL COMPANY SERIES
CONTINUED
| | | | Shares | | Value†† | |
| Consumer Staples — (Continued) | | | | | |
| | Shoei Foods Corp. | 44,000 | | $ | 293,755 | |
| | Showa Sangyo Co., Ltd. | 524,000 | | | 1,612,096 | |
| | Sogo Medical Co., Ltd. | 23,000 | | | 772,317 | |
| | Sonton Food Industry Co., Ltd. | 43,000 | | | 392,298 | |
| | Starzen Co., Ltd. | 279,000 | | | 835,946 | |
| | Sugi Holdings Co., Ltd. | 129,700 | | | 3,774,147 | |
| | Takara Holdings, Inc. | 730,000 | | | 4,686,913 | |
| | Three F Co., Ltd. | 17,700 | | | 106,334 | |
| # | | Tobu Store Co., Ltd. | 205,000 | | | 700,643 | |
| | TOHO Co., Ltd. | 158,000 | | | 638,257 | |
| # | | Tohto Suisan Co., Ltd. | 120,000 | | | 203,750 | |
| | Torigoe Co., Ltd. (The) | 84,500 | | | 747,072 | |
| | | Toyo Sugar Refining Co., Ltd. | 157,000 | | | 186,614 | |
| | Tsukiji Uoichiba Co., Ltd. | 15,000 | | | 17,936 | |
| | Tsuruha Holdings, Inc. | 64,600 | | | 3,603,653 | |
| #* | | Unicafe, Inc. | 15,060 | | | 66,576 | |
| | Uoriki Co., Ltd. | 400 | | | 4,602 | |
| | Valor Co., Ltd. | 175,400 | | | 2,724,428 | |
| | Warabeya Nichiyo Co., Ltd. | 51,360 | | | 669,802 | |
| | Yaizu Suisankagaku Industry Co., Ltd. | 41,000 | | | 372,204 | |
| | Yaoko Co., Ltd. | 40,800 | | | 1,381,478 | |
| | Yokohama Reito Co., Ltd. | 188,000 | | | 1,531,263 | |
| | Yomeishu Seizo Co., Ltd. | 100,000 | | | 938,971 | |
| | Yonekyu Corp. | 100,000 | | | 962,539 | |
| | Yuasa Funashoku Co., Ltd. | 112,000 | | | 268,587 | |
| # | | Yukiguni Maitake Co., Ltd. | 101,856 | | | 449,094 | |
| | Yutaka Foods Corp. | 6,000 | | | 119,973 | |
| Total Consumer Staples | | | | 159,351,580 | |
| | | |
| Energy — (0.9%) | | | | | |
| | AOC Holdings, Inc. | 154,800 | | | 937,311 | |
| # | | BP Castrol K.K. | 66,500 | | | 292,403 | |
| #* | | Fuji Kosan Co., Ltd. | 277,000 | | | 254,785 | |
| | Itochu Enex Co., Ltd. | 302,200 | | | 1,690,358 | |
| # | | Japan Drilling Co., Ltd. | 19,700 | | | 561,268 | |
| | Japan Oil Transportation Co., Ltd. | 79,000 | | | 190,773 | |
| | Kanto Natural Gas Development Co., Ltd. | 155,000 | | | 773,763 | |
| # | | Kyoei Tanker Co., Ltd. | 111,000 | | | 175,904 | |
| | MITSUUROKO HOLDINGS CO., LTD. | 166,300 | | | 945,496 | |
| | Modec, Inc. | 82,100 | | | 1,412,414 | |
| # | | Nippon Gas Co., Ltd. | 148,900 | | | 2,081,994 | |
| | Nippon Seiro Co., Ltd. | 64,000 | | | 231,262 | |
| | Sala Corp. | 128,500 | | | 766,494 | |
| | San-Ai Oil Co., Ltd. | 273,000 | | | 1,156,527 | |
| | Shinko Plantech Co., Ltd. | 164,000 | | | 1,322,875 | |
| | Sinanen Co., Ltd. | 251,000 | | | 1,108,360 | |
| | Toa Oil Co., Ltd. | 352,000 | | | 420,697 | |
| | Toyo Kanetsu K.K. | 507,000 | | | 921,545 | |
| Total Energy | | | | 15,244,229 | |
| | | |
| Financials — (10.2%) | | | | | |
| | 77 Bank, Ltd. (The) | 43,000 | | | 184,553 | |
| | Aichi Bank, Ltd. (The) | 53,800 | | | 3,112,295 | |
| | Airport Facilities Co., Ltd. | 121,970 | | | 487,616 | |
| | Akita Bank, Ltd. (The) | 791,400 | | | 2,277,783 | |
| | Aomori Bank, Ltd. (The) | 828,000 | | | 2,520,542 | |
| | Asax Co., Ltd. | 17 | | | 17,896 | |
| # | | Awa Bank, Ltd. (The) | 503,000 | | | 3,377,466 | |
| | Bank of Iwate, Ltd. (The) | 67,500 | | | 2,914,224 | |
| | Bank of Kochi, Ltd. (The) | 2,000 | | | 2,053 | |
| | Bank of Nagoya, Ltd. (The) | 621,297 | | | 1,981,730 | |
8
THE JAPANESE SMALL COMPANY SERIES
CONTINUED
| | | | Shares | | Value†† | |
| Financials — (Continued) | | | | | |
| | Bank of Okinawa, Ltd. (The) | 94,000 | | $ | 3,979,271 | |
| | Bank of Saga, Ltd. (The) | 625,000 | | | 1,565,636 | |
| | Bank of the Ryukyus, Ltd. | 141,280 | | | 1,743,971 | |
| | Century Tokyo Leasing Corp. | 146,715 | | | 2,762,285 | |
| * | | Chiba Kogyo Bank, Ltd. (The) | 180,300 | | | 950,085 | |
| | Chukyo Bank, Ltd. (The) | 675,000 | | | 1,735,325 | |
| | Daibiru Corp. | 209,700 | | | 1,316,348 | |
| | Daiko Clearing Services Corp. | 49,700 | | | 161,240 | |
| * | | Daikyo, Inc. | 1,289,000 | | | 2,539,774 | |
| | Daisan Bank, Ltd. (The) | 627,000 | | | 1,288,567 | |
| | Daishi Bank, Ltd. (The) | 1,403,000 | | | 4,568,464 | |
| | Daito Bank, Ltd. (The) | 488,000 | | | 386,059 | |
| | | Ehime Bank, Ltd. (The) | 641,000 | | | 1,899,877 | |
| | Eighteenth Bank, Ltd. (The) | 1,079,000 | | | 2,732,409 | |
| | FIDEA Holdings Co., Ltd. | 270,300 | | | 699,918 | |
| | Fukui Bank, Ltd. (The) | 915,000 | | | 2,778,855 | |
| * | | Fukushima Bank, Ltd. | 846,000 | | | 438,097 | |
| | Fuyo General Lease Co., Ltd. | 84,500 | | | 2,898,436 | |
| | Goldcrest Co., Ltd. | 73,070 | | | 1,162,796 | |
| | Heiwa Real Estate Co., Ltd. | 492,500 | | | 977,441 | |
| | Higashi-Nippon Bank, Ltd. | 659,000 | | | 1,372,660 | |
| | Higo Bank, Ltd. (The) | 663,000 | | | 3,739,868 | |
| | Hitachi Capital Corp. | 6,000 | | | 82,853 | |
| | Hokkoku Bank, Ltd. (The) | 996,000 | | | 3,640,166 | |
| | Hokuetsu Bank, Ltd. (The) | 958,000 | | | 1,936,162 | |
| # | | Hulic Co., Ltd. | 39,200 | | | 456,598 | |
| | Hyakugo Bank, Ltd. (The) | 1,045,609 | | | 4,134,014 | |
| | Hyakujishi Bank, Ltd. (The) | 1,022,000 | | | 4,556,887 | |
| | IBJ Leasing Co., Ltd. | 85,800 | | | 1,900,395 | |
| | Ichiyoshi Securities Co., Ltd. | 165,800 | | | 705,651 | |
| | Iida Home Max Co., Ltd. | 74,900 | | | 559,597 | |
| | Iwai Cosmo Holdings, Inc. | 26,300 | | | 77,678 | |
| * | | Japan Asia Investment Co., Ltd. | 412,000 | | | 277,592 | |
| | Juroku Bank, Ltd. | 1,337,000 | | | 4,357,179 | |
| # | | kabu.com Securities Co., Ltd. | 334,700 | | | 984,886 | |
| | Kagoshima Bank, Ltd. (The) | 500,000 | | | 3,506,460 | |
| | Keihanshin Building Co., Ltd. | 27,700 | | | 122,105 | |
| | Keiyo Bank, Ltd. (The) | 471,000 | | | 2,329,756 | |
| * | | Kenedix, Inc. | 11,449 | | | 1,485,788 | |
| | Kirayaka Bank, Ltd. | 98,000 | | | 93,986 | |
| | Kita-Nippon Bank, Ltd. (The) | 49,406 | | | 1,206,434 | |
| | Kiyo Holdings, Inc. | 2,635,900 | | | 4,103,204 | |
| | Kobayashi Yoko Co., Ltd. | 230,900 | | | 515,109 | |
| #* | | Kosei Securities Co., Ltd. | 285,000 | | | 210,842 | |
| | Kyokuto Securities Co., Ltd. | 67,000 | | | 359,656 | |
| #* | | Leopalace21 Corp. | 985,885 | | | 1,927,286 | |
| | Marusan Securities Co., Ltd. | 287,400 | | | 877,869 | |
| #* | | Matsui Securities Co., Ltd. | 463,600 | | | 2,254,175 | |
| | Michinoku Bank, Ltd. (The) | 736,000 | | | 1,386,989 | |
| | Mie Bank, Ltd. (The) | 150,000 | | | 338,932 | |
| | Minato Bank, Ltd. (The) | 1,063,000 | | | 1,924,376 | |
| | Mito Securities Co., Ltd. | 254,000 | | | 316,823 | |
| | Miyazaki Bank, Ltd. (The) | 605,000 | | | 1,482,039 | |
| | Monex Group, Inc. | 8,052 | | | 1,168,603 | |
| | Musashino Bank, Ltd. | 130,300 | | | 4,325,581 | |
| | Nagano Bank, Ltd. (The) | 331,000 | | | 657,650 | |
| | Nanto Bank, Ltd. (The) | 293,000 | | | 1,622,186 | |
| * | | New Real Property K.K. | 43,900 | | | — | |
| * | | NIS Group Co., Ltd. | 1,015,125 | | | 53,377 | |
| | Nisshin Fudosan Co., Ltd. | 95,000 | | | 536,111 | |
| | Ogaki Kyoritsu Bank, Ltd. (The) | 1,315,000 | | | 4,282,437 | |
9
The Japanese Small Company Series
continued
| | | | | Shares | | Value†† | |
| Financials — (Continued) | | | | | | |
| | Oita Bank, Ltd. (The) | | 685,900 | | $ | 1,975,516 | |
| | Okasan Securities Group, Inc. | | 804,000 | | | 2,539,330 | |
| | Ricoh Leasing Co., Ltd. | | 78,500 | | | 1,751,901 | |
| | San-in Godo Bank, Ltd. (The) | | 627,000 | | | 4,698,208 | |
| | Sankei Building Co., Ltd. | | 173,500 | | | 664,408 | |
| | Sapporo Hokuyo Holdings, Inc. | | 433,100 | | | 1,548,862 | |
| | Shiga Bank, Ltd. | | 179,000 | | | 1,217,028 | |
| | Shikoku Bank, Ltd. | | 811,000 | | | 3,047,654 | |
| # | | Shimizu Bank, Ltd. | | 34,600 | | | 1,265,013 | |
| | Sumitomo Real Estate Sales Co., Ltd. | | 36,860 | | | 1,431,927 | |
| * | | Sun Frontier Fudousan Co., Ltd. | | 208 | | | 22,650 | |
| # | | Taiko Bank, Ltd. (The) | | 35,000 | | | 112,693 | |
| #* | | Takagi Securities Co., Ltd. | | 206,000 | | | 165,024 | |
| * | | Takara Leben Co., Ltd. | | 23,100 | | | 135,510 | |
| | TOC Co., Ltd. | | 435,250 | | | 1,971,626 | |
| | Tochigi Bank, Ltd. | | 726,000 | | | 2,596,517 | |
| | Toho Bank, Ltd. | | 915,200 | | | 2,649,420 | |
| | Toho Real Estate Co., Ltd. | | 140,700 | | | 723,566 | |
| | Tohoku Bank, Ltd. (The) | | 393,000 | | | 617,640 | |
| | Tokai Tokyo Financial Holdings, Inc. | | 997,000 | | | 2,697,348 | |
| | Tokyo Rakutenchi Co., Ltd. | | 218,000 | | | 797,396 | |
| | Tokyo Tatemono Co., Ltd. | | 1,726,000 | | | 5,200,495 | |
| | Tokyo Tatemono Real Estate Sales Co., Ltd. | | 7,000 | | | 18,965 | |
| # | | Tokyo Theatres Co., Inc. | | 290,000 | | | 387,932 | |
| | Tokyo Tomin Bank, Ltd. | | 132,500 | | | 1,609,226 | |
| | Tokyu Livable, Inc. | | 103,200 | | | 791,251 | |
| | Tomato Bank, Ltd. | | 399,000 | | | 667,784 | |
| | TOMONY Holdings, Inc. | | 614,250 | | | 2,696,481 | |
| | Tosei Corp. | | 636 | | | 162,339 | |
| | Tottori Bank, Ltd. | | 328,000 | | | 614,344 | |
| | Towa Bank, Ltd. | | 1,384,000 | | | 1,598,099 | |
| | Toyo Securities Co., Ltd. | | 327,000 | | | 440,554 | |
| | Tsukuba Bank, Ltd. | | 241,500 | | | 791,984 | |
| | Yachiyo Bank, Ltd. (The) | | 29,800 | | | 705,737 | |
| | Yamagata Bank, Ltd. | | 646,500 | | | 3,153,909 | |
| | Yamanashi Chuo Bank, Ltd. | | 649,000 | | | 2,637,661 | |
| Total Financials | | | | | 173,436,970 | |
| | | |
| Health Care — (4.0%) | | | | | | |
| | As One Corp. | | 71,668 | | | 1,452,195 | |
| | ASKA Pharmaceutical Co., Ltd. | | 106,000 | | | 628,364 | |
| | BML, Inc. | | 41,500 | | | 978,778 | |
| # | | CMIC Co., Ltd. | | 17,500 | | | 283,160 | |
| | Create Medic Co., Ltd. | | 28,000 | | | 293,161 | |
| | Eiken Chemical Co., Ltd. | | 74,800 | | | 1,011,180 | |
| | EPS Corp. | | 227 | | | 436,577 | |
| | FALCO SD HOLDINGS Co., Ltd. | | 34,300 | | | 389,280 | |
| | Fuso Pharmaceutical Industries, Ltd. | | 320,000 | | | 814,508 | |
| | Hitachi Medical Corp. | | 85,000 | | | 872,570 | |
| | Hogy Medical Co., Ltd. | | 49,000 | | | 2,070,887 | |
| | Iwaki & Co., Ltd. | | 55,000 | | | 132,628 | |
| | Japan Medical Dynamic Marketing, Inc. | | 44,900 | | | 181,708 | |
| | Jeol, Ltd. | | 273,000 | | | 681,832 | |
| | JMS Co., Ltd. | | 126,000 | | | 387,602 | |
| | Kaken Pharmaceutical Co., Ltd. | | 353,000 | | | 4,686,210 | |
| | Kawanishi Holdings, Ltd. | | 7,400 | | | 83,024 | |
| | Kawasumi Laboratories, Inc. | | 45,000 | | | 255,884 | |
| | Kissei Pharmaceutical Co., Ltd. | | 106,300 | | | 2,186,290 | |
| | KYORIN Holdings, Inc. | | 205,000 | | | 3,597,918 | |
| | Mochida Pharmaceutical Co., Ltd. | | 281,000 | | | 3,148,779 | |
| | Nagaileben Co., Ltd. | | 25,400 | | | 336,455 | |
10
The Japanese Small Company Series
continued
| | | | | Shares | | Value†† | |
| Health Care — (Continued) | | | | | | |
| # | | Nichii Gakkan Co. | | 227,100 | | $ | 2,763,635 | |
| # | | Nihon Kohden Corp. | | 159,200 | | | 3,915,865 | |
| | Nikkiso Co., Ltd. | | 252,000 | | | 2,139,998 | |
| | Nippon Chemiphar Co., Ltd. | | 131,000 | | | 485,410 | |
| | Nippon Shinyaku Co., Ltd. | | 239,000 | | | 2,954,226 | |
| # | | Nipro Corp. | | 385,600 | | | 3,241,401 | |
| | Nissui Pharmaceutical Co., Ltd. | | 64,200 | | | 571,886 | |
| * | | Paramount Bed Holdings Co., Ltd. | | 82,000 | | | 2,495,050 | |
| | Rion Co., Ltd. | | 5,000 | | | 40,310 | |
| | Rohto Pharmaceutical Co., Ltd. | | 360,000 | | | 4,620,581 | |
| # | | Sawai Pharmaceutical Co., Ltd. | | 50,500 | | | 5,239,003 | |
| | Seikagaku Corp. | | 179,800 | | | 1,928,257 | |
| | Shin Nippon Biomedical Laboratories, Ltd. | | 24,700 | | | 62,976 | |
| | Ship Healthcare Holdings, Inc. | | 118,100 | | | 2,577,154 | |
| * | | Techno Medica Co., Ltd. | | 1 | | | 3,622 | |
| | Toho Holdings Co., Ltd. | | 196,100 | | | 2,711,449 | |
| | Torii Pharmaceutical Co., Ltd. | | 65,200 | | | 1,221,539 | |
| # | | Towa Pharmaceutical Co., Ltd. | | 42,600 | | | 1,810,812 | |
| # | | Vital KSK Holdings, Inc. | | 150,600 | | | 1,093,788 | |
| #* | | Wakamoto Pharmaceutical Co., Ltd. | | 100,000 | | | 281,405 | |
| | ZERIA Pharmaceutical Co., Ltd. | | 109,000 | | | 1,875,976 | |
| Total Health Care | | | | | 66,943,333 | |
| | | |
| Industrials — (24.6%) | | | | | | |
| #* | | A&A Material Corp. | | 235,000 | | | 213,240 | |
| | Advan Co., Ltd. | | 96,900 | | | 836,228 | |
| #* | | Advanex, Inc. | | 73,000 | | | 58,695 | |
| | Aeon Delight Co., Ltd. | | 85,600 | | | 1,725,620 | |
| | Aica Kogyo Co., Ltd. | | 244,300 | | | 3,300,748 | |
| | Aichi Corp. | | 132,000 | | | 519,210 | |
| | Aida Engineering, Ltd. | | 273,600 | | | 1,256,983 | |
| | Airtech Japan, Ltd. | | 18,300 | | | 82,372 | |
| | Alps Logistics Co., Ltd. | | 50,700 | | | 474,352 | |
| # | | Altech Co., Ltd. | | 23,000 | | | 57,363 | |
| | Altech Corp. | | 37,150 | | | 317,961 | |
| | Amano Corp. | | 281,000 | | | 2,494,741 | |
| | Ando Corp. | | 450,000 | | | 564,284 | |
| | Anest Iwata Corp. | | 149,000 | | | 602,808 | |
| # | | Asahi Diamond Industrial Co., Ltd. | | 241,000 | | | 2,899,962 | |
| | Asahi Holdings, Inc. | | 115,950 | | | 2,296,044 | |
| | Asahi Kogyosha Co., Ltd. | | 109,000 | | | 467,815 | |
| # | | Asanuma Corp. | | 796,000 | | | 650,815 | |
| | Asia Air Survey Co., Ltd. | | 32,000 | | | 90,674 | |
| | Asunaro Aoki Construction Co., Ltd. | | 154,000 | | | 784,093 | |
| | Ataka Construction & Engineering Co., Ltd. | | 60,000 | | | 187,348 | |
| | Bando Chemical Industries, Ltd. | | 348,000 | | | 1,306,565 | |
| | Benefit One, Inc. | | 3 | | | 2,080 | |
| | Biken Techno Corp. | | 14,100 | | | 82,115 | |
| | Bunka Shutter Co., Ltd. | | 227,000 | | | 772,919 | |
| # | | Central Glass Co., Ltd. | | 732,000 | | | 3,522,524 | |
| | Central Security Patrols Co., Ltd. | | 43,700 | | | 444,325 | |
| | Chiyoda Integre Co., Ltd. | | 5,400 | | | 64,537 | |
| | Chudenko Corp. | | 130,500 | | | 1,376,015 | |
| | Chugai Ro Co., Ltd. | | 340,000 | | | 1,089,681 | |
| | CKD Corp. | | 241,400 | | | 1,650,886 | |
| | COMSYS Holdings Corp. | | 378,300 | | | 3,967,301 | |
| # | | Cosel Co., Ltd. | | 108,800 | | | 1,544,717 | |
| | CTI Engineering Co., Ltd. | | 44,000 | | | 299,338 | |
| | Dai-Dan Co., Ltd. | | 156,000 | | | 1,081,975 | |
| | Daido Kogyo Co., Ltd. | | 145,000 | | | 231,832 | |
| | Daifuku Co., Ltd. | | 366,000 | | | 1,878,313 | |
11
The Japanese Small Company Series
continued
| | | | | Shares | | Value†† | |
| Industrials — (Continued) | | | | | | |
| | Daihen Corp. | | 448,000 | | $ | 1,560,950 | |
| # | | Daiho Corp. | | 763,000 | | | 909,952 | |
| #* | | Daiichi Chuo K.K. | | 478,000 | | | 618,403 | |
| | Daiichi Jitsugyo Co., Ltd. | | 188,000 | | | 773,376 | |
| # | | Daiseki Co., Ltd. | | 153,963 | | | 2,501,642 | |
| * | | Daiseki Eco. Solution Co., Ltd. | | 84 | | | 164,679 | |
| #* | | Daisue Construction Co., Ltd. | | 271,500 | | | 144,528 | |
| | Daiwa Industries, Ltd. | | 178,000 | | | 897,939 | |
| | Daiwa Odakyu Construction Co., Ltd. | | 63,500 | | | 162,561 | |
| #* | | Danto Holdings Corp. | | 441,000 | | | 439,364 | |
| # | | Denyo Co., Ltd. | | 85,100 | | | 1,135,560 | |
| * | | Dijet Industrial Co., Ltd. | | 80,000 | | | 146,447 | |
| | DMW Corp. | | 4,800 | | | 85,598 | |
| * | | Dream Incubator, Inc. | | 168 | | | 123,527 | |
| | Duskin Co., Ltd. | | 212,500 | | | 4,178,565 | |
| | Ebara Corp. | | 221,000 | | | 758,430 | |
| * | | Ebara Jitsugyo Co., Ltd. | | 1,800 | | | 28,058 | |
| #* | | Enshu, Ltd. | | 143,000 | | | 165,573 | |
| | Freesia Macross Corp. | | 1,355,000 | | | 262,434 | |
| #* | | Fudo Tetra Corp. | | 364,100 | | | 690,077 | |
| | Fujikura, Ltd. | | 1,170,000 | | | 3,407,846 | |
| * | | Fujisash Co., Ltd. | | 49,300 | | | 34,364 | |
| | Fujitec Co., Ltd. | | 319,000 | | | 1,987,463 | |
| # | | Fukuda Corp. | | 630,000 | | | 1,997,204 | |
| | Fukusima Industries Corp. | | 29,700 | | | 361,714 | |
| | Fukuyama Transporting Co., Ltd. | | 606,400 | | | 3,660,790 | |
| | Funai Consulting, Inc. | | 99,300 | | | 694,854 | |
| * | | Furukawa Co., Ltd. | | 1,391,000 | | | 1,136,797 | |
| # | | Furusato Industries, Ltd. | | 50,600 | | | 399,110 | |
| | Futaba Corp. | | 154,300 | | | 2,452,836 | |
| | Gecoss Corp. | | 112,400 | | | 446,674 | |
| | Glory, Ltd. | | 62,400 | | | 1,342,244 | |
| | Hamai Co., Ltd. | | 92,000 | | | 90,898 | |
| | Hamakyorex Co., Ltd. | | 4,800 | | | 142,694 | |
| | Hanwa Co., Ltd. | | 774,000 | | | 3,366,063 | |
| #* | | Hazama Corp. | | 285,800 | | | 646,309 | |
| | Hibiya Engineering, Ltd. | | 125,900 | | | 1,353,371 | |
| | Hisaka Works, Ltd. | | 7,000 | | | 76,782 | |
| * | | Hitachi Cable, Ltd. | | 755,000 | | | 1,595,305 | |
| | Hitachi Koki Co., Ltd. | | 213,200 | | | 1,617,934 | |
| | Hitachi Metals Techno, Ltd. | | 56,500 | | | 330,877 | |
| | Hitachi Tool Engineering, Ltd. | | 94,000 | | | 999,842 | |
| | Hitachi Transport System, Ltd. | | 50,500 | | | 866,096 | |
| | Hitachi Zosen Corp. | | 2,951,000 | | | 3,700,498 | |
| | Hokuetsu Industries Co., Ltd. | | 85,000 | | | 215,688 | |
| | Hokuriku Electrical Construction Co., Ltd. | | 56,000 | | | 148,922 | |
| | Hoshizaki Electric Co., Ltd. | | 123,200 | | | 2,890,310 | |
| | Hosokawa Micron Corp. | | 140,000 | | | 658,986 | |
| #* | | Howa Machinery, Ltd. | | 379,000 | | | 328,955 | |
| # | | Ichiken Co., Ltd. | | 87,000 | | | 143,685 | |
| | Ichinen Holdings Co., Ltd. | | 71,100 | | | 362,587 | |
| | Idec Corp. | | 137,000 | | | 1,442,224 | |
| | IHI Transport Machinery Co., Ltd. | | 73,000 | | | 416,565 | |
| # | | Iino Kaiun Kaisha, Ltd. | | 354,300 | | | 1,480,270 | |
| | Inaba Denki Sangyo Co., Ltd. | | 86,300 | | | 2,416,285 | |
| | Inaba Seisakusho Co., Ltd. | | 58,800 | | | 719,016 | |
| | Inabata & Co., Ltd. | | 317,300 | | | 1,895,513 | |
| | Inui Steamship Co., Ltd. | | 95,900 | | | 325,082 | |
| #* | | Iseki & Co., Ltd. | | 718,000 | | | 1,532,361 | |
| | Ishii Iron Works Co., Ltd. | | 110,000 | | | 204,789 | |
| #* | | Ishikawa Seisakusho, Ltd. | | 101,000 | | | 81,512 | |
12
The Japanese Small Company Series
continued
| | | | | Shares | | Value†† | |
| Industrials — (Continued) | | | | | | |
| | Ishikawajima Construction Materials Co., Ltd. | | 202,000 | | $ | 394,997 | |
| | Itoki Corp. | | 174,200 | | | 379,575 | |
| #* | | Iwasaki Electric Co., Ltd. | | 48,000 | | | 99,773 | |
| | Iwatani International Corp. | | 887,000 | | | 2,953,617 | |
| | Jalux, Inc. | | 40,800 | | | 382,653 | |
| # | | Jamco Corp. | | 80,000 | | | 440,919 | |
| | Japan Airport Terminal Co., Ltd. | | 163,900 | | | 2,132,893 | |
| # | | Japan Foundation Engineering Co., Ltd. | | 162,500 | | | 491,794 | |
| | Japan Kenzai Co., Ltd. | | 92,540 | | | 420,347 | |
| | Japan Pulp & Paper Co., Ltd. | | 464,000 | | | 1,625,243 | |
| | Japan Transcity Corp. | | 231,000 | | | 765,326 | |
| # | | JFE Shoji Holdings, Inc. | | 411,000 | | | 1,706,745 | |
| # | | Juki Corp. | | 370,000 | | | 831,832 | |
| | Kamei Corp. | | 153,000 | | | 1,452,135 | |
| | Kanaden Corp. | | 116,000 | | | 743,074 | |
| | Kanagawa Chuo Kotsu Co., Ltd. | | 192,000 | | | 1,034,818 | |
| | Kanamoto Co., Ltd. | | 112,000 | | | 875,832 | |
| | Kandenko Co., Ltd. | | 431,000 | | | 2,088,522 | |
| * | | Kanematsu Corp. | | 1,529,625 | | | 1,428,607 | |
| #* | | Kanematsu-NNK Corp. | | 113,000 | | | 223,597 | |
| | Katakura Industries Co., Ltd. | | 115,100 | | | 1,070,531 | |
| | Kato Works Co., Ltd. | | 287,000 | | | 841,218 | |
| | KAWADA TECHNOLOGIES, Inc. | | 102,600 | | | 1,347,930 | |
| | Kawagishi Bridge Works Co., Ltd. | | 38,000 | | | 90,152 | |
| | Kawasaki Kinkai Kisen Kaisha, Ltd. | | 99,000 | | | 247,617 | |
| * | | Kawasaki Kisen Kaisha, Ltd. | | 1,980,000 | | | 3,565,303 | |
| | Keihin Co., Ltd. (The) | | 199,000 | | | 227,245 | |
| #* | | KI HOLDINGS CO., LTD. | | 102,000 | | | 111,793 | |
| # | | Kimura Chemical Plants Co., Ltd. | | 59,900 | | | 232,972 | |
| * | | King Jim Co., Ltd. | | 4,800 | | | 35,232 | |
| | Kinki Sharyo Co., Ltd. | | 185,000 | | | 587,571 | |
| | Kintetsu World Express, Inc. | | 79,000 | | | 2,294,594 | |
| | Kitagawa Iron Works Co., Ltd. | | 335,000 | | | 572,370 | |
| | Kitano Construction Corp. | | 242,000 | | | 586,204 | |
| | Kitazawa Sangyo Co., Ltd. | | 54,500 | | | 109,486 | |
| | Kito Corp. | | 45 | | | 32,291 | |
| # | | Kitz Corp. | | 416,800 | | | 1,669,860 | |
| | Kodensha Co., Ltd. (The) | | 25,000 | | | 57,757 | |
| | Koike Sanso Kogyo Co., Ltd. | | 149,000 | | | 392,476 | |
| | Kokuyo Co., Ltd. | | 303,525 | | | 2,139,952 | |
| # | | KOMAIHALTEC, Inc. | | 167,000 | | | 390,696 | |
| | Komatsu Wall Industry Co., Ltd. | | 48,300 | | | 488,842 | |
| | Komori Corp. | | 407,800 | | | 2,731,486 | |
| | Kondotec, Inc. | | 81,000 | | | 517,866 | |
| #* | | Kosaido Co., Ltd. | | 356,100 | | | 905,408 | |
| | KRS Corp. | | 37,200 | | | 409,500 | |
| * | | Kumagai Gumi Co., Ltd. | | 583,800 | | | 521,506 | |
| | Kuroda Electric Co., Ltd. | | 115,400 | | | 1,243,613 | |
| | Kyodo Printing Co., Ltd. | | 540,000 | | | 1,260,955 | |
| # | | Kyoei Sangyo Co., Ltd. | | 97,000 | | | 180,171 | |
| | Kyokuto Boeki Kaisha, Ltd. | | 58,000 | | | 154,535 | |
| | Kyokuto Kaihatsu Kogyo Co., Ltd. | | 210,100 | | | 1,378,870 | |
| | Kyosan Electric Manufacturing Co., Ltd. | | 225,000 | | | 947,109 | |
| | Kyowa Exeo Corp. | | 335,600 | | | 3,163,585 | |
| | Kyudenko Corp. | | 204,000 | | | 1,245,462 | |
| * | | Lonseal Corp. | | 116,000 | | | 117,535 | |
| | Maeda Corp. | | 845,000 | | | 3,109,079 | |
| | Maeda Road Construction Co., Ltd. | | 289,000 | | | 3,033,462 | |
| * | | Maezawa Industries, Inc. | | 35,700 | | | 78,544 | |
| | Maezawa Kasei Industries Co., Ltd. | | 50,700 | | | 514,961 | |
| | Maezawa Kyuso Industries Co., Ltd. | | 50,400 | | | 690,548 | |
13
The Japanese Small Company Series
continued
| | | | | Shares | | Value†† | |
| Industrials — (Continued) | | | | | | |
| # | | Makino Milling Machine Co., Ltd. | | 436,000 | | $ | 2,675,776 | |
| * | | Marubeni Construction Material Lease Co., Ltd. | | 75,000 | | | 138,337 | |
| | Maruka Machinery Co., Ltd. | | 28,100 | | | 242,421 | |
| | Maruwn Corp. | | 66,000 | | | 164,319 | |
| # | | Maruyama Manufacturing Co., Inc. | | 150,000 | | | 327,347 | |
| | Maruzen Showa Unyu Co., Ltd. | | 306,000 | | | 984,824 | |
| # | | Matsuda Sangyo Co., Ltd. | | 80,682 | | | 1,231,623 | |
| | Matsui Construction Co., Ltd. | | 128,600 | | | 508,254 | |
| | Max Co., Ltd. | | 189,000 | | | 2,365,428 | |
| # | | Meidensha Corp. | | 773,050 | | | 2,592,071 | |
| | Meiji Shipping Co., Ltd. | | 105,700 | | | 297,631 | |
| | Meitec Corp. | | 137,300 | | | 2,646,410 | |
| | Meito Transportation Co., Ltd. | | 22,000 | | | 173,717 | |
| | Meiwa Trading Co., Ltd. | | 140,000 | | | 384,336 | |
| | Mesco, Inc. | | 30,000 | | | 246,586 | |
| | Minebea Co., Ltd. | | 50,000 | | | 208,252 | |
| | Mirait Holdings Corp. | | 274,685 | | | 2,063,865 | |
| | Mitani Corp. | | 53,100 | | | 624,319 | |
| # | | Mitsubishi Kakoki Kaisha, Ltd. | | 229,000 | | | 389,282 | |
| | Mitsubishi Pencil Co., Ltd. | | 104,500 | | | 1,883,374 | |
| * | | Mitsubishi Research Institute, Inc. | | 200 | | | 3,640 | |
| | Mitsuboshi Belting, Ltd. | | 287,000 | | | 1,471,437 | |
| * | | Mitsui Engineering & Shipbuilding Co., Ltd. | | 763,000 | | | 1,185,054 | |
| | Mitsui Matsushima Co., Ltd. | | 372,000 | | | 679,793 | |
| | Mitsui-Soko Co., Ltd. | | 485,000 | | | 1,823,797 | |
| | Mitsumura Printing Co., Ltd. | | 93,000 | | | 294,416 | |
| # | | Miura Co., Ltd. | | 137,600 | | | 3,875,611 | |
| * | | Miura Printing Corp. | | 18,000 | | | 17,855 | |
| * | | Miyachi Corp. | | 600 | | | 4,861 | |
| #* | | Miyaji Engineering Group, Inc. | | 1,349,175 | | | 2,401,556 | |
| #* | | Miyakoshi Holdings, Inc. | | 45,000 | | | 118,098 | |
| * | | Mori Denki Manufacturing Co., Ltd. | | 625,000 | | | 56,512 | |
| # | | Mori Seiki Co., Ltd. | | 428,400 | | | 3,782,860 | |
| | Morita Holdings Corp. | | 156,000 | | | 884,337 | |
| # | | Moshi Moshi Hotline, Inc. | | 217,300 | | | 2,046,243 | |
| | Mystar Engineering Corp. | | 15,600 | | | 82,123 | |
| # | | NAC CO., LTD. | | 25,400 | | | 478,959 | |
| | Nachi-Fujikoshi Corp. | | 704,000 | | | 3,105,133 | |
| * | | Nagase & Co., Ltd. | | 23,400 | | | 254,652 | |
| | Naikai Zosen Corp. | | 73,000 | | | 311,555 | |
| | Nakano Corp. | | 98,000 | | | 218,880 | |
| | Narasaki Sangyo Co., Ltd. | | 56,000 | | | 83,573 | |
| | NEC Capital Solutions, Ltd. | | 45,100 | | | 655,559 | |
| | NEC Networks & System Integration Corp. | | 109,600 | | | 1,597,016 | |
| | Nichias Corp. | | 436,000 | | | 2,405,116 | |
| | Nichiban Co., Ltd. | | 122,000 | | | 395,139 | |
| | Nichiden Corp. | | 3,400 | | | 111,823 | |
| | Nichiha Corp. | | 98,380 | | | 1,054,375 | |
| | Nichireki Co., Ltd. | | 96,000 | | | 452,435 | |
| | Nihon M&A Center, Inc. | | 150 | | | 782,795 | |
| * | | Nihon Trim Co., Ltd. | | 1,000 | | | 23,004 | |
| | Nikko Co., Ltd. | | 127,000 | | | 450,823 | |
| | Nippo Corp. | | 256,000 | | | 2,451,145 | |
| | Nippon Carbon Co., Ltd. | | 421,000 | | | 1,179,532 | |
| | Nippon Conveyor Co., Ltd. | | 168,000 | | | 169,145 | |
| | Nippon Densetsu Kogyo Co., Ltd. | | 191,000 | | | 1,841,411 | |
| | Nippon Denwa Shisetu Co., Ltd. | | 203,000 | | | 666,510 | |
| | Nippon Filcon Co., Ltd. | | 70,900 | | | 369,632 | |
| | Nippon Hume Corp. | | 112,000 | | | 415,417 | |
| | Nippon Jogesuido Sekkei Co., Ltd. | | 289 | | | 380,525 | |
| | Nippon Kanzai Co., Ltd. | | 43,000 | | | 778,532 | |
14
The Japanese Small Company Series
continued
| | | | | Shares | | Value†† | |
| Industrials — (Continued) | | | | | | |
| | Nippon Koei Co., Ltd. | | 272,000 | | $ | 980,395 | |
| | Nippon Konpo Unyu Soko Co., Ltd. | | 261,000 | | | 2,809,750 | |
| | Nippon Parking Development Co., Ltd. | | 3,089 | | | 142,118 | |
| | Nippon Road Co., Ltd. (The) | | 26,000 | | | 74,206 | |
| | Nippon Seisen Co., Ltd. | | 103,000 | | | 499,570 | |
| | Nippon Sharyo, Ltd. | | 291,000 | | | 1,112,937 | |
| | Nippon Shindo Co., Ltd. | | 8,000 | | | 10,783 | |
| | Nippon Signal Co., Ltd. | | 218,600 | | | 1,294,893 | |
| | Nippon Steel Trading Co., Ltd. | | 294,000 | | | 789,486 | |
| | Nippon Thompson Co., Ltd. | | 272,000 | | | 1,578,313 | |
| | Nippon Tungsten Co., Ltd. | | 80,000 | | | 151,689 | |
| # | | Nippon Yusoki Co., Ltd. | | 138,000 | | | 372,252 | |
| | Nishimatsu Construction Co., Ltd. | | 1,855,000 | | | 3,183,245 | |
| * | | Nishishiba Electric Co., Ltd. | | 101,000 | | | 151,795 | |
| | Nissei Corp. | | 104,600 | | | 921,884 | |
| | Nissei Plastic Industrial Co., Ltd. | | 374,100 | | | 1,669,725 | |
| # | | Nissha Printing Co., Ltd. | | 122,700 | | | 1,516,983 | |
| | Nisshinbo Holdings, Inc. | | 39,000 | | | 350,670 | |
| | Nissin Corp. | | 350,000 | | | 854,062 | |
| | Nissin Electric Co., Ltd. | | 193,000 | | | 1,077,030 | |
| | Nitchitsu Co., Ltd. | | 58,000 | | | 130,099 | |
| | Nitta Corp. | | 105,800 | | | 1,984,239 | |
| # | | Nitto Boseki Co., Ltd. | | 888,000 | | | 3,080,112 | |
| | Nitto Kogyo Corp. | | 149,000 | | | 1,709,711 | |
| # | | Nitto Kohki Co., Ltd. | | 67,900 | | | 1,539,317 | |
| | Nitto Seiko Co., Ltd. | | 122,000 | | | 322,417 | |
| # | | Nittoc Construction Co., Ltd. | | 316,000 | | | 409,613 | |
| | Noda Corp. | | 169,300 | | | 625,313 | |
| | Nomura Co., Ltd. | | 205,000 | | | 602,182 | |
| | Noritake Co., Ltd. | | 531,000 | | | 1,583,871 | |
| | Noritz Corp. | | 113,300 | | | 2,056,437 | |
| | NS United Kaiun Kaisha, Ltd. | | 470,000 | | | 704,209 | |
| * | | Oak Capital Corp. | | 53,135 | | | 76,700 | |
| | Obara Corp. | | 24,400 | | | 275,791 | |
| # | | Obayashi Road Corp. | | 175,000 | | | 419,195 | |
| | Oiles Corp. | | 123,842 | | | 2,338,961 | |
| * | | Okamoto Machine Tool Works, Ltd. | | 163,000 | | | 205,869 | |
| | Okamura Corp. | | 286,900 | | | 1,954,093 | |
| | Okano Valve Manufacturing Co., Ltd. | | 45,000 | | | 141,323 | |
| # | | Oki Electric Cable Co., Ltd. | | 90,000 | | | 171,301 | |
| * | | OKK Corp. | | 255,000 | | | 287,299 | |
| | OKUMA Corp. | | 586,000 | | | 3,731,709 | |
| | Okumura Corp. | | 754,400 | | | 3,091,459 | |
| | Onoken Co., Ltd. | | 58,900 | | | 478,031 | |
| | Organo Corp. | | 163,000 | | | 1,240,166 | |
| * | | Original Engineering Consultants Co., Ltd. | | 13,500 | | | 21,151 | |
| | OSG Corp. | | 289,400 | | | 3,638,305 | |
| | Oyo Corp. | | 100,900 | | | 1,163,520 | |
| | P.S. Mitsubishi Construction Co., Ltd. | | 76,800 | | | 221,185 | |
| | Park24 Co., Ltd. | | 208,300 | | | 2,755,091 | |
| # | | Pasco Corp. | | 62,000 | | | 219,114 | |
| | Pasona Group, Inc. | | 186 | | | 180,228 | |
| | Penta-Ocean Construction Co., Ltd. | | 1,087,500 | | | 3,324,341 | |
| | Pilot Corp. | | 763 | | | 1,481,175 | |
| | Pronexus, Inc. | | 133,200 | | | 666,493 | |
| | Raito Kogyo Co., Ltd. | | 193,700 | | | 1,060,037 | |
| * | | Rasa Industries, Ltd. | | 202,000 | | | 312,289 | |
| | Rheon Automatic Machinery Co., Ltd. | | 64,000 | | | 157,160 | |
| | Ryobi, Ltd. | | 575,200 | | | 2,100,336 | |
| * | | Sailor Pen Co., Ltd. | | 69,000 | | | 30,335 | |
| | Sakai Heavy Industries, Ltd. | | 183,000 | | | 315,345 | |
15
The Japanese Small Company Series
continued
| | | | | Shares | | Value†† | |
| Industrials — (Continued) | | | | | | |
| * | | Sakurada Co., Ltd. | | 57,000 | | $ | 14,106 | |
| #* | | Sanix, Inc. | | 135,300 | | | 380,346 | |
| | Sanki Engineering Co., Ltd. | | 340,000 | | | 1,771,909 | |
| # | | Sanko Metal Industrial Co., Ltd. | | 118,000 | | | 318,616 | |
| * | | Sankyo-Tateyama Holdings, Inc. | | 1,710,000 | | | 2,500,604 | |
| | Sankyu, Inc. | | 1,049,000 | | | 3,952,045 | |
| | Sanritsu Corp. | | 16,700 | | | 110,375 | |
| | Sanwa Holdings Corp. | | 859,000 | | | 2,563,700 | |
| | Sanyo Denki Co., Ltd. | | 210,000 | | | 1,069,343 | |
| | Sanyo Engineering & Construction, Inc. | | 48,000 | | | 161,437 | |
| | Sanyo Industries, Ltd. | | 77,000 | | | 146,619 | |
| # | | Sasebo Heavy Industries Co., Ltd. | | 573,000 | | | 927,738 | |
| * | | Sata Construction Co., Ltd. | | 12,000 | | | 9,338 | |
| | SATO HOLDINGS CORP. | | 109,300 | | | 1,352,917 | |
| | Sato Shoji Corp. | | 65,300 | | | 381,434 | |
| | Sawafuji Electric Co., Ltd. | | 42,000 | | | 121,378 | |
| | Secom Joshinetsu Co., Ltd. | | 33,900 | | | 1,015,071 | |
| | Seibu Electric Industry Co., Ltd. | | 67,000 | | | 302,441 | |
| | Seika Corp. | | 285,000 | | | 757,165 | |
| #* | | Seikitokyu Kogyo Co., Ltd. | | 307,000 | | | 182,964 | |
| | Seino Holdings Co., Ltd. | | 375,000 | | | 2,899,835 | |
| | Sekisui Jushi Co., Ltd. | | 142,000 | | | 1,431,758 | |
| # | | Senko Co., Ltd. | | 384,000 | | | 1,521,179 | |
| | Senshu Electric Co., Ltd. | | 37,300 | | | 456,229 | |
| | Shibusawa Warehouse Co., Ltd. | | 231,000 | | | 644,043 | |
| | Shibuya Kogyo Co., Ltd. | | 80,100 | | | 844,287 | |
| # | | Shima Seiki Manufacturing Co., Ltd. | | 115,300 | | | 1,959,337 | |
| | Shin Nippon Air Technologies Co., Ltd. | | 88,780 | | | 480,098 | |
| | Shin-Keisei Electric Railway Co., Ltd. | | 174,000 | | | 790,136 | |
| | Shin-Kobe Electric Machinery Co., Ltd. | | 102,000 | | | 2,257,020 | |
| | Shinmaywa Industries, Ltd. | | 418,000 | | | 1,671,583 | |
| | Shinnihon Corp. | | 194,800 | | | 520,435 | |
| | Shinsho Corp. | | 202,000 | | | 473,323 | |
| | Shinwa Co., Ltd. | | 1,800 | | | 19,789 | |
| # | | Sho-Bond Corp. | | 100,600 | | | 2,211,550 | |
| | Shoko Co., Ltd. | | 316,000 | | | 491,937 | |
| # | | Showa Aircraft Industry Co., Ltd. | | 112,000 | | | 639,836 | |
| # | | Sinfonia Technology Co., Ltd. | | 496,000 | | | 1,008,827 | |
| | Sintokogio, Ltd. | | 201,000 | | | 1,762,579 | |
| | Soda Nikka Co., Ltd. | | 67,000 | | | 295,752 | |
| # | | Sodick Co., Ltd. | | 81,800 | | | 398,646 | |
| | Sohgo Security Services Co., Ltd. | | 252,800 | | | 2,664,936 | |
| | Sotetsu Holdings, Inc. | | 554,000 | | | 1,697,363 | |
| | Space Co., Ltd. | | 73,420 | | | 451,843 | |
| | Subaru Enterprise Co., Ltd. | | 59,000 | | | 182,334 | |
| | Sugimoto & Co., Ltd. | | 34,100 | | | 307,578 | |
| | Sumikin Bussan Corp. | | 31,000 | | | 78,481 | |
| * | | Sumiseki Holdings, Inc. | | 107,100 | | | 91,381 | |
| | Sumitomo Densetsu Co., Ltd. | | 98,100 | | | 558,930 | |
| * | | Sumitomo Mitsui Construction Co., Ltd. | | 416,800 | | | 275,868 | |
| | Sumitomo Precision Products Co., Ltd. | | 156,000 | | | 957,932 | |
| | Sumitomo Warehouse Co., Ltd. | | 564,000 | | | 2,671,394 | |
| | Suzuki Metal Industry Co., Ltd. | | 71,000 | | | 136,109 | |
| * | | SWCC Showa Holdings Co., Ltd. | | 1,732,000 | | | 1,568,136 | |
| | Tadano, Ltd. | | 445,579 | | | 2,817,414 | |
| | Taihei Dengyo Kaisha, Ltd. | | 158,000 | | | 1,218,797 | |
| | Taihei Kogyo Co., Ltd. | | 256,000 | | | 1,362,138 | |
| | Taiheiyo Kouhatsu, Inc. | | 95,000 | | | 88,937 | |
| | Taikisha, Ltd. | | 131,000 | | | 2,794,318 | |
| | Takada Kiko Co., Ltd. | | 272,000 | | | 646,199 | |
| | Takano Co., Ltd. | | 51,100 | | | 302,580 | |
16
The Japanese Small Company Series
continued
| | | | | Shares | | Value†† | |
| Industrials — (Continued) | | | | | | |
| # | | Takaoka Electric Manufacturing Co., Ltd. | | 262,000 | | $ | 561,795 | |
| # | | Takara Printing Co., Ltd. | | 38,055 | | | 277,281 | |
| | Takara Standard Co., Ltd. | | 501,000 | | | 3,786,757 | |
| # | | Takasago Thermal Engineering Co., Ltd. | | 291,400 | | | 2,483,926 | |
| # | | Takashima & Co., Ltd. | | 137,000 | | | 334,396 | |
| | Takigami Steel Construction Co., Ltd. | | 50,000 | | | 142,860 | |
| | Takisawa Machine Tool Co., Ltd. | | 191,000 | | | 252,105 | |
| #* | | Takuma Co., Ltd. | | 316,000 | | | 1,297,788 | |
| | Tanseisha Co., Ltd. | | 74,000 | | | 182,690 | |
| # | | Tatsuta Electric Wire & Cable Co., Ltd. | | 215,000 | | | 910,162 | |
| | TECHNO ASSOCIE Co., Ltd. | | 58,400 | | | 492,048 | |
| | Techno Ryowa, Ltd. | | 71,390 | | | 374,052 | |
| | Teikoku Electric Manufacturing Co., Ltd. | | 31,800 | | | 567,844 | |
| | Tekken Corp. | | 763,000 | | | 861,835 | |
| # | | Temp Holdings Co., Ltd. | | 48,600 | | | 437,509 | |
| | Teraoka Seisakusho Co., Ltd. | | 53,600 | | | 242,167 | |
| | TOA Corp. | | 780,000 | | | 1,314,061 | |
| # | | TOA ROAD Corp. | | 155,000 | | | 294,062 | |
| #* | | Tobishima Corp. | | 347,400 | | | 320,944 | |
| | Tocalo Co., Ltd. | | 57,100 | | | 1,204,226 | |
| | Toda Corp. | | 865,000 | | | 3,149,723 | |
| | Toenec Corp. | | 212,000 | | | 1,146,805 | |
| # | | TOKAI Holdings Corp. | | 214,000 | | | 1,063,576 | |
| | Tokai Lease Co., Ltd. | | 92,000 | | | 194,967 | |
| # | | Toko Electric Corp. | | 76,000 | | | 282,164 | |
| | Tokyo Energy & Systems, Inc. | | 143,000 | | | 740,966 | |
| # | | TOKYO KEIKI, Inc. | | 265,000 | | | 451,873 | |
| #* | | Tokyo Kikai Seisakusho, Ltd. | | 300,000 | | | 179,667 | |
| | Tokyo Sangyo Co., Ltd. | | 78,000 | | | 245,758 | |
| | Tokyu Community Corp. | | 32,600 | | | 1,015,715 | |
| | Tokyu Construction Co., Ltd. | | 33,650 | | | 81,155 | |
| | Toli Corp. | | 236,000 | | | 428,616 | |
| # | | Tomoe Corp. | | 115,500 | | | 420,979 | |
| | Tomoe Engineering Co., Ltd. | | 9,300 | | | 166,747 | |
| | Tonami Holdings Co., Ltd. | | 331,000 | | | 731,210 | |
| | Toppan Forms Co., Ltd. | | 202,900 | | | 1,542,311 | |
| | Torishima Pump Manufacturing Co., Ltd. | | 85,800 | | | 1,098,079 | |
| | Toshiba Machine Co., Ltd. | | 440,000 | | | 2,215,833 | |
| | TOSHIBA PLANT SYSTEMS & SERVICES CORP. | | 191,450 | | | 1,935,969 | |
| | Tosho Printing Co., Ltd. | | 243,000 | | | 408,902 | |
| | Totetsu Kogyo Co., Ltd. | | 122,000 | | | 1,049,496 | |
| #* | | Totoku Electric Co., Ltd. | | 61,000 | | | 56,686 | |
| # | | Toyo Construction Co., Ltd. | | 600,000 | | | 544,661 | |
| | Toyo Electric Manufacturing Co., Ltd. | | 159,000 | | | 614,528 | |
| | Toyo Engineering Corp. | | 581,400 | | | 2,075,473 | |
| # | | Toyo Machinery & Metal Co., Ltd. | | 42,400 | | | 104,295 | |
| | Toyo Tanso Co., Ltd. | | 45,000 | | | 1,847,254 | |
| # | | Toyo Wharf & Warehouse Co., Ltd. | | 274,000 | | | 444,147 | |
| * | | Trancom Co., Ltd. | | 4,700 | | | 89,052 | |
| | Trinity Industrial Corp. | | 56,000 | | | 198,671 | |
| | Trusco Nakayama Corp. | | 98,900 | | | 1,800,181 | |
| | Tsubakimoto Chain Co. | | 584,700 | | | 3,013,524 | |
| | Tsubakimoto Kogyo Co., Ltd. | | 97,000 | | | 261,059 | |
| #* | | Tsudakoma Corp. | | 27,000 | | | 61,928 | |
| # | | Tsugami Corp. | | 267,000 | | | 1,851,185 | |
| | Tsukishima Kikai Co., Ltd. | | 127,000 | | | 1,039,772 | |
| | Tsurumi Manufacturing Co., Ltd. | | 94,000 | | | 693,867 | |
| # | | Tsuzuki Denki Co., Ltd. | | 75,000 | | | 803,501 | |
| | TTK Co., Ltd. | | 62,000 | | | 308,273 | |
| | Uchida Yoko Co., Ltd. | | 331,000 | | | 905,451 | |
| # | | Ueki Corp. | | 430,000 | | | 967,143 | |
17
The Japanese Small Company Series
continued
| | | | | Shares | | Value†† | |
| Industrials — (Continued) | | | | | | |
| | Union Tool Co. | | 59,400 | | $ | 1,025,686 | |
| | Utoc Corp. | | 92,900 | | | 295,757 | |
| #* | | Wakachiku Construction Co., Ltd. | | 1,204,000 | | | 1,630,626 | |
| # | | Weathernews, Inc. | | 26,700 | | | 734,835 | |
| | Yahagi Construction Co., Ltd. | | 141,500 | | | 699,094 | |
| | Yamabiko Corp. | | 28,782 | | | 324,173 | |
| | Yamato Corp. | | 82,000 | | | 322,439 | |
| | Yamaura Corp. | | 40,500 | | | 117,899 | |
| | Yamazen Co., Ltd. | | 305,500 | | | 2,232,787 | |
| | Yasuda Warehouse Co., Ltd. (The) | | 95,800 | | | 593,003 | |
| | Yokogawa Bridge Holdings Corp. | | 139,400 | | | 912,765 | |
| | Yondenko Corp. | | 132,800 | | | 576,075 | |
| | Yuasa Trading Co., Ltd. | | 810,000 | | | 1,188,133 | |
| | Yuken Kogyo Co., Ltd. | | 156,000 | | | 317,737 | |
| | Yurtec Corp. | | 256,000 | | | 1,275,995 | |
| | Yusen Logistics Co., Ltd. | | 69,000 | | | 883,930 | |
| | Yushin Precision Equipment Co., Ltd. | | 55,934 | | | 1,045,348 | |
| Total Industrials | | | | | 416,976,747 | |
| | | |
| Information Technology — (9.8%) | | | | | | |
| | A&D Co., Ltd. | | 30,600 | | | 103,504 | |
| | Ai Holdings Corp. | | 182,600 | | | 784,382 | |
| # | | Aichi Tokei Denki Co., Ltd. | | 113,000 | | | 401,356 | |
| | Aiphone Co., Ltd. | | 70,900 | | | 1,347,855 | |
| # | | ALLIED TELESIS HOLDINGS K.K. | | 470,700 | | | 414,571 | |
| | Alpha Systems, Inc. | | 27,300 | | | 417,446 | |
| | Alps Electric Co., Ltd. | | 490,200 | | | 3,356,157 | |
| # | | Anritsu Corp. | | 458,000 | | | 5,029,089 | |
| # | | AOI Electronic Co., Ltd. | | 35,200 | | | 461,282 | |
| * | | Apic Yamada Corp. | | 31,000 | | | 50,310 | |
| * | | Argo Graphics, Inc. | | 100 | | | 1,302 | |
| | Arisawa Manufacturing Co., Ltd. | | 79,300 | | | 293,387 | |
| | Asahi Net, Inc. | | 34,000 | | | 158,518 | |
| * | | Axell Corp. | | 3,300 | | | 66,407 | |
| | CAC Corp. | | 62,700 | | | 513,206 | |
| | Canon Electronics, Inc. | | 82,100 | | | 2,054,240 | |
| | Capcom Co., Ltd. | | 205,600 | | | 4,861,819 | |
| | Chino Corp. | | 151,000 | | | 375,913 | |
| * | | CMK Corp. | | 263,200 | | | 833,484 | |
| | Computer Engineering & Consulting, Ltd. | | 61,500 | | | 294,223 | |
| | Core Corp. | | 45,700 | | | 405,049 | |
| | Cresco, Ltd. | | 23,200 | | | 191,857 | |
| | Cybernet Systems Co., Ltd. | | 85 | | | 21,125 | |
| # | | Cybozu, Inc. | | 1,221 | | | 396,047 | |
| * | | Daiko Denshi Tsushin, Ltd. | | 12,000 | | | 31,908 | |
| | Daito Electron Co., Ltd. | | 5,900 | | | 32,200 | |
| | Daiwabo Holdings Co., Ltd. | | 685,000 | | | 1,557,494 | |
| | Denki Kogyo Co., Ltd. | | 255,000 | | | 1,106,375 | |
| # | | DKK TOA Corp. | | 31,000 | | | 104,142 | |
| | DTS Corp. | | 89,600 | | | 1,039,320 | |
| # | | Dwango Co., Ltd. | | 436 | | | 714,235 | |
| # | | eAccess, Ltd. | | 7,290 | | | 1,728,983 | |
| | Eizo Nanao Corp. | | 76,800 | | | 1,568,942 | |
| # | | Elematec Corp. | | 26,800 | | | 445,270 | |
| * | | Elna Co., Ltd. | | 92,000 | | | 90,357 | |
| #* | | Elpida Memory, Inc. | | 463,600 | | | 2,144,886 | |
| # | | Enplas Corp. | | 32,000 | | | 662,346 | |
| | ESPEC Corp. | | 82,200 | | | 493,486 | |
| | Excel Co., Ltd. | | 1,700 | | | 16,898 | |
| | Faith, Inc. | | 1,831 | | | 192,343 | |
| #* | | FDK Corp. | | 431,000 | | | 435,556 | |
18
THE JAPANESE SMALL COMPANY SERIES
CONTINUED
| | | | | Shares | | Value†† | |
| Information Technology — (Continued) | | | | | | |
| | Fuji Electronics Co., Ltd. | | 16,200 | | $ | 229,926 | |
| # | | Fuji Soft, Inc. | | 100,600 | | | 1,802,919 | |
| * | | Fujitsu Component, Ltd. | | 139 | | | 48,558 | |
| | Fujitsu Frontech, Ltd. | | 77,500 | | | 508,428 | |
| | Future Architect, Inc. | | 1,172 | | | 457,746 | |
| # | | GMO Internet, Inc. | | 252,400 | | | 962,877 | |
| | | Hakuto Co., Ltd. | | 73,700 | | | 715,431 | |
| | Hioki EE Corp. | | 12,300 | | | 213,414 | |
| | Hitachi Kokusai Electric, Inc. | | 249,500 | | | 2,019,484 | |
| | Hochiki Corp. | | 97,000 | | | 494,939 | |
| | Hokuriku Electric Industry Co., Ltd. | | 299,000 | | | 426,787 | |
| | Horiba, Ltd. | | 160,950 | | | 4,828,595 | |
| | Hosiden Corp. | | 262,900 | | | 1,751,094 | |
| | Icom, Inc. | | 49,700 | | | 1,270,985 | |
| #* | | Ikegami Tsushinki Co., Ltd. | | 174,000 | | | 110,765 | |
| | Ines Corp. | | 202,300 | | | 1,422,089 | |
| | I-Net Corp. | | 47,800 | | | 287,277 | |
| | Information Services International-Dentsu, Ltd. | | 76,700 | | | 758,971 | |
| | Innotech Corp. | | 18,200 | | | 120,506 | |
| # | | Internet Initiative Japan, Inc. | | 485 | | | 1,741,351 | |
| #* | | Ishii Hyoki Co., Ltd. | | 23,700 | | | 80,724 | |
| | IT Holdings Corp. | | 357,401 | | | 4,278,832 | |
| | ITC Networks Corp. | | 51,000 | | | 323,847 | |
| | ITFOR, Inc. | | 20,500 | | | 70,337 | |
| | Iwatsu Electric Co., Ltd. | | 309,000 | | | 276,961 | |
| | Japan Aviation Electronics Industry, Ltd. | | 252,600 | | | 1,737,367 | |
| # | | Japan Cash Machine Co., Ltd. | | 79,315 | | | 588,290 | |
| | Japan Digital Laboratory Co., Ltd. | | 109,700 | | | 1,082,080 | |
| | Japan Radio Co., Ltd. | | 81,000 | | | 183,835 | |
| # | | Jastec Co., Ltd. | | 61,400 | | | 346,647 | |
| | JBCC Holdings, Inc. | | 73,200 | | | 492,802 | |
| | JBIS Holdings, Inc. | | 79,600 | | | 243,516 | |
| | JFE Systems, Inc. | | 174 | | | 154,512 | |
| | JIEC Co., Ltd. | | 199 | | | 224,747 | |
| | Kaga Electronics Co., Ltd. | | 100,400 | | | 1,047,321 | |
| | Kanematsu Electronics, Ltd. | | 83,100 | | | 858,457 | |
| | Koa Corp. | | 151,600 | | | 1,330,875 | |
| #* | | Kubotek Corp. | | 370 | | | 103,938 | |
| | Kyoden Co., Ltd. | | 156,900 | | | 227,973 | |
| | Kyowa Electronic Instruments Co., Ltd. | | 52,000 | | | 154,535 | |
| | Macnica, Inc. | | 50,100 | | | 1,150,800 | |
| # | | Macromill, Inc. | | 83,100 | | | 840,988 | |
| | Marubun Corp. | | 98,500 | | | 402,576 | |
| # | | Maruwa Co., Ltd. | | 38,400 | | | 1,766,840 | |
| # | | Megachips Corp. | | 84,800 | | | 1,408,119 | |
| * | | Meisei Electric Co., Ltd. | | 305,000 | | | 334,657 | |
| | Melco Holdings, Inc. | | 49,600 | | | 1,339,500 | |
| | Mimasu Semiconductor Industry Co., Ltd. | | 86,881 | | | 723,008 | |
| | Miroku Jyoho Service Co., Ltd. | | 105,000 | | | 328,509 | |
| | Mitsui High-Tec, Inc. | | 131,600 | | | 556,086 | |
| | Mitsui Knowledge Industry Co., Ltd. | | 3,643 | | | 664,480 | |
| | Mitsumi Electric Co., Ltd. | | 328,500 | | | 2,432,831 | |
| * | | Moritex Corp. | | 7,700 | | | 31,829 | |
| # | | Mutoh Holdings Co., Ltd. | | 160,000 | | | 429,456 | |
| * | | Nagano Japan Radio Co., Ltd. | | 83,000 | | | 110,714 | |
| | Nagano Keiki Co., Ltd. | | 2,800 | | | 28,074 | |
| | Nakayo Telecommunications, Inc. | | 541,000 | | | 1,734,179 | |
| | NEC Fielding, Ltd. | | 95,000 | | | 1,221,843 | |
| | NEC Mobiling, Ltd. | | 46,800 | | | 1,565,633 | |
| | Net One Systems Co., Ltd. | | 1,984 | | | 5,400,355 | |
| * | | New Japan Radio Co., Ltd. | | 37,000 | | | 52,789 | |
19
THE JAPANESE SMALL COMPANY SERIES
CONTINUED
| | | | | Shares | | Value†† | |
| Information Technology — (Continued) | | | | | | |
| # | | Nichicon Corp. | | 270,300 | | $ | 2,707,716 | |
| | Nidec Copal Electronics Corp. | | 38,700 | | | 230,264 | |
| # | | Nidec Sankyo Corp. | | 191,000 | | | 1,210,858 | |
| | NIFTY Corp. | | 250 | | | 276,155 | |
| | Nihon Dempa Kogyo Co., Ltd. | | 71,100 | | | 847,968 | |
| #* | | Nihon Inter Electronics Corp. | | 104,700 | | | 132,882 | |
| | Nihon Unisys, Ltd. | | 240,875 | | | 1,529,724 | |
| * | | Nippon Avionics Co., Ltd. | | 78,000 | | | 103,374 | |
| # | | Nippon Ceramic Co., Ltd. | | 86,600 | | | 1,607,790 | |
| # | | Nippon Chemi-Con Corp. | | 604,000 | | | 2,033,593 | |
| | Nippon Systemware Co., Ltd. | | 27,900 | | | 110,726 | |
| | Nohmi Bosai, Ltd. | | 123,000 | | | 766,873 | |
| | NS Solutions Corp. | | 79,400 | | | 1,572,308 | |
| | NSD Co., Ltd. | | 170,300 | | | 1,331,889 | |
| | Obic Business Consultants Co., Ltd. | | 21,900 | | | 1,021,558 | |
| | Okaya Electric Industries Co., Ltd. | | 73,000 | | | 318,643 | |
| * | | Oki Electric Industry Co., Ltd. | | 2,681,000 | | | 2,395,262 | |
| * | | ONO Sokki Co., Ltd. | | 103,000 | | | 284,473 | |
| | Optex Co., Ltd. | | 21,600 | | | 282,773 | |
| | Origin Electric Co., Ltd. | | 105,000 | | | 309,487 | |
| | Osaki Electric Co., Ltd. | | 126,000 | | | 1,199,206 | |
| | Panasonic Electric Works Information Systems Co., Ltd. | | 13,600 | | | 349,715 | |
| # | | Panasonic Electric Works SUNX Co., Ltd. | | 109,000 | | | 530,515 | |
| | PCA Corp. | | 17,500 | | | 189,346 | |
| #* | | Pixela Corp. | | 18,400 | | | 40,930 | |
| | Riken Keiki Co., Ltd. | | 77,500 | | | 562,385 | |
| | Riso Kagaku Corp. | | 48,900 | | | 697,205 | |
| | Roland DG Corp. | | 54,400 | | | 602,872 | |
| | Ryoden Trading Co., Ltd. | | 141,000 | | | 801,539 | |
| | Ryosan Co., Ltd. | | 140,600 | | | 2,973,076 | |
| | Ryoyo Electro Corp. | | 113,200 | | | 1,253,821 | |
| | Sanken Electric Co., Ltd. | | 496,000 | | | 1,551,000 | |
| | Sanko Co., Ltd. | | 21,000 | | | 52,620 | |
| | Sanshin Electronics Co., Ltd. | | 139,500 | | | 1,154,522 | |
| | Satori Electric Co., Ltd. | | 79,080 | | | 473,223 | |
| | Saxa Holdings, Inc. | | 307,000 | | | 433,162 | |
| # | | SCSK Corp. | | 214,863 | | | 3,430,034 | |
| # | | Shibaura Mechatronics Corp. | | 142,000 | | | 354,838 | |
| | Shindengen Electric Manufacturing Co., Ltd. | | 311,000 | | | 1,299,700 | |
| # | | Shinkawa, Ltd. | | 68,300 | | | 310,507 | |
| # | | Shinko Electric Industries Co., Ltd. | | 309,200 | | | 2,096,472 | |
| | Shinko Shoji Co., Ltd. | | 81,400 | | | 645,224 | |
| | Shizuki Electric Co., Inc. | | 103,000 | | | 374,006 | |
| # | | Siix Corp. | | 79,500 | | | 1,008,093 | |
| # | | Simplex Holdings, Inc. | | 1,082 | | | 348,941 | |
| # | | SMK Corp. | | 290,000 | | | 934,032 | |
| | Softbank Technology Corp. | | 100 | | | 770 | |
| | So-net Entertainment Corp. | | 504 | | | 1,831,078 | |
| | Soshin Electric Co., Ltd. | | 4,600 | | | 18,994 | |
| | SRA Holdings, Inc. | | 49,700 | | | 509,022 | |
| | Star Micronics Co., Ltd. | | 180,700 | | | 1,627,203 | |
| # | | Sumida Corp. | | 61,549 | | | 407,542 | |
| | Sun-Wa Technos Corp. | | 3,900 | | | 35,268 | |
| # | | Systena Corp. | | 1,096 | | | 754,360 | |
| | Tachibana Eletech Co., Ltd. | | 62,400 | | | 577,818 | |
| # | | Taiyo Yuden Co., Ltd. | | 467,300 | | | 3,475,194 | |
| # | | Tamura Corp. | | 280,000 | | | 667,567 | |
| * | | Teac Corp. | | 332,000 | | | 116,451 | |
| # | | Tecmo Koei Holdings Co., Ltd. | | 150,730 | | | 1,238,429 | |
| | Teikoku Tsushin Kogyo Co., Ltd. | | 172,000 | | | 270,082 | |
| | TKC Corp. | | 86,800 | | | 1,798,788 | |
20
THE JAPANESE SMALL COMPANY SERIES
CONTINUED
| | | | | Shares | | Value†† | |
| Information Technology — (Continued) | | | | | | |
| #* | | Toko, Inc. | | 334,000 | | $ | 571,366 | |
| | Tokyo Denpa Co., Ltd. | | 24,900 | | | 114,979 | |
| # | | Tokyo Electron Device, Ltd. | | 342 | | | 605,253 | |
| | Tokyo Seimitsu Co., Ltd. | | 161,000 | | | 3,051,138 | |
| # | | Tomen Devices Corp. | | 2,000 | | | 43,550 | |
| | Tomen Electronics Corp. | | 50,600 | | | 611,184 | |
| # | | Topcon Corp. | | 254,800 | | | 1,168,801 | |
| | Tose Co., Ltd. | | 22,100 | | | 144,559 | |
| | Toshiba TEC Corp. | | 540,000 | | | 1,915,492 | |
| # | | Toukei Computer Co., Ltd. | | 26,810 | | | 358,715 | |
| | Towa Corp. | | 70,900 | | | 377,940 | |
| | Toyo Corp. | | 116,900 | | | 1,229,066 | |
| | Transcosmos, Inc. | | 122,300 | | | 1,456,907 | |
| * | | UKC Holdings Corp. | | 2,100 | | | 19,813 | |
| * | | Ulvac, Inc. | | 180,700 | | | 2,207,117 | |
| | Uniden Corp. | | 377,000 | | | 1,257,708 | |
| # | | Wacom Co., Ltd. | | 1,580 | | | 2,396,261 | |
| | XNET Corp. | | 21 | | | 30,836 | |
| | Y. A. C. Co., Ltd. | | 34,100 | | | 269,835 | |
| * | | Yamaichi Electronics Co., Ltd. | | 75,700 | | | 166,056 | |
| * | | Yaskawa Information Systems Corp. | | 40,000 | | | 88,180 | |
| | Yokowo Co., Ltd. | | 69,500 | | | 322,147 | |
| # | | Zuken, Inc. | | 94,600 | | | 651,740 | |
| Total Information Technology | | | | | 166,828,783 | |
| | | |
| Materials — (10.2%) | | | | | | |
| | Achilles Corp. | | 703,000 | | | 956,632 | |
| | Adeka Corp. | | 364,400 | | | 3,567,982 | |
| | Agro-Kanesho Co., Ltd. | | 14,000 | | | 66,559 | |
| | Aichi Steel Corp. | | 450,000 | | | 2,298,981 | |
| | Alconix Corp. | | 10,800 | | | 211,326 | |
| | Arakawa Chemical Industries, Ltd. | | 67,700 | | | 596,141 | |
| | Araya Industrial Co., Ltd. | | 276,000 | | | 429,572 | |
| | Asahi Organic Chemicals Industry Co., Ltd. | | 343,000 | | | 909,288 | |
| | Chuetsu Pulp & Paper Co., Ltd. | | 568,000 | | | 957,813 | |
| * | | Chugai Mining Co., Ltd. | | 852,400 | | | 166,096 | |
| | Chugoku Marine Paints, Ltd. | | 249,000 | | | 1,538,153 | |
| #* | | Chugokukogyo Co., Ltd. | | 62,000 | | | 68,054 | |
| | Chuo Denki Kogyo Co., Ltd. | | 90,000 | | | 468,160 | |
| #* | | Co-Op Chemical Co., Ltd. | | 159,000 | | | 216,210 | |
| # | | Dai Nippon Toryo, Ltd. | | 518,000 | | | 543,101 | |
| # | | Daiichi Kigenso Kagaku-Kyogyo Co., Ltd. | | 14,300 | | | 566,700 | |
| | Daiichi Kogyo Seiyaku Co., Ltd. | | 121,000 | | | 338,666 | |
| | Daiken Corp. | | 401,000 | | | 1,201,556 | |
| #* | | Daiki Aluminium Industry Co., Ltd. | | 51,000 | | | 208,797 | |
| | Dainichiseika Colour & Chemicals Manufacturing Co., Ltd. | | 319,000 | | | 1,378,392 | |
| # | | Daio Paper Corp. | | 314,500 | | | 2,196,959 | |
| | Daiso Co., Ltd. | | 355,000 | | | 1,104,305 | |
| | DC Co., Ltd. | | 113,900 | | | 316,318 | |
| | Dynapac Co., Ltd. | | 25,000 | | | 66,943 | |
| | Earth Chemical Co., Ltd. | | 50,300 | | | 1,853,140 | |
| | Ebara-Udylite Co., Ltd. | | 2,700 | | | 68,368 | |
| | FP Corp. | | 61,200 | | | 3,965,084 | |
| | Fuji Seal International, Inc. | | 80,400 | | | 1,449,793 | |
| | Fujikura Kasei Co., Ltd. | | 96,500 | | | 460,420 | |
| | Fujimi, Inc. | | 25,000 | | | 283,082 | |
| * | | Fujimori Kogyo Co., Ltd. | | 500 | | | 6,897 | |
| # | | Fumakilla, Ltd. | | 85,000 | | | 326,641 | |
| # | | Furukawa-Sky Aluminum Corp. | | 321,000 | | | 795,058 | |
| | Geostar Corp. | | 38,000 | | | 85,350 | |
| | Godo Steel, Ltd. | | 899,000 | | | 2,225,634 | |
21
THE JAPANESE SMALL COMPANY SERIES
CONTINUED
| | | | | Shares | | Value†† | |
| Materials — (Continued) | | | | | | |
| | Gun Ei Chemical Industry Co., Ltd. | | 347,000 | | $ | 897,748 | |
| | Harima Chemicals, Inc. | | 73,300 | | | 573,497 | |
| # | | Hodogaya Chemical Co., Ltd. | | 265,000 | | | 826,726 | |
| | Hokkan Holdings, Ltd. | | 283,000 | | | 808,654 | |
| | Hokko Chemical Industry Co., Ltd. | | 90,000 | | | 260,077 | |
| # | | Hokuetsu Kishu Paper Co., Ltd. | | 862,199 | | | 5,789,984 | |
| * | | Hokushin Co., Ltd. | | 61,400 | | | 120,392 | |
| | Honshu Chemical Industry Co., Ltd. | | 35,000 | | | 237,940 | |
| | Ihara Chemical Industry Co., Ltd. | | 155,000 | | | 570,165 | |
| # | | Ise Chemical Corp. | | 83,000 | | | 443,004 | |
| #* | | Ishihara Sangyo Kaisha, Ltd. | | 1,374,500 | | | 1,588,697 | |
| | Japan Carlit Co., Ltd. | | 59,800 | | | 307,709 | |
| | Japan Pure Chemical Co., Ltd. | | 7 | | | 18,622 | |
| | JSP Corp. | | 103,900 | | | 1,635,667 | |
| # | | Kanto Denka Kogyo Co., Ltd. | | 195,000 | | | 714,014 | |
| * | | Katakura Chikkarin Co., Ltd. | | 43,000 | | | 107,956 | |
| | Kawakin Holdings Co., Ltd. | | 11,000 | | | 33,463 | |
| | Kawasaki Kasei Chemicals, Ltd. | | 121,000 | | | 160,654 | |
| | Koatsu Gas Kogyo Co., Ltd. | | 163,493 | | | 993,522 | |
| | Kohsoku Corp. | | 61,900 | | | 508,489 | |
| | Konishi Co., Ltd. | | 66,900 | | | 914,639 | |
| # | | Kumiai Chemical Industry Co., Ltd. | | 233,000 | | | 873,902 | |
| | Kureha Corp. | | 573,500 | | | 2,842,958 | |
| * | | Kurimoto, Ltd. | | 702,000 | | | 1,454,489 | |
| | Kurosaki Harima Corp. | | 221,000 | | | 669,257 | |
| | Kyoei Steel, Ltd. | | 63,700 | | | 1,176,930 | |
| | Kyowa Leather Cloth Co., Ltd. | | 71,700 | | | 263,249 | |
| | Lintec Corp. | | 50,200 | | | 908,442 | |
| | MEC Co., Ltd. | | 61,200 | | | 213,896 | |
| * | | Mitsubishi Paper Mills, Ltd. | | 1,159,000 | | | 1,052,113 | |
| | Mitsubishi Steel Manufacturing Co., Ltd. | | 554,000 | | | 1,389,763 | |
| | Mitsui Mining & Smelting Co., Ltd. | | 256,000 | | | 658,281 | |
| | Mory Industries, Inc. | | 154,000 | | | 512,520 | |
| | Nakabayashi Co., Ltd. | | 181,000 | | | 443,327 | |
| * | | Nakayama Steel Works, Ltd. | | 639,000 | | | 579,643 | |
| | Neturen Co., Ltd. | | 152,800 | | | 1,139,674 | |
| | Nichia Steel Works, Ltd. | | 175,900 | | | 443,400 | |
| | Nihon Kagaku Sangyo Co., Ltd. | | 78,000 | | | 551,192 | |
| | Nihon Nohyaku Co., Ltd. | | 225,000 | | | 924,172 | |
| | Nihon Parkerizing Co., Ltd. | | 240,000 | | | 2,870,591 | |
| | Nihon Seiko Co., Ltd. | | 18,000 | | | 59,673 | |
| | Nihon Yamamura Glass Co., Ltd. | | 490,000 | | | 1,226,897 | |
| # | | Nippon Carbide Industries Co., Inc. | | 209,000 | | | 303,077 | |
| # | | Nippon Chemical Industrial Co., Ltd. | | 281,000 | | | 466,054 | |
| # | | Nippon Chutetsukan K.K. | | 50,000 | | | 98,432 | |
| # | | Nippon Chuzo K.K. | | 111,000 | | | 180,965 | |
| | Nippon Coke & Engineering Co., Ltd. | | 863,000 | | | 1,106,791 | |
| # | | Nippon Concrete Industries Co., Ltd. | | 180,000 | | | 396,618 | |
| | Nippon Denko Co., Ltd. | | 394,000 | | | 1,771,207 | |
| | Nippon Fine Chemical Co., Ltd. | | 85,600 | | | 567,467 | |
| # | | Nippon Kasei Chemical Co., Ltd. | | 309,000 | | | 529,512 | |
| #* | | Nippon Kinzoku Co., Ltd. | | 222,000 | | | 400,549 | |
| | Nippon Koshuha Steel Co., Ltd. | | 366,000 | | | 403,178 | |
| | Nippon Light Metal Co., Ltd. | | 2,138,000 | | | 2,823,901 | |
| #* | | Nippon Metal Industry Co., Ltd. | | 556,000 | | | 454,251 | |
| | Nippon Paint Co., Ltd. | | 5,200 | | | 35,915 | |
| | Nippon Pigment Co., Ltd. | | 43,000 | | | 102,594 | |
| | Nippon Pillar Packing Co., Ltd. | | 83,000 | | | 606,177 | |
| | Nippon Soda Co., Ltd. | | 557,000 | | | 2,509,833 | |
| | Nippon Synthetic Chemical Industry Co., Ltd. (The) | | 256,000 | | | 1,466,612 | |
| # | | Nippon Valqua Industries, Ltd. | | 328,000 | | | 847,336 | |
22
THE JAPANESE SMALL COMPANY SERIES
CONTINUED
| | | | | Shares | | Value†† | |
| Materials — (Continued) | | | | | | |
| #* | | Nippon Yakin Kogyo Co., Ltd. | | 509,500 | | $ | 799,160 | |
| * | | Nisshin Steel Co., Ltd. | | 209,000 | | | 319,779 | |
| | Nittetsu Mining Co., Ltd. | | 375,000 | | | 1,483,160 | |
| | Nitto FC Co., Ltd. | | 72,000 | | | 432,656 | |
| # | | NOF Corp. | | 726,000 | | | 3,699,516 | |
| | Ohara, Inc. | | 3,100 | | | 31,853 | |
| | Okabe Co., Ltd. | | 186,900 | | | 929,038 | |
| | Okamoto Industries, Inc. | | 400,000 | | | 1,532,557 | |
| | Okura Industrial Co., Ltd. | | 305,000 | | | 936,901 | |
| | Osaka Organic Chemical Industry, Ltd. | | 66,000 | | | 336,428 | |
| | Osaka Steel Co., Ltd. | | 77,700 | | | 1,488,897 | |
| | Pacific Metals Co., Ltd. | | 614,000 | | | 2,967,610 | |
| # | | Pack Corp. (The) | | 66,200 | | | 958,465 | |
| | Riken Technos Corp. | | 197,000 | | | 555,299 | |
| * | | S Science Co., Ltd. | | 2,704,000 | | | 105,130 | |
| # | | S.T. Chemical Co., Ltd. | | 77,000 | | | 970,727 | |
| | Sakai Chemical Industry Co., Ltd. | | 401,000 | | | 1,472,701 | |
| | Sakata INX Corp. | | 196,000 | | | 880,568 | |
| | Sanyo Chemical Industries, Ltd. | | 305,000 | | | 1,990,079 | |
| | Sanyo Special Steel Co., Ltd. | | 480,300 | | | 2,538,171 | |
| | Sekisui Plastics Co., Ltd. | | 209,000 | | | 799,577 | |
| | Shikoku Chemicals Corp. | | 184,000 | | | 979,921 | |
| | Shinagawa Refractories Co., Ltd. | | 224,000 | | | 646,842 | |
| | Shin-Etsu Polymer Co., Ltd. | | 224,100 | | | 934,812 | |
| | Shinko Wire Co., Ltd. | | 184,000 | | | 291,088 | |
| | Somar Corp. | | 43,000 | | | 106,391 | |
| # | | Stella Chemifa Corp. | | 42,600 | | | 1,292,346 | |
| # | | Sumitomo Bakelite Co., Ltd. | | 624,000 | | | 3,481,035 | |
| * | | Sumitomo Light Metal Industries, Ltd. | | 1,767,000 | | | 1,625,728 | |
| | Sumitomo Osaka Cement Co., Ltd. | | 1,676,000 | | | 4,565,205 | |
| | Sumitomo Pipe & Tube Co., Ltd. | | 108,100 | | | 852,913 | |
| | Sumitomo Seika Chemicals Co., Ltd. | | 223,000 | | | 934,234 | |
| | T. Hasegawa Co., Ltd. | | 121,300 | | | 1,862,221 | |
| | Taiheiyo Cement Corp. | | 85,000 | | | 162,677 | |
| | Taisei Lamick Co., Ltd. | | 18,900 | | | 591,889 | |
| | Taiyo Holdings Co., Ltd. | | 68,300 | | | 1,760,262 | |
| | Takasago International Corp. | | 356,000 | | | 1,646,758 | |
| | Takiron Co., Ltd. | | 304,000 | | | 1,030,357 | |
| | Tayca Corp. | | 151,000 | | | 598,267 | |
| | Tenma Corp. | | 87,000 | | | 775,077 | |
| # | | Titan Kogyo K.K. | | 78,000 | | | 386,932 | |
| | Toagosei Co., Ltd. | | 1,096,000 | | | 4,483,673 | |
| # | | Toda Kogyo Corp. | | 161,000 | | | 1,429,454 | |
| # | | Toho Titanium Co., Ltd. | | 132,900 | | | 2,274,807 | |
| | Toho Zinc Co., Ltd. | | 551,000 | | | 2,090,262 | |
| # | | Tokai Carbon Co., Ltd. | | 825,000 | | | 4,468,390 | |
| | Tokushu Tokai Paper Co., Ltd. | | 501,580 | | | 1,126,121 | |
| # | | Tokuyama Corp. | | 1,202,000 | | | 3,812,193 | |
| | Tokyo Ohka Kogyo Co., Ltd. | | 180,800 | | | 3,580,325 | |
| # | | Tokyo Rope Manufacturing Co., Ltd. | | 558,000 | | | 1,084,114 | |
| | Tokyo Steel Manufacturing Co., Ltd. | | 316,400 | | | 2,562,872 | |
| | Tokyo Tekko Co., Ltd. | | 3,000 | | | 8,530 | |
| | TOMOEGAWA CO., LTD. | | 125,000 | | | 258,267 | |
| | Tomoku Co., Ltd. | | 294,000 | | | 780,865 | |
| | Topy Industries, Ltd. | | 781,000 | | | 1,914,048 | |
| | Toyo Ink SC Holdings Co., Ltd. | | 735,000 | | | 2,716,386 | |
| | Toyo Kohan Co., Ltd. | | 247,000 | | | 853,242 | |
| | TYK Corp. | | 138,000 | | | 328,784 | |
| # | | Ube Material Industries, Ltd. | | 226,000 | | | 691,700 | |
| | Wood One Co., Ltd. | | 169,000 | | | 611,550 | |
| | Yodogawa Steel Works, Ltd. | | 786,500 | | | 3,405,352 | |
23
THE JAPANESE SMALL COMPANY SERIES
CONTINUED
| | | | | Shares | | Value†† | |
| Materials — (Continued) | | | | | | | |
| * | | Yuki Gosei Kogyo Co., Ltd. | | | 64,000 | | $ | 154,755 | |
| | Yushiro Chemical Industry Co., Ltd. | | | 47,100 | | | 520,021 | |
| Total Materials | | | | | | 173,637,566 | |
| | |
| Utilities — (0.5%) | | | | | | | |
| | Hokkaido Gas Co., Ltd. | | | 210,000 | | | 725,468 | |
| | Hokuriku Gas Co., Ltd. | | | 99,000 | | | 263,737 | |
| | Okinawa Electric Power Co., Ltd. | | | 63,871 | | | 2,722,445 | |
| | Saibu Gas Co., Ltd. | | | 1,279,000 | | | 3,369,842 | |
| | Shizuoka Gas Co., Ltd. | | | 241,500 | | | 1,528,644 | |
| Total Utilities | | | | | | 8,610,136 | |
| TOTAL COMMON STOCKS | | | | | | 1,529,702,877 | |
| RIGHTS/WARRANTS — (0.0%) | | | | | | | |
| * | | Oak Capital Corp. Warrants 08/31/12 | | | 53,135 | | | 25,542 | |
| | |
| | | | Shares/ | | | | |
| | | | Face | | | | |
| | | | Amount | | Value† | |
| | | | (000) | | | | |
| SECURITIES LENDING COLLATERAL — (9.8%) | | | | | | | |
| §@DFA Short Term Investment Fund | | | 166,000,000 | | | 166,000,000 | |
| @ | | Repurchase Agreement, Deutsche Bank Securities, Inc. 0.08%, 01/03/12 (Collateralized | | | | | | | |
| | by U.S. Treasury Note 1.375%, 09/30/18, valued at $667,386) to be repurchased at | | | | | | | |
| | $654,306 | | $ | 654 | | | 654,300 | |
| | |
| TOTAL SECURITIES LENDING COLLATERAL | | | | | | 166,654,300 | |
| | | | | | | | | |
| TOTAL INVESTMENTS — (100.0%) | | | | | | | |
| | (Cost $1,832,235,713)^ | | | | | $ | 1,696,382,719 | |
____________________
^ The cost for federal income taxes is $1,833,532,699.
24
THE ASIA PACIFIC SMALL COMPANY SERIES
SCHEDULE OF INVESTMENTS
December 31, 2011
(Unaudited)
| | | | | Shares | | Value†† | |
| COMMON STOCKS — (83.2%) | | | | | | |
| AUSTRALIA — (52.6%) | | | | | | |
| * | | ABM Resources NL | | 4,447,721 | | $ | 253,241 | |
| * | | Acacia Coal, Ltd. | | 1,958,775 | | | 97,796 | |
| #* | | A-Cap Resources, Ltd. | | 332,583 | | | 81,864 | |
| * | | Acer Energy, Ltd. | | 229,729 | | | 29,205 | |
| # | | Acrux, Ltd. | | 494,126 | | | 1,447,826 | |
| | Adelaide Brighton, Ltd. | | 1,927,272 | | | 5,693,709 | |
| # | | Aditya Birla Minerals, Ltd. | | 878,000 | | | 617,784 | |
| * | | ADX Energy, Ltd. | | 473,905 | | | 32,833 | |
| * | | AED Oil, Ltd. | | 363,401 | | | 53,894 | |
| * | | African Iron, Ltd. | | 37,307 | | | 13,530 | |
| * | | Ainsworth Game Technology, Ltd. | | 326,556 | | | 163,037 | |
| * | | AJ Lucas Group, Ltd. | | 317,969 | | | 334,975 | |
| #* | | Alchemia, Ltd. | | 724,903 | | | 223,079 | |
| # | | Alesco Corp., Ltd. | | 457,971 | | | 542,020 | |
| #* | | Alkane Resources, Ltd. | | 938,520 | | | 868,206 | |
| * | | Alliance Resources, Ltd. | | 444,483 | | | 95,432 | |
| * | | Allied Gold Mining P.L.C. | | 17,047 | | | 38,196 | |
| #* | | Altona Mining, Ltd. | | 1,108,169 | | | 227,824 | |
| * | | Amadeus Energy, Ltd. | | 819,137 | | | 171,948 | |
| # | | Amalgamated Holdings, Ltd. | | 462,247 | | | 2,664,352 | |
| | Amcom Telecommunications, Ltd. | | 529,694 | | | 438,992 | |
| #* | | Ampella Mining, Ltd. | | 225,174 | | | 343,405 | |
| | Ansell, Ltd. | | 503,479 | | | 7,475,505 | |
| #* | | Antares Energy, Ltd. | | 937,175 | | | 410,803 | |
| # | | AP Eagers, Ltd. | | 44,147 | | | 537,434 | |
| | APA Group, Ltd. | | 666,450 | | | 3,058,727 | |
| #* | | Apex Minerals NL | | 3,458,027 | | | 17,682 | |
| # | | APN News & Media, Ltd. | | 1,865,918 | | | 1,357,880 | |
| #* | | Aquarius Platinum, Ltd. | | 1,035,154 | | | 2,478,197 | |
| #* | | Arafura Resources, Ltd. | | 1,093,749 | | | 409,235 | |
| # | | ARB Corp., Ltd. | | 339,077 | | | 2,683,548 | |
| | Ariadne Australia, Ltd. | | 267,324 | | | 89,248 | |
| # | | Aristocrat Leisure, Ltd. | | 1,897,825 | | | 4,262,477 | |
| # | | ASG Group, Ltd. | | 356,085 | | | 314,429 | |
| #* | | Aspire Mining, Ltd. | | 902,429 | | | 341,119 | |
| #* | | Astron, Ltd. | | 87,221 | | | 227,930 | |
| #* | | Atlantic, Ltd. | | 238,482 | | | 304,914 | |
| #* | | Aurora Oil & Gas, Ltd. | | 1,265,748 | | | 4,387,027 | |
| | Ausdrill, Ltd. | | 1,127,632 | | | 3,455,631 | |
| # | | Ausenco, Ltd. | | 196,579 | | | 497,004 | |
| * | | Ausgold, Ltd. | | 52,096 | | | 48,043 | |
| # | | Austal, Ltd. | | 581,980 | | | 1,279,052 | |
| * | | Austar United Communications, Ltd. | | 2,887,442 | | | 3,524,390 | |
| | Austbrokers Holdings, Ltd. | | 89,395 | | | 551,154 | |
| # | | Austin Engineering, Ltd. | | 179,622 | | | 725,931 | |
| * | | Austpac Resources NL | | 2,524,951 | | | 121,474 | |
| * | | Australian Agricultural Co., Ltd. | | 923,263 | | | 1,259,011 | |
| # | | Australian Infrastructure Fund NL | | 3,166,751 | | | 6,232,048 | |
| | Australian Pharmaceutical Industries, Ltd. | | 5,528,865 | | | 1,502,797 | |
| * | | Australian Worldwide Exploration, Ltd. | | 2,047,923 | | | 2,724,894 | |
| | Automotive Holdings Group NL | | 559,572 | | | 991,554 | |
| * | | Autron Corporation, Ltd. | | 989,247 | | | — | |
| * | | Avanco Resources, Ltd. | | 2,010,636 | | | 206,201 | |
| # | | AVJennings, Ltd. | | 5,185,036 | | | 2,006,702 | |
| * | | Azimuth Resources, Ltd. | | 386,980 | | | 197,142 | |
| #* | | Azumah Resources, Ltd. | | 737,953 | | | 311,722 | |
| * | | Ballarat South Gold, Ltd. | | 1,996 | | | — | |
| #* | | Bandanna Energy, Ltd. | | 622,869 | | | 394,271 | |
25
THE ASIA PACIFIC SMALL COMPANY SERIES
CONTINUED
| | | | | Shares | | Value†† | |
| AUSTRALIA — (Continued) | | | | | | |
| # | | Bank of Queensland, Ltd. | | 398,694 | | $ | 2,969,579 | |
| #* | | Bannerman Resources, Ltd. | | 332,217 | | | 68,394 | |
| #* | | BC Iron, Ltd. | | 252,005 | | | 681,273 | |
| | Beach Energy, Ltd. | | 4,828,492 | | | 6,084,689 | |
| #* | | Beadell Resources, Ltd. | | 1,500,515 | | | 924,568 | |
| #* | | Berkeley Resources, Ltd. | | 434,006 | | | 160,638 | |
| | Beyond International, Ltd. | | 61,256 | | | 43,857 | |
| # | | Billabong International, Ltd. | | 843,248 | | | 1,525,603 | |
| #* | | Bionomics, Ltd. | | 207,468 | | | 125,713 | |
| * | | Biota Holdings, Ltd. | | 1,027,571 | | | 838,782 | |
| * | | Bisalloy Steel Group, Ltd. | | 469,001 | | | 126,245 | |
| # | | Blackmores, Ltd. | | 76,842 | | | 2,239,868 | |
| * | | BlueScope Steel, Ltd. | | 10,743,876 | | | 4,431,884 | |
| #* | | BMA Gold, Ltd. | | 1,829,221 | | | 953,946 | |
| # | | Boart Longyear Group | | 2,239,911 | | | 6,368,916 | |
| * | | Boom Logistics, Ltd. | | 211,688 | | | 48,924 | |
| * | | Boulder Steel, Ltd. | | 1,667,795 | | | 59,771 | |
| | Bradken, Ltd. | | 785,359 | | | 5,736,837 | |
| # | | Breville Group, Ltd. | | 598,466 | | | 1,674,940 | |
| # | | Brickworks, Ltd. | | 132,797 | | | 1,469,191 | |
| * | | Brockman Resources, Ltd. | | 10,283 | | | 21,411 | |
| | BSA, Ltd. | | 642,847 | | | 131,124 | |
| # | | BT Investment Management, Ltd. | | 193,869 | | | 356,901 | |
| * | | Buccaneer Energy, Ltd. | | 2,801,232 | | | 169,217 | |
| * | | Buru Energy, Ltd. | | 256,598 | | | 321,563 | |
| | Cabcharge Australia, Ltd. | | 503,044 | | | 2,295,576 | |
| | Calliden Group, Ltd. | | 633,393 | | | 122,574 | |
| | Campbell Brothers, Ltd. | | 183,237 | | | 9,175,496 | |
| #* | | Cape Lambert Resources, Ltd. | | 373,413 | | | 181,579 | |
| * | | Cape Range Wireless, Ltd. | | 7,260 | | | — | |
| #* | | Capral, Ltd. | | 58,499 | | | 10,463 | |
| # | | Cardno, Ltd. | | 332,245 | | | 1,763,182 | |
| #* | | Carnarvon Petroleum, Ltd. | | 3,885,525 | | | 384,373 | |
| * | | Carnegie Wave Energy, Ltd. | | 1,008,948 | | | 57,538 | |
| # | | carsales.com, Ltd. | | 961,726 | | | 4,687,260 | |
| # | | Cash Converters International, Ltd. | | 1,180,931 | | | 645,534 | |
| * | | CDS Technologies, Ltd. | | 13,276 | | | — | |
| | Cedar Woods Properties, Ltd. | | 111,357 | | | 381,528 | |
| * | | Centaurus Metals, Ltd. | | 143,557 | | | 73,396 | |
| * | | Central Petroleum, Ltd. | | 1,759,865 | | | 92,423 | |
| * | | Centrex Metals, Ltd. | | 51,889 | | | 14,818 | |
| #* | | Ceramic Fuel Cells, Ltd. | | 4,248,715 | | | 457,751 | |
| #* | | Cerro Resources NL | | 1,961,035 | | | 211,817 | |
| #* | | CGA Mining, Ltd. | | 10,124 | | | 20,660 | |
| #* | | Chalice Gold Mines, Ltd. | | 320,684 | | | 86,662 | |
| | Challenger, Ltd. | | 412,725 | | | 1,740,980 | |
| | Chandler Macleod Group, Ltd. | | 338,118 | | | 126,000 | |
| * | | Chemeq, Ltd. | | 166,742 | | | — | |
| * | | ChemGenex Pharmaceuticals, Ltd. | | 115,291 | | | 2,948 | |
| * | | Chesser Resources, Ltd. | | 156,921 | | | 77,057 | |
| #* | | Citigold Corp., Ltd. | | 3,765,806 | | | 262,340 | |
| # | | Clarius Group, Ltd. | | 1,099,217 | | | 421,532 | |
| #* | | Clinuvel Pharmaceuticals, Ltd. | | 118,435 | | | 186,356 | |
| # | | Clough, Ltd. | | 1,527,345 | | | 1,077,740 | |
| | Clover Corp., Ltd. | | 269,348 | | | 80,344 | |
| * | | CO2 Group, Ltd. | | 844,559 | | | 137,612 | |
| #* | | Coal of Africa, Ltd. | | 601,070 | | | 511,375 | |
| #* | | Coalspur Mines, Ltd. | | 1,239,823 | | | 1,935,865 | |
| #* | | Cobar Consolidated Resources, Ltd. | | 112,626 | | | 60,089 | |
| * | | Cockatoo Coal, Ltd. | | 3,265,604 | | | 1,247,106 | |
| # | | Codan, Ltd. | | 156,399 | | | 195,257 | |
26
THE ASIA PACIFIC SMALL COMPANY SERIES
CONTINUED
| | | | | Shares | | Value†† | |
| AUSTRALIA — (Continued) | | | | | | |
| * | | Coffey International, Ltd. | | 1,048,636 | | $ | 457,508 | |
| | Collection House, Ltd. | | 1,774,073 | | | 1,268,235 | |
| * | | Comet Ridge, Ltd. | | 65,567 | | | 10,705 | |
| # | | Consolidated Media Holdings, Ltd. | | 1,276,820 | | | 3,395,462 | |
| * | | Continental Coal, Ltd. | | 564,114 | | | 98,534 | |
| * | | Cooper Energy, Ltd. | | 336,842 | | | 113,446 | |
| | Coventry Group, Ltd. | | 144,778 | | | 344,170 | |
| # | | Credit Corp. Group, Ltd. | | 110,382 | | | 505,961 | |
| * | | Crusader Resources, Ltd. | | 155,861 | | | 125,152 | |
| # | | CSG, Ltd. | | 674,612 | | | 409,648 | |
| | CSR, Ltd. | | 2,491,176 | | | 4,987,698 | |
| | CTI Logistics, Ltd. | | 6,000 | | | 8,653 | |
| #* | | Cudeco, Ltd. | | 399,317 | | | 1,513,940 | |
| #* | | Cue Energy Resources, Ltd. | | 1,264,976 | | | 270,680 | |
| # | | Customers, Ltd. | | 494,648 | | | 500,722 | |
| * | | Data#3, Ltd. | | 205,654 | | | 240,853 | |
| # | | David Jones, Ltd. | | 1,881,866 | | | 4,548,695 | |
| # | | Decmil Group, Ltd. | | 470,416 | | | 986,810 | |
| * | | Deep Yellow, Ltd. | | 850,894 | | | 113,445 | |
| #* | | Devine, Ltd. | | 497,498 | | | 370,658 | |
| #* | | Discovery Metals, Ltd. | | 1,249,162 | | | 1,676,876 | |
| | Domino’s Pizza Enterprises, Ltd. | | 13,757 | | | 110,840 | |
| #* | | Downer EDI, Ltd. | | 1,768,446 | | | 5,772,439 | |
| * | | Dragon Mining, Ltd. | | 170,143 | | | 212,638 | |
| #* | | Drillsearch Energy, Ltd. | | 726,602 | | | 599,871 | |
| | DUET Group, Ltd. | | 4,437,176 | | | 7,965,931 | |
| # | | DuluxGroup, Ltd. | | 1,538,157 | | | 4,532,941 | |
| # | | DWS, Ltd. | | 242,161 | | | 310,090 | |
| #* | | Dyesol, Ltd. | | 383,671 | | | 101,921 | |
| #* | | Elders, Ltd. | | 1,380,363 | | | 366,900 | |
| #* | | Elemental Minerals, Ltd. | | 388,188 | | | 418,648 | |
| * | | Ellect Holdings, Ltd. | | 482 | | | — | |
| # | | Emeco Holdings, Ltd. | | 2,143,907 | | | 2,113,699 | |
| * | | Endeavour Mining Corp. | | 381,222 | | | 931,892 | |
| #* | | Energy Resources of Australia, Ltd. | | 638,803 | | | 799,695 | |
| #* | | Energy World Corp., Ltd. | | 3,906,481 | | | 2,725,458 | |
| * | | Engenco, Ltd. | | 22,880 | | | 24,964 | |
| # | | Envestra, Ltd. | | 5,142,027 | | | 3,752,254 | |
| #* | | Equatorial Resources, Ltd. | | 176,571 | | | 302,271 | |
| | Euroz, Ltd. | | 74,221 | | | 94,988 | |
| * | | Evolution Mining, Ltd. | | 1,257,818 | | | 1,939,047 | |
| # | | Exco Resources, Ltd. | | 429,909 | | | 81,394 | |
| #* | | Extract Resources, Ltd. | | 262,940 | | | 2,274,542 | |
| # | | Fantastic Holdings, Ltd. | | 355,613 | | | 801,544 | |
| * | | FAR, Ltd. | | 5,163,174 | | | 148,633 | |
| | Finbar Group, Ltd. | | 58,051 | | | 52,707 | |
| * | | Finders Resources, Ltd. | | 7,442 | | | 2,740 | |
| | FKP Property Group, Ltd. | | 3,090,231 | | | 1,509,471 | |
| # | | Fleetwood Corp., Ltd. | | 284,707 | | | 3,484,578 | |
| # | | FlexiGroup, Ltd. | | 597,372 | | | 1,137,846 | |
| # | | Flight Centre, Ltd. | | 192,954 | | | 3,179,152 | |
| #* | | Flinders Mines, Ltd. | | 6,909,293 | | | 1,975,219 | |
| * | | Focus Minerals, Ltd. | | 18,734,882 | | | 978,109 | |
| * | | Forest Enterprises Australia, Ltd. | | 2,849,173 | | | — | |
| # | | Forge Group, Ltd. | | 242,109 | | | 1,188,942 | |
| #* | | Forte Energy NL | | 1,036,232 | | | 28,617 | |
| | G8 Education, Ltd. | | 67,817 | | | 39,554 | |
| #* | | Galaxy Resources, Ltd. | | 760,450 | | | 548,312 | |
| | Gazal Corp., Ltd. | | 104,542 | | | 178,887 | |
| #* | | Geodynamics, Ltd. | | 1,015,653 | | | 161,211 | |
| #* | | Gindalbie Metals, Ltd. | | 2,600,255 | | | 1,398,848 | |
27
The Asia Pacific Small Company Series
continued
| | | | | Shares | | Value†† | |
| AUSTRALIA — (Continued) | | | | | | |
| #* | | Gloucester Coal, Ltd. | | 232,730 | | $ | 2,046,602 | |
| #* | | Gold Road Resources, Ltd. | | 111,697 | | | 35,648 | |
| * | | Golden Rim Resources, Ltd. | | 722,577 | | | 81,862 | |
| # | | Goodman Fielder, Ltd. | | 8,296,037 | | | 3,673,797 | |
| | GrainCorp, Ltd. | | 759,612 | | | 6,078,950 | |
| # | | Grange Resources, Ltd. | | 1,245,669 | | | 712,691 | |
| #* | | Great Southern, Ltd. | | 9,302,784 | | | — | |
| #* | | Greenland Minerals & Energy, Ltd. | | 711,078 | | | 330,623 | |
| #* | | Gryphon Minerals, Ltd. | | 1,030,817 | | | 1,214,095 | |
| # | | GUD Holdings, Ltd. | | 432,916 | | | 3,121,416 | |
| * | | Gujarat NRE Coking Coal, Ltd. | | 119,865 | | | 22,209 | |
| #* | | Gunns, Ltd. | | 2,872,620 | | | 368,447 | |
| # | | GWA Group, Ltd. | | 1,061,543 | | | 2,320,665 | |
| #* | | Hastie Group, Ltd. | | 81,042 | | | 46,578 | |
| * | | Havilah Resources NL | | 258,836 | | | 177,702 | |
| | HFA Holdings, Ltd. | | 235,865 | | | 201,695 | |
| | HGL, Ltd. | | 102,586 | | | 111,601 | |
| #* | | Highlands Pacific, Ltd. | | 2,651,500 | | | 367,553 | |
| #* | | Hillgrove Resources, Ltd. | | 909,242 | | | 181,523 | |
| # | | Hills Holdings, Ltd. | | 986,165 | | | 1,135,253 | |
| #* | | Horizon Oil, Ltd. | | 4,076,594 | | | 836,909 | |
| * | | Hutchison Telecommunications Australia, Ltd. | | 7,262,431 | | | 434,561 | |
| #* | | Icon Energy, Ltd. | | 1,077,030 | | | 182,164 | |
| * | | IDM International, Ltd. | | 23,969 | | | 3,310 | |
| # | | iiNet, Ltd. | | 581,396 | | | 1,696,892 | |
| | Iluka Resources, Ltd. | | 401,932 | | | 6,366,203 | |
| # | | Imdex, Ltd. | | 891,692 | | | 1,687,076 | |
| # | | IMF Australia, Ltd. | | 314,016 | | | 417,856 | |
| #* | | IMX Resources, Ltd. | | 594,082 | | | 190,453 | |
| # | | Independence Group NL | | 1,024,848 | | | 3,959,817 | |
| * | | Indo Mines, Ltd. | | 81,968 | | | 22,921 | |
| #* | | Indophil Resources NL | | 3,118,946 | | | 1,320,565 | |
| # | | Industrea, Ltd. | | 1,462,998 | | | 1,463,816 | |
| # | | Infigen Energy, Ltd. | | 1,622,704 | | | 447,584 | |
| # | | Infomedia, Ltd. | | 1,458,074 | | | 320,326 | |
| #* | | Integra Mining, Ltd. | | 3,188,345 | | | 1,760,940 | |
| # | | Integrated Research, Ltd. | | 261,513 | | | 125,540 | |
| #* | | Intrepid Mines, Ltd. | | 1,794,707 | | | 2,007,539 | |
| # | | Invocare, Ltd. | | 572,622 | | | 4,509,447 | |
| # | | IOOF Holdings, Ltd. | | 989,055 | | | 5,164,887 | |
| | Iress Market Technology, Ltd. | | 476,807 | | | 3,377,336 | |
| #* | | Iron Ore Holdings, Ltd. | | 336,216 | | | 472,788 | |
| #* | | Ivanhoe Australia, Ltd. | | 396,947 | | | 577,160 | |
| # | | JB Hi-Fi, Ltd. | | 450,518 | | | 5,193,555 | |
| #* | | Jupiter Mines, Ltd. | | 465,443 | | | 129,185 | |
| # | | K&S Corp., Ltd. | | 210,812 | | | 254,195 | |
| #* | | Kagara, Ltd. | | 1,743,898 | | | 456,084 | |
| * | | Kagara, Ltd. | | 201,495 | | | 52,553 | |
| #* | | Kangaroo Resources, Ltd. | | 2,874,627 | | | 426,817 | |
| * | | Karoon Gas Australia, Ltd. | | 667,086 | | | 3,072,000 | |
| #* | | Kasbah Resources, Ltd. | | 478,599 | | | 73,591 | |
| * | | KBL Mining, Ltd. | | 204,110 | | | 56,437 | |
| # | | Kingsgate Consolidated, Ltd. | | 573,622 | | | 3,359,677 | |
| #* | | Kingsrose Mining, Ltd. | | 608,858 | | | 882,332 | |
| * | | Lednium, Ltd. | | 195,019 | | | 15,957 | |
| #* | | Lemarne Corp., Ltd. | | 25,882 | | | 14,061 | |
| * | | Linc Energy, Ltd. | | 1,497,847 | | | 1,676,871 | |
| #* | | Liquefied Natural Gas, Ltd. | | 595,144 | | | 162,135 | |
| | Little World Beverages, Ltd. | | 502 | | | 1,645 | |
| | Lycopodium, Ltd. | | 56,126 | | | 343,629 | |
| # | | M2 Telecommunications Group, Ltd. | | 377,934 | | | 1,080,077 | |
28
The Asia Pacific Small Company Series
continued
| | | | | Shares | | Value†† | |
| AUSTRALIA — (Continued) | | | | | | |
| * | | MacMahon Holdings, Ltd. | | 3,174,294 | | $ | 1,812,132 | |
| #* | | Macmin Silver, Ltd. | | 2,951,370 | | | 240,600 | |
| * | | Macquarie Atlas Roads Group NL | | 311,785 | | | 430,333 | |
| # | | Macquarie Telecom Group, Ltd. | | 35,019 | | | 254,838 | |
| #* | | Magma Metals, Ltd. | | 240,771 | | | 27,276 | |
| * | | Manhattan Corp., Ltd. | | 7,972 | | | 1,802 | |
| #* | | Marengo Mining, Ltd. | | 1,428,204 | | | 313,991 | |
| # | | Matrix Composites & Engineering, Ltd. | | 130,877 | | | 407,070 | |
| | MaxiTRANS Industries, Ltd. | | 942,578 | | | 367,004 | |
| | Mayne Pharma Group, Ltd. | | 205,191 | | | 79,648 | |
| # | | McGuigan Simeon Wines, Ltd. | | 2,437,348 | | | 733,868 | |
| # | | McMillan Shakespeare, Ltd. | | 228,148 | | | 2,000,886 | |
| # | | McPherson’s, Ltd. | | 303,441 | | | 537,098 | |
| # | | Medusa Mining, Ltd. | | 617,332 | | | 2,832,694 | |
| # | | Melbourne IT, Ltd. | | 440,506 | | | 697,763 | |
| #* | | MEO Australia, Ltd. | | 681,039 | | | 121,381 | |
| # | | Mermaid Marine Australia, Ltd. | | 906,563 | | | 2,631,833 | |
| #* | | Mesoblast, Ltd. | | 169,618 | | | 1,192,383 | |
| * | | Metals X, Ltd. | | 173,131 | | | 41,602 | |
| #* | | Metgasco, Ltd. | | 667,052 | | | 272,742 | |
| * | | Metminco, Ltd. | | 1,879,249 | | | 230,969 | |
| * | | MetroCoal, Ltd. | | 68,725 | | | 34,068 | |
| #* | | MHM Metals, Ltd. | | 287,217 | | | 264,435 | |
| # | | Mincor Resources NL | | 990,706 | | | 685,327 | |
| #* | | Minemakers, Ltd. | | 102,785 | | | 28,814 | |
| #* | | Mineral Deposits, Ltd. | | 222,046 | | | 1,153,561 | |
| | Mineral Resources, Ltd. | | 388,955 | | | 4,376,479 | |
| #* | | Mirabela Nickel, Ltd. | | 1,647,279 | | | 1,882,381 | |
| #* | | Molopo Energy, Ltd. | | 1,186,993 | | | 774,119 | |
| #* | | Moly Mines, Ltd. | | 25,253 | | | 8,002 | |
| # | | Monadelphous Group, Ltd. | | 319,624 | | | 6,571,746 | |
| * | | Morning Star Gold NL | | 332,749 | | | 78,469 | |
| # | | Mortgage Choice, Ltd. | | 631,109 | | | 826,100 | |
| # | | Mount Gibson Iron, Ltd. | | 2,962,399 | | | 3,385,503 | |
| # | | MSF Sugar, Ltd. | | 81,056 | | | 366,903 | |
| #* | | Murchison Metals, Ltd. | | 1,229,022 | | | 546,805 | |
| # | | Myer Holdings, Ltd. | | 2,954,756 | | | 5,833,130 | |
| | MyState, Ltd. | | 25,088 | | | 86,245 | |
| #* | | Nanosonics, Ltd. | | 259,364 | | | 158,865 | |
| # | | National Can Industries, Ltd. | | 97,017 | | | 104,686 | |
| #* | | Navigator Resources, Ltd. | | 1,876,284 | | | 27,052 | |
| # | | Navitas, Ltd. | | 1,157,537 | | | 4,138,972 | |
| #* | | New Guinea Energy, Ltd. | | 359,345 | | | 16,834 | |
| * | | NewSat, Ltd. | | 38,743 | | | 23,191 | |
| #* | | Nexbis, Ltd. | | 580,630 | | | 48,662 | |
| * | | Nexus Energy, Ltd. | | 4,594,720 | | | 963,824 | |
| # | | NIB Holdings, Ltd. | | 542,247 | | | 833,505 | |
| * | | Nido Petroleum, Ltd. | | 6,093,154 | | | 248,021 | |
| #* | | Noble Mineral Resources, Ltd. | | 859,168 | | | 423,880 | |
| # | | Norfolk Group, Ltd. | | 302,473 | | | 327,452 | |
| * | | North Australian Diamonds, Ltd. | | 16,663 | | | 4,408 | |
| #* | | Northern Iron, Ltd. | | 499,291 | | | 327,388 | |
| * | | Northern Star Resources, Ltd. | | 940,055 | | | 762,965 | |
| * | | Norton Gold Fields, Ltd. | | 515,173 | | | 93,026 | |
| | NRW Holdings, Ltd. | | 798,432 | | | 2,108,199 | |
| #* | | Nucoal Resources NL | | 429,538 | | | 120,569 | |
| * | | Nufarm, Ltd. | | 754,110 | | | 3,197,378 | |
| | Oakton, Ltd. | | 378,695 | | | 479,090 | |
| #* | | Oilex, Ltd. | | 247,428 | | | 56,267 | |
| * | | OneSteel, Ltd. | | 3,720,920 | | | 2,660,380 | |
| #* | | Orocobre, Ltd. | | 257,530 | | | 334,276 | |
29
The Asia Pacific Small Company Series
continued
| | | | | Shares | | Value†† | |
| AUSTRALIA — (Continued) | | | | | | |
| # | | OrotonGroup, Ltd. | | 89,486 | | $ | 695,696 | |
| * | | Otto Energy, Ltd. | | 1,518,553 | | | 140,280 | |
| # | | Pacific Brands, Ltd. | | 4,412,120 | | | 2,480,064 | |
| * | | Pacific Niugini, Ltd. | | 200,616 | | | 90,450 | |
| #* | | Paladin Energy, Ltd. | | 2,824,953 | | | 3,972,632 | |
| #* | | Pan Pacific Petroleum NL | | 1,094,343 | | | 157,630 | |
| * | | PanAust, Ltd. | | 1,780,618 | | | 5,843,964 | |
| #* | | Pancontinental Oil & Gas NL | | 1,057,588 | | | 83,166 | |
| # | | Panoramic Resources, Ltd. | | 971,509 | | | 1,151,683 | |
| * | | PaperlinX, Ltd. | | 2,771,649 | | | 237,720 | |
| * | | Papillon Resources, Ltd. | | 32,010 | | | 18,843 | |
| | Patties Foods, Ltd. | | 36,136 | | | 61,486 | |
| # | | Peet, Ltd. | | 1,096,798 | | | 896,005 | |
| #* | | Peninsula Energy, Ltd. | | 5,178,834 | | | 189,656 | |
| #* | | Perilya, Ltd. | | 1,461,946 | | | 494,148 | |
| # | | Perpetual Trustees Australia, Ltd. | | 190,719 | | | 3,977,522 | |
| #* | | Perseus Mining, Ltd. | | 1,605,654 | | | 3,982,596 | |
| #* | | Pharmaxis, Ltd. | | 1,018,699 | | | 1,088,168 | |
| * | | Photon Group, Ltd. | | 371,433 | | | 20,194 | |
| * | | Plantcorp NL | | 4,329 | | | — | |
| #* | | Platinum Australia, Ltd. | | 1,251,560 | | | 105,611 | |
| #* | | Pluton Resources, Ltd. | | 538,056 | | | 123,238 | |
| | PMP, Ltd. | | 2,395,607 | | | 1,203,807 | |
| * | | Poseidon Nickel, Ltd. | | 452,002 | | | 82,968 | |
| # | | Premier Investments, Ltd. | | 262,755 | | | 1,277,171 | |
| #* | | Prima Biomed, Ltd. | | 2,338,194 | | | 381,923 | |
| # | | Primary Health Care, Ltd. | | 1,960,174 | | | 6,168,563 | |
| # | | Prime Media Group, Ltd. | | 1,777,139 | | | 1,223,591 | |
| # | | PrimeAg, Ltd. | | 64,299 | | | 70,079 | |
| | Programmed Maintenance Service, Ltd. | | 549,269 | | | 1,242,825 | |
| * | | QRxPharma, Ltd. | | 109,867 | | | 169,238 | |
| * | | Quickstep Holdings, Ltd. | | 462,355 | | | 80,166 | |
| # | | Ramelius Resources, Ltd. | | 1,268,789 | | | 1,395,700 | |
| * | | Range Resources, Ltd. | | 51,250 | | | 6,488 | |
| # | | RCR Tomlinson, Ltd. | | 1,056,974 | | | 1,712,705 | |
| # | | REA Group, Ltd. | | 211,832 | | | 2,712,118 | |
| | Reckon, Ltd. | | 215,815 | | | 516,995 | |
| * | | Red 5, Ltd. | | 9,022 | | | 15,056 | |
| #* | | Red Fork Energy, Ltd. | | 605,587 | | | 520,949 | |
| | Redflex Holdings, Ltd. | | 377,855 | | | 643,976 | |
| | Reece Australia, Ltd. | | 238,457 | | | 4,476,495 | |
| #* | | Reed Resources, Ltd. | | 698,001 | | | 218,320 | |
| #* | | Regis Resources, Ltd. | | 1,195,060 | | | 4,153,550 | |
| # | | Reject Shop, Ltd. (The) | | 117,972 | | | 1,241,853 | |
| * | | Resolute Mining, Ltd. | | 2,026,007 | | | 3,429,526 | |
| #* | | Resource & Investment NL | | 283,117 | | | 185,485 | |
| * | | Resource Equipment, Ltd. | | 118,411 | | | 40,537 | |
| * | | Resource Generation, Ltd. | | 338,381 | | | 128,346 | |
| | Retail Food Group, Ltd. | | 53,237 | | | 133,070 | |
| #* | | Rex Minerals, Ltd. | | 403,087 | | | 576,231 | |
| #* | | Rialto Energy, Ltd. | | 1,264,038 | | | 308,894 | |
| # | | Ridley Corp., Ltd. | | 1,283,068 | | | 1,375,612 | |
| * | | RiverCity Motorway Group, Ltd. | | 1,563,354 | | | — | |
| #* | | Robust Resources, Ltd. | | 136,513 | | | 187,138 | |
| #* | | Roc Oil Co., Ltd. | | 6,490,268 | | | 1,688,226 | |
| | Runge, Ltd. | | 30,702 | | | 11,481 | |
| # | | Ruralco Holdings, Ltd. | | 88,146 | | | 295,102 | |
| # | | SAI Global, Ltd. | | 1,064,331 | | | 4,901,978 | |
| * | | Salinas Energy, Ltd. | | 1,265,718 | | | 660,290 | |
| # | | Salmat, Ltd. | | 664,807 | | | 1,636,802 | |
| #* | | Samson Oil & Gas, Ltd. | | 5,178,299 | | | 507,130 | |
30
The Asia Pacific Small Company Series
continued
| | | | | Shares | | Value†† | |
| AUSTRALIA — (Continued) | | | | | | |
| #* | | Sandfire Resources NL | | 394,850 | | $ | 2,655,623 | |
| * | | Santos, Ltd. | | 182,362 | | | 2,282,174 | |
| * | | Saracen Mineral Holdings, Ltd. | | 1,959,658 | | | 1,517,601 | |
| | Schaffer Corp., Ltd. | | 33,766 | | | 112,338 | |
| # | | Sedgman, Ltd. | | 401,236 | | | 751,634 | |
| # | | Seek, Ltd. | | 666,916 | | | 3,866,846 | |
| # | | Select Harvests, Ltd. | | 292,826 | | | 514,521 | |
| * | | Senex Energy, Ltd. | | 2,170,206 | | | 1,409,230 | |
| # | | Servcorp, Ltd. | | 301,327 | | | 805,553 | |
| #* | | Service Stream, Ltd. | | 1,432,710 | | | 439,071 | |
| | Seven Group Holdings, Ltd. | | 544,133 | | | 3,939,065 | |
| | Seven West Media, Ltd. | | 603,065 | | | 1,997,399 | |
| # | | Sigma Pharmaceuticals, Ltd. | | 4,898,960 | | | 2,758,769 | |
| * | | Sihayo Gold, Ltd. | | 603,971 | | | 64,730 | |
| #* | | Silex System, Ltd. | | 532,291 | | | 1,335,282 | |
| #* | | Silver Lake Resources, Ltd. | | 660,551 | | | 2,053,592 | |
| * | | Sipa Resources International NL | | 416,066 | | | 59,095 | |
| # | | Sirtex Medical, Ltd. | | 218,046 | | | 998,857 | |
| # | | Skilled Group, Ltd. | | 490,220 | | | 829,230 | |
| | Slater & Gordon, Ltd. | | 24,701 | | | 45,208 | |
| # | | SMS Management & Technology, Ltd. | | 426,040 | | | 1,971,218 | |
| * | | Southern Cross Electrical Engineering, Ltd. | | 16,785 | | | 14,081 | |
| | Southern Cross Media Group, Ltd. | | 2,546,520 | | | 2,803,844 | |
| # | | SP Telemedia, Ltd. | | 1,519,352 | | | 2,065,858 | |
| | Spark Infrastructure Group, Ltd. | | 5,543,872 | | | 7,788,490 | |
| # | | Specialty Fashion Group, Ltd. | | 809,557 | | | 376,513 | |
| # | | Spotless Group, Ltd. | | 1,215,571 | | | 2,949,267 | |
| #* | | St. Barbara, Ltd. | | 1,636,736 | | | 3,287,198 | |
| #* | | Starpharma Holdings, Ltd. | | 818,617 | | | 952,927 | |
| * | | Straits Resources, Ltd. | | 878,069 | | | 581,312 | |
| * | | Strike Energy, Ltd. | | 88,132 | | | 9,512 | |
| | Structural Systems, Ltd. | | 138,772 | | | 114,977 | |
| # | | STW Communications Group, Ltd. | | 885,459 | | | 761,532 | |
| #* | | Sundance Energy Australia, Ltd. | | 786,380 | | | 335,145 | |
| #* | | Sundance Resources, Ltd. | | 8,756,539 | | | 3,539,328 | |
| * | | Sunland Group, Ltd. | | 741,191 | | | 500,236 | |
| # | | Super Retail Group, Ltd. | | 1,268,454 | | | 6,882,737 | |
| * | | Swick Mining Services, Ltd. | | 71,883 | | | 22,189 | |
| # | | Symex Holdings, Ltd. | | 513,662 | | | 76,000 | |
| # | | Talent2 International, Ltd. | | 472,312 | | | 241,533 | |
| * | | Talisman Mining, Ltd. | | 217,981 | | | 74,826 | |
| #* | | Tanami Gold NL | | 531,462 | | | 364,859 | |
| * | | Tap Oil, Ltd. | | 1,450,696 | | | 883,690 | |
| # | | Tassal Group, Ltd. | | 626,912 | | | 896,228 | |
| # | | Technology One, Ltd. | | 1,322,653 | | | 1,348,002 | |
| # | | Ten Network Holdings, Ltd. | | 3,492,166 | | | 2,993,778 | |
| * | | Terramin Australia, Ltd. | | 155,209 | | | 21,414 | |
| #* | | Texon Petroleum, Ltd. | | 738,375 | | | 422,542 | |
| # | | TFS Corp., Ltd. | | 1,393,854 | | | 881,921 | |
| # | | Thakral Holdings Group, Ltd. | | 2,559,697 | | | 1,408,590 | |
| | ThinkSmart, Ltd. | | 146,612 | | | 60,812 | |
| # | | Thorn Group, Ltd. | | 370,228 | | | 609,646 | |
| * | | Thundelarra Exploration, Ltd. | | 260,965 | | | 39,938 | |
| #* | | Tiger Resources, Ltd. | | 1,751,101 | | | 657,174 | |
| * | | TNG, Ltd. | | 87,408 | | | 7,179 | |
| * | | Toro Energy, Ltd. | | 70,156 | | | 6,313 | |
| | Tox Free Solutions, Ltd. | | 428,631 | | | 949,181 | |
| # | | Transfield Services, Ltd. | | 1,880,286 | | | 4,164,576 | |
| #* | | Transpacific Industries Group, Ltd. | | 4,533,180 | | | 3,786,246 | |
| # | | Troy Resources NL | | 396,528 | | | 1,740,186 | |
| # | | Trust Co., Ltd. (The) | | 85,563 | | | 443,421 | |
31
The Asia Pacific Small Company Series
continued
| | | | | Shares | | Value†† | |
| AUSTRALIA — (Continued) | | | | | | |
| | UGL, Ltd. | | 143,161 | | $ | 1,739,745 | |
| * | | Unity Mining, Ltd. | | 92,075 | | | 9,348 | |
| # | | UXC, Ltd. | | 1,169,545 | | | 478,428 | |
| #* | | Venture Minerals, Ltd. | | 450,858 | | | 129,224 | |
| * | | Venturex Resources, Ltd. | | 42,171 | | | 3,023 | |
| | Village Roadshow, Ltd. | | 855,994 | | | 2,626,275 | |
| #* | | Virgin Australia Holdings, Ltd. | | 7,648,897 | | | 2,221,611 | |
| | Warrnambool Cheese & Butter Factory Co. Holding, Ltd. | | 1,203 | | | 4,484 | |
| # | | Watpac, Ltd. | | 711,698 | | | 771,053 | |
| # | | WDS, Ltd. | | 375,342 | | | 229,823 | |
| * | | Webfirm Group, Ltd. | | 124,813 | | | 7,449 | |
| # | | Webjet, Ltd. | | 356,064 | | | 906,103 | |
| | Webster, Ltd. | | 144,737 | | | 69,458 | |
| # | | Western Areas NL | | 596,079 | | | 3,107,351 | |
| * | | Western Desert Resouurces, Ltd. | | 46,483 | | | 21,170 | |
| * | | Westgold Resources, Ltd. | | 59,310 | | | 11,894 | |
| #* | | White Energy Co., Ltd. | | 643,913 | | | 250,052 | |
| | WHK Group, Ltd. | | 1,202,433 | | | 1,014,374 | |
| # | | Wide Bay Australia, Ltd. | | 81,906 | | | 614,013 | |
| #* | | WildHorse Energy, Ltd. | | 212,714 | | | 32,729 | |
| * | | Willmott Forests, Ltd. | | 17,224 | | | — | |
| #* | | Windimurra Vanadium, Ltd. | | 537,429 | | | — | |
| # | | Wotif.com Holdings, Ltd. | | 505,776 | | | 1,842,098 | |
| # | | WPG Resources, Ltd. | | 702,896 | | | 55,219 | |
| #* | | YTC Resources, Ltd. | | 73,367 | | | 31,629 | |
| TOTAL AUSTRALIA | | | | | 518,724,650 | |
| | | |
| HONG KONG — (15.4%) | | | | | | |
| | Aeon Credit Service (Asia) Co., Ltd. | | 580,000 | | | 421,723 | |
| | Aeon Stores Hong Kong Co., Ltd. | | 234,000 | | | 530,134 | |
| | Alco Holdings, Ltd. | | 1,426,000 | | | 464,056 | |
| | Allan International Holdings, Ltd. | | 720,000 | | | 189,924 | |
| | Allied Group, Ltd. | | 683,200 | | | 1,603,512 | |
| | Allied Overseas, Ltd. | | 50,000 | | | 23,215 | |
| | Allied Properties, Ltd. | | 12,297,857 | | | 1,694,758 | |
| * | | Amax Holdings, Ltd. | | 9,312,000 | | | 104,022 | |
| * | | Apac Resources, Ltd. | | 12,620,000 | | | 534,920 | |
| * | | Apollo Solar Energy Technology Holdings, Ltd. | | 11,692,000 | | | 427,551 | |
| | APT Satellite Holdings, Ltd. | | 1,275,000 | | | 212,421 | |
| * | | Artel Solutions Group Holdings, Ltd. | | 7,885,000 | | | 103,079 | |
| * | | Artini China Co., Ltd. | | 2,481,000 | | | 47,466 | |
| | Arts Optical International Holdings, Ltd. | | 730,000 | | | 196,397 | |
| | Asia Financial Holdings, Ltd. | | 2,474,908 | | | 862,181 | |
| | Asia Satellite Telecommunications Holdings, Ltd. | | 962,000 | | | 1,955,085 | |
| | Asia Standard Hotel Group, Ltd. | | 11,797,218 | | | 788,671 | |
| | Asia Standard International Group, Ltd. | | 13,365,185 | | | 2,061,718 | |
| | Associated International Hotels, Ltd. | | 980,000 | | | 1,891,761 | |
| | Aupu Group Holding Co., Ltd. | | 2,504,000 | | | 189,813 | |
| | Automated Systems Holdings, Ltd. | | 394,000 | | | 47,256 | |
| | Bauhaus International Holdings, Ltd. | | 662,000 | | | 158,143 | |
| * | | Beijing Yu Sheng Tang Pharmaceutical Group, Ltd. | | 2,440,000 | | | 10,639 | |
| * | | Bel Global Resources Holdings, Ltd. | | 2,576,000 | | | 47,098 | |
| * | | Bio-Dynamic Group, Ltd. | | 2,544,000 | | | 254,551 | |
| * | | Birmingham International Holdings, Ltd. | | 6,502,000 | | | 127,251 | |
| | Bonjour Holdings, Ltd. | | 4,356,000 | | | 664,949 | |
| | Bossini International Holdings, Ltd. | | 3,871,500 | | | 287,798 | |
| #* | | Burwill Holdings, Ltd. | | 8,888,960 | | | 119,879 | |
| | Cafe de Coral Holdings, Ltd. | | 1,006,000 | | | 2,303,114 | |
| * | | Capital Estate, Ltd. | | 5,151,000 | | | 124,627 | |
| * | | Carico Holdings, Ltd. | | 13,640,000 | | | 621,021 | |
| | Century City International Holdings, Ltd. | | 6,419,460 | | | 428,679 | |
32
The Asia Pacific Small Company Series
continued
| | | | | Shares | | Value†† | |
| HONG KONG — (Continued) | | | | | | |
| * | | Century Sunshine Group Holdings, Ltd. | | 3,655,000 | | $ | 101,736 | |
| | Champion Technology Holdings, Ltd. | | 14,734,387 | | | 194,874 | |
| | Chen Hsong Holdings, Ltd. | | 898,000 | | | 277,902 | |
| | Cheuk Nang Holdings, Ltd. | | 386,457 | | | 137,817 | |
| | Chevalier International Holdings, Ltd. | | 737,482 | | | 737,194 | |
| | Chevalier Pacific Holdings, Ltd. | | 5,497,500 | | | 138,571 | |
| * | | China Best Group Holding, Ltd. | | 3,721,400 | | | 42,798 | |
| * | | China Billion Resources, Ltd. | | 4,876,000 | | | 54,620 | |
| * | | China Boon Holdings, Ltd. | | 6,200,000 | | | 103,567 | |
| * | | China CBM Group, Ltd. | | 6,930,301 | | | 93,295 | |
| * | | China Digicontent Co., Ltd. | | 2,710,000 | | | 3,489 | |
| * | | China Digital Licensing Group, Ltd. | | 2,190,000 | | | 76,078 | |
| * | | China Electronics Corp. Holdings Co., Ltd. | | 2,888,250 | | | 240,647 | |
| * | | China Energy Development Holdings, Ltd. | | 21,966,000 | | | 287,960 | |
| * | | China Financial Services Holdings, Ltd. | | 954,000 | | | 56,995 | |
| * | | China Flavors & Fragrances Co., Ltd. | | 144,924 | | | 25,146 | |
| * | | China Gamma Group, Ltd. | | 7,500,000 | | | 150,480 | |
| * | | China Infrastructure Investment, Ltd. | | 8,680,000 | | | 223,527 | |
| * | | China Investments Holdings, Ltd. | | 149,000 | | | 4,203 | |
| #* | | China Mandarin Holdings, Ltd. | | 5,012,400 | | | 77,204 | |
| | China Metal International Holdings, Ltd. | | 2,582,000 | | | 444,383 | |
| * | | China Motion Telecom International, Ltd. | | 5,080,000 | | | 74,542 | |
| | China Motor Bus Co., Ltd. | | 50,000 | | | 400,347 | |
| * | | China Ocean Shipbuilding Industry Group, Ltd. | | 4,137,500 | | | 54,215 | |
| * | | China Oriental Culture Group, Ltd. | | 3,600,000 | | | 168,842 | |
| * | | China Pipe Group, Ltd. | | 100,000 | | | 385 | |
| #* | | China Public Procurement, Ltd. | | 5,230,000 | | | — | |
| * | | China Renji Medical Group, Ltd. | | 12,784,000 | | | 98,761 | |
| #* | | China Resources and Transportation Group, Ltd. | | 32,400,000 | | | 1,268,191 | |
| #* | | China Solar Energy Holdings, Ltd. | | 37,990,000 | | | 258,872 | |
| * | | China Strategic Holdings, Ltd. | | 12,585,000 | | | 248,884 | |
| # | | China Taisan Technology Group Holdings, Ltd. | | 564,915 | | | 40,015 | |
| | China Ting Group Holdings, Ltd. | | 2,443,151 | | | 146,124 | |
| * | | China Tycoon Beverage Holdings, Ltd. | | 2,732,000 | | | 53,987 | |
| * | | China WindPower Group, Ltd. | | 14,630,000 | | | 543,867 | |
| * | | China Yunnan Tin Minerals Group Co., Ltd. | | 9,428,000 | | | 31,417 | |
| | China-Hongkong Photo Products Holdings, Ltd. | | 2,123,000 | | | 144,402 | |
| | Chinney Investments, Ltd. | | 1,144,000 | | | 130,790 | |
| | Chong Hing Bank, Ltd. | | 878,000 | | | 1,558,151 | |
| | Chow Sang Sang Holdings International, Ltd. | | 24,680 | | | 55,313 | |
| | Chu Kong Shipping Development Co., Ltd. | | 2,188,000 | | | 328,639 | |
| * | | Chuang’s China Investments, Ltd. | | 3,388,000 | | | 171,536 | |
| | Chuang’s Consortium International, Ltd. | | 3,569,965 | | | 338,974 | |
| * | | Chun Wo Development Holdings, Ltd. | | 2,002,926 | | | 92,574 | |
| # | | Citic Telecom International Holdings, Ltd. | | 4,388,000 | | | 900,640 | |
| * | | City e-Solutions, Ltd. | | 186,000 | | | 15,794 | |
| # | | City Telecom, Ltd. | | 1,540,751 | | | 804,279 | |
| | CK Life Sciences International Holdings, Inc. | | 12,548,000 | | | 555,949 | |
| * | | Climax International Co., Ltd. | | 40,700 | | | 131 | |
| | CNT Group, Ltd. | | 8,315,264 | | | 416,253 | |
| * | | COL Capital, Ltd. | | 2,725,840 | | | 350,133 | |
| | Computer & Technologies Holdings, Ltd. | | 432,000 | | | 89,034 | |
| | Continental Holdings, Ltd. | | 5,148,250 | | | 53,547 | |
| | Cosmos Machinery Enterprises, Ltd. | | 1,616,400 | | | 120,246 | |
| * | | Cosway Corp., Ltd. | | 1,950,000 | | | 261,225 | |
| * | | CP Lotus Corp., Ltd. | | 11,420,000 | | | 403,801 | |
| | Cross-Harbour Holdings, Ltd. (The) | | 659,520 | | | 535,032 | |
| | CSI Properties, Ltd. | | 22,229,625 | | | 642,032 | |
| * | | CST Mining Group, Ltd. | | 71,688,000 | | | 579,254 | |
| * | | Culture Landmark Investment, Ltd. | | 10,196,000 | | | 110,310 | |
| * | | Culturecom Holdings, Ltd. | | 1,020,000 | | | 119,185 | |
33
The Asia Pacific Small Company Series
continued
| | | | | Shares | | Value†† | |
| HONG KONG — (Continued) | | | | | | |
| | Dah Sing Banking Group, Ltd. | | 1,071,840 | | $ | 911,029 | |
| | Dah Sing Financial Holdings, Ltd. | | 520,550 | | | 1,553,607 | |
| * | | Dan Form Holdings Co., Ltd. | | 3,261,260 | | | 221,807 | |
| #* | | Dejin Resources Group Co., Ltd. | | 23,892,000 | | | 202,707 | |
| | Dickson Concepts International, Ltd. | | 924,500 | | | 479,983 | |
| * | | Doxen Energy Group, Ltd. | | 542,796 | | | 76,924 | |
| | DVN Holdings, Ltd. | | 2,183,000 | | | 75,768 | |
| | Dynamic Holdings, Ltd. | | 374,000 | | | 57,927 | |
| | Eagle Nice International Holdings, Ltd. | | 1,078,000 | | | 208,977 | |
| # | | EcoGreen Fine Chemicals Group, Ltd. | | 1,112,000 | | | 230,091 | |
| * | | eForce Holdings, Ltd. | | 80,960 | | | 2,131 | |
| * | | EganaGoldpfeil Holdings, Ltd. | | 4,121,757 | | | — | |
| * | | e-Kong Group, Ltd. | | 620,000 | | | 24,702 | |
| | Emperor Entertainment Hotel, Ltd. | | 2,440,000 | | | 347,844 | |
| | Emperor International Holdings, Ltd. | | 5,836,753 | | | 898,086 | |
| # | | Emperor Watch & Jewellery, Ltd. | | 11,770,000 | | | 1,475,446 | |
| * | | ENM Holdings, Ltd. | | 15,112,000 | | | 1,006,615 | |
| * | | Enviro Energy International Holdings, Ltd. | | 4,138,000 | | | 103,507 | |
| * | | EPI Holdings, Ltd. | | 4,259,927 | | | 91,351 | |
| * | | eSun Holdings, Ltd. | | 2,438,000 | | | 343,814 | |
| | EVA Precision Industrial Holdings, Ltd. | | 5,544,000 | | | 1,338,806 | |
| * | | Ezcom Holdings, Ltd. | | 72,576 | | | 449 | |
| | Fairwood, Ltd. | | 337,600 | | | 440,954 | |
| | Far East Consortium International, Ltd. | | 4,570,342 | | | 644,597 | |
| * | | Far East Technology International, Ltd. | | 179,520 | | | 17,798 | |
| * | | First Natural Foods Holdings, Ltd. | | 2,365,000 | | | — | |
| #* | | Fook Woo Group Holdings, Ltd. | | 952,000 | | | 166,704 | |
| * | | Foundation Group, Ltd. | | 2,350,000 | | | 35,402 | |
| | Fountain SET Holdings, Ltd. | | 4,622,000 | | | 557,371 | |
| | Four Seas Mercantile Holdings, Ltd. | | 592,000 | | | 148,242 | |
| * | | Frasers Property China, Ltd. | | 16,477,000 | | | 349,564 | |
| * | | Freeman Corp., Ltd. | | 6,328,888 | | | 27,647 | |
| | Fujikon Industrial Holdings, Ltd. | | 912,000 | | | 109,194 | |
| * | | Genting Hong Kong, Ltd. | | 17,000 | | | 4,800 | |
| | Get Nice Holdings, Ltd. | | 19,044,000 | | | 733,322 | |
| | Giordano International, Ltd. | | 7,162,000 | | | 5,164,890 | |
| * | | Global Tech Holdings, Ltd. | | 5,098,000 | | | 19,918 | |
| # | | Glorious Sun Enterprises, Ltd. | | 2,662,000 | | | 808,083 | |
| | Gold Peak Industries Holding, Ltd. | | 3,118,642 | | | 284,749 | |
| | Golden Resources Development International, Ltd. | | 3,330,500 | | | 156,380 | |
| * | | Goldin Financial Holdings, Ltd. | | 480,000 | | | 44,441 | |
| * | | Goldin Properties Holdings, Ltd. | | 2,040,000 | | | 534,072 | |
| | Golik Holdings, Ltd. | | 250,500 | | | 16,698 | |
| * | | Good Fellow Resources Holdings, Ltd. | | 1,670,000 | | | 70,751 | |
| * | | Grande Holdings, Ltd. | | 882,000 | | | 46,561 | |
| | Great Eagle Holdings, Ltd. | | 248,160 | | | 485,925 | |
| * | | Greenheart Group, Ltd. | | 1,626,000 | | | 137,489 | |
| * | | G-Resources Group, Ltd. | | 53,682,000 | | | 2,997,388 | |
| * | | Group Sense International, Ltd. | | 2,448,000 | | | 51,104 | |
| | Guangnan Holdings, Ltd. | | 2,249,600 | | | 288,524 | |
| | Haitong International Securities Group, Ltd. | | 1,203,586 | | | 393,443 | |
| * | | Hang Fung Gold Technology, Ltd. | | 1,972,482 | | | — | |
| # | | Hang Ten Group Holdings, Ltd. | | 2,254,000 | | | 766,261 | |
| | Hanny Holdings, Ltd. | | 747,979 | | | 22,591 | |
| * | | Hans Energy Co., Ltd. | | 7,556,000 | | | 153,805 | |
| | Harbour Centre Development, Ltd. | | 957,500 | | | 1,097,047 | |
| * | | Hengli Commercial Properties Group, Ltd. | | 336,000 | | | 16,623 | |
| | High Fashion International, Ltd. | | 268,000 | | | 96,669 | |
| | HKR International, Ltd. | | 5,895,136 | | | 1,840,466 | |
| | Hon Kwok Land Investment Co., Ltd. | | 314,800 | | | 102,828 | |
| * | | Hong Fok Land, Ltd. | | 1,210,000 | | | 1,558 | |
34
The Asia Pacific Small Company Series
continued
| | | | | Shares | | Value†† | |
| HONG KONG — (Continued) | | | | | | |
| | Hong Kong Ferry Holdings, Ltd. | | 809,300 | | $ | 634,655 | |
| | Hong Kong Food Investment Holdings, Ltd. | | 202,184 | | | 21,929 | |
| | Hongkong Chinese, Ltd. | | 4,774,000 | | | 821,954 | |
| | Hop Fung Group Holdings, Ltd. | | 888,000 | | | 53,363 | |
| | Hsin Chong Construction Group, Ltd. | | 1,569,658 | | | 249,821 | |
| * | | Huafeng Group Holdings, Ltd. | | 6,713,325 | | | 146,398 | |
| | Hung Hing Printing Group, Ltd. | | 1,188,000 | | | 235,761 | |
| | Hutchison Harbour Ring, Ltd. | | 9,432,000 | | | 799,735 | |
| | Hutchison Telecommunications Hong Kong Holdings, Ltd. | | 378,000 | | | 145,195 | |
| * | | Hybrid Kinetic Group, Ltd. | | 14,884,000 | | | 160,511 | |
| * | | HyComm Wireless, Ltd. | | 89,090 | | | 12,319 | |
| * | | I-Cable Communications, Ltd. | | 531,000 | | | 26,921 | |
| * | | IDT International, Ltd. | | 6,240,183 | | | 72,096 | |
| * | | Imagi International Holdings, Ltd. | | 17,320,000 | | | 419,257 | |
| | iOne Holdings, Ltd. | | 3,140,000 | | | 34,230 | |
| | IPE Group, Ltd. | | 2,060,000 | | | 182,543 | |
| # | | IT, Ltd. | | 2,802,532 | | | 1,537,855 | |
| | ITC Corp., Ltd. | | 893,645 | | | 40,811 | |
| #* | | ITC Properties Group, Ltd. | | 3,645,747 | | | 945,976 | |
| #* | | Jinchuan Group International Resources Co., Ltd. | | 1,319,000 | | | 353,173 | |
| * | | Jinhui Holdings, Ltd. | | 384,000 | | | 67,570 | |
| * | | Jiuzhou Development Co., Ltd. | | 2,558,000 | | | 161,290 | |
| | JLF Investment Co., Ltd. | | 3,293,500 | | | 214,806 | |
| | Joyce Boutique Holdings, Ltd. | | 1,530,000 | | | 143,147 | |
| | Junefield Department Store Group, Ltd. | | 306,000 | | | 18,905 | |
| # | | K Wah International Holdings, Ltd. | | 5,583,405 | | | 1,411,921 | |
| | Kam Hing International Holdings, Ltd. | | 1,974,000 | | | 167,138 | |
| | Kantone Holdings, Ltd. | | 14,737,991 | | | 134,518 | |
| * | | Karl Thomson Holdings, Ltd. | | 1,188,000 | | | 50,732 | |
| | Karrie International Holdings, Ltd. | | 1,383,600 | | | 64,946 | |
| | Keck Seng Investments (Hong Kong), Ltd. | | 904,600 | | | 378,318 | |
| | Kin Yat Holdings, Ltd. | | 586,000 | | | 94,325 | |
| * | | King Pacific International Holdings, Ltd. | | 1,404,200 | | | 22,058 | |
| * | | King Stone Energy Group, Ltd. | | 2,822,000 | | | 270,831 | |
| | Kingmaker Footwear Holdings, Ltd. | | 1,476,955 | | | 203,241 | |
| | Kingston Financial Group, Ltd. | | 11,683,000 | | | 1,199,776 | |
| | Kith Holdings, Ltd. | | 204,000 | | | 27,784 | |
| * | | Kiu Hung Energy Holdings, Ltd. | | 10,810,000 | | | 95,770 | |
| * | | Ko Yo Chemical Group, Ltd. | | 16,260,000 | | | 229,822 | |
| | Kowloon Development Co., Ltd. | | 1,588,000 | | | 1,389,328 | |
| * | | KTP Holdings, Ltd. | | 560,400 | | | 51,474 | |
| | Kwoon Chung Bus Holdings, Ltd. | | 556,000 | | | 117,198 | |
| * | | Lai Sun Development Co., Ltd. | | 63,116,466 | | | 843,018 | |
| * | | Lai Sun Garment International, Ltd. | | 2,770,000 | | | 210,152 | |
| | Lam Soon Hong Kong, Ltd. | | 302,310 | | | 173,859 | |
| * | | Leading Spirit High-Tech Holdings Co., Ltd. | | 2,310,000 | | | 2,974 | |
| # | | Lee & Man Chemical Co., Ltd. | | 1,420,000 | | | 851,656 | |
| # | | Lee & Man Handbags, Ltd. | | 1,420,000 | | | 112,658 | |
| | Lee’s Pharmaceutical Holdings, Ltd. | | 5,000 | | | 1,865 | |
| | Lerado Group Holdings Co., Ltd. | | 1,900,000 | | | 173,308 | |
| | Li Heng Chemical Fibre Technologies, Ltd. | | 2,023,000 | | | 191,746 | |
| | Lippo China Resources, Ltd. | | 8,092,000 | | | 163,192 | |
| | Lippo, Ltd. | | 1,195,700 | | | 355,476 | |
| * | | Lisi Group Holdings, Ltd. | | 4,262,000 | | | 166,954 | |
| | Liu Chong Hing Investment, Ltd. | | 775,200 | | | 770,382 | |
| * | | Longrun Tea Group Co., Ltd. | | 1,900,000 | | | 88,047 | |
| | Luen Thai Holdings, Ltd. | | 1,345,000 | | | 95,315 | |
| | Luks Industrial Group, Ltd. | | 428,913 | | | 85,280 | |
| * | | Lung Cheong International Holdings, Ltd. | | 6,790,000 | | | 244,137 | |
| | Lung Kee (Bermuda) Holdings, Ltd. | | 1,597,875 | | | 736,178 | |
| * | | Madex International Holdings, Ltd. | | 3,182,000 | | | 58,041 | |
35
The Asia Pacific Small Company Series
continued
| | | | | Shares | | Value†† | |
| HONG KONG — (Continued) | | | | | | |
| | Magnificent Estates, Ltd. | | 13,184,000 | | $ | 439,987 | |
| | Mainland Headwear Holdings, Ltd. | | 765,600 | | | 78,789 | |
| | Man Yue Technology Holdings, Ltd. | | 1,064,000 | | | 205,202 | |
| #* | | Mascotte Holdings, Ltd. | | 12,352,000 | | | 367,389 | |
| | Matrix Holdings, Ltd. | | 1,067,414 | | | 241,871 | |
| * | | Mei Ah Entertainment Group, Ltd. | | 11,040,000 | | | 177,600 | |
| | Melbourne Enterprises, Ltd. | | 40,500 | | | 583,665 | |
| # | | Melco International Development, Ltd. | | 3,309,000 | | | 2,446,163 | |
| # | | Midland Holdings, Ltd. | | 2,934,000 | | | 1,521,805 | |
| | Ming Fai International Holdings, Ltd. | | 1,680,000 | | | 217,921 | |
| * | | Ming Fung Jewellery Group, Ltd. | | 9,050,000 | | | 544,687 | |
| | Miramar Hotel & Investment Co., Ltd. | | 772,000 | | | 815,646 | |
| | Modern Beauty Salon Holdings, Ltd. | | 160,000 | | | 15,032 | |
| * | | Mongolia Energy Corp., Ltd. | | 10,603,000 | | | 964,575 | |
| * | | Nan Nan Resources Enterprise, Ltd. | | 330,000 | | | 36,831 | |
| | Nanyang Holdings, Ltd. | | 137,500 | | | 345,124 | |
| | National Electronics Holdings, Ltd. | | 2,266,000 | | | 195,106 | |
| | Natural Beauty Bio-Technology, Ltd. | | 4,470,000 | | | 776,995 | |
| # | | Neo-Neon Holdings, Ltd. | | 1,898,000 | | | 314,283 | |
| | Net2Gather China Holdings, Ltd. | | 8,139,720 | | | 125,404 | |
| | New Century Group Hong Kong, Ltd. | | 13,351,464 | | | 270,878 | |
| * | | New Focus Auto Tech Holdings, Ltd. | | 104,000 | | | 22,331 | |
| * | | New Smart Energy Group, Ltd. | | 23,975,000 | | | 277,824 | |
| #* | | New Times Energy Corp., Ltd. | | 1,297,600 | | | 98,354 | |
| | Neway Group Holdings, Ltd. | | 24,579,087 | | | 176,803 | |
| | NewOcean Green Energy Holdings, Ltd. | | 3,032,000 | | | 592,688 | |
| * | | Next Media, Ltd. | | 3,725,183 | | | 325,208 | |
| * | | Ngai LiK Industrial Holdings, Ltd. | | 252,200 | | | 13,963 | |
| * | | Norstar Founders Group, Ltd. | | 3,256,000 | | | — | |
| * | | North Asia Resources Holdings, Ltd. | | 2,108,600 | | | 60,190 | |
| * | | Orange Sky Golden Harvest Entertainment Holdings, Ltd. | | 6,229,706 | | | 232,390 | |
| * | | Orient Power Holdings, Ltd. | | 804,000 | | | 19,462 | |
| # | | Oriental Watch Holdings, Ltd. | | 1,604,800 | | | 733,320 | |
| | Pacific Andes International Holdings, Ltd. | | 5,262,919 | | | 459,204 | |
| | Pacific Basin Shipping, Ltd. | | 7,551,000 | | | 3,024,603 | |
| * | | Pacific Century Premium Developments, Ltd. | | 4,403,000 | | | 639,785 | |
| | Pacific Textile Holdings, Ltd. | | 1,750,000 | | | 989,612 | |
| | Paliburg Holdings, Ltd. | | 3,152,830 | | | 907,465 | |
| * | | Pan Asia Environmental Protection Group, Ltd. | | 1,258,432 | | | 105,260 | |
| * | | Paul Y Engineering Group (BVI), Ltd. | | 77,759 | | | 3,004 | |
| | Paul Y Engineering Group, Ltd. | | 107,666 | | | 6,154 | |
| #* | | Peace Mark Holdings, Ltd. | | 2,738,022 | | | — | |
| | Pearl Oriental Oil, Ltd. | | 5,886,800 | | | 468,628 | |
| | Pegasus International Holdings, Ltd. | | 226,000 | | | 35,058 | |
| | Pico Far East Holdings, Ltd. | | 3,910,000 | | | 698,726 | |
| * | | PME Group, Ltd. | | 7,020,000 | | | 160,325 | |
| * | | PNG Resources Holdings, Ltd. | | 16,626,362 | | | 209,782 | |
| | Pokfulam Development Co., Ltd. | | 234,000 | | | 223,222 | |
| | Polytec Asset Holdings, Ltd. | | 10,763,526 | | | 1,117,920 | |
| | Public Financial Holdings, Ltd. | | 3,194,000 | | | 1,423,458 | |
| | PYI Corp., Ltd. | | 12,919,134 | | | 315,515 | |
| * | | Pyxis Group, Ltd. | | 1,936,000 | | | 42,376 | |
| | Raymond Industrial, Ltd. | | 1,383,400 | | | 129,363 | |
| | Regal Hotels International Holdings, Ltd. | | 2,415,800 | | | 729,398 | |
| | Richfield Group Holdings, Ltd. | | 3,248,000 | | | 156,186 | |
| * | | Rising Development Holdings, Ltd. | | 2,278,000 | | | 284,057 | |
| | Rivera Holdings, Ltd. | | 5,710,000 | | | 167,138 | |
| | Roadshow Holdings, Ltd. | | 1,456,000 | | | 118,177 | |
| | S.A.S. Dragon Holdings, Ltd. | | 1,212,000 | | | 248,928 | |
| | Sa Sa International Holdings, Ltd. | | 326,000 | | | 179,266 | |
| | Safety Godown Co., Ltd. | | 398,000 | | | 266,183 | |
36
The Asia Pacific Small Company Series
continued
| | | | | Shares | | Value†† | |
| HONG KONG — (Continued) | | | | | | |
| | Samling Global, Ltd. | | 6,160,000 | | $ | 300,207 | |
| | Samson Paper Holdings, Ltd. | | 1,800,000 | | | 86,542 | |
| * | | San Miguel Brewery Hong Kong, Ltd. | | 612,800 | | | 99,367 | |
| * | | Sanyuan Group, Ltd. | | 415,000 | | | 8,015 | |
| | SEA Holdings, Ltd. | | 1,140,000 | | | 488,197 | |
| * | | SEEC Media Group, Ltd. | | 136,000 | | | 4,005 | |
| * | | Sheng Yuan Holdings, Ltd. | | 210,000 | | | 11,207 | |
| # | | Shenyin Wanguo, Ltd. | | 1,297,500 | | | 343,919 | |
| | Shenzhen High-Tech Holdings, Ltd. | | 812,000 | | | 45,413 | |
| * | | Shougang Concord Grand Group, Ltd. | | 2,451,000 | | | 81,777 | |
| * | | Shougang Concord Technology Holdings, Ltd. | | 4,201,809 | | | 162,303 | |
| * | | Shun Ho Resources Holdings, Ltd. | | 483,000 | | | 65,341 | |
| * | | Shun Ho Technology Holdings, Ltd. | | 1,037,452 | | | 133,367 | |
| | Shun Tak Holdings, Ltd. | | 4,569,941 | | | 1,699,119 | |
| | Sing Tao News Corp., Ltd. | | 1,974,000 | | | 279,015 | |
| | Singamas Container Holdings, Ltd. | | 5,922,000 | | | 1,115,532 | |
| * | | Sino Dragon New Energy Holdings, Ltd. | | 5,816,000 | | | 258,352 | |
| * | | Sino Gas Group, Ltd. | | 4,980,000 | | | 134,358 | |
| * | | Sinocan Holdings, Ltd. | | 350,000 | | | 1,758 | |
| * | | Sinocop Resources Holdings, Ltd. | | 3,980,000 | | | 399,712 | |
| * | | Sino-Tech International Holdings, Ltd. | | 27,990,000 | | | 304,967 | |
| #* | | Sinotel Technologies, Ltd. | | 763,000 | | | 63,926 | |
| | SIS International Holdings, Ltd. | | 34,000 | | | 12,464 | |
| * | | Skyfame Realty Holdings, Ltd. | | 1,975,750 | | | 248,578 | |
| | SmarTone Telecommunications Holdings, Ltd. | | 1,463,000 | | | 2,526,336 | |
| * | | SMI Publishing Group, Ltd. | | 250,511 | | | 484 | |
| | SOCAM Development, Ltd. | | 938,771 | | | 864,218 | |
| * | | Solomon Systech International, Ltd. | | 6,312,000 | | | 141,899 | |
| * | | Soundwill Holdings, Ltd. | | 12,000 | | | 13,498 | |
| | South China (China), Ltd. | | 6,744,000 | | | 390,043 | |
| | South China Financial Holdings, Ltd. | | 4,872,000 | | | 38,165 | |
| * | | South China Land, Ltd. | | 20,847,170 | | | 248,772 | |
| | Southeast Asia Properties & Finance, Ltd. | | 289,891 | | | 72,765 | |
| | Stella International Holdings, Ltd. | | 323,574 | | | 702,368 | |
| | Styland Holdings, Ltd. | | 129,347 | | | 966 | |
| * | | Success Universe Group, Ltd. | | 5,552,000 | | | 142,783 | |
| | Sun Hing Vision Group Holdings, Ltd. | | 358,000 | | | 128,367 | |
| | Sun Hung Kai & Co., Ltd. | | 1,422,621 | | | 745,898 | |
| * | | Sun Innovation Holdings, Ltd. | | 10,735,655 | | | 150,003 | |
| | Sunwah Kingsway Capital Holdings, Ltd. | | 5,750,000 | | | 111,770 | |
| * | | Sunway International Holdings, Ltd. | | 866,000 | | | 26,019 | |
| * | | Superb Summit International Timber Co., Ltd. | | 12,186,600 | | | 298,362 | |
| # | | Sustainable Forest Holdings, Ltd. | | 10,775,250 | | | 208,717 | |
| | Synergis Holdings, Ltd. | | 322,033 | | | 27,324 | |
| * | | Tack Fiori International Group, Ltd. | | 44,480 | | | 859 | |
| * | | Tack Hsin Holdings, Ltd. | | 1,024,000 | | | 231,133 | |
| | Tai Cheung Holdings, Ltd. | | 1,919,000 | | | 1,172,466 | |
| | Tai Sang Land Development, Ltd. | | 576,984 | | | 215,977 | |
| * | | Talent Property Group, Ltd. | | 5,106,420 | | | 141,913 | |
| | Tan Chong International, Ltd. | | 1,212,000 | | | 287,607 | |
| #* | | Taung Gold International, Ltd. | | 11,460,000 | | | 220,572 | |
| | Techtronic Industries Co., Ltd. | | 2,592,000 | | | 2,658,755 | |
| * | | Termbray Industries International (Holdings), Ltd. | | 2,304,900 | | | 175,150 | |
| | Tern Properties Co., Ltd. | | 51,200 | | | 21,966 | |
| | Texwinca Holdings, Ltd. | | 1,934,000 | | | 2,141,797 | |
| #* | | Theme International Holdings, Ltd. | | 4,130,000 | | | 125,213 | |
| | Tian Teck Land, Ltd. | | 1,054,000 | | | 848,718 | |
| | Tianda Holdings, Ltd. | | 306,000 | | | 17,353 | |
| #* | | Titan Petrochemicals Group, Ltd. | | 11,860,000 | | | 486,431 | |
| * | | Tom Group, Ltd. | | 3,612,000 | | | 315,110 | |
| | Tongda Group Holdings, Ltd. | | 10,120,000 | | | 279,198 | |
37
The Asia Pacific Small Company Series
continued
| | | | | Shares | | Value†† | |
| HONG KONG — (Continued) | | | | | | |
| # | | Top Form International, Ltd. | | 2,760,000 | | $ | 127,683 | |
| * | | Topsearch International Holdings, Ltd. | | 3,850,000 | | | 104,066 | |
| | Town Health International Investments, Ltd. | | 1,175,165 | | | 176,647 | |
| | Tradelink Electronic Commerce, Ltd. | | 804,000 | | | 104,191 | |
| | Transport International Holdings, Ltd. | | 876,941 | | | 1,715,046 | |
| | Trinity, Ltd. | | 960,000 | | | 691,800 | |
| | Tristate Holdings, Ltd. | | 188,000 | | | 95,429 | |
| * | | TSC Group Holdings, Ltd. | | 1,928,000 | | | 291,200 | |
| # | | Tse Sui Luen Jewellery International, Ltd. | | 300,000 | | | 204,387 | |
| | Tungtex Holdings Co., Ltd. | | 910,000 | | | 102,992 | |
| | Tysan Holdings, Ltd. | | 1,040,773 | | | 187,289 | |
| # | | United Laboratories International Holdings, Ltd. (The) | | 2,146,000 | | | 1,231,975 | |
| | Universal Technologies Holdings, Ltd. | | 6,000,000 | | | 366,324 | |
| * | | U-Right International Holdings, Ltd. | | 4,746,000 | | | 8,555 | |
| * | | Value Convergence Holdings, Ltd. | | 1,216,000 | | | 118,591 | |
| # | | Value Partners Group, Ltd. | | 2,782,000 | | | 1,416,830 | |
| | Van Shung Chong Holdings, Ltd. | | 2,171,335 | | | 117,425 | |
| * | | Vantage International Holdings, Ltd. | | 2,778,000 | | | 146,317 | |
| | Varitronix International, Ltd. | | 1,072,293 | | | 453,079 | |
| | Vedan International Holdings, Ltd. | | 3,272,000 | | | 199,832 | |
| | Veeko International Holdings, Ltd. | | 4,423,751 | | | 128,383 | |
| | Victory City International Holdings, Ltd. | | 3,363,076 | | | 327,993 | |
| * | | Vision Values Holdings, Ltd. | | 281,400 | | | 7,968 | |
| | Vitasoy International Holdings, Ltd. | | 3,623,000 | | | 2,664,442 | |
| * | | Vongroup, Ltd. | | 10,865,000 | | | 48,748 | |
| * | | VST Holdings, Ltd. | | 2,312,000 | | | 287,541 | |
| | Wah Ha Realty Co., Ltd. | | 278,600 | | | 97,212 | |
| #* | | Wah Nam International Holdings, Ltd. | | 22,765,720 | | | 1,924,440 | |
| | Wai Kee Holdings, Ltd. | | 7,960,738 | | | 1,340,591 | |
| | Wang On Group, Ltd. | | 8,391,286 | | | 66,854 | |
| * | | Warderly International Holdings, Ltd. | | 520,000 | | | 32,138 | |
| | Water Oasis Group, Ltd. | | 1,632,000 | | | 255,498 | |
| | Win Hanverky Holdings, Ltd. | | 1,712,000 | | | 147,213 | |
| * | | Winfoong International, Ltd. | | 1,031,000 | | | 8,192 | |
| | Wing On Co. International, Ltd. | | 781,000 | | | 1,547,767 | |
| | Wing Tai Properties, Ltd. | | 1,957,331 | | | 615,794 | |
| * | | Winteam Pharmaceutical Group, Ltd. | | 4,264,000 | | | 706,356 | |
| * | | Wo Kee Hong Holdings, Ltd. | | 1,175,000 | | | 30,576 | |
| | Wong’s International (Holdings), Ltd. | | 737,641 | | | 131,695 | |
| | Wong’s Kong King International Holdings, Ltd. | | 120,000 | | | 11,582 | |
| | Xingye Copper International Group, Ltd. | | 1,615,000 | | | 205,089 | |
| | Y. T. Realty Group, Ltd. | | 865,000 | | | 203,910 | |
| | Yangtzekiang Garment, Ltd. | | 606,500 | | | 155,115 | |
| | Yau Lee Holdings, Ltd. | | 534,000 | | | 66,590 | |
| | Yeebo (International Holdings), Ltd. | | 572,000 | | | 91,616 | |
| # | | YGM Trading, Ltd. | | 362,000 | | | 934,300 | |
| | Yugang International, Ltd. | | 93,492,000 | | | 516,136 | |
| TOTAL HONG KONG | | | | | 151,640,732 | |
| | | |
| MALAYSIA — (0.0%) | | | | | | |
| * | | Autoways Holdings Berhad | | 10,000 | | | 4,069 | |
| * | | Rekapacific Berhad | | 473,000 | | | — | |
| TOTAL MALAYSIA | | | | | 4,069 | |
| | | |
| NEW ZEALAND — (5.9%) | | | | | | |
| | Abano Healthcare Group, Ltd. | | 26,266 | | | 85,733 | |
| # | | Air New Zealand, Ltd. | | 2,209,230 | | | 1,546,434 | |
| | Auckland International Airport, Ltd. | | 1,384,681 | | | 2,712,071 | |
| | Cavalier Corp., Ltd. | | 283,674 | | | 425,325 | |
| | CDL Investments (New Zealand), Ltd. | | 395,965 | | | 92,653 | |
| | Colonial Motor Co., Ltd. | | 148,846 | | | 301,718 | |
38
The Asia Pacific Small Company Series
continued
| | | | | Shares | | Value†† | |
| NEW ZEALAND — (Continued) | | | | | | |
| | Ebos Group, Ltd. | | 175,913 | | $ | 896,498 | |
| * | | Fisher & Paykel Appliances Holdings, Ltd. | | 3,104,317 | | | 869,823 | |
| | Fisher & Paykel Healthcare Corp., Ltd. | | 2,826,030 | | | 5,520,467 | |
| | Freightways, Ltd. | | 777,409 | | | 2,226,456 | |
| | Hallenstein Glasson Holdings, Ltd. | | 242,461 | | | 660,188 | |
| * | | Heartland New Zealand, Ltd. | | 173,369 | | | 66,103 | |
| | Hellaby Holdings, Ltd. | | 344,804 | | | 645,870 | |
| | Infratil, Ltd. | | 2,260,467 | | | 3,303,938 | |
| | Mainfreight, Ltd. | | 424,578 | | | 3,266,592 | |
| # | | Methven, Ltd. | | 70,490 | | | 59,183 | |
| | Michael Hill International, Ltd. | | 1,534,152 | | | 1,060,565 | |
| | Millennium & Copthorne Hotels (New Zealand), Ltd. | | 1,387,344 | | | 429,157 | |
| | New Zealand Exchange, Ltd. | | 370,853 | | | 663,737 | |
| | New Zealand Oil & Gas, Ltd. | | 1,873,428 | | | 1,024,365 | |
| | New Zealand Refining Co., Ltd. | | 614,710 | | | 1,339,498 | |
| | Northland Port Corp. (New Zealand), Ltd. | | 217,513 | | | 258,753 | |
| # | | Nuplex Industries, Ltd. | | 1,013,819 | | | 1,803,955 | |
| * | | Pike River Coal, Ltd. | | 490,805 | | | — | |
| | Port of Tauranga, Ltd. | | 528,322 | | | 4,090,750 | |
| | Pumpkin Patch, Ltd. | | 606,913 | | | 301,604 | |
| * | | Pyne Gould Corp., Ltd. | | 173,369 | | | 46,514 | |
| * | | Pyne Gould Guinness, Ltd. | | 336,600 | | | 99,526 | |
| * | | Rakon, Ltd. | | 346,364 | | | 121,266 | |
| | Restaurant Brands New Zealand, Ltd. | | 406,610 | | | 655,084 | |
| * | | Richina Pacific, Ltd. | | 274,180 | | | 76,832 | |
| * | | Rubicon, Ltd. | | 1,113,829 | | | 314,481 | |
| | Ryman Healthcare, Ltd. | | 1,673,055 | | | 3,525,028 | |
| # | | Sanford, Ltd. | | 393,618 | | | 1,253,130 | |
| | Scott Technology, Ltd. | | 35,843 | | | 42,477 | |
| * | | Seafresh Fisheries, Ltd. | | 80,520 | | | 1,755 | |
| | Skellerup Holdings, Ltd. | | 277,959 | | | 294,067 | |
| | Sky City Entertainment Group, Ltd. | | 3,025,486 | | | 8,083,163 | |
| | Sky Network Television, Ltd. | | 991,419 | | | 4,091,030 | |
| | South Port (New Zealand), Ltd. | | 30,744 | | | 85,075 | |
| | Steel & Tube Holdings, Ltd. | | 389,046 | | | 639,277 | |
| * | | Tenon, Ltd. | | 19,132 | | | 10,794 | |
| * | | Tourism Holdings, Ltd. | | 274,867 | | | 126,235 | |
| | Tower, Ltd. | | 902,876 | | | 1,073,876 | |
| | TrustPower, Ltd. | | 34,905 | | | 192,867 | |
| | Vector, Ltd. | | 970,171 | | | 1,861,978 | |
| | Warehouse Group, Ltd. | | 584,483 | | | 1,367,042 | |
| TOTAL NEW ZEALAND | | | | | 57,612,933 | |
| | | |
| SINGAPORE — (9.3%) | | | | | | |
| #* | | Abterra, Ltd. | | 528,800 | | | 303,347 | |
| | Advanced Holdings, Ltd. | | 691,000 | | | 69,452 | |
| | Armstrong Industrial Corp., Ltd. | | 1,236,000 | | | 214,467 | |
| * | | Asiasons Capital, Ltd. | | 1,048,000 | | | 153,961 | |
| * | | Asiatravel.com Holdings, Ltd. | | 17,879 | | | 4,124 | |
| # | | ASL Marine Holdings, Ltd. | | 719,600 | | | 265,903 | |
| | A-Sonic Aerospace, Ltd. | | 408,996 | | | 14,031 | |
| * | | AusGroup, Ltd. | | 1,915,000 | | | 464,012 | |
| | Baker Technology, Ltd. | | 1,272,000 | | | 239,789 | |
| #* | | Ban Joo & Co., Ltd. | | 2,179,000 | | | 18,557 | |
| | Banyan Tree Holdings, Ltd. | | 955,000 | | | 441,458 | |
| | Beng Kuang Marine, Ltd. | | 922,000 | | | 107,900 | |
| | Best World International, Ltd. | | 221,500 | | | 24,611 | |
| | Beyonics Technology, Ltd. | | 6,510,300 | | | 1,279,212 | |
| # | | BH Global Marine, Ltd. | | 621,000 | | | 91,604 | |
| * | | Biosensors International Group, Ltd. | | 3,419,237 | | | 3,763,725 | |
| | Bonvests Holdings, Ltd. | | 978,000 | | | 662,517 | |
39
The Asia Pacific Small Company Series
continued
| | | | | Shares | | Value†† | |
| SINGAPORE — (Continued) | | | | | | |
| | Boustead Singapore, Ltd. | | 887,000 | | $ | 554,668 | |
| | Breadtalk Group, Ltd. | | 385,800 | | | 160,816 | |
| # | | Broadway Industrial Group, Ltd. | | 922,000 | | | 213,025 | |
| | Brothers Holdings, Ltd. | | 454,628 | | | 59,587 | |
| | Bukit Sembawang Estates, Ltd. | | 423,003 | | | 1,281,392 | |
| * | | Bund Center Investment, Ltd. | | 1,014,000 | | | 99,298 | |
| | CEI Contract Manufacturing, Ltd. | | 432,000 | | | 34,307 | |
| | Cerebos Pacific, Ltd. | | 545,000 | | | 2,084,318 | |
| | CH Offshore, Ltd. | | 1,539,400 | | | 416,915 | |
| * | | Changjiang Fertilizer Holdings, Ltd. | | 515 | | | 80 | |
| | China Aviation Oil Singapore Corp., Ltd. | | 936,000 | | | 710,881 | |
| * | | China Dairy Group, Ltd. | | 1,502,000 | | | 105,379 | |
| * | | China Energy, Ltd. | | 3,110,000 | | | 134,324 | |
| | China Merchants Holdings Pacific, Ltd. | | 809,000 | | | 393,987 | |
| | China Sunsine Chemical Holdings, Ltd. | | 28,000 | | | 5,350 | |
| | | China XLX Fertiliser, Ltd. | | 618,000 | | | 151,979 | |
| | Chip Eng Seng Corp., Ltd. | | 1,972,800 | | | 569,970 | |
| | Chosen Holdings, Ltd. | | 1,202,000 | | | 109,662 | |
| | Chuan Hup Holdings, Ltd. | | 3,967,000 | | | 635,391 | |
| # | | Creative Technology, Ltd. | | 272,200 | | | 457,022 | |
| | CSC Holdings, Ltd. | | 1,829,000 | | | 132,064 | |
| | CSE Global, Ltd. | | 2,046,000 | | | 1,185,410 | |
| | CWT, Ltd. | | 1,046,700 | | | 797,956 | |
| | Datapulse Technology, Ltd. | | 27,000 | | | 3,906 | |
| * | | Delong Holdings, Ltd. | | 1,361,000 | | | 271,270 | |
| | Ellipsiz, Ltd. | | 123,000 | | | 6,401 | |
| | EnGro Corp, Ltd. | | 354,000 | | | 205,085 | |
| * | | Enviro-Hub Holdings, Ltd. | | 1,445,666 | | | 109,923 | |
| | Etika International Holdings, Ltd. | | 179,000 | | | 35,165 | |
| | Eu Yan Sang International, Ltd. | | 562,800 | | | 291,133 | |
| * | | euNetworks Group, Ltd. | | 411,000 | | | 5,721 | |
| # | | Ezion Holdings, Ltd. | | 1,968,000 | | | 1,001,051 | |
| # | | Ezra Holdings, Ltd. | | 2,321,000 | | | 1,499,844 | |
| | F.J. Benjamin Holdings, Ltd. | | 1,210,000 | | | 270,490 | |
| | Falcon Energy Group, Ltd. | | 1,007,000 | | | 144,811 | |
| * | | Federal International 2000, Ltd. | | 1,675,350 | | | 43,917 | |
| # | | First Resources, Ltd. | | 1,203,000 | | | 1,399,870 | |
| | Food Empire Holdings, Ltd. | | 1,094,400 | | | 265,465 | |
| # | | Fragrance Group, Ltd. | | 2,749,000 | | | 666,216 | |
| | Freight Links Express Holdings, Ltd. | | 4,140,737 | | | 178,205 | |
| * | | Fu Yu Corp., Ltd. | | 3,544,750 | | | 168,870 | |
| #* | | Gallant Venture, Ltd. | | 2,386,000 | | | 440,896 | |
| | GK Goh Holdings, Ltd. | | 1,458,000 | | | 786,016 | |
| | Global Yellow Pages, Ltd. | | 299,000 | | | 19,852 | |
| #* | | GMG Global, Ltd. | | 8,978,000 | | | 774,471 | |
| | Goodpack, Ltd. | | 1,160,000 | | | 1,238,381 | |
| | GP Batteries International, Ltd. | | 343,000 | | | 270,925 | |
| | GP Industries, Ltd. | | 2,872,209 | | | 810,401 | |
| * | | Grand Banks Yachts, Ltd. | | 240,000 | | | 38,672 | |
| | GuocoLand, Ltd. | | 433,314 | | | 587,722 | |
| | GuocoLeisure, Ltd. | | 1,460,000 | | | 668,971 | |
| | Guthrie GTS, Ltd. | | 282,000 | | | 98,843 | |
| * | | Healthway Medical Corp., Ltd. | | 4,193,776 | | | 255,357 | |
| | Hersing Corp., Ltd. | | 1,285,000 | | | 217,260 | |
| * | | HG Metal Manufacturing, Ltd. | | 426,000 | | | 29,356 | |
| | Hiap Seng Engineering, Ltd. | | 612,000 | | | 132,087 | |
| | Hi-P International, Ltd. | | 1,203,000 | | | 561,520 | |
| | Ho Bee Investment, Ltd. | | 1,063,000 | | | 839,395 | |
| * | | Hong Fok Corp., Ltd. | | 2,769,700 | | | 863,242 | |
| | Hong Leong Asia, Ltd. | | 522,000 | | | 629,685 | |
| | Hotel Grand Central, Ltd. | | 1,182,535 | | | 633,254 | |
40
The Asia Pacific Small Company Series
continued
| | | | | Shares | | Value†† | |
| SINGAPORE — (Continued) | | | | | | |
| | Hotel Properties, Ltd. | | 1,346,400 | | $ | 1,802,778 | |
| | Hour Glass, Ltd. | | 622,744 | | | 513,576 | |
| | HTL International Holdings, Ltd. | | 1,063,843 | | | 253,969 | |
| #* | | Huan Hsin Holdings, Ltd. | | 1,106,400 | | | 56,431 | |
| | HupSteel, Ltd. | | 1,572,875 | | | 235,832 | |
| | Hwa Hong Corp., Ltd. | | 2,186,000 | | | 733,116 | |
| # | | Hyflux, Ltd. | | 2,347,500 | | | 2,180,122 | |
| | | IFS Capital, Ltd. | | 421,080 | | | 113,747 | |
| * | | Informatics Education, Ltd. | | 2,722,000 | | | 119,300 | |
| | InnoTek, Ltd. | | 846,000 | | | 217,887 | |
| | IPC Corp., Ltd. | | 724,000 | | | 61,474 | |
| | Isetan (Singapore), Ltd. | | 122,500 | | | 315,119 | |
| | Jadason Enterprises, Ltd. | | 728,000 | | | 31,820 | |
| * | | Jasper Investments, Ltd. | | 90,680 | | | 4,276 | |
| * | | Jaya Holdings, Ltd. | | 1,468,000 | | | 530,707 | |
| * | | JES International Holdings, Ltd. | | 2,096,000 | | | 252,325 | |
| * | | Jiutian Chemical Group, Ltd. | | 2,337,000 | | | 76,355 | |
| #* | | Jurong Technologies Industrial Corp., Ltd. | | 2,227,680 | | | — | |
| | K1 Ventures, Ltd. | | 3,349,500 | | | 196,226 | |
| # | | Keppel Telecommunications & Transportation, Ltd. | | 1,409,600 | | | 1,207,977 | |
| | Khong Guan Flour Milling, Ltd. | | 35,000 | | | 42,230 | |
| | Kian Ann Engineering, Ltd. | | 1,276,000 | | | 186,895 | |
| | Kian Ho Bearings, Ltd. | | 664,500 | | | 113,007 | |
| | Koh Brothers Group, Ltd. | | 1,312,000 | | | 186,249 | |
| * | | Lafe Corp., Ltd. | | 1,234,800 | | | 55,516 | |
| | LC Development, Ltd. | | 2,829,504 | | | 298,802 | |
| | Lee Kim Tah Holdings, Ltd. | | 1,600,000 | | | 741,350 | |
| | Lion Asiapac, Ltd. | | 473,000 | | | 58,504 | |
| | Lum Chang Holdings, Ltd. | | 1,042,030 | | | 225,109 | |
| | M1, Ltd. | | 1,427,000 | | | 2,751,573 | |
| #* | | Manhattan Resources, Ltd. | | 960,000 | | | 698,933 | |
| #* | | Marco Polo Marine, Ltd. | | 608,000 | | | 154,726 | |
| | Memstar Technology, Ltd. | | 1,114,000 | | | 49,016 | |
| | Memtech International, Ltd. | | 1,322,000 | | | 99,192 | |
| # | | Mercator Lines Singapore, Ltd. | | 555,000 | | | 49,334 | |
| | Metro Holdings, Ltd. | | 2,085,792 | | | 1,053,296 | |
| * | | Miclyn Express Offshore, Ltd. | | 45,953 | | | 93,099 | |
| # | | Midas Holdings, Ltd. | | 4,612,000 | | | 1,172,467 | |
| * | | Mirach Energy, Ltd. | | 460,000 | | | 33,882 | |
| | Miyoshi Precision, Ltd. | | 353,500 | | | 18,918 | |
| | Multi-Chem, Ltd. | | 1,263,000 | | | 97,596 | |
| * | | Nam Cheong, Ltd. | | 871,740 | | | 87,091 | |
| | Nera Telecommunications, Ltd. | | 1,079,000 | | | 350,140 | |
| | New Toyo International Holdings, Ltd. | | 1,624,000 | | | 293,088 | |
| | Novo Group, Ltd. | | 55,500 | | | 9,521 | |
| | NSL, Ltd. | | 417,000 | | | 424,424 | |
| #* | | Oceanus Group, Ltd. | | 5,528,000 | | | 290,104 | |
| # | | OKP Holdings, Ltd. | | 207,000 | | | 84,350 | |
| | Orchard Parade Holdings, Ltd. | | 990,359 | | | 977,298 | |
| | OSIM International, Ltd. | | 1,356,000 | | | 1,207,257 | |
| | Ossia International, Ltd. | | 522,554 | | | 50,286 | |
| # | | Otto Marine, Ltd. | | 2,451,000 | | | 221,210 | |
| | Pan Pacific Hotels Group, Ltd. | | 1,669,500 | | | 2,376,052 | |
| | Pan-United Corp., Ltd. | | 2,006,000 | | | 680,669 | |
| * | | Penguin International, Ltd. | | 400,000 | | | 21,048 | |
| | Petra Foods, Ltd. | | 871,000 | | | 1,242,051 | |
| | Popular Holdings, Ltd. | | 2,763,650 | | | 346,649 | |
| | PSC Corp., Ltd. | | 1,823,419 | | | 265,322 | |
| | QAF, Ltd. | | 907,561 | | | 406,414 | |
| | Qian Hu Corp., Ltd. | | 674,600 | | | 44,359 | |
| # | | Raffles Education Corp., Ltd. | | 2,355,593 | | | 770,115 | |
41
The Asia Pacific Small Company Series
continued
| | | | | Shares | | Value†† | |
| SINGAPORE — (Continued) | | | | | | |
| # | | Raffles Medical Group, Ltd. | | 774,067 | | $ | 1,265,524 | |
| # | | Rotary Engineering, Ltd. | | 1,143,600 | | | 505,081 | |
| | Roxy-Pacific Holdings, Ltd. | | 214,000 | | | 64,450 | |
| * | | S i2i, Ltd. | | 13,387,000 | | | 431,601 | |
| | San Teh, Ltd. | | 999,087 | | | 461,341 | |
| | Sapphire Corp., Ltd. | | 704,000 | | | 71,969 | |
| | SBS Transit, Ltd. | | 953,500 | | | 1,257,128 | |
| | SC Global Developments, Ltd. | | 416,000 | | | 317,142 | |
| * | | Seroja Investments, Ltd. | | 17,767 | | | 2,577 | |
| | Sim Lian Group, Ltd. | | 2,281,855 | | | 838,037 | |
| * | | Sinarmas Land, Ltd. | | 4,095,000 | | | 628,366 | |
| | Sing Investments & Finance, Ltd. | | 198,450 | | | 220,303 | |
| | | Singapore Land, Ltd. | | 60,000 | | | 257,814 | |
| | Singapore Post, Ltd. | | 3,282,120 | | | 2,364,182 | |
| | Singapore Reinsurance Corp., Ltd. | | 1,514,530 | | | 337,402 | |
| | Singapore Shipping Corp., Ltd. | | 1,689,000 | | | 224,406 | |
| | Singapura Finance, Ltd. | | 174,062 | | | 187,392 | |
| | Sinostar PEC Holdings, Ltd. | | 160,000 | | | 19,877 | |
| * | | Sinwa, Ltd. | | 388,500 | | | 30,742 | |
| | SMB United, Ltd. | | 1,253,000 | | | 380,533 | |
| # | | Sound Global, Ltd. | | 1,432,000 | | | 553,268 | |
| | Stamford Land Corp., Ltd. | | 2,927,000 | | | 1,263,292 | |
| | Straco Corp., Ltd. | | 130,000 | | | 18,762 | |
| | Sunningdale Tech, Ltd. | | 2,086,000 | | | 158,146 | |
| # | | Sunvic Chemical Holdings, Ltd. | | 1,056,000 | | | 357,461 | |
| # | | Super Group, Ltd. | | 1,022,000 | | | 1,035,180 | |
| | Superbowl Holdings, Ltd. | | 522,000 | | | 114,454 | |
| #* | | Swiber Holdings, Ltd. | | 1,697,000 | | | 699,575 | |
| #* | | Swissco Holdings, Ltd. | | 579,000 | | | 87,706 | |
| | Tat Hong Holdings, Ltd. | | 1,116,800 | | | 759,232 | |
| # | | Technics Oil & Gas, Ltd. | | 583,000 | | | 383,982 | |
| | Thakral Corp., Ltd. | | 6,028,000 | | | 120,022 | |
| #* | | Tiger Airways Holdings, Ltd. | | 1,798,500 | | | 879,275 | |
| | Tiong Woon Corp. Holding, Ltd. | | 901,000 | | | 149,472 | |
| * | | Transcu Group, Ltd. | | 4,936,000 | | | 190,278 | |
| | Trek 2000 International, Ltd. | | 973,000 | | | 228,515 | |
| # | | Tuan Sing Holdings, Ltd. | | 3,613,475 | | | 723,415 | |
| | UMS Holdings, Ltd. | | 1,082,000 | | | 316,268 | |
| | United Engineers, Ltd. | | 730,014 | | | 1,057,554 | |
| # | | United Envirotech, Ltd. | | 1,098,000 | | | 274,176 | |
| | United Industrial Corp., Ltd. | | 230,000 | | | 484,234 | |
| | United Overseas Insurance, Ltd. | | 187,250 | | | 463,415 | |
| | UOB-Kay Hian Holdings, Ltd. | | 1,475,400 | | | 1,746,691 | |
| | Venture Corp., Ltd. | | 469,000 | | | 2,243,919 | |
| | Vicom, Ltd. | | 120,000 | | | 333,753 | |
| # | | WBL Corp., Ltd. | | 597,000 | | | 1,289,882 | |
| | Wee Hur Holdings, Ltd. | | 979,000 | | | 203,669 | |
| | Wheelock Properties, Ltd. | | 1,210,000 | | | 1,409,978 | |
| | Wing Tai Holdings, Ltd. | | 2,128,000 | | | 1,549,121 | |
| | Xpress Holdings, Ltd. | | 3,079,000 | | | 63,916 | |
| | YHI International, Ltd. | | 1,174,000 | | | 244,037 | |
| * | | Yoma Strategic Holdings, Ltd. | | 132,000 | | | 21,776 | |
| | Yongnam Holdings, Ltd. | | 3,921,000 | | | 694,010 | |
| TOTAL SINGAPORE | | | | | 92,090,580 | |
| TOTAL COMMON STOCKS | | | | | 820,072,964 | |
| | | | | | | |
| RIGHTS/WARRANTS — (0.0%) | | | | | | |
| AUSTRALIA — (0.0%) | | | | | | |
| * | | AJ Lucas Group, Ltd. Rights 01/27/12 | | 158,984 | | | — | |
| * | | Centrebet International, Ltd. Claim Units | | 81,336 | | | — | |
| * | | Centrebet International, Ltd. Litigation Rights | | 81,336 | | | — | |
42
The Asia Pacific Small Company Series
continued
| | | | | Shares | | Value†† | |
| AUSTRALIA — (Continued) | | | | | | | | |
| * | | IDM International, Ltd. Warrants 06/08/13 | | | 545 | | | $ | 8 | |
| * | | NewSat, Ltd. Rights 01/25/12 | | | 9,686 | | | | — | |
| TOTAL AUSTRALIA | | | | | | | 8 | |
| | |
| HONG KONG — (0.0%) | | | | | | | | |
| * | | Success Universe Group, Ltd. Rights 01/09/12 | | | 3,701,333 | | | | 4,766 | |
| | |
| SINGAPORE — (0.0%) | | | | | | | | |
| * | | Transcu Group, Ltd. Warrants 09/01/13 | | | 1,018,000 | | | | 15,697 | |
| TOTAL RIGHTS/WARRANTS | | | | | | | 20,471 | |
| | |
| | | | Shares/ | | | | |
| | | | Face | | | | |
| | | | Amount | | Value† | |
| | | | (000) | | | | |
| SECURITIES LENDING COLLATERAL — (16.8%) | | | | | | | | |
| §@ | | DFA Short Term Investment Fund | | | 165,000,000 | | | | 165,000,000 | |
| @ | | Repurchase Agreement, Deutsche Bank Securities, Inc. 0.08%, 01/03/12 (Collateralized | | | | | | | | |
| | by U.S. Treasury Note 1.375%, 09/30/18, valued at $866,063) to be repurchased at | | | | | | | | |
| | $849,089 | | $ | 849 | | | | 849,081 | |
| TOTAL SECURITIES LENDING COLLATERAL | | | | | | | 165,849,081 | |
| TOTAL INVESTMENTS — (100.0%) | | | | | | | | |
| | | (Cost $1,034,796,383)^ | | | | | | $ | 985,942,516 | |
____________________
^ The cost for federal income tax purposes is $1,038,719,321.
43
THE UNITED KINGDOM SMALL COMPANY SERIES
SCHEDULE OF INVESTMENTS
December 31, 2011
(Unaudited)
| | | | | Shares | | Value†† | |
| COMMON STOCKS — (99.1%) | | | | | | |
| Consumer Discretionary — (22.1%) | | | | | | |
| | 4imprint Group P.L.C. | | 96,735 | | $ | 342,384 | |
| * | | 888 Holdings P.L.C. | | 120,972 | | | 80,762 | |
| | Aegis Group P.L.C. | | 3,302,990 | | | 7,402,581 | |
| | Aga Rangemaster Group P.L.C. | | 453,866 | | | 501,705 | |
| | | Arena Leisure P.L.C. | | 1,368,472 | | | 787,405 | |
| | Avon Rubber P.L.C. | | 26,060 | | | 127,383 | |
| * | | Barratt Developments P.L.C. | | 3,809,758 | | | 5,478,867 | |
| | Bellway P.L.C. | | 481,114 | | | 5,323,144 | |
| * | | Berkeley Group Holdings P.L.C. (The) | | 511,780 | | | 10,139,684 | |
| | Bloomsbury Publishing P.L.C. | | 271,841 | | | 423,830 | |
| | Bovis Homes Group P.L.C. | | 875,787 | | | 5,976,578 | |
| # | | Bwin.Party Digital Entertainment P.L.C. | | 1,651,275 | | | 4,197,611 | |
| # | | Carpetright P.L.C. | | 176,546 | | | 1,312,052 | |
| | Carphone Warehouse Group P.L.C. | | 388,934 | | | 1,864,478 | |
| | Centaur Media P.L.C. | | 556,967 | | | 286,487 | |
| | Chime Communications P.L.C. | | 222,427 | | | 590,342 | |
| | Churchill China P.L.C. | | 18,500 | | | 77,471 | |
| | Cineworld Group P.L.C. | | 85,773 | | | 273,320 | |
| * | | Clinton Cards P.L.C. | | 740,506 | | | 118,098 | |
| | Creston P.L.C. | | 13,626 | | | 15,140 | |
| | Daily Mail & General Trust P.L.C. Series A | | 1,077,408 | | | 6,684,189 | |
| | Debenhams P.L.C. | | 4,585,455 | | | 4,161,870 | |
| | Dignity P.L.C. | | 214,913 | | | 2,740,522 | |
| * | | Dixons Retail P.L.C. | | 12,909,628 | | | 1,965,031 | |
| | Domino’s Pizza UK & IRL P.L.C. | | 251,341 | | | 1,570,701 | |
| | Dunelm Group P.L.C. | | 141,435 | | | 944,958 | |
| * | | Enterprise Inns P.L.C. | | 1,808,533 | | | 786,194 | |
| | Euromoney Institutional Investor P.L.C. | | 292,779 | | | 2,846,377 | |
| * | | Findel P.L.C. | | 4,998,346 | | | 270,987 | |
| * | | Forminster P.L.C. | | 43,333 | | | 2,524 | |
| | French Connection Group P.L.C. | | 373,475 | | | 231,497 | |
| | Fuller Smith & Turner P.L.C. | | 129,026 | | | 1,435,990 | |
| | Future P.L.C. | | 1,301,863 | | | 183,929 | |
| | Game Group P.L.C. | | 1,527,764 | | | 177,798 | |
| | Games Workshop Group P.L.C. | | 101,889 | | | 710,692 | |
| | GKN P.L.C. | | 3,414,280 | | | 9,695,522 | |
| | Greene King P.L.C. | | 1,421,372 | | | 10,748,766 | |
| | Halfords Group P.L.C. | | 752,842 | | | 3,379,768 | |
| | Haynes Publishing Group P.L.C. | | 14,703 | | | 49,765 | |
| | Headlam Group P.L.C. | | 330,383 | | | 1,310,026 | |
| | Henry Boot P.L.C. | | 426,786 | | | 811,712 | |
| | HMV Group P.L.C. | | 1,482,545 | | | 80,499 | |
| | Home Retail Group P.L.C. | | 2,403,649 | | | 3,098,449 | |
| | Hornby P.L.C. | | 154,220 | | | 331,146 | |
| * | | Howden Joinery Group P.L.C. | | 2,029,836 | | | 3,166,616 | |
| | Huntsworth P.L.C. | | 854,550 | | | 469,160 | |
| | Inchcape P.L.C. | | 1,915,975 | | | 8,717,127 | |
| | Informa P.L.C. | | 2,292,105 | | | 12,851,263 | |
| | ITV P.L.C. | | 8,448,636 | | | 8,925,370 | |
| | JD Sports Fashion P.L.C. | | 120,013 | | | 1,161,065 | |
| | JD Wetherspoon P.L.C. | | 462,380 | | | 2,979,487 | |
| * | | JJB Sports P.L.C. | | 24,720 | | | 2,015 | |
| | John Menzies P.L.C. | | 244,534 | | | 2,009,860 | |
| * | | Johnston Press P.L.C. | | 507,412 | | | 49,250 | |
| | Kesa Electricals P.L.C. | | 2,105,278 | | | 2,205,586 | |
| | Ladbrokes P.L.C. | | 3,578,739 | | | 7,218,497 | |
| | Laura Ashley Holdings P.L.C. | | 1,500,394 | | | 460,194 | |
| | Lookers P.L.C. | | 1,097,970 | | | 864,551 | |
44
The United Kingdom Small Company Series
continued
| | | | | Shares | | Value†† | |
| Consumer Discretionary — (Continued) | | | | | | |
| | Marston’s P.L.C. | | 2,308,218 | | $ | 3,291,020 | |
| | Mecom Group P.L.C. | | 220,112 | | | 700,450 | |
| | Millennium & Copthorne Hotels P.L.C. | | 1,048,561 | | | 6,615,856 | |
| * | | Mitchells & Butlers P.L.C. | | 987,029 | | | 3,582,587 | |
| | Mothercare P.L.C. | | 342,220 | | | 883,468 | |
| | N Brown Group P.L.C. | | 862,304 | | | 3,112,354 | |
| | Pace P.L.C. | | 919,304 | | | 1,025,762 | |
| * | | Pendragon P.L.C. | | 2,428,575 | | | 287,035 | |
| | Persimmon P.L.C. | | 1,177,634 | | | 8,591,189 | |
| | Photo-Me International P.L.C. | | 3,631 | | | 2,732 | |
| * | | Punch Taverns P.L.C. | | 2,380,301 | | | 369,646 | |
| * | | Redrow P.L.C. | | 1,485,274 | | | 2,612,337 | |
| | Restaurant Group P.L.C. | | 780,418 | | | 3,611,852 | |
| | Rightmove P.L.C. | | 378,372 | | | 7,310,653 | |
| | Smiths News P.L.C. | | 705,619 | | | 895,232 | |
| * | | Spirit Pub Co. P.L.C. | | 2,380,301 | | | 1,585,243 | |
| * | | Sportech P.L.C. | | 329,794 | | | 227,367 | |
| * | | Sports Direct International P.L.C. | | 670,447 | | | 2,219,631 | |
| | St. Ives Group P.L.C. | | 665,998 | | | 856,936 | |
| * | | Stylo P.L.C. | | 64,096 | | | 4,728 | |
| #* | | SuperGroup P.L.C. | | 54,686 | | | 430,086 | |
| * | | Tandem Group P.L.C. Non-Voting Shares | | 327,365 | | | — | |
| * | | Taylor Wimpey P.L.C. | | 12,108,224 | | | 7,057,285 | |
| | Ted Baker P.L.C. | | 149,926 | | | 1,523,644 | |
| # | | Thomas Cook Group P.L.C. | | 3,076,507 | | | 704,037 | |
| | Topps Tiles P.L.C. | | 810,881 | | | 333,805 | |
| * | | Torotrak P.L.C. | | 22,750 | | | 12,404 | |
| * | | Trinity Mirror P.L.C. | | 1,688,565 | | | 1,258,242 | |
| | TUI Travel P.L.C. | | 949,580 | | | 2,449,243 | |
| | UBM P.L.C. | | 917,439 | | | 6,808,558 | |
| | UTV Media P.L.C. | | 230,855 | | | 332,099 | |
| | Vitec Group P.L.C. (The) | | 160,303 | | | 1,383,194 | |
| * | | Wagon P.L.C. | | 237,979 | | | 4,620 | |
| | WH Smith P.LC. | | 620,413 | | | 5,111,668 | |
| | Whitbread P.L.C. | | 103,235 | | | 2,506,374 | |
| | William Hill P.L.C. | | 2,873,883 | | | 9,033,316 | |
| | Wilmington Group P.L.C. | | 346,234 | | | 439,375 | |
| #* | | Yell Group P.L.C. | | 6,919,067 | | | 567,664 | |
| Total Consumer Discretionary | | | | | 238,359,967 | |
| | | |
| Consumer Staples — (4.2%) | | | | | | |
| | A.G. Barr P.L.C. | | 137,531 | | | 2,585,262 | |
| | Anglo-Eastern Plantations P.L.C. | | 108,153 | | | 1,165,255 | |
| | Booker Group P.L.C. | | 2,566,631 | | | 2,946,611 | |
| | Britvic P.L.C. | | 920,135 | | | 4,593,210 | |
| | Cranswick P.L.C. | | 202,347 | | | 2,322,857 | |
| | Dairy Crest Group P.L.C. | | 560,392 | | | 2,923,902 | |
| | Devro P.L.C. | | 654,975 | | | 2,624,721 | |
| * | | European Home Retail P.L.C. | | 109,256 | | | — | |
| | Fiberweb P.L.C. | | 482,639 | | | 401,061 | |
| | Greggs P.L.C. | | 422,420 | | | 3,319,775 | |
| | Hilton Food Group, Ltd. | | 1,604 | | | 6,867 | |
| * | | McBride P.L.C. | | 832,651 | | | 1,442,820 | |
| * | | Premier Foods P.L.C. | | 7,951,806 | | | 716,563 | |
| | PZ Cussons P.L.C. | | 1,287,639 | | | 6,999,863 | |
| | | R.E.A. Holdings P.L.C. | | 49,233 | | | 433,032 | |
| | Robert Wiseman Dairies P.L.C. | | 221,312 | | | 881,344 | |
| | Tate & Lyle P.L.C. | | 1,074,000 | | | 11,741,438 | |
| | Thorntons P.L.C. | | 313,060 | | | 97,726 | |
| | Young & Co.’s Brewery P.L.C. | | 26,250 | | | 213,002 | |
45
The United Kingdom Small Company Series
continued
| | | | | Shares | | Value†† | |
| Consumer Staples — (Continued) | | | | | | |
| | Young & Co.’s Brewery P.L.C. Series A | | 13,436 | | $ | 137,730 | |
| Total Consumer Staples | | | | | 45,553,039 | |
| | | |
| Energy — (4.7%) | | | | | | |
| * | | Afren P.L.C. | | 3,944,497 | | | 5,248,507 | |
| | Anglo Pacific Group P.L.C. | | 440,799 | | | 1,887,585 | |
| * | | Cadogan Petroleum P.L.C. | | 110,970 | | | 42,782 | |
| * | | EnQuest P.L.C. | | 1,929,639 | | | 2,766,621 | |
| * | | Exillon Energy P.L.C. | | 146,023 | | | 568,511 | |
| | Fortune Oil P.L.C. | | 6,170,225 | | | 1,153,051 | |
| * | | Hardy Oil & Gas P.L.C. | | 69,032 | | | 157,209 | |
| * | | Heritage Oil P.L.C. | | 653,846 | | | 1,953,104 | |
| | Hunting P.L.C. | | 462,895 | | | 5,386,077 | |
| | James Fisher & Sons P.L.C. | | 171,886 | | | 1,359,599 | |
| | JKX Oil & Gas P.L.C. | | 456,676 | | | 964,132 | |
| | John Wood Group P.L.C. | | 1,034,385 | | | 10,288,678 | |
| | Lamprell P.L.C. | | 482,383 | | | 2,008,746 | |
| | | Melrose Resources P.L.C. | | 336,039 | | | 616,023 | |
| * | | Premier Oil P.L.C. | | 1,778,192 | | | 10,013,866 | |
| * | | Salamander Energy P.L.C. | | 567,570 | | | 1,776,644 | |
| * | | Soco International P.L.C. | | 892,380 | | | 4,050,572 | |
| * | | UK Coal P.L.C. | | 1,470,907 | | | 650,376 | |
| Total Energy | | | | | 50,892,083 | |
| | | |
| Financials — (13.0%) | | | | | | |
| | Aberdeen Asset Management P.L.C. | | 2,820,342 | | | 9,285,387 | |
| * | | Admiral Group P.L.C. | | 49,277 | | | 653,306 | |
| | Amlin P.L.C. | | 1,905,352 | | | 9,279,530 | |
| | Arbuthnot Banking Group P.L.C. | | 55,997 | | | 289,178 | |
| | Ashmore Group P.L.C. | | 1,040,465 | | | 5,392,153 | |
| * | | BCB Holdings, Ltd. | | 5,979 | | | 2,538 | |
| | Beazley P.L.C. | | 2,052,831 | | | 4,277,738 | |
| | Brewin Dolphin Holdings P.L.C. | | 962,833 | | | 2,048,891 | |
| | Capital & Counties Properties P.L.C. | | 519,115 | | | 1,489,931 | |
| * | | Capital & Regional P.L.C. | | 1,493,345 | | | 729,605 | |
| | Catlin Group, Ltd. | | 1,357,851 | | | 8,408,376 | |
| | Charles Stanley Group P.L.C. | | 126,349 | | | 521,679 | |
| | Charles Taylor Consulting P.L.C. | | 139,215 | | | 269,005 | |
| | Chesnara P.L.C. | | 323,615 | | | 883,816 | |
| | Close Brothers Group P.L.C. | | 561,047 | | | 5,395,445 | |
| | Collins Stewart Hawkpoint P.L.C. | | 585,111 | | | 785,985 | |
| | Daejan Holdings P.L.C. | | 32,436 | | | 1,399,328 | |
| | Development Securities P.L.C. | | 460,015 | | | 1,074,761 | |
| * | | DTZ Holdings P.L.C. | | 224,770 | | | 24,295 | |
| # | | F&C Asset Management P.L.C. | | 1,905,097 | | | 1,934,443 | |
| | GlobeOp Financial Services SA | | 24,996 | | | 110,349 | |
| | Hansard Global P.L.C. | | 16,468 | | | 38,867 | |
| | Hardy Underwriting Group P.L.C. | | 161,307 | | | 473,974 | |
| | Hargreaves Lansdown P.L.C. | | 661,513 | | | 4,419,858 | |
| | Helical Bar P.L.C. | | 657,998 | | | 1,904,313 | |
| | Henderson Group P.L.C. | | 3,869,133 | | | 6,161,244 | |
| | Hiscox, Ltd. | | 1,562,751 | | | 9,050,013 | |
| * | | ICAP P.L.C. | | 213,082 | | | 1,147,751 | |
| | IG Group Holdings P.L.C. | | 1,317,769 | | | 9,752,922 | |
| * | | Industrial & Commercial Holdings P.L.C. | | 5,000 | | | 116 | |
| | Intermediate Capital Group P.L.C. | | 597,502 | | | 2,121,304 | |
| | International Personal Finance P.L.C. | | 711,644 | | | 1,891,151 | |
| | Investec P.L.C. | | 239,236 | | | 1,259,007 | |
| * | | IP Group P.L.C. | | 441,218 | | | 536,069 | |
| | Jardine Lloyd Thompson Group P.L.C. | | 485,644 | | | 5,200,428 | |
| * | | Jupiter Fund Management P.L.C. | | 176,329 | | | 592,390 | |
46
THE UNITED KINGDOM SMALL COMPANY SERIES
CONTINUED
| | | | | Shares | | Value†† | |
| Financials — (Continued) | | | | | | |
| | | Lancashire Holdings, Ltd. | | 566,254 | | $ | 6,373,947 | |
| * | | Liontrust Asset Management P.L.C. | | 129,935 | | | 146,247 | |
| | London Stock Exchange Group P.L.C. | | 579,642 | | | 7,128,631 | |
| | LSL Property Services P.L.C. | | 137,031 | | | 503,699 | |
| * | | MWB Group Holdings P.L.C. | | 379,622 | | | 92,689 | |
| | Novae Group P.L.C. | | 212,950 | | | 1,115,452 | |
| | Phoenix Group Holdings P.L.C. | | 42,673 | | | 347,788 | |
| | Provident Financial P.L.C. | | 499,581 | | | 7,301,768 | |
| * | | Puma Brandenburg, Ltd. Capital Shares | | 1,193,004 | | | 92,643 | |
| * | | Puma Brandenburg, Ltd. Income Shares | | 1,193,004 | | | 38,601 | |
| * | | Quintain Estates & Development P.L.C. | | 1,157,466 | | | 678,051 | |
| | Rathbone Brothers P.L.C. | | 165,692 | | | 2,726,327 | |
| | Raven Russia, Ltd. | | 181,450 | | | 146,744 | |
| | S&U P.L.C. | | 21,140 | | | 199,415 | |
| | Safestore Holdings P.L.C. | | 350,351 | | | 542,739 | |
| | Savills P.L.C. | | 543,867 | | | 2,767,778 | |
| | Shore Capital Group, Ltd. | | 1,002,751 | | | 256,786 | |
| | St. James’s Place P.L.C. | | 791,622 | | | 3,976,876 | |
| | St. Modwen Properties P.L.C. | | 630,419 | | | 1,108,826 | |
| | Tullett Prebon P.L.C. | | 872,729 | | | 3,655,767 | |
| | Unite Group P.L.C. | | 641,711 | | | 1,669,453 | |
| * | | Waterloo Investment Holdings, Ltd. | | 5,979 | | | 650 | |
| Total Financials | | | | | 139,676,023 | |
| | | | | | | |
| Health Care — (1.9%) | | | | | | |
| #* | | Alizyme P.L.C. | | 660,805 | | | 41,049 | |
| | Assura Group, Ltd. | | 55,851 | | | 25,402 | |
| | Bioquell P.L.C. | | 90,893 | | | 151,814 | |
| * | | BTG P.L.C. | | 1,160,406 | | | 5,648,620 | |
| | Consort Medical P.L.C. | | 116,271 | | | 970,864 | |
| | Corin Group P.L.C. | | 126,637 | | | 84,571 | |
| | Dechra Pharmaceuticals P.L.C. | | 245,802 | | | 1,980,100 | |
| | Genus P.L.C. | | 205,779 | | | 3,333,352 | |
| | Hikma Pharmaceuticals P.L.C. | | 539,988 | | | 5,192,775 | |
| * | | Optos P.L.C. | | 27,973 | | | 94,603 | |
| * | | Oxford Biomedica P.L.C. | | 2,821,652 | | | 155,587 | |
| * | | Renovo Group P.L.C. | | 87,461 | | | 22,477 | |
| * | | Southern Cross Healthcare P.L.C. | | 191,826 | | | 18,619 | |
| | Synergy Health P.L.C. | | 135,291 | | | 1,779,732 | |
| * | | Vectura Group P.L.C. | | 1,349,073 | | | 1,179,626 | |
| Total Health Care | | | | | 20,679,191 | |
| | | | | | | |
| Industrials — (30.7%) | | | | | | |
| * | | AEA Technology Group P.L.C. | | 539,970 | | | 4,022 | |
| # | | Air Partner P.L.C. | | 37,086 | | | 179,083 | |
| | Alumasc Group P.L.C. | | 124,366 | | | 231,716 | |
| | Ashtead Group P.L.C. | | 2,124,586 | | | 7,441,350 | |
| * | | Autologic Holdings P.L.C. | | 80,000 | | | 17,351 | |
| | Babcock International Group P.L.C. | | 1,446,405 | | | 16,501,362 | |
| | Balfour Beatty P.L.C. | | 2,828,972 | | | 11,628,302 | |
| | BBA Aviation P.L.C. | | 2,792,163 | | | 7,708,203 | |
| | Berendsen P.L.C. | | 709,591 | | | 4,781,347 | |
| | Bodycote P.L.C. | | 1,253,236 | | | 5,109,094 | |
| | Braemar Shipping Services P.L.C. | | 81,108 | | | 373,869 | |
| | Brammer P.L.C. | | 194,030 | | | 722,682 | |
| | Bunzl P.L.C. | | 227,489 | | | 3,121,475 | |
| | Camellia P.L.C. | | 2,481 | | | 384,195 | |
| | Cape P.L.C. | | 195,647 | | | 995,798 | |
| | Carillion P.L.C. | | 1,773,138 | | | 8,273,953 | |
| | Carr’s Milling Industries P.L.C. | | 35,330 | | | 437,306 | |
| | Castings P.L.C. | | 162,757 | | | 677,361 | |
47
THE UNITED KINGDOM SMALL COMPANY SERIES
CONTINUED
| | | | | Shares | | Value†† | |
| Industrials — (Continued) | | | | | | |
| | Charter International P.L.C. | | 664,438 | | $ | 9,741,359 | |
| | Chemring Group P.L.C. | | 783,476 | | | 4,868,266 | |
| | Clarkson P.L.C. | | 61,518 | | | 1,089,985 | |
| | Cobham P.L.C. | | 3,090,004 | | | 8,798,519 | |
| | Communisis P.L.C. | | 561,133 | | | 236,822 | |
| #* | | Connaught P.L.C. | | 307,612 | | | — | |
| | Cookson Group P.L.C. | | 1,135,834 | | | 8,964,334 | |
| | Costain Group P.L.C. | | 139,449 | | | 408,108 | |
| | De La Rue P.L.C. | | 387,017 | | | 5,352,432 | |
| * | | easyJet P.L.C. | | 690,633 | | | 4,200,443 | |
| * | | Eleco P.L.C. | | 80,000 | | | 12,390 | |
| | Fenner P.L.C. | | 715,591 | | | 4,451,178 | |
| | Firstgroup P.L.C. | | 1,789,126 | | | 9,376,858 | |
| | Galliford Try P.L.C. | | 233,981 | | | 1,723,277 | |
| | Go-Ahead Group P.L.C. | | 173,516 | | | 3,717,790 | |
| * | | Hampson Industries P.L.C. | | 712,146 | | | 42,818 | |
| | Harvey Nash Group P.L.C. | | 6,308 | | | 4,990 | |
| | Hays P.L.C. | | 5,445,665 | | | 5,409,609 | |
| * | | Helphire P.L.C. | | 956,560 | | | 28,572 | |
| | Hogg Robinson Group P.L.C. | | 152,400 | | | 134,387 | |
| | Homeserve P.L.C. | | 1,162,452 | | | 5,178,301 | |
| | Hyder Consulting P.L.C. | | 171,164 | | | 954,302 | |
| | IMI P.L.C. | | 1,053,765 | | | 12,438,291 | |
| * | | Impellam Group P.L.C. | | 34,877 | | | 144,574 | |
| | Interserve P.L.C. | | 529,664 | | | 2,638,656 | |
| | Intertek Group P.L.C. | | 456,070 | | | 14,402,128 | |
| | Invensys P.L.C. | | 2,426,737 | | | 7,935,997 | |
| | ITE Group P.L.C. | | 1,059,501 | | | 3,356,430 | |
| | J Smart & Co. (Contractors) P.L.C. | | 112,500 | | | 122,105 | |
| | Keller Group P.L.C. | | 276,404 | | | 1,148,986 | |
| | Kier Group P.L.C. | | 158,443 | | | 3,349,419 | |
| | Latchways P.L.C. | | 36,248 | | | 607,575 | |
| | Lavendon Group P.L.C. | | 504,595 | | | 684,779 | |
| | Low & Bonar P.L.C. | | 828,300 | | | 514,060 | |
| | Management Consulting Group P.L.C. | | 1,290,496 | | | 609,557 | |
| | Mears Group P.L.C. | | 196,480 | | | 670,690 | |
| | Meggitt P.L.C. | | 2,465,596 | | | 13,496,107 | |
| | Melrose P.L.C. | | 1,583,124 | | | 8,356,075 | |
| | Michael Page International P.L.C. | | 1,310,832 | | | 7,101,476 | |
| | Mitie Group P.L.C. | | 1,286,774 | | | 4,852,525 | |
| | MJ Gleeson Group P.L.C. | | 195,875 | | | 335,022 | |
| | Morgan Crucible Co. P.L.C. | | 1,252,304 | | | 5,109,112 | |
| | Morgan Sindall P.L.C. | | 169,608 | | | 1,567,270 | |
| * | | Mouchel Group P.L.C. | | 434,192 | | | 35,842 | |
| | National Express Group P.L.C. | | 1,701,575 | | | 5,886,392 | |
| * | | Northgate P.L.C. | | 473,070 | | | 1,410,095 | |
| | PayPoint P.L.C. | | 105,160 | | | 900,842 | |
| | | Qinetiq P.L.C. | | 2,474,225 | | | 5,073,575 | |
| | Regus P.L.C. | | 3,337,697 | | | 4,373,909 | |
| * | | Renold P.L.C. | | 57,486 | | | 22,725 | |
| * | | Rentokil Initial P.L.C. | | 6,753,492 | | | 6,570,816 | |
| | Ricardo P.L.C. | | 217,815 | | | 1,238,169 | |
| * | | Richmond Oil & Gas P.L.C. | | 220,000 | | | — | |
| | Robert Walters P.L.C. | | 387,999 | | | 973,275 | |
| | Rotork P.L.C. | | 366,679 | | | 10,977,031 | |
| | RPS Group P.L.C. | | 836,994 | | | 2,334,230 | |
| | Senior P.L.C. | | 1,762,689 | | | 4,673,266 | |
| | Severfield-Rowen P.L.C. | | 371,550 | | | 957,551 | |
| | Shanks Group P.L.C. | | 1,786,148 | | | 2,511,701 | |
| | SIG P.L.C. | | 2,074,440 | | | 2,699,758 | |
| | Speedy Hire P.L.C. | | 1,274,296 | | | 394,195 | |
48
THE UNITED KINGDOM SMALL COMPANY SERIES
CONTINUED
| | | | | Shares | | Value†† | |
| Industrials — (Continued) | | | | | | |
| | Spirax-Sarco Engineering P.L.C. | | 319,520 | | $ | 9,292,347 | |
| | Stagecoach Group P.L.C. | | 1,718,521 | | | 7,258,447 | |
| | Sthree P.L.C. | | 330,670 | | | 1,162,776 | |
| | T. Clarke P.L.C. | | 147,457 | | | 92,319 | |
| | Tarsus Group P.L.C. | | 212,372 | | | 427,830 | |
| | Travis Perkins P.L.C. | | 922,110 | | | 11,379,408 | |
| | Tribal Group P.L.C. | | 132,810 | | | 89,377 | |
| * | | Trifast P.L.C. | | 359,985 | | | 201,624 | |
| | UK Mail Group P.L.C. | | 197,261 | | | 632,476 | |
| | Ultra Electronics Holdings P.L.C. | | 283,178 | | | 6,496,284 | |
| | Umeco P.L.C. | | 196,406 | | | 1,114,443 | |
| # | | Volex P.L.C. | | 229,354 | | | 928,636 | |
| | Vp P.L.C. | | 167,297 | | | 582,740 | |
| | Wincanton P.L.C. | | 479,763 | | | 463,865 | |
| | WS Atkins P.L.C. | | 501,683 | | | 4,825,260 | |
| | WSP Group P.L.C. | | 276,589 | | | 890,477 | |
| # | | XP Power, Ltd | | 73,546 | | | 1,069,231 | |
| Total Industrials | | | | | 330,664,955 | |
| | | |
| Information Technology — (10.0%) | | | | | | |
| | Acal P.L.C. | | 104,729 | | | 282,479 | |
| | Alphameric P.L.C. | | 95,741 | | | 34,987 | |
| * | | Alterian P.L.C. | | 179,139 | | | 305,083 | |
| | Anite P.L.C. | | 1,166,924 | | | 1,700,043 | |
| | Aveva Group P.L.C. | | 289,692 | | | 6,439,922 | |
| | Computacenter P.L.C. | | 446,179 | | | 2,315,593 | |
| | CSR P.L.C. | | 683,977 | | | 1,947,752 | |
| | Dialight P.L.C. | | 111,362 | | | 1,204,503 | |
| | Diploma P.L.C. | | 482,456 | | | 2,542,996 | |
| | Domino Printing Sciences P.L.C. | | 455,803 | | | 3,622,594 | |
| | E2V Technologies P.L.C. | | 354,068 | | | 578,839 | |
| | Electrocomponents P.L.C. | | 1,730,514 | | | 5,055,652 | |
| | Fidessa Group P.L.C. | | 137,261 | | | 3,226,316 | |
| | Halma P.L.C. | | 1,541,075 | | | 7,904,969 | |
| * | | Imagination Technologies Group P.L.C. | | 961,901 | | | 8,200,427 | |
| * | | Innovation Group P.L.C. | | 3,208,091 | | | 1,009,933 | |
| | Kewill P.L.C. | | 368,863 | | | 441,754 | |
| * | | Kofax P.L.C. | | 317,667 | | | 1,163,021 | |
| | Laird P.L.C. | | 917,292 | | | 2,198,834 | |
| | Logica P.L.C. | | 6,339,968 | | | 6,084,872 | |
| | Micro Focus International P.L.C. | | 568,939 | | | 3,428,340 | |
| * | | Misys P.L.C. | | 1,604,251 | | | 5,784,975 | |
| | Moneysupermarket.com Group P.L.C. | | 483,650 | | | 789,276 | |
| * | | NCC Group P.L.C. | | 1,703 | | | 22,140 | |
| | Oxford Instruments P.L.C. | | 217,414 | | | 3,205,158 | |
| | Phoenix IT Group, Ltd. | | 204,552 | | | 513,198 | |
| | Premier Farnell P.L.C. | | 1,467,203 | | | 4,100,583 | |
| | Psion P.L.C. | | 500,223 | | | 343,569 | |
| | PV Crystalox Solar P.L.C. | | 956,033 | | | 63,516 | |
| | Renishaw P.L.C. | | 188,423 | | | 2,886,649 | |
| | RM P.L.C. | | 363,499 | | | 330,822 | |
| | SDL P.L.C. | | 338,168 | | | 3,489,898 | |
| | Spectris P.L.C. | | 515,234 | | | 10,295,072 | |
| | Spirent Communications P.L.C. | | 2,622,105 | | | 4,786,205 | |
| * | | Telecity Group P.L.C. | | 656,917 | | | 6,600,743 | |
| | TT electronics P.L.C. | | 635,179 | | | 1,325,128 | |
| | Vislink P.L.C. | | 274,226 | | | 87,530 | |
| * | | Wolfson Microelectronics P.L.C. | | 504,759 | | | 1,024,480 | |
| | Xaar P.L.C. | | 251,590 | | | 939,579 | |
| * | | Xchanging P.L.C. | | 730,123 | | | 734,000 | |
| Total Information Technology | | | | | 107,011,430 | |
49
THE UNITED KINGDOM SMALL COMPANY SERIES
CONTINUED
| | | | | Shares | | Value†† | |
| Materials — (7.3%) | | | | | | |
| | African Barrick Gold, Ltd. | | 175,432 | | $ | 1,251,642 | |
| * | | Allied Gold Mining PLC | | 964 | | | 2,164 | |
| | British Polythene Industries P.L.C. | | 102,332 | | | 539,603 | |
| | Carclo P.L.C. | | 214,230 | | | 971,330 | |
| * | | Centamin P.L.C. | | 2,940,820 | | | 3,763,256 | |
| | Croda International P.L.C. | | 520,183 | | | 14,562,102 | |
| | DS Smith P.L.C. | | 2,106,170 | | | 6,471,970 | |
| | Elementis P.L.C. | | 1,966,934 | | | 4,192,933 | |
| | Ferrexpo P.L.C. | | 888,830 | | | 3,710,230 | |
| | Filtrona P.L.C. | | 753,961 | | | 4,454,603 | |
| * | | Gem Diamonds, Ltd. | | 424,075 | | | 1,278,458 | |
| | Hill & Smith Holdings P.L.C. | | 289,549 | | | 1,126,863 | |
| | Hochschild Mining P.L.C. | | 640,518 | | | 3,841,308 | |
| * | | International Ferro Metals, Ltd. | | 238,075 | | | 68,424 | |
| * | | Inveresk P.L.C. | | 125,000 | | | 3,203 | |
| * | | Lonmin P.L.C. | | 215,607 | | | 3,285,051 | |
| | Marshalls P.L.C. | | 722,366 | | | 1,009,475 | |
| | Mondi P.L.C. | | 1,231,343 | | | 8,697,714 | |
| * | | Namakwa Diamonds, Ltd. | | 6,057 | | | 739 | |
| | New World Resources P.L.C. Series A | | 77,748 | | | 533,028 | |
| | Petropavlovsk P.L.C. | | 646,643 | | | 6,188,094 | |
| | Porvair P.L.C. | | 146,460 | | | 212,327 | |
| | RPC Group P.L.C. | | 622,691 | | | 3,457,646 | |
| #* | | Talvivaara Mining Co. P.L.C. | | 349,633 | | | 1,082,964 | |
| | Victrex P.L.C. | | 340,523 | | | 5,793,281 | |
| | Yule Catto & Co. P.L.C. | | 831,772 | | | 2,122,260 | |
| | Zotefoams P.L.C. | | 96,852 | | | 176,094 | |
| Total Materials | | | | | 78,796,762 | |
| | | |
| Telecommunication Services — (2.5%) | | | | | | |
| | Cable & Wireless Communications P.L.C. | | 9,400,024 | | | 5,566,230 | |
| | Cable & Wireless Worldwide P.L.C. | | 6,594,754 | | | 1,664,944 | |
| * | | Colt Group SA | | 1,287,437 | | | 1,821,857 | |
| | Inmarsat P.L.C. | | 1,347,950 | | | 8,441,793 | |
| | Kcom Group P.L.C. | | 2,643,350 | | | 2,872,432 | |
| | TalkTalk Telecom Group P.L.C. | | 1,746,112 | | | 3,668,449 | |
| | Telecom Plus P.L.C. | | 265,603 | | | 3,188,610 | |
| Total Telecommunication Services | | | | | 27,224,315 | |
| | | |
| Utilities — (2.7%) | | | | | | |
| | Dee Valley Group P.L.C. | | 12,109 | | | 244,163 | |
| | Drax Group P.L.C. | | 1,479,700 | | | 12,514,618 | |
| | Pennon Group P.L.C. | | 1,445,401 | | | 16,006,243 | |
| Total Utilities | | | | | 28,765,024 | |
| TOTAL COMMON STOCKS | | | | | 1,067,622,789 | |
| PREFERRED STOCKS — (0.0%) | | | | | | |
| Consumer Staples — (0.0%) | | | | | | |
| | R.E.A. Holdings P.L.C. | | 5,414 | | | 9,292 | |
| RIGHTS/WARRANTS — (0.0%) | | | | | | |
| * | | SFI Holdings, Ltd. Litigation Certificate | | 26,713 | | | — | |
| * | | Ultraframe P.L.C. Litigation Notes | | 319,285 | | | — | |
| TOTAL RIGHTS/WARRANTS | | | | | — | |
50
THE UNITED KINGDOM SMALL COMPANY SERIES
CONTINUED
| | | | | Shares/ | | | | |
| | | | Face | | | | |
| | | | Amount | | Value† | |
| | | | (000) | | | | |
| SECURITIES LENDING COLLATERAL — (0.9%) | | | | | | | |
| §@ | | DFA Short Term Investment Fund | | | 7,000,000 | | $ | 7,000,000 | |
| @ | | Repurchase Agreement, Deutsche Bank Securities, Inc. 0.08%, 01/03/12 (Collateralized | | | | | | | |
| | by U.S. Treasury Note 1.375%, 09/30/18, valued at $2,235,983) to be repurchased at | | | | | | | |
| | $2,192,159 | | $ | 2,192 | | | 2,192,140 | |
| TOTAL SECURITIES LENDING COLLATERAL | | | | | | 9,192,140 | |
| | | | | | | | |
| TOTAL INVESTMENTS — (100.0%) | | | | | | | |
| | (Cost $1,118,700,276)^ | | | | | $ | 1,076,824,221 | |
____________________
^ The cost for federal income tax purposes is $1,123,288,705.
51
THE CONTINENTAL SMALL COMPANY SERIES
SCHEDULE OF INVESTMENTS
December 31, 2011
(Unaudited)
| | | | | Shares | | Value†† | |
| COMMON STOCKS — (83.6%) | | | | | | |
| AUSTRIA — (1.9%) | | | | | | |
| | Agrana Beteiligungs AG | | 17,322 | | $ | 1,792,739 | |
| #* | | A-TEC Industries AG | | 21,828 | | | 23,731 | |
| | Atrium European Real Estate, Ltd. | | 346,698 | | | 1,562,777 | |
| | | Austria Email AG | | 715 | | | 6,962 | |
| | Austria Technologie & Systemtechnik AG | | 38,888 | | | 422,710 | |
| | BKS Bank AG | | 3,120 | | | 71,070 | |
| # | | BWT AG | | 32,881 | | | 554,858 | |
| * | | CA Immobilien Anlagen AG | | 163,483 | | | 1,753,247 | |
| * | | Constantia Packaging AG Escrow Shares | | 18,095 | | | — | |
| * | | DO & CO Restaurants & Catering AG | | 1,359 | | | 45,925 | |
| * | | EAG-Beteiligungs AG | | 1,650 | | | 779 | |
| # | | EVN AG | | 96,845 | | | 1,349,736 | |
| # | | Flughafen Wien AG | | 43,364 | | | 1,641,053 | |
| | Frauenthal Holding AG | | 12,084 | | | 147,047 | |
| #* | | Intercell AG | | 104,732 | | | 256,543 | |
| | Josef Manner & Co. AG | | 870 | | | 60,804 | |
| # | | Kapsch TrafficCom AG | | 16,512 | | | 1,248,210 | |
| | Lenzing AG | | 33,289 | | | 2,748,609 | |
| # | | Mayr-Melnhof Karton AG | | 32,872 | | | 2,785,303 | |
| | Oberbank AG | | 37,973 | | | 2,325,075 | |
| # | | Oesterreichischen Post AG | | 112,815 | | | 3,397,264 | |
| # | | Palfinger AG | | 48,572 | | | 773,848 | |
| #* | | Polytec Holding AG | | 48,001 | | | 336,419 | |
| # | | RHI AG | | 98,844 | | | 1,930,870 | |
| | Rosenbauer International AG | | 12,941 | | | 605,419 | |
| #* | | S IMMO AG | | 169,918 | | | 989,407 | |
| * | | S&T System Integration & Technology Distribution AG | | 6,318 | | | 14,336 | |
| # | | Schoeller-Bleckmann Oilfield Equipment AG | | 37,937 | | | 3,349,165 | |
| | Semperit Holding AG | | 35,539 | | | 1,367,309 | |
| # | | Strabag SE | | 101,540 | | | 2,900,664 | |
| | UBM Realitaetenentwicklung AG | | 1,440 | | | 46,593 | |
| # | | Uniqa Versicherungen AG | | 184,842 | | | 2,250,257 | |
| #* | | Warimpex Finanz und Beteiligungs AG | | 10,047 | | | 10,119 | |
| # | | Wienerberger AG | | 398,730 | | | 3,589,132 | |
| | Wolford AG | | 11,252 | | | 340,719 | |
| # | | Zumtobel AG | | 98,271 | | | 1,359,646 | |
| TOTAL AUSTRIA | | | | | 42,058,345 | |
| | | |
| BELGIUM — (3.0%) | | | | | | |
| #* | | Ablynx NV | | 69,930 | | | 308,239 | |
| | Ackermans & van Haaren NV | | 94,712 | | | 7,040,950 | |
| * | | Agfa-Gevaert NV | | 598,923 | | | 949,352 | |
| | Arseus NV | | 68,759 | | | 980,558 | |
| # | | Atenor Group NV | | 3,415 | | | 107,234 | |
| | Banque Nationale de Belgique SA | | 952 | | | 2,779,156 | |
| | Barco NV | | 55,666 | | | 2,782,111 | |
| # | | Bekaert NV | | 72,959 | | | 2,329,860 | |
| | Co.Br.Ha Societe Commerciale de Brasserie SA | | 115 | | | 223,679 | |
| | Compagnie d’Entreprises SA | | 41,428 | | | 2,030,540 | |
| * | | Compagnie du Bois Sauvage SA | | 87 | | | — | |
| | Compagnie Immobiliere de Belgique SA | | 10,535 | | | 336,453 | |
| | Compagnie Maritime Belge SA | | 64,746 | | | 1,417,695 | |
| #* | | Deceuninck NV | | 268,523 | | | 252,988 | |
| #* | | Devgen NV | | 48,195 | | | 332,239 | |
| | D’Ieteren SA | | 129,060 | | | 5,680,627 | |
| # | | Duvel Moorgat SA | | 8,799 | | | 807,998 | |
| | Econocom Group SA | | 65,485 | | | 1,317,020 | |
| | Elia System Operator SA | | 124,286 | | | 4,808,416 | |
52
The Continental Small Company Series
continued
| | | | | Shares | | Value†† | |
| BELGIUM — (Continued) | | | | | | |
| #* | | Euronav SA | | 86,554 | | $ | 417,643 | |
| # | | EVS Broadcast Equipment SA | | 44,026 | | | 2,245,397 | |
| # | | Exmar NV | | 132,340 | | | 980,938 | |
| | | Floridienne SA | | 2,033 | | | 342,155 | |
| * | | Galapagos NV | | 78,747 | | | 1,056,618 | |
| | Gimv NV | | 13,874 | | | 660,833 | |
| | Hamon & Compagnie International SA | | 3,876 | | | 73,415 | |
| | Henex SA | | 4,294 | | | 222,652 | |
| | Image Recognition Integrated Systems (I.R.I.S.) SA | | 6,284 | | | 207,444 | |
| | Ion Beam Applications SA | | 79,751 | | | 491,833 | |
| | Jensen-Group NV | | 12,030 | | | 117,491 | |
| | Kinepolis Group NV | | 15,819 | | | 1,128,691 | |
| # | | Lotus Bakeries NV | | 1,361 | | | 732,566 | |
| | Melexis NV | | 93,665 | | | 1,253,854 | |
| # | | Nyrstar NV | | 552,850 | | | 4,341,553 | |
| | Omega Pharma SA | | 85,437 | | | 3,966,832 | |
| #* | | Picanol NV | | 16,620 | | | 217,083 | |
| * | | RealDolmen NV | | 7,428 | | | 160,409 | |
| | Recticel SA | | 68,845 | | | 405,582 | |
| | Resilux SA | | 4,095 | | | 272,701 | |
| | Rosier SA | | 655 | | | 211,361 | |
| | Roularta Media Group NV | | 8,511 | | | 160,781 | |
| * | | SAPEC SA | | 3,531 | | | 194,434 | |
| | Sioen Industries NV | | 52,140 | | | 353,316 | |
| | Sipef NV | | 27,048 | | | 2,027,484 | |
| | Softimat SA | | 24,253 | | | 128,878 | |
| * | | Spector Photo Group SA | | 8,349 | | | 4,101 | |
| | Telenet Group Holding NV | | 6,645 | | | 253,031 | |
| # | | Ter Beke NV | | 2,281 | | | 150,605 | |
| | Tessenderlo Chemie NV | | 107,469 | | | 2,848,370 | |
| #* | | ThromboGenics NV | | 111,651 | | | 2,723,397 | |
| * | | TiGenix NV | | 22,164 | | | 20,918 | |
| | Van de Velde NV | | 27,539 | | | 1,256,310 | |
| | VPK Packaging Group SA | | 12,084 | | | 472,987 | |
| TOTAL BELGIUM | | | | | 64,586,778 | |
| | | |
| DENMARK — (2.7%) | | | | | | |
| * | | Aarhus Lokalbank A.S. | | 7,872 | | | 6,485 | |
| * | | Aktieselskabet Skjern Bank A.S. | | 3,276 | | | 45,954 | |
| | Alk-Abello A.S. | | 25,725 | | | 1,434,409 | |
| * | | Alm. Brand A.S. | | 466,665 | | | 661,343 | |
| * | | Amagerbanken A.S. | | 647,900 | | | — | |
| | Ambu A.S. Series B | | 23,899 | | | 598,281 | |
| * | | Arkil Holdings A.S. Series B | | 736 | | | 49,900 | |
| | Auriga Industries A.S. Series B | | 96,829 | | | 1,254,675 | |
| * | | Bang & Olufsen Holdings A.S. | | 138,857 | | | 1,302,856 | |
| * | | Bavarian Nordic A.S. | | 96,869 | | | 645,309 | |
| | BoConcept Holding A.S. | | 5,650 | | | 77,777 | |
| | Brodrene Hartmann A.S. Series B | | 11,730 | | | 206,143 | |
| * | | Brondbyernes IF Fodbold A.S. Series B | | 13,156 | | | 29,816 | |
| | D/S Norden A.S. | | 110,869 | | | 2,589,249 | |
| * | | Dalhoff Larsen & Horneman A.S. | | 40,950 | | | 45,730 | |
| * | | Dantherm Holding A.S. | | 3,104 | | | 7,524 | |
| # | | DFDS A.S. | | 18,568 | | | 1,144,754 | |
| * | | Djursland Bank A.S. | | 8,970 | | | 206,373 | |
| # | | East Asiatic Co., Ltd. A.S. | | 55,571 | | | 1,142,980 | |
| * | | F.E. Bording A.S. | | 600 | | | 45,967 | |
| * | | Fionia Holding A.S. | | 17,880 | | | — | |
| | Fluegger A.S. Series B | | 4,198 | | | 229,824 | |
| * | | Genmab A.S. | | 140,715 | | | 919,193 | |
| | GN Store Nord A.S. | | 798,612 | | | 6,702,503 | |
53
The Continental Small Company Series
continued
| | | | | Shares | | Value†† | |
| DENMARK — (Continued) | | | | | | |
| * | | GPV Industri A.S. Series B | | 2,200 | | $ | 11,492 | |
| | Gronlandsbanken A.S. | | 768 | | | 39,463 | |
| * | | H&H International A.S. Series B | | 17,280 | | | 127,414 | |
| | | Harboes Bryggeri A.S. | | 12,252 | | | 184,693 | |
| | Hojgaard Holding A.S. Series B | | 2,750 | | | 43,009 | |
| # | | IC Companys A.S. | | 35,278 | | | 628,238 | |
| * | | Incentive A.S. | | 3,575 | | | 11,516 | |
| | Jeudan A.S. | | 4,620 | | | 305,654 | |
| * | | Jyske Bank A.S. | | 171,851 | | | 4,213,178 | |
| | Lan & Spar Bank A.S. | | 5,150 | | | 242,108 | |
| * | | Lastas A.S. Series B | | 10,343 | | | 52,240 | |
| | Lollands Bank A.S. | | 248 | | | 4,303 | |
| * | | Mols-Linien A.S. | | 27,490 | | | 66,776 | |
| #* | | NeuroSearch A.S. | | 79,539 | | | 245,138 | |
| # | | NKT Holding A.S. | | 92,105 | | | 3,046,388 | |
| | Nordjyske Bank A.S. | | 17,600 | | | 202,495 | |
| | Norresundby Bank A.S. | | 7,350 | | | 189,549 | |
| | North Media A.S. | | 36,665 | | | 145,252 | |
| * | | Ostjydsk Bank A.S. | | 3,305 | | | 100,574 | |
| #* | | Pandora A/S | | 107,011 | | | 1,000,702 | |
| #* | | Parken Sport & Entertainment A.S. | | 33,556 | | | 406,351 | |
| | Per Aarsleff A.S. Series B | | 6,396 | | | 447,461 | |
| | Ringkjoebing Landbobank A.S. | | 16,763 | | | 1,686,676 | |
| | Roblon A.S. Series B | | 540 | | | 60,006 | |
| # | | Rockwool International A.S. Series B | | 20,954 | | | 1,677,153 | |
| | Royal Unibrew A.S. | | 40,267 | | | 2,250,207 | |
| * | | Salling Bank A.S. | | 430 | | | 14,989 | |
| | Schouw & Co. A.S. | | 74,017 | | | 1,191,816 | |
| | SimCorp A.S. | | 19,486 | | | 2,978,275 | |
| * | | Sjaelso Gruppen A.S. | | 18,337 | | | 4,572 | |
| * | | SKAKO A.S. | | 1,577 | | | 4,757 | |
| | Solar Holdings A.S. Series B | | 18,041 | | | 721,649 | |
| * | | Spar Nord Bank A.S. | | 126,467 | | | 704,163 | |
| * | | Sparbank A.S. | | 10,930 | | | 75,733 | |
| * | | Sparekassen Faaborg A.S. | | 1,972 | | | 85,945 | |
| | Sydbank A.S. | | 279,299 | | | 4,366,115 | |
| | Thrane & Thrane A.S. | | 16,739 | | | 745,112 | |
| | Tivoli A.S. | | 969 | | | 502,988 | |
| #* | | TK Development A.S. | | 153,640 | | | 358,017 | |
| * | | Topdanmark A.S. | | 53,386 | | | 8,304,872 | |
| #* | | TopoTarget A.S. | | 415,899 | | | 181,482 | |
| * | | Topsil Semiconductor Materials A.S. | | 194,350 | | | 16,196 | |
| #* | | Torm A.S. | | 123,250 | | | 80,517 | |
| | United International Enterprises A.S. | | 3,155 | | | 389,771 | |
| * | | Vestas Wind Systems A.S. | | 3,191 | | | 34,320 | |
| * | | Vestjysk Bank A.S. | | 27,573 | | | 89,386 | |
| TOTAL DENMARK | | | | | 57,585,756 | |
| | | |
| FINLAND — (5.5%) | | | | | | |
| | Ahlstrom Oyj | | 22,304 | | | 359,724 | |
| | Aktia Oyj Series A | | 13,711 | | | 86,591 | |
| # | | Alma Media Oyj | | 277,852 | | | 2,206,154 | |
| | Amer Sports Oyj Series A | | 421,831 | | | 4,901,919 | |
| | Aspo Oyj | | 77,875 | | | 684,605 | |
| | Atria P.L.C. | | 20,043 | | | 154,144 | |
| * | | Bank of Aland P.L.C. Series B | | 22,078 | | | 247,076 | |
| | BasWare Oyj | | 34,550 | | | 734,317 | |
| #* | | Biotie Therapies Corp. Oyj | | 774,610 | | | 502,723 | |
| | Cargotec Oyj Series B | | 132,519 | | | 3,916,879 | |
| | Citycon Oyj | | 649,070 | | | 1,938,128 | |
| * | | Componenta Oyj | | 34,813 | | | 151,852 | |
54
The Continental Small Company Series
continued
| | | | | Shares | | Value†† | |
| FINLAND — (Continued) | | | | | | |
| | Comptel P.L.C. | | 324,863 | | $ | 204,990 | |
| | Cramo Oyj | | 155,694 | | | 1,589,429 | |
| | Digia P.L.C. | | 55,020 | | | 172,230 | |
| * | | Efore Oyj | | 114,965 | | | 106,873 | |
| * | | Elcoteq SE | | 3,041 | | | 905 | |
| * | | Elektrobit Corp. Oyj | | 2,476 | | | 1,219 | |
| # | | Elisa Oyj | | 494,801 | | | 10,302,204 | |
| * | | eQ P.L.C. | | 67,120 | | | 135,099 | |
| | Etteplan Oyj | | 62,600 | | | 181,338 | |
| * | | Finnair Oyj | | 277,805 | | | 826,043 | |
| * | | Finnlines Oyj | | 124,906 | | | 1,243,918 | |
| | Fiskars Oyj Abp | | 181,663 | | | 3,272,794 | |
| # | | F-Secure Oyj | | 463,536 | | | 1,205,299 | |
| * | | GeoSentric Oyj | | 244,900 | | | 3,170 | |
| * | | Glaston Oyj Abp | | 131,940 | | | 76,481 | |
| | HKScan Oyj Series A | | 99,158 | | | 721,564 | |
| | Huhtamaki Oyj | | 362,987 | | | 4,287,832 | |
| | Ilkka-Yhtyma Oyj | | 61,503 | | | 525,683 | |
| # | | KCI Konecranes Oyj | | 245,559 | | | 4,592,333 | |
| # | | Kemira Oyj | | 368,427 | | | 4,360,102 | |
| | Kesko Oyj Series B | | 76,731 | | | 2,572,190 | |
| | Laennen Tehtaat Oyj | | 18,920 | | | 359,675 | |
| | Lassila & Tikanoja Oyj | | 125,791 | | | 1,870,729 | |
| # | | Lemminkainen Oyj | | 22,035 | | | 532,903 | |
| #* | | M-real Oyj Series B | | 1,549,706 | | | 2,652,654 | |
| * | | Neo Industrial Oyj | | 15,900 | | | 51,349 | |
| * | | Neste Oil Oyj | | 285,400 | | | 2,870,363 | |
| | Nordic Aluminium Oyj | | 10,440 | | | 340,109 | |
| | Okmetic Oyj | | 54,904 | | | 348,746 | |
| | Olvi Oyj Series A | | 62,708 | | | 1,196,887 | |
| # | | Oriola-KD Oyj Series A | | 5,045 | | | 12,347 | |
| # | | Oriola-KD Oyj Series B | | 346,706 | | | 771,378 | |
| | Orion Oyj Series A | | 128,371 | | | 2,515,963 | |
| # | | Orion Oyj Series B | | 337,043 | | | 6,548,837 | |
| # | | Outokumpu Oyj | | 381,565 | | | 2,495,890 | |
| | Outotec Oyj | | 133,044 | | | 6,230,991 | |
| | PKC Group Oyj | | 55,424 | | | 820,024 | |
| | Pohjola Bank P.L.C. Series A | | 331,849 | | | 3,215,529 | |
| | Ponsse Oyj | | 25,336 | | | 229,144 | |
| # | | Poyry Oyj | | 187,165 | | | 1,309,902 | |
| | Raisio P.L.C. Series V | | 490,304 | | | 1,514,555 | |
| | Ramirent Oyj | | 314,761 | | | 2,230,706 | |
| | Rapala VMC Oyj | | 113,258 | | | 826,020 | |
| # | | Rautaruukki Oyj Series K | | 323,076 | | | 2,958,896 | |
| | Raute Oyj Series A | | 10,298 | | | 82,668 | |
| | Ruukki Group Oyj | | 604,909 | | | 697,154 | |
| | Saga Furs Oyj | | 8,490 | | | 180,395 | |
| # | | Sanoma Oyj | | 276,990 | | | 3,170,114 | |
| | Sievi Capital P.L.C. | | 123,479 | | | 313,181 | |
| | SRV Group P.L.C. | | 7,277 | | | 37,611 | |
| | Stockmann Oyj Abp Series A | | 43,914 | | | 774,888 | |
| # | | Stockmann Oyj Abp Series B | | 107,109 | | | 1,658,308 | |
| | Technopolis Oyj | | 177,167 | | | 766,333 | |
| | Teleste Oyj | | 53,559 | | | 207,648 | |
| # | | Tieto Oyj | | 291,983 | | | 4,144,140 | |
| # | | Tikkurila Oyj | | 118,741 | | | 1,977,470 | |
| | Tulikivi Oyj | | 62,013 | | | 50,669 | |
| # | | Uponor Oyj Series A | | 217,678 | | | 1,931,823 | |
| | Vacon Oyj | | 45,190 | | | 1,801,798 | |
| | Vaisala Oyj Series A | | 39,132 | | | 828,158 | |
| | Viking Line Abp | | 10,400 | | | 296,583 | |
55
The Continental Small Company Series
continued
| | | | | Shares | | Value†† | |
| FINLAND — (Continued) | | | | | | |
| # | | Yit Oyj | | 390,890 | | $ | 6,240,392 | |
| TOTAL FINLAND | | | | | 119,328,738 | |
| | | | |
| FRANCE — (9.6%) | | | | | | |
| # | | ABC Arbitrage SA | | 26,282 | | | 209,123 | |
| #* | | Air France-KLM | | 252,948 | | | 1,291,862 | |
| # | | Akka Technologies SA | | 8,695 | | | 181,965 | |
| | Ales Groupe SA | | 32,210 | | | 471,207 | |
| * | | Altamir Amboise SA | | 68,287 | | | 530,631 | |
| | ALTEN SA | | 68,354 | | | 1,603,848 | |
| #* | | Altran Technologies SA | | 676,432 | | | 2,434,812 | |
| | April SA | | 74,171 | | | 1,126,880 | |
| #* | | Archos SA | | 32,722 | | | 280,021 | |
| | Arkema SA | | 130,795 | | | 9,190,786 | |
| * | | Artprice.com SA | | 3,246 | | | 214,078 | |
| | Assystem | | 55,571 | | | 851,163 | |
| #* | | Atari SA | | 56,179 | | | 115,316 | |
| | AtoS | | 71,224 | | | 3,111,711 | |
| | Aubay SA | | 10,285 | | | 61,417 | |
| | Audika SA | | 21,251 | | | 359,458 | |
| # | | Aurea SA | | 3,551 | | | 23,167 | |
| # | | Avenir Telecom SA | | 17,841 | | | 12,424 | |
| * | | Axway Software SA | | 22,982 | | | 490,007 | |
| * | | Baccarat SA | | 1,090 | | | 197,299 | |
| | Banque Tarneaud SA | | 1,430 | | | 177,714 | |
| # | | Beneteau SA | | 179,820 | | | 1,876,556 | |
| #* | | Bigben Interactive SA | | 10,448 | | | 97,195 | |
| * | | BioAlliance Pharma SA | | 22,124 | | | 92,177 | |
| | Boiron SA | | 28,682 | | | 744,524 | |
| | Boizel Chanoine Champagne SA | | 7,266 | | | 422,458 | |
| | Bonduelle SCA | | 13,650 | | | 1,103,696 | |
| | Bongrain SA | | 34,266 | | | 2,142,890 | |
| # | | Bourbon SA | | 182,469 | | | 4,997,012 | |
| * | | Boursorama SA | | 54,045 | | | 386,915 | |
| * | | Bull SA | | 309,488 | | | 1,140,067 | |
| | Burelle SA | | 3,894 | | | 851,633 | |
| | Cafom SA | | 5,092 | | | 59,216 | |
| | CBo Territoria SA | | 28,320 | | | 93,321 | |
| # | | Cegedim SA | | 16,591 | | | 364,886 | |
| | CEGID Group SA | | 8,757 | | | 162,254 | |
| | CFAO SA | | 35,382 | | | 1,197,025 | |
| * | | Cie des Alpes | | 4,636 | | | 86,028 | |
| * | | Cie Generale de Geophysique - Veritas SA | | 12,983 | | | 301,361 | |
| | Ciments Francais SA | | 6,053 | | | 467,541 | |
| #* | | Club Mediterranee SA | | 81,291 | | | 1,379,871 | |
| | Compagnie Industrielle et Financiere D’Entreprises SA | | 1,200 | | | 78,693 | |
| * | | CS Communication & Systemes SA | | 5,100 | | | 16,241 | |
| | Damartex SA | | 21,101 | | | 491,722 | |
| #* | | Derichebourg SA | | 548,515 | | | 1,650,964 | |
| | Devoteam SA | | 16,890 | | | 221,139 | |
| * | | Dynaction SA | | 12,745 | | | 100,589 | |
| * | | Eiffage SA | | 38,250 | | | 921,575 | |
| # | | Electricite de Strasbourg SA | | 21,886 | | | 2,891,259 | |
| | Entrepose Contracting SA | | 3,437 | | | 295,757 | |
| | Esso SA Francaise | | 9,411 | | | 824,117 | |
| # | | Establissements Maurel et Prom SA | | 323,678 | | | 4,916,266 | |
| * | | Etam Developpement SA | | 1,148 | | | 15,672 | |
| | Euler Hermes SA | | 39,146 | | | 2,310,539 | |
| #* | | Euro Disney SCA | | 138,383 | | | 632,082 | |
| # | | Eurofins Scientific SA | | 12,661 | | | 920,538 | |
| | Exel Industries SA Series A | | 10,680 | | | 440,002 | |
56
THE CONTINENTAL SMALL COMPANY SERIES
CONTINUED
| | | | | Shares | | Value†† | |
| FRANCE — (Continued) | | | | | | |
| | Faiveley Transport SA | | 20,842 | | $ | 1,295,591 | |
| | Faurecia SA | | 97,449 | | | 1,836,632 | |
| | Fimalac SA | | 31,490 | | | 1,193,095 | |
| | Fleury Michon SA | | 4,694 | | | 172,213 | |
| | Flo Groupe SA | | 29,358 | | | 134,679 | |
| #* | | GameLoft SA | | 84,916 | | | 530,490 | |
| * | | Gascogne SA | | 6,907 | | | 205,718 | |
| | Gaumont SA | | 14,043 | | | 767,595 | |
| #* | | GECI International SA | | 59,392 | | | 104,073 | |
| | Gemalto NV | | 109,597 | | | 5,311,776 | |
| | Gevelot SA | | 3,584 | | | 217,680 | |
| #* | | GFI Informatique SA | | 134,770 | | | 395,207 | |
| | GL Events SA | | 21,143 | | | 379,798 | |
| | GPE Groupe Pizzorno SA | | 5,200 | | | 72,058 | |
| | Groupe Crit SA | | 24,255 | | | 360,140 | |
| * | | Groupe Go Sport SA | | 1,125 | | | 14,075 | |
| # | | Groupe Gorge SA | | 18,510 | | | 194,954 | |
| # | | Groupe Guillin SA | | 1,200 | | | 73,567 | |
| * | | Groupe Open SA | | 27,590 | | | 168,273 | |
| #* | | Groupe Partouche SA | | 61,786 | | | 96,333 | |
| # | | Groupe Steria SCA | | 82,770 | | | 1,402,970 | |
| | Guerbet SA | | 6,577 | | | 536,954 | |
| | Guyenne et Gascogne SA | | 25,083 | | | 2,624,844 | |
| * | | Haulotte Group SA | | 61,352 | | | 370,240 | |
| | Havas SA | | 1,237,226 | | | 5,074,669 | |
| * | | Hi-Media SA | | 100,249 | | | 285,466 | |
| * | | Idsud SA | | 2,227 | | | 62,113 | |
| | Ingenico SA | | 118,736 | | | 4,277,410 | |
| # | | Interparfums SA | | 15,050 | | | 318,435 | |
| | Ipsen SA | | 57,266 | | | 1,795,243 | |
| | Ipsos SA | | 89,607 | | | 2,541,671 | |
| * | | Jacquet Metal Service SA | | 48,141 | | | 495,834 | |
| * | | Kaufman & Broad SA | | 1,917 | | | 34,974 | |
| | Korian SA | | 8,204 | | | 133,831 | |
| # | | Laurent-Perrier SA | | 12,546 | | | 1,177,345 | |
| | LDC SA | | 19 | | | 1,955 | |
| # | | Lectra SA | | 83,499 | | | 496,849 | |
| | Lisi SA | | 16,907 | | | 1,109,038 | |
| * | | LVL Medical Groupe SA | | 18,786 | | | 291,241 | |
| | M6 Metropole Television SA | | 155,729 | | | 2,315,958 | |
| | Maisons France Confort SA | | 6,671 | | | 164,610 | |
| #* | | Manitou BF SA | | 48,911 | | | 738,422 | |
| | Manutan International SA | | 14,553 | | | 635,987 | |
| #* | | Maurel & Prom Nigeria | | 323,678 | | | 816,894 | |
| * | | Medica SA | | 59,126 | | | 993,319 | |
| | Mersen SA | | 64,007 | | | 1,928,429 | |
| #* | | METabolic EXplorer SA | | 3,034 | | | 11,289 | |
| | MGI Coutier SA | | 2,753 | | | 118,943 | |
| | Montupet SA | | 1,081 | | | 5,312 | |
| | Mr. Bricolage SA | | 30,731 | | | 367,126 | |
| # | | Naturex SA | | 12,810 | | | 859,439 | |
| # | | Neopost SA | | 91,985 | | | 6,185,863 | |
| | Nexans SA | | 131,823 | | | 6,807,411 | |
| | Nexity SA | | 83,910 | | | 1,892,806 | |
| * | | NicOx SA | | 33,240 | | | 43,511 | |
| | Norbert Dentressangle SA | | 20,989 | | | 1,464,810 | |
| * | | NRJ Group SA | | 12,748 | | | 110,993 | |
| | Oeneo SA | | 113,285 | | | 282,482 | |
| # | | Orpea SA | | 101,314 | | | 3,298,686 | |
| | Osiatis SA | | 1,400 | | | 9,132 | |
| # | | PagesJaunes Groupe SA | | 384,634 | | | 1,392,787 | |
57
THE CONTINENTAL SMALL COMPANY SERIES
CONTINUED
| | | | | Shares | | Value†† | |
| FRANCE — (Continued) | | | | | | |
| | Paris Orleans et Cie SA | | 1,401 | | $ | 26,464 | |
| * | | Parrot SA | | 18,832 | | | 421,916 | |
| | Pierre & Vacances SA | | 18,411 | | | 608,629 | |
| | Plastic Omnium SA | | 95,424 | | | 1,886,891 | |
| | Plastivaloire SA | | 4,552 | | | 105,529 | |
| | PSB Industries SA | | 8,438 | | | 221,301 | |
| | Rallye SA | | 95,651 | | | 2,666,339 | |
| #* | | Recylex SA | | 55,481 | | | 214,376 | |
| | Remy Cointreau SA | | 82,777 | | | 6,638,753 | |
| | Robertet SA | | 3,167 | | | 491,515 | |
| #* | | Rodriguez Group SA | | 31,298 | | | 126,268 | |
| | Rougier SA | | 6,115 | | | 238,226 | |
| | Rubis SA | | 78,288 | | | 4,080,517 | |
| * | | Rue du Commerce SA | | 136 | | | 1,578 | |
| #* | | S.T. Dupont SA | | 300,960 | | | 151,147 | |
| # | | Sa des Ciments Vicat SA | | 29,610 | | | 1,693,070 | |
| | Sabeton SA | | 13,500 | | | 223,856 | |
| | Saft Groupe SA | | 75,425 | | | 2,127,315 | |
| | Samse SA | | 8,342 | | | 600,498 | |
| | Sartorius Stedim Biotech SA | | 5,122 | | | 324,377 | |
| | Seche Environnement SA | | 4,452 | | | 164,674 | |
| # | | Sechilienne SA | | 60,146 | | | 849,535 | |
| | Securidev SA | | 2,500 | | | 113,161 | |
| # | | Sequana SA | | 46,996 | | | 259,786 | |
| * | | Societe Anonyme d’Explosifs et de Produits Chimiques SA | | 524 | | | 135,278 | |
| | Societe BIC SA | | 74,331 | | | 6,575,875 | |
| | Societe d’Edition de Canal Plus SA | | 306,742 | | | 1,698,707 | |
| # | | Societe des Bains de Mer et du Cercle des Etrangers a Monaco SA | | 46,150 | | | 2,446,069 | |
| | Societe Internationale de Plantations d’Heveas SA | | 4,451 | | | 342,194 | |
| | Societe Pour l’Informatique Industrielle SA | | 40,908 | | | 220,800 | |
| | Societe Television Francaise 1 SA | | 303,495 | | | 2,952,218 | |
| #* | | Soitec SA | | 383,996 | | | 1,878,142 | |
| # | | Somfy SA | | 21,738 | | | 4,275,790 | |
| | Sopra Group SA | | 22,982 | | | 1,060,812 | |
| * | | Spir Communication SA | | 2,956 | | | 81,117 | |
| * | | Stallergenes SA | | 3,386 | | | 184,894 | |
| #* | | Ste Industrielle d’Aviation Latecoere SA | | 16,344 | | | 199,791 | |
| | STEF-TFE SA | | 29,121 | | | 1,319,325 | |
| * | | Store Electronic SA | | 2,100 | | | 27,467 | |
| | Sucriere de Pithiviers Le Vieil SA | | 1,745 | | | 3,599,821 | |
| | Sword Group SA | | 17,347 | | | 270,103 | |
| | Synergie SA | | 54,902 | | | 646,188 | |
| #* | | Technicolor SA | | 321,494 | | | 481,327 | |
| | Teleperformance SA | | 181,538 | | | 4,032,869 | |
| | Tessi SA | | 5,050 | | | 456,494 | |
| #* | | Theolia SA | | 347,281 | | | 385,329 | |
| * | | Thermador Groupe | | 431 | | | 59,583 | |
| # | | Tonnellerie Francois Freres SA | | 3,839 | | | 144,621 | |
| | Total Gabon SA | | 662 | | | 253,328 | |
| | Touax SA | | 1,317 | | | 37,135 | |
| | Toupargel Groupe SA | | 111 | | | 1,295 | |
| #* | | Transgene SA | | 13,430 | | | 133,429 | |
| | Trigano SA | | 29,525 | | | 443,769 | |
| * | | UbiSoft Entertainment SA | | 304,461 | | | 2,025,519 | |
| | Union Financiere de France Banque SA | | 16,828 | | | 435,778 | |
| | Valeo SA | | 196,323 | | | 7,769,667 | |
| | Viel et Compagnie SA | | 158,130 | | | 509,404 | |
| # | | Vilmorin & Cie SA | | 20,195 | | | 1,922,219 | |
| | Virbac SA | | 17,494 | | | 2,709,837 | |
| #* | | Vivalis SA | | 12,089 | | | 86,042 | |
| | VM Materiaux SA | | 6,914 | | | 207,926 | |
58
THE CONTINENTAL SMALL COMPANY SERIES
CONTINUED
| | | | | Shares | | Value†† | |
| FRANCE — (Continued) | | | | | | |
| | Vranken Pommery Monopole SA | | 14,162 | | $ | 501,559 | |
| # | | Zodiac Aerospace SA | | 89,170 | | | 7,532,929 | |
| TOTAL FRANCE | | | | | 206,908,279 | |
| | | | |
| GERMANY — (12.1%) | | | | | | |
| | A.S. Creation Tapeton AG | | 6,853 | | | 216,871 | |
| * | | AAP Implantate AG | | 47,250 | | | 42,733 | |
| * | | Aareal Bank AG | | 423,110 | | | 7,633,993 | |
| * | | Abwicklungsgesellschaft Roesch AG Medizintechnik | | 7,300 | | | 274 | |
| * | | ADVA AG Optical Networking | | 128,074 | | | 599,090 | |
| | AGROB Immobilien AG | | 5,800 | | | 67,351 | |
| #* | | Air Berlin P.L.C. | | 117,774 | | | 380,211 | |
| # | | Aixtron SE | | 314,748 | | | 4,000,180 | |
| * | | Aligna AG | | 318,087 | | | 5,317 | |
| | Allgeier Holding AG | | 3,177 | | | 44,067 | |
| # | | Amadeus Fire AG | | 16,192 | | | 557,547 | |
| * | | Andreae-Noris Zahn AG | | 26,412 | | | 989,582 | |
| # | | Asian Bamboo AG | | 29,133 | | | 559,983 | |
| # | | AUGUSTA Technologie AG | | 28,595 | | | 529,412 | |
| | Aurubis AG | | 152,783 | | | 8,130,677 | |
| | Baader Bank AG | | 132,511 | | | 348,862 | |
| #* | | Balda AG | | 127,634 | | | 715,885 | |
| # | | Bauer AG | | 22,556 | | | 615,083 | |
| # | | BayWa AG | | 20,761 | | | 731,910 | |
| | Bechtle AG | | 43,981 | | | 1,488,857 | |
| # | | Bertrandt AG | | 23,001 | | | 1,506,616 | |
| * | | Beta Systems Software AG | | 8,550 | | | 21,563 | |
| * | | Bijou Brigitte AG | | 812 | | | 76,625 | |
| | Bilfinger Berger SE | | 125,406 | | | 10,677,964 | |
| * | | Biolitec AG | | 26,229 | | | 62,778 | |
| # | | Biotest AG | | 20,784 | | | 1,106,859 | |
| * | | BKN International AG | | 33,408 | | | 562 | |
| * | | BMP Media Vestors AG | | 42,481 | | | 30,340 | |
| * | | Borussia Dortmund GmbH & Co. KGaA | | 208,512 | | | 512,312 | |
| * | | CANCOM AG | | 1,156 | | | 13,167 | |
| # | | Carl Zeiss Meditec AG | | 86,687 | | | 1,828,006 | |
| | CAT Oil AG | | 47,541 | | | 272,466 | |
| #* | | Celesio AG | | 119,149 | | | 1,884,688 | |
| | CENIT AG | | 1,487 | | | 11,534 | |
| * | | Centrosolar Group AG | | 12,706 | | | 21,322 | |
| | Centrotec Sustainable AG | | 42,634 | | | 621,010 | |
| # | | Centrotherm Photovoltaics AG | | 28,152 | | | 360,036 | |
| | Cewe Color Holding AG | | 15,268 | | | 619,351 | |
| * | | Colonia Real Estate AG | | 3,523 | | | 13,664 | |
| | Comdirect Bank AG | | 139,558 | | | 1,349,665 | |
| # | | CompuGroup Medical AG | | 14,015 | | | 157,602 | |
| #* | | Conergy AG | | 221,174 | | | 89,691 | |
| #* | | Constantin Medien AG | | 359,780 | | | 595,558 | |
| | CropEnergies AG | | 57,113 | | | 361,682 | |
| | CTS Eventim AG | | 106,100 | | | 3,183,442 | |
| * | | Curanum AG | | 100,137 | | | 258,121 | |
| # | | DAB Bank AG | | 130,043 | | | 557,724 | |
| | Data Modul AG | | 11,455 | | | 170,555 | |
| | Delticom AG | | 6,024 | | | 518,931 | |
| | Deufol AG | | 113,203 | | | 143,010 | |
| # | | Deutsche Beteiligungs AG | | 29,695 | | | 597,723 | |
| | Deutsche Wohnen AG | | 243,836 | | | 3,238,157 | |
| * | | Deutz AG | | 263,835 | | | 1,402,118 | |
| * | | Dialog Semiconductor P.L.C. | | 166,323 | | | 2,698,605 | |
| | DIC Asset AG | | 13,115 | | | 90,862 | |
| | Dierig Holding AG | | 10,500 | | | 177,359 | |
59
THE CONTINENTAL SMALL COMPANY SERIES
CONTINUED
| | | | | Shares | | Value†† | |
| GERMANY — (Continued) | | | | | | |
| # | | Douglas Holding AG | | 105,346 | | $ | 3,786,632 | |
| | Dr. Hoenle AG | | 14,858 | | | 175,800 | |
| | Draegerwerk AG & Co. KGaA | | 921 | | | 59,387 | |
| | Drillisch AG | | 158,285 | | | 1,451,764 | |
| | Duerr AG | | 36,111 | | | 1,586,907 | |
| | DVB Bank SE | | 173,470 | | | 5,376,462 | |
| # | | Eckert & Ziegler AG | | 7,196 | | | 210,259 | |
| # | | Elmos Semiconductor AG | | 34,592 | | | 355,427 | |
| # | | ElreingKlinger AG | | 105,909 | | | 2,624,994 | |
| #* | | Epigenomics AG | | 5,535 | | | 9,310 | |
| | Erlus AG | | 2,970 | | | 115,167 | |
| #* | | Euromicron AG | | 11,385 | | | 234,400 | |
| | Euwax AG | | 17,978 | | | 1,152,427 | |
| #* | | Evotec AG | | 1,165,338 | | | 3,514,703 | |
| | Fielmann AG | | 46,199 | | | 4,386,562 | |
| * | | First Sensor AG | | 3,931 | | | 46,176 | |
| * | | FJA AG | | 217 | | | 359 | |
| # | | Freenet AG | | 372,758 | | | 4,820,504 | |
| # | | Fuchs Petrolub AG | | 139,623 | | | 5,418,709 | |
| # | | GAGFAH SA | | 281,532 | | | 1,446,024 | |
| | GBW AG | | 28,417 | | | 624,148 | |
| | Gerresheimer AG | | 89,828 | | | 3,737,131 | |
| | Gerry Weber International AG | | 89,108 | | | 2,712,309 | |
| #* | | Gesco AG | | 10,010 | | | 818,523 | |
| | GFK SE | | 72,083 | | | 2,853,736 | |
| | GFT Technologies AG | | 66,050 | | | 231,914 | |
| #* | | Gigaset AG | | 151,718 | | | 482,757 | |
| * | | Gildemeister AG | | 134,092 | | | 1,688,615 | |
| #* | | Grammer AG | | 38,035 | | | 639,901 | |
| | Grenkeleasing AG | | 33,471 | | | 1,688,196 | |
| | H&R AG | | 21,428 | | | 458,011 | |
| | Hamborner REIT AG | | 28,257 | | | 233,994 | |
| | Hamburger Hafen und Logistik AG | | 55,006 | | | 1,622,767 | |
| #* | | Hansa Group AG | | 146,815 | | | 610,872 | |
| | Hawesko Holding AG | | 19,463 | | | 885,626 | |
| #* | | Heidelberger Druckmaschinen AG | | 734,833 | | | 1,177,592 | |
| | Homag Group AG | | 13,586 | | | 137,041 | |
| * | | IKB Deutsche Industriebank AG | | 21,843 | | | 12,269 | |
| | Indus Holding AG | | 45,532 | | | 1,110,620 | |
| | Innovation in Traffic Systems AG | | 23,949 | | | 439,726 | |
| # | | Interseroh SE | | 21,642 | | | 1,482,486 | |
| #* | | Intershop Communications AG | | 62,598 | | | 166,648 | |
| | Isra Vision Systems AG | | 10,917 | | | 215,116 | |
| #* | | IVG Immobilien AG | | 480,972 | | | 1,304,188 | |
| * | | Jenoptik AG | | 162,963 | | | 960,901 | |
| * | | Joyou AG | | 2,461 | | | 25,148 | |
| * | | Kampa AG | | 35,505 | | | 1,664 | |
| # | | Kloeckner & Co. SE | | 341,221 | | | 4,367,470 | |
| | Koenig & Bauer AG | | 7,004 | | | 90,148 | |
| # | | Kontron AG | | 189,937 | | | 1,242,153 | |
| # | | Krones AG | | 72,618 | | | 3,444,865 | |
| # | | KSB AG | | 3,584 | | | 2,009,594 | |
| #* | | Kuka AG | | 102,786 | | | 1,878,077 | |
| | KWS Saat AG | | 17,224 | | | 3,432,641 | |
| | Leifheit AG | | 12,500 | | | 331,064 | |
| # | | Leoni AG | | 115,635 | | | 3,845,985 | |
| #* | | Loewe AG | | 25,187 | | | 81,372 | |
| # | | LPKF Laser & Electronics AG | | 20,347 | | | 249,764 | |
| #* | | Manz AG | | 5,470 | | | 154,066 | |
| #* | | Masterflex AG | | 19,347 | | | 129,827 | |
| * | | Maxdata Computer AG | | 94,120 | | | 14,740 | |
60
THE CONTINENTAL SMALL COMPANY SERIES
CONTINUED
| | | | | Shares | | Value†† | |
| GERMANY — (Continued) | | | | | | |
| | Mediclin AG | | 119,554 | | $ | 577,023 | |
| #* | | Medigene AG | | 87,499 | | | 109,787 | |
| # | | Mensch und Maschine Software AG | | 27,532 | | | 165,698 | |
| | MLP AG | | 216,957 | | | 1,436,997 | |
| | Mobotix AG | | 4,367 | | | 124,189 | |
| * | | Mologen AG | | 24,513 | | | 222,675 | |
| * | | Morphosys AG | | 62,322 | | | 1,412,254 | |
| #* | | MPC Muenchmeyer Petersen Capital AG | | 5,101 | | | 9,213 | |
| | MTU Aero Engines Holding AG | | 142,908 | | | 9,124,965 | |
| # | | Muehlbauer Holding & Co. AG | | 14,905 | | | 422,349 | |
| # | | MVV Energie AG | | 114,055 | | | 3,366,808 | |
| | Nemetschek AG | | 24,668 | | | 821,969 | |
| * | | Nexus AG | | 33,813 | | | 306,110 | |
| #* | | Nordex SE | | 126,718 | | | 648,165 | |
| # | | OHB AG | | 35,659 | | | 525,205 | |
| | Oldenburgische Landesbank AG | | 4,234 | | | 167,316 | |
| | P&I Personal & Informatik AG | | 17,889 | | | 638,796 | |
| * | | Patrizia Immobilien AG | | 41,860 | | | 185,458 | |
| # | | Pfeiffer Vacuum Technology AG | | 34,071 | | | 2,976,006 | |
| * | | Pfleiderer AG | | 98,494 | | | 35,088 | |
| | Phoenix Solar AG | | 10,092 | | | 28,056 | |
| | PNE Wind AG | | 167,451 | | | 400,755 | |
| # | | Praktiker AG | | 195,237 | | | 344,345 | |
| | Progress-Werk Oberkirch AG | | 6,250 | | | 253,224 | |
| # | | PSI AG Gesellschaft Fuer Produkte und Systeme der Informationstechnologie | | 30,993 | | | 589,541 | |
| | PVA TePla AG | | 46,019 | | | 182,801 | |
| #* | | Q-Cells SE | | 226,583 | | | 151,534 | |
| #* | | QSC AG | | 306,094 | | | 825,507 | |
| | R Stahl AG | | 14,410 | | | 505,179 | |
| # | | Rational AG | | 15,420 | | | 3,345,798 | |
| * | | REALTECH AG | | 13,541 | | | 87,801 | |
| | Renk AG | | 18,838 | | | 1,487,560 | |
| | Rheinmetall AG | | 126,352 | | | 5,595,512 | |
| | Rhoen-Klinikum AG | | 406,308 | | | 7,732,812 | |
| | Ruecker AG | | 18,869 | | | 251,044 | |
| | S.A.G. Solarstrom AG | | 21,788 | | | 95,906 | |
| * | | SAF-Holland SA | | 54,481 | | | 250,079 | |
| | Schaltbau Holding AG | | 1,921 | | | 174,765 | |
| * | | Sedo Holding AG | | 69,691 | | | 239,227 | |
| | Sektkellerei Schloss Wachenheim AG | | 14,520 | | | 139,761 | |
| * | | SER Systems AG | | 9,400 | | | 207 | |
| #* | | SGL Carbon SE | | 229,387 | | | 11,290,812 | |
| #* | | Singulus Technologies AG | | 236,814 | | | 620,895 | |
| | Sinner AG | | 2,660 | | | 53,895 | |
| | Sixt AG | | 81,198 | | | 1,432,218 | |
| * | | SKW Stahl-Metallurgie Holding AG | | 15,276 | | | 224,161 | |
| #* | | Sky Deutschland AG | | 1,051,866 | | | 1,908,833 | |
| * | | SM Wirtschaftsberatungs AG | | 18,133 | | | 112,414 | |
| #* | | SMA Solar Technology AG | | 20,774 | | | 1,157,927 | |
| #* | | SMT Scharf AG | | 2,431 | | | 69,961 | |
| | Software AG | | 163,367 | | | 6,022,864 | |
| * | | Solar Millennium AG | | 26,755 | | | 10,390 | |
| * | | Solar-Fabrik AG | | 11,580 | | | 23,322 | |
| # | | Solarworld AG | | 285,203 | | | 1,200,720 | |
| * | | Solon SE | | 23,485 | | | 11,217 | |
| | Stada Arzneimittel AG | | 185,987 | | | 4,627,570 | |
| | STINAG Stuttgart Invest AG | | 35,003 | | | 768,649 | |
| | Stoehr & Co. AG | | 6,000 | | | 13,770 | |
| | STRATEC Biomedical AG | | 27,909 | | | 1,145,046 | |
| * | | Stroer Out-of-Home Media AG | | 12,572 | | | 206,376 | |
| * | | Sunways AG | | 15,010 | | | 29,899 | |
61
THE CONTINENTAL SMALL COMPANY SERIES
CONTINUED
| | | | | Shares | | Value†† | |
| GERMANY — (Continued) | | | | | | |
| #* | | Suss Microtec AG | | 59,969 | | $ | 435,143 | |
| # | | Symrise AG | | 330,233 | | | 8,794,596 | |
| | Syzygy AG | | 30,656 | | | 139,782 | |
| #* | | TAG Immobilien AG | | 194,383 | | | 1,548,598 | |
| | Takkt AG | | 126,507 | | | 1,393,521 | |
| # | | TDS Informationstechnologie AG | | 89,063 | | | 564,756 | |
| # | | Telegate AG | | 16,807 | | | 115,269 | |
| * | | Tipp24 SE | | 9,654 | | | 411,878 | |
| * | | Tom Tailor Holding AG | | 15,736 | | | 250,367 | |
| | Tomorrow Focus AG | | 113,715 | | | 492,432 | |
| #* | | TUI AG | | 468,655 | | | 2,907,045 | |
| | UMS United Medical Systems International AG | | 6,203 | | | 48,127 | |
| | UmweltBank AG | | 17,805 | | | 572,082 | |
| | United Internet AG | | 11,771 | | | 209,821 | |
| | VBH Holding AG | | 9,415 | | | 47,295 | |
| * | | Verbio AG | | 50,804 | | | 210,851 | |
| # | | Vossloh AG | | 37,975 | | | 3,636,175 | |
| | VTG AG | | 32,073 | | | 551,348 | |
| # | | Wacker Neuson SE | | 45,820 | | | 565,212 | |
| * | | Wanderer-Werke AG | | 7,903 | | | 552 | |
| | Washtec AG | | 1,983 | | | 18,851 | |
| | Wincor Nixdorf AG | | 119,287 | | | 5,327,867 | |
| | Wirecard AG | | 284,730 | | | 4,570,462 | |
| | Wuerttembergische Lebensversicherung AG | | 27,308 | | | 471,197 | |
| | Wuerttembergische Metallwarenfabrik AG | | 29,451 | | | 1,121,800 | |
| | XING AG | | 5,288 | | | 280,505 | |
| # | | Zhongde Waste Technology AG | | 4,008 | | | 19,487 | |
| #* | | zooplus AG | | 4,427 | | | 246,169 | |
| TOTAL GERMANY | | | | | 259,094,803 | |
| | | |
| GREECE — (1.8%) | | | | | | |
| * | | Aegean Airlines S.A. | | 5,746 | | | 9,653 | |
| * | | Aegek S.A. | | 120,000 | | | 13,445 | |
| * | | Agricultural Bank of Greece S.A. | | 63,660 | | | 24,310 | |
| * | | Alfa Alfa Energy S.A. | | 3,810 | | | 6,854 | |
| * | | Alpha Bank A.E. | | 584,671 | | | 402,800 | |
| * | | Alumil Aluminum Industry S.A. | | 48,665 | | | 15,463 | |
| * | | Alysida S.A. | | 2,376 | | | 6,123 | |
| * | | Anek Lines S.A. | | 498,242 | | | 76,388 | |
| * | | Astir Palace Hotels S.A. | | 93,886 | | | 179,262 | |
| * | | Athens Medical Center S.A. | | 150,874 | | | 50,596 | |
| * | | Atlantic Supermarkets S.A. | | 34,730 | | | 3,596 | |
| * | | Attica Bank S.A. | | 184,869 | | | 49,593 | |
| * | | Atti-Kat S.A. | | 56,554 | | | 1,901 | |
| * | | Autohellas S.A. | | 83,520 | | | 121,916 | |
| * | | Babis Vovos International Construction S.A. | | 40,085 | | | 22,675 | |
| * | | Balafas S.A. | | 15,200 | | | 3,738 | |
| * | | Balkan Real Estate S.A. | | 5,450 | | | 2,674 | |
| | Bank of Cyprus Public Co., Ltd. S.A. | | 2,354,228 | | | 1,848,317 | |
| | Bank of Greece S.A. | | 133,571 | | | 2,153,633 | |
| * | | Daios Plastics S.A. | | 16,350 | | | 116,178 | |
| * | | Diagnostic & Therapeutic Center of Athens Hygeia S.A. | | 275,576 | | | 89,069 | |
| * | | Dionic S.A. | | 16,092 | | | 22,069 | |
| * | | EFG Eurobank Ergasias S.A. | | 971,907 | | | 473,354 | |
| * | | Elastron S.A. | | 95,358 | | | 49,782 | |
| * | | Elbisco Holding S.A. | | 28,098 | | | 13,608 | |
| | Elektrak S.A. | | 37,647 | | | 71,885 | |
| * | | Elektroniki Athinon S.A. | | 7,497 | | | 7,843 | |
| | Ellaktor S.A. | | 531,699 | | | 829,021 | |
| * | | Elval - Hellenic Aluminium Industry S.A. | | 28,590 | | | 43,792 | |
| * | | Etma Rayon S.A. | | 11,242 | | | 20,515 | |
62
THE CONTINENTAL SMALL COMPANY SERIES
CONTINUED
| | | | | Shares | | Value†† | |
| GREECE — (Continued) | | | | | | |
| | Euro Reliance General Insurance Co. S.A. | | 54,730 | | $ | 29,717 | |
| * | | Euromedica S.A. | | 33,079 | | | 18,713 | |
| | EYDAP Athens Water Supply & Sewage Co. S.A. | | 108,270 | | | 432,514 | |
| * | | F.G. Europe S.A. | | 4,536 | | | 2,688 | |
| * | | Folli Follie Group S.A. | | 124,720 | | | 1,246,531 | |
| * | | Forthnet S.A. | | 253,290 | | | 35,675 | |
| * | | Fourlis Holdings S.A. | | 146,787 | | | 271,214 | |
| | Frigoglass S.A. | | 113,901 | | | 530,950 | |
| | GEK Terna S.A. | | 296,155 | | | 230,940 | |
| * | | Geniki Bank S.A. | | 31,074 | | | 10,434 | |
| * | | Halkor S.A. | | 226,556 | | | 125,782 | |
| * | | Hellenic Cables S.A. | | 65,236 | | | 95,711 | |
| | Hellenic Exchanges S.A. | | 259,239 | | | 965,152 | |
| | Hellenic Petroleum S.A. | | 325,823 | | | 2,680,973 | |
| * | | Hellenic Sugar Industry S.A. | | 78,005 | | | 91,681 | |
| * | | Hellenic Telecommunication Organization Co. S.A. | | 460,012 | | | 1,708,760 | |
| * | | Heracles General Cement Co. S.A. | | 77,436 | | | 185,604 | |
| * | | Iaso S.A. | | 206,042 | | | 176,080 | |
| | Inform P. Lykos S.A. | | 23,285 | | | 20,128 | |
| * | | Informatics S.A. | | 3,778 | | | 1,516 | |
| * | | Intracom Holdings S.A. | | 313,001 | | | 67,418 | |
| * | | Intracom Technical & Steel Constructions S.A. | | 74,651 | | | 34,052 | |
| | Intralot S.A.-Integrated Lottery Systems & Services | | 433,742 | | | 375,451 | |
| * | | Ionian Hotel Enterprises S.A. | | 16,914 | | | 306,472 | |
| * | | Ipirotiki Software & Publications S.A. | | 22,110 | | | 55,515 | |
| | JUMBO S.A. | | 322,485 | | | 1,581,794 | |
| | Karelia Tobacco Co., Inc. S.A. | | 5,787 | | | 598,220 | |
| * | | Kathimerini Publishing S.A. | | 47,170 | | | 156,380 | |
| * | | Lambrakis Press S.A. | | 115,149 | | | 17,010 | |
| * | | Lamda Development S.A. | | 905 | | | 2,921 | |
| * | | Lan-Net S.A. | | 12,688 | | | 19,706 | |
| * | | Lavipharm S.A. | | 57,739 | | | 14,872 | |
| | Loulis Mills S.A. | | 41,702 | | | 71,397 | |
| * | | Marfin Investment Group S.A. | | 2,380,237 | | | 1,131,057 | |
| * | | Marfin Popular Bank PCL | | 3,674,665 | | | 1,396,536 | |
| | Metka S.A. | | 99,168 | | | 762,587 | |
| * | | Michaniki S.A. | | 155,442 | | | 43,904 | |
| | Motor Oil (Hellas) Corinth Refineries S.A. | | 217,638 | | | 1,662,867 | |
| * | | Mytilineos Holdings S.A. | | 353,384 | | | 1,423,606 | |
| * | | National Bank of Greece S.A. | | 511,564 | | | 1,057,505 | |
| * | | Neorion Holdings S.A. | | 14,991 | | | 5,198 | |
| * | | OPAP S.A. | | 61,283 | | | 539,310 | |
| * | | Pegasus Publishing S.A. | | 94,144 | | | 92,603 | |
| * | | Piraeus Bank S.A. | | 4,630,988 | | | 1,504,355 | |
| | Piraeus Port Authority S.A. | | 19,968 | | | 219,547 | |
| * | | Promota Hellas S.A. | | 8,860 | | | 2,637 | |
| * | | Proton Bank S.A. | | 141,214 | | | — | |
| | Public Power Corp. S.A. | | 420,190 | | | 2,057,901 | |
| * | | Real Estate Development & Services S.A. | | 94,497 | | | 70,142 | |
| | S&B Industrial Minerals S.A. | | 68,336 | | | 361,120 | |
| * | | Sarantis S.A. | | 74,884 | | | 187,802 | |
| * | | Selected Textile S.A. | | 61,219 | | | 40,254 | |
| * | | Sfakianakis S.A. | | 17,776 | | | 23,062 | |
| * | | Sidenor Steel Products Manufacturing Co. S.A. | | 203,373 | | | 267,863 | |
| * | | Spyroy Agricultural Products S.A. | | 61,348 | | | 25,378 | |
| * | | T Bank S.A. | | 228,007 | | | 14,165 | |
| * | | Technical Olympic S.A. | | 2,237 | | | 3,514 | |
| * | | Teletypos S.A. Mega Channel | | 77,669 | | | 24,222 | |
| | Terna Energy S.A. | | 132,478 | | | 223,974 | |
| * | | Themeliodomi S.A. | | 37,422 | | | 17,920 | |
| | Thessaloniki Port Authority S.A. | | 6,936 | | | 85,234 | |
63
THE CONTINENTAL SMALL COMPANY SERIES
CONTINUED
| | | | | Shares | | Value†† | |
| GREECE — (Continued) | | | | | | |
| | Thessaloniki Water Supply & Sewage Co. S.A. | | 11,146 | | $ | 45,922 | |
| | Thrace Plastics Co. S.A. | | 99,700 | | | 59,933 | |
| | Titan Cement Co. S.A. | | 195,743 | | | 2,928,361 | |
| * | | TT Hellenic Postbank S.A. | | 695,353 | | | 357,498 | |
| * | | Varvaressos S.A. European Spinning Mills | | 10,832 | | | 1,293 | |
| * | | Viohalco S.A. | | 603,593 | | | 2,353,554 | |
| TOTAL GREECE | | | | | 37,882,848 | |
| | | | |
| IRELAND — (2.8%) | | | | | | |
| | Abbey P.L.C. | | 83,845 | | | 553,199 | |
| * | | Aer Lingus Group P.L.C. | | 763,185 | | | 626,348 | |
| * | | Aminex P.L.C. | | 496,086 | | | 25,717 | |
| | C&C Group P.L.C. (B010DT8) | | 399,607 | | | 1,472,874 | |
| | C&C Group P.L.C. (B011Y09) | | 1,014,594 | | | 3,767,111 | |
| | DCC P.L.C. (0242493) | | 308,989 | | | 7,296,468 | |
| | DCC P.L.C. (4189477) | | 18,170 | | | 429,326 | |
| | Donegal Creameries P.L.C. | | 26,085 | | | 111,056 | |
| | Dragon Oil P.L.C. | | 1,324,770 | | | 9,406,480 | |
| * | | Elan Corp. P.L.C. | | 74,754 | | | 1,036,272 | |
| | FBD Holdings P.L.C. | | 125,728 | | | 1,056,929 | |
| | Fyffes P.L.C. | | 1,020,533 | | | 474,918 | |
| | Glanbia P.L.C. (0066950) | | 700,613 | | | 4,192,284 | |
| | Glanbia P.L.C. (4058629) | | 69,229 | | | 413,927 | |
| | Grafton Group P.L.C. | | 557,027 | | | 1,717,988 | |
| | Greencore Group P.L.C. (0386410) | | 1,129,199 | | | 906,158 | |
| | Greencore Group P.L.C. (5013832) | | 347,358 | | | 282,953 | |
| | IFG Group P.L.C. | | 337,495 | | | 458,260 | |
| * | | Independent News & Media P.L.C. (B59HWB1) | | 387,242 | | | 102,712 | |
| * | | Independent News & Media P.L.C. (B5TR5N4) | | 318,060 | | | 84,407 | |
| | Irish Continental Group P.L.C. | | 91,000 | | | 1,787,739 | |
| * | | Kenmare Resources P.L.C. (0487948) | | 4,136,548 | | | 2,885,409 | |
| * | | Kenmare Resources P.L.C. (4490737) | | 334,447 | | | 233,045 | |
| | Kingspan Group P.L.C. (0492793) | | 351,640 | | | 2,891,954 | |
| | Kingspan Group P.L.C. (4491235) | | 78,980 | | | 649,418 | |
| * | | McInerney Holdings P.L.C. | | 697,135 | | | 35,730 | |
| | Paddy Power P.L.C. (0258810) | | 180,573 | | | 10,388,718 | |
| | Paddy Power P.L.C. (4828974) | | 10,071 | | | 579,741 | |
| * | | Providence Resources P.L.C. | | 62,580 | | | 190,988 | |
| * | | Smurfit Kappa Group P.L.C. | | 456,586 | | | 2,753,442 | |
| | Total Produce P.L.C. | | 871,395 | | | 429,004 | |
| | United Drug P.L.C. (3302480) | | 820,214 | | | 2,173,800 | |
| | United Drug P.L.C. (3335969) | | 63,911 | | | 169,286 | |
| TOTAL IRELAND | | | | | 59,583,661 | |
| | | | |
| ISRAEL — (2.2%) | | | | | | |
| * | | Africa Israel Investments, Ltd. | | 254,834 | | | 774,436 | |
| * | | Africa Israel Properties, Ltd. | | 31,703 | | | 205,430 | |
| | Africa Israel Residences, Ltd. | | 594 | | | 6,268 | |
| * | | Airport City, Ltd. | | 64,912 | | | 275,716 | |
| * | | Alon Holdings Blue Square Israel, Ltd. | | 46,194 | | | 189,200 | |
| * | | AL-ROV Israel, Ltd. | | 15,025 | | | 306,868 | |
| | Alrov Properties & Lodgings, Ltd. | | 3,721 | | | 58,615 | |
| * | | Alvarion, Ltd. | | 186,966 | | | 167,410 | |
| | Amot Investments, Ltd. | | 65,457 | | | 159,107 | |
| * | | AudioCodes, Ltd. | | 159,083 | | | 609,081 | |
| | Avgol Industries 1953, Ltd. | | 214,865 | | | 161,006 | |
| * | | Azorim Investment Development & Construction Co., Ltd. | | 189 | | | 165 | |
| | Bayside Land Corp. | | 2,122 | | | 429,063 | |
| * | | Big Shopping Centers 2004, Ltd. | | 1,832 | | | 40,182 | |
| * | | Biocell, Ltd. | | 16,731 | | | 95,769 | |
| * | | BioLineRX, Ltd. | | 499,334 | | | 150,571 | |
64
THE CONTINENTAL SMALL COMPANY SERIES
CONTINUED
| | | | | Shares | | Value†† | |
| ISRAEL — (Continued) | | | | | | |
| * | | Blue Square Real Estate, Ltd. | | 3,782 | | $ | 68,420 | |
| | British Israel Investments, Ltd. | | 27,461 | | | 95,056 | |
| * | | Ceragon Networks, Ltd. | | 27,850 | | | 221,703 | |
| * | | Clal Biotechnology Industries, Ltd. | | 146,663 | | | 709,902 | |
| | Clal Industries & Investments, Ltd. | | 285,112 | | | 1,321,891 | |
| | Clal Insurance Enterprises Holdings, Ltd. | | 83,321 | | | 1,242,632 | |
| * | | Compugen, Ltd. | | 27,479 | | | 139,199 | |
| | Delek Automotive Systems, Ltd. | | 107,838 | | | 654,974 | |
| | Delta-Galil Industries, Ltd. | | 15,443 | | | 107,645 | |
| | Direct Insurance - I.D.I. Insurance Co., Ltd. | | 30,880 | | | 62,251 | |
| | DS Apex Holdings, Ltd. | | 38,130 | | | 158,397 | |
| * | | El Al Israel Airlines, Ltd. | | 738,714 | | | 119,026 | |
| * | | Elbit Medical Imaging, Ltd. | | 53,265 | | | 122,771 | |
| * | | Electra Real Estate, Ltd. | | 19,237 | | | 42,112 | |
| | Electra, Ltd. | | 5,423 | | | 421,854 | |
| * | | Elron Electronic Industries, Ltd. | | 57,768 | | | 230,571 | |
| * | | Evogene, Ltd. | | 56,711 | | | 223,884 | |
| * | | EZchip Semiconductor, Ltd. | | 49,025 | | | 1,406,532 | |
| * | | First International Bank of Israel, Ltd. | | 98,118 | | | 877,097 | |
| | FMS Enterprises Migun, Ltd. | | 10,300 | | | 152,168 | |
| | Formula Systems (1985), Ltd. | | 36,549 | | | 555,522 | |
| | Frutarom Industries, Ltd. | | 162,348 | | | 1,447,828 | |
| * | | Gilat Satellite Networks, Ltd. | | 76,929 | | | 302,660 | |
| * | | Given Imaging, Ltd. | | 31,987 | | | 547,608 | |
| | Golf & Co., Ltd. | | 57,649 | | | 208,566 | |
| | Granite Hacarmel Investments, Ltd. | | 144,714 | | | 176,698 | |
| * | | Hadera Paper, Ltd. | | 9,516 | | | 368,550 | |
| | Harel Insurance Investments & Finances, Ltd. | | 34,574 | | | 1,266,041 | |
| * | | Hot Telecommunications Systems, Ltd. | | 92,836 | | | 1,155,923 | |
| * | | Industrial Building Corp., Ltd. | | 241,071 | | | 374,816 | |
| * | | Israel Cold Storage & Supply Co., Ltd. | | 1,076 | | | 12,225 | |
| * | | Israel Discount Bank, Ltd. Series A | | 843,743 | | | 1,132,491 | |
| | Israel Land Development Co., Ltd. (The) | | 22,615 | | | 154,308 | |
| | Ituran Location & Control, Ltd. | | 84,441 | | | 1,162,470 | |
| * | | Jerusalem Oil Exploration, Ltd. | | 30,438 | | | 499,131 | |
| * | | Kamada, Ltd. | | 110,315 | | | 595,790 | |
| | Kardan Vehicle, Ltd. | | 293 | | | 1,867 | |
| * | | Kardan Yazamut | | 95,268 | | | 12,524 | |
| | Maabarot Products, Ltd. | | 21,999 | | | 190,459 | |
| * | | Magic Software Enterprises, Ltd. | | 3,179 | | | 16,628 | |
| | Matrix IT, Ltd. | | 171,428 | | | 850,008 | |
| | Melisron, Ltd. | | 36,615 | | | 588,622 | |
| * | | Mellanox Technologies, Ltd. | | 89,067 | | | 2,911,822 | |
| * | | Menorah Mivtachim Holdings, Ltd. | | 101,061 | | | 762,156 | |
| | Migdal Insurance & Financial Holding, Ltd. | | 934,324 | | | 1,274,437 | |
| | Mizrahi Tefahot Bank, Ltd. | | 64,286 | | | 510,477 | |
| * | | Naphtha Israel Petroleum Corp., Ltd. | | 103,666 | | | 307,552 | |
| | Neto Me Holdings, Ltd. | | 5,411 | | | 228,611 | |
| * | | NICE Systems, Ltd. | | 18,938 | | | 650,889 | |
| * | | NICE Systems, Ltd. Sponsored ADR | | 51,458 | | | 1,772,728 | |
| * | | Nitsba Holdings 1995, Ltd. | | 84,868 | | | 680,607 | |
| * | | Oil Refineries, Ltd. | | 3,239,580 | | | 1,634,317 | |
| | Ormat Industries, Ltd. | | 293,852 | | | 1,400,488 | |
| | Osem Investments, Ltd. | | 89,710 | | | 1,313,048 | |
| | Paz Oil Co., Ltd. | | 14,646 | | | 1,777,749 | |
| | Phoenix Holdings, Ltd. (The) | | 195,715 | | | 507,666 | |
| | Plasson Industries, Ltd. | | 6,571 | | | 144,126 | |
| * | | RADVision, Ltd. | | 20,382 | | | 167,309 | |
| | Rami Levi Chain Stores Hashikma Marketing 2006, Ltd. | | 27,880 | | | 864,935 | |
| * | | Retalix, Ltd. | | 65,875 | | | 1,070,072 | |
| | Scailex Corp, Ltd. | | 29,002 | | | 124,996 | |
65
THE CONTINENTAL SMALL COMPANY SERIES
CONTINUED
| | | | | Shares | | Value†† | |
| ISRAEL — (Continued) | | | | | | |
| | Shikun & Binui, Ltd. | | 794,937 | | $ | 1,305,860 | |
| * | | Space Communication, Ltd. | | 11,241 | | | 181,776 | |
| | Strauss Group, Ltd. | | 122,758 | | | 1,507,984 | |
| * | | Suny Electronic, Ltd. | | 33,820 | | | 69,753 | |
| | Super-Sol, Ltd. Series B | | 368,517 | | | 1,299,236 | |
| * | | Tower Semiconductor, Ltd. | | 1,325,086 | | | 800,826 | |
| | Union Bank of Israel, Ltd. | | 130,630 | | | 368,574 | |
| TOTAL ISRAEL | | | | | 47,265,701 | |
| | | |
| ITALY — (6.7%) | | | | | | |
| | ACEA SpA | | 280,731 | | | 1,770,132 | |
| | Acegas-APS SpA | | 110,973 | | | 469,909 | |
| #* | | Acotel Group SpA | | 810 | | | 20,454 | |
| #* | | Aedes SpA | | 1,412,879 | | | 111,568 | |
| #* | | Aeffe SpA | | 76,830 | | | 58,161 | |
| | Aeroporto de Firenze SpA | | 17,399 | | | 225,178 | |
| # | | Alerion Cleanpower SpA | | 67,767 | | | 361,524 | |
| # | | Amplifon SpA | | 189,650 | | | 800,559 | |
| | Ansaldo STS SpA | | 321,559 | | | 3,049,684 | |
| # | | Arnoldo Mondadori Editore SpA | | 392,186 | | | 685,022 | |
| | Ascopiave SpA | | 137,754 | | | 240,637 | |
| | Astaldi SpA | | 228,281 | | | 1,457,364 | |
| | Autogrill SpA | | 397,526 | | | 3,864,314 | |
| | Azimut Holding SpA | | 454,770 | | | 3,632,584 | |
| # | | Banca Finnat Euramerica SpA | | 685,945 | | | 255,633 | |
| | Banca Generali SpA | | 140,519 | | | 1,306,323 | |
| | Banca IFIS SpA | | 102,347 | | | 529,678 | |
| | Banca Piccolo Credito Valtellinese Scarl | | 826,041 | | | 1,868,985 | |
| # | | Banca Popolare dell’Emilia Romagna Scarl | | 777,413 | | | 5,540,413 | |
| * | | Banca Popolare dell’Etruria e del Lazio Scarl | | 142,043 | | | 206,146 | |
| # | | Banca Popolare di Milano Scarl | | 11,537,798 | | | 4,565,012 | |
| | Banca Popolare di Sondrio Scarl | | 922,722 | | | 7,404,493 | |
| | Banca Profilo SpA | | 564,974 | | | 179,122 | |
| | Banco di Desio e della Brianza SpA | | 232,296 | | | 892,242 | |
| # | | Banco Popolare Scarl | | 1,895,684 | | | 2,445,600 | |
| # | | BasicNet SpA | | 105,627 | | | 290,149 | |
| # | | Beghelli SpA | | 427,981 | | | 248,282 | |
| # | | Benetton Group SpA | | 220,256 | | | 839,771 | |
| * | | Biesse SpA | | 54,004 | | | 198,893 | |
| | Bonifica Terreni Ferraresi e Imprese Agricole SpA | | 10,867 | | | 276,159 | |
| # | | Brembo SpA | | 162,145 | | | 1,383,252 | |
| #* | | Brioschi Sviluppo Immobiliare SpA | | 174,780 | | | 18,752 | |
| * | | Buongiorno SpA | | 395,420 | | | 522,572 | |
| * | | Buzzi Unicem SpA | | 284,221 | | | 2,475,709 | |
| # | | C.I.R. SpA - Compagnie Industriali Riunite | | 1,614,226 | | | 2,574,250 | |
| | Cairo Communication SpA | | 28,815 | | | 104,463 | |
| | Caltagirone Editore SpA | | 6,120 | | | 7,588 | |
| | Caltagirone SpA | | 246,310 | | | 442,778 | |
| * | | Carraro SpA | | 113,633 | | | 216,765 | |
| | Cembre SpA | | 40,330 | | | 288,029 | |
| | Cementir Holding SpA | | 336,239 | | | 691,266 | |
| * | | Class Editore SpA | | 165,655 | | | 54,339 | |
| | Credito Artigiano SpA | | 361,183 | | | 384,966 | |
| | Credito Bergamasco SpA | | 129,374 | | | 3,274,875 | |
| # | | Credito Emiliano SpA | | 376,390 | | | 1,334,545 | |
| | CSP International Fashion Group SpA | | 12,861 | | | 12,289 | |
| * | | Dada SpA | | 6,181 | | | 16,997 | |
| * | | d’Amico International Shipping S.A. | | 133,519 | | | 76,569 | |
| # | | Danieli & Co. SpA | | 58,099 | | | 1,221,945 | |
| | Datalogic SpA | | 42,401 | | | 315,102 | |
| | Davide Campari - Milano SpA | | 990,609 | | | 6,584,272 | |
66
The Continental Small Company Series
continued
| | | | | Shares | | Value†† | |
| ITALY — (Continued) | | | | | | |
| * | | DeA Capital SpA | | 243,327 | | $ | 418,134 | |
| | De’Longhi SpA | | 305,654 | | | 2,690,887 | |
| # | | DiaSorin SpA | | 77,818 | | | 1,959,972 | |
| * | | Digital Multimedia Technologies SpA | | 39,294 | | | 954,613 | |
| * | | EEMS Italia SpA | | 101,107 | | | 81,422 | |
| | Elica SpA | | 44,844 | | | 45,025 | |
| | Emak SpA | | 57,399 | | | 36,446 | |
| | Engineering Ingegneria Informatica SpA | | 13,822 | | | 395,833 | |
| | ERG SpA | | 242,145 | | | 2,744,245 | |
| | Esprinet SpA | | 104,855 | | | 354,151 | |
| #* | | Eurotech SpA | | 103,698 | | | 175,330 | |
| # | | Falck Renewables SpA | | 452,790 | | | 496,101 | |
| * | | Fiera Milano SpA | | 37,863 | | | 174,123 | |
| * | | Finmeccanica SpA | | 52,103 | | | 191,847 | |
| #* | | Fondiaria - Sai SpA | | 366,128 | | | 292,873 | |
| * | | Gas Plus SpA | | 6,463 | | | 41,169 | |
| | Gefran SpA | | 32,485 | | | 118,776 | |
| #* | | Gemina SpA | | 2,562,430 | | | 1,975,242 | |
| # | | Geox SpA | | 305,569 | | | 854,213 | |
| * | | Gruppo Ceramiche Ricchetti SpA | | 55,510 | | | 11,945 | |
| # | | Gruppo Editoriale L’Espresso SpA | | 670,242 | | | 941,274 | |
| | Gruppo MutuiOnline SpA | | 18,403 | | | 80,909 | |
| # | | Hera SpA | | 1,822,830 | | | 2,594,073 | |
| * | | I Grandi Viaggi SpA | | 98,547 | | | 85,827 | |
| | Immsi SpA | | 743,533 | | | 538,158 | |
| | Impregilo SpA | | 1,243,552 | | | 3,837,325 | |
| | Indesit Co. SpA | | 185,473 | | | 888,307 | |
| | Industria Macchine Automatiche SpA | | 58,626 | | | 1,002,297 | |
| | Industria Romagnola Conduttori Elettrici SpA | | 43,452 | | | 104,033 | |
| | Intek SpA | | 267,440 | | | 122,014 | |
| | Interpump Group SpA | | 255,327 | | | 1,711,845 | |
| | Iren SpA | | 1,758,434 | | | 1,652,492 | |
| | Isagro SpA | | 10,591 | | | 34,218 | |
| # | | Italcementi SpA | | 279,135 | | | 1,641,586 | |
| | Italmobiliare SpA | | 46,873 | | | 881,977 | |
| * | | Juventus Football Club SpA | | 69,408 | | | 27,220 | |
| * | | Kerself SpA | | 35,065 | | | 71,976 | |
| | KME Group SpA | | 1,654,192 | | | 647,045 | |
| # | | Landi Renzo SpA | | 203,171 | | | 320,421 | |
| #* | | Lottomatica SpA | | 177,645 | | | 2,658,532 | |
| # | | Maire Tecnimont SpA | | 601,549 | | | 768,458 | |
| # | | Marcolin SpA | | 60,205 | | | 246,625 | |
| #* | | Mariella Burani SpA | | 32,721 | | | — | |
| | Marr SpA | | 132,607 | | | 1,110,602 | |
| # | | Mediolanum SpA | | 634,523 | | | 2,458,575 | |
| #* | | Milano Assicurazioni SpA | | 1,476,243 | | | 428,122 | |
| * | | Monrif SpA | | 315,834 | | | 117,900 | |
| * | | Montefibre SpA | | 108,372 | | | 15,280 | |
| | Nice SpA | | 40,071 | | | 123,977 | |
| * | | Pagnossin SpA | | 9,000 | | | — | |
| * | | PanariaGroup Industrie Ceramiche SpA | | 42,000 | | | 53,089 | |
| | Piaggio & C. SpA | | 511,332 | | | 1,198,922 | |
| * | | Pininfarina SpA | | 82,321 | | | 339,197 | |
| | Piquadro SpA | | 7,354 | | | 14,604 | |
| | Pirelli & Co. SpA | | 657,369 | | | 5,510,580 | |
| * | | Poltrona Frau SpA | | 140,932 | | | 159,524 | |
| * | | Prelios SpA | | 2,389,900 | | | 253,535 | |
| #* | | Premafin Finanziaria SpA | | 961,257 | | | 173,621 | |
| | Prysmian SpA | | 653,038 | | | 8,068,757 | |
| #* | | RCS MediaGroup SpA | | 308,389 | | | 269,617 | |
| | Recordati SpA | | 408,182 | | | 2,944,228 | |
67
The Continental Small Company Series
continued
| | | | | Shares | | Value†† | |
| ITALY — (Continued) | | | | | | |
| | Reply SpA | | 12,068 | | $ | 249,575 | |
| * | | Retelit SpA | | 113,922 | | | 51,408 | |
| * | | Richard-Ginori 1735 SpA | | 8,489 | | | 2,578 | |
| | Sabaf SpA | | 24,109 | | | 348,265 | |
| | | SAES Getters SpA | | 30,068 | | | 258,462 | |
| * | | Safilo Group SpA | | 140,163 | | | 882,432 | |
| * | | Saras SpA | | 1,269,180 | | | 1,584,147 | |
| | SAVE SpA | | 5,818 | | | 47,178 | |
| | Screen Service Broadcasting Technologies SpA | | 152,715 | | | 96,694 | |
| #* | | Seat Pagine Gialle SpA | | 2,988,837 | | | 95,830 | |
| #* | | Snai SpA | | 41,423 | | | 106,056 | |
| | Societa Cattolica di Assicurazioni Scrl | | 180,734 | | | 3,373,008 | |
| | Societa Iniziative Autostradali e Servizi SpA | | 217,716 | | | 1,636,542 | |
| | Sogefi SpA | | 186,290 | | | 468,448 | |
| | Sol SpA | | 166,511 | | | 882,343 | |
| * | | Sorin SpA | | 1,139,193 | | | 1,744,699 | |
| #* | | Stefanel SpA | | 112,528 | | | 44,820 | |
| | Tamburi Investment Partners SpA | | 36,591 | | | 71,176 | |
| #* | | Telecom Italia Media SpA | | 1,206,455 | | | 251,344 | |
| #* | | Tiscali SpA | | 3,437,478 | | | 150,215 | |
| # | | Tod’s SpA | | 47,508 | | | 3,859,211 | |
| # | | Trevi Finanziaria SpA | | 138,583 | | | 879,076 | |
| * | | Uni Land SpA | | 51,835 | | | 33,812 | |
| * | | Unipol Gruppo Finanziario SpA | | 3,295,121 | | | 1,061,515 | |
| | Vianini Industria SpA | | 59,070 | | | 96,062 | |
| | Vianini Lavori SpA | | 175,180 | | | 746,524 | |
| | Vittoria Assicurazioni SpA | | 121,346 | | | 470,287 | |
| #* | | Yoox SpA | | 101,604 | | | 1,092,432 | |
| | Zignago Vetro SpA | | 28,411 | | | 165,552 | |
| TOTAL ITALY | | | | | 144,654,094 | |
| | | | |
| NETHERLANDS — (4.5%) | | | | | | |
| | Aalberts Industries NV | | 384,012 | | | 6,424,692 | |
| | Accell Group NV | | 78,668 | | | 1,436,671 | |
| * | | AFC Ajax NV | | 18,134 | | | 173,416 | |
| #* | | AMG Advanced Metallurgical Group NV | | 103,749 | | | 1,014,000 | |
| # | | Amsterdam Commodities NV | | 60,751 | | | 812,359 | |
| # | | APERAM NV | | 98,594 | | | 1,384,011 | |
| # | | Arcadis NV | | 193,913 | | | 3,027,732 | |
| # | | ASM International NV | | 205,174 | | | 6,008,507 | |
| * | | Atag Group NV | | 4,630 | | | 1,738 | |
| * | | Ballast Nedam | | 339 | | | 5,868 | |
| | Batenburg Techniek NV | | 10,306 | | | 212,791 | |
| # | | BE Semiconductor Industries NV | | 147,135 | | | 971,827 | |
| | Beter Bed Holding NV | | 72,418 | | | 1,310,339 | |
| | BinckBank NV | | 207,515 | | | 2,230,159 | |
| # | | Brunel International NV | | 51,660 | | | 1,517,927 | |
| * | | Crown Van Gelder NV | | 17,878 | | | 83,359 | |
| # | | CSM NV | | 271,908 | | | 4,226,511 | |
| | Delta Lloyd NV | | 91,074 | | | 1,525,797 | |
| | DOCdata NV | | 22,463 | | | 422,085 | |
| # | | Exact Holding NV | | 61,464 | | | 1,270,147 | |
| | Fornix Biosciences NV | | 2,224 | | | 1,713 | |
| # | | Grontmij NV | | 78,097 | | | 528,632 | |
| | Heijmans NV | | 66,281 | | | 698,412 | |
| | Hunter Douglas NV | | 7,522 | | | 281,902 | |
| # | | Imtech NV | | 272,621 | | | 7,030,961 | |
| #* | | Kardan NV | | 122,078 | | | 312,191 | |
| | KAS Bank NV | | 50,870 | | | 562,806 | |
| # | | Kendrion NV | | 39,829 | | | 848,515 | |
| # | | Koninklijke Bam Groep NV | | 909,266 | | | 3,817,873 | |
68
The Continental Small Company Series
continued
| | | | | Shares | | Value†† | |
| NETHERLANDS — (Continued) | | | | | | |
| | Koninklijke Ten Cate NV | | 110,282 | | $ | 3,022,513 | |
| | Koninklijke Wessanen NV | | 328,280 | | | 1,196,873 | |
| #* | | LBi International NV | | 148,925 | | | 332,795 | |
| | Macintosh Retail Group NV | | 51,952 | | | 678,321 | |
| | Mediq NV | | 247,085 | | | 3,752,720 | |
| | Nederlandsche Apparatenfabriek NV | | 28,810 | | | 746,293 | |
| | Nutreco NV | | 145,366 | | | 9,546,244 | |
| #* | | Ordina NV | | 192,481 | | | 239,876 | |
| #* | | Pharming Group NV | | 1,210,244 | | | 128,160 | |
| * | | PostNL NV | | 749,799 | | | 2,379,010 | |
| * | | Qurius NV | | 79,233 | | | 15,644 | |
| * | | Roto Smeets Group NV | | 11,826 | | | 138,953 | |
| | Royal Reesink NV | | 1,428 | | | 141,445 | |
| | SBM Offshore NV | | 380,277 | | | 7,795,170 | |
| | Sligro Food Group NV | | 98,516 | | | 2,646,586 | |
| * | | SNS Reaal Groep NV | | 590,383 | | | 1,282,899 | |
| # | | Stern Groep NV | | 1,274 | | | 34,306 | |
| | Telegraaf Media Groep NV | | 163,704 | | | 2,106,363 | |
| | TKH Group NV | | 136,825 | | | 2,989,741 | |
| #* | | TomTom NV | | 547,355 | | | 2,153,287 | |
| | Unit 4 NV | | 91,177 | | | 2,155,794 | |
| | USG People NV | | 237,495 | | | 1,957,994 | |
| * | | Wavin NV | | 168,212 | | | 2,065,035 | |
| * | | Xeikon NV | | 60,525 | | | 231,682 | |
| TOTAL NETHERLANDS | | | | | 95,880,645 | |
| | | |
| NORWAY — (2.8%) | | | | | | |
| # | | ABG Sundal Collier Holding ASA | | 743,363 | | | 456,913 | |
| # | | Acta Holding ASA | | 588,069 | | | 118,591 | |
| | AF Gruppen ASA | | 2,718 | | | 19,980 | |
| | Aktiv Kapital ASA | | 82,564 | | | 372,823 | |
| * | | Algeta ASA | | 77,466 | | | 1,973,600 | |
| * | | Archer, Ltd. ASA | | 43,582 | | | 116,827 | |
| | Arendals Fosse Kompani ASA | | 100 | | | 28,085 | |
| | Atea ASA | | 246,557 | | | 2,463,373 | |
| | Austevoll Seafood ASA | | 240,343 | | | 840,193 | |
| | Bonheur ASA | | 68,100 | | | 1,318,901 | |
| | BW Offshore, Ltd. ASA | | 1,004,602 | | | 1,581,584 | |
| # | | BWG Homes ASA | | 241,807 | | | 386,435 | |
| | Cermaq ASA | | 265,931 | | | 3,114,050 | |
| #* | | Clavis Pharma ASA | | 47,089 | | | 375,252 | |
| * | | Copeinca ASA | | 76,559 | | | 428,370 | |
| * | | Deep Sea Supply P.L.C. | | 337,427 | | | 421,172 | |
| * | | Det Norske Oljeselskap ASA | | 169,996 | | | 2,492,273 | |
| #* | | DNO International ASA | | 3,379,836 | | | 4,213,577 | |
| * | | Dockwise, Ltd. | | 43,489 | | | 698,449 | |
| #* | | DOF ASA | | 143,497 | | | 513,721 | |
| * | | EDB ErgoGroup ASA | | 266,739 | | | 432,684 | |
| * | | Eitzen Chemical ASA | | 297,422 | | | 7,921 | |
| | Ekornes ASA | | 109,590 | | | 1,791,318 | |
| * | | Electromagnetic GeoServices ASA | | 326,537 | | | 720,225 | |
| #* | | Eltek ASA | | 1,292,456 | | | 699,351 | |
| | Farstad Shipping ASA | | 59,843 | | | 1,505,940 | |
| * | | Fornebu Utvikling ASA | | 120,455 | | | 31,346 | |
| # | | Frontline, Ltd. ASA | | 93,902 | | | 397,468 | |
| * | | Funcom NV | | 2,338 | | | 6,078 | |
| | Ganger Rolf ASA | | 54,510 | | | 967,321 | |
| | Golar LNG, Ltd. | | 27,613 | | | 1,212,147 | |
| # | | Golden Ocean Group, Ltd. | | 871,300 | | | 546,773 | |
| # | | Grieg Seafood ASA | | 122,305 | | | 88,414 | |
| #* | | Havila Shipping ASA | | 22,400 | | | 128,822 | |
69
The Continental Small Company Series
continued
| | | | | Shares | | Value†† | |
| NORWAY — (Continued) | | | | | | |
| #* | | Hurtigruten ASA | | 686,470 | | $ | 346,556 | |
| #* | | Intex Resources ASA | | 45,445 | | | 36,014 | |
| * | | Jason Shipping ASA | | 5,820 | | | 2,228 | |
| #* | | Kongsberg Automotive Holding ASA | | 1,766,658 | | | 425,808 | |
| | Kongsberg Gruppen ASA | | 13,922 | | | 269,322 | |
| * | | Kverneland ASA | | 423,895 | | | 752,875 | |
| | Leroey Seafood Group ASA | | 47,686 | | | 669,685 | |
| * | | Natural ASA | | 388,026 | | | 83,222 | |
| # | | Nordic Semiconductor ASA | | 537,446 | | | 1,282,173 | |
| #* | | Norse Energy Corp. ASA | | 540,000 | | | 23,366 | |
| * | | Norske Skogindustrier ASA Series A | | 71,223 | | | 53,571 | |
| | Northern Offshore, Ltd. | | 207,383 | | | 439,986 | |
| #* | | Norwegian Air Shuttle ASA | | 75,844 | | | 698,290 | |
| #* | | Norwegian Energy Co. | | 720,771 | | | 558,601 | |
| | Odfjell ASA Series A | | 138,810 | | | 833,716 | |
| | Olav Thon Eiendomsselskap ASA | | 12,879 | | | 1,691,912 | |
| # | | Opera Software ASA | | 295,148 | | | 1,431,060 | |
| #* | | Panoro Energy ASA | | 122,537 | | | 86,781 | |
| * | | PCI Biotech ASA | | 3,357 | | | 21,778 | |
| * | | Petrolia ASA | | 699,740 | | | 53,818 | |
| #* | | Photocure ASA | | 33,562 | | | 194,346 | |
| * | | Pronova BioPharma ASA | | 669,131 | | | 874,576 | |
| | Prosafe ASA | | 499,634 | | | 3,416,956 | |
| * | | Q-Free ASA | | 103,196 | | | 287,148 | |
| #* | | Renewable Energy Corp. ASA | | 910,709 | | | 502,178 | |
| | Salmar ASA | | 16,094 | | | 80,339 | |
| #* | | Scana Industrier ASA | | 319,755 | | | 105,640 | |
| * | | Seabird Exploration P.L.C. | | 117,944 | | | 4,530 | |
| #* | | Sevan Marine ASA | | 23,858 | | | 33,039 | |
| #* | | Sevan Marine ASA I-11 Shares | | 71,571 | | | 98,127 | |
| * | | Siem Offshore, Inc. ASA | | 319,069 | | | 442,208 | |
| | Solstad Offshore ASA | | 57,727 | | | 823,113 | |
| * | | Songa Offshore SE | | 845,806 | | | 2,575,423 | |
| | SpareBanken 1 SMN | | 273,273 | | | 1,791,407 | |
| | Stolt-Nielsen, Ltd. | | 20,635 | | | 413,264 | |
| # | | Tomra Systems ASA | | 619,160 | | | 4,139,357 | |
| * | | TTS Marine ASA | | 75,639 | | | 119,525 | |
| | Veidekke ASA | | 327,908 | | | 2,113,592 | |
| | Wilh Wilhelmsen Holding ASA | | 62,749 | | | 1,424,670 | |
| TOTAL NORWAY | | | | | 59,670,177 | |
| | | |
| PORTUGAL — (1.0%) | | | | | | |
| # | | Altri SGPS SA | | 470,719 | | | 729,044 | |
| #* | | Banco BPI SA | | 1,997,111 | | | 1,238,421 | |
| #* | | Banco Comercial Portugues SA | | 8,921,215 | | | 1,563,147 | |
| #* | | Banco Espirito Santo SA | | 1,147,346 | | | 1,998,078 | |
| * | | Banif SGPS SA | | 585,123 | | | 256,418 | |
| #* | | Brisa SA | | 765,199 | | | 2,516,531 | |
| | Corticeira Amorim SGPS SA | | 223,729 | | | 390,441 | |
| | Ibersol SGPS SA | | 20,401 | | | 107,233 | |
| * | | Impresa SGPS SA | | 369,303 | | | 224,495 | |
| * | | Investimentos Participacoes e Gestao SA | | 232,518 | | | 42,131 | |
| # | | Mota-Engil SGPS SA | | 359,581 | | | 481,232 | |
| | Novabase SGPS SA | | 65,729 | | | 177,570 | |
| * | | ParaRede SGPS SA | | 66,955 | | | 10,418 | |
| # | | Portucel-Empresa Produtora de Pasta de Papel SA | | 815,988 | | | 1,937,351 | |
| | Redes Energeticas Nacionais SA | | 722,306 | | | 1,971,430 | |
| * | | Sag Gest - Solucoes Automovel Globais SGPS SA | | 251,556 | | | 136,758 | |
| | Sociedade de Investimento e Gestao SGPS SA | | 267,754 | | | 1,856,072 | |
| * | | Sonae Capital SGPS SA | | 41,386 | | | 14,433 | |
| #* | | Sonae Industria SGPS SA | | 443,755 | | | 363,100 | |
70
The Continental Small Company Series
continued
| | | | | Shares | | Value†† | |
| PORTUGAL — (Continued) | | | | | | |
| # | | Sonae SGPS SA | | 3,216,938 | | $ | 1,906,668 | |
| | Sonaecom SGPS SA | | 565,634 | | | 886,645 | |
| * | | Sumol & Compal SA | | 67,967 | | | 104,820 | |
| | Teixeira Duarte SA | | 734,737 | | | 199,346 | |
| | Toyota Caetano Portugal SA | | 53,308 | | | 275,975 | |
| # | | Zon Multimedia Servicos de Telecomunicacoes e Multimedia SGPS SA | | 621,293 | | | 1,863,909 | |
| TOTAL PORTUGAL | | | | | 21,251,666 | |
| | | | |
| SPAIN — (4.8%) | | | | | | |
| # | | Abengoa SA | | 168,206 | | | 3,552,992 | |
| * | | Adolfo Dominguez SA | | 20,351 | | | 136,083 | |
| | Almirall SA | | 186,806 | | | 1,279,485 | |
| #* | | Amper SA | | 96,925 | | | 207,345 | |
| # | | Antena 3 de Television SA | | 279,539 | | | 1,674,451 | |
| * | | Azkoyen SA | | 70,532 | | | 102,698 | |
| | Banco de Sabadell SA Convertible Shares | | 212,446 | | | 927,982 | |
| #* | | Banco de Valencia SA | | 535,721 | | | 424,976 | |
| # | | Banco Pastor SA | | 343,327 | | | 1,480,756 | |
| # | | Bankinter SA | | 1,006,147 | | | 6,156,407 | |
| * | | Baron de Ley SA | | 13,910 | | | 781,680 | |
| # | | Bolsas y Mercados Espanoles SA | | 236,082 | | | 6,338,306 | |
| # | | Caja de Ahorros del Mediterraneo SA | | 116,412 | | | 200,638 | |
| | Campofrio Food Group SA | | 95,179 | | | 791,570 | |
| #* | | Cementos Portland Valderrivas SA | | 45,565 | | | 401,089 | |
| #* | | Cie Automotive SA | | 114,494 | | | 828,946 | |
| #* | | Codere SA | | 67,023 | | | 527,933 | |
| | Compania Vinicola del Norte de Espana SA | | 16,119 | | | 312,888 | |
| | Construcciones y Auxiliar de Ferrocarriles SA | | 7,518 | | | 3,731,866 | |
| * | | Corporacion Dermoestetica SA | | 19,777 | | | 15,165 | |
| #* | | Deoleo SA | | 1,403,240 | | | 778,830 | |
| | Dinamia Capital Privado Sociedad de Capital Riesgo SA | | 20,213 | | | 103,217 | |
| * | | Distribuidora Internacional de Alimentacion SA | | 96,278 | | | 433,430 | |
| | Duro Felguera SA | | 276,209 | | | 1,803,663 | |
| | Ebro Foods SA | | 340,839 | | | 6,312,169 | |
| # | | Elecnor SA | | 198,254 | | | 2,557,091 | |
| * | | Ercros SA | | 303,500 | | | 266,215 | |
| # | | Faes Farma SA | | 614,031 | | | 992,297 | |
| * | | Fersa Energias Renovables SA | | 93,691 | | | 85,869 | |
| | Fluidra SA | | 51,323 | | | 126,734 | |
| | Fomento de Construcciones y Contratas SA | | 48,395 | | | 1,249,456 | |
| # | | Gamesa Corp Tecnologica SA | | 1,081,002 | | | 4,464,820 | |
| * | | General de Alquiler de Maquinaria SA | | 30,716 | | | 15,062 | |
| * | | Grifols SA | | 6,257 | | | 104,841 | |
| | Grupo Catalana Occidente SA | | 166,328 | | | 2,635,501 | |
| # | | Grupo Empresarial Ence SA | | 867,472 | | | 1,949,309 | |
| #* | | Grupo Ezentis SA | | 1,009,562 | | | 339,320 | |
| * | | Grupo Tavex SA | | 244,131 | | | 98,025 | |
| | Iberpapel Gestion SA | | 25,850 | | | 438,009 | |
| # | | Indra Sistemas SA | | 371,374 | | | 4,708,258 | |
| * | | Inmobiliaria Colonial SA | | 108,920 | | | 322,348 | |
| | Inmobiliaria del Sur SA | | 2,902 | | | 21,765 | |
| #* | | Jazztel P.L.C. | | 779,346 | | | 3,756,787 | |
| * | | La Seda de Barcelona SA Series B | | 10,928,289 | | | 720,326 | |
| # | | Laboratorios Farmaceuticos Rovi SA | | 47,773 | | | 314,459 | |
| # | | Mediaset Espana Comunicacion SA | | 582,684 | | | 3,307,599 | |
| # | | Melia Hotels International SA | | 214,757 | | | 1,077,910 | |
| # | | Miquel y Costas & Miquel SA | | 34,815 | | | 831,879 | |
| * | | Natra SA | | 109,456 | | | 127,065 | |
| #* | | Natraceutical SA | | 645,689 | | | 130,224 | |
| #* | | NH Hoteles SA | | 521,131 | | | 1,458,888 | |
| * | | Nicolas Correa SA | | 15,000 | | | 19,974 | |
71
The Continental Small Company Series
continued
| | | | | Shares | | Value†† | |
| SPAIN — (Continued) | | | | | | |
| # | | Obrascon Huarte Lain SA | | 156,289 | | $ | 3,897,943 | |
| | Papeles y Cartones de Europa SA | | 226,938 | | | 731,344 | |
| | Pescanova SA | | 43,729 | | | 1,459,816 | |
| | Prim SA | | 39,424 | | | 204,086 | |
| #* | | Promotora de Informaciones SA Series A | | 933,834 | | | 1,047,114 | |
| # | | Prosegur Cia de Seguridad SA | | 87,574 | | | 3,816,422 | |
| #* | | Quabit Inmobiliaria SA | | 788,621 | | | 82,484 | |
| #* | | Realia Business SA | | 297,777 | | | 419,557 | |
| * | | Renta Corp Real Estate SA | | 20,828 | | | 27,165 | |
| #* | | Reyal Urbis SA | | 24,393 | | | 15,067 | |
| # | | Sacyr Vallehermoso SA | | 356,705 | | | 1,820,181 | |
| * | | Service Point Solutions SA | | 727,483 | | | 213,714 | |
| * | | Sociedad Nacional Industrias Aplicaciones Celulosa Espanola SA | | 227,522 | | | 280,238 | |
| # | | Solaria Energia y Medio Ambiente SA | | 231,009 | | | 286,837 | |
| # | | Tecnicas Reunidas SA | | 96,655 | | | 3,459,681 | |
| | Telecomunicaciones y Energia SA | | 146,125 | | | 264,791 | |
| #* | | Tubacex SA | | 427,191 | | | 1,026,626 | |
| #* | | Tubos Reunidos SA | | 416,951 | | | 825,188 | |
| | Unipapel SA | | 47,385 | | | 731,274 | |
| #* | | Vertice Trescientos Sesenta Grados SA | | 57,183 | | | 11,097 | |
| | Vidrala SA | | 72,437 | | | 1,737,409 | |
| # | | Viscofan SA | | 183,430 | | | 6,785,197 | |
| #* | | Vocento SA | | 196,990 | | | 394,999 | |
| #* | | Vueling Airlines SA | | 60,195 | | | 299,907 | |
| #* | | Zeltia SA | | 637,268 | | | 1,412,092 | |
| TOTAL SPAIN | | | | | 102,674,825 | |
| | | | |
| SWEDEN — (8.8%) | | | | | | |
| | Aarhuskarlshamn AB | | 91,608 | | | 2,651,746 | |
| | Acando AB | | 224,754 | | | 472,948 | |
| #* | | Active Biotech AB | | 145,913 | | | 466,584 | |
| # | | AddNode AB | | 16,806 | | | 67,611 | |
| | AddTech AB Series B | | 64,962 | | | 1,479,845 | |
| | AF AB Series B | | 113,629 | | | 1,832,253 | |
| #* | | Alliance Oil Co., Ltd. AB GDR | | 227,095 | | | 2,813,701 | |
| * | | Anoto Group AB | | 80,683 | | | 31,018 | |
| * | | Arise Windpower AB | | 2,638 | | | 12,816 | |
| | Aros Quality Group AB | | 41,400 | | | 218,260 | |
| | Atrium Ljungberg AB Series B | | 26,686 | | | 283,475 | |
| | Avanza Bank Holding AB | | 67,915 | | | 1,620,674 | |
| | Axfood AB | | 93,882 | | | 3,455,230 | |
| | Axis Communications AB | | 183,851 | | | 3,683,526 | |
| | B&B Tools AB Series B | | 92,589 | | | 802,191 | |
| * | | BE Group AB | | 170,187 | | | 492,697 | |
| # | | Beiger Electronics AB | | 53,856 | | | 473,521 | |
| # | | Beijer Alma AB | | 64,479 | | | 1,064,978 | |
| | Bergs Timber AB Series B | | 8,074 | | | 12,938 | |
| * | | Betsson AB | | 104,736 | | | 2,299,328 | |
| | Bilia AB Series A | | 113,425 | | | 1,589,161 | |
| | Billerud AB | | 355,810 | | | 3,009,615 | |
| | BioGaia AB Series B | | 49,122 | | | 1,161,398 | |
| * | | BioInvent International AB | | 190,404 | | | 443,919 | |
| | Biotage AB | | 143,915 | | | 108,573 | |
| * | | Bjorn Borg AB | | 64,280 | | | 328,717 | |
| #* | | Black Earth Farming, Ltd. AB | | 44,076 | | | 88,529 | |
| | Bong Ljungdahl AB | | 24,800 | | | 64,548 | |
| * | | Boras Waefveri AB Series B | | 6,564 | | | 1,259 | |
| | Brinova Fastigheter AB | | 98 | | | 1,415 | |
| * | | Bure Equity AB | | 284,971 | | | 659,623 | |
| * | | Byggmax Group AB | | 55,356 | | | 212,771 | |
| # | | Cantena AB | | 56,762 | | | 473,929 | |
72
The Continental Small Company Series
continued
| | | | | Shares | | Value†† | |
| SWEDEN — (Continued) | | | | | | |
| | Castellum AB | | 569,221 | | $ | 7,043,794 | |
| * | | Catella AB | | 226,140 | | | 229,308 | |
| * | | CDON Group AB | | 67,801 | | | 371,347 | |
| # | | Clas Ohlson AB Series B | | 133,394 | | | 1,558,089 | |
| | Cloetta AB | | 55,296 | | | 270,862 | |
| #* | | Concentric AB | | 164,760 | | | 952,163 | |
| | Concordia Maritime AB Series B | | 70,300 | | | 132,362 | |
| | Connecta AB | | 29,886 | | | 327,358 | |
| * | | Consilium AB Series B | | 10,856 | | | 27,555 | |
| | CyberCom Group AB | | 49,332 | | | 71,441 | |
| * | | Dedicare AB Series B | | 16,575 | | | 55,655 | |
| * | | Diamyd Medical AB | | 17,274 | | | 22,393 | |
| | DORO AB | | 94,695 | | | 374,577 | |
| | Duni AB | | 122,608 | | | 962,059 | |
| | East Capital Explorer AB | | 51,309 | | | 399,586 | |
| | Elekta AB Series B | | 255,842 | | | 11,062,417 | |
| * | | Enea AB | | 56,200 | | | 236,979 | |
| #* | | Eniro AB | | 343,664 | | | 569,458 | |
| | Fabege AB | | 516,241 | | | 4,034,534 | |
| | Fagerhult AB | | 16,891 | | | 390,901 | |
| * | | Fastighets AB Balder Series B | | 196,938 | | | 721,167 | |
| | Fenix Outdoor AB | | 6,455 | | | 143,562 | |
| | G & L Beijer AB Series B | | 28,958 | | | 919,085 | |
| * | | Global Health Partner AB | | 827 | | | 934 | |
| | Gunnebo AB | | 174,854 | | | 607,531 | |
| # | | Hakon Invest AB | | 173,328 | | | 2,418,806 | |
| | Haldex AB | | 196,886 | | | 717,321 | |
| | Heba Fastighets AB Series B | | 43,722 | | | 381,093 | |
| # | | Hexpol AB | | 90,282 | | | 2,633,576 | |
| #* | | HIQ International AB | | 198,652 | | | 833,645 | |
| | HMS Networks AB | | 7,040 | | | 96,655 | |
| | Hoganas AB Series B | | 94,864 | | | 2,916,283 | |
| | Holmen AB Series B | | 197,696 | | | 5,661,638 | |
| #* | | HQ AB (B1VVHM9) | | 19,037 | | | 2,755 | |
| #* | | HQ AB (B4BMKQ8) | | 28,555 | | | 3,693 | |
| | Hufvudstaden AB Series A | | 189,483 | | | 1,926,154 | |
| * | | Husqvarna AB Series A | | 29,425 | | | 135,005 | |
| * | | Husqvarna AB Series B | | 603,255 | | | 2,769,738 | |
| | Industrial & Financial Systems AB Series B | | 73,987 | | | 945,272 | |
| | Indutrade AB | | 46,767 | | | 1,242,184 | |
| | Intrum Justitia AB | | 241,545 | | | 3,773,213 | |
| | JM AB | | 299,638 | | | 4,860,732 | |
| #* | | KappAhl AB | | 384,267 | | | 333,757 | |
| #* | | Karo Bio AB | | 904,968 | | | 194,570 | |
| | Klovern AB | | 387,861 | | | 1,456,592 | |
| | KNOW IT AB | | 72,015 | | | 495,551 | |
| | Kungsleden AB | | 502,887 | | | 3,352,376 | |
| | Lagercrantz Group AB Series B | | 74,627 | | | 462,836 | |
| | Lennart Wallenstam Byggnads AB Series B | | 385,959 | | | 3,552,062 | |
| | Lindab International AB | | 186,119 | | | 1,007,485 | |
| | Loomis AB Series B | | 247,640 | | | 3,557,526 | |
| * | | Lundin Petroleum AB | | 439,229 | | | 10,757,873 | |
| | Meda AB Series A | | 770,903 | | | 7,999,630 | |
| #* | | Medivir AB Series B | | 84,833 | | | 817,877 | |
| | Mekonomen AB | | 68,473 | | | 2,233,784 | |
| * | | Micronic Mydata AB | | 374,226 | | | 647,598 | |
| * | | Midsona AB Series B | | 1,733 | | | 3,349 | |
| * | | MQ Holding AB | | 7,197 | | | 21,599 | |
| * | | NCC AB Series A | | 17,161 | | | 301,832 | |
| | NCC AB Series B | | 297,398 | | | 5,209,591 | |
| | Nederman Holding AB | | 3,347 | | | 48,457 | |
73
The Continental Small Company Series
continued
| | | | | Shares | | Value†† | |
| SWEDEN — (Continued) | | | | | | |
| #* | | Net Entertainment NE AB | | 78,296 | | $ | 728,833 | |
| #* | | Net Insight AB Series B | | 1,181,753 | | | 351,074 | |
| # | | New Wave Group AB Series B | | 176,018 | | | 585,602 | |
| # | | NIBE Industrier AB Series B | | 269,369 | | | 3,970,941 | |
| #* | | Nobia AB | | 596,780 | | | 2,118,365 | |
| | Nolato AB Series B | | 75,775 | | | 557,560 | |
| #* | | Nordic Mines AB | | 94,674 | | | 887,936 | |
| | Nordnet AB Series B | | 290,879 | | | 658,012 | |
| * | | Observer AB | | 5,113 | | | 27,418 | |
| | | OEM International AB Series B | | 44,400 | | | 354,468 | |
| #* | | Opcon AB | | 55,670 | | | 21,591 | |
| # | | Orc Group AB | | 74,009 | | | 921,065 | |
| #* | | Orexo AB | | 72,042 | | | 289,370 | |
| | Oriflame Cosmetics SA SDR | | 119,547 | | | 3,765,180 | |
| * | | PA Resources AB | | 2,515,097 | | | 771,199 | |
| * | | Partnertech AB | | 28,800 | | | 89,146 | |
| | Peab AB Series B | | 604,361 | | | 3,005,185 | |
| | Poolia AB Series B | | 29,527 | | | 60,798 | |
| | Pricer AB Series B | | 252,242 | | | 416,627 | |
| | ProAct IT Group AB | | 29,271 | | | 670,135 | |
| | Proffice AB Series B | | 231,361 | | | 719,787 | |
| | RaySearch Laboratories AB | | 45,598 | | | 95,709 | |
| | Readsoft AB Series B | | 71,271 | | | 193,156 | |
| #* | | Rederi AB Transatlantic | | 112,133 | | | 148,609 | |
| * | | Rezidor Hotel Group AB | | 264,241 | | | 846,169 | |
| #* | | RNB Retail & Brands AB | | 411,548 | | | 159,778 | |
| | Rottneros AB | | 207,512 | | | 63,557 | |
| | Saab AB Series B | | 167,907 | | | 3,466,381 | |
| | Sagax AB | | 1,718 | | | 41,111 | |
| #* | | SAS AB | | 573,665 | | | 665,052 | |
| | Seco Tools AB Series B | | 89,660 | | | 1,322,456 | |
| * | | Sectra AB | | 20,046 | | | 154,423 | |
| * | | Securitas AB Series B | | 254,999 | | | 2,193,356 | |
| #* | | Semcon AB | | 39,900 | | | 138,705 | |
| | Sigma AB Series B | | 25,800 | | | 19,419 | |
| | Sintercast AB | | 11,800 | | | 76,938 | |
| # | | Skistar AB | | 97,008 | | | 1,149,849 | |
| * | | SSAB AB Series A | | 341,913 | | | 2,994,087 | |
| * | | SSAB AB Series B | | 60,099 | | | 458,494 | |
| * | | Studsvik AB | | 18,826 | | | 86,887 | |
| | Sweco AB Series B | | 187,009 | | | 1,559,409 | |
| * | | Swedish Orphan Biovitrum AB | | 486,703 | | | 1,065,302 | |
| * | | Swedol AB Class B | | 6,059 | | | 25,978 | |
| | Systemair AB | | 12,847 | | | 154,463 | |
| * | | TradeDoubler AB | | 145,091 | | | 572,353 | |
| | Trelleborg AB Series B | | 928,357 | | | 8,022,870 | |
| # | | Unibet Group P.L.C. SDR | | 95,019 | | | 2,185,925 | |
| | Uniflex AB Series B | | 18,150 | | | 83,215 | |
| | VBG AB Series B | | 1,084 | | | 11,908 | |
| | Vitrolife AB | | 51,263 | | | 333,606 | |
| | Wihlborgs Fastigheter AB | | 225,805 | | | 2,979,497 | |
| TOTAL SWEDEN | | | | | 189,874,976 | |
| | | | |
| SWITZERLAND — (13.4%) | | | | | | |
| | Acino Holding AG | | 9,235 | | | 987,810 | |
| * | | Addex Pharmaceuticals, Ltd. | | 1,491 | | | 8,747 | |
| | Advanced Digital Broadcast Holdings SA | | 2,024 | | | 17,683 | |
| * | | Affichage Holding SA | | 5,703 | | | 825,646 | |
| | AFG Arbonia-Forster Holding AG | | 46,165 | | | 863,045 | |
| | Allreal Holding AG | | 34,985 | | | 5,081,494 | |
| | ALSO-Actebis Holding AG | | 16,195 | | | 722,694 | |
74
The Continental Small Company Series
continued
| | | | | Shares | | Value†† | |
| SWITZERLAND — (Continued) | | | | | | |
| | Aryzta AG | | 242,276 | | $ | 11,688,187 | |
| | Ascom Holding AG | | 160,822 | | | 1,434,469 | |
| | Austriamicrosystems AG | | 35,754 | | | 1,459,485 | |
| * | | Autoneum Holding AG | | 15,956 | | | 830,398 | |
| # | | Bachem Holdings AG | | 24,136 | | | 835,216 | |
| | Baloise Holding AG | | 8,111 | | | 554,913 | |
| | Bank Coop AG | | 31,671 | | | 2,108,480 | |
| | Bank Sarasin & Cie AG Series B | | 182,505 | | | 5,317,553 | |
| | Banque Cantonale de Geneve SA | | 4,021 | | | 838,767 | |
| | Banque Cantonale du Jura SA | | 4,500 | | | 287,132 | |
| | Banque Cantonale Vaudoise AG | | 6,943 | | | 3,365,282 | |
| | Banque Privee Edmond de Rothschild SA | | 157 | | | 4,011,882 | |
| | Barry Callebaut AG | | 4,093 | | | 4,026,832 | |
| | Basellandschaftliche Kantonalbank AG | | 446 | | | 616,812 | |
| * | | Basilea Pharmaceutica AG | | 20,383 | | | 772,237 | |
| | | Basler Kantonalbank AG | | 1,295 | | | 182,506 | |
| | Belimo Holdings AG | | 1,830 | | | 3,297,281 | |
| | Bell AG | | 79 | | | 148,154 | |
| | Bellevue Group AG | | 27,519 | | | 405,461 | |
| | Berner Kantonalbank AG | | 23,232 | | | 6,163,467 | |
| #* | | BKW SA | | 27,437 | | | 1,064,706 | |
| * | | Bobst Group AG | | 39,409 | | | 977,543 | |
| | Bossard Holding AG | | 8,386 | | | 907,145 | |
| | Bucher Industries AG | | 33,342 | | | 5,809,506 | |
| | Burckhardt Compression Holding AG | | 6,936 | | | 1,726,763 | |
| | Calida Holding AG | | 7,920 | | | 235,664 | |
| | Carlo Gavazzi Holding AG | | 1,069 | | | 203,402 | |
| | Centralschweizerische Kraftwerke AG | | 145 | | | 50,816 | |
| | Cham Paper Holding AG | | 649 | | | 108,568 | |
| | Charles Voegele Holding AG | | 32,044 | | | 625,604 | |
| * | | Cicor Technologies | | 4,889 | | | 175,617 | |
| | Cie Financiere Tradition SA | | 6,784 | | | 504,861 | |
| * | | Clariant AG | | 699,758 | | | 6,870,204 | |
| | Coltene Holding AG | | 16,008 | | | 541,821 | |
| | Conzzeta AG | | 1,345 | | | 2,580,337 | |
| * | | Cytos Biotechnology AG | | 1,934 | | | 4,017 | |
| | Daetwyler Holding AG | | 29,754 | | | 1,759,133 | |
| * | | Dufry AG | | 65,162 | | | 5,980,744 | |
| # | | EFG International AG | | 205,702 | | | 1,552,233 | |
| * | | ELMA Electronic AG | | 472 | | | 215,806 | |
| | Emmi AG | | 13,244 | | | 2,746,818 | |
| | EMS-Chemie Holding AG | | 27,979 | | | 4,721,298 | |
| | Energiedienst Holding AG | | 71,249 | | | 3,641,889 | |
| | Flughafen Zuerich AG | | 14,025 | | | 4,864,627 | |
| | Forbo Holding AG | | 6,314 | | | 3,304,178 | |
| # | | Galenica Holding AG | | 18,828 | | | 10,997,155 | |
| | GAM Holding AG | | 780,910 | | | 8,456,882 | |
| * | | Gategroup Holding AG | | 65,671 | | | 1,582,155 | |
| | George Fisher AG | | 15,351 | | | 5,230,235 | |
| * | | Gottex Fund Management Holdings, Ltd. | | 824 | | | 2,267 | |
| | Gurit Holding AG | | 1,489 | | | 644,822 | |
| | Helvetia Holding AG | | 22,754 | | | 7,130,595 | |
| | Highlight Communications AG | | 27,009 | | | 120,277 | |
| # | | Huber & Suhner AG | | 22,577 | | | 949,207 | |
| | Implenia AG | | 49,733 | | | 1,250,723 | |
| | Inficon Holding AG | | 4,954 | | | 810,477 | |
| * | | Interroll Holding AG | | 2,404 | | | 712,628 | |
| | Intershop Holding AG | | 3,559 | | | 1,212,183 | |
| * | | Jungfraubahn Holding AG | | 229 | | | 13,596 | |
| | Kaba Holding AG | | 11,858 | | | 4,138,074 | |
| * | | Kardex AG | | 21,055 | | | 267,218 | |
75
The Continental Small Company Series
continued
| | | | | Shares | | Value†† | |
| SWITZERLAND — (Continued) | | | | | | |
| | Komax Holding AG | | 9,976 | | $ | 727,578 | |
| | Kudelski SA | | 115,691 | | | 1,042,972 | |
| * | | Kuoni Reisen Holding AG Series B | | 13,163 | | | 3,147,047 | |
| # | | LEM Holding SA | | 3,667 | | | 1,501,802 | |
| | Liechtensteinische Landesbank AG | | 8,445 | | | 372,303 | |
| #* | | LifeWatch AG | | 55,532 | | | 259,629 | |
| #* | | Logitech International SA | | 676,961 | | | 5,251,689 | |
| | Lonza Group AG | | 146,907 | | | 8,656,139 | |
| | Luzerner Kantonalbank AG | | 17,399 | | | 5,774,332 | |
| | Metall Zug AG | | 233 | | | 914,565 | |
| #* | | Meyer Burger Technology AG | | 200,895 | | | 3,137,076 | |
| * | | Micronas Semiconductor Holding AG | | 155,041 | | | 1,027,143 | |
| * | | Mikron Holding AG | | 585 | | | 3,297 | |
| | Mobilezone Holding AG | | 119,357 | | | 1,206,800 | |
| | Mobimo Holding AG | | 11,983 | | | 2,650,557 | |
| * | | Myriad Group AG | | 12,956 | | | 52,336 | |
| | Nobel Biocare Holding AG | | 478,680 | | | 5,554,545 | |
| * | | OC Oerlikon Corp. AG | | 372,542 | | | 1,987,036 | |
| | Orascom Development Holding AG | | 8,205 | | | 125,021 | |
| | Orell Fuessli Holding AG | | 4,930 | | | 555,490 | |
| * | | Orior AG | | 348 | | | 17,957 | |
| * | | Panalpina Welttransport Holding AG | | 46,070 | | | 4,701,198 | |
| * | | Parco Industriale e Immobiliare SA | | 600 | | | 2,236 | |
| | Partners Group Holding AG | | 15,663 | | | 2,728,679 | |
| #* | | Petroplus Holdings AG | | 370,438 | | | 680,854 | |
| | Phoenix Mecano AG | | 3,100 | | | 1,614,632 | |
| | PSP Swiss Property AG | | 148,327 | | | 12,399,222 | |
| | PubliGroupe SA | | 2,171 | | | 296,179 | |
| * | | Rieters Holdings AG | | 15,956 | | | 2,390,181 | |
| | Romande Energie Holding SA | | 2,714 | | | 3,461,879 | |
| * | | Schaffner Holding AG | | 2,066 | | | 503,905 | |
| * | | Schmolz & Bickenbach AG | | 72,817 | | | 413,148 | |
| | Schweiter Technologies AG | | 4,191 | | | 2,247,565 | |
| | Schweizerische National-Versicherungs-Gesellschaft AG | | 45,720 | | | 1,568,781 | |
| * | | Siegfried Holding AG | | 8,325 | | | 795,274 | |
| | Societa Elettrica Sopracenerina SA | | 2,340 | | | 477,081 | |
| | St. Galler Kantonalbank AG | | 9,942 | | | 3,742,931 | |
| | Straumann Holding AG | | 21,440 | | | 3,692,645 | |
| | Sulzer AG | | 64,067 | | | 6,822,251 | |
| | Swiss Life Holding AG | | 94,071 | | | 8,615,819 | |
| | Swisslog Holding AG | | 914,407 | | | 671,055 | |
| | Swissquote Group Holding SA | | 47,450 | | | 1,665,797 | |
| # | | Tamedia AG | | 14,891 | | | 1,845,726 | |
| | Tecan Group AG | | 41,765 | | | 2,819,894 | |
| #* | | Temenos Group AG | | 259,801 | | | 4,241,305 | |
| * | | Tornos Holding AG | | 38,028 | | | 332,564 | |
| * | | U-Blox AG | | 13,855 | | | 605,224 | |
| | Uster Technologies AG | | 2,848 | | | 124,603 | |
| | Valartis Group AG | | 936 | | | 17,159 | |
| | Valiant Holding AG | | 45,575 | | | 5,762,301 | |
| | Valora Holding AG | | 12,070 | | | 2,519,777 | |
| | Vaudoise Assurances Holding SA | | 3,219 | | | 903,350 | |
| | Verwaltungs und Privat-Bank AG | | 7,692 | | | 678,722 | |
| | Vetropack Holding AG | | 234 | | | 408,280 | |
| | Villars Holding SA | | 150 | | | 83,765 | |
| #* | | Von Roll Holding AG | | 149,133 | | | 405,353 | |
| | Vontobel Holdings AG | | 121,104 | | | 2,704,440 | |
| | VZ Holding AG | | 818 | | | 83,891 | |
| | Walliser Kantonalbank AG | | 1,416 | | | 1,202,927 | |
| | WMH Walter Meier Holding AG | | 4,738 | | | 1,042,286 | |
| # | | Ypsomed Holdings AG | | 6,709 | | | 391,994 | |
76
THE CONTINENTAL SMALL COMPANY SERIES
CONTINUED
| | | | | Shares | | Value†† | |
| SWITZERLAND — (Continued) | | | | | | | | |
| | Zehnder Group AG | | | 35,840 | | | $ | 1,956,664 | |
| #* | | Zueblin Immobilien Holding AG | | | 261,040 | | | | 665,607 | |
| | Zuger Kantonalbank AG | | | 623 | | | | 3,341,303 | |
| TOTAL SWITZERLAND | | | | | | | 287,137,188 | |
| TOTAL COMMON STOCKS | | | | | | | 1,795,438,480 | |
| RIGHTS/WARRANTS — (0.0%) | | | | | | | | |
| BELGIUM — (0.0%) | | | | | | | | |
| * | | Agfa-Gevaert NV STRIP VVPR | | | 122,950 | | | | 159 | |
| * | | Deceuninck NV STRIP VVPR | | | 247,412 | | | | 320 | |
| #* | | Nyrstar NV STRIP VVPR | | | 178,031 | | | | 464 | |
| * | | RealDolmen NV STRIP VVPR | | | 6,067 | | | | 79 | |
| * | | SAPEC SA STRIP VVPR | | | 75 | | | | 357 | |
| #* | | Tessenderlo Chemie NV STRIP VVPR | | | 3,985 | | | | 307 | |
| * | | Zenitel NV STRIP VVPR | | | 8,654 | | | | 11 | |
| TOTAL BELGIUM | | | | | | | 1,697 | |
| | |
| ITALY — (0.0%) | | | | | | | | |
| * | | Intek SpA Warrants 12/30/11 | | | 62,985 | | | | — | |
| #* | | Juventus Football Club SpA Rights 01/18/12 | | | 196,980 | | | | 25,876 | |
| * | | KME Group SpA Warrants 12/30/11 | | | 104,975 | | | | 14 | |
| TOTAL ITALY | | | | | | | 25,890 | |
| TOTAL RIGHTS/WARRANTS | | | | | | | 27,587 | |
| | |
| | | | Shares/ | | | | |
| | | | Face | | | | |
| | | | Amount | | Value† | |
| | | | (000) | | | | |
| SECURITIES LENDING COLLATERAL — (16.4%) | | | | | | | | |
| §@ | | DFA Short Term Investment Fund | | | 353,000,000 | | | $ | 353,000,000 | |
| @ | | Repurchase Agreement, Deutsche Bank Securities, Inc. 0.08%, 01/03/12 | | | | | | | | |
| | (Collateralized by U.S. Treasury Note 1.375%, 09/30/18, valued at $172,911) | | | | | | | | |
| | to be repurchased at $169,523 | | $ | 170 | | | | 169,521 | |
| TOTAL SECURITIES LENDING COLLATERAL | | | | | | | 353,169,521 | |
| | |
| TOTAL INVESTMENTS — (100.0%) | | | | | | | | |
| (Cost $2,412,394,669)^ | | | | | | $ | 2,148,635,588 | |
____________________
^ The cost for federal income tax purposes is $2,413,711,366.
77
THE CANADIAN SMALL COMPANY SERIES
SCHEDULE OF INVESTMENTS
December 31, 2011
(Unaudited)
| | | | Shares | | Value†† | |
| COMMON STOCKS — (76.1%) | | | | | |
| Consumer Discretionary — (8.4%) | | | | | |
| * | | AlarmForce Industries, Inc. | 4,310 | | $ | 43,787 | |
| | Astral Media, Inc. Class A | 195,947 | | | 6,826,168 | |
| | AutoCanada, Inc. | 600 | | | 3,769 | |
| * | | Azure Dynamics Corp. | 1,049,423 | | | 66,957 | |
| #* | | Ballard Power Systems, Inc. | 559,352 | | | 603,963 | |
| | BMTC Group, Inc. Class A | 14,059 | | | 259,445 | |
| * | | Brick, Ltd. (The) | 125,224 | | | 378,591 | |
| * | | Brookfield Residential Properties, Inc. | 800 | | | 6,345 | |
| # | | Cineplex, Inc. | 197,159 | | | 4,977,599 | |
| * | | Coastal Contacts, Inc. | 234,745 | | | 587,583 | |
| # | | Cogeco Cable, Inc. | 66,661 | | | 3,360,042 | |
| | Cogeco, Inc. | 4,889 | | | 232,225 | |
| # | | Corus Entertainment, Inc. Class B | 295,300 | | | 5,948,030 | |
| # | | Dollarama, Inc. | 197,346 | | | 8,620,267 | |
| | Dorel Industries, Inc. Class B | 107,500 | | | 2,696,074 | |
| | easyhome, Ltd. | 3,600 | | | 18,552 | |
| | Gamehost, Inc. | 2,833 | | | 31,493 | |
| | Glacier Media, Inc. | 137,300 | | | 283,023 | |
| | Glentel, Inc. | 60,400 | | | 1,078,455 | |
| * | | Great Canadian Gaming Corp. | 284,300 | | | 2,338,586 | |
| | Groupe Aeroplan, Inc. | 696,151 | | | 8,159,061 | |
| #* | | Imax Corp. | 259,237 | | | 4,755,965 | |
| | Indigo Books & Music, Inc. | 746 | | | 5,309 | |
| | Le Chateau, Inc. Class A | 73,800 | | | 119,529 | |
| | Leon’s Furniture, Ltd. | 143,275 | | | 1,743,912 | |
| | Linamar Corp. | 191,380 | | | 2,630,007 | |
| * | | Martinrea International, Inc. | 271,156 | | | 1,982,932 | |
| | MDC Partners, Inc. Class A | 1,698 | | | 23,051 | |
| #* | | MEGA Brands, Inc. | 37,306 | | | 304,307 | |
| #* | | Mood Media Corp. | 57,338 | | | 135,641 | |
| | Quebecor, Inc. Class B | 111,093 | | | 3,804,697 | |
| | Reitmans Canada, Ltd. | 13,456 | | | 198,786 | |
| | Reitmans Canada, Ltd. Class A | 202,400 | | | 2,944,361 | |
| | RONA, Inc. | 677,175 | | | 6,474,292 | |
| * | | Sears Canada, Inc. | 26,345 | | | 269,980 | |
| | Torstar Corp. Class B | 234,377 | | | 1,904,924 | |
| | TVA Group, Inc. Class B | 7,000 | | | 59,333 | |
| # | | Uni-Select, Inc. | 59,151 | | | 1,524,136 | |
| # | | Yellow Media, Inc. | 393,969 | | | 71,543 | |
| Total Consumer Discretionary | | | | 75,472,720 | |
| | | |
| Consumer Staples — (2.5%) | | | | | |
| | Alliance Grain Traders, Inc. | 70,568 | | | 1,438,721 | |
| | Andrew Peller, Ltd. Class A | 400 | | | 3,652 | |
| * | | Atrium Innovations, Inc. | 130,236 | | | 1,518,728 | |
| #* | | BioExx Specialty Proteins, Ltd. | 540,917 | | | 84,954 | |
| | Canada Bread Co., Ltd. | 14,021 | | | 597,862 | |
| | Colabor Group, Inc. | 67,124 | | | 698,419 | |
| | Corby Distilleries, Ltd. Class A | 63,258 | | | 1,018,337 | |
| #* | | Cott Corp. | 473,596 | | | 2,975,229 | |
| * | | GLG Life Tech Corp. | 28,148 | | | 24,867 | |
| | High Liner Foods, Inc. | 3,500 | | | 56,172 | |
| | Jean Coutu Group PJC, Inc. Class A (The) | 400,161 | | | 5,008,150 | |
| # | | Liquor Stores N.A., Ltd. | 46,446 | | | 686,147 | |
| | Maple Leaf Foods, Inc. | 334,926 | | | 3,560,489 | |
| # | | North West Co., Inc. (The) | 136,273 | | | 2,695,363 | |
| # | | Premium Brands Holdings Corp. | 72,405 | | | 1,183,355 | |
| | Rogers Sugar, Inc. | 87,976 | | | 454,237 | |
78
THE CANADIAN SMALL COMPANY SERIES
CONTINUED
| | | | Shares | | Value†† | |
| Consumer Staples — (Continued) | | | | | |
| * | | SunOpta, Inc. | 193,373 | | $ | 958,561 | |
| * | | Sun-Rype Products, Ltd. | 100 | | | 612 | |
| Total Consumer Staples | | | | 22,963,855 | |
| | | |
| Energy — (19.7%) | | | | | |
| * | | Advantage Oil & Gas, Ltd. | 1,098,231 | | | 4,570,797 | |
| | Akita Drilling, Ltd. Class A | 42,000 | | | 409,796 | |
| # | | AltaGas, Ltd. | 276,864 | | | 8,653,104 | |
| #* | | Anderson Energy, Ltd. | 608,395 | | | 322,487 | |
| * | | Angle Energy, Inc. | 302,132 | | | 1,883,228 | |
| #* | | Antrim Energy, Inc. | 568,800 | | | 658,831 | |
| #* | | Arsenal Energy, Inc. | 490,450 | | | 332,182 | |
| # | | AvenEx Energy Corp. | 134,840 | | | 692,234 | |
| #* | | Bankers Petroleum, Ltd. | 813,220 | | | 3,544,242 | |
| #* | | Bellatrix Exploration, Ltd. | 533,443 | | | 2,570,999 | |
| * | | Bengal Energy, Ltd. | 600 | | | 471 | |
| #* | | Birchcliff Energy, Ltd. | 355,600 | | | 4,747,151 | |
| * | | BlackPearl Resources, Inc. | 954,830 | | | 3,852,124 | |
| #* | | BNK Petroleum, Inc. | 164,191 | | | 249,812 | |
| # | | Bonterra Energy Corp. | 50,962 | | | 2,577,239 | |
| * | | C&C Energia, Ltd. | 48,832 | | | 362,855 | |
| | Calfrac Well Services, Ltd. | 126,564 | | | 3,540,686 | |
| * | | Calmena Energy Services, Inc. | 95,771 | | | 22,562 | |
| * | | Calvalley Petroleum, Inc. Class A | 345,539 | | | 600,348 | |
| # | | Canadian Energy Services & Technology Corp. | 147,683 | | | 1,616,359 | |
| | Canyon Services Group, Inc. | 145,892 | | | 1,711,322 | |
| # | | Cathedral Energy Services, Ltd. | 125,006 | | | 887,159 | |
| * | | CE Franklin, Ltd. | 20,400 | | | 165,403 | |
| * | | Celtic Exploration, Ltd. | 269,000 | | | 6,038,802 | |
| * | | Cequence Energy, Ltd. | 394,862 | | | 1,143,404 | |
| * | | Chinook Energy, Inc. | 95,783 | | | 153,253 | |
| #* | | CIC Energy Corp. | 31,465 | | | 29,342 | |
| #* | | Connacher Oil & Gas, Ltd. | 1,609,005 | | | 1,200,337 | |
| #* | | Corridor Resources, Inc. | 367,780 | | | 357,401 | |
| * | | Crew Energy, Inc. | 403,769 | | | 4,458,799 | |
| * | | Crocotta Energy, Inc. | 124,020 | | | 440,689 | |
| * | | Delphi Energy Corp. | 432,969 | | | 901,001 | |
| #* | | Denison Mines Corp. | 2,168,583 | | | 2,703,411 | |
| # | | Enbridge Income Fund Holdings, Inc. | 76,206 | | | 1,503,549 | |
| | Enerflex, Ltd. | 279,959 | | | 3,643,933 | |
| | Ensign Energy Services, Inc. | 226,952 | | | 3,620,093 | |
| * | | Epsilon Energy, Ltd. | 193,780 | | | 536,402 | |
| * | | Equal Energy, Ltd. | 86,320 | | | 388,917 | |
| * | | Essential Energy Services, Ltd. | 341,006 | | | 689,543 | |
| * | | Fairborne Energy, Ltd. | 544,251 | | | 1,581,333 | |
| * | | Flint Energy Services, Ltd. | 189,506 | | | 2,375,452 | |
| #* | | Forsys Metals Corp. | 109,974 | | | 78,803 | |
| * | | GeoMark Exploration, Ltd. | 81,040 | | | 65,230 | |
| * | | Gran Tierra Energy, Inc. | 969,291 | | | 4,681,140 | |
| * | | Guide Exploration, Ltd. Class A | 611,603 | | | 1,897,095 | |
| #* | | Ivanhoe Energy, Inc. | 939,785 | | | 1,033,187 | |
| # | | Keyera Corp. | 92,981 | | | 4,563,485 | |
| * | | Legacy Oil & Gas, Inc. | 476,295 | | | 4,899,702 | |
| #* | | Mega Uranium, Ltd. | 796,410 | | | 156,350 | |
| #* | | MGM Energy Corp. | 19,000 | | | 4,476 | |
| * | | Midway Energy, Ltd. | 305,540 | | | 971,730 | |
| # | | Mullen Group, Ltd. | 274,057 | | | 5,286,106 | |
| # | | NAL Energy Corp. | 542,913 | | | 4,199,415 | |
| #* | | North American Energy Partners, Inc. | 58,256 | | | 372,838 | |
| | Nuvista Energy, Ltd. | 481,347 | | | 2,475,836 | |
| #* | | Open Range Energy Corp. | 244,459 | | | 448,725 | |
79
THE CANADIAN SMALL COMPANY SERIES
CONTINUED
| | | | Shares | | Value†† | |
| Energy — (Continued) | | | | | |
| #* | | Pace Oil & Gas, Ltd. | 178,777 | | $ | 754,592 | |
| * | | Paramount Resources, Ltd. Class A | 136,127 | | | 5,678,918 | |
| # | | Parkland Fuel Corp. | 202,167 | | | 2,518,281 | |
| | Pason Systems, Inc. | 237,900 | | | 2,802,258 | |
| # | | Perpetual Energy, Inc. | 394,093 | | | 452,603 | |
| # | | PetroBakken Energy, Ltd. Class A | 207,305 | | | 2,610,771 | |
| #* | | Petrobank Energy & Resources, Ltd. | 259,385 | | | 2,693,785 | |
| # | | Petrominerales, Ltd. | 58,900 | | | 957,432 | |
| # | | Peyto Exploration & Development Corp. | 101,471 | | | 2,429,328 | |
| # | | PHX Energy Services Corp. | 31,216 | | | 326,945 | |
| # | | Poseidon Concepts Corp. | 216,077 | | | 2,640,650 | |
| * | | Precision Drilling Corp. | 43,254 | | | 445,808 | |
| # | | Progress Energy Resources Corp. | 116,557 | | | 1,514,812 | |
| # | | Provident Energy, Ltd. | 231,814 | | | 2,241,343 | |
| | Pulse Seismic, Inc. | 266,280 | | | 457,413 | |
| #* | | Questerre Energy Corp. | 724,660 | | | 433,907 | |
| * | | RMP Energy, Inc. | 450,693 | | | 982,124 | |
| #* | | Rock Energy, Inc. | 105,433 | | | 214,230 | |
| * | | Savanna Energy Services Corp. | 324,088 | | | 2,370,018 | |
| * | | Secure Energy Services, Inc. | 89,527 | | | 603,731 | |
| | ShawCor, Ltd. Class A | 222,500 | | | 6,307,534 | |
| * | | Sonde Resources Corp. | 82,870 | | | 215,564 | |
| #* | | Southern Pacific Resource Corp. | 1,456,343 | | | 2,001,355 | |
| * | | SouthGobi Resources, Ltd. | 455,682 | | | 2,683,771 | |
| * | | Sprott Resource Corp. | 386,304 | | | 1,505,401 | |
| * | | Terra Energy Corp. | 115,780 | | | 61,371 | |
| #* | | Tethys Petroleum, Ltd. | 290,489 | | | 148,274 | |
| | Total Energy Services, Inc. | 115,129 | | | 1,961,855 | |
| * | | TransGlobe Energy Corp. | 224,571 | | | 1,778,933 | |
| # | | Trilogy Energy Corp. | 191,610 | | | 7,066,295 | |
| | Trinidad Drilling, Ltd. | 482,433 | | | 3,679,514 | |
| * | | Twin Butte Energy, Ltd. | 545,545 | | | 1,140,624 | |
| #* | | UEX Corp. | 608,088 | | | 393,951 | |
| # | | Uranium One, Inc. | 179,870 | | | 381,369 | |
| #* | | Ur-Energy, Inc. | 309,416 | | | 264,237 | |
| # | | Veresen, Inc. | 283,972 | | | 4,264,806 | |
| * | | Vero Energy, Inc. | 218,138 | | | 445,376 | |
| * | | Westfire Energy, Ltd. | 152,738 | | | 854,583 | |
| #* | | Whitecap Resources, Inc. | 71,600 | | | 582,640 | |
| * | | Winstar Resources, Ltd. | 78,401 | | | 293,980 | |
| * | | Xtreme Coil Drilling Corp. | 115,619 | | | 425,591 | |
| # | | Zargon Oil & Gas, Ltd. | 75,607 | | | 1,011,557 | |
| * | | ZCL Composite, Inc. | 90,700 | | | 262,640 | |
| Total Energy | | | | 177,731,340 | |
| | | |
| Financials — (5.9%) | | | | | |
| # | | AGF Management, Ltd. Class B | 330,879 | | | 5,138,165 | |
| | Altus Group, Ltd. | 11,426 | | | 39,255 | |
| | Brookfield Real Estate Services, Inc. | 8,075 | | | 99,793 | |
| # | | Canaccord Capital, Inc. | 289,695 | | | 2,218,033 | |
| # | | Canadian Western Bank | 266,672 | | | 6,753,509 | |
| # | | Cash Store Financial Services, Inc. (The) | 51,170 | | | 300,867 | |
| | Clairvest Group, Inc. | 1,900 | | | 29,262 | |
| | Davis & Henderson Corp. | 216,244 | | | 3,576,649 | |
| #* | | Dundee Capital Markets, Inc. | 189,580 | | | 206,561 | |
| * | | EGI Financial Holdings, Inc. | 14,650 | | | 101,525 | |
| | E-L Financial Corp., Ltd. | 711 | | | 237,291 | |
| | Equitable Group, Inc. | 52,295 | | | 1,283,313 | |
| * | | Equity Financial Holdings, Inc. | 800 | | | 7,452 | |
| | Fiera Sceptre, Inc. | 36,300 | | | 224,125 | |
| | Firm Capital Mortgage Investment Corp. | 2,494 | | | 32,290 | |
80
THE CANADIAN SMALL COMPANY SERIES
CONTINUED
| | | | Shares | | Value†† | |
| Financials — (Continued) | | | | | |
| | First National Financial Corp. | 11,240 | | $ | 192,528 | |
| * | | FirstService Corp. | 112,879 | | | 2,986,100 | |
| * | | Genesis Land Development Corp. | 69,817 | | | 197,372 | |
| # | | Genworth MI Canada, Inc. | 79,056 | | | 1,590,820 | |
| | Gluskin Sheff + Associates, Inc. | 61,507 | | | 900,191 | |
| | GMP Capital, Inc. | 253,000 | | | 1,758,272 | |
| | Guardian Capital Group, Ltd. Class A | 8,727 | | | 82,237 | |
| | Home Capital Group, Inc. | 120,600 | | | 5,812,476 | |
| # | | Killam Properties, Inc. | 115,599 | | | 1,312,864 | |
| * | | Kingsway Financial Services, Inc. | 223,835 | | | 116,449 | |
| | Laurentian Bank of Canada | 92,400 | | | 4,338,152 | |
| * | | Mainstreet Equity Corp. | 4,697 | | | 110,607 | |
| | Melcor Developments, Ltd. | 10,257 | | | 132,598 | |
| | MI Developments, Inc. | 48,148 | | | 1,540,263 | |
| * | | Pacific & Western Credit Corp. | 8,800 | | | 11,229 | |
| # | | Sprott Resource Lending Corp. | 750,703 | | | 1,046,379 | |
| | Sprott, Inc. | 248,556 | | | 1,412,652 | |
| | TMX Group, Inc. | 231,476 | | | 9,472,623 | |
| #* | | Westaim Corp. | 165,381 | | | 86,039 | |
| Total Financials | | | | 53,347,941 | |
| | | |
| Health Care — (1.7%) | | | | | |
| #* | | AEterna Zentaris, Inc. | 295,803 | | | 452,960 | |
| * | | Bioniche Life Sciences, Inc. | 46,000 | | | 25,737 | |
| #* | | Burcon NutraScience Corp. | 61,538 | | | 431,597 | |
| * | | Cangene Corp. | 140,432 | | | 272,938 | |
| * | | Cardiome Pharma Corp. | 278,700 | | | 733,169 | |
| # | | CML HealthCare, Inc. | 208,565 | | | 1,977,657 | |
| | Futuremed Healthcare Products Corp. | 34,438 | | | 272,124 | |
| * | | Helix BioPharma Corp. | 13,153 | | | 24,531 | |
| #* | | IMRIS, Inc. | 74,879 | | | 202,862 | |
| # | | Leisureworld Senior Care Corp. | 59,274 | | | 656,305 | |
| | MDS, Inc. | 464,108 | | | 3,895,090 | |
| #* | | Oncolytics Biotech, Inc. | 205,321 | | | 806,168 | |
| * | | Paladin Labs, Inc. | 50,700 | | | 2,077,269 | |
| * | | Patheon, Inc. | 17,320 | | | 21,762 | |
| * | | ProMetic Life Sciences, Inc. | 648,697 | | | 89,146 | |
| * | | QLT, Inc. | 226,610 | | | 1,630,480 | |
| #* | | Resverlogix Corp. | 112,020 | | | 155,041 | |
| #* | | Theratechnologies, Inc. | 277,500 | | | 759,975 | |
| * | | Transition Therapeutics, Inc. | 50,610 | | | 71,040 | |
| * | | TSO3, Inc. | 151,452 | | | 275,029 | |
| #* | | YM Biosciences, Inc. | 242,157 | | | 396,959 | |
| Total Health Care | | | | 15,227,839 | |
| | | |
| Industrials — (7.4%) | | | | | |
| # | | Aecon Group, Inc. | 226,967 | | | 2,330,380 | |
| # | | AG Growth International, Inc. | 46,339 | | | 1,704,820 | |
| * | | Air Canada Class A | 313,328 | | | 313,712 | |
| | Algoma Central Corp. | 2,569 | | | 257,215 | |
| * | | ATS Automation Tooling System, Inc. | 343,717 | | | 2,176,171 | |
| # | | Bird Construction, Inc. | 57,219 | | | 647,593 | |
| # | | Black Diamond Group, Ltd. | 95,091 | | | 1,723,072 | |
| | CAE, Inc. | 79,988 | | | 776,522 | |
| # | | Canadian Helicopters Group, Inc. | 14,988 | | | 353,974 | |
| # | | CanWel Building Materials Group, Ltd. | 42,200 | | | 82,847 | |
| | Cargojet, Inc. | 1,944 | | | 16,869 | |
| | Chorus Aviation, Inc. | 2,381 | | | 7,385 | |
| # | | Churchill Corp. Class A (The) | 76,845 | | | 862,173 | |
| * | | Clarke, Inc. | 48,894 | | | 192,936 | |
| | Contrans Group, Inc. Class A | 80,442 | | | 631,692 | |
81
THE CANADIAN SMALL COMPANY SERIES
CONTINUED
| | | | Shares | | Value†† | |
| Industrials — (Continued) | | | | | |
| | DirectCash Payments, Inc. | 14,154 | | $ | 277,870 | |
| #* | | Electrovaya, Inc. | 141,865 | | | 108,618 | |
| # | | Exchange Income Corp. | 14,111 | | | 351,961 | |
| | Exco Technologies, Ltd. | 10,400 | | | 33,484 | |
| * | | Garda World Security Corp. Class A | 108,840 | | | 780,977 | |
| # | | Genivar, Inc. | 74,593 | | | 1,927,154 | |
| #* | | GLV, Inc. Class A | 64,773 | | | 227,619 | |
| * | | Heroux-Devtek, Inc. | 88,827 | | | 585,931 | |
| | Horizon North Logistics, Inc. | 210,945 | | | 964,912 | |
| | IBI Group, Inc. | 11,496 | | | 148,954 | |
| | K-Bro Linen, Inc. | 7,158 | | | 156,264 | |
| | Morneau Shepell, Inc. | 49,882 | | | 511,183 | |
| | Newalta Corp. | 166,722 | | | 2,030,940 | |
| | Progressive Waste Solutions, Ltd. | 209,167 | | | 4,091,974 | |
| | Richelieu Hardware, Ltd. | 61,562 | | | 1,734,915 | |
| # | | Ritchie Brothers Auctioneers, Inc. | 244,637 | | | 5,379,012 | |
| # | | Rocky Mountain Dealerships, Inc. | 40,341 | | | 351,635 | |
| | Russel Metals, Inc. | 243,400 | | | 5,356,592 | |
| * | | Stantec, Inc. | 168,695 | | | 4,565,321 | |
| # | | Student Transportation, Inc. | 221,438 | | | 1,425,898 | |
| # | | Superior Plus Corp. | 391,430 | | | 2,209,298 | |
| * | | Swisher Hygiene, Inc. | 35,140 | | | 131,424 | |
| | Toromont Industries, Ltd. | 282,567 | | | 5,913,451 | |
| # | | Transcontinental, Inc. Class A | 271,264 | | | 3,357,682 | |
| # | | TransForce, Inc. | 312,897 | | | 3,977,439 | |
| | Vicwest, Inc. | 22,293 | | | 199,133 | |
| # | | Wajax Corp. | 37,742 | | | 1,428,546 | |
| | WaterFurnace Renewable Energy, Inc. | 29,581 | | | 451,809 | |
| | Westjet Airlines, Ltd. | 1,420 | | | 16,183 | |
| #* | | Westport Innovations, Inc. | 189,501 | | | 6,281,668 | |
| Total Industrials | | | | 67,055,208 | |
| | | |
| Information Technology — (3.4%) | | | | | |
| #* | | 5N Plus, Inc. | 183,848 | | | 925,782 | |
| | Aastra Technologies, Ltd. | 26,544 | | | 361,129 | |
| #* | | Absolute Software Corp. | 160,300 | | | 777,307 | |
| * | | AXIA NetMedia Corp. | 182,767 | | | 218,872 | |
| | Calian Technologies, Ltd. | 15,406 | | | 262,677 | |
| * | | Celestica, Inc. | 847,607 | | | 6,231,731 | |
| #* | | COM DEV International, Ltd. | 288,576 | | | 580,693 | |
| | Computer Modelling Group, Ltd. | 112,238 | | | 1,691,144 | |
| # | | Constellation Software, Inc. | 25,116 | | | 1,891,928 | |
| * | | Descartes Systems Group, Inc. (The) | 203,354 | | | 1,461,155 | |
| #* | | DragonWave, Inc. | 146,883 | | | 504,629 | |
| # | | Enghouse Systems, Ltd. | 38,278 | | | 459,900 | |
| | Evertz Technologies, Ltd. | 133,981 | | | 1,597,908 | |
| * | | EXFO, Inc. | 83,677 | | | 502,678 | |
| | Gennum Corp. | 130,300 | | | 786,596 | |
| | MacDonald Dettweiler & Associates, Ltd. | 111,753 | | | 5,165,594 | |
| * | | March Networks Corp. | 8,829 | | | 41,599 | |
| | Mediagrif Interactive Technologies, Inc. | 1,586 | | | 24,909 | |
| * | | Miranda Technologies, Inc. | 84,901 | | | 759,213 | |
| * | | Points International, Ltd. | 46,889 | | | 356,702 | |
| * | | Redknee Solutions, Inc. | 122,828 | | | 115,142 | |
| * | | Ruggedcom, Inc. | 32,125 | | | 759,963 | |
| #* | | Sandvine Corp. | 511,691 | | | 572,592 | |
| * | | Sierra Wireless, Inc. | 127,100 | | | 892,039 | |
| * | | Smart Technologies, Inc. Class A | 10,681 | | | 39,212 | |
| * | | Softchoice Corp. | 6,773 | | | 68,278 | |
| * | | Vecima Network, Inc. | 30,729 | | | 88,982 | |
82
THE CANADIAN SMALL COMPANY SERIES
CONTINUED
| | | | Shares | | Value†† | |
| Information Technology — (Continued) | | | | | |
| | Wi-Lan, Inc. | 666,819 | | $ | 3,842,187 | |
| Total Information Technology | | | | 30,980,541 | |
| | | |
| Materials — (24.1%) | | | | | |
| | Aberdeen International, Inc. | 122,333 | | | 78,053 | |
| * | | Ainsworth Lumber Co., Ltd. | 227,838 | | | 219,172 | |
| * | | Alacer Gold Corp. | 144,558 | | | 1,488,504 | |
| | Alamos Gold, Inc. | 423,220 | | | 7,290,808 | |
| #* | | Alexco Resource Corp. | 231,426 | | | 1,574,265 | |
| #* | | Almaden Minerals, Ltd. | 108,300 | | | 273,208 | |
| * | | Altius Minerals Corp. | 112,600 | | | 1,192,593 | |
| # | | Amerigo Resources, Ltd. | 504,854 | | | 282,470 | |
| * | | Anvil Mining, Ltd. | 387,530 | | | 2,792,118 | |
| * | | Argonaut Gold, Inc. | 353,205 | | | 2,409,595 | |
| #* | | Atna Resource, Ltd. | 156,447 | | | 128,997 | |
| #* | | Augusta Resource Corp. | 308,545 | | | 960,086 | |
| * | | Aura Minerals, Inc. | 526,169 | | | 645,606 | |
| #* | | AuRico Gold, Inc. | 967,321 | | | 7,776,549 | |
| #* | | Aurizon Mines, Ltd. | 615,868 | | | 3,022,665 | |
| #* | | Avalon Rare Metals, Inc. | 352,025 | | | 832,766 | |
| #* | | Avion Gold Corp. | 1,620,486 | | | 2,576,871 | |
| #* | | B2Gold Corp. | 1,023,831 | | | 3,115,461 | |
| #* | | Baja Mining Corp. | 886,518 | | | 696,161 | |
| #* | | Brigus Gold Corp. | 664,229 | | | 652,004 | |
| #* | | Canadian Zinc Corp. | 280,925 | | | 181,998 | |
| | Canam Group, Inc. Class A | 194,100 | | | 781,163 | |
| #* | | Canexus Corp. | 65,500 | | | 415,342 | |
| #* | | Canfor Corp. | 379,755 | | | 3,969,954 | |
| | Canfor Pulp Products, Inc. | 136,336 | | | 1,662,128 | |
| * | | Capstone Mining Corp. | 1,040,232 | | | 2,838,621 | |
| #* | | Cardero Resource Corp. | 224,360 | | | 224,635 | |
| #* | | Carpathian Gold, Inc. | 587,371 | | | 250,804 | |
| | Cascades, Inc. | 489,976 | | | 2,130,644 | |
| * | | Catalyst Paper Corp. | 540,689 | | | 18,576 | |
| | CCL Industries, Inc. Class B | 100,740 | | | 3,096,117 | |
| #* | | China Gold International Resources Corp., Ltd. | 722,757 | | | 1,816,204 | |
| #* | | Claude Resources, Inc. | 934,700 | | | 1,247,796 | |
| #* | | Cline Mining Corp. | 519,100 | | | 820,369 | |
| * | | Colossus Minerals, Inc. | 311,816 | | | 1,845,645 | |
| #* | | Copper Mountain Mining Corp. | 366,515 | | | 2,025,501 | |
| #* | | Crocodile Gold Corp. | 343,215 | | | 175,187 | |
| #* | | Duluth Metals, Ltd. | 388,214 | | | 796,434 | |
| #* | | Dundee Precious Metals, Inc. | 372,067 | | | 3,002,101 | |
| * | | Dynasty Metals & Mining, Inc. | 108,369 | | | 227,641 | |
| * | | Eastern Platinum, Ltd. | 3,177,460 | | | 1,684,249 | |
| #* | | Eastmain Resources, Inc. | 274,250 | | | 271,894 | |
| #* | | Eco Oro Minerals Corp. | 261,445 | | | 382,383 | |
| #* | | Endeavour Mining Corp. | 403,333 | | | 962,061 | |
| * | | Endeavour Silver Corp. | 293,999 | | | 2,854,135 | |
| * | | Entree Gold, Inc. | 286,898 | | | 352,022 | |
| * | | Euro Goldfields, Ltd. | 521,960 | | | 6,086,758 | |
| * | | Excellon Resources, Inc. | 805,400 | | | 450,629 | |
| * | | Exeter Resource Corp. | 74,037 | | | 194,041 | |
| * | | Fibrek, Inc. | 97,662 | | | 96,823 | |
| #* | | First Majestic Silver Corp. | 354,783 | | | 5,982,991 | |
| * | | First Nickel, Inc. | 50,300 | | | 5,431 | |
| #* | | Formation Capital Corp. | 154,881 | | | 85,137 | |
| * | | Fortress Paper, Ltd. | 44,933 | | | 1,172,779 | |
| * | | Fortuna Silver Mines, Inc. | 460,768 | | | 2,528,288 | |
| #* | | Fortune Minerals, Ltd. | 214,672 | | | 151,719 | |
| #* | | Golden Star Resources, Ltd. | 1,045,109 | | | 1,713,209 | |
83
THE CANADIAN SMALL COMPANY SERIES
CONTINUED
| | | | Shares | | Value†† | |
| Materials — (Continued) | | | | | |
| * | | Grande Cache Coal Corp. | 334,014 | | $ | 3,249,157 | |
| #* | | Great Basin Gold, Ltd. | 1,488,730 | | | 1,388,264 | |
| #* | | Great Panther Silver, Ltd. | 546,209 | | | 1,066,951 | |
| * | | Guyana Goldfields, Inc. | 230,342 | | | 1,695,769 | |
| * | | Hanfeng Evergreen, Inc. | 81,388 | | | 219,698 | |
| * | | Harry Winston Diamond Corp. | 266,629 | | | 2,842,298 | |
| #* | | High River Gold Mines, Ltd. | 597,342 | | | 703,618 | |
| # | | HudBay Minerals, Inc. | 657,566 | | | 6,545,000 | |
| * | | Imperial Metals Corp. | 168,580 | | | 2,068,466 | |
| #* | | Inter-Citic Minerals, Inc. | 283,484 | | | 269,919 | |
| * | | International Forest Products, Ltd. Class A | 188,500 | | | 795,632 | |
| #* | | International Minerals Corp. | 33,000 | | | 187,877 | |
| #* | | International Tower Hill Mines, Ltd. | 220,027 | | | 956,780 | |
| * | | Intertape Polymer Group, Inc. | 171,190 | | | 556,210 | |
| #* | | Jaguar Mining, Inc. | 362,916 | | | 2,315,538 | |
| #* | | Katanga Mining, Ltd. | 1,003,662 | | | 1,152,672 | |
| #* | | Keegan Resources, Inc. | 271,644 | | | 1,037,247 | |
| * | | Kimber Resources, Inc. | 21,200 | | | 18,313 | |
| #* | | Kirkland Lake Gold, Inc. | 213,280 | | | 3,228,248 | |
| * | | La Mancha Resources, Inc. | 344,099 | | | 925,479 | |
| * | | Labrador Iron Mines Holdings, Ltd. | 123,133 | | | 603,125 | |
| #* | | Lake Shore Gold Corp. | 1,280,732 | | | 1,609,165 | |
| #* | | Laramide Resources, Ltd. | 20,368 | | | 14,395 | |
| * | | Lundin Mining Corp. | 177,800 | | | 675,422 | |
| #* | | MAG Silver Corp. | 156,360 | | | 1,028,331 | |
| # | | Major Drilling Group International, Inc. | 319,200 | | | 4,869,073 | |
| * | | MDN, Inc. | 220,980 | | | 46,636 | |
| #* | | Mercator Minerals, Ltd. | 905,221 | | | 1,341,726 | |
| | Methanex Corp. | 289,704 | | | 6,631,556 | |
| #* | | Migao Corp. | 156,300 | | | 615,227 | |
| * | | Minco Base Metals Corp. | 2,780 | | | — | |
| #* | | Minco Silver Corp. | 125,224 | | | 244,609 | |
| #* | | Minefinders Corp. | 305,883 | | | 3,251,743 | |
| #* | | Minera Andes, Inc. | 731,944 | | | 1,099,263 | |
| #* | | Nautilus Minerals, Inc. | 89,354 | | | 157,877 | |
| #* | | Neo Material Technologies, Inc. | 405,900 | | | 2,920,488 | |
| #* | | Nevada Copper Corp. | 160,491 | | | 816,043 | |
| #* | | NGEx Resources, Inc. | 287,000 | | | 760,638 | |
| * | | Norbord, Inc. | 78,010 | | | 620,251 | |
| #* | | North American Palladium, Ltd. | 444,465 | | | 1,138,703 | |
| * | | Northern Dynasty Minerals, Ltd. | 203,498 | | | 1,228,479 | |
| * | | Northland Resources SA | 54,983 | | | 79,877 | |
| #* | | NovaGold Resources, Inc. | 612,655 | | | 5,219,971 | |
| * | | OceanaGold Corp. | 1,077,616 | | | 2,380,011 | |
| * | | Oromin Explorations, Ltd. | 168,799 | | | 178,948 | |
| #* | | Orvana Minerals Corp. | 302,452 | | | 320,636 | |
| #* | | Peregrine Diamonds, Ltd. | 260,272 | | | 150,734 | |
| #* | | Petaquilla Minerals, Ltd. | 519,282 | | | 300,738 | |
| * | | Phoscan Chemical Corp. | 432,579 | | | 133,754 | |
| * | | Pilot Gold, Inc. | 86,150 | | | 109,088 | |
| #* | | Platinum Group Metals, Ltd. | 241,887 | | | 218,440 | |
| #* | | PolyMet Mining Corp. | 423,377 | | | 436,364 | |
| * | | Primero Mining Corp. | 156,629 | | | 499,675 | |
| * | | Quadra FNX Mining, Ltd. | 483,002 | | | 7,149,615 | |
| #* | | Queenston Mining, Inc. | 220,773 | | | 1,068,379 | |
| * | | Richmont Mines, Inc. | 103,444 | | | 1,110,849 | |
| #* | | Rubicon Minerals Corp. | 508,405 | | | 1,931,315 | |
| #* | | Sabina Gold & Silver Corp. | 383,055 | | | 1,443,859 | |
| #* | | San Gold Corp. | 898,095 | | | 1,666,159 | |
| #* | | Scorpio Mining Corp. | 782,699 | | | 1,498,172 | |
| * | | Seabridge Gold, Inc. | 121,852 | | | 1,973,554 | |
84
THE CANADIAN SMALL COMPANY SERIES
CONTINUED
| | | | Shares | | Value†† | |
| Materials — (Continued) | | | | | |
| * | | SEMAFO, Inc. | 922,285 | | $ | 5,975,049 | |
| | Sherritt International Corp. | 1,571,926 | | | 8,424,752 | |
| * | | Shore Gold, Inc. | 837,013 | | | 353,291 | |
| * | | Silver Standard Resources, Inc. | 194,193 | | | 2,687,726 | |
| | Silvercorp Metals, Inc. | 36,000 | | | 231,107 | |
| #* | | St. Andrew Goldfields, Ltd. | 580,353 | | | 290,533 | |
| | Stella-Jones, Inc. | 32,540 | | | 1,293,615 | |
| * | | Stornoway Diamond Corp. | 297,297 | | | 262,643 | |
| #* | | Sulliden Gold Corp., Ltd. | 659,525 | | | 796,285 | |
| #* | | Tanzanian Royalty Exploration Corp. | 350,339 | | | 845,972 | |
| #* | | Taseko Mines, Ltd. | 793,230 | | | 2,172,380 | |
| #* | | Tembec, Inc. | 280,756 | | | 768,892 | |
| #* | | Thompson Creek Metals Co., Inc. | 610,028 | | | 4,263,460 | |
| * | | Timminco, Ltd. | 69,822 | | | 10,281 | |
| #* | | Torex Gold Resources, Inc. | 818,006 | | | 1,373,046 | |
| * | | Virginia Mines, Inc. | 99,162 | | | 827,364 | |
| | Wesdome Gold Mines, Ltd. | 325,464 | | | 479,211 | |
| | West Fraser Timber Co., Ltd. | 131,316 | | | 5,336,424 | |
| * | | Western Forest Products, Inc. | 116,719 | | | 96,239 | |
| | Winpak, Ltd. | 66,195 | | | 779,720 | |
| #* | | Yukon-Nevada Gold Corp. | 1,741,678 | | | 495,791 | |
| Total Materials | | | | 217,039,166 | |
| | | |
| Telecommunication Services — (0.3%) | | | | | |
| | Manitoba Telecom Services, Inc. | 74,117 | | | 2,158,578 | |
| * | | Wireless Matrix Corp. | 111,939 | | | 96,693 | |
| Total Telecommunication Services | | | | 2,255,271 | |
| | | |
| Utilities — (2.7%) | | | | | |
| # | | Algonquin Power & Utilities Corp. | 456,886 | | | 2,879,223 | |
| #* | | Alterra Power Corp. | 909,570 | | | 366,060 | |
| # | | Atlantic Power Corp. | 268,030 | | | 3,820,167 | |
| * | | Boralex, Inc. Class A | 94,733 | | | 663,015 | |
| * | | Capital Power Corp. | 83,342 | | | 2,055,019 | |
| # | | Capstone Infrastructure Corp. | 218,803 | | | 818,296 | |
| # | | Innergex Renewable Energy, Inc. | 239,796 | | | 2,424,441 | |
| # | | Just Energy Group, Inc. | 507,878 | | | 5,713,160 | |
| * | | Maxim Power Corp. | 92,234 | | | 181,073 | |
| # | | Northland Power, Inc. | 249,185 | | | 4,385,656 | |
| #* | | Ram Power Corp. | 554,037 | | | 187,625 | |
| | Valener, Inc. | 42,710 | | | 669,944 | |
| Total Utilities | | | | 24,163,679 | |
| TOTAL COMMON STOCKS | | | | 686,237,560 | |
| RIGHTS/WARRANTS — (0.0%) | | | | | |
| #* | | Compton Petroleum Corp. Warrants 08/23/14 | 7,790 | | | 15,293 | |
| * | | Duluth Metals, Ltd. Warrants 01/18/13 | 24,225 | | | 10,701 | |
| TOTAL RIGHTS/WARRANTS | | | | 25,994 | |
85
THE CANADIAN SMALL COMPANY SERIES
CONTINUED
| | | | Shares/ | | | | |
| | | Face | | | | |
| | | Amount | | Value† | |
| | | (000) | | | | |
| SECURITIES LENDING COLLATERAL — (23.9%) | | | | | | |
| §@ | | DFA Short Term Investment Fund | | 215,000,000 | | $ | 215,000,000 | |
| @ | | Repurchase Agreement, Deutsche Bank Securities, Inc. 0.08%, 01/03/12 | | | | | | |
| | (Collateralized by U.S. Treasury Note 1.375%, 09/30/18, valued at $430,027) | | | | | | |
| | to be repurchased at $421,599 | $ | 422 | | | 421,595 | |
| TOTAL SECURITIES LENDING COLLATERAL | | | | | 215,421,595 | |
| | |
| TOTAL INVESTMENTS — (100.0%) | | | | | | |
| (Cost $967,169,070)^ | | | | $ | 901,685,149 | |
____________________
^ The cost for federal income tax purposes is $967,171,653.
86
THE JAPANESE SMALL COMPANY SERIES
SCHEDULE OF INVESTMENTS
OCTOBER 31, 2011
| | | | SHARES | | VALUE†† | |
| COMMON STOCKS — (89.2%) | | | | | |
| Consumer Discretionary — (20.6%) | | | | | |
| # | | Accordia Golf Co., Ltd. | 4,489 | | $ | 3,304,974 | |
| | Aeon Fantasy Co., Ltd. | 57,832 | | | 813,401 | |
| | Ahresty Corp. | 16,200 | | | 99,168 | |
| # | | Aichi Machine Industry Co., Ltd. | 294,000 | | | 903,803 | |
| # | | Aigan Co., Ltd. | 96,200 | | | 482,159 | |
| | Aisan Industry Co., Ltd. | 132,800 | | | 1,237,235 | |
| # | | Akebono Brake Industry Co., Ltd. | 326,700 | | | 1,554,039 | |
| | Alpen Co., Ltd. | 70,600 | | | 1,211,230 | |
| | Alpha Corp. | 30,200 | | | 337,502 | |
| | Alpine Electronics, Inc. | 206,300 | | | 2,422,496 | |
| # | | Amiyaki Tei Co., Ltd. | 235 | | | 573,783 | |
| | Amuse, Inc. | 29,999 | | | 386,815 | |
| #* | | Anrakutei Co., Ltd. | 50,000 | | | 257,728 | |
| | AOI Advertising Promotion, Inc. | 39,000 | | | 200,467 | |
| | AOKI Holdings, Inc. | 97,100 | | | 1,293,877 | |
| | Aoyama Trading Co., Ltd. | 250,500 | | | 3,957,036 | |
| | Arc Land Sakamoto Co., Ltd. | 24,000 | | | 439,358 | |
| # | | Arnest One Corp. | 183,900 | | | 1,814,341 | |
| # | | Asahi Co., Ltd. | 35,100 | | | 777,609 | |
| * | | ASAHI TEC CORP. | 1,772,000 | | | 517,596 | |
| # | | Asatsu-DK, Inc. | 120,400 | | | 2,825,709 | |
| * | | Ashimori Industry Co., Ltd. | 319,000 | | | 425,490 | |
| # | | ASKUL Corp. | 75,200 | | | 1,072,159 | |
| | Asti Corp. | 46,000 | | | 118,040 | |
| #* | | Atom Corp. | 170,700 | | | 583,174 | |
| | Atsugi Co., Ltd. | 750,000 | | | 882,810 | |
| | Autobacs Seven Co., Ltd. | 97,200 | | | 4,450,886 | |
| | Avex Group Holdings, Inc. | 152,900 | | | 1,808,877 | |
| | Belluna Co., Ltd. | 6,950 | | | 54,307 | |
| * | | Best Denki Co., Ltd. | 304,500 | | | 832,756 | |
| # | | Bic Camera, Inc. | 2,531 | | | 1,339,794 | |
| # | | Bookoff Corp. | 33,500 | | | 276,311 | |
| | Calsonic Kansei Corp. | 617,000 | | | 3,620,527 | |
| | Can Do Co., Ltd. | 261 | | | 284,326 | |
| #* | | Carchs Holdings Co., Ltd. | 707,200 | | | 250,491 | |
| | Central Sports Co., Ltd. | 1,000 | | | 11,693 | |
| #* | | CHI Group Co., Ltd. | 11,000 | | | 28,580 | |
| | Chiyoda Co., Ltd. | 120,900 | | | 2,136,446 | |
| | Chofu Seisakusho Co., Ltd. | 88,800 | | | 2,264,662 | |
| | Chori Co., Ltd. | 658,000 | | | 723,912 | |
| | Chuo Spring Co., Ltd. | 202,000 | | | 686,526 | |
| #* | | Clarion Co., Ltd. | 496,000 | | | 839,994 | |
| | Cleanup Corp. | 131,900 | | | 786,854 | |
| | Colowide Co., Ltd. | 210,950 | | | 1,362,816 | |
| | Corona Corp. | 76,200 | | | 1,326,609 | |
| | Cross Plus, Inc. | 22,000 | | | 203,050 | |
| | Daido Metal Co., Ltd. | 144,000 | | | 1,472,278 | |
| | Daidoh, Ltd. | 113,600 | | | 1,120,156 | |
| #* | | Daiei, Inc. (The) | 379,250 | | | 1,438,499 | |
| | Daikoku Denki Co., Ltd. | 36,900 | | | 330,399 | |
| | Daimaruenawin Co., Ltd. | 400 | | | 2,608 | |
| | Dainichi Co., Ltd. | 54,900 | | | 611,975 | |
| # | | Daisyo Corp. | 54,300 | | | 642,824 | |
| | DCM Holdings Co., Ltd. | 350,600 | | | 2,804,167 | |
| | Descente, Ltd. | 231,000 | | | 1,305,652 | |
| # | | Doshisha Co., Ltd. | 54,800 | | | 1,361,439 | |
| | Doutor Nichires Holdings Co., Ltd. | 140,986 | | | 1,685,540 | |
| | Dynic Corp. | 127,000 | | | 209,173 | |
87
The Japanese Small Company Series
continued
| | | | SHARES | | VALUE†† | |
| Consumer Discretionary — (Continued) | | | | | |
| | Eagle Industry Co., Ltd. | 108,000 | | $ | 1,204,605 | |
| # | | Edion Corp. | 300,500 | | | 2,404,363 | |
| | | Exedy Corp. | 119,700 | | | 3,467,778 | |
| | F&A Aqua Holdings, Inc. | 60,638 | | | 584,978 | |
| | FCC Co., Ltd. | 132,600 | | | 2,801,595 | |
| | Fine Sinter Co., Ltd. | 49,000 | | | 143,757 | |
| | Foster Electric Co., Ltd. | 86,500 | | | 1,266,681 | |
| # | | France Bed Holdings Co., Ltd. | 750,000 | | | 1,040,053 | |
| # | | F-Tech, Inc. | 20,100 | | | 243,015 | |
| # | | Fuji Co., Ltd. | 97,000 | | | 2,140,373 | |
| | Fuji Corp, Ltd. | 102,300 | | | 482,555 | |
| #* | | Fuji Kiko Co., Ltd. | 148,000 | | | 456,462 | |
| | Fuji Kyuko Co., Ltd. | 311,000 | | | 1,775,095 | |
| | Fuji Oozx, Inc. | 6,000 | | | 22,681 | |
| | Fujibo Holdings, Inc. | 205,000 | | | 398,474 | |
| | Fujikura Rubber, Ltd. | 72,900 | | | 284,197 | |
| | Fujita Kanko, Inc. | 394,100 | | | 1,295,507 | |
| # | | Fujitsu General, Ltd. | 285,000 | | | 1,685,201 | |
| # | | Funai Electric Co., Ltd. | 84,200 | | | 1,654,922 | |
| # | | Furukawa Battery Co., Ltd. | 71,000 | | | 350,173 | |
| | Futaba Industrial Co., Ltd. | 163,800 | | | 1,043,968 | |
| # | | G-7 Holdings, Inc. | 29,200 | | | 137,848 | |
| * | | Gajoen Kanko Co. | 37,000 | | | — | |
| | Gakken Holdings Co., Ltd. | 322,000 | | | 569,543 | |
| #* | | Genki Sushi Co., Ltd. | 19,400 | | | 234,076 | |
| # | | GEO Co., Ltd. | 1,351 | | | 1,360,404 | |
| # | | GLOBERIDE, Inc. | 463,000 | | | 482,313 | |
| | Goldwin, Inc. | 175,000 | | | 572,615 | |
| * | | Gourmet Kineya Co., Ltd. | 87,000 | | | 457,307 | |
| #* | | GSI Creos Corp. | 194,000 | | | 238,950 | |
| | Gulliver International Co., Ltd. | 21,640 | | | 956,056 | |
| | Gunze, Ltd. | 758,000 | | | 2,298,876 | |
| | H2O Retailing Corp. | 387,000 | | | 2,791,996 | |
| * | | Hagihara Industries, Inc. | 2,700 | | | 40,220 | |
| | Hakuyosha Co., Ltd. | 88,000 | | | 232,140 | |
| # | | Happinet Corp. | 36,100 | | | 565,584 | |
| | Haruyama Trading Co., Ltd. | 47,900 | | | 216,614 | |
| * | | Haseko Corp. | 5,986,000 | | | 3,763,301 | |
| | Heiwa Corp. | 154,600 | | | 2,561,878 | |
| | Hiday Hidaka Corp. | 21,800 | | | 329,809 | |
| # | | Hikari Tsushin, Inc. | 95,800 | | | 2,230,336 | |
| | Himaraya Co., Ltd. | 35,900 | | | 242,339 | |
| | HIS Co., Ltd. | 101,800 | | | 2,631,014 | |
| | Hitachi Koki Co., Ltd. | 200,900 | | | 1,506,655 | |
| # | | Honeys Co., Ltd. | 38,980 | | | 561,193 | |
| | Horipro, Inc. | 41,800 | | | 355,473 | |
| | I Metal Technology Co., Ltd. | 142,000 | | | 253,332 | |
| # | | Ichibanya Co., Ltd. | 17,200 | | | 517,299 | |
| | Ichikawa Co., Ltd. | 63,000 | | | 119,666 | |
| # | | Ichikoh Industries, Ltd. | 285,000 | | | 469,380 | |
| # | | Ikyu Corp. | 526 | | | 232,137 | |
| # | | Imasen Electric Industrial Co., Ltd. | 54,800 | | | 680,652 | |
| | Imperial Hotel, Ltd. | 10,950 | | | 263,466 | |
| #* | | Impress Holdings, Inc. | 110,400 | | | 121,139 | |
| | Intage, Inc. | 14,800 | | | 290,674 | |
| | Ishizuka Glass Co., Ltd. | 109,000 | | | 213,193 | |
| * | | Izuhakone Railway Co., Ltd. | 300 | | | 20,721 | |
| | Izumi Co., Ltd. | 96,700 | | | 1,470,954 | |
| * | | Izutsuya Co., Ltd. | 350,000 | | | 197,702 | |
| * | | Janome Sewing Machine Co., Ltd. | 364,000 | | | 258,423 | |
| | Japan Vilene Co., Ltd. | 139,000 | | | 577,591 | |
88
The Japanese Small Company Series
continued
| | | | SHARES | | VALUE†† | |
| Consumer Discretionary — (Continued) | | | | | |
| | Japan Wool Textile Co., Ltd. (The) | 310,000 | | $ | 2,494,671 | |
| #* | | Jeans Mate Corp. | 30,308 | | | 74,467 | |
| | Jidosha Buhin Kogyo Co., Ltd. | 79,000 | | | 432,657 | |
| #* | | Joban Kosan Co., Ltd. | 221,000 | | | 223,749 | |
| # | | Joshin Denki Co., Ltd. | 205,000 | | | 2,182,951 | |
| | Juntendo Co., Ltd. | 31,000 | | | 51,227 | |
| #* | | JVC Kenwood Holdings, Inc. | 468,130 | | | 1,901,943 | |
| | Kabuki-Za Co., Ltd. | 39,000 | | | 1,845,759 | |
| # | | Kadokawa Holdings, Inc. | 88,600 | | | 2,760,645 | |
| | Kanto Auto Works, Ltd. | 168,000 | | | 1,391,862 | |
| | Kappa Create Co., Ltd. | 52,050 | | | 1,118,619 | |
| | Kasai Kogyo Co., Ltd. | 118,000 | | | 694,961 | |
| # | | Kawai Musical Instruments Manufacturing Co., Ltd. | 256,000 | | | 515,914 | |
| | Keihin Corp. | 165,500 | | | 2,552,727 | |
| # | | Keiyo Co., Ltd. | 173,500 | | | 1,010,162 | |
| # | | Kentucky Fried Chicken Japan, Ltd. | 78,000 | | | 1,994,571 | |
| # | | Kimoto Co., Ltd. | 39,300 | | | 309,725 | |
| #* | | Kinki Nippon Tourist Co., Ltd. | 213,000 | | | 228,241 | |
| #* | | Kinugawa Rubber Industrial Co., Ltd. | 198,000 | | | 1,494,213 | |
| # | | Kisoji Co., Ltd. | 85,300 | | | 1,528,476 | |
| | Koekisha Co., Ltd. | 13,600 | | | 214,934 | |
| | Kohnan Shoji Co., Ltd. | 96,800 | | | 1,678,162 | |
| # | | Kojima Co., Ltd. | 145,700 | | | 998,758 | |
| | Komatsu Seiren Co., Ltd. | 145,000 | | | 656,117 | |
| | Komeri Co., Ltd. | 121,500 | | | 3,827,963 | |
| | Konaka Co., Ltd. | 116,660 | | | 412,281 | |
| | Kourakuen Corp. | 19,100 | | | 272,743 | |
| | KU Holdings Co., Ltd. | 68,200 | | | 324,103 | |
| # | | Kura Corp. | 54,800 | | | 696,420 | |
| | Kurabo Industries, Ltd. | 1,067,000 | | | 2,023,461 | |
| | Kuraudia Co., Ltd. | 5,700 | | | 73,273 | |
| | Kuroganeya Co., Ltd. | 14,000 | | | 54,334 | |
| # | | KYB Co., Ltd. | 633,000 | | | 3,637,518 | |
| | Kyoritsu Maintenance Co., Ltd. | 46,160 | | | 743,428 | |
| | Kyoto Kimono Yuzen Co., Ltd. | 55,700 | | | 647,943 | |
| | Kyowa Leather Cloth Co., Ltd. | 71,700 | | | 247,335 | |
| #* | | Laox Co., Ltd. | 419,000 | | | 204,849 | |
| | LEC, Inc. | 900 | | | 16,998 | |
| #* | | Look, Inc. | 159,000 | | | 347,917 | |
| | Mamiya-Op Co., Ltd. | 285,000 | | | 329,543 | |
| | Marche Corp. | 23,000 | | | 203,242 | |
| | Mars Engineering Corp. | 43,600 | | | 691,298 | |
| #* | | Maruei Department Store Co., Ltd. | 142,000 | | | 148,769 | |
| # | | Maruzen Co., Ltd. | 46,000 | | | 292,356 | |
| #* | | Matsuya Co., Ltd. | 158,400 | | | 920,587 | |
| | Matsuya Foods Co., Ltd. | 46,900 | | | 892,770 | |
| # | | Megane TOP Co., Ltd. | 76,200 | | | 889,847 | |
| | Meiko Network Japan Co., Ltd. | 22,900 | | | 189,614 | |
| | Meiwa Estate Co., Ltd. | 12,300 | | | 56,213 | |
| * | | Meiwa Industry Co., Ltd. | 29,000 | | | 41,940 | |
| | Mikuni Corp. | 108,000 | | | 225,259 | |
| * | | Misawa Homes Co., Ltd. | 105,100 | | | 626,723 | |
| | Misawa Resort Co., Ltd. | 180,000 | | | 333,802 | |
| * | | Mitsuba Corp. | 152,690 | | | 1,219,107 | |
| | Mitsui Home Co., Ltd. | 155,000 | | | 777,893 | |
| # | | Mizuno Corp. | 435,000 | | | 2,108,000 | |
| | MOS Food Services, Inc. | 115,300 | | | 2,199,027 | |
| | Mr Max Corp. | 119,000 | | | 449,185 | |
| | Murakami Corp. | 5,000 | | | 49,650 | |
| | Musashi Seimitsu Industry Co., Ltd. | 85,100 | | | 2,011,718 | |
| * | | Naigai Co., Ltd. | 2,643,000 | | | 1,168,238 | |
89
The Japanese Small Company Series
continued
| | | | SHARES | | VALUE†† | |
| Consumer Discretionary — (Continued) | | | | | |
| #* | | Nexyz Corp. | 1,920 | | $ | 48,169 | |
| | Nice Holdings, Inc. | 451,000 | | | 915,757 | |
| | Nidec Copal Corp. | 88,700 | | | 940,070 | |
| # | | Nidec Tosok Corp. | 109,300 | | | 1,314,125 | |
| # | | Nifco, Inc. | 191,700 | | | 4,999,788 | |
| | Nihon Eslead Corp. | 1,700 | | | 14,238 | |
| | Nihon Tokushu Toryo Co., Ltd. | 56,000 | | | 214,634 | |
| | | Nikkato Corp. | 700 | | | 3,990 | |
| #* | | Nippon Columbia Co., Ltd. | 563,000 | | | 205,825 | |
| | Nippon Felt Co., Ltd. | 67,200 | | | 325,657 | |
| #* | | Nippon Piston Ring Co., Ltd. | 277,000 | | | 531,375 | |
| | Nippon Seiki Co., Ltd. | 169,400 | | | 1,701,948 | |
| | Nishimatsuya Chain Co., Ltd. | 234,700 | | | 1,813,576 | |
| | Nissan Shatai Co., Ltd. | 362,023 | | | 3,245,662 | |
| #* | | Nissan Tokyo Sales Holdings Co., Ltd. | 236,000 | | | 328,498 | |
| | Nissen Holdings Co., Ltd. | 181,591 | | | 1,099,103 | |
| | Nissin Kogyo Co., Ltd. | 151,100 | | | 2,129,232 | |
| | Nittan Valve Co., Ltd. | 82,800 | | | 272,352 | |
| * | | Nitto Kako Co., Ltd. | 60,000 | | | 40,854 | |
| * | | Noritsu Koki Co., Ltd. | 101,700 | | | 457,339 | |
| | Omikenshi Co., Ltd. | 127,000 | | | 70,458 | |
| | Onward Holdings Co., Ltd. | 495,000 | | | 3,644,194 | |
| | Pacific Industrial Co., Ltd. | 181,000 | | | 902,872 | |
| # | | Pal Co., Ltd. | 12,900 | | | 468,876 | |
| * | | Paltac Corp. | 300 | | | 5,349 | |
| | PanaHome Corp. | 398,200 | | | 2,744,628 | |
| * | | Paramount Bed Holdings Co., Ltd. | 82,000 | | | 1,942,492 | |
| | Parco Co., Ltd. | 268,200 | | | 2,010,327 | |
| # | | Paris Miki Holdings, Inc. | 160,100 | | | 1,291,859 | |
| # | | PGM Holdings K.K. | 2,086 | | | 1,370,744 | |
| #* | | PIA Corp. | 26,700 | | | 265,831 | |
| | Piolax, Inc. | 44,500 | | | 962,481 | |
| #* | | Pioneer Electronic Corp. | 981,300 | | | 3,934,768 | |
| | Plenus Co., Ltd. | 83,900 | | | 1,290,904 | |
| | Point, Inc. | 66,930 | | | 2,886,833 | |
| | Press Kogyo Co., Ltd. | 396,000 | | | 1,851,540 | |
| #* | | Renown, Inc. | 242,600 | | | 458,157 | |
| | Resorttrust, Inc. | 139,408 | | | 2,085,363 | |
| | Rhythm Watch Co., Ltd. | 650,000 | | | 885,267 | |
| # | | Right On Co., Ltd. | 67,325 | | | 458,578 | |
| | Riken Corp. | 362,000 | | | 1,483,057 | |
| # | | Ringer Hut Co., Ltd. | 72,700 | | | 977,257 | |
| | Riso Kyoiku Co., Ltd. | 7,533 | | | 420,776 | |
| | Roland Corp. | 92,800 | | | 810,710 | |
| | Round One Corp. | 266,600 | | | 1,946,499 | |
| # | | Royal Holdings Co., Ltd. | 135,300 | | | 1,520,728 | |
| | Ryohin Keikaku Co., Ltd. | 94,300 | | | 4,475,211 | |
| #* | | Sagami Chain Co., Ltd. | 77,000 | | | 486,780 | |
| * | | Sagami Co., Ltd. | 225,000 | | | 228,693 | |
| | Saizeriya Co., Ltd. | 145,800 | | | 2,362,916 | |
| #* | | Sakai Ovex Co., Ltd. | 205,000 | | | 285,769 | |
| # | | Sanden Corp. | 497,000 | | | 1,704,654 | |
| # | | Sangetsu Co., Ltd. | 76,525 | | | 2,001,546 | |
| | Sankyo Seiko Co., Ltd. | 28,100 | | | 91,231 | |
| | Sanoh Industrial Co., Ltd. | 118,600 | | | 1,020,458 | |
| | Sanyo Housing Nagoya Co., Ltd. | 354 | | | 332,783 | |
| | Sanyo Shokai, Ltd. | 421,000 | | | 992,892 | |
| | Scroll Corp. | 77,300 | | | 258,496 | |
| # | | Seiko Holdings Corp. | 477,407 | | | 1,181,542 | |
| | Seiren Co., Ltd. | 223,900 | | | 1,329,567 | |
| | Senshukai Co., Ltd. | 165,200 | | | 1,098,359 | |
90
The Japanese Small Company Series
continued
| | | | SHARES | | VALUE†† | |
| Consumer Discretionary — (Continued) | | | | | |
| * | | Seven Seas Holdings Co., Ltd. | 331,000 | | $ | 96,331 | |
| # | | Shikibo, Ltd. | 521,000 | | | 606,230 | |
| | Shimachu Co., Ltd. | 187,000 | | | 4,033,239 | |
| # | | Shimojima Co., Ltd. | 14,100 | | | 171,167 | |
| * | | Shinyei Kaisha | 96,000 | | | 160,727 | |
| | Shiroki Corp. | 285,000 | | | 807,916 | |
| | Shobunsha Publications, Inc. | 339,400 | | | 2,450,183 | |
| # | | Shochiku Co., Ltd. | 404,400 | | | 3,668,953 | |
| | Shoei Co., Ltd. | 1,600 | | | 10,766 | |
| * | | Showa Corp. | 320,400 | | | 1,855,737 | |
| | SKY Perfect JSAT Holdings, Inc. | 7,630 | | | 3,708,231 | |
| | SNT Corp. | 101,800 | | | 393,975 | |
| | Soft99 Corp. | 70,600 | | | 402,529 | |
| | | Sotoh Co., Ltd. | 49,700 | | | 483,959 | |
| | SPK Corp. | 16,800 | | | 271,078 | |
| | SRI Sports, Ltd. | 12,200 | | | 129,928 | |
| | St. Marc Holdings Co., Ltd. | 37,600 | | | 1,390,628 | |
| | Studio Alice Co., Ltd. | 31,700 | | | 548,860 | |
| # | | Suminoe Textile Co., Ltd. | 323,000 | | | 545,050 | |
| | Sumitomo Forestry Co., Ltd. | 436,666 | | | 3,778,511 | |
| #* | | SxL Corp. | 493,000 | | | 1,020,901 | |
| # | | T. RAD Co., Ltd. | 268,000 | | | 974,377 | |
| # | | Tac Co., Ltd. | 15,400 | | | 36,723 | |
| # | | Tachikawa Corp. | 50,800 | | | 285,929 | |
| | Tachi-S Co., Ltd. | 112,840 | | | 1,927,318 | |
| # | | Tact Home Co., Ltd. | 221 | | | 185,785 | |
| | Taiho Kogyo Co., Ltd. | 92,800 | | | 801,335 | |
| | Takamatsu Construction Group Co., Ltd. | 90,500 | | | 1,433,890 | |
| | Taka-Q Co., Ltd. | 48,000 | | | 83,691 | |
| | Take & Give Needs Co., Ltd. | 2,096 | | | 129,105 | |
| | Takihyo Co., Ltd. | 18,000 | | | 99,303 | |
| # | | Tamron Co., Ltd. | 65,200 | | | 1,755,368 | |
| * | | TASAKI & Co., Ltd. | 498,000 | | | 314,316 | |
| | Taya Co., Ltd. | 5,000 | | | 41,898 | |
| # | | TBK Co., Ltd. | 72,000 | | | 305,676 | |
| * | | TDF Corp. | 11,000 | | | 17,837 | |
| | Teikoku Piston Ring Co., Ltd. | 103,500 | | | 1,204,621 | |
| | Teikoku Sen-I Co., Ltd. | 78,000 | | | 506,682 | |
| # | | Telepark Corp. | 735 | | | 1,353,129 | |
| #* | | Ten Allied Co., Ltd. | 50,000 | | | 164,039 | |
| | Tigers Polymer Corp. | 59,000 | | | 233,886 | |
| * | | Toabo Corp. | 130,000 | | | 85,469 | |
| | Toei Co., Ltd. | 284,000 | | | 1,332,316 | |
| * | | Tokai Kanko Co., Ltd. | 505,999 | | | 128,102 | |
| | Tokai Rika Co., Ltd. | 72,600 | | | 1,169,456 | |
| | Tokai Rubber Industries, Ltd. | 154,200 | | | 1,936,764 | |
| | Tokai Senko K.K. | 215,000 | | | 228,327 | |
| * | | Token Corp. | 20,690 | | | 743,744 | |
| * | | Tokyo Dome Corp. | 680,200 | | | 1,546,187 | |
| # | | Tokyo Individualized Educational Institute, Inc. | 93,100 | | | 147,442 | |
| | Tokyo Kaikan Co., Ltd. | 12,000 | | | 45,229 | |
| | Tokyo Soir Co., Ltd. | 49,000 | | | 120,265 | |
| | Tokyotokeiba Co., Ltd. | 828,000 | | | 1,132,005 | |
| | Tokyu Recreation Co., Ltd. | 77,000 | | | 470,759 | |
| # | | Tomy Co., Ltd. | 297,893 | | | 2,044,250 | |
| | Topre Corp. | 185,700 | | | 1,798,324 | |
| # | | Toridoll.corp | 36,600 | | | 346,604 | |
| | Totenko Co., Ltd. | 57,000 | | | 81,382 | |
| # | | Touei Housing Corp. | 76,040 | | | 746,075 | |
| # | | Tow Co., Ltd. | 7,000 | | | 39,461 | |
| | Toyo Tire & Rubber Co., Ltd. | 767,000 | | | 1,861,477 | |
91
The Japanese Small Company Series
continued
| | | | SHARES | | VALUE†† | |
| Consumer Discretionary — (Continued) | | | | | |
| | Toyobo Co., Ltd. | 3,218,000 | | $ | 4,570,007 | |
| | TS TECH CO., Ltd. | 185,600 | | | 2,786,025 | |
| * | | TSI Holdings Co., Ltd. | 281,495 | | | 1,452,153 | |
| * | | Tsukamoto Co., Ltd. | 52,000 | | | 58,838 | |
| | Tsutsumi Jewelry Co., Ltd. | 49,300 | | | 1,148,801 | |
| | TV Asahi Corp. | 326 | | | 513,587 | |
| | TV Tokyo Holdings Corp. | 6,200 | | | 84,193 | |
| | Umenohana Co., Ltd. | 13 | | | 25,221 | |
| | Unipres Corp. | 130,200 | | | 3,551,438 | |
| # | | United Arrows, Ltd. | 71,300 | | | 1,386,865 | |
| #* | | Unitika, Ltd. | 1,765,000 | | | 1,018,291 | |
| | U-Shin, Ltd. | 94,500 | | | 825,862 | |
| | Watabe Wedding Corp. | 29,500 | | | 233,291 | |
| # | | Watami Food Service Co., Ltd. | 104,500 | | | 2,435,280 | |
| | Xebio Co., Ltd. | 98,000 | | | 2,372,938 | |
| # | | Yamatane Corp. | 185,000 | | | 297,853 | |
| | Yellow Hat, Ltd. | 73,700 | | | 948,606 | |
| | Yokohama Reito Co., Ltd. | 183,600 | | | 1,370,494 | |
| | Yomiuri Land Co., Ltd. | 225,000 | | | 714,692 | |
| | Yonex Co., Ltd. | 40,000 | | | 253,029 | |
| | Yorozu Corp. | 62,500 | | | 1,473,837 | |
| # | | Yoshinoya Holdings Co., Ltd. | 2,180 | | | 2,776,426 | |
| | Zenrin Co., Ltd. | 130,000 | | | 1,162,440 | |
| # | | Zensho Co., Ltd. | 298,400 | | | 3,723,858 | |
| Total Consumer Discretionary | | | | 342,967,393 | |
| | | | | | | |
| Consumer Staples — (9.0%) | | | | | |
| * | | Aderans Co., Ltd. | 120,250 | | | 1,235,071 | |
| * | | Aeon Hokkaido Corp. | 391,700 | | | 1,644,380 | |
| | Ahjikan Co., Ltd. | 10,500 | | | 107,668 | |
| | Ain Pharmaciez, Inc. | 39,900 | | | 1,630,476 | |
| # | | Arcs Co., Ltd. | 80,700 | | | 1,436,801 | |
| | Ariake Japan Co., Ltd. | 103,700 | | | 1,797,762 | |
| | Cawachi, Ltd. | 81,900 | | | 1,556,557 | |
| | Chubu Shiryo Co., Ltd. | 89,000 | | | 545,034 | |
| | Chuo Gyorui Co., Ltd. | 93,000 | | | 205,137 | |
| | Circle K Sunkus Co., Ltd. | 161,900 | | | 2,639,616 | |
| | Coca-Cola Central Japan Co., Ltd. | 111,200 | | | 1,475,811 | |
| | Cocokara fine, Inc. | 59,560 | | | 1,480,552 | |
| | Cosmos Pharmaceutical Corp. | 34,200 | | | 1,586,318 | |
| | CVS Bay Area, Inc. | 51,000 | | | 62,861 | |
| | Daikokutenbussan Co., Ltd. | 4,700 | | | 134,888 | |
| | Dr. Ci:Labo Co., Ltd. | 532 | | | 2,862,356 | |
| | Dydo Drinco, Inc. | 49,800 | | | 1,891,725 | |
| | Echo Trading Co., Ltd. | 11,000 | | | 98,193 | |
| | Ensuiko Sugar Refining Co., Ltd. | 102,000 | | | 244,728 | |
| | Ezaki Glico Co., Ltd. | 5,000 | | | 59,387 | |
| # | | Fancl Corp. | 157,800 | | | 2,202,282 | |
| #* | | First Baking Co., Ltd. | 183,000 | | | 180,047 | |
| | Fuji Oil Co., Ltd. | 258,900 | | | 3,674,846 | |
| | Fujicco Co., Ltd. | 116,600 | | | 1,441,598 | |
| #* | | Fujiya Co., Ltd. | 474,000 | | | 932,069 | |
| | Hagoromo Foods Corp. | 40,000 | | | 585,385 | |
| | Harashin Narus Holdings Co., Ltd. | 61,500 | | | 968,454 | |
| #* | | Hayashikane Sangyo Co., Ltd. | 299,000 | | | 240,571 | |
| # | | Heiwado Co., Ltd. | 152,800 | | | 1,850,098 | |
| # | | Hohsui Corp. | 120,000 | | | 130,200 | |
| | Hokkaido Coca-Cola Bottling Co., Ltd. | 87,000 | | | 431,012 | |
| | Hokuto Corp. | 106,700 | | | 2,203,817 | |
| | Inageya Co., Ltd. | 175,000 | | | 1,991,123 | |
| # | | Ito En, Ltd. | 80,800 | | | 1,369,659 | |
92
The Japanese Small Company Series
continued
| | | | SHARES | | VALUE†† | |
| Consumer Staples — (Continued) | | | | | |
| | Itochu-Shokuhin Co., Ltd. | 27,400 | | $ | 941,849 | |
| # | | Itoham Foods, Inc. | 674,800 | | | 2,323,507 | |
| | Izumiya Co., Ltd. | 447,000 | | | 2,021,323 | |
| | J-Oil Mills, Inc. | 477,000 | | | 1,372,894 | |
| # | | Kameda Seika Co., Ltd. | 70,000 | | | 1,319,325 | |
| | Kasumi Co., Ltd. | 203,100 | | | 1,292,993 | |
| | Kato Sangyo Co., Ltd. | 109,300 | | | 2,134,985 | |
| # | | Key Coffee, Inc. | 79,000 | | | 1,400,407 | |
| | Kirindo Co., Ltd. | 28,300 | | | 171,086 | |
| | Kose Corp. | 84,900 | | | 2,022,915 | |
| | | Kyodo Shiryo Co., Ltd. | 330,000 | | | 364,379 | |
| # | | Kyokuyo Co., Ltd. | 370,000 | | | 831,309 | |
| | Life Corp. | 183,400 | | | 3,201,475 | |
| | Lion Corp. | 82,000 | | | 457,012 | |
| | Mandom Corp. | 81,100 | | | 2,070,828 | |
| | Marudai Food Co., Ltd. | 465,000 | | | 1,549,520 | |
| # | | Maruetsu, Inc. (The) | 375,000 | | | 1,321,589 | |
| | Maruha Nichiro Holdings, Inc. | 1,719,069 | | | 3,104,963 | |
| * | | Maruya Co., Ltd. | 7,400 | | | 15,871 | |
| # | | Matsumotokiyoshi Holdings Co., Ltd. | 111,200 | | | 2,106,654 | |
| * | | Maxvalu Tohok Co., Ltd. | 18,200 | | | 150,038 | |
| | Maxvalu Tokai Co., Ltd. | 57,500 | | | 777,254 | |
| # | | Megmilk Snow Brand Co., Ltd. | 194,300 | | | 3,735,258 | |
| | Meito Sangyo Co., Ltd. | 53,600 | | | 685,252 | |
| | Mikuni Coca-Cola Bottling Co., Ltd. | 171,600 | | | 1,483,088 | |
| # | | Milbon Co., Ltd. | 49,014 | | | 1,504,306 | |
| | Ministop Co., Ltd. | 70,200 | | | 1,262,800 | |
| | Mitsubishi Shokuhin Co., Ltd. | 87,800 | | | 2,037,602 | |
| | Mitsui Sugar Co., Ltd. | 453,850 | | | 1,890,801 | |
| | Miyoshi Oil & Fat Co., Ltd. | 261,000 | | | 341,996 | |
| | Morinaga & Co., Ltd. | 933,000 | | | 2,206,157 | |
| | Morinaga Milk Industry Co., Ltd. | 886,000 | | | 3,507,044 | |
| | Morishita Jinton Co., Ltd. | 47,800 | | | 183,537 | |
| | Morozoff, Ltd. | 108,000 | | | 382,213 | |
| # | | Nagatanien Co., Ltd. | 115,000 | | | 1,255,032 | |
| | Nakamuraya Co., Ltd. | 203,000 | | | 1,033,567 | |
| #* | | Nichimo Co., Ltd. | 112,000 | | | 196,414 | |
| | Nichirei Corp. | 1,019,000 | | | 4,522,962 | |
| # | | Nihon Chouzai Co., Ltd. | 20,300 | | | 742,037 | |
| | Niitaka Co., Ltd. | 7,260 | | | 85,973 | |
| | Nippon Beet Sugar Manufacturing Co., Ltd. | 543,000 | | | 1,118,533 | |
| | Nippon Flour Mills Co., Ltd. | 557,000 | | | 2,491,532 | |
| #* | | Nippon Formula Feed Manufacturing Co., Ltd. | 267,000 | | | 352,018 | |
| # | | Nippon Suisan Kaisha, Ltd. | 936,700 | | | 3,164,110 | |
| | Nisshin Oillio Group, Ltd. (The) | 550,000 | | | 2,459,082 | |
| * | | Nisshin Sugar Holdings Co., Ltd. | 14,900 | | | 323,805 | |
| | Nitto Flour Milling Co., Ltd. | 64,000 | | | 247,475 | |
| | Noevir Holdings Co., Ltd. | 6,800 | | | 75,948 | |
| | Oenon Holdings, Inc. | 247,000 | | | 558,602 | |
| # | | Oie Sangyo Co., Ltd. | 20,900 | | | 209,924 | |
| | Okuwa Co., Ltd. | 115,000 | | | 1,604,428 | |
| | Olympic Corp. | 64,900 | | | 575,237 | |
| | Pietro Co., Ltd. | 10,300 | | | 110,585 | |
| | Pigeon Corp. | 72,300 | | | 2,671,220 | |
| | Poplar Co., Ltd. | 25,760 | | | 142,835 | |
| | Prima Meat Packers, Ltd. | 671,000 | | | 875,616 | |
| # | | Riken Vitamin Co., Ltd. | 79,200 | | | 2,252,070 | |
| | Rock Field Co., Ltd. | 47,000 | | | 755,765 | |
| | S Foods, Inc. | 73,762 | | | 554,004 | |
| | Sakata Seed Corp. | 164,600 | | | 2,329,224 | |
| | San-A Co., Ltd. | 22,500 | | | 866,412 | |
93
The Japanese Small Company Series
continued
| | | | SHARES | | VALUE†† | |
| Consumer Staples — (Continued) | | | | | |
| #* | | Sapporo Holdings, Ltd. | 694,000 | | $ | 2,587,229 | |
| # | | Shoei Foods Corp. | 44,000 | | | 297,827 | |
| | Showa Sangyo Co., Ltd. | 524,000 | | | 1,579,946 | |
| | Sogo Medical Co., Ltd. | 23,000 | | | 769,057 | |
| | Sonton Food Industry Co., Ltd. | 43,000 | | | 371,359 | |
| | Starzen Co., Ltd. | 279,000 | | | 813,723 | |
| | Sugi Holdings Co., Ltd. | 129,700 | | | 3,384,856 | |
| | Takara Holdings, Inc. | 714,000 | | | 4,219,127 | |
| | Three F Co., Ltd. | 17,700 | | | 104,249 | |
| # | | Tobu Store Co., Ltd. | 205,000 | | | 669,889 | |
| | | TOHO Co., Ltd. | 158,000 | | | 617,080 | |
| # | | Tohto Suisan Co., Ltd. | 120,000 | | | 202,645 | |
| | Torigoe Co., Ltd. (The) | 84,500 | | | 752,576 | |
| | Toyo Sugar Refining Co., Ltd. | 157,000 | | | 183,580 | |
| | Tsukiji Uoichiba Co., Ltd. | 15,000 | | | 18,786 | |
| | Tsuruha Holdings, Inc. | 64,600 | | | 3,300,432 | |
| #* | | Unicafe, Inc. | 15,060 | | | 67,001 | |
| | Uoriki Co., Ltd. | 400 | | | 4,624 | |
| | Valor Co., Ltd. | 175,400 | | | 2,608,675 | |
| | Warabeya Nichiyo Co., Ltd. | 51,360 | | | 661,815 | |
| # | | Yaizu Suisankagaku Industry Co., Ltd. | 41,000 | | | 379,303 | |
| | Yaoko Co., Ltd. | 40,800 | | | 1,338,217 | |
| | Yomeishu Seizo Co., Ltd. | 100,000 | | | 920,746 | |
| | Yonekyu Corp. | 100,000 | | | 873,708 | |
| | Yuasa Funashoku Co., Ltd. | 112,000 | | | 256,645 | |
| # | | Yukiguni Maitake Co., Ltd. | 101,856 | | | 484,408 | |
| | Yutaka Foods Corp. | 6,000 | | | 109,843 | |
| Total Consumer Staples | | | | 150,220,468 | |
| | | | | | | | |
| Energy — (0.9%) | | | | | |
| | AOC Holdings, Inc. | 154,800 | | | 888,213 | |
| | BP Castrol K.K. | 66,500 | | | 277,840 | |
| #* | | Fuji Kosan Co., Ltd. | 264,000 | | | 225,718 | |
| | Itochu Enex Co., Ltd. | 302,200 | | | 1,568,266 | |
| # | | Japan Drilling Co., Ltd. | 16,900 | | | 553,978 | |
| | Japan Oil Transportation Co., Ltd. | 79,000 | | | 185,410 | |
| | Kanto Natural Gas Development Co., Ltd. | 155,000 | | | 802,721 | |
| # | | Kyoei Tanker Co., Ltd. | 111,000 | | | 157,291 | |
| | Mitsuuroko Co., Ltd. | 166,300 | | | 989,246 | |
| # | | Modec, Inc. | 82,100 | | | 1,433,247 | |
| # | | Nippon Gas Co., Ltd. | 148,900 | | | 2,270,555 | |
| # | | Nippon Seiro Co., Ltd. | 64,000 | | | 241,838 | |
| | Sala Corp. | 128,500 | | | 769,754 | |
| | San-Ai Oil Co., Ltd. | 273,000 | | | 1,185,245 | |
| | Shinko Plantech Co., Ltd. | 164,000 | | | 1,456,725 | |
| | Sinanen Co., Ltd. | 251,000 | | | 1,141,115 | |
| | Toa Oil Co., Ltd. | 337,000 | | | 435,347 | |
| | Toyo Kanetsu K.K. | 507,000 | | | 932,727 | |
| Total Energy | | | | 15,515,236 | |
| | | | | | | |
| Financials — (10.1%) | | | | | |
| | 77 Bank, Ltd. (The) | 43,000 | | | 169,374 | |
| | Aichi Bank, Ltd. (The) | 53,800 | | | 2,986,018 | |
| | Airport Facilities Co., Ltd. | 120,570 | | | 459,808 | |
| | Akita Bank, Ltd. (The) | 785,400 | | | 2,250,223 | |
| | Aomori Bank, Ltd. (The) | 819,000 | | | 2,361,846 | |
| | Asax Co., Ltd. | 17 | | | 21,402 | |
| # | | Awa Bank, Ltd. (The) | 503,000 | | | 3,343,186 | |
| | Bank of Iwate, Ltd. (The) | 67,100 | | | 3,045,057 | |
| | Bank of Kochi, Ltd. (The) | 2,000 | | | 1,936 | |
| | Bank of Nagoya, Ltd. (The) | 612,297 | | | 1,937,813 | |
94
The Japanese Small Company Series
continued
| | | | SHARES | | VALUE†† | |
| Financials — (Continued) | | | | | |
| | Bank of Okinawa, Ltd. (The) | 92,500 | | $ | 3,692,807 | |
| | Bank of Saga, Ltd. (The) | 624,000 | | | 1,479,192 | |
| | Bank of the Ryukyus, Ltd. | 135,880 | | | 1,661,699 | |
| | Century Tokyo Leasing Corp. | 223,890 | | | 4,476,323 | |
| * | | Chiba Kogyo Bank, Ltd. (The) | 180,300 | | | 979,948 | |
| # | | Chukyo Bank, Ltd. (The) | 675,000 | | | 1,611,549 | |
| | Daibiru Corp. | 209,700 | | | 1,416,563 | |
| | Daiko Clearing Services Corp. | 49,700 | | | 153,060 | |
| * | | Daikyo, Inc. | 1,289,000 | | | 2,197,472 | |
| | Daisan Bank, Ltd. (The) | 621,000 | | | 1,308,154 | |
| | Daishi Bank, Ltd. (The) | 1,398,000 | | | 4,448,525 | |
| | | Daito Bank, Ltd. (The) | 485,000 | | | 344,008 | |
| | Ehime Bank, Ltd. (The) | 641,000 | | | 1,852,463 | |
| | Eighteenth Bank, Ltd. (The) | 1,079,000 | | | 2,762,389 | |
| * | | FIDEA Holdings Co., Ltd. | 264,800 | | | 691,768 | |
| | Fukui Bank, Ltd. (The) | 912,000 | | | 2,639,668 | |
| | Fukushima Bank, Ltd. | 846,000 | | | 406,203 | |
| # | | Fuyo General Lease Co., Ltd. | 84,500 | | | 2,903,499 | |
| | Goldcrest Co., Ltd. | 73,070 | | | 1,340,580 | |
| | Heiwa Real Estate Co., Ltd. | 427,500 | | | 926,365 | |
| | Higashi-Nippon Bank, Ltd. | 659,000 | | | 1,329,239 | |
| | Higo Bank, Ltd. (The) | 657,000 | | | 3,587,195 | |
| | Hitachi Capital Corp. | 6,000 | | | 73,319 | |
| | Hokkoku Bank, Ltd. (The) | 988,000 | | | 3,327,636 | |
| | Hokuetsu Bank, Ltd. (The) | 920,000 | | | 1,727,221 | |
| | Hulic Co., Ltd. | 39,200 | | | 419,664 | |
| | Hyakugo Bank, Ltd. (The) | 1,045,609 | | | 4,066,286 | |
| | Hyakujishi Bank, Ltd. (The) | 1,022,000 | | | 3,913,596 | |
| # | | IBJ Leasing Co., Ltd. | 85,800 | | | 1,920,228 | |
| | Ichiyoshi Securities Co., Ltd. | 165,800 | | | 959,798 | |
| | Iida Home Max Co., Ltd. | 73,000 | | | 589,795 | |
| | Iwai Cosmo Holdings, Inc. | 26,300 | | | 89,586 | |
| #* | | Japan Asia Investment Co., Ltd. | 345,000 | | | 262,778 | |
| | Juroku Bank, Ltd. | 1,331,000 | | | 3,980,608 | |
| # | | kabu.com Securities Co., Ltd. | 328,200 | | | 922,597 | |
| | Kagoshima Bank, Ltd. (The) | 467,000 | | | 3,057,962 | |
| | Keihanshin Real Estate Co., Ltd. | 26,000 | | | 120,388 | |
| | Keiyo Bank, Ltd. (The) | 424,000 | | | 2,059,792 | |
| * | | Kenedix, Inc. | 9,893 | | | 1,466,630 | |
| | Kirayaka Bank, Ltd. | 98,000 | | | 90,356 | |
| | Kita-Nippon Bank, Ltd. (The) | 49,406 | | | 1,147,135 | |
| | Kiyo Holdings, Inc. | 2,635,900 | | | 3,720,995 | |
| | Kobayashi Yoko Co., Ltd. | 231,400 | | | 521,441 | |
| #* | | Kosei Securities Co., Ltd. | 285,000 | | | 220,156 | |
| | Kyokuto Securities Co., Ltd. | 65,800 | | | 415,397 | |
| #* | | Leopalace21 Corp. | 985,885 | | | 2,689,036 | |
| | Marusan Securities Co., Ltd. | 284,100 | | | 1,020,612 | |
| #* | | Matsui Securities Co., Ltd. | 444,400 | | | 2,091,319 | |
| | Michinoku Bank, Ltd. (The) | 736,000 | | | 1,420,654 | |
| | Mie Bank, Ltd. (The) | 142,000 | | | 327,616 | |
| | Minato Bank, Ltd. (The) | 1,063,000 | | | 1,825,985 | |
| | Mito Securities Co., Ltd. | 254,000 | | | 336,119 | |
| | Miyazaki Bank, Ltd. (The) | 586,000 | | | 1,235,930 | |
| | Mizuho Financial Group, Inc. | 56,580 | | | 79,194 | |
| # | | Monex Group, Inc. | 7,893 | | | 1,206,070 | |
| | Musashino Bank, Ltd. | 130,300 | | | 4,143,571 | |
| | Nagano Bank, Ltd. (The) | 321,000 | | | 651,179 | |
| | Nanto Bank, Ltd. (The) | 293,000 | | | 1,561,912 | |
| * | | New Real Property K.K. | 43,900 | | | — | |
| * | | NIS Group Co., Ltd. | 1,015,125 | | | 65,373 | |
| | Nisshin Fudosan Co., Ltd. | 95,000 | | | 538,433 | |
95
The Japanese Small Company Series
continued
| | | | SHARES | | VALUE†† | |
| Financials — (Continued) | | | | | |
| | Ogaki Kyoritsu Bank, Ltd. (The) | 1,315,000 | | $ | 4,076,621 | |
| | Oita Bank, Ltd. (The) | 676,900 | | | 1,921,150 | |
| | Okasan Securities Group, Inc. | 795,000 | | | 2,440,385 | |
| | Ricoh Leasing Co., Ltd. | 78,500 | | | 1,716,865 | |
| | San-in Godo Bank, Ltd. (The) | 592,000 | | | 4,303,496 | |
| | Sankei Building Co., Ltd. | 173,500 | | | 722,622 | |
| | Sapporo Hokuyo Holdings, Inc. | 342,700 | | | 1,134,899 | |
| | Shiga Bank, Ltd. | 179,000 | | | 1,152,586 | |
| # | | Shikoku Bank, Ltd. | 802,000 | | | 2,824,417 | |
| # | | Shimizu Bank, Ltd. | 34,200 | | | 1,259,078 | |
| | Sumitomo Real Estate Sales Co., Ltd. | 36,340 | | | 1,461,622 | |
| * | | Sun Frontier Fudousan Co., Ltd. | 208 | | | 21,833 | |
| # | | Taiko Bank, Ltd. (The) | 31,000 | | | 87,028 | |
| #* | | Takagi Securities Co., Ltd. | 206,000 | | | 183,260 | |
| # | | TOC Co., Ltd. | 435,250 | | | 1,915,504 | |
| | Tochigi Bank, Ltd. | 726,000 | | | 2,546,200 | |
| | Toho Bank, Ltd. | 915,200 | | | 2,376,487 | |
| | Toho Real Estate Co., Ltd. | 140,700 | | | 726,367 | |
| | Tohoku Bank, Ltd. (The) | 389,000 | | | 618,458 | |
| | Tokai Tokyo Financial Holdings, Inc. | 997,000 | | | 2,769,054 | |
| | Tokyo Rakutenchi Co., Ltd. | 218,000 | | | 753,717 | |
| | Tokyo Tatemono Co., Ltd. | 1,552,000 | | | 4,870,859 | |
| | Tokyo Tatemono Real Estate Sales Co., Ltd. | 7,000 | | | 20,687 | |
| # | | Tokyo Theatres Co., Inc. | 290,000 | | | 417,482 | |
| | Tokyo Tomin Bank, Ltd. | 127,000 | | | 1,475,640 | |
| # | | Tokyu Livable, Inc. | 103,200 | | | 929,151 | |
| | Tomato Bank, Ltd. | 397,000 | | | 694,746 | |
| | TOMONY Holdings, Inc. | 612,950 | | | 2,430,634 | |
| # | | Tosei Corp. | 570 | | | 158,347 | |
| | Tottori Bank, Ltd. | 328,000 | | | 698,207 | |
| | Towa Bank, Ltd. | 1,370,000 | | | 1,593,908 | |
| | Toyo Securities Co., Ltd. | 327,000 | | | 484,243 | |
| | Tsukuba Bank, Ltd. | 231,600 | | | 765,314 | |
| | Yachiyo Bank, Ltd. (The) | 28,500 | | | 698,576 | |
| | Yamagata Bank, Ltd. | 635,500 | | | 3,040,381 | |
| | Yamanashi Chuo Bank, Ltd. | 637,000 | | | 2,559,633 | |
| Total Financials | | | | 168,901,156 | |
| | | | | | | |
| Health Care — (3.8%) | | | | | |
| | As One Corp. | 71,668 | | | 1,369,420 | |
| | ASKA Pharmaceutical Co., Ltd. | 106,000 | | | 769,605 | |
| | BML, Inc. | 41,500 | | | 999,339 | |
| # | | CMIC Co., Ltd. | 17,500 | | | 290,257 | |
| | Create Medic Co., Ltd. | 28,000 | | | 282,219 | |
| | Eiken Chemical Co., Ltd. | 74,800 | | | 946,083 | |
| | EPS Co., Ltd. | 195 | | | 408,695 | |
| | FALCO SD HOLDINGS Co., Ltd. | 34,300 | | | 320,876 | |
| | Fuso Pharmaceutical Industries, Ltd. | 320,000 | | | 819,464 | |
| | Hitachi Medical Corp. | 85,000 | | | 919,469 | |
| | Hogy Medical Co., Ltd. | 49,000 | | | 2,076,091 | |
| | Iwaki & Co., Ltd. | 55,000 | | | 140,942 | |
| | Japan Medical Dynamic Marketing, Inc. | 44,900 | | | 97,484 | |
| | Jeol, Ltd. | 273,000 | | | 722,897 | |
| | JMS Co., Ltd. | 126,000 | | | 384,528 | |
| | Kaken Pharmaceutical Co., Ltd. | 353,000 | | | 4,430,753 | |
| | Kawanishi Holdings, Ltd. | 7,400 | | | 84,897 | |
| | Kawasumi Laboratories, Inc. | 45,000 | | | 267,311 | |
| # | | Kissei Pharmaceutical Co., Ltd. | 106,300 | | | 1,996,621 | |
| | KYORIN Holdings, Inc. | 205,000 | | | 3,772,136 | |
| * | | M3, Inc. | 263 | | | 1,189,398 | |
| | Mochida Pharmaceutical Co., Ltd. | 281,000 | | | 2,872,266 | |
96
The Japanese Small Company Series
continued
| | | | SHARES | | VALUE†† | |
| Health Care — (Continued) | | | | | |
| | Nagaileben Co., Ltd. | 22,600 | | $ | 311,448 | |
| # | | Nichii Gakkan Co. | 227,100 | | | 2,268,612 | |
| # | | Nihon Kohden Corp. | 159,200 | | | 3,716,689 | |
| | Nikkiso Co., Ltd. | 252,000 | | | 2,095,486 | |
| # | | Nippon Chemiphar Co., Ltd. | 131,000 | | | 510,708 | |
| | Nippon Shinyaku Co., Ltd. | 239,000 | | | 2,779,496 | |
| # | | Nipro Corp. | 385,600 | | | 3,269,240 | |
| | Nissui Pharmaceutical Co., Ltd. | 64,200 | | | 549,462 | |
| | Rion Co., Ltd. | 5,000 | | | 35,895 | |
| | Rohto Pharmaceutical Co., Ltd. | 360,000 | | | 4,147,178 | |
| # | | Sawai Pharmaceutical Co., Ltd. | 50,500 | | | 4,723,834 | |
| | Seikagaku Corp. | 179,800 | | | 1,950,077 | |
| # | | Shin Nippon Biomedical Laboratories, Ltd. | 24,700 | | | 67,658 | |
| | Ship Healthcare Holdings, Inc. | 105,900 | | | 2,574,568 | |
| * | | Techno Medica Co., Ltd. | 1 | | | 3,477 | |
| # | | Toho Holdings Co., Ltd. | 196,100 | | | 2,474,563 | |
| | Torii Pharmaceutical Co., Ltd. | 65,200 | | | 1,219,214 | |
| # | | Towa Pharmaceutical Co., Ltd. | 42,300 | | | 1,859,806 | |
| # | | Vital KSK Holdings, Inc. | 150,600 | | | 1,247,596 | |
| #* | | Wakamoto Pharmaceutical Co., Ltd. | 100,000 | | | 289,821 | |
| | ZERIA Pharmaceutical Co., Ltd. | 109,000 | | | 1,790,502 | |
| Total Health Care | | | | 63,046,081 | |
| | | | | | |
| Industrials — (24.1%) | | | | | |
| #* | | A&A Material Corp. | 235,000 | | | 238,924 | |
| | Advan Co., Ltd. | 96,900 | | | 880,364 | |
| #* | | Advanex, Inc. | 73,000 | | | 57,970 | |
| | Aeon Delight Co., Ltd. | 85,600 | | | 1,722,876 | |
| | Aica Kogyo Co., Ltd. | 244,300 | | | 3,304,876 | |
| | Aichi Corp. | 132,000 | | | 525,100 | |
| | Aida Engineering, Ltd. | 273,600 | | | 1,365,315 | |
| | Airtech Japan, Ltd. | 18,300 | | | 76,303 | |
| | Alps Logistics Co., Ltd. | 50,700 | | | 458,542 | |
| # | | Altech Co., Ltd. | 23,000 | | | 52,903 | |
| | Altech Corp. | 37,150 | | | 310,140 | |
| | Amano Corp. | 281,000 | | | 2,365,182 | |
| | Ando Corp. | 450,000 | | | 580,901 | |
| | Anest Iwata Corp. | 149,000 | | | 611,296 | |
| # | | Asahi Diamond Industrial Co., Ltd. | 241,000 | | | 3,548,979 | |
| | Asahi Holdings, Inc. | 115,950 | | | 2,278,835 | |
| | Asahi Kogyosha Co., Ltd. | 109,000 | | | 445,989 | |
| #* | | Asanuma Corp. | 796,000 | | | 824,216 | |
| | Asia Air Survey Co., Ltd. | 32,000 | | | 85,822 | |
| | Asunaro Aoki Construction Co., Ltd. | 154,000 | | | 779,278 | |
| | Ataka Construction & Engineering Co., Ltd. | 60,000 | | | 185,139 | |
| | Bando Chemical Industries, Ltd. | 348,000 | | | 1,351,800 | |
| | Benefit One, Inc. | 3 | | | 2,018 | |
| | Biken Techno Corp. | 14,100 | | | 77,599 | |
| | Bunka Shutter Co., Ltd. | 227,000 | | | 711,124 | |
| # | | Central Glass Co., Ltd. | 732,000 | | | 3,272,182 | |
| | Central Security Patrols Co., Ltd. | 43,700 | | | 430,278 | |
| | Chiyoda Integre Co., Ltd. | 3,700 | | | 49,014 | |
| | Chudenko Corp. | 130,500 | | | 1,412,644 | |
| | Chugai Ro Co., Ltd. | 340,000 | | | 999,310 | |
| | CKD Corp. | 241,400 | | | 1,620,723 | |
| | COMSYS Holdings Corp. | 359,800 | | | 3,521,792 | |
| | Cosel Co., Ltd. | 108,800 | | | 1,518,761 | |
| | CTI Engineering Co., Ltd. | 44,000 | | | 302,971 | |
| | Dai-Dan Co., Ltd. | 156,000 | | | 1,016,944 | |
| | Daido Kogyo Co., Ltd. | 145,000 | | | 254,696 | |
| | Daifuku Co., Ltd. | 366,000 | | | 1,898,771 | |
97
The Japanese Small Company Series
continued
| | | | SHARES | | VALUE†† | |
| Industrials — (Continued) | | | | | |
| | Daihen Corp. | 448,000 | | $ | 1,534,348 | |
| #* | | Daiho Corp. | 763,000 | | | 962,941 | |
| #* | | Daiichi Chuo K.K. | 475,000 | | | 639,587 | |
| | | Daiichi Jitsugyo Co., Ltd. | 188,000 | | | 762,740 | |
| # | | Daiseki Co., Ltd. | 144,463 | | | 2,641,657 | |
| #* | | Daiseki Eco. Solution Co., Ltd. | 71 | | | 166,771 | |
| #* | | Daisue Construction Co., Ltd. | 271,500 | | | 150,036 | |
| | Daiwa Industries, Ltd. | 178,000 | | | 879,013 | |
| | Daiwa Odakyu Construction Co., Ltd. | 63,500 | | | 162,881 | |
| #* | | Danto Holdings Corp. | 441,000 | | | 414,201 | |
| # | | Denyo Co., Ltd. | 85,100 | | | 1,213,209 | |
| * | | Dijet Industrial Co., Ltd. | 80,000 | | | 148,985 | |
| | DMW Corp. | 4,800 | | | 88,267 | |
| * | | Dream Incubator, Inc. | 168 | | | 127,885 | |
| | Duskin Co., Ltd. | 212,500 | | | 4,129,397 | |
| * | | Ebara Jitsugyo Co., Ltd. | 1,800 | | | 27,897 | |
| #* | | Enshu, Ltd. | 142,000 | | | 155,658 | |
| | Freesia Macross Corp. | 1,355,000 | | | 239,106 | |
| #* | | Fudo Tetra Corp. | 230,500 | | | 487,008 | |
| | Fujikura, Ltd. | 768,000 | | | 2,451,282 | |
| * | | Fujisash Co., Ltd. | 49,300 | | | 35,826 | |
| | Fujitec Co., Ltd. | 319,000 | | | 1,613,610 | |
| # | | Fukuda Corp. | 630,000 | | | 2,256,089 | |
| | Fukusima Industries Corp. | 29,700 | | | 356,013 | |
| | Fukuyama Transporting Co., Ltd. | 595,400 | | | 3,056,861 | |
| | Funai Consulting, Inc. | 99,300 | | | 660,327 | |
| * | | Furukawa Co., Ltd. | 1,391,000 | | | 1,347,595 | |
| # | | Furusato Industries, Ltd. | 50,600 | | | 388,343 | |
| | Futaba Corp. | 154,300 | | | 2,910,326 | |
| | Gecoss Corp. | 112,400 | | | 434,981 | |
| | Glory, Ltd. | 51,000 | | | 1,091,607 | |
| | Hamai Co., Ltd. | 92,000 | | | 98,103 | |
| | Hamakyorex Co., Ltd. | 3,600 | | | 103,000 | |
| | Hanwa Co., Ltd. | 773,000 | | | 3,234,617 | |
| * | | Hazama Corp. | 285,800 | | | 514,083 | |
| | Hibiya Engineering, Ltd. | 125,900 | | | 1,234,736 | |
| | Hisaka Works, Ltd. | 4,000 | | | 47,371 | |
| * | | Hitachi Cable, Ltd. | 755,000 | | | 1,784,193 | |
| | Hitachi Metals Techno, Ltd. | 56,500 | | | 302,635 | |
| | Hitachi Tool Engineering, Ltd. | 94,000 | | | 933,103 | |
| | Hitachi Transport System, Ltd. | 50,500 | | | 878,713 | |
| | Hitachi Zosen Corp. | 2,951,000 | | | 3,989,842 | |
| | Hokuetsu Industries Co., Ltd. | 85,000 | | | 228,421 | |
| | Hokuriku Electrical Construction Co., Ltd. | 56,000 | | | 152,912 | |
| | Hoshizaki Electric Co., Ltd. | 123,200 | | | 2,753,156 | |
| | Hosokawa Micron Corp. | 140,000 | | | 588,554 | |
| * | | Howa Machinery, Ltd. | 379,000 | | | 299,349 | |
| # | | Ichiken Co., Ltd. | 87,000 | | | 132,838 | |
| | Ichinen Holdings Co., Ltd. | 71,100 | | | 347,412 | |
| * | | Idec Corp. | 137,000 | | | 1,416,936 | |
| | IHI Transport Machinery Co., Ltd. | 73,000 | | | 379,285 | |
| # | | Iino Kaiun Kaisha, Ltd. | 354,300 | | | 1,667,684 | |
| | Inaba Denki Sangyo Co., Ltd. | 86,300 | | | 2,468,339 | |
| | Inaba Seisakusho Co., Ltd. | 58,800 | | | 663,037 | |
| | Inabata & Co., Ltd. | 317,300 | | | 1,721,055 | |
| | Inui Steamship Co., Ltd. | 87,900 | | | 343,907 | |
| #* | | Iseki & Co., Ltd. | 718,000 | | | 1,577,267 | |
| | Ishii Iron Works Co., Ltd. | 110,000 | | | 194,497 | |
| * | | Ishikawa Seisakusho, Ltd. | 101,000 | | | 66,892 | |
| | Ishikawajima Construction Materials Co., Ltd. | 202,000 | | | 223,356 | |
| | Itoki Corp. | 174,200 | | | 383,745 | |
98
The Japanese Small Company Series
continued
| | | | SHARES | | VALUE†† | |
| Industrials — (Continued) | | | | | |
| * | | Iwasaki Electric Co., Ltd. | 14,000 | | $ | 31,637 | |
| # | | Iwatani International Corp. | 887,000 | | | 3,060,517 | |
| | Jalux, Inc. | 40,800 | | | 372,774 | |
| * | | Jamco Corp. | 80,000 | | | 477,567 | |
| | Japan Airport Terminal Co., Ltd. | 163,900 | | | 2,168,182 | |
| # | | Japan Foundation Engineering Co., Ltd. | 162,500 | | | 553,662 | |
| | Japan Kenzai Co., Ltd. | 92,540 | | | 400,530 | |
| | Japan Pulp & Paper Co., Ltd. | 464,000 | | | 1,556,729 | |
| | Japan Transcity Corp. | 231,000 | | | 681,351 | |
| # | | JFE Shoji Holdings, Inc. | 411,000 | | | 1,667,207 | |
| # | | Juki Corp. | 208,000 | | | 464,735 | |
| | Kamei Corp. | 153,000 | | | 992,797 | |
| | Kanaden Corp. | 116,000 | | | 753,872 | |
| | Kanagawa Chuo Kotsu Co., Ltd. | 192,000 | | | 1,001,045 | |
| | Kanamoto Co., Ltd. | 112,000 | | | 758,632 | |
| | Kandenko Co., Ltd. | 431,000 | | | 1,893,553 | |
| * | | Kanematsu Corp. | 1,526,625 | | | 1,287,203 | |
| #* | | Kanematsu-NNK Corp. | 113,000 | | | 193,152 | |
| | Katakura Industries Co., Ltd. | 115,100 | | | 1,143,936 | |
| | Kato Works Co., Ltd. | 287,000 | | | 739,032 | |
| | KAWADA TECHNOLOGIES, Inc. | 102,600 | | | 1,537,074 | |
| | Kawagishi Bridge Works Co., Ltd. | 38,000 | | | 90,517 | |
| | Kawasaki Kinkai Kisen Kaisha, Ltd. | 99,000 | | | 251,235 | |
| | Keihin Co., Ltd. (The) | 199,000 | | | 232,617 | |
| # | | Kimura Chemical Plants Co., Ltd. | 59,900 | | | 240,895 | |
| * | | King Jim Co., Ltd. | 4,800 | | | 34,199 | |
| * | | Kinki Sharyo Co., Ltd. | 185,000 | | | 616,142 | |
| | Kintetsu World Express, Inc. | 79,000 | | | 2,406,591 | |
| | Kitagawa Iron Works Co., Ltd. | 335,000 | | | 485,799 | |
| | Kitano Construction Corp. | 242,000 | | | 523,361 | |
| | Kitazawa Sangyo Co., Ltd. | 54,500 | | | 105,309 | |
| | Kito Corp. | 23 | | | 15,985 | |
| # | | Kitz Corp. | 416,800 | | | 1,914,546 | |
| | Kodensha Co., Ltd. (The) | 25,000 | | | 53,929 | |
| | Koike Sanso Kogyo Co., Ltd. | 149,000 | | | 380,362 | |
| #* | | Koito Industries, Ltd. | 102,000 | | | 106,967 | |
| | Kokuyo Co., Ltd. | 300,425 | | | 2,237,378 | |
| # | | Komai Tekko, Inc. | 167,000 | | | 414,606 | |
| | Komatsu Wall Industry Co., Ltd. | 48,300 | | | 439,979 | |
| | Komori Corp. | 407,800 | | | 2,546,297 | |
| | Kondotec, Inc. | 40,500 | | | 452,485 | |
| #* | | Kosaido Co., Ltd. | 356,100 | | | 950,241 | |
| | KRS Corp. | 37,200 | | | 412,806 | |
| * | | Kumagai Gumi Co., Ltd. | 583,800 | | | 521,499 | |
| | Kuroda Electric Co., Ltd. | 115,400 | | | 1,256,573 | |
| | Kyodo Printing Co., Ltd. | 540,000 | | | 1,229,996 | |
| # | | Kyoei Sangyo Co., Ltd. | 97,000 | | | 161,745 | |
| # | | Kyokuto Boeki Kaisha, Ltd. | 58,000 | | | 145,421 | |
| | Kyokuto Kaihatsu Kogyo Co., Ltd. | 210,100 | | | 1,139,660 | |
| | Kyosan Electric Manufacturing Co., Ltd. | 225,000 | | | 994,415 | |
| | Kyowa Exeo Corp. | 335,600 | | | 2,952,011 | |
| | Kyudenko Corp. | 204,000 | | | 1,233,861 | |
| * | | Lonseal Corp. | 116,000 | | | 112,027 | |
| | Maeda Corp. | 845,000 | | | 3,080,594 | |
| | Maeda Road Construction Co., Ltd. | 289,000 | | | 2,874,057 | |
| * | | Maezawa Industries, Inc. | 35,700 | | | 81,291 | |
| | Maezawa Kasei Industries Co., Ltd. | 50,700 | | | 546,461 | |
| | Maezawa Kyuso Industries Co., Ltd. | 50,400 | | | 674,369 | |
| | Makino Milling Machine Co., Ltd. | 389,000 | | | 2,582,091 | |
| * | | Marubeni Construction Material Lease Co., Ltd. | 75,000 | | | 129,653 | |
| | Maruka Machinery Co., Ltd. | 28,100 | | | 235,402 | |
99
The Japanese Small Company Series
continued
| | | | SHARES | | VALUE†† | |
| Industrials — (Continued) | | | | | |
| | Maruwn Corp. | 66,000 | | $ | 158,195 | |
| | Maruyama Manufacturing Co., Inc. | 150,000 | | | 333,146 | |
| | Maruzen Showa Unyu Co., Ltd. | 306,000 | | | 1,000,363 | |
| | | Matsuda Sangyo Co., Ltd. | 80,682 | | | 1,191,557 | |
| | Matsui Construction Co., Ltd. | 128,600 | | | 508,838 | |
| | Max Co., Ltd. | 189,000 | | | 2,257,949 | |
| # | | Meidensha Corp. | 773,050 | | | 2,910,510 | |
| | Meiji Shipping Co., Ltd. | 105,700 | | | 296,788 | |
| | Meitec Corp. | 137,300 | | | 2,556,745 | |
| | Meito Transportation Co., Ltd. | 22,000 | | | 162,997 | |
| # | | Meiwa Trading Co., Ltd. | 140,000 | | | 394,492 | |
| | Mesco, Inc. | 30,000 | | | 235,263 | |
| * | | Minebea Co., Ltd. | 50,000 | | | 178,178 | |
| | Mirait Holdings Corp. | 274,685 | | | 2,101,231 | |
| | Mitani Corp. | 52,600 | | | 582,033 | |
| # | | Mitsubishi Kakoki Kaisha, Ltd. | 229,000 | | | 439,776 | |
| | Mitsubishi Pencil Co., Ltd. | 104,500 | | | 1,796,876 | |
| | Mitsuboshi Belting, Ltd. | 287,000 | | | 1,505,813 | |
| # | | Mitsui Engineering & Shipbuilding Co., Ltd. | 611,000 | | | 970,463 | |
| | Mitsui Matsushima Co., Ltd. | 338,000 | | | 591,974 | |
| | Mitsui-Soko Co., Ltd. | 485,000 | | | 1,699,083 | |
| | Mitsumura Printing Co., Ltd. | 93,000 | | | 296,277 | |
| # | | Miura Co., Ltd. | 137,600 | | | 3,691,708 | |
| * | | Miura Printing Corp. | 18,000 | | | 21,438 | |
| #* | | Miyaji Engineering Group, Inc. | 1,349,175 | | | 1,326,930 | |
| #* | | Miyakoshi Holdings, Inc. | 45,000 | | | 134,689 | |
| * | | Mori Denki Mfg. Co., Ltd. | 625,000 | | | 62,726 | |
| # | | Mori Seiki Co., Ltd. | 385,600 | | | 3,476,863 | |
| | Morita Holdings Corp. | 156,000 | | | 840,228 | |
| # | | Moshi Moshi Hotline, Inc. | 217,300 | | | 2,088,822 | |
| | Mystar Engineering Corp. | 15,600 | | | 75,178 | |
| # | | NAC CO., Ltd. | 25,400 | | | 475,730 | |
| | Nachi-Fujikoshi Corp. | 663,000 | | | 3,674,507 | |
| | Naikai Zosen Corp. | 73,000 | | | 291,950 | |
| | Nakano Corp. | 98,000 | | | 224,628 | |
| | Narasaki Sangyo Co., Ltd. | 56,000 | | | 87,133 | |
| | NEC Capital Solutions, Ltd. | 45,100 | | | 646,827 | |
| | NEC Networks & System Integration Corp. | 109,600 | | | 1,647,949 | |
| | Nichias Corp. | 436,000 | | | 2,368,289 | |
| | Nichiban Co., Ltd. | 122,000 | | | 409,643 | |
| | Nichiden Corp. | 2,600 | | | 84,089 | |
| | Nichiha Corp. | 98,380 | | | 1,146,711 | |
| | Nichireki Co., Ltd. | 96,000 | | | 470,398 | |
| # | | Nihon M&A Center, Inc. | 86 | | | 485,424 | |
| | Nikko Co., Ltd. | 127,000 | | | 465,618 | |
| | Nippo Corp. | 256,000 | | | 2,254,541 | |
| | Nippon Carbon Co., Ltd. | 421,000 | | | 1,240,172 | |
| | Nippon Conveyor Co., Ltd. | 168,000 | | | 151,555 | |
| | Nippon Densetsu Kogyo Co., Ltd. | 191,000 | | | 1,895,150 | |
| | Nippon Denwa Shisetu Co., Ltd. | 203,000 | | | 647,203 | |
| | Nippon Filcon Co., Ltd. | 70,900 | | | 371,910 | |
| | Nippon Hume Corp. | 112,000 | | | 418,743 | |
| # | | Nippon Jogesuido Sekkei Co., Ltd. | 289 | | | 377,746 | |
| | Nippon Kanzai Co., Ltd. | 43,000 | | | 794,276 | |
| | Nippon Koei Co., Ltd. | 272,000 | | | 957,195 | |
| | Nippon Konpo Unyu Soko Co., Ltd. | 261,000 | | | 2,687,399 | |
| | Nippon Parking Development Co., Ltd. | 2,983 | | | 133,558 | |
| | Nippon Road Co., Ltd. (The) | 20,000 | | | 51,540 | |
| | Nippon Seisen Co., Ltd. | 103,000 | | | 528,248 | |
| | Nippon Sharyo, Ltd. | 291,000 | | | 1,173,975 | |
| | Nippon Shindo Co., Ltd. | 8,000 | | | 11,349 | |
100
The Japanese Small Company Series
continued
| | | | SHARES | | VALUE†† | |
| Industrials — (Continued) | | | | | |
| | Nippon Signal Co., Ltd. | 218,600 | | $ | 1,601,820 | |
| | Nippon Steel Trading Co., Ltd. | 294,000 | | | 764,949 | |
| | | Nippon Thompson Co., Ltd. | 272,000 | | | 1,751,929 | |
| # | | Nippon Tungsten Co., Ltd. | 80,000 | | | 176,832 | |
| # | | Nippon Yusoki Co., Ltd. | 138,000 | | | 370,599 | |
| | Nishimatsu Construction Co., Ltd. | 1,855,000 | | | 3,047,174 | |
| * | | Nishishiba Electric Co., Ltd. | 101,000 | | | 155,240 | |
| | Nissei Corp. | 104,600 | | | 943,718 | |
| | Nissei Plastic Industrial Co., Ltd. | 374,100 | | | 1,122,002 | |
| # | | Nissha Printing Co., Ltd. | 114,500 | | | 1,349,253 | |
| | Nisshinbo Holdings, Inc. | 39,000 | | | 354,068 | |
| | Nissin Corp. | 350,000 | | | 815,494 | |
| | Nissin Electric Co., Ltd. | 175,000 | | | 1,076,357 | |
| | Nitchitsu Co., Ltd. | 58,000 | | | 122,378 | |
| | Nitta Corp. | 105,800 | | | 1,920,482 | |
| | Nitto Boseki Co., Ltd. | 888,000 | | | 2,657,215 | |
| | Nitto Kogyo Corp. | 149,000 | | | 1,723,056 | |
| # | | Nitto Kohki Co., Ltd. | 67,900 | | | 1,538,124 | |
| | Nitto Seiko Co., Ltd. | 122,000 | | | 312,253 | |
| # | | Nittoc Construction Co., Ltd. | 316,000 | | | 375,284 | |
| | Noda Corp. | 169,300 | | | 664,053 | |
| | Nomura Co., Ltd. | 205,000 | | | 603,214 | |
| | Noritake Co., Ltd. | 531,000 | | | 1,690,971 | |
| | Noritz Corp. | 106,700 | | | 2,168,752 | |
| * | | NS United Kaiun Kaisha, Ltd. | 470,000 | | | 703,519 | |
| #* | | Oak Capital Corp. | 53,135 | | | 63,239 | |
| | Obara Corp. | 20,200 | | | 251,851 | |
| # | | Obayashi Road Corp. | 175,000 | | | 425,775 | |
| | Oiles Corp. | 123,842 | | | 2,223,399 | |
| * | | Okamoto Machine Tool Works, Ltd. | 163,000 | | | 212,026 | |
| | Okamura Corp. | 286,900 | | | 1,740,456 | |
| | Okano Valve Manufacturing Co., Ltd. | 45,000 | | | 149,588 | |
| # | | Oki Electric Cable Co., Ltd. | 90,000 | | | 158,359 | |
| * | | OKK Corp. | 255,000 | | | 290,284 | |
| | OKUMA Corp. | 517,000 | | | 3,805,376 | |
| | Okumura Corp. | 754,400 | | | 2,977,541 | |
| | Onoken Co., Ltd. | 58,900 | | | 479,164 | |
| | Organo Corp. | 163,000 | | | 1,278,308 | |
| * | | Original Engineering Consultants Co., Ltd. | 14,000 | | | 24,153 | |
| | OSG Corp. | 289,400 | | | 3,708,430 | |
| | Oyo Corp. | 100,900 | | | 1,005,137 | |
| | P.S. Mitsubishi Construction Co., Ltd. | 76,800 | | | 222,022 | |
| | Park24 Co., Ltd. | 208,300 | | | 2,394,989 | |
| # | | Pasco Corp. | 55,000 | | | 176,121 | |
| | Pasona Group, Inc. | 156 | | | 150,808 | |
| # | | Penta-Ocean Construction Co., Ltd. | 1,087,500 | | | 3,455,646 | |
| | Pilot Corp. | 763 | | | 1,567,607 | |
| | Pronexus, Inc. | 133,200 | | | 653,871 | |
| | Raito Kogyo Co., Ltd. | 193,700 | | | 805,699 | |
| #* | | Rasa Industries, Ltd. | 160,000 | | | 258,771 | |
| | Rheon Automatic Machinery Co., Ltd. | 64,000 | | | 143,963 | |
| | Ryobi, Ltd. | 575,200 | | | 2,321,680 | |
| * | | Sailor Pen Co., Ltd. | 69,000 | | | 32,091 | |
| | Sakai Heavy Industries, Ltd. | 183,000 | | | 326,686 | |
| * | | Sakurada Co., Ltd. | 57,000 | | | 13,096 | |
| #* | | Sanix, Inc. | 135,300 | | | 430,221 | |
| | Sanki Engineering Co., Ltd. | 340,000 | | | 1,830,560 | |
| # | | Sanko Metal Industrial Co., Ltd. | 118,000 | | | 380,589 | |
| * | | Sankyo-Tateyama Holdings, Inc. | 1,710,000 | | | 2,151,124 | |
| | Sankyu, Inc. | 969,000 | | | 3,836,727 | |
| | Sanritsu Corp. | 16,700 | | | 109,233 | |
101
The Japanese Small Company Series
continued
| | | | SHARES | | VALUE†† | |
| Industrials — (Continued) | | | | | |
| | Sanwa Holdings Corp. | 844,000 | | $ | 2,528,040 | |
| | | Sanyo Denki Co., Ltd. | 210,000 | | | 1,243,423 | |
| | Sanyo Engineering & Construction, Inc. | 48,000 | | | 149,261 | |
| # | | Sanyo Industries, Ltd. | 77,000 | | | 138,789 | |
| # | | Sasebo Heavy Industries Co., Ltd. | 573,000 | | | 855,610 | |
| | Sato Corp. | 109,300 | | | 1,330,434 | |
| | Sato Shoji Corp. | 65,300 | | | 363,401 | |
| | Sawafuji Electric Co., Ltd. | 42,000 | | | 126,588 | |
| | Secom Joshinetsu Co., Ltd. | 33,900 | | | 989,760 | |
| | Seibu Electric Industry Co., Ltd. | 67,000 | | | 289,698 | |
| | Seika Corp. | 285,000 | | | 705,386 | |
| #* | | Seikitokyu Kogyo Co., Ltd. | 307,000 | | | 188,586 | |
| | Seino Holdings Co., Ltd. | 375,000 | | | 2,813,398 | |
| | Sekisui Jushi Co., Ltd. | 142,000 | | | 1,339,430 | |
| # | | Senko Co., Ltd. | 384,000 | | | 1,455,997 | |
| | Senshu Electric Co., Ltd. | 37,300 | | | 458,564 | |
| | Shibusawa Warehouse Co., Ltd. | 231,000 | | | 665,111 | |
| | Shibuya Kogyo Co., Ltd. | 80,100 | | | 812,302 | |
| # | | Shima Seiki Manufacturing Co., Ltd. | 104,000 | | | 1,935,582 | |
| | Shin Nippon Air Technologies Co., Ltd. | 88,780 | | | 453,537 | |
| | Shin-Keisei Electric Railway Co., Ltd. | 174,000 | | | 770,239 | |
| # | | Shin-Kobe Electric Machinery Co., Ltd. | 102,000 | | | 1,750,478 | |
| | Shinmaywa Industries, Ltd. | 418,000 | | | 1,413,192 | |
| | Shinnihon Corp. | 194,800 | | | 495,439 | |
| | Shinsho Corp. | 202,000 | | | 466,127 | |
| | Shinwa Co., Ltd. | 1,500 | | | 16,634 | |
| # | | Sho-Bond Corp. | 100,600 | | | 2,244,089 | |
| | Shoko Co., Ltd. | 316,000 | | | 465,823 | |
| # | | Showa Aircraft Industry Co., Ltd. | 112,000 | | | 727,865 | |
| # | | Sinfonia Technology Co., Ltd. | 496,000 | | | 1,231,749 | |
| | Sintokogio, Ltd. | 201,000 | | | 1,819,042 | |
| | Soda Nikka Co., Ltd. | 67,000 | | | 289,272 | |
| # | | Sodick Co., Ltd. | 72,200 | | | 398,630 | |
| | Sohgo Security Services Co., Ltd. | 252,800 | | | 2,649,967 | |
| | Sotetsu Holdings, Inc. | 554,000 | | | 1,704,722 | |
| | Space Co., Ltd. | 73,420 | | | 441,937 | |
| | Subaru Enterprise Co., Ltd. | 59,000 | | | 172,650 | |
| | Sugimoto & Co., Ltd. | 34,100 | | | 303,230 | |
| | Sumikin Bussan Corp. | 31,000 | | | 68,623 | |
| * | | Sumiseki Holdings, Inc. | 107,100 | | | 93,625 | |
| | Sumitomo Densetsu Co., Ltd. | 98,100 | | | 578,212 | |
| * | | Sumitomo Mitsui Construction Co., Ltd. | 367,300 | | | 245,985 | |
| # | | Sumitomo Precision Products Co., Ltd. | 156,000 | | | 1,010,819 | |
| | Sumitomo Warehouse Co., Ltd. | 556,000 | | | 2,491,907 | |
| | Suzuki Metal Industry Co., Ltd. | 71,000 | | | 150,968 | |
| * | | SWCC Showa Holdings Co., Ltd. | 1,732,000 | | | 1,642,536 | |
| | Tadano, Ltd. | 442,579 | | | 2,953,445 | |
| | Taihei Dengyo Kaisha, Ltd. | 146,000 | | | 961,133 | |
| | Taihei Kogyo Co., Ltd. | 256,000 | | | 1,374,981 | |
| | Taiheiyo Kouhatsu, Inc. | 95,000 | | | 80,472 | |
| | Taikisha, Ltd. | 131,000 | | | 2,836,686 | |
| | Takada Kiko Co., Ltd. | 272,000 | | | 568,131 | |
| | Takano Co., Ltd. | 51,100 | | | 294,457 | |
| # | | Takaoka Electric Manufacturing Co., Ltd. | 262,000 | | | 681,982 | |
| #* | | Takara Printing Co., Ltd. | 38,055 | | | 295,068 | |
| | Takara Standard Co., Ltd. | 501,000 | | | 3,667,023 | |
| # | | Takasago Thermal Engineering Co., Ltd. | 291,400 | | | 2,319,637 | |
| # | | Takashima & Co., Ltd. | 137,000 | | | 295,779 | |
| | Takigami Steel Construction Co., Ltd. | 50,000 | | | 135,568 | |
| | Takisawa Machine Tool Co., Ltd. | 191,000 | | | 223,956 | |
| #* | | Takuma Co., Ltd. | 316,000 | | | 1,490,630 | |
102
The Japanese Small Company Series
continued
| | | | SHARES | | VALUE†† | |
| Industrials — (Continued) | | | | | |
| # | | Tanseisha Co., Ltd. | 74,000 | | $ | 211,330 | |
| # | | Tatsuta Electric Wire & Cable Co., Ltd. | 215,000 | | | 967,408 | |
| | TECHNO ASSOCIE Co., Ltd. | 58,400 | | | 484,226 | |
| | Techno Ryowa, Ltd. | 71,390 | | | 372,873 | |
| | Teikoku Electric Manufacturing Co., Ltd. | 31,800 | | | 627,678 | |
| | Tekken Corp. | 763,000 | | | 875,044 | |
| # | | Temp Holdings Co., Ltd. | 48,600 | | | 416,401 | |
| | Teraoka Seisakusho Co., Ltd. | 53,600 | | | 233,111 | |
| | TOA Corp. | 780,000 | | | 1,373,589 | |
| # | | TOA ROAD Corp. | 155,000 | | | 286,433 | |
| #* | | Tobishima Corp. | 321,300 | | | 313,733 | |
| | Tocalo Co., Ltd. | 55,100 | | | 1,117,826 | |
| | Toda Corp. | 865,000 | | | 3,069,263 | |
| | Toenec Corp. | 212,000 | | | 1,100,850 | |
| # | | TOKAI Holdings Corp. | 214,000 | | | 1,081,761 | |
| | Tokai Lease Co., Ltd. | 92,000 | | | 193,204 | |
| # | | Toko Electric Corp. | 76,000 | | | 335,740 | |
| | Tokyo Energy & Systems, Inc. | 143,000 | | | 676,352 | |
| # | | TOKYO KEIKI, Inc. | 265,000 | | | 403,296 | |
| #* | | Tokyo Kikai Seisakusho, Ltd. | 300,000 | | | 181,499 | |
| | Tokyo Sangyo Co., Ltd. | 78,000 | | | 242,167 | |
| | Tokyu Community Corp. | 32,600 | | | 1,014,194 | |
| | Tokyu Construction Co., Ltd. | 14,950 | | | 40,907 | |
| | Toli Corp. | 236,000 | | | 423,868 | |
| # | | Tomoe Corp. | 115,500 | | | 401,033 | |
| * | | Tomoe Engineering Co., Ltd. | 2,800 | | | 49,268 | |
| | Tonami Holdings Co., Ltd. | 331,000 | | | 665,102 | |
| | Toppan Forms Co., Ltd. | 202,900 | | | 1,588,084 | |
| # | | Torishima Pump Manufacturing Co., Ltd. | 85,800 | | | 1,186,256 | |
| | Toshiba Machine Co., Ltd. | 440,000 | | | 2,179,800 | |
| | Toshiba Plant Kensetsu Co., Ltd. | 191,450 | | | 2,046,635 | |
| | Tosho Printing Co., Ltd. | 243,000 | | | 447,794 | |
| | Totetsu Kogyo Co., Ltd. | 122,000 | | | 1,044,495 | |
| #* | | Totoku Electric Co., Ltd. | 61,000 | | | 53,939 | |
| # | | Toyo Construction Co., Ltd. | 379,000 | | | 385,517 | |
| # | | Toyo Electric Manufacturing Co., Ltd. | 159,000 | | | 702,041 | |
| | Toyo Engineering Corp. | 581,400 | | | 1,922,093 | |
| # | | Toyo Machinery & Metal Co., Ltd. | 42,400 | | | 105,275 | |
| | Toyo Tanso Co., Ltd. | 44,400 | | | 2,060,160 | |
| # | | Toyo Wharf & Warehouse Co., Ltd. | 274,000 | | | 452,104 | |
| * | | Trancom Co., Ltd. | 3,200 | | | 65,058 | |
| | Trinity Industrial Corp. | 56,000 | | | 192,991 | |
| | Trusco Nakayama Corp. | 98,900 | | | 1,832,287 | |
| | Tsubakimoto Chain Co. | 584,700 | | | 3,000,799 | |
| | Tsubakimoto Kogyo Co., Ltd. | 97,000 | | | 261,202 | |
| * | | Tsudakoma Corp. | 12,000 | | | 22,415 | |
| # | | Tsugami Corp. | 267,000 | | | 1,469,744 | |
| | Tsukishima Kikai Co., Ltd. | 127,000 | | | 980,323 | |
| | Tsurumi Manufacturing Co., Ltd. | 94,000 | | | 725,086 | |
| # | | Tsuzuki Denki Co., Ltd. | 75,000 | | | 709,685 | |
| | TTK Co., Ltd. | 62,000 | | | 307,826 | |
| | Uchida Yoko Co., Ltd. | 331,000 | | | 917,556 | |
| #* | | Ueki Corp. | 430,000 | | | 912,451 | |
| # | | Union Tool Co. | 59,400 | | | 1,066,063 | |
| | Utoc Corp. | 92,900 | | | 302,963 | |
| #* | | Wakachiku Construction Co., Ltd. | 1,204,000 | | | 1,824,945 | |
| | Weathernews, Inc. | 26,700 | | | 835,910 | |
| | Yahagi Construction Co., Ltd. | 141,500 | | | 690,229 | |
| | Yamabiko Corp. | 28,782 | | | 326,309 | |
| | Yamato Corp. | 82,000 | | | 330,372 | |
| | Yamaura Corp. | 40,500 | | | 108,316 | |
103
The Japanese Small Company Series
continued
| | | | SHARES | | VALUE†† | |
| Industrials — (Continued) | | | | | |
| # | | Yamazen Co., Ltd. | 305,500 | | $ | 2,162,930 | |
| | Yasuda Warehouse Co., Ltd. (The) | 95,800 | | | 568,569 | |
| | Yokogawa Bridge Holdings Corp. | 139,400 | | | 803,611 | |
| | Yondenko Corp. | 132,800 | | | 533,697 | |
| | Yuasa Trading Co., Ltd. | 810,000 | | | 1,131,790 | |
| | Yuken Kogyo Co., Ltd. | 156,000 | | | 346,320 | |
| | Yurtec Corp. | 256,000 | | | 1,270,104 | |
| | Yusen Logistics Co., Ltd. | 67,700 | | | 900,901 | |
| | Yushin Precision Equipment Co., Ltd. | 55,934 | | | 1,078,864 | |
| Total Industrials | | | | 401,802,802 | |
| | | | | | | |
| Information Technology — (9.6%) | | | | | |
| * | | A&D Co., Ltd. | 30,000 | | | 109,265 | |
| | Ai Holdings Corp. | 182,600 | | | 765,504 | |
| # | | Aichi Tokei Denki Co., Ltd. | 113,000 | | | 351,667 | |
| | Aiphone Co., Ltd. | 70,900 | | | 1,238,027 | |
| # | | ALLIED TELESIS HOLDINGS K.K. | 470,700 | | | 389,067 | |
| | Alpha Systems, Inc. | 27,300 | | | 385,261 | |
| | Alps Electric Co., Ltd. | 33,000 | | | 248,492 | |
| # | | Anritsu Corp. | 458,000 | | | 5,178,398 | |
| # | | AOI Electronic Co., Ltd. | 35,200 | | | 475,474 | |
| * | | Apic Yamada Corp. | 31,000 | | | 51,371 | |
| * | | Argo Graphics, Inc. | 100 | | | 1,255 | |
| | Arisawa Manufacturing Co., Ltd. | 67,600 | | | 300,424 | |
| | Asahi Net, Inc. | 26,000 | | | 114,283 | |
| | CAC Corp. | 62,700 | | | 461,830 | |
| # | | Canon Electronics, Inc. | 82,100 | | | 1,996,467 | |
| | Capcom Co., Ltd. | 205,600 | | | 5,378,552 | |
| | Chino Corp. | 151,000 | | | 374,721 | |
| * | | CMK Corp. | 263,200 | | | 963,550 | |
| | Computer Engineering & Consulting, Ltd. | 61,500 | | | 287,564 | |
| | Core Corp. | 45,700 | | | 376,564 | |
| | Cresco, Ltd. | 23,200 | | | 143,659 | |
| | Cybernet Systems Co., Ltd. | 85 | | | 21,112 | |
| # | | Cybozu, Inc. | 1,221 | | | 263,858 | |
| * | | Daiko Denshi Tsushin, Ltd. | 12,000 | | | 21,124 | |
| | Dainippon Screen Manufacturing Co., Ltd. | 1,000 | | | 7,678 | |
| | Daito Electron Co., Ltd. | 5,900 | | | 45,312 | |
| # | | Daiwabo Holdings Co., Ltd. | 618,000 | | | 1,450,463 | |
| | Denki Kogyo Co., Ltd. | 248,000 | | | 939,369 | |
| | DKK TOA Corp. | 31,000 | | | 104,991 | |
| # | | DTS Corp. | 89,600 | | | 1,054,872 | |
| # | | Dwango Co., Ltd. | 409 | | | 724,636 | |
| # | | eAccess, Ltd. | 6,475 | | | 1,748,697 | |
| | Eizo Nanao Corp. | 76,800 | | | 1,472,360 | |
| # | | Elematec Corp. | 17,200 | | | 282,752 | |
| * | | Elna Co., Ltd. | 92,000 | | | 85,370 | |
| # | | Enplas Corp. | 25,600 | | | 545,922 | |
| | ESPEC Corp. | 81,800 | | | 513,125 | |
| | Excel Co., Ltd. | 1,700 | | | 15,490 | |
| # | | Faith, Inc. | 1,774 | | | 186,544 | |
| #* | | FDK Corp. | 431,000 | | | 458,279 | |
| | Fuji Electronics Co., Ltd. | 13,500 | | | 177,951 | |
| # | | Fuji Soft, Inc. | 100,600 | | | 1,595,632 | |
| * | | Fujitsu Component, Ltd. | 139 | | | 49,158 | |
| | Fujitsu Frontech, Ltd. | 77,500 | | | 521,795 | |
| | Future Architect, Inc. | 1,172 | | | 478,700 | |
| # | | GMO Internet, Inc. | 236,300 | | | 1,018,492 | |
| | Hakuto Co., Ltd. | 73,700 | | | 668,655 | |
| | Hioki EE Corp. | 12,300 | | | 223,738 | |
| | Hitachi Business Solution Co., Ltd. | 42,500 | | | 362,554 | |
104
The Japanese Small Company Series
continued
| | | | SHARES | | VALUE†† | |
| Information Technology — (Continued) | | | | | |
| | Hitachi Kokusai Electric, Inc. | 249,500 | | $ | 1,858,086 | |
| | Hochiki Corp. | 97,000 | | | 492,487 | |
| | Hokuriku Electric Industry Co., Ltd. | 289,000 | | | 447,998 | |
| | Horiba, Ltd. | 160,950 | | | 5,105,623 | |
| | Hosiden Corp. | 262,900 | | | 1,812,123 | |
| | Icom, Inc. | 49,700 | | | 1,214,745 | |
| #* | | Ikegami Tsushinki Co., Ltd. | 174,000 | | | 105,178 | |
| | Ines Corp. | 202,300 | | | 1,320,767 | |
| | I-Net Corp. | 47,800 | | | 269,795 | |
| | Information Services International-Dentsu, Ltd. | 76,700 | | | 676,209 | |
| # | | Innotech Corp. | 9,200 | | | 63,746 | |
| | Internet Initiative Japan, Inc. | 485 | | | 1,767,427 | |
| #* | | Ishii Hyoki Co., Ltd. | 23,700 | | | 88,878 | |
| | IT Holdings Corp. | 357,401 | | | 3,671,509 | |
| | ITC Networks Corp. | 50,300 | | | 309,033 | |
| | ITFOR, Inc. | 17,300 | | | 64,503 | |
| | | Iwatsu Electric Co., Ltd. | 303,000 | | | 266,608 | |
| # | | Japan Aviation Electronics Industry, Ltd. | 252,600 | | | 1,758,916 | |
| | Japan Business Computer Co., Ltd. | 73,200 | | | 470,598 | |
| # | | Japan Cash Machine Co., Ltd. | 79,315 | | | 654,387 | |
| | Japan Digital Laboratory Co., Ltd. | 109,700 | | | 1,037,899 | |
| | Japan Radio Co., Ltd. | 55,000 | | | 133,209 | |
| # | | Jastec Co., Ltd. | 61,400 | | | 400,387 | |
| | JBIS Holdings, Inc. | 79,600 | | | 256,852 | |
| | JIEC Co., Ltd. | 199 | | | 232,400 | |
| | Kaga Electronics Co., Ltd. | 100,400 | | | 964,361 | |
| | Kanematsu Electronics, Ltd. | 83,100 | | | 829,932 | |
| | Kawatetsu Systems, Inc. | 174 | | | 140,952 | |
| | Koa Corp. | 151,600 | | | 1,480,777 | |
| #* | | Kubotek Corp. | 370 | | | 113,596 | |
| | Kyoden Co., Ltd. | 156,900 | | | 223,881 | |
| | Kyowa Electronic Instruments Co., Ltd. | 52,000 | | | 166,339 | |
| | Macnica, Inc. | 50,100 | | | 1,058,656 | |
| # | | Macromill, Inc. | 69,700 | | | 816,671 | |
| | Marubun Corp. | 98,500 | | | 380,067 | |
| # | | Maruwa Co., Ltd. | 36,500 | | | 1,579,163 | |
| # | | Megachips Corp. | 84,800 | | | 1,169,906 | |
| * | | Meisei Electric Co., Ltd. | 305,000 | | | 312,557 | |
| | Melco Holdings, Inc. | 49,600 | | | 1,380,083 | |
| | Mimasu Semiconductor Industry Co., Ltd. | 86,881 | | | 727,653 | |
| | Miroku Jyoho Service Co., Ltd. | 105,000 | | | 316,598 | |
| | Mitsui High-Tec, Inc. | 131,600 | | | 592,294 | |
| # | | Mitsui Knowledge Industry Co., Ltd. | 3,643 | | | 580,561 | |
| | Mitsumi Electric Co., Ltd. | 317,700 | | | 2,521,159 | |
| * | | Moritex Corp. | 7,700 | | | 29,146 | |
| | Mutoh Holdings Co., Ltd. | 160,000 | | | 263,854 | |
| #* | | Nagano Japan Radio Co., Ltd. | 83,000 | | | 120,900 | |
| | Nagano Keiki Co., Ltd. | 2,200 | | | 20,538 | |
| | Nakayo Telecommunications, Inc. | 541,000 | | | 1,231,624 | |
| | NEC Fielding, Ltd. | 95,000 | | | 1,149,163 | |
| | NEC Mobiling, Ltd. | 46,800 | | | 1,562,583 | |
| | Net One Systems Co., Ltd. | 1,984 | | | 5,160,385 | |
| * | | New Japan Radio Co., Ltd. | 37,000 | | | 61,503 | |
| # | | Nichicon Corp. | 270,300 | | | 3,191,538 | |
| | Nidec Copal Electronics Corp. | 34,600 | | | 218,001 | |
| # | | Nidec Sankyo Corp. | 191,000 | | | 1,215,843 | |
| | NIFTY Corp. | 195 | | | 226,273 | |
| # | | Nihon Dempa Kogyo Co., Ltd. | 71,100 | | | 972,194 | |
| #* | | Nihon Inter Electronics Corp. | 104,700 | | | 139,536 | |
| # | | Nihon Unisys, Ltd. | 240,875 | | | 1,363,798 | |
| * | | Nippon Avionics Co., Ltd. | 78,000 | | | 99,548 | |
105
The Japanese Small Company Series
continued
| | | | SHARES | | VALUE†† | |
| Information Technology — (Continued) | | | | | |
| | Nippon Ceramic Co., Ltd. | 86,600 | | $ | 1,576,210 | |
| | Nippon Chemi-Con Corp. | 570,000 | | | 2,171,220 | |
| | Nippon Systemware Co., Ltd. | 27,900 | | | 104,309 | |
| | Nohmi Bosai, Ltd. | 123,000 | | | 761,175 | |
| | NS Solutions Corp. | 79,400 | | | 1,727,570 | |
| | NSD Co., Ltd. | 170,300 | | | 1,356,624 | |
| # | | Obic Business Consultants Co., Ltd. | 21,700 | | | 1,060,758 | |
| | Okaya Electric Industries Co., Ltd. | 73,000 | | | 323,842 | |
| * | | Oki Electric Industry Co., Ltd. | 2,665,000 | | | 2,268,129 | |
| * | | ONO Sokki Co., Ltd. | 103,000 | | | 280,888 | |
| | Optex Co., Ltd. | 20,400 | | | 248,167 | |
| | Origin Electric Co., Ltd. | 105,000 | | | 381,386 | |
| # | | Osaki Electric Co., Ltd. | 123,000 | | | 1,093,037 | |
| | Panasonic Electric Works Information Systems Co., Ltd. | 13,500 | | | 366,775 | |
| | PCA Corp. | 17,500 | | | 206,623 | |
| #* | | Pixela Corp. | 18,400 | | | 45,571 | |
| | Riken Keiki Co., Ltd. | 77,500 | | | 543,680 | |
| * | | Riso Kagaku Corp. | 48,900 | | | 839,510 | |
| | Roland DG Corp. | 54,400 | | | 571,134 | |
| | Ryoden Trading Co., Ltd. | 141,000 | | | 814,245 | |
| | Ryosan Co., Ltd. | 140,000 | | | 2,878,667 | |
| | Ryoyo Electro Corp. | 113,200 | | | 1,028,310 | |
| # | | Sanken Electric Co., Ltd. | 463,000 | | | 1,737,086 | |
| | Sanko Co., Ltd. | 21,000 | | | 48,383 | |
| | Sanshin Electronics Co., Ltd. | 139,500 | | | 1,169,515 | |
| | Satori Electric Co., Ltd. | 79,080 | | | 481,803 | |
| | Saxa Holdings, Inc. | 307,000 | | | 466,407 | |
| # | | Shibaura Mechatronics Corp. | 138,000 | | | 425,661 | |
| # | | Shindengen Electric Manufacturing Co., Ltd. | 311,000 | | | 1,323,322 | |
| # | | Shinkawa, Ltd. | 68,300 | | | 364,323 | |
| # | | Shinko Electric Industries Co., Ltd. | 297,700 | | | 2,151,065 | |
| | Shinko Shoji Co., Ltd. | 81,400 | | | 628,612 | |
| | Shizuki Electric Co., Inc. | 103,000 | | | 380,868 | |
| # | | Siix Corp. | 79,500 | | | 1,015,351 | |
| # | | Simplex Holdings, Inc. | 952 | | | 351,129 | |
| # | | SMK Corp. | 277,000 | | | 912,208 | |
| | Softbank Technology Corp. | 100 | | | 815 | |
| | So-net Entertainment Corp. | 498 | | | 1,973,936 | |
| | Soshin Electric Co., Ltd. | 4,600 | | | 20,549 | |
| | SRA Holdings, Inc. | 49,700 | | | 475,620 | |
| | Star Micronics Co., Ltd. | 162,400 | | | 1,590,568 | |
| # | | Sumida Corp. | 61,549 | | | 477,781 | |
| # | | Sumisho Computer Systems Corp. | 214,863 | | | 3,364,222 | |
| | Sun-Wa Technos Corp. | 3,000 | | | 25,578 | |
| # | | Sunx, Ltd. | 109,000 | | | 603,592 | |
| # | | Systena Corp. | 1,096 | | | 759,834 | |
| | Tachibana Eletech Co., Ltd. | 62,400 | | | 499,733 | |
| # | | Taiyo Yuden Co., Ltd. | 412,000 | | | 3,192,309 | |
| # | | Tamura Corp. | 269,000 | | | 688,994 | |
| * | | Teac Corp. | 332,000 | | | 117,307 | |
| | Tecmo Koei Holdings Co., Ltd. | 150,730 | | | 1,352,335 | |
| | Teikoku Tsushin Kogyo Co., Ltd. | 172,000 | | | 298,289 | |
| | TKC, Corp. | 86,800 | | | 1,687,172 | |
| #* | | Toko, Inc. | 325,000 | | | 695,260 | |
| | Tokyo Denpa Co., Ltd. | 24,900 | | | 123,600 | |
| | Tokyo Electron Device, Ltd. | 342 | | | 597,491 | |
| | Tokyo Seimitsu Co., Ltd. | 161,000 | | | 2,918,201 | |
| # | | Tomen Devices Corp. | 2,000 | | | 45,008 | |
| | Tomen Electronics Corp. | 50,600 | | | 598,606 | |
| # | | Topcon Corp. | 236,700 | | | 1,219,915 | |
| | Tose Co., Ltd. | 22,100 | | | 139,608 | |
106
The Japanese Small Company Series
continued
| | | | SHARES | | VALUE†† | |
| Information Technology — (Continued) | | | | | |
| | Toshiba TEC Corp. | 525,000 | | $ | 1,934,664 | |
| | Toukei Computer Co., Ltd. | 26,810 | | | 381,200 | |
| | Towa Corp. | 70,900 | | | 310,052 | |
| | Toyo Corp. | 116,900 | | | 1,231,269 | |
| | Trans Cosmos, Inc. | 122,300 | | | 1,385,968 | |
| * | | UKC Holdings Corp. | 1,600 | | | 15,435 | |
| * | | Ulvac, Inc. | 176,200 | | | 2,476,963 | |
| | Uniden Corp. | 377,000 | | | 1,466,924 | |
| # | | Wacom Co., Ltd. | 1,580 | | | 2,175,503 | |
| | XNET Corp. | 21 | | | 30,834 | |
| | Y. A. C. Co., Ltd. | 31,700 | | | 269,933 | |
| #* | | Yamaichi Electronics Co., Ltd. | 75,700 | | | 183,803 | |
| * | | Yaskawa Information Systems Corp. | 40,000 | | | 86,035 | |
| | Yokowo Co., Ltd. | 69,500 | | | 375,023 | |
| # | | Zuken, Inc. | 94,600 | | | 697,891 | |
| Total Information Technology | | | | 160,082,403 | |
| | | | | | | | |
| Materials — (10.6%) | | | | | |
| | Achilles Corp. | 703,000 | | | 974,989 | |
| | Adeka Corp. | 354,300 | | | 3,543,247 | |
| | Agro-Kanesho Co., Ltd. | 14,000 | | | 67,865 | |
| | | Aichi Steel Corp. | 410,000 | | | 2,155,638 | |
| | Alconix Corp. | 8,300 | | | 180,870 | |
| | Arakawa Chemical Industries, Ltd. | 67,700 | | | 563,442 | |
| | Araya Industrial Co., Ltd. | 276,000 | | | 416,829 | |
| | Asahi Organic Chemicals Industry Co., Ltd. | 343,000 | | | 886,353 | |
| | Chuetsu Pulp & Paper Co., Ltd. | 568,000 | | | 862,934 | |
| * | | Chugai Mining Co., Ltd. | 852,400 | | | 216,622 | |
| | Chugoku Marine Paints, Ltd. | 242,000 | | | 1,703,326 | |
| * | | Chugokukogyo Co., Ltd. | 62,000 | | | 64,455 | |
| | Chuo Denki Kogyo Co., Ltd. | 90,000 | | | 344,645 | |
| #* | | Co-Op Chemical Co., Ltd. | 159,000 | | | 191,765 | |
| # | | Dai Nippon Toryo, Ltd. | 518,000 | | | 533,936 | |
| # | | Daiichi Kigenso Kagaku-Kyogyo Co., Ltd. | 14,300 | | | 610,396 | |
| | Daiichi Kogyo Seiyaku Co., Ltd. | 121,000 | | | 349,874 | |
| | Daiken Corp. | 401,000 | | | 1,224,174 | |
| | Daiki Aluminium Industry Co., Ltd. | 14,000 | | | 46,044 | |
| | Dainichiseika Colour & Chemicals Manufacturing Co., Ltd. | 319,000 | | | 1,432,956 | |
| # | | Daio Paper Corp. | 293,500 | | | 2,206,047 | |
| | Daiso Co., Ltd. | 355,000 | | | 1,189,956 | |
| # | | DC Co., Ltd. | 113,900 | | | 322,511 | |
| | Dynapac Co., Ltd. | 25,000 | | | 67,062 | |
| * | | Earth Chemical Co., Ltd. | 50,300 | | | 1,831,002 | |
| | Ebara-Udylite Co., Ltd. | 2,700 | | | 70,022 | |
| | FP Corp. | 61,200 | | | 3,896,208 | |
| | Fuji Seal International, Inc. | 77,800 | | | 1,472,417 | |
| | Fujikura Kasei Co., Ltd. | 96,500 | | | 453,657 | |
| | Fujimi, Inc. | 21,600 | | | 258,576 | |
| # | | Fumakilla, Ltd. | 85,000 | | | 328,270 | |
| # | | Furukawa-Sky Aluminum Corp. | 320,000 | | | 946,359 | |
| | Geostar Corp. | 38,000 | | | 66,180 | |
| | Godo Steel, Ltd. | 899,000 | | | 2,126,918 | |
| | Gun Ei Chemical Industry Co., Ltd. | 347,000 | | | 929,080 | |
| | Harima Chemicals, Inc. | 73,300 | | | 594,257 | |
| # | | Hodogaya Chemical Co., Ltd. | 265,000 | | | 862,705 | |
| | Hokkan Holdings, Ltd. | 283,000 | | | 871,637 | |
| | Hokko Chemical Industry Co., Ltd. | 90,000 | | | 255,343 | |
| # | | Hokuetsu Kishu Paper Co., Ltd. | 862,199 | | | 5,674,954 | |
| * | | Hokushin Co., Ltd. | 61,400 | | | 108,542 | |
| | Honshu Chemical Industry Co., Ltd. | 35,000 | | | 225,348 | |
| | Ihara Chemical Industry Co., Ltd. | 155,000 | | | 547,912 | |
107
The Japanese Small Company Series
continued
| | | | SHARES | | VALUE†† | |
| Materials — (Continued) | | | | | |
| # | | Ise Chemical Corp. | 83,000 | | $ | 455,870 | |
| #* | | Ishihara Sangyo Kaisha, Ltd. | 1,374,500 | | | 1,661,288 | |
| | Japan Carlit Co., Ltd. | 59,800 | | | 306,762 | |
| | Japan Pure Chemical Co., Ltd. | 2 | | | 4,970 | |
| | JSP Corp. | 103,900 | | | 1,525,061 | |
| # | | Kanto Denka Kogyo Co., Ltd. | 195,000 | | | 955,903 | |
| * | | Katakura Chikkarin Co., Ltd. | 43,000 | | | 103,565 | |
| | Kawakin Holdings Co., Ltd. | 11,000 | | | 37,340 | |
| | Kawasaki Kasei Chemicals, Ltd. | 121,000 | | | 151,892 | |
| | Koatsu Gas Kogyo Co., Ltd. | 163,493 | | | 915,554 | |
| | Kohsoku Corp. | 61,900 | | | 484,207 | |
| | Konishi Co., Ltd. | 66,900 | | | 879,324 | |
| # | | Kumiai Chemical Industry Co., Ltd. | 233,000 | | | 822,473 | |
| | Kureha Corp. | 573,500 | | | 2,561,320 | |
| | Kurimoto, Ltd. | 702,000 | | | 1,055,129 | |
| # | | Kurosaki Harima Corp. | 221,000 | | | 752,205 | |
| | Kyoei Steel, Ltd. | 63,700 | | | 1,126,475 | |
| | MEC Co., Ltd. | 61,200 | | | 217,122 | |
| * | | Mitsubishi Paper Mills, Ltd. | 1,159,000 | | | 1,094,393 | |
| | Mitsubishi Steel Manufacturing Co., Ltd. | 554,000 | | | 1,483,032 | |
| | Mitsui Mining & Smelting Co., Ltd. | 7,000 | | | 19,078 | |
| | Mory Industries, Inc. | 154,000 | | | 576,195 | |
| | Nakabayashi Co., Ltd. | 181,000 | | | 422,536 | |
| * | | Nakayama Steel Works, Ltd. | 639,000 | | | 634,196 | |
| | Neturen Co., Ltd. | 152,800 | | | 1,144,958 | |
| | Nichia Steel Works, Ltd. | 175,900 | | | 446,545 | |
| | Nihon Kagaku Sangyo Co., Ltd. | 78,000 | | | 543,572 | |
| # | | Nihon Nohyaku Co., Ltd. | 225,000 | | | 988,727 | |
| | Nihon Parkerizing Co., Ltd. | 240,000 | | | 3,230,875 | |
| | Nihon Seiko Co., Ltd. | 18,000 | | | 66,087 | |
| | Nihon Yamamura Glass Co., Ltd. | 490,000 | | | 1,132,536 | |
| # | | Nippon Carbide Industries Co., Inc. | 201,000 | | | 294,538 | |
| # | | Nippon Chemical Industrial Co., Ltd. | 281,000 | | | 500,107 | |
| # | | Nippon Chutetsukan K.K. | 50,000 | | | 109,321 | |
| # | | Nippon Chuzo K.K. | 111,000 | | | 199,128 | |
| | Nippon Coke & Engineering Co., Ltd. | 863,000 | | | 1,174,904 | |
| # | | Nippon Concrete Industries Co., Ltd. | 180,000 | | | 430,401 | |
| | Nippon Denko Co., Ltd. | 394,000 | | | 2,101,369 | |
| | Nippon Fine Chemical Co., Ltd. | 85,600 | | | 546,043 | |
| # | | Nippon Kasei Chemical Co., Ltd. | 309,000 | | | 571,605 | |
| #* | | Nippon Kinzoku Co., Ltd. | 222,000 | | | 373,202 | |
| # | | Nippon Koshuha Steel Co., Ltd. | 366,000 | | | 385,988 | |
| | Nippon Light Metal Co., Ltd. | 2,002,000 | | | 2,905,062 | |
| #* | | Nippon Metal Industry Co., Ltd. | 556,000 | | | 543,802 | |
| | Nippon Paint Co., Ltd. | 34,200 | | | 260,398 | |
| | Nippon Pigment Co., Ltd. | 43,000 | | | 109,141 | |
| | Nippon Pillar Packing Co., Ltd. | 83,000 | | | 530,273 | |
| | Nippon Soda Co., Ltd. | 557,000 | | | 2,564,038 | |
| | Nippon Synthetic Chemical Industry Co., Ltd. (The) | 256,000 | | | 1,422,081 | |
| # | | Nippon Valqua Industries, Ltd. | 328,000 | | | 823,114 | |
| * | | Nippon Yakin Kogyo Co., Ltd. | 409,000 | | | 716,389 | |
| | Nittetsu Mining Co., Ltd. | 375,000 | | | 1,522,225 | |
| | Nitto FC Co., Ltd. | 72,000 | | | 416,953 | |
| # | | NOF Corp. | 726,000 | | | 3,403,317 | |
| | Ohara, Inc. | 3,100 | | | 30,113 | |
| | Okabe Co., Ltd. | 186,900 | | | 911,355 | |
| | Okamoto Industries, Inc. | 400,000 | | | 1,634,911 | |
| | Okura Industrial Co., Ltd. | 305,000 | | | 1,128,362 | |
| | Osaka Organic Chemical Industry, Ltd. | 66,000 | | | 310,446 | |
| | Osaka Steel Co., Ltd. | 77,700 | | | 1,307,595 | |
| | Pacific Metals Co., Ltd. | 546,000 | | | 3,154,129 | |
108
The Japanese Small Company Series
continued
| | | | SHARES | | VALUE†† | |
| Materials — (Continued) | | | | | |
| | Pack Corp. (The) | 66,200 | | $ | 994,615 | |
| | Riken Technos Corp. | 197,000 | | | 600,908 | |
| * | | S Science Co., Ltd. | 2,704,000 | | | 137,973 | |
| # | | S.T. Chemical Co., Ltd. | 77,000 | | | 1,001,668 | |
| | Sakai Chemical Industry Co., Ltd. | 375,000 | | | 1,486,335 | |
| | Sakata INX Corp. | 196,000 | | | 862,160 | |
| | Sanyo Chemical Industries, Ltd. | 305,000 | | | 1,972,347 | |
| | Sanyo Special Steel Co., Ltd. | 480,300 | | | 2,613,185 | |
| | Sekisui Plastics Co., Ltd. | 209,000 | | | 824,430 | |
| | Shikoku Chemicals Corp. | 184,000 | | | 1,031,679 | |
| | Shinagawa Refractories Co., Ltd. | 224,000 | | | 616,277 | |
| | Shin-Etsu Polymer Co., Ltd. | 224,100 | | | 1,072,455 | |
| | Shinko Wire Co., Ltd. | 184,000 | | | 266,482 | |
| | Somar Corp. | 43,000 | | | 106,544 | |
| # | | Stella Chemifa Corp. | 42,600 | | | 1,233,870 | |
| # | | Sumitomo Bakelite Co., Ltd. | 591,000 | | | 3,460,413 | |
| * | | Sumitomo Light Metal Industries, Ltd. | 1,757,000 | | | 1,498,306 | |
| # | | Sumitomo Osaka Cement Co., Ltd. | 1,640,000 | | | 4,968,204 | |
| | Sumitomo Pipe & Tube Co., Ltd. | 108,100 | | | 688,879 | |
| | Sumitomo Seika Chemicals Co., Ltd. | 223,000 | | | 1,006,024 | |
| | T. Hasegawa Co., Ltd. | 121,300 | | | 1,921,467 | |
| | Taiheiyo Cement Corp. | 2,664,000 | | | 5,175,243 | |
| | Taisei Lamick Co., Ltd. | 18,500 | | | 551,153 | |
| # | | Taiyo Holdings Co., Ltd. | 66,000 | | | 1,725,532 | |
| | Takasago International Corp. | 356,000 | | | 1,662,330 | |
| | Takiron Co., Ltd. | 304,000 | | | 1,018,030 | |
| | Tayca Corp. | 151,000 | | | 583,248 | |
| | Tenma Corp. | 87,000 | | | 755,331 | |
| # | | Titan Kogyo K.K. | 63,000 | | | 312,077 | |
| | Toagosei Co., Ltd. | 1,096,000 | | | 4,895,489 | |
| # | | Toda Kogyo Corp. | 161,000 | | | 1,194,398 | |
| # | | Toho Titanium Co., Ltd. | 120,500 | | | 2,570,847 | |
| | Toho Zinc Co., Ltd. | 528,000 | | | 2,152,981 | |
| | Tokai Carbon Co., Ltd. | 825,000 | | | 4,092,463 | |
| | Tokushu Tokai Paper Co., Ltd. | 501,580 | | | 1,066,815 | |
| # | | Tokuyama Corp. | 810,000 | | | 2,919,347 | |
| | Tokyo Ohka Kogyo Co., Ltd. | 169,200 | | | 3,515,968 | |
| # | | Tokyo Rope Manufacturing Co., Ltd. | 558,000 | | | 1,271,339 | |
| | Tokyo Steel Manufacturing Co., Ltd. | 229,300 | | | 1,922,185 | |
| | Tokyo Tekko Co., Ltd. | 3,000 | | | 8,484 | |
| # | | Tomoegawa Paper Co., Ltd. | 125,000 | | | 263,043 | |
| | Tomoku Co., Ltd. | 294,000 | | | 775,649 | |
| | Topy Industries, Ltd. | 781,000 | | | 1,887,000 | |
| | Toyo Ink Manufacturing Co., Ltd. | 724,000 | | | 2,868,747 | |
| | Toyo Kohan Co., Ltd. | 247,000 | | | 974,688 | |
| | TYK Corp. | 138,000 | | | 272,624 | |
| # | | Ube Material Industries, Ltd. | 226,000 | | | 782,021 | |
| | Wood One Co., Ltd. | 169,000 | | | 622,864 | |
| | Yodogawa Steel Works, Ltd. | 786,500 | | | 3,124,879 | |
| * | | Yuki Gosei Kogyo Co., Ltd. | 64,000 | | | 130,824 | |
| | Yushiro Chemical Industry Co., Ltd. | 47,100 | | | 546,658 | |
| Total Materials | | | | 175,861,301 | |
| | | | | | |
| Utilities — (0.5%) | | | | | |
| | Hokkaido Gas Co., Ltd. | 210,000 | | | 708,766 | |
| | Hokuriku Gas Co., Ltd. | 99,000 | | | 265,593 | |
| | Okinawa Electric Power Co., Ltd. | 62,571 | | | 2,551,409 | |
| | Saibu Gas Co., Ltd. | 1,270,000 | | | 3,132,006 | |
109
The Japanese Small Company Series
continued
| | | | SHARES | | VALUE†† | |
| Utilities — (Continued) | | | | | | |
| | Shizuoka Gas Co., Ltd. | | 241,500 | | $ | 1,459,705 | |
| Total Utilities | | | | | 8,117,479 | |
| TOTAL COMMON STOCKS | | | | | 1,486,514,319 | |
| RIGHTS/WARRANTS — (0.0%) | | | | | | |
| | *Oak Capital Corp. Warrants 11/30/11 | | 55,735 | | | — | |
| | |
| | | SHARES/ | | | | |
| | | FACE | | | | |
| | | AMOUNT | | VALUE† | |
| | | (000) | | | | |
| SECURITIES LENDING COLLATERAL — (10.8%) | | | | | | |
| §@ | | DFA Short Term Investment Fund | 179,334,778 | | | 179,334,778 | |
| @ | | Repurchase Agreement, Deutsche Bank Securities, Inc. 0.11%, | | | | | | |
| | 11/01/11 (Collateralized by FNM A 3.500%, 11/01/31, valued at | | | | | | |
| | $383,050) to be repurchased at $375,540 | $ | 376 | | | 375,539 | |
| TOTAL SECURITIES LENDING COLLATERAL | | | | | 179,710,317 | |
| TOTAL INVESTMENTS — (100.0%) | | | | | | |
| | (Cost $1,814,743,819) | | | | $ | 1,666,224,636 | |
110
THE ASIA PACIFIC SMALL COMPANY SERIES
SCHEDULE OF INVESTMENTS
OCTOBER 31, 2011
| | | | SHARES | | VALUE†† | |
| COMMON STOCKS — (82.0%) | | | | | |
| AUSTRALIA — (51.7%) | | | | | |
| * | | ABM Resources NL | 4,447,721 | | $ | 290,936 | |
| #* | | A-Cap Resources, Ltd. | 332,583 | | | 99,614 | |
| * | | Acer Energy, Ltd. | 229,729 | | | 28,427 | |
| # | | Acrux, Ltd. | 494,126 | | | 1,749,486 | |
| #* | | Adamus Resources, Ltd. | 1,337,620 | | | 973,720 | |
| | Adelaide Brighton, Ltd. | 1,927,272 | | | 5,766,974 | |
| # | | Aditya Birla Minerals, Ltd. | 878,000 | | | 891,877 | |
| * | | ADX Energy, Ltd. | 473,905 | | | 49,467 | |
| * | | AED Oil, Ltd. | 363,401 | | | 55,533 | |
| * | | African Iron, Ltd. | 37,307 | | | 10,851 | |
| * | | Ainsworth Game Technology, Ltd. | 326,556 | | | 117,784 | |
| * | | AJ Lucas Group, Ltd. | 317,969 | | | 452,394 | |
| * | | Alchemia, Ltd. | 724,903 | | | 210,930 | |
| # | | Alesco Corp., Ltd. | 457,971 | | | 675,535 | |
| #* | | Alkane Resources, Ltd. | 938,520 | | | 1,137,424 | |
| * | | Alliance Resources, Ltd. | 444,483 | | | 62,232 | |
| * | | Allied Gold Mining P.L.C. | 17,047 | | | 43,521 | |
| #* | | Allied Healthcare Group, Ltd. | 310,840 | | | 13,061 | |
| #* | | Altona Mining, Ltd. | 1,108,169 | | | 287,829 | |
| * | | Amadeus Energy, Ltd. | 819,137 | | | 173,432 | |
| | Amalgamated Holdings, Ltd. | 462,247 | | | 2,745,180 | |
| | Amcom Telecommunications, Ltd. | 482,578 | | | 422,263 | |
| * | | Ampella Mining, Ltd. | 225,174 | | | 426,612 | |
| | Ansell, Ltd. | 503,479 | | | 7,363,989 | |
| #* | | Antares Energy, Ltd. | 934,515 | | | 394,325 | |
| | AP Eagers, Ltd. | 44,147 | | | 533,632 | |
| # | | APA Group, Ltd. | 1,403,768 | | | 6,401,846 | |
| * | | Apex Minerals NL | 3,458,027 | | | 28,671 | |
| # | | APN News & Media, Ltd. | 1,762,638 | | | 1,616,607 | |
| * | | Aquarius Platinum, Ltd. | 348,079 | | | 1,021,115 | |
| #* | | Arafura Resources, Ltd. | 1,093,749 | | | 690,611 | |
| | ARB Corp., Ltd. | 339,077 | | | 2,847,494 | |
| | Ariadne Australia, Ltd. | 267,324 | | | 88,707 | |
| # | | Aristocrat Leisure, Ltd. | 1,611,890 | | | 3,816,054 | |
| # | | ASG Group, Ltd. | 351,392 | | | 320,870 | |
| #* | | Aspire Mining, Ltd. | 902,429 | | | 394,778 | |
| * | | Astron, Ltd. | 87,221 | | | 264,514 | |
| * | | Atlantic, Ltd. | 238,482 | | | 398,179 | |
| | Atlas Iron, Ltd. | 41,166 | | | 133,517 | |
| #* | | Aurora Oil & Gas, Ltd. | 1,265,748 | | | 3,811,235 | |
| | Ausdrill, Ltd. | 1,006,775 | | | 3,070,980 | |
| # | | Ausenco, Ltd. | 173,244 | | | 487,963 | |
| #* | | Ausgold, Ltd. | 52,096 | | | 65,271 | |
| # | | Austal, Ltd. | 581,980 | | | 1,383,966 | |
| * | | Austar United Communications, Ltd. | 2,887,442 | | | 3,496,638 | |
| | Austbrokers Holdings, Ltd. | 86,074 | | | 567,304 | |
| # | | Austin Engineering, Ltd. | 172,059 | | | 708,425 | |
| * | | Austpac Resources NL | 2,524,951 | | | 121,305 | |
| * | | Australian Agricultural Co., Ltd. | 921,392 | | | 1,352,018 | |
| # | | Australian Infrastructure Fund NL | 3,159,690 | | | 6,272,817 | |
| | Australian Pharmaceutical Industries, Ltd. | 5,528,865 | | | 1,736,287 | |
| * | | Australian Worldwide Exploration, Ltd. | 1,952,017 | | | 2,815,086 | |
| | Automotive Holdings Group NL | 548,754 | | | 1,200,419 | |
| * | | Autron Corporation, Ltd. | 989,247 | | | 13,553 | |
| #* | | Avanco Resources, Ltd. | 2,010,636 | | | 228,676 | |
| # | | AVJennings, Ltd. | 5,185,036 | | | 2,400,232 | |
| #* | | Azumah Resources, Ltd. | 737,953 | | | 306,717 | |
| * | | Ballarat South Gold, Ltd. | 1,996 | | | — | |
111
The Asia Pacific Small Company Series
continued
| | | | SHARES | | VALUE†† | |
| AUSTRALIA — (Continued) | | | | | |
| #* | | Bandanna Energy, Ltd. | 622,869 | | $ | 531,615 | |
| # | | Bank of Queensland, Ltd. | 384,781 | | | 3,383,389 | |
| #* | | Bannerman Resources, Ltd. | 332,217 | | | 92,978 | |
| #* | | BC Iron, Ltd. | 243,697 | | | 615,413 | |
| | Beach Energy, Ltd. | 4,828,492 | | | 5,934,225 | |
| * | | Beadell Resources, Ltd. | 1,500,515 | | | 1,230,504 | |
| #* | | Berkeley Resources, Ltd. | 434,006 | | | 145,690 | |
| | Beyond International, Ltd. | 61,256 | | | 44,545 | |
| # | | Billabong International, Ltd. | 703,518 | | | 3,142,876 | |
| * | | Bionomics, Ltd. | 207,468 | | | 89,668 | |
| * | | Biota Holdings, Ltd. | 1,027,571 | | | 863,989 | |
| * | | Bisalloy Steel Group, Ltd. | 469,001 | | | 101,058 | |
| # | | Blackmores, Ltd. | 76,842 | | | 2,372,615 | |
| * | | BlueScope Steel, Ltd. | 3,577,801 | | | 3,129,953 | |
| #* | | BMA Gold, Ltd. | 1,829,221 | | | 1,049,182 | |
| | Boart Longyear Group | 1,792,094 | | | 6,100,440 | |
| * | | Boom Logistics, Ltd. | 51,533 | | | 16,202 | |
| * | | Boulder Steel, Ltd. | 1,667,795 | | | 86,559 | |
| * | | Bow Energy, Ltd. | 928,159 | | | 1,442,061 | |
| | Bradken, Ltd. | 708,039 | | | 5,710,618 | |
| | Breville Group, Ltd. | 598,466 | | | 1,918,394 | |
| # | | Brickworks, Ltd. | 132,797 | | | 1,558,928 | |
| * | | Brockman Resources, Ltd. | 7,285 | | | 13,002 | |
| | BSA, Ltd. | 642,847 | | | 135,425 | |
| # | | BT Investment Management, Ltd. | 172,259 | | | 363,762 | |
| * | | Buccaneer Energy, Ltd. | 2,428,539 | | | 175,894 | |
| * | | Buru Energy, Ltd. | 88,374 | | | 83,899 | |
| | Cabcharge Australia, Ltd. | 501,916 | | | 2,209,763 | |
| | Calliden Group, Ltd. | 633,393 | | | 113,310 | |
| | Campbell Brothers, Ltd. | 261,443 | | | 12,585,834 | |
| #* | | Cape Lambert Resources, Ltd. | 373,413 | | | 164,264 | |
| * | | Cape Range Wireless, Ltd. | 7,260 | | | — | |
| * | | Capral, Ltd. | 58,499 | | | 12,134 | |
| # | | Cardno, Ltd. | 316,614 | | | 1,740,510 | |
| #* | | Carnarvon Petroleum, Ltd. | 3,885,525 | | | 541,232 | |
| * | | Carnegie Wave Energy, Ltd. | 1,008,948 | | | 75,912 | |
| # | | carsales.com, Ltd. | 809,574 | | | 4,185,086 | |
| # | | Cash Converters International, Ltd. | 1,180,931 | | | 534,117 | |
| #* | | Catalpa Resources, Ltd. | 907,492 | | | 1,641,675 | |
| * | | CDS Technologies, Ltd. | 13,276 | | | — | |
| | Cedar Woods Properties, Ltd. | 111,357 | | | 408,187 | |
| | Cellnet Group, Ltd. | 520,067 | | | 185,425 | |
| * | | Centaurus Metals, Ltd. | 143,557 | | | 109,455 | |
| * | | Central Petroleum, Ltd. | 1,759,865 | | | 98,979 | |
| * | | Centrebet International, Ltd. Claim Units | 81,336 | | | — | |
| * | | Centrex Metals, Ltd. | 51,889 | | | 16,345 | |
| #* | | Ceramic Fuel Cells, Ltd. | 3,181,070 | | | 430,481 | |
| #* | | Cerro Resources NL | 1,961,035 | | | 324,307 | |
| * | | CGA Mining, Ltd. | 10,124 | | | 24,798 | |
| #* | | Chalice Gold Mines, Ltd. | 320,684 | | | 86,935 | |
| | Challenger, Ltd. | 1,063,324 | | | 5,069,014 | |
| | Chandler Macleod Group, Ltd. | 338,118 | | | 124,506 | |
| * | | Chemeq, Ltd. | 166,742 | | | — | |
| * | | ChemGenex Pharmaceuticals, Ltd. | 115,291 | | | 3,038 | |
| * | | Chesser Resources, Ltd. | 156,921 | | | 95,677 | |
| #* | | Citigold Corp., Ltd. | 3,765,806 | | | 284,705 | |
| # | | Clarius Group, Ltd. | 1,099,217 | | | 605,202 | |
| #* | | Clinuvel Pharmaceuticals, Ltd. | 118,435 | | | 185,220 | |
| # | | Clough, Ltd. | 1,527,345 | | | 1,287,423 | |
| | Clover Corp., Ltd. | 269,348 | | | 83,302 | |
| #* | | CO2 Group, Ltd. | 844,559 | | | 140,905 | |
112
The Asia Pacific Small Company Series
continued
| | | | SHARES | | VALUE†† | |
| AUSTRALIA — (Continued) | | | | | |
| #* | | Coal of Africa, Ltd. | 589,980 | | $ | 491,234 | |
| #* | | Coalspur Mines, Ltd. | 1,239,823 | | | 2,404,728 | |
| * | | Cockatoo Coal, Ltd. | 3,240,540 | | | 1,291,889 | |
| # | | Codan, Ltd. | 156,399 | | | 212,699 | |
| | Coffey International, Ltd. | 1,048,636 | | | 415,588 | |
| | Collection House, Ltd. | 1,698,942 | | | 1,441,834 | |
| * | | Comet Ridge, Ltd. | 65,567 | | | 10,669 | |
| # | | ConnectEast Group, Ltd. | 30,321 | | | 17,416 | |
| # | | Consolidated Media Holdings, Ltd. | 1,276,820 | | | 3,506,949 | |
| * | | Continental Coal, Ltd. | 461,945 | | | 102,357 | |
| * | | Cooper Energy, Ltd. | 336,842 | | | 135,432 | |
| # | | Count Financial, Ltd. | 858,791 | | | 1,251,875 | |
| | Coventry Group, Ltd. | 144,778 | | | 332,344 | |
| | Credit Corp. Group, Ltd. | 110,382 | | | 453,765 | |
| * | | Crusader Resources, Ltd. | 155,861 | | | 182,570 | |
| # | | CSG, Ltd. | 674,612 | | | 803,472 | |
| | CSR, Ltd. | 2,025,158 | | | 5,158,339 | |
| * | | CTI Logistics, Ltd. | 6,000 | | | 7,272 | |
| #* | | Cudeco, Ltd. | 399,317 | | | 1,317,225 | |
| #* | | Cue Energy Resources, Ltd. | 1,225,966 | | | 299,321 | |
| # | | Customers, Ltd. | 477,130 | | | 532,432 | |
| | Data#3, Ltd. | 19,405 | | | 257,487 | |
| # | | David Jones, Ltd. | 1,783,074 | | | 6,294,519 | |
| | Decmil Group, Ltd. | 326,140 | | | 720,547 | |
| * | | Deep Yellow, Ltd. | 850,894 | | | 109,311 | |
| # | | Devine, Ltd. | 1,989,993 | | | 468,948 | |
| #* | | Discovery Metals, Ltd. | 1,249,162 | | | 1,803,263 | |
| | Domino’s Pizza Enterprises, Ltd. | 11,342 | | | 79,925 | |
| #* | | Downer EDI, Ltd. | 1,591,674 | | | 5,054,618 | |
| * | | Dragon Mining, Ltd. | 168,012 | | | 234,717 | |
| #* | | Drillsearch Energy, Ltd. | 409,967 | | | 262,341 | |
| | DUET Group, Ltd. | 4,437,176 | | | 7,732,961 | |
| # | | DuluxGroup, Ltd. | 1,193,687 | | | 3,288,564 | |
| | DWS Advanced Business Solutions, Ltd. | 223,802 | | | 313,375 | |
| #* | | Dyesol, Ltd. | 383,671 | | | 133,883 | |
| #* | | Eastern Star Gas, Ltd. | 3,259,013 | | | 3,005,391 | |
| #* | | Elders, Ltd. | 1,380,363 | | | 401,341 | |
| #* | | Elemental Minerals, Ltd. | 388,188 | | | 505,628 | |
| * | | Ellect Holdings, Ltd. | 482 | | | — | |
| * | | Ellex Medical Lasers, Ltd. | 164,826 | | | 22,975 | |
| | Emeco Holdings, Ltd. | 2,143,907 | | | 2,221,058 | |
| #* | | Energy Resources of Australia, Ltd. | 638,803 | | | 1,307,761 | |
| #* | | Energy World Corp., Ltd. | 3,906,481 | | | 2,352,188 | |
| * | | Engenco, Ltd. | 228,803 | | | 22,092 | |
| | Envestra, Ltd. | 5,142,027 | | | 3,464,898 | |
| #* | | Equatorial Resources, Ltd. | 176,571 | | | 426,114 | |
| | Euroz, Ltd. | 74,221 | | | 108,616 | |
| * | | Exco Resources, Ltd. | 429,909 | | | 315,750 | |
| * | | Extract Resources, Ltd. | 262,940 | | | 2,105,378 | |
| # | | Fantastic Holdings, Ltd. | 355,613 | | | 838,354 | |
| * | | FAR, Ltd. | 2,769,553 | | | 89,101 | |
| | Finbar Group, Ltd. | 58,051 | | | 58,271 | |
| * | | Finders Resources, Ltd. | 7,442 | | | 2,956 | |
| # | | FKP Property Group, Ltd. | 2,647,008 | | | 1,364,198 | |
| # | | Fleetwood Corp., Ltd. | 284,707 | | | 3,637,381 | |
| # | | FlexiGroup, Ltd. | 597,372 | | | 1,407,028 | |
| # | | Flight Centre, Ltd. | 192,954 | | | 4,006,413 | |
| #* | | Flinders Mines, Ltd. | 6,909,293 | | | 1,109,458 | |
| #* | | Focus Minerals, Ltd. | 14,997,678 | | | 932,181 | |
| * | | Forest Enterprises Australia, Ltd. | 2,849,173 | | | — | |
| # | | Forge Group, Ltd. | 236,028 | | | 1,168,263 | |
113
The Asia Pacific Small Company Series
continued
| | | | | SHARES | | VALUE†† | |
| AUSTRALIA — (Continued) | | | | | | |
| #* | | Forte Energy NL | | 1,036,232 | | $ | 39,026 | |
| | G8 Education, Ltd. | | 67,817 | | | 35,436 | |
| #* | | Galaxy Resources, Ltd. | | 760,450 | | | 507,429 | |
| | Gazal Corp., Ltd. | | 104,542 | | | 196,883 | |
| #* | | Geodynamics, Ltd. | | 1,015,653 | | | 248,163 | |
| #* | | Gindalbie Metals, Ltd. | | 2,600,255 | | | 1,478,320 | |
| * | | Gloucester Coal, Ltd. | | 226,467 | | | 1,616,400 | |
| * | | Golden Rim Resources, Ltd. | | 722,577 | | | 82,543 | |
| # | | Goodman Fielder, Ltd. | | 8,233,537 | | | 4,788,349 | |
| | GrainCorp, Ltd. | | 693,457 | | | 5,712,269 | |
| | Grange Resources, Ltd. | | 1,234,843 | | | 578,110 | |
| #* | | Great Southern, Ltd. | | 9,302,784 | | | — | |
| #* | | Greenland Minerals & Energy, Ltd. | | 711,078 | | | 392,362 | |
| #* | | Gryphon Minerals, Ltd. | | 857,705 | | | 1,259,787 | |
| | GUD Holdings, Ltd. | | 432,916 | | | 3,548,539 | |
| * | | Gujarat NRE Coking Coal, Ltd. | | 119,865 | | | 30,893 | |
| #* | | Gunns, Ltd. | | 2,872,620 | | | 793,573 | |
| # | | GWA Group, Ltd. | | 1,019,230 | | | 2,441,808 | |
| * | | Hastie Group, Ltd. | | 810,423 | | | 89,134 | |
| * | | Havilah Resources NL | | 258,836 | | | 145,834 | |
| * | | HFA Holdings, Ltd. | | 235,865 | | | 229,659 | |
| | HGL, Ltd. | | 102,586 | | | 127,030 | |
| * | | Highlands Pacific, Ltd. | | 2,651,500 | | | 593,922 | |
| * | | Hillgrove Resources, Ltd. | | 909,242 | | | 225,398 | |
| # | | Hills Holdings, Ltd. | | 986,165 | | | 1,123,434 | |
| #* | | Horizon Oil, Ltd. | | 3,560,142 | | | 884,645 | |
| * | | Hutchison Telecommunications Australia, Ltd. | | 7,610,556 | | | 495,224 | |
| #* | | Icon Energy, Ltd. | | 1,014,750 | | | 148,758 | |
| # | | iiNet, Ltd. | | 489,281 | | | 1,326,167 | |
| | Iluka Resources, Ltd. | | 573,137 | | | 9,528,200 | |
| | Imdex, Ltd. | | 813,645 | | | 1,776,663 | |
| | IMF Australia, Ltd. | | 314,016 | | | 475,928 | |
| * | | IMX Resources, Ltd. | | 594,082 | | | 230,687 | |
| # | | Independence Group NL | | 892,724 | | | 4,935,443 | |
| * | | Indo Mines, Ltd. | | 81,968 | | | 29,672 | |
| #* | | Indophil Resources NL | | 3,118,946 | | | 1,234,785 | |
| # | | Industrea, Ltd. | | 1,420,051 | | | 1,904,824 | |
| * | | Industrial Minerals Corp., Ltd. | | 23,969 | | | 4,325 | |
| # | | Infigen Energy, Ltd. | | 1,622,704 | | | 490,078 | |
| | Infomedia, Ltd. | | 1,458,074 | | | 336,522 | |
| #* | | Integra Mining, Ltd. | | 3,188,345 | | | 1,767,756 | |
| | Integrated Research, Ltd. | | 261,513 | | | 136,043 | |
| #* | | Intrepid Mines, Ltd. | | 1,794,707 | | | 2,132,485 | |
| # | | Invocare, Ltd. | | 572,622 | | | 4,172,041 | |
| # | | IOOF Holdings, Ltd. | | 989,055 | | | 6,550,695 | |
| | Iress Market Technology, Ltd. | | 434,895 | | | 3,465,758 | |
| #* | | Iron Ore Holdings, Ltd. | | 336,216 | | | 444,493 | |
| #* | | Ivanhoe Australia, Ltd. | | 396,947 | | | 441,385 | |
| # | | JB Hi-Fi, Ltd. | | 407,557 | | | 6,726,320 | |
| #* | | Jupiter Mines, Ltd. | | 465,443 | | | 162,596 | |
| | K&S Corp., Ltd. | | 210,812 | | | 278,801 | |
| * | | Kagara, Ltd. | | 1,731,649 | | | 724,189 | |
| #* | | Kangaroo Resources, Ltd. | | 2,778,905 | | | 453,398 | |
| * | | Karoon Gas Australia, Ltd. | | 667,086 | | | 3,078,403 | |
| #* | | Kasbah Resources, Ltd. | | 478,599 | | | 99,482 | |
| * | | Kimberley Metals, Ltd. | | 204,110 | | | 65,643 | |
| # | | Kingsgate Consolidated, Ltd. | | 560,879 | | | 4,421,985 | |
| #* | | Kingsrose Mining, Ltd. | | 464,332 | | | 756,934 | |
| * | | Lednium, Ltd. | | 195,019 | | | 16,442 | |
| | Lemarne Corp., Ltd. | | 25,882 | | | 100,746 | |
| * | | Linc Energy, Ltd. | | 1,232,302 | | | 2,645,397 | |
114
The Asia Pacific Small Company Series
continued
| | | | | SHARES | | VALUE†† | |
| AUSTRALIA — (Continued) | | | | | | |
| #* | | Liquefied Natural Gas, Ltd. | | 595,144 | | $ | 214,302 | |
| | Little World Beverages, Ltd. | | 502 | | | 1,807 | |
| | Lycopodium, Ltd. | | 56,126 | | | 361,363 | |
| # | | M2 Telecommunications Group, Ltd. | | 345,036 | | | 1,026,043 | |
| * | | MacMahon Holdings, Ltd. | | 3,174,294 | | | 2,011,281 | |
| * | | Macmin Silver, Ltd. | | 371,910 | | | 39,084 | |
| | Macquarie Telecom Group, Ltd. | | 35,019 | | | 304,442 | |
| #* | | Magma Metals, Ltd. | | 240,771 | | | 30,109 | |
| * | | Manhattan Corp., Ltd. | | 7,972 | | | 2,863 | |
| #* | | Marengo Mining, Ltd. | | 1,428,204 | | | 295,240 | |
| # | | Matrix Composites & Engineering, Ltd. | | 130,877 | | | 437,499 | |
| | MaxiTRANS Industries, Ltd. | | 942,578 | | | 342,164 | |
| | | Mayne Pharma Group, Ltd. | | 205,191 | | | 82,332 | |
| * | | McGuigan Simeon Wines, Ltd. | | 2,437,348 | | | 705,680 | |
| # | | McMillan Shakespeare, Ltd. | | 228,148 | | | 2,273,908 | |
| | McPherson’s, Ltd. | | 303,441 | | | 734,177 | |
| # | | Medusa Mining, Ltd. | | 579,085 | | | 4,070,719 | |
| # | | Melbourne IT, Ltd. | | 437,638 | | | 649,414 | |
| #* | | MEO Australia, Ltd. | | 681,039 | | | 137,903 | |
| # | | Mermaid Marine Australia, Ltd. | | 906,563 | | | 2,921,190 | |
| #* | | Mesoblast, Ltd. | | 232,262 | | | 1,974,685 | |
| * | | Metals X, Ltd. | | 173,131 | | | 43,428 | |
| #* | | Metgasco, Ltd. | | 667,052 | | | 338,844 | |
| * | | Metminco, Ltd. | | 1,879,249 | | | 406,261 | |
| * | | MetroCoal, Ltd. | | 68,725 | | | 49,321 | |
| #* | | MHM Metals, Ltd. | | 226,490 | | | 173,805 | |
| * | | Mikoh Corp., Ltd. | | 777,771 | | | 19,541 | |
| # | | Mincor Resources NL | | 990,706 | | | 876,217 | |
| * | | Mineral Deposits, Ltd. | | 155,272 | | | 1,049,157 | |
| | Mineral Resources, Ltd. | | 419,678 | | | 4,920,651 | |
| #* | | Mirabela Nickel, Ltd. | | 1,206,109 | | | 2,073,822 | |
| #* | | Molopo Energy, Ltd. | | 1,186,993 | | | 900,996 | |
| #* | | Moly Mines, Ltd. | | 25,253 | | | 13,282 | |
| # | | Monadelphous Group, Ltd. | | 318,887 | | | 6,064,967 | |
| * | | Morning Star Gold NL | | 332,749 | | | 113,604 | |
| | Mortgage Choice, Ltd. | | 631,109 | | | 829,865 | |
| # | | Mount Gibson Iron, Ltd. | | 2,962,399 | | | 4,738,207 | |
| | MSF Sugar, Ltd. | | 76,721 | | | 268,679 | |
| #* | | Murchison Metals, Ltd. | | 1,229,022 | | | 380,868 | |
| # | | Myer Holdings, Ltd. | | 2,456,107 | | | 6,703,584 | |
| | MyState, Ltd. | | 802 | | | 3,082 | |
| #* | | Nanosonics, Ltd. | | 259,364 | | | 149,509 | |
| | National Can Industries, Ltd. | | 97,017 | | | 109,403 | |
| #* | | Navigator Resources, Ltd. | | 1,876,284 | | | 53,230 | |
| # | | Navitas, Ltd. | | 1,157,537 | | | 5,013,315 | |
| #* | | New Guinea Energy, Ltd. | | 359,345 | | | 21,357 | |
| * | | Newland Resources, Ltd. | | 1,958,775 | | | 133,608 | |
| * | | Nexbis, Ltd. | | 580,630 | | | 35,148 | |
| * | | Nexus Energy, Ltd. | | 4,137,686 | | | 918,998 | |
| # | | NIB Holdings, Ltd. | | 478,733 | | | 753,829 | |
| * | | Nido Petroleum, Ltd. | | 6,093,154 | | | 330,320 | |
| #* | | Noble Mineral Resources, Ltd. | | 859,168 | | | 548,082 | |
| | Norfolk Group, Ltd. | | 302,473 | | | 366,505 | |
| * | | North Australian Diamonds, Ltd. | | 16,663 | | | 6,097 | |
| #* | | Northern Iron, Ltd. | | 390,502 | | | 473,036 | |
| * | | Northern Star Resources, Ltd. | | 739,223 | | | 441,639 | |
| * | | Norton Gold Fields, Ltd. | | 299,909 | | | 61,677 | |
| | NRW Holdings, Ltd. | | 650,440 | | | 1,654,955 | |
| #* | | Nucoal Resources NL | | 429,538 | | | 156,383 | |
| * | | Nufarm, Ltd. | | 638,490 | | | 3,141,961 | |
| | Oakton, Ltd. | | 378,695 | | | 666,729 | |
115
The Asia Pacific Small Company Series
continued
| | | | | SHARES | | VALUE†† | |
| AUSTRALIA — (Continued) | | | | | | |
| #* | | Oilex, Ltd. | | 247,428 | | $ | 65,691 | |
| #* | | Orocobre, Ltd. | | 257,530 | | | 317,630 | |
| # | | OrotonGroup, Ltd. | | 89,486 | | | 773,346 | |
| * | | Otto Energy, Ltd. | | 1,518,553 | | | 115,364 | |
| # | | Pacific Brands, Ltd. | | 4,412,120 | | | 2,756,610 | |
| * | | Pacific Niugini, Ltd. | | 200,616 | | | 79,684 | |
| * | | Paladin Energy, Ltd. | | 1,158,193 | | | 1,768,701 | |
| * | | Pan Pacific Petroleum NL | | 1,094,343 | | | 132,374 | |
| * | | PanAust, Ltd. | | 1,780,618 | | | 6,016,882 | |
| #* | | Pancontinental Oil & Gas NL | | 1,057,588 | | | 115,189 | |
| # | | Panoramic Resources, Ltd. | | 943,159 | | | 1,353,475 | |
| * | | PaperlinX, Ltd. | | 2,771,649 | | | 275,217 | |
| | Patties Foods, Ltd. | | 36,136 | | | 62,164 | |
| # | | Peet, Ltd. | | 1,096,798 | | | 1,396,187 | |
| #* | | Peninsula Energy, Ltd. | | 5,178,834 | | | 225,034 | |
| * | | Perilya, Ltd. (6681584) | | 891,134 | | | 424,090 | |
| * | | Perilya, Ltd. (B3R3QH1) | | 445,567 | | | 216,007 | |
| # | | Perpetual Trustees Australia, Ltd. | | 167,142 | | | 3,950,909 | |
| #* | | Perseus Mining, Ltd. | | 1,605,654 | | | 5,309,539 | |
| #* | | Pharmaxis, Ltd. | | 764,024 | | | 1,037,608 | |
| * | | Photon Group, Ltd. | | 240,874 | | | 10,347 | |
| * | | PlantCorp. NL | | 4,329 | | | — | |
| #* | | Platinum Australia, Ltd. | | 1,251,560 | | | 232,135 | |
| #* | | Pluton Resources, Ltd. | | 538,056 | | | 154,966 | |
| | PMP, Ltd. | | 2,395,607 | | | 1,435,567 | |
| * | | Poseidon Nickel, Ltd. | | 452,002 | | | 101,408 | |
| # | | Premier Investments, Ltd. | | 217,219 | | | 1,159,812 | |
| #* | | Prima Biomed, Ltd. | | 2,338,194 | | | 459,056 | |
| # | | Primary Health Care, Ltd. | | 1,866,288 | | | 6,495,676 | |
| | Prime Media Group, Ltd. | | 1,777,139 | | | 1,236,596 | |
| # | | PrimeAg, Ltd. | | 64,299 | | | 73,783 | |
| | Programmed Maintenance Service, Ltd. | | 549,269 | | | 1,134,986 | |
| * | | QRxPharma, Ltd. | | 109,867 | | | 183,543 | |
| * | | Quickstep Holdings, Ltd. | | 462,355 | | | 108,066 | |
| * | | Ramelius Resources, Ltd. | | 1,125,876 | | | 1,462,619 | |
| * | | Range Resources, Ltd. | | 51,250 | | | 7,801 | |
| # | | RCR Tomlinson, Ltd. | | 1,056,974 | | | 1,568,081 | |
| # | | REA Group, Ltd. | | 211,832 | | | 2,874,987 | |
| | Reckon, Ltd. | | 207,249 | | | 575,917 | |
| * | | Red 5, Ltd. | | 90,225 | | | 17,598 | |
| * | | Red Fork Energy, Ltd. | | 382,887 | | | 218,375 | |
| | Redflex Holdings, Ltd. | | 377,855 | | | 698,167 | |
| | Reece Australia, Ltd. | | 238,457 | | | 4,689,436 | |
| #* | | Reed Resources, Ltd. | | 633,326 | | | 241,474 | |
| #* | | Regis Resources, Ltd. | | 1,195,060 | | | 3,775,884 | |
| # | | Reject Shop, Ltd. (The) | | 117,972 | | | 1,226,036 | |
| * | | Resolute Mining, Ltd. | | 1,882,950 | | | 3,317,183 | |
| * | | Resource & Investment NL | | 283,117 | | | 199,791 | |
| * | | Resource Equipment, Ltd. | | 118,411 | | | 51,139 | |
| #* | | Resource Generation, Ltd. | | 338,381 | | | 171,498 | |
| | Retail Food Group, Ltd. | | 53,237 | | | 141,791 | |
| #* | | Rex Minerals, Ltd. | | 403,087 | | | 709,112 | |
| #* | | Rialto Energy, Ltd. | | 1,264,038 | | | 446,925 | |
| # | | Ridley Corp., Ltd. | | 1,283,068 | | | 1,569,013 | |
| * | | RiverCity Motorway Group, Ltd. | | 1,563,354 | | | — | |
| #* | | Robust Resources, Ltd. | | 136,513 | | | 199,558 | |
| #* | | Roc Oil Co., Ltd. | | 6,490,268 | | | 2,016,511 | |
| | Rock Building Society, Ltd. | | 31,054 | | | 89,929 | |
| | Runge, Ltd. | | 30,702 | | | 12,706 | |
| # | | Ruralco Holdings, Ltd. | | 88,146 | | | 333,834 | |
| # | | SAI Global, Ltd. | | 1,064,331 | | | 5,301,870 | |
116
The Asia Pacific Small Company Series
continued
| | | | | SHARES | | VALUE†† | |
| AUSTRALIA — (Continued) | | | | | | |
| * | | Salinas Energy, Ltd. | | 1,161,854 | | $ | 418,259 | |
| # | | Salmat, Ltd. | | 664,807 | | | 1,951,353 | |
| #* | | Samson Oil & Gas, Ltd. | | 4,815,117 | | | 556,378 | |
| #* | | Sandfire Resources NL | | 394,850 | | | 2,801,816 | |
| #* | | Saracen Mineral Holdings, Ltd. | | 1,594,324 | | | 1,278,330 | |
| | Schaffer Corp., Ltd. | | 33,766 | | | 145,183 | |
| # | | Sedgman, Ltd. | | 372,558 | | | 760,587 | |
| # | | Seek, Ltd. | | 666,916 | | | 4,323,680 | |
| # | | Select Harvests, Ltd. | | 292,826 | | | 503,866 | |
| * | | Senex Energy, Ltd. | | 1,875,375 | | | 988,884 | |
| # | | Servcorp, Ltd. | | 301,327 | | | 873,712 | |
| #* | | Service Stream, Ltd. | | 1,432,710 | | | 508,243 | |
| | Seven Group Holdings, Ltd. | | 641,345 | | | 5,152,442 | |
| # | | Seven West Media, Ltd. | | 1,335,509 | | | 5,003,193 | |
| # | | Sigma Pharmaceuticals, Ltd. | | 4,898,960 | | | 3,569,851 | |
| * | | Sihayo Gold, Ltd. | | 603,971 | | | 62,609 | |
| * | | Silex System, Ltd. | | 532,291 | | | 1,251,727 | |
| * | | Silver Lake Resources, Ltd. | | 603,018 | | | 2,068,181 | |
| * | | Sipa Resources International NL | | 130,098 | | | 19,538 | |
| # | | Sirtex Medical, Ltd. | | 218,046 | | | 1,071,885 | |
| # | | Skilled Group, Ltd. | | 485,248 | | | 924,602 | |
| | Slater & Gordon, Ltd. | | 24,701 | | | 50,574 | |
| # | | SMS Management & Technology, Ltd. | | 373,130 | | | 2,116,297 | |
| * | | Southern Cross Electrical Engineering, Ltd. | | 16,785 | | | 14,564 | |
| # | | Southern Cross Media Group, Ltd. | | 2,546,520 | | | 3,278,716 | |
| # | | SP Telemedia, Ltd. | | 1,494,571 | | | 2,235,722 | |
| | Spark Infrastructure Group, Ltd. | | 4,783,165 | | | 6,094,155 | |
| # | | Specialty Fashion Group, Ltd. | | 809,557 | | | 515,540 | |
| # | | Spotless Group, Ltd. | | 1,196,861 | | | 2,492,269 | |
| #* | | St. Barbara, Ltd. | | 1,636,736 | | | 3,792,059 | |
| * | | Starpharma Holdings, Ltd. | | 652,875 | | | 758,527 | |
| * | | Straits Resources, Ltd. | | 878,069 | | | 635,910 | |
| * | | Strike Energy, Ltd. | | 88,132 | | | 11,007 | |
| | Structural Systems, Ltd. | | 138,772 | | | 108,539 | |
| | STW Communications Group, Ltd. | | 840,071 | | | 808,970 | |
| #* | | Sundance Energy Australia, Ltd. | | 751,727 | | | 365,129 | |
| #* | | Sundance Resources, Ltd. | | 8,756,539 | | | 3,955,560 | |
| #* | | Sunland Group, Ltd. | | 741,191 | | | 692,507 | |
| # | | Super Retail Group, Ltd. | | 909,056 | | | 5,150,189 | |
| * | | Super Retail Group, Ltd. (B3XZSK8) | | 359,398 | | | 2,045,348 | |
| * | | Swick Mining Services, Ltd. | | 71,883 | | | 25,474 | |
| | Symex Holdings, Ltd. | | 513,662 | | | 193,152 | |
| | | Talent2 International, Ltd. | | 472,312 | | | 631,877 | |
| * | | Talisman Mining, Ltd. | | 217,981 | | | 99,817 | |
| #* | | Tanami Gold NL | | 510,409 | | | 528,453 | |
| * | | Tap Oil, Ltd. | | 1,465,268 | | | 1,119,840 | |
| | Tassal Group, Ltd. | | 626,912 | | | 1,021,480 | |
| | Technology One, Ltd. | | 1,322,653 | | | 1,505,696 | |
| # | | Ten Network Holdings, Ltd. | | 3,492,166 | | | 3,376,725 | |
| #* | | Terramin Australia, Ltd. | | 155,209 | | | 24,219 | |
| #* | | Texon Petroleum, Ltd. | | 644,848 | | | 426,666 | |
| # | | TFS Corp., Ltd. | | 1,323,074 | | | 915,870 | |
| | Thakral Holdings Group, Ltd. | | 2,559,697 | | | 1,404,384 | |
| | ThinkSmart, Ltd. | | 146,612 | | | 66,670 | |
| # | | Thorn Group, Ltd. | | 370,228 | | | 642,616 | |
| * | | Thundelarra Exploration, Ltd. | | 260,965 | | | 49,767 | |
| #* | | Tiger Resources, Ltd. | | 1,751,101 | | | 850,563 | |
| * | | TNG, Ltd. | | 87,408 | | | 9,596 | |
| * | | Toro Energy, Ltd. | | 70,156 | | | 5,989 | |
| | Tox Free Solutions, Ltd. | | 355,104 | | | 809,607 | |
| # | | Transfield Services, Ltd. | | 1,784,320 | | | 4,258,408 | |
117
The Asia Pacific Small Company Series
continued
| | | | | SHARES | | VALUE†† | |
| AUSTRALIA — (Continued) | | | | | | |
| * | | Transpacific Industries Group, Ltd. (B0736RR) | | 1,181,222 | | $ | 927,440 | |
| #* | | Transpacific Industries Group, Ltd. (B0736T2) | | 2,759,327 | | | 2,166,493 | |
| # | | Troy Resources NL | | 352,784 | | | 1,499,267 | |
| | Trust Co., Ltd. (The) | | 82,756 | | | 488,210 | |
| | UGL, Ltd. | | 332,576 | | | 4,601,399 | |
| * | | Unity Mining, Ltd. | | 92,075 | | | 12,590 | |
| #* | | UXC, Ltd. | | 1,169,545 | | | 670,485 | |
| #* | | Venture Minerals, Ltd. | | 450,858 | | | 161,969 | |
| * | | Venturex Resources, Ltd. | | 42,171 | | | 3,313 | |
| | Village Roadshow, Ltd. | | 855,994 | | | 2,590,489 | |
| #* | | Virgin Blue Holdings, Ltd. | | 7,648,897 | | | 2,982,245 | |
| | Warrnambool Cheese & Butter Factory Co. Holding, Ltd. | | 1,203 | | | 4,998 | |
| # | | Watpac, Ltd. | | 711,698 | | | 853,828 | |
| | WDS, Ltd. | | 375,342 | | | 292,133 | |
| * | | Webfirm Group, Ltd. | | 124,813 | | | 9,126 | |
| # | | Webjet, Ltd. | | 356,064 | | | 898,156 | |
| * | | Webster, Ltd. | | 144,737 | | | 60,902 | |
| # | | Western Areas NL | | 558,671 | | | 3,362,850 | |
| * | | Westgold Resources, Ltd. | | 59,310 | | | 11,181 | |
| #* | | White Energy Co., Ltd. | | 643,913 | | | 1,115,658 | |
| | WHK Group, Ltd. | | 1,202,433 | | | 1,071,613 | |
| # | | Wide Bay Australia, Ltd. | | 81,906 | | | 670,445 | |
| #* | | WildHorse Energy, Ltd. | | 212,714 | | | 39,033 | |
| * | | Willmott Forests, Ltd. | | 17,224 | | | — | |
| #* | | Windimurra Vanadium, Ltd. | | 537,429 | | | — | |
| # | | Wotif.com Holdings, Ltd. | | 505,776 | | | 1,948,971 | |
| #* | | WPG Resources, Ltd. | | 702,896 | | | 84,098 | |
| * | | YTC Resources, Ltd. | | 16,666 | | | 8,402 | |
| TOTAL AUSTRALIA | | | | | 562,036,493 | |
| | | | | | | | | |
| HONG KONG — (15.4%) | | | | | | |
| | Aeon Credit Service (Asia) Co., Ltd. | | 580,000 | | | 427,631 | |
| | Aeon Stores Hong Kong Co., Ltd. | | 234,000 | | | 510,318 | |
| | AlCo. Holdings, Ltd. | | 1,426,000 | | | 447,996 | |
| | Allan International Holdings, Ltd. | | 720,000 | | | 215,461 | |
| | Allied Group, Ltd. | | 683,200 | | | 1,749,241 | |
| | Allied Overseas, Ltd. | | 50,000 | | | 21,345 | |
| # | | Allied Properties, Ltd. | | 12,297,857 | | | 1,697,752 | |
| * | | Amax Holdings, Ltd. | | 9,312,000 | | | 94,447 | |
| * | | Apac Resources, Ltd. | | 12,620,000 | | | 463,989 | |
| * | | Apollo Solar Energy Technology Holdings, Ltd. | | 11,692,000 | | | 419,197 | |
| | APT Satellite Holdings, Ltd. | | 1,275,000 | | | 211,421 | |
| #* | | Artel Solutions Group Holdings, Ltd. | | 7,885,000 | | | 149,153 | |
| * | | Artini China Co., Ltd. | | 2,481,000 | | | 59,630 | |
| | Arts Optical International Holdings, Ltd. | | 730,000 | | | 234,936 | |
| | Asia Financial Holdings, Ltd. | | 2,474,908 | | | 909,429 | |
| | Asia Satellite Telecommunications Holdings, Ltd. | | 962,000 | | | 1,791,203 | |
| | Asia Standard Hotel Group, Ltd. | | 11,797,218 | | | 884,453 | |
| | Asia Standard International Group, Ltd. | | 13,365,185 | | | 2,214,906 | |
| | Associated International Hotels, Ltd. | | 980,000 | | | 1,949,232 | |
| | Aupu Group Holding Co., Ltd. | | 2,504,000 | | | 210,680 | |
| | Automated Systems Holdings, Ltd. | | 394,000 | | | 40,364 | |
| | Bauhaus International Holdings, Ltd. | | 662,000 | | | 237,606 | |
| * | | Beijing Yu Sheng Tang Pharmaceutical Group, Ltd. | | 2,440,000 | | | 36,163 | |
| * | | Bel Global Resources Holdings, Ltd. | | 2,576,000 | | | 47,085 | |
| * | | Bio-Dynamic Group, Ltd. | | 2,544,000 | | | 278,925 | |
| * | | Birmingham International Holdings, Ltd. | | 6,502,000 | | | 127,214 | |
| | Bonjour Holdings, Ltd. | | 4,356,000 | | | 688,366 | |
| | Bossini International Holdings, Ltd. | | 3,871,500 | | | 367,357 | |
| #* | | Burwill Holdings, Ltd. | | 8,888,960 | | | 180,188 | |
| # | | Cafe de Coral Holdings, Ltd. | | 1,106,000 | | | 2,504,349 | |
118
The Asia Pacific Small Company Series
continued
| | | | | SHARES | | VALUE†† | |
| HONG KONG — (Continued) | | | | | | |
| * | | Capital Estate, Ltd. | | 5,151,000 | | $ | 167,581 | |
| | Century City International Holdings, Ltd. | | 6,419,460 | | | 415,559 | |
| * | | Century Sunshine Group Holdings, Ltd. | | 3,655,000 | | | 92,630 | |
| | Champion Technology Holdings, Ltd. | | 14,734,387 | | | 210,610 | |
| | | Chen Hsong Holdings, Ltd. | | 898,000 | | | 351,818 | |
| | Cheuk Nang Holdings, Ltd. | | 379,041 | | | 149,755 | |
| | Chevalier International Holdings, Ltd. | | 737,482 | | | 821,287 | |
| | Chevalier Pacific Holdings, Ltd. | | 5,497,500 | | | 136,843 | |
| # | | Chigo Holding, Ltd. | | 722,000 | | | 33,507 | |
| * | | China Best Group Holding, Ltd. | | 3,721,400 | | | 48,799 | |
| * | | China Billion Resources, Ltd. | | 4,876,000 | | | 54,605 | |
| * | | China Boon Holdings, Ltd. | | 6,200,000 | | | 191,183 | |
| * | | China CBM Group, Ltd. | | 6,930,301 | | | 603,339 | |
| * | | China Digicontent Co., Ltd. | | 2,710,000 | | | 3,488 | |
| * | | China Digital Licensing Group, Ltd. | | 2,190,000 | | | 63,741 | |
| * | | China Electronics Corp. Holdings Co., Ltd. | | 2,888,250 | | | 212,292 | |
| * | | China Energy Development Holdings, Ltd. | | 21,966,000 | | | 306,045 | |
| * | | China Financial Services Holdings, Ltd. | | 954,000 | | | 58,106 | |
| * | | China Flavors & Fragrances Co., Ltd. | | 144,924 | | | 27,501 | |
| * | | China Gamma Group, Ltd. | | 7,500,000 | | | 171,521 | |
| * | | China Infrastructure Investment, Ltd. | | 8,680,000 | | | 200,296 | |
| * | | China Investments Holdings, Ltd. | | 149,000 | | | 3,330 | |
| #* | | China Mandarin Holdings, Ltd. | | 5,012,400 | | | 100,752 | |
| | China Metal International Holdings, Ltd. | | 2,582,000 | | | 460,100 | |
| * | | China Motion Telecom International, Ltd. | | 5,080,000 | | | 74,476 | |
| | China Motor Bus Co., Ltd. | | 50,000 | | | 426,410 | |
| * | | China Ocean Shipbuilding Industry Group, Ltd. | | 4,137,500 | | | 61,400 | |
| * | | China Oriental Culture Group, Ltd. | | 3,600,000 | | | 169,712 | |
| | China Overseas Grand Oceans Group, Ltd. | | 15,000 | | | 11,442 | |
| * | | China Pipe Group, Ltd. | | 100,000 | | | 404 | |
| #* | | China Public Procurement, Ltd. | | 5,230,000 | | | — | |
| * | | China Renji Medical Group, Ltd. | | 12,784,000 | | | 98,733 | |
| #* | | China Resources and Transportation Group, Ltd. | | 32,400,000 | | | 1,150,363 | |
| * | | China Solar Energy Holdings, Ltd. | | 37,990,000 | | | 324,053 | |
| * | | China Strategic Holdings, Ltd. | | 12,585,000 | | | 288,429 | |
| # | | China Taisan Technology Group Holdings, Ltd. | | 564,915 | | | 43,711 | |
| | China Ting Group Holdings, Ltd. | | 2,443,151 | | | 165,430 | |
| * | | China Tycoon Beverage Holdings, Ltd. | | 2,732,000 | | | 63,390 | |
| * | | China WindPower Group, Ltd. | | 14,630,000 | | | 685,916 | |
| * | | China Yunnan Tin Minerals Group Co., Ltd. | | 9,428,000 | | | 54,834 | |
| | China-Hongkong Photo Products Holdings, Ltd. | | 2,123,000 | | | 148,271 | |
| | Chinney Investments, Ltd. | | 1,144,000 | | | 148,401 | |
| | Chong Hing Bank, Ltd. | | 878,000 | | | 1,633,855 | |
| # | | Chow Sang Sang Holdings International, Ltd. | | 393,680 | | | 1,209,220 | |
| | Chu Kong Shipping Development Co., Ltd. | | 2,188,000 | | | 343,574 | |
| * | | Chuang’s China Investments, Ltd. | | 3,388,000 | | | 171,662 | |
| | Chuang’s Consortium International, Ltd. | | 3,569,965 | | | 356,371 | |
| * | | Chun Wo Development Holdings, Ltd. | | 2,002,926 | | | 89,161 | |
| # | | Citic Telecom International Holdings, Ltd. | | 4,388,000 | | | 972,859 | |
| * | | City e-Solutions, Ltd. | | 186,000 | | | 20,676 | |
| # | | City Telecom, Ltd. | | 1,540,751 | | | 734,713 | |
| | CK Life Sciences International Holdings, Inc. | | 12,548,000 | | | 543,064 | |
| * | | Climax International Co., Ltd. | | 40,700 | | | 131 | |
| | CNT Group, Ltd. | | 8,315,264 | | | 393,980 | |
| * | | COL Capital, Ltd. | | 2,725,840 | | | 353,730 | |
| | Computer & Technologies Holdings, Ltd. | | 432,000 | | | 83,012 | |
| | Continental Holdings, Ltd. | | 5,148,250 | | | 73,028 | |
| | Cosmos Machinery Enterprises, Ltd. | | 1,616,400 | | | 114,800 | |
| * | | Cosway Corp., Ltd. | | 1,950,000 | | | 256,827 | |
| * | | CP Lotus Corp., Ltd. | | 11,420,000 | | | 319,479 | |
| | Cross-Harbour Holdings, Ltd. (The) | | 659,520 | | | 522,684 | |
119
The Asia Pacific Small Company Series
continued
| | | | | SHARES | | VALUE†† | |
| HONG KONG — (Continued) | | | | | | |
| | CSI Properties, Ltd. | | 22,229,625 | | $ | 545,048 | |
| * | | CST Mining Group, Ltd. | | 71,688,000 | | | 993,897 | |
| * | | Culture Landmark Investment, Ltd. | | 10,196,000 | | | 143,807 | |
| * | | Culturecom Holdings, Ltd. | | 965,000 | | | 90,898 | |
| | Dah Sing Banking Group, Ltd. | | 1,071,840 | | | 1,042,793 | |
| | Dah Sing Financial Holdings, Ltd. | | 480,950 | | | 1,489,976 | |
| * | | Dan Form Holdings Co., Ltd. | | 3,261,260 | | | 263,880 | |
| | DBA Telecommunication Asia Holdings, Ltd. | | 1,812,000 | | | 537,146 | |
| #* | | Dejin Resources Group Co., Ltd. | | 23,892,000 | | | 249,106 | |
| | Dickson Concepts International, Ltd. | | 924,500 | | | 530,454 | |
| * | | Digitalhongkong.com | | 25,388 | | | 3,151 | |
| * | | Doxen Energy Group, Ltd. | | 542,796 | | | 103,830 | |
| * | | Dragonite International, Ltd. | | 330,000 | | | 2,719 | |
| | DVN Holdings, Ltd. | | 2,183,000 | | | 80,406 | |
| | Dynamic Holdings, Ltd. | | 374,000 | | | 58,703 | |
| | Eagle Nice International Holdings, Ltd. | | 1,078,000 | | | 170,049 | |
| | EcoGreen Fine Chemicals Group, Ltd. | | 1,112,000 | | | 296,154 | |
| * | | Eforce Holdings, Ltd. | | 2,024,000 | | | 3,826 | |
| * | | EganaGoldpfeil Holdings, Ltd. | | 4,121,757 | | | — | |
| * | | e-Kong Group, Ltd. | | 620,000 | | | 30,874 | |
| | Emperor Entertainment Hotel, Ltd. | | 2,440,000 | | | 398,523 | |
| | Emperor International Holdings, Ltd. | | 5,836,753 | | | 968,640 | |
| # | | Emperor Watch & Jewellery, Ltd. | | 9,550,000 | | | 1,554,693 | |
| #* | | ENM Holdings, Ltd. | | 15,112,000 | | | 1,180,784 | |
| * | | Enviro Energy International Holdings, Ltd. | | 4,138,000 | | | 123,224 | |
| * | | EPI Holdings, Ltd. | | 4,259,927 | | | 103,476 | |
| * | | eSun Holdings, Ltd. | | 2,322,000 | | | 425,147 | |
| | EVA Precision Industrial Holdings, Ltd. | | 5,544,000 | | | 1,431,744 | |
| * | | Ezcom Holdings, Ltd. | | 72,576 | | | 448 | |
| | Fairwood, Ltd. | | 337,600 | | | 438,858 | |
| | Far East Consortium International, Ltd. | | 4,570,342 | | | 793,937 | |
| * | | Far East Technology International, Ltd. | | 179,520 | | | 17,793 | |
| * | | First Natural Foods Holdings, Ltd. | | 2,365,000 | | | — | |
| #* | | Fook Woo Group Holdings, Ltd. | | 952,000 | | | 179,884 | |
| * | | Foundation Group, Ltd. | | 2,350,000 | | | 35,392 | |
| | Fountain SET Holdings, Ltd. | | 4,622,000 | | | 562,041 | |
| | Four Seas Mercantile Holdings, Ltd. | | 592,000 | | | 159,306 | |
| * | | Frasers Property China, Ltd. | | 16,477,000 | | | 353,644 | |
| * | | Freeman Corp., Ltd. | | 6,328,888 | | | 37,912 | |
| | Fujikon Industrial Holdings, Ltd. | | 912,000 | | | 107,627 | |
| * | | Genting Hong Kong, Ltd. | | 17,000 | | | 5,327 | |
| | Get Nice Holdings, Ltd. | | 19,044,000 | | | 846,356 | |
| | Giordano International, Ltd. | | 7,162,000 | | | 5,374,945 | |
| * | | Global Tech Holdings, Ltd. | | 5,498,000 | | | 23,222 | |
| # | | Glorious Sun Enterprises, Ltd. | | 2,662,000 | | | 871,411 | |
| | Gold Peak Industries Holding, Ltd. | | 3,118,642 | | | 317,473 | |
| | Golden Resources Development International, Ltd. | | 3,330,500 | | | 170,145 | |
| | Goldin Financial Holdings, Ltd. | | 480,000 | | | 49,268 | |
| * | | Goldin Properties Holdings, Ltd. | | 2,040,000 | | | 700,772 | |
| | Golik Holdings, Ltd. | | 250,500 | | | 17,395 | |
| * | | Good Fellow Resources Holdings, Ltd. | | 1,670,000 | | | 64,001 | |
| * | | Grande Holdings, Ltd. | | 882,000 | | | 46,548 | |
| | Great Eagle Holdings, Ltd. | | 355,499 | | | 784,126 | |
| * | | Greenheart Group, Ltd. | | 1,626,000 | | | 124,788 | |
| * | | G-Resources Group, Ltd. | | 52,053,000 | | | 3,139,591 | |
| * | | Group Sense International, Ltd. | | 2,448,000 | | | 51,150 | |
| * | | Guangnan Holdings, Ltd. | | 2,249,600 | | | 299,724 | |
| * | | Guojin Resources Holdings, Ltd. | | 594,295 | | | 2,892 | |
| | Haitong International Securities Group, Ltd. | | 1,203,586 | | | 469,270 | |
| * | | Hang Fung Gold Technology, Ltd. | | 1,972,482 | | | — | |
| # | | Hang Ten Group Holdings, Ltd. | | 2,254,000 | | | 490,401 | |
120
The Asia Pacific Small Company Series
continued
| | | | | SHARES | | VALUE†† | |
| HONG KONG — (Continued) | | | | | | |
| | Hannstar Board International Holdings, Ltd. | | 1,446,000 | | $ | 227,542 | |
| | Hanny Holdings, Ltd. | | 747,979 | | | 20,856 | |
| * | | Hans Energy Co., Ltd. | | 7,556,000 | | | 116,166 | |
| | Harbour Centre Development, Ltd. | | 957,500 | | | 1,064,500 | |
| * | | Hengli Commercial Properties Group, Ltd. | | 336,000 | | | 20,233 | |
| | High Fashion International, Ltd. | | 268,000 | | | 98,882 | |
| | HKR International, Ltd. | | 5,895,136 | | | 2,437,443 | |
| | Hon Kwok Land Investment Co., Ltd. | | 314,800 | | | 102,989 | |
| * | | Hong Fok Land, Ltd. | | 1,210,000 | | | 1,558 | |
| | Hong Kong Ferry Holdings, Ltd. | | 809,300 | | | 632,312 | |
| | Hong Kong Food Investment Holdings, Ltd. | | 202,184 | | | 22,187 | |
| | Hongkong Chinese, Ltd. | | 4,774,000 | | | 757,355 | |
| | Hop Fung Group Holdings, Ltd. | | 888,000 | | | 62,256 | |
| # | | Hsin Chong Construction Group, Ltd. | | 1,569,658 | | | 267,097 | |
| * | | Huafeng Group Holdings, Ltd. | | 6,713,325 | | | 153,347 | |
| | Hung Hing Printing Group, Ltd. | | 1,188,000 | | | 281,437 | |
| | Hutchison Harbour Ring, Ltd. | | 9,432,000 | | | 804,893 | |
| | Hutchison Telecommunications Hong Kong Holdings, Ltd. | | 1,218,000 | | | 433,039 | |
| * | | Hybrid Kinetic Group, Ltd. | | 14,884,000 | | | 140,586 | |
| * | | HyComm Wireless, Ltd. | | 89,090 | | | 20,463 | |
| * | | I-Cable Communications, Ltd. | | 531,000 | | | 32,147 | |
| * | | IDT International, Ltd. | | 6,240,183 | | | 87,568 | |
| * | | Imagi International Holdings, Ltd. | | 17,320,000 | | | 450,204 | |
| | iOne Holdings, Ltd. | | 3,140,000 | | | 24,868 | |
| | IPE Group, Ltd. | | 2,060,000 | | | 164,345 | |
| # | | IT, Ltd. | | 2,802,532 | | | 1,745,406 | |
| | ITC Corp., Ltd. | | 893,645 | | | 30,420 | |
| * | | ITC Properties Group, Ltd. | | 3,645,747 | | | 821,611 | |
| #* | | Jinchuan Group International Resources Co., Ltd. | | 1,104,000 | | | 254,715 | |
| * | | Jinhui Holdings, Ltd. | | 384,000 | | | 65,441 | |
| * | | Jiuzhou Development Co., Ltd. | | 2,558,000 | | | 160,199 | |
| | JLF Investment Co., Ltd. | | 3,293,500 | | | 204,931 | |
| | Joyce Boutique Holdings, Ltd. | | 1,530,000 | | | 140,857 | |
| | Junefield Department Store Group, Ltd. | | 306,000 | | | 21,798 | |
| # | | K Wah International Holdings, Ltd. | | 5,583,405 | | | 1,508,992 | |
| | Kam Hing International Holdings, Ltd. | | 1,974,000 | | | 196,332 | |
| | Kantone Holdings, Ltd. | | 14,737,990 | | | 169,978 | |
| * | | Karl Thomson Holdings, Ltd. | | 1,188,000 | | | 53,049 | |
| | Karrie International Holdings, Ltd. | | 1,383,600 | | | 66,092 | |
| | Keck Seng Investments (Hong Kong), Ltd. | | 904,600 | | | 374,820 | |
| | Kin Yat Holdings, Ltd. | | 586,000 | | | 116,068 | |
| * | | King Pacific International Holdings, Ltd. | | 1,404,200 | | | 22,051 | |
| * | | King Stone Energy Group, Ltd. | | 2,822,000 | | | 296,700 | |
| | Kingmaker Footwear Holdings, Ltd. | | 1,476,955 | | | 237,387 | |
| # | | Kingston Financial Group, Ltd. | | 11,717,000 | | | 1,244,024 | |
| | Kith Holdings, Ltd. | | 204,000 | | | 29,994 | |
| * | | Kiu Hung Energy Holdings, Ltd. | | 10,810,000 | | | 115,879 | |
| * | | Ko Yo Chemical Group, Ltd. | | 16,260,000 | | | 288,280 | |
| * | | Kowloon Development Co., Ltd. | | 1,588,000 | | | 1,528,034 | |
| * | | KTP Holdings, Ltd. | | 560,400 | | | 54,447 | |
| | Kwoon Chung Bus Holdings, Ltd. | | 556,000 | | | 123,470 | |
| * | | Lai Sun Development Co., Ltd. | | 44,552,800 | | | 931,040 | |
| * | | Lai Sun Garment International, Ltd. | | 2,770,000 | | | 254,737 | |
| | Lam Soon Hong Kong, Ltd. | | 302,310 | | | 194,860 | |
| * | | Leading Spirit High-Tech Holdings Co., Ltd. | | 2,310,000 | | | 2,973 | |
| # | | Lee & Man Handbags, Ltd. | | 1,420,000 | | | 102,358 | |
| # | | Lee & Man Holdings, Ltd. | | 1,420,000 | | | 959,599 | |
| | Lee’s Pharmaceutical Holdings, Ltd. | | 5,000 | | | 1,894 | |
| | Lerado Group Holdings Co., Ltd. | | 1,900,000 | | | 178,324 | |
| | Li Heng Chemical Fibre Technologies, Ltd. | | 2,023,000 | | | 197,607 | |
| | Lippo China Resources, Ltd. | | 8,092,000 | | | 185,270 | |
121
The Asia Pacific Small Company Series
continued
| | | | | SHARES | | VALUE†† | |
| HONG KONG — (Continued) | | | | | | |
| | Lippo, Ltd. | | 1,195,700 | | $ | 386,791 | |
| * | | Lisi Group Holdings, Ltd. | | 4,262,000 | | | 198,010 | |
| | Liu Chong Hing Investment, Ltd. | | 775,200 | | | 737,180 | |
| * | | Longrun Tea Group Co., Ltd. | | 1,900,000 | | | 88,927 | |
| | Luen Thai Holdings, Ltd. | | 1,345,000 | | | 110,164 | |
| | Luk Fook Holdings International, Ltd. | | 94,000 | | | 403,608 | |
| # | | Luks Industrial Group, Ltd. | | 428,913 | | | 91,953 | |
| * | | Lung Cheong International Holdings, Ltd. | | 6,790,000 | | | 244,369 | |
| | Lung Kee (Bermuda) Holdings, Ltd. | | 1,597,875 | | | 844,700 | |
| * | | Madex International Holdings, Ltd. | | 3,182,000 | | | 52,108 | |
| | Magnificent Estates, Ltd. | | 13,184,000 | | | 419,189 | |
| | Mainland Headwear Holdings, Ltd. | | 765,600 | | | 66,003 | |
| | Man Yue Technology Holdings, Ltd. | | 1,064,000 | | | 202,204 | |
| #* | | Mascotte Holdings, Ltd. | | 7,688,000 | | | 364,416 | |
| | Matrix Holdings, Ltd. | | 1,067,414 | | | 241,801 | |
| * | | Mei Ah Entertainment Group, Ltd. | | 11,040,000 | | | 190,731 | |
| | Melbourne Enterprises, Ltd. | | 40,500 | | | 590,839 | |
| # | | Melco International Development, Ltd. | | 3,309,000 | | | 2,644,969 | |
| # | | Midland Holdings, Ltd. | | 2,934,000 | | | 1,435,058 | |
| | Ming Fai International Holdings, Ltd. | | 1,680,000 | | | 244,533 | |
| * | | Ming Fung Jewellery Group, Ltd. | | 9,050,000 | | | 651,929 | |
| | Miramar Hotel & Investment Co., Ltd. | | 772,000 | | | 814,549 | |
| | Modern Beauty Salon Holdings, Ltd. | | 160,000 | | | 16,558 | |
| * | | Mongolia Energy Corp., Ltd. | | 10,603,000 | | | 1,031,156 | |
| * | | Nan Nan Resources Enterprise, Ltd. | | 330,000 | | | 34,180 | |
| | Nanyang Holdings, Ltd. | | 137,500 | | | 371,102 | |
| | National Electronics Holdings, Ltd. | | 2,266,000 | | | 207,440 | |
| | Natural Beauty Bio-Technology, Ltd. | | 4,470,000 | | | 680,125 | |
| # | | Neo-Neon Holdings, Ltd. | | 1,898,000 | | | 324,180 | |
| | Net2Gather China Holdings, Ltd. | | 8,139,720 | | | 180,246 | |
| | New Century Group Hong Kong, Ltd. | | 13,351,464 | | | 308,898 | |
| * | | New Focus Auto Tech Holdings, Ltd. | | 104,000 | | | 30,327 | |
| * | | New Smart Energy Group, Ltd. | | 23,975,000 | | | 308,606 | |
| #* | | New Times Energy Corp., Ltd. | | 25,952,000 | | | 162,072 | |
| | Neway Group Holdings, Ltd. | | 24,579,087 | | | 255,120 | |
| | NewOcean Green Energy Holdings, Ltd. | | 3,032,000 | | | 600,952 | |
| * | | Next Media, Ltd. | | 3,725,183 | | | 323,415 | |
| * | | Ngai LiK Industrial Holdings, Ltd. | | 252,200 | | | 19,478 | |
| * | | Norstar Founders Group, Ltd. | | 3,256,000 | | | — | |
| #* | | North Asia Resources Holdings, Ltd. | | 2,108,600 | | | 118,222 | |
| #* | | Orange Sky Golden Harvest Entertainment Holdings, Ltd. | | 6,229,706 | | | 300,800 | |
| * | | Orient Power Holdings, Ltd. | | 804,000 | | | 19,456 | |
| # | | Oriental Watch Holdings, Ltd. | | 1,604,800 | | | 925,908 | |
| | Pacific Andes International Holdings, Ltd. | | 5,262,919 | | | 509,184 | |
| | Pacific Basin Shipping, Ltd. | | 7,551,000 | | | 3,443,034 | |
| * | | Pacific Century Premium Developments, Ltd. | | 4,403,000 | | | 666,786 | |
| | Pacific Textile Holdings, Ltd. | | 1,750,000 | | | 984,777 | |
| | Paliburg Holdings, Ltd. | | 3,152,830 | | | 992,121 | |
| * | | Pan Asia Environmental Protection Group, Ltd. | | 1,258,432 | | | 124,128 | |
| | Paul Y Engineering Group, Ltd. | | 77,759 | | | 8,399 | |
| #* | | Peace Mark Holdings, Ltd. | | 2,738,022 | | | — | |
| | Pearl Oriental Innovation, Ltd. | | 5,886,800 | | | 599,538 | |
| | Pegasus International Holdings, Ltd. | | 226,000 | | | 35,650 | |
| | Pico Far East Holdings, Ltd. | | 3,910,000 | | | 696,139 | |
| * | | PME Group, Ltd. | | 6,410,000 | | | 173,260 | |
| * | | PNG Resources Holdings, Ltd. | | 16,626,362 | | | 221,551 | |
| | Pokfulam Development Co., Ltd. | | 234,000 | | | 233,657 | |
| | Polytec Asset Holdings, Ltd. | | 10,763,526 | | | 942,232 | |
| | Public Financial Holdings, Ltd. | | 3,194,000 | | | 1,351,210 | |
| | PYI Corp., Ltd. | | 12,919,134 | | | 396,819 | |
| * | | Pyxis Group, Ltd. | | 1,936,000 | | | 42,364 | |
122
The Asia Pacific Small Company Series
continued
| | | | | SHARES | | VALUE†† | |
| HONG KONG — (Continued) | | | | | | |
| * | | QPL International Holdings, Ltd. | | 603,000 | | $ | 16,940 | |
| | Raymond Industrial, Ltd. | | 1,383,400 | | | 136,351 | |
| | Regal Hotels International Holdings, Ltd. | | 2,415,800 | | | 804,992 | |
| * | | Richfield Group Holdings, Ltd. | | 2,624,000 | | | 154,366 | |
| * | | Rising Development Holdings, Ltd. | | 2,278,000 | | | 302,667 | |
| | Rivera Holdings, Ltd. | | 5,710,000 | | | 150,673 | |
| | Roadshow Holdings, Ltd. | | 1,456,000 | | | 113,571 | |
| | Royale Furniture Holdings, Ltd. | | 1,480,387 | | | 448,025 | |
| | S.A.S. Dragon Holdings, Ltd. | | 1,212,000 | | | 269,022 | |
| # | | Sa Sa International Holdings, Ltd. | | 1,168,000 | | | 694,370 | |
| | Safety Godown Co., Ltd. | | 398,000 | | | 254,510 | |
| | Samling Global, Ltd. | | 6,160,000 | | | 354,096 | |
| | Samson Paper Holdings, Ltd. | | 1,800,000 | | | 80,748 | |
| * | | San Miguel Brewery Hong Kong, Ltd. | | 612,800 | | | 93,197 | |
| * | | Sanyuan Group, Ltd. | | 415,000 | | | 8,013 | |
| | SEA Holdings, Ltd. | | 1,140,000 | | | 503,127 | |
| * | | SEEC Media Group, Ltd. | | 136,000 | | | 4,664 | |
| * | | Sheng Yuan Holdings, Ltd. | | 210,000 | | | 12,530 | |
| # | | Shenyin Wanguo, Ltd. | | 1,297,500 | | | 386,282 | |
| | Shenzhen High-Tech Holdings, Ltd. | | 812,000 | | | 46,196 | |
| * | | Shougang Concord Grand Group, Ltd. | | 2,451,000 | | | 86,267 | |
| * | | Shougang Concord Technology Holdings, Ltd. | | 4,201,809 | | | 195,624 | |
| * | | Shun Ho Resources Holdings, Ltd. | | 483,000 | | | 63,036 | |
| * | | Shun Ho Technology Holdings, Ltd. | | 1,037,452 | | | 131,650 | |
| | Shun Tak Holdings, Ltd. | | 4,333,941 | | | 2,029,820 | |
| | Sing Tao News Corp., Ltd. | | 1,974,000 | | | 310,544 | |
| | Singamas Container Holdings, Ltd. | | 5,922,000 | | | 1,329,703 | |
| * | | Sino Dragon New Energy Holdings, Ltd. | | 5,816,000 | | | 334,178 | |
| * | | Sino Gas Group, Ltd. | | 4,980,000 | | | 149,199 | |
| * | | Sinocan Holdings, Ltd. | | 350,000 | | | 1,757 | |
| * | | Sinocop Resources Holdings, Ltd. | | 3,980,000 | | | 401,328 | |
| * | | Sino-Tech International Holdings, Ltd. | | 27,990,000 | | | 323,435 | |
| #* | | Sinotel Technologies, Ltd. | | 763,000 | | | 80,093 | |
| | SIS International Holdings, Ltd. | | 34,000 | | | 11,922 | |
| * | | Skyfame Realty Holdings, Ltd. | | 2,737,750 | | | 304,440 | |
| | SmarTone Telecommunications Holdings, Ltd. | | 2,051,500 | | | 3,794,252 | |
| * | | SMI Publishing Group, Ltd. | | 250,511 | | | 484 | |
| | SOCAM Development, Ltd. | | 938,771 | | | 895,959 | |
| * | | Solomon Systech International, Ltd. | | 6,312,000 | | | 165,885 | |
| * | | Soundwill Holdings, Ltd. | | 12,000 | | | 12,953 | |
| | South China (China), Ltd. | | 6,744,000 | | | 419,928 | |
| | South China Financial Holdings, Ltd. | | 4,872,000 | | | 37,715 | |
| * | | South China Land, Ltd. | | 20,847,170 | | | 308,451 | |
| | Southeast Asia Properties & Finance, Ltd. | | 289,891 | | | 60,134 | |
| * | | Starlight International Holdings, Ltd. | | 3,125,325 | | | 41,970 | |
| | Stella International Holdings, Ltd. | | 442,074 | | | 997,820 | |
| | Styland Holdings, Ltd. | | 129,347 | | | 291 | |
| * | | Success Universe Group, Ltd. | | 5,552,000 | | | 153,980 | |
| | Sun Hing Vision Group Holdings, Ltd. | | 358,000 | | | 131,146 | |
| | Sun Hung Kai & Co., Ltd. | | 1,422,621 | | | 830,136 | |
| #* | | Sun Innovation Holdings, Ltd. | | 10,735,655 | | | 187,623 | |
| | Sunwah Kingsway Capital Holdings, Ltd. | | 5,750,000 | | | 106,464 | |
| * | | Sunway International Holdings, Ltd. | | 866,000 | | | 28,278 | |
| * | | Superb Summit International Timber Co., Ltd. | | 12,186,600 | | | 338,700 | |
| # | | Sustainable Forest Holdings, Ltd. | | 10,775,250 | | | 271,679 | |
| | Synergis Holdings, Ltd. | | 322,033 | | | 28,891 | |
| * | | Tack Fat Group International, Ltd. | | 44,480 | | | 830 | |
| * | | Tack Hsin Holdings, Ltd. | | 1,024,000 | | | 306,408 | |
| | Tai Cheung Holdings, Ltd. | | 1,919,000 | | | 1,326,205 | |
| | Tai Sang Land Development, Ltd. | | 576,984 | | | 213,551 | |
| * | | Talent Property Group, Ltd. | | 5,106,420 | | | 143,299 | |
123
The Asia Pacific Small Company Series
continued
| | | | | SHARES | | VALUE†† | |
| HONG KONG — (Continued) | | | | | | |
| | Tan Chong International, Ltd. | | 1,212,000 | | $ | 280,493 | |
| # | | Techtronic Industries Co., Ltd. | | 4,086,000 | | | 3,535,343 | |
| * | | Termbray Industries International (Holdings), Ltd. | | 2,304,900 | | | 183,544 | |
| | Tern Properties Co., Ltd. | | 51,200 | | | 22,068 | |
| | Texhong Textile Group, Ltd. | | 212,000 | | | 61,595 | |
| | Texwinca Holdings, Ltd. | | 2,136,000 | | | 2,706,129 | |
| * | | Theme International Holdings, Ltd. | | 4,130,000 | | | 150,600 | |
| | Tian Teck Land, Ltd. | | 1,054,000 | | | 911,235 | |
| | Tianda Holdings, Ltd. | | 306,000 | | | 17,332 | |
| #* | | Titan Petrochemicals Group, Ltd. | | 11,860,000 | | | 467,401 | |
| * | | Tom Group, Ltd. | | 3,612,000 | | | 302,858 | |
| | Tongda Group Holdings, Ltd. | | 10,120,000 | | | 315,282 | |
| # | | Top Form International, Ltd. | | 2,760,000 | | | 147,532 | |
| * | | Topsearch International Holdings, Ltd. | | 3,850,000 | | | 141,935 | |
| | Town Health International Investments, Ltd. | | 1,175,165 | | | 120,885 | |
| | Tradelink Electronic Commerce, Ltd. | | 804,000 | | | 101,947 | |
| | Transport International Holdings, Ltd. | | 870,541 | | | 1,777,940 | |
| | Trinity, Ltd. | | 1,788,000 | | | 1,616,026 | |
| | Tristate Holdings, Ltd. | | 188,000 | | | 97,054 | |
| * | | TSC Group Holdings, Ltd. | | 1,928,000 | | | 258,880 | |
| # | | Tse Sui Luen Jewellery International, Ltd. | | 300,000 | | | 249,031 | |
| | Tungtex Holdings Co., Ltd. | | 910,000 | | | 117,100 | |
| | Tysan Holdings, Ltd. | | 1,040,773 | | | 198,922 | |
| # | | United Laboratories International Holdings, Ltd. (The) | | 1,948,000 | | | 1,503,467 | |
| | Universal Technologies Holdings, Ltd. | | 6,000,000 | | | 397,355 | |
| * | | U-Right International Holdings, Ltd. | | 4,746,000 | | | 8,553 | |
| * | | Value Convergence Holdings, Ltd. | | 1,216,000 | | | 128,545 | |
| # | | Value Partners Group, Ltd. | | 2,678,000 | | | 1,540,991 | |
| | Van Shung Chong Holdings, Ltd. | | 2,171,335 | | | 119,988 | |
| * | | Vantage International Holdings, Ltd. | | 2,778,000 | | | 175,495 | |
| | Varitronix International, Ltd. | | 1,072,293 | | | 488,221 | |
| | Vedan International Holdings, Ltd. | | 3,272,000 | | | 195,975 | |
| | Veeko International Holdings, Ltd. | | 4,423,751 | | | 137,936 | |
| | Victory City International Holdings, Ltd. | | 3,225,076 | | | 347,435 | |
| * | | Vision Values Holdings, Ltd. | | 281,400 | | | 6,834 | |
| * | | Vital Group Holdings, Ltd. | | 470,000 | | | 61,919 | |
| | Vitasoy International Holdings, Ltd. | | 3,623,000 | | | 2,557,528 | |
| * | | Vongroup, Ltd. | | 10,865,000 | | | 52,152 | |
| * | | VST Holdings, Ltd. | | 2,312,000 | | | 367,850 | |
| | Wah Ha Realty Co., Ltd. | | 278,600 | | | 101,462 | |
| #* | | Wah Nam International Holdings, Ltd. | | 22,765,720 | | | 1,929,225 | |
| | Wai Kee Holdings, Ltd. | | 7,960,738 | | | 1,336,802 | |
| | Wai Yuen Tong Medicine Holdings, Ltd. | | 1,664,341 | | | 16,492 | |
| | Wang On Group, Ltd. | | 8,391,286 | | | 77,639 | |
| * | | Warderly International Holdings, Ltd. | | 520,000 | | | 32,129 | |
| | Water Oasis Group, Ltd. | | 1,632,000 | | | 146,555 | |
| | Win Hanverky Holdings, Ltd. | | 1,712,000 | | | 145,799 | |
| * | | Winfoong International, Ltd. | | 1,331,000 | | | 11,810 | |
| #* | | Wing Hing International Holdings, Ltd. | | 7,970,000 | | | 303,592 | |
| | Wing On Co. International, Ltd. | | 781,000 | | | 1,552,912 | |
| | Wing Tai Properties, Ltd. | | 1,957,331 | | | 678,495 | |
| * | | Winteam Pharmaceutical Group, Ltd. | | 4,264,000 | | | 605,673 | |
| * | | Wo Kee Hong Holdings, Ltd. | | 725,000 | | | 43,091 | |
| | Wong’s International (Holdings), Ltd. | | 737,641 | | | 135,515 | |
| | Wong’s Kong King International Holdings, Ltd. | | 120,000 | | | 12,015 | |
| | Xingye Copper International Group, Ltd. | | 1,615,000 | | | 228,189 | |
| | Y. T. Realty Group, Ltd. | | 865,000 | | | 214,931 | |
| | Yangtzekiang Garment, Ltd. | | 606,500 | | | 159,459 | |
| | Yau Lee Holdings, Ltd. | | 534,000 | | | 67,909 | |
| | Yeebo (International Holdings), Ltd. | | 572,000 | | | 106,136 | |
| # | | YGM Trading, Ltd. | | 362,000 | | | 845,982 | |
124
The Asia Pacific Small Company Series
continued
| | | | | SHARES | | VALUE†† | |
| HONG KONG — (Continued) | | | | | | |
| | Yugang International, Ltd. | | 93,492,000 | | $ | 618,808 | |
| TOTAL HONG KONG | | | | | 168,120,916 | |
| | | | | | | | |
| MALAYSIA — (0.0%) | | | | | | |
| * | | Autoways Holdings Berhad | | 10,000 | | | 4,205 | |
| * | | Rekapacific Berhad | | 473,000 | | | — | |
| TOTAL MALAYSIA | | | | | 4,205 | |
| | | | | | | | |
| NEW ZEALAND — (5.5%) | | | | | | |
| | Abano Healthcare Group, Ltd. | | 26,266 | | | 94,479 | |
| # | | Air New Zealand, Ltd. | | 2,209,230 | | | 1,867,093 | |
| | Auckland International Airport, Ltd. | | 1,384,681 | | | 2,614,436 | |
| | Cavalier Corp., Ltd. | | 283,674 | | | 662,832 | |
| | CDL Investments (New Zealand), Ltd. | | 395,965 | | | 98,518 | |
| | Colonial Motor Co., Ltd. | | 148,846 | | | 318,601 | |
| | Ebos Group, Ltd. | | 175,110 | | | 976,174 | |
| * | | Fisher & Paykel Appliances Holdings, Ltd. | | 3,072,837 | | | 1,121,184 | |
| | Fisher & Paykel Healthcare Corp., Ltd. | | 2,659,497 | | | 4,946,589 | |
| | Freightways, Ltd. | | 747,545 | | | 2,043,139 | |
| | Hallenstein Glasson Holdings, Ltd. | | 242,461 | | | 731,171 | |
| * | | Heartland New Zealand, Ltd. | | 173,369 | | | 72,551 | |
| | Hellaby Holdings, Ltd. | | 344,804 | | | 774,852 | |
| | Infratil, Ltd. | | 2,240,331 | | | 3,335,483 | |
| | Mainfreight, Ltd. | | 410,596 | | | 3,216,458 | |
| | Methven, Ltd. | | 70,490 | | | 67,493 | |
| | Michael Hill International, Ltd. | | 1,534,152 | | | 1,073,236 | |
| | Millennium & Copthorne Hotels (New Zealand), Ltd. | | 1,387,344 | | | 430,391 | |
| | New Zealand Exchange, Ltd. | | 358,081 | | | 673,519 | |
| | New Zealand Oil & Gas, Ltd. | | 1,873,428 | | | 1,051,685 | |
| | New Zealand Refining Co., Ltd. | | 614,710 | | | 1,574,896 | |
| | Northland Port Corp. (New Zealand), Ltd. | | 217,513 | | | 243,451 | |
| # | | Nuplex Industries, Ltd. | | 1,009,646 | | | 2,118,717 | |
| * | | Pike River Coal, Ltd. | | 490,805 | | | — | |
| | Port of Tauranga, Ltd. | | 528,322 | | | 4,135,066 | |
| | Pumpkin Patch, Ltd. | | 606,913 | | | 340,991 | |
| | Pyne Gould Corp., Ltd. | | 173,369 | | | 44,733 | |
| * | | Pyne Gould Guinness, Ltd. | | 336,600 | | | 111,074 | |
| * | | Rakon, Ltd. | | 346,364 | | | 192,272 | |
| | Restaurant Brands New Zealand, Ltd. | | 395,866 | | | 687,827 | |
| * | | Richina Pacific, Ltd. | | 274,180 | | | 79,827 | |
| * | | Rubicon, Ltd. | | 1,113,829 | | | 353,766 | |
| | Ryman Healthcare, Ltd. | | 1,665,657 | | | 3,629,957 | |
| | Sanford, Ltd. | | 393,618 | | | 1,512,302 | |
| | Scott Technology, Ltd. | | 34,446 | | | 43,607 | |
| * | | Seafresh Fisheries, Ltd. | | 80,520 | | | 1,823 | |
| | Skellerup Holdings, Ltd. | | 274,790 | | | 289,834 | |
| | Sky City Entertainment Group, Ltd. | | 2,938,887 | | | 8,361,441 | |
| | Sky Network Television, Ltd. | | 940,466 | | | 4,163,442 | |
| | South Port (New Zealand), Ltd. | | 30,744 | | | 84,538 | |
| | Steel & Tube Holdings, Ltd. | | 389,046 | | | 735,053 | |
| * | | Tenon, Ltd. | | 19,132 | | | 9,764 | |
| | Tourism Holdings, Ltd. | | 274,867 | | | 135,085 | |
| | Tower, Ltd. | | 889,946 | | | 978,723 | |
| * | | TrustPower, Ltd. | | 29,925 | | | 175,153 | |
| | Vector, Ltd. | | 968,771 | | | 2,020,989 | |
| | Warehouse Group, Ltd. | | 524,171 | | | 1,425,476 | |
| TOTAL NEW ZEALAND | | | | | 59,619,691 | |
| | | | | | | |
| SINGAPORE — (9.4%) | | | | | | |
| #* | | Abterra, Ltd. | | 528,800 | | | 347,031 | |
125
The Asia Pacific Small Company Series
continued
| | | | | SHARES | | VALUE†† | |
| SINGAPORE — (Continued) | | | | | | |
| | Advanced Holdings, Ltd. | | 691,000 | | $ | 75,532 | |
| | Armstrong Industrial Corp., Ltd. | | 1,236,000 | | | 238,628 | |
| * | | Asiasons Capital, Ltd. | | 1,023,000 | | | 151,277 | |
| * | | Asiatravel.com Holdings, Ltd. | | 17,879 | | | 4,985 | |
| | ASL Marine Holdings, Ltd. | | 719,600 | | | 305,030 | |
| | A-Sonic Aerospace, Ltd. | | 408,996 | | | 17,202 | |
| | AusGroup, Ltd. | | 1,915,000 | | | 561,265 | |
| | Baker Technology, Ltd. | | 1,272,000 | | | 274,669 | |
| #* | | Ban Joo & Co., Ltd. | | 2,179,000 | | | 12,021 | |
| | Banyan Tree Holdings, Ltd. | | 955,000 | | | 596,489 | |
| | Beng Kuang Marine, Ltd. | | 922,000 | | | 112,654 | |
| | Best World International, Ltd. | | 221,500 | | | 27,989 | |
| | Beyonics Technology, Ltd. | | 6,510,300 | | | 1,288,007 | |
| # | | BH Global Marine, Ltd. | | 621,000 | | | 96,166 | |
| * | | Biosensors International Group, Ltd. | | 3,419,237 | | | 3,811,638 | |
| | Bonvests Holdings, Ltd. | | 978,000 | | | 734,570 | |
| | Boustead Singapore, Ltd. | | 887,000 | | | 579,335 | |
| # | | Breadtalk Group, Ltd. | | 385,800 | | | 157,376 | |
| # | | Broadway Industrial Group, Ltd. | | 922,000 | | | 247,924 | |
| | Brothers Holdings, Ltd. | | 454,628 | | | 65,216 | |
| | Bukit Sembawang Estates, Ltd. | | 409,003 | | | 1,266,478 | |
| * | | Bund Center Investment, Ltd. | | 1,014,000 | | | 131,975 | |
| | CEI Contract Manufacturing, Ltd. | | 432,000 | | | 34,405 | |
| | Cerebos Pacific, Ltd. | | 545,000 | | | 2,076,105 | |
| | CH Offshore, Ltd. | | 1,539,400 | | | 497,971 | |
| * | | Changjiang Fertilizer Holdings, Ltd. | | 515 | | | 78 | |
| | China Aviation Oil Singapore Corp., Ltd. | | 936,000 | | | 708,691 | |
| * | | China Dairy Group, Ltd. | | 1,502,000 | | | 157,617 | |
| * | | China Energy, Ltd. | | 3,110,000 | | | 134,129 | |
| | China Merchants Holdings Pacific, Ltd. | | 809,000 | | | 371,823 | |
| | China Sunsine Chemical Holdings, Ltd. | | 28,000 | | | 5,330 | |
| | China XLX Fertiliser, Ltd. | | 618,000 | | | 152,285 | |
| | Chip Eng Seng Corp., Ltd. | | 1,972,800 | | | 583,874 | |
| | Chosen Holdings, Ltd. | | 1,202,000 | | | 115,535 | |
| | Chuan Hup Holdings, Ltd. | | 3,967,000 | | | 689,673 | |
| * | | Compact Metal Industries, Ltd. | | 643,000 | | | 2,050 | |
| # | | Creative Technology, Ltd. | | 272,200 | | | 592,314 | |
| | CSC Holdings, Ltd. | | 1,829,000 | | | 145,682 | |
| | CSE Global, Ltd. | | 2,046,000 | | | 1,362,271 | |
| | CWT, Ltd. | | 1,046,700 | | | 867,024 | |
| | Datapulse Technology, Ltd. | | 27,000 | | | 4,716 | |
| * | | Delong Holdings, Ltd. | | 1,361,000 | | | 354,551 | |
| * | | Digiland International, Ltd. | | 11,763,000 | | | 9,374 | |
| | Ellipsiz, Ltd. | | 123,000 | | | 9,027 | |
| | EnGro Corp, Ltd. | | 354,000 | | | 227,251 | |
| * | | Enviro-Hub Holdings, Ltd. | | 1,445,666 | | | 112,445 | |
| | Etika International Holdings, Ltd. | | 179,000 | | | 37,962 | |
| | Eu Yan Sang International, Ltd. | | 562,800 | | | 336,082 | |
| * | | Eucon Holdings, Ltd. | | 1,274,000 | | | 19,890 | |
| * | | euNetworks Group, Ltd. | | 411,000 | | | 4,850 | |
| | Ezion Holdings, Ltd. | | 1,968,000 | | | 903,026 | |
| # | | Ezra Holdings, Ltd. | | 2,321,000 | | | 1,784,785 | |
| | F.J. Benjamin Holdings, Ltd. | | 1,210,000 | | | 334,611 | |
| | Falcon Energy Group, Ltd. | | 1,007,000 | | | 206,329 | |
| * | | Federal International 2000, Ltd. | | 1,675,350 | | | 50,047 | |
| # | | First Resources, Ltd. | | 2,043,000 | | | 2,287,368 | |
| | Food Empire Holdings, Ltd. | | 1,094,400 | | | 288,559 | |
| * | | Fragrance Group, Ltd. | | 2,749,000 | | | 703,431 | |
| | Freight Links Express Holdings, Ltd. | | 4,140,737 | | | 195,163 | |
| * | | Fu Yu Corp., Ltd. | | 3,544,750 | | | 182,422 | |
| #* | | Gallant Venture, Ltd. | | 2,386,000 | | | 553,124 | |
126
The Asia Pacific Small Company Series
continued
| | | | | SHARES | | VALUE†† | |
| SINGAPORE — (Continued) | | | | | | |
| | GK Goh Holdings, Ltd. | | 1,458,000 | | $ | 843,242 | |
| | Global Yellow Pages, Ltd. | | 299,000 | | | 24,335 | |
| #* | | GMG Global, Ltd. | | 4,489,000 | | | 831,899 | |
| | Goodpack, Ltd. | | 1,160,000 | | | 1,546,016 | |
| | GP Batteries International, Ltd. | | 343,000 | | | 277,280 | |
| | GP Industries, Ltd. | | 2,872,209 | | | 983,127 | |
| * | | Grand Banks Yachts, Ltd. | | 250,000 | | | 57,778 | |
| * | | GuocoLand, Ltd. | | 463,564 | | | 697,302 | |
| * | | GuocoLeisure, Ltd. | | 1,161,000 | | | 558,206 | |
| | Guthrie GTS, Ltd. | | 234,000 | | | 88,669 | |
| * | | Healthway Medical Corp., Ltd. | | 4,193,776 | | | 289,174 | |
| | Hersing Corp., Ltd. | | 1,285,000 | | | 245,137 | |
| * | | HG Metal Manufacturing, Ltd. | | 426,000 | | | 27,720 | |
| | Hiap Seng Engineering, Ltd. | | 612,000 | | | 133,203 | |
| | Hi-P International, Ltd. | | 1,203,000 | | | 546,815 | |
| | Ho Bee Investment, Ltd. | | 1,063,000 | | | 1,078,936 | |
| * | | Hong Fok Corp., Ltd. | | 2,769,700 | | | 939,296 | |
| | Hong Leong Asia, Ltd. | | 522,000 | | | 810,445 | |
| | Hotel Grand Central, Ltd. | | 1,182,535 | | | 672,972 | |
| | Hotel Properties, Ltd. | | 1,346,400 | | | 2,151,806 | |
| | Hour Glass, Ltd. | | 622,744 | | | 552,206 | |
| | HTL International Holdings, Ltd. | | 1,063,843 | | | 280,639 | |
| #* | | Huan Hsin Holdings, Ltd. | | 1,106,400 | | | 272,250 | |
| | HupSteel, Ltd. | | 1,572,875 | | | 247,061 | |
| | Hwa Hong Corp., Ltd. | | 2,186,000 | | | 778,159 | |
| # | | Hyflux, Ltd. | | 2,347,500 | | | 2,665,905 | |
| | IFS Capital, Ltd. | | 421,080 | | | 127,752 | |
| * | | Informatics Education, Ltd. | | 2,722,000 | | | 126,384 | |
| | InnoTek, Ltd. | | 846,000 | | | 250,019 | |
| | Intraco, Ltd. | | 390,500 | | | 61,219 | |
| | IPC Corp., Ltd. | | 724,000 | | | 62,105 | |
| | Isetan (Singapore), Ltd. | | 122,500 | | | 317,792 | |
| | Jadason Enterprises, Ltd. | | 728,000 | | | 33,936 | |
| * | | Jasper Investments, Ltd. | | 90,680 | | | 4,949 | |
| * | | Jaya Holdings, Ltd. | | 1,468,000 | | | 557,274 | |
| * | | JES International Holdings, Ltd. | | 2,096,000 | | | 296,608 | |
| * | | Jiutian Chemical Group, Ltd. | | 2,337,000 | | | 99,635 | |
| #* | | Jurong Technologies Industrial Corp., Ltd. | | 2,227,680 | | | — | |
| | K1 Ventures, Ltd. | | 3,349,500 | | | 275,134 | |
| # | | Keppel Telecommunications & Transportation, Ltd. | | 1,409,600 | | | 1,343,207 | |
| | Khong Guan Flour Milling, Ltd. | | 35,000 | | | 40,724 | |
| | Kian Ann Engineering, Ltd. | | 1,276,000 | | | 221,172 | |
| | Kian Ho Bearings, Ltd. | | 664,500 | | | 127,488 | |
| | Koh Brothers Group, Ltd. | | 1,312,000 | | | 190,796 | |
| * | | Lafe Corp., Ltd. | | 1,234,800 | | | 56,853 | |
| | LC Development, Ltd. | | 2,631,504 | | | 312,182 | |
| | Lee Kim Tah Holdings, Ltd. | | 1,600,000 | | | 725,444 | |
| * | | Lion Asiapac, Ltd. | | 473,000 | | | 67,403 | |
| | Lum Chang Holdings, Ltd. | | 1,042,030 | | | 247,473 | |
| | M1, Ltd. | | 1,701,000 | | | 3,322,079 | |
| #* | | Manhattan Resources, Ltd. | | 960,000 | | | 760,219 | |
| #* | | MarCo. Polo Marine, Ltd. | | 608,000 | | | 177,936 | |
| | Memstar Technology, Ltd. | | 1,114,000 | | | 41,137 | |
| | Memtech International, Ltd. | | 1,322,000 | | | 104,198 | |
| # | | Mercator Lines Singapore, Ltd. | | 555,000 | | | 61,380 | |
| | Metro Holdings, Ltd. | | 2,085,792 | | | 1,092,788 | |
| # | | Midas Holdings, Ltd. | | 4,612,000 | | | 1,496,064 | |
| * | | Mirach Energy, Ltd. | | 460,000 | | | 41,419 | |
| | Miyoshi Precision, Ltd. | | 353,500 | | | 19,202 | |
| | Multi-Chem, Ltd. | | 1,263,000 | | | 128,493 | |
| | Nam Cheong, Ltd. | | 871,740 | | | 84,452 | |
127
The Asia Pacific Small Company Series
continued
| | | | | SHARES | | VALUE†† | |
| SINGAPORE — (Continued) | | | | | | |
| | Nera Telecommunications, Ltd. | | 1,079,000 | | $ | 308,405 | |
| | New Toyo International Holdings, Ltd. | | 1,624,000 | | | 289,332 | |
| | Novo Group, Ltd. | | 55,500 | | | 9,288 | |
| | NSL, Ltd. | | 417,000 | | | 417,089 | |
| #* | | Oceanus Group, Ltd. | | 5,528,000 | | | 483,054 | |
| # | | OKP Holdings, Ltd. | | 207,000 | | | 91,738 | |
| | Orchard Parade Holdings, Ltd. | | 990,359 | | | 1,124,995 | |
| # | | OSIM International, Ltd. | | 1,356,000 | | | 1,333,086 | |
| | Ossia International, Ltd. | | 522,554 | | | 55,223 | |
| # | | Otto Marine, Ltd. | | 2,451,000 | | | 258,888 | |
| | Pan Pacific Hotels Group, Ltd. | | 1,669,500 | | | 2,486,716 | |
| | Pan-United Corp., Ltd. | | 2,006,000 | | | 696,524 | |
| * | | Penguin International, Ltd. | | 400,000 | | | 24,868 | |
| | Petra Foods, Ltd. | | 871,000 | | | 1,177,343 | |
| | Popular Holdings, Ltd. | | 2,763,650 | | | 348,972 | |
| | PSC Corp., Ltd. | | 1,823,419 | | | 273,576 | |
| | QAF, Ltd. | | 907,561 | | | 431,196 | |
| | Qian Hu Corp., Ltd. | | 674,600 | | | 45,374 | |
| # | | Raffles Education Corp., Ltd. | | 2,355,593 | | | 824,494 | |
| # | | Raffles Medical Group, Ltd. | | 773,067 | | | 1,374,977 | |
| | Rotary Engineering, Ltd. | | 1,143,600 | | | 579,050 | |
| | Roxy-Pacific Holdings, Ltd. | | 214,000 | | | 67,738 | |
| * | | S i2i, Ltd. | | 13,387,000 | | | 616,320 | |
| | San Teh, Ltd. | | 999,087 | | | 465,959 | |
| * | | Sapphire Corp., Ltd. | | 704,000 | | | 89,755 | |
| | SBS Transit, Ltd. | | 953,500 | | | 1,333,875 | |
| | SC Global Developments, Ltd. | | 416,000 | | | 375,874 | |
| * | | Seroja Investments, Ltd. | | 17,767 | | | 2,807 | |
| | Sim Lian Group, Ltd. | | 2,070,000 | | | 853,522 | |
| * | | Sinarmas Land, Ltd. | | 4,095,000 | | | 670,881 | |
| | Sing Investments & Finance, Ltd. | | 198,450 | | | 228,686 | |
| | Singapore Land, Ltd. | | 60,000 | | | 279,584 | |
| | Singapore Post, Ltd. | | 3,458,120 | | | 2,815,957 | |
| | Singapore Reinsurance Corp., Ltd. | | 1,514,530 | | | 317,185 | |
| | Singapore Shipping Corp., Ltd. | | 1,689,000 | | | 247,780 | |
| | Singapura Finance, Ltd. | | 174,062 | | | 212,241 | |
| | Sinostar PEC Holdings, Ltd. | | 160,000 | | | 15,104 | |
| * | | Sinwa, Ltd. | | 388,500 | | | 33,839 | |
| | SMB United, Ltd. | | 1,253,000 | | | 296,867 | |
| # | | Sound Global, Ltd. | | 1,432,000 | | | 629,770 | |
| | Stamford Land Corp., Ltd. | | 2,927,000 | | | 1,341,727 | |
| | Straco Corp., Ltd. | | 130,000 | | | 17,499 | |
| | Sunningdale Tech, Ltd. | | 2,086,000 | | | 161,173 | |
| # | | Sunvic Chemical Holdings, Ltd. | | 1,056,000 | | | 468,167 | |
| # | | Super Group, Ltd. | | 1,022,000 | | | 1,215,833 | |
| | Superbowl Holdings, Ltd. | | 522,000 | | | 111,294 | |
| #* | | Swiber Holdings, Ltd. | | 1,697,000 | | | 800,557 | |
| #* | | Swissco Holdings, Ltd. | | 579,000 | | | 93,712 | |
| | Tat Hong Holdings, Ltd. | | 1,116,800 | | | 592,401 | |
| # | | Technics Oil & Gas, Ltd. | | 583,000 | | | 408,744 | |
| | Thakral Corp., Ltd. | | 6,028,000 | | | 122,939 | |
| #* | | Tiger Airways Holdings, Ltd. | | 1,798,500 | | | 1,093,290 | |
| | Tiong Woon Corp. Holding, Ltd. | | 901,000 | | | 162,853 | |
| * | | Transcu Group, Ltd. | | 4,936,000 | | | 196,685 | |
| | Trek 2000 International, Ltd. | | 973,000 | | | 236,507 | |
| # | | Tuan Sing Holdings, Ltd. | | 3,613,475 | | | 838,754 | |
| # | | UMS Holdings, Ltd. | | 1,082,000 | | | 289,371 | |
| # | | United Engineers, Ltd. | | 730,014 | | | 1,086,442 | |
| # | | United Envirotech, Ltd. | | 1,098,000 | | | 303,145 | |
| | United Industrial Corp., Ltd. | | 230,000 | | | 493,090 | |
| | United Overseas Insurance, Ltd. | | 187,250 | | | 477,720 | |
128
The Asia Pacific Small Company Series
continued
| | | | | SHARES | | VALUE†† | |
| SINGAPORE — (Continued) | | | | | | | |
| | UOB-Kay Hian Holdings, Ltd. | | | 1,475,400 | | $ | 1,802,916 | |
| | Venture Corp., Ltd. | | | 431,000 | | | 2,298,702 | |
| | Vicom, Ltd. | | | 120,000 | | | 327,593 | |
| # | | WBL Corp., Ltd. | | | 597,000 | | | 1,490,487 | |
| # | | Wee Hur Holdings, Ltd. | | | 979,000 | | | 216,528 | |
| | Wheelock Properties, Ltd. | | | 1,210,000 | | | 1,540,296 | |
| | Wing Tai Holdings, Ltd. | | | 1,974,000 | | | 2,002,434 | |
| | Xpress Holdings, Ltd. | | | 3,079,000 | | | 80,902 | |
| | YHI International, Ltd. | | | 1,174,000 | | | 284,908 | |
| * | | Yoma Strategic Holdings, Ltd. | | | 132,000 | | | 8,489 | |
| | Yongnam Holdings, Ltd. | | | 3,921,000 | | | 727,790 | |
| TOTAL SINGAPORE | | | | | | 102,160,701 | |
| | | | | | | | | |
| TOTAL COMMON STOCKS | | | | | | 891,942,006 | |
| | | | | | | | | |
| RIGHTS/WARRANTS — (0.0%) | | | | | | | |
| AUSTRALIA — (0.0%) | | | | | | | |
| * | | Arafura Resources, Ltd. Rights 11/22/11 | | | 364,583 | | | 3,842 | |
| * | | Centrebet International, Ltd. Litigation Rights | | | 81,336 | | | — | |
| * | | Industrial Minerals Corp., Ltd. Warrants 06/08/13 | | | 545 | | | 22 | |
| TOTAL AUSTRALIA | | | | | | 3,864 | |
| | | | | | | | | |
| HONG KONG — (0.0%) | | | | | | | |
| * | | Allied Properties, Ltd. Warrants 06/13/16 | | | 2,449,571 | | | 40,990 | |
| | | | | | | | | |
| SINGAPORE — (0.0%) | | | | | | | |
| * | | Sinarmas Land, Ltd. Warrants 11/18/15 | | | 877,451 | | | 62,935 | |
| * | | Transcu Group, Ltd. Warrants 09/01/13 | | | 1,018,000 | | | 16,226 | |
| TOTAL SINGAPORE | | | | | | 79,161 | |
| | | | | | | | | |
| TOTAL RIGHTS/WARRANTS | | | | | | 124,015 | |
| | |
| | | | SHARES/ | | | | |
| | | | FACE | | | | |
| | | | AMOUNT | | VALUE† | |
| | | | (000) | | | | |
| SECURITIES LENDING COLLATERAL — (18.0%) | | | | | | | |
| §@ | | DFA Short Term Investment Fund | | 194,946,384 | | | 194,946,384 | |
| @ | | Repurchase Agreement, Deutsche Bank Securities, Inc. 0.11%, | | | | | | | |
| | 11/01/11 (Collateralized by FNMA 3.500%, 11/01/31, valued at | | | | | | | |
| | $507,060) to be repurchased at $497,120 | | $ | 497 | | | 497,118 | |
| TOTAL SECURITIES LENDING COLLATERAL | | | | | | 195,443,502 | |
| | | | | | | | |
| TOTAL INVESTMENTS — (100.0%) | | | | | | | |
| | (Cost $1,048,582,657) | | | | | $ | 1,087,509,523 | |
129
THE UNITED KINGDOM SMALL COMPANY SERIES
SCHEDULE OF INVESTMENTS
OCTOBER 31, 2011
| | | | | SHARES | | VALUE†† | |
| COMMON STOCKS — (99.5%) | | | | | | |
| Consumer Discretionary — (22.6%) | | | | | | |
| | 4imprint Group P.L.C. | | 96,735 | | $ | 396,550 | |
| * | | 888 Holdings P.L.C. | | 87,404 | | | 46,174 | |
| | Aegis Group P.L.C. | | 3,302,990 | | | 7,250,104 | |
| | Aga Rangemaster Group P.L.C. | | 453,866 | | | 555,794 | |
| | Arena Leisure P.L.C. | | 1,368,472 | | | 835,738 | |
| | Avon Rubber P.L.C. | | 21,719 | | | 106,210 | |
| * | | Barratt Developments P.L.C. | | 3,809,758 | | | 5,428,184 | |
| | Bellway P.L.C. | | 481,114 | | | 5,474,561 | |
| * | | Berkeley Group Holdings P.L.C. (The) | | 511,780 | | | 10,262,607 | |
| | Bloomsbury Publishing P.L.C. | | 271,841 | | | 429,238 | |
| | Bovis Homes Group P.L.C. | | 873,848 | | | 6,594,489 | |
| | Bwin.Party Digital Entertainment P.L.C. | | 1,648,895 | | | 2,890,559 | |
| # | | Carpetright P.L.C. | | 176,546 | | | 1,305,026 | |
| | Carphone Warehouse Group P.L.C. | | 417,635 | | | 2,349,014 | |
| | Centaur Media P.L.C. | | 556,967 | | | 344,391 | |
| | Chime Communications P.L.C. | | 222,427 | | | 722,511 | |
| | Churchill China P.L.C. | | 30,000 | | | 131,209 | |
| | Cineworld Group P.L.C. | | 58,664 | | | 179,236 | |
| * | | Clinton Cards P.L.C. | | 740,506 | | | 136,923 | |
| | Creston P.L.C. | | 13,626 | | | 19,204 | |
| | Daily Mail & General Trust P.L.C. Series A | | 1,068,559 | | | 7,147,691 | |
| | Debenhams P.L.C. | | 4,585,455 | | | 4,779,639 | |
| | Dignity P.L.C. | | 214,913 | | | 2,816,271 | |
| * | | Dixons Retail P.L.C. | | 12,217,921 | | | 2,319,710 | |
| | Domino’s Pizza UK & IRL P.L.C. | | 225,442 | | | 1,653,521 | |
| | Dunelm Group P.L.C. | | 122,119 | | | 982,824 | |
| * | | Enterprise Inns P.L.C. | | 1,808,533 | | | 804,725 | |
| | Euromoney Institutional Investor P.L.C. | | 292,779 | | | 3,183,200 | |
| * | | Findel P.L.C. | | 4,998,346 | | | 307,111 | |
| * | | Forminster P.L.C. | | 43,333 | | | 2,613 | |
| | French Connection Group P.L.C. | | 373,475 | | | 470,749 | |
| | Fuller Smith & Turner P.L.C. | | 129,026 | | | 1,446,867 | |
| | Future P.L.C. | | 1,324,863 | | | 220,400 | |
| | Game Group P.L.C. | | 1,527,764 | | | 473,763 | |
| | Games Workshop Group P.L.C. | | 101,889 | | | 712,204 | |
| | GKN P.L.C. | | 3,414,280 | | | 10,379,451 | |
| | Greene King P.L.C. | | 1,421,372 | | | 10,248,985 | |
| | Halfords Group P.L.C. | | 752,842 | | | 3,947,998 | |
| | Haynes Publishing Group P.L.C. | | 14,703 | | | 53,219 | |
| | Headlam Group P.L.C. | | 330,383 | | | 1,415,107 | |
| | Henry Boot P.L.C. | | 426,786 | | | 799,475 | |
| # | | HMV Group P.L.C. | | 1,545,882 | | | 112,427 | |
| | Home Retail Group P.L.C. | | 2,403,649 | | | 3,878,574 | |
| | Hornby P.L.C. | | 154,220 | | | 321,344 | |
| * | | Howden Joinery Group P.L.C. | | 1,985,001 | | | 3,748,715 | |
| | Huntsworth P.L.C. | | 852,060 | | | 854,180 | |
| | Inchcape P.L.C. | | 1,915,975 | | | 10,215,753 | |
| | Informa P.L.C. | | 2,227,041 | | | 12,932,542 | |
| * | | ITV P.L.C. | | 8,448,636 | | | 8,656,619 | |
| * | | JD Sports Fashion P.L.C. | | 120,013 | | | 1,608,429 | |
| | JD Wetherspoon P.L.C. | | 462,380 | | | 3,200,157 | |
| * | | JJB Sports P.L.C. | | 156,013 | | | 28,922 | |
| | John Menzies P.L.C. | | 244,534 | | | 1,927,674 | |
| * | | Johnston Press P.L.C. | | 507,412 | | | 39,951 | |
| | Kesa Electricals P.L.C. | | 2,105,278 | | | 3,480,437 | |
| | Ladbrokes P.L.C. | | 3,578,739 | | | 7,926,071 | |
| | Laura Ashley Holdings P.L.C. | | 1,500,394 | | | 480,325 | |
| | Lookers P.L.C. | | 1,097,970 | | | 953,238 | |
130
The United Kingdom Small Company Series
continued
| | | | | SHARES | | VALUE†† | |
| Consumer Discretionary — (Continued) | | | | | | |
| | Marston’s P.L.C. | | 2,175,504 | | $ | 3,382,623 | |
| | Mecom Group P.L.C. | | 200,000 | | | 496,967 | |
| | Millennium & Copthorne Hotels P.L.C. | | 1,048,561 | | | 7,496,839 | |
| * | | Mitchells & Butlers P.L.C. | | 987,029 | | | 3,801,743 | |
| | Mothercare P.L.C. | | 342,220 | | | 923,322 | |
| | N Brown Group P.L.C. | | 862,304 | | | 3,654,064 | |
| | Pace P.L.C. | | 834,489 | | | 1,059,376 | |
| * | | Pendragon P.L.C. | | 2,428,575 | | | 371,246 | |
| | Persimmon P.L.C. | | 1,135,393 | | | 9,054,346 | |
| | Photo-Me International P.L.C. | | 3,631 | | | 3,604 | |
| * | | Punch Taverns P.L.C. | | 2,380,301 | | | 401,000 | |
| * | | Redrow P.L.C. | | 1,485,274 | | | 2,777,962 | |
| | Restaurant Group P.L.C. | | 780,418 | | | 3,755,317 | |
| | Rightmove P.L.C. | | 378,372 | | | 7,916,679 | |
| | Smiths News P.L.C. | | 705,619 | | | 1,085,533 | |
| * | | Spirit Pub Co. P.L.C. | | 2,380,301 | | | 1,827,527 | |
| * | | Sportech P.L.C. | | 329,794 | | | 211,801 | |
| * | | Sports Direct International P.L.C. | | 670,447 | | | 2,469,624 | |
| | St. Ives Group P.L.C. | | 665,998 | | | 958,395 | |
| * | | Stylo P.L.C. | | 64,096 | | | 4,895 | |
| * | | SuperGroup P.L.C. | | 29,413 | | | 294,381 | |
| * | | Tandem Group P.L.C. Non-Voting Shares | | 327,365 | | | — | |
| * | | Taylor Wimpey P.L.C. | | 11,523,893 | | | 6,820,670 | |
| | Ted Baker P.L.C. | | 149,926 | | | 1,797,251 | |
| | Thomas Cook Group P.L.C. | | 3,076,507 | | | 2,552,802 | |
| | Topps Tiles P.L.C. | | 810,881 | | | 409,022 | |
| * | | Torotrak P.L.C. | | 22,750 | | | 12,983 | |
| * | | Trinity Mirror P.L.C. | | 1,688,565 | | | 1,314,893 | |
| | TUI Travel P.L.C. | | 770,956 | | | 2,109,652 | |
| | UBM P.L.C. | | 917,439 | | | 7,467,863 | |
| | UTV Media P.L.C. | | 230,855 | | | 443,437 | |
| | Vitec Group P.L.C. (The) | | 160,303 | | | 1,543,814 | |
| * | | Wagon P.L.C. | | 237,979 | | | 4,783 | |
| | WH Smith P.LC | | 620,413 | | | 5,457,360 | |
| | Whitbread P.L.C. | | 103,235 | | | 2,743,095 | |
| | William Hill P.L.C. | | 2,873,883 | | | 9,975,029 | |
| | Wilmington Group P.L.C. | | 346,234 | | | 469,962 | |
| #* | | Yell Group P.L.C. | | 6,668,448 | | | 387,122 | |
| Total Consumer Discretionary | | | | | 255,445,585 | |
| | | | | | | |
| Consumer Staples — (4.1%) | | | | | | |
| | A.G. Barr P.L.C. | | 136,709 | | | 2,655,108 | |
| | Anglo-Eastern Plantations P.L.C. | | 108,153 | | | 1,113,352 | |
| | Booker Group P.L.C. | | 2,013,499 | | | 2,434,972 | |
| | Britvic P.L.C. | | 920,135 | | | 4,872,566 | |
| | Cranswick P.L.C. | | 199,793 | | | 2,219,528 | |
| | Dairy Crest Group P.L.C. | | 560,392 | | | 3,107,552 | |
| | Devro P.L.C. | | 654,975 | | | 2,586,838 | |
| * | | European Home Retail P.L.C. | | 109,256 | | | — | |
| | Fiberweb P.L.C. | | 482,639 | | | 316,914 | |
| | Greggs P.L.C. | | 422,420 | | | 3,465,462 | |
| * | | Hilton Food Group, Ltd. | | 1,604 | | | 7,130 | |
| | McBride P.L.C. | | 832,651 | | | 1,825,247 | |
| * | | McBride P.L.C. Redeemable B Shares | | 39,967,248 | | | 64,263 | |
| * | | Premier Foods P.L.C. | | 7,951,806 | | | 500,658 | |
| | PZ Cussons P.L.C. | | 1,287,639 | | | 7,603,992 | |
| | R.E.A. Holdings P.L.C. | | 49,233 | | | 454,065 | |
| | Robert Wiseman Dairies P.L.C. | | 221,312 | | | 1,026,273 | |
| | Tate & Lyle P.L.C. | | 1,074,000 | | | 11,236,585 | |
| | Thorntons P.L.C. | | 313,060 | | | 215,248 | |
| | Young & Co.’s Brewery P.L.C. | | 35,000 | | | 291,174 | |
131
The United Kingdom Small Company Series
continued
| | | | SHARES | | VALUE†† | |
| Consumer Staples — (Continued) | | | | | |
| | Young & Co.’s Brewery P.L.C. Series A | 20,936 | | $ | 226,689 | |
| Total Consumer Staples | | | | 46,223,616 | |
| | | | | | | |
| Energy — (4.7%) | | | | | |
| * | | Afren P.L.C. | 3,944,497 | | | 6,238,755 | |
| | Anglo Pacific Group P.L.C. | 448,773 | | | 1,939,193 | |
| * | | Cadogan Petroleum P.L.C. | 89,523 | | | 60,002 | |
| * | | EnQuest P.L.C. | 1,922,771 | | | 3,324,326 | |
| * | | Exillon Energy P.L.C. | 106,183 | | | 510,821 | |
| | Fortune Oil P.L.C. | 6,170,225 | | | 946,455 | |
| * | | Hardy Oil & Gas P.L.C. | 65,370 | | | 160,820 | |
| * | | Heritage Oil P.L.C. | 583,397 | | | 2,041,911 | |
| | Hunting P.L.C. | 462,895 | | | 4,931,050 | |
| | James Fisher & Sons P.L.C. | 171,886 | | | 1,531,260 | |
| | JKX Oil & Gas P.L.C. | 456,676 | | | 1,154,387 | |
| | John Wood Group P.L.C. | 1,034,385 | | | 10,241,235 | |
| | Lamprell P.L.C. | 459,120 | | | 1,779,769 | |
| | Melrose Resources P.L.C. | 336,039 | | | 601,932 | |
| * | | Premier Oil P.L.C. | 1,778,192 | | | 10,468,183 | |
| * | | Salamander Energy P.L.C. | 538,491 | | | 1,715,751 | |
| * | | Soco International P.L.C. | 892,380 | | | 4,710,888 | |
| * | | UK Coal P.L.C. | 1,470,907 | | | 800,384 | |
| Total Energy | | | | 53,157,122 | |
| | | | | | |
| Financials — (13.4%) | | | | | |
| | Aberdeen Asset Management P.L.C. | 2,820,342 | | | 8,684,151 | |
| | Amlin P.L.C. | 1,905,352 | | | 8,788,141 | |
| | Arbuthnot Banking Group P.L.C. | 60,497 | | | 309,681 | |
| | Ashmore Group P.L.C. | 1,022,611 | | | 5,705,401 | |
| * | | BCB Holdings, Ltd. | 5,979 | | | 3,845 | |
| | Beazley P.L.C. | 2,046,568 | | | 4,128,440 | |
| | Brewin Dolphin Holdings P.L.C. | 926,221 | | | 1,872,438 | |
| | Capital & Counties Properties P.L.C. | 682,254 | | | 1,968,921 | |
| * | | Capital & Regional P.L.C. | 1,493,345 | | | 814,476 | |
| | Catlin Group, Ltd. | 1,357,851 | | | 8,637,469 | |
| | Charles Stanley Group P.L.C. | 126,349 | | | 595,256 | |
| | Charles Taylor Consulting P.L.C. | 139,215 | | | 289,862 | |
| | Chesnara P.L.C. | 306,964 | | | 953,638 | |
| | Close Brothers Group P.L.C. | 561,047 | | | 6,376,108 | |
| | Collins Stewart Hawkpoint P.L.C. | 493,302 | | | 482,192 | |
| | Daejan Holdings P.L.C. | 32,842 | | | 1,448,701 | |
| | Development Securities P.L.C. | 460,015 | | | 1,434,412 | |
| * | | DTZ Holdings P.L.C. | 224,770 | | | 71,480 | |
| | Evolution Group P.L.C. | 1,034,580 | | | 1,434,810 | |
| | F&C Asset Management P.L.C. | 1,764,254 | | | 2,074,987 | |
| | GlobeOp Financial Services SA | 21,502 | | | 98,512 | |
| | Hansard Global P.L.C. | 16,468 | | | 43,694 | |
| | Hardy Underwriting Group P.L.C. | 161,307 | | | 570,073 | |
| | Hargreaves Lansdown P.L.C. | 616,496 | | | 4,954,059 | |
| | Helical Bar P.L.C. | 657,998 | | | 2,105,708 | |
| | Henderson Group P.L.C. | 3,838,880 | | | 7,392,054 | |
| | Hiscox, Ltd. | 1,562,751 | | | 9,550,834 | |
| | IG Group Holdings P.L.C. | 1,317,769 | | | 9,826,558 | |
| * | | Industrial & Commercial Holdings P.L.C. | 5,000 | | | 121 | |
| | Intermediate Capital Group P.L.C. | 892,250 | | | 3,493,734 | |
| | International Personal Finance P.L.C. | 845,821 | | | 3,713,360 | |
| * | | IP Group P.L.C. | 393,072 | | | 443,883 | |
| | Jardine Lloyd Thompson Group P.L.C. | 638,821 | | | 7,365,218 | |
| * | | Jupiter Fund Management P.L.C. | 92,588 | | | 352,381 | |
| | Lancashire Holdings, Ltd. | 545,449 | | | 6,262,160 | |
| * | | Liontrust Asset Management P.L.C. | 129,935 | | | 120,354 | |
132
The United Kingdom Small Company Series
continued
| | | | SHARES | | VALUE†† | |
| Financials — (Continued) | | | | | |
| | London Stock Exchange Group P.L.C. | 579,642 | | $ | 8,368,165 | |
| | LSL Property Services P.L.C. | 137,031 | | | 519,422 | |
| * | | MWB Group Holdings P.L.C. | 379,622 | | | 148,650 | |
| | Novae Group P.L.C. | 212,950 | | | 1,003,785 | |
| | Phoenix Group Holdings P.L.C. | 32,406 | | | 271,092 | |
| | Provident Financial P.L.C. | 541,018 | | | 9,615,833 | |
| * | | Puma Brandenburg, Ltd. Capital Shares | 1,193,004 | | | 123,807 | |
| * | | Puma Brandenburg, Ltd. Income Shares | 1,193,004 | | | 49,523 | |
| * | | Quintain Estates & Development P.L.C. | 959,280 | | | 573,252 | |
| | Rathbone Brothers P.L.C. | 168,876 | | | 3,107,508 | |
| * | | Raven Russia, Ltd. | 141,602 | | | 125,773 | |
| * | | Rutland Trust P.L.C. | 85,288 | | | — | |
| | S&U P.L.C. | 21,140 | | | 209,950 | |
| | Safestore Holdings P.L.C. | 294,888 | | | 490,617 | |
| | Savills P.L.C. | 543,867 | | | 2,709,304 | |
| | Shore Capital Group, Ltd. | 1,193,004 | | | 364,796 | |
| | St. James’s Place P.L.C. | 791,622 | | | 4,477,026 | |
| | St. Modwen Properties P.L.C. | 630,419 | | | 1,261,687 | |
| | Tullett Prebon P.L.C. | 830,878 | | | 4,685,140 | |
| * | | Unite Group P.L.C. | 567,169 | | | 1,606,760 | |
| * | | Waterloo Investment Holdings, Ltd. | 5,979 | | | 673 | |
| Total Financials | | | | 152,079,875 | |
| | | | | | | |
| Health Care — (1.9%) | | | | | |
| #* | | Alizyme P.L.C. | 660,805 | | | 42,500 | |
| | Assura Group, Ltd. | 55,851 | | | 35,003 | |
| | Axis-Shield P.L.C. | 234,766 | | | 1,767,600 | |
| | Bioquell P.L.C. | 90,893 | | | 160,248 | |
| * | | BTG P.L.C. | 1,131,735 | | | 5,017,212 | |
| | Consort Medical P.L.C. | 116,271 | | | 961,181 | |
| | Corin Group P.L.C. | 126,637 | | | 81,468 | |
| | Dechra Pharmaceuticals P.L.C. | 238,079 | | | 1,878,821 | |
| | Genus P.L.C. | 192,290 | | | 3,165,902 | |
| | Hikma Pharmaceuticals P.L.C. | 532,214 | | | 5,764,299 | |
| * | | Optos P.L.C. | 6,631 | | | 21,942 | |
| * | | Oxford Biomedica P.L.C. | 2,821,652 | | | 242,118 | |
| * | | Renovo Group P.L.C. | 95,255 | | | 22,429 | |
| * | | Southern Cross Healthcare P.L.C. | 191,826 | | | 19,277 | |
| | Synergy Health P.L.C. | 106,913 | | | 1,429,399 | |
| * | | Vectura Group P.L.C. | 1,349,073 | | | 1,319,507 | |
| Total Health Care | | | | 21,928,906 | |
| | | | | | | |
| Industrials — (30.5%) | | | | | |
| * | | AEA Technology Group P.L.C. | 539,970 | | | 17,264 | |
| # | | Air Partner P.L.C. | 37,086 | | | 206,537 | |
| | Alumasc Group P.L.C. | 124,366 | | | 284,648 | |
| | Ashtead Group P.L.C. | 2,124,586 | | | 5,286,824 | |
| * | | Autologic Holdings P.L.C. | 80,000 | | | 23,032 | |
| | Babcock International Group P.L.C. | 1,446,405 | | | 16,346,634 | |
| | Balfour Beatty P.L.C. | 2,828,972 | | | 11,412,635 | |
| | BBA Aviation P.L.C. | 2,792,163 | | | 7,949,170 | |
| | Berendsen P.L.C. | 709,591 | | | 5,286,736 | |
| | Bodycote P.L.C. | 1,253,236 | | | 5,670,081 | |
| | Braemar Shipping Services P.L.C. | 81,108 | | | 482,355 | |
| | Brammer P.L.C. | 189,963 | | | 825,162 | |
| | Bunzl P.L.C. | 227,489 | | | 2,942,709 | |
| | Camellia P.L.C. | 2,481 | | | 353,821 | |
| | Cape P.L.C. | 147,406 | | | 1,140,986 | |
| | Carillion P.L.C. | 1,773,138 | | | 9,848,482 | |
| | Carr’s Milling Industries P.L.C. | 35,330 | | | 425,412 | |
| | Castings P.L.C. | 162,757 | | | 741,383 | |
133
The United Kingdom Small Company Series
continued
| | | | SHARES | | VALUE†† | |
| Industrials — (Continued) | | | | | |
| | Charter International P.L.C. | 664,438 | | $ | 9,570,201 | |
| | Chemring Group P.L.C. | 783,476 | | | 6,410,587 | |
| | Clarkson P.L.C. | 64,187 | | | 1,077,461 | |
| | Cobham P.L.C. | 2,256,164 | | | 6,510,754 | |
| | Communisis P.L.C. | 561,133 | | | 228,673 | |
| #* | | Connaught P.L.C. | 307,612 | | | — | |
| | Cookson Group P.L.C. | 1,135,834 | | | 8,730,616 | |
| | Costain Group P.L.C. | 139,449 | | | 438,000 | |
| | De La Rue P.L.C. | 387,017 | | | 5,242,912 | |
| * | | easyJet P.L.C. | 690,633 | | | 3,957,984 | |
| * | | Eleco P.L.C. | 80,000 | | | 11,293 | |
| | Fenner P.L.C. | 715,591 | | | 3,903,932 | |
| | Firstgroup P.L.C. | 1,763,210 | | | 9,443,194 | |
| | Galliford Try P.L.C. | 229,513 | | | 1,714,797 | |
| | Go-Ahead Group P.L.C. | 173,516 | | | 3,866,709 | |
| * | | Hampson Industries P.L.C. | 712,146 | | | 92,050 | |
| | Harvey Nash Group P.L.C. | 6,308 | | | 6,266 | |
| | Hays P.L.C. | 5,445,665 | | | 6,914,072 | |
| * | | Helphire P.L.C. | 956,560 | | | 43,340 | |
| | Hogg Robinson Group P.L.C. | 142,542 | | | 120,459 | |
| | Homeserve P.L.C. | 1,162,452 | | | 6,528,576 | |
| | Hyder Consulting P.L.C. | 171,164 | | | 931,997 | |
| | IMI P.L.C. | 1,053,765 | | | 13,887,888 | |
| * | | Impellam Group P.L.C. | 34,877 | | | 156,360 | |
| | Interserve P.L.C. | 529,664 | | | 2,807,051 | |
| | Intertek Group P.L.C. | 506,207 | | | 16,690,015 | |
| | Invensys P.L.C. | 2,110,010 | | | 7,633,539 | |
| | ITE Group P.L.C. | 1,059,501 | | | 3,194,156 | |
| | Keller Group P.L.C. | 276,404 | | | 1,629,137 | |
| | Kier Group P.L.C. | 152,839 | | | 3,447,458 | |
| | Latchways P.L.C. | 39,288 | | | 757,934 | |
| | Lavendon Group P.L.C. | 500,631 | | | 734,886 | |
| | Low & Bonar P.L.C. | 828,300 | | | 596,345 | |
| | Management Consulting Group P.L.C. | 1,207,875 | | | 645,171 | |
| | Mears Group P.L.C. | 160,046 | | | 681,196 | |
| | Meggitt P.L.C. | 2,465,596 | | | 15,216,658 | |
| | Melrose P.L.C. | 1,583,124 | | | 8,361,271 | |
| | Michael Page International P.L.C. | 1,310,832 | | | 8,438,432 | |
| | Mitie Group P.L.C. | 1,286,774 | | | 5,193,280 | |
| * | | MJ Gleeson Group P.L.C. | 195,875 | | | 350,354 | |
| | Morgan Crucible Co. P.L.C. | 1,252,304 | | | 5,683,256 | |
| | Morgan Sindall P.L.C. | 169,608 | | | 1,508,754 | |
| * | | Mouchel Group P.L.C. | 469,006 | | | 101,074 | |
| | National Express Group P.L.C. | 1,701,575 | | | 6,285,227 | |
| * | | Northgate P.L.C. | 453,699 | | | 1,878,151 | |
| | PayPoint P.L.C. | 105,160 | | | 852,521 | |
| | Qinetiq P.L.C. | 2,474,225 | | | 4,637,257 | |
| | Regus P.L.C. | 3,337,697 | | | 4,051,062 | |
| * | | Renold P.L.C. | 20,048 | | | 9,672 | |
| * | | Rentokil Initial P.L.C. | 6,753,492 | | | 7,788,542 | |
| | Ricardo P.L.C. | 217,815 | | | 1,282,939 | |
| * | | Richmond Oil & Gas P.L.C. | 220,000 | | | — | |
| | Robert Walters P.L.C. | 387,999 | | | 1,278,520 | |
| | Rotork P.L.C. | 366,679 | | | 9,890,187 | |
| | RPS Group P.L.C. | 836,994 | | | 2,423,962 | |
| | Senior P.L.C. | 1,762,689 | | | 4,699,945 | |
| | Severfield-Rowen P.L.C. | 371,550 | | | 953,159 | |
| | Shanks Group P.L.C. | 1,786,148 | | | 3,168,547 | |
| * | | SIG P.L.C. | 2,074,440 | | | 3,196,261 | |
| | Smart (J) & Co. (Contractors) P.L.C. | 22,500 | | | 135,672 | |
| | Speedy Hire P.L.C. | 1,262,151 | | | 415,851 | |
134
The United Kingdom Small Company Series
continued
| | | | SHARES | | VALUE†† | |
| Industrials — (Continued) | | | | | |
| | Spirax-SarCo. Engineering P.L.C. | 319,520 | | $ | 9,815,375 | |
| | Stagecoach Group P.L.C. | 1,718,521 | | | 6,831,289 | |
| | Sthree P.L.C. | 330,670 | | | 1,510,365 | |
| | T Clarke P.L.C. | 148,717 | | | 102,127 | |
| | Tarsus Group P.L.C. | 212,372 | | | 437,003 | |
| | Travis Perkins P.L.C. | 922,110 | | | 13,042,544 | |
| | Tribal Group P.L.C. | 132,810 | | | 96,699 | |
| * | | Trifast P.L.C. | 359,985 | | | 234,334 | |
| | UK Mail Group P.L.C. | 197,261 | | | 652,009 | |
| | Ultra Electronics Holdings P.L.C. | 283,178 | | | 7,224,994 | |
| | UmeCo. P.L.C. | 196,406 | | | 792,754 | |
| # | | Volex P.L.C. | 229,354 | | | 1,118,991 | |
| | Vp P.L.C. | 167,297 | | | 584,623 | |
| | Wincanton P.L.C. | 479,763 | | | 557,300 | |
| | WS Atkins P.L.C. | 501,683 | | | 4,614,757 | |
| | WSP Group P.L.C. | 276,589 | | | 1,022,749 | |
| # | | XP Power, Ltd. | 73,546 | | | 1,183,333 | |
| Total Industrials | | | | 345,470,680 | |
| | | | | | | |
| Information Technology — (10.1%) | | | | | |
| | Acal P.L.C. | 104,729 | | | 414,988 | |
| | Alphameric P.L.C. | 127,141 | | | 55,064 | |
| * | | Alterian P.L.C. | 179,139 | | | 254,115 | |
| | Anite P.L.C. | 1,166,924 | | | 1,247,869 | |
| | Aveva Group P.L.C. | 289,692 | | | 7,334,814 | |
| | Computacenter P.L.C. | 446,179 | | | 2,727,992 | |
| | CSR P.L.C. | 683,977 | | | 1,983,714 | |
| | Dialight P.L.C. | 111,362 | | | 1,340,507 | |
| | Diploma P.L.C. | 482,456 | | | 2,488,642 | |
| | Domino Printing Sciences P.L.C. | 455,803 | | | 4,186,572 | |
| | E2V Technologies P.L.C. | 346,435 | | | 606,146 | |
| | Electrocomponents P.L.C. | 1,730,514 | | | 6,087,562 | |
| | Fidessa Group P.L.C. | 137,261 | | | 3,582,625 | |
| | Halma P.L.C. | 1,541,075 | | | 8,281,224 | |
| * | | Imagination Technologies Group P.L.C. | 961,901 | | | 7,071,566 | |
| * | | Innovation Group P.L.C. | 3,208,091 | | | 1,014,103 | |
| | Kewill P.L.C. | 368,863 | | | 406,677 | |
| * | | Kofax P.L.C. | 317,667 | | | 1,395,918 | |
| | Laird P.L.C. | 915,289 | | | 2,189,761 | |
| | Logica P.L.C. | 6,339,968 | | | 9,513,413 | |
| | Micro Focus International P.L.C. | 568,939 | | | 3,078,051 | |
| * | | Misys P.L.C. | 1,604,251 | | | 7,512,729 | |
| | Moneysupermarket.com Group P.L.C. | 483,650 | | | 817,704 | |
| * | | NCC Group P.L.C. | 694 | | | 7,397 | |
| | Oxford Instruments P.L.C. | 217,414 | | | 2,676,982 | |
| | Phoenix IT Group, Ltd. | 204,552 | | | 640,295 | |
| | Premier Farnell P.L.C. | 1,467,203 | | | 4,116,268 | |
| | Psion P.L.C. | 500,223 | | | 402,048 | |
| | PV Crystalox Solar P.L.C. | 956,033 | | | 116,984 | |
| | Renishaw P.L.C. | 188,423 | | | 2,951,907 | |
| | RM P.L.C. | 363,499 | | | 391,222 | |
| | SDL P.L.C. | 338,168 | | | 3,574,969 | |
| | Spectris P.L.C. | 515,234 | | | 10,526,946 | |
| | Spirent Communications P.L.C. | 2,622,105 | | | 5,257,721 | |
| * | | Telecity Group P.L.C. | 633,394 | | | 6,082,300 | |
| | TT electronics P.L.C. | 635,179 | | | 1,602,182 | |
| # | | Vislink P.L.C. | 274,226 | | | 69,306 | |
| * | | Wolfson Microelectronics P.L.C. | 504,759 | | | 950,189 | |
| | Xaar P.L.C. | 251,590 | | | 984,190 | |
| * | | Xchanging P.L.C. | 701,347 | | | 767,877 | |
| Total Information Technology | | | | 114,710,539 | |
135
The United Kingdom Small Company Series
continued
| | | | SHARES | | VALUE† | |
| Materials — (7.3%) | | | | | |
| | African Barrick Gold, Ltd. | 73,625 | | $ | 637,671 | |
| | British Polythene Industries P.L.C. | 102,332 | | | 527,324 | |
| | Carclo P.L.C. | 214,230 | | | 1,001,103 | |
| * | | Centamin Egypt, Ltd. | 2,597,619 | | | 4,557,087 | |
| * | | Central Rand Gold, Ltd. | 388,384 | | | 2,496 | |
| | Croda International P.L.C. | 520,183 | | | 14,624,049 | |
| | DS Smith P.L.C. | 2,106,170 | | | 7,195,643 | |
| | Elementis P.L.C. | 1,966,934 | | | 4,540,691 | |
| | Ferrexpo P.L.C. | 888,830 | | | 4,574,970 | |
| | Filtrona P.L.C. | 753,961 | | | 4,801,881 | |
| * | | Gem Diamonds, Ltd. | 424,075 | | | 1,508,644 | |
| | Hill & Smith Holdings P.L.C. | 289,549 | | | 1,240,858 | |
| | Hochschild Mining P.L.C. | 640,518 | | | 4,588,505 | |
| * | | International Ferro Metals, Ltd. | 175,625 | | | 59,396 | |
| * | | Inveresk P.L.C. | 125,000 | | | 3,316 | |
| * | | Lonmin P.L.C. | 74,647 | | | 1,298,202 | |
| | Marshalls P.L.C. | 721,612 | | | 997,620 | |
| | Mondi P.L.C. | 1,078,021 | | | 8,199,053 | |
| * | | Namakwa Diamonds, Ltd. | 6,057 | | | 738 | |
| | New World Resources P.L.C. Series A | 61,691 | | | 516,193 | |
| | Petropavlovsk P.L.C. | 621,750 | | | 7,318,337 | |
| | Porvair P.L.C. | 146,460 | | | 217,364 | |
| | RPC Group P.L.C. | 622,691 | | | 3,533,056 | |
| #* | | Talvivaara Mining Co. P.L.C. | 325,263 | | | 1,206,473 | |
| | Victrex P.L.C. | 340,523 | | | 6,926,455 | |
| | Yule Catto & Co. P.L.C. | 831,772 | | | 2,270,194 | |
| | Zotefoams P.L.C. | 96,852 | | | 209,979 | |
| Total Materials | | | | 82,557,298 | |
| | | | | | |
| Telecommunication Services — (2.3%) | | | | | |
| | Cable & Wireless Communications P.L.C. | 9,309,312 | | | 5,410,100 | |
| * | | Cable & Wireless Worldwide P.L.C. | 6,285,045 | | | 2,812,350 | |
| * | | Colt Group SA | 1,287,437 | | | 2,087,847 | |
| * | | Inmarsat P.L.C. | 758,673 | | | 5,723,284 | |
| | Kcom Group P.L.C. | 2,643,350 | | | 3,104,340 | |
| | TalkTalk Telecom Group P.L.C. | 1,692,557 | | | 3,523,642 | |
| * | | Telecom Plus P.L.C. | 265,603 | | | 3,158,429 | |
| Total Telecommunication Services | | | | 25,819,992 | |
| | | | | | |
| Utilities — (2.6%) | | | | | |
| | Dee Valley Group P.L.C. | 12,109 | | | 240,136 | |
| | Drax Group P.L.C. | 1,479,700 | | | 12,880,863 | |
| | Pennon Group P.L.C. | 1,445,401 | | | 16,146,166 | |
| Total Utilities | | | | 29,267,165 | |
| TOTAL COMMON STOCKS | | | | 1,126,660,778 | |
| | | | | | |
| PREFERRED STOCKS — (0.0%) | | | | | |
| Consumer Staples — (0.0%) | | | | | |
| | R.E.A. Holdings P.L.C. | 5,414 | | | 9,625 | |
| | | | | | |
| RIGHTS/WARRANTS — (0.0%) | | | | | |
| * | | Management Consulting Group P.L.C. Warrants 12/31/11 | 52,718 | | | 9,536 | |
| * | | SFI Holdings, Ltd. Litigation Certificate | 26,713 | | | — | |
| * | | Ultraframe P.L.C. Litigation Notes | 319,285 | | | — | |
| TOTAL RIGHTS/WARRANTS | | | | 9,536 | |
136
The United Kingdom Small Company Series
continued
| | | | | SHARES/ | | | | |
| | | | FACE | | | | |
| | | | AMOUNT | | VALUE† | |
| | | | (000) | | | | |
| SECURITIES LENDING COLLATERAL — (0.5%) | | | | | | | |
| §@ | | DFA Short Term Investment Fund | | | 3,124,051 | | $ | 3,124,051 | |
| @ | | Repurchase Agreement, Deutsche Bank Securities, Inc. 0.11%, | | | | | | | |
| | 11/01/11 (Collateralized by FNM A 3.500%, 11/01/31, valued at | | | | | | |
| | $2,571,372) to be repurchased at $2,520,961 | | $ | 2,521 | | | 2,520,953 | |
| TOTAL SECURITIES LENDING COLLATERAL | | | | | | 5,645,004 | |
| TOTAL INVESTMENTS — (100.0%) | | | | | | | |
| (Cost $1,103,961,462) | | | | | $ | 1,132,324,943 | |
137
THE CONTINENTAL SMALL COMPANY SERIES
SCHEDULE OF INVESTMENTS
OCTOBER 31, 2011
| | | | SHARES | | VALUE†† | |
| COMMON STOCKS — (86.7%) | | | | | |
| AUSTRIA — (2.1%) | | | | | |
| | Agrana Beteiligungs AG | 17,322 | | $ | 1,967,310 | |
| | Andritz AG | 52,680 | | | 4,656,516 | |
| #* | | A-TEC Industries AG | 21,828 | | | 25,371 | |
| | Atrium European Real Estate, Ltd. | 288,925 | | | 1,456,338 | |
| | Austria Email AG | 715 | | | 6,913 | |
| * | | Austria Technologie & Systemtechnik AG | 38,157 | | | 494,794 | |
| | BKS Bank AG | 3,120 | | | 76,885 | |
| | BWT AG | 29,870 | | | 572,454 | |
| * | | CA Immobilien Anlagen AG | 163,483 | | | 2,091,683 | |
| * | | Constantia Packaging AG Escrow Shares | 18,095 | | | — | |
| * | | DO & CO Restaurants & Catering AG | 203 | | | 7,723 | |
| * | | EAG-Beteiligungs AG | 1,650 | | | 1,735 | |
| # | | EVN AG | 80,076 | | | 1,160,325 | |
| # | | Flughafen Wien AG | 42,954 | | | 1,930,640 | |
| | Frauenthal Holding AG | 12,084 | | | 153,681 | |
| #* | | Intercell AG | 104,732 | | | 280,126 | |
| | Josef Manner & Co. AG | 870 | | | 60,251 | |
| # | | Kapsch TrafficCom AG | 12,655 | | | 948,214 | |
| # | | Lenzing AG | 32,907 | | | 3,494,771 | |
| # | | Mayr-Melnhof Karton AG | 32,872 | | | 3,043,114 | |
| | Oberbank AG | 37,973 | | | 2,468,629 | |
| # | | Oesterreichischen Post AG | 105,958 | | | 3,195,653 | |
| # | | Palfinger AG | 48,572 | | | 1,000,134 | |
| #* | | Polytec Holding AG | 34,049 | | | 305,936 | |
| # | | RHI AG | 98,844 | | | 2,150,752 | |
| | Rosenbauer International AG | 12,941 | | | 533,460 | |
| * | | S IMMO AG | 113,456 | | | 665,465 | |
| * | | S&T System Integration & Technology Distribution AG | 6,318 | | | 21,362 | |
| # | | Schoeller-Bleckmann Oilfield Equipment AG | 35,247 | | | 2,784,922 | |
| | Semperit Holding AG | 29,431 | | | 1,272,608 | |
| * | | Strabag SE | 101,540 | | | 3,122,214 | |
| | UBM Realitaetenentwicklung AG | 1,440 | | | 49,813 | |
| # | | Uniqa Versicherungen AG | 184,842 | | | 2,876,601 | |
| #* | | Warimpex Finanz und Beteiligungs AG | 10,047 | | | 16,858 | |
| # | | Wienerberger AG | 343,922 | | | 4,155,389 | |
| | Wolford AG | 11,252 | | | 417,629 | |
| # | | Zumtobel AG | 85,416 | | | 1,769,642 | |
| TOTAL AUSTRIA | | | | 49,235,911 | |
| | | | | | | |
| BELGIUM — (2.9%) | | | | | |
| * | | Ablynx NV | 69,930 | | | 369,701 | |
| | Ackermans & van Haaren NV | 87,214 | | | 7,026,076 | |
| * | | Agfa-Gevaert NV | 598,923 | | | 1,496,095 | |
| | Arseus NV | 48,662 | | | 773,048 | |
| | Atenor Group NV | 2,205 | | | 86,177 | |
| | Banque Nationale de Belgique SA | 952 | | | 3,031,378 | |
| | Barco NV | 55,666 | | | 3,010,093 | |
| # | | Bekaert SA | 15,700 | | | 696,824 | |
| | Co.Br.Ha Societe Commerciale de Brasserie SA | 115 | | | 256,192 | |
| | Compagnie d’Entreprises SA | 41,428 | | | 2,325,908 | |
| * | | Compagnie du Bois Sauvage SA | 87 | | | 4 | |
| | Compagnie Immobiliere de Belgique SA | 10,535 | | | 370,766 | |
| | Compagnie Maritime Belge SA | 64,746 | | | 1,518,232 | |
| #* | | Deceuninck NV | 268,523 | | | 421,568 | |
| #* | | Devgen NV | 38,445 | | | 262,258 | |
| * | | D’ieteren SA | 129,060 | | | 7,344,614 | |
| | Duvel Moorgat SA | 8,799 | | | 838,576 | |
| | Econocom Group SA | 65,485 | | | 1,158,516 | |
138
The Continental Small Company Series
continued
| | | | SHARES | | VALUE†† | |
| BELGIUM — (Continued) | | | | | |
| | Elia System Operator SA | 124,286 | | $ | 5,043,453 | |
| #* | | Euronav SA | 86,554 | | | 382,928 | |
| | EVS Broadcast Equipment SA | 35,362 | | | 1,809,804 | |
| | Exmar NV | 132,340 | | | 993,833 | |
| | Floridienne SA | 2,033 | | | 380,977 | |
| * | | Galapagos NV | 44,568 | | | 375,096 | |
| | Gimv NV | 13,874 | | | 706,397 | |
| | Hamon & Compagnie International SA | 3,876 | | | 97,629 | |
| | Henex SA | 5,455 | | | 330,228 | |
| | Image Recognition Integrated Systems (I.R.I.S.) SA | 6,284 | | | 224,095 | |
| | Ion Beam Applications SA | 79,751 | | | 622,465 | |
| | Jensen-Group NV | 12,030 | | | 141,679 | |
| * | | Kinepolis Group NV | 13,363 | | | 1,036,017 | |
| # | | Lotus Bakeries NV | 1,361 | | | 773,992 | |
| # | | Melexis NV | 93,665 | | | 1,317,195 | |
| # | | Nyrstar NV | 545,316 | | | 4,769,202 | |
| # | | Omega Pharma SA | 85,437 | | | 4,034,256 | |
| * | | Option NV | 61,536 | | | 33,236 | |
| * | | Picanol NV | 16,620 | | | 229,231 | |
| * | | RealDolmen NV | 6,745 | | | 167,492 | |
| | Recticel SA | 62,884 | | | 428,681 | |
| | Resilux SA | 4,095 | | | 305,376 | |
| | Rosier SA | 655 | | | 244,683 | |
| | Roularta Media Group NV | 8,180 | | | 172,497 | |
| * | | SAPEC SA | 3,531 | | | 229,807 | |
| | Sioen Industries NV | 52,140 | | | 390,037 | |
| | Sipef NV | 25,469 | | | 2,010,085 | |
| | Softimat SA | 25,531 | | | 134,236 | |
| * | | Spector Photo Group SA | 8,349 | | | 5,542 | |
| | Telenet Group Holding NV | 35,417 | | | 1,366,038 | |
| | Ter Beke NV | 2,281 | | | 166,061 | |
| | Tessenderlo Chemie NV | 103,618 | | | 3,215,078 | |
| #* | | ThromboGenics NV | 86,580 | | | 2,268,336 | |
| * | | TiGenix NV | 22,164 | | | 25,463 | |
| | Van de Velde NV | 27,539 | | | 1,344,271 | |
| | VPK Packaging Group SA | 12,084 | | | 480,192 | |
| TOTAL BELGIUM | | | | 67,241,614 | |
| | | | | | | |
| DENMARK — (2.6%) | | | | | |
| * | | Aarhus Lokalbank A.S. | 7,872 | | | 7,406 | |
| * | | Aktieselskabet Skjern Bank A.S. | 3,276 | | | 54,405 | |
| * | | Alk-Abello A.S. | 24,459 | | | 1,449,337 | |
| * | | Alm. Brand A.S. | 466,665 | | | 676,583 | |
| * | | Amagerbanken A.S. | 647,900 | | | — | |
| | Ambu A.S. Series B | 23,899 | | | 549,110 | |
| * | | Arkil Holdings A.S. Series B | 780 | | | 67,699 | |
| | Auriga Industries A.S. Series B | 96,829 | | | 1,492,494 | |
| * | | Bang & Olufsen Holdings A.S. | 128,288 | | | 1,495,066 | |
| * | | Bavarian Nordic A.S. | 66,632 | | | 490,267 | |
| # | | BoConcept Holding A.S. | 5,650 | | | 98,854 | |
| | Brodrene Hartmann A.S. Series B | 11,730 | | | 209,946 | |
| * | | Brondbyernes IF Fodbold A.S. Series B | 13,508 | | | 42,947 | |
| # | | D/S Norden A.S. | 98,813 | | | 2,881,866 | |
| * | | Dalhoff Larsen & Horneman A.S. | 40,950 | | | 62,188 | |
| * | | Dantherm Holding A.S. | 3,547 | | | 9,267 | |
| | DFDS A.S. | 18,568 | | | 1,236,803 | |
| * | | DiBa Bank A.S. | 423 | | | 2,596 | |
| * | | Djursland Bank A.S. | 8,970 | | | 232,311 | |
| # | | East Asiatic Co., Ltd. A.S. | 55,571 | | | 1,301,995 | |
| * | | F.E. Bording A.S. | 600 | | | 47,419 | |
| * | | Fionia Holding A.S. | 17,880 | | | — | |
139
The Continental Small Company Series
continued
| | | | SHARES | | VALUE†† | |
| DENMARK — (Continued) | | | | | |
| | Fluegger A.S. Series B | 4,198 | | $ | 272,981 | |
| * | | Genmab A.S. | 140,715 | | | 821,899 | |
| | GN Store Nord A.S. | 798,612 | | | 5,885,792 | |
| * | | GPV Industri A.S. Series B | 2,200 | | | 12,273 | |
| | Gronlandsbanken A.S. | 768 | | | 46,417 | |
| * | | H&H International A.S. Series B | 17,280 | | | 136,290 | |
| | Harboes Bryggeri A.S. | 12,252 | | | 214,625 | |
| | Hojgaard Holding A.S. Series B | 2,750 | | | 56,796 | |
| | IC Companys A.S. | 35,278 | | | 935,271 | |
| * | | Incentive A.S. | 3,575 | | | 12,299 | |
| | Jeudan A.S. | 4,620 | | | 320,312 | |
| * | | Jyske Bank A.S. | 162,232 | | | 4,715,477 | |
| | Lan & Spar Bank A.S. | 5,150 | | | 260,967 | |
| * | | Lastas A.S. Series B | 10,870 | | | 67,463 | |
| | Lollands Bank A.S. | 310 | | | 6,354 | |
| * | | Mols-Linien A.S. | 27,490 | | | 60,732 | |
| * | | NeuroSearch A.S. | 79,539 | | | 300,378 | |
| # | | NKT Holding A.S. | 92,105 | | | 3,495,503 | |
| | Nordjyske Bank A.S. | 17,600 | | | 245,066 | |
| | Norresundby Bank A.S. | 7,350 | | | 211,709 | |
| | North Media A.S. | 36,665 | | | 190,654 | |
| * | | Ostjydsk Bank A.S. | 3,405 | | | 112,622 | |
| #* | | Parken Sport & Entertainment A.S. | 33,556 | | | 506,890 | |
| | Per Aarsleff A.S. Series B | 6,080 | | | 473,912 | |
| | Ringkjoebing Landbobank A.S. | 16,422 | | | 1,793,257 | |
| | Roblon A.S. Series B | 540 | | | 60,036 | |
| # | | Rockwool International A.S. Series B | 12,814 | | | 1,250,456 | |
| | Royal Unibrew A.S. | 37,715 | | | 1,968,820 | |
| * | | Salling Bank A.S. | 430 | | | 22,599 | |
| | Schouw & Co. A.S. | 74,017 | | | 1,612,934 | |
| | SimCorp A.S. | 17,973 | | | 3,080,043 | |
| * | | Sjaelso Gruppen A.S. | 78,110 | | | 21,052 | |
| * | | SKAKO A.S. | 1,577 | | | 5,532 | |
| | Solar Holdings A.S. Series B | 16,132 | | | 664,449 | |
| * | | Spar Nord Bank A.S. | 124,439 | | | 873,134 | |
| * | | Sparbank A.S. | 10,930 | | | 69,036 | |
| * | | Sparekassen Faaborg A.S. | 1,972 | | | 95,322 | |
| | Sydbank A.S. | 279,299 | | | 5,172,253 | |
| | Thrane & Thrane A.S. | 15,703 | | | 738,327 | |
| | Tivoli A.S. | 969 | | | 521,153 | |
| #* | | TK Development A.S. | 153,640 | | | 419,460 | |
| * | | Topdanmark A.S. | 53,386 | | | 8,789,962 | |
| #* | | TopoTarget A.S. | 378,484 | | | 129,444 | |
| #* | | Topsil Semiconductor Materials A.S. | 194,350 | | | 16,571 | |
| #* | | Torm A.S. | 123,250 | | | 135,008 | |
| | United International Enterprises A.S. | 2,256 | | | 246,475 | |
| * | | Vestjysk Bank A.S. | 27,573 | | | 149,771 | |
| TOTAL DENMARK | | | | 59,606,335 | |
| | | | | | |
| FINLAND — (5.8%) | | | | | |
| | Ahlstrom Oyj | 21,405 | | | 369,026 | |
| | Aktia Oyj Series A | 7,053 | | | 55,484 | |
| # | | Alma Media Oyj | 277,852 | | | 2,420,489 | |
| | Amer Sports Oyj Series A | 421,831 | | | 5,808,883 | |
| | Aspo Oyj | 77,875 | | | 747,830 | |
| | Atria P.L.C. | 17,705 | | | 155,125 | |
| * | | Bank of Aland P.L.C. Series B | 22,078 | | | 293,275 | |
| | BasWare Oyj | 34,550 | | | 885,841 | |
| #* | | Biotie Therapies Corp. Oyj | 774,610 | | | 505,561 | |
| | Cargotec Oyj Series B | 132,519 | | | 4,434,610 | |
| * | | Citycon Oyj | 384,363 | | | 1,415,552 | |
140
The Continental Small Company Series
continued
| | | | SHARES | | VALUE†† | |
| FINLAND — (Continued) | | | | | |
| * | | Componenta Oyj | 34,813 | | $ | 184,791 | |
| * | | Comptel P.L.C. | 324,863 | | | 299,331 | |
| | Cramo Oyj | 155,694 | | | 1,848,782 | |
| | Digia P.L.C. | 55,020 | | | 223,877 | |
| * | | Efore Oyj | 114,965 | | | 142,929 | |
| * | | Elcoteq SE | 3,041 | | | 968 | |
| * | | Elektrobit Corp. Oyj | 2,476 | | | 1,608 | |
| # | | Elisa Oyj | 494,801 | | | 10,431,808 | |
| * | | eQ P.L.C. | 67,120 | | | 152,138 | |
| | Etteplan Oyj | 62,600 | | | 185,724 | |
| * | | Finnair Oyj | 264,846 | | | 1,036,807 | |
| * | | Finnlines Oyj | 124,906 | | | 1,282,329 | |
| | Fiskars Oyj Abp | 181,663 | | | 3,626,860 | |
| # | | F-Secure Oyj | 463,536 | | | 1,374,498 | |
| * | | GeoSentric Oyj | 244,900 | | | 3,389 | |
| * | | Glaston Oyj Abp | 131,940 | | | 108,619 | |
| | HKScan Oyj Series A | 99,158 | | | 791,281 | |
| | Huhtamaki Oyj | 362,987 | | | 4,146,975 | |
| | Ilkka-Yhtyma Oyj | 61,503 | | | 549,746 | |
| # | | KCI Konecranes Oyj | 245,559 | | | 5,589,266 | |
| # | | Kemira Oyj | 368,427 | | | 5,045,993 | |
| | Kesko Oyj Series B | 107,555 | | | 3,817,582 | |
| | Laennen Tehtaat Oyj | 18,920 | | | 379,460 | |
| | Lassila & Tikanoja Oyj | 125,791 | | | 1,961,816 | |
| | Lemminkainen Oyj | 21,103 | | | 589,345 | |
| #* | | M-real Oyj Series B | 1,549,706 | | | 3,356,158 | |
| * | | Neo Industrial Oyj | 16,402 | | | 66,442 | |
| * | | Neste Oil Oyj | 258,824 | | | 3,131,542 | |
| | Nordic Aluminium Oyj | 10,440 | | | 395,875 | |
| | Okmetic Oyj | 54,904 | | | 373,228 | |
| | Olvi Oyj Series A | 62,708 | | | 1,347,282 | |
| # | | Oriola-KD Oyj Series A | 5,045 | | | 14,116 | |
| | Oriola-KD Oyj Series B | 323,025 | | | 898,352 | |
| | Orion Oyj Series A | 128,371 | | | 2,614,864 | |
| | Orion Oyj Series B | 337,043 | | | 7,013,846 | |
| # | | Outokumpu Oyj | 381,565 | | | 3,225,000 | |
| | Outotec Oyj | 133,044 | | | 6,176,081 | |
| | PKC Group Oyj | 55,424 | | | 917,393 | |
| | Pohjola Bank P.L.C. Series A | 403,547 | | | 4,640,145 | |
| | Ponsse Oyj | 25,336 | | | 257,541 | |
| # | | Poyry Oyj | 187,165 | | | 1,689,469 | |
| | Raisio P.L.C. Series V | 490,304 | | | 1,583,025 | |
| | Ramirent Oyj | 314,761 | | | 2,694,084 | |
| | Rapala VMC Oyj | 113,258 | | | 874,243 | |
| | Rautaruukki Oyj Series K | 323,076 | | | 3,443,713 | |
| | Raute Oyj Series A | 10,390 | | | 100,740 | |
| | Ruukki Group Oyj | 604,909 | | | 814,574 | |
| | Saga Furs Oyj | 8,490 | | | 190,129 | |
| # | | Sanoma Oyj | 276,990 | | | 3,716,138 | |
| | Sievi Capital P.L.C. | 123,479 | | | 359,104 | |
| * | | SRV Group P.L.C. | 7,277 | | | 44,296 | |
| | Stockmann Oyj Abp Series A | 43,914 | | | 907,723 | |
| # | | Stockmann Oyj Abp Series B | 107,109 | | | 1,903,705 | |
| * | | Technopolis Oyj | 121,527 | | | 572,243 | |
| # | | Teleste Oyj | 53,559 | | | 233,376 | |
| | Tieto Oyj | 291,983 | | | 4,622,834 | |
| | Tikkurila Oyj | 118,741 | | | 2,308,117 | |
| | Tulikivi Oyj | 79,440 | | | 86,373 | |
| # | | Uponor Oyj Series A | 217,678 | | | 2,252,087 | |
| | Vacon Oyj | 45,190 | | | 2,275,532 | |
| | Vaisala Oyj Series A | 39,132 | | | 942,666 | |
141
The Continental Small Company Series
continued
| | | | SHARES | | VALUE†† | |
| FINLAND — (Continued) | | | | | |
| | Viking Line Abp | 10,400 | | $ | 334,348 | |
| | Yit Oyj | 390,890 | | | 6,168,452 | |
| TOTAL FINLAND | | | | 133,412,434 | |
| | | | | | |
| FRANCE — (10.1%) | | | | | |
| | ABC Arbitrage SA | 26,282 | | | 235,042 | |
| #* | | Air France-KLM | 237,715 | | | 1,805,272 | |
| # | | Akka Technologies SA | 7,320 | | | 173,395 | |
| | Ales Groupe SA | 32,239 | | | 495,074 | |
| * | | Altamir Amboise SA | 55,025 | | | 509,486 | |
| | ALTEN SA | 68,354 | | | 1,946,468 | |
| #* | | Altran Technologies SA | 676,432 | | | 3,426,985 | |
| | April SA | 74,171 | | | 1,288,362 | |
| #* | | Archos SA | 32,722 | | | 311,025 | |
| * | | Arkema SA | 139,427 | | | 9,475,335 | |
| * | | Artprice.com SA | 3,246 | | | 152,698 | |
| | Assystem | 55,571 | | | 1,010,015 | |
| #* | | Atari SA | 33,339 | | | 62,349 | |
| | AtoS | 105,405 | | | 5,095,777 | |
| | Aubay SA | 10,285 | | | 73,367 | |
| # | | Audika SA | 21,251 | | | 469,829 | |
| # | | Aurea SA | 3,551 | | | 30,022 | |
| * | | Avanquest Software SA | 5,228 | | | 12,549 | |
| * | | Avenir Telecom SA | 17,841 | | | 16,056 | |
| * | | Axway Software SA | 22,982 | | | 470,643 | |
| * | | Baccarat SA | 1,090 | | | 235,475 | |
| | Banque Tarneaud SA | 1,430 | | | 195,468 | |
| | Beneteau SA | 179,820 | | | 2,565,971 | |
| #* | | Bigben Interactive SA | 10,448 | | | 109,939 | |
| * | | BioAlliance Pharma SA | 20,080 | | | 102,409 | |
| | Boiron SA | 28,682 | | | 816,191 | |
| | Boizel Chanoine Champagne SA | 7,266 | | | 526,768 | |
| | Bonduelle SCA | 13,650 | | | 1,232,517 | |
| | Bongrain SA | 34,266 | | | 2,430,916 | |
| # | | Bourbon SA | 182,469 | | | 5,064,639 | |
| * | | Boursorama SA | 42,063 | | | 363,907 | |
| * | | Bull SA | 309,488 | | | 1,463,262 | |
| | Burelle SA | 3,894 | | | 1,023,495 | |
| | Cafom SA | 5,092 | | | 58,429 | |
| | CBo Territoria SA | 28,320 | | | 111,864 | |
| | Cegedim SA | 16,591 | | | 492,177 | |
| | CEGID Group SA | 4,416 | | | 103,259 | |
| | CFAO SA | 25,339 | | | 978,797 | |
| * | | Cie des Alpes | 1,055 | | | 26,586 | |
| * | | Cie Generale de Geophysique - Veritas SA | 142,257 | | | 3,108,230 | |
| | Ciments Francais SA | 4,853 | | | 428,613 | |
| * | | Club Mediterranee SA | 75,641 | | | 1,429,822 | |
| | Compagnie Industrielle et Financiere D’Entreprises SA | 1,200 | | | 90,755 | |
| * | | CS Communication & Systemes SA | 7,643 | | | 28,144 | |
| | Damartex SA | 21,101 | | | 597,591 | |
| | Derichebourg SA | 548,515 | | | 2,184,779 | |
| | Devoteam SA | 13,383 | | | 231,272 | |
| * | | Dynaction SA | 13,501 | | | 127,170 | |
| * | | Eiffage SA | 11,355 | | | 385,123 | |
| | Electricite de Strasbourg SA | 21,886 | | | 3,144,713 | |
| | Entrepose Contracting SA | 889 | | | 99,296 | |
| | ESSO SA Francaise | 9,411 | | | 968,707 | |
| | Establissements Maurel et Prom SA | 323,678 | | | 6,507,280 | |
| * | | Etam Developpement SA | 1,148 | | | 21,226 | |
| | Euler Hermes SA | 37,816 | | | 2,730,174 | |
| #* | | Euro Disney SCA | 138,383 | | | 951,289 | |
142
The Continental Small Company Series
continued
| | | | SHARES | | VALUE†† | |
| FRANCE — (Continued) | | | | | |
| # | | Eurofins Scientific SA | 10,894 | | $ | 978,566 | |
| | Exel Industries SA Series A | 10,680 | | | 546,537 | |
| | Faiveley Transport SA | 9,465 | | | 647,689 | |
| | Faurecia SA | 87,585 | | | 2,315,764 | |
| | Fimalac SA | 31,490 | | | 1,311,019 | |
| | Fleury Michon SA | 4,694 | | | 191,392 | |
| | Flo Groupe SA | 29,358 | | | 192,501 | |
| #* | | GameLoft SA | 72,585 | | | 403,344 | |
| * | | Gascogne SA | 6,907 | | | 311,677 | |
| | Gaumont SA | 14,043 | | | 663,499 | |
| #* | | GECI International SA | 59,392 | | | 129,936 | |
| | Gemalto NV | 109,597 | | | 4,984,962 | |
| | Gevelot SA | 3,584 | | | 255,992 | |
| * | | GFI Informatique SA | 134,770 | | | 550,893 | |
| | GL Events SA | 20,234 | | | 513,350 | |
| | GPE Groupe Pizzorno SA | 5,200 | | | 101,272 | |
| | Groupe Crit SA | 24,255 | | | 516,907 | |
| * | | Groupe Go Sport SA | 1,695 | | | 23,449 | |
| | Groupe Gorge SA | 18,510 | | | 192,289 | |
| | Groupe Guillin SA | 1,200 | | | 92,703 | |
| * | | Groupe Open SA | 27,590 | | | 181,000 | |
| * | | Groupe Partouche SA | 47,224 | | | 114,994 | |
| # | | Groupe Steria SCA | 71,983 | | | 1,372,959 | |
| | Guerbet SA | 6,577 | | | 645,278 | |
| # | | Guyenne et Gascogne SA | 25,083 | | | 2,873,344 | |
| * | | Haulotte Group SA | 61,352 | | | 684,893 | |
| | Havas SA | 1,237,226 | | | 5,326,202 | |
| * | | Hi-Media SA | 100,249 | | | 357,850 | |
| * | | Idsud SA | 2,227 | | | 72,059 | |
| | Ingenico SA | 118,736 | | | 4,693,902 | |
| | Interparfums SA | 11,184 | | | 337,915 | |
| * | | Ipsen SA | 55,251 | | | 1,823,442 | |
| | Ipsos SA | 89,607 | | | 2,932,159 | |
| * | | Jacquet Metal Service SA | 48,141 | | | 669,199 | |
| * | | Kaufman & Broad SA | 3,733 | | | 74,535 | |
| | Korian SA | 8,204 | | | 159,053 | |
| | Laurent-Perrier SA | 12,546 | | | 1,292,502 | |
| | LDC SA | 19 | | | 1,959 | |
| | Lectra SA | 83,499 | | | 629,273 | |
| | Lisi SA | 16,907 | | | 1,364,230 | |
| * | | LVL Medical Groupe SA | 18,786 | | | 317,958 | |
| | M6 Metropole Television SA | 155,729 | | | 2,662,141 | |
| | Maisons France Confort SA | 5,260 | | | 187,609 | |
| #* | | Manitou BF SA | 48,911 | | | 982,231 | |
| | Manutan International SA | 14,553 | | | 746,168 | |
| * | | Medica SA | 11,566 | | | 230,359 | |
| | Mersen SA | 64,007 | | | 2,498,711 | |
| #* | | METabolic EXplorer SA | 3,034 | | | 15,396 | |
| | MGI Coutier SA | 2,753 | | | 154,731 | |
| | Montupet SA | 1,081 | | | 5,876 | |
| | Mr. Bricolage SA | 30,731 | | | 449,676 | |
| # | | Naturex SA | 11,133 | | | 845,142 | |
| # | | Neopost SA | 91,985 | | | 6,996,144 | |
| # | | Nexans SA | 131,823 | | | 8,292,007 | |
| | Nexity SA | 83,910 | | | 2,417,512 | |
| #* | | NicOx SA | 13,013 | | | 19,389 | |
| | Norbert Dentressangle SA | 20,989 | | | 1,860,590 | |
| * | | NRJ Group SA | 12,748 | | | 125,678 | |
| | Oeneo SA | 113,285 | | | 296,792 | |
| | Orpea SA | 101,314 | | | 4,359,288 | |
| | Osiatis SA | 1,400 | | | 10,096 | |
143
The Continental Small Company Series
continued
| | | | SHARES | | VALUE†† | |
| FRANCE — (Continued) | | | | | |
| # | | PagesJaunes Groupe SA | 384,634 | | $ | 1,641,194 | |
| | Paris Orleans et Cie SA | 2,265 | | | 51,380 | |
| * | | Parrot SA | 17,614 | | | 414,851 | |
| | Pierre & Vacances SA | 18,411 | | | 717,369 | |
| | Plastic Omnium SA | 95,424 | | | 2,652,877 | |
| | Plastivaloire SA | 4,552 | | | 114,418 | |
| | PSB Industries SA | 8,438 | | | 286,029 | |
| | Rallye SA | 95,651 | | | 3,058,226 | |
| * | | Recylex SA | 55,481 | | | 246,572 | |
| | Remy Cointreau SA | 82,777 | | | 6,781,256 | |
| | Robertet SA | 3,167 | | | 543,728 | |
| #* | | Rodriguez Group SA | 31,298 | | | 140,303 | |
| | Rougier SA | 6,115 | | | 245,362 | |
| | Rubis SA | 75,949 | | | 4,316,083 | |
| * | | Rue du Commerce SA | 136 | | | 1,685 | |
| * | | Sa des Ciments Vicat SA | 21,047 | | | 1,375,486 | |
| | Sabeton SA | 13,500 | | | 241,006 | |
| | Saft Groupe SA | 75,425 | | | 2,291,721 | |
| | Samse SA | 8,342 | | | 692,082 | |
| | Sartorius Stedim Biotech SA | 2,950 | | | 199,463 | |
| | SEB SA | 286 | | | 23,977 | |
| | Seche Environnement SA | 3,547 | | | 160,903 | |
| # | | Sechilienne SA | 60,146 | | | 1,121,939 | |
| | Securidev SA | 2,500 | | | 126,338 | |
| # | | Sequana SA | 46,996 | | | 287,618 | |
| * | | Societe Anonyme d’Explosifs et de Produits Chimiques SA | 524 | | | 160,497 | |
| | Societe BIC SA | 74,331 | | | 6,633,340 | |
| | Societe d’Edition de Canal Plus SA | 306,742 | | | 1,865,560 | |
| | Societe des Bains de Mer et du Cercle des Etrangers a Monaco | | | | | |
| | SA | 46,150 | | | 2,561,492 | |
| | Societe Internationale de Plantations d’Heveas SA | 2,482 | | | 271,427 | |
| | Societe Pour l’Informatique Industrielle SA | 40,908 | | | 265,159 | |
| * | | Societe Television Francaise 1 SA | 204,984 | | | 2,752,300 | |
| #* | | Soitec SA | 383,996 | | | 1,916,259 | |
| | Somfy SA | 21,738 | | | 5,182,199 | |
| | Sopra Group SA | 22,982 | | | 1,457,404 | |
| * | | Spir Communication SA | 934 | | | 35,300 | |
| #* | | ST Dupont SA | 88,031 | | | 56,001 | |
| * | | Stallergenes SA | 846 | | | 55,075 | |
| #* | | Ste Industrielle d’Aviation Latecoere SA | 12,186 | | | 148,567 | |
| | STEF-TFE SA | 29,121 | | | 1,471,842 | |
| * | | Store Electronic SA | 118 | | | 1,723 | |
| | Sucriere de Pithiviers Le Vieil SA | 1,745 | | | 3,986,931 | |
| * | | Sword Group SA | 10,447 | | | 188,315 | |
| | Synergie SA | 54,902 | | | 686,065 | |
| #* | | Technicolor SA | 321,494 | | | 870,458 | |
| | Teleperformance SA | 181,538 | | | 3,833,091 | |
| | Tessi SA | 5,050 | | | 438,404 | |
| #* | | Theolia SA | 264,526 | | | 375,863 | |
| | Tonnellerie Francois Freres SA | 3,839 | | | 149,638 | |
| | Total Gabon SA | 523 | | | 220,112 | |
| | Touax SA | 1,317 | | | 43,476 | |
| | Toupargel Groupe SA | 111 | | | 1,764 | |
| #* | | Transgene SA | 11,052 | | | 133,620 | |
| | Trigano SA | 23,420 | | | 426,789 | |
| #* | | UbiSoft Entertainment SA | 225,444 | | | 1,350,483 | |
| | Union Financiere de France Banque SA | 16,828 | | | 499,552 | |
| | Valeo SA | 229,231 | | | 11,506,324 | |
| | Viel et Compagnie SA | 158,130 | | | 631,851 | |
| # | | Vilmorin & Cie SA | 20,195 | | | 2,218,324 | |
| | Virbac SA | 17,494 | | | 3,022,271 | |
| #* | | Vivalis SA | 11,168 | | | 92,255 | |
144
The Continental Small Company Series
continued
| | | | SHARES | | VALUE†† | |
| FRANCE — (Continued) | | | | | |
| | VM Materiaux SA | 6,914 | | $ | 292,803 | |
| | Vranken Pommery Monopole SA | 14,162 | | | 574,879 | |
| | Zodiac Aerospace SA | 89,170 | | | 6,991,700 | |
| * | | Zueblin Immobiliere France SA | 1,365 | | | 5,037 | |
| TOTAL FRANCE | | | | 233,106,001 | |
| | | | | | | |
| GERMANY — (12.8%) | | | | | |
| | A.S. Creation Tapeton AG | 6,853 | | | 218,222 | |
| * | | AAP Implantate AG | 47,250 | | | 59,408 | |
| * | | Aareal Bank AG | 423,110 | | | 8,478,484 | |
| * | | Abwicklungsgesellschaft Roesch AG Medizintechnik | 7,300 | | | 283 | |
| #* | | ADVA AG Optical Networking | 128,074 | | | 756,576 | |
| | AGROB Immobilien AG | 5,800 | | | 70,947 | |
| #* | | Air Berlin P.L.C. | 117,774 | | | 430,956 | |
| # | | Aixtron SE | 314,748 | | | 4,456,496 | |
| * | | Aligna AG | 318,087 | | | 11,444 | |
| * | | Allgeier Holding AG | 1,692 | | | 26,143 | |
| | Amadeus Fire AG | 16,192 | | | 619,125 | |
| * | | Andreae-Noris Zahn AG | 26,412 | | | 1,044,867 | |
| #* | | Asian Bamboo AG | 29,133 | | | 432,614 | |
| | AUGUSTA Technologie AG | 28,595 | | | 621,970 | |
| | Aurubis AG | 152,783 | | | 8,620,221 | |
| | Baader Bank AG | 132,511 | | | 400,304 | |
| #* | | Balda AG | 127,634 | | | 905,048 | |
| | Bauer AG | 22,556 | | | 520,127 | |
| # | | BayWa AG | 20,761 | | | 914,150 | |
| | Bechtle AG | 41,242 | | | 1,538,538 | |
| # | | Bertrandt AG | 23,001 | | | 1,289,810 | |
| * | | Beta Systems Software AG | 8,550 | | | 21,941 | |
| | Bilfinger Berger SE | 162,980 | | | 14,547,368 | |
| * | | Biolitec AG | 26,843 | | | 82,863 | |
| | Biotest AG | 20,784 | | | 1,194,442 | |
| * | | BKN International AG | 33,408 | | | 786 | |
| * | | BMP Media Vestors AG | 43,506 | | | 40,090 | |
| * | | Borussia Dortmund GmbH & Co. KGaA | 208,512 | | | 620,368 | |
| # | | Carl Zeiss Meditec AG | 86,687 | | | 1,651,939 | |
| * | | CAT Oil AG | 47,541 | | | 304,367 | |
| | Celesio AG | 119,149 | | | 1,879,200 | |
| | CENIT AG | 1,487 | | | 9,952 | |
| * | | Centrosolar Group AG | 20,542 | | | 51,986 | |
| | Centrotec Sustainable AG | 42,634 | | | 827,207 | |
| # | | Centrotherm Photovoltaics AG | 28,152 | | | 531,158 | |
| | Cewe Color Holding AG | 15,268 | | | 593,663 | |
| * | | Colonia Real Estate AG | 2,965 | | | 13,909 | |
| # | | Comdirect Bank AG | 139,558 | | | 1,440,160 | |
| # | | CompuGroup Medical AG | 14,015 | | | 180,363 | |
| #* | | Conergy AG | 221,174 | | | 94,603 | |
| #* | | Constantin Medien AG | 359,780 | | | 747,892 | |
| | CropEnergies AG | 53,810 | | | 396,220 | |
| | CTS Eventim AG | 106,100 | | | 3,507,457 | |
| * | | Curanum AG | 100,137 | | | 297,139 | |
| | DAB Bank AG | 130,043 | | | 556,485 | |
| | Data Modul AG | 11,455 | | | 194,882 | |
| | Delticom AG | 6,024 | | | 671,218 | |
| | Deufol AG | 113,203 | | | 171,620 | |
| | Deutsche Beteiligungs AG | 29,695 | | | 634,475 | |
| | Deutsche Wohnen AG | 194,621 | | | 2,865,477 | |
| * | | Deutz AG | 263,835 | | | 1,649,888 | |
| #* | | Dialog Semiconductor P.L.C. | 166,323 | | | 3,201,672 | |
| | DIC Asset AG | 13,115 | | | 119,630 | |
| | Dierig Holding AG | 10,500 | | | 170,932 | |
145
The Continental Small Company Series
continued
| | | | SHARES | | VALUE†† | |
| GERMANY — (Continued) | | | | | |
| # | | Douglas Holding AG | 105,346 | | $ | 4,255,553 | |
| | Dr. Hoenle AG | 14,858 | | | 217,100 | |
| | Draegerwerk AG & Co. KGaA | 921 | | | 73,157 | |
| | Drillisch AG | 158,285 | | | 1,810,038 | |
| | Duerr AG | 36,111 | | | 1,574,362 | |
| | DVB Bank SE | 173,470 | | | 5,679,236 | |
| | Eckert & Ziegler AG | 6,924 | | | 254,562 | |
| # | | Elmos Semiconductor AG | 34,592 | | | 369,172 | |
| # | | ElreingKlinger AG | 105,909 | | | 2,922,403 | |
| #* | | Epigenomics AG | 5,535 | | | 31,228 | |
| | | Erlus AG | 2,970 | | | 121,100 | |
| #* | | Euromicron AG | 6,147 | | | 172,172 | |
| | Euwax AG | 17,978 | | | 1,220,218 | |
| * | | Evotec AG | 1,165,338 | | | 3,901,874 | |
| # | | Fielmann AG | 52,283 | | | 5,493,398 | |
| * | | First Sensor AG | 3,931 | | | 54,693 | |
| * | | FJA AG | 217 | | | 463 | |
| # | | Freenet AG | 372,758 | | | 4,805,524 | |
| # | | Fuchs Petrolub AG | 139,623 | | | 6,591,425 | |
| #* | | GAGFAH SA | 281,532 | | | 1,803,131 | |
| | GBW AG | 28,417 | | | 673,744 | |
| | Gerresheimer AG | 89,828 | | | 3,980,890 | |
| | Gerry Weber International AG | 89,108 | | | 2,766,373 | |
| * | | Gesco AG | 10,010 | | | 807,227 | |
| | GFK SE | 72,083 | | | 3,333,216 | |
| | GFT Technologies AG | 66,050 | | | 251,872 | |
| #* | | Gigaset AG | 125,274 | | | 447,806 | |
| * | | Gildemeister AG | 120,934 | | | 1,756,181 | |
| #* | | Grammer AG | 32,013 | | | 586,614 | |
| | Grenkeleasing AG | 33,471 | | | 1,842,093 | |
| | H&R AG | 21,428 | | | 467,355 | |
| | Hamborner REIT AG | 28,257 | | | 245,966 | |
| # | | Hamburger Hafen und Logistik AG | 55,006 | | | 1,691,178 | |
| #* | | Hansa Group AG | 146,815 | | | 807,804 | |
| | Hawesko Holding AG | 19,463 | | | 899,359 | |
| #* | | Heidelberger Druckmaschinen AG | 734,833 | | | 1,443,449 | |
| * | | Homag Group AG | 13,586 | | | 158,895 | |
| * | | IKB Deutsche Industriebank AG | 21,843 | | | 14,840 | |
| | Indus Holding AG | 45,532 | | | 1,188,274 | |
| | Innovation in Traffic Systems AG | 23,949 | | | 569,632 | |
| # | | Interseroh SE | 21,642 | | | 1,517,948 | |
| #* | | Intershop Communications AG | 62,598 | | | 211,747 | |
| | Isra Vision Systems AG | 10,917 | | | 241,656 | |
| * | | IVG Immobilien AG | 480,972 | | | 2,143,529 | |
| * | | Jenoptik AG | 162,963 | | | 1,076,789 | |
| * | | Kampa AG | 35,505 | | | 3,193 | |
| | Kloeckner & Co. SE | 341,221 | | | 5,085,802 | |
| # | | Koenig & Bauer AG | 6,358 | | | 99,664 | |
| | Kontron AG | 189,937 | | | 1,344,350 | |
| # | | Krones AG | 72,618 | | | 3,701,907 | |
| | KSB AG | 3,584 | | | 2,270,480 | |
| #* | | Kuka AG | 102,786 | | | 1,955,717 | |
| | KWS Saat AG | 17,224 | | | 3,512,270 | |
| | Leifheit AG | 12,500 | | | 286,178 | |
| | Leoni AG | 115,635 | | | 4,827,488 | |
| * | | Loewe AG | 25,187 | | | 109,636 | |
| # | | LPKF Laser & Electronics AG | 20,347 | | | 287,806 | |
| #* | | Manz AG | 5,470 | | | 164,546 | |
| #* | | Masterflex AG | 19,347 | | | 138,096 | |
| * | | Maxdata Computer AG | 94,120 | | | 15,758 | |
| | Mediclin AG | 119,554 | | | 619,472 | |
146
The Continental Small Company Series
continued
| | | | SHARES | | VALUE†† | |
| GERMANY — (Continued) | | | | | |
| #* | | Medigene AG | 87,499 | | $ | 117,182 | |
| # | | Mensch und Maschine Software AG | 27,532 | | | 188,118 | |
| # | | MLP AG | 216,957 | | | 1,459,522 | |
| * | | Mobotix AG | 562 | | | 50,119 | |
| * | | Mologen AG | 24,513 | | | 249,631 | |
| * | | Morphosys AG | 62,322 | | | 1,518,325 | |
| #* | | MPC Muenchmeyer Petersen Capital AG | 5,101 | | | 13,949 | |
| | MTU Aero Engines Holding AG | 176,697 | | | 11,832,506 | |
| # | | Muehlbauer Holding & Co. AG | 14,905 | | | 567,892 | |
| # | | MVV Energie AG | 114,055 | | | 3,783,688 | |
| | Nemetschek AG | 24,668 | | | 948,576 | |
| * | | Nexus AG | 33,813 | | | 319,348 | |
| #* | | Nordex SE | 126,718 | | | 783,583 | |
| # | | OHB AG | 35,659 | | | 615,302 | |
| | Oldenburgische Landesbank AG | 4,234 | | | 178,050 | |
| | P&I Personal & Informatik AG | 17,889 | | | 653,220 | |
| * | | Patrizia Immobilien AG | 34,823 | | | 190,877 | |
| | Pfeiffer Vacuum Technology AG | 34,071 | | | 3,443,404 | |
| * | | Pfleiderer AG | 108,541 | | | 57,393 | |
| #* | | Phoenix Solar AG | 15,055 | | | 105,587 | |
| | PNE Wind AG | 167,451 | | | 377,286 | |
| # | | Praktiker AG | 195,237 | | | 772,922 | |
| | Progress-Werk Oberkirch AG | 6,250 | | | 282,853 | |
| # | | PSI AG Gesellschaft Fuer Produkte und Systeme der | | | | | |
| | Informationstechnologie | 30,993 | | | 729,187 | |
| | PVA TePla AG | 46,019 | | | 226,459 | |
| #* | | Q-Cells SE | 226,583 | | | 224,988 | |
| * | | QSC AG | 306,094 | | | 1,006,197 | |
| | R Stahl AG | 14,410 | | | 471,760 | |
| # | | Rational AG | 15,420 | | | 3,550,159 | |
| * | | REALTECH AG | 13,541 | | | 108,061 | |
| | Renk AG | 18,838 | | | 1,757,478 | |
| | Repower Systems SE | 4,765 | | | 943,176 | |
| | Rheinmetall AG | 126,352 | | | 6,700,932 | |
| | Rhoen-Klinikum AG | 406,308 | | | 8,107,235 | |
| * | | Roth & Rau AG | 216 | | | 6,538 | |
| | Ruecker AG | 18,949 | | | 256,202 | |
| | S.A.G. Solarstrom AG | 21,788 | | | 103,389 | |
| * | | SAF-Holland SA | 54,481 | | | 335,967 | |
| | Schaltbau Holding AG | 1,557 | | | 164,894 | |
| * | | Sedo Holding AG | 69,691 | | | 212,626 | |
| | Sektkellerei Schloss Wachenheim AG | 14,520 | | | 148,608 | |
| * | | SER Systems AG | 9,400 | | | 221 | |
| #* | | SGL Carbon SE | 229,387 | | | 14,257,094 | |
| #* | | Singulus Technologies AG | 236,814 | | | 900,922 | |
| | Sinner AG | 2,660 | | | 51,872 | |
| | Sixt AG | 81,198 | | | 1,705,464 | |
| * | | SKW Stahl-Metallurgie Holding AG | 14,708 | | | 296,064 | |
| * | | Sky Deutschland AG | 1,051,866 | | | 3,099,550 | |
| * | | SM Wirtschaftsberatungs AG | 18,841 | | | 123,182 | |
| #* | | SMA Solar Technology AG | 13,470 | | | 809,594 | |
| #* | | SMT Scharf AG | 942 | | | 27,012 | |
| | Software AG | 192,899 | | | 7,988,782 | |
| #* | | Solar Millennium AG | 34,471 | | | 109,214 | |
| * | | Solar-Fabrik AG | 13,966 | | | 45,826 | |
| # | | Solarworld AG | 285,203 | | | 1,391,755 | |
| * | | Solon SE | 24,350 | | | 44,513 | |
| | Stada Arzneimittel AG | 185,987 | | | 4,492,842 | |
| | STINAG Stuttgart Invest AG | 35,003 | | | 772,648 | |
| | Stoehr & Co. AG | 6,000 | | | 27,892 | |
| | STRATEC Biomedical AG | 27,909 | | | 1,133,004 | |
| * | | Sunways AG | 15,188 | | | 45,890 | |
147
The Continental Small Company Series
continued
| | | | SHARES | | VALUE†† | |
| GERMANY — (Continued) | | | | | |
| #* | | Suss Microtec AG | 59,969 | | $ | 628,585 | |
| | Symrise AG | 330,233 | | | 8,548,072 | |
| | Syzygy AG | 30,656 | | | 143,426 | |
| * | | TAG Immobilien AG | 137,518 | | | 1,174,133 | |
| | Takkt AG | 126,507 | | | 1,608,901 | |
| * | | TDS Informationstechnologie AG | 89,063 | | | 506,290 | |
| | | Telegate AG | 16,807 | | | 136,537 | |
| * | | Tipp24 SE | 7,589 | | | 353,250 | |
| #* | | Tom Tailor Holding AG | 6,943 | | | 108,028 | |
| | Tomorrow Focus AG | 113,715 | | | 605,594 | |
| #* | | TUI AG | 468,655 | | | 3,056,971 | |
| | UMS United Medical Systems International AG | 7,531 | | | 63,493 | |
| | UmweltBank AG | 17,805 | | | 587,925 | |
| | United Internet AG | 11,771 | | | 231,962 | |
| | VBH Holding AG | 9,415 | | | 47,647 | |
| #* | | Verbio AG | 50,804 | | | 235,272 | |
| # | | Vossloh AG | 37,975 | | | 3,970,068 | |
| | VTG AG | 28,856 | | | 578,606 | |
| # | | Wacker Neuson SE | 42,575 | | | 529,689 | |
| * | | Wanderer-Werke AG | 7,903 | | | 774 | |
| | Washtec AG | 1,318 | | | 16,738 | |
| | Wincor Nixdorf AG | 119,287 | | | 6,679,841 | |
| | Wirecard AG | 284,730 | | | 4,528,892 | |
| | Wuerttembergische Lebensversicherung AG | 27,308 | | | 553,478 | |
| | Wuerttembergische Metallwarenfabrik AG | 29,451 | | | 1,153,409 | |
| # | | XING AG | 5,288 | | | 442,458 | |
| | Zhongde Waste Technology AG | 4,008 | | | 29,905 | |
| #* | | zooplus AG | 2,612 | | | 215,522 | |
| TOTAL GERMANY | | | | 293,206,690 | |
| | | | | | |
| GREECE — (1.9%) | | | | | |
| * | | Aegean Airlines S.A. | 5,746 | | | 12,689 | |
| * | | Aegek S.A. | 120,000 | | | 13,791 | |
| * | | Agricultural Bank of Greece S.A. | 75,249 | | | 25,128 | |
| * | | Alfa Alfa Energy S.A. | 3,810 | | | 7,328 | |
| * | | Alpha Bank A.E | 584,671 | | | 777,542 | |
| * | | Alumil Aluminum Industry S.A. | 48,665 | | | 19,558 | |
| * | | Alysida S.A. | 2,376 | | | 6,546 | |
| * | | Anek Lines S.A. | 504,442 | | | 68,374 | |
| * | | Astir Palace Hotels S.A. | 93,886 | | | 245,842 | |
| * | | Athens Medical Center S.A. | 150,874 | | | 70,435 | |
| * | | Atlantic Supermarkets S.A. | 34,730 | | | 3,844 | |
| * | | Attica Bank S.A. | 184,869 | | | 57,388 | |
| * | | Atti-Kat S.A. | 56,554 | | | 1,562 | |
| * | | Autohellas S.A. | 83,520 | | | 145,437 | |
| * | | Babis Vovos International Construction S.A. | 59,807 | | | 37,814 | |
| * | | Balafas S.A. | 15,200 | | | 3,996 | |
| * | | Balkan Real Estate S.A. | 5,450 | | | 2,839 | |
| * | | Bank of Cyprus Public Co., Ltd. S.A. | 2,310,600 | | | 3,164,144 | |
| | Bank of Greece S.A. | 133,571 | | | 2,733,471 | |
| * | | Daios Plastics S.A. | 16,350 | | | 138,003 | |
| * | | Diagnostic & Therapeutic Center of Athens Hygeia S.A. | 275,576 | | | 113,477 | |
| * | | EFG Eurobank Ergasias S.A. | 971,907 | | | 892,581 | |
| * | | Elastron S.A. | 97,711 | | | 59,022 | |
| * | | ElbisCo. Holding S.A. | 28,098 | | | 20,962 | |
| | Elektrak S.A. | 37,647 | | | 77,653 | |
| * | | Elektroniki Athinon S.A. | 22,490 | | | 2,816 | |
| | Ellaktor S.A. | 522,735 | | | 973,263 | |
| * | | Elval - Hellenic Aluminium Industry S.A. | 28,590 | | | 54,908 | |
| * | | Etma Rayon S.A. | 11,242 | | | 21,933 | |
| | Euro Reliance General Insurance Co. S.A. | 54,730 | | | 31,601 | |
148
The Continental Small Company Series
continued
| | | | SHARES | | VALUE†† | |
| GREECE — (Continued) | | | | | |
| * | | Euromedica S.A. | 33,079 | | $ | 16,962 | |
| | EYDAP Athens Water Supply & Sewage Co. S.A. | 108,270 | | | 444,878 | |
| * | | F.G. Europe S.A. | 4,536 | | | 2,798 | |
| * | | Folli Follie Group S.A. | 115,021 | | | 1,385,132 | |
| * | | Forthnet S.A. | 254,703 | | | 55,460 | |
| * | | Fourlis Holdings S.A. | 146,787 | | | 632,380 | |
| | Frigoglass S.A. | 112,792 | | | 887,078 | |
| | GEK Terna S.A. | 296,155 | | | 408,024 | |
| * | | Geniki Bank S.A. | 31,074 | | | 12,189 | |
| * | | Halkor S.A. | 226,556 | | | 210,248 | |
| * | | Hellenic Cables S.A. | 65,236 | | | 133,636 | |
| | | Hellenic Exchanges S.A. | 251,904 | | | 1,230,463 | |
| | Hellenic Petroleum S.A. | 324,378 | | | 2,842,377 | |
| * | | Hellenic Sugar Industry S.A. | 78,005 | | | 110,069 | |
| * | | Hellenic Telecommunication Organization Co. S.A. | 233,793 | | | 1,286,395 | |
| * | | Heracles General Cement Co. S.A. | 77,436 | | | 222,291 | |
| * | | Iaso S.A. | 206,042 | | | 210,234 | |
| | Inform P. Lykos S.A. | 32,660 | | | 34,198 | |
| * | | Informatics S.A. | 3,778 | | | 1,621 | |
| * | | Intracom Holdings S.A. | 315,975 | | | 109,416 | |
| * | | Intracom Technical & Steel Constructions S.A. | 75,202 | | | 45,000 | |
| | Intralot S.A.-Integrated Lottery Systems & Services | 431,249 | | | 619,603 | |
| * | | Ionian Hotel Enterprises S.A. | 16,914 | | | 327,605 | |
| * | | Ipirotiki Software & Publications S.A. | 22,110 | | | 59,352 | |
| | JUMBO S.A. | 277,018 | | | 1,501,458 | |
| | Karelia Tobacco Co., Inc. S.A. | 5,787 | | | 463,660 | |
| * | | Kathimerini Publishing S.A. | 47,170 | | | 209,162 | |
| * | | Lambrakis Press S.A. | 115,149 | | | 17,343 | |
| * | | Lamda Development S.A. | 905 | | | 3,572 | |
| * | | Lan-Net S.A. | 12,688 | | | 21,068 | |
| * | | Lavipharm S.A. | 65,331 | | | 21,541 | |
| | Loulis Mills S.A. | 41,702 | | | 84,062 | |
| * | | Marfin Investment Group S.A. | 2,342,108 | | | 1,269,365 | |
| * | | Marfin Popular Bank PCL | 3,674,665 | | | 1,253,209 | |
| | Metka S.A. | 99,168 | | | 927,459 | |
| * | | Michaniki S.A. | 158,545 | | | 30,228 | |
| | Motor Oil (Hellas) Corinth Refineries S.A. | 184,802 | | | 1,662,678 | |
| * | | Mytilineos Holdings S.A. | 340,799 | | | 1,575,081 | |
| * | | Neorion Holdings S.A. | 14,991 | | | 1,694 | |
| | OPAP S.A. | 4,388 | | | 50,679 | |
| * | | Pegasus Publishing S.A. | 94,144 | | | 65,667 | |
| * | | Piraeus Bank S.A. | 4,630,988 | | | 1,320,799 | |
| | Piraeus Port Authority S.A. | 19,885 | | | 320,580 | |
| * | | Promota Hellas S.A. | 8,860 | | | 2,820 | |
| * | | Proton Bank S.A. | 141,214 | | | — | |
| | Public Power Corp. S.A. | 306,969 | | | 2,618,062 | |
| * | | Real Estate Development & Services S.A. | 94,497 | | | 86,541 | |
| | S&B Industrial Minerals S.A. | 68,336 | | | 372,538 | |
| * | | Sarantis S.A. | 74,884 | | | 214,257 | |
| * | | Selected Textile S.A. | 67,947 | | | 33,585 | |
| * | | Sfakianakis S.A. | 17,776 | | | 25,622 | |
| * | | Sidenor Steel Products Manufacturing Co. S.A. | 203,373 | | | 496,523 | |
| * | | Spyroy Agricultural Products S.A. | 61,348 | | | 34,568 | |
| * | | T Bank S.A. | 228,007 | | | 5,885 | |
| * | | Technical Olympic S.A. | 2,237 | | | 4,108 | |
| * | | Teletypos S.A. Mega Channel | 77,669 | | | 50,665 | |
| | Terna Energy S.A. | 118,894 | | | 299,575 | |
| * | | Themeliodomi S.A. | 37,422 | | | 19,159 | |
| | Thessaloniki Port Authority S.A. | 6,936 | | | 98,834 | |
| | Thessaloniki Water Supply & Sewage Co. S.A. | 11,146 | | | 47,899 | |
| | Thrace Plastics Co. S.A. | 102,616 | | | 62,766 | |
149
The Continental Small Company Series
continued
| | | | SHARES | | VALUE†† | |
| GREECE — (Continued) | | | | | |
| | Titan Cement Co. S.A. | 190,572 | | $ | 3,680,333 | |
| * | | TT Hellenic Postbank S.A. | 695,353 | | | 342,657 | |
| * | | Varvaressos S.A. European Spinning Mills | 36,350 | | | 3,687 | |
| * | | ViohalCo. S.A. | 603,593 | | | 2,714,599 | |
| TOTAL GREECE | | | | 43,085,344 | |
| | | | | | | |
| IRELAND — (2.9%) | | | | | |
| | Abbey P.L.C. | 84,370 | | | 617,526 | |
| * | | Aer Lingus Group P.L.C. | 763,185 | | | 760,367 | |
| * | | Allied Irish Banks P.L.C. | 279,051 | | | 38,612 | |
| * | | Aminex P.L.C. | 496,086 | | | 27,240 | |
| | C&C Group P.L.C. (B010DT8) | 399,607 | | | 1,597,731 | |
| | C&C Group P.L.C. (B011Y09) | 1,014,594 | | | 4,086,189 | |
| | DCC P.L.C. | 308,989 | | | 8,564,908 | |
| | DCC P.L.C. (4189477) | 18,170 | | | 502,707 | |
| | Donegal Creameries P.L.C. | 26,085 | | | 123,060 | |
| | Dragon Oil P.L.C. | 1,339,680 | | | 12,083,896 | |
| * | | Elan Corp. P.L.C. | 74,754 | | | 886,522 | |
| | FBD Holdings P.L.C. | 125,728 | | | 1,122,829 | |
| | Fyffes P.L.C. | 1,020,533 | | | 560,501 | |
| | Glanbia P.L.C. (0066950) | 700,613 | | | 4,558,021 | |
| | Glanbia P.L.C. (4058629) | 69,229 | | | 451,926 | |
| | Grafton Group P.L.C. | 555,000 | | | 2,141,482 | |
| | Greencore Group P.L.C. (0386410) | 1,129,199 | | | 1,139,245 | |
| | Greencore Group P.L.C. (5013832) | 347,358 | | | 348,130 | |
| | IFG Group P.L.C. | 337,495 | | | 521,977 | |
| * | | Independent News & Media P.L.C. (B59HWB1) | 387,242 | | | 148,084 | |
| * | | Independent News & Media P.L.C. (B5TR5N4) | 318,060 | | | 122,262 | |
| | Irish Continental Group P.L.C. | 91,000 | | | 1,859,741 | |
| * | | Kenmare Resources P.L.C. (0487948) | 4,136,548 | | | 2,736,956 | |
| * | | Kenmare Resources P.L.C. (4490737) | 314,971 | | | 203,742 | |
| | Kingspan Group P.L.C. (0492793) | 351,640 | | | 3,127,188 | |
| | Kingspan Group P.L.C. (4491235) | 66,637 | | | 592,012 | |
| * | | McInerney Holdings P.L.C. | 697,135 | | | 38,199 | |
| | Paddy Power P.L.C. | 180,573 | | | 9,997,277 | |
| | Paddy Power P.L.C. (4828974) | 10,071 | | | 553,966 | |
| * | | Providence Resources P.L.C. | 62,580 | | | 182,712 | |
| * | | Smurfit Kappa Group P.L.C. | 456,586 | | | 3,131,024 | |
| | Total Produce P.L.C. | 871,395 | | | 461,084 | |
| | United Drug P.L.C. (3302480) | 820,214 | | | 2,555,475 | |
| * | | United Drug P.L.C. (3335969) | 53,080 | | | 163,805 | |
| TOTAL IRELAND | | | | 66,006,396 | |
| | | | | | | |
| ISRAEL — (2.4%) | | | | | |
| * | | Africa Israel Investments, Ltd. | 254,834 | | | 1,034,089 | |
| * | | Africa Israel Properties, Ltd. | 31,703 | | | 310,312 | |
| | Africa Israel Residences, Ltd. | 594 | | | 6,855 | |
| * | | Airport City, Ltd. | 54,010 | | | 235,029 | |
| | Alon Holdings Blue Square Israel, Ltd. | 44,917 | | | 264,107 | |
| * | | AL-ROV Israel, Ltd. | 15,025 | | | 380,219 | |
| | Alrov Properties & Lodgings, Ltd. | 3,721 | | | 63,597 | |
| * | | Alvarion, Ltd. | 186,966 | | | 216,515 | |
| | Amot Investments, Ltd. | 65,457 | | | 179,523 | |
| * | | AudioCodes, Ltd. | 159,083 | | | 565,068 | |
| | Avgol Industries 1953, Ltd. | 166,877 | | | 128,612 | |
| * | | Azorim Investment Development & Construction Co., Ltd. | 189 | | | 306 | |
| | Bayside Land Corp. | 2,122 | | | 453,461 | |
| * | | Big Shopping Centers 2004, Ltd. | 1,832 | | | 41,405 | |
| * | | Biocell, Ltd. | 16,731 | | | 120,160 | |
| * | | BioLineRX, Ltd. | 535,468 | | | 208,989 | |
| * | | Blue Square Real Estate, Ltd. | 3,782 | | | 76,007 | |
150
The Continental Small Company Series
continued
| | | | SHARES | | VALUE†† | |
| ISRAEL — (Continued) | | | | | |
| | British Israel Investments, Ltd. | 27,461 | | $ | 98,021 | |
| * | | Ceragon Networks, Ltd. | 18,636 | | | 188,088 | |
| * | | Clal Biotechnology Industries, Ltd. | 146,663 | | | 768,797 | |
| | Clal Industries & Investments, Ltd. | 285,112 | | | 1,344,286 | |
| | Clal Insurance Enterprises Holdings, Ltd. | 83,321 | | | 1,449,025 | |
| * | | Compugen, Ltd. | 27,479 | | | 116,894 | |
| | Delek Automotive Systems, Ltd. | 107,838 | | | 825,670 | |
| | Delta-Galil Industries, Ltd. | 14,983 | | | 96,621 | |
| | | Direct Insurance - I.D.I. Insurance Co., Ltd. | 30,880 | | | 69,747 | |
| | DS Apex Holdings, Ltd. | 38,130 | | | 191,962 | |
| * | | El Al Israel Airlines, Ltd. | 738,714 | | | 150,487 | |
| * | | Elbit Medical Imaging, Ltd. | 53,265 | | | 243,918 | |
| * | | Electra Real Estate, Ltd. | 19,237 | | | 62,219 | |
| | Electra, Ltd. | 4,994 | | | 481,773 | |
| * | | Elron Electronic Industries, Ltd. | 57,768 | | | 229,334 | |
| * | | Evogene, Ltd. | 54,299 | | | 221,869 | |
| * | | EZchip Semiconductor, Ltd. | 49,025 | | | 1,750,412 | |
| * | | First International Bank of Israel, Ltd. | 98,118 | | | 1,022,471 | |
| | FMS Enterprises Migun, Ltd. | 10,300 | | | 182,530 | |
| | Formula Systems (1985), Ltd. | 36,549 | | | 567,191 | |
| | Frutarom Industries, Ltd. | 162,348 | | | 1,492,233 | |
| | Fundtech, Ltd. | 10,817 | | | 246,915 | |
| * | | Gilat Satellite Networks, Ltd. | 73,122 | | | 281,937 | |
| * | | Given Imaging, Ltd. | 31,987 | | | 489,864 | |
| | Golf & Co., Ltd. | 57,649 | | | 258,994 | |
| | Granite Hacarmel Investments, Ltd. | 144,714 | | | 230,346 | |
| * | | Hadera Paper, Ltd. | 9,516 | | | 461,070 | |
| | Harel Insurance Investments & Finances, Ltd. | 34,332 | | | 1,484,675 | |
| * | | Hot Telecommunications Systems, Ltd. | 92,836 | | | 1,219,074 | |
| * | | Industrial Building Corp., Ltd. | 195,485 | | | 334,312 | |
| * | | Israel Cold Storage & Supply Co., Ltd. | 1,076 | | | 12,000 | |
| * | | Israel Discount Bank, Ltd. Series A | 971,957 | | | 1,606,586 | |
| | Israel Land Development Co., Ltd. (The) | 22,615 | | | 162,064 | |
| | Ituran Location & Control, Ltd. | 84,441 | | | 1,098,297 | |
| * | | Jerusalem Oil Exploration, Ltd. | 29,594 | | | 458,205 | |
| * | | Kamada, Ltd. | 110,315 | | | 670,511 | |
| | Kardan Vehicle, Ltd. | 293 | | | 2,184 | |
| #* | | Kardan Yazamut | 95,268 | | | 18,922 | |
| | Maabarot Products, Ltd. | 21,999 | | | 206,094 | |
| * | | Magic Software Enterprises, Ltd. | 3,179 | | | 15,573 | |
| | Matrix IT, Ltd. | 171,428 | | | 882,985 | |
| | Melisron, Ltd. | 29,510 | | | 504,434 | |
| * | | Mellanox Technologies, Ltd. | 84,859 | | | 2,691,458 | |
| * | | Menorah Mivtachim Holdings, Ltd. | 101,061 | | | 910,500 | |
| | Migdal Insurance & Financial Holding, Ltd. | 934,324 | | | 1,347,925 | |
| | Mizrahi Tefahot Bank, Ltd. | 163,782 | | | 1,409,308 | |
| * | | Naphtha Israel Petroleum Corp., Ltd. | 103,666 | | | 335,785 | |
| * | | Neto Me Holdings, Ltd. | 5,411 | | | 253,048 | |
| * | | NICE Systems, Ltd. | 32,666 | | | 1,163,358 | |
| * | | NICE Systems, Ltd. Sponsored ADR | 66,570 | | | 2,380,543 | |
| * | | Nitsba Holdings 1995, Ltd. | 72,932 | | | 624,071 | |
| * | | Oil Refineries, Ltd. | 3,239,580 | | | 1,858,336 | |
| * | | Orckit Communications, Ltd. | 29,866 | | | 41,680 | |
| | Ormat Industries, Ltd. | 293,852 | | | 1,782,334 | |
| | Osem Investments, Ltd. | 101,782 | | | 1,410,121 | |
| | Paz Oil Co., Ltd. | 12,287 | | | 1,745,239 | |
| | Phoenix Holdings, Ltd. (The) | 195,715 | | | 536,603 | |
| | Plasson Industries, Ltd. | 3,838 | | | 88,756 | |
| * | | RADVision, Ltd. | 20,382 | | | 104,720 | |
| | Rami Levi Chain Stores Hashikma Marketing 2006, Ltd. | 27,880 | | | 915,597 | |
| * | | Retalix, Ltd. | 65,875 | | | 976,818 | |
151
The Continental Small Company Series
continued
| | | | SHARES | | VALUE†† | |
| ISRAEL — (Continued) | | | | | |
| | Scailex Corp, Ltd. | 29,002 | | $ | 239,584 | |
| | Shikun & Binui, Ltd. | 794,937 | | | 1,574,995 | |
| * | | Space Communication, Ltd. | 11,241 | | | 176,809 | |
| * | | Strauss Group, Ltd. | 122,758 | | | 1,612,205 | |
| * | | Suny Electronic, Ltd. | 33,820 | | | 194,460 | |
| | Super-Sol, Ltd. Series B | 368,517 | | | 1,589,740 | |
| * | | Tower Semiconductor, Ltd. | 1,325,086 | | | 1,060,838 | |
| | Union Bank of Israel, Ltd. | 130,630 | | | 482,828 | |
| TOTAL ISRAEL | | | | 53,990,503 | |
| | | | | | |
| ITALY — (7.1%) | | | | | |
| | ACEA SpA | 280,731 | | | 2,128,447 | |
| | Acegas-APS SpA | 110,973 | | | 577,582 | |
| * | | Acotel Group SpA | 810 | | | 30,449 | |
| * | | Aedes SpA | 1,412,879 | | | 163,532 | |
| #* | | Aeffe SpA | 76,830 | | | 68,342 | |
| | Aeroporto de Firenze SpA | 17,399 | | | 219,810 | |
| # | | Alerion Cleanpower SpA | 67,767 | | | 443,448 | |
| # | | Amplifon SpA | 189,650 | | | 911,223 | |
| | Ansaldo STS SpA | 321,559 | | | 3,401,940 | |
| | Arnoldo Mondadori Editore SpA | 392,186 | | | 805,488 | |
| | Ascopiave SpA | 137,754 | | | 281,182 | |
| | Astaldi SpA | 228,281 | | | 1,343,734 | |
| | Autogrill SpA | 397,526 | | | 4,597,612 | |
| | Azimut Holding SpA | 454,770 | | | 3,544,836 | |
| | Banca Carige SpA | 15,054 | | | 29,424 | |
| | Banca Finnat Euramerica SpA | 685,945 | | | 324,098 | |
| # | | Banca Generali SpA | 140,519 | | | 1,404,887 | |
| | Banca IFIS SpA | 102,347 | | | 589,422 | |
| # | | Banca Piccolo Credito Valtellinese Scarl | 803,224 | | | 2,329,317 | |
| # | | Banca Popolare dell’Emilia Romagna Scarl | 727,034 | | | 5,862,015 | |
| * | | Banca Popolare dell’Etruria e del Lazio Scarl | 101,302 | | | 198,959 | |
| #* | | Banca Popolare di Milano Scarl | 1,769,606 | | | 1,089,018 | |
| # | | Banca Popolare di Sondrio Scarl | 922,722 | | | 7,039,189 | |
| | Banca Profilo SpA | 564,974 | | | 220,320 | |
| | Banco di Desio e della Brianza SpA | 232,296 | | | 993,539 | |
| # | | Banco Popolare Scarl | 1,470,932 | | | 2,183,024 | |
| # | | BasicNet SpA | 105,627 | | | 335,023 | |
| | Beghelli SpA | 427,981 | | | 289,407 | |
| # | | Benetton Group SpA | 220,256 | | | 1,267,220 | |
| * | | Biesse SpA | 54,004 | | | 287,533 | |
| | Bonifica Terreni Ferraresi e Imprese Agricole SpA | 10,867 | | | 336,307 | |
| | Brembo SpA | 162,145 | | | 1,726,161 | |
| * | | Brioschi Sviluppo Immobiliare SpA | 174,780 | | | 28,970 | |
| * | | Buongiorno SpA | 395,420 | | | 552,002 | |
| #* | | Buzzi Unicem SpA | 284,221 | | | 2,598,627 | |
| # | | C.I.R. SpA - Compagnie Industriali Riunite | 1,614,226 | | | 3,227,320 | |
| | Cairo Communication SpA | 28,815 | | | 115,978 | |
| | Caltagirone Editore SpA | 6,120 | | | 10,906 | |
| | Caltagirone SpA | 246,310 | | | 511,017 | |
| * | | Carraro SpA | 113,633 | | | 365,322 | |
| | Cembre SpA | 40,330 | | | 411,439 | |
| | Cementir Holding SpA | 336,239 | | | 787,937 | |
| * | | Class Editore SpA | 165,655 | | | 77,677 | |
| | Credito Artigiano SpA | 361,183 | | | 449,725 | |
| # | | Credito Bergamasco SpA | 129,374 | | | 3,607,577 | |
| | Credito Emiliano SpA | 376,390 | | | 1,600,976 | |
| | CSP International Fashion Group SpA | 13,481 | | | 16,365 | |
| * | | Dada SpA | 6,181 | | | 19,760 | |
| * | | d’Amico International Shipping S.A. | 133,519 | | | 106,589 | |
| # | | Danieli & Co. SpA | 58,099 | | | 1,472,262 | |
152
The Continental Small Company Series
continued
| | | | SHARES | | VALUE†† | |
| ITALY — (Continued) | | | | | |
| | Datalogic SpA | 37,322 | | $ | 279,272 | |
| | Davide Campari - Milano SpA | 990,609 | | | 7,652,926 | |
| * | | DeA Capital SpA | 243,327 | | | 508,563 | |
| | De’Longhi SpA | 305,654 | | | 3,340,205 | |
| | DiaSorin SpA | 77,818 | | | 2,519,016 | |
| * | | Digital Multimedia Technologies SpA | 39,294 | | | 976,316 | |
| * | | EEMS Italia SpA | 110,285 | | | 116,037 | |
| | Elica SpA | 44,844 | | | 63,993 | |
| | Emak SpA | 57,399 | | | 190,515 | |
| | Engineering Ingegneria Informatica SpA | 9,609 | | | 316,047 | |
| # | | ERG SpA | 242,145 | | | 2,979,223 | |
| #* | | ErgyCapital SpA | 5,992 | | | 2,802 | |
| | Esprinet SpA | 104,855 | | | 429,422 | |
| #* | | Eurotech SpA | 103,698 | | | 247,140 | |
| # | | Falck Renewables SpA | 452,790 | | | 514,919 | |
| #* | | Fiera Milano SpA | 37,863 | | | 205,156 | |
| * | | Fondiaria - Sai SpA | 366,128 | | | 804,393 | |
| * | | Gas Plus SpA | 975 | | | 8,685 | |
| | Gefran SpA | 32,485 | | | 159,462 | |
| #* | | Gemina SpA | 2,562,430 | | | 2,181,183 | |
| # | | Geox SpA | 305,569 | | | 1,218,886 | |
| * | | Gruppo Ceramiche Ricchetti SpA | 100,487 | | | 23,634 | |
| | Gruppo Editoriale L’Espresso SpA | 670,242 | | | 1,183,843 | |
| | Gruppo MutuiOnline SpA | 13,650 | | | 76,498 | |
| | | Hera SpA | 1,822,830 | | | 2,980,482 | |
| * | | I Grandi Viaggi SpA | 98,547 | | | 99,939 | |
| | Immsi SpA | 743,533 | | | 643,590 | |
| | Impregilo SpA | 1,243,552 | | | 3,657,642 | |
| | Indesit Co. SpA | 185,473 | | | 1,266,328 | |
| | Industria Macchine Automatiche SpA | 58,626 | | | 1,148,292 | |
| | Industria Romagnola Conduttori Elettrici SpA | 43,452 | | | 120,614 | |
| | Intek SpA | 267,440 | | | 141,990 | |
| | Interpump Group SpA | 255,327 | | | 1,637,312 | |
| | Iren SpA | 1,758,434 | | | 2,126,950 | |
| | Isagro SpA | 10,591 | | | 42,951 | |
| # | | Italcementi SpA | 279,135 | | | 1,856,294 | |
| | Italmobiliare SpA | 46,873 | | | 1,312,573 | |
| #* | | Juventus Football Club SpA | 165,717 | | | 137,781 | |
| * | | Kerself SpA | 38,610 | | | 91,300 | |
| | KME Group SpA | 1,654,192 | | | 749,042 | |
| # | | Landi Renzo SpA | 203,171 | | | 414,532 | |
| * | | Lottomatica SpA | 177,645 | | | 3,391,231 | |
| # | | Maire Tecnimont SpA | 601,549 | | | 991,702 | |
| # | | Marcolin SpA | 60,205 | | | 324,783 | |
| #* | | Mariella Burani SpA | 32,721 | | | — | |
| | Marr SpA | 132,607 | | | 1,422,132 | |
| * | | Mediolanum SpA | 634,523 | | | 2,431,848 | |
| #* | | Milano Assicurazioni SpA | 1,476,243 | | | 629,543 | |
| * | | Monrif SpA | 315,834 | | | 152,802 | |
| | Montefibre SpA | 135,004 | | | 24,463 | |
| | Nice SpA | 40,071 | | | 152,788 | |
| * | | Pagnossin SpA | 9,000 | | | — | |
| * | | PanariaGroup Industrie Ceramiche SpA | 42,000 | | | 62,431 | |
| | Piaggio & C. SpA | 511,332 | | | 1,699,430 | |
| * | | Pininfarina SpA | 82,321 | | | 358,312 | |
| | Piquadro SpA | 7,354 | | | 19,107 | |
| | Pirelli & Co. SpA | 657,369 | | | 5,801,554 | |
| * | | Poltrona Frau SpA | 140,932 | | | 169,192 | |
| * | | Prelios SpA | 2,389,900 | | | 701,391 | |
| #* | | Premafin Finanziaria SpA | 961,257 | | | 311,954 | |
| | Prysmian SpA | 653,038 | | | 9,872,100 | |
153
The Continental Small Company Series
continued
| | | | SHARES | | VALUE†† | |
| ITALY — (Continued) | | | | | |
| #* | | RCS MediaGroup SpA | 257,601 | | $ | 247,592 | |
| | Recordati SpA | 408,182 | | | 3,553,480 | |
| | Reply SpA | 8,854 | | | 206,486 | |
| * | | Retelit SpA | 113,922 | | | 55,595 | |
| * | | Richard-Ginori 1735 SpA | 14,080 | | | 5,777 | |
| | Sabaf SpA | 24,109 | | | 462,369 | |
| | SAES Getters SpA | 30,068 | | | 256,967 | |
| * | | Safilo Group SpA | 140,163 | | | 1,161,447 | |
| * | | Saras SpA | 1,269,180 | | | 2,086,954 | |
| | SAVE SpA | 5,818 | | | 53,013 | |
| | Screen Service Broadcasting Technologies SpA | 152,715 | | | 74,504 | |
| #* | | Seat Pagine Gialle SpA | 2,988,837 | | | 162,776 | |
| * | | Snai SpA | 2,304 | | | 7,257 | |
| | Societa Cattolica di Assicurazioni Scrl | 180,734 | | | 4,023,189 | |
| | Societa Iniziative Autostradali e Servizi SpA | 217,716 | | | 1,799,340 | |
| | Sogefi SpA | 186,290 | | | 645,002 | |
| | Sol SpA | 166,511 | | | 1,041,883 | |
| * | | Sorin SpA | 1,139,193 | | | 2,381,133 | |
| #* | | Stefanel SpA | 112,528 | | | 56,388 | |
| | Tamburi Investment Partners SpA | 36,591 | | | 74,511 | |
| #* | | Telecom Italia Media SpA | 1,206,455 | | | 279,265 | |
| #* | | Tiscali SpA | 3,437,478 | | | 237,543 | |
| | | Tod’s SpA | 47,508 | | | 4,742,258 | |
| # | | Trevi Finanziaria SpA | 138,583 | | | 1,545,232 | |
| * | | Uni Land SpA | 51,835 | | | 36,149 | |
| * | | Unipol Gruppo Finanziario SpA | 3,245,411 | | | 1,330,744 | |
| | Vianini Industria SpA | 59,070 | | | 95,776 | |
| | Vianini Lavori SpA | 175,180 | | | 953,600 | |
| | Vittoria Assicurazioni SpA | 121,346 | | | 514,138 | |
| #* | | Yoox SpA | 101,604 | | | 1,454,911 | |
| | Zignago Vetro SpA | 28,411 | | | 189,143 | |
| TOTAL ITALY | | | | 163,659,870 | |
| | | | | | |
| NETHERLANDS — (4.6%) | | | | | |
| | Aalberts Industries NV | 384,012 | | | 6,753,750 | |
| | Accell Group NV | 78,668 | | | 1,775,677 | |
| * | | AFC Ajax NV | 18,134 | | | 167,210 | |
| #* | | AMG Advanced Metallurgical Group NV | 103,749 | | | 1,282,116 | |
| # | | Amsterdam Commodities NV | 60,751 | | | 865,957 | |
| # | | Arcadis NV | 193,913 | | | 3,803,206 | |
| # | | ASM International NV | 205,174 | | | 5,776,428 | |
| * | | Atag Group NV | 4,630 | | | 1,858 | |
| | Batenburg Beheer NV | 10,306 | | | 270,948 | |
| # | | BE Semiconductor Industries NV | 136,793 | | | 925,503 | |
| | Beter Bed Holding NV | 72,418 | | | 1,491,883 | |
| * | | BinckBank NV | 184,527 | | | 2,140,578 | |
| | Brunel International NV | 51,660 | | | 1,858,191 | |
| * | | Crown Van Gelder NV | 17,892 | | | 99,969 | |
| | CSM NV | 271,908 | | | 3,984,958 | |
| | Delta Lloyd NV | 81,014 | | | 1,422,564 | |
| | DOCdata NV | 22,463 | | | 371,214 | |
| | Exact Holding NV | 61,464 | | | 1,622,329 | |
| | Fornix Biosciences NV | 22,083 | | | 17,869 | |
| # | | Grontmij NV | 77,715 | | | 1,213,909 | |
| | Heijmans NV | 66,281 | | | 1,016,525 | |
| | Hunter Douglas NV | 3,870 | | | 177,370 | |
| # | | Imtech NV | 272,621 | | | 8,053,728 | |
| #* | | Kardan NV | 97,650 | | | 309,421 | |
| | KAS Bank NV | 50,870 | | | 625,853 | |
| # | | Kendrion NV | 39,829 | | | 1,016,312 | |
| | Koninklijke Bam Groep NV | 876,605 | | | 3,641,267 | |
154
The Continental Small Company Series
continued
| | | | SHARES | | VALUE†† | |
| NETHERLANDS — (Continued) | | | | | |
| | Koninklijke Ten Cate NV | 110,282 | | $ | 3,785,891 | |
| * | | Koninklijke Wessanen NV | 300,030 | | | 1,497,696 | |
| #* | | LBi International NV | 148,925 | | | 321,706 | |
| | | Macintosh Retail Group NV | 51,332 | | | 820,320 | |
| | Mediq NV | 247,085 | | | 3,921,288 | |
| # | | Nederlandsche Apparatenfabriek NV | 28,810 | | | 818,076 | |
| | Nutreco NV | 145,366 | | | 9,658,003 | |
| #* | | Ordina NV | 192,481 | | | 346,214 | |
| #* | | Pharming Group NV | 1,152,540 | | | 144,135 | |
| | PostNL NV | 539,573 | | | 2,732,069 | |
| * | | Punch Graphix NV | 60,525 | | | 234,771 | |
| * | | Qurius NV | 233,092 | | | 52,115 | |
| * | | Roto Smeets Group NV | 11,826 | | | 138,231 | |
| | Royal Reesink NV | 1,428 | | | 152,126 | |
| | SBM Offshore NV | 563,703 | | | 12,385,902 | |
| | Sligro Food Group NV | 98,516 | | | 3,224,648 | |
| * | | SNS Reaal Groep NV | 507,589 | | | 1,414,884 | |
| # | | Stern Groep NV | 1,274 | | | 38,262 | |
| | Telegraaf Media Groep NV | 163,704 | | | 2,249,826 | |
| | TKH Group NV | 129,083 | | | 3,182,637 | |
| #* | | TomTom NV | 547,355 | | | 2,730,674 | |
| | Unit 4 NV | 83,556 | | | 2,365,988 | |
| | USG People NV | 237,495 | | | 2,103,513 | |
| * | | Wavin NV | 168,212 | | | 1,245,448 | |
| TOTAL NETHERLANDS | | | | 106,251,016 | |
| | | | | | | |
| NORWAY — (2.8%) | | | | | |
| # | | ABG Sundal Collier Holding ASA | 743,363 | | | 535,122 | |
| # | | Acta Holding ASA | 588,069 | | | 156,798 | |
| | AF Gruppen ASA | 2,718 | | | 22,826 | |
| | Aker ASA Series A | 2,312 | | | 65,632 | |
| # | | Aktiv Kapital ASA | 82,564 | | | 457,575 | |
| * | | Algeta ASA | 77,466 | | | 2,698,938 | |
| | Arendals Fosse Kompani ASA | 100 | | | 29,588 | |
| | Atea ASA | 246,557 | | | 2,176,477 | |
| | Austevoll Seafood ASA | 240,343 | | | 946,860 | |
| | Bonheur ASA | 68,100 | | | 1,513,613 | |
| | BW Offshore, Ltd. ASA | 1,004,602 | | | 1,875,108 | |
| # | | BWG Homes ASA | 241,807 | | | 554,373 | |
| * | | Camillo Eitze & Co. ASA | 58,200 | | | 8,363 | |
| * | | Cermaq ASA | 265,931 | | | 2,949,686 | |
| * | | Clavis Pharma ASA | 21,574 | | | 162,834 | |
| * | | Copeinca ASA | 76,559 | | | 494,036 | |
| * | | Deep Sea Supply P.L.C. | 337,427 | | | 485,507 | |
| #* | | Det Norske Oljeselskap ASA | 169,996 | | | 2,525,116 | |
| #* | | DNO International ASA | 3,379,836 | | | 3,951,697 | |
| * | | Dockwise, Ltd. | 43,489 | | | 708,432 | |
| * | | DOF ASA | 143,497 | | | 678,736 | |
| * | | EDB ErgoGroup ASA | 266,739 | | | 502,911 | |
| * | | Eitzen Chemical ASA | 297,422 | | | 13,351 | |
| | Ekornes ASA | 109,590 | | | 2,233,718 | |
| * | | Electromagnetic GeoServices ASA | 326,537 | | | 799,761 | |
| * | | Eltek ASA | 1,292,456 | | | 739,558 | |
| | Farstad Shipping ASA | 59,843 | | | 1,636,954 | |
| * | | Fornebu Utvikling ASA | 120,455 | | | 37,084 | |
| #* | | Frontline, Ltd. ASA | 60,211 | | | 306,393 | |
| | Ganger Rolf ASA | 54,510 | | | 1,063,681 | |
| | Golar LNG, Ltd. | 27,613 | | | 1,102,713 | |
| # | | Golden Ocean Group, Ltd. | 863,548 | | | 665,497 | |
| #* | | Grieg Seafood ASA | 122,305 | | | 84,642 | |
| #* | | Havila Shipping ASA | 22,400 | | | 164,608 | |
155
The Continental Small Company Series
continued
| | | | SHARES | | VALUE†† | |
| NORWAY — (Continued) | | | | | |
| #* | | Hurtigruten ASA | 608,100 | | $ | 356,974 | |
| * | | Intex Resources ASA | 45,445 | | | 35,782 | |
| * | | Kongsberg Automotive Holding ASA | 1,766,658 | | | 636,864 | |
| | Kongsberg Gruppen ASA | 26,196 | | | 561,514 | |
| * | | Kverneland ASA | 423,895 | | | 394,540 | |
| | Leroey Seafood Group ASA | 39,304 | | | 608,181 | |
| * | | Natural ASA | 388,026 | | | 107,494 | |
| # | | Nordic Semiconductor ASA | 537,446 | | | 1,335,778 | |
| #* | | Norse Energy Corp. ASA | 1,872,731 | | | 90,059 | |
| #* | | Norske Skogindustrier ASA Series A | 541,477 | | | 304,776 | |
| | | Northern Offshore, Ltd. | 182,074 | | | 354,564 | |
| #* | | Norwegian Air Shuttle ASA | 75,844 | | | 992,473 | |
| #* | | Norwegian Energy Co. | 720,771 | | | 772,986 | |
| * | | Odfjell ASA Series A | 138,810 | | | 886,149 | |
| | Olav Thon Eiendomsselskap ASA | 12,960 | | | 1,861,003 | |
| * | | Opera Software ASA | 295,148 | | | 1,328,200 | |
| #* | | Panoro Energy ASA | 122,537 | | | 116,116 | |
| * | | PCI Biotech ASA | 3,357 | | | 22,535 | |
| * | | Petrolia ASA | 707,748 | | | 71,167 | |
| #* | | Photocure ASA | 33,562 | | | 222,648 | |
| * | | Pronova BioPharma ASA | 669,131 | | | 601,362 | |
| | Prosafe ASA | 594,067 | | | 4,490,405 | |
| * | | Q-Free ASA | 81,437 | | | 277,837 | |
| | Salmar ASA | 16,094 | | | 97,689 | |
| * | | Scana Industrier ASA | 319,755 | | | 122,590 | |
| * | | Seabird Exploration P.L.C. | 215,858 | | | 12,647 | |
| #* | | Sevan Marine ASA | 2,385,768 | | | 119,313 | |
| * | | Siem Offshore, Inc. ASA | 319,069 | | | 525,076 | |
| | Solstad Offshore ASA | 57,727 | | | 859,164 | |
| * | | Songa Offshore SE | 845,806 | | | 3,384,848 | |
| | SpareBanken 1 SMN | 273,273 | | | 2,171,054 | |
| | Stolt-Nielsen, Ltd. | 20,635 | | | 408,078 | |
| # | | Tomra Systems ASA | 619,160 | | | 4,540,005 | |
| * | | TTS Marine ASA | 75,639 | | | 126,619 | |
| | Veidekke ASA | 327,908 | | | 2,257,287 | |
| | Wilh Wilhelmsen Holding ASA | 62,749 | | | 1,518,111 | |
| TOTAL NORWAY | | | | 64,920,076 | |
| | | | | | |
| PORTUGAL — (0.9%) | | | | | |
| # | | Altri SGPS SA | 441,547 | | | 720,999 | |
| #* | | Banco BPI SA | 1,997,111 | | | 1,363,711 | |
| #* | | Banco Comercial Portugues SA | 8,314,951 | | | 1,759,203 | |
| * | | Banif SGPS SA | 556,422 | | | 243,590 | |
| #* | | Brisa SA | 680,569 | | | 2,316,341 | |
| | Corticeira Amorim SGPS SA | 223,729 | | | 367,350 | |
| | Ibersol SGPS SA | 20,401 | | | 145,513 | |
| * | | Impresa SGPS SA | 369,303 | | | 224,505 | |
| * | | Investimentos Participacoes e Gestao SA | 232,518 | | | 51,478 | |
| # | | Mota-Engil SGPS SA | 359,581 | | | 511,963 | |
| | Novabase SGPS SA | 65,729 | | | 201,647 | |
| * | | ParaRede SGPS SA | 66,955 | | | 13,944 | |
| | Portucel-Empresa Produtora de Pasta de Papel SA | 815,988 | | | 2,047,587 | |
| | Redes Energeticas Nacionais SA | 647,384 | | | 1,872,701 | |
| * | | Sag Gest - Solucoes Automovel Globais SGPS SA | 251,556 | | | 167,077 | |
| | Sociedade de Investimento e Gestao SGPS SA | 267,754 | | | 2,015,723 | |
| * | | Sonae Capital SGPS SA | 41,386 | | | 13,641 | |
| #* | | Sonae Industria SGPS SA | 443,755 | | | 468,773 | |
| | Sonae SGPS SA | 2,981,987 | | | 2,147,036 | |
| | Sonaecom SGPS SA | 565,634 | | | 1,010,176 | |
| * | | Sumol & Compal SA | 67,967 | | | 116,884 | |
| | Teixeira Duarte SA | 734,737 | | | 202,102 | |
156
The Continental Small Company Series
continued
| | | | | SHARES | | VALUE†† | |
| PORTUGAL — (Continued) | | | | | | |
| | Toyota Caetano Portugal SA | | 53,308 | | $ | 274,396 | |
| # | | Zon Multimedia Servicos de Telecomunicacoes e Multimedia SGPS SA | | 621,293 | | | 1,934,469 | |
| TOTAL PORTUGAL | | | | | 20,190,809 | |
| | | | | | | | |
| SPAIN — (5.4%) | | | | | | |
| # | | Abengoa SA | | 168,206 | | | 3,907,675 | |
| * | | Adolfo Dominguez SA | | 20,351 | | | 165,367 | |
| # | | Almirall SA | | 176,170 | | | 1,310,746 | |
| #* | | Amper SA | | 96,925 | | | 292,226 | |
| # | | Antena 3 de Television SA | | 279,539 | | | 1,673,804 | |
| * | | Azkoyen SA | | 70,532 | | | 165,328 | |
| | Banco de Sabadell SA Convertible Shares | | 212,446 | | | 180,786 | |
| #* | | Banco de Valencia SA | | 535,721 | | | 653,874 | |
| # | | Banco Pastor SA | | 343,327 | | | 1,612,771 | |
| # | | Bankinter SA | | 1,006,147 | | | 6,142,583 | |
| * | | Baron de Ley SA | | 13,910 | | | 837,884 | |
| # | | Bolsas y Mercados Espanoles SA | | 236,082 | | | 6,761,301 | |
| # | | Caja de Ahorros del Mediterraneo SA | | 116,412 | | | 225,159 | |
| | Campofrio Food Group SA | | 95,179 | | | 808,811 | |
| #* | | Cementos Portland Valderrivas SA | | 45,565 | | | 630,875 | |
| #* | | Cie Automotive SA | | 114,494 | | | 946,543 | |
| #* | | Codere SA | | 64,206 | | | 734,306 | |
| | Compania Vinicola del Norte de Espana SA | | 16,119 | | | 334,398 | |
| | Construcciones y Auxiliar de Ferrocarriles SA | | 7,518 | | | 3,987,969 | |
| * | | Corporacion Dermoestetica SA | | 21,236 | | | 23,948 | |
| #* | | Deoleo SA | | 1,371,618 | | | 689,867 | |
| | Dinamia Capital Privado Sociedad de Capital Riesgo SA | | 19,817 | | | 114,501 | |
| * | | Dinamia Capital Privado Sociedad de Capital Riesgo SA Issue-11 Shares | | 396 | | | 2,279 | |
| | Duro Felguera SA | | 276,209 | | | 1,847,835 | |
| | Ebro Foods SA | | 340,839 | | | 6,906,928 | |
| # | | Elecnor SA | | 198,254 | | | 2,689,202 | |
| * | | Ercros SA | | 291,279 | | | 354,757 | |
| # | | Faes Farma SA | | 602,381 | | | 1,233,624 | |
| * | | Fersa Energias Renovables SA | | 87,062 | | | 97,248 | |
| | Fluidra SA | | 51,323 | | | 170,951 | |
| # | | Fomento de Construcciones y Contratas SA | | 69,047 | | | 1,787,511 | |
| | Gamesa Corp. Tecnologica SA | | 1,081,002 | | | 5,220,452 | |
| #* | | General de Alquiler de Maquinaria SA | | 32,241 | | | 27,159 | |
| #* | | Grifols SA | | 457,616 | | | 8,508,217 | |
| | Grupo Catalana Occidente SA | | 166,328 | | | 3,065,280 | |
| # | | Grupo Empresarial Ence SA | | 867,472 | | | 2,571,330 | |
| * | | Grupo Ezentis SA | | 1,009,562 | | | 205,531 | |
| * | | Grupo Tavex SA | | 244,131 | | | 129,098 | |
| | Iberpapel Gestion SA | | 25,850 | | | 480,563 | |
| # | | Indra Sistemas SA | | 371,374 | | | 6,222,848 | |
| #* | | Inmobiliaria Colonial SA | | 108,920 | | | 469,229 | |
| | Inmobiliaria del Sur SA | | 2,902 | | | 26,635 | |
| #* | | Jazztel P.L.C. | | 779,346 | | | 4,482,696 | |
| * | | La Seda de Barcelona SA Series B | | 10,928,289 | | | 910,340 | |
| # | | Laboratorios Farmaceuticos Rovi SA | | 47,773 | | | 343,279 | |
| # | | Mediaset Espana Comunicacion SA | | 542,744 | | | 3,591,777 | |
| # | | Melia Hotels International SA | | 214,757 | | | 1,574,444 | |
| | Miquel y Costas & Miquel SA | | 26,111 | | | 590,813 | |
| * | | Miquel y Costas & Miquel SA Issue-11 Shares | | 8,704 | | | 198,714 | |
| * | | Natra SA | | 109,456 | | | 153,307 | |
| #* | | Natraceutical SA | | 645,689 | | | 157,245 | |
| #* | | NH Hoteles SA | | 521,131 | | | 2,550,165 | |
| * | | Nicolas Correa SA | | 24,485 | | | 44,059 | |
| # | | Obrascon Huarte Lain SA | | 156,289 | | | 4,357,796 | |
| | Papeles y Cartones de Europa SA | | 226,938 | | | 903,774 | |
| | Pescanova SA | | 43,729 | | | 1,506,251 | |
157
The Continental Small Company Series
continued
| | | | | SHARES | | VALUE†† | |
| SPAIN — (Continued) | | | | | | |
| | Prim SA | | 39,424 | | $ | 212,268 | |
| #* | | Promotora de Informaciones SA Series A | | 910,275 | | | 939,749 | |
| # | | Prosegur Cia de Seguridad SA | | 87,574 | | | 4,353,976 | |
| #* | | Quabit Inmobiliaria SA | | 788,621 | | | 120,733 | |
| * | | Realia Business SA | | 297,777 | | | 455,867 | |
| * | | Renta Corp. Real Estate SA | | 20,828 | | | 32,994 | |
| #* | | Reyal Urbis SA | | 24,393 | | | 20,455 | |
| # | | Sacyr Vallehermoso SA | | 311,251 | | | 2,173,551 | |
| * | | Service Point Solutions SA | | 727,483 | | | 273,243 | |
| #* | | Sociedad Nacional Industrias Aplicaciones Celulosa Espanola SA | | 227,522 | | | 400,421 | |
| | Solaria Energia y Medio Ambiente SA | | 231,009 | | | 475,448 | |
| # | | Tecnicas Reunidas SA | | 96,655 | | | 3,889,119 | |
| | Telecomunicaciones y Energia SA | | 146,125 | | | 297,276 | |
| #* | | Tubacex SA | | 427,191 | | | 1,124,514 | |
| * | | Tubos Reunidos SA | | 416,951 | | | 987,043 | |
| | Unipapel SA | | 47,385 | | | 833,989 | |
| #* | | Vertice Trescientos Sesenta Grados SA | | 57,183 | | | 12,245 | |
| | Vidrala SA | | 68,988 | | | 1,937,322 | |
| | Viscofan SA | | 183,430 | | | 7,043,085 | |
| #* | | Vocento SA | | 196,990 | | | 525,313 | |
| #* | | Vueling Airlines SA | | 60,195 | | | 424,830 | |
| #* | | Zeltia SA | | 637,268 | | | 1,459,246 | |
| TOTAL SPAIN | | | | | 123,574,746 | |
| | | | | | | | |
| SWEDEN — (8.3%) | | | | | | |
| | Aarhuskarlshamn AB | | 88,601 | | | 2,387,795 | |
| | Acando AB | | 224,754 | | | 497,126 | |
| #* | | Active Biotech AB | | 145,913 | | | 653,209 | |
| # | | AddNode AB | | 16,806 | | | 75,800 | |
| | AddTech AB Series B | | 64,026 | | | 1,445,596 | |
| | AF AB Series B | | 109,179 | | | 1,839,246 | |
| #* | | Alliance Oil Co., Ltd. GDR | | 168,037 | | | 2,172,448 | |
| * | | Anoto Group AB | | 80,683 | | | 34,712 | |
| | Aros Quality Group AB | | 41,400 | | | 294,159 | |
| | Atrium Ljungberg AB Series B | | 25,834 | | | 297,830 | |
| | Avanza Bank Holding AB | | 67,915 | | | 1,810,634 | |
| | Axfood AB | | 93,882 | | | 3,560,096 | |
| | Axis Communications AB | | 183,851 | | | 4,084,033 | |
| # | | B&B Tools AB Series B | | 92,589 | | | 845,933 | |
| * | | BE Group AB | | 170,187 | | | 653,476 | |
| # | | Beiger Electronics AB | | 53,856 | | | 508,196 | |
| # | | Beijer Alma AB | | 62,074 | | | 1,164,201 | |
| | Bergs Timber AB Series B | | 10,861 | | | 22,390 | |
| * | | Betsson AB | | 104,736 | | | 2,465,556 | |
| | Bilia AB Series A | | 113,425 | | | 1,650,971 | |
| | Billerud AB | | 355,810 | | | 2,763,255 | |
| | BioGaia AB Series B | | 45,558 | | | 1,151,545 | |
| * | | BioInvent International AB | | 152,143 | | | 423,176 | |
| | Biotage AB | | 143,915 | | | 115,725 | |
| * | | Bjorn Borg AB | | 64,280 | | | 378,730 | |
| * | | Black Earth Farming, Ltd. | | 44,076 | | | 130,135 | |
| | Bong Ljungdahl AB | | 24,800 | | | 93,906 | |
| * | | Boras Waefveri AB Series B | | 6,564 | | | 1,329 | |
| | Brinova Fastigheter AB | | 98 | | | 1,481 | |
| * | | Bure Equity AB | | 284,971 | | | 840,588 | |
| * | | Byggmax Group AB | | 1,100 | | | 5,147 | |
| # | | Cantena AB | | 56,762 | | | 578,661 | |
| * | | Castellum AB | | 548,218 | | | 7,421,699 | |
| * | | Catella AB | | 226,140 | | | 290,128 | |
| * | | CDON Group AB | | 11,067 | | | 55,966 | |
| # | | Clas Ohlson AB Series B | | 124,325 | | | 1,524,924 | |
158
The Continental Small Company Series
continued
| | | | | SHARES | | VALUE†† | |
| SWEDEN — (Continued) | | | | | | |
| | Cloetta AB | | 55,296 | | $ | 261,496 | |
| #* | | Concentric AB | | 145,352 | | | 892,079 | |
| | Concordia Maritime AB Series B | | 70,300 | | | 148,264 | |
| | Connecta AB | | 25,172 | | | 266,272 | |
| * | | Consilium AB Series B | | 14,965 | | | 36,699 | |
| | CyberCom Group AB | | 49,332 | | | 89,508 | |
| * | | Dedicare AB Series B | | 16,575 | | | 62,140 | |
| #* | | Diamyd Medical AB | | 52,148 | | | 63,903 | |
| # | | DORO AB | | 94,695 | | | 337,325 | |
| * | | Duni AB | | 103,417 | | | 878,238 | |
| | East Capital Explorer AB | | 51,309 | | | 413,291 | |
| | Elekta AB Series B | | 255,842 | | | 10,216,832 | |
| * | | Enea AB | | 56,200 | | | 214,349 | |
| #* | | Eniro AB | | 343,664 | | | 530,994 | |
| * | | Fabege AB | | 500,592 | | | 4,296,699 | |
| | Fagerhult AB | | 16,891 | | | 397,960 | |
| * | | Fastighets AB Balder Series B | | 196,938 | | | 804,407 | |
| | Fenix Outdoor AB | | 4,571 | | | 119,908 | |
| | G & L Beijer AB Series B | | 28,958 | | | 969,332 | |
| * | | Global Health Partner AB | | 827 | | | 1,308 | |
| # | | Gunnebo AB | | 174,854 | | | 705,264 | |
| # | | Hakon Invest AB | | 168,274 | | | 2,352,573 | |
| | Haldex AB | | 173,128 | | | 739,058 | |
| | Heba Fastighets AB Series B | | 43,722 | | | 389,929 | |
| | Hexpol AB | | 90,282 | | | 2,323,024 | |
| #* | | HIQ International AB | | 181,737 | | | 802,381 | |
| | HMS Networks AB | | 7,040 | | | 104,387 | |
| | Hoganas AB Series B | | 91,448 | | | 2,914,791 | |
| | Holmen AB Series B | | 181,073 | | | 5,123,381 | |
| * | | HQ AB | | 19,037 | | | 9,911 | |
| | Hufvudstaden AB Series A | | 189,483 | | | 2,055,698 | |
| * | | Husqvarna AB Series A | | 12,008 | | | 61,222 | |
| * | | Husqvarna AB Series B | | 222,394 | | | 1,129,519 | |
| | Industrial & Financial Systems AB Series B | | 69,650 | | | 983,243 | |
| | Indutrade AB | | 44,403 | | | 1,188,397 | |
| | Intrum Justitia AB | | 241,545 | | | 3,963,154 | |
| # | | JM AB | | 299,638 | | | 5,436,757 | |
| # | | KappAhl AB | | 195,033 | | | 423,445 | |
| #* | | Karo Bio AB | | 904,968 | | | 147,537 | |
| * | | Klovern AB | | 387,861 | | | 1,618,584 | |
| | KNOW IT AB | | 72,015 | | | 529,892 | |
| * | | Kungsleden AB | | 488,858 | | | 3,737,988 | |
| | Lagercrantz Group AB Series B | | 70,775 | | | 522,851 | |
| | Lammhults Design Group AB | | 19,547 | | | 70,481 | |
| | Lennart Wallenstam Byggnads AB Series B | | 385,959 | | | 3,809,445 | |
| * | | Lindab International AB | | 175,890 | | | 1,085,866 | |
| | Loomis AB Series B | | 241,411 | | | 3,320,916 | |
| * | | Lundin Petroleum AB | | 439,229 | | | 10,719,305 | |
| * | | Meda AB Series A | | 750,311 | | | 7,635,753 | |
| * | | Medivir AB Series B | | 84,833 | | | 1,166,427 | |
| | Mekonomen AB | | 64,824 | | | 2,365,090 | |
| * | | Micronic Mydata AB | | 338,267 | | | 602,079 | |
| * | | Midsona AB Series B | | 1,733 | | | 3,989 | |
| * | | MQ Holding AB | | 229 | | | 744 | |
| * | | NCC AB Series A | | 6,526 | | | 118,826 | |
| | NCC AB Series B | | 297,398 | | | 5,450,599 | |
| | Nederman Holding AB | | 3,347 | | | 50,015 | |
| #* | | Net Entertainment NE AB | | 67,146 | | | 677,312 | |
| #* | | Net Insight AB Series B | | 1,181,753 | | | 438,909 | |
| | New Wave Group AB Series B | | 152,864 | | | 695,307 | |
| # | | NIBE Industrier AB Series B | | 237,265 | | | 3,545,502 | |
159
The Continental Small Company Series
continued
| | | | | SHARES | | | VALUE†† | |
| SWEDEN — (Continued) | | | | | | |
| * | | Nobia AB | | 493,534 | | $ | 2,134,617 | |
| | Nolato AB Series B | | 75,775 | | | 629,768 | |
| * | | Nordic Mines AB | | 94,674 | | | 782,587 | |
| | Nordnet AB Series B | | 252,192 | | | 693,653 | |
| * | | Observer AB | | 5,113 | | | 33,891 | |
| | OEM International AB Series B | | 44,400 | | | 366,734 | |
| #* | | Opcon AB | | 11,134 | | | 4,680 | |
| * | | Opcon AB Issue-11 Shares | | 44,536 | | | 17,357 | |
| # | | Orc Group AB | | 70,376 | | | 641,788 | |
| #* | | Orexo AB | | 72,042 | | | 314,481 | |
| | Oriflame Cosmetics SA SDR | | 119,547 | | | 4,756,260 | |
| * | | PA Resources AB | | 2,194,495 | | | 583,149 | |
| * | | Partnertech AB | | 28,800 | | | 103,188 | |
| | Peab AB Series B | | 589,201 | | | 3,206,591 | |
| | Poolia AB Series B | | 33,150 | | | 80,931 | |
| # | | Pricer AB Series B | | 252,242 | | | 459,749 | |
| | ProAct IT Group AB | | 29,271 | | | 639,680 | |
| | Proffice AB Series B | | 231,361 | | | 822,099 | |
| | Profilgruppen AB | | 13,582 | | | 80,297 | |
| | RaySearch Laboratories AB | | 45,598 | | | 132,777 | |
| | | Readsoft AB Series B | | 63,310 | | | 179,456 | |
| #* | | Rederi AB Transatlantic | | 112,133 | | | 257,149 | |
| * | | Rezidor Hotel Group AB | | 264,241 | | | 954,383 | |
| * | | RNB Retail & Brands AB | | 411,548 | | | 183,103 | |
| | Rottneros AB | | 207,512 | | | 72,931 | |
| | Saab AB Series B | | 166,049 | | | 3,198,279 | |
| | Sagax AB | | 1,718 | | | 44,340 | |
| #* | | SAS AB | | 573,665 | | | 949,620 | |
| | Seco Tools AB Series B | | 89,660 | | | 1,209,699 | |
| * | | Sectra AB | | 17,656 | | | 116,472 | |
| | Securitas AB Series B | | 345,289 | | | 3,146,372 | |
| #* | | Semcon AB | | 39,900 | | | 165,248 | |
| | Sigma AB Series B | | 25,800 | | | 21,598 | |
| | Sintercast AB | | 11,800 | | | 87,209 | |
| # | | Skistar AB | | 97,008 | | | 1,400,748 | |
| | SSAB AB Series A | | 306,432 | | | 2,962,288 | |
| | SSAB AB Series B | | 46,838 | | | 396,851 | |
| * | | Studsvik AB | | 21,900 | | | 116,867 | |
| | Sweco AB Series B | | 187,009 | | | 1,652,666 | |
| * | | Swedish Orphan Biovitrum AB | | 464,573 | | | 1,136,135 | |
| | Systemair AB | | 9,379 | | | 108,077 | |
| * | | TradeDoubler AB | | 138,527 | | | 613,723 | |
| | Trelleborg AB Series B | | 928,357 | | | 7,858,668 | |
| * | | Unibet Group P.L.C. SDR | | 42,094 | | | 976,345 | |
| | Uniflex AB Series B | | 18,150 | | | 97,341 | |
| | VBG AB Series B | | 1,084 | | | 14,124 | |
| | Vitrolife AB | | 45,755 | | | 313,556 | |
| | Wihlborgs Fastigheter AB | | 225,805 | | | 3,085,052 | |
| TOTAL SWEDEN | | | | | 190,062,934 | |
| | | | | | | | | |
| SWITZERLAND — (14.1%) | | | | | | |
| | Acino Holding AG | | 8,754 | | | 899,412 | |
| * | | Addex Pharmaceuticals, Ltd. | | 1,491 | | | 10,856 | |
| | Advanced Digital Broadcast Holdings SA | | 2,024 | | | 27,445 | |
| * | | Affichage Holding SA | | 5,703 | | | 896,487 | |
| | AFG Arbonia-Forster Holding AG | | 46,165 | | | 1,060,070 | |
| | Allreal Holding AG | | 34,985 | | | 5,628,997 | |
| | ALSO-Actebis Holding AG | | 16,195 | | | 858,023 | |
| * | | Aryzta AG | | 289,931 | | | 13,979,948 | |
| | Ascom Holding AG | | 160,822 | | | 1,717,485 | |
| | Austriamicrosystems AG | | 35,754 | | | 1,693,394 | |
160
The Continental Small Company Series
continued
| | | | | SHARES | | VALUE†† | |
| SWITZERLAND — (Continued) | | | | | | |
| * | | Autoneum Holding AG | | 15,956 | | $ | 1,078,734 | |
| # | | Bachem Holdings AG | | 24,136 | | | 1,118,787 | |
| | Baloise Holding AG | | 8,111 | | | 660,688 | |
| | Bank Coop AG | | 31,671 | | | 2,297,334 | |
| | Bank Sarasin & Cie AG Series B | | 182,505 | | | 6,937,974 | |
| | Banque Cantonale de Geneve SA | | 4,021 | | | 889,678 | |
| | Banque Cantonale du Jura SA | | 4,500 | | | 327,821 | |
| | Banque Cantonale Vaudoise AG | | 8,060 | | | 4,172,586 | |
| | Banque Privee Edmond de Rothschild SA | | 157 | | | 4,374,321 | |
| | Barry Callebaut AG | | 4,962 | | | 4,704,527 | |
| | Basellandschaftliche Kantonalbank AG | | 520 | | | 746,079 | |
| * | | Basilea Pharmaceutica AG | | 20,383 | | | 914,657 | |
| * | | Basler Kantonalbank AG | | 4,137 | | | 648,617 | |
| | Belimo Holdings AG | | 1,830 | | | 3,277,900 | |
| | Bell AG | | 54 | | | 110,706 | |
| | Bellevue Group AG | | 27,519 | | | 457,815 | |
| | Berner Kantonalbank AG | | 23,232 | | | 6,534,128 | |
| * | | BKW FMB Energie AG | | 27,437 | | | 1,240,377 | |
| * | | Bobst Group AG | | 39,409 | | | 787,880 | |
| | Bossard Holding AG | | 8,386 | | | 1,011,000 | |
| | | Bucher Industries AG | | 33,342 | | | 5,755,982 | |
| | Burckhardt Compression Holding AG | | 6,936 | | | 1,533,098 | |
| | Calida Holding AG | | 7,920 | | | 239,274 | |
| | Carlo Gavazzi Holding AG | | 1,069 | | | 249,164 | |
| | Centralschweizerische Kraftwerke AG | | 145 | | | 54,129 | |
| | Cham Paper Holding AG | | 649 | | | 112,386 | |
| | Charles Voegele Holding AG | | 32,044 | | | 986,569 | |
| * | | Cicor Technologies | | 4,889 | | | 209,116 | |
| | Cie Financiere Tradition SA | | 6,784 | | | 588,829 | |
| * | | Clariant AG | | 699,758 | | | 7,577,735 | |
| | Coltene Holding AG | | 16,008 | | | 650,987 | |
| | Conzzeta AG | | 1,345 | | | 2,807,457 | |
| * | | Cytos Biotechnology AG | | 1,934 | | | 3,986 | |
| | Daetwyler Holding AG | | 29,754 | | | 1,957,302 | |
| * | | Dufry AG | | 65,162 | | | 6,975,452 | |
| | EFG International AG | | 205,702 | | | 1,717,354 | |
| * | | ELMA Electronic AG | | 472 | | | 231,167 | |
| | Emmi AG | | 13,244 | | | 2,652,271 | |
| # | | EMS-Chemie Holding AG | | 28,622 | | | 5,046,817 | |
| | Energiedienst Holding AG | | 71,249 | | | 4,213,663 | |
| | Flughafen Zuerich AG | | 14,025 | | | 5,378,478 | |
| | Forbo Holding AG | | 6,314 | | | 2,983,847 | |
| # | | Galenica Holding AG | | 18,828 | | | 10,906,687 | |
| | GAM Holding AG | | 780,910 | | | 9,336,078 | |
| * | | Gategroup Holding AG | | 65,671 | | | 2,229,073 | |
| | George Fisher AG | | 15,351 | | | 6,360,877 | |
| * | | Gottex Fund Management Holdings, Ltd. | | 824 | | | 3,205 | |
| | Gurit Holding AG | | 1,489 | | | 734,046 | |
| | Helvetia Holding AG | | 22,754 | | | 8,313,855 | |
| | Highlight Communications AG | | 8,169 | | | 39,130 | |
| | Huber & Suhner AG | | 17,212 | | | 924,793 | |
| | Implenia AG | | 49,733 | | | 1,172,914 | |
| | Inficon Holding AG | | 4,954 | | | 844,262 | |
| * | | Interroll Holding AG | | 2,404 | | | 830,190 | |
| | Intershop Holding AG | | 3,559 | | | 1,300,403 | |
| | Jungfraubahn Holding AG | | 229 | | | 14,129 | |
| | Kaba Holding AG | | 11,858 | | | 4,585,629 | |
| * | | Kardex AG | | 21,055 | | | 315,558 | |
| | Komax Holding AG | | 9,976 | | | 768,220 | |
| | Kudelski SA | | 107,664 | | | 1,114,608 | |
| * | | Kuoni Reisen Holding AG Series B | | 13,163 | | | 4,489,476 | |
161
The Continental Small Company Series
continued
| | | | | SHARES | | VALUE†† | |
| SWITZERLAND — (Continued) | | | | | | |
| # | | LEM Holding SA | | 3,667 | | $ | 1,589,753 | |
| | Liechtensteinische Landesbank AG | | 8,371 | | | 463,816 | |
| * | | LifeWatch AG | | 55,532 | | | 198,881 | |
| #* | | Logitech International SA | | 676,961 | | | 6,533,795 | |
| | Lonza Group AG | | 140,493 | | | 9,345,357 | |
| # | | Luzerner Kantonalbank AG | | 17,399 | | | 6,295,945 | |
| | | Metall Zug AG | | 233 | | | 885,104 | |
| #* | | Meyer Burger Technology AG | | 200,895 | | | 4,808,703 | |
| * | | Micronas Semiconductor Holding AG | | 155,041 | | | 1,270,630 | |
| * | | Mikron Holding AG | | 585 | | | 4,058 | |
| * | | Mobilezone Holding AG | | 119,357 | | | 1,250,288 | |
| | Mobimo Holding AG | | 11,582 | | | 2,905,695 | |
| * | | NIBE Industrier AB Series B | | 24,214 | | | 339,294 | |
| | Nobel Biocare Holding AG | | 478,680 | | | 5,861,913 | |
| * | | OC Oerlikon Corp. AG | | 372,542 | | | 2,230,911 | |
| | Orascom Development Holding AG | | 8,205 | | | 181,494 | |
| | Orell Fuessli Holding AG | | 4,930 | | | 602,486 | |
| * | | Panalpina Welttransport Holding AG | | 46,070 | | | 4,556,172 | |
| * | | Parco Industriale e Immobiliare SA | | 600 | | | 2,392 | |
| | Partners Group Holding AG | | 23,084 | | | 4,318,193 | |
| #* | | Petroplus Holdings AG | | 370,438 | | | 2,209,628 | |
| | Phoenix Mecano AG | | 3,100 | | | 1,638,317 | |
| * | | Precious Woods Holding AG | | 49 | | | 649 | |
| * | | PSP Swiss Property AG | | 148,327 | | | 13,494,819 | |
| | PubliGroupe SA | | 2,161 | | | 332,312 | |
| * | | Rieters Holdings AG | | 15,956 | | | 3,319,779 | |
| | Romande Energie Holding SA | | 2,714 | | | 4,016,590 | |
| * | | Schaffner Holding AG | | 2,066 | | | 595,601 | |
| * | | Schmolz & Bickenbach AG | | 72,817 | | | 591,888 | |
| | Schweiter Technologies AG | | 4,191 | | | 2,345,215 | |
| | Schweizerische National-Versicherungs-Gesellschaft AG | | 45,720 | | | 1,601,437 | |
| * | | Siegfried Holding AG | | 8,325 | | | 848,626 | |
| | Societa Elettrica Sopracenerina SA | | 2,340 | | | 519,096 | |
| | St. Galler Kantonalbank AG | | 9,942 | | | 4,319,506 | |
| | Straumann Holding AG | | 21,440 | | | 3,774,012 | |
| * | | Sulzer AG | | 64,067 | | | 7,466,988 | |
| | Swiss Life Holding AG | | 93,938 | | | 11,537,216 | |
| | Swisslog Holding AG | | 914,407 | | | 746,037 | |
| | Swissquote Group Holding SA | | 47,450 | | | 1,996,888 | |
| # | | Tamedia AG | | 14,891 | | | 1,814,701 | |
| | Tecan Group AG | | 41,765 | | | 2,632,878 | |
| #* | | Temenos Group AG | | 259,801 | | | 4,941,166 | |
| * | | Tornos Holding AG | | 38,028 | | | 370,730 | |
| * | | U-Blox AG | | 11,680 | | | 510,978 | |
| | Uster Technologies AG | | 2,848 | | | 113,511 | |
| | Valartis Group AG | | 936 | | | 16,487 | |
| # | | Valiant Holding AG | | 45,575 | | | 6,309,348 | |
| | Valora Holding AG | | 12,070 | | | 2,506,775 | |
| | Vaudoise Assurances Holding SA | | 3,219 | | | 947,501 | |
| | Verwaltungs und Privat-Bank AG | | 7,692 | | | 773,266 | |
| | Vetropack Holding AG | | 184 | | | 344,666 | |
| | Villars Holding SA | | 150 | | | 86,845 | |
| #* | | Von Roll Holding AG | | 126,544 | | | 443,931 | |
| | Vontobel Holdings AG | | 121,104 | | | 3,613,419 | |
| | VZ Holding AG | | 818 | | | 93,313 | |
| | Walliser Kantonalbank AG | | 1,416 | | | 1,263,386 | |
| | WMH Walter Meier Holding AG | | 4,738 | | | 1,150,753 | |
| # | | Ypsomed Holdings AG | | 6,709 | | | 425,096 | |
| | Zehnder Group AG | | 35,840 | | | 2,128,973 | |
| #* | | Zueblin Immobilien Holding AG | | 261,040 | | | 893,343 | |
162
The Continental Small Company Series
continued
| | | | | SHARES | | VALUE†† | |
| SWITZERLAND — (Continued) | | | | | | | |
| | Zuger Kantonalbank AG | | | 623 | | $ | 3,540,878 | |
| TOTAL SWITZERLAND | | | | | | 325,193,350 | |
| TOTAL COMMON STOCKS | | | | | | 1,992,744,029 | |
| | | | | | | | |
| RIGHTS/WARRANTS — (0.1%) | | | | | | | |
| BELGIUM — (0.0%) | | | | | | | |
| * | | Agfa-Gevaert NV STRIP VVPR | | | 122,950 | | | 170 | |
| * | | Deceuninck NV STRIP VVPR | | | 247,412 | | | 342 | |
| #* | | Nyrstar NV STRIP VVPR | | | 178,031 | | | 246 | |
| * | | RealDolmen NV STRIP VVPR | | | 6,067 | | | 84 | |
| * | | SAPEC SA STRIP VVPR | | | 75 | | | 109 | |
| * | | Tessenderlo Chemie NV STRIP VVPR | | | 3,985 | | | 439 | |
| * | | Zenitel NV STRIP VVPR | | | 8,654 | | | 12 | |
| TOTAL BELGIUM | | | | | | 1,402 | |
| | | | | | | | | | |
| ITALY — (0.1%) | | | | | | | |
| * | | Banca Popolare di Milano Scarl Rights 11/18/11 | | | 1,769,606 | | | 1,667,499 | |
| * | | Intek SpA Warrants 12/30/11 | | | 62,985 | | | 166 | |
| * | | KME Group SpA Warrants 12/30/11 | | | 104,975 | | | 261 | |
| TOTAL ITALY | | | | | | 1,667,926 | |
| | | | | | | | | | |
| NORWAY — (0.0%) | | | | | | | |
| * | | DOF ASA Rights 10/31/11 | | | 20,735 | | | — | |
| TOTAL RIGHTS/WARRANTS | | | | | | 1,669,328 | |
| | | | | | | | | | |
| | | | SHARES/ | | | | |
| | | | FACE | | | | |
| | | | AMOUNT | | VALUE† | |
| | | | | (000) | | | | |
| SECURITIES LENDING COLLATERAL — (13.2%) | | | | | | | |
| §@ | | DFA Short Term Investment Fund | | | 303,408,660 | | | 303,408,660 | |
| @ | | Repurchase Agreement, Deutsche Bank Securities, Inc. 0.11%, | | | | | | | |
| | 11/01/11 (Collateralized by FNMA 3.500%, 11/01/31, valued at | | | | | | | |
| | | $1,237,089) to be repurchased at $1,212,836 | | $ | 1,213 | | | 1,212,832 | |
| TOTAL SECURITIES LENDING COLLATERAL | | | | | | 304,621,492 | |
| | | | | | | | | |
| TOTAL INVESTMENTS — (100.0%) | | | | | | | |
| (Cost $2,351,668,120) | | | | | $ | 2,299,034,849 | |
163
THE CANADIAN SMALL COMPANY SERIES
SCHEDULE OF INVESTMENTS
OCTOBER 31, 2011
| | | | | SHARES | | VALUE†† | |
| COMMON STOCKS — (77.5%) | | | | | | |
| Consumer Discretionary — (7.9%) | | | | | | |
| * | | AlarmForce Industries, Inc. | | 4,310 | | $ | 48,602 | |
| | Astral Media, Inc. Class A | | 195,947 | | | 6,727,170 | |
| #* | | Azure Dynamics Corp. | | 1,049,423 | | | 121,077 | |
| #* | | Ballard Power Systems, Inc. | | 559,352 | | | 830,540 | |
| | | BMTC Group, Inc. Class A | | 13,065 | | | 284,435 | |
| * | | Brick, Ltd. (The) | | 93,107 | | | 269,957 | |
| # | | Cineplex, Inc. | | 191,278 | | | 5,079,637 | |
| #* | | Coastal Contacts, Inc. | | 234,745 | | | 732,437 | |
| | Cogeco Cable, Inc. | | 66,661 | | | 3,172,040 | |
| | Cogeco, Inc. | | 4,489 | | | 205,456 | |
| # | | Corus Entertainment, Inc. Class B | | 295,300 | | | 5,655,658 | |
| # | | Dollarama, Inc. | | 197,346 | | | 7,428,565 | |
| | Dorel Industries, Inc. Class B | | 107,500 | | | 2,614,296 | |
| | easyhome, Ltd. | | 3,600 | | | 22,357 | |
| | Gamehost, Inc. | | 2,433 | | | 26,533 | |
| | Glacier Media, Inc. | | 137,300 | | | 260,343 | |
| | Glentel, Inc. | | 59,700 | | | 931,362 | |
| * | | Great Canadian Gaming Corp. | | 284,300 | | | 2,338,861 | |
| | Groupe Aeroplan, Inc. | | 696,151 | | | 8,017,872 | |
| * | | Imax Corp. | | 186,337 | | | 3,594,944 | |
| | Indigo Books & Music, Inc. | | 746 | | | 4,977 | |
| | Le Chateau, Inc. Class A | | 73,800 | | | 273,950 | |
| | Leon’s Furniture, Ltd. | | 143,275 | | | 1,696,158 | |
| | Linamar Corp. | | 191,380 | | | 3,037,503 | |
| * | | Martinrea International, Inc. | | 270,856 | | | 1,913,044 | |
| | MDC Partners, Inc. Class A | | 1,698 | | | 28,483 | |
| * | | MEGA Brands, Inc. | | 37,306 | | | 323,749 | |
| #* | | Mood Media Corp. | | 46,738 | | | 139,733 | |
| | Quebecor, Inc. Class B | | 108,793 | | | 3,765,597 | |
| | Reitmans Canada, Ltd. | | 13,456 | | | 211,273 | |
| | Reitmans Canada, Ltd. Class A | | 202,400 | | | 3,173,827 | |
| | RONA, Inc. | | 677,175 | | | 6,522,077 | |
| * | | Sears Canada, Inc. | | 28,360 | | | 430,201 | |
| | Torstar Corp. Class B | | 234,377 | | | 2,454,874 | |
| | TVA Group, Inc. Class B | | 7,000 | | | 70,228 | |
| | Uni-Select, Inc. | | 57,156 | | | 1,486,314 | |
| # | | Yellow Media, Inc. | | 1,222,317 | | | 447,600 | |
| Total Consumer Discretionary | | | | | 74,341,730 | |
| | | | | | | | |
| Consumer Staples — (2.4%) | | | | | | |
| | Alliance Grain Traders, Inc. | | 60,868 | | | 1,271,404 | |
| | Andrew Peller, Ltd. Class A | | 400 | | | 3,612 | |
| * | | Atrium Innovations, Inc. | | 130,236 | | | 1,710,348 | |
| #* | | BioExx Specialty Proteins, Ltd. | | 540,917 | | | 168,231 | |
| | Canada Bread Co., Ltd. | | 14,021 | | | 604,306 | |
| | Colabor Group, Inc. | | 57,986 | | | 587,568 | |
| | Corby Distilleries, Ltd. Class A | | 63,258 | | | 1,031,929 | |
| #* | | Cott Corp. | | 473,596 | | | 3,325,981 | |
| #* | | GLG Life Tech Corp. | | 39,937 | | | 70,518 | |
| | High Liner Foods, Inc. | | 3,500 | | | 53,163 | |
| | Jean Coutu Group PJC, Inc. Class A (The) | | 400,161 | | | 5,118,688 | |
| # | | Liquor Stores N.A., Ltd. | | 35,769 | | | 520,342 | |
| | Maple Leaf Foods, Inc. | | 334,926 | | | 3,797,004 | |
| # | | North West Co., Inc. (The) | | 105,773 | | | 1,992,894 | |
| # | | Premium Brands Holdings Corp. | | 65,605 | | | 1,030,066 | |
| | Rogers Sugar, Inc. | | 49,376 | | | 258,088 | |
| * | | SunOpta, Inc. | | 193,373 | | | 1,026,279 | |
164
The Canadian Small Company Series
continued
| | | | SHARES | | VALUE†† | |
| Consumer Staples — (Continued) | | | | | |
| * | | Sun-Rype Products, Ltd. | 100 | | $ | 713 | |
| Total Consumer Staples | | | | 22,571,134 | |
| | | | | | | |
| Energy — (19.8%) | | | | | |
| * | | Advantage Oil & Gas, Ltd. | 1,098,231 | | | 5,828,585 | |
| | Akita Drilling, Ltd. Class A | 42,000 | | | 414,206 | |
| # | | AltaGas, Ltd. | 276,864 | | | 8,169,120 | |
| #* | | Anderson Energy, Ltd. | 558,395 | | | 347,334 | |
| * | | Angle Energy, Inc. | 287,932 | | | 1,854,551 | |
| #* | | Antrim Energy, Inc. | 512,200 | | | 549,841 | |
| #* | | Arsenal Energy, Inc. | 486,950 | | | 302,893 | |
| # | | AvenEx Energy Corp. | 100,544 | | | 553,786 | |
| #* | | Bankers Petroleum, Ltd. | 810,182 | | | 4,307,965 | |
| #* | | Bellatrix Exploration, Ltd. | 490,944 | | | 2,280,482 | |
| * | | Bengal Energy, Ltd. | 600 | | | 656 | |
| #* | | Birchcliff Energy, Ltd. | 355,600 | | | 5,394,203 | |
| * | | BlackPearl Resources, Inc. | 954,830 | | | 4,550,231 | |
| * | | BNK Petroleum, Inc. | 127,691 | | | 263,901 | |
| # | | Bonterra Energy Corp. | 46,062 | | | 2,485,292 | |
| * | | C&C Energia, Ltd. | 39,632 | | | 333,597 | |
| | Calfrac Well Services, Ltd. | 126,564 | | | 3,923,579 | |
| * | | Calmena Energy Services, Inc. | 95,771 | | | 25,942 | |
| * | | Calvalley Petroleum, Inc. Class A | 345,539 | | | 485,332 | |
| # | | Canadian Energy Services & Technology Corp. | 132,183 | | | 1,648,392 | |
| | Canyon Services Group, Inc. | 138,592 | | | 1,662,965 | |
| # | | Cathedral Energy Services, Ltd. | 121,906 | | | 819,433 | |
| * | | CE Franklin, Ltd. | 20,400 | | | 173,965 | |
| * | | Celtic Exploration, Ltd. | 269,000 | | | 6,663,266 | |
| * | | Cequence Energy, Ltd. | 278,462 | | | 1,273,927 | |
| * | | Chinook Energy, Inc. | 92,783 | | | 145,213 | |
| #* | | CIC Energy Corp. | 31,465 | | | 68,502 | |
| #* | | Connacher Oil & Gas, Ltd. | 1,534,505 | | | 708,174 | |
| * | | Corridor Resources, Inc. | 367,780 | | | 907,689 | |
| * | | Crew Energy, Inc. | 358,669 | | | 3,943,830 | |
| * | | Crocotta Energy, Inc. | 113,720 | | | 339,991 | |
| # | | Daylight Energy, Ltd. | 739,288 | | | 7,305,730 | |
| * | | Delphi Energy Corp. | 416,369 | | | 881,403 | |
| #* | | Denison Mines Corp. | 2,168,583 | | | 3,415,777 | |
| # | | Enbridge Income Fund Holdings, Inc. | 68,006 | | | 1,287,457 | |
| | Enerflex, Ltd. | 279,959 | | | 2,881,745 | |
| | Ensign Energy Services, Inc. | 226,952 | | | 3,413,103 | |
| #* | | Epsilon Energy, Ltd. | 193,780 | | | 592,956 | |
| * | | Equal Energy, Ltd. | 75,353 | | | 422,597 | |
| #* | | Essential Energy Services, Ltd. | 274,264 | | | 489,782 | |
| * | | Fairborne Energy, Ltd. | 544,251 | | | 1,943,851 | |
| * | | Flint Energy Services, Ltd. | 172,550 | | | 2,068,696 | |
| #* | | Forsys Metals Corp. | 109,974 | | | 76,129 | |
| #* | | Galleon Energy, Inc. Class A | 611,603 | | | 1,718,072 | |
| * | | GeoMark Exploration, Ltd. | 82,540 | | | 72,458 | |
| * | | Gran Tierra Energy, Inc. | 969,291 | | | 5,941,678 | |
| #* | | Ivanhoe Energy, Inc. | 939,785 | | | 1,159,705 | |
| # | | Keyera Corp. | 92,651 | | | 4,226,577 | |
| * | | Legacy Oil & Gas, Inc. | 438,795 | | | 3,970,836 | |
| #* | | Mega Uranium, Ltd. | 796,410 | | | 255,682 | |
| #* | | MGM Energy Corp. | 14,000 | | | 3,511 | |
| * | | Midway Energy, Ltd. | 286,140 | | | 1,079,394 | |
| # | | Mullen Group, Ltd. | 274,057 | | | 5,507,260 | |
| # | | NAL Energy Corp. | 517,913 | | | 4,588,083 | |
| #* | | North American Energy Partners, Inc. | 53,156 | | | 369,039 | |
| | Nuvista Energy, Ltd. | 481,347 | | | 2,969,936 | |
| #* | | Open Range Energy Corp. | 244,459 | | | 2,815,540 | |
165
The Canadian Small Company Series
continued
| | | | SHARES | | VALUE†† | |
| Energy — (Continued) | | | | | |
| #* | | Pace Oil & Gas, Ltd. | 175,677 | | $ | 893,587 | |
| * | | Paramount Resources, Ltd. Class A | 136,127 | | | 4,953,425 | |
| # | | Parkland Fuel Corp. | 197,967 | | | 2,061,598 | |
| # | | Pason Systems, Inc. | 237,900 | | | 3,226,895 | |
| # | | Perpetual Energy, Inc. | 394,093 | | | 648,420 | |
| # | | PetroBakken Energy, Ltd. Class A | 171,305 | | | 1,560,521 | |
| #* | | Petrobank Energy & Resources, Ltd. | 251,385 | | | 2,262,276 | |
| # | | Peyto Exploration & Development Corp. | 101,471 | | | 2,214,190 | |
| | PHX Energy Services Corp. | 28,916 | | | 297,355 | |
| * | | Precision Drilling Corp. | 278,079 | | | 3,225,075 | |
| # | | Progress Energy Resources Corp. | 116,557 | | | 1,649,982 | |
| # | | Provident Energy, Ltd. | 230,627 | | | 2,089,352 | |
| | Pulse Seismic, Inc. | 263,880 | | | 503,007 | |
| #* | | Questerre Energy Corp. | 700,260 | | | 702,543 | |
| #* | | RMP Energy, Inc. | 446,093 | | | 998,031 | |
| * | | Rock Energy, Inc. | 102,033 | | | 247,725 | |
| * | | Savanna Energy Services Corp. | 315,188 | | | 2,659,374 | |
| * | | Secure Energy Services, Inc. | 67,427 | | | 531,028 | |
| | ShawCor, Ltd. Class A | 222,500 | | | 5,323,928 | |
| * | | Sonde Resources Corp. | 75,670 | | | 223,954 | |
| #* | | Southern Pacific Resource Corp. | 1,391,443 | | | 2,052,091 | |
| * | | SouthGobi Resources, Ltd. | 455,682 | | | 3,803,636 | |
| * | | Sprott Resource Corp. | 349,600 | | | 1,525,719 | |
| * | | Terra Energy Corp. | 115,780 | | | 72,018 | |
| #* | | Tethys Petroleum, Ltd. | 274,989 | | | 171,049 | |
| | Total Energy Services, Inc. | 104,829 | | | 1,504,994 | |
| * | | TransGlobe Energy Corp. | 221,040 | | | 2,275,265 | |
| # | | Trilogy Energy Corp. | 191,610 | | | 6,528,293 | |
| | Trinidad Drilling, Ltd. | 482,433 | | | 3,775,247 | |
| * | | Twin Butte Energy, Ltd. | 531,245 | | | 1,012,657 | |
| * | | UEX Corp. | 608,088 | | | 451,452 | |
| #* | | Uranium One, Inc. | 179,870 | | | 541,369 | |
| #* | | Ur-Energy, Inc. | 309,416 | | | 391,135 | |
| # | | Veresen, Inc. | 283,972 | | | 4,105,379 | |
| * | | Vero Energy, Inc. | 218,138 | | | 667,490 | |
| * | | Westfire Energy, Ltd. | 140,738 | | | 648,094 | |
| * | | Winstar Resources, Ltd. | 78,401 | | | 239,903 | |
| * | | Xtreme Coil Drilling Corp. | 97,707 | | | 313,682 | |
| # | | Zargon Oil & Gas, Ltd. | 58,907 | | | 831,524 | |
| * | | ZCL Composite, Inc. | 90,700 | | | 300,286 | |
| Total Energy | | | | 187,367,389 | |
| | | | | | | |
| Financials — (5.6%) | | | | | |
| # | | AGF Management, Ltd. Class B | 330,879 | | | 5,304,687 | |
| | Altus Group, Ltd. | 10,326 | | | 31,390 | |
| | Brookfield Real Estate Services, Inc. | 8,075 | | | 108,882 | |
| | Canaccord Capital, Inc. | 289,695 | | | 2,740,731 | |
| | Canadian Western Bank | 255,372 | | | 7,301,833 | |
| # | | Cash Store Financial Services, Inc. (The) | 51,170 | | | 494,374 | |
| | Clairvest Group, Inc. | 1,900 | | | 31,462 | |
| | Davis & Henderson Corp. | 200,244 | | | 3,415,248 | |
| #* | | Dundee Capital Markets, Inc. | 189,580 | | | 152,159 | |
| * | | EGI Financial Holdings, Inc. | 14,650 | | | 106,191 | |
| | E-L Financial Corp., Ltd. | 309 | | | 120,903 | |
| | Equitable Group, Inc. | 52,295 | | | 1,342,068 | |
| * | | Equity Financial Holdings, Inc. | 800 | | | 7,625 | |
| | Fiera Sceptre, Inc. | 36,300 | | | 220,331 | |
| | Firm Capital Mortgage Investment Corp. | 2,494 | | | 31,527 | |
| | First Capital Realty, Inc. | 9,200 | | | 150,172 | |
| | First National Financial Corp. | 6,583 | | | 100,058 | |
| * | | FirstService Corp. | 112,879 | | | 3,153,930 | |
166
The Canadian Small Company Series
continued
| | | | SHARES | | VALUE†† | |
| Financials — (Continued) | | | | | |
| * | | Genesis Land Development Corp. | 69,817 | | $ | 213,636 | |
| | Genworth MI Canada, Inc. | 59,756 | | | 1,318,918 | |
| | Gluskin Sheff + Associates, Inc. | 61,507 | | | 996,577 | |
| | GMP Capital, Inc. | 253,000 | | | 1,807,234 | |
| | Guardian Capital Group, Ltd. Class A | 6,788 | | | 69,123 | |
| | Home Capital Group, Inc. | 120,600 | | | 5,454,375 | |
| * | | Killam Properties, Inc. | 85,316 | | | 916,714 | |
| * | | Kingsway Financial Services, Inc. | 223,835 | | | 159,441 | |
| | Laurentian Bank of Canada | 92,400 | | | 4,262,405 | |
| * | | Mainstreet Equity Corp. | 3,897 | | | 69,045 | |
| * | | Melcor Developments, Ltd. | 8,659 | | | 107,809 | |
| * | | MI Developments, Inc. | 800 | | | 25,395 | |
| * | | Pacific & Western Credit Corp. | 8,800 | | | 12,360 | |
| # | | Sprott Resource Lending Corp. | 750,703 | | | 1,077,006 | |
| # | | Sprott, Inc. | 247,356 | | | 1,739,619 | |
| | TMX Group, Inc. | 231,476 | | | 10,171,707 | |
| #* | | Westaim Corp. | 145,481 | | | 77,356 | |
| Total Financials | | | | 53,292,291 | |
| | | | | | | |
| Health Care — (1.6%) | | | | | |
| #* | | AEterna Zentaris, Inc. | 262,354 | | | 442,192 | |
| * | | Bioniche Life Sciences, Inc. | 46,000 | | | 27,690 | |
| #* | | Burcon NutraScience Corp. | 61,538 | | | 478,475 | |
| * | | Cangene Corp. | 140,432 | | | 274,735 | |
| * | | Cardiome Pharma Corp. | 278,700 | | | 922,709 | |
| # | | CML HealthCare, Inc. | 128,198 | | | 1,246,289 | |
| | Futuremed Healthcare Products Corp. | 34,438 | | | 279,857 | |
| * | | Helix BioPharma Corp. | 13,153 | | | 27,447 | |
| #* | | IMRIS, Inc. | 74,879 | | | 256,170 | |
| # | | Leisureworld Senior Care Corp. | 50,378 | | | 537,264 | |
| | MDS, Inc. | 464,108 | | | 4,074,186 | |
| #* | | Oncolytics Biotech, Inc. | 205,321 | | | 972,275 | |
| * | | Paladin Labs, Inc. | 50,700 | | | 1,885,068 | |
| * | | Patheon, Inc. | 17,320 | | | 24,327 | |
| * | | ProMetic Life Sciences, Inc. | 648,697 | | | 78,097 | |
| * | | QLT, Inc. | 226,610 | | | 1,561,887 | |
| #* | | Resverlogix Corp. | 112,020 | | | 130,367 | |
| #* | | Theratechnologies, Inc. | 277,500 | | | 857,487 | |
| * | | Transition Therapeutics, Inc. | 50,610 | | | 81,240 | |
| * | | TSO3, Inc. | 150,052 | | | 222,801 | |
| #* | | YM Biosciences, Inc. | 242,157 | | | 432,445 | |
| Total Health Care | | | | 14,813,008 | |
| | | | | | | |
| Industrials — (7.0%) | | | | | |
| | Aecon Group, Inc. | 218,667 | | | 1,974,420 | |
| # | | AG Growth International, Inc. | 41,539 | | | 1,329,415 | |
| * | | Air Canada Class A | 313,328 | | | 452,663 | |
| #* | | Alexco Resource Corp. | 224,026 | | | 1,714,892 | |
| | Algoma Central Corp. | 2,569 | | | 244,851 | |
| * | | ATS Automation Tooling System, Inc. | 337,817 | | | 2,104,684 | |
| | Bird Construction, Inc. | 42,319 | | | 451,742 | |
| #* | | Black Diamond Group, Ltd. | 91,391 | | | 1,426,681 | |
| | CAE, Inc. | 79,988 | | | 853,045 | |
| | Canadian Helicopters Group, Inc. | 14,988 | | | 364,343 | |
| * | | CanWel Building Materials Group, Ltd. | 4,500 | | | 9,120 | |
| | Cargojet, Inc. | 1,944 | | | 14,062 | |
| # | | Churchill Corp. Class A (The) | 73,613 | | | 1,111,488 | |
| * | | Clarke, Inc. | 48,894 | | | 202,100 | |
| | Contrans Group, Inc. Class A | 79,242 | | | 564,453 | |
| | DirectCash Payments, Inc. | 13,254 | | | 257,035 | |
| #* | | Electrovaya, Inc. | 141,865 | | | 176,486 | |
167
The Canadian Small Company Series
continued
| | | | SHARES | | VALUE†† | |
| Industrials — (Continued) | | | | | |
| | Exchange Income Corp. | 14,111 | | $ | 293,616 | |
| | Exco Technologies, Ltd. | 10,400 | | | 34,432 | |
| * | | Garda World Security Corp. Class A | 107,340 | | | 865,828 | |
| | Genivar, Inc. | 69,393 | | | 1,605,420 | |
| #* | | GLV, Inc. Class A | 61,573 | | | 271,805 | |
| * | | Heroux-Devtek, Inc. | 88,127 | | | 592,376 | |
| | Horizon North Logistics, Inc. | 204,345 | | | 922,551 | |
| | IBI Group, Inc. | 8,296 | | | 101,957 | |
| | K-Bro Linen, Inc. | 5,758 | | | 108,372 | |
| | Morneau Shepell, Inc. | 26,865 | | | 269,526 | |
| | Newalta Corp. | 166,722 | | | 1,975,407 | |
| | Progressive Waste Solutions, Ltd. | 209,167 | | | 4,406,829 | |
| | Richelieu Hardware, Ltd. | 60,962 | | | 1,627,488 | |
| # | | Ritchie Brothers Auctioneers, Inc. | 244,637 | | | 4,869,424 | |
| | Rocky Mountain Dealerships, Inc. | 38,741 | | | 355,247 | |
| | Russel Metals, Inc. | 243,400 | | | 5,601,802 | |
| * | | Stantec, Inc. | 168,695 | | | 4,148,196 | |
| # | | Student Transportation, Inc. | 221,438 | | | 1,348,511 | |
| # | | Superior Plus Corp. | 391,430 | | | 2,709,673 | |
| #* | | Swisher Hygiene, Inc. | 214,309 | | | 934,387 | |
| | Toromont Industries, Ltd. | 282,567 | | | 5,301,232 | |
| # | | Transcontinental, Inc. Class A | 271,264 | | | 3,456,286 | |
| | TransForce, Inc. | 312,897 | | | 3,776,424 | |
| | Vicwest, Inc. | 19,193 | | | 155,585 | |
| # | | Wajax Corp. | 19,455 | | | 702,859 | |
| | WaterFurnace Renewable Energy, Inc. | 27,314 | | | 520,384 | |
| | Westjet Airlines, Ltd. | 1,420 | | | 18,734 | |
| #* | | Westport Innovations, Inc. | 189,501 | | | 5,718,776 | |
| Total Industrials | | | | 65,944,607 | |
| | | | | | | |
| Information Technology — (4.3%) | | | | | |
| * | | 5N Plus, Inc. | 174,648 | | | 1,182,719 | |
| | Aastra Technologies, Ltd. | 25,044 | | | 395,729 | |
| #* | | Absolute Software Corp. | 160,100 | | | 825,597 | |
| * | | AXIA NetMedia Corp. | 182,767 | | | 201,699 | |
| | Calian Technologies, Ltd. | 12,829 | | | 242,615 | |
| * | | Celestica, Inc. | 847,607 | | | 7,032,566 | |
| #* | | COM DEV International, Ltd. | 271,685 | | | 526,062 | |
| | Computer Modelling Group, Ltd. | 110,238 | | | 1,529,563 | |
| #* | | Constellation Software, Inc. | 24,516 | | | 1,715,813 | |
| * | | Descartes Systems Group, Inc. (The) | 191,571 | | | 1,431,857 | |
| #* | | DragonWave, Inc. | 146,283 | | | 554,753 | |
| * | | Enghouse Systems, Ltd. | 37,378 | | | 368,999 | |
| | Evertz Technologies, Ltd. | 133,981 | | | 1,688,288 | |
| * | | EXFO, Inc. | 83,477 | | | 506,683 | |
| | Gennum Corp. | 130,300 | | | 801,343 | |
| | MacDonald Dettweiler & Associates, Ltd. | 111,753 | | | 5,023,980 | |
| * | | March Networks Corp. | 8,829 | | | 50,932 | |
| | Mediagrif Interactive Technologies, Inc. | 100 | | | 1,280 | |
| * | | Miranda Technologies, Inc. | 84,901 | | | 587,727 | |
| | Mosaid Technologies, Inc. | 42,937 | | | 1,960,004 | |
| * | | Open Text Corp. | 107,738 | | | 6,594,528 | |
| * | | Points International, Ltd. | 46,289 | | | 415,173 | |
| * | | Redknee Solutions, Inc. | 122,828 | | | 135,551 | |
| * | | Ruggedcom, Inc. | 30,225 | | | 492,454 | |
| * | | Sandvine Corp. | 454,830 | | | 720,975 | |
| * | | Sierra Wireless, Inc. | 127,100 | | | 942,332 | |
| * | | Softchoice Corp. | 6,773 | | | 59,457 | |
| * | | Vecima Network, Inc. | 30,729 | | | 89,405 | |
| | Wi-Lan, Inc. | 666,819 | | | 4,963,930 | |
| Total Information Technology | | | | 41,042,014 | |
168
The Canadian Small Company Series
continued
| | | | SHARES | | VALUE†† | |
| Materials — (26.6%) | | | | | |
| | Aberdeen International, Inc. | 122,333 | | $ | 81,003 | |
| * | | Ainsworth Lumber Co., Ltd. | 227,838 | | | 347,443 | |
| * | | Alacer Gold Corp. | 359,258 | | | 4,144,938 | |
| | Alamos Gold, Inc. | 423,220 | | | 7,833,869 | |
| #* | | Almaden Minerals, Ltd. | 108,300 | | | 300,969 | |
| * | | Altius Minerals Corp. | 112,600 | | | 1,262,973 | |
| | Amerigo Resources, Ltd. | 504,854 | | | 334,290 | |
| * | | Anvil Mining, Ltd. | 387,530 | | | 2,799,314 | |
| #* | | Argonaut Gold, Inc. | 353,205 | | | 2,161,576 | |
| #* | | Atna Resource, Ltd. | 145,447 | | | 113,819 | |
| #* | | Augusta Resource Corp. | 308,545 | | | 1,145,339 | |
| #* | | Aura Minerals, Inc. | 479,469 | | | 755,221 | |
| #* | | AuRico Gold, Inc. | 967,320 | | | 9,365,074 | |
| #* | | Aurizon Mines, Ltd. | 609,380 | | | 3,448,110 | |
| #* | | Avalon Rare Metals, Inc. | 352,025 | | | 1,172,534 | |
| #* | | Avion Gold Corp. | 1,405,943 | | | 3,004,423 | |
| #* | | B2Gold Corp. | 924,431 | | | 3,403,724 | |
| #* | | Baja Mining Corp. | 886,518 | | | 853,832 | |
| #* | | Brigus Gold Corp. | 611,029 | | | 803,058 | |
| #* | | Canadian Zinc Corp. | 280,925 | | | 186,015 | |
| | Canam Group, Inc. Class A | 194,100 | | | 765,300 | |
| * | | Canexus Corp. | 5,600 | | | 34,946 | |
| #* | | Canfor Corp. | 379,755 | | | 3,840,412 | |
| | Canfor Pulp Products, Inc. | 136,336 | | | 1,832,859 | |
| #* | | Capstone Mining Corp. | 1,040,232 | | | 3,527,448 | |
| #* | | Cardero Resource Corp. | 200,960 | | | 217,744 | |
| * | | Carpathian Gold, Inc. | 587,371 | | | 253,393 | |
| | Cascades, Inc. | 489,976 | | | 2,236,660 | |
| * | | Catalyst Paper Corp. | 540,689 | | | 35,259 | |
| | CCL Industries, Inc. Class B | 100,740 | | | 2,930,986 | |
| #* | | China Gold International Resources Corp., Ltd. | 722,757 | | | 2,182,592 | |
| #* | | Claude Resources, Inc. | 934,700 | | | 1,828,608 | |
| #* | | Cline Mining Corp. | 519,100 | | | 1,098,872 | |
| #* | | Colossus Minerals, Inc. | 311,816 | | | 2,221,112 | |
| * | | Copper Mountain Mining Corp. | 366,515 | | | 1,956,218 | |
| * | | Crocodile Gold Corp. | 317,715 | | | 165,750 | |
| * | | Crosshair Exploration & Mining Corp. | 35,900 | | | 18,729 | |
| #* | | Crystallex International Corp. | 1,068,921 | | | 193,033 | |
| * | | Detour Gold Corp. | 237,256 | | | 7,854,977 | |
| #* | | Duluth Metals, Ltd. | 388,214 | | | 1,039,911 | |
| #* | | Dundee Precious Metals, Inc. | 372,067 | | | 2,986,241 | |
| * | | Dynasty Metals & Mining, Inc. | 108,369 | | | 248,974 | |
| #* | | Eastern Platinum, Ltd. | 3,072,960 | | | 2,003,937 | |
| * | | Eastmain Resources, Inc. | 274,250 | | | 365,942 | |
| #* | | ECo. Oro Minerals Corp. | 261,445 | | | 660,990 | |
| #* | | Endeavour Mining Corp. | 397,033 | | | 828,521 | |
| * | | Endeavour Silver Corp. | 290,399 | | | 3,149,449 | |
| * | | Entree Gold, Inc. | 286,898 | | | 544,005 | |
| * | | Euro Goldfields, Ltd. | 521,960 | | | 5,875,487 | |
| * | | Excellon Resources, Inc. | 770,400 | | | 494,664 | |
| #* | | Exeter Resource Corp. | 74,037 | | | 267,402 | |
| * | | Fibrek, Inc. | 97,662 | | | 87,203 | |
| * | | First Majestic Silver Corp. | 350,583 | | | 5,954,723 | |
| * | | First Nickel, Inc. | 50,300 | | | 5,803 | |
| #* | | Formation Capital Corp. | 72,881 | | | 34,731 | |
| * | | Fortress Paper, Ltd. | 41,133 | | | 1,578,880 | |
| #* | | Fortuna Silver Mines, Inc. | 425,568 | | | 2,702,629 | |
| #* | | Fortune Minerals, Ltd. | 214,672 | | | 208,911 | |
| * | | Golden Minerals, Co. | 6,859 | | | 48,082 | |
| #* | | Golden Star Resources, Ltd. | 974,609 | | | 1,926,240 | |
| * | | Grande Cache Coal Corp. | 334,014 | | | 3,307,467 | |
169
The Canadian Small Company Series
continued
| | | | SHARES | | VALUE†† | |
| Materials — (Continued) | | | | | |
| #* | | Great Basin Gold, Ltd. | 1,333,830 | | $ | 1,873,451 | |
| #* | | Great Panther Silver, Ltd. | 546,209 | | | 1,435,734 | |
| #* | | Guyana Goldfields, Inc. | 230,342 | | | 2,024,375 | |
| #* | | Hanfeng Evergreen, Inc. | 147,991 | | | 458,783 | |
| * | | Harry Winston Diamond Corp. | 266,629 | | | 3,231,380 | |
| * | | High River Gold Mines, Ltd. | 519,142 | | | 687,502 | |
| # | | HudBay Minerals, Inc. | 611,960 | | | 6,704,392 | |
| * | | Imperial Metals Corp. | 84,290 | | | 1,780,090 | |
| #* | | Inter-Citic Minerals, Inc. | 283,484 | | | 307,161 | |
| * | | International Forest Products, Ltd. Class A | 174,500 | | | 721,284 | |
| * | | International Minerals Corp. | 3,200 | | | 22,184 | |
| #* | | International Tower Hill Mines, Ltd. | 220,027 | | | 1,108,137 | |
| * | | Intertape Polymer Group, Inc. | 154,552 | | | 457,415 | |
| #* | | Jaguar Mining, Inc. | 362,916 | | | 1,875,112 | |
| #* | | Katanga Mining, Ltd. | 1,003,662 | | | 1,429,847 | |
| * | | Keegan Resources, Inc. | 271,644 | | | 1,621,552 | |
| * | | Kimber Resources, Inc. | 21,200 | | | 28,926 | |
| #* | | Kirkland Lake Gold, Inc. | 210,980 | | | 3,943,373 | |
| * | | La Mancha Resources, Inc. | 344,099 | | | 766,391 | |
| * | | Labrador Iron Mines Holdings, Ltd. | 123,133 | | | 852,388 | |
| #* | | Lake Shore Gold Corp. | 1,280,732 | | | 1,901,664 | |
| * | | Laramide Resources, Ltd. | 20,368 | | | 19,208 | |
| #* | | MAG Silver Corp. | 156,360 | | | 1,466,733 | |
| | Major Drilling Group International, Inc. | 319,200 | | | 4,268,810 | |
| * | | MDN, Inc. | 220,980 | | | 53,208 | |
| #* | | Mercator Minerals, Ltd. | 905,221 | | | 1,843,590 | |
| # | | Methanex Corp. | 289,704 | | | 7,469,669 | |
| #* | | Migao Corp. | 156,300 | | | 606,853 | |
| * | | Minco Base Metals Corp. | 2,780 | | | — | |
| #* | | Minco Silver Corp. | 125,224 | | | 288,954 | |
| #* | | Minefinders Corp. | 272,841 | | | 3,867,814 | |
| #* | | Minera Andes, Inc. | 731,944 | | | 1,402,571 | |
| #* | | Nautilus Minerals, Inc. | 89,354 | | | 237,560 | |
| #* | | Neo Material Technologies, Inc. | 405,900 | | | 3,139,693 | |
| #* | | Nevada Copper Corp. | 160,491 | | | 816,342 | |
| #* | | NGEx Resources, Inc. | 287,000 | | | 849,411 | |
| * | | Norbord, Inc. | 78,010 | | | 685,596 | |
| #* | | North American Palladium, Ltd. | 418,765 | | | 1,399,034 | |
| * | | Northern Dynasty Minerals, Ltd. | 203,498 | | | 1,651,667 | |
| #* | | Northland Resources SA | 54,983 | | | 80,537 | |
| #* | | NovaGold Resources, Inc. | 612,655 | | | 5,624,071 | |
| #* | | OceanaGold Corp. | 1,077,616 | | | 2,724,447 | |
| * | | Oromin Explorations, Ltd. | 168,799 | | | 165,962 | |
| #* | | Orvana Minerals Corp. | 302,452 | | | 518,879 | |
| #* | | Peregrine Diamonds, Ltd. | 260,272 | | | 276,788 | |
| #* | | Petaquilla Minerals, Ltd. | 491,782 | | | 360,171 | |
| * | | Phoscan Chemical Corp. | 432,579 | | | 138,877 | |
| * | | Pilot Gold, Inc. | 86,150 | | | 127,918 | |
| #* | | Platinum Group Metals, Ltd. | 241,887 | | | 315,478 | |
| #* | | Platmin, Ltd. | 108,562 | | | 30,496 | |
| * | | Polaris Miner Corp. | 29,838 | | | 9,130 | |
| #* | | PolyMet Mining Corp. | 423,377 | | | 552,185 | |
| #* | | Primero Mining Corp. | 104,423 | | | 293,338 | |
| * | | Quadra FNX Mining, Ltd. | 408,502 | | | 4,713,091 | |
| * | | Queenston Mining, Inc. | 220,773 | | | 1,346,677 | |
| * | | Richmont Mines, Inc. | 103,444 | | | 1,261,980 | |
| #* | | Rubicon Minerals Corp. | 508,405 | | | 2,060,653 | |
| * | | Sabina Gold & Silver Corp. | 383,055 | | | 1,660,193 | |
| #* | | San Gold Corp. | 700,717 | | | 1,448,184 | |
| #* | | Scorpio Mining Corp. | 746,699 | | | 1,513,250 | |
| #* | | Seabridge Gold, Inc. | 121,852 | | | 2,867,969 | |
170
The Canadian Small Company Series
continued
| | | | SHARES | | VALUE†† | |
| Materials — (Continued) | | | | | |
| #* | | SEMAFO, Inc. | 905,185 | | $ | 6,947,244 | |
| | Sherritt International Corp. | 1,571,926 | | | 9,036,505 | |
| * | | Shore Gold, Inc. | 837,013 | | | 411,474 | |
| * | | Silver Standard Resources, Inc. | 194,193 | | | 3,791,318 | |
| # | | Silvercorp Metals, Inc. | 620,630 | | | 5,771,999 | |
| #* | | St. Andrew Goldfields, Ltd. | 513,853 | | | 304,162 | |
| | Stella-Jones, Inc. | 32,540 | | | 1,298,009 | |
| #* | | Stornoway Diamond Corp. | 297,297 | | | 450,382 | |
| * | | Sulliden Gold Corp., Ltd. | 659,525 | | | 1,204,249 | |
| #* | | Tanzanian Royalty Exploration Corp. | 350,339 | | | 1,335,629 | |
| #* | | Taseko Mines, Ltd. | 793,230 | | | 2,880,855 | |
| * | | Tembec, Inc. | 257,356 | | | 826,224 | |
| #* | | Thompson Creek Metals Co., Inc. | 584,600 | | | 4,199,384 | |
| * | | Timminco, Ltd. | 69,822 | | | 13,309 | |
| #* | | Torex Gold Resources, Inc. | 818,006 | | | 1,247,423 | |
| #* | | Virginia Mines, Inc. | 99,162 | | | 835,677 | |
| | Wesdome Gold Mines, Ltd. | 325,464 | | | 822,844 | |
| | West Fraser Timber Co., Ltd. | 131,316 | | | 5,664,999 | |
| * | | Western Forest Products, Inc. | 116,219 | | | 90,946 | |
| | Winpak, Ltd. | 66,195 | | | 780,327 | |
| #* | | Yukon-Nevada Gold Corp. | 1,708,678 | | | 634,272 | |
| Total Materials | | | | 250,967,973 | |
| | | | | | | |
| Telecommunication Services — (0.3%) | | | | | |
| # | | Manitoba Telecom Services, Inc. | 74,117 | | | 2,374,272 | |
| * | | Wireless Matrix Corp. | 111,939 | | | 93,212 | |
| Total Telecommunication Services | | | | 2,467,484 | |
| | | | | | | |
| Utilities — (2.0%) | | | | | |
| # | | Algonquin Power & Utilities Corp. | 409,186 | | | 2,298,913 | |
| * | | Alterra Power Corp. | 909,570 | | | 428,892 | |
| # | | Atlantic Power Corp. | 233,230 | | | 3,142,492 | |
| * | | Boralex, Inc. Class A | 94,733 | | | 570,251 | |
| # | | Capstone Infrastructure Corp. | 149,466 | | | 913,216 | |
| # | | Innergex Renewable Energy, Inc. | 188,190 | | | 1,782,306 | |
| # | | Just Energy Group, Inc. | 467,883 | | | 5,050,836 | |
| * | | Maxim Power Corp. | 92,234 | | | 189,696 | |
| # | | Northland Power, Inc. | 211,085 | | | 3,502,730 | |
| | Pacific Northern Gas, Ltd. | 9,998 | | | 367,822 | |
| #* | | Ram Power Corp. | 454,560 | | | 141,373 | |
| | Valener, Inc. | 40,005 | | | 589,991 | |
| Total Utilities | | | | 18,978,518 | |
| TOTAL COMMON STOCKS | | | | 731,786,148 | |
| RIGHTS/WARRANTS — (0.0%) | | | | | |
| #* | | Compton Petroleum Corp. Warrants 08/23/14 | 7,790 | | | 32,434 | |
| * | | Duluth Metals, Ltd. Warrants 01/18/13 | 24,225 | | | 10,937 | |
| TOTAL RIGHTS/WARRANTS | | | | 43,371 | |
171
The Canadian Small Company Series
continued
| SHARES/ | | | |
| FACE | | | | |
| AMOUNT | | VALUE† | |
| (000) | | | | |
| SECURITIES LENDING COLLATERAL — (22.5%) | | | | | | |
| §@ | | DFA Short Term Investment Fund | | 210,374,890 | | $ | 210,374,890 | |
| @ | | Repurchase Agreement, Deutsche Bank Securities, Inc. 0.11%, | | | | | | |
| | | 11/01/11 (Collateralized by FNMA 3.500%, 11/01/31, valued at | | | | | | |
| | | $2,366,389) to be repurchased at $2,319,996 | $ | 2,320 | | | 2,319,989 | |
| TOTAL SECURITIES LENDING COLLATERAL | | | | | 212,694,879 | |
| | | | | | |
| TOTAL INVESTMENTS — (100.0%) | | | | | | |
| | (Cost $970,256,943) | | | | $ | 944,524,398 | |
172
(b) Not applicable.
Item 7. Disclosure of Proxy Voting Policies and Procedures for Closed-End Management Investment Companies.
Not applicable to the registrant.
Item 8. Portfolio Managers of Closed-End Management Investment Companies.
Not applicable to the registrant.
Item 9. Purchases of Equity Securities by Closed-End Management Investment Company and Affiliated Purchasers.
Not applicable to the registrant.
Item 10. Submission of Matters to a Vote of Security Holders.
The registrant has not adopted procedures by which shareholders may recommend nominees to the registrant's Board of Trustees.
Item 11. Controls and Procedures.
(a) Within 90 days of the filing date of this Form N-CSR, Alexander B. Potts, the registrant’s President and Chief Executive Officer, and Michael Clinton, the registrant’s Treasurer and Chief Financial and Accounting Officer, reviewed the registrant’s disclosure controls and procedures (as defined in rule 30a-3(c) under the Investment Company Act of 1940, as amended (the “1940 Act”)) and evaluated their effectiveness. Based on their review, Messrs. Potts and Clinton determined that the disclosure controls and procedures are reasonably designed to ensure that information required to be disclosed by the registrant on Form N-CSR and Form N-Q is accumulated and communicated to the registrant’s management to allow timely decisions regarding required disclosure.
(b) There were no changes in the registrant’s internal control over financial reporting (as defined in Rule 30a-3(d) under the 1940 Act) that occurred during the second fiscal quarter of the period covered by this report that has materially affected, or is reasonably likely to materially affect, the registrant’s internal control over financial reporting.
Item 12. Exhibits.
(a)(1) Not applicable.
(a)(2) The certifications required by Rule 30a-2(a) of the 1940 Act and Section 302 of the Sarbanes-Oxley Act of 2002 (“Sarbanes-Oxley Act”) are filed herewith.
(a)(3) Not applicable.
(b) The certifications required by Rule 30a-2(b) of the 1940 Act and Section 906 of the Sarbanes-Oxley Act are filed herewith.
The certifications provided pursuant to Rule 30a-2(b) of the 1940 Act and Section 906 of the Sarbanes-Oxley Act are not deemed “filed” for purposes of Section 18 of the Securities Exchange Act of 1934, as amended (the “Exchange Act”), or otherwise subject to the liability of that section. Such certifications will not be deemed to be incorporated by reference into any filing under the Securities Act of 1933 or the Exchange Act, except to the extent that the registrant specifically incorporates them by reference.
SIGNATURES
Pursuant to the requirements of the Securities Exchange Act of 1934 and the Investment Company Act of 1940, the registrant has duly caused this report to be signed on its behalf by the undersigned, thereunto duly authorized.
SA FUNDS – INVESTMENT TRUST
| By: | | /s/ Alexander B. Potts | |
| | | Alexander B. Potts |
| | | President and Chief Executive Officer |
| | | |
| Date: | March 1, 2012 |
Pursuant to the requirements of the Securities Exchange Act of 1934 and the Investment Company Act of 1940, this report has been signed below by the following persons on behalf of the registrant and in the capacities and on the dates indicated.
| By: | | /s/ Alexander B. Potts | |
| | | Alexander B. Potts |
| | | President and Chief Executive Officer |
| | |
| Date: | March 1, 2012 |
| | | |
| By: | | /s/ Michael Clinton | |
| | | Michael Clinton |
| | | Treasurer and Chief Financial and Accounting Officer |
| | |
| Date: | |