UNITED STATES
SECURITIES AND EXCHANGE COMMISSION
Washington, D.C. 20549
FORM N-CSR
CERTIFIED SHAREHOLDER REPORT OF REGISTERED
MANAGEMENT INVESTMENT COMPANIES
Investment Company Act file number: 811-09195
| |
SA FUNDS – INVESTMENT TRUST | |
| | |
| (Exact name of registrant as specified in charter) |
| |
| 10 Almaden Blvd., 15th Floor, San Jose, CA 95113 |
| |
| (Address of principal executive offices) (zip code) |
Deborah Djeu, Esq.
Chief Compliance Officer
SA Funds – Investment Trust
10 Almaden Blvd., 15th Floor,
San Jose, CA 95113
(Name and Address of Agent for Service)
Copies to:
| Brian F. Link, Esq. | Mark D. Perlow, Esq. |
| Vice President and Managing Counsel | Counsel to the Trust |
| State Street Bank and Trust Company | Dechert LLP |
| 100 Summer Street, 7th Floor | One Bush Street, Suite 1600 |
| Boston, Massachusetts 02111 | San Francisco, California 94104-4446 |
Registrant’s telephone number, including area code: (844) 366-0905
Date of fiscal year end: June 30
Date of reporting period: December 31, 2016
Item 1. Report to Shareholders.
SEMI-ANNUAL REPORT
December 31, 2016 |
|
 |
TABLE OF CONTENTS
| | Page |
| Portfolios of Investments | | |
| SA U.S. Fixed Income Fund | | 1 |
| SA Global Fixed Income Fund | | 4 |
| SA U.S. Core Market Fund | | 8 |
| SA U.S. Value Fund | | 12 |
| SA U.S. Small Company Fund | | 15 |
| SA International Value Fund | | 19 |
| SA International Small Company Fund | | 22 |
| SA Emerging Markets Value Fund | | 23 |
| SA Real Estate Securities Fund | | 26 |
| SA Worldwide Moderate Growth Fund | | 29 |
| Statements of Assets and Liabilities | | 30 |
| Statements of Operations | | 32 |
| Statements of Changes in Net Assets | | 34 |
| Financial Highlights | | 41 |
| Notes to Financial Statements | | 51 |
| Proxy Voting Policies and Procedures | | 67 |
| Quarterly Portfolio Schedule | | 67 |
| Semi-Annual Portfolio Schedule | | 67 |
| Understanding Your Fund’s Expenses | | 68 |
| Selected Financial Statements of DFA Investment Dimensions Group Inc. | | 70 |
Any information in this shareholder report regarding market or economic trends or the factors influencing the performance of SA Funds – Investment Trust (the “Trust”) are statements of the opinion of Trust management as of the date of this report. Any such opinion is subject to change at any time based upon market or other conditions and we disclaim responsibility to update such opinions. These statements should not be relied upon as investment advice. Past performance is no guarantee of future results, and there is no guarantee that stated investment objectives will be achieved.
SA U.S. Fixed Income Fund
PORTFOLIO OF INVESTMENTS –– AS OF DECEMBER 31, 2016 (Unaudited)
| | | FACE | | | | |
| | | | AMOUNT | | VALUE† | |
| BONDS AND NOTES — 99.3% | | | | | | | | | |
| Australia — 2.0% | | | | | | | | | |
| Australia & New Zealand | | | | | | | | | |
| Banking Group Ltd. MTN, | | | | | | | | | |
| 1.875%, 10/06/17 | | USD | | | 5,000,000 | | $ | 5,020,540 | |
| Commonwealth Bank of Australia, | | | | | | | | | |
| 1.125%, 3/13/17 | | USD | | | 1,600,000 | | | 1,600,173 | |
| National Australia Bank Ltd. | | | | | | | | | |
| MTN, 2.750%, 3/09/17 | | USD | | | 3,880,000 | | | 3,891,524 | |
| Westpac Banking Corp., | | | | | | | | | |
| 1.500%, 12/01/17 | | USD | | | 2,000,000 | | | 2,000,874 | |
| | | | | | | | | 12,513,111 | |
| Canada — 6.3% | | | | | | | | | |
| Bank of Montreal, | | | | | | | | | |
| 1.400%, 4/10/18 | | USD | | | 1,500,000 | | | 1,496,405 | |
| Bank of Montreal MTN, | | | | | | | | | |
| 1.400%, 9/11/17 | | USD | | | 6,450,000 | | | 6,450,980 | |
| Province of Ontario Canada, | | | | | | | | | |
| 1.200%, 2/14/18 | | USD | | | 2,500,000 | | | 2,494,760 | |
| Royal Bank of Canada GMTN, | | | | | | | | | |
| 1.400%, 10/13/17 | | USD | | | 2,000,000 | | | 2,000,070 | |
| Royal Bank of Canada GMTN, | | | | | | | | | |
| 1.800%, 7/30/18 | | USD | | | 2,000,000 | | | 2,006,870 | |
| Royal Bank of Canada GMTN, | | | | | | | | | |
| 2.200%, 7/27/18 | | USD | | | 3,812,000 | | | 3,838,326 | |
| Royal Bank of Canada MTN, | | | | | | | | | |
| 1.500%, 1/16/18 | | USD | | | 2,400,000 | | | 2,396,995 | |
| Toronto-Dominion Bank (The) | | | | | | | | | |
| GMTN, 1.450%, 9/06/18 | | USD | | | 6,180,000 | | | 6,151,448 | |
| Toronto-Dominion Bank (The) | | | | | | | | | |
| GMTN, 1.750%, 7/23/18 | | USD | | | 1,646,000 | | | 1,648,953 | |
| Toronto-Dominion Bank (The) | | | | | | | | | |
| MTN, 1.400%, 4/30/18 | | USD | | | 7,500,000 | | | 7,483,343 | |
| Toronto-Dominion Bank (The) | | | | | | | | | |
| MTN, 1.625%, 3/13/18 | | USD | | | 2,125,000 | | | 2,127,582 | |
| | | | | | | | | 38,095,732 | |
| France — 1.7% | | | | | | | | | |
| Societe Generale SA, | | | | | | | | | |
| 2.625%, 10/01/18 | | USD | | | 1,500,000 | | | 1,519,260 | |
| Societe Generale SA, | | | | | | | | | |
| 2.750%, 10/12/17 | | USD | | | 1,306,000 | | | 1,318,279 | |
| Total Capital SA, | | | | | | | | | |
| 2.125%, 8/10/18 | | USD | | | 7,285,000 | | | 7,342,522 | |
| | | | | | | | | 10,180,061 | |
| Netherlands — 2.3% | | | | | | | | | |
| Cooperatieve Rabobank UA, | | | | | | | | | |
| 1.700%, 3/19/18 | | USD | | | 1,435,000 | | | 1,435,382 | |
| Shell International Finance BV, | | | | | | | | | |
| 1.125%, 8/21/17 | | USD | | | 4,500,000 | | | 4,500,216 | |
| | Shell International Finance BV, | | | | | | | | | |
| 1.900%, 8/10/18 | | USD | | | 5,835,000 | | | 5,872,029 | |
| Shell International Finance BV, | | | | | | | | | |
| 2.000%, 11/15/18 | | USD | | | 1,397,000 | | | 1,406,735 | |
| Siemens | | | | | | | | | |
| Financieringsmaatschappij NV, | | | | | | | | | |
| 1.450%, 5/25/18 ± | | USD | | | 1,000,000 | | | 999,102 | |
| | | | | | | | | 14,213,464 | |
| Norway — 0.1% | | | | | | | | | |
| Statoil ASA, 1.950%, 11/08/18 | | USD | | | 444,000 | | | 445,556 | |
| | |
| Sweden — 1.1% | | | | | | | | | |
| Nordea Bank AB, | | | | | | | | | |
| 3.125%, 3/20/17 | | USD | | | 4,000,000 | | | 4,018,288 | |
| Svensk Exportkredit AB, | | | | | | | | | |
| 1.125%, 4/05/18 | | USD | | | 1,500,000 | | | 1,494,576 | |
| Svenska Handelsbanken AB | | | | | | | | | |
| MTN, 1.625%, 3/21/18 | | USD | | | 1,000,000 | | | 998,987 | |
| | | | | | | | | 6,511,851 | |
| United Kingdom — 0.3% | | | | | | | | | |
| AstraZeneca PLC, | | | | | | | | | |
| 1.750%, 11/16/18 | | USD | | | 1,875,000 | | | 1,878,866 | |
| | |
| United States — 85.5% | | | | | | | | | |
| 3M Co. MTN, 1.375%, 8/07/18 | | | | $ | 2,000,000 | | | 1,999,788 | |
| Actavis, Inc., 1.875%, 10/01/17 | | | | | 2,000,000 | | | 2,004,190 | |
| Aetna, Inc., 1.700%, 6/07/18 | | | | | 4,300,000 | | | 4,297,515 | |
| American Express Co., | | | | | | | | | |
| 7.000%, 3/19/18 | | | | | 2,000,000 | | | 2,126,006 | |
| American Express Credit Corp., | | | | | | | | | |
| 2.125%, 7/27/18 | | | | | 3,000,000 | | | 3,020,025 | |
| Anthem, Inc., 2.375%, 2/15/17 | | | | | 3,500,000 | | | 3,503,993 | |
| Apple, Inc., 1.000%, 5/03/18 | | | | | 2,876,000 | | | 2,865,779 | |
| Apple, Inc., 1.300%, 2/23/18 | | | | | 3,700,000 | | | 3,703,352 | |
| AT&T, Inc., 2.375%, 11/27/18 | | | | | 1,000,000 | | | 1,009,203 | |
| AT&T, Inc., 5.500%, 2/01/18 | | | | | 4,500,000 | | | 4,676,688 | |
| Bank of America Corp. MTN, | | | | | | | | | |
| 5.650%, 5/01/18 | | | | | 2,000,000 | | | 2,096,196 | |
| Berkshire Hathaway Finance | | | | | | | | | |
| Corp., 1.300%, 5/15/18 | | | | | 1,500,000 | | | 1,496,463 | |
| Berkshire Hathaway Finance | | | | | | | | | |
| Corp., 1.450%, 3/07/18 | | | | | 9,235,000 | | | 9,245,648 | |
| Berkshire Hathaway, Inc., | | | | | | | | | |
| 1.150%, 8/15/18 | | | | | 3,000,000 | | | 2,985,657 | |
| Berkshire Hathaway, Inc., | | | | | | | | | |
| 1.550%, 2/09/18 | | | | | 4,037,000 | | | 4,045,793 | |
| Cardinal Health, Inc., | | | | | | | | | |
| 1.700%, 3/15/18 | | | | | 927,000 | | | 926,342 | |
| Cardinal Health, Inc., | | | | | | | | | |
| 1.900%, 6/15/17 | | | | | 1,470,000 | | | 1,474,192 | |
| Caterpillar Financial Services | | | | | | | | | |
| Corp., 2.450%, 9/06/18 | | | | | 1,000,000 | | | 1,013,083 | |
| Caterpillar Financial Services Corp. | | | | | | | | | |
| GMTN, 1.500%, 2/23/18 | | | | | 4,000,000 | | | 3,999,172 | |
| Caterpillar Financial Services Corp. | | | | | | | | | |
| MTN, 1.000%, 3/03/17 | | | | | 943,300 | | | 943,104 | |
| Chevron Corp., | | | | | | | | | |
| 1.344%, 11/09/17 | | | | | 17,250,000 | | | 17,242,720 | |
| Cisco Systems, Inc., | | | | | | | | | |
| 1.400%, 2/28/18 | | | | | 9,710,000 | | | 9,728,313 | |
See notes to financial statements
1
SA U.S. Fixed Income Fund
PORTFOLIO OF INVESTMENTS –– AS OF DECEMBER 31, 2016 (Unaudited) (Continued)
| | | FACE | | | | |
| | | | AMOUNT | | VALUE† | |
| BONDS AND NOTES (Continued) | | | | |
| United States (Continued) | | | | | | | |
| Cisco Systems, Inc., | | | | | | | |
| 1.650%, 6/15/18 | | $ | 7,860,000 | | $ | 7,885,396 | |
| Citigroup, Inc., 2.050%, 12/07/18 | | | 2,500,000 | | | 2,500,892 | |
| Citigroup, Inc., 2.500%, 9/26/18 | | | 3,340,000 | | | 3,373,367 | |
| Coca-Cola Co. (The), | | | | | | | |
| 0.875%, 10/27/17 | | | 3,000,000 | | | 2,994,690 | |
| Coca-Cola Co. (The), | | | | | | | |
| 1.150%, 4/01/18 | | | 3,300,000 | | | 3,293,129 | |
| Coca-Cola Co. (The), | | | | | | | |
| 1.650%, 3/14/18 | | | 6,975,000 | | | 6,999,956 | |
| Corning, Inc., 1.450%, 11/15/17 | | | 3,897,000 | | | 3,894,927 | |
| Corning, Inc., 1.500%, 5/08/18 | | | 1,000,000 | | | 997,382 | |
| Danaher Corp., | | | | | | | |
| 1.650%, 9/15/18 | | | 3,750,000 | | | 3,755,944 | |
| Dover Corp., 5.450%, 3/15/18 | | | 1,500,000 | | | 1,572,484 | |
| eBay, Inc., 2.500%, 3/09/18 | | | 5,746,000 | | | 5,798,122 | |
| | Exxon Mobil Corp., | | | | | | | |
| 1.305%, 3/06/18 | | | 4,349,000 | | | 4,348,726 | |
| Exxon Mobil Corp., | | | | | | | |
| 1.439%, 3/01/18 | | | 13,600,000 | | | 13,618,686 | |
| Federal Home Loan Banks, | | | | | | | |
| 0.625%, 8/07/18 | | | 16,000,000 | | | 15,875,344 | |
| Federal Home Loan Banks, | | | | | | | |
| 0.875%, 10/01/18 | | | 15,000,000 | | | 14,920,035 | |
| Federal Home Loan Banks, | | | | | | | |
| 1.250%, 6/08/18 | | | 10,660,000 | | | 10,685,765 | |
| Federal Home Loan Banks, | | | | | | | |
| 1.750%, 12/14/18 | | | 9,400,000 | | | 9,500,223 | |
| Federal Home Loan Mortgage | | | | | | | |
| Corp., 0.875%, 10/12/18 | | | 13,000,000 | | | 12,931,607 | |
| Federal Home Loan | | | | | | | |
| Mortgage Corp. GMTN, | | | | | | | |
| 0.750%, 4/09/18 | | | 2,500,000 | | | 2,491,087 | |
| Federal National Mortgage | | | | | | | |
| Association, 1.125%, 7/20/18 | | | 5,000,000 | | | 5,000,845 | |
| Federal National Mortgage | | | | | | | |
| Association, 1.125%, 10/19/18 | | | 4,750,000 | | | 4,744,998 | |
| Federal National Mortgage | | | | | | | |
| Association, 1.125%, 12/14/18 | | | 6,600,000 | | | 6,587,645 | |
| Federal National Mortgage | | | | | | | |
| Association, 1.625%, 11/27/18 | | | 10,000,000 | | | 10,077,260 | |
| Federal National Mortgage | | | | | | | |
| Association, 1.875%, 9/18/18 | | | 14,500,000 | | | 14,670,520 | |
| Ford Motor Credit Co. LLC, | | | | | | | |
| 2.240%, 6/15/18 | | | 1,000,000 | | | 1,001,709 | |
| Ford Motor Credit Co. LLC, | | | | | | | |
| 2.551%, 10/05/18 | | | 1,500,000 | | | 1,509,078 | |
| Ford Motor Credit Co. LLC, | | | | | | | |
| 5.000%, 5/15/18 | | | 2,900,000 | | | 3,014,762 | |
| General Electric Co., | | | | | | | |
| 5.250%, 12/06/17 | | | 5,000,000 | | | 5,180,380 | |
| General Electric Co. GMTN, | | | | | | | |
| 5.625%, 5/01/18 | | | 11,216,000 | | | 11,839,598 | |
| Gilead Sciences, Inc., | | | | | | | |
| 1.850%, 9/04/18 | | | 4,793,000 | | | 4,812,273 | |
| Goldman Sachs Group, Inc. (The), | | | | | | | |
| 6.150%, 4/01/18 | | | 2,800,000 | | | 2,946,250 | |
| Intercontinental Exchange, Inc., | | | | | | | |
| 2.500%, 10/15/18 | | | 2,000,000 | | | 2,028,280 | |
| International Business Machines | | | | | | | |
| Corp., 1.125%, 2/06/18 | | | 3,000,000 | | | 2,993,664 | |
| International Business Machines | | | | | | | |
| Corp., 5.700%, 9/14/17 | | | 13,000,000 | | | 13,391,014 | |
| JPMorgan Chase & Co., | | | | | | | |
| 1.625%, 5/15/18 | | | 2,735,000 | | | 2,732,041 | |
| JPMorgan Chase & Co., | | | | | | | |
| 6.000%, 1/15/18 | | | 1,700,000 | | | 1,773,581 | |
| KeyBank NA, 1.700%, 6/01/18 | | | 4,500,000 | | | 4,498,402 | |
| Kraft Foods Group, Inc., | | | | | | | |
| 2.250%, 6/05/17 | | | 3,431,000 | | | 3,442,309 | |
| McDonald’s Corp. MTN, | | | | | | | |
| 2.100%, 12/07/18 | | | 3,000,000 | | | 3,019,233 | |
| Medtronic, Inc., | | | | | | | |
| 1.375%, 4/01/18 | | | 1,117,000 | | | 1,115,292 | |
| Merck & Co., Inc., | | | | | | | |
| 1.100%, 1/31/18 | | | 1,793,000 | | | 1,789,613 | |
| Microsoft Corp., | | | | | | | |
| 1.300%, 11/03/18 | | | 9,205,000 | | | 9,200,130 | |
| Morgan Stanley MTN, | | | | | | | |
| 6.250%, 8/28/17 | | | 2,000,000 | | | 2,061,050 | |
| NetApp, Inc., 2.000%, 12/15/17 | | | 2,970,000 | | | 2,978,934 | |
| PepsiCo, Inc., 5.000%, 6/01/18 | | | 2,000,000 | | | 2,100,784 | |
| Pfizer, Inc., 1.100%, 5/15/17 | | | 3,000,000 | | | 3,000,204 | |
| Pfizer, Inc., 1.200%, 6/01/18 | | | 14,100,000 | | | 14,065,991 | |
| Philip Morris International, Inc., | | | | | | | |
| 5.650%, 5/16/18 | | | 4,188,000 | | | 4,414,994 | |
| Southern Power Co., | | | | | | | |
| 1.500%, 6/01/18 | | | 3,500,000 | | | 3,485,307 | |
| Stryker Corp., 1.300%, 4/01/18 | | | 6,000,000 | | | 5,976,642 | |
| Toyota Motor Credit Corp. | | | | | | | |
| GMTN, 1.550%, 7/13/18 | | | 1,500,000 | | | 1,499,964 | |
| Toyota Motor Credit Corp. | | | | | | | |
| MTN, 1.200%, 4/06/18 | | | 2,425,000 | | | 2,414,672 | |
| Toyota Motor Credit Corp. | | | | | | | |
| MTN, 2.000%, 10/24/18 | | | 669,000 | | | 673,142 | |
| United States Treasury Note, | | | | | | | |
| 0.750%, 8/31/18 | | | 15,000,000 | | | 14,908,020 | |
| United States Treasury Note, | | | | | | | |
| 1.250%, 10/31/18 | | | 9,000,000 | | | 9,015,822 | |
| United States Treasury Note, | | | | | | | |
| 1.250%, 11/15/18 | | | 67,200,000 | | | 67,312,896 | |
| United States Treasury Note, | | | | | | | |
| 1.250%, 11/30/18 | | | 35,000,000 | | | 35,054,005 | |
| United States Treasury Note, | | | | | | | |
| 1.250%, 12/15/18 | | | 5,000,000 | | | 5,006,250 | |
| United States Treasury Note, | | | | | | | |
| 1.375%, 12/31/18 | | | 3,500,000 | | | 3,511,893 | |
| Wal-Mart Stores, Inc., | | | | | | | |
| 1.950%, 12/15/18 | | | 1,200,000 | | | 1,211,764 | |
| Walgreens Boots Alliance, Inc., | | | | | | | |
| 1.750%, 5/30/18 | | | 2,000,000 | | | 2,002,690 | |
| Wells Fargo Bank NA, | | | | | | | |
| 1.650%, 1/22/18 | | | 4,000,000 | | | 4,000,512 | |
See notes to financial statements
2
SA U.S. Fixed Income Fund
PORTFOLIO OF INVESTMENTS –– AS OF DECEMBER 31, 2016 (Unaudited) (Continued)
| | | FACE | | | | |
| | | | AMOUNT | | VALUE† | |
| BONDS AND NOTES (Continued) | | | | |
| United States (Continued) | | | | | | | |
| Xerox Corp., 2.950%, 3/15/17 | | $ | 3,900,000 | | $ | 3,911,942 | |
| Xerox Corp., 6.750%, 2/01/17 | | | 1,000,000 | | | 1,003,631 | |
| | | | | | | 518,820,970 | |
| |
| TOTAL BONDS AND NOTES | | | | | | | |
| | (Identified Cost $603,955,159) | | | | | | 602,659,611 | |
| |
| | | SHARES | | VALUE† | |
| SHORT-TERM INVESTMENTS — 0.4% | | | | |
| Investment Company — 0.4% | | | | | | | |
| State Street Institutional U.S. | | | | | | | |
| Government Money Market | | | | | | | |
| Fund, 0.170% | | | 2,338,890 | | | 2,338,890 | |
| TOTAL SHORT-TERM | | | | | | | |
| INVESTMENTS | | | | | | | |
| (Identified Cost $2,338,890) | | | | | | 2,338,890 | |
| |
| Total Investments — 99.7% | | | | | | | |
| (Identified Cost $606,294,049)# | | | | | | 604,998,501 | |
| Cash and Other Assets, Less | | | | | | | |
| Liabilities — 0.3% | | | | | | 1,882,533 | |
| Net Assets — 100.0% | | | | | $ | 606,881,034 | |
| | † | | See Note 1 |
| ± | | 144A Securities. Securities exempt from registration under Rule 144A of the Securities Act of 1933. These securities may be resold in transactions exempt from registration to qualified institutional buyers. These securities have been deemed by the Fund to be liquid and at December 31, 2016 amounted to $999,102 or 0.16% of the net assets of the Fund. |
| # | | At December 31, 2016, the aggregate cost of investment securities for U.S. federal income tax purposes was $606,294,049. Net unrealized depreciation aggregated $1,295,548 of which $98,612 related to appreciated investment securities and $1,394,160 related to depreciated investment securities. |
Key to abbreviations:
GMTN — Global Medium Term Note
MTN — Medium Term Note
USD — U.S. Dollar
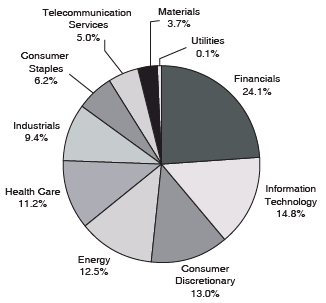
Portfolio Sectors
(% of portfolio market value)+

| + | Excludes Short-Term Investments |
See notes to financial statements
3
SA Global Fixed Income Fund
PORTFOLIO OF INVESTMENTS — AS OF DECEMBER 31, 2016 (Unaudited)
| | | FACE | | | | |
| | | | AMOUNT | | VALUE† | |
| BONDS AND NOTES — 98.9% | | | | | | |
| Australia — 9.0% | | | | | | | | |
| Australia & New Zealand | | | | | | | | |
| Banking Group Ltd MTN, | | | | | | | | |
| 1.450%, 5/15/18 | | USD | | 6,500,000 | | $ | 6,471,836 | |
| Australia & New Zealand | | | | | | | | |
| Banking Group Ltd MTN, | | | | | | | | |
| 2.250%, 6/13/19 | | USD | | 3,500,000 | | | 3,512,572 | |
| Commonwealth Bank of Australia, | | | | | | | | |
| 2.300%, 9/06/19 | | USD | | 2,350,000 | | | 2,357,945 | |
| | Commonwealth Bank of Australia, | | | | | | | | |
| 2.300%, 3/12/20@ | | USD | | 3,000,000 | | | 2,986,182 | |
| Commonwealth Bank of Australia, | | | | | | | | |
| 2.500%, 9/20/18@ | | USD | | 14,443,000 | | | 14,613,297 | |
| National Australia Bank Ltd., | | | | | | | | |
| 2.300%, 7/25/18 | | USD | | 6,925,000 | | | 6,980,538 | |
| National Australia Bank Ltd., | | | | | | | | |
| 2.400%, 12/09/19± | | USD | | 8,000,000 | | | 8,067,240 | |
| National Australia Bank Ltd., | | | | | | | | |
| 2.625%, 7/23/20 | | USD | | 5,000,000 | | | 5,032,335 | |
| Westpac Banking Corp., | | | | | | | | |
| 2.250%, 1/17/19 | | USD | | 10,500,000 | | | 10,543,701 | |
| Westpac Banking Corp., | | | | | | | | |
| 2.600%, 11/23/20 | | USD | | 2,300,000 | | | 2,310,569 | |
| Westpac Banking Corp., | | | | | | | | |
| 4.875%, 11/19/19 | | USD | | 1,500,000 | | | 1,610,268 | |
| | | | | | | | 64,486,483 | |
| | |
| Austria — 2.9% | | | | | | | | |
| Oesterreichische Kontrollbank | | | | | | | | |
| AG, 1.125%, 5/29/18 | | USD | | 10,000,000 | | | 9,964,480 | |
| Oesterreichische Kontrollbank | | | | | | | | |
| AG, 1.625%, 3/12/19 | | USD | | 11,000,000 | | | 11,002,013 | |
| | | | | | | | 20,966,493 | |
| Canada — 12.7% | | | | | | | | |
| Bank of Nova Scotia (The), | | | | | | | | |
| 2.050%, 6/05/19 | | USD | | 10,732,000 | | | 10,744,578 | |
| Bank of Nova Scotia (The), | | | | | | | | |
| 2.350%, 10/21/20 | | USD | | 5,000,000 | | | 4,984,770 | |
| Bank of Nova Scotia (The), | | | | | | | | |
| 2.800%, 7/21/21 | | USD | | 1,561,000 | | | 1,573,813 | |
| Province of Alberta Canada, | | | | | | | | |
| 1.750%, 8/26/20@± | | USD | | 2,000,000 | | | 1,982,050 | |
| Province of Manitoba Canada, | | | | | | | | |
| 1.750%, 5/30/19@ | | USD | | 5,000,000 | | | 5,004,700 | |
| Province of Ontario Canada, | | | | | | | | |
| 2.000%, 1/30/19 | | USD | | 2,500,000 | | | 2,517,475 | |
| Province of Ontario Canada, | | | | | | | | |
| 2.500%, 9/10/21 | | USD | | 8,082,000 | | | 8,149,598 | |
| Province of Ontario Canada, | | | | | | | | |
| 4.000%, 10/07/19 | | USD | | 7,000,000 | | | 7,398,839 | |
| Province of Quebec Canada, | | | | | | | | |
| 3.500%, 7/29/20 | | USD | | 10,000,000 | | | 10,545,310 | |
| Royal Bank of Canada, | | | | | | | | |
| 2.150%, 3/15/19 | | USD | | 5,000,000 | | | 5,021,295 | |
| Royal Bank of Canada, | | | | | | | | |
| 2.150%, 3/06/20 | | USD | | 5,640,000 | | | 5,612,409 | |
| Royal Bank of Canada, | | | | | | | | |
| 2.200%, 7/27/18 | | USD | | 4,700,000 | | | 4,732,458 | |
| Royal Bank of Canada, | | | | | | | | |
| 2.500%, 1/19/21 | | USD | | 5,000,000 | | | 5,015,105 | |
| Toronto-Dominion Bank (The), | | | | | | | | |
| 1.800%, 7/13/21 | | USD | | 9,750,000 | | | 9,447,691 | |
| Toronto-Dominion Bank (The), | | | | | | | | |
| 2.500%, 12/14/20 | | USD | | 1,500,000 | | | 1,506,284 | |
| Toronto-Dominion Bank (The) | | | | | | | | |
| MTN, 2.125%, 4/07/21 | | USD | | 6,500,000 | | | 6,404,508 | |
| | | | | | | | 90,640,883 | |
| Denmark — 1.1% | | | | | | | | |
| Kommunekredit, | | | | | | | | |
| 1.125%, 3/15/18 | | USD | | 7,658,000 | | | 7,635,754 | |
| | |
| France — 7.4% | | | | | | | | |
| Agence Francaise de | | | | | | | | |
| Developpement, | | | | | | | | |
| 1.625%, 1/21/20 | | USD | | 15,000,000 | | | 14,838,165 | |
| Caisse d’Amortissement de la | | | | | | | | |
| Dette Sociale, | | | | | | | | |
| 2.000%, 3/22/21 | | USD | | 7,000,000 | | | 6,921,565 | |
| Dexia Credit Local SA, | | | | | | | | |
| 1.875%, 1/29/20 | | USD | | 5,898,000 | | | 5,822,948 | |
| Dexia Credit Local SA, | | | | | | | | |
| 2.250%, 1/30/19 | | USD | | 3,000,000 | | | 3,010,569 | |
| Sanofi, 4.000%, 3/29/21 | | USD | | 3,500,000 | | | 3,728,424 | |
| Total Capital International SA, | | | | | | | | |
| 2.100%, 6/19/19 | | USD | | 7,000,000 | | | 7,036,344 | |
| Total Capital International SA, | | | | | | | | |
| 2.125%, 1/10/19 | | USD | | 6,000,000 | | | 6,049,488 | |
| Total Capital SA, | | | | | | | | |
| 2.125%, 8/10/18 | | USD | | 4,342,000 | | | 4,376,284 | |
| Total Capital SA, | | | | | | | | |
| 3.875%, 12/14/18 | | GBP | | 611,000 | | | 800,201 | |
| | | | | | | | 52,583,988 | |
| Germany — 3.5% | | | | | | | | |
| FMS Wertmanagement AoeR, | | | | | | | | |
| 1.375%, 6/08/21 | | USD | | 5,000,000 | | | 4,833,345 | |
| KFW, 1.000%, 6/11/18 | | USD | | 8,500,000 | | | 8,463,144 | |
| KFW, 1.625%, 3/15/21 | | USD | | 2,000,000 | | | 1,965,088 | |
| Landwirtschaftliche Rentenbank, | | | | | | | | |
| 1.875%, 9/17/18 | | USD | | 10,000,000 | | | 10,085,730 | |
| | | | | | | | 25,347,307 | |
| Ireland — 2.6% | | | | | | | | |
| GE Capital International | | | | | | | | |
| Funding Co., Unlimited Co., | | | | | | | | |
| 2.342%, 11/15/20 | | USD | | 18,500,000 | | | 18,501,369 | |
| Japan — 2.0% | | | | | | | | |
| Japan Finance Organization | | | | | | | | |
| for Municipalities, | | | | | | | | |
| 2.125%, 3/06/19 | | USD | | 14,000,000 | | | 13,974,912 | |
See notes to financial statements
4
SA Global Fixed Income Fund
PORTFOLIO OF INVESTMENTS — AS OF DECEMBER 31, 2016 (Unaudited) (Continued)
| | | FACE | | | | |
| | | | AMOUNT | | VALUE† | |
| BONDS AND NOTES (Continued) | | | | |
| Netherlands — 5.0% | | | | | | | | |
| Bank Nederlandse Gemeenten | | | | | | | | |
| NV, 1.625%, 4/19/21 | | USD | | 11,000,000 | | $ | 10,715,100 | |
| Cooperatieve Centrale | | | | | | | | |
| Raiffeisen-Boerenleenbank BA, | | | | | | | | |
| 2.250%, 1/14/19 | | USD | | 2,300,000 | | | 2,312,997 | |
| Nederlandse Waterschapsbank | | | | | | | | |
| NV, 1.875%, 3/13/19 | | USD | | 1,700,000 | | | 1,706,030 | |
| Shell International Finance BV, | | | | | | | | |
| 1.750%, 9/12/21 | | USD | | 2,500,000 | | | 2,431,060 | |
| Shell International Finance BV, | | | | | | | | |
| 2.125%, 5/11/20 | | USD | | 13,495,000 | | | 13,485,378 | |
| Shell International Finance BV, | | | | | | | | |
| 2.250%, 11/10/20 | | USD | | 5,100,000 | | | 5,095,701 | |
| | | | | | | | 35,746,266 | |
| Norway — 2.7% | | | | | | | | |
| Kommunalbanken AS, | | | | | | | | |
| 1.625%, 1/15/20 | | USD | | 5,000,000 | | | 4,960,250 | |
| Kommunalbanken AS, | | | | | | | | |
| 1.625%, 2/10/21 | | USD | | 5,000,000 | | | 4,891,765 | |
| | Statoil ASA, 1.950%, 11/08/18 | | USD | | 1,500,000 | | | 1,505,257 | |
| Statoil ASA, 2.250%, 11/08/19 | | USD | | 8,000,000 | | | 8,069,744 | |
| | | | | | | | 19,427,016 | |
| Singapore — 1.0% | | | | | | | | |
| Singapore Government Bond, | | | | | | | | |
| 1.250%, 10/01/21 | | SGD | | 6,000,000 | | | 4,038,704 | |
| Singapore Government Bond, | | | | | | | | |
| 1.625%, 10/01/19 | | SGD | | 5,000,000 | | | 3,460,277 | |
| | | | | | | | 7,498,981 | |
| Supranational — 4.0% | | | | | | | | |
| Council of Europe Development | | | | | | | | |
| Bank, 1.625%, 3/16/21 | | USD | | 2,500,000 | | | 2,445,860 | |
| EUROFIMA, 1.750%, 5/29/20 | | USD | | 5,000,000 | | | 4,972,430 | |
| European Investment Bank, | | | | | | | | |
| 1.625%, 6/15/21 | | USD | | 2,250,000 | | | 2,198,572 | |
| European Investment Bank, | | | | | | | | |
| 1.875%, 3/15/19 | | USD | | 19,000,000 | | | 19,135,888 | |
| | | | | | | | 28,752,750 | |
| Sweden — 8.2% | | | | | | | | |
| Kommuninvest I Sverige AB, | | | | | | | | |
| 2.000%, 11/12/19@ | | USD | | 3,000,000 | | | 3,016,470 | |
| Kommuninvest I Sverige AB, | | | | | | | | |
| 2.500%, 12/01/20 | | SEK | | 15,000,000 | | | 1,802,401 | |
| Nordea Bank AB, | | | | | | | | |
| 1.625%, 5/15/18 | | USD | | 1,680,000 | | | 1,676,302 | |
| Nordea Bank AB, | | | | | | | | |
| 2.375%, 4/04/19 | | USD | | 15,000,000 | | | 15,105,390 | |
| Nordea Bank AB, | | | | | | | | |
| 2.500%, 9/17/20± | | USD | | 4,000,000 | | | 4,005,196 | |
| Svensk Exportkredit AB, | | | | | | | | |
| 1.125%, 4/05/18 | | USD | | 3,000,000 | | | 2,989,152 | |
| Svensk Exportkredit AB, | | | | | | | | |
| 1.750%, 8/28/20@ | | USD | | 4,000,000 | | | 3,976,464 | |
| Svensk Exportkredit AB, | | | | | | | | |
| 1.750%, 3/10/21@ | | USD | | 3,500,000 | | | 3,436,849 | |
| Svensk Exportkredit AB, | | | | | | | | |
| 1.875%, 6/17/19 | | USD | | 1,500,000 | | | 1,504,139 | |
| Svenska Handelsbanken AB, | | | | | | | | |
| 5.125%, 3/30/20± | | USD | | 5,000,000 | | | 5,408,665 | |
| Svenska Handelsbanken AB | | | | | | | | |
| MTN, 1.625%, 3/21/18 | | USD | | 3,700,000 | | | 3,696,252 | |
| Svenska Handelsbanken AB | | | | | | | | |
| MTN, 2.250%, 6/17/19 | | USD | | 6,595,000 | | | 6,617,944 | |
| Sweden Government Bond, | | | | | | | | |
| 5.000%, 12/01/20 | | SEK | | 41,100,000 | | | 5,470,077 | |
| | | | | | | | 58,705,301 | |
| Switzerland — 0.2% | | | | | | | | |
| Novartis Capital Corp., | | | | | | | | |
| 4.400%, 4/24/20 | | USD | | 1,000,000 | | | 1,073,144 | |
| | |
| United States — 36.6% | | | | | | | | |
| 3M Co MTN, | | | | | | | | |
| 2.000%, 8/07/20@ | | USD | | 2,500,000 | | | 2,498,700 | |
| Alphabet, Inc., 3.625%, 5/19/21 | | USD | | 6,929,000 | | | 7,352,487 | |
| Apple, Inc., 1.550%, 2/07/20 | | USD | | 10,000,000 | | | 9,882,210 | |
| Apple, Inc., 2.100%, 5/06/19 | | USD | | 11,000,000 | | | 11,108,141 | |
| Berkshire Hathaway, Inc., | | | | | | | | |
| 1.550%, 2/09/18 | | USD | | 2,385,000 | | | 2,390,195 | |
| Berkshire Hathaway, Inc., | | | | | | | | |
| 2.100%, 8/14/19 | | USD | | 11,500,000 | | | 11,607,893 | |
| Berkshire Hathaway, Inc., | | | | | | | | |
| 2.200%, 3/15/21 | | USD | | 2,500,000 | | | 2,496,290 | |
| Berkshire Hathaway, Inc., | | | | | | | | |
| 3.750%, 8/15/21@ | | USD | | 1,200,000 | | | 1,271,647 | |
| Chevron Corp., | | | | | | | | |
| 1.961%, 3/03/20 | | USD | | 6,600,000 | | | 6,581,051 | |
| Chevron Corp., | | | | | | | | |
| 2.193%, 11/15/19 | | USD | | 11,000,000 | | | 11,114,169 | |
| Chevron Corp., | | | | | | | | |
| 2.419%, 11/17/20 | | USD | | 500,000 | | | 503,832 | |
| Chevron Corp., | | | | | | | | |
| 2.427%, 6/24/20 | | USD | | 3,000,000 | | | 3,030,435 | |
| Cisco Systems, Inc., | | | | | | | | |
| 2.125%, 3/01/19 | | USD | | 4,000,000 | | | 4,053,988 | |
| Cisco Systems, Inc., | | | | | | | | |
| 2.200%, 2/28/21 | | USD | | 7,950,000 | | | 7,937,558 | |
| Cisco Systems, Inc., | | | | | | | | |
| 4.450%, 1/15/20@ | | USD | | 8,000,000 | | | 8,577,552 | |
| Coca-Cola Co. (The), | | | | | | | | |
| 1.875%, 10/27/20@ | | USD | | 2,000,000 | | | 1,984,092 | |
| Coca-Cola Co. (The), | | | | | | | | |
| 3.150%, 11/15/20 | | USD | | 1,970,000 | | | 2,047,655 | |
| Coca-Cola Co. (The), | | | | | | | | |
| 3.300%, 9/01/21 | | USD | | 10,645,000 | | | 11,115,200 | |
| Colgate-Palmolive Co MTN, | | | | | | | | |
| 1.500%, 11/01/18 | | USD | | 6,424,000 | | | 6,439,752 | |
| Exxon Mobil Corp., | | | | | | | | |
| 1.819%, 3/15/19 | | USD | | 8,300,000 | | | 8,316,193 | |
See notes to financial statements
5
SA Global Fixed Income Fund
PORTFOLIO OF INVESTMENTS — AS OF DECEMBER 31, 2016 (Unaudited) (Continued)
| | | FACE | | | | |
| | | | AMOUNT | | VALUE† | |
| BONDS AND NOTES (Continued) | | | | |
| United States (Continued) | | | | | | | | |
| Exxon Mobil Corp., | | | | | | | | |
| 1.912%, 3/06/20 | | USD | | 5,000,000 | | $ | 4,997,050 | |
| Exxon Mobil Corp., | | | | | | | | |
| 2.222%, 3/01/21 | | USD | | 5,005,000 | | | 5,019,384 | |
| Federal National | | | | | | | | |
| Mortgage Association, | | | | | | | | |
| 1.500%, 6/22/20@ | | USD | | 1,000,000 | | | 995,841 | |
| International Business Machines | | | | | | | | |
| Corp., 1.250%, 2/08/18 | | USD | | 16,000,000 | | | 15,983,712 | |
| International Business Machines | | | | | | | | |
| Corp., 2.250%, 2/19/21 | | USD | | 1,382,000 | | | 1,381,131 | |
| Johnson & Johnson, | | | | | | | | |
| 1.650%, 12/05/18 | | USD | | 4,000,000 | | | 4,023,152 | |
| Merck & Co., Inc., | | | | | | | | |
| 1.850%, 2/10/20 | | USD | | 15,500,000 | | | 15,516,678 | |
| Merck & Co., Inc., | | | | | | | | |
| 3.875%, 1/15/21 | | USD | | 3,000,000 | | | 3,185,406 | |
| Merck Sharp & Dohme Corp., | | | | | | | | |
| 5.000%, 6/30/19 | | USD | | 1,250,000 | | | 1,354,255 | |
| Microsoft Corp., | | | | | | | | |
| 1.550%, 8/08/21 | | USD | | 7,000,000 | | | 6,793,864 | |
| Microsoft Corp., | | | | | | | | |
| 1.625%, 12/06/18@ | | USD | | 11,000,000 | | | 11,064,669 | |
| Microsoft Corp., | | | | | | | | |
| 2.000%, 11/03/20 | | USD | | 3,000,000 | | | 3,004,725 | |
| Oracle Corp., 1.900%, 9/15/21 | | USD | | 6,000,000 | | | 5,867,082 | |
| Oracle Corp., 2.800%, 7/08/21 | | USD | | 13,500,000 | | | 13,767,948 | |
| Pfizer, Inc., 1.950%, 6/03/21 | | USD | | 4,000,000 | | | 3,958,620 | |
| Pfizer, Inc., 2.100%, 5/15/19 | | USD | | 16,375,000 | | | 16,532,544 | |
| Toyota Motor Credit Corp. MTN, | | | | | | | | |
| 1.375%, 1/10/18 | | USD | | 4,726,000 | | | 4,720,731 | |
| Toyota Motor Credit Corp. MTN, | | | | | | | | |
| 2.100%, 1/17/19 | | USD | | 5,000,000 | | | 5,028,945 | |
| Toyota Motor Credit Corp. MTN, | | | | | | | | |
| 2.125%, 7/18/19 | | USD | | 7,000,000 | | | 7,032,970 | |
| Toyota Motor Credit Corp. MTN, | | | | | | | | |
| 2.150%, 3/12/20 | | USD | | 3,000,000 | | | 2,996,022 | |
| Toyota Motor Credit Corp. MTN, | | | | | | | | |
| 2.000%, 10/24/18 | | USD | | 933,000 | | | 938,776 | |
| United States Treasury Note, | | | | | | | | |
| 1.125%, 7/31/21 | | USD | | 1,000,000 | | | 966,777 | |
| United States Treasury Note, | | | | | | | | |
| 1.875%, 6/30/20 | | USD | | 1,500,000 | | | 1,514,736 | |
| US Bank NA/Cincinnati OH, | | | | | | | | |
| 2.125%, 10/28/19 | | USD | | 4,500,000 | | | 4,518,050 | |
| | | | | | | | 261,472,108 | |
| TOTAL BONDS AND NOTES | | | | | | | | |
| (Identified Cost | | | | | | | | |
| $711,381,158) | | | | | | | 706,812,755 | |
| | | | | |
| SHORT-TERM INVESTMENTS — 1.9% | | | | |
| Investment Company — 0.3% | | | | | | | | |
| | State Street Institutional U.S. | | | | | | | | |
| Government Money Market | | | | | | | | |
| Fund, 0.170% | | | | 2,290,087 | | | 2,290,087 | |
| | |
| Collateral For Securities On Loan — 1.6% | | | | | | | | |
| State Street Navigator Securities | | | | | | | | |
| Lending Government Money | | | | | | | | |
| Market Portfolio | | | | 11,401,718 | | | 11,401,718 | |
| |
| TOTAL SHORT-TERM | | | | | | | | |
| INVESTMENTS | | | | | | | | |
| (Identified Cost $13,691,805) | | | | | | | 13,691,805 | |
| | | | | | | | | |
| Total Investments — 100.8% | | | | | | | | |
| (Identified Cost $725,072,963)# | | | | | | | 720,504,560 | |
| Liabilities, Less Cash and Other | | | | | | | | |
| Assets — (0.8%) | | | | | | | (5,959,672 | ) |
| Net Assets — 100.0% | | | | | | $ | 714,544,888 | |
| | † | | See Note 1 |
| | @ | | A portion or all of the security/securities were held on loan. As of December 31, 2016, the market value of the securities on loan was $21,580,155. |
| | ± | | 144A Securities. Securities exempt from registration under Rule 144A of the Securities Act of 1933. These securities may be resold in transactions exempt from registration to qualified institutional buyers. These securities have been deemed by the Fund to be liquid and at December 31, 2016 amounted to $19,463,151 or 2.72% of the net assets of the Fund. |
| | # | | At December 31, 2016, the aggregate cost of investment securities for U.S. federal income tax purposes was $725,072,963. Net unrealized depreciation aggregated $4,568,403 of which $881,412 related to appreciated investment securities and $5,449,815 related to depreciated investment securities. |
Key to abbreviations:
GBP — British Pound
MTN — Medium Term Note
SEK — Swedish Krona
SGD — Singapore Dollar
USD — U.S. Dollar
See notes to financial statements
6
SA Global Fixed Income Fund
PORTFOLIO OF INVESTMENTS — AS OF DECEMBER 31, 2016 (Unaudited) (Continued)
Country Weightings
(% of portfolio market value)+

| + | | Excludes Short-Term Investments |
See notes to financial statements
7
SA U.S. Core Market Fund
SUMMARY PORTFOLIO OF INVESTMENTS — AS OF DECEMBER 31, 2016 (Unaudited)
| | | | SHARES | | VALUE† | |
| COMMON STOCKS — 95.4% | | | | | | |
| Aerospace & Defense — 2.7% | | | | | | |
| Boeing Co. (The) | | 29,229 | | $ | 4,550,371 | |
| Lockheed Martin Corp. | | 12,054 | | | 3,012,777 | |
| Other Securities^ | | 106,560 | | | 11,270,124 | |
| | | | | | 18,833,272 | |
| Air Freight & Logistics — 1.0% | | | | | | |
| United Parcel Service, Inc., Class B | | 33,744 | | | 3,868,412 | |
| | Other Securities^ | | 27,992 | | | 2,854,967 | |
| | | | | | 6,723,379 | |
| Airlines — 1.0% | | | | | | |
| Other Securities^ | | 134,834 | | | 7,102,099 | |
| Auto Components — 0.5% | | | | | | |
| Other Securities^ | | 73,339 | | | 3,411,811 | |
| Automobiles — 0.7% | | | | | | |
| Other Securities^ | | 215,067 | | | 4,605,981 | |
| Beverages — 2.4% | | | | | | |
| Coca-Cola Co. (The) | | 169,850 | | | 7,041,981 | |
| PepsiCo, Inc. | | 67,969 | | | 7,111,596 | |
| Other Securities^ | | 40,970 | | | 2,859,428 | |
| | | | | | 17,013,005 | |
| Biotechnology — 3.1% | | | | | | |
| AbbVie, Inc. | | 75,823 | | | 4,748,036 | |
| Amgen, Inc. | | 23,546 | | | 3,442,661 | |
| Celgene Corp.* | | 27,905 | | | 3,230,004 | |
| Gilead Sciences, Inc. | | 65,679 | | | 4,703,273 | |
| Other Securities^ | | 44,029 | | | 5,409,753 | |
| | | | | | 21,533,727 | |
| Building Products — 0.4% | | | | | | |
| Other Securities^@ | | 65,525 | | | 2,921,600 | |
| Capital Markets — 2.1% | | | | | | |
| Other Securities^@ | | 235,666 | | | 14,581,360 | |
| Chemicals — 2.5% | | | | | | |
| Other Securities^ | | 222,077 | | | 17,592,804 | |
| Commercial Banks — 4.1% | | | | | | |
| Bank of America Corp. | | 139,262 | | | 3,077,712 | |
| JPMorgan Chase & Co. | | 79,768 | | | 6,883,181 | |
| Wells Fargo & Co. | | 99,974 | | | 5,509,567 | |
| Other Securities^ | | 305,014 | | | 13,052,089 | |
| | | | | | 28,522,549 | |
| Commercial Services & Supplies — 0.6% | | | | | | |
| Other Securities^ | | 89,668 | | | 4,252,162 | |
| Communications Equipment — 0.9% | | | | | | |
| Cisco Systems, Inc. | | 128,469 | | | 3,882,333 | |
| Other Securities^ | | 62,609 | | | 2,730,696 | |
| | | | | | 6,613,029 | |
| Computers & Peripherals — 4.6% | | | | | | |
| Apple, Inc. | | 245,388 | | | 28,420,838 | |
| Other Securities^ | | 135,658 | | | 3,344,351 | |
| | | | | | 31,765,189 | |
| Construction & Engineering — 0.2% | | | | | | |
| Other Securities^ | | 23,796 | | | 1,052,348 | |
| Construction Materials — 0.1% | | | | | | |
| Other Securities^ | | 4,943 | | | 674,682 | |
| Consumer Finance — 0.9% | | | | | | |
| Other Securities^ | | 136,659 | | | 6,328,579 | |
| Containers & Packaging — 0.6% | | | | | | |
| Other Securities^ | | 83,274 | | | 3,842,412 | |
| Distributors — 0.1% | | | | | | |
| Other Securities^ | | 17,405 | | | 1,045,069 | |
| Diversified Consumer Services — 0.2% | | | | | | |
| Other Securities^ | | 37,354 | | | 1,161,837 | |
| Diversified Financial Services — 1.2% | | | | | | |
| Berkshire Hathaway, Inc., Class B* | | 51,921 | | | 8,462,085 | |
| Other Securities^ | | 8,739 | | | 209,660 | |
| | | | | | 8,671,745 | |
| Diversified Telecommunication Services — 3.2% | | | | |
| AT&T, Inc. | | 241,453 | | | 10,268,996 | |
| Verizon Communications, Inc. | | 201,557 | | | 10,759,113 | |
| Other Securities^@ | | 54,073 | | | 1,369,331 | |
| | | | | | 22,397,440 | |
| Electric Utilities — 1.7% | | | | | | |
| Other Securities^ | | 223,610 | | | 12,140,435 | |
| Electrical Equipment — 0.6% | | | | | | |
| Other Securities^ | | 63,491 | | | 4,246,449 | |
| Electronic Equipment, Instruments & Components — 0.7% | |
| Other Securities^ | | 116,113 | | | 4,869,553 | |
| Energy Equipment & Services — 0.6% | | | | | | |
| Other Securities^@ | | 111,703 | | | 4,189,656 | |
| Food & Staples Retailing — 2.3% | | | | | | |
| Wal-Mart Stores, Inc. | | 63,562 | | | 4,393,406 | |
| Other Securities^ | | 212,369 | | | 11,420,385 | |
| | | | | | 15,813,791 | |
| Food Products — 1.4% | | | | | | |
| Other Securities^ | | 173,949 | | | 10,056,940 | |
| Gas Utilities — 0.2% | | | | | | |
| Other Securities^ | | 19,861 | | | 1,116,510 | |
| Health Care Equipment & Supplies — 1.8% | | | | | | |
| Other Securities^ | | 167,559 | | | 12,245,087 | |
See notes to financial statements
8
SA U.S. Core Market Fund
SUMMARY PORTFOLIO OF INVESTMENTS — AS OF DECEMBER 31, 2016 (Unaudited) (Continued)
| | | SHARES | | VALUE† | |
| COMMON STOCKS (Continued) | | | | | |
| Health Care Providers & Services — 2.7% | | | | | |
| UnitedHealth Group, Inc. | 34,842 | | $ | 5,576,114 | |
| | Other Securities^ | 159,951 | | | 12,963,974 | |
| | | | | 18,540,088 | |
| Health Care Technology — 0.1% | | | | | |
| Other Securities ^@ | 19,011 | | | 693,046 | |
| | |
| Hotels, Restaurants & Leisure — 2.2% | | | | | |
| McDonald’s Corp. | 26,982 | | | 3,284,249 | |
| Starbucks Corp. | 70,918 | | | 3,937,367 | |
| Other Securities^ | 161,244 | | | 8,222,424 | |
| | | | | 15,444,040 | |
| Household Durables — 0.4% | | | | | |
| Other Securities^ | 55,114 | | | 3,099,130 | |
| | |
| Household Products — 1.7% | | | | | |
| Procter & Gamble Co. (The) | 79,992 | | | 6,725,727 | |
| Other Securities^ | 64,219 | | | 4,919,296 | |
| | | | | 11,645,023 | |
| Independent Power Producers & Energy Traders — 0.1% | |
| Other Securities^ | 42,778 | | | 519,491 | |
| | |
| Industrial Conglomerates — 1.7% | | | | | |
| 3M Co. | 29,721 | | | 5,307,279 | |
| Honeywell International, Inc. | 29,098 | | | 3,371,003 | |
| Other Securities^ | 87,654 | | | 3,181,783 | |
| | | | | 11,860,065 | |
| Insurance — 2.0% | | | | | |
| Other Securities^ | 221,583 | | | 14,025,073 | |
| | |
| Internet & Catalog Retail — 2.7% | | | | | |
| Amazon.com, Inc.* | 19,686 | | | 14,761,941 | |
| Priceline Group, Inc. (The)* | 2,025 | | | 2,968,771 | |
| Other Securities^ | 26,402 | | | 1,283,698 | |
| | | | | 19,014,410 | |
| Internet Software & Services — 2.9% | | | | | |
| Alphabet, Inc., Class A* | 6,607 | | | 5,235,717 | |
| Alphabet, Inc., Class C* | 6,925 | | | 5,344,854 | |
| Facebook, Inc., Class A* | 58,613 | | | 6,743,426 | |
| Other Securities^ | 77,860 | | | 2,935,175 | |
| | | | | 20,259,172 | |
| IT Services — 4.9% | | | | | |
| Accenture PLC, Class A | 30,549 | | | 3,578,204 | |
| International Business Machines Corp. | 44,625 | | | 7,407,304 | |
| MasterCard, Inc., Class A | 47,484 | | | 4,902,723 | |
| Visa, Inc., Class A | 70,380 | | | 5,491,048 | |
| Other Securities^ | 226,035 | | | 12,499,108 | |
| | | | | 33,878,387 | |
| Leisure Equipment & Products — 0.2% | | | | | |
| Other Securities^ | 22,331 | | | 1,083,325 | |
| | | | | | |
| Life Sciences Tools & Services — 0.5% | | | | | |
| Other Securities^ | 37,571 | | | 3,694,547 | |
| | |
| Machinery — 2.0% | | | | | |
| Other Securities^ | 200,098 | | | 14,047,348 | |
| | |
| Marine — 0.0% | | | | | |
| Other Securities^ | 3,200 | | | 163,024 | |
| | |
| Media — 3.5% | | | | | |
| Comcast Corp., Class A | 98,097 | | | 6,773,598 | |
| Walt Disney Co. (The) | 62,435 | | | 6,506,976 | |
| Other Securities^ | 290,752 | | | 11,032,071 | |
| | | | | 24,312,645 | |
| Metals & Mining — 0.3% | | | | | |
| Other Securities^ | 98,673 | | | 2,389,661 | |
| | |
| Multi-Utilities — 0.9% | | | | | |
| Other Securities^ | 115,864 | | | 6,420,857 | |
| | |
| Multiline Retail — 0.7% | | | | | |
| Other Securities^ | 84,782 | | | 4,923,951 | |
| | |
| Oil, Gas & Consumable Fuels — 3.3% | | | | | |
| Exxon Mobil Corp. | 75,147 | | | 6,782,768 | |
| Other Securities^ | 368,491 | | | 16,268,059 | |
| | | | | 23,050,827 | |
| Paper & Forest Products — 0.0% | | | | | |
| Other Securities^ | 10,933 | | | 261,464 | |
| | |
| Personal Products — 0.2% | | | | | |
| Other Securities^ | 29,518 | | | 1,059,816 | |
| | |
| Pharmaceuticals — 4.2% | | | | | |
| Johnson & Johnson | 90,418 | | | 10,417,058 | |
| Merck & Co., Inc. | 90,641 | | | 5,336,036 | |
| Pfizer, Inc. | 183,764 | | | 5,968,655 | |
| Other Securities^ | 122,436 | | | 7,722,560 | |
| | | | | 29,444,309 | |
| Professional Services — 0.3% | | | | | |
| Other Securities^ | 36,750 | | | 2,380,622 | |
| | |
| Real Estate Management & Development — 0.1% | | | | |
| Other Securities^ | 21,417 | | | 782,028 | |
| | |
| Road & Rail — 1.0% | | | | | |
| Union Pacific Corp. | 30,668 | | | 3,179,658 | |
| Other Securities^ | 65,100 | | | 3,706,711 | |
| | | | | 6,886,369 | |
| Semiconductors & Semiconductor Equipment — 3.1% | | | | |
| Intel Corp. | 155,933 | | | 5,655,690 | |
| QUALCOMM, Inc. | 45,357 | | | 2,957,276 | |
| Texas Instruments, Inc. | 41,523 | | | 3,029,933 | |
| Other Securities^ | 223,425 | | | 9,759,008 | |
| | | | | 21,401,907 | |
See notes to financial statements
9
SA U.S. Core Market Fund
SUMMARY PORTFOLIO OF INVESTMENTS — AS OF DECEMBER 31, 2016 (Unaudited) (Continued)
| | | SHARES | | VALUE† | |
| COMMON STOCKS (Continued) | | | | | |
| Software — 4.5% | | | | | |
| Microsoft Corp. | 305,137 | | $ | 18,961,213 | |
| | Oracle Corp. | 101,025 | | | 3,884,411 | |
| Other Securities^ | 170,050 | | | 8,673,939 | |
| | | | | 31,519,563 | |
| Specialty Retail — 3.5% | | | | | |
| Home Depot, Inc. (The) | 60,729 | | | 8,142,544 | |
| Lowe’s Cos., Inc. | 43,365 | | | 3,084,119 | |
| Other Securities^@ | 228,408 | | | 12,917,984 | |
| | | | | 24,144,647 | |
| Textiles, Apparel & Luxury Goods — 0.8% | | | | | |
| Other Securities^ | 137,637 | | | 5,832,543 | |
| | |
| Thrifts & Mortgage Finance — 0.1% | | | | | |
| Other Securities^ | 23,300 | | | 444,784 | |
| | |
| Tobacco — 1.7% | | | | | |
| Altria Group, Inc. | 96,309 | | | 6,512,415 | |
| Philip Morris International, Inc. | 50,318 | | | 4,603,594 | |
| Other Securities^@ | 10,464 | | | 530,624 | |
| | | | | 11,646,633 | |
| Trading Companies & Distributors — 0.4% | | | | | |
| Other Securities^ | 43,424 | | | 2,730,953 | |
| | |
| Transportation Infrastructure — 0.0% | | | | | |
| Other Securities^ | 1,285 | | | 104,984 | |
| | |
| Water Utilities — 0.1% | | | | | |
| Other Securities^ | 9,668 | | | 507,481 | |
| | |
| Wireless Telecommunication Services — 0.2% | | | | |
| Other Securities^ | 32,783 | | | 1,052,505 | |
| | |
| TOTAL COMMON STOCKS | | | | | |
| (Identified Cost $359,590,833) | | | | 664,589,218 | |
| | |
| RIGHTS AND WARRANTS — 0.0% | | | | | |
| Biotechnology — 0.0% | | | | | |
| Other Securities ^¶ | 1,858 | | | 2,062 | |
| | |
| Consumer Discretionary — 0.0% | | | | | |
| Other Securities ^¶ | 21,220 | | | 11,286 | |
| | |
| Health Care Providers & Services — 0.0% | | | | | |
| Other Securities^ | 7,172 | | | 32 | |
| TOTAL RIGHTS AND WARRANTS | | | | | |
| (Identified Cost $13,814) | | | | 13,380 | |
| | |
| MUTUAL FUNDS — 4.2% | | | | | |
| Other — 4.2% | | | | | |
| DFA U.S. Micro Cap Portfolio | 1,412,127 | | | 29,499,340 | |
| | |
| TOTAL MUTUAL FUNDS | | | | | |
| (Identified Cost $17,923,603) | | | | 29,499,340 | |
| | | | | | | |
| Investment Company — 0.3% | | | | | |
| State Street Institutional U.S. | | | | | |
| Government Money Market Fund, | | | | | |
| 0.170% | 2,191,027 | | | 2,191,027 | |
| |
| Collateral For Securities On Loan — 0.5% | | | | | |
| State Street Navigator Securities | | | | | |
| Lending Government Money Market | | | | | |
| Portfolio | 3,299,309 | | | 3,299,309 | |
| |
| SHORT-TERM INVESTMENTS — 0.8% | | | | |
| TOTAL SHORT-TERM INVESTMENTS | | | | | |
| (Identified Cost $5,490,336) | | | | 5,490,336 | |
| | | | | | |
| Total Investments — 100.4% | | | | | |
| (Identified Cost $383,018,586)# | | | | 699,592,274 | |
| Liabilities, Less Cash and | | | | | |
| Other Assets — (0.4%) | | | | (2,497,558 | ) |
| Net Assets — 100.0% | | | $ | 697,094,716 | |
| | † | | See Note 1 |
| | * | | Non-income producing security |
| | @ | | A portion or all of the security/securities were held on loan. As of December 31, 2016, the market value of the securities on loan was $22,860,086. |
| | ^ | | The Summary Portfolio of Investments does not reflect the Fund’s complete portfolio holdings. “Other Securities” are those securities that are not among the top 50 holdings of the Fund or do not represent more than 1% of the net assets of the Fund. Certain individual securities within this category may include non-income producing securities, bankrupt/delisted, and/or fair valued securities. |
| | ¶ | | Contingent value rights based on future performance. |
| | # | | At December 31, 2016, the aggregate cost of investment securities for U.S. federal income tax purposes was $383,018,586. Net unrealized appreciation aggregated $316,573,688 of which $323,259,174 related to appreciated investment securities and $6,685,486 related to depreciated investment securities. |
See notes to financial statements
10
SA U.S. Core Market Fund
SUMMARY PORTFOLIO OF INVESTMENTS — AS OF DECEMBER 31, 2016 (Unaudited) (Continued)
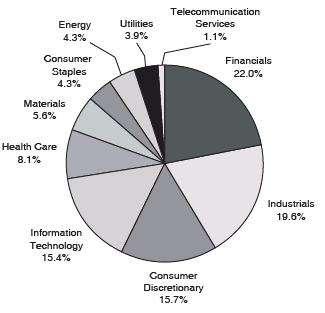
Portfolio Sectors
(% of portfolio market value)+

| + | Excludes Short-Term Investments |
See notes to financial statements
11
SA U.S. Value Fund
SUMMARY PORTFOLIO OF INVESTMENTS — AS OF DECEMBER 31, 2016 (Unaudited)
| | | SHARES | | VALUE† | |
| COMMON STOCKS — 99.7% | | | | | |
| Aerospace & Defense — 1.0% | | | | | |
| Other Securities^ | 92,441 | | $ | 5,784,718 | |
| | |
| Air Freight & Logistics — 0.5% | | | | | |
| Other Securities^ | 20,462 | | | 2,916,597 | |
| | |
| Airlines — 1.1% | | | | | |
| Southwest Airlines Co. | 58,229 | | | 2,902,133 | |
| Other Securities^ | 86,452 | | | 3,207,071 | |
| | | | | 6,109,204 | |
| Auto Components — 0.5% | | | | | |
| Other Securities^@ | 67,844 | | | 2,663,288 | |
| | |
| Automobiles — 1.9% | | | | | |
| Ford Motor Co. | 419,903 | | | 5,093,424 | |
| General Motors Co. | 158,398 | | | 5,518,586 | |
| | | | | 10,612,010 | |
| Beverages — 0.2% | | | | | |
| Other Securities^ | 11,973 | | | 1,165,093 | |
| | |
| Biotechnology — 0.1% | | | | | |
| Other Securities^ | 3,956 | | | 567,409 | |
| | |
| Building Products — 0.3% | | | | | |
| Other Securities^ | 33,862 | | | 1,540,483 | |
| | |
| Capital Markets — 3.0% | | | | | |
| Bank of New York Mellon Corp. (The) | 92,611 | | | 4,387,909 | |
| Goldman Sachs Group, Inc. (The) | 24,637 | | | 5,899,330 | |
| Morgan Stanley | 90,875 | | | 3,839,469 | |
| Other Securities^ | 32,325 | | | 2,873,491 | |
| | | | | 17,000,199 | |
| Chemicals — 1.2% | | | | | |
| Other Securities^@ | 129,385 | | | 6,605,004 | |
| | |
| Commercial Banks — 13.0% | | | | | |
| Bank of America Corp. | 538,411 | | | 11,898,883 | |
| Citigroup, Inc. | 212,682 | | | 12,639,691 | |
| Fifth Third BanCorp. | 127,987 | | | 3,451,809 | |
| JPMorgan Chase & Co. | 281,434 | | | 24,284,940 | |
| PNC Financial Services Group, | | | | | |
| Inc. (The) | 36,349 | | | 4,251,379 | |
| Wells Fargo & Co. | 88,253 | | | 4,863,623 | |
| Other Securities^@ | 474,908 | | | 12,646,764 | |
| | | | | 74,037,089 | |
| Commercial Services & Supplies — 0.5% | | | | | |
| Other Securities^ | 48,088 | | | 2,743,420 | |
| | |
| Communications Equipment — 3.3% | | | | | |
| Cisco Systems, Inc. | 558,956 | | | 16,891,650 | |
| Other Securities^ | 90,239 | | | 1,924,937 | |
| | | | | 18,816,587 | |
| Computers & Peripherals — 2.0% | | | | | |
| Hewlett Packard Enterprise Co. | 226,855 | | | 5,249,425 | |
| HP, Inc. | 255,741 | | | 3,795,196 | |
| Other Securities^@ | 39,578 | | | 2,439,650 | |
| | | | | 11,484,271 | |
| Construction & Engineering — 0.3% | | | | | |
| Other Securities^ | 30,917 | | | 1,587,741 | |
| | |
| Construction Materials — 0.2% | | | | | |
| Other Securities^ | 10,532 | | | 1,318,080 | |
| | |
| Consumer Finance — 1.1% | | | | | |
| Capital One Financial Corp. | 56,650 | | | 4,942,146 | |
| Other Securities^ | 79,063 | | | 1,454,618 | |
| | | | | 6,396,764 | |
| Containers & Packaging — 0.6% | | | | | |
| Other Securities^ | 61,018 | | | 3,189,587 | |
| | |
| Distributors — 0.1% | | | | | |
| Other Securities^ | 22,712 | | | 696,123 | |
| | |
| Diversified Financial Services — 0.1% | | | | | |
| Other Securities^ | 14,013 | | | 437,912 | |
| | |
| Diversified Telecommunication Services — 4.7% | | | | |
| AT&T, Inc. | 544,137 | | | 23,142,147 | |
| Other Securities^@ | 199,044 | | | 3,439,849 | |
| | | | | 26,581,996 | |
| Electrical Equipment — 0.5% | | | | | |
| Other Securities^ | 40,532 | | | 2,719,292 | |
| | |
| Electronic Equipment, Instruments & Components — 1.2% | |
| Other Securities^ | 185,910 | | | 6,600,342 | |
| | |
| Energy Equipment & Services — 1.5% | | | | | |
| Other Securities^@ | 239,162 | | | 8,233,071 | |
| | |
| Food & Staples Retailing — 2.8% | | | | | |
| CVS Health Corp. | 99,326 | | | 7,837,815 | |
| Wal-Mart Stores, Inc. | 82,417 | | | 5,696,663 | |
| Other Securities^ | 33,853 | | | 2,385,154 | |
| | | | | 15,919,632 | |
| Food Products — 3.1% | | | | | |
| Mondelez International, Inc., Class A | 99,636 | | | 4,416,864 | |
| Tyson Foods, Inc., Class A | 48,892 | | | 3,015,659 | |
| Other Securities^ | 144,348 | | | 10,342,132 | |
| | | | | 17,774,655 | |
| Health Care Equipment & Supplies — 2.4% | | | | | |
| Danaher Corp. | 42,050 | | | 3,273,172 | |
| Medtronic PLC | 94,115 | | | 6,703,811 | |
| Other Securities^ | 98,136 | | | 3,402,608 | |
| | | | | 13,379,591 | |
See notes to financial statements
12
SA U.S. Value Fund
SUMMARY PORTFOLIO OF INVESTMENTS — AS OF DECEMBER 31, 2016 (Unaudited) (Continued)
| | | SHARES | | VALUE† | |
| COMMON STOCKS (Continued) | | | | | |
| Health Care Providers & Services — 4.9% | | | | | |
| Aetna, Inc. | 44,742 | | $ | 5,548,455 | |
| | Anthem, Inc. | 36,223 | | | 5,207,781 | |
| Express Scripts Holding Co.* | 71,055 | | | 4,887,873 | |
| Humana, Inc. | 21,137 | | | 4,312,582 | |
| Other Securities^ | 81,567 | | | 7,768,371 | |
| | | | | 27,725,062 | |
| Hotels, Restaurants & Leisure — 1.2% | | | | | |
| Other Securities^ | 147,405 | | | 6,663,157 | |
| | |
| Household Durables — 1.4% | | | | | |
| Other Securities^@ | 160,003 | | | 8,183,225 | |
| | |
| Independent Power Producers & Energy Traders — 0.1% | | |
| Other Securities^ | 68,177 | | | 816,025 | |
| | |
| Industrial Conglomerates — 0.3% | | | | | |
| Other Securities^ | 40,852 | | | 1,676,032 | |
| | |
| Insurance — 6.7% | | | | | |
| American International Group, Inc. | 67,235 | | | 4,391,118 | |
| Hartford Financial Services Group, Inc. | 61,614 | | | 2,935,907 | |
| Travelers Companies, Inc. (The) | 27,179 | | | 3,327,253 | |
| Other Securities^@ | 427,137 | | | 27,606,533 | |
| | | | | 38,260,811 | |
| Internet & Catalog Retail — 0.3% | | | | | |
| Other Securities^ | 72,385 | | | 1,459,460 | |
| | |
| Internet Software & Services — 0.2% | | | | | |
| Other Securities^ | 25,865 | | | 929,327 | |
| | |
| IT Services — 0.9% | | | | | |
| Other Securities^ | 237,401 | | | 5,193,066 | |
| | |
| Life Sciences Tools & Services — 0.6% | | | | | |
| Thermo Fisher Scientific, Inc. | 23,812 | | | 3,359,873 | |
| Other Securities^ | 372 | | | 41,782 | |
| | | | | 3,401,655 | |
| Machinery — 2.5% | | | | | |
| Caterpillar, Inc.@ | 35,868 | | | 3,326,398 | |
| Stanley Black & Decker, Inc. | 28,415 | | | 3,258,916 | |
| Other Securities^ | 104,221 | | | 7,355,563 | |
| | | | | 13,940,877 | |
| Media — 6.4% | | | | | |
| Charter Communications, Inc., Class A* | 23,379 | | | 6,731,282 | |
| Comcast Corp., Class A | 279,514 | | | 19,300,442 | |
| Time Warner, Inc. | 94,794 | | | 9,150,465 | |
| Other Securities^@ | 52,303 | | | 1,341,120 | |
| | | | | 36,523,309 | |
| Metals & Mining — 1.7% | | | | | |
| Newmont Mining Corp. | 87,348 | | | 2,975,946 | |
| Other Securities^ | 234,373 | | | 6,871,304 | |
| | | | | 9,847,250 | |
| Multiline Retail — 0.5% | | | | | |
| Other Securities^@ | 66,578 | | | 2,923,186 | |
| | | | | | |
| Oil, Gas & Consumable Fuels — 11.1% | | | | | |
| Chevron Corp. | 91,767 | | | 10,800,976 | |
| ConocoPhillips | 78,895 | | | 3,955,795 | |
| Exxon Mobil Corp. | 242,185 | | | 21,859,618 | |
| Marathon Petroleum Corp. | 64,008 | | | 3,222,803 | |
| Phillips 66. | 51,511 | | | 4,451,066 | |
| Valero Energy Corp. | 68,980 | | | 4,712,714 | |
| Other Securities^ | 271,701 | | | 13,718,494 | |
| | | | | 62,721,466 | |
| Pharmaceuticals — 3.2% | | | | | |
| Allergan PLC* | 14,401 | | | 3,024,354 | |
| Pfizer, Inc. | 430,824 | | | 13,993,164 | |
| Other Securities^ | 29,840 | | | 1,257,021 | |
| | | | | 18,274,539 | |
| Professional Services — 0.1% | | | | | |
| Other Securities^ | 6,208 | | | 551,705 | |
| | |
| Real Estate Management & Development — 0.0% | | | | |
| Other Securities^ | 500 | | | 50,520 | |
| | |
| Road & Rail — 2.2% | | | | | |
| CSX Corp. | 143,799 | | | 5,166,698 | |
| Norfolk Southern Corp. | 39,083 | | | 4,223,700 | |
| Other Securities^ | 41,861 | | | 3,321,826 | |
| | | | | 12,712,224 | |
| Semiconductors & Semiconductor Equipment — 6.3% | | | | |
| Intel Corp. | 530,175 | | | 19,229,447 | |
| NVIDIA Corp.@ | 62,745 | | | 6,697,401 | |
| QUALCOMM, Inc. | 74,056 | | | 4,828,451 | |
| Other Securities^@ | 160,087 | | | 5,263,831 | |
| | | | | 36,019,130 | |
| Software — 0.8% | | | | | |
| Other Securities^ | 137,584 | | | 4,540,972 | |
| | |
| Specialty Retail — 0.5% | | | | | |
| Other Securities^ | 114,098 | | | 3,037,803 | |
| | |
| Textiles, Apparel & Luxury Goods — 0.2% | | | | | |
| Other Securities^ | 12,422 | | | 1,121,194 | |
| | |
| Thrifts & Mortgage Finance — 0.0% | | | | | |
| Other Securities^ | 11,787 | | | 187,531 | |
| | |
| Trading Companies & | | | | | |
| Distributors — 0.1% | | | | | |
| Other Securities^ | 4,421 | | | 466,769 | |
| | |
| Transportation Infrastructure — 0.0% | | | | | |
| Other Securities^ | 2,420 | | | 197,714 | |
See notes to financial statements
13
SA U.S. Value Fund
SUMMARY PORTFOLIO OF INVESTMENTS — AS OF DECEMBER 31, 2016 (Unaudited) (Continued)
| | | SHARES | | VALUE† | |
| COMMON STOCKS (Continued) | | | | | |
| Wireless Telecommunication Services — 0.3% | | | | |
| Other Securities^@ | 54,373 | | $ | 1,655,420 | |
| |
| TOTAL COMMON STOCKS | | | | | |
| (Identified Cost $387,345,252) | | | | 565,959,587 | |
| |
| SHORT-TERM INVESTMENTS — 0.5% | | | | |
| Investment Company — 0.2% | | | | | |
| State Street Institutional U.S. Government | | | | | |
| Money Market Fund, 0.170% | 1,301,019 | | | 1,301,019 | |
| |
| Collateral For Securities On Loan — 0.3% | | | | | |
| State Street Navigator Securities Lending | | | | | |
| Government Money Market Portfolio | 1,347,522 | | | 1,347,522 | |
| |
| TOTAL SHORT-TERM INVESTMENTS | | | | | |
| (Identified Cost $2,648,541) | | | | 2,648,541 | |
| |
| Total Investments — 100.2% | | | | | |
| (Identified Cost $389,993,793)# | | | | 568,608,128 | |
| Liabilities, Less Cash and | | | | | |
| Other Assets — (0.2%) | | | | (924,795 | ) |
| Net Assets — 100.0% | | | $ | 567,683,333 | |
| | † | | See Note 1 |
| | ^ | | The Summary Portfolio of Investments does not reflect the Fund’s complete portfolio holdings. “Other Securities” are those securities that are not among the top 50 holdings of the Fund or do not represent more than 1% of the net assets of the Fund. Certain individual securities within this category may include non-income producing securities, bankrupt/delisted, and/or fair valued securities. |
| | * | | Non-income producing security |
| | @ | | A portion or all of the security/securities were held on loan. As of December 31, 2016, the market value of the securities on loan was $18,596,188. |
| | # | | At December 31, 2016, the aggregate cost of investment securities for U.S. federal income tax purposes was $389,993,793. Net unrealized appreciation aggregated $178,614,335 of which $191,318,226 related to appreciated investment securities and $12,703,891 related to depreciated investment securities. |
Portfolio Sectors
(% of portfolio market value)+
| + | Excludes Short-Term Investments |
See notes to financial statements
14
SA U.S. Small Company Fund
SUMMARY PORTFOLIO OF INVESTMENTS — AS OF DECEMBER 31, 2016 (Unaudited)
| | | SHARES | | VALUE† | |
| COMMON STOCKS — 99.6% | | | | | |
| Aerospace & Defense — 1.7% | | | | | |
| Other Securities^ | 210,707 | | $ | 6,837,872 | |
| | | |
| Air Freight & Logistics — 0.4% | | | | | |
| Other Securities^ | 56,614 | | | 1,755,520 | |
| | |
| Airlines — 0.7% | | | | | |
| Other Securities^@ | 43,296 | | | 2,793,275 | |
| | |
| Auto Components — 1.7% | | | | | |
| Tenneco, Inc.* | 14,371 | | | 897,756 | |
| Other Securities^ | 207,166 | | | 6,049,478 | |
| | | | | 6,947,234 | |
| Automobiles — 0.3% | | | | | |
| Thor Industries, Inc. | 11,128 | | | 1,113,356 | |
| Other Securities^ | 10,123 | | | 320,393 | |
| | | | | 1,433,749 | |
| Beverages — 0.4% | | | | | |
| Other Securities^ | 36,320 | | | 1,617,163 | |
| | |
| Biotechnology — 0.6% | | | | | |
| Other Securities^ | 165,769 | | | 2,611,913 | |
| | |
| Building Products — 1.6% | | | | | |
| Other Securities^ | 209,561 | | | 6,762,597 | |
| | |
| Capital Markets — 1.8% | | | | | |
| Other Securities^@ | 353,264 | | | 7,618,242 | |
| | |
| Chemicals — 2.6% | | | | | |
| Chemtura Corp.* | 27,875 | | | 925,450 | |
| PolyOne Corp. | 29,803 | | | 954,888 | |
| Sensient Technologies Corp. | 10,853 | | | 852,829 | |
| Other Securities^ | 278,884 | | | 8,051,748 | |
| | | | | 10,784,915 | |
| Commercial Banks — 11.9% | | | | | |
| Associated Banc-Corp. | 38,741 | | | 956,903 | |
| BancorpSouth, Inc. | 29,895 | | | 928,240 | |
| Bank of Hawaii Corp.@ | 12,794 | | | 1,134,700 | |
| FNB Corp. | 54,993 | | | 881,538 | |
| Fulton Financial Corp. | 44,920 | | | 844,496 | |
| Home Bancshares, Inc. | 36,276 | | | 1,007,385 | |
| MB Financial, Inc. | 19,316 | | | 912,295 | |
| Private Bancorp, Inc. | 19,760 | | | 1,070,794 | |
| TCF Financial Corp. | 43,473 | | | 851,636 | |
| Texas Capital Bancshares, Inc.* | 11,663 | | | 914,379 | |
| UMB Financial Corp. | 11,656 | | | 898,911 | |
| Webster Financial Corp. | 16,775 | | | 910,547 | |
| Other Securities^ | 1,177,912 | | | 37,804,521 | |
| | | | | 49,116,345 | |
| Commercial Services & Supplies — 3.3% | | | | | |
| Deluxe Corp. | 12,510 | | | 895,841 | |
| Other Securities^ | 461,474 | | | 12,841,829 | |
| | | | | 13,737,670 | |
| Communications Equipment — 1.9% | | | | | |
| Other Securities^ | 394,983 | | | 8,046,022 | |
| | | |
| Computers & Peripherals — 0.4% | | | | | |
| Other Securities^ | 82,824 | | | 1,681,907 | |
| | | |
| Construction & Engineering — 1.6% | | | | | |
| EMCOR Group, Inc. | 15,815 | | | 1,119,069 | |
| MasTec, Inc.* | 22,810 | | | 872,483 | |
| Other Securities^ | 160,085 | | | 4,786,873 | |
| | | | | 6,778,425 | |
| Construction Materials — 0.2% | | | | | |
| Other Securities^@ | 24,651 | | | 795,735 | |
| | |
| Consumer Finance — 0.8% | | | | | |
| Other Securities^ | 164,751 | | | 3,465,415 | |
| | |
| Containers & Packaging — 0.2% | | | | | |
| Other Securities^ | 26,069 | | | 979,042 | |
| | |
| Distributors — 0.2% | | | | | |
| Other Securities^ | 15,388 | | | 850,704 | |
| | |
| Diversified Consumer Services — 1.0% | | | | | |
| Other Securities^ | 175,481 | | | 4,188,152 | |
| | |
| Diversified Financial Services — 0.1% | | | | | |
| Other Securities^ | 25,619 | | | 325,998 | |
| | |
| Diversified Telecommunication Services — 0.7% | | | | |
| Other Securities^ | 162,111 | | | 2,892,823 | |
| | |
| Electric Utilities — 1.3% | | | | | |
| Allete, Inc. | 13,923 | | | 893,717 | |
| Other Securities^@ | 110,060 | | | 4,538,213 | |
| | | | | 5,431,930 | |
| Electrical Equipment — 0.9% | | | | | |
| EnerSys | 12,221 | | | 954,460 | |
| Other Securities^ | 87,015 | | | 2,694,834 | |
| | | | | 3,649,294 | |
| Electronic Equipment, Instruments & Components — 3.5% | |
| Belden, Inc. | 13,079 | | | 977,917 | |
| Coherent, Inc.* | 6,253 | | | 859,068 | |
| Littelfuse, Inc. | 6,629 | | | 1,006,083 | |
| Other Securities^ | 399,042 | | | 11,521,732 | |
| | | | | 14,364,800 | |
See notes to financial statements
15
SA U.S. Small Company Fund
SUMMARY PORTFOLIO OF INVESTMENTS — AS OF DECEMBER 31, 2016 (Unaudited) (Continued)
| | | SHARES | | VALUE† | |
| COMMON STOCKS (Continued) | | | | | |
| Energy Equipment & Services — 2.2% | | | | | |
| Patterson-UTI Energy, Inc.@ | 31,203 | | $ | 839,985 | |
| Other Securities^ | 555,701 | | | 8,319,897 | |
| | | | | 9,159,882 | |
| Food & Staples Retailing — 0.7% | | | | | |
| Other Securities^ | 117,206 | | | 2,818,156 | |
| | |
| Food Products — 1.9% | | | | | |
| Fresh Del Monte Produce, Inc. | 16,722 | | | 1,013,855 | |
| Other Securities^@ | 178,471 | | | 7,009,052 | |
| | | | | 8,022,907 | |
| Gas Utilities — 1.3% | | | | | |
| | ONE Gas, Inc. | 13,260 | | | 848,110 | |
| Southwest Gas Corp. | 11,874 | | | 909,786 | |
| WGL Holdings, Inc. | 12,554 | | | 957,619 | |
| Other Securities^ | 61,213 | | | 2,701,497 | |
| | | | | 5,417,012 | |
| Health Care Equipment & Supplies — 3.1% | | | | | |
| Masimo Corp.* | 13,405 | | | 903,497 | |
| Other Securities^ | 328,644 | | | 11,843,694 | |
| | | | | 12,747,191 | |
| Health Care Providers & Services — 2.5% | | | | | |
| Chemed Corp.@ | 5,381 | | | 863,166 | |
| Other Securities^ | 360,540 | | | 9,408,867 | |
| | | | | 10,272,033 | |
| Health Care Technology — 0.4% | | | | | |
| Other Securities^ | 101,594 | | | 1,574,028 | |
| | |
| Hotels, Restaurants & Leisure — 4.0% | | | | | |
| Cheesecake Factory, Inc. (The) | 14,048 | | | 841,194 | |
| Papa John’s International, Inc.@ | 12,658 | | | 1,083,272 | |
| Jack in the Box, Inc. | 9,359 | | | 1,044,839 | |
| Texas Roadhouse, Inc. | 19,524 | | | 941,838 | |
| Wendy’s Co. (The)@ | 69,630 | | | 941,398 | |
| Other Securities^ | 427,175 | | | 11,504,351 | |
| | | | | 16,356,892 | |
| Household Durables — 1.4% | | | | | |
| Other Securities^@ | 202,675 | | | 5,719,157 | |
| | | | | | |
| Household Products — 0.5% | | | | | |
| Other Securities^ | 62,240 | | | 1,985,000 | |
| | |
| Independent Power Producers & Energy Traders — 0.3% | | |
| Other Securities^ | 54,124 | | | 1,114,875 | |
| | |
| Industrial Conglomerates — 0.1% | | | | | |
| Other Securities^ | 9,755 | | | 245,826 | |
| | | | | | |
| Insurance — 4.2% | | | | | |
| Aspen Insurance Holdings Ltd. | 19,284 | | | 1,060,620 | |
| CNO Financial Group, Inc. | 53,833 | | | 1,030,902 | |
| Primerica, Inc. | 13,776 | | | 952,610 | |
| RLI Corp. | 13,400 | | | 845,942 | |
| Other Securities^ | 405,192 | | | 13,502,055 | |
| | | | | 17,392,129 | |
| Internet & Catalog Retail — 0.5% | | | | | |
| Other Securities^ | 85,598 | | | 2,064,362 | |
| | |
| Internet Software & Services — 1.3% | | | | | |
| Other Securities^ | 338,074 | | | 5,504,611 | |
| | |
| IT Services — 2.2% | | | | | |
| Science Applications | | | | | |
| International Corp. | 11,148 | | | 945,350 | |
| Other Securities^ | 338,393 | | | 8,030,259 | |
| | | | | 8,975,609 | |
| Leisure Equipment & Products — 0.4% | | | | | |
| Other Securities^ | 83,122 | | | 1,724,230 | |
| | |
| Life Sciences Tools & Services — 0.6% | | | | | |
| Other Securities^@ | 78,162 | | | 2,275,842 | |
| | |
| Machinery — 4.7% | | | | | |
| CLARCOR, Inc. | 10,249 | | | 845,235 | |
| Other Securities^ | 614,857 | | | 18,534,486 | |
| | | | | 19,379,721 | |
| Marine — 0.2% | | | | | |
| Other Securities^ | 16,033 | | | 732,353 | |
| | |
| Media — 1.5% | | | | | |
| Other Securities^ | 311,470 | | | 6,186,906 | |
| | |
| Metals & Mining — 1.7% | | | | | |
| United States Steel Corp. | 26,257 | | | 866,743 | |
| Other Securities^ | 409,701 | | | 5,962,604 | |
| | | | | 6,829,347 | |
| Multi-Utilities — 0.6% | | | | | |
| Other Securities^ | 45,243 | | | 2,291,860 | |
| | |
| Multiline Retail — 0.3% | | | | | |
| Other Securities^ | 76,092 | | | 1,294,059 | |
| | |
| Oil, Gas & Consumable Fuels — 2.1% | | | | | |
| RSP Permian, Inc.* | 18,721 | | | 835,331 | |
| Other Securities^ | 535,051 | | | 7,809,497 | |
| | | | | 8,644,828 | |
| Paper & Forest Products — 0.9% | | | | | |
| Other Securities^ | 141,282 | | | 3,760,456 | |
See notes to financial statements
16
SA U.S. Small Company Fund
SUMMARY PORTFOLIO OF INVESTMENTS — AS OF DECEMBER 31, 2016 (Unaudited) (Continued)
| | | SHARES | | VALUE† | |
| COMMON STOCKS (Continued) | | | | | |
| Personal Products — 0.5% | | | | | |
| Other Securities^@ | 125,169 | | $ | 2,245,491 | |
| | |
| Pharmaceuticals — 0.9% | | | | | |
| Other Securities^@ | 178,848 | | | 3,843,643 | |
| | |
| Professional Services — 1.6% | | | | | |
| Other Securities^ | 238,071 | | | 6,720,195 | |
| | |
| Real Estate Management & Development — 0.6% | | | | |
| Other Securities^ | 87,695 | | | 2,463,104 | |
| | |
| Road & Rail — 1.2% | | | | | |
| Landstar System, Inc. | 10,561 | | | 900,853 | |
| Other Securities^ | 149,160 | | | 3,916,894 | |
| | | | | 4,817,747 | |
| Semiconductors & Semiconductor Equipment — 3.6% | | | | |
| Cirrus Logic, Inc.* | 15,545 | | | 878,914 | |
| Integrated Device Technology, Inc.* | 38,007 | | | 895,445 | |
| Other Securities^ | 637,775 | | | 13,103,805 | |
| | | | | 14,878,164 | |
| Software — 2.4% | | | | | |
| Mentor Graphics Corp. | 32,443 | | | 1,196,822 | |
| Other Securities^ | 473,313 | | | 8,595,358 | |
| | | | | 9,792,180 | |
| Specialty Retail — 3.4% | | | | | |
| Other Securities^ | 757,250 | | | 14,013,709 | |
| | |
| Textiles, Apparel & Luxury Goods — 0.9% | | | | | |
| Other Securities^ | 167,408 | | | 3,892,102 | |
| | |
| Thrifts & Mortgage Finance — 2.4% | | | | | |
| Washington Federal, Inc. | 25,804 | | | 886,367 | |
| Other Securities^ | 462,442 | | | 8,892,132 | |
| | | | | 9,778,499 | |
| Tobacco — 0.3% | | | | | |
| Other Securities^@ | 42,136 | | | 1,181,485 | |
| | |
| Trading Companies & Distributors — 1.5% | | | | | |
| Other Securities^ | 208,351 | | | 6,237,992 | |
| | | | | | |
| Transportation Infrastructure — 0.0% | | | | | |
| Other Securities^@ | 3,964 | | | 12,288 | |
| | |
| Water Utilities — 0.5% | | | | | |
| Other Securities^@ | 48,486 | | | 1,949,458 | |
| | |
| Wireless Telecommunication Services — 0.4% | | | | |
| Other Securities^ | 61,613 | | | 1,458,336 | |
| | | | | | | |
| TOTAL COMMON STOCKS | | | | | |
| (Identified Cost $274,570,992) | | | | 411,240,407 | |
| | |
| RIGHTS AND WARRANTS — 0.0% | | | | |
| Pharmaceuticals — 0.0% | | | | | |
| Other Securities^¶ | 14,384 | | | — | |
| | |
| Software — 0.0% | | | | | |
| Other Securities^@¶ | 5,000 | | | — | |
| | |
| Wireless Telecommunication Services — 0.0% | | | | |
| Other Securities^¶ | 2,600 | | | — | |
| | | | | | | |
| TOTAL RIGHTS AND WARRANTS | | | | | |
| (Identified Cost $19,319) | | | | — | |
| | |
| SHORT-TERM INVESTMENTS — 4.8% | | | | |
| Investment Company — 0.2% | | | | | |
| State Street Institutional U.S. | | | | | |
| Government Money Market Fund, | | | | | |
| 0.170% | 804,000 | | | 804,000 | |
| | |
| Collateral For Securities On Loan — 4.6% | | | | | |
| State Street Navigator Securities
Lending Government Money Market
Portfolio | 18,935,730 | | | 18,935,730 | |
| | |
| TOTAL SHORT-TERM INVESTMENTS
(Identified Cost $19,739,730) | | | | 19,739,730 | |
| Total Investments — 104.4%
(Identified Cost $294,330,041)# | | | | 430,980,137 | |
| | |
| Liabilities, Less Cash and
Other Assets — (4.4%) | | | | (18,170,495 | ) |
| Net Assets — 100.0% | | $ | 412,809,642 | |
See notes to financial statements
17
SA U.S. Small Company Fund
SUMMARY PORTFOLIO OF INVESTMENTS — AS OF DECEMBER 31, 2016 (Unaudited) (Continued)
| | † | | See Note 1 |
| | * | | Non-income producing security |
| | @ | | A portion or all of the security/securities were held on loan. As of December 31, 2016, the market value of the securities on loan was $38,956,598. |
| | ^ | | The Summary Portfolio of Investments does not reflect the Fund’s complete portfolio holdings. “Other Securities” are those securities that are not among the top 50 holdings of the Fund or do not represent more than 1% of the net assets of the Fund. Certain individual securities within this category may include non-income producing securities, bankrupt/delisted, and/or fair valued securities. |
| | ¶ | | Contingent value rights based on future performance. |
| | # | | At December 31, 2016, the aggregate cost of investment securities for U.S. federal income tax purposes was $294,330,041. Net unrealized appreciation aggregated $136,650,096 of which $162,040,587 related to appreciated investment securities and $25,390,491 related to depreciated investment securities. |
Portfolio Sectors
(% of portfolio market value)+
| + | Excludes Short-Term Investments |
See notes to financial statements
18
SA International Value Fund
SUMMARY PORTFOLIO OF INVESTMENTS — AS OF DECEMBER 31, 2016 (Unaudited)
| | | SHARES | | VALUE† | |
| COMMON STOCKS — 98.3% | | | | | |
| Australia — 6.3% | | | | | |
| Australia & New Zealand Banking | | | | | |
| | Group Ltd. | 412,220 | | $ | 9,049,300 | |
| BHP Billiton Ltd. | 402,051 | | | 7,270,913 | |
| BHP Billiton Ltd., ADR @ | 86,553 | | | 3,096,866 | |
| Woodside Petroleum Ltd. | 211,619 | | | 4,758,596 | |
| Other Securities ^@ | 3,180,536 | | | 18,091,631 | |
| | | | | 42,267,306 | |
| Austria — 0.2% | | | | | |
| Other Securities ^ | 29,707 | | | 994,292 | |
| | | | | | |
| Belgium — 1.0% | | | | | |
| Other Securities ^ | 110,364 | | | 7,017,173 | |
| | |
| Canada — 7.6% | | | | | |
| Bank of Montreal | 116,542 | | | 8,381,701 | |
| Manulife Financial Corp. ¥ | 126,128 | | | 2,246,096 | |
| Manulife Financial Corp. | 111,272 | | | 1,982,867 | |
| Suncor Energy, Inc. | 266,726 | | | 8,721,015 | |
| Suncor Energy, Inc. | 65,644 | | | 2,145,902 | |
| Other Securities ^@¥ | 2,108,802 | | | 28,105,201 | |
| | | | | 51,582,782 | |
| Denmark — 1.7% | | | | | |
| Other Securities ^ | 207,090 | | | 11,440,553 | |
| | |
| Finland — 0.8% | | | | | |
| Other Securities ^ | 349,537 | | | 5,253,404 | |
| | |
| France — 9.8% | | | | | |
| AXA SA | 149,383 | | | 3,771,595 | |
| BNP Paribas SA | 111,531 | | | 7,108,761 | |
| Cie de Saint-Gobain | 114,199 | | | 5,319,965 | |
| Engie SA | 296,273 | | | 3,779,887 | |
| Orange SA | 358,763 | | | 5,451,407 | |
| Renault SA | 50,745 | | | 4,514,249 | |
| Societe Generale SA | 134,518 | | | 6,619,112 | |
| Total SA | 303,760 | | | 15,578,371 | |
| Other Securities ^@ | 838,925 | | | 14,337,809 | |
| | | | | 66,481,156 | |
| Germany — 7.8% | | | | | |
| Allianz SE | 75,950 | | | 12,551,962 | |
| Bayerische Motoren Werke AG | 63,112 | | | 5,896,095 | |
| Daimler AG | 169,178 | | | 12,594,192 | |
| E.On AG | 550,518 | | | 3,882,670 | |
| Other Securities ^ | 720,631 | | | 17,447,267 | |
| | | | | 52,372,186 | |
| Hong Kong — 2.4% | | | | | |
| CK Hutchison Holdings Ltd. | 377,124 | | | 4,274,834 | |
| Other Securities ^@ | 4,374,997 | | | 12,056,799 | |
| | | | | 16,331,633 | |
| Ireland — 0.3% | | | | | |
| Other Securities ^ | 3,154,539 | | | 2,273,609 | |
| | |
| Israel — 0.5% | | | | | |
| Other Securities ^ | 502,581 | | | 3,393,106 | |
| | |
| Italy — 0.8% | | | | | |
| Other Securities ^@ | 2,978,262 | | | 5,107,560 | |
| | |
| Japan — 22.4% | | | | | |
| Hitachi Ltd. | 699,000 | | | 3,779,833 | |
| Honda Motor Co., Ltd. | 245,500 | | | 7,173,326 | |
| ITOCHU Corp. | 256,800 | | | 3,410,084 | |
| Mitsubishi UFJ Financial Group, | | | | | |
| Inc., ADR | 1,031,340 | | | 6,353,054 | |
| Mizuho Financial Group, Inc. | 4,432,400 | | | 7,956,514 | |
| Nissan Motor Co., Ltd. | 426,800 | | | 4,292,649 | |
| Sumitomo Mitsui Financial Group, Inc. | 225,900 | | | 8,620,441 | |
| Other Securities ^ | 12,106,033 | | | 109,651,304 | |
| | | | | 151,237,205 | |
| Netherlands — 3.4% | | | | | |
| ING Groep NV | 513,355 | | | 7,224,925 | |
| Koninklijke Philips NV | 105,517 | | | 3,225,655 | |
| Other Securities ^¢ | 941,667 | | | 12,593,520 | |
| | | | | 23,044,100 | |
| New Zealand — 0.1% | | | | | |
| Other Securities ^ | 108,665 | | | 703,825 | |
| | |
| Norway — 0.6% | | | | | |
| Other Securities ^ | 379,299 | | | 3,827,584 | |
| | |
| Portugal — 0.0% | | | | | |
| Other Securities ^ | 446,935 | | | 205,679 | |
| | |
| Singapore — 0.9% | | | | | |
| Other Securities ^ | 3,102,461 | | | 6,039,639 | |
| | |
| Spain — 2.7% | | | | | |
| Banco Santander SA | 2,369,099 | | | 12,366,918 | |
| Other Securities ^@ | 1,572,574 | | | 5,850,576 | |
| | | | | 18,217,494 | |
| Sweden — 2.2% | | | | | |
| Nordea Bank AB | 329,011 | | | 3,658,246 | |
| Other Securities ^@ | 1,156,704 | | | 10,869,616 | |
| | | | | 14,527,862 | |
See notes to financial statements
19
SA International Value Fund
SUMMARY PORTFOLIO OF INVESTMENTS — AS OF DECEMBER 31, 2016 (Unaudited) (Continued)
| | | SHARES | | VALUE† | |
| COMMON STOCKS (Continued) | | | | | |
| Switzerland — 7.8% | | | | | |
| ABB Ltd. * | 239,563 | | $ | 5,053,337 | |
| Adecco Group SA | 49,724 | | | 3,254,546 | |
| Cie Financiere Richemont SA | 87,601 | | | 5,802,502 | |
| LafargeHolcim Ltd. *µ | 36,060 | | | 1,899,852 | |
| LafargeHolcim Ltd. *= | 35,941 | | | 1,888,450 | |
| Novartis AG | 81,820 | | | 5,953,905 | |
| Swatch Group AG (The) µ | 8,156 | | | 2,536,586 | |
| Swiss Re AG | 72,191 | | | 6,841,237 | |
| UBS Group AG | 263,220 | | | 4,122,910 | |
| Zurich Insurance Group AG * | 25,793 | | | 7,102,384 | |
| Other Securities ^*µ | 237,801 | | | 8,433,349 | |
| | | | | 52,889,058 | |
| United Kingdom — 19.0% | | | | | |
| Anglo American PLC * | 245,068 | | | 3,503,452 | |
| Barclays PLC, ADR | 313,402 | | | 3,447,422 | |
| BP PLC, ADR @ | 782,273 | | | 29,241,365 | |
| Glencore PLC * | 2,491,810 | | | 8,517,158 | |
| HSBC Holdings PLC | 386,814 | | | 3,131,505 | |
| HSBC Holdings PLC, ADR @ | 425,068 | | | 17,079,232 | |
| Royal Dutch Shell PLC, ADR, | | | | | |
| Class A @ | 303,319 | | | 16,494,487 | |
| Royal Dutch Shell PLC, ADR, | | | | | |
| Class B @ | 253,799 | | | 14,712,728 | |
| Vodafone Group PLC | 7,028,749 | | | 17,311,464 | |
| Other Securities ^@ | 2,516,598 | | | 15,080,674 | |
| | | | | 128,519,487 | |
| TOTAL COMMON STOCKS | | | | | |
| (Identified Cost $661,927,436) | | | | 663,726,693 | |
| | |
| PREFERRED STOCKS — 0.8% | | | | | |
| Germany — 0.8% | | | | | |
| Volkswagen AG, 4.550% | 30,797 | | | 4,323,003 | |
| Other Securities ^ | 24,473 | | | 1,546,255 | |
| | | | | 5,869,258 | |
| TOTAL PREFERRED STOCKS | | | | | |
| (Identified Cost $9,328,586) | | | | 5,869,258 | |
| | |
| RIGHTS AND WARRANTS — 0.0% | | | | |
| Spain — 0.0% | | | | | |
| Other Securities ^ | 143,928 | | | 53,330 | |
| | |
| TOTAL RIGHTS AND WARRANTS | | | | | |
| (Identified Cost $50,349) | | | | 53,330 | |
| | | | | |
| SHORT-TERM INVESTMENTS — 4.9% | | | | |
| Investment Company — 0.5% | | | | | |
| State Street Institutional U.S. | | | | | |
| Government Money Market | | | | | |
| Fund, 0.170% | 3,383,000 | | | 3,383,000 | |
| |
| Collateral For Securities On Loan — 4.4% | | | | | |
| State Street Navigator Securities | | | | | |
| Lending Government Money | | | | | |
| Market Portfolio | 29,617,358 | | | 29,617,358 | |
| |
| TOTAL SHORT-TERM INVESTMENTS | | | | | |
| (Identified Cost $33,000,358) | | | | 33,000,358 | |
| |
| Total Investments — 104.0% | | | | | |
| (Identified Cost $704,306,729)# | | | | 702,649,639 | |
| Liabilities, Less Cash and Other | | | | | |
| Assets — (4.0%) | | | | (27,348,112 | ) |
| Net Assets — 100.0% | | | $ | 675,301,527 | |
| | † | | See Note 1 |
| @ | | A portion or all of the security/securities were held on loan. As of December 31, 2016, the market value of the securities on loan was $68,009,899. |
| * | | Non-income producing security |
| ^ | | The Summary Portfolio of Investments does not reflect the Fund’s complete portfolio holdings. “Other Securities” are those securities that are not among the top 50 holdings of the Fund or do not represent more than 1% of the net assets of the Fund. Certain individual securities within this category may include non-income producing securities, bankrupt/delisted, and/or fair valued securities. |
| ¥ | | Traded on the Canada, Toronto Stock Exchange. |
| ¢ | | Traded on the Netherlands, Euronext Amsterdam Stock Market. |
| µ | | Traded on the Switzerland, Swiss Exchange. |
| = | | Traded on the France, Euronext Paris Exchange. |
| # | | At December 31, 2016, the aggregate cost of investment securities for U.S. federal income tax purposes was $704,306,729. Net unrealized depreciation aggregated $1,657,090 of which $81,494,547 related to appreciated investment securities and $83,151,637 related to depreciated investment securities. |
Key to abbreviations:
ADR — American Depository Receipt
See notes to financial statements
20
SA International Value Fund
SUMMARY PORTFOLIO OF INVESTMENTS — AS OF DECEMBER 31, 2016 (Unaudited) (Continued)
Ten largest industry holdings as of December 31, 2016
(As a percentage of net assets):
| Industry | | Percentage | |
| Commercial Banks | 20.2 | % | |
| Oil, Gas & Consumable Fuels | 16.4 | % | |
| Insurance | 9.4 | % | |
| Metals & Mining | 7.8 | % | |
| Automobiles | 7.6 | % | |
| Short-Term | 4.9 | % | |
| Chemicals | 3.6 | % | |
| Wireless Telecommunication Services | 2.6 | % | |
| Real Estate Management & Development | 1.9 | % | |
| Auto Components | 1.7 | % | |
Country Weightings
(% of portfolio market value)+
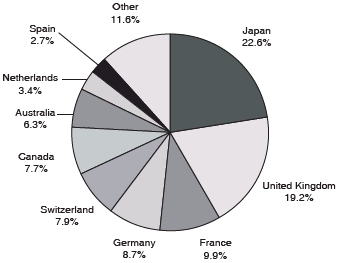
+ Excludes Short-Term Investments
See notes to financial statements
21
SA International Small Company Fund
SUMMARY PORTFOLIO OF INVESTMENTS — AS OF DECEMBER 31, 2016 (Unaudited)
| | | SHARES | | VALUE† | |
| MUTUAL FUNDS — 100.0% | | | | | |
| Other — 100.0% | | | | | |
| DFA International Small | | | | | |
| Company Portfolio£ | 18,352,025 | | $ | 316,939,477 | |
| | |
| TOTAL MUTUAL FUNDS | | | | | |
| (Identified Cost $222,881,877) | | | | 316,939,477 | |
| | |
| Total Investments — 100.0% | | | | | |
| (Identified Cost $222,881,877)# | | | | 316,939,477 | |
| Cash and Other Assets, | | | | | |
| Less Liabilities — 0.0% | | | | 103,040 | |
| Net Assets — 100.0% | | | $ | 317,042,517 | |
| | † | | See Note 1 |
| £ | | Please refer to the Portfolio of Investments of the DFA International Small Company Portfolio included elsewhere in this report. |
| # | | At December 31, 2016, the aggregate cost of investment securities for U.S. federal income tax purposes was $222,881,877. Net unrealized appreciation aggregated $94,057,600, which related solely to appreciated investment securities. |
See notes to financial statements
22
SA Emerging Markets Value Fund
SUMMARY PORTFOLIO OF INVESTMENTS — AS OF DECEMBER 31, 2016 (Unaudited)
| | | SHARES | | VALUE† | |
| COMMON STOCKS — 95.9% | | | | | |
| Brazil — 4.7% | | | | | |
| Petroleo Brasileiro SA * | 382,443 | | $ | 1,990,532 | |
| Vale SA | 169,416 | | | 1,336,714 | |
| Other Securities ^ | 1,084,751 | | | 5,085,879 | |
| | | | | 8,413,125 | |
| Chile — 1.4% | | | | | |
| Other Securities ^ | 938,026 | | | 2,494,950 | |
| | |
| China — 16.1% | | | | | |
| Agricultural Bank of China Ltd., | | | | | |
| H Shares | 1,727,000 | | | 708,216 | |
| Bank of China Ltd., H Shares | 5,257,902 | | | 2,332,476 | |
| China Construction Bank Corp., | | | | | |
| H Shares | 8,382,810 | | | 6,453,721 | |
| China Petroleum & Chemical Corp., | | | | | |
| H Shares | 1,732,400 | | | 1,228,732 | |
| CNOOC Ltd. | 1,521,000 | | | 1,902,599 | |
| Industrial & Commercial Bank of China | | | | | |
| Ltd., H Shares | 5,440,000 | | | 3,262,106 | |
| Other Securities ^ | 23,854,235 | | | 12,909,782 | |
| | | | | 28,797,632 | |
| Colombia — 0.5% | | | | | |
| Other Securities ^ | 125,579 | | | 975,730 | |
| | |
| Czech Republic — 0.2% | | | | | |
| Other Securities ^ | 28,833 | | | 382,924 | |
| | |
| Greece — 0.1% | | | | | |
| Other Securities ^ | 92,060 | | | 195,623 | |
| | |
| Hungary — 0.4% | | | | | |
| Other Securities ^ | 17,550 | | | 680,536 | |
| | |
| India — 11.9% | | | | | |
| Axis Bank Ltd. | 180,957 | | | 1,200,603 | |
| Bharti Airtel Ltd. | 189,175 | | | 851,943 | |
| ICICI Bank Ltd. | 199,777 | | | 750,746 | |
| Larsen & Toubro Ltd. | 49,087 | | | 975,556 | |
| Reliance Industries Ltd. | 146,455 | | | 2,332,016 | |
| Tata Motors Ltd. | 174,932 | | | 1,211,147 | |
| Other Securities ^± | 4,875,148 | | | 13,888,877 | |
| | | | | 21,210,888 | |
| Indonesia — 3.2% | | | | | |
| Bank Mandiri Tbk PT | 1,289,800 | | | 1,108,141 | |
| Other Securities ^ | 49,390,822 | | | 4,566,279 | |
| | | | | 5,674,420 | |
| Korea — 16.0% | | | | | |
| Hana Financial Group, Inc. | 29,388 | | | 760,370 | |
| Hyundai Motor Co. | 22,799 | | | 2,755,965 | |
| KB Financial Group, Inc., ADR * | 29,675 | | | 1,047,231 | |
| Kia Motors Corp. | 44,490 | | | 1,445,796 | |
| LG Display Co., Ltd., ADR * | 62,695 | | | 805,631 | |
| LG Electronics, Inc. | 19,054 | | | 814,031 | |
| POSCO, ADR | 28,384 | | | 1,491,579 | |
| Shinhan Financial Group Co., Ltd. | 20,589 | | | 771,363 | |
| Shinhan Financial Group | | | | | |
| Co., Ltd., ADR * | 24,410 | | | 918,792 | |
| SK Hynix, Inc. | 21,155 | | | 782,935 | |
| SK Innovation Co., Ltd. | 10,175 | | | 1,234,176 | |
| Other Securities ^> | 788,117 | | | 15,756,029 | |
| | | | | 28,583,898 | |
| Malaysia — 3.0% | | | | | |
| Other Securities ^ | 9,161,162 | | | 5,290,784 | |
| | |
| Mexico — 4.4% | | | | | |
| Cemex SAB de CV * | 952,873 | | | 762,127 | |
| Grupo Financiero Banorte SAB de CV | 223,987 | | | 1,103,206 | |
| Grupo Mexico SAB de CV, Series B | 579,771 | | | 1,574,330 | |
| Other Securities ^ | 1,919,992 | | | 4,402,268 | |
| | | | | 7,841,931 | |
| Philippines — 1.4% | | | | | |
| Other Securities ^ | 8,261,770 | | | 2,473,871 | |
| | |
| Poland — 1.5% | | | | | |
| Other Securities ^ | 483,233 | | | 2,718,375 | |
| | |
| Russia — 2.3% | | | | | |
| Gazprom PAO, ADR | 432,870 | | | 2,185,993 | |
| Lukoil PJSC, ADR | 30,968 | | | 1,737,305 | |
| Other Securities ^ | 96,618 | | | 221,139 | |
| | | | | 4,144,437 | |
| South Africa — 8.4% | | | | | |
| Barclays Africa Group Ltd. | 72,512 | | | 890,656 | |
| MTN Group Ltd. | 215,960 | | | 1,983,994 | |
| Sasol Ltd. | 25,120 | | | 729,616 | |
| Sasol Ltd., ADR | 48,002 | | | 1,372,377 | |
| Standard Bank Group Ltd. | 207,913 | | | 2,297,319 | |
| Steinhoff International Holdings NV | 260,553 | | | 1,352,305 | |
| Other Securities ^ | 1,740,929 | | | 6,368,862 | |
| | | | | 14,995,129 | |
See notes to financial statements
23
SA Emerging Markets Value Fund
SUMMARY PORTFOLIO OF INVESTMENTS — AS OF DECEMBER 31, 2016 (Unaudited) (Continued)
| | | SHARES | | VALUE† | |
| COMMON STOCKS (Continued) | | | | | |
| Taiwan — 16.0% | | | | | |
| Asustek Computer, Inc. | 86,000 | | | 707,127 | |
| Cathay Financial Holding Co., Ltd. | 704,000 | | | 1,052,865 | |
| China Steel Corp. | 1,495,800 | | | 1,144,046 | |
| CTBC Financial Holding Co., Ltd. | 2,174,280 | | | 1,190,730 | |
| Fubon Financial Holding Co., Ltd. | 993,211 | | | 1,571,683 | |
| Hon Hai Precision Industry Co., Ltd. | 665,335 | | | 1,738,224 | |
| Mega Financial Holding Co., Ltd. | 1,210,850 | | | 864,115 | |
| United Microelectronics Corp. | 2,099,513 | | | 742,637 | |
| Other Securities ^ | 33,244,314 | | | 19,538,064 | |
| | | | | 28,549,491 | |
| Thailand — 3.1% | | | | | |
| PTT Exploration & Production PCL | 291,500 | | | 783,482 | |
| PTT PCL | 204,200 | | | 2,121,233 | |
| Other Securities ^ | 7,734,001 | | | 2,544,642 | |
| | | | | 5,449,357 | |
| Turkey — 1.3% | | | | | |
| Other Securities ^ | 1,721,012 | | | 2,241,486 | |
| | | | | | |
| TOTAL COMMON STOCKS | | | | | |
| (Identified Cost $185,492,837) | | | | 171,114,587 | |
| | |
| PREFERRED STOCKS — 3.5% | | | | | |
| Brazil — 3.3% | | | | | |
| Petroleo Brasileiro SA, ADR 0.900% * | 146,867 | | | 1,293,898 | |
| Petroleo Brasileiro SA, 0.998% * | 395,307 | | | 1,806,070 | |
| Vale SA, 8.000% | 254,690 | | | 1,826,425 | |
| Other Securities ^ | 257,101 | | | 1,000,609 | |
| | | | | 5,927,002 | |
| Colombia — 0.2% | | | | | |
| Other Securities ^ | 60,056 | | | 225,074 | |
| | | | | | |
| TOTAL PREFERRED STOCKS | | | | | |
| (Identified Cost $8,000,602) | | | | 6,152,076 | |
| | |
| RIGHTS AND WARRANTS — 0.0% | | | | | |
| Thailand — 0.0% | | | | | |
| Other Securities ^ | 6,596 | | | — | |
| | | | | | |
| TOTAL RIGHTS AND WARRANTS | | | | | |
| (Identified Cost $0) | | | | — | |
| | | | | |
| SHORT-TERM INVESTMENTS — 1.7% | | | | |
| Investment Company — 0.4% | | | | | |
| State Street Institutional U.S. | | | | | |
| Government Money Market | | | | | |
| Fund, 0.170% | 660,012 | | | 660,012 | |
| |
| Collateral For Securities On Loan — 1.3% | | | | | |
| State Street Navigator Securities | | | | | |
| Lending Government Money | | | | | |
| Market Portfolio | 2,362,815 | | | 2,362,815 | |
| |
| TOTAL SHORT-TERM INVESTMENTS | | | | | |
| (Identified Cost $3,022,827) | | | | 3,022,827 | |
| |
| Total Investments — 101.1% | | | | | |
| (Identified Cost $196,516,266)# | | | | 180,289,490 | |
| Liabilities, Less Cash and | | | | | |
| Other Assets — (1.1%) | | | | (1,948,197 | ) |
| Net Assets — 100.0% | | | $ | 178,341,293 | |
| | † | | See Note 1 |
| * | | Non-income producing security |
| ^ | | The Summary Portfolio of Investments does not reflect the Fund’s complete portfolio holdings. “Other Securities” are those securities that are not among the top 50 holdings of the Fund or do not represent more than 1% of the net assets of the Fund. Certain individual securities within this category may include non-income producing securities, bankrupt/delisted, and/or fair valued securities. |
| ± | | 144A Securities. Securities exempt from registration under Rule 144A of the Securities Act of 1933. These securities may be resold in transactions exempt from registration to qualified institutional buyers. These securities have been deemed by the Fund to be liquid and at December 31, 2016 amounted to $277,791 or 0.17% of the net assets of the Fund. |
| > | | Traded on the Korea (South), KRX KOSPI Market. |
| # | | At December 31, 2016, the aggregate cost of investment securities for U.S. federal income tax purposes was $196,516,266. Net unrealized depreciation aggregated $16,226,776 of which $16,486,394 related to appreciated investment securities and $32,713,170 related to depreciated investment securities. |
Key to abbreviations:
ADR — American Depository Receipt
See notes to financial statements
24
SA Emerging Markets Value Fund
SUMMARY PORTFOLIO OF INVESTMENTS — AS OF DECEMBER 31, 2016 (Unaudited) (Continued)
Ten largest industry holdings as of December 31, 2016
(As a percentage of net assets):
| Industry | | Percentage | |
| Commercial Banks | 24.0 | % | |
| Oil, Gas & Consumable Fuels | 14.4 | % | |
| Metals & Mining | 8.2 | % | |
| Electronic Equipment, Instruments & Components | 4.2 | % | |
| Automobiles | 3.7 | % | |
| Chemicals | 3.7 | % | |
| Real Estate Management & Development | 3.2 | % | |
| Industrial Conglomerates | 3.0 | % | |
| Computers & Peripherals | 2.6 | % | |
| Insurance | 2.3 | % | |
Country Weightings
(% of portfolio market value)+
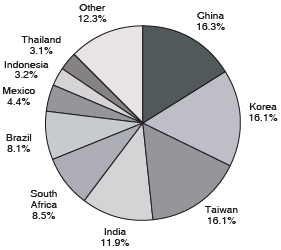
+ Excludes Short-Term Investments
See notes to financial statements
25
SA Real Estate Securities Fund
PORTFOLIO OF INVESTMENTS — AS OF DECEMBER 31, 2016 (Unaudited)
| | | SHARES | | VALUE† | |
| COMMON STOCKS — 99.1% | | | | | |
| Real Estate Investment Trusts (REITs) — 99.1% | | | | |
| Acadia Realty Trust | 17,192 | | $ | 561,835 | |
| Agree Realty Corp. | 5,009 | | | 230,664 | |
| Alexander’s, Inc. | 518 | | | 221,119 | |
| Alexandria Real Estate Equities, Inc. | 17,452 | | | 1,939,441 | |
| American Assets Trust, Inc. | 8,315 | | | 358,210 | |
| American Campus Communities, Inc. | 27,869 | | | 1,387,040 | |
| American Homes 4 Rent., Class A | 31,890 | | | 669,052 | |
| Apartment Investment &
Management Co., Class A | 35,040 | | | 1,592,568 | |
| Apple Hospitality REIT, Inc. | 24,002 | | | 479,560 | |
| Ashford Hospitality Prime, Inc. | 7,756 | | | 105,869 | |
| Ashford Hospitality Trust, Inc. | 19,998 | | | 155,184 | |
| AvalonBay Communities, Inc. | 30,117 | | | 5,335,227 | |
| Bluerock Residential Growth
REIT, Inc. | 3,300 | | | 45,276 | |
| Boston Properties, Inc. | 33,591 | | | 4,225,076 | |
| Brandywine Realty Trust | 39,490 | | | 651,980 | |
| Brixmor Property Group, Inc. | 54,447 | | | 1,329,596 | |
| Camden Property Trust | 19,725 | | | 1,658,281 | |
| Care Capital Properties, Inc. | 19,528 | | | 488,200 | |
| CareTrust REIT, Inc. | 11,450 | | | 175,414 | |
| CBL & Associates Properties, Inc. | 34,365 | | | 395,197 | |
| Cedar Realty Trust, Inc. | 17,672 | | | 115,398 | |
| Chatham Lodging Trust | 8,674 | | | 178,251 | |
| Chesapeake Lodging Trust | 14,236 | | | 368,143 | |
| City Office REIT, Inc. | 2,976 | | | 39,194 | |
| Colony Starwood Homes | 8,009 | | | 230,739 | |
| Columbia Property Trust, Inc. | 20,692 | | | 446,947 | |
| CoreSite Realty Corp.@ | 7,619 | | | 604,720 | |
| Corporate Office Properties Trust | 20,988 | | | 655,245 | |
| Cousins Properties, Inc. | 67,428 | | | 573,812 | |
| CubeSmart | 40,685 | | | 1,089,137 | |
| CyrusOne, Inc. | 15,754 | | | 704,676 | |
| DCT Industrial Trust, Inc. | 20,528 | | | 982,881 | |
| DDR Corp. | 70,573 | | | 1,077,650 | |
| DiamondRock Hospitality Co. | 45,908 | | | 529,319 | |
| Digital Realty Trust, Inc. | 32,333 | | | 3,177,041 | |
| Douglas Emmett, Inc. | 32,605 | | | 1,192,039 | |
| Duke Realty Corp. | 77,881 | | | 2,068,519 | |
| DuPont Fabros Technology, Inc. | 16,321 | | | 716,982 | |
| Easterly Government Properties, Inc. | 1,300 | | | 26,026 | |
| EastGroup Properties, Inc. | 7,513 | | | 554,760 | |
| Education Realty Trust, Inc. | 14,022 | | | 593,131 | |
| Empire State Realty Trust, Inc.,
Class A | 25,972 | | | 524,375 | |
| EPR Properties | 14,464 | | | 1,038,081 | |
| Equinix, Inc. | 13,480 | | | 4,817,887 | |
| Equity Commonwealth* | 27,081 | | | 818,929 | |
| Equity LifeStyle Properties, Inc. | 18,280 | | | 1,317,988 | |
| Equity One, Inc. | 19,218 | | | 589,800 | |
| Equity Residential | 80,223 | | | 5,163,152 | |
| Essex Property Trust, Inc. | 14,520 | | | 3,375,900 | |
| Extra Space Storage, Inc. | 28,249 | | | 2,181,953 | |
| Federal Realty Investment Trust | 15,985 | | | 2,271,628 | |
| FelCor Lodging Trust, Inc. | 27,703 | | | 221,901 | |
| First Industrial Realty Trust, Inc. | 26,455 | | | 742,063 | |
| First Potomac Realty Trust | 12,872 | | | 141,206 | |
| Forest City Realty Trust, Inc., Class A | 41,437 | | | 863,547 | |
| Four Corners Property Trust, Inc. | 1,963 | | | 40,281 | |
| Franklin Street Properties Corp. | 22,915 | | | 296,978 | |
| Gaming & Leisure Properties, Inc. | 37,864 | | | 1,159,396 | |
| General Growth Properties, Inc. | 126,933 | | | 3,170,786 | |
| Getty Realty Corp. | 6,637 | | | 169,177 | |
| Gladstone Commercial Corp. | 5,964 | | | 119,876 | |
| Gladstone Land Corp.@ | 1,515 | | | 17,029 | |
| Global Net Lease, Inc.@ | 4,979 | | | 38,986 | |
| Government Properties
Income Trust@ | 17,229 | | | 328,471 | |
| Gramercy Property Trust | 46,773 | | | 429,376 | |
| HCP, Inc. | 103,101 | | | 3,064,162 | |
| Healthcare Realty Trust, Inc. | 24,902 | | | 755,029 | |
| Healthcare Trust of America, Inc.,
Class A | 31,584 | | | 919,410 | |
| Hersha Hospitality Trust | 9,632 | | | 207,088 | |
| Highwoods Properties, Inc. | 22,688 | | | 1,157,315 | |
| Hospitality Properties Trust | 36,298 | | | 1,152,099 | |
| Host Hotels & Resorts, Inc. | 165,383 | | | 3,115,816 | |
| Hudson Pacific Properties, Inc. | 19,019 | | | 661,481 | |
| Independence Realty Trust, Inc. | 6,510 | | | 58,069 | |
| Investors Real Estate Trust | 26,116 | | | 186,207 | |
| Iron Mountain, Inc. | 49,787 | | | 1,617,082 | |
| Kilroy Realty Corp. | 20,805 | | | 1,523,342 | |
| Kimco Realty Corp. | 92,831 | | | 2,335,628 | |
| Kite Realty Group Trust | 19,357 | | | 454,502 | |
| LaSalle Hotel Properties | 25,244 | | | 769,185 | |
| Lexington Realty Trust | 48,883 | | | 527,936 | |
| Liberty Property Trust | 33,234 | | | 1,312,743 | |
| Life Storage, Inc. | 8,992 | | | 766,658 | |
| LTC Properties, Inc. | 8,869 | | | 416,666 | |
| Macerich Co. (The) | 27,104 | | | 1,920,047 | |
| Mack-Cali Realty Corp. | 19,584 | | | 568,328 | |
| Medical Properties Trust, Inc. | 58,588 | | | 720,632 | |
| Mid-America Apartment
Communities, Inc. | 26,488 | | | 2,593,705 | |
| Monmouth Real Estate Investment
Corp., Class A | 14,037 | | | 213,924 | |
| Monogram Residential Trust, Inc. | 7,657 | | | 82,849 | |
| National Health Investors, Inc. | 8,820 | | | 654,179 | |
| National Retail Properties, Inc. | 33,434 | | | 1,477,783 | |
| National Storage Affiliates Trust | 1,654 | | | 36,504 | |
| New Senior Investment Group, Inc. | 17,592 | | | 172,226 | |
| New York REIT, Inc. | 22,408 | | | 226,769 | |
| NexPoint Residential Trust, Inc. | 2,800 | | | 62,552 | |
| NorthStar Realty Europe Corp. | 7,232 | | | 90,906 | |
| Omega Healthcare Investors, Inc. | 43,595 | | | 1,362,780 | |
| One Liberty Properties, Inc. | 2,871 | | | 72,120 | |
| Paramount Group, Inc. | 23,557 | | | 376,676 | |
| Parkway, Inc.* | 10,766 | | | 239,543 | |
| Pebblebrook Hotel Trust@ | 16,826 | | | 500,573 | |
| Pennsylvania REIT | 14,993 | | | 284,267 | |
| Physicians Realty Trust | 14,151 | | | 268,303 | |
| Piedmont Office Realty Trust, Inc.,
Class A | 32,747 | | | 684,740 | |
| Prologis, Inc. | 114,395 | | | 6,038,912 | |
See notes to financial statements
26
SA Real Estate Securities Fund
PORTFOLIO OF INVESTMENTS — AS OF DECEMBER 31, 2016 (Unaudited) (Continued)
| | | SHARES | | VALUE† | |
| COMMON STOCKS (Continued) | | | | |
| Real Estate Investment Trusts (REITs) (Continued) | | | | | |
| PS Business Parks, Inc. | 4,655 | | $ | 542,401 | |
| Public Storage | 32,082 | | | 7,170,327 | |
| QTS Realty Trust, Inc., Class A | 8,920 | | | 442,878 | |
| Quality Care Properties, Inc.* | 20,620 | | | 319,610 | |
| Ramco-Gershenson Properties Trust | 18,901 | | | 313,379 | |
| Realty Income Corp. | 56,780 | | | 3,263,714 | |
| Regency Centers Corp. | 23,034 | | | 1,588,194 | |
| Retail Opportunity Investments Corp. | 24,585 | | | 519,481 | |
| Retail Properties of America, Inc.,
Class A | 53,599 | | | 821,673 | |
| Rexford Industrial Realty, Inc. | 12,916 | | | 299,522 | |
| RLJ Lodging Trust | 28,027 | | | 686,381 | |
| Ryman Hospitality Properties | 10,494 | | | 661,227 | |
| Sabra Healthcare REIT, Inc. | 15,652 | | | 382,222 | |
| Saul Centers, Inc. | 3,327 | | | 221,611 | |
| Select Income REIT | 15,667 | | | 394,808 | |
| Senior Housing Properties Trust | 53,916 | | | 1,020,630 | |
| Seritage Growth Properties,
Class A@ | 164 | | | 7,004 | |
| Silver Bay Realty Trust Corp. | 7,694 | | | 131,875 | |
| Simon Property Group, Inc. | 68,122 | | | 12,103,236 | |
| SL Green Realty Corp. | 22,219 | | | 2,389,653 | |
| Sotherly Hotels, Inc. | 3,111 | | | 21,124 | |
| Spirit Realty Capital, Inc. | 109,173 | | | 1,185,619 | |
| STAG Industrial, Inc. | 16,666 | | | 397,817 | |
| STORE Capital Corp. | 19,575 | | | 483,698 | |
| Summit Hotel Properties, Inc. | 21,227 | | | 340,269 | |
| Sun Communities, Inc. | 13,063 | | | 1,000,756 | |
| Sunstone Hotel Investors, Inc. | 48,579 | | | 740,830 | |
| Tanger Factory Outlet Centers, Inc. | 21,805 | | | 780,183 | |
| Taubman Centers, Inc. | 13,717 | | | 1,014,098 | |
| Terreno Realty Corp. | 10,190 | | | 290,313 | |
| Tier REIT, Inc. | 2,000 | | | 34,780 | |
| UDR, Inc. | 59,824 | | | 2,182,380 | |
| UMH Properties, Inc. | 5,369 | | | 80,803 | |
| Universal Health Realty
Income Trust | 3,394 | | | 222,612 | |
| Urban Edge Properties | 22,808 | | | 627,448 | |
| Urstadt Biddle Properties, Inc. | 1,000 | | | 19,600 | |
| Urstadt Biddle Properties, Inc.,
Class A | 6,307 | | | 152,062 | |
| Ventas, Inc. | 76,469 | | | 4,780,842 | |
| VEREIT, Inc. | 197,221 | | | 1,668,490 | |
| Vornado Realty Trust | 37,435 | | | 3,907,091 | |
| Washington Prime Group, Inc. | 43,142 | | | 449,108 | |
| Washington REIT | 16,908 | | | 552,723 | |
| Weingarten Realty Investors | 27,738 | | | 992,743 | |
| Welltower, Inc. | 78,397 | | | 5,247,111 | |
| Whitestone REIT | 7,118 | | | 102,357 | |
| WP Carey, Inc. | 22,588 | | | 1,334,725 | |
| Xenia Hotels & Resorts, Inc. | 10,828 | | | 210,280 | |
| | | | | 169,516,589 | |
| TOTAL COMMON STOCKS
(Identified Cost $112,750,561) | | | | 169,516,589 | |
| | | | | | |
| SHORT-TERM INVESTMENTS — 0.5% | | | | |
| Investment Company — 0.4% | | | | | |
| State Street Institutional U.S. Government
Money Market Fund, 0.170% | 645,045 | | | 645,045 | |
| | |
| Collateral For Securities On Loan — 0.1% | | | | | |
| State Street Navigator Securities
Lending Government Money
Market Portfolio | 265,531 | | | 265,531 | |
| TOTAL SHORT-TERM INVESTMENTS
(Identified Cost $910,576) | | | | 910,576 | |
| | |
Total Investments — 99.6%
(Identified Cost $113,661,137)# | | | | 170,427,165 | |
| Cash and Other Assets,
Less Liabilities — 0.4% | | | | 617,788 | |
| Net Assets — 100.0% | | | $ | 171,044,953 | |
| | † | | See Note 1 |
| @ | | A portion or all of the security/securities were held on loan. As of December 31, 2016, the market value of the securities on loan was $1,249,108. |
| * | | Non-income producing security |
| # | | At December 31, 2016, the aggregate cost of investment securities for U.S. federal income tax purposes was $113,661,137. Net unrealized appreciation aggregated $56,766,028 of which $59,234,977 related to appreciated investment securities and $2,468,949 related to depreciated investment securities. |
Key to abbreviations:
REIT — Real Estate Investment Trust
See notes to financial statements
27
SA Real Estate Securities Fund
PORTFOLIO OF INVESTMENTS — AS OF DECEMBER 31, 2016 (Unaudited) (Continued)
Portfolio Sectors
(% of portfolio market value)+

+ Excludes Short-Term Investments
See notes to financial statements
28
SA Worldwide Moderate Growth Fund
PORTFOLIO OF INVESTMENTS — AS OF DECEMBER 31, 2016 (Unaudited)
| SHARES | | VALUE† | |
| MUTUAL FUNDS — 100.1% | | | | | | |
| Other — 100.1% | | | | | | |
| SA Emerging Markets Value Fund€ | 211,917 | | $ | 1,750,437 | | |
| SA Global Fixed Income Fund€ | 236,013 | | | 2,258,641 | | |
| SA International Value Fund€ | 322,673 | | | 3,297,718 | | |
| SA Real Estate Securities Fund€ | 78,428 | | | 876,041 | | |
| SA U.S. Core Market Fund€ | 155,547 | | | 3,098,490 | | |
| SA U.S. Fixed Income Fund€ | 204,746 | | | 2,082,271 | | |
| SA U.S. Small Company Fund€ | 61,170 | | | 1,548,205 | | |
| SA U.S. Value Fund€ | 137,577 | | | 2,408,975 | | |
| | | | | 17,320,778 | | |
| | |
| TOTAL MUTUAL FUNDS | | | | | | |
| (Identified Cost $16,615,477) | | | | 17,320,778 | | |
| | |
| Total Investments — 100.1% | | | | | | |
| (Identified Cost $16,615,477)# | | | | 17,320,778 | | |
| Liabilities, Less Cash and | | | | | | |
| Other Assets — (0.1%) | | | | (8,807 | ) | |
| Net Assets — 100.0% | | | $ | 17,311,971 | | |
| † | See Note 1 |
| € | Affiliated company |
| # | At December 31, 2016, the aggregate cost of investment securities for U.S. federal income tax purposes was $16,615,477. Net unrealized appreciation aggregated $705,301 of which $740,388 related to appreciated investment securities and $35,087 related to depreciated investment securities. |
See notes to financial statements
29
STATEMENTS OF ASSETS AND LIABILITIES — DECEMBER 31, 2016 (Unaudited)
| SA | | SA | | SA | |
| U.S. Fixed | | Global Fixed | | U.S. Core | |
| Income Fund | | Income Fund | | Market Fund | |
| ASSETS | | | | | | | | | | | |
| Investments in unaffiliated securities, at value | $ | 604,998,501 | | | $ | 720,504,560 | | | $ | 699,592,274 | |
| Investments in affiliated securities, at value | | — | | | | — | | | | — | |
| Cash | | 743 | | | | 202 | | | | 4,387 | |
| Foreign currency, at value | | — | | | | 700 | | | | — | |
| Receivable for investments sold | | 2,494,800 | | | | — | | | | 52,730 | |
| Dividends and interest receivable | | 2,457,417 | | | | 4,340,038 | | | | 712,969 | |
| Receivable for fund shares sold | | 1,513,875 | | | | 1,534,659 | | | | 1,123,210 | |
| Unrealized appreciation on forward foreign | | | | | | | | | | | |
| currency exchange contracts (Note 1) | | — | | | | 726,061 | | | | — | |
| Receivable from the Adviser (Note 2) | | — | | | | — | | | | — | |
| Receivable for tax reclaims | | — | | | | — | | | | — | |
| Prepaid expenses | | 14,417 | | | | 19,674 | | | | 19,406 | |
| Other assets | | — | | | | — | | | | 1,151 | |
| Total Assets | | 611,479,753 | | | | 727,125,894 | | | | 701,506,127 | |
| | |
| LIABILITIES | | | | | | | | | | | |
| Payable for investments purchased | | 3,511,895 | | | | — | | | | — | |
| Payable for fund shares redeemed | | 736,692 | | | | 693,224 | | | | 547,484 | |
| Collateral for securities on loan (Note 1) | | — | | | | 11,401,718 | | | | 3,299,309 | |
| Unrealized depreciation on forward foreign | | | | | | | | | | | |
| currency exchange contracts (Note 1) | | — | | | | 23,311 | | | | — | |
| Advisory fee payable (Note 2) | | 86,692 | | | | 151,257 | | | | 266,539 | |
| Sub-Advisory fee payable (Note 2) | | 25,738 | | | | 30,251 | | | | 27,365 | |
| Administration fee payable (Note 2) | | 51,475 | | | | 60,503 | | | | 59,231 | |
| Sub-Administration fee payable (Note 2) | | 9,572 | | | | 11,811 | | | | 9,933 | |
| Custody and accounting fees payable | | 6,583 | | | | 9,211 | | | | 7,869 | |
| Trustees’ fees payable (Note 2) | | 108 | | | | 108 | | | | 108 | |
| Shareholder servicing fee payable (Note 2) | | 128,689 | | | | 151,257 | | | | 148,077 | |
| Transfer agent fee payable | | 12,892 | | | | 13,136 | | | | 15,023 | |
| Professional fees payable | | 20,089 | | | | 24,770 | | | | 23,142 | |
| Accrued expenses and other liabilities | | 8,294 | | | | 10,449 | | | | 7,331 | |
| Total Liabilities | | 4,598,719 | | | | 12,581,006 | | | | 4,411,411 | |
| | |
| NET ASSETS | $ | 606,881,034 | | | $ | 714,544,888 | | | $ | 697,094,716 | |
| NET ASSETS CONSIST OF: | | | | | | | | | | | |
| Paid-in capital | $ | 608,175,443 | | | $ | 718,922,799 | | | $ | 375,902,179 | |
| Undistributed (overdistributed) net investment income (loss) | | (25,702 | ) | | | 63,702 | | | | 24,404 | |
| Accumulated net realized gain (loss) | | 26,841 | | | | (575,528 | ) | | | 4,594,445 | |
| Net unrealized appreciation (depreciation) on: | | | | | | | | | | | |
| Investments (1) | | (1,295,548 | ) | | | (4,568,403 | ) | | | 316,573,688 | |
| Foreign currency and forward currency transactions | | — | | | | 702,318 | | | | — | |
| | |
| NET ASSETS | $ | 606,881,034 | | | $ | 714,544,888 | | | $ | 697,094,716 | |
| Shares of beneficial interest outstanding | | | | | | | | | | | |
| ($0.01 par value, unlimited shares authorized) | | 59,674,069 | | | | 74,644,196 | | | | 35,000,920 | |
| Net asset value per share | $ | 10.17 | | | $ | 9.57 | | | $ | 19.92 | |
| Identified cost of unaffiliated investments | $ | 606,294,049 | | | $ | 725,072,963 | | | $ | 383,018,586 | |
| Cost of foreign currency | $ | — | | | $ | 704 | | | $ | — | |
| (1) Net of deferred capital gain country tax of: | $ | — | | | $ | — | | | $ | — | |
See notes to financial statements
30
| | SA | | SA | | SA | | SA International | | SA | | SA | | SA Worldwide | |
| U.S. Value | | U.S. Small | | International | | Small Company | | Emerging Markets | | Real Estate | | Moderate | |
| Fund | | Company Fund | | Value Fund | | Fund | | Value Fund | | Securities Fund | | Growth Fund | |
| $ | 568,608,128 | | $ | 430,980,137 | | | $ | 702,649,639 | | | $ | 316,939,477 | | | $ | 180,289,490 | | | $ | 170,427,165 | | | $ | — | | |
| | — | | | — | | | | — | | | | — | | | | — | | | | — | | | | 17,320,778 | | |
| | 9,513 | | | 414 | | | | 22,093 | | | | 372 | | | | 967 | | | | 442 | | | | — | | |
| | | — | | | — | | | | 860,562 | | | | — | | | | 583,244 | | | | — | | | | — | | |
| | 926,581 | | | 637,878 | | | | — | | | | — | | | | 214,727 | | | | — | | | | 32,662 | | |
| | 584,322 | | | 361,179 | | | | 680,170 | | | | — | | | | 72,314 | | | | 819,039 | | | | — | | |
| | 883,563 | | | 584,257 | | | | 1,158,010 | | | | 531,092 | | | | 548,604 | | | | 344,565 | | | | 5,112 | | |
| | |
| | |
| | — | | | — | | | | — | | | | — | | | | — | | | | — | | | | — | | |
| | — | | | 22,845 | | | | — | | | | — | | | | 38,149 | | | | 9,118 | | | | 8,797 | | |
| | — | | | — | | | | 697,702 | | | | — | | | | 11,726 | | | | — | | | | — | | |
| | 18,335 | | | 16,847 | | | | 21,697 | | | | 28,051 | | | | 11,139 | | | | 14,687 | | | | 12,979 | | |
| | — | | | — | | | | — | | | | — | | | | — | | | | — | | | | 3,722 | | |
| | 571,030,442 | | | 432,603,557 | | | | 706,089,873 | | | | 317,498,992 | | | | 181,770,360 | | | | 171,615,016 | | | | 17,384,050 | | |
| | |
| | | | | | | | | | | | | | | | | | | | | | | | | | | |
| | 1,067,819 | | | 99,310 | | | | — | | | | — | | | | 527,890 | | | | — | | | | — | | |
| | 446,558 | | | 309,618 | | | | 514,997 | | | | 186,378 | | | | 123,231 | | | | 146,041 | | | | 37,774 | | |
| | 1,347,522 | | | 18,935,730 | | | | 29,617,358 | | | | — | | | | 2,362,815 | | | | 265,531 | | | | — | | |
| | |
| | — | | | — | | | | — | | | | — | | | | — | | | | — | | | | — | | |
| | 217,448 | | | 158,382 | | | | 285,710 | | | | 132,731 | | | | 75,307 | | | | 49,422 | | | | — | | |
| | 48,322 | | | 123,186 | | | | 114,284 | | | | — | | | | 75,307 | | | | 21,181 | | | | — | | |
| | 48,322 | | | 35,196 | | | | 57,142 | | | | 26,546 | | | | 15,061 | | | | 14,121 | | | | — | | |
| | 7,229 | | | 5,127 | | | | 8,417 | | | | 5,021 | | | | 1,948 | | | | 3,399 | | | | 274 | | |
| | 3,933 | | | 4,279 | | | | 11,118 | | | | 931 | | | | 11,672 | | | | 2,805 | | | | 1,875 | | |
| | 108 | | | 108 | | | | 108 | | | | 108 | | | | 108 | | | | 108 | | | | 108 | | |
| | 120,805 | | | 87,990 | | | | 142,855 | | | | 66,365 | | | | 37,654 | | | | 35,302 | | | | — | | |
| | 14,625 | | | 14,459 | | | | 15,114 | | | | 14,403 | | | | 12,968 | | | | 13,203 | | | | 5,741 | | |
| | 19,979 | | | 19,883 | | | | 21,243 | | | | 23,992 | | | | 17,076 | | | | 18,259 | | | | 20,976 | | |
| | 4,439 | | | 647 | | | | — | | | | — | | | | 168,030 | | | | 691 | | | | 5,331 | | |
| | 3,347,109 | | | 19,793,915 | | | | 30,788,346 | | | | 456,475 | | | | 3,429,067 | | | | 570,063 | | | | 72,079 | | |
| | |
| $ | 567,683,333 | | $ | 412,809,642 | | | $ | 675,301,527 | | | $ | 317,042,517 | | | $ | 178,341,293 | | | $ | 171,044,953 | | | $ | 17,311,971 | | |
| | |
| $ | 381,284,381 | | $ | 268,756,337 | | | $ | 712,752,420 | | | $ | 245,684,245 | | | $ | 206,854,124 | | | $ | 114,418,391 | | | $ | 16,349,636 | | |
| | 14,363 | | | (254,800 | ) | | | 2,959,153 | | | | (557,978 | ) | | | (863,389 | ) | | | 718,027 | | | | (5,525 | ) | |
| | 7,770,254 | | | 7,658,009 | | | | (38,688,588 | ) | | | (22,141,350 | ) | | | (11,240,484 | ) | | | (3,912,244 | ) | | | 262,559 | | |
| | |
| | 178,614,335 | | | 136,650,096 | | | | (1,657,090 | ) | | | 94,057,600 | | | | (16,404,664 | ) | | | 59,820,779 | | | | 705,301 | | |
| | — | | | — | | | | (64,368 | ) | | | — | | | | (4,294 | ) | | | — | | | | — | | |
| | |
| $ | 567,683,333 | | $ | 412,809,642 | | | $ | 675,301,527 | | | $ | 317,042,517 | | | $ | 178,341,293 | | | $ | 171,044,953 | | | $ | 17,311,971 | | |
| | |
| | | | | | | | | | | | | | | | | | | | | | | | | | | | |
| | 32,416,715 | | | 16,312,651 | | | | 66,053,365 | | | | 16,625,851 | | | | 21,580,785 | | | | 15,309,581 | | | | 1,714,853 | | |
| $ | 17.51 | | $ | 25.31 | | | $ | 10.22 | | | $ | 19.07 | | | $ | 8.26 | | | $ | 11.17 | | | $ | 10.10 | | |
| $ | 389,993,793 | | $ | 294,330,041 | | | $ | 704,306,729 | | | $ | 222,881,877 | | | $ | 196,516,266 | | | $ | 113,661,137 | | | $ | 16,615,477 | | |
| $ | — | | $ | — | | | $ | 857,692 | | | $ | — | | | $ | 584,357 | | | $ | — | | | $ | — | | |
| $ | — | | $ | — | | | $ | — | | | $ | — | | | $ | 177,888 | | | $ | — | | | $ | — | | |
See notes to financial statements
31
STATEMENTS OF OPERATIONS—SIX MONTHS ENDED DECEMBER 31, 2016 (Unaudited)
| SA U.S. | | SA Global | | SA U.S. | |
| Fixed Income | | Fixed Income | | Core Market | |
| Fund | | Fund | | Fund | |
| INVESTMENT INCOME | | | | | | | | | | | | |
| Income: | | | | | | | | | | | | |
| Unaffiliated dividends | $ | — | | | $ | — | | | $ | 7,059,355 | | |
| Affiliated dividends | | — | | | | — | | | | — | | |
| Interest (1) | | 3,422,551 | | | | 6,189,469 | | | | 50,665 | | |
| Other income | | — | | | | 36 | | | | 6,600 | | |
| Taxes withheld | | — | | | | — | | | | — | | |
| Total Income | | 3,422,551 | | | | 6,189,505 | | | | 7,116,620 | | |
| Expenses: | | | | | | | | | | | | |
| Advisory fees (Note 2) | | 462,126 | | | | 913,675 | | | | 1,553,232 | | |
| Shareholder Services fees (Note 2) | | 770,210 | | | | 913,675 | | | | 862,907 | | |
| Administration fees (Note 2) | | 308,084 | | | | 365,470 | | | | 345,163 | | |
| Sub-Advisory fees (Note 2) | | 154,042 | | | | 182,735 | | | | 159,465 | | |
| Expense recouped by the Adviser (Note 2) | | 52,470 | | | | — | | | | — | | |
| Sub-Administration fees (Note 2) | | 56,827 | | | | 67,928 | | | | 62,604 | | |
| Trustees’ fees and expenses (Note 2) | | 13,283 | | | | 13,283 | | | | 13,283 | | |
| Custody and accounting fees | | 43,993 | | | | 31,889 | | | | 42,895 | | |
| Transfer agent fees | | 64,894 | | | | 66,479 | | | | 76,379 | | |
| Professional fees * | | 22,798 | | | | 27,295 | | | | 25,979 | | |
| Registration fees | | 17,054 | | | | 18,622 | | | | 17,491 | | |
| Other expenses ** | | 36,766 | | | | 42,611 | | | | 42,677 | | |
| Total expenses before waivers and reimbursements: | | 2,002,547 | | | | 2,643,662 | | | | 3,202,075 | | |
| Less: Fee waiver by the Adviser (Note 2) | | — | | | | — | | | | (6,792 | ) | |
| Net expenses | | 2,002,547 | | | | 2,643,662 | | | | 3,195,283 | | |
| Net investment income | | 1,420,004 | | | | 3,545,843 | | | | 3,921,337 | | |
| | |
| NET REALIZED AND UNREALIZED GAIN (LOSS) ON INVESTMENTS | | | | | | | | | | | | |
| Realized gain (loss) on: | | | | | | | | | | | | |
| Investments (2) | | 195,707 | | | | (3,013,237 | ) | | | 20,108,837 | | |
| Foreign currency and forward currency transactions | | — | | | | 2,634,294 | | | | 6 | | |
| Capital gain distributions from Underlying Funds | | — | | | | — | | | | — | | |
| Increase (decrease) in unrealized appreciation (depreciation) on: | | | | | | | | | | | | |
| Investments (3) | | (3,289,826 | ) | | | (12,330,641 | ) | | | 29,011,996 | | |
| Foreign currency and forward currency transactions | | — | | | | (528,315 | ) | | | — | | |
| Net realized and unrealized gain (loss) on investments and foreign | | | | | | | | | | | | |
| currency transactions | | (3,094,119 | ) | | | (13,237,899 | ) | | | 49,120,839 | | |
| | |
| Net increase (decrease) in net assets resulting from operations | $ | (1,674,115 | ) | | $ | (9,692,056 | ) | | $ | 53,042,176 | | |
| (1) Interest income includes security lending income of: | $ | — | | | $ | 41,454 | | | $ | 50,217 | | |
| (2) Net of capital gain country tax of: | $ | — | | | $ | — | | | $ | — | | |
| (3) Net of increase of deferred capital gain country tax accrual of: | $ | — | | | $ | — | | | $ | — | | |
| * Professional fees include, but are not limited to, fees associated | | | | | | | | | | | | |
| with legal, audit and tax services. | | | | | | | | | | | | |
| ** Other expenses include, but are not limited to, fees associated | | | | | | | | | | | | |
| with insurance and printing services. | | | | | | | | | | | | |
See notes to financial statements
32
| | SA U.S. | | SA U.S. | | SA International | | SA International | | SA | | SA | | SA | |
| | Value | | Small Company | | Value | | Small Company | | Emerging Markets | | Real Estate | | Worldwide Moderate | |
| Fund | | Fund | | Fund | | Fund | | Value Fund | | Securities Fund | | Growth Fund | |
| | |
| | |
| | $ | 6,352,797 | | $ | 2,719,301 | | | $ | 9,631,126 | | | $ | 3,166,149 | | $ | 2,148,901 | | | $ | 4,645,893 | | | $ | — | | |
| | — | | | — | | | | — | | | | — | | | — | | | | — | | | | 231,154 | | |
| | 14,363 | | | 187,000 | | | | 293,991 | | | | — | | | 20,290 | | | | 7,615 | | | | — | | |
| | 18 | | | 24,773 | | | | 95,175 | | | | 2,486 | | | 38 | | | | — | | | | — | | |
| | — | | | (894 | ) | | | (493,936 | ) | | | — | | | (318,828 | ) | | | — | | | | — | | |
| | 6,367,178 | | | 2,930,180 | | | | 9,526,356 | | | | 3,168,635 | | | 1,850,401 | | | | 4,653,508 | | | | 231,154 | | |
| | | | | | | | | | | | | | | | | | | | | | | | | | |
| | 1,226,423 | | | 878,208 | | | | 1,628,783 | | | | 801,867 | | | 449,962 | | | | 310,134 | | | | — | | |
| | 681,346 | | | 487,893 | | | | 814,392 | | | | 400,934 | | | 224,981 | | | | 221,525 | | | | — | | |
| | 272,538 | | | 195,157 | | | | 325,757 | | | | 160,374 | | | 89,992 | | | | 88,610 | | | | — | | |
| | 272,538 | | | 683,051 | | | | 651,513 | | | | — | | | 449,962 | | | | 132,915 | | | | — | | |
| | 47,235 | | | — | | | | — | | | | — | | | — | | | | — | | | | — | | |
| | 48,654 | | | 34,730 | | | | 57,835 | | | | 29,726 | | | 15,847 | | | | 17,235 | | | | 1,522 | | |
| | 13,283 | | | 13,283 | | | | 13,283 | | | | 13,283 | | | 13,283 | | | | 13,283 | | | | 13,283 | | |
| | 24,136 | | | 48,333 | | | | — | | | | — | | | 105,457 | | | | 23,117 | | | | 15,798 | | |
| | 74,957 | | | 73,903 | | | | 77,076 | | | | 73,619 | | | 66,637 | | | | 68,233 | | | | — | | |
| | 22,784 | | | 23,198 | | | | 24,567 | | | | 19,175 | | | 27,134 | | | | 21,572 | | | | 10,829 | | |
| | 16,174 | | | 14,700 | | | | 17,543 | | | | 13,911 | | | 12,561 | | | | 11,993 | | | | 10,454 | | |
| | 36,501 | | | 30,392 | | | | 45,286 | | | | 31,789 | | | 26,287 | | | | 21,895 | | | | 2,787 | | |
| | 2,736,569 | | | 2,482,848 | | | | 3,656,035 | | | | 1,544,678 | | | 1,482,103 | | | | 930,512 | | | | 54,673 | | |
| | — | | | (140,961 | ) | | | — | | | | — | | | (222,209 | ) | | | (44,413 | ) | | | (54,673 | ) | |
| | 2,736,569 | | | 2,341,887 | | | | 3,656,035 | | | | 1,544,678 | | | 1,259,894 | | | | 886,099 | | | | — | | |
| | 3,630,609 | | | 588,293 | | | | 5,870,321 | | | | 1,623,957 | | | 590,507 | | | | 3,767,409 | | | | 231,154 | | |
| | |
| | |
| | |
| | 17,645,721 | | | 16,089,174 | | | | 2,696,897 | | | | 48,735 | | | (1,510,230 | ) | | | 485,206 | | | | 2,393 | | |
| | — | | | — | | | | (344,124 | ) | | | — | | | (9,525 | ) | | | — | | | | — | | |
| | — | | | — | | | | — | | | | 7,655,854 | | | — | | | | — | | | | 297,670 | | |
| | |
| | 50,722,744 | | | 50,488,780 | | | | 80,030,534 | | | | 9,379,745 | | | 13,474,298 | | | | (12,834,509 | ) | | | 596,377 | | |
| | — | | | — | | | | 25,069 | | | | — | | | (7,372 | ) | | | — | | | | — | | |
| | |
| | 68,368,465 | | | 66,577,954 | | | | 82,408,376 | | | | 17,084,334 | | | 11,947,171 | | | | (12,349,303 | ) | | | 896,440 | | |
| | |
| $ | 71,999,074 | | $ | 67,166,247 | | | $ | 88,278,697 | | | $ | 18,708,291 | | $ | 12,537,678 | | | $ | (8,581,894 | ) | | $ | 1,127,594 | | |
| $ | 13,762 | | $ | 186,372 | | | $ | 294,814 | | | $ | — | | $ | 21,827 | | | $ | 7,427 | | | $ | — | | |
| $ | — | | $ | — | | | $ | — | | | $ | — | | $ | 23,670 | | | $ | — | | | $ | — | | |
| $ | — | | $ | — | | | $ | — | | | $ | — | | $ | 43,965 | | | $ | — | | | $ | — | | |
| | | | | | | | | | | | | | | | | | | | | | | | | | |
| | | | | | | | | | | | | | | | | | | | | | | | | | |
| | | | | | | | | | | | | | | | | | | | | | | | | | |
| | | | | | | | | | | | | | | | | | | | | | | | | | |
See notes to financial statements
33
STATEMENTS OF CHANGES IN NET ASSETS
| | SA U.S. Fixed Income Fund | |
| | Six Months Ended | | | | | |
| | December 31, 2016 | | Year Ended | |
| | (Unaudited) | | June 30, 2016 | |
| INCREASE (DECREASE) IN NET ASSETS | | | | | | | | | |
| Operations: | | | | | | | | | |
| Net investment income | | $ | 1,420,004 | | | $ | 1,906,528 | | |
| Net realized gain (loss) on investments and foreign currency transactions | | | 195,707 | | | | (75,004 | ) | |
| Net increase (decrease) in unrealized appreciation (depreciation) | | | (3,289,826 | ) | | | 1,958,649 | | |
| Net increase (decrease) in net assets from operations | | | (1,674,115 | ) | | | 3,790,173 | | |
| | |
| Distributions to shareholders from: | | | | | | | | | |
| Net investment income | | | (1,565,995 | ) | | | (1,786,239 | ) | |
| Net realized gains | | | — | | | | (848,180 | ) | |
| Total distributions | | | (1,565,995 | ) | | | (2,634,419 | ) | |
| | |
| Share transactions | | | | | | | | | |
| Proceeds from sale of shares | | | 60,445,853 | | | | 143,461,977 | | |
| Value of distributions reinvested | | | 1,525,865 | | | | 2,583,017 | | |
| Cost of shares redeemed | | | (66,964,315 | ) | | | (144,216,312 | ) | |
| Total share transactions | | | (4,992,597 | ) | | | 1,828,682 | | |
| Total increase (decrease) in net assets | | | (8,232,707 | ) | | | 2,984,436 | | |
| | |
| NET ASSETS | | | | | | | | | |
| Beginning of year | | | 615,113,741 | | | | 612,129,305 | | |
| End of period | | $ | 606,881,034 | | | $ | 615,113,741 | | |
| | |
| Undistributed net investment income (loss), end of period | | $ | (25,702 | ) | | $ | 120,289 | | |
| CAPITAL SHARE TRANSACTIONS | | | | | | | | | |
| Shares sold by subscription | | | 5,925,208 | | | | 14,066,549 | | |
| Shares issued for distributions reinvested | | | 149,941 | | | | 253,836 | | |
| Shares redeemed | | | (6,564,491 | ) | | | (14,141,186 | ) | |
| Net increase (decrease) in fund shares | | | (489,342 | ) | | | 179,199 | | |
See notes to financial statements
34
| | SA Global Fixed Income Fund | | SA U.S. Core Market Fund | |
| Six Months Ended | | | | | | Six Months Ended | | | | | |
| December 31, 2016 | | Year Ended | | December 31, 2016 | | Year Ended | |
| (Unaudited) | | June 30, 2016 | | (Unaudited) | | June 30, 2016 | |
| | |
| | |
| $ | 3,545,843 | | | $ | 6,743,599 | | | $ | 3,921,337 | | | $ | 7,236,062 | | |
| | (378,943 | ) | | | (942,950 | ) | | | 20,108,843 | | | | 27,971,437 | | |
| | (12,858,956 | ) | | | 11,436,009 | | | | 29,011,996 | | | | (27,830,841 | ) | |
| | (9,692,056 | ) | | | 17,236,658 | | | | 53,042,176 | | | | 7,376,658 | | |
| | |
| | (4,863,643 | ) | | | (4,200,039 | ) | | | (8,632,903 | ) | | | (5,958,899 | ) | |
| | (1,734,127 | ) | | | (521,751 | ) | | | (32,247,166 | ) | | | — | | |
| | | (6,597,770 | ) | | | (4,721,790 | ) | | | (40,880,069 | ) | | | (5,958,899 | ) | |
| | |
| | |
| | 62,782,830 | | | | 145,648,330 | | | | 48,094,490 | | | | 126,843,737 | | |
| | 6,458,680 | | | | 4,651,680 | | | | 40,305,496 | | | | 5,877,205 | | |
| | (71,355,891 | ) | | | (183,328,698 | ) | | | (72,068,726 | ) | | | (165,181,376 | ) | |
| | (2,114,381 | ) | | | (33,028,688 | ) | | | 16,331,260 | | | | (32,460,434 | ) | |
| | (18,404,207 | ) | | | (20,513,820 | ) | | | 28,493,367 | | | | (31,042,675 | ) | |
| | |
| | 732,949,095 | | | | 753,462,915 | | | | 668,601,349 | | | | 699,644,024 | | |
| $ | 714,544,888 | | | $ | 732,949,095 | | | $ | 697,094,716 | | | $ | 668,601,349 | | |
| | |
| $ | 63,702 | | | $ | 1,381,502 | | | $ | 24,404 | | | $ | 4,735,970 | | |
| | |
| | 6,463,887 | | | | 15,059,520 | | | | 2,362,629 | | | | 6,685,684 | | |
| | 671,023 | | | | 482,301 | | | | 2,004,251 | | | | 310,143 | | |
| | (7,344,774 | ) | | | (18,953,038 | ) | | | (3,541,582 | ) | | | (8,745,865 | ) | |
| | (209,864 | ) | | | (3,411,217 | ) | | | 825,298 | | | | (1,750,038 | ) | |
See notes to financial statements
35
STATEMENTS OF CHANGES IN NET ASSETS (Continued)
| SA U.S. Value Fund | |
| Six Months Ended | | | | | |
| December 31, 2016 | | Year Ended | |
| (Unaudited) | | June 30, 2016 | |
| INCREASE (DECREASE) IN NET ASSETS | | | | | | | | |
| Operations: | | | | | | | | |
| Net investment income | $ | 3,630,609 | | | $ | 7,927,822 | | |
| Net realized gain (loss) on investments and foreign currency transactions | | 17,645,721 | | | | 18,881,361 | | |
| Net increase (decrease) in unrealized appreciation (depreciation) | | 50,722,744 | | | | (35,202,715 | ) | |
| Net increase (decrease) in net assets from operations | | 71,999,074 | | | | (8,393,532 | ) | |
| | |
| Distributions to shareholders from: | | | | | | | | |
| Net investment income | | (7,686,726 | ) | | | (6,964,473 | ) | |
| Net realized gains | | (19,834,192 | ) | | | (26,041,905 | ) | |
| Total distributions | | (27,520,918 | ) | | | (33,006,378 | ) | |
| | |
| Share transactions | | | | | | | | |
| Proceeds from sale of shares | | 38,015,894 | | | | 101,298,110 | | |
| Value of distributions reinvested | | 27,138,156 | | | | 32,564,376 | | |
| Cost of shares redeemed | | (61,164,244 | ) | | | (119,700,445 | ) | |
| Total share transactions | | 3,989,806 | | | | 14,162,041 | | |
| Total increase (decrease) in net assets | | 48,467,962 | | | | (27,237,869 | ) | |
| NET ASSETS | | | | | | | | |
| Beginning of year | | 519,215,371 | | | | 546,453,240 | | |
| End of period | $ | 567,683,333 | | | $ | 519,215,371 | | |
| | |
| Undistributed net investment income, end of period | $ | 14,363 | | | $ | 4,070,480 | | |
| CAPITAL SHARE TRANSACTIONS | | | | | | | | |
| Shares sold by subscription | | 2,227,831 | | | | 6,304,051 | | |
| Shares issued for distributions reinvested | | 1,534,096 | | | | 2,099,573 | | |
| Shares redeemed | | (3,566,922 | ) | | | (7,503,188 | ) | |
| Net increase in fund shares | | 195,005 | | | | 900,436 | | |
See notes to financial statements
36
| | SA U.S. Small Company Fund | | SA International Value Fund | |
| Six Months Ended | | | | | | Six Months Ended | | | | | |
| December 31, 2016 | | Year Ended | | December 31, 2016 | | Year Ended | |
| (Unaudited) | | June 30, 2016 | | (Unaudited) | | June 30, 2016 | |
| | |
| | |
| $ | 588,293 | | | $ | 1,530,003 | | | $ | 5,870,321 | | | $ | 15,882,717 | | |
| | | 16,089,174 | | | | 22,827,043 | | | | 2,352,773 | | | | (13,989,583 | ) | |
| | 50,488,780 | | | | (46,118,483 | ) | | | 80,055,603 | | | | (127,220,754 | ) | |
| | 67,166,247 | | | | (21,761,437 | ) | | | 88,278,697 | | | | (125,327,620 | ) | |
| | |
| | |
| | (1,239,503 | ) | | | (1,340,724 | ) | | | (19,000,049 | ) | | | (11,905,295 | ) | |
| | (19,100,258 | ) | | | (27,243,542 | ) | | | — | | | | — | | |
| | (20,339,761 | ) | | | (28,584,266 | ) | | | (19,000,049 | ) | | | (11,905,295 | ) | |
| | |
| | |
| | 24,935,694 | | | | 69,178,100 | | | | 48,235,781 | | | | 155,830,245 | | |
| | 20,070,148 | | | | 28,217,743 | | | | 18,741,550 | | | | 11,752,609 | | |
| | (45,187,164 | ) | | | (85,285,331 | ) | | | (63,519,261 | ) | | | (138,494,707 | ) | |
| | (181,322 | ) | | | 12,110,512 | | | | 3,458,070 | | | | 29,088,147 | | |
| | 46,645,164 | | | | (38,235,191 | ) | | | 72,736,718 | | | | (108,144,768 | ) | |
| | |
| | 366,164,478 | | | | 404,399,669 | | | | 602,564,809 | | | | 710,709,577 | | |
| $ | 412,809,642 | | | $ | 366,164,478 | | | $ | 675,301,527 | | | $ | 602,564,809 | | |
| | |
| $ | (254,800 | ) | | $ | 396,410 | | | $ | 2,959,153 | | | $ | 16,088,881 | | |
| | |
| | 1,030,860 | | | | 3,037,867 | | | | 4,854,779 | | | | 16,003,874 | | |
| | 787,992 | | | | 1,298,562 | | | | 1,832,019 | | | | 1,217,887 | | |
| | (1,853,859 | ) | | | (3,760,085 | ) | | | (6,385,781 | ) | | | (14,136,387 | ) | |
| | (35,007 | ) | | | 576,344 | | | | 301,017 | | | | 3,085,374 | | |
See notes to financial statements
37
STATEMENTS OF CHANGES IN NET ASSETS (Continued)
| SA International Small Company Fund | |
| Six Months Ended | | | | | |
| December 31, 2016 | | Year Ended | |
| (Unaudited) | | June 30, 2016 | |
| INCREASE (DECREASE) IN NET ASSETS | | | | | | | | |
| Operations: | | | | | | | | |
| Net investment income | $ | 1,623,957 | | | $ | 6,814,716 | | |
| Net realized gain (loss) on investments and foreign currency transactions | | 7,704,589 | | | | 3,323,085 | | |
| Net increase (decrease) in unrealized appreciation (depreciation) | | 9,379,745 | | | | (26,660,828 | ) | |
| Net increase (decrease) in net assets from operations | | 18,708,291 | | | | (16,523,027 | ) | |
| | |
| Distributions to shareholders from: | | | | | | | | |
| Net investment income | | (5,697,584 | ) | | | (3,046,363 | ) | |
| Net realized gains | | (6,714,423 | ) | | | (8,910,053 | ) | |
| Total distributions | | (12,412,007 | ) | | | (11,956,416 | ) | |
| | |
| Share transactions | | | | | | | | |
| Proceeds from sale of shares | | 22,019,168 | | | | 58,720,813 | | |
| Value of distributions reinvested | | 12,249,956 | | | | 11,806,935 | | |
| Cost of shares redeemed | | (31,025,388 | ) | | | (72,205,124 | ) | |
| Total share transactions | | 3,243,736 | | | | (1,677,376 | ) | |
| Total increase (decrease) in net assets | | 9,540,020 | | | | (30,156,819 | ) | |
| NET ASSETS | | | | | | | | |
| Beginning of year | | 307,502,497 | | | | 337,659,316 | | |
| End of period | $ | 317,042,517 | | | $ | 307,502,497 | | |
| | |
| Net investment loss, end of period | $ | (557,978 | ) | | $ | 3,515,649 | | |
| CAPITAL SHARE TRANSACTIONS | | | | | | | | |
| Shares sold by subscription | | 1,120,630 | | | | 3,077,019 | | |
| Shares issued for distributions reinvested | | 650,555 | | | | 630,376 | | |
| Shares redeemed | | (1,575,866 | ) | | | (3,800,918 | ) | |
| Net increase in fund shares | | 195,319 | | | | (93,523 | ) | |
See notes to financial statements
38
| SA Emerging Markets Value Fund | | SA Real Estate Securities Fund | |
| Six Months Ended | | | | | | Six Months Ended | | | | | |
| December 31, 2016 | | Year Ended | | December 31, 2016 | | Year Ended | |
| (Unaudited) | | June 30, 2016 | | (Unaudited) | | June 30, 2016 | |
| | |
| | |
| $ | 590,507 | | | $ | 2,302,833 | | | $ | 3,767,409 | | | $ | 4,123,760 | | |
| | (1,519,755 | ) | | | (7,885,385 | ) | | | 485,206 | | | | 3,112,071 | | |
| | 13,466,926 | | | | (15,040,967 | ) | | | (12,834,509 | ) | | | 29,215,746 | | |
| | 12,537,678 | | | | (20,623,519 | ) | | | (8,581,894 | ) | | | 36,451,577 | | |
| | |
| | |
| | (2,156,880 | ) | | | (1,817,756 | ) | | | (5,124,470 | ) | | | (3,077,193 | ) | |
| | — | | | | — | | | | (935,057 | ) | | | — | | |
| | (2,156,880 | ) | | | (1,817,756 | ) | | | (6,059,527 | ) | | | (3,077,193 | ) | |
| | |
| | |
| | 16,844,762 | | | | 57,015,554 | | | | 13,356,086 | | | | 33,128,827 | | |
| | 2,128,084 | | | | 1,793,716 | | | | 5,971,156 | | | | 3,031,526 | | |
| | (17,799,937 | ) | | | (36,800,838 | ) | | | (19,856,701 | ) | | | (43,564,419 | ) | |
| | 1,172,909 | | | | 22,008,432 | | | | (529,459 | ) | | | (7,404,066 | ) | |
| | 11,553,707 | | | | (432,843 | ) | | | (15,170,880 | ) | | | 25,970,318 | | |
| | |
| | 166,787,586 | | | | 167,220,429 | | | | 186,215,833 | | | | 160,245,515 | | |
| $ | 178,341,293 | | | $ | 166,787,586 | | | $ | 171,044,953 | | | $ | 186,215,833 | | |
| | |
| $ | (863,389 | ) | | $ | 702,984 | | | $ | 718,027 | | | $ | 2,075,088 | | |
| | |
| | 2,007,472 | | | | 7,665,171 | | | | 1,142,542 | | | | 3,097,563 | | |
| | 262,079 | | | | 251,926 | | | | 546,309 | | | | 285,454 | | |
| | (2,118,627 | ) | | | (4,962,735 | ) | | | (1,677,834 | ) | | | (4,063,892 | ) | |
| | 150,924 | | | | 2,954,362 | | | | 11,017 | | | | (680,875 | ) | |
See notes to financial statements
39
STATEMENTS OF CHANGES IN NET ASSETS (Continued)
| SA Worldwide Moderate Growth Fund | |
| Six Months Ended | | | | | |
| December 31, 2016 | | Year Ended | |
| (Unaudited) | | June 30, 2016(1) | |
| INCREASE (DECREASE) IN NET ASSETS | | | | | | | | |
| Operations: | | | | | | | | |
| Net investment income | $ | 231,154 | | | $ | 58,781 | | |
| Net realized gain (loss) on investments and foreign currency transactions | | 300,063 | | | | 54,945 | | |
| Net increase (decrease) in unrealized appreciation (depreciation) | | 596,377 | | | | 108,924 | | |
| Net increase (decrease) in net assets from operations | | 1,127,594 | | | | 222,650 | | |
| | |
| Distributions to shareholders from: | | | | | | | | |
| Net investment income | | (242,453 | ) | | | (55,637 | ) | |
| Net realized gains | | (90,385 | ) | | | — | | |
| Total distributions | | (332,838 | ) | | | (55,637 | ) | |
| | |
| Share transactions | | | | | | | | |
| Proceeds from sale of shares | | 6,046,875 | | | | 12,218,002 | (2) | |
| Value of distributions reinvested | | 329,206 | | | | 54,548 | | |
| Cost of shares redeemed | | (1,521,353 | ) | | | (777,076 | ) | |
| Total share transactions | | 4,854,728 | | | | 11,495,474 | | |
| Total increase (decrease) in net assets | | 5,649,484 | | | | 11,662,487 | | |
| NET ASSETS | | | | | | | | |
| Beginning of year | | 11,662,487 | | | | — | | |
| End of period | $ | 17,311,971 | | | $ | 11,662,487 | | |
| | |
| Net investment loss, end of period | $ | (5,525 | ) | | $ | 5,774 | | |
| CAPITAL SHARE TRANSACTIONS | | | | | | | | |
| Shares sold by subscription | | 608,795 | | | | 1,305,312 | (2) | |
| Shares issued for distributions reinvested | | 32,627 | | | | 5,840 | | |
| Shares redeemed | | (153,094 | ) | | | (84,627 | ) | |
| Net increase in fund shares | | 488,328 | | | | 1,226,525 | | |
| (1) | | Fund commenced operations on July 1, 2015. |
| (2) | | On July 1, 2015, the SA Worldwide Moderate Growth Fund purchased 10,000 shares for a total of $100,000 to act as initial seed capital for the Fund. |
See notes to financial statements
40
FINANCIAL HIGHLIGHTS
| | SA U.S. Fixed Income Fund |
| | Six Months Ended | | | | | | | | | | | | | | | | | | | | |
| | December 31, 2016 | | Year Ended June 30 |
| | (Unaudited) | | 2016 | | 2015 | | 2014 | | 2013 | | 2012 |
| Net asset value, beginning of period | | $ | 10.22 | | | $ | 10.20 | | | $ | 10.19 | | | $ | 10.20 | | | $ | 10.24 | | | $ | 10.27 | |
| |
| Income from investment operations: | | | | | | | | | | | | | | | | | | | | | | |
| Net investment income (loss) | | | 0.02 | | | | 0.03 | | | | 0.00 | (1) | | | (0.02 | ) | | | (0.01 | ) | | | 0.01 | |
| Net realized and unrealized | | | | | | | | | | | | | | | | | | | | | | | | |
| gain (loss) on investments | | | (0.04 | ) | | | 0.03 | | | | 0.01 | | | | 0.01 | | | | — | | | | 0.01 | |
| Total from investment operations | | | (0.02 | ) | | | 0.06 | | | | 0.01 | | | | (0.01 | ) | | | (0.01 | ) | | | 0.02 | |
| |
| Less distributions from: | | | | | | | | | | | | | | | | | | | | | | | | |
| Net investment income | | | (0.03 | ) | | | (0.03 | ) | | | — | | | | — | | | | — | | | | (0.01 | ) |
| Capital gains | | | — | | | | (0.01 | ) | | | (0.00 | )(1) | | | (0.00 | )(1) | | | (0.03 | ) | | | (0.04 | ) |
| Total distributions | | | (0.03 | ) | | | (0.04 | ) | | | (0.00 | )(1) | | | (0.00 | )(1) | | | (0.03 | ) | | | (0.05 | ) |
| |
| Net asset value, end of period | | $ | 10.17 | | | $ | 10.22 | | | $ | 10.20 | | | $ | 10.19 | | | $ | 10.20 | | | $ | 10.24 | |
| |
| Total return (2) | | | (0.23 | )% | | | 0.53 | % | | | 0.22 | % | | | (0.07 | )% | | | (0.10 | )% | | | 0.16 | % |
| Net assets, end of period (000s) | | $ | 606,881 | | | $ | 615,114 | | | $ | 612,129 | | | $ | 564,205 | | | $ | 430,976 | | | $ | 368,700 | |
| Ratio of net expenses to | | | | | | | | | | | | | | | | | | | | | | | | |
| average net assets (3) | | | 0.65 | % | | | 0.65 | % | | | 0.65 | % | | | 0.65 | % | | | 0.65 | % | | | 0.65 | % |
| Ratio of gross expenses to | | | | | | | | | | | | | | | | | | | | | | | | |
| average net assets (3) | | | 0.65 | % | | | 0.65 | % | | | 0.74 | %(4) | | | 0.75 | %(4) | | | 0.81 | %(4) | | | 0.83 | %(4) |
| Ratio of net investment income | | | | | | | | | | | | | | | | | | | | | | | | |
| (loss) to average net assets (3) | | | 0.46 | % | | | 0.31 | % | | | (0.01 | )% | | | (0.23 | )% | | | (0.14 | )% | | | 0.05 | % |
| Portfolio turnover rate | | | 63 | % | | | 140 | % | | | 202 | % | | | 94 | % | | | 33 | % | | | 95 | % |
| Without giving effect to the expense | | | | | | | | | | | | | | | | | | | | | | | | |
| waiver described in Note 2 | | | | | | | | | | | | | | | | | | | | | | | | |
| to the Financial Statements, | | | | | | | | | | | | | | | | | | | | | | | | |
| net investment income (loss) | | | | | | | | | | | | | | | | | | | | | | | | |
| per share would have been | | $ | 0.02 | | | $ | 0.03 | | | $ | (0.01 | )(4) | | $ | (0.03 | )(4) | | $ | (0.03 | )(4) | | $ | (0.01 | )(4) |
| (1) | | Amount rounds to less than $0.005 per share. |
| (2) | | Periods less than one year are not annualized. |
| (3) | | Annualized for periods less than one year. |
| (4) | | Gross expenses before waivers of expenses. |
See notes to financial statements
41
FINANCIAL HIGHLIGHTS (Continued)
| | SA Global Fixed Income Fund |
| | Six Months Ended | | | | | | | | | | | | | | | | |
| | December 31, 2016 | | Year Ended June 30 |
| | (Unaudited) | | 2016 | | 2015 | | 2014 | | 2013 | | 2012 |
| Net asset value, beginning of period | | $ | 9.79 | | | $ | 9.63 | | | $ | 9.69 | | | $ | 9.68 | | | $ | 9.95 | | | $ | 10.03 | |
| |
| Income from investment | | | | | | | | | | | | | | | | | | | | | | | | |
| operations: | | | | | | | | | | | | | | | | | | | | | | | | |
| Net investment income | | | 0.05 | | | | 0.06 | | | | 0.11 | | | | 0.10 | | | | 0.11 | | | | 0.19 | |
| Net realized and unrealized | | | | | | | | | | | | | | | | | | | | | | | | |
| gain (loss) on investments | | | (0.18 | ) | | | 0.17 | | | | (0.01 | ) | | | — | | | | (0.06 | ) | | | — | |
| Total from investment operations | | | (0.13 | ) | | | 0.23 | | | | 0.10 | | | | 0.10 | | | | 0.05 | | | | 0.19 | |
| |
| Less distributions from: | | | | | | | | | | | | | | | | | | | | | | | | |
| Net investment income | | | (0.07 | ) | | | (0.06 | ) | | | (0.15 | ) | | | (0.09 | ) | | | (0.32 | ) | | | (0.27 | ) |
| Capital gains | | | (0.02 | ) | | | (0.01 | ) | | | (0.01 | ) | | | — | | | | — | | | | — | |
| Total distributions | | | (0.09 | ) | | | (0.07 | ) | | | (0.16 | ) | | | (0.09 | ) | | | (0.32 | ) | | | (0.27 | ) |
| |
| Net asset value, end of period | | $ | 9.57 | | | $ | 9.79 | | | $ | 9.63 | | | $ | 9.69 | | | $ | 9.68 | | | $ | 9.95 | |
| |
| Total return (1) | | | (1.34 | )% | | | 2.32 | % | | | 1.00 | % | | | 0.99 | % | | | 0.48 | % | | | 1.96 | % |
| Net assets, end of period (000s) | | $ | 714,545 | | | $ | 732,949 | | | $ | 753,463 | | | $ | 724,587 | | | $ | 603,798 | | | $ | 555,836 | |
| Ratio of net expenses to | | | | | | | | | | | | | | | | | | | | | | | | |
| average net assets (2) | | | 0.72 | % | | | 0.73 | % | | | 0.79 | % | | | 0.80 | % | | | 0.80 | % | | | 0.82 | % |
| Ratio of gross expenses to | | | | | | | | | | | | | | | | | | | | | | | | |
| average net assets (2) | | | 0.72 | % | | | 0.73 | % | | | 0.79 | % | | | 0.80 | %(3) | | | 0.80 | %(3) | | | 0.82 | %(3) |
| Ratio of net investment income | | | | | | | | | | | | | | | | | | | | | | | | |
| to average net assets (2) | | | 0.97 | % | | | 0.91 | % | | | 1.04 | % | | | 1.00 | % | | | 1.19 | % | | | 1.85 | % |
| Portfolio turnover rate | | | 19 | % | | | 42 | % | | | 72 | % | | | 24 | % | | | 36 | % | | | 36 | % |
| Without giving effect to the expense | | | | | | | | | | | | | | | | | | | | | | | | |
| waiver described in Note 2 | | | | | | | | | | | | | | | | | | | | | | | | |
| to the Financial Statements, | | | | | | | | | | | | | | | | | | | | | | | | |
| net investment income (loss) | | | | | | | | | | | | | | | | | | | | | | | | |
| per share would have been | | $ | 0.05 | | | $ | 0.06 | | | $ | 0.11 | | | $ | 0.10 | (3) | | $ | 0.11 | (3) | | $ | 0.19 | (3) |
| (1) | | Periods less than one year are not annualized. |
| (2) | | Annualized for periods less than one year. |
| (3) | | Gross expenses before waivers of expenses. |
See notes to financial statements
42
FINANCIAL HIGHLIGHTS (Continued)
| | SA U.S. Core Market Fund |
| | Six Months Ended | | | | | | | | | | | | | | | | |
| | December 31, 2016 | | Year Ended June 30 |
| | (unaudited) | | 2016 | | 2015 | | 2014 | | 2013 | | 2012 |
| Net asset value, beginning | | | | | | | | | | | | | | | | | | | | | | | | |
| of period | | $ | 19.56 | | | $ | 19.47 | | | $ | 18.49 | | | $ | 14.99 | | | $ | 12.57 | | | $ | 12.31 | |
| |
| Income from investment | | | | | | | | | | | | | | | | | | | | | | | | |
| operations: | | | | | | | | | | | | | | | | | | | | | | | | |
| Net investment income | | | 0.12 | | | | 0.21 | | | | 0.19 | | | | 0.14 | | | | 0.17 | | | | 0.13 | |
| Net realized and unrealized | | | | | | | | | | | | | | | | | | | | | | | | |
| gain (loss) on investments | | | 1.47 | | | | 0.05 | | | | 0.95 | | | | 3.50 | | | | 2.44 | | | | 0.21 | |
| Total from investment operations | | | 1.59 | | | | 0.26 | | | | 1.14 | | | | 3.64 | | | | 2.61 | | | | 0.34 | |
| |
| Less distributions from: | | | | | | | | | | | | | | | | | | | | | | | | |
| Net investment income | | | (0.26 | ) | | | (0.17 | ) | | | (0.16 | ) | | | (0.14 | ) | | | (0.19 | ) | | | (0.08 | ) |
| Capital gains | | | (0.97 | ) | | | — | | | | — | | | | — | | | | — | | | | — | |
| Total distributions | | | (1.23 | ) | | | (0.17 | ) | | | (0.16 | ) | | | (0.14 | ) | | | (0.19 | ) | | | (0.08 | ) |
| |
| Net asset value, end of period | | $ | 19.92 | | | $ | 19.56 | | | $ | 19.47 | | | $ | 18.49 | | | $ | 14.99 | | | $ | 12.57 | |
| |
| Total return (1) | | | 8.09 | % | | | 1.31 | % | | | 6.22 | % | | | 24.36 | % | | | 20.98 | % | | | 2.80 | % |
| Net assets, end of period (000s) | | $ | 697,095 | | | $ | 668,601 | | | $ | 699,644 | | | $ | 662,126 | | | $ | 482,418 | | | $ | 405,579 | |
| Ratio of net expenses to | | | | | | | | | | | | | | | | | | | | | | | | |
| average net assets (2) | | | 0.93 | % | | | 0.98 | % | | | 1.00 | % | | | 1.00 | % | | | 1.00 | % | | | 1.00 | % |
| Ratio of gross expenses to | | | | | | | | | | | | | | | | | | | | | | | | |
| average net assets (2) | | | 0.93 | % | | | 0.98 | % | | | 1.00 | % | | | 1.00 | % | | | 1.07 | %(3) | | | 1.09 | %(3) |
| Ratio of net investment income | | | | | | | | | | | | | | | | | | | | | | | | |
| to average net assets (2) | | | 1.14 | % | | | 1.09 | % | | | 0.99 | % | | | 0.89 | % | | | 1.20 | % | | | 1.04 | % |
| Portfolio turnover rate | | | 6 | % | | | 11 | % | | | 10 | % | | | 11 | % | | | 5 | % | | | 6 | % |
| Without giving effect to the expense | | | | | | | | | | | | | | | | | | | | | | | | |
| waiver described in Note 2 | | | | | | | | | | | | | | | | | | | | | | | | |
| to the Financial Statements, | | | | | | | | | | | | | | | | | | | | | | | | |
| net investment income (loss) | | | | | | | | | | | | | | | | | | | | | | | | |
| per share would have been | | $ | 0.12 | | | $ | 0.21 | | | $ | 0.19 | | | $ | 0.14 | | | $ | 0.16 | (3) | | $ | 0.12 | (3) |
| (1) | | Periods less than one year are not annualized. |
| (2) | | Annualized for periods less than one year. |
| (3) | | Gross expenses before waivers of expenses. |
See notes to financial statements
43
FINANCIAL HIGHLIGHTS (Continued)
| | SA U.S. Value Fund |
| | Six Months Ended | | | | | | | | | | | | | | | | | | | | |
| | December 31, 2016 | | Year Ended June 30, |
| | (Unaudited) | | 2016 | | 2015 | | 2014 | | 2013 | | 2012 |
| Net asset value, | | | | | | | | | | | | | | | | | | | | | | | | |
| beginning of period | | $ | 16.11 | | | $ | 17.45 | | | $ | 18.08 | | | $ | 14.63 | | | $ | 11.22 | | | $ | 11.81 | |
| |
| Income from investment | | | | | | | | | | | | | | | | | | | | | | | | |
| operations: | | | | | | | | | | | | | | | | | | | | | | | | |
| Net investment income | | | 0.12 | | | | 0.24 | | | | 0.20 | | | | 0.14 | | | | 0.15 | | | | 0.13 | |
| Net realized and unrealized | | | | | | | | | | | | | | | | | | | | | | | | |
| gain (loss) on investments | | | 2.17 | | | | (0.52 | ) | | | 0.23 | | | | 3.77 | | | | 3.41 | | | | (0.62 | ) |
| Total from investment | | | | | | | | | | | | | | | | | | | | | | | | |
| operations | | | 2.29 | | | | (0.28 | ) | | | 0.43 | | | | 3.91 | | | | 3.56 | | | | (0.49 | ) |
| Less distributions from: | | | | | | | | | | | | | | | | | | | | | | | | |
| Net investment income | | | (0.25 | ) | | | (0.22 | ) | | | (0.17 | ) | | | (0.13 | ) | | | (0.15 | ) | | | (0.10 | ) |
| Capital gains | | | (0.64 | ) | | | (0.84 | ) | | | (0.89 | ) | | | (0.33 | ) | | | — | | | | — | |
| Total distributions | | | (0.89 | ) | | | (1.06 | ) | | | (1.06 | ) | | | (0.46 | ) | | | (0.15 | ) | | | (0.10 | ) |
| Net asset value, end of period | | $ | 17.51 | | | $ | 16.11 | | | $ | 17.45 | | | $ | 18.08 | | | $ | 14.63 | | | $ | 11.22 | |
| |
| Total return (1) | | | 14.15 | % | | | (1.35 | )% | | | 2.54 | % | | | 27.01 | % | | | 31.92 | % | | | (4.02 | )% |
| Net assets, end of period (000s) | | $ | 567,683 | | | $ | 519,215 | | | $ | 546,453 | | | $ | 526,814 | | | $ | 383,854 | | | $ | 308,668 | |
| Ratio of net expenses to | | | | | | | | | | | | | | | | | | | | | | | | |
| average net assets (2) | | | 1.00 | % | | | 1.05 | % | | | 1.05 | % | | | 1.05 | % | | | 1.05 | % | | | 1.05 | % |
| Ratio of gross expenses to | | | | | | | | | | | | | | | | | | | | | | | | |
| average net assets (2) | | | 1.00 | % | | | 1.05 | % | | | 1.05 | %(3) | | | 1.06 | %(3) | | | 1.14 | %(3) | | | 1.17 | %(3) |
| Ratio of net investment income | | | | | | | | | | | | | | | | | | | | | | | | |
| to average net assets (2) | | | 1.33 | % | | | 1.55 | % | | | 1.17 | % | | | 0.90 | % | | | 1.14 | % | | | 1.21 | % |
| Portfolio turnover rate | | | 9 | % | | | 21 | % | | | 23 | % | | | 20 | % | | | 21 | % | | | 11 | % |
| Without giving effect to the | | | | | | | | | | | | | | | | | | | | | | | | |
| expense waiver described | | | | | | | | | | | | | | | | | | | | | | | | |
| in Note 2 to the Financial | | | | | | | | | | | | | | | | | | | | | | | | |
| Statements, net investment | | | | | | | | | | | | | | | | | | | | | | | | |
| income (loss) per share | | | | | | | | | | | | | | | | | | | | | | | | |
| would have been | | $ | 0.12 | | | $ | 0.24 | | | $ | 0.20 | (3) | | $ | 0.14 | (3) | | $ | 0.14 | (3) | | $ | 0.12 | (3) |
| (1) | | Periods less than one year are not annualized. |
| (2) | | Annualized for periods less than one year. |
| (3) | | Gross expenses before waivers of expenses. |
See notes to financial statements
44
FINANCIAL HIGHLIGHTS (Continued)
| SA U.S. Small Company Fund |
| Six Months Ended | | | | | | | | | | | | | | | | | | | | |
| December 31, 2016 | | Year Ended June 30, |
| (Unaudited) | | 2016 | | 2015 | | 2014 | | 2013 | | 2012 |
| Net asset value, beginning of period | $ | 22.40 | | | $ | 25.64 | | | $ | 25.77 | | | $ | 21.29 | | | $ | 16.94 | | | $ | 17.51 | |
| |
| Income from investment operations: | | | | | | | | | | | | | | | | | | | | | | | |
| Net investment income | | 0.04 | | | | 0.09 | | | | 0.07 | | | | 0.01 | | | | 0.18 | | | | 0.05 | |
| Net realized and unrealized | | | | | | | | | | | | | | | | | | | | | | | |
| gain (loss) on investments | | 4.18 | | | | (1.48 | ) | | | 1.11 | | | | 5.12 | | | | 4.40 | | | | (0.54 | ) |
| Total from investment operations | | 4.22 | | | | (1.39 | ) | | | 1.18 | | | | 5.13 | | | | 4.58 | | | | (0.49 | ) |
| Less distributions from: | | | | | | | | | | | | | | | | | | | | | | | |
| Net investment income | | (0.08 | ) | | | (0.09 | ) | | | (0.03 | ) | | | (0.03 | ) | | | (0.21 | ) | | | — | |
| Capital gains | | (1.23 | ) | | | (1.76 | ) | | | (1.28 | ) | | | (0.62 | ) | | | (0.02 | ) | | | (0.08 | ) |
| Total distributions | | (1.31 | ) | | | (1.85 | ) | | | (1.31 | ) | | | (0.65 | ) | | | (0.23 | ) | | | (0.08 | ) |
| Net asset value, end of period | $ | 25.31 | | | $ | 22.40 | | | $ | 25.64 | | | $ | 25.77 | | | $ | 21.29 | | | $ | 16.94 | |
| |
| Total return (1) | | 18.79 | % | | | (5.23 | )% | | | 4.81 | % | | | 24.29 | % | | | 27.26 | % | | | (2.74 | )% |
| Net assets, end of period (000s) | $ | 412,810 | | | $ | 366,164 | | | $ | 404,400 | | | $ | 385,094 | | | $ | 298,211 | | | $ | 245,839 | |
| Ratio of net expenses to | | | | | | | | | | | | | | | | | | | | | | | |
| average net assets (2) | | 1.20 | % | | | 1.20 | % | | | 1.20 | % | | | 1.20 | % | | | 1.20 | % | | | 1.20 | % |
| Ratio of gross expenses to | | | | | | | | | | | | | | | | | | | | | | | |
| average net assets (2)(3) | | 1.27 | % | | | 1.28 | % | | | 1.34 | % | | | 1.35 | % | | | 1.43 | % | | | 1.45 | % |
| Ratio of net investment income | | | | | | | | | | | | | | | | | | | | | | | |
| to average net assets (2) | | 0.30 | % | | | 0.42 | % | | | 0.27 | % | | | 0.05 | % | | | 0.96 | % | | | 0.31 | % |
| Portfolio turnover rate | | 6 | % | | | 12 | % | | | 11 | % | | | 13 | % | | | 23 | % | | | 14 | % |
| Without giving effect to the expense | | | | | | | | | | | | | | | | | | | | | | | |
| waiver described in Note 2 to | | | | | | | | | | | | | | | | | | | | | | | |
| the Financial Statements, net | | | | | | | | | | | | | | | | | | | | | | | |
| investment income (loss) per | | | | | | | | | | | | | | | | | | | | | | | |
| share would have been (3) | $ | 0.03 | | | $ | 0.07 | | | $ | 0.03 | | | $ | (0.01 | ) | | $ | 0.14 | | | $ | 0.01 | |
| (1) | | Periods less than one year are not annualized. |
| (2) | | Annualized for periods less than one year. |
| (3) | | Gross expenses before waivers of expenses. |
See notes to financial statements
45
FINANCIAL HIGHLIGHTS (Continued)
| SA International Value Fund |
| Six Months Ended | | | | | | | | | | | | | | | | | | | | |
| December 31, 2016 | | Year Ended June 30, |
| (Unaudited) | | 2016 | | 2015 | | 2014 | | 2013 | | 2012 |
| Net asset value, beginning of period | $ | 9.16 | | | $ | 11.34 | | | $ | 12.59 | | | $ | 10.16 | | | $ | 8.96 | | | $ | 11.50 | |
| |
| Income from investment operations: | | | | | | | | | | | | | | | | | | | | | | | |
| Net investment income | | 0.10 | | | | 0.25 | | | | 0.22 | | | | 0.40 | | | | 0.23 | | | | 0.24 | |
| Net realized and unrealized | | | | | | | | | | | | | | | | | | | | | | | |
| gain (loss) on investments | | 1.26 | | | | (2.24 | ) | | | (1.08 | ) | | | 2.25 | | | | 1.25 | | | | (2.57 | ) |
| Total from investment operations | | 1.36 | | | | (1.99 | ) | | | (0.86 | ) | | | 2.65 | | | | 1.48 | | | | (2.33 | ) |
| Less distributions from: | | | | | | | | | | | | | | | | | | | | | | | |
| Net investment income | | (0.30 | ) | | | (0.19 | ) | | | (0.39 | ) | | | (0.22 | ) | | | (0.28 | ) | | | (0.21 | ) |
| Capital gains | | — | | | | — | | | | — | | | | — | | | | — | | | | — | |
| Total distributions | | (0.30 | ) | | | (0.19 | ) | | | (0.39 | ) | | | (0.22 | ) | | | (0.28 | ) | | | (0.21 | ) |
| Net asset value, end of period | $ | 10.22 | | | $ | 9.16 | | | $ | 11.34 | | | $ | 12.59 | | | $ | 10.16 | | | $ | 8.96 | |
| |
| Total return (1) | | 14.80 | % | | | (17.66 | )% | | | (6.62 | )% | | | 26.23 | % | | | 16.59 | % | | | (20.23 | )% |
| Net assets, end of period (000s) | $ | 675,302 | | | $ | 602,565 | | | $ | 710,710 | | | $ | 725,911 | | | $ | 522,423 | | | $ | 442,289 | |
| Ratio of net expenses to | | | | | | | | | | | | | | | | | | | | | | | |
| average net assets (2) | | 1.12 | %(3) | | | 1.16 | % | | | 1.26 | % | | | 1.26 | % | | | 1.33 | % | | | 1.34 | % |
| Ratio of gross expenses to | | | | | | | | | | | | | | | | | | | | | | | |
| average net assets (2) | | 1.12 | %(3) | | | 1.16 | % | | | 1.26 | % | | | 1.26 | % | | | 1.33 | % | | | 1.34 | % |
| Ratio of net investment income | | | | | | | | | | | | | | | | | | | | | | | |
| to average net assets (2) | | 1.80 | % | | | 2.51 | % | | | 2.12 | % | | | 3.58 | % | | | 2.32 | % | | | 2.60 | % |
| Portfolio turnover rate | | 8 | % | | | 21 | % | | | 21 | % | | | 15 | % | | | 17 | % | | | 22 | % |
| Without giving effect to the expense | | | | | | | | | | | | | | | | | | | | | | | |
| waiver described in Note 2 to | | | | | | | | | | | | | | | | | | | | | | | |
| the Financial Statements, net | | | | | | | | | | | | | | | | | | | | | | | |
| investment income (loss) per | | | | | | | | | | | | | | | | | | | | | | | |
| share would have been | $ | 0.10 | | | $ | 0.25 | | | $ | 0.22 | | | $ | 0.40 | | | $ | 0.23 | | | $ | 0.24 | |
| (1) | | Periods less than one year are not annualized. |
| (2) | | Annualized for periods less than one year. |
| (3) | | Reflects the Fund’s receipt of a one-time reimbursement of custody expenses paid in prior years. Had such reimbursement not been included in this period, the annualized net and gross expense ratios would have been 1.15% and 1.15%, respectively. |
See notes to financial statements
46
FINANCIAL HIGHLIGHTS (Continued)
| | SA International Small Company Fund |
| | Six Months Ended | | | | | | | | | | | | | | | | | | | | |
| | December 31, 2016 | | Year Ended June 30, |
| | (Unaudited) | | 2016 | | 2015 | | 2014 | | 2013 | | 2012 |
| Net asset value, beginning | | | | | | | | | | | | | | | | | | | | | | | | |
| of period | | $ | 18.72 | | | $ | 20.43 | | | $ | 22.05 | | | $ | 17.30 | | | $ | 15.07 | | | $ | 18.25 | |
| |
| Income from investment | | | | | | | | | | | | | | | | | | | | | | | | |
| operations: | | | | | | | | | | | | | | | | | | | | | | | | |
| Net investment income | | | 0.11 | | | | 0.42 | | | | 0.23 | | | | 0.15 | | | | 0.24 | | | | 0.30 | |
| Net realized and unrealized | | | | | | | | | | | | | | | | | | | | | | | | |
| gain (loss) on investments | | | 1.02 | | | | (1.40 | ) | | | (1.42 | ) | | | 4.95 | | | | 2.39 | | | | (3.29 | ) |
| Total from investment operations | | | 1.13 | | | | (0.98 | ) | | | (1.19 | ) | | | 5.10 | | | | 2.63 | | | | (2.99 | ) |
| Less distributions from: | | | | | | | | | | | | | | | | | | | | | | | | |
| Net investment income | | | (0.36 | ) | | | (0.19 | ) | | | (0.31 | ) | | | (0.35 | ) | | | (0.40 | ) | | | (0.19 | ) |
| Capital gains | | | (0.42 | ) | | | (0.54 | ) | | | (0.12 | ) | | | — | | | | — | | | | — | |
| Total distributions | | | (0.78 | ) | | | (0.73 | ) | | | (0.43 | ) | | | (0.35 | ) | | | (0.40 | ) | | | (0.19 | ) |
| Net asset value, end of period | | $ | 19.07 | | | $ | 18.72 | | | $ | 20.43 | | | $ | 22.05 | | | $ | 17.30 | | | $ | 15.07 | |
| |
| Total return (1) | | | 6.07 | % | | | (4.81 | )% | | | (5.21 | )% | | | 29.68 | % | | | 17.55 | % | | | (16.35 | )% |
| Net assets, end of period (000s) | | $ | 317,043 | | | $ | 307,502 | | | $ | 337,659 | | | $ | 337,334 | | | $ | 233,313 | | | $ | 192,472 | |
| Ratio of net expenses to | | | | | | | | | | | | | | | | | | | | | | | | |
| average net assets (2)† | | | 0.96 | %(4) | | | 1.04 | % | | | 1.10 | % | | | 1.10 | % | | | 1.10 | % | | | 1.10 | % |
| Ratio of gross expenses to | | | | | | | | | | | | | | | | | | | | | | | | |
| average net assets (2)† | | | 0.96 | %(4) | | | 1.04 | % | | | 1.12 | %(3) | | | 1.10 | %(3) | | | 1.17 | %(3) | | | 1.18 | %(3) |
| Ratio of net investment income | | | | | | | | | | | | | | | | | | | | | | | | |
| to average net assets (2)† | | | 1.01 | % | | | 2.15 | % | | | 1.15 | % | | | 0.75 | % | | | 1.46 | % | | | 1.92 | % |
| Ratio of expenses to average | | | | | | | | | | | | | | | | | | | | | | | | |
| net assets for the DFA | | | | | | | | | | | | | | | | | | | | | | | | |
| Portfolio (unaudited) (5)† | | | 0.53 | % | | | 0.53 | % | | | 0.53 | % | | | 0.53 | % | | | 0.56 | % | | | 0.56 | % |
| Ratio of expenses to average net | | | | | | | | | | | | | | | | | | | | | | | | |
| assets for the DFA Portfolio (6)† | | | 0.53 | % | | | 0.54 | % | | | 0.53 | % | | | 0.54 | % | | | 0.56 | % | | | 0.55 | % |
| Portfolio turnover rate | | | N/A | | | | N/A | | | | N/A | | | | N/A | | | | N/A | | | | N/A | |
| Without giving effect to the | | | | | | | | | | | | | | | | | | | | | | | | |
| expense waiver described | | | | | | | | | | | | | | | | | | | | | | | | |
| in Note 2 to the Financial | | | | | | | | | | | | | | | | | | | | | | | | |
| Statements, net investment | | | | | | | | | | | | | | | | | | | | | | | | |
| income (loss) per share | | | | | | | | | | | | | | | | | | | | | | | | |
| would have been | | $ | 0.11 | | | $ | 0.42 | | | $ | 0.23 | (3) | | $ | 0.15 | (3) | | $ | 0.23 | (3) | | $ | 0.29 | (3) |
| † | | The DFA Portfolio expenses are not included in the stated expense information of the SA International Small Company Fund. The financial statements of the DFA Portfolio are included elsewhere in this report. |
| (1) | | Periods less than one year are not annualized. |
| (2) | | Annualized for periods less than one year. |
| (3) | | Gross expenses before waivers of expenses. |
| (4) | | Reflects the Fund’s receipt of a one-time reimbursement of custody expenses paid in prior years. Had such reimbursement not been included in this period, the annualized net and gross expense ratios would have been 0.97% and 0.97%, respectively. |
| (5) | | The DFA Portfolio expense ratios are as of April 30, 2016, 2015, 2014, 2013 and 2012, respectively and are unaudited. |
| (6) | | The DFA Portfolio expense ratios are for the fiscal years ended October 31, 2016, 2015, 2014, 2013, 2012 and 2011, respectively. |
See notes to financial statements
47
FINANCIAL HIGHLIGHTS (Continued)
| SA Emerging Markets Value Fund |
| Six Months Ended | | | | | | | | | | | | | | | | | | | | |
| December 31, 2016 | | Year Ended June 30, |
| (Unaudited) | | 2016 | | 2015 | | 2014 | | 2013 | | 2012 |
| Net asset value, beginning of period | $ | 7.78 | | | $ | 9.05 | | | $ | 10.51 | | | $ | 9.32 | | | $ | 9.28 | | | $ | 12.40 | |
| |
| Income from investment operations: | | | | | | | | | | | | | | | | | | | | | | | |
| Net investment income | | 0.03 | | | | 0.11 | | | | 0.11 | | | | 0.10 | | | | 0.08 | | | | 0.09 | |
| Net realized and unrealized | | | | | | | | | | | | | | | | | | | | | | | |
| gain (loss) on investments | | 0.55 | | | | (1.29 | ) | | | (1.43 | ) | | | 1.26 | | | | 0.03 | | | | (2.85 | ) |
| Total from investment operations | | 0.58 | | | | (1.18 | ) | | | (1.32 | ) | | | 1.36 | | | | 0.11 | | | | (2.76 | ) |
| Less distributions from: | | | | | | | | | | | | | | | | | | | | | | | |
| Net investment income | | (0.10 | ) | | | (0.09 | ) | | | (0.13 | ) | | | (0.08 | ) | | | (0.07 | ) | | | (0.09 | ) |
| Capital gains | | — | | | | — | | | | (0.01 | ) | | | (0.09 | ) | | | — | | | | (0.27 | ) |
| Total distributions | | (0.10 | ) | | | (0.09 | ) | | | (0.14 | ) | | | (0.17 | ) | | | (0.07 | ) | | | (0.36 | ) |
| Net asset value, end of period | $ | 8.26 | | | $ | 7.78 | | | $ | 9.05 | | | $ | 10.51 | | | $ | 9.32 | | | $ | 9.28 | |
| |
| Total return (1) | | 7.50 | % | | | (12.95 | )% | | | (12.53 | )% | | | 14.70 | % | | | 1.13 | % | | | (22.19 | )% |
| Net assets, end of period (000s) | $ | 178,341 | | | $ | 166,788 | | | $ | 167,220 | | | $ | 162,333 | | | $ | 96,991 | | | $ | 76,901 | |
| Ratio of net expenses to | | | | | | | | | | | | | | | | | | | | | | | |
| average net assets (2) | | 1.40 | % | | | 1.40 | % | | | 1.45 | % | | | 1.45 | % | | | 1.45 | % | | | 1.45 | % |
| Ratio of gross expenses to | | | | | | | | | | | | | | | | | | | | | | | |
| average net assets (2)(3) | | 1.65 | % | | | 1.72 | % | | | 1.83 | % | | | 1.93 | % | | | 2.03 | % | | | 2.10 | % |
| Ratio of net investment income | | | | | | | | | | | | | | | | | | | | | | | |
| to average net assets (2) | | 0.66 | % | | | 1.52 | % | | | 1.17 | % | | | 1.12 | % | | | 0.90 | % | | | 0.99 | % |
| Portfolio turnover rate | | 10 | % | | | 13 | % | | | 14 | % | | | 10 | % | | | 7 | % | | | 13 | % |
| Without giving effect to the expense | | | | | | | | | | | | | | | | | | | | | | | |
| waiver described in Note 2 to | | | | | | | | | | | | | | | | | | | | | | | |
| the Financial Statements, net | | | | | | | | | | | | | | | | | | | | | | | |
| investment income (loss) per | | | | | | | | | | | | | | | | | | | | | | | |
| share would have been (3) | $ | 0.02 | | | $ | 0.09 | | | $ | 0.07 | | | $ | 0.06 | | | $ | 0.03 | | | $ | 0.03 | |
| (1) | | Periods less than one year are not annualized. |
| (2) | | Annualized for periods less than one year. |
| (3) | | Gross expenses before waivers of expenses. |
See notes to financial statements
48
FINANCIAL HIGHLIGHTS (Continued)
| | SA Real Estate Securities Fund | |
| | Six Months Ended | | | | | | | | | | | | | | | | | | | | | |
| | December 31, 2016 | | Year Ended June 30, | |
| | (Unaudited) | | 2016 | | 2015 | | 2014 | | 2013 | | 2012 | |
| Net asset value, beginning of period | | | $ | 12.17 | | | $ | 10.03 | | | $ | 9.94 | | | $ | 9.04 | | | $ | 8.50 | | | $ | 7.68 | | |
| | |
| Income from investment operations: | | | | | | | | | | | | | | | | | | | | | | | | | | |
| Net investment income | | | | 0.26 | | | | 0.26 | | | | 0.19 | | | | 0.20 | | | | 0.15 | | | | 0.21 | | |
| Net realized and unrealized | | | | | | | | | | | | | | | | | | | | | | | | | | |
| gain (loss) on investments | | | | (0.85 | ) | | | 2.07 | | | | 0.13 | | | | 0.86 | | | | 0.51 | | | | 0.71 | | |
| Total from investment operations | | | | (0.59 | ) | | | 2.33 | | | | 0.32 | | | | 1.06 | | | | 0.66 | | | | 0.92 | | |
| Less distributions from: | | | | | | | | | | | | | | | | | | | | | | | | | | |
| Net investment income | | | | (0.35 | ) | | | (0.19 | ) | | | (0.23 | ) | | | (0.16 | ) | | | (0.12 | ) | | | (0.10 | ) | |
| Capital gains | | | | (0.06 | ) | | | — | | | | — | | | | — | | | | — | | | | — | | |
| Total distributions | | | | (0.41 | ) | | | (0.19 | ) | | | (0.23 | ) | | | (0.16 | ) | | | (0.12 | ) | | | (0.10 | ) | |
| Net asset value, end of period | | | $ | 11.17 | | | $ | 12.17 | | | $ | 10.03 | | | $ | 9.94 | | | $ | 9.04 | | | $ | 8.50 | | |
| | |
| Total return (1) | | | | (4.77 | )% | | | 23.56 | % | | | 3.12 | % | | | 12.10 | % | | | 7.81 | % | | | 12.19 | % | |
| Net assets, end of period (000s) | | | $ | 171,045 | | | $ | 186,216 | | | $ | 160,246 | | | $ | 150,198 | | | $ | 105,040 | | | $ | 91,427 | | |
| Ratio of net expenses to | | | | | | | | | | | | | | | | | | | | | | | | | | |
| average net assets (2) | | | | 1.00 | % | | | 1.00 | % | | | 1.00 | % | | | 1.00 | % | | | 1.00 | % | | | 1.00 | % | |
| Ratio of gross expenses to | | | | | | | | | | | | | | | | | | | | | | | | | | |
| average net assets (2)(3) | | | | 1.05 | % | | | 1.06 | % | | | 1.23 | % | | | 1.31 | % | | | 1.38 | % | | | 1.42 | % | |
| Ratio of net investment income | | | | | | | | | | | | | | | | | | | | | | | | | | |
| to average net assets (2) | | | | 4.25 | % | | | 2.43 | % | | | 1.85 | % | | | 2.43 | % | | | 1.67 | % | | | 2.77 | % | |
| Portfolio turnover rate | | | | 3 | % | | | 7 | % | | | 3 | % | | | 0 | %(4) | | | 2 | % | | | 4 | % | |
| Without giving effect to the expense | | | | | | | | | | | | | | | | | | | | | | | | | | |
| waiver described in Note 2 to | | | | | | | | | | | | | | | | | | | | | | | | | | |
| the Financial Statements, net | | | | | | | | | | | | | | | | | | | | | | | | | | |
| investment income (loss) per | | | | | | | | | | | | | | | | | | | | | | | | | | |
| share would have been (3) | | | $ | 0.26 | | | $ | 0.25 | | | $ | 0.17 | | | $ | 0.18 | | | $ | 0.11 | | | $ | 0.18 | | |
| (1) | | Periods less than one year are not annualized. |
| (2) | | Annualized for periods less than one year. |
| (3) | | Gross expenses before waivers of expenses. |
| (4) | | Amount rounds to less than 0.5%. |
See notes to financial statements
49
FINANCIAL HIGHLIGHTS (Continued)
| | SA Worldwide Moderate Growth Fund |
| | Six Months Ended | | | |
| | December 31, | | Year Ended |
| | 2016 (Unaudited) | | June 30, 2016‡ |
| Net asset value, beginning of period | | | $ | 9.51 | | | | $ | 10.00 | | |
| | |
| Income from investment operations: | | | | | | | | | | | |
| Net investment income | | | | 0.14 | | | | | 0.10 | | |
| Net realized and unrealized gain (loss) on investments | | | | 0.64 | | | | | (0.49 | ) | |
| Total from investment operations | | | | 0.78 | | | | | (0.39 | ) | |
| Less distributions from: | | | | | | | | | | | |
| Net investment income | | | | (0.14 | ) | | | | (0.10 | ) | |
| Capital gains | | | | (0.05 | ) | | | | — | | |
| Total distributions | | | | (0.19 | ) | | | | (0.10 | ) | |
| Net asset value, end of period | | | $ | 10.10 | | | | $ | 9.51 | | |
| | |
| Total return (1) | | | | 8.29 | % | | | | (3.89 | )% | |
| Net assets, end of period (000s) | | | $ | 17,312 | | | | $ | 11,662 | | |
| Ratio of net expenses to average net assets (2) | | | | — | % | | | | — | % | |
| Ratio of gross expenses to average net assets (2)(3) | | | | 0.74 | % | | | | 2.72 | % | |
| Ratio of net investment income to average net assets (2) | | | | 3.15 | % | | | | 1.11 | % | |
| Portfolio turnover rate | | | | 5 | % | | | | 5 | % | |
| Without giving effect to the expense waiver described in Note 2 to the Financial | | | | | | | | | | | |
| Statements, net investment income (loss) per share would have been (3) | | | $ | 0.11 | | | | $ | (0.02 | ) | |
| ‡ | | Fund commenced operations on July 1, 2015. |
| (1) | | Periods less than one year are not annualized. |
| (2) | | Annualized for periods less than one year. |
| (3) | | Gross expenses before waivers of expenses. |
See notes to financial statements
50
SA FUNDS
NOTES TO FINANCIAL STATEMENTS — DECEMBER 31, 2016 (Unaudited)
1. Organization and Significant Accounting Policies
SA Funds — Investment Trust (the “Trust”) is a Delaware statutory trust that was organized on June 16, 1998. The Agreement and Declaration of Trust permits the Trust to offer separate portfolios (“Funds”) of shares of beneficial interest and different classes of shares of each Fund. The Trust is registered under the Investment Company Act of 1940 (the “1940 Act”), and currently offers the following ten Funds, each of which (with the exception of the SA Worldwide Moderate Growth Fund) is a diversified mutual fund as defined in the 1940 Act:
SA U.S. Fixed Income Fund
SA Global Fixed Income Fund
SA U.S. Core Market Fund
SA U.S. Value Fund
SA U.S. Small Company Fund
SA International Value Fund
SA International Small Company Fund
SA Emerging Markets Value Fund
SA Real Estate Securities Fund
SA Worldwide Moderate Growth Fund
All of the Funds commenced investment operations on August 5, 1999, except SA Global Fixed Income Fund, which commenced operations on July 29, 1999, SA U.S. Fixed Income Fund, SA Emerging Markets Value Fund, and SA Real Estate Securities Fund, which commenced operations on April 2, 2007, and SA Worldwide Moderate Growth Fund, which commenced operations on July 1, 2015.
SA International Small Company Fund invests substantially all of its assets in the International Small Company Portfolio (the “DFA Portfolio”), a series of DFA Investment Dimensions Group Inc., an open-end management investment company. The DFA Portfolio has the same investment objective as SA International Small Company Fund and invests its assets in The Japanese Small Company Series, The Asia Pacific Small Company Series, The United Kingdom Small Company Series, The Continental Small Company Series and The Canadian Small Company Series, each a series of The DFA Investment Trust Company (each a “Series”), an open-end management investment company. As of December 31, 2016, SA International Small Company Fund held approximately 3.31% of the DFA Portfolio. The performance of SA International Small Company Fund is directly affected by the performance of the DFA Portfolio. The financial statements of the DFA Portfolio and the Series in which it invests are included elsewhere in this report and should be read in conjunction with the financial statements of SA International Small Company Fund.
SA Worldwide Moderate Growth Fund invests substantially all of its assets in the Underlying SA Funds managed by LWI Financial Inc. (the “Adviser”) comprising various asset categories and strategies. The Adviser has established an asset allocation target for the Fund. This target is the approximate percentage of the Fund’s assets that will be invested in equity investments and fixed income investments. Under normal market conditions, the Fund currently expects that it will invest approximately 75% of its assets in equity investments and approximately 25% of its assets in fixed income investments as represented by the holdings of the Underlying SA Funds. The performance of the SA Worldwide Moderate Growth Fund is directly affected by the performance of the Underlying SA Funds. The financial statements of the Underlying SA Funds are included elsewhere in the report and should be read in conjunction with the financial statements of SA Worldwide Moderate Growth Fund.
51
SA FUNDS
NOTES TO FINANCIAL STATEMENTS — DECEMBER 31, 2016 (Unaudited) (Continued)
Use of Estimates — The Funds are investment companies that follow the accounting and reporting guidance of Accounting Standards Codification Topic 946 applicable to investment companies.
The preparation of financial statements in accordance with accounting principles generally accepted in the United States of America requires management to make estimates and assumptions that affect the reported amounts and disclosures in the financial statements. Actual results could differ from those estimates.
The following summarizes the significant accounting policies of the Funds:
Security Valuation — Domestic equity securities listed on an exchange or stock market for which market quotations are readily available are valued according to the official closing price, if any, or at their last reported sale price on the exchange or stock market where the security is primarily traded, or in the absence of such reported prices, at the mean between the most recent quoted bid and asked prices. Domestic equity securities traded on the over-the-counter markets are valued at the mean between the most recent quoted bid and asked prices in the absence of an official closing price or last reported sale price.
Foreign equity securities traded on a foreign exchange or over-the-counter markets are generally valued at the most recent quoted bid price in the absence of an official closing price or last reported sale price. Foreign securities quoted in foreign currencies are translated into U.S. dollars using prevailing exchange rates.
Fixed income investments are generally valued based on prices received from independent pricing services. In determining the value of a fixed income investment, pricing services may use certain information with respect to transactions in such investments, quotations from dealers, pricing matrixes, market transactions in comparable investments, various relationships observed in the market between investments and calculated yield measures.
Shares of registered open-end investment companies are valued at the investment company’s net asset value. Forward currency contracts are valued based on prices received from independent pricing services. Securities for which market quotations are not readily available, or for which available quotations appear not to accurately reflect the current value of an investment, are valued at fair value as determined in good faith by a pricing committee (the “Pricing Committee”) (or its designee) appointed by the Board of Trustees of the Trust (the “Board” or the “Trustees”) pursuant to procedures approved by the Board.
Certain Funds hold securities traded in foreign markets. Foreign securities are valued at the latest market price in the foreign market. However, if events occurring after the close of the foreign market (but before the close of regular trading on the New York Stock Exchange) are believed to materially affect the value of those securities, such securities may be valued at fair value as determined in good faith by the Pricing Committee (or its designee). Any determinations of fair value made by the Pricing Committee (or its designee) are presented to the Board for ratification.
Valuation of securities by the DFA Portfolio and the Series in which it invests is discussed in the “Selected Financial Statements of DFA Investment Dimensions Group Inc. – Notes to Financial Statements,” and “Selected Financial Statements of the DFA Investment Trust Company – Notes to Financial Statements,” which are included elsewhere in this report.
52
SA FUNDS
NOTES TO FINANCIAL STATEMENTS — DECEMBER 31, 2016 (Unaudited) (Continued)
Fair Value Measurement — The Board has adopted provisions respecting fair value measurement which provide enhanced guidance to the Pricing Committee (or its designee) for using fair value to measure assets and liabilities. The Funds value their investments based on a three-level hierarchy of inputs that establishes classification of fair value measurements for disclosure purposes. If inputs used to measure a financial instrument fall within different levels of the hierarchy, the categorization is based on the lowest level input that is significant to the valuation. The three-level hierarchy of inputs is summarized in the three broad levels below.
Level 1 – quoted prices in active markets for identical investments.
Level 2 – significant observable inputs other than quoted prices within Level 1 (including quoted prices for similar investments, interest rates, yield curves, foreign exchange rates, put or call provisions, credit risk and default rates for similar securities).
Level 3 – significant unobservable inputs to the extent that observable inputs are not available (including the Pricing Committee’s own assumptions used to determine the fair value of investments).
Fair value pricing involves subjective judgment and it is possible that the fair value determined for a security is materially different than the value that could be realized upon the sale of that security. The inputs or methodologies used for valuing securities are not necessarily an indication of the risk associated with investing in those securities.
The tables below provide a summary of the inputs as of December 31, 2016, in valuing each Fund’s investments:
| | Investments in Securities | | | | |
| | Unadjusted Quoted | | | | | | | | | | | |
| | Prices in Active | | | | | | Significant | | | | |
| | Markets for Identical | | Significant Other | | Unobservable | | Balance as of | |
| | Investments | | Observable Inputs | | Inputs | | December 31, 2016 | |
| | (Level 1) | | (Level 2)* | | (Level 3) | | Total | |
| SA U.S. Fixed Income Fund | | | | | | | | | | | | | | |
| Bonds and Notes | | $ | — | | $ | 602,659,611 | | | $ | — | | $ | 602,659,611 | |
| Short-Term Investments | | | 2,338,890 | | | — | | | | — | | | 2,338,890 | |
| Total Investments | | $ | 2,338,890 | | $ | 602,659,611 | | | $ | — | | $ | 604,998,501 | |
| SA Global Fixed Income Fund | | | | | | | | | | | | | | |
| Assets | | | | | | | | | | | | | | |
| Bonds and Notes | | $ | — | | $ | 706,812,755 | | | $ | — | | $ | 706,812,755 | |
| Short-Term Investments | | | 13,691,805 | | | — | | | | — | | | 13,691,805 | |
| Other Financial Instruments | | | | | | | | | | | | | | |
| Forward Foreign Currency Contracts | | $ | — | | $ | 726,061 | | | $ | — | | $ | 726,061 | |
| Total Investments | | $ | 13,691,805 | | $ | 707,538,816 | | | $ | — | | $ | 721,230,621 | |
| Liabilities | | | | | | | | | | | | | | |
| Other Financial Instruments | | | | | | | | | | | | | | |
| Forward Foreign Currency Contracts | | $ | — | | $ | (23,311 | ) | | $ | — | | $ | (23,311 | ) |
| SA U.S. Core Market Fund | | | | | | | | | | | | | | |
| Common Stocks | | $ | 664,589,218 | | $ | — | | | $ | — | | $ | 664,589,218 | |
| Rights and Warrants | | | 32 | | | — | | | | 13,348 | | | 13,380 | |
| Mutual Funds | | | 29,499,340 | | | — | | | | — | | | 29,499,340 | |
| Short-Term Investments | | | 5,490,336 | | | — | | | | — | | | 5,490,336 | |
| Total Investments | | $ | 699,578,926 | | $ | — | | | $ | 13,348 | | $ | 699,592,274 | |
53
SA FUNDS
NOTES TO FINANCIAL STATEMENTS — DECEMBER 31, 2016 (Unaudited) (Continued)
| | Investments in Securities | | | |
| | Unadjusted Quoted | | | | | | | | | | |
| | Prices in Active | | | | | Significant | | | |
| | Markets for Identical | | Significant Other | | Unobservable | | Balance as of |
| | Investments | | Observable Inputs | | Inputs | | December 31, 2016 |
| | (Level 1) | | (Level 2)* | | (Level 3) | | | Total |
| SA U.S. Value Fund | | | | | | | | | | | | | |
| Common Stocks | | $ | 565,959,587 | | $ | — | | $ | — | | | $ | 565,959,587 |
| Short-Term Investments | | | 2,648,541 | | | — | | | — | | | | 2,648,541 |
| Total Investments | | $ | 568,608,128 | | $ | — | | $ | — | | | $ | 568,608,128 |
| SA U.S. Small Company Fund | | | | | | | | | | | | | |
| Common Stocks | | $ | 411,032,060 | | $ | 208,347 | | $ | — | † | | $ | 411,240,407 |
| Rights and Warrants | | | — | | | — | | | — | † | | | — |
| Short-Term Investments | | | 19,739,730 | | | — | | | — | | | | 19,739,730 |
| Total Investments | | $ | 430,771,790 | | $ | 208,347 | | $ | — | | | $ | 430,980,137 |
| SA International Value Fund | | | | | | | | | | | | | |
| Common Stocks | | $ | 663,726,693 | | $ | — | | $ | — | † | | $ | 663,726,693 |
| Preferred Stocks | | | 5,869,258 | | | — | | | — | | | | 5,869,258 |
| Rights and Warrants | | | 53,330 | | | — | | | — | | | | 53,330 |
| �� Short-Term Investments | | | 33,000,358 | | | — | | | — | | | | 33,000,358 |
| Total Investments | | $ | 702,649,639 | | $ | — | | $ | — | | | $ | 702,649,639 |
| SA International Small Company Fund | | | | | | | | | | | | | |
| Mutual Funds | | $ | 316,939,477 | | $ | — | | $ | — | | | $ | 316,939,477 |
| Total Investments | | $ | 316,939,477 | | $ | — | | $ | — | | | $ | 316,939,477 |
| SA Emerging Markets Value Fund | | | | | | | | | | | | | |
| Common Stocks | | $ | 170,975,992 | | $ | 78,556 | | $ | 60,039 | † | | $ | 171,114,587 |
| Preferred Stocks | | | 6,152,076 | | | — | | | — | | | | 6,152,076 |
| Rights and Warrants | | | — | | | — | † | | — | | | | — |
| Short-Term Investments | | | 3,022,827 | | | — | | | — | | | | 3,022,827 |
| Total Investments | | $ | 180,150,895 | | $ | 78,556 | | $ | 60,039 | | | $ | 180,289,490 |
| SA Real Estate Securities Fund | | | | | | | | | | | | | |
| Common Stocks | | $ | 169,516,589 | | $ | — | | $ | — | | | $ | 169,516,589 |
| Short-Term Investments | | | 910,576 | | | — | | | — | | | | 910,576 |
| Total Investments | | $ | 170,427,165 | | $ | — | | $ | — | | | $ | 170,427,165 |
| SA Worldwide Moderate Growth Fund | | | | | | | | | | | | | |
| Mutual Funds† | | $ | 17,320,778 | | $ | — | | $ | — | | | $ | 17,320,778 |
| Total Investments | | $ | 17,320,778 | | $ | — | | $ | — | | | $ | 17,320,778 |
| * | The end of period timing recognition is used for transfers between levels of the Fund’s assets and liabilities. |
| † | Contains securities with a market value of $0. |
54
SA FUNDS
NOTES TO FINANCIAL STATEMENTS — DECEMBER 31, 2016 (Unaudited) (Continued)
Transfers between investment valuation levels may occur as the markets fluctuate and/or the availability of data used in an investment’s valuation changes.
The following is a reconciliation of Level 3 assets for which significant unobservable inputs were used to determine fair value. The Funds’ policy is to recognize transfers between the levels as of the end of the year. The table presents the fiscal year-to-date activity of Level 3 securities held at the beginning and the end of the period.
| | | | | | | | | | | | | | | | | | | | | | | | | Net Change |
| | | | | | | | | | | | | | | | | | | | | | | | | in Unrealized |
| | | | | | | | | | | | | | | | | | | | | | | | | Appreciation |
| | | | | | | | | | | | Total | | | | | | | | | | | (Depreciation) |
| | Beginning | | | | | | | | realized and | | | | | | Ending | | on Investments |
| | Balance | | | | | | Accrued | | unrealized | | Transfers | | Transfers | | Balance | | Held at |
| | June 30, | | | | | | discounts | | gains | | in to | | out of | | December 31, | | December 31, |
| | 2016 | | Purchases | | Sales | | (premiums) | | (losses)* | | Level 3 | | Level 3 | | 2016 | | 2016* |
| SA U.S. Core Market Fund | | | | | | | | | | | | | | | | | | | | | | | | | | | |
| Rights and Warrants | | $ | 13,348 | | | — | | — | | — | | | — | | | — | | — | | | $ | 13,348 | | | | — | |
| SA Emerging Markets | | | | | | | | | | | | | | | | | | | | | | | | | | | |
| Value Fund | | | | | | | | | | | | | | | | | | | | | | | | | | | |
| Common Stocks(1) | | | 111,743 | | | — | | — | | — | | | (58,491 | ) | | 42,426 | | — | | | | 95,678 | | | | (58,491 | ) |
(1) Level 3 at December 31, 2016 included securities with a fair value of $0.
* All net realized and changes in unrealized gains (losses) are reflected on the accompanying Statement of Operations.
Securities Lending — The Funds may lend any of their securities held by State Street Bank and Trust Company (“State Street”) as custodian to certain qualified broker-dealers, banks and other institutions, except those securities which LWI Financial Inc. (the “Adviser”) specifically identifies as not being available. Any gain or loss in the market price of the securities loaned that might occur and any interest or dividends declared during the term of the loan would accrue to the account of the Funds. Risks of delay in recovery of the securities or even loss of rights in the collateral may occur should the borrower of the securities fail financially. Risks may also arise to the extent that the value of the collateral decreases below the value of the securities loaned.
Upon entering into a securities lending transaction, a fund maintains cash or other securities as collateral in an amount equal to or exceeding 100% of the current market value of the loaned securities with respect to securities of the U.S. government or its agencies or instrumentalities, a loan of sovereign debt issued by non-U.S. governments, or a loan of non-U.S. corporate debt, 102% of the current market value of the loaned securities with respect to other U.S. securities and 105% of the current market value of the loaned securities with respect to foreign equity securities. Any cash received as collateral is generally invested by State Street, acting in its capacity as securities lending agent (the “Agent”), in the State Street Navigator Securities Lending Government Money Market Portfolio, which is a money market fund registered under the 1940 Act. A portion of the income received on the collateral is rebated to the borrower of the securities, and the remainder is split between the Agent and the Fund.
55
SA FUNDS
NOTES TO FINANCIAL STATEMENTS — DECEMBER 31, 2016 (Unaudited) (Continued)
As of December 31, 2016, the following Funds had securities on loan, which were collateralized by short-term investments. The value of securities on loan and the value of the related collateral were as follows:
| | | | | | | | | | | Total | |
| | | | | | | | | | | Collateral | |
| | | | | | | | Value of | | (Including | |
| | Value of | | Value of Cash | | Non-Cash | | Calculated | |
| | Securities | | Collateral | | Collateral* | | Mark)† | |
| SA Global Fixed Income Fund | | $ | 21,580,155 | | $ | 11,401,718 | | $ | 10,614,080 | | $ | 22,015,798 | |
| SA U.S Core Market Fund | | $ | 22,860,086 | | $ | 3,299,309 | | $ | 20,293,156 | | $ | 23,592,464 | |
| SA U.S. Value Fund | | $ | 18,596,188 | | $ | 1,347,522 | | $ | 18,052,218 | | $ | 19,399,740 | |
| SA U.S. Small Company Fund | | $ | 38,956,598 | | $ | 18,935,730 | | $ | 21,272,580 | | $ | 40,208,310 | |
| SA International Value Fund | | $ | 68,009,899 | | $ | 29,617,358 | | $ | 40,690,966 | | $ | 70,308,323 | |
| SA Emerging Markets Value Fund | | $ | 3,155,922 | | $ | 2,362,815 | | $ | 1,057,769 | | $ | 3,420,585 | |
| SA Real Estate Securities Fund | | $ | 1,249,108 | | $ | 265,531 | | $ | 1,009,318 | | $ | 1,274,849 | |
† Balances represent the end-of-day fair market value of securities lending collateral that will be reflected by the Funds as of the next business day.
* The Funds cannot repledge or resell this collateral. The non-cash collateral is comprised of U.S. government securities.
The Funds have adopted the disclosure provisions of FASB Accounting Standards Update No. 2014-11 (“ASU No. 2014-11”), Transfers & Servicing (Topic 860): Repurchase-to-Maturity Transactions, Repurchase Financings, and Disclosures. ASU No. 2014-11 is intended to provide increased transparency about the types of collateral pledged in repurchase agreements and other similar transactions that are accounted for as secured borrowing.
| | Remaining Contractual Maturity of the Agreements |
| | As of December 31, 2016 |
| | Overnight and | | | | | Between | | | | | | |
| Securities Lending Transaction(1) | | Continuous | | <30 days | | 30 & 90 days | | >90 days | | Total |
| SA Global Fixed Income Fund | | | | | | | | | | | | | | | |
| Bonds and Notes | | $ | 11,401,718 | | $ | — | | $ | — | | $ | — | | $ | 11,401,718 |
| Total Borrowings | | $ | 11,401,718 | | $ | — | | $ | — | | $ | — | | $ | 11,401,718 |
| Gross amount of recognized liabilities for securities lending transactions | | | | | | | | | | | $ | 11,401,718 |
| |
| SA U.S. Core Market Fund | | | | | | | | | | | | | | | |
| Common Stocks | | $ | 3,299,309 | | $ | — | | $ | — | | $ | — | | $ | 3,299,309 |
| Total Borrowings | | $ | 3,299,309 | | $ | — | | $ | — | | $ | — | | $ | 3,299,309 |
| Gross amount of recognized liabilities for securities lending transactions | | | | | | | | | | | $ | 3,299,309 |
| |
| SA U.S. Value Fund | | | | | | | | | | | | | | | |
| Common Stocks | | $ | 1,347,522 | | $ | — | | $ | — | | $ | — | | $ | 1,347,522 |
| Total Borrowings | | $ | 1,347,522 | | $ | — | | $ | — | | $ | — | | $ | 1,347,522 |
| Gross amount of recognized liabilities for securities lending transactions | | | | | | | | | | | $ | 1,347,522 |
56
SA FUNDS
NOTES TO FINANCIAL STATEMENTS — DECEMBER 31, 2016 (Unaudited) (Continued)
| | Remaining Contractual Maturity of the Agreements |
| | As of December 31, 2016 |
| | Overnight and | | | | | Between | | | | | | |
| Securities Lending Transaction(1) | | Continuous | | <30 days | | 30 & 90 days | | >90 days | | Total |
| SA U.S. Small Company Fund | | | | | | | | | | | | | | | |
| Common Stocks | | $ | 18,935,730 | | $ | — | | $ | — | | $ | — | | $ | 18,935,730 |
| Total Borrowings | | $ | 18,935,730 | | $ | — | | $ | — | | $ | — | | $ | 18,935,730 |
| Gross amount of recognized liabilities for securities lending transactions | | | | | $ | 18,935,730 |
| |
| SA International Value Fund | | | | | | | | | | | | | | | |
| Common Stocks | | $ | 29,617,358 | | $ | — | | $ | — | | $ | — | | $ | 29,617,358 |
| Total Borrowings | | $ | 29,617,358 | | $ | — | | $ | — | | $ | — | | $ | 29,617,358 |
| Gross amount of recognized liabilities for securities lending transactions | | | | | $ | 29,617,358 |
| |
| SA Emerging Markets Value Fund | | | | | | | | | | | | | | | |
| Common Stocks | | $ | 2,362,815 | | $ | — | | $ | — | | $ | — | | $ | 2,362,815 |
| Total Borrowings | | $ | 2,362,815 | | $ | — | | $ | — | | $ | — | | $ | 2,362,815 |
| Gross amount of recognized liabilities for securities lending transactions | | | | | $ | 2,362,815 |
| |
| SA Real Estate Securities Fund | | | | | | | | | | | | | | | |
| Common Stocks | | $ | 265,531 | | $ | — | | $ | — | | $ | — | | $ | 265,531 |
| Total Borrowings | | $ | 265,531 | | $ | — | | $ | — | | $ | — | | $ | 265,531 |
| Gross amount of recognized liabilities for securities lending transactions | | | | | $ | 265,531 |
(1) Amounts represent the payable for cash collateral received on securities on loan. This will generally be in the “Overnight and Continuous” column as the securities are typically callable on demand. The payable will be allocated into categories of securities based on the market value of the securities on loan.
Foreign Currency Translation and Foreign Investments — The books and records of the Funds are maintained in U.S. dollars. The value of securities, currencies and other assets and liabilities denominated in currencies other than U.S. dollars are translated into U.S. dollars based upon foreign currency exchange rates prevailing at the end of the period. Purchases and sales of investment securities are translated at contractual currency exchange rates established at the time of the trade. Income and expenses are translated at prevailing exchange rates on the respective dates of such transactions.
The results of operations resulting from changes in foreign exchange rates on investments are not reported separately from fluctuations arising from changes in market prices of securities held. All such fluctuations are included with net realized and unrealized gain or loss on investments.
Investing in foreign securities may involve certain sovereign and other risks, in addition to the credit and market risks normally associated with domestic securities. Investments in foreign securities are subject to fluctuations in currency exchange rates, which may negatively affect the value of the Fund’s portfolio. Additional risks may include exposure to less developed or less efficient trading markets; social, political or economic instability; nationalization
57
SA FUNDS
NOTES TO FINANCIAL STATEMENTS — DECEMBER 31, 2016 (Unaudited) (Continued)
of assets, currency controls or redenomination; changes in tax policy; high transaction costs; settlement, custodial or other operation risks, and less stringent accounting, auditing, financial reporting, and legal standards and practices. As a result, foreign securities can fluctuate more widely in price, and may also be less liquid, than comparable U.S. securities.
Forward Foreign Currency Exchange Contracts — Each Fund that may invest in foreign securities may enter into forward foreign currency exchange contracts. A forward foreign currency exchange contract is an agreement between two parties to buy or sell currency at a set price on a future date. By entering into a forward contract for the purchase or sale for a fixed amount of dollars of the amount of foreign currency involved in an underlying security transaction, a fund may be able to protect itself against a possible loss resulting from an adverse change in the relationship between the U.S. dollar and the applicable foreign currency during the period between the date the security is purchased or sold and the date on which payment is made or received.
The market value of a contract will fluctuate with changes in currency exchange rates. The contract is marked-to-market daily using the 4:00 PM Eastern Time pricing for the forward currency exchange rate, and the change in market value is recorded as unrealized appreciation (depreciation) on foreign currency and forward currency transactions in a fund’s statement of assets and liabilities. When the contract is closed, a realized gain or loss is recognized, which is equal to the difference between the value of the contract at the time it was opened and the value at the time it was closed, and recorded as realized gain (loss) on foreign currency and forward currency transactions in a fund’s statement of operations.
Forward foreign currency exchange contracts may involve risks from the potential inability of counterparties to meet the terms of their contracts and from unanticipated movements in the value of a foreign currency relative to the U.S. dollar.
At December 31, 2016, SA Global Fixed Income Fund had the following open forward foreign currency exchange contracts:
| | | | Local | | Aggregate | | | | Unrealized |
| | Delivery | | Currency | | Face | | Total | | Appreciation/ |
| | Date | | Amount | | Amount | | Value | | (Depreciation) |
| Pound Sterling (sell) | | 1/20/2017 | | 650,886 | | $ | 804,160 | | $ | 802,536 | | | $ | 1,624 | |
| Swedish Krona (sell) | | 1/03/2017 | | 67,879,210 | | $ | 7,998,352 | | $ | 7,450,575 | | | $ | 547,776 | |
| Swedish Krona (buy) | | 1/03/2017 | | 67,879,210 | | $ | 7,427,954 | | $ | 7,450,575 | | | $ | 22,621 | |
| Swedish Krona (sell) | | 1/30/2017 | | 66,629,149 | | $ | 7,302,386 | | $ | 7,325,697 | | | $ | (23,311 | ) |
| Singapore Dollar (sell) | | 1/09/2017 | | 10,923,346 | | $ | 7,696,670 | | $ | 7,542,631 | | | $ | 154,039 | |
| | | | | | | | | | | | | $ | 702,750 | |
The Funds have adopted provisions surrounding disclosures regarding derivative instruments and hedging activities which require qualitative disclosures about objectives and strategies for using derivatives, quantitative disclosures about fair value amounts of gains and losses on derivative instruments, and disclosures about currency risk-related contingent features in derivative agreements.
58
SA FUNDS
NOTES TO FINANCIAL STATEMENTS — DECEMBER 31, 2016 (Unaudited) (Continued)
In order to better define its contractual rights and to secure rights that will help the SA Global Fixed Income Fund mitigate its counterparty risk, the SA Global Fixed Income Fund may enter into an International Swaps and Derivatives Association, Inc. Master Agreement (“ISDA Master Agreement”) or similar agreement with its derivative contract counterparties. An ISDA Master Agreement is a bilateral agreement between the SA Global Fixed Income Fund and a counterparty that governs OTC derivatives and foreign exchange contracts and typically contains, among other things, collateral posting terms and netting provisions in the event of a default and/or termination event. Under an ISDA Master Agreement, the SA Global Fixed Income Fund may, under certain circumstances, offset with the counterparty certain derivative financial instrument’s payables and/or receivables with collateral held and/or posted and create one single net payment. The provisions of the ISDA Master Agreement typically permit a single net payment in the event of default (close-out netting) including the bankruptcy or insolvency of the counterparty. Note, however, that bankruptcy or insolvency laws of a particular jurisdiction may impose restrictions on or prohibitions against the right of offset in bankruptcy, insolvency or other events.
For financial reporting purposes, the SA Global Fixed Income Fund does not offset derivative assets and derivative liabilities that are subject to netting arrangements in its Statement of Assets and Liabilities.
The following tables, grouped into appropriate risk categories, discloses the amounts related to the SA Global Fixed Income Fund’s use of derivative instruments and hedging activities at December 31, 2016, on a gross basis:
| | | | | | Gain or (Loss) on Derivatives |
| | | | | | Recognized in Income |
| | Asset Derivative | | Liability Derivative | | | | Change in |
| Risk Type | | Fair Value(1) | | Fair Value(2) | | Realized Gain(3) | | Appreciation(4) |
| Foreign currency | | $726,061 | | $23,311 | | $2,642,412 | | $(541,981) |
Forward Currency Contracts Assets and Collateral Held by Counterparty as of December 31, 2016:
| | Gross Amounts of | | Financial | | | | |
| | Assets Presented in | | Instruments | | | | |
| | Statements of | | Available for | | Collateral | | Net Amount (not |
| Counterparty | | Assets & Liabilities | | Offset | | Received | | less than $0) |
| State Street Bank and Trust Co. | | $726,061 | | — | | — | | $726,061 |
(1) Statement of Assets and Liabilities location: Unrealized appreciation on forward foreign currency exchange contracts.
(2) Statement of Assets and Liabilities location: Unrealized depreciation on forward foreign currency exchange contracts held, at value.
(3) Statement of Operations location: Realized gain (loss) on: Foreign currency and forward currency transactions.
(4) Statement of Operations location: Increase (decrease) in unrealized appreciation (depreciation) on: Foreign currency and forward currency translations.
59
SA FUNDS
NOTES TO FINANCIAL STATEMENTS — DECEMBER 31, 2016 (Unaudited) (Continued)
For the six months ended December 31, 2016, the average monthly principal amount of forward foreign currency exchange contracts was $17,551,527.
Investment Transactions, Income and Expenses — Investments in securities are accounted for as of trade date (the date the buy or sell is executed). Dividend income is recorded on the ex-dividend date. Interest income is recorded on an accrual basis and includes amortization of discounts and premiums based on the effective interest method. Gains and losses are determined on the identified cost basis, which is the same for U.S. federal income tax purposes.
The Funds characterize distributions received from mutual fund investments on the Statements of Operations using the same characterization as the distribution received.
Expenses directly attributable to a specific Fund are charged to the respective Fund. Expenses that cannot be attributed to a particular Fund are apportioned among the Funds evenly or based on relative net assets.
Indemnifications — Under the Trust’s organizational documents, its officers and Trustees are indemnified against certain liabilities arising out of the performance of their duties to the Funds. The Trustees are also indemnified against certain liabilities pursuant to an Indemnity Agreement between the Trust and each Trustee. In addition, in the normal course of business the Trust enters into contracts that contain a variety of representations and warranties which provide general indemnifications. The Funds’ maximum exposures under these arrangements are unknown as this would involve potential future claims against the Funds that have not yet occurred. However, the Funds expect the risk of loss to be remote.
Foreign Taxes — Each Fund may be subject to foreign taxes (a portion of which may be reclaimable) on income, corporate events, or capital gains on investments or currency repatriation. All foreign taxes are recorded in accordance with the applicable foreign tax regulations and rates that exist in the foreign markets in which the Fund invests. These foreign taxes, if any, are paid by each Fund and are disclosed in its Statement of Operations. Foreign taxes payable as of December 31, 2016, if any, are reflected in each Fund’s Statement of Assets and Liabilities.
Federal Income Tax — Each Fund is treated as a separate entity for U.S. federal income tax purposes. Each Fund’s policy is to comply with the requirements of Subchapter M of the Internal Revenue Code that are applicable to regulated investment companies and to distribute substantially all of the Funds’ taxable income and net capital gain to their shareholders. Therefore, no income tax provision is required.
Each Fund recognizes the tax benefits of uncertain tax positions only when the position is “more likely than not” to be sustained upon examination by the tax authorities based on the technical merits of the tax position. As of June 30, 2016, and for all open tax year, each Fund has determined that no liability for unrecognized tax benefits is required in each Fund’s financial statements related to uncertain tax positions taken on a tax return (or expected to be taken on future tax returns). Open tax years are those that remain subject to examination and are based on each tax jurisdiction’s statute of limitation.
60
SA FUNDS
NOTES TO FINANCIAL STATEMENTS — DECEMBER 31, 2016 (Unaudited) (Continued)
The Trust management has analyzed the Funds’ tax positions, and has concluded that no liability for unrecognized tax benefits should be recorded with respect to uncertain tax positions taken on returns filed for open tax years (2013- 2015), or expected to be taken in the Funds’ 2016 tax returns.
As of June 30, 2016, for U.S. federal income tax purposes, the SA Emerging Markets Value Fund had an amount of $9,686,308 in unlimited long-term losses available to offset future net realized gains.
Distributions to Shareholders — Each Fund, excluding SA Global Fixed Income Fund and SA U.S. Fixed Income Fund, declares and pays dividends from its net investment income, if any, annually. SA Global Fixed Income Fund and SA U.S. Fixed Income Fund declare and pay dividends from net investment income, if any, quarterly. All of the Funds declare and pay distributions from net realized capital gains, if any, at least annually.
SA Real Estate Securities Fund characterizes distributions received from REIT investments based on information provided by the REITs into the following categories: ordinary income, long-term capital gains, and return of capital. If information is not available on a timely basis from the REITs in which the Fund invests, the characterization will be estimated based on available information, which may include the previous year’s allocation. If new or additional information becomes available from one or more of those REITs at a later date, a recharacterization will be made in the following year. The Fund records any amount recharacterized as dividend income as ordinary income, any amount recharacterized as long-term capital gain as realized gain in the Statement of Operations, and any amount recharacterized as a return of capital as a reduction to the cost of investments in the Statement of Assets and Liabilities and in the Portfolio of Investments. These recharacterizations are reflected in the accompanying financial statements.
Dividends to shareholders are recorded on the ex-dividend date. Income and capital gain distributions are determined in accordance with federal income tax regulations, which may differ from generally accepted accounting principles in the U.S. These differences are primarily due to differing treatments of income and gains on various investment securities held by the Funds, timing differences and differing characterizations of distributions made by the Funds. To the extent that distributions exceed the sum of net investment income and net capital gains for federal income tax purposes, they are reported as distributions of paid-in capital. Permanent book and tax basis differences relating to shareholder distributions will result in reclassifications to paid-in capital. Undistributed net investment income and undistributed accumulated net realized gain (loss) on investments and foreign currency transactions may include temporary book and tax differences such as wash sales, passive foreign investment companies, non-REIT return of capital, and foreign currency transactions that will reverse in a subsequent period. During any particular year, a fund’s net realized gains from investment transactions in excess of available capital loss carry forwards will be taxable to a fund if not distributed and, therefore, will be distributed to shareholders annually.
2. Agreements and Transactions with Affiliates
The Trust has an Investment Advisory and Administrative Services Agreement with the Adviser (the “Investment Advisory Agreement”) under which the Adviser manages the investments of, and provides administrative services to, each Fund. The Adviser is an indirect, wholly-owned subsidiary of Loring Ward Holdings, Inc., a U.S. company based in San Jose, California. Loring Ward Holdings, Inc. is controlled by Mr. Eli Reinhard through his sole ownership
61
SA FUNDS
NOTES TO FINANCIAL STATEMENTS — DECEMBER 31, 2016 (Unaudited) (Continued)
interest in Arcadia Loring Ward, LLC and Mr. Reinhard’s role as the sole trustee of ten trusts administered for the benefit of Mr. Reinhard’s family, each of which has an ownership interest in Loring Ward Holdings, Inc. For the advisory services provided to the Funds, the Adviser is entitled to a fee from each Fund computed daily and payable monthly at an annual rate based on each Fund’s average daily net assets as follows:
| Advisory Fees |
| SA U.S. Fixed Income Fund | 0.15% |
| SA Global Fixed Income Fund | 0.25% |
| SA U.S. Core Market Fund | 0.45% |
| SA U.S. Value Fund | 0.45% |
| SA U.S. Small Company Fund | 0.45% |
| SA International Value Fund | 0.50% |
| SA International Small Company Fund | 0.50% |
| SA Emerging Markets Value Fund | 0.50% |
| SA Real Estate Securities Fund | 0.35% |
| SA Worldwide Moderate Growth Fund | 0.00%* |
* The management fee for the SA Worldwide Moderate Growth Fund has two components. There is no management fee on assets invested in the Underlying SA Funds, any other investment companies advised or sub-advised by the Adviser, money market funds or held in cash or cash equivalents. The Fund is subject to a management fee of 0.25% on assets invested in any other investments. The Fund does not currently intend to make investments that would be subject to a management fee.
For the administrative services provided to the Funds, the Adviser is entitled to a fee from each Fund, except the SA Worldwide Moderate Growth Fund, computed daily and payable monthly at the annual rate of 0.10% of the average daily net assets of each Fund.
The Trust and the Adviser have jointly entered into an Investment Sub-Advisory Agreement (the “Sub-Advisory Agreement”) with Dimensional Fund Advisors LP (the “Sub-Adviser”). For the sub-advisory services provided to the Funds, except the SA Worldwide Moderate Growth Fund, the Sub-Adviser is entitled to a fee from each Fund computed daily and payable monthly at an annual rate based on each Fund’s average daily net assets. SA
62
SA FUNDS
NOTES TO FINANCIAL STATEMENTS — DECEMBER 31, 2016 (Unaudited) (Continued)
International Small Company Fund will not pay a fee to the Sub-Adviser for its sub-advisory services for as long as it invests substantially all of its assets in the DFA Portfolio. However, the Sub-Adviser receives an administration fee from the DFA Portfolio and also receives advisory fees for providing advisory services to the Series in which the DFA Portfolio invests.
| | Sub-Advisory |
| | Fees |
| SA U.S. Fixed Income Fund | | | 0.05 | % | |
| SA Global Fixed Income Fund | | | 0.05 | % | |
| SA U.S. Core Market Fund | | | 0.05 | %* | |
| SA U.S. Value Fund | | | 0.10 | % | |
| SA U.S. Small Company Fund | | | 0.35 | % | |
| SA International Value Fund | | | 0.20 | % | |
| SA Emerging Markets Value Fund | | | 0.50 | % | |
| SA Real Estate Securities Fund | | | 0.15 | % | |
* The Sub-Adviser will not receive any sub-advisory fee for its sub-advisory services to the SA U.S. Core Market Fund with respect to any assets of the SA U.S. Core Market Fund invested in the U.S. Micro Cap Portfolio of the DFA Investment Dimensions Group Inc. For its management services, the Sub-Adviser receives an investment advisory fee from the U.S. Micro Cap Portfolio.
The Trust has a Shareholder Servicing Agreement with the Adviser. For the shareholder services provided to the Funds, the Adviser is entitled to a fee from each Fund computed daily and payable monthly at the annual rate of 0.25% of the average daily net assets of each Fund except the SA Worldwide Moderate Growth Fund. There is no shareholder servicing fee on assets of the SA Worldwide Moderate Growth Fund that are invested in the Underlying SA Funds, any other investment companies advised or sub-advised by the Adviser, money market funds or held in cash or cash equivalents. The SA Worldwide Moderate Growth Fund is subject to a shareholder servicing fee of 0.25% on assets invested in any other investment. The SA Worldwide Moderate Growth Fund does not currently intend to make investments that would be subject to a shareholder servicing fee.
The Adviser has contractually agreed to waive its advisory fees and/or to reimburse expenses to the extent each Fund’s (with the exception of the SA Worldwide Moderate Growth Fund) operating expenses (excluding interest, taxes, brokerage commissions, acquired fund fees and expenses, and extraordinary expenses) exceed, in the aggregate, the rate per annum shown in the table below. This agreement will remain in effect until October 28, 2021, at which time the agreement may be continued, modified or eliminated and net expenses will be adjusted as necessary. In addition, the Adviser has contractually agreed to waive fees and/or reimburse expenses so that the SA Worldwide Moderate Growth Fund’s total annual operating expenses (excluding interest, taxes, brokerage commissions, acquired fund fees and expenses and extraordinary expenses) do not exceed the total annual acquired fund fees and expenses related to the Fund’s investments in the Underlying SA Funds, any other
63
SA FUNDS
NOTES TO FINANCIAL STATEMENTS — DECEMBER 31, 2016 (Unaudited) (Continued)
investment companies advised or sub-advised by the Adviser, or any money market fund. This agreement will remain in effect until July 1, 2025, at which time the agreement may be continued, modified or eliminated and net expenses will be adjusted as necessary. These agreements may only be amended or terminated during their terms with the approval of the Board.
| Expense |
| Limitation |
| SA U.S. Fixed Income Fund | 0.65% |
| SA Global Fixed Income Fund | 0.80% |
| SA U.S. Core Market Fund | 1.00% |
| SA U.S. Value Fund | 1.05% |
| SA U.S. Small Company Fund | 1.20% |
| SA International Value Fund | 1.20% |
| SA International Small Company Fund | 1.10% |
| SA Emerging Markets Value Fund | 1.40% |
| SA Real Estate Securities Fund | 1.00% |
| SA Worldwide Moderate Growth Fund | 0.00% |
The Adviser may elect to recapture any amounts waived or reimbursed pursuant to the above agreement, subject to the following conditions: (1) the Adviser must request reimbursement within three years from the end of the year in which the waiver/reimbursement is made, (2) the Board must approve the reimbursement, (3) reimbursement will be permitted if, and to the extent that, the relevant Fund does not exceed its operating expense limitation after giving effect to the reimbursement, and (4) the Adviser may not request or receive reimbursements for the reductions and waivers before payment of the relevant Fund’s operating expenses for the current fiscal year. During the six months ended December 31, 2016, the Adviser recaptured $140,961 from SA U.S. Small Company Fund, $222,209 from SA Emerging Markets Value Fund, and $44,123 from SA Real Estate Securities Fund pursuant to these conditions. As of December 31, 2016 the following amounts are subject to this recapture through June 30, 2017, June 30, 2018 and June 30, 2019, respectively.
| Expires | | Expires | | Expires |
| June 30, 2017 | | June 30, 2018 | | June 30, 2019 |
| SA U.S. Fixed Income Fund | $489,141 | | $545,837 | | $ | — |
| SA U.S. Value Fund | 30,908 | | 16,327 | | | — |
| SA U.S. Small Company Fund | 502,642 | | 528,001 | | | 310,516 |
| SA Emerging Markets Value Fund | 592,997 | | 623,893 | | | 480,239 |
| SA Real Estate Securities Fund | 371,620 | | 383,400 | | | 108,097 |
Trustees’ Fees and Expenses — For their services as Trustees, the Trustees of the Trust received an annual retainer fee of $85,000, as well as reimbursement for expenses incurred in connection with each meeting of the Board and its Committees. The Chairman of the Board received an additional $8,500 per year.
64
SA FUNDS
NOTES TO FINANCIAL STATEMENTS — DECEMBER 31, 2016 (Unaudited) (Continued)
Sub-Administration Fees — State Street serves as sub-administrator for the Trust, pursuant to a Sub-Administration Agreement with the Trust and the Adviser. State Street receives a fee that is calculated daily and paid monthly at an annual rate based on the aggregate average daily net assets of the Trust as follows: 0.02% of the first $1.5 billion of net assets and 0.0175% of net assets over $1.5 billion. The fee is then allocated to each Fund based on the relative net assets of each Fund, subject to a minimum fee of $70,000 annually per Fund, except for SA International Small Company Fund and SA Worldwide Moderate Growth Fund, which are subject to a minimum fee of $50,000 annually per Fund. Fees are calculated for the fund complex and then allocated to the Funds based upon each Fund’s total net assets, which may cause a fund to pay less than the minimum annual charge.
3. Purchases and Sales of Securities
Excluding short-term investments, each Fund’s purchases and sales of securities for the six months ended December 31, 2016 were as follows:
| | | Purchases | | Sales |
| | | | U.S. Government | | Other | | U.S. Government | | Other |
| SA U.S. Fixed Income Fund | | $244,443,064 | | $137,411,314 | | $254,012,564 | | $130,543,900 |
| SA Global Fixed Income Fund | | 4,513,079 | | 129,136,548 | | 1,013,120 | | 134,841,453 |
| SA U.S. Core Market Fund | | 0 | | 41,923,460 | | 0 | | 61,257,107 |
| | SA U.S. Value Fund | | 0 | | 47,994,167 | | 0 | | 65,074,858 |
| SA U.S. Small Company Fund | | 0 | | 24,392,817 | | 0 | | 43,294,805 |
| SA International Value Fund | | 0 | | 49,668,574 | | 0 | | 60,007,675 |
| SA International Small Company Fund | | N/A | | N/A | | N/A | | N/A |
| SA Emerging Markets Value Fund | | 0 | | 17,915,676 | | 0 | | 17,654,478 |
| SA Real Estate Securities Fund | | 0 | | 5,352,973 | | 0 | | 9,343,652 |
| SA Worldwide Moderate Growth Fund | | 0 | | 5,749,920 | | 0 | | 696,391 |
N/A — Refer to the financial statements of the DFA Portfolio and the Series in which SA International Small Company Fund invests, which are included elsewhere in this report.
65
SA FUNDS
NOTES TO FINANCIAL STATEMENTS — DECEMBER 31, 2016 (Unaudited) (Continued)
4. Capital Shares and Affiliated Ownership
The SA Worldwide Moderate Growth Fund invests in Underlying Securities and other Investment Companies, certain of which may be deemed to be under common control because of the same or affiliated investment adviser and membership in a common family of investment companies (the “Affiliated Underlying Funds”). A summary of the transactions with each Affiliated Underlying Fund during the six months ended December 31, 2016 follows:
| | Balance | | | | | | | Balance of | | | | | | | | | | | | |
| | of Shares | | | | | | | Shares | | | | | Realized | | | | | |
| | Held at | | Gross | | Gross | | Held at | | Value at | | Gain | | Distributions |
| | 6/30/2016 | | Additions | | Sales | | 12/31/2016 | | 12/31/2016 | | (Loss) | | Received(a) |
| SA Emerging Markets Value Fund | | 151,396 | | 73,782 | | (13,261 | ) | | 211,917 | | $ | 1,750,437 | | $ | 5,542 | | | | $ | 20,984 | |
| SA Global Fixed Income Fund | | 151,939 | | 88,924 | | (4,850 | ) | | 236,013 | | | 2,258,641 | | | 487 | | | | | 18,998 | |
| SA International Value Fund | | 242,188 | | 95,970 | | (15,485 | ) | | 322,673 | | | 3,297,718 | | | (19,291 | ) | | | | 91,362 | |
| SA Real Estate Securities Fund | | 48,234 | | 34,447 | | (4,253 | ) | | 78,428 | | | 876,041 | | | 5,820 | | | | | 30,959 | |
| SA U.S. Core Market Fund | | 108,087 | | 51,105 | | (3,645 | ) | | 155,547 | | | 3,098,490 | | | 2,401 | | | | | 177,915 | |
| SA U.S. Fixed Income Fund | | 134,277 | | 74,448 | | (3,979 | ) | | 204,746 | | | 2,082,271 | | | 8 | | | | | 4,931 | |
| SA U.S. Small Company Fund | | 47,508 | | 18,667 | | (5,005 | ) | | 61,170 | | | 1,548,205 | | | 2,335 | | | | | 74,570 | |
| SA U.S. Value Fund | | 102,578 | | 40,182 | | (5,183 | ) | | 137,577 | | | 2,408,975 | | | (433 | ) | | | | 114,628 | |
| Totals | | | | | | | | | | | $ | 17,320,778 | | $ | (3,131 | ) | | | $ | 534,347 | |
(a) Distributions received include distributions from net investment income and from capital gains from the Affiliated Underlying Funds
5. Recent Accounting Pronouncements
In May 2015, the Financial Accounting Standards Board issued ASU No. 2015-07 entitled Fair Value Measurement (Topic 820) - Disclosures for Investments in Certain Entities That Calculate Net Asset Value per Share (or Its Equivalent). The amendment removes the requirement to categorize within the fair value hierarchy all investments for which fair value is measured using the Net Asset Value per Share practical expedient. The Fund is required to apply ASU No. 2015-07 for fiscal years beginning after December 15, 2015 and interim periods within those fiscal years. The Trust Manager is currently evaluating the impact of ASU No. 2015-07.
6. Subsequent Events
Effective January 1, 2017, the annual compensation of each Trustee increased from $85,000 to $90,000. In addition, the Chairman of the Board’s annual supplemental compensation was increased by 10% from $8,500 to $9,000. The Trustees approved these increases at the Board meeting on December 2, 2016.
66
SA FUNDS
ADDITIONAL INFORMATION (Unaudited)
Proxy Voting Policies and Procedures
The Sub-Adviser is responsible for exercising the voting rights associated with the securities purchased and/or held by the Funds. A description of the policies and procedures that are used by the Sub-Adviser to vote proxies relating to the Funds’ portfolio securities is available without charge, upon request, by calling (844) 366-0905 and on the Securities and Exchange Commission’s website (“SEC”) at http://www.sec.gov. Information regarding how the Sub-Adviser voted these proxies during the most recent 12-month period ended June 30th is listed in the Trust’s Form N-PX, which is available after August 31st without charge, upon request, by calling the same number or visiting the SEC’s website at http://www.sec.gov.
Quarterly Portfolio Schedule
The Trust files a complete schedule of portfolio holdings for each Fund for the first and third quarters of each fiscal year on Form N-Q. The Trust’s Forms N-Q are available on the SEC’s website at http://www.sec.gov or may be reviewed and copied at the SEC’s Public Reference Room in Washington, D.C. Information on the operation of the Public Reference Room may be obtained by calling 1-800-SEC-0330. The Trust’s most recent Form N-Q is also available without charge, upon request, by calling (844) 366-0905.
Semi-Annual Portfolio Schedule
The Trust files a complete schedule of portfolio holdings for each Fund for the second quarter of each fiscal year on Form N-CSR. The Trust’s Form N-CSR is available on the SEC’s website at http://www.sec.gov or may be reviewed and copied at the SEC’s Public Reference Room in Washington, D.C. Information on the operation of the Public Reference Room may be obtained by calling 1-800-SEC-0330. The Trust’s most recent Form N-CSR is also available without charge, upon request, by calling (844) 366-0905.
67
SA FUNDS
ADDITIONAL INFORMATION (Unaudited) (Continued)
Understanding Your Fund’s Expenses
Shareholder Expense Example
As a mutual fund shareholder you incur ongoing costs including management fees, shareholder services fees, fees for administrative services and other Fund expenses. These costs are described in more detail in the Funds’ prospectus. The examples below are intended to help you understand your ongoing costs of investing in the Funds and help you compare these with the ongoing costs of investing in other mutual funds. The following examples are based on an investment of $1,000 made at the beginning of the period, July 1, 2016 through December 31, 2016. Expenses paid during the period in the tables below are equal to the Fund’s annualized expense ratio, multiplied by the average account value over the period, multiplied by 184/365 to reflect the one-half year period. Such expenses are limited by an agreement between the Fund and the Adviser and may be recovered by the Adviser under certain circumstances.
You can find additional information about the Fund’s expenses, including the expense limitation agreement, in the Notes to Financial Statements section of this report and in the Fund’s current prospectus.
Actual Expenses
The table below shows the actual account values and actual Fund expenses, based on the Fund’s actual performance during the period. You may use the information in this line, together with the amount you invested, to estimate the expenses you paid over the period. Simply divide your account value by $1,000 (for example $8,600 account value divided by $1,000 = 8.6) then multiply the result by the number in the first line of the table for your Fund under the heading “Expenses Paid During Period” to estimate the expenses you paid over the period.
| | | Actual Expenses |
| | Beginning | | Ending | | Annual | | Expenses |
| | Account | | Account | | Expense | | Paid During |
| | Value | | Value | | Ratio | | Period |
| SA U.S. Fixed Income Fund | | $ | 1,000 | | | $ | 997.70 | | 0.65 | % | | | $ | 3.27 | |
| SA Global Fixed Income Fund | | | 1,000 | | | | 986.60 | | 0.72 | | | | | 3.61 | |
| | SA U.S. Core Market Fund | | | 1,000 | | | | 1,080.90 | | 0.93 | | | | | 4.88 | |
| SA U.S. Value Fund | | | 1,000 | | | | 1,141.50 | | 1.00 | | | | | 5.40 | |
| SA U.S. Small Company Fund | | | 1,000 | | | | 1,187.90 | | 1.20 | | | | | 6.62 | |
| SA International Value Fund | | | 1,000 | | | | 1,148.00 | | 1.12 | | | | | 6.06 | |
| SA International Small Company Fund | | | 1,000 | | | | 1,060.70 | | 0.96 | | | | | 4.99 | |
| SA Emerging Markets Value Fund | | | 1,000 | | | | 1,075.00 | | 1.40 | | | | | 7.32 | |
| SA Real Estate Securities Fund | | | 1,000 | | | | 952.30 | | 1.00 | | | | | 4.92 | |
| SA Worldwide Moderate Growth Fund | | | 1,000 | | | | 1,082.90 | | 0.00 | | | | | 0.00 | |
68
SA FUNDS
ADDITIONAL INFORMATION (Unaudited) (Continued)
Hypothetical Example for Comparison Purposes
The table below provides information about hypothetical account values and hypothetical expenses based on the Fund’s actual expense ratio and an assumed rate of return of 5% per year before expenses, which is not the Fund’s actual return. Thus, you should not use the hypothetical account values and expenses to estimate the actual ending account balance or your expenses for the period. Rather, these figures are provided to enable you to compare the ongoing costs of investing in the Fund versus other funds. To do so, compare this 5% hypothetical example with the 5% hypothetical examples that appear in the shareholder reports of the other funds.
| | | | Hypothetical Expenses |
| | | Beginning | | Ending | | Annual | | Expenses |
| | | Account | | Account | | Expense | | Paid During |
| | | Value | | Value | | Ratio | | Period |
| SA U.S. Fixed Income Fund | | | $ | 1,000 | | | $ | 1,021.93 | | | 0.65 | % | | | | $ | 3.31 | |
| SA Global Fixed Income Fund | | | | 1,000 | | | | 1,021.58 | | | 0.72 | | | | | | 3.67 | |
| SA U.S. Core Market Fund | | | | 1,000 | | | | 1,020.52 | | | 0.93 | | | | | | 4.74 | |
| SA U.S. Value Fund | | | | 1,000 | | | | 1,020.16 | | | 1.00 | | | | | | 5.09 | |
| SA U.S. Small Company Fund | | | | 1,000 | | | | 1,019.16 | | | 1.20 | | | | | | 6.11 | |
| SA International Value Fund | | | | 1,000 | | | | 1,019.56 | | | 1.12 | | | | | | 5.70 | |
| SA International Small Company Fund | | | | 1,000 | | | | 1,020.37 | | | 0.96 | | | | | | 4.89 | |
| SA Emerging Markets Value Fund | | | | 1,000 | | | | 1,018.15 | | | 1.40 | | | | | | 7.12 | |
| SA Real Estate Securities Fund | | | | 1,000 | | | | 1,020.16 | | | 1.00 | | | | | | 5.09 | |
| SA Worldwide Moderate Growth Fund | | | | 1,000 | | | | 1,025.21 | | | 0.00 | | | | | | 0.00 | |
Please note that the expenses shown in the tables are meant to highlight your ongoing costs only and do not reflect any transaction costs, such as sales charges (loads), or redemption fees. Therefore, the second line of the table is useful in comparing ongoing costs only, and will not help you determine the relative total costs of investing in different funds. In addition, if these transaction costs were included, your costs would have been higher.
69
Selected Financial Statements of DFA Investment Dimensions Group Inc.
International Small Company Portfolio
TABLE OF CONTENTS
| | Page |
| Definitions of Abbreviations and Footnotes | 71 |
| Disclosure of Fund Expenses — October 31, 2016 (Unaudited) | 72 |
| Disclosure of Portfolio Holdings — October 31, 2016 (Unaudited) | 73 |
| Summary Schedule of Investments — December 31, 2016 (Unaudited) | 74 |
| Schedule of Investments — October 31, 2016 | 75 |
| Statement of Assets and Liabilities — December 31, 2016 (Unaudited) | 76 |
| Statement of Assets and Liabilities — October 31, 2016 | 77 |
| Statement of Operations — October 31, 2016 | 78 |
| Statement of Changes in Net Assets | 79 |
| Financial Highlights | 80 |
| Notes to Financial Statements — October 31, 2016 | 81 |
| Report of Independent Registered Public Accounting Firm | 88 |
70
DFA INVESTMENT DIMENSIONS GROUP INC.
THE DFA INVESTMENT TRUST COMPANY
DEFINITIONS OF ABBREVIATIONS AND FOOTNOTES
Schedules of Investments/Summary Schedules of Portfolio Holdings
| Investment Abbreviations |
| | ADR | | American Depositary Receipt |
| P.L.C. | | Public Limited Company |
| |
| Investment Footnotes |
| † | | See Note B to Financial Statements. |
| †† | | Securities that have generally been fair value factored. See Note B to Financial Statements. |
| * | | Non-Income Producing Securities. |
| # | | Total or Partial Securities on Loan. |
| @ | | Security purchased with cash proceeds from Securities on Loan. |
| § | | Affiliated Fund. |
| |
| Financial Highlights |
| (A) | | Computed using average shares outstanding. |
| (B) | | Represents the combined ratios for the respective portfolio and its respective pro-rata share of its Master Fund(s). |
| |
| All Statements, Schedules and Notes to Financial Statements |
| — | | Amounts designated as — are either zero or rounded to zero. |
| SEC | | Securities and Exchange Commission |
71
DFA INVESTMENT DIMENSIONS GROUP INC.
INTERNATIONAL SMALL COMPANY PORTFOLIO
DISCLOSURE OF FUND EXPENSES
(Unaudited)
The following Expense Tables are shown so that you can understand the impact of fees on your investment. All mutual funds have operating expenses. As a shareholder of the fund, you incur ongoing costs, which include costs for portfolio management, administrative services, and shareholder reports, among others. Operating expenses, legal and audit services, which are deducted from a fund’s gross income, directly reduce the investment return of the fund. A fund’s expenses are expressed as a percentage of its average net assets. This figure is known as the expense ratio. The following examples are intended to help you understand the ongoing costs, in dollars, of investing in the fund and to compare these costs with those of other mutual funds. The examples are based on an investment of $1,000 made at the beginning of the period shown and held for the entire period.
The Expense Tables below illustrate your fund’s costs in two ways.
Actual Fund Return
This section helps you to estimate the actual expenses after fee waivers that you paid over the period. The “Ending Account Value” shown is derived from the fund’s actual return and “Expenses Paid During Period” reflect the dollar amount that would have been paid by an investor who started with $1,000 in the fund. You may use the information here, together with the amount you invested, to estimate the expenses that you paid over the period.
To do so, simply divide your account value by $1,000 (for example, a $7,500 account value divided by $1,000 = 7.5), then multiply the result by the number given for your fund under the heading “Expenses Paid During Period.”
Hypothetical Example for Comparison Purposes
This section is intended to help you compare your fund’s costs with those of other mutual funds. The hypothetical “Ending Account Value” and “Expenses Paid During Period” are derived from the fund’s actual expense ratio and an assumed 5% annual return before expenses. In this case, because the return used is not the fund’s actual return, the results do not apply to your investment. The example is useful in making comparisons because the SEC requires all mutual funds to calculate expenses based on a 5% annual return. You can assess your fund’s costs by comparing this hypothetical example with the hypothetical examples that appear in shareholder reports of other funds.
Please note that the expenses shown in the tables are meant to highlight and help you compare ongoing costs only and do not reflect any transactional costs, if applicable. The “Annualized Expense Ratio” represents the actual expenses for the six-month period indicated.
Six Months Ended October 31, 2016
EXPENSE TABLES
| | Beginning | | Ending | | | | Expenses | |
| | Account | | Account | | Annualized | | Paid | |
| | Value | | Value | | Expense | | During | |
| | 05/01/16 | | 10/31/16 | | Ratio* | | Period* | |
| International Small Company Portfolio***** | | | | | | | | | | | | | |
| Actual Fund Return | | | | | | | | | | | | | |
| Institutional Class Shares | | $ | 1,000.00 | | $ | 1,023.90 | | 0.54 | % | | $ | 2.75 | |
| Hypothetical 5% Annual Return | | | | | | | | | | | | | |
| Institutional Class Shares | | $ | 1,000.00 | | $ | 1,022.42 | | 0.54 | % | | $ | 2.75 | |
____________________
| ***** | | The Portfolio is a Fund of Funds. The expenses shown reflect the direct expenses of the Fund of Funds and the Fund of Funds’ portion of the expenses of its Master Funds. |
72
DFA INVESTMENT DIMENSIONS GROUP INC.
INTERNATIONAL SMALL COMPANY PORTFOLIO
DISCLOSURE OF PORTFOLIO HOLDINGS
(Unaudited)
The SEC requires that all funds file a complete Schedule of Investments with the SEC for their first and third fiscal quarters on Form N-Q. For DFA Investment Dimensions Group Inc., this would be for the fiscal quarters ending January 31 and July 31. The Form N-Q filing must be made within 60 days of the end of the quarter. DFA Investment Dimensions Group Inc. filed its most recent Form N-Q with the SEC on September 28, 2016. They are available upon request, without charge, by calling collect: (512) 306-7400 or by mailing a request to Dimensional Fund Advisors LP, 6300 Bee Cave Road, Building One, Austin, Texas 78746, or by visiting the SEC’s website at http://www.sec.gov, or they may be reviewed and copied at the SEC’s Public Reference Room in Washington, D.C. (call 1-800-732-0330 for information on the operation of the Public Reference Room).
SEC regulations permit a fund to include in its reports to shareholders a “Summary Schedule of Portfolio Holdings” in lieu of a full Schedule of Investments. The Summary Schedule of Portfolio Holdings reports the fund’s 50 largest holdings in unaffiliated issuers and any investments that exceed one percent of the fund’s net assets at the end of the reporting period. The regulations also require that the Summary Schedule of Portfolio Holdings identify each category of investments that are held.
A fund is required to file a complete Schedule of Investments with the SEC on Form N-CSR within ten days after mailing the annual and semi-annual reports to shareholders. It will be available upon request, without charge, by calling collect: (512) 306-7400 or by mailing a request to Dimensional Fund Advisors LP, 6300 Bee Cave Road, Building One, Austin, Texas 78746, or by visiting the SEC’s website at http://www.sec.gov, or they may be reviewed and copied at the SEC’s Public Reference Room in Washington, D.C. (call 1-800-732-0330 for information on the operation of the Public Reference Room).
PORTFOLIO HOLDINGS
The SEC requires that all funds present their categories of portfolio holdings in a table, chart or graph format in their annual and semi-annual shareholder reports, whether or not a Schedule of Investments is utilized. The following table, which presents portfolio holdings as a percent of total investments before short-term investments and collateral for loaned securities, is provided in compliance with such requirement. The categories shown below represent broad industry sectors. Each industry sector consists of one or more specific industry classifications.
The categories of industry classification for the Affiliated Investment Companies are represented in their Disclosures of Portfolio Holdings, which are included elsewhere within the report. Refer to the Schedule of Investments/Summary Schedule of Portfolio Holdings for each of the underlying Affiliated Investment Company’s holdings, which reflect the investments by category or country.
| FUND OF FUNDS | Affiliated Investment Companies | |
| International Small Company Portfolio | 100.0% | |
73
DFA INVESTMENT DIMENSIONS GROUP INC.
INTERNATIONAL SMALL COMPANY PORTFOLIO
SUMMARY SCHEDULE OF PORTFOLIO HOLDINGS
December 31, 2016
(Unaudited)
| | Value† | |
| AFFILIATED INVESTMENT COMPANIES — (100.0%) | | | | |
| Investment in The Continental Small Company Series | | | | |
| of The DFA Investment Trust Company | | | 3,841,873,777 | |
| Investment in The Japanese Small Company Series | | | | |
| of The DFA Investment Trust Company | | | 2,527,485,071 | |
| Investment in The United Kingdom Small Company Series | | | | |
| of The DFA Investment Trust Company | | | 1,700,080,135 | |
| Investment in The Asia Pacific Small Company Series | | | | |
| of The DFA Investment Trust Company | | | 1,233,057,322 | |
| Investment in The Canadian Small Company Series | | | | |
| of The DFA Investment Trust Company | | | 975,749,776 | |
| TOTAL INVESTMENTS IN AFFILIATED | | | | |
| INVESTMENT COMPANIES (Cost $9,539,310,019) | | | 10,278,246,081 | |
| TOTAL INVESTMENTS — (100.0%) (Cost $9,539,310,019)^ | | $ | 10,278,246,081 | |
____________________
| ^ | | The cost for federal income tax purposes is $8,621,224,928. |
Summary of the Portfolio’s investments as of December 31, 2016, based on their valuation inputs, is as follows (See Security Valuation Note):
| | Investments in Securities (Market Value) | | |
| | Level 1 | | | Level 2 | | Level 3 | | Total | | |
| Affiliated Investment Companies | | $ | 10,278,246,081 | | | — | | — | | $ | 10,278,246,081 | | |
| Futures Contracts** | | | (521,202 | ) | | — | | — | | | (521,202 | ) | |
| TOTAL | | $ | 10,277,724,879 | | | — | | — | | $ | 10,277,724,879 | | |
____________________
| ** | | Not reflected in the Summary Schedule of Portfolio Holdings, valued at the unrealized appreciation/(depreciation) on the investment. |
74
DFA INVESTMENT DIMENSIONS GROUP INC.
INTERNATIONAL SMALL COMPANY PORTFOLIO
SCHEDULE OF INVESTMENTS
October 31, 2016
| Value† | |
| AFFILIATED INVESTMENT COMPANIES — (100.0%) | | | |
| Investment in The Continental Small Company Series | | | |
| of The DFA Investment Trust Company | $ | 3,831,133,408 | |
| Investment in The Japanese Small Company Series | | | |
| of The DFA Investment Trust Company | | 2,622,939,356 | |
| Investment in The United Kingdom Small Company Series | | | |
| of The DFA Investment Trust Company | | 1,623,793,646 | |
| Investment in The Asia Pacific Small Company Series | | | |
| of The DFA Investment Trust Company | | 1,304,060,854 | |
| Investment in The Canadian Small Company Series | | | |
| of The DFA Investment Trust Company | | 912,080,702 | |
| TOTAL INVESTMENTS IN AFFILIATED | | | |
| INVESTMENT COMPANIES (Cost $9,548,011,247) | | 10,294,007,966 | |
| TOTAL INVESTMENTS — (100.0%) (Cost $9,548,011,247) | $ | 10,294,007,966 | |
Summary of the Portfolio’s investments as of October 31, 2016, based on their valuation inputs, is as follows (See Security Valuation Note):
| | Investments in Securities (Market Value) | | |
| | Level 1 | | | Level 2 | | Level 3 | | Total | | |
| Affiliated Investment Companies | | $ | 10,294,007,966 | | | — | | — | | $ | 10,294,007,966 | | |
| Futures Contracts** | | | (2,788,124 | ) | | — | | — | | | (2,788,124 | ) | |
| TOTAL | | $ | 10,291,219,842 | | | — | | — | | $ | 10,291,219,842 | | |
____________________
| ** | | Not reflected in the Schedule of Investments, valued at the unrealized appreciation/(depreciation) on the investment. (Note H) |
See accompanying Notes to Financial Statements.
75
DFA INVESTMENT DIMENSIONS GROUP INC.
INTERNATIONAL SMALL COMPANY PORTFOLIO
STATEMENT OF ASSETS AND LIABILITIES
DECEMBER 31, 2016
(Unaudited)
(Amounts in thousands, except share and per share amounts)
| ASSETS: | | | | | |
| Investments in Affiliated Investment Companies at Value | | $ | 10,278,246 | | |
| Segregated Cash for Futures Contracts | | | 2,692 | | |
| Cash | | | 88,402 | | |
| Receivables: | | | | | |
| Fund Shares Sold | | | 11,365 | | |
| Prepaid Expenses and Other Assets | | | 119 | | |
| Total Assets | | | 10,380,824 | | |
| LIABILITIES: | | | | | |
| Payables: | | | | | |
| Fund Shares Redeemed | | | 12,817 | | |
| Due to Advisor | | | 3,488 | | |
| Futures Margin Variation | | | 246 | | |
| Accrued Expenses and Other Liabilities | | | 531 | | |
| Total Liabilities | | | 17,082 | | |
| NET ASSETS | | $ | 10,363,742 | | |
| NET ASSET VALUE, OFFERING AND REDEMPTION PRICE PER SHARE: | | | | | |
| Institutional Class Shares — based on net assets of $10,363,742 and | | | | | |
| shares outstanding of 600,117,023 | | $ | 17.27 | | |
| NUMBER OF SHARES AUTHORIZED | | | 1,500,000,000 | | |
| Investments in Affiliated Investment Companies at Cost | | $ | 9,539,310 | | |
| NET ASSETS CONSIST OF: | | | | | |
| Paid-In Capital | | $ | 9,674,899 | | |
| Undistributed Net Investment Income (Distributions in Excess of Net Investment Income) | | | (76,781 | ) | |
| Accumulated Net Realized Gain (Loss) | | | 27,758 | | |
| Net Unrealized Foreign Exchange Gain (Loss) | | | (549 | ) | |
| Net Unrealized Appreciation (Depreciation) | | | 738,415 | | |
| NET ASSETS | | $ | 10,363,742 | | |
See accompanying Notes to Financial Statements.
76
DFA INVESTMENT DIMENSIONS GROUP INC.
INTERNATIONAL SMALL COMPANY PORTFOLIO
STATEMENTS OF ASSETS AND LIABILITIES
OCTOBER 31, 2016
(Amounts in thousands, except share and per share amounts)
| ASSETS: | | | | | |
| Investments in Affiliated Investment Companies at Value | | $ | 10,294,008 | | |
| Investments at Value | | | — | | |
| Segregated Cash for Futures Contracts | | | 3,866 | | |
| Cash | | | 97,178 | | |
| Receivables: | | | | | |
| Fund Shares Sold | | | 2,600 | | |
| Prepaid Expenses and Other Assets | | | 110 | | |
| Total Assets | | | 10,397,762 | | |
| LIABILITIES: | | | | | |
| Payables: | | | | | |
| Fund Shares Redeemed | | | 6,350 | | |
| Due to Advisor | | | 3,567 | | |
| Futures Margin Variation | | | 2 | | |
| Accrued Expenses and Other Liabilities | | | 482 | | |
| Total Liabilities | | | 10,401 | | |
| NET ASSETS | | $ | 10,387,361 | | |
| NET ASSET VALUE, OFFERING AND REDEMPTION PRICE PER SHARE: | | | | | |
Institutional Class Shares — based on net assets of $10,387,361 and shares outstanding of
584,367,957, respectively | | $ | 17.78 | | |
| NUMBER OF SHARES AUTHORIZED | | | 1,500,000,000 | | |
| Investments in Affiliated Investment Companies at Cost | | $ | 9,548,011 | | |
| NET ASSETS CONSIST OF: | | | | | |
| Paid-In Capital | | $ | 9,407,620 | | |
| Undistributed Net Investment Income (Distributions in Excess of Net Investment Income) | | | (18,870 | ) | |
| Accumulated Net Realized Gain (Loss) | | | 256,462 | | |
| Net Unrealized Foreign Exchange Gain (Loss) | | | (1,059 | ) | |
| Net Unrealized Appreciation (Depreciation) | | | 743,208 | | |
| NET ASSETS | | $ | 10,387,361 | | |
See accompanying Notes to Financial Statements.
77
DFA INVESTMENT DIMENSIONS GROUP INC.
INTERNATIONAL SMALL COMPANY PORTFOLIO*
STATEMENTS OF OPERATIONS
FOR THE YEAR ENDED OCTOBER 31, 2016
(Amounts in thousands)
| Investment Income | | | | | |
| Net Investment Income Allocated from Affiliated Investment Companies: | | | | | |
| Dividends (Net of Foreign Taxes Withheld of $20,552) | | $ | 262,595 | | |
| Income from Securities Lending | | | 27,016 | | |
| Expenses Allocated from Affiliated Investment Companies | | | (12,006 | ) | |
| Total Net Investment Income Received from Affiliated Investment Companies | | | 277,605 | | |
| Fund Expenses | | | | | |
| Investment Management Fees | | | 38,540 | | |
| Accounting & Transfer Agent Fees | | | 58 | | |
| Custodian Fees | | | 6 | | |
| Filing Fees | | | 279 | | |
| Shareholders’ Reports | | | 280 | | |
| Directors’/Trustees’ Fees & Expenses | | | 66 | | |
| Professional Fees | | | 66 | | |
| Other | | | 77 | | |
| Total Expenses | | | 39,372 | | |
| Net Expenses | | | 39,372 | | |
| Net Investment Income (Loss) | | | 238,233 | | |
| Realized and Unrealized Gain (Loss) | | | | | |
| Net Realized Gain (Loss) on: | | | | | |
| Investment Securities Sold** | | | 261,664 | | |
| Futures | | | 17,796 | | |
| Foreign Currency Transactions | | | 673 | | |
| Forward Currency Contracts | | | — | | |
| Change in Unrealized Appreciation (Depreciation) of: | | | | | |
| Investment Securities and Foreign Currency | | | 13,423 | | |
| Futures | | | (2,771 | ) | |
| Translation of Foreign Currency Denominated Amounts | | | (814 | ) | |
| Net Realized and Unrealized Gain (Loss) | | | 289,971 | | |
| Net Increase (Decrease) in Net Assets Resulting from Operations | | $ | 528,204 | | |
____________________
| * | | Investment Income and Realized and Unrealized Gain (Loss) were allocated from the Portfolio’s Master Fund (Affiliated Investment Company). |
| |
| ** | | Net of foreign capital gain taxes withheld of $0. |
See accompanying Notes to Financial Statements.
78
DFA INVESTMENT DIMENSIONS GROUP INC.
INTERNATIONAL SMALL COMPANY PORTFOLIO
STATEMENTS OF CHANGES IN NET ASSETS
(Amounts in thousands)
| | Year | | Year | |
| | Ended | | Ended | |
| | Oct. 31, 2016 | | Oct. 31, 2015 | |
| Increase (Decrease) in Net Assets | | | | | | | | | | | | |
| Operations: | | | | | | | | | | | | |
| Net Investment Income (Loss) | | | $ | 238,233 | | | | | $ | 208,124 | | |
| Net Realized Gain (Loss) on: | | | | | | | | | | | | |
| Investment Securities Sold* | | | | 261,664 | | | | | | 376,613 | | |
| Futures | | | | 17,796 | | | | | | (4,583 | ) | |
| Foreign Currency Transactions | | | | 673 | | | | | | (2,876 | ) | |
| Change in Unrealized Appreciation (Depreciation) of: | | | | | | | | | | | | |
| Investment Securities and Foreign Currency | | | | 13,423 | | | | | | (293,604 | ) | |
| Futures | | | | (2,771 | ) | | | | | (22 | ) | |
| Translation of Foreign Currency Denominated Amounts | | | | (814 | ) | | | | | 344 | | |
| Net Increase (Decrease) in Net Assets Resulting from Operations | | | | 528,204 | | | | | | 283,996 | | |
| Distributions From: | | | | | | | | | | | | |
| Net Investment Income: | | | | | | | | | | | | |
| Institutional Class Shares | | | | (283,791 | ) | | | | | (208,535 | ) | |
| Net Short-Term Gains: | | | | | | | | | | | | |
| Institutional Class Shares | | | | — | | | | | | (27,069 | ) | |
| Net Long-Term Gains: | | | | | | | | | | | | |
| Institutional Class Shares | | | | (207,859 | ) | | | | | (250,320 | ) | |
| Total Distributions | | | | (491,650 | ) | | | | | (485,924 | ) | |
| Capital Share Transactions (1): | | | | | | | | | | | | |
| Shares Issued | | | | 2,126,348 | | | | | | 1,961,417 | | |
| Shares Issued in Lieu of Cash Distributions | | | | 473,837 | | | | | | 472,853 | | |
| Shares Redeemed | | | | (1,572,870 | ) | | | | | (1,753,367 | ) | |
| Net Increase (Decrease) from Capital Share Transactions | | | | 1,027,315 | | | | | | 680,903 | | |
| Total Increase (Decrease) in Net Assets | | | | 1,063,869 | | | | | | 478,975 | | |
| Net Assets | | | | | | | | | | | | |
| Beginning of Year | | | | 9,323,492 | | | | | | 8,844,517 | | |
| End of Year | | | $ | 10,387,361 | | | | | $ | 9,323,492 | | |
| (1) Shares Issued and Redeemed: | | | | | | | | | | | | |
| Shares Issued | | | | 124,163 | | | | | | 110,551 | | |
| Shares Issued in Lieu of Cash Distributions | | | | 27,874 | | | | | | 28,178 | | |
| Shares Redeemed | | | | (92,160 | ) | | | | | (99,058 | ) | |
| Net Increase (Decrease) from Shares Issued and Redeemed | | | | 59,877 | | | | | | 39,671 | | |
| Undistributed Net Investment Income (Distributions in Excess of Net | | | | | | | | | | | | |
| Investment Income) | | | $ | (18,870 | ) | | | | $ | 34,648 | | |
____________________
| * | Net of foreign capital gain taxes withheld of $0. |
See accompanying Notes to Financial Statements.
79
DFA INVESTMENT DIMENSIONS GROUP INC.
INTERNATIONAL SMALL COMPANY PORTFOLIO
FINANCIAL HIGHLIGHTS
(for a share outstanding throughout each period)
| | Year | | Year | | Year | | Year | | Year | |
| | Ended | | Ended | | Ended | | Ended | | Ended | |
| | Oct. 31, | | Oct. 31, | | Oct. 31, | | Oct. 31, | | Oct. 31, | |
| | 2016 | | 2015 | | 2014 | | 2013 | | 2012 | |
| Net Asset Value, Beginning of Year | | $ | 17.78 | | | $ | 18.24 | | | $ | 19.40 | | | $ | 15.28 | | | $ | 15.21 | | |
| Income from Investment Operations | | | | | | | | | | | | | | | | | | | | | |
| Net Investment Income (Loss) (A) | | | 0.43 | | | | 0.41 | | | | 0.42 | | | | 0.42 | | | | 0.38 | | |
| Net Gains (Losses) on Securities | | | | | | | | | | | | | | | | | | | | | |
| (Realized and Unrealized) | | | 0.48 | | | | 0.12 | | | | (0.62 | ) | | | 4.16 | | | | 0.39 | | |
| Total from Investment Operations | | | 0.91 | | | | 0.53 | | | | (0.20 | ) | | | 4.58 | | | | 0.77 | | |
| Less Distributions | | | | | | | | | | | | | | | | | | | | | |
| Net Investment Income | | | (0.51 | ) | | | (0.42 | ) | | | (0.42 | ) | | | (0.37 | ) | | | (0.42 | ) | |
| Net Realized Gains | | | (0.40 | ) | | | (0.57 | ) | | | (0.54 | ) | | | (0.09 | ) | | | (0.28 | ) | |
| Total Distributions | | | (0.91 | ) | | | (0.99 | ) | | | (0.96 | ) | | | (0.46 | ) | | | (0.70 | ) | |
| Net Asset Value, End of Year | | $ | 17.78 | | | $ | 17.78 | | | $ | 18.24 | | | $ | 19.40 | | | $ | 15.28 | | |
| Total Return | | | 5.43 | % | | | 3.30 | % | | | (1.09 | )% | | | 30.66 | % | | | 5.63 | % | |
| Net Assets, End of Year (thousands) | | $ | 10,387,361 | | | $ | 9,323,492 | | | $ | 8,844,517 | | | $ | 8,520,717 | | | $ | 6,423,160 | | |
| Ratio of Expenses to Average Net Assets (B) | | | 0.53 | % | | | 0.54 | % | | | 0.53 | % | | | 0.54 | % | | | 0.56 | % | |
| Ratio of Expenses to Average Net Assets | | | | | | | | | | | | | | | | | | | | | |
| (Excluding Fees (Waived), (Expenses | | | | | | | | | | | | | | | | | | | | | |
| Reimbursed), and/or Previously Waived | | | | | | | | | | | | | | | | | | | | | |
| Fees Recovered by Advisor) (B) | | | 0.53 | % | | | 0.54 | % | | | 0.53 | % | | | 0.54 | % | | | 0.56 | % | |
| Ratio of Net Investment Income to Average | | | | | | | | | | | | | | | | | | | | | |
| Net Assets | | | 2.47 | % | | | 2.30 | % | | | 2.15 | % | | | 2.47 | % | | | 2.58 | % | |
See page 1 for the Definitions of Abbreviations and Footnotes.
See accompanying Notes to Financial Statements.
80
DFA INVESTMENT DIMENSIONS GROUP INC.
NOTES TO FINANCIAL STATEMENTS
A. Organization:
DFA Investment Dimensions Group Inc. (the “Fund”) is an open-end management investment company registered under the Investment Company Act of 1940, whose shares are generally offered to institutional investors, retirement plans and clients of registered investment advisors. The Fund consists of ninety-five operational portfolios, of which the International Small Company Portfolio (the “Portfolio”) is included in this Report.
The Portfolio is a Fund of Funds that invests in five series of The DFA Investment Trust Company (the “Master Funds”):
| | | | Percentage | |
| | | | Ownership | |
| Fund of Funds | | | Master Funds | | | at 10/31/16 | |
| International Small Company Portfolio | | The Continental Small Company Series | | 92% | |
| | The Japanese Small Company Series | | 84% | |
| | The United Kingdom Small Company Series | | 96% | |
| | The Asia Pacific Small Company Series | | 84% | |
| | The Canadian Small Company Series | | 98% | |
The Portfolio also invests in short-term temporary cash investments and futures.
The financial statements of the Master Funds are included elsewhere in this report and should be read in conjunction with the financial statements of the Portfolio.
B. Significant Accounting Policies:
The following significant accounting policies are in conformity with accounting principles generally accepted in the United States of America. Such policies are consistently followed by the Fund in preparation of its financial statements. The preparation of financial statements in accordance with accounting principles generally accepted in the United States of America requires management to make estimates and assumptions that affect the fair value of investments, the reported amounts of assets and liabilities and disclosure of contingent assets and liabilities at the date of the financial statements and the reported amounts of increases and decreases in net assets from operations during the reporting period. Actual results could differ from those estimates and those differences could be material.
1. Security Valuation: The Portfolio utilizes a fair value hierarchy which prioritizes the inputs to valuation techniques used to measure fair value into three broad levels described below:
● Level 1 – inputs are quoted prices in active markets for identical securities (including equity securities, open-end investment companies, futures contracts)
● Level 2 – other significant observable inputs (including quoted prices for similar securities, interest rates, prepayment speeds, credit risk, etc.)
● Level 3 – significant unobservable inputs (including the Portfolio’s own assumptions in determining the fair value of investments) Listed derivatives, such as futures, that are actively traded are valued based on quoted prices from the exchange and are categorized as Level 1 in the hierarchy.
The International Small Company Portfolio’s investments in series of DFAITC reflect its proportionate interest in the net assets of such corresponding Master Fund. These valuations are classified as Level 1 in the hierarchy.
2. Deferred Compensation Plan: Each eligible Director of the Fund may elect participation in The Fee Deferral Plan for Independent Directors and Trustees (the “Plan”). Under the Plan, effective January 1, 2002, such Directors may defer payment of all or a portion of their total fees earned as a Director. These deferred amounts may be treated as though such amounts had been invested in shares of the following funds: U.S. Large Cap Value Portfolio; U.S. Core Equity 1 Portfolio; U.S. Core Equity 2 Portfolio; U.S. Vector Equity Portfolio; U.S. Micro Cap Portfolio; DFA International Value Portfolio; International Core Equity Portfolio; Emerging Markets Portfolio; Emerging Markets Core Equity Portfolio; and/or DFA Two-Year Global Fixed Income Portfolio. Contributions made under the Plan and the change in unrealized appreciation (depreciation) and income are included in Directors’ Fees & Expenses.
81
Each Director has the option to receive their distribution of proceeds in one of the following methods: lump sum; annual installments over a period of agreed upon years; or quarterly installments over a period of agreed-upon years. Each Director shall have the right in a notice of election (the “Notice”) to defer the receipt of the Director’s deferred compensation until a date specified by such Director/Trustee in the Notice, which date may not be sooner than the earlier of: (i) the first business day of January following the year in which such Director ceases to be a member of the Board; and (ii) five years following the effective date of the Director’s first deferral election. If a Director who elects to defer fees fails to designate in the Notice a time or date as of which payment of the Director’s deferred fee account shall commence, payment of such amount shall commence as of the first business day of January following the year in which the Director/Trustee ceases to be a member of the Board (unless the Director files an amended Notice selecting a different distribution date). As of October 31, 2016, none of the Directors have requested or received a distribution of proceeds of a deferred fee account.
3. Other: Security transactions are accounted for as of the trade date. Costs used in determining realized gains and losses on the sale of investment securities/affiliated investment companies and foreign currency are on the basis of identified cost. Dividend income and distributions to shareholders are recorded on the ex-dividend date. Distributions received on securities and from the investment in affiliated investment companies that represent a return of capital or capital gains are recorded as a reduction of cost of investments or as a realized gain, respectively. The Portfolio estimates the character of distributions received that may be considered return of capital distributions. Interest income is recorded on an accrual basis. Discount and premium on debt securities purchased are amortized over the lives of the respective securities, utilizing the effective interest method. Expenses directly attributable to the Portfolio are directly charged. Common expenses of the Fund or Portfolios are allocated using methods approved by the Board, generally based on average net assets.
International Small Company Portfolio recognizes its pro-rata share of net investment income and realized and unrealized gains/losses on a daily basis from their respective Master Fund within DFAITC, which are treated as partnerships for federal income tax purposes.
The Portfolio may be subject to taxes imposed by countries in which they invest, with respect to their investments in issuers existing or operating in such countries. Such taxes are generally based on income earned or repatriated and capital gains realized on the sale of such investments. The Portfolio accrues such taxes when the related income or capital gains are earned or throughout the holding period. Some countries require governmental approval for the repatriation of investment income, capital or the proceeds of sales earned by foreign investors. In addition, if there is a deterioration in a country’s balance of payments or for other reasons, a country may impose temporary restrictions on foreign capital remittances abroad.
C. Investment Advisor and Administrator:
The Advisor, Dimensional Fund Advisors LP, provides investment management services to the Portfolio.
For the year ended October 31, 2016, the International Small Company Portfolio’s investment management fees were accrued daily and paid monthly to the Advisor based on an effective annual rate of 0.40% of average daily net assets.
Pursuant to an Amended and Restated Fee Waiver and/or Expense Assumption Agreement (the “Fee Waiver Agreement”), effective July 21, 2015, the Advisor has contractually agreed to waive all or a portion of its management fee and to assume the other direct expenses of a class of the Portfolio (excluding expenses incurred through its investment in other investment companies) (“Portfolio Expenses”) to the extent necessary to limit the Portfolio Expenses of a class of the Portfolio to 0.45% of the average net assets of a class of the Portfolio on an annualized basis (the “Expense Limitation Amount”). At any time that the Portfolio Expenses of a class of the Portfolio are less than Expense Limitation Amount for such class of shares of the Portfolio, the Advisor retains the right to recover any fees previously waived and/or expenses previously assumed to the extent that such recovery will not cause the annualized Portfolio Expenses for such class of shares of the Portfolio to exceed the Expense Limitation Amount listed above. The Portfolio is not obligated to reimburse the Advisor for fees previously waived or expenses previously assumed by the Advisor more than thirty-six months before the date of such reimbursement. Prior to July 21, 2015, the Advisor had contractually agreed to waive its administration fee and to assume Portfolio Expenses to the extent necessary to limit the Portfolio Expenses of the Portfolio, on an annualized basis, to the Expense Limitation Amount listed above. At any time that the Portfolio Expenses of the Portfolio were less than the Expense Limitation Amount listed above, the Advisor retained the right to seek reimbursement for any fees previously waived and/or expenses previously assumed to the extent that the amount of such reimbursement was within thirty-six months and did not cause the annualized Portfolio Expenses of the Portfolio to exceed the applicable Expense Limitation Amount then in effect.
82
Fees Paid to Officers and Directors/Trustees:
Certain Officers and Directors of the Advisor are also Officers and Directors of the Fund; however, such Officers and Directors (with the exception of the Chief Compliance Officer (“CCO”)) receive no compensation from the Fund. For the year ended October 31, 2016, the total related amounts paid by the Fund to the CCO were $291 (in thousands). The total related amounts paid by each of the Portfolios are included in Other Expenses on the Statement of Operations.
D. Deferred Compensation:
At October 31, 2016, the total liability for deferred compensation to Directors was $257 and is included in Accrued Expenses and Other Liabilities on the Statement of Assets and Liabilities (amounts in thousands).
E. Federal Income Taxes:
The Portfolio has qualified and intends to continue to qualify as a regulated investment company under Subchapter M of the Internal Revenue Code for federal income tax purposes and to distribute substantially all of its taxable income and net capital gains to its shareholders. Accordingly, no provision has been made for federal income taxes.
Distributions from net investment income and net realized capital gains are determined in accordance with U.S. federal income tax regulations, which may differ from those amounts determined under accounting principles generally accepted in the United States of America. These book/tax differences are either temporary or permanent in nature. To the extent these differences are permanent, they are charged or credited to paid-in capital, undistributed net investment income or accumulated net realized gains or losses, as appropriate, in the period that the differences arise. Accordingly, the following permanent differences as of October 31, 2016, primarily attributable to realized gains on securities considered to be “passive foreign investment companies”, non-deductible expenses, realized foreign capital gains tax, tax-equalization, non-deductible 90 day stock issuance cost, net foreign currency gains/losses, distributions received from real estate investment trusts and distribution redesignations, were reclassified to the following accounts. These reclassifications had no effect on net assets or net asset value per share (amounts in thousands):
| | | | Increase | | Increase | |
| | Increase | | (Decrease) | | (Decrease) | |
| | (Decrease) | | Undistributed | | Accumulated | |
| | | Paid-In | | Net Investment | | Net Realized | |
| | Capital | | Income | | Gains (Losses) | |
| International Small Company Portfolio | | 22,671 | | (7,960) | | (14,711) | |
The tax character of dividends and distributions declared and paid during the years ended October 31, 2015 and October 31, 2016 were as follows (amounts in thousands):
| | Net Investment | | | | | |
| | Income and | | | | | |
| | Short-Term | | Long-Term | | | |
| | Capital Gains | | Capital Gains | | Total | |
| International Small Company Portfolio | | | | | | | |
| 2015 | | 235,604 | | 250,320 | | 485,924 | |
| 2016 | | 283,791 | | 207,859 | | 491,650 | |
At October 31, 2016, the following net investment income and short-term capital gains and long-term capital gains distributions designated for federal income tax purposes are due to the utilization of accumulated earnings and profits distributed to shareholders upon redemption of shares (amounts in thousands):
| | Net Investment | | | | | |
| | Income and | | | | | |
| | Short-Term | | Long-Term | | | |
| | Capital Gains | | Capital Gains | | Total | |
| International Small Company Portfolio | | (11,313) | | (10,494) | | (21,808) | |
83
At October 31, 2016, the components of distributable earnings (accumulated losses) were as follows (amounts in thousands):
| | Undistributed | | | | | | | | Total Net | |
| | Net Investment | | | | | | | | Distributable | |
| | Income and | | Undistributed | | | | Unrealized | | Earnings | |
| | | Short-Term | | Long-Term | | Capital Loss | | Appreciation | | (Accumulated | |
| | Capital Gains | | Capital Gains | | Carryforwards | | (Depreciation) | | Losses) | |
| International Small Company Portfolio | | $81,583 | | $251,071 | | — | | $647,525 | | $980,179 | |
For federal income tax purposes, the Fund measures its capital loss carryforwards annually at October 31, its fiscal year end. Capital loss carryforwards may be carried forward and applied against future capital gains. Under the Regulated Investment Company Modernization Act of 2010, capital losses incurred by the Portfolio after October 31, 2011, will not be subject to expiration and will retain their character as either short-term or long-term capital losses. In addition, such losses must be utilized prior to the losses incurred in the years preceding enactment. As of October 31, 2016, the Portfolio did not have any capital loss carryforwards available to offset future realized capital gains.
At October 31, 2016, the total cost and aggregate gross unrealized appreciation (depreciation) of securities for federal income tax purposes were different from amounts reported for financial reporting purposes, as follows (amounts in thousands):
| | | | | | | | Net | |
| | | | | | | | Unrealized | |
| | Federal | | Unrealized | | Unrealized | | Appreciation | |
| | Tax Cost | | Appreciation | | Depreciation | | (Depreciation) | |
| International Small Company Portfolio | | $9,645,400 | | $901,692 | | $(253,084) | | $648,608 | |
The difference between book-basis and tax-basis unrealized appreciation (depreciation) is primarily attributable to the tax deferral of losses on wash sales and investments in passive foreign investment companies.
Accounting for Uncertainty in Income Taxes sets forth a minimum threshold for financial statement recognition of the benefit of a tax position taken or expected to be taken in a tax return. Management has analyzed the Portfolio’s tax positions and has concluded that no additional provision for income tax is required in the Portfolio’s financial statements. The Portfolio is not aware of any tax positions for which it is more likely than not that the total amounts of unrecognized tax benefits will significantly change in the next twelve months. The Portfolio’s federal tax returns for the prior three fiscal years remain subject to examination by the Internal Revenue Service.
F. Financial Instruments:
In accordance with the Portfolio’s investment objective and policies, the Portfolio may invest, either directly or indirectly through its investment in a corresponding Master Fund, in certain financial instruments that have off-balance sheet risk in excess of the amounts recognized in the financial statements and concentrations of credit and market risk. These instruments and their significant corresponding risks are described below:
1. Foreign Market Risks: Investments in foreign markets may involve certain considerations and risks not typically associated with investments in the United States of America, including the possibility of future political and economic developments and the level of foreign governmental supervision and regulation of foreign securities markets. These markets are generally smaller, less liquid and more volatile than the major securities markets in the United States of America. Consequently, acquisition and disposition of international securities held by the Portfolio may be inhibited.
Derivative Financial instruments:
Summarized below are the specific types of derivative instruments used by the Portfolio.
2. Futures Contracts: The Portfolio may purchase or sell futures contracts and options on futures contracts for equity securities and indices to adjust market exposure based on actual or expected cash inflows to or outflows from the Portfolio. The Portfolio, however, does not intend to sell futures contracts to establish short positions in individual securities. Upon entering into a futures contract, the Portfolio deposits cash or pledges U.S. government securities to a broker, equal to the minimum “initial margin” requirements of the exchange on which the contract is traded. Subsequent payments are received from or paid to the broker each day, based on the daily fluctuation in the market value of the contract. These receipts or payments are known as “variation margin” and are recorded daily by the Portfolio as unrealized gains or losses until the contracts are closed.
84
When the contracts are closed, the Portfolio records a realized gain or loss, which is presented in the Statements of Operations as a net realized gain or loss on futures, equal to the difference between the value of the contract at the time it was opened and the value at the time it was closed.
Risks may arise upon entering into futures contracts from potential imperfect price correlations between the futures contracts and the underlying securities, from the possibility of an illiquid secondary market for these instruments and from the possibility that the Portfolio could lose more than the initial margin requirements. When entering into stock index futures, the Portfolio is subject to equity price risk from those futures contracts. Counterparty credit risk related to exchange-traded futures is minimal because the exchange’s clearinghouse, as counterparty to all exchange-traded futures, guarantees the futures against default.
At October 31, 2016, the Portfolio had outstanding futures contracts (dollar amounts in thousands):
| | | | Expiration | | Number of | | Contract | | Unrealized | | Cash | |
| | Description | | Date | | Contracts* | | Value | | Gain (Loss) | | Collateral | |
| International Small | | | | | | | | | | | | | | | | | | | | |
| Company Portfolio | | Russell 2000 Index® | | 12/16/16 | | 270 | | | $ | 32,111 | | | | $ | (1,548 | ) | | | $1,450 | |
| International Small | | | | | | | | | | | | | | | | | | | | |
| Company Portfolio | | S&P 500 Emini Index® | | 12/16/16 | | 505 | | | | 53,533 | | | | | (1,240 | ) | | | 2,416 | |
| | | | | | | | | $ | 85,644 | | | | $ | (2,788 | ) | | | $3,866 | |
The average volume (based on the open positions at each fiscal month-end) of derivative activity for the year ended October 31, 2016 (amounts in thousands):
| | | Futures | |
| International Small Company Portfolio | | $69,319 | |
Securities have been segregated as collateral for open futures contracts.
The following is a summary of the location of derivatives on the Portfolio’s Statements of Assets and Liabilities as of October 31, 2016:
| | Location on the Statements of Assets and Liabilities | |
| Derivative Type | | Asset Derivatives | | Liability Derivatives | |
| Equity contracts | | Receivables: Futures | | Payables: Futures | |
| | | Margin Variation | | Margin Variation | |
The following is a summary of the Portfolio’s derivative instrument holdings categorized by primary risk exposure as of October 31, 2016 (amounts in thousands):
| | Liability Derivatives Value | |
| | Total Value | | | |
| | | at | | Equity | |
| | October 31, 2016 | | Contracts* | |
| International Small Company Portfolio | | (2,788) | | (2,788) | |
* Includes cumulative appreciation (depreciation) of futures contracts. Only current day’s margin variation is reported within the Statement of Assets and Liabilities.
The following is a summary of the location on the Portfolio’s Statements of Operations of realized and change in unrealized gains and losses from the Portfolio’s derivative instrument holdings through the year ended October 31, 2016:
| Derivative Type | | Location of Gain (Loss) on Derivatives |
| Equity contracts | | Net Realized Gain (Loss) on: Futures |
| | Change in Unrealized Appreciation (Depreciation) of: Futures |
85
The following is a summary of the realized and change in unrealized gains and losses from the Portfolios’ derivative instrument holdings categorized by primary risk exposure through the year ended October 31, 2016 (amounts in thousands):
| | Realized Gain (Loss) on | |
| | Derivatives | |
| | | | Equity | |
| | Total | | Contracts | |
| International Small Company Portfolio | | 17,796 | | 17,796 | |
| | |
| | Change in Unrealized | |
| | Appreciation (Depreciation) on | |
| | Derivatives | |
| | | | Equity | |
| | | Total | | Contracts | |
| International Small Company Portfolio | | (2,771) | | (2,771) | |
G. Line of Credit and Interfund Lending:
The Fund, together with other Dimensional-advised portfolios, has entered into a $500 million uncommitted, unsecured discretionary line of credit effective March 30, 2016 with its domestic custodian bank. A line of credit with similar terms was in effect through March 29, 2016. Each portfolio is permitted to borrow, subject to its investment limitations, up to a maximum of $500 million, as long as total borrowings under the line of credit do not exceed $500 million in the aggregate. Borrowings under the line of credit are charged interest at rates agreed upon by the parties at the time of borrowing. Each portfolio is individually, and not jointly, liable for its particular advances under the line of credit. There is no commitment fee on the unused portion of the line of credit. The agreement for the discretionary line of credit may be terminated by either party at any time. The agreement for the line of credit expires on March 29, 2017.
The Fund, together with other Dimensional-advised portfolios, has also entered into an additional $500 million unsecured line of credit with its international custodian bank effective January 8, 2016. A line of credit with similar terms was in effect through January 7, 2016. Each portfolio is permitted to borrow, subject to its investment limitations, up to a maximum of $500 million, as long as total borrowings under the line of credit do not exceed $500 million in the aggregate. Each portfolio is individually, and not jointly, liable for its particular advances under the line of credit. Borrowings under the line of credit are charged interest at rates agreed upon by the parties at the time of borrowing. There is no commitment fee on the unused portion of the line of credit. The line of credit agreement expires on January 7, 2017.
For the year ended October 31, 2016, borrowings by the Portfolio under the lines of credit were as follows (amounts in thousands, except percentages and days):
| | Weighted | | Weighted | | Number of | | Interest | | Maximum Amount | |
| | Average | | Average | | Days | | Expense | | Borrowed During | |
| | | Interest Rate | | Loan Balance | | Outstanding* | | Incurred | | The Period | |
| International Small Company Portfolio | | 1.00% | | $3,790 | | 13 | | $1 | | $18,387 | |
* Number of Days Outstanding represents the total of single or consecutive days during the year ended October 31, 2016, that the Portfolio’s available line of credit was utilized.
There were no outstanding borrowings by the Portfolio under the lines of credit as of October 31, 2016.
Pursuant to an exemptive order issued by the SEC (the “Order”), the Portfolio may participate in an interfund lending program among certain Portfolios managed by the Advisor (portfolios that operate as feeder funds do not participate in the program). The program allows the participating Portfolios to borrow money from and loan money to each other for temporary or emergency purposes, subject to the conditions in the Order. A loan can only be made through the program if the interfund loan rate on that day is more favorable to both the borrowing and lending Portfolios as compared to rates available through short-term bank loans or investments in overnight repurchase agreements and money market funds, respectively, as detailed in the Order. Further, a Portfolio may participate in the program only if and to the extent that such participation is consistent with its investment objectives and limitations. Interfund loans have a maximum duration of seven days and may be called on one business days’ notice.
The Portfolio did not utilize the interfund lending program during the year ended October 31, 2016.
86
H. Indemnitees; Contractual Obligations:
Under the Fund’s organizational documents, its officers and directors are indemnified against certain liabilities arising out of the performance of their duties to the Fund.
In the normal course of business, the Fund enters into contracts that contain a variety of representations and warranties which provide general indemnification. The Fund’s maximum exposure under these arrangements is unknown as this would involve future claims that may be made against the Fund and/or its affiliates that have not yet occurred. However, based on experience, the Fund expects the risk of loss to be remote.
I. Other:
At October 31, 2016, the following number of shareholders held the following approximate percentages of the stated Portfolio’s outstanding shares. One or more of the shareholders may be omnibus accounts, which typically hold shares for the benefit of several other underlying investors.
| | | | Approximate | |
| | Number of | | Percentage of | |
| | | Shareholders | | Ownership Shares | |
| International Small Company Portfolio – Institutional Class Shares | | 4 | | 61% | |
J. Subsequent Event Evaluations:
Management has evaluated the impact of all subsequent events on the Portfolio through the date that the financial statements were issued and has determined that there are no subsequent events requiring recognition or disclosure in the financial statements.
87
REPORT OF INDEPENDENT REGISTERED PUBLIC ACCOUNTING FIRM
To the Board of Directors of DFA Investment Dimensions Group Inc. and
Shareholders of the International Small Company Portfolio:
In our opinion, the accompanying statement of assets and liabilities, including the schedule of investments, and the related statements of operations and of changes in net assets and the financial highlights present fairly, in all material respects, the financial position of International Small Company Portfolio (one of the portfolios constituting DFA Investment Dimensions Group Inc., hereafter referred to as the “Portfolio”) as of October 31, 2016, the results of its operations for the year then ended, the changes in its net assets for each of the two years in the period then ended and the financial highlights for each of the five years in the period then ended, in conformity with accounting principles generally accepted in the United States of America. These financial statements and financial highlights (hereafter referred to as “financial statements”) are the responsibility of the Portfolio’s management. Our responsibility is to express an opinion on these financial statements based on our audits. We conducted our audits of these financial statements in accordance with the standards of the Public Company Accounting Oversight Board (United States). Those standards require that we plan and perform the audit to obtain reasonable assurance about whether the financial statements are free of material misstatement. An audit includes examining, on a test basis, evidence supporting the amounts and disclosures in the financial statements, assessing the accounting principles used and significant estimates made by management, and evaluating the overall financial statement presentation. We believe that our audits, which included confirmation of securities as of October 31, 2016 by correspondence with the transfer agent of the investee funds, provide a reasonable basis for our opinion.
PricewaterhouseCoopers LLP
Philadelphia, Pennsylvania
December 20, 2016
88
Selected Financial Statements of The DFA Investment Trust Company
The Japanese Small Company Series
The Asia Pacific Small Company Series
The United Kingdom Small Company Series
The Continental Small Company Series
The Canadian Small Company Series
TABLE OF CONTENTS
| | Page |
| Disclosure of Fund Expenses — October 31, 2016 (Unaudited) | | 90 |
| | | |
| Disclosure of Portfolio Holdings — October 31, 2016 (Unaudited) | | 92 |
| | | |
| Summary Schedules of Portfolio Holdings — December 31, 2016 (Unaudited) | | 93 |
| The Japanese Small Company Series | | 94 |
| The Asia Pacific Small Company Series | | 96 |
| The United Kingdom Small Company Series | | 99 |
| The Continental Small Company Series | | 102 |
| The Canadian Small Company Series | | 106 |
| | | |
| Summary Schedules of Portfolio Holdings — October 31, 2016 | | 109 |
| The Japanese Small Company Series | | 109 |
| The Asia Pacific Small Company Series | | 112 |
| The United Kingdom Small Company Series | | 115 |
| The Continental Small Company Series | | 119 |
| The Canadian Small Company Series | | 123 |
| | | |
| Statements of Assets and Liabilities — December 31, 2016 (Unaudited) | | 126 |
| | | |
| Statements of Assets and Liabilities — October 31, 2016 (Unaudited) | | 127 |
| | | |
| Statements of Operations — October 31, 2016 (Unaudited) | | 129 |
| | | |
| Statements of Changes in Net Assets | | 131 |
| | | |
| Financial Highlights | | 134 |
| | | |
| Notes to Financial Statements — October 31, 2016 | | 136 |
| | | |
| Report of Independent Registered Public Accounting Firm | | 145 |
| | | |
| Fund Management — October 31, 2016 | | 146 |
| | | |
| Voting Proxies on Fund Portfolio Securities | | 159 |
89
THE DFA INVESTMENT TRUST COMPANY
DISCLOSURE OF FUND EXPENSES
(Unaudited)
The following Expense Tables are shown so that you can understand the impact of fees on your investment. All mutual funds have operating expenses. As a shareholder of the fund, you incur ongoing costs, which include costs for portfolio management, administrative services, and shareholder reports, among others. Operating expenses, legal and audit services, which are deducted from a fund’s gross income, directly reduce the investment return of the fund. A fund’s expenses are expressed as a percentage of its average net assets. This figure is known as the expense ratio. The following examples are intended to help you understand the ongoing costs, in dollars, of investing in the fund and to compare these costs with those of other mutual funds. The examples are based on an investment of $1,000 made at the beginning of the period shown and held for the entire period.
The Expense Tables below illustrate your fund’s costs in two ways.
Actual Fund Return
This section helps you to estimate the actual expenses after fee waivers that you paid over the period. The “Ending Account Value” shown is derived from the fund’s actual return and “Expenses Paid During Period” reflect the dollar amount that would have been paid by an investor who started with $1,000 in the fund. You may use the information here, together with the amount you invested, to estimate the expenses that you paid over the period.
To do so, simply divide your account value by $1,000 (for example, a $7,500 account value divided by $1,000 = 7.5), then multiply the result by the number given for your fund under the heading “Expenses Paid During Period.”
Hypothetical Example for Comparison Purposes
This section is intended to help you compare your fund’s costs with those of other mutual funds. The hypothetical “Ending Account Value” and “Expenses Paid During Period” are derived from the fund’s actual expense ratio and an assumed 5% annual return before expenses. In this case, because the return used is not the fund’s actual return, the results do not apply to your investment. The example is useful in making comparisons because the SEC requires all mutual funds to calculate expenses based on a 5% annual return. You can assess your fund’s costs by comparing this hypothetical example with the hypothetical examples that appear in shareholder reports of other funds.
Please note that the expenses shown in the tables are meant to highlight and help you compare ongoing costs only and do not reflect any transactional costs, if applicable. The “Annualized Expense Ratio” represents the actual expenses for the six-month period indicated.
Six Months Ended October 31, 2016
EXPENSE TABLES
| | Beginning | | Ending | | | | Expenses |
| | Account | | Account | | Annualized | | Paid |
| | Value | | Value | | Expense | | During |
| | 05/01/16 | | 10/31/16 | | Ratio* | | Period* |
| The Japanese Small Company Series | | | | | | | | | | |
| Actual Fund Return | | $ | 1,000.00 | | $ | 1,136.10 | | 0.13% | | $0.70 |
| Hypothetical 5% Annual Return | | $ | 1,000.00 | | $ | 1,024.48 | | 0.13% | | $0.66 |
| |
| The Asia Pacific Small Company Series | | | | | | | | | | |
| Actual Fund Return | | $ | 1,000.00 | | $ | 1,065.90 | | 0.13% | | $0.68 |
| Hypothetical 5% Annual Return | | $ | 1,000.00 | | $ | 1,024.48 | | 0.13% | | $0.66 |
| |
| The United Kingdom Small Company Series | | | | | | | | | | |
| Actual Fund Return | | $ | 1,000.00 | | $ | 884.20 | | 0.12% | | $0.57 |
| Hypothetical 5% Annual Return | | $ | 1,000.00 | | $ | 1,024.53 | | 0.12% | | $0.61 |
90
| | Beginning | | Ending | | | | Expenses |
| | Account | | Account | | Annualized | | Paid |
| | Value | | Value | | Expense | | During |
| | 05/01/16 | | 10/31/16 | | Ratio* | | Period* |
| The Continental Small Company Series | | | | | | | | |
| Actual Fund Return | | $1,000.00 | | $1,017.80 | | 0.13% | | $0.66 |
| Hypothetical 5% Annual Return | | $1,000.00 | | $1,024.48 | | 0.13% | | $0.66 |
| |
| The Canadian Small Company Series | | | | | | | | |
| Actual Fund Return | | $1,000.00 | | $1,004.00 | | 0.12% | | $0.60 |
| Hypothetical 5% Annual Return | | $1,000.00 | | $1,024.53 | | 0.12% | | $0.61 |
____________________
| * | Expenses are equal to the fund’s annualized expense ratio for the six-month period, multiplied by the average account value over the period, multiplied by the number of days in the most recent six-month period (184), then divided by the number of days in the year (366) to reflect the six-month period. |
91
THE DFA INVESTMENT TRUST COMPANY
DISCLOSURE OF PORTFOLIO HOLDINGS
(Unaudited)
The SEC requires that all funds file a complete Schedule of Investments with the SEC for their first and third fiscal quarters on Form N-Q. For The DFA Investment Trust Company, this would be for the fiscal quarters ending January 31 and July 31. The Form N-Q filing must be made within 60 days of the end of the quarter. The DFA Investment Trust Company filed its most recent Form N-Q with the SEC on September 29, 2015. They are available upon request, without charge, by calling collect: (512) 306-7400 or by mailing a request to Dimensional Fund Advisors LP, 6300 Bee Cave Road, Building One, Austin, Texas 78746, or by visiting the SEC’s website at http://www.sec.gov, or they may be reviewed and copied at the SEC’s Public Reference Room in Washington, D.C. (call 1-800-732-0330 for information on the operation of the Public Reference Room).
SEC regulations permit a fund to include in its reports to shareholders a “Summary Schedule of Portfolio Holdings” in lieu of a full Schedule of Investments. The Summary Schedule of Portfolio Holdings reports the fund’s 50 largest holdings in unaffiliated issuers and any investments that exceed one percent of the fund’s net assets at the end of the reporting period. The amendments also require that the Summary Schedule of Portfolio Holdings identify each category of investments that are held.
A fund is required to file a complete Schedule of Investments with the SEC on Form N-CSR within ten days after mailing the annual and semi-annual reports to shareholders. It will be available upon request, without charge, by calling collect: (512) 306-7400 or by mailing a request to Dimensional Fund Advisors LP, 6300 Bee Cave Road, Building One, Austin, Texas 78746, or by visiting the SEC’s website at http://www.sec.gov, or they may be reviewed and copied at the SEC’s Public Reference Room in Washington, D.C. (call 1-800-732-0330 for information on the operation of the Public Reference Room).
PORTFOLIO HOLDINGS
The SEC requires that all funds present their categories of portfolio holdings in a table, chart or graph format in their annual and semi-annual shareholder reports, whether or not a Schedule of Investments is utilized. The following table, which presents portfolio holdings as a percent of total investments before short-term investments and collateral for loaned securities, is provided in compliance with such requirement. The categories shown below represent broad industry sectors. Each industry sector consists of one or more specific industry classifications.
DOMESTIC AND INTERNATIONAL EQUITY PORTFOLIOS
| Consumer | | Consumer | | | | | | | | Health | | | | | Information | | | | | Real | | Telecommunication | | | | |
| Discretionary | | Staples | | Energy | | Financials | | Care | | Industrials | | Technology | | Materials | | Estate | | Services | | Utilities | | Total |
| The Japanese Small | | | | | | | | | | | | | | | | | | | | | | | | | | | | | | |
| Company Series | 19.4 | % | | 8.5% | | 1.0 | % | | 9.4 | % | | 4.4 | % | | 28.6 | % | | 13.1 | % | | 12.7 | % | | 2.0% | | 0.1% | | 0.8% | | 100% |
| The Asia Pacific Small | | | | | | | | | | | | | | | | | | | | | | | | | | | | | | |
| Company Series | 25.4 | % | | 5.9% | | 2.8 | % | | 10.1 | % | | 6.6 | % | | 16.0 | % | | 6.1 | % | | 14.5 | % | | 6.2% | | 3.1% | | 3.3% | | 100% |
| The United Kingdom Small | | | | | | | | | | | | | | | | | | | | | | | | | | | | | |
| Company Series | 20.2 | % | | 5.6% | | 5.2 | % | | 14.0 | % | | 3.9 | % | | 27.5 | % | | 10.0 | % | | 8.4 | % | | 2.5% | | 0.7% | | 2.0% | | 100% |
| The Continental Small | | | | | | | | | | | | | | | | | | | | | | | | | | | | | | |
| Company Series | 12.8 | % | | 6.1% | | 3.0 | % | | 11.6 | % | | 9.2 | % | | 26.3 | % | | 9.4 | % | | 10.4 | % | | 6.0% | | 2.7% | | 2.5% | | 100% |
| The Canadian Small | | | | | | | | | | | | | | | | | | | | | | | | | | | | | | |
| Company Series | 9.5 | % | | 4.4% | | 23.6 | % | | 6.0 | % | | 1.6 | % | | 12.6 | % | | 3.9 | % | | 29.1 | % | | 2.0% | | 0.5% | | 6.8% | | 100% |
92
THE JAPANESE SMALL COMPANY SERIES
SUMMARY SCHEDULE OF PORTFOLIO HOLDINGS
December 31, 2016
(Unaudited)
| | | | | | | | | Percentage | |
| | | | Shares | | Value†† | | of Net Assets** | |
| COMMON STOCKS — (92.0%) | | | | | | | | | |
| Consumer Discretionary — (17.8%) | | | | | | | | | |
| Aoyama Trading Co., Ltd. | | 304,000 | | $ | 10,563,899 | | 0.4 | % | |
| Shimachu Co., Ltd. | | 297,200 | | | 7,908,168 | | 0.3 | % | |
| Toyo Tire & Rubber Co., Ltd. | | 623,700 | | | 7,746,745 | | 0.3 | % | |
| Wacoal Holdings Corp. | | 676,000 | | | 7,869,935 | | 0.3 | % | |
| Other Securities | | | | | 547,758,675 | | 17.9 | % | |
| Total Consumer Discretionary | | | | | 581,847,422 | | 19.2 | % | |
| | | | | | | | | | |
| Consumer Staples — (7.4%) | | | | | | | | | |
| Ain Holdings, Inc. | | 124,600 | | | 8,235,354 | | 0.3 | % | |
| Morinaga Milk Industry Co., Ltd. | | 1,164,000 | | | 8,368,211 | | 0.3 | % | |
| Takara Holdings, Inc. | | 980,300 | | | 9,002,362 | | 0.3 | % | |
| Other Securities | | | | | 215,978,548 | | 7.1 | % | |
| Total Consumer Staples | | | | | 241,584,475 | | 8.0 | % | |
| | | | | | | | | | |
| Energy — (1.0%) | | | | | | | | | |
| Other Securities | | | | | 32,397,781 | | 1.1 | % | |
| | |
| Financials — (9.0%) | | | | | | | | | |
| 77 Bank, Ltd. (The) | | 1,749,760 | | | 8,427,668 | | 0.3 | % | |
| Daishi Bank, Ltd. (The) | | 2,071,000 | | | 9,273,305 | | 0.3 | % | |
| North Pacific Bank, Ltd. | | 2,303,600 | | | 9,486,865 | | 0.3 | % | |
| San-In Godo Bank, Ltd. (The) | | 957,000 | | | 7,973,031 | | 0.3 | % | |
| Other Securities | | | | | 261,303,828 | | 8.6 | % | |
| Total Financials | | | | | 296,464,697 | | 9.8 | % | |
| | | | | | | | | | |
| Health Care — (4.0%) | | | | | | | | | |
| Nipro Corp. | | 702,100 | | | 7,661,180 | | 0.3 | % | |
| # | Rohto Pharmaceutical Co., Ltd. | | 546,700 | | | 8,575,059 | | 0.3 | % | |
| Tsumura & Co. | | 359,800 | | | 9,902,975 | | 0.3 | % | |
| Other Securities | | | | | 103,585,426 | | 3.4 | % | |
| Total Health Care | | | | | 129,724,640 | | 4.3 | % | |
| | | | | | | | | | |
| Industrials — (26.6%) | | | | | | | | | |
| Aica Kogyo Co., Ltd. | | 314,300 | | | 8,273,967 | | 0.3 | % | |
| Fujikura, Ltd. | | 1,935,000 | | | 10,478,704 | | 0.4 | % | |
| Furukawa Electric Co., Ltd. | | 462,800 | | | 13,505,376 | | 0.5 | % | |
| Glory, Ltd. | | 268,900 | | | 8,473,658 | | 0.3 | % | |
| GS Yuasa Corp. | | 2,130,000 | | | 8,831,089 | | 0.3 | % | |
| Hanwa Co., Ltd. | | 1,221,000 | | | 7,965,602 | | 0.3 | % | |
| Mitsui Engineering & Shipbuilding Co., Ltd. | | 5,109,000 | | | 7,900,418 | | 0.3 | % | |
| Nishimatsu Construction Co., Ltd. | | 1,794,000 | | | 8,670,321 | | 0.3 | % | |
| Nisshinbo Holdings, Inc. | | 870,500 | | | 8,381,913 | | 0.3 | % | |
| NTN Corp. | | 2,488,000 | | | 10,037,113 | | 0.3 | % | |
| OKUMA Corp. | | 849,000 | | | 8,077,795 | | 0.3 | % | |
| # | OSG Corp. | | 452,700 | | | 8,888,747 | | 0.3 | % | |
| Penta-Ocean Construction Co., Ltd. | | 1,724,600 | | | 8,320,221 | | 0.3 | % | |
| Pilot Corp. | | 188,800 | | | 7,783,466 | | 0.3 | % | |
| Sankyu, Inc. | | 1,540,000 | | | 9,292,447 | | 0.3 | % | |
| Sanwa Holdings Corp. | | 1,232,600 | | | 11,723,223 | | 0.4 | % | |
93
The Japanese Small Company Series
continued
| | | | | | | | | Percentage | |
| | | | Shares | | Value†† | | of Net Assets** | |
| Industrials — (Continued) | | | | | | | | | |
| Ushio, Inc. | | 655,900 | | $ | 8,342,207 | | 0.3 | % | |
| Other Securities | | | | | 717,742,707 | | 23.3 | % | |
| Total Industrials | | | | | 872,688,974 | | 28.8 | % | |
| | | | | | | | | | |
| Information Technology — (12.0%) | | | | | | | | | |
| Citizen Watch Co., Ltd. | | 1,523,200 | | | 9,081,490 | | 0.3 | % | |
| Horiba, Ltd. | | 212,650 | | | 9,820,736 | | 0.3 | % | |
| Ibiden Co., Ltd. | | 620,978 | | | 8,328,189 | | 0.3 | % | |
| Taiyo Yuden Co., Ltd. | | 678,700 | | | 8,119,220 | | 0.3 | % | |
| TIS, Inc. | | 505,101 | | | 10,795,796 | | 0.4 | % | |
| Topcon Corp. | | 595,400 | | | 8,932,130 | | 0.3 | % | |
| Ulvac, Inc. | | 252,600 | | | 7,711,327 | | 0.3 | % | |
| Other Securities | | | | | 332,108,333 | | 10.8 | % | |
| Total Information Technology | | | | | 394,897,221 | | 13.0 | % | |
| | | | | | | | | | |
| Materials — (11.5%) | | | | | | | | | |
| Denka Co., Ltd. | | 1,949,000 | | | 8,580,724 | | 0.3 | % | |
| Mitsui Mining & Smelting Co., Ltd. | | 3,627,000 | | | 9,117,334 | | 0.3 | % | |
| Nippon Kayaku Co., Ltd. | | 683,000 | | | 8,421,941 | | 0.3 | % | |
| NOF Corp. | | 870,000 | | | 8,345,792 | | 0.3 | % | |
| Showa Denko KK | | 845,099 | | | 12,071,509 | | 0.4 | % | |
| Sumitomo Osaka Cement Co., Ltd. | | 2,493,000 | | | 9,393,234 | | 0.3 | % | |
| * | Tokuyama Corp. | | 2,159,000 | | | 8,172,315 | | 0.3 | % | |
| Toyobo Co., Ltd. | | 5,688,000 | | | 8,453,957 | | 0.3 | % | |
| Ube Industries, Ltd. | | 6,661,000 | | | 13,918,861 | | 0.5 | % | |
| # | Zeon Corp. | | 770,000 | | | 7,583,490 | | 0.3 | % | |
| Other Securities | | | | | 283,156,849 | | 9.2 | % | |
| Total Materials | | | | | 377,216,006 | | 12.5 | % | |
| | | | | | | | | | |
| Real Estate — (1.9%) | | | | | | | | | |
| Leopalace21 Corp. | | 1,960,700 | | | 10,829,792 | | 0.4 | % | |
| Other Securities | | | | | 50,765,146 | | 1.6 | % | |
| Total Real Estate | | | | | 61,594,938 | | 2.0 | % | |
| | | | | | | | | | |
| Telecommunication Services — (0.1%) | | | | | | | | | |
| Other Securities | | | | | 2,223,722 | | 0.1 | % | |
| | |
| Utilities — (0.7%) | | | | | | | | | |
| Hokkaido Electric Power Co., Inc. | | 1,082,100 | | | 8,434,319 | | 0.3 | % | |
| Other Securities | | | | | 15,171,608 | | 0.5 | % | |
| Total Utilities | | | | | 23,605,927 | | 0.8 | % | |
| TOTAL COMMON STOCKS | | | | | 3,014,245,803 | | 99.6 | % | |
| | | |
| TOTAL INVESTMENT SECURITIES | | | | | 3,014,245,803 | | | | |
| | |
| | | | | Value† | | | | |
| SECURITIES LENDING COLLATERAL — (8.0%) | | | | | | | | | |
| §@DFA Short Term Investment Fund | | 22,781,334 | | | 263,625,595 | | 8.7 | % | |
| TOTAL INVESTMENTS — (100.0%) (Cost $2,944,292,033)^ | | | | $ | 3,277,871,398 | | 108.3 | % | |
____________________
^ The cost for federal income tax purposes is $2,944,292,033.
94
The Japanese Small Company Series
continued
Summary of the Series’ investments as of December 31, 2016, based on their valuation inputs, is as follows (See Security Valuation Note):
| | Investments in | |
| | Securities | |
| | (Market Value) | |
| | Level 1 | | Level 2 | | Level 3 | | Total | |
| Common Stocks | | | | | | | | | | | | |
| Consumer Discretionary | | $ | 1,155,861 | | $ | 580,691,561 | | — | | $ | 581,847,422 | |
| Consumer Staples | | | 4,124,406 | | | 237,460,069 | | — | | | 241,584,475 | |
| Energy | | | — | | | 32,397,781 | | — | | | 32,397,781 | |
| Financials | | | 5,227,900 | | | 291,236,797 | | — | | | 296,464,697 | |
| Health Care | | | — | | | 129,724,640 | | — | | | 129,724,640 | |
| Industrials | | | — | | | 872,688,974 | | — | | | 872,688,974 | |
| Information Technology | | | — | | | 394,897,221 | | — | | | 394,897,221 | |
| Materials | | | — | | | 377,216,006 | | — | | | 377,216,006 | |
| Real Estate | | | — | | | 61,594,938 | | — | | | 61,594,938 | |
| Telecommunication Services | | | — | | | 2,223,722 | | — | | | 2,223,722 | |
| Utilities | | | — | | | 23,605,927 | | — | | | 23,605,927 | |
| Securities Lending Collateral | | | — | | | 263,625,595 | | — | | | 263,625,595 | |
| TOTAL | | $ | 10,508,167 | | $ | 3,267,363,231 | | — | | $ | 3,277,871,398 | |
See accompanying Notes to Financial Statements.
95
THE ASIA PACIFIC SMALL COMPANY SERIES
SUMMARY SCHEDULE OF PORTFOLIO HOLDINGS
December 31, 2016
(Unaudited)
| | | | | | | | | Percentage | |
| | | | Shares | | Value†† | | of Net Assets** | |
| COMMON STOCKS — (86.0%) | | | | | | | | | |
| AUSTRALIA — (43.3%) | | | | | | | | | |
| Adelaide Brighton, Ltd. | | 3,668,074 | | $ | 14,347,509 | | 1.0 | % | |
| # | Alumina, Ltd. | | 7,413,478 | | | 9,693,819 | | 0.7 | % | |
| Ansell, Ltd. | | 563,728 | | | 10,030,349 | | 0.7 | % | |
| Bank of Queensland, Ltd. | | 923,162 | | | 7,889,368 | | 0.5 | % | |
| Beach Energy, Ltd. | | 13,573,519 | | | 8,260,061 | | 0.6 | % | |
| BlueScope Steel, Ltd. | | 1,511,506 | | | 10,045,567 | | 0.7 | % | |
| Boral, Ltd. | | 3,427,616 | | | 13,343,977 | | 0.9 | % | |
| carsales.com, Ltd. | | 1,702,940 | | | 13,912,570 | | 0.9 | % | |
| Cleanaway Waste Management, Ltd. | | 10,357,050 | | | 9,173,336 | | 0.6 | % | |
| CSR, Ltd. | | 3,350,138 | | | 11,138,076 | | 0.8 | % | |
| Downer EDI, Ltd. | | 2,910,872 | | | 12,745,830 | | 0.9 | % | |
| DuluxGroup, Ltd. | | 3,101,823 | | | 13,926,770 | | 0.9 | % | |
| Fairfax Media, Ltd. | | 15,303,894 | | | 9,805,179 | | 0.7 | % | |
| GrainCorp, Ltd. Class A | | 1,251,687 | | | 8,625,073 | | 0.6 | % | |
| # | InvoCare, Ltd. | | 905,619 | | | 9,050,224 | | 0.6 | % | |
| # | IOOF Holdings, Ltd. | | 1,900,338 | | | 12,596,047 | | 0.9 | % | |
| # | IRESS, Ltd. | | 1,123,183 | | | 9,597,858 | | 0.7 | % | |
| # | JB Hi-Fi, Ltd. | | 962,791 | | | 19,460,401 | | 1.3 | % | |
| Magellan Financial Group, Ltd. | | 493,135 | | | 8,428,794 | | 0.6 | % | |
| #* | Metcash, Ltd. | | 5,144,197 | | | 8,459,988 | | 0.6 | % | |
| # | Mineral Resources, Ltd. | | 1,168,088 | | | 10,167,310 | | 0.7 | % | |
| nib holdings, Ltd. | | 2,713,689 | | | 9,286,375 | | 0.6 | % | |
| # | Northern Star Resources, Ltd. | | 4,806,957 | | | 12,285,908 | | 0.8 | % | |
| Nufarm, Ltd. | | 1,280,776 | | | 8,439,156 | | 0.6 | % | |
| Orora, Ltd. | | 3,956,731 | | | 8,508,962 | | 0.6 | % | |
| OZ Minerals, Ltd. | | 2,198,276 | | | 12,419,670 | | 0.8 | % | |
| # | Perpetual, Ltd. | | 356,426 | | | 12,503,310 | | 0.9 | % | |
| Primary Health Care, Ltd. | | 3,292,878 | | | 9,672,775 | | 0.7 | % | |
| # | Sims Metal Management, Ltd. | | 1,382,214 | | | 12,705,601 | | 0.9 | % | |
| # | Spark Infrastructure Group | | 11,913,246 | | | 20,435,277 | | 1.4 | % | |
| # | Super Retail Group, Ltd. | | 1,280,749 | | | 9,534,725 | | 0.7 | % | |
| Tabcorp Holdings, Ltd. | | 3,586,818 | | | 12,426,532 | | 0.8 | % | |
| # | Vocus Communications, Ltd. | | 4,260,609 | | | 11,864,629 | | 0.8 | % | |
| #* | Whitehaven Coal, Ltd. | | 4,143,411 | | | 7,756,054 | | 0.5 | % | |
| Other Securities | | | | | 359,532,639 | | 24.0 | % | |
| TOTAL AUSTRALIA | | | | | 738,069,719 | | 50.0 | % | |
| | | | | | | | | | |
| CHINA — (0.2%) | | | | | | | | | |
| Other Securities | | | | | 2,848,817 | | 0.2 | % | |
| | |
| HONG KONG — (24.2%) | | | | | | | | | |
| # | Dah Sing Financial Holdings, Ltd. | | 1,435,744 | | | 9,692,762 | | 0.7 | % | |
| #* | Esprit Holdings, Ltd. | | 14,664,650 | | | 11,494,234 | | 0.8 | % | |
| Hopewell Holdings, Ltd. | | 3,243,000 | | | 11,148,993 | | 0.8 | % | |
| Luk Fook Holdings International, Ltd. | | 3,154,000 | | | 8,219,240 | | 0.6 | % | |
| Man Wah Holdings, Ltd. | | 13,578,800 | | | 9,168,694 | | 0.6 | % | |
| # | Vitasoy International Holdings, Ltd. | | 5,433,000 | | | 10,885,584 | | 0.7 | % | |
| VTech Holdings, Ltd. | | 735,400 | | | 9,817,835 | | 0.7 | % | |
| Xinyi Glass Holdings, Ltd. | | 17,658,000 | | | 14,385,560 | | 1.0 | % | |
| Other Securities | | | | | 328,092,875 | | 22.0 | % | |
| TOTAL HONG KONG | | | | | 412,905,777 | | 27.9 | % | |
96
The Asia Pacific Small Company Series
continued
| | | | | | | | | Percentage | |
| | | | Shares | | Value†† | | of Net Assets** | |
| NEW ZEALAND — (7.5%) | | | | | | | | | |
| Fisher & Paykel Healthcare Corp., Ltd. | | 2,108,984 | | $ | 12,473,749 | | 0.8 | % | |
| # | Ryman Healthcare, Ltd. | | 1,681,908 | | | 9,470,224 | | 0.6 | % | |
| SKYCITY Entertainment Group, Ltd. | | 5,162,402 | | | 14,085,503 | | 1.0 | % | |
| Other Securities | | | | | 92,577,268 | | 6.3 | % | |
| TOTAL NEW ZEALAND | | | | | 128,606,744 | | 8.7 | % | |
| | | | | | | | | | |
| SINGAPORE — (10.8%) | | | | | | | | | |
| #* | Noble Group, Ltd. | | 75,184,800 | | | 8,768,142 | | 0.6 | % | |
| SATS, Ltd. | | 2,695,900 | | | 9,019,882 | | 0.6 | % | |
| # | Singapore Post, Ltd. | | 10,300,000 | | | 10,402,463 | | 0.7 | % | |
| UOL Group, Ltd. | | 1,967,864 | | | 8,112,659 | | 0.6 | % | |
| Venture Corp., Ltd. | | 1,994,100 | | | 13,582,050 | | 0.9 | % | |
| Other Securities | | | | | 134,277,389 | | 9.1 | % | |
| TOTAL SINGAPORE | | | | | 184,162,585 | | 12.5 | % | |
| TOTAL COMMON STOCKS | | | | | 1,466,593,642 | | 99.3 | % | |
| | | | | | | | | | |
| RIGHTS/WARRANTS — (0.0%) | | | | | | | | | |
| AUSTRALIA — (0.0%) | | | | | | | | | |
| Other Securities | | | | | 28,211 | | 0.0 | % | |
| | | | | | | | | | |
| BERMUDA — (0.0%) | | | | | | | | | |
| Other Securities | | | | | 9,305 | | 0.0 | % | |
| | | | | | | | | | |
| SINGAPORE — (0.0%) | | | | | | | | | |
| Other Securities | | | | | 28,247 | | 0.0 | % | |
| | | | | | | | | | |
| TOTAL RIGHTS/WARRANTS | | | | | 65,763 | | 0.0 | % | |
| TOTAL INVESTMENT SECURITIES | | | | | 1,466,659,405 | | | | |
| | |
| | | | | Value† | | | | |
| SECURITIES LENDING COLLATERAL — (14.0%) | | | | | | | | | |
| §@DFA Short Term Investment Fund | | 20,548,587 | | | 237,788,253 | | 16.1 | % | |
| TOTAL INVESTMENTS — (100.0%) (Cost $1,812,819,807)^ | | | | $ | 1,704,447,658 | | 115.4 | % | |
____________________
^ The cost for federal income tax purposes is $1,812,819,807.
97
The Asia Pacific Small Company Series
continued
Summary of the Series’ investments as of December 31, 2016, based on their valuation inputs, is as follows (See Security Valuation Note):
| | Investments in | |
| | Securities | |
| | (Market Value) | |
| | Level 1 | | Level 2 | | Level 3 | | Total | |
| Common Stocks | | | | | | | | | | | | |
| Australia | | $ | 977,582 | | $ | 737,092,137 | | — | | $ | 738,069,719 | |
| China | | | — | | | 2,848,817 | | — | | | 2,848,817 | |
| Hong Kong | | | 237,551 | | | 412,668,226 | | — | | | 412,905,777 | |
| New Zealand | | | 376,334 | | | 128,230,410 | | — | | | 128,606,744 | |
| Singapore | | | 306,508 | | | 183,856,077 | | — | | | 184,162,585 | |
| Rights/Warrants | | | | | | | | | | | | |
| Australia | | | — | | | 28,211 | | — | | | 28,211 | |
| Bermuda | | | — | | | 9,305 | | — | | | 9,305 | |
| Hong Kong | | | — | | | — | | — | | | — | |
| Singapore | | | — | | | 28,247 | | — | | | 28,247 | |
| Securities Lending Collateral | | | — | | | 237,788,253 | | — | | | 237,788,253 | |
| TOTAL | | $ | 1,897,975 | | $ | 1,702,549,683 | | — | | $ | 1,704,447,658 | |
See accompanying Notes to Financial Statements.
98
THE UNITED KINGDOM SMALL COMPANY SERIES
SUMMARY SCHEDULE OF PORTFOLIO HOLDINGS
December 31, 2016
(Unaudited)
| | | | | | | Percentage | |
| | | Shares | | Value†† | | of Net Assets** | |
| COMMON STOCKS — (96.6%) | | | | | | | | |
| Consumer Discretionary — (19.3%) | | | | | | | | |
| B&M European Value Retail SA | 3,300,251 | | $ | 11,307,266 | | 0.6 | % | |
| Bellway P.L.C. | 637,459 | | | 19,431,469 | | 1.1 | % | |
| Daily Mail & General Trust P.L.C. Class A | 1,271,481 | | | 12,176,097 | | 0.7 | % | |
| Domino’s Pizza Group P.L.C. | 2,536,833 | | | 11,257,720 | | 0.6 | % | |
| Greene King P.L.C. | 1,786,209 | | | 15,348,504 | | 0.9 | % | |
| Inchcape P.L.C. | 2,190,976 | | | 18,934,318 | | 1.1 | % | |
| UBM P.L.C. | 1,950,843 | | | 17,560,077 | | 1.0 | % | |
| WH Smith P.L.C. | 680,498 | | | 13,038,881 | | 0.7 | % | |
| William Hill P.L.C. | 4,185,519 | | | 14,949,611 | | 0.8 | % | |
| Other Securities | | | | 217,149,732 | | 12.3 | % | |
| Total Consumer Discretionary | | | | 351,153,675 | | 19.8 | % | |
| | | |
| Consumer Staples — (5.3%) | | | | | | | | |
| Booker Group P.L.C. | 8,105,070 | | | 17,519,847 | | 1.0 | % | |
| Tate & Lyle P.L.C. | 2,319,044 | | | 20,181,815 | | 1.1 | % | |
| Other Securities | | | | 58,639,690 | | 3.3 | % | |
| Total Consumer Staples | | | | 96,341,352 | | 5.4 | % | |
| | |
| Energy — (5.6%) | | | | | | | | |
| Amec Foster Wheeler P.L.C. | 2,037,469 | | | 11,765,464 | | 0.7 | % | |
| John Wood Group P.L.C. | 1,887,172 | | | 20,378,522 | | 1.1 | % | |
| Petrofac, Ltd. | 1,141,776 | | | 12,218,826 | | 0.7 | % | |
| #* | Tullow Oil P.L.C. | 5,009,214 | | | 19,308,190 | | 1.1 | % | |
| Other Securities | | | | 37,485,129 | | 2.1 | % | |
| Total Energy | | | | 101,156,131 | | 5.7 | % | |
| | |
| Financials — (13.0%) | | | | | | | | |
| Beazley P.L.C. | 2,740,810 | | | 13,100,391 | | 0.7 | % | |
| Close Brothers Group P.L.C. | 785,896 | | | 13,958,020 | | 0.8 | % | |
| Henderson Group P.L.C. | 5,628,395 | | | 16,244,585 | | 0.9 | % | |
| Hiscox, Ltd. | 1,494,924 | | | 18,732,398 | | 1.1 | % | |
| Intermediate Capital Group P.L.C. | 1,340,691 | | | 11,542,751 | | 0.7 | % | |
| Jupiter Fund Management P.L.C. | 2,162,762 | | | 11,777,958 | | 0.7 | % | |
| Man Group P.L.C. | 8,025,798 | | | 11,677,493 | | 0.7 | % | |
| Phoenix Group Holdings | 1,466,980 | | | 13,279,377 | | 0.7 | % | |
| Saga P.L.C. | 4,624,740 | | | 11,138,116 | | 0.6 | % | |
| Tullett Prebon P.L.C. | 2,563,777 | | | 13,634,997 | | 0.8 | % | |
| Other Securities | | | | 101,293,587 | | 5.7 | % | |
| Total Financials | | | | 236,379,673 | | 13.4 | % | |
| | |
| Health Care — (3.5%) | | | | | | | | |
| *BTG P.L.C. | 1,870,654 | | | 13,584,615 | | 0.8 | % | |
| Indivior P.L.C. | 3,662,912 | | | 13,346,335 | | 0.7 | % | |
| Other Securities | | | | 36,545,253 | | 2.1 | % | |
| Total Health Care | | | | 63,476,203 | | 3.6 | % | |
99
The United Kingdom Small Company Series
continued
| | | | | | | Percentage | |
| | | Shares | | Value†† | | of Net Assets** | |
| Industrials — (27.4%) | | | | | | | | |
| Aggreko P.L.C. | 1,332,278 | | $ | 15,039,277 | | 0.8 | % | |
| Balfour Beatty P.L.C. | 3,549,781 | | | 11,722,644 | | 0.7 | % | |
| BBA Aviation P.L.C. | 5,623,297 | | | 19,605,290 | | 1.1 | % | |
| Cobham P.L.C. | 8,760,026 | | | 17,637,802 | | 1.0 | % | |
| G4S P.L.C. | 4,186,631 | | | 12,100,926 | | 0.7 | % | |
| Hays P.L.C. | 6,566,676 | | | 12,049,293 | | 0.7 | % | |
| Howden Joinery Group P.L.C. | 3,165,528 | | | 14,938,171 | | 0.8 | % | |
| | IMI P.L.C. | 1,291,794 | | | 16,520,476 | | 0.9 | % | |
| Meggitt P.L.C. | 3,090,230 | | | 17,451,115 | | 1.0 | % | |
| Melrose Industries P.L.C. | 10,887,020 | | | 26,462,934 | | 1.5 | % | |
| Rentokil Initial P.L.C. | 8,861,710 | | | 24,243,686 | | 1.4 | % | |
| Rotork P.L.C. | 3,918,039 | | | 11,627,202 | | 0.7 | % | |
| Spirax-Sarco Engineering P.L.C. | 355,118 | | | 18,275,928 | | 1.0 | % | |
| Weir Group P.L.C. (The) | 1,080,278 | | | 25,104,799 | | 1.4 | % | |
| Other Securities | | | | 257,055,424 | | 14.6 | % | |
| Total Industrials | | | | 499,834,967 | | 28.3 | % | |
| | | | | | | | | |
| Information Technology — (9.5%) | | | | | | | | |
| Electrocomponents P.L.C. | 2,396,207 | | | 14,062,924 | | 0.8 | % | |
| Halma P.L.C. | 1,951,180 | | | 21,586,831 | | 1.2 | % | |
| # | Micro Focus International P.L.C. | 539,522 | | | 14,489,419 | | 0.8 | % | |
| Playtech P.L.C. | 1,111,348 | | | 11,306,677 | | 0.6 | % | |
| Rightmove P.L.C. | 477,301 | | | 22,927,820 | | 1.3 | % | |
| Spectris P.L.C. | 613,329 | | | 17,476,706 | | 1.0 | % | |
| Other Securities | | | | 70,589,289 | | 4.0 | % | |
| Total Information Technology | | | | 172,439,666 | | 9.7 | % | |
| | | | | | | | | |
| Materials — (7.8%) | | | | | | | | |
| DS Smith P.L.C. | 4,938,232 | | | 24,797,760 | | 1.4 | % | |
| RPC Group P.L.C. | 1,638,321 | | | 21,475,299 | | 1.2 | % | |
| Other Securities | | | | 96,487,380 | | 5.5 | % | |
| Total Materials | | | | 142,760,439 | | 8.1 | % | |
| | | | | | | | | | |
| Real Estate — (2.5%) | | | | | | | | |
| Other Securities | | | | 45,964,718 | | 2.6 | % | |
| | | | | | | | | | |
| Telecommunication Services — (0.7%) | | | | | | | | |
| Other Securities | | | | 13,365,743 | | 0.8 | % | |
| | | | | | | | | |
| Utilities — (2.0%) | | | | | | | | |
| Pennon Group P.L.C. | 1,994,817 | | | 20,302,685 | | 1.1 | % | |
| Other Securities | | | | 15,415,665 | | 0.9 | % | |
| Total Utilities | | | | 35,718,350 | | 2.0 | % | |
TOTAL COMMON STOCKS | | | | 1,758,590,917 | | 99.4 | % | |
TOTAL INVESTMENT SECURITIES | | | | 1,758,590,917 | | | | |
| | | | | | | | |
| | | | | Value† | | | | |
| SECURITIES LENDING COLLATERAL — (3.4%) | | | | | | | | |
| § @ | DFA Short Term Investment Fund | 5,356,427 | | | 61,984,568 | | 3.5 | % | |
| TOTAL INVESTMENTS — (100.0%) | | | | | | | | |
| (Cost $1,731,563,401)^ | | | $ | 1,820,575,485 | | 102.9 | % | |
____________________
| ^ | | The cost for federal income tax purposes is $1,731,563,401. |
100
The United Kingdom Small Company Series
continued
Summary of the Series’ investments as of December 31, 2016, based on their valuation inputs, is as follows (See Security Valuation Note):
| | Investments in | |
| | Securities | |
| | (Market Value) | |
| | Level 1 | | Level 2 | | Level 3 | | Total | |
| Common Stocks | | | | | | | | | | | | |
| Consumer Discretionary | | | — | | $ | 351,153,675 | | — | | $ | 351,153,675 | |
| Consumer Staples | | | — | | | 96,341,352 | | — | | | 96,341,352 | |
| Energy | | | — | | | 101,156,131 | | — | | | 101,156,131 | |
| Financials | | $ | 8,825,450 | | | 227,554,223 | | — | | | 236,379,673 | |
| Health Care | | | — | | | 63,476,203 | | — | | | 63,476,203 | |
| Industrials | | | — | | | 499,834,967 | | — | | | 499,834,967 | |
| Information Technology | | | 1,309,557 | | | 171,130,109 | | — | | | 172,439,666 | |
| Materials | | | — | | | 142,760,439 | | — | | | 142,760,439 | |
| Real Estate | | | — | | | 45,964,718 | | — | | | 45,964,718 | |
| Telecommunication Services | | | — | | | 13,365,743 | | — | | | 13,365,743 | |
| Utilities | | | — | | | 35,718,350 | | — | | | 35,718,350 | |
| Securities Lending Collateral | | | — | | | 61,984,568 | | — | | | 61,984,568 | |
| TOTAL | | $ | 10,135,007 | | $ | 1,810,440,478 | | — | | $ | 1,820,575,485 | |
See accompanying Notes to Financial Statements.
101
THE CONTINENTAL SMALL COMPANY SERIES
SUMMARY SCHEDULE OF PORTFOLIO HOLDINGS
December 31, 2016
(Unaudited)
| | | | | | | Percentage | |
| | | Shares | | Value†† | | of Net Assets** | |
| COMMON STOCKS — (89.9%) | | | | | | | | |
| AUSTRIA — (3.0%) | | | | | | | | |
| ANDRITZ AG | 310,627 | | $ | 15,566,678 | | 0.4 | % | |
| Other Securities | | | | 121,572,943 | | 2.9 | % | |
| TOTAL AUSTRIA | | | | 137,139,621 | | 3.3 | % | |
| | | |
| BELGIUM — (4.2%) | | | | | | | | |
| Ackermans & van Haaren NV | 134,383 | | | 18,666,762 | | 0.5 | % | |
| Umicore SA | 412,343 | | | 23,458,773 | | 0.6 | % | |
| Other Securities | | | | 149,301,875 | | 3.5 | % | |
| TOTAL BELGIUM | | | | 191,427,410 | | 4.6 | % | |
| | | |
| DENMARK — (4.2%) | | | | | | | | |
| GN Store Nord A.S. | 826,732 | | | 17,097,087 | | 0.4 | % | |
| Jyske Bank A.S. | 345,747 | | | 16,441,309 | | 0.4 | % | |
| * | TDC A.S. | 4,165,514 | | | 21,353,969 | | 0.5 | % | |
| Other Securities | | | | 138,783,599 | | 3.4 | % | |
| TOTAL DENMARK | | | | 193,675,964 | | 4.7 | % | |
| | | |
| FINLAND — (6.7%) | | | | | | | | |
| Amer Sports Oyj | 641,324 | | | 17,018,455 | | 0.4 | % | |
| Elisa Oyj | 734,075 | | | 23,829,141 | | 0.6 | % | |
| Huhtamaki Oyj | 467,536 | | | 17,327,232 | | 0.4 | % | |
| Kesko Oyj Class B | 345,206 | | | 17,227,737 | | 0.4 | % | |
| Metso Oyj | 549,230 | | | 15,625,000 | | 0.4 | % | |
| Nokian Renkaat Oyj | 623,433 | | | 23,177,911 | | 0.6 | % | |
| Orion Oyj Class B | 436,647 | | | 19,401,023 | | 0.5 | % | |
| * | Outokumpu Oyj | 3,022,031 | | | 26,909,215 | | 0.7 | % | |
| Other Securities | | | | 143,868,736 | | 3.3 | % | |
| TOTAL FINLAND | | | | 304,384,450 | | 7.3 | % | |
| | | |
| FRANCE — (12.5%) | | | | | | | | |
| Arkema SA | 298,145 | | | 29,143,870 | | 0.7 | % | |
| Edenred | 946,779 | | | 18,746,715 | | 0.5 | % | |
| Lagardere SCA | 619,304 | | | 17,189,044 | | 0.4 | % | |
| Rexel SA | 1,596,995 | | | 26,238,437 | | 0.6 | % | |
| Rubis SCA | 203,675 | | | 16,774,964 | | 0.4 | % | |
| SEB SA | 120,657 | | | 16,349,482 | | 0.4 | % | |
| STMicroelectronics NV | 2,136,887 | | | 24,220,433 | | 0.6 | % | |
| Teleperformance | 336,308 | | | 33,716,824 | | 0.8 | % | |
| * | Ubisoft Entertainment SA | 521,852 | | | 18,544,365 | | 0.5 | % | |
| Other Securities | | | | 369,336,180 | | 8.8 | % | |
| TOTAL FRANCE | | | | 570,260,314 | | 13.7 | % | |
102
The Continental Small Company Series
continued
| | | | | | | Percentage | |
| | | Shares | | Value†† | | of Net Assets** | |
| GERMANY — (15.0%) | | | | | | | | |
| Aareal Bank AG | 409,233 | | $ | 15,348,599 | | 0.4 | % | |
| * | Dialog Semiconductor P.L.C. | 382,079 | | | 16,053,013 | | 0.4 | % | |
| Freenet AG | 652,809 | | | 18,346,927 | | 0.4 | % | |
| Hugo Boss AG | 261,242 | | | 15,948,572 | | 0.4 | % | |
| # | K+S AG | 990,931 | | | 23,605,024 | | 0.6 | % | |
| * | KUKA AG | 134,984 | | | 16,316,193 | | 0.4 | % | |
| Lanxess AG | 484,758 | | | 31,743,525 | | 0.8 | % | |
| LEG Immobilien AG | 306,750 | | | 23,791,358 | | 0.6 | % | |
| # | MTU Aero Engines AG | 249,839 | | | 28,818,892 | | 0.7 | % | |
| Osram Licht AG | 343,036 | | | 17,963,212 | | 0.4 | % | |
| * | QIAGEN NV | 744,663 | | | 20,867,950 | | 0.5 | % | |
| Stada Arzneimittel AG | 306,492 | | | 15,833,942 | | 0.4 | % | |
| Other Securities | | | | 441,349,607 | | 10.5 | % | |
| TOTAL GERMANY | | | | 685,986,814 | | 16.5 | % | |
| | |
| IRELAND — (1.2%) | | | | | | | | |
| | Kingspan Group P.L.C. | 622,048 | | | 16,815,462 | | 0.4 | % | |
| Other Securities | | | | 37,082,604 | | 0.9 | % | |
| TOTAL IRELAND | | | | 53,898,066 | | 1.3 | % | |
| | | |
| ISRAEL — (1.8%) | | | | | | | | |
| Other Securities | | | | 84,469,736 | | 2.0 | % | |
| | | |
| ITALY — (8.7%) | | | | | | | | |
| # | Mediaset SpA | 4,351,208 | | | 18,740,361 | | 0.5 | % | |
| Prysmian SpA | 1,026,230 | | | 26,302,604 | | 0.6 | % | |
| Other Securities | | | | 351,973,004 | | 8.4 | % | |
| TOTAL ITALY | | | | 397,015,969 | | 9.5 | % | |
| | | |
| NETHERLANDS — (4.7%) | | | | | | | | |
| Aalberts Industries NV | 600,156 | | | 19,443,822 | | 0.5 | % | |
| Delta Lloyd NV | 2,709,093 | | | 15,141,665 | | 0.4 | % | |
| # | Gemalto NV | 304,031 | | | 17,558,209 | | 0.4 | % | |
| Other Securities | | | | 162,396,444 | | 3.9 | % | |
| TOTAL NETHERLANDS | | | | 214,540,140 | | 5.2 | % | |
| | | |
| NORWAY — (2.7%) | | | | | | | | |
| Other Securities | | | | 122,009,871 | | 2.9 | % | |
| | | |
| PORTUGAL — (0.9%) | | | | | | | | |
| Other Securities | | | | 41,090,554 | | 1.0 | % | |
103
The Continental Small Company Series
continued
| | | | | | | | Percentage | |
| | Shares | | Value†† | | of Net Assets** | |
| SPAIN — (5.1%) | | | | | | | | |
| | Gamesa Corp. Tecnologica SA | 1,203,576 | | $ | 24,333,507 | | 0.6 | % | |
| | Other Securities | | | | 209,676,210 | | 5.0 | % | |
| TOTAL SPAIN | | | | 234,009,717 | | 5.6 | % | |
| | |
| SWEDEN — (7.6%) | | | | | | | | |
| Other Securities | | | | 345,727,344 | | 8.3 | % | |
| | |
| SWITZERLAND — (11.6%) | | | | | | | | |
| Baloise Holding AG | 131,033 | | | 16,488,511 | | 0.4 | % | |
| Flughafen Zuerich AG | 104,871 | | | 19,433,325 | | 0.5 | % | |
| Georg Fischer AG | 22,511 | | | 18,410,048 | | 0.4 | % | |
| Helvetia Holding AG | 36,269 | | | 19,514,567 | | 0.5 | % | |
| Logitech International SA | 650,486 | | | 16,189,561 | | 0.4 | % | |
| PSP Swiss Property AG | 201,709 | | | 17,420,956 | | 0.4 | % | |
| Straumann Holding AG | 44,803 | | | 17,457,993 | | 0.4 | % | |
| Temenos Group AG | 318,043 | | | 22,107,453 | | 0.5 | % | |
| Other Securities | | | | 383,375,647 | | 9.3 | % | |
| TOTAL SWITZERLAND | | | | 530,398,061 | | 12.8 | % | |
| TOTAL COMMON STOCKS | | | | 4,106,034,031 | | 98.7 | % | |
| | |
| PREFERRED STOCKS — (0.7%) | | | | | | | | |
| | |
| GERMANY — (0.7%) | | | | | | | | |
| Other Securities | | | | 32,397,362 | | 0.8 | % | |
| TOTAL PREFERRED STOCKS | | | | 32,397,362 | | 0.8 | % | |
| | |
| RIGHTS/WARRANTS — (0.0%) | | | | | | | | |
| | |
| NORWAY — (0.0%) | | | | | | | | |
| Other Securities | | | | 88,315 | | 0.0 | % | |
| | |
| SPAIN — (0.0%) | | | | | | | | |
| Other Securities | | | | 132,136 | | 0.0 | % | |
| TOTAL RIGHTS/WARRANTS | | | | 220,451 | | 0.0 | % | |
| TOTAL INVESTMENT SECURITIES | | | | 4,138,651,844 | | | | |
| | |
| | | | Value† | | | | |
| SECURITIES LENDING COLLATERAL — (9.4%) | | | | | | | | |
| §@ | DFA Short Term Investment Fund | 37,009,517 | | | 428,274,127 | | 10.3 | % | |
| TOTAL INVESTMENTS — (100.0%) (Cost $3,937,134,875)^ | | | $ | 4,566,925,971 | | 109.8 | % | |
____________________
| ^ | | The cost for federal income tax purposes is $3,937,134,875. |
104
The Continental Small Company Series
continued
Summary of the Series’ investments as of December 31, 2016, based on their valuation inputs, is as follows (See Security Valuation Note):
| | Investments in | |
| | Securities | |
| | (Market Value) | |
| | Level 1 | | Level 2 | | Level 3 | | Total | |
| Common Stocks | | | | | | | | | | | | |
| Austria | | | — | | $ | 137,139,621 | | — | | $ | 137,139,621 | |
| Belgium | | | — | | | 191,427,410 | | — | | | 191,427,410 | |
| Denmark | | | — | | | 193,675,964 | | — | | | 193,675,964 | |
| Finland | | | — | | | 304,384,450 | | — | | | 304,384,450 | |
| France | | | — | | | 570,260,314 | | — | | | 570,260,314 | |
| Germany | | | — | | | 685,986,814 | | — | | | 685,986,814 | |
| Greece | | | — | | | — | | — | | | — | |
| Ireland | | | — | | | 53,898,066 | | — | | | 53,898,066 | |
| Israel | | | — | | | 84,469,736 | | — | | | 84,469,736 | |
| Italy | | | — | | | 397,015,969 | | — | | | 397,015,969 | |
| Netherlands | | $ | 154,357 | | | 214,385,783 | | — | | | 214,540,140 | |
| Norway | | | — | | | 122,009,871 | | — | | | 122,009,871 | |
| Portugal | | | — | | | 41,090,554 | | — | | | 41,090,554 | |
| Spain | | | — | | | 234,009,717 | | — | | | 234,009,717 | |
| Sweden | | | — | | | 345,727,344 | | — | | | 345,727,344 | |
| Switzerland | | | — | | | 530,398,061 | | — | | | 530,398,061 | |
| Preferred Stocks | | | | | | | | | | | | |
| Germany | | | — | | | 32,397,362 | | — | | | 32,397,362 | |
| Rights/Warrants | | | | | | | | | | | | |
| Austria | | | — | | | — | | — | | | — | |
| Italy | | | — | | | — | | — | | | — | |
| Norway | | | — | | | 88,315 | | — | | | 88,315 | |
| Spain | | | — | | | 132,136 | | — | | | 132,136 | |
| Securities Lending Collateral | | | — | | | 428,274,127 | | — | | | 428,274,127 | |
| TOTAL | | $ | 154,357 | | $ | 4,566,771,614 | | — | | $ | 4,566,925,971 | |
See accompanying Notes to Financial Statements.
105
THE CANADIAN SMALL COMPANY SERIES
SUMMARY SCHEDULE OF PORTFOLIO HOLDINGS
December 31, 2016
(Unaudited)
| | | | | | | Percentage | |
| | | Shares | | Value†† | | of Net Assets** | |
| COMMON STOCKS — (84.5%) | | | | | | | | |
| Consumer Discretionary — (7.8%) | | | | | | | | |
| Cineplex, Inc. | 321,092 | | $ | 12,249,158 | | 1.2 | % | |
| # | Corus Entertainment, Inc. Class B | 740,938 | | | 6,953,278 | | 0.7 | % | |
| # | Enercare, Inc. | 527,359 | | | 7,007,101 | | 0.7 | % | |
| #* | IMAX Corp. | 259,917 | | | 8,161,394 | | 0.8 | % | |
| Linamar Corp. | 179,512 | | | 7,713,140 | | 0.8 | % | |
| Other Securities | | | | 49,678,761 | | 5.0 | % | |
| Total Consumer Discretionary | | | | 91,762,832 | | 9.2 | % | |
| | | |
| Consumer Staples — (3.6%) | | | | | | | | |
| Cott Corp. | 600,036 | | | 6,792,945 | | 0.7 | % | |
| Maple Leaf Foods, Inc. | 305,864 | | | 6,405,910 | | 0.6 | % | |
| Premium Brands Holdings Corp. | 144,762 | | | 7,435,138 | | 0.8 | % | |
| Other Securities | | | | 22,115,899 | | 2.2 | % | |
| Total Consumer Staples | | | | 42,749,892 | | 4.3 | % | |
| | | |
| Energy — (21.8%) | | | | | | | | |
| * | Advantage Oil & Gas, Ltd. | 1,116,844 | | | 7,586,204 | | 0.8 | % | |
| * | Birchcliff Energy, Ltd. | 1,028,636 | | | 7,178,579 | | 0.7 | % | |
| # | Enbridge Income Fund Holdings, Inc. | 251,755 | | | 6,519,585 | | 0.7 | % | |
| Enerplus Corp. | 721,959 | | | 6,850,451 | | 0.7 | % | |
| # | Gibson Energy, Inc. | 702,339 | | | 9,928,421 | | 1.0 | % | |
| # | Mullen Group, Ltd. | 551,525 | | | 8,145,638 | | 0.8 | % | |
| * | Parex Resources, Inc. | 765,891 | | | 9,640,307 | | 1.0 | % | |
| # | Parkland Fuel Corp. | 477,625 | | | 10,006,771 | | 1.0 | % | |
| Precision Drilling Corp. | 1,782,881 | | | 9,720,098 | | 1.0 | % | |
| * | Raging River Exploration, Inc. | 1,094,651 | | | 8,609,478 | | 0.9 | % | |
| # | Secure Energy Services, Inc. | 837,639 | | | 7,305,517 | | 0.7 | % | |
| ShawCor, Ltd. | 319,981 | | | 8,541,406 | | 0.9 | % | |
| Veresen, Inc. | 1,597,192 | | | 15,595,417 | | 1.6 | % | |
| Whitecap Resources, Inc. | 1,466,035 | | | 13,277,463 | | 1.3 | % | |
| Other Securities | | | | 128,777,589 | | 12.7 | % | |
| Total Energy | | | | 257,682,924 | | 25.8 | % | |
| | | |
| Financials — (5.5%) | | | | | | | | |
| # | Canadian Western Bank | 468,032 | | | 10,576,167 | | 1.1 | % | |
| # | Home Capital Group, Inc. | 325,263 | | | 7,592,256 | | 0.8 | % | |
| Laurentian Bank of Canada | 197,446 | | | 8,489,597 | | 0.9 | % | |
| TMX Group, Ltd. | 191,063 | | | 10,177,504 | | 1.0 | % | |
| Other Securities | | | | 28,089,262 | | 2.7 | % | |
| Total Financials | | | | 64,924,786 | | 6.5 | % | |
| | | |
| Health Care — (1.3%) | | | | | | | | |
| Other Securities | | | | 15,576,783 | | 1.6 | % | |
| | | |
| Industrials — (10.7%) | | | | | | | | |
| MacDonald Dettwiler & Associates, Ltd. | 172,507 | | | 8,594,193 | | 0.9 | % | |
| New Flyer Industries, Inc. | 254,471 | | | 7,740,361 | | 0.8 | % | |
| Russel Metals, Inc. | 362,155 | | | 6,899,732 | | 0.7 | % | |
| # | Stantec, Inc. | 410,229 | | | 10,363,809 | | 1.0 | % | |
106
The Canadian Small Company Series
continued
| | | | | | | Percentage | |
| | | Shares | | Value†† | | of Net Assets** | |
| Industrials — (Continued) | | | | | | | | |
| TFI International, Inc. | 491,359 | | $ | 12,768,417 | | 1.3 | % | |
| Toromont Industries, Ltd. | 398,385 | | | 12,565,899 | | 1.3 | % | |
| Other Securities | | | | 67,233,905 | | 6.6 | % | |
| Total Industrials | | | | 126,166,316 | | 12.6 | % | |
| | |
| Information Technology — (3.3%) | | | | | | | | |
| Other Securities | | | | 39,674,251 | | 4.0 | % | |
| | |
| Materials — (22.7%) | | | | | | | | |
| Alamos Gold, Inc. Class A | 1,545,462 | | | 10,658,757 | | 1.1 | % | |
| * | B2Gold Corp. | 5,284,073 | | | 12,554,421 | | 1.3 | % | |
| HudBay Minerals, Inc. | 1,453,305 | | | 8,312,950 | | 0.8 | % | |
| * | IAMGOLD Corp. | 2,443,241 | | | 9,444,323 | | 0.9 | % | |
| * | Lundin Mining Corp. | 2,567,823 | | | 12,240,023 | | 1.2 | % | |
| Methanex Corp. | 188,866 | | | 8,283,856 | | 0.8 | % | |
| * | New Gold, Inc. | 2,777,383 | | | 9,743,026 | | 1.0 | % | |
| | OceanaGold Corp. | 3,061,665 | | | 8,916,032 | | 0.9 | % | |
| Pan American Silver Corp. | 990,673 | | | 14,941,443 | | 1.5 | % | |
| * | Silver Standard Resources, Inc. | 760,590 | | | 6,803,475 | | 0.7 | % | |
| # | Stella-Jones, Inc. | 204,600 | | | 6,640,947 | | 0.7 | % | |
| West Fraser Timber Co., Ltd. | 266,200 | | | 9,518,685 | | 1.0 | % | |
| Other Securities | | | | 150,803,972 | | 15.0 | % | |
| Total Materials | | | | 268,861,910 | | 26.9 | % | |
| | |
| Real Estate — (1.7%) | | | | | | | | |
| FirstService Corp. | 163,033 | | | 7,739,711 | | 0.8 | % | |
| Other Securities | | | | 12,998,563 | | 1.3 | % | |
| Total Real Estate | | | | 20,738,274 | | 2.1 | % | |
| | |
| Telecommunication Services — (0.4%) | | | | | | | | |
| Other Securities | | | | 4,559,893 | | 0.4 | % | |
| | | |
| Utilities — (5.7%) | | | | | | | | |
| # | Algonquin Power & Utilities Corp. | 1,268,653 | | | 10,762,267 | | 1.1 | % | |
| Capital Power Corp. | 535,609 | | | 9,266,895 | | 0.9 | % | |
| # | Northland Power, Inc. | 536,896 | | | 9,317,154 | | 0.9 | % | |
| # | Superior Plus Corp. | 737,043 | | | 6,999,068 | | 0.7 | % | |
| TransAlta Corp. | 1,451,525 | | | 8,032,496 | | 0.8 | % | |
| Other Securities | | | | 23,271,113 | | 2.4 | % | |
| Total Utilities | | | | 67,648,993 | | 6.8 | % | |
| TOTAL COMMON STOCKS | | | | 1,000,346,854 | | 100.2 | % | |
| TOTAL INVESTMENT SECURITIES | | | | 1,000,346,854 | | | | |
| | |
| | | | Value† | | | | |
| SECURITIES LENDING COLLATERAL — (15.5%) | | | | | | | | |
| §@ | DFA Short Term Investment Fund | 15,843,339 | | | 183,339,124 | | 18.4 | % | |
| TOTAL INVESTMENTS — (100.0%) (Cost $1,372,271,170)^ | | | $ | 1,183,685,978 | | 118.6 | % | |
____________________
| ^ | | The cost for federal income tax purposes is $1,372,271,170. |
107
The Canadian Small Company Series
continued
Summary of the Series’ investments as of December 31, 2016, based on their valuation inputs, is as follows (See Security Valuation Note):
| | Investments in | |
| | Securities | |
| | (Market Value) | |
| | Level 1 | | Level 2 | | Level 3 | | Total | |
| Common Stocks | | | | | | | | | | | | |
| Consumer Discretionary | | $ | 91,756,086 | | $ | 6,746 | | — | | $ | 91,762,832 | |
| Consumer Staples | | | 42,749,892 | | | — | | — | | | 42,749,892 | |
| Energy | | | 257,624,002 | | | 58,922 | | — | | | 257,682,924 | |
| Financials | | | 64,924,786 | | | — | | — | | | 64,924,786 | |
| Health Care | | | 15,576,783 | | | — | | — | | | 15,576,783 | |
| Industrials | | | 126,166,316 | | | — | | — | | | 126,166,316 | |
| Information Technology | | | 39,674,251 | | | — | | — | | | 39,674,251 | |
| Materials | | | 268,861,752 | | | 158 | | — | | | 268,861,910 | |
| Real Estate | | | 20,738,274 | | | — | | — | | | 20,738,274 | |
| Telecommunication Services | | | 4,559,893 | | | — | | — | | | 4,559,893 | |
| Utilities | | | 67,648,993 | | | — | | — | | | 67,648,993 | |
| Rights/Warrants | | | — | | | — | | — | | | — | |
| Securities Lending Collateral | | | — | | | 183,339,124 | | — | | | 183,339,124 | |
| TOTAL | | $ | 1,000,281,028 | | $ | 183,404,950 | | — | | $ | 1,183,685,978 | |
See accompanying Notes to Financial Statements.
108
THE JAPANESE SMALL COMPANY SERIES
SUMMARY SCHEDULE OF PORTFOLIO HOLDINGS
October 31, 2016
| | | | | | | | Percentage | |
| | | | Shares | | Value†† | | of Net Assets** | |
| COMMON STOCKS — (91.7%) | | | | | | | | |
| Consumer Discretionary — (17.8%) | | | | | | | | |
| Aoyama Trading Co., Ltd. | | 304,000 | | $ | 10,709,561 | | 0.4% | |
| | Shimachu Co., Ltd. | | 297,200 | | | 7,974,727 | | 0.3% | |
| Toyo Tire & Rubber Co., Ltd. | | 623,700 | | | 9,673,815 | | 0.3% | |
| Other Securities | | | | | 575,455,539 | | 18.3% | |
| Total Consumer Discretionary | | | | | 603,813,642 | | 19.3% | |
| | | |
| Consumer Staples — (7.7%) | | | | | | | | |
| Ain Holdings, Inc. | | 124,600 | | | 8,409,946 | | 0.3% | |
| Morinaga Milk Industry Co., Ltd. | | 1,164,000 | | | 9,375,501 | | 0.3% | |
| Takara Holdings, Inc. | | 980,300 | | | 9,284,173 | | 0.3% | |
| Other Securities | | | | | 235,670,534 | | 7.5% | |
| Total Consumer Staples | | | | | 262,740,154 | | 8.4% | |
| | | |
| Energy — (1.0%) | | | | | | | | |
| Other Securities | | | | | 32,552,672 | | 1.0% | |
| | | |
| Financials — (8.7%) | | | | | | | | |
| 77 Bank, Ltd. (The) | | 1,749,760 | | | 7,904,201 | | 0.3% | |
| Daishi Bank, Ltd. (The) | | 2,071,000 | | | 8,905,139 | | 0.3% | |
| North Pacific Bank, Ltd. | | 2,303,600 | | | 8,591,023 | | 0.3% | |
| Other Securities | | | | | 268,141,185 | | 8.5% | |
| Total Financials | | | | | 293,541,548 | | 9.4% | |
| | | |
| Health Care — (4.1%) | | | | | | | | |
| Nipro Corp. | | 702,100 | | | 8,670,187 | | 0.3% | |
| Rohto Pharmaceutical Co., Ltd. | | 546,700 | | | 9,592,173 | | 0.3% | |
| Ship Healthcare Holdings, Inc. | | 279,700 | | | 8,181,874 | | 0.3% | |
| Tsumura & Co. | | 359,800 | | | 10,225,153 | | 0.3% | |
| Other Securities | | | | | 101,447,537 | | 3.2% | |
| Total Health Care | | | | | 138,116,924 | | 4.4% | |
| | | |
| Industrials — (26.2%) | | | | | | | | |
| Aica Kogyo Co., Ltd. | | 314,300 | | | 8,968,870 | | 0.3% | |
| # | Chiyoda Corp. | | 993,000 | | | 8,661,260 | | 0.3% | |
| Daifuku Co., Ltd. | | 444,100 | | | 8,024,354 | | 0.3% | |
| Fujikura, Ltd. | | 1,935,000 | | | 11,369,097 | | 0.4% | |
| Furukawa Electric Co., Ltd. | | 462,800 | | | 13,615,795 | | 0.4% | |
| Glory, Ltd. | | 268,900 | | | 8,889,500 | | 0.3% | |
| GS Yuasa Corp. | | 2,130,000 | | | 9,197,857 | | 0.3% | |
| Japan Steel Works, Ltd. (The) | | 398,400 | | | 8,557,307 | | 0.3% | |
| Nishimatsu Construction Co., Ltd. | | 1,794,000 | | | 8,378,134 | | 0.3% | |
| Nisshinbo Holdings, Inc. | | 870,500 | | | 8,666,919 | | 0.3% | |
| # | NTN Corp. | | 2,488,000 | | | 9,417,732 | | 0.3% | |
| # | OSG Corp. | | 452,700 | | | 9,641,884 | | 0.3% | |
| Penta-Ocean Construction Co., Ltd. | | 1,724,600 | | | 10,277,125 | | 0.3% | |
| Pilot Corp. | | 188,800 | | | 8,441,250 | | 0.3% | |
| Sankyu, Inc. | | 1,540,000 | | | 9,068,678 | | 0.3% | |
| Sanwa Holdings Corp. | | 1,232,600 | | | 12,275,880 | | 0.4% | |
109
THE JAPANESE SMALL COMPANY SERIES
CONTINUED
| | | | | | | | Percentage | |
| | | | Shares | | Value†† | | of Net Assets** | |
| Industrials — (Continued) | | | | | | | | |
| Ushio, Inc. | | 655,900 | | $ | 7,912,689 | | 0.3% | |
| Other Securities | | | | | 726,289,505 | | 22.9% | |
| Total Industrials | | | | | 887,653,836 | | 28.3% | |
| | | |
| Information Technology — (12.0%) | | | | | | | | |
| Citizen Watch Co., Ltd. | | 1,437,500 | | | 8,078,459 | | 0.3% | |
| Horiba, Ltd. | | 212,650 | | | 10,168,702 | | 0.3% | |
| Ibiden Co., Ltd. | | 620,978 | | | 9,014,732 | | 0.3% | |
| TIS, Inc. | | 505,101 | | | 11,429,663 | | 0.4% | |
| # | Topcon Corp. | | 595,400 | | | 8,886,823 | | 0.3% | |
| Ulvac, Inc. | | 252,600 | | | 7,975,585 | | 0.3% | |
| Other Securities | | | | | 350,942,720 | | 11.1% | |
| Total Information Technology | | | | | 406,496,684 | | 13.0% | |
| | | |
| Materials — (11.6%) | | | | | | | | |
| ADEKA Corp. | | 544,000 | | | 8,223,372 | | 0.3% | |
| Denka Co., Ltd. | | 1,949,000 | | | 8,841,805 | | 0.3% | |
| Dowa Holdings Co., Ltd. | | 1,464,000 | | | 10,872,844 | | 0.4% | |
| FP Corp. | | 148,000 | | | 7,971,867 | | 0.3% | |
| Mitsui Mining & Smelting Co., Ltd. | | 3,627,000 | | | 8,080,917 | | 0.3% | |
| NOF Corp. | | 870,000 | | | 9,456,776 | | 0.3% | |
| Rengo Co., Ltd. | | 1,261,000 | | | 7,908,112 | | 0.3% | |
| Showa Denko KK | | 845,099 | | | 11,166,525 | | 0.4% | |
| Sumitomo Osaka Cement Co., Ltd. | | 2,493,000 | | | 10,325,300 | | 0.3% | |
| #* | Tokuyama Corp. | | 2,159,000 | | | 9,231,383 | | 0.3% | |
| Toyobo Co., Ltd. | | 5,688,000 | | | 9,310,397 | | 0.3% | |
| Ube Industries, Ltd. | | 6,661,000 | | | 13,745,559 | | 0.4% | |
| Other Securities | | | | | 278,920,108 | | 8.7% | |
| Total Materials | | | | | 394,054,965 | | 12.6% | |
| | | |
| Real Estate — (1.8%) | | | | | | | | |
| Leopalace21 Corp. | | 1,960,700 | | | 12,748,059 | | 0.4% | |
| | Other Securities | | | | | 50,288,777 | | 1.6% | |
| Total Real Estate | | | | | 63,036,836 | | 2.0% | |
| | | |
| Telecommunication Services — (0.1%) | | | | | | | | |
| Other Securities | | | | | 2,374,986 | | 0.1% | |
| | |
| Utilities — (0.7%) | | | | | | | | |
| Hokkaido Electric Power Co., Inc. | | 1,082,100 | | | 8,229,493 | | 0.3% | |
| Other Securities | | | | | 15,378,862 | | 0.4% | |
| Total Utilities | | | | | 23,608,355 | | 0.7% | |
| TOTAL COMMON STOCKS | | | | | 3,107,990,602 | | 99.2% | |
| TOTAL INVESTMENT SECURITIES | | | | | 3,107,990,602 | | | |
| | |
| | | | | Value† | | | |
| SECURITIES LENDING COLLATERAL — (8.3%) | | | | | | | | |
| §@ | DFA Short Term Investment Fund | | 24,279,430 | | | 280,961,564 | | 9.0% | |
| TOTAL INVESTMENTS — (100.0%) (Cost $2,964,543,542) | | | | $ | 3,388,952,166 | | 108.2% | |
110
THE JAPANESE SMALL COMPANY SERIES
CONTINUED
Summary of the Series’ investments as of October 31, 2016, based on their valuation inputs, is as follows (See Security Valuation Note):
| | Investments in | |
| | Securities | |
| | (Market Value) | |
| | Level 1 | | Level 2 | | Level 3 | | Total | |
| Common Stocks | | | | | | | | | | | | |
| Consumer Discretionary | | $ | 796,842 | | $ | 603,016,800 | | — | | $ | 603,813,642 | |
| Consumer Staples | | | — | | | 262,740,154 | | — | | | 262,740,154 | |
| Energy | | | — | | | 32,552,672 | | — | | | 32,552,672 | |
| Financials | | | 4,973,609 | | | 288,567,939 | | — | | | 293,541,548 | |
| Health Care | | | — | | | 138,116,924 | | — | | | 138,116,924 | |
| Industrials | | | — | | | 887,653,836 | | — | | | 887,653,836 | |
| Information Technology | | | — | | | 406,496,684 | | — | | | 406,496,684 | |
| Materials | | | — | | | 394,054,965 | | — | | | 394,054,965 | |
| Real Estate | | | — | | | 63,036,836 | | — | | | 63,036,836 | |
| Telecommunication Services | | | — | | | 2,374,986 | | — | | | 2,374,986 | |
| Utilities | | | — | | | 23,608,355 | | — | | | 23,608,355 | |
| Securities Lending Collateral | | | — | | | 280,961,564 | | — | | | 280,961,564 | |
| TOTAL | | $ | 5,770,451 | | $ | 3,383,181,715 | | — | | $ | 3,388,952,166 | |
See accompanying Notes to Financial Statements.
111
THE ASIA PACIFIC SMALL COMPANY SERIES
SUMMARY SCHEDULE OF PORTFOLIO HOLDINGS
October 31, 2016
| | | | | | | | Percentage | |
| | | | Shares | | Value†† | | of Net Assets** | |
| COMMON STOCKS — (85.5%) | | | | | | | | |
| AUSTRALIA — (44.3%) | | | | | | | | |
| Adelaide Brighton, Ltd. | | 3,668,074 | | $ | 14,902,982 | | 1.0% | |
| # | Alumina, Ltd. | | 9,800,265 | | | 11,778,711 | | 0.8% | |
| Ansell, Ltd. | | 563,728 | | | 9,287,434 | | 0.6% | |
| # | Bendigo & Adelaide Bank, Ltd. | | 1,000,124 | | | 8,445,910 | | 0.5% | |
| BlueScope Steel, Ltd. | | 2,354,984 | | | 13,971,247 | | 0.9% | |
| Boral, Ltd. | | 2,174,013 | | | 10,386,960 | | 0.7% | |
| carsales.com, Ltd. | | 1,702,940 | | | 13,782,286 | | 0.9% | |
| Cleanaway Waste Management, Ltd. | | 10,357,050 | | | 9,119,140 | | 0.6% | |
| CSR, Ltd. | | 3,350,138 | | | 9,302,355 | | 0.6% | |
| # | Downer EDI, Ltd. | | 2,910,872 | | | 12,865,733 | | 0.8% | |
| DuluxGroup, Ltd. | | 3,101,823 | | | 15,169,738 | | 1.0% | |
| Evolution Mining, Ltd. | | 4,976,497 | | | 8,775,916 | | 0.6% | |
| Fairfax Media, Ltd. | | 15,303,894 | | | 9,586,076 | | 0.6% | |
| # | InvoCare, Ltd. | | 905,619 | | | 8,985,727 | | 0.6% | |
| # | IOOF Holdings, Ltd. | | 1,900,338 | | | 11,830,056 | | 0.8% | |
| # | IRESS, Ltd. | | 1,123,183 | | | 9,672,022 | | 0.6% | |
| JB Hi-Fi, Ltd. | | 962,791 | | | 20,754,808 | | 1.3% | |
| Mineral Resources, Ltd. | | 1,168,088 | | | 10,276,124 | | 0.7% | |
| # | nib holdings, Ltd. | | 2,713,689 | | | 9,937,859 | | 0.6% | |
| # | Northern Star Resources, Ltd. | | 4,806,957 | | | 15,547,800 | | 1.0% | |
| Nufarm, Ltd. | | 1,280,776 | | | 8,597,852 | | 0.6% | |
| Orora, Ltd. | | 3,956,731 | | | 8,718,958 | | 0.6% | |
| OZ Minerals, Ltd. | | 2,198,276 | | | 11,231,748 | | 0.7% | |
| # | Perpetual, Ltd. | | 356,426 | | | 12,238,862 | | 0.8% | |
| Primary Health Care, Ltd. | | 3,292,878 | | | 9,598,026 | | 0.6% | |
| # | Sims Metal Management, Ltd. | | 1,382,214 | | | 10,514,951 | | 0.7% | |
| Sirtex Medical, Ltd. | | 413,240 | | | 8,746,855 | | 0.6% | |
| Spark Infrastructure Group | | 11,913,246 | | | 20,084,154 | | 1.3% | |
| Star Entertainment Grp, Ltd. (The) | | 4,207,608 | | | 15,921,346 | | 1.0% | |
| # | Super Retail Group, Ltd. | | 1,280,749 | | | 9,521,373 | | 0.6% | |
| # | Tabcorp Holdings, Ltd. | | 3,586,818 | | | 13,177,917 | | 0.9% | |
| # | Vocus Communications, Ltd. | | 4,260,609 | | | 18,472,126 | | 1.2% | |
| #* | Whitehaven Coal, Ltd. | | 4,143,411 | | | 9,528,724 | | 0.6% | |
| Other Securities | | | | | 409,368,233 | | 26.0% | |
| TOTAL AUSTRALIA | | | | | 800,100,009 | | 51.4% | |
| | |
| CHINA — (0.2%) | | | | | | | | |
| Other Securities | | | | | 3,344,793 | | 0.2% | |
| | |
| HONG KONG — (23.1%) | | | | | | | | |
| Cafe de Coral Holdings, Ltd. | | 2,330,000 | | | 8,226,629 | | 0.5% | |
| Dah Sing Financial Holdings, Ltd. | | 1,408,144 | | | 9,551,504 | | 0.6% | |
| #* | Esprit Holdings, Ltd. | | 14,507,050 | | | 11,964,200 | | 0.8% | |
| # | Guotai Junan International Holdings, Ltd. | | 22,013,797 | | | 8,406,293 | | 0.6% | |
| Hopewell Holdings, Ltd. | | 3,184,000 | | | 11,148,424 | | 0.7% | |
| Luk Fook Holdings International, Ltd. | | 3,142,000 | | | 9,213,353 | | 0.6% | |
| Man Wah Holdings, Ltd. | | 13,578,800 | | | 9,012,166 | | 0.6% | |
112
THE ASIA PACIFIC SMALL COMPANY SERIES
CONTINUED
| | | | | | | | Percentage | |
| | | | Shares | | Value†† | | of Net Assets** | |
| HONG KONG — (Continued) | | | | | | | | |
| # | Vitasoy International Holdings, Ltd. | | 5,277,000 | | $ | 11,020,785 | | 0.7% | |
| VTech Holdings, Ltd. | | 700,400 | | | 8,591,259 | | 0.6% | |
| # | Xinyi Glass Holdings, Ltd. | | 17,658,000 | | | 15,182,993 | | 1.0% | |
| | Other Securities | | | | | 315,322,094 | | 20.2% | |
| TOTAL HONG KONG | | | | | 417,639,700 | | 26.9% | |
| | | |
| NEW ZEALAND — (7.4%) | | | | | | | | |
| Fisher & Paykel Healthcare Corp., Ltd. | | 2,455,045 | | | 15,543,967 | | 1.0% | |
| # | Ryman Healthcare, Ltd. | | 1,772,699 | | | 11,251,074 | | 0.7% | |
| SKYCITY Entertainment Group, Ltd. | | 5,162,402 | | | 14,391,898 | | 0.9% | |
| Other Securities | | | | | 93,352,887 | | 6.1% | |
| TOTAL NEW ZEALAND | | | | | 134,539,826 | | 8.7% | |
| | | |
| SINGAPORE — (10.5%) | | | | | | | | |
| #* | Noble Group, Ltd. | | 75,184,800 | | | 8,939,601 | | 0.6% | |
| SATS, Ltd. | | 2,695,900 | | | 9,378,680 | | 0.6% | |
| # | Singapore Post, Ltd. | | 10,132,100 | | | 11,641,927 | | 0.8% | |
| Venture Corp., Ltd. | | 1,994,100 | | | 13,622,092 | | 0.9% | |
| | Other Securities | | | | | 145,991,424 | | 9.3% | |
| TOTAL SINGAPORE | | | | | 189,573,724 | | 12.2% | |
| | | |
| UNITED STATES — (0.0%) | | | | | | | | |
| Other Securities | | | | | 54,219 | | 0.0% | |
| | | |
| TOTAL COMMON STOCKS | | | | | 1,545,252,271 | | 99.4% | |
| | | |
| RIGHTS/WARRANTS — (0.0%) | | | | | | | | |
| | | |
| AUSTRALIA — (0.0%) | | | | | | | | |
| Other Securities | | | | | 96,131 | | 0.0% | |
| | | |
| HONG KONG — (0.0%) | | | | | | | | |
| Other Securities | | | | | 1,362 | | 0.0% | |
| | | |
| SINGAPORE — (0.0%) | | | | | | | | |
| Other Securities | | | | | 35,970 | | 0.0% | |
| | | |
| TOTAL RIGHTS/WARRANTS | | | | | 133,463 | | 0.0% | |
| TOTAL INVESTMENT SECURITIES | | | | | 1,545,385,734 | | | |
| | |
| | | | | | Value† | | | |
| SECURITIES LENDING COLLATERAL — (14.5%) | | | | | | | | |
| §@ | DFA Short Term Investment Fund | | 22,627,303 | | | 261,843,149 | | 16.8% | |
| TOTAL INVESTMENTS — (100.0%) (Cost $1,857,750,342) | | | | $ | 1,807,228,883 | | 116.2% | |
113
THE ASIA PACIFIC SMALL COMPANY SERIES
CONTINUED
Summary of the Series’ investments as of October 31, 2016, based on their valuation inputs, is as follows (See Security Valuation Note):
| | Investments in | |
| | Securities | |
| | (Market Value) | |
| | Level 1 | | Level 2 | | Level 3 | | Total | |
| Common Stocks | | | | | | | | | | | | |
| Australia | | | — | | $ | 800,100,009 | | — | | $ | 800,100,009 | |
| China | | | — | | | 3,344,793 | | — | | | 3,344,793 | |
| Hong Kong | | $ | 941,157 | | | 416,698,543 | | — | | | 417,639,700 | |
| New Zealand | | | 412,321 | | | 134,127,505 | | — | | | 134,539,826 | |
| Singapore | | | 315,107 | | | 189,258,617 | | — | | | 189,573,724 | |
| United States | | | 54,219 | | | — | | — | | | 54,219 | |
| Rights/Warrants | | | | | | | | | | | | |
| Australia | | | — | | | 96,131 | | — | | | 96,131 | |
| Hong Kong | | | — | | | 1,362 | | — | | | 1,362 | |
| New Zealand | | | — | | | — | | — | | | — | |
| Singapore | | | — | | | 35,970 | | — | | | 35,970 | |
| Securities Lending Collateral | | | — | | | 261,843,149 | | — | | | 261,843,149 | |
| TOTAL | | $ | 1,722,804 | | $ | 1,805,506,079 | | — | | $ | 1,807,228,883 | |
See accompanying Notes to Financial Statements.
114
THE UNITED KINGDOM SMALL COMPANY SERIES
SUMMARY SCHEDULE OF PORTFOLIO HOLDINGS
October 31, 2016
| | | | | | | | Percentage | |
| | | | Shares | | Value†† | | of Net Assets** | |
| COMMON STOCKS — (96.6%) | | | | | | | | |
| Consumer Discretionary — (19.6%) | | | | | | | | |
| Bellway P.L.C. | | 637,459 | | $ | 18,446,930 | | 1.1% | |
| Daily Mail & General Trust P.L.C. Class A | | 1,271,481 | | | 11,670,462 | | 0.7% | |
| Greene King P.L.C. | | 1,786,209 | | | 15,978,447 | | 1.0% | |
| GVC Holdings P.L.C. | | 1,240,374 | | | 10,567,421 | | 0.6% | |
| Inchcape P.L.C. | | 2,190,976 | | | 17,419,824 | | 1.0% | |
| Informa P.L.C. | | 1,305,509 | | | 10,740,551 | | 0.6% | |
| UBM P.L.C. | | 1,950,843 | | | 17,128,208 | | 1.0% | |
| WH Smith P.L.C. | | 680,498 | | | 12,248,606 | | 0.7% | |
| William Hill P.L.C. | | 4,105,574 | | | 14,851,757 | | 0.9% | |
| Other Securities | | | | | 208,464,577 | | 12.4% | |
| Total Consumer Discretionary | | | | | 337,516,783 | | 20.0% | |
| | | |
| Consumer Staples — (5.4%) | | | | | | | | |
| Booker Group P.L.C. | | 7,989,596 | | | 17,523,270 | | 1.0% | |
| Tate & Lyle P.L.C. | | 2,319,044 | | | 22,116,631 | | 1.3% | |
| Other Securities | | | | | 54,160,367 | | 3.3% | |
| Total Consumer Staples | | | | | 93,800,268 | | 5.6% | |
| | | |
| Energy — (5.0%) | | | | | | | | |
| Amec Foster Wheeler P.L.C. | | 2,037,469 | | | 11,116,254 | | 0.7% | |
| John Wood Group P.L.C. | | 1,887,172 | | | 17,737,852 | | 1.0% | |
| Petrofac, Ltd. | | 1,141,776 | | | 11,244,821 | | 0.7% | |
| #* | Tullow Oil P.L.C. | | 5,000,074 | | | 16,143,884 | | 0.9% | |
| Other Securities | | | | | 30,000,063 | | 1.8% | |
| Total Energy | | | | | 86,242,874 | | 5.1% | |
| | | |
| Financials — (13.5%) | | | | | | | | |
| Beazley P.L.C. | | 2,740,810 | | | 12,203,670 | | 0.7% | |
| Close Brothers Group P.L.C. | | 785,896 | | | 12,753,035 | | 0.8% | |
| Henderson Group P.L.C. | | 5,628,395 | | | 15,924,719 | | 0.9% | |
| Hiscox, Ltd. | | 1,493,459 | | | 18,648,536 | | 1.1% | |
| ICAP P.L.C. | | 2,697,973 | | | 15,997,519 | | 1.0% | |
| IG Group Holdings P.L.C. | | 1,792,534 | | | 18,101,357 | | 1.1% | |
| Jupiter Fund Management P.L.C. | | 2,162,762 | | | 11,403,328 | | 0.7% | |
| Man Group P.L.C. | | 7,936,721 | | | 12,099,824 | | 0.7% | |
| Phoenix Group Holdings | | 1,208,721 | | | 10,797,905 | | 0.6% | |
| Other Securities | | | | | 105,371,972 | | 6.3% | |
| Total Financials | | | | | 233,301,865 | | 13.9% | |
| | | |
| Health Care — (3.8%) | | | | | | | | |
| * | BTG P.L.C. | | 1,870,654 | | | 15,053,103 | | 0.9% | |
| Indivior P.L.C. | | 3,662,912 | | | 14,068,115 | | 0.9% | |
| Other Securities | | | | | 36,308,225 | | 2.1% | |
| Total Health Care | | | | | 65,429,443 | | 3.9% | |
115
THE UNITED KINGDOM SMALL COMPANY SERIES
CONTINUED
| | | | | | | | Percentage | |
| | | | Shares | | Value†† | | of Net Assets** | |
| Industrials — (26.6%) | | | | | | | | |
| Aggreko P.L.C. | | 1,332,278 | | $ | 13,026,413 | | 0.8% | |
| Balfour Beatty P.L.C. | | 3,549,781 | | | 11,769,319 | | 0.7% | |
| BBA Aviation P.L.C. | | 5,623,297 | | | 17,781,017 | | 1.0% | |
| Cobham P.L.C. | | 8,502,869 | | | 14,835,365 | | 0.9% | |
| G4S P.L.C. | | 4,118,797 | | | 11,063,582 | | 0.7% | |
| Hays P.L.C. | | 6,566,676 | | | 10,967,970 | | 0.6% | |
| Howden Joinery Group P.L.C. | | 3,165,528 | | | 14,495,414 | | 0.9% | |
| IMI P.L.C. | | 1,282,137 | | | 15,573,467 | | 0.9% | |
| Meggitt P.L.C. | | 3,040,190 | | | 16,173,674 | | 1.0% | |
| Melrose Industries P.L.C. | | 10,887,020 | | | 22,467,470 | | 1.3% | |
| Rentokil Initial P.L.C. | | 8,861,710 | | | 24,718,157 | | 1.5% | |
| Spirax-Sarco Engineering P.L.C. | | 355,118 | | | 19,146,216 | | 1.1% | |
| Weir Group P.L.C. (The) | | 1,070,092 | | | 22,228,790 | | 1.3% | |
| Other Securities | | | | | 243,821,126 | | 14.5% | |
| Total Industrials | | | | | 458,067,980 | | 27.2% | |
| | | |
| Information Technology — (9.6%) | | | | | | | | |
| Electrocomponents P.L.C. | | 2,396,207 | | | 10,916,359 | | 0.7% | |
| Halma P.L.C. | | 1,951,180 | | | 24,978,831 | | 1.5% | |
| # | Micro Focus International P.L.C. | | 539,522 | | | 14,127,662 | | 0.8% | |
| * | Paysafe Group P.L.C. | | 2,265,858 | | | 11,976,435 | | 0.7% | |
| Playtech P.L.C. | | 1,111,348 | | | 12,606,141 | | 0.8% | |
| Rightmove P.L.C. | | 477,301 | | | 21,787,416 | | 1.3% | |
| Spectris P.L.C. | | 613,329 | | | 15,356,848 | | 0.9% | |
| Other Securities | | | | | 54,527,225 | | 3.2% | |
| Total Information Technology | | | | | 166,276,917 | | 9.9% | |
| | |
| Materials — (8.1%) | | | | | | | | |
| Centamin P.L.C. | | 6,065,603 | | | 11,748,394 | | 0.7% | |
| DS Smith P.L.C. | | 4,938,232 | | | 24,079,775 | | 1.4% | |
| RPC Group P.L.C. | | 1,638,321 | | | 18,998,878 | | 1.1% | |
| Other Securities | | | | | 84,422,273 | | 5.1% | |
| Total Materials | | | | | 139,249,320 | | 8.3% | |
| | |
| Real Estate — (2.4%) | | | | | | | | |
| Other Securities | | | | | 42,003,507 | | 2.5% | |
| | |
| Telecommunication Services — (0.6%) | | | | | | | | |
| Other Securities | | | | | 11,042,463 | | 0.6% | |
| | |
| Utilities — (2.0%) | | | | | | | | |
| Pennon Group P.L.C. | | 1,994,817 | | | 20,358,554 | | 1.2% | |
| Other Securities | | | | | 13,528,264 | | 0.8% | |
| Total Utilities | | | | | 33,886,818 | | 2.0% | |
| TOTAL COMMON STOCKS | | | | | 1,666,818,238 | | 99.0% | |
| | |
| PREFERRED STOCKS — (0.0%) | | | | | | | | |
| Other Securities | | | | | 28,411 | | 0.0% | |
116
THE UNITED KINGDOM SMALL COMPANY SERIES
CONTINUED
| | | | | | | | Percentage | |
| | | | Shares | | Value†† | | of Net Assets** | |
| RIGHTS/WARRANTS — (0.1%) | | | | | | | | |
| Other Securities | | | | $ | 2,265,507 | | 0.1% | |
| TOTAL INVESTMENT SECURITIES | | | | | 1,669,112,156 | | | |
| |
| | | | | Value† | | | |
| SECURITIES LENDING COLLATERAL — (3.3%) | | | | | | | | |
| §@ | DFA Short Term Investment Fund | | 4,889,717 | | | 56,583,806 | | 3.4% | |
| TOTAL INVESTMENTS — (100.0%) (Cost $1,690,364,152) | | | | $ | 1,725,695,962 | | 102.5% | |
117
THE UNITED KINGDOM SMALL COMPANY SERIES
CONTINUED
Summary of the Series’ investments as of October 31, 2016, based on their valuation inputs, is as follows (See Security Valuation Note):
| | Investments in | |
| | Securities | |
| | (Market Value) | |
| | Level 1 | | Level 2 | | Level 3 | | Total | |
| Common Stocks | | | | | | | | | | | |
| Consumer Discretionary | | — | | $ | 337,516,783 | | — | | $ | 337,516,783 | |
| Consumer Staples | | — | | | 93,800,268 | | — | | | 93,800,268 | |
| Energy | | — | | | 86,242,874 | | — | | | 86,242,874 | |
| Financials | | — | | | 233,301,865 | | — | | | 233,301,865 | |
| Health Care | | — | | | 65,429,443 | | — | | | 65,429,443 | |
| Industrials | | — | | | 458,067,980 | | — | | | 458,067,980 | |
| Information Technology | | — | | | 166,276,917 | | — | | | 166,276,917 | |
| Materials | | — | | | 139,249,320 | | — | | | 139,249,320 | |
| Real Estate | | — | | | 42,003,507 | | — | | | 42,003,507 | |
| Telecommunication Services | | — | | | 11,042,463 | | — | | | 11,042,463 | |
| Utilities | | — | | | 33,886,818 | | — | | | 33,886,818 | |
| Preferred Stocks | | — | | | 28,411 | | — | | | 28,411 | |
| Rights/Warrants | | — | | | 2,265,507 | | — | | | 2,265,507 | |
| Securities Lending Collateral | | — | | | 56,583,806 | | — | | | 56,583,806 | |
| TOTAL | | — | | $ | 1,725,695,962 | | — | | $ | 1,725,695,962 | |
See accompanying Notes to Financial Statements.
118
THE CONTINENTAL SMALL COMPANY SERIES
SUMMARY SCHEDULE OF PORTFOLIO HOLDINGS
October 31, 2016
| | | | | | | Percentage | |
| | | Shares | | Value†† | | of Net Assets** | |
| COMMON STOCKS — (91.4%) | | | | | | | | |
| AUSTRIA — (3.1%) | | | | | | | | |
| ANDRITZ AG | 310,627 | | $ | 16,241,244 | | 0.4 | % | |
| | Other Securities | | | | 122,038,613 | | 2.9 | % | |
| TOTAL AUSTRIA | | | | 138,279,857 | | 3.3 | % | |
| | |
| BELGIUM — (4.3%) | | | | | | | | |
| Ackermans & van Haaren NV | 134,383 | | | 18,652,359 | | 0.5 | % | |
| Umicore SA | 412,343 | | | 25,063,062 | | 0.6 | % | |
| Other Securities | | | | 147,950,280 | | 3.5 | % | |
| TOTAL BELGIUM | | | | 191,665,701 | | 4.6 | % | |
| | | |
| DENMARK — (4.5%) | | | | | | | | |
| GN Store Nord A.S. | 826,732 | | | 16,756,414 | | 0.4 | % | |
| Jyske Bank A.S. | 345,747 | | | 15,676,272 | | 0.4 | % | |
| * | TDC A.S. | 4,148,072 | | | 22,870,392 | | 0.6 | % | |
| Other Securities | | | | 148,738,122 | | 3.5 | % | |
| TOTAL DENMARK | | | | 204,041,200 | | 4.9 | % | |
| | | |
| FINLAND — (6.5%) | | | | | | | | |
| Amer Sports Oyj | 641,324 | | | 17,449,969 | | 0.4 | % | |
| Elisa Oyj | 734,075 | | | 24,731,862 | | 0.6 | % | |
| Huhtamaki Oyj | 467,536 | | | 18,868,806 | | 0.5 | % | |
| Kesko Oyj Class B | 345,206 | | | 17,153,261 | | 0.4 | % | |
| Nokian Renkaat Oyj | 623,433 | | | 20,910,928 | | 0.5 | % | |
| Orion Oyj Class B | 436,647 | | | 18,585,395 | | 0.5 | % | |
| #* | Outokumpu Oyj | 3,022,031 | | | 21,068,282 | | 0.5 | % | |
| Other Securities | | | | 153,616,179 | | 3.6 | % | |
| TOTAL FINLAND | | | | 292,384,682 | | 7.0 | % | |
| | | |
| FRANCE — (12.5%) | | | | | | | | |
| Arkema SA | 298,145 | | | 28,270,807 | | 0.7 | % | |
| Edenred | 946,779 | | | 21,911,853 | | 0.5 | % | |
| Eurofins Scientific SE | 38,653 | | | 17,565,704 | | 0.4 | % | |
| Lagardere SCA | 619,304 | | | 15,771,620 | | 0.4 | % | |
| Rexel SA | 1,596,995 | | | 22,149,109 | | 0.5 | % | |
| Rubis SCA | 203,675 | | | 18,573,358 | | 0.5 | % | |
| SEB SA | 120,657 | | | 17,757,736 | | 0.4 | % | |
| # | STMicroelectronics NV | 2,136,887 | | | 20,281,219 | | 0.5 | % | |
| Teleperformance | 336,308 | | | 35,533,493 | | 0.9 | % | |
| * | Ubisoft Entertainment SA | 521,852 | | | 17,756,325 | | 0.4 | % | |
| Other Securities | | | | 344,488,930 | | 8.3 | % | |
| TOTAL FRANCE | | | | 560,060,154 | | 13.5 | % | |
119
The Continental Small Company Series
continued
| | | | | | | | Percentage | |
| | Shares | | Value†† | | of Net Assets** | |
| GERMANY — (15.4%) | | | | | | | | |
| * | Dialog Semiconductor P.L.C. | 382,079 | | $ | 15,026,045 | | 0.4 | % | |
| Freenet AG | 652,809 | | | 18,715,461 | | 0.5 | % | |
| Gerresheimer AG | 198,146 | | | 14,946,146 | | 0.4 | % | |
| # | K+S AG | 990,931 | | | 20,066,101 | | 0.5 | % | |
| KION Group AG | 258,832 | | | 15,638,698 | | 0.4 | % | |
| * | KUKA AG | 135,482 | | | 15,374,609 | | 0.4 | % | |
| Lanxess AG | 484,758 | | | 31,084,953 | | 0.8 | % | |
| LEG Immobilien AG | 306,750 | | | 25,874,994 | | 0.6 | % | |
| MTU Aero Engines AG | 249,839 | | | 26,089,184 | | 0.6 | % | |
| Osram Licht AG | 343,036 | | | 19,483,339 | | 0.5 | % | |
| * | QIAGEN NV | 744,663 | | | 18,212,580 | | 0.4 | % | |
| Rheinmetall AG | 223,411 | | | 15,508,712 | | 0.4 | % | |
| Stada Arzneimittel AG | 306,492 | | | 15,370,132 | | 0.4 | % | |
| Other Securities | | | | 439,286,005 | | 10.4 | % | |
| TOTAL GERMANY | | | | 690,676,959 | | 16.7 | % | |
| | | |
| IRELAND — (1.2%) | | | | | | | | |
| Other Securities | | | | 53,214,050 | | 1.3 | % | |
| | | |
| ISRAEL — (1.8%) | | | | | | | | |
| Other Securities | | | | 82,999,079 | | 2.0 | % | |
| | | |
| ITALY — (8.6%) | | | | | | | | |
| Prysmian SpA | 1,026,230 | | | 25,519,884 | | 0.6 | % | |
| Other Securities | | | | 358,680,759 | | 8.7 | % | |
| TOTAL ITALY | | | | 384,200,643 | | 9.3 | % | |
| | | |
| NETHERLANDS — (4.7%) | | | | | | | | |
| Aalberts Industries NV | 600,156 | | | 18,953,870 | | 0.5 | % | |
| Delta Lloyd NV | 2,709,093 | | | 16,366,532 | | 0.4 | % | |
| # | Gemalto NV | 304,031 | | | 16,518,507 | | 0.4 | % | |
| Other Securities | | | | 158,514,893 | | 3.8 | % | |
| TOTAL NETHERLANDS | | | | 210,353,802 | | 5.1 | % | |
| | | |
| NORWAY — (2.6%) | | | | | | | | |
| Other Securities | | | | 118,249,011 | | 2.9 | % | |
| | | |
| PORTUGAL — (0.9%) | | | | | | | | |
| Other Securities | | | | 41,152,687 | | 1.0 | % | |
| | | |
| SPAIN — (5.4%) | | | | | | | | |
| Distribuidora Internacional de Alimentacion SA | 2,929,226 | | | 15,645,268 | | 0.4 | % | |
| Gamesa Corp. Tecnologica SA | 1,203,576 | | | 27,788,671 | | 0.7 | % | |
| Other Securities | | | | 199,203,293 | | 4.7 | % | |
| TOTAL SPAIN | | | | 242,637,232 | | 5.8 | % | |
| | | |
| SWEDEN — (7.8%) | | | | | | | | |
| Other Securities | | | | 348,471,161 | | 8.4 | % | |
120
The Continental Small Company Series
continued
| | | | | | | Percentage | |
| | | Shares | | Value†† | | of Net Assets** | |
| SWITZERLAND — (12.1%) | | | | | | | | |
| Baloise Holding AG | 193,722 | | $ | 23,833,522 | | 0.6 | % | |
| Flughafen Zuerich AG | 104,871 | | | 19,277,802 | | 0.5 | % | |
| Georg Fischer AG | 22,511 | | | 19,958,153 | | 0.5 | % | |
| Helvetia Holding AG | 36,269 | | | 18,869,464 | | 0.5 | % | |
| # | Logitech International SA | 650,486 | | | 15,732,970 | | 0.4 | % | |
| PSP Swiss Property AG | 201,709 | | | 18,048,619 | | 0.4 | % | |
| Straumann Holding AG | 45,962 | | | 17,244,502 | | 0.4 | % | |
| Temenos Group AG | 318,043 | | | 20,539,697 | | 0.5 | % | |
| Other Securities | | | | 386,994,688 | | 9.2 | % | |
| TOTAL SWITZERLAND | | | | 540,499,417 | | 13.0 | % | |
| TOTAL COMMON STOCKS | | | | 4,098,885,635 | | 98.8 | % | |
| | | |
| PREFERRED STOCKS — (0.8%) | | | | | | | | |
| GERMANY — (0.8%) | | | | | | | | |
| Other Securities | | | | 34,254,167 | | 0.9 | % | |
| TOTAL PREFERRED STOCKS | | | | 34,254,167 | | 0.9 | % | |
| | | |
| RIGHTS/WARRANTS — (0.0%) | | | | | | | | |
| SPAIN — (0.0%) | | | | | | | | |
| Other Securities | | | | 55,356 | | 0.0 | % | |
| TOTAL RIGHTS/WARRANTS | | | | 55,356 | | 0.0 | % | |
| TOTAL INVESTMENT SECURITIES | | | | 4,133,195,158 | | | | |
| | | |
| | | | Value† | | | | |
| SECURITIES LENDING COLLATERAL — (7.8%) | | | | | | | | |
| §@ | DFA Short Term Investment Fund | 30,261,802 | | | 350,189,570 | | 8.4 | % | |
| TOTAL INVESTMENTS — (100.0%) (Cost $3,879,139,342) | | | $ | 4,483,384,728 | | 108.1 | % | |
121
The Continental Small Company Series
continued
Summary of the Series’ investments as of October 31, 2016, based on their valuation inputs, is as follows (See Security Valuation Note):
| | Investments in | |
| | Securities | |
| | (Market Value) | |
| | Level 1 | | Level 2 | | Level 3 | | Total | |
| Common Stocks | | | | | | | | | | | | |
| Austria | | | — | | $ | 138,279,857 | | — | | $ | 138,279,857 | |
| Belgium | | | — | | | 191,665,701 | | — | | | 191,665,701 | |
| Denmark | | | — | | | 204,041,200 | | — | | | 204,041,200 | |
| Finland | | | — | | | 292,384,682 | | — | | | 292,384,682 | |
| France | | | — | | | 560,060,154 | | — | | | 560,060,154 | |
| Germany | | $ | 1,885,545 | | | 688,791,414 | | — | | | 690,676,959 | |
| Ireland | | | — | | | 53,214,050 | | — | | | 53,214,050 | |
| Israel | | | — | | | 82,999,079 | | — | | | 82,999,079 | |
| Italy | | | — | | | 384,200,643 | | — | | | 384,200,643 | |
| Netherlands | | | — | | | 210,353,802 | | — | | | 210,353,802 | |
| Norway | | | — | | | 118,249,011 | | — | | | 118,249,011 | |
| Portugal | | | — | | | 41,152,687 | | — | | | 41,152,687 | |
| Spain | | | — | | | 242,637,232 | | — | | | 242,637,232 | |
| Sweden | | | 124,117 | | | 348,347,044 | | — | | | 348,471,161 | |
| Switzerland | | | — | | | 540,499,417 | | — | | | 540,499,417 | |
| Preferred Stocks | | | | | | | | | | | | |
| Germany | | | — | | | 34,254,167 | | — | | | 34,254,167 | |
| Rights/Warrants | | | | | | | | | | | | |
| Spain | | | — | | | 55,356 | | — | | | 55,356 | |
| Securities Lending Collateral | | | — | | | 350,189,570 | | — | | | 350,189,570 | |
| TOTAL | | $ | 2,009,662 | | $ | 4,481,375,066 | | — | | $ | 4,483,384,728 | |
See accompanying Notes to Financial Statements.
122
THE CANADIAN SMALL COMPANY SERIES
SUMMARY SCHEDULE OF PORTFOLIO HOLDINGS
October 31, 2016
| | | | | | | Percentage | |
| | Shares | | Value†† | | of Net Assets** | |
| COMMON STOCKS — (81.3%) | | | | | | | | |
| Consumer Discretionary — (7.7%) | | | | | | | | |
| Cineplex, Inc. | 318,474 | | $ | 12,109,278 | | 1.3 | % | |
| # | Corus Entertainment, Inc. Class B | 740,938 | | | 6,115,100 | | 0.7 | % | |
| # | Enercare, Inc. | 509,859 | | | 7,366,784 | | 0.8 | % | |
| #*I | MAX Corp. | 259,917 | | | 7,862,489 | | 0.9 | % | |
| Linamar Corp. | 144,412 | | | 5,873,164 | | 0.6 | % | |
| | Other Securities | | | | 49,050,359 | | 5.2 | % | |
| Total Consumer Discretionary | | | | 88,377,174 | | 9.5 | % | |
| | |
| Consumer Staples — (3.6%) | | | | | | | | |
| Cott Corp. | 600,036 | | | 7,868,958 | | 0.9 | % | |
| Premium Brands Holdings Corp. | 132,462 | | | 6,410,280 | | 0.7 | % | |
| Other Securities | | | | 26,731,797 | | 2.8 | % | |
| Total Consumer Staples | | | | 41,011,035 | | 4.4 | % | |
| | |
| Energy — (19.2%) | | | | | | | | |
| * | Advantage Oil & Gas, Ltd. | 1,100,531 | | | 7,425,487 | | 0.8 | % | |
| # | Enbridge Income Fund Holdings, Inc. | 251,755 | | | 6,389,130 | | 0.7 | % | |
| # | Gibson Energy, Inc. | 702,339 | | | 8,812,619 | | 0.9 | % | |
| # | Mullen Group, Ltd. | 536,825 | | | 7,440,227 | | 0.8 | % | |
| * | Parex Resources, Inc. | 765,891 | | | 8,810,630 | | 0.9 | % | |
| # | Parkland Fuel Corp. | 474,825 | | | 11,090,932 | | 1.2 | % | |
| # | Precision Drilling Corp. | 1,736,481 | | | 7,741,860 | | 0.8 | % | |
| * | Raging River Exploration, Inc. | 1,087,151 | | | 8,713,095 | | 0.9 | % | |
| ShawCor, Ltd. | 319,981 | | | 8,003,700 | | 0.9 | % | |
| # | Veresen, Inc. | 1,597,192 | | | 14,467,966 | | 1.6 | % | |
| # | Whitecap Resources, Inc. | 1,466,035 | | | 11,716,913 | | 1.3 | % | |
| Other Securities | | | | 119,454,762 | | 12.8 | % | |
| Total Energy | | | | 220,067,321 | | 23.6 | % | |
| | | |
| Financials — (4.8%) | | | | | | | | |
| # | Canadian Western Bank | 441,032 | | | 8,368,198 | | 0.9 | % | |
| # | Home Capital Group, Inc. | 325,263 | | | 6,438,330 | | 0.7 | % | |
| Laurentian Bank of Canada | 196,746 | | | 7,271,080 | | 0.8 | % | |
| TMX Group, Ltd. | 191,063 | | | 8,815,991 | | 0.9 | % | |
| Other Securities | | | | 24,707,351 | | 2.7 | % | |
| Total Financials | | | | 55,600,950 | | 6.0 | % | |
| | | |
| Health Care — (1.3%) | | | | | | | | |
| Other Securities | | | | 14,491,248 | | 1.5 | % | |
| | |
| Industrials — (10.3%) | | | | | | | | |
| MacDonald Dettwiler & Associates, Ltd. | 172,507 | | | 9,873,527 | | 1.1 | % | |
| New Flyer Industries, Inc. | 254,471 | | | 7,114,488 | | 0.8 | % | |
| Russel Metals, Inc. | 362,155 | | | 5,764,564 | | 0.6 | % | |
| # | Stantec, Inc. | 410,229 | | | 9,126,395 | | 1.0 | % | |
| Toromont Industries, Ltd. | 390,325 | | | 11,465,597 | | 1.2 | % | |
| TransForce, Inc. | 474,880 | | | 10,773,577 | | 1.2 | % | |
123
The Canadian Small Company Series
continued
| | | | | | | Percentage | |
| | | Shares | | Value†† | | of Net Assets** | |
| Industrials — (Continued) | | | | | | | | |
| Westshore Terminals Investment Corp. | 318,149 | | $ | 6,136,222 | | 0.7 | % | |
| Other Securities | | | | 57,383,009 | | 6.0 | % | |
| Total Industrials | | | | 117,637,379 | | 12.6 | % | |
| | | |
| Information Technology — (3.1%) | | | | | | | | |
| Other Securities | | | | 35,787,691 | | 3.8 | % | |
| | | |
| Materials — (23.7%) | | | | | | | | |
| Alamos Gold, Inc. Class A | 1,545,462 | | | 12,121,272 | | 1.3 | % | |
| * | B2Gold Corp. | 5,268,073 | | | 15,239,039 | | 1.6 | % | |
| * | Endeavour Mining Corp. | 316,838 | | | 6,188,881 | | 0.7 | % | |
| * | Fortuna Silver Mines, Inc. | 876,406 | | | 5,991,682 | | 0.6 | % | |
| HudBay Minerals, Inc. | 1,398,004 | | | 5,888,856 | | 0.6 | % | |
| * | IAMGOLD Corp. | 2,443,241 | | | 9,781,707 | | 1.1 | % | |
| * | Lundin Mining Corp. | 2,567,823 | | | 10,050,750 | | 1.1 | % | |
| # | Methanex Corp. | 267,966 | | | 9,739,314 | | 1.0 | % | |
| * | New Gold, Inc. | 2,668,183 | | | 10,523,140 | | 1.1 | % | |
| OceanaGold Corp. | 3,061,665 | | | 9,358,702 | | 1.0 | % | |
| Pan American Silver Corp. | 990,673 | | | 15,820,633 | | 1.7 | % | |
| * | SEMAFO, Inc. | 1,661,946 | | | 6,517,435 | | 0.7 | % | |
| #* | Silver Standard Resources, Inc. | 760,590 | | | 8,347,040 | | 0.9 | % | |
| # | Stella-Jones, Inc. | 204,600 | | | 7,260,837 | | 0.8 | % | |
| West Fraser Timber Co., Ltd. | 213,500 | | | 7,309,267 | | 0.8 | % | |
| Other Securities | | | | 131,140,488 | | 14.1 | % | |
| Total Materials | | | | 271,279,043 | | 29.1 | % | |
| | | |
| Real Estate — (1.6%) | | | | | | | | |
| FirstService Corp. | 160,533 | | | 6,504,860 | | 0.7 | % | |
| Other Securities | | | | 12,104,751 | | 1.3 | % | |
| Total Real Estate | | | | 18,609,611 | | 2.0 | % | |
| | | |
| Telecommunication Services — (0.4%) | | | | | | | | |
| Other Securities | | | | 4,507,968 | | 0.5 | % | |
| | |
| Utilities — (5.6%) | | | | | | | | |
| Algonquin Power & Utilities Corp. | 1,173,558 | | | 10,368,048 | | 1.1 | % | |
| Capital Power Corp. | 523,509 | | | 8,059,689 | | 0.9 | % | |
| # | Northland Power, Inc. | 536,896 | | | 9,606,728 | | 1.0 | % | |
| Superior Plus Corp. | 702,443 | | | 6,253,015 | | 0.7 | % | |
| TransAlta Corp. | 1,446,740 | | | 6,374,587 | | 0.7 | % | |
| Other Securities | | | | 23,050,047 | | 2.4 | % | |
| Total Utilities | | | | 63,712,114 | | 6.8 | % | |
| TOTAL COMMON STOCKS | | | | 931,081,534 | | 99.8 | % | |
| TOTAL INVESTMENT SECURITIES | | | | 931,081,534 | | | | |
| | | |
| | | | Value† | | | | |
| SECURITIES LENDING COLLATERAL — (18.7%) | | | | | | | | |
| §@ | DFA Short Term Investment Fund | 18,505,165 | | | 214,141,764 | | 22.9 | % | |
| TOTAL INVESTMENTS — (100.0%) (Cost $1,376,781,398) | | | $ | 1,145,223,298 | | 122.7 | % | |
124
The Canadian Small Company Series
continued
Summary of the Series’ investments as of October 31, 2016, based on their valuation inputs, is as follows (See Security Valuation Note):
| | Investments in | |
| | Securities | |
| | (Market Value) | |
| | Level 1 | | Level 2 | | Level 3 | | Total | |
| Common Stocks | | | | | | | | | | | | |
| Consumer Discretionary | | $ | 88,194,376 | | $ | 182,798 | | — | | $ | 88,377,174 | |
| Consumer Staples | | | 41,011,035 | | | — | | — | | | 41,011,035 | |
| Energy | | | 220,008,340 | | | 58,981 | | — | | | 220,067,321 | |
| Financials | | | 55,600,950 | | | — | | — | | | 55,600,950 | |
| Health Care | | | 14,491,248 | | | — | | — | | | 14,491,248 | |
| Industrials | | | 117,637,379 | | | — | | — | | | 117,637,379 | |
| Information Technology | | | 35,787,691 | | | — | | — | | | 35,787,691 | |
| Materials | | | 271,278,805 | | | 238 | | — | | | 271,279,043 | |
| Real Estate | | | 18,609,611 | | | — | | — | | | 18,609,611 | |
| Telecommunication Services | | | 4,507,968 | | | — | | — | | | 4,507,968 | |
| Utilities | | | 63,712,114 | | | — | | — | | | 63,712,114 | |
| Securities Lending Collateral | | | — | | | 214,141,764 | | — | | | 214,141,764 | |
| TOTAL | | $ | 930,839,517 | | $ | 214,383,781 | | — | | $ | 1,145,223,298 | |
See accompanying Notes to Financial Statements.
125
THE DFA INVESTMENT TRUST COMPANY
STATEMENTS OF ASSETS AND LIABILITIES
DECEMBER 31, 2016
(Unaudited)
(Amounts in thousands)
| | The | | The | | The United | | The | | The |
| | Japanese | | Asia Pacific | | Kingdom | | Continental | | Canadian |
| | Small | | Small | | Small | | Small | | Small |
| | Company | | Company | | Company | | Company | | Company |
| | Series* | | Series* | | Series* | | Series* | | Series* |
| ASSETS: | | | | | | | | | | | | | | | |
| Investments at Value (including $256,204, $250,871, | | | | | | | | | | | | | | | |
| $58,849, $408,062 and $176,804 of securities on | | | | | | | | | | | | | | | |
| loan, respectively) | | $ | 3,014,246 | | $ | 1,466,659 | | $ | 1,758,591 | | $ | 4,138,652 | | $ | 1,000,347 |
| Collateral from Securities on Loan Invested in Affiliate at | | | | | | | | | | | | | | | |
| Value (including cost of $263,605, $238,252, $61,978, | | | | | | | | | | | | | | | |
| $428,245 and $197,495) | | | 263,626 | | | 237,788 | | | 61,985 | | | 428,274 | | | 183,339 |
| Foreign Currencies at Value | | | 5,493 | | | 5,665 | | | 576 | | | 2,478 | | | 543 |
| Cash | | | 8,347 | | | 6,284 | | | 5,298 | | | 16,621 | | | 18,118 |
| Receivables: | | | | | | | | | | | | | | | |
| Investment Securities Sold | | | 673 | | | 138 | | | 1,063 | | | 348 | | | — |
| Dividends, Interest and Tax Reclaims | | | 3,246 | | | 1,196 | | | 4,724 | | | 5,141 | | | 1,967 |
| Securities Lending Income | | | 492 | | | 396 | | | 79 | | | 1,044 | | | 410 |
| Unrealized Gain on Foreign Currency Contracts | | | — | | | — | | | — | | | 1 | | | 25 |
| Prepaid Expenses and Other Assets | | | — | | | — | | | 1 | | | — | | | — |
| Total Assets | | | 3,296,123 | | | 1,718,126 | | | 1,832,317 | | | 4,592,559 | | | 1,204,749 |
| LIABILITIES: | | | | | | | | | | | | | | | |
| Payables: | | | | | | | | | | | | | | | |
| Upon Return of Securities Loaned | | | 263,552 | | | 237,741 | | | 61,973 | | | 428,215 | | | 183,298 |
| Investment Securities Purchased | | | 5,941 | | | 3,044 | | | 1,197 | | | 2,732 | | | 23,137 |
| Due to Advisor | | | 258 | | | 127 | | | 149 | | | 345 | | | 83 |
| Unrealized Loss on Foreign Currency Contracts | | | — | | | — | | | 1 | | | 1 | | | — |
| Accrued Expenses and Other Liabilities | | | 217 | | | 114 | | | 121 | | | 309 | | | 60 |
| Total Liabilities | | | 269,968 | | | 241,026 | | | 63,441 | | | 431,602 | | | 206,578 |
| NET ASSETS | | $ | 3,026,155 | | $ | 1,477,100 | | $ | 1,768,876 | | $ | 4,160,957 | | $ | 998,171 |
| Investments at Cost | | $ | 2,680,687 | | $ | 1,574,568 | | $ | 1,669,586 | | $ | 3,508,890 | | $ | 1,174,776 |
| Foreign Currencies at Cost | | $ | 5,467 | | $ | 5,636 | | $ | 578 | | $ | 2,473 | | $ | 543 |
____________________
| * | | The Series received non-cash collateral consisting of short and/or long term U.S. Treasury securities with a market value of $6,508, $31,161, $0, $8,325 and $2,805, respectively. |
See accompanying Notes to Financial Statements.
126
THE DFA INVESTMENT TRUST COMPANY
STATEMENTS OF ASSETS AND LIABILITIES
OCTOBER 31, 2016
(Amounts in thousands)
| | The | | The |
| | Japanese | | Asia Pacific |
| | Small | | Small |
| | Company | | Company |
| | Series* | | Series* |
| ASSETS: | | | | | | |
| Investments at Value (including $271,364 and $262,488 of securities on loan, respectively) | | $ | 3,107,991 | | $ | 1,545,386 |
Collateral from Securities on Loan Invested in Affiliate at Value (including cost of $280,916
and $261,799) | | | 280,962 | | | 261,843 |
| Foreign Currencies at Value | | | 2,507 | | | 2,689 |
| Cash | | | 1,795 | | | 392 |
| Receivables: | | | | | | |
| Investment Securities Sold | | | 4,478 | | | 6,989 |
| Dividends, Interest and Tax Reclaims | | | 19,244 | | | 1,409 |
| Securities Lending Income | | | 684 | | | 420 |
| Futures Margin Variation | | | — | | | — |
| Total Assets | | | 3,417,661 | | | 1,819,128 |
| LIABILITIES: | | | | | | |
| Payables: | | | | | | |
| Upon Return of Securities Loaned | | | 280,889 | | | 261,796 |
| Investment Securities Purchased | | | 3,734 | | | 1,368 |
| Due to Advisor | | | 261 | | | 134 |
| Futures Margin Variation | | | — | | | — |
| Accrued Expenses and Other Liabilities | | | 183 | | | 94 |
| Total Liabilities | | | 285,067 | | | 263,392 |
| NET ASSETS | | $ | 3,132,594 | | $ | 1,555,736 |
| Investments at Cost | | $ | 2,683,628 | | $ | 1,595,952 |
| Foreign Currencies at Cost | | $ | 2,500 | | $ | 2,692 |
____________________
| * | | See Note J in the Notes to Financial Statements for additional securities lending collateral. |
See accompanying Notes to Financial Statements.
127
THE DFA INVESTMENT TRUST COMPANY
STATEMENTS OF ASSETS AND LIABILITIES
OCTOBER 31, 2016
(Amounts in thousands)
| | The United | | The | | The |
| | Kingdom | | Continental | | Canadian |
| | Small | | Small | | Small |
| | Company | | Company | | Company |
| | Series | | Series* | | Series* |
| ASSETS: | | | | | | | | | |
Investments at Value (including $53,170, $327,025, $202,280 of securities
on loan, respectively) | | $ | 1,669,112 | | $ | 4,133,195 | | $ | 931,082 |
Collateral from Securities on Loan Invested in Affiliate at Value
(including cost of $56,574, $350,137, $214,106) | | | 56,584 | | | 350,190 | | | 214,142 |
| Foreign Currencies at Value | | | 5,978 | | | 1,645 | | | 279 |
| Cash | | | 2,698 | | | 5,855 | | | 4,248 |
| Receivables: | | | | | | | | | |
| Investment Securities Sold | | | 936 | | | 2,988 | | | 55 |
| Dividends, Interest and Tax Reclaims | | | 4,896 | | | 5,730 | | | 705 |
| Securities Lending Income | | | 93 | | | 1,051 | | | 375 |
| Unrealized Gain on Foreign Currency Contracts | | | — | | | — | | | 1 |
| Total Assets | | | 1,740,297 | | | 4,500,654 | | | 1,150,887 |
| LIABILITIES: | | | | | | | | | |
| Payables: | | | | | | | | | |
| Upon Return of Securities Loaned | | | 56,573 | | | 350,129 | | | 214,100 |
| Investment Securities Purchased | | | — | | | 1,969 | | | 3,384 |
| Due to Advisor | | | 148 | | | 359 | | | 81 |
| Unrealized Loss on Foreign Currency Contracts | | | — | | | — | | | 5 |
| Accrued Expenses and Other Liabilities | | | 111 | | | 272 | | | 53 |
| Total Liabilities | | | 56,832 | | | 352,729 | | | 217,623 |
| NET ASSETS | | $ | 1,683,465 | | $ | 4,147,925 | | $ | 933,264 |
| Investments at Cost | | $ | 1,633,790 | | $ | 3,529,003 | | $ | 1,162,676 |
| Foreign Currencies at Cost | | $ | 5,962 | | $ | 1,647 | | $ | 279 |
____________________
| * | | See Note J in the Notes to Financial Statements for additional securities lending collateral. |
See accompanying Notes to Financial Statements.
128
THE DFA INVESTMENT TRUST COMPANY
STATEMENTS OF OPERATIONS
FOR THE YEAR ENDED OCTOBER 31, 2016
(Amounts in thousands)
| | The | | The |
| | Japanese | | Asia Pacific |
| | Small | | Small |
| | Company | | Company |
| | Series | | Series |
| Investment Income | | | | | | | | |
| Dividends (Net of Foreign Taxes Withheld of $5,758 and $1,317, respectively) | | $ | 52,010 | | | $ | 52,135 | |
| Income from Securities Lending | | | 5,693 | | | | 5,042 | |
| Total Investment Income | | | 57,703 | | | | 57,177 | |
| Expenses | | | | | | | | |
| Investment Management Fees | | | 2,725 | | | | 1,385 | |
| Accounting & Transfer Agent Fees | | | 138 | | | | 78 | |
| Custodian Fees | | | 441 | | | | 250 | |
| Shareholders’ Reports | | | 11 | | | | 5 | |
| Directors’/Trustees’ Fees & Expenses | | | 19 | | | | 9 | |
| Professional Fees | | | 54 | | | | 27 | |
| Other | | | 104 | | | | 54 | |
| Total Expenses | | | 3,492 | | | | 1,808 | |
| Fees Paid Indirectly (Note C) | | | (15 | ) | | | (10 | ) |
| Net Expenses | | | 3,477 | | | | 1,798 | |
| Net Investment Income (Loss) | | | 54,226 | | | | 55,379 | |
| Realized and Unrealized Gain (Loss) | | | | | | | | |
| Net Realized Gain (Loss) on: | | | | | | | | |
| Investment Securities Sold** | | | 122,152 | | | | (8,246 | ) |
| Futures | | | — | | | | — | |
| Foreign Currency Transactions | | | 2,170 | | | | 309 | |
| Forward Currency Contracts | | | (36 | ) | | | (18 | ) |
| Change in Unrealized Appreciation (Depreciation) of: | | | | | | | | |
| Investment Securities and Foreign Currency | | | 214,787 | | | | 168,801 | |
| Futures | | | — | | | | — | |
| Translation of Foreign Currency Denominated Amounts | | | (688 | ) | | | 22 | |
| Net Realized and Unrealized Gain (Loss) | | | 338,385 | | | | 160,868 | |
| Net Increase (Decrease) in Net Assets | | | | | | | | |
| Resulting from Operations | | $ | 392,611 | | | $ | 216,247 | |
____________________
| ** | Net of foreign capital gain taxes withheld of $0 and $0, respectively. |
See accompanying Notes to Financial Statements.
129
THE DFA INVESTMENT TRUST COMPANY
STATEMENTS OF OPERATIONS
FOR THE YEAR ENDED OCTOBER 31, 2016
(Amounts in thousands)
| | The United | | The | | The |
| | Kingdom | | Continental | | Canadian |
| | Small | | Small | | Small |
| | Company | | Company | | Company |
| | Series | | Series | | Series |
| Investment Income | | | | | | | | | | | | |
| Dividends (Net of Foreign Taxes Withheld of $50, $12,963, $2,757, respectively) | | $ | 79,890 | | | $ | 89,305 | | | $ | 16,189 | |
| Interest | | | — | | | | — | | | | — | |
| Income from Securities Lending | | | 1,716 | | | | 14,119 | | | | 3,503 | |
| Total Investment Income | | | 81,606 | | | | 103,424 | | | | 19,692 | |
| Expenses | | | | | | | | | | | | |
| Investment Management Fees | | | 1,820 | | | | 3,945 | | | | 747 | |
| Accounting & Transfer Agent Fees | | | 94 | | | | 204 | | | | 37 | |
| Custodian Fees | | | 106 | | | | 610 | | | | 56 | |
| Shareholders’ Reports | | | 8 | | | | 14 | | | | 3 | |
| Directors’/Trustees’ Fees & Expenses | | | 13 | | | | 27 | | | | 5 | |
| Professional Fees | | | 39 | | | | 183 | | | | 13 | |
| Other | | | 76 | | | | 165 | | | | 22 | |
| Total Expenses | | | 2,156 | | | | 5,148 | | | | 883 | |
| Fees Paid Indirectly (Note C) | | | (15 | ) | | | (36 | ) | | | (13 | ) |
| Net Expenses | | | 2,141 | | | | 5,112 | | | | 870 | |
| Net Investment Income (Loss) | | | 79,465 | | | | 98,312 | | | | 18,822 | |
| Realized and Unrealized Gain (Loss) | | | | | | | | | | | | |
| Net Realized Gain (Loss) on: | | | | | | | | | | | | |
| Investment Securities Sold* | | | 71,244 | | | | 122,507 | | | | (24,152 | ) |
| Futures | | | — | | | | 687 | | | | — | |
| Foreign Currency Transactions | | | (1,277 | ) | | | (394 | ) | | | 229 | |
| Forward Currency Contracts | | | — | | | | (5 | ) | | | — | |
| Change in Unrealized Appreciation (Depreciation) of: | | | | | | | | | | | | |
| Investment Securities and Foreign Currency | | | (469,059 | ) | | | 27,064 | | | | 135,836 | |
| Futures | | | — | | | | 19 | | | | — | |
| Translation of Foreign Currency Denominated Amounts | | | (215 | ) | | | (32 | ) | | | (6 | ) |
| Net Realized and Unrealized Gain (Loss) | | | (399,307 | ) | | | 149,846 | | | | 111,907 | |
| Net Increase (Decrease) in Net Assets Resulting from Operations | | $ | (319,842 | ) | | $ | 248,158 | | | $ | 130,729 | |
____________________
* Net of foreign capital gain taxes withheld of $0, $0, and $0, respectively.
See accompanying Notes to Financial Statements.
130
THE DFA INVESTMENT TRUST COMPANY
STATEMENTS OF CHANGES IN NET ASSETS
(Amounts in thousands)
| | The Japanese Small |
| | Company Series |
| | Year | | Year |
| | Ended | | Ended |
| | Oct. 31, | | Oct. 31, |
| | 2016 | | 2015 |
| Increase (Decrease) in Net Assets | | | | | | | | |
| Operations: | | | | | | | | |
| Net Investment Income (Loss) | | $ | 54,226 | | | $ | 43,264 | |
| Net Realized Gain (Loss) on: | | | | | | | | |
| Investment Securities Sold* | | | 122,152 | | | | 69,828 | |
| Futures | | | — | | | | — | |
| Foreign Currency Transactions | | | 2,170 | | | | (1,869 | ) |
| Forward Currency Contracts | | | (36 | ) | | | — | |
| In-Kind Redemptions | | | — | | | | 27,130 | |
| Change in Unrealized Appreciation (Depreciation) of: | | | | | | | | |
| Investment Securities and Foreign Currency | | | 214,787 | | | | 85,013 | |
| Futures | | | — | | | | — | |
| Translation of Foreign Currency Denominated Amounts | | | (688 | ) | | | 382 | |
| Net Increase (Decrease) in Net Assets Resulting from Operations | | | 392,611 | | | | 223,748 | |
| Transactions in Interest: | | | | | | | | |
| Contributions | | | 224,138 | | | | 102,092 | |
| Withdrawals | | | (115,843 | ) | | | (199,561 | ) |
| Net Increase (Decrease) from Transactions in Interest | | | 108,295 | | | | (97,469 | ) |
| Total Increase (Decrease) in Net Assets | | | 500,906 | | | | 126,279 | |
| Net Assets | | | | | | | | |
| Beginning of Year | | | 2,631,688 | | | | 2,505,409 | |
| End of Year | | $ | 3,132,594 | | | $ | 2,631,688 | |
____________________
* Net of foreign capital gain taxes withheld of $0.
See accompanying Notes to Financial Statements.
131
THE DFA INVESTMENT TRUST COMPANY
STATEMENTS OF CHANGES IN NET ASSETS
(Amounts in thousands)
| | The Asia Pacific Small | | | The United Kingdom Small | | | The Continental Small |
| | Company Series | | | Company Series | | | Company Series |
| | Year | | Year | | | Year | | Year | | | Year | | Year |
| | Ended | | Ended | | | Ended | | Ended | | | Ended | | Ended |
| | Oct. 31, | | Oct. 31, | | | Oct. 31, | | Oct. 31, | | | Oct. 31, | | Oct. 31, |
| | 2016 | | 2015 | | | 2016 | | 2015 | | | 2016 | | 2015 |
| Increase (Decrease) in Net Assets | | | | | | | | | | | | | | | | | | | | | | | | | | |
| Operations: | | | | | | | | | | | | | | | | | | | | | | | | | | |
| Net Investment Income (Loss) | | $ | 55,379 | | | $ | 54,891 | | | | $ | 79,465 | | | $ | 71,555 | | | | $ | 98,312 | | | $ | 82,887 | |
| Net Realized Gain (Loss) on: | | | | | | | | | | | | | | | | | | | | | | | | | | |
| Investment Securities Sold* | | | (8,246 | ) | | | (15,143 | ) | | | | 71,244 | | | | 82,685 | | | | | 122,507 | | | | 115,635 | |
| Futures | | | — | | | | — | | | | | — | | | | — | | | | | 687 | | | | (4,875 | ) |
| Foreign Currency Transactions | | | 309 | | | | (913 | ) | | | | (1,277 | ) | | | 144 | | | | | (394 | ) | | | (1,002 | ) |
| Forward Currency Contracts | | | (18 | ) | | | — | | | | | — | | | | — | | | | | (5 | ) | | | — | |
| In-Kind Redemptions | | | — | | | | 18,027 | | | | | — | | | | 42,293 | | | | | — | | | | 58,734 | |
| Change in Unrealized Appreciation | | | | | | | | | | | | | | | | | | | | | | | | | | |
| (Depreciation) of: | | | | | | | | | | | | | | | | | | | | | | | | | | |
| Investment Securities and | | | | | | | | | | | | | | | | | | | | | | | | | | |
| Foreign Currency | | | 168,801 | | | | (224,570 | ) | | | | (469,059 | ) | | | (104 | ) | | | | 27,064 | | | | 55,052 | |
| Futures | | | — | | | | — | | | | | — | | | | — | | | | | 19 | | | | (19 | ) |
| Translation of Foreign Currency | | | | | | | | | | | | | | | | | | | | | | | | | | |
| Denominated Amounts | | | 22 | | | | (13 | ) | | | | (215 | ) | | | 86 | | | | | (32 | ) | | | (57 | ) |
| Net Increase (Decrease) | | | | | | | | | | | | | | | | | | | | | | | | | | |
| in Net Assets Resulting | | | | | | | | | | | | | | | | | | | | | | | | | | |
| from Operations | | | 216,247 | | | | (167,721 | ) | | | | (319,842 | ) | | | 196,659 | | | | | 248,158 | | | | 306,355 | |
| Transactions in Interest: | | | | | | | | | | | | | | | | | | | | | | | | | | |
| Contributions | | | 137,711 | | | | 119,899 | | | | | 112,811 | | | | 12,907 | | | | | 441,553 | | | | 454,912 | |
| Withdrawals | | | (26,496 | ) | | | (177,690 | ) | | | | (193,617 | ) | | | (121,351 | ) | | | | (195,529 | ) | | | (259,801 | ) |
| Net Increase (Decrease) from | | | | | | | | | | | | | | | | | | | | | | | | | | |
| Transactions in Interest | | | 111,215 | | | | (57,791 | ) | | | | (80,806 | ) | | | (108,444 | ) | | | | 246,024 | | | | 195,111 | |
| Total Increase (Decrease) in | | | | | | | | | | | | | | | | | | | | | | | | | | |
| Net Assets | | | 327,462 | | | | (225,512 | ) | | | | (400,648 | ) | | | 88,215 | | | | | 494,182 | | | | 501,466 | |
| Net Assets | | | | | | | | | | | | | | | | | | | | | | | | | | |
| Beginning of Year | | | 1,228,274 | | | | 1,453,786 | | | | | 2,084,113 | | | | 1,995,898 | | | | | 3,653,743 | | | | 3,152,277 | |
| End of Year | | $ | 1,555,736 | | | $ | 1,228,274 | | | | $ | 1,683,465 | | | $ | 2,084,113 | | | | $ | 4,147,925 | | | $ | 3,653,743 | |
____________________
* Net of foreign capital gain taxes withheld of $0, $0 and $0, respectively.
See accompanying Notes to Financial Statements.
132
THE DFA INVESTMENT TRUST COMPANY
STATEMENTS OF CHANGES IN NET ASSETS
(Amounts in thousands)
| | The Canadian Small |
| | Company Series |
| | Year | | Year |
| | Ended | | Ended |
| | Oct. 31, | | Oct. 31, |
| | 2016 | | 2015 |
| Increase (Decrease) in Net Assets | | | | | | | | |
| Operations: | | | | | | | | |
| Net Investment Income (Loss) | | $ | 18,822 | | | $ | 19,902 | |
| Net Realized Gain (Loss) on: | | | | | | | | |
| Investment Securities Sold* | | | (24,152 | ) | | | (9,138 | ) |
| Futures | | | — | | | | — | |
| Foreign Currency Transactions | | | 229 | | | | 149 | |
| Forward Currency Contracts | | | — | | | | — | |
| In-Kind Redemptions | | | — | | | | 8,042 | |
| Change in Unrealized Appreciation (Depreciation) of: | | | | | | | | |
| Investment Securities and Foreign Currency | | | 135,836 | | | | (228,267 | ) |
| Futures | | | — | | | | — | |
| Translation of Foreign Currency Denominated Amounts | | | (6 | ) | | | 11 | |
| Net Increase (Decrease) in Net Assets Resulting from Operations | | | 130,729 | | | | (209,301 | ) |
| Transactions in Interest: | | | | | | | | |
| Contributions | | | 187,903 | | | | 20,480 | |
| Withdrawals | | | (8,500 | ) | | | (37,476 | ) |
| Net Increase (Decrease) from Transactions in Interest | | | 179,403 | | | | (16,996 | ) |
| Total Increase (Decrease) in Net Assets | | | 310,132 | | | | (226,297 | ) |
| Net Assets | | | | | | | | |
| Beginning of Year | | | 623,132 | | | | 849,429 | |
| End of Year | | $ | 933,264 | | | $ | 623,132 | |
____________________
* Net of foreign capital gain taxes withheld of $0.
See accompanying Notes to Financial Statements.
133
THE DFA INVESTMENT TRUST COMPANY
FINANCIAL HIGHLIGHTS
| | The Japanese Small Company Series | | | The Asia Pacific Small Company Series |
| | Year | | Year | | Year | | Year | | Year | | | Year | | Year | | Year | | Year | | Year |
| | Ended | | Ended | | Ended | | Ended | | Ended | | | Ended | | Ended | | Ended | | Ended | | Ended |
| | Oct. 31, | | Oct. 31, | | Oct. 31, | | Oct. 31, | | Oct. 31, | | | Oct. 31, | | Oct. 31, | | Oct. 31, | | Oct. 31, | | Oct. 31, |
| | 2016 | | 2015 | | 2014 | | 2013 | | 2012 | | | 2016 | | 2015 | | 2014 | | 2013 | | 2012 |
| Total Return | | | 14.53 | % | | | 9.04 | % | | | 2.46 | % | | | 30.62 | % | | | 0.54 | % | | | | 16.69 | % | | | (11.83 | )% | | | (3.46 | )% | | | 10.97 | % | | | 7.48 | % |
| Net Assets, End of Year (thousands) | | $ | 3,132,594 | | | $ | 2,631,688 | | | $ | 2,505,409 | | | $ | 2,281,624 | | | $ | 1,686,731 | | | | $ | 1,555,736 | | | $ | 1,228,274 | | | $ | 1,453,786 | | | $ | 1,265,498 | | | $ | 1,003,860 | |
| Ratio of Expenses to Average | | | | | | | | | | | | | | | | | | | | | | | | | | | | | | | | | | | | | | | | | |
| Net Assets | | | 0.13 | % | | | 0.13 | % | | | 0.13 | % | | | 0.14 | % | | | 0.15 | % | | | | 0.13 | % | | | 0.13 | % | | | 0.13 | % | | | 0.15 | % | | | 0.16 | % |
| Ratio of Expenses to Average | | | | | | | | | | | | | | | | | | | | | | | | | | | | | | | | | | | | | | | | | |
| Net Assets (Excluding Fees | | | | | | | | | | | | | | | | | | | | | | | | | | | | | | | | | | | | | | | | | |
| Paid Indirectly) | | | 0.13 | % | | | 0.13 | % | | | 0.13 | % | | | 0.14 | % | | | 0.15 | % | | | | 0.13 | % | | | 0.13 | % | | | 0.13 | % | | | 0.15 | % | | | 0.16 | % |
| Ratio of Net Investment Income to | | | | | | | | | | | | | | | | | | | | | | | | | | | | | | | | | | | | | | | | | |
| Average Net Assets | | | 1.99 | % | | | 1.69 | % | | | 1.71 | % | | | 1.87 | % | | | 2.17 | % | | | | 4.00 | % | | | 4.17 | % | | | 3.96 | % | | | 4.64 | % | | | 4.26 | % |
| Portfolio Turnover Rate | | | 10 | % | | | 6 | % | | | 9 | % | | | 16 | % | | | 7 | % | | | | 10 | % | | | 7 | % | | | 7 | % | | | 9 | % | | | 18 | % |
| |
| | The United Kingdom Small Company Series | | | The Continental Small Company Series |
| | Year | | Year | | Year | | Year | | Year | | | Year | | Year | | Year | | Year | | Year |
| | Ended | | Ended | | Ended | | Ended | | Ended | | | Ended | | Ended | | Ended | | Ended | | Ended |
| | Oct. 31, | | Oct. 31, | | Oct. 31, | | Oct. 31, | | Oct. 31, | | | Oct. 31, | | Oct. 31, | | Oct. 31, | | Oct. 31, | | Oct. 31, |
| | 2016 | | 2015 | | 2014 | | 2013 | | 2012 | | | 2016 | | 2015 | | 2014 | | 2013 | | 2012 |
| Total Return | | | (15.82) | % | | | 9.95 | % | | | 1.22 | % | | | 37.42 | % | | | 23.41 | % | | | | 6.10 | % | | | 9.81 | % | | | (2.25 | )% | | | 43.67 | % | | | 2.29 | % |
| Net Assets, End of Year (thousands) | | $ | 1,683,465 | | | $ | 2,084,113 | | | $ | 1,995,898 | | | $ | 1,988,287 | | | $ | 1,464,838 | | | | $ | 4,147,925 | | | $ | 3,653,743 | | | $ | 3,152,277 | | | $ | 3,217,766 | | | $ | 2,245,179 | |
| Ratio of Expenses to Average | | | | | | | | | | | | | | | | | | | | | | | | | | | | | | | | | | | | | | | | | |
| Net Assets | | | 0.12 | % | | | 0.11 | % | | | 0.11 | % | | | 0.12 | % | | | 0.13 | % | | | | 0.13 | % | | | 0.13 | % | | | 0.13 | % | | | 0.14 | % | | | 0.16 | % |
| Ratio of Expenses to Average | | | | | | | | | | | | | | | | | | | | | | | | | | | | | | | | | | | | | | | | | |
| Net Assets (Excluding Fees | | | | | | | | | | | | | | | | | | | | | | | | | | | | | | | | | | | | | | | | | |
| Paid Indirectly) | | | 0.12 | % | | | 0.11 | % | | | 0.11 | % | | | 0.12 | % | | | 0.13 | % | | | | 0.13 | % | | | 0.13 | % | | | 0.13 | % | | | 0.14 | % | | | 0.16 | % |
| Ratio of Net Investment Income to | | | | | | | | | | | | | | | | | | | | | | | | | | | | | | | | | | | | | | | | | |
| Average Net Assets | | | 4.36 | % | | | 3.44 | % | | | 2.98 | % | | | 3.29 | % | | | 3.37 | % | | | | 2.49 | % | | | 2.44 | % | | | 2.40 | % | | | 2.67 | % | | | 3.15 | % |
| Portfolio Turnover Rate | | | 15 | % | | | 10 | % | | | 8 | % | | | 17 | % | | | 6 | % | | | | 9 | % | | | 14 | % | | | 13 | % | | | 13 | % | | | 9 | % |
| See page 1 for the Definitions of Abbreviations and Footnotes. |
See accompanying Notes to Financial Statements.
134
THE DFA INVESTMENT TRUST COMPANY
FINANCIAL HIGHLIGHTS
| | The Canadian Small Company Series |
| | Year | | Year | | Year | | Year | | Year |
| | Ended | | Ended | | Ended | | Ended | | Ended |
| | Oct. 31, | | Oct. 31, | | Oct. 31, | | Oct. 31, | | Oct. 31, |
| | 2016 | | 2015 | | 2014 | | 2013 | | 2012 |
| Total Return | | | 20.77 | % | | | (25.00 | )% | | | (3.83 | )% | | | 5.71 | % | | | (2.51 | )% |
| Net Assets, End of Year (thousands) | | $ | 933,264 | | | $ | 623,132 | | | $ | 849,429 | | | $ | 741,204 | | | $ | 689,086 | |
| Ratio of Expenses to Average Net Assets | | | 0.12 | % | | | 0.12 | % | | | 0.12 | % | | | 0.13 | % | | | 0.15 | % |
| Ratio of Expenses to Average Net Assets | | | | | | | | | | | | | | | | | | | | |
| (Excluding Fees Paid Indirectly) | | | 0.12 | % | | | 0.12 | % | | | 0.12 | % | | | 0.13 | % | | | 0.15 | % |
| Ratio of Net Investment Income to Average Net Assets | | | 2.52 | % | | | 2.73 | % | | | 2.42 | % | | | 2.99 | % | | | 2.29 | % |
| Portfolio Turnover Rate | | | 8 | % | | | 18 | % | | | 5 | % | | | 14 | % | | | 22 | % |
| See page 1 for the Definitions of Abbreviations and Footnotes. | | | | | | | | | | | | | | | | | | | | |
See accompanying Notes to Financial Statements.
135
THE DFA INVESTMENT TRUST COMPANY
NOTES TO FINANCIAL STATEMENTS
A. Organization:
The DFA Investment Trust Company (the “Trust”) is an open-end management investment company registered under the Investment Company Act of 1940. The Trust consists of eleven portfolios, five of which are included in this section of the report (collectively, the “Series”). The remaining operational portfolios are presented in separate reports. The Series are investment companies, and accordingly, follow the accounting and reporting guidance under Financial Accounting Standards Board (“FASB”) Accounting Standards Certification (“ASC”) Topic 946, “Financial Services-Investment Companies.”
| International Equity Portfolios | |
| The Japanese Small Company Series |
| The Asia Pacific Small Company Series |
| The United Kingdom Small Company Series |
| The Continental Small Company Series |
| The Canadian Small Company Series |
B. Significant Accounting Policies:
The following significant accounting policies are in conformity with accounting principles generally accepted in the United States of America. Such policies are consistently followed by the Trust in preparation of its financial statements. The preparation of financial statements in accordance with accounting principles generally accepted in the United States of America requires management to make estimates and assumptions that affect the fair value of investments, the reported amounts of assets and liabilities and disclosure of contingent assets and liabilities at the date of the financial statements and the reported amounts of increases and decreases in net assets from operations during the reporting period. Actual results could differ from those estimates and those differences could be material.
1. Security Valuation: The Series utilize a fair value hierarchy which prioritizes the inputs to valuation techniques used to measure fair value into three broad levels described below:
| ● | Level 1 – inputs are quoted prices in active markets for identical securities (including equity securities, open-end investment companies, futures contracts)
|
| ● | Level 2 – other significant observable inputs (including quoted prices for similar securities, interest rates, prepayment speeds, credit risk, etc.)
|
| ● | Level 3 – significant unobservable inputs (including the Series’ own assumptions in determining the fair value of investments) |
Securities held by the International Equity Portfolios, including over-the-counter securities, are valued at the last quoted sale price at the close of the exchanges on which they are principally traded (official closing price). International equity securities are subject to a fair value factor, as described later in this note. Securities held by the International Equity Portfolios that are listed on NASDAQ are valued at the Nasdaq Official Closing Price (“NOCP”). If there is no last reported sale price or NOCP for the day, the International Equity Portfolios value the securities within the range of the most recent quoted bid and asked prices. Price information on listed securities is taken from the exchange where the security is primarily traded. Generally, securities issued by open-end investment companies are valued using their respective net asset values or public offering prices, as appropriate, for purchase orders placed at the close of the New York Stock Exchange (NYSE). These securities are generally categorized as Level 1 in the hierarchy.
Securities for which no market quotations are readily available (including restricted securities), or for which market quotations have become unreliable, are valued in good faith at fair value in accordance with procedures adopted by the Board of Trustees of the Trust. Fair value pricing may also be used if events that have a significant effect on the value of an investment (as determined in the discretion of Dimensional Fund Advisors LP) occur before the net asset value is
136
calculated. When fair value pricing is used, the prices of securities used by the International Equity Portfolios may differ from the quoted or published prices for the same securities on their primary markets or exchanges. These securities are generally categorized as Level 2 in the hierarchy.
The International Equity Portfolios will also apply a fair value price in the circumstances described below. Generally, trading in foreign securities markets is completed each day at various times prior to the close of the NYSE. For example, trading in the Japanese securities markets is completed each day at the close of the Tokyo Stock Exchange (normally, 2:00 a.m. ET), which is fourteen hours before the close of the NYSE (normally, 4:00 p.m. ET) and the time that the net asset values of the International Equity Portfolios are computed. Due to the time differences between the closings of the relevant foreign securities exchanges and the time the International Equity Portfolios price their shares at the close of the NYSE, the International Equity Portfolios will fair value their foreign investments when it is determined that the market quotations for the foreign investments are either unreliable or not readily available. The fair value prices will attempt to reflect the impact of the U.S. financial markets’ perceptions and trading activities on the International Equity Portfolios’ foreign investments since the last closing prices of the foreign investments were calculated on their primary foreign securities markets or exchanges. For these purposes, the Board of Trustees of the International Equity Portfolios has determined that movements in relevant indices or other appropriate market indicators, after the close of the Tokyo Stock Exchange or the London Stock Exchange, demonstrate that market quotations may be unreliable. Fair valuation of portfolio securities may occur on a daily basis. The fair value pricing by the International Equity Portfolios utilizes data furnished by an independent pricing service (and that data draws upon, among other information, the market values of foreign investments). When an International Equity Portfolio uses fair value pricing, the values assigned to the International Equity Portfolio’s foreign investments may not be the quoted or published prices of the investments on their primary markets or exchanges. These securities are generally categorized as Level 2 in the hierarchy.
Futures contracts held by the Series are valued using the settlement price established each day on the exchange on which they are traded. These valuations are generally categorized as Level 1 in the hierarchy. Over-the-counter derivative contracts, which include forward currency contracts, do not require material subjectivity as pricing inputs are observed from quoted markets and are categorized as Level 2 in the hierarchy.
A summary of the inputs used to value the Series’ investments by each major security type, industry and/or country is disclosed previously in this note. Valuation hierarchy tables have been included at the end of the Summary Schedules of Portfolio Holdings. The inputs or methodology used for valuing securities are not necessarily an indication of the risk associated with investing in those securities.
Transfers between investment levels may occur as the markets fluctuate and/or the availability of data used in an investment’s valuation changes. The Series recognize transfers between the levels as of the end of the period. As of October 31, 2016, the Series had no significant transfers of securities.
2. Foreign Currency Translation: Securities and other assets and liabilities of the International Equity Portfolios, whose values are initially expressed in foreign currencies are translated to U.S. dollars using the mean between the most recent bid and asked prices for the U.S. dollar as quoted by generally recognized reliable sources. Dividend and interest income and certain expenses are translated to U.S. dollars at the rate of exchange on their respective accrual dates. Receivables and payables denominated in foreign currencies are marked-to-market daily based on daily exchange rates and exchange gains or losses are realized upon ultimate receipt or disbursement.
The International Equity Portfolios do not isolate the effect of fluctuations in foreign currency rates when determining the realized gain or loss upon the sale or maturity of foreign currency denominated debt obligations pursuant to U.S. federal income tax regulations; such amounts are categorized as foreign exchange gain or loss for income tax reporting purposes.
Realized gains or losses on foreign currency transactions represent net foreign exchange gains or losses from the disposition of foreign currencies, currency gains or losses realized between the trade and settlement dates on securities transactions, and the difference between amounts of interest, dividends and any foreign withholding taxes recorded on the books of the International Equity Portfolios and the U.S. dollar equivalent amounts actually received or paid.
137
3. Deferred Compensation Plan: Each eligible Trustee of the Trust may elect participation in The Fee Deferral Plan for Independent Directors and Trustees (the “Plan”). Under the Plan, effective January 1, 2002, such Trustees may defer payment of all or a portion of their total fees earned as a Trustee. These deferred amounts may be treated as though such amounts had been invested in shares of the following funds: U.S. Large Cap Value Portfolio; U.S. Core Equity 1 Portfolio; U.S. Core Equity 2 Portfolio; U.S. Vector Equity Portfolio; U.S. Micro Cap Portfolio; DFA International Value Portfolio; International Core Equity Portfolio; Emerging Markets Portfolio; Emerging Markets Core Equity Portfolio; and/or DFA Two-Year Global Fixed Income Portfolio. Contributions made under the Plan and the change in unrealized appreciation (depreciation) and income are included in Directors’/Trustees’ Fees & Expenses.
Each Trustee has the option to receive their distribution of proceeds in one of the following methods: lump sum; annual installments over a period of agreed upon years; or quarterly installments over a period of agreed upon years. Each Trustee shall have the right in a notice of election (the “Notice”) to defer the receipt of the Trustee’s deferred compensation until a date specified by such Trustee in the Notice, which date may not be sooner than the earlier of: (i) the first business day of January following the year in which such Trustee ceases to be a member of the Board; and (ii) five years following the effective date of the Trustee’s first deferral election. If a Trustee who elects to defer fees fails to designate in the Notice a time or date as of which payment of the Trustee’s deferred fee account shall commence, payment of such amount shall commence as of the first business day of January following the year in which the Trustee ceases to be a member of the Board (unless the Trustee files an amended Notice selecting a different distribution date). As of October 31, 2016, none of the Trustees have requested or received a distribution of proceeds of a deferred fee account.
4. Other: Security transactions are accounted for as of the trade date. Costs used in determining realized gains and losses on the sale of investment securities and foreign currency are on the basis of identified cost. Dividend income and distributions to shareholders are recorded on the ex-dividend date. Distributions received on securities that represent a return of capital or capital gains are recorded as a reduction of cost of investments or as a realized gain, respectively. The Series estimate the character of distributions received that may be considered return of capital distributions. Interest income is recorded on an accrual basis. Discount and premium on securities purchased are amortized over the lives of the respective securities, utilizing the effective interest method. Expenses directly attributable to a Series are directly charged. Common expenses of the Trust or Series are allocated using methods approved by the Board of Trustees, generally based on average net assets.
The International Equity Portfolios may be subject to taxes imposed by countries in which they invest, with respect to their investments in issuers existing or operating in such countries. Such taxes are generally based on income earned or repatriated and capital gains realized on the sale of such investments. The Series accrue such taxes when the related income or capital gains are earned or throughout the holding period. Some countries require governmental approval for the repatriation of investment income, capital or the proceeds of sales earned by foreign investors. In addition, if there is a deterioration in a country’s balance of payments or for other reasons, a country may impose temporary restrictions on foreign capital remittances abroad.
C. Investment Advisor:
The Advisor, Dimensional Fund Advisors LP, provides investment management services to the Series. For the year ended October 31, 2016, the Series’ investment management fees were accrued daily and paid monthly to the Advisor based on the following effective annual rates of average daily net assets:
| The Japanese Small Company Series | 0.10% |
| The Asia Pacific Small Company Series | 0.10% |
| The United Kingdom Small Company Series | 0.10% |
| The Continental Small Company Series | 0.10% |
| The Canadian Small Company Series | 0.10% |
138
Earned Income Credit:
In addition, the Series have entered into arrangements with their custodian whereby net interest earned on uninvested cash balances was used to reduce a portion of each Series’ custody expenses. Custody expense in the accompanying financial statements is presented before reduction for credits. The impact of such credits is generally less than one basis point of each Series’ net assets. During the year ended October 31, 2016, expenses reduced were as follows (amounts in thousands):
| | Fees Paid |
| | Indirectly |
| The Japanese Small Company Series | | $ | 15 | |
| The Asia Pacific Small Company Series | | | 10 | |
| The United Kingdom Small Company Series | | | 15 | |
| The Continental Small Company Series | | | 36 | |
| The Canadian Small Company Series | | | 13 | |
Fees Paid to Officers and Directors/Trustees:
Certain Officers and Trustees of the Advisor are also Officers and Trustees of the Trust; however, such Officers and Trustees (with the exception of the Chief Compliance Officer (“CCO”)) receive no compensation from the Trust. For the year ended October 31, 2016, the total related amounts paid by the Trust to the CCO were $83 (in thousands). The total related amounts paid by each of the Series are included in Other Expenses on the Statement of Operations.
D. Deferred Compensation:
At October 31, 2016, the total liability for deferred compensation to Trustees is included in Accrued Expenses and Other Liabilities on the Statement of Assets and Liabilities as follows (amounts in thousands):
| The Japanese Small Company Series | | $75 |
| The Asia Pacific Small Company Series | | 39 |
| The United Kingdom Small Company Series | | 50 |
| The Continental Small Company Series | | 95 |
| The Canadian Small Company Series | | 23 |
E. Purchases and Sales of Securities:
For the year ended October 31, 2016, the Series made the following purchases and sales of investment securities, other than short-term securities and U.S. government securities (amounts in thousands):
| | Purchases | | Sales |
| The Japanese Small Company Series | | $ | 435,288 | | $ | 279,916 |
| The Asia Pacific Small Company Series | | | 305,915 | | | 130,653 |
| The United Kingdom Small Company Series | | | 317,512 | | | 275,930 |
| The Continental Small Company Series | | | 698,769 | | | 338,855 |
| The Canadian Small Company Series | | | 264,983 | | | 63,519 |
There were no purchases or sales of long-term U.S. government securities.
F. Federal Income Taxes:
No provision for federal income taxes is required since the Series are treated as partnerships for federal income tax purposes. Any net investment income and realized and unrealized gains and losses have been deemed to have been “passed down” to their respective partners.
139
At October 31, 2016, the total cost and aggregate gross unrealized appreciation (depreciation) of securities for federal income tax purposes were different from amounts reported for financial reporting purposes, as follows (amounts in thousands):
| | | | | | | | | | | | Net |
| | | | | | | | | | | | Unrealized |
| | Federal | | Unrealized | | Unrealized | | Appreciation |
| | | Tax Cost | | Appreciation | | (Depreciation) | | (Depreciation) |
| The Japanese Small Company Series | | $ | 2,964,544 | | $ | 692,022 | | $ | (267,614 | ) | | $ | 424,408 | |
| The Asia Pacific Small Company Series | | | 1,857,750 | | | 330,139 | | | (380,660 | ) | | | (50,521 | ) |
| The United Kingdom Small Company Series | | | 1,690,364 | | | 319,739 | | | (284,407 | ) | | | 35,332 | |
| The Continental Small Company Series | | | 3,879,139 | | | 1,155,725 | | | (551,479 | ) | | | 604,246 | |
| The Canadian Small Company Series | | | 1,376,781 | | | 117,905 | | | (349,463 | ) | | | (231,558 | ) |
The difference between book basis and tax-basis unrealized appreciation (depreciation) is primarily attributable to the tax deferral of losses on wash sales and investments in passive foreign investment companies.
Accounting for Uncertainty in Income Taxes sets forth a minimum threshold for financial statement recognition of the benefit of a tax position taken or expected to be taken in a tax return. Management has analyzed the Series’ tax positions and has concluded that no additional provision for income tax is required in any Series’ financial statements. The Series are not aware of any tax positions for which it is more likely than not that the total amounts of unrecognized tax benefits will significantly change in the next twelve months. The Series’ federal tax returns for the prior three fiscal years remain subject to examination by the Internal Revenue Service.
G. Financial Instruments:
In accordance with the Series’ investment objectives and policies, the Series may invest in certain financial instruments that have off-balance sheet risk in excess of the amounts recognized in the financial statements and concentrations of credit and market risk. These instruments and their significant corresponding risks are described below:
1. Foreign Market Risks: Investments in foreign markets may involve certain considerations and risks not typically associated with investments in the United States of America, including the possibility of future political and economic developments and the level of foreign governmental supervision and regulation of foreign securities markets. These markets are generally smaller, less liquid and more volatile than the major securities markets in the United States of America. Consequently, acquisition and disposition of international securities held by the Series may be inhibited.
Derivative Financial Instruments:
Summarized below are the specific types of derivative instruments used by the Series.
2. Futures Contracts: The Series may purchase or sell futures contracts and options on futures contracts for equity securities and indices to adjust market exposure based on actual or expected cash inflows to or outflows from the Series. The Series, however, do not intend to sell futures contracts to establish short positions in individual securities. Upon entering into a futures contract, the Series deposit cash or pledge U.S. government securities to a broker, equal to the minimum “initial margin” requirements of the exchange on which the contract is traded. Subsequent payments are received from or paid to the broker each day, based on the daily fluctuation in the market value of the contract. These receipts or payments are known as “variation margin” and are recorded daily by the Series as unrealized gains or losses until the contracts are closed. When the contracts are closed, the Series record a realized gain or loss, which is presented in the Statements of Operations as a net realized gain or loss on futures, equal to the difference between the value of the contract at the time it was opened and the value at the time it was closed.
Risks may arise upon entering into futures contracts from potential imperfect price correlations between the futures contracts and the underlying securities, from the possibility of an illiquid secondary market for these instruments and from the possibility that the Series could lose more than the initial margin requirements. The Series entering into stock
140
index futures are subject to equity price risk from those futures contracts. Counterparty credit risk related to exchange-traded futures is minimal because the exchange’s clearinghouse, as counterparty to all exchange-traded futures, guarantees the futures against default.
3. Forward Currency Contracts: The International Equity Portfolios may acquire and sell forward currency contracts to hedge against adverse changes in the relationship of the U.S. dollar to foreign currencies (foreign exchange rate risk). The decision to hedge a Series’ currency exposure with respect to a foreign market will be based primarily on the Series’ existing exposure to a given foreign currency. Each contract is valued daily and the change in value is recorded by the Series as an unrealized gain or loss, which is presented in the Statements of Operations as the change in unrealized appreciation or depreciation from translation of foreign currency denominated amounts. When the contract is closed or offset with the same counterparty, the Series records a realized gain or loss equal to the change in the value of the contract when it was opened and the value at the time it was closed or offset. This is presented in the Statements of Operations as a net realized gain or loss on foreign currency transactions. At October 31, 2016, the International Equity Portfolios had no outstanding forward currency contracts.
The average volume (based on the open positions at each fiscal month-end) of derivative activity for the year ended October 31, 2016 (amounts in thousands):
| Forward |
| Currency |
| Contracts |
| The Asia Pacific Small Company Series* | $ | 341 | |
| The Canadian Small Company Series* | | 114 | |
*The Series had derivative activity during the period but it did not have open forward currency contract positions at October 31, 2016.
The following is a summary of the location of derivatives on the Series’ Statements of Assets and Liabilities as of October 31, 2016:
| Location on the Statements of Assets and Liabilities |
| Derivative Type | | Asset Derivatives | | Liability Derivatives |
| Equity contracts | Receivables: Futures Margin Variation | | Payables: Futures Margin Variation |
The following is a summary of the realized and change in unrealized gains and losses from the Series’ derivative instrument holdings categorized by primary risk exposure through the year ended October 31, 2016 (amounts in thousands):
| | Realized Gain (Loss) on |
| | Derivatives Recognized in Income |
| | | | Foreign | | |
| | | | Exchange | | Equity |
| | Total | | Contracts | | Contracts |
| The Japanese Small Company Series | | $(36) | | (36) | | — |
| The Asia Pacific Small Company Series | | (18) | | (18) | | — |
| The Continental Small Company Series | | 682 | | (5) | | 687 |
| |
| | Change in Unrealized |
| | Appreciation (Depreciation) |
| | on Derivatives |
| | | | Foreign | | |
| | | | Exchange | | Equity |
| | Total | | Contracts | | Contracts |
| The Continental Small Company Series | | $19 | | — | | $19 |
141
H. Line of Credit and Interfund Lending Program:
The Trust, together with other Dimensional-advised portfolios, has entered into a $500 million uncommitted, unsecured discretionary line of credit effective March 30, 2016 with its domestic custodian bank. A line of credit with similar terms was in effect through March 29, 2016. Each portfolio is permitted to borrow, subject to its investment limitations, up to a maximum of $500 million, as long as total borrowings under the line of credit do not exceed $500 million in the aggregate. Borrowings under the line of credit are charged interest at rates agreed upon by the parties at the time of borrowing. Each portfolio is individually, and not jointly, liable for its particular advances under the line of credit. There is no commitment fee on the unused portion of the line of credit. The agreement for the discretionary line of credit may be terminated by either party at any time. The agreement for the line of credit expires on March 29, 2017.
The Trust, together with other Dimensional-advised portfolios, has also entered into an additional $500 million unsecured line of credit with its international custodian bank effective January 8, 2016. A line of credit with similar terms was in effect through January 7, 2016. Each portfolio is permitted to borrow, subject to its investment limitations, up to a maximum of $500 million, as long as total borrowings under the line of credit do not exceed $500 million in the aggregate. Each portfolio is individually, and not jointly, liable for its particular advances under the line of credit. Borrowings under the line of credit are charged interest at rates agreed upon by the parties at the time of borrowing. There is no commitment fee on the unused portion of the line of credit. The line of credit agreement expires on January 7, 2017.
For the year ended October 31, 2016, borrowings by the Series under the lines of credit were as follows (amounts in thousands, except percentages and days):
| | Weighted | | Weighted | | Number of | | Interest | | Maximum Amount |
| | Average | | Average | | Days | | Expense | | Borrowed During |
| | Interest Rate | | Loan Balance | | Outstanding* | | Incurred | | the Period |
| The Japanese Small Company Series | | 1.06% | | $ | 4,697 | | | 23 | | $ | 3 | | | $ | 35,507 | |
| The Asia Pacific Small Company Series | | 1.07% | | | 120 | | | 11 | | | — | | | | 188 | |
| The United Kingdom Small Company Series | | 1.02% | | | 3,099 | | | 17 | | | 1 | | | | 18,012 | |
| The Continental Small Company Series | | 1.10% | | | 8,539 | | | 14 | | | 4 | | | | 33,487 | |
*Number of Days Outstanding represents the total of single or consecutive days during the year ended October 31, 2016, that each Series’ available line of credit was utilized.
There we no outstanding borrowings by the Series under the lines of credit as of October 31, 2016.
Pursuant to an exemptive order issued by the SEC (the “Order”), the Series may participate in an interfund lending program among certain portfolios managed by the Advisor (portfolios that operate as feeder funds do not participate in the program). The program allows the participating portfolios to borrow money from and loan money to each other for temporary or emergency purposes, subject to the conditions in the Order. A loan can only be made through the program if the interfund loan rate on that day is more favorable to both the borrowing and lending portfolios as compared to rates available through short-term bank loans or investments in overnight repurchase agreements and money market funds, respectively, as detailed in the Order. Further, a portfolio may participate in the program only if and to the extent that such participation is consistent with its investment objectives and limitations. Interfund loans have a maximum duration of seven days and may be called on one business day’s notice.
The Series did not utilize the interfund lending program during the year ended October 31, 2016.
142
I. Affiliated Trades:
Cross trades for the year ended October 31, 2016, if any, were executed by the Series pursuant to procedures adopted by the Board of Trustees of the Trust to ensure compliance with Rule 17a-7 under the Investment Company Act of 1940 (the “1940 Act”). Cross trading is the buying or selling of portfolio securities between series of investment companies, or between a series of an investment company and another entity, that are or could be considered affiliates by virtue of having a common investment adviser (or affiliated investment advisers), common directors/trustees and/or common officers. At its regularly scheduled meetings, the Board reviews such transactions for compliance with the requirements and restrictions set forth by Rule 17a-7 under the 1940 Act.
For the year ended October 31, 2016, cross trades by the Portfolios under Rule 17a-7 were as follows (amounts in thousands):
| | | | | | | | Realized |
| Portfolio | | | Purchases | | Sales | | Gain (Loss) |
| The Japanese Small Company Series | | $ | 42,370 | | $ | 46,367 | | $ | 3,752 | |
| The Asia Pacific Small Company Series | | | 29,585 | | | 29,869 | | | (873 | ) |
| The Continental Small Company Series | | | 36,654 | | | 49,457 | | | 1,095 | |
| The Canadian Small Company Series | | | 29,808 | | | 29,863 | | | 1,183 | |
J. Securities Lending:
As of October 31, 2016, each Series had securities on loan to brokers/dealers, for which each such Series received cash collateral. In addition, the following Series received non-cash collateral consisting of short and/or long term U.S. government securities (amounts in thousands):
| | Market | | Overestimated |
| | Value | | Cash |
| The Japanese Small Company Series | | $ | 8,397 | | $ | — | |
| The Asia Pacific Small Company Series | | | 22,601 | | | — | |
| The Continental Small Company Series | | | 4,118 | | | — | |
| The Canadian Small Company Series | | | — | | | (529 | ) |
Each Series invests the cash collateral, as described below, and records a liability for the return of the collateral, during the period the securities are on loan. Loans of securities are expected at all times to be secured by collateral in an amount (i) equal to at least 100% of the current market value of the loaned securities with respect to securities of the U.S. government or its agencies, (ii) generally equal to 102% of the current market value of the loaned securities with respect to U.S. securities, and (iii) generally equal to 105% of the current market value of the loaned securities with respect to foreign securities. However, daily market fluctuations could cause the Series’ collateral to be lower or higher than the expected thresholds. If this were to occur, the collateral would be adjusted the next business day to ensure adequate collateralization. In the event of default or bankruptcy by the other party to the agreement, realization and/or retention of the collateral may be subject to legal proceedings. If the borrower fails to return loaned securities, and cash collateral being maintained by the borrower is insufficient to cover the value of loaned securities and provided such collateral insufficiency is not the result of investment losses, the lending agent has agreed to pay the amount of the shortfall to the Series or, at the option of the lending agent, to replace the securities. In the event of the bankruptcy of the borrower, a Series could experience delay in recovering the loaned securities or only recover cash or a security of equivalent value.
143
Subject to their stated investment policies, each Series will generally invest the cash collateral received for the loaned securities in The DFA Short Term Investment Fund (the “Money Market Series”), an affiliated registered money market fund advised by the Advisor for which the Advisor receives a management fee of 0.05% of the average daily net assets of the Money Market Series. Such Series also may invest the cash collateral received for the loaned securities in securities of the U.S. government or its agencies, repurchase agreements collateralized by securities of the U.S. government or its agencies, and affiliated and unaffiliated registered and unregistered money market funds. For purposes of this paragraph, agencies include both agency debentures and agency mortgage- backed securities. In addition, each Series will be able to terminate the loan at any time and will receive reasonable interest on the loan, as well as amounts equal to any dividends, interest or other distributions on the loaned securities. However, dividend income received from loaned securities may not be eligible to be taxed at qualified dividend income rates.
The following table reflects a breakdown of transactions accounted for as secured borrowings, the gross obligation by the type of collateral pledged, and the remaining contractual maturity of those transactions as of October 31, 2016:
| | Remaining Contractual Maturity of the Agreements |
| | As of October 31, 2016 |
| | Overnight and | | | | Between | | | | | |
| | Continuous | | <30 days | | 30 & 90 days | | >90 days | | Total |
| Securities Lending Transactions | | | | | | | | | | | | |
| The Japanese Small Company Series | | | | | | | | | | | | |
| Common Stocks | | $ | 280,961,564 | | $— | | $— | | $— | | $ | 280,961,564 |
| The Asia Pacific Small Company Series | | | | | | | | | | | | |
| Common Stocks | | $ | 261,843,149 | | $— | | $— | | $— | | $ | 261,843,149 |
| The United Kingdom Small Company Series | | | | | | | | | | | | |
| Common Stocks | | $ | 56,583,806 | | $— | | $— | | $— | | $ | 56,583,806 |
| The Continental Small Company Series | | | | | | | | | | | | |
| Common Stocks | | $ | 350,189,570 | | $— | | $— | | $— | | $ | 350,189,570 |
| The Canadian Small Company Series | | | | | | | | | | | | |
| Common Stocks | | $ | 214,141,764 | | $— | | $— | | $— | | $ | 214,141,764 |
K. Indemnitees; Contractual Obligations:
Under the Trust’s organizational documents, its officers and directors are indemnified against certain liabilities arising out of the performance of their duties to the Trust.
In the normal course of business, the Trust enters into contracts that contain a variety of representations and warranties which provide general indemnification. The Trust’s maximum exposure under these arrangements is unknown as this would involve future claims that may be made against the Trust and/or its affiliates that have not yet occurred. However, based on experience, the Trust expects the risk of loss to be remote.
L. Subsequent Event Evaluations:
Management has evaluated the impact of all subsequent events on the Series through the date that the financial statements were issued and has determined that there are no subsequent events requiring recognition or disclosure in the financial statements.
144
REPORT OF INDEPENDENT REGISTERED PUBLIC ACCOUNTING FIRM
To the Board of Trustees of The DFA Investment Trust Company and
Shareholders of the Series, as defined:
In our opinion, the accompanying statements of assets and liabilities, including the summary schedules of portfolio holdings, and the related statements of operations and of changes in net assets and the financial highlights present fairly, in all material respects, the financial position of The Japanese Small Company Series, The Asia Pacific Small Company Series, The United Kingdom Small Company Series, The Continental Small Company Series and The Canadian Small Company Series, (constituting portfolios within The DFA Investment Trust Company, hereafter referred to as the “Series”) as of October 31, 2016, the results of each of their operations for the year then ended, the changes in each of their net assets for each of the two years in the period then ended and the financial highlights for each of the five years in the period then ended, in conformity with accounting principles generally accepted in the United States of America. These financial statements and financial highlights (hereafter referred to as “financial statements”) are the responsibility of the Series’ management. Our responsibility is to express an opinion on these financial statements based on our audits. We conducted our audits of these financial statements in accordance with the standards of the Public Company Accounting Oversight Board (United States). Those standards require that we plan and perform the audit to obtain reasonable assurance about whether the financial statements are free of material misstatement. An audit includes examining, on a test basis, evidence supporting the amounts and disclosures in the financial statements, assessing the accounting principles used and significant estimates made by management, and evaluating the overall financial statement presentation. We believe that our audits, which included confirmation of securities as of October 31, 2016 by correspondence with the custodian, brokers and the transfer agent of the investee fund, provide a reasonable basis for our opinion.
PricewaterhouseCoopers LLP
Philadelphia, Pennsylvania
December 20, 2016
145
FUND MANAGEMENT
(Unaudited)
Trustees/Directors
Each Board of Trustees/Directors (each, the “Board” and collectively, the “Boards”) of The DFA Investment Trust Company (“DFAITC”), DFA Investment Dimensions Group Inc. (“DFAIDG”), Dimensional Investment Group Inc. (“DIG”), and Dimensional Emerging Markets Value Fund (“DEM”) (each, the “Fund” and collectively, the “Funds”) is responsible for establishing the Funds’ policies and for overseeing the management of the Funds. The Trustees/Directors of the Funds, including all of the disinterested Trustees/Directors, have adopted written procedures to monitor potential conflicts of interest that might develop between portfolios of the Funds (the “Feeder Portfolios”) that invest in certain series of DFAITC or DEM (the “Master Funds”).
Each Board has three standing committees: an Audit Committee, a Nominating Committee, and an Investment Strategy Committee (the “Strategy Committee”). The Audit Committee is composed of George M. Constantinides, Roger G. Ibbotson, and Abbie J. Smith. Each member of the Audit Committee is a disinterested Trustee/Director. The Audit Committee oversees the Fund’s accounting and financial reporting policies and practices, the Fund’s internal controls, the Fund’s financial statements and the independent audits thereof and performs other oversight functions as requested by the Board. The Audit Committee recommends the appointment of each Fund’s independent registered certified public accounting firm and also acts as a liaison between the Fund’s independent registered certified public accounting firm and the full Board. There were two Audit Committee meetings held during the fiscal year ended October 31, 2016.
Each Board’s Nominating Committee is composed of George M. Constantinides, John P. Gould, Roger G. Ibbotson, Myron S. Scholes, Edward P. Lazear, and Abbie J. Smith. Each member of the Nominating Committee is a disinterested Trustee/Director. The Nominating Committee for each Board makes recommendations for nominations of disinterested and interested members on the Board to the full Board. The Nominating Committee evaluates a candidate’s qualification for Board membership and the independence of such candidate from the Advisor and other principal service providers. The Nominating Committee did not meet during the fiscal year ended October 31, 2016.
Each Board’s Strategy Committee consists of both interested and disinterested Trustees/Directors. The Strategy Committee is composed of John P. Gould, Edward P. Lazear, Myron S. Scholes, and Eduardo A. Repetto. The Strategy Committee assists the Board in carrying out its fiduciary duties with respect to the oversight of the Fund and its performance. At the request of the Board or the Advisor, the Strategy Committee may (i) review the design of possible new series of the Fund, (ii) review performance of existing portfolios of the Fund and discuss and recommend possible enhancements to the portfolios’ investment strategies, (iii) review proposals by the Advisor to modify or enhance the investment strategies or policies of each portfolio, and (iv) consider issues relating to investment services for each portfolio of the Fund. The Strategy Committee was formed on December 17, 2010, and there were three Strategy Committee meetings held during the fiscal year ended October 31, 2016.
Certain biographical information for each disinterested Trustee/Director and each interested Trustee/Director of the Funds is set forth in the tables below, including a description of each Trustee/Director’s experience as a Trustee/ Director of the Funds and as a director or trustee of other funds, as well as other recent professional experience.
The statements of additional information (together, “SAI”) of the Funds include additional information about each Trustee/Director. You may obtain copies of the SAI and prospectus of each Fund advised by Dimensional Fund Advisors LP by calling collect (512) 306-7400 or by mailing a request to Dimensional Fund Advisors LP, 6300 Bee Cave Road, Building One, Austin, Texas 78746. Prospectuses are also available at http://us.dimensional.com
146
Name, Position
with the Fund,
Address and Year of Birth | Term of Office1 and
Length of Service | Portfolios within the
DFA Fund Complex2
Overseen | Principal Occupation(s) During Past 5 Years and
Other Directorships of Public Companies Held |
| Disinterested Trustees/Directors |
George M. Constantinides
Director of DFAIDG and DIG.
Trustee of DFAITC and DEM.
The University of Chicago
Booth School of Business
5807 S. Woodlawn Avenue
Chicago, IL 60637
1947 | Since Inception | 122 portfolios in 4
investment companies | Leo Melamed Professor of Finance, The University of Chicago Booth School of Business. |
John P. Gould
Director of DFAIDG and DIG
Trustee of DFAITC and DEM
The University of Chicago
Booth School of Business
5807 S. Woodlawn Avenue
Chicago, IL 60637
1939 | DFAIDG-Since 1986
DIG-Since 1993
DFAITC-Since 1992
DEM-Since 1993 | 122 portfolios in 4
investment companies | Steven G. Rothmeier Professor and Distinguished Service Professor of Economics, University of Chicago Booth School of Business (since 1965). Member and Chair, Competitive Markets Advisory Council, Chicago Mercantile Exchange (futures trading exchange) (since 2004). Trustee, Harbor Fund (registered investment company) (29 Portfolios) (since 1994). Formerly, Member of the Board of Milwaukee Insurance Company (1997-2010). |
Roger G. Ibbotson
Director of DFAIDG and DIG
Trustee of DFAITC and DEM
Yale School of Management
P.O. Box 208200
New Haven, CT 06520-8200
1943 | DFAIDG-Since 1981
DIG-Since 1993
DFAITC-Since 1992
DEM-Since 1993 | 122 portfolios in 4
investment companies | Professor in Practice of Finance, Yale School of Management (since 1984). Chairman, CIO and Partner, Zebra Capital Management, LLC (hedge fund and asset manager) (since 2001). Consultant to Morningstar Inc. (since 2006). Formerly, Director, BIRR Portfolio Analysis, Inc. (sofware Products) (1990-2010). |
Edward P. Lazear
Director of DFAIDG and DIG
Trustee of DFAITC and DEM
Stanford University Graduate
School of Business
434 Galvez Mall Stanford,
CA 94305
1948 | DFAIDG-Since 2010
DIG-Since 2010
DFAITC-Since 2010
DEM-Since 2010 | 122 portfolios in 4
investment companies | Morris Arnold Cox Senior Fellow, Hoover Institution (since 2002). Jack Steele Parker Professor of Human Resources Management and Economics, Graduate School of Business, Stanford University (since 1995). Cornerstone Research (expert testimony and economic and financial analysis) (since 2009). Formerly, Chairman of the President George W. Bush’s Council of Economic Advisors, State of California (2005-2006). Formerly, Commissioner, White House Panel on Tax Reform (2005) |
Myron S. Scholes
Director of DFAIDG and DIG
Trustee of DFAITC and DEM
c/o Dimensional Fund Advisers, LP
6300 Bee Cave Road
Building 1 Austin, TX 78746
1941 | DFAIDG-Since 1981
DIG-Since 1993
DFAITC-Since 1992
DEM-Since 1993 | 122 portfolios in 4
investment companies | Chief Investment Strategist, Janus Capital Group Inc. (since 2014). Frank E. Buck Professor of Finance Emeritus, Graduate School of Business, Stanford University (since 1981). Chairman, Ruapay Inc. (since 2013). Formerly, Chairman, Platinum Grove Asset Management, L.P. (hedge fund) (formerly, Oak Hill Platinum Partners) (1999-2009). Formerly, Director, American Centruy Fund Complex (registered investment companies) (43 Portfolios) (1980-2014). |
Abbie J. Smith
Director of DFAIDG and DIG
Trustee of DFAITC and DEM
The University of Chicago
Booth School of Business
5807 S. Woodlawn Avenue
Chicago, IL 60637
1953 | DFAIDG-Since 2000
DIG-Since 2000
DFAITC-Since 2000
DEM-Since 2000 | 122 portfolios in 4
investment companies | Boris and Irene Stern Distinguished Service Professor of Accounting, University of Chicago Booth School of Business (since 1980). Director, HNI Corporation (formerly known as HON Industries Inc.) (office furniture) (since 2000). Director, Ryder System Inc. (transportation, logistics and supply-chain management) (since 2003). Trustee, UBS Funds (4 investment companies within the fund complex) (33 portfolios) (since 2009). Formerly, Co-Director Investment Research, Fundamental Investment Advisors (hedge fund) (2008-2011). |
147
Name, Position
with the Fund,
Address and Year of Birth | Term of Office1 and
Length of Service | Portfolios within the
DFA Fund Complex2
Overseen | Principal Occupation(s) During Past 5 Years and
Other Directorships of Public Companies Held |
| Interested Trustees/Directors* |
David G. Booth
Chairman, Director/Trustee,
President and Co-Chief
Executive Officer
6300 Bee Cave Road
Building One
Austin, TX 78746
1946 | DFAIDG-Since 1981
DIG-Since 1992
DFAITC-Since 1992
DEM-Since 1993 | 122 portfolios in 4
investment companies | Chairman, Director/Trustee, President, Co-Chief Executive Officer and formerly, Chief Executive Officer (until 1/1/2010) of the following companies: Dimensional Holdings Inc., Dimensional Fund Advisors LP, DFA Securities LLC, DEM, DFAIDG, DIG and DFAITC (collectively, the “DFA Entities”). Director of Dimensional Fund Advisors Ltd. and formerly, Chief Investment Officer. Director of DFA Australia Limited and formerly, President and Chief Investment Officer. Director of Dimensional Advisors Ltd., Dimensional Funds plc and Dimensional Funds II plc. Formerly, President, Dimensional SmartNest (US) LLC (2009-2014). Formerly, Limited Partner, Oak Hill Partners (2001-2010). Limited Partner, VSC Investors, LLC (since 2007). Trustee, University of Chicago. Trustee, University of Kansas Endowment Association. Formerly, Director, SA Funds (registered investment company). Chairman, Director and Co-Chief Executive Officer of Dimensional Fund Advisors Canada ULC. Director and President (since 2012) of Dimensional Japan Ltd. Chairman, Director, President, and Co-Chief Executive Officer of Dimensional Cayman Commodity Fund I Ltd. (since 2010). |
Eduardo A. Repetto
Director/Trustee, Co-Chief
Executive Officer and Co-Chief
Investment Officer
6300 Bee Cave Road,
Building One Austin,
TX 78746
1967 | DFAIDG-Since 2009
DIG-Since 2009
DFAITC-Since 2009
DEM-Since 2009 | 122 portfolios in 4
investment companies | Co-Chief Executive Officer (beginning January 2010), Co-Chief Investment Officer (since June 2014), Director/Trustee, and formerly, Chief Investment Officer (March 2007-June 2014) of the DFA Entities. Director, Co-Chief Executive Officer and Chief Investment Officer (since 2010) of Dimensional Cayman Commodity Fund I Ltd. Director, Co-Chief Executive Officer, President and Co-Chief Investment Officer of Dimensional Fund Advisors Canada ULC and formerly, Chief Investment Officer (until April 2014). Co-Chief Investment Officer, Vice President, and Director of DFA Australia Limited and formerly, Chief Investment Officer (until April 2014). Director of Dimensional Fund Advisors Ltd., Dimensional Funds plc, Dimensional Funds II plc and Dimensional Advisors Ltd. Formerly, Vice President of the DFA Entities and Dimensional Fund Advisors Canada ULC. Director and Chief Investment Officer (since December 2012) of Dimensional Japan Ltd. |
| 1 | | Each Trustee/Director holds office for an indefinite term until his or her successor is elected and qualified. |
| |
| 2 | | Each Trustee/Director is a director or trustee of each of the four registered investment companies within the DFA Fund Complex, which includes the DFAIDG, DIG, DFAITC and DEM. Each disinterested Trustee/Director also serves on the Independent Review Committee of the Dimensional Funds, mutual funds registered in the provinces of Canada and managed by an affiliate of Dimensional Fund Advisors LP (the “Advisor”), Dimensional Fund Advisors Canada ULC. |
| |
| * | | Interested Trustees/Directors are described as such because they are deemed to be “interested persons,” as that term is defined under the Investment Company Act of 1940, as amended, due to their positions with the Advisor. |
148
Officers
Below is the name, year of birth, information regarding positions with the Funds and the principal occupation for each officer of the Funds. The address of each officer is 6300 Bee Cave Road, Building One, Austin, TX 78746. Each of the officers listed below holds the same office (except as otherwise noted) in the DFA Entities.
Name and Year
of Birth | Position | Term of Office1
and Length of
Service | Principal Occupation During Past 5 Years |
April A. Aandal
1963 | Vice President | Since 2008 | Vice President of all the DFA Entities. |
Robyn G. Alcorta
1974 | Vice President | Since 2012 | Vice President of all the DFA Entities. Formerly, Vice President, Business Development at Capson Physicians Insurance Company (2010-2012). |
Magdalia S. Armstrong
1977 | Vice President | Since 2016 | Vice President of all the DFA Entities. Formerly, Regional Director for Dimensional Fund Advisors LP (January 2011 – January 2016). |
Darryl D. Avery
1966 | Vice President | Since 2005 | Vice President of all the DFA Entities. |
Arthur H. Barlow
1955 | Vice President | Since 1993 | Vice President of all the DFA Entities. Director and Managing Director of Dimensional Fund Advisors Ltd (since September 2013). Director of Dimensional Funds plc and Dimensional Funds II plc (since November 2013). |
Lana Bergstein
1974 | Vice President | Since 2014 | Vice President of all the DFA Entities. Formerly, Client Service Manager for Dimensional Fund Advisors LP (February 2008 – January 2014). |
Stanley W. Black
1970 | Vice President | Since 2014 | Vice President of all the DFA Entities. Formerly, Senior Research Associate (January 2012 – January 2014) and Research Associate (2006 – 2011) for Dimensional Fund Advisors LP. |
Aaron T. Borders
1973 | Vice President | Since 2014 | Vice President of all the DFA Entities. Formerly, Regional Director for Dimensional Fund Advisors LP (April 2008 – January 2014). |
Scott A. Bosworth
1968 | Vice President | Since 2007 | Vice President of all the DFA Entities. |
Valerie A. Brown
1967 | Vice President and
Assistant Secretary | Since 2001 | Vice President and Assistant Secretary of all the DFA Entities, DFA Australia Limited, Dimensional Fund Advisors Ltd., Dimensional Cayman Commodity Fund I Ltd., Dimensional Fund Advisors Pte. and Dimensional Hong Kong Limited. Director, Vice President, Director and Assistant Secretary of Dimensional Fund Advisors Canada ULC. |
David P. Butler
1964 | Vice President | Since 2007 | Vice President of all the DFA Entities. Head of Global Financial Services for Dimensional Fund Advisors LP (since 2008). |
Douglas M. Byrkit
1970 | Vice President | Since 2012 | Vice President of all the DFA Entities. Formerly, Regional Director for Dimensional Fund Advisors LP (December 2010 – January 2012). |
Hunt M. Cairns
1973 | Vice President | Since 2014 | Vice President of all the DFA Entities. Formerly, Regional Director (January 2010 – January 2014) for Dimensional Fund Advisors LP. |
David K. Campbell
1966 | Vice President | Since 2016 | Vice President of all the DFA Entities. Formerly, DC Relationship Manager for Dimensional Fund Advisors LP (October 2010 – January 2016). |
Dennis M. Chamberlain
1972 | Vice President | Since 2015 | Vice President of all the DFA Entities. Formerly, Regional Director (January 2012 – January 2015) for Dimensional Fund Advisors LP; Principal for Chamberlain Financial Group (October 2010 – December 2011). |
Ryan J. Chaplinski
1971 | Vice President | Since 2015 | Vice President of all the DFA Entities. Formerly, Regional Director (June 2011 – January 2015) for Dimensional Fund Advisors LP; Sales Executive for Vanguard (2004 – June 2011). |
James G. Charles
1956 | Vice President | Since 2011 | Vice President of all the DFA Entities. |
149
Name and Year
of Birth | Position | Term of Office1
and Length of
Service | Principal Occupation During Past 5 Years |
Joseph H. Chi
1966 | Vice President | Since 2009 | Vice President of all the DFA Entities. Co-Head of Portfolio Management (since March 2012) and Senior Portfolio Manager (since January 2012) for Dimensional Fund Advisors LP. Vice President of Dimensional Fund Advisors Canada ULC (since April 2016). Formerly, Portfolio Manager for Dimensional Fund Advisors LP (October 2005 to January 2012). |
Pil Sun Choi
1972 | Vice President | Since 2014 | Vice President of all the DFA Entities. Formerly, Counsel for Dimensional Fund Advisors LP (April 2012 – January 2014); Vice President and Counsel for AllianceBernstein L.P. (2006 – 2012). |
Stephen A. Clark
1972 | Vice President | Since 2004 | Vice President of all the DFA Entities. Director and Vice President of Dimensional Japan Ltd (since February 2016). President and Director of Dimensional Fund Advisors Canada ULC (since February 2016), Vice President of DFA Australia Limited (since April 2008) and Director (since Oct 2016). Director of Dimensional Advisors Ltd, Dimensional Fund Advisors Pte. Ltd., and Dimensional Hong Kong Limited, (since April 2016), Vice President of Dimensional Fund Advisors Pte Ltd. (since June 2016), Head of Global Institutional Services for Dimensional Fund Advisors LP (since January 2014). Formerly, Vice President of Dimensional Fund Advisors Canada ULC (December 2010 – February 2016); Head of Institutional, North America (March 2012 to December 2013) and Head of Portfolio Management (January 2006 to March 2012) for Dimensional Fund Advisors LP. |
Matthew B. Cobb
1971 | Vice President | Since 2013 | Vice President of all the DFA Entities. Formerly, Regional Director for Dimensional Fund Advisors LP (September 2011 – March 2013); Vice President at MullinTBG (2005-2011). |
Rose C. Cooke
1971 | Vice President | Since 2014 | Vice President of all the DFA Entities. Formerly, Regional Director for Dimensional Fund Advisors LP (August 2010 – March 2014). |
Ryan Cooper
1979 | Vice President | Since 2013 | Vice President of all the DFA Entities. Formerly, Regional Director for Dimensional Fund Advisors LP (2003 – March 2014). |
Jeffrey D. Cornell
1976 | Vice President | Since 2012 | Vice President of all the DFA Entities. Formerly, Regional Director for Dimensional Fund Advisors LP (August 2002 – January 2012). |
Robert P. Cornell
1949 | Vice President | Since 2007 | Vice President of all the DFA Entities. |
John W. Crill (Wes)
1982 | Vice President | Since 2016 | Vice President of all the DFA Entities. Formerly, Senior Associate, Research (January 2015 – January 2016); Associate, Research (January 2014 – January 2015); Analyst, Research (July 2010 – January 2014) for Dimensional Fund Advisors LP. |
Christopher S. Crossan
1965 | Vice President and Global Chief Compliance Officer | Since 2004 | Vice President and Global Chief Compliance Officer of all the DFA Entities, DFA Australia Limited and Dimensional Fund Advisors Ltd. Chief Compliance Officer and Chief Privacy Officer of Dimensional Fund Advisors Canada ULC, Chief Compliance Officer of Dimensional Fund Advisors Pte. Ltd. Formerly, Vice President and Global Chief Compliance Officer for Dimensional SmartNest (US) LLC (October 2010 – 2014). |
John T. Curnutte
1980 | Vice President | Since 2016 | Vice President of all the DFA Entities. Formerly, Manager, Research Systems (November 2012 – January 2016) for Dimensional Fund Advisors LP; Assistant Vice President, Oaktree Capital Management (April 2011 – October 2012. |
John Dashtara
1980 | Vice President | Since 2015 | Vice President of all the DFA Entities. Formerly, Regional Director (July 2013 – January 2015) for Dimensional Fund Advisors LP; Relationship Manager for Blackrock, Inc. (July 2011 – July 2013); Vice President for Towers Watson (formerly, WellsCanning) (June 2009 – July 2011). |
James L. Davis
1956 | Vice President | Since 1999 | Vice President of all the DFA Entities. |
Robert T. Deere
1957 | Vice President | Since 1994 | Vice President of all the DFA Entities, DFA Australia Limited and Dimensional Fund Advisors Canada ULC. |
150
Name and Year
of Birth | Position | Term of Office1
and Length of
Service | Principal Occupation During Past 5 Years |
Johnathon K. DeKinder
1979 | Vice President | Since 2014 | Vice President of all the DFA Entities. Formerly, Regional Director (January 2012 – January 2014) and Senior Associate (August 2010 – December 2011) for Dimensional Fund Advisors LP. |
Mark J. Dennis
1976 | Vice President | Since 2015 | Vice President of all DFA Entities. Formerly, Regional Director (May 2011 – January 2015) for Dimensional Fund Advisors LP; Vice President, Portfolio Specialist (January 2007 – May 2011) for Morgan Stanley Investment Management. |
Massimiliano DeSantis
1971 | Vice President | Since 2015 | Vice President of all DFA Entities. Formerly, Senior Associate, Research (November 2012 – January 2015) for Dimensional Fund Advisors LP; Senior Consultant, NERA Economic Consulting, New York (May 2010 – November 2012). |
Peter F. Dillard
1972 | Vice President | Since 2010 | Vice President of all the DFA Entities. Chief Data Officer for Dimensional Fund Advisors LP (since January 2016). |
Robert W. Dintzner
1970 | Vice President | Since 2001 | Vice President of all the DFA Entities. |
Karen M. Dolan
1979 | Vice President | Since 2014 | Vice President of all the DFA Entities. Head of Marketing for Dimensional Fund Advisors LP (since February 2013). Formerly, Senior Manager of Research and Marketing for Dimensional Fund Advisors LP (June 2012 – January 2013); Director of Mutual Fund Analysis at Morningstar (January 2008 – May 2012). |
L. Todd Erskine
1959 | Vice President | Since 2015 | Vice President of all DFA Entities. Formerly, Regional Director (May 2008 – January 2015) for Dimensional Fund Advisors LP. |
Richard A. Eustice
1965 | Vice President and Assistant Secretary | Since 1998 | Vice President and Assistant Secretary of all the DFA Entities and DFA Australia Limited. Chief Operating Officer for Dimensional Fund Advisors Pte. Ltd. (since April 2013). Formerly, Chief Operating Officer for Dimensional Fund Advisors Ltd. (July 2008 – March 2013). |
Gretchen A. Flicker
1971 | Vice President | Since 2004 | Vice President of all the DFA Entities. |
Jed S. Fogdall
1974 | Vice President | Since 2008 | Vice President of all the DFA Entities. Co-Head of Portfolio Management (since March 2012) and Senior Portfolio Manager (since January 2012) of Dimensional Fund Advisors LP. Vice President of Dimensional Fund Advisors Canada ULC (since April 2016). Formerly, Portfolio Manager of Dimensional Fund Advisors LP (September 2004 – January 2012). |
Edward A. Foley
1976 | Vice President | Since 2014 | Vice President of all the DFA Entities. Formerly, Regional Director for Dimensional Fund Advisors LP (August 2011 – January 2014); Senior Vice President of First Trust Advisors L.P. (2007 – July 2011). |
Deborah J.G. Foster
1959 | Vice President | Since 2015 | Vice President of all the DFA Entities. Formerly, Senior Associate (May 2011 – January 2015) for Dimensional Fund Advisors LP. |
Jeremy P. Freeman
1970 | Vice President | Since 2009 | Vice President of all the DFA Entities. |
Kimberly A. Ginsburg
1970 | Vice President | Since 2015 | Vice President of all the DFA Entities. Formerly, Vice President for Dimensional SmartNest (US) LLC (January 2012 - November 2014); Senior Vice President for Morningstar (July 2004 – July 2011). |
Mark R. Gochnour
1967 | Vice President | Since 2007 | Vice President of all the DFA Entities. |
Tom M. Goodrum
1968 | Vice President | Since 2012 | Vice President of all the DFA Entities. Formerly, Managing Director at BlackRock (2004 – January 2012). |
Henry F. Gray
1967 | Vice President | Since 2000 | Vice President of all the DFA Entities. |
151
Name and Year
of Birth | Position | Term of Office1
and Length of
Service | Principal Occupation During Past 5 Years |
John T. Gray
1974 | Vice President | Since 2007 | Vice President of all the DFA Entities. |
Christian Gunther
1975 | Vice President | Since 2011 | Vice President of all the DFA Entities. Senior Trader for Dimensional Fund Advisors LP (since 2012). Formerly, Senior Trader (2009-2012). |
Robert W. Hawkins
1974 | Vice President | Since 2014 | Vice President of all the DFA Entities. Formerly, Counsel for Dimensional Fund Advisors LP (January 2011 – January 2014). |
Joel H. Hefner
1967 | Vice President | Since 2007 | Vice President of all the DFA Entities. |
Kevin B. Hight
1967 | Vice President | Since 2005 | Vice President of all the DFA Entities. |
Gregory K. Hinkle
1958 | Vice President, Chief Financial Officer, and Treasurer | Since 2016 | Vice President, Chief Financial Officer, and Treasurer of all the DFA Entities. Interim Chief Financial Officer, interim Treasurer and Vice President of Dimensional Advisors Ltd., Dimensional Hong Kong Limited, Dimensional Cayman Commodity Fund I Ltd., Dimensional Fund Advisors Canada ULC, Dimensional Fund Advisors Pte. Ltd, DFA Australia Ltd. Formerly, interim Chief Financial Officer and interim Treasurer (April 2016 – September 2016), and Controller (August 2015 – September 2016) of all the DFA Entities); Vice President of T. Rowe Price Group, Inc. and Director of Investment Treasury and Treasurer of the T. Rowe Price Funds (March 2008 – July 2015). |
Christine W. Ho
1967 | Vice President | Since 2004 | Vice President of all the DFA Entities. |
Michael C. Horvath
1960 | Vice President | Since 2011 | Vice President of all the DFA Entities. Formerly, Managing Director, Co-Head Global Consultant Relations at BlackRock (2004-2011). |
Mark A. Hunter
1971 | Vice President | Since 2015 | Vice President of all the DFA Entities. Formerly, Senior Compliance Officer (November 2010 – January 2015) for Dimensional Fund Advisors LP. |
Alan R. Hutchison
1977 | Vice President | Since 2016 | Vice President of all the DFA Entities. Portfolio Manager for Dimensional Fund Advisors LP (January 2013 – Present). Formerly, Investment Associate for Dimensional Fund Advisors LP (January 2010 - January 2013). |
Shahryar S. Jaberzadeh
1983 | Vice President | Since 2016 | Vice President of all the DFA Entities. Formerly, Regional Director for Dimensional Fund Advisors LP (April 2006 – January 2016). |
Jeremy R. James
1977 | Vice President | Since 2016 | Vice President of all the DFA Entities. Formerly, Manager, IT Service Management (October 2014 – January 2016); Manager, Managed DC Systems (October 2005 – October 2014) for Dimensional Fund Advisors LP. |
Jeff J. Jeon
1973 | Vice President | Since 2004 | Vice President of all the DFA Entities and Dimensional Cayman Commodity Fund I Ltd. |
Garret D. Jones
1971 | Vice President | Since 2014 | Vice President of all the DFA Entities. Formerly, Manager of Sales and Marketing Systems (January 2011 – January 2014) for Dimensional Fund Advisors LP. |
Stephen W. Jones
1968 | Vice President | Since 2012 | Vice President of all the DFA Entities. Formerly, Facilities Manager for Dimensional Fund Advisors LP (October 2008 – January 2012). |
Scott P. Kaup
1975 | Vice President | Since 2015 | Vice President of all the DFA Entities. Formerly, Senior Manager, Investment Operations (January 2014 – January 2015) and Investment Operations Manager (May 2008 – January 2014) for Dimensional Fund Advisors LP. |
David M. Kavanaugh
1978 | Vice President | Since 2014 | Vice President of all the DFA Entities. Head of Operations for Financial Advisor Services for Dimensional Fund Advisors LP (since July 2014). Formerly, Counsel of Dimensional Fund Advisors LP (August 2011 – January 2014); Associate at Andrews Kurth LLP (2006 – 2011). |
152
Name and Year
of Birth | Position | Term of Office1
and Length of
Service | Principal Occupation During Past 5 Years |
Patrick M. Keating
1954 | Vice President | Since 2003 | Vice President of DFAIDG, DIG, DFAITC, DEM, Dimensional Holdings Inc., Dimensional Fund Advisors LP and Dimensional Japan Ltd. Chief Operating Officer and Director of Dimensional Japan Ltd. Formerly, Vice President of DFA Securities LLC, Dimensional Cayman Commodity Fund I Ltd. and Dimensional Advisors Ltd (until February 2015); Chief Operating Officer of Dimensional Holdings Inc., DFA Securities LLC, Dimensional Fund Advisors LP, Dimensional Cayman Commodity Fund I Ltd., Dimensional Advisors Ltd. and Dimensional Fund Advisors Pte. Ltd. (until February 2015); Director, Vice President, and Chief Privacy Officer of Dimensional Fund Advisors Canada ULC (until February 2015); Director of DFA Australia Limited, Dimensional Fund Advisors Ltd. and Dimensional Advisors Ltd. (until February 2015); and Director and Vice President of Dimensional Hong Kong Limited and Dimensional Fund Advisors Pte. Ltd. (until February 2015). |
Andrew K. Keiper
1977 | Vice President | Since 2013 | Vice President of all the DFA Entities. Formerly, Regional Director for Dimensional Fund Advisors LP (October 2004 – January 2013). |
David M. Kershner
1971 | Vice President | Since 2010 | Vice President of all the DFA Entities. Portfolio Manager for Dimensional Fund Advisors LP (since June 2004). |
Arun C. Keswani
1975 | Vice President | Since 2016 | Vice President of all the DFA Entities. Senior Portfolio Manager for Dimensional Fund Advisors LP (January 2015 – Present). Formerly, Portfolio Manager (January 2013 – January 2015) and Investment Associate (October 2011 – January 2013) for Dimensional Fund Advisors LP; Investment Banking Associate at Morgan Stanley (August 2010 – September 2011). |
Kimberly L. Kiser
1972 | Vice President | Since 2014 | Vice President of all the DFA Entities. Formerly, Creative Director for Dimensional Fund Advisors LP (September 2012 – January 2014); Vice President and Global Creative Director at Morgan Stanley (2007 – 2012); Visiting Assistant Professor, Graduate Communications Design at Pratt Institute (2004 – 2012). |
Natalia Y. Knych
1971 | Vice President | Since 2016 | Vice President of all the DFA Entities. Formerly, Manager, RFP, Institutional (January 2015 – January 2016); Senior Associate, Institutional (April 2007 – January 2015) for Dimensional Fund Advisors LP. |
Timothy R. Kohn
1971 | Vice President | Since 2011 | Vice President of all the DFA Entities. Head of Defined Contribution Sales for Dimensional Fund Advisors LP (since August 2010). |
Joseph F. Kolerich
1971 | Vice President | Since 2004 | Vice President of all the DFA Entities. Senior Portfolio Manager of Dimensional Fund Advisors LP (since January 2012). Formerly, Portfolio Manager for Dimensional (April 2001 – January 2012). |
Mark D. Krasniewski
1981 | Vice President | Since 2013 | Vice President of all the DFA Entities. Formerly, Senior Associate, Investment Analytics and Data (January 2012 – December 2012) and Systems Developer (June 2007 – December 2011) for Dimensional Fund Advisors LP. |
Kahne L. Krause
1966 | Vice President | Since 2014 | Vice President of all the DFA Entities. Formerly, Regional Director (May 2010 – January 2014) for Dimensional Fund Advisors LP. |
Stephen W. Kurad
1968 | Vice President | Since 2011 | Vice President of all the DFA Entities. |
Michael F. Lane
1967 | Vice President | Since 2004 | Vice President of all the DFA Entities. Formerly, Chief Executive Officer for Dimensional SmartNest (US) LLC (July 2012 – November 2014). |
Francis R. Lao
1969 | Vice President | Since 2011 | Vice President of all the DFA Entities. Formerly, Vice President – Global Operations at Janus Capital Group (2005-2011). |
David F. LaRusso
1978 | Vice President | Since 2013 | Vice President of all the DFA Entities. Formerly, Senior Trader (January 2010 – December 2012) for Dimensional Fund Advisors LP. |
Juliet H. Lee
1971 | Vice President | Since 2005 | Vice President of all the DFA Entities. |
153
Name and Year
of Birth | Position | Term of Office1
and Length of
Service | Principal Occupation During Past 5 Years |
Marlena I. Lee
1980 | Vice President | Since 2011 | Vice President of all the DFA Entities. |
Paul A. Lehman
1971 | Vice President | Since 2015 | Vice President of all the DFA Entities. Formerly, Regional Director (July 2013 – January 2015) for Dimensional Fund Advisors LP; Chief Investment Officer (April 2005 – April 2013) for First Citizens Bancorporation. |
John B. Lessley
1960 | Vice President | Since 2013 | Vice President of all the DFA Entities. Formerly, Regional Director for Dimensional Fund Advisors LP (January 2008 – January 2013). |
Joy L. Lopez
1971 | Vice President | Since 2015 | Vice President of all the DFA Entities. Formerly, Senior Tax Manager (February 2013 – January 2015) for Dimensional Fund Advisors LP; Vice President and Tax Manager, North America (August 2006 – April 2012) for Pacific Investment Management Company. |
Apollo D. Lupescu
1969 | Vice President | Since 2009 | Vice President of all the DFA Entities. |
Timothy P. Luyet
1972 | Vice President | Since 2015 | Vice President of all the DFA Entities. Formerly, Senior Manager, Marketing Operations (January 2014 – January 2015), Manager, Client Systems (October 2011 – January 2014) and RFP Manager (April 2010 – October 2011) for Dimensional Fund Advisors LP. |
Peter Magnusson
1969 | Vice President | Since 2014 | Vice President of all the DFA Entities. Formerly, Regional Director for Dimensional Fund Advisors LP (January 2011 – January 2014). |
Kenneth M. Manell
1972 | Vice President | Since 2010 | Vice President of all the DFA Entities and Dimensional Cayman Commodity Fund I Ltd. |
Aaron M. Marcus
1970 | Vice President | Since 2008 | Vice President of all DFA Entities and Head of Global Human Resources for Dimensional Fund Advisors LP. |
Duane R. Mattson
1965 | Vice President | Since 2015 | Vice President of all the DFA Entities. Formerly, Senior Compliance Officer (May 2012 – January 2015) for Dimensional Fund Advisors LP; Chief Compliance Officer (April 2010 – April 2012) for Al Frank Asset Management. |
Bryan R. McClune
1975 | Vice President | Since 2014 | Vice President of all the DFA Entities. Formerly, Regional Director of Dimensional Fund Advisors LP (January 2009 – January 2014). |
Philip P. McInnis
1984 | Vice President | Since 2014 | Vice President of all the DFA Entities. Formerly, Regional Director (January 2009 – January 2014) and Senior Associate (2011) for Dimensional Fund Advisors LP. |
Francis L. McNamara
1959 | Vice President | Since 2016 | Vice President of all the DFA Entities. Formerly, Manager, Project Management Office for Dimensional Fund Advisors LP (October 2006 – January 2016). |
Travis A. Meldau
1981 | Vice President | Since 2015 | Vice President of all the DFA Entities. Portfolio Manager (since September 2011) for Dimensional Fund Advisors LP. Formerly, Portfolio Manager for Wells Capital Management (October 2004 – September 2011). |
Tracy R. Mitchell
1974 | Vice President | Since 2016 | Vice President of all the DFA Entities. Formerly, Regional Director for Dimensional Fund Advisors LP (September 2013 – January 2016); Managing Director, Client Services, Charles Schwab (December 2009 – August 2013). |
Jonathan G. Nelson
1971 | Vice President | Since 2013 | Vice President of all the DFA Entities. Formerly, Manager, Investment Systems (2011 – January 2013) for Dimensional Fund Advisors LP. |
154
Name and Year
of Birth | Position | Term of Office1
and Length of
Service | Principal Occupation During Past 5 Years |
Catherine L. Newell
1964 | Vice President and Secretary | Vice President since 1997 and Secretary since 2000 | Vice President and Secretary of all the DFA Entities. Director, Vice President and Secretary of DFA Australia Limited and Dimensional Fund Advisors Ltd. (since February 2002, April 1997, and May 2002, respectively). Vice President and Secretary of Dimensional Fund Advisors Canada ULC (since June 2003), Dimensional Cayman Commodity Fund I Ltd., Dimensional Japan Ltd (since February 2012), Dimensional Advisors Ltd (since March 2012), Dimensional Fund Advisors Pte. Ltd. (since June 2012). Director of Dimensional Funds plc and Dimensional Funds II plc (since 2002 and 2006, respectively). Director of Dimensional Japan Ltd., Dimensional Advisors Ltd., Dimensional Fund Advisors Pte. Ltd. and Dimensional Hong Kong Limited (since August 2012 and July 2012). Formerly, Vice President and Secretary of Dimensional SmartNest (US) LLC (October 2010 – November 2014). |
John R. Nicholson
1977 | Vice President | Since 2015 | Vice President of all the DFA Entities. Formerly, Regional Director (June 2011 – January 2015) for Dimensional Fund Advisors LP; Sales Executive for Vanguard (July 2008 – May 2011). |
Pamela B. Noble
1964 | Vice President | Since 2011 | Vice President of all the DFA Entities. Formerly, Portfolio Manager for Dimensional Fund Advisors LP (2008 - 2010). |
Selwyn Notelovitz
1961 | Vice President and Deputy Chief Compliance Officer | Since 2013 | Vice President and Deputy Chief Compliance Officer of all the DFA Entities. Deputy Chief Compliance Officer of Dimensional Fund Advisors LP (since December 2012). Formerly, Chief Compliance Officer of Wellington Management Company, LLP (2004 – 2011). |
Carolyn L. O
1974 | Vice President | Since 2010 | Vice President of all the DFA Entities, Dimensional Cayman Commodity Fund I Ltd., and Dimensional Fund Advisors Canada ULC (since April 2016). Deputy General Counsel, Funds (since 2011). |
Gerard K. O’Reilly
1976 | Vice President and Co-Chief Investment Officer | Vice President since 2007 and Co-Chief Investment Officer since 2014 | Vice President and Co-Chief Investment Officer of all the DFA Entities, Dimensional Fund Advisors Canada ULC, and Dimensional Japan Ltd. Director of Dimensional Funds plc and Dimensional Fund II plc. |
Randy C. Olson
1980 | Vice President | Since 2016 | Vice President of all the DFA Entities. Formerly, Senior Compliance Officer for Dimensional Fund Advisors LP (July 2014 – January 2016); Vice President Regional Head of Investment Compliance, Asia, PIMCO Asia Private Limited (July 2012 – July 2014); Country Compliance Officer, Janus Capital, Singapore Private Limited (May 2011 – June 2012). |
Daniel C. Ong
1973 | Vice President | Since 2009 | Vice President of all the DFA Entities. Portfolio Manager for Dimensional Fund Advisors LP (since July 2005). |
Kyle K. Ozaki
1978 | Vice President | Since 2010 | Vice President of all the DFA Entities. |
Matthew A. Pawlak
1977 | Vice President | Since 2013 | Vice President of all the DFA Entities. Formerly, Regional Director for Dimensional Fund Advisors LP (2012 – January 2013); Senior Consultant (June 2011-December 2011) and Senior Investment Analyst and Consultant (July 2008-June 2011) at Hewitt EnnisKnupp. |
Mary T. Phillips
1981 | Vice President | Since 2016 | Vice President of all the DFA Entities. Senior Portfolio Manager (January 2015 – present). Formerly, Portfolio Manager (April 2014 – January 2015) and Investment Associate for Dimensional Fund Advisors LP (July 2012 – March 2014). |
Jeffrey L. Pierce
1984 | Vice President | Since 2015 | Vice President of all the DFA Entities. Senior Manager, Advisor Benchmarking (since January 2015) for Dimensional Fund Advisors LP. Formerly, Manager, Advisor Benchmarking (April 2012 – December 2014) for Dimensional Fund Advisors LP; Senior Manager, Research and Consulting (October 2010 – April 2012) for Crain Communications Inc. |
Olivian T. Pitis
1974 | Vice President | Since 2015 | Vice President of all the DFA Entities. Formerly, Regional Director (May 2011 – January 2015) for Dimensional Fund Advisors LP. |
155
Name and Year
of Birth | Position | Term of Office1
and Length of
Service | Principal Occupation During Past 5 Years |
Brian P. Pitre
1976 | Vice President | Since 2015 | Vice President of all the DFA Entities. Counsel for Dimensional Fund Advisors LP (since February 2015). Formerly, Chief Financial Officer and General Counsel for Relentless (March 2014 – January 2015); Vice President of all the DFA Entities (January 2013 – March 2014); Counsel for Dimensional Fund Advisors LP (January 2009 - March 2014). |
David A. Plecha
1961 | Vice President | Since 1993 | Vice President of all the DFA Entities, DFA Australia Limited, Dimensional Fund Advisors Ltd. and Dimensional Fund Advisors Canada ULC. |
Allen Pu
1970 | Vice President | Since 2011 | Vice President of all the DFA Entities. Senior Portfolio Manager for Dimensional Fund Advisors LP (since January 2015). Formerly, Portfolio Manager for Dimensional Fund Advisors LP (2006 – January 2015). |
David J. Rapozo
1967 | Vice President | Since 2014 | Vice President of all the DFA Entities. Formerly, Regional Director for Dimensional Fund Advisors LP (January 2011 – January 2014). |
Mark A. Regier
1969 | Vice President | Since 2013 | Vice President of all the DFA Entities. Formerly, Planning and Analysis Manager for Dimensional Fund Advisors LP (July 2007 – January 2014). |
Cory T. Riedberger
1979 | Vice President | Since 2015 | Vice President of all the DFA Entities. Formerly, Regional Director (March 2011 – January 2015) for Dimensional Fund Advisors LP. |
Savina B. Rizova
1981 | Vice President | Since 2012 | Vice President of all the DFA Entities. Formerly, Research Associate (June 2011 – January 2012) for Dimensional Fund Advisors LP. |
Michael F. Rocque
1968 | Vice President | Since 2015 | Vice President of all the DFA Entities. Formerly, Senior Fund Accounting Manager (July 2013 – January 2015) for Dimensional Fund Advisors LP; Senior Financial Consultant and Chief Accounting Officer (July 2002 – July 2013) for MFS Investment Management. |
L. Jacobo Rodríguez
1971 | Vice President | Since 2005 | Vice President of all the DFA Entities. |
Austin S. Rosenthal
1978 | Vice President | Since 2015 | Vice President of all the DFA Entities. Formerly, Vice President for Dimensional SmartNest (US) LLC (September 2010 - November 2014). |
Oliver J. Rowe
1960 | Vice President | Since 2014 | Vice President of all the DFA Entities. Formerly, Senior Manager, Human Resources for Dimensional Fund Advisors LP (January 2012 – January 2014); Director of Human Resources at Spansion, Inc. (March 2009 – December 2011). |
Joseph S. Ruzicka
1987 | Vice President | Since 2015 | Vice President of all the DFA Entities. Formerly, Manager Investment Analytics and Data (January 2014 – January 2015), Senior Associate, Investment Analytics and Data (January 2013 – January 2014), Associate, Investment Analytics and Data (January 2012 – January 2013), and Investment Data Analyst (April 2010 – January 2012) for Dimensional Fund Advisors LP. |
Julie A. Saft
1959 | Vice President | Since 2010 | Vice President of all the DFA Entities. |
Joel P. Schneider
1980 | Vice President | Since 2015 | Vice President of all the DFA Entities. Portfolio Manager (since 2013) for Dimensional Fund Advisors LP. Formerly, Investment Associate (April 2011 – January 2013) for Dimensional Fund Advisors LP. |
Ashish Shrestha
1978 | Vice President | Since 2015 | Vice President of all the DFA Entities. Formerly, Regional Director (September 2009 – January 2015) for Dimensional Fund Advisors LP. |
Bruce A. Simmons
1965 | Vice President | Since 2009 | Vice President of all the DFA Entities. |
Ted R. Simpson
1968 | Vice President | Since 2007 | Vice President of all the DFA Entities. |
156
Name and Year
of Birth | Position | Term of Office1
and Length of
Service | Principal Occupation During Past 5 Years |
Bhanu P. Singh
1981 | Vice President | Since 2014 | Vice President of all the DFA Entities. Senior Portfolio Manager for Dimensional Fund Advisors LP (since January 2015). Formerly, Portfolio Manager (January 2012 – January 2015) and Investment Associate for Dimensional Fund Advisors LP (August 2010 – December 2011). |
Bryce D. Skaff
1975 | Vice President | Since 2007 | Vice President of all the DFA Entities. |
Lukas J. Smart
1977 | Vice President | Since 2014 | Vice President of all the DFA Entities. Portfolio Manager of Dimensional Fund Advisors LP (since January 2010). |
Andrew D. Smith
1968 | Vice President | Since 2011 | Vice President of all the DFA Entities. |
Grady M. Smith
1956 | Vice President | Since 2004 | Vice President of all the DFA Entities and Dimensional Fund Advisors Canada ULC. |
Matthew Snider
1976 | Vice President | Since 2016 | Vice President of all the DFA Entities. Formerly, Regional Director for Dimensional Fund Advisors LP (September 2011 – January 2016); Sales Executive, Vanguard (May 2008 – August 2011). |
Lawrence R. Spieth
1947 | Vice President | Since 2004 | Vice President of all the DFA Entities. |
Charlene L. St. John
1965 | Vice President | Since 2016 | Vice President of all the DFA Entities. Formerly, Senior Manager for Dimensional Fund Advisors LP (September 2014 - January 2016); Vice President of Marketing, Forward Management/Salient (January 2008 – February 2014). |
Brent M. Stone
1971 | Vice President | Since 2016 | Vice President of all the DFA Entities. Formerly, Project Manager (September 2012 – December 2015) and Manager, Corporate Systems for Dimensional Fund Advisors LP (January 2011 – September 2012). |
Richard H. Tatlow V
1971 | Vice President | Since 2013 | Vice President of all the DFA Entities. Formerly, Regional Director for Dimensional Fund Advisors LP (April 2010 – January 2013). |
Blake T. Tatsuta
1973 | Vice President | Since 2013 | Vice President of all the DFA Entities. Formerly, Manager, Investment Analytics and Data (2012 – January 2013) and Research Assistant (2002-2011) for Dimensional Fund Advisors LP. |
James J. Taylor
1983 | Vice President | Since 2016 | Vice President of all the DFA Entities. Formerly, Accounting Manager for Dimensional Fund Advisors LP (November 2009 – January 2016). |
Erik T. Totten
1980 | Vice President | Since 2013 | Vice President of all the DFA Entities. Formerly, Regional Director (2010 – January 2013) for Dimensional Fund Advisors LP. |
John H. Totten
1978 | Vice President | Since 2012 | Vice President of all the DFA Entities. Formerly, Regional Director for Dimensional Fund Advisors LP (January 2008 - January 2012). |
Robert C. Trotter
1958 | Vice President | Since 2009 | Vice President of all the DFA Entities. |
Dave C. Twardowski
1982 | Vice President | Since 2015 | Vice President of all the DFA Entities. Formerly, Research Associate (June 2011 – January 2015) for Dimensional Fund Advisors LP. |
Karen E. Umland
1966 | Vice President | Since 1997 | Vice President of all the DFA Entities, DFA Australia Limited, Dimensional Fund Advisors Ltd., and Dimensional Fund Advisors Canada ULC. |
Benjamin C. Walker
1979 | Vice President | Since 2014 | Vice President of all the DFA Entities. Formerly, Regional Director for Dimensional Fund Advisors LP (September 2008 – January 2014). |
Brian J. Walsh
1970 | Vice President | Since 2009 | Vice President of all the DFA Entities. Portfolio Manager for Dimensional Fund Advisors LP (since 2004). |
157
Name and Year
of Birth | Position | Term of Office1
and Length of
Service | Principal Occupation During Past 5 Years |
Jessica Walton
1974 | Vice President | Since 2015 | Vice President of all the DFA Entities. Formerly, Regional Director (January 2012 – January 2015) for Dimensional Fund Advisors LP; Director of Marketing and Investor Relations for Treaty Oak Capital Management (July 2011 – October 2011); Vice President for Rockspring Capital (October 2010 – July 2011). |
Griffin S. Watkins
1985 | Vice President | Since 2016 | Vice President of all the DFA Entities. Formerly, Regional Director (January 2014 – January 2016) and Senior Associate (January 2011 – December 2013). for Dimensional Fund Advisors LP. |
Timothy P. Wei
1968 | Vice President | Since 2016 | Vice President of all the DFA Entities. Formerly, Counsel for Dimensional Fund Advisors LP (July 2014 – January 2016); Assistant General Counsel, Teacher Retirement System of Texas (October 2008 – June 2014). |
Weston J. Wellington
1951 | Vice President | Since 1997 | Vice President of all the DFA Entities. |
Ryan J. Wiley
1976 | Vice President | Since 2007 | Vice President of all the DFA Entities. |
Kristina M. Williams
1975 | Vice President | Since 2016 | Vice President of all the DFA Entities. Formerly, Client Service Supervisor for Dowling & Yahnke (July 2014-January 2016); Head of Operations for The Elements Financial Group (January 2013-June 2014); Head of Operations for Vericimetry Advisors LLC (July 2011-December 2012). |
Jeremy J. Willis
1976 | Vice President | Since 2016 | Vice President of all the DFA Entities. Formerly, Manager, Client Systems for Dimensional Fund Advisors LP (May 2012 – January 2016); Vice President, Implementations, Citigroup (August 2006 – October 2011). |
Stacey E. Winning
1981 | Vice President | Since 2015 | Vice President of all the DFA Entities. Head of Global Recruiting and Development (since June 2014) for Dimensional Fund Advisors LP. Formerly, Senior Manager, Recruiting (December 2012 – June 2014) for Dimensional Fund Advisors LP; Co-Head of Global Recruiting (May 2009 – November 2012) for Two Sigma Investments. |
Cecelia K. Wong
1981 | Vice President | Since 2016 | Vice President of all the DFA Entities. Formerly, Client Service Manager for Dimensional Fund Advisors LP (June 2005 – January 2016). |
Craig A. Wright
1982 | Vice President | Since 2016 | Vice President of all the DFA Entities. Formerly, Accounting Manager for Dimensional Fund Advisors LP (November 2011 – January 2016); Senior Associate, PricewaterhouseCoopers LP (July 2009 – November 2011). |
Joseph L. Young
1978 | Vice President | Since 2011 | Vice President of all the DFA Entities. |
| 1 | Each officer holds office for an indefinite term at the pleasure of the Board of Directors and until his or her successor is elected and qualified. |
158
VOTING PROXIES ON FUND PORTFOLIO SECURITIES
A description of the policies and procedures that the Fund uses in voting proxies relating to securities held in the portfolio is available (1) without charge, upon request, by calling collect: (512) 306-7400; (2) from the Advisor’s website at http://us.dimensional.com; and (3) on the SEC’s website at http://www.sec.gov. Information regarding how the Advisor votes these proxies is available from the EDGAR database on the SEC’s website at http://www.sec.gov and from the Advisor’s website at http://us.dimensional.com and reflects the twelve-month period beginning July 1st and ending June 30th.
159
|

|
| | PORTFOLIOS OF INVESTMENTS
SA U.S. FIXED INCOME FUND
SA GLOBAL FIXED INCOME FUND
SA U.S. CORE MARKET FUND
SA U.S. VALUE FUND
SA U.S. SMALL COMPANY FUND
SA INTERNATIONAL VALUE FUND
SA INTERNATIONAL SMALL COMPANY FUND
SA EMERGING MARKETS VALUE FUND
SA REAL ESTATE SECURITIES FUND SA WORLDWIDE MODERATE GROWTH FUND LWI FINANCIAL INC.
10 Almaden Blvd., 15th Floor | San Jose, CA 95113
1-844-366-0905 | sa-funds.com Member FINRA/SIPC, this report is prepared for the general information of shareholders and is not an offer of shares of the SA Funds. Shares are sold only through the currently effective prospectus, which must precede or accompany this report. |
Item 2. Code of Ethics.
Not applicable.
Item 3. Audit Committee Financial Expert.
Not applicable.
Item 4. Principal Accountant Fees and Services.
Not applicable.
Item 5. Audit Committee of Listed Registrants.
Not applicable to the registrant.
Item 6. Schedule of Investments.
(a)
SA U.S. Core Market Fund
PORTFOLIO OF INVESTMENTS — AS OF DECEMBER 31, 2016 (Unaudited)
| | | | SHARES | | VALUE† | |
| COMMON STOCKS — 95.4% | | | | | | |
| Aerospace & Defense — 2.7% | | | | | | |
| Arconic, Inc. | | 4,935 | | $ | 91,495 | |
| BE Aerospace, Inc. | | 4,563 | | | 274,647 | |
| Boeing Co. (The) | | 29,229 | | | 4,550,371 | |
| BWX Technologies, Inc. | | 5,045 | | | 200,286 | |
| Cubic Corp. | | 500 | | | 23,975 | |
| Curtiss-Wright Corp. | | 1,160 | | | 114,098 | |
| DigitalGlobe, Inc.* | | 1,509 | | | 43,233 | |
| Engility Holdings, Inc.* | | 495 | | | 16,682 | |
| | Esterline Technologies Corp.* | | 736 | | | 65,651 | |
| General Dynamics Corp. | | 10,584 | | | 1,827,433 | |
| HEICO Corp. | | 677 | | | 52,231 | |
| HEICO Corp., Class A | | 1,226 | | | 83,245 | |
| Hexcel Corp. | | 3,100 | | | 159,464 | |
| Huntington Ingalls Industries, Inc. | | 1,972 | | | 363,223 | |
| KLX, Inc.* | | 1,200 | | | 54,132 | |
| L3 Technologies, Inc. | | 826 | | | 125,643 | |
| Lockheed Martin Corp. | | 12,054 | | | 3,012,777 | |
| Moog, Inc., Class A* | | 1,100 | | | 72,248 | |
| Northrop Grumman Corp. | | 7,231 | | | 1,681,786 | |
| Orbital ATK, Inc. | | 573 | | | 50,269 | |
| Raytheon Co. | | 9,666 | | | 1,372,572 | |
| Rockwell Collins, Inc. | | 5,848 | | | 542,460 | |
| Spirit Aerosystems Holdings, Inc.,
Class A | | 5,105 | | | 297,877 | |
| Teledyne Technologies, Inc.* | | 800 | | | 98,400 | |
| Textron, Inc. | | 8,122 | | | 394,404 | |
| TransDigm Group, Inc. | | 1,620 | | | 403,315 | |
| Triumph Group, Inc. | | 1,120 | | | 29,680 | |
| United Technologies Corp. | | 25,637 | | | 2,810,328 | |
| Vectrus, Inc.* | | 366 | | | 8,729 | |
| Wesco Aircraft Holdings, Inc.* | | 844 | | | 12,618 | |
| | | | | | 18,833,272 | |
| Air Freight & Logistics — 1.0% | | | | | | |
| CH Robinson Worldwide, Inc.@ | | 6,400 | | | 468,864 | |
| Expeditors International of
Washington, Inc. | | 7,407 | | | 392,275 | |
| FedEx Corp. | | 9,639 | | | 1,794,782 | |
| Forward Air Corp. | | 536 | | | 25,396 | |
| HUB Group, Inc., Class A* | | 982 | | | 42,962 | |
| United Parcel Service, Inc., Class B | | 33,744 | | | 3,868,412 | |
| XPO Logistics, Inc.* | | 3,028 | | | 130,688 | |
| | | | | | 6,723,379 | |
| Airlines — 1.0% | | | | | | |
| Alaska Air Group, Inc. | | 5,828 | | | 517,118 | |
| Allegiant Travel Co. | | 800 | | | 133,120 | |
| American Airlines Group, Inc. | | 27,103 | | | 1,265,439 | |
| Copa Holdings SA, Class A | | 1,041 | | | 94,554 | |
| Delta Air Lines, Inc. | | 36,650 | | | 1,802,814 | |
| Hawaiian Holdings, Inc.* | | 2,703 | | | 154,071 | |
| JetBlue Airways Corp.* | | 10,625 | | | 238,213 | |
| Skywest, Inc. | | 500 | | | 18,225 | |
| Southwest Airlines Co. | | 30,212 | | | 1,505,766 | |
| Spirit Airlines, Inc.@* | | 2,600 | | | 150,436 | |
| United Continental Holdings, Inc.* | | 16,772 | | | 1,222,343 | |
| | | | | | 7,102,099 | |
| Auto Components — 0.5% | | | | | | |
| Adient PLC* | | 2,642 | | | 154,821 | |
| American Axle & Manufacturing
Holdings, Inc.* | | 4,031 | | | 77,798 | |
| Autoliv, Inc.@ | | 2,700 | | | 305,505 | |
| BorgWarner, Inc.@ | | 7,568 | | | 298,482 | |
| Cooper Tire & Rubber Co. | | 2,400 | | | 93,240 | |
| Dana, Inc. | | 6,712 | | | 127,394 | |
| Delphi Automotive PLC | | 13,800 | | | 929,430 | |
| Dorman Products, Inc.@* | | 1,109 | | | 81,024 | |
| Federal-Mogul Holdings Corp.* | | 1,249 | | | 12,877 | |
| Gentex Corp. | | 10,100 | | | 198,869 | |
| Gentherm, Inc.* | | 1,000 | | | 33,850 | |
| Goodyear Tire & Rubber Co. (The) | | 12,112 | | | 373,897 | |
| Horizon Global Corp.* | | 587 | | | 14,088 | |
| LCI Industries | | 900 | | | 96,975 | |
| Lear Corp. | | 2,724 | | | 360,576 | |
| Tenneco, Inc.@* | | 2,500 | | | 156,175 | |
| Visteon Corp. | | 1,205 | | | 96,810 | |
| | | | | | 3,411,811 | |
| Automobiles — 0.7% | | | | | | |
| Ford Motor Co. | | 148,394 | | | 1,800,019 | |
| General Motors Co. | | 56,248 | | | 1,959,680 | |
| Harley-Davidson, Inc.@ | | 7,722 | | | 450,502 | |
| Tesla Motors, Inc.* | | 1,103 | | | 235,700 | |
| Thor Industries, Inc. | | 1,600 | | | 160,080 | |
| | | | | | 4,605,981 | |
| Beverages — 2.4% | | | | | | |
| Boston Beer Co., Inc. (The),
Class A@* | | 422 | | | 71,677 | |
| Brown-Forman Corp., Class A | | 1,902 | | | 87,968 | |
| Brown-Forman Corp., Class B | | 11,440 | | | 513,885 | |
| Coca-Cola Bottling Co., Consolidated | | 200 | | | 35,770 | |
| Coca-Cola Co. (The) | | 169,850 | | | 7,041,981 | |
| Constellation Brands, Inc., Class A | | 3,898 | | | 597,602 | |
| Dr Pepper Snapple Group, Inc. | | 8,222 | | | 745,489 | |
| Molson Coors Brewing Co., Class B | | 2,775 | | | 270,035 | |
| Monster Beverage Corp.* | | 12,111 | | | 537,002 | |
| PepsiCo, Inc. | | 67,969 | | | 7,111,596 | |
| | | | | | 17,013,005 | |
| Biotechnology — 3.1% | | | | | | |
| AbbVie, Inc. | | 75,823 | | | 4,748,036 | |
| Alexion Pharmaceuticals, Inc.* | | 1,781 | | | 217,905 | |
| Alkermes PLC* | | 1,979 | | | 109,993 | |
| Alnylam Pharmaceuticals, Inc.@* | | 810 | | | 30,326 | |
| Amgen, Inc. | | 23,546 | | | 3,442,661 | |
| Aptevo Therapeutics, Inc.* | | 51 | | | 124 | |
| Biogen, Inc.* | | 9,175 | | | 2,601,846 | |
| BioMarin Pharmaceutical, Inc.* | | 1,527 | | | 126,497 | |
| Celgene Corp.* | | 27,905 | | | 3,230,004 | |
| Emergent BioSolutions, Inc.* | | 102 | | | 3,350 | |
| Exelixis, Inc.* | | 6,333 | | | 94,425 | |
| Gilead Sciences, Inc. | | 65,679 | | | 4,703,273 | |
| Incyte Corp.* | | 5,067 | | | 508,068 | |
| Insys Therapeutics, Inc.@* | | 201 | | | 1,849 | |
See notes to financial statements
SA U.S. Core Market Fund
PORTFOLIO OF INVESTMENTS — AS OF DECEMBER 31, 2016 (Unaudited) (Continued)
| | | | SHARES | | VALUE† | |
| COMMON STOCKS (Continued) | | | | | | |
| Biotechnology (Continued) | | | | | | |
| Ionis Pharmaceuticals, Inc.@* | | 1,162 | | $ | 55,578 | |
| Ligand Pharmaceuticals, Inc.* | | 374 | | | 38,002 | |
| Myriad Genetics, Inc.@* | | 2,380 | | | 39,675 | |
| Neurocrine Biosciences, Inc.* | | 1,008 | | | 39,010 | |
| Opko Health, Inc.@* | | 3,300 | | | 30,690 | |
| Regeneron Pharmaceuticals, Inc.* | | 2,508 | | | 920,662 | |
| Seattle Genetics, Inc.* | | 1,502 | | | 79,261 | |
| TESARO, Inc.@* | | 616 | | | 82,840 | |
| Ultragenyx Pharmaceutical, Inc.@* | | 618 | | | 43,452 | |
| United Therapeutics Corp.@* | | 1,803 | | | 258,604 | |
| Vertex Pharmaceuticals, Inc.* | | 1,732 | | | 127,596 | |
| | | | | | 21,533,727 | |
| Building Products — 0.4% | | | | | | |
| A.O. Smith Corp. | | 4,700 | | | 222,545 | |
| AAON, Inc. | | 400 | | | 13,220 | |
| Allegion PLC | | 4,647 | | | 297,408 | |
| Apogee Enterprises, Inc. | | 400 | | | 21,424 | |
| Armstrong Flooring, Inc.* | | 711 | | | 14,156 | |
| Armstrong World Industries, Inc.@* | | 1,422 | | | 59,440 | |
| Builders FirstSource, Inc.* | | 1,300 | | | 14,261 | |
| Fortune Brands Home & Security, Inc. | | 4,126 | | | 220,576 | |
| Johnson Controls International PLC | | 26,423 | | | 1,088,363 | |
| Lennox International, Inc. | | 1,236 | | | 189,318 | |
| Masco Corp. | | 11,358 | | | 359,140 | |
| Owens Corning | | 3,497 | | | 180,305 | |
| Simpson Manufacturing Co., Inc. | | 1,080 | | | 47,250 | |
| Trex Co., Inc.* | | 800 | | | 51,520 | |
| Universal Forest Products, Inc. | | 597 | | | 61,001 | |
| USG Corp.@* | | 2,828 | | | 81,673 | |
| | | | | | 2,921,600 | |
| Capital Markets — 2.1% | | | | | | |
| Affiliated Managers Group, Inc.* | | 1,930 | | | 280,429 | |
| Ameriprise Financial, Inc. | | 5,167 | | | 573,227 | |
| Artisan Partners Asset Management,
Inc., Class A | | 1,440 | | | 42,840 | |
| Bank of New York Mellon Corp. (The) | | 22,232 | | | 1,053,352 | |
| BGC Partners, Inc., Class A | | 7,600 | | | 77,748 | |
| BlackRock, Inc. | | 2,592 | | | 986,360 | |
| CBOE Holdings, Inc. | | 3,888 | | | 287,284 | |
| Charles Schwab Corp. (The) | | 25,698 | | | 1,014,300 | |
| CME Group, Inc. | | 3,590 | | | 414,106 | |
| Cohen & Steers, Inc. | | 500 | | | 16,800 | |
| Donnelley Financial Solutions, Inc.* | | 1,074 | | | 24,681 | |
| E*Trade Financial Corp.* | | 4,507 | | | 156,168 | |
| Eaton Vance Corp. | | 5,845 | | | 244,789 | |
| Evercore Partners, Inc., Class A | | 1,380 | | | 94,806 | |
| FactSet Research Systems, Inc. | | 1,947 | | | 318,198 | |
| Federated Investors, Inc., Class B | | 3,536 | | | 99,998 | |
| Financial Engines, Inc. | | 700 | | | 25,725 | |
| Franklin Resources, Inc. | | 8,861 | | | 350,718 | |
| GAMCO Investors, Inc., Class A | | 200 | | | 6,178 | |
| Goldman Sachs Group, Inc. (The) | | 5,595 | | | 1,339,723 | |
| Interactive Brokers Group, Inc.,
Class A | | 2,247 | | | 82,038 | |
| Intercontinental Exchange, Inc. | | 10,435 | | | 588,743 | |
| Invesco Ltd. | | 8,325 | | | 252,580 | |
| Janus Capital Group, Inc. | | 4,300 | | | 57,061 | |
| Legg Mason, Inc. | | 1,900 | | | 56,829 | |
| LPL Financial Holdings, Inc. | | 2,967 | | | 104,468 | |
| MarketAxess Holdings, Inc. | | 1,300 | | | 190,996 | |
| Moody’s Corp. | | 5,690 | | | 536,396 | |
| Morgan Stanley | | 22,940 | | | 969,215 | |
| Morningstar, Inc. | | 700 | | | 51,492 | |
| MSCI, Inc., Class A | | 3,286 | | | 258,871 | |
| Nasdaq, Inc. | | 1,536 | | | 103,096 | |
| Northern Trust Corp. | | 4,761 | | | 423,967 | |
| NorthStar Asset Management Group, Inc. | | 4,703 | | | 70,169 | |
| Raymond James Financial, Inc. | | 2,600 | | | 180,102 | |
| S&P Global, Inc. | | 12,709 | | | 1,366,726 | |
| SEI Investments Co. | | 4,110 | | | 202,870 | |
| State Street Corp. | | 4,356 | | | 338,548 | |
| Stifel Financial Corp.* | | 1,686 | | | 84,216 | |
| T. Rowe Price Group, Inc. | | 10,102 | | | 760,277 | |
| TD Ameritrade Holding Corp. | | 7,939 | | | 346,140 | |
| Virtus Investment Partners, Inc. | | 200 | | | 23,610 | |
| Waddell & Reed Financial, Inc.,
Class A@ | | 3,561 | | | 69,475 | |
| WisdomTree Investments, Inc.@ | | 5,031 | | | 56,045 | |
| | | | | | 14,581,360 | |
| Chemicals — 2.5% | | | | | | |
| AdvanSix, Inc.* | | 1,163 | | | 25,749 | |
| Air Products & Chemicals, Inc. | | 6,940 | | | 998,111 | |
| Albemarle Corp. | | 3,067 | | | 264,007 | |
| Ashland Global Holdings, Inc. | | 1,329 | | | 145,246 | |
| Axalta Coating Systems Ltd.* | | 5,614 | | | 152,701 | |
| Balchem Corp. | | 1,093 | | | 91,725 | |
| Cabot Corp. | | 1,800 | | | 90,972 | |
| Celanese Corp., Series A | | 2,723 | | | 214,409 | |
| CF Industries Holdings, Inc.@ | | 5,854 | | | 184,284 | |
| Dow Chemical Co. (The) | | 35,427 | | | 2,027,133 | |
| Eastman Chemical Co. | | 6,348 | | | 477,433 | |
| Ecolab, Inc. | | 8,393 | | | 983,827 | |
| EI Du Pont de Nemours & Co. | | 28,819 | | | 2,115,315 | |
| Flotek Industries, Inc.@* | | 1,026 | | | 9,634 | |
| FMC Corp. | | 1,919 | | | 108,539 | |
| GCP Applied Technologies, Inc.* | | 3,212 | | | 85,921 | |
| H.B. Fuller Co. | | 1,077 | | | 52,030 | |
| Huntsman Corp. | | 6,809 | | | 129,916 | |
| Ingevity Corp.* | | 830 | | | 45,534 | |
| International Flavors &
Fragrances, Inc. | | 3,158 | | | 372,107 | |
| LyondellBasell Industries NV, Class A | | 17,535 | | | 1,504,152 | |
| Minerals Technologies, Inc. | | 1,316 | | | 101,661 | |
| Monsanto Co. | | 19,039 | | | 2,003,093 | |
| Mosaic Co. (The) | | 4,187 | | | 122,805 | |
| NewMarket Corp. | | 462 | | | 195,814 | |
| Olin Corp.@ | | 3,768 | | | 96,498 | |
| Platform Specialty Products Corp.* | | 1,155 | | | 11,331 | |
| PolyOne Corp. | | 2,800 | | | 89,712 | |
| PPG Industries, Inc. | | 10,610 | | | 1,005,404 | |
| Praxair, Inc. | | 14,061 | | | 1,647,809 | |
| RPM International, Inc. | | 4,928 | | | 265,274 | |
See notes to financial statements
SA U.S. Core Market Fund
PORTFOLIO OF INVESTMENTS — AS OF DECEMBER 31, 2016 (Unaudited) (Continued)
| | | | SHARES | | VALUE† | |
| COMMON STOCKS (Continued) | | | | | | |
| Chemicals (Continued) | | | | | | |
| Scotts Miracle-Gro Co. (The),
Class A | | 2,064 | | $ | 197,215 | |
| Sensient Technologies Corp. | | 1,000 | | | 78,580 | |
| Sherwin Williams Co. (The) | | 3,887 | | | 1,044,592 | |
| Trinseo SA | | 1,665 | | | 98,734 | |
| Tronox Ltd., Class A | | 771 | | | 7,949 | |
| Valspar Corp. (The) | | 3,512 | | | 363,878 | |
| W.R. Grace & Co. | | 2,716 | | | 183,710 | |
| | | | | | 17,592,804 | |
| Commercial Banks — 4.1% | | | | | | |
| Associated Banc-Corp. | | 4,367 | | | 107,865 | |
| BancorpSouth, Inc. | | 2,260 | | | 70,173 | |
| Bank of America Corp. | | 139,262 | | | 3,077,712 | |
| Bank of Hawaii Corp. | | 1,300 | | | 115,297 | |
| Bank of the Ozarks, Inc. | | 2,453 | | | 129,003 | |
| BankUnited, Inc. | | 2,100 | | | 79,149 | |
| BB&T Corp. | | 8,677 | | | 407,993 | |
| Cathay General Bancorp | | 2,343 | | | 89,104 | |
| Chemical Financial Corp. | | 1,945 | | | 105,361 | |
| CIT Group, Inc. | | 2,643 | | | 112,803 | |
| Citigroup, Inc. | | 40,085 | | | 2,382,252 | |
| Citizens Financial Group, Inc. | | 6,158 | | | 219,410 | |
| Columbia Banking System, Inc. | | 1,612 | | | 72,024 | |
| Comerica, Inc. | | 3,113 | | | 212,026 | |
| Commerce Bancshares, Inc. | | 2,416 | | | 139,669 | |
| Community Bank System, Inc. | | 1,228 | | | 75,878 | |
| Cullen/Frost Bankers, Inc. | | 681 | | | 60,085 | |
| CVB Financial Corp. | | 2,712 | | | 62,186 | |
| Eagle Bancorp, Inc.* | | 460 | | | 28,037 | |
| East West Bancorp, Inc. | | 3,444 | | | 175,059 | |
| Fifth Third Bancorp | | 18,398 | | | 496,194 | |
| First Citizens Bancshares, Inc.,
Class A | | 46 | | | 16,330 | |
| First Financial Bankshares, Inc. | | 705 | | | 31,866 | |
| First Horizon National Corp. | | 5,445 | | | 108,954 | |
| First Midwest Bancorp, Inc. | | 1,735 | | | 43,774 | |
| First Republic Bank | | 2,906 | | | 267,759 | |
| FNB Corp. | | 4,017 | | | 64,393 | |
| Fulton Financial Corp. | | 5,467 | | | 102,780 | |
| Glacier Bancorp, Inc. | | 3,134 | | | 113,545 | |
| Great Western Bancorp, Inc. | | 1,288 | | | 56,144 | |
| Hancock Holding Co. | | 2,100 | | | 90,510 | |
| Hilltop Holdings, Inc. | | 2,327 | | | 69,345 | |
| Home Bancshares, Inc. | | 1,846 | | | 51,263 | |
| Hope Bancorp, Inc. | | 2,893 | | | 63,328 | |
| Huntington Bancshares, Inc. | | 17,050 | | | 225,401 | |
| Iberiabank Corp. | | 891 | | | 74,621 | |
| International Bancshares Corp. | | 1,350 | | | 55,080 | |
| Investors Bancorp, Inc. | | 5,282 | | | 73,684 | |
| JPMorgan Chase & Co. | | 79,768 | | | 6,883,181 | |
| KeyCorp. | | 13,595 | | | 248,381 | |
| LegacyTexas Financial Group, Inc. | | 399 | | | 17,181 | |
| M&T Bank Corp. | | 1,384 | | | 216,499 | |
| MB Financial, Inc. | | 1,600 | | | 75,568 | |
| Old National Bancorp | | 2,800 | | | 50,820 | |
| PacWest Bancorp | | 1,900 | | | 103,436 | |
| People’s United Financial, Inc. | | 2,892 | | | 55,989 | |
| Pinnacle Financial Partners, Inc. | | 641 | | | 44,421 | |
| PNC Financial Services
Group, Inc. (The) | | 9,592 | | | 1,121,880 | |
| Popular, Inc. | | 2,182 | | | 95,615 | |
| Private Bancorp, Inc. | | 2,000 | | | 108,380 | |
| Prosperity Bancshares, Inc. | | 1,226 | | | 88,002 | |
| Regions Financial Corp. | | 15,317 | | | 219,952 | |
| ServisFirst Bancshares, Inc. | | 434 | | | 16,249 | |
| Signature Bank* | | 1,100 | | | 165,220 | |
| Simmons First National Corp., Class A | | 600 | | | 37,290 | |
| South State Corp. | | 799 | | | 69,833 | |
| Sterling Bancorp | | 2,975 | | | 69,615 | |
| SunTrust Banks, Inc. | | 10,671 | | | 585,304 | |
| SVB Financial Group* | | 1,100 | | | 188,826 | |
| Synovus Financial Corp. | | 3,279 | | | 134,701 | |
| TCF Financial Corp. | | 4,700 | | | 92,073 | |
| Texas Capital Bancshares, Inc.* | | 827 | | | 64,837 | |
| Trustmark Corp. | | 1,900 | | | 67,735 | |
| UMB Financial Corp. | | 900 | | | 69,408 | |
| Umpqua Holdings Corp. | | 3,100 | | | 58,218 | |
| United Bankshares, Inc.@ | | 1,262 | | | 58,367 | |
| United Community Banks, Inc. | | 396 | | | 11,730 | |
| US Bancorp | | 34,532 | | | 1,773,909 | |
| Valley National Bancorp | | 5,707 | | | 66,429 | |
| Webster Financial Corp. | | 1,276 | | | 69,261 | |
| Wells Fargo & Co. | | 99,974 | | | 5,509,567 | |
| Westamerica Bancorp | | 500 | | | 31,465 | |
| Western Alliance Bancorp* | | 2,242 | | | 109,208 | |
| Wintrust Financial Corp. | | 1,100 | | | 79,827 | |
| Zions Bancorp | | 3,209 | | | 138,115 | |
| | | | | | 28,522,549 | |
| Commercial Services & Supplies — 0.6% | | | | | | |
| ABM Industries, Inc. | | 1,200 | | | 49,008 | |
| Brady Corp., Class A | | 1,200 | | | 45,060 | |
| Brink’s Co. (The) | | 1,230 | | | 50,738 | |
| Cintas Corp. | | 3,459 | | | 399,722 | |
| Civeo Corp.* | | 3,200 | | | 7,040 | |
| Clean Harbors, Inc.* | | 1,735 | | | 96,553 | |
| Copart, Inc.* | | 4,171 | | | 231,115 | |
| Covanta Holding Corp.@ | | 3,570 | | | 55,692 | |
| Deluxe Corp. | | 2,000 | | | 143,220 | |
| Essendant, Inc. | | 900 | | | 18,810 | |
| Healthcare Services Group, Inc. | | 2,053 | | | 80,416 | |
| Herman Miller, Inc. | | 2,059 | | | 70,418 | |
| HNI Corp. | | 1,066 | | | 59,611 | |
| Interface, Inc. | | 1,200 | | | 22,260 | |
| KAR Auction Services, Inc. | | 5,425 | | | 231,213 | |
| LSC Communications, Inc. | | 1,074 | | | 31,876 | |
| Mobile Mini, Inc. | | 1,083 | | | 32,761 | |
| MSA Safety, Inc. | | 1,100 | | | 76,263 | |
| Pitney Bowes, Inc. | | 9,123 | | | 138,578 | |
| Republic Services, Inc. | | 7,222 | | | 412,015 | |
| Rollins, Inc. | | 4,221 | | | 142,585 | |
| RR Donnelley & Sons Co. | | 2,865 | | | 46,757 | |
| Steelcase, Inc., Class A. | | 3,679 | | | 65,854 | |
| Stericycle, Inc.* | | 1,894 | | | 145,914 | |
| Tetra Tech, Inc. | | 1,092 | | | 47,120 | |
See notes to financial statements
SA U.S. Core Market Fund
PORTFOLIO OF INVESTMENTS — AS OF DECEMBER 31, 2016 (Unaudited) (Continued)
| | | | SHARES | | VALUE† | |
| COMMON STOCKS (Continued) | | | | | | |
| Commercial Services & Supplies (Continued) | | | | | | |
| UniFirst Corp. | | 477 | | $ | 68,521 | |
| Waste Management, Inc. | | 20,670 | | | 1,465,710 | |
| West Corp. | | 700 | | | 17,332 | |
| | | | | | 4,252,162 | |
| Communications Equipment — 0.9% | | | | |
| ADTRAN, Inc. | | 1,300 | | | 29,055 | |
| Arista Networks, Inc.* | | 864 | | | 83,609 | |
| ARRIS International PLC* | | 4,019 | | | 121,092 | |
| Brocade Communications
Systems, Inc. | | 11,672 | | | 145,783 | |
| Ciena Corp.* | | 4,911 | | | 119,878 | |
| Cisco Systems, Inc. | | 128,469 | | | 3,882,333 | |
| CommScope Holding Co., Inc.* | | 6,010 | | | 223,572 | |
| EchoStar Corp., Class A* | | 1,040 | | | 53,446 | |
| F5 Networks, Inc.* | | 2,800 | | | 405,216 | |
| Finisar Corp.* | | 2,900 | | | 87,783 | |
| Harris Corp. | | 3,277 | | | 335,794 | |
| InterDigital, Inc. | | 1,772 | | | 161,872 | |
| Juniper Networks, Inc. | | 4,904 | | | 138,587 | |
| Lumentum Holdings, Inc.* | | 1,020 | | | 39,423 | |
| Motorola Solutions, Inc. | | 4,325 | | | 358,499 | |
| NETGEAR, Inc.* | | 426 | | | 23,153 | |
| NetScout Systems, Inc.* | | 2,150 | | | 67,725 | |
| Palo Alto Networks, Inc.@* | | 756 | | | 94,538 | |
| Plantronics, Inc. | | 1,300 | | | 71,188 | |
| Ubiquiti Networks, Inc.* | | 932 | | | 53,870 | |
| Viasat, Inc.* | | 1,131 | | | 74,895 | |
| Viavi Solutions, Inc.* | | 5,100 | | | 41,718 | |
| | | | | | 6,613,029 | |
| Computers & Peripherals — 4.6% | | | | | | |
| 3D Systems Corp.@* | | 1,421 | | | 18,885 | |
| Apple, Inc. | | 245,388 | | | 28,420,838 | |
| Electronics for Imaging, Inc.* | | 1,399 | | | 61,360 | |
| Hewlett Packard Enterprise Co. | | 41,903 | | | 969,635 | |
| HP, Inc. | | 56,387 | | | 836,783 | |
| NCR Corp.* | | 4,927 | | | 199,839 | |
| NetApp, Inc. | | 7,606 | | | 268,264 | |
| Seagate Technology PLC | | 15,309 | | | 584,345 | |
| Stratasys Ltd.@* | | 981 | | | 16,226 | |
| Western Digital Corp. | | 5,725 | | | 389,014 | |
| | | | | | 31,765,189 | |
| Construction & Engineering — 0.2% | | | | |
| AECOM* | | 2,636 | | | 95,845 | |
| Chicago Bridge & Iron Co. NV | | 2,347 | | | 74,517 | |
| Dycom Industries, Inc.@* | | 1,788 | | | 143,559 | |
| EMCOR Group, Inc. | | 1,700 | | | 120,292 | |
| Fluor Corp. | | 3,842 | | | 201,782 | |
| Granite Construction, Inc. | | 245 | | | 13,475 | |
| Jacobs Engineering Group, Inc.* | | 1,095 | | | 62,415 | |
| KBR, Inc. | | 2,987 | | | 49,853 | |
| MasTec, Inc.* | | 2,200 | | | 84,150 | |
| Primoris Services Corp. | | 1,000 | | | 22,780 | |
| Quanta Services, Inc.* | | 3,524 | | | 122,811 | |
| Valmont Industries, Inc. | | 432 | | | 60,869 | |
| | | | | | 1,052,348 | |
| Construction Materials — 0.1% | | | | | | |
| Eagle Materials, Inc. | | 1,471 | | | 144,938 | |
| Martin Marietta Materials, Inc. | | 988 | | | 218,872 | |
| Vulcan Materials Co. | | 2,484 | | | 310,872 | |
| | | | | | 674,682 | |
| Consumer Finance — 0.9% | | | | | | |
| Ally Financial, Inc. | | 14,704 | | | 279,670 | |
| American Express Co. | | 32,806 | | | 2,430,269 | |
| Capital One Financial Corp. | | 11,832 | | | 1,032,224 | |
| Credit Acceptance Corp.* | | 284 | | | 61,773 | |
| Discover Financial Services | | 13,305 | | | 959,157 | |
| FirstCash, Inc. | | 1,400 | | | 65,800 | |
| Navient Corp. | | 13,453 | | | 221,033 | |
| Nelnet, Inc., Class A | | 156 | | | 7,917 | |
| OneMain Holdings, Inc.@* | | 893 | | | 19,771 | |
| PRA Group, Inc.* | | 1,500 | | | 58,650 | |
| Santander Consumer
USA Holdings, Inc.* | | 3,992 | | | 53,892 | |
| SLM Corp.* | | 15,724 | | | 173,278 | |
| Synchrony Financial | | 26,610 | | | 965,145 | |
| | | | | | 6,328,579 | |
| Containers & Packaging — 0.6% | | | | | | |
| Aptargroup, Inc. | | 2,499 | | | 183,552 | |
| Avery Dennison Corp. | | 4,556 | | | 319,922 | |
| Ball Corp. | | 3,343 | | | 250,959 | |
| Bemis Co., Inc. | | 3,733 | | | 178,512 | |
| Berry Plastics Group, Inc.* | | 4,752 | | | 231,565 | |
| Crown Holdings, Inc.* | | 6,068 | | | 318,995 | |
| Graphic Packaging Holding Co. | | 13,226 | | | 165,061 | |
| Greif, Inc., Class A | | 1,000 | | | 51,310 | |
| International Paper Co. | | 14,819 | | | 786,296 | |
| Owens-Illinois, Inc.* | | 6,988 | | | 121,661 | |
| Packaging Corp. of America | | 4,365 | | | 370,239 | |
| Sealed Air Corp. | | 9,671 | | | 438,483 | |
| Silgan Holdings, Inc. | | 1,968 | | | 100,722 | |
| Sonoco Products Co. | | 3,106 | | | 163,686 | |
| WestRock Co. | | 3,180 | | | 161,449 | |
| | | | | | 3,842,412 | |
| Distributors — 0.1% | | | | | | |
| Core-Mark Holding Co., Inc. | | 724 | | | 31,182 | |
| Genuine Parts Co. | | 5,605 | | | 535,502 | |
| LKQ Corp.* | | 9,191 | | | 281,704 | |
| Pool Corp. | | 1,885 | | | 196,681 | |
| | | | | | 1,045,069 | |
| Diversified Consumer Services — 0.2% | | | | | | |
| Apollo Education Group, Inc.* | | 4,463 | | | 44,184 | |
| Bright Horizons Family
Solutions, Inc.* | | 1,729 | | | 121,064 | |
| DeVry Education Group, Inc.@ | | 1,600 | | | 49,920 | |
| Graham Holdings Co., Class B | | 100 | | | 51,195 | |
| Grand Canyon Education, Inc.* | | 2,002 | | | 117,017 | |
See notes to financial statements
SA U.S. Core Market Fund
PORTFOLIO OF INVESTMENTS — AS OF DECEMBER 31, 2016 (Unaudited) (Continued)
| | | | SHARES | | VALUE† | |
| COMMON STOCKS (Continued) | | | | | | |
| Diversified Consumer Services (Continued) | | | | | | |
| H&R Block, Inc. | | 8,277 | | $ | 190,288 | |
| Houghton Mifflin Harcourt Co.* | | 2,049 | | | 22,232 | |
| Service Corp. International | | 9,025 | | | 256,310 | |
| ServiceMaster Global Holdings, Inc.* | | 6,209 | | | 233,893 | |
| Sotheby’s | | 1,900 | | | 75,734 | |
| | | | | | 1,161,837 | |
| Diversified Financial Services — 1.2% | | | | | | |
| Berkshire Hathaway, Inc., Class B* | | 51,921 | | | 8,462,085 | |
| FNFV Group* | | 2,320 | | | 31,784 | |
| Leucadia National Corp. | | 4,626 | | | 107,555 | |
| Voya Financial, Inc. | | 1,793 | | | 70,321 | |
| | | | | | 8,671,745 | |
| Diversified Telecommunication Services — 3.2% | | | | |
| AT&T, Inc. | | 241,453 | | | 10,268,996 | |
| CenturyLink, Inc. | | 19,042 | | | 452,819 | |
| Cogent Communications Holdings, Inc. | | 1,228 | | | 50,778 | |
| Frontier Communications Corp.@ | | 18,754 | | | 63,388 | |
| Level 3 Communications, Inc.* | | 6,484 | | | 365,438 | |
| SBA Communications Corp., Class A* | | 3,900 | | | 402,714 | |
| Verizon Communications, Inc. | | 201,557 | | | 10,759,113 | |
| Windstream Holdings, Inc.@ | | 4,665 | | | 34,194 | |
| | | | | | 22,397,440 | |
| Electric Utilities — 1.7% | | | | | | |
| Allete, Inc. | | 1,400 | | | 89,866 | |
| Alliant Energy Corp. | | 5,892 | | | 223,248 | |
| American Electric Power Co., Inc. | | 14,430 | | | 908,513 | |
| Avangrid, Inc. | | 1,433 | | | 54,282 | |
| Duke Energy Corp. | | 18,792 | | | 1,458,635 | |
| Edison International | | 10,408 | | | 749,272 | |
| El Paso Electric Co. | | 1,200 | | | 55,800 | |
| Entergy Corp. | | 4,316 | | | 317,097 | |
| Eversource Energy | | 8,109 | | | 447,860 | |
| Exelon Corp. | | 29,315 | | | 1,040,389 | |
| FirstEnergy Corp. | | 10,397 | | | 321,995 | |
| Great Plains Energy, Inc. | | 4,084 | | | 111,697 | |
| Hawaiian Electric Industries, Inc. | | 3,245 | | | 107,312 | |
| IDACORP, Inc. | | 1,576 | | | 126,947 | |
| MGE Energy, Inc. | | 573 | | | 37,417 | |
| NextEra Energy, Inc. | | 14,718 | | | 1,758,212 | |
| OGE Energy Corp. | | 5,840 | | | 195,348 | |
| PG&E Corp. | | 13,322 | | | 809,578 | |
| Pinnacle West Capital Corp. | | 3,190 | | | 248,916 | |
| PNM Resources, Inc. | | 2,600 | | | 89,180 | |
| Portland General Electric Co. | | 2,100 | | | 90,993 | |
| PPL Corp. | | 19,020 | | | 647,631 | |
| Southern Co. (The) | | 27,660 | | | 1,360,595 | |
| Westar Energy, Inc. | | 4,860 | | | 273,861 | |
| Xcel Energy, Inc. | | 15,130 | | | 615,791 | |
| | | | | | 12,140,435 | |
| Electrical Equipment — 0.6% | | | | | | |
| Acuity Brands, Inc. | | 1,379 | | | 318,356 | |
| AMETEK, Inc. | | 7,303 | | | 354,926 | |
| Babcock & Wilcox Enterprises, Inc.* | | 1,486 | | | 24,652 | |
| Eaton Corp. PLC | | 9,300 | | | 623,937 | |
| Emerson Electric Co. | | 26,180 | | | 1,459,535 | |
| EnerSys | | 1,200 | | | 93,720 | |
| Generac Holdings, Inc.* | | 2,200 | | | 89,628 | |
| Hubbell, Inc. | | 1,994 | | | 232,700 | |
| Regal Beloit Corp. | | 967 | | | 66,965 | |
| Rockwell Automation, Inc.@ | | 5,603 | | | 753,043 | |
| Sensata Technologies Holding NV* | | 5,879 | | | 228,987 | |
| | | | | | 4,246,449 | |
| Electronic Equipment, Instruments & Components — 0.7% | | |
| Amphenol Corp., Class A | | 11,806 | | | 793,363 | |
| Anixter International, Inc.* | | 800 | | | 64,840 | |
| Arrow Electronics, Inc.* | | 2,885 | | | 205,700 | |
| Avnet, Inc. | | 2,642 | | | 125,786 | |
| Belden, Inc. | | 1,699 | | | 127,034 | |
| CDW Corp. | | 6,754 | | | 351,816 | |
| Cognex Corp. | | 1,853 | | | 117,888 | |
| Coherent, Inc.* | | 580 | | | 79,683 | |
| Corning, Inc. | | 13,249 | | | 321,553 | |
| Daktronics, Inc. | | 100 | | | 1,070 | |
| Dolby Laboratories, Inc., Class A | | 1,700 | | | 76,823 | |
| Flex Ltd.* | | 21,283 | | | 305,837 | |
| FLIR Systems, Inc. | | 3,073 | | | 111,212 | |
| IPG Photonics Corp.* | | 763 | | | 75,316 | |
| Itron, Inc.* | | 545 | | | 34,253 | |
| Jabil Circuit, Inc. | | 5,400 | | | 127,818 | |
| Keysight Technologies, Inc.* | | 5,963 | | | 218,067 | |
| Knowles Corp.* | | 1,850 | | | 30,913 | |
| Littelfuse, Inc. | | 380 | | | 57,673 | |
| Methode Electronics, Inc. | | 400 | | | 16,540 | |
| National Instruments Corp. | | 1,558 | | | 48,018 | |
| OSI Systems, Inc.* | | 572 | | | 43,541 | |
| Plexus Corp.* | | 900 | | | 48,636 | |
| Sanmina Corp.* | | 900 | | | 32,985 | |
| SYNNEX Corp. | | 735 | | | 88,950 | |
| TE Connectivity Ltd. | | 11,810 | | | 818,197 | |
| Tech Data Corp.* | | 1,300 | | | 110,084 | |
| Trimble, Inc.* | | 5,941 | | | 179,121 | |
| Universal Display Corp.@* | | 99 | | | 5,574 | |
| VeriFone Systems, Inc.* | | 2,891 | | | 51,257 | |
| Vishay Intertechnology, Inc.@ | | 4,130 | | | 66,906 | |
| Zebra Technologies Corp., Class A* | | 1,552 | | | 133,099 | |
| | | | | | 4,869,553 | |
| Energy Equipment & Services — 0.6% | | | | | | |
| Archrock, Inc. | | 1,688 | | | 22,282 | |
| Atwood Oceanics, Inc.@ | | 1,100 | | | 14,443 | |
| Baker Hughes, Inc. | | 5,494 | | | 356,945 | |
| Bristow Group, Inc. | | 1,083 | | | 22,180 | |
| CARBO Ceramics, Inc.* | | 300 | | | 3,138 | |
| Core Laboratories NV | | 1,811 | | | 217,392 | |
| Diamond Offshore Drilling, Inc. | | 1,386 | | | 24,532 | |
| Dril-Quip, Inc.@* | | 900 | | | 54,045 | |
| Era Group, Inc.* | | 400 | | | 6,788 | |
| Exterran Corp.* | | 844 | | | 20,172 | |
| FMC Technologies, Inc.* | | 3,165 | | | 112,453 | |
| Forum Energy Technologies, Inc.* | | 1,368 | | | 30,096 | |
| Gulfmark Offshore, Inc., Class A@* | | 600 | | | 1,050 | |
See notes to financial statements
SA U.S. Core Market Fund
PORTFOLIO OF INVESTMENTS — AS OF DECEMBER 31, 2016 (Unaudited) (Continued)
| | | | SHARES | | VALUE† | |
| COMMON STOCKS (Continued) | | | | | | |
| Energy Equipment & Services (Continued) | | | | | | |
| Halliburton Co. | | 9,916 | | $ | 536,356 | |
| Helix Energy Solutions Group, Inc.* | | 2,643 | | | 23,311 | |
| Helmerich & Payne, Inc. | | 952 | | | 73,685 | |
| Hornbeck Offshore Services, Inc.* | | 900 | | | 6,498 | |
| McDermott International, Inc.* | | 6,400 | | | 47,296 | |
| Nabors Industries Ltd. | | 8,800 | | | 144,320 | |
| National Oilwell Varco, Inc. | | 4,522 | | | 169,304 | |
| Noble Corp. PLC@ | | 5,783 | | | 34,235 | |
| Oceaneering International, Inc. | | 2,700 | | | 76,167 | |
| Oil States International, Inc.* | | 1,400 | | | 54,600 | |
| Pacific Drilling SA@* | | 2 | | | 8 | |
| Patterson-UTI Energy, Inc.@ | | 4,300 | | | 115,756 | |
| Rowan Cos. PLC, Class A@ | | 2,805 | | | 52,986 | |
| Schlumberger Ltd. | | 20,262 | | | 1,700,995 | |
| SEACOR Holdings, Inc.* | | 500 | | | 35,640 | |
| Superior Energy Services, Inc. | | 2,568 | | | 43,348 | |
| Tidewater, Inc. | | 1,400 | | | 4,774 | |
| Transocean Ltd.* | | 6,878 | | | 101,382 | |
| U.S. Silica Holdings, Inc. | | 212 | | | 12,016 | |
| Unit Corp.* | | 1,300 | | | 34,931 | |
| Weatherford International PLC@* | | 7,321 | | | 36,532 | |
| | | | | | 4,189,656 | |
| Food & Staples Retailing — 2.3% | | | | | | |
| Andersons, Inc. (The) | | 486 | | | 21,724 | |
| Casey’s General Stores, Inc. | | 1,701 | | | 202,215 | |
| Costco Wholesale Corp. | | 17,536 | | | 2,807,689 | |
| CVS Health Corp. | | 34,931 | | | 2,756,405 | |
| Kroger Co. (The) | | 43,800 | | | 1,511,538 | |
| PriceSmart, Inc. | | 600 | | | 50,100 | |
| Rite Aid Corp.* | | 44,924 | | | 370,174 | |
| Sprouts Farmers Market, Inc.* | | 4,416 | | | 83,551 | |
| SUPERVALU, Inc.* | | 5,600 | | | 26,152 | |
| Sysco Corp. | | 21,676 | | | 1,200,200 | |
| United Natural Foods, Inc.* | | 1,400 | | | 66,808 | |
| Wal-Mart Stores, Inc. | | 63,562 | | | 4,393,406 | |
| Walgreens Boots Alliance, Inc. | | 23,392 | | | 1,935,922 | |
| Weis Markets, Inc. | | 600 | | | 40,104 | |
| Whole Foods Market, Inc. | | 11,307 | | | 347,803 | |
| | | | | | 15,813,791 | |
| Food Products — 1.4% | | | | | | |
| Archer-Daniels-Midland Co. | | 8,248 | | | 376,521 | |
| B&G Foods, Inc. | | 2,370 | | | 103,806 | |
| Blue Buffalo Pet Products, Inc.* | | 2,386 | | | 57,359 | |
| Bunge Ltd. | | 3,123 | | | 225,606 | |
| Cal-Maine Foods, Inc.@ | | 1,089 | | | 48,107 | |
| Campbell Soup Co. | | 8,657 | | | 523,489 | |
| ConAgra Brands, Inc. | | 6,911 | | | 273,330 | |
| Darling Ingredients, Inc.* | | 6,645 | | | 85,787 | |
| Dean Foods Co. | | 4,792 | | | 104,370 | |
| Flowers Foods, Inc.@ | | 5,407 | | | 107,978 | |
| Fresh Del Monte Produce, Inc. | | 1,100 | | | 66,693 | |
| General Mills, Inc. | | 24,938 | | | 1,540,420 | |
| Hain Celestial Group, Inc. (The)* | | 2,595 | | | 101,283 | |
| Hershey Co. (The) | | 7,200 | | | 744,696 | |
| Hormel Foods Corp.@ | | 9,190 | | | 319,904 | |
| Ingredion, Inc. | | 2,464 | | | 307,901 | |
| J&J Snack Foods Corp. | | 457 | | | 60,977 | |
| J.M. Smucker Co. (The) | | 2,349 | | | 300,813 | |
| Kellogg Co. | | 11,146 | | | 821,572 | |
| Kraft Heinz Co. (The) | | 8,932 | | | 779,942 | |
| Lamb Weston Holdings, Inc.* | | 4,692 | | | 177,592 | |
| Lancaster Colony Corp. | | 722 | | | 102,084 | |
| McCormick & Co., Inc. | | 4,223 | | | 394,133 | |
| Mead Johnson Nutrition Co. | | 6,182 | | | 437,438 | |
| Mondelez International, Inc., Class A | | 14,408 | | | 638,707 | |
| Pilgrim’s Pride Corp.@ | | 1,700 | | | 32,283 | |
| Pinnacle Foods, Inc. | | 3,213 | | | 171,735 | |
| Post Holdings, Inc.* | | 1,507 | | | 121,148 | |
| Sanderson Farms, Inc.@ | | 839 | | | 79,067 | |
| Snyders-Lance, Inc.@ | | 1,354 | | | 51,912 | |
| Tootsie Roll Industries, Inc.@ | | 339 | | | 13,475 | |
| TreeHouse Foods, Inc.@* | | 916 | | | 66,126 | |
| Tyson Foods, Inc., Class A | | 8,281 | | | 510,772 | |
| WhiteWave Foods Co., Class A* | | 5,574 | | | 309,914 | |
| | | | | | 10,056,940 | |
| Gas Utilities — 0.2% | | | | | | |
| Atmos Energy Corp. | | 3,300 | | | 244,695 | |
| National Fuel Gas Co.@ | | 1,600 | | | 90,624 | |
| New Jersey Resources Corp. | | 2,300 | | | 81,650 | |
| Northwest Natural Gas Co. | | 456 | | | 27,269 | |
| ONE Gas, Inc. | | 1,600 | | | 102,336 | |
| South Jersey Industries, Inc. | | 1,600 | | | 53,904 | |
| Southwest Gas Corp. | | 1,343 | | | 102,901 | |
| Spire, Inc. | | 963 | | | 62,161 | |
| UGI Corp. | | 5,299 | | | 244,178 | |
| WGL Holdings, Inc. | | 1,400 | | | 106,792 | |
| | | | | | 1,116,510 | |
| Health Care Equipment & Supplies — 1.8% | | | | | | |
| Abbott Laboratories | | 30,360 | | | 1,166,128 | |
| ABIOMED, Inc.* | | 957 | | | 107,835 | |
| Alere, Inc.* | | 2,200 | | | 85,734 | |
| Align Technology, Inc.* | | 2,300 | | | 221,099 | |
| Baxter International, Inc. | | 9,977 | | | 442,380 | |
| Becton Dickinson & Co. | | 5,839 | | | 966,646 | |
| Boston Scientific Corp.* | | 14,210 | | | 307,362 | |
| Cantel Medical Corp. | | 1,074 | | | 84,578 | |
| Cooper Companies, Inc. (The) | | 939 | | | 164,259 | |
| CR Bard, Inc. | | 3,279 | | | 736,660 | |
| Danaher Corp. | | 10,617 | | | 826,427 | |
| Dentsply Sirona, Inc. | | 2,030 | | | 117,192 | |
| DexCom, Inc.@* | | 883 | | | 52,715 | |
| Edwards Lifesciences Corp.* | | 6,748 | | | 632,288 | |
| Globus Medical, Inc., Class A@* | | 1,500 | | | 37,215 | |
| Haemonetics Corp.* | | 1,000 | | | 40,200 | |
| Halyard Health, Inc.* | | 1,856 | | | 68,635 | |
| Hill-Rom Holdings, Inc. | | 1,280 | | | 71,859 | |
| Hologic, Inc.* | | 6,826 | | | 273,859 | |
| ICU Medical, Inc.* | | 98 | | | 14,440 | |
| Idexx Laboratories, Inc.* | | 3,159 | | | 370,456 | |
| Integra LifeSciences Holdings Corp.@* | | 584 | | | 50,101 | |
| Intuitive Surgical, Inc.* | | 725 | | | 459,773 | |
| LivaNova PLC* | | 1,115 | | | 50,142 | |
See notes to financial statements
SA U.S. Core Market Fund
PORTFOLIO OF INVESTMENTS — AS OF DECEMBER 31, 2016 (Unaudited) (Continued)
| | | | SHARES | | VALUE† | |
| COMMON STOCKS (Continued) | | | | | | |
| Health Care Equipment & Supplies (Continued) | | | | | | |
| Masimo Corp.* | | 1,500 | | $ | 101,100 | |
| Medtronic PLC | | 18,950 | | | 1,349,809 | |
| Neogen Corp.* | | 167 | | | 11,022 | |
| NuVasive, Inc.* | | 1,369 | | | 92,216 | |
| ResMed, Inc.@ | | 4,096 | | | 254,157 | |
| SeaSpine Holdings Corp.* | | 266 | | | 2,101 | |
| St. Jude Medical, Inc. | | 10,312 | | | 826,919 | |
| STERIS PLC | | 1,291 | | | 87,001 | |
| Stryker Corp. | | 10,173 | | | 1,218,827 | |
| Teleflex, Inc. | | 764 | | | 123,119 | |
| Varian Medical Systems, Inc.* | | 3,205 | | | 287,745 | |
| West Pharmaceutical Services, Inc. | | 1,773 | | | 150,404 | |
| Wright Medical Group NV* | | 427 | | | 9,812 | |
| Zimmer Biomet Holdings, Inc. | | 3,710 | | | 382,872 | |
| | | | | | 12,245,087 | |
| Health Care Providers & Services — 2.7% | | | | |
| Acadia Healthcare Co., Inc.@* | | 916 | | | 30,320 | |
| Aetna, Inc. | | 10,865 | | | 1,347,369 | |
| Air Methods Corp.@* | | 1,200 | | | 38,220 | |
| AmerisourceBergen Corp. | | 6,392 | | | 499,790 | |
| AMN Healthcare Services, Inc.* | | 1,300 | | | 49,985 | |
| Anthem, Inc. | | 5,244 | | | 753,930 | |
| Brookdale Senior Living, Inc.* | | 3,601 | | | 44,724 | |
| Cardinal Health, Inc. | | 13,412 | | | 965,262 | |
| Centene Corp.* | | 2,669 | | | 150,825 | |
| Chemed Corp.@ | | 690 | | | 110,683 | |
| CIGNA Corp. | | 8,271 | | | 1,103,269 | |
| Community Health Systems, Inc.* | | 4,567 | | | 25,530 | |
| DaVita, Inc.* | | 5,848 | | | 375,442 | |
| Diplomat Pharmacy, Inc.* | | 170 | | | 2,142 | |
| Envision Healthcare Corp.@* | | 3,353 | | | 212,211 | |
| Express Scripts Holding Co.* | | 23,331 | | | 1,604,939 | |
| HCA Holdings, Inc.* | | 10,031 | | | 742,495 | |
| HealthEquity, Inc.@* | | 400 | | | 16,208 | |
| Healthsouth Corp.@ | | 3,958 | | | 163,228 | |
| Henry Schein, Inc.* | | 2,586 | | | 392,322 | |
| Humana, Inc. | | 3,785 | | | 772,254 | |
| Kindred Healthcare, Inc. | | 1,371 | | | 10,762 | |
| Laboratory Corp. of America Holdings* | | 2,802 | | | 359,721 | |
| LifePoint Health, Inc.* | | 1,533 | | | 87,074 | |
| Magellan Health, Inc.* | | 708 | | | 53,277 | |
| McKesson Corp. | | 9,082 | | | 1,275,567 | |
| Mednax, Inc.* | | 2,600 | | | 173,316 | |
| Molina Healthcare, Inc.@* | | 1,439 | | | 78,080 | |
| Owens & Minor, Inc. | | 1,695 | | | 59,817 | |
| Patterson Cos., Inc.@ | | 2,215 | | | 90,881 | |
| Premier, Inc., Class A* | | 455 | | | 13,814 | |
| Quest Diagnostics, Inc. | | 4,438 | | | 407,852 | |
| Quorum Health Corp.* | | 1,141 | | | 8,295 | |
| Select Medical Holdings Corp.* | | 2,804 | | | 37,153 | |
| Surgical Care Affiliates, Inc.* | | 822 | | | 38,034 | |
| Team Health Holdings, Inc.* | | 3,194 | | | 138,779 | |
| Tenet Healthcare Corp.* | | 4,329 | | | 64,242 | |
| UnitedHealth Group, Inc. | | 34,842 | | | 5,576,114 | |
| Universal Health Services, Inc., Class B | | 3,403 | | | 362,011 | |
| VCA, Inc.* | | 2,228 | | | 152,952 | |
| WellCare Health Plans, Inc.* | | 1,103 | | | 151,199 | |
| | | | | | 18,540,088 | |
| Health Care Technology — 0.1% | | | | | | |
| Allscripts Healthcare Solutions, Inc.* | | 5,500 | | | 56,155 | |
| athenahealth, Inc.@* | | 948 | | | 99,701 | |
| Cerner Corp.* | | 9,114 | | | 431,730 | |
| HMS Holdings Corp.* | | 1,549 | | | 28,130 | |
| Veeva Systems, Inc., Class A@* | | 1,900 | | | 77,330 | |
| | | | | | 693,046 | |
| Hotels, Restaurants & Leisure — 2.2% | | | | | | |
| Aramark | | 8,191 | | | 292,583 | |
| Belmond Ltd., Class A* | | 1,547 | | | 20,653 | |
| Bloomin’ Brands, Inc. | | 6,102 | | | 110,019 | |
| Bob Evans Farms, Inc. | | 800 | | | 42,568 | |
| Brinker International, Inc.@ | | 1,448 | | | 71,720 | |
| Buffalo Wild Wings, Inc.* | | 843 | | | 130,159 | |
| Carnival Corp. | | 8,038 | | | 418,458 | |
| Cheesecake Factory, Inc. (The) | | 1,877 | | | 112,395 | |
| Chipotle Mexican Grill, Inc.@* | | 475 | | | 179,227 | |
| Choice Hotels International, Inc. | | 1,000 | | | 56,050 | |
| Churchill Downs, Inc. | | 115 | | | 17,302 | |
| ClubCorp Holdings, Inc. | | 110 | | | 1,579 | |
| Cracker Barrel Old Country Store, Inc.@ | | 1,060 | | | 176,999 | |
| Darden Restaurants, Inc. | | 3,965 | | | 288,335 | |
| Dave & Buster’s Entertainment, Inc.* | | 1,491 | | | 83,943 | |
| DineEquity, Inc. | | 590 | | | 45,430 | |
| Domino’s Pizza, Inc. | | 1,789 | | | 284,880 | |
| Dunkin’ Brands Group, Inc. | | 2,994 | | | 157,005 | |
| Fiesta Restaurant Group, Inc.@* | | 484 | | | 14,447 | |
| Hilton Worldwide Holdings, Inc. | | 16,346 | | | 444,611 | |
| Hyatt Hotels Corp., Class A* | | 300 | | | 16,578 | |
| ILG, Inc. | | 4,076 | | | 74,061 | |
| International Game Technology PLC | | 1,437 | | | 36,672 | |
| J Alexander’s Holdings, Inc.* | | 400 | | | 4,300 | |
| Jack in the Box, Inc. | | 1,189 | | | 132,740 | |
| La Quinta Holdings, Inc.* | | 615 | | | 8,739 | |
| Las Vegas Sands Corp. | | 18,663 | | | 996,791 | |
| Marriott International, Inc., Class A | | 6,996 | | | 578,429 | |
| Marriott Vacations Worldwide Corp. | | 295 | | | 25,031 | |
| McDonald’s Corp. | | 26,982 | | | 3,284,249 | |
| MGM Resorts International* | | 9,774 | | | 281,785 | |
| Norwegian Cruise Line Holdings Ltd.* | | 4,276 | | | 181,858 | |
| Panera Bread Co., Class A@* | | 1,166 | | | 239,135 | |
| Papa John’s International, Inc. | | 761 | | | 65,126 | |
| Pinnacle Entertainment, Inc.@* | | 112 | | | 1,624 | |
| Royal Caribbean Cruises Ltd. | | 3,273 | | | 268,517 | |
| SeaWorld Entertainment, Inc. | | 2,000 | | | 37,860 | |
| Six Flags Entertainment Corp. | | 2,952 | | | 177,002 | |
| Sonic Corp. | | 1,700 | | | 45,067 | |
| Starbucks Corp. | | 70,918 | | | 3,937,367 | |
| Texas Roadhouse, Inc. | | 1,857 | | | 89,582 | |
| Vail Resorts, Inc. | | 1,332 | | | 214,865 | |
| Wendy’s Co. (The)@ | | 7,777 | | | 105,145 | |
| Wyndham Worldwide Corp. | | 4,979 | | | 380,246 | |
| Wynn Resorts Ltd. | | 2,638 | | | 228,213 | |
See notes to financial statements
SA U.S. Core Market Fund
PORTFOLIO OF INVESTMENTS — AS OF DECEMBER 31, 2016 (Unaudited) (Continued)
| | | | SHARES | | VALUE† | |
| COMMON STOCKS (Continued) | | | | | | |
| Hotels, Restaurants & Leisure (Continued) | | | | | | |
| Yum China Holdings, Inc.* | | 10,694 | | $ | 279,327 | |
| Yum! Brands, Inc. | | 12,717 | | | 805,368 | |
| | | | | | 15,444,040 | |
| Household Durables — 0.4% | | | | | | |
| CalAtlantic Group, Inc.@ | | 1,929 | | | 65,605 | |
| DR Horton, Inc. | | 6,639 | | | 181,444 | |
| Garmin Ltd.@ | | 2,389 | | | 115,843 | |
| GoPro, Inc., Class A@* | | 1,515 | | | 13,196 | |
| Harman International Industries, Inc. | | 2,025 | | | 225,099 | |
| Helen of Troy Ltd.* | | 818 | | | 69,080 | |
| KB Home@ | | 922 | | | 14,577 | |
| La-Z-Boy, Inc. | | 1,500 | | | 46,575 | |
| Leggett & Platt, Inc. | | 4,900 | | | 239,512 | |
| Lennar Corp., Class A | | 3,700 | | | 158,841 | |
| Meritage Homes Corp.* | | 900 | | | 31,320 | |
| Mohawk Industries, Inc.* | | 1,866 | | | 372,603 | |
| Newell Brands, Inc. | | 4,648 | | | 207,533 | |
| NVR, Inc.* | | 159 | | | 265,371 | |
| PulteGroup, Inc. | | 7,850 | | | 144,283 | |
| Taylor Morrison Home Corp.,
Class A* | | 469 | | | 9,033 | |
| Tempur Sealy International, Inc.@* | | 2,741 | | | 187,155 | |
| Toll Brothers, Inc.* | | 2,700 | | | 83,700 | |
| TopBuild Corp.* | | 1,706 | | | 60,733 | |
| TRI Pointe Group, Inc.* | | 854 | | | 9,804 | |
| Tupperware Brands Corp. | | 2,245 | | | 118,132 | |
| Whirlpool Corp. | | 2,639 | | | 479,691 | |
| | | | | | 3,099,130 | |
| Household Products — 1.7% | | | | | | |
| Church & Dwight Co., Inc. | | 10,788 | | | 476,722 | |
| Clorox Co. (The) | | 5,655 | | | 678,713 | |
| Colgate-Palmolive Co. | | 27,465 | | | 1,797,309 | |
| Energizer Holdings, Inc. | | 1,802 | | | 80,387 | |
| HRG Group, Inc.* | | 2,369 | | | 36,862 | |
| Kimberly-Clark Corp. | | 15,072 | | | 1,720,017 | |
| Procter & Gamble Co. (The) | | 79,992 | | | 6,725,727 | |
| Spectrum Brands Holdings, Inc.@ | | 817 | | | 99,944 | |
| WD-40 Co. | | 251 | | | 29,342 | |
| | | | | | 11,645,023 | |
| Independent Power Producers & Energy Traders — 0.1% | | |
| AES Corp. | | 23,347 | | | 271,292 | |
| Calpine Corp.* | | 10,515 | | | 120,187 | |
| Dynegy, Inc.* | | 1,700 | | | 14,382 | |
| NRG Energy, Inc. | | 5,265 | | | 64,549 | |
| NRG Yield, Inc., Class A | | 475 | | | 7,296 | |
| NRG Yield, Inc., Class C | | 475 | | | 7,505 | |
| Ormat Technologies, Inc. | | 441 | | | 23,646 | |
| Pattern Energy Group, Inc. | | 560 | | | 10,634 | |
| | | | | | 519,491 | |
| Industrial Conglomerates — 1.7% | | | | | | |
| 3M Co. | | 29,721 | | | 5,307,279 | |
| Carlisle Cos., Inc. | | 1,461 | | | 161,134 | |
| General Electric Co. | | 83,254 | | | 2,630,826 | |
| Honeywell International, Inc. | | 29,098 | | | 3,371,003 | |
| Raven Industries, Inc. | | 939 | | | 23,663 | |
| Roper Technologies, Inc. | | 2,000 | | | 366,160 | |
| | | | | | 11,860,065 | |
| Insurance — 2.0% | | | | | | |
| Aflac, Inc. | | 9,074 | | | 631,550 | |
| Alleghany Corp.* | | 225 | | | 136,827 | |
| Allied World Assurance Co.,
Holdings Ltd. | | 2,343 | | | 125,843 | |
| Allstate Corp. (The) | | 8,601 | | | 637,506 | |
| American Equity Investment
Life Holding Co. | | 3,500 | | | 78,890 | |
| American Financial Group, Inc. | | 853 | | | 75,166 | |
| American International Group, Inc. | | 16,007 | | | 1,045,417 | |
| American National Insurance Co. | | 117 | | | 14,579 | |
| Amtrust Financial Services, Inc. | | 2,204 | | | 60,346 | |
| Aon PLC | | 10,845 | | | 1,209,543 | |
| Arch Capital Group Ltd.* | | 1,734 | | | 149,627 | |
| Arthur J. Gallagher & Co. | | 3,180 | | | 165,233 | |
| Aspen Insurance Holdings Ltd. | | 1,050 | | | 57,750 | |
| Assurant, Inc. | | 1,751 | | | 162,598 | |
| Assured Guaranty Ltd. | | 3,800 | | | 143,526 | |
| Axis Capital Holdings Ltd. | | 1,300 | | | 84,851 | |
| Brown & Brown, Inc. | | 4,168 | | | 186,976 | |
| Chubb Ltd. | | 4,047 | | | 534,690 | |
| Cincinnati Financial Corp. | | 1,449 | | | 109,762 | |
| CNO Financial Group, Inc. | | 5,300 | | | 101,495 | |
| Endurance Specialty Holdings Ltd. | | 1,350 | | | 124,740 | |
| Enstar Group Ltd.* | | 300 | | | 59,310 | |
| Erie Indemnity Co., Class A | | 1,030 | | | 115,824 | |
| Everest Re Group Ltd. | | 328 | | | 70,979 | |
| First American Financial Corp. | | 3,390 | | | 124,176 | |
| FNF Group | | 3,562 | | | 120,966 | |
| Genworth Financial, Inc., Class A* | | 12,668 | | | 48,265 | |
| Hanover Insurance Group, Inc. (The) | | 696 | | | 63,343 | |
| Hartford Financial Services Group, Inc. | | 9,198 | | | 438,285 | |
| Kemper Corp. | | 1,200 | | | 53,160 | |
| Lincoln National Corp. | | 2,076 | | | 137,577 | |
| Loews Corp. | | 2,022 | | | 94,690 | |
| Markel Corp.* | | 100 | | | 90,450 | |
| Marsh & McLennan Cos., Inc. | | 20,780 | | | 1,404,520 | |
| MBIA, Inc.* | | 3,900 | | | 41,730 | |
| Mercury General Corp. | | 800 | | | 48,168 | |
| MetLife, Inc. | | 14,080 | | | 758,771 | |
| National General Holdings Corp. | | 1,173 | | | 29,313 | |
| Old Republic International Corp. | | 2,900 | | | 55,100 | |
| Primerica, Inc. | | 1,400 | | | 96,810 | |
| Principal Financial Group, Inc. | | 6,395 | | | 370,015 | |
| ProAssurance Corp. | | 917 | | | 51,535 | |
| Progressive Corp. (The) | | 12,327 | | | 437,608 | |
| Prudential Financial, Inc. | | 6,803 | | | 707,920 | |
| Reinsurance Group of America, Inc. | | 777 | | | 97,770 | |
| RenaissanceRe Holdings Ltd. | | 816 | | | 111,156 | |
| RLI Corp. | | 1,000 | | | 63,130 | |
| Selective Insurance Group, Inc. | | 829 | | | 35,688 | |
| Torchmark Corp. | | 2,328 | | | 171,713 | |
| Travelers Companies, Inc. (The) | | 11,978 | | | 1,466,347 | |
| Unum Group | | 3,955 | | | 173,743 | |
| Validus Holdings Ltd. | | 1,760 | | | 96,818 | |
See notes to financial statements
SA U.S. Core Market Fund
PORTFOLIO OF INVESTMENTS — AS OF DECEMBER 31, 2016 (Unaudited) (Continued)
| | | | SHARES | | VALUE† | |
| COMMON STOCKS (Continued) | | | | | | |
| Insurance (Continued) | | | | | | |
| White Mountains Insurance Group Ltd. | | 84 | | $ | 70,228 | |
| Willis Towers Watson PLC | | 1,900 | | | 232,332 | |
| WR Berkley Corp. | | 1,931 | | | 128,431 | |
| XL Group Ltd. | | 3,282 | | | 122,287 | |
| | | | | | 14,025,073 | |
| Internet & Catalog Retail — 2.7% | | | | | | |
| Amazon.com, Inc.* | | 19,686 | | | 14,761,941 | |
| Expedia, Inc.@ | | 2,480 | | | 280,934 | |
| HSN, Inc. | | 1,490 | | | 51,107 | |
| Lands’ End, Inc.@* | | 357 | | | 5,409 | |
| Liberty Expedia Holdings, Inc.,
Class A* | | 1,430 | | | 56,728 | |
| Liberty Interactive Corp. QVC Group,
Class A* | | 9,939 | | | 198,581 | |
| Liberty TripAdvisor Holdings, Inc.,
Class A* | | 2,162 | | | 32,538 | |
| Liberty Ventures, Series A* | | 2,145 | | | 79,086 | |
| Netflix, Inc.* | | 3,622 | | | 448,404 | |
| Priceline Group, Inc. (The)* | | 2,025 | | | 2,968,771 | |
| Shutterfly, Inc.* | | 562 | | | 28,201 | |
| TripAdvisor, Inc.* | | 2,215 | | | 102,710 | |
| | | | | | 19,014,410 | |
| Internet Software & Services — 2.9% | | | | | | |
| Akamai Technologies, Inc.* | | 5,452 | | | 363,539 | |
| Alphabet, Inc., Class A* | | 6,607 | | | 5,235,717 | |
| Alphabet, Inc., Class C* | | 6,925 | | | 5,344,854 | |
| Bankrate, Inc.* | | 1,027 | | | 11,348 | |
| Cimpress NV* | | 1,180 | | | 108,100 | |
| CommerceHub, Inc., Series A* | | 357 | | | 5,359 | |
| CommerceHub, Inc., Series C* | | 715 | | | 10,746 | |
| CoStar Group, Inc.* | | 421 | | | 79,354 | |
| eBay, Inc.* | | 43,234 | | | 1,283,618 | |
| Envestnet, Inc.@* | | 90 | | | 3,173 | |
| Facebook, Inc., Class A* | | 58,613 | | | 6,743,426 | |
| GrubHub, Inc.* | | 800 | | | 30,096 | |
| IAC/InterActiveCorp | | 1,298 | | | 84,097 | |
| j2 Global, Inc.@ | | 1,413 | | | 115,583 | |
| LogMeIn, Inc. | | 671 | | | 64,785 | |
| NIC, Inc. | | 1,910 | | | 45,649 | |
| Shutterstock, Inc.* | | 191 | | | 9,076 | |
| Twitter, Inc.* | | 5,571 | | | 90,807 | |
| VeriSign, Inc.@* | | 3,200 | | | 243,424 | |
| Web.com Group, Inc.* | | 1,185 | | | 25,063 | |
| WebMD Health Corp.* | | 1,031 | | | 51,107 | |
| Yahoo!, Inc.* | | 6,519 | | | 252,090 | |
| Zillow Group, Inc., Class A@* | | 436 | | | 15,892 | |
| Zillow Group, Inc., Class C* | | 1,159 | | | 42,269 | |
| | | | | | 20,259,172 | |
| IT Services — 4.9% | | | | | | |
| Accenture PLC, Class A | | 30,549 | | | 3,578,204 | |
| Acxiom Corp.* | | 2,292 | | | 61,426 | |
| Alliance Data Systems Corp.@ | | 2,927 | | | 668,819 | |
| Amdocs Ltd. | | 2,698 | | | 157,158 | |
| Automatic Data Processing, Inc. | | 18,744 | | | 1,926,508 | |
| Blackhawk Network Holdings, Inc.@* | | 1,743 | | | 65,667 | |
| Booz Allen Hamilton Holding Corp. | | 5,575 | | | 201,090 | |
| Broadridge Financial Solutions, Inc. | | 5,758 | | | 381,755 | |
| CACI International, Inc., Class A* | | 756 | | | 93,971 | |
| Cardtronics PLC, Class A* | | 1,505 | | | 82,128 | |
| | Cognizant Technology Solutions Corp., | | | | | | |
| | Class A* | | 19,308 | | | 1,081,827 | |
| Computer Sciences Corp. | | 5,162 | | | 306,726 | |
| | Convergys Corp. | | 3,200 | | | 78,592 | |
| CoreLogic, Inc.* | | 3,207 | | | 118,114 | |
| | CSRA, Inc. | | 7,110 | | | 226,382 | |
| DST Systems, Inc. | | 1,060 | | | 113,579 | |
| | EPAM Systems, Inc.* | | 1,205 | | | 77,494 | |
| Euronet Worldwide, Inc.* | | 1,400 | | | 101,402 | |
| | ExlService Holdings, Inc.* | | 546 | | | 27,540 | |
| Fidelity National Information | | | | | | |
| Services, Inc. | | 6,542 | | | 494,837 | |
| | Fiserv, Inc.* | | 9,400 | | | 999,032 | |
| | FleetCor Technologies, Inc.* | | 2,330 | | | 329,742 | |
| Gartner, Inc., Class A* | | 2,845 | | | 287,544 | |
| | Genpact Ltd.* | | 4,492 | | | 109,335 | |
| Global Payments, Inc. | | 3,167 | | | 219,821 | |
| | International Business | | | | | | |
| | Machines Corp. | | 44,625 | | | 7,407,304 | |
| Jack Henry & Associates, Inc. | | 3,000 | | | 266,340 | |
| | Leidos Holdings, Inc. | | 5,049 | | | 258,206 | |
| MasterCard, Inc., Class A | | 47,484 | | | 4,902,723 | |
| | MAXIMUS, Inc. | | 3,001 | | | 167,426 | |
| NeuStar, Inc., Class A* | | 1,900 | | | 63,460 | |
| | Paychex, Inc. | | 14,712 | | | 895,667 | |
| PayPal Holdings, Inc.* | | 19,870 | | | 784,269 | |
| | Sabre Corp.@ | | 8,718 | | | 217,514 | |
| Science Applications International Corp. | | 1,571 | | | 133,221 | |
| | Syntel, Inc.@ | | 1,200 | | | 23,748 | |
| Teradata Corp.* | | 3,627 | | | 98,546 | |
| | Total System Services, Inc. | | 5,258 | | | 257,800 | |
| Travelport Worldwide Ltd. | | 4,076 | | | 57,472 | |
| | Unisys Corp.@* | | 917 | | | 13,709 | |
| Vantiv, Inc., Class A* | | 6,385 | | | 380,674 | |
| | Visa, Inc., Class A | | 70,380 | | | 5,491,048 | |
| Western Union Co. (The)@ | | 23,670 | | | 514,112 | |
| | WEX, Inc.* | | 663 | | | 73,991 | |
| Xerox Corp. | | 9,446 | | | 82,464 | |
| | | | | | | 33,878,387 | |
| Leisure Equipment & Products — 0.2% | | | | | | |
| Brunswick Corp. | | 2,766 | | | 150,858 | |
| Hasbro, Inc. | | 4,346 | | | 338,076 | |
| Mattel, Inc.@ | | 10,566 | | | 291,093 | |
| Polaris Industries, Inc. | | 2,893 | | | 238,354 | |
| Vista Outdoor, Inc.* | | 1,760 | | | 64,944 | |
| | | | | | 1,083,325 | |
| Life Sciences Tools & Services — 0.5% | | | | | | |
| Agilent Technologies, Inc. | | 7,050 | | | 321,198 | |
| Bio-Rad Laboratories, Inc., | | | | | | |
| Class A@* | | 308 | | | 56,142 | |
| Bio-Techne Corp. | | 612 | | | 62,932 | |
| Bruker Corp. | | 2,422 | | | 51,298 | |
See notes to financial statements
SA U.S. Core Market Fund
PORTFOLIO OF INVESTMENTS — AS OF DECEMBER 31, 2016 (Unaudited) (Continued)
| | | | SHARES | | VALUE† | |
| COMMON STOCKS (Continued) | | | | | | |
| Life Sciences Tools & Services (Continued) | | | | | | |
| Cambrex Corp.* | | 882 | | $ | 47,584 | |
| Charles River Laboratories
International, Inc.* | | 1,850 | | | 140,951 | |
| Illumina, Inc.* | | 4,674 | | | 598,459 | |
| INC Research Holdings, Inc.,
Class A* | | 1,903 | | | 100,098 | |
| Mettler-Toledo International, Inc.* | | 1,316 | | | 550,825 | |
| Parexel International Corp.@* | | 2,045 | | | 134,397 | |
| PerkinElmer, Inc. | | 2,130 | | | 111,080 | |
| Thermo Fisher Scientific, Inc. | | 8,067 | | | 1,138,254 | |
| VWR Corp.* | | 1,812 | | | 45,354 | |
| Waters Corp.* | | 2,500 | | | 335,975 | |
| | | | | | 3,694,547 | |
| Machinery — 2.0% | | | | | | |
| Actuant Corp., Class A | | 1,508 | | | 39,133 | |
| AGCO Corp. | | 2,007 | | | 116,125 | |
| Allison Transmission Holdings, Inc. | | 6,306 | | | 212,449 | |
| Barnes Group, Inc. | | 1,200 | | | 56,904 | |
| Caterpillar, Inc.@ | | 19,921 | | | 1,847,473 | |
| Chart Industries, Inc.* | | 663 | | | 23,881 | |
| CLARCOR, Inc. | | 1,500 | | | 123,705 | |
| Colfax Corp.* | | 1,602 | | | 57,560 | |
| Crane Co. | | 1,500 | | | 108,180 | |
| Cummins, Inc. | | 5,162 | | | 705,491 | |
| Deere & Co.@ | | 11,270 | | | 1,161,261 | |
| Donaldson Co., Inc. | | 5,304 | | | 223,192 | |
| Dover Corp. | | 4,973 | | | 372,627 | |
| EnPro Industries, Inc. | | 200 | | | 13,472 | |
| Flowserve Corp. | | 3,614 | | | 173,653 | |
| Fortive Corp. | | 6,738 | | | 361,359 | |
| Franklin Electric Co., Inc. | | 1,200 | | | 46,680 | |
| Graco, Inc. | | 2,723 | | | 226,254 | |
| Greenbrier Cos., Inc. (The) | | 500 | | | 20,775 | |
| Harsco Corp. | | 2,911 | | | 39,590 | |
| Hillenbrand, Inc. | | 1,890 | | | 72,481 | |
| Hyster-Yale Materials Handling, Inc. | | 300 | | | 19,131 | |
| IDEX Corp. | | 2,500 | | | 225,150 | |
| Illinois Tool Works, Inc. | | 15,547 | | | 1,903,886 | |
| Ingersoll-Rand PLC | | 7,939 | | | 595,743 | |
| ITT, Inc. | | 2,181 | | | 84,121 | |
| John Bean Technologies Corp. | | 1,592 | | | 136,832 | |
| Joy Global, Inc. | | 2,250 | | | 63,000 | |
| Kennametal, Inc. | | 2,100 | | | 65,646 | |
| Lincoln Electric Holdings, Inc. | | 1,491 | | | 114,315 | |
| Manitowoc Co., Inc. (The)* | | 5,372 | | | 32,125 | |
| Manitowoc Foodservice, Inc.* | | 5,372 | | | 103,841 | |
| Middleby Corp.@* | | 1,500 | | | 193,215 | |
| Mueller Industries, Inc. | | 1,390 | | | 55,544 | |
| Mueller Water Products, Inc., Class A | | 5,028 | | | 66,923 | |
| Nordson Corp. | | 2,147 | | | 240,571 | |
| Oshkosh Corp. | | 2,000 | | | 129,220 | |
| PACCAR, Inc. | | 12,002 | | | 766,928 | |
| Parker Hannifin Corp. | | 4,653 | | | 651,420 | |
| Pentair PLC | | 2,837 | | | 159,071 | |
| Proto Labs, Inc.* | | 473 | | | 24,289 | |
| RBC Bearings, Inc.* | | 421 | | | 39,073 | |
| Rexnord Corp.* | | 3,100 | | | 60,729 | |
| Snap-On, Inc. | | 1,800 | | | 308,286 | |
| SPX Corp.* | | 700 | | | 16,604 | |
| SPX FLOW, Inc.* | | 700 | | | 22,442 | |
| Stanley Black & Decker, Inc. | | 4,505 | | | 516,678 | |
| Terex Corp. | | 2,693 | | | 84,910 | |
| Timken Co., (The) | | 1,644 | | | 65,267 | |
| Toro Co. (The) | | 4,654 | | | 260,391 | |
| Trimas Corp.* | | 1,468 | | | 34,498 | |
| Trinity Industries, Inc. | | 4,800 | | | 133,248 | |
| WABCO Holdings, Inc.* | | 2,200 | | | 233,530 | |
| Wabtec Corp.@ | | 3,000 | | | 249,060 | |
| Watts Water Technologies, Inc., Class A | | 400 | | | 26,080 | |
| Woodward, Inc. | | 1,750 | | | 120,837 | |
| Xylem, Inc. | | 4,897 | | | 242,499 | |
| | | | | | 14,047,348 | |
| Marine — 0.0% | | | | | | |
| Kirby Corp.* | | 1,600 | | | 106,400 | |
| Matson, Inc. | | 1,600 | | | 56,624 | |
| | | | | | 163,024 | |
| Media — 3.5% | | | | | | |
| AMC Networks, Inc., Class A* | | 2,046 | | | 107,088 | |
| Cable One, Inc. | | 211 | | | 131,185 | |
| CBS Corp., Class A | | 1,116 | | | 72,149 | |
| CBS Corp., Class B | | 15,888 | | | 1,010,795 | |
| Charter Communications, Inc.,
Class A* | | 2,913 | | | 838,711 | |
| Cinemark Holdings, Inc. | | 4,417 | | | 169,436 | |
| Clear Channel Outdoor Holdings, Inc.,
Class A | | 1,565 | | | 7,903 | |
| Comcast Corp., Class A | | 98,097 | | | 6,773,598 | |
| Cumulus Media, Inc., Class A* | | 276 | | | 282 | |
| Discovery Communications, Inc.,
Class A* | | 5,911 | | | 162,021 | |
| Discovery Communications, Inc.,
Class C* | | 10,813 | | | 289,572 | |
| DISH Network Corp., Class A* | | 10,182 | | | 589,843 | |
| Gannett Co., Inc. | | 3,120 | | | 30,295 | |
| Interpublic Group of Cos., Inc. (The) | | 14,910 | | | 349,043 | |
| John Wiley & Sons, Inc., Class A | | 1,300 | | | 70,850 | |
| Liberty Braves Group, Class A* | | 126 | | | 2,582 | |
| Liberty Braves Group, Class C* | | 117 | | | 2,409 | |
| Liberty Broadband Corp., Class A* | | 315 | | | 22,825 | |
| Liberty Broadband Corp., Class C* | | 1,048 | | | 77,625 | |
| Liberty Media Group, Class A@* | | 315 | | | 9,875 | |
| Liberty Media Group, Class C@* | | 294 | | | 9,211 | |
| Liberty SiriusXM Group, Class A* | | 1,263 | | | 43,599 | |
| Liberty SiriusXM Group, Class C* | | 1,178 | | | 39,958 | |
| Lions Gate Entertainment Corp.,
Class A@ | | 632 | | | 17,001 | |
| Lions Gate Entertainment Corp.,
Class B@* | | 3,112 | | | 76,368 | |
| Live Nation Entertainment, Inc.* | | 5,674 | | | 150,928 | |
| Madison Square Garden Co.
(The), Class A* | | 447 | | | 76,665 | |
| Meredith Corp. | | 900 | | | 53,235 | |
| MSG Networks, Inc., Class A* | | 1,643 | | | 35,324 | |
See notes to financial statements
SA U.S. Core Market Fund
PORTFOLIO OF INVESTMENTS — AS OF DECEMBER 31, 2016 (Unaudited) (Continued)
| | | | SHARES | | VALUE† | |
| COMMON STOCKS (Continued) | | | | | | |
| Media (Continued) | | | | | | |
| New York Times Co. (The), Class A | | 701 | | $ | 9,323 | |
| News Corp., Class A | | 6,361 | | | 72,897 | |
| News Corp., Class B | | 1,525 | | | 17,995 | |
| Nexstar Broadcasting Group, Inc.,
Class A@ | | 900 | | | 56,970 | |
| Omnicom Group, Inc. | | 11,518 | | | 980,297 | |
| Regal Entertainment Group, Class A | | 2,586 | | | 53,272 | |
| Scripps Networks Interactive, Inc.,
Class A@ | | 3,567 | | | 254,577 | |
| Sinclair Broadcast Group, Inc.,
Class A@ | | 2,200 | | | 73,370 | |
| Sirius XM Holdings, Inc.@ | | 59,371 | | | 264,201 | |
| TEGNA, Inc. | | 6,935 | | | 148,340 | |
| Time Warner, Inc. | | 24,747 | | | 2,388,828 | |
| Time, Inc. | | 2,965 | | | 52,925 | |
| Twenty-First Century Fox, Inc.,
Class B | | 17,373 | | | 473,414 | |
| Twenty-First Century Fox, Inc.,
Class A | | 43,545 | | | 1,221,002 | |
| Viacom, Inc., Class A@ | | 294 | | | 11,319 | |
| Viacom, Inc., Class B | | 14,432 | | | 506,563 | |
| Walt Disney Co. (The) | | 62,435 | | | 6,506,976 | |
| | | | | | 24,312,645 | |
| Metals & Mining — 0.3% | | | | | | |
| AK Steel Holding Corp.* | | 4,103 | | | 41,892 | |
| Alcoa Corp. | | 1,645 | | | 46,192 | |
| Allegheny Technologies, Inc.@ | | 3,100 | | | 49,383 | |
| Carpenter Technology Corp. | | 1,500 | | | 54,255 | |
| Commercial Metals Co. | | 3,500 | | | 76,230 | |
| Compass Minerals International, Inc.@ | | 1,484 | | | 116,271 | |
| Freeport-McMoRan, Inc.* | | 38,835 | | | 512,234 | |
| Hecla Mining Co. | | 7,576 | | | 39,698 | |
| Newmont Mining Corp. | | 12,386 | | | 421,991 | |
| Nucor Corp. | | 6,200 | | | 369,024 | |
| Reliance Steel & Aluminum Co. | | 1,390 | | | 110,561 | |
| Royal Gold, Inc. | | 1,700 | | | 107,695 | |
| Southern Copper Corp. | | 2,789 | | | 89,081 | |
| Steel Dynamics, Inc. | | 3,895 | | | 138,584 | |
| Stillwater Mining Co.* | | 1,623 | | | 26,146 | |
| SunCoke Energy, Inc.* | | 1,575 | | | 17,860 | |
| TimkenSteel Corp.@* | | 1,300 | | | 20,124 | |
| United States Steel Corp. | | 2,823 | | | 93,187 | |
| Worthington Industries, Inc. | | 1,249 | | | 59,253 | |
| | | | | | 2,389,661 | |
| Multi-Utilities — 0.9% | | | | | | |
| Ameren Corp. | | 6,985 | | | 366,433 | |
| Avista Corp. | | 1,575 | | | 62,984 | |
| Black Hills Corp.@ | | 1,500 | | | 92,010 | |
| Centerpoint Energy, Inc. | | 11,464 | | | 282,473 | |
| CMS Energy Corp. | | 9,645 | | | 401,425 | |
| Consolidated Edison, Inc. | | 8,292 | | | 610,955 | |
| Dominion Resources, Inc. | | 19,684 | | | 1,507,598 | |
| DTE Energy Co. | | 4,500 | | | 443,295 | |
| MDU Resources Group, Inc. | | 5,125 | | | 147,446 | |
| NiSource, Inc. | | 9,152 | | | 202,625 | |
| NorthWestern Corp. | | 1,200 | | | 68,244 | |
| Public Service Enterprise Group, Inc. | | 15,286 | | | 670,750 | |
| SCANA Corp. | | 3,636 | | | 266,446 | |
| Sempra Energy | | 6,382 | | | 642,284 | |
| Vectren Corp. | | 2,300 | | | 119,945 | |
| WEC Energy Group, Inc. | | 9,138 | | | 535,944 | |
| | | | | | 6,420,857 | |
| Multiline Retail — 0.7% | | | | | | |
| Big Lots, Inc.@ | | 1,950 | | | 97,910 | |
| Dillard’s, Inc., Class A | | 915 | | | 57,361 | |
| Dollar General Corp. | | 11,236 | | | 832,251 | |
| Dollar Tree, Inc.* | | 8,858 | | | 683,660 | |
| J.C. Penney Co., Inc.@* | | 4,700 | | | 39,057 | |
| Kohl’s Corp.@ | | 8,612 | | | 425,261 | |
| Macy’s, Inc. | | 15,108 | | | 541,017 | |
| Nordstrom, Inc. | | 6,801 | | | 325,972 | |
| Target Corp. | | 26,602 | | | 1,921,462 | |
| | | | | | 4,923,951 | |
| Oil, Gas & Consumable Fuels — 3.3% | | | | | | |
| Anadarko Petroleum Corp. | | 7,595 | | | 529,599 | |
| Antero Resources Corp.* | | 1,854 | | | 43,847 | |
| Apache Corp. | | 3,851 | | | 244,423 | |
| Cabot Oil & Gas Corp. | | 3,890 | | | 90,870 | |
| Cheniere Energy, Inc.@* | | 6,794 | | | 281,475 | |
| Chesapeake Energy Corp.* | | 21,432 | | | 150,453 | |
| Chevron Corp. | | 25,011 | | | 2,943,795 | |
| Cimarex Energy Co. | | 1,115 | | | 151,528 | |
| Cobalt International Energy, Inc.@* | | 7,771 | | | 9,481 | |
| Concho Resources, Inc.* | | 1,671 | | | 221,575 | |
| ConocoPhillips | | 13,582 | | | 681,001 | |
| CONSOL Energy, Inc. | | 6,400 | | | 116,672 | |
| Continental Resources, Inc.* | | 1,746 | | | 89,989 | |
| CVR Energy, Inc.@ | | 600 | | | 15,234 | |
| Delek US Holdings, Inc. | | 1,900 | | | 45,733 | |
| Denbury Resources, Inc.* | | 5,421 | | | 19,949 | |
| Devon Energy Corp. | | 6,226 | | | 284,341 | |
| Diamondback Energy, Inc.* | | 605 | | | 61,141 | |
| Energen Corp. | | 2,396 | | | 138,177 | |
| EnLink Midstream LLC | | 1,100 | | | 20,955 | |
| EOG Resources, Inc. | | 12,435 | | | 1,257,178 | |
| EQT Corp. | | 3,262 | | | 213,335 | |
| Exxon Mobil Corp. | | 75,147 | | | 6,782,768 | |
| GasLog Ltd. | | 343 | | | 5,522 | |
| Green Plains, Inc. | | 300 | | | 8,355 | |
| Gulfport Energy Corp.* | | 3,029 | | | 65,548 | |
| Hess Corp. | | 2,999 | | | 186,808 | |
| HollyFrontier Corp. | | 2,161 | | | 70,794 | |
| Kinder Morgan, Inc. | | 31,532 | | | 653,028 | |
| Kosmos Energy Ltd.@* | | 3,400 | | | 23,834 | |
| Laredo Petroleum, Inc.* | | 2,562 | | | 36,227 | |
| Marathon Oil Corp. | | 9,800 | | | 169,638 | |
| Marathon Petroleum Corp. | | 17,081 | | | 860,028 | |
| Murphy Oil Corp.@ | | 2,327 | | | 72,440 | |
| Newfield Exploration Co.* | | 2,082 | | | 84,321 | |
| Noble Energy, Inc. | | 3,720 | | | 141,583 | |
See notes to financial statements
SA U.S. Core Market Fund
PORTFOLIO OF INVESTMENTS — AS OF DECEMBER 31, 2016 (Unaudited) (Continued)
| | | | SHARES | | VALUE† | |
| COMMON STOCKS (Continued) | | | | | | |
| Oil, Gas & Consumable Fuels (Continued) | | | | | | |
| Oasis Petroleum, Inc.* | | 3,512 | | $ | 53,172 | |
| Occidental Petroleum Corp. | | 6,200 | | | 441,626 | |
| ONEOK, Inc. | | 9,360 | | | 537,358 | |
| Parsley Energy, Inc., Class A* | | 3,133 | | | 110,407 | |
| PBF Energy, Inc., Class A | | 2,220 | | | 61,894 | |
| PDC Energy, Inc.* | | 1,026 | | | 74,467 | |
| Phillips 66 | | 6,896 | | | 595,883 | |
| Pioneer Natural Resources Co. | | 2,254 | | | 405,878 | |
| QEP Resources, Inc. | | 4,300 | | | 79,163 | |
| Range Resources Corp. | | 2,234 | | | 76,760 | |
| Rice Energy, Inc.* | | 2,602 | | | 55,553 | |
| RSP Permian, Inc.* | | 1,319 | | | 58,854 | |
| Scorpio Tankers, Inc. | | 5,186 | | | 23,493 | |
| SemGroup Corp., Class A | | 841 | | | 35,112 | |
| SM Energy Co. | | 2,100 | | | 72,408 | |
| Southwestern Energy Co.* | | 14,665 | | | 158,675 | |
| Spectra Energy Corp. | | 17,531 | | | 720,349 | |
| Synergy Resources Corp.@* | | 1,700 | | | 15,147 | |
| Targa Resources Corp. | | 3,319 | | | 186,096 | |
| Teekay Corp.@ | | 2,035 | | | 16,341 | |
| Tesoro Corp. | | 4,856 | | | 424,657 | |
| Valero Energy Corp. | | 15,563 | | | 1,063,264 | |
| Western Refining, Inc. | | 3,200 | | | 121,120 | |
| Whiting Petroleum Corp.* | | 5,395 | | | 64,848 | |
| Williams Companies, Inc. (The) | | 21,318 | | | 663,843 | |
| World Fuel Services Corp. | | 1,600 | | | 73,456 | |
| WPX Energy, Inc.* | | 6,133 | | | 89,358 | |
| | | | | | 23,050,827 | |
| Paper & Forest Products — 0.0% | | | | | | |
| Domtar Corp. | | 2,000 | | | 78,060 | |
| KapStone Paper & Packaging Corp. | | 2,832 | | | 62,446 | |
| Louisiana-Pacific Corp.* | | 3,743 | | | 70,855 | |
| Resolute Forest Products, Inc.* | | 1,425 | | | 7,624 | |
| Schweitzer-Mauduit International, Inc. | | 933 | | | 42,479 | |
| | | | | | 261,464 | |
| Personal Products — 0.2% | | | | | | |
| Avon Products, Inc.* | | 14,900 | | | 75,096 | |
| Edgewell Personal Care Co.* | | 1,061 | | | 77,442 | |
| Estee Lauder Companies, Inc.
(The), Class A | | 9,234 | | | 706,309 | |
| Herbalife Ltd.@* | | 2,291 | | | 110,289 | |
| Nu Skin Enterprises, Inc., Class A | | 1,688 | | | 80,653 | |
| Revlon, Inc., Class A* | | 344 | | | 10,027 | |
| | | | | | 1,059,816 | |
| Pharmaceuticals — 4.2% | | | | | | |
| Akorn, Inc.* | | 3,779 | | | 82,495 | |
| Allergan PLC* | | 5,595 | | | 1,175,006 | |
| Bristol-Myers Squibb Co. | | 31,714 | | | 1,853,366 | |
| Catalent, Inc.* | | 3,906 | | | 105,306 | |
| Eli Lilly & Co. | | 30,615 | | | 2,251,733 | |
| Endo International PLC* | | 2,551 | | | 42,015 | |
| Horizon Pharma PLC* | | 2,542 | | | 41,129 | |
| Impax Laboratories, Inc.* | | 1,887 | | | 25,003 | |
| Jazz Pharmaceuticals PLC* | | 1,878 | | | 204,758 | |
| Johnson & Johnson | | 90,418 | | | 10,417,058 | |
| Lannett Co., Inc.@* | | 997 | | | 21,984 | |
| Mallinckrodt PLC* | | 2,574 | | | 128,237 | |
| Merck & Co., Inc. | | 90,641 | | | 5,336,036 | |
| Mylan NV* | | 7,971 | | | 304,094 | |
| Perrigo Co. PLC | | 1,701 | | | 141,574 | |
| Pfizer, Inc. | | 183,764 | | | 5,968,655 | |
| Prestige Brands Holdings, Inc.* | | 1,608 | | | 83,777 | |
| Taro Pharmaceutical Industries
Ltd.@* | | 475 | | | 50,003 | |
| Zoetis, Inc. | | 22,643 | | | 1,212,080 | |
| | | | | | 29,444,309 | |
| Professional Services — 0.3% | | | | | | |
| Advisory Board Co. (The)* | | 800 | | | 26,600 | |
| CEB, Inc. | | 1,546 | | | 93,688 | |
| Dun & Bradstreet Corp. | | 1,200 | | | 145,584 | |
| Equifax, Inc. | | 4,110 | | | 485,925 | |
| FTI Consulting, Inc.* | | 1,200 | | | 54,096 | |
| Huron Consulting Group, Inc.* | | 334 | | | 16,917 | |
| Insperity, Inc. | | 171 | | | 12,133 | |
| Korn/Ferry International | | 800 | | | 23,544 | |
| Manpowergroup, Inc. | | 2,190 | | | 194,625 | |
| Nielsen Holdings PLC | | 10,130 | | | 424,954 | |
| On Assignment, Inc.* | | 1,277 | | | 56,392 | |
| Robert Half International, Inc. | | 6,151 | | | 300,046 | |
| TriNet Group, Inc.* | | 165 | | | 4,227 | |
| Verisk Analytics, Inc., Class A* | | 6,676 | | | 541,891 | |
| | | | | | 2,380,622 | |
| Real Estate Management & Development — 0.1% | | | | |
| Alexander & Baldwin, Inc. | | 1,272 | | | 57,075 | |
| Altisource Asset Management
Corp.@* | | 40 | | | 2,140 | |
| Altisource Portfolio Solutions SA@* | | 400 | | | 10,636 | |
| CBRE Group, Inc., Class A* | | 10,202 | | | 321,261 | |
| HFF, Inc., Class A | | 799 | | | 24,170 | |
| Howard Hughes Corp. (The)* | | 589 | | | 67,205 | |
| Jones Lang LaSalle, Inc. | | 1,300 | | | 131,352 | |
| Kennedy-Wilson Holdings, Inc. | | 1,369 | | | 28,064 | |
| Realogy Holdings Corp. | | 5,446 | | | 140,125 | |
| | | | | | 782,028 | |
| Road & Rail — 1.0% | | | | | | |
| AMERCO | | 336 | | | 124,182 | |
| Avis Budget Group, Inc.* | | 4,512 | | | 165,500 | |
| CSX Corp. | | 25,213 | | | 905,903 | |
| Genesee & Wyoming, Inc., Class A* | | 1,018 | | | 70,659 | |
| Heartland Express, Inc.@ | | 1,283 | | | 26,122 | |
| Hertz Global Holdings, Inc.* | | 3,948 | | | 85,119 | |
| JB Hunt Transport Services, Inc. | | 4,393 | | | 426,429 | |
| Kansas City Southern | | 2,591 | | | 219,846 | |
| Knight Transportation, Inc.@ | | 1,500 | | | 49,575 | |
| Landstar System, Inc. | | 1,847 | | | 157,549 | |
| Norfolk Southern Corp. | | 9,212 | | | 995,541 | |
| Old Dominion Freight Line, Inc.* | | 2,371 | | | 203,408 | |
| Ryder System, Inc. | | 2,122 | | | 157,962 | |
| Swift Transportation Co.@* | | 3,554 | | | 86,576 | |
| Union Pacific Corp. | | 30,668 | | | 3,179,658 | |
See notes to financial statements
SA U.S. Core Market Fund
PORTFOLIO OF INVESTMENTS — AS OF DECEMBER 31, 2016 (Unaudited) (Continued)
| | | | SHARES | | VALUE† | |
| COMMON STOCKS (Continued) | | | | | | |
| Road & Rail (Continued) | | | | | | |
| Werner Enterprises, Inc. | | 1,200 | | $ | 32,340 | |
| | | | | | 6,886,369 | |
| Semiconductors & Semiconductor Equipment — 3.1% | | | | |
| Advanced Energy Industries, Inc.* | | 1,099 | | | 60,170 | |
| Advanced Micro Devices, Inc.@* | | 21,408 | | | 242,767 | |
| Amkor Technology, Inc.* | | 246 | | | 2,595 | |
| Analog Devices, Inc. | | 6,496 | | | 471,740 | |
| Applied Materials, Inc. | | 34,230 | | | 1,104,602 | |
| Broadcom Ltd. | | 5,197 | | | 918,674 | |
| Cavium, Inc.@* | | 870 | | | 54,323 | |
| Cirrus Logic, Inc.* | | 1,900 | | | 107,426 | |
| Cree, Inc.* | | 3,245 | | | 85,636 | |
| Cypress Semiconductor Corp.@ | | 4,692 | | | 53,676 | |
| Entegris, Inc.* | | 4,137 | | | 74,052 | |
| First Solar, Inc.@* | | 1,200 | | | 38,508 | |
| Integrated Device Technology, Inc.* | | 3,400 | | | 80,104 | |
| Intel Corp. | | 155,933 | | | 5,655,690 | |
| Intersil Corp., Class A | | 2,035 | | | 45,381 | |
| Kla-Tencor Corp. | | 6,527 | | | 513,544 | |
| Lam Research Corp. | | 3,562 | | | 376,610 | |
| Linear Technology Corp. | | 9,378 | | | 584,718 | |
| Marvell Technology Group Ltd. | | 4,536 | | | 62,914 | |
| Maxim Integrated Products, Inc. | | 6,609 | | | 254,909 | |
| Microchip Technology, Inc.@ | | 4,417 | | | 283,351 | |
| Micron Technology, Inc.* | | 37,552 | | | 823,140 | |
| Microsemi Corp.@* | | 1,846 | | | 99,629 | |
| MKS Instruments, Inc. | | 1,183 | | | 70,270 | |
| Monolithic Power Systems, Inc. | | 706 | | | 57,843 | |
| NVIDIA Corp.@ | | 15,382 | | | 1,641,875 | |
| ON Semiconductor Corp.* | | 13,130 | | | 167,539 | |
| Power Integrations, Inc. | | 73 | | | 4,953 | |
| Qorvo, Inc.@* | | 1,548 | | | 81,626 | |
| QUALCOMM, Inc. | | 45,357 | | | 2,957,276 | |
| Rambus, Inc.* | | 825 | | | 11,360 | |
| Semtech Corp.* | | 600 | | | 18,930 | |
| Silicon Laboratories, Inc.* | | 600 | | | 39,000 | |
| Skyworks Solutions, Inc. | | 7,317 | | | 546,287 | |
| Synaptics, Inc.@* | | 1,074 | | | 57,545 | |
| Teradyne, Inc. | | 2,878 | | | 73,101 | |
| Tessera Holding Corp. | | 1,797 | | | 79,427 | |
| Texas Instruments, Inc. | | 41,523 | | | 3,029,933 | |
| Veeco Instruments, Inc.* | | 312 | | | 9,095 | |
| Versum Materials, Inc.* | | 3,951 | | | 110,905 | |
| Xilinx, Inc. | | 7,467 | | | 450,783 | |
| | | | | | 21,401,907 | |
| Software — 4.5% | | | | | | |
| ACI Worldwide, Inc.* | | 4,317 | | | 78,354 | |
| Activision Blizzard, Inc. | | 12,581 | | | 454,300 | |
| Adobe Systems, Inc.* | | 9,085 | | | 935,301 | |
| ANSYS, Inc.* | | 1,467 | | | 135,683 | |
| Aspen Technology, Inc.@* | | 3,299 | | | 180,389 | |
| Autodesk, Inc.* | | 2,729 | | | 201,973 | |
| Blackbaud, Inc. | | 1,688 | | | 108,032 | |
| CA, Inc. | | 9,776 | | | 310,584 | |
| Cadence Design Systems, Inc.* | | 10,300 | | | 259,766 | |
| CDK Global, Inc. | | 4,892 | | | 292,003 | |
| Citrix Systems, Inc.* | | 5,243 | | | 468,252 | |
| Covisint Corp.* | | 785 | | | 1,492 | |
| Dell Technologies, Inc., Class V* | | 6,122 | | | 336,526 | |
| Electronic Arts, Inc.* | | 9,752 | | | 768,068 | |
| Ellie Mae, Inc.@* | | 328 | | | 27,447 | |
| Fair Isaac Corp. | | 1,150 | | | 137,103 | |
| FireEye, Inc.* | | 1,314 | | | 15,637 | |
| Fortinet, Inc.* | | 2,008 | | | 60,481 | |
| Guidewire Software, Inc.* | | 839 | | | 41,388 | |
| Intuit, Inc. | | 11,110 | | | 1,273,317 | |
| Manhattan Associates, Inc.* | | 3,523 | | | 186,825 | |
| Microsoft Corp. | | 305,137 | | | 18,961,213 | |
| MicroStrategy, Inc., Class A* | | 297 | | | 58,628 | |
| Nuance Communications, Inc.* | | 4,400 | | | 65,560 | |
| Oracle Corp. | | 101,025 | | | 3,884,411 | |
| Paycom Software, Inc.@* | | 932 | | | 42,397 | |
| Pegasystems, Inc. | | 704 | | | 25,344 | |
| Proofpoint, Inc.@* | | 578 | | | 40,836 | |
| PTC, Inc.* | | 1,100 | | | 50,897 | |
| Red Hat, Inc.* | | 5,521 | | | 384,814 | |
| Salesforce.com, Inc.* | | 5,134 | | | 351,474 | |
| ServiceNow, Inc.* | | 1,383 | | | 102,812 | |
| Splunk, Inc.@* | | 1,116 | | | 57,083 | |
| SS&C Technologies Holdings, Inc.@ | | 3,681 | | | 105,277 | |
| Symantec Corp. | | 12,225 | | | 292,055 | |
| Synchronoss Technologies, Inc.* | | 800 | | | 30,640 | |
| Synopsys, Inc.* | | 2,768 | | | 162,924 | |
| Tableau Software, Inc., Class A* | | 700 | | | 29,505 | |
| Take-Two Interactive Software, Inc.* | | 2,296 | | | 113,170 | |
| TiVo Corp.* | | 1,378 | | | 28,800 | |
| Tyler Technologies, Inc.@* | | 739 | | | 105,507 | |
| Ultimate Software Group, Inc.* | | 550 | | | 100,292 | |
| Verint Systems, Inc.* | | 1,038 | | | 36,589 | |
| VMware, Inc., Class A@* | | 1,425 | | | 112,190 | |
| Workday, Inc., Class A@* | | 873 | | | 57,697 | |
| Zynga, Inc., Class A* | | 18,104 | | | 46,527 | |
| | | | | | 31,519,563 | |
| Specialty Retail — 3.5% | | | | | | |
| Aaron’s, Inc. | | 2,250 | | | 71,977 | |
| Abercrombie & Fitch Co., Class A | | 2,500 | | | 30,000 | |
| Advance Auto Parts, Inc. | | 2,947 | | | 498,397 | |
| American Eagle Outfitters, Inc.@ | | 7,250 | | | 109,982 | |
| Asbury Automotive Group, Inc.* | | 1,176 | | | 72,559 | |
| Ascena Retail Group, Inc.* | | 5,534 | | | 34,255 | |
| AutoNation, Inc.* | | 3,240 | | | 157,626 | |
| AutoZone, Inc.@* | | 960 | | | 758,198 | |
| Bed Bath & Beyond, Inc.@ | | 7,503 | | | 304,922 | |
| Best Buy Co., Inc. | | 10,525 | | | 449,102 | |
| Buckle, Inc. (The) | | 900 | | | 20,520 | |
| Burlington Stores, Inc.* | | 3,757 | | | 318,406 | |
| Cabela’s, Inc.* | | 1,580 | | | 92,509 | |
| Carmax, Inc.@* | | 6,946 | | | 447,253 | |
| Chico’s FAS, Inc. | | 2,500 | | | 35,975 | |
| Children’s Place, Inc. (The) | | 506 | | | 51,081 | |
| Conn’s, Inc.* | | 600 | | | 7,590 | |
See notes to financial statements
SA U.S. Core Market Fund
PORTFOLIO OF INVESTMENTS — AS OF DECEMBER 31, 2016 (Unaudited) (Continued)
| | | | SHARES | | VALUE† | |
| COMMON STOCKS (Continued) | | | | | | |
| Specialty Retail (Continued) | | | | | | |
| CST Brands, Inc. | | 3,093 | | $ | 148,928 | |
| Dick’s Sporting Goods, Inc. | | 4,100 | | | 217,710 | |
| DSW, Inc., Class A | | 2,490 | | | 56,398 | |
| Express, Inc.* | | 2,600 | | | 27,976 | |
| Five Below, Inc.@* | | 2,400 | | | 95,904 | |
| Foot Locker, Inc. | | 5,009 | | | 355,088 | |
| GameStop Corp., Class A | | 3,588 | | | 90,633 | |
| Gap, Inc. (The) | | 11,172 | | | 250,700 | |
| Genesco, Inc.* | | 700 | | | 43,470 | |
| GNC Holdings, Inc., Class A@ | | 3,256 | | | 35,946 | |
| Group 1 Automotive, Inc. | | 680 | | | 52,999 | |
| Guess?, Inc. | | 1,900 | | | 22,990 | |
| Hibbett Sports, Inc.* | | 557 | | | 20,776 | |
| Home Depot, Inc. (The) | | 60,729 | | | 8,142,544 | |
| L Brands, Inc. | | 7,995 | | | 526,391 | |
| Lithia Motors, Inc., Class A@ | | 900 | | | 87,147 | |
| Lowe’s Cos., Inc. | | 43,365 | | | 3,084,119 | |
| Lumber Liquidators Holdings, Inc.@* | | 853 | | | 13,426 | |
| Michaels Companies, Inc. (The)* | | 1,873 | | | 38,303 | |
| Monro Muffler Brake, Inc. | | 783 | | | 44,788 | |
| Murphy USA, Inc.* | | 2,086 | | | 128,226 | |
| O’Reilly Automotive, Inc.* | | 4,697 | | | 1,307,692 | |
| Office Depot, Inc. | | 14,200 | | | 64,184 | |
| Penske Auto Group, Inc. | | 1,318 | | | 68,325 | |
| Pier 1 Imports, Inc. | | 3,200 | | | 27,328 | |
| Rent-A-Center, Inc.@ | | 1,700 | | | 19,125 | |
| RH* | | 1,047 | | | 32,143 | |
| Ross Stores, Inc. | | 18,898 | | | 1,239,709 | |
| Sally Beauty Holdings, Inc.* | | 5,102 | | | 134,795 | |
| Select Comfort Corp.* | | 1,700 | | | 38,454 | |
| Signet Jewelers Ltd.@ | | 2,400 | | | 226,224 | |
| Staples, Inc. | | 5,510 | | | 49,866 | |
| Tiffany & Co.@ | | 4,018 | | | 311,114 | |
| TJX Cos., Inc. | | 31,596 | | | 2,373,807 | |
| Tractor Supply Co. | | 6,137 | | | 465,246 | |
| Ulta Salon Cosmetics &
Fragrance, Inc.* | | 2,100 | | | 535,374 | |
| Urban Outfitters, Inc.@* | | 3,400 | | | 96,832 | |
| Vitamin Shoppe, Inc.* | | 676 | | | 16,055 | |
| Williams-Sonoma, Inc.@ | | 4,000 | | | 193,560 | |
| | | | | | 24,144,647 | |
| Textiles, Apparel & Luxury Goods — 0.8% | | | | | | |
| Carter’s, Inc. | | 2,255 | | | 194,809 | |
| Coach, Inc. | | 7,810 | | | 273,506 | |
| Columbia Sportswear Co. | | 858 | | | 50,021 | |
| Deckers Outdoor Corp.* | | 977 | | | 54,116 | |
| Fossil Group, Inc.* | | 2,139 | | | 55,315 | |
| G-III Apparel Group Ltd.@* | | 1,271 | | | 37,571 | |
| Hanesbrands, Inc. | | 17,125 | | | 369,386 | |
| Iconix Brand Group, Inc.* | | 1,972 | | | 18,418 | |
| Kate Spade & Co.* | | 3,274 | | | 61,126 | |
| Lululemon Athletica, Inc.* | | 3,400 | | | 220,966 | |
| Michael Kors Holdings Ltd.* | | 8,573 | | | 368,468 | |
| NIKE, Inc., Class B | | 54,656 | | | 2,778,165 | |
| PVH Corp. | | 1,250 | | | 112,800 | |
| Ralph Lauren Corp. | | 1,100 | | | 99,352 | |
| Skechers U.S.A., Inc., Class A* | | 3,300 | | | 81,114 | |
| Steven Madden Ltd.* | | 1,944 | | | 69,498 | |
| Under Armour, Inc., Class A@* | | 5,400 | | | 156,870 | |
| Under Armour, Inc., Class C* | | 5,438 | | | 136,874 | |
| VF Corp. | | 11,695 | | | 623,928 | |
| Wolverine World Wide, Inc. | | 3,200 | | | 70,240 | |
| | | | | | 5,832,543 | |
| Thrifts & Mortgage Finance — 0.1% | | | | | | |
| Astoria Financial Corp. | | 741 | | | 13,820 | |
| BofI Holding, Inc.@* | | 2,800 | | | 79,940 | |
| Capitol Federal Financial, Inc. | | 4,009 | | | 65,988 | |
| EverBank Financial Corp. | | 41 | | | 797 | |
| New York Community Bancorp, Inc. | | 5,639 | | | 89,716 | |
| Northwest Bancshares, Inc. | | 1,400 | | | 25,242 | |
| Ocwen Financial Corp.* | | 3,425 | | | 18,461 | |
| PHH Corp.* | | 405 | | | 6,140 | |
| Provident Financial Services, Inc. | | 800 | | | 22,640 | |
| TFS Financial Corp. | | 1,093 | | | 20,811 | |
| Washington Federal, Inc. | | 2,947 | | | 101,229 | |
| | | | | | 444,784 | |
| Tobacco — 1.7% | | | | | | |
| Altria Group, Inc. | | 96,309 | | | 6,512,415 | |
| Philip Morris International, Inc. | | 50,318 | | | 4,603,594 | |
| Reynolds American, Inc. | | 8,789 | | | 492,535 | |
| Vector Group Ltd.@ | | 1,675 | | | 38,089 | |
| | | | | | 11,646,633 | |
| Trading Companies & Distributors — 0.4% | | | | | | |
| Air Lease Corp. | | 3,438 | | | 118,027 | |
| Applied Industrial Technologies, Inc. | | 1,164 | | | 69,142 | |
| Beacon Roofing Supply, Inc.* | | 1,400 | | | 64,498 | |
| DXP Enterprises, Inc.* | | 295 | | | 10,248 | |
| Fastenal Co. | | 11,794 | | | 554,082 | |
| GATX Corp.@ | | 1,100 | | | 67,738 | |
| HD Supply Holdings, Inc.* | | 5,845 | | | 248,471 | |
| Herc Holdings, Inc.* | | 1,316 | | | 52,851 | |
| MRC Global, Inc.* | | 3,000 | | | 60,780 | |
| MSC Industrial Direct Co., Class A | | 1,509 | | | 139,417 | |
| NOW, Inc.* | | 2,249 | | | 46,037 | |
| Textainer Group Holdings Ltd. | | 52 | | | 387 | |
| Triton International Ltd. | | 773 | | | 12,213 | |
| United Rentals, Inc.* | | 4,687 | | | 494,853 | |
| Veritiv Corp.* | | 226 | | | 12,147 | |
| Watsco, Inc. | | 800 | | | 118,496 | |
| WESCO International, Inc.* | | 1,300 | | | 86,515 | |
| WW Grainger, Inc. | | 2,476 | | | 575,051 | |
| | | | | | 2,730,953 | |
| Transportation Infrastructure — 0.0% | | | | | | |
| Macquarie Infrastructure Corp. | | 1,285 | | | 104,984 | |
| | | | | | | |
| Water Utilities — 0.1% | | | | | | |
| American States Water Co. | | 180 | | | 8,201 | |
| American Water Works Co., Inc. | | 4,991 | | | 361,149 | |
| Aqua America, Inc. | | 3,709 | | | 111,418 | |
| California Water Service Group | | 788 | | | 26,713 | |
| | | | | | 507,481 | |
See notes to financial statements
SA U.S. Core Market Fund
PORTFOLIO OF INVESTMENTS — AS OF DECEMBER 31, 2016 (Unaudited) (Continued)
| | | | SHARES | | VALUE† | |
| COMMON STOCKS (Continued) | | | | | | |
| Wireless Telecommunication Services — 0.2% | | | | |
| Shenandoah Telecommunications Co. | | 510 | | $ | 13,923 | |
| Sprint Corp.@* | | 15,015 | | | 126,426 | |
| T-Mobile US, Inc.@* | | 14,245 | | | 819,230 | |
| Telephone & Data Systems, Inc. | | 2,613 | | | 75,438 | |
| United States Cellular Corp.* | | 400 | | | 17,488 | |
| | | | | | 1,052,505 | |
| TOTAL COMMON STOCKS
(Identified Cost $359,590,833) | | | | | 664,589,218 | |
| |
| RIGHTS AND WARRANTS — 0.0% | | | | | | |
| Biotechnology — 0.0% | | | | | | |
| Dyax Corp. CVR ~¶§* | | 1,858 | | | 2,062 | |
| |
| Consumer Discretionary — 0.0% | | | | | | |
| Safeway Casa Ley CVR ~¶§* | | 10,610 | | | 10,768 | |
| Safeway PDC, LLC CVR ~¶§* | | 10,610 | | | 518 | |
| | | | | | 11,286 | |
| Health Care Providers & Services — 0.0% | | | | | | |
| Health Systems, Inc., CVR* | | 7,172 | | | 32 | |
| | | | | | | | |
| TOTAL RIGHTS AND WARRANTS
(Identified Cost $13,814) | | | | | 13,380 | |
| | |
| MUTUAL FUNDS — 4.2% | | | | | | |
| Other — 4.2% | | | | | | |
| DFA U.S. Micro Cap Portfolio | | 1,412,127 | | | 29,499,340 | |
| | | | | | | |
| TOTAL MUTUAL FUNDS
(Identified Cost $17,923,603) | | | | | 29,499,340 | |
| |
| SHORT-TERM INVESTMENTS — 0.8% | | | | |
| Investment Company — 0.3% | | | | | | |
| State Street Institutional U.S.
Government Money Market
Fund, 0.170% | | 2,191,027 | | | 2,191,027 | |
| |
| Collateral For Securities On Loan — 0.5% | | | | | | |
| State Street Navigator Securities Lending
Government Money Market Portfolio | | 3,299,309 | | | 3,299,309 | |
| | | | | | | |
| TOTAL SHORT-TERM INVESTMENTS
(Identified Cost $5,490,336) | | | | | 5,490,336 | |
| |
| Total Investments — 100.4% | | | | | | |
| (Identified Cost $383,018,586)# | | | | | 699,592,274 | |
| Liabilities, Less Cash and
Other Assets — (0.4%) | | | | | (2,497,558 | ) |
| Net Assets — 100.0% | | | | $ | 697,094,716 | |
| | † | | See Note 1 |
| | * | | Non-income producing security |
| | @ | | A portion or all of the security/securities were held on loan. As of December 31, 2016, the market value of the securities on loan was $22,860,086. |
| | ~ | | Bankrupt/delisted security |
| | ¶ | | Contingent value rights based on future performance. |
| | § | | Fair valued security. Fair values are determined pursuant to procedures approved by the Fund’s Board of Trustees. See Note 1 |
| | # | | At December 31, 2016, the aggregate cost of investment securities for U.S. federal income tax purposes was $383,018,586. Net unrealized appreciation aggregated $316,573,688 of which $323,259,174 related to appreciated investment securities and $6,685,486 related to depreciated investment securities. |
Key to abbreviations:
CVR — Contingent Value Rights
See notes to financial statements
SA U.S. Small Company Fund
PORTFOLIO OF INVESTMENTS — AS OF DECEMBER 31, 2016 (Unaudited)
| | | SHARES | | VALUE† | |
| COMMON STOCKS — 99.6% | | | | | | |
| Aerospace & Defense — 1.7% | | | | | | |
| AAR Corp. | | 10,684 | | $ | 353,106 | |
| Aerojet Rocketdyne Holdings, Inc.* | | 17,568 | | | 315,346 | |
| Aerovironment, Inc.* | | 7,907 | | | 212,145 | |
| Astronics Corp.*@ | | 4,849 | | | 164,090 | |
| | Astronics Corp., Class B*@ | | 598 | | | 20,153 | |
| BWX Technologies, Inc. | | 11,997 | | | 476,281 | |
| CPI Aerostructures, Inc.* | | 1,342 | | | 12,413 | |
| Cubic Corp. | | 6,500 | | | 311,675 | |
| Curtiss-Wright Corp. | | 6,457 | | | 635,110 | |
| DigitalGlobe, Inc.* | | 18,452 | | | 528,650 | |
| Ducommun, Inc.* | | 3,610 | | | 92,272 | |
| Engility Holdings, Inc.* | | 5,031 | | | 169,545 | |
| Esterline Technologies Corp.* | | 7,884 | | | 703,253 | |
| HEICO Corp., Class A | | 3,050 | | | 207,095 | |
| Innovative Solutions & Support, Inc.* | | 3,248 | | | 10,816 | |
| KEYW Holding Corp. (The)* | | 2,370 | | | 27,942 | |
| KLX, Inc.* | | 9,583 | | | 432,289 | |
| Kratos Defense &
Security Solutions, Inc.* | | 17,754 | | | 131,380 | |
| LMI Aerospace, Inc.* | | 2,400 | | | 20,688 | |
| Mercury Systems, Inc.* | | 8,267 | | | 249,829 | |
| Moog, Inc., Class A* | | 8,996 | | | 590,857 | |
| National Presto Industries, Inc. | | 918 | | | 97,675 | |
| SIFCO Industries, Inc.* | | 1,187 | | | 9,081 | |
| Sparton Corp.* | | 1,324 | | | 31,577 | |
| Taser International, Inc.*@ | | 13,491 | | | 327,022 | |
| Teledyne Technologies, Inc.* | | 517 | | | 63,591 | |
| Triumph Group, Inc. | | 9,084 | | | 240,726 | |
| Vectrus, Inc.* | | 2,243 | | | 53,495 | |
| Wesco Aircraft Holdings, Inc.* | | 23,396 | | | 349,770 | |
| | | | | | 6,837,872 | |
| Air Freight & Logistics — 0.4% | | | | | | |
| Air Transport Services Group, Inc.* | | 15,898 | | | 253,732 | |
| Atlas Air Worldwide Holdings, Inc.* | | 6,303 | | | 328,701 | |
| Echo Global Logistics, Inc.* | | 6,700 | | | 167,835 | |
| Forward Air Corp. | | 6,951 | | | 329,338 | |
| HUB Group, Inc., Class A* | | 11,481 | | | 502,294 | |
| Park-Ohio Holdings Corp. | | 3,551 | | | 151,273 | |
| Radiant Logistics, Inc.* | | 5,730 | | | 22,347 | |
| | | | | | 1,755,520 | |
| | |
| Airlines — 0.7% | | | | | | |
| Allegiant Travel Co. | | 4,532 | | | 754,125 | |
| ATA Holdings Corp.*~§ | | 600 | | | — | |
| Copa Holdings SA, Class A | | 3,630 | | | 329,713 | |
| Hawaiian Holdings, Inc.* | | 12,656 | | | 721,392 | |
| Skywest, Inc. | | 12,976 | | | 472,975 | |
| Spirit Airlines, Inc.*@ | | 8,902 | | | 515,070 | |
| | | | | | 2,793,275 | |
| Auto Components — 1.7% | | | | | | |
| American Axle & Manufacturing
Holdings, Inc.* | | 23,588 | | | 455,248 | |
| Cooper Tire & Rubber Co. | | 15,551 | | | 604,156 | |
| Cooper-Standard Holding, Inc.* | | 2,464 | | | 254,728 | |
| Dana, Inc. | | 32,214 | | | 611,422 | |
| Dorman Products, Inc.*@ | | 8,380 | | | 612,243 | |
| Federal-Mogul Holdings Corp.* | | 13,611 | | | 140,330 | |
| Fox Factory Holding Corp.* | | 6,593 | | | 182,956 | |
| Gentherm, Inc.* | | 9,644 | | | 326,449 | |
| Horizon Global Corp.* | | 7,663 | | | 183,912 | |
| LCI Industries | | 5,572 | | | 600,383 | |
| | Modine Manufacturing Co.* | | 11,514 | | | 171,559 | |
| Motorcar Parts of America, Inc.* | | 4,392 | | | 118,233 | |
| Shiloh Industries, Inc.* | | 3,600 | | | 24,876 | |
| Spartan Motors, Inc. | | 10,808 | | | 99,974 | |
| Standard Motor Products, Inc. | | 8,131 | | | 432,732 | |
| Stoneridge, Inc.* | | 13,800 | | | 244,122 | |
| Strattec Security Corp. | | 700 | | | 28,210 | |
| Superior Industries International, Inc. | | 6,600 | | | 173,910 | |
| Sypris Solutions, Inc.* | | 4,000 | | | 3,520 | |
| Tenneco, Inc.* | | 14,371 | | | 897,756 | |
| Tower International, Inc. | | 6,346 | | | 179,909 | |
| Visteon Corp. | | 7,195 | | | 578,046 | |
| VOXX International Corp.* | | 4,800 | | | 22,560 | |
| | | | | | 6,947,234 | |
| Automobiles — 0.3% | | | | | | |
| Thor Industries, Inc. | | 11,128 | | | 1,113,356 | |
| Winnebago Industries, Inc. | | 10,123 | | | 320,393 | |
| | | | | | 1,433,749 | |
| Beverages — 0.4% | | | | | | |
| Boston Beer Co., Inc. (The),
Class A*@ | | 1,852 | | | 314,562 | |
| Coca-Cola Bottling Co., Consolidated | | 1,262 | | | 225,709 | |
| Craft Brew Alliance, Inc.* | | 9,433 | | | 159,418 | |
| MGP Ingredients, Inc.@ | | 5,354 | | | 267,593 | |
| National Beverage Corp. | | 10,920 | | | 557,793 | |
| Primo Water Corp.* | | 7,499 | | | 92,088 | |
| | | | | | 1,617,163 | |
| Biotechnology — 0.6% | | | | | | |
| Acorda Therapeutics, Inc.* | | 12,403 | | | 233,176 | |
| Adamas Pharmaceuticals, Inc.*@ | | 2,419 | | | 40,881 | |
| AMAG Pharmaceuticals, Inc.* | | 2,638 | | | 91,802 | |
| Amicus Therapeutics, Inc.*@ | | 1,429 | | | 7,102 | |
| Aptevo Therapeutics, Inc.* | | 4,906 | | | 11,971 | |
| Aviragen Therapeutics, Inc.* | | 1,516 | | | 1,865 | |
| BioSpecifics Technologies Corp.* | | 2,311 | | | 128,723 | |
| Cara Therapeutics, Inc.*@ | | 4,673 | | | 43,412 | |
| Chimerix, Inc.* | | 2,211 | | | 10,171 | |
| Concert Pharmaceuticals, Inc.* | | 3,010 | | | 30,973 | |
| Emergent BioSolutions, Inc.* | | 9,812 | | | 322,226 | |
| Enanta Pharmaceuticals, Inc.* | | 835 | | | 27,973 | |
| Epizyme, Inc.* | | 940 | | | 11,374 | |
| Five Prime Therapeutics, Inc.* | | 4,603 | | | 230,656 | |
| Insys Therapeutics, Inc.*@ | | 11,096 | | | 102,083 | |
| Karyopharm Therapeutics, Inc.* | | 1,236 | | | 11,618 | |
| Ligand Pharmaceuticals, Inc.* | | 3,443 | | | 349,843 | |
| Molecular Insight | | | | | | |
| Pharmaceuticals, Inc.*~§ | | 3,500 | | | — | |
| Myriad Genetics, Inc.*@ | | 19,349 | | | 322,548 | |
See notes to financial statements
SA U.S. Small Company Fund
PORTFOLIO OF INVESTMENTS — AS OF DECEMBER 31, 2016 (Unaudited) (Continued)
| | | | SHARES | | VALUE† | |
| COMMON STOCKS (Continued) | | | | | | |
| Biotechnology (Continued) | | | | | | |
| Otonomy, Inc.* | | 2,246 | | $ | 35,711 | |
| PDL BioPharma, Inc. | | 18,702 | | | 39,648 | |
| PTC Therapeutics, Inc.* | | 5,972 | | | 65,155 | |
| Recro Pharma, Inc.* | | 1,313 | | | 10,583 | |
| Repligen Corp.* | | 6,722 | | | 207,172 | |
| Retrophin, Inc.* | | 8,373 | | | 158,501 | |
| | Rigel Pharmaceuticals, Inc.* | | 9,661 | | | 22,993 | |
| Spectrum Pharmaceuticals, Inc.* | | 15,253 | | | 67,571 | |
| Stemline Therapeutics, Inc.*@ | | 1,284 | | | 13,739 | |
| Zafgen, Inc.* | | 3,913 | | | 12,443 | |
| | | | | | 2,611,913 | |
| Building Products — 1.6% | | | | | | |
| AAON, Inc. | | 14,109 | | | 466,302 | |
| Advanced Drainage Systems, Inc.@ | | 8,118 | | | 167,231 | |
| American Woodmark Corp.* | | 7,156 | | | 538,489 | |
| Apogee Enterprises, Inc. | | 11,866 | | | 635,543 | |
| Armstrong Flooring, Inc.* | | 6,993 | | | 139,231 | |
| Armstrong World Industries, Inc.*@ | | 15,180 | | | 634,524 | |
| Builders FirstSource, Inc.* | | 24,352 | | | 267,141 | |
| Continental Building Products, Inc.* | | 9,323 | | | 215,361 | |
| CSW Industrials, Inc.* | | 302 | | | 11,129 | |
| Gibraltar Industries, Inc.* | | 8,000 | | | 333,200 | |
| Griffon Corp. | | 12,945 | | | 339,159 | |
| Insteel Industries, Inc. | | 8,468 | | | 301,800 | |
| NCI Building Systems, Inc.* | | 12,026 | | | 188,207 | |
| Patrick Industries, Inc.* | | 3,786 | | | 288,872 | |
| PGT Innovations, Inc.* | | 20,987 | | | 240,301 | |
| Ply Gem Holdings, Inc.* | | 10,477 | | | 170,251 | |
| Quanex Building Products Corp. | | 9,211 | | | 186,983 | |
| Simpson Manufacturing Co., Inc. | | 12,600 | | | 551,250 | |
| Trex Co., Inc.* | | 8,162 | | | 525,633 | |
| Universal Forest Products, Inc. | | 5,500 | | | 561,990 | |
| | | | | | 6,762,597 | |
| Capital Markets — 1.8% | | | | | | |
| Artisan Partners Asset Management, Inc.,
Class A | | 9,304 | | | 276,794 | |
| BGC Partners, Inc., Class A | | 53,525 | | | 547,561 | |
| Calamos Asset Management, Inc.,
Series A | | 5,037 | | | 43,066 | |
| Cohen & Steers, Inc. | | 7,453 | | | 250,421 | |
| Cowen Group, Inc., Class A*@ | | 6,131 | | | 95,030 | |
| Diamond Hill Investment Group, Inc. | | 191 | | | 40,183 | |
| Donnelley Financial Solutions, Inc.* | | 2,974 | | | 68,343 | |
| Evercore Partners, Inc., Class A | | 9,789 | | | 672,504 | |
| Federated Investors, Inc., Class B | | 20,626 | | | 583,303 | |
| Fifth Street Asset Management, Inc. | | 728 | | | 4,878 | |
| Financial Engines, Inc.@ | | 2,009 | | | 73,831 | |
| Gain Capital Holdings, Inc. | | 9,997 | | | 65,780 | |
| GAMCO Investors, Inc., Class A | | 1,700 | | | 52,513 | |
| Greenhill & Co., Inc. | | 7,133 | | | 197,584 | |
| Interactive Brokers Group, Inc., Class A | | 16,151 | | | 589,673 | |
| Intl FCStone, Inc.* | | 3,859 | | | 152,816 | |
| Investment Technology Group, Inc. | | 9,700 | | | 191,478 | |
| Janus Capital Group, Inc. | | 44,921 | | | 596,102 | |
| KCG Holdings, Inc., Class A* | | 15,787 | | | 209,178 | |
| Ladenburg Thalmann
Financial Services, Inc.* | | 16,604 | | | 40,514 | |
| LPL Financial Holdings, Inc. | | 3,619 | | | 127,425 | |
| Manning & Napier, Inc.@ | | 2,524 | | | 19,056 | |
| MarketAxess Holdings, Inc. | | 3,081 | | | 452,661 | |
| Moelis & Co., Class A@ | | 3,839 | | | 130,142 | |
| NorthStar Asset Management
Group, Inc. | | 28,137 | | | 419,804 | |
| OM Asset Management PLC | | 5,801 | | | 84,114 | |
| Oppenheimer Holdings, Inc., Class A | | 2,133 | | | 39,674 | |
| Piper Jaffray Cos.* | | 4,033 | | | 292,392 | |
| Pzena Investment
Management, Inc., Class A | | 1,895 | | | 21,053 | |
| Safeguard Scientifics, Inc.* | | 5,834 | | | 78,467 | |
| Silvercrest Asset Management Group,
Inc., Class A | | 759 | | | 9,981 | |
| Stifel Financial Corp.* | | 12,616 | | | 630,169 | |
| Virtus Investment Partners, Inc. | | 1,071 | | | 126,432 | |
| Waddell & Reed Financial, Inc.,
Class A@ | | 442 | | | 8,623 | |
| Westwood Holdings Group, Inc. | | 1,013 | | | 60,770 | |
| WisdomTree Investments, Inc.@ | | 32,848 | | | 365,927 | |
| | | | | | 7,618,242 | |
| Chemicals — 2.6% | | | | | | |
| A. Schulman, Inc. | | 6,827 | | | 228,363 | |
| American Vanguard Corp. | | 8,140 | | | 155,881 | |
| Balchem Corp. | | 7,283 | | | 611,189 | |
| Cabot Corp. | | 9,527 | | | 481,495 | |
| Calgon Carbon Corp. | | 17,075 | | | 290,275 | |
| Chase Corp. | | 2,101 | | | 175,539 | |
| Chemtura Corp.* | | 27,875 | | | 925,450 | |
| Core Molding Technologies, Inc.* | | 1,500 | | | 25,665 | |
| Ferro Corp.* | | 31,788 | | | 455,522 | |
| Flotek Industries, Inc.*@ | | 15,037 | | | 141,197 | |
| FutureFuel Corp. | | 10,473 | | | 145,575 | |
| GCP Applied Technologies, Inc.* | | 2,256 | | | 60,348 | |
| H.B. Fuller Co. | | 13,143 | | | 634,938 | |
| Hawkins, Inc. | | 2,085 | | | 112,486 | |
| Innophos Holdings, Inc. | | 5,400 | | | 282,204 | |
| Innospec, Inc. | | 5,850 | | | 400,725 | |
| Intrepid Potash, Inc.* | | 10,268 | | | 21,357 | |
| KMG Chemicals, Inc. | | 3,001 | | | 116,709 | |
| Koppers Holdings, Inc.* | | 4,597 | | | 185,259 | |
| Kraton Corp.* | | 6,776 | | | 192,980 | |
| Kronos Worldwide, Inc. | | 10,857 | | | 129,633 | |
| LSB Industries, Inc.* | | 5,556 | | | 46,782 | |
| Minerals Technologies, Inc. | | 9,665 | | | 746,621 | |
| Northern Technologies
International Corp.* | | 800 | | | 11,000 | |
| Olin Corp.@ | | 12,737 | | | 326,195 | |
| Omnova Solutions, Inc.* | | 20,358 | | | 203,580 | |
| PolyOne Corp. | | 29,803 | | | 954,888 | |
| Quaker Chemical Corp. | | 3,387 | | | 433,333 | |
| Rayonier Advanced Materials, Inc. | | 14,733 | | | 227,772 | |
| Sensient Technologies Corp. | | 10,853 | | | 852,829 | |
| Stepan Co. | | 3,991 | | | 325,187 | |
See notes to financial statements
SA U.S. Small Company Fund
PORTFOLIO OF INVESTMENTS — AS OF DECEMBER 31, 2016 (Unaudited) (Continued)
| | | | SHARES | | VALUE† | |
| COMMON STOCKS (Continued) | | | | | | |
| Chemicals (Continued) | | | | | | |
| Trecora Resources* | | 3,438 | | $ | 47,616 | |
| Tredegar Corp. | | 8,700 | | | 208,800 | |
| Trinseo SA | | 8,507 | | | 504,465 | |
| Tronox Ltd., Class A | | 11,384 | | | 117,369 | |
| Valhi, Inc. | | 1,644 | | | 5,688 | |
| | | | | | 10,784,915 | |
| Commercial Banks — 11.9% | | | | | | |
| 1st Source Corp. | | 7,264 | | | 324,410 | |
| Access National Corp.@ | | 2,671 | | | 74,147 | |
| American National Bankshares, Inc. | | 1,452 | | | 50,530 | |
| Ameris Bancorp | | 12,574 | | | 548,226 | |
| AmeriServ Financial, Inc. | | 4,400 | | | 16,280 | |
| Arrow Financial Corp. | | 3,976 | | | 161,028 | |
| Associated Banc-Corp. | | 38,741 | | | 956,903 | |
| Banc of California, Inc. | | 8,558 | | | 148,481 | |
| Bancfirst Corp. | | 3,000 | | | 279,150 | |
| Bancorp, Inc. (The)* | | 8,408 | | | 66,087 | |
| BancorpSouth, Inc. | | 29,895 | | | 928,240 | |
| Bank of Hawaii Corp.@ | | 12,794 | | | 1,134,700 | |
| Bank of Marin Bancorp | | 443 | | | 30,899 | |
| BankUnited, Inc. | | 3,110 | | | 117,216 | |
| Banner Corp. | | 6,700 | | | 373,927 | |
| Bar Harbor Bankshares | | 678 | | | 32,090 | |
| Berkshire Hills Bancorp, Inc. | | 6,399 | | | 235,803 | |
| Blue Hills Bancorp, Inc. | | 894 | | | 16,763 | |
| BNC Bancorp | | 5,605 | | | 178,800 | |
| Boston Private Financial Holdings, Inc. | | 21,569 | | | 356,967 | |
| Bridge Bancorp, Inc. | | 1,132 | | | 42,903 | |
| Brookline Bancorp, Inc. | | 18,706 | | | 306,778 | |
| Bryn Mawr Bank Corp. | | 4,700 | | | 198,105 | |
| Camden National Corp. | | 4,293 | | | 190,824 | |
| Capital Bank Financial Corp., Class A | | 6,376 | | | 250,258 | |
| Capital City Bank Group, Inc. | | 664 | | | 13,599 | |
| Cardinal Financial Corp. | | 8,280 | | | 271,501 | |
| Carolina Financial Corp. | | 868 | | | 26,726 | |
| Cascade Bancorp* | | 9,720 | | | 78,926 | |
| Cathay General Bancorp | | 21,914 | | | 833,389 | |
| Centerstate Banks, Inc. | | 9,586 | | | 241,280 | |
| Central Pacific Financial Corp. | | 7,849 | | | 246,616 | |
| Century Bancorp, Inc., Class A | | 200 | | | 12,000 | |
| Chemical Financial Corp. | | 14,135 | | | 765,693 | |
| Citizens & Northern Corp. | | 852 | | | 22,322 | |
| City Holding Co. | | 6,502 | | | 439,535 | |
| CNB Financial Corp. | | 1,780 | | | 47,597 | |
| CoBiz Financial, Inc. | | 11,363 | | | 191,921 | |
| Columbia Banking System, Inc. | | 14,910 | | | 666,179 | |
| Community Bank System, Inc. | | 9,634 | | | 595,285 | |
| Community Trust Bancorp, Inc. | | 4,634 | | | 229,846 | |
| Connectone Bancorp, Inc. | | 3,802 | | | 98,662 | |
| CU Bancorp* | | 1,197 | | | 42,853 | |
| Customers Bancorp, Inc.* | | 5,348 | | | 191,565 | |
| CVB Financial Corp. | | 27,325 | | | 626,562 | |
| Eagle Bancorp, Inc.* | | 6,777 | | | 413,058 | |
| Enterprise Bancorp, Inc. | | 331 | | | 12,432 | |
| Enterprise Financial Services Corp. | | 3,837 | | | 164,991 | |
| Farmers Capital Bank Corp. | | 767 | | | 32,252 | |
| Farmers National Banc Corp. | | 710 | | | 10,082 | |
| FCB Financial Holdings, Inc., Class A* | | 5,732 | | | 273,416 | |
| Fidelity Southern Corp. | | 7,069 | | | 167,323 | |
| Financial Institutions, Inc. | | 3,105 | | | 106,191 | |
| First Bancorp, Inc. | | 1,683 | | | 55,707 | |
| First Bancorp/Puerto Rico* | | 35,131 | | | 232,216 | |
| | First Bancorp/Southern Pines NC | | 3,813 | | | 103,485 | |
| First Busey Corp. | | 7,922 | | | 243,839 | |
| First Business Financial Services, Inc. | | 551 | | | 13,070 | |
| First Citizens Bancshares, Inc., Class A | | 295 | | | 104,725 | |
| | First Commonwealth Financial Corp. | | 23,740 | | | 336,633 | |
| First Community Bancshares, Inc. | | 4,452 | | | 134,183 | |
| First Connecticut Bancorp, Inc. | | 477 | | | 10,804 | |
| First Financial Bancorp | | 15,133 | | | 430,534 | |
| First Financial Bankshares, Inc.@ | | 13,804 | | | 623,941 | |
| First Financial Corp. | | 2,698 | | | 142,454 | |
| First Financial Northwest, Inc. | | 2,239 | | | 44,198 | |
| First Foundation, Inc.* | | 1,275 | | | 36,338 | |
| First Horizon National Corp. | | 38,809 | | | 776,568 | |
| First Interstate Bancsystem, Inc. | | 5,224 | | | 222,281 | |
| First Merchants Corp. | | 8,330 | | | 313,624 | |
| First Midwest Bancorp, Inc. | | 18,632 | | | 470,085 | |
| First NBC Bank Holding Co.* | | 4,253 | | | 31,047 | |
| First of Long Island Corp. (The) | | 2,016 | | | 57,557 | |
| Flushing Financial Corp. | | 7,140 | | | 209,845 | |
| FNB Corp. | | 54,993 | | | 881,538 | |
| Franklin Financial Network, Inc.* | | 500 | | | 20,925 | |
| Fulton Financial Corp. | | 44,920 | | | 844,496 | |
| German American Bancorp, Inc. | | 2,400 | | | 126,264 | |
| Glacier Bancorp, Inc. | | 19,481 | | | 705,797 | |
| Great Southern Bancorp, Inc. | | 3,323 | | | 181,602 | |
| Great Western Bancorp, Inc. | | 71 | | | 3,095 | |
| Guaranty Bancorp | | 4,394 | | | 106,335 | |
| Hancock Holding Co. | | 17,160 | | | 739,596 | |
| Hanmi Financial Corp. | | 8,053 | | | 281,050 | |
| Heartland Financial USA, Inc. | | 5,400 | | | 259,200 | |
| Heritage Commerce Corp. | | 8,770 | | | 126,551 | |
| Heritage Financial Corp. | | 4,648 | | | 119,686 | |
| Heritage Oaks Bancorp | | 1,418 | | | 17,484 | |
| Hilltop Holdings, Inc. | | 25,969 | | | 773,876 | |
| Home Bancshares, Inc. | | 36,276 | | | 1,007,385 | |
| HomeTrust Bancshares, Inc.* | | 701 | | | 18,156 | |
| Hope Bancorp, Inc. | | 34,605 | | | 757,503 | |
| Horizon Bancorp | | 3,884 | | | 108,752 | |
| Iberiabank Corp. | | 9,378 | | | 785,407 | |
| Independent Bank Corp. | | 4,840 | | | 340,978 | |
| International Bancshares Corp. | | 15,750 | | | 642,600 | |
| Lakeland Bancorp, Inc. | | 6,732 | | | 131,274 | |
| Lakeland Financial Corp. | | 5,055 | | | 239,405 | |
| LegacyTexas Financial Group, Inc. | | 11,096 | | | 477,794 | |
| Macatawa Bank Corp. | | 5,469 | | | 56,932 | |
| MainSource Financial Group, Inc. | | 5,357 | | | 184,281 | |
| MB Financial, Inc. | | 19,316 | | | 912,295 | |
| MBT Financial Corp. | | 5,012 | | | 56,886 | |
| Mercantile Bank Corp. | | 2,751 | | | 103,713 | |
| Merchants Bancshares, Inc. | | 1,081 | | | 58,590 | |
| Midsouth Bancorp, Inc. | | 2,100 | | | 28,560 | |
See notes to financial statements
SA U.S. Small Company Fund
PORTFOLIO OF INVESTMENTS — AS OF DECEMBER 31, 2016 (Unaudited) (Continued)
| | | | SHARES | | VALUE† | |
| COMMON STOCKS (Continued) | | | | | | |
| Commercial Banks (Continued) | | | | | | |
| National Bank Holdings Corp., Class A | | 5,759 | | $ | 183,655 | |
| NBT Bancorp, Inc. | | 10,025 | | | 419,847 | |
| Northrim Bancorp, Inc. | | 1,164 | | | 36,782 | |
| OFG Bancorp | | 10,569 | | | 138,454 | |
| Old Line Bancshares, Inc. | | 221 | | | 5,300 | |
| Old National Bancorp | | 29,051 | | | 527,276 | |
| Opus Bank | | 4,401 | | | 132,250 | |
| Pacific Continental Corp. | | 6,270 | | | 137,000 | |
| Pacific Mercantile Bancorp* | | 2,500 | | | 18,250 | |
| Pacific Premier Bancorp, Inc.* | | 5,398 | | | 190,819 | |
| Park National Corp. | | 3,450 | | | 412,827 | |
| Park Sterling Corp. | | 10,219 | | | 110,263 | |
| Peapack Gladstone Financial Corp. | | 2,840 | | | 87,699 | |
| Penns Woods Bancorp, Inc. | | 476 | | | 24,038 | |
| People’s Utah Bancorp | | 1,346 | | | 36,140 | |
| Peoples Bancorp, Inc. | | 3,092 | | | 100,366 | |
| Pinnacle Financial Partners, Inc. | | 9,240 | | | 640,332 | |
| Popular, Inc. | | 16,479 | | | 722,110 | |
| Preferred Bank | | 2,640 | | | 138,389 | |
| Premier Financial Bancorp, Inc. | | 1,381 | | | 27,758 | |
| Private Bancorp, Inc. | | 19,760 | | | 1,070,794 | |
| Prosperity Bancshares, Inc. | | 1,027 | | | 73,718 | |
| QCR Holdings, Inc. | | 1,536 | | | 66,509 | |
| Renasant Corp. | | 8,712 | | | 367,821 | |
| Republic Bancorp, Inc., Class A | | 7,344 | | | 290,382 | |
| S&T Bancorp, Inc. | | 8,302 | | | 324,110 | |
| Sandy Spring Bancorp, Inc. | | 6,300 | | | 251,937 | |
| Seacoast Banking Corp. of Florida* | | 5,668 | | | 125,036 | |
| Select Bancorp, Inc.* | | 200 | | | 1,970 | |
| ServisFirst Bancshares, Inc. | | 5,778 | | | 216,328 | |
| Sierra Bancorp | | 3,246 | | | 86,311 | |
| Simmons First National Corp., Class A | | 5,764 | | | 358,233 | |
| South State Corp. | | 4,736 | | | 413,926 | |
| Southside Bancshares, Inc. | | 5,993 | | | 225,756 | |
| Southwest Bancorp, Inc. | | 5,110 | | | 148,190 | |
| State Bank Financial Corp. | | 4,771 | | | 128,149 | |
| Sterling Bancorp | | 32,230 | | | 754,182 | |
| Stock Yards Bancorp, Inc. | | 4,336 | | | 203,575 | |
| Stonegate Bank | | 274 | | | 11,434 | |
| Suffolk Bancorp | | 3,195 | | | 136,810 | |
| Sun Bancorp, Inc. | | 1,651 | | | 42,926 | |
| Synovus Financial Corp. | | 3,643 | | | 149,654 | |
| TCF Financial Corp. | | 43,473 | | | 851,636 | |
| Texas Capital Bancshares, Inc.* | | 11,663 | | | 914,379 | |
| Tompkins Financial Corp. | | 2,420 | | | 228,787 | |
| TowneBank | | 6,582 | | | 218,852 | |
| Trico Bancshares | | 5,350 | | | 182,863 | |
| TriState Capital Holdings, Inc.* | | 3,742 | | | 82,698 | |
| Trustmark Corp. | | 17,352 | | | 618,599 | |
| UMB Financial Corp. | | 11,656 | | | 898,911 | |
| Umpqua Holdings Corp. | | 4,737 | | | 88,961 | |
| Union Bankshares Corp. | | 9,688 | | | 346,249 | |
| United Bankshares, Inc.@ | | 17,021 | | | 787,221 | |
| | United Community Banks, Inc. | | 15,888 | | | 470,603 | |
| Univest Corp. of Pennsylvania | | 5,066 | | | 156,539 | |
| Valley National Bancorp | | 57,348 | | | 667,531 | |
| Veritex Holdings, Inc.* | | 597 | | | 15,946 | |
| Washington Trust Bancorp, Inc. | | 3,000 | | | 168,150 | |
| Webster Financial Corp. | | 16,775 | | | 910,547 | |
| WesBanco, Inc. | | 8,410 | | | 362,135 | |
| West Bancorp, Inc. | | 4,412 | | | 108,976 | |
| Westamerica Bancorp | | 6,329 | | | 398,284 | |
| Western Alliance Bancorp* | | 10,513 | | | 512,088 | |
| Wintrust Financial Corp. | | 11,283 | | | 818,807 | |
| Xenith Bankshares, Inc.* | | 460 | | | 12,972 | |
| Yadkin Financial Corp. | | 6,563 | | | 224,848 | |
| | | | | | 49,116,345 | |
| Commercial Services & Supplies — 3.3% | | | | | | |
| ABM Industries, Inc. | | 14,023 | | | 572,699 | |
| ACCO Brands Corp.* | | 26,340 | | | 343,737 | |
| ARC Document Solutions, Inc.* | | 11,111 | | | 56,444 | |
| Brady Corp., Class A | | 11,602 | | | 435,655 | |
| Brink’s Co. (The) | | 11,715 | | | 483,244 | |
| Casella Waste Systems, Inc., Class A* | | 18,957 | | | 235,256 | |
| Ceco Environmental Corp. | | 6,316 | | | 88,108 | |
| Cenveo, Inc.*@ | | 409 | | | 2,859 | |
| Civeo Corp.* | | 7,095 | | | 15,609 | |
| Clean Harbors, Inc.* | | 12,448 | | | 692,731 | |
| Command Security Corp.* | | 4,300 | | | 11,825 | |
| Covanta Holding Corp.@ | | 31,607 | | | 493,069 | |
| Deluxe Corp. | | 12,510 | | | 895,841 | |
| Ennis, Inc. | | 5,800 | | | 100,630 | |
| Essendant, Inc. | | 12,825 | | | 268,043 | |
| Fuel Tech, Inc.* | | 4,500 | | | 5,175 | |
| G&K Services, Inc., Class A | | 4,600 | | | 443,670 | |
| Healthcare Services Group, Inc. | | 15,886 | | | 622,255 | |
| Heritage-Crystal Clean, Inc.* | | 712 | | | 11,178 | |
| Herman Miller, Inc. | | 14,286 | | | 488,581 | |
| HNI Corp. | | 11,460 | | | 640,843 | |
| Hudson Technologies, Inc.* | | 7,854 | | | 62,911 | |
| Innerworkings, Inc.* | | 10,302 | | | 101,475 | |
| Interface, Inc. | | 19,482 | | | 361,391 | |
| Intersections, Inc.*@ | | 3,104 | | | 12,385 | |
| Kimball International, Inc., Class B | | 14,278 | | | 250,722 | |
| Knoll, Inc. | | 12,851 | | | 358,928 | |
| LSC Communications, Inc. | | 2,974 | | | 88,268 | |
| Matthews International Corp., Class A | | 8,044 | | | 618,181 | |
| Mcgrath Rentcorp | | 5,300 | | | 207,707 | |
| Mobile Mini, Inc. | | 14,147 | | | 427,947 | |
| MSA Safety, Inc. | | 8,900 | | | 617,037 | |
| Multi-Color Corp. | | 4,321 | | | 335,310 | |
| NL Industries, Inc.* | | 5,586 | | | 45,526 | |
| Performant Financial Corp.* | | 7,231 | | | 16,993 | |
| Quad/Graphics, Inc. | | 4,591 | | | 123,406 | |
| RR Donnelley & Sons Co. | | 7,931 | | | 129,434 | |
| SP Plus Corp.* | | 4,000 | | | 112,600 | |
| Steelcase, Inc., Class A | | 26,730 | | | 478,467 | |
| Team, Inc.* | | 8,031 | | | 315,217 | |
| Tetra Tech, Inc. | | 15,308 | | | 660,540 | |
| TRC Cos., Inc.* | | 7,000 | | | 74,200 | |
| UniFirst Corp. | | 3,000 | | | 430,950 | |
| US Ecology, Inc. | | 5,445 | | | 267,622 | |
See notes to financial statements
SA U.S. Small Company Fund
PORTFOLIO OF INVESTMENTS — AS OF DECEMBER 31, 2016 (Unaudited) (Continued)
| | | | SHARES | | VALUE† | |
| COMMON STOCKS (Continued) | | | | | | |
| Commercial Services & Supplies (Continued) | | | | |
| Versar, Inc.* | | 2,000 | | $ | 2,760 | |
| Viad Corp. | | 4,500 | | | 198,450 | |
| Virco Manufacturing Corp.* | | 2,494 | | | 10,724 | |
| VSE Corp. | | 1,700 | | | 66,028 | |
| West Corp. | | 18,378 | | | 455,039 | |
| | | | | | 13,737,670 | |
| Communications Equipment — 1.9% | | | | | | |
| ADTRAN, Inc. | | 20,619 | | | 460,835 | |
| Bel Fuse, Inc., Class B | | 4,393 | | | 135,744 | |
| Black Box Corp. | | 5,203 | | | 79,346 | |
| CalAmp Corp.* | | 13,756 | | | 199,462 | |
| | Calix, Inc.* | | 13,728 | | | 105,706 | |
| Ciena Corp.* | | 31,072 | | | 758,468 | |
| Clearfield, Inc.* | | 1,600 | | | 33,120 | |
| Communications Systems, Inc. | | 1,418 | | | 6,565 | |
| Comtech Telecommunications Corp. | | 4,325 | | | 51,251 | |
| Digi International, Inc.* | | 7,600 | | | 104,500 | |
| EMCORE Corp. | | 4,428 | | | 38,524 | |
| Extreme Networks, Inc.* | | 21,668 | | | 108,990 | |
| Finisar Corp.* | | 25,900 | | | 783,993 | |
| Harmonic, Inc.*@ | | 24,420 | | | 122,100 | |
| Infinera Corp.* | | 22,351 | | | 189,760 | |
| InterDigital, Inc. | | 9,067 | | | 828,270 | |
| Ixia* | | 18,986 | | | 305,675 | |
| KVH Industries, Inc.* | | 5,534 | | | 65,301 | |
| Lumentum Holdings, Inc.* | | 5,125 | | | 198,081 | |
| NETGEAR, Inc.* | | 8,512 | | | 462,627 | |
| NetScout Systems, Inc.* | | 12,873 | | | 405,499 | |
| Oclaro, Inc.* | | 7,713 | | | 69,031 | |
| Optical Cable Corp.* | | 374 | | | 1,197 | |
| PC-Tel, Inc. | | 4,100 | | | 22,058 | |
| Plantronics, Inc. | | 11,041 | | | 604,605 | |
| Relm Wireless Corp. | | 2,000 | | | 9,500 | |
| ShoreTel, Inc.* | | 20,766 | | | 148,477 | |
| Sonus Networks, Inc.* | | 17,744 | | | 111,787 | |
| Tessco Technologies, Inc. | | 1,000 | | | 13,000 | |
| Ubiquiti Networks, Inc.* | | 11,643 | | | 672,965 | |
| Viasat, Inc.* | | 8,465 | | | 560,552 | |
| Viavi Solutions, Inc.* | | 47,559 | | | 389,033 | |
| | | | | | 8,046,022 | |
| Computers & Peripherals — 0.4% | | | | | | |
| AstroNova, Inc. | | 1,572 | | | 22,401 | |
| Avid Technology, Inc.* | | 18,069 | | | 79,504 | |
| Concurrent Computer Corp. | | 1,362 | | | 7,287 | |
| Cray, Inc.* | | 9,970 | | | 206,379 | |
| Diebold Nixdorf, Inc.@ | | 14,553 | | | 366,008 | |
| Eastman Kodak Co.* | | 800 | | | 12,400 | |
| Electronics for Imaging, Inc.* | | 12,878 | | | 564,829 | |
| Immersion Corp.*@ | | 3,781 | | | 40,192 | |
| Intevac, Inc.*@ | | 4,883 | | | 41,750 | |
| Super Micro Computer, Inc.* | | 11,510 | | | 322,855 | |
| Transact Technologies, Inc. | | 1,515 | | | 9,999 | |
| USA Technologies, Inc.* | | 1,931 | | | 8,303 | |
| | | | | | 1,681,907 | |
| Construction & Engineering — 1.6% | | | | | | |
| Aegion Corp.* | | 10,061 | | | 238,446 | |
| Ameresco, Inc., Class A* | | 4,779 | | | 26,285 | |
| Argan, Inc. | | 5,881 | | | 414,905 | |
| Comfort Systems USA, Inc. | | 8,930 | | | 297,369 | |
| Dycom Industries, Inc.*@ | | 9,800 | | | 786,842 | |
| EMCOR Group, Inc. | | 15,815 | | | 1,119,069 | |
| Goldfield Corp. (The)* | | 7,136 | | | 36,394 | |
| Granite Construction, Inc. | | 9,422 | | | 518,210 | |
| Great Lakes Dredge & Dock Corp.* | | 15,377 | | | 64,583 | |
| IES Holdings, Inc.* | | 6,062 | | | 116,087 | |
| KBR, Inc. | | 27,114 | | | 452,533 | |
| Layne Christensen Co.* | | 1,221 | | | 13,272 | |
| MasTec, Inc.* | | 22,810 | | | 872,483 | |
| MYR Group, Inc.* | | 5,036 | | | 189,756 | |
| Northwest Pipe Co.* | | 2,795 | | | 48,130 | |
| NV5 Global, Inc.* | | 1,729 | | | 57,749 | |
| Orion Marine Group, Inc.* | | 5,671 | | | 56,426 | |
| Primoris Services Corp. | | 16,878 | | | 384,481 | |
| Sterling Construction Co., Inc.* | | 5,877 | | | 49,719 | |
| Tutor Perini Corp.* | | 11,189 | | | 313,292 | |
| Valmont Industries, Inc. | | 5,127 | | | 722,394 | |
| | | | | | 6,778,425 | |
| Construction Materials — 0.2% | | | | | | |
| Headwaters, Inc.* | | 19,917 | | | 468,448 | |
| United States Lime & Minerals, Inc. | | 1,679 | | | 127,184 | |
| US Concrete, Inc.*@ | | 3,055 | | | 200,103 | |
| | | | | | 795,735 | |
| Consumer Finance — 0.8% | | | | | | |
| Asta Funding, Inc.* | | 2,600 | | | 25,480 | |
| Atlanticus Holdings Corp.* | | 5,476 | | | 15,607 | |
| Consumer Portfolio Services, Inc.* | | 7,272 | | | 37,233 | |
| Encore Capital Group, Inc.* | | 6,224 | | | 178,317 | |
| Enova International, Inc.* | | 10,026 | | | 125,826 | |
| Ezcorp, Inc., Class A* | | 11,381 | | | 121,208 | |
| FirstCash, Inc. | | 13,459 | | | 632,573 | |
| Green Dot Corp., Class A* | | 12,631 | | | 297,460 | |
| Nelnet, Inc., Class A | | 9,709 | | | 492,732 | |
| PRA Group, Inc.* | | 12,540 | | | 490,314 | |
| Regional Management Corp.* | | 3,000 | | | 78,840 | |
| SLM Corp.* | | 66,797 | | | 736,103 | |
| World Acceptance Corp.* | | 3,636 | | | 233,722 | |
| | | | | | 3,465,415 | |
| Containers & Packaging — 0.2% | | | | | | |
| AEP Industries, Inc. | | 1,000 | | | 116,100 | |
| Greif, Inc., Class A | | 4,826 | | | 247,622 | |
| Greif, Inc., Class B | | 503 | | | 33,978 | |
| Myers Industries, Inc. | | 11,631 | | | 166,323 | |
| Silgan Holdings, Inc. | | 8,109 | | | 415,019 | |
| | | | | | 979,042 | |
| Distributors — 0.2% | | | | | | |
| Core-Mark Holding Co., Inc. | | 11,498 | | | 495,219 | |
| Pool Corp. | | 3,200 | | | 333,888 | |
| Weyco Group, Inc. | | 690 | | | 21,597 | |
| | | | | | 850,704 | |
See notes to financial statements
SA U.S. Small Company Fund
PORTFOLIO OF INVESTMENTS — AS OF DECEMBER 31, 2016 (Unaudited) (Continued)
| | | | SHARES | | VALUE† | |
| COMMON STOCKS (Continued) | | | | | | |
| Diversified Consumer Services — 1.0% | | | | | | |
| American Public Education, Inc.* | | 3,569 | | $ | 87,619 | |
| Apollo Education Group, Inc.* | | 24,712 | | | 244,649 | |
| Ascent Capital Group, Inc., Class A* | | 2,620 | | | 42,601 | |
| Bridgepoint Education, Inc.* | | 11,558 | | | 117,082 | |
| Bright Horizons Family Solutions, Inc.* | | 2,118 | | | 148,302 | |
| Cambium Learning Group, Inc.* | | 1,370 | | | 6,836 | |
| Capella Education Co. | | 2,200 | | | 193,160 | |
| | Career Education Corp.* | | 20,047 | | | 202,274 | |
| Carriage Services, Inc. | | 5,101 | | | 146,093 | |
| Collectors Universe, Inc. | | 1,790 | | | 38,002 | |
| DeVry Education Group, Inc.@ | | 15,103 | | | 471,214 | |
| Graham Holdings Co., Class B | | 523 | | | 267,750 | |
| Grand Canyon Education, Inc.* | | 13,010 | | | 760,434 | |
| Houghton Mifflin Harcourt Co.* | | 29,496 | | | 320,032 | |
| K12, Inc.* | | 7,149 | | | 122,677 | |
| Regis Corp.* | | 11,780 | | | 171,046 | |
| Sotheby’s | | 14,093 | | | 561,747 | |
| Strayer Education, Inc.* | | 3,342 | | | 269,465 | |
| Universal Technical Institute, Inc. | | 5,900 | | | 17,169 | |
| | | | | | 4,188,152 | |
| Diversified Financial Services — 0.1% | | | | | | |
| A-Mark Precious Metals, Inc. | | 1,256 | | | 24,492 | |
| FNFV Group* | | 4,237 | | | 58,047 | |
| Marlin Business Services Corp. | | 2,800 | | | 58,520 | |
| NewStar Financial, Inc.* | | 13,144 | | | 121,582 | |
| Pico Holdings, Inc.* | | 4,182 | | | 63,357 | |
| | | | | | 325,998 | |
| Diversified Telecommunication Services — 0.7% | | | | |
| Alaska Communications
Systems Group, Inc.* | | 2,448 | | | 4,015 | |
| ATN International, Inc. | | 3,600 | | | 288,468 | |
| Cincinnati Bell, Inc.* | | 10,380 | | | 231,993 | |
| Cogent Communications Holdings, Inc. | | 11,951 | | | 494,174 | |
| Consolidated Communications
Holdings, Inc. | | 13,459 | | | 361,374 | |
| FairPoint Communications, Inc.* | | 2,829 | | | 52,902 | |
| General Communication, Inc., Class A* | | 14,261 | | | 277,376 | |
| Hawaiian Telcom Holdco, Inc.* | | 187 | | | 4,634 | |
| IDT Corp., Class B | | 9,094 | | | 168,603 | |
| Inteliquent, Inc. | | 15,093 | | | 345,932 | |
| Lumos Networks Corp.* | | 8,561 | | | 133,723 | |
| Orbcomm, Inc.* | | 16,422 | | | 135,810 | |
| Straight Path
Communications, Inc., Class B* | | 928 | | | 31,468 | |
| Vonage Holdings Corp.* | | 52,898 | | | 362,351 | |
| | | | | | 2,892,823 | |
| Electric Utilities — 1.3% | | | | | | |
| Allete, Inc. | | 13,923 | | | 893,717 | |
| El Paso Electric Co. | | 11,005 | | | 511,733 | |
| Empire District Electric Co. (The) | | 11,448 | | | 390,262 | |
| Genie Energy Ltd., Class B* | | 4,900 | | | 28,175 | |
| Hawaiian Electric Industries, Inc. | | 18,884 | | | 624,494 | |
| IDACORP, Inc. | | 7,578 | | | 610,408 | |
| MGE Energy, Inc. | | 7,437 | | | 485,636 | |
| Otter Tail Corp. | | 8,433 | | | 344,067 | |
| PNM Resources, Inc. | | 21,371 | | | 733,025 | |
| Portland General Electric Co. | | 18,004 | | | 780,113 | |
| Spark Energy, Inc., Class A@ | | 1,000 | | | 30,300 | |
| | | | | | 5,431,930 | |
| Electrical Equipment — 0.9% | | | | | | |
| Allied Motion Technologies, Inc. | | 2,799 | | | 59,871 | |
| AZZ, Inc. | | 7,298 | | | 466,342 | |
| Babcock & Wilcox Enterprises, Inc.* | | 6,318 | | | 104,816 | |
| Encore Wire Corp. | | 5,600 | | | 242,760 | |
| EnerSys | | 12,221 | | | 954,460 | |
| Espey Manufacturing &
Electronics Corp. | | 565 | | | 14,704 | |
| Generac Holdings, Inc.* | | 15,486 | | | 630,900 | |
| General Cable Corp.@ | | 11,120 | | | 211,836 | |
| LSI Industries, Inc. | | 4,900 | | | 47,726 | |
| Orion Energy Systems, Inc.* | | 3,100 | | | 6,727 | |
| Powell Industries, Inc. | | 2,600 | | | 101,400 | |
| Preformed Line Products Co. | | 850 | | | 49,402 | |
| Regal Beloit Corp. | | 6,719 | | | 465,291 | |
| Thermon Group Holdings, Inc.* | | 8,204 | | | 156,614 | |
| Ultralife Corp.* | | 3,600 | | | 17,820 | |
| Vicor Corp.* | | 7,856 | | | 118,625 | |
| | | | | | 3,649,294 | |
| Electronic Equipment, Instruments & Components — 3.5% | | |
| ADDvantage Technologies Group, Inc.* | | 2,400 | | | 4,248 | |
| Agilysys, Inc.* | | 7,363 | | | 76,281 | |
| Anixter International, Inc.* | | 8,602 | | | 697,192 | |
| AVX Corp. | | 15,085 | | | 235,779 | |
| Badger Meter, Inc. | | 6,000 | | | 221,700 | |
| Belden, Inc. | | 13,079 | | | 977,917 | |
| Benchmark Electronics, Inc.* | | 7,901 | | | 240,980 | |
| Cognex Corp. | | 2,265 | | | 144,099 | |
| Coherent, Inc.* | | 6,253 | | | 859,068 | |
| Control4 Corp.* | | 1,880 | | | 19,176 | |
| CTS Corp. | | 9,329 | | | 208,970 | |
| Daktronics, Inc. | | 16,961 | | | 181,483 | |
| Electro Scientific Industries, Inc.* | | 7,067 | | | 41,837 | |
| ePlus, Inc.* | | 1,200 | | | 138,240 | |
| Fabrinet* | | 9,194 | | | 370,518 | |
| FARO Technologies, Inc.* | | 4,180 | | | 150,480 | |
| Frequency Electronics, Inc.* | | 1,400 | | | 15,120 | |
| I.D. Systems, Inc.* | | 2,750 | | | 14,905 | |
| IEC Electronics Corp.* | | 800 | | | 2,856 | |
| II-VI, Inc.* | | 21,222 | | | 629,232 | |
| Insight Enterprises, Inc.* | | 9,272 | | | 374,960 | |
| IntriCon Corp.* | | 1,000 | | | 6,900 | |
| InvenSense, Inc.* | | 1,685 | | | 21,551 | |
| Itron, Inc.* | | 9,844 | | | 618,695 | |
| Kemet Corp.* | | 8,936 | | | 59,246 | |
| Key Tronic Corp.* | | 1,700 | | | 13,294 | |
| Kimball Electronics, Inc.* | | 5,879 | | | 106,998 | |
| Knowles Corp.* | | 11,920 | | | 199,183 | |
| Littelfuse, Inc. | | 6,629 | | | 1,006,083 | |
| Maxwell Technologies, Inc.*@ | | 7,005 | | | 35,866 | |
See notes to financial statements
SA U.S. Small Company Fund
PORTFOLIO OF INVESTMENTS — AS OF DECEMBER 31, 2016 (Unaudited) (Continued)
| | | | SHARES | | VALUE† | |
| COMMON STOCKS (Continued) | | | | | | |
| Electronic Equipment, Instruments & Components (Continued) | |
| Mesa Laboratories, Inc.@ | | 860 | | $ | 105,565 | |
| Methode Electronics, Inc. | | 11,077 | | | 458,034 | |
| MOCON, Inc. | | 600 | | | 11,700 | |
| MTS Systems Corp. | | 3,800 | | | 215,460 | |
| NAPCO Security Technologies, Inc.* | | 4,850 | | | 41,225 | |
| Novanta, Inc.* | | 4,922 | | | 103,362 | |
| OSI Systems, Inc.* | | 5,346 | | | 406,938 | |
| PAR Technology Corp.* | | 3,000 | | | 16,740 | |
| Park Electrochemical Corp. | | 5,535 | | | 103,228 | |
| PC Connection, Inc. | | 6,200 | | | 174,158 | |
| PCM, Inc.* | | 5,438 | | | 122,355 | |
| Perceptron, Inc.* | | 1,100 | | | 7,304 | |
| Plexus Corp.* | | 9,156 | | | 494,790 | |
| | Radisys Corp.*@ | | 15,948 | | | 70,650 | |
| Richardson Electronics Ltd. | | 2,700 | | | 17,010 | |
| Rogers Corp.* | | 3,742 | | | 287,423 | |
| Sanmina Corp.* | | 21,944 | | | 804,248 | |
| Scansource, Inc.* | | 6,290 | | | 253,801 | |
| SYNNEX Corp. | | 6,819 | | | 825,235 | |
| Systemax, Inc. | | 8,559 | | | 75,062 | |
| Tech Data Corp.* | | 9,625 | | | 815,045 | |
| TTM Technologies, Inc.*@ | | 20,635 | | | 281,255 | |
| Universal Display Corp.*@ | | 500 | | | 28,150 | |
| VeriFone Systems, Inc.* | | 18,762 | | | 332,650 | |
| Vishay Intertechnology, Inc. | | 34,292 | | | 555,530 | |
| Vishay Precision Group, Inc.* | | 4,187 | | | 79,134 | |
| Wayside Technology Group, Inc. | | 315 | | | 5,891 | |
| | | | | | 14,364,800 | |
| Energy Equipment & Services — 2.2% | | | | | | |
| Archrock, Inc. | | 20,013 | | | 264,172 | |
| Atwood Oceanics, Inc.@ | | 9,099 | | | 119,470 | |
| Bristow Group, Inc. | | 9,706 | | | 198,779 | |
| CARBO Ceramics, Inc.* | | 4,505 | | | 47,122 | |
| Dawson Geophysical Co.* | | 5,627 | | | 45,241 | |
| Diamond Offshore Drilling, Inc. | | 20,830 | | | 368,691 | |
| Dril-Quip, Inc.*@ | | 8,636 | | | 518,592 | |
| ENGlobal Corp.* | | 2,100 | | | 5,019 | |
| Ensco PLC, Class A | | 4,073 | | | 39,590 | |
| Era Group, Inc.* | | 5,219 | | | 88,566 | |
| Exterran Corp.* | | 10,006 | | | 239,143 | |
| Forum Energy Technologies, Inc.* | | 20,325 | | | 447,150 | |
| Frank’s International NV | | 12,111 | | | 149,086 | |
| Geospace Technologies Corp.* | | 2,574 | | | 52,407 | |
| Gulf Island Fabrication, Inc. | | 3,600 | | | 42,840 | |
| Gulfmark Offshore, Inc., Class A*@ | | 6,282 | | | 10,994 | |
| Helix Energy Solutions Group, Inc.* | | 26,950 | | | 237,699 | |
| Hornbeck Offshore Services, Inc.*@ | | 9,178 | | | 66,265 | |
| ION Geophysical Corp.*@ | | 2,918 | | | 17,508 | |
| Matrix Service Co.* | | 7,876 | | | 178,785 | |
| McDermott International, Inc.* | | 51,671 | | | 381,849 | |
| Mitcham Industries, Inc.* | | 2,601 | | | 10,794 | |
| Nabors Industries Ltd. | | 41,414 | | | 679,190 | |
| Natural Gas Services Group, Inc.* | | 2,700 | | | 86,805 | |
| Newpark Resources, Inc.* | | 35,623 | | | 267,173 | |
| Noble Corp. PLC@ | | 39,010 | | | 230,939 | |
| Oceaneering International, Inc. | | 9,417 | | | 265,654 | |
| Oil States International, Inc.* | | 8,226 | | | 320,814 | |
| Pacific Drilling SA*@ | | 508 | | | 2,062 | |
| Parker Drilling Co.* | | 28,864 | | | 75,046 | |
| Patterson-UTI Energy, Inc.@ | | 31,203 | | | 839,985 | |
| PHI, Inc.* | | 2,300 | | | 41,446 | |
| Pioneer Energy Services Corp.* | | 14,380 | | | 98,503 | |
| RigNet, Inc.* | | 3,277 | | | 75,863 | |
| Rowan Cos. PLC, Class A@ | | 21,417 | | | 404,567 | |
| RPC, Inc.@ | | 3,729 | | | 73,871 | |
| SEACOR Holdings, Inc.* | | 5,019 | | | 357,754 | |
| Superior Energy Services, Inc. | | 33,300 | | | 562,104 | |
| Tesco Corp. | | 10,822 | | | 89,282 | |
| Tetra Technologies, Inc.* | | 17,573 | | | 88,216 | |
| Tidewater, Inc. | | 7,841 | | | 26,738 | |
| Unit Corp.* | | 11,332 | | | 304,491 | |
| US Silica Holdings, Inc. | | 13,049 | | | 739,617 | |
| | | | | | 9,159,882 | |
| Food & Staples Retailing — 0.7% | | | | | | |
| Andersons, Inc. (The) | | 8,013 | | | 358,181 | |
| Chefs’ Warehouse Inc. (The)* | | 5,365 | | | 84,767 | |
| Ingles Markets, Inc., Class A | | 2,846 | | | 136,893 | |
| Natural Grocers by Vitamin
Cottage, Inc.*@ | | 2,967 | | | 35,278 | |
| PriceSmart, Inc. | | 7,615 | | | 635,852 | |
| Smart & Final Stores, Inc.*@ | | 220 | | | 3,102 | |
| SpartanNash Co. | | 9,360 | | | 370,094 | |
| SUPERVALU, Inc.* | | 63,930 | | | 298,553 | |
| United Natural Foods, Inc.* | | 8,554 | | | 408,197 | |
| Village Super Market, Inc., Class A | | 1,946 | | | 60,131 | |
| Weis Markets, Inc. | | 6,390 | | | 427,108 | |
| | | | | | 2,818,156 | |
| Food Products — 1.9% | | | | | | |
| B&G Foods, Inc. | | 14,705 | | | 644,079 | |
| Cal-Maine Foods, Inc.@ | | 10,494 | | | 463,572 | |
| Calavo Growers, Inc. | | 5,041 | | | 309,517 | |
| Coffee Holding Co., Inc.* | | 600 | | | 2,790 | |
| Darling Ingredients, Inc.* | | 37,935 | | | 489,741 | |
| Dean Foods Co. | | 22,086 | | | 481,033 | |
| Farmer Bros. Co.* | | 5,356 | | | 196,565 | |
| Fresh Del Monte Produce, Inc. | | 16,722 | | | 1,013,855 | |
| Inventure Foods, Inc.*@ | | 3,661 | | | 36,061 | |
| J&J Snack Foods Corp. | | 4,900 | | | 653,807 | |
| John B. Sanfilippo & Son, Inc. | | 2,650 | | | 186,534 | |
| Lancaster Colony Corp. | | 5,562 | | | 786,411 | |
| Landec Corp.* | | 9,074 | | | 125,221 | |
| Lifeway Foods, Inc.* | | 3,800 | | | 43,738 | |
| Limoneira Co. | | 810 | | | 17,423 | |
| Omega Protein Corp.* | | 5,237 | | | 131,187 | |
| Post Holdings, Inc.* | | 7,886 | | | 633,956 | |
| Rocky Mountain Chocolate Factory, Inc. | | 1,260 | | | 12,839 | |
| Sanderson Farms, Inc.@ | | 6,194 | | | 583,723 | |
| Seneca Foods Corp., Class A* | | 1,738 | | | 69,607 | |
| Snyders-Lance, Inc.@ | | 21,746 | | | 833,742 | |
| Tootsie Roll Industries, Inc.@ | | 7,736 | | | 307,506 | |
| | | | | | 8,022,907 | |
See notes to financial statements
SA U.S. Small Company Fund
PORTFOLIO OF INVESTMENTS — AS OF DECEMBER 31, 2016 (Unaudited) (Continued)
| | | | SHARES | | VALUE† | |
| COMMON STOCKS (Continued) | | | | | | |
| Gas Utilities — 1.3% | | | | | | |
| Chesapeake Utilities Corp. | | 3,064 | | $ | 205,135 | |
| Delta Natural Gas Co., Inc. | | 400 | | | 11,732 | |
| Gas Natural, Inc. | | 836 | | | 10,492 | |
| New Jersey Resources Corp. | | 21,532 | | | 764,386 | |
| Northwest Natural Gas Co. | | 6,553 | | | 391,869 | |
| ONE Gas, Inc. | | 13,260 | | | 848,110 | |
| RGC Resources, Inc. | | 400 | | | 10,068 | |
| South Jersey Industries, Inc. | | 17,084 | | | 575,560 | |
| Southwest Gas Corp. | | 11,874 | | | 909,786 | |
| Spire, Inc. | | 11,344 | | | 732,255 | |
| | WGL Holdings, Inc. | | 12,554 | | | 957,619 | |
| | | | | | 5,417,012 | |
| Health Care Equipment & Supplies — 3.1% | | | | | | |
| Abaxis, Inc. | | 7,231 | | | 381,580 | |
| Accuray, Inc.* | | 14,899 | | | 68,535 | |
| Alere, Inc.* | | 13,837 | | | 539,228 | |
| Analogic Corp. | | 5,580 | | | 462,861 | |
| Angiodynamics, Inc.* | | 9,660 | | | 162,964 | |
| Anika Therapeutics, Inc.* | | 7,139 | | | 349,525 | |
| Atrion Corp. | | 566 | | | 287,075 | |
| Bovie Medical Corp.*@ | | 4,900 | | | 17,591 | |
| Cantel Medical Corp. | | 10,310 | | | 811,912 | |
| Conmed Corp. | | 7,150 | | | 315,816 | |
| CryoLife, Inc. | | 15,417 | | | 295,236 | |
| Cutera, Inc.* | | 2,299 | | | 39,888 | |
| Cynosure, Inc., Class A* | | 6,160 | | | 280,896 | |
| Electromed, Inc.* | | 2,929 | | | 11,365 | |
| Exactech, Inc.* | | 3,109 | | | 84,876 | |
| Globus Medical, Inc., Class A*@ | | 18,325 | | | 454,643 | |
| Haemonetics Corp.* | | 12,126 | | | 487,465 | |
| Halyard Health, Inc.* | | 9,638 | | | 356,413 | |
| Hill-Rom Holdings, Inc. | | 11,689 | | | 656,220 | |
| ICU Medical, Inc.* | | 4,198 | | | 618,575 | |
| Inogen, Inc.* | | 3,628 | | | 243,693 | |
| Integer Holdings Corp.* | | 7,181 | | | 211,480 | |
| Integra LifeSciences Holdings Corp.*@ | | 8,892 | | | 762,845 | |
| Invacare Corp. | | 8,104 | | | 105,757 | |
| Iridex Corp.* | | 671 | | | 9,434 | |
| LeMaitre Vascular, Inc. | | 7,298 | | | 184,931 | |
| LivaNova PLC* | | 5,780 | | | 259,927 | |
| Masimo Corp.* | | 13,405 | | | 903,497 | |
| Meridian Bioscience, Inc. | | 9,934 | | | 175,832 | |
| Merit Medical Systems, Inc.* | | 11,860 | | | 314,290 | |
| Misonix, Inc.* | | 2,200 | | | 22,990 | |
| Natus Medical, Inc.* | | 8,702 | | | 302,830 | |
| Neogen Corp.* | | 7,095 | | | 468,270 | |
| NuVasive, Inc.* | | 11,981 | | | 807,040 | |
| Nuvectra Corp.* | | 2,393 | | | 12,037 | |
| OraSure Technologies, Inc.* | | 15,720 | | | 138,022 | |
| Orthofix International NV* | | 3,915 | | | 141,645 | |
| Quidel Corp.*@ | | 8,803 | | | 188,560 | |
| RTI Surgical, Inc.* | | 13,049 | | | 42,409 | |
| SeaSpine Holdings Corp.* | | 2,964 | | | 23,416 | |
| Span-America Medical Systems, Inc. | | 500 | | | 9,120 | |
| SurModics, Inc.* | | 5,316 | | | 135,026 | |
| Utah Medical Products, Inc. | | 831 | | | 60,455 | |
| Vascular Solutions, Inc.* | | 6,160 | | | 345,576 | |
| Wright Medical Group NV* | | 8,505 | | | 195,445 | |
| | | | | | 12,747,191 | |
| Health Care Providers & Services — 2.5% | | | | | | |
| Aceto Corp. | | 11,515 | | | 252,985 | |
| Addus HomeCare Corp.* | | 5,190 | | | 181,910 | |
| Adeptus Health, Inc., Class A*@ | | 2,200 | | | 16,808 | |
| Air Methods Corp.*@ | | 11,576 | | | 368,696 | |
| Alliance HealthCare Services, Inc.* | | 190 | | | 1,824 | |
| Almost Family, Inc.* | | 3,282 | | | 144,736 | |
| Amedisys, Inc.* | | 8,123 | | | 346,283 | |
| AMN Healthcare Services, Inc.* | | 12,336 | | | 474,319 | |
| BioScrip, Inc.*@ | | 9,341 | | | 9,715 | |
| BioTelemetry, Inc.* | | 12,558 | | | 280,671 | |
| Brookdale Senior Living, Inc.* | | 5,231 | | | 64,969 | |
| Capital Senior Living Corp.* | | 9,398 | | | 150,838 | |
| Chemed Corp.@ | | 5,381 | | | 863,166 | |
| Corvel Corp.* | | 5,100 | | | 186,660 | |
| Cross Country Healthcare, Inc.* | | 4,677 | | | 73,008 | |
| Digirad Corp. | | 2,100 | | | 10,500 | |
| Diplomat Pharmacy, Inc.* | | 6,252 | | | 78,775 | |
| Ensign Group, Inc. (The) | | 12,996 | | | 288,641 | |
| Envision Healthcare Corp.*@ | | 7,305 | | | 462,333 | |
| Five Star Quality Care, Inc.* | | 6,297 | | | 17,002 | |
| Genesis Healthcare, Inc.* | | 4,555 | | | 19,359 | |
| HealthEquity, Inc.*@ | | 7,664 | | | 310,545 | |
| HealthSouth Corp.@ | | 2,195 | | | 90,522 | |
| Healthways, Inc.* | | 9,735 | | | 221,471 | |
| Kindred Healthcare, Inc. | | 17,194 | | | 134,973 | |
| Landauer, Inc. | | 2,730 | | | 131,313 | |
| LHC Group, Inc.* | | 3,800 | | | 173,660 | |
| LifePoint Health, Inc.* | | 11,178 | | | 634,910 | |
| Magellan Health, Inc.* | | 7,580 | | | 570,395 | |
| Medcath Corp.*~§ | | 3,122 | | | — | |
| Molina Healthcare, Inc.*@ | | 10,975 | | | 595,504 | |
| National Healthcare Corp. | | 3,000 | | | 227,370 | |
| National Research Corp., Class A | | 4,425 | | | 84,075 | |
| National Research Corp., Class B | | 737 | | | 30,711 | |
| Nobilis Health Corp.*@ | | 1,318 | | | 2,768 | |
| Owens & Minor, Inc. | | 19,632 | | | 692,813 | |
| PharMerica Corp.* | | 7,236 | | | 181,985 | |
| Providence Service Corp. (The)* | | 4,498 | | | 171,149 | |
| Psychemedics Corp. | | 1,935 | | | 47,756 | |
| Quorum Health Corp.* | | 1,795 | | | 13,050 | |
| RadNet, Inc.* | | 14,650 | | | 94,493 | |
| Select Medical Holdings Corp.* | | 33,903 | | | 449,215 | |
| Surgical Care Affiliates, Inc.* | | 8,633 | | | 399,449 | |
| Tenet Healthcare Corp.* | | 16,691 | | | 247,694 | |
| Triple-S Management Corp., Class B* | | 5,369 | | | 111,138 | |
| U.S. Physical Therapy, Inc. | | 2,650 | | | 186,030 | |
| Universal American Corp.* | | 17,673 | | | 175,846 | |
| | | | | | 10,272,033 | |
See notes to financial statements
SA U.S. Small Company Fund
PORTFOLIO OF INVESTMENTS — AS OF DECEMBER 31, 2016 (Unaudited) (Continued)
| | | | SHARES | | VALUE† | |
| COMMON STOCKS (Continued) | | | | | | |
| Health Care Technology — 0.4% | | | | | | |
| Allscripts Healthcare Solutions, Inc.* | | 46,706 | | $ | 476,868 | |
| Arrhythmia Research Technology, Inc.* | | 200 | | | 760 | |
| Computer Programs & Systems, Inc.@ | | 2,670 | | | 63,012 | |
| HealthStream, Inc.* | | 6,062 | | | 151,853 | |
| HMS Holdings Corp.* | | 20,254 | | | 367,813 | |
| Omnicell, Inc.* | | 8,824 | | | 299,134 | |
| Quality Systems, Inc. | | 14,776 | | | 194,304 | |
| Simulations Plus, Inc. | | 2,102 | | | 20,284 | |
| | | | | | 1,574,028 | |
| Hotels, Restaurants & Leisure — 4.0% | | | | | | |
| | Belmond Ltd., Class A* | | 24,303 | | | 324,445 | |
| Biglari Holdings, Inc.* | | 1 | | | 473 | |
| BJ’s Restaurants, Inc.* | | 6,741 | | | 264,921 | |
| Bloomin’ Brands, Inc. | | 28,360 | | | 511,331 | |
| Bob Evans Farms, Inc. | | 8,100 | | | 431,001 | |
| Bravo Brio Restaurant Group, Inc.* | | 4,343 | | | 16,503 | |
| Brinker International, Inc.@ | | 14,448 | | | 715,609 | |
| Buffalo Wild Wings, Inc.* | | 4,994 | | | 771,074 | |
| Carrols Restaurant Group, Inc.* | | 12,779 | | | 194,880 | |
| Cheesecake Factory, Inc. (The) | | 14,048 | | | 841,194 | |
| Choice Hotels International, Inc. | | 13,792 | | | 773,042 | |
| Churchill Downs, Inc. | | 1,540 | | | 231,693 | |
| Chuy’s Holdings, Inc.* | | 4,008 | | | 130,060 | |
| ClubCorp Holdings, Inc. | | 13,876 | | | 199,121 | |
| Cracker Barrel Old Country
Store, Inc.@ | | 3,395 | | | 566,897 | |
| Dave & Buster’s Entertainment, Inc.* | | 8,459 | | | 476,242 | |
| Del Frisco’s Restaurant Group, Inc.* | | 5,669 | | | 96,373 | |
| Del Taco Restaurants, Inc.* | | 2,400 | | | 33,888 | |
| Denny’s Corp.* | | 20,830 | | | 267,249 | |
| DineEquity, Inc. | | 5,483 | | | 422,191 | |
| Dover Motorsports, Inc. | | 4,000 | | | 9,200 | |
| El Pollo Loco Holdings, Inc.*@ | | 2,900 | | | 35,670 | |
| Famous Dave’s of America, Inc.* | | 2,145 | | | 10,618 | |
| Fiesta Restaurant Group, Inc.*@ | | 8,023 | | | 239,487 | |
| Gaming Partners International Corp. | | 1,300 | | | 15,353 | |
| ILG, Inc. | | 23,589 | | | 428,612 | |
| International Game Technology PLC | | 1,039 | | | 26,515 | |
| International Speedway Corp., Class A | | 6,688 | | | 246,118 | |
| Intrawest Resorts Holdings, Inc.* | | 5,008 | | | 89,393 | |
| Isle of Capri Casinos, Inc.* | | 5,718 | | | 141,177 | |
| Jack in the Box, Inc. | | 9,359 | | | 1,044,839 | |
| Jamba, Inc.*@ | | 4,407 | | | 45,392 | |
| Kona Grill, Inc.*@ | | 3,389 | | | 42,532 | |
| La Quinta Holdings, Inc.* | | 25,321 | | | 359,811 | |
| Lindblad Expeditions Holdings, Inc.* | | 732 | | | 6,917 | |
| Luby’s, Inc.* | | 7,260 | | | 31,073 | |
| Marcus Corp. (The) | | 4,500 | | | 141,750 | |
| Marriott Vacations Worldwide Corp. | | 8,070 | | | 684,739 | |
| Monarch Casino & Resort, Inc.* | | 1,490 | | | 38,412 | |
| Nathan’s Famous, Inc.* | | 1,385 | | | 89,886 | |
| Noodles & Co.* | | 810 | | | 3,321 | |
| Papa John’s International, Inc.@ | | 12,658 | | | 1,083,272 | |
| Papa Murphy’s Holdings, Inc.*@ | | 672 | | | 2,836 | |
| Penn National Gaming, Inc.* | | 8,352 | | | 115,174 | |
| Pinnacle Entertainment, Inc.*@ | | 15,578 | | | 225,881 | |
| Popeyes Louisiana Kitchen, Inc.* | | 6,875 | | | 415,800 | |
| Potbelly Corp.* | | 3,872 | | | 49,949 | |
| RCI Hospitality Holdings, Inc. | | 2,209 | | | 37,774 | |
| Red Lion Hotels Corp.* | | 4,500 | | | 37,575 | |
| Red Robin Gourmet Burgers, Inc.* | | 3,800 | | | 214,320 | |
| Ruby Tuesday, Inc.* | | 16,960 | | | 54,781 | |
| Ruth’s Hospitality Group, Inc. | | 9,286 | | | 169,934 | |
| SeaWorld Entertainment, Inc. | | 18,699 | | | 353,972 | |
| Shake Shack, Inc., Class A* | | 2,567 | | | 91,873 | |
| Sonic Corp. | | 13,946 | | | 369,708 | |
| Speedway Motorsports, Inc. | | 10,200 | | | 221,034 | |
| Texas Roadhouse, Inc. | | 19,524 | | | 941,838 | |
| Town Sports International
Holdings, Inc.* | | 8,000 | | | 20,000 | |
| Wendy’s Co. (The)@ | | 69,630 | | | 941,398 | |
| Wingstop, Inc. | | 364 | | | 10,771 | |
| | | | | | 16,356,892 | |
| Household Durables — 1.4% | | | | | | |
| | Bassett Furniture Industries, Inc. | | 2,600 | | | 79,040 | |
| Beazer Homes USA, Inc.* | | 1,643 | | | 21,852 | |
| | CalAtlantic Group, Inc.@ | | 5,120 | | | 174,131 | |
| California Coastal
Communities, Inc.*~§ | | 1,800 | | | — | |
| | Cavco Industries, Inc.* | | 1,100 | | | 109,835 | |
| Century Communities, Inc.* | | 614 | | | 12,894 | |
| | CSS Industries, Inc. | | 2,100 | | | 56,847 | |
| Dixie Group, Inc. (The)* | | 1,200 | | | 4,320 | |
| | Ethan Allen Interiors, Inc. | | 6,796 | | | 250,433 | |
| Flexsteel Industries, Inc. | | 1,266 | | | 78,074 | |
| | Green Brick Partners, Inc.* | | 2,837 | | | 28,512 | |
| Helen of Troy Ltd.* | | 7,429 | | | 627,379 | |
| | Hooker Furniture Corp. | | 2,500 | | | 94,875 | |
| Installed Building Products, Inc.* | | 6,010 | | | 248,213 | |
| | iRobot Corp.* | | 6,627 | | | 387,348 | |
| KB Home@ | | 22,962 | | | 363,029 | |
| | La-Z-Boy, Inc. | | 12,996 | | | 403,526 | |
| Libbey, Inc. | | 10,888 | | | 211,881 | |
| | Lifetime Brands, Inc. | | 3,200 | | | 56,800 | |
| M.D.C. Holdings, Inc. | | 12,413 | | | 318,518 | |
| | M/I Homes, Inc.* | | 5,641 | | | 142,040 | |
| Meritage Homes Corp.* | | 10,314 | | | 358,927 | |
| | NACCO Industries, Inc., Class A | | 1,000 | | | 90,550 | |
| Orleans Homebuilders, Inc.*@~§ | | 4,953 | | | — | |
| | Taylor Morrison Home Corp., Class A* | | 7,918 | | | 152,501 | |
| Tempur Sealy International, Inc.*@ | | 244 | | | 16,660 | |
| | TopBuild Corp.* | | 1,536 | | | 54,682 | |
| TRI Pointe Group, Inc.* | | 31,575 | | | 362,481 | |
| | Tupperware Brands Corp.@ | | 11,712 | | | 616,285 | |
| Universal Electronics, Inc.* | | 3,832 | | | 247,356 | |
| | WCI Communities, Inc.* | | 1,041 | | | 24,411 | |
| William Lyon Homes, Class A*@ | | 4,109 | | | 78,194 | |
| | ZAGG, Inc.*@ | | 6,699 | | | 47,563 | |
| | | | | | 5,719,157 | |
See notes to financial statements
SA U.S. Small Company Fund
PORTFOLIO OF INVESTMENTS — AS OF DECEMBER 31, 2016 (Unaudited) (Continued)
| | | | SHARES | | VALUE† | |
| COMMON STOCKS (Continued) | | | | | | |
| Household Products — 0.5% | | | | | | |
| Central Garden & Pet Co.* | | 3,317 | | $ | 109,760 | |
| Central Garden & Pet Co., Class A* | | 7,899 | | | 244,079 | |
| Energizer Holdings, Inc. | | 11,460 | | | 511,231 | |
| HRG Group, Inc.* | | 32,243 | | | 501,701 | |
| Orchids Paper Products Co.@ | | 2,619 | | | 68,565 | |
| WD-40 Co. | | 4,702 | | | 549,664 | |
| | | | | | 1,985,000 | |
| Independent Power Producers & Energy Traders — 0.3% | | |
| Dynegy, Inc.* | | 12,990 | | | 109,895 | |
| NRG Yield, Inc., Class A | | 6,260 | | | 96,154 | |
| NRG Yield, Inc., Class C | | 11,658 | | | 184,196 | |
| Ormat Technologies, Inc. | | 8,194 | | | 439,362 | |
| Pattern Energy Group, Inc. | | 15,022 | | | 285,268 | |
| | | | | | 1,114,875 | |
| Industrial Conglomerates — 0.1% | | | | | | |
| Raven Industries, Inc. | | 9,755 | | | 245,826 | |
| Insurance — 4.2% | | | | | | |
| Allied World Assurance Co.,
Holdings Ltd. | | 10,329 | | | 554,771 | |
| Ambac Financial Group, Inc.* | | 10,842 | | | 243,945 | |
| American Equity Investment
Life Holding Co. | | 20,884 | | | 470,725 | |
| American National Insurance Co. | | 1,163 | | | 144,921 | |
| AMERISAFE, Inc. | | 8,359 | | | 521,184 | |
| Argo Group International Holdings Ltd. | | 9,260 | | | 610,234 | |
| Aspen Insurance Holdings Ltd. | | 19,284 | | | 1,060,620 | |
| Atlas Financial Holdings, Inc.* | | 393 | | | 7,094 | |
| Baldwin & Lyons, Inc., Class B | | 1,818 | | | 45,814 | |
| Citizens, Inc.* | | 11,958 | | | 117,428 | |
| CNO Financial Group, Inc. | | 53,833 | | | 1,030,902 | |
| Crawford & Co., Class A | | 10,528 | | | 99,700 | |
| Crawford & Co., Class B@ | | 4,545 | | | 57,085 | |
| Donegal Group, Inc., Class A | | 5,354 | | | 93,588 | |
| eHealth, Inc.*@ | | 7,651 | | | 81,483 | |
| EMC Insurance Group, Inc. | | 5,700 | | | 171,057 | |
| Employers Holdings, Inc. | | 8,660 | | | 342,936 | |
| Endurance Specialty Holdings Ltd. | | 7,731 | | | 714,344 | |
| Enstar Group Ltd.* | | 2,516 | | | 497,413 | |
| FBL Financial Group, Inc., Class A | | 6,600 | | | 515,790 | |
| Federated National Holding Co. | | 3,383 | | | 63,228 | |
| Fidelity & Guaranty Life | | 263 | | | 6,233 | |
| First Acceptance Corp.* | | 15,539 | | | 16,161 | |
| First American Financial Corp. | | 3,923 | | | 143,699 | |
| Genworth Financial, Inc., Class A* | | 14,918 | | | 56,838 | |
| Global Indemnity Ltd.* | | 3,524 | | | 134,652 | |
| Greenlight Capital Re Ltd., Class A* | | 7,410 | | | 168,948 | |
| Hallmark Financial Services, Inc.* | | 5,700 | | | 66,291 | |
| Hanover Insurance Group, Inc. (The) | | 5,413 | | | 492,637 | |
| HCI Group, Inc.@ | | 3,748 | | | 147,971 | |
| Heritage Insurance Holdings, Inc. | | 3,869 | | | 60,627 | |
| Horace Mann Educators Corp. | | 12,678 | | | 542,618 | |
| Independence Holding Co. | | 3,520 | | | 68,816 | |
| Infinity Property & Casualty Corp. | | 3,270 | | | 287,433 | |
| Investors Title Co. | | 292 | | | 46,189 | |
| Kemper Corp. | | 15,116 | | | 669,639 | |
| Maiden Holdings Ltd. | | 18,753 | | | 327,240 | |
| MBIA, Inc.* | | 35,223 | | | 376,886 | |
| Mercury General Corp. | | 12,517 | | | 753,649 | |
| National General Holdings Corp. | | 17,357 | | | 433,751 | |
| Navigators Group, Inc. (The) | | 3,600 | | | 423,900 | |
| OneBeacon Insurance
Group Ltd., Class A | | 6,225 | | | 99,911 | |
| Primerica, Inc. | | 13,776 | | | 952,610 | |
| ProAssurance Corp. | | 11,624 | | | 653,269 | |
| RLI Corp. | | 13,400 | | | 845,942 | |
| Safety Insurance Group, Inc. | | 3,996 | | | 294,505 | |
| Selective Insurance Group, Inc. | | 13,673 | | | 588,623 | |
| State Auto Financial Corp. | | 9,900 | | | 265,419 | |
| State National Cos., Inc. | | 2,779 | | | 38,517 | |
| Stewart Information Services Corp. | | 5,055 | | | 232,934 | |
| Unico American Corp.* | | 1,700 | | | 18,275 | |
| United Fire Group, Inc. | | 6,100 | | | 299,937 | |
| United Insurance Holdings Corp. | | 4,721 | | | 71,476 | |
| Universal Insurance Holdings, Inc. | | 12,620 | | | 358,408 | |
| WMIH Corp.* | | 2,492 | | | 3,863 | |
| | | | | | 17,392,129 | |
| Internet & Catalog Retail — 0.5% | | | | | | |
| 1-800-Flowers.com, Inc., Class A* | | 13,623 | | | 145,766 | |
| Blue Nile, Inc. | | 3,142 | | | 127,660 | |
| CafePress, Inc.* | | 2,322 | | | 6,827 | |
| FTD Cos., Inc.* | | 6,039 | | | 143,970 | |
| HSN, Inc. | | 13,151 | | | 451,079 | |
| Liberty TripAdvisor
Holdings, Inc., Class A* | | 11,266 | | | 169,553 | |
| NutriSystem, Inc. | | 7,768 | | | 269,161 | |
| Overstock.com, Inc.* | | 4,154 | | | 72,695 | |
| PetMed Express, Inc. | | 5,572 | | | 128,546 | |
| Shutterfly, Inc.* | | 10,368 | | | 520,266 | |
| US Auto Parts Network, Inc.* | | 8,193 | | | 28,839 | |
| | | | | | 2,064,362 | |
| Internet Software & Services — 1.3% | | | | | | |
| Actua Corp.* | | 12,110 | | | 169,540 | |
| Angie’s List, Inc.* | | 4,421 | | | 36,385 | |
| Bankrate, Inc.* | | 13,455 | | | 148,678 | |
| | Bazaarvoice, Inc.* | | 10,930 | | | 53,010 | |
| Blucora, Inc.* | | 10,400 | | | 153,400 | |
| | Carbonite, Inc.* | | 7,052 | | | 115,653 | |
| Care.com, Inc.* | | 534 | | | 4,576 | |
| Cimpress NV* | | 6,915 | | | 633,483 | |
| CommerceHub, Inc., Series A* | | 298 | | | 4,473 | |
| comScore, Inc.* | | 511 | | | 16,137 | |
| DHI Group, Inc.* | | 21,431 | | | 133,944 | |
| EarthLink Holdings Corp. | | 29,174 | | | 164,541 | |
| Envestnet, Inc.*@ | | 7,051 | | | 248,548 | |
| GTT Communications, Inc.* | | 7,000 | | | 201,250 | |
| Internap Corp.* | | 14,992 | | | 23,088 | |
| IntraLinks Holdings, Inc.* | | 14,256 | | | 192,741 | |
| Inuvo, Inc.* | | 3,400 | | | 5,678 | |
| j2 Global, Inc.@ | | 6,984 | | | 571,291 | |
See notes to financial statements
SA U.S. Small Company Fund
PORTFOLIO OF INVESTMENTS — AS OF DECEMBER 31, 2016 (Unaudited) (Continued)
| | | | SHARES | | VALUE† | |
| COMMON STOCKS (Continued) | | | | | | |
| Internet Software & Services (Continued) | | | | | | |
| Leaf Group Ltd.* | | 803 | | $ | 5,260 | |
| Limelight Networks, Inc.* | | 30,774 | | | 77,550 | |
| Liquidity Services, Inc.* | | 4,750 | | | 46,313 | |
| LogMeIn, Inc. | | 200 | | | 19,310 | |
| MeetMe, Inc.*@ | | 24,045 | | | 118,542 | |
| NIC, Inc. | | 16,603 | | | 396,812 | |
| Numerex Corp., Class A* | | 2,359 | | | 17,457 | |
| QuinStreet, Inc.* | | 9,301 | | | 34,972 | |
| Qumu Corp.* | | 3,400 | | | 8,092 | |
| RealNetworks, Inc.* | | 11,295 | | | 54,894 | |
| | Reis, Inc. | | 2,969 | | | 66,060 | |
| RetailMeNot, Inc.* | | 7,590 | | | 70,587 | |
| Shutterstock, Inc.* | | 8,258 | | | 392,420 | |
| Stamps.com, Inc.* | | 2,485 | | | 284,905 | |
| TechTarget, Inc.* | | 3,038 | | | 25,914 | |
| Travelzoo, Inc.* | | 2,482 | | | 23,331 | |
| Web.com Group, Inc.* | | 14,150 | | | 299,272 | |
| WebMD Health Corp.* | | 9,013 | | | 446,774 | |
| XO Group, Inc.* | | 10,260 | | | 199,557 | |
| Yelp, Inc.* | | 812 | | | 30,962 | |
| YuMe, Inc.* | | 2,573 | | | 9,211 | |
| | | | | | 5,504,611 | |
| IT Services — 2.2% | | | | | | |
| Acxiom Corp.* | | 29,790 | | | 798,372 | |
| Blackhawk Network Holdings, Inc.*@ | | 13,958 | | | 525,868 | |
| CACI International, Inc., Class A* | | 6,111 | | | 759,597 | |
| Cardtronics PLC, Class A* | | 12,536 | | | 684,090 | |
| Cass Information Systems, Inc. | | 2,759 | | | 202,980 | |
| Ciber, Inc.* | | 17,360 | | | 10,968 | |
| Computer Task Group, Inc. | | 4,027 | | | 16,954 | |
| Convergys Corp. | | 23,323 | | | 572,813 | |
| CoreLogic, Inc.* | | 9,502 | | | 349,959 | |
| CSG Systems International, Inc. | | 9,625 | | | 465,850 | |
| Datalink Corp.* | | 7,595 | | | 85,520 | |
| Edgewater Technology, Inc.* | | 2,300 | | | 17,250 | |
| EPAM Systems, Inc.* | | 566 | | | 36,399 | |
| Euronet Worldwide, Inc.* | | 521 | | | 37,736 | |
| Everi Holdings, Inc.* | | 16,896 | | | 36,664 | |
| ExlService Holdings, Inc.* | | 9,262 | | | 467,175 | |
| Forrester Research, Inc. | | 8,761 | | | 376,285 | |
| Hackett Group, Inc. (The) | | 14,155 | | | 249,977 | |
| Innodata, Inc.* | | 5,684 | | | 13,926 | |
| Lionbridge Technologies, Inc.* | | 21,926 | | | 127,171 | |
| Mantech International Corp., Class A | | 5,860 | | | 247,585 | |
| ModusLink Global Solutions, Inc.* | | 6,850 | | | 10,001 | |
| MoneyGram International, Inc.* | | 9,824 | | | 116,021 | |
| NCI, Inc., Class A | | 134 | | | 1,869 | |
| Perficient, Inc.* | | 7,956 | | | 139,150 | |
| PFSweb, Inc.* | | 4,255 | | | 36,168 | |
| Planet Payment, Inc.* | | 10,115 | | | 41,269 | |
| PRGX Global, Inc.* | | 4,649 | | | 27,429 | |
| Science Applications International Corp. | | 11,148 | | | 945,350 | |
| SYKES Enterprises, Inc.* | | 11,744 | | | 338,932 | |
| TeleTech Holdings, Inc. | | 16,779 | | | 511,760 | |
| Travelport Worldwide Ltd. | | 21,337 | | | 300,852 | |
| Unisys Corp.*@ | | 13,257 | | | 198,192 | |
| Virtusa Corp.* | | 8,976 | | | 225,477 | |
| | | | | | 8,975,609 | |
| Leisure Equipment & Products — 0.4% | | | | | | |
| American Outdoor Brands Corp.* | | 11,555 | | | 243,579 | |
| Arctic Cat, Inc. | | 3,625 | | | 54,448 | |
| Black Diamond, Inc.* | | 1,900 | | | 10,165 | |
| Callaway Golf Co. | | 21,022 | | | 230,401 | |
| Escalade, Inc. | | 1,950 | | | 25,740 | |
| Jakks Pacific, Inc.*@ | | 5,129 | | | 26,414 | |
| Johnson Outdoors, Inc., Class A | | 1,000 | | | 39,690 | |
| Malibu Boats, Inc., Class A* | | 2,439 | | | 46,536 | |
| Marine Products Corp. | | 4,652 | | | 64,523 | |
| Nautilus, Inc.* | | 11,702 | | | 216,487 | |
| Sturm Ruger & Co., Inc.@ | | 6,113 | | | 322,155 | |
| Vista Outdoor, Inc.* | | 12,035 | | | 444,092 | |
| | | | | | 1,724,230 | |
| Life Sciences Tools & Services — 0.6% | | | | | | |
| Albany Molecular Research, Inc.*@ | | 8,825 | | | 165,557 | |
| Bruker Corp. | | 5,966 | | | 126,360 | |
| Cambrex Corp.* | | 7,454 | | | 402,143 | |
| Charles River Laboratories
International, Inc.* | | 4,754 | | | 362,207 | |
| Enzo Biochem, Inc.* | | 14,189 | | | 98,472 | |
| Fluidigm Corp.* | | 1,136 | | | 8,270 | |
| Harvard Bioscience, Inc.* | | 10,123 | | | 30,875 | |
| INC Research Holdings, Inc., Class A* | | 8,565 | | | 450,519 | |
| Luminex Corp.*@ | | 10,896 | | | 220,426 | |
| Parexel International Corp.*@ | | 6,254 | | | 411,013 | |
| | | | | | 2,275,842 | |
| Machinery — 4.7% | | | | | | |
| Actuant Corp., Class A | | 16,193 | | | 420,208 | |
| Alamo Group, Inc. | | 2,600 | | | 197,860 | |
| Albany International Corp., Class A | | 11,847 | | | 548,516 | |
| Altra Industrial Motion Corp. | | 12,275 | | | 452,947 | |
| American Railcar Industries, Inc.@ | | 5,900 | | | 267,211 | |
| Astec Industries, Inc. | | 4,892 | | | 330,014 | |
| Barnes Group, Inc. | | 17,454 | | | 827,669 | |
| Blue Bird Corp.* | | 895 | | | 13,828 | |
| Briggs & Stratton Corp. | | 11,874 | | | 264,315 | |
| Chart Industries, Inc.* | | 6,711 | | | 241,730 | |
| CIRCOR International, Inc. | | 4,348 | | | 282,098 | |
| CLARCOR, Inc. | | 10,249 | | | 845,235 | |
| Colfax Corp.* | | 413 | | | 14,839 | |
| Columbus McKinnon Corp. | | 5,051 | | | 136,579 | |
| Commercial Vehicle Group, Inc.* | | 10,768 | | | 59,547 | |
| Crane Co. | | 3,749 | | | 270,378 | |
| DMC Global, Inc. | | 3,484 | | | 55,221 | |
| Douglas Dynamics, Inc. | | 5,987 | | | 201,463 | |
| Eastern Co. (The) | | 500 | | | 10,450 | |
| Energy Recovery, Inc.* | | 2,616 | | | 27,076 | |
| EnPro Industries, Inc. | | 6,545 | | | 440,871 | |
| ESCO Technologies, Inc. | | 5,761 | | | 326,361 | |
| Federal Signal Corp. | | 16,169 | | | 252,398 | |
See notes to financial statements
SA U.S. Small Company Fund
PORTFOLIO OF INVESTMENTS — AS OF DECEMBER 31, 2016 (Unaudited) (Continued)
| | | | SHARES | | VALUE† | |
| COMMON STOCKS (Continued) | | | | | | |
| Machinery (Continued) | | | | | | |
| Franklin Electric Co., Inc. | | 13,269 | | $ | 516,164 | |
| FreightCar America, Inc. | | 2,400 | | | 35,832 | |
| Global Brass & Copper Holdings, Inc. | | 6,925 | | | 237,528 | |
| | Gorman-Rupp Co. (The) | | 5,455 | | | 168,832 | |
| Graham Corp. | | 1,900 | | | 42,085 | |
| Greenbrier Cos., Inc. (The)@ | | 6,690 | | | 277,969 | |
| Hardinge, Inc. | | 1,500 | | | 16,620 | |
| Harsco Corp. | | 19,401 | | | 263,854 | |
| Hillenbrand, Inc. | | 18,458 | | | 707,864 | |
| Hurco Cos., Inc. | | 1,000 | | | 33,100 | |
| Hyster-Yale Materials Handling, Inc. | | 2,000 | | | 127,540 | |
| ITT, Inc. | | 6,391 | | | 246,501 | |
| John Bean Technologies Corp. | | 8,769 | | | 753,696 | |
| Joy Global, Inc. | | 9,106 | | | 254,968 | |
| Kadant, Inc. | | 3,400 | | | 208,080 | |
| Kennametal, Inc. | | 14,622 | | | 457,084 | |
| Key Technology, Inc.* | | 1,100 | | | 12,826 | |
| LB Foster Co., Class A | | 2,471 | | | 33,606 | |
| Lindsay Corp. | | 2,399 | | | 178,989 | |
| Lydall, Inc.* | | 3,767 | | | 232,989 | |
| Manitex International, Inc.* | | 1,300 | | | 8,918 | |
| Manitowoc Co., Inc. (The)* | | 32,658 | | | 195,295 | |
| Manitowoc Foodservice, Inc.* | | 32,658 | | | 631,279 | |
| Meritor, Inc.* | | 24,635 | | | 305,967 | |
| Mfri, Inc.* | | 1,900 | | | 15,390 | |
| Miller Industries, Inc. | | 2,958 | | | 78,239 | |
| Mueller Industries, Inc. | | 17,150 | | | 685,314 | |
| Mueller Water Products, Inc., Class A | | 41,506 | | | 552,445 | |
| NN, Inc. | | 7,482 | | | 142,532 | |
| Omega Flex, Inc. | | 488 | | | 27,211 | |
| Proto Labs, Inc.* | | 5,527 | | | 283,811 | |
| RBC Bearings, Inc.* | | 5,604 | | | 520,107 | |
| Rexnord Corp.* | | 24,475 | | | 479,465 | |
| SPX Corp.* | | 6,967 | | | 165,257 | |
| SPX FLOW, Inc.* | | 6,533 | | | 209,448 | |
| Standex International Corp. | | 3,825 | | | 336,026 | |
| Sun Hydraulics Corp. | | 6,200 | | | 247,814 | |
| Supreme Industries, Inc., Class A | | 6,980 | | | 109,586 | |
| Tennant Co. | | 4,939 | | | 351,657 | |
| Terex Corp. | | 11,454 | | | 361,145 | |
| Timken Co. (The) | | 17,684 | | | 702,055 | |
| Titan International, Inc.@ | | 14,568 | | | 163,307 | |
| Trimas Corp.* | | 12,810 | | | 301,035 | |
| Twin Disc, Inc. | | 2,200 | | | 32,120 | |
| Wabash National Corp.*@ | | 20,517 | | | 324,579 | |
| Watts Water Technologies, Inc., Class A | | 7,800 | | | 508,560 | |
| Woodward, Inc. | | 4,871 | | | 336,343 | |
| Xerium Technologies, Inc.* | | 2,113 | | | 11,875 | |
| | | | | | 19,379,721 | |
| Marine — 0.2% | | | | | | |
| Kirby Corp.* | | 5,302 | | | 352,583 | |
| Matson, Inc. | | 10,731 | | | 379,770 | |
| | | | | | 732,353 | |
| Media — 1.5% | | | | | | |
| AH Belo Corp., Class A | | 3,878 | | | 24,625 | |
| AMC Entertainment | | | | | | |
| Holdings, Inc., Class A | | 6,707 | | | 225,691 | |
| Ballantyne Strong, Inc.* | | 3,464 | | | 27,712 | |
| Beasley Broadcast Group, Inc., Class A | | 1,657 | | | 10,273 | |
| Clear Channel Outdoor | | | | | | |
| Holdings, Inc., Class A | | 3,398 | | | 17,160 | |
| Cumulus Media, Inc., Class A* | | 5,136 | | | 5,239 | |
| Entercom Communications | | | | | | |
| Corp., Class A | | 4,435 | | | 67,856 | |
| Entravision Communications | | | | | | |
| Corp., Class A | | 18,319 | | | 128,233 | |
| EW Scripps Co. (The), Class A*@ | | 22,625 | | | 437,341 | |
| Gannett Co., Inc. | | 19,363 | | | 188,015 | |
| Global Eagle Entertainment, Inc.* | | 2,123 | | | 13,715 | |
| Gray Television, Inc.* | | 15,960 | | | 173,166 | |
| Harte-Hanks, Inc. | | 17,183 | | | 25,946 | |
| John Wiley & Sons, Inc., Class A | | 10,578 | | | 576,501 | |
| Lions Gate Entertainment | | | | | | |
| Corp., Class B*@ | | 5,731 | | | 140,639 | |
| McClatchy Co. (The), Class A* | | 73 | | | 962 | |
| Media General, Inc.* | | 3,965 | | | 74,661 | |
| Meredith Corp. | | 8,903 | | | 526,612 | |
| MSG Networks, Inc., Class A* | | 12,409 | | | 266,793 | |
| National CineMedia, Inc. | | 15,891 | | | 234,074 | |
| New York Times Co. (The), Class A | | 38,149 | | | 507,382 | |
| Nexstar Broadcasting | | | | | | |
| Group, Inc., Class A | | 8,989 | | | 569,004 | |
| Radio One, Inc.*@ | | 6,700 | | | 19,430 | |
| Reading International, Inc., Class A* | | 2,200 | | | 36,520 | |
| Regal Entertainment Group, Class A | | 21,304 | | | 438,862 | |
| Saga Communications, Inc., Class A | | 1,116 | | | 56,135 | |
| Salem Media Group, Inc., Class A | | 1,041 | | | 6,506 | |
| Scholastic Corp. | | 7,171 | | | 340,551 | |
| Sinclair Broadcast | | | | | | |
| Group, Inc., Class A@. | | 18,743 | | | 625,079 | |
| Time, Inc. | | 20,834 | | | 371,887 | |
| tronc, Inc.@ | | 2,800 | | | 38,836 | |
| World Wrestling | | | | | | |
| Entertainment, Inc., Class A | | 625 | | | 11,500 | |
| | | | | | 6,186,906 | |
| Metals & Mining — 1.7% | | | | | | |
| AK Steel Holding Corp.* | | 20,706 | | | 211,408 | |
| | Ampco-Pittsburgh Corp. | | 2,200 | | | 36,850 | |
| Carpenter Technology Corp. | | 9,739 | | | 352,259 | |
| | Century Aluminum Co.* | | 20,953 | | | 179,358 | |
| Cliffs Natural Resources, Inc.*@ | | 11,460 | | | 96,378 | |
| | Coeur Mining, Inc.* | | 22,496 | | | 204,489 | |
| Commercial Metals Co. | | 31,042 | | | 676,095 | |
| | Compass Minerals International, Inc.@ | | 7,742 | | | 606,586 | |
| Ferroglobe PLC | | 24,025 | | | 260,191 | |
| | Ferroglobe Representation & | | | | | | |
| | Warranty Insurance Trust~§ | | 24,025 | | | — | |
See notes to financial statements
SA U.S. Small Company Fund
PORTFOLIO OF INVESTMENTS — AS OF DECEMBER 31, 2016 (Unaudited) (Continued)
| | | | SHARES | | VALUE† | |
| COMMON STOCKS (Continued) | | | | | | |
| Metals & Mining (Continued) | | | | | | |
| Friedman Industries, Inc. | | 700 | | $ | 4,662 | |
| Gold Resource Corp. | | 16,351 | | | 71,127 | |
| Haynes International, Inc. | | 2,521 | | | 108,378 | |
| Hecla Mining Co. | | 87,123 | | | 456,524 | |
| Kaiser Aluminum Corp. | | 4,533 | | | 352,169 | |
| Materion Corp. | | 5,300 | | | 209,880 | |
| McEwen Mining, Inc.@ | | 21,736 | | | 63,252 | |
| Olympic Steel, Inc. | | 1,900 | | | 46,037 | |
| | Real Industry, Inc.* | | 1,320 | | | 8,052 | |
| Ryerson Holding Corp.* | | 9,188 | | | 122,660 | |
| Schnitzer Steel Industries, Inc., Class A | | 9,223 | | | 237,031 | |
| Stillwater Mining Co.* | | 32,208 | | | 518,871 | |
| SunCoke Energy, Inc.* | | 17,109 | | | 194,016 | |
| TimkenSteel Corp.*@ | | 7,647 | | | 118,375 | |
| United States Steel Corp. | | 26,257 | | | 866,743 | |
| Universal Stainless & | | | | | | |
| Alloy Products, Inc.* | | 1,400 | | | 18,914 | |
| Worthington Industries, Inc. | | 17,054 | | | 809,042 | |
| | | | | | 6,829,347 | |
| Multi-Utilities — 0.6% | | | | | | |
| Avista Corp. | | 16,713 | | | 668,353 | |
| Black Hills Corp.@ | | 12,049 | | | 739,086 | |
| NorthWestern Corp. | | 11,897 | | | 676,582 | |
| Unitil Corp. | | 4,584 | | | 207,839 | |
| | | | | | 2,291,860 | |
| Multiline Retail — 0.3% | | | | | | |
| Big Lots, Inc.@ | | 13,429 | | | 674,270 | |
| Bon-Ton Stores, Inc. (The)* | | 2,700 | | | 3,969 | |
| Dillard’s, Inc., Class A | | 1,249 | | | 78,300 | |
| Fred’s, Inc., Class A@ | | 9,237 | | | 171,439 | |
| Gordmans Stores, Inc.*@ | | 2,170 | | | 1,487 | |
| J.C. Penney Co., Inc.*@ | | 37,504 | | | 311,658 | |
| Tuesday Morning Corp.* | | 9,803 | | | 52,936 | |
| | | | | | 1,294,059 | |
| Oil, Gas & Consumable Fuels — 2.1% | | | | | | |
| Abraxas Petroleum Corp.* | | 14,400 | | | 37,008 | |
| Adams Resources & Energy, Inc. | | 900 | | | 35,685 | |
| Alon USA Energy, Inc. | | 16,621 | | | 189,147 | |
| Approach Resources, Inc.* | | 1,249 | | | 4,184 | |
| Barnwell Industries, Inc.* | | 2,159 | | | 3,541 | |
| Bill Barrett Corp.* | | 11,138 | | | 77,855 | |
| Callon Petroleum Co.* | | 13,793 | | | 211,998 | |
| Clayton Williams Energy, Inc.* | | 2,100 | | | 250,446 | |
| Clean Energy Fuels Corp.* | | 15,954 | | | 45,628 | |
| Cloud Peak Energy, Inc.*@ | | 14,607 | | | 81,945 | |
| CONSOL Energy, Inc. | | 1,325 | | | 24,155 | |
| Contango Oil & Gas Co.* | | 4,510 | | | 42,123 | |
| CVR Energy, Inc.@ | | 334 | | | 8,480 | |
| Delek US Holdings, Inc. | | 14,875 | | | 358,041 | |
| DHT Holdings, Inc.@ | | 19,547 | | | 80,925 | |
| Dorian LPG Ltd.*@ | | 1,202 | | | 9,868 | |
| Eclipse Resources Corp.* | | 4,008 | | | 10,701 | |
| EnLink Midstream LLC | | 17,997 | | | 342,843 | |
| EP Energy Corp., Class A*@ | | 9,937 | | | 65,087 | |
| Evolution Petroleum Corp. | | 3,835 | | | 38,350 | |
| GasLog Ltd. | | 18,166 | | | 292,473 | |
| Gastar Exploration, Inc.* | | 472 | | | 732 | |
| Green Plains, Inc. | | 9,194 | | | 256,053 | |
| Gulfport Energy Corp.* | | 4,889 | | | 105,798 | |
| International Seaways, Inc.* | | 134 | | | 1,881 | |
| Jones Energy, Inc., Class A*@ | | 1,074 | | | 5,370 | |
| Kosmos Energy Ltd.*@ | | 30,371 | | | 212,901 | |
| Laredo Petroleum, Inc.* | | 7,352 | | | 103,957 | |
| Northern Oil & Gas, Inc.* | | 8,420 | | | 23,155 | |
| Oasis Petroleum, Inc.* | | 33,182 | | | 502,375 | |
| Overseas Shipholding | | | | | | |
| Group, Inc., Class A | | 404 | | | 1,547 | |
| Panhandle Oil & Gas, Inc., Class A | | 3,073 | | | 72,369 | |
| Par Pacific Holdings, Inc.*@ | | 2,890 | | | 42,021 | |
| Parsley Energy, Inc., Class A* | | 5,390 | | | 189,944 | |
| PBF Energy, Inc., Class A | | 20,151 | | | 561,810 | |
| PDC Energy, Inc.* | | 9,518 | | | 690,816 | |
| PetroQuest Energy, Inc.* | | 471 | | | 1,559 | |
| Renewable Energy Group, Inc.*@ | | 10,144 | | | 98,397 | |
| Rex American Resources Corp.* | | 1,575 | | | 155,531 | |
| Rice Energy, Inc.* | | 6,705 | | | 143,152 | |
| Ring Energy, Inc.* | | 5,341 | | | 69,380 | |
| RSP Permian, Inc.* | | 18,721 | | | 835,331 | |
| Scorpio Tankers, Inc.@ | | 42,198 | | | 191,157 | |
| SemGroup Corp., Class A | | 11,286 | | | 471,191 | |
| Ship Finance International Ltd.@ | | 20,026 | | | 297,386 | |
| SM Energy Co. | | 9,500 | | | 327,560 | |
| Synergy Resources Corp.*@ | | 35,804 | | | 319,014 | |
| Teekay Corp. | | 5,035 | | | 40,431 | |
| Teekay Tankers Ltd., Class A@ | | 13,575 | | | 30,680 | |
| Vaalco Energy, Inc.* | | 14,113 | | | 14,678 | |
| Western Refining, Inc. | | 3,742 | | | 141,635 | |
| World Fuel Services Corp. | | 2,684 | | | 123,222 | |
| WPX Energy, Inc.* | | 27,681 | | | 403,312 | |
| | | | | | 8,644,828 | |
| Paper & Forest Products — 0.9% | | | | | | |
| Boise Cascade Co.* | | 9,706 | | | 218,385 | |
| Clearwater Paper Corp.* | | 5,623 | | | 368,588 | |
| Deltic Timber Corp. | | 2,800 | | | 215,796 | |
| Domtar Corp. | | 13,884 | | | 541,892 | |
| KapStone Paper & Packaging Corp. | | 25,673 | | | 566,090 | |
| Louisiana-Pacific Corp.* | | 38,019 | | | 719,700 | |
| Mercer International, Inc. | | 13,909 | | | 148,131 | |
| Neenah Paper, Inc. | | 3,300 | | | 281,160 | |
| P. H. Glatfelter Co. | | 11,389 | | | 272,083 | |
| Resolute Forest Products, Inc.* | | 8,572 | | | 45,860 | |
| Schweitzer-Mauduit International, Inc. | | 8,407 | | | 382,771 | |
| | | | | | 3,760,456 | |
| Personal Products — 0.5% | | | | | | |
| Avon Products, Inc.* | | 75,554 | | | 380,792 | |
| CCA Industries, Inc.* | | 556 | | | 1,460 | |
| Inter Parfums, Inc. | | 10,446 | | | 342,107 | |
| Medifast, Inc. | | 5,232 | | | 217,808 | |
See notes to financial statements
SA U.S. Small Company Fund
PORTFOLIO OF INVESTMENTS — AS OF DECEMBER 31, 2016 (Unaudited) (Continued)
| | | | SHARES | | VALUE† | |
| COMMON STOCKS (Continued) | | | | | | |
| Personal Products (Continued) | | | | | | |
| Natural Alternatives International, Inc.* | | 1,000 | | $ | 11,300 | |
| Natural Health Trends Corp.@ | | 1,100 | | | 27,335 | |
| Natures Sunshine Products, Inc. | | 1,700 | | | 25,500 | |
| Nu Skin Enterprises, Inc., Class A | | 8,645 | | | 413,058 | |
| Nutraceutical International Corp. | | 2,300 | | | 80,385 | |
| | Revlon, Inc., Class A* | | 11,462 | | | 334,117 | |
| United-Guardian, Inc. | | 600 | | | 9,300 | |
| USANA Health Sciences, Inc.*@ | | 6,574 | | | 402,329 | |
| | | | | | 2,245,491 | |
| Pharmaceuticals — 0.9% | | | | | | |
| Akorn, Inc.* | | 5,685 | | | 124,104 | |
| Amphastar Pharmaceuticals, Inc.* | | 6,749 | | | 124,317 | |
| ANI Pharmaceuticals, Inc.* | | 885 | | | 53,649 | |
| Aralez Pharmaceuticals, Inc.*@ | | 707 | | | 3,118 | |
| Catalent, Inc.* | | 19,051 | | | 513,615 | |
| Cumberland Pharmaceuticals, Inc.* | | 5,912 | | | 32,516 | |
| Depomed, Inc.*@ | | 11,562 | | | 208,347 | |
| Horizon Pharma PLC* | | 7,317 | | | 118,389 | |
| Impax Laboratories, Inc.* | | 18,471 | | | 244,741 | |
| Innoviva, Inc.*@ | | 1,313 | | | 14,049 | |
| Juniper Pharmaceuticals, Inc.* | | 1,500 | | | 8,400 | |
| Lannett Co., Inc.*@ | | 9,415 | | | 207,601 | |
| Lipocine, Inc.*@ | | 4,394 | | | 16,170 | |
| Medicines Co. (The)*@ | | 15,577 | | | 528,683 | |
| Phibro Animal Health Corp., Class A | | 3,593 | | | 105,275 | |
| Prestige Brands Holdings, Inc.* | | 15,321 | | | 798,224 | |
| Sciclone Pharmaceuticals, Inc.* | | 17,503 | | | 189,032 | |
| Sucampo Pharmaceuticals, Inc., | | | | | | |
| Class A* | | 13,942 | | | 188,914 | |
| Supernus Pharmaceuticals, Inc.* | | 12,411 | | | 313,378 | |
| Tetraphase Pharmaceuticals, Inc.* | | 2,448 | | | 9,865 | |
| Titan Pharmaceuticals, Inc.*@ | | 2,529 | | | 10,116 | |
| Zogenix, Inc.*@ | | 2,563 | | | 31,140 | |
| | | | | | 3,843,643 | |
| Professional Services — 1.6% | | | | | | |
| Acacia Research Corp. | | 7,978 | | | 51,857 | |
| Advisory Board Co. (The)* | | 9,942 | | | 330,572 | |
| Barrett Business Services, Inc. | | 2,602 | | | 166,788 | |
| CBIZ, Inc.* | | 15,700 | | | 215,090 | |
| CDI Corp. | | 4,800 | | | 35,520 | |
| CEB, Inc. | | 9,267 | | | 561,580 | |
| CRA International, Inc. | | 2,200 | | | 80,520 | |
| Exponent, Inc. | | 6,651 | | | 401,055 | |
| Franklin Covey Co.* | | 5,596 | | | 112,759 | |
| FTI Consulting, Inc.* | | 10,148 | | | 457,472 | |
| GP Strategies Corp.* | | 5,007 | | | 143,200 | |
| Heidrick & Struggles International, Inc. | | 4,281 | | | 103,386 | |
| Hill International, Inc.* | | 9,200 | | | 40,020 | |
| Hudson Global, Inc. | | 2,471 | | | 3,361 | |
| Huron Consulting Group, Inc.* | | 5,494 | | | 278,271 | |
| ICF International, Inc.* | | 4,955 | | | 273,516 | |
| Insperity, Inc. | | 5,700 | | | 404,415 | |
| Kelly Services, Inc., Class A | | 7,420 | | | 170,066 | |
| Kforce, Inc. | | 11,164 | | | 257,888 | |
| Korn/Ferry International | | 13,550 | | | 398,777 | |
| Mastech Digital, Inc.* | | 1,061 | | | 7,225 | |
| Mistras Group, Inc.* | | 6,408 | | | 164,558 | |
| Navigant Consulting, Inc.* | | 11,322 | | | 296,410 | |
| On Assignment, Inc.* | | 15,403 | | | 680,197 | |
| Pendrell Corp.* | | 2,266 | | | 15,296 | |
| RCM Technologies, Inc.* | | 2,995 | | | 19,048 | |
| Resources Connection, Inc. | | 11,493 | | | 221,240 | |
| RPX Corp.* | | 14,391 | | | 155,423 | |
| TriNet Group, Inc.* | | 13,099 | | | 335,596 | |
| TrueBlue, Inc.* | | 10,021 | | | 247,018 | |
| Volt Information Sciences, Inc.* | | 2,024 | | | 13,864 | |
| Willdan Group, Inc.* | | 3,462 | | | 78,207 | |
| | | | | | 6,720,195 | |
| Real Estate Management & Development — 0.6% | | | | |
| Alexander & Baldwin, Inc. | | 13,989 | | | 627,686 | |
| Altisource Asset Management Corp.*@ | | 596 | | | 31,886 | |
| Altisource Portfolio Solutions SA*@ | | 5,434 | | | 144,490 | |
| AV Homes, Inc.* | | 2,349 | | | 37,114 | |
| Consolidated-Tomoka Land Co. | | 995 | | | 53,153 | |
| Forestar Group, Inc.* | | 10,487 | | | 139,477 | |
| Griffin Industrial Realty, Inc. | | 420 | | | 13,327 | |
| HFF, Inc., Class A | | 9,968 | | | 301,532 | |
| Kennedy-Wilson Holdings, Inc. | | 22,178 | | | 454,649 | |
| Marcus & Millichap, Inc.* | | 7,383 | | | 197,274 | |
| RE/MAX Holdings, Inc., Class A | | 3,519 | | | 197,064 | |
| RMR Group, Inc. (The), Class A | | 1,159 | | | 45,780 | |
| St. Joe Co. (The)*@ | | 2,649 | | | 50,331 | |
| Stratus Properties, Inc.* | | 313 | | | 10,251 | |
| Tejon Ranch Co.* | | 6,256 | | | 159,090 | |
| | | | | | 2,463,104 | |
| Road & Rail — 1.2% | | | | | | |
| AMERCO | | 1,235 | | | 456,444 | |
| ArcBest Corp. | | 6,195 | | | 171,292 | |
| Avis Budget Group, Inc.* | | 979 | | | 35,910 | |
| Celadon Group, Inc.@ | | 5,488 | | | 39,239 | |
| Covenant Transportation Group, Inc., | | | | | | |
| Class A* | | 3,731 | | | 72,157 | |
| Heartland Express, Inc.@ | | 22,347 | | | 454,985 | |
| Knight Transportation, Inc.@ | | 20,988 | | | 693,653 | |
| Landstar System, Inc. | | 10,561 | | | 900,853 | |
| Marten Transport Ltd. | | 8,967 | | | 208,931 | |
| P.A.M. Transportation Services, Inc.* | | 1,523 | | | 39,568 | |
| Roadrunner Transportation | | | | | | |
| Systems, Inc.* | | 8,254 | | | 85,759 | |
| Saia, Inc.* | | 7,375 | | | 325,606 | |
| Swift Transportation Co.*@ | | 18,903 | | | 460,477 | |
| Universal Truckload Services, Inc. | | 3,300 | | | 53,955 | |
| USA Truck, Inc.* | | 1,900 | | | 16,549 | |
| Werner Enterprises, Inc. | | 21,804 | | | 587,618 | |
| YRC Worldwide, Inc.* | | 16,171 | | | 214,751 | |
| | | | | | 4,817,747 | |
See notes to financial statements
SA U.S. Small Company Fund
PORTFOLIO OF INVESTMENTS — AS OF DECEMBER 31, 2016 (Unaudited) (Continued)
| | | | SHARES | | VALUE† | |
| COMMON STOCKS (Continued) | | | | | | |
| Semiconductors & Semiconductor Equipment — 3.6% | | | | |
| Advanced Energy Industries, Inc.* | | 15,048 | | $ | 823,878 | |
| Alpha & Omega Semiconductor Ltd.* | | 6,435 | | | 136,872 | |
| Ambarella, Inc.*@ | | 3,901 | | | 211,161 | |
| Amkor Technology, Inc.* | | 66,467 | | | 701,227 | |
| Amtech Systems, Inc.* | | 2,200 | | | 9,350 | |
| Axcelis Technologies, Inc.* | | 13,370 | | | 194,534 | |
| | AXT, Inc.* | | 12,200 | | | 58,560 | |
| Brooks Automation, Inc. | | 16,972 | | | 289,712 | |
| Cabot Microelectronics Corp. | | 5,995 | | | 378,704 | |
| Cavium, Inc.*@ | | 942 | | | 58,819 | |
| Ceva, Inc.* | | 4,958 | | | 166,341 | |
| Cirrus Logic, Inc.* | | 15,545 | | | 878,914 | |
| Cohu, Inc. | | 4,866 | | | 67,637 | |
| Cree, Inc.* | | 11,395 | | | 300,714 | |
| Cyberoptics Corp.* | | 1,700 | | | 44,370 | |
| Diodes, Inc.* | | 11,325 | | | 290,713 | |
| DSP Group, Inc.* | | 2,800 | | | 36,540 | |
| Entegris, Inc.* | | 35,542 | | | 636,202 | |
| Exar Corp.* | | 16,656 | | | 179,552 | |
| FormFactor, Inc.* | | 16,807 | | | 188,238 | |
| GigPeak, Inc.*@ | | 2,684 | | | 6,764 | |
| GSI Technology, Inc.* | | 4,125 | | | 25,575 | |
| Integrated Device Technology, Inc.* | | 38,007 | | | 895,445 | |
| Intersil Corp., Class A | | 35,197 | | | 784,893 | |
| IXYS Corp. | | 8,202 | | | 97,604 | |
| Kopin Corp.* | | 28,174 | | | 80,014 | |
| Kulicke & Soffa Industries, Inc.* | | 18,438 | | | 294,086 | |
| Lattice Semiconductor Corp.* | | 28,018 | | | 206,213 | |
| MACOM Technology Solutions
Holdings, Inc.*@ | | 3,168 | | | 146,615 | |
| Magnachip Semiconductor Corp.* | | 5,846 | | | 36,245 | |
| MaxLinear, Inc., Class A* | | 9,792 | | | 213,466 | |
| MKS Instruments, Inc. | | 13,879 | | | 824,413 | |
| Monolithic Power Systems, Inc. | | 2,385 | | | 195,403 | |
| Nanometrics, Inc.* | | 8,125 | | | 203,613 | |
| NeoPhotonics Corp.* | | 17,049 | | | 184,300 | |
| NVE Corp. | | 200 | | | 14,286 | |
| PDF Solutions, Inc.* | | 10,588 | | | 238,759 | |
| Photronics, Inc.* | | 16,333 | | | 184,563 | |
| Power Integrations, Inc. | | 8,577 | | | 581,949 | |
| Rambus, Inc.* | | 28,336 | | | 390,187 | |
| Rudolph Technologies, Inc.* | | 8,906 | | | 207,955 | |
| Semtech Corp.* | | 18,554 | | | 585,379 | |
| Sigma Designs, Inc.* | | 15,433 | | | 92,598 | |
| Silicon Laboratories, Inc.* | | 10,644 | | | 691,860 | |
| SolarEdge Technologies, Inc.*@ | | 1,621 | | | 20,100 | |
| SunPower Corp.*@ | | 19,307 | | | 127,619 | |
| Synaptics, Inc.*@ | | 10,527 | | | 564,037 | |
| Tessera Holding Corp. | | 14,056 | | | 621,275 | |
| Ultra Clean Holdings, Inc.* | | 6,729 | | | 65,271 | |
| Ultratech, Inc.* | | 11,337 | | | 271,861 | |
| Veeco Instruments, Inc.* | | 9,575 | | | 279,111 | |
| Xcerra Corp.* | | 12,391 | | | 94,667 | |
| | | | | | 14,878,164 | |
| Software — 2.4% | | | | | | |
| ACI Worldwide, Inc.* | | 34,283 | | | 622,236 | |
| American Software, Inc., Class A | | 9,433 | | | 97,443 | |
| Aspen Technology, Inc.*@ | | 7,809 | | | 426,996 | |
| Aware, Inc.* | | 4,900 | | | 29,890 | |
| Barracuda Networks, Inc.* | | 8,761 | | | 187,748 | |
| Blackbaud, Inc. | | 11,875 | | | 760,000 | |
| Bottomline Technologies de, Inc.* | | 7,935 | | | 198,534 | |
| Bsquare Corp.* | | 2,300 | | | 13,455 | |
| Covisint Corp.* | | 7,419 | | | 14,096 | |
| Datawatch Corp.* | | 2,445 | | | 13,448 | |
| Ebix, Inc.@ | | 2,155 | | | 122,943 | |
| Ellie Mae, Inc.*@ | | 2,220 | | | 185,770 | |
| EnerNOC, Inc.* | | 6,500 | | | 39,000 | |
| Fair Isaac Corp. | | 6,592 | | | 785,898 | |
| Globant SA* | | 760 | | | 25,346 | |
| Glu Mobile, Inc.*@ | | 14,543 | | | 28,213 | |
| GSE Systems, Inc.*@ | | 2,896 | | | 10,136 | |
| Mentor Graphics Corp. | | 32,443 | | | 1,196,822 | |
| MicroStrategy, Inc., Class A* | | 1,426 | | | 281,492 | |
| Monotype Imaging Holdings, Inc. | | 10,597 | | | 210,350 | |
| Paycom Software, Inc.*@ | | 14,902 | | | 677,892 | |
| Pegasystems, Inc. | | 18,834 | | | 678,024 | |
| Progress Software Corp. | | 13,610 | | | 434,567 | |
| QAD, Inc., Class A | | 4,909 | | | 149,234 | |
| QAD, Inc., Class B | | 1,219 | | | 31,145 | |
| Qualys, Inc.* | | 6,337 | | | 200,566 | |
| Rosetta Stone, Inc.* | | 772 | | | 6,879 | |
| Rubicon Project, Inc. (The)* | | 6,490 | | | 48,156 | |
| Seachange International, Inc.* | | 7,100 | | | 16,330 | |
| Silver Spring Networks, Inc.* | | 8,114 | | | 107,997 | |
| Synchronoss Technologies, Inc.* | | 11,475 | | | 439,493 | |
| Tangoe, Inc.* | | 3,351 | | | 26,406 | |
| TeleNav, Inc.* | | 8,331 | | | 58,734 | |
| TiVo Corp.* | | 30,394 | | | 635,235 | |
| VASCO Data Security
International, Inc.* | | 7,796 | | | 106,415 | |
| Verint Systems, Inc.* | | 12,694 | | | 447,464 | |
| Zedge, Inc., Class B* | | 2,411 | | | 7,546 | |
| Zix Corp.* | | 14,383 | | | 71,052 | |
| Zynga, Inc., Class A* | | 155,342 | | | 399,229 | |
| | | | | | 9,792,180 | |
| Specialty Retail — 3.4% | | | | | | |
| Aaron’s, Inc. | | 18,376 | | | 587,848 | |
| Abercrombie & Fitch Co., Class A@ | | 14,745 | | | 176,940 | |
| America’s Car-Mart, Inc.* | | 2,516 | | | 110,075 | |
| American Eagle Outfitters, Inc.@ | | 38,979 | | | 591,311 | |
| Asbury Automotive Group, Inc.* | | 8,762 | | | 540,615 | |
| Ascena Retail Group, Inc.* | | 43,780 | | | 270,998 | |
| Barnes & Noble Education, Inc.* | | 10,227 | | | 117,304 | |
| Barnes & Noble, Inc. | | 15,776 | | | 175,902 | |
| bebe stores, Inc.*@ | | 1,921 | | | 9,778 | |
| Big 5 Sporting Goods Corp. | | 6,183 | | | 107,275 | |
| Boot Barn Holdings, Inc.* | | 1,195 | | | 14,961 | |
| Buckle, Inc. (The)@ | | 12,544 | | | 286,003 | |
See notes to financial statements
SA U.S. Small Company Fund
PORTFOLIO OF INVESTMENTS — AS OF DECEMBER 31, 2016 (Unaudited) (Continued)
| | | | SHARES | | VALUE† | |
| COMMON STOCKS (Continued) | | | | | | |
| Specialty Retail (Continued) | | | | | | |
| Build-A-Bear Workshop, Inc.* | | 3,739 | | $ | 51,411 | |
| Cabela’s, Inc.* | | 2,975 | | | 174,186 | |
| Caleres, Inc. | | 11,677 | | | 383,239 | |
| Cato Corp. (The), Class A | | 6,792 | | | 204,303 | |
| Chico’s FAS, Inc. | | 32,315 | | | 465,013 | |
| Children’s Place, Inc. (The)@ | | 4,800 | | | 484,560 | |
| Christopher & Banks Corp.* | | 7,704 | | | 18,027 | |
| | Citi Trends, Inc. | | 3,643 | | | 68,634 | |
| Conn’s, Inc.* | | 8,299 | | | 104,982 | |
| CST Brands, Inc. | | 7,795 | | | 375,329 | |
| Destination Maternity Corp. | | 2,800 | | | 14,476 | |
| Destination XL Group, Inc.* | | 9,525 | | | 40,481 | |
| DSW, Inc., Class A | | 17,801 | | | 403,193 | |
| Express, Inc.* | | 18,936 | | | 203,751 | |
| Finish Line Inc. (The), Class A@ | | 14,724 | | | 276,959 | |
| Five Below, Inc.*@ | | 13,253 | | | 529,590 | |
| Francesca’s Holdings Corp.* | | 8,973 | | | 161,783 | |
| GameStop Corp., Class A | | 7,712 | | | 194,805 | |
| Genesco, Inc.* | | 6,525 | | | 405,203 | |
| GNC Holdings, Inc., Class A@ | | 9,345 | | | 103,169 | |
| Group 1 Automotive, Inc. | | 6,400 | | | 498,816 | |
| Guess?, Inc. | | 19,715 | | | 238,552 | |
| Haverty Furniture Cos., Inc. | | 4,500 | | | 106,650 | |
| hhgregg, Inc.*@ | | 7,855 | | | 11,233 | |
| Hibbett Sports, Inc.*@ | | 6,748 | | | 251,700 | |
| Kirkland’s, Inc.* | | 5,977 | | | 92,703 | |
| Lithia Motors, Inc., Class A@ | | 7,255 | | | 702,502 | |
| Lumber Liquidators Holdings, Inc.*@ | | 6,687 | | | 105,253 | |
| MarineMax, Inc.* | | 5,699 | | | 110,276 | |
| Monro Muffler Brake, Inc. | | 9,650 | | | 551,980 | |
| Murphy USA, Inc.* | | 11,781 | | | 724,178 | |
| New York & Co., Inc.* | | 17,542 | | | 39,820 | |
| Office Depot, Inc. | | 129,524 | | | 585,449 | |
| Penske Auto Group, Inc. | | 5,415 | | | 280,714 | |
| Perfumania Holdings, Inc.* | | 1,156 | | | 1,763 | |
| Pier 1 Imports, Inc. | | 25,113 | | | 214,465 | |
| Rent-A-Center, Inc.@ | | 12,778 | | | 143,753 | |
| Select Comfort Corp.* | | 13,560 | | | 306,727 | |
| Shoe Carnival, Inc. | | 3,860 | | | 104,143 | |
| Sonic Automotive, Inc., Class A@ | | 9,895 | | | 226,596 | |
| Sportsman’s Warehouse
Holdings, Inc.*@ | | 7,232 | | | 67,909 | |
| Stage Stores, Inc.@ | | 7,304 | | | 31,919 | |
| Stein Mart, Inc. | | 12,554 | | | 68,796 | |
| Tailored Brands, Inc. | | 3,260 | | | 83,293 | |
| Tandy Leather Factory, Inc.* | | 3,611 | | | 29,249 | |
| Tile Shop Holdings, Inc.* | | 4,471 | | | 87,408 | |
| Tilly’s, Inc., Class A* | | 2,125 | | | 28,029 | |
| Trans World Entertainment Corp.* | | 5,400 | | | 17,820 | |
| Urban Outfitters, Inc.*@ | | 1,362 | | | 38,790 | |
| Vitamin Shoppe, Inc.* | | 7,763 | | | 184,371 | |
| West Marine, Inc.* | | 5,255 | | | 55,020 | |
| Winmark Corp. | | 1,162 | | | 146,586 | |
| Zumiez, Inc.* | | 10,304 | | | 225,142 | |
| | | | | | 14,013,709 | |
| Textiles, Apparel & Luxury Goods — 0.9% | | | | | | |
| Cherokee, Inc.* | | 1,700 | | | 17,850 | |
| Columbia Sportswear Co. | | 1,363 | | | 79,463 | |
| Crocs, Inc.* | | 21,632 | | | 148,396 | |
| Culp, Inc. | | 4,958 | | | 184,190 | |
| Deckers Outdoor Corp.* | | 7,708 | | | 426,946 | |
| Delta Apparel, Inc.* | | 1,153 | | | 23,902 | |
| Fossil Group, Inc.* | | 2,477 | | | 64,055 | |
| G-III Apparel Group Ltd.*@ | | 12,918 | | | 381,856 | |
| Iconix Brand Group, Inc.* | | 13,700 | | | 127,958 | |
| Kate Spade & Co.* | | 21,772 | | | 406,483 | |
| Lakeland Industries, Inc.* | | 440 | | | 4,576 | |
| Movado Group, Inc. | | 4,486 | | | 128,972 | |
| Oxford Industries, Inc. | | 4,436 | | | 266,737 | |
| Perry Ellis International, Inc.* | | 3,333 | | | 83,025 | |
| Rocky Brands, Inc. | | 1,000 | | | 11,550 | |
| Sequential Brands Group, Inc.* | | 1,723 | | | 8,064 | |
| Steven Madden Ltd.* | | 18,385 | | | 657,264 | |
| Superior Uniform Group, Inc. | | 2,200 | | | 43,164 | |
| Unifi, Inc.* | | 4,533 | | | 147,912 | |
| Vera Bradley, Inc.* | | 7,472 | | | 87,572 | |
| Vince Holding Corp.* | | 3,729 | | | 15,102 | |
| Wolverine World Wide, Inc. | | 26,290 | | | 577,065 | |
| | | | | | 3,892,102 | |
| Thrifts & Mortgage Finance — 2.4% | | | | | | |
| Astoria Financial Corp. | | 26,701 | | | 497,974 | |
| | Atlantic Coast Financial Corp.* | | 1,765 | | | 12,002 | |
| Bank Mutual Corp. | | 10,012 | | | 94,613 | |
| | BankFinancial Corp. | | 4,900 | | | 72,618 | |
| Bear State Financial, Inc. | | 1,232 | | | 12,505 | |
| | Beneficial Bancorp, Inc. | | 19,038 | | | 350,299 | |
| BofI Holding, Inc.*@ | | 16,994 | | | 485,179 | |
| | Capitol Federal Financial, Inc. | | 38,288 | | | 630,221 | |
| Charter Financial Corp. | | 307 | | | 5,118 | |
| | Citizens Community Bancorp, Inc. | | 400 | | | 4,972 | |
| Clifton Bancorp, Inc. | | 4,918 | | | 83,213 | |
| | Dime Community Bancshares, Inc. | | 9,230 | | | 185,523 | |
| ESSA Bancorp, Inc. | | 1,900 | | | 29,868 | |
| | EverBank Financial Corp. | | 16,352 | | | 318,046 | |
| Federal Agricultural Mortgage Corp.,
Class C | | 1,400 | | | 80,178 | |
| | First Defiance Financial Corp. | | 1,100 | | | 55,814 | |
| Flagstar Bancorp, Inc.* | | 13,420 | | | 361,535 | |
| | Hingham Institution for Savings@ | | 213 | | | 41,914 | |
| Home Bancorp, Inc. | | 994 | | | 38,378 | |
| | HomeStreet, Inc.* | | 4,321 | | | 136,544 | |
| HopFed Bancorp, Inc. | | 415 | | | 5,586 | |
| | Impac Mortgage Holdings, Inc.*@ | | 301 | | | 4,220 | |
| Kearny Financial Corp. | | 23,771 | | | 369,639 | |
| | Lake Sunapee Bank Group | | 200 | | | 4,718 | |
| LendingTree, Inc.* | | 2,115 | | | 214,355 | |
| | Meridian Bancorp, Inc. | | 11,660 | | | 220,374 | |
| Meta Financial Group, Inc. | | 2,736 | | | 281,534 | |
| | MGIC Investment Corp.* | | 38,605 | | | 393,385 | |
| Nationstar Mortgage Holdings, Inc.* | | 4,024 | | | 72,673 | |
| | NMI Holdings, Inc., Class A* | | 4,062 | | | 43,260 | |
See notes to financial statements
SA U.S. Small Company Fund
PORTFOLIO OF INVESTMENTS — AS OF DECEMBER 31, 2016 (Unaudited) (Continued)
| | | | SHARES | | VALUE† | |
| COMMON STOCKS (Continued) | | | | | | |
| Thrifts & Mortgage Finance (Continued) | | | | | | |
| Northfield Bancorp, Inc. | | 14,040 | | $ | 280,379 | |
| Northwest Bancshares, Inc. | | 25,789 | | | 464,976 | |
| OceanFirst Financial Corp. | | 5,554 | | | 166,787 | |
| Oritani Financial Corp. | | 13,840 | | | 259,500 | |
| PennyMac Financial
Services, Inc., Class A* | | 1,561 | | | 25,991 | |
| PHH Corp.* | | 13,064 | | | 198,050 | |
| Provident Financial Holdings, Inc. | | 1,124 | | | 22,727 | |
| Provident Financial Services, Inc. | | 15,994 | | | 452,630 | |
| Radian Group, Inc. | | 22,936 | | | 412,389 | |
| SI Financial Group, Inc. | | 2,065 | | | 31,801 | |
| | Southern Missouri Bancorp, Inc. | | 300 | | | 10,614 | |
| Territorial Bancorp, Inc. | | 2,302 | | | 75,598 | |
| Timberland Bancorp, Inc. | | 2,600 | | | 53,716 | |
| Trustco Bank Corp. NY | | 24,992 | | | 218,680 | |
| United Community Financial Corp. | | 13,392 | | | 119,724 | |
| United Financial Bancorp, Inc. | | 13,701 | | | 248,810 | |
| Walker & Dunlop, Inc.* | | 7,823 | | | 244,078 | |
| Washington Federal, Inc. | | 25,804 | | | 886,367 | |
| Waterstone Financial, Inc. | | 8,664 | | | 159,418 | |
| Western New England Bancorp, Inc. | | 5,000 | | | 46,750 | |
| WSFS Financial Corp. | | 6,327 | | | 293,256 | |
| | | | | | 9,778,499 | |
| Tobacco — 0.3% | | | | | | |
| Alliance One International, Inc.* | | 1,792 | | | 34,406 | |
| Universal Corp. | | 5,600 | | | 357,000 | |
| Vector Group Ltd.@ | | 34,744 | | | 790,079 | |
| | | | | | 1,181,485 | |
| Trading Companies & Distributors — 1.5% | | | | | | |
| Air Lease Corp. | | 13,048 | | | 447,938 | |
| Aircastle Ltd. | | 15,000 | | | 312,750 | |
| Applied Industrial Technologies, Inc. | | 12,730 | | | 756,162 | |
| Beacon Roofing Supply, Inc.* | | 14,009 | | | 645,395 | |
| BMC Stock Holdings, Inc.* | | 7,486 | | | 145,977 | |
| CAI International, Inc.* | | 4,585 | | | 39,752 | |
| DXP Enterprises, Inc.*@ | | 7,010 | | | 243,527 | |
| GATX Corp.@ | | 11,502 | | | 708,293 | |
| H&E Equipment Services, Inc. | | 12,565 | | | 292,136 | |
| Herc Holdings, Inc.* | | 5,162 | | | 207,306 | |
| Houston Wire & Cable Co. | | 5,746 | | | 37,349 | |
| Huttig Building Products, Inc.* | | 1,858 | | | 12,281 | |
| Kaman Corp., Class A | | 7,224 | | | 353,470 | |
| Lawson Products, Inc.* | | 1,575 | | | 37,485 | |
| MRC Global, Inc.* | | 23,031 | | | 466,608 | |
| Neff Corp., Class A* | | 1,000 | | | 14,100 | |
| NOW, Inc.* | | 21,709 | | | 444,383 | |
| Rush Enterprises, Inc., Class A* | | 8,185 | | | 261,102 | |
| Textainer Group Holdings Ltd. | | 13,035 | | | 97,111 | |
| Titan Machinery, Inc.* | | 3,710 | | | 54,055 | |
| Triton International Ltd. | | 9,264 | | | 146,371 | |
| Univar, Inc.* | | 1,103 | | | 31,292 | |
| WESCO International, Inc.* | | 6,914 | | | 460,127 | |
| Willis Lease Finance Corp.* | | 900 | | | 23,022 | |
| | | | | | 6,237,992 | |
| Transportation Infrastructure — 0.0% | | | | | | |
| Sino-Global Shipping America Ltd.*@ | | 3,964 | | | 12,288 | |
| | |
| Water Utilities — 0.5% | | | | | | |
| American States Water Co. | | 13,456 | | | 613,055 | |
| Artesian Resources Corp., Class A | | 2,052 | | | 65,541 | |
| California Water Service Group | | 11,688 | | | 396,223 | |
| Connecticut Water Service, Inc. | | 3,754 | | | 209,661 | |
| Consolidated Water Co., Ltd. | | 2,822 | | | 30,619 | |
| Middlesex Water Co. | | 5,644 | | | 242,353 | |
| Pure Cycle Corp.* | | 1,000 | | | 5,500 | |
| SJW Corp. | | 4,400 | | | 246,312 | |
| York Water Co.@ | | 3,670 | | | 140,194 | |
| | | | | | 1,949,458 | |
| Wireless Telecommunication Services — 0.4% | | | | | | |
| Boingo Wireless, Inc.* | | 15,932 | | | 194,211 | |
| Shenandoah Telecommunications Co. | | 19,824 | | | 541,195 | |
| Spok Holdings, Inc. | | 4,608 | | | 95,616 | |
| Telephone & Data Systems, Inc. | | 20,316 | | | 586,523 | |
| United States Cellular Corp.* | | 933 | | | 40,791 | |
| | | | | | 1,458,336 | |
| TOTAL COMMON STOCKS
(Identified Cost $274,570,992) | | | | | 411,240,407 | |
| | |
| RIGHTS AND WARRANTS — 0.0% | | | | | | |
| Pharmaceuticals — 0.0% | | | | | | |
| FRD Acquisition Co. CVR*~§¶ | | 656 | | | — | |
| Fresenius Kabi Pharmaceuticals Holding,
Inc., CVR*~§¶ | | 13,728 | | | — | |
| | | | | | — | |
| Software — 0.0% | | | | | | |
| Gerber Scientific CVR*@§¶ | | 5,000 | | | — | |
| | | | | | | | |
| Wireless Telecommunication Services — 0.0% | | | | | | |
| Leap Wireless International, Inc. CVR,
expires 3/31/17*§¶ | | 2,600 | | | — | |
| TOTAL RIGHTS AND WARRANTS
(Identified Cost $19,319) | | | | | — | |
See notes to financial statements
SA U.S. Small Company Fund
PORTFOLIO OF INVESTMENTS — AS OF DECEMBER 31, 2016 (Unaudited) (Continued)
| | | | SHARES | | VALUE† | |
| SHORT-TERM INVESTMENTS — 4.8% | | | | |
| Investment Company — 0.2% | | | | | | |
| State Street Institutional U.S. Government
Money Market Fund, 0.170% | | 804,000 | | $ | 804,000 | |
| Collateral For Securities On Loan — 4.6% | | | | | | |
| State Street Navigator Securities Lending
Government Money Market Portfolio | | 18,935,730 | | | 18,935,730 | |
| TOTAL SHORT-TERM INVESTMENTS
(Identified Cost $19,739,730) | | | | | 19,739,730 | |
| |
| Total Investments — 104.4% | | | | | | |
| (Identified Cost $294,330,041)# | | | | | 430,980,137 | |
| Liabilities, Less Cash and
Other Assets — (4.4%) | | | | | (18,170,495 | ) |
| Net Assets — 100.0% | | | | $ | 412,809,642 | |
| † | See Note 1 | |
| * | Non-income producing security | |
| @ | A portion or all of the security/securities were held on loan. As of December 31, 2016, the market value of the securities on loan was $38,956,598. | |
| ~ | Bankrupt/delisted security | |
| § | Fair valued security. Fair values are determined pursuant to procedures approved by the Fund’s Board of Trustees. See Note 1 | |
| ¶ | Contingent value rights based on future performance. | |
| # | At December 31, 2016, the aggregate cost of investment securities for U.S. federal income tax purposes was $294,330,041. Net unrealized appreciation aggregated $136,650,096 of which $162,040,587 related to appreciated investment securities and $25,390,491 related to depreciated investment securities. | |
Key to abbreviations:
CVR — Contingent Value Rights
SA U.S. Value Fund
PORTFOLIO OF INVESTMENTS — AS OF DECEMBER 31, 2016 (Unaudited)
| | | | SHARES | | VALUE† | |
| COMMON STOCKS — 99.7% | | | | | | |
| Aerospace & Defense — 1.0% | | | | | | |
| | Arconic, Inc. | | 38,186 | | $ | 707,968 | |
| L3 Technologies, Inc. | | 9,636 | | | 1,465,732 | |
| Northrop Grumman Corp. | | 7,390 | | | 1,718,766 | |
| Orbital ATK, Inc. | | 2,155 | | | 189,058 | |
| Textron, Inc. | | 35,074 | | | 1,703,194 | |
| | | | | | 5,784,718 | |
| Air Freight & Logistics — 0.5% | | | | | | |
| FedEx Corp. | | 14,216 | | | 2,647,019 | |
| XPO Logistics, Inc.* | | 6,246 | | | 269,578 | |
| | | | | | 2,916,597 | |
| Airlines — 1.1% | | | | | | |
| JetBlue Airways Corp.* | | 61,307 | | | 1,374,503 | |
| Southwest Airlines Co. | | 58,229 | | | 2,902,133 | |
| United Continental Holdings, Inc.* | | 25,145 | | | 1,832,568 | |
| | | | | | 6,109,204 | |
| Auto Components — 0.5% | | | | | | |
| Adient PLC* | | 972 | | | 56,959 | |
| BorgWarner, Inc.@ | | 18,580 | | | 732,795 | |
| Gentex Corp. | | 12,955 | | | 255,084 | |
| Goodyear Tire & Rubber Co. (The) | | 30,139 | | | 930,391 | |
| Lear Corp. | | 5,198 | | | 688,059 | |
| | | | | | 2,663,288 | |
| Automobiles — 1.9% | | | | | | |
| Ford Motor Co. | | 419,903 | | | 5,093,424 | |
| General Motors Co. | | 158,398 | | | 5,518,586 | |
| | | | | | 10,612,010 | |
| Beverages — 0.2% | | | | | | |
| Molson Coors Brewing Co., Class B | | 11,973 | | | 1,165,093 | |
| | |
| Biotechnology — 0.1% | | | | | | |
| United Therapeutics Corp.* | | 3,956 | | | 567,409 | |
| | |
| Building Products — 0.3% | | | | | | |
| Johnson Controls International PLC | | 9,720 | | | 400,367 | |
| Owens Corning | | 19,528 | | | 1,006,864 | |
| USG Corp.* | | 4,614 | | | 133,252 | |
| | | | | | 1,540,483 | |
| Capital Markets — 3.0% | | | | | | |
| Bank of New York Mellon Corp. (The) | | 92,611 | | | 4,387,909 | |
| CME Group, Inc. | | 12,336 | | | 1,422,957 | |
| Goldman Sachs Group, Inc. (The) | | 24,637 | | | 5,899,330 | |
| Morgan Stanley | | 90,875 | | | 3,839,469 | |
| Nasdaq, Inc. | | 9,718 | | | 652,272 | |
| State Street Corp. | | 10,271 | | | 798,262 | |
| | | | | | 17,000,199 | |
| Chemicals — 1.2% | | | | | | |
| Albemarle Corp. | | 8,223 | | | 707,836 | |
| Ashland Global Holdings, Inc. | | 9,009 | | | 984,593 | |
| CF Industries Holdings, Inc.@ | | 17,389 | | | 547,406 | |
| Dow Chemical Co. (The) | | 18,037 | | | 1,032,077 | |
| Eastman Chemical Co. | | 22,022 | | | 1,656,275 | |
| Ingevity Corp.* | | 3,495 | | | 191,736 | |
| Mosaic Co. (The) | | 46,665 | | | 1,368,684 | |
| Olin Corp. | | 4,545 | | | 116,397 | |
| | | | | | 6,605,004 | |
| Commercial Banks — 13.0% | | | | | | |
| Bank of America Corp. | | 538,411 | | | 11,898,883 | |
| BB&T Corp. | | 44,415 | | | 2,088,393 | |
| BOK Financial Corp. | | 765 | | | 63,526 | |
| CIT Group, Inc. | | 9,004 | | | 384,291 | |
| Citigroup, Inc. | | 212,682 | | | 12,639,691 | |
| Citizens Financial Group, Inc. | | 15,542 | | | 553,762 | |
| Comerica, Inc. | | 6,521 | | | 444,145 | |
| Fifth Third Bancorp | | 127,987 | | | 3,451,809 | |
| Huntington Bancshares, Inc. | | 95,253 | | | 1,259,245 | |
| JPMorgan Chase & Co. | | 281,434 | | | 24,284,940 | |
| KeyCorp | | 70,333 | | | 1,284,984 | |
| M&T Bank Corp. | | 5,838 | | | 913,238 | |
| PacWest Bancorp | | 5,207 | | | 283,469 | |
| People’s United Financial, Inc. | | 5,834 | | | 112,946 | |
| PNC Financial Services
Group, Inc. (The) | | 36,349 | | | 4,251,379 | |
| Regions Financial Corp. | | 155,307 | | | 2,230,209 | |
| SunTrust Banks, Inc. | | 34,538 | | | 1,894,409 | |
| Wells Fargo & Co. | | 88,253 | | | 4,863,623 | |
| Zions Bancorp@ | | 26,351 | | | 1,134,147 | |
| | | | | | 74,037,089 | |
| Commercial Services & Supplies — 0.5% | | | | | | |
| Republic Services, Inc. | | 48,088 | | | 2,743,420 | |
| Communications Equipment — 3.3% | | | | | | |
| ARRIS International PLC* | | 11,809 | | | 355,805 | |
| Brocade Communications Systems, Inc. | | 46,325 | | | 578,599 | |
| Cisco Systems, Inc. | | 558,956 | | | 16,891,650 | |
| EchoStar Corp., Class A* | | 3,599 | | | 184,953 | |
| Juniper Networks, Inc. | | 28,506 | | | 805,580 | |
| | | | | | 18,816,587 | |
| Computers & Peripherals — 2.0% | | | | | | |
| Hewlett Packard Enterprise Co. | | 226,855 | | | 5,249,425 | |
| HP, Inc. | | 255,741 | | | 3,795,196 | |
| NetApp, Inc. | | 7,640 | | | 269,463 | |
| Western Digital Corp.@ | | 31,938 | | | 2,170,187 | |
| | | | | | 11,484,271 | |
| Construction & Engineering — 0.3% | | | | | | |
| AECOM* | | 6,180 | | | 224,705 | |
| EMCOR Group, Inc. | | 1,400 | | | 99,064 | |
| Fluor Corp. | | 14,785 | | | 776,508 | |
| Jacobs Engineering Group, Inc.* | | 8,552 | | | 487,464 | |
| | | | | | 1,587,741 | |
| Construction Materials — 0.2% | | | | | | |
| Vulcan Materials Co. | | 10,532 | | | 1,318,080 | |
See notes to financial statements
SA U.S. Value Fund
PORTFOLIO OF INVESTMENTS — AS OF DECEMBER 31, 2016 (Unaudited) (Continued)
| | | | SHARES | | VALUE† | |
| COMMON STOCKS (Continued) | | | | | | |
| Consumer Finance — 1.1% | | | | | | |
| Ally Financial, Inc. | | 63,046 | | $ | 1,199,135 | |
| Capital One Financial Corp. | | 56,650 | | | 4,942,146 | |
| Navient Corp. | | 13,397 | | | 220,113 | |
| Santander Consumer USA | | | | | | |
| Holdings, Inc.* | | 2,620 | | | 35,370 | |
| | | | | | 6,396,764 | |
| Containers & Packaging — 0.6% | | | | | | |
| International Paper Co. | | 40,045 | | | 2,124,788 | |
| WestRock Co. | | 20,973 | | | 1,064,799 | |
| | | | | | 3,189,587 | |
| Distributors — 0.1% | | | | | | |
| LKQ Corp.* | | 22,712 | | | 696,123 | |
| | |
| Diversified Financial Services — 0.1% | | | | | | |
| Leucadia National Corp. | | 6,993 | | | 162,587 | |
| Voya Financial, Inc. | | 7,020 | | | 275,325 | |
| | | | | | 437,912 | |
| Diversified Telecommunication Services — 4.7% | | | | |
| AT&T, Inc. | | 544,137 | | | 23,142,147 | |
| CenturyLink, Inc. | | 84,635 | | | 2,012,620 | |
| Frontier Communications Corp.@ | | 94,769 | | | 320,319 | |
| Level 3 Communications, Inc.* | | 19,640 | | | 1,106,910 | |
| | | | | | 26,581,996 | |
| Electrical Equipment — 0.5% | | | | | | |
| Eaton Corp. PLC | | 40,532 | | | 2,719,292 | |
| | |
| Electronic Equipment, Instruments & Components — 1.2% | |
| Arrow Electronics, Inc.* | | 17,315 | | | 1,234,560 | |
| Avnet, Inc. | | 21,265 | | | 1,012,427 | |
| Corning, Inc. | | 67,872 | | | 1,647,253 | |
| Flex Ltd.* | | 37,947 | | | 545,298 | |
| Jabil Circuit, Inc. | | 17,551 | | | 415,432 | |
| SYNNEX Corp. | | 1,651 | | | 199,804 | |
| TE Connectivity Ltd. | | 22,309 | | | 1,545,568 | |
| | | | | | 6,600,342 | |
| Energy Equipment & Services — 1.5% | | | | | | |
| Baker Hughes, Inc. | | 27,661 | | | 1,797,135 | |
| FMC Technologies, Inc.* | | 19,634 | | | 697,596 | |
| Helmerich & Payne, Inc.@ | | 18,327 | | | 1,418,510 | |
| National Oilwell Varco, Inc.@ | | 42,885 | | | 1,605,614 | |
| Schlumberger Ltd. | | 22,471 | | | 1,886,440 | |
| Transocean Ltd.*@ | | 29,532 | | | 435,302 | |
| Weatherford International PLC*@ | | 78,652 | | | 392,474 | |
| | | | | | 8,233,071 | |
| Food & Staples Retailing — 2.8% | | | | | | |
| CVS Health Corp. | | 99,326 | | | 7,837,815 | |
| Wal-Mart Stores, Inc. | | 82,417 | | | 5,696,663 | |
| Walgreens Boots Alliance, Inc. | | 25,843 | | | 2,138,767 | |
| Whole Foods Market, Inc. | | 8,010 | | | 246,387 | |
| | | | | | 15,919,632 | |
| Food Products — 3.1% | | | | | | |
| Archer-Daniels-Midland Co. | | 60,447 | | | 2,759,406 | |
| Bunge Ltd. | | 23,481 | | | 1,696,267 | |
| Ingredion, Inc. | | 3,073 | | | 384,002 | |
| J.M. Smucker Co. (The) | | 18,460 | | | 2,363,988 | |
| Kraft Heinz Co. (The) | | 18,870 | | | 1,647,728 | |
| Mondelez International, Inc., Class A | | 99,636 | | | 4,416,864 | |
| Pinnacle Foods, Inc. | | 15,318 | | | 818,747 | |
| Post Holdings, Inc.* | | 4,623 | | | 371,643 | |
| Seaboard Corp.* | | 76 | | | 300,351 | |
| Tyson Foods, Inc., Class A | | 48,892 | | | 3,015,659 | |
| | | | | | 17,774,655 | |
| Health Care Equipment & Supplies — 2.4% | | | | | | |
| Abbott Laboratories | | 51,781 | | | 1,988,908 | |
| Boston Scientific Corp.* | | 41,960 | | | 907,595 | |
| Danaher Corp. | | 42,050 | | | 3,273,172 | |
| Medtronic PLC | | 94,115 | | | 6,703,811 | |
| STERIS PLC | | 376 | | | 25,339 | |
| Teleflex, Inc. | | 1,139 | | | 183,550 | |
| Zimmer Biomet Holdings, Inc. | | 2,880 | | | 297,216 | |
| | | | | | 13,379,591 | |
| Health Care Providers & Services — 4.9% | | | | | | |
| Aetna, Inc. | | 44,742 | | | 5,548,455 | |
| Anthem, Inc. | | 36,223 | | | 5,207,781 | |
| Centene Corp.* | | 12,702 | | | 717,790 | |
| CIGNA Corp. | | 10,533 | | | 1,404,997 | |
| DaVita, Inc.* | | 8,165 | | | 524,193 | |
| Envision Healthcare Corp.*@ | | 219 | | | 13,861 | |
| Express Scripts Holding Co.* | | 71,055 | | | 4,887,873 | |
| Humana, Inc. | | 21,137 | | | 4,312,582 | |
| Laboratory Corp. of America Holdings* | | 13,266 | | | 1,703,089 | |
| Mednax, Inc.*@ | | 6,080 | | | 405,293 | |
| Quest Diagnostics, Inc. | | 22,080 | | | 2,029,152 | |
| Universal Health Services, Inc., Class B | | 6,456 | | | 686,789 | |
| WellCare Health Plans, Inc.* | | 2,066 | | | 283,207 | |
| | | | | | 27,725,062 | |
| Hotels, Restaurants & Leisure — 1.2% | | | | | | |
| Carnival Corp. | | 27,130 | | | 1,412,388 | |
| Hyatt Hotels Corp., Class A* | | 3,874 | | | 214,077 | |
| MGM Resorts International* | | 84,812 | | | 2,445,130 | |
| Royal Caribbean Cruises Ltd. | | 31,589 | | | 2,591,562 | |
| | | | | | 6,663,157 | |
See notes to financial statements
SA U.S. Value Fund
PORTFOLIO OF INVESTMENTS — AS OF DECEMBER 31, 2016 (Unaudited) (Continued)
| | | | SHARES | | VALUE† | |
| COMMON STOCKS (Continued) | | | | | | |
| Household Durables — 1.4% | | | | | | |
| DR Horton, Inc. | | 51,376 | | $ | 1,404,106 | |
| Garmin Ltd.@ | | 7,023 | | | 340,545 | |
| Harman International Industries, Inc. | | 3,771 | | | 419,184 | |
| Lennar Corp., Class A | | 28,692 | | | 1,231,748 | |
| Mohawk Industries, Inc.* | | 10,083 | | | 2,013,374 | |
| PulteGroup, Inc. | | 38,222 | | | 702,520 | |
| Toll Brothers, Inc.* | | 11,379 | | | 352,749 | |
| Whirlpool Corp. | | 9,457 | | | 1,718,999 | |
| | | | | | 8,183,225 | |
| Independent Power Producers & Energy Traders — 0.1% | | |
| Calpine Corp.* | | 23,886 | | | 273,017 | |
| NRG Energy, Inc. | | 44,291 | | | 543,008 | |
| | | | | | 816,025 | |
| Industrial Conglomerates — 0.3% | | | | | | |
| Carlisle Cos., Inc. | | 4,894 | | | 539,759 | |
| General Electric Co. | | 35,958 | | | 1,136,273 | |
| | | | | | 1,676,032 | |
| Insurance — 6.7% | | | | | | |
| Aflac, Inc. | | 27,103 | | | 1,886,369 | |
| Alleghany Corp.* | | 701 | | | 426,292 | |
| Allied World Assurance Co., | | | | | | |
| Holdings Ltd. | | 7,656 | | | 411,204 | |
| Allstate Corp. (The) | | 25,783 | | | 1,911,036 | |
| American Financial Group, Inc. | | 12,362 | | | 1,089,340 | |
| American International Group, Inc. | | 67,235 | | | 4,391,118 | |
| Arch Capital Group Ltd.* | | 2,302 | | | 198,640 | |
| Assurant, Inc. | | 9,601 | | | 891,549 | |
| Assured Guaranty Ltd. | | 13,828 | | | 522,284 | |
| Axis Capital Holdings Ltd. | | 12,616 | | | 823,446 | |
| Chubb Ltd. | | 8,167 | | | 1,079,024 | |
| CNA Financial Corp. | | 7,604 | | | 315,566 | |
| Endurance Specialty Holdings Ltd. | | 1,516 | | | 140,078 | |
| Everest Re Group Ltd. | | 6,500 | | | 1,406,600 | |
| First American Financial Corp. | | 5,621 | | | 205,897 | |
| Hartford Financial Services Group, Inc. | | 61,614 | | | 2,935,907 | |
| Lincoln National Corp. | | 26,059 | | | 1,726,930 | |
| Loews Corp. | | 37,469 | | | 1,754,673 | |
| MetLife, Inc. | | 46,445 | | | 2,502,921 | |
| Old Republic International Corp. | | 23,484 | | | 446,196 | |
| Principal Financial Group, Inc. | | 40,855 | | | 2,363,870 | |
| Prudential Financial, Inc. | | 25,348 | | | 2,637,713 | |
| Reinsurance Group of America, Inc. | | 9,075 | | | 1,141,907 | |
| RenaissanceRe Holdings Ltd.@ | | 3,401 | | | 463,284 | |
| Travelers Companies, Inc. (The) | | 27,179 | | | 3,327,253 | |
| Unum Group | | 32,590 | | | 1,431,679 | |
| Validus Holdings Ltd. | | 5,533 | | | 304,370 | |
| WR Berkley Corp. | | 6,915 | | | 459,917 | |
| XL Group Ltd. | | 28,603 | | | 1,065,748 | |
| | | | | | 38,260,811 | |
| Internet & Catalog Retail — 0.3% | | | | | | |
| Liberty Interactive Corp. QVC Group, | | | | | | |
| Class A* | | 71,603 | | | 1,430,628 | |
| Liberty Ventures, Series A* | | 782 | | | 28,832 | |
| | | | | | 1,459,460 | |
| Internet Software & Services — 0.2% | | | | | | |
| CommerceHub, Inc., Series C* | | 2,998 | | | 45,060 | |
| Yahoo!, Inc.* | | 22,867 | | | 884,267 | |
| | | | | | 929,327 | |
| IT Services — 0.9% | | | | | | |
| Amdocs Ltd. | | 8,428 | | | 490,931 | |
| Fidelity National Information | | | | | | |
| Services, Inc. | | 36,595 | | | 2,768,046 | |
| Leidos Holdings, Inc. | | 6,004 | | | 307,044 | |
| Xerox Corp. | | 186,374 | | | 1,627,045 | |
| | | | | | 5,193,066 | |
| Life Sciences Tools & Services — 0.6% | | | | | | |
| Bio-Rad Laboratories, Inc., Class A* | | 172 | | | 31,352 | |
| PerkinElmer, Inc. | | 200 | | | 10,430 | |
| Thermo Fisher Scientific, Inc. | | 23,812 | | | 3,359,873 | |
| | | | | | 3,401,655 | |
| Machinery — 2.5% | | | | | | |
| AGCO Corp. | | 11,477 | | | 664,059 | |
| Caterpillar, Inc.@ | | 35,868 | | | 3,326,398 | |
| Cummins, Inc. | | 7,596 | | | 1,038,145 | |
| Dover Corp. | | 19,819 | | | 1,485,038 | |
| Ingersoll-Rand PLC | | 21,416 | | | 1,607,057 | |
| Oshkosh Corp. | | 3,003 | | | 194,024 | |
| PACCAR, Inc. | | 14,232 | | | 909,425 | |
| Pentair PLC | | 25,335 | | | 1,420,533 | |
| Stanley Black & Decker, Inc. | | 28,415 | | | 3,258,916 | |
| Trinity Industries, Inc. | | 1,343 | | | 37,282 | |
| | | | | | 13,940,877 | |
| Media — 6.4% | | | | | | |
| CBS Corp., Class A | | 1,291 | | | 83,463 | |
| Charter Communications, Inc., Class A* | | 23,379 | | | 6,731,282 | |
| Comcast Corp., Class A | | 279,514 | | | 19,300,442 | |
| Liberty Braves Group, Class A* | | 438 | | | 8,975 | |
| Liberty Braves Group, Class C* | | 877 | | | 18,057 | |
| Liberty Media Group, Class A*@ | | 1,097 | | | 34,391 | |
| Liberty Media Group, Class C*@ | | 2,194 | | | 68,738 | |
| Liberty SiriusXM Group, Class A* | | 4,389 | | | 151,508 | |
| Liberty SiriusXM Group, Class C* | | 8,778 | | | 297,750 | |
| Madison Square Garden Co. (The), | | | | | | |
| Class A* | | 443 | | | 75,979 | |
| News Corp., Class A | | 8,320 | | | 95,347 | |
| News Corp., Class B | | 1,734 | | | 20,461 | |
| TEGNA, Inc. | | 22,742 | | | 486,451 | |
| Time Warner, Inc. | | 94,794 | | | 9,150,465 | |
| | | | | | 36,523,309 | |
See notes to financial statements
SA U.S. Value Fund
PORTFOLIO OF INVESTMENTS — AS OF DECEMBER 31, 2016 (Unaudited) (Continued)
| | | | SHARES | | VALUE† | |
| COMMON STOCKS (Continued) | | | | | | |
| Metals & Mining — 1.7% | | | | | | |
| Alcoa Corp. | | 12,728 | | $ | 357,402 | |
| Freeport-McMoRan, Inc.* | | 133,393 | | | 1,759,454 | |
| Newmont Mining Corp. | | 87,348 | | | 2,975,946 | |
| Nucor Corp. | | 44,717 | | | 2,661,556 | |
| Reliance Steel & Aluminum Co. | | 12,373 | | | 984,148 | |
| Steel Dynamics, Inc. | | 31,162 | | | 1,108,744 | |
| | | | | | 9,847,250 | |
| Multiline Retail — 0.5% | | | | | | |
| Kohl’s Corp.@ | | 39,722 | | | 1,961,473 | |
| Macy’s, Inc. | | 26,856 | | | 961,713 | |
| | | | | | 2,923,186 | |
| Oil, Gas & Consumable Fuels — 11.1% | | | | | | |
| Anadarko Petroleum Corp. | | 21,958 | | | 1,531,131 | |
| Apache Corp. | | 5,567 | | | 353,338 | |
| Chevron Corp. | | 91,767 | | | 10,800,976 | |
| Concho Resources, Inc.* | | 6,539 | | | 867,071 | |
| ConocoPhillips | | 78,895 | | | 3,955,795 | |
| CONSOL Energy, Inc. | | 4,388 | | | 79,993 | |
| EOG Resources, Inc. | | 16,400 | | | 1,658,040 | |
| Exxon Mobil Corp. | | 242,185 | | | 21,859,618 | |
| Hess Corp. | | 20,959 | | | 1,305,536 | |
| HollyFrontier Corp. | | 15,834 | | | 518,722 | |
| Kinder Morgan, Inc. | | 29,336 | | | 607,549 | |
| Marathon Oil Corp. | | 51,156 | | | 885,510 | |
| Marathon Petroleum Corp. | | 64,008 | | | 3,222,803 | |
| Noble Energy, Inc. | | 35,505 | | | 1,351,320 | |
| Occidental Petroleum Corp. | | 28,855 | | | 2,055,342 | |
| PDC Energy, Inc.* | | 1,283 | | | 93,120 | |
| Phillips 66 | | 51,511 | | | 4,451,066 | |
| Southwestern Energy Co.* | | 1,031 | | | 11,155 | |
| Targa Resources Corp. | | 15,155 | | | 849,741 | |
| Tesoro Corp. | | 17,735 | | | 1,550,926 | |
| Valero Energy Corp. | | 68,980 | | | 4,712,714 | |
| | | | | | 62,721,466 | |
| Pharmaceuticals — 3.2% | | | | | | |
| Allergan PLC* | | 14,401 | | | 3,024,354 | |
| Mallinckrodt PLC* | | 10,165 | | | 506,420 | |
| Mylan NV* | | 19,675 | | | 750,601 | |
| Pfizer, Inc. | | 430,824 | | | 13,993,164 | |
| | | | | | 18,274,539 | |
| Professional Services — 0.1% | | | | | | |
| Manpowergroup, Inc. | | 6,208 | | | 551,705 | |
| | |
| Real Estate Management & Development — 0.0% | | | | |
| Jones Lang LaSalle, Inc. | | 500 | | | 50,520 | |
| | |
| Road & Rail — 2.2% | | | | | | |
| AMERCO | | 188 | | | 69,483 | |
| CSX Corp. | | 143,799 | | | 5,166,698 | |
| Hertz Global Holdings, Inc.* | | 9,240 | | | 199,214 | |
| Kansas City Southern | | 13,489 | | | 1,144,542 | |
| Norfolk Southern Corp. | | 39,083 | | | 4,223,700 | |
| Ryder System, Inc. | | 1,899 | | | 141,361 | |
| Union Pacific Corp. | | 17,045 | | | 1,767,226 | |
| | | | | | 12,712,224 | |
| Semiconductors & Semiconductor Equipment — 6.3% | | | | |
| First Solar, Inc.*@ | | 7,096 | | | 227,711 | |
| Intel Corp. | | 530,175 | | | 19,229,447 | |
| Lam Research Corp. | | 23,431 | | | 2,477,360 | |
| Marvell Technology Group Ltd. | | 18,929 | | | 262,545 | |
| Micron Technology, Inc.* | | 96,568 | | | 2,116,771 | |
| NVIDIA Corp.@ | | 62,745 | | | 6,697,401 | |
| ON Semiconductor Corp.* | | 14,063 | | | 179,444 | |
| QUALCOMM, Inc. | | 74,056 | | | 4,828,451 | |
| | | | | | 36,019,130 | |
| Software — 0.8% | | | | | | |
| CA, Inc. | | 75,041 | | | 2,384,052 | |
| Dell Technologies, Inc., Class V* | | 16,758 | | | 921,187 | |
| Nuance Communications, Inc.* | | 2,812 | | | 41,899 | |
| SS&C Technologies Holdings, Inc. | | 3,456 | | | 98,842 | |
| Symantec Corp. | | 35,201 | | | 840,952 | |
| Synopsys, Inc.* | | 4,316 | | | 254,040 | |
| | | | | | 4,540,972 | |
| Specialty Retail — 0.5% | | | | | | |
| AutoNation, Inc.* | | 4,083 | | | 198,638 | |
| Bed Bath & Beyond, Inc. | | 6,574 | | | 267,167 | |
| Best Buy Co., Inc. | | 45,609 | | | 1,946,136 | |
| Penske Auto Group, Inc. | | 2,395 | | | 124,157 | |
| Staples, Inc. | | 55,437 | | | 501,705 | |
| | | | | | 3,037,803 | |
| Textiles, Apparel & Luxury Goods — 0.2% | | | | | | |
| PVH Corp. | | 9,516 | | | 858,724 | |
| Ralph Lauren Corp. | | 2,906 | | | 262,470 | |
| | | | | | 1,121,194 | |
| Thrifts & Mortgage Finance — 0.0% | | | | | | |
| New York Community Bancorp, Inc. | | 11,787 | | | 187,531 | |
| | |
| Trading Companies & Distributors — 0.1% | | | | | | |
| United Rentals, Inc.* | | 4,421 | | | 466,769 | |
| | |
| Transportation Infrastructure — 0.0% | | | | | | |
| Macquarie Infrastructure Corp. | | 2,420 | | | 197,714 | |
| | |
| Wireless Telecommunication Services — 0.3% | | | | | | |
| Sprint Corp.*@ | | 29,977 | | | 252,406 | |
| T-Mobile US, Inc.*@ | | 24,396 | | | 1,403,014 | |
| | | | | | 1,655,420 | |
| TOTAL COMMON STOCKS | | | | | | |
| (Identified Cost $387,345,252) | | | | | 565,959,587 | |
See notes to financial statements
SA U.S. Value Fund
PORTFOLIO OF INVESTMENTS — AS OF DECEMBER 31, 2016 (Unaudited) (Continued)
| | SHARES | | VALUE† | |
| SHORT-TERM INVESTMENTS — 0.5% | | | | | |
| Investment Company — 0.2% | | | | | | | |
| State Street Institutional U.S. Government | | | | | | | |
| Money Market Fund, 0.170% | | 1,301,019 | | $ | 1,301,019 | | |
| | |
| Collateral For Securities On Loan — 0.3% | | | | | | | |
| State Street Navigator Securities Lending | | | | | | | |
| Government Money Market Portfolio | | 1,347,522 | | | 1,347,522 | | |
| TOTAL SHORT-TERM INVESTMENTS | | | | | | | |
| (Identified Cost $2,648,541) | | | | | 2,648,541 | | |
| | |
| Total Investments — 100.2% | | | | | | | |
| (Identified Cost $389,993,793)# | | | | | 568,608,128 | | |
| Liabilities, Less Cash and | | | | | | | |
| Other Assets — (0.2%) | | | | | (924,795 | ) | |
| Net Assets — 100.0% | | | | $ | 567,683,333 | | |
| | † | | See Note 1 |
| | * | | Non-income producing security |
| | @ | | A portion or all of the security/securities were held on loan. As of December 31, 2016, the market value of the securities on loan was $18,596,188. |
| | # | | At December 31, 2016, the aggregate cost of investment securities for U.S. federal income tax purposes was $389,993,793. Net unrealized appreciation aggregated $178,614,335 of which $191,318,226 related to appreciated investment securities and $12,703,891 related to depreciated investment securities. |
See notes to financial statements
SA International Value Fund
PORTFOLIO OF INVESTMENTS — AS OF DECEMBER 31, 2016 (Unaudited)
| | | SHARES | | VALUE† | |
| COMMON STOCKS — 98.3% | | | | | |
| Australia — 6.3% | | | | | |
| | Aurizon Holdings Ltd. | 280,816 | | $ | 1,023,387 | |
| Australia & New Zealand | | | | | |
| Banking Group Ltd. | 412,220 | | | 9,049,300 | |
| | Bank of Queensland Ltd. | 58,107 | | | 497,744 | |
| Bendigo & Adelaide Bank Ltd. | 68,660 | | | 629,761 | |
| | BHP Billiton Ltd. | 402,051 | | | 7,270,913 | |
| BHP Billiton Ltd., ADR@ | 86,553 | | | 3,096,866 | |
| | BlueScope Steel Ltd. | 136,906 | | | 916,848 | |
| Boral Ltd. | 193,802 | | | 756,628 | |
| | Crown Resorts Ltd. | 12,415 | | | 103,749 | |
| Fortescue Metals Group Ltd.@ | 463,439 | | | 1,969,856 | |
| | Incitec Pivot Ltd. | 253,567 | | | 658,752 | |
| National Australia Bank Ltd. | 19,340 | | | 428,052 | |
| | Newcrest Mining Ltd. | 189,724 | | | 2,772,516 | |
| Origin Energy Ltd. | 261,406 | | | 1,243,162 | |
| | QBE Insurance Group Ltd. | 190,746 | | | 1,709,636 | |
| Rio Tinto Ltd. | 24,644 | | | 1,065,282 | |
| | Santos Ltd. | 294,384 | | | 854,018 | |
| South32 Ltd. | 369,297 | | | 732,884 | |
| | South32 Ltd., ADR | 27,785 | | | 275,072 | |
| Star Entertainment Group Ltd. (The) | 113,959 | | | 425,173 | |
| | Suncorp Group Ltd. | 156,947 | | | 1,531,286 | |
| Treasury Wine Estates Ltd. | 64,592 | | | 497,825 | |
| | Woodside Petroleum Ltd. | 211,619 | | | 4,758,596 | |
| | | | | 42,267,306 | |
| Austria — 0.2% | | | | | |
| Erste Group Bank AG* | 9,138 | | | 267,652 | |
| | OMV AG | 20,569 | | | 726,640 | |
| | | | | 994,292 | |
| Belgium — 1.0% | | | | | |
| Ageas | 34,647 | | | 1,371,681 | |
| | KBC Groep NV | 32,412 | | | 2,007,192 | |
| Proximus | 6,735 | | | 193,971 | |
| | Solvay SA | 21,530 | | | 2,523,588 | |
| UCB SA | 8,916 | | | 571,667 | |
| | Umicore SA | 6,124 | | | 349,074 | |
| | | | | 7,017,173 | |
| Canada — 7.6% | | | | | |
| AltaGas Ltd.@ | 25,283 | | | 638,360 | |
| Bank of Montreal | 116,542 | | | 8,381,701 | |
| Blackberry Ltd.@* | 41,542 | | | 286,224 | |
| Blackberry Ltd.@¥* | 1,615 | | | 11,114 | |
| Cameco Corp.@¥ | 27,448 | | | 287,022 | |
| Cameco Corp.@ | 49,846 | | | 521,888 | |
| Canadian Natural Resources Ltd.¥ | 8,567 | | | 273,029 | |
| Canadian Natural Resources Ltd. | 43,357 | | | 1,382,221 | |
| Cenovus Energy, Inc.@ | 85,947 | | | 1,300,378 | |
| Crescent Point Energy Corp.@¥ | 46,074 | | | 626,262 | |
| Crescent Point Energy Corp.@ | 109,595 | | | 1,489,396 | |
| Empire Co., Ltd., Class A | 57,934 | | | 678,302 | |
| Enbridge Income Fund | | | | | |
| Holdings, Inc.@ | 4,700 | | | 121,714 | |
| Encana Corp. | 128,227 | | | 1,505,385 | |
| Fairfax Financial Holdings Ltd. | 3,960 | | | 1,912,680 | |
| Finning International, Inc. | 80 | | | 1,566 | |
| First Quantum Minerals Ltd. | 116,246 | | | 1,155,837 | |
| Genworth MI Canada, Inc.@ | 3,068 | | | 76,914 | |
| Goldcorp, Inc.@ | 118,744 | | | 1,614,918 | |
| Goldcorp, Inc.¥ | 8,798 | | | 119,784 | |
| Husky Energy, Inc.* | 84,483 | | | 1,025,009 | |
| Imperial Oil Ltd.@ | 3,300 | | | 114,708 | |
| Industrial Alliance Insurance & | | | | | |
| Financial Services, Inc. | 28,427 | | | 1,130,390 | |
| Kinross Gold Corp.* | 345,631 | | | 1,078,609 | |
| Lundin Mining Corp.* | 122,562 | | | 584,215 | |
| Magna International, Inc. | 18,483 | | | 802,162 | |
| Manulife Financial Corp.¥ | 126,128 | | | 2,246,096 | |
| Manulife Financial Corp. | 111,272 | | | 1,982,867 | |
| Maple Leaf Foods, Inc. | 7,763 | | | 162,586 | |
| Silver Wheaton Corp.@ | 21,030 | | | 406,300 | |
| Sun Life Financial, Inc.¥ | 30,213 | | | 1,160,005 | |
| Sun Life Financial, Inc. | 50,072 | | | 1,923,265 | |
| Suncor Energy, Inc.¥ | 266,726 | | | 8,721,015 | |
| Suncor Energy, Inc. | 65,644 | | | 2,145,902 | |
| Teck Resources Ltd., Class B¥ | 75,600 | | | 1,512,957 | |
| Teck Resources Ltd., Class B@ | 37,025 | | | 741,611 | |
| Tourmaline Oil Corp.* | 58,150 | | | 1,555,257 | |
| Turquoise Hill Resources Ltd.* | 106,042 | | | 340,402 | |
| Whitecap Resources, Inc.@ | 55,800 | | | 505,365 | |
| WSP Global, Inc.@ | 17,882 | | | 595,201 | |
| Yamana Gold, Inc.@ | 165,308 | | | 464,165 | |
| | | | | 51,582,782 | |
| Denmark — 1.7% | | | | | |
| AP Moeller - Maersk A/S, Class A | 508 | | | 767,485 | |
| AP Moeller - Maersk A/S, Class B | 925 | | | 1,476,071 | |
| Carlsberg A/S, Class B | 13,642 | | | 1,177,317 | |
| Danske Bank A/S | 70,374 | | | 2,134,387 | |
| DSV A/S | 34,914 | | | 1,553,271 | |
| H Lundbeck A/S* | 3,061 | | | 124,520 | |
| ISS A/S | 29,861 | | | 1,007,981 | |
| Novozymes A/S, B Shares | 6,176 | | | 212,935 | |
| Tryg A/S | 2,321 | | | 41,967 | |
| Vestas Wind Systems A/S | 45,308 | | | 2,944,619 | |
| | | | | 11,440,553 | |
| Finland — 0.8% | | | | | |
| Fortum Oyj@ | 60,298 | | | 924,797 | |
| Neste Oil Oyj | 8,812 | | | 338,572 | |
| Nokia Oyj | 48,272 | | | 233,133 | |
| Stora Enso Oyj, R Shares | 140,861 | | | 1,513,912 | |
| UPM-Kymmene Oyj | 91,294 | | | 2,242,990 | |
| | | | | 5,253,404 | |
See notes to financial statements
SA International Value Fund
PORTFOLIO OF INVESTMENTS — AS OF DECEMBER 31, 2016 (Unaudited) (Continued)
| | | SHARES | | VALUE† | |
| COMMON STOCKS (Continued) | | | | | |
| France — 9.8% | | | | | |
| AXA SA | 149,383 | | $ | 3,771,595 | |
| BNP Paribas SA | 111,531 | | | 7,108,761 | |
| Bollore SA | 72,853 | | | 256,907 | |
| Bouygues SA | 54,784 | | | 1,963,321 | |
| Casino Guichard Perrachon SA | 14,968 | | | 718,319 | |
| Cie de Saint-Gobain | 114,199 | | | 5,319,965 | |
| Cie Generale des | | | | | |
| Etablissements Michelin | 23,216 | | | 2,583,132 | |
| CNP Assurances | 41,115 | | | 761,723 | |
| Credit Agricole SA | 58,593 | | | 726,566 | |
| Electricite de France SA@ | 48,286 | | | 492,018 | |
| Engie SA | 296,273 | | | 3,779,887 | |
| Natixis SA | 153,346 | | | 865,210 | |
| Orange SA | 358,763 | | | 5,451,407 | |
| Peugeot SA* | 127,344 | | | 2,077,085 | |
| Renault SA | 50,745 | | | 4,514,249 | |
| SCOR SE | 27,061 | | | 935,188 | |
| Societe Generale SA | 134,518 | | | 6,619,112 | |
| STMicroelectronics NV@ | 153,028 | | | 1,735,691 | |
| Total SA | 303,760 | | | 15,578,371 | |
| Vivendi SA | 64,331 | | | 1,222,649 | |
| | | | | 66,481,156 | |
| Germany — 7.8% | | | | | |
| Allianz SE | 75,950 | | | 12,551,962 | |
| Bayerische Motoren Werke AG | 63,112 | | | 5,896,095 | |
| Commerzbank AG | 126,955 | | | 968,350 | |
| Daimler AG | 169,178 | | | 12,594,192 | |
| Deutsche Bank AG* | 124,546 | | | 2,254,283 | |
| Deutsche Lufthansa AG | 59,537 | | | 768,981 | |
| E.On AG | 550,518 | | | 3,882,670 | |
| Evonik Industries AG | 11,652 | | | 348,094 | |
| Fraport AG Frankfurt Airport | | | | | |
| Services Worldwide | 5,611 | | | 331,764 | |
| Hannover Rueck SE | 5,114 | | | 553,399 | |
| HeidelbergCement AG | 25,503 | | | 2,379,338 | |
| Linde AG | 12,049 | | | 1,979,876 | |
| Metro AG | 49,876 | | | 1,658,275 | |
| Muenchener Rueckversicherungs AG | 11,046 | | | 2,088,894 | |
| RWE AG* | 140,259 | | | 1,744,410 | |
| Talanx AG* | 13,218 | | | 442,046 | |
| Telefonica Deutschland Holding AG | 72,027 | | | 308,584 | |
| Uniper SE* | 57,491 | | | 793,693 | |
| Volkswagen AG | 5,747 | | | 827,280 | |
| | | | | 52,372,186 | |
| Hong Kong — 2.4% | | | | | |
| Cathay Pacific Airways Ltd.@ | 343,000 | | | 451,170 | |
| CK Hutchison Holdings Ltd. | 377,124 | | | 4,274,834 | |
| Guoco Group Ltd. | 5,000 | | | 55,129 | |
| Hang Lung Group Ltd. @ | 185,000 | | | 644,142 | |
| Hang Lung Properties Ltd. | 312,000 | | | 661,458 | |
| Henderson Land | 21,944 | | | 116,731 | |
| Development Co., Ltd. | | | | | |
| Hopewell Holdings Ltd. | 63,500 | | | 219,050 | |
| Kerry Properties Ltd. | 95,000 | | | 257,883 | |
| MTR Corp. Ltd. | 109,539 | | | 532,545 | |
| New World Development Co., Ltd. | 1,748,907 | | | 1,849,383 | |
| NWS Holdings Ltd. | 179,137 | | | 291,997 | |
| Shangri-La Asia Ltd. | 273,143 | | | 288,131 | |
| Sino Land Co., Ltd. | 79,243 | | | 118,744 | |
| Sun Hung Kai Properties Ltd. | 173,677 | | | 2,194,899 | |
| Swire Pacific Ltd., Series A | 136,500 | | | 1,303,479 | |
| Swire Pacific Ltd., Series B | 147,500 | | | 253,363 | |
| Tsim Sha Tsui Properties | 60,907 | | | 175,939 | |
| Wharf Holdings Ltd. (The) | 179,000 | | | 1,189,948 | |
| Wheelock & Co., Ltd. | 251,000 | | | 1,412,876 | |
| Yue Yuen Industrial Holdings Ltd. | 11,000 | | | 39,932 | |
| | | | | 16,331,633 | |
| Ireland — 0.3% | | | | | |
| Bank of Ireland* | 3,111,363 | | | 766,392 | |
| CRH PLC, ADR | 42,861 | | | 1,473,561 | |
| Paddy Power Betfair PLC | 315 | | | 33,656 | |
| | | | | 2,273,609 | |
| Israel — 0.5% | | | | | |
| Azrieli Group | 2,868 | | | 124,413 | |
| Bank Hapoalim B.M. | 243,823 | | | 1,450,133 | |
| Bank Leumi Le-Israel* | 215,232 | | | 886,172 | |
| Israel Discount Bank Ltd., Series A* | — | | | 1 | |
| Mizrahi Tefahot Bank Ltd. | 25,043 | | | 366,343 | |
| Teva Pharmaceutical | | | | | |
| Industries Ltd., ADR | 15,615 | | | 566,044 | |
| | | | | 3,393,106 | |
| Italy — 0.8% | | | | | |
| Assicurazioni Generali SpA | 21,673 | | | 322,135 | |
| Mediobanca SpA | 71,656 | | | 584,950 | |
| Telecom Italia SpA@* | 2,041,106 | | | 1,798,354 | |
| UniCredit SpA@ | 808,247 | | | 2,326,091 | |
| UnipolSai SpA@ | 35,580 | | | 76,030 | |
| | | | | 5,107,560 | |
| Japan — 22.4% | | | | | |
| Aeon Co., Ltd. | 165,400 | | | 2,343,550 | |
| Aisin Seiki Co., Ltd. | 36,200 | | | 1,570,344 | |
| Alfresa Holdings Corp. | 21,700 | | | 359,083 | |
| Amada Holdings Co., Ltd. | 39,400 | | | 439,932 | |
| Aoyama Trading Co., Ltd. | 4,500 | | | 156,706 | |
| Asahi Glass Co., Ltd. | 208,000 | | | 1,416,625 | |
| Asahi Kasei Corp. | 169,000 | | | 1,474,186 | |
| Bank of Kyoto Ltd. (The) | 40,000 | | | 297,070 | |
| Brother Industries Ltd. | 27,600 | | | 498,040 | |
| Calsonic Kansei Corp. | 12,000 | | | 183,683 | |
| Canon Marketing Japan, Inc. | 8,000 | | | 134,571 | |
See notes to financial statements
SA International Value Fund
PORTFOLIO OF INVESTMENTS — AS OF DECEMBER 31, 2016 (Unaudited) (Continued)
| | | | SHARES | | VALUE† | |
| COMMON STOCKS (Continued) | | | | | | |
| Japan (Continued) | | | | | | |
| Chiba Bank Ltd. (The) | | 79,000 | | $ | 484,646 | |
| Chugoku Bank Ltd. (The) | | 19,700 | | | 282,837 | |
| Citizen Watch Co., Ltd. | | 64,400 | | | 385,160 | |
| Coca-Cola East Japan Co., Ltd. | | 4,500 | | | 99,183 | |
| Coca-Cola West Co., Ltd. | | 15,200 | | | 448,034 | |
| COMSYS Holdings Corp. | | 2,500 | | | 45,797 | |
| Concordia Financial Group Ltd. | | 144,000 | | | 693,171 | |
| Credit Saison Co., Ltd. | | 2,900 | | | 51,536 | |
| Dai Nippon Printing Co., Ltd. | | 60,000 | | | 592,941 | |
| Dai-ichi Life Holdings, Inc. (The) | | 88,500 | | | 1,473,549 | |
| Daido Steel Co., Ltd. | | 14,000 | | | 57,976 | |
| Daiwa Securities Group, Inc. | | 55,000 | | | 338,965 | |
| Denka Co., Ltd. | | 67,000 | | | 295,803 | |
| Denso Corp. | | 23,300 | | | 1,009,351 | |
| DIC Corp. | | 13,300 | | | 403,979 | |
| Dowa Holdings Co., Ltd. | | 6,000 | | | 45,895 | |
| Ebara Corp. | | 16,800 | | | 478,665 | |
| Fuji Media Holdings, Inc. | | 3,800 | | | 53,192 | |
| FUJIFILM Holdings Corp. | | 59,800 | | | 2,269,202 | |
| Fukuoka Financial Group, Inc. | | 90,000 | | | 399,658 | |
| Glory Ltd. | | 11,200 | | | 353,609 | |
| Gunma Bank Ltd. (The) | | 47,000 | | | 257,369 | |
| H2O Retailing Corp. | | 14,000 | | | 213,698 | |
| Hachijuni Bank Ltd. (The) | | 48,000 | | | 278,451 | |
| Hankyu Hanshin Holdings, Inc. | | 50,400 | | | 1,617,112 | |
| Heiwa Corp. | | 1,600 | | | 36,579 | |
| Hiroshima Bank Ltd. (The) | | 48,000 | | | 224,240 | |
| Hitachi Capital Corp. | | 9,900 | | | 243,699 | |
| Hitachi Chemical Co., Ltd. | | 24,000 | | | 600,231 | |
| Hitachi Construction | | | | | | |
| Machinery Co., Ltd. | | 24,800 | | | 537,059 | |
| Hitachi Ltd. | | 699,000 | | | 3,779,833 | |
| Hitachi Metals Ltd. | | 18,100 | | | 245,308 | |
| Hitachi Transport System Ltd. | | 7,700 | | | 156,339 | |
| Hokuhoku Financial Group, Inc. | | 20,000 | | | 345,155 | |
| Honda Motor Co., Ltd. | | 245,500 | | | 7,173,326 | |
| Ibiden Co., Ltd. | | 32,600 | | | 438,758 | |
| Idemitsu Kosan Co., Ltd. | | 11,500 | | | 305,519 | |
| Iida Group Holdings Co., Ltd. | | 26,800 | | | 508,369 | |
| Isetan Mitsukoshi Holdings Ltd. | | 26,300 | | | 283,534 | |
| ITOCHU Corp. | | 256,800 | | | 3,410,084 | |
| Iyo Bank Ltd. (The) | | 29,500 | | | 203,440 | |
| J Front Retailing Co., Ltd. | | 69,600 | | | 937,925 | |
| JFE Holdings, Inc. | | 92,200 | | | 1,404,201 | |
| JGC Corp. | | 3,100 | | | 56,337 | |
| JSR Corp. | | 24,400 | | | 384,763 | |
| JTEKT Corp. | | 37,900 | | | 606,400 | |
| JX Holdings, Inc. | | 243,400 | | | 1,030,246 | |
| K’s Holdings Corp.@ | | 7,800 | | | 136,613 | |
| Kamigumi Co., Ltd. | | 25,000 | | | 238,289 | |
| Kaneka Corp. | | 80,000 | | | 651,636 | |
| Kawasaki Heavy Industries Ltd. | | 57,000 | | | 178,986 | |
| Kawasaki Kisen Kaisha Ltd.@ | | 195,000 | | | 442,139 | |
| Kinden Corp. | | 3,000 | | | 37,425 | |
| Kobe Steel Ltd.* | | 61,800 | | | 590,636 | |
| Komatsu Ltd. | | 88,200 | | | 1,997,942 | |
| Konica Minolta, Inc. | | 142,000 | | | 1,410,584 | |
| Kuraray Co., Ltd. | | 76,400 | | | 1,147,879 | |
| Kurita Water Industries Ltd. | | 3,100 | | | 68,273 | |
| Kyocera Corp. | | 14,900 | | | 740,952 | |
| Kyushu Financial Group, Inc. | | 44,870 | | | 304,444 | |
| LIXIL Group Corp. | | 32,900 | | | 747,094 | |
| Marubeni Corp. | | 329,200 | | | 1,866,898 | |
| Mazda Motor Corp. | | 135,400 | | | 2,215,057 | |
| Mebuki Financial Group, Inc. | | 83,070 | | | 307,759 | |
| Medipal Holdings Corp. | | 24,200 | | | 381,609 | |
| Mitsubishi Chemical Holdings Corp. | | 429,900 | | | 2,788,143 | |
| Mitsubishi Corp. | | 62,600 | | | 1,333,681 | |
| Mitsubishi Gas Chemical Co., Inc. | | 32,700 | | | 558,173 | |
| Mitsubishi Heavy Industries Ltd. | | 441,000 | | | 2,009,639 | |
| Mitsubishi Materials Corp. | | 35,500 | | | 1,090,439 | |
| Mitsubishi Motors Corp. | | 124,600 | | | 710,020 | |
| Mitsubishi UFJ Financial Group, Inc. | | 234,800 | | | 1,446,870 | |
| Mitsubishi UFJ Financial | | | | | | |
| Group, Inc., ADR | | 1,031,340 | | | 6,353,054 | |
| Mitsubishi UFJ Lease & | | | | | | |
| Finance Co., Ltd. | | 110,200 | | | 569,504 | |
| Mitsui & Co., Ltd. | | 27,500 | | | 378,118 | |
| Mitsui & Co., Ltd., ADR | | 2,885 | | | 793,375 | |
| Mitsui Chemicals, Inc. | | 236,000 | | | 1,060,107 | |
| Mitsui Fudosan Co., Ltd. | | 11,000 | | | 254,588 | |
| Mitsui OSK Lines Ltd.@ | | 209,000 | | | 579,388 | |
| Mizuho Financial Group, Inc. | | 4,432,400 | | | 7,956,514 | |
| MS&AD Insurance Group | | | | | | |
| Holdings, Inc. | | 42,428 | | | 1,315,586 | |
| NEC Corp. | | 734,000 | | | 1,946,866 | |
| NH Foods Ltd. | | 16,067 | | | 433,723 | |
| NHK Spring Co., Ltd. | | 42,200 | | | 402,231 | |
| Nikon Corp. | | 46,300 | | | 719,804 | |
| Nippo Corp. | | 11,000 | | | 205,271 | |
| Nippon Electric Glass Co., Ltd. | | 44,000 | | | 237,929 | |
| Nippon Express Co., Ltd. | | 246,000 | | | 1,323,927 | |
| Nippon Paper Industries Co., Ltd. | | 30,700 | | | 520,094 | |
| Nippon Shokubai Co., Ltd. | | 4,600 | | | 287,316 | |
| Nippon Steel Sumitomo Metal Corp. | | 134,827 | | | 3,007,435 | |
| Nippon Yusen KK | | 501,000 | | | 930,199 | |
| Nissan Motor Co., Ltd. | | 426,800 | | | 4,292,649 | |
| Nisshinbo Holdings, Inc. | | 23,000 | | | 221,981 | |
| NOK Corp. | | 17,600 | | | 356,292 | |
| Nomura Holdings, Inc. | | 221,800 | | | 1,307,742 | |
| Nomura Real Estate Holdings, Inc. | | 16,600 | | | 282,360 | |
| NSK Ltd. | | 25,400 | | | 294,260 | |
| NTN Corp. | | 45,000 | | | 182,118 | |
See notes to financial statements
SA International Value Fund
PORTFOLIO OF INVESTMENTS — AS OF DECEMBER 31, 2016 (Unaudited) (Continued)
| | | SHARES | | VALUE† | |
| COMMON STOCKS (Continued) | | | | | |
| Japan (Continued) | | | | | |
| Obayashi Corp. | 17,000 | | $ | 162,473 | |
| Oji Holdings Corp. | 226,000 | | | 920,436 | |
| Resona Holdings, Inc. | 477,800 | | | 2,450,833 | |
| Ricoh Co., Ltd. | 230,800 | | | 1,951,062 | |
| Rohm Co., Ltd. | 6,900 | | | 397,322 | |
| Sankyo Co., Ltd. | 5,400 | | | 174,417 | |
| SBI Holdings, Inc. | 41,400 | | | 526,732 | |
| Sega Sammy Holdings, Inc. | 3,100 | | | 46,125 | |
| Seino Holdings Co., Ltd. | 18,400 | | | 204,348 | |
| Sekisui Chemical Co., Ltd. | 40,000 | | | 637,947 | |
| Sekisui House Ltd. | 100,700 | | | 1,676,251 | |
| Shinsei Bank Ltd. | 185,000 | | | 310,246 | |
| Shizuoka Bank Ltd. (The) | 58,000 | | | 487,324 | |
| Showa Denko KK | 8,900 | | | 127,475 | |
| Sojitz Corp. | 145,400 | | | 353,314 | |
| Sompo Holdings, Inc. | 27,643 | | | 936,610 | |
| Sumco Corp. | 5,300 | | | 68,475 | |
| Sumitomo Chemical Co., Ltd. | 491,000 | | | 2,335,795 | |
| Sumitomo Corp. | 55,600 | | | 654,356 | |
| Sumitomo Electric Industries Ltd. | 177,700 | | | 2,564,202 | |
| Sumitomo Forestry Co., Ltd. | 38,000 | | | 503,307 | |
| Sumitomo Heavy Industries Ltd. | 117,000 | | | 753,805 | |
| Sumitomo Metal Mining Co., Ltd. | 78,000 | | | 1,005,741 | |
| Sumitomo Mitsui Financial Group, Inc. | 225,900 | | | 8,620,441 | |
| Sumitomo Mitsui Trust Holdings, Inc. | 31,600 | | | 1,130,976 | |
| Sumitomo Rubber Industries Ltd. | 42,800 | | | 679,673 | |
| Suzuken Co., Ltd. | 9,240 | | | 302,005 | |
| T&D Holdings, Inc. | 165,100 | | | 2,183,205 | |
| Taiheiyo Cement Corp. | 207,000 | | | 655,316 | |
| Takashimaya Co., Ltd. | 47,000 | | | 387,662 | |
| TDK Corp. | 26,700 | | | 1,836,732 | |
| Teijin Ltd. | 53,199 | | | 1,078,318 | |
| THK Co., Ltd. | 15,500 | | | 342,956 | |
| TOKAI RIKA Co., Ltd. | 11,500 | | | 230,738 | |
| Tokio Marine Holdings, Inc. | 23,300 | | | 956,122 | |
| Tokyo Tatemono Co., Ltd.@ | 9,900 | | | 132,395 | |
| Tokyu Fudosan Holdings Corp. | 101,100 | | | 596,868 | |
| Toppan Printing Co., Ltd. | 60,000 | | | 572,920 | |
| Tosoh Corp. | 128,000 | | | 905,720 | |
| Toyo Seikan Group Holdings Ltd. | 18,400 | | | 343,519 | |
| Toyoda Gosei Co., Ltd. | 14,500 | | | 339,191 | |
| Toyota Motor Corp. | 30,290 | | | 1,782,542 | |
| Toyota Motor Corp., ADR | 10,414 | | | 1,220,521 | |
| Toyota Tsusho Corp. | 65,600 | | | 1,709,108 | |
| Ube Industries Ltd. | 247,000 | | | 517,775 | |
| Yamada Denki Co., Ltd.@ | 136,300 | | | 734,708 | |
| Yamaguchi Financial Group, Inc.@ | 23,000 | | | 250,516 | |
| Yokohama Rubber Co., Ltd. (The) | 24,000 | | | 430,409 | |
| Zeon Corp. | 2,000 | | | 19,748 | |
| | | | | 151,237,205 | |
| Netherlands — 3.4% | | | | | |
| Aegon NV | 196,914 | | | 1,083,668 | |
| Akzo Nobel NV | 2,487 | | | 155,479 | |
| ArcelorMittal* | 46,375 | | | 342,498 | |
| ArcelorMittal-NY Registered* | 239,502 | | | 1,748,365 | |
| Boskalis Westminster NV | 9,197 | | | 319,384 | |
| Fiat Chrysler Automobiles NV | 222,459 | | | 2,029,096 | |
| Gemalto NV | 3,984 | | | 230,321 | |
| ING Groep NV | 513,355 | | | 7,224,925 | |
| Koninklijke Ahold Delhaize NV | 136,115 | | | 2,869,929 | |
| Koninklijke DSM NV | 37,404 | | | 2,242,705 | |
| Koninklijke Philips NV¢ | 8,490 | | | 259,173 | |
| Koninklijke Philips NV | 105,517 | | | 3,225,655 | |
| NN Group NV | 38,740 | | | 1,312,902 | |
| | | | | 23,044,100 | |
| New Zealand — 0.1% | | | | | |
| Auckland International Airport Ltd. | 28,519 | | | 123,826 | |
| Fletcher Building Ltd. | 76,960 | | | 566,719 | |
| Fonterra Co-operative Group Ltd. | 3,186 | | | 13,280 | |
| | | | | 703,825 | |
| Norway — 0.6% | | | | | |
| DNB ASA | 113,847 | | | 1,692,804 | |
| Norsk Hydro ASA | 144,894 | | | 692,980 | |
| Statoil ASA | 29,016 | | | 532,247 | |
| Storebrand ASA* | 56,200 | | | 298,853 | |
| Subsea 7 SA* | 29,227 | | | 369,934 | |
| Yara International ASA | 6,115 | | | 240,766 | |
| | | | | 3,827,584 | |
| Portugal — 0.0% | | | | | |
| Banco Espirito Santo SA§* | 414,564 | | | — | |
| EDP Renovaveis SA | 32,371 | | | 205,679 | |
| | | | | 205,679 | |
| Singapore — 0.9% | | | | | |
| CapitaLand Ltd.@ | 194,100 | | | 404,780 | |
| City Developments Ltd. | 74,000 | | | 423,105 | |
| DBS Group Holdings Ltd. | 135,860 | | | 1,626,774 | |
| Frasers Centrepoint Ltd. | 45,000 | | | 48,942 | |
| Golden Agri-Resources Ltd. | 811,000 | | | 240,811 | |
| Hutchison Port Holdings Trust | 1,160,800 | | | 504,948 | |
| Keppel Corp. Ltd. | 358,100 | | | 1,431,757 | |
| Sembcorp Industries Ltd. | 80,900 | | | 159,213 | |
| Singapore Airlines Ltd. | 132,240 | | | 883,031 | |
| United Industrial Corp. Ltd. | 63,243 | | | 120,970 | |
| UOL Group Ltd. | 47,218 | | | 195,308 | |
| | | | | 6,039,639 | |
See notes to financial statements
SA International Value Fund
PORTFOLIO OF INVESTMENTS — AS OF DECEMBER 31, 2016 (Unaudited) (Continued)
| | | | SHARES | | VALUE† | |
| COMMON STOCKS (Continued) | | | | | | |
| Spain — 2.7% | | | | | | |
| Banco de Sabadell SA@ | | 576,189 | | $ | 802,433 | |
| Banco Popular Espanol SA@ | | 281,068 | | | 271,605 | |
| Banco Santander SA | | 2,369,099 | | | 12,366,918 | |
| CaixaBank SA | | 252,915 | | | 835,966 | |
| Iberdrola SA | | 266,463 | | | 1,748,590 | |
| Mapfre SA | | 52,011 | | | 158,773 | |
| Repsol SA | | 143,928 | | | 2,033,209 | |
| | | | | | 18,217,494 | |
| Sweden — 2.2% | | | | | | |
| Boliden AB | | 77,171 | | | 2,015,123 | |
| Millicom International Cellular SA | | 5,454 | | | 233,052 | |
| Nordea Bank AB | | 329,011 | | | 3,658,246 | |
| SSAB AB, B Shares | | 84,920 | | | 890,623 | |
| Svenska Cellulosa AB, Series A | | 244 | | | 6,864 | |
| Svenska Cellulosa AB, Series B | | 80,970 | | | 2,286,741 | |
| Svenska Handelsbanken AB, | | | | | | |
| A Shares | | 27,515 | | | 382,346 | |
| Swedbank AB, A Shares | | 3,027 | | | 73,195 | |
| Tele2 AB, B Shares@ | | 37,132 | | | 297,729 | |
| Telefonaktiebolaget LM Ericsson | | 408,846 | | | 2,400,858 | |
| Telefonaktiebolaget LM Ericsson, | | | | | | |
| A Shares | | 698 | | | 4,060 | |
| Telia Co. AB | | 396,003 | | | 1,595,644 | |
| Trelleborg AB | | 34,724 | | | 683,381 | |
| | | | | | 14,527,862 | |
| Switzerland — 7.8% | | | | | | |
| ABB Ltd.* | | 239,563 | | | 5,053,337 | |
| Adecco Group SA | | 49,724 | | | 3,254,546 | |
| Baloise Holding AG | | 10,839 | | | 1,365,652 | |
| Banque Cantonale Vaudoise | | 63 | | | 39,905 | |
| Cie Financiere Richemont SA | | 87,601 | | | 5,802,502 | |
| Clariant AG* | | 72,927 | | | 1,258,300 | |
| Credit Suisse Group AG* | | 111,703 | | | 1,602,652 | |
| Dufry AG* | | 7,464 | | | 930,893 | |
| Flughafen Zuerich AG | | 1,343 | | | 249,134 | |
| Helvetia Holding AG | | 352 | | | 189,602 | |
| Julius Baer Group Ltd.* | | 16,881 | | | 749,806 | |
| LafargeHolcim Ltd.*µ | | 36,060 | | | 1,899,852 | |
| LafargeHolcim Ltd.*= | | 35,941 | | | 1,888,450 | |
| Novartis AG | | 81,820 | | | 5,953,905 | |
| Swatch Group AG (The)µ | | 11,473 | | | 701,359 | |
| Swatch Group AG (The)µ | | 8,156 | | | 2,536,586 | |
| Swiss Life Holding AG* | | 4,756 | | | 1,346,046 | |
| Swiss Re AG | | 72,191 | | | 6,841,237 | |
| UBS Group AG | | 263,220 | | | 4,122,910 | |
| Zurich Insurance Group AG* | | 25,793 | | | 7,102,384 | |
| | | | | | 52,889,058 | |
| United Kingdom — 19.0% | | | | | | |
| Anglo American PLC* | | 245,068 | | | 3,503,452 | |
| Antofagasta PLC@ | | 61,941 | | | 515,269 | |
| Aviva PLC | | 122,471 | | | 734,139 | |
| Barclays PLC, ADR | | 313,402 | | | 3,447,422 | |
| Barratt Developments PLC | | 96,613 | | | 550,560 | |
| BHP Billiton PLC, ADR | | 60,076 | | | 1,889,991 | |
| BP PLC, ADR@ | | 782,273 | | | 29,241,365 | |
| Carnival PLC | | 10,045 | | | 514,204 | |
| Carnival PLC, ADR | | 7,555 | | | 384,070 | |
| Coca-Cola European Partners PLC | | 3,617 | | | 114,299 | |
| Glencore PLC* | | 2,491,810 | | | 8,517,158 | |
| HSBC Holdings PLC | | 386,814 | | | 3,131,505 | |
| HSBC Holdings PLC, ADR@ | | 425,068 | | | 17,079,232 | |
| J Sainsbury PLC@ | | 422,622 | | | 1,298,452 | |
| Kingfisher PLC | | 407,694 | | | 1,760,054 | |
| Lloyds Banking Group PLC, ADR | | 240,107 | | | 744,332 | |
| Pearson PLC | | 44,520 | | | 449,082 | |
| Pearson PLC, ADR | | 74,580 | | | 745,054 | |
| Royal Bank of Scotland Group PLC* | | 83,038 | | | 229,847 | |
| Royal Bank of Scotland Group PLC, | | | | | | |
| ADR@* | | 81,693 | | | 451,762 | |
| Royal Dutch Shell PLC, A Shares | | 18,215 | | | 503,400 | |
| Royal Dutch Shell PLC, ADR, | | | | | | |
| Class A@ | | 303,319 | | | 16,494,487 | |
| Royal Dutch Shell PLC, ADR, | | | | | | |
| Class B@ | | 253,799 | | | 14,712,728 | |
| Royal Mail PLC | | 94,049 | | | 535,602 | |
| Standard Chartered PLC* | | 319,612 | | | 2,613,853 | |
| Vodafone Group PLC | | 7,028,749 | | | 17,311,464 | |
| WM Morrison Supermarkets PLC@ | | 368,150 | | | 1,046,704 | |
| | | | | | 128,519,487 | |
| TOTAL COMMON STOCKS | | | | | | |
| (Identified Cost $661,927,436) | | | | | 663,726,693 | |
| | |
| PREFERRED STOCKS — 0.8% | | | | | | |
| Germany — 0.8% | | | | | | |
| Bayerische Motoren | | | | | | |
| Werke AG, 4.500% | | 9,670 | | | 740,023 | |
| Porsche Automobil | | | | | | |
| Holding SE, 4.640% | | 14,803 | | | 806,232 | |
| Volkswagen AG, 4.550% | | 30,797 | | | 4,323,003 | |
| | | | | | 5,869,258 | |
| TOTAL PREFERRED STOCKS | | | | | | |
| (Identified Cost $9,328,586) | | | | | 5,869,258 | |
See notes to financial statements
SA International Value Fund
PORTFOLIO OF INVESTMENTS — AS OF DECEMBER 31, 2016 (Unaudited) (Continued)
| | | | SHARES | | VALUE† | | |
| RIGHTS AND WARRANTS — 0.0% | | | | | |
| Spain — 0.0% | | | | | | | |
| Repsol SA, expires 1/12/2017* | | 143,928 | | $ | 53,330 | | |
| | |
| TOTAL RIGHTS AND WARRANTS | | | | | | | |
| (Identified Cost $50,349) | | | | | 53,330 | | |
| | |
| SHORT-TERM INVESTMENTS — 4.9% | | | | | |
| Investment Company — 0.5% | | | | | | | |
| State Street Institutional U.S. | | | | | | | |
| Government Money | | | | | | | |
| Market Fund, 0.170% | | 3,383,000 | | | 3,383,000 | | |
| | |
| Collateral For Securities On Loan — 4.4% | | | | | | | |
| State Street Navigator Securities | | | | | | | |
| Lending Government Money | | | | | | | |
| Market Portfolio | | 29,617,358 | | | 29,617,358 | | |
| | |
| TOTAL SHORT-TERM INVESTMENTS | | | | | | | |
| (Identified Cost $33,000,358) | | | | | 33,000,358 | | |
| | |
| Total Investments — 104.0% | | | | | | | |
| (Identified Cost $704,306,729)# | | | | | 702,649,639 | | |
| Liabilities, Less Cash and | | | | | | | |
| Other Assets — (4.0%) | | | | | (27,348,112 | ) | |
| Net Assets — 100.0% | | | | $ | 675,301,527 | | |
| | † | | See Note 1 |
| @ | | A portion or all of the security/securities were held on loan. As of December 31, 2016, the market value of the securities on loan was $68,009,899. |
| * | | Non-income producing security |
| ¥ | | Traded on the Canada, Toronto Stock Exchange. |
| ¢ | | Traded on the Netherlands, Euronext Amsterdam Stock Market. |
| § | | Fair valued security. Fair values are determined pursuant to procedures approved by the Fund’s Board of Trustees. See Note 1 |
| µ | | Traded on the Switzerland, Swiss Exchange. |
| = | | Traded on the France, Euronext Paris Exchange. |
| # | | At December 31, 2016, the aggregate cost of investment securities for U.S. federal income tax purposes was $704,306,729. Net unrealized depreciation aggregated $1,657,090 of which $81,494,547 related to appreciated investment securities and $83,151,637 related to depreciated investment securities. |
Key to abbreviations:
ADR — American Depository Receipt
See notes to financial statements
SA Emerging Markets Value Fund
PORTFOLIO OF INVESTMENTS — AS OF DECEMBER 31, 2016 (Unaudited)
| | | SHARES | | VALUE† | |
| COMMON STOCKS — 95.9% | | | | | |
| Brazil — 4.7% | | | | | |
| Aliansce Shopping Centers SA | 3,347 | | $ | 14,860 | |
| B2W Cia Digital* | 8,916 | | | 27,942 | |
| Banco Bradesco SA | 9,863 | | | 88,306 | |
| Banco do Brasil SA | 66,769 | | | 576,256 | |
| Banco Santander Brasil SA | 40,193 | | | 364,672 | |
| BM&F BOVESPA SA | 52,702 | | | 267,178 | |
| Cia Siderurgica Nacional SA* | 101,942 | | | 339,838 | |
| Cosan SA Industria e Comercio | 8,600 | | | 100,805 | |
| Cyrela Brazil Realty SA | | | | | |
| Empreendimentos e Participacoes | 35,900 | | | 113,280 | |
| Duratex SA* | 47,495 | | | 99,231 | |
| Embraer SA, ADR | 11,177 | | | 215,157 | |
| Estacio Participacoes SA | 9,900 | | | 48,060 | |
| Even Construtora e | | | | | |
| Incorporadora SA | 34,300 | | | 38,993 | |
| Ez Tec Empreendimentos e | | | | | |
| Participacoes SA | 8,658 | | | 41,631 | |
| Fibria Celulose SA | 11,200 | | | 109,739 | |
| Fibria Celulose SA, ADR@ | 42,916 | | | 412,423 | |
| Gerdau SA | 25,800 | | | 62,623 | |
| Gerdau SA, ADR | 137,953 | | | 433,172 | |
| Guararapes Confeccoes SA | 1,200 | | | 22,417 | |
| International Meal Co. | | | | | |
| Alimentacao SA* | 10,400 | | | 15,881 | |
| Iochpe Maxion SA | 10,397 | | | 37,247 | |
| JBS SA | 129,293 | | | 452,865 | |
| Kroton Educacional SA | 37,674 | | | 154,298 | |
| Magnesita Refratarios SA* | 1,500 | | | 10,946 | |
| MRV Engenharia e Participacoes SA | 58,421 | | | 196,370 | |
| Petroleo Brasileiro SA* | 382,443 | | | 1,990,532 | |
| Petroleo Brasileiro SA, ADR* | 34,495 | | | 348,744 | |
| Porto Seguro SA | 14,438 | | | 119,330 | |
| Rumo Logistica Operadora | | | | | |
| Multimodal SA* | 72,097 | | | 136,011 | |
| SLC Agricola SA | 8,505 | | | 37,812 | |
| Sul America SA | 20,400 | | | 112,822 | |
| Usinas Siderurgicas de Minas | | | | | |
| Gerais SA* | 8,500 | | | 21,572 | |
| Vale SA | 169,416 | | | 1,336,714 | |
| Via Varejo SA | 19,800 | | | 65,398 | |
| | | | | 8,413,125 | |
| Chile — 1.4% | | | | | |
| CAP SA | 16,619 | | | 118,602 | |
| Cencosud SA | 20,119 | | | 56,471 | |
| Cencosud SA, ADR | 28,050 | | | 235,620 | |
| Empresas CMPC SA | 112,729 | | | 229,078 | |
| Empresas COPEC SA | 56,080 | | | 537,444 | |
| Enel Chile SA, ADR | 40,302 | | | 183,374 | |
| Enersis Americas SA, ADR | 40,302 | | | 330,879 | |
| ENTEL Chile SA* | 21,165 | | | 224,955 | |
| Grupo Security SA | 133,299 | | | 44,975 | |
| Inversiones Aguas Metropolitanas SA | 36,299 | | | 52,357 | |
| Latam Airlines Group SA, ADR@* | 44,483 | | | 363,871 | |
| Ripley Corp. SA | 107,262 | | | 63,953 | |
| Salfacorp SA | 30,886 | | | 22,134 | |
| Sigdo Koppers SA | 10,144 | | | 12,722 | |
| Sociedad Matriz SAAM SA | 240,287 | | | 18,515 | |
| | | | | 2,494,950 | |
| China — 16.1% | | | | | |
| 361 Degrees International Ltd. | 71,000 | | | 27,468 | |
| Agile Group Holdings Ltd. | 227,091 | | | 115,676 | |
| Agricultural Bank of China Ltd., | | | | | |
| H Shares | 1,727,000 | | | 708,216 | |
| Angang Steel Co., Ltd., H Shares* | 116,000 | | | 68,961 | |
| Bank of China Ltd., H Shares | 5,257,902 | | | 2,332,476 | |
| Bank of Chongqing Co., Ltd., | | | | | |
| H Shares | 46,500 | | | 39,397 | |
| Bank of Communications Co., Ltd., | | | | | |
| H Shares | 489,400 | | | 354,057 | |
| BBMG Corp., H Shares | 40,000 | | | 13,824 | |
| Beijing Capital Land Ltd., H Shares | 136,000 | | | 51,036 | |
| Beijing Enterprises Holdings Ltd. | 29,500 | | | 139,426 | |
| Bosideng International | | | | | |
| Holdings Ltd. | 64,000 | | | 5,530 | |
| BYD Electronic | | | | | |
| International Co., Ltd. | 47,500 | | | 37,365 | |
| C C Land Holdings Ltd. | 115,000 | | | 33,219 | |
| China Aerospace International | | | | | |
| Holdings Ltd. | 318,000 | | | 40,188 | |
| China Agri-Industries Holdings Ltd.* | 167,700 | | | 65,527 | |
| China Aoyuan Property Group Ltd. | 156,000 | | | 35,809 | |
| China BlueChemical Ltd., H Shares | 192,000 | | | 53,234 | |
| China Citic Bank Corp. Ltd., | | | | | |
| H Shares | 485,000 | | | 308,344 | |
| China Coal Energy Co., Ltd., | | | | | |
| H Shares* | 161,000 | | | 76,405 | |
| China Communication | | | | | |
| Services Corp. Ltd., H Shares | 227,600 | | | 144,992 | |
| China Communications | | | | | |
| Construction Co., Ltd., H Shares | 166,000 | | | 190,950 | |
| China Construction Bank Corp., | | | | | |
| H Shares | 8,382,810 | | | 6,453,721 | |
| China Everbright Bank Co., Ltd., | | | | | |
| H Shares | 213,000 | | | 96,962 | |
| China Everbright Ltd. | 42,000 | | | 79,943 | |
| China Evergrande Group@ | 365,000 | | | 227,345 | |
| China Galaxy Securities Co., Ltd., | | | | | |
| H Shares | 40,500 | | | 36,507 | |
| China Hongqiao Group Ltd.@ | 162,500 | | | 142,917 | |
| China Jinmao Holdings Group Ltd. | 380,000 | | | 102,418 | |
| China Lumena New | | | | | |
| Materials Corp.@*§~ | 224,000 | | | — | |
| China Merchants Bank Co., Ltd., | | | | | |
| H Shares | 156,500 | | | 366,906 | |
| China Merchants Port | | | | | |
| Holdings Co., Ltd. | 80,515 | | | 199,769 | |
| China Minsheng Banking Corp. Ltd., | | | | | |
| H Shares | 301,400 | | | 322,214 | |
| China Modern Dairy Holdings Ltd.@* | 239,000 | | | 58,868 | |
| China National Building | | | | | |
| Material Co., Ltd., H Shares@ | 394,000 | | | 191,551 | |
See notes to financial statements
SA Emerging Markets Value Fund
PORTFOLIO OF INVESTMENTS — AS OF DECEMBER 31, 2016 (Unaudited) (Continued)
| | | SHARES | | VALUE† | |
| COMMON STOCKS (Continued) | | | | | |
| China (Continued) | | | | | |
| China National Materials Co., Ltd., | | | | | |
| H Shares | 121,000 | | $ | 28,243 | |
| China Oil & Gas Group Ltd.* | 200,000 | | | 15,733 | |
| China Oilfield Services Ltd., H Shares | 124,000 | | | 115,133 | |
| China Overseas Grand Oceans | | | | | |
| Group Ltd.* | 77,000 | | | 25,122 | |
| China Overseas Land & | | | | | |
| Investment Ltd. | 94,000 | | | 249,107 | |
| China Petroleum & | | | | | |
| Chemical Corp., ADR | 6,621 | | | 470,223 | |
| China Petroleum & Chemical Corp., | | | | | |
| H Shares | 1,732,400 | | | 1,228,732 | |
| China Resources Cement | | | | | |
| Holdings Ltd. | 166,000 | | | 64,435 | |
| China Resources Enterprise Ltd.* | 45,456 | | | 90,273 | |
| China Resources Land Ltd. | 148,000 | | | 332,855 | |
| China SCE Property Holdings Ltd. | 151,000 | | | 45,371 | |
| China Shanshui Cement | | | | | |
| Group Ltd.@*§ | 125,000 | | | 16,426 | |
| China Shenhua Energy Co., Ltd. | 191,500 | | | 360,552 | |
| China Singyes Solar Technologies | | | | | |
| Holdings Ltd. | 36,000 | | | 17,177 | |
| China South City Holdings Ltd.@ | 204,000 | | | 42,618 | |
| China Southern Airlines Co., Ltd., | | | | | |
| H Shares | 98,000 | | | 50,930 | |
| China Travel International Investment | | | | | |
| Hong Kong Ltd.@ | 374,000 | | | 102,730 | |
| China Unicom Hong Kong Ltd. | 132,000 | | | 153,712 | |
| China Unicom Hong Kong Ltd., ADR | 55,304 | | | 638,761 | |
| China Yurun Food Group Ltd.@* | 23,000 | | | 3,441 | |
| China ZhengTong Auto Services | | | | | |
| Holdings Ltd. | 91,500 | | | 26,667 | |
| China Zhongwang Holdings Ltd.@ | 154,000 | | | 65,536 | |
| Chongqing Rural Commercial | | | | | |
| Bank Co., Ltd., H Shares | 226,000 | | | 132,607 | |
| CIFI Holdings Group Co., Ltd. | 266,000 | | | 71,693 | |
| CIMC Enric Holdings Ltd.@ | 4,000 | | | 1,883 | |
| CITIC Ltd. | 471,000 | | | 674,202 | |
| Citic Resources Holdings Ltd.@* | 150,000 | | | 18,376 | |
| CNOOC Ltd. | 1,521,000 | | | 1,902,599 | |
| Comba Telecom Systems | | | | | |
| Holdings Ltd. | 193,600 | | | 34,453 | |
| Concord New Energy Group Ltd. | 420,000 | | | 22,206 | |
| Coolpad Group Ltd.* | 240,200 | | | 24,780 | |
| COSCO SHIPPING Development Co., | | | | | |
| Ltd., H Shares* | 70,200 | | | 14,485 | |
| COSCO SHIPPING Energy | | | | | |
| Transportation Co., Ltd., H Shares | 36,000 | | | 20,102 | |
| COSCO SHIPPING Ports Ltd. | 145,835 | | | 146,503 | |
| Country Garden Holdings Co., Ltd. | 544,000 | | | 304,463 | |
| Dah Chong Hong Holdings Ltd. | 35,000 | | | 13,360 | |
| Dongfeng Motor Group Co., Ltd., | | | | | |
| H Shares | 168,000 | | | 164,003 | |
| Dongyue Group Ltd.*§ | 234,000 | | | 15,504 | |
| Fantasia Holdings Group Co., Ltd.* | 142,500 | | | 18,193 | |
| Fosun International Ltd. | 123,000 | | | 174,162 | |
| Fufeng Group Ltd. | 155,000 | | | 76,556 | |
| Fullshare Holdings Ltd. | 197,500 | | | 92,198 | |
| Future Land Development | | | | | |
| Holdings Ltd. | 170,000 | | | 34,857 | |
| GCL-Poly Energy Holdings Ltd.@* | 723,000 | | | 86,710 | |
| Glorious Property Holdings Ltd.* | 228,000 | | | 22,346 | |
| GOME Electrical Appliances | | | | | |
| Holding Ltd.@ | 972,000 | | | 117,826 | |
| Greentown China Holdings Ltd.@* | 76,000 | | | 61,549 | |
| Guangshen Railway Co., Ltd., ADR | 2,674 | | | 80,808 | |
| Guangzhou R&F Properties Co., Ltd., | | | | | |
| H Shares | 109,600 | | | 132,574 | |
| Harbin Electric Co., Ltd., H Shares | 54,000 | | | 25,209 | |
| Hengdeli Holdings Ltd.* | 184,000 | | | 26,813 | |
| Hopson Development Holdings Ltd. | 58,000 | | | 51,684 | |
| Hua Han Health Industry | | | | | |
| Holdings Ltd. | 640,000 | | | 42,917 | |
| Huabao International Holdings Ltd.* | 94,000 | | | 39,881 | |
| Huaneng Renewables Corp. Ltd., | | | | | |
| H Shares | 312,000 | | | 101,391 | |
| Huishang Bank Corp. Ltd., H Shares | 64,000 | | | 32,600 | |
| Industrial & Commercial Bank of | | | | | |
| China Ltd., H Shares | 5,440,000 | | | 3,262,106 | |
| Intime Retail Group Co., Ltd.§ | 3,500 | | | 3,173 | |
| Jiangxi Copper Co., Ltd., H Shares | 92,000 | | | 128,369 | |
| Joy City Property Ltd. | 118,000 | | | 14,913 | |
| Ju Teng International Holdings Ltd. | 56,000 | | | 17,332 | |
| K Wah International Holdings Ltd. | 45,000 | | | 20,891 | |
| Kaisa Group Holdings Ltd.@*§ | 172,000 | | | 12,976 | |
| Kingboard Chemical Holdings Ltd. | 75,000 | | | 227,287 | |
| Kingboard Laminates Holdings Ltd. | 50,000 | | | 49,133 | |
| Kunlun Energy Co., Ltd. | 296,000 | | | 221,394 | |
| KWG Property Holding Ltd. | 147,500 | | | 83,693 | |
| Logan Property Holdings Co., Ltd. | 62,000 | | | 23,426 | |
| Longfor Properties Co., Ltd. | 133,500 | | | 169,404 | |
| Lonking Holdings Ltd. | 281,000 | | | 59,791 | |
| Maanshan Iron & Steel Co., Ltd., | | | | | |
| H Shares* | 116,000 | | | 33,807 | |
| Maoye International Holdings Ltd.* | 82,000 | | | 7,614 | |
| Metallurgical Corp. of China Ltd., | | | | | |
| H Shares | 76,000 | | | 29,598 | |
| Mingfa Group | | | | | |
| International Co., Ltd.*§ | 91,000 | | | 8,318 | |
| MMG Ltd.@* | 131,999 | | | 33,874 | |
| Nine Dragons Paper Holdings Ltd. | 128,000 | | | 116,041 | |
| PetroChina Co., Ltd., H Shares | 314,000 | | | 234,047 | |
| Poly Property Group Co., Ltd.@* | 229,000 | | | 75,895 | |
| Powerlong Real Estate | | | | | |
| Holdings Ltd. | 183,000 | | | 53,570 | |
| Renhe Commercial | | | | | |
| Holdings Co., Ltd.@* | 726,000 | | | 18,631 | |
| Semiconductor Manufacturing | | | | | |
| International Corp.@* | 149,800 | | | 235,291 | |
| Shandong Chenming Paper | | | | | |
| Holdings Ltd., H Shares | 45,000 | | | 46,367 | |
| Shanghai Electric Group Co., Ltd., | | | | | |
| H Shares* | 42,000 | | | 18,794 | |
| Shanghai Industrial Holdings Ltd. | 45,000 | | | 121,865 | |
See notes to financial statements
SA Emerging Markets Value Fund
PORTFOLIO OF INVESTMENTS — AS OF DECEMBER 31, 2016 (Unaudited) (Continued)
| | | SHARES | | VALUE† | |
| COMMON STOCKS (Continued) | | | | | |
| China (Continued) | | | | | |
| Shenzhen International Holdings Ltd. | 31,001 | | $ | 45,175 | |
| Shenzhen Investment Ltd. | 238,830 | | | 95,785 | |
| Shimao Property Holdings Ltd. | 147,500 | | | 192,875 | |
| Shougang Fushan Resources | | | | | |
| Group Ltd. | 176,000 | | | 34,499 | |
| Shunfeng International Clean | | | | | |
| Energy Ltd.* | 220,000 | | | 13,760 | |
| Sino-Ocean Land Holdings Ltd. | 246,212 | | | 110,175 | |
| Sinofert Holdings Ltd.@ | 244,000 | | | 33,039 | |
| Sinopec Engineering Group Co., Ltd., | | | | | |
| H Shares | 43,000 | | | 35,877 | |
| Sinotrans Ltd., H Shares | 122,000 | | | 54,436 | |
| Sinotrans Shipping Ltd.* | 51,573 | | | 9,710 | |
| Sinotruk Hong Kong Ltd. | 60,000 | | | 42,788 | |
| Skyworth Digital Holdings Ltd. | 129,591 | | | 73,866 | |
| SOHO China Ltd. | 131,000 | | | 64,533 | |
| Sunac China Holdings Ltd.@ | 145,000 | | | 120,607 | |
| TCC International Holdings Ltd. | 196,000 | | | 45,749 | |
| Tian An China Investment Co., Ltd. | 10,000 | | | 5,855 | |
| Tianjin Port Development | | | | | |
| Holdings Ltd. | 70,000 | | | 10,742 | |
| Truly International Holdings Ltd.@ | 178,000 | | | 69,322 | |
| West China Cement Ltd.* | 198,000 | | | 22,214 | |
| Xingda International Holdings Ltd. | 70,000 | | | 31,685 | |
| Yanzhou Coal Mining Co., Ltd., | | | | | |
| H Shares | 66,000 | | | 45,024 | |
| Yingde Gases Group Co., Ltd.§ | 101,500 | | | 39,791 | |
| Yuexiu Property Co., Ltd. | 863,033 | | | 117,972 | |
| Yuzhou Properties Co., Ltd. | 153,000 | | | 53,272 | |
| Zhongsheng Group Holdings Ltd. | 35,500 | | | 31,725 | |
| Zoomlion Heavy Industry Science & | | | | | |
| Technology Co., Ltd., H Shares | 57,000 | | | 25,065 | |
| | | | | 28,797,632 | |
| Colombia — 0.5% | | | | | |
| Almacenes Exito SA | 23,686 | | | 117,562 | |
| Cementos Argos SA | 10,173 | | | 40,191 | |
| Ecopetrol SA, ADR@* | 26,868 | | | 243,156 | |
| Grupo Argos SA | 33,565 | | | 215,567 | |
| Grupo de Inversiones | | | | | |
| Suramericana SA | 22,514 | | | 286,487 | |
| Grupo Nutresa SA | 8,773 | | | 72,767 | |
| | | | | 975,730 | |
| Czech Republic — 0.2% | | | | | |
| CEZ, AS | 18,401 | | | 308,231 | |
| Unipetrol, AS | 10,432 | | | 74,693 | |
| | | | | 382,924 | |
| Greece — 0.1% | | | | | |
| Alpha Bank AE* | 927 | | | 1,854 | |
| Ellaktor SA* | 11,652 | | | 13,370 | |
| GEK Terna Holding Real Estate | | | | | |
| Construction SA* | 8,282 | | | 19,877 | |
| Hellenic Petroleum SA* | 9,036 | | | 42,042 | |
| Marfin Investment Group | | | | | |
| Holdings SA* | 45,244 | | | 7,144 | |
| Mytilineos Holdings SA* | 16,096 | | | 104,202 | |
| Piraeus Bank SA* | 524 | | | 115 | |
| Titan Cement Co. SA | 299 | | | 7,019 | |
| | | | | 195,623 | |
| Hungary — 0.4% | | | | | |
| MOL Hungarian Oil & Gas PLC | 4,292 | | | 301,461 | |
| OTP Bank PLC | 13,258 | | | 379,075 | |
| | | | | 680,536 | |
| India — 11.9% | | | | | |
| ACC Ltd. | 6,589 | | | 129,120 | |
| Adani Enterprises Ltd. | 48,033 | | | 54,353 | |
| Adani Ports & Special Economic | | | | | |
| Zone Ltd. | 51,806 | | | 204,148 | |
| Adani Power Ltd.* | 220,211 | | | 97,338 | |
| Adani Transmissions Ltd.* | 48,033 | | | 39,951 | |
| Aditya Birla Fashion & Retail Ltd.* | 57,350 | | | 117,032 | |
| Aditya Birla Nuvo Ltd. | 11,029 | | | 208,490 | |
| Allahabad Bank Ltd.* | 1,836 | | | 1,634 | |
| Ambuja Cements Ltd. | 74,140 | | | 225,031 | |
| Apollo Tyres Ltd. | 62,493 | | | 170,113 | |
| Arvind Ltd. | 27,861 | | | 144,498 | |
| Ashoka Buildcon Ltd. | 4,899 | | | 11,369 | |
| Axis Bank Ltd. | 180,957 | | | 1,200,603 | |
| Bajaj Finserv Ltd. | 6,329 | | | 268,565 | |
| Bajaj Holdings & Investment Ltd. | 5,460 | | | 146,093 | |
| Balkrishna Industries Ltd. | 4,079 | | | 66,110 | |
| Balrampur Chini Mills Ltd. | 11,931 | | | 22,088 | |
| Bank of Baroda* | 63,461 | | | 143,435 | |
| Bank of India* | 22,041 | | | 34,781 | |
| Bharat Electronics Ltd. | 2,797 | | | 56,665 | |
| Bharat Heavy Electricals Ltd. | 68,415 | | | 121,921 | |
| Bharti Airtel Ltd. | 189,175 | | | 851,943 | |
| Birla Corp., Ltd. | 2,074 | | | 19,169 | |
| Cairn India Ltd. | 81,823 | | | 292,053 | |
| Canara Bank* | 23,213 | | | 89,883 | |
| Ceat Ltd. | 3,536 | | | 60,441 | |
| Century Textiles & Industries Ltd. | 4,065 | | | 47,700 | |
| Cipla Ltd. | 13,689 | | | 114,361 | |
| Container Corp. of India Ltd. | 2,946 | | | 48,147 | |
| Coromandel International Ltd. | 7,470 | | | 32,430 | |
| Corporation Bank* | 735 | | | 450 | |
| Cox & Kings Ltd. | 11,953 | | | 31,630 | |
| Crompton Greaves Consumer | | | | | |
| Electricals Ltd.* | 49,779 | | | 106,606 | |
| Crompton Greaves Ltd.* | 49,779 | | | 43,530 | |
| Cyient Ltd. | 6,096 | | | 45,403 | |
| DCB Bank Ltd.* | 3,524 | | | 5,610 | |
| Dewan Housing Finance Corp. Ltd. | 35,252 | | | 126,813 | |
| DLF Ltd. | 35,103 | | | 57,410 | |
| EID Parry India Ltd.* | 7,288 | | | 27,382 | |
| EIH Ltd. | 13,530 | | | 19,028 | |
| Engineers India Ltd.* | 11,771 | | | 26,293 | |
| Engineers India Ltd. | 11,771 | | | 26,293 | |
See notes to financial statements
SA Emerging Markets Value Fund
PORTFOLIO OF INVESTMENTS — AS OF DECEMBER 31, 2016 (Unaudited) (Continued)
| | | SHARES | | VALUE† | |
| COMMON STOCKS (Continued) | | | | | |
| India (Continued) | | | | | |
| Exide Industries Ltd. | 41,825 | | $ | 111,110 | |
| Federal Bank Ltd. | 155,672 | | | 153,332 | |
| GAIL India Ltd. | 42,704 | | | 274,679 | |
| GAIL India Ltd., GDR | 155 | | | 5,929 | |
| Gateway Distriparks Ltd. | 5,474 | | | 19,720 | |
| Great Eastern Shipping Co., Ltd. (The) | 11,618 | | | 62,130 | |
| Gujarat Fluorochemicals Ltd. | 5,933 | | | 40,693 | |
| Gujarat State Petronet Ltd. | 33,607 | | | 69,002 | |
| Himachal Futuristic | | | | | |
| Communications Ltd.* | 111,266 | | | 20,492 | |
| Hindalco Industries Ltd. | 169,579 | | | 386,781 | |
| ICICI Bank Ltd. | 199,777 | | | 750,746 | |
| ICICI Bank Ltd., ADR | 74,950 | | | 561,375 | |
| IDBI Bank Ltd.* | 16,131 | | | 16,518 | |
| Idea Cellular Ltd. | 194,607 | | | 212,184 | |
| IDFC Bank Ltd. | 28,677 | | | 25,478 | |
| IDFC Ltd.* | 28,677 | | | 22,753 | |
| IFCI Ltd. | 131,851 | | | 52,647 | |
| IIFL Holdings Ltd. | 30,722 | | | 117,895 | |
| India Cements Ltd. (The) | 73,961 | | | 127,010 | |
| Indiabulls Housing Finance Ltd. | 21,960 | | | 209,990 | |
| Indian Bank | 12,173 | | | 39,674 | |
| Indian Hotels Co., Ltd. (The) | 47,733 | | | 69,205 | |
| Jain Irrigation Systems Ltd. | 44,473 | | | 57,926 | |
| Jaiprakash Associates Ltd.* | 179,807 | | | 21,459 | |
| Jammu & Kashmir Bank Ltd. (The) | 24,690 | | | 21,536 | |
| Jindal Steel & Power Ltd.* | 85,132 | | | 86,361 | |
| JSW Energy Ltd. | 116,585 | | | 104,269 | |
| JSW Steel Ltd. | 14,671 | | | 350,314 | |
| Jubilant Life Sciences Ltd. | 13,390 | | | 123,602 | |
| Karnataka Bank Ltd. (The) | 25,825 | | | 42,655 | |
| Karur Vysya Bank Ltd. (The) | 21,915 | | | 26,381 | |
| Kaveri Seed Co., Ltd.* | 5,328 | | | 32,139 | |
| KPIT Technologies Ltd. | 21,169 | | | 41,795 | |
| L&T Finance Holdings Ltd. | 78,014 | | | 100,233 | |
| Larsen & Toubro Ltd. | 49,087 | | | 975,556 | |
| LIC Housing Finance Ltd. | 24,674 | | | 202,496 | |
| Mahindra & Mahindra Financial | | | | | |
| Services Ltd. | 44,270 | | | 176,017 | |
| Mahindra & Mahindra Ltd. | 38,681 | | | 672,287 | |
| Manappuram Finance Ltd. | 39,514 | | | 39,211 | |
| Mphasis Ltd. | 17,602 | | | 145,728 | |
| MRF Ltd. | 256 | | | 183,787 | |
| Muthoot Finance Ltd. | 15,546 | | | 64,181 | |
| National Aluminium Co., Ltd. | 84,641 | | | 82,059 | |
| NCC Ltd. | 58,777 | | | 70,018 | |
| NIIT Technologies Ltd. | 6,690 | | | 42,548 | |
| Oberoi Realty Ltd. | 14,000 | | | 60,676 | |
| Oriental Bank of Commerce | 14,300 | | | 22,323 | |
| PC Jeweller Ltd. | 3,805 | | | 22,201 | |
| Persistent Systems Ltd. | 4,682 | | | 42,415 | |
| Petronet LNG Ltd. | 34,695 | | | 187,456 | |
| Piramal Enterprises Ltd. | 6,642 | | | 158,539 | |
| Power Finance Corp., Ltd. | 129,380 | | | 231,996 | |
| Prestige Estates Projects Ltd. | 5,865 | | | 14,863 | |
| PTC India Ltd. | 28,037 | | | 30,404 | |
| Ramco Cements Ltd. (The) | 6,184 | | | 49,439 | |
| Raymond Ltd. | 1,722 | | | 12,508 | |
| Redington India Ltd. | 23,584 | | | 32,664 | |
| Reliance Communications Ltd.* | 167,238 | | | 83,779 | |
| Reliance Industries Ltd. | 146,455 | | | 2,332,016 | |
| Reliance Industries Ltd., GDR± | 9,730 | | | 306,981 | |
| Reliance Power Ltd. | 91,910 | | | 55,726 | |
| Rural Electrification Corp. Ltd. | 117,454 | | | 215,370 | |
| Shriram City Union Finance Ltd. | 837 | | | 22,322 | |
| Shriram Transport Finance Co., Ltd. | 20,278 | | | 254,558 | |
| Sintex Industries Ltd. | 60,470 | | | 66,823 | |
| Sobha Ltd. | 6,105 | | | 22,034 | |
| South Indian Bank Ltd. (The) | 67,916 | | | 19,663 | |
| SRF Ltd. | 2,665 | | | 60,470 | |
| State Bank of India | 127,435 | | | 469,972 | |
| State Bank of India Ltd., GDR | 2,800 | | | 102,900 | |
| Syndicate Bank* | 19,381 | | | 17,605 | |
| Tata Chemicals Ltd. | 12,834 | | | 94,936 | |
| Tata Global Beverages Ltd. | 61,016 | | | 109,680 | |
| Tata Motors Ltd. | 174,932 | | | 1,211,147 | |
| Tata Steel Ltd. | 42,573 | | | 245,264 | |
| Tech Mahindra Ltd. | 32,802 | | | 236,119 | |
| Tube Investments of India Ltd. | 8,913 | | | 76,175 | |
| TV18 Broadcast Ltd.* | 55,772 | | | 29,953 | |
| Union Bank of India | 37,465 | | | 67,621 | |
| UPL Ltd. | 30,684 | | | 292,441 | |
| VA Tech Wabag Ltd. | 1,790 | | | 12,343 | |
| Vardhman Textiles Ltd. | 3,096 | | | 50,815 | |
| Vedanta Ltd. | 144,721 | | | 461,222 | |
| Vedanta Ltd., ADR | 14,869 | | | 184,673 | |
| Videocon Industries Ltd.* | 3,464 | | | 5,311 | |
| Wipro Ltd. | 68,731 | | | 481,836 | |
| Wockhardt Ltd. | 4,111 | | | 39,735 | |
| Yes Bank Ltd. | 8,955 | | | 152,395 | |
| Zensar Technologies Ltd. | 1,122 | | | 15,705 | |
| | | | | 21,210,888 | |
| Indonesia — 3.2% | | | | | |
| Adaro Energy Tbk PT | 3,002,600 | | | 377,763 | |
| Adhi Karya Persero Tbk PT | 265,600 | | | 41,006 | |
| Agung Podomoro Land Tbk PT* | 1,262,900 | | | 19,685 | |
| Alam Sutera Realty Tbk PT* | 2,593,800 | | | 67,769 | |
| Aneka Tambang Tbk PT* | 1,015,016 | | | 67,429 | |
| Astra Agro Lestari Tbk PT | 39,844 | | | 49,611 | |
| Astra International Tbk PT | 113,700 | | | 69,836 | |
| Bank Bukopin Tbk PT | 428,300 | | | 20,346 | |
| Bank CIMB Niaga Tbk PT* | 54,229 | | | 3,401 | |
| Bank Danamon Indonesia Tbk PT | 378,773 | | | 104,305 | |
| Bank Mandiri Tbk PT | 1,289,800 | | | 1,108,141 | |
| Bank Negara Indonesia | | | | | |
| Persero Tbk PT | 1,027,766 | | | 421,481 | |
| Bank Pan Indonesia Tbk PT* | 967,400 | | | 53,854 | |
| Bank Pembangunan Daerah | | | | | |
| Jawa Barat Dan Banten Tbk PT | 649,700 | | | 163,480 | |
| Bank Pembangunan Daerah | | | | | |
| Jawa Timur Tbk PT | 69,000 | | | 2,919 | |
| Bank Tabungan Negara Tbk PT | 671,490 | | | 86,724 | |
| Bumi Serpong Damai Tbk PT | 805,600 | | | 104,942 | |
See notes to financial statements
SA Emerging Markets Value Fund
PORTFOLIO OF INVESTMENTS — AS OF DECEMBER 31, 2016 (Unaudited) (Continued)
| | | SHARES | | VALUE† | |
| COMMON STOCKS (Continued) | | | | | |
| Indonesia (Continued) | | | | | |
| Ciputra Development Tbk PT | 1,610,377 | | $ | 159,573 | |
| Eagle High Plantations Tbk PT* | 1,380,100 | | | 28,068 | |
| Gajah Tunggal Tbk PT* | 517,400 | | | 41,092 | |
| Garuda Indonesia Persero Tbk PT* | 400,470 | | | 10,047 | |
| Global Mediacom Tbk PT | 1,084,300 | | | 49,497 | |
| Gudang Garam Tbk PT | 13,000 | | | 61,659 | |
| Hanson International Tbk PT* | 6,335,700 | | | 79,475 | |
| Holcim Indonesia Tbk PT | 308,000 | | | 20,575 | |
| Indah Kiat Pulp & | | | | | |
| Paper Corp., Tbk PT | 344,500 | | | 24,420 | |
| Indo Tambangraya Megah Tbk PT | 64,900 | | | 81,291 | |
| Indocement Tunggal | | | | | |
| Prakarsa Tbk PT | 19,000 | | | 21,718 | |
| Indofood Sukses Makmur Tbk PT | 802,500 | | | 472,059 | |
| Intiland Development Tbk PT | 1,370,300 | | | 50,855 | |
| Japfa Comfeed Indonesia Tbk PT | 565,400 | | | 61,062 | |
| Lippo Cikarang Tbk PT* | 74,400 | | | 27,888 | |
| Lippo Karawaci Tbk PT | 3,218,075 | | | 171,981 | |
| Medco Energi Internasional Tbk PT* | 379,700 | | | 37,202 | |
| Mitra Adiperkasa Tbk PT* | 51,800 | | | 20,762 | |
| MNC Investama Tbk PT* | 4,910,300 | | | 49,203 | |
| Modernland Realty Tbk PT* | 1,758,100 | | | 44,629 | |
| Multipolar Tbk PT* | 1,293,500 | | | 32,836 | |
| Panin Financial Tbk PT* | 2,998,200 | | | 38,277 | |
| Perusahaan Perkebunan London | | | | | |
| Sumatra Indonesia Tbk PT | 844,800 | | | 109,108 | |
| Salim Ivomas Pratama Tbk PT | 964,200 | | | 35,355 | |
| Semen Indonesia Persero Tbk PT | 362,500 | | | 246,869 | |
| Sinar Mas Multiartha Tbk PT | 7,500 | | | 4,774 | |
| Sri Rejeki Isman Tbk PT | 996,900 | | | 17,019 | |
| Surya Semesta Internusa Tbk PT | 1,030,600 | | | 33,200 | |
| Tambang Batubara Bukit Asam | | | | | |
| Persero Tbk PT | 127,900 | | | 118,668 | |
| Tiga Pilar Sejahtera Food Tbk* | 168,600 | | | 24,340 | |
| Timah Tbk PT | 762,382 | | | 60,832 | |
| United Tractors Tbk PT | 316,000 | | | 498,423 | |
| Vale Indonesia Tbk PT* | 362,800 | | | 75,940 | |
| XL Axiata Tbk PT* | 600,900 | | | 103,031 | |
| | | | | 5,674,420 | |
| Korea — 16.0% | | | | | |
| Asiana Airlines, Inc.* | 12,488 | | | 43,632 | |
| BNK Financial Group, Inc. | 36,464 | | | 262,053 | |
| CJ E&M Corp. | 1,328 | | | 77,956 | |
| CJ Hellovision Co., Ltd. | 4,225 | | | 32,777 | |
| CJ O Shopping Co., Ltd. | 354 | | | 47,745 | |
| Daeduck Electronics Co. | 3,845 | | | 25,977 | |
| Daeduck GDS Co., Ltd. | 4,539 | | | 48,479 | |
| Daelim Industrial Co., Ltd. | 3,115 | | | 224,637 | |
| Daesang Holdings Co., Ltd. | 3,626 | | | 30,922 | |
| Daewoo Engineering & | | | | | |
| Construction Co., Ltd.* | 18,273 | | | 76,856 | |
| Daewoo Shipbuilding & Marine | | | | | |
| Engineering Co., Ltd.*§ | 12,811 | | | 35,639 | |
| Daishin Securities Co., Ltd. | 5,898 | | | 50,786 | |
| Daou Technology, Inc. | 2,100 | | | 31,297 | |
| DGB Financial Group, Inc. | 21,254 | | | 171,925 | |
| Dong Ah Tire & Rubber Co., Ltd. | 1,550 | | | 31,955 | |
| Dongkuk Steel Mill Co., Ltd.* | 5,154 | | | 47,153 | |
| Dongwon Development Co., Ltd. | 12,028 | | | 42,424 | |
| Doosan Corp. | 1,027 | | | 89,282 | |
| Doosan Heavy Industries & | | | | | |
| Construction Co., Ltd. | 4,983 | | | 112,219 | |
| Doosan Infracore Co., Ltd.* | 19,877 | | | 145,152 | |
| E-Mart Co., Ltd. | 2,514 | | | 380,909 | |
| Eugene Corp. | 10,995 | | | 46,518 | |
| GS Engineering & Construction Corp.* | 5,034 | | | 110,450 | |
| GS Holdings Corp. | 8,604 | | | 385,392 | |
| Halla Holdings Corp. | 930 | | | 46,662 | |
| Hana Financial Group, Inc. | 29,388 | | | 760,370 | |
| Handsome Co., Ltd. | 1,970 | | | 56,843 | |
| Hanil Cement Co., Ltd. | 309 | | | 19,444 | |
| Hanjin Kal Corp. | 5,540 | | | 70,408 | |
| Hanjin Transportation Co., Ltd. | 2,144 | | | 51,124 | |
| Hankook Tire Co., Ltd. | 3,921 | | | 188,291 | |
| Hansol Holdings Co., Ltd.* | 10,320 | | | 57,248 | |
| Hansol Paper Co., Ltd. | 437 | | | 7,128 | |
| Hanwha Chem Corp. | 15,695 | | | 320,969 | |
| Hanwha Corp.> | 8,404 | | | 243,882 | |
| Hanwha General Insurance Co., Ltd. | 4,793 | | | 28,691 | |
| Hanwha Investment & | | | | | |
| Securities Co., Ltd.* | 18,065 | | | 31,185 | |
| Hanwha Life Insurance Co., Ltd. | 37,615 | | | 203,366 | |
| Hanwha Techwin Co., Ltd. | 389 | | | 13,994 | |
| Heungkuk Fire & Marine | | | | | |
| Insurance Co., Ltd.* | 1,548 | | | 4,749 | |
| Humax Co., Ltd. | 1,390 | | | 15,824 | |
| Hy-Lok Corp. | 918 | | | 16,037 | |
| Hyosung Corp. | 952 | | | 114,685 | |
| Hyundai Department Store Co., Ltd. | 2,366 | | | 213,524 | |
| Hyundai Engineering & | | | | | |
| Construction Co., Ltd. | 11,588 | | | 410,636 | |
| Hyundai Greenfood Co., Ltd. | 2,006 | | | 25,577 | |
| Hyundai Heavy Industries Co., Ltd.* | 4,822 | | | 580,892 | |
| Hyundai Home Shopping | | | | | |
| Network Corp. | 431 | | | 39,788 | |
| Hyundai Hy Communications & Networks | | | | | |
| Co., Ltd. | 3,997 | | | 13,684 | |
| Hyundai Marine & Fire | | | | | |
| Insurance Co., Ltd. | 2,703 | | | 70,495 | |
| Hyundai Mobis Co., Ltd. | 1,845 | | | 403,279 | |
| Hyundai Motor Co. | 22,799 | | | 2,755,965 | |
| Hyundai Rotem Co., Ltd.* | 2,813 | | | 42,272 | |
| Hyundai Steel Co. | 13,422 | | | 633,428 | |
| Hyundai Wia Corp. | 2,659 | | | 160,711 | |
| Ilshin Spinning Co., Ltd. | 296 | | | 30,267 | |
| Industrial Bank of Korea | 38,675 | | | 406,667 | |
| Interpark Holdings Corp. | 7,348 | | | 30,541 | |
| JB Financial Group Co., Ltd. | 10,318 | | | 49,377 | |
| KB Capital Co., Ltd. | 980 | | | 21,745 | |
| KB Financial Group, Inc. | 4,355 | | | 154,325 | |
| KB Financial Group, Inc., ADR* | 29,675 | | | 1,047,231 | |
| KB Insurance Co., Ltd. | 5,730 | | | 124,060 | |
| KCC Corp. | 454 | | | 135,132 | |
See notes to financial statements
SA Emerging Markets Value Fund
PORTFOLIO OF INVESTMENTS — AS OF DECEMBER 31, 2016 (Unaudited) (Continued)
| | | SHARES | | VALUE† | |
| COMMON STOCKS (Continued) | | | | | |
| Korea (Continued) | | | | | |
| KH Vatec Co., Ltd. | 2,458 | | $ | 27,576 | |
| Kia Motors Corp. | 44,490 | | | 1,445,796 | |
| KISWIRE Ltd. | 840 | | | 27,923 | |
| Kolon Industries, Inc. | 2,613 | | | 160,094 | |
| Korea Investment Holdings Co., Ltd. | 4,714 | | | 163,534 | |
| Korea Line Corp.* | 3,081 | | | 43,876 | |
| Korean Air Lines Co., Ltd.* | 4,632 | | | 104,889 | |
| Korean Reinsurance Co. | 9,715 | | | 91,696 | |
| Kumho Tire Co., Inc.* | 5,182 | | | 36,383 | |
| Kwangju Bank | 1,074 | | | 9,604 | |
| LF Corp. | 2,480 | | | 44,249 | |
| LG Chem Ltd. | 384 | | | 82,981 | |
| LG Corp. | 13,099 | | | 650,720 | |
| LG Display Co., Ltd. | 6,336 | | | 164,984 | |
| LG Display Co., Ltd., ADR* | 62,695 | | | 805,631 | |
| LG Electronics, Inc. | 19,054 | | | 814,031 | |
| LG Hausys Ltd. | 907 | | | 71,866 | |
| LG Innotek Co., Ltd. | 1,536 | | | 112,421 | |
| LG International Corp. | 3,030 | | | 73,379 | |
| LG Uplus Corp. | 26,566 | | | 251,847 | |
| Lotte Chemical Corp. | 379 | | | 115,790 | |
| Lotte Chilsung Beverage Co., Ltd. | 92 | | | 111,210 | |
| Lotte Confectionery Co., Ltd. | 640 | | | 94,585 | |
| LOTTE Fine Chemicals Co., Ltd. | 2,019 | | | 51,236 | |
| Lotte Food Co., Ltd. | 93 | | | 49,973 | |
| LOTTE Himart Co., Ltd. | 1,781 | | | 62,227 | |
| Lotte Shopping Co., Ltd. | 1,161 | | | 212,917 | |
| LS Corp. | 2,609 | | | 128,095 | |
| Mando Corp. | 264 | | | 51,257 | |
| Meritz Fire & Marine | | | | | |
| Insurance Co., Ltd. | 2,167 | | | 27,451 | |
| Mirae Asset Life Insurance Co., Ltd. | 13,679 | | | 58,327 | |
| Mirae Asset Securities Co., Ltd.§ | 6,038 | | | 107,554 | |
| Namyang Dairy Products Co., Ltd. | 26 | | | 15,801 | |
| NH Investment & Securities Co., Ltd. | 14,888 | | | 118,951 | |
| NHN Entertainment Corp.* | 1,327 | | | 55,264 | |
| Nong Shim Co., Ltd. | 284 | | | 78,183 | |
| Nong Shim Holdings Co., Ltd. | 185 | | | 18,457 | |
| OCI Co., Ltd.* | 2,081 | | | 135,597 | |
| Pan Ocean Co., Ltd.* | 24,376 | | | 80,426 | |
| Poongsan Corp. | 2,993 | | | 100,361 | |
| Posco Daewoo Corp. | 4,166 | | | 93,130 | |
| POSCO, ADR | 28,384 | | | 1,491,579 | |
| S&T Dynamics Co., Ltd. | 1,950 | | | 15,015 | |
| S&T Motiv Co., Ltd. | 920 | | | 37,210 | |
| S-Oil Corp. | 1,379 | | | 96,706 | |
| Samsung Card Co., Ltd. | 3,348 | | | 110,048 | |
| Samsung Electro-Mechanics Co., Ltd. | 8,433 | | | 354,691 | |
| Samsung Electronics Co., Ltd. | 371 | | | 553,520 | |
| Samsung Heavy Industries Co., Ltd.* | 29,124 | | | 223,048 | |
| Samsung Life Insurance Co., Ltd. | 5,872 | | | 546,945 | |
| Samsung SDI Co., Ltd. | 3,484 | | | 314,420 | |
| Samsung Securities Co., Ltd. | 5,314 | | | 139,472 | |
| Samyang Corp. | 295 | | | 25,646 | |
| Samyang Holdings Corp. | 471 | | | 46,601 | |
| SeAH Besteel Corp. | 1,570 | | | 33,212 | |
| SeAH Steel Corp. | 446 | | | 34,194 | |
| Sebang Co., Ltd. | 1,306 | | | 16,382 | |
| Sebang Global Battery Co., Ltd. | 589 | | | 18,239 | |
| Shinhan Financial Group Co., Ltd. | 20,589 | | | 771,363 | |
| Shinhan Financial | | | | | |
| Group Co., Ltd., ADR* | 24,410 | | | 918,792 | |
| Shinsegae Co., Ltd. | 895 | | | 130,419 | |
| SK Chemicals Co., Ltd. | 2,335 | | | 129,529 | |
| SK Gas Co., Ltd. | 599 | | | 64,225 | |
| SK Holdings Co., Ltd. | 1,525 | | | 289,773 | |
| SK Hynix, Inc. | 21,155 | | | 782,935 | |
| SK Innovation Co., Ltd. | 10,175 | | | 1,234,176 | |
| SK Networks Co., Ltd. | 13,860 | | | 79,410 | |
| SKC Co., Ltd. | 3,360 | | | 91,803 | |
| SL Corp. | 532 | | | 9,492 | |
| Ssangyong Cement | | | | | |
| Industrial Co., Ltd.* | 3,374 | | | 41,344 | |
| Sung Kwang Bend Co., Ltd. | 4,581 | | | 33,605 | |
| Sungwoo Hitech Co., Ltd. | 5,817 | | | 37,037 | |
| Taekwang Industrial Co., Ltd. | 36 | | | 28,226 | |
| Taewoong Co., Ltd.* | 2,152 | | | 40,000 | |
| Taeyoung Engineering & | | | | | |
| Construction Co., Ltd.* | 5,008 | | | 22,473 | |
| Tongyang Life Insurance Co., Ltd. | 6,487 | | | 68,211 | |
| Tongyang, Inc. | 18,180 | | | 44,931 | |
| Unid Co., Ltd. | 1,035 | | | 38,305 | |
| Woori Bank | 35,181 | | | 371,384 | |
| Woori Bank, ADR@* | 3,083 | | | 98,656 | |
| Young Poong Corp. | 19 | | | 16,738 | |
| Youngone Corp. | 1,575 | | | 39,968 | |
| Youngone Holdings Co., Ltd. | 357 | | | 17,587 | |
| Yuanta Securities Korea Co., Ltd.* | 9,125 | | | 23,685 | |
| | | | | 28,583,898 | |
| Malaysia — 3.0% | | | | | |
| Affin Holdings Bhd | 65,370 | | | 34,827 | |
| AirAsia Bhd | 212,600 | | | 108,527 | |
| Alliance Financial Group Berhad | 167,400 | | | 138,816 | |
| AMMB Holdings Berhad | 305,987 | | | 293,982 | |
| Batu Kawan Berhad | 18,800 | | | 77,111 | |
| Berjaya Corp. Berhad | 455,775 | | | 34,544 | |
| Berjaya Land Berhad* | 215,200 | | | 31,661 | |
| Boustead Holdings Berhad | 114,039 | | | 67,874 | |
| Boustead Plantations Bhd | 11,600 | | | 4,292 | |
| Bumi Armada Bhd* | 491,700 | | | 66,313 | |
| Cahya Mata Sarawak Bhd | 22,500 | | | 20,062 | |
| CIMB Group Holdings Bhd | 423,329 | | | 425,594 | |
| Coastal Contracts Bhd | 55,400 | | | 17,166 | |
| DRB-Hicom Berhad | 191,500 | | | 49,092 | |
| Eco World Development Group Bhd* | 61,000 | | | 18,221 | |
| Felda Global Ventures Holdings Bhd | 258,800 | | | 89,420 | |
| Genting Bhd | 314,300 | | | 560,499 | |
| Genting Malaysia Bhd | 280,700 | | | 286,582 | |
| HAP Seng Consolidated Berhad | 63,500 | | | 125,415 | |
| Hap Seng Plantations | | | | | |
| Holdings Berhad | 19,600 | | | 11,010 | |
| Hong Leong Financial Group Berhad | 35,521 | | | 112,597 | |
| Hong Leong Industries Bhd | 9,900 | | | 20,745 | |
See notes to financial statements
SA Emerging Markets Value Fund
PORTFOLIO OF INVESTMENTS — AS OF DECEMBER 31, 2016 (Unaudited) (Continued)
| | | SHARES | | VALUE† | |
| COMMON STOCKS (Continued) | | | | | |
| Malaysia (Continued) | | | | | |
| IJM Corp. Berhad | 421,460 | | $ | 300,640 | |
| IOI Properties Group Bhd | 132,900 | | | 62,214 | |
| Jaya Tiasa Holdings Bhd | 54,200 | | | 16,190 | |
| KNM Group Bhd* | 258,360 | | | 19,581 | |
| KSL Holdings Bhd* | 91,419 | | | 20,583 | |
| Mah Sing Group Bhd | 205,885 | | | 65,630 | |
| Malayan Banking Bhd | 63,069 | | | 115,284 | |
| Malaysia Airports Holdings Bhd | 102,400 | | | 138,329 | |
| Malaysia Building Society Bhd | 100,100 | | | 20,082 | |
| Malaysian Resources Corp. Bhd | 168,400 | | | 49,927 | |
| Media Prima Bhd | 105,700 | | | 27,097 | |
| MISC Berhad | 152,820 | | | 250,385 | |
| MMC Corp. Berhad | 137,800 | | | 71,572 | |
| Multi-Purpose Holdings Bhd | 86,100 | | | 41,649 | |
| Oriental Holdings Berhad | 23,560 | | | 35,503 | |
| OSK Holdings Berhad | 49,637 | | | 15,491 | |
| Parkson Holdings Bhd* | 87,151 | | | 12,142 | |
| Pos Malaysia Berhad | 21,200 | | | 18,478 | |
| PPB Group Berhad | 25,900 | | | 91,568 | |
| Press Metal Bhd | 210,560 | | | 74,630 | |
| RHB Capital Berhad | 130,771 | | | 137,301 | |
| SapuraKencana Petroleum Bhd* | 564,500 | | | 203,854 | |
| Selangor Properties Bhd | 6,500 | | | 6,520 | |
| SP Setia Bhd Group | 93,775 | | | 65,429 | |
| Star Publications Malaysia Bhd | 2,200 | | | 1,099 | |
| Sunway Bhd | 110,600 | | | 74,703 | |
| Supermax Corp. Bhd | 71,200 | | | 33,489 | |
| Ta Ann Holdings Bhd | 33,360 | | | 29,374 | |
| TA Enterprise Bhd | 140,200 | | | 14,064 | |
| TA Global Berhad | 55,560 | | | 3,034 | |
| TAN Chong Motor Holdings Bhd | 9,600 | | | 3,809 | |
| Time dotCom Bhd | 42,580 | | | 74,036 | |
| UEM Sunrise Bhd | 225,600 | | | 52,804 | |
| UMW Holdings Bhd | 75,700 | | | 77,118 | |
| UMW Oil & Gas Corp. Bhd* | 110,500 | | | 21,553 | |
| Unisem M Bhd | 81,900 | | | 43,086 | |
| UOA Development Bhd | 99,100 | | | 51,914 | |
| Wah Seong Corp. Bhd | 3,573 | | | 641 | |
| WCT Holdings Bhd | 158,992 | | | 61,314 | |
| YTL Corp. Berhad | 851,809 | | | 294,317 | |
| | | | | 5,290,784 | |
| Mexico — 4.4% | | | | | |
| Alfa SAB de CV, Class A | 316,744 | | | 392,079 | |
| Alpek SA de CV | 61,784 | | | 73,796 | |
| Axtel SAB de CV* | 61,878 | | | 10,507 | |
| Cemex SAB de CV* | 952,873 | | | 762,127 | |
| Cemex SAB de CV, ADR@* | 54,111 | | | 434,511 | |
| Coca-Cola Femsa SAB de CV, ADR | 1,151 | | | 73,135 | |
| Coca-Cola Femsa SAB de CV, | | | | | |
| Series L | 28,260 | | | 179,133 | |
| Consorcio ARA SAB de CV | 33,090 | | | 10,312 | |
| Credito Real SAB de CV SOFOM ER | 20,141 | | | 26,641 | |
| Fomento Economico Mexicano | | | | | |
| SAB de CV | 46,223 | | | 351,840 | |
| Fomento Economico Mexicano | | | | | |
| SAB de CV, ADR | 1,052 | | | 80,173 | |
| Genomma Lab Internacional | | | | | |
| SAB de CV, Series B* | 44,630 | | | 46,310 | |
| Grupo Aeromexico SAB de CV* | 5,400 | | | 10,157 | |
| Grupo Aeroportuario del Pacifico | | | | | |
| SAB de CV, ADR@ | 2,939 | | | 242,526 | |
| Grupo Aeroportuario del Sureste | | | | | |
| SAB de CV, ADR | 1,215 | | | 174,826 | |
| Grupo Carso SAB de CV, Series A | 47,917 | | | 192,711 | |
| Grupo Comercial Chedraui SA de CV | 54,670 | | | 97,553 | |
| Grupo Elektra SAB de CV | 5,444 | | | 68,326 | |
| Grupo Financiero Banorte SAB de CV | 223,987 | | | 1,103,206 | |
| Grupo Financiero Inbursa SA | 165,066 | | | 250,191 | |
| Grupo Financiero Interacciones | | | | | |
| SA de CV | 16,197 | | | 63,164 | |
| Grupo Financiero Santander Mexico | | | | | |
| SAB de CV, Class B | 230,955 | | | 332,122 | |
| Grupo Herdez SAB de CV | 24,163 | | | 43,734 | |
| Grupo Industrial Saltillo SAB de CV | 5,300 | | | 9,455 | |
| Grupo Mexico SAB de CV, Series B | 579,771 | | | 1,574,330 | |
| Grupo Sanborns SAB de CV | 49,041 | | | 51,242 | |
| Grupo Simec SAB de CV, Series B* | 9,186 | | | 44,003 | |
| Industrias Bachoco | | | | | |
| SAB de CV, ADR@ | 1,639 | | | 80,344 | |
| Industrias Bachoco | | | | | |
| SAB de CV, Series B | 3,309 | | | 13,536 | |
| Industrias CH SAB de CV, Series B* | 9,563 | | | 61,120 | |
| Industrias Penoles SAB de CV | 16,671 | | | 309,050 | |
| La Comer SAB de CV* | 37,216 | | | 28,061 | |
| Megacable Holdings SAB de CV | 1,300 | | | 4,387 | |
| Mexichem SAB de CV | 121,912 | | | 276,586 | |
| Minera Frisco SAB de CV, Class A1* | 20,406 | | | 15,357 | |
| OHL Mexico SAB de CV | 97,166 | | | 95,574 | |
| Organizacion Cultiba SAB de CV | 907 | | | 826 | |
| Organizacion Soriana SAB de CV, | | | | | |
| Class B* | 103,520 | | | 224,622 | |
| TV Azteca SAB de CV | 219,826 | | | 34,358 | |
| | | | | 7,841,931 | |
| Philippines — 1.4% | | | | | |
| Alliance Global Group, Inc. | 479,100 | | | 123,166 | |
| Bank of the Philippine Islands | 41,850 | | | 74,755 | |
| BDO Unibank, Inc. | 196,550 | | | 443,213 | |
| Bloomberry Resorts Corp.* | 110,000 | | | 13,608 | |
| Cebu Air, Inc. | 23,560 | | | 44,075 | |
| China Banking Corp. | 9,504 | | | 7,265 | |
| Cosco Capital, Inc. | 170,500 | | | 29,153 | |
| DMCI Holdings, Inc. | 47,300 | | | 12,616 | |
| Emperador, Inc. | 147,300 | | | 20,741 | |
| Energy Development Corp. | 306,100 | | | 31,711 | |
| Filinvest Land, Inc. | 1,435,000 | | | 44,165 | |
| First Philippine Holdings Corp. | 33,750 | | | 46,097 | |
| JG Summit Holdings, Inc. | 355,780 | | | 484,154 | |
| Lopez Holdings Corp. | 414,200 | | | 64,989 | |
| LT Group, Inc. | 220,200 | | | 55,634 | |
| Megaworld Corp. | 1,270,700 | | | 91,253 | |
| Metropolitan Bank & Trust | 38,258 | | | 55,872 | |
See notes to financial statements
SA Emerging Markets Value Fund
PORTFOLIO OF INVESTMENTS — AS OF DECEMBER 31, 2016 (Unaudited) (Continued)
| | | SHARES | | VALUE† | |
| COMMON STOCKS (Continued) | | | | | |
| Philippines (Continued) | | | | | |
| Petron Corp. | 421,800 | | $ | 84,424 | |
| Philippine National Bank | 30,748 | | | 33,771 | |
| Premium Leisure Corp. | 846,000 | | | 19,911 | |
| Rizal Commercial Banking Corp. | 34,780 | | | 23,472 | |
| Robinsons Land Corp. | 319,900 | | | 167,310 | |
| Robinsons Retail Holdings, Inc. | 22,800 | | | 34,054 | |
| San Miguel Corp. | 67,120 | | | 124,620 | |
| Security Bank Corp. | 48,450 | | | 185,175 | |
| Top Frontier Investment Holdings, Inc.* | 8,630 | | | 45,483 | |
| Travellers International Hotel | | | | | |
| Group, Inc. | 183,800 | | | 12,164 | |
| Union Bank of the Philippines | 2,590 | | | 3,887 | |
| Vista Land & Lifescapes, Inc. | 975,500 | | | 97,133 | |
| | | | | 2,473,871 | |
| Poland — 1.5% | | | | | |
| Asseco Poland SA | 17,044 | | | 219,778 | |
| Bank Millennium SA* | 93,801 | | | 116,336 | |
| Enea SA* | 36,048 | | | 81,836 | |
| Grupa Azoty SA | 5,997 | | | 89,812 | |
| Grupa Lotos SA* | 18,791 | | | 171,760 | |
| Kernel Holding SA | 8,100 | | | 123,591 | |
| KGHM Polska Miedz SA | 18,104 | | | 400,095 | |
| Lubelski Wegiel Bogdanka SA* | 963 | | | 15,994 | |
| Netia SA | 36,890 | | | 40,552 | |
| Orbis SA | 1,581 | | | 27,580 | |
| PGE SA | 157,586 | | | 393,527 | |
| PKP Cargo SA* | 3,933 | | | 44,174 | |
| Polski Koncern Naftowy Orlen SA | 31,174 | | | 635,451 | |
| Powszechna Kasa Oszczednosci | | | | | |
| Bank Polski SA* | 53,221 | | | 357,889 | |
| | | | | 2,718,375 | |
| Russia — 2.3% | | | | | |
| Gazprom PAO, ADR | 432,870 | | | 2,185,993 | |
| Lukoil PJSC, ADR | 30,968 | | | 1,737,305 | |
| Magnitogorsk Iron & Steel | | | | | |
| OJSC, GDR | 11,936 | | | 83,313 | |
| Magnitogorsk Iron & Steel | | | | | |
| Works, GDR | 2,645 | | | 18,462 | |
| RusHydro PJSC, ADR | 82,037 | | | 119,364 | |
| | | | | 4,144,437 | |
| South Africa — 8.4% | | | | | |
| Aeci Ltd. | 22,951 | | | 168,952 | |
| African Bank Investments Ltd.* | 72,611 | | | 28 | |
| African Rainbow Minerals Ltd. | 16,931 | | | 121,431 | |
| Alexander Forbes Group Holdings Ltd. | 70,087 | | | 40,571 | |
| ArcelorMittal South Africa Ltd.* | 23,974 | | | 20,075 | |
| Aveng Ltd.* | 43,063 | | | 24,896 | |
| Barclays Africa Group Ltd. | 72,512 | | | 890,656 | |
| Barloworld Ltd. | 39,661 | | | 340,477 | |
| Bid Corp., Ltd. | 5,021 | | | 89,626 | |
| Bidvest Group Ltd. (The) | 5,021 | | | 66,264 | |
| Blue Label Telecoms Ltd. | 3,193 | | | 4,231 | |
| Caxton & CTP Publishers & | | | | | |
| Printers Ltd. | 18,814 | | | 17,370 | |
| Clover Industries Ltd. | 8,698 | | | 12,002 | |
| Consolidated Infrastructure Group Ltd.* | 8,948 | | | 15,624 | |
| DataTec Ltd. | 43,259 | | | 155,854 | |
| Exxaro Resources Ltd. | 27,762 | | | 180,919 | |
| Gold Fields Ltd., ADR | 163,422 | | | 491,900 | |
| Grindrod Ltd. | 36,236 | | | 35,487 | |
| Group Five Ltd. | 12,182 | | | 21,785 | |
| Harmony Gold Mining Co., Ltd., ADR | 55,043 | | | 121,645 | |
| Hudaco Industries Ltd. | 1,852 | | | 15,405 | |
| Impala Platinum Holdings Ltd.* | 77,694 | | | 241,787 | |
| Imperial Holdings Ltd. | 38,000 | | | 504,794 | |
| Investec Ltd. | 36,632 | | | 242,057 | |
| KAP Industrial Holdings Ltd. | 93,894 | | | 51,139 | |
| Kumba Iron Ore Ltd.@* | 8,122 | | | 94,031 | |
| Lewis Group Ltd.@ | 12,796 | | | 39,309 | |
| Liberty Holdings Ltd. | 21,825 | | | 176,396 | |
| Metair Investments Ltd. | 17,195 | | | 27,545 | |
| Mmi Holdings Ltd. | 165,787 | | | 284,767 | |
| Mondi Ltd. | 9,365 | | | 190,924 | |
| Mpact Ltd. | 8,681 | | | 17,857 | |
| MTN Group Ltd. | 215,960 | | | 1,983,994 | |
| Murray & Roberts Holdings Ltd. | 41,444 | | | 34,764 | |
| Nampak Ltd. | 66,852 | | | 90,345 | |
| Nedbank Group Ltd. | 27,286 | | | 473,113 | |
| Northam Platinum Ltd.* | 32,643 | | | 96,262 | |
| Omnia Holdings Ltd. | 11,411 | | | 153,711 | |
| Raubex Group Ltd. | 16,897 | | | 30,266 | |
| RCL Foods Ltd. | 15,951 | | | 14,750 | |
| Reunert Ltd. | 18,781 | | | 93,114 | |
| Royal Bafokeng Platinum Ltd.* | 4,240 | | | 10,994 | |
| Sanlam Ltd. | 13,414 | | | 61,436 | |
| Sappi Ltd.* | 44,625 | | | 292,274 | |
| Sappi Ltd., ADR* | 44,800 | | | 297,920 | |
| Sasol Ltd. | 25,120 | | | 729,616 | |
| Sasol Ltd., ADR | 48,002 | | | 1,372,377 | |
| Sibanye Gold Ltd. | 74,520 | | | 137,767 | |
| Standard Bank Group Ltd. | 207,913 | | | 2,297,319 | |
| Steinhoff International Holdings NV | 260,553 | | | 1,352,305 | |
| Super Group Ltd.* | 56,256 | | | 158,236 | |
| Telkom SA SOC Ltd. | 55,054 | | | 296,601 | |
| Tongaat Hulett Ltd. | 20,152 | | | 191,913 | |
| Trencor Ltd. | 21,056 | | | 43,695 | |
| Wilson Bayly Holmes-Ovcon Ltd. | 6,827 | | | 76,553 | |
| | | | | 14,995,129 | |
| Taiwan — 16.0% | | | | | |
| A-DATA Technology Co., Ltd. | 20,000 | | | 32,703 | |
| Ability Enterprise Co., Ltd. | 25,195 | | | 13,133 | |
| AcBel Polytech, Inc. | 46,000 | | | 34,326 | |
| Acer, Inc.* | 332,884 | | | 135,306 | |
| Alpha Networks, Inc. | 25,200 | | | 15,325 | |
| Altek Corp. | 23,905 | | | 16,429 | |
| Ambassador Hotel (The) | 20,000 | | | 14,490 | |
| AmTRAN Technology Co., Ltd. | 99,360 | | | 68,287 | |
| Arcadyan Technology Corp. | 17,000 | | | 30,066 | |
| Ardentec Corp. | 61,092 | | | 45,304 | |
See notes to financial statements
SA Emerging Markets Value Fund
PORTFOLIO OF INVESTMENTS — AS OF DECEMBER 31, 2016 (Unaudited) (Continued)
| | | SHARES | | VALUE† | |
| COMMON STOCKS (Continued) | | | | | |
| Taiwan (Continued) | | | | | |
| Asia Cement Corp. | 269,269 | | $ | 220,151 | |
| Asia Optical Co., Inc.* | 41,000 | | | 38,800 | |
| Asia Pacific Telecom Co., Ltd.* | 192,000 | | | 61,659 | |
| Asia Polymer Corp. | 26,775 | | | 15,826 | |
| Asia Vital Components Co., Ltd. | 53,000 | | | 41,277 | |
| Asustek Computer, Inc. | 86,000 | | | 707,127 | |
| AU Optronics Corp. | 868,000 | | | 317,801 | |
| AU Optronics Corp., ADR | 73,574 | | | 260,452 | |
| BES Engineering Corp. | 229,000 | | | 44,054 | |
| Capital Securities Corp. | 239,661 | | | 72,057 | |
| Career Technology MFG. Co., Ltd. | 39,000 | | | 21,721 | |
| Casetek Holdings Ltd. | 16,000 | | | 42,645 | |
| Cathay Financial Holding Co., Ltd. | 704,000 | | | 1,052,865 | |
| Cathay Real Estate Development | | | | | |
| Co., Ltd.* | 70,000 | | | 39,530 | |
| Chang Hwa Commercial Bank Ltd. | 568,824 | | | 302,688 | |
| Cheng Loong Corp. | 114,000 | | | 45,807 | |
| Cheng Uei Precision Industry Co., Ltd. | 62,543 | | | 71,025 | |
| Chia Hsin Cement Corp.§ | 22,000 | | | 5,959 | |
| Chin-Poon Industrial Co., Ltd. | 55,000 | | | 103,587 | |
| China Airlines Ltd. | 422,111 | | | 121,804 | |
| China Bills Finance Corp. | 110,000 | | | 44,370 | |
| China Development Financial | | | | | |
| Holding Corp. | 1,191,468 | | | 297,969 | |
| China Life Insurance Co., Ltd. | 534,508 | | | 531,539 | |
| China Metal Products | 31,000 | | | 30,684 | |
| China Motor Corp. | 71,195 | | | 57,877 | |
| China Steel Corp. | 1,495,800 | | | 1,144,046 | |
| China Synthetic Rubber Corp. | 61,261 | | | 54,268 | |
| Chipbond Technology Corp. | 97,000 | | | 138,296 | |
| ChipMOS TECHNOLOGIES, Inc. | 34,000 | | | 24,528 | |
| Chung Hung Steel Corp.* | 105,000 | | | 31,016 | |
| Chung Hwa Pulp Corp. | 79,367 | | | 22,681 | |
| Chung-Hsin Electric & Machinery | | | | | |
| Manufacturing Corp. | 87,000 | | | 52,234 | |
| Clevo Co. | 71,000 | | | 61,243 | |
| CMC Magnetics Corp.* | 288,337 | | | 31,223 | |
| Compal Electronics, Inc. | 648,000 | | | 370,958 | |
| Compeq Manufacturing Co., Ltd. | 118,000 | | | 56,933 | |
| Continental Holdings Corp. | 42,000 | | | 13,618 | |
| Coretronic Corp. | 64,800 | | | 68,160 | |
| CSBC Corp. | 67,240 | | | 28,791 | |
| CTBC Financial Holding Co., Ltd. | 2,174,280 | | | 1,190,730 | |
| D-Link Corp.* | 77,112 | | | 25,721 | |
| Depo Auto Parts Ind Co., Ltd. | 5,000 | | | 13,295 | |
| Dynapack International | | | | | |
| Technology Corp. | 23,000 | | | 26,476 | |
| E Ink Holdings, Inc. | 138,000 | | | 98,269 | |
| E.Sun Financial Holding Co., Ltd. | 1,075,442 | | | 612,317 | |
| Elite Semiconductor Memory | | | | | |
| Technology, Inc. | 45,000 | | | 46,426 | |
| Elitegroup Computer Systems Co., Ltd. | 58,877 | | | 28,499 | |
| Entie Commercial Bank Co., Ltd. | 45,000 | | | 20,316 | |
| Epistar Corp.* | 128,828 | | | 92,537 | |
| Eternal Materials Co., Ltd. | 40,046 | | | 40,942 | |
| Eva Airways Corp. | 324,728 | | | 147,104 | |
| Evergreen International Storage & | | | | | |
| Transport Corp. | 54,000 | | | 21,447 | |
| Evergreen Marine Corp. Taiwan Ltd.* | 220,794 | | | 76,044 | |
| Everlight Chemical Industrial Corp. | 26,000 | | | 16,256 | |
| Everlight Electronics Co., Ltd. | 51,000 | | | 72,950 | |
| Far Eastern Department Stores Ltd. | 134,220 | | | 66,633 | |
| Far Eastern International Bank | 301,174 | | | 85,038 | |
| Far Eastern New Century Corp. | 495,338 | | | 371,938 | |
| Farglory Land Development Co., Ltd. | 51,721 | | | 59,297 | |
| Federal Corp. | 75,590 | | | 30,373 | |
| Feng Hsin Iron & Steel Co. | 63,000 | | | 88,453 | |
| First Financial Holding Co., Ltd. | 1,052,744 | | | 561,829 | |
| Formosa Chemicals & Fibre Corp. | 87,000 | | | 259,955 | |
| Formosa Taffeta Co., Ltd. | 67,000 | | | 61,327 | |
| Formosan Rubber Group, Inc. | 61,200 | | | 30,383 | |
| Foxconn Technology Co., Ltd. | 137,127 | | | 362,932 | |
| Fubon Financial Holding Co., Ltd. | 993,211 | | | 1,571,683 | |
| Gemtek Technology Corp. | 47,000 | | | 34,343 | |
| Genius Electronic Optical Co., Ltd.* | 9,000 | | | 31,276 | |
| Getac Technology Corp. | 45,000 | | | 53,128 | |
| Gigabyte Technology Co., Ltd. | 76,000 | | | 101,635 | |
| Gigastorage Corp.* | 77,000 | | | 58,534 | |
| Gintech Energy Corp.* | 51,762 | | | 31,077 | |
| Gloria Material Technology Corp. | 94,392 | | | 55,061 | |
| Goldsun Building Materials Co., Ltd. | 193,953 | | | 39,899 | |
| Grand Pacific Petrochemical | 168,000 | | | 109,467 | |
| Great Wall Enterprise Co., Ltd. | 66,300 | | | 59,863 | |
| Greatek Electronics, Inc. | 33,000 | | | 39,933 | |
| Green Energy Technology, Inc.* | 40,149 | | | 20,056 | |
| HannStar Display Corp.* | 443,770 | | | 108,227 | |
| Hey Song Corp. | 19,750 | | | 19,794 | |
| Ho Tung Chemical Corp.* | 105,013 | | | 27,012 | |
| Holy Stone Enterprise Co., Ltd. | 18,200 | | | 18,155 | |
| Hon Hai Precision Industry Co., Ltd. | 665,335 | | | 1,738,224 | |
| HTC Corp.* | 64,000 | | | 156,877 | |
| Hua Nan Financial Holdings Co., Ltd. | 727,091 | | | 366,602 | |
| Huaku Development Co., Ltd. | 27,000 | | | 50,684 | |
| Hung Poo Real Estate | | | | | |
| Development Corp. | 21,000 | | | 16,746 | |
| Hung Sheng Construction Co., Ltd. | 66,000 | | | 38,295 | |
| Ichia Technologies, Inc.* | 72,000 | | | 35,521 | |
| Innolux Corp. | 1,455,757 | | | 523,962 | |
| Inventec Co., Ltd. | 364,282 | | | 249,795 | |
| ITEQ Corp. | 20,000 | | | 20,665 | |
| Jih Sun Financial Holdings Co., Ltd. | 235,822 | | | 50,488 | |
| KEE TAI Properties Co., Ltd. | 99,000 | | | 29,827 | |
| Kindom Construction Corp. | 42,000 | | | 25,477 | |
| King Yuan Electronics Co., Ltd. | 185,100 | | | 144,731 | |
| King’s Town Bank Co., Ltd. | 103,000 | | | 89,964 | |
| Kinpo Electronics | 230,000 | | | 84,924 | |
| Kinsus Interconnect Technology Corp. | 44,000 | | | 97,204 | |
| Kuoyang Construction Co., Ltd. | 39,000 | | | 14,461 | |
| LCY Chemical Corp. | 61,000 | | | 84,225 | |
| Lealea Enterprise Co., Ltd. | 109,406 | | | 27,972 | |
| Lextar Electronics Corp. | 40,000 | | | 16,383 | |
| Li Peng Enterprise Co., Ltd.* | 91,245 | | | 23,017 | |
| Lien Hwa Industrial Corp. | 66,975 | | | 45,822 | |
| Lite-On Technology Corp. | 302,874 | | | 456,721 | |
See notes to financial statements
SA Emerging Markets Value Fund
PORTFOLIO OF INVESTMENTS — AS OF DECEMBER 31, 2016 (Unaudited) (Continued)
| | | SHARES | | VALUE† | |
| COMMON STOCKS (Continued) | | | | | |
| Taiwan (Continued) | | | | | |
| Long Chen Paper Co., Ltd. | 89,698 | | $ | 45,504 | |
| Lotes Co., Ltd. | 12,000 | | | 35,446 | |
| Macronix International* | 577,044 | | | 82,898 | |
| Masterlink Securities Corp. | 120,725 | | | 33,638 | |
| Mega Financial Holding Co., Ltd. | 1,210,850 | | | 864,115 | |
| Mercuries & Associates Holdings Ltd. | 28,350 | | | 20,100 | |
| Mercuries Life Insurance Co., Ltd.* | 77,306 | | | 40,777 | |
| Micro-Star International Co., Ltd. | 40,374 | | | 92,200 | |
| Mitac Holdings Corp. | 48,059 | | | 46,226 | |
| Motech Industries, Inc.* | 34,000 | | | 29,855 | |
| Nan Ya Printed Circuit Board Corp. | 24,200 | | | 18,509 | |
| Neo Solar Power Corp.* | 91,849 | | | 43,033 | |
| Nien Hsing Textile Co., Ltd. | 19,358 | | | 14,566 | |
| OptoTech Corp. | 72,000 | | | 31,164 | |
| Orient Semiconductor Electronics Ltd.* | 62,000 | | | 21,834 | |
| Oriental Union Chemical Corp.* | 58,000 | | | 41,571 | |
| Pan-International Industrial Corp. | 34,380 | | | 26,295 | |
| Pegatron Corp. | 287,249 | | | 686,282 | |
| POU Chen Corp. | 146,133 | | | 182,275 | |
| Powertech Technology, Inc. | 107,000 | | | 288,839 | |
| President Securities Corp. | 104,825 | | | 38,380 | |
| Prince Housing & Development Corp. | 148,970 | | | 48,533 | |
| Qisda Corp. | 315,400 | | | 147,283 | |
| Radiant Opto-Electronics Corp. | 54,000 | | | 94,164 | |
| Radium Life Tech Co., Ltd.* | 99,488 | | | 28,924 | |
| Realtek Semiconductor Corp. | 19,000 | | | 60,132 | |
| Rich Development Co., Ltd. | 120,978 | | | 29,992 | |
| Ritek Corp.* | 117,247 | | | 18,553 | |
| Ruentex Development Co., Ltd.* | 43,097 | | | 49,209 | |
| Sampo Corp. | 62,000 | | | 35,204 | |
| Sanyang Industry Co., Ltd. | 24,573 | | | 15,783 | |
| Shihlin Electric & Engineering Corp. | 27,000 | | | 33,929 | |
| Shin Kong Financial Holding Co., Ltd.* | 881,813 | | | 216,151 | |
| Shin Zu Shing Co., Ltd. | 16,000 | | | 41,007 | |
| Shining Building Business Co., Ltd.* | 64,900 | | | 20,842 | |
| Shinkong Synthetic Fibers Corp. | 186,151 | | | 52,272 | |
| Sigurd Microelectronics Corp. | 53,000 | | | 38,316 | |
| Simplo Technology Co., Ltd. | 5,000 | | | 14,412 | |
| Sincere Navigation Corp. | 27,000 | | | 16,336 | |
| Sino-American Silicon Products, Inc. | 93,000 | | | 96,379 | |
| SinoPac Financial Holdings Co., Ltd. | 1,104,571 | | | 311,195 | |
| Sirtec International Co., Ltd. | 15,000 | | | 20,316 | |
| Solar Applied Materials | | | | | |
| Technology Co.*§ | 25,000 | | | 6,787 | |
| Synnex Technology International Corp. | 127,300 | | | 128,370 | |
| Systex Corp. | 20,000 | | | 36,055 | |
| TA Chen Stainless Pipe Co., Ltd.* | 84,918 | | | 46,373 | |
| Taichung Commercial Bank Co., Ltd. | 178,605 | | | 50,873 | |
| Taiflex Scientific Co., Ltd. | 37,740 | | | 39,755 | |
| Tainan Spinning Co., Ltd. | 142,427 | | | 53,914 | |
| Taishin Financial Holding Co., Ltd. | 949,647 | | | 347,694 | |
| Taiwan Business Bank | 466,276 | | | 117,911 | |
| Taiwan Cement Corp. | 499,772 | | | 545,068 | |
| Taiwan Cogeneration Corp. | 19,000 | | | 13,147 | |
| Taiwan Cooperative Financial | | | | | |
| Holding Co., Ltd. | 733,482 | | | 319,756 | |
| Taiwan Fertilizer Co., Ltd. | 87,000 | | | 108,382 | |
| Taiwan Glass Industrial Corp.* | 169,321 | | | 69,874 | |
| Taiwan Hon Chuan Enterprise Co., Ltd. | 36,925 | | | 60,379 | |
| Taiwan PCB Techvest Co., Ltd. | 28,000 | | | 26,107 | |
| Taiwan Styrene Monomer | 46,000 | | | 28,474 | |
| Taiwan Surface Mounting | | | | | |
| Technology Co., Ltd. | 27,518 | | | 22,541 | |
| Taiwan Union Technology Corp. | 46,000 | | | 53,166 | |
| Tatung Co., Ltd.* | 323,784 | | | 95,842 | |
| Teco Electric & Machinery Co., Ltd. | 247,000 | | | 213,823 | |
| Test Rite International Co., Ltd. | 36,000 | | | 22,452 | |
| Ton Yi Industrial Corp. | 120,000 | | | 51,568 | |
| Tong Hsing Electronic Industries Ltd. | 17,000 | | | 58,022 | |
| Tong Yang Industry Co., Ltd. | 2,921 | | | 5,755 | |
| TPK Holding Co., Ltd.* | 35,000 | | | 64,616 | |
| Tripod Technology Corp. | 71,000 | | | 160,377 | |
| TSRC Corp. | 90,000 | | | 92,432 | |
| Tung Ho Steel Enterprise Corp. | 119,000 | | | 78,093 | |
| TXC Corp. | 56,000 | | | 70,806 | |
| U-Ming Marine Transport Corp. | 47,000 | | | 36,604 | |
| Unimicron Technology Corp. | 197,000 | | | 75,795 | |
| Union Bank of Taiwan | 147,593 | | | 40,987 | |
| Unitech Printed Circuit Board Corp. | 92,000 | | | 26,062 | |
| United Microelectronics Corp. | 2,099,513 | | | 742,637 | |
| Universal Cement Corp. | 45,472 | | | 34,779 | |
| UPC Technology Corp. | 127,125 | | | 49,305 | |
| USI Corp. | 127,000 | | | 62,458 | |
| Wah Lee Industrial Corp. | 25,000 | | | 35,605 | |
| Walsin Lihwa Corp. | 385,000 | | | 141,557 | |
| Wan Hai Lines Ltd. | 133,650 | | | 67,594 | |
| Wei Chuan Foods Corp.* | 41,000 | | | 22,263 | |
| Win Semiconductors Corp. | 36,699 | | | 103,507 | |
| Winbond Electronics Corp. | 389,000 | | | 120,337 | |
| Wisdom Marine Lines Co., Ltd.* | 53,178 | | | 50,243 | |
| Wistron Corp. | 407,601 | | | 315,543 | |
| WPG Holdings Ltd. | 231,000 | | | 272,363 | |
| WT Microelectronics Co., Ltd. | 63,751 | | | 85,057 | |
| Yageo Corp. | 66,578 | | | 121,055 | |
| Yang Ming Marine Transport Corp.* | 189,365 | | | 28,320 | |
| Yeong Guan Energy Technology | | | | | |
| Group Co., Ltd. | 9,000 | | | 28,763 | |
| YFY, Inc. | 150,385 | | | 45,168 | |
| Yieh Phui Enterprise Co., Ltd.* | 143,105 | | | 49,953 | |
| Yuanta Financial Holding Co., Ltd. | 1,088,815 | | | 405,404 | |
| Yulon Motor Co., Ltd. | 111,272 | | | 92,528 | |
| Zhen Ding Technology Holding Ltd. | 54,000 | | | 106,898 | |
| | | | | 28,549,491 | |
| Thailand — 3.1% | | | | | |
| AP Thailand PCL | 308,500 | | | 64,611 | |
| Asia Aviation PCL, NUDR | 299,900 | | | 50,667 | |
| Bangchak Petroleum PCL | 74,000 | | | 69,225 | |
| Bangkok Bank PCL, NUDR | 23,100 | | | 102,887 | |
| Bangkok Insurance PCL | 2,100 | | | 20,173 | |
| Bangkokland PCL | 1,039,700 | | | 49,937 | |
| Banpu PCL | 178,550 | | | 95,731 | |
| Charoen Pokphand Foods PCL | 346,800 | | | 285,687 | |
| Esso Thailand PCL* | 67,600 | | | 24,163 | |
See notes to financial statements
SA Emerging Markets Value Fund
PORTFOLIO OF INVESTMENTS — AS OF DECEMBER 31, 2016 (Unaudited) (Continued)
| | | SHARES | | VALUE† | | |
| COMMON STOCKS (Continued) | | | | | | |
| Thailand (Continued) | | | | | | |
| Hana Microelectronics PCL | 43,900 | | $ | 48,423 | | |
| Indorama Ventures PCL | 128,400 | | | 120,116 | | |
| IRPC PCL | 1,153,000 | | | 154,547 | | |
| Kasikornbank PCL, NUDR | 12,000 | | | 59,480 | | |
| Kiatnakin Bank PCL | 58,000 | | | 95,559 | | |
| Krung Thai Bank PCL | 560,075 | | | 276,827 | | |
| MBK PCL | 15,500 | | | 6,276 | | |
| Precious Shipping PCL* | 87,600 | | | 20,059 | | |
| PTT Exploration & Production PCL | 291,500 | | | 783,482 | | |
| PTT Global Chemical PCL | 194,328 | | | 341,874 | | |
| PTT PCL | 204,200 | | | 2,121,233 | | |
| Quality Houses PCL | 280,800 | | | 20,230 | | |
| Sansiri PCL | 950,800 | | | 44,074 | | |
| Thai Airways International PCL* | 92,500 | | | 58,635 | | |
| Thai Oil PCL | 109,500 | | | 220,923 | | |
| Thaicom PCL | 48,300 | | | 26,166 | | |
| Thanachart Capital PCL | 81,200 | | | 99,770 | | |
| Thoresen Thai Agencies PCL | 166,348 | | | 42,272 | | |
| Tisco Financial Group PCL | 22,000 | | | 37,014 | | |
| TMB Bank PCL | 278,300 | | | 16,320 | | |
| TPI Polene PCL | 1,068,700 | | | 73,414 | | |
| Vinythai PCL | 42,500 | | | 19,582 | | |
| | | | | 5,449,357 | | |
| Turkey — 1.3% | | | | | | |
| Akbank TAS | 118,570 | | | 262,899 | | |
| Aksa Akrilik Kimya Sanayii | 9,237 | | | 24,043 | | |
| Anadolu Efes Biracilik Ve Malt | | | | | | |
| Sanayii AS | 8,559 | | | 42,784 | | |
| Dogan Sirketler Grubu Holding AS* | 220,612 | | | 47,539 | | |
| EIS Eczacibasi Ilac ve Sinai ve Finansal | | | | | | |
| Yatirimlar Sanayi ve Ticaret AS | 8,587 | | | 7,596 | | |
| Eregli Demir ve Celik Fabrikalari TAS | 22,426 | | | 32,683 | | |
| Kardemir Karabuk Demir Celik Sanayi | | | | | | |
| ve Ticaret AS, Class D | 116,190 | | | 37,885 | | |
| KOC Holding AS | 27,408 | | | 107,242 | | |
| Koza Altin Isletmeleri AS* | 2,999 | | | 13,894 | | |
| Koza Anadolu Metal Madencilik | | | | | | |
| Isletmeleri AS* | 13,776 | | | 8,359 | | |
| Sekerbank TAS* | 54,778 | | | 18,327 | | |
| Selcuk Ecza Deposu Ticaret ve | | | | | | |
| Sanayi AS | 11,784 | | | 10,258 | | |
| Tekfen Holding AS | 26,275 | | | 48,126 | | |
| Trakya Cam Sanayi AS | 56,975 | | | 45,879 | | |
| Turk Hava Yollari* | 102,444 | | | 145,523 | | |
| Turk Sise ve Cam Fabrikalari AS | 136,525 | | | 148,258 | | |
| Turkiye Garanti Bankasi AS | 188,742 | | | 407,784 | | |
| Turkiye Halk Bankasi AS | 102,935 | | | 272,594 | | |
| Turkiye Is Bankasi | 215,333 | | | 316,262 | | |
| Turkiye Sinai Kalkinma Bankasi AS | 86,052 | | | 34,402 | | |
| Turkiye Vakiflar Bankasi TAO | 90,420 | | | 111,522 | | |
| Yapi ve Kredi Bankasi AS* | 100,385 | | | 97,627 | | |
| | | | | 2,241,486 | | |
| TOTAL COMMON STOCKS | | | | | | |
| (Identified Cost $185,492,837) | | | | 171,114,587 | | |
| | | | | | | |
| PREFERRED STOCKS — 3.5% | | | | | | |
| Brazil — 3.3% | | | | | | |
| Banco ABC Brasil SA, 7.120% | 16,778 | | | 71,809 | | |
| Banco Bradesco SA, 4.600% | 58 | | | 517 | | |
| Banco do Estado do Rio Grande do | | | | | | |
| Sul SA, PF B, 10.740% | 22,800 | | | 72,294 | | |
| Cia Brasileira de Distribuicao, 2.550% | 28,643 | | | 481,828 | | |
| Marcopolo SA, 0.058% | 88,210 | | | 74,260 | | |
| Petroleo Brasileiro SA, 0.900% ADR* | 146,867 | | | 1,293,898 | | |
| Petroleo Brasileiro SA, 0.998%* | 395,307 | | | 1,806,070 | | |
| Suzano Papel e Celulose SA, | | | | | | |
| PF A, 2.330% | 55,800 | | | 243,451 | | |
| Usinas Siderurgicas de Minas Gerais SA, | | | | | | |
| PF A, 1.910%* | 44,812 | | | 56,450 | | |
| Vale SA, 8.000% | 254,690 | | | 1,826,425 | | |
| | | | | 5,927,002 | | |
| Colombia — 0.2% | | | | | | |
| Avianca Holdings SA, 2.500% | 41,262 | | | 49,482 | | |
| Grupo Argos SA, 1.430% | 8,921 | | | 53,906 | | |
| Grupo de Inversiones Suramericana | | | | | | |
| SA, 1.120% | 9,873 | | | 121,686 | | |
| | | | | 225,074 | | |
| TOTAL PREFERRED STOCKS | | | | | | |
| (Identified Cost $8,000,602) | | | | 6,152,076 | | |
| | |
| RIGHTS AND WARRANTS — 0.0% | | | | | | |
| Thailand — 0.0% | | | | | | |
| TPI Polene PCL 3/1/2017*§~ | 6,596 | | | — | | |
| TOTAL RIGHTS AND WARRANTS | | | | | | |
| (Identified Cost $0) | | | | — | | |
| | |
| SHORT-TERM INVESTMENTS — 1.7% | | | | | |
| Investment Company — 0.4% | | | | | | |
| State Street Institutional U.S. | | | | | | |
| Government Money Market | | | | | | |
| Fund, 0.170% | 660,012 | | | 660,012 | | |
| | |
| Collateral For Securities On Loan — 1.3% | | | | | | |
| State Street Navigator Securities | | | | | | |
| Lending Government Money | | | | | | |
| Market Portfolio | 2,362,815 | | | 2,362,815 | | |
| | |
| TOTAL SHORT-TERM INVESTMENTS | | | | | | |
| (Identified Cost $3,022,827) | | | | 3,022,827 | | |
| | |
| Total Investments — 101.1% | | | | | | |
| (Identified Cost $196,516,266)# | | | | 180,289,490 | | |
| Liabilities, Less Cash and | | | | | | |
| Other Assets — (1.1%) | | | | (1,948,197 | ) | |
| Net Assets — 100.0% | | | $ | 178,341,293 | | |
See notes to financial statements
SA Emerging Markets Value Fund
PORTFOLIO OF INVESTMENTS — AS OF DECEMBER 31, 2016 (Unaudited) (Continued)
| | † | | See Note 1 |
| @ | | A portion or all of the security/securities were held on loan. As of December 31, 2016, the market value of the securities on loan was $3,155,922. |
| * | | Non-income producing security |
| § | | Fair valued security. Fair values are determined pursuant to procedures approved by the Fund’s Board of Trustees. See Note 1 |
| ~ | | Bankrupt/delisted security |
| ± | | 144A Securities. Securities exempt from registration under Rule 144A of the Securities Act of 1933. These securities may be resold in transactions exempt from registration to qualified institutional buyers. These securities have been deemed by the Fund to be liquid and at December 31, 2016 amounted to $277,791 or 0.17% of the net assets of the Fund. |
| > | | Traded on the Korea (South), KRX KOSPI Market. |
| # | | At December 31, 2016, the aggregate cost of investment securities for U.S. federal income tax purposes was $196,516,266. Net unrealized depreciation aggregated $16,226,776 of which $16,486,394 related to appreciated investment securities and $32,713,170 related to depreciated investment securities. |
Key to abbreviations:
ADR — American Depository Receipt
GDR — Global Depository Receipt
MTN — Medium Term Note
See notes to financial statements
DFA INVESTMENT DIMENSIONS GROUP INC.
THE DFA INVESTMENT TRUST COMPANY
DEFINITIONS OF ABBREVIATIONS AND FOOTNOTES
Schedules of Investments/Summary Schedules of Portfolio Holdings
| Investment Abbreviations |
| | ADR | | American Depositary Receipt |
| P.L.C. | | Public Limited Company |
| | | |
| Investment Footnotes |
| † | | See Note B to Financial Statements. |
| †† | | Securities that have generally been fair value factored. See Note B to Financial Statements. |
| * | | Non-Income Producing Securities. |
| # | | Total or Partial Securities on Loan. |
| @ | | Security purchased with cash proceeds from Securities on Loan. |
| § | | Affiliated Fund. |
| | | |
| Financial Highlights |
| (A) | | Computed using average shares outstanding. |
| (B) | | Represents the combined ratios for the respective portfolio and its respective pro-rata share of its Master Fund(s). |
| | | |
| All Statements, Schedules and Notes to Financial Statements |
| — | | Amounts designated as — are either zero or rounded to zero. |
| SEC | | Securities and Exchange Commission |
THE JAPANESE SMALL COMPANY SERIES
SCHEDULE OF INVESTMENTS
December 31, 2016
(Unaudited)
| | | | | | | | Percentage | |
| | | | Shares | | Value†† | | of Net Assets** | |
| COMMON STOCKS — (92.0%) | | | | | | | | |
| Consumer Discretionary — (17.8%) | | | | | | | | |
| # | | Accordia Golf Co., Ltd. | 375,789 | | $ | 3,858,233 | | 0.1 | % | |
| | Adastria Co., Ltd. | 194,640 | | | 5,035,976 | | 0.2 | % | |
| # | | Aeon Fantasy Co., Ltd. | 49,332 | | | 1,347,144 | | 0.1 | % | |
| * | | AGORA Hospitality Group Co., Ltd. | 591,000 | | | 196,881 | | 0.0 | % | |
| | Ahresty Corp. | 137,600 | | | 1,540,686 | | 0.1 | % | |
| | Aigan Co., Ltd. | 37,800 | | | 63,019 | | 0.0 | % | |
| | Aisan Industry Co., Ltd. | 201,800 | | | 1,723,634 | | 0.1 | % | |
| #* | | Akebono Brake Industry Co., Ltd. | 588,400 | | | 1,522,166 | | 0.1 | % | |
| # | | Alpen Co., Ltd. | 111,900 | | | 2,005,878 | | 0.1 | % | |
| | Alpha Corp. | 30,400 | | | 293,220 | | 0.0 | % | |
| | Alpine Electronics, Inc. | 277,500 | | | 3,600,402 | | 0.1 | % | |
| | Amiyaki Tei Co., Ltd. | 25,600 | | | 853,153 | | 0.0 | % | |
| | Amuse, Inc. | 70,298 | | | 1,080,378 | | 0.0 | % | |
| * | | Anrakutei Co., Ltd. | 2,200 | | | 85,896 | | 0.0 | % | |
| #* | | AOI Pro, Inc. | 46,500 | | | 346,537 | | 0.0 | % | |
| | AOKI Holdings, Inc. | 268,400 | | | 3,294,544 | | 0.1 | % | |
| | Aoyama Trading Co., Ltd. | 304,000 | | | 10,563,899 | | 0.4 | % | |
| | Arata Corp. | 27,200 | | | 615,012 | | 0.0 | % | |
| | Arcland Sakamoto Co., Ltd. | 176,200 | | | 2,041,167 | | 0.1 | % | |
| | Arcland Service Holdings Co., Ltd. | 38,700 | | | 948,889 | | 0.0 | % | |
| | Asahi Broadcasting Corp. | 24,800 | | | 148,159 | | 0.0 | % | |
| | Asahi Co., Ltd. | 103,300 | | | 1,134,631 | | 0.0 | % | |
| | Asante, Inc. | 16,100 | | | 239,807 | | 0.0 | % | |
| | Asatsu-DK, Inc. | 207,400 | | | 5,014,787 | | 0.2 | % | |
| # | | Ashimori Industry Co., Ltd. | 254,000 | | | 346,731 | | 0.0 | % | |
| # | | ASKUL Corp. | 42,000 | | | 1,433,725 | | 0.1 | % | |
| | Atom Corp. | 420,300 | | | 2,586,623 | | 0.1 | % | |
| | Atsugi Co., Ltd. | 961,000 | | | 1,026,226 | | 0.0 | % | |
| | Autobacs Seven Co., Ltd. | 455,700 | | | 6,837,024 | | 0.2 | % | |
| | Avex Group Holdings, Inc. | 225,400 | | | 3,235,349 | | 0.1 | % | |
| | Belluna Co., Ltd. | 291,800 | | | 1,794,377 | | 0.1 | % | |
| | Best Denki Co., Ltd. | 351,100 | | | 458,702 | | 0.0 | % | |
| | Bic Camera, Inc. | 546,600 | | | 4,996,911 | | 0.2 | % | |
| | Bookoff Corp. | 59,400 | | | 399,577 | | 0.0 | % | |
| # | | BRONCO BILLY Co., Ltd. | 62,800 | | | 1,573,354 | | 0.1 | % | |
| | Calsonic Kansei Corp. | 241,000 | | | 3,693,896 | | 0.1 | % | |
| | Can Do Co., Ltd. | 65,500 | | | 986,148 | | 0.0 | % | |
| | Central Automotive Products, Ltd. | 1,400 | | | 12,711 | | 0.0 | % | |
| | Central Sports Co., Ltd. | 33,800 | | | 805,849 | | 0.0 | % | |
| # | | CHIMNEY Co., Ltd. | 27,800 | | | 682,877 | | 0.0 | % | |
| | Chiyoda Co., Ltd. | 102,100 | | | 2,421,389 | | 0.1 | % | |
| | Chofu Seisakusho Co., Ltd. | 109,200 | | | 2,447,746 | | 0.1 | % | |
| | Chori Co., Ltd. | 71,800 | | | 1,077,896 | | 0.0 | % | |
| | Chuo Spring Co., Ltd. | 196,000 | | | 530,681 | | 0.0 | % | |
| | Clarion Co., Ltd. | 677,000 | | | 2,422,207 | | 0.1 | % | |
| | Cleanup Corp. | 129,700 | | | 1,054,186 | | 0.0 | % | |
| | Coco's Japan Co., Ltd. | 2,100 | | | 34,482 | | 0.0 | % | |
| | Colowide Co., Ltd. | 357,500 | | | 5,932,400 | | 0.2 | % | |
| | Corona Corp. | 86,700 | | | 851,213 | | 0.0 | % | |
| | Create Restaurants Holdings, Inc. | 174,300 | | | 1,518,316 | | 0.1 | % | |
| #* | | Cross Plus, Inc. | 5,300 | | | 27,786 | | 0.0 | % | |
The Japanese Small Company Series
continued
| | | | | | | | Percentage | |
| | | | Shares | | Value†† | | of Net Assets** | |
| Consumer Discretionary — (Continued) | | | | | | | | |
| * | | D.A. Consortium Holdings, Inc. | 118,700 | | $ | 889,679 | | 0.0 | % | |
| | Daido Metal Co., Ltd. | 193,000 | | | 1,923,150 | | 0.1 | % | |
| # | | Daidoh, Ltd. | 139,800 | | | 486,586 | | 0.0 | % | |
| | Daiichikosho Co., Ltd. | 101,900 | | | 4,021,896 | | 0.1 | % | |
| | Daikoku Denki Co., Ltd. | 51,800 | | | 793,414 | | 0.0 | % | |
| | Daikyonishikawa Corp. | 221,700 | | | 2,842,862 | | 0.1 | % | |
| | Dainichi Co., Ltd. | 49,300 | | | 299,450 | | 0.0 | % | |
| | Daisyo Corp. | 47,200 | | | 641,522 | | 0.0 | % | |
| # | | DCM Holdings Co., Ltd. | 530,600 | | | 4,708,766 | | 0.2 | % | |
| | Descente, Ltd. | 250,600 | | | 2,878,545 | | 0.1 | % | |
| #* | | DLE, Inc. | 43,400 | | | 234,206 | | 0.0 | % | |
| | Doshisha Co., Ltd. | 146,100 | | | 2,620,392 | | 0.1 | % | |
| | Doutor Nichires Holdings Co., Ltd. | 195,386 | | | 3,588,361 | | 0.1 | % | |
| | Dunlop Sports Co., Ltd. | 76,600 | | | 678,339 | | 0.0 | % | |
| | Dynic Corp. | 174,000 | | | 261,708 | | 0.0 | % | |
| | Eagle Industry Co., Ltd. | 147,200 | | | 1,955,871 | | 0.1 | % | |
| # | | EDION Corp. | 513,900 | | | 4,812,395 | | 0.2 | % | |
| # | | ES-Con Japan, Ltd. | 209,400 | | | 781,830 | | 0.0 | % | |
| | Exedy Corp. | 193,000 | | | 5,420,973 | | 0.2 | % | |
| # | | F-Tech, Inc. | 40,800 | | | 457,596 | | 0.0 | % | |
| | FCC Co., Ltd. | 231,400 | | | 4,152,461 | | 0.1 | % | |
| | Fields Corp. | 75,900 | | | 879,726 | | 0.0 | % | |
| | Fine Sinter Co., Ltd. | 9,800 | | | 155,301 | | 0.0 | % | |
| | First Juken Co., Ltd. | 22,400 | | | 288,677 | | 0.0 | % | |
| | FJ Next Co., Ltd. | 36,800 | | | 230,808 | | 0.0 | % | |
| | Foster Electric Co., Ltd. | 140,200 | | | 2,641,266 | | 0.1 | % | |
| | France Bed Holdings Co., Ltd. | 139,600 | | | 1,108,081 | | 0.0 | % | |
| # | | FTGroup Co., Ltd. | 74,000 | | | 448,958 | | 0.0 | % | |
| # | | Fuji Co., Ltd. | 110,400 | | | 2,301,318 | | 0.1 | % | |
| | Fuji Corp. | 5,000 | | | 93,716 | | 0.0 | % | |
| | Fuji Corp., Ltd. | 149,600 | | | 961,919 | | 0.0 | % | |
| | Fuji Kiko Co., Ltd. | 137,400 | | | 582,071 | | 0.0 | % | |
| # | | Fuji Kyuko Co., Ltd. | 250,000 | | | 2,309,951 | | 0.1 | % | |
| | Fuji Oozx, Inc. | 6,000 | | | 19,560 | | 0.0 | % | |
| | Fujibo Holdings, Inc. | 67,100 | | | 1,901,544 | | 0.1 | % | |
| # | | Fujikura Rubber, Ltd. | 88,400 | | | 500,118 | | 0.0 | % | |
| # | | Fujio Food System Co., Ltd. | 8,300 | | | 187,707 | | 0.0 | % | |
| | Fujishoji Co., Ltd. | 47,100 | | | 524,012 | | 0.0 | % | |
| # | | Fujita Kanko, Inc. | 147,000 | | | 442,007 | | 0.0 | % | |
| | FuKoKu Co., Ltd. | 40,800 | | | 324,144 | | 0.0 | % | |
| # | | Funai Electric Co., Ltd. | 121,700 | | | 956,617 | | 0.0 | % | |
| # | | Furukawa Battery Co., Ltd. (The) | 89,000 | | | 564,392 | | 0.0 | % | |
| | Futaba Industrial Co., Ltd. | 344,700 | | | 2,008,548 | | 0.1 | % | |
| | G-7 Holdings, Inc. | 32,000 | | | 438,335 | | 0.0 | % | |
| | G-Tekt Corp. | 110,800 | | | 2,145,748 | | 0.1 | % | |
| | Gakken Holdings Co., Ltd. | 313,000 | | | 853,305 | | 0.0 | % | |
| | Gakkyusha Co., Ltd. | 10,500 | | | 129,495 | | 0.0 | % | |
| # | | Genki Sushi Co., Ltd. | 13,700 | | | 246,980 | | 0.0 | % | |
| # | | Geo Holdings Corp. | 223,300 | | | 2,595,734 | | 0.1 | % | |
| | Gfoot Co., Ltd. | 8,500 | | | 58,489 | | 0.0 | % | |
| # | | GLOBERIDE, Inc. | 62,299 | | | 1,027,773 | | 0.0 | % | |
| # | | Gokurakuyu Holdings Co., Ltd. | 18,000 | | | 134,381 | | 0.0 | % | |
The Japanese Small Company Series
continued
| | | | | | | | Percentage | |
| | | | Shares | | Value†† | | of Net Assets** | |
| Consumer Discretionary — (Continued) | | | | | | | | |
| | Goldwin, Inc. | 4,000 | | $ | 178,154 | | 0.0 | % | |
| | Golf Digest Online, Inc. | 49,500 | | | 375,391 | | 0.0 | % | |
| # | | Gourmet Kineya Co., Ltd. | 85,000 | | | 731,672 | | 0.0 | % | |
| | GSI Creos Corp. | 306,000 | | | 324,011 | | 0.0 | % | |
| | Gunze, Ltd. | 1,080,000 | | | 3,584,839 | | 0.1 | % | |
| | H-One Co., Ltd. | 84,200 | | | 763,137 | | 0.0 | % | |
| | H2O Retailing Corp. | 326,600 | | | 4,974,395 | | 0.2 | % | |
| | Hagihara Industries, Inc. | 35,500 | | | 788,615 | | 0.0 | % | |
| # | | Hakuyosha Co., Ltd. | 6,500 | | | 149,027 | | 0.0 | % | |
| # | | Handsman Co., Ltd. | 18,200 | | | 305,130 | | 0.0 | % | |
| # | | Happinet Corp. | 93,800 | | | 1,023,915 | | 0.0 | % | |
| | Hard Off Corp. Co., Ltd. | 57,900 | | | 606,568 | | 0.0 | % | |
| | Haruyama Holdings, Inc. | 47,900 | | | 351,831 | | 0.0 | % | |
| | Heiwa Corp. | 200,400 | | | 4,578,404 | | 0.2 | % | |
| | HI-LEX Corp. | 62,500 | | | 1,573,822 | | 0.1 | % | |
| | Hiday Hidaka Corp. | 97,447 | | | 2,320,686 | | 0.1 | % | |
| # | | Himaraya Co., Ltd. | 35,900 | | | 261,483 | | 0.0 | % | |
| # | | Hiramatsu, Inc. | 174,500 | | | 1,001,743 | | 0.0 | % | |
| # | | HIS Co., Ltd. | 247,200 | | | 6,481,648 | | 0.2 | % | |
| | Honeys Co., Ltd. | 106,040 | | | 1,103,290 | | 0.0 | % | |
| | Hoosiers Holdings | 181,100 | | | 938,234 | | 0.0 | % | |
| # | | Hotland Co., Ltd. | 32,300 | | | 311,513 | | 0.0 | % | |
| | I K K, Inc. | 21,700 | | | 125,794 | | 0.0 | % | |
| * | | IBJ, Inc. | 103,500 | | | 569,061 | | 0.0 | % | |
| | Ichibanya Co., Ltd. | 47,058 | | | 1,500,209 | | 0.1 | % | |
| # | | Ichikoh Industries, Ltd. | 286,000 | | | 920,444 | | 0.0 | % | |
| # | | IDOM, Inc. | 420,500 | | | 2,313,920 | | 0.1 | % | |
| | IJT Technology Holdings Co., Ltd. | 124,680 | | | 492,064 | | 0.0 | % | |
| | Imasen Electric Industrial | 93,900 | | | 803,658 | | 0.0 | % | |
| | Imperial Hotel, Ltd. | 13,000 | | | 230,664 | | 0.0 | % | |
| # | | Intage Holdings, Inc. | 95,900 | | | 1,620,492 | | 0.1 | % | |
| * | | Izuhakone Railway Co., Ltd. | 300 | | | — | | 0.0 | % | |
| * | | Izutsuya Co., Ltd. | 61,699 | | | 209,526 | | 0.0 | % | |
| #* | | Janome Sewing Machine Co., Ltd. | 106,400 | | | 726,541 | | 0.0 | % | |
| | Japan Wool Textile Co., Ltd. (The) | 343,000 | | | 2,549,630 | | 0.1 | % | |
| # | | Jin Co., Ltd. | 84,100 | | | 3,864,939 | | 0.1 | % | |
| # | | Joban Kosan Co., Ltd. | 35,399 | | | 483,527 | | 0.0 | % | |
| | Jolly - Pasta Co., Ltd. | 1,000 | | | 11,295 | | 0.0 | % | |
| | Joshin Denki Co., Ltd. | 205,000 | | | 1,731,838 | | 0.1 | % | |
| | Joyful Honda Co., Ltd. | 18,900 | | | 507,427 | | 0.0 | % | |
| # | | JP-Holdings, Inc. | 374,800 | | | 815,361 | | 0.0 | % | |
| | JVC Kenwood Corp. | 885,430 | | | 2,411,812 | | 0.1 | % | |
| # | | K's Holdings Corp. | 48,000 | | | 839,212 | | 0.0 | % | |
| * | | Kadokawa Dwango | 328,233 | | | 4,735,019 | | 0.2 | % | |
| # | | Kappa Create Co., Ltd. | 144,100 | | | 1,609,833 | | 0.1 | % | |
| | Kasai Kogyo Co., Ltd. | 143,900 | | | 1,702,828 | | 0.1 | % | |
| | Kawai Musical Instruments Manufacturing Co., Ltd. | 45,200 | | | 891,599 | | 0.0 | % | |
| | Keihin Corp. | 267,500 | | | 4,675,204 | | 0.2 | % | |
| # | | Keiyo Co., Ltd. | 179,800 | | | 860,694 | | 0.0 | % | |
| # | | KFC Holdings Japan, Ltd. | 88,700 | | | 1,453,098 | | 0.1 | % | |
| #* | | Kintetsu Department Store Co., Ltd. | 216,000 | | | 641,907 | | 0.0 | % | |
| | Kitamura Co., Ltd. | 2,000 | | | 13,822 | | 0.0 | % | |
The Japanese Small Company Series
continued
| | | | | | | | Percentage | |
| | | | Shares | | Value†† | | of Net Assets** | |
| Consumer Discretionary — (Continued) | | | | | | | | |
| #* | | KNT-CT Holdings Co., Ltd. | 697,000 | | $ | 863,417 | | 0.0 | % | |
| # | | Kohnan Shoji Co., Ltd. | 188,500 | | | 3,541,108 | | 0.1 | % | |
| #* | | Kojima Co., Ltd. | 176,000 | | | 434,505 | | 0.0 | % | |
| # | | Komatsu Seiren Co., Ltd. | 193,700 | | | 1,250,423 | | 0.1 | % | |
| # | | Komehyo Co., Ltd. | 18,600 | | | 219,189 | | 0.0 | % | |
| | Komeri Co., Ltd. | 202,200 | | | 4,558,800 | | 0.2 | % | |
| # | | Konaka Co., Ltd. | 117,560 | | | 586,435 | | 0.0 | % | |
| # | | Koshidaka Holdings Co., Ltd. | 56,300 | | | 954,171 | | 0.0 | % | |
| | Kourakuen Holdings Corp. | 48,400 | | | 677,151 | | 0.0 | % | |
| # | | KU Holdings Co., Ltd. | 130,900 | | | 915,977 | | 0.0 | % | |
| | Kura Corp. | 69,200 | | | 2,905,770 | | 0.1 | % | |
| | Kurabo Industries, Ltd. | 1,241,000 | | | 2,424,821 | | 0.1 | % | |
| | KYB Corp. | 1,157,000 | | | 5,597,718 | | 0.2 | % | |
| | Kyoritsu Maintenance Co., Ltd. | 83,831 | | | 4,879,933 | | 0.2 | % | |
| #* | | Laox Co., Ltd. | 172,800 | | | 1,055,095 | | 0.0 | % | |
| | LEC, Inc. | 41,600 | | | 1,147,430 | | 0.1 | % | |
| | Look, Inc. | 228,000 | | | 327,342 | | 0.0 | % | |
| # | | Mamiya-Op Co., Ltd. | 25,800 | | | 270,477 | | 0.0 | % | |
| | Mars Engineering Corp. | 50,500 | | | 970,601 | | 0.0 | % | |
| #* | | Maruzen CHI Holdings Co., Ltd. | 41,700 | | | 132,946 | | 0.0 | % | |
| # | | Matsuya Co., Ltd. | 188,500 | | | 1,646,317 | | 0.1 | % | |
| # | | Matsuya Foods Co., Ltd. | 52,100 | | | 1,680,244 | | 0.1 | % | |
| # | | Meiko Network Japan Co., Ltd. | 146,800 | | | 1,361,389 | | 0.1 | % | |
| | Meiwa Estate Co., Ltd. | 62,800 | | | 381,938 | | 0.0 | % | |
| | Mikuni Corp. | 118,000 | | | 398,739 | | 0.0 | % | |
| # | | Misawa Homes Co., Ltd. | 164,000 | | | 1,461,442 | | 0.1 | % | |
| | Mitsuba Corp. | 208,690 | | | 3,377,868 | | 0.1 | % | |
| | Mitsui Home Co., Ltd. | 165,000 | | | 718,762 | | 0.0 | % | |
| | Mizuno Corp. | 594,000 | | | 2,885,468 | | 0.1 | % | |
| # | | Monogatari Corp. (The) | 31,500 | | | 1,124,456 | | 0.0 | % | |
| | Morito Co., Ltd. | 18,700 | | | 144,541 | | 0.0 | % | |
| | Mr Max Corp. | 99,200 | | | 354,610 | | 0.0 | % | |
| | Murakami Corp. | 12,300 | | | 236,169 | | 0.0 | % | |
| | Musashi Seimitsu Industry Co., Ltd. | 145,900 | | | 3,784,183 | | 0.1 | % | |
| # | | Nafco Co., Ltd. | 35,800 | | | 546,950 | | 0.0 | % | |
| | Nagawa Co., Ltd. | 16,800 | | | 654,450 | | 0.0 | % | |
| * | | Naigai Co., Ltd. | 544,000 | | | 283,484 | | 0.0 | % | |
| # | | Nakayamafuku Co., Ltd. | 12,300 | | | 85,315 | | 0.0 | % | |
| # | | Next Co., Ltd. | 319,300 | | | 2,156,016 | | 0.1 | % | |
| | NHK Spring Co., Ltd. | 123,200 | | | 1,171,686 | | 0.1 | % | |
| | Nice Holdings, Inc. | 444,000 | | | 573,069 | | 0.0 | % | |
| | Nichirin Co., Ltd. | 15,600 | | | 234,637 | | 0.0 | % | |
| | Nihon Eslead Corp. | 35,000 | | | 403,925 | | 0.0 | % | |
| | Nihon House Holdings Co., Ltd. | 233,300 | | | 984,444 | | 0.0 | % | |
| | Nihon Plast Co., Ltd. | 44,500 | | | 415,882 | | 0.0 | % | |
| | Nihon Tokushu Toryo Co., Ltd. | 78,800 | | | 1,154,991 | | 0.1 | % | |
| | Nippon Felt Co., Ltd. | 58,200 | | | 255,277 | | 0.0 | % | |
| | Nippon Piston Ring Co., Ltd. | 48,600 | | | 848,669 | | 0.0 | % | |
| | Nippon Seiki Co., Ltd. | 244,400 | | | 5,199,618 | | 0.2 | % | |
| | Nippon View Hotel Co., Ltd. | 4,300 | | | 54,949 | | 0.0 | % | |
| | Nishikawa Rubber Co., Ltd. | 15,000 | | | 227,757 | | 0.0 | % | |
| | Nishimatsuya Chain Co., Ltd. | 172,700 | | | 2,064,448 | | 0.1 | % | |
The Japanese Small Company Series
continued
| | | | | | | | Percentage | |
| | | | Shares | | Value†† | | of Net Assets** | |
| Consumer Discretionary — (Continued) | | | | | | | | |
| | Nissan Shatai Co., Ltd. | 248,800 | | $ | 2,414,949 | | 0.1 | % | |
| | Nissan Tokyo Sales Holdings Co., Ltd. | 208,000 | | | 592,926 | | 0.0 | % | |
| | Nissei Build Kogyo Co., Ltd. | 388,000 | | | 1,758,114 | | 0.1 | % | |
| | Nissin Kogyo Co., Ltd. | 230,200 | | | 3,632,609 | | 0.1 | % | |
| | Nittan Valve Co., Ltd. | 86,000 | | | 293,181 | | 0.0 | % | |
| | Nojima Corp. | 129,700 | | | 1,393,098 | | 0.1 | % | |
| | Ohashi Technica, Inc. | 36,600 | | | 439,888 | | 0.0 | % | |
| # | | Ohsho Food Service Corp. | 66,700 | | | 2,511,466 | | 0.1 | % | |
| | Onward Holdings Co., Ltd. | 736,000 | | | 5,149,882 | | 0.2 | % | |
| | Ootoya Holdings Co., Ltd. | 9,400 | | | 160,040 | | 0.0 | % | |
| #* | | OPT Holdings, Inc. | 86,700 | | | 533,157 | | 0.0 | % | |
| # | | Otsuka Kagu, Ltd. | 55,600 | | | 507,379 | | 0.0 | % | |
| # | | Pacific Industrial Co., Ltd. | 248,400 | | | 3,152,746 | | 0.1 | % | |
| # | | PAL GROUP Holdings Co., Ltd. | 75,500 | | | 1,790,833 | | 0.1 | % | |
| | PALTAC Corp. | 214,634 | | | 5,062,176 | | 0.2 | % | |
| | PanaHome Corp. | 507,200 | | | 4,098,866 | | 0.1 | % | |
| | PAPYLESS Co., Ltd. | 3,100 | | | 119,173 | | 0.0 | % | |
| | Parco Co., Ltd. | 123,400 | | | 1,088,626 | | 0.0 | % | |
| | Paris Miki Holdings, Inc. | 159,100 | | | 632,872 | | 0.0 | % | |
| # | | PC Depot Corp. | 234,241 | | | 1,240,547 | | 0.1 | % | |
| | People Co., Ltd. | 17,000 | | | 337,367 | | 0.0 | % | |
| | PIA Corp. | 15,600 | | | 390,141 | | 0.0 | % | |
| | Piolax, Inc. | 56,700 | | | 3,759,296 | | 0.1 | % | |
| * | | Pioneer Corp. | 1,938,300 | | | 3,898,866 | | 0.1 | % | |
| | Plenus Co., Ltd. | 133,800 | | | 2,608,827 | | 0.1 | % | |
| | Press Kogyo Co., Ltd. | 577,600 | | | 2,545,621 | | 0.1 | % | |
| | Pressance Corp. | 214,000 | | | 2,650,242 | | 0.1 | % | |
| | Proto Corp. | 64,100 | | | 734,339 | | 0.0 | % | |
| # | | Raccoon Co., Ltd. | 30,400 | | | 122,162 | | 0.0 | % | |
| | Renaissance, Inc. | 60,600 | | | 771,800 | | 0.0 | % | |
| #* | | Renown, Inc. | 306,000 | | | 295,481 | | 0.0 | % | |
| # | | Resol Holdings Co., Ltd. | 168,000 | | | 477,681 | | 0.0 | % | |
| | Rhythm Watch Co., Ltd. | 559,000 | | | 873,919 | | 0.0 | % | |
| # | | Riberesute Corp. | 36,900 | | | 247,114 | | 0.0 | % | |
| # | | Ride On Express Co., Ltd. | 18,700 | | | 138,300 | | 0.0 | % | |
| # | | Right On Co., Ltd. | 87,425 | | | 751,411 | | 0.0 | % | |
| | Riken Corp. | 54,100 | | | 2,045,480 | | 0.1 | % | |
| | Ringer Hut Co., Ltd. | 122,100 | | | 2,366,659 | | 0.1 | % | |
| | Riso Kyoiku Co., Ltd. | 211,700 | | | 1,072,971 | | 0.0 | % | |
| | Round One Corp. | 456,600 | | | 3,160,255 | | 0.1 | % | |
| # | | Royal Holdings Co., Ltd. | 186,600 | | | 2,979,960 | | 0.1 | % | |
| # | | Sac's Bar Holdings, Inc. | 103,450 | | | 1,048,346 | | 0.0 | % | |
| | Saizeriya Co., Ltd. | 194,300 | | | 4,362,662 | | 0.2 | % | |
| # | | Sakai Ovex Co., Ltd. | 29,799 | | | 446,281 | | 0.0 | % | |
| | San Holdings, Inc. | 15,400 | | | 204,452 | | 0.0 | % | |
| | Sanden Holdings Corp. | 714,000 | | | 2,266,591 | | 0.1 | % | |
| # | | Sanei Architecture Planning Co., Ltd. | 50,300 | | | 745,023 | | 0.0 | % | |
| | Sangetsu Corp. | 328,750 | | | 5,689,231 | | 0.2 | % | |
| # | | Sanko Marketing Foods Co., Ltd. | 27,800 | | | 226,506 | | 0.0 | % | |
| | Sankyo Seiko Co., Ltd. | 183,400 | | | 625,419 | | 0.0 | % | |
| | Sanoh Industrial Co., Ltd. | 136,500 | | | 965,552 | | 0.0 | % | |
| # | | Sanrio Co., Ltd. | 306,400 | | | 5,768,593 | | 0.2 | % | |
The Japanese Small Company Series
continued
| | | | | | | | Percentage | |
| | | | Shares | | Value†† | | of Net Assets** | |
| Consumer Discretionary — (Continued) | | | | | | | | |
| | Sanyo Electric Railway Co., Ltd. | 296,000 | | $ | 1,539,782 | | 0.1 | % | |
| | Sanyo Housing Nagoya Co., Ltd. | 46,100 | | | 430,532 | | 0.0 | % | |
| # | | Sanyo Shokai, Ltd. | 694,000 | | | 1,043,805 | | 0.0 | % | |
| | Sato Restaurant Systems Co., Ltd. | 41,700 | | | 291,414 | | 0.0 | % | |
| # | | Scroll Corp. | 166,300 | | | 488,768 | | 0.0 | % | |
| # | | Seiko Holdings Corp. | 979,407 | | | 3,466,074 | | 0.1 | % | |
| | Seiren Co., Ltd. | 306,800 | | | 3,759,753 | | 0.1 | % | |
| | Senshukai Co., Ltd. | 174,500 | | | 1,056,047 | | 0.0 | % | |
| # | | Septeni Holdings Co., Ltd. | 609,000 | | | 2,082,471 | | 0.1 | % | |
| # | | SFP Dining Co., Ltd. | 49,600 | | | 628,008 | | 0.0 | % | |
| # | | Shidax Corp. | 105,200 | | | 392,338 | | 0.0 | % | |
| | Shikibo, Ltd. | 779,000 | | | 912,733 | | 0.0 | % | |
| | Shimachu Co., Ltd. | 297,200 | | | 7,908,168 | | 0.3 | % | |
| | Shimojima Co., Ltd. | 27,900 | | | 266,834 | | 0.0 | % | |
| | Shobunsha Publications, Inc. | 258,500 | | | 1,466,704 | | 0.1 | % | |
| | Shochiku Co., Ltd. | 54,000 | | | 598,903 | | 0.0 | % | |
| | Shoei Co., Ltd. | 44,400 | | | 793,418 | | 0.0 | % | |
| | Showa Corp. | 317,500 | | | 2,204,727 | | 0.1 | % | |
| | SKY Perfect JSAT Holdings, Inc. | 764,600 | | | 3,512,810 | | 0.1 | % | |
| # | | Snow Peak, Inc. | 22,200 | | | 578,524 | | 0.0 | % | |
| | SNT Corp. | 90,600 | | | 511,478 | | 0.0 | % | |
| # | | Soft99 Corp. | 68,600 | | | 468,663 | | 0.0 | % | |
| # | | Sotoh Co., Ltd. | 41,400 | | | 403,533 | | 0.0 | % | |
| | SPK Corp. | 19,800 | | | 403,517 | | 0.0 | % | |
| | St Marc Holdings Co., Ltd. | 101,400 | | | 3,079,268 | | 0.1 | % | |
| | Starts Corp., Inc. | 178,400 | | | 3,010,636 | | 0.1 | % | |
| | Step Co., Ltd. | 40,700 | | | 469,181 | | 0.0 | % | |
| # | | Studio Alice Co., Ltd. | 57,700 | | | 1,067,779 | | 0.0 | % | |
| | Suminoe Textile Co., Ltd. | 323,000 | | | 694,626 | | 0.0 | % | |
| | Sumitomo Riko Co., Ltd. | 235,200 | | | 2,304,005 | | 0.1 | % | |
| # | | Sun Corp. | 52,500 | | | 317,565 | | 0.0 | % | |
| | Suncall Corp. | 27,000 | | | 127,360 | | 0.0 | % | |
| | T RAD Co., Ltd. | 412,000 | | | 1,024,414 | | 0.0 | % | |
| | T-Gaia Corp. | 155,100 | | | 2,520,006 | | 0.1 | % | |
| | Tachi-S Co., Ltd. | 166,140 | | | 2,782,613 | | 0.1 | % | |
| # | | Tachikawa Corp. | 52,400 | | | 395,092 | | 0.0 | % | |
| | Taiho Kogyo Co., Ltd. | 98,200 | | | 1,372,027 | | 0.1 | % | |
| #* | | Takata Corp. | 168,000 | | | 1,232,265 | | 0.1 | % | |
| | Take And Give Needs Co., Ltd. | 54,070 | | | 337,268 | | 0.0 | % | |
| | Takihyo Co., Ltd. | 79,000 | | | 307,207 | | 0.0 | % | |
| # | | Tama Home Co., Ltd. | 95,900 | | | 430,187 | | 0.0 | % | |
| | Tamron Co., Ltd. | 128,500 | | | 2,128,808 | | 0.1 | % | |
| # | | TASAKI & Co., Ltd. | 88,900 | | | 1,194,106 | | 0.1 | % | |
| | TBK Co., Ltd. | 115,600 | | | 491,401 | | 0.0 | % | |
| | Tear Corp. | 7,100 | | | 38,892 | | 0.0 | % | |
| | Tenpos Busters Co., Ltd. | 5,000 | | | 74,909 | | 0.0 | % | |
| | Tigers Polymer Corp. | 50,600 | | | 345,832 | | 0.0 | % | |
| | Toa Corp. | 127,800 | | | 1,145,522 | | 0.0 | % | |
| #* | | Toabo Corp. | 54,799 | | | 256,057 | | 0.0 | % | |
| | Toei Animation Co., Ltd. | 26,100 | | | 1,345,829 | | 0.1 | % | |
| | Toei Co., Ltd. | 449,000 | | | 3,884,796 | | 0.1 | % | |
| | Tohokushinsha Film Corp. | 22,500 | | | 140,040 | | 0.0 | % | |
The Japanese Small Company Series
continued
| | | | | | | | Percentage | |
| | | | Shares | | Value†† | | of Net Assets** | |
| Consumer Discretionary — (Continued) | | | | | | | | |
| | Tokai Rika Co., Ltd. | 318,800 | | $ | 6,382,027 | | 0.2 | % | |
| | Token Corp. | 47,550 | | | 3,372,554 | | 0.1 | % | |
| | Tokyo Dome Corp. | 567,100 | | | 5,580,234 | | 0.2 | % | |
| # | | Tokyo Individualized Educational Institute, Inc. | 112,900 | | | 912,840 | | 0.0 | % | |
| | Tokyo Radiator Manufacturing Co., Ltd. | 1,700 | | | 14,152 | | 0.0 | % | |
| # | | Tokyotokeiba Co., Ltd. | 758,000 | | | 1,737,098 | | 0.1 | % | |
| # | | Tokyu Recreation Co., Ltd. | 83,000 | | | 559,519 | | 0.0 | % | |
| | Tomy Co., Ltd. | 440,593 | | | 4,668,519 | | 0.2 | % | |
| | Topre Corp. | 264,300 | | | 6,599,452 | | 0.2 | % | |
| | Toridoll Holdings Corp. | 146,300 | | | 3,149,669 | | 0.1 | % | |
| | Torikizoku Co., Ltd. | 43,700 | | | 934,337 | | 0.0 | % | |
| | Tosho Co., Ltd. | 51,200 | | | 2,352,431 | | 0.1 | % | |
| # | | Tow Co., Ltd. | 69,300 | | | 385,335 | | 0.0 | % | |
| | Toyo Tire & Rubber Co., Ltd. | 623,700 | | | 7,746,745 | | 0.3 | % | |
| | TPR Co., Ltd. | 131,000 | | | 3,676,080 | | 0.1 | % | |
| | TS Tech Co., Ltd. | 291,000 | | | 7,481,017 | | 0.3 | % | |
| | TSI Holdings Co., Ltd. | 436,295 | | | 2,610,842 | | 0.1 | % | |
| # | | Tsukada Global Holdings, Inc. | 109,400 | | | 636,152 | | 0.0 | % | |
| | Tsukamoto Corp. Co., Ltd. | 190,000 | | | 207,819 | | 0.0 | % | |
| | Tsutsumi Jewelry Co., Ltd. | 48,600 | | | 811,891 | | 0.0 | % | |
| | TV Asahi Holdings Corp. | 63,100 | | | 1,243,209 | | 0.1 | % | |
| | Tv Tokyo Holdings Corp. | 86,300 | | | 1,708,010 | | 0.1 | % | |
| #* | | Tyo, Inc. | 352,400 | | | 458,308 | | 0.0 | % | |
| # | | U-Shin, Ltd. | 114,300 | | | 747,646 | | 0.0 | % | |
| | Umenohana Co., Ltd. | 1,000 | | | 22,856 | | 0.0 | % | |
| | Unipres Corp. | 230,700 | | | 4,580,688 | | 0.2 | % | |
| # | | United Arrows, Ltd. | 155,700 | | | 4,294,125 | | 0.2 | % | |
| #* | | Unitika, Ltd. | 3,992,000 | | | 2,860,432 | | 0.1 | % | |
| * | | Universal Entertainment Corp. | 116,400 | | | 3,355,774 | | 0.1 | % | |
| | Usen Corp. | 685,080 | | | 2,479,843 | | 0.1 | % | |
| | ValueCommerce Co., Ltd. | 57,700 | | | 161,571 | | 0.0 | % | |
| # | | Vector, Inc. | 166,500 | | | 1,671,161 | | 0.1 | % | |
| | VIA Holdings, Inc. | 30,000 | | | 266,182 | | 0.0 | % | |
| # | | Village Vanguard Co., Ltd. | 32,100 | | | 323,891 | | 0.0 | % | |
| # | | VT Holdings Co., Ltd. | 504,700 | | | 2,485,122 | | 0.1 | % | |
| | Wacoal Holdings Corp. | 676,000 | | | 7,869,935 | | 0.3 | % | |
| # | | WATAMI Co., Ltd. | 141,100 | | | 1,332,132 | | 0.1 | % | |
| | Watts Co., Ltd. | 3,300 | | | 31,400 | | 0.0 | % | |
| | Workman Co., Ltd. | 2,200 | | | 64,368 | | 0.0 | % | |
| | Wowow, Inc. | 49,200 | | | 1,473,389 | | 0.1 | % | |
| | Xebio Holdings Co., Ltd. | 159,900 | | | 2,465,266 | | 0.1 | % | |
| | Yachiyo Industry Co., Ltd. | 24,000 | | | 212,987 | | 0.0 | % | |
| | Yamato International, Inc. | 13,900 | | | 47,867 | | 0.0 | % | |
| | Yellow Hat, Ltd. | 92,700 | | | 2,000,202 | | 0.1 | % | |
| # | | Yomiuri Land Co., Ltd. | 239,000 | | | 987,342 | | 0.0 | % | |
| | Yondoshi Holdings, Inc. | 17,520 | | | 369,499 | | 0.0 | % | |
| | Yorozu Corp. | 110,100 | | | 1,580,000 | | 0.1 | % | |
| | Yoshinoya Holdings Co., Ltd. | 54,500 | | | 747,169 | | 0.0 | % | |
| # | | Yume No Machi Souzou Iinkai Co., Ltd. | 14,300 | | | 334,203 | | 0.0 | % | |
| | Yutaka Giken Co., Ltd. | 3,100 | | | 61,294 | | 0.0 | % | |
| | Zenrin Co., Ltd. | 161,500 | | | 2,927,966 | | 0.1 | % | |
The Japanese Small Company Series
continued
| | | | | | | | Percentage | |
| | | | Shares | | Value†† | | of Net Assets** | |
| Consumer Discretionary — (Continued) | | | | | | | | |
| # | | Zojirushi Corp. | 232,300 | | $ | 3,112,010 | | 0.1 | % | |
| Total Consumer Discretionary | | | | 581,847,422 | | 19.2 | % | |
| Consumer Staples — (7.4%) | | | | | | | | |
| | Aeon Hokkaido Corp. | 273,900 | | | 1,382,056 | | 0.0 | % | |
| | Ain Holdings, Inc. | 124,600 | | | 8,235,354 | | 0.3 | % | |
| | Albis Co., Ltd. | 9,500 | | | 263,840 | | 0.0 | % | |
| | Arcs Co., Ltd. | 232,800 | | | 5,226,793 | | 0.2 | % | |
| | Ariake Japan Co., Ltd. | 115,800 | | | 6,187,610 | | 0.2 | % | |
| | Artnature, Inc. | 113,600 | | | 686,716 | | 0.0 | % | |
| | Axial Retailing, Inc. | 88,900 | | | 3,049,524 | | 0.1 | % | |
| | Belc Co., Ltd. | 59,400 | | | 2,288,154 | | 0.1 | % | |
| | Bourbon Corp. | 9,300 | | | 190,424 | | 0.0 | % | |
| | C'BON COSMETICS Co., Ltd. | 3,000 | | | 61,368 | | 0.0 | % | |
| | Cawachi, Ltd. | 91,800 | | | 2,287,333 | | 0.1 | % | |
| | Chubu Shiryo Co., Ltd. | 119,300 | | | 1,035,457 | | 0.0 | % | |
| # | | Chuo Gyorui Co., Ltd. | 93,000 | | | 220,312 | | 0.0 | % | |
| | Ci:z Holdings Co., Ltd. | 157,300 | | | 4,419,456 | | 0.2 | % | |
| | Coca-Cola East Japan Co., Ltd. | 108,400 | | | 2,386,331 | | 0.1 | % | |
| | Cocokara fine, Inc. | 109,660 | | | 4,022,363 | | 0.1 | % | |
| | Cota Co., Ltd. | 4,500 | | | 49,296 | | 0.0 | % | |
| | Create SD Holdings Co., Ltd. | 164,400 | | | 3,514,999 | | 0.1 | % | |
| # | | Daikokutenbussan Co., Ltd. | 38,300 | | | 1,605,706 | | 0.1 | % | |
| | DyDo Group Holdings, Inc. | 47,100 | | | 2,448,022 | | 0.1 | % | |
| # | | Earth Chemical Co., Ltd. | 26,300 | | | 1,068,805 | | 0.0 | % | |
| | Eco's Co., Ltd. | 22,000 | | | 245,599 | | 0.0 | % | |
| | FamilyMart UNY Holdings Co., Ltd. | — | | | 27 | | 0.0 | % | |
| | Fancl Corp. | 95,300 | | | 1,331,689 | | 0.0 | % | |
| | Feed One Co., Ltd. | 812,440 | | | 1,075,335 | | 0.0 | % | |
| * | | First Baking Co., Ltd. | 183,000 | | | 214,377 | | 0.0 | % | |
| | Fuji Oil Holdings, Inc. | 362,600 | | | 7,112,207 | | 0.2 | % | |
| | Fujicco Co., Ltd. | 90,400 | | | 1,864,369 | | 0.1 | % | |
| # | | Genky Stores, Inc. | 24,200 | | | 1,161,794 | | 0.0 | % | |
| # | | HABA Laboratories, Inc. | 3,300 | | | 109,809 | | 0.0 | % | |
| | Hagoromo Foods Corp. | 39,000 | | | 432,570 | | 0.0 | % | |
| | Halows Co., Ltd. | 19,300 | | | 395,713 | | 0.0 | % | |
| * | | Hayashikane Sangyo Co., Ltd. | 24,200 | | | 178,184 | | 0.0 | % | |
| | Heiwado Co., Ltd. | 182,000 | | | 4,290,317 | | 0.1 | % | |
| # | | Hokkaido Coca-Cola Bottling Co., Ltd. | 87,000 | | | 486,732 | | 0.0 | % | |
| | Hokuto Corp. | 152,100 | | | 2,742,821 | | 0.1 | % | |
| # | | House Foods Group, Inc. | 99,700 | | | 2,062,810 | | 0.1 | % | |
| | Ichimasa Kamaboko Co., Ltd. | 3,300 | | | 32,252 | | 0.0 | % | |
| # | | Inageya Co., Ltd. | 177,800 | | | 2,248,446 | | 0.1 | % | |
| | Itochu-Shokuhin Co., Ltd. | 26,800 | | | 1,001,679 | | 0.0 | % | |
| | Iwatsuka Confectionery Co., Ltd. | 2,200 | | | 76,816 | | 0.0 | % | |
| | J-Oil Mills, Inc. | 56,300 | | | 1,918,065 | | 0.1 | % | |
| | Kadoya Sesame Mills, Inc. | 400 | | | 12,790 | | 0.0 | % | |
| # | | Kakiyasu Honten Co., Ltd. | 27,700 | | | 457,757 | | 0.0 | % | |
| | Kameda Seika Co., Ltd. | 72,000 | | | 3,283,803 | | 0.1 | % | |
| | Kaneko Seeds Co., Ltd. | 28,700 | | | 371,626 | | 0.0 | % | |
| | Kato Sangyo Co., Ltd. | 119,100 | | | 2,784,135 | | 0.1 | % | |
| # | | Kenko Mayonnaise Co., Ltd. | 58,500 | | | 1,648,517 | | 0.1 | % | |
The Japanese Small Company Series
continued
| | | | Shares | | Value†† | | Percentage
of Net Assets** | |
| Consumer Staples — (Continued) | | | | | | | | |
| # | | Key Coffee, Inc. | 109,700 | | $ | 2,042,005 | | 0.1 | % | |
| | Kirindo Holdings Co., Ltd. | 29,300 | | | 208,182 | | 0.0 | % | |
| | Kobe Bussan Co., Ltd. | 78,000 | | | 2,730,949 | | 0.1 | % | |
| # | | Kotobuki Spirits Co., Ltd. | 107,100 | | | 2,553,153 | | 0.1 | % | |
| | Kusuri no Aoki Holdings Co., Ltd. | 92,700 | | | 4,124,406 | | 0.1 | % | |
| | Kyokuyo Co., Ltd. | 58,699 | | | 1,369,656 | | 0.0 | % | |
| | Life Corp. | 165,100 | | | 4,645,666 | | 0.2 | % | |
| | Mandom Corp. | 104,400 | | | 4,494,644 | | 0.2 | % | |
| | | Marudai Food Co., Ltd. | 602,000 | | | 2,537,073 | | 0.1 | % | |
| | Maruha Nichiro Corp. | 244,307 | | | 6,582,885 | | 0.2 | % | |
| # | | Maxvalu Nishinihon Co., Ltd. | 5,600 | | | 79,551 | | 0.0 | % | |
| # | | Maxvalu Tokai Co., Ltd. | 49,300 | | | 795,653 | | 0.0 | % | |
| | Medical System Network Co., Ltd. | 143,300 | | | 527,813 | | 0.0 | % | |
| | Megmilk Snow Brand Co., Ltd. | 88,700 | | | 2,438,199 | | 0.1 | % | |
| | Meito Sangyo Co., Ltd. | 52,200 | | | 617,541 | | 0.0 | % | |
| | Milbon Co., Ltd. | 66,576 | | | 2,515,734 | | 0.1 | % | |
| | Ministop Co., Ltd. | 92,800 | | | 1,620,108 | | 0.1 | % | |
| | Mitsubishi Shokuhin Co., Ltd. | 81,100 | | | 2,406,662 | | 0.1 | % | |
| | Mitsui Sugar Co., Ltd. | 112,770 | | | 2,415,575 | | 0.1 | % | |
| | Miyoshi Oil & Fat Co., Ltd. | 379,000 | | | 469,255 | | 0.0 | % | |
| | Morinaga & Co., Ltd. | 40,300 | | | 1,676,431 | | 0.1 | % | |
| | Morinaga Milk Industry Co., Ltd. | 1,164,000 | | | 8,368,211 | | 0.3 | % | |
| | Morozoff, Ltd. | 189,000 | | | 815,312 | | 0.0 | % | |
| | Nagatanien Holdings Co., Ltd. | 138,000 | | | 1,647,461 | | 0.1 | % | |
| | Nakamuraya Co., Ltd. | 18,400 | | | 784,677 | | 0.0 | % | |
| | Natori Co., Ltd. | 39,700 | | | 645,731 | | 0.0 | % | |
| | Nichimo Co., Ltd. | 170,000 | | | 251,115 | | 0.0 | % | |
| | Nihon Chouzai Co., Ltd. | 28,760 | | | 1,070,357 | | 0.0 | % | |
| | Niitaka Co., Ltd. | 2,060 | | | 25,522 | | 0.0 | % | |
| | Nippon Beet Sugar Manufacturing Co., Ltd. | 66,100 | | | 1,310,086 | | 0.0 | % | |
| | Nippon Flour Mills Co., Ltd. | 361,000 | | | 5,009,985 | | 0.2 | % | |
| | Nippon Suisan Kaisha, Ltd. | 1,570,900 | | | 7,541,841 | | 0.3 | % | |
| | Nisshin Oillio Group, Ltd. (The) | 793,000 | | | 3,642,215 | | 0.1 | % | |
| | Nissin Sugar Co., Ltd. | 62,600 | | | 884,313 | | 0.0 | % | |
| | Nitto Fuji Flour Milling Co., Ltd. | 6,400 | | | 210,056 | | 0.0 | % | |
| | Noevir Holdings Co., Ltd. | 61,300 | | | 1,916,156 | | 0.1 | % | |
| | Oenon Holdings, Inc. | 307,000 | | | 679,475 | | 0.0 | % | |
| # | | OIE Sangyo Co., Ltd. | 20,900 | | | 195,446 | | 0.0 | % | |
| | Okuwa Co., Ltd. | 123,000 | | | 1,234,215 | | 0.0 | % | |
| | Olympic Group Corp. | 63,100 | | | 337,176 | | 0.0 | % | |
| # | | OUG Holdings, Inc. | 34,000 | | | 76,107 | | 0.0 | % | |
| | Prima Meat Packers, Ltd. | 956,000 | | | 3,396,448 | | 0.1 | % | |
| | Qol Co., Ltd. | 90,900 | | | 1,085,777 | | 0.0 | % | |
| | Riken Vitamin Co., Ltd. | 74,100 | | | 2,995,110 | | 0.1 | % | |
| | Rock Field Co., Ltd. | 132,000 | | | 1,785,278 | | 0.1 | % | |
| | Rokko Butter Co., Ltd. | 69,000 | | | 1,489,291 | | 0.1 | % | |
| # | | S Foods, Inc. | 77,062 | | | 1,996,993 | | 0.1 | % | |
| | S&B Foods, Inc. | 499 | | | 21,293 | | 0.0 | % | |
| | Sagami Rubber Industries Co., Ltd. | 2,000 | | | 15,463 | | 0.0 | % | |
| | Sakata Seed Corp. | 154,500 | | | 4,357,664 | | 0.1 | % | |
| | San-A Co., Ltd. | 101,200 | | | 4,887,735 | | 0.2 | % | |
| | Sapporo Holdings, Ltd. | 200,000 | | | 5,138,430 | | 0.2 | % | |
The Japanese Small Company Series
continued
| | | | Shares | | Value†† | | Percentage
of Net Assets** | |
| Consumer Staples — (Continued) | | | | | | | | |
| # | | Shoei Foods Corp. | 75,600 | | $ | 1,428,164 | | 0.1 | % | |
| | Showa Sangyo Co., Ltd. | 609,000 | | | 3,124,156 | | 0.1 | % | |
| | Sogo Medical Co., Ltd. | 55,800 | | | 2,045,373 | | 0.1 | % | |
| | ST Corp. | 81,200 | | | 1,052,888 | | 0.0 | % | |
| # | | Starzen Co., Ltd. | 55,800 | | | 2,301,764 | | 0.1 | % | |
| | Takara Holdings, Inc. | 980,300 | | | 9,002,362 | | 0.3 | % | |
| | Tobu Store Co., Ltd. | 19,000 | | | 460,686 | | 0.0 | % | |
| | Toho Co., Ltd. | 44,100 | | | 953,302 | | 0.0 | % | |
| | Tohto Suisan Co., Ltd. | 17,299 | | | 269,678 | | 0.0 | % | |
| # | | Torigoe Co., Ltd. (The) | 82,000 | | | 545,935 | | 0.0 | % | |
| | Toyo Sugar Refining Co., Ltd. | 157,000 | | | 154,394 | | 0.0 | % | |
| | Transaction Co., Ltd. | 9,500 | | | 134,068 | | 0.0 | % | |
| | United Super Markets Holdings, Inc. | 300,300 | | | 2,529,309 | | 0.1 | % | |
| | Valor Holdings Co., Ltd. | 220,500 | | | 5,737,992 | | 0.2 | % | |
| | Warabeya Nichiyo Holdings Co., Ltd. | 85,460 | | | 1,802,216 | | 0.1 | % | |
| | Watahan & Co., Ltd. | 27,500 | | | 385,324 | | 0.0 | % | |
| | YA-MAN, Ltd. | 800 | | | 39,814 | | 0.0 | % | |
| # | | Yaizu Suisankagaku Industry Co., Ltd. | 46,100 | | | 437,638 | | 0.0 | % | |
| | Yakuodo Co., Ltd. | 54,300 | | | 1,012,856 | | 0.0 | % | |
| | Yamatane Corp. | 53,500 | | | 725,559 | | 0.0 | % | |
| # | | Yamaya Corp. | 25,600 | | | 373,843 | | 0.0 | % | |
| | Yamazawa Co., Ltd. | 700 | | | 10,546 | | 0.0 | % | |
| | Yaoko Co., Ltd. | 111,400 | | | 4,431,528 | | 0.2 | % | |
| # | | Yokohama Reito Co., Ltd. | 291,700 | | | 2,555,311 | | 0.1 | % | |
| | Yomeishu Seizo Co., Ltd. | 49,800 | | | 799,536 | | 0.0 | % | |
| | Yuasa Funashoku Co., Ltd. | 125,000 | | | 335,351 | | 0.0 | % | |
| | Yutaka Foods Corp. | 6,000 | | | 98,644 | | 0.0 | % | |
| Total Consumer Staples | | | | 241,584,475 | | 8.0 | % | |
| | | | | | | | | |
| Energy — (1.0%) | | | | | | | | |
| # | | BP Castrol K.K. | 57,400 | | | 680,338 | | 0.0 | % | |
| | Cosmo Energy Holdings Co., Ltd. | 363,000 | | | 5,089,753 | | 0.2 | % | |
| | Fuji Kosan Co., Ltd. | 33,100 | | | 128,341 | | 0.0 | % | |
| * | | Fuji Oil Co., Ltd. | 284,800 | | | 927,181 | | 0.0 | % | |
| | Itochu Enex Co., Ltd. | 302,200 | | | 2,368,205 | | 0.1 | % | |
| # | | Japan Drilling Co., Ltd. | 41,100 | | | 857,119 | | 0.0 | % | |
| | Japan Oil Transportation Co., Ltd. | 8,400 | | | 174,072 | | 0.0 | % | |
| | Japan Petroleum Exploration Co., Ltd. | 190,600 | | | 4,225,502 | | 0.2 | % | |
| | Mitsuuroko Group Holdings Co., Ltd. | 181,700 | | | 1,078,087 | | 0.0 | % | |
| # | | Modec, Inc. | 108,300 | | | 1,726,278 | | 0.1 | % | |
| | Nippon Coke & Engineering Co., Ltd. | 1,272,800 | | | 1,163,465 | | 0.0 | % | |
| | Nippon Gas Co., Ltd. | 206,100 | | | 5,904,166 | | 0.2 | % | |
| | Sala Corp. | 208,100 | | | 1,158,110 | | 0.0 | % | |
| | San-Ai Oil Co., Ltd. | 310,000 | | | 2,213,817 | | 0.1 | % | |
| | Shinko Plantech Co., Ltd. | 237,200 | | | 1,721,630 | | 0.1 | % | |
| | Sinanen Holdings Co., Ltd. | 52,000 | | | 948,329 | | 0.0 | % | |
| | Toa Oil Co., Ltd. | 415,000 | | | 507,051 | | 0.0 | % | |
| | Toyo Kanetsu K.K. | 568,000 | | | 1,526,337 | | 0.1 | % | |
| Total Energy | | | | 32,397,781 | | 1.1 | % | |
| | | | | | | | | |
| Financials — (9.0%) | | | | | | | | |
| | 77 Bank, Ltd. (The) | 1,749,760 | | | 8,427,668 | | 0.3 | % | |
The Japanese Small Company Series
continued
| | | | Shares | | Value†† | | Percentage
of Net Assets** | |
| Financials — (Continued) | | | | | | | | |
| # | | Accretive Co., Ltd. | 57,800 | | $ | 236,420 | | 0.0 | % | |
| | Advance Create Co., Ltd. | 3,200 | | | 48,471 | | 0.0 | % | |
| | Aichi Bank, Ltd. (The) | 51,700 | | | 2,916,724 | | 0.1 | % | |
| | Aizawa Securities Co., Ltd. | 162,800 | | | 911,475 | | 0.0 | % | |
| | Akita Bank, Ltd. (The) | 1,079,400 | | | 3,486,958 | | 0.1 | % | |
| | Anicom Holdings, Inc. | 88,500 | | | 1,829,299 | | 0.1 | % | |
| | Aomori Bank, Ltd. (The) | 1,186,000 | | | 3,973,469 | | 0.1 | % | |
| | Asax Co., Ltd. | 1,700 | | | 23,556 | | 0.0 | % | |
| | Awa Bank, Ltd. (The) | 1,178,000 | | | 7,178,698 | | 0.2 | % | |
| # | | Bank of Iwate, Ltd. (The) | 99,400 | | | 4,000,471 | | 0.1 | % | |
| | Bank of Kochi, Ltd. (The) | 301,000 | | | 342,089 | | 0.0 | % | |
| # | | Bank of Nagoya, Ltd. (The) | 102,430 | | | 3,630,519 | | 0.1 | % | |
| | Bank of Okinawa, Ltd. (The) | 132,960 | | | 4,836,381 | | 0.2 | % | |
| | Bank of Saga, Ltd. (The) | 808,000 | | | 2,059,881 | | 0.1 | % | |
| | Bank of the Ryukyus, Ltd. | 227,380 | | | 2,980,862 | | 0.1 | % | |
| | Bank of Toyama, Ltd. (The) | 300 | | | 11,514 | | 0.0 | % | |
| | Chiba Kogyo Bank, Ltd. (The) | 259,600 | | | 1,311,512 | | 0.0 | % | |
| # | | Chukyo Bank, Ltd. (The) | 70,000 | | | 1,403,730 | | 0.1 | % | |
| # | | Daisan Bank, Ltd. (The) | 85,500 | | | 1,328,950 | | 0.1 | % | |
| | Daishi Bank, Ltd. (The) | 2,071,000 | | | 9,273,305 | | 0.3 | % | |
| | Daito Bank, Ltd. (The) | 873,000 | | | 1,246,907 | | 0.0 | % | |
| | Dream Incubator, Inc. | 8,300 | | | 143,072 | | 0.0 | % | |
| # | | DSB Co., Ltd. | 55,800 | | | 298,311 | | 0.0 | % | |
| | eGuarantee, Inc. | 39,200 | | | 828,549 | | 0.0 | % | |
| # | | Ehime Bank, Ltd. (The) | 190,600 | | | 2,245,189 | | 0.1 | % | |
| | Eighteenth Bank, Ltd. (The) | 1,048,000 | | | 3,121,321 | | 0.1 | % | |
| | FIDEA Holdings Co., Ltd. | 874,800 | | | 1,559,153 | | 0.1 | % | |
| # | | Financial Products Group Co., Ltd. | 409,700 | | | 3,529,693 | | 0.1 | % | |
| | Fukui Bank, Ltd. (The) | 1,317,000 | | | 3,313,824 | | 0.1 | % | |
| | Fukushima Bank, Ltd. (The) | 1,421,000 | | | 1,177,922 | | 0.0 | % | |
| | Fuyo General Lease Co., Ltd. | 92,800 | | | 4,425,142 | | 0.2 | % | |
| | GCA Corp. | 119,400 | | | 837,743 | | 0.0 | % | |
| | GMO Click Holdings, Inc. | 19,500 | | | 143,848 | | 0.0 | % | |
| | Gunma Bank, Ltd. (The) | 458,100 | | | 2,503,384 | | 0.1 | % | |
| | Hokkoku Bank, Ltd. (The) | 1,742,000 | | | 6,184,349 | | 0.2 | % | |
| | Hokuetsu Bank, Ltd. (The) | 130,000 | | | 2,941,461 | | 0.1 | % | |
| | Hokuhoku Financial Group, Inc. | 364,900 | | | 6,286,485 | | 0.2 | % | |
| | Hyakugo Bank, Ltd. (The) | 1,614,609 | | | 6,552,965 | | 0.2 | % | |
| | Hyakujushi Bank, Ltd. (The) | 1,584,000 | | | 5,370,322 | | 0.2 | % | |
| | IBJ Leasing Co., Ltd. | 116,300 | | | 2,596,496 | | 0.1 | % | |
| | Ichiyoshi Securities Co., Ltd. | 229,400 | | | 1,755,176 | | 0.1 | % | |
| | IwaiCosmo Holdings, Inc. | 106,900 | | | 998,857 | | 0.0 | % | |
| | Iyo Bank, Ltd. (The) | 419,200 | | | 2,885,094 | | 0.1 | % | |
| | J Trust Co., Ltd. | 171,900 | | | 1,735,738 | | 0.1 | % | |
| | Jaccs Co., Ltd. | 449,000 | | | 1,983,489 | | 0.1 | % | |
| | Jafco Co., Ltd. | 218,500 | | | 7,153,050 | | 0.2 | % | |
| | Japan Securities Finance Co., Ltd. | 352,600 | | | 1,917,755 | | 0.1 | % | |
| | Jimoto Holdings, Inc. | 533,300 | | | 902,679 | | 0.0 | % | |
| | Juroku Bank, Ltd. (The) | 2,085,000 | | | 7,295,171 | | 0.2 | % | |
| | kabu.com Securities Co., Ltd. | 1,026,600 | | | 3,527,332 | | 0.1 | % | |
| | Kansai Urban Banking Corp. | 149,200 | | | 1,859,500 | | 0.1 | % | |
| | Keiyo Bank, Ltd. (The) | 1,576,000 | | | 7,130,615 | | 0.2 | % | |
The Japanese Small Company Series
continued
| | | | Shares | | Value†† | | Percentage
of Net Assets** | |
| Financials — (Continued) | | | | | | | | |
| | Kita-Nippon Bank, Ltd. (The) | 49,506 | | $ | 1,319,513 | | 0.0 | % | |
| | Kiyo Bank, Ltd. (The) | 396,690 | | | 6,327,307 | | 0.2 | % | |
| | Kosei Securities Co., Ltd. (The) | 67,000 | | | 113,420 | | 0.0 | % | |
| | Kyokuto Securities Co., Ltd. | 128,800 | | | 1,899,766 | | 0.1 | % | |
| | Kyushu Financial Group, Inc. | 410,520 | | | 2,781,478 | | 0.1 | % | |
| * | | M&A Capital Partners Co., Ltd. | 27,300 | | | 746,201 | | 0.0 | % | |
| # | | Marusan Securities Co., Ltd. | 119,100 | | | 1,002,118 | | 0.0 | % | |
| | Matsui Securities Co., Ltd. | 77,900 | | | 669,937 | | 0.0 | % | |
| # | | Michinoku Bank, Ltd. (The) | 846,000 | | | 1,611,176 | | 0.1 | % | |
| | Mie Bank, Ltd. (The) | 52,300 | | | 1,041,547 | | 0.0 | % | |
| # | | Minato Bank, Ltd. (The) | 108,400 | | | 1,936,943 | | 0.1 | % | |
| | Mito Securities Co., Ltd. | 338,500 | | | 941,527 | | 0.0 | % | |
| | Miyazaki Bank, Ltd. (The) | 931,000 | | | 2,866,109 | | 0.1 | % | |
| # | | Monex Group, Inc. | 1,215,700 | | | 3,375,164 | | 0.1 | % | |
| # | | Money Partners Group Co., Ltd. | 88,700 | | | 412,428 | | 0.0 | % | |
| | Musashino Bank, Ltd. (The) | 206,000 | | | 5,925,765 | | 0.2 | % | |
| # | | Nagano Bank, Ltd. (The) | 51,799 | | | 900,263 | | 0.0 | % | |
| | Nanto Bank, Ltd. (The) | 121,600 | | | 4,615,158 | | 0.2 | % | |
| | New Real Property K.K. | 43,900 | | | — | | 0.0 | % | |
| * | | Nishi-Nippon Financial Holdings, Inc. | 499,600 | | | 5,227,900 | | 0.2 | % | |
| | North Pacific Bank, Ltd. | 2,303,600 | | | 9,486,865 | | 0.3 | % | |
| | OAK Capital Corp. | 265,200 | | | 391,103 | | 0.0 | % | |
| | Ogaki Kyoritsu Bank, Ltd. (The) | 1,857,000 | | | 7,218,214 | | 0.2 | % | |
| # | | Oita Bank, Ltd. (The) | 1,014,900 | | | 3,785,395 | | 0.1 | % | |
| | Okasan Securities Group, Inc. | 775,000 | | | 4,773,121 | | 0.2 | % | |
| | Pocket Card Co., Ltd. | 26,900 | | | 129,049 | | 0.0 | % | |
| | Ricoh Leasing Co., Ltd. | 96,900 | | | 2,981,520 | | 0.1 | % | |
| | San-In Godo Bank, Ltd. (The) | 957,000 | | | 7,973,031 | | 0.3 | % | |
| # | | Sawada Holdings Co., Ltd. | 142,000 | | | 1,143,590 | | 0.0 | % | |
| | Senshu Ikeda Holdings, Inc. | 1,424,200 | | | 6,558,571 | | 0.2 | % | |
| # | | Shiga Bank, Ltd. (The) | 1,365,000 | | | 7,418,540 | | 0.3 | % | |
| | Shikoku Bank, Ltd. (The) | 1,210,000 | | | 2,954,883 | | 0.1 | % | |
| | Shimane Bank, Ltd. (The) | 16,600 | | | 194,174 | | 0.0 | % | |
| | Shimizu Bank, Ltd. (The) | 48,000 | | | 1,502,276 | | 0.1 | % | |
| # | | Sparx Group Co., Ltd. | 573,900 | | | 1,111,680 | | 0.0 | % | |
| | Taiko Bank, Ltd. (The) | 219,000 | | | 491,881 | | 0.0 | % | |
| # | | Takagi Securities Co., Ltd. | 224,000 | | | 430,875 | | 0.0 | % | |
| | Tochigi Bank, Ltd. (The) | 705,000 | | | 3,458,875 | | 0.1 | % | |
| | Toho Bank, Ltd. (The) | 1,323,200 | | | 4,938,084 | | 0.2 | % | |
| | Tohoku Bank, Ltd. (The) | 588,000 | | | 783,934 | | 0.0 | % | |
| | Tokai Tokyo Financial Holdings, Inc. | 1,190,900 | | | 6,319,583 | | 0.2 | % | |
| | Tokyo TY Financial Group, Inc. | 155,338 | | | 5,406,780 | | 0.2 | % | |
| | Tomato Bank, Ltd. | 48,400 | | | 663,004 | | 0.0 | % | |
| | TOMONY Holdings, Inc. | 913,950 | | | 4,722,278 | | 0.2 | % | |
| | Tottori Bank, Ltd. (The) | 35,300 | | | 576,759 | | 0.0 | % | |
| | Towa Bank, Ltd. (The) | 2,066,000 | | | 1,957,780 | | 0.1 | % | |
| | Toyo Securities Co., Ltd. | 419,000 | | | 1,011,425 | | 0.0 | % | |
| | Tsukuba Bank, Ltd. | 495,100 | | | 1,466,925 | | 0.1 | % | |
| # | | Yamagata Bank, Ltd. (The) | 854,500 | | | 3,599,088 | | 0.1 | % | |
| | Yamanashi Chuo Bank, Ltd. (The) | 976,000 | | | 4,639,150 | | 0.2 | % | |
| Total Financials | | | | 296,464,697 | | 9.8 | % | |
The Japanese Small Company Series
continued
| | | | Shares | | Value†† | | Percentage
of Net Assets** | |
| Health Care — (4.0%) | | | | | | | | |
| | As One Corp. | 86,768 | | $ | 3,604,592 | | 0.1 | % | |
| # | | ASKA Pharmaceutical Co., Ltd. | 131,300 | | | 1,911,206 | | 0.1 | % | |
| | Biofermin Pharmaceutical Co., Ltd. | 13,900 | | | 347,055 | | 0.0 | % | |
| | BML, Inc. | 136,600 | | | 3,252,084 | | 0.1 | % | |
| # | | CMIC Holdings Co., Ltd. | 72,200 | | | 934,154 | | 0.0 | % | |
| | Create Medic Co., Ltd. | 28,000 | | | 229,189 | | 0.0 | % | |
| # | | Daiken Medical Co., Ltd. | 101,500 | | | 697,515 | | 0.0 | % | |
| | Daito Pharmaceutical Co., Ltd. | 69,580 | | | 1,337,982 | | 0.1 | % | |
| | Dvx, Inc. | 7,700 | | | 90,173 | | 0.0 | % | |
| | Eiken Chemical Co., Ltd. | 95,200 | | | 2,502,921 | | 0.1 | % | |
| | EPS Holdings, Inc. | 198,600 | | | 2,311,744 | | 0.1 | % | |
| | FALCO HOLDINGS Co., Ltd. | 45,700 | | | 574,366 | | 0.0 | % | |
| # | | FINDEX, Inc. | 98,600 | | | 797,945 | | 0.0 | % | |
| | Fuji Pharma Co., Ltd. | 46,200 | | | 1,065,631 | | 0.0 | % | |
| | Fukuda Denshi Co., Ltd. | 2,400 | | | 132,196 | | 0.0 | % | |
| | Fuso Pharmaceutical Industries, Ltd. | 41,500 | | | 988,039 | | 0.0 | % | |
| | Hogy Medical Co., Ltd. | 71,300 | | | 4,390,969 | | 0.2 | % | |
| | Iwaki & Co., Ltd. | 154,000 | | | 294,816 | | 0.0 | % | |
| | Japan Lifeline Co., Ltd. | 99,400 | | | 1,974,102 | | 0.1 | % | |
| | Japan Medical Dynamic Marketing, Inc. | 108,100 | | | 762,740 | | 0.0 | % | |
| | Jeol, Ltd. | 512,000 | | | 2,229,827 | | 0.1 | % | |
| | JMS Co., Ltd. | 157,000 | | | 406,041 | | 0.0 | % | |
| | Kawasumi Laboratories, Inc. | 69,100 | | | 399,832 | | 0.0 | % | |
| | Kissei Pharmaceutical Co., Ltd. | 163,700 | | | 4,070,983 | | 0.1 | % | |
| | KYORIN Holdings, Inc. | 276,100 | | | 5,908,329 | | 0.2 | % | |
| # | | Linical Co., Ltd. | 80,000 | | | 857,885 | | 0.0 | % | |
| | Mani, Inc. | 134,700 | | | 3,202,374 | | 0.1 | % | |
| | Menicon Co., Ltd. | 40,800 | | | 1,148,331 | | 0.1 | % | |
| | Mochida Pharmaceutical Co., Ltd. | 78,399 | | | 5,433,309 | | 0.2 | % | |
| # | | N Field Co., Ltd. | 67,900 | | | 786,249 | | 0.0 | % | |
| | Nagaileben Co., Ltd. | 51,200 | | | 1,115,042 | | 0.0 | % | |
| | Nakanishi, Inc. | 117,700 | | | 4,549,248 | | 0.2 | % | |
| | ND Software Co., Ltd. | 5,200 | | | 54,660 | | 0.0 | % | |
| # | | Nichi-iko Pharmaceutical Co., Ltd. | 264,250 | | | 3,769,726 | | 0.1 | % | |
| # | | NichiiGakkan Co., Ltd. | 244,000 | | | 1,755,952 | | 0.1 | % | |
| | Nikkiso Co., Ltd. | 391,100 | | | 3,708,386 | | 0.1 | % | |
| | Nippon Chemiphar Co., Ltd. | 17,100 | | | 795,788 | | 0.0 | % | |
| | Nipro Corp. | 702,100 | | | 7,661,180 | | 0.3 | % | |
| | Nissui Pharmaceutical Co., Ltd. | 69,700 | | | 768,371 | | 0.0 | % | |
| | Paramount Bed Holdings Co., Ltd. | 114,200 | | | 4,562,138 | | 0.2 | % | |
| | Rion Co., Ltd. | 44,300 | | | 612,603 | | 0.0 | % | |
| # | | Rohto Pharmaceutical Co., Ltd. | 546,700 | | | 8,575,059 | | 0.3 | % | |
| | Seed Co., Ltd. | 12,200 | | | 208,416 | | 0.0 | % | |
| * | | Shin Nippon Biomedical Laboratories, Ltd. | 22,500 | | | 112,384 | | 0.0 | % | |
| | Ship Healthcare Holdings, Inc. | 279,700 | | | 7,170,039 | | 0.2 | % | |
| | Shofu, Inc. | 35,700 | | | 411,629 | | 0.0 | % | |
| | Software Service, Inc. | 18,000 | | | 865,382 | | 0.0 | % | |
| | Taiko Pharmaceutical Co., Ltd. | 51,400 | | | 813,795 | | 0.0 | % | |
| | Techno Medica Co., Ltd. | 26,400 | | | 443,031 | | 0.0 | % | |
| # | | Toho Holdings Co., Ltd. | 321,000 | | | 6,397,573 | | 0.2 | % | |
| | Tokai Corp. | 59,700 | | | 2,030,985 | | 0.1 | % | |
| | Torii Pharmaceutical Co., Ltd. | 81,400 | | | 1,797,679 | | 0.1 | % | |
The Japanese Small Company Series
continued
| | | | Shares | | Value†† | | Percentage
of Net Assets** | |
| Health Care — (Continued) | | | | | | | | |
| # | | Towa Pharmaceutical Co., Ltd. | 59,100 | | $ | 2,313,071 | | 0.1 | % | |
| | Tsukui Corp. | 339,000 | | | 2,291,857 | | 0.1 | % | |
| | Tsumura & Co. | 359,800 | | | 9,902,975 | | 0.3 | % | |
| | Uchiyama Holdings Co., Ltd. | 24,200 | | | 88,983 | | 0.0 | % | |
| # | | Vital KSK Holdings, Inc. | 206,600 | | | 1,747,341 | | 0.1 | % | |
| # | | Wakamoto Pharmaceutical Co., Ltd. | 107,000 | | | 227,815 | | 0.0 | % | |
| | WIN-Partners Co., Ltd. | 41,600 | | | 358,128 | | 0.0 | % | |
| | ZERIA Pharmaceutical Co., Ltd. | 128,099 | | | 1,972,825 | | 0.1 | % | |
| Total Health Care | | | | 129,724,640 | | 4.3 | % | |
| | | | | | | | | |
| Industrials — (26.6%) | | | | | | | | |
| # | | A&A Material Corp. | 127,000 | | | 138,842 | | 0.0 | % | |
| | Abist Co., Ltd. | 6,000 | | | 184,162 | | 0.0 | % | |
| | Advan Co., Ltd. | 167,700 | | | 1,724,516 | | 0.1 | % | |
| | Advanex, Inc. | 22,099 | | | 308,329 | | 0.0 | % | |
| | Aeon Delight Co., Ltd. | 111,400 | | | 3,108,021 | | 0.1 | % | |
| | Aica Kogyo Co., Ltd. | 314,300 | | | 8,273,967 | | 0.3 | % | |
| | Aichi Corp. | 202,700 | | | 1,418,798 | | 0.1 | % | |
| # | | Aida Engineering, Ltd. | 344,200 | | | 3,255,077 | | 0.1 | % | |
| | AIT Corp. | 22,700 | | | 211,687 | | 0.0 | % | |
| | Ajis Co., Ltd. | 10,700 | | | 500,413 | | 0.0 | % | |
| # | | Alinco, Inc. | 70,300 | | | 632,347 | | 0.0 | % | |
| | Alps Logistics Co., Ltd. | 98,600 | | | 568,770 | | 0.0 | % | |
| | Altech Corp. | 44,750 | | | 945,430 | | 0.0 | % | |
| | Anest Iwata Corp. | 185,100 | | | 1,810,167 | | 0.1 | % | |
| #* | | Arrk Corp. | 422,400 | | | 424,804 | | 0.0 | % | |
| | Asahi Diamond Industrial Co., Ltd. | 328,200 | | | 2,391,137 | | 0.1 | % | |
| | Asahi Kogyosha Co., Ltd. | 25,000 | | | 624,086 | | 0.0 | % | |
| | Asanuma Corp. | 383,000 | | | 1,250,886 | | 0.0 | % | |
| | Asunaro Aoki Construction Co., Ltd. | 142,800 | | | 953,464 | | 0.0 | % | |
| | Bando Chemical Industries, Ltd. | 231,000 | | | 2,042,693 | | 0.1 | % | |
| | Benefit One, Inc. | 96,900 | | | 2,394,940 | | 0.1 | % | |
| | Bunka Shutter Co., Ltd. | 346,100 | | | 2,660,626 | | 0.1 | % | |
| | Canare Electric Co., Ltd. | 3,500 | | | 62,933 | | 0.0 | % | |
| | Career Design Center Co., Ltd. | 28,800 | | | 312,389 | | 0.0 | % | |
| | Central Glass Co., Ltd. | 1,214,000 | | | 5,648,659 | | 0.2 | % | |
| # | | Central Security Patrols Co., Ltd. | 48,200 | | | 863,679 | | 0.0 | % | |
| | Chilled & Frozen Logistics Holdings Co., Ltd. | 22,000 | | | 251,992 | | 0.0 | % | |
| # | | Chiyoda Corp. | 993,000 | | | 6,854,261 | | 0.2 | % | |
| | Chiyoda Integre Co., Ltd. | 74,300 | | | 1,494,444 | | 0.1 | % | |
| | Chudenko Corp. | 157,900 | | | 3,479,451 | | 0.1 | % | |
| | Chugai Ro Co., Ltd. | 373,000 | | | 716,340 | | 0.0 | % | |
| | Chuo Warehouse Co., Ltd. | 900 | | | 8,246 | | 0.0 | % | |
| | CKD Corp. | 341,900 | | | 3,867,162 | | 0.1 | % | |
| | Comany, Inc. | 3,100 | | | 45,271 | | 0.0 | % | |
| | Cosel Co., Ltd. | 120,800 | | | 1,291,512 | | 0.1 | % | |
| | Creek & River Co., Ltd. | 18,700 | | | 133,886 | | 0.0 | % | |
| | CTI Engineering Co., Ltd. | 72,300 | | | 642,302 | | 0.0 | % | |
| | CTS Co., Ltd. | 900 | | | 11,283 | | 0.0 | % | |
| | Dai-Dan Co., Ltd. | 160,000 | | | 1,333,848 | | 0.1 | % | |
| | Daido Kogyo Co., Ltd. | 200,000 | | | 446,769 | | 0.0 | % | |
| | Daifuku Co., Ltd. | 303,400 | | | 6,445,671 | | 0.2 | % | |
The Japanese Small Company Series
continued
| | | | Shares | | Value†† | | Percentage
of Net Assets** | |
| Industrials — (Continued) | | | | | | | | |
| | Daihatsu Diesel Manufacturing Co., Ltd. | 86,000 | | $ | 522,992 | | 0.0 | % | |
| | Daihen Corp. | 641,000 | | | 3,951,242 | | 0.1 | % | |
| | Daiho Corp. | 521,000 | | | 2,456,246 | | 0.1 | % | |
| | Daiichi Jitsugyo Co., Ltd. | 260,000 | | | 1,483,817 | | 0.1 | % | |
| #* | | Daikokuya Holdings Co., Ltd. | 389,900 | | | 289,741 | | 0.0 | % | |
| | Daiseki Co., Ltd. | 216,263 | | | 4,425,425 | | 0.2 | % | |
| # | | Daiseki Eco. Solution Co., Ltd. | 22,200 | | | 273,020 | | 0.0 | % | |
| # | | Daisue Construction Co., Ltd. | 41,100 | | | 335,252 | | 0.0 | % | |
| | Daiwa Industries, Ltd. | 173,000 | | | 1,311,499 | | 0.1 | % | |
| #* | | Danto Holdings Corp. | 165,000 | | | 272,338 | | 0.0 | % | |
| | Denyo Co., Ltd. | 86,300 | | | 1,167,630 | | 0.0 | % | |
| # | | DMG Mori Co., Ltd. | 434,800 | | | 5,265,372 | | 0.2 | % | |
| | DMW Corp. | 4,800 | | | 75,295 | | 0.0 | % | |
| | Duskin Co., Ltd. | 224,100 | | | 4,601,611 | | 0.2 | % | |
| # | | Ebara Jitsugyo Co., Ltd. | 39,300 | | | 451,741 | | 0.0 | % | |
| # | | EF-ON, Inc. | 50,300 | | | 407,387 | | 0.0 | % | |
| | Eidai Co., Ltd. | 124,000 | | | 537,241 | | 0.0 | % | |
| | en-japan, Inc. | 134,500 | | | 2,404,838 | | 0.1 | % | |
| | Endo Lighting Corp. | 60,200 | | | 449,436 | | 0.0 | % | |
| #* | | Enshu, Ltd. | 197,000 | | | 166,663 | | 0.0 | % | |
| ° | | Escrow Agent Japan Co., Ltd. | 3,500 | | | 46,065 | | 0.0 | % | |
| | F&M Co., Ltd. | 9,400 | | | 74,214 | | 0.0 | % | |
| | Freund Corp. | 34,300 | | | 460,677 | | 0.0 | % | |
| | Fudo Tetra Corp. | 1,050,500 | | | 1,839,430 | | 0.1 | % | |
| | Fuji Machine Manufacturing Co., Ltd. | 119,900 | | | 1,368,921 | | 0.1 | % | |
| | Fujikura, Ltd. | 1,935,000 | | | 10,478,704 | | 0.4 | % | |
| | Fujisash Co., Ltd. | 505,600 | | | 430,630 | | 0.0 | % | |
| # | | Fujitec Co., Ltd. | 436,800 | | | 5,109,339 | | 0.2 | % | |
| # | | Fukuda Corp. | 395,000 | | | 3,780,221 | | 0.1 | % | |
| | Fukushima Industries Corp. | 85,300 | | | 2,455,629 | | 0.1 | % | |
| # | | Fukuyama Transporting Co., Ltd. | 774,400 | | | 4,387,675 | | 0.2 | % | |
| | FULLCAST Holdings Co., Ltd. | 121,700 | | | 999,767 | | 0.0 | % | |
| # | | Funai Soken Holdings, Inc. | 159,360 | | | 2,499,392 | | 0.1 | % | |
| | Furukawa Co., Ltd. | 1,800,000 | | | 3,267,949 | | 0.1 | % | |
| | Furukawa Electric Co., Ltd. | 462,800 | | | 13,505,376 | | 0.5 | % | |
| | Furusato Industries, Ltd. | 52,000 | | | 753,079 | | 0.0 | % | |
| # | | Futaba Corp. | 206,300 | | | 3,459,746 | | 0.1 | % | |
| | Gecoss Corp. | 104,400 | | | 989,474 | | 0.0 | % | |
| | Giken, Ltd. | 13,000 | | | 210,894 | | 0.0 | % | |
| | Glory, Ltd. | 268,900 | | | 8,473,658 | | 0.3 | % | |
| | GS Yuasa Corp. | 2,130,000 | | | 8,831,089 | | 0.3 | % | |
| # | | Hamakyorex Co., Ltd. | 92,400 | | | 1,712,880 | | 0.1 | % | |
| # | | Haneda Zenith Holdings Co., Ltd. | 132,100 | | | 335,629 | | 0.0 | % | |
| | Hanwa Co., Ltd. | 1,221,000 | | | 7,965,602 | | 0.3 | % | |
| | Hazama Ando Corp. | 1,082,400 | | | 7,122,602 | | 0.2 | % | |
| | Helios Techno Holdings Co., Ltd. | 11,900 | | | 51,860 | | 0.0 | % | |
| | Hibiya Engineering, Ltd. | 118,200 | | | 1,676,899 | | 0.1 | % | |
| | Hirakawa Hewtech Corp. | 24,400 | | | 268,639 | | 0.0 | % | |
| | Hirano Tecseed Co., Ltd. | 12,800 | | | 126,834 | | 0.0 | % | |
| # | | Hirata Corp. | 29,500 | | | 1,672,608 | | 0.1 | % | |
| | Hisaka Works, Ltd. | 109,500 | | | 824,470 | | 0.0 | % | |
| | Hitachi Koki Co., Ltd. | 311,600 | | | 3,916,935 | | 0.1 | % | |
The Japanese Small Company Series
continued
| | | | Shares | | Value†† | | Percentage
of Net Assets** | |
| Industrials — (Continued) | | | | | | | | |
| | Hitachi Transport System, Ltd. | 278,000 | | $ | 5,632,096 | | 0.2 | % | |
| | Hitachi Zosen Corp. | 991,379 | | | 5,172,876 | | 0.2 | % | |
| # | | Hito Communications, Inc. | 35,100 | | | 459,487 | | 0.0 | % | |
| | Hokuetsu Industries Co., Ltd. | 107,600 | | | 731,303 | | 0.0 | % | |
| # | | Hokuriku Electrical Construction Co., Ltd. | 23,000 | | | 167,790 | | 0.0 | % | |
| | Hosokawa Micron Corp. | 204,000 | | | 1,315,287 | | 0.1 | % | |
| # | | Howa Machinery, Ltd. | 72,100 | | | 377,905 | | 0.0 | % | |
| # | | Ichiken Co., Ltd. | 143,000 | | | 524,696 | | 0.0 | % | |
| | Ichinen Holdings Co., Ltd. | 114,200 | | | 1,114,395 | | 0.0 | % | |
| | Idec Corp. | 161,700 | | | 1,506,697 | | 0.1 | % | |
| | Iino Kaiun Kaisha, Ltd. | 541,400 | | | 2,130,047 | | 0.1 | % | |
| | Inaba Denki Sangyo Co., Ltd. | 138,700 | | | 4,768,471 | | 0.2 | % | |
| | Inaba Seisakusho Co., Ltd. | 49,700 | | | 572,423 | | 0.0 | % | |
| | Inabata & Co., Ltd. | 296,300 | | | 3,259,739 | | 0.1 | % | |
| | Interworks, Inc. | 6,800 | | | 59,624 | | 0.0 | % | |
| | Inui Global Logistics Co., Ltd. | 71,880 | | | 606,839 | | 0.0 | % | |
| # | | Iseki & Co., Ltd. | 1,110,000 | | | 2,131,599 | | 0.1 | % | |
| # | | Ishii Iron Works Co., Ltd. | 11,000 | | | 173,844 | | 0.0 | % | |
| # | | Itoki Corp. | 215,800 | | | 1,361,013 | | 0.1 | % | |
| | Iwasaki Electric Co., Ltd. | 372,000 | | | 593,993 | | 0.0 | % | |
| | Iwatani Corp. | 1,087,000 | | | 5,768,978 | | 0.2 | % | |
| # | | JAC Recruitment Co., Ltd. | 93,100 | | | 1,043,717 | | 0.0 | % | |
| # | | Jalux, Inc. | 39,500 | | | 676,095 | | 0.0 | % | |
| # | | Jamco Corp. | 68,400 | | | 1,406,492 | | 0.1 | % | |
| | Japan Foundation Engineering Co., Ltd. | 119,500 | | | 362,220 | | 0.0 | % | |
| | Japan Pulp & Paper Co., Ltd. | 529,000 | | | 1,665,113 | | 0.1 | % | |
| | Japan Steel Works, Ltd. (The) | 398,400 | | | 7,047,871 | | 0.2 | % | |
| | Japan Transcity Corp. | 242,000 | | | 882,805 | | 0.0 | % | |
| | JK Holdings Co., Ltd. | 89,940 | | | 450,461 | | 0.0 | % | |
| | Juki Corp. | 185,800 | | | 1,674,913 | | 0.1 | % | |
| | Kamei Corp. | 148,700 | | | 1,515,299 | | 0.1 | % | |
| | Kanaden Corp. | 110,600 | | | 1,005,025 | | 0.0 | % | |
| # | | Kanagawa Chuo Kotsu Co., Ltd. | 190,000 | | | 1,183,773 | | 0.0 | % | |
| | Kanamoto Co., Ltd. | 171,600 | | | 4,532,183 | | 0.2 | % | |
| | Kandenko Co., Ltd. | 626,000 | | | 5,638,821 | | 0.2 | % | |
| | Kanematsu Corp. | 2,438,625 | | | 4,097,957 | | 0.1 | % | |
| # | | Katakura Industries Co., Ltd. | 137,300 | | | 1,604,186 | | 0.1 | % | |
| | Kato Works Co., Ltd. | 61,800 | | | 1,599,886 | | 0.1 | % | |
| | KAWADA TECHNOLOGIES, Inc. | 53,700 | | | 3,626,086 | | 0.1 | % | |
| | Kawasaki Kinkai Kisen Kaisha, Ltd. | 96,000 | | | 240,491 | | 0.0 | % | |
| # | | Kawasaki Kisen Kaisha, Ltd. | 3,035,000 | | | 6,857,818 | | 0.2 | % | |
| | Keihin Co., Ltd. | 249,000 | | | 325,160 | | 0.0 | % | |
| | KFC, Ltd. | 2,000 | | | 35,705 | | 0.0 | % | |
| #* | | KI Holdings Co., Ltd. | 88,000 | | | 253,927 | | 0.0 | % | |
| # | | Kimura Chemical Plants Co., Ltd. | 39,900 | | | 114,066 | | 0.0 | % | |
| | King Jim Co., Ltd. | 13,000 | | | 93,908 | | 0.0 | % | |
| # | | Kinki Sharyo Co., Ltd. | 15,299 | | | 341,943 | | 0.0 | % | |
| | Kintetsu World Express, Inc. | 191,200 | | | 2,645,366 | | 0.1 | % | |
| | Kitagawa Iron Works Co., Ltd. | 49,600 | | | 964,703 | | 0.0 | % | |
| | Kitano Construction Corp. | 259,000 | | | 711,027 | | 0.0 | % | |
| # | | Kito Corp. | 108,500 | | | 1,171,078 | | 0.0 | % | |
| | Kitz Corp. | 543,500 | | | 2,967,331 | | 0.1 | % | |
The Japanese Small Company Series
continued
| | | | | | | | | Percentage | |
| | | | | Shares | | Value†† | | of Net Assets** | |
| Industrials — (Continued) | | | | | | | | | |
| | Kobelco Eco-Solutions Co., Ltd. | | 97,000 | | $ | 368,765 | | 0.0 | % | |
| | Koike Sanso Kogyo Co., Ltd. | | 145,000 | | | 363,898 | | 0.0 | % | |
| # | | Kokusai Co., Ltd. | | 41,700 | | | 290,036 | | 0.0 | % | |
| | Kokuyo Co., Ltd. | | 525,125 | | | 6,032,719 | | 0.2 | % | |
| | KOMAIHALTEC, Inc. | | 22,700 | | | 414,434 | | 0.0 | % | |
| | Komatsu Wall Industry Co., Ltd. | | 40,000 | | | 649,092 | | 0.0 | % | |
| | Komori Corp. | | 348,700 | | | 4,555,588 | | 0.2 | % | |
| | Kondotec, Inc. | | 124,000 | | | 898,534 | | 0.0 | % | |
| | Konoike Transport Co., Ltd. | | 119,200 | | | 1,564,538 | | 0.1 | % | |
| #* | | Kosaido Co., Ltd. | | 248,600 | | | 764,273 | | 0.0 | % | |
| | KRS Corp. | | 38,100 | | | 795,072 | | 0.0 | % | |
| | Kumagai Gumi Co., Ltd. | | 2,175,000 | | | 5,569,902 | | 0.2 | % | |
| | Kuroda Electric Co., Ltd. | | 219,100 | | | 4,321,591 | | 0.2 | % | |
| | Kyodo Printing Co., Ltd. | | 506,000 | | | 1,729,671 | | 0.1 | % | |
| | Kyokuto Boeki Kaisha, Ltd. | | 64,000 | | | 132,725 | | 0.0 | % | |
| | Kyokuto Kaihatsu Kogyo Co., Ltd. | | 185,700 | | | 2,490,639 | | 0.1 | % | |
| | Kyoritsu Printing Co., Ltd. | | 119,300 | | | 324,275 | | 0.0 | % | |
| | Kyowa Exeo Corp. | | 481,800 | | | 6,920,845 | | 0.2 | % | |
| | Kyudenko Corp. | | 219,000 | | | 5,868,830 | | 0.2 | % | |
| | Like Co., Ltd. | | 22,300 | | | 363,196 | | 0.0 | % | |
| # | | Link And Motivation, Inc. | | 251,400 | | | 919,636 | | 0.0 | % | |
| | Lonseal Corp. | | 11,600 | | | 204,802 | | 0.0 | % | |
| | Maeda Corp. | | 821,000 | | | 7,140,937 | | 0.2 | % | |
| | Maeda Kosen Co., Ltd. | | 109,900 | | | 1,202,245 | | 0.0 | % | |
| | Maeda Road Construction Co., Ltd. | | 387,000 | | | 6,454,215 | | 0.2 | % | |
| | Maezawa Industries, Inc. | | 35,700 | | | 110,347 | | 0.0 | % | |
| | Maezawa Kasei Industries Co., Ltd. | | 54,000 | | | 551,414 | | 0.0 | % | |
| | Maezawa Kyuso Industries Co., Ltd. | | 49,100 | | | 638,240 | | 0.0 | % | |
| | Makino Milling Machine Co., Ltd. | | 655,000 | | | 5,111,023 | | 0.2 | % | |
| | Marubeni Construction Material Lease Co., Ltd. | | 75,000 | | | 142,236 | | 0.0 | % | |
| | Marufuji Sheet Piling Co., Ltd. | | 58,000 | | | 126,374 | | 0.0 | % | |
| | Maruka Machinery Co., Ltd. | | 32,200 | | | 437,923 | | 0.0 | % | |
| # | | Maruwa Unyu Kikan Co., Ltd. | | 34,300 | | | 847,433 | | 0.0 | % | |
| | Maruyama Manufacturing Co., Inc. | | 230,000 | | | 373,282 | | 0.0 | % | |
| | Maruzen Co., Ltd. | | 46,000 | | | 451,304 | | 0.0 | % | |
| | Maruzen Showa Unyu Co., Ltd. | | 304,000 | | | 1,185,029 | | 0.0 | % | |
| | Matsuda Sangyo Co., Ltd. | | 83,782 | | | 1,074,975 | | 0.0 | % | |
| | Matsui Construction Co., Ltd. | | 135,300 | | | 1,225,970 | | 0.0 | % | |
| | Max Co., Ltd. | | 191,000 | | | 2,330,004 | | 0.1 | % | |
| | Meidensha Corp. | | 1,175,050 | | | 4,032,951 | | 0.1 | % | |
| | Meiji Shipping Co., Ltd. | | 111,000 | | | 405,521 | | 0.0 | % | |
| # | | Meisei Industrial Co., Ltd. | | 251,000 | | | 1,221,334 | | 0.0 | % | |
| | Meitec Corp. | | 181,300 | | | 6,925,850 | | 0.2 | % | |
| # | | Meiwa Corp. | | 158,000 | | | 548,274 | | 0.0 | % | |
| | Mesco, Inc. | | 22,000 | | | 209,265 | | 0.0 | % | |
| | METAWATER Co., Ltd. | | 61,500 | | | 1,454,134 | | 0.1 | % | |
| | Mie Kotsu Group Holdings, Inc. | | 165,700 | | | 548,659 | | 0.0 | % | |
| | Mirait Holdings Corp. | | 374,085 | | | 3,371,366 | | 0.1 | % | |
| | Mitani Corp. | | 68,200 | | | 1,866,039 | | 0.1 | % | |
| | Mitsubishi Kakoki Kaisha, Ltd. | | 168,000 | | | 308,360 | | 0.0 | % | |
| | Mitsubishi Nichiyu Forklift Co., Ltd. | | 189,100 | | | 1,370,400 | | 0.1 | % | |
| # | | Mitsubishi Pencil Co., Ltd. | | 100,300 | | | 5,266,070 | | 0.2 | % | |
The Japanese Small Company Series
continued
| | | | | | | | | Percentage | |
| | | | | Shares | | Value†† | | of Net Assets** | |
| Industrials — (Continued) | | | | | | | | | |
| | Mitsuboshi Belting, Ltd. | | 328,000 | | $ | 2,789,067 | | 0.1 | % | |
| | Mitsui Engineering & Shipbuilding Co., Ltd. | | 5,109,000 | | | 7,900,418 | | 0.3 | % | |
| | Mitsui Matsushima Co., Ltd. | | 84,700 | | | 933,630 | | 0.0 | % | |
| | Mitsui-Soko Holdings Co., Ltd. | | 626,000 | | | 1,837,500 | | 0.1 | % | |
| | Mitsumura Printing Co., Ltd. | | 93,000 | | | 174,096 | | 0.0 | % | |
| # | | Miyaji Engineering Group, Inc. | | 332,175 | | | 543,025 | | 0.0 | % | |
| | Morita Holdings Corp. | | 227,700 | | | 3,224,617 | | 0.1 | % | |
| # | | NAC Co., Ltd. | | 61,700 | | | 515,316 | | 0.0 | % | |
| # | | Nachi-Fujikoshi Corp. | | 1,045,000 | | | 4,515,343 | | 0.2 | % | |
| | Nagase & Co., Ltd. | | 481,100 | | | 6,273,890 | | 0.2 | % | |
| | Naigai Trans Line, Ltd. | | 3,800 | | | 34,919 | | 0.0 | % | |
| | Nakabayashi Co., Ltd. | | 211,000 | | | 481,061 | | 0.0 | % | |
| | Nakano Corp. | | 38,100 | | | 197,113 | | 0.0 | % | |
| | Namura Shipbuilding Co., Ltd. | | 314,028 | | | 2,141,541 | | 0.1 | % | |
| | Narasaki Sangyo Co., Ltd. | | 103,000 | | | 259,689 | | 0.0 | % | |
| | NDS Co., Ltd. | | 24,100 | | | 599,063 | | 0.0 | % | |
| # | | NEC Capital Solutions, Ltd. | | 48,900 | | | 757,175 | | 0.0 | % | |
| | Nichias Corp. | | 587,000 | | | 5,646,503 | | 0.2 | % | |
| | Nichiban Co., Ltd. | | 141,000 | | | 975,216 | | 0.0 | % | |
| | Nichiden Corp. | | 24,700 | | | 664,189 | | 0.0 | % | |
| | Nichiha Corp. | | 178,680 | | | 4,404,705 | | 0.2 | % | |
| | Nichireki Co., Ltd. | | 148,000 | | | 1,164,907 | | 0.0 | % | |
| | Nihon Dengi Co., Ltd. | | 4,700 | | | 80,348 | | 0.0 | % | |
| | Nihon Flush Co., Ltd. | | 15,700 | | | 174,706 | | 0.0 | % | |
| | Nihon Trim Co., Ltd. | | 30,700 | | | 1,183,387 | | 0.0 | % | |
| | Nikkato Corp. | | 700 | | | 2,433 | | 0.0 | % | |
| | Nikko Co., Ltd. | | 31,800 | | | 573,687 | | 0.0 | % | |
| | Nikkon Holdings Co., Ltd. | | 356,800 | | | 7,429,645 | | 0.3 | % | |
| | Nippi, Inc. | | 27,000 | | | 190,755 | | 0.0 | % | |
| | Nippo Corp. | | 227,000 | | | 4,229,117 | | 0.1 | % | |
| | Nippon Air Conditioning Services Co., Ltd. | | 40,300 | | | 209,700 | | 0.0 | % | |
| # | | Nippon Carbon Co., Ltd. | | 665,000 | | | 1,287,561 | | 0.1 | % | |
| | Nippon Densetsu Kogyo Co., Ltd. | | 227,300 | | | 3,625,224 | | 0.1 | % | |
| | Nippon Dry-Chemical Co., Ltd. | | 300 | | | 5,969 | | 0.0 | % | |
| | Nippon Filcon Co., Ltd. | | 70,900 | | | 348,328 | | 0.0 | % | |
| | Nippon Hume Corp. | | 129,400 | | | 764,341 | | 0.0 | % | |
| | Nippon Kanzai Co., Ltd. | | 88,700 | | | 1,374,433 | | 0.1 | % | |
| | Nippon Koei Co., Ltd. | | 78,000 | | | 1,722,413 | | 0.1 | % | |
| # | | Nippon Parking Development Co., Ltd. | | 1,224,400 | | | 1,735,458 | | 0.1 | % | |
| | Nippon Rietec Co., Ltd. | | 7,000 | | | 66,761 | | 0.0 | % | |
| | Nippon Road Co., Ltd. (The) | | 384,000 | | | 1,495,429 | | 0.1 | % | |
| # | | Nippon Seisen Co., Ltd. | | 100,000 | | | 503,788 | | 0.0 | % | |
| #* | | Nippon Sharyo, Ltd. | | 422,000 | | | 1,005,652 | | 0.0 | % | |
| * | | Nippon Sheet Glass Co., Ltd. | | 584,800 | | | 4,243,063 | | 0.1 | % | |
| | Nippon Steel & Sumikin Bussan Corp. | | 95,560 | | | 3,682,655 | | 0.1 | % | |
| | Nippon Thompson Co., Ltd. | | 410,000 | | | 1,728,012 | | 0.1 | % | |
| | Nippon Tungsten Co., Ltd. | | 62,000 | | | 93,631 | | 0.0 | % | |
| | Nishi-Nippon Railroad Co., Ltd. | | 1,441,000 | | | 6,581,286 | | 0.2 | % | |
| | Nishimatsu Construction Co., Ltd. | | 1,794,000 | | | 8,670,321 | | 0.3 | % | |
| | Nishio Rent All Co., Ltd. | | 93,700 | | | 2,868,168 | | 0.1 | % | |
| # | | Nissei ASB Machine Co., Ltd. | | 52,300 | | | 1,054,850 | | 0.0 | % | |
| | Nissei Corp. | | 37,900 | | | 324,266 | | 0.0 | % | |
The Japanese Small Company Series
continued
| | | | | | | | | Percentage | |
| | | | | Shares | | Value†† | | of Net Assets** | |
| Industrials — (Continued) | | | | | | | | | |
| | Nissei Plastic Industrial Co., Ltd. | | 184,500 | | $ | 1,593,452 | | 0.1 | % | |
| # | | Nissha Printing Co., Ltd. | | 165,400 | | | 3,978,914 | | 0.1 | % | |
| | Nisshinbo Holdings, Inc. | | 870,500 | | | 8,381,913 | | 0.3 | % | |
| | Nissin Corp. | | 409,000 | | | 1,264,382 | | 0.1 | % | |
| | Nissin Electric Co., Ltd. | | 279,000 | | | 3,071,758 | | 0.1 | % | |
| | Nitta Corp. | | 105,000 | | | 2,853,482 | | 0.1 | % | |
| | Nitto Boseki Co., Ltd. | | 934,000 | | | 3,643,533 | | 0.1 | % | |
| | Nitto Kogyo Corp. | | 161,500 | | | 2,198,838 | | 0.1 | % | |
| | Nitto Kohki Co., Ltd. | | 68,500 | | | 1,517,273 | | 0.1 | % | |
| | Nitto Seiko Co., Ltd. | | 149,000 | | | 530,723 | | 0.0 | % | |
| # | | Nittoc Construction Co., Ltd. | | 158,500 | | | 637,240 | | 0.0 | % | |
| # | | Nittoku Engineering Co., Ltd. | | 81,900 | | | 1,132,055 | | 0.0 | % | |
| | NJS Co., Ltd. | | 30,200 | | | 357,805 | | 0.0 | % | |
| | Noda Corp. | | 153,600 | | | 901,887 | | 0.0 | % | |
| | Nomura Co., Ltd. | | 220,200 | | | 3,178,952 | | 0.1 | % | |
| | Noritake Co., Ltd. | | 64,200 | | | 1,561,287 | | 0.1 | % | |
| | Noritz Corp. | | 172,400 | | | 2,904,495 | | 0.1 | % | |
| | NS United Kaiun Kaisha, Ltd. | | 599,000 | | | 1,021,406 | | 0.0 | % | |
| | NTN Corp. | | 2,488,000 | | | 10,037,113 | | 0.3 | % | |
| | Obara Group, Inc. | | 79,200 | | | 3,525,154 | | 0.1 | % | |
| | Obayashi Road Corp. | | 166,300 | | | 993,423 | | 0.0 | % | |
| # | | Odelic Co., Ltd. | | 20,300 | | | 723,552 | | 0.0 | % | |
| | Oiles Corp. | | 151,350 | | | 2,716,681 | | 0.1 | % | |
| | Okabe Co., Ltd. | | 242,100 | | | 1,985,534 | | 0.1 | % | |
| # | | Okamoto Machine Tool Works, Ltd. | | 205,000 | | | 245,065 | | 0.0 | % | |
| | Okamura Corp. | | 381,900 | | | 3,425,017 | | 0.1 | % | |
| # | | OKK Corp. | | 425,000 | | | 427,878 | | 0.0 | % | |
| | OKUMA Corp. | | 849,000 | | | 8,077,795 | | 0.3 | % | |
| | Okumura Corp. | | 999,400 | | | 5,612,204 | | 0.2 | % | |
| | Onoken Co., Ltd. | | 84,600 | | | 982,436 | | 0.0 | % | |
| | Organo Corp. | | 228,000 | | | 917,728 | | 0.0 | % | |
| # | | OSG Corp. | | 452,700 | | | 8,888,747 | | 0.3 | % | |
| # | | OSJB Holdings Corp. | | 677,200 | | | 1,375,149 | | 0.1 | % | |
| # | | Outsourcing, Inc. | | 81,300 | | | 2,529,046 | | 0.1 | % | |
| | Oyo Corp. | | 111,300 | | | 1,332,704 | | 0.1 | % | |
| | Paraca, Inc. | | 5,400 | | | 94,130 | | 0.0 | % | |
| # | | Pasco Corp. | | 137,000 | | | 458,998 | | 0.0 | % | |
| # | | Pasona Group, Inc. | | 126,800 | | | 869,673 | | 0.0 | % | |
| | Pegasus Sewing Machine Manufacturing Co., Ltd. | | 43,600 | | | 266,221 | | 0.0 | % | |
| | Penta-Ocean Construction Co., Ltd. | | 1,724,600 | | | 8,320,221 | | 0.3 | % | |
| | Pilot Corp. | | 188,800 | | | 7,783,466 | | 0.3 | % | |
| | Prestige International, Inc. | | 284,800 | | | 2,009,810 | | 0.1 | % | |
| | Pronexus, Inc. | | 126,400 | | | 1,189,425 | | 0.0 | % | |
| # | | PS Mitsubishi Construction Co., Ltd. | | 147,700 | | | 487,090 | | 0.0 | % | |
| | Punch Industry Co., Ltd. | | 5,600 | | | 43,014 | | 0.0 | % | |
| | Quick Co., Ltd. | | 35,600 | | | 317,485 | | 0.0 | % | |
| | Raito Kogyo Co., Ltd. | | 313,100 | | | 3,207,252 | | 0.1 | % | |
| | Relia, Inc. | | 198,500 | | | 1,956,148 | | 0.1 | % | |
| | Rheon Automatic Machinery Co., Ltd. | | 110,500 | | | 829,474 | | 0.0 | % | |
| | Rix Corp. | | 900 | | | 11,416 | | 0.0 | % | |
| | Ryobi, Ltd. | | 820,200 | | | 3,210,584 | | 0.1 | % | |
| | Sakai Heavy Industries, Ltd. | | 237,000 | | | 661,675 | | 0.0 | % | |
The Japanese Small Company Series
continued
| | | | | | | | | Percentage | |
| | | | | Shares | | Value†† | | of Net Assets** | |
| Industrials — (Continued) | | | | | | | | | |
| # | | Sakai Moving Service Co., Ltd. | | 60,800 | | $ | 1,399,749 | | 0.1 | % | |
| | Sanki Engineering Co., Ltd. | | 297,600 | | | 2,474,415 | | 0.1 | % | |
| | Sanko Metal Industrial Co., Ltd. | | 13,600 | | | 365,547 | | 0.0 | % | |
| # | | Sankyo Tateyama, Inc. | | 166,200 | | | 2,258,260 | | 0.1 | % | |
| | Sankyu, Inc. | | 1,540,000 | | | 9,292,447 | | 0.3 | % | |
| # | | Sanoyas Holdings Corp. | | 141,400 | | | 325,819 | | 0.0 | % | |
| | Sansei Technologies, Inc. | | 4,300 | | | 30,765 | | 0.0 | % | |
| | Sanwa Holdings Corp. | | 1,232,600 | | | 11,723,223 | | 0.4 | % | |
| | Sanyo Denki Co., Ltd. | | 262,000 | | | 1,824,819 | | 0.1 | % | |
| | Sanyo Engineering & Construction, Inc. | | 48,000 | | | 252,455 | | 0.0 | % | |
| | Sanyo Industries, Ltd. | | 99,000 | | | 163,962 | | 0.0 | % | |
| | Sanyo Trading Co., Ltd. | | 19,200 | | | 262,295 | | 0.0 | % | |
| # | | Sata Construction Co., Ltd. | | 85,399 | | | 321,297 | | 0.0 | % | |
| | Sato Holdings Corp. | | 154,500 | | | 3,087,627 | | 0.1 | % | |
| | Sato Shoji Corp. | | 66,800 | | | 484,187 | | 0.0 | % | |
| | SBS Holdings, Inc. | | 114,100 | | | 793,396 | | 0.0 | % | |
| | Secom Joshinetsu Co., Ltd. | | 32,900 | | | 962,365 | | 0.0 | % | |
| | Seibu Electric Industry Co., Ltd. | | 15,600 | | | 298,672 | | 0.0 | % | |
| | Seika Corp. | | 313,000 | | | 911,030 | | 0.0 | % | |
| | Seikitokyu Kogyo Co., Ltd. | | 178,300 | | | 752,494 | | 0.0 | % | |
| | Seino Holdings Co., Ltd. | | 258,600 | | | 2,865,407 | | 0.1 | % | |
| | Sekisui Jushi Corp. | | 180,900 | | | 2,851,618 | | 0.1 | % | |
| # | | Senko Co., Ltd. | | 564,500 | | | 3,803,282 | | 0.1 | % | |
| | Senshu Electric Co., Ltd. | | 35,800 | | | 580,913 | | 0.0 | % | |
| | Shibusawa Warehouse Co., Ltd. (The) | | 263,000 | | | 782,357 | | 0.0 | % | |
| | Shibuya Corp. | | 104,400 | | | 2,181,729 | | 0.1 | % | |
| # | | Shima Seiki Manufacturing, Ltd. | | 161,400 | | | 5,450,319 | | 0.2 | % | |
| | Shin Nippon Air Technologies Co., Ltd. | | 86,280 | | | 932,319 | | 0.0 | % | |
| # | | Shin-Keisei Electric Railway Co., Ltd. | | 181,000 | | | 637,551 | | 0.0 | % | |
| | Shinmaywa Industries, Ltd. | | 550,000 | | | 4,934,274 | | 0.2 | % | |
| | Shinnihon Corp. | | 186,700 | | | 1,499,643 | | 0.1 | % | |
| | Shinsho Corp. | | 29,000 | | | 602,102 | | 0.0 | % | |
| | Shinwa Co., Ltd. | | 27,100 | | | 403,837 | | 0.0 | % | |
| * | | Shoko Co., Ltd. | | 198,000 | | | 171,042 | | 0.0 | % | |
| | Showa Aircraft Industry Co., Ltd. | | 15,837 | | | 151,660 | | 0.0 | % | |
| | Sinfonia Technology Co., Ltd. | | 684,000 | | | 1,535,269 | | 0.1 | % | |
| | Sinko Industries, Ltd. | | 110,700 | | | 1,324,103 | | 0.1 | % | |
| | Sintokogio, Ltd. | | 265,000 | | | 2,303,070 | | 0.1 | % | |
| | Soda Nikka Co., Ltd. | | 76,800 | | | 331,772 | | 0.0 | % | |
| | Sodick Co., Ltd. | | 285,400 | | | 2,354,683 | | 0.1 | % | |
| | Space Co., Ltd. | | 66,220 | | | 697,570 | | 0.0 | % | |
| # | | Srg Takamiya Co., Ltd. | | 118,600 | | | 628,448 | | 0.0 | % | |
| # | | Star Micronics Co., Ltd. | | 208,000 | | | 2,826,095 | | 0.1 | % | |
| # | | Subaru Enterprise Co., Ltd. | | 55,000 | | | 237,857 | | 0.0 | % | |
| | Sugimoto & Co., Ltd. | | 31,500 | | | 402,984 | | 0.0 | % | |
| | Sumitomo Densetsu Co., Ltd. | | 104,400 | | | 1,144,397 | | 0.0 | % | |
| | Sumitomo Mitsui Construction Co., Ltd. | | 5,237,600 | | | 5,491,645 | | 0.2 | % | |
| | Sumitomo Precision Products Co., Ltd. | | 189,000 | | | 571,461 | | 0.0 | % | |
| | Sumitomo Warehouse Co., Ltd. (The) | | 819,000 | | | 4,320,212 | | 0.2 | % | |
| * | | SWCC Showa Holdings Co., Ltd. | | 1,562,000 | | | 1,144,178 | | 0.0 | % | |
| # | | Tadano, Ltd. | | 591,700 | | | 7,438,111 | | 0.3 | % | |
| | Taihei Dengyo Kaisha, Ltd. | | 189,000 | | | 1,831,905 | | 0.1 | % | |
The Japanese Small Company Series
continued
| | | | | | | | | Percentage | |
| | | | | Shares | | Value†† | | of Net Assets** | |
| Industrials — (Continued) | | | | | | | | | |
| # | | Taiheiyo Kouhatsu, Inc. | | 407,000 | | $ | 347,856 | | 0.0 | % | |
| | Taikisha, Ltd. | | 147,000 | | | 3,579,394 | | 0.1 | % | |
| | Takamatsu Construction Group Co., Ltd. | | 80,000 | | | 1,698,897 | | 0.1 | % | |
| # | | Takano Co., Ltd. | | 49,400 | | | 359,362 | | 0.0 | % | |
| | Takaoka Toko Co., Ltd. | | 61,420 | | | 1,136,687 | | 0.0 | % | |
| | Takara Printing Co., Ltd. | | 51,955 | | | 686,603 | | 0.0 | % | |
| | Takara Standard Co., Ltd. | | 253,500 | | | 4,144,354 | | 0.1 | % | |
| # | | Takasago Thermal Engineering Co., Ltd. | | 355,200 | | | 4,562,851 | | 0.2 | % | |
| | Takashima & Co., Ltd. | | 225,000 | | | 365,162 | | 0.0 | % | |
| | Takeei Corp. | | 129,400 | | | 1,062,479 | | 0.0 | % | |
| | Takeuchi Manufacturing Co., Ltd. | | 208,300 | | | 4,616,385 | | 0.2 | % | |
| | Takigami Steel Construction Co., Ltd. (The) | | 53,000 | | | 201,105 | | 0.0 | % | |
| | Takisawa Machine Tool Co., Ltd. | | 368,000 | | | 496,682 | | 0.0 | % | |
| | Takuma Co., Ltd. | | 438,000 | | | 3,737,058 | | 0.1 | % | |
| # | | Tanseisha Co., Ltd. | | 213,249 | | | 1,459,432 | | 0.1 | % | |
| | Tatsuta Electric Wire and Cable Co., Ltd. | | 257,400 | | | 999,519 | | 0.0 | % | |
| | TECHNO ASSOCIE Co., Ltd. | | 56,800 | | | 524,787 | | 0.0 | % | |
| | Techno Ryowa, Ltd. | | 69,390 | | | 455,974 | | 0.0 | % | |
| | TechnoPro Holdings, Inc. | | 154,000 | | | 4,922,257 | | 0.2 | % | |
| | Teikoku Electric Manufacturing Co., Ltd. | | 96,000 | | | 834,285 | | 0.0 | % | |
| # | | Teikoku Sen-I Co., Ltd. | | 103,100 | | | 1,345,991 | | 0.1 | % | |
| # | | Tekken Corp. | | 464,000 | | | 1,356,679 | | 0.1 | % | |
| | Teraoka Seisakusho Co., Ltd. | | 53,600 | | | 173,165 | | 0.0 | % | |
| | Toa Corp. | | 110,300 | | | 1,878,251 | | 0.1 | % | |
| | TOA ROAD Corp. | | 266,000 | | | 787,305 | | 0.0 | % | |
| # | | Tobishima Corp. | | 1,073,200 | | | 1,682,539 | | 0.1 | % | |
| | Tocalo Co., Ltd. | | 83,100 | | | 1,801,506 | | 0.1 | % | |
| | Toda Corp. | | 1,230,000 | | | 6,464,095 | | 0.2 | % | |
| | Toenec Corp. | | 212,000 | | | 1,040,414 | | 0.0 | % | |
| | Togami Electric Manufacturing Co., Ltd. | | 20,000 | | | 79,110 | | 0.0 | % | |
| # | | TOKAI Holdings Corp. | | 528,400 | | | 3,686,662 | | 0.1 | % | |
| # | | Tokai Lease Co., Ltd. | | 162,000 | | | 287,285 | | 0.0 | % | |
| | Tokyo Energy & Systems, Inc. | | 139,000 | | | 1,186,648 | | 0.0 | % | |
| | Tokyo Keiki, Inc. | | 354,000 | | | 680,299 | | 0.0 | % | |
| * | | Tokyo Kikai Seisakusho, Ltd. | | 17,000 | | | 10,612 | | 0.0 | % | |
| | Tokyo Sangyo Co., Ltd. | | 81,000 | | | 331,083 | | 0.0 | % | |
| | Tokyu Construction Co., Ltd. | | 352,500 | | | 2,830,529 | | 0.1 | % | |
| | Toli Corp. | | 261,000 | | | 830,358 | | 0.0 | % | |
| | Tomoe Corp. | | 152,000 | | | 466,358 | | 0.0 | % | |
| # | | Tomoe Engineering Co., Ltd. | | 37,200 | | | 536,770 | | 0.0 | % | |
| | Tonami Holdings Co., Ltd. | | 308,000 | | | 939,356 | | 0.0 | % | |
| | Toppan Forms Co., Ltd. | | 298,500 | | | 3,107,838 | | 0.1 | % | |
| # | | Torishima Pump Manufacturing Co., Ltd. | | 117,100 | | | 1,136,084 | | 0.0 | % | |
| | Toshiba Machine Co., Ltd. | | 698,000 | | | 2,791,119 | | 0.1 | % | |
| # | | Toshiba Plant Systems & Services Corp. | | 262,650 | | | 3,455,138 | | 0.1 | % | |
| # | | Tosho Printing Co., Ltd. | | 227,000 | | | 948,760 | | 0.0 | % | |
| | Totech Corp. | | 900 | | | 12,423 | | 0.0 | % | |
| | Totetsu Kogyo Co., Ltd. | | 148,900 | | | 3,852,682 | | 0.1 | % | |
| | Toyo Construction Co., Ltd. | | 428,400 | | | 1,498,558 | | 0.1 | % | |
| | Toyo Denki Seizo K.K. | | 42,600 | | | 577,292 | | 0.0 | % | |
| | Toyo Engineering Corp. | | 892,400 | | | 2,376,318 | | 0.1 | % | |
| | Toyo Machinery & Metal Co., Ltd. | | 87,400 | | | 334,629 | | 0.0 | % | |
The Japanese Small Company Series
continued
| | | | | | | | | Percentage | |
| | | | | Shares | | Value†† | | of Net Assets** | |
| Industrials — (Continued) | | | | | | | | | |
| | Toyo Tanso Co., Ltd. | | 67,000 | | $ | 1,074,502 | | 0.0 | % | |
| # | | Toyo Wharf & Warehouse Co., Ltd. | | 340,000 | | | 533,921 | | 0.0 | % | |
| | Trancom Co., Ltd. | | 42,300 | | | 2,069,399 | | 0.1 | % | |
| | Trinity Industrial Corp. | | 19,000 | | | 85,414 | | 0.0 | % | |
| # | | Trusco Nakayama Corp. | | 242,200 | | | 5,064,527 | | 0.2 | % | |
| | Trust Tech, Inc. | | 48,900 | | | 693,032 | | 0.0 | % | |
| | Tsubakimoto Chain Co. | | 864,700 | | | 7,011,336 | | 0.2 | % | |
| | Tsubakimoto Kogyo Co., Ltd. | | 117,000 | | | 335,616 | | 0.0 | % | |
| #* | | Tsudakoma Corp. | | 294,000 | | | 413,698 | | 0.0 | % | |
| | Tsugami Corp. | | 395,000 | | | 2,261,964 | | 0.1 | % | |
| | Tsukishima Kikai Co., Ltd. | | 171,300 | | | 1,793,106 | | 0.1 | % | |
| | Tsurumi Manufacturing Co., Ltd. | | 106,000 | | | 1,531,825 | | 0.1 | % | |
| | TTK Co., Ltd. | | 62,000 | | | 256,779 | | 0.0 | % | |
| | Uchida Yoko Co., Ltd. | | 297,000 | | | 1,233,960 | | 0.0 | % | |
| | Ueki Corp. | | 348,000 | | | 767,151 | | 0.0 | % | |
| # | | Union Tool Co. | | 55,600 | | | 1,443,010 | | 0.1 | % | |
| | Ushio, Inc. | | 655,900 | | | 8,342,207 | | 0.3 | % | |
| | Utoc Corp. | | 98,700 | | | 343,556 | | 0.0 | % | |
| # | | Wakachiku Construction Co., Ltd. | | 1,052,000 | | | 1,382,078 | | 0.1 | % | |
| | Wakita & Co., Ltd. | | 219,800 | | | 1,827,978 | | 0.1 | % | |
| | WDB Holdings Co., Ltd. | | 19,100 | | | 224,837 | | 0.0 | % | |
| | Weathernews, Inc. | | 28,900 | | | 887,958 | | 0.0 | % | |
| # | | World Holdings Co., Ltd. | | 43,300 | | | 758,003 | | 0.0 | % | |
| # | | Yahagi Construction Co., Ltd. | | 159,400 | | | 1,471,062 | | 0.1 | % | |
| | YAMABIKO Corp. | | 210,828 | | | 2,927,477 | | 0.1 | % | |
| | YAMADA Consulting Group Co., Ltd. | | 4,100 | | | 167,152 | | 0.0 | % | |
| | Yamato Corp. | | 82,000 | | | 406,573 | | 0.0 | % | |
| | Yamaura Corp. | | 16,200 | | | 77,353 | | 0.0 | % | |
| | Yamazen Corp. | | 345,700 | | | 2,884,088 | | 0.1 | % | |
| | Yasuda Logistics Corp. | | 94,300 | | | 610,039 | | 0.0 | % | |
| | Yokogawa Bridge Holdings Corp. | | 198,000 | | | 2,300,495 | | 0.1 | % | |
| | Yondenko Corp. | | 128,800 | | | 493,182 | | 0.0 | % | |
| | Yuasa Trading Co., Ltd. | | 105,000 | | | 2,615,557 | | 0.1 | % | |
| # | | Yuken Kogyo Co., Ltd. | | 196,000 | | | 368,157 | | 0.0 | % | |
| # | | Yumeshin Holdings Co., Ltd. | | 179,600 | | | 1,208,534 | | 0.0 | % | |
| | Yurtec Corp. | | 249,000 | | | 1,686,632 | | 0.1 | % | |
| | Yusen Logistics Co., Ltd. | | 109,500 | | | 1,137,980 | | 0.0 | % | |
| # | | Yushin Precision Equipment Co., Ltd. | | 42,100 | | | 1,040,978 | | 0.0 | % | |
| | Zenitaka Corp. (The) | | 63,000 | | | 272,129 | | 0.0 | % | |
| # | | Zuiko Corp. | | 21,100 | | | 745,338 | | 0.0 | % | |
| Total Industrials | | | | | 872,688,974 | | 28.8 | % | |
| | | | | | | | | | |
| Information Technology — (12.0%) | | | | | | | | | |
| # | | A&D Co., Ltd. | | 113,900 | | | 455,515 | | 0.0 | % | |
| # | | Ai Holdings Corp. | | 247,200 | | | 4,900,007 | | 0.2 | % | |
| | Aichi Tokei Denki Co., Ltd. | | 18,700 | | | 592,248 | | 0.0 | % | |
| | Aiphone Co., Ltd. | | 71,900 | | | 1,207,509 | | 0.0 | % | |
| # | | Aisan Technology Co., Ltd. | | 12,000 | | | 416,869 | | 0.0 | % | |
| | Alpha Systems, Inc. | | 33,260 | | | 529,574 | | 0.0 | % | |
| | Amano Corp. | | 377,600 | | | 6,618,477 | | 0.2 | % | |
| | Anritsu Corp. | | 873,500 | | | 4,698,096 | | 0.2 | % | |
| | AOI Electronic Co., Ltd. | | 26,900 | | | 698,382 | | 0.0 | % | |
The Japanese Small Company Series
continued
| | | | | | | | | Percentage | |
| | | | | Shares | | Value†† | | of Net Assets** | |
| Information Technology — (Continued) | | | | | | | | | |
| | Argo Graphics, Inc. | | 32,700 | | $ | 656,955 | | 0.0 | % | |
| | Arisawa Manufacturing Co., Ltd. | | 200,900 | | | 1,103,990 | | 0.0 | % | |
| # | | ArtSpark Holdings, Inc. | | 32,000 | | | 477,978 | | 0.0 | % | |
| | Asahi Net, Inc. | | 77,400 | | | 324,135 | | 0.0 | % | |
| # | | Ateam, Inc. | | 62,600 | | | 1,230,287 | | 0.0 | % | |
| | Axell Corp. | | 44,900 | | | 375,822 | | 0.0 | % | |
| | Azbil Corp. | | 190,300 | | | 5,347,311 | | 0.2 | % | |
| | Broadband Tower, Inc. | | 234,500 | | | 459,948 | | 0.0 | % | |
| # | | Broadleaf Co., Ltd. | | 266,000 | | | 1,435,725 | | 0.1 | % | |
| | CAC Holdings Corp. | | 61,900 | | | 467,472 | | 0.0 | % | |
| | Canon Electronics, Inc. | | 133,800 | | | 2,014,068 | | 0.1 | % | |
| | Capcom Co., Ltd. | | 294,600 | | | 6,915,406 | | 0.2 | % | |
| | Chino Corp. | | 35,900 | | | 335,745 | | 0.0 | % | |
| | Citizen Watch Co., Ltd. | | 1,523,200 | | | 9,081,490 | | 0.3 | % | |
| * | | CMK Corp. | | 271,300 | | | 1,595,707 | | 0.1 | % | |
| # | | COLOPL, Inc. | | 259,900 | | | 2,195,958 | | 0.1 | % | |
| | Computer Engineering & Consulting, Ltd. | | 80,000 | | | 1,264,808 | | 0.1 | % | |
| | Computer Institute of Japan, Ltd. | | 26,700 | | | 120,355 | | 0.0 | % | |
| # | | Comture Corp. | | 19,100 | | | 533,696 | | 0.0 | % | |
| | CONEXIO Corp. | | 114,700 | | | 1,461,565 | | 0.1 | % | |
| #* | | COOKPAD, Inc. | | 287,400 | | | 2,632,788 | | 0.1 | % | |
| | Cresco, Ltd. | | 28,500 | | | 581,769 | | 0.0 | % | |
| # | | CROOZ, Inc. | | 40,500 | | | 949,383 | | 0.0 | % | |
| | Cube System, Inc. | | 12,300 | | | 71,105 | | 0.0 | % | |
| | Cybernet Systems Co., Ltd. | | 4,600 | | | 25,273 | | 0.0 | % | |
| | Dai-ichi Seiko Co., Ltd. | | 55,600 | | | 623,123 | | 0.0 | % | |
| # | | Daishinku Corp. | | 40,999 | | | 499,509 | | 0.0 | % | |
| | Daitron Co., Ltd. | | 5,900 | | | 47,197 | | 0.0 | % | |
| | Daiwabo Holdings Co., Ltd. | | 1,186,000 | | | 2,896,790 | | 0.1 | % | |
| | Denki Kogyo Co., Ltd. | | 313,000 | | | 1,531,692 | | 0.1 | % | |
| | Densan System Co., Ltd. | | 3,700 | | | 55,408 | | 0.0 | % | |
| * | | Dexerials Corp. | | 209,000 | | | 1,981,657 | | 0.1 | % | |
| | Digital Arts, Inc. | | 58,800 | | | 1,325,015 | | 0.1 | % | |
| | Digital Garage, Inc. | | 118,500 | | | 2,040,278 | | 0.1 | % | |
| # | | Dip Corp. | | 174,100 | | | 3,587,511 | | 0.1 | % | |
| | DKK-Toa Corp. | | 38,200 | | | 173,008 | | 0.0 | % | |
| | DTS Corp. | | 123,600 | | | 2,629,180 | | 0.1 | % | |
| | Eizo Corp. | | 104,800 | | | 3,111,678 | | 0.1 | % | |
| | Elecom Co., Ltd. | | 102,900 | | | 1,723,230 | | 0.1 | % | |
| | Elematec Corp. | | 52,271 | | | 816,116 | | 0.0 | % | |
| | EM Systems Co., Ltd. | | 42,600 | | | 585,531 | | 0.0 | % | |
| | Enplas Corp. | | 59,300 | | | 1,745,555 | | 0.1 | % | |
| | ESPEC Corp. | | 118,000 | | | 1,347,991 | | 0.1 | % | |
| # | | Excel Co., Ltd. | | 49,300 | | | 644,858 | | 0.0 | % | |
| # | | F@N Communications, Inc. | | 279,800 | | | 1,770,967 | | 0.1 | % | |
| # | | Faith, Inc. | | 27,910 | | | 291,710 | | 0.0 | % | |
| #* | | FDK Corp. | | 552,000 | | | 457,510 | | 0.0 | % | |
| | Ferrotec Corp. | | 187,500 | | | 2,428,815 | | 0.1 | % | |
| | Forval Corp. | | 4,700 | | | 29,221 | | 0.0 | % | |
| | Fuji Soft, Inc. | | 117,500 | | | 2,783,365 | | 0.1 | % | |
| | Fujitsu Frontech, Ltd. | | 75,300 | | | 944,766 | | 0.0 | % | |
| | Fukui Computer Holdings, Inc. | | 26,300 | | | 655,042 | | 0.0 | % | |
The Japanese Small Company Series
continued
| | | | | | | | | Percentage | |
| | | | | Shares | | Value†† | | of Net Assets** | |
| Information Technology — (Continued) | | | | | | | | | |
| | Furuno Electric Co., Ltd. | | 137,500 | | $ | 993,176 | | 0.0 | % | |
| | Furuya Metal Co., Ltd. | | 11,800 | | | 167,806 | | 0.0 | % | |
| | Future Corp. | | 129,200 | | | 800,512 | | 0.0 | % | |
| # | | GMO internet, Inc. | | 410,800 | | | 5,226,498 | | 0.2 | % | |
| # | | GMO Payment Gateway, Inc. | | 98,500 | | | 4,367,200 | | 0.2 | % | |
| | Gree, Inc. | | 672,200 | | | 3,532,519 | | 0.1 | % | |
| | Gurunavi, Inc. | | 172,800 | | | 3,423,961 | | 0.1 | % | |
| | Hagiwara Electric Co., Ltd. | | 19,500 | | | 351,524 | | 0.0 | % | |
| | Hakuto Co., Ltd. | | 84,500 | | | 750,895 | | 0.0 | % | |
| # | | Hearts United Group Co., Ltd. | | 84,800 | | | 1,221,250 | | 0.0 | % | |
| | Hibino Corp. | | 1,300 | | | 42,048 | | 0.0 | % | |
| # | | Hioki EE Corp. | | 53,500 | | | 963,384 | | 0.0 | % | |
| | Hitachi Kokusai Electric, Inc. | | 332,500 | | | 6,926,599 | | 0.2 | % | |
| | Hitachi Maxell, Ltd. | | 142,200 | | | 2,423,526 | | 0.1 | % | |
| # | | Hochiki Corp. | | 140,000 | | | 1,707,571 | | 0.1 | % | |
| # | | Hokuriku Electric Industry Co., Ltd. | | 482,000 | | | 551,853 | | 0.0 | % | |
| | Honda Tsushin Kogyo Co., Ltd. | | 17,900 | | | 195,454 | | 0.0 | % | |
| | Horiba, Ltd. | | 212,650 | | | 9,820,736 | | 0.3 | % | |
| | Hosiden Corp. | | 362,000 | | | 2,924,228 | | 0.1 | % | |
| | I-Net Corp. | | 59,290 | | | 550,429 | | 0.0 | % | |
| | I-O Data Device, Inc. | | 6,400 | | | 66,049 | | 0.0 | % | |
| | Ibiden Co., Ltd. | | 620,978 | | | 8,328,189 | | 0.3 | % | |
| | Icom, Inc. | | 50,200 | | | 970,424 | | 0.0 | % | |
| # | | Ikegami Tsushinki Co., Ltd. | | 339,000 | | | 478,987 | | 0.0 | % | |
| # | | Imagica Robot Holdings, Inc. | | 87,500 | | | 514,001 | | 0.0 | % | |
| | Ines Corp. | | 183,900 | | | 1,911,936 | | 0.1 | % | |
| | Infocom Corp. | | 80,400 | | | 1,134,563 | | 0.0 | % | |
| # | | Infomart Corp. | | 433,800 | | | 2,531,470 | | 0.1 | % | |
| | Information Services International-Dentsu, Ltd. | | 75,900 | | | 1,161,151 | | 0.0 | % | |
| | Innotech Corp. | | 105,000 | | | 514,925 | | 0.0 | % | |
| | Internet Initiative Japan, Inc. | | 192,400 | | | 2,897,987 | | 0.1 | % | |
| # | | Iriso Electronics Co., Ltd. | | 55,300 | | | 3,159,988 | | 0.1 | % | |
| # | | Istyle, Inc. | | 179,300 | | | 1,269,035 | | 0.1 | % | |
| | Itfor, Inc. | | 112,800 | | | 608,471 | | 0.0 | % | |
| * | | Iwatsu Electric Co., Ltd. | | 572,000 | | | 410,636 | | 0.0 | % | |
| | Japan Asia Group, Ltd. | | 79,600 | | | 293,665 | | 0.0 | % | |
| # | | Japan Aviation Electronics Industry, Ltd. | | 421,000 | | | 5,911,464 | | 0.2 | % | |
| #* | | Japan Display, Inc. | | 2,144,300 | | | 6,089,716 | | 0.2 | % | |
| # | | Japan Material Co., Ltd. | | 118,600 | | | 1,827,267 | | 0.1 | % | |
| # | | Japan Radio Co., Ltd. | | 71,000 | | | 848,478 | | 0.0 | % | |
| | Jastec Co., Ltd. | | 51,100 | | | 461,427 | | 0.0 | % | |
| # | | JBCC Holdings, Inc. | | 87,500 | | | 567,155 | | 0.0 | % | |
| | Justsystems Corp. | | 198,400 | | | 1,913,981 | | 0.1 | % | |
| | Kaga Electronics Co., Ltd. | | 105,100 | | | 1,703,918 | | 0.1 | % | |
| | Kanematsu Electronics, Ltd. | | 74,100 | | | 1,587,809 | | 0.1 | % | |
| #* | | KLab, Inc. | | 191,400 | | | 1,081,471 | | 0.0 | % | |
| | Koa Corp. | | 195,900 | | | 1,862,661 | | 0.1 | % | |
| | Kyosan Electric Manufacturing Co., Ltd. | | 279,000 | | | 938,525 | | 0.0 | % | |
| | Kyowa Electronics Instruments Co., Ltd. | | 135,100 | | | 451,644 | | 0.0 | % | |
| # | | LAC Co., Ltd. | | 87,300 | | | 771,110 | | 0.0 | % | |
| # | | Lasertec Corp. | | 106,800 | | | 2,081,627 | | 0.1 | % | |
| * | | Livesense, Inc. | | 2,700 | | | 10,184 | | 0.0 | % | |
The Japanese Small Company Series
continued
| | | | | | | | Percentage | |
| | | | Shares | | Value†† | | of Net Assets** | |
| Information Technology — (Continued) | | | | | | | | |
| | Macnica Fuji Electronics Holdings, Inc. | 193,550 | | $ | 2,543,346 | | 0.1 | % | |
| | Mamezou Holdings Co., Ltd. | 85,300 | | | 737,411 | | 0.0 | % | |
| | MarkLines Co., Ltd. | 500 | | | 12,157 | | 0.0 | % | |
| | Marubun Corp. | 95,700 | | | 560,650 | | 0.0 | % | |
| | Maruwa Co., Ltd. | 56,800 | | | 1,877,305 | | 0.1 | % | |
| # | | Marvelous, Inc. | 196,300 | | | 1,297,753 | | 0.1 | % | |
| | MCJ Co., Ltd. | 165,400 | | | 1,619,233 | | 0.1 | % | |
| | Media Do Co., Ltd. | 14,000 | | | 164,727 | | 0.0 | % | |
| | Megachips Corp. | 1,700 | | | 37,572 | | 0.0 | % | |
| * | | Meiko Electronics Co., Ltd. | 121,800 | | | 933,059 | | 0.0 | % | |
| | Melco Holdings, Inc. | 75,500 | | | 2,049,176 | | 0.1 | % | |
| # | | Micronics Japan Co., Ltd. | 191,600 | | | 1,890,457 | | 0.1 | % | |
| | Mimaki Engineering Co., Ltd. | 69,100 | | | 410,397 | | 0.0 | % | |
| | Mimasu Semiconductor Industry Co., Ltd. | 92,281 | | | 1,305,509 | | 0.1 | % | |
| | Miraial Co., Ltd. | 29,800 | | | 254,612 | | 0.0 | % | |
| | Miroku Jyoho Service Co., Ltd. | 104,100 | | | 1,598,616 | | 0.1 | % | |
| # | | Mitsubishi Research Institute, Inc. | 36,500 | | | 1,026,027 | | 0.0 | % | |
| | Mitsui High-Tec, Inc. | 139,000 | | | 989,528 | | 0.0 | % | |
| #* | | Mitsumi Electric Co., Ltd. | 527,600 | | | 2,888,458 | | 0.1 | % | |
| | MTI, Ltd. | 189,500 | | | 1,175,363 | | 0.0 | % | |
| | Mutoh Holdings Co., Ltd. | 146,000 | | | 314,071 | | 0.0 | % | |
| | Nagano Keiki Co., Ltd. | 14,900 | | | 88,434 | | 0.0 | % | |
| # | | Nakayo, Inc. | 390,000 | | | 1,312,803 | | 0.1 | % | |
| | NEC Networks & System Integration Corp. | 136,600 | | | 2,462,795 | | 0.1 | % | |
| | NET One Systems Co., Ltd. | 525,900 | | | 3,359,887 | | 0.1 | % | |
| * | | New Japan Radio Co., Ltd. | 96,000 | | | 324,235 | | 0.0 | % | |
| # | | Nexyz Group Corp. | 48,000 | | | 576,086 | | 0.0 | % | |
| | Nichicon Corp. | 334,200 | | | 2,909,920 | | 0.1 | % | |
| | Nihon Dempa Kogyo Co., Ltd. | 102,700 | | | 780,880 | | 0.0 | % | |
| | Nihon Unisys, Ltd. | 351,175 | | | 4,408,314 | | 0.2 | % | |
| # | | Nippon Ceramic Co., Ltd. | 62,200 | | | 1,062,750 | | 0.0 | % | |
| | Nippon Chemi-Con Corp. | 950,000 | | | 2,064,745 | | 0.1 | % | |
| # | | Nippon Kodoshi Corp. | 25,000 | | | 192,823 | | 0.0 | % | |
| | Nippon Signal Co., Ltd. | 316,400 | | | 2,673,457 | | 0.1 | % | |
| | Nippon Systemware Co., Ltd. | 39,900 | | | 487,089 | | 0.0 | % | |
| | Nohmi Bosai, Ltd. | 145,900 | | | 2,148,948 | | 0.1 | % | |
| | Noritsu Koki Co., Ltd. | 117,500 | | | 846,115 | | 0.0 | % | |
| | NS Solutions Corp. | 192,200 | | | 3,450,759 | | 0.1 | % | |
| | NSD Co., Ltd. | 177,280 | | | 2,780,467 | | 0.1 | % | |
| # | | Nuflare Technology, Inc. | 25,300 | | | 1,533,838 | | 0.1 | % | |
| # | | Ohara, Inc. | 47,600 | | | 337,315 | | 0.0 | % | |
| # | | Okaya Electric Industries Co., Ltd. | 73,000 | | | 254,077 | | 0.0 | % | |
| | Oki Electric Industry Co., Ltd. | 493,000 | | | 6,905,580 | | 0.2 | % | |
| | ONO Sokki Co., Ltd. | 58,400 | | | 436,924 | | 0.0 | % | |
| # | | Optex Group Co., Ltd. | 76,000 | | | 1,659,706 | | 0.1 | % | |
| #* | | Optim Corp. | 11,900 | | | 544,933 | | 0.0 | % | |
| | Origin Electric Co., Ltd. | 173,000 | | | 463,458 | | 0.0 | % | |
| | Osaki Electric Co., Ltd. | 246,000 | | | 2,556,808 | | 0.1 | % | |
| | Panasonic Industrial Devices SUNX Co., Ltd. | 111,600 | | | 761,139 | | 0.0 | % | |
| | PCA Corp. | 2,500 | | | 30,172 | | 0.0 | % | |
| | Poletowin Pitcrew Holdings, Inc. | 76,100 | | | 644,204 | | 0.0 | % | |
| | Renesas Easton Co., Ltd. | 2,400 | | | 10,748 | | 0.0 | % | |
The Japanese Small Company Series
continued
| | | | | | | | Percentage | |
| | | | Shares | | Value†† | | of Net Assets** | |
| Information Technology — (Continued) | | | | | | | | |
| | Riken Keiki Co., Ltd. | 83,800 | | $ | 1,200,477 | | 0.0 | % | |
| | Riso Kagaku Corp. | 179,500 | | | 3,025,552 | | 0.1 | % | |
| # | | Roland DG Corp. | 57,100 | | | 1,488,514 | | 0.1 | % | |
| | Rorze Corp. | 49,400 | | | 734,481 | | 0.0 | % | |
| * | | RVH, Inc. | 58,700 | | | 454,522 | | 0.0 | % | |
| | Ryoden Corp. | 178,000 | | | 1,120,924 | | 0.0 | % | |
| | Ryosan Co., Ltd. | 191,900 | | | 5,785,488 | | 0.2 | % | |
| # | | Ryoyo Electro Corp. | 122,600 | | | 1,540,051 | | 0.1 | % | |
| # | | Sakura Internet, Inc. | 79,100 | | | 637,909 | | 0.0 | % | |
| * | | Sanken Electric Co., Ltd. | 698,000 | | | 3,044,568 | | 0.1 | % | |
| | Sanshin Electronics Co., Ltd. | 164,300 | | | 1,581,086 | | 0.1 | % | |
| | Satori Electric Co., Ltd. | 85,880 | | | 534,861 | | 0.0 | % | |
| # | | Saxa Holdings, Inc. | 298,000 | | | 557,061 | | 0.0 | % | |
| # | | Scala, Inc. | 62,800 | | | 412,378 | | 0.0 | % | |
| | Shibaura Electronics Co., Ltd. | 29,100 | | | 594,632 | | 0.0 | % | |
| | Shibaura Mechatronics Corp. | 200,000 | | | 438,168 | | 0.0 | % | |
| | Shindengen Electric Manufacturing Co., Ltd. | 450,000 | | | 1,668,110 | | 0.1 | % | |
| #* | | Shinkawa, Ltd. | 94,400 | | | 657,265 | | 0.0 | % | |
| | Shinko Electric Industries Co., Ltd. | 470,400 | | | 3,168,893 | | 0.1 | % | |
| | Shinko Shoji Co., Ltd. | 127,300 | | | 1,350,894 | | 0.1 | % | |
| | Shizuki Electric Co., Inc. | 100,000 | | | 569,356 | | 0.0 | % | |
| # | | Siix Corp. | 92,900 | | | 3,129,749 | | 0.1 | % | |
| | SK-Electronics Co., Ltd. | 10,400 | | | 82,175 | | 0.0 | % | |
| | SMK Corp. | 372,000 | | | 1,321,460 | | 0.1 | % | |
| # | | SMS Co., Ltd. | 150,200 | | | 3,321,450 | | 0.1 | % | |
| # | | Softbank Technology Corp. | 29,000 | | | 803,743 | | 0.0 | % | |
| #* | | Softbrain Co., Ltd. | 161,300 | | | 545,254 | | 0.0 | % | |
| | Softcreate Holdings Corp. | 25,400 | | | 287,406 | | 0.0 | % | |
| # | | Sourcenext Corp. | 64,200 | | | 317,754 | | 0.0 | % | |
| | SRA Holdings | 57,400 | | | 1,259,701 | | 0.0 | % | |
| | Sumida Corp. | 112,849 | | | 1,019,911 | | 0.0 | % | |
| | Sun-Wa Technos Corp. | 40,500 | | | 325,518 | | 0.0 | % | |
| | Suzuden Corp. | 1,200 | | | 10,573 | | 0.0 | % | |
| | Systena Corp. | 116,600 | | | 1,776,834 | | 0.1 | % | |
| | Tabuchi Electric Co., Ltd. | 154,600 | | | 525,488 | | 0.0 | % | |
| | Tachibana Eletech Co., Ltd. | 85,260 | | | 968,547 | | 0.0 | % | |
| | Taiyo Yuden Co., Ltd. | 678,700 | | | 8,119,220 | | 0.3 | % | |
| | Takachiho Koheki Co., Ltd. | 300 | | | 2,577 | | 0.0 | % | |
| | TAKEBISHI Corp. | 600 | | | 6,112 | | 0.0 | % | |
| | Tamura Corp. | 457,000 | | | 1,722,584 | | 0.1 | % | |
| | TDC Software Engineering, Inc. | 1,700 | | | 16,645 | | 0.0 | % | |
| | TechMatrix Corp. | 46,400 | | | 809,134 | | 0.0 | % | |
| # | | Tecnos Japan, Inc. | 98,800 | | | 1,063,854 | | 0.0 | % | |
| | Teikoku Tsushin Kogyo Co., Ltd. | 198,000 | | | 297,524 | | 0.0 | % | |
| | TIS, Inc. | 505,101 | | | 10,795,796 | | 0.4 | % | |
| | TKC Corp. | 104,700 | | | 2,847,300 | | 0.1 | % | |
| | Tokyo Electron Device, Ltd. | 37,200 | | | 501,172 | | 0.0 | % | |
| | Tokyo Seimitsu Co., Ltd. | 240,800 | | | 7,119,187 | | 0.2 | % | |
| | Tomen Devices Corp. | 2,400 | | | 42,004 | | 0.0 | % | |
| | Topcon Corp. | 595,400 | | | 8,932,130 | | 0.3 | % | |
| | Torex Semiconductor, Ltd. | 23,700 | | | 362,485 | | 0.0 | % | |
| | Tose Co., Ltd. | 22,100 | | | 156,364 | | 0.0 | % | |
The Japanese Small Company Series
continued
| | | | | | | | Percentage | |
| | | | Shares | | Value†† | | of Net Assets** | |
| Information Technology — (Continued) | | | | | | | | |
| * | | Toshiba TEC Corp. | 806,000 | | $ | 3,853,512 | | 0.1 | % | |
| | Toukei Computer Co., Ltd. | 22,710 | | | 401,058 | | 0.0 | % | |
| | Towa Corp. | 131,400 | | | 1,847,809 | | 0.1 | % | |
| | Toyo Corp. | 141,000 | | | 1,249,424 | | 0.0 | % | |
| | Transcosmos, Inc. | 154,000 | | | 3,590,222 | | 0.1 | % | |
| # | | Tri Chemical Laboratories, Inc. | 29,200 | | | 579,817 | | 0.0 | % | |
| | UKC Holdings Corp. | 77,800 | | | 1,392,591 | | 0.1 | % | |
| | Ulvac, Inc. | 252,600 | | | 7,711,327 | | 0.3 | % | |
| * | | Uniden Holdings Corp. | 376,000 | | | 532,911 | | 0.0 | % | |
| | UNIRITA, Inc. | 3,500 | | | 52,762 | | 0.0 | % | |
| * | | UT Group Co., Ltd. | 189,500 | | | 1,558,754 | | 0.1 | % | |
| # | | V Technology Co., Ltd. | 26,300 | | | 2,930,926 | | 0.1 | % | |
| #* | | V-Cube, Inc. | 67,700 | | | 376,569 | | 0.0 | % | |
| # | | VeriServe Corp. | 11,700 | | | 310,219 | | 0.0 | % | |
| | Vitec Holdings Co., Ltd. | 45,100 | | | 479,680 | | 0.0 | % | |
| # | | Voyage Group, Inc. | 33,500 | | | 299,206 | | 0.0 | % | |
| # | | Wacom Co., Ltd. | 920,300 | | | 2,403,653 | | 0.1 | % | |
| | Wellnet Corp. | 80,700 | | | 891,840 | | 0.0 | % | |
| # | | Y A C Co., Ltd. | 48,900 | | | 531,331 | | 0.0 | % | |
| # | | Yamaichi Electronics Co., Ltd. | 146,000 | | | 1,415,621 | | 0.1 | % | |
| | Yashima Denki Co., Ltd. | 25,600 | | | 133,543 | | 0.0 | % | |
| | Yokowo Co., Ltd. | 86,200 | | | 708,691 | | 0.0 | % | |
| * | | Zappallas, Inc. | 55,900 | | | 199,506 | | 0.0 | % | |
| | Zuken, Inc. | 81,600 | | | 833,350 | | 0.0 | % | |
| Total Information Technology | | | | 394,897,221 | | 13.0 | % | |
| | | | | | | | | |
| Materials — (11.5%) | | | | | | | | |
| | Achilles Corp. | 91,900 | | | 1,230,809 | | 0.0 | % | |
| | ADEKA Corp. | 544,000 | | | 7,379,983 | | 0.3 | % | |
| | Agro-Kanesho Co., Ltd. | 62,400 | | | 648,373 | | 0.0 | % | |
| | Aichi Steel Corp. | 65,400 | | | 2,736,108 | | 0.1 | % | |
| | Alconix Corp. | 57,200 | | | 813,634 | | 0.0 | % | |
| | Arakawa Chemical Industries, Ltd. | 89,500 | | | 1,428,347 | | 0.1 | % | |
| | Araya Industrial Co., Ltd. | 268,000 | | | 363,538 | | 0.0 | % | |
| | Asahi Holdings, Inc. | 178,650 | | | 3,096,991 | | 0.1 | % | |
| | Asahi Printing Co., Ltd. | 800 | | | 17,936 | | 0.0 | % | |
| | Asahi Yukizai Corp. | 412,000 | | | 767,296 | | 0.0 | % | |
| | Asia Pile Holdings Corp. | 41,600 | | | 189,613 | | 0.0 | % | |
| # | | C Uyemura & Co., Ltd. | 24,500 | | | 1,068,439 | | 0.0 | % | |
| | Carlit Holdings Co., Ltd. | 76,400 | | | 362,368 | | 0.0 | % | |
| | Chuetsu Pulp & Paper Co., Ltd. | 552,000 | | | 1,121,961 | | 0.0 | % | |
| * | | Chugai Mining Co., Ltd. | 1,012,400 | | | 251,476 | | 0.0 | % | |
| | Chugoku Marine Paints, Ltd. | 347,000 | | | 2,550,250 | | 0.1 | % | |
| | Dai Nippon Toryo Co., Ltd. | 740,000 | | | 1,496,469 | | 0.1 | % | |
| | Daido Steel Co., Ltd. | 1,685,000 | | | 6,950,752 | | 0.2 | % | |
| # | | Daiichi Kigenso Kagaku-Kogyo Co., Ltd. | 17,600 | | | 601,374 | | 0.0 | % | |
| | Daiken Corp. | 84,200 | | | 1,482,121 | | 0.1 | % | |
| | Daiki Aluminium Industry Co., Ltd. | 157,000 | | | 677,015 | | 0.0 | % | |
| | Dainichiseika Color & Chemicals Manufacturing Co., Ltd. | 408,000 | | | 2,193,610 | | 0.1 | % | |
| # | | Daio Paper Corp. | 497,300 | | | 5,250,522 | | 0.2 | % | |
| | Denka Co., Ltd. | 1,949,000 | | | 8,580,724 | | 0.3 | % | |
| # | | DKS Co., Ltd. | 247,000 | | | 784,261 | | 0.0 | % | |
The Japanese Small Company Series
continued
| | | | | | | | Percentage | |
| | | | Shares | | Value†† | | of Net Assets** | |
| Materials — (Continued) | | | | | | | | |
| | Dowa Holdings Co., Ltd. | 889,000 | | $ | 6,760,356 | | 0.2 | % | |
| | Dynapac Co., Ltd. | 25,000 | | | 56,604 | | 0.0 | % | |
| | FP Corp. | 148,000 | | | 6,774,649 | | 0.2 | % | |
| | Fuji Seal International, Inc. | 264,200 | | | 5,633,103 | | 0.2 | % | |
| | Fujikura Kasei Co., Ltd. | 145,500 | | | 815,759 | | 0.0 | % | |
| | Fujimi, Inc. | 103,500 | | | 1,932,249 | | 0.1 | % | |
| | Fujimori Kogyo Co., Ltd. | 88,500 | | | 2,202,290 | | 0.1 | % | |
| | Fumakilla, Ltd. | 94,000 | | | 573,715 | | 0.0 | % | |
| | Fuso Chemical Co., Ltd. | 80,400 | | | 1,723,437 | | 0.1 | % | |
| # | | Geostr Corp. | 23,700 | | | 181,405 | | 0.0 | % | |
| | Godo Steel, Ltd. | 87,400 | | | 1,575,434 | | 0.1 | % | |
| | Gun-Ei Chemical Industry Co., Ltd. | 28,600 | | | 813,391 | | 0.0 | % | |
| | Hakudo Co., Ltd. | 1,000 | | | 12,049 | | 0.0 | % | |
| | Harima Chemicals Group, Inc. | 73,300 | | | 470,871 | | 0.0 | % | |
| # | | Hodogaya Chemical Co., Ltd. | 37,000 | | | 851,982 | | 0.0 | % | |
| | Hokkan Holdings, Ltd. | 275,000 | | | 1,105,926 | | 0.0 | % | |
| | Hokko Chemical Industry Co., Ltd. | 104,000 | | | 393,980 | | 0.0 | % | |
| # | | Hokuetsu Kishu Paper Co., Ltd. | 857,799 | | | 4,862,093 | | 0.2 | % | |
| | Honshu Chemical Industry Co., Ltd. | 14,000 | | | 95,942 | | 0.0 | % | |
| | Ihara Chemical Industry Co., Ltd. | 199,100 | | | 1,918,114 | | 0.1 | % | |
| | Ise Chemicals Corp. | 81,000 | | | 341,981 | | 0.0 | % | |
| * | | Ishihara Sangyo Kaisha, Ltd. | 191,150 | | | 1,495,769 | | 0.1 | % | |
| # | | Ishizuka Glass Co., Ltd. | 119,000 | | | 199,154 | | 0.0 | % | |
| | JCU Corp. | 30,400 | | | 1,470,022 | | 0.1 | % | |
| | JSP Corp. | 75,800 | | | 1,760,802 | | 0.1 | % | |
| | Kanto Denka Kogyo Co., Ltd. | 255,000 | | | 2,291,604 | | 0.1 | % | |
| | Katakura & Co-op Agri Corp. | 39,000 | | | 76,322 | | 0.0 | % | |
| | Kawakin Holdings Co., Ltd. | 11,000 | | | 32,578 | | 0.0 | % | |
| | Kimoto Co., Ltd. | 228,000 | | | 486,951 | | 0.0 | % | |
| | Koatsu Gas Kogyo Co., Ltd. | 158,493 | | | 1,020,291 | | 0.0 | % | |
| # | | Kogi Corp. | 55,000 | | | 120,690 | | 0.0 | % | |
| | Kohsoku Corp. | 60,200 | | | 570,757 | | 0.0 | % | |
| | Konishi Co., Ltd. | 193,600 | | | 2,080,894 | | 0.1 | % | |
| | Krosaki Harima Corp. | 275,000 | | | 719,846 | | 0.0 | % | |
| # | | Kumiai Chemical Industry Co., Ltd. | 40,800 | | | 248,065 | | 0.0 | % | |
| | Kureha Corp. | 87,650 | | | 3,289,782 | | 0.1 | % | |
| | Kurimoto, Ltd. | 61,500 | | | 1,189,394 | | 0.0 | % | |
| | Kuriyama Holdings Corp. | 1,000 | | | 14,340 | | 0.0 | % | |
| | Kyoei Steel, Ltd. | 106,200 | | | 2,019,110 | | 0.1 | % | |
| | Kyowa Leather Cloth Co., Ltd. | 47,700 | | | 346,140 | | 0.0 | % | |
| | Lintec Corp. | 286,700 | | | 6,238,233 | | 0.2 | % | |
| # | | MEC Co., Ltd. | 109,500 | | | 905,873 | | 0.0 | % | |
| | Mitani Sekisan Co., Ltd. | 31,700 | | | 813,555 | | 0.0 | % | |
| * | | Mitsubishi Paper Mills, Ltd. | 167,900 | | | 1,078,981 | | 0.0 | % | |
| | Mitsubishi Steel Manufacturing Co., Ltd. | 849,000 | | | 1,650,416 | | 0.1 | % | |
| | Mitsui Mining & Smelting Co., Ltd. | 3,627,000 | | | 9,117,334 | | 0.3 | % | |
| # | | MORESCO Corp. | 41,300 | | | 551,893 | | 0.0 | % | |
| | Mory Industries, Inc. | 30,400 | | | 501,413 | | 0.0 | % | |
| * | | Nakayama Steel Works, Ltd. | 86,700 | | | 535,661 | | 0.0 | % | |
| | Neturen Co., Ltd. | 181,700 | | | 1,395,678 | | 0.1 | % | |
| #* | | New Japan Chemical Co., Ltd. | 182,300 | | | 247,366 | | 0.0 | % | |
| | Nicca Chemical Co., Ltd. | 1,400 | | | 13,379 | | 0.0 | % | |
The Japanese Small Company Series
continued
| | | | | | | | Percentage | |
| | | | Shares | | Value†† | | of Net Assets** | |
| Materials — (Continued) | | | | | | | | |
| # | | Nichia Steel Works, Ltd. | 164,900 | | $ | 386,927 | | 0.0 | % | |
| | Nihon Kagaku Sangyo Co., Ltd. | 71,000 | | | 548,320 | | 0.0 | % | |
| # | | Nihon Nohyaku Co., Ltd. | 266,000 | | | 1,463,817 | | 0.1 | % | |
| | Nihon Parkerizing Co., Ltd. | 553,500 | | | 6,472,538 | | 0.2 | % | |
| | Nihon Yamamura Glass Co., Ltd. | 503,000 | | | 876,239 | | 0.0 | % | |
| | Nippon Carbide Industries Co., Inc. | 434,000 | | | 558,553 | | 0.0 | % | |
| | Nippon Chemical Industrial Co., Ltd. | 477,000 | | | 972,187 | | 0.0 | % | |
| # | | Nippon Concrete Industries Co., Ltd. | 253,600 | | | 735,616 | | 0.0 | % | |
| * | | Nippon Denko Co., Ltd. | 673,414 | | | 1,380,630 | | 0.1 | % | |
| | Nippon Fine Chemical Co., Ltd. | 81,000 | | | 622,920 | | 0.0 | % | |
| * | | Nippon Kasei Chemical Co., Ltd. | 192,000 | | | 261,498 | | 0.0 | % | |
| | Nippon Kayaku Co., Ltd. | 683,000 | | | 8,421,941 | | 0.3 | % | |
| #* | | Nippon Kinzoku Co., Ltd. | 29,300 | | | 318,277 | | 0.0 | % | |
| # | | Nippon Koshuha Steel Co., Ltd. | 460,000 | | | 333,810 | | 0.0 | % | |
| # | | Nippon Light Metal Holdings Co., Ltd. | 3,065,900 | | | 6,454,879 | | 0.2 | % | |
| # | | Nippon Paper Industries Co., Ltd. | 290,600 | | | 4,909,641 | | 0.2 | % | |
| | Nippon Pillar Packing Co., Ltd. | 116,800 | | | 1,219,789 | | 0.0 | % | |
| | Nippon Soda Co., Ltd. | 827,000 | | | 3,879,592 | | 0.1 | % | |
| # | | Nippon Valqua Industries, Ltd. | 97,799 | | | 1,284,740 | | 0.0 | % | |
| | Nippon Yakin Kogyo Co., Ltd. | 831,300 | | | 1,353,045 | | 0.1 | % | |
| # | | Nisshin Steel Co., Ltd. | 582,592 | | | 7,155,520 | | 0.2 | % | |
| # | | Nitta Gelatin, Inc. | 77,400 | | | 489,539 | | 0.0 | % | |
| | Nittetsu Mining Co., Ltd. | 34,400 | | | 1,622,269 | | 0.1 | % | |
| # | | Nitto FC Co., Ltd. | 74,500 | | | 583,370 | | 0.0 | % | |
| | NOF Corp. | 870,000 | | | 8,345,792 | | 0.3 | % | |
| | Nozawa Corp. | 1,200 | | | 10,787 | | 0.0 | % | |
| | Okamoto Industries, Inc. | 405,000 | | | 3,725,660 | | 0.1 | % | |
| | Okura Industrial Co., Ltd. | 284,000 | | | 1,202,037 | | 0.0 | % | |
| | Osaka Organic Chemical Industry, Ltd. | 69,700 | | | 573,742 | | 0.0 | % | |
| | Osaka Soda Co., Ltd. | 424,000 | | | 1,688,437 | | 0.1 | % | |
| | Osaka Steel Co., Ltd. | 83,300 | | | 1,540,559 | | 0.1 | % | |
| #* | | OSAKA Titanium Technologies Co., Ltd. | 46,200 | | | 639,911 | | 0.0 | % | |
| #* | | Pacific Metals Co., Ltd. | 941,000 | | | 2,985,297 | | 0.1 | % | |
| | Pack Corp. (The) | 80,200 | | | 1,789,061 | | 0.1 | % | |
| #* | | Rasa Industries, Ltd. | 480,000 | | | 557,051 | | 0.0 | % | |
| | Rengo Co., Ltd. | 1,261,000 | | | 6,847,835 | | 0.2 | % | |
| # | | Riken Technos Corp. | 212,600 | | | 972,876 | | 0.0 | % | |
| | Sakai Chemical Industry Co., Ltd. | 570,000 | | | 1,901,909 | | 0.1 | % | |
| | Sakata INX Corp. | 252,400 | | | 3,109,891 | | 0.1 | % | |
| | Sanyo Chemical Industries, Ltd. | 69,800 | | | 2,974,734 | | 0.1 | % | |
| | Sanyo Special Steel Co., Ltd. | 650,300 | | | 3,067,141 | | 0.1 | % | |
| # | | Seiko PMC Corp. | 5,700 | | | 57,383 | | 0.0 | % | |
| | Sekisui Plastics Co., Ltd. | 134,000 | | | 933,567 | | 0.0 | % | |
| | Shikoku Chemicals Corp. | 225,000 | | | 2,040,536 | | 0.1 | % | |
| | Shin-Etsu Polymer Co., Ltd. | 258,500 | | | 2,015,913 | | 0.1 | % | |
| | Shinagawa Refractories Co., Ltd. | 264,000 | | | 551,369 | | 0.0 | % | |
| # | | Shinko Wire Co., Ltd. | 184,000 | | | 218,360 | | 0.0 | % | |
| | Showa Denko K.K. | 845,099 | | | 12,071,509 | | 0.4 | % | |
| | Soken Chemical & Engineering Co., Ltd. | 1,100 | | | 11,123 | | 0.0 | % | |
| # | | Stella Chemifa Corp. | 61,800 | | | 1,645,765 | | 0.1 | % | |
| | Sumitomo Bakelite Co., Ltd. | 1,163,000 | | | 6,503,906 | | 0.2 | % | |
| | Sumitomo Osaka Cement Co., Ltd. | 2,493,000 | | | 9,393,234 | | 0.3 | % | |
The Japanese Small Company Series
continued
| | | | | | | | Percentage | |
| | | | Shares | | Value†† | | of Net Assets** | |
| Materials — (Continued) | | | | | | | | |
| | Sumitomo Seika Chemicals Co., Ltd. | 55,800 | | $ | 2,185,308 | | 0.1 | % | |
| | T Hasegawa Co., Ltd. | 134,800 | | | 2,240,537 | | 0.1 | % | |
| # | | T&K Toka Co., Ltd. | 80,000 | | | 699,232 | | 0.0 | % | |
| | Taisei Lamick Co., Ltd. | 29,600 | | | 805,005 | | 0.0 | % | |
| | Taiyo Holdings Co., Ltd. | 104,900 | | | 4,066,935 | | 0.1 | % | |
| | Takasago International Corp. | 87,200 | | | 2,302,438 | | 0.1 | % | |
| | Takiron Co., Ltd. | 295,000 | | | 1,306,693 | | 0.1 | % | |
| #* | | Tanaka Chemical Corp. | 62,500 | | | 447,406 | | 0.0 | % | |
| | Tayca Corp. | 175,000 | | | 956,288 | | 0.0 | % | |
| | Tenma Corp. | 80,800 | | | 1,385,962 | | 0.1 | % | |
| | Toagosei Co., Ltd. | 658,000 | | | 6,458,490 | | 0.2 | % | |
| # | | Toda Kogyo Corp. | 253,000 | | | 606,544 | | 0.0 | % | |
| # | | Toho Titanium Co., Ltd. | 183,700 | | | 1,228,751 | | 0.0 | % | |
| | Toho Zinc Co., Ltd. | 800,000 | | | 3,080,965 | | 0.1 | % | |
| | Tokai Carbon Co., Ltd. | 1,289,000 | | | 4,153,891 | | 0.1 | % | |
| | Tokushu Tokai Paper Co., Ltd. | 57,258 | | | 1,933,788 | | 0.1 | % | |
| * | | Tokuyama Corp. | 2,159,000 | | | 8,172,315 | | 0.3 | % | |
| | Tokyo Ohka Kogyo Co., Ltd. | 220,600 | | | 7,418,901 | | 0.3 | % | |
| | Tokyo Rope Manufacturing Co., Ltd. | 84,800 | | | 1,421,406 | | 0.1 | % | |
| | Tokyo Steel Manufacturing Co., Ltd. | 652,000 | | | 4,976,080 | | 0.2 | % | |
| | Tokyo Tekko Co., Ltd. | 251,000 | | | 1,009,301 | | 0.0 | % | |
| # | | Tomoegawa Co., Ltd. | 125,000 | | | 246,459 | | 0.0 | % | |
| # | | Tomoku Co., Ltd. | 339,000 | | | 948,314 | | 0.0 | % | |
| | Topy Industries, Ltd. | 114,200 | | | 2,935,494 | | 0.1 | % | |
| | Toyo Ink SC Holdings Co., Ltd. | 1,157,000 | | | 5,279,144 | | 0.2 | % | |
| | Toyo Kohan Co., Ltd. | 286,000 | | | 902,655 | | 0.0 | % | |
| | Toyobo Co., Ltd. | 5,688,000 | | | 8,453,957 | | 0.3 | % | |
| | TYK Corp. | 138,000 | | | 222,709 | | 0.0 | % | |
| # | | UACJ Corp. | 1,486,415 | | | 4,060,486 | | 0.1 | % | |
| | Ube Industries, Ltd. | 6,661,000 | | | 13,918,861 | | 0.5 | % | |
| # | | W-Scope Corp. | 148,900 | | | 2,231,140 | | 0.1 | % | |
| | Wood One Co., Ltd. | 164,000 | | | 382,673 | | 0.0 | % | |
| | Yamato Kogyo Co., Ltd. | 188,800 | | | 5,265,510 | | 0.2 | % | |
| | Yodogawa Steel Works, Ltd. | 144,700 | | | 3,771,063 | | 0.1 | % | |
| | Yotai Refractories Co., Ltd. | 8,000 | | | 23,236 | | 0.0 | % | |
| | Yuki Gosei Kogyo Co., Ltd. | 36,200 | | | 78,594 | | 0.0 | % | |
| | Yushiro Chemical Industry Co., Ltd. | 61,400 | | | 753,350 | | 0.0 | % | |
| # | | Zeon Corp. | 770,000 | | | 7,583,490 | | 0.3 | % | |
| Total Materials | | | | 377,216,006 | | 12.5 | % | |
| | | | | | | | | |
| Real Estate — (1.9%) | | | | | | | | |
| | AD Works Co., Ltd. | 572,000 | | | 220,283 | | 0.0 | % | |
| | Airport Facilities Co., Ltd. | 132,770 | | | 652,962 | | 0.0 | % | |
| | Anabuki Kosan, Inc. | 2,200 | | | 49,835 | | 0.0 | % | |
| | Aoyama Zaisan Networks Co., Ltd. | 3,800 | | | 23,196 | | 0.0 | % | |
| # | | Apamanshop Holdings Co., Ltd. | 40,900 | | | 335,823 | | 0.0 | % | |
| # | | Ardepro Co., Ltd. | 872,800 | | | 1,169,610 | | 0.0 | % | |
| #* | | Ascot Corp. | 42,600 | | | 186,564 | | 0.0 | % | |
| | CRE, Inc. | 1,000 | | | 12,909 | | 0.0 | % | |
| | Daibiru Corp. | 303,600 | | | 2,598,097 | | 0.1 | % | |
| | Daikyo, Inc. | 1,904,000 | | | 3,810,273 | | 0.1 | % | |
| | Dear Life Co., Ltd. | 3,300 | | | 10,771 | | 0.0 | % | |
The Japanese Small Company Series
continued
| | | | | | | | Percentage | |
| | | | Shares | | Value†† | | of Net Assets** | |
| Real Estate — (Continued) | | | | | | | | |
| | Goldcrest Co., Ltd. | 101,790 | | $ | 1,827,382 | | 0.1 | % | |
| | Grandy House Corp. | 27,800 | | | 94,957 | | 0.0 | % | |
| | Heiwa Real Estate Co., Ltd. | 236,600 | | | 3,219,416 | | 0.1 | % | |
| | Ichigo, Inc. | 1,238,500 | | | 4,574,099 | | 0.2 | % | |
| # | | Japan Property Management Center Co., Ltd. | 75,300 | | | 836,982 | | 0.0 | % | |
| # | | Kabuki-Za Co., Ltd. | 36,000 | | | 1,564,661 | | 0.1 | % | |
| | Keihanshin Building Co., Ltd. | 197,900 | | | 1,034,030 | | 0.0 | % | |
| # | | Kenedix, Inc. | 1,201,100 | | | 4,267,937 | | 0.1 | % | |
| # | | Land Business Co., Ltd. | 59,500 | | | 138,369 | | 0.0 | % | |
| | Leopalace21 Corp. | 1,960,700 | | | 10,829,792 | | 0.4 | % | |
| | Mugen Estate Co., Ltd. | 66,300 | | | 411,082 | | 0.0 | % | |
| | Nisshin Fudosan Co. | 186,100 | | | 859,481 | | 0.0 | % | |
| | Open House Co., Ltd. | 179,100 | | | 4,249,832 | | 0.1 | % | |
| * | | Properst Co., Ltd. | 26,600 | | | 52,096 | | 0.0 | % | |
| # | | Raysum Co., Ltd. | 78,500 | | | 522,589 | | 0.0 | % | |
| # | | SAMTY Co., Ltd. | 76,900 | | | 746,952 | | 0.0 | % | |
| | Sankyo Frontier Co., Ltd. | 10,000 | | | 102,378 | | 0.0 | % | |
| # | | Shinoken Group Co., Ltd. | 76,100 | | | 1,348,941 | | 0.1 | % | |
| | Star Mica Co., Ltd. | 28,200 | | | 473,760 | | 0.0 | % | |
| * | | Striders Corp. | 103,000 | | | 64,227 | | 0.0 | % | |
| | Sumitomo Real Estate Sales Co., Ltd. | 106,460 | | | 2,477,071 | | 0.1 | % | |
| | Sun Frontier Fudousan Co., Ltd. | 163,300 | | | 1,439,162 | | 0.1 | % | |
| # | | Takara Leben Co., Ltd. | 552,800 | | | 3,211,210 | | 0.1 | % | |
| # | | TOC Co., Ltd. | 323,950 | | | 2,579,180 | | 0.1 | % | |
| | Tokyo Rakutenchi Co., Ltd. | 207,000 | | | 951,221 | | 0.0 | % | |
| # | | Tokyo Theatres Co., Inc. | 468,000 | | | 647,752 | | 0.0 | % | |
| | Tosei Corp. | 201,700 | | | 1,509,135 | | 0.1 | % | |
| | Unizo Holdings Co., Ltd. | 92,900 | | | 2,456,442 | | 0.1 | % | |
| | Urbanet Corp. Co., Ltd. | 11,300 | | | 34,479 | | 0.0 | % | |
| Total Real Estate | | | | 61,594,938 | | 2.0 | % | |
| | | | | | | | | |
| Telecommunication Services — (0.1%) | | | | | | | | |
| * | | Broadmedia Corp. | 257,200 | | | 201,849 | | 0.0 | % | |
| | Freebit Co., Ltd. | 23,300 | | | 159,357 | | 0.0 | % | |
| # | | Okinawa Cellular Telephone Co. | 43,600 | | | 1,300,047 | | 0.1 | % | |
| # | | WirelessGate, Inc. | 38,700 | | | 562,469 | | 0.0 | % | |
| Total Telecommunication Services | | | | 2,223,722 | | 0.1 | % | |
| | | | | | | | | |
| Utilities — (0.7%) | | | | | | | | |
| # | | eRex Co., Ltd. | 29,400 | | | 849,382 | | 0.0 | % | |
| | Hiroshima Gas Co., Ltd. | 102,000 | | | 325,873 | | 0.0 | % | |
| | Hokkaido Electric Power Co., Inc. | 1,082,100 | | | 8,434,319 | | 0.3 | % | |
| | Hokkaido Gas Co., Ltd. | 281,000 | | | 663,254 | | 0.0 | % | |
| | Hokuriku Gas Co., Ltd. | 9,900 | | | 233,352 | | 0.0 | % | |
| | K&O Energy Group, Inc. | 79,000 | | | 1,244,741 | | 0.1 | % | |
| | Okinawa Electric Power Co., Inc. (The) | 214,834 | | | 4,826,055 | | 0.2 | % | |
| | Saibu Gas Co., Ltd. | 1,861,000 | | | 4,007,671 | | 0.1 | % | |
| | Shizuoka Gas Co., Ltd. | 315,100 | | | 2,220,447 | | 0.1 | % | |
| | Toell Co., Ltd. | 12,500 | | | 103,509 | | 0.0 | % | |
The Japanese Small Company Series
continued
| | | | | | | | Percentage | |
| | | | Shares | | Value†† | | of Net Assets** | |
| Utilities — (Continued) | | | | | | | | |
| | West Holdings Corp. | 96,800 | | $ | 697,324 | | 0.0 | % | |
| Total Utilities | | | | 23,605,927 | | 0.8 | % | |
| TOTAL COMMON STOCKS | | | | 3,014,245,803 | | 99.6 | % | |
| TOTAL INVESTMENT SECURITIES | | | | 3,014,245,803 | | | | |
| | | |
| | | | | Value† | | | | |
| SECURITIES LENDING COLLATERAL — (8.0%) | | | | | | | | |
| §@ | | DFA Short Term Investment Fund | 22,781,334 | | | 263,625,595 | | 8.7 | % | |
| TOTAL INVESTMENTS — (100.0%) (Cost $2,944,292,033)^ | | | $ | 3,277,871,398 | | 108.3 | % | |
__________________
^ The cost for federal income tax purposes is $2,944,292,033.
The Japanese Small Company Series
continued
Summary of the Series' investments as of December 31, 2016, based on their valuation inputs, is as follows (See Security Valuation Note):
| | Investments in Securities (Market Value) | |
| | Level 1 | | Level 2 | | Level 3 | | Total | |
| Common Stocks | | | | | | | | | | | | |
| Consumer Discretionary | | $ | 1,155,861 | | $ | 580,691,561 | | — | | $ | 581,847,422 | |
| Consumer Staples | | | 4,124,406 | | | 237,460,069 | | — | | | 241,584,475 | |
| Energy | | | — | | | 32,397,781 | | — | | | 32,397,781 | |
| Financials | | | 5,227,900 | | | 291,236,797 | | — | | | 296,464,697 | |
| Health Care | | | — | | | 129,724,640 | | — | | | 129,724,640 | |
| Industrials | | | — | | | 872,688,974 | | — | | | 872,688,974 | |
| Information Technology | | | — | | | 394,897,221 | | — | | | 394,897,221 | |
| Materials | | | — | | | 377,216,006 | | — | | | 377,216,006 | |
| Real Estate | | | — | | | 61,594,938 | | — | | | 61,594,938 | |
| Telecommunication Services | | | — | | | 2,223,722 | | — | | | 2,223,722 | |
| Utilities | | | — | | | 23,605,927 | | — | | | 23,605,927 | |
| Securities Lending Collateral | | | — | | | 263,625,595 | | — | | | 263,625,595 | |
| TOTAL | | $ | 10,508,167 | | $ | 3,267,363,231 | | — | | $ | 3,277,871,398 | |
THE ASIA PACIFIC SMALL COMPANY SERIES
SCHEDULE OF INVESTMENTS
December 31, 2016
(Unaudited)
| | | | | | | | | Percentage | |
| | | | | Shares | | Value†† | | of Net Assets** | |
| COMMON STOCKS — (86.0%) | | | | | | | | |
| AUSTRALIA — (43.3%) | | | | | | | | |
| * | | 3P Learning, Ltd. | | 16,559 | | $ | 13,727 | | 0.0% | |
| * | | AAT Corp., Ltd. | | 99 | | | — | | 0.0% | |
| #* | | Acrux, Ltd. | | 660,428 | | | 147,601 | | 0.0% | |
| | Adacel Technologies, Ltd. | | 15,787 | | | 27,970 | | 0.0% | |
| | Adelaide Brighton, Ltd. | | 3,668,074 | | | 14,347,509 | | 1.0% | |
| * | | AED Oil, Ltd. | | 363,401 | | | — | | 0.0% | |
| # | | Ainsworth Game Technology, Ltd. | | 801,969 | | | 1,219,688 | | 0.1% | |
| * | | Alkane Resources, Ltd. | | 1,463,658 | | | 358,524 | | 0.0% | |
| | ALS, Ltd. | | 1,315,878 | | | 5,717,962 | | 0.4% | |
| # | | Altium, Ltd. | | 222,654 | | | 1,297,775 | | 0.1% | |
| * | | Altona Mining, Ltd. | | 1,108,169 | | | 106,462 | | 0.0% | |
| # | | Alumina, Ltd. | | 7,413,478 | | | 9,693,819 | | 0.7% | |
| # | | AMA Group, Ltd. | | 207,879 | | | 147,537 | | 0.0% | |
| | Amaysim Australia, Ltd. | | 59,140 | | | 84,742 | | 0.0% | |
| | Ansell, Ltd. | | 563,728 | | | 10,030,349 | | 0.7% | |
| * | | Antares Energy, Ltd. | | 199,346 | | | 20 | | 0.0% | |
| # | | AP Eagers, Ltd. | | 234,655 | | | 1,560,515 | | 0.1% | |
| * | | APN News & Media, Ltd. | | 1,801,612 | | | 3,680,267 | | 0.3% | |
| | APN Outdoor Group, Ltd. | | 320,081 | | | 1,361,126 | | 0.1% | |
| | APN Property Group, Ltd. | | 26,661 | | | 8,067 | | 0.0% | |
| | Appen, Ltd. | | 23,436 | | | 47,937 | | 0.0% | |
| # | | ARB Corp., Ltd. | | 478,040 | | | 6,077,079 | | 0.4% | |
| # | | Ardent Leisure Group | | 598,078 | | | 1,006,662 | | 0.1% | |
| #* | | Arrium, Ltd. | | 17,951,296 | | | 91 | | 0.0% | |
| | Asaleo Care, Ltd. | | 780,908 | | | 832,496 | | 0.1% | |
| * | | Atlas Iron, Ltd. | | 2,098,007 | | | 41,003 | | 0.0% | |
| | AUB Group, Ltd. | | 261,159 | | | 1,980,775 | | 0.1% | |
| * | | Ausdrill, Ltd. | | 1,723,145 | | | 1,563,046 | | 0.1% | |
| # | | Austal, Ltd. | | 1,199,248 | | | 1,501,279 | | 0.1% | |
| #* | | Australian Agricultural Co., Ltd. | | 2,474,967 | | | 3,020,399 | | 0.2% | |
| | Australian Pharmaceutical Industries, Ltd. | | 2,416,756 | | | 3,582,702 | | 0.2% | |
| | Australian Vintage, Ltd. | | 4,105,188 | | | 1,480,351 | | 0.1% | |
| # | | Auswide Bank, Ltd. | | 94,385 | | | 346,610 | | 0.0% | |
| | Automotive Holdings Group, Ltd. | | 1,705,372 | | | 4,853,240 | | 0.3% | |
| * | | Avanco Resources, Ltd. | | 2,444,368 | | | 118,344 | | 0.0% | |
| | Aveo Group | | 839,791 | | | 2,023,240 | | 0.1% | |
| # | | AVJennings, Ltd. | | 7,051,385 | | | 3,078,704 | | 0.2% | |
| #* | | AWE, Ltd. | | 3,834,269 | | | 1,705,837 | | 0.1% | |
| | Bank of Queensland, Ltd. | | 923,162 | | | 7,889,368 | | 0.5% | |
| # | | Bapcor, Ltd. | | 641,446 | | | 2,734,096 | | 0.2% | |
| | Beach Energy, Ltd. | | 13,573,519 | | | 8,260,061 | | 0.6% | |
| #* | | Beadell Resources, Ltd. | | 5,672,449 | | | 1,076,155 | | 0.1% | |
| # | | Bega Cheese, Ltd. | | 570,837 | | | 1,742,530 | | 0.1% | |
| # | | Bellamy's Australia, Ltd. | | 270,885 | | | 1,305,834 | | 0.1% | |
| #* | | Billabong International, Ltd. | | 756,968 | | | 685,007 | | 0.1% | |
| # | | Blackmores, Ltd. | | 81,784 | | | 6,087,286 | | 0.4% | |
| # | | Blue Sky Alternative Investments, Ltd. | | 37,325 | | | 188,398 | | 0.0% | |
| | BlueScope Steel, Ltd. | | 1,511,506 | | | 10,045,567 | | 0.7% | |
| * | | Boart Longyear, Ltd. | | 2,546,867 | | | 229,093 | | 0.0% | |
| * | | Boom Logistics, Ltd. | | 166,262 | | | 12,570 | | 0.0% | |
| | Boral, Ltd. | | 3,427,616 | | | 13,343,977 | | 0.9% | |
The Asia Pacific Small Company Series
continued
| | | | | | | | | Percentage | |
| | | | | Shares | | Value†† | | of Net Assets** | |
| AUSTRALIA — (Continued) | | | | | | | | | |
| * | | Bradken, Ltd. | | 1,242,062 | | $ | 2,880,409 | | 0.2 | % | |
| # | | Breville Group, Ltd. | | 786,318 | | | 4,907,059 | | 0.3 | % | |
| | Brickworks, Ltd. | | 228,958 | | | 2,242,665 | | 0.2 | % | |
| # | | BT Investment Management, Ltd. | | 613,273 | | | 4,684,641 | | 0.3 | % | |
| #* | | Buccaneer Energy, Ltd. | | 3,283,586 | | | — | | 0.0 | % | |
| #* | | Buru Energy, Ltd. | | 316,943 | | | 46,819 | | 0.0 | % | |
| # | | Cabcharge Australia, Ltd. | | 863,423 | | | 2,413,723 | | 0.2 | % | |
| | Capilano Honey, Ltd. | | 4,776 | | | 58,553 | | 0.0 | % | |
| * | | Capitol Health, Ltd. | | 164,543 | | | 15,396 | | 0.0 | % | |
| * | | Capral, Ltd. | | 58,499 | | | 6,839 | | 0.0 | % | |
| #* | | Cardno, Ltd. | | 1,615,947 | | | 1,101,007 | | 0.1 | % | |
| * | | Carnarvon Petroleum, Ltd. | | 5,095,141 | | | 363,337 | | 0.0 | % | |
| * | | Carnegie Clean Energy, Ltd. | | 563,165 | | | 24,797 | | 0.0 | % | |
| | carsales.com, Ltd. | | 1,702,940 | | | 13,912,570 | | 0.9 | % | |
| # | | Cash Converters International, Ltd. | | 2,406,480 | | | 580,085 | | 0.0 | % | |
| * | | CDS Technologies, Ltd. | | 13,276 | | | — | | 0.0 | % | |
| | Cedar Woods Properties, Ltd. | | 323,002 | | | 1,174,940 | | 0.1 | % | |
| | Cleanaway Waste Management, Ltd. | | 10,357,050 | | | 9,173,336 | | 0.6 | % | |
| #* | | Clinuvel Pharmaceuticals, Ltd. | | 44,995 | | | 241,833 | | 0.0 | % | |
| | Codan, Ltd. | | 425,680 | | | 620,918 | | 0.0 | % | |
| # | | Collection House, Ltd. | | 2,175,227 | | | 2,288,303 | | 0.2 | % | |
| | Collins Foods, Ltd. | | 324,217 | | | 1,535,082 | | 0.1 | % | |
| * | | Cooper Energy, Ltd. | | 719,967 | | | 183,904 | | 0.0 | % | |
| # | | Corporate Travel Management, Ltd. | | 238,654 | | | 3,147,540 | | 0.2 | % | |
| | Costa Group Holdings, Ltd. | | 85,344 | | | 211,384 | | 0.0 | % | |
| # | | Cover-More Group, Ltd. | | 353,468 | | | 490,963 | | 0.0 | % | |
| # | | Credit Corp. Group, Ltd. | | 148,153 | | | 1,912,787 | | 0.1 | % | |
| # | | CSG, Ltd. | | 1,003,475 | | | 528,453 | | 0.0 | % | |
| | CSR, Ltd. | | 3,350,138 | | | 11,138,076 | | 0.8 | % | |
| #* | | CuDeco, Ltd. | | 387,893 | | | 145,325 | | 0.0 | % | |
| | Data#3, Ltd. | | 581,410 | | | 643,929 | | 0.0 | % | |
| # | | Decmil Group, Ltd. | | 867,988 | | | 646,896 | | 0.0 | % | |
| * | | Devine, Ltd. | | 224,413 | | | 76,041 | | 0.0 | % | |
| | Dicker Data, Ltd. | | 12,339 | | | 20,110 | | 0.0 | % | |
| | Donaco International, Ltd. | | 28,566 | | | 7,519 | | 0.0 | % | |
| | Downer EDI, Ltd. | | 2,910,872 | | | 12,745,830 | | 0.9 | % | |
| * | | DSHE Holdings, Ltd. | | 91,564 | | | — | | 0.0 | % | |
| | DuluxGroup, Ltd. | | 3,101,823 | | | 13,926,770 | | 0.9 | % | |
| | DWS, Ltd. | | 395,621 | | | 370,725 | | 0.0 | % | |
| | Eclipx Group, Ltd. | | 150,597 | | | 406,578 | | 0.0 | % | |
| #* | | Elders, Ltd. | | 478,012 | | | 1,368,685 | | 0.1 | % | |
| * | | Emeco Holdings, Ltd. | | 1,193,646 | | | 57,318 | | 0.0 | % | |
| #* | | Energy Resources of Australia, Ltd. | | 1,156,799 | | | 362,531 | | 0.0 | % | |
| #* | | Energy World Corp., Ltd. | | 4,185,404 | | | 784,627 | | 0.1 | % | |
| * | | Enero Group, Ltd. | | 12,387 | | | 8,293 | | 0.0 | % | |
| # | | EQT Holdings, Ltd. | | 22,542 | | | 284,251 | | 0.0 | % | |
| # | | ERM Power, Ltd. | | 783,474 | | | 725,350 | | 0.1 | % | |
| # | | Estia Health, Ltd. | | 201,546 | | | 377,335 | | 0.0 | % | |
| | Euroz, Ltd. | | 101,762 | | | 76,794 | | 0.0 | % | |
| | Event Hospitality and Entertainment, Ltd. | | 495,773 | | | 4,922,350 | | 0.3 | % | |
| | Evolution Mining, Ltd. | | 4,976,497 | | | 7,441,627 | | 0.5 | % | |
| | Fairfax Media, Ltd. | | 15,303,894 | | | 9,805,179 | | 0.7 | % | |
The Asia Pacific Small Company Series
continued
| | | | | | | | | Percentage | |
| | | | | Shares | | Value†† | | of Net Assets** | |
| AUSTRALIA — (Continued) | | | | | | | | | |
| #* | | FAR, Ltd. | | 1,592,550 | | $ | 86,036 | | 0.0 | % | |
| | Finbar Group, Ltd. | | 154,390 | | | 102,862 | | 0.0 | % | |
| #* | | Fleetwood Corp., Ltd. | | 394,575 | | | 560,447 | | 0.0 | % | |
| # | | FlexiGroup, Ltd. | | 1,034,377 | | | 1,683,378 | | 0.1 | % | |
| # | | Flight Centre Travel Group, Ltd. | | 165,496 | | | 3,729,714 | | 0.3 | % | |
| # | | G8 Education, Ltd. | | 1,470,843 | | | 3,801,459 | | 0.3 | % | |
| # | | Gateway Lifestyle | | 120,201 | | | 187,075 | | 0.0 | % | |
| | Gazal Corp., Ltd. | | 22,520 | | | 36,594 | | 0.0 | % | |
| # | | GBST Holdings, Ltd. | | 32,801 | | | 88,893 | | 0.0 | % | |
| # | | Genworth Mortgage Insurance Australia, Ltd. | | 200,049 | | | 471,507 | | 0.0 | % | |
| | Global Construction Services, Ltd. | | 4,832 | | | 1,971 | | 0.0 | % | |
| | GrainCorp, Ltd. Class A | | 1,251,687 | | | 8,625,073 | | 0.6 | % | |
| | Grange Resources, Ltd. | | 1,724,297 | | | 174,476 | | 0.0 | % | |
| # | | Greencross, Ltd. | | 188,425 | | | 931,329 | | 0.1 | % | |
| # | | GUD Holdings, Ltd. | | 882,277 | | | 6,653,541 | | 0.5 | % | |
| | GWA Group, Ltd. | | 1,958,668 | | | 4,173,525 | | 0.3 | % | |
| # | | Hansen Technologies, Ltd. | | 190,397 | | | 537,646 | | 0.0 | % | |
| | Healthscope, Ltd. | | 1,336,318 | | | 2,202,854 | | 0.2 | % | |
| | HFA Holdings, Ltd. | | 310,766 | | | 537,812 | | 0.0 | % | |
| #* | | Hills, Ltd. | | 1,277,876 | | | 423,781 | | 0.0 | % | |
| * | | Horizon Oil, Ltd. | | 4,073,887 | | | 164,377 | | 0.0 | % | |
| * | | IDM International, Ltd. | | 958 | | | — | | 0.0 | % | |
| | Iluka Resources, Ltd. | | 1,381,380 | | | 7,192,789 | | 0.5 | % | |
| #* | | Imdex, Ltd. | | 1,586,552 | | | 657,941 | | 0.0 | % | |
| # | | IMF Bentham, Ltd. | | 762,337 | | | 961,018 | | 0.1 | % | |
| | Independence Group NL | | 2,082,153 | | | 6,386,883 | | 0.4 | % | |
| #* | | Infigen Energy | | 2,347,820 | | | 1,522,455 | | 0.1 | % | |
| | Infomedia, Ltd. | | 2,051,811 | | | 1,079,550 | | 0.1 | % | |
| | Integrated Research, Ltd. | | 339,277 | | | 684,871 | | 0.1 | % | |
| # | | InvoCare, Ltd. | | 905,619 | | | 9,050,224 | | 0.6 | % | |
| # | | IOOF Holdings, Ltd. | | 1,900,338 | | | 12,596,047 | | 0.9 | % | |
| # | | IRESS, Ltd. | | 1,123,183 | | | 9,597,858 | | 0.7 | % | |
| # | | iSelect, Ltd. | | 140,276 | | | 191,251 | | 0.0 | % | |
| # | | iSentia Group, Ltd. | | 305,169 | | | 629,842 | | 0.0 | % | |
| # | | Japara Healthcare, Ltd. | | 200,671 | | | 326,707 | | 0.0 | % | |
| # | | JB Hi-Fi, Ltd. | | 962,791 | | | 19,460,401 | | 1.3 | % | |
| * | | Jupiter Mines, Ltd. | | 405,443 | | | 5,384 | | 0.0 | % | |
| | K&S Corp., Ltd. | | 265,983 | | | 307,073 | | 0.0 | % | |
| * | | Karoon Gas Australia, Ltd. | | 775,139 | | | 999,106 | | 0.1 | % | |
| #* | | Kingsgate Consolidated, Ltd. | | 1,717,937 | | | 351,561 | | 0.0 | % | |
| * | | Kingsrose Mining, Ltd. | | 937,248 | | | 67,637 | | 0.0 | % | |
| * | | Lednium Technology Pty, Ltd. | | 195,019 | | | — | | 0.0 | % | |
| #* | | Lynas Corp., Ltd. | | 3,390,978 | | | 178,095 | | 0.0 | % | |
| | MACA, Ltd. | | 700,787 | | | 864,728 | | 0.1 | % | |
| * | | Macmahon Holdings, Ltd. | | 6,881,875 | | | 496,397 | | 0.0 | % | |
| | Macquarie Atlas Roads Group | | 565,764 | | | 2,058,719 | | 0.1 | % | |
| | Magellan Financial Group, Ltd. | | 493,135 | | | 8,428,794 | | 0.6 | % | |
| | Mantra Group, Ltd. | | 700,704 | | | 1,552,054 | | 0.1 | % | |
| | MaxiTRANS Industries, Ltd. | | 915,613 | | | 339,841 | | 0.0 | % | |
| #* | | Mayne Pharma Group, Ltd. | | 6,419,629 | | | 6,210,582 | | 0.4 | % | |
| | McMillan Shakespeare, Ltd. | | 427,034 | | | 3,343,786 | | 0.2 | % | |
| | McPherson's, Ltd. | | 558,677 | | | 414,494 | | 0.0 | % | |
The Asia Pacific Small Company Series
continued
| | | | | | | | | Percentage | |
| | | | | Shares | | Value†† | | of Net Assets** | |
| AUSTRALIA — (Continued) | | | | | | | | | |
| * | | Medusa Mining, Ltd. | | 1,263,898 | | $ | 450,249 | | 0.0 | % | |
| | Melbourne IT, Ltd. | | 441,811 | | | 598,435 | | 0.0 | % | |
| #* | | Mesoblast, Ltd. | | 143,272 | | | 147,511 | | 0.0 | % | |
| #* | | Metals X, Ltd. | | 1,642,001 | | | 661,941 | | 0.0 | % | |
| #* | | Metcash, Ltd. | | 5,144,197 | | | 8,459,988 | | 0.6 | % | |
| # | | Michael Hill International, Ltd. | | 1,490,263 | | | 1,349,675 | | 0.1 | % | |
| * | | Millennium Minerals, Ltd. | | 45,061 | | | 7,221 | | 0.0 | % | |
| * | | Mincor Resources NL | | 1,067,643 | | | 161,135 | | 0.0 | % | |
| # | | Mineral Resources, Ltd. | | 1,168,088 | | | 10,167,310 | | 0.7 | % | |
| #* | | MMA Offshore, Ltd. | | 2,189,075 | | | 425,672 | | 0.0 | % | |
| # | | Monadelphous Group, Ltd. | | 792,858 | | | 6,407,684 | | 0.4 | % | |
| | Monash IVF Group, Ltd. | | 107,778 | | | 159,315 | | 0.0 | % | |
| # | | Money3 Corp., Ltd. | | 29,801 | | | 34,242 | | 0.0 | % | |
| * | | Morning Star Gold NL | | 332,749 | | | 72 | | 0.0 | % | |
| | Mortgage Choice, Ltd. | | 680,426 | | | 1,170,932 | | 0.1 | % | |
| * | | Mount Gibson Iron, Ltd. | | 4,617,886 | | | 1,159,889 | | 0.1 | % | |
| # | | Myer Holdings, Ltd. | | 5,669,367 | | | 5,635,998 | | 0.4 | % | |
| | MyState, Ltd. | | 193,507 | | | 617,894 | | 0.0 | % | |
| | Navitas, Ltd. | | 1,459,890 | | | 5,237,276 | | 0.4 | % | |
| #* | | Nearmap, Ltd. | | 199,803 | | | 94,155 | | 0.0 | % | |
| #* | | NetComm Wireless, Ltd. | | 36,441 | | | 56,612 | | 0.0 | % | |
| | New Hope Corp., Ltd. | | 212,522 | | | 253,552 | | 0.0 | % | |
| * | | NEXTDC, Ltd. | | 42,329 | | | 110,899 | | 0.0 | % | |
| | nib holdings, Ltd. | | 2,713,689 | | | 9,286,375 | | 0.6 | % | |
| | Nick Scali, Ltd. | | 168,860 | | | 749,189 | | 0.1 | % | |
| # | | Nine Entertainment Co. Holdings, Ltd. | | 596,849 | | | 457,774 | | 0.0 | % | |
| # | | Northern Star Resources, Ltd. | | 4,806,957 | | | 12,285,908 | | 0.8 | % | |
| #* | | NRW Holdings, Ltd. | | 2,147,851 | | | 1,025,957 | | 0.1 | % | |
| | Nufarm, Ltd. | | 1,280,776 | | | 8,439,156 | | 0.6 | % | |
| # | | OFX Group, Ltd. | | 557,214 | | | 674,373 | | 0.1 | % | |
| | oOh!media, Ltd. | | 49,189 | | | 162,073 | | 0.0 | % | |
| #* | | Orocobre, Ltd. | | 389,899 | | | 1,265,781 | | 0.1 | % | |
| | Orora, Ltd. | | 3,956,731 | | | 8,508,962 | | 0.6 | % | |
| # | | OrotonGroup, Ltd. | | 131,885 | | | 211,936 | | 0.0 | % | |
| | OZ Minerals, Ltd. | | 2,198,276 | | | 12,419,670 | | 0.8 | % | |
| # | | Pacific Current Group, Ltd. | | 30,242 | | | 91,768 | | 0.0 | % | |
| | Pacific Smiles Group, Ltd. | | 247,728 | | | 363,617 | | 0.0 | % | |
| | Pact Group Holdings, Ltd. | | 255,068 | | | 1,239,352 | | 0.1 | % | |
| #* | | Paladin Energy, Ltd. | | 9,564,569 | | | 593,375 | | 0.0 | % | |
| * | | Panoramic Resources, Ltd. | | 1,781,726 | | | 348,241 | | 0.0 | % | |
| # | | Peet, Ltd. | | 1,645,757 | | | 1,152,189 | | 0.1 | % | |
| #* | | Peninsula Energy, Ltd. | | 209,095 | | | 84,633 | | 0.0 | % | |
| # | | Perpetual, Ltd. | | 356,426 | | | 12,503,310 | | 0.9 | % | |
| #* | | Perseus Mining, Ltd. | | 3,800,711 | | | 898,975 | | 0.1 | % | |
| # | | Platinum Asset Management, Ltd. | | 349,770 | | | 1,329,215 | | 0.1 | % | |
| * | | Pluton Resources, Ltd. | | 20,710 | | | — | | 0.0 | % | |
| # | | PMP, Ltd. | | 2,327,074 | | | 1,132,722 | | 0.1 | % | |
| | Premier Investments, Ltd. | | 594,567 | | | 6,183,574 | | 0.4 | % | |
| * | | Prima Biomed, Ltd. | | 1,409,121 | | | 36,636 | | 0.0 | % | |
| | Primary Health Care, Ltd. | | 3,292,878 | | | 9,672,775 | | 0.7 | % | |
| # | | Prime Media Group, Ltd. | | 2,031,951 | | | 454,512 | | 0.0 | % | |
| | Pro Medicus, Ltd. | | 3,343 | | | 11,564 | | 0.0 | % | |
The Asia Pacific Small Company Series
continued
| | | | | | | | | Percentage | |
| | | | | Shares | | Value†† | | of Net Assets** | |
| AUSTRALIA — (Continued) | | | | | | | | | |
| # | | Programmed Maintenance Services, Ltd. | | 1,681,782 | | $ | 2,329,325 | | 0.2 | % | |
| # | | Qube Holdings, Ltd. | | 2,674,107 | | | 4,697,417 | | 0.3 | % | |
| #* | | Ramelius Resources, Ltd. | | 2,088,879 | | | 745,045 | | 0.1 | % | |
| # | | RCG Corp., Ltd. | | 418,699 | | | 448,814 | | 0.0 | % | |
| | RCR Tomlinson, Ltd. | | 1,055,209 | | | 2,091,116 | | 0.1 | % | |
| | Reckon, Ltd. | | 372,996 | | | 427,628 | | 0.0 | % | |
| * | | Red 5, Ltd. | | 9,022 | | | 563 | | 0.0 | % | |
| | Reece, Ltd. | | 228,772 | | | 7,389,850 | | 0.5 | % | |
| # | | Regis Healthcare, Ltd. | | 319,693 | | | 1,054,713 | | 0.1 | % | |
| | Regis Resources, Ltd. | | 2,618,798 | | | 5,506,895 | | 0.4 | % | |
| # | | Reject Shop, Ltd. (The) | | 265,486 | | | 1,621,537 | | 0.1 | % | |
| # | | Resolute Mining, Ltd. | | 4,897,793 | | | 4,455,267 | | 0.3 | % | |
| # | | Retail Food Group, Ltd. | | 1,099,481 | | | 5,558,579 | | 0.4 | % | |
| | Ridley Corp., Ltd. | | 1,365,765 | | | 1,230,402 | | 0.1 | % | |
| * | | RiverCity Motorway Group | | 1,563,354 | | | — | | 0.0 | % | |
| * | | RungePincockMinarco, Ltd. | | 30,702 | | | 12,008 | | 0.0 | % | |
| | Ruralco Holdings, Ltd. | | 115,893 | | | 249,251 | | 0.0 | % | |
| #* | | Salmat, Ltd. | | 645,788 | | | 261,575 | | 0.0 | % | |
| | Sandfire Resources NL | | 650,878 | | | 2,634,636 | | 0.2 | % | |
| * | | Saracen Mineral Holdings, Ltd. | | 6,350,203 | | | 4,454,554 | | 0.3 | % | |
| # | | SeaLink Travel Group, Ltd. | | 30,221 | | | 99,975 | | 0.0 | % | |
| # | | Select Harvests, Ltd. | | 532,021 | | | 2,541,236 | | 0.2 | % | |
| * | | Senetas Corp., Ltd. | | 131,335 | | | 9,473 | | 0.0 | % | |
| #* | | Senex Energy, Ltd. | | 6,438,932 | | | 1,224,217 | | 0.1 | % | |
| | Servcorp, Ltd. | | 319,070 | | | 1,805,798 | | 0.1 | % | |
| | Service Stream, Ltd. | | 1,778,827 | | | 1,407,786 | | 0.1 | % | |
| | Seven Group Holdings, Ltd. | | 559,015 | | | 3,152,563 | | 0.2 | % | |
| # | | Seven West Media, Ltd. | | 7,785,820 | | | 4,509,929 | | 0.3 | % | |
| | SG Fleet Group, Ltd. | | 60,289 | | | 144,801 | | 0.0 | % | |
| | Shine Corporate, Ltd. | | 15,573 | | | 8,367 | | 0.0 | % | |
| | Sigma Pharmaceuticals, Ltd. | | 7,584,855 | | | 7,052,760 | | 0.5 | % | |
| #* | | Silex Systems, Ltd. | | 511,695 | | | 146,016 | | 0.0 | % | |
| # | | Silver Chef, Ltd. | | 107,708 | | | 688,318 | | 0.1 | % | |
| #* | | Silver Lake Resources, Ltd. | | 3,044,995 | | | 1,380,862 | | 0.1 | % | |
| # | | Sims Metal Management, Ltd. | | 1,382,214 | | | 12,705,601 | | 0.9 | % | |
| | Sirtex Medical, Ltd. | | 413,240 | | | 4,212,184 | | 0.3 | % | |
| #* | | Slater & Gordon, Ltd. | | 2,016,208 | | | 326,738 | | 0.0 | % | |
| | SmartGroup Corp., Ltd. | | 36,277 | | | 164,017 | | 0.0 | % | |
| # | | SMS Management & Technology, Ltd. | | 575,318 | | | 552,164 | | 0.0 | % | |
| | Southern Cross Media Group, Ltd. | | 3,965,374 | | | 4,411,843 | | 0.3 | % | |
| # | | Spark Infrastructure Group | | 11,913,246 | | | 20,435,277 | | 1.4 | % | |
| * | | Specialty Fashion Group, Ltd. | | 786,397 | | | 288,496 | | 0.0 | % | |
| | SpeedCast International, Ltd. | | 95,790 | | | 241,715 | | 0.0 | % | |
| | Spotless Group Holdings, Ltd. | | 3,040,648 | | | 2,167,417 | | 0.2 | % | |
| * | | St Barbara, Ltd. | | 3,864,261 | | | 5,583,335 | | 0.4 | % | |
| | Star Entertainment Grp, Ltd. (The) | | 1,234,530 | | | 4,594,496 | | 0.3 | % | |
| | Steadfast Group, Ltd. | | 1,838,882 | | | 2,926,230 | | 0.2 | % | |
| * | | Strike Energy, Ltd. | | 1,576,787 | | | 90,951 | | 0.0 | % | |
| #* | | Sundance Energy Australia, Ltd. | | 5,606,547 | | | 885,354 | | 0.1 | % | |
| | Sunland Group, Ltd. | | 729,757 | | | 849,577 | | 0.1 | % | |
| # | | Super Retail Group, Ltd. | | 1,280,749 | | | 9,534,725 | | 0.7 | % | |
| * | | Superloop, Ltd. | | 2,718 | | | 5,365 | | 0.0 | % | |
The Asia Pacific Small Company Series
continued
| | | | | | | | | Percentage | |
| | | | | Shares | | Value†† | | of Net Assets** | |
| AUSTRALIA — (Continued) | | | | | | | | | |
| #* | | Syrah Resources, Ltd. | | 167,002 | | $ | 366,365 | | 0.0 | % | |
| | Tabcorp Holdings, Ltd. | | 3,586,818 | | | 12,426,532 | | 0.8 | % | |
| | Tassal Group, Ltd. | | 918,653 | | | 2,747,930 | | 0.2 | % | |
| | Technology One, Ltd. | | 1,645,166 | | | 6,686,052 | | 0.5 | % | |
| #* | | Ten Network Holdings, Ltd. | | 1,309,458 | | | 872,416 | | 0.1 | % | |
| # | | TFS Corp., Ltd. | | 2,070,093 | | | 2,475,987 | | 0.2 | % | |
| | Thorn Group, Ltd. | | 617,981 | | | 855,819 | | 0.1 | % | |
| * | | Tiger Resources, Ltd. | | 9,447,997 | | | 245,078 | | 0.0 | % | |
| * | | Toro Energy, Ltd. | | 70,156 | | | 2,077 | | 0.0 | % | |
| # | | Tox Free Solutions, Ltd. | | 1,156,521 | | | 2,157,866 | | 0.2 | % | |
| | Treasury Wine Estates, Ltd. | | 507,715 | | | 3,905,662 | | 0.3 | % | |
| * | | Tribune Resources, Ltd. | | 3,093 | | | 11,952 | | 0.0 | % | |
| #* | | Troy Resources, Ltd. | | 2,230,415 | | | 229,394 | | 0.0 | % | |
| # | | Villa World, Ltd. | | 275,888 | | | 453,621 | | 0.0 | % | |
| # | | Village Roadshow, Ltd. | | 831,506 | | | 2,731,567 | | 0.2 | % | |
| * | | Virgin Australia Holdings, Ltd.(B43DQC7) | | 11,885,050 | | | 2,016,803 | | 0.1 | % | |
| * | | Virgin Australia Holdings, Ltd.() | | 7,648,897 | | | — | | 0.0 | % | |
| | Virtus Health, Ltd. | | 212,311 | | | 954,699 | | 0.1 | % | |
| # | | Vita Group, Ltd. | | 100,413 | | | 233,647 | | 0.0 | % | |
| # | | Vocus Group, Ltd. | | 4,260,609 | | | 11,864,629 | | 0.8 | % | |
| #* | | Watpac, Ltd. | | 760,701 | | | 424,244 | | 0.0 | % | |
| # | | Webjet, Ltd. | | 594,951 | | | 4,540,582 | | 0.3 | % | |
| | Webster, Ltd. | | 23,507 | | | 23,122 | | 0.0 | % | |
| #* | | Western Areas, Ltd. | | 1,821,505 | | | 3,999,271 | | 0.3 | % | |
| #* | | Westgold Resources, Ltd. | | 820,999 | | | 977,582 | | 0.1 | % | |
| #* | | Whitehaven Coal, Ltd. | | 4,143,411 | | | 7,756,054 | | 0.5 | % | |
| * | | WorleyParsons, Ltd. | | 550,059 | | | 3,828,959 | | 0.3 | % | |
| | WPP AUNZ, Ltd. | | 2,447,007 | | | 2,130,462 | | 0.1 | % | |
| TOTAL AUSTRALIA | | | | | 738,069,719 | | 50.0 | % | |
| | | | | | | | | | |
| CHINA — (0.2%) | | | | | | | | | |
| # | | China Everbright Water, Ltd. | | 3,794,800 | | | 1,306,240 | | 0.1 | % | |
| | K Wah International Holdings, Ltd. | | 2,487,632 | | | 1,150,000 | | 0.1 | % | |
| * | | Lifestyle China Group, Ltd. | | 1,649,000 | | | 392,577 | | 0.0 | % | |
| TOTAL CHINA | | | | | 2,848,817 | | 0.2 | % | |
| | | | | | | | | | |
| HONG KONG — (24.2%) | | | | | | | | | |
| * | | 13 Holdings, Ltd. (The) | | 54,500 | | | 16,034 | | 0.0 | % | |
| | Aeon Credit Service Asia Co., Ltd. | | 564,000 | | | 397,417 | | 0.0 | % | |
| | Aeon Stores Hong Kong Co., Ltd. | | 248,000 | | | 225,911 | | 0.0 | % | |
| | Agritrade Resources, Ltd. | | 3,065,000 | | | 638,854 | | 0.1 | % | |
| | Alco Holdings, Ltd. | | 1,614,000 | | | 479,332 | | 0.0 | % | |
| | Allan International Holdings | | 32,000 | | | 7,760 | | 0.0 | % | |
| | Allied Group, Ltd. | | 663,200 | | | 3,450,820 | | 0.2 | % | |
| | Allied Properties HK, Ltd. | | 12,007,857 | | | 2,669,431 | | 0.2 | % | |
| * | | Anxian Yuan China Holdings, Ltd. | | 3,100,000 | | | 39,560 | | 0.0 | % | |
| * | | Apac Resources, Ltd. | | 31,747,350 | | | 433,806 | | 0.0 | % | |
| * | | Applied Development Holdings, Ltd. | | 5,550,000 | | | 592,965 | | 0.0 | % | |
| | APT Satellite Holdings, Ltd. | | 2,977,500 | | | 1,428,379 | | 0.1 | % | |
| | Arts Optical International Hldgs, Ltd. | | 730,000 | | | 280,622 | | 0.0 | % | |
| | Asia Financial Holdings, Ltd. | | 2,404,908 | | | 1,151,465 | | 0.1 | % | |
| * | | Asia Satellite Telecommunications Holdings, Ltd. | | 934,500 | | | 1,164,347 | | 0.1 | % | |
The Asia Pacific Small Company Series
continued
| | | | | | | | | Percentage | |
| | | | | Shares | | Value†† | | of Net Assets** | |
| HONG KONG — (Continued) | | | | | | | | | |
| | Asia Standard Hotel Group, Ltd. | | 11,437,218 | | $ | 375,366 | | 0.0 | % | |
| | Asia Standard International Group, Ltd. | | 13,316,917 | | | 2,705,514 | | 0.2 | % | |
| | ASM Pacific Technology, Ltd. | | 400,200 | | | 4,232,273 | | 0.3 | % | |
| | Associated International Hotels, Ltd. | | 952,000 | | | 2,697,882 | | 0.2 | % | |
| * | | Auto Italia Holdings | | 1,900,000 | | | 29,328 | | 0.0 | % | |
| * | | BeijingWest Industries International, Ltd. | | 419,600 | | | 104,442 | | 0.0 | % | |
| * | | Bel Global Resources Holdings, Ltd. | | 2,576,000 | | | — | | 0.0 | % | |
| # | | BEP International Holdings, Ltd. | | 19,310,000 | | | 1,102,855 | | 0.1 | % | |
| | Bestway International Holdings, Ltd. | | 1,495,000 | | | 227,494 | | 0.0 | % | |
| | Bonjour Holdings, Ltd. | | 13,988,600 | | | 629,385 | | 0.1 | % | |
| | Bossini International Holdings, Ltd. | | 3,699,500 | | | 200,122 | | 0.0 | % | |
| | Bright Smart Securities & Commodities Group, Ltd. | | 5,126,000 | | | 1,677,585 | | 0.1 | % | |
| # | | Brightoil Petroleum Holdings, Ltd. | | 6,187,000 | | | 1,751,409 | | 0.1 | % | |
| #* | | Brockman Mining, Ltd. | | 22,810,814 | | | 393,433 | | 0.0 | % | |
| * | | Burwill Holdings, Ltd. | | 30,792,960 | | | 1,006,758 | | 0.1 | % | |
| | Cafe de Coral Holdings, Ltd. | | 2,388,000 | | | 7,728,869 | | 0.5 | % | |
| * | | Cash Financial Services Group, Ltd. | | 3,438,000 | | | 185,450 | | 0.0 | % | |
| * | | CCT Land Holdings, Ltd. | | 480,000 | | | 743 | | 0.0 | % | |
| | Century City International Holdings, Ltd. | | 6,235,460 | | | 432,843 | | 0.0 | % | |
| * | | CGN Mining Co., Ltd. | | 825,000 | | | 62,492 | | 0.0 | % | |
| * | | Champion Technology Holdings, Ltd. | | 17,285,089 | | | 319,983 | | 0.0 | % | |
| | Chen Hsong Holdings | | 1,212,000 | | | 303,295 | | 0.0 | % | |
| | Cheuk Nang Holdings, Ltd. | | 649,742 | | | 455,871 | | 0.0 | % | |
| # | | Chevalier International Holdings, Ltd. | | 820,989 | | | 1,258,532 | | 0.1 | % | |
| * | | China Billion Resources, Ltd. | | 2,438,000 | | | 9,090 | | 0.0 | % | |
| * | | China Chuanglian Education Group, Ltd. | | 4,664,000 | | | 93,070 | | 0.0 | % | |
| * | | China Digicontent Co., Ltd. | | 2,710,000 | | | — | | 0.0 | % | |
| * | | China Energy Development Holdings, Ltd. | | 52,140,000 | | | 582,977 | | 0.0 | % | |
| * | | China Environmental Energy Investment, Ltd. | | 196,000 | | | 12,197 | | 0.0 | % | |
| * | | China Ever Grand Financial Leasing Group Co., Ltd. | | 810,000 | | | 9,891 | | 0.0 | % | |
| | China Flavors & Fragrances Co., Ltd. | | 517,028 | | | 163,055 | | 0.0 | % | |
| * | | China Healthcare Enterprise Group, Ltd. | | 7,756,000 | | | 111,598 | | 0.0 | % | |
| # | | China LNG Group, Ltd. | | 9,920,000 | | | 231,260 | | 0.0 | % | |
| * | | China Ludao Technology Co., Ltd. | | 580,000 | | | 133,079 | | 0.0 | % | |
| * | | China Medical & Healthcare Group, Ltd. | | 42,916,800 | | | 2,151,347 | | 0.2 | % | |
| | China Metal International Holdings, Inc. | | 2,670,000 | | | 842,678 | | 0.1 | % | |
| # | | China Motor Bus Co., Ltd. | | 51,800 | | | 595,047 | | 0.0 | % | |
| * | | China National Culture Group, Ltd. | | 7,410,000 | | | 36,122 | | 0.0 | % | |
| #* | | China Smarter Energy Group Holdings, Ltd. | | 196,000 | | | 21,189 | | 0.0 | % | |
| * | | China Solar Energy Holdings, Ltd. | | 1,669,500 | | | 7,266 | | 0.0 | % | |
| * | | China Star Entertainment, Ltd. | | 1,850,000 | | | 113,918 | | 0.0 | % | |
| #* | | China Strategic Holdings, Ltd. | | 51,391,250 | | | 1,163,870 | | 0.1 | % | |
| | China Ting Group Holdings, Ltd. | | 2,565,151 | | | 155,181 | | 0.0 | % | |
| * | | China Wah Yan Healthcare, Ltd. | | 11,685,000 | | | 64,617 | | 0.0 | % | |
| # | | Chinese Estates Holdings, Ltd. | | 55,000 | | | 95,496 | | 0.0 | % | |
| | Chinney Investments, Ltd. | | 1,144,000 | | | 255,159 | | 0.0 | % | |
| | Chong Hing Bank, Ltd. | | 75,000 | | | 144,543 | | 0.0 | % | |
| | Chow Sang Sang Holdings International, Ltd. | | 2,321,000 | | | 4,299,010 | | 0.3 | % | |
| | Chuang's China Investments, Ltd. | | 7,391,407 | | | 451,960 | | 0.0 | % | |
| | Chuang's Consortium International, Ltd. | | 6,883,043 | | | 1,283,050 | | 0.1 | % | |
| | CITIC Telecom International Holdings, Ltd. | | 11,973,125 | | | 3,586,913 | | 0.3 | % | |
| | CK Life Sciences International Holdings, Inc. | | 22,408,000 | | | 1,987,109 | | 0.1 | % | |
The Asia Pacific Small Company Series
continued
| | | | | | | | | Percentage | |
| | | | | Shares | | Value†† | | of Net Assets** | |
| HONG KONG — (Continued) | | | | | | | | | |
| * | | CMMB Vision Holdings, Ltd. | | 3,032,000 | | $ | 241,344 | | 0.0 | % | |
| | CNQC International Holdings, Ltd. | | 2,482,500 | | | 967,830 | | 0.1 | % | |
| | CNT Group, Ltd. | | 8,303,264 | | | 673,131 | | 0.1 | % | |
| * | | Common Splendor International Health Industry Group, Ltd. | | 7,584,000 | | | 654,161 | | 0.1 | % | |
| * | | Continental Holdings, Ltd. | | 450,000 | | | 7,575 | | 0.0 | % | |
| | Convenience Retail Asia, Ltd. | | 142,000 | | | 67,898 | | 0.0 | % | |
| * | | Convoy Global Holdings, Ltd. | | 45,144,000 | | | 1,339,294 | | 0.1 | % | |
| #* | | Cowell e Holdings, Inc. | | 1,683,000 | | | 420,716 | | 0.0 | % | |
| * | | CP Lotus Corp. | | 11,880,000 | | | 215,988 | | 0.0 | % | |
| * | | Crocodile Garments | | 1,427,000 | | | 187,068 | | 0.0 | % | |
| # | | Cross-Harbour Holdings, Ltd. (The) | | 847,956 | | | 1,223,917 | | 0.1 | % | |
| # | | CSI Properties, Ltd. | | 37,036,383 | | | 1,308,832 | | 0.1 | % | |
| # | | CW Group Holdings, Ltd. | | 2,624,000 | | | 515,325 | | 0.0 | % | |
| | Dah Sing Banking Group, Ltd. | | 3,773,516 | | | 6,916,604 | | 0.5 | % | |
| # | | Dah Sing Financial Holdings, Ltd. | | 1,435,744 | | | 9,692,762 | | 0.7 | % | |
| | Dickson Concepts International, Ltd. | | 1,252,000 | | | 448,820 | | 0.0 | % | |
| * | | Ding He Mining Holdings, Ltd. | | 2,832,000 | | | 47,370 | | 0.0 | % | |
| * | | Dragonite International, Ltd. | | 56,000 | | | 12,171 | | 0.0 | % | |
| | Dynamic Holdings, Ltd. | | 18,000 | | | 11,378 | | 0.0 | % | |
| | Eagle Nice International Holdings, Ltd. | | 1,846,000 | | | 519,488 | | 0.0 | % | |
| | EcoGreen International Group, Ltd. | | 1,634,640 | | | 353,488 | | 0.0 | % | |
| * | | EganaGoldpfeil Holdings, Ltd. | | 4,121,757 | | | — | | 0.0 | % | |
| | Emperor Capital Group, Ltd. | | 29,067,000 | | | 2,573,793 | | 0.2 | % | |
| | Emperor Entertainment Hotel, Ltd. | | 4,405,000 | | | 1,035,561 | | 0.1 | % | |
| | Emperor International Holdings, Ltd. | | 8,756,753 | | | 1,979,635 | | 0.1 | % | |
| * | | Emperor Watch & Jewellery, Ltd. | | 26,450,000 | | | 953,691 | | 0.1 | % | |
| #* | | Enerchina Holdings, Ltd. | | 4,914,000 | | | 195,144 | | 0.0 | % | |
| * | | ENM Holdings, Ltd. | | 14,680,000 | | | 1,093,612 | | 0.1 | % | |
| * | | EPI Holdings, Ltd. | | 1,950,001 | | | 46,839 | | 0.0 | % | |
| #* | | Esprit Holdings, Ltd. | | 14,664,650 | | | 11,494,234 | | 0.8 | % | |
| * | | eSun Holdings, Ltd. | | 4,344,000 | | | 391,162 | | 0.0 | % | |
| * | | Eternity Investment, Ltd. | | 830,000 | | | 25,433 | | 0.0 | % | |
| * | | Ezcom Holdings, Ltd. | | 72,576 | | | — | | 0.0 | % | |
| # | | Fairwood Holdings, Ltd. | | 719,100 | | | 2,624,850 | | 0.2 | % | |
| | Far East Consortium International, Ltd. | | 9,262,798 | | | 3,940,344 | | 0.3 | % | |
| * | | Far East Holdings International, Ltd. | | 720,000 | | | 83,153 | | 0.0 | % | |
| | FIH Mobile, Ltd. | | 11,798,000 | | | 3,719,105 | | 0.3 | % | |
| | First Pacific Co., Ltd. | | 4,658,000 | | | 3,249,434 | | 0.2 | % | |
| | First Shanghai Investments, Ltd. | | 4,648,000 | | | 702,783 | | 0.1 | % | |
| | Fountain SET Holdings, Ltd. | | 5,446,000 | | | 686,811 | | 0.1 | % | |
| | Four Seas Mercantile Holdings, Ltd. | | 610,000 | | | 306,656 | | 0.0 | % | |
| * | | Freeman FinTech Corp., Ltd. | | 1,820,000 | | | 115,825 | | 0.0 | % | |
| | Fulum Group Holdings, Ltd. | | 76,000 | | | 11,439 | | 0.0 | % | |
| | Future Bright Holdings, Ltd. | | 3,288,000 | | | 346,077 | | 0.0 | % | |
| | G-Resources Group, Ltd. | | 167,529,600 | | | 3,057,855 | | 0.2 | % | |
| #* | | GCL New Energy Holdings, Ltd. | | 21,846,000 | | | 1,276,847 | | 0.1 | % | |
| # | | Get Nice Financial Group, Ltd. | | 966,600 | | | 118,154 | | 0.0 | % | |
| # | | Get Nice Holdings, Ltd. | | 40,426,000 | | | 1,374,567 | | 0.1 | % | |
| | Giordano International, Ltd. | | 10,852,000 | | | 5,851,280 | | 0.4 | % | |
| #* | | Global Brands Group Holding, Ltd. | | 29,114,000 | | | 3,851,150 | | 0.3 | % | |
| | Glorious Sun Enterprises, Ltd. | | 4,240,000 | | | 529,515 | | 0.0 | % | |
| | Gold Peak Industries Holdings, Ltd. | | 3,029,642 | | | 285,193 | | 0.0 | % | |
The Asia Pacific Small Company Series
continued
| | | | | | | | | Percentage | |
| | | | | Shares | | Value†† | | of Net Assets** | |
| HONG KONG — (Continued) | | | | | | | | | |
| | Golden Resources Development International, Ltd. | | 3,330,500 | | $ | 184,327 | | 0.0 | % | |
| #* | | Good Resources Holdings, Ltd. | | 4,260,000 | | | 262,109 | | 0.0 | % | |
| * | | Grande Holdings, Ltd. (The) | | 882,000 | | | 51,074 | | 0.0 | % | |
| | Great Eagle Holdings, Ltd. | | 474,467 | | | 2,256,892 | | 0.2 | % | |
| | Guangnan Holdings, Ltd. | | 2,363,600 | | | 285,733 | | 0.0 | % | |
| | Guoco Group, Ltd. | | 2,000 | | | 22,023 | | 0.0 | % | |
| # | | Guotai Junan International Holdings, Ltd. | | 23,731,797 | | | 7,267,081 | | 0.5 | % | |
| # | | Haitong International Securities Group, Ltd. | | 10,217,015 | | | 5,823,915 | | 0.4 | % | |
| | Hanison Construction Holdings, Ltd. | | 2,103,649 | | | 378,379 | | 0.0 | % | |
| * | | Hao Tian Development Group, Ltd. | | 16,639,200 | | | 608,096 | | 0.1 | % | |
| | Harbour Centre Development, Ltd. | | 935,500 | | | 1,722,678 | | 0.1 | % | |
| | High Fashion International, Ltd. | | 268,000 | | | 67,896 | | 0.0 | % | |
| # | | HKBN, Ltd. | | 1,752,000 | | | 1,917,610 | | 0.1 | % | |
| * | | HKR International, Ltd. | | 5,957,536 | | | 2,723,419 | | 0.2 | % | |
| | Hon Kwok Land Investment Co., Ltd. | | 314,800 | | | 122,816 | | 0.0 | % | |
| # | | Hong Kong Aircraft Engineering Co., Ltd. | | 109,600 | | | 731,040 | | 0.1 | % | |
| * | | Hong Kong Building & Loan Agency, Ltd. (The) | | 200,000 | | | 9,630 | | 0.0 | % | |
| | Hong Kong Ferry Holdings Co., Ltd. | | 855,300 | | | 965,948 | | 0.1 | % | |
| | Hong Kong Shanghai Alliance Holdings, Ltd. | | 1,248,002 | | | 124,463 | | 0.0 | % | |
| * | | Hong Kong Television Network, Ltd. | | 2,688,751 | | | 456,222 | | 0.0 | % | |
| * | | HongDa Financial Holding, Ltd. | | 1,560,000 | | | 70,290 | | 0.0 | % | |
| # | | Hongkong & Shanghai Hotels, Ltd. (The) | | 1,629,612 | | | 1,803,916 | | 0.1 | % | |
| | Hongkong Chinese, Ltd. | | 5,038,000 | | | 881,845 | | 0.1 | % | |
| | Hop Hing Group Holdings, Ltd. | | 1,812,000 | | | 31,209 | | 0.0 | % | |
| | Hopewell Holdings, Ltd. | | 3,243,000 | | | 11,148,993 | | 0.8 | % | |
| #* | | Hsin Chong Group Holdings, Ltd. | | 12,089,658 | | | 551,706 | | 0.0 | % | |
| * | | Huarong Investment Stock Corp., Ltd. | | 150,000 | | | 29,674 | | 0.0 | % | |
| | Hung Hing Printing Group, Ltd. | | 2,628,000 | | | 439,841 | | 0.0 | % | |
| | Hutchison Telecommunications Hong Kong Holdings, Ltd. | | 11,810,000 | | | 3,800,487 | | 0.3 | % | |
| * | | I-CABLE Communications, Ltd. | | 4,437,000 | | | 444,823 | | 0.0 | % | |
| | IGG, Inc. | | 6,386,000 | | | 4,278,635 | | 0.3 | % | |
| #* | | Imagi International Holdings, Ltd. | | 17,138,400 | | | 330,506 | | 0.0 | % | |
| * | | International Standard Resources Holdings, Ltd. | | 32,591,500 | | | 419,400 | | 0.0 | % | |
| * | | iOne Holdings, Ltd. | | 11,400,000 | | | 307,526 | | 0.0 | % | |
| | IPE Group, Ltd. | | 3,345,000 | | | 862,039 | | 0.1 | % | |
| * | | IRC, Ltd. | | 10,590,266 | | | 441,232 | | 0.0 | % | |
| | IT, Ltd. | | 4,224,532 | | | 1,679,921 | | 0.1 | % | |
| | ITC Corp., Ltd. | | 1,619,150 | | | 197,457 | | 0.0 | % | |
| | ITC Properties Group, Ltd. | | 4,859,749 | | | 1,962,837 | | 0.1 | % | |
| * | | Jinhui Holdings Co., Ltd. | | 102,000 | | | 14,458 | | 0.0 | % | |
| | Johnson Electric Holdings, Ltd. | | 2,186,250 | | | 5,761,358 | | 0.4 | % | |
| | Kader Holdings Co., Ltd. | | 92,000 | | | 9,365 | | 0.0 | % | |
| | Kam Hing International Holdings, Ltd. | | 1,830,000 | | | 117,631 | | 0.0 | % | |
| * | | Kantone Holdings, Ltd. | | 919,364 | | | 87,435 | | 0.0 | % | |
| | Karrie International Holdings, Ltd. | | 138,000 | | | 12,041 | | 0.0 | % | |
| | Keck Seng Investments | | 878,600 | | | 633,877 | | 0.1 | % | |
| | Kerry Logistics Network, Ltd. | | 1,934,000 | | | 2,434,598 | | 0.2 | % | |
| * | | King Pacific International Holdings, Ltd. | | 1,404,200 | | | — | | 0.0 | % | |
| | Kingmaker Footwear Holdings, Ltd. | | 1,830,955 | | | 581,872 | | 0.0 | % | |
| # | | Kingston Financial Group, Ltd. | | 6,867,000 | | | 2,953,371 | | 0.2 | % | |
| * | | Kong Sun Holdings, Ltd. | | 175,000 | | | 7,678 | | 0.0 | % | |
| | Kowloon Development Co., Ltd. | | 2,541,000 | | | 2,401,823 | | 0.2 | % | |
The Asia Pacific Small Company Series
continued
| | | | | | | | | Percentage | |
| | | | | Shares | | Value†† | | of Net Assets** | |
| HONG KONG — (Continued) | | | | | | | | | |
| * | | Kwan On Holdings, Ltd. | | 1,830,000 | | $ | 506,713 | | 0.0 | % | |
| | Kwoon Chung Bus Holdings, Ltd. | | 20,000 | | | 10,203 | | 0.0 | % | |
| | L'Occitane International SA | | 560,250 | | | 1,058,592 | | 0.1 | % | |
| * | | L'sea Resources International Holdings, Ltd. | | 5,480,000 | | | 70,405 | | 0.0 | % | |
| | Lai Sun Development Co., Ltd. | | 87,547,466 | | | 1,629,425 | | 0.1 | % | |
| | Lai Sun Garment International, Ltd. | | 3,321,680 | | | 692,850 | | 0.1 | % | |
| | Lam Soon Hong Kong, Ltd. | | 302,310 | | | 337,068 | | 0.0 | % | |
| * | | Landing International Development, Ltd. | | 23,185,000 | | | 297,968 | | 0.0 | % | |
| | Landsea Green Properties Co., Ltd. | | 948,000 | | | 71,982 | | 0.0 | % | |
| * | | Leading Spirit High-Tech Holdings Co., Ltd. | | 2,310,000 | | | — | | 0.0 | % | |
| | Lifestyle International Holdings, Ltd. | | 1,877,000 | | | 2,414,249 | | 0.2 | % | |
| | Lippo China Resources, Ltd. | | 20,922,000 | | | 623,127 | | 0.1 | % | |
| | Lippo, Ltd. | | 1,161,700 | | | 679,349 | | 0.1 | % | |
| | Lisi Group Holdings, Ltd. | | 10,142,000 | | | 914,485 | | 0.1 | % | |
| # | | Liu Chong Hing Investment, Ltd. | | 1,289,200 | | | 1,719,597 | | 0.1 | % | |
| | Luen Thai Holdings, Ltd. | | 1,207,000 | | | 508,307 | | 0.0 | % | |
| | Luk Fook Holdings International, Ltd. | | 3,154,000 | | | 8,219,240 | | 0.6 | % | |
| | Luks Group Vietnam Holdings Co., Ltd. | | 514,913 | | | 184,980 | | 0.0 | % | |
| | Lung Kee Bermuda Holdings | | 1,567,875 | | | 524,742 | | 0.0 | % | |
| #* | | Macau Legend Development, Ltd. | | 14,957,000 | | | 3,013,410 | | 0.2 | % | |
| | Magnificent Hotel Investment, Ltd. | | 13,170,000 | | | 293,123 | | 0.0 | % | |
| # | | Major Holdings, Ltd. | | 780,000 | | | 120,285 | | 0.0 | % | |
| * | | Man Sang International, Ltd. | | 132,000 | | | 9,170 | | 0.0 | % | |
| | Man Wah Holdings, Ltd. | | 13,578,800 | | | 9,168,694 | | 0.6 | % | |
| #* | | Mason Financial Holdings, Ltd. | | 19,270,000 | | | 459,428 | | 0.0 | % | |
| # | | Master Glory Group, Ltd.(BYTP1T9) | | 17,655,296 | | | 895,039 | | 0.1 | % | |
| # | | Master Glory Group, Ltd.(BYTP1T9) | | 197,430 | | | 10,057 | | 0.0 | % | |
| | Matrix Holdings, Ltd. | | 1,067,414 | | | 449,450 | | 0.0 | % | |
| | Melbourne Enterprises, Ltd. | | 39,500 | | | 875,559 | | 0.1 | % | |
| # | | Melco International Development, Ltd. | | 4,978,000 | | | 6,727,584 | | 0.5 | % | |
| #* | | Midland Holdings, Ltd. | | 5,182,000 | | | 1,334,713 | | 0.1 | % | |
| #* | | Midland IC&I, Ltd. | | 25,910,000 | | | 149,803 | | 0.0 | % | |
| | Ming Fai International Holdings, Ltd. | | 2,038,000 | | | 322,591 | | 0.0 | % | |
| | Miramar Hotel & Investment | | 901,000 | | | 1,887,406 | | 0.1 | % | |
| #* | | Mongolian Mining Corp. | | 8,115,500 | | | 376,365 | | 0.0 | % | |
| # | | NagaCorp, Ltd. | | 10,544,000 | | | 6,063,743 | | 0.4 | % | |
| | Nanyang Holdings, Ltd. | | 133,500 | | | 688,583 | | 0.1 | % | |
| | National Electronic Hldgs | | 2,668,600 | | | 333,147 | | 0.0 | % | |
| * | | National United Resources Holdings, Ltd. | | 18,280,000 | | | 251,057 | | 0.0 | % | |
| * | | Neo-Neon Holdings, Ltd. | | 2,337,500 | | | 346,547 | | 0.0 | % | |
| * | | Neptune Group, Ltd. | | 2,785,000 | | | 118,211 | | 0.0 | % | |
| * | | NetMind Financial Holdings, Ltd. | | 130,048,000 | | | 1,004,612 | | 0.1 | % | |
| * | | New Century Group Hong Kong, Ltd. | | 13,351,464 | | | 240,421 | | 0.0 | % | |
| * | | New Times Energy Corp., Ltd. | | 2,276,400 | | | 65,249 | | 0.0 | % | |
| | Newocean Energy Holdings, Ltd. | | 7,864,000 | | | 2,081,967 | | 0.1 | % | |
| * | | Next Digital, Ltd. | | 4,295,183 | | | 204,572 | | 0.0 | % | |
| * | | Nine Express, Ltd. | | 10,260,000 | | | 617,799 | | 0.1 | % | |
| * | | O Luxe Holdings, Ltd. | | 10,414,500 | | | 993,789 | | 0.1 | % | |
| * | | Orange Sky Golden Harvest Entertainment Holdings, Ltd. | | 9,489,706 | | | 694,343 | | 0.1 | % | |
| | Orient Overseas International, Ltd. | | 1,440,500 | | | 5,959,443 | | 0.4 | % | |
| * | | Orient Power Holdings, Ltd. | | 804,000 | | | — | | 0.0 | % | |
| # | | Oriental Watch Holdings | | 3,070,800 | | | 592,945 | | 0.0 | % | |
The Asia Pacific Small Company Series
continued
| | | | | | | | | Percentage | |
| | | | | Shares | | Value†† | | of Net Assets** | |
| HONG KONG — (Continued) | | | | | | | | | |
| * | | Pacific Andes International Holdings, Ltd. | | 19,435,067 | | $ | 68,672 | | 0.0 | % | |
| #* | | Pacific Basin Shipping, Ltd. | | 29,772,000 | | | 4,856,896 | | 0.3 | % | |
| # | | Pacific Textiles Holdings, Ltd. | | 6,390,000 | | | 6,926,164 | | 0.5 | % | |
| | Pak Fah Yeow International, Ltd. | | 5,000 | | | 2,305 | | 0.0 | % | |
| | Paliburg Holdings, Ltd. | | 3,104,830 | | | 969,436 | | 0.1 | % | |
| * | | Pan Asia Environmental Protection Group, Ltd. | | 214,000 | | | 48,169 | | 0.0 | % | |
| #* | | Paradise Entertainment, Ltd. | | 3,652,000 | | | 720,537 | | 0.1 | % | |
| #* | | Peace Mark Holdings, Ltd. | | 2,712,022 | | | — | | 0.0 | % | |
| * | | Pearl Oriental Oil, Ltd. | | 11,849,400 | | | 403,476 | | 0.0 | % | |
| * | | Pegasus Entertainment Holdings, Ltd. | | 664,000 | | | 27,788 | | 0.0 | % | |
| | Pegasus International Holdings, Ltd. | | 226,000 | | | 36,388 | | 0.0 | % | |
| | Perfect Shape Beauty Technology, Ltd. | | 1,172,000 | | | 87,614 | | 0.0 | % | |
| # | | Pico Far East Holdings, Ltd. | | 5,218,000 | | | 1,598,216 | | 0.1 | % | |
| | Playmates Holdings, Ltd. | | 692,000 | | | 905,711 | | 0.1 | % | |
| | Playmates Toys, Ltd. | | 6,208,000 | | | 1,141,695 | | 0.1 | % | |
| # | | Pokfulam Development Co. | | 234,000 | | | 473,847 | | 0.0 | % | |
| | Polytec Asset Holdings, Ltd. | | 11,323,526 | | | 762,128 | | 0.1 | % | |
| | Public Financial Holdings, Ltd. | | 3,102,000 | | | 1,396,768 | | 0.1 | % | |
| * | | PYI Corp., Ltd. | | 24,147,973 | | | 428,376 | | 0.0 | % | |
| * | | Pyxis Group, Ltd. | | 1,936,000 | | | — | | 0.0 | % | |
| * | | Qianhai Health Holdings, Ltd. | | 157,499 | | | 2,930 | | 0.0 | % | |
| # | | Quam, Ltd. | | 2,500,000 | | | 417,830 | | 0.0 | % | |
| | Raymond Industrial, Ltd. | | 30,400 | | | 4,189 | | 0.0 | % | |
| # | | Regal Hotels International Holdings, Ltd. | | 2,871,800 | | | 1,575,593 | | 0.1 | % | |
| #* | | Rentian Technology Holdings, Ltd. | | 6,070,000 | | | 421,663 | | 0.0 | % | |
| | Rivera Holdings, Ltd. | | 5,710,000 | | | 389,544 | | 0.0 | % | |
| | SA SA International Holdings, Ltd. | | 11,234,688 | | | 4,452,728 | | 0.3 | % | |
| | Safety Godown Co., Ltd. | | 400,000 | | | 923,131 | | 0.1 | % | |
| | SAS Dragon Holdings, Ltd. | | 2,120,000 | | | 436,932 | | 0.0 | % | |
| # | | SEA Holdings, Ltd. | | 1,162,000 | | | 2,884,150 | | 0.2 | % | |
| * | | SEEC Media Group, Ltd. | | 4,840,000 | | | 78,982 | | 0.0 | % | |
| | Shangri-La Asia, Ltd. | | 652,000 | | | 686,590 | | 0.1 | % | |
| # | | Shenwan Hongyuan HK, Ltd. | | 4,201,250 | | | 1,818,095 | | 0.1 | % | |
| * | | Shougang Concord Grand Group, Ltd. | | 1,158,000 | | | 36,777 | | 0.0 | % | |
| | Shun Ho Property Investments, Ltd. | | 1,254,757 | | | 439,755 | | 0.0 | % | |
| * | | Shun Tak Holdings, Ltd. | | 13,787,419 | | | 4,749,929 | | 0.3 | % | |
| * | | Silver base Group Holdings, Ltd. | | 3,641,515 | | | 217,434 | | 0.0 | % | |
| #* | | Sincere Watch Hong Kong, Ltd. | | 4,030,000 | | | 103,465 | | 0.0 | % | |
| * | | Sing Pao Media Enterprises, Ltd. | | 250,511 | | | — | | 0.0 | % | |
| | Sing Tao News Corp., Ltd. | | 1,974,000 | | | 256,631 | | 0.0 | % | |
| #* | | Singamas Container Holdings, Ltd. | | 10,968,000 | | | 1,183,691 | | 0.1 | % | |
| * | | Sinocan Holdings, Ltd. | | 350,000 | | | — | | 0.0 | % | |
| | SIS International Holdings | | 34,000 | | | 18,277 | | 0.0 | % | |
| # | | SITC International Holdings Co., Ltd. | | 452,000 | | | 274,240 | | 0.0 | % | |
| | Sitoy Group Holdings, Ltd. | | 1,132,000 | | | 294,662 | | 0.0 | % | |
| #* | | Skyway Securities Group, Ltd. | | 12,270,000 | | | 323,072 | | 0.0 | % | |
| | SmarTone Telecommunications Holdings, Ltd. | | 3,918,031 | | | 5,259,634 | | 0.4 | % | |
| * | | SOCAM Development, Ltd. | | 1,744,771 | | | 585,795 | | 0.0 | % | |
| * | | Solartech International Holdings, Ltd. | | 7,100,000 | | | 425,203 | | 0.0 | % | |
| * | | Solomon Systech International, Ltd. | | 9,504,000 | | | 409,312 | | 0.0 | % | |
| | Soundwill Holdings, Ltd. | | 552,000 | | | 1,002,635 | | 0.1 | % | |
| * | | South China Assets Holdings, Ltd. | | 1,679,170 | | | 15,561 | | 0.0 | % | |
The Asia Pacific Small Company Series
continued
| | | | | | | | | Percentage | |
| | | | | Shares | | Value†† | | of Net Assets** | |
| HONG KONG — (Continued) | | | | | | | | | |
| * | | South China Financial Holdings, Ltd. | | 16,950,000 | | $ | 152,352 | | 0.0 | % | |
| * | | South China Holdings Co., Ltd. | | 17,774,503 | | | 904,559 | | 0.1 | % | |
| # | | Stella International Holdings, Ltd. | | 1,547,500 | | | 2,489,555 | | 0.2 | % | |
| * | | Stelux Holdings International, Ltd. | | 3,011,400 | | | 205,205 | | 0.0 | % | |
| * | | Success Universe Group, Ltd. | | 6,716,000 | | | 172,873 | | 0.0 | % | |
| | Sun Hing Vision Group Holdings, Ltd. | | 358,000 | | | 128,886 | | 0.0 | % | |
| | Sun Hung Kai & Co., Ltd. | | 4,688,429 | | | 2,894,315 | | 0.2 | % | |
| | Sunwah Kingsway Capital Holdings, Ltd. | | 7,690,000 | | | 139,604 | | 0.0 | % | |
| # | | TAI Cheung Holdings, Ltd. | | 2,040,000 | | | 1,791,578 | | 0.1 | % | |
| | Tai Sang Land Development, Ltd. | | 781,910 | | | 447,184 | | 0.0 | % | |
| * | | Talent Property Group, Ltd. | | 8,445,000 | | | 157,504 | | 0.0 | % | |
| # | | Tan Chong International, Ltd. | | 1,176,000 | | | 363,202 | | 0.0 | % | |
| | Tao Heung Holdings, Ltd. | | 1,166,000 | | | 288,316 | | 0.0 | % | |
| * | | TCL Display Technology Holdings, Ltd. | | 1,728,000 | | | 160,007 | | 0.0 | % | |
| # | | Television Broadcasts, Ltd. | | 2,094,300 | | | 6,876,290 | | 0.5 | % | |
| * | | Termbray Industries International Holdings, Ltd. | | 2,304,900 | | | 211,273 | | 0.0 | % | |
| | Tern Properties Co., Ltd. | | 51,200 | | | 29,385 | | 0.0 | % | |
| # | | Texwinca Holdings, Ltd. | | 6,672,000 | | | 4,355,310 | | 0.3 | % | |
| | Tian Teck Land, Ltd. | | 1,024,000 | | | 1,093,116 | | 0.1 | % | |
| * | | Titan Petrochemicals Group, Ltd. | | 13,140,000 | | | 130,053 | | 0.0 | % | |
| #* | | TOM Group, Ltd. | | 572,000 | | | 129,458 | | 0.0 | % | |
| # | | Town Health International Medical Group, Ltd. | | 2,672,000 | | | 430,001 | | 0.0 | % | |
| | Tradelink Electronic Commerce, Ltd. | | 5,160,000 | | | 1,062,123 | | 0.1 | % | |
| # | | Transport International Holdings, Ltd. | | 1,252,941 | | | 3,566,141 | | 0.3 | % | |
| #* | | Trinity, Ltd. | | 8,046,000 | | | 600,619 | | 0.0 | % | |
| * | | Tristate Holdings, Ltd. | | 100,000 | | | 22,268 | | 0.0 | % | |
| * | | TSC Group Holdings, Ltd. | | 3,386,000 | | | 482,940 | | 0.0 | % | |
| # | | Tsui Wah Holdings, Ltd. | | 1,602,000 | | | 267,452 | | 0.0 | % | |
| #* | | United Laboratories International Holdings, Ltd. (The) | | 5,470,000 | | | 3,707,906 | | 0.3 | % | |
| * | | Universal Technologies Holdings, Ltd. | | 7,410,000 | | | 319,749 | | 0.0 | % | |
| * | | Up Energy Development Group, Ltd. | | 3,929,000 | | | 49,046 | | 0.0 | % | |
| | Upbest Group, Ltd. | | 72,000 | | | 11,341 | | 0.0 | % | |
| * | | Value Convergence Holdings, Ltd. | | 3,156,000 | | | 738,202 | | 0.1 | % | |
| # | | Value Partners Group, Ltd. | | 3,009,000 | | | 2,376,968 | | 0.2 | % | |
| | Vanke Property Overseas, Ltd. | | 49,000 | | | 31,484 | | 0.0 | % | |
| | Vantage International Holdings, Ltd. | | 2,536,000 | | | 342,426 | | 0.0 | % | |
| | Varitronix International, Ltd. | | 2,769,293 | | | 1,155,492 | | 0.1 | % | |
| | Vedan International Holdings, Ltd. | | 3,360,000 | | | 423,818 | | 0.0 | % | |
| | Victory City International Holdings, Ltd. | | 23,509,660 | | | 770,584 | | 0.1 | % | |
| # | | Vitasoy International Holdings, Ltd. | | 5,433,000 | | | 10,885,584 | | 0.7 | % | |
| * | | VS International Group, Ltd. | | 488,000 | | | 18,834 | | 0.0 | % | |
| # | | VST Holdings, Ltd. | | 5,123,600 | | | 1,791,218 | | 0.1 | % | |
| | VTech Holdings, Ltd. | | 735,400 | | | 9,817,835 | | 0.7 | % | |
| | Wai Kee Holdings, Ltd. | | 7,640,738 | | | 2,444,975 | | 0.2 | % | |
| | Wang On Group, Ltd. | | 4,000,000 | | | 34,985 | | 0.0 | % | |
| | Win Hanverky Holdings, Ltd. | | 2,734,000 | | | 442,730 | | 0.0 | % | |
| * | | Winfull Group Holdings, Ltd. | | 9,512,000 | | | 217,448 | | 0.0 | % | |
| | Wing On Co. International, Ltd. | | 759,000 | | | 2,329,788 | | 0.2 | % | |
| | Wing Tai Properties, Ltd. | | 1,923,331 | | | 1,159,290 | | 0.1 | % | |
| | Wonderful Sky Financial Group Holdings, Ltd. | | 270,000 | | | 72,425 | | 0.0 | % | |
| | Wong's International Holdings, Ltd. | | 737,641 | | | 255,434 | | 0.0 | % | |
| | Wong's Kong King International | | 322,000 | | | 39,387 | | 0.0 | % | |
The Asia Pacific Small Company Series
continued
| | | | | | | | | Percentage | |
| | | | | Shares | | Value†† | | of Net Assets** | |
| HONG KONG — (Continued) | | | | | | | | | |
| * | | Xinyi Automobile Glass Hong Kong Enterprises, Ltd. | | 76,500 | | $ | 14,559 | | 0.0 | % | |
| | Xinyi Glass Holdings, Ltd. | | 17,658,000 | | | 14,385,560 | | 1.0 | % | |
| | Yangtzekiang Garment, Ltd. | | 606,500 | | | 223,942 | | 0.0 | % | |
| * | | Yat Sing Holdings, Ltd. | | 120,000 | | | 61,106 | | 0.0 | % | |
| * | | Yau Lee Holdings, Ltd. | | 424,000 | | | 52,420 | | 0.0 | % | |
| | Yeebo International Holdings, Ltd. | | 2,612,000 | | | 1,519,042 | | 0.1 | % | |
| | YGM Trading, Ltd. | | 447,000 | | | 421,444 | | 0.0 | % | |
| | YT Realty Group, Ltd. | | 749,000 | | | 273,098 | | 0.0 | % | |
| | Yugang International, Ltd. | | 90,818,000 | | | 1,727,269 | | 0.1 | % | |
| TOTAL HONG KONG | | | | | 412,905,777 | | 27.9 | % | |
| | | | | | | | | | |
| NEW ZEALAND — (7.5%) | | | | | | | | | |
| #* | | a2 Milk Co., Ltd. | | 1,585,984 | | | 2,340,022 | | 0.2 | % | |
| | Abano Healthcare Group, Ltd. | | 30,725 | | | 179,350 | | 0.0 | % | |
| | Air New Zealand, Ltd. | | 3,693,701 | | | 5,625,186 | | 0.4 | % | |
| | Briscoe Group, Ltd. | | 2,235 | | | 6,187 | | 0.0 | % | |
| | Chorus, Ltd. | | 2,169,937 | | | 5,980,935 | | 0.4 | % | |
| | Colonial Motor Co., Ltd. (The) | | 144,588 | | | 702,977 | | 0.1 | % | |
| # | | Contact Energy, Ltd. | | 2,259,220 | | | 7,305,638 | | 0.5 | % | |
| # | | EBOS Group, Ltd. | | 451,590 | | | 5,236,095 | | 0.4 | % | |
| | Fisher & Paykel Healthcare Corp., Ltd. | | 2,108,984 | | | 12,473,749 | | 0.8 | % | |
| | Freightways, Ltd. | | 974,609 | | | 4,566,094 | | 0.3 | % | |
| | Genesis Energy, Ltd. | | 661,422 | | | 964,477 | | 0.1 | % | |
| | Hallenstein Glasson Holdings, Ltd. | | 242,445 | | | 513,298 | | 0.0 | % | |
| # | | Heartland Bank, Ltd. | | 651,773 | | | 679,318 | | 0.0 | % | |
| | Hellaby Holdings, Ltd. | | 384,437 | | | 942,526 | | 0.1 | % | |
| | Infratil, Ltd. | | 3,268,694 | | | 6,244,414 | | 0.4 | % | |
| | Kathmandu Holdings, Ltd. | | 663,170 | | | 898,531 | | 0.1 | % | |
| # | | Mainfreight, Ltd. | | 539,049 | | | 7,752,534 | | 0.5 | % | |
| # | | Mercury NZ, Ltd. | | 173,490 | | | 356,411 | | 0.0 | % | |
| | Methven, Ltd. | | 93,877 | | | 86,746 | | 0.0 | % | |
| | Metlifecare, Ltd. | | 574,517 | | | 2,214,249 | | 0.2 | % | |
| | Metro Performance Glass, Ltd. | | 10,753 | | | 14,339 | | 0.0 | % | |
| | Millennium & Copthorne Hotels New Zealand, Ltd. | | 395,725 | | | 682,288 | | 0.0 | % | |
| | New Zealand Oil & Gas, Ltd. | | 1,659,791 | | | 726,336 | | 0.1 | % | |
| | New Zealand Refining Co., Ltd. (The) | | 574,344 | | | 1,036,756 | | 0.1 | % | |
| | NZME, Ltd. | | 945,851 | | | 374,443 | | 0.0 | % | |
| | NZX, Ltd. | | 952,265 | | | 693,500 | | 0.1 | % | |
| # | | Opus International Consultants, Ltd. | | 12,925 | | | 7,996 | | 0.0 | % | |
| * | | Orion Health Group, Ltd. | | 4,001 | | | 5,562 | | 0.0 | % | |
| #* | | Pacific Edge, Ltd. | | 442,720 | | | 181,365 | | 0.0 | % | |
| | PGG Wrightson, Ltd. | | 999,976 | | | 341,916 | | 0.0 | % | |
| * | | Pike River Coal, Ltd. | | 490,805 | | | — | | 0.0 | % | |
| # | | Port of Tauranga, Ltd. | | 2,576,525 | | | 6,888,205 | | 0.5 | % | |
| | Restaurant Brands New Zealand, Ltd. | | 580,362 | | | 2,047,210 | | 0.1 | % | |
| * | | Richina Pacific, Ltd. | | 274,180 | | | — | | 0.0 | % | |
| * | | Rubicon, Ltd. | | 1,442,620 | | | 220,533 | | 0.0 | % | |
| # | | Ryman Healthcare, Ltd. | | 1,681,908 | | | 9,470,224 | | 0.6 | % | |
| | Sanford, Ltd. | | 382,357 | | | 1,801,073 | | 0.1 | % | |
| | Scales Corp., Ltd. | | 6,694 | | | 16,036 | | 0.0 | % | |
| | Scott Technology, Ltd. | | 39,805 | | | 59,404 | | 0.0 | % | |
| # | | Skellerup Holdings, Ltd. | | 563,985 | | | 595,007 | | 0.0 | % | |
The Asia Pacific Small Company Series
continued
| | | | | | | | | Percentage | |
| | | | | Shares | | Value†† | | of Net Assets** | |
| NEW ZEALAND — (Continued) | | | | | | | | | |
| | SKY Network Television, Ltd. | | 2,080,268 | | $ | 6,566,315 | | 0.4 | % | |
| | SKYCITY Entertainment Group, Ltd. | | 5,162,402 | | | 14,085,503 | | 1.0 | % | |
| | Steel & Tube Holdings, Ltd. | | 441,625 | | | 727,253 | | 0.1 | % | |
| | Summerset Group Holdings, Ltd. | | 531,772 | | | 1,727,879 | | 0.1 | % | |
| | Tilt Renewables, Ltd. | | 81,096 | | | 109,295 | | 0.0 | % | |
| | Tourism Holdings, Ltd. | | 342,879 | | | 881,007 | | 0.1 | % | |
| | Tower, Ltd. | | 887,040 | | | 514,423 | | 0.0 | % | |
| # | | Trade Me Group, Ltd. | | 1,693,962 | | | 5,890,499 | | 0.4 | % | |
| | Trustpower, Ltd. | | 81,096 | | | 267,039 | | 0.0 | % | |
| | Vector, Ltd. | | 1,381,288 | | | 3,106,200 | | 0.2 | % | |
| | Warehouse Group, Ltd. (The) | | 698,604 | | | 1,382,560 | | 0.1 | % | |
| #* | | Xero, Ltd. | | 173,810 | | | 2,110,153 | | 0.1 | % | |
| # | | Z Energy, Ltd. | | 199,895 | | | 1,007,688 | | 0.1 | % | |
| TOTAL NEW ZEALAND | | | | | 128,606,744 | | 8.7 | % | |
| | | | | | | | | | |
| SINGAPORE — (10.8%) | | | | | | | | | |
| * | | Abterra, Ltd. | | 531,800 | | | 139,396 | | 0.0 | % | |
| | Accordia Golf Trust | | 3,040,700 | | | 1,322,347 | | 0.1 | % | |
| | Amara Holdings, Ltd. | | 922,800 | | | 258,474 | | 0.0 | % | |
| | Ascendas India Trust | | 1,141,600 | | | 798,124 | | 0.1 | % | |
| | ASL Marine Holdings, Ltd. | | 610,750 | | | 54,279 | | 0.0 | % | |
| | Aspial Corp., Ltd. | | 75,877 | | | 13,853 | | 0.0 | % | |
| | Baker Technology, Ltd. | | 289,580 | | | 123,375 | | 0.0 | % | |
| #* | | Banyan Tree Holdings, Ltd. | | 1,022,900 | | | 340,037 | | 0.0 | % | |
| # | | Best World International, Ltd. | | 1,033,625 | | | 953,708 | | 0.1 | % | |
| | Bonvests Holdings, Ltd. | | 950,000 | | | 804,785 | | 0.1 | % | |
| * | | Boustead Projects, Ltd. | | 497,612 | | | 249,957 | | 0.0 | % | |
| | Boustead Singapore, Ltd. | | 1,827,636 | | | 1,012,605 | | 0.1 | % | |
| | Breadtalk Group, Ltd. | | 894,200 | | | 715,982 | | 0.1 | % | |
| * | | Broadway Industrial Group, Ltd. | | 835,330 | | | 109,296 | | 0.0 | % | |
| | Bukit Sembawang Estates, Ltd. | | 606,203 | | | 1,871,553 | | 0.1 | % | |
| | Bund Center Investment, Ltd. | | 659,825 | | | 319,020 | | 0.0 | % | |
| # | | Centurion Corp., Ltd. | | 825,900 | | | 188,390 | | 0.0 | % | |
| # | | China Aviation Oil Singapore Corp., Ltd. | | 2,336,199 | | | 2,255,620 | | 0.2 | % | |
| # | | Chip Eng Seng Corp., Ltd. | | 3,445,300 | | | 1,498,845 | | 0.1 | % | |
| | Chuan Hup Holdings, Ltd. | | 3,853,500 | | | 622,191 | | 0.1 | % | |
| #* | | Cityneon Holdings, Ltd. | | 486,200 | | | 316,742 | | 0.0 | % | |
| | Civmec, Ltd. | | 53,200 | | | 19,528 | | 0.0 | % | |
| #* | | COSCO Corp. Singapore, Ltd. | | 8,095,300 | | | 1,565,227 | | 0.1 | % | |
| * | | Creative Technology, Ltd. | | 272,200 | | | 180,911 | | 0.0 | % | |
| | CSE Global, Ltd. | | 3,443,600 | | | 1,087,566 | | 0.1 | % | |
| # | | CWT, Ltd. | | 1,799,000 | | | 2,396,568 | | 0.2 | % | |
| # | | Del Monte Pacific, Ltd. | | 2,363,364 | | | 552,683 | | 0.0 | % | |
| # | | Delfi, Ltd. | | 788,500 | | | 1,206,739 | | 0.1 | % | |
| * | | DMX Technologies Group, Ltd. | | 2,096,000 | | | 62,539 | | 0.0 | % | |
| #* | | Dyna-Mac Holdings, Ltd. | | 2,007,300 | | | 227,007 | | 0.0 | % | |
| | Elec & Eltek International Co., Ltd. | | 147,000 | | | 123,864 | | 0.0 | % | |
| | EnGro Corp., Ltd. | | 354,000 | | | 212,773 | | 0.0 | % | |
| #* | | Ezion Holdings, Ltd. | | 12,591,378 | | | 3,319,449 | | 0.2 | % | |
| #* | | Ezra Holdings, Ltd. | | 19,242,923 | | | 645,568 | | 0.1 | % | |
| | Falcon Energy Group, Ltd. | | 2,008,800 | | | 204,664 | | 0.0 | % | |
| | Far East Orchard, Ltd. | | 1,074,985 | | | 1,093,585 | | 0.1 | % | |
The Asia Pacific Small Company Series
continued
| | | | | | | | | Percentage | |
| | | | | Shares | | Value†† | | of Net Assets** | |
| SINGAPORE — (Continued) | | | | | | | | | |
| # | | First Resources, Ltd. | | 4,935,500 | | $ | 6,465,176 | | 0.4 | % | |
| * | | First Ship Lease Trust | | 160,900 | | | 17,691 | | 0.0 | % | |
| | First Sponsor Group, Ltd. | | 440,661 | | | 408,230 | | 0.0 | % | |
| * | | Food Empire Holdings, Ltd. | | 1,306,400 | | | 404,907 | | 0.0 | % | |
| # | | Fragrance Group, Ltd. | | 6,077,000 | | | 672,559 | | 0.1 | % | |
| | Frasers Centrepoint, Ltd. | | 461,300 | | | 501,323 | | 0.0 | % | |
| | Fu Yu Corp., Ltd. | | 1,539,300 | | | 200,507 | | 0.0 | % | |
| #* | | Gallant Venture, Ltd. | | 4,992,500 | | | 409,367 | | 0.0 | % | |
| * | | Geo Energy Resources, Ltd. | | 432,000 | | | 66,960 | | 0.0 | % | |
| | GK Goh Holdings, Ltd. | | 1,484,065 | | | 842,421 | | 0.1 | % | |
| | GL, Ltd. | | 3,401,300 | | | 1,786,209 | | 0.1 | % | |
| * | | Global Premium Hotels, Ltd. | | 559,480 | | | 114,052 | | 0.0 | % | |
| | Golden Agri-Resources, Ltd. | | 17,549,200 | | | 5,195,891 | | 0.4 | % | |
| | GP Batteries International, Ltd. | | 235,000 | | | 127,301 | | 0.0 | % | |
| | GP Industries, Ltd. | | 2,567,609 | | | 1,024,251 | | 0.1 | % | |
| | GSH Corp., Ltd. | | 60,860 | | | 21,401 | | 0.0 | % | |
| # | | GuocoLand, Ltd. | | 606,014 | | | 752,535 | | 0.1 | % | |
| * | | Halcyon Agri Corp., Ltd. | | 1,669,048 | | | 703,726 | | 0.1 | % | |
| * | | Hanwell Holdings, Ltd. | | 1,771,219 | | | 293,782 | | 0.0 | % | |
| | Haw Par Corp., Ltd. | | 30,400 | | | 190,507 | | 0.0 | % | |
| # | | Health Management International, Ltd. | | 1,065,100 | | | 470,571 | | 0.0 | % | |
| | Hi-P International, Ltd. | | 1,271,600 | | | 447,638 | | 0.0 | % | |
| | Hiap Hoe, Ltd. | | 498,000 | | | 244,689 | | 0.0 | % | |
| | Ho Bee Land, Ltd. | | 1,604,700 | | | 2,248,192 | | 0.2 | % | |
| # | | Hong Fok Corp., Ltd. | | 3,551,394 | | | 1,540,709 | | 0.1 | % | |
| * | | Hong Fok Land, Ltd. | | 1,210,000 | | | — | | 0.0 | % | |
| | Hong Leong Asia, Ltd. | | 690,700 | | | 320,642 | | 0.0 | % | |
| | Hotel Grand Central, Ltd. | | 1,461,261 | | | 1,362,760 | | 0.1 | % | |
| | Hour Glass, Ltd. (The) | | 1,814,832 | | | 788,785 | | 0.1 | % | |
| | Hutchison Port Holdings Trust | | 112,400 | | | 48,773 | | 0.0 | % | |
| | Hwa Hong Corp., Ltd. | | 2,123,500 | | | 438,745 | | 0.0 | % | |
| # | | Hyflux, Ltd. | | 3,262,300 | | | 1,159,501 | | 0.1 | % | |
| # | | Indofood Agri Resources, Ltd. | | 3,432,100 | | | 1,241,386 | | 0.1 | % | |
| * | | InnoTek, Ltd. | | 512,500 | | | 98,388 | | 0.0 | % | |
| # | | Innovalues, Ltd. | | 1,659,300 | | | 1,139,237 | | 0.1 | % | |
| | IPC Corp., Ltd. | | 225,970 | | | 85,465 | | 0.0 | % | |
| | Isetan Singapore, Ltd. | | 119,000 | | | 306,508 | | 0.0 | % | |
| | Japfa, Ltd. | | 2,179,700 | | | 1,359,378 | | 0.1 | % | |
| #* | | Jurong Technologies Industrial Corp., Ltd. | | 2,227,680 | | | — | | 0.0 | % | |
| | k1 Ventures, Ltd. | | 1,005,220 | | | 620,328 | | 0.1 | % | |
| | Keppel Infrastructure Trust | | 6,740,532 | | | 2,209,977 | | 0.2 | % | |
| | Keppel Telecommunications & Transportation, Ltd. | | 1,369,300 | | | 1,618,877 | | 0.1 | % | |
| * | | Koh Brothers Eco Engineering, Ltd. | | 143,200 | | | 4,476 | | 0.0 | % | |
| | Koh Brothers Group, Ltd. | | 1,432,000 | | | 256,440 | | 0.0 | % | |
| #* | | KrisEnergy, Ltd. | | 296,200 | | | 37,528 | | 0.0 | % | |
| | KSH Holdings, Ltd. | | 57,200 | | | 21,329 | | 0.0 | % | |
| | Lian Beng Group, Ltd. | | 2,253,500 | | | 723,711 | | 0.1 | % | |
| | Low Keng Huat Singapore, Ltd. | | 889,800 | | | 352,875 | | 0.0 | % | |
| | Lum Chang Holdings, Ltd. | | 1,094,030 | | | 264,299 | | 0.0 | % | |
| # | | M1, Ltd. | | 2,667,000 | | | 3,604,064 | | 0.3 | % | |
| # | | Mandarin Oriental International, Ltd. | | 91,700 | | | 116,837 | | 0.0 | % | |
| * | | Marco Polo Marine, Ltd. | | 882,000 | | | 33,490 | | 0.0 | % | |
The Asia Pacific Small Company Series
continued
| | | | | | | | | Percentage | |
| | | | | Shares | | Value†† | | of Net Assets** | |
| SINGAPORE — (Continued) | | | | | | | | | |
| | Metro Holdings, Ltd. | | 2,689,592 | | $ | 1,846,275 | | 0.1 | % | |
| | Mewah International, Inc. | | 89,000 | | | 16,924 | | 0.0 | % | |
| | Midas Holdings, Ltd. | | 8,558,700 | | | 1,271,143 | | 0.1 | % | |
| #* | | Nam Cheong, Ltd. | | 7,506,340 | | | 319,790 | | 0.0 | % | |
| # | | Nera Telecommunications, Ltd. | | 1,143,400 | | | 315,312 | | 0.0 | % | |
| | New Toyo International Holdings, Ltd. | | 1,624,000 | | | 325,169 | | 0.0 | % | |
| #* | | Noble Group, Ltd. | | 75,184,800 | | | 8,768,142 | | 0.6 | % | |
| | NSL, Ltd. | | 409,900 | | | 449,037 | | 0.0 | % | |
| | Olam International, Ltd. | | 290,300 | | | 394,733 | | 0.0 | % | |
| # | | OUE, Ltd. | | 1,996,500 | | | 2,417,744 | | 0.2 | % | |
| # | | Overseas Education, Ltd. | | 65,300 | | | 16,784 | | 0.0 | % | |
| # | | Oxley Holdings, Ltd. | | 1,442,400 | | | 427,710 | | 0.0 | % | |
| # | | Pacc Offshore Services Holdings, Ltd. | | 478,200 | | | 105,591 | | 0.0 | % | |
| | Pacific Radiance, Ltd. | | 145,200 | | | 14,396 | | 0.0 | % | |
| | Pan-United Corp., Ltd. | | 1,948,600 | | | 791,861 | | 0.1 | % | |
| | Penguin International, Ltd. | | 446,032 | | | 70,746 | | 0.0 | % | |
| # | | Q&M Dental Group Singapore, Ltd. | | 2,188,300 | | | 1,078,924 | | 0.1 | % | |
| | QAF, Ltd. | | 1,359,162 | | | 1,303,383 | | 0.1 | % | |
| * | | Raffles Education Corp., Ltd. | | 4,176,710 | | | 548,211 | | 0.0 | % | |
| # | | Raffles Medical Group, Ltd. | | 4,319,173 | | | 4,261,461 | | 0.3 | % | |
| | RHT Health Trust | | 2,131,100 | | | 1,346,713 | | 0.1 | % | |
| * | | Rickmers Maritime | | 1,008,350 | | | 18,104 | | 0.0 | % | |
| # | | Riverstone Holdings, Ltd. | | 1,089,000 | | | 660,133 | | 0.1 | % | |
| # | | Rotary Engineering, Ltd. | | 1,443,100 | | | 376,996 | | 0.0 | % | |
| #* | | Rowsley, Ltd. | | 298,400 | | | 25,278 | | 0.0 | % | |
| | Roxy-Pacific Holdings, Ltd. | | 297,500 | | | 90,168 | | 0.0 | % | |
| | San Teh, Ltd. | | 248,387 | | | 35,472 | | 0.0 | % | |
| | SATS, Ltd. | | 2,695,900 | | | 9,019,882 | | 0.6 | % | |
| # | | SBS Transit, Ltd. | | 926,200 | | | 1,356,041 | | 0.1 | % | |
| # | | SembCorp Industries, Ltd. | | 3,431,700 | | | 6,729,881 | | 0.5 | % | |
| # | | SembCorp Marine, Ltd. | | 3,089,000 | | | 2,929,127 | | 0.2 | % | |
| # | | Sheng Siong Group, Ltd. | | 4,266,400 | | | 2,781,322 | | 0.2 | % | |
| # | | SHS Holdings, Ltd. | | 2,304,100 | | | 316,643 | | 0.0 | % | |
| | SIA Engineering Co., Ltd. | | 245,200 | | | 569,793 | | 0.0 | % | |
| #* | | SIIC Environment Holdings, Ltd. | | 4,246,920 | | | 1,714,513 | | 0.1 | % | |
| # | | Sinarmas Land, Ltd. | | 6,788,400 | | | 1,987,600 | | 0.1 | % | |
| | Sing Holdings, Ltd. | | 1,134,000 | | | 242,743 | | 0.0 | % | |
| | Sing Investments & Finance, Ltd. | | 297,675 | | | 247,621 | | 0.0 | % | |
| # | | Singapore Post, Ltd. | | 10,300,000 | | | 10,402,463 | | 0.7 | % | |
| | Singapore Reinsurance Corp., Ltd. | | 1,514,530 | | | 321,332 | | 0.0 | % | |
| | Singapore Shipping Corp., Ltd. | | 1,640,700 | | | 283,023 | | 0.0 | % | |
| * | | Singapura Finance, Ltd. | | 348,124 | | | 206,864 | | 0.0 | % | |
| # | | Sino Grandness Food Industry Group, Ltd. | | 2,981,300 | | | 491,061 | | 0.0 | % | |
| | Stamford Land Corp., Ltd. | | 3,188,100 | | | 1,058,936 | | 0.1 | % | |
| # | | Straco Corp., Ltd. | | 130,000 | | | 68,165 | | 0.0 | % | |
| | Sunningdale Tech, Ltd. | | 793,060 | | | 602,468 | | 0.1 | % | |
| * | | SunVic Chemical Holdings, Ltd. | | 1,137,845 | | | 70,950 | | 0.0 | % | |
| # | | Super Group, Ltd. | | 3,509,900 | | | 3,099,255 | | 0.2 | % | |
| #* | | Swiber Holdings, Ltd. | | 2,895,250 | | | 163,541 | | 0.0 | % | |
| #* | | Tat Hong Holdings, Ltd. | | 2,218,800 | | | 527,532 | | 0.0 | % | |
| | Thakral Corp., Ltd. | | 139,165 | | | 23,944 | | 0.0 | % | |
| | Tiong Woon Corp. Holding, Ltd. | | 228,100 | | | 38,902 | | 0.0 | % | |
The Asia Pacific Small Company Series
continued
| | | | | | | | | Percentage | |
| | | | | Shares | | Value†† | | of Net Assets** | |
| SINGAPORE — (Continued) | | | | | | | | | |
| # | | Tuan Sing Holdings, Ltd. | | 4,167,162 | | $ | 814,521 | | 0.1 | % | |
| # | | UMS Holdings, Ltd. | | 2,656,700 | | | 1,118,184 | | 0.1 | % | |
| | United Engineers, Ltd. | | 3,219,528 | | | 5,683,010 | | 0.4 | % | |
| | United Industrial Corp., Ltd. | | 19,552 | | | 37,396 | | 0.0 | % | |
| | United Overseas Insurance, Ltd. | | 181,850 | | | 595,898 | | 0.0 | % | |
| # | | UOB-Kay Hian Holdings, Ltd. | | 1,955,133 | | | 1,713,366 | | 0.1 | % | |
| | UOL Group, Ltd. | | 1,967,864 | | | 8,112,659 | | 0.6 | % | |
| | UPP Holdings, Ltd. | | 2,972,500 | | | 553,634 | | 0.0 | % | |
| | Valuetronics Holdings, Ltd. | | 1,619,300 | | | 580,876 | | 0.0 | % | |
| #* | | Vard Holdings, Ltd. | | 4,915,200 | | | 845,194 | | 0.1 | % | |
| | Venture Corp., Ltd. | | 1,994,100 | | | 13,582,050 | | 0.9 | % | |
| | Vibrant Group, Ltd. | | 1,974,019 | | | 462,761 | | 0.0 | % | |
| | Vicom, Ltd. | | 119,500 | | | 469,466 | | 0.0 | % | |
| # | | Wee Hur Holdings, Ltd. | | 2,670,400 | | | 414,133 | | 0.0 | % | |
| # | | Wheelock Properties Singapore, Ltd. | | 1,293,200 | | | 1,321,812 | | 0.1 | % | |
| # | | Wing Tai Holdings, Ltd. | | 3,573,667 | | | 3,914,251 | | 0.3 | % | |
| | Yeo Hiap Seng, Ltd. | | 223,731 | | | 205,443 | | 0.0 | % | |
| | YHI International, Ltd. | | 458,900 | | | 104,673 | | 0.0 | % | |
| #* | | Yongnam Holdings, Ltd. | | 2,977,200 | | | 405,131 | | 0.0 | % | |
| * | | Yuuzoo Corp., Ltd. | | 4,202,500 | | | 425,172 | | 0.0 | % | |
| | Zhongmin Baihui Retail Group, Ltd. | | 26,900 | | | 21,509 | | 0.0 | % | |
| TOTAL SINGAPORE | | | | | 184,162,585 | | 12.5 | % | |
| TOTAL COMMON STOCKS | | | | | 1,466,593,642 | | 99.3 | % | |
| | | | | | | | | | |
| RIGHTS/WARRANTS — (0.0%) | | | | | | | | | |
| AUSTRALIA — (0.0%) | | | | | | | | | |
| * | | Centrebet International, Ltd. Claim Units Rights | | 81,336 | | | — | | 0.0 | % | |
| * | | Centrebet International, Ltd. Litigation Rights | | 81,336 | | | — | | 0.0 | % | |
| * | | Corporate Travel Management, Ltd. 1/17/17 | | 11,364 | | | 28,211 | | 0.0 | % | |
| * | | Estia Health, Ltd. Rights 1/11/17 | | 50,387 | | | — | | 0.0 | % | |
| TOTAL AUSTRALIA | | | | | 28,211 | | 0.0 | % | |
| | | | | | | | | | |
| HONG KONG — (0.0%) | | | | | | | | | |
| * | | Enerchina Holdings, Ltd. Rights 03/06/17 | | 1,603,500 | | | 9,305 | | 0.0 | % | |
| * | | Enviro Energy International Holdings, Ltd. Warrants 11/17/16 | | 1,171,800 | | | — | | 0.0 | % | |
| TOTAL HONG KONG | | | | | 9,305 | | 0.0 | % | |
| | | | | | | | | | |
| SINGAPORE — (0.0%) | | | | | | | | | |
| * | | Ezion Holdings, Ltd. Warrants 04/24/20 | | 492,843 | | | 28,247 | | 0.0 | % | |
The Asia Pacific Small Company Series
continued
| | | | | | | | | Percentage | |
| | | | | Shares | | Value†† | | of Net Assets** | |
| SINGAPORE — (Continued) | | | | | | | | | |
| * | | Krisenergy, Ltd. 1/16/17 | | 27,547 | | $ | — | | 0.0 | % | |
| TOTAL SINGAPORE | | | | | 28,247 | | 0.0 | % | |
| TOTAL RIGHTS/WARRANTS | | | | | 65,763 | | 0.0 | % | |
| TOTAL INVESTMENT SECURITIES | | | | | 1,466,659,405 | | | | |
| | | |
| | | | | | Value† | | | | |
| SECURITIES LENDING COLLATERAL — (14.0%) | | | | | | | | | |
| §@ | | DFA Short Term Investment Fund | | 20,548,587 | | | 237,788,253 | | 16.1 | % | |
| TOTAL INVESTMENTS — (100.0%) (Cost $1,812,819,807) | | | | $ | 1,704,447,658 | | 115.4 | % | |
^ The cost for federal income tax purposes is $1,812,819,807.
The Asia Pacific Small Company Series
continued
Summary of the Series' investments as of December 31, 2016, based on their valuation inputs, is as follows (See Security Valuation Note):
| | | | Investments in Securities (Market Value) | |
| | | Level 1 | | Level 2 | | Level 3 | | Total | |
| Common Stocks | | | | | | | | | | | | |
| Australia | | $ | 977,582 | | $ | 737,092,137 | | — | | $ | 738,069,719 | |
| China | | | — | | | 2,848,817 | | — | | | 2,848,817 | |
| Hong Kong | | | 237,551 | | | 412,668,226 | | — | | | 412,905,777 | |
| New Zealand | | | 376,334 | | | 128,230,410 | | — | | | 128,606,744 | |
| Singapore | | | 306,508 | | | 183,856,077 | | — | | | 184,162,585 | |
| Rights/Warrants | | | | | | | | | | | | |
| Australia | | | — | | | 28,211 | | — | | | 28,211 | |
| Bermuda | | | — | | | 9,305 | | — | | | 9,305 | |
| Hong Kong | | | — | | | — | | — | | | — | |
| Singapore | | | — | | | 28,247 | | — | | | 28,247 | |
| Securities Lending Collateral | | | — | | | 237,788,253 | | — | | | 237,788,253 | |
| TOTAL | | $ | 1,897,975 | | $ | 1,702,549,683 | | — | | $ | 1,704,447,658 | |
THE UNITED KINGDOM SMALL COMPANY SERIES
SCHEDULE OF INVESTMENTS
December 31, 2016
(Unaudited)
| | | | | | | | | Percentage | |
| | | | | Shares | | Value†† | | of Net Assets** | |
| COMMON STOCKS — (96.6%) | | | | | | | | | |
| Consumer Discretionary — (19.3%) | | | | | | | | | |
| | 4imprint Group P.L.C. | | 96,987 | | $ | 2,124,857 | | 0.1 | % | |
| | 888 Holdings P.L.C. | | 1,003,090 | | | 2,684,591 | | 0.2 | % | |
| | AA P.L.C. | | 2,961,476 | | | 10,116,249 | | 0.6 | % | |
| | B&M European Value Retail SA | | 3,300,251 | | | 11,307,266 | | 0.6 | % | |
| | Bellway P.L.C. | | 637,459 | | | 19,431,469 | | 1.1 | % | |
| | Berkeley Group Holdings P.L.C. | | 262,704 | | | 9,081,369 | | 0.5 | % | |
| | Bloomsbury Publishing P.L.C. | | 274,093 | | | 572,633 | | 0.0 | % | |
| | Bovis Homes Group P.L.C. | | 833,940 | | | 8,417,028 | | 0.5 | % | |
| | Card Factory P.L.C. | | 623,214 | | | 1,951,505 | | 0.1 | % | |
| #* | | Carpetright P.L.C. | | 82,608 | | | 154,505 | | 0.0 | % | |
| # | | Centaur Media P.L.C. | | 537,905 | | | 284,761 | | 0.0 | % | |
| | Cineworld Group P.L.C. | | 1,228,419 | | | 8,539,773 | | 0.5 | % | |
| | Connect Group P.L.C. | | 1,312,384 | | | 2,467,696 | | 0.1 | % | |
| | Crest Nicholson Holdings P.L.C. | | 1,155,163 | | | 6,431,668 | | 0.4 | % | |
| | Daily Mail & General Trust P.L.C. Class A | | 1,271,481 | | | 12,176,097 | | 0.7 | % | |
| | Debenhams P.L.C. | | 6,545,871 | | | 4,619,884 | | 0.3 | % | |
| | Dignity P.L.C. | | 251,989 | | | 7,677,257 | | 0.4 | % | |
| | Domino's Pizza Group P.L.C. | | 2,536,833 | | | 11,257,720 | | 0.6 | % | |
| | Dunelm Group P.L.C. | | 374,998 | | | 3,717,028 | | 0.2 | % | |
| * | | Enterprise Inns P.L.C. | | 2,902,133 | | | 4,357,064 | | 0.2 | % | |
| | Entertainment One, Ltd. | | 544,866 | | | 1,545,966 | | 0.1 | % | |
| | Euromoney Institutional Investor P.L.C. | | 282,895 | | | 3,994,863 | | 0.2 | % | |
| * | | Findel P.L.C. | | 239,314 | | | 550,532 | | 0.0 | % | |
| * | | Forminster P.L.C. | | 43,333 | | | — | | 0.0 | % | |
| | Fuller Smith & Turner P.L.C. Class A | | 134,418 | | | 1,613,967 | | 0.1 | % | |
| * | | Future P.L.C. | | 781,879 | | | 132,409 | | 0.0 | % | |
| | Games Workshop Group P.L.C. | | 96,572 | | | 850,358 | | 0.1 | % | |
| | Greene King P.L.C. | | 1,786,209 | | | 15,348,504 | | 0.9 | % | |
| * | | Groupe Fnac SA | | 53,282 | | | 3,528,037 | | 0.2 | % | |
| * | | GVC Holdings P.L.C. | | 1,254,675 | | | 9,924,681 | | 0.6 | % | |
| | Halfords Group P.L.C. | | 1,155,920 | | | 5,220,559 | | 0.3 | % | |
| | Headlam Group P.L.C. | | 390,021 | | | 2,345,173 | | 0.1 | % | |
| | Henry Boot P.L.C. | | 417,992 | | | 1,038,510 | | 0.1 | % | |
| | Huntsworth P.L.C. | | 938,084 | | | 438,538 | | 0.0 | % | |
| | Inchcape P.L.C. | | 2,190,976 | | | 18,934,318 | | 1.1 | % | |
| | Informa P.L.C. | | 116,716 | | | 977,633 | | 0.1 | % | |
| | ITE Group P.L.C. | | 1,527,105 | | | 2,900,990 | | 0.2 | % | |
| # | | J D Wetherspoon P.L.C. | | 481,928 | | | 5,272,587 | | 0.3 | % | |
| | JD Sports Fashion P.L.C. | | 2,325,390 | | | 9,116,377 | | 0.5 | % | |
| #* | | Jimmy Choo P.L.C. | | 146,913 | | | 253,415 | | 0.0 | % | |
| | John Menzies P.L.C. | | 471,800 | | | 3,463,659 | | 0.2 | % | |
| # | | Ladbrokes Coral Group P.L.C | | 5,357,119 | | | 7,654,251 | | 0.4 | % | |
| | Laura Ashley Holdings P.L.C. | | 1,465,488 | | | 359,398 | | 0.0 | % | |
| | Lookers P.L.C. | | 1,876,000 | | | 2,696,391 | | 0.2 | % | |
| | Marston's P.L.C. | | 3,507,036 | | | 5,888,181 | | 0.3 | % | |
| | Millennium & Copthorne Hotels P.L.C. | | 1,000,376 | | | 5,701,582 | | 0.3 | % | |
| | Mitchells & Butlers P.L.C. | | 1,050,403 | | | 3,253,654 | | 0.2 | % | |
| | MJ Gleeson P.L.C. | | 189,171 | | | 1,273,084 | | 0.1 | % | |
| * | | Mothercare P.L.C. | | 596,178 | | | 832,505 | | 0.1 | % | |
| | N Brown Group P.L.C. | | 882,575 | | | 2,419,153 | | 0.1 | % | |
| #* | | Ocado Group P.L.C. | | 2,584,145 | | | 8,406,458 | | 0.5 | % | |
The United Kingdom Small Company Series
continued
| | | | | | | | | Percentage | |
| | | | | Shares | | Value†† | | of Net Assets** | |
| Consumer Discretionary — (Continued) | | | | | | | | | |
| | Pendragon P.L.C. | | 6,452,203 | | $ | 2,478,360 | | 0.1 | % | |
| | Pets at Home Group P.L.C. | | 1,206,630 | | | 3,558,856 | | 0.2 | % | |
| | Photo-Me International P.L.C. | | 1,062,418 | | | 2,146,962 | | 0.1 | % | |
| * | | Punch Taverns P.L.C. | | 133,442 | | | 311,147 | | 0.0 | % | |
| | Rank Group P.L.C. | | 556,279 | | | 1,339,131 | | 0.1 | % | |
| # | | Redrow P.L.C. | | 1,386,677 | | | 7,337,013 | | 0.4 | % | |
| | Restaurant Group P.L.C. (The) | | 977,184 | | | 3,905,677 | | 0.2 | % | |
| * | | Sportech P.L.C. | | 371,065 | | | 402,398 | | 0.0 | % | |
| * | | Sports Direct International P.L.C. | | 422,490 | | | 1,448,177 | | 0.1 | % | |
| | SSP Group P.L.C. | | 1,378,674 | | | 6,586,321 | | 0.4 | % | |
| | STV Group P.L.C. | | 4,868 | | | 21,513 | | 0.0 | % | |
| | SuperGroup P.L.C. | | 239,090 | | | 4,846,271 | | 0.3 | % | |
| | Tarsus Group P.L.C. | | 207,820 | | | 725,188 | | 0.0 | % | |
| | Ted Baker P.L.C. | | 153,478 | | | 5,319,393 | | 0.3 | % | |
| #* | | Thomas Cook Group P.L.C. | | 6,943,222 | | | 7,458,257 | | 0.4 | % | |
| | Topps Tiles P.L.C. | | 925,429 | | | 999,909 | | 0.1 | % | |
| * | | Tribal Group P.L.C. | | 39,352 | | | 28,182 | | 0.0 | % | |
| | Trinity Mirror P.L.C. | | 1,612,879 | | | 2,108,455 | | 0.1 | % | |
| | UBM P.L.C. | | 1,950,843 | | | 17,560,077 | | 1.0 | % | |
| | Vitec Group P.L.C. (The) | | 159,712 | | | 1,277,743 | | 0.1 | % | |
| | WH Smith P.L.C. | | 680,498 | | | 13,038,881 | | 0.7 | % | |
| | William Hill P.L.C. | | 4,185,519 | | | 14,949,611 | | 0.8 | % | |
| Total Consumer Discretionary | | | | | 351,153,675 | | 19.8 | % | |
| | | | | | | | | | |
| Consumer Staples — (5.3%) | | | | | | | | | |
| | A.G. Barr P.L.C. | | 553,074 | | | 3,416,498 | | 0.2 | % | |
| | Anglo-Eastern Plantations P.L.C. | | 104,452 | | | 867,716 | | 0.1 | % | |
| | Booker Group P.L.C. | | 8,105,070 | | | 17,519,847 | | 1.0 | % | |
| | Britvic P.L.C. | | 1,162,274 | | | 8,115,425 | | 0.5 | % | |
| | Cranswick P.L.C. | | 267,585 | | | 7,719,759 | | 0.4 | % | |
| # | | Dairy Crest Group P.L.C. | | 790,454 | | | 6,030,257 | | 0.3 | % | |
| | Devro P.L.C. | | 930,843 | | | 2,178,756 | | 0.1 | % | |
| | Greencore Group P.L.C. | | 3,643,038 | | | 11,048,210 | | 0.6 | % | |
| | Greggs P.L.C. | | 562,228 | | | 6,703,810 | | 0.4 | % | |
| | Hilton Food Group P.L.C. | | 32,989 | | | 251,982 | | 0.0 | % | |
| | McBride P.L.C. | | 995,483 | | | 2,219,200 | | 0.1 | % | |
| | McColl's Retail Group P.L.C. | | 22,532 | | | 51,909 | | 0.0 | % | |
| * | | Premier Foods P.L.C. | | 4,643,015 | | | 2,680,294 | | 0.2 | % | |
| | PZ Cussons P.L.C. | | 1,392,526 | | | 5,735,793 | | 0.3 | % | |
| * | | REA Holdings P.L.C. | | 50,639 | | | 219,821 | | 0.0 | % | |
| | Stock Spirits Group P.L.C. | | 629,381 | | | 1,400,260 | | 0.1 | % | |
| | Tate & Lyle P.L.C. | | 2,319,044 | | | 20,181,815 | | 1.1 | % | |
| Total Consumer Staples | | | | | 96,341,352 | | 5.4 | % | |
| | | | | | | | | | |
| Energy — (5.6%) | | | | | | | | | |
| #* | | Afren P.L.C. | | 5,446,344 | | | — | | 0.0 | % | |
| | Amec Foster Wheeler P.L.C. | | 2,037,469 | | | 11,765,464 | | 0.7 | % | |
| | Anglo Pacific Group P.L.C. | | 650,526 | | | 1,035,986 | | 0.1 | % | |
| * | | Cairn Energy P.L.C. | | 3,385,007 | | | 9,835,070 | | 0.6 | % | |
| #* | | EnQuest P.L.C. | | 5,248,159 | | | 2,719,128 | | 0.1 | % | |
| | Gulf Marine Services P.L.C. | | 31,549 | | | 19,065 | | 0.0 | % | |
| | Hunting P.L.C. | | 855,838 | | | 6,608,325 | | 0.4 | % | |
The United Kingdom Small Company Series
continued
| | | | | | | | | Percentage | |
| | | | | Shares | | Value†† | | of Net Assets** | |
| Energy — (Continued) | | | | | | | | | |
| | James Fisher & Sons P.L.C. | | 255,650 | | $ | 4,905,575 | | 0.3 | % | |
| | John Wood Group P.L.C. | | 1,887,172 | | | 20,378,522 | | 1.1 | % | |
| * | | Lamprell P.L.C. | | 1,137,514 | | | 1,289,316 | | 0.1 | % | |
| * | | Ophir Energy P.L.C. | | 3,356,189 | | | 3,972,291 | | 0.2 | % | |
| | Petrofac, Ltd. | | 1,141,776 | | | 12,218,826 | | 0.7 | % | |
| #* | | Premier Oil P.L.C. | | 2,986,706 | | | 2,720,612 | | 0.1 | % | |
| | Soco International P.L.C. | | 1,115,663 | | | 2,189,305 | | 0.1 | % | |
| | Stobart Group, Ltd. | | 999,060 | | | 2,190,456 | | 0.1 | % | |
| #* | | Tullow Oil P.L.C. | | 5,009,214 | | | 19,308,190 | | 1.1 | % | |
| Total Energy | | | | | 101,156,131 | | 5.7 | % | |
| | | | | | | | | | |
| Financials — (13.0%) | | | | | | | | | |
| | Aberdeen Asset Management P.L.C. | | 1,974,486 | | | 6,242,904 | | 0.4 | % | |
| * | | Aldermore Group P.L.C. | | 540,542 | | | 1,582,314 | | 0.1 | % | |
| | Arrow Global Group P.L.C. | | 830,179 | | | 3,048,981 | | 0.2 | % | |
| | Ashmore Group P.L.C. | | 1,895,266 | | | 6,587,418 | | 0.4 | % | |
| | Beazley P.L.C. | | 2,740,810 | | | 13,100,391 | | 0.7 | % | |
| | BGEO Group P.L.C. | | 184,238 | | | 6,783,570 | | 0.4 | % | |
| | Brewin Dolphin Holdings P.L.C. | | 1,582,577 | | | 5,968,148 | | 0.3 | % | |
| | Charles Stanley Group P.L.C. | | 122,025 | | | 439,145 | | 0.0 | % | |
| | Charles Taylor P.L.C. | | 192,071 | | | 572,612 | | 0.0 | % | |
| | Chesnara P.L.C. | | 629,962 | | | 2,840,834 | | 0.2 | % | |
| | Close Brothers Group P.L.C. | | 785,896 | | | 13,958,020 | | 0.8 | % | |
| | esure Group P.L.C. | | 1,432,087 | | | 3,543,406 | | 0.2 | % | |
| | Hansard Global P.L.C. | | 16,468 | | | 21,468 | | 0.0 | % | |
| | Henderson Group P.L.C. | | 5,628,395 | | | 16,244,585 | | 0.9 | % | |
| | Hiscox, Ltd. | | 1,494,924 | | | 18,732,398 | | 1.1 | % | |
| | IG Group Holdings P.L.C. | | 1,792,534 | | | 10,894,001 | | 0.6 | % | |
| * | | Industrial & Commercial Holdings P.L.C. | | 5,000 | | | — | | 0.0 | % | |
| | Intermediate Capital Group P.L.C. | | 1,340,691 | | | 11,542,751 | | 0.7 | % | |
| | International Personal Finance P.L.C. | | 1,060,000 | | | 2,248,602 | | 0.1 | % | |
| #* | | IP Group P.L.C. | | 1,626,154 | | | 3,567,206 | | 0.2 | % | |
| | Jardine Lloyd Thompson Group P.L.C. | | 622,168 | | | 7,549,806 | | 0.4 | % | |
| | JRP Group P.L.C. | | 1,097,189 | | | 2,018,947 | | 0.1 | % | |
| | Jupiter Fund Management P.L.C. | | 2,162,762 | | | 11,777,958 | | 0.7 | % | |
| | Lancashire Holdings, Ltd. | | 1,084,204 | | | 9,281,505 | | 0.5 | % | |
| | Man Group P.L.C. | | 8,025,798 | | | 11,677,493 | | 0.7 | % | |
| * | | NEX Group P.L.C. | | 1,541,699 | | | 8,825,450 | | 0.5 | % | |
| | Novae Group P.L.C. | | 324,392 | | | 2,750,223 | | 0.2 | % | |
| | OneSavings Bank P.L.C. | | 439,887 | | | 1,827,890 | | 0.1 | % | |
| | Paragon Group of Cos. P.L.C. (The) | | 1,079,643 | | | 5,501,644 | | 0.3 | % | |
| | Phoenix Group Holdings | | 1,466,980 | | | 13,279,377 | | 0.7 | % | |
| | Rathbone Brothers P.L.C. | | 198,409 | | | 4,834,764 | | 0.3 | % | |
| | S&U P.L.C. | | 20,417 | | | 557,810 | | 0.0 | % | |
| | Saga P.L.C. | | 4,624,740 | | | 11,138,116 | | 0.6 | % | |
| * | | Shawbrook Group P.L.C. | | 226,307 | | | 758,764 | | 0.0 | % | |
| | TP ICAP P.L.C. | | 2,563,777 | | | 13,634,997 | | 0.8 | % | |
| | Virgin Money Holdings UK P.L.C. | | 816,196 | | | 3,045,659 | | 0.2 | % | |
| * | | Waterloo Investment Holdings, Ltd. | | 5,979 | | | 516 | | 0.0 | % | |
| Total Financials | | | | | 236,379,673 | | 13.4 | % | |
The United Kingdom Small Company Series
continued
| | | | | | | | | Percentage | |
| | | | | Shares | | Value†† | | of Net Assets** | |
| Health Care — (3.5%) | | | | | | | | | |
| #* | | Alizyme P.L.C. | | 660,805 | | $ | — | | 0.0 | % | |
| * | | BTG P.L.C. | | 1,870,654 | | | 13,584,615 | | 0.8 | % | |
| * | | Cambian Group P.L.C. | | 209,345 | | | 319,264 | | 0.0 | % | |
| #* | | Circassia Pharmaceuticals P.L.C. | | 285,098 | | | 330,839 | | 0.0 | % | |
| | Consort Medical P.L.C. | | 243,634 | | | 3,181,854 | | 0.2 | % | |
| | Dechra Pharmaceuticals P.L.C. | | 437,070 | | | 7,241,869 | | 0.4 | % | |
| | Genus P.L.C. | | 310,228 | | | 6,869,069 | | 0.4 | % | |
| | Indivior P.L.C. | | 3,662,912 | | | 13,346,335 | | 0.7 | % | |
| | Spire Healthcare Group P.L.C. | | 874,903 | | | 3,636,235 | | 0.2 | % | |
| | UDG Healthcare P.L.C. | | 1,224,291 | | | 10,081,703 | | 0.6 | % | |
| * | | Vectura Group P.L.C. | | 2,891,647 | | | 4,884,420 | | 0.3 | % | |
| Total Health Care | | | | | 63,476,203 | | 3.6 | % | |
| | | | | | | | | | |
| Industrials — (27.4%) | | | | | | | | | |
| | Aggreko P.L.C. | | 1,332,278 | | | 15,039,277 | | 0.8 | % | |
| | Air Partner P.L.C. | | 40,969 | | | 254,138 | | 0.0 | % | |
| | Alumasc Group P.L.C. (The) | | 120,110 | | | 228,708 | | 0.0 | % | |
| | Avon Rubber P.L.C. | | 101,804 | | | 1,304,569 | | 0.1 | % | |
| | Balfour Beatty P.L.C. | | 3,549,781 | | | 11,722,644 | | 0.7 | % | |
| | BBA Aviation P.L.C. | | 5,623,297 | | | 19,605,290 | | 1.1 | % | |
| | Berendsen P.L.C. | | 823,219 | | | 8,826,147 | | 0.5 | % | |
| | Bodycote P.L.C. | | 1,121,708 | | | 8,894,204 | | 0.5 | % | |
| | Braemar Shipping Services P.L.C. | | 84,411 | | | 290,257 | | 0.0 | % | |
| # | | Brammer P.L.C. | | 668,388 | | | 1,357,791 | | 0.1 | % | |
| | Cape P.L.C. | | 685,676 | | | 1,237,385 | | 0.1 | % | |
| # | | Carillion P.L.C. | | 2,653,376 | | | 7,698,853 | | 0.4 | % | |
| | Carr's Group P.L.C. | | 343,111 | | | 631,700 | | 0.0 | % | |
| | Castings P.L.C. | | 157,187 | | | 807,790 | | 0.0 | % | |
| * | | Chemring Group P.L.C. | | 1,487,205 | | | 3,116,476 | | 0.2 | % | |
| # | | Clarkson P.L.C. | | 104,310 | | | 2,782,778 | | 0.2 | % | |
| | Cobham P.L.C. | | 8,760,026 | | | 17,637,802 | | 1.0 | % | |
| | Communisis P.L.C. | | 1,025,909 | | | 547,211 | | 0.0 | % | |
| | Costain Group P.L.C. | | 486,534 | | | 2,110,705 | | 0.1 | % | |
| | De La Rue P.L.C. | | 611,081 | | | 4,630,901 | | 0.3 | % | |
| * | | Dialight P.L.C. | | 103,553 | | | 1,009,202 | | 0.1 | % | |
| | Diploma P.L.C. | | 586,339 | | | 7,522,556 | | 0.4 | % | |
| | Fenner P.L.C. | | 1,085,686 | | | 3,147,885 | | 0.2 | % | |
| * | | Firstgroup P.L.C. | | 6,359,105 | | | 8,105,995 | | 0.5 | % | |
| * | | Flybe Group P.L.C. | | 320,823 | | | 173,939 | | 0.0 | % | |
| | G4S P.L.C. | | 4,186,631 | | | 12,100,926 | | 0.7 | % | |
| | Galliford Try P.L.C. | | 430,288 | | | 6,844,216 | | 0.4 | % | |
| | Go-Ahead Group P.L.C. | | 220,066 | | | 6,059,105 | | 0.3 | % | |
| | Goodwin P.L.C. | | 383 | | | 8,263 | | 0.0 | % | |
| | Grafton Group P.L.C. | | 1,000,382 | | | 6,765,849 | | 0.4 | % | |
| | Harvey Nash Group P.L.C. | | 46,693 | | | 35,517 | | 0.0 | % | |
| | Hays P.L.C. | | 6,566,676 | | | 12,049,293 | | 0.7 | % | |
| | Hogg Robinson Group P.L.C. | | 134,014 | | | 112,609 | | 0.0 | % | |
| | HomeServe P.L.C. | | 1,369,369 | | | 10,459,646 | | 0.6 | % | |
| | Howden Joinery Group P.L.C. | | 3,165,528 | | | 14,938,171 | | 0.8 | % | |
| | IMI P.L.C. | | 1,291,794 | | | 16,520,476 | | 0.9 | % | |
| | Interserve P.L.C. | | 841,666 | | | 3,544,062 | | 0.2 | % | |
| | IWG P.L.C. | | 3,349,423 | | | 10,131,395 | | 0.6 | % | |
The United Kingdom Small Company Series
continued
| | | | | | | | | Percentage | |
| | | | | Shares | | Value†† | | of Net Assets** | |
| Industrials — (Continued) | | | | | | | | | |
| | John Laing Group P.L.C. | | 738,465 | | $ | 2,467,088 | | 0.1 | % | |
| | Keller Group P.L.C. | | 403,236 | | | 4,210,141 | | 0.2 | % | |
| | Kier Group P.L.C. | | 541,660 | | | 9,174,237 | | 0.5 | % | |
| | Lavendon Group P.L.C. | | 844,223 | | | 2,754,295 | | 0.1 | % | |
| | Management Consulting Group P.L.C. | | 1,467,589 | | | 70,013 | | 0.0 | % | |
| | Mears Group P.L.C. | | 550,537 | | | 3,090,698 | | 0.2 | % | |
| | Meggitt P.L.C. | | 3,090,230 | | | 17,451,115 | | 1.0 | % | |
| | Melrose Industries P.L.C. | | 10,887,020 | | | 26,462,934 | | 1.5 | % | |
| | # Mitie Group P.L.C. | | 1,998,966 | | | 5,519,610 | | 0.3 | % | |
| | Morgan Advanced Materials P.L.C. | | 1,499,667 | | | 5,262,562 | | 0.3 | % | |
| | Morgan Sindall Group P.L.C. | | 191,927 | | | 1,765,409 | | 0.1 | % | |
| | National Express Group P.L.C. | | 2,195,042 | | | 9,565,341 | | 0.5 | % | |
| | Norcros P.L.C. | | 27,976 | | | 62,206 | | 0.0 | % | |
| | Northgate P.L.C. | | 801,556 | | | 4,871,081 | | 0.3 | % | |
| | Pagegroup P.L.C. | | 1,368,971 | | | 6,574,715 | | 0.4 | % | |
| | PayPoint P.L.C. | | 246,900 | | | 3,059,843 | | 0.2 | % | |
| | Polypipe Group P.L.C. | | 631,474 | | | 2,516,427 | | 0.1 | % | |
| | QinetiQ Group P.L.C. | | 3,269,092 | | | 10,582,846 | | 0.6 | % | |
| * | | Renold P.L.C. | | 193,435 | | | 105,159 | | 0.0 | % | |
| | Rentokil Initial P.L.C. | | 8,861,710 | | | 24,243,686 | | 1.4 | % | |
| | Ricardo P.L.C. | | 271,798 | | | 3,228,224 | | 0.2 | % | |
| | Robert Walters P.L.C. | | 381,498 | | | 1,605,198 | | 0.1 | % | |
| | Rotork P.L.C. | | 3,918,039 | | | 11,627,202 | | 0.7 | % | |
| | RPS Group P.L.C. | | 1,250,133 | | | 3,423,841 | | 0.2 | % | |
| | Senior P.L.C. | | 2,337,741 | | | 5,590,610 | | 0.3 | % | |
| * | | Serco Group P.L.C. | | 2,627,163 | | | 4,634,899 | | 0.3 | % | |
| | Severfield P.L.C. | | 1,262,597 | | | 1,167,718 | | 0.1 | % | |
| | Shanks Group P.L.C. | | 3,324,590 | | | 3,776,010 | | 0.2 | % | |
| | SIG P.L.C. | | 3,113,733 | | | 3,963,648 | | 0.2 | % | |
| | Speedy Hire P.L.C. | | 2,827,989 | | | 1,778,232 | | 0.1 | % | |
| | Spirax-Sarco Engineering P.L.C. | | 355,118 | | | 18,275,928 | | 1.0 | % | |
| | St. Ives P.L.C. | | 654,912 | | | 1,027,843 | | 0.1 | % | |
| | Stagecoach Group P.L.C. | | 2,052,864 | | | 5,464,306 | | 0.3 | % | |
| | Sthree P.L.C. | | 407,731 | | | 1,560,954 | | 0.1 | % | |
| | T Clarke P.L.C. | | 147,457 | | | 107,863 | | 0.0 | % | |
| | Travis Perkins P.L.C. | | 177,453 | | | 3,172,184 | | 0.2 | % | |
| | Trifast P.L.C. | | 447,201 | | | 1,131,989 | | 0.1 | % | |
| | Tyman P.L.C. | | 154,929 | | | 527,612 | | 0.0 | % | |
| | Ultra Electronics Holdings P.L.C. | | 392,382 | | | 9,379,121 | | 0.5 | % | |
| | Vesuvius P.L.C. | | 1,389,950 | | | 6,758,303 | | 0.4 | % | |
| * | | Volex P.L.C. | | 307,047 | | | 182,206 | | 0.0 | % | |
| | Vp P.L.C. | | 160,962 | | | 1,519,378 | | 0.1 | % | |
| | Weir Group P.L.C. (The) | | 1,080,278 | | | 25,104,799 | | 1.4 | % | |
| | Wilmington P.L.C. | | 334,384 | | | 1,118,302 | | 0.1 | % | |
| | Wincanton P.L.C. | | 626,212 | | | 1,896,243 | | 0.1 | % | |
| * | | Wizz Air Holdings P.L.C. | | 141,798 | | | 3,128,334 | | 0.2 | % | |
| | WS Atkins P.L.C. | | 502,623 | | | 9,019,693 | | 0.5 | % | |
| | XP Power, Ltd. | | 74,988 | | | 1,601,190 | | 0.1 | % | |
| Total Industrials | | | | | 499,834,967 | | 28.3 | % | |
| | | | | | | | | | |
| Information Technology — (9.5%) | | | | | | | | | |
| | Acal P.L.C. | | 293,479 | | | 816,470 | | 0.1 | % | |
The United Kingdom Small Company Series
continued
| | | | | | | | | Percentage | |
| | | | | Shares | | Value†† | | of Net Assets** | |
| Information Technology — (Continued) | | | | | | | | | |
| | AVEVA Group P.L.C. | | 322,264 | | $ | 7,472,003 | | 0.4 | % | |
| | Computacenter P.L.C. | | 389,033 | | | 3,828,864 | | 0.2 | % | |
| | E2V Technologies P.L.C. | | 846,513 | | | 2,852,907 | | 0.2 | % | |
| | Electrocomponents P.L.C. | | 2,396,207 | | | 14,062,924 | | 0.8 | % | |
| | FDM Group Holdings P.L.C. | | 26,428 | | | 183,341 | | 0.0 | % | |
| | Fidessa Group P.L.C. | | 205,277 | | | 5,782,241 | | 0.3 | % | |
| * | | Gocompare.Com Group P.L.C. | | 1,496,630 | | | 1,309,557 | | 0.1 | % | |
| | Halma P.L.C. | | 1,951,180 | | | 21,586,831 | | 1.2 | % | |
| * | | Imagination Technologies Group P.L.C. | | 1,260,452 | | | 3,906,779 | | 0.2 | % | |
| | Laird P.L.C. | | 1,470,974 | | | 2,779,819 | | 0.2 | % | |
| # | | Micro Focus International P.L.C. | | 539,522 | | | 14,489,419 | | 0.8 | % | |
| | Moneysupermarket.com Group P.L.C. | | 2,403,304 | | | 8,704,621 | | 0.5 | % | |
| | NCC Group P.L.C. | | 700,295 | | | 1,566,744 | | 0.1 | % | |
| | Oxford Instruments P.L.C. | | 255,490 | | | 2,297,417 | | 0.1 | % | |
| * | | Paysafe Group P.L.C. | | 2,313,667 | | | 10,570,178 | | 0.6 | % | |
| | Playtech P.L.C. | | 1,111,348 | | | 11,306,677 | | 0.6 | % | |
| | Renishaw P.L.C. | | 172,556 | | | 5,363,769 | | 0.3 | % | |
| | Rightmove P.L.C. | | 477,301 | | | 22,927,820 | | 1.3 | % | |
| | RM P.L.C. | | 318,504 | | | 528,947 | | 0.0 | % | |
| | SDL P.L.C. | | 395,868 | | | 2,152,720 | | 0.1 | % | |
| * | | Sepura P.L.C. | | 429,568 | | | 100,464 | | 0.0 | % | |
| | Spectris P.L.C. | | 613,329 | | | 17,476,706 | | 1.0 | % | |
| | Spirent Communications P.L.C. | | 2,954,007 | | | 3,594,807 | | 0.2 | % | |
| | TT Electronics P.L.C. | | 828,017 | | | 1,671,738 | | 0.1 | % | |
| | Xaar P.L.C. | | 370,936 | | | 1,827,266 | | 0.1 | % | |
| | Zoopla Property Group P.L.C. | | 833,606 | | | 3,278,637 | | 0.2 | % | |
| Total Information Technology | | | | | 172,439,666 | | 9.7 | % | |
| | | | | | | | | | |
| Materials — (7.8%) | | | | | | | | | |
| | Acacia Mining P.L.C. | | 900,534 | | | 4,126,450 | | 0.2 | % | |
| # | | Carclo P.L.C. | | 213,640 | | | 356,975 | | 0.0 | % | |
| | Centamin P.L.C. | | 6,065,603 | | | 10,267,021 | | 0.6 | % | |
| | Croda International P.L.C. | | 224,656 | | | 8,835,640 | | 0.5 | % | |
| | DS Smith P.L.C. | | 4,938,232 | | | 24,797,760 | | 1.4 | % | |
| | Elementis P.L.C. | | 2,601,104 | | | 8,885,609 | | 0.5 | % | |
| | Essentra P.L.C. | | 1,251,793 | | | 7,107,509 | | 0.4 | % | |
| * | | Evraz P.L.C. | | 1,496,580 | | | 4,077,791 | | 0.2 | % | |
| * | | Ferrexpo P.L.C. | | 433,035 | | | 712,766 | | 0.0 | % | |
| | Gem Diamonds, Ltd. | | 633,596 | | | 860,773 | | 0.1 | % | |
| | Hill & Smith Holdings P.L.C. | | 416,549 | | | 6,160,074 | | 0.4 | % | |
| | Hochschild Mining P.L.C. | | 1,480,894 | | | 3,816,349 | | 0.2 | % | |
| * | | KAZ Minerals P.L.C. | | 1,307,816 | | | 5,766,878 | | 0.3 | % | |
| * | | Lonmin P.L.C. | | 1,647,895 | | | 2,853,788 | | 0.2 | % | |
| | Low & Bonar P.L.C. | | 1,119,286 | | | 904,574 | | 0.1 | % | |
| | Marshalls P.L.C. | | 1,079,270 | | | 3,888,897 | | 0.2 | % | |
| * | | Petra Diamonds, Ltd. | | 3,007,687 | | | 5,773,766 | | 0.3 | % | |
| #* | | Petropavlovsk P.L.C. | | 13,101,159 | | | 1,117,439 | | 0.1 | % | |
| | RPC Group P.L.C. | | 1,638,321 | | | 21,475,299 | | 1.2 | % | |
| | Synthomer P.L.C. | | 1,317,365 | | | 6,213,216 | | 0.4 | % | |
| | Vedanta Resources P.L.C. | | 365,710 | | | 3,924,466 | | 0.2 | % | |
| | Victrex P.L.C. | | 443,677 | | | 10,549,955 | | 0.6 | % | |
The United Kingdom Small Company Series
continued
| | | | | | | | | Percentage | |
| | | | | Shares | | Value†† | | of Net Assets** | |
| Materials — (Continued) | | | | | | | | | |
| | Zotefoams P.L.C. | | 93,537 | | $ | 287,444 | | 0.0 | % | |
| Total Materials | | | | | 142,760,439 | | 8.1 | % | |
| | | | | | | | | | |
| Real Estate — (2.5%) | | | | | | | | | |
| # | | Capital & Counties Properties P.L.C. | | 2,645,264 | | | 9,685,293 | | 0.5 | % | |
| * | | CLS Holdings P.L.C. | | 21,962 | | | 413,004 | | 0.0 | % | |
| | Countrywide P.L.C. | | 649,114 | | | 1,399,306 | | 0.1 | % | |
| | Daejan Holdings P.L.C. | | 36,075 | | | 2,749,662 | | 0.2 | % | |
| | Foxtons Group P.L.C. | | 725,836 | | | 910,723 | | 0.1 | % | |
| | Grainger P.L.C. | | 1,794,861 | | | 5,267,476 | | 0.3 | % | |
| | Harworth Group P.L.C. | | 30,680 | | | 34,017 | | 0.0 | % | |
| | Helical P.L.C. | | 619,438 | | | 2,249,056 | | 0.1 | % | |
| | LSL Property Services P.L.C. | | 328,694 | | | 925,649 | | 0.1 | % | |
| * | | Raven Russia, Ltd. | | 1,046,108 | | | 576,039 | | 0.0 | % | |
| | Savills P.L.C. | | 715,881 | | | 6,191,933 | | 0.3 | % | |
| | St. Modwen Properties P.L.C. | | 1,098,776 | | | 4,133,624 | | 0.2 | % | |
| | U & I Group P.L.C. | | 642,624 | | | 1,342,341 | | 0.1 | % | |
| | UNITE Group P.L.C. (The) | | 1,349,912 | | | 10,086,595 | | 0.6 | % | |
| Total Real Estate | | | | | 45,964,718 | | 2.6 | % | |
| | | | | | | | | | |
| Telecommunication Services — (0.7%) | | | | | | | | | |
| | Inmarsat P.L.C. | | 458,644 | | | 4,243,646 | | 0.3 | % | |
| | KCOM Group P.L.C. | | 3,197,302 | | | 3,734,073 | | 0.2 | % | |
| # | | TalkTalk Telecom Group P.L.C. | | 2,586,447 | | | 5,388,024 | | 0.3 | % | |
| Total Telecommunication Services | | | | | 13,365,743 | | 0.8 | % | |
| | | | | | | | | | |
| Utilities — (2.0%) | | | | | | | | | |
| | Dee Valley Group P.L.C. | | 12,109 | | | 270,253 | | 0.0 | % | |
| | Drax Group P.L.C. | | 2,261,324 | | | 10,517,539 | | 0.6 | % | |
| | Pennon Group P.L.C. | | 1,994,817 | | | 20,302,685 | | 1.1 | % | |
| | Telecom Plus P.L.C. | | 319,153 | | | 4,627,873 | | 0.3 | % | |
| Total Utilities | | | | | 35,718,350 | | 2.0 | % | |
| TOTAL COMMON STOCKS | | | | | 1,758,590,917 | | 99.4 | % | |
| TOTAL INVESTMENT SECURITIES | | | | | 1,758,590,917 | | | | |
| | |
| | | | | | Value† | | | | |
| SECURITIES LENDING COLLATERAL — (3.4%) | | | | | | | | | |
| §@ | | DFA Short Term Investment Fund | | 5,356,427 | | | 61,984,568 | | 3.5 | % | |
| TOTAL INVESTMENTS — (100.0%) (Cost $1,731,563,401)^ | | | | $ | 1,820,575,485 | | 102.9 | % | |
____________________
^ The cost for federal income tax purposes is $1,731,563,401.
The United Kingdom Small Company Series
continued
Summary of the Series' investments as of December 31, 2016, based on their valuation inputs, is as follows (See Security Valuation Note):
| | Investments in Securities (Market Value) | |
| | Level 1 | | Level 2 | | Level 3 | | Total | |
| Common Stocks | | | | | | | | | | | | |
| Consumer Discretionary | | | — | | $ | 351,153,675 | | — | | $ | 351,153,675 | |
| Consumer Staples | | | — | | | 96,341,352 | | — | | | 96,341,352 | |
| Energy | | | — | | | 101,156,131 | | — | | | 101,156,131 | |
| Financials | | $ | 8,825,450 | | | 227,554,223 | | — | | | 236,379,673 | |
| Health Care | | | — | | | 63,476,203 | | — | | | 63,476,203 | |
| Industrials | | | — | | | 499,834,967 | | — | | | 499,834,967 | |
| Information Technology | | | 1,309,557 | | | 171,130,109 | | — | | | 172,439,666 | |
| Materials | | | — | | | 142,760,439 | | — | | | 142,760,439 | |
| Real Estate | | | — | | | 45,964,718 | | — | | | 45,964,718 | |
| Telecommunication Services | | | — | | | 13,365,743 | | — | | | 13,365,743 | |
| Utilities | | | — | | | 35,718,350 | | — | | | 35,718,350 | |
| Securities Lending Collateral | | | — | | | 61,984,568 | | — | | | 61,984,568 | |
| TOTAL | | $ | 10,135,007 | | $ | 1,810,440,478 | | — | | $ | 1,820,575,485 | |
THE CONTINENTAL SMALL COMPANY SERIES
SCHEDULE OF INVESTMENTS
December 31, 2016
(Unaudited)
| | | | | | | | | Percentage | |
| | | Shares | | Value†† | | of Net Assets** | |
| COMMON STOCKS — (89.9%) | | | | | | | |
| AUSTRIA — (3.0%) | | | | | | | |
| | Agrana Beteiligungs AG | 16,785 | | $ | 1,992,288 | | 0.0% | |
| | ANDRITZ AG | 310,627 | | | 15,566,678 | | 0.4% | |
| | Atrium European Real Estate, Ltd. | 722,120 | | | 2,978,528 | | 0.1% | |
| # | | Austria Technologie & Systemtechnik AG | 154,803 | | | 1,513,264 | | 0.0% | |
| | BUWOG AG | 336,656 | | | 7,815,424 | | 0.2% | |
| | CA Immobilien Anlagen AG | 332,305 | | | 6,100,501 | | 0.1% | |
| # | | Conwert Immobilien Invest SE | 367,906 | | | 6,278,708 | | 0.2% | |
| # | | DO & CO AG | 29,227 | | | 1,920,754 | | 0.0% | |
| | EVN AG | 200,982 | | | 2,371,279 | | 0.1% | |
| * | | FACC AG | 23,201 | | | 124,774 | | 0.0% | |
| | Flughafen Wien AG | 4,221 | | | 103,937 | | 0.0% | |
| # | | IMMOFINANZ AG | 3,445,943 | | | 6,707,742 | | 0.2% | |
| | Josef Manner & Co. AG | 870 | | | 52,658 | | 0.0% | |
| | Kapsch TrafficCom AG | 30,685 | | | 1,204,328 | | 0.0% | |
| | Lenzing AG | 51,632 | | | 6,248,595 | | 0.2% | |
| | Mayr Melnhof Karton AG | 49,358 | | | 5,236,091 | | 0.1% | |
| | Oberbank AG | 45,050 | | | 2,860,479 | | 0.1% | |
| | Oesterreichische Post AG | 203,557 | | | 6,823,308 | | 0.2% | |
| | Palfinger AG | 79,849 | | | 2,401,310 | | 0.1% | |
| | POLYTEC Holding AG | 92,160 | | | 1,006,205 | | 0.0% | |
| | Porr Ag | 48,724 | | | 1,996,297 | | 0.0% | |
| * | | Raiffeisen Bank International AG | 533,683 | | | 9,728,498 | | 0.2% | |
| | RHI AG | 147,894 | | | 3,765,641 | | 0.1% | |
| # | | Rosenbauer International AG | 18,560 | | | 1,057,491 | | 0.0% | |
| | S IMMO AG | 330,386 | | | 3,472,565 | | 0.1% | |
| | Schoeller-Bleckmann Oilfield Equipment AG | 61,970 | | | 4,982,068 | | 0.1% | |
| | Semperit AG Holding | 68,546 | | | 1,856,348 | | 0.0% | |
| | Strabag SE | 104,184 | | | 3,690,122 | | 0.1% | |
| | Telekom Austria AG | 399,167 | | | 2,356,087 | | 0.1% | |
| | UBM Development AG | 314 | | | 10,267 | | 0.0% | |
| # | | UNIQA Insurance Group AG | 598,622 | | | 4,526,689 | | 0.1% | |
| # | | Verbund AG | 308,524 | | | 4,918,407 | | 0.1% | |
| | Vienna Insurance Group AG Wiener Versicherung Gruppe | 98,712 | | | 2,208,572 | | 0.1% | |
| | Voestalpine AG | 4,113 | | | 160,831 | | 0.0% | |
| | Wienerberger AG | 573,239 | | | 9,943,961 | | 0.2% | |
| | Wolford AG | 11,252 | | | 245,424 | | 0.0% | |
| | Zumtobel Group AG | 163,135 | | | 2,913,502 | | 0.1% | |
| TOTAL AUSTRIA | | | | 137,139,621 | | 3.3% | |
| | | | | | | | |
| BELGIUM — (4.2%) | | | | | | | |
| #* | | Ablynx NV | 303,349 | | | 3,445,566 | | 0.1% | |
| | Ackermans & van Haaren NV | 134,383 | | | 18,666,762 | | 0.5% | |
| * | | AGFA-Gevaert NV | 965,465 | | | 3,726,032 | | 0.1% | |
| | Atenor | 7,383 | | | 353,640 | | 0.0% | |
| | Banque Nationale de Belgique | 986 | | | 3,109,551 | | 0.1% | |
| | Barco NV | 65,535 | | | 5,517,719 | | 0.1% | |
| | Bekaert SA | 183,930 | | | 7,434,357 | | 0.2% | |
| | bpost SA | 447,777 | | | 10,585,719 | | 0.3% | |
| #* | | Celyad SA | 17,193 | | | 321,160 | | 0.0% | |
| # | | Cie d'Entreprises CFE | 49,147 | | | 5,335,884 | | 0.1% | |
The Continental Small Company Series
continued
| | | | | | | | | Percentage | |
| | | Shares | | Value†† | | of Net Assets** | |
| BELGIUM — (Continued) | | | | | | | |
| #* | | Cie Immobiliere de Belgique SA | 14,788 | | $ | 824,621 | | 0.0% | |
| | Co.Br.Ha Societe Commerciale de Brasserie SA | 111 | | | 332,041 | | 0.0% | |
| | D'ieteren SA | 131,557 | | | 5,810,620 | | 0.1% | |
| #* | | Dalenys | 20,562 | | | 143,639 | | 0.0% | |
| | Deceuninck NV | 358,205 | | | 855,589 | | 0.0% | |
| | Econocom Group SA | 343,333 | | | 5,034,015 | | 0.1% | |
| | Elia System Operator SA | 169,789 | | | 8,874,156 | | 0.2% | |
| | Euronav NV | 679,242 | | | 5,402,820 | | 0.1% | |
| | EVS Broadcast Equipment SA | 74,156 | | | 2,590,033 | | 0.1% | |
| # | | Exmar NV | 174,456 | | | 1,413,074 | | 0.0% | |
| #* | | Fagron | 224,088 | | | 2,287,892 | | 0.1% | |
| * | | Galapagos NV | 175,431 | | | 11,235,509 | | 0.3% | |
| | Gimv NV | 29,320 | | | 1,622,643 | | 0.0% | |
| # | | Ion Beam Applications | 115,719 | | | 5,063,244 | | 0.1% | |
| | Jensen-Group NV | 13,482 | | | 490,262 | | 0.0% | |
| # | | Kinepolis Group NV | 94,699 | | | 4,232,013 | | 0.1% | |
| # | | Lotus Bakeries | 1,454 | | | 3,821,284 | | 0.1% | |
| #* | | MDxHealth | 180,487 | | | 908,842 | | 0.0% | |
| | Melexis NV | 113,838 | | | 7,614,682 | | 0.2% | |
| #* | | Nyrstar NV | 745,541 | | | 6,110,157 | | 0.2% | |
| | Ontex Group NV | 314,694 | | | 9,342,629 | | 0.2% | |
| * | | Orange Belgium SA | 167,280 | | | 3,492,190 | | 0.1% | |
| | Picanol | 28,800 | | | 2,351,623 | | 0.1% | |
| | RealDolmen | 8,137 | | | 211,399 | | 0.0% | |
| | RealDolmen NV | 120 | | | 2 | | 0.0% | |
| | Recticel SA | 218,046 | | | 1,520,525 | | 0.0% | |
| | Resilux | 5,006 | | | 826,559 | | 0.0% | |
| | Roularta Media Group NV | 10,263 | | | 262,752 | | 0.0% | |
| | Sioen Industries NV | 50,430 | | | 1,484,913 | | 0.0% | |
| | Sipef SA | 25,871 | | | 1,646,468 | | 0.0% | |
| * | | Telenet Group Holding NV | 49,363 | | | 2,736,028 | | 0.1% | |
| | TER Beke SA | 2,260 | | | 333,660 | | 0.0% | |
| * | | Tessenderlo Chemie NV | 190,301 | | | 6,954,441 | | 0.2% | |
| #* | | ThromboGenics NV | 159,152 | | | 424,162 | | 0.0% | |
| | Umicore SA | 412,343 | | | 23,458,773 | | 0.6% | |
| | Van de Velde NV | 35,498 | | | 2,470,472 | | 0.1% | |
| * | | Viohalco SA | 583,796 | | | 747,288 | | 0.0% | |
| TOTAL BELGIUM | | | | 191,427,410 | | 4.6% | |
| | | | | | | | |
| DENMARK — (4.2%) | | | | | | | |
| | ALK-Abello A.S. | 30,494 | | | 3,962,870 | | 0.1% | |
| | Alm Brand A.S. | 468,716 | | | 3,572,938 | | 0.1% | |
| # | | Ambu A.S. Class B | 124,859 | | | 5,005,794 | | 0.1% | |
| | Arkil Holding A.S. Class B | 504 | | | 62,416 | | 0.0% | |
| * | | Bang & Olufsen A.S. | 210,691 | | | 2,383,531 | | 0.1% | |
| | BankNordik P/F | 1,753 | | | 33,643 | | 0.0% | |
| #* | | Bavarian Nordic A.S. | 146,880 | | | 5,166,434 | | 0.1% | |
| | Brodrene Hartmann A.S. | 13,519 | | | 646,711 | | 0.0% | |
| #* | | D/S Norden A.S. | 136,704 | | | 2,133,716 | | 0.1% | |
| | DFDS A.S. | 157,956 | | | 7,201,732 | | 0.2% | |
| | Djurslands Bank A.S. | 8,970 | | | 295,244 | | 0.0% | |
| | FLSmidth & Co. A.S. | 260,041 | | | 10,782,456 | | 0.3% | |
The Continental Small Company Series
continued
| | | | | | | | | Percentage | |
| | | Shares | | Value†† | | of Net Assets** | |
| DENMARK — (Continued) | | | | | | | |
| | Fluegger A.S. Class B | 4,198 | | $ | 194,585 | | 0.0% | |
| | GN Store Nord A.S. | 826,732 | | | 17,097,087 | | 0.4% | |
| * | | GPV Industri A.S. Class B | 2,200 | | | — | | 0.0% | |
| | Gronlandsbanken A.S. | 1,125 | | | 97,833 | | 0.0% | |
| * | | H+H International A.S. Class B | 44,617 | | | 475,626 | | 0.0% | |
| | Harboes Bryggeri A.S. Class B | 16,516 | | | 324,876 | | 0.0% | |
| | IC Group A.S. | 39,094 | | | 818,187 | | 0.0% | |
| * | | Jeudan A.S. | 5,970 | | | 606,552 | | 0.0% | |
| | Jyske Bank A.S. | 345,747 | | | 16,441,309 | | 0.4% | |
| | Lan & Spar Bank | 4,981 | | | 320,616 | | 0.0% | |
| | Matas A.S. | 180,232 | | | 2,458,696 | | 0.1% | |
| | NKT Holding A.S. | 135,151 | | | 9,530,483 | | 0.2% | |
| # | | NNIT A.S. | 13,778 | | | 397,565 | | 0.0% | |
| | Nordjyske Bank A.S. | 36,553 | | | 543,792 | | 0.0% | |
| * | | Parken Sport & Entertainment A.S. | 33,556 | | | 327,872 | | 0.0% | |
| | Per Aarsleff Holding A.S. | 108,010 | | | 2,691,494 | | 0.1% | |
| | Ringkjoebing Landbobank A.S. | 23,199 | | | 4,803,958 | | 0.1% | |
| | Roblon A.S. Class B | 2,700 | | | 87,595 | | 0.0% | |
| | Rockwool International A.S. Class B | 39,532 | | | 6,966,697 | | 0.2% | |
| | Royal Unibrew A.S. | 227,860 | | | 8,785,776 | | 0.2% | |
| | RTX A.S. | 36,014 | | | 719,866 | | 0.0% | |
| * | | Santa Fe Group A.S. | 127,806 | | | 1,011,275 | | 0.0% | |
| | Schouw & Co. AB | 71,589 | | | 5,329,173 | | 0.1% | |
| | SimCorp A.S. | 210,233 | | | 10,238,372 | | 0.3% | |
| | Solar A.S. Class B | 27,904 | | | 1,424,088 | | 0.0% | |
| | Spar Nord Bank A.S. | 354,296 | | | 4,058,440 | | 0.1% | |
| | Sydbank A.S. | 359,022 | | | 11,123,091 | | 0.3% | |
| * | | TDC A.S. | 4,165,514 | | | 21,353,969 | | 0.5% | |
| * | | Tivoli A.S. | 9,370 | | | 585,115 | | 0.0% | |
| * | | TK Development A.S. | 608,784 | | | 815,291 | | 0.0% | |
| * | | Topdanmark A.S. | 491,266 | | | 12,448,897 | | 0.3% | |
| | Tryg A.S. | 65,070 | | | 1,175,068 | | 0.0% | |
| | United International Enterprises | 10,218 | | | 1,797,002 | | 0.1% | |
| * | | Vestjysk Bank A.S. | 53,413 | | | 98,377 | | 0.0% | |
| * | | William Demant Holding A.S. | 365,410 | | | 6,346,974 | | 0.2% | |
| #* | | Zealand Pharma A.S. | 62,015 | | | 932,882 | | 0.0% | |
| TOTAL DENMARK | | | | 193,675,964 | | 4.7% | |
| | | | | | | | |
| FINLAND — (6.7%) | | | | | | | |
| | Ahlstrom Oyj | 48,392 | | | 767,840 | | 0.0% | |
| | Aktia Bank Oyj | 92,898 | | | 950,627 | | 0.0% | |
| # | | Alandsbanken Abp Class B | 21,354 | | | 322,877 | | 0.0% | |
| | Alma Media Oyj | 42,130 | | | 223,137 | | 0.0% | |
| | Amer Sports Oyj | 641,324 | | | 17,018,455 | | 0.4% | |
| # | | Apetit Oyj | 18,766 | | | 255,969 | | 0.0% | |
| | Aspo Oyj | 92,762 | | | 797,986 | | 0.0% | |
| | Atria Oyj | 42,958 | | | 519,152 | | 0.0% | |
| #* | | BasWare Oyj | 43,305 | | | 1,649,987 | | 0.0% | |
| # | | Bittium Oyj | 124,764 | | | 743,136 | | 0.0% | |
| | Cargotec Oyj Class B | 235,592 | | | 10,606,831 | | 0.3% | |
| # | | Caverion Corp. | 522,975 | | | 4,352,098 | | 0.1% | |
| | Citycon Oyj | 2,200,212 | | | 5,404,017 | | 0.1% | |
The Continental Small Company Series
continued
| | | | | | | | | Percentage | |
| | | Shares | | Value†† | | of Net Assets** | |
| FINLAND — (Continued) | | | | | | | |
| # | | Comptel Oyj | 360,144 | | $ | 897,161 | | 0.0% | |
| | Cramo Oyj | 191,199 | | | 4,782,274 | | 0.1% | |
| | Digia Oyj | 48,912 | | | 161,957 | | 0.0% | |
| | Elisa Oyj | 734,075 | | | 23,829,141 | | 0.6% | |
| | F-Secure Oyj | 529,757 | | | 1,935,177 | | 0.1% | |
| * | | Finnair Oyj | 450,180 | | | 1,908,815 | | 0.0% | |
| # | | Fiskars Oyj Abp | 190,312 | | | 3,522,987 | | 0.1% | |
| * | | Glaston Oyj Abp | 46,084 | | | 19,563 | | 0.0% | |
| | HKScan Oyj Class A | 172,657 | | | 579,004 | | 0.0% | |
| | Huhtamaki Oyj | 467,536 | | | 17,327,232 | | 0.4% | |
| | Ilkka-Yhtyma Oyj | 61,503 | | | 175,193 | | 0.0% | |
| | Kemira Oyj | 653,778 | | | 8,333,971 | | 0.2% | |
| | Kesko Oyj Class A | 11,168 | | | 516,222 | | 0.0% | |
| | Kesko Oyj Class B | 345,206 | | | 17,227,737 | | 0.4% | |
| | Konecranes Oyj | 262,339 | | | 9,295,572 | | 0.2% | |
| | Lassila & Tikanoja Oyj | 171,857 | | | 3,475,223 | | 0.1% | |
| | Lemminkainen Oyj | 30,098 | | | 646,072 | | 0.0% | |
| # | | Metsa Board Oyj | 1,336,761 | | | 9,531,201 | | 0.2% | |
| | Metso Oyj | 549,230 | | | 15,625,000 | | 0.4% | |
| # | | Munksjo Oyj | 24,345 | | | 404,075 | | 0.0% | |
| | Nokian Renkaat Oyj | 623,433 | | | 23,177,911 | | 0.6% | |
| | Olvi Oyj Class A | 68,749 | | | 2,025,162 | | 0.1% | |
| | Oriola-KD Oyj Class A | 6,054 | | | 27,041 | | 0.0% | |
| | Oriola-KD Oyj Class B | 628,439 | | | 2,844,610 | | 0.1% | |
| | Orion Oyj Class A | 126,645 | | | 5,637,535 | | 0.1% | |
| | Orion Oyj Class B | 436,647 | | | 19,401,023 | | 0.5% | |
| * | | Outokumpu Oyj | 3,022,031 | | | 26,909,215 | | 0.7% | |
| #* | | Outotec Oyj | 900,395 | | | 4,707,879 | | 0.1% | |
| # | | PKC Group Oyj | 115,436 | | | 1,920,892 | | 0.1% | |
| | Ponsse Oy | 47,631 | | | 1,201,558 | | 0.0% | |
| * | | Poyry Oyj | 188,253 | | | 656,116 | | 0.0% | |
| * | | QT Group Oyj | 48,912 | | | 288,588 | | 0.0% | |
| | Raisio Oyj Class V | 573,332 | | | 2,152,806 | | 0.1% | |
| | Ramirent Oyj | 378,668 | | | 2,941,623 | | 0.1% | |
| | Rapala VMC Oyj | 109,543 | | | 475,747 | | 0.0% | |
| | Revenio Group Oyj | 23,248 | | | 744,852 | | 0.0% | |
| | Sanoma Oyj | 754,064 | | | 6,540,586 | | 0.2% | |
| | Sponda Oyj | 515,835 | | | 2,371,018 | | 0.1% | |
| | SRV Group Oyj | 23,502 | | | 134,377 | | 0.0% | |
| * | | Stockmann Oyj Abp Class A | 42,474 | | | 316,631 | | 0.0% | |
| #* | | Stockmann Oyj Abp Class B | 157,936 | | | 1,170,732 | | 0.0% | |
| | Technopolis Oyj | 905,646 | | | 2,977,591 | | 0.1% | |
| | Teleste Oyj | 46,406 | | | 432,568 | | 0.0% | |
| | Tieto Oyj | 295,694 | | | 8,045,775 | | 0.2% | |
| # | | Tikkurila Oyj | 209,297 | | | 4,134,590 | | 0.1% | |
| # | | Uponor Oyj | 283,661 | | | 4,922,881 | | 0.1% | |
| | Vaisala Oyj Class A | 47,987 | | | 1,702,997 | | 0.0% | |
| | Valmet Oyj | 526,890 | | | 7,736,062 | | 0.2% | |
| | Viking Line Abp | 10,366 | | | 220,730 | | 0.0% | |
| | YIT Oyj | 598,077 | | | 4,759,665 | | 0.1% | |
| TOTAL FINLAND | | | | 304,384,450 | | 7.3% | |
The Continental Small Company Series
continued
| | | | | | | | | Percentage | |
| | | Shares | | Value†† | | of Net Assets** | |
| FRANCE — (12.5%) | | | | | | | |
| | ABC Arbitrage | 144,886 | | $ | 1,096,243 | | 0.0% | |
| | Actia Group | 48,398 | | | 384,440 | | 0.0% | |
| #* | | Air France-KLM | 993,402 | | | 5,403,547 | | 0.1% | |
| | Akka Technologies | 51,478 | | | 1,875,613 | | 0.1% | |
| | Albioma SA | 95,177 | | | 1,656,119 | | 0.0% | |
| | Altamir | 111,564 | | | 1,499,266 | | 0.0% | |
| | Alten SA | 136,617 | | | 9,591,439 | | 0.2% | |
| | Altran Technologies SA | 771,932 | | | 11,265,755 | | 0.3% | |
| | April SA | 74,473 | | | 939,986 | | 0.0% | |
| #* | | Archos | 138,714 | | | 196,958 | | 0.0% | |
| | Arkema SA | 298,145 | | | 29,143,870 | | 0.7% | |
| | Assystem | 62,634 | | | 1,745,003 | | 0.1% | |
| | Aubay | 29,713 | | | 828,473 | | 0.0% | |
| * | | Ausy | 980 | | | 56,580 | | 0.0% | |
| | Axway Software SA | 30,384 | | | 978,808 | | 0.0% | |
| | Bastide le Confort Medical | 8,920 | | | 222,984 | | 0.0% | |
| # | | Beneteau SA | 193,357 | | | 2,796,995 | | 0.1% | |
| * | | Bigben Interactive | 3,583 | | | 26,386 | | 0.0% | |
| # | | BioMerieux | 67,996 | | | 10,148,786 | | 0.3% | |
| | Boiron SA | 38,334 | | | 3,396,290 | | 0.1% | |
| | Bonduelle SCA | 74,889 | | | 1,971,482 | | 0.1% | |
| # | | Bourbon Corp. | 93,321 | | | 1,202,460 | | 0.0% | |
| | Burelle SA | 3,717 | | | 3,717,219 | | 0.1% | |
| | Casino Guichard Perrachon SA | 3,794 | | | 181,788 | | 0.0% | |
| # | | Catering International Services | 14,124 | | | 251,269 | | 0.0% | |
| #* | | Cegedim SA | 23,645 | | | 652,542 | | 0.0% | |
| * | | Cegid Group SA | 26,749 | | | — | | 0.0% | |
| #* | | CGG SA | 97,011 | | | 1,394,889 | | 0.0% | |
| | Chargeurs SA | 95,815 | | | 1,609,833 | | 0.0% | |
| | Cie des Alpes | 38,937 | | | 774,480 | | 0.0% | |
| | Cie Plastic Omnium SA | 318,364 | | | 10,153,109 | | 0.3% | |
| * | | Coface SA | 136,925 | | | 893,094 | | 0.0% | |
| | Derichebourg SA | 549,528 | | | 2,429,164 | | 0.1% | |
| | Devoteam SA | 27,976 | | | 1,692,231 | | 0.1% | |
| | Dom Security | 2,414 | | | 129,706 | | 0.0% | |
| | Edenred | 946,779 | | | 18,746,715 | | 0.5% | |
| | Electricite de Strasbourg SA | 21,168 | | | 2,329,251 | | 0.1% | |
| | Elior Group | 353,796 | | | 8,082,219 | | 0.2% | |
| | Elis SA | 126,804 | | | 2,261,298 | | 0.1% | |
| * | | Eramet | 28,909 | | | 1,722,284 | | 0.1% | |
| * | | Esso SA Francaise | 14,895 | | | 645,103 | | 0.0% | |
| #* | | Etablissements Maurel et Prom | 844,597 | | | 3,744,513 | | 0.1% | |
| | Euler Hermes Group | 56,627 | | | 4,973,268 | | 0.1% | |
| | Eurofins Scientific SE | 30,496 | | | 12,992,630 | | 0.3% | |
| | Euronext NV | 224,956 | | | 9,271,797 | | 0.2% | |
| | Eutelsat Communications SA | 33,157 | | | 641,179 | | 0.0% | |
| | Exel Industries Class A | 10,330 | | | 830,058 | | 0.0% | |
| | Faiveley Transport SA | 34,183 | | | 3,603,082 | | 0.1% | |
| | Faurecia | 306,467 | | | 11,870,459 | | 0.3% | |
| # | | Fimalac | 272 | | | 29,165 | | 0.0% | |
| | Fleury Michon SA | 5,962 | | | 404,117 | | 0.0% | |
| # | | Gaumont SA | 13,521 | | | 788,862 | | 0.0% | |
The Continental Small Company Series
continued
| | | | | | | | | Percentage | |
| | | Shares | | Value†† | | of Net Assets** | |
| FRANCE — (Continued) | | | | | | | |
| | Gaztransport Et Technigaz SA | 72,536 | | $ | 3,133,663 | | 0.1% | |
| | GEA | 2,433 | | | 237,518 | | 0.0% | |
| | Gevelot SA | 3,466 | | | 529,785 | | 0.0% | |
| | GL Events | 48,589 | | | 869,362 | | 0.0% | |
| | Groupe Crit | 23,258 | | | 1,664,686 | | 0.0% | |
| * | | Groupe Fnac SA | 49,162 | | | 3,321,392 | | 0.1% | |
| #* | | Groupe Gorge | 22,858 | | | 508,313 | | 0.0% | |
| | Groupe Open | 26,685 | | | 638,075 | | 0.0% | |
| | Guerbet | 32,666 | | | 2,446,418 | | 0.1% | |
| | Haulotte Group SA | 74,466 | | | 1,101,289 | | 0.0% | |
| | Havas SA | 519,269 | | | 4,372,004 | | 0.1% | |
| * | | Herige SADCS | 4,147 | | | 112,894 | | 0.0% | |
| #* | | HiPay Group SA | 24,579 | | | 279,425 | | 0.0% | |
| * | | ID Logistics Group | 5,586 | | | 793,803 | | 0.0% | |
| | Imerys SA | 145,098 | | | 10,992,929 | | 0.3% | |
| | Ingenico Group SA | 43,343 | | | 3,458,158 | | 0.1% | |
| # | | Interparfums SA | 54,443 | | | 1,570,745 | | 0.0% | |
| | Ipsen SA | 162,032 | | | 11,707,628 | | 0.3% | |
| | IPSOS | 168,064 | | | 5,280,248 | | 0.1% | |
| | Jacquet Metal Service | 68,090 | | | 1,419,093 | | 0.0% | |
| | Korian SA | 196,034 | | | 5,742,225 | | 0.1% | |
| | Lagardere SCA | 619,304 | | | 17,189,044 | | 0.4% | |
| # | | Lanson-BCC | 8,795 | | | 312,933 | | 0.0% | |
| | Laurent-Perrier | 12,372 | | | 937,789 | | 0.0% | |
| | Le Noble Age | 24,612 | | | 915,313 | | 0.0% | |
| | Lectra | 115,852 | | | 2,197,000 | | 0.1% | |
| | Linedata Services | 8,608 | | | 423,792 | | 0.0% | |
| | LISI | 94,248 | | | 3,039,987 | | 0.1% | |
| | Maisons France Confort SA | 15,298 | | | 764,556 | | 0.0% | |
| | Manitou BF SA | 48,399 | | | 952,299 | | 0.0% | |
| | Manutan International | 14,076 | | | 1,032,927 | | 0.0% | |
| | Mersen SA | 117,956 | | | 2,521,629 | | 0.1% | |
| #* | | METabolic EXplorer SA | 151,621 | | | 392,065 | | 0.0% | |
| | Metropole Television SA | 293,607 | | | 5,457,763 | | 0.1% | |
| | MGI Coutier | 55,136 | | | 1,652,792 | | 0.0% | |
| | Mr Bricolage | 30,731 | | | 397,056 | | 0.0% | |
| #* | | Naturex | 31,570 | | | 2,824,130 | | 0.1% | |
| | Neopost SA | 176,348 | | | 5,507,617 | | 0.1% | |
| * | | Nexans SA | 188,998 | | | 9,774,725 | | 0.2% | |
| | Nexity SA | 171,171 | | | 8,005,939 | | 0.2% | |
| #* | | Nicox | 76,283 | | | 684,258 | | 0.0% | |
| * | | NRJ Group | 71,278 | | | 716,594 | | 0.0% | |
| # | | Oeneo SA | 107,682 | | | 897,543 | | 0.0% | |
| #* | | Onxeo SA(B04P0G6) | 160,610 | | | 422,128 | | 0.0% | |
| #* | | Onxeo SA(BPFJVR0) | 48,958 | | | 128,870 | | 0.0% | |
| # | | Orpea | 182,255 | | | 14,714,274 | | 0.4% | |
| #* | | Parrot SA | 25,254 | | | 275,763 | | 0.0% | |
| #* | | Pierre & Vacances SA | 26,157 | | | 1,044,324 | | 0.0% | |
| | Plastivaloire | 1,182 | | | 175,240 | | 0.0% | |
| | PSB Industries SA | 8,161 | | | 433,816 | | 0.0% | |
| # | | Rallye SA | 128,234 | | | 2,483,172 | | 0.1% | |
| | Remy Cointreau SA | 55,277 | | | 4,711,676 | | 0.1% | |
The Continental Small Company Series
continued
| | | | | | | | | Percentage | |
| | | Shares | | Value†† | | of Net Assets** | |
| FRANCE — (Continued) | | | | | | | |
| | Rexel SA | 1,596,995 | | $ | 26,238,437 | | 0.6% | |
| # | | Robertet SA | 3,063 | | | 1,128,694 | | 0.0% | |
| | Rothschild & Co. | 21,871 | | | 591,476 | | 0.0% | |
| | Rubis SCA | 203,675 | | | 16,774,964 | | 0.4% | |
| | Samse SA | 8,068 | | | 1,240,006 | | 0.0% | |
| | Sartorius Stedim Biotech | 101,854 | | | 6,426,099 | | 0.2% | |
| | Savencia SA | 33,142 | | | 2,333,934 | | 0.1% | |
| | SEB SA | 120,657 | | | 16,349,482 | | 0.4% | |
| | Seche Environnement SA | 11,799 | | | 359,635 | | 0.0% | |
| #* | | Sequana SA | 289,137 | | | 514,010 | | 0.0% | |
| * | | SES-imagotag SA | 14,048 | | | 403,057 | | 0.0% | |
| * | | Societe des Bains de Mer et du Cercle des Etrangers a Monaco | 60,258 | | | 1,908,180 | | 0.1% | |
| #* | | Societe Internationale de Plantations d'Heveas SA | 7,523 | | | 416,279 | | 0.0% | |
| | Societe Marseillaise du Tunnel Prado-Carenage SA | 3,434 | | | 115,531 | | 0.0% | |
| # | | Societe pour l'Informatique Industrielle | 39,566 | | | 800,118 | | 0.0% | |
| * | | SOITEC | 1,279,868 | | | 1,977,675 | | 0.1% | |
| #* | | Solocal Group | 170,329 | | | 551,637 | | 0.0% | |
| | Somfy SA | 20,959 | | | 8,547,645 | | 0.2% | |
| | Sopra Steria Group | 74,501 | | | 8,452,791 | | 0.2% | |
| | SPIE SA | 97,080 | | | 2,043,254 | | 0.1% | |
| * | | Stallergenes Greer P.L.C. | 12,201 | | | 396,994 | | 0.0% | |
| #* | | Ste Industrielle d'Aviation Latecoere SA | 310,883 | | | 1,370,261 | | 0.0% | |
| | Stef SA | 28,166 | | | 2,366,656 | | 0.1% | |
| | STMicroelectronics NV | 2,136,887 | | | 24,220,433 | | 0.6% | |
| | Sword Group | 32,374 | | | 989,405 | | 0.0% | |
| | Synergie SA | 69,989 | | | 2,577,783 | | 0.1% | |
| | Tarkett SA | 54,324 | | | 1,948,424 | | 0.1% | |
| | Technicolor SA | 1,482,868 | | | 8,017,791 | | 0.2% | |
| | Teleperformance | 336,308 | | | 33,716,824 | | 0.8% | |
| # | | Television Francaise 1 | 626,436 | | | 6,217,608 | | 0.2% | |
| | Tessi SA | 6,807 | | | 1,153,681 | | 0.0% | |
| # | | TFF Group | 5,065 | | | 533,191 | | 0.0% | |
| # | | Thermador Groupe | 13,789 | | | 1,211,428 | | 0.0% | |
| | Total Gabon | 1,515 | | | 248,658 | | 0.0% | |
| * | | Touax SA | 5,568 | | | 64,472 | | 0.0% | |
| | Trigano SA | 46,958 | | | 3,672,516 | | 0.1% | |
| * | | Ubisoft Entertainment SA | 521,852 | | | 18,544,365 | | 0.5% | |
| | Union Financiere de France BQE SA | 16,855 | | | 422,247 | | 0.0% | |
| #* | | Vallourec SA | 989,735 | | | 6,800,520 | | 0.2% | |
| #* | | Valneva SE | 218,939 | | | 712,191 | | 0.0% | |
| | Vetoquinol SA | 16,625 | | | 796,691 | | 0.0% | |
| | Vicat SA | 86,767 | | | 5,265,394 | | 0.1% | |
| | VIEL & Cie SA | 161,700 | | | 739,920 | | 0.0% | |
| # | | Vilmorin & Cie SA | 27,056 | | | 1,703,588 | | 0.1% | |
| #* | | Virbac SA | 22,063 | | | 3,880,218 | | 0.1% | |
| | Vranken-Pommery Monopole SA | 18,262 | | | 432,417 | | 0.0% | |
| * | | Worldline SA | 23,932 | | | 674,260 | | 0.0% | |
| TOTAL FRANCE | | | | 570,260,314 | | 13.7% | |
| | | | | | | | |
| GERMANY — (15.0%) | | | | | | | |
| | Aareal Bank AG | 409,233 | | | 15,348,599 | | 0.4% | |
| | Adler Modemaerkte AG | 41,855 | | | 206,981 | | 0.0% | |
The Continental Small Company Series
continued
| | | | | | | | | Percentage | |
| | | Shares | | Value†† | | of Net Assets** | |
| GERMANY — (Continued) | | | | | | | |
| #* | | ADLER Real Estate AG | 111,691 | | $ | 1,705,857 | | 0.0% | |
| * | | ADVA Optical Networking SE | 194,362 | | | 1,573,737 | | 0.0% | |
| #* | | AIXTRON SE | 396,410 | | | 1,289,864 | | 0.0% | |
| * | | Aligna AG | 318,087 | | | — | | 0.0% | |
| | All for One Steeb AG | 569 | | | 31,376 | | 0.0% | |
| # | | Allgeier SE | 26,260 | | | 477,916 | | 0.0% | |
| # | | Amadeus Fire AG | 30,007 | | | 2,318,181 | | 0.1% | |
| * | | AS Creation Tapeten | 7,109 | | | 223,344 | | 0.0% | |
| | Aurubis AG | 180,566 | | | 10,392,016 | | 0.3% | |
| | Axel Springer SE | 194,300 | | | 9,421,372 | | 0.2% | |
| | Basler AG | 3,576 | | | 226,899 | | 0.0% | |
| | Bauer AG | 33,835 | | | 406,052 | | 0.0% | |
| | BayWa AG(5838057) | 78,978 | | | 2,557,588 | | 0.1% | |
| | BayWa AG(5838068) | 124 | | | 4,107 | | 0.0% | |
| | Bechtle AG | 80,333 | | | 8,352,754 | | 0.2% | |
| # | | Bertrandt AG | 27,357 | | | 2,779,922 | | 0.1% | |
| | Bijou Brigitte AG | 19,236 | | | 1,116,487 | | 0.0% | |
| #* | | Bilfinger SE | 178,040 | | | 6,854,985 | | 0.2% | |
| | Biotest AG | 60,306 | | | 1,008,477 | | 0.0% | |
| * | | BKN International AG | 33,408 | | | — | | 0.0% | |
| # | | Borussia Dortmund GmbH & Co. KGaA | 473,904 | | | 2,622,162 | | 0.1% | |
| | BRAAS Monier Building Group SA | 20,914 | | | 554,149 | | 0.0% | |
| # | | CANCOM SE | 86,805 | | | 4,117,546 | | 0.1% | |
| | Carl Zeiss Meditec AG | 160,352 | | | 5,900,231 | | 0.1% | |
| # | | CENIT AG | 50,111 | | | 1,052,664 | | 0.0% | |
| | CENTROTEC Sustainable AG | 44,227 | | | 710,927 | | 0.0% | |
| | Cewe Stiftung & Co. KGAA | 31,218 | | | 2,769,360 | | 0.1% | |
| # | | Clere AG | 21,096 | | | 353,782 | | 0.0% | |
| | Comdirect Bank AG | 182,514 | | | 1,851,845 | | 0.0% | |
| # | | CompuGroup Medical SE | 119,816 | | | 4,913,500 | | 0.1% | |
| * | | Constantin Medien AG | 340,089 | | | 739,281 | | 0.0% | |
| | CropEnergies AG | 116,924 | | | 627,274 | | 0.0% | |
| # | | CTS Eventim AG & Co. KGaA | 216,083 | | | 6,804,500 | | 0.2% | |
| | Data Modul AG | 11,455 | | | 590,968 | | 0.0% | |
| #* | | DEAG Deutsche Entertainment AG | 13,697 | | | 40,958 | | 0.0% | |
| # | | Delticom AG | 28,981 | | | 546,191 | | 0.0% | |
| | Deutsche Beteiligungs AG | 48,698 | | | 1,575,687 | | 0.0% | |
| | Deutsche EuroShop AG | 220,384 | | | 8,964,095 | | 0.2% | |
| # | | Deutsche Lufthansa AG | 28,830 | | | 371,640 | | 0.0% | |
| | Deutsche Pfandbriefbank AG | 22,610 | | | 216,563 | | 0.0% | |
| | Deutz AG | 599,311 | | | 3,362,525 | | 0.1% | |
| * | | Dialog Semiconductor P.L.C. | 382,079 | | | 16,053,013 | | 0.4% | |
| | DIC Asset AG | 265,874 | | | 2,543,528 | | 0.1% | |
| | DMG Mori AG | 200,984 | | | 9,118,820 | | 0.2% | |
| | Dr Hoenle AG | 25,078 | | | 741,009 | | 0.0% | |
| | Draegerwerk AG & Co. KGaA | 9,773 | | | 669,551 | | 0.0% | |
| # | | Drillisch AG | 225,064 | | | 9,667,300 | | 0.2% | |
| | Duerr AG | 133,802 | | | 10,728,441 | | 0.3% | |
| | Eckert & Ziegler AG | 17,297 | | | 486,416 | | 0.0% | |
| | Elmos Semiconductor AG | 53,988 | | | 806,152 | | 0.0% | |
| # | | ElringKlinger AG | 167,277 | | | 2,791,725 | | 0.1% | |
| * | | Euromicron AG | 32,612 | | | 200,625 | | 0.0% | |
The Continental Small Company Series
continued
| | | | | | | | | Percentage | |
| | | Shares | | Value†† | | of Net Assets** | |
| GERMANY — (Continued) | | | | | | | |
| * | | Evotec AG | 1,103,203 | | $ | 8,619,214 | | 0.2% | |
| # | | Fielmann AG | 114,167 | | | 7,534,145 | | 0.2% | |
| * | | First Sensor AG | 19,888 | | | 303,505 | | 0.0% | |
| | Francotyp-Postalia Holding AG Class A | 53,729 | | | 310,497 | | 0.0% | |
| | Fraport AG Frankfurt Airport Services Worldwide | 179,584 | | | 10,596,881 | | 0.3% | |
| | Freenet AG | 652,809 | | | 18,346,927 | | 0.4% | |
| | Fuchs Petrolub SE | 147,943 | | | 5,746,090 | | 0.1% | |
| | Gerresheimer AG | 198,146 | | | 14,695,756 | | 0.4% | |
| | Gerry Weber International AG | 98,127 | | | 1,133,164 | | 0.0% | |
| # | | Gesco AG | 43,467 | | | 1,028,847 | | 0.0% | |
| | GFK SE | 76,920 | | | 3,511,750 | | 0.1% | |
| # | | GFT Technologies SE | 90,843 | | | 1,956,453 | | 0.1% | |
| | Grammer AG | 79,765 | | | 3,979,831 | | 0.1% | |
| | GRENKE AG | 36,620 | | | 5,738,572 | | 0.1% | |
| * | | H&R GmbH & Co. KGaA | 33,528 | | | 527,156 | | 0.0% | |
| | Hamburger Hafen und Logistik AG | 113,533 | | | 2,109,767 | | 0.1% | |
| #* | | Heidelberger Druckmaschinen AG | 1,401,673 | | | 3,729,128 | | 0.1% | |
| | Hella KGaA Hueck & Co. | 106,323 | | | 4,001,660 | | 0.1% | |
| * | | Highlight Communications AG | 94,846 | | | 566,740 | | 0.0% | |
| * | | HolidayCheck Group AG | 114,390 | | | 278,964 | | 0.0% | |
| | Hornbach Baumarkt AG | 21,270 | | | 619,170 | | 0.0% | |
| | Hugo Boss AG | 261,242 | | | 15,948,572 | | 0.4% | |
| | Indus Holding AG | 129,827 | | | 7,041,709 | | 0.2% | |
| # | | Init Innovation In Traffic Systems AG | 23,180 | | | 363,699 | | 0.0% | |
| | Isra Vision AG | 18,038 | | | 1,919,045 | | 0.0% | |
| | Jenoptik AG | 262,122 | | | 4,518,808 | | 0.1% | |
| # | | K+S AG | 990,931 | | | 23,605,024 | | 0.6% | |
| * | | Kampa AG | 7,101 | | | 127 | | 0.0% | |
| | KION Group AG | 258,832 | | | 14,370,732 | | 0.3% | |
| * | | Kloeckner & Co. SE | 555,392 | | | 6,935,224 | | 0.2% | |
| * | | Koenig & Bauer AG | 69,890 | | | 3,137,272 | | 0.1% | |
| #* | | Kontron AG | 437,004 | | | 1,310,822 | | 0.0% | |
| # | | Krones AG | 75,044 | | | 6,854,020 | | 0.2% | |
| | KSB AG | 3,466 | | | 1,359,670 | | 0.0% | |
| * | | KUKA AG | 134,984 | | | 16,316,193 | | 0.4% | |
| # | | KWS Saat SE | 15,970 | | | 4,737,273 | | 0.1% | |
| | Lanxess AG | 484,758 | | | 31,743,525 | | 0.8% | |
| | LEG Immobilien AG | 306,750 | | | 23,791,358 | | 0.6% | |
| | Leifheit AG | 13,935 | | | 827,806 | | 0.0% | |
| | Leoni AG | 159,356 | | | 5,666,025 | | 0.1% | |
| #* | | LPKF Laser & Electronics AG | 76,947 | | | 561,847 | | 0.0% | |
| #* | | Manz AG | 20,001 | | | 697,731 | | 0.0% | |
| * | | MasterFlex SE | 19,347 | | | 134,032 | | 0.0% | |
| * | | Mediclin AG | 88,966 | | | 549,743 | | 0.0% | |
| #* | | Medigene AG | 56,083 | | | 700,022 | | 0.0% | |
| | MLP AG | 296,006 | | | 1,298,227 | | 0.0% | |
| * | | msg life ag | 11,646 | | | 35,488 | | 0.0% | |
| # | | MTU Aero Engines AG | 249,839 | | | 28,818,892 | | 0.7% | |
| | MVV Energie AG | 1,278 | | | 28,901 | | 0.0% | |
| | Nemetschek SE | 107,874 | | | 6,271,885 | | 0.2% | |
| | Nexus AG | 49,542 | | | 933,061 | | 0.0% | |
| #* | | Nordex SE | 307,691 | | | 6,590,488 | | 0.2% | |
The Continental Small Company Series
continued
| | | | | | | | | Percentage | |
| | | Shares | | Value†† | | of Net Assets** | |
| GERMANY — (Continued) | | | | | | | |
| | Norma Group SE | 202,672 | | $ | 8,633,124 | | 0.2% | |
| | OHB SE | 34,003 | | | 663,199 | | 0.0% | |
| | Osram Licht AG | 343,036 | | | 17,963,212 | | 0.4% | |
| | paragon AG | 4,815 | | | 210,617 | | 0.0% | |
| * | | Patrizia Immobilien AG | 263,203 | | | 4,368,080 | | 0.1% | |
| #* | | Petro Welt Technologies AG | 6,474 | | | 47,622 | | 0.0% | |
| | Pfeiffer Vacuum Technology AG | 52,225 | | | 4,871,024 | | 0.1% | |
| | PNE Wind AG | 367,537 | | | 842,970 | | 0.0% | |
| | Progress-Werk Oberkirch AG | 7,571 | | | 318,521 | | 0.0% | |
| | PSI AG Gesellschaft Fuer Produkte und Systeme der
Informationstechnologie | 27,232 | | | 349,849 | | 0.0% | |
| | Puma SE | 10,528 | | | 2,763,792 | | 0.1% | |
| * | | PVA TePla AG | 46,019 | | | 110,283 | | 0.0% | |
| * | | QIAGEN NV | 744,663 | | | 20,867,950 | | 0.5% | |
| # | | QSC AG | 498,723 | | | 1,005,203 | | 0.0% | |
| # | | R Stahl AG | 14,952 | | | 447,347 | | 0.0% | |
| | Rational AG | 14,449 | | | 6,444,141 | | 0.2% | |
| | Rheinmetall AG | 223,411 | | | 14,993,275 | | 0.4% | |
| | RHOEN-KLINIKUM AG | 235,088 | | | 6,345,761 | | 0.2% | |
| # | | RIB Software AG | 157,104 | | | 2,061,265 | | 0.1% | |
| # | | S&T AG | 15,456 | | | 141,323 | | 0.0% | |
| | SAF-Holland SA | 248,917 | | | 3,568,069 | | 0.1% | |
| | Salzgitter AG | 212,972 | | | 7,472,264 | | 0.2% | |
| # | | Schaltbau Holding AG | 27,311 | | | 883,824 | | 0.0% | |
| | Schloss Wachenheim AG | 7,479 | | | 120,574 | | 0.0% | |
| * | | SER Systems AG | 9,400 | | | — | | 0.0% | |
| #* | | SGL Carbon SE | 266,687 | | | 2,341,879 | | 0.1% | |
| | SHW AG | 25,624 | | | 879,159 | | 0.0% | |
| * | | Siltronic AG | 6,953 | | | 321,566 | | 0.0% | |
| # | | Sixt Leasing SE | 7,617 | | | 143,656 | | 0.0% | |
| | Sixt SE | 80,910 | | | 4,333,633 | | 0.1% | |
| # | | SMA Solar Technology AG | 59,062 | | | 1,557,381 | | 0.0% | |
| * | | SMT Scharf AG | 18,103 | | | 263,633 | | 0.0% | |
| | Softing AG | 21,576 | | | 291,551 | | 0.0% | |
| | Software AG | 309,788 | | | 11,227,782 | | 0.3% | |
| #* | | Solarworld AG | 13,177 | | | 33,652 | | 0.0% | |
| * | | Stabilus SA | 30,774 | | | 1,653,157 | | 0.0% | |
| | Stada Arzneimittel AG | 306,492 | | | 15,833,942 | | 0.4% | |
| | STRATEC Biomedical AG | 8,807 | | | 424,246 | | 0.0% | |
| # | | Stroeer SE & Co. KGaA | 116,515 | | | 5,107,090 | | 0.1% | |
| | Suedzucker AG | 438,206 | | | 10,445,333 | | 0.3% | |
| #* | | Suess MicroTec AG | 105,674 | | | 710,833 | | 0.0% | |
| | Surteco SE | 25,640 | | | 637,915 | | 0.0% | |
| | TAG Immobilien AG | 798,736 | | | 10,525,702 | | 0.3% | |
| | Takkt AG | 163,454 | | | 3,693,533 | | 0.1% | |
| | Technotrans AG | 32,047 | | | 772,238 | | 0.0% | |
| | TLG Immobilien AG | 152,128 | | | 2,863,875 | | 0.1% | |
| * | | Tom Tailor Holding AG | 108,631 | | | 592,711 | | 0.0% | |
| | VERBIO Vereinigte BioEnergie AG | 127,536 | | | 972,016 | | 0.0% | |
| #* | | Vossloh AG | 68,437 | | | 4,295,675 | | 0.1% | |
| # | | VTG AG | 80,128 | | | 2,392,969 | | 0.1% | |
| # | | Wacker Chemie AG | 77,716 | | | 8,066,094 | | 0.2% | |
| | Wacker Neuson SE | 146,155 | | | 2,367,300 | | 0.1% | |
The Continental Small Company Series
continued
| | | | | | | | | Percentage | |
| | | Shares | | Value†† | | of Net Assets** | |
| GERMANY — (Continued) | | | | | | | |
| | Washtec AG | 42,100 | | $ | 2,191,163 | | 0.1% | |
| | XING AG | 16,563 | | | 3,056,716 | | 0.1% | |
| | Zeal Network SE | 33,676 | | | 1,306,745 | | 0.0% | |
| TOTAL GERMANY | | | | 685,986,814 | | 16.5% | |
| | | | | | | | |
| GREECE — (0.0%) | | | | | | | |
| * | | Alfa Alfa Energy SA | 3,810 | | | — | | 0.0% | |
| * | | Alysida SA | 2,376 | | | — | | 0.0% | |
| * | | Atlantic Supermarkets SA | 34,730 | | | — | | 0.0% | |
| * | | Babis Vovos International Construction SA | 21,073 | | | — | | 0.0% | |
| * | | Balafas SA | 15,200 | | | — | | 0.0% | |
| * | | Elektroniki Athinon SA | 7,497 | | | — | | 0.0% | |
| * | | Etma Rayon SA | 11,242 | | | — | | 0.0% | |
| * | | Informatics SA | 3,778 | | | — | | 0.0% | |
| * | | Ipirotiki Software & Publications SA | 22,110 | | | — | | 0.0% | |
| * | | Lan-Net SA | 12,688 | | | — | | 0.0% | |
| * | | Neorion Holdings SA | 14,991 | | | — | | 0.0% | |
| * | | Promota Hellas SA | 8,860 | | | — | | 0.0% | |
| * | | T Bank SA | 228,007 | | | — | | 0.0% | |
| * | | Themeliodomi SA | 37,422 | | | — | | 0.0% | |
| TOTAL GREECE | | | | — | | 0.0% | |
| | | | | | | | |
| IRELAND — (1.2%) | | | | | | | |
| | C&C Group P.L.C.(B010DT8) | 399,607 | | | 1,669,304 | | 0.1% | |
| | C&C Group P.L.C.(B011Y09) | 1,077,904 | | | 4,360,781 | | 0.1% | |
| | Datalex P.L.C. | 60,575 | | | 216,000 | | 0.0% | |
| * | | FBD Holdings P.L.C. | 125,728 | | | 860,235 | | 0.0% | |
| | Glanbia P.L.C.(0066950) | 700,613 | | | 11,684,912 | | 0.3% | |
| | Glanbia P.L.C.(4058629) | 26,140 | | | 433,884 | | 0.0% | |
| | IFG Group P.L.C. | 302,015 | | | 566,331 | | 0.0% | |
| * | | Independent News & Media P.L.C. | 1,593,163 | | | 213,590 | | 0.0% | |
| | Irish Continental Group P.L.C.(BLP5857) | 366,782 | | | 1,733,972 | | 0.1% | |
| | Irish Continental Group P.L.C.(BLP59W1) | 234,200 | | | 1,066,637 | | 0.0% | |
| | Kingspan Group P.L.C. | 622,048 | | | 16,815,462 | | 0.4% | |
| | Paddy Power Betfair P.L.C. | 4,809 | | | 511,689 | | 0.0% | |
| | Smurfit Kappa Group P.L.C. | 601,045 | | | 13,765,269 | | 0.3% | |
| TOTAL IRELAND | | | | 53,898,066 | | 1.3% | |
| | | | | | | | |
| ISRAEL — (1.8%) | | | | | | | |
| * | | ADO Group, Ltd. | 49,052 | | | 557,175 | | 0.0% | |
| #* | | Africa Israel Investments, Ltd. | 1,160,746 | | | 172,708 | | 0.0% | |
| | Africa Israel Properties, Ltd. | 78,320 | | | 1,344,486 | | 0.0% | |
| | Africa Israel Residences, Ltd. | 594 | | | 11,510 | | 0.0% | |
| #* | | Airport City, Ltd. | 316,100 | | | 3,141,883 | | 0.1% | |
| | Albaad Massuot Yitzhak, Ltd. | 466 | | | 7,428 | | 0.0% | |
| #* | | Allot Communications, Ltd. | 127,151 | | | 611,907 | | 0.0% | |
| | Alrov Properties and Lodgings, Ltd. | 44,380 | | | 964,138 | | 0.0% | |
| | Amot Investments, Ltd. | 452,653 | | | 1,920,303 | | 0.1% | |
| | Arad, Ltd. | 1,053 | | | 10,590 | | 0.0% | |
| | Ashtrom Properties, Ltd. | 23,018 | | | 82,256 | | 0.0% | |
| #* | | AudioCodes, Ltd. | 163,675 | | | 1,019,081 | | 0.0% | |
The Continental Small Company Series
continued
| | | | | | | | | Percentage | |
| | | Shares | | Value†† | | of Net Assets** | |
| ISRAEL — (Continued) | | | | | | | |
| | Avgol Industries 1953, Ltd. | 407,132 | | $ | 489,230 | | 0.0% | |
| * | | Azorim-Investment Development & Construction Co., Ltd. | 380,820 | | | 341,057 | | 0.0% | |
| | Bayside Land Corp. | 3,610 | | | 1,309,350 | | 0.0% | |
| # | | Big Shopping Centers, Ltd. | 17,790 | | | 1,167,569 | | 0.0% | |
| * | | BioLine RX, Ltd. | 59,630 | | | 53,356 | | 0.0% | |
| # | | Blue Square Real Estate, Ltd. | 22,369 | | | 852,889 | | 0.0% | |
| | Brack Capital Properties NV | 12,827 | | | 1,147,370 | | 0.0% | |
| #* | | Cellcom Israel, Ltd. | 283,451 | | | 2,272,990 | | 0.1% | |
| * | | Ceragon Networks, Ltd. | 109,184 | | | 276,555 | | 0.0% | |
| #* | | Clal Biotechnology Industries, Ltd. | 174,162 | | | 108,279 | | 0.0% | |
| * | | Clal Insurance Enterprises Holdings, Ltd. | 88,091 | | | 1,127,682 | | 0.0% | |
| * | | Cohen Development & Industrial Buildings, Ltd. | 2,564 | | | 64,928 | | 0.0% | |
| #* | | Compugen, Ltd. | 185,531 | | | 941,595 | | 0.0% | |
| | Delek Automotive Systems, Ltd. | 168,811 | | | 1,493,900 | | 0.0% | |
| # | | Delta-Galil Industries, Ltd. | 56,527 | | | 1,641,185 | | 0.1% | |
| | Direct Insurance Financial Investments, Ltd. | 73,126 | | | 652,217 | | 0.0% | |
| | El Al Israel Airlines | 1,470,062 | | | 972,122 | | 0.0% | |
| | Electra Consumer Products 1970, Ltd. | 12,719 | | | 174,706 | | 0.0% | |
| # | | Electra, Ltd. | 8,540 | | | 1,370,680 | | 0.0% | |
| # | | Elron Electronic Industries, Ltd. | 62,094 | | | 287,966 | | 0.0% | |
| # | | Energix-Renewable Energies, Ltd. | 78,065 | | | 48,142 | | 0.0% | |
| * | | Equital, Ltd. | 7,312 | | | 138,596 | | 0.0% | |
| #* | | Evogene, Ltd. | 70,559 | | | 358,627 | | 0.0% | |
| # | | First International Bank Of Israel, Ltd. | 180,262 | | | 2,641,629 | | 0.1% | |
| | FMS Enterprises Migun, Ltd. | 11,414 | | | 306,301 | | 0.0% | |
| | Formula Systems 1985, Ltd. | 44,239 | | | 1,793,289 | | 0.1% | |
| | Fox Wizel, Ltd. | 19,541 | | | 315,485 | | 0.0% | |
| | Frutarom Industries, Ltd. | 678 | | | 34,607 | | 0.0% | |
| * | | Gilat Satellite Networks, Ltd. | 113,132 | | | 570,594 | | 0.0% | |
| #* | | Hadera Paper, Ltd. | 10,176 | | | 346,988 | | 0.0% | |
| | Harel Insurance Investments & Financial Services, Ltd. | 552,043 | | | 2,530,343 | | 0.1% | |
| | Hilan, Ltd. | 45,185 | | | 681,615 | | 0.0% | |
| # | | IDI Insurance Co., Ltd. | 22,850 | | | 1,103,417 | | 0.0% | |
| # | | Industrial Buildings Corp., Ltd. | 475,849 | | | 567,833 | | 0.0% | |
| * | | Israel Discount Bank, Ltd. Class A | 2,736,507 | | | 5,679,010 | | 0.2% | |
| | Israel Land Development Co., Ltd. (The) | 22,310 | | | 118,639 | | 0.0% | |
| * | | Jerusalem Oil Exploration | 45,662 | | | 1,954,179 | | 0.1% | |
| #* | | Kamada, Ltd. | 126,672 | | | 691,987 | | 0.0% | |
| * | | Kenon Holdings, Ltd. | 27,135 | | | 318,773 | | 0.0% | |
| | Kerur Holdings, Ltd. | 7,088 | | | 183,143 | | 0.0% | |
| | Klil Industries, Ltd. | 550 | | | 46,728 | | 0.0% | |
| | Maabarot Products, Ltd. | 21,999 | | | 340,944 | | 0.0% | |
| | Magic Software Enterprises, Ltd. | 92,863 | | | 635,664 | | 0.0% | |
| # | | Matrix IT, Ltd. | 178,144 | | | 1,423,443 | | 0.0% | |
| | Maytronics, Ltd. | 129,036 | | | 494,794 | | 0.0% | |
| #* | | Mazor Robotics, Ltd. | 228,777 | | | 2,524,400 | | 0.1% | |
| | Meitav DS Investments, Ltd. | 44,186 | | | 203,019 | | 0.0% | |
| # | | Melisron, Ltd. | 52,894 | | | 2,254,544 | | 0.1% | |
| * | | Menora Mivtachim Holdings, Ltd. | 123,424 | | | 1,118,162 | | 0.0% | |
| #* | | Migdal Insurance & Financial Holding, Ltd. | 1,543,756 | | | 1,260,981 | | 0.0% | |
| # | | Mivtach Shamir Holdings, Ltd. | 22,547 | | | 458,976 | | 0.0% | |
| #* | | Naphtha Israel Petroleum Corp., Ltd. | 160,542 | | | 1,033,695 | | 0.0% | |
The Continental Small Company Series
continued
| | | | | | | | | Percentage | |
| | | Shares | | Value†† | | of Net Assets** | |
| ISRAEL — (Continued) | | | | | | | |
| | Neto ME Holdings, Ltd. | 5,555 | | $ | 430,943 | | 0.0% | |
| #* | | Nova Measuring Instruments, Ltd. | 119,308 | | | 1,587,818 | | 0.1% | |
| * | | Oil Refineries, Ltd. | 5,367,932 | | | 1,888,561 | | 0.1% | |
| #* | | Partner Communications Co., Ltd. | 459,954 | | | 2,197,938 | | 0.1% | |
| | Paz Oil Co., Ltd. | 23,314 | | | 3,417,965 | | 0.1% | |
| * | | Perion Network, Ltd. | 16,455 | | | 22,566 | | 0.0% | |
| * | | Phoenix Holdings, Ltd. (The) | 280,698 | | | 971,964 | | 0.0% | |
| # | | Plasson Industries, Ltd. | 13,484 | | | 397,633 | | 0.0% | |
| # | | Rami Levy Chain Stores Hashikma Marketing 2006, Ltd. | 32,629 | | | 1,317,705 | | 0.0% | |
| #* | | Redhill Biopharma, Ltd. | 45,309 | | | 47,503 | | 0.0% | |
| # | | Sapiens International Corp. NV | 109,799 | | | 1,572,699 | | 0.1% | |
| | Scope Metals Group, Ltd. | 830 | | | 16,628 | | 0.0% | |
| | Shapir Engineering and Industry, Ltd. | 37,161 | | | 80,876 | | 0.0% | |
| # | | Shikun & Binui, Ltd. | 1,044,647 | | | 1,992,399 | | 0.1% | |
| | Shufersal, Ltd. | 392,383 | | | 1,464,734 | | 0.0% | |
| * | | Space Communication, Ltd. | 17,611 | | | 111,066 | | 0.0% | |
| | Strauss Group, Ltd. | 136,109 | | | 2,149,189 | | 0.1% | |
| * | | Summit Real Estate Holdings, Ltd. | 104,998 | | | 564,642 | | 0.0% | |
| | Tadiran Holdings, Ltd. | 6,059 | | | 135,080 | | 0.0% | |
| #* | | Tower Semiconductor, Ltd. | 251,518 | | | 4,779,928 | | 0.1% | |
| * | | Union Bank of Israel | 126,346 | | | 554,261 | | 0.0% | |
| TOTAL ISRAEL | | | | 84,469,736 | | 2.0% | |
| | | | | | | | |
| ITALY — (8.7%) | | | | | | | |
| | A2A SpA | 8,290,391 | | | 10,706,874 | | 0.3% | |
| | ACEA SpA | 302,509 | | | 3,671,061 | | 0.1% | |
| * | | Aedes SIIQ SpA | 691,904 | | | 280,723 | | 0.0% | |
| #* | | Aeffe SpA | 167,738 | | | 195,777 | | 0.0% | |
| | Amplifon SpA | 515,448 | | | 4,908,749 | | 0.1% | |
| | Anima Holding SpA | 761,265 | | | 4,126,530 | | 0.1% | |
| | Ansaldo STS SpA | 572,443 | | | 7,134,411 | | 0.2% | |
| * | | Arnoldo Mondadori Editore SpA | 724,145 | | | 892,387 | | 0.0% | |
| | Ascopiave SpA | 424,667 | | | 1,216,855 | | 0.0% | |
| # | | Astaldi SpA | 288,057 | | | 1,637,000 | | 0.1% | |
| | Autogrill SpA | 728,145 | | | 6,570,418 | | 0.2% | |
| # | | Azimut Holding SpA | 623,078 | | | 10,363,894 | | 0.3% | |
| #* | | Banca Carige SpA | 1,893,751 | | | 633,451 | | 0.0% | |
| # | | Banca Finnat Euramerica SpA | 616,149 | | | 241,559 | | 0.0% | |
| | Banca Generali SpA | 284,313 | | | 6,762,305 | | 0.2% | |
| | Banca IFIS SpA | 147,336 | | | 4,025,937 | | 0.1% | |
| | Banca Mediolanum SpA | 1,097,031 | | | 7,869,130 | | 0.2% | |
| #* | | Banca Monte dei Paschi di Siena SpA | 19,884 | | | 310,592 | | 0.0% | |
| #* | | Banca Popolare dell'Etruria e del Lazio SC | 1,058,027 | | | — | | 0.0% | |
| # | | Banca Popolare di Milano Scarl | 22,383,595 | | | 8,418,715 | | 0.2% | |
| | Banca Popolare di Sondrio SCPA | 2,316,219 | | | 7,599,380 | | 0.2% | |
| | Banca Profilo SpA | 1,221,744 | | | 222,736 | | 0.0% | |
| | Banco di Desio e della Brianza SpA | 224,677 | | | 464,623 | | 0.0% | |
| | Banco Popolare SC | 2,966,423 | | | 7,138,856 | | 0.2% | |
| # | | BasicNet SpA | 170,033 | | | 599,882 | | 0.0% | |
| | Biesse SpA | 68,574 | | | 1,378,608 | | 0.0% | |
| | BPER Banca | 2,548,728 | | | 13,527,093 | | 0.3% | |
| | Brembo SpA | 161,253 | | | 9,755,032 | | 0.2% | |
The Continental Small Company Series
continued
| | | | | | | | | Percentage | |
| | | Shares | | Value†† | | of Net Assets** | |
| ITALY — (Continued) | | | | | | | |
| # | | Brunello Cucinelli SpA | 101,511 | | $ | 2,173,154 | | 0.1% | |
| | Buzzi Unicem SpA | 409,864 | | | 9,698,138 | | 0.2% | |
| # | | Cairo Communication SpA | 339,858 | | | 1,359,239 | | 0.0% | |
| * | | Caltagirone Editore SpA | 6,277 | | | 4,851 | | 0.0% | |
| | Cembre SpA | 39,007 | | | 570,633 | | 0.0% | |
| | Cementir Holding SpA | 325,211 | | | 1,437,086 | | 0.0% | |
| | Cerved Information Solutions SpA | 620,171 | | | 5,140,515 | | 0.1% | |
| | CIR-Compagnie Industriali Riunite SpA | 2,065,487 | | | 2,244,979 | | 0.1% | |
| | Credito Emiliano SpA | 471,853 | | | 2,824,856 | | 0.1% | |
| # | | Credito Valtellinese SC | 5,732,088 | | | 2,238,119 | | 0.1% | |
| | d'Amico International Shipping SA | 830,428 | | | 290,316 | | 0.0% | |
| | Danieli & C Officine Meccaniche SpA | 72,897 | | | 1,480,743 | | 0.0% | |
| | Datalogic SpA | 111,466 | | | 2,192,488 | | 0.1% | |
| | Davide Campari-Milano SpA | 1,402,760 | | | 13,701,107 | | 0.3% | |
| | De' Longhi SpA | 274,771 | | | 6,522,245 | | 0.2% | |
| | DeA Capital SpA | 526,890 | | | 664,955 | | 0.0% | |
| | DiaSorin SpA | 116,636 | | | 6,897,597 | | 0.2% | |
| #* | | Ei Towers SpA | 87,314 | | | 4,700,616 | | 0.1% | |
| | El.En. SpA | 48,277 | | | 1,191,795 | | 0.0% | |
| | Elica SpA | 4,665 | | | 9,119 | | 0.0% | |
| # | | ERG SpA | 319,564 | | | 3,427,882 | | 0.1% | |
| | Esprinet SpA | 169,978 | | | 1,266,494 | | 0.0% | |
| * | | Eurotech SpA | 90,850 | | | 144,826 | | 0.0% | |
| | Falck Renewables SpA | 704,182 | | | 684,476 | | 0.0% | |
| * | | Fincantieri SpA | 2,268,686 | | | 1,127,638 | | 0.0% | |
| # | | FinecoBank Banca Fineco SpA | 922,158 | | | 5,155,956 | | 0.1% | |
| | FNM SpA | 627,039 | | | 326,045 | | 0.0% | |
| # | | Geox SpA | 453,868 | | | 1,053,507 | | 0.0% | |
| * | | Gruppo Editoriale L'Espresso SpA | 481,852 | | | 374,034 | | 0.0% | |
| # | | Gruppo MutuiOnline SpA | 103,077 | | | 917,081 | | 0.0% | |
| | Hera SpA | 3,352,671 | | | 7,716,829 | | 0.2% | |
| | IMMSI SpA | 1,202,186 | | | 467,518 | | 0.0% | |
| | Industria Macchine Automatiche SpA | 70,748 | | | 4,284,711 | | 0.1% | |
| | Infrastrutture Wireless Italiane SpA | 257,283 | | | 1,193,916 | | 0.0% | |
| * | | Intek Group SpA | 1,768,514 | | | 378,089 | | 0.0% | |
| | Interpump Group SpA | 425,898 | | | 6,968,000 | | 0.2% | |
| | Iren SpA | 2,952,554 | | | 4,830,393 | | 0.1% | |
| | Italmobiliare SpA | 45,336 | | | 2,133,398 | | 0.1% | |
| * | | Juventus Football Club SpA | 2,188,514 | | | 692,988 | | 0.0% | |
| | La Doria SpA | 65,929 | | | 621,997 | | 0.0% | |
| # | | Maire Tecnimont SpA | 643,190 | | | 1,741,725 | | 0.1% | |
| # | | MARR SpA | 182,251 | | | 3,322,447 | | 0.1% | |
| # | | Mediaset SpA | 4,351,208 | | | 18,740,361 | | 0.5% | |
| | Moncler SpA | 664,534 | | | 11,547,291 | | 0.3% | |
| # | | Nice SpA | 71,162 | | | 190,653 | | 0.0% | |
| | OVS SpA | 81,957 | | | 411,670 | | 0.0% | |
| | Parmalat SpA | 1,761,867 | | | 5,493,177 | | 0.1% | |
| # | | Piaggio & C SpA | 961,442 | | | 1,603,247 | | 0.1% | |
| #* | | Prelios SpA | 127,326 | | | 12,382 | | 0.0% | |
| # | | Prima Industrie SpA | 15,358 | | | 255,504 | | 0.0% | |
| | Prysmian SpA | 1,026,230 | | | 26,302,604 | | 0.6% | |
| | RAI Way SpA | 13,096 | | | 49,352 | | 0.0% | |
The Continental Small Company Series
continued
| | | | | | | | | Percentage | |
| | | Shares | | Value†† | | of Net Assets** | |
| ITALY — (Continued) | | | | | | | |
| | Recordati SpA | 474,431 | | $ | 13,442,019 | | 0.3% | |
| # | | Reno de Medici SpA | 840,050 | | | 269,419 | | 0.0% | |
| | Reply SpA | 23,664 | | | 2,937,633 | | 0.1% | |
| * | | Retelit SpA | 732,206 | | | 823,705 | | 0.0% | |
| * | | Richard-Ginori 1735 SpA | 8,489 | | | — | | 0.0% | |
| | Sabaf SpA | 25,688 | | | 281,147 | | 0.0% | |
| # | | SAES Getters SpA | 40,332 | | | 505,327 | | 0.0% | |
| * | | Safilo Group SpA | 176,776 | | | 1,481,956 | | 0.0% | |
| * | | Saipem SpA | 26,968,903 | | | 15,084,034 | | 0.4% | |
| # | | Salini Impregilo SpA | 1,159,746 | | | 3,655,579 | | 0.1% | |
| # | | Salvatore Ferragamo SpA | 262,482 | | | 6,190,812 | | 0.2% | |
| | Saras SpA | 1,637,194 | | | 2,955,395 | | 0.1% | |
| | SAVE SpA | 85,250 | | | 1,558,780 | | 0.0% | |
| | Servizi Italia SpA | 34,833 | | | 131,033 | | 0.0% | |
| #* | | Snai SpA | 117,457 | | | 161,859 | | 0.0% | |
| | Societa Cattolica di Assicurazioni SCRL | 852,357 | | | 4,990,274 | | 0.1% | |
| | Societa Iniziative Autostradali e Servizi SpA | 349,366 | | | 2,978,515 | | 0.1% | |
| * | | Sogefi SpA | 284,842 | | | 729,168 | | 0.0% | |
| | SOL SpA | 161,050 | | | 1,348,960 | | 0.0% | |
| | Tamburi Investment Partners SpA | 418,473 | | | 1,582,847 | | 0.0% | |
| #* | | Tiscali SpA | 9,160,788 | | | 438,810 | | 0.0% | |
| # | | Tod's SpA | 70,079 | | | 4,551,561 | | 0.1% | |
| #* | | Trevi Finanziaria Industriale SpA | 509,518 | | | 524,388 | | 0.0% | |
| | TXT e-solutions SpA | 28,342 | | | 223,695 | | 0.0% | |
| # | | Unione di Banche Italiane SpA | 1,455,627 | | | 3,985,606 | | 0.1% | |
| | Unipol Gruppo Finanziario SpA | 2,168,748 | | | 7,798,551 | | 0.2% | |
| # | | UnipolSai SpA | 4,147,843 | | | 8,847,027 | | 0.2% | |
| | Vittoria Assicurazioni SpA | 124,843 | | | 1,330,004 | | 0.0% | |
| #* | | Yoox Net-A-Porter Group SpA | 280,998 | | | 7,945,800 | | 0.2% | |
| | Zignago Vetro SpA | 142,878 | | | 830,745 | | 0.0% | |
| TOTAL ITALY | | | | 397,015,969 | | 9.5% | |
| | | | | | | | |
| NETHERLANDS — (4.7%) | | | | | | | |
| | Aalberts Industries NV | 600,156 | | | 19,443,822 | | 0.5% | |
| | Accell Group | 142,072 | | | 3,274,646 | | 0.1% | |
| | AFC Ajax NV | 18,134 | | | 166,963 | | 0.0% | |
| | AMG Advanced Metallurgical Group NV | 171,531 | | | 2,665,610 | | 0.1% | |
| | Amsterdam Commodities NV | 92,796 | | | 2,042,069 | | 0.1% | |
| # | | APERAM SA | 270,393 | | | 12,339,630 | | 0.3% | |
| | Arcadis NV | 376,441 | | | 5,275,601 | | 0.1% | |
| # | | ASM International NV | 290,828 | | | 13,038,622 | | 0.3% | |
| * | | Atag Group NV | 4,630 | | | — | | 0.0% | |
| | BE Semiconductor Industries NV | 196,836 | | | 6,547,545 | | 0.2% | |
| | Beter Bed Holding NV | 97,492 | | | 1,733,251 | | 0.0% | |
| | BinckBank NV | 265,526 | | | 1,535,389 | | 0.0% | |
| | Boskalis Westminster | 431,756 | | | 14,978,510 | | 0.4% | |
| | Brunel International NV | 118,473 | | | 1,916,658 | | 0.1% | |
| | Corbion NV | 334,113 | | | 8,935,323 | | 0.2% | |
| | Delta Lloyd NV | 2,709,093 | | | 15,141,665 | | 0.4% | |
| | Flow Traders | 5,391 | | | 185,546 | | 0.0% | |
| * | | Fugro NV | 381,770 | | | 5,829,592 | | 0.1% | |
| # | | Gemalto NV(B9MS8P5) | 304,031 | | | 17,558,209 | | 0.4% | |
The Continental Small Company Series
continued
| | | | | | | | | Percentage | |
| | | Shares | | Value†† | | of Net Assets** | |
| NETHERLANDS — (Continued) | | | | | | | |
| | Gemalto NV(B011JK4) | 2,670 | | $ | 154,357 | | 0.0% | |
| #* | | Heijmans NV | 126,289 | | | 734,319 | | 0.0% | |
| | Hunter Douglas NV | 9,827 | | | 552,850 | | 0.0% | |
| | IMCD Group NV | 50,186 | | | 2,138,272 | | 0.1% | |
| | KAS Bank NV | 80,799 | | | 716,531 | | 0.0% | |
| | Kendrion NV | 67,325 | | | 1,895,258 | | 0.0% | |
| # | | Koninklijke BAM Groep NV | 1,407,837 | | | 6,508,471 | | 0.2% | |
| | Koninklijke Vopak NV | 180,802 | | | 8,530,249 | | 0.2% | |
| | Nederland Apparatenfabriek | 27,865 | | | 979,819 | | 0.0% | |
| #* | | OCI NV | 292,497 | | | 5,101,457 | | 0.1% | |
| #* | | Ordina NV | 866,273 | | | 1,911,580 | | 0.0% | |
| * | | PostNL NV | 2,511,108 | | | 10,787,947 | | 0.3% | |
| | Refresco Group NV | 26,486 | | | 402,079 | | 0.0% | |
| | SBM Offshore NV | 949,667 | | | 14,868,291 | | 0.4% | |
| # | | Sligro Food Group NV | 134,261 | | | 4,672,163 | | 0.1% | |
| #* | | SNS Reaal NV | 705,718 | | | — | | 0.0% | |
| | Telegraaf Media Groep NV | 170,034 | | | 849,024 | | 0.0% | |
| | TKH Group NV | 223,860 | | | 8,853,241 | | 0.2% | |
| #* | | TomTom NV | 575,952 | | | 5,174,624 | | 0.1% | |
| | Van Lanschot NV | 25,348 | | | 532,818 | | 0.0% | |
| | Wessanen | 469,148 | | | 6,568,139 | | 0.2% | |
| TOTAL NETHERLANDS | | | | 214,540,140 | | 5.2% | |
| | | | | | | | |
| NORWAY — (2.7%) | | | | | | | |
| # | | ABG Sundal Collier Holding ASA | 1,786,130 | | | 1,021,131 | | 0.0% | |
| | AF Gruppen ASA | 18,991 | | | 339,563 | | 0.0% | |
| #* | | Akastor ASA | 917,989 | | | 1,719,223 | | 0.0% | |
| # | | Aker ASA Class A | 130,540 | | | 4,876,914 | | 0.1% | |
| | Aker BP ASA | 465,731 | | | 8,322,095 | | 0.2% | |
| #* | | Aker Solutions ASA | 629,094 | | | 3,007,644 | | 0.1% | |
| # | | American Shipping Co. ASA | 201,106 | | | 565,204 | | 0.0% | |
| | Arendals Fossekompani A.S. | 90 | | | 30,870 | | 0.0% | |
| | Atea ASA | 352,576 | | | 3,244,125 | | 0.1% | |
| | Austevoll Seafood ASA | 517,682 | | | 5,016,394 | | 0.1% | |
| | Avance Gas Holding, Ltd. | 17,315 | | | 53,060 | | 0.0% | |
| #* | | Axactor AB | 4,237,217 | | | 1,298,123 | | 0.0% | |
| | Bakkafrost P/F | 172,423 | | | 6,839,223 | | 0.2% | |
| * | | Biotec Pharmacon ASA | 139,685 | | | 182,889 | | 0.0% | |
| | Bonheur ASA | 140,320 | | | 1,172,755 | | 0.0% | |
| | Borregaard ASA | 468,193 | | | 4,581,262 | | 0.1% | |
| # | | BW LPG, Ltd. | 259,105 | | | 1,088,480 | | 0.0% | |
| * | | BW Offshore, Ltd. | 863,791 | | | 2,764,113 | | 0.1% | |
| #* | | Deep Sea Supply P.L.C. | 254,547 | | | 40,862 | | 0.0% | |
| #* | | DNO ASA | 3,249,546 | | | 3,181,219 | | 0.1% | |
| | Ekornes ASA | 111,584 | | | 1,375,168 | | 0.0% | |
| | Entra ASA | 24,798 | | | 246,512 | | 0.0% | |
| #* | | Fred Olsen Energy ASA | 147,008 | | | 538,320 | | 0.0% | |
| # | | Frontline, Ltd. | 173,160 | | | 1,240,779 | | 0.0% | |
| | Grieg Seafood ASA | 257,604 | | | 2,435,979 | | 0.1% | |
| #* | | Hexagon Composites ASA | 394,620 | | | 1,228,858 | | 0.0% | |
| # | | Hoegh LNG Holdings, Ltd. | 220,215 | | | 2,452,547 | | 0.1% | |
| * | | Kongsberg Automotive ASA | 2,171,519 | | | 1,425,315 | | 0.0% | |
The Continental Small Company Series
continued
| | | | | | | | | Percentage | |
| | | Shares | | Value†† | | of Net Assets** | |
| NORWAY — (Continued) | | | | | | | |
| # | | Kongsberg Gruppen ASA | 5,129 | | $ | 73,967 | | 0.0% | |
| * | | Kvaerner ASA | 1,616,475 | | | 2,261,805 | | 0.1% | |
| #* | | Nordic Semiconductor ASA | 703,953 | | | 2,855,506 | | 0.1% | |
| #* | | Norske Skogindustrier ASA | 1,270,388 | | | 417,744 | | 0.0% | |
| #* | | Norwegian Air Shuttle ASA | 149,161 | | | 4,954,631 | | 0.1% | |
| # | | Ocean Yield ASA | 230,469 | | | 1,731,934 | | 0.1% | |
| * | | Odfjell Drilling, Ltd. | 15,249 | | | 30,525 | | 0.0% | |
| * | | Odfjell SE Class A | 134,257 | | | 455,302 | | 0.0% | |
| # | | Olav Thon Eiendomsselskap ASA | 115,054 | | | 2,130,221 | | 0.1% | |
| # | | Opera Software ASA | 514,924 | | | 2,224,082 | | 0.1% | |
| #* | | Petroleum Geo-Services ASA | 1,043,141 | | | 3,514,867 | | 0.1% | |
| #* | | PhotoCure ASA | 57,224 | | | 278,245 | | 0.0% | |
| #* | | Prosafe SE | 51,519 | | | 220,339 | | 0.0% | |
| # | | Protector Forsikring ASA | 285,028 | | | 2,268,445 | | 0.1% | |
| * | | Q-Free ASA | 179,836 | | | 163,982 | | 0.0% | |
| #* | | REC Silicon ASA | 14,281,005 | | | 1,881,819 | | 0.1% | |
| # | | Scatec Solar ASA | 166,203 | | | 740,424 | | 0.0% | |
| #* | | Seadrill, Ltd. | 343,714 | | | 1,181,021 | | 0.0% | |
| | Selvaag Bolig ASA | 139,333 | | | 644,622 | | 0.0% | |
| #* | | Sevan Marine ASA | 124,800 | | | 245,389 | | 0.0% | |
| * | | Solstad Offshore ASA | 72,220 | | | 96,224 | | 0.0% | |
| #* | | Songa Offshore | 89,043 | | | 323,978 | | 0.0% | |
| | SpareBank 1 SMN | 131,684 | | | 986,546 | | 0.0% | |
| | SpareBank 1 SR-Bank ASA | 200,102 | | | 1,407,467 | | 0.0% | |
| | Stolt-Nielsen, Ltd. | 121,666 | | | 1,494,001 | | 0.0% | |
| * | | Storebrand ASA | 762,009 | | | 4,047,778 | | 0.1% | |
| # | | TGS Nopec Geophysical Co. ASA | 351,607 | | | 7,794,678 | | 0.2% | |
| | Tomra Systems ASA | 647,834 | | | 6,786,652 | | 0.2% | |
| #* | | Treasure ASA | 249,256 | | | 481,803 | | 0.0% | |
| | Veidekke ASA | 395,147 | | | 5,646,275 | | 0.1% | |
| # | | Wilh Wilhelmsen ASA | 306,364 | | | 1,198,922 | | 0.0% | |
| | Wilh Wilhelmsen Holding ASA Class A | 61,068 | | | 1,399,443 | | 0.0% | |
| # | | XXL ASA | 157,112 | | | 1,782,607 | | 0.1% | |
| TOTAL NORWAY | | | | 122,009,871 | | 2.9% | |
| | | | | | | | |
| PORTUGAL — (0.9%) | | | | | | | |
| | Altri SGPS SA | 577,518 | | | 2,348,466 | | 0.1% | |
| * | | Banco BPI SA | 2,573,144 | | | 3,060,601 | | 0.1% | |
| #* | | Banco Comercial Portugues SA Class R | 4,200,763 | | | 4,728,012 | | 0.1% | |
| * | | Banco Espirito Santo SA | 4,777,921 | | | — | | 0.0% | |
| | CTT-Correios de Portugal SA | 692,539 | | | 4,694,176 | | 0.1% | |
| | EDP Renovaveis SA | 182,845 | | | 1,161,271 | | 0.0% | |
| | Ibersol SGPS SA | 24,481 | | | 321,803 | | 0.0% | |
| | Mota-Engil SGPS SA | 677,759 | | | 1,147,255 | | 0.0% | |
| | Navigator Co. SA (The) | 2,010,412 | | | 6,909,430 | | 0.2% | |
| | NOS SGPS SA | 1,079,047 | | | 6,404,019 | | 0.2% | |
| | Novabase SGPS SA | 65,729 | | | 172,089 | | 0.0% | |
| # | | REN - Redes Energeticas Nacionais SGPS SA | 1,346,999 | | | 3,821,761 | | 0.1% | |
| | Semapa-Sociedade de Investimento e Gestao | 104,857 | | | 1,479,639 | | 0.0% | |
| # | | Sonae Capital SGPS SA | 252,051 | | | 198,278 | | 0.0% | |
| | Sonae SGPS SA | 4,901,591 | | | 4,504,519 | | 0.1% | |
The Continental Small Company Series
continued
| | | | | | | | | Percentage | |
| | | Shares | | Value†† | | of Net Assets** | |
| PORTUGAL — (Continued) | | | | | | | |
| | Teixeira Duarte SA | 710,639 | | $ | 139,235 | | 0.0% | |
| TOTAL PORTUGAL | | | | 41,090,554 | | 1.0% | |
| | | | | | | | |
| SPAIN — (5.1%) | | | | | | | |
| | Acciona SA | 148,641 | | | 10,918,093 | | 0.3% | |
| | Acerinox SA | 839,895 | | | 11,097,837 | | 0.3% | |
| # | | Adveo Group International SA | 104,096 | | | 373,591 | | 0.0% | |
| | Almirall SA | 289,516 | | | 4,491,210 | | 0.1% | |
| #* | | Amper SA | 2,752,422 | | | 639,799 | | 0.0% | |
| | Applus Services SA | 407,282 | | | 4,127,591 | | 0.1% | |
| # | | Atresmedia Corp. de Medios de Comunicacion SA | 353,910 | | | 3,863,341 | | 0.1% | |
| | Azkoyen SA | 64,022 | | | 395,705 | | 0.0% | |
| # | | Banco Popular Espanol SA | 1,383,720 | | | 1,333,209 | | 0.0% | |
| * | | Baron de Ley | 13,360 | | | 1,683,895 | | 0.0% | |
| # | | Bolsas y Mercados Espanoles SHMSF SA | 410,153 | | | 12,059,099 | | 0.3% | |
| #* | | Caja de Ahorros del Mediterraneo | 116,412 | | | — | | 0.0% | |
| # | | Cellnex Telecom SA | 557,498 | | | 8,002,399 | | 0.2% | |
| * | | Cementos Portland Valderrivas SA | 68,410 | | | 430,960 | | 0.0% | |
| | Cia de Distribucion Integral Logista Holdings SA | 141,672 | | | 3,278,167 | | 0.1% | |
| | Cie Automotive SA | 249,123 | | | 4,847,823 | | 0.1% | |
| # | | Clinica Baviera SA | 3,698 | | | 37,003 | | 0.0% | |
| | Construcciones y Auxiliar de Ferrocarriles SA | 91,240 | | | 3,675,164 | | 0.1% | |
| #* | | Deoleo SA | 1,012,691 | | | 244,558 | | 0.0% | |
| # | | Distribuidora Internacional de Alimentacion SA | 2,929,226 | | | 14,366,618 | | 0.4% | |
| #* | | Duro Felguera SA | 420,986 | | | 495,201 | | 0.0% | |
| | Ebro Foods SA | 366,900 | | | 7,678,558 | | 0.2% | |
| * | | eDreams ODIGEO SA | 279,986 | | | 874,321 | | 0.0% | |
| | Elecnor SA | 191,752 | | | 1,811,642 | | 0.0% | |
| | Ence Energia y Celulosa SA | 1,037,062 | | | 2,732,543 | | 0.1% | |
| * | | Ercros SA | 793,700 | | | 1,536,242 | | 0.0% | |
| * | | Euskaltel SA | 18,315 | | | 162,111 | | 0.0% | |
| | Faes Farma SA | 1,379,422 | | | 4,870,217 | | 0.1% | |
| | Fluidra SA | 159,343 | | | 722,793 | | 0.0% | |
| | Gamesa Corp. Tecnologica SA | 1,203,576 | | | 24,333,507 | | 0.6% | |
| | Grupo Catalana Occidente SA | 203,062 | | | 6,637,137 | | 0.2% | |
| #* | | Grupo Ezentis SA | 946,893 | | | 515,772 | | 0.0% | |
| | Iberpapel Gestion SA | 37,248 | | | 897,606 | | 0.0% | |
| * | | Indra Sistemas SA | 587,934 | | | 6,430,483 | | 0.2% | |
| | Inmobiliaria Colonial SA | 1,007,155 | | | 6,970,161 | | 0.2% | |
| | Inmobiliaria del Sur SA | 2,902 | | | 24,176 | | 0.0% | |
| # | | Laboratorios Farmaceuticos Rovi SA | 68,607 | | | 884,208 | | 0.0% | |
| * | | Liberbank SA | 1,775,702 | | | 1,835,116 | | 0.0% | |
| | Mediaset Espana Comunicacion SA | 943,903 | | | 11,056,647 | | 0.3% | |
| | Melia Hotels International SA | 459,423 | | | 5,348,372 | | 0.1% | |
| | Miquel y Costas & Miquel SA | 67,651 | | | 1,761,131 | | 0.0% | |
| * | | NH Hotel Group SA | 1,249,728 | | | 5,044,310 | | 0.1% | |
| | Nmas1 Dinamia SA | 20,438 | | | 172,940 | | 0.0% | |
| # | | Obrascon Huarte Lain SA | 747,423 | | | 2,585,074 | | 0.1% | |
| | Papeles y Cartones de Europa SA | 286,581 | | | 1,579,833 | | 0.0% | |
| * | | Pescanova SA | 68,547 | | | — | | 0.0% | |
| * | | Pharma Mar SA | 983,996 | | | 2,800,387 | | 0.1% | |
| | Prim SA | 39,424 | | | 368,980 | | 0.0% | |
The Continental Small Company Series
continued
| | | | | | | | | Percentage | |
| | | Shares | | Value†† | | of Net Assets** | |
| SPAIN — (Continued) | | | | | | | |
| #* | | Promotora de Informaciones SA Class A | 284,300 | | $ | 1,567,147 | | 0.0% | |
| | Prosegur Cia de Seguridad SA | 1,304,355 | | | 8,139,664 | | 0.2% | |
| #* | | Quabit Inmobiliaria SA | 164,890 | | | 333,940 | | 0.0% | |
| * | | Realia Business SA | 755,842 | | | 681,786 | | 0.0% | |
| #* | | Sacyr SA | 1,590,914 | | | 3,699,965 | | 0.1% | |
| | Saeta Yield SA | 87,546 | | | 748,345 | | 0.0% | |
| #* | | Solaria Energia y Medio Ambiente SA | 207,171 | | | 166,820 | | 0.0% | |
| #* | | Talgo SA | 176,744 | | | 839,269 | | 0.0% | |
| # | | Tecnicas Reunidas SA | 165,741 | | | 6,778,337 | | 0.2% | |
| | Tecnocom Telecomunicaciones y Energia SA | 147,909 | | | 653,562 | | 0.0% | |
| | Tubacex SA | 655,565 | | | 1,876,566 | | 0.1% | |
| #* | | Tubos Reunidos SA | 510,636 | | | 464,311 | | 0.0% | |
| | Vidrala SA | 82,427 | | | 4,247,239 | | 0.1% | |
| # | | Viscofan SA | 229,641 | | | 11,307,938 | | 0.3% | |
| #* | | Vocento SA | 231,302 | | | 300,266 | | 0.0% | |
| | Zardoya Otis SA | 735,771 | | | 6,209,032 | | 0.2% | |
| TOTAL SPAIN | | | | 234,009,717 | | 5.6% | |
| | | | | | | | |
| SWEDEN — (7.6%) | | | | | | | |
| # | | AAK AB | 121,469 | | | 7,987,653 | | 0.2% | |
| | Acando AB | 433,023 | | | 1,229,168 | | 0.0% | |
| * | | AddLife AB | 84,566 | | | 1,273,140 | | 0.0% | |
| | AddNode Group AB | 22,737 | | | 140,755 | | 0.0% | |
| | AddTech AB Class B | 273,971 | | | 4,275,465 | | 0.1% | |
| | AF AB Class B | 294,773 | | | 5,393,615 | | 0.1% | |
| #* | | Anoto Group AB | 4,862,822 | | | 79,996 | | 0.0% | |
| * | | Arise AB | 36,861 | | | 80,830 | | 0.0% | |
| # | | Atrium Ljungberg AB Class B | 102,923 | | | 1,604,492 | | 0.0% | |
| | Avanza Bank Holding AB | 95,405 | | | 3,857,539 | | 0.1% | |
| | B&B Tools AB Class B | 123,792 | | | 2,592,669 | | 0.1% | |
| * | | BE Group AB | 1,335 | | | 6,091 | | 0.0% | |
| | Beijer Alma AB | 109,736 | | | 2,801,785 | | 0.1% | |
| | Beijer Electronics AB | 53,995 | | | 242,203 | | 0.0% | |
| | Beijer Ref AB | 71,389 | | | 1,689,705 | | 0.0% | |
| | Betsson AB | 443,610 | | | 4,269,586 | | 0.1% | |
| | Bilia AB Class A | 317,389 | | | 7,282,751 | | 0.2% | |
| | BillerudKorsnas AB | 343,224 | | | 5,748,355 | | 0.1% | |
| | BioGaia AB Class B | 80,672 | | | 2,654,422 | | 0.1% | |
| | Biotage AB | 313,327 | | | 1,576,368 | | 0.0% | |
| # | | Bjorn Borg AB | 33,945 | | | 125,406 | | 0.0% | |
| #* | | Bonava AB | 9,670 | | | 148,278 | | 0.0% | |
| * | | Bonava AB Class B | 169,639 | | | 2,627,974 | | 0.1% | |
| | Bulten AB | 78,904 | | | 768,864 | | 0.0% | |
| | Bure Equity AB | 316,106 | | | 3,583,648 | | 0.1% | |
| # | | Byggmax Group AB | 343,939 | | | 2,373,385 | | 0.1% | |
| | Catena AB | 53,725 | | | 757,298 | | 0.0% | |
| # | | Cavotec SA | 16,457 | | | 38,721 | | 0.0% | |
| | Clas Ohlson AB Class B | 176,242 | | | 2,589,315 | | 0.1% | |
| | Cloetta AB Class B | 1,234,003 | | | 3,887,055 | | 0.1% | |
| | Com Hem Holding AB | 202,663 | | | 1,930,946 | | 0.1% | |
| | Concentric AB | 225,779 | | | 2,816,958 | | 0.1% | |
| | Concordia Maritime AB Class B | 100,760 | | | 153,671 | | 0.0% | |
The Continental Small Company Series
continued
| | | | | | | | | Percentage | |
| | | Shares | | Value†† | | of Net Assets** | |
| SWEDEN — (Continued) | | | | | | | |
| | Corem Property Group AB Class B | 2,296 | | $ | 9,327 | | 0.0% | |
| # | | Dios Fastigheter AB | 254,122 | | | 1,671,935 | | 0.0% | |
| #* | | Doro AB | 151,342 | | | 879,697 | | 0.0% | |
| | Duni AB | 203,817 | | | 2,792,453 | | 0.1% | |
| # | | Dustin Group AB | 83,591 | | | 586,814 | | 0.0% | |
| | East Capital Explorer AB | 52,072 | | | 381,267 | | 0.0% | |
| | Elanders AB Class B | 10,907 | | | 126,910 | | 0.0% | |
| # | | Elekta AB Class B | 1,454,797 | | | 12,843,801 | | 0.3% | |
| | Eltel AB | 62,791 | | | 430,731 | | 0.0% | |
| | Enea AB | 63,008 | | | 662,607 | | 0.0% | |
| | Fabege AB | 651,224 | | | 10,617,300 | | 0.3% | |
| # | | Fagerhult AB | 61,882 | | | 1,584,776 | | 0.0% | |
| | Fenix Outdoor International AG | 8,198 | | | 606,925 | | 0.0% | |
| | Granges AB | 249,848 | | | 2,354,274 | | 0.1% | |
| | Gunnebo AB | 149,602 | | | 633,648 | | 0.0% | |
| | Haldex AB | 218,762 | | | 2,787,658 | | 0.1% | |
| | Heba Fastighets AB Class B | 42,288 | | | 528,252 | | 0.0% | |
| | Hemfosa Fastigheter AB | 672,254 | | | 6,251,857 | | 0.2% | |
| | Hexpol AB | 767,636 | | | 7,096,420 | | 0.2% | |
| | HIQ International AB | 281,281 | | | 1,897,994 | | 0.1% | |
| | HMS Networks AB | 6,927 | | | 230,734 | | 0.0% | |
| # | | Hoist Finance AB | 70,420 | | | 654,210 | | 0.0% | |
| | Holmen AB Class B | 264,932 | | | 9,483,663 | | 0.2% | |
| | Hufvudstaden AB Class A | 235,964 | | | 3,723,297 | | 0.1% | |
| | Indutrade AB | 377,535 | | | 7,566,238 | | 0.2% | |
| # | | Intrum Justitia AB | 385,511 | | | 12,997,167 | | 0.3% | |
| | Inwido AB | 164,661 | | | 1,706,049 | | 0.1% | |
| | ITAB Shop Concept AB Class B | 57,019 | | | 508,388 | | 0.0% | |
| | JM AB | 385,931 | | | 11,125,610 | | 0.3% | |
| | KappAhl AB | 307,283 | | | 1,700,498 | | 0.0% | |
| #* | | Karo Pharma AB | 30,450 | | | 93,955 | | 0.0% | |
| * | | Karolinska Development AB Class B | 5,146 | | | 3,390 | | 0.0% | |
| # | | Kindred Group P.L.C. | 1,048,368 | | | 9,820,098 | | 0.2% | |
| | Klovern AB Class B | 2,268,287 | | | 2,374,019 | | 0.1% | |
| | KNOW IT AB | 70,555 | | | 693,392 | | 0.0% | |
| | Kungsleden AB | 819,649 | | | 5,183,809 | | 0.1% | |
| | Lagercrantz Group AB Class B | 244,772 | | | 2,238,988 | | 0.1% | |
| | Lifco AB Class B | 17,777 | | | 453,962 | | 0.0% | |
| | Lindab International AB | 388,746 | | | 3,107,105 | | 0.1% | |
| | Loomis AB Class B | 312,800 | | | 9,287,920 | | 0.2% | |
| * | | Medivir AB Class B | 149,493 | | | 1,609,397 | | 0.0% | |
| # | | Mekonomen AB | 149,584 | | | 2,812,765 | | 0.1% | |
| # | | Modern Times Group MTG AB Class B | 319,844 | | | 9,453,717 | | 0.2% | |
| | MQ Holding AB | 165,718 | | | 658,014 | | 0.0% | |
| # | | Mycronic AB | 460,561 | | | 4,944,724 | | 0.1% | |
| | NCC AB Class B | 449,781 | | | 11,110,119 | | 0.3% | |
| | Nederman Holding AB | 4,621 | | | 94,667 | | 0.0% | |
| * | | Net Insight AB Class B | 1,123,665 | | | 1,093,869 | | 0.0% | |
| | NetEnt AB | 876,576 | | | 6,745,629 | | 0.2% | |
| | New Wave Group AB Class B | 241,923 | | | 1,464,147 | | 0.0% | |
| | Nibe Industrier AB Class B | 342,597 | | | 2,694,010 | | 0.1% | |
| | Nobia AB | 745,291 | | | 6,929,721 | | 0.2% | |
The Continental Small Company Series
continued
| | | | | | | | | Percentage | |
| | | Shares | | Value†† | | of Net Assets** | |
| SWEDEN — (Continued) | | | | | | | |
| | Nolato AB Class B | 134,540 | | $ | 3,880,641 | | 0.1% | |
| | Nordnet AB Class B | 388,808 | | | 1,591,132 | | 0.0% | |
| | OEM International AB Class B | 44,190 | | | 732,150 | | 0.0% | |
| | Opus Group AB | 883,206 | | | 629,182 | | 0.0% | |
| | Oriflame Holding AG | 150,200 | | | 4,529,020 | | 0.1% | |
| | Pandox AB | 5,098 | | | 79,055 | | 0.0% | |
| | Peab AB | 816,406 | | | 6,461,610 | | 0.2% | |
| | Pricer AB Class B | 788,670 | | | 804,438 | | 0.0% | |
| | Proact IT Group AB | 39,943 | | | 639,866 | | 0.0% | |
| | Probi AB | 14,628 | | | 763,020 | | 0.0% | |
| #* | | Qliro Group AB | 424,463 | | | 401,583 | | 0.0% | |
| | Ratos AB Class B | 1,069,160 | | | 5,055,199 | | 0.1% | |
| | RaySearch Laboratories AB | 81,567 | | | 1,648,947 | | 0.0% | |
| | Recipharm AB Class B | 88,879 | | | 1,181,109 | | 0.0% | |
| | Rezidor Hotel Group AB | 413,235 | | | 1,606,574 | | 0.0% | |
| | Rottneros AB | 26,323 | | | 23,227 | | 0.0% | |
| | Saab AB Class B | 45,651 | | | 1,702,506 | | 0.0% | |
| | Sagax AB Class B | 83,213 | | | 744,701 | | 0.0% | |
| #* | | SAS AB | 738,160 | | | 1,127,713 | | 0.0% | |
| | Scandi Standard AB | 215,392 | | | 1,344,339 | | 0.0% | |
| | Sectra AB Class B | 58,461 | | | 828,303 | | 0.0% | |
| # | | Semcon AB | 100,425 | | | 505,907 | | 0.0% | |
| #* | | Sensys Gatso Group AB | 409,923 | | | 63,276 | | 0.0% | |
| | SkiStar AB | 110,113 | | | 1,841,365 | | 0.1% | |
| #* | | SSAB AB Class A(B17H0S8) | 1,081,113 | | | 4,083,183 | | 0.1% | |
| #* | | SSAB AB Class A(BPRBWK4) | 189,016 | | | 715,533 | | 0.0% | |
| * | | SSAB AB Class B(B17H3F6) | 2,535,211 | | | 7,980,355 | | 0.2% | |
| #* | | SSAB AB Class B(BPRBWM6) | 1,131,651 | | | 3,536,052 | | 0.1% | |
| | Sweco AB Class B | 316,495 | | | 6,247,091 | | 0.2% | |
| | Swedol AB Class B | 48,327 | | | 137,182 | | 0.0% | |
| | Systemair AB | 48,630 | | | 650,392 | | 0.0% | |
| | Thule Group AB (The) | 226,270 | | | 3,532,438 | | 0.1% | |
| | Transcom Worldwide AB | 35,939 | | | 345,702 | | 0.0% | |
| | VBG Group AB Class B | 137 | | | 2,408 | | 0.0% | |
| # | | Victoria Park AB Class B | 358,165 | | | 880,691 | | 0.0% | |
| | Vitrolife AB | 71,728 | | | 3,044,317 | | 0.1% | |
| | Wallenstam AB Class B | 790,622 | | | 6,141,173 | | 0.2% | |
| | Wihlborgs Fastigheter AB | 342,126 | | | 6,349,940 | | 0.2% | |
| TOTAL SWEDEN | | | | 345,727,344 | | 8.3% | |
| | | | | | | | |
| SWITZERLAND — (11.6%) | | | | | | | |
| | Allreal Holding AG | 61,547 | | | 9,141,238 | | 0.2% | |
| * | | Alpiq Holding AG | 11,235 | | | 930,735 | | 0.0% | |
| | ALSO Holding AG | 16,232 | | | 1,434,222 | | 0.0% | |
| # | | ams AG | 372,640 | | | 10,559,441 | | 0.3% | |
| | APG SGA SA | 7,581 | | | 3,326,487 | | 0.1% | |
| * | | Arbonia AG | 183,624 | | | 2,954,875 | | 0.1% | |
| | Aryzta AG | 317,447 | | | 13,960,144 | | 0.3% | |
| # | | Ascom Holding AG | 210,467 | | | 3,302,298 | | 0.1% | |
| | Autoneum Holding AG | 16,300 | | | 4,272,696 | | 0.1% | |
| | Bachem Holding AG Class B | 23,344 | | | 2,069,095 | | 0.1% | |
| | Baloise Holding AG | 131,033 | | | 16,488,511 | | 0.4% | |
The Continental Small Company Series
continued
| | | | | | | | | Percentage | |
| | | Shares | | Value†† | | of Net Assets** | |
| SWITZERLAND — (Continued) | | | | | | | |
| | Bank Coop AG | 30,632 | | $ | 1,263,312 | | 0.0% | |
| | Banque Cantonale de Geneve | 3,968 | | | 1,160,330 | | 0.0% | |
| | Banque Cantonale du Jura SA | 4,442 | | | 244,025 | | 0.0% | |
| | Banque Cantonale Vaudoise | 11,753 | | | 7,440,417 | | 0.2% | |
| # | | Basler Kantonalbank | 5,896 | | | 388,076 | | 0.0% | |
| | Belimo Holding AG | 2,156 | | | 6,519,913 | | 0.2% | |
| | Bell AG | 4,181 | | | 1,800,683 | | 0.0% | |
| | Bellevue Group AG | 49,926 | | | 768,942 | | 0.0% | |
| # | | Berner Kantonalbank AG | 22,665 | | | 4,091,728 | | 0.1% | |
| | BFW Liegenschaften AG | 620 | | | 23,966 | | 0.0% | |
| | BKW AG | 64,177 | | | 3,100,411 | | 0.1% | |
| | Bobst Group SA | 44,716 | | | 3,104,244 | | 0.1% | |
| # | | Bossard Holding AG Class A | 32,905 | | | 4,631,416 | | 0.1% | |
| | Bucher Industries AG | 32,887 | | | 8,089,998 | | 0.2% | |
| # | | Burckhardt Compression Holding AG | 11,640 | | | 3,058,149 | | 0.1% | |
| | Burkhalter Holding AG | 20,988 | | | 2,831,175 | | 0.1% | |
| | Calida Holding AG | 25,084 | | | 857,000 | | 0.0% | |
| | Carlo Gavazzi Holding AG | 1,415 | | | 337,250 | | 0.0% | |
| | Cembra Money Bank AG | 119,427 | | | 8,687,456 | | 0.2% | |
| | Cham Paper Holding AG | 1,894 | | | 607,556 | | 0.0% | |
| * | | Cicor Technologies | 5,936 | | | 162,641 | | 0.0% | |
| | Cie Financiere Tradition SA | 9,458 | | | 761,166 | | 0.0% | |
| | Clariant AG | 815,669 | | | 14,058,301 | | 0.3% | |
| | Coltene Holding AG | 20,595 | | | 1,496,642 | | 0.0% | |
| | Conzzeta AG | 6,116 | | | 4,323,930 | | 0.1% | |
| | Daetwyler Holding AG | 37,940 | | | 5,153,809 | | 0.1% | |
| | DKSH Holding AG | 91,087 | | | 6,252,464 | | 0.2% | |
| | dormakaba Holding AG | 16,675 | | | 12,379,205 | | 0.3% | |
| | Edmond de Rothschild Suisse SA | 139 | | | 1,910,845 | | 0.1% | |
| | EFG International AG | 299,186 | | | 1,805,514 | | 0.0% | |
| | Emmi AG | 12,810 | | | 7,745,366 | | 0.2% | |
| | Energiedienst Holding AG | 68,912 | | | 1,637,532 | | 0.0% | |
| #* | | Evolva Holding SA | 417,920 | | | 298,622 | | 0.0% | |
| | Feintool International Holding AG | 7,642 | | | 819,096 | | 0.0% | |
| | Flughafen Zuerich AG | 104,871 | | | 19,433,325 | | 0.5% | |
| | Forbo Holding AG | 6,853 | | | 8,827,228 | | 0.2% | |
| | GAM Holding AG | 925,197 | | | 10,707,383 | | 0.3% | |
| | Georg Fischer AG | 22,511 | | | 18,410,048 | | 0.4% | |
| | Gurit Holding AG | 2,329 | | | 1,849,781 | | 0.0% | |
| | Helvetia Holding AG | 36,269 | | | 19,514,567 | | 0.5% | |
| # | | HOCHDORF Holding AG | 3,854 | | | 1,171,765 | | 0.0% | |
| | Huber & Suhner AG | 69,938 | | | 3,879,576 | | 0.1% | |
| | Implenia AG | 85,074 | | | 6,279,937 | | 0.2% | |
| | Inficon Holding AG | 9,382 | | | 3,375,595 | | 0.1% | |
| | Interroll Holding AG | 3,127 | | | 3,407,147 | | 0.1% | |
| | Intershop Holding AG | 8,065 | | | 3,967,797 | | 0.1% | |
| | Jungfraubahn Holding AG | 4,567 | | | 437,325 | | 0.0% | |
| | Kardex AG | 35,549 | | | 3,322,973 | | 0.1% | |
| | Komax Holding AG | 18,489 | | | 4,558,996 | | 0.1% | |
| | Kudelski SA | 195,049 | | | 3,375,831 | | 0.1% | |
| * | | Lastminute.com NV | 3,079 | | | 43,543 | | 0.0% | |
| | LEM Holding SA | 3,773 | | | 3,525,536 | | 0.1% | |
The Continental Small Company Series
continued
| | | | | | | | | Percentage | |
| | | Shares | | Value†† | | of Net Assets** | |
| SWITZERLAND — (Continued) | | | | | | | |
| | Liechtensteinische Landesbank AG | 29,463 | | $ | 1,167,292 | | 0.0% | |
| | Logitech International SA | 650,486 | | | 16,189,561 | | 0.4% | |
| | Luzerner Kantonalbank AG | 16,857 | | | 6,633,259 | | 0.2% | |
| | MCH Group AG | 1,404 | | | 95,265 | | 0.0% | |
| | Metall Zug AG Class B | 880 | | | 2,797,633 | | 0.1% | |
| #* | | Meyer Burger Technology AG | 2,370,456 | | | 1,550,499 | | 0.0% | |
| # | | Mobilezone Holding AG | 133,170 | | | 1,894,141 | | 0.1% | |
| | Mobimo Holding AG | 32,716 | | | 8,178,173 | | 0.2% | |
| # | | OC Oerlikon Corp. AG | 929,429 | | | 9,118,189 | | 0.2% | |
| #* | | Orascom Development Holding AG | 60,240 | | | 301,839 | | 0.0% | |
| # | | Orell Fuessli Holding AG | 5,028 | | | 617,717 | | 0.0% | |
| | Orior AG | 28,059 | | | 2,058,863 | | 0.1% | |
| | Panalpina Welttransport Holding AG | 63,044 | | | 7,861,325 | | 0.2% | |
| * | | Parco Industriale e Immobiliare SA | 600 | | | — | | 0.0% | |
| # | | Phoenix Mecano AG | 3,019 | | | 1,390,564 | | 0.0% | |
| | Plazza AG | 5,852 | | | 1,289,899 | | 0.0% | |
| | PSP Swiss Property AG | 201,709 | | | 17,420,956 | | 0.4% | |
| | Rieter Holding AG | 17,376 | | | 3,018,509 | | 0.1% | |
| | Romande Energie Holding SA | 2,625 | | | 3,314,060 | | 0.1% | |
| # | | Schaffner Holding AG | 2,950 | | | 703,888 | | 0.0% | |
| #* | | Schmolz + Bickenbach AG | 2,676,034 | | | 1,785,871 | | 0.0% | |
| | Schweiter Technologies AG | 4,417 | | | 4,984,919 | | 0.1% | |
| | SFS Group AG | 28,472 | | | 2,322,636 | | 0.1% | |
| | Siegfried Holding AG | 21,530 | | | 4,500,211 | | 0.1% | |
| | St Galler Kantonalbank AG | 11,780 | | | 4,578,710 | | 0.1% | |
| | Straumann Holding AG | 44,803 | | | 17,457,993 | | 0.4% | |
| | Sulzer AG | 107,928 | | | 11,110,421 | | 0.3% | |
| | Sunrise Communications Group AG | 123,442 | | | 8,112,601 | | 0.2% | |
| | Swiss Prime Site AG | 139,414 | | | 11,407,769 | | 0.3% | |
| | Swissquote Group Holding SA | 45,894 | | | 1,074,151 | | 0.0% | |
| | Tamedia AG | 14,493 | | | 2,221,518 | | 0.1% | |
| | Tecan Group AG | 39,022 | | | 6,085,498 | | 0.2% | |
| | Temenos Group AG | 318,043 | | | 22,107,453 | | 0.5% | |
| | Thurgauer Kantonalbank | 659 | | | 57,272 | | 0.0% | |
| | u-blox Holding AG | 30,554 | | | 5,730,852 | | 0.1% | |
| | Valiant Holding AG | 83,882 | | | 8,346,339 | | 0.2% | |
| | Valora Holding AG | 15,777 | | | 4,479,447 | | 0.1% | |
| | Vaudoise Assurances Holding SA | 5,091 | | | 2,408,243 | | 0.1% | |
| | Vetropack Holding AG | 949 | | | 1,652,901 | | 0.0% | |
| * | | Von Roll Holding AG | 250,484 | | | 152,423 | | 0.0% | |
| | Vontobel Holding AG | 136,975 | | | 7,184,752 | | 0.2% | |
| | VP Bank AG | 6,787 | | | 719,432 | | 0.0% | |
| | VZ Holding AG | 10,596 | | | 3,173,675 | | 0.1% | |
| | Walliser Kantonalbank | 16,716 | | | 1,255,522 | | 0.0% | |
| | Walter Meier AG | 22,913 | | | 813,445 | | 0.0% | |
| | Ypsomed Holding AG | 16,382 | | | 2,971,804 | | 0.1% | |
| * | | Zehnder Group AG | 57,019 | | | 1,799,504 | | 0.0% | |
| # | | Zug Estates Holding AG Class B | 612 | | | 993,665 | | 0.0% | |
The Continental Small Company Series
continued
| | | | | | | | | Percentage | |
| | | Shares | | Value†† | | of Net Assets** | |
| SWITZERLAND — (Continued) | | | | | | | |
| | Zuger Kantonalbank AG | 608 | | $ | 2,968,127 | | 0.1% | |
| TOTAL SWITZERLAND | | | | 530,398,061 | | 12.8% | |
| TOTAL COMMON STOCKS | | | | 4,106,034,031 | | 98.7% | |
| | | | | | | | |
| PREFERRED STOCKS — (0.7%) | | | | | | | |
| GERMANY — (0.7%) | | | | | | | |
| | Biotest AG | 88,910 | | | 1,251,830 | | 0.0% | |
| | Draegerwerk AG & Co. KGaA | 31,651 | | | 2,644,825 | | 0.1% | |
| | Fuchs Petrolub SE | 212,417 | | | 8,898,003 | | 0.2% | |
| | Jungheinrich AG | 245,511 | | | 7,030,585 | | 0.2% | |
| | Sartorius AG | 117,188 | | | 8,682,441 | | 0.2% | |
| | Sixt SE | 60,257 | | | 2,474,165 | | 0.1% | |
| | STO SE & Co. KGaA | 8,021 | | | 782,859 | | 0.0% | |
| # | | Villeroy & Boch AG | 41,209 | | | 632,654 | | 0.0% | |
| TOTAL GERMANY | | | | 32,397,362 | | 0.8% | |
| TOTAL PREFERRED STOCKS | | | | 32,397,362 | | 0.8% | |
| | | | | | | | |
| RIGHTS/WARRANTS — (0.0%) | | | | | | | |
| AUSTRIA — (0.0%) | | | | | | | |
| * | | Intercell AG Rights 05/16/13 | 254,689 | | | — | | 0.0% | |
| | | | | | | | |
| ITALY — (0.0%) | | | | | | | |
| * | | Banca Popolare Di Milano Scarl Rights | 22,383,595 | | | — | | 0.0% | |
| #* | | Credito Valtellinese Rights | 5,732,088 | | | — | | 0.0% | |
| TOTAL ITALY | | | | — | | 0.0% | |
| | | | | | | | |
| NORWAY — (0.0%) | | | | | | | |
| * | | Petroleum Geo Services Rights | 113,825 | | | 88,315 | | 0.0% | |
| | | | | | | | |
| SPAIN — (0.0%) | | | | | | | |
| * | | Faes Farma SA | 1,379,422 | | | 132,136 | | 0.0% | |
| TOTAL RIGHTS/WARRANTS | | | | 220,451 | | 0.0% | |
| TOTAL INVESTMENT SECURITIES | | | | 4,138,651,844 | | | |
| | |
| | | | | Value† | | | |
| SECURITIES LENDING COLLATERAL — (9.4%) | | | | | | | |
| §@ DFA Short Term Investment Fund | 37,009,517 | | | 428,274,127 | | 10.3% | |
| TOTAL INVESTMENTS — (100.0%) (Cost $3,937,134,875)^ | | | $ | 4,566,925,971 | | 109.8% | |
____________________
^ The cost for federal income tax purposes is $3,937,134,875.
The Continental Small Company Series
continued
Summary of the Series' investments as of December 31, 2016, based on their valuation inputs, is as follows (See Security Valuation Note):
| Investments in Securities (Market Value) | |
| Level 1 | | Level 2 | | Level 3 | | Total | |
| Common Stocks | | | | | | | | | | | |
| Austria | | — | | $ | 137,139,621 | | — | | $ | 137,139,621 | |
| Belgium | | — | | | 191,427,410 | | — | | | 191,427,410 | |
| Denmark | | — | | | 193,675,964 | | — | | | 193,675,964 | |
| Finland | | — | | | 304,384,450 | | — | | | 304,384,450 | |
| France | | — | | | 570,260,314 | | — | | | 570,260,314 | |
| Germany | | — | | | 685,986,814 | | — | | | 685,986,814 | |
| Greece | | — | | | — | | — | | | — | |
| Ireland | | — | | | 53,898,066 | | — | | | 53,898,066 | |
| Israel | | — | | | 84,469,736 | | — | | | 84,469,736 | |
| Italy | | — | | | 397,015,969 | | — | | | 397,015,969 | |
| Netherlands | $ | 154,357 | | | 214,385,783 | | — | | | 214,540,140 | |
| Norway | | — | | | 122,009,871 | | — | | | 122,009,871 | |
| Portugal | | — | | | 41,090,554 | | — | | | 41,090,554 | |
| Spain | | — | | | 234,009,717 | | — | | | 234,009,717 | |
| Sweden | | — | | | 345,727,344 | | — | | | 345,727,344 | |
| Switzerland | | — | | | 530,398,061 | | — | | | 530,398,061 | |
| Preferred Stocks | | | | | | | | | | | |
| Germany | | — | | | 32,397,362 | | — | | | 32,397,362 | |
| Rights/Warrants | | | | | | | | | | | |
| Austria | | — | | | — | | — | | | — | |
| Italy | | — | | | — | | — | | | — | |
| Norway | | — | | | 88,315 | | — | | | 88,315 | |
| Spain | | — | | | 132,136 | | — | | | 132,136 | |
| Securities Lending Collateral | | — | | | 428,274,127 | | — | | | 428,274,127 | |
| TOTAL | $ | 154,357 | | $ | 4,566,771,614 | | — | | $ | 4,566,925,971 | |
THE CANADIAN SMALL COMPANY SERIES
SCHEDULE OF INVESTMENTS
December 31, 2016
(Unaudited)
| | | | | | | | | Percentage | |
| | | | | Shares | | Value†† | | of Net Assets** | |
| COMMON STOCKS — (84.5%) | | | | | | | | | |
| Consumer Discretionary — (7.8%) | | | | | | | | | |
| | Aimia, Inc. | | 487,793 | | $ | 3,226,159 | | 0.3 | % | |
| #* | | Amaya, Inc. | | 17,000 | | | 240,696 | | 0.0 | % | |
| # | | AutoCanada, Inc. | | 137,166 | | | 2,361,954 | | 0.2 | % | |
| # | | BMTC Group, Inc. | | 17,481 | | | 173,814 | | 0.0 | % | |
| * | | BRP, Inc. | | 174,422 | | | 3,682,913 | | 0.4 | % | |
| | Cineplex, Inc. | | 321,092 | | | 12,249,158 | | 1.2 | % | |
| | Cogeco Communications, Inc. | | 85,848 | | | 4,235,334 | | 0.4 | % | |
| | Cogeco, Inc. | | 38,068 | | | 1,608,176 | | 0.2 | % | |
| # | | Corus Entertainment, Inc. Class B | | 740,938 | | | 6,953,278 | | 0.7 | % | |
| * | | Craft Oil, Ltd. | | 349,041 | | | — | | 0.0 | % | |
| | DHX Media, Ltd.(BRF12P5) | | 375,910 | | | 1,973,832 | | 0.2 | % | |
| | DHX Media, Ltd.(BRF12N3) | | 2,500 | | | 13,146 | | 0.0 | % | |
| | Dorel Industries, Inc. Class B | | 169,797 | | | 4,906,806 | | 0.5 | % | |
| # | | Enercare, Inc. | | 527,359 | | | 7,007,101 | | 0.7 | % | |
| # | | Gamehost, Inc. | | 46,573 | | | 387,805 | | 0.0 | % | |
| * | | Glacier Media, Inc. | | 171,625 | | | 88,200 | | 0.0 | % | |
| | goeasy, Ltd. | | 3,600 | | | 65,423 | | 0.0 | % | |
| * | | Great Canadian Gaming Corp. | | 299,800 | | | 5,577,778 | | 0.6 | % | |
| # | | Hudson's Bay Co. | | 365,311 | | | 3,588,763 | | 0.4 | % | |
| #* | | IMAX Corp. | | 259,917 | | | 8,161,394 | | 0.8 | % | |
| * | | Indigo Books & Music, Inc. | | 2,302 | | | 30,844 | | 0.0 | % | |
| * | | Intertain Group, Ltd. (The) | | 348,348 | | | 2,433,623 | | 0.3 | % | |
| # | | Leon's Furniture, Ltd. | | 138,675 | | | 1,867,385 | | 0.2 | % | |
| | Linamar Corp. | | 179,512 | | | 7,713,140 | | 0.8 | % | |
| | Martinrea International, Inc. | | 476,656 | | | 3,049,548 | | 0.3 | % | |
| # | | MTY Food Group, Inc. | | 73,963 | | | 2,785,215 | | 0.3 | % | |
| # | | Pizza Pizza Royalty Corp. | | 104,726 | | | 1,377,471 | | 0.1 | % | |
| | Reitmans Canada, Ltd. Class A | | 260,312 | | | 1,130,316 | | 0.1 | % | |
| #* | | Sears Canada, Inc. | | 50,217 | | | 83,031 | | 0.0 | % | |
| # | | Torstar Corp. Class B | | 352,389 | | | 501,294 | | 0.1 | % | |
| * | | TVA Group, Inc. Class B | | 7,000 | | | 16,944 | | 0.0 | % | |
| | Uni-Select, Inc. | | 105,705 | | | 2,321,707 | | 0.2 | % | |
| #* | | Yellow Pages, Ltd. | | 147,535 | | | 1,943,838 | | 0.2 | % | |
| | Zenith Capital Corp. | | 111,820 | | | 6,746 | | 0.0 | % | |
| Total Consumer Discretionary | | | | | 91,762,832 | | 9.2 | % | |
| | | | | | | | | | |
| Consumer Staples — (3.6%) | | | | | | | | | |
| | AGT Food & Ingredients, Inc. | | 125,802 | | | 3,433,051 | | 0.4 | % | |
| | Andrew Peller, Ltd. Class A | | 25,900 | | | 225,695 | | 0.0 | % | |
| | Clearwater Seafoods, Inc. | | 90,557 | | | 785,751 | | 0.1 | % | |
| | Corby Spirit and Wine, Ltd. | | 70,767 | | | 1,175,892 | | 0.1 | % | |
| | Cott Corp.(22163N106) | | 96,682 | | | 1,095,407 | | 0.1 | % | |
| | Cott Corp.(2228952) | | 600,036 | | | 6,792,945 | | 0.7 | % | |
| | High Liner Foods, Inc. | | 87,391 | | | 1,298,515 | | 0.1 | % | |
| | Jean Coutu Group PJC, Inc. (The) Class A | | 154,993 | | | 2,414,966 | | 0.2 | % | |
| # | | Liquor Stores N.A., Ltd. | | 181,111 | | | 1,420,399 | | 0.1 | % | |
| | Maple Leaf Foods, Inc. | | 305,864 | | | 6,405,910 | | 0.6 | % | |
| * | | Neptune Technologies & Bioressources, Inc. | | 22,102 | | | 21,400 | | 0.0 | % | |
| | North West Co., Inc. (The) | | 266,936 | | | 5,471,328 | | 0.6 | % | |
| | Premium Brands Holdings Corp. | | 144,762 | | | 7,435,138 | | 0.8 | % | |
The Canadian Small Company Series
continued
| | | | | | | | Percentage | |
| | | | | Shares | | Value†† | | of Net Assets** | |
| Consumer Staples — (Continued) | | | | | | | | | |
| # | | Rogers Sugar, Inc. | | 510,071 | | $ | 2,587,110 | | 0.3 | % | |
| #* | | SunOpta, Inc. | | 306,745 | | | 2,186,385 | | 0.2 | % | |
| Total Consumer Staples | | | | | 42,749,892 | | 4.3 | % | |
| | | | | | | | | | |
| Energy — (21.8%) | | | | | | | | | |
| * | | Advantage Oil & Gas, Ltd. | | 1,116,844 | | | 7,586,204 | | 0.8 | % | |
| #* | | Africa Oil Corp. | | 374,599 | | | 742,139 | | 0.1 | % | |
| | AKITA Drilling, Ltd. Class A | | 40,600 | | | 255,517 | | 0.0 | % | |
| #* | | Athabasca Oil Corp. | | 1,791,785 | | | 2,735,753 | | 0.3 | % | |
| #* | | Baytex Energy Corp. | | 1,304,806 | | | 6,375,100 | | 0.6 | % | |
| #* | | Bellatrix Exploration, Ltd. | | 1,120,054 | | | 1,067,791 | | 0.1 | % | |
| * | | Birchcliff Energy, Ltd. | | 1,028,636 | | | 7,178,579 | | 0.7 | % | |
| #* | | BlackPearl Resources, Inc. | | 1,397,501 | | | 1,696,590 | | 0.2 | % | |
| | Bonavista Energy Corp. | | 1,157,876 | | | 4,148,053 | | 0.4 | % | |
| | Bonterra Energy Corp. | | 175,395 | | | 3,800,127 | | 0.4 | % | |
| # | | Calfrac Well Services, Ltd. | | 512,149 | | | 1,815,685 | | 0.2 | % | |
| #* | | Canacol Energy, Ltd. | | 719,842 | | | 2,455,498 | | 0.2 | % | |
| | Canadian Energy Services & Technology Corp. | | 953,842 | | | 5,441,798 | | 0.5 | % | |
| | Canyon Services Group, Inc. | | 401,132 | | | 2,100,293 | | 0.2 | % | |
| * | | Cequence Energy, Ltd. | | 863,916 | | | 228,422 | | 0.0 | % | |
| #* | | Chinook Energy, Inc. | | 496,199 | | | 168,153 | | 0.0 | % | |
| * | | Corridor Resources, Inc. | | 1,246 | | | 520 | | 0.0 | % | |
| * | | Crew Energy, Inc. | | 860,700 | | | 4,814,253 | | 0.5 | % | |
| #* | | Delphi Energy Corp. | | 911,939 | | | 1,147,862 | | 0.1 | % | |
| #* | | Denison Mines Corp. | | 2,713,471 | | | 1,414,687 | | 0.1 | % | |
| # | | Enbridge Income Fund Holdings, Inc. | | 251,755 | | | 6,519,585 | | 0.7 | % | |
| | Enerflex, Ltd. | | 445,163 | | | 5,653,021 | | 0.6 | % | |
| #* | | Energy Fuels, Inc. | | 108,528 | | | 178,637 | | 0.0 | % | |
| | Enerplus Corp. | | 721,959 | | | 6,850,451 | | 0.7 | % | |
| # | | Ensign Energy Services, Inc. | | 758,725 | | | 5,300,593 | | 0.5 | % | |
| #* | | Epsilon Energy, Ltd. | | 260,061 | | | 563,645 | | 0.1 | % | |
| * | | Essential Energy Services Trust | | 779,741 | | | 482,021 | | 0.1 | % | |
| # | | Freehold Royalties, Ltd. | | 477,614 | | | 5,040,622 | | 0.5 | % | |
| * | | GASFRAC Energy Services, Inc. | | 91,560 | | | 9 | | 0.0 | % | |
| # | | Gibson Energy, Inc. | | 702,339 | | | 9,928,421 | | 1.0 | % | |
| * | | Gran Tierra Energy, Inc. | | 1,603,812 | | | 4,849,720 | | 0.5 | % | |
| | Granite Oil Corp. | | 195,608 | | | 858,102 | | 0.1 | % | |
| #* | | Ithaca Energy, Inc. | | 1,679,779 | | | 2,114,346 | | 0.2 | % | |
| #* | | Kelt Exploration, Ltd. | | 251,041 | | | 1,265,816 | | 0.1 | % | |
| * | | Lightstream Resources, Ltd. | | 687,816 | | | 58,913 | | 0.0 | % | |
| * | | McCoy Global, Inc. | | 10,437 | | | 15,314 | | 0.0 | % | |
| #* | | MEG Energy Corp. | | 717,075 | | | 4,929,507 | | 0.5 | % | |
| # | | Mullen Group, Ltd. | | 551,525 | | | 8,145,638 | | 0.8 | % | |
| # | | Newalta Corp. | | 494,282 | | | 854,083 | | 0.1 | % | |
| | North American Energy Partners, Inc. | | 129,534 | | | 499,748 | | 0.1 | % | |
| # | | Northern Blizzard Resources, Inc. | | 174,800 | | | 505,138 | | 0.1 | % | |
| * | | NuVista Energy, Ltd. | | 854,869 | | | 4,418,717 | | 0.4 | % | |
| * | | Painted Pony Petroleum, Ltd. | | 553,861 | | | 3,803,373 | | 0.4 | % | |
| #* | | Paramount Resources, Ltd. Class A | | 303,969 | | | 4,090,954 | | 0.4 | % | |
| * | | Parex Resources, Inc. | | 765,891 | | | 9,640,307 | | 1.0 | % | |
| # | | Parkland Fuel Corp. | | 477,625 | | | 10,006,771 | | 1.0 | % | |
| | Pason Systems, Inc. | | 356,252 | | | 5,211,179 | | 0.5 | % | |
The Canadian Small Company Series
continued
| | | | | | | | Percentage | |
| | | | | Shares | | Value†† | | of Net Assets** | |
| Energy — (Continued) | | | | | | | | | |
| # | | Pengrowth Energy Corp. | | 2,992,716 | | $ | 4,301,897 | | 0.4 | % | |
| * | | Penn West Petroleum, Ltd. | | 2,531,535 | | | 4,468,579 | | 0.4 | % | |
| * | | Perpetual Energy, Inc. | | 41,575 | | | 72,767 | | 0.0 | % | |
| * | | Petrus Resources, Ltd. | | 19,582 | | | 47,399 | | 0.0 | % | |
| # | | PHX Energy Services Corp. | | 151,074 | | | 462,454 | | 0.0 | % | |
| #* | | Pine Cliff Energy, Ltd. | | 248,300 | | | 208,974 | | 0.0 | % | |
| | Precision Drilling Corp. | | 1,782,881 | | | 9,720,098 | | 1.0 | % | |
| #* | | Pulse Seismic, Inc. | | 268,280 | | | 467,564 | | 0.0 | % | |
| * | | Questerre Energy Corp. Class A | | 745,460 | | | 483,037 | | 0.1 | % | |
| * | | Raging River Exploration, Inc. | | 1,094,651 | | | 8,609,478 | | 0.9 | % | |
| #* | | RMP Energy, Inc. | | 982,111 | | | 555,919 | | 0.1 | % | |
| #* | | Savanna Energy Services Corp. | | 520,779 | | | 814,535 | | 0.1 | % | |
| # | | Secure Energy Services, Inc. | | 837,639 | | | 7,305,517 | | 0.7 | % | |
| | ShawCor, Ltd. | | 319,981 | | | 8,541,406 | | 0.9 | % | |
| #* | | Spartan Energy Corp. | | 1,623,143 | | | 4,025,670 | | 0.4 | % | |
| #* | | Sprott Resource Corp. | | 455,390 | | | 167,890 | | 0.0 | % | |
| * | | Strad Energy Services, Ltd. | | 39,947 | | | 50,430 | | 0.0 | % | |
| # | | Surge Energy, Inc. | | 1,302,723 | | | 3,211,569 | | 0.3 | % | |
| | TORC Oil & Gas, Ltd. | | 732,501 | | | 4,511,811 | | 0.5 | % | |
| | Total Energy Services, Inc. | | 178,778 | | | 1,941,372 | | 0.2 | % | |
| | TransGlobe Energy Corp. | | 448,945 | | | 759,025 | | 0.1 | % | |
| * | | Trican Well Service, Ltd. | | 830,838 | | | 2,846,501 | | 0.3 | % | |
| #* | | Trilogy Energy Corp. | | 387,642 | | | 2,179,792 | | 0.2 | % | |
| | Trinidad Drilling, Ltd. | | 1,372,323 | | | 3,413,814 | | 0.3 | % | |
| | Veresen, Inc. | | 1,597,192 | | | 15,595,417 | | 1.6 | % | |
| # | | Western Energy Services Corp. | | 463,897 | | | 1,071,076 | | 0.1 | % | |
| | Whitecap Resources, Inc. | | 1,466,035 | | | 13,277,463 | | 1.3 | % | |
| * | | Xtreme Drilling Corp. | | 224,819 | | | 468,844 | | 0.0 | % | |
| # | | ZCL Composites, Inc. | | 118,527 | | | 1,144,971 | | 0.1 | % | |
| Total Energy | | | | | 257,682,924 | | 25.8 | % | |
| | | | | | | | | | |
| Financials — (5.5%) | | | | | | | | | |
| | AGF Management, Ltd. Class B | | 449,269 | | | 2,098,027 | | 0.2 | % | |
| # | | Alaris Royalty Corp. | | 176,560 | | | 3,149,452 | | 0.3 | % | |
| # | | Callidus Capital Corp. | | 84,120 | | | 1,156,560 | | 0.1 | % | |
| | Canaccord Genuity Group, Inc. | | 674,378 | | | 2,395,846 | | 0.2 | % | |
| # | | Canadian Western Bank | | 468,032 | | | 10,576,167 | | 1.1 | % | |
| # | | Chesswood Group, Ltd. | | 26,142 | | | 232,672 | | 0.0 | % | |
| | Clairvest Group, Inc. | | 1,900 | | | 42,800 | | 0.0 | % | |
| # | | Clarke, Inc. | | 17,242 | | | 120,199 | | 0.0 | % | |
| | E-L Financial Corp., Ltd. | | 1,878 | | | 1,027,994 | | 0.1 | % | |
| # | | Echelon Financial Holdings, Inc. | | 14,650 | | | 121,115 | | 0.0 | % | |
| # | | Equitable Group, Inc. | | 58,995 | | | 2,656,566 | | 0.3 | % | |
| * | | Equity Financial Holdings, Inc. | | 800 | | | 5,899 | | 0.0 | % | |
| | Fiera Capital Corp. | | 180,437 | | | 1,717,488 | | 0.2 | % | |
| | Firm Capital Mortgage Investment Corp. | | 46,946 | | | 481,121 | | 0.1 | % | |
| # | | First National Financial Corp. | | 54,637 | | | 1,095,873 | | 0.1 | % | |
| # | | Genworth MI Canada, Inc. | | 249,970 | | | 6,266,704 | | 0.6 | % | |
| | Gluskin Sheff + Associates, Inc. | | 162,696 | | | 2,113,297 | | 0.2 | % | |
| # | | GMP Capital, Inc. | | 294,287 | | | 966,600 | | 0.1 | % | |
| | Guardian Capital Group, Ltd. Class A | | 25,297 | | | 471,969 | | 0.0 | % | |
| # | | Home Capital Group, Inc. | | 325,263 | | | 7,592,256 | | 0.8 | % | |
The Canadian Small Company Series
continued
| | | | | | | | Percentage | |
| | | | | Shares | | Value†† | | of Net Assets** | |
| Financials — (Continued) | | | | | | | | | |
| * | | Kingsway Financial Services, Inc. | | 14,370 | | $ | 89,476 | | 0.0 | % | |
| | Laurentian Bank of Canada | | 197,446 | | | 8,489,597 | | 0.9 | % | |
| | Sprott, Inc. | | 915,388 | | | 1,711,260 | | 0.2 | % | |
| #* | | Street Capital Group, Inc. | | 120,227 | | | 168,344 | | 0.0 | % | |
| | TMX Group, Ltd. | | 191,063 | | | 10,177,504 | | 1.0 | % | |
| Total Financials | | | | | 64,924,786 | | 6.5 | % | |
| | | | | | | | | | |
| Health Care — (1.3%) | | | | | | | | | |
| # | | Concordia International Corp.(BDD7WR9) | | 47,100 | | | 99,978 | | 0.0 | % | |
| | Concordia International Corp.(20653P102) | | 65,542 | | | 138,949 | | 0.0 | % | |
| * | | CRH Medical Corp. | | 207,180 | | | 1,106,379 | | 0.1 | % | |
| # | | Extendicare, Inc. | | 561,871 | | | 4,134,574 | | 0.4 | % | |
| * | | Knight Therapeutics, Inc. | | 491,558 | | | 3,932,025 | | 0.4 | % | |
| | Medical Facilities Corp. | | 177,969 | | | 2,328,913 | | 0.3 | % | |
| #* | | Merus Labs International, Inc. | | 384,845 | | | 332,492 | | 0.0 | % | |
| * | | Novelion Therapeutics, Inc. | | 43,802 | | | 366,362 | | 0.1 | % | |
| # | | Sienna Senior Living, Inc. | | 231,915 | | | 2,815,488 | | 0.3 | % | |
| #* | | Theratechnologies, Inc. | | 157,601 | | | 321,623 | | 0.0 | % | |
| Total Health Care | | | | | 15,576,783 | | 1.6 | % | |
| | | | | | | | | | |
| Industrials — (10.7%) | | | | | | | | | |
| | Aecon Group, Inc. | | 408,101 | | | 4,635,266 | | 0.5 | % | |
| # | | Ag Growth International, Inc. | | 91,331 | | | 3,572,565 | | 0.3 | % | |
| * | | Air Canada | | 312,200 | | | 3,178,620 | | 0.3 | % | |
| | Algoma Central Corp. | | 25,790 | | | 235,301 | | 0.0 | % | |
| * | | ATS Automation Tooling Systems, Inc. | | 522,530 | | | 4,872,510 | | 0.5 | % | |
| # | | Badger Daylighting, Ltd. | | 225,381 | | | 5,388,396 | | 0.5 | % | |
| #* | | Ballard Power Systems, Inc. | | 122,047 | | | 201,798 | | 0.0 | % | |
| # | | Bird Construction, Inc. | | 204,133 | | | 1,377,459 | | 0.1 | % | |
| # | | Black Diamond Group, Ltd. | | 252,541 | | | 850,173 | | 0.1 | % | |
| | CanWel Building Materials Group, Ltd. | | 138,770 | | | 620,132 | | 0.1 | % | |
| | Cargojet, Inc. | | 3,049 | | | 103,870 | | 0.0 | % | |
| # | | Cervus Equipment Corp. | | 34,597 | | | 408,418 | | 0.0 | % | |
| # | | DirectCash Payments, Inc. | | 78,722 | | | 1,112,832 | | 0.1 | % | |
| * | | DIRTT Environmental Solutions | | 70,700 | | | 330,160 | | 0.0 | % | |
| # | | Exchange Income Corp. | | 113,984 | | | 3,544,358 | | 0.3 | % | |
| | Exco Technologies, Ltd. | | 128,615 | | | 1,032,637 | | 0.1 | % | |
| # | | Finning International, Inc. | | 238,878 | | | 4,677,394 | | 0.5 | % | |
| * | | Heroux-Devtek, Inc. | | 148,254 | | | 1,623,159 | | 0.2 | % | |
| | HNZ Group, Inc. | | 23,088 | | | 230,596 | | 0.0 | % | |
| # | | Horizon North Logistics, Inc. | | 518,783 | | | 757,319 | | 0.1 | % | |
| # | | K-Bro Linen, Inc. | | 30,453 | | | 956,015 | | 0.1 | % | |
| | Logistec Corp. Class B | | 300 | | | 7,843 | | 0.0 | % | |
| | MacDonald Dettwiler & Associates, Ltd. | | 172,507 | | | 8,594,193 | | 0.9 | % | |
| | Magellan Aerospace Corp. | | 75,876 | | | 1,016,088 | | 0.1 | % | |
| | Morneau Shepell, Inc. | | 271,111 | | | 3,874,889 | | 0.4 | % | |
| | New Flyer Industries, Inc. | | 254,471 | | | 7,740,361 | | 0.8 | % | |
| | Richelieu Hardware, Ltd. | | 245,655 | | | 4,676,529 | | 0.5 | % | |
| # | | Rocky Mountain Dealerships, Inc. | | 82,555 | | | 595,805 | | 0.1 | % | |
| | Russel Metals, Inc. | | 362,155 | | | 6,899,732 | | 0.7 | % | |
| # | | Stantec, Inc.(2854238) | | 410,229 | | | 10,363,809 | | 1.0 | % | |
| | Stantec, Inc.(85472N109) | | 3,715 | | | 93,804 | | 0.0 | % | |
The Canadian Small Company Series
continued
| | | | | | | | Percentage | |
| | | | | Shares | | Value†† | | of Net Assets** | |
| Industrials — (Continued) | | | | | | | | | |
| | Stuart Olson, Inc. | | 88,659 | | $ | 384,972 | | 0.0 | % | |
| # | | Student Transportation, Inc. | | 505,490 | | | 2,827,416 | | 0.3 | % | |
| | TFI International, Inc. | | 491,359 | | | 12,768,417 | | 1.3 | % | |
| | Toromont Industries, Ltd. | | 398,385 | | | 12,565,899 | | 1.3 | % | |
| | Transcontinental, Inc. Class A | | 360,976 | | | 5,965,857 | | 0.6 | % | |
| | Wajax Corp. | | 106,738 | | | 1,833,224 | | 0.2 | % | |
| # | | WestJet Airlines, Ltd. | | 6,379 | | | 109,464 | | 0.0 | % | |
| * | | Westport Fuel Systems, Inc. | | 3,750 | | | 4,245 | | 0.0 | % | |
| | Westshore Terminals Investment Corp. | | 318,149 | | | 6,134,791 | | 0.6 | % | |
| Total Industrials | | | | | 126,166,316 | | 12.6 | % | |
| | | | | | | | | | |
| Information Technology — (3.3%) | | | | | | | | | |
| #* | | 5N Plus, Inc. | | 359,429 | | | 479,185 | | 0.1 | % | |
| # | | Absolute Software Corp. | | 234,888 | | | 1,116,140 | | 0.1 | % | |
| #* | | Avigilon Corp. | | 199,393 | | | 1,903,860 | | 0.2 | % | |
| | Calian Group, Ltd. | | 25,255 | | | 461,217 | | 0.0 | % | |
| * | | Celestica, Inc.(15101Q108) | | 36,408 | | | 431,435 | | 0.0 | % | |
| * | | Celestica, Inc.(2263362) | | 519,635 | | | 6,157,519 | | 0.6 | % | |
| # | | Computer Modelling Group, Ltd. | | 407,452 | | | 2,764,598 | | 0.3 | % | |
| * | | Descartes Systems Group, Inc. (The) | | 268,938 | | | 5,734,700 | | 0.6 | % | |
| # | | DH Corp. | | 270,455 | | | 4,487,944 | | 0.5 | % | |
| | Enghouse Systems, Ltd. | | 99,557 | | | 4,147,930 | | 0.4 | % | |
| | Evertz Technologies, Ltd. | | 143,053 | | | 1,799,550 | | 0.2 | % | |
| #* | | EXFO, Inc. | | 686 | | | 2,984 | | 0.0 | % | |
| # | | Mediagrif Interactive Technologies, Inc. | | 11,670 | | | 164,709 | | 0.0 | % | |
| * | | Mitel Networks Corp. | | 385,524 | | | 2,618,685 | | 0.3 | % | |
| * | | Points International, Ltd.(730843208) | | 3,323 | | | 25,388 | | 0.0 | % | |
| * | | Points International, Ltd.(2556879) | | 36,359 | | | 278,112 | | 0.0 | % | |
| | Pure Technologies, Ltd. | | 67,445 | | | 241,117 | | 0.0 | % | |
| #* | | Redknee Solutions, Inc. | | 56,511 | | | 65,659 | | 0.0 | % | |
| # | | Sandvine Corp. | | 1,036,169 | | | 2,168,573 | | 0.2 | % | |
| * | | Sierra Wireless, Inc.(826516106) | | 10,722 | | | 168,335 | | 0.0 | % | |
| #* | | Sierra Wireless, Inc.(2418968) | | 161,792 | | | 2,532,952 | | 0.3 | % | |
| #* | | Solium Capital, Inc. | | 96,906 | | | 609,158 | | 0.1 | % | |
| | Vecima Networks, Inc. | | 6,059 | | | 41,698 | | 0.0 | % | |
| | Wi-LAN, Inc. | | 780,333 | | | 1,272,803 | | 0.1 | % | |
| Total Information Technology | | | | | 39,674,251 | | 4.0 | % | |
| | | | | | | | | | |
| Materials — (22.7%) | | | | | | | | | |
| | Acadian Timber Corp. | | 35,988 | | | 491,848 | | 0.1 | % | |
| # | | AirBoss of America Corp. | | 80,062 | | | 706,614 | | 0.1 | % | |
| * | | Alacer Gold Corp. | | 1,485,088 | | | 2,477,635 | | 0.2 | % | |
| | Alamos Gold, Inc. Class A | | 1,545,462 | | | 10,658,757 | | 1.1 | % | |
| #* | | Almaden Minerals, Ltd. Class B | | 50,744 | | | 49,510 | | 0.0 | % | |
| # | | Altius Minerals Corp. | | 127,600 | | | 1,205,056 | | 0.1 | % | |
| * | | Americas Silver Corp. | | 81,208 | | | 211,693 | | 0.0 | % | |
| * | | Argonaut Gold, Inc. | | 923,902 | | | 1,458,811 | | 0.1 | % | |
| * | | Asanko Gold, Inc. | | 771,844 | | | 2,368,448 | | 0.2 | % | |
| * | | AuRico Metals, Inc. | | 679,583 | | | 511,212 | | 0.1 | % | |
| * | | B2Gold Corp. | | 5,284,073 | | | 12,554,421 | | 1.3 | % | |
| #* | | Banro Corp. | | 184,289 | | | 34,314 | | 0.0 | % | |
| | Caledonia Mining Corp. P.L.C. | | 2,700 | | | 2,916 | | 0.0 | % | |
The Canadian Small Company Series
continued
| | | | | | | | Percentage | |
| | | | | Shares | | Value†† | | of Net Assets** | |
| Materials — (Continued) | | | | | | | | | |
| | Canam Group, Inc. | | 237,796 | | $ | 1,597,527 | | 0.2 | % | |
| | Canexus Corp. | | 753,464 | | | 914,718 | | 0.1 | % | |
| * | | Canfor Corp. | | 322,770 | | | 3,670,873 | | 0.4 | % | |
| | Canfor Pulp Products, Inc. | | 206,915 | | | 1,558,046 | | 0.2 | % | |
| * | | Capstone Mining Corp. | | 2,219,255 | | | 2,082,644 | | 0.2 | % | |
| | Cascades, Inc. | | 477,193 | | | 4,300,477 | | 0.4 | % | |
| | Centerra Gold, Inc. | | 1,111,077 | | | 5,205,136 | | 0.5 | % | |
| #* | | China Gold International Resources Corp., Ltd. | | 1,219,957 | | | 1,799,065 | | 0.2 | % | |
| * | | Continental Gold, Inc. | | 464,000 | | | 1,520,575 | | 0.2 | % | |
| #* | | Copper Mountain Mining Corp. | | 684,831 | | | 479,456 | | 0.0 | % | |
| * | | Detour Gold Corp. | | 79,500 | | | 1,082,974 | | 0.1 | % | |
| | Dominion Diamond Corp.(257287102) | | 20,700 | | | 200,376 | | 0.0 | % | |
| | Dominion Diamond Corp.(B95LX89) | | 487,201 | | | 4,720,877 | | 0.5 | % | |
| #* | | Dundee Precious Metals, Inc. | | 665,722 | | | 1,115,611 | | 0.1 | % | |
| #* | | Eastern Platinum, Ltd. | | 299,296 | | | 98,082 | | 0.0 | % | |
| #* | | Eastmain Resources, Inc. | | 49,500 | | | 18,802 | | 0.0 | % | |
| * | | EcoSynthetix, Inc. | | 1,500 | | | 2,536 | | 0.0 | % | |
| * | | Eldorado Gold Corp. | | 1,179,508 | | | 3,795,088 | | 0.4 | % | |
| * | | Endeavour Mining Corp. | | 321,438 | | | 4,802,472 | | 0.5 | % | |
| #* | | Endeavour Silver Corp. | | 197,026 | | | 697,035 | | 0.1 | % | |
| #* | | Exeter Resource Corp. | | 4,111 | | | 3,093 | | 0.0 | % | |
| #* | | First Majestic Silver Corp. | | 571,687 | | | 4,368,608 | | 0.4 | % | |
| #* | | Fortress Paper, Ltd. Class A | | 16,706 | | | 87,098 | | 0.0 | % | |
| * | | Fortuna Silver Mines, Inc. | | 876,406 | | | 4,954,323 | | 0.5 | % | |
| #* | | Golden Star Resources, Ltd. | | 1,118,762 | | | 824,917 | | 0.1 | % | |
| #* | | Great Panther Silver, Ltd. | | 700,801 | | | 1,158,737 | | 0.1 | % | |
| * | | Guyana Goldfields, Inc. | | 287,744 | | | 1,311,580 | | 0.1 | % | |
| * | | Hanfeng Evergreen, Inc. | | 45,837 | | | — | | 0.0 | % | |
| | HudBay Minerals, Inc. | | 1,453,305 | | | 8,312,950 | | 0.8 | % | |
| * | | IAMGOLD Corp. | | 2,443,241 | | | 9,444,323 | | 0.9 | % | |
| #* | | Imperial Metals Corp. | | 244,960 | | | 1,105,618 | | 0.1 | % | |
| * | | Interfor Corp. | | 394,708 | | | 4,418,472 | | 0.4 | % | |
| * | | International Tower Hill Mines, Ltd. | | 13,001 | | | 7,262 | | 0.0 | % | |
| | Intertape Polymer Group, Inc. | | 328,477 | | | 6,160,243 | | 0.6 | % | |
| * | | Ivanhoe Mines, Ltd. Class A | | 1,914,589 | | | 3,621,983 | | 0.4 | % | |
| * | | Kirkland Lake Gold, Ltd. | | 531,244 | | | 2,777,591 | | 0.3 | % | |
| * | | Klondex Mines, Ltd. | | 499,610 | | | 2,325,671 | | 0.2 | % | |
| # | | Labrador Iron Ore Royalty Corp. | | 290,156 | | | 4,023,911 | | 0.4 | % | |
| | Lucara Diamond Corp. | | 1,407,865 | | | 3,187,658 | | 0.3 | % | |
| * | | Lundin Mining Corp. | | 2,567,823 | | | 12,240,023 | | 1.2 | % | |
| * | | Lydian International, Ltd. | | 91,514 | | | 22,493 | | 0.0 | % | |
| * | | Major Drilling Group International, Inc. | | 559,212 | | | 2,923,821 | | 0.3 | % | |
| | Mandalay Resources Corp. | | 1,371,135 | | | 816,972 | | 0.1 | % | |
| # | | Methanex Corp.(59151K108) | | 92,958 | | | 4,071,560 | | 0.4 | % | |
| | Methanex Corp.(2654416) | | 188,866 | | | 8,283,856 | | 0.8 | % | |
| #* | | Midas Gold Corp. | | 293,884 | | | 190,429 | | 0.0 | % | |
| * | | Minco Base Metals Corp. | | 2,780 | | | — | | 0.0 | % | |
| * | | Nautilus Minerals, Inc. | | 227,078 | | | 24,523 | | 0.0 | % | |
| | Nevsun Resources, Ltd. | | 1,477,819 | | | 4,567,794 | | 0.5 | % | |
| * | | New Gold, Inc. | | 2,777,383 | | | 9,743,026 | | 1.0 | % | |
| | Norbord, Inc. | | 195,580 | | | 4,939,575 | | 0.5 | % | |
| #* | | Northern Dynasty Minerals, Ltd. | | 148,624 | | | 306,624 | | 0.0 | % | |
The Canadian Small Company Series
continued
| | | | | | | | Percentage | |
| | | | | Shares | | Value†† | | of Net Assets** | |
| Materials — (Continued) | | | | | | | | | |
| #* | | Novagold Resources, Inc. | | 46,529 | | $ | 212,779 | | 0.0 | % | |
| | OceanaGold Corp. | | 3,061,665 | | | 8,916,032 | | 0.9 | % | |
| * | | Orbite Technologies, Inc. | | 73,500 | | | 15,875 | | 0.0 | % | |
| | Osisko Gold Royalties, Ltd. | | 630,175 | | | 6,143,808 | | 0.6 | % | |
| | Pan American Silver Corp. | | 990,673 | | | 14,941,443 | | 1.5 | % | |
| * | | Pilot Gold, Inc. | | 153,861 | | | 50,995 | | 0.0 | % | |
| * | | Platinum Group Metals, Ltd. | | 105,831 | | | 152,915 | | 0.0 | % | |
| #* | | PolyMet Mining Corp. | | 613,665 | | | 457,055 | | 0.0 | % | |
| * | | Pretium Resources, Inc.(B57Q8S9) | | 114,400 | | | 947,476 | | 0.1 | % | |
| #* | | Pretium Resources, Inc.(74139C102) | | 325,217 | | | 2,679,788 | | 0.3 | % | |
| #* | | Primero Mining Corp. | | 1,071,138 | | | 845,645 | | 0.1 | % | |
| #* | | RB Energy, Inc. | | 396,013 | | | 158 | | 0.0 | % | |
| * | | Richmont Mines, Inc. | | 256,813 | | | 1,667,903 | | 0.2 | % | |
| * | | Royal Nickel Corp. | | 385,500 | | | 78,958 | | 0.0 | % | |
| #* | | Sabina Gold & Silver Corp. | | 924,221 | | | 674,589 | | 0.1 | % | |
| * | | Sandstorm Gold, Ltd. | | 767,972 | | | 3,014,347 | | 0.3 | % | |
| #* | | Seabridge Gold, Inc. | | 111,235 | | | 914,635 | | 0.1 | % | |
| * | | SEMAFO, Inc. | | 1,661,946 | | | 5,471,122 | | 0.5 | % | |
| #* | | Sherritt International Corp. | | 2,013,361 | | | 1,994,392 | | 0.2 | % | |
| * | | Silver Standard Resources, Inc. | | 760,590 | | | 6,803,475 | | 0.7 | % | |
| # | | Stella-Jones, Inc. | | 204,600 | | | 6,640,947 | | 0.7 | % | |
| #* | | Stornoway Diamond Corp. | | 1,252,797 | | | 933,078 | | 0.1 | % | |
| | Tahoe Resources, Inc. | | 39,600 | | | 373,098 | | 0.0 | % | |
| #* | | Tanzanian Royalty Exploration Corp. | | 298,950 | | | 149,180 | | 0.0 | % | |
| * | | Taseko Mines, Ltd. | | 976,266 | | | 843,458 | | 0.1 | % | |
| * | | Tembec, Inc. | | 403,476 | | | 721,217 | | 0.1 | % | |
| #* | | Teranga Gold Corp. | | 2,220,363 | | | 1,356,048 | | 0.1 | % | |
| #* | | Timmins Gold Corp. | | 1,530,103 | | | 472,940 | | 0.0 | % | |
| * | | Torex Gold Resources, Inc. | | 168,160 | | | 2,603,840 | | 0.3 | % | |
| * | | Trevali Mining Corp. | | 1,173,759 | | | 987,858 | | 0.1 | % | |
| * | | Wesdome Gold Mines, Ltd. | | 402,664 | | | 626,796 | | 0.1 | % | |
| | West Fraser Timber Co., Ltd. | | 266,200 | | | 9,518,685 | | 1.0 | % | |
| | Western Forest Products, Inc. | | 2,211,609 | | | 3,113,202 | | 0.3 | % | |
| | Winpak, Ltd. | | 153,235 | | | 5,183,729 | | 0.5 | % | |
| | Yamana Gold, Inc. | | 262,157 | | | 736,105 | | 0.1 | % | |
| Total Materials | | | | | 268,861,910 | | 26.9 | % | |
| | | | | | | | | | |
| Real Estate — (1.7%) | | | | | | | | | |
| # | | Altus Group, Ltd. | | 211,914 | | | 4,886,499 | | 0.5 | % | |
| # | | Brookfield Real Estate Services, Inc. | | 14,069 | | | 165,246 | | 0.0 | % | |
| | Colliers International Group, Inc. | | 162,348 | | | 5,984,138 | | 0.6 | % | |
| | FirstService Corp.(BYL7ZF7) | | 163,033 | | | 7,739,711 | | 0.8 | % | |
| | FirstService Corp.(33767E103) | | 1,234 | | | 58,590 | | 0.0 | % | |
| | Genesis Land Development Corp. | | 76,842 | | | 171,123 | | 0.0 | % | |
| | Information Services Corp. | | 3,674 | | | 49,638 | | 0.0 | % | |
| #* | | Mainstreet Equity Corp. | | 26,949 | | | 664,768 | | 0.1 | % | |
| | Melcor Developments, Ltd. | | 42,540 | | | 459,412 | | 0.0 | % | |
| | Morguard Corp. | | 4,268 | | | 559,149 | | 0.1 | % | |
| Total Real Estate | | | | | 20,738,274 | | 2.1 | % | |
The Canadian Small Company Series
continued
| | | | | | | | Percentage | |
| | | | | Shares | | Value†† | | of Net Assets** | |
| Telecommunication Services — (0.4%) | | | | | | | | | |
| # | | Manitoba Telecom Services, Inc. | | 161,284 | | $ | 4,559,893 | | 0.4 | % | |
| | | | | | | | | | |
| Utilities — (5.7%) | | | | | | | | | |
| # | | Algonquin Power & Utilities Corp. | | 1,268,653 | | | 10,762,267 | | 1.1 | % | |
| | Alterra Power Corp. | | 110,442 | | | 428,558 | | 0.1 | % | |
| | Boralex, Inc. Class A | | 285,291 | | | 4,069,059 | | 0.4 | % | |
| | Capital Power Corp. | | 535,609 | | | 9,266,895 | | 0.9 | % | |
| # | | Innergex Renewable Energy, Inc. | | 520,627 | | | 5,440,284 | | 0.6 | % | |
| # | | Just Energy Group, Inc. | | 727,176 | | | 3,975,326 | | 0.4 | % | |
| * | | Maxim Power Corp. | | 92,234 | | | 202,652 | | 0.0 | % | |
| # | | Northland Power, Inc. | | 536,896 | | | 9,317,154 | | 0.9 | % | |
| # | | Superior Plus Corp. | | 737,043 | | | 6,999,068 | | 0.7 | % | |
| | TransAlta Corp. | | 1,451,525 | | | 8,032,496 | | 0.8 | % | |
| | TransAlta Renewables, Inc. | | 456,746 | | | 4,878,217 | | 0.5 | % | |
| # | | Valener, Inc. | | 273,976 | | | 4,277,017 | | 0.4 | % | |
| Total Utilities | | | | | 67,648,993 | | 6.8 | % | |
| TOTAL COMMON STOCKS | | | | | 1,000,346,854 | | 100.2 | % | |
| | | | | | | | | | |
| RIGHTS/WARRANTS — (0.0%) | | | | | | | | | |
| * | | QLT, Inc. Rights 11/23/17 Class A | | 219,010 | | | — | | 0.0 | % | |
| * | | QLT, Inc. Rights 11/23/17 | | 219,010 | | | — | | 0.0 | % | |
| TOTAL RIGHTS/WARRANTS | | | | | — | | 0.0 | % | |
| TOTAL INVESTMENT SECURITIES | | | | | 1,000,346,854 | | | | |
| | |
| | |
| | | | Value† | | | | |
| SECURITIES LENDING COLLATERAL — (15.5%) | | | | | | | | | |
| §@ | | DFA Short Term Investment Fund | | 15,843,339 | | | 183,339,124 | | 18.4 | % | |
| TOTAL INVESTMENTS — (100.0%) (Cost $1,372,271,170)^ | | | | $ | 1,183,685,978 | | 118.6 | % | |
| ^ | The cost for federal income tax purposes is $1,372,271,170. |
The Canadian Small Company Series
continued
Summary of the Series' investments as of December 31, 2016, based on their valuation inputs, is as follows (See Security Valuation Note):
| | Investments in Securities (Market Value) | |
| | Level 1 | | Level 2 | | Level 3 | | Total | |
| Common Stocks | | | | | | | | | | | | |
| Consumer Discretionary | | $ | 91,756,086 | | $ | 6,746 | | — | | $ | 91,762,832 | |
| Consumer Staples | | | 42,749,892 | | | — | | — | | | 42,749,892 | |
| Energy | | | 257,624,002 | | | 58,922 | | — | | | 257,682,924 | |
| Financials | | | 64,924,786 | | | — | | — | | | 64,924,786 | |
| Health Care | | | 15,576,783 | | | — | | — | | | 15,576,783 | |
| Industrials | | | 126,166,316 | | | — | | — | | | 126,166,316 | |
| Information Technology | | | 39,674,251 | | | — | | — | | | 39,674,251 | |
| Materials | | | 268,861,752 | | | 158 | | — | | | 268,861,910 | |
| Real Estate | | | 20,738,274 | | | — | | — | | | 20,738,274 | |
| Telecommunication Services | | | 4,559,893 | | | — | | — | | | 4,559,893 | |
| Utilities | | | 67,648,993 | | | — | | — | | | 67,648,993 | |
| Rights/Warrants | | | — | | | — | | — | | | — | |
| Securities Lending Collateral | | | — | | | 183,339,124 | | — | | | 183,339,124 | |
| TOTAL | | $ | 1,000,281,028 | | $ | 183,404,950 | | — | | $ | 1,183,685,978 | |
(b) Not applicable.
Item 7. Disclosure of Proxy Voting Policies and Procedures for Closed-End Management Investment Companies.
Not applicable to the registrant.
Item 8. Portfolio Managers of Closed-End Management Investment Companies.
Not applicable to the registrant.
Item 9. Purchases of Equity Securities by Closed-End Management Investment Company and Affiliated Purchasers.
Not applicable to the registrant.
Item 10. Submission of Matters to a Vote of Security Holders.
The registrant has not adopted procedures by which shareholders may recommend nominees to the registrant's Board of Trustees.
Item 11. Controls and Procedures.
(a) Within 90 days of the filing date of this Form N-CSR, Alexander B. Potts, the registrant’s President and Chief Executive Officer, and Michael Clinton, the registrant’s Treasurer and Chief Financial and Accounting Officer, reviewed the registrant’s disclosure controls and procedures (as defined in rule 30a-3(c) under the Investment Company Act of 1940, as amended (the “1940 Act”)) and evaluated their effectiveness. Based on their review, Messrs. Potts and Clinton determined that the disclosure controls and procedures are reasonably designed to ensure that information required to be disclosed by the registrant on Form N-CSR and Form N-Q is accumulated and communicated to the registrant’s management to allow timely decisions regarding required disclosure.
(b) There were no changes in the registrant’s internal control over financial reporting (as defined in Rule 30a-3(d) under the 1940 Act) that occurred during the second fiscal quarter of the period covered by this report that has materially affected, or is reasonably likely to materially affect, the registrant’s internal control over financial reporting.
Item 12. Exhibits.
(a)(1) Not applicable.
(a)(2) The certifications required by Rule 30a-2(a) of the 1940 Act and Section 302 of the Sarbanes-Oxley Act of 2002 (“Sarbanes-Oxley Act”) are filed herewith.
(a)(3) Not applicable.
(b) The certifications required by Rule 30a-2(b) of the 1940 Act and Section 906 of the Sarbanes-Oxley Act are filed herewith.
The certifications provided pursuant to Rule 30a-2(b) of the 1940 Act and Section 906 of the Sarbanes-Oxley Act are not deemed “filed” for purposes of Section 18 of the Securities Exchange Act of 1934, as amended (the “Exchange Act”), or otherwise subject to the liability of that section. Such certifications will not be deemed to be incorporated by reference into any filing under the Securities Act of 1933 or the Exchange Act, except to the extent that the registrant specifically incorporates them by reference.
SIGNATURES
Pursuant to the requirements of the Securities Exchange Act of 1934 and the Investment Company Act of 1940, the registrant has duly caused this report to be signed on its behalf by the undersigned, thereunto duly authorized.
SA FUNDS – INVESTMENT TRUST
| By: | /s/ Alexander B. Potts |
| Alexander B. Potts |
| President and Chief Executive Officer |
Date: March 1, 2017
Pursuant to the requirements of the Securities Exchange Act of 1934 and the Investment Company Act of 1940, this report has been signed below by the following persons on behalf of the registrant and in the capacities and on the dates indicated.
| By: | /s/ Alexander B. Potts |
| Alexander B. Potts |
| President and Chief Executive Officer |
Date: March 1, 2017
| By: | /s/ Michael Clinton |
| Michael Clinton |
| Treasurer and Chief Financial and Accounting Officer |
Date: March 1, 2017