UNITED STATES
SECURITIES AND EXCHANGE COMMISSION
Washington, D.C. 20549
FORM N-CSR
CERTIFIED SHAREHOLDER REPORT OF REGISTERED
MANAGEMENT INVESTMENT COMPANIES
Investment Company Act file number: 811-09195
______________________________________________
SA FUNDS – INVESTMENT TRUST
______________________________________________________________________
(Exact name of registrant as specified in charter)
8182 Maryland Avenue, Suite 500, St. Louis, Missouri 63105
______________________________________________________________________
(Address of principal executive offices) (zip code)
Jeff Yorg, Esq.
Chief Compliance Officer
SA Funds – Investment Trust
8182 Maryland Avenue, Suite 500
St. Louis, Missouri 63105
(Name and Address of Agent for Service)
Copies to:
Brian F. Link, Esq. Vice President and Managing Counsel State Street Bank and Trust Company 1 Congress Street Boston, Massachusetts 02114 | Mark D. Perlow, Esq. Counsel to the Trust Dechert LLP One Bush Street, Suite 1600 San Francisco, California 94104-4446 |
Registrant’s telephone number, including area code: (844) 366-0905
Date of fiscal year end: June 30
Date of reporting period: June 30, 2023
Item 1. Report to Shareholders.
ANNUAL REPORT
June 30, 2023
TABLE OF CONTENTS
Any information in this shareholder report regarding market or economic trends or the factors influencing the performance of SA Funds – Investment Trust (the “Trust”) are statements of the opinion of Trust management as of the date of this report. Any such opinion is subject to change at any time based upon market or other conditions and we disclaim responsibility to update such opinions. These statements should not be relied upon as investment advice. Past performance is no guarantee of future results, and there is no guarantee that stated investment objectives will be achieved.
SA U.S. Fixed Income Fund
MANAGEMENT DISCUSSION OF FUND PERFORMANCE (Unaudited)
The SA U.S. Fixed Income Fund’s goal is to achieve a generally stable return consistent with preservation of capital. Buckingham Strategic Partners, LLC (the “Adviser”) serves as the Fund’s investment adviser and Dimensional Fund Advisors, L.P. (the “Sub-Adviser”) serves as the Fund’s investment sub-adviser. The Fund pursues its goal by investing primarily in obligations issued or guaranteed by the U.S. government or its agencies or instrumentalities, dollar-denominated obligations of foreign issuers issued in the United States, bank obligations, including those of U.S. banks and savings and loan associations and dollar denominated obligations of U.S. subsidiaries and branches of foreign banks, corporate debt obligations, commercial paper, obligations of supranational organizations and repurchase agreements. Generally, the Fund acquires obligations that mature within three years from the date of settlement.
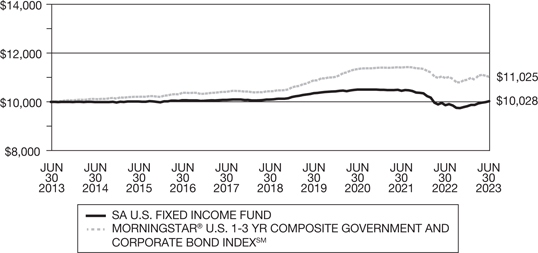
For the fiscal year ended June 30, 2023, the Fund had a net return of 1.65%, compared to a return of 0.47% for the Fund’s benchmark index, the Morningstar® U.S. 1-3 Year Composite Government and Corporate Bond IndexSM. The benchmark index is unmanaged and does not involve fees and expenses like the Fund. The Fund outperformed the benchmark during the fiscal year by 1.18%, after deducting the Fund’s net operating expenses for the year. The Fund outperformed the benchmark index for the fiscal year primarily due to the Fund’s maturity allocation choices. During the fiscal year, the Fund increased the fraction of its assets held in securities with maturities under one year. The benchmark index, however, held on average only a much smaller fraction (4%) in securities that mature in less than one year. During the fiscal year, the US Federal Reserve raised interest rates seven times. When interest rates rise, shorter maturity bonds tend to experience better returns than do longer maturity bonds. As a result, the Fund’s heavier exposure to shorter maturity bonds than that of its benchmark resulted in the Fund’s better performance relative to its benchmark.
Comparison of Change in Value of a $10,000 Investment in the
SA U.S. Fixed Income Fund vs. the Morningstar® U.S. 1-3 Year Composite Government and
Corporate Bond IndexSM from June 30, 2013 through June 30, 2023
SA U.S. Fixed Income Fund
MANAGEMENT DISCUSSION OF FUND PERFORMANCE (Unaudited) (Continued)
The Morningstar® U.S. 1-3 Year Composite Government and Corporate Bond IndexSM is a subset of the Morningstar® U.S. Composite Government and Corporate Bond. The Index is comprised of securities with maturities less than 3 years from the Morningstar® U.S. Composite Government and Corporate Bond IndexSM. The parent index is composed of fixed-rate, investment grade, USD-denominated Corporate, Treasury and Agency bonds with maturities greater than one year. The broader index excludes bonds with embedded options, zero coupon bonds, securitized bonds, and convertible bonds. The index is calculated on a total return basis and is measured in U.S. dollars. The index is unmanaged and reflects reinvested dividends and/or other distributions, but does not reflect sales charges, commissions, expenses, or taxes. You cannot invest directly in an index.
PERFORMANCE INFORMATION – Average Annual Total Returns as of June 30, 2023
| | | Since Inception | | One Year | | Five Years | | Ten Years |
| SA U.S. Fixed Income Fund | | 0.68% | (a) | | 1.65 | % | | -0.14 | % | | -0.03 | % |
| (a) | From commencement of operations on April 2, 2007. |
All returns include the reinvestment of income dividends and other distributions. Results represent past performance and do not indicate future results. Both the value of an investment in the Fund and the return on investment will fluctuate, so that redemption proceeds may be higher or lower than an investor’s original cost. The returns shown do not reflect the deduction of taxes that an investor would pay on Fund distributions or the redemption of Fund shares. Returns would have been lower if Buckingham Strategic Partners, LLC (the “Adviser”) had not reimbursed certain expenses and/or waived a portion of the Advisory fees during certain of the periods shown. As stated in the Fund’s most recent prospectuses, the total annual operating expense ratios for fiscal year 2022 was 0.41% (before expense reimbursement and/or fee waivers, if any). Updated Fund performance information can be obtained by visiting http://www.sa-funds.com.
SA Global Fixed Income Fund
MANAGEMENT DISCUSSION OF FUND PERFORMANCE (Unaudited)
The SA Global Fixed Income Fund’s goal is to maximize total return available from a universe of higher- quality fixed income investments maturing in five years or less from the date of settlement. Buckingham Strategic Partners, LLC (the “Adviser”) serves as the Fund’s investment adviser and Dimensional Fund Advisors, L.P. (the “Sub-Adviser”) serves as the Fund’s investment sub-adviser. The Fund pursues its goal by investing primarily in obligations issued or guaranteed by the U.S. and foreign governments of developed countries or their agencies or instrumentalities; obligations of supranational organizations, and obligations of other U.S. and foreign issuers including corporate debt obligations; commercial paper; bank obligations; and repurchase agreements. The Fund attempts to maximize its total return by allocating assets among countries depending on prevailing interest rates. Securities in which the Fund invests may be denominated in currencies other than U.S. dollars. The Fund may also enter into forward foreign currency exchange contracts to attempt to protect against uncertainty in the level of future foreign currency rates, to hedge against fluctuations in currency exchange rates, or to transfer balances from one currency to another. The Fund may also lend its portfolio securities.
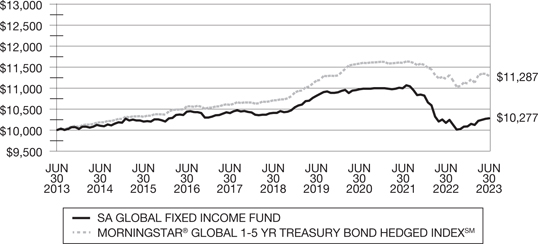
For the fiscal year ended June 30, 2023, the Fund had a net return of 1.06%, compared to a return of 0.63% for the Fund’s benchmark index, the Morningstar® Global 1-5 Year Treasury Bond Hedged IndexSM. The benchmark index is unmanaged and does not involve fees and expenses like the Fund. The Fund outperformed the benchmark during the fiscal year by 0.43% after deducting the Fund’s net operating expenses for the year. The Fund’s outperformance relative to the benchmark across the fiscal year was primarily the result of two factors. First, the Fund tends to hold more non-government securities (such as commercial paper, and corporate bonds) than does the benchmark, during a time when non-government fixed income securities had stronger performance. Second, the Fund tended to hold shorter maturity debt than the benchmark towards the end of the fiscal year, during a time when global interest rates were rising. Shorter maturity debt tends to outperform longer maturity debt during periods of rising interest rates (as was the case during the fiscal year), hence the Fund, with its heavier concentrations in shorter maturity debt than the benchmark, tended to outperform the benchmark.
Comparison of Change in Value of a $10,000 Investment in the
SA Global Fixed Income Fund vs. the Morningstar® Global 1-5 Year Treasury Bond
Hedged IndexSM from June 30, 2013 through June 30, 2023
SA Global Fixed Income Fund
MANAGEMENT DISCUSSION OF FUND PERFORMANCE (Unaudited) (Continued)
The Morningstar® Global 1-5 Year Treasury Bond Hedged IndexSM index is comprised of securities with maturities less than 5 years from the Morningstar® Global Treasury Bond Hedged IndexSM. The parent index is composed of domestic treasury debt publicly issued by sovereign governments in their own currency (or in Euros as applicable), with maturities greater than one year, issued by countries identified by Morningstar as having developed markets. The index is unmanaged and reflects reinvested dividends and/or other distributions, but does not reflect sales charges, commissions, expenses, or taxes. You cannot invest directly in an index.
PERFORMANCE INFORMATION – Average Annual Total Returns as of June 30, 2023:
| | | Since Inception | | One Year | | Five Years | | Ten Years |
| SA Global Fixed Income Fund | | 2.17% | (a) | | 1.06 | % | | -0.25 | % | | 0.27 | % |
| (a) | From commencement of operations on July 29, 1999. |
All returns include the reinvestment of income dividends and other distributions. Results represent past performance and do not indicate future results. Both the value of an investment in the Fund and the return on investment will fluctuate, so that redemption proceeds may be higher or lower than an investor’s original cost. The returns shown do not reflect the deduction of taxes that an investor would pay on Fund distributions or the redemption of Fund shares. Return would have been lower if the Adviser had not reimbursed certain expenses and/or waived a portion of the Advisory fees during certain periods shown. As stated in the Fund’s most recent prospectuses, the total annual operating expense ratios for fiscal year 2022 was 0.50% (before expense reimbursement and/or fee waivers, if any). Updated Fund performance information can be obtained by visiting
http://www.sa-funds.com.
SA U.S. Core Market Fund
MANAGEMENT DISCUSSION OF FUND PERFORMANCE (Unaudited)
The SA U.S. Core Market Fund’s goal is to achieve long-term capital appreciation. Buckingham Strategic Partners, LLC (the “Adviser”) serves as the Fund’s investment adviser and Dimensional Fund Advisors, L.P. (the “Sub-Adviser”) serves as the Fund’s investment sub-adviser. The Fund pursues its goal by generally investing in a broad and diverse group of readily marketable equity securities of U.S. companies traded on a principal U.S. exchange or on the over-the-counter market in the United States. Currently the Sub-Adviser has narrowed the universe of eligible securities to those of companies whose market capitalizations generally are either in the highest 96% of total market capitalization, or companies whose market capitalizations are larger than the 1,500th largest U.S. company, whichever results in the higher market capitalization threshold. The Fund may also invest up to 5% of its total assets in the U.S. Micro Cap Portfolio, a portfolio of DFA Investment Dimensions Group, Inc., a separate registered investment company, to gain more efficient and cost effective exposure to securities whose market capitalizations are generally in the lowest 5% of total market capitalization or companies whose market capitalizations are smaller than the 1,500th largest U.S. company, whichever results in the higher market capitalization threshold. The Fund may also lend its portfolio securities.
For the fiscal year ended June 30, 2023, the Fund had a net return of 19.19% compared to a return of 19.06% for the Fund’s benchmark index, the Morningstar® U.S. Market Extended IndexSM. The benchmark index is unmanaged and does not involve fees and expenses like the Fund. The Fund outperformed the benchmark during the fiscal year by 0.13%, after deducting the Fund’s net operating expenses for the year. Across the fiscal year the Fund held a larger position than did the benchmark in stocks of companies with higher levels of operating profitability while also holding a smaller position than the benchmark in stocks of companies with lower levels of operating profitability. This strategy contributed to the outperformance of the Fund against its benchmark index during the fiscal year. This outperformance was because during the fiscal year the stocks of companies with higher operating profitability (in which the Fund had a larger position than in the benchmark) performed better than the stocks of companies with lower profitability (stocks in which the Fund held smaller positions than in the benchmark).
Comparison of Change in Value of a $10,000 Investment in
the SA U.S. Core Market Fund vs. the Morningstar® U.S. Market
Extended IndexSM from June 30, 2013 through June 30, 2023

SA U.S. Core Market Fund
MANAGEMENT DISCUSSION OF FUND PERFORMANCE (Unaudited) (Continued)
The Morningstar® U.S. Market Extended IndexSM index measures the performance of U.S. equity securities and targets 99.5% market capitalization coverage of the investable U.S. universe. The index is calculated on a total return basis and is measured in U.S. dollars. The index is unmanaged and reflects reinvested dividends and/or other distributions, but does not reflect sales charges, commissions, expenses, or taxes. You cannot invest directly in an index.
PERFORMANCE INFORMATION – Average Annual Total Returns as of June 30, 2023
| | | Since Inception | | One Year | | Five Years | | Ten Years |
| SA U.S. Core Market Fund | | 7.18% | (a) | | 19.19 | % | | 11.16 | % | | 11.98 | % |
| (a) | From commencement of operations on August 5, 1999. |
All returns include the reinvestment of income dividends and other distributions. Results represent past performance and do not indicate future results. Both the value of an investment in the Fund and the return on investment will fluctuate, so that redemption proceeds may be higher or lower than an investor’s original cost. The returns shown do not reflect the deduction of taxes that an investor would pay on Fund distributions or the redemption of Fund shares. Return would have been lower if the Adviser had not reimbursed certain expenses and/or waived a portion of the Advisory fees during certain periods shown. As stated in the Fund’s most recent prospectuses, the total annual operating expense ratios for fiscal year 2022 was 0.67% (before expense reimbursement and/or fee waivers, if any). Updated Fund performance information can be obtained by visiting
http://www.sa-funds.com.
SA U.S. Value Fund
MANAGEMENT DISCUSSION OF FUND PERFORMANCE (Unaudited)
The SA U.S. Value Fund’s goal is to achieve long-term capital appreciation. Buckingham Strategic Partners, LLC (the “Adviser”) serves as the Fund’s investment adviser and Dimensional Fund Advisors, L.P. (the “Sub-Adviser”) serves as the Fund’s investment sub-adviser. The Fund pursues its goal by generally investing in a broad and diverse group of readily marketable equity securities of large and mid-cap U.S. companies traded on a principal U.S. exchange or on the over-the-counter market in the United States that the Sub-Adviser believes are “value” stocks at the time of investment. The Sub-Adviser considers value stocks primarily to be those of companies with high book values (values that are derived from a company’s balance sheet) in relation to their market values (values that are derived by multiplying the market price per share of a company’s stock by the number of outstanding shares of that stock). Currently the Sub-Adviser considers large and mid-capitalization companies to be companies whose market capitalizations generally are either in the highest 90% of total market capitalization or companies whose market capitalizations are larger than the 1,000th largest U.S. company, whichever results in the higher market capitalization threshold. The Fund may also lend its portfolio securities.
For the fiscal year ended June 30, 2023, the Fund had a net return of 11.31%, compared to a return of 13.10% for the Fund’s benchmark index, the Morningstar® U.S. Large-Mid Cap Broad Value IndexSM. The benchmark index is unmanaged and does not involve fees and expenses like the Fund. The Fund underperformed the benchmark during the fiscal year by 1.79%, after deducting the Fund’s net operating expenses for the year. Across the fiscal year the Fund maintained a larger position than that of the benchmark in the stocks of companies whose ratio of price-to-book-value was below the average level in the marketplace (known as “deeper value stocks”). The Fund also maintained larger exposures during the fiscal year to smaller capitalization stocks than did the Fund’s benchmark index. Due to the fact that during the fiscal year, both deeper value and smaller cap stocks exhibited weaker performance relative to the other stocks in the Fund’s benchmark, this contributed to the Fund’s underperformance relative to its benchmark.
Comparison of Change in Value of a $10,000 Investment in the
SA U.S. Value Fund vs. the Morningstar® U.S. Large-Mid Cap Broad Value IndexSM
from June 30, 2013 through June 30, 2023

SA U.S. Value Fund
MANAGEMENT DISCUSSION OF FUND PERFORMANCE (Unaudited) (Continued)
The Morningstar® U.S. Large-Mid Cap Broad Value IndexSM targets U.S. equity securities in the cheaper half of the U.S. large and mid-cap markets, as measured by Morningstar’s style score. The index is calculated on a total return basis and is measured in U.S. dollars. The index is unmanaged and reflects reinvested dividends and/or other distributions, but does not reflect sales charges, commissions, expenses, or taxes. You cannot invest directly in an index.
PERFORMANCE INFORMATION – Average Annual Total Returns as of June 30, 2023
| | | Since Inception | | One Year | | Five Years | | Ten Years |
| SA U.S. Value Fund | | 6.25% | (a) | | 11.31 | % | | 6.29 | % | | 8.71 | % |
| (a) | From commencement of operations on August 5, 1999. |
All returns include the reinvestment of income dividends and other distributions. Results represent past performance and do not indicate future results. Both the value of an investment in the Fund and the return on investment will fluctuate, so that redemption proceeds may be higher or lower than an investor’s original cost. The returns shown do not reflect the deduction of taxes that an investor would pay on Fund distributions or the redemption of Fund shares. Return would have been lower if the Adviser had not reimbursed certain expenses and/or waived a portion of the Advisory fees during certain periods shown. As stated in the Fund’s most recent prospectuses, the total annual operating expense ratio for fiscal year 2022 was 0.73% (before expense reimbursement and/or fee waivers, if any). Updated Fund performance information can be obtained by visiting
http://www.sa-funds.com.
SA U.S. Small Company Fund
MANAGEMENT DISCUSSION OF FUND PERFORMANCE (Unaudited)
The SA U.S. Small Company Fund’s goal is to achieve long-term capital appreciation. Buckingham Strategic Partners, LLC (the “Adviser”) serves as the Fund’s investment adviser and Dimensional Fund Advisors, L.P. (the “Sub-Adviser”) serves as the Fund’s investment sub-adviser. The Fund pursues its goal by generally investing in a broad and diverse group of readily marketable equity securities of small capitalization companies traded on a principal U.S. exchange or on the over-the-counter market in the United States. Currently the Sub-Adviser considers small capitalization companies to be companies whose market capitalizations generally are either in the lowest 12.5% of total market capitalization, or companies whose market capitalizations are smaller than the 1,000th largest U.S. company, whichever results in the higher market capitalization threshold. The Fund may also lend its portfolio securities.
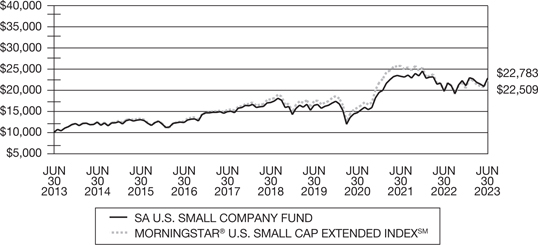
For the fiscal year ended June 30, 2023, the Fund had a net return of 15.29% compared to a return of 13.88% for the Fund’s benchmark index, the Morningstar® U.S. Small Cap Extended IndexSM. The benchmark index is unmanaged and does not involve fees and expenses like the Fund. The Fund outperformed the benchmark during the fiscal year by 1.41% after deducting the Fund’s net operating expenses for the year. The Fund’s outperformance relative to its benchmark index over the fiscal year was the result of multiple factors. First, the Fund tends to exclude stocks of real estate investment trusts, which are held in the Fund’s benchmark index. This exclusion was the primary driver of the Fund’s outperformance against its benchmark index across the fiscal year. Also contributing to the Fund’s outperformance against its benchmark index was the Fund’s tendency to hold the stocks of companies with larger market capitalizations than those found in the index, during a period when such stocks outperformed the smaller capitalization stocks found in the Fund’s benchmark.
Comparison of Change in Value of a $10,000 Investment in the
SA U.S. Small Company Fund vs. the Morningstar® U.S. Small Cap Extended IndexSM
from June 30, 2013 through June 30, 2023
SA U.S. Small Company Fund
MANAGEMENT DISCUSSION OF FUND PERFORMANCE (Unaudited) (Continued)
The Morningstar® U.S. Small Cap Extended IndexSM Index measures the performance of U.S. securities that are within the Morningstar® U.S. Market Extended IndexSM and that fall within the 90th to the 99th percentile of ranked market capitalization of that investable universe. The index is calculated on a total return basis and is measured in U.S. dollars. The index is unmanaged and reflects reinvested dividends and/or other distributions, but does not reflect sales charges, commissions, expenses, or taxes. You cannot invest directly in an index.
PERFORMANCE INFORMATION – Average Annual Total Returns as of June 30, 2023
| | | Since Inception | | One Year | | Five Years | | Ten Years |
| SA U.S. Small Company Fund | | 8.47% | (a) | | 15.29 | % | | 5.90 | % | | 8.58 | % |
| (a) | From commencement of operations on August 5, 1999. |
All returns include the reinvestment of income dividends and other distributions. Results represent past performance and do not indicate future results. Both the value of an investment in the Fund and the return on investment will fluctuate, so that redemption proceeds may be higher or lower than an investor’s original cost. The returns shown do not reflect the deduction of taxes that an investor would pay on Fund distributions or the redemption of Fund shares. Return would have been lower if the Adviser had not reimbursed certain expenses and/or waived a portion of the Advisory fees during certain periods shown. As stated in the Fund’s most recent prospectuses, the total annual operating expense ratios for fiscal year 2022 was 0.87% (before expense reimbursement and/or fee waivers, if any). Updated Fund performance information can be obtained by visiting
http://www.sa-funds.com.
SA International Value Fund
MANAGEMENT DISCUSSION OF FUND PERFORMANCE (Unaudited)
The SA International Value Fund’s goal is to achieve long-term capital appreciation. Buckingham Strategic Partners, LLC (the “Adviser”) serves as the Fund’s investment adviser and Dimensional Fund Advisors, L.P. (the “Sub-Adviser”) serves as the Fund’s investment sub-adviser. The Fund pursues its goal by generally investing in a broad and diverse group of readily marketable equity securities of large- and mid-cap non-U.S. companies that the Sub-Adviser believes are “value” stocks at the time of investment. The Fund’s Sub-Adviser considers value stocks primarily to be those of companies with high book values (values that are derived from a company’s balance sheet) in relation to their market values (values that are derived by multiplying the market price per share of a company’s stock by the number of outstanding shares of that stock). The Fund invests in companies in countries with developed markets designated by the Sub-Adviser as approved markets. Under normal market conditions, the Fund invests in companies organized or having a majority of their operating income from sources in at least three non-U.S. countries. The Fund may also lend its portfolio securities.
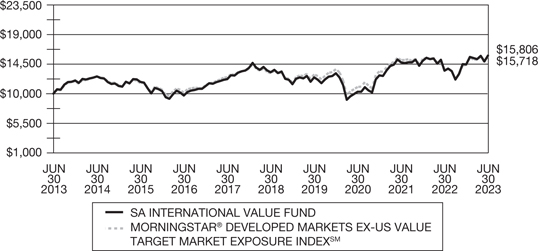
For the fiscal year ended June 30, 2023, the Fund had a net return of 17.05% compared to a return of 16.59% for the Fund’s benchmark index, the Morningstar® Developed Markets ex-U.S. Value Target Market Exposure IndexSM. The benchmark index is unmanaged and does not involve fees and expenses like the Fund. The Fund outperformed the benchmark during the fiscal year by 0.46% after deducting the Fund’s net operating expenses for the year. The outperformance of the Fund relative to the benchmark index was largely due to the Fund’s greater holding of stocks with the lowest ratios of price-to-book-value than the benchmark, commonly called “deep value” stocks. Such deep value stocks had returns during the fiscal year that were stronger than the overall return of the benchmark, hence the Fund’s emphasis on those stocks contributed to the Fund outperforming the benchmark.
Comparison of Change in Value of a $10,000 Investment in the SA International
Value Fund vs. the Morningstar® Developed Markets ex-US Value Target Market
Exposure IndexSM from June 30, 2013 through June 30, 2023
SA International Value Fund
MANAGEMENT DISCUSSION OF FUND PERFORMANCE (Unaudited) (Continued)
The Morningstar® Developed Markets ex-US Value Target Market Exposure IndexSM. The Index contains the cheaper half of the Morningstar® Developed Markets ex-US Target Market Exposure IndexSM, with “cheaper” being defined by Morningstar’s style score. The Morningstar® Developed Markets ex-U.S. Target Market Exposure IndexSM selects those securities that are in the 85% of stocks with the largest market capitalization in each country. Developed markets are those considered “high income” by the World Bank, and currently constitutes (excluding the U.S.) 22 countries. The Index is measured in U.S. dollars and is calculated on a total return basis assuming the reinvestment of dividends after deduction of the local withholding tax that is withheld to non-resident individuals who do not benefit from double taxation treaties.
PERFORMANCE INFORMATION – Average Annual Total Returns as of June 30, 2023
| | | Since Inception | | One Year | | Five Years | | Ten Years |
| SA International Value Fund | | 4.38% | (a) | | 17.05 | % | | 3.57 | % | | 4.68 | % |
| (a) | From commencement of operations on August 5, 1999. |
All returns include the reinvestment of income dividends and other distributions. Results represent past performance and do not indicate future results. Both the value of an investment in the Fund and the return on investment will fluctuate, so that redemption proceeds may be higher or lower than an investor’s original cost. The returns shown do not reflect the deduction of taxes that an investor would pay on Fund distributions or the redemption of Fund shares. Return would have been lower if the Adviser had not reimbursed certain expenses and/or waived a portion of the Advisory fees during certain periods shown. As stated in the Fund’s most recent prospectuses, the total annual operating expense ratios for fiscal year 2022 was 0.89% (before expense reimbursement and/or fee waivers, if any). Updated Fund performance information can be obtained by visiting
http://www.sa-funds.com.
SA International Small Company Fund
MANAGEMENT DISCUSSION OF FUND PERFORMANCE (Unaudited)
The SA International Small Company Fund’s goal is to achieve long-term capital appreciation. Buckingham Strategic Partners, LLC (the “Adviser”) serves as the Fund’s investment adviser and Dimensional Fund Advisors, L.P. (the “Sub-Adviser”) serves as the Fund’s investment sub-adviser. The Fund pursues its goal by investing substantially all its assets in the International Small Company Portfolio of DFA Investment Dimensions Group Inc. (the “DFA Portfolio”), a separate registered investment company with the same investment objective and investment policies as the Fund. The DFA Portfolio invests substantially all its assets in the following series of The DFA Investment Trust Company: The Japanese Small Company Series, The United Kingdom Small Company Series, The Continental Small Company Series, The Asia Pacific Small Company Series and The Canadian Small Company Series (each a “Series”). Each Series invests in small companies using a market capitalization weighted approach in each country or region designated by the Fund’s Sub-Adviser as an approved market for investments. The DFA Portfolio may also have some exposure to small capitalization equity securities associated with other countries or regions but does not invest in emerging market countries. Each Series may also lend its portfolio securities.
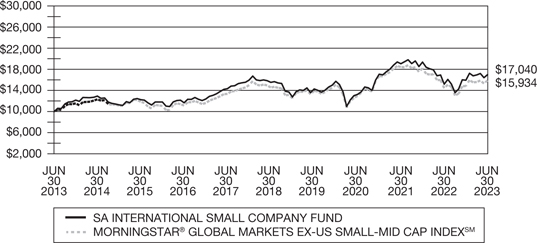
For the fiscal year ended June 30, 2023, the Fund had a net return of 11.85%, compared to a return of 10.12% for the Fund’s benchmark index, the Morningstar® Global Markets ex-US Small-Mid Cap IndexSM. The benchmark index is unmanaged and does not involve fees and expenses like the Fund. The Fund outperformed the benchmark during the fiscal year by 1.73% after deducting the Fund’s net operating expenses for the year. The Fund’s outperformance relative to its benchmark index across the fiscal year was due primarily to the Fund’s larger positioning to smaller stocks in the benchmark during a year when the smaller stocks chosen for the Fund outperformed the benchmark’s overall performance.
Comparison of Change in Value of a $10,000 Investment in the SA International Small
Company Fund vs. the Morningstar® Global Markets ex-US Small-Mid Cap IndexSM
from June 30, 2013 through June 30, 2023
SA International Small Company Fund
MANAGEMENT DISCUSSION OF FUND PERFORMANCE (Unaudited) (Continued)
The Morningstar® Global Markets ex-US Small-Mid Cap IndexSM is a subset of the Morningstar® Global Markets ex-US IndexSM. It contains stocks considered to be small or mid-cap, which includes those stocks falling within the 70th and 97th percentile ranked by market cap. “Global Markets” include both the 22 countries with developed markets (excluding the United States) and the 26 countries considered to be emerging markets. The Index is measured in U.S. dollars and is calculated on a total return basis assuming the reinvestment of dividends after deduction of the local withholding tax that is withheld to non-resident individuals who do not benefit from double taxation treaties. You cannot invest directly in an index.
PERFORMANCE INFORMATION – Average Annual Total Returns as of June 30, 2023
| | | Since Inception | | One Year | | Five Years | | Ten Years |
| SA International Small Company Fund | | 6.42% | (a) | | 11.85 | % | | 1.81 | % | | 5.47 | % |
| (a) | From commencement of operations on August 5, 1999. |
All returns include the reinvestment of income dividends and other distributions. Results represent past performance and do not indicate future results. Both the value of an investment in the Fund and the return on investment will fluctuate, so that redemption proceeds may be higher or lower than an investor’s original cost. The returns shown do not reflect the deduction of taxes that an investor would pay on Fund distributions or the redemption of Fund shares. Return would have been lower if the Adviser had not reimbursed certain expenses and/or waived a portion of the Advisory fees during certain periods shown. As stated in the Fund’s most recent prospectuses, the total annual operating expense ratios for fiscal year 2022 was 0.93% (before expense reimbursement and/or fee waivers, if any). Updated Fund performance information can be obtained by visiting http://www.sa-funds.com.
SA Emerging Markets Value Fund
MANAGEMENT DISCUSSION OF FUND PERFORMANCE (Unaudited)
The SA Emerging Markets Value Fund’s goal is to achieve long-term capital appreciation. Buckingham Strategic Partners, LLC (the “Adviser”) serves as the Fund’s investment adviser and Dimensional Fund Advisors, L.P. (the “Sub-Adviser”) serves as the Fund’s investment sub-adviser. The Fund pursues its goal by generally investing in a broad and diverse group of equity securities of companies in emerging markets, which may include frontier markets (i.e., emerging market countries in an earlier stage of development). The Fund intends to purchase securities of companies with small, medium, and large market capitalizations in their respective markets that the Sub-Adviser considers to be “value” stocks at the time of investment. The Sub-Adviser considers value stocks primarily to be those of companies with high book values (values that are derived from a company’s balance sheet) in relation to their market values (values that are derived by multiplying the market price per share of a company’s stock by the number of outstanding shares of that stock).
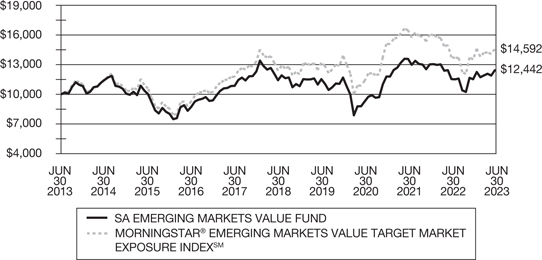
For the fiscal year ended June 30, 2023, the Fund had a net return of 7.72%, compared to a return of 6.03% for the Fund’s benchmark index, the Morningstar® Emerging Markets Value Target Market Exposure IndexSM. The benchmark index is unmanaged and does not involve fees and expenses like the Fund. The Fund outperformed the benchmark during the fiscal year by 1.69% after deducting the Fund’s net operating expenses for the year. Across the fiscal year the Fund maintained a larger position than that of the benchmark in the stocks of companies whose ratio of price-to-book-value was below the average level in the marketplace (known as “deeper value stocks”). During the fiscal year, deeper value stocks exhibited strong performance overall relative to the other stocks in the Fund’s benchmark, contributing to the Fund’s outperformance relative to its benchmark.
Comparison of Change in Value of a $10,000 Investment in the
SA Emerging Markets Value Fund vs. the Morningstar® Emerging Markets
Value Target Market Exposure IndexSM from June 30, 2013 through June 30, 2023
SA Emerging Markets Value Fund
MANAGEMENT DISCUSSION OF FUND PERFORMANCE (Unaudited) (Continued)
The Morningstar® Emerging Markets Value Target Market Exposure IndexSM contains the cheaper half of the Morningstar® Emerging Markets Target Market Exposure IndexSM, with “cheaper” being defined by Morningstar’s style score. The index selects those securities that are in the 85% of stocks with the largest market capitalization in each country (which Morningstar considers to be the large and mid-cap universe). Morningstar defines emerging markets as those countries not considered developed markets, but also meeting a minimum level of economic activity set by Morningstar. The index is measured in U.S. dollars and is calculated on a total return basis assuming the reinvestment of dividends after deduction of the local withholding tax that is withheld to non-resident individuals who do not benefit from double taxation treaties. You cannot invest directly in an index.
PERFORMANCE INFORMATION – Average Annual Total Returns as of June 30, 2023
| | | Since Inception | | One Year | | Five Years | | Ten Years |
| SA Emerging Markets Value Fund | | 1.80% | (a) | | 7.72 | % | | 1.70 | % | | 2.21 | % |
| (a) | From commencement of operations on April 2, 2007. |
All returns include the reinvestment of income dividends and other distributions. Results represent past performance and do not indicate future results. Both the value of an investment in the Fund and the return on investment will fluctuate, so that redemption proceeds may be higher or lower than an investor’s original cost. The returns shown do not reflect the deduction of taxes that an investor would pay on Fund distributions or the redemption of Fund shares. Returns would have been lower if the Adviser had not reimbursed certain expenses and/or waived a portion of the Advisory fees during certain of the periods shown. As stated in the Fund’s most recent prospectuses, the total annual operating expense ratios for fiscal year 2022 was 1.29% (before expense reimbursement and/or fee waivers, if any). Updated Fund performance information can be obtained by visiting http://www.sa-funds.com.
SA Real Estate Securities Fund
MANAGEMENT DISCUSSION OF FUND PERFORMANCE (Unaudited)
The SA Real Estate Securities Fund’s goal is to achieve long-term capital appreciation. Buckingham Strategic Partners, LLC (the “Adviser”) serves as the Fund’s investment adviser and Dimensional Fund Advisors, L.P. (the “Sub-Adviser”) serves as the Fund’s investment sub-adviser. The Fund pursues its goal by generally investing in readily marketable equity securities of companies, the principal activities of which include development, ownership, management, construction, or sale of residential, commercial, or industrial real estate. Investments include, principally, equity securities of companies in the following sectors of the real estate industry: certain real estate investment trusts (“REITS”), companies engaged in residential construction and firms, excluding partnerships, the principal business of which is to develop commercial property. The Fund will make equity investments only in securities traded in the U.S. securities markets.
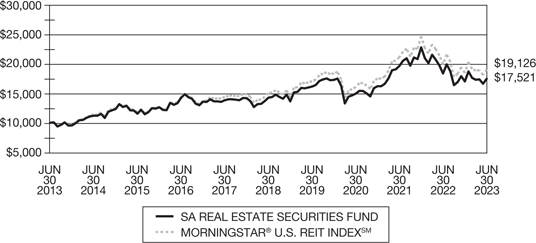
For the fiscal year ended June 30, 2023, the Fund had a net return of −4.95%, compared to a return of -4.32% for the Fund’s benchmark index, the Morningstar® U.S. REIT IndexSM. The benchmark index is unmanaged and does not involve fees and expenses like the Fund. The Fund underperformed the benchmark during the fiscal year by 0.63% after deducting the Fund’s net operating expenses for the year. During the fiscal year, the Fund’s portfolio, prior to the deduction of fees, performed relatively similarly to that of the Fund’s benchmark, which does not charge fees. Hence the primary reason that the Fund’s net performance was less than that of the benchmark during the fiscal year was due to the Fund’s fees and expenses.
Comparison of Change in Value of a $10,000 Investment in the
SA Real Estate Securities Fund vs. the Morningstar® U.S. REIT IndexSM
from June 30, 2013 through June 30, 2023
SA Real Estate Securities Fund
MANAGEMENT DISCUSSION OF FUND PERFORMANCE (Unaudited) (Continued)
The Morningstar® U.S. REIT IndexSM is a subset of the Morningstar® Global REIT IndexSM family. The index tracks the performance of U.S. publicly traded REITs that have been identified for inclusion in the index by a proprietary Morningstar industry classification methodology known as “GECS.” The qualifying standards for inclusion are that the REIT must contain companies that own, manage or lease investment-grade income producing commercial real estate. The index is calculated on a total return basis and is measured in U.S. dollars. You cannot invest directly in an index.
PERFORMANCE INFORMATION – Average Annual Total Returns as of June 30, 2023
| | | Since Inception | | One Year | | Five Years | | Ten Years |
| SA Real Estate Securities Fund | | 3.72% | (a) | | -4.95 | % | | 4.16 | % | | 5.77 | % |
| (a) | From commencement of operations on April 2, 2007. |
All returns include the reinvestment of income dividends and other distributions. Results represent past performance and do not indicate future results. Both the value of an investment in the Fund and the return on investment will fluctuate, so that redemption proceeds may be higher or lower than an investor’s original cost. The returns shown do not reflect the deduction of taxes that an investor would pay on Fund distributions or the redemption of Fund shares. Returns would have been lower if the Adviser had not reimbursed certain expenses and/or waived a portion of the Advisory fees during certain of the periods shown. As stated in the Fund’s most recent prospectuses, the total annual operating expense ratios for fiscal year 2022 was 0.77% (before expense reimbursement and/or fee waivers, if any). Updated Fund performance information can be obtained by visiting http://www.sa-funds.com.
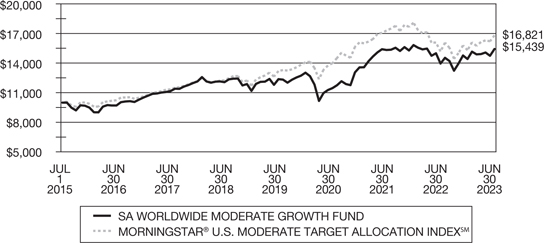
SA Worldwide Moderate Growth Fund
MANAGEMENT DISCUSSION OF FUND PERFORMANCE (Unaudited)
The SA Worldwide Moderate Growth Fund’s goal is to achieve long-term capital appreciation and current income with a greater emphasis on long-term capital appreciation. Buckingham Strategic Partners, LLC (the “Adviser”) serves as the Fund’s investment adviser. The Fund pursues its goal by investing in other mutual funds (“Underlying SA Funds”) managed by the Adviser comprising various asset categories and strategies. Under normal market conditions, the Fund invested approximately 70% of its assets in equity investments and approximately 30% of its assets in fixed income investments as represented by the holdings of the Underlying SA Funds in which the Fund invests. Actual allocations to fixed income investments or equity investments can deviate by up to 10%.
For the fiscal year ended June 30, 2023, the Fund had a net return of 10.57%, compared to a return of 10.73% for the Fund’s benchmark index, the Morningstar® U.S. Moderate Target Allocation IndexSM. The Fund underperformed its benchmark index over the fiscal year by 0.16%. The Fund invests only in Underlying SA Funds, hence the performance of the Fund across the fiscal year was primarily the result of the performance of its Underlying SA Funds. Given the relatively small amount of underperformance of the Fund relative to its benchmark index over the fiscal year, the impact on the Fund’s relative performance by any particular underlying fund was offsetting against the other underlying funds.
Comparison of Change in Value of a $10,000 Investment in the SA Worldwide
Moderate Growth Fund vs. the Morningstar® U.S. Moderate Target
Allocation IndexSM from July 1, 2015 through June 30, 2023
SA Worldwide Moderate Growth Fund
MANAGEMENT DISCUSSION OF FUND PERFORMANCE (Unaudited) (Continued)
The Morningstar® U.S. Moderate Target Allocation IndexSM is a 60% equity and 40% fixed income/cash global asset allocation index designed to be oriented for the USD-based investor. The index is formed as a fixed-weight combination of existing Morningstar indexes that have been designed to give exposure to global stocks and bonds in both developed and emerging markets. The index is calculated on a total return basis and is converted to U.S. dollar returns. You cannot invest directly in an index.
PERFORMANCE INFORMATION – Average Annual Total Returns as of June 30, 2023
| | | Since Inception | | One Year | | Five Years |
| SA Worldwide Moderate Growth Fund | | 5.45% | (a) | | 10.57 | % | | 5.04 | % |
| (a) | From commencement of operations on July 1, 2015. |
All returns include the reinvestment of income dividends and other distributions. Results represent past performance and do not indicate future results. Both the value of an investment in the Fund and the return on investment will fluctuate, so that redemption proceeds may be higher or lower than an investor’s original cost. The returns shown do not reflect the deduction of taxes that an investor would pay on Fund distributions or the redemption of Fund shares. Returns would have been lower if the Adviser had not reimbursed certain expenses and/or waived a portion of the Advisory fees during certain of the periods shown. As stated in the Fund’s most recent prospectus, the total annual operating expense ratio for fiscal year 2022 was 1.37% (before expense reimbursement and/or fee waivers, if any). Updated Fund performance information can be obtained by visiting
http://www.sa-funds.com.
SA U.S. Fixed Income Fund
PORTFOLIO OF INVESTMENTS — AS OF JUNE 30, 2023
| | | FACE
AMOUNT | | | VALUE† | |
| YANKEE CORPORATE BONDS AND NOTES — 11.0% | | | | | | | | |
| Communication — 0.8% | | | | | | | | |
| NTT Finance Corp., 0.583%, 3/01/24 ± | | $ | 3,500,000 | | | $ | 3,382,186 | |
| Financial — 9.7% | | | | | | | | |
| AerCap Ireland Capital DAC/AerCap Global Aviation Trust, 2.875%, 8/14/24 | | | 3,000,000 | | | | 2,883,874 | |
| Bank of Montreal, 0.625%, 7/09/24 | | | 2,000,000 | | | | 1,899,975 | |
| Bank of Montreal, SOFR + 1.330%, 6.420%, 6/05/26 ‡ | | | 1,000,000 | | | | 1,007,152 | |
| Bank of Nova Scotia, SOFR + 1.090%, 6.180%, 6/12/25 ‡ | | | 3,500,000 | | | | 3,509,498 | |
| Canadian Imperial Bank of Commerce, 3.100%, 4/02/24 | | | 4,500,000 | | | | 4,399,629 | |
| Cooperatieve Rabobank UA, 2.625%, 7/22/24 ± | | | 2,000,000 | | | | 1,931,953 | |
| Mitsubishi UFJ Financial Group, Inc., 3.407%, 3/07/24 | | | 3,946,000 | | | | 3,883,401 | |
| NatWest Markets PLC, 0.800%, 8/12/24 ± | | | 4,250,000 | | | | 4,003,677 | |
| Royal Bank of Canada, SOFR + 0.440%, 5.486%, 1/21/25 ‡ | | | 635,000 | | | | 632,184 | |
| Skandinaviska Enskilda Banken AB, 0.650%, 9/09/24 ± | | | 1,000,000 | | | | 940,117 | |
| Societe Generale SA, 2.625%, 10/16/24 ± | | | 750,000 | | | | 710,036 | |
| Sumitomo Mitsui Banking Corp., 3.400%, 7/11/24 | | | 1,000,000 | | | | 975,810 | |
| Sumitomo Mitsui Financial Group, Inc., 2.696%, 7/16/24 | | | 1,966,000 | | | | 1,903,088 | |
| Sumitomo Mitsui Trust Bank Ltd., 0.850%, 3/25/24 ± | | | 4,000,000 | | | | 3,859,084 | |
| Svenska Handelsbanken AB, 3.900%, 11/20/23 | | | 2,000,000 | | | | 1,985,682 | |
| Westpac Banking Corp., 1.019%, 11/18/24 | | | 3,300,000 | | | | 3,105,953 | |
| Westpac Banking Corp., 3.300%, 2/26/24 | | | 2,000,000 | | | | 1,969,245 | |
| | | | | | | | 39,600,358 | |
| Government — 0.5% | | | | | | | | |
| International Bank for Reconstruction & Development, 3.000%, 9/27/23 | | | 1,000,000 | | | | 994,312 | |
| Province of Alberta Canada, 3.350%, 11/01/23 | | | 1,000,000 | | | | 993,283 | |
| | | | | | | | 1,987,595 | |
TOTAL YANKEE CORPORATE BONDS AND NOTES
(Identified Cost $46,532,186) | | | | | | | 44,970,139 | |
| | | | | | | | | |
| CORPORATE BONDS AND NOTES — 13.2% | | | | | | | | |
| Basic Material — 0.2% | | | | | | | | |
| Georgia-Pacific LLC, 3.600%, 3/01/25 ± | | | 1,000,000 | | | | 963,865 | |
| | | | | | | | | |
| Communications — 1.9% | | | | | | | | |
| Amazon.com, Inc., 2.730%, 4/13/24 | | | 5,000,000 | | | | 4,895,851 | |
| Discovery Communications LLC, 3.900%, 11/15/24 | | | 2,680,000 | | | | 2,599,864 | |
| | | | | | | | 7,495,715 | |
| | | | | | | | | |
| Consumer, Cyclical — 1.6% | | | | | | | | |
| General Motors Financial Co., Inc., SOFR + 0.620%, 5.649%, 10/15/24 ‡ | | | 1,939,000 | | | | 1,925,367 | |
| Marriott International, Inc., 3.600%, 4/15/24 | | | 2,750,000 | | | | 2,704,245 | |
| Volkswagen Group of America Finance LLC, 2.850%, 9/26/24 ± | | | 2,000,000 | | | | 1,928,747 | |
| | | | | | | | 6,558,359 | |
| Consumer, Non-cyclical — 1.4% | | | | | | | | |
| Cardinal Health, Inc., 3.079%, 6/15/24 | | | 3,165,000 | | | | 3,082,868 | |
| Elevance Health, Inc., 3.500%, 8/15/24 | | | 1,500,000 | | | | 1,461,756 | |
| Gilead Sciences, Inc., 3.700%, 4/01/24 | | | 1,001,000 | | | | 986,771 | |
| | | | | | | | 5,531,395 | |
| Energy — 0.7% | | | | | | | | |
| Marathon Petroleum Corp., 3.625%, 9/15/24 | | | 3,000,000 | | | | 2,922,026 | |
| | | | | | | | | |
| Financial — 5.6% | | | | | | | | |
| American Express Co., 3.375%, 5/03/24 | | | 4,500,000 | | | | 4,413,457 | |
| American Tower Corp., 0.600%, 1/15/24 | | | 2,500,000 | | | | 2,430,855 | |
| Capital One Financial Corp., 3.200%, 2/05/25 | | | 1,000,000 | | | | 951,534 | |
| Citigroup, Inc., 3.750%, 6/16/24 | | | 3,000,000 | | | | 2,944,388 | |
| Goldman Sachs Group, Inc. (The), 3.850%, 7/08/24 | | | 2,000,000 | | | | 1,962,106 | |
| Goldman Sachs Group, Inc. (The), 4.000%, 3/03/24 | | | 1,000,000 | | | | 987,387 | |
| Morgan Stanley, 3.875%, 4/29/24 | | | 4,800,000 | | | | 4,730,413 | |
| Nuveen Finance LLC, 4.125%, 11/01/24 ± | | | 4,000,000 | | | | 3,885,141 | |
| Ventas Realty LP, 3.750%, 5/01/24 | | | 493,000 | | | | 483,666 | |
| | | | | | | | 22,788,947 | |
| Industrial — 1.1% | | | | | | | | |
| Penske Truck Leasing Co. LP/PTL Finance Corp., 3.450%, 7/01/24 ± | | | 1,750,000 | | | | 1,705,154 | |
| Raytheon Technologies Corp., 3.200%, 3/15/24 | | | 2,695,000 | | | | 2,650,013 | |
| | | | | | | | 4,355,167 | |
| Utility — 0.7% | | | | | | | | |
| Edison International, 3.550%, 11/15/24 | | | 3,000,000 | | | | 2,900,497 | |
TOTAL CORPORATE BONDS AND NOTES
(Identified Cost $55,212,557) | | | | | | | 53,515,971 | |
The accompanying notes are an integral part of these financial statements.
SA U.S. Fixed Income Fund
PORTFOLIO OF INVESTMENTS — AS OF JUNE 30, 2023 (Continued)
| | | FACE
AMOUNT | | | VALUE† | |
| U.S. GOVERNMENT & AGENCY OBLIGATIONS — 64.4% | | | | | | | | |
| Sovereign — 0.2% | | | | | | | | |
| Federal Home Loan Bank Discount Notes, 0.000%, 2/06/24 # | | $ | 1,000,000 | | | $ | 969,546 | |
| | | | | | | | | |
| U.S. Treasury Securities — 64.2% | | | | | | | | |
| U.S. Treasury Floating Rate Note, 3 mo. Treasury Money Market Yield + 0.140%, 5.389%, 10/31/24 ‡ | | | 22,500,000 | | | | 22,517,375 | |
| U.S. Treasury Floating Rate Note, 3 mo. Treasury Money Market Yield + 0.169%, 5.418%, 4/30/25 ‡ | | | 23,750,000 | | | | 23,768,465 | |
| U.S. Treasury Floating Rate Note, 3 mo. Treasury Money Market Yield + 0.200%, 5.449%, 1/31/25 ‡ | | | 40,000,000 | | | | 40,066,905 | |
| U.S. Treasury Note, 0.125%, 8/31/23 | | | 8,000,000 | | | | 7,934,481 | |
| U.S. Treasury Note, 0.125%, 10/15/23 | | | 32,250,000 | | | | 31,784,332 | |
| U.S. Treasury Note, 0.250%, 9/30/23 | | | 27,750,000 | | | | 27,412,874 | |
| U.S. Treasury Note, 0.250%, 11/15/23 | | | 38,000,000 | | | | 37,300,046 | |
| U.S. Treasury Note, 0.375%, 10/31/23 | | | 33,500,000 | | | | 32,973,166 | |
| U.S. Treasury Note, 0.500%, 11/30/23 | | | 37,750,000 | | | | 37,007,539 | |
| | | | | | | | 260,765,183 | |
TOTAL U.S. GOVERNMENT & AGENCY OBLIGATIONS
(Identified Cost $262,942,325) | | | | | | | 261,734,729 | |
| | | | | | | | | |
| SHORT-TERM INVESTMENTS — 11.5% | | | | | | | | |
| Commercial Paper — 9.3% | | | | | | | | |
| Amcor Finance USA, Inc., 5.440%, 7/06/23 | | | 2,500,000 | | | | 2,497,795 | |
| Australia & New Zealand Banking Group Ltd., 0.010%, 11/08/23 | | | 3,000,000 | | | | 2,941,367 | |
| Australia & New Zealand Banking Group Ltd., 5.450%, 11/30/23 | | | 8,000,000 | | | | 7,816,026 | |
| Bayer Corp., 5.300%, 7/10/23 | | | 2,000,000 | | | | 1,997,094 | |
| Entergy Corp., 5.322%, 7/12/23 | | | 2,500,000 | | | | 2,495,604 | |
| Glencore Funding LLC, 5.670%, 11/10/23 | | | 1,793,000 | | | | 1,755,229 | |
| Harley-Davidson Financial Services, Inc., 0.010%, 8/03/23 | | | 2,500,000 | | | | 2,486,759 | |
| John Deere Canada ULC, 0.010%, 7/06/23 | | | 1,000,000 | | | | 999,163 | |
| Lloyds Bank PLC, 5.270%, 8/01/23 | | | 3,500,000 | | | | 3,483,959 | |
| National Securities Clearing Corp., 4.950%, 7/11/23 | | | 2,000,000 | | | | 1,996,904 | |
| National Securities Clearing Corp., 4.960%, 7/13/23 | | | 2,000,000 | | | | 1,996,336 | |
| Nutrien Ltd., 5.500%, 7/24/23 | | | 2,500,000 | | | | 2,491,023 | |
| Sherwin Williams Co., 5.420%, 7/18/23 | | | 2,500,000 | | | | 2,493,452 | |
| Stanley Black & Decker, Inc., 5.450%, 7/18/23 | | | 2,500,000 | | | | 2,493,384 | |
| | | | | | | | 37,944,095 | |
| Investment Company — 2.2% | | | | | | | | |
| State Street Institutional U.S. Government Money Market Fund 4.780% | | | 8,828,846 | | | | 8,828,846 | |
| | | | | | | | | |
TOTAL SHORT-TERM INVESTMENTS
(Identified Cost $46,775,112) | | | | | | $ | 46,772,941 | |
| | | | | | | | | |
Total Investments — 100.1%
(Identified Cost $411,462,180) | | | | | | | 406,993,780 | |
| Liabilities in excess of Cash and Other Assets — (0.1%) | | | | | | | (459,633 | ) |
| Net Assets — 100.0% | | | | | | $ | 406,534,147 | |
| ± | 144A Securities. Securities exempt from registration under Rule 144A of the Securities Act of 1933. These securities may be resold in transactions exempt from registration to qualified institutional buyers. These securities have been deemed by the Fund to be liquid and at June 30, 2023 amounted to $23,309,961 or 5.73% of the net assets of the Fund. |
| ‡ | Floating rate or variable rate note. Rate shown is as of June 30, 2023. |
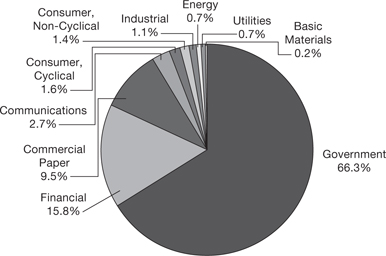
Portfolio Sectors as of June 30, 2023
(As a percentage of total investment excluding short-term money market investment) (Unaudited)
The accompanying notes are an integral part of these financial statements.
SA Global Fixed Income Fund
PORTFOLIO OF INVESTMENTS — AS OF JUNE 30, 2023
| | | | | FACE AMOUNT | | | VALUE† | |
| BONDS AND NOTES — 88.2% | | | | | | | | | | |
| Australia — 5.5% | | | | | | | | | | |
| Australia & New Zealand Banking Group Ltd., 4.050%, 5/12/25 | | AUD | | | 1,000,000 | | | $ | 654,116 | |
| Australia & New Zealand Banking Group Ltd., (3-mo. Swap + 0.920%), 4.792%, 11/04/25 ‡ | | AUD | | | 2,000,000 | | | | 1,339,486 | |
| Australia & New Zealand Banking Group Ltd., (3-mo. Swap + 0.970%), 4.855%, 5/12/27 ‡ | | AUD | | | 500,000 | | | | 334,446 | |
| Australia & New Zealand Banking Group Ltd., (3-mo. Swap + 0.830%), 5.181%, 3/31/26 ‡ | | AUD | | | 1,000,000 | | | | 668,164 | |
| Commonwealth Bank of Australia, 4.200%, 8/18/25 | | AUD | | | 1,700,000 | | | | 1,112,752 | |
| Commonwealth Bank of Australia, (3-mo. Swap + 0.700%), 4.354%, 1/14/27 ‡ | | AUD | | | 1,000,000 | | | | 663,701 | |
| Commonwealth Bank of Australia, (3-mo. Swap + 0.900%), 4.545%, 1/13/26 ‡ | | AUD | | | 3,000,000 | | | | 2,008,534 | |
| Commonwealth Bank of Australia, (3-mo. Swap + 0.800%), 4.719%, 8/18/25 ‡ | | AUD | | | 1,500,000 | | | | 1,002,022 | |
| Commonwealth Bank of Australia, (3-mo. Swap + 1.150%), 4.795%, 1/13/28 ‡ | | AUD | | | 1,500,000 | | | | 1,009,902 | |
| National Australia Bank Ltd., 0.250%, 5/20/24 | | EUR | | | 2,076,000 | | | | 2,191,613 | |
| National Australia Bank Ltd., 2.900%, 2/25/27 | | AUD | | | 1,000,000 | | | | 618,311 | |
| National Australia Bank Ltd., 3.900%, 5/30/25 | | AUD | | | 2,400,000 | | | | 1,564,657 | |
| National Australia Bank Ltd., (3-mo. Swap + 0.920%), 4.850%, 11/25/25 ‡ | | AUD | | | 2,500,000 | | | | 1,673,924 | |
| National Australia Bank Ltd., (3-mo. Swap + 0.900%), 4.858%, 5/30/25 ‡ | | AUD | | | 3,500,000 | | | | 2,343,049 | |
| National Australia Bank Ltd., (3-mo. Swap + 1.200%), 5.130%, 11/25/27 ‡ | | AUD | | | 500,000 | | | | 337,080 | |
| National Australia Bank Ltd., (SOFR + 0.760%), 5.839%, 5/13/25 ౠ| | USD | | | 3,110,000 | | | | 3,119,523 | |
| Westpac Banking Corp., 0.750%, 10/17/23 | | EUR | | | 1,200,000 | | | | 1,297,243 | |
| Westpac Banking Corp., 2.700%, 3/17/25 | | AUD | | | 1,400,000 | | | | 896,543 | |
| Westpac Banking Corp., 3.300%, 2/26/24 | | USD | | | 3,535,000 | | | | 3,480,640 | |
| Westpac Banking Corp., 4.125%, 6/04/26 | | AUD | | | 2,300,000 | | | | 1,491,866 | |
| Westpac Banking Corp., (3-mo. Swap + 0.700%), 4.376%, 1/25/27 ‡ | | AUD | | | 1,000,000 | | | | 663,572 | |
| Westpac Banking Corp., (3-mo. Swap + 0.750%), 4.662%, 2/16/26 ‡ | | AUD | | | 1,000,000 | | | | 666,542 | |
| Westpac Banking Corp., (3-mo. Swap + 0.800%), 4.674%, 8/11/25 ‡ | | AUD | | | 6,000,000 | | | | 4,008,117 | |
| Westpac Banking Corp., (3-mo. Swap + 0.950%), 4.824%, 11/11/25 ‡ | | AUD | | | 900,000 | | | | 603,149 | |
| Westpac Banking Corp., (3-mo. Swap + 0.950%), 4.862%, 11/16/23 ‡ | | AUD | | | 100,000 | | | | 66,734 | |
| Westpac Banking Corp., (3-mo. Swap + 0.980%), 4.892%, 2/16/28 ‡ | | AUD | | | 500,000 | | | | 334,032 | |
| Westpac Banking Corp., (3-mo. Swap + 0.690%), 5.005%, 3/17/25 ‡ | | AUD | | | 3,000,000 | | | | 2,002,281 | |
| Westpac Banking Corp., (3-mo. Swap + 1.230%), 5.104%, 11/11/27 ‡ | | AUD | | | 1,500,000 | | | | 1,012,399 | |
| | | | | | | | | | 37,164,398 | |
| | | | | | | | | | | |
| Austria — 0.5% | | | | | | | | | | |
| Oesterreichische Kontrollbank AG, 1.250%, 12/15/23 | | GBP | | | 1,400,000 | | | | 1,743,131 | |
| Republic of Austria Government Bond, 1.750%, 10/20/23 ± | | EUR | | | 1,200,000 | | | | 1,303,307 | |
| | | | | | | | | | 3,046,438 | |
| | | | | | | | | | | |
| Belgium — 1.2% | | | | | | | | | | |
| Euroclear Bank SA, 0.125%, 7/07/25 | | EUR | | | 150,000 | | | | 151,807 | |
| Euroclear Bank SA, 0.500%, 7/10/23 | | EUR | | | 1,250,000 | | | | 1,363,323 | |
| Kingdom of Belgium Government Bond, 0.200%, 10/22/23 ± | | EUR | | | 2,900,000 | | | | 3,133,472 | |
| Kingdom of Belgium Government Bond, 2.600%, 6/22/24 ± | | EUR | | | 2,900,000 | | | | 3,136,146 | |
| | | | | | | | | | 7,784,748 | |
| | | | | | | | | | | |
| Canada — 11.7% | | | | | | | | | | |
| Canada Government Bonds, 0.500%, 11/01/23 | | CAD | | | 1,000,000 | | | | 743,999 | |
| CDP Financial, Inc., (SOFR + 0.400%), 5.490%, 5/19/25 ౠ| | USD | | | 5,400,000 | | | | 5,400,045 | |
| CPPIB Capital, Inc., 0.375%, 7/25/23 | | GBP | | | 1,300,000 | | | | 1,646,158 | |
| CPPIB Capital, Inc., 0.375%, 6/20/24 | | EUR | | | 6,450,000 | | | | 6,804,108 | |
| CPPIB Capital, Inc., 0.875%, 12/17/24 | | GBP | | | 1,100,000 | | | | 1,298,447 | |
The accompanying notes are an integral part of these financial statements.
SA Global Fixed Income Fund
PORTFOLIO OF INVESTMENTS — AS OF JUNE 30, 2023 (Continued)
| | | | | FACE
AMOUNT | | | VALUE† | |
| BONDS AND NOTES (Continued) | | | | | | | | | | |
| Canada (Continued) | | | | | | | | | | |
| CPPIB Capital, Inc., 3.125%, 9/25/23 ± | | USD | | | 400,000 | | | $ | 397,820 | |
| Export Development Canada, 0.000%, 1/27/25 # | | EUR | | | 700,000 | | | | 720,791 | |
| Export Development Canada, 1.375%, 12/08/23 | | GBP | | | 1,366,000 | | | | 1,703,162 | |
| Export Development Canada, 2.625%, 2/21/24 | | USD | | | 55,000 | | | | 53,999 | |
| OMERS Finance Trust, 0.450%, 5/13/25 | | EUR | | | 2,450,000 | | | | 2,507,621 | |
| OMERS Finance Trust, 2.500%, 5/02/24 | | USD | | | 810,000 | | | | 789,536 | |
| Ontario Teachers' Finance Trust, 0.500%, 5/06/25 | | EUR | | | 1,350,000 | | | | 1,382,644 | |
| Province of Alberta Canada, 0.500%, 4/16/25 | | EUR | | | 1,900,000 | | | | 1,958,462 | |
| Province of Alberta Canada, 0.625%, 4/18/25 | | EUR | | | 2,300,000 | | | | 2,375,029 | |
| Province of Alberta Canada, 2.950%, 1/23/24 | | USD | | | 1,980,000 | | | | 1,951,850 | |
| Province of Alberta Canada, 3.350%, 11/01/23 | | USD | | | 3,649,000 | | | | 3,624,491 | |
| Province of Manitoba Canada, 2.600%, 4/16/24 | | USD | | | 4,300,000 | | | | 4,201,253 | |
| Province of Ontario Canada, 0.375%, 6/14/24 | | EUR | | | 2,000,000 | | | | 2,110,320 | |
| Province of Ontario Canada, 0.500%, 12/15/23 | | GBP | | | 650,000 | | | | 806,610 | |
| Province of Ontario Canada, 0.875%, 1/21/25 | | EUR | | | 200,000 | | | | 208,460 | |
| Province of Ontario Canada, 3.050%, 1/29/24 | | USD | | | 6,320,000 | | | | 6,230,027 | |
| Province of Ontario Canada, 3.100%, 8/26/25 | | AUD | | | 2,000,000 | | | | 1,283,156 | |
| Province of Ontario Canada, 3.400%, 10/17/23 | | USD | | | 4,528,000 | | | | 4,501,230 | |
| Province of Quebec Canada, 0.750%, 12/13/24 | | GBP | | | 600,000 | | | | 707,428 | |
| Province of Quebec Canada, 0.875%, 1/15/25 | | EUR | | | 2,400,000 | | | | 2,502,686 | |
| Province of Quebec Canada, 2.250%, 7/17/23 | | EUR | | | 2,000,000 | | | | 2,181,482 | |
| Province of Quebec Canada, 2.500%, 4/09/24 | | USD | | | 8,336,000 | | | | 8,142,951 | |
| Province of Quebec Canada, 3.700%, 5/20/26 | | AUD | | | 4,500,000 | | | | 2,905,600 | |
| Royal Bank of Canada, 4.200%, 6/22/26 | | AUD | | | 500,000 | | | | 323,635 | |
| Toronto-Dominion Bank (The), 0.750%, 1/06/26 | | USD | | | 590,000 | | | | 526,741 | |
| Toronto-Dominion Bank (The), 1.200%, 6/03/26 | | USD | | | 259,000 | | | | 230,315 | |
| Toronto-Dominion Bank (The), 1.909%, 7/18/23 | | CAD | | | 5,900,000 | | | | 4,448,874 | |
| Toronto-Dominion Bank (The), 0.625%, 7/20/23 | | EUR | | | 400,000 | | | | 435,912 | |
| Toronto-Dominion Bank (The), 3.226%, 7/24/24 | | CAD | | | 5,300,000 | | | | 3,913,999 | |
| | | | | | | | | | 79,018,841 | |
| | | | | | | | | | | |
| Denmark — 4.2% | | | | | | | | | | |
| Denmark Government Bond, 0.000%, 11/15/24 # | | DKK | | | 143,000,000 | | | | 20,008,586 | |
| Kommunekredit, 0.125%, 8/28/23 | | EUR | | | 1,400,000 | | | | 1,520,015 | |
| Kommunekredit, 0.250%, 2/16/24 | | EUR | | | 2,000,000 | | | | 2,135,649 | |
| Kommunekredit, 0.375%, 11/15/24 | | GBP | | | 250,000 | | | | 294,489 | |
| Kommunekredit, 1.000%, 12/15/23 | | USD | | | 2,600,000 | | | | 2,547,843 | |
| Kommunekredit, 2.000%, 6/25/24 | | GBP | | | 1,300,000 | | | | 1,590,071 | |
| Novo Nordisk Finance Netherlands BV, 0.750%, 3/31/25 @ | | EUR | | | 200,000 | | | | 206,851 | |
| | | | | | | | | | 28,303,504 | |
| | | | | | | | | | | |
| Finland — 2.1% | | | | | | | | | | |
| Finland Government Bond, 0.000%, 9/15/24 ±# | | EUR | | | 3,000,000 | | | | 3,143,234 | |
| Finland Government Bond, 2.000%, 4/15/24 ± | | EUR | | | 800,000 | | | | 863,696 | |
| Finland Treasury Bill, 0.000%, 8/14/23 # | | EUR | | | 2,800,000 | | | | 3,044,301 | |
| Kuntarahoitus Oyj, 0.875%, 12/16/24 @ | | GBP | | | 2,900,000 | | | | 3,423,214 | |
| Kuntarahoitus Oyj, 0.000%, 11/15/24 # | | EUR | | | 500,000 | | | | 518,726 | |
| Kuntarahoitus Oyj, 0.125%, 3/07/24 | | EUR | | | 2,250,000 | | | | 2,398,672 | |
| OP Corporate Bank plc, 1.000%, 5/22/25 | | EUR | | | 1,000,000 | | | | 1,031,549 | |
| | | | | | | | | | 14,423,392 | |
| | | | | | | | | | | |
| France — 5.9% | | | | | | | | | | |
| Agence Francaise de Developpement EPIC, 3.125%, 1/04/24 | | EUR | | | 5,000,000 | | | | 5,433,550 | |
| BNP Paribas SA, 2.875%, 9/26/23 | | EUR | | | 175,000 | | | | 190,560 | |
| Caisse d'Amortissement de la Dette Sociale, 0.125%, 10/25/23 | | EUR | | | 1,300,000 | | | | 1,403,212 | |
| Caisse d'Amortissement de la Dette Sociale, 0.375%, 5/27/24 | | USD | | | 1,500,000 | | | | 1,431,238 | |
| Caisse d'Amortissement de la Dette Sociale, 1.375%, 11/25/24 | | EUR | | | 800,000 | | | | 846,165 | |
| Caisse d'Amortissement de la Dette Sociale, 2.375%, 1/25/24 | | EUR | | | 5,500,000 | | | | 5,959,459 | |
| Caisse d'Amortissement de la Dette Sociale, 3.375%, 3/20/24 | | USD | | | 371,000 | | | | 365,302 | |
The accompanying notes are an integral part of these financial statements.
SA Global Fixed Income Fund
PORTFOLIO OF INVESTMENTS — AS OF JUNE 30, 2023 (Continued)
| | | | | FACE
AMOUNT | | | VALUE† | |
| BONDS AND NOTES (Continued) | | | | | | | | | | |
| France (Continued) | | | | | | | | | | |
| Dexia Credit Local SA, 0.000%, 5/29/24 # | | EUR | | | 1,200,000 | | | $ | 1,264,825 | |
| Dexia Credit Local SA, 0.500%, 7/22/23 | | GBP | | | 1,200,000 | | | | 1,520,203 | |
| Dexia Credit Local SA, 0.500%, 7/16/24 | | USD | | | 5,500,000 | | | | 5,218,793 | |
| Dexia Credit Local SA, 0.500%, 1/17/25 | | EUR | | | 500,000 | | | | 518,567 | |
| Dexia Credit Local SA, 1.250%, 11/26/24 | | EUR | | | 3,500,000 | | | | 3,685,220 | |
| Dexia Credit Local SA, 1.625%, 12/08/23 | | GBP | | | 600,000 | | | | 748,799 | |
| France Treasury Bills BTF, 0.000%, 8/16/23 # | | EUR | | | 100,000 | | | | 108,690 | |
| French Republic Government Bond OAT, 0.000%, 3/25/24 # | | EUR | | | 2,000,000 | | | | 2,127,938 | |
| French Republic Government Bond OAT, 2.250%, 5/25/24 | | EUR | | | 1,000,000 | | | | 1,079,268 | |
| SFIL SA, 0.000%, 5/24/24 # | | EUR | | | 500,000 | | | | 527,074 | |
| SFIL SA, 0.125%, 10/18/24 | | EUR | | | 1,900,000 | | | | 1,979,461 | |
| SNCF Reseau, 4.500%, 1/30/24 | | EUR | | | 200,000 | | | | 218,990 | |
| Societe Nationale SNCF SA, 4.125%, 2/19/25 | | EUR | | | 1,500,000 | | | | 1,645,381 | |
| Societe Nationale SNCF SA, 4.625%, 2/02/24 | | EUR | | | 1,350,000 | | | | 1,478,827 | |
| UNEDIC ASSEO, 0.125%, 11/25/24 | | EUR | | | 800,000 | | | | 830,268 | |
| UNEDIC ASSEO, 0.625%, 2/17/25 | | EUR | | | 300,000 | | | | 312,051 | |
| UNEDIC ASSEO, 2.375%, 5/25/24 | | EUR | | | 1,100,000 | | | | 1,184,921 | |
| | | | | | | | | | 40,078,762 | |
| | | | | | | | | | | |
| Germany — 5.6% | | | | | | | | | | |
| Erste Abwicklungsanstalt, 0.010%, 11/03/23 | | EUR | | | 1,000,000 | | | | 1,078,210 | |
| Erste Abwicklungsanstalt, 0.250%, 3/01/24 | | USD | | | 9,000,000 | | | | 8,685,247 | |
| FMS Wertmanagement, 1.375%, 3/07/25 | | GBP | | | 300,000 | | | | 354,326 | |
| Free State of Bavaria, 0.010%, 1/17/25 | | EUR | | | 150,000 | | | | 154,777 | |
| Kreditanstalt fuer Wiederaufbau, 0.000%, 11/15/24 # | | EUR | | | 300,000 | | | | 312,329 | |
| Kreditanstalt fuer Wiederaufbau, 0.250%, 3/08/24 | | USD | | | 4,733,000 | | | | 4,568,742 | |
| Kreditanstalt fuer Wiederaufbau, 0.875%, 7/18/24 | | GBP | | | 400,000 | | | | 483,547 | |
| Kreditanstalt fuer Wiederaufbau, 1.250%, 12/29/23 | | GBP | | | 1,733,000 | | | | 2,154,377 | |
| Land Berlin, 0.010%, 11/21/23 | | EUR | | | 82,000 | | | | 88,259 | |
| Landeskreditbank Baden-Wuerttemberg Foerderbank, 0.375%, 12/09/24 | | GBP | | | 2,408,000 | | | | 2,826,341 | |
| Landeskreditbank Baden- Wuerttemberg Foerderbank, 1.375%, 12/15/23 | | GBP | | | 1,100,000 | | | | 1,370,167 | |
| Landeskreditbank Baden- Wuerttemberg Foerderbank, 2.000%, 7/23/24 | | USD | | | 7,562,000 | | | | 7,282,508 | |
| Landwirtschaftliche Rentenbank, 4.250%, 1/09/25 | | AUD | | | 3,780,000 | | | | 2,501,749 | |
| Landwirtschaftliche Rentenbank, 5.375%, 4/23/24 | | NZD | | | 1,000,000 | | | | 611,271 | |
| NRW Bank, 0.375%, 12/16/24 | | GBP | | | 1,600,000 | | | | 1,875,630 | |
| NRW Bank, 1.050%, 3/31/26 | | AUD | | | 2,350,000 | | | | 1,416,026 | |
| NRW Bank, 1.375%, 12/15/23 | | GBP | | | 600,000 | | | | 747,456 | |
| State of North Rhine-Westphalia Germany, 0.625%, 12/16/24 | | GBP | | | 1,300,000 | | | | 1,529,184 | |
| | | | | | | | | | 38,040,146 | |
| | | | | | | | | | | |
| Netherlands — 5.0% | | | | | | | | | | |
| BNG Bank NV, 0.050%, 7/11/23 | | EUR | | | 1,100,000 | | | | 1,199,543 | |
| BNG Bank NV, 0.250%, 6/07/24 | | EUR | | | 1,900,000 | | | | 2,008,212 | |
| BNG Bank NV, 2.000%, 4/12/24 | | GBP | | | 2,565,000 | | | | 3,162,318 | |
| BNG Bank NV, 3.250%, 7/15/25 | | AUD | | | 1,400,000 | | | | 904,818 | |
| Enexis Holding NV, 1.500%, 10/20/23 | | EUR | | | 455,000 | | | | 493,097 | |
| Nederlandse Waterschapsbank NV, 2.000%, 12/16/24 | | GBP | | | 1,950,000 | | | | 2,339,501 | |
| Nederlandse Waterschapsbank NV, 0.125%, 9/25/23 | | EUR | | | 130,000 | | | | 140,783 | |
| Nederlandse Waterschapsbank NV, 1.125%, 3/15/24 | | USD | | | 2,150,000 | | | | 2,084,324 | |
| Nederlandse Waterschapsbank NV, 3.000%, 11/16/23 | | EUR | | | 1,000,000 | | | | 1,088,456 | |
| Netherlands Government Bond, 0.000%, 1/15/24 ±# | | EUR | | | 3,050,000 | | | | 3,269,482 | |
| Netherlands Government Bond, 2.000%, 7/15/24 ± | | EUR | | | 9,600,000 | | | | 10,326,077 | |
| Shell International Finance BV, 0.750%, 5/12/24 | | EUR | | | 4,900,000 | | | | 5,208,922 | |
| Shell International Finance BV, 1.125%, 4/07/24 | | EUR | | | 1,130,000 | | | | 1,207,304 | |
| | | | | | | | | | 33,432,837 | |
The accompanying notes are an integral part of these financial statements.
SA Global Fixed Income Fund
PORTFOLIO OF INVESTMENTS — AS OF JUNE 30, 2023 (Continued)
| | | | | FACE
AMOUNT | | | VALUE† | |
| BONDS AND NOTES (Continued) | | | | | | | | | | |
| New Zealand — 0.9% | | | | | | | | | | |
| New Zealand Government Bond, 0.500%, 5/15/24 | | NZD | | | 3,500,000 | | | $ | 2,059,821 | |
| New Zealand Local Government Funding Agency Bond, 2.250%, 4/15/24 | | NZD | | | 6,800,000 | | | | 4,060,615 | |
| | | | | | | | | | 6,120,436 | |
| Norway — 3.1% | | | | | | | | | | |
| DNB Bank ASA, 0.050%, 11/14/23 | | EUR | | | 1,375,000 | | | | 1,479,635 | |
| DNB Bank ASA, 0.600%, 9/25/23 | | EUR | | | 2,000,000 | | | | 2,167,338 | |
| Kommunalbanken AS, 0.250%, 12/08/23 | | USD | | | 5,100,000 | | | | 4,988,200 | |
| Kommunalbanken AS, 1.000%, 12/12/24 | | GBP | | | 750,000 | | | | 887,564 | |
| Kommunalbanken AS, 0.600%, 6/01/26 | | AUD | | | 1,500,000 | | | | 887,127 | |
| Kommunalbanken AS, 1.500%, 12/15/23 | | GBP | | | 400,000 | | | | 498,500 | |
| Kommunalbanken AS, 2.000%, 6/19/24 | | USD | | | 2,000,000 | | | | 1,932,032 | |
| Kommunalbanken AS, 2.750%, 2/05/24 | | USD | | | 600,000 | | | | 590,166 | |
| Kommunalbanken AS, 4.250%, 7/16/25 | | AUD | | | 1,490,000 | | | | 981,715 | |
| Norway Government Bond, 3.000%, 3/14/24 ± | | NOK | | | 68,000,000 | | | | 6,289,595 | |
| | | | | | | | | | 20,701,872 | |
| Supranational — 16.9% | | | | | | | | | | |
| African Development Bank, 0.250%, 1/24/24 | | EUR | | | 800,000 | | | | 856,020 | |
| Asian Development Bank, 1.375%, 12/15/23 | | GBP | | | 6,990,000 | | | | 8,708,902 | |
| Asian Development Bank, 1.625%, 3/15/24 @ | | USD | | | 6,126,000 | | | | 5,964,923 | |
| Asian Development Bank, 2.500%, 12/19/24 | | GBP | | | 750,000 | | | | 907,838 | |
| Asian Infrastructure Investment Bank, (SOFR + 0.620%), 5.079%, 8/16/27 ‡ | | USD | | | 5,000,000 | | | | 4,997,719 | |
| Asian Infrastructure Investment Bank (The), 0.250%, 9/29/23 | | USD | | | 3,299,000 | | | | 3,258,998 | |
| Asian Infrastructure Investment Bank (The), 1.000%, 5/06/26 | | AUD | | | 2,400,000 | | | | 1,430,577 | |
| Council of Europe Development Bank, 0.375%, 3/27/25 | | EUR | | | 787,000 | | | | 810,858 | |
| Eurofima Europaeische Gesellschaft fuer die Finanzierung von Eisenbahnmaterial, 0.250%, 2/09/24 | | EUR | | | 191,000 | | | | 203,986 | |
| Eurofima Europaeische Gesellschaft fuer die Finanzierung von Eisenbahnmaterial, 0.375%, 11/16/23 | | USD | | | 1,000,000 | | | | 981,387 | |
| European Financial Stability Facility, 0.000%, 4/19/24 # | | EUR | | | 9,990,000 | | | | 10,603,378 | |
| European Financial Stability Facility, 0.125%, 10/17/23 | | EUR | | | 756,000 | | | | 817,406 | |
| European Financial Stability Facility, 1.750%, 6/27/24 | | EUR | | | 598,000 | | | | 640,865 | |
| European Financial Stability Facility, 2.125%, 2/19/24 | | EUR | | | 6,550,000 | | | | 7,084,966 | |
| European Investment Bank, 0.000%, 10/16/23 # | | EUR | | | 3,800,000 | | | | 4,108,334 | |
| European Investment Bank, 0.050%, 12/15/23 | | EUR | | | 500,000 | | | | 537,431 | |
| European Investment Bank, 0.500%, 11/15/23 | | EUR | | | 210,000 | | | | 226,801 | |
| European Investment Bank, 0.750%, 11/15/24 | | GBP | | | 1,100,000 | | | | 1,305,894 | |
| European Investment Bank, 0.875%, 12/15/23 | | GBP | | | 2,590,000 | | | | 3,220,381 | |
| European Investment Bank, 0.875%, 9/13/24 @ | | EUR | | | 450,000 | | | | 475,446 | |
| European Investment Bank, 1.250%, 5/12/25 | | SEK | | | 5,000,000 | | | | 441,088 | |
| European Investment Bank, 1.375%, 3/07/25 | | GBP | | | 2,397,000 | | | | 2,836,286 | |
| European Investment Bank, 2.625%, 3/15/24 | | USD | | | 2,100,000 | | | | 2,059,590 | |
| European Investment Bank, 3.250%, 1/29/24 | | USD | | | 1,623,000 | | | | 1,602,902 | |
| European Investment Bank, 4.750%, 8/07/24 | | AUD | | | 700,000 | | | | 466,544 | |
| European Stability Mechanism, 0.000%, 12/16/24 # | | EUR | | | 1,600,000 | | | | 1,658,637 | |
| European Stability Mechanism, 0.100%, 7/31/23 | | EUR | | | 900,000 | | | | 979,885 | |
| European Stability Mechanism, 0.125%, 4/22/24 | | EUR | | | 11,772,620 | | | | 12,499,283 | |
| European Union, 0.800%, 7/04/25 | | EUR | | | 1,104,000 | | | | 1,143,158 | |
| European Union, 1.875%, 4/04/24 | | EUR | | | 500,000 | | | | 538,914 | |
| European Union Bills, 0.000%, 8/04/23 # | | EUR | | | 900,000 | | | | 979,310 | |
| European Union Bills, 0.000%, 10/06/23 # | | EUR | | | 916,000 | | | | 990,507 | |
| Inter-American Development Bank, 1.250%, 12/15/23 | | GBP | | | 9,380,000 | | | | 11,680,560 | |
| Inter-American Development Bank, 1.375%, 12/15/24 | | GBP | | | 1,350,000 | | | | 1,608,279 | |
| Inter-American Development Bank, 3.000%, 2/21/24 | | USD | | | 963,000 | | | | 947,160 | |
| Inter-American Development Bank, 4.750%, 8/27/24 | | AUD | | | 5,500,000 | | | | 3,664,423 | |
| International Bank for Reconstruction & Development, 2.500%, 8/03/23 | | CAD | | | 800,000 | | | | 602,738 | |
The accompanying notes are an integral part of these financial statements.
SA Global Fixed Income Fund
PORTFOLIO OF INVESTMENTS — AS OF JUNE 30, 2023 (Continued)
| | | | | FACE
AMOUNT | | | VALUE† | |
| BONDS AND NOTES (Continued) | | | | | | | | | | |
| Supranational (Continued) | | | | | | | | | | |
| International Bank for Reconstruction & Development, 2.500%, 3/19/24 | | USD | | | 11,000,000 | | | $ | 10,771,921 | |
| International Development Association, 0.750%, 12/12/24 | | GBP | | | 637,000 | | | | 752,126 | |
| Nordic Investment Bank, 1.500%, 3/13/25 | | NOK | | | 6,000,000 | | | | 532,467 | |
| | | | | | | | | | 113,897,888 | |
| | | | | | | | | | | |
| Sweden — 6.8% | | | | | | | | | | |
| Kommuninvest I Sverige AB, 3.250%, 1/16/24 | | USD | | | 3,343,000 | | | | 3,301,469 | |
| Kommuninvest I Sverige AB, 0.375%, 2/16/24 | | USD | | | 1,500,000 | | | | 1,453,144 | |
| Kommuninvest I Sverige AB, 1.000%, 11/13/23 | | SEK | | | 24,000,000 | | | | 2,202,698 | |
| Kommuninvest I Sverige AB, 1.000%, 10/02/24 | | SEK | | | 40,670,000 | | | | 3,631,727 | |
| Kommuninvest I Sverige AB, 1.000%, 5/12/25 | | SEK | | | 19,000,000 | | | | 1,668,034 | |
| Kommuninvest I Sverige AB, 1.375%, 5/08/24 ± | | USD | | | 750,000 | | | | 724,240 | |
| Kommuninvest I Sverige AB, 1.375%, 5/08/24 | | USD | | | 4,200,000 | | | | 4,055,742 | |
| Kommuninvest I Sverige AB, 2.875%, 7/03/24 ± | | USD | | | 1,671,000 | | | | 1,626,939 | |
| Skandinaviska Enskilda Banken AB, 1.200%, 9/09/26 ± | | USD | | | 1,899,000 | | | | 1,648,789 | |
| Skandinaviska Enskilda Banken AB, 1.400%, 11/19/25 ± | | USD | | | 1,966,000 | | | | 1,772,127 | |
| Svensk Exportkredit AB, 3.625%, 9/03/24 | | USD | | | 2,875,000 | | | | 2,810,664 | |
| Svensk Exportkredit AB, 0.375%, 3/11/24 | | USD | | | 3,000,000 | | | | 2,895,060 | |
| Svensk Exportkredit AB, 0.375%, 7/30/24 | | USD | | | 6,363,000 | | | | 6,020,746 | |
| Svensk Exportkredit AB, 0.500%, 11/10/23 | | USD | | | 2,000,000 | | | | 1,966,235 | |
| Svensk Exportkredit AB, 1.375%, 12/15/23 | | GBP | | | 1,900,000 | | | | 2,366,392 | |
| Svenska Handelsbanken AB, 0.125%, 6/18/24 | | EUR | | | 1,700,000 | | | | 1,788,087 | |
| Svenska Handelsbanken AB, 0.550%, 6/11/24 ± | | USD | | | 250,000 | | | | 237,992 | |
| Svenska Handelsbanken AB, 1.000%, 4/15/25 | | EUR | | | 300,000 | | | | 310,494 | |
| Sweden Government Bond, 1.500%, 11/13/23 | | SEK | | | 57,500,000 | | | | 5,290,197 | |
| | | | | | | | | | 45,770,776 | |
| | | | | | | | | | | |
| Switzerland — 0.2% | | | | | | | | | | |
| Novartis Finance SA, 0.125%, 9/20/23 | | EUR | | | 1,000,000 | | | | 1,082,972 | |
| | | | | | | | | | | |
| United Kingdom — 2.3% | | | | | | | | | | |
| Network Rail Infrastructure Finance PLC, 4.750%, 1/22/24 | | GBP | | | 1,955,000 | | | | 2,467,627 | |
| U.K. Treasury Bill, 0.000%, 7/31/23 # | | GBP | | | 5,700,000 | | | | 7,212,267 | |
| U.K. Treasury Bill, 0.000%, 12/04/23 # | | GBP | | | 4,800,000 | | | | 5,957,450 | |
| | | | | | | | | | 15,637,344 | |
| | | | | | | | | | | |
| United States — 16.3% | | | | | | | | | | |
| Abbott Ireland Financing DAC, 0.100%, 11/19/24 | | EUR | | | 250,000 | | | | 258,821 | |
| Abbott Ireland Financing DAC, 0.875%, 9/27/23 | | EUR | | | 1,480,000 | | | | 1,604,084 | |
| Amazon.com, Inc., 1.000%, 5/12/26 | | USD | | | 1,604,000 | | | | 1,442,138 | |
| Amazon.com, Inc., 2.730%, 4/13/24 | | USD | | | 7,000,000 | | | | 6,854,192 | |
| Apple, Inc., 0.700%, 2/08/26 | | USD | | | 304,000 | | | | 274,068 | |
| Apple, Inc., 2.513%, 8/19/24 | | CAD | | | 5,000,000 | | | | 3,660,717 | |
| Apple, Inc., 3.600%, 6/10/26 | | AUD | | | 500,000 | | | | 321,455 | |
| Berkshire Hathaway, Inc., 0.000%, 3/12/25 # | | EUR | | | 420,000 | | | | 429,180 | |
| Berkshire Hathaway, Inc., 3.125%, 3/15/26 | | USD | | | 3,578,000 | | | | 3,447,983 | |
| Exxon Mobil Corp., 0.142%, 6/26/24 | | EUR | | | 4,614,000 | | | | 4,851,829 | |
| Federal Home Loan Bank Discount Notes, 0.000%, 2/26/24 # | | USD | | | 2,000,000 | | | | 1,934,858 | |
| Procter & Gamble Co. (The), 0.625%, 10/30/24 | | EUR | | | 1,000,000 | | | | 1,045,878 | |
| Procter & Gamble Co. (The), 1.125%, 11/02/23 | | EUR | | | 100,000 | | | | 108,194 | |
| Roche Holdings, Inc., 3.350%, 9/30/24 ± | | USD | | | 5,000,000 | | | | 4,872,929 | |
| Sanofi, 0.625%, 4/05/24 | | EUR | | | 2,900,000 | | | | 3,092,995 | |
| Sanofi, 0.875%, 4/06/25 | | EUR | | | 300,000 | | | | 311,723 | |
| U.S. Treasury Floating Rate Note, (3 mo. Treasury money market yield + 0.140%), 5.389%, 10/31/24 ‡ | | USD | | | 10,000,000 | | | | 10,007,722 | |
| U.S. Treasury Floating Rate Note, (3 mo. Treasury money market yield + 0.169%), 5.418%, 4/30/25 ‡@ | | USD | | | 38,000,000 | | | | 38,029,545 | |
| U.S. Treasury Floating Rate Note, (3 mo. Treasury money market yield + 0.200%), 5.449%, 1/31/25 ‡ | | USD | | | 12,000,000 | | | | 12,020,072 | |
| U.S. Treasury Note, 0.125%, 8/15/23 | | USD | | | 7,250,000 | | | | 7,206,120 | |
| U.S. Treasury Note, 0.125%, 10/15/23 | | USD | | | 8,000,000 | | | | 7,884,485 | |
| | | | | | | | | | 109,658,988 | |
| | | | | | | | | | | |
| TOTAL BONDS AND NOTES | | | | | | | | | | |
| (Identified Cost $589,151,363) | | | | | | | | | 594,163,342 | |
The accompanying notes are an integral part of these financial statements.
SA Global Fixed Income Fund
PORTFOLIO OF INVESTMENTS — AS OF JUNE 30, 2023 (Continued)
| | | FACE
AMOUNT | | | VALUE† | |
| BONDS AND NOTES (Continued) | | | | | | | | |
| SHORT-TERM INVESTMENTS — 11.8% | | | | | | | | |
| Commercial Paper — 10.8% | | | | | | | | |
| Australia & New Zealand Banking Group Ltd. | | | 4,000,000 | | | $ | 3,908,013 | |
| Bank of Montreal | | | 5,000,000 | | | | 4,843,450 | |
| Bank of Montreal | | | 4,000,000 | | | | 3,974,000 | |
| Bank of Montreal | | | 1,000,000 | | | | 992,446 | |
| Canadian Imperial Bank of Commerce | | | 8,000,000 | | | | 7,761,752 | |
| Canadian Imperial Bank of Commerce | | | 3,500,000 | | | | 3,417,907 | |
| Canadian Imperial Bank of Commerce | | | 3,500,000 | | | | 3,415,652 | |
| Cooperatieve Rabobank UA | | | 2,000,000 | | | | 1,952,833 | |
| DNB Bank ASA | | | 7,000,000 | | | | 6,798,450 | |
| Export Development Canada | | | 10,000,000 | | | | 9,696,211 | |
| Fms Wertmanagement | | | 1,000,000 | | | | 987,783 | |
| Hydro Quebec | | | 3,500,000 | | | | 3,497,093 | |
| National Securities Clearing Corp. | | | 2,000,000 | | | | 1,996,904 | |
| National Securities Clearing Corp. | | | 2,000,000 | | | | 1,996,336 | |
| Toronto Dominion Bank (The) | | | 7,000,000 | | | | 6,788,407 | |
| United Overseas Bank Ltd. | | | 11,000,000 | | | | 10,916,647 | |
| | | | | | | | 72,943,884 | |
| | | | | | | | | |
| | | SHARES | | | | | |
| Investment Company — 0.2% | | | | | | | | |
| State Street Institutional U.S. Government Money Market Fund 4.780% | | | 1,077,536 | | | | 1,077,536 | |
| | | | | | | | | |
| Collateral For Securities On Loan — 0.8% | | | | | | | | |
| State Street Navigator Securities Lending Government Money Market Portfolio 5.110% | | | 5,297,645 | | | | 5,297,645 | |
| | | | | | | | | |
TOTAL SHORT-TERM INVESTMENTS
(Identified Cost $79,336,614) | | | | | | | 79,319,065 | |
| | | | | | | | | |
Total Investments — 100.0%
(Identified Cost $668,487,977) | | | | | | | 673,482,407 | |
| Liabilities in excess of Cash and Other Assets — 0.0% | | | | | | | (24,852 | ) |
| Net Assets — 100.0% | | | | | | $ | 673,457,555 | |
| ‡ | Floating rate or variable rate note. Rate shown is as of June 30, 2023. |
| ± | 144A Securities. Securities exempt from registration under Rule 144A of the Securities Act of 1933. These securities may be resold in transactions exempt from registration to qualified institutional buyers. These securities have been deemed by the Fund to be liquid and at June 30, 2023 amounted to $51,265,414 or 7.61% of the net assets of the Fund. |
| @ | A portion or all of the security were held on loan. As of June 30, 2023, the fair value of the securities on loan was $5,146,321. |
Key to abbreviations:
AUD — Australian Dollar
CAD — Canadian Dollar
DKK — Danish Krone
EUR — Euro Currency
GBP — British Pound
NOK — Norwegian Krone
NZD — New Zealand Dollar
SEK — Swedish Krona
SGD — Singapore Dollar
USD — U.S. Dollar
Country weightings as of June 30, 2023
(As a percentage of total investment excluding short-term money market investment) (Unaudited)
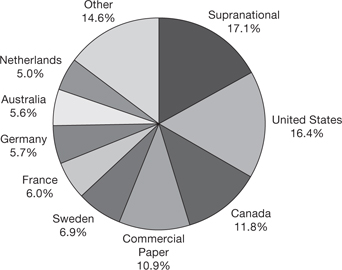
The accompanying notes are an integral part of these financial statements.
SA Global Fixed Income Fund
PORTFOLIO OF INVESTMENTS — AS OF JUNE 30, 2023 (Continued)
| Forward Foreign Currency Exchange Contracts sold outstanding as of June 30, 2023 | |
| Settlement | | Currency | | Currency | | | | Total | | | Unrealized | | | Unrealized | |
| Date | | Purchased | | Sold | | Counterparty | | Value | | | Appreciation | | | Depreciation | |
| 07/03/23 | | USD | | 611,357 | | AUD | | 898,155 | | State Street Bank and Trust Co. | | $ | 598,306 | | | $ | 13,051 | | | | — | |
| 07/03/23 | | USD | | 7,459,868 | | AUD | | 11,483,688 | | State Street Bank and Trust Co. | | | 7,649,861 | | | | — | | | | (189,993 | ) |
| 07/03/23 | | USD | | 45,723,186 | | EUR | | 42,478,034 | | UBS | | | 46,352,045 | | | | — | | | | (628,859 | ) |
| 07/06/23 | | USD | | 1,576,678 | | AUD | | 2,344,304 | | State Street Bank and Trust Co. | | | 1,561,701 | | | | 14,977 | | | | — | |
| 07/06/23 | | USD | | 6,367,591 | | AUD | | 9,658,491 | | State Street Bank and Trust Co. | | | 6,434,181 | | | | — | | | | (66,589 | ) |
| 07/06/23 | | USD | | 43,781,196 | | EUR | | 40,572,943 | | Morgan Stanley & Co., Inc. | | | 44,275,301 | | | | — | | | | (494,105 | ) |
| 07/10/23 | | USD | | 5,860,330 | | DKK | | 40,662,500 | | State Street Bank and Trust Co. | | | 5,960,898 | | | | — | | | | (100,568 | ) |
| 07/14/23 | | USD | | 39,200,838 | | EUR | | 36,177,953 | | UBS | | | 39,494,358 | | | | — | | | | (293,519 | ) |
| 07/17/23 | | USD | | 40,346,042 | | EUR | | 37,274,910 | | State Street Bank and Trust Co. | | | 40,697,905 | | | | — | | | | (351,863 | ) |
| 07/17/23 | | USD | | 82,875,641 | | GBP | | 65,488,761 | | State Street Bank and Trust Co. | | | 83,177,195 | | | | — | | | | (301,554 | ) |
| 07/19/23 | | USD | | 40,264,862 | | AUD | | 59,746,622 | | Citibank N.A. London | | | 39,815,845 | | | | 449,016 | | | | — | |
| 07/20/23 | | USD | | 3,002,185 | | SGD | | 3,988,000 | | State Street Bank and Trust Co. | | | 2,950,407 | | | | 51,778 | | | | — | |
| 07/21/23 | | USD | | 5,133,236 | | SEK | | 55,147,119 | | Bank of America N.A. | | | 5,116,792 | | | | 16,443 | | | | — | |
| 07/27/23 | | USD | | 7,353,009 | | DKK | | 50,759,304 | | State Street Bank and Trust Co. | | | 7,448,476 | | | | — | | | | (95,467 | ) |
| 07/31/23 | | USD | | 8,235,452 | | AUD | | 12,404,205 | | State Street Bank and Trust Co. | | | 8,269,168 | | | | — | | | | (33,716 | ) |
| 07/31/23 | | USD | | 39,335,733 | | EUR | | 35,920,813 | | State Street Bank and Trust Co. | | | 39,246,613 | | | | 89,120 | | | | — | |
| 08/14/23 | | USD | | 6,598,537 | | DKK | | 45,365,538 | | Morgan Stanley & Co., Inc. | | | 6,664,251 | | | | — | | | | (65,715 | ) |
| 08/21/23 | | USD | | 6,952,243 | | NOK | | 74,249,208 | | Bank of America N.A. | | | 6,929,164 | | | | 23,079 | | | | — | |
| 08/22/23 | | USD | | 40,604,184 | | EUR | | 37,103,309 | | Citibank N.A. London | | | 40,582,855 | | | | 21,329 | | | | — | |
| 08/22/23 | | USD | | 6,797,831 | | NZD | | 11,034,312 | | State Street Bank and Trust Co. | | | 6,770,383 | | | | 27,448 | | | | — | |
| 08/28/23 | | USD | | 5,999,155 | | SEK | | 64,127,635 | | State Street Bank and Trust Co. | | | 5,960,781 | | | | 38,374 | | | | — | |
| 08/29/23 | | USD | | 13,453,286 | | CAD | | 17,805,016 | | State Street Bank and Trust Co. | | | 13,451,761 | | | | 1,525 | | | | — | |
| 09/27/23 | | USD | | 2,299,876 | | SEK | | 24,703,919 | | State Street Bank and Trust Co. | | | 2,299,714 | | | | 162 | | | | — | |
| | | | | | | | | | | | | | | | | $ | 746,302 | | | $ | (2,621,948 | ) |
| | | | | | | | | | | | | | | | | | | | | | | |
| Forward Foreign Currency Exchange Contracts purchased outstanding as of June 30, 2023 | | |
| Settlement | | Currency | | Currency | | | | | Total | | | | Unrealized | | | | Unrealized | |
| Date | | Purchased | | Sold | | Counterparty | | | Value | | | | Appreciation | | | | Depreciation | |
| 07/03/23 | | AUD | | 12,381,843 | | USD | | 8,214,238 | | State Street Bank and Trust Co. | | $ | 8,248,167 | | | $ | 33,928 | | | $ | — | |
| 07/03/23 | | EUR | | 6,630,139 | | USD | | 7,123,539 | | State Street Bank and Trust Co. | | | 7,234,810 | | | | 111,271 | | | | — | |
| 07/03/23 | | EUR | | 35,847,895 | | USD | | 39,201,824 | | State Street Bank and Trust Co. | | | 39,117,235 | | | | — | | | | (84,589 | ) |
| 07/06/23 | | EUR | | 3,757,372 | | USD | | 4,044,854 | | State Street Bank and Trust Co. | | | 4,100,239 | | | | 55,386 | | | | — | |
| 07/06/23 | | EUR | | 18,006,881 | | USD | | 19,658,460 | | State Street Bank and Trust Co. | | | 19,650,043 | | | | — | | | | (8,416 | ) |
| 07/14/23 | | EUR | | 612,571 | | USD | | 669,444 | | State Street Bank and Trust Co. | | | 668,725 | | | | — | | | | (719 | ) |
| 07/17/23 | | EUR | | 1,757,926 | | USD | | 1,926,583 | | State Street Bank and Trust Co. | | | 1,919,359 | | | | — | | | | (7,225 | ) |
| 07/19/23 | | AUD | | 3,935,309 | | USD | | 2,578,752 | | State Street Bank and Trust Co. | | | 2,622,536 | | | | 43,784 | | | | — | |
| 07/19/23 | | AUD | | 13,370,369 | | USD | | 8,995,419 | | State Street Bank and Trust Co. | | | 8,910,169 | | | | — | | | | (85,249 | ) |
| 07/20/23 | | SGD | | 3,988,000 | | USD | | 2,968,619 | | State Street Bank and Trust Co. | | | 2,950,407 | | | | — | | | | (18,213 | ) |
| 07/31/23 | | EUR | | 3,492,045 | | USD | | 3,816,154 | | State Street Bank and Trust Co. | | | 3,815,363 | | | | — | | | | (791 | ) |
| 08/22/23 | | EUR | | 1,566,455 | | USD | | 1,724,523 | | State Street Bank and Trust Co. | | | 1,713,357 | | | | — | | | | (11,166 | ) |
| | | | | | | | | | | | | | | | | $ | 244,369 | | | $ | (216,368 | ) |
| Total | | | | | | | | | | | | | | | | $ | 990,671 | | | $ | (2,838,316 | ) |
The accompanying notes are an integral part of these financial statements.
SA U.S. Core Market Fund
PORTFOLIO OF INVESTMENTS — AS OF JUNE 30, 2023
| | | SHARES | | | VALUE† | |
| COMMON STOCKS — 96.1% | | | | | | | | |
| Aerospace & Defense — 1.6% | | | | | | | | |
| Aerojet Rocketdyne Holdings, Inc.* | | | 897 | | | $ | 49,218 | |
| Axon Enterprise, Inc.* | | | 500 | | | | 97,560 | |
| Boeing Co. (The)* | | | 8,201 | | | | 1,731,723 | |
| BWX Technologies, Inc. | | | 2,913 | | | | 208,483 | |
| Curtiss-Wright Corp. | | | 847 | | | | 155,560 | |
| General Dynamics Corp. | | | 3,788 | | | | 814,988 | |
| HEICO Corp. | | | 574 | | | | 101,563 | |
| HEICO Corp., Class A | | | 625 | | | | 87,875 | |
| Hexcel Corp. | | | 778 | | | | 59,144 | |
| Howmet Aerospace, Inc. | | | 1,946 | | | | 96,444 | |
| Huntington Ingalls Industries, Inc. | | | 827 | | | | 188,225 | |
| L3Harris Technologies, Inc. | | | 2,258 | | | | 442,049 | |
| Lockheed Martin Corp. | | | 6,160 | | | | 2,835,941 | |
| Northrop Grumman Corp. | | | 2,330 | | | | 1,062,014 | |
| Parsons Corp.* | | | 540 | | | | 25,996 | |
| Raytheon Technologies Corp. | | | 14,657 | | | | 1,435,800 | |
| Textron, Inc. | | | 2,582 | | | | 174,621 | |
| TransDigm Group, Inc. | | | 928 | | | | 829,790 | |
| Woodward, Inc. | | | 1,151 | | | | 136,865 | |
| | | | | | | | 10,533,859 | |
| | | | | | | | | |
| Air Freight & Logistics — 0.7% | | | | | | | | |
| CH Robinson Worldwide, Inc. | | | 2,800 | | | | 264,180 | |
| Expeditors International of Washington, Inc. | | | 3,525 | | | | 426,983 | |
| FedEx Corp. | | | 4,796 | | | | 1,188,928 | |
| GXO Logistics, Inc.* | | | 1,934 | | | | 121,494 | |
| United Parcel Service, Inc., Class B | | | 14,911 | | | | 2,672,797 | |
| | | | | | | | 4,674,382 | |
| | | | | | | | | |
| Automobile Components — 0.2% | | | | | | | | |
| Adient PLC* | | | 1,020 | | | | 39,087 | |
| Aptiv PLC* | | | 2,924 | | | | 298,511 | |
| Autoliv, Inc. | | | 1,465 | | | | 124,584 | |
| BorgWarner, Inc. | | | 3,685 | | | | 180,233 | |
| Fox Factory Holding Corp.* | | | 500 | | | | 54,255 | |
| Gentex Corp. | | | 4,249 | | | | 124,326 | |
| Goodyear Tire & Rubber Co. (The)* | | | 3,778 | | | | 51,683 | |
| Lear Corp. | | | 957 | | | | 137,377 | |
| Visteon Corp.* | | | 294 | | | | 42,221 | |
| | | | | | | | 1,052,277 | |
| | | | | | | | | |
| Automobiles — 1.5% | | | | | | | | |
| Ford Motor Co. | | | 38,192 | | | | 577,845 | |
| General Motors Co. | | | 9,249 | | | | 356,641 | |
| Harley-Davidson, Inc. | | | 974 | | | | 34,295 | |
| Tesla, Inc.* | | | 31,938 | | | | 8,360,410 | |
| Thor Industries, Inc. | | | 1,179 | | | | 122,027 | |
| | | | | | | | 9,451,218 | |
| | | | | | | | | |
| Beverages — 1.9% | | | | | | | | |
| Boston Beer Co., Inc. (The), Class A* | | | 197 | | | | 60,763 | |
| Brown-Forman Corp., Class A | | | 1,202 | | | | 81,820 | |
| Brown-Forman Corp., Class B | | | 5,458 | | | | 364,485 | |
| Celsius Holdings, Inc.*@ | | | 396 | | | | 59,079 | |
| Coca-Cola Co. (The) | | | 73,733 | | | | 4,440,201 | |
| Coca-Cola Consolidated, Inc. | | | 132 | | | | 83,955 | |
| Constellation Brands, Inc., Class A | | | 1,757 | | | | 432,451 | |
| Keurig Dr Pepper, Inc. | | | 3,375 | | | | 105,536 | |
| Molson Coors Beverage Co., Class B | | | 1,400 | | | | 92,176 | |
| Monster Beverage Corp.* | | | 9,422 | | | | 541,200 | |
| National Beverage Corp.* | | | 881 | | | | 42,596 | |
| PepsiCo, Inc. | | | 32,018 | | | | 5,930,374 | |
| | | | | | | | 12,234,636 | |
| | | | | | | | | |
| Biotechnology — 2.3% | | | | | | | | |
| AbbVie, Inc. | | | 37,978 | | | | 5,116,776 | |
| Alkermes PLC* | | | 1,447 | | | | 45,291 | |
| Alnylam Pharmaceuticals, Inc.* | | | 1,198 | | | | 227,548 | |
| Amgen, Inc. | | | 12,097 | | | | 2,685,776 | |
| Biogen, Inc.* | | | 2,404 | | | | 684,779 | |
| BioMarin Pharmaceutical, Inc.* | | | 1,169 | | | | 101,329 | |
| CRISPR Therapeutics AG*@ | | | 655 | | | | 36,772 | |
| Exact Sciences Corp.* | | | 1,421 | | | | 133,432 | |
| Exelixis, Inc.* | | | 3,578 | | | | 68,376 | |
| Gilead Sciences, Inc. | | | 23,535 | | | | 1,813,842 | |
| Halozyme Therapeutics, Inc.* | | | 3,014 | | | | 108,715 | |
| Horizon Therapeutics PLC* | | | 1,910 | | | | 196,444 | |
| Incyte Corp.* | | | 894 | | | | 55,652 | |
| Karuna Therapeutics, Inc.* | | | 193 | | | | 41,852 | |
| Moderna, Inc.* | | | 6,737 | | | | 818,545 | |
| Neurocrine Biosciences, Inc.* | | | 608 | | | | 57,334 | |
| Regeneron Pharmaceuticals, Inc.* | | | 1,340 | | | | 962,844 | |
| Sarepta Therapeutics, Inc.* | | | 702 | | | | 80,393 | |
| Seagen, Inc.* | | | 1,042 | | | | 200,543 | |
| United Therapeutics Corp.* | | | 835 | | | | 184,326 | |
| Vertex Pharmaceuticals, Inc.* | | | 2,966 | | | | 1,043,765 | |
| | | | | | | | 14,664,334 | |
| | | | | | | | | |
| Broadline Retail — 3.2% | | | | | | | | |
| Amazon.com, Inc.* | | | 150,045 | | | | 19,559,866 | |
| Dillard’s, Inc., Class A@ | | | 100 | | | | 32,628 | |
| eBay, Inc. | | | 9,533 | | | | 426,030 | |
| Etsy, Inc.* | | | 2,334 | | | | 197,480 | |
| Macy’s, Inc. | | | 4,200 | | | | 67,410 | |
| Ollie’s Bargain Outlet Holdings, Inc.* | | | 691 | | | | 40,029 | |
| | | | | | | | 20,323,443 | |
| | | | | | | | | |
| Building Products — 0.6% | | | | | | | | |
| A.O. Smith Corp. | | | 2,378 | | | | 173,071 | |
| Advanced Drainage Systems, Inc. | | | 200 | | | | 22,756 | |
| Allegion PLC | | | 2,744 | | | | 329,335 | |
| Builders FirstSource, Inc.* | | | 2,521 | | | | 342,856 | |
| Carlisle Cos., Inc. | | | 1,113 | | | | 285,518 | |
| Carrier Global Corp. | | | 15,513 | | | | 771,151 | |
| Fortune Brands Innovations, Inc. | | | 2,330 | | | | 167,644 | |
| Johnson Controls International PLC | | | 580 | | | | 39,521 | |
| Lennox International, Inc. | | | 835 | | | | 272,268 | |
| Masco Corp. | | | 4,275 | | | | 245,299 | |
| Owens Corning | | | 2,690 | | | | 351,045 | |
| Trane Technologies PLC | | | 3,350 | | | | 640,721 | |
| Trex Co., Inc.* | | | 3,239 | | | | 212,349 | |
| UFP Industries, Inc. | | | 812 | | | | 78,805 | |
| | | | | | | | 3,932,339 | |
The accompanying notes are an integral part of these financial statements.
SA U.S. Core Market Fund
PORTFOLIO OF INVESTMENTS — AS OF JUNE 30, 2023 (Continued)
| | | SHARES | | | VALUE† | |
| COMMON STOCKS (Continued) | | | | | | | | |
| Capital Markets — 2.2% | | | | | | | | |
| Affiliated Managers Group, Inc. | | | 600 | | | $ | 89,934 | |
| Ameriprise Financial, Inc. | | | 2,269 | | | | 753,671 | |
| Ares Management Corp., Class A | | | 1,606 | | | | 154,738 | |
| Bank of New York Mellon Corp. (The) | | | 4,707 | | | | 209,556 | |
| BlackRock, Inc. | | | 1,265 | | | | 874,292 | |
| Blackstone, Inc. | | | 6,683 | | | | 621,319 | |
| Carlyle Group, Inc. (The) | | | 1,219 | | | | 38,947 | |
| Cboe Global Markets, Inc. | | | 1,317 | | | | 181,759 | |
| Charles Schwab Corp. (The) | | | 14,444 | | | | 818,686 | |
| CME Group, Inc. | | | 2,477 | | | | 458,963 | |
| Coinbase Global, Inc., Class A* | | | 739 | | | | 52,875 | |
| Evercore, Inc., Class A | | | 400 | | | | 49,436 | |
| FactSet Research Systems, Inc. | | | 757 | | | | 303,292 | |
| Federated Hermes, Inc. | | | 1,052 | | | | 37,714 | |
| Franklin Resources, Inc. | | | 2,732 | | | | 72,972 | |
| Goldman Sachs Group, Inc. (The) | | | 2,825 | | | | 911,176 | |
| Hamilton Lane, Inc. Class A | | | 723 | | | | 57,826 | |
| Houlihan Lokey, Inc. | | | 916 | | | | 90,052 | |
| Interactive Brokers Group, Inc., Class A | | | 962 | | | | 79,913 | |
| Intercontinental Exchange, Inc. | | | 4,781 | | | | 540,635 | |
| Invesco Ltd. | | | 2,611 | | | | 43,891 | |
| Janus Henderson Group PLC | | | 1,850 | | | | 50,413 | |
| Jefferies Financial Group, Inc. | | | 1,620 | | | | 53,735 | |
| KKR & Co., Inc. | | | 5,286 | | | | 296,016 | |
| LPL Financial Holdings, Inc. | | | 2,186 | | | | 475,302 | |
| MarketAxess Holdings, Inc. | | | 800 | | | | 209,136 | |
| Moody’s Corp. | | | 3,822 | | | | 1,328,986 | |
| Morgan Stanley | | | 17,547 | | | | 1,498,514 | |
| Morningstar, Inc. | | | 304 | | | | 59,605 | |
| MSCI, Inc. | | | 1,424 | | | | 668,269 | |
| Nasdaq, Inc. | | | 4,902 | | | | 244,365 | |
| Northern Trust Corp. | | | 2,859 | | | | 211,966 | |
| Raymond James Financial, Inc. | | | 3,195 | | | | 331,545 | |
| Robinhood Markets, Inc., Class A* | | | 1,886 | | | | 18,822 | |
| S&P Global, Inc. | | | 3,341 | | | | 1,339,374 | |
| SEI Investments Co. | | | 2,631 | | | | 156,860 | |
| State Street Corp. | | | 1,628 | | | | 119,137 | |
| Stifel Financial Corp. | | | 2,529 | | | | 150,905 | |
| T. Rowe Price Group, Inc. | | | 4,162 | | | | 466,227 | |
| Tradeweb Markets, Inc., Class A | | | 683 | | | | 46,772 | |
| | | | | | | | 14,167,596 | |
| | | | | | | | | |
| Chemicals — 1.5% | | | | | | | | |
| Air Products & Chemicals, Inc. | | | 3,414 | | | | 1,022,595 | |
| Albemarle Corp. | | | 956 | | | | 213,274 | |
| Ashland, Inc. | | | 970 | | | | 84,303 | |
| Avient Corp. | | | 700 | | | | 28,630 | |
| Axalta Coating Systems Ltd.* | | | 1,604 | | | | 52,627 | |
| Balchem Corp. | | | 630 | | | | 84,930 | |
| Cabot Corp. | | | 991 | | | | 66,288 | |
| Celanese Corp. | | | 1,968 | | | | 227,894 | |
| CF Industries Holdings, Inc. | | | 2,192 | | | | 152,169 | |
| Chemours Co. (The) | | | 2,570 | | | | 94,807 | |
| Corteva, Inc. | | | 5,428 | | | | 311,024 | |
| Dow, Inc. | | | 12,298 | | | | 654,992 | |
| DuPont de Nemours, Inc. | | | 2,632 | | | | 188,030 | |
| Eastman Chemical Co. | | | 1,476 | | | | 123,571 | |
| Ecolab, Inc. | | | 3,437 | | | | 641,654 | |
| Element Solutions, Inc. | | | 4,600 | | | | 88,320 | |
| FMC Corp. | | | 1,937 | | | | 202,107 | |
| H.B. Fuller Co. | | | 339 | | | | 24,242 | |
| Huntsman Corp. | | | 4,223 | | | | 114,106 | |
| International Flavors & Fragrances, Inc. | | | 2,270 | | | | 180,669 | |
| Linde PLC | | | 4,857 | | | | 1,850,906 | |
| Livent Corp.*@ | | | 1,666 | | | | 45,698 | |
| LyondellBasell Industries NV, Class A | | | 6,211 | | | | 570,356 | |
| Mosaic Co. (The) | | | 5,609 | | | | 196,315 | |
| NewMarket Corp. | | | 82 | | | | 32,974 | |
| Olin Corp. | | | 1,800 | | | | 92,502 | |
| PPG Industries, Inc. | | | 3,241 | | | | 480,640 | |
| RPM International, Inc. | | | 2,334 | | | | 209,430 | |
| Sherwin Williams Co. (The) | | | 5,981 | | | | 1,588,075 | |
| Valvoline, Inc. | | | 3,671 | | | | 137,699 | |
| Westlake Corp. | | | 439 | | | | 52,447 | |
| | | | | | | | 9,813,274 | |
| | | | | | | | | |
| Commercial Banks — 2.0% | | | | | | | | |
| Bank of America Corp. | | | 66,036 | | | | 1,894,573 | |
| Bank OZK | | | 1,661 | | | | 66,706 | |
| BOK Financial Corp. | | | 300 | | | | 24,234 | |
| Cadence Bank | | | 3,669 | | | | 72,059 | |
| Citigroup, Inc. | | | 6,473 | | | | 298,017 | |
| Citizens Financial Group, Inc. | | | 454 | | | | 11,840 | |
| Columbia Banking System, Inc. | | | 1,668 | | | | 33,827 | |
| Comerica, Inc. | | | 1,832 | | | | 77,603 | |
| Commerce Bancshares, Inc. | | | 2,384 | | | | 116,101 | |
| Community Bank System, Inc. | | | 356 | | | | 16,689 | |
| Cullen/Frost Bankers, Inc. | | | 956 | | | | 102,799 | |
| East West Bancorp, Inc. | | | 2,039 | | | | 107,639 | |
| Fifth Third Bancorp | | | 7,840 | | | | 205,486 | |
| First Citizens Bancshares, Inc., Class A | | | 112 | | | | 143,746 | |
| First Financial Bankshares, Inc. | | | 3,094 | | | | 88,148 | |
| First Horizon Corp. | | | 7,194 | | | | 81,076 | |
| First Interstate Bancsystem, Inc., Class A | | | 900 | | | | 21,456 | |
| FNB Corp. | | | 5,930 | | | | 67,839 | |
| Home Bancshares, Inc. | | | 1,840 | | | | 41,952 | |
| Huntington Bancshares, Inc. | | | 7,352 | | | | 79,255 | |
| JPMorgan Chase & Co. | | | 38,234 | | | | 5,560,753 | |
| KeyCorp | | | 7,104 | | | | 65,641 | |
| M&T Bank Corp. | | | 522 | | | | 64,603 | |
| New York Community Bancorp, Inc. | | | 6,032 | | | | 67,800 | |
| Pinnacle Financial Partners, Inc. | | | 1,009 | | | | 57,160 | |
| PNC Financial Services Group, Inc. (The) | | | 3,193 | | | | 402,158 | |
| Popular, Inc. | | | 1,880 | | | | 113,778 | |
| Prosperity Bancshares, Inc. | | | 1,026 | | | | 57,948 | |
| Regions Financial Corp. | | | 9,428 | | | | 168,007 | |
| South State Corp. | | | 400 | | | | 26,320 | |
| Synovus Financial Corp. | | | 1,811 | | | | 54,783 | |
| Truist Financial Corp. | | | 7,663 | | | | 232,572 | |
The accompanying notes are an integral part of these financial statements.
SA U.S. Core Market Fund
PORTFOLIO OF INVESTMENTS — AS OF JUNE 30, 2023 (Continued)
| | | SHARES | | | VALUE† | |
| COMMON STOCKS (Continued) | | | | | | | | |
| Commercial Banks (Continued) | | | | | | | | |
| United Bankshares, Inc. | | | 778 | | | $ | 23,083 | |
| US Bancorp | | | 19,610 | | | | 647,914 | |
| Valley National Bancorp | | | 5,897 | | | | 45,702 | |
| Wells Fargo & Co. | | | 31,501 | | | | 1,344,463 | |
| Western Alliance Bancorp | | | 2,242 | | | | 81,766 | |
| Wintrust Financial Corp. | | | 600 | | | | 43,572 | |
| Zions Bancorp NA | | | 2,092 | | | | 56,191 | |
| | | | | | | | 12,665,259 | |
| | | | | | | | | |
| Commercial Services & Supplies — 0.7% | | | | | | | | |
| Casella Waste Systems, Inc., Class A* | | | 549 | | | | 49,657 | |
| Cintas Corp. | | | 1,987 | | | | 987,698 | |
| Clean Harbors, Inc.* | | | 770 | | | | 126,611 | |
| Copart, Inc.* | | | 5,831 | | | | 531,845 | |
| Driven Brands Holdings, Inc.* | | | 1,393 | | | | 37,695 | |
| MSA Safety, Inc. | | | 600 | | | | 104,376 | |
| Republic Services, Inc. | | | 4,657 | | | | 713,313 | |
| Rollins, Inc. | | | 4,629 | | | | 198,260 | |
| Stericycle, Inc.* | | | 1,544 | | | | 71,703 | |
| Tetra Tech, Inc. | | | 640 | | | | 104,794 | |
| Waste Management, Inc. | | | 9,583 | | | | 1,661,884 | |
| | | | | | | | 4,587,836 | |
| | | | | | | | | |
| Communications Equipment — 0.8% | | | | | | | | |
| Arista Networks, Inc.* | | | 2,688 | | | | 435,617 | |
| Ciena Corp.* | | | 2,569 | | | | 109,157 | |
| Cisco Systems, Inc. | | | 63,490 | | | | 3,284,972 | |
| F5, Inc.* | | | 769 | | | | 112,474 | |
| Juniper Networks, Inc. | | | 4,954 | | | | 155,209 | |
| Motorola Solutions, Inc. | | | 2,888 | | | | 846,993 | |
| | | | | | | | 4,944,422 | |
| | | | | | | | | |
| Computers & Peripherals — 8.3% | | | | | | | | |
| Apple, Inc. | | | 264,637 | | | | 51,331,639 | |
| Dell Technologies, Inc., Class C | | | 3,734 | | | | 202,047 | |
| Hewlett Packard Enterprise Co. | | | 9,599 | | | | 161,263 | |
| HP, Inc. | | | 17,328 | | | | 532,143 | |
| NetApp, Inc. | | | 4,285 | | | | 327,374 | |
| Pure Storage, Inc., Class A* | | | 2,027 | | | | 74,634 | |
| Seagate Technology Holdings PLC | | | 4,998 | | | | 309,226 | |
| Super Micro Computer, Inc.* | | | 218 | | | | 54,336 | |
| Western Digital Corp.* | | | 3,176 | | | | 120,466 | |
| | | | | | | | 53,113,128 | |
| | | | | | | | | |
| Construction & Engineering — 0.2% | | | | | | | | |
| AECOM | | | 1,355 | | | | 114,755 | |
| API Group Corp.* | | | 1,855 | | | | 50,567 | |
| Comfort Systems USA, Inc. | | | 533 | | | | 87,519 | |
| EMCOR Group, Inc. | | | 1,104 | | | | 203,997 | |
| Fluor Corp.* | | | 831 | | | | 24,598 | |
| MasTec, Inc.* | | | 1,400 | | | | 165,158 | |
| MDU Resources Group, Inc. | | | 3,960 | | | | 82,922 | |
| Quanta Services, Inc. | | | 2,550 | | | | 500,948 | |
| Valmont Industries, Inc. | | | 200 | | | | 58,210 | |
| WillScot Mobile Mini Holdings Corp.* | | | 1,927 | | | | 92,091 | |
| | | | | | | | 1,380,765 | |
| Construction Materials — 0.1% | | | | | | | | |
| Eagle Materials, Inc. | | | 626 | | | | 116,699 | |
| Knife River Corp.* | | | 990 | | | | 43,065 | |
| Martin Marietta Materials, Inc. | | | 664 | | | | 306,562 | |
| Summit Materials, Inc., Class A* | | | 1,335 | | | | 50,530 | |
| Vulcan Materials Co. | | | 1,521 | | | | 342,894 | |
| | | | | | | | 859,750 | |
| | | | | | | | | |
| Consumer Finance — 0.6% | | | | | | | | |
| Ally Financial, Inc. | | | 3,311 | | | | 89,430 | |
| American Express Co. | | | 12,072 | | | | 2,102,942 | |
| Capital One Financial Corp. | | | 4,875 | | | | 533,179 | |
| Credit Acceptance Corp.*@ | | | 184 | | | | 93,459 | |
| Discover Financial Services | | | 6,077 | | | | 710,097 | |
| FirstCash Holdings, Inc. | | | 1,032 | | | | 96,317 | |
| Nelnet, Inc., Class A | | | 414 | | | | 39,943 | |
| OneMain Holdings, Inc. | | | 677 | | | | 29,578 | |
| SLM Corp. | | | 2,583 | | | | 42,155 | |
| Synchrony Financial | | | 5,488 | | | | 186,153 | |
| | | | | | | | 3,923,253 | |
| | | | | | | | | |
| Consumer Staples Distribution & Retail — 2.1% | | | | | | | | |
| Albertsons Cos., Inc. Class A | | | 714 | | | | 15,579 | |
| BJ’s Wholesale Club Holdings, Inc.* | | | 2,341 | | | | 147,506 | |
| Casey’s General Stores, Inc. | | | 774 | | | | 188,763 | |
| Costco Wholesale Corp. | | | 7,931 | | | | 4,269,892 | |
| Dollar General Corp. | | | 5,246 | | | | 890,666 | |
| Dollar Tree, Inc.* | | | 2,846 | | | | 408,401 | |
| Fresh Market, Inc.@*§ | | | 1,100 | | | | — | |
| Kroger Co. (The) | | | 17,571 | | | | 825,837 | |
| Performance Food Group Co.* | | | 1,336 | | | | 80,481 | |
| Sprouts Farmers Market, Inc.* | | | 1,478 | | | | 54,287 | |
| Sysco Corp. | | | 9,579 | | | | 710,762 | |
| Target Corp. | | | 11,134 | | | | 1,468,575 | |
| US Foods Holding Corp.* | | | 1,600 | | | | 70,400 | |
| Walgreens Boots Alliance, Inc. | | | 6,082 | | | | 173,276 | |
| Walmart, Inc. | | | 25,166 | | | | 3,955,592 | |
| | | | | | | | 13,260,017 | |
| | | | | | | | | |
| Containers & Packaging — 0.4% | | | | | | | | |
| Amcor PLC | | | 13,861 | | | | 138,333 | |
| AptarGroup, Inc. | | | 1,483 | | | | 171,820 | |
| Avery Dennison Corp. | | | 2,232 | | | | 383,458 | |
| Ball Corp. | | | 6,118 | | | | 356,129 | |
| Berry Global Group, Inc. | | | 3,918 | | | | 252,084 | |
| Crown Holdings, Inc.@ | | | 3,506 | | | | 304,566 | |
| Graphic Packaging Holding Co. | | | 6,877 | | | | 165,254 | |
| Greif, Inc., Class A | | | 641 | | | | 44,159 | |
| Greif, Inc., Class B | | | 320 | | | | 24,720 | |
| International Paper Co. | | | 4,336 | | | | 137,928 | |
| O-I Glass, Inc.* | | | 903 | | | | 19,261 | |
| Packaging Corp. of America | | | 1,552 | | | | 205,112 | |
| Sealed Air Corp. | | | 3,059 | | | | 122,360 | |
| Silgan Holdings, Inc. | | | 2,057 | | | | 96,453 | |
| Sonoco Products Co. | | | 1,933 | | | | 114,086 | |
| WestRock Co. | | | 2,401 | | | | 69,797 | |
| | | | | | | | 2,605,520 | |
The accompanying notes are an integral part of these financial statements.
SA U.S. Core Market Fund
PORTFOLIO OF INVESTMENTS — AS OF JUNE 30, 2023 (Continued)
| | | SHARES | | | VALUE† | |
| COMMON STOCKS (Continued) | | | | | | | | |
| Distributors — 0.2% | | | | | | | | |
| Genuine Parts Co. | | | 2,179 | | | $ | 368,752 | |
| LKQ Corp. | | | 4,303 | | | | 250,736 | |
| Pool Corp. | | | 1,026 | | | | 384,381 | |
| | | | | | | | 1,003,869 | |
| | | | | | | | | |
| Diversified Consumer Services — 0.1% | | | | | | | | |
| ADT, Inc. | | | 3,988 | | | | 24,048 | |
| Bright Horizons Family Solutions, Inc.* | | | 639 | | | | 59,076 | |
| Grand Canyon Education, Inc.* | | | 200 | | | | 20,642 | |
| H&R Block, Inc. | | | 2,885 | | | | 91,945 | |
| Service Corp. International | | | 4,767 | | | | 307,900 | |
| | | | | | | | 503,611 | |
| | | | | | | | | |
| Diversified Telecommunication Services — 0.7% | | | | | | | | |
| AT&T, Inc. | | | 65,472 | | | | 1,044,278 | |
| Cogent Communications Holdings, Inc. | | | 659 | | | | 44,344 | |
| Frontier Communications Parent, Inc.* | | | 1,656 | | | | 30,868 | |
| Iridium Communications, Inc. | | | 3,043 | | | | 189,031 | |
| Verizon Communications, Inc. | | | 90,967 | | | | 3,383,063 | |
| | | | | | | | 4,691,584 | |
| | | | | | | | | |
| Electric Utilities — 1.7% | | | | | | | | |
| Allete, Inc. | | | 300 | | | | 17,391 | |
| Alliant Energy Corp. | | | 4,621 | | | | 242,510 | |
| American Electric Power Co., Inc. | | | 8,417 | | | | 708,711 | |
| Avangrid, Inc. | | | 1,433 | | | | 53,995 | |
| Constellation Energy Corp. | | | 5,321 | | | | 487,138 | |
| Duke Energy Corp. | | | 13,107 | | | | 1,176,222 | |
| Edison International | | | 6,635 | | | | 460,801 | |
| Entergy Corp. | | | 2,869 | | | | 279,354 | |
| Evergy, Inc. | | | 3,652 | | | | 213,350 | |
| Eversource Energy | | | 5,876 | | | | 416,726 | |
| Exelon Corp. | | | 15,965 | | | | 650,414 | |
| FirstEnergy Corp. | | | 8,176 | | | | 317,883 | |
| Hawaiian Electric Industries, Inc. | | | 2,245 | | | | 81,269 | |
| IDACORP, Inc. | | | 647 | | | | 66,382 | |
| NextEra Energy, Inc. | | | 36,253 | | | | 2,689,973 | |
| NRG Energy, Inc. | | | 5,256 | | | | 196,522 | |
| OGE Energy Corp. | | | 3,314 | | | | 119,006 | |
| PG&E Corp.* | | | 2,100 | | | | 36,288 | |
| Pinnacle West Capital Corp. | | | 1,978 | | | | 161,128 | |
| PNM Resources, Inc. | | | 2,100 | | | | 94,710 | |
| Portland General Electric Co. | | | 1,411 | | | | 66,077 | |
| PPL Corp. | | | 9,200 | | | | 243,432 | |
| Southern Co. (The) | | | 17,830 | | | | 1,252,557 | |
| Xcel Energy, Inc. | | | 9,222 | | | | 573,332 | |
| | | | | | | | 10,605,171 | |
| | | | | | | | | |
| Electrical Equipment — 0.7% | | | | | | | | |
| Acuity Brands, Inc. | | | 739 | | | | 120,516 | |
| AMETEK, Inc. | | | 3,185 | | | | 515,588 | |
| Atkore, Inc.* | | | 943 | | | | 147,051 | |
| Eaton Corp. PLC | | | 5,446 | | | | 1,095,191 | |
| Emerson Electric Co. | | | 6,519 | | | | 589,252 | |
| EnerSys | | | 564 | | | | 61,205 | |
| Generac Holdings, Inc.* | | | 967 | | | | 144,209 | |
| Hubbell, Inc. | | | 1,043 | | | | 345,817 | |
| nVent Electric PLC | | | 2,290 | | | | 118,324 | |
| Plug Power, Inc.*@ | | | 670 | | | | 6,961 | |
| Regal Rexnord Corp. | | | 1,234 | | | | 189,913 | |
| Rockwell Automation, Inc. | | | 2,306 | | | | 759,712 | |
| Sensata Technologies Holding PLC | | | 2,621 | | | | 117,919 | |
| Shoals Technologies Group, Inc., Class A* | | | 2,112 | | | | 53,983 | |
| Sunrun, Inc.* | | | 1,483 | | | | 26,486 | |
| | | | | | | | 4,292,127 | |
| | | | | | | | | |
| Electronic Equipment, Instruments & Components — 0.8% | | | | | | | | |
| Advanced Energy Industries, Inc. | | | 112 | | | | 12,483 | |
| Amphenol Corp., Class A | | | 10,379 | | | | 881,696 | |
| Arrow Electronics, Inc.* | | | 830 | | | | 118,881 | |
| Avnet, Inc. | | | 944 | | | | 47,625 | |
| Badger Meter, Inc. | | | 331 | | | | 48,842 | |
| CDW Corp. | | | 2,939 | | | | 539,307 | |
| Cognex Corp. | | | 1,711 | | | | 95,850 | |
| Corning, Inc. | | | 8,949 | | | | 313,573 | |
| Fabrinet* | | | 506 | | | | 65,719 | |
| Flex Ltd.* | | | 7,316 | | | | 202,214 | |
| Insight Enterprises, Inc.* | | | 300 | | | | 43,902 | |
| IPG Photonics Corp.* | | | 471 | | | | 63,971 | |
| Jabil, Inc. | | | 3,689 | | | | 398,154 | |
| Keysight Technologies, Inc.* | | | 3,226 | | | | 540,194 | |
| Littelfuse, Inc. | | | 380 | | | | 110,698 | |
| National Instruments Corp. | | | 1,428 | | | | 81,967 | |
| Novanta, Inc.* | | | 661 | | | | 121,690 | |
| Sanmina Corp.* | | | 431 | | | | 25,976 | |
| TD SYNNEX Corp. | | | 836 | | | | 78,584 | |
| TE Connectivity Ltd. | | | 3,575 | | | | 501,072 | |
| Teledyne Technologies, Inc.* | | | 573 | | | | 235,566 | |
| Trimble, Inc.* | | | 2,830 | | | | 149,820 | |
| Vontier Corp. | | | 3,024 | | | | 97,403 | |
| Zebra Technologies Corp., Class A* | | | 767 | | | | 226,902 | |
| | | | | | | | 5,002,089 | |
| | | | | | | | | |
| Energy Equipment & Services — 0.2% | | | | | | | | |
| Baker Hughes Co. | | | 3,464 | | | | 109,497 | |
| ChampionX Corp. | | | 3,461 | | | | 107,430 | |
| Halliburton Co. | | | 12,219 | | | | 403,105 | |
| Helmerich & Payne, Inc. | | | 805 | | | | 28,537 | |
| NOV, Inc. | | | 4,002 | | | | 64,192 | |
| Schlumberger Ltd. | | | 12,666 | | | | 622,154 | |
| TechnipFMC PLC* | | | 4,963 | | | | 82,485 | |
| Transocean Ltd.* | | | 6,590 | | | | 46,196 | |
| Weatherford International PLC* | | | 977 | | | | 64,892 | |
| | | | | | | | 1,528,488 | |
| | | | | | | | | |
| Entertainment — 0.9% | | | | | | | | |
| Activision Blizzard, Inc.* | | | 9,560 | | | | 805,908 | |
| Electronic Arts, Inc. | | | 2,838 | | | | 368,089 | |
| Endeavor Group Holdings, Inc., Class A* | | | 1,972 | | | | 47,170 | |
| Liberty Media Corp.-Liberty Formula One, Class A* | | | 315 | | | | 21,300 | |
| Liberty Media Corp.-Liberty Formula One, Class C* | | | 1,723 | | | | 129,708 | |
The accompanying notes are an integral part of these financial statements.
SA U.S. Core Market Fund
PORTFOLIO OF INVESTMENTS — AS OF JUNE 30, 2023 (Continued)
| | | SHARES | | | VALUE† | |
| COMMON STOCKS (Continued) | | | | | | | | |
| Entertainment (Continued) | | | | | | | | |
| Live Nation Entertainment, Inc.* | | | 2,466 | | | $ | 224,677 | |
| Madison Square Garden Sports Corp. | | | 279 | | | | 52,466 | |
| Netflix, Inc.* | | | 4,747 | | | | 2,091,006 | |
| ROBLOX Corp., Class A* | | | 2,017 | | | | 81,285 | |
| Spotify Technology SA* | | | 572 | | | | 91,835 | |
| Take-Two Interactive Software, Inc.* | | | 2,052 | | | | 301,972 | |
| Walt Disney Co. (The)* | | | 17,551 | | | | 1,566,953 | |
| Warner Bros Discovery, Inc.* | | | 12,527 | | | | 157,089 | |
| Warner Music Group Corp., Class A | | | 1,467 | | | | 38,274 | |
| World Wrestling Entertainment, Inc., Class A | | | 628 | | | | 68,119 | |
| | | | | | | | 6,045,851 | |
| | | | | | | | | |
| Financial Services — 4.1% | | | | | | | | |
| Apollo Global Management, Inc. | | | 5,734 | | | | 440,429 | |
| Berkshire Hathaway, Inc., Class B* | | | 15,784 | | | | 5,382,344 | |
| Block, Inc., Class A* | | | 2,826 | | | | 188,127 | |
| Equitable Holdings, Inc. | | | 7,584 | | | | 205,981 | |
| Essent Group Ltd. | | | 700 | | | | 32,760 | |
| Euronet Worldwide, Inc.* | | | 911 | | | | 106,924 | |
| Fidelity National Information Services, Inc. | | | 5,983 | | | | 327,270 | |
| Fiserv, Inc.* | | | 5,324 | | | | 671,623 | |
| FleetCor Technologies, Inc.* | | | 1,396 | | | | 350,508 | |
| Global Payments, Inc. | | | 3,120 | | | | 307,382 | |
| Jack Henry & Associates, Inc. | | | 1,300 | | | | 217,529 | |
| MasterCard, Inc., Class A | | | 21,373 | | | | 8,406,001 | |
| MGIC Investment Corp. | | | 4,400 | | | | 69,476 | |
| PayPal Holdings, Inc.* | | | 12,255 | | | | 817,776 | |
| Rocket Cos, Inc.Class A* | | | 3,544 | | | | 31,754 | |
| Shift4 Payments, Inc., Class A*@ | | | 780 | | | | 52,970 | |
| TFS Financial Corp. | | | 134 | | | | 1,684 | |
| Toast, Inc., Class A*@ | | | 2,632 | | | | 59,404 | |
| Visa, Inc., Class A | | | 34,029 | | | | 8,081,207 | |
| Voya Financial, Inc. | | | 1,519 | | | | 108,928 | |
| Western Union Co. (The) | | | 6,874 | | | | 80,632 | |
| WEX, Inc.* | | | 663 | | | | 120,712 | |
| | | | | | | | 26,061,421 | |
| Food Products — 0.9% | | | | | | | | |
| Archer-Daniels-Midland Co. | | | 4,142 | | | | 312,969 | |
| Bunge Ltd. | | | 1,401 | | | | 132,184 | |
| Campbell Soup Co. | | | 4,243 | | | | 193,948 | |
| Conagra Brands, Inc. | | | 3,575 | | | | 120,549 | |
| Darling Ingredients, Inc.* | | | 3,101 | | | | 197,813 | |
| Flowers Foods, Inc. | | | 3,652 | | | | 90,862 | |
| General Mills, Inc. | | | 8,511 | | | | 652,794 | |
| Hershey Co. (The) | | | 2,946 | | | | 735,616 | |
| Hormel Foods Corp. | | | 4,014 | | | | 161,443 | |
| Hostess Brands, Inc.* | | | 1,697 | | | | 42,968 | |
| Ingredion, Inc. | | | 1,548 | | | | 164,011 | |
| J.M. Smucker Co. (The) | | | 1,268 | | | | 187,246 | |
| Kellogg Co. | | | 5,208 | | | | 351,019 | |
| Kraft Heinz Co. (The) | | | 5,057 | | | | 179,523 | |
| Lamb Weston Holdings, Inc. | | | 4,603 | | | | 529,115 | |
| Lancaster Colony Corp. | | | 261 | | | | 52,484 | |
| McCormick & Co., Inc. | | | 3,138 | | | | 273,728 | |
| McCormick & Co., Inc. | | | 190 | | | | 16,454 | |
| Mondelez International, Inc., Class A | | | 11,759 | | | | 857,701 | |
| Pilgrim’s Pride Corp.* | | | 1,700 | | | | 36,533 | |
| Post Holdings, Inc.* | | | 1,501 | | | | 130,062 | |
| Seaboard Corp. | | | 11 | | | | 39,168 | |
| Simply Good Foods Co. (The)* | | | 1,063 | | | | 38,895 | |
| Tyson Foods, Inc., Class A | | | 4,098 | | | | 209,162 | |
| | | | | | | | 5,706,247 | |
| | | | | | | | | |
| Gas Utilities — 0.1% | | | | | | | | |
| Atmos Energy Corp. | | | 2,360 | | | | 274,562 | |
| National Fuel Gas Co. | | | 1,600 | | | | 82,176 | |
| New Jersey Resources Corp. | | | 954 | | | | 45,029 | |
| ONE Gas, Inc. | | | 249 | | | | 19,126 | |
| Southwest Gas Holdings, Inc. | | | 1,343 | | | | 85,482 | |
| Spire, Inc. | | | 549 | | | | 34,828 | |
| UGI Corp. | | | 2,799 | | | | 75,489 | |
| | | | | | | | 616,692 | |
| | | | | | | | | |
| Ground Transportation — 1.3% | | | | | | | | |
| Avis Budget Group, Inc.* | | | 673 | | | | 153,895 | |
| CSX Corp. | | | 47,289 | | | | 1,612,555 | |
| Hertz Global Holdings, Inc.* | | | 1,191 | | | | 21,902 | |
| JB Hunt Transport Services, Inc. | | | 2,021 | | | | 365,862 | |
| Knight-Swift Transportation Holdings, Inc. | | | 2,249 | | | | 124,954 | |
| Landstar System, Inc. | | | 1,073 | | | | 206,595 | |
| Norfolk Southern Corp. | | | 4,620 | | | | 1,047,631 | |
| Old Dominion Freight Line, Inc. | | | 1,937 | | | | 716,206 | |
| Saia, Inc.* | | | 200 | | | | 68,482 | |
| Schneider National, Inc., Class B | | | 1,939 | | | | 55,688 | |
| U-Haul Holding Co.@ | | | 152 | | | | 8,409 | |
| U-Haul Holding Co. | | | 1,368 | | | | 69,317 | |
| Uber Technologies, Inc.* | | | 9,836 | | | | 424,620 | |
| Union Pacific Corp. | | | 15,597 | | | | 3,191,458 | |
| XPO Logistics, Inc.* | | | 1,934 | | | | 114,106 | |
| | | | | | | | 8,181,680 | |
| | | | | | | | | |
| Health Care Equipment & Supplies — 1.8% | | | | | | | | |
| Abbott Laboratories | | | 19,151 | | | | 2,087,842 | |
| Align Technology, Inc.* | | | 833 | | | | 294,582 | |
| Baxter International, Inc. | | | 7,728 | | | | 352,088 | |
| Becton Dickinson & Co. | | | 2,001 | | | | 528,284 | |
| Boston Scientific Corp.* | | | 10,979 | | | | 593,854 | |
| Cooper Cos., Inc. (The) | | | 521 | | | | 199,767 | |
| Dentsply Sirona, Inc. | | | 1,213 | | | | 48,544 | |
| DexCom, Inc.* | | | 3,789 | | | | 486,924 | |
| Edwards Lifesciences Corp.* | | | 8,835 | | | | 833,406 | |
| Envista Holdings Corp.* | | | 2,222 | | | | 75,192 | |
| GE HealthCare Technologies, Inc.* | | | 909 | | | | 73,847 | |
| Globus Medical, Inc., Class A* | | | 1,500 | | | | 89,310 | |
| Haemonetics Corp.* | | | 657 | | | | 55,937 | |
| Hologic, Inc.* | | | 4,636 | | | | 375,377 | |
| Idexx Laboratories, Inc.* | | | 2,000 | | | | 1,004,460 | |
| Inspire Medical Systems, Inc.* | | | 157 | | | | 50,968 | |
| Insulet Corp.* | | | 740 | | | | 213,372 | |
| Intuitive Surgical, Inc.* | | | 1,973 | | | | 674,648 | |
The accompanying notes are an integral part of these financial statements.
SA U.S. Core Market Fund
PORTFOLIO OF INVESTMENTS — AS OF JUNE 30, 2023 (Continued)
| | | SHARES | | | VALUE† | |
| COMMON STOCKS (Continued) | | | | | | | | |
| Health Care Equipment & Supplies (Continued) | | | | | | | | |
| Lantheus Holdings, Inc.* | | | 601 | | | $ | 50,436 | |
| Masimo Corp.* | | | 608 | | | | 100,046 | |
| Medtronic PLC | | | 9,595 | | | | 845,320 | |
| Merit Medical Systems, Inc.* | | | 769 | | | | 64,319 | |
| Novocure Ltd.* | | | 300 | | | | 12,450 | |
| Penumbra, Inc.* | | | 389 | | | | 133,839 | |
| ResMed, Inc. | | | 2,063 | | | | 450,766 | |
| Shockwave Medical, Inc.* | | | 212 | | | | 60,507 | |
| STERIS plc | | | 889 | | | | 200,007 | |
| Stryker Corp. | | | 4,501 | | | | 1,373,210 | |
| Teleflex, Inc. | | | 364 | | | | 88,099 | |
| Zimmer Biomet Holdings, Inc. | | | 1,186 | | | | 172,682 | |
| | | | | | | | 11,590,083 | |
| | | | | | | | | |
| Health Care Providers & Services — 2.8% | | | | | | | | |
| Acadia Healthcare Co., Inc.* | | | 1,169 | | | | 93,099 | |
| agilon health, Inc.* | | | 1,131 | | | | 19,612 | |
| AmerisourceBergen Corp. | | | 2,652 | | | | 510,324 | |
| AMN Healthcare Services, Inc.* | | | 799 | | | | 87,187 | |
| Cardinal Health, Inc. | | | 3,943 | | | | 372,889 | |
| Centene Corp.* | | | 4,920 | | | | 331,854 | |
| Chemed Corp. | | | 339 | | | | 183,626 | |
| Cigna Group (The) | | | 4,734 | | | | 1,328,360 | |
| Contra Abiomed, Inc.*§ | | | 350 | | | | 4,098 | |
| CVS Health Corp. | | | 14,512 | | | | 1,003,215 | |
| DaVita, Inc.* | | | 2,100 | | | | 210,987 | |
| Elevance Health, Inc. | | | 3,438 | | | | 1,527,469 | |
| Encompass Health Corp. | | | 2,141 | | | | 144,967 | |
| Ensign Group, Inc. (The) | | | 687 | | | | 65,581 | |
| HCA Healthcare, Inc. | | | 3,366 | | | | 1,021,514 | |
| HealthEquity, Inc.* | | | 331 | | | | 20,899 | |
| Henry Schein, Inc.* | | | 2,629 | | | | 213,212 | |
| Humana, Inc. | | | 1,553 | | | | 694,393 | |
| Laboratory Corp. of America Holdings | | | 1,510 | | | | 364,408 | |
| McKesson Corp. | | | 2,941 | | | | 1,256,719 | |
| Molina Healthcare, Inc.* | | | 1,058 | | | | 318,712 | |
| Option Care Health, Inc.* | | | 1,563 | | | | 50,782 | |
| Quest Diagnostics, Inc. | | | 2,094 | | | | 294,333 | |
| Select Medical Holdings Corp. | | | 1,423 | | | | 45,337 | |
| Tenet Healthcare Corp.* | | | 1,281 | | | | 104,248 | |
| UnitedHealth Group, Inc. | | | 15,196 | | | | 7,303,805 | |
| Universal Health Services, Inc., Class B | | | 1,473 | | | | 232,395 | |
| | | | | | | | 17,804,025 | |
| | | | | | | | | |
| Health Care Technology — 0.0% | | | | | | | | |
| Teladoc Health, Inc.* | | | 1,855 | | | | 46,968 | |
| Veeva Systems, Inc., Class A* | | | 1,334 | | | | 263,772 | |
| | | | | | | | 310,740 | |
| | | | | | | | | |
| Hotels, Restaurants & Leisure — 2.1% | | | | | | | | |
| Aramark | | | 2,445 | | | | 105,257 | |
| Booking Holdings, Inc.* | | | 578 | | | | 1,560,791 | |
| Boyd Gaming Corp. | | | 1,142 | | | | 79,221 | |
| Caesars Entertainment, Inc.* | | | 2,407 | | | | 122,685 | |
| Chipotle Mexican Grill, Inc.* | | | 423 | | | | 904,797 | |
| Choice Hotels International, Inc.@ | | | 1,000 | | | | 117,520 | |
| Churchill Downs, Inc. | | | 1,048 | | | | 145,850 | |
| Darden Restaurants, Inc. | | | 2,002 | | | | 334,494 | |
| Domino’s Pizza, Inc. | | | 716 | | | | 241,285 | |
| DraftKings, Inc. Class A* | | | 2,512 | | | | 66,744 | |
| Expedia Group, Inc.* | | | 2,025 | | | | 221,515 | |
| Hilton Grand Vacations, Inc.* | | | 500 | | | | 22,720 | |
| Hilton Worldwide Holdings, Inc. | | | 3,388 | | | | 493,123 | |
| Hyatt Hotels Corp., Class A | | | 300 | | | | 34,374 | |
| Las Vegas Sands Corp.* | | | 3,185 | | | | 184,730 | |
| Marriott International, Inc., Class A | | | 5,910 | | | | 1,085,608 | |
| Marriott Vacations Worldwide Corp. | | | 750 | | | | 92,040 | |
| McDonald’s Corp. | | | 12,813 | | | | 3,823,527 | |
| MGM Resorts International | | | 3,426 | | | | 150,470 | |
| Penn Entertainment, Inc.*@ | | | 1,589 | | | | 38,184 | |
| Planet Fitness, Inc. Class A* | | | 1,127 | | | | 76,005 | |
| Royal Caribbean Cruises Ltd.* | | | 2,550 | | | | 264,537 | |
| SeaWorld Entertainment, Inc.* | | | 920 | | | | 51,529 | |
| Starbucks Corp. | | | 19,320 | | | | 1,913,839 | |
| Texas Roadhouse, Inc. | | | 1,257 | | | | 141,136 | |
| Vail Resorts, Inc. | | | 666 | | | | 167,672 | |
| Wendy’s Co. (The) | | | 5,687 | | | | 123,692 | |
| Wingstop, Inc. | | | 324 | | | | 64,852 | |
| Wyndham Hotels & Resorts, Inc. | | | 1,765 | | | | 121,026 | |
| Wynn Resorts Ltd. | | | 738 | | | | 77,940 | |
| Yum! Brands, Inc. | | | 5,152 | | | | 713,810 | |
| | | | | | | | 13,540,973 | |
| | | | | | | | | |
| Household Durables — 0.5% | | | | | | | | |
| DR Horton, Inc. | | | 5,753 | | | | 700,083 | |
| Garmin Ltd. | | | 2,030 | | | | 211,709 | |
| Leggett & Platt, Inc. | | | 3,378 | | | | 100,056 | |
| Lennar Corp., B Shares | | | 72 | | | | 8,135 | |
| Lennar Corp., Class A | | | 3,122 | | | | 391,218 | |
| Mohawk Industries, Inc.* | | | 600 | | | | 61,896 | |
| Newell Brands, Inc. | | | 1,165 | | | | 10,136 | |
| NVR, Inc.* | | | 68 | | | | 431,842 | |
| PulteGroup, Inc. | | | 4,404 | | | | 342,103 | |
| Skyline Champion Corp.* | | | 370 | | | | 24,216 | |
| Taylor Morrison Home Corp.* | | | 1,243 | | | | 60,621 | |
| Tempur Sealy International, Inc. | | | 3,440 | | | | 137,841 | |
| Toll Brothers, Inc. | | | 1,650 | | | | 130,465 | |
| TopBuild Corp.* | | | 500 | | | | 133,010 | |
| Whirlpool Corp. | | | 1,555 | | | | 231,368 | |
| | | | | | | | 2,974,699 | |
| | | | | | | | | |
| Household Products — 1.5% | | | | | | | | |
| Church & Dwight Co., Inc. | | | 4,542 | | | | 455,245 | |
| Clorox Co. (The) | | | 2,311 | | | | 367,541 | |
| Colgate-Palmolive Co. | | | 14,429 | | | | 1,111,610 | |
| Kimberly-Clark Corp. | | | 4,641 | | | | 640,736 | |
| Procter & Gamble Co. (The) | | | 45,612 | | | | 6,921,165 | |
| Reynolds Consumer Products, Inc. | | | 878 | | | | 24,804 | |
| | | | | | | | 9,521,101 | |
| | | | | | | | | |
| Independent Power Producers & Energy Traders — 0.1% | | | | | | | | |
| AES Corp. (The) | | | 11,000 | | | | 228,030 | |
| Clearway Energy, Inc., Class A | | | 1,270 | | | | 34,290 | |
The accompanying notes are an integral part of these financial statements.
SA U.S. Core Market Fund
PORTFOLIO OF INVESTMENTS — AS OF JUNE 30, 2023 (Continued)
| | | SHARES | | | VALUE† | |
| COMMON STOCKS (Continued) | | | | | | | | |
| Independent Power Producers & Energy Traders (Continued) | | | | | | | | |
| Clearway Energy, Inc., Class C | | | 2,400 | | | $ | 68,544 | |
| Ormat Technologies, Inc. | | | 741 | | | | 59,621 | |
| Vistra Corp. | | | 3,161 | | | | 82,976 | |
| | | | | | | | 473,461 | |
| Industrial Conglomerates — 0.7% | | | | | | | | |
| 3M Co. | | | 13,151 | | | | 1,316,283 | |
| General Electric Co. | | | 2,729 | | | | 299,781 | |
| Honeywell International, Inc. | | | 12,502 | | | | 2,594,165 | |
| | | | | | | | 4,210,229 | |
| | | | | | | | | |
| Insurance — 1.9% | | | | | | | | |
| Aflac, Inc. | | | 7,013 | | | | 489,507 | |
| Allstate Corp. (The) | | | 2,506 | | | | 273,254 | |
| American Financial Group, Inc. | | | 747 | | | | 88,706 | |
| American International Group, Inc. | | | 12,909 | | | | 742,784 | |
| Aon PLC, Class A | | | 4,134 | | | | 1,427,057 | |
| Arch Capital Group Ltd.* | | | 3,373 | | | | 252,469 | |
| Arthur J. Gallagher & Co. | | | 2,175 | | | | 477,565 | |
| Assurant, Inc. | | | 793 | | | | 99,696 | |
| Axis Capital Holdings Ltd. | | | 1,300 | | | | 69,979 | |
| Brown & Brown, Inc. | | | 4,399 | | | | 302,827 | |
| Chubb Ltd. | | | 3,276 | | | | 630,827 | |
| Cincinnati Financial Corp. | | | 1,150 | | | | 111,918 | |
| CNA Financial Corp. | | | 943 | | | | 36,419 | |
| Enstar Group Ltd.* | | | 300 | | | | 73,272 | |
| Erie Indemnity Co., Class A | | | 506 | | | | 106,265 | |
| Everest Re Group Ltd. | | | 191 | | | | 65,295 | |
| F&G Annuities & Life, Inc.@ | | | 306 | | | | 7,583 | |
| Fidelity National Financial, Inc. | | | 4,510 | | | | 162,360 | |
| First American Financial Corp. | | | 2,024 | | | | 115,408 | |
| Globe Life, Inc. | | | 1,141 | | | | 125,076 | |
| Hanover Insurance Group, Inc. (The) | | | 696 | | | | 78,669 | |
| Hartford Financial Services Group, Inc. (The) | | | 4,796 | | | | 345,408 | |
| Kemper Corp. | | | 723 | | | | 34,892 | |
| Kinsale Capital Group, Inc. | | | 257 | | | | 96,169 | |
| Lincoln National Corp. | | | 2,031 | | | | 52,319 | |
| Loews Corp. | | | 1,471 | | | | 87,348 | |
| Markel Group, Inc.* | | | 100 | | | | 138,318 | |
| Marsh & McLennan Cos., Inc. | | | 9,000 | | | | 1,692,720 | |
| MetLife, Inc. | | | 4,850 | | | | 274,170 | |
| Old Republic International Corp. | | | 2,863 | | | | 72,062 | |
| Primerica, Inc. | | | 919 | | | | 181,741 | |
| Principal Financial Group, Inc. | | | 2,619 | | | | 198,625 | |
| Progressive Corp. (The) | | | 6,873 | | | | 909,779 | |
| Prudential Financial, Inc. | | | 3,077 | | | | 271,453 | |
| Reinsurance Group of America, Inc. | | | 777 | | | | 107,762 | |
| RenaissanceRe Holdings Ltd. | | | 783 | | | | 146,045 | |
| RLI Corp. | | | 700 | | | | 95,529 | |
| Selective Insurance Group, Inc. | | | 829 | | | | 79,543 | |
| Travelers Companies, Inc. (The) | | | 5,151 | | | | 894,523 | |
| Unum Group | | | 1,700 | | | | 81,090 | |
| W. R. Berkley Corp. | | | 2,655 | | | | 158,132 | |
| White Mountains Insurance Group Ltd. | | | 33 | | | | 45,834 | |
| Willis Towers Watson PLC | | | 1,050 | | | | 247,275 | |
| | | | | | | | 11,947,673 | |
| Interactive Media & Services — 5.2% | | | | | | | | |
| Alphabet, Inc., Class A* | | | 91,160 | | | | 10,911,852 | |
| Alphabet, Inc., Class C* | | | 88,669 | | | | 10,726,289 | |
| Match Group, Inc.* | | | 3,467 | | | | 145,094 | |
| Meta Platforms, Inc., Class A* | | | 40,998 | | | | 11,765,606 | |
| Pinterest, Inc., Class A* | | | 810 | | | | 22,145 | |
| Snap, Inc., Class A* | | | 3,870 | | | | 45,821 | |
| ZoomInfo Technologies, Inc.* | | | 878 | | | | 22,292 | |
| | | | | | | | 33,639,099 | |
| | | | | | | | | |
| IT Services — 1.5% | | | | | | | | |
| Accenture PLC, Class A | | | 12,877 | | | | 3,973,585 | |
| Akamai Technologies, Inc.* | | | 2,286 | | | | 205,443 | |
| Amdocs Ltd. | | | 2,260 | | | | 223,401 | |
| Cloudflare, Inc., Class A* | | | 1,142 | | | | 74,652 | |
| Cognizant Technology Solutions Corp., Class A | | | 8,574 | | | | 559,711 | |
| DXC Technology Co.* | | | 2,810 | | | | 75,083 | |
| EPAM Systems, Inc.* | | | 781 | | | | 175,530 | |
| Gartner, Inc.* | | | 1,713 | | | | 600,081 | |
| Globant SA* | | | 394 | | | | 70,810 | |
| GoDaddy, Inc., Class A* | | | 2,137 | | | | 160,553 | |
| International Business Machines Corp. | | | 20,148 | | | | 2,696,004 | |
| MongoDB, Inc.* | | | 284 | | | | 116,721 | |
| Okta, Inc.* | | | 1,243 | | | | 86,202 | |
| Snowflake, Inc., Class A* | | | 1,051 | | | | 184,955 | |
| Squarespace, Inc.* | | | 1,804 | | | | 56,898 | |
| Twilio, Inc., Class A* | | | 1,065 | | | | 67,755 | |
| VeriSign, Inc.* | | | 1,702 | | | | 384,601 | |
| | | | | | | | 9,711,985 | |
| | | | | | | | | |
| Leisure Equipment & Products — 0.1% | | | | | | | | |
| Brunswick Corp. | | | 1,810 | | | | 156,818 | |
| Hasbro, Inc. | | | 2,087 | | | | 135,175 | |
| Mattel, Inc.* | | | 6,862 | | | | 134,083 | |
| Polaris, Inc. | | | 1,034 | | | | 125,042 | |
| Topgolf Callaway Brands Corp.* | | | 3,115 | | | | 61,833 | |
| YETI Holdings, Inc.* | | | 1,220 | | | | 47,385 | |
| | | | | | | | 660,336 | |
| | | | | | | | | |
| Life Sciences Tools & Services — 1.3% | | | | | | | | |
| Agilent Technologies, Inc. | | | 3,928 | | | | 472,342 | |
| Avantor, Inc.* | | | 4,257 | | | | 87,439 | |
| Bio-Rad Laboratories, Inc., Class A* | | | 223 | | | | 84,544 | |
| Bio-Techne Corp. | | | 1,892 | | | | 154,444 | |
| Bruker Corp. | | | 2,044 | | | | 151,092 | |
| Charles River Laboratories International, Inc.* | | | 640 | | | | 134,560 | |
| Danaher Corp. | | | 6,554 | | | | 1,572,960 | |
| Illumina, Inc.* | | | 1,577 | | | | 295,672 | |
| IQVIA Holdings, Inc.* | | | 2,790 | | | | 627,108 | |
| Maravai LifeSciences Holdings, Inc., Class A* | | | 2,496 | | | | 31,025 | |
| Medpace Holdings, Inc.* | | | 500 | | | | 120,085 | |
| Mettler-Toledo International, Inc.* | | | 519 | | | | 680,741 | |
| Repligen Corp.* | | | 355 | | | | 50,218 | |
| Revvity, Inc. | | | 1,653 | | | | 196,360 | |
The accompanying notes are an integral part of these financial statements.
SA U.S. Core Market Fund
PORTFOLIO OF INVESTMENTS — AS OF JUNE 30, 2023 (Continued)
| | | SHARES | | | VALUE† | |
| COMMON STOCKS (Continued) | | | | | | | | |
| Life Sciences Tools & Services (Continued) | | | | | | | | |
| Syneos Health, Inc.* | | | 927 | | | $ | 39,064 | |
| Thermo Fisher Scientific, Inc. | | | 4,798 | | | | 2,503,357 | |
| Waters Corp.* | | | 1,391 | | | | 370,757 | |
| West Pharmaceutical Services, Inc. | | | 1,211 | | | | 463,171 | |
| | | | | | | | 8,034,939 | |
| | | | | | | | | |
| Machinery — 2.3% | | | | | | | | |
| AGCO Corp. | | | 1,297 | | | | 170,452 | |
| Albany International Corp., Class A | | | 288 | | | | 26,865 | |
| Allison Transmission Holdings, Inc. | | | 1,376 | | | | 77,689 | |
| Caterpillar, Inc. | | | 11,832 | | | | 2,911,264 | |
| Chart Industries, Inc.* | | | 200 | | | | 31,958 | |
| Crane Co. | | | 1,115 | | | | 99,369 | |
| Crane NXT Co. | | | 1,115 | | | | 62,931 | |
| Cummins, Inc. | | | 2,551 | | | | 625,403 | |
| Deere & Co. | | | 6,456 | | | | 2,615,907 | |
| Donaldson Co., Inc. | | | 2,651 | | | | 165,714 | |
| Dover Corp. | | | 2,615 | | | | 386,105 | |
| Esab Corp. | | | 564 | | | | 37,529 | |
| Federal Signal Corp. | | | 808 | | | | 51,736 | |
| Flowserve Corp. | | | 1,775 | | | | 65,941 | |
| Fortive Corp. | | | 3,548 | | | | 265,284 | |
| Franklin Electric Co., Inc. | | | 300 | | | | 30,870 | |
| Graco, Inc. | | | 3,370 | | | | 290,999 | |
| IDEX Corp. | | | 1,004 | | | | 216,121 | |
| Illinois Tool Works, Inc. | | | 6,946 | | | | 1,737,611 | |
| Ingersoll Rand, Inc. | | | 3,972 | | | | 259,610 | |
| ITT, Inc. | | | 1,797 | | | | 167,498 | |
| John Bean Technologies Corp. | | | 200 | | | | 24,260 | |
| Lincoln Electric Holdings, Inc. | | | 1,491 | | | | 296,157 | |
| Middleby Corp. (The)* | | | 1,043 | | | | 154,187 | |
| Mueller Industries, Inc. | | | 388 | | | | 33,865 | |
| Nordson Corp. | | | 848 | | | | 210,457 | |
| Oshkosh Corp. | | | 1,700 | | | | 147,203 | |
| Otis Worldwide Corp. | | | 5,642 | | | | 502,194 | |
| PACCAR, Inc. | | | 8,490 | | | | 710,188 | |
| Parker-Hannifin Corp. | | | 2,404 | | | | 937,656 | |
| Pentair PLC | | | 1,393 | | | | 89,988 | |
| RBC Bearings, Inc.* | | | 421 | | | | 91,555 | |
| Snap-On, Inc. | | | 1,046 | | | | 301,447 | |
| Stanley Black & Decker, Inc. | | | 1,936 | | | | 181,422 | |
| Terex Corp. | | | 417 | | | | 24,949 | |
| Timken Co., (The) | | | 1,513 | | | | 138,485 | |
| Toro Co. (The) | | | 2,683 | | | | 272,727 | |
| Watts Water Technologies, Inc., Class A | | | 400 | | | | 73,492 | |
| Westinghouse Air Brake Technologies Corp. | | | 1,144 | | | | 125,462 | |
| Xylem, Inc. | | | 2,968 | | | | 334,256 | |
| | | | | | | | 14,946,806 | |
| | | | | | | | | |
| Marine Transportation — 0.0% | | | | | | | | |
| Kirby Corp.* | | | 322 | | | | 24,778 | |
| | | | | | | | | |
| Media — 0.8% | | | | | | | | |
| Cable One, Inc. | | | 101 | | | | 66,365 | |
| Charter Communications, Inc., Class A* | | | 2,672 | | | | 981,613 | |
| Comcast Corp., Class A | | | 59,894 | | | | 2,488,596 | |
| Fox Corp. Class A | | | 3,686 | | | | 125,324 | |
| Fox Corp. Class B | | | 661 | | | | 21,079 | |
| Interpublic Group of Cos., Inc. (The) | | | 6,061 | | | | 233,833 | |
| Liberty Broadband Corp., Class A* | | | 315 | | | | 25,115 | |
| Liberty Broadband Corp., Class C* | | | 1,371 | | | | 109,831 | |
| Liberty Media Corp.-Liberty Siriusxm, Class A* | | | 1,263 | | | | 41,439 | |
| Liberty Media Corp.-Liberty Siriusxm, Class C* | | | 1,178 | | | | 38,556 | |
| New York Times Co. (The), Class A | | | 1,641 | | | | 64,622 | |
| News Corp., Class A | | | 3,913 | | | | 76,303 | |
| News Corp., Class B | | | 1,525 | | | | 30,073 | |
| Nexstar Media Group, Inc. Class A | | | 900 | | | | 149,895 | |
| Omnicom Group, Inc. | | | 4,831 | | | | 459,670 | |
| Paramount Global, Class A | | | 616 | | | | 11,433 | |
| Paramount Global, Class B | | | 1,143 | | | | 18,185 | |
| Sirius XM Holdings, Inc.@ | | | 12,754 | | | | 57,776 | |
| TEGNA, Inc. | | | 2,624 | | | | 42,614 | |
| Trade Desk, Inc. (The), Class A* | | | 4,830 | | | | 372,973 | |
| | | | | | | | 5,415,295 | |
| | | | | | | | | |
| Metals & Mining — 0.5% | | | | | | | | |
| Alcoa Corp. | | | 2,296 | | | | 77,903 | |
| ATI, Inc.* | | | 1,233 | | | | 54,535 | |
| Cleveland-Cliffs, Inc.* | | | 6,698 | | | | 112,258 | |
| Commercial Metals Co. | | | 2,430 | | | | 127,964 | |
| Freeport-McMoRan, Inc. | | | 18,470 | | | | 738,800 | |
| Hecla Mining Co. | | | 4,267 | | | | 21,975 | |
| MP Materials Corp.* | | | 923 | | | | 21,118 | |
| Newmont Corp. | | | 7,854 | | | | 335,052 | |
| Nucor Corp. | | | 5,263 | | | | 863,027 | |
| Reliance Steel & Aluminum Co. | | | 1,403 | | | | 381,041 | |
| Royal Gold, Inc. | | | 1,115 | | | | 127,980 | |
| Southern Copper Corp. | | | 1,769 | �� | | | 126,908 | |
| Steel Dynamics, Inc. | | | 3,175 | | | | 345,853 | |
| United States Steel Corp. | | | 2,198 | | | | 54,972 | |
| | | | | | | | 3,389,386 | |
| | | | | | | | | |
| Multi-Utilities — 0.7% | | | | | | | | |
| Ameren Corp. | | | 3,328 | | | | 271,798 | |
| Avista Corp. | | | 929 | | | | 36,482 | |
| Black Hills Corp. | | | 1,300 | | | | 78,338 | |
| Centerpoint Energy, Inc. | | | 6,700 | | | | 195,305 | |
| CMS Energy Corp. | | | 5,199 | | | | 305,441 | |
| Consolidated Edison, Inc. | | | 5,063 | | | | 457,695 | |
| Dominion Energy, Inc. | | | 13,388 | | | | 693,364 | |
| DTE Energy Co. | | | 3,247 | | | | 357,235 | |
| NiSource, Inc. | | | 5,791 | | | | 158,384 | |
| NorthWestern Corp. | | | 683 | | | | 38,767 | |
| Public Service Enterprise Group, Inc. | | | 8,415 | | | | 526,863 | |
| Sempra Energy | | | 4,736 | | | | 689,514 | |
| WEC Energy Group, Inc. | | | 4,990 | | | | 440,318 | |
| | | | | | | | 4,249,504 | |
The accompanying notes are an integral part of these financial statements.
SA U.S. Core Market Fund
PORTFOLIO OF INVESTMENTS — AS OF JUNE 30, 2023 (Continued)
| | | SHARES | | | VALUE† | |
| COMMON STOCKS (Continued) | | | | | | | | |
| Oil, Gas & Consumable Fuels — 3.4% | | | | | | | | |
| Antero Midstream Corp. | | | 3,600 | | | $ | 41,760 | |
| Antero Resources Corp.* | | | 3,300 | | | | 75,999 | |
| APA Corp. | | | 5,617 | | | | 191,933 | |
| Cheniere Energy, Inc. | | | 4,227 | | | | 644,026 | |
| Chesapeake Energy Corp.@ | | | 1,889 | | | | 158,071 | |
| Chevron Corp. | | | 20,184 | | | | 3,175,952 | |
| Civitas Resources, Inc. | | | 478 | | | | 33,159 | |
| ConocoPhillips | | | 20,640 | | | | 2,138,510 | |
| Coterra Energy, Inc. | | | 12,762 | | | | 322,879 | |
| Denbury, Inc.* | | | 911 | | | | 78,583 | |
| Devon Energy Corp. | | | 12,088 | | | | 584,334 | |
| Diamondback Energy, Inc. | | | 2,409 | | | | 316,446 | |
| DT Midstream, Inc.* | | | 1,623 | | | | 80,452 | |
| EnLink Midstream LLC* | | | 3,400 | | | | 36,040 | |
| EOG Resources, Inc. | | | 9,574 | | | | 1,095,648 | |
| EQT Corp. | | | 3,800 | | | | 156,294 | |
| Exxon Mobil Corp. | | | 57,030 | | | | 6,116,467 | |
| Hess Corp. | | | 4,540 | | | | 617,213 | |
| HF Sinclair Corp. | | | 2,161 | | | | 96,402 | |
| Kinder Morgan, Inc. | | | 8,265 | | | | 142,323 | |
| Kosmos Energy Ltd.* | | | 5,250 | | | | 31,447 | |
| Magnolia Oil & Gas Corp., Class A | | | 1,900 | | | | 39,710 | |
| Marathon Oil Corp. | | | 8,798 | | | | 202,530 | |
| Marathon Petroleum Corp. | | | 7,521 | | | | 876,949 | |
| Matador Resources Co. | | | 1,362 | | | | 71,260 | |
| Murphy Oil Corp. | | | 1,330 | | | | 50,939 | |
| New Fortress Energy, Inc.@ | | | 1,001 | | | | 26,807 | |
| Occidental Petroleum Corp. | | | 18,731 | | | | 1,101,383 | |
| ONEOK, Inc. | | | 6,698 | | | | 413,401 | |
| Ovintiv, Inc. | | | 3,582 | | | | 136,367 | |
| PBF Energy, Inc., Class A | | | 1,038 | | | | 42,496 | |
| PDC Energy, Inc. | | | 985 | | | | 70,073 | |
| Peabody Energy Corp. | | | 1,941 | | | | 42,042 | |
| Phillips 66 | | | 3,291 | | | | 313,896 | |
| Pioneer Natural Resources Co. | | | 3,510 | | | | 727,202 | |
| Range Resources Corp. | | | 3,129 | | | | 91,993 | |
| Southwestern Energy Co.* | | | 16,772 | | | | 100,800 | |
| Targa Resources Corp. | | | 1,997 | | | | 151,972 | |
| Texas Pacific Land Corp. | | | 58 | | | | 76,357 | |
| Valero Energy Corp. | | | 6,425 | | | | 753,652 | |
| Vitesse Energy, Inc. | | | 190 | | | | 4,256 | |
| Williams Cos., Inc. (The) | | | 13,491 | | | | 440,211 | |
| | | | | | | | 21,868,234 | |
| | | | | | | | | |
| Paper & Forest Products — 0.0% | | | | | | | | |
| Louisiana-Pacific Corp. | | | 1,880 | | | | 140,962 | |
| | | | | | | | | |
| Passenger Airlines — 0.1% | | | | | | | | |
| Alaska Air Group, Inc.* | | | 2,503 | | | | 133,110 | |
| American Airlines Group, Inc.* | | | 10,481 | | | | 188,029 | |
| Delta Air Lines, Inc.* | | | 4,487 | | | | 213,312 | |
| Southwest Airlines Co. | | | 5,800 | | | | 210,018 | |
| United Airlines Holdings, Inc.* | | | 2,884 | | | | 158,245 | |
| | | | | | | | 902,714 | |
| | | | | | | |
| Personal Products — 0.2% | | | | | | |
| BellRing Brands, Inc.* | | | 2,728 | | | | 99,845 | |
| Coty, Inc., Class A* | | | 2,516 | | | | 30,922 | |
| e.l.f. Beauty, Inc.* | | | 574 | | | | 65,568 | |
| Estee Lauder Companies, Inc. (The), Class A | | | 4,869 | | | | 956,174 | |
| | | | | | | | 1,152,509 | |
| | | | | | | | | |
| Pharmaceuticals — 4.7% | | | | | | | | |
| Bristol-Myers Squibb Co. | | | 35,866 | | | | 2,293,631 | |
| Catalent, Inc.* | | | 2,337 | | | | 101,332 | |
| Elanco Animal Health, Inc.* | | | 4,517 | | | | 45,441 | |
| Eli Lilly & Co. | | | 19,445 | | | | 9,119,316 | |
| Jazz Pharmaceuticals PLC* | | | 1,092 | | | | 135,375 | |
| Johnson & Johnson | | | 44,819 | | | | 7,418,441 | |
| Merck & Co., Inc. | | | 47,673 | | | | 5,500,987 | |
| Organon & Co. | | | 4,671 | | | | 97,204 | |
| Perrigo Co. PLC | | | 1,790 | | | | 60,770 | |
| Pfizer, Inc. | | | 79,600 | | | | 2,919,728 | |
| Royalty Pharma PLC, Class A | | | 2,744 | | | | 84,351 | |
| Viatris, Inc. | | | 10,369 | | | | 103,483 | |
| Zoetis, Inc. | | | 11,289 | | | | 1,944,079 | |
| | | | | | | | 29,824,138 | |
| | | | | | | | | |
| Professional Services — 1.1% | | | | | | | | |
| Alight, Inc., Class A* | | | 4,692 | | | | 43,354 | |
| Automatic Data Processing, Inc. | | | 9,817 | | | | 2,157,678 | |
| Booz Allen Hamilton Holding Corp. | | | 3,549 | | | | 396,068 | |
| Broadridge Financial Solutions, Inc. | | | 2,485 | | | | 411,591 | |
| CACI International, Inc., Class A* | | | 457 | | | | 155,764 | |
| Clarivate PLC* | | | 1,732 | | | | 16,506 | |
| Concentrix Corp. | | | 1,048 | | | | 84,626 | |
| CoStar Group, Inc.* | | | 2,890 | | | | 257,210 | |
| Dun & Bradstreet Holdings, Inc. | | | 2,459 | | | | 28,451 | |
| Equifax, Inc. | | | 1,711 | | | | 402,598 | |
| ExlService Holdings, Inc.* | | | 264 | | | | 39,880 | |
| Exponent, Inc. | | | 799 | | | | 74,563 | |
| FTI Consulting, Inc.* | | | 662 | | | | 125,912 | |
| Genpact Ltd. | | | 2,839 | | | | 106,661 | |
| Insperity, Inc. | | | 451 | | | | 53,651 | |
| Jacobs Solutions, Inc. | | | 195 | | | | 23,184 | |
| KBR, Inc. | | | 2,555 | | | | 166,228 | |
| Leidos Holdings, Inc. | | | 2,174 | | | | 192,356 | |
| Manpowergroup, Inc. | | | 1,325 | | | | 105,205 | |
| Maximus, Inc. | | | 1,426 | | | | 120,511 | |
| Paychex, Inc. | | | 5,938 | | | | 664,284 | |
| Robert Half International, Inc. | | | 2,642 | | | | 198,731 | |
| Science Applications International Corp. | | | 1,254 | | | | 141,050 | |
| SS&C Technologies Holdings, Inc. | | | 3,246 | | | | 196,708 | |
| TransUnion | | | 2,647 | | | | 207,340 | |
| TriNet Group, Inc.* | | | 865 | | | | 82,149 | |
| Verisk Analytics, Inc. | | | 3,116 | | | | 704,309 | |
| | | | | | | | 7,156,568 | |
| | | | | | | | | |
| Real Estate Management & Development — 0.1% | | | | | | | | |
| CBRE Group, Inc., Class A* | | | 5,492 | | | | 443,259 | |
| Howard Hughes Corp. (The)* | | | 424 | | | | 33,462 | |
The accompanying notes are an integral part of these financial statements.
SA U.S. Core Market Fund
PORTFOLIO OF INVESTMENTS — AS OF JUNE 30, 2023 (Continued)
| | | SHARES | | | VALUE† | |
| COMMON STOCKS (Continued) | | | | | | | | |
| Real Estate Management & Development (Continued) | | | | | | | | |
| Jones Lang LaSalle, Inc.* | | | 958 | | | $ | 149,257 | |
| Zillow Group, Inc., Class A* | | | 436 | | | | 21,451 | |
| Zillow Group, Inc., Class C* | | | 1,159 | | | | 58,251 | |
| | | | | | | | 705,680 | |
| | | | | | | | | |
| Semiconductors & Semiconductor Equipment — 7.1% | | | | | | | | |
| Advanced Micro Devices, Inc.* | | | 15,994 | | | | 1,821,877 | |
| Allegro MicroSystems, Inc.* | | | 1,167 | | | | 52,678 | |
| Amkor Technology, Inc. | | | 2,141 | | | | 63,695 | |
| Analog Devices, Inc. | | | 4,750 | | | | 925,347 | |
| Applied Materials, Inc. | | | 19,686 | | | | 2,845,414 | |
| Axcelis Technologies, Inc.* | | | 381 | | | | 69,849 | |
| Broadcom, Inc. | | | 8,068 | | | | 6,998,425 | |
| Cirrus Logic, Inc.* | | | 1,237 | | | | 100,209 | |
| Diodes, Inc.* | | | 541 | | | | 50,037 | |
| Enphase Energy, Inc.* | | | 1,883 | | | | 315,365 | |
| Entegris, Inc. | | | 2,007 | | | | 222,416 | |
| First Solar, Inc.* | | | 1,023 | | | | 194,462 | |
| Intel Corp. | | | 46,277 | | | | 1,547,503 | |
| KLA Corp. | | | 3,591 | | | | 1,741,707 | |
| Lam Research Corp. | | | 3,332 | | | | 2,142,010 | |
| Lattice Semiconductor Corp.* | | | 1,742 | | | | 167,354 | |
| MACOM Technology Solutions Holdings, Inc.* | | | 878 | | | | 57,535 | |
| Marvell Technology, Inc. | | | 6,428 | | | | 384,266 | |
| Microchip Technology, Inc. | | | 8,612 | | | | 771,549 | |
| Micron Technology, Inc. | | | 15,518 | | | | 979,341 | |
| MKS Instruments, Inc. | | | 391 | | | | 42,267 | |
| Monolithic Power Systems, Inc. | | | 581 | | | | 313,874 | |
| NVIDIA Corp. | | | 33,925 | | | | 14,350,953 | |
| NXP Semiconductors NV | | | 2,249 | | | | 460,325 | |
| ON Semiconductor Corp.* | | | 8,229 | | | | 778,299 | |
| Onto Innovation, Inc.* | | | 307 | | | | 35,756 | |
| Power Integrations, Inc. | | | 846 | | | | 80,091 | |
| Qorvo, Inc.* | | | 1,637 | | | | 167,023 | |
| QUALCOMM, Inc. | | | 25,043 | | | | 2,981,119 | |
| Silicon Laboratories, Inc.* | | | 600 | | | | 94,644 | |
| Skyworks Solutions, Inc. | | | 3,226 | | | | 357,086 | |
| SolarEdge Technologies, Inc.* | | | 455 | | | | 122,418 | |
| Synaptics, Inc.* | | | 445 | | | | 37,994 | |
| Teradyne, Inc. | | | 3,943 | | | | 438,974 | |
| Texas Instruments, Inc. | | | 21,009 | | | | 3,782,040 | |
| Universal Display Corp. | | | 786 | | | | 113,286 | |
| Wolfspeed, Inc.*@ | | | 857 | | | | 47,641 | |
| | | | | | | | 45,654,829 | |
| | | | | | | | | |
| Software — 8.4% | | | | | | | | |
| Adobe, Inc.* | | | 9,085 | | | | 4,442,474 | |
| ANSYS, Inc.* | | | 813 | | | | 268,510 | |
| Aspen Technology, Inc.* | | | 923 | | | | 154,704 | |
| Atlassian Corp. Ltd. Class A* | | | 1,245 | | | | 208,923 | |
| Autodesk, Inc.* | | | 2,329 | | | | 476,537 | |
| Bentley Systems, Inc., Class B | | | 2,343 | | | | 127,061 | |
| Bill.com Holdings, Inc.* | | | 791 | | | | 92,428 | |
| Black Knight, Inc.* | | | 2,102 | | | | 125,552 | |
| Blackbaud, Inc.* | | | 638 | | | | 45,413 | |
| Box, Inc., Class A* | | | 2,773 | | | | 81,471 | |
| Cadence Design Systems, Inc.* | | | 4,679 | | | | 1,097,319 | |
| Ceridian HCM Holding, Inc.* | | | 995 | | | | 66,635 | |
| Crowdstrike Holdings, Inc., Class A* | | | 825 | | | | 121,168 | |
| Datadog, Inc., Class A* | | | 1,407 | | | | 138,421 | |
| DocuSign, Inc.* | | | 1,359 | | | | 69,431 | |
| Dolby Laboratories, Inc., Class A | | | 938 | | | | 78,492 | |
| DoubleVerify Holdings, Inc.* | | | 540 | | | | 21,017 | |
| Dropbox, Inc., Class A* | | | 5,131 | | | | 136,844 | |
| Dynatrace, Inc.* | | | 1,205 | | | | 62,021 | |
| Envestnet, Inc.* | | | 580 | | | | 34,423 | |
| Fair Isaac Corp.* | | | 488 | | | | 394,894 | |
| Fortinet, Inc.* | | | 13,129 | | | | 992,421 | |
| Gen Digital, Inc. | | | 5,861 | | | | 108,722 | |
| Guidewire Software, Inc.* | | | 488 | | | | 37,127 | |
| HubSpot, Inc.* | | | 406 | | | | 216,029 | |
| Intuit, Inc. | | | 3,267 | | | | 1,496,907 | |
| Manhattan Associates, Inc.* | | | 2,113 | | | | 422,346 | |
| Microsoft Corp. | | | 96,765 | | | | 32,952,353 | |
| Oracle Corp. | | | 26,244 | | | | 3,125,398 | |
| Palantir Technologies, Inc., Class A* | | | 13,943 | | | | 213,746 | |
| Palo Alto Networks, Inc.* | | | 2,385 | | | | 609,391 | |
| Paycom Software, Inc. | | | 888 | | | | 285,261 | |
| Paylocity Holding Corp.* | | | 668 | | | | 123,266 | |
| Procore Technologies, Inc.* | | | 362 | | | | 23,555 | |
| PTC, Inc.* | | | 1,031 | | | | 146,711 | |
| Qualys, Inc.* | | | 503 | | | | 64,973 | |
| Roper Technologies, Inc. | | | 1,156 | | | | 555,805 | |
| Salesforce, Inc.* | | | 7,199 | | | | 1,520,861 | |
| SentinelOne, Inc., Class A* | | | 2,184 | | | | 32,978 | |
| ServiceNow, Inc.* | | | 1,610 | | | | 904,772 | |
| Splunk, Inc.* | | | 1,045 | | | | 110,864 | |
| SPS Commerce, Inc.* | | | 393 | | | | 75,480 | |
| Synopsys, Inc.* | | | 1,737 | | | | 756,307 | |
| Teradata Corp.* | | | 1,256 | | | | 67,083 | |
| Tyler Technologies, Inc.* | | | 424 | | | | 176,583 | |
| VMware, Inc., Class A* | | | 2,695 | | | | 387,245 | |
| Workday, Inc., Class A* | | | 981 | | | | 221,598 | |
| Zoom Video Communications, Inc., Class A* | | | 832 | | | | 56,476 | |
| Zscaler, Inc.* | | | 705 | | | | 103,142 | |
| | | | | | | | 54,031,138 | |
| | | | | | | | | |
| Specialty Retail — 2.6% | | | | | | | | |
| Academy Sports & Outdoors, Inc. | | | 1,110 | | | | 59,996 | |
| Advance Auto Parts, Inc. | | | 1,238 | | | | 87,031 | |
| AutoNation, Inc.* | | | 961 | | | | 158,190 | |
| AutoZone, Inc.* | | | 304 | | | | 757,981 | |
| Bath & Body Works, Inc. | | | 2,883 | | | | 108,113 | |
| Best Buy Co., Inc. | | | 6,478 | | | | 530,872 | |
| Burlington Stores, Inc.* | | | 571 | | | | 89,870 | |
| Carmax, Inc.* | | | 2,112 | | | | 176,774 | |
| Chewy, Inc., Class A* | | | 1,146 | | | | 45,233 | |
| Dick’s Sporting Goods, Inc. | | | 1,695 | | | | 224,062 | |
| Five Below, Inc.* | | | 1,000 | | | | 196,540 | |
| Floor & Decor Holdings, Inc., Class A* | | | 701 | | | | 72,876 | |
| Foot Locker, Inc.@ | | | 1,017 | | | | 27,571 | |
| GameStop Corp., Class A* | | | 1,519 | | | | 36,836 | |
The accompanying notes are an integral part of these financial statements.
SA U.S. Core Market Fund
PORTFOLIO OF INVESTMENTS — AS OF JUNE 30, 2023 (Continued)
| | | SHARES | | | VALUE† | |
| COMMON STOCKS (Continued) | | | | | | | | |
| Specialty Retail (Continued) | | | | | | | | |
| Group 1 Automotive, Inc. | | | 214 | | | $ | 55,233 | |
| Home Depot, Inc. (The) | | | 18,311 | | | | 5,688,129 | |
| Lithia Motors, Inc. | | | 199 | | | | 60,518 | |
| Lowe’s Cos., Inc. | | | 10,897 | | | | 2,459,453 | |
| Murphy USA, Inc. | | | 810 | | | | 251,999 | |
| O’Reilly Automotive, Inc.* | | | 1,006 | | | | 961,032 | |
| Penske Automotive Group, Inc. | | | 470 | | | | 78,316 | |
| RH* | | | 330 | | | | 108,765 | |
| Ross Stores, Inc. | | | 6,470 | | | | 725,481 | |
| TJX Cos., Inc. (The) | | | 27,206 | | | | 2,306,797 | |
| Tractor Supply Co. | | | 2,732 | | | | 604,045 | |
| Ulta Beauty, Inc.* | | | 984 | | | | 463,065 | |
| Williams-Sonoma, Inc. | | | 2,178 | | | | 272,555 | |
| | | | | | | | 16,607,333 | |
| | | | | | | | | |
| Textiles, Apparel & Luxury Goods — 0.7% | | | | | | | | |
| Capri Holdings Ltd.* | | | 1,085 | | | | 38,941 | |
| Columbia Sportswear Co. | | | 858 | | | | 66,272 | |
| Crocs, Inc.* | | | 1,415 | | | | 159,103 | |
| Deckers Outdoor Corp.* | | | 473 | | | | 249,583 | |
| Levi Strauss & Co., Class A | | | 2,933 | | | | 42,323 | |
| Lululemon Athletica, Inc.* | | | 2,254 | | | | 853,139 | |
| NIKE, Inc., Class B | | | 23,472 | | | | 2,590,605 | |
| PVH Corp. | | | 760 | | | | 64,577 | |
| Ralph Lauren Corp. | | | 1,100 | | | | 135,630 | |
| Skechers U.S.A., Inc., Class A* | | | 1,800 | | | | 94,788 | |
| Tapestry, Inc. | | | 5,352 | | | | 229,065 | |
| VF Corp. | | | 5,509 | | | | 105,167 | |
| | | | | | | | 4,629,193 | |
| | | | | | | | | |
| Tobacco — 0.5% | | | | | | | | |
| Altria Group, Inc. | | | 27,551 | | | | 1,248,060 | |
| Philip Morris International, Inc. | | | 21,397 | | | | 2,088,775 | |
| | | | | | | | 3,336,835 | |
| | | | | | | | | |
| Trading Companies & Distributors — 0.5% | | | | | | | | |
| Air Lease Corp. | | | 1,296 | | | | 54,238 | |
| Applied Industrial Technologies, Inc. | | | 374 | | | | 54,166 | |
| Beacon Roofing Supply, Inc.* | | | 1,400 | | | | 116,172 | |
| Core & Main, Inc., Class A* | | | 1,729 | | | | 54,187 | |
| Fastenal Co. | | | 12,697 | | | | 748,996 | |
| GATX Corp. | | | 410 | | | | 52,783 | |
| MSC Industrial Direct Co., Inc., Class A | | | 1,100 | | | | 104,808 | |
| SiteOne Landscape Supply, Inc.* | | | 654 | | | | 109,453 | |
| Triton International Ltd. | | | 400 | | | | 33,304 | |
| United Rentals, Inc. | | | 2,064 | | | | 919,244 | |
| Univar Solutions, Inc.* | | | 2,156 | | | | 77,271 | |
| Watsco, Inc.@ | | | 474 | | | | 180,817 | |
| WESCO International, Inc. | | | 596 | | | | 106,720 | |
| WW Grainger, Inc. | | | 1,097 | | | | 865,083 | |
| | | | | | | | 3,477,242 | |
| | | | | | | | | |
| Water Utilities — 0.1% | | | | | | | | |
| American Water Works Co., Inc. | | | 3,475 | | | | 496,056 | |
| Essential Utilities, Inc. | | | 3,662 | | | | 146,151 | |
| | | | | | | | 642,207 | |
| | | | | | | | | |
| Wireless Telecommunication Services — 0.2% | | | | | | | | |
| T-Mobile US, Inc.* | | | 8,733 | | | | 1,213,014 | |
TOTAL COMMON STOCKS
(Identified Cost $132,720,864) | | | | | | | 616,213,846 | |
| | | | | | | | | |
| MUTUAL FUNDS — 3.7% | | | | | | | | |
| Others — 3.7% | | | | | | | | |
| DFA U.S. Micro Cap Portfolio | | | 975,997 | | | | 23,687,442 | |
| | | | | | | | | |
TOTAL MUTUAL FUNDS
(Identified Cost $11,191,094) | | | | | | | 23,687,442 | |
| | | | | | | | | |
| SHORT-TERM INVESTMENTS — 0.2% | | | | | | | | |
| Investment Company — 0.1% | | | | | | | | |
| State Street Institutional U.S. Government Money Market Fund 4.780% | | | 933,791 | | | | 933,791 | |
| | | | | | | | | |
| Collateral For Securities On Loan — 0.1% | | | | | | | | |
| State Street Navigator Securities Lending Government Money Market Portfolio 5.110% | | | 314,743 | | | | 314,743 | |
| | | | | | | | | |
TOTAL SHORT-TERM INVESTMENTS
(Identified Cost $1,248,534) | | | | | | | 1,248,534 | |
| | | | | | | | | |
Total Investments — 100.0%
(Identified Cost $145,160,492) | | | | | | | 641,149,822 | |
| Liabilities in excess of Cash and Other Assets — (0.0%) | | | | | | | (274,127 | ) |
| Net Assets — 100.0% | | | | | | $ | 640,875,695 | |
| * | Non-income producing security |
| @ | A portion or all of the security was held on loan. As of June 30, 2023, the fair value of the securities on loan was $1,357,807. |
| § | Fair valued security. Security is valued using significant unobservable inputs as determined pursuant to procedures approved by the Fund’s Board of Trustees. See Note 1 |
The accompanying notes are an integral part of these financial statements.
SA U.S. Core Market Fund
PORTFOLIO OF INVESTMENTS — AS OF JUNE 30, 2023 (Continued)
Portfolio Sectors as of June 30, 2023
(As a percentage of long-term investments) (Unaudited)
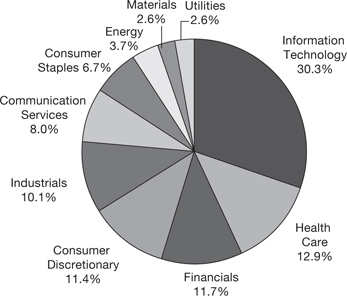
The accompanying notes are an integral part of these financial statements.
SA U.S. Value Fund
PORTFOLIO OF INVESTMENTS — AS OF JUNE 30, 2023
| | | SHARES | | | VALUE† | |
| COMMON STOCKS — 99.7% | | | | | | | | |
| Aerospace & Defense — 1.9% | | | | | | | | |
| General Dynamics Corp. | | | 7,826 | | | $ | 1,683,764 | |
| Howmet Aerospace, Inc. | | | 12,551 | | | | 622,028 | |
| L3Harris Technologies, Inc. | | | 4,688 | | | | 917,770 | |
| Northrop Grumman Corp. | | | 2,915 | | | | 1,328,657 | |
| Raytheon Technologies Corp. | | | 36,091 | | | | 3,535,474 | |
| Textron, Inc. | | | 26,765 | | | | 1,810,117 | |
| | | | | | | | 9,897,810 | |
| |
| Air Freight & Logistics — 0.9% | | | | | | | | |
| FedEx Corp. | | | 16,968 | | | | 4,206,367 | |
| GXO Logistics, Inc.* | | | 4,547 | | | | 285,643 | |
| | | | | | | | 4,492,010 | |
| |
| Automobile Components — 0.4% | | | | | | | | |
| Aptiv PLC* | | | 4,329 | | | | 441,948 | |
| BorgWarner, Inc. | | | 24,241 | | | | 1,185,627 | |
| Gentex Corp. | | | 863 | | | | 25,251 | |
| Lear Corp. | | | 4,071 | | | | 584,392 | |
| | | | | | | | 2,237,218 | |
| |
| Automobiles — 1.2% | | | | | | | | |
| Ford Motor Co. | | | 150,516 | | | | 2,277,307 | |
| General Motors Co. | | | 98,964 | | | | 3,816,052 | |
| | | | | | | | 6,093,359 | |
| |
| Beverages — 0.4% | | | | | | | | |
| Constellation Brands, Inc., Class A | | | 5,660 | | | | 1,393,096 | |
| Keurig Dr Pepper, Inc. | | | 2,705 | | | | 84,586 | |
| Molson Coors Beverage Co., Class B | | | 10,592 | | | | 697,377 | |
| | | | | | | | 2,175,059 | |
| |
| Biotechnology — 1.9% | | | | | | | | |
| Biogen, Inc.* | | | 9,693 | | | | 2,761,051 | |
| Gilead Sciences, Inc. | | | 44,490 | | | | 3,428,845 | |
| Moderna, Inc.* | | | 8,724 | | | | 1,059,966 | |
| Regeneron Pharmaceuticals, Inc.* | | | 3,232 | | | | 2,322,321 | |
| United Therapeutics Corp.* | | | 683 | | | | 150,772 | |
| | | | | | | | 9,722,955 | |
| |
| Broadline Retail — 0.0% | | | | | | | | |
| eBay, Inc. | | | 4,559 | | | | 203,742 | |
| |
| Building Products — 1.3% | | | | | | | | |
| Builders FirstSource, Inc.* | | | 7,125 | | | | 969,000 | |
| Carlisle Cos., Inc. | | | 2,854 | | | | 732,137 | |
| Carrier Global Corp. | | | 6,137 | | | | 305,070 | |
| Fortune Brands Innovations, Inc. | | | 11,027 | | | | 793,393 | |
| Johnson Controls International PLC | | | 34,370 | | | | 2,341,972 | |
| Owens Corning | | | 12,209 | | | | 1,593,274 | |
| | | | | | | | 6,734,846 | |
| |
| Capital Markets — 2.8% | | | | | | | | |
| Bank of New York Mellon Corp. (The) | | | 52,444 | | | | 2,334,807 | |
| Franklin Resources, Inc. | | | 5,210 | | | | 139,159 | |
| Goldman Sachs Group, Inc. (The) | | | 18,862 | | | | 6,083,750 | |
| Jefferies Financial Group, Inc. | | | 6,993 | | | | 231,958 | |
| Morgan Stanley | | | 58,923 | | | | 5,032,024 | |
| Northern Trust Corp. | | | 938 | | | | 69,543 | |
| State Street Corp. | | | 10,112 | | | | 739,996 | |
| | | | | | | | 14,631,237 | |
| |
| Chemicals — 3.7% | | | | | | | | |
| Air Products & Chemicals, Inc. | | | 5,579 | | | | 1,671,078 | |
| Albemarle Corp. | | | 1,519 | | | | 338,874 | |
| Celanese Corp. | | | 4,202 | | | | 486,591 | |
| CF Industries Holdings, Inc. | | | 11,835 | | | | 821,586 | |
| Corteva, Inc. | | | 18,513 | | | | 1,060,795 | |
| Dow, Inc. | | | 51,700 | | | | 2,753,542 | |
| DuPont de Nemours, Inc. | | | 13,259 | | | | 947,223 | |
| Eastman Chemical Co. | | | 17,799 | | | | 1,490,132 | |
| FMC Corp. | | | 500 | | | | 52,170 | |
| International Flavors & Fragrances, Inc. | | | 9,315 | | | | 741,381 | |
| Linde PLC | | | 14,100 | | | | 5,373,228 | |
| LyondellBasell Industries NV, Class A | | | 21,390 | | | | 1,964,244 | |
| Mosaic Co. (The) | | | 12,646 | | | | 442,610 | |
| PPG Industries, Inc. | | | 775 | | | | 114,932 | |
| Westlake Corp. | | | 7,968 | | | | 951,937 | |
| | | | | | | | 19,210,323 | |
| |
| Commercial Banks — 9.0% | | | | | | | | |
| Bank of America Corp. | | | 199,928 | | | | 5,735,934 | |
| Citigroup, Inc. | | | 79,030 | | | | 3,638,541 | |
| Citizens Financial Group, Inc. | | | 18,613 | | | | 485,427 | |
| East West Bancorp, Inc. | | | 2,390 | | | | 126,168 | |
| Fifth Third Bancorp | | | 70,601 | | | | 1,850,452 | |
| Huntington Bancshares, Inc. | | | 72,900 | | | | 785,862 | |
| JPMorgan Chase & Co. | | | 142,484 | | | | 20,722,873 | |
| KeyCorp | | | 33,936 | | | | 313,569 | |
| M&T Bank Corp. | | | 3,759 | | | | 465,214 | |
| PNC Financial Services Group, Inc. (The) | | | 11,566 | | | | 1,456,738 | |
| Regions Financial Corp. | | | 119,937 | | | | 2,137,277 | |
| Truist Financial Corp. | | | 64,730 | | | | 1,964,556 | |
| US Bancorp | | | 40,031 | | | | 1,322,624 | |
| Wells Fargo & Co. | | | 126,013 | | | | 5,378,235 | |
| Zions Bancorp NA | | | 20,193 | | | | 542,384 | |
| | | | | | | | 46,925,854 | |
| |
| Commercial Services & Supplies — 0.7% | | | | | | | | |
| Republic Services, Inc. | | | 25,359 | | | | 3,884,238 | |
| |
| Communications Equipment — 0.2% | | | | | | | | |
| Cisco Systems, Inc. | | | 4,155 | | | | 214,980 | |
| Juniper Networks, Inc. | | | 19,365 | | | | 606,705 | |
| | | | | | | | 821,685 | |
| |
| Computers & Peripherals — 1.4% | | | | | | | | |
| Dell Technologies, Inc., Class C | | | 861 | | | | 46,589 | |
| Hewlett Packard Enterprise Co. | | | 141,847 | | | | 2,383,029 | |
| HP, Inc. | | | 137,996 | | | | 4,237,857 | |
| Western Digital Corp.* | | | 15,020 | | | | 569,709 | |
| Xerox Holdings Corp. | | | 2,019 | | | | 30,063 | |
| | | | | | | | 7,267,247 | |
The accompanying notes are an integral part of these financial statements.
SA U.S. Value Fund
PORTFOLIO OF INVESTMENTS — AS OF JUNE 30, 2023 (Continued)
| | | SHARES | | | VALUE† | |
| COMMON STOCKS (Continued) | | | | | | | | |
| Construction & Engineering — 0.4% | | | | | | | | |
| AECOM | | | 11,462 | | | $ | 970,717 | |
| Quanta Services, Inc. | | | 6,815 | | | | 1,338,807 | |
| | | | | | | | 2,309,524 | |
| |
| Construction Materials — 0.7% | | | | | | | | |
| Martin Marietta Materials, Inc. | | | 4,136 | | | | 1,909,550 | |
| Vulcan Materials Co. | | | 8,594 | | | | 1,937,431 | |
| | | | | | | | 3,846,981 | |
| |
| Consumer Finance — 1.2% | | | | | | | | |
| Ally Financial, Inc. | | | 52,963 | | | | 1,430,531 | |
| Capital One Financial Corp. | | | 28,539 | | | | 3,121,310 | |
| Discover Financial Services | | | 5,171 | | | | 604,231 | |
| Synchrony Financial | | | 25,544 | | | | 866,453 | |
| | | | | | | | 6,022,525 | |
| |
| Consumer Staples Distribution & Retail — 2.4% | | | | | | | | |
| Dollar Tree, Inc.* | | | 12,596 | | | | 1,807,526 | |
| Kroger Co. (The) | | | 64,415 | | | | 3,027,505 | |
| US Foods Holding Corp.* | | | 9,124 | | | | 401,456 | |
| Walgreens Boots Alliance, Inc. | | | 44,769 | | | | 1,275,469 | |
| Walmart, Inc. | | | 37,425 | | | | 5,882,461 | |
| | | | | | | | 12,394,417 | |
| |
| Containers & Packaging — 0.5% | | | | | | | | |
| Amcor PLC | | | 20,769 | | | | 207,275 | |
| International Paper Co. | | | 44,343 | | | | 1,410,551 | |
| Packaging Corp. of America | | | 2,898 | | | | 383,000 | |
| Sonoco Products Co. | | | 611 | | | | 36,061 | |
| WestRock Co. | | | 13,537 | | | | 393,520 | |
| | | | | | | | 2,430,407 | |
| |
| Distributors — 0.4% | | | | | | | | |
| LKQ Corp. | | | 37,512 | | | | 2,185,824 | |
| |
| Diversified Telecommunication Services — 2.8% | | | | | | | | |
| AT&T, Inc. | | | 455,881 | | | | 7,271,302 | |
| Verizon Communications, Inc. | | | 198,247 | | | | 7,372,806 | |
| | | | | | | | 14,644,108 | |
| |
| Electric Utilities — 0.2% | | | | | | | | |
| NRG Energy, Inc. | | | 22,148 | | | | 828,114 | |
| |
| Electrical Equipment — 1.0% | | | | | | | | |
| AMETEK, Inc. | | | 5,351 | | | | 866,220 | |
| Eaton Corp. PLC | | | 19,988 | | | | 4,019,587 | |
| Sensata Technologies Holding PLC | | | 1,781 | | | | 80,127 | |
| | | | | | | | 4,965,934 | |
| |
| Electronic Equipment, Instruments & Components — 1.3% |
| Corning, Inc. | | | 84,494 | | | | 2,960,670 | |
| Flex Ltd.* | | | 31,420 | | | | 868,449 | |
| Jabil, Inc. | | | 2,125 | | | | 229,351 | |
| TD SYNNEX Corp. | | | 1,605 | | | | 150,870 | |
| TE Connectivity Ltd. | | | 19,391 | | | | 2,717,842 | |
| Vontier Corp. | | | 1,095 | | | | 35,270 | |
| | | | | | | | 6,962,452 | |
| Energy Equipment & Services — 0.4% | | | | | | |
| Baker Hughes Co. | | | 32,142 | | | | 1,016,009 | |
| Schlumberger Ltd. | | | 16,278 | | | | 799,575 | |
| | | | | | | | 1,815,584 | |
| |
| Entertainment — 1.4% | | | | | | | | |
| Activision Blizzard, Inc.* | | | 21,184 | | | | 1,785,811 | |
| Electronic Arts, Inc. | | | 1,911 | | | | 247,857 | |
| Liberty Media Corp.-Liberty Formula One, Class A* | | | 1,097 | | | | 74,179 | |
| Liberty Media Corp.-Liberty Formula One, Class C* | | | 2,194 | | | | 165,164 | |
| Take-Two Interactive Software, Inc.* | | | 725 | | | | 106,691 | |
| Walt Disney Co. (The)* | | | 41,483 | | | | 3,703,602 | |
| Warner Bros Discovery, Inc.* | | | 96,742 | | | | 1,213,145 | |
| | | | | | | | 7,296,449 | |
| |
| Financial Services — 3.1% | | | | | | | | |
| Berkshire Hathaway, Inc., Class B* | | | 38,388 | | | | 13,090,308 | |
| Fidelity National Information Services, Inc. | | | 17,462 | | | | 955,172 | |
| Fiserv, Inc.* | | | 12,529 | | | | 1,580,533 | |
| Global Payments, Inc. | | | 4,923 | | | | 485,014 | |
| | | | | | | | 16,111,027 | |
| |
| Food Products — 3.1% | | | | | | | | |
| Archer-Daniels-Midland Co. | | | 24,965 | | | | 1,886,355 | |
| Bunge Ltd. | | | 12,845 | | | | 1,211,926 | |
| Campbell Soup Co. | | | 3,702 | | | | 169,218 | |
| Conagra Brands, Inc. | | | 19,827 | | | | 668,566 | |
| Darling Ingredients, Inc.* | | | 5,424 | | | | 345,997 | |
| General Mills, Inc. | | | 38,095 | | | | 2,921,887 | |
| Hormel Foods Corp. | | | 5,728 | | | | 230,380 | |
| J.M. Smucker Co. (The) | | | 13,087 | | | | 1,932,557 | |
| Kraft Heinz Co. (The) | | | 20,920 | | | | 742,660 | |
| McCormick & Co., Inc. | | | 1,921 | | | | 167,569 | |
| Mondelez International, Inc., Class A | | | 51,728 | | | | 3,773,040 | |
| Post Holdings, Inc.* | | | 973 | | | | 84,311 | |
| Seaboard Corp. | | | 22 | | | | 78,336 | |
| Tyson Foods, Inc., Class A | | | 41,844 | | | | 2,135,718 | |
| | | | | | | | 16,348,520 | |
| |
| Ground Transportation — 0.9% | | | | | | | | |
| Norfolk Southern Corp. | | | 16,359 | | | | 3,709,567 | |
| U-Haul Holding Co.@ | | | 2,003 | | | | 110,806 | |
| U-Haul Holding Co. | | | 18,027 | | | | 913,428 | |
| | | | | | | | 4,733,801 | |
| |
| Health Care Equipment & Supplies — 1.5% | | | | | | | | |
| Becton Dickinson & Co. | | | 6,060 | | | | 1,599,901 | |
| Boston Scientific Corp.* | | | 7,514 | | | | 406,432 | |
| Cooper Cos., Inc. (The) | | | 137 | | | | 52,530 | |
| Embecta Corp. | | | 478 | | | | 10,325 | |
| GE HealthCare Technologies, Inc.* | | | 3,987 | | | | 323,904 | |
| Hologic, Inc.* | | | 2,895 | | | | 234,408 | |
| Medtronic PLC | | | 37,706 | | | | 3,321,899 | |
| STERIS PLC | | | 3,097 | | | | 696,763 | |
| Zimmer Biomet Holdings, Inc. | | | 8,154 | | | | 1,187,222 | |
| Zimvie, Inc.* | | | 815 | | | | 9,152 | |
| | | | | | | | 7,842,536 | |
The accompanying notes are an integral part of these financial statements.
SA U.S. Value Fund
PORTFOLIO OF INVESTMENTS — AS OF JUNE 30, 2023 (Continued)
| | | SHARES | | | VALUE† | |
| COMMON STOCKS (Continued) | | | | | | | | |
| Health Care Providers & Services — 5.2% | | | | | | | | |
| Centene Corp.* | | | 19,196 | | | $ | 1,294,770 | |
| Cigna Group (The) | | | 19,065 | | | | 5,349,639 | |
| CVS Health Corp. | | | 58,448 | | | | 4,040,510 | |
| Elevance Health, Inc. | | | 13,010 | | | | 5,780,213 | |
| Henry Schein, Inc.* | | | 3,777 | | | | 306,315 | |
| Humana, Inc. | | | 7,918 | | | | 3,540,375 | |
| Laboratory Corp. of America Holdings | | | 13,769 | | | | 3,322,873 | |
| McKesson Corp. | | | 1,060 | | | | 452,949 | |
| Quest Diagnostics, Inc. | | | 18,783 | | | | 2,640,138 | |
| Universal Health Services, Inc., Class B | | | 1,221 | | | | 192,637 | |
| | | | | | | | 26,920,419 | |
| |
| Hotels, Restaurants & Leisure — 0.5% | | | | | | | | |
| Aramark | | | 16,117 | | | | 693,837 | |
| Carnival Corp.*@ | | | 27,865 | | | | 524,698 | |
| Hyatt Hotels Corp., Class A | | | 3,174 | | | | 363,677 | |
| MGM Resorts International | | | 26,967 | | | | 1,184,390 | |
| | | | | | | | 2,766,602 | |
| |
| Household Durables — 2.7% | | | | | | | | |
| DR Horton, Inc. | | | 50,225 | | | | 6,111,880 | |
| Garmin Ltd. | | | 12,982 | | | | 1,353,893 | |
| Lennar Corp., B Shares | | | 573 | | | | 64,738 | |
| Lennar Corp., Class A | | | 23,116 | | | | 2,896,666 | |
| Mohawk Industries, Inc.* | | | 369 | | | | 38,066 | |
| PulteGroup, Inc. | | | 41,840 | | | | 3,250,131 | |
| Toll Brothers, Inc. | | | 116 | | | | 9,172 | |
| Whirlpool Corp. | | | 3,147 | | | | 468,242 | |
| | | | | | | | 14,192,788 | |
| |
| Independent Power Producers & Energy Traders — 0.1% |
| Vistra Corp. | | | 25,467 | | | | 668,509 | |
| |
| Industrial Conglomerates — 0.4% | | | | | | | | |
| 3M Co. | | | 6,962 | | | | 696,826 | |
| General Electric Co. | | | 11,962 | | | | 1,314,026 | |
| | | | | | | | 2,010,852 | |
| |
| Insurance — 4.0% | | | | | | | | |
| Aflac, Inc. | | | 32,730 | | | | 2,284,554 | |
| Allstate Corp. (The) | | | 940 | | | | 102,498 | |
| American International Group, Inc. | | | 29,118 | | | | 1,675,450 | |
| Arch Capital Group Ltd.* | | | 11,691 | | | | 875,071 | |
| Chubb Ltd. | | | 11,440 | | | | 2,202,886 | |
| Cincinnati Financial Corp. | | | 370 | | | | 36,008 | |
| CNA Financial Corp. | | | 4,467 | | | | 172,516 | |
| Everest Re Group Ltd. | | | 1,938 | | | | 662,525 | |
| F&G Annuities & Life, Inc.@ | | | 103 | | | | 2,552 | |
| Fidelity National Financial, Inc. | | | 1,515 | | | | 54,540 | |
| Hartford Financial Services Group, Inc. (The) | | | 47,472 | | | | 3,418,933 | |
| Lincoln National Corp. | | | 9,516 | | | | 245,132 | |
| Loews Corp. | | | 15,964 | | | | 947,942 | |
| Markel Group, Inc.* | | | 116 | | | | 160,449 | |
| MetLife, Inc. | | | 10,237 | | | | 578,698 | |
| Old Republic International Corp. | | | 14,636 | | | | 368,388 | |
| Principal Financial Group, Inc. | | | 28,632 | | | | 2,171,451 | |
| Prudential Financial, Inc. | | | 12,032 | | | | 1,061,463 | |
| RenaissanceRe Holdings Ltd. | | | 469 | | | | 87,478 | |
| Travelers Companies, Inc. (The) | | | 21,374 | | | | 3,711,809 | |
| | | | | | | | 20,820,343 | |
| |
| Interactive Media & Services — 2.8% | | | | | | | | |
| Meta Platforms, Inc., Class A* | | | 50,392 | | | | 14,461,496 | |
| |
| IT Services — 0.8% | | | | | | | | |
| Akamai Technologies, Inc.* | | | 3,310 | | | | 297,470 | |
| Amdocs Ltd. | | | 15,213 | | | | 1,503,805 | |
| Cognizant Technology Solutions Corp., Class A | | | 34,305 | | | | 2,239,431 | |
| DXC Technology Co.* | | | 10,285 | | | | 274,815 | |
| Kyndryl Holdings, Inc.* | | | 1,933 | | | | 25,670 | |
| | | | | | | | 4,341,191 | |
| |
| Life Sciences Tools & Services — 1.9% | | | | | | | | |
| Bio-Rad Laboratories, Inc., Class A* | | | 172 | | | | 65,209 | |
| Danaher Corp. | | | 19,132 | | | | 4,591,680 | |
| Revvity, Inc. | | | 1,932 | | | | 229,502 | |
| Thermo Fisher Scientific, Inc. | | | 9,074 | | | | 4,734,359 | |
| | | | | | | | 9,620,750 | |
| |
| Machinery — 3.7% | | | | | | | | |
| AGCO Corp. | | | 6,768 | | | | 889,451 | |
| Cummins, Inc. | | | 10,946 | | | | 2,683,521 | |
| Dover Corp. | | | 6,916 | | | | 1,021,147 | |
| Fortive Corp. | | | 7,311 | | | | 546,643 | |
| Ingersoll Rand, Inc. | | | 14,939 | | | | 976,413 | |
| Oshkosh Corp. | | | 984 | | | | 85,205 | |
| Otis Worldwide Corp. | | | 25,885 | | | | 2,304,024 | |
| PACCAR, Inc. | | | 34,507 | | | | 2,886,511 | |
| Parker-Hannifin Corp. | | | 7,084 | | | | 2,763,043 | |
| Pentair PLC | | | 20,400 | | | | 1,317,840 | |
| Snap-On, Inc. | | | 6,351 | | | | 1,830,295 | |
| Stanley Black & Decker, Inc. | | | 14,985 | | | | 1,404,244 | |
| Westinghouse Air Brake Technologies Corp. | | | 5,333 | | | | 584,870 | |
| | | | | | | | 19,293,207 | |
| |
| Media — 3.0% | | | | | | | | |
| Comcast Corp., Class A | | | 285,775 | | | | 11,873,951 | |
| Fox Corp. Class A | | | 24,883 | | | | 846,022 | |
| Fox Corp. Class B | | | 14,510 | | | | 462,724 | |
| Interpublic Group of Cos., Inc. (The) | | | 21,833 | | | | 842,317 | |
| Liberty Broadband Corp., Class C* | | | 3,887 | | | | 311,388 | |
| Liberty Media Corp.-Liberty Siriusxm, Class A* | | | 4,389 | | | | 144,003 | |
| Liberty Media Corp.-Liberty Siriusxm, Class C* | | | 8,778 | | | | 287,304 | |
| News Corp., Class A | | | 8,320 | | | | 162,240 | |
| News Corp., Class B | | | 1,734 | | | | 34,195 | |
| Paramount Global, Class B | | | 25,564 | | | | 406,723 | |
| | | | | | | | 15,370,867 | |
| |
| Metals & Mining — 3.8% | | | | | | | | |
| Alcoa Corp. | | | 2,284 | | | | 77,496 | |
| Arconic Corp.* | | | 1,634 | | | | 48,334 | |
The accompanying notes are an integral part of these financial statements.
SA U.S. Value Fund
PORTFOLIO OF INVESTMENTS — AS OF JUNE 30, 2023 (Continued)
| | | SHARES | | | VALUE† | |
| COMMON STOCKS (Continued) | | | | | | | | |
| Metals & Mining (Continued) | | | | | | | | |
| Cleveland-Cliffs, Inc.* | | | 9,779 | | | $ | 163,896 | |
| Freeport-McMoRan, Inc. | | | 106,539 | | | | 4,261,560 | |
| Newmont Corp. | | | 47,892 | | | | 2,043,073 | |
| Nucor Corp. | | | 41,998 | | | | 6,886,832 | |
| Reliance Steel & Aluminum Co. | | | 9,348 | | | | 2,538,823 | |
| Royal Gold, Inc. | | | 725 | | | | 83,215 | |
| Steel Dynamics, Inc. | | | 33,820 | | | | 3,684,013 | |
| | | | | | | | 19,787,242 | |
| Oil, Gas & Consumable Fuels — 13.2% | | | | | | | | |
| Chevron Corp. | | | 97,929 | | | | 15,409,128 | |
| ConocoPhillips | | | 96,658 | | | | 10,014,735 | |
| Coterra Energy, Inc. | | | 14,312 | | | | 362,094 | |
| Devon Energy Corp. | | | 13,044 | | | | 630,547 | |
| Diamondback Energy, Inc. | | | 4,617 | | | | 606,489 | |
| EOG Resources, Inc. | | | 23,992 | | | | 2,745,645 | |
| Exxon Mobil Corp. | | | 222,398 | | | | 23,852,186 | |
| HF Sinclair Corp. | | | 471 | | | | 21,011 | |
| Kinder Morgan, Inc. | | | 54,102 | | | | 931,636 | |
| Marathon Oil Corp. | | | 18,183 | | | | 418,573 | |
| Marathon Petroleum Corp. | | | 30,104 | | | | 3,510,126 | |
| Occidental Petroleum Corp. | | | 34,021 | | | | 2,000,435 | |
| ONEOK, Inc. | | | 1,519 | | | | 93,753 | |
| Phillips 66 | | | 15,495 | | | | 1,477,913 | |
| Pioneer Natural Resources Co. | | | 10,352 | | | | 2,144,727 | |
| Valero Energy Corp. | | | 19,826 | | | | 2,325,590 | |
| Vitesse Energy, Inc. | | | 823 | | | | 18,435 | |
| Williams Cos., Inc. (The) | | | 70,657 | | | | 2,305,538 | |
| | | | | | | | 68,868,561 | |
| |
| Passenger Airlines — 0.3% | | | | | | | | |
| Alaska Air Group, Inc.* | | | 964 | | | | 51,266 | |
| Delta Air Lines, Inc.* | | | 14,135 | | | | 671,978 | |
| Southwest Airlines Co. | | | 27,340 | | | | 989,981 | |
| | | | | | | | 1,713,225 | |
| |
| Personal Products — 0.0% | | | | | | | | |
| BellRing Brands, Inc.* | | | 1,233 | | | | 45,128 | |
| |
| Pharmaceuticals — 3.6% | | | | | | | | |
| Bristol-Myers Squibb Co. | | | 73,422 | | | | 4,695,337 | |
| Jazz Pharmaceuticals PLC* | | | 4,730 | | | | 586,378 | |
| Pfizer, Inc. | | | 340,714 | | | | 12,497,389 | |
| Viatris, Inc. | | | 69,023 | | | | 688,850 | |
| | | | | | | | 18,467,954 | |
| |
| Professional Services — 0.5% | | | | | | | | |
| Concentrix Corp. | | | 1,605 | | | | 129,604 | |
| Jacobs Solutions, Inc. | | | 6,136 | | | | 729,509 | |
| Leidos Holdings, Inc. | | | 16,200 | | | | 1,433,376 | |
| Manpowergroup, Inc. | | | 632 | | | | 50,181 | |
| SS&C Technologies Holdings, Inc. | | | 7,467 | | | | 452,500 | |
| | | | | | | | 2,795,170 | |
| Real Estate Management & Development — 0.4% | | | | | | | | |
| CBRE Group, Inc., Class A* | | | 19,100 | | | | 1,541,561 | |
| Jones Lang LaSalle, Inc.* | | | 4,753 | | | | 740,517 | |
| | | | | | | | 2,282,078 | |
| |
| Semiconductors & Semiconductor Equipment — 3.8% | | | | | | | | |
| Advanced Micro Devices, Inc.* | | | 7,678 | | | | 874,601 | |
| Analog Devices, Inc. | | | 14,798 | | | | 2,882,798 | |
| Intel Corp. | | | 250,177 | | | | 8,365,919 | |
| Marvell Technology, Inc. | | | 18,929 | | | | 1,131,576 | |
| Micron Technology, Inc. | | | 75,683 | | | | 4,776,354 | |
| Qorvo, Inc.* | | | 11,125 | | | | 1,135,084 | |
| Skyworks Solutions, Inc. | | | 4,292 | | | | 475,081 | |
| | | | | | | | 19,641,413 | |
| |
| Software — 0.4% | | | | | | | | |
| Gen Digital, Inc. | | | 3,129 | | | | 58,043 | |
| Roper Technologies, Inc. | | | 366 | | | | 175,973 | |
| Salesforce, Inc.* | | | 8,903 | | | | 1,880,848 | |
| | | | | | | | 2,114,864 | |
| |
| Specialty Retail — 0.1% | | | | | | | | |
| Carmax, Inc.* | | | 8,119 | | | | 679,560 | |
| |
| Textiles, Apparel & Luxury Goods — 0.1% | | | | | | | | |
| Ralph Lauren Corp. | | | 1,676 | | | | 206,651 | |
| Tapestry, Inc. | | | 6,979 | | | | 298,701 | |
| | | | | | | | 505,352 | |
| |
| Trading Companies & Distributors — 0.5% | | | | | | | | |
| United Rentals, Inc. | | | 5,460 | | | | 2,431,720 | |
| |
| Wireless Telecommunication Services — 0.8% | | | | | | | | |
| T-Mobile US, Inc.* | | | 29,534 | | | | 4,102,273 | |
| TOTAL COMMON STOCKS | | | | | | | | |
| (Identified Cost $312,847,968) | | | | | | | 518,937,350 | |
| |
| SHORT-TERM INVESTMENTS — 0.2% | | | | | | | | |
| Investment Company — 0.2% | | | | | | | | |
| State Street Institutional U.S. Government Money Market Fund 4.780% | | | 877,802 | | | | 877,802 | |
| |
| TOTAL SHORT-TERM INVESTMENTS | | | | | | | | |
| (Identified Cost $877,802) | | | | | | | 877,802 | |
| |
| Total Investments — 99.9% | | | | | | | | |
| (Identified Cost $313,725,770) | | | | | | | 519,815,152 | |
| Cash and Other Assets, Less Liabilities — 0.1% | | | | | | | 382,465 | |
| Net Assets — 100.0% | | | | | | $ | 520,197,617 | |
| * | Non-income producing security |
| @ | A portion or all of the security was held on loan. As of June 30, 2023, the fair value of the securities on loan was $590,900. |
The accompanying notes are an integral part of these financial statements.
SA U.S. Value Fund
PORTFOLIO OF INVESTMENTS — AS OF JUNE 30, 2023 (Continued)
Portfolio Sectors as of June 30, 2023
(As a percentage of long-term investments) (Unaudited)

The accompanying notes are an integral part of these financial statements.
SA U.S. Small Company Fund
PORTFOLIO OF INVESTMENTS — AS OF JUNE 30, 2023
| | | SHARES | | | VALUE† | |
| COMMON STOCKS — 99.9% | | | | | | | | |
| Aerospace & Defense — 1.5% | | | | | | | | |
| AAR Corp.* | | | 4,010 | | | $ | 231,618 | |
| Aerojet Rocketdyne Holdings, Inc.* | | | 13,783 | | | | 756,273 | |
| Aerovironment, Inc.* | | | 2,697 | | | | 275,849 | |
| Astronics Corp. Class B* | | | 693 | | | | 13,049 | |
| Axon Enterprise, Inc.* | | | 3,341 | | | | 651,896 | |
| BWX Technologies, Inc. | | | 3,927 | | | | 281,055 | |
| Curtiss-Wright Corp. | | | 2,577 | | | | 473,292 | |
| Ducommun, Inc.* | | | 1,489 | | | | 64,876 | |
| Hexcel Corp. | | | 5,671 | | | | 431,109 | |
| Innovative Solutions & Support, Inc.* | | | 3,248 | | | | 23,288 | |
| Kaman Corp. | | | 3,031 | | | | 73,744 | |
| Kratos Defense & Security Solutions, Inc.* | | | 11,721 | | | | 168,079 | |
| Mercury Systems, Inc.* | | | 4,277 | | | | 147,942 | |
| Moog, Inc., Class A | | | 3,044 | | | | 330,061 | |
| National Presto Industries, Inc. | | | 709 | | | | 51,899 | |
| Park Aerospace Corp. | | | 2,501 | | | | 34,514 | |
| Parsons Corp.* | | | 1,163 | | | | 55,987 | |
| V2X, Inc.* | | | 1,491 | | | | 73,894 | |
| Woodward, Inc. | | | 4,322 | | | | 513,929 | |
| | | | | | | | 4,652,354 | |
| | | | | | | | | |
| Air Freight & Logistics — 0.3% | | | | | | | | |
| Air Transport Services Group, Inc.* | | | 8,228 | | | | 155,262 | |
| Forward Air Corp. | | | 3,327 | | | | 353,028 | |
| HUB Group, Inc., Class A* | | | 4,420 | | | | 355,015 | |
| Radiant Logistics, Inc.* | | | 6,146 | | | | 41,301 | |
| | | | | | | | 904,606 | |
| | | | | | | | | |
| Automobile Components — 1.7% | | | | | | | | |
| Adient PLC* | | | 4,024 | | | | 154,200 | |
| American Axle & Manufacturing Holdings, Inc.* | | | 3,721 | | | | 30,773 | |
| Autoliv, Inc. | | | 6,598 | | | | 561,094 | |
| BorgWarner, Inc. | | | 15,123 | | | | 739,666 | |
| Cooper-Standard Holdings, Inc.* | | | 1,153 | | | | 16,442 | |
| Dana, Inc. | | | 9,900 | | | | 168,300 | |
| Dorman Products, Inc.* | | | 3,535 | | | | 278,664 | |
| Fox Factory Holding Corp.* | | | 4,825 | | | | 523,561 | |
| Gentex Corp. | | | 15,377 | | | | 449,931 | |
| Gentherm, Inc.* | | | 4,234 | | | | 239,263 | |
| Goodyear Tire & Rubber Co. (The)* | | | 6,748 | | | | 92,313 | |
| LCI Industries | | | 2,757 | | | | 348,374 | |
| Lear Corp. | | | 4,020 | | | | 577,071 | |
| Modine Manufacturing Co.* | | | 6,449 | | | | 212,946 | |
| Motorcar Parts of America, Inc.* | | | 2,267 | | | | 17,547 | |
| Patrick Industries, Inc. | | | 2,334 | | | | 186,720 | |
| Standard Motor Products, Inc. | | | 2,639 | | | | 99,015 | |
| Stoneridge, Inc.* | | | 2,727 | | | | 51,404 | |
| Strattec Security Corp.* | | | 941 | | | | 17,126 | |
| Visteon Corp.* | | | 2,696 | | | | 387,172 | |
| XPEL, Inc.* | | | 305 | | | | 25,687 | |
| | | | | | | | 5,177,269 | |
| Automobiles — 0.3% | | | | �� | | |
| Harley-Davidson, Inc. | | | 9,600 | | | | 338,016 | |
| Thor Industries, Inc. | | | 2,397 | | | | 248,089 | |
| Winnebago Industries, Inc. | | | 3,191 | | | | 212,808 | |
| | | | | | | | 798,913 | |
| Beverages — 0.7% | | | | | | | | |
| Boston Beer Co., Inc. (The), Class A* | | | 69 | | | | 21,282 | |
| Celsius Holdings, Inc.*@ | | | 846 | | | | 126,215 | |
| Coca-Cola Consolidated, Inc. | | | 1,082 | | | | 688,174 | |
| Duckhorn Portfolio, Inc. (The)* | | | 7,536 | | | | 97,742 | |
| MGP Ingredients, Inc.@ | | | 1,851 | | | | 196,724 | |
| Molson Coors Beverage Co., Class B | | | 9,730 | | | | 640,623 | |
| National Beverage Corp.* | | | 8,395 | | | | 405,898 | |
| | | | | | | | 2,176,658 | |
| Biotechnology — 2.2% | | | | | | | | |
| Adicet Bio, Inc.*@ | | | 2,222 | | | | 5,399 | |
| Agios Pharmaceuticals, Inc.* | | | 4,111 | | | | 116,424 | |
| Aldeyra Therapeutics, Inc.* | | | 3,971 | | | | 33,317 | |
| Alkermes PLC* | | | 7,251 | | | | 226,956 | |
| Allogene Therapeutics, Inc.* | | | 9,669 | | | | 48,055 | |
| AnaptysBio, Inc.* | | | 2,569 | | | | 52,253 | |
| Anika Therapeutics, Inc.* | | | 1,795 | | | | 46,634 | |
| Apellis Pharmaceuticals, Inc.* | | | 961 | | | | 87,547 | |
| Arcturus Therapeutics Holdings, Inc.* | | | 2,548 | | | | 73,077 | |
| Arcus Biosciences, Inc.* | | | 2,904 | | | | 58,980 | |
| Avid Bioservices, Inc.* | | | 6,409 | | | | 89,534 | |
| Avidity Biosciences, Inc.* | | | 4,762 | | | | 52,811 | |
| Beam Therapeutics, Inc.* | | | 497 | | | | 15,869 | |
| Biomea Fusion, Inc.* | | | 1,472 | | | | 32,310 | |
| Bluebird Bio, Inc.*@ | | | 5,659 | | | | 18,618 | |
| Blueprint Medicines Corp.* | | | 1,537 | | | | 97,138 | |
| Catalyst Pharmaceuticals, Inc.* | | | 8,570 | | | | 115,181 | |
| Chinook Therapeutics, Inc.* | | | 5,000 | | | | 192,100 | |
| Crinetics Pharmaceuticals, Inc.* | | | 551 | | | | 9,929 | |
| CRISPR Therapeutics AG*@ | | | 1,927 | | | | 108,182 | |
| Cullinan Oncology, Inc.* | | | 1,139 | | | | 12,256 | |
| Deciphera Pharmaceuticals, Inc.* | | | 5,724 | | | | 80,594 | |
| Design Therapeutics, Inc.*@ | | | 1,007 | | | | 6,344 | |
| Dynavax Technologies Corp.*@ | | | 7,915 | | | | 102,262 | |
| Dyne Therapeutics, Inc.* | | | 1,485 | | | | 16,706 | |
| Eagle Pharmaceuticals, Inc.* | | | 488 | | | | 9,487 | |
| Editas Medicine, Inc.* | | | 4,524 | | | | 37,233 | |
| Emergent BioSolutions, Inc.* | | | 5,055 | | | | 37,154 | |
| Enanta Pharmaceuticals, Inc.* | | | 2,226 | | | | 47,636 | |
| Exelixis, Inc.* | | | 22,934 | | | | 438,269 | |
| Fate Therapeutics, Inc.* | | | 2,137 | | | | 10,172 | |
| Generation Bio Co.* | | | 1,523 | | | | 8,376 | |
| Graphite Bio, Inc.* | | | 3,123 | | | | 8,120 | |
| Gritstone bio, Inc.* | | | 6,203 | | | | 12,096 | |
| Halozyme Therapeutics, Inc.* | | | 10,812 | | | | 389,989 | |
| Ideaya Biosciences, Inc.* | | | 4,393 | | | | 103,235 | |
| Immunovant, Inc.* | | | 486 | | | | 9,219 | |
| Intellia Therapeutics, Inc.* | | | 2,590 | | | | 105,620 | |
| Iovance Biotherapeutics, Inc.* | | | 6,868 | | | | 48,351 | |
| Ironwood Pharmaceuticals, Inc.* | | | 11,743 | | | | 124,945 | |
| KalVista Pharmaceuticals, Inc.* | | | 767 | | | | 6,903 | |
| Karuna Therapeutics, Inc.* | | | 1,267 | | | | 274,749 | |
The accompanying notes are an integral part of these financial statements.
SA U.S. Small Company Fund
PORTFOLIO OF INVESTMENTS — AS OF JUNE 30, 2023 (Continued)
| | | SHARES | | | VALUE† | |
| COMMON STOCKS (Continued) | | | | | | | | |
| Biotechnology (Continued) | | | | | | | | |
| Kodiak Sciences, Inc.* | | | 2,149 | | | $ | 14,828 | |
| Krystal Biotech, Inc.* | | | 1,598 | | | | 187,605 | |
| Kura Oncology, Inc.* | | | 5,384 | | | | 56,963 | |
| Kymera Therapeutics, Inc.*@ | | | 3,129 | | | | 71,936 | |
| MacroGenics, Inc.* | | | 1,907 | | | | 10,202 | |
| Mirati Therapeutics, Inc.* | | | 1,395 | | | | 50,401 | |
| Myriad Genetics, Inc.* | | | 8,130 | | | | 188,453 | |
| Neurocrine Biosciences, Inc.* | | | 7,426 | | | | 700,272 | |
| Nurix Therapeutics, Inc.* | | | 2,828 | | | | 28,252 | |
| PDL BioPharma, Inc.*§ | | | 18,262 | | | | 29,449 | |
| PMV Pharmaceuticals, Inc.* | | | 3,331 | | | | 20,852 | |
| Prothena Corp. PLC* | | | 932 | | | | 63,637 | |
| RAPT Therapeutics, Inc.* | | | 1,843 | | | | 34,464 | |
| Recursion Pharmaceuticals, Inc.* | | | 1,754 | | | | 13,102 | |
| REGENXBIO, Inc.* | | | 2,731 | | | | 54,593 | |
| Relay Therapeutics, Inc.* | | | 7,635 | | | | 95,896 | |
| Replimune Group, Inc.* | | | 3,690 | | | | 85,682 | |
| REVOLUTION Medicines, Inc.* | | | 5,705 | | | | 152,609 | |
| Rocket Pharmaceuticals, Inc.* | | | 3,576 | | | | 71,055 | |
| Sage Therapeutics, Inc.* | | | 3,363 | | | | 158,128 | |
| Sangamo Therapeutics, Inc.* | | | 9,669 | | | | 12,570 | |
| Stoke Therapeutics, Inc.*@ | | | 2,970 | | | | 31,571 | |
| Sutro Biopharma, Inc.* | | | 908 | | | | 4,222 | |
| Syndax Pharmaceuticals, Inc.* | | | 5,678 | | | | 118,841 | |
| Twist Bioscience Corp.*@ | | | 3,895 | | | | 79,692 | |
| United Therapeutics Corp.* | | | 2,637 | | | | 582,118 | |
| Vaxcyte, Inc.* | | | 672 | | | | 33,560 | |
| Veracyte, Inc.* | | | 4,340 | | | | 110,540 | |
| Vericel Corp.* | | | 713 | | | | 26,787 | |
| Xencor, Inc.* | | | 3,940 | | | | 98,382 | |
| Xenon Pharmaceuticals, Inc.* | | | 338 | | | | 13,013 | |
| | | | | | | | 6,569,705 | |
| Broadline Retail — 0.3% | | | | | | | | |
| Big Lots, Inc.@ | | | 1,156 | | | | 10,208 | |
| Dillard’s, Inc., Class A@ | | | 1,103 | | | | 359,887 | |
| Kohl’s Corp. | | | 2,281 | | | | 52,577 | |
| Macy’s, Inc. | | | 19,449 | | | | 312,156 | |
| Nordstrom, Inc. | | | 2,914 | | | | 59,650 | |
| Ollie’s Bargain Outlet Holdings, Inc.* | | | 3,753 | | | | 217,411 | |
| | | | | | | | 1,011,889 | |
| Building Products — 3.1% | | | | | | | | |
| A.O. Smith Corp. | | | 8,970 | | | | 652,837 | |
| AAON, Inc. | | | 7,440 | | | | 705,386 | |
| Advanced Drainage Systems, Inc. | | | 7,559 | | | | 860,063 | |
| Allegion PLC | | | 575 | | | | 69,012 | |
| American Woodmark Corp.* | | | 1,353 | | | | 103,329 | |
| Apogee Enterprises, Inc. | | | 2,316 | | | | 109,941 | |
| Armstrong World Industries, Inc. | | | 4,794 | | | | 352,167 | |
| AZZ, Inc. | | | 2,809 | | | | 122,079 | |
| Builders FirstSource, Inc.* | | | 13,840 | | | | 1,882,240 | |
| CSW Industrials, Inc. | | | 1,174 | | | | 195,107 | |
| Gibraltar Industries, Inc.* | | | 3,042 | | | | 191,403 | |
| Insteel Industries, Inc. | | | 2,278 | | | | 70,891 | |
| Lennox International, Inc. | | | 1,677 | | | | 546,819 | |
| Masco Corp. | | | 2,284 | | | | 131,056 | |
| Masonite International Corp.* | | | 169 | | | | 17,312 | |
| Owens Corning | | | 6,683 | | | | 872,131 | |
| PGT Innovations, Inc.* | | | 6,135 | | | | 178,835 | |
| Quanex Building Products Corp. | | | 3,883 | | | | 104,259 | |
| Resideo Technologies, Inc.* | | | 681 | | | | 12,026 | |
| Simpson Manufacturing Co., Inc. | | | 4,397 | | | | 608,984 | |
| Trex Co., Inc.* | | | 10,510 | | | | 689,036 | |
| UFP Industries, Inc. | | | 7,021 | | | | 681,388 | |
| Zurn Elkay Water Solutions Corp. | | | 14,150 | | | | 380,494 | |
| | | | | | | | 9,536,795 | |
| | | | | | | | | |
| Capital Markets — 2.5% | | | | | | | | |
| Affiliated Managers Group, Inc. | | | 4,043 | | | | 606,005 | |
| Artisan Partners Asset Management, Inc., Class A@ | | | 7,515 | | | | 295,415 | |
| AssetMark Financial Holdings, Inc.* | | | 3,140 | | | | 93,132 | |
| B Riley Financial, Inc. | | | 1,204 | | | | 55,360 | |
| BGC Partners, Inc., Class A | | | 30,567 | | | | 135,412 | |
| Blucora, Inc.* | | | 7,622 | | | | 170,580 | |
| Brightsphere Investment Group, Inc. | | | 2,826 | | | | 59,205 | |
| Cboe Global Markets, Inc. | | | 197 | | | | 27,188 | |
| Cohen & Steers, Inc. | | | 5,127 | | | | 297,315 | �� |
| Diamond Hill Investment Group, Inc. | | | 289 | | | | 49,506 | |
| Donnelley Financial Solutions, Inc.* | | | 4,189 | | | | 190,725 | |
| Evercore, Inc., Class A | | | 3,659 | | | | 452,216 | |
| Federated Hermes, Inc. | | | 10,797 | | | | 387,073 | |
| Hamilton Lane, Inc. Class A | | | 1,792 | | | | 143,324 | |
| Houlihan Lokey, Inc. | | | 1,002 | | | | 98,507 | |
| Invesco Ltd. | | | 24,055 | | | | 404,365 | |
| Janus Henderson Group PLC | | | 14,636 | | | | 398,831 | |
| Jefferies Financial Group, Inc. | | | 21,621 | | | | 717,169 | |
| Lazard Ltd., Class A | | | 6,742 | | | | 215,744 | |
| MarketAxess Holdings, Inc. | | | 710 | | | | 185,608 | |
| Moelis & Co., Class A@ | | | 3,960 | | | | 179,546 | |
| Morningstar, Inc. | | | 2,847 | | | | 558,211 | |
| Open Lending Corp., Class A* | | | 2,793 | | | | 29,354 | |
| Oppenheimer Holdings, Inc., Class A | | | 1,244 | | | | 49,984 | |
| Piper Sandler Cos. | | | 2,274 | | | | 293,937 | |
| PJT Partners, Inc., Class A | | | 1,422 | | | | 99,028 | |
| SEI Investments Co. | | | 4,732 | | | | 282,122 | |
| Silvercrest Asset Management Group, Inc., Class A | | | 759 | | | | 15,370 | |
| StepStone Group, Inc., Class A | | | 446 | | | | 11,065 | |
| Stifel Financial Corp. | | | 9,673 | | | | 577,188 | |
| Stonex Group, Inc.* | | | 2,079 | | | | 172,723 | |
| Victory Capital Holdings, Inc., Class A | | | 982 | | | | 30,972 | |
| Virtu Financial, Inc., Class A | | | 4,501 | | | | 76,922 | |
| Virtus Investment Partners, Inc. | | | 853 | | | | 168,442 | |
| Westwood Holdings Group, Inc. | | | 1,157 | | | | 14,347 | |
| WisdomTree, Inc.@ | | | 4,286 | | | | 29,402 | |
| | | | | | | | 7,571,293 | |
| | | | | | | | | |
| Chemicals — 2.4% | | | | | | | | |
| AdvanSix, Inc. | | | 3,198 | | | | 111,866 | |
| American Vanguard Corp. | | | 3,554 | | | | 63,510 | |
| Ashland, Inc. | | | 4,253 | | | | 369,628 | |
| Avient Corp. | | | 10,014 | | | | 409,573 | |
| Axalta Coating Systems Ltd.* | | | 16,030 | | | | 525,944 | |
The accompanying notes are an integral part of these financial statements.
SA U.S. Small Company Fund
PORTFOLIO OF INVESTMENTS — AS OF JUNE 30, 2023 (Continued)
| | | SHARES | | | VALUE† | |
| COMMON STOCKS (Continued) | | | | | | | | |
| Chemicals (Continued) | | | | | | | | |
| Balchem Corp. | | | 3,741 | | | $ | 504,324 | |
| Cabot Corp. | | | 5,463 | | | | 365,420 | |
| Celanese Corp. | | | 452 | | | | 52,342 | |
| Chase Corp. | | | 1,129 | | | | 136,857 | |
| Chemours Co. (The) | | | 8,849 | | | | 326,440 | |
| Core Molding Technologies, Inc.* | | | 1,500 | | | | 34,125 | |
| Eastman Chemical Co. | | | 997 | | | | 83,469 | |
| Ecovyst, Inc.* | | | 5,086 | | | | 58,286 | |
| Element Solutions, Inc. | | | 21,963 | | | | 421,690 | |
| H.B. Fuller Co. | | | 6,101 | | | | 436,282 | |
| Hawkins, Inc. | | | 2,648 | | | | 126,283 | |
| Huntsman Corp. | | | 12,047 | | | | 325,510 | |
| Ingevity Corp.* | | | 2,357 | | | | 137,083 | |
| Innospec, Inc. | | | 2,704 | | | | 271,590 | |
| Intrepid Potash, Inc.* | | | 1,589 | | | | 36,054 | |
| Koppers Holdings, Inc. | | | 2,308 | | | | 78,703 | |
| Kronos Worldwide, Inc. | | | 2,278 | | | | 19,887 | |
| Livent Corp.*@ | | | 7,893 | | | | 216,505 | |
| LSB Industries, Inc.* | | | 3,802 | | | | 37,450 | |
| Mativ Holdings, Inc. | | | 6,136 | | | | 92,776 | |
| Minerals Technologies, Inc. | | | 3,081 | | | | 177,743 | |
| NewMarket Corp. | | | 504 | | | | 202,668 | |
| Olin Corp. | | | 3,715 | | | | 190,914 | |
| Orion SA | | | 3,504 | | | | 74,355 | |
| Quaker Chemical Corp. | | | 784 | | | | 152,802 | |
| RPM International, Inc. | | | 3,629 | | | | 325,630 | |
| Sensient Technologies Corp. | | | 4,568 | | | | 324,922 | |
| Stepan Co. | | | 2,418 | | | | 231,064 | |
| Tronox Holdings PLC Class A | | | 1,464 | | | | 18,607 | |
| Valvoline, Inc. | | | 6,915 | | | | 259,382 | |
| | | | | | | | 7,199,684 | |
| | | | | | | | | |
| Commercial Banks — 7.7% | | | | | | | | |
| 1st Source Corp. | | | 2,546 | | | | 106,754 | |
| Amalgamated Financial Corp. | | | 477 | | | | 7,675 | |
| Amerant Bancorp, Inc. | | | 661 | | | | 11,363 | |
| American National Bankshares, Inc. | | | 1,508 | | | | 43,702 | |
| Ameris Bancorp | | | 7,199 | | | | 246,278 | |
| AmeriServ Financial, Inc. | | | 4,400 | | | | 11,176 | |
| Arrow Financial Corp. | | | 2,213 | | | | 44,570 | |
| Associated Banc-Corp. | | | 15,878 | | | | 257,700 | |
| Atlantic Union Bankshares Corp.@ | | | 6,981 | | | | 181,157 | |
| Axos Financial, Inc.* | | | 7,155 | | | | 282,193 | |
| Banc of California, Inc. | | | 5,994 | | | | 69,411 | |
| Bancfirst Corp. | | | 3,303 | | | | 303,876 | |
| Bancorp, Inc. (The)* | | | 6,121 | | | | 199,851 | |
| Bank of Hawaii Corp.@ | | | 3,456 | | | | 142,491 | |
| Bank of Marin Bancorp | | | 1,580 | | | | 27,919 | |
| Bank OZK | | | 4,569 | | | | 183,491 | |
| BankUnited, Inc. | | | 3,310 | | | | 71,330 | |
| Bankwell Financial Group, Inc. | | | 326 | | | | 7,948 | |
| Banner Corp. | | | 3,355 | | | | 146,513 | |
| Bar Harbor Bankshares | | | 2,089 | | | | 51,473 | |
| BCB Bancorp, Inc. | | | 878 | | | | 10,308 | |
| Berkshire Hills Bancorp, Inc. | | | 4,455 | | | | 92,352 | |
| BOK Financial Corp. | | | 5,182 | | | | 418,602 | |
| Bridgewater Bancshares, Inc.* | | | 700 | | | | 6,895 | |
| Brookline Bancorp, Inc. | | | 7,431 | | | | 64,947 | |
| Business First Bancshares, Inc. | | | 553 | | | | 8,334 | |
| Byline Bancorp, Inc. | | | 1,299 | | | | 23,499 | |
| C&F Financial Corp. | | | 466 | | | | 25,024 | |
| Cadence Bank | | | 15,454 | | | | 303,517 | |
| Camden National Corp. | | | 1,756 | | | | 54,383 | |
| Capital City Bank Group, Inc. | | | 1,890 | | | | 57,910 | |
| Capitol Federal Financial, Inc. | | | 9,589 | | | | 59,164 | |
| Carter Bankshares, Inc.* | | | 711 | | | | 10,516 | |
| Cathay General Bancorp. | | | 7,259 | | | | 233,667 | |
| Central Pacific Financial Corp. | | | 3,116 | | | | 48,952 | |
| Central Valley Community Bancorp. | | | 1,638 | | | | 25,307 | |
| Citizens & Northern Corp. | | | 852 | | | | 16,444 | |
| Citizens Community Bancorp, Inc. | | | 400 | | | | 3,540 | |
| City Holding Co. | | | 1,686 | | | | 151,723 | |
| Civista Bancshares, Inc. | | | 270 | | | | 4,698 | |
| CNB Financial Corp. | | | 2,264 | | | | 39,960 | |
| Coastal Financial Corp.* | | | 555 | | | | 20,896 | |
| Columbia Banking System, Inc. | | | 8,311 | | | | 168,547 | |
| Columbia Financial, Inc.*@ | | | 2,819 | | | | 48,740 | |
| Comerica, Inc. | | | 7,707 | | | | 326,469 | |
| Commerce Bancshares, Inc. | | | 8,574 | | | | 417,554 | |
| Community Bank System, Inc. | | | 4,718 | | | | 221,180 | |
| Community Trust Bancorp, Inc. | | | 2,206 | | | | 78,467 | |
| Connectone Bancorp, Inc. | | | 4,989 | | | | 82,767 | |
| Cullen/Frost Bankers, Inc. | | | 3,828 | | | | 411,625 | |
| Customers Bancorp, Inc.* | | | 4,720 | | | | 142,827 | |
| CVB Financial Corp. | | | 13,166 | | | | 174,844 | |
| Dime Community Bancshares, Inc. | | | 4,460 | | | | 78,630 | |
| Eagle Bancorp, Inc. | | | 3,436 | | | | 72,706 | |
| East West Bancorp, Inc. | | | 9,740 | | | | 514,175 | |
| Enterprise Bancorp, Inc. | | | 331 | | | | 9,579 | |
| Enterprise Financial Services Corp. | | | 2,901 | | | | 113,429 | |
| Equity Bancshares, Inc., Class A | | | 1,470 | | | | 33,487 | |
| Esquire Financial Holdings, Inc. | | | 569 | | | | 26,026 | |
| ESSA Bancorp, Inc. | | | 1,900 | | | | 28,405 | |
| Farmers & Merchants Bancorp, Inc.@ | | | 1,205 | | | | 27,125 | |
| Farmers National Banc Corp. | | | 3,991 | | | | 49,369 | |
| FB Financial Corp. | | | 3,274 | | | | 91,836 | |
| Financial Institutions, Inc. | | | 1,855 | | | | 29,198 | |
| First Bancorp. | | | 22,823 | | | | 278,897 | |
| First Bancorp, Inc. (The) | | | 1,876 | | | | 45,662 | |
| First Bancorp/Southern Pines NC | | | 3,381 | | | | 100,585 | |
| First Bancshares, Inc. (The) | | | 1,367 | | | | 35,323 | |
| First Busey Corp. | | | 5,571 | | | | 111,977 | |
| First Business Financial Services, Inc. | | | 551 | | | | 16,249 | |
| First Citizens Bancshares, Inc., Class A | | | 388 | | | | 497,979 | |
| First Commonwealth Financial Corp. | | | 9,286 | | | | 117,468 | |
| First Community Bankshares, Inc. | | | 1,982 | | | | 58,925 | |
| First Financial Bancorp. | | | 8,992 | | | | 183,796 | |
| First Financial Bankshares, Inc. | | | 14,820 | | | | 422,222 | |
| First Financial Corp. | | | 1,395 | | | | 45,296 | |
| First Financial Northwest, Inc. | | | 2,239 | | | | 25,457 | |
| First Foundation, Inc. | | | 4,921 | | | | 19,536 | |
| First Hawaiian, Inc. | | | 1,200 | | | | 21,612 | |
| First Horizon Corp. | | | 34,954 | | | | 393,932 | |
| First Internet Bancorp. | | | 1,284 | | | | 19,067 | |
The accompanying notes are an integral part of these financial statements.
SA U.S. Small Company Fund
PORTFOLIO OF INVESTMENTS — AS OF JUNE 30, 2023 (Continued)
| | | SHARES | | | VALUE† | |
| COMMON STOCKS (Continued) | | | | | | | | |
| Commercial Banks (Continued) | | | | | | | | |
| First Interstate Bancsystem, Inc., Class A | | | 5,123 | | | $ | 122,132 | |
| First Merchants Corp. | | | 5,621 | | | | 158,681 | |
| First Mid Bancshares, Inc. | | | 500 | | | | 12,070 | |
| First of Long Island Corp. (The) | | | 2,295 | | | | 27,586 | |
| Flushing Financial Corp. | | | 3,899 | | | | 47,919 | |
| FNB Corp. | | | 22,576 | | | | 258,269 | |
| FS Bancorp, Inc. | | | 962 | | | | 28,927 | |
| Fulton Financial Corp. | | | 15,678 | | | | 186,882 | |
| German American Bancorp, Inc. | | | 3,217 | | | | 87,438 | |
| Glacier Bancorp, Inc. | | | 11,842 | | | | 369,115 | |
| Great Southern Bancorp, Inc. | | | 1,501 | | | | 76,146 | |
| Hancock Whitney Corp. | | | 6,503 | | | | 249,585 | |
| Hanmi Financial Corp. | | | 3,586 | | | | 53,539 | |
| Harborone Bancorp, Inc. | | | 6,045 | | | | 52,471 | |
| Heartland Financial USA, Inc. | | | 4,558 | | | | 127,031 | |
| Heritage Commerce Corp. | | | 6,526 | | | | 54,035 | |
| Heritage Financial Corp. | | | 4,162 | | | | 67,300 | |
| Hilltop Holdings, Inc. | | | 6,988 | | | | 219,842 | |
| Hingham Institution For Savings (The)@ | | | 236 | | | | 50,310 | |
| Home Bancorp, Inc. | | | 994 | | | | 33,011 | |
| Home Bancshares, Inc. | | | 13,006 | | | | 296,537 | |
| HomeStreet, Inc. | | | 2,447 | | | | 14,486 | |
| HomeTrust Bancshares, Inc. | | | 2,255 | | | | 47,107 | |
| Hope Bancorp, Inc. | | | 11,541 | | | | 97,175 | |
| Horizon Bancorp, Inc. | | | 5,096 | | | | 53,049 | |
| Independent Bank Corp. | | | 600 | | | | 10,176 | |
| Independent Bank Corp. | | | 5,005 | | | | 222,773 | |
| Independent Bank Group, Inc. | | | 2,187 | | | | 75,517 | |
| International Bancshares Corp. | | | 5,903 | | | | 260,913 | |
| Kearny Financial Corp. | | | 7,750 | | | | 54,637 | |
| Lakeland Bancorp, Inc. | | | 5,547 | | | | 74,274 | |
| Lakeland Financial Corp. | | | 3,146 | | | | 152,644 | |
| Live Oak Bancshares, Inc. | | | 847 | | | | 22,285 | |
| Macatawa Bank Corp. | | | 5,141 | | | | 47,708 | |
| Mercantile Bank Corp. | | | 1,601 | | | | 44,220 | |
| Metropolitan Bank Holding Corp.* | | | 321 | | | | 11,148 | |
| Midland States Bancorp, Inc. | | | 1,086 | | | | 21,622 | |
| MidWestOne Financial Group, Inc. | | | 613 | | | | 13,100 | |
| National Bank Holdings Corp., Class A | | | 3,376 | | | | 98,039 | |
| NBT Bancorp, Inc. | | | 4,206 | | | | 133,961 | |
| New York Community Bancorp, Inc. | | | 49,763 | | | | 559,336 | |
| Nicolet Bankshares, Inc. | | | 1,020 | | | | 69,268 | |
| Northeast Bank | | | 896 | | | | 37,336 | |
| Northfield Bancorp, Inc. | | | 5,020 | | | | 55,120 | |
| Northrim Bancorp, Inc. | | | 836 | | | | 32,880 | |
| Northwest Bancshares, Inc. | | | 12,344 | | | | 130,846 | |
| OceanFirst Financial Corp. | | | 5,639 | | | | 88,081 | |
| OFG Bancorp | | | 5,852 | | | | 152,620 | |
| Old National Bancorp | | | 28,203 | | | | 393,150 | |
| Old Second Bancorp, Inc. | | | 2,244 | | | | 29,307 | |
| Origin Bancorp, Inc. | | | 1,342 | | | | 39,321 | |
| Pacific Premier Bancorp, Inc. | | | 6,941 | | | | 143,540 | |
| Park National Corp. | | | 1,732 | | | | 177,218 | |
| Pathward Financial, Inc. | | | 3,897 | | | | 180,665 | |
| Peapack Gladstone Financial Corp. | | | 1,992 | | | | 53,943 | |
| Penns Woods Bancorp, Inc. | | | 1,138 | | | | 28,484 | |
| Peoples Bancorp, Inc. | | | 3,204 | | | | 85,066 | |
| Pinnacle Financial Partners, Inc. | | | 3,365 | | | | 190,627 | |
| Popular, Inc. | | | 7,138 | | | | 431,992 | |
| Preferred Bank | | | 1,561 | | | | 85,839 | |
| Premier Financial Corp. | | | 4,193 | | | | 67,172 | |
| Primis Financial Corp. | | | 2,721 | | | | 22,911 | |
| Prosperity Bancshares, Inc. | | | 7,853 | | | | 443,537 | |
| Provident Financial Holdings, Inc. | | | 1,124 | | | | 14,522 | |
| Provident Financial Services, Inc. | | | 7,592 | | | | 124,053 | |
| QCR Holdings, Inc. | | | 1,914 | | | | 78,531 | |
| Renasant Corp. | | | 5,355 | | | | 139,926 | |
| Republic Bancorp, Inc., Class A | | | 1,997 | | | | 84,872 | |
| Riverview Bancorp, Inc. | | | 2,557 | | | | 12,887 | |
| S&T Bancorp, Inc. | | | 3,996 | | | | 108,651 | |
| Sandy Spring Bancorp, Inc. | | | 4,282 | | | | 97,116 | |
| Seacoast Banking Corp. of Florida | | | 5,003 | | | | 110,566 | |
| ServisFirst Bancshares, Inc.@ | | | 5,630 | | | | 230,380 | |
| Sierra Bancorp | | | 2,000 | | | | 33,940 | |
| Simmons First National Corp., Class A | | | 10,791 | | | | 186,145 | |
| South State Corp. | | | 7,217 | | | | 474,879 | |
| Southern First Bancshares, Inc.* | | | 923 | | | | 22,844 | |
| Southern Missouri Bancorp, Inc. | | | 686 | | | | 26,377 | |
| Southside Bancshares, Inc. | | | 3,368 | | | | 88,107 | |
| Stellar Bancorp, Inc. | | | 3,386 | | | | 77,506 | |
| Stock Yards Bancorp, Inc. | | | 2,936 | | | | 133,206 | |
| Summit Financial Group, Inc. | | | 392 | | | | 8,099 | |
| Synovus Financial Corp. | | | 9,560 | | | | 289,190 | |
| Territorial Bancorp, Inc. | | | 1,557 | | | | 19,120 | |
| Texas Capital Bancshares, Inc.* | | | 3,132 | | | | 161,298 | |
| Timberland Bancorp, Inc. | | | 921 | | | | 23,559 | |
| Tompkins Financial Corp. | | | 1,559 | | | | 86,836 | |
| Towne Bank | | | 5,809 | | | | 135,001 | |
| Trico Bancshares | | | 2,959 | | | | 98,239 | |
| Triumph Bancorp, Inc.* | | | 2,441 | | | | 148,218 | |
| TrustCo Bank Corp. | | | 2,134 | | | | 61,054 | |
| Trustmark Corp. | | | 5,770 | | | | 121,862 | |
| UMB Financial Corp. | | | 4,960 | | | | 302,064 | |
| United Bankshares, Inc. | | | 12,088 | | | | 358,651 | |
| United Community Banks, Inc. | | | 8,563 | | | | 213,989 | |
| Univest Financial Corp | | | 3,363 | | | | 60,803 | |
| Valley National Bancorp | | | 37,407 | | | | 289,904 | |
| Veritex Holdings, Inc. | | | 3,570 | | | | 64,010 | |
| Washington Federal, Inc. | | | 6,377 | | | | 169,118 | |
| Washington Trust Bancorp, Inc. | | | 2,001 | | | | 53,647 | |
| Webster Financial Corp. | | | 11,093 | | | | 418,761 | |
| WesBanco, Inc. | | | 6,661 | | | | 170,588 | |
| West Bancorp, Inc. | | | 1,763 | | | | 32,457 | |
| Westamerica Bancorp | | | 2,658 | | | | 101,801 | |
| Western Alliance Bancorp | | | 5,446 | | | | 198,616 | |
| Western New England Bancorp, Inc. | | | 3,161 | | | | 18,460 | |
| Wintrust Financial Corp. | | | 4,936 | | | | 358,452 | |
| WSFS Financial Corp. | | | 6,445 | | | | 243,105 | |
| Zions Bancorp NA | | | 10,151 | | | | 272,656 | |
| | | | | | | | 23,674,462 | |
The accompanying notes are an integral part of these financial statements.
SA U.S. Small Company Fund
PORTFOLIO OF INVESTMENTS — AS OF JUNE 30, 2023 (Continued)
| | | SHARES | | | VALUE† | |
| COMMON STOCKS (Continued) | | | | | | | | |
| Commercial Services & Supplies — 1.9% | | | | | | | | |
| ABM Industries, Inc. | | | 7,749 | | | $ | 330,495 | |
| ACCO Brands Corp. | | | 6,694 | | | | 34,876 | |
| Brady Corp., Class A | | | 5,019 | | | | 238,754 | |
| Brink’s Co. (The) | | | 4,837 | | | | 328,094 | |
| Casella Waste Systems, Inc., Class A* | | | 6,377 | | | | 576,800 | |
| Ceco Environmental Corp.* | | | 4,211 | | | | 56,259 | |
| Cimpress PLC* | | | 1,426 | | | | 84,818 | |
| Clean Harbors, Inc.* | | | 5,266 | | | | 865,888 | |
| Deluxe Corp. | | | 4,032 | | | | 70,479 | |
| Driven Brands Holdings, Inc.* | | | 1,606 | | | | 43,458 | |
| Ennis, Inc. | | | 3,110 | | | | 63,382 | |
| Heritage-Crystal Clean, Inc.* | | | 2,532 | | | | 95,684 | |
| HNI Corp. | | | 4,225 | | | | 119,060 | |
| Interface, Inc. | | | 5,834 | | | | 51,281 | |
| Liquidity Services, Inc.* | | | 4,207 | | | | 69,416 | |
| Matthews International Corp., Class A | | | 3,451 | | | | 147,082 | |
| MillerKnoll, Inc. | | | 3,785 | | | | 55,942 | |
| MSA Safety, Inc. | | | 4,156 | | | | 722,978 | |
| NL Industries, Inc. | | | 4,571 | | | | 25,278 | |
| OPENLANE, Inc.* | | | 2,720 | | | | 41,398 | |
| SP Plus Corp.* | | | 2,555 | | | | 99,926 | |
| Steelcase, Inc., Class A | | | 11,344 | | | | 87,462 | |
| Stericycle, Inc.* | | | 4,797 | | | | 222,773 | |
| Tetra Tech, Inc. | | | 6,444 | | | | 1,055,141 | |
| UniFirst Corp. | | | 1,645 | | | | 254,991 | |
| Virco Manufacturing Corp.* | | | 2,494 | | | | 10,400 | |
| VSE Corp. | | | 1,412 | | | | 77,222 | |
| | | | | | | | 5,829,337 | |
| | | | | | | | | |
| Communications Equipment — 1.3% | | | | | | | | |
| ADTRAN Holdings, Inc. | | | 1,640 | | | | 17,269 | |
| BK Technologies Corp. | | | 400 | | | | 6,624 | |
| Calix, Inc.* | | | 3,366 | | | | 167,997 | |
| Cambium Networks Corp.* | | | 2,226 | | | | 33,880 | |
| Ciena Corp.* | | | 15,659 | | | | 665,351 | |
| Clearfield, Inc.*@ | | | 2,380 | | | | 112,693 | |
| CommScope Holding Co., Inc.* | | | 8,376 | | | | 47,157 | |
| Comtech Telecommunications Corp. | | | 3,207 | | | | 29,312 | |
| Digi International, Inc.* | | | 3,397 | | | | 133,808 | |
| DZS, Inc.*@ | | | 2,548 | | | | 10,116 | |
| Extreme Networks, Inc.* | | | 7,358 | | | | 191,676 | |
| F5, Inc.* | | | 3,709 | | | | 542,478 | |
| Harmonic, Inc.* | | | 10,330 | | | | 167,036 | |
| Infinera Corp.* | | | 5,375 | | | | 25,961 | |
| Juniper Networks, Inc. | | | 19,819 | | | | 620,929 | |
| KVH Industries, Inc.* | | | 2,387 | | | | 21,817 | |
| Lantronix, Inc.* | | | 1,100 | | | | 4,631 | |
| Lumentum Holdings, Inc.*@ | | | 4,956 | | | | 281,154 | |
| NETGEAR, Inc.* | | | 3,539 | | | | 50,112 | |
| NetScout Systems, Inc.* | | | 8,182 | | | | 253,233 | |
| Optical Cable Corp.* | | | 374 | | | | 1,511 | |
| PC-Tel, Inc. | | | 2,629 | | | | 12,606 | |
| Viasat, Inc.* | | | 5,325 | | | | 219,710 | |
| Viavi Solutions, Inc.* | | | 21,651 | | | | 245,306 | |
| | | | | | | | 3,862,367 | |
| |
| Computers & Peripherals — 0.6% | | | | | | | | |
| AstroNova, Inc.* | | | 1,572 | | | | 22,794 | |
| Avid Technology, Inc.* | | | 7,133 | | | | 181,892 | |
| Pure Storage, Inc., Class A* | | | 16,030 | | | | 590,225 | |
| Seagate Technology Holdings PLC | | | 1,159 | | | | 71,707 | |
| Stratasys Ltd.* | | | 3,784 | | | | 67,204 | |
| Super Micro Computer, Inc.* | | | 2,778 | | | | 692,416 | |
| Western Digital Corp.* | | | 2,204 | | | | 83,598 | |
| Xerox Holdings Corp. | | | 9,706 | | | | 144,522 | |
| | | | | | | | 1,854,358 | |
| | | | | | | | | |
| Construction & Engineering — 2.2% | | | | | | | | |
| AECOM | | | 2,553 | | | | 216,214 | |
| Ameresco, Inc., Class A*@ | | | 4,050 | | | | 196,951 | |
| Arcosa, Inc. | | | 1,853 | | | | 140,402 | |
| Comfort Systems USA, Inc. | | | 4,850 | | | | 796,370 | |
| Dycom Industries, Inc.* | | | 4,084 | | | | 464,147 | |
| EMCOR Group, Inc. | | | 5,995 | | | | 1,107,756 | |
| Fluor Corp.* | | | 6,585 | | | | 194,916 | |
| Granite Construction, Inc. | | | 4,358 | | | | 173,361 | |
| Great Lakes Dredge & Dock Corp.* | | | 7,436 | | | | 60,678 | |
| IES Holdings, Inc.* | | | 2,548 | | | | 144,930 | |
| MasTec, Inc.* | | | 6,602 | | | | 778,838 | |
| Matrix Service Co.* | | | 4,086 | | | | 24,066 | |
| MDU Resources Group, Inc. | | | 11,285 | | | | 236,308 | |
| MYR Group, Inc.* | | | 1,935 | | | | 267,688 | |
| Northwest Pipe Co.* | | | 1,211 | | | | 36,621 | |
| Primoris Services Corp. | | | 5,726 | | | | 174,471 | |
| Sterling Infrastructure, Inc.* | | | 3,492 | | | | 194,854 | |
| Tutor Perini Corp.* | | | 3,153 | | | | 22,544 | |
| Valmont Industries, Inc. | | | 2,069 | | | | 602,182 | |
| WillScot Mobile Mini Holdings Corp.* | | | 18,811 | | | | 898,978 | |
| | | | | | | | 6,732,275 | |
| | | | | | | | | |
| Construction Materials — 0.3% | | | | | | | | |
| Eagle Materials, Inc. | | | 1,439 | | | | 268,258 | |
| Knife River Corp.* | | | 2,821 | | | | 122,714 | |
| Summit Materials, Inc., Class A* | | | 5,504 | | | | 208,326 | |
| United States Lime & Minerals, Inc. | | | 949 | | | | 198,237 | |
| | | | | | | | 797,535 | |
| | | | | | | | | |
| Consumer Finance — 1.1% | | | | | | | | |
| Atlanticus Holdings Corp.* | | | 3,144 | | | | 132,079 | |
| Bread Financial Holdings, Inc. | | | 856 | | | | 26,870 | |
| Consumer Portfolio Services, Inc.* | | | 4,988 | | | | 58,210 | |
| Credit Acceptance Corp.*@ | | | 760 | | | | 386,027 | |
| Encore Capital Group, Inc.* | | | 3,784 | | | | 183,978 | |
| Enova International, Inc.* | | | 4,283 | | | | 227,513 | |
| Ezcorp, Inc., Class A* | | | 5,994 | | | | 50,230 | |
| FirstCash Holdings, Inc. | | | 4,847 | | | | 452,370 | |
| Green Dot Corp., Class A* | | | 5,205 | | | | 97,542 | |
| LendingClub Corp.* | | | 1,512 | | | | 14,742 | |
| LendingTree, Inc.* | | | 900 | | | | 19,899 | |
| Navient Corp. | | | 17,562 | | | | 326,302 | |
The accompanying notes are an integral part of these financial statements.
SA U.S. Small Company Fund
PORTFOLIO OF INVESTMENTS — AS OF JUNE 30, 2023 (Continued)
| | | SHARES | | | VALUE† | |
| COMMON STOCKS (Continued) | | | | | | | | |
| Consumer Finance (Continued) | | | | | | | | |
| Nelnet, Inc., Class A | | | 3,245 | | | $ | 313,078 | |
| OneMain Holdings, Inc. | | | 7,656 | | | | 334,491 | |
| PRA Group, Inc.* | | | 5,417 | | | | 123,778 | |
| PROG Holdings, Inc.* | | | 6,028 | | | | 193,619 | |
| Regional Management Corp. | | | 1,467 | | | | 44,743 | |
| SLM Corp. | | | 14,278 | | | | 233,017 | |
| World Acceptance Corp.*@ | | | 977 | | | | 130,928 | |
| | | | | | | | 3,349,416 | |
| | | | | | | | | |
| Consumer Staples Distribution & Retail — 1.2% | | | | | | | | |
| Andersons, Inc. (The) | | | 4,055 | | | | 187,138 | |
| BJ’s Wholesale Club Holdings, Inc.* | | | 4,618 | | | | 290,980 | |
| Casey’s General Stores, Inc. | | | 2,455 | | | | 598,725 | |
| Chefs’ Warehouse Inc. (The)* | | | 4,636 | | | | 165,783 | |
| Fresh Market, Inc.*@§ | | | 11,040 | | | | — | |
| Grocery Outlet Holding Corp.* | | | 2,734 | | | | 83,688 | |
| Ingles Markets, Inc., Class A | | | 1,973 | | | | 163,069 | |
| Natural Grocers by Vitamin Cottage, Inc. | | | 2,710 | | | | 33,225 | |
| Performance Food Group Co.* | | | 9,263 | | | | 558,003 | |
| PriceSmart, Inc. | | | 3,201 | | | | 237,066 | |
| SpartanNash Co. | | | 4,477 | | | | 100,777 | |
| Sprouts Farmers Market, Inc.* | | | 7,149 | | | | 262,583 | |
| United Natural Foods, Inc.* | | | 4,219 | | | | 82,481 | |
| US Foods Holding Corp.* | | | 13,615 | | | | 599,060 | |
| Village Super Market, Inc., Class A | | | 1,435 | | | | 32,747 | |
| Weis Markets, Inc. | | | 2,943 | | | | 188,970 | |
| | | | | | | | 3,584,295 | |
| | | | | | | | | |
| Containers & Packaging — 1.3% | | | | | | | | |
| AptarGroup, Inc. | | | 5,666 | | | | 656,463 | |
| Berry Global Group, Inc. | | | 9,609 | | | | 618,243 | |
| Crown Holdings, Inc.@ | | | 2,141 | | | | 185,989 | |
| Graphic Packaging Holding Co. | | | 8,918 | | | | 214,299 | |
| Greif, Inc., Class A | | | 2,553 | | | | 175,876 | |
| Greif, Inc., Class B | | | 1,193 | | | | 92,159 | |
| International Paper Co. | | | 690 | | | | 21,949 | |
| Myers Industries, Inc. | | | 4,361 | | | | 84,734 | |
| O-I Glass, Inc.* | | | 8,143 | | | | 173,690 | |
| Pactiv Evergreen, Inc. | | | 8,108 | | | | 61,378 | |
| Sealed Air Corp. | | | 10,816 | | | | 432,640 | |
| Silgan Holdings, Inc. | | | 12,267 | | | | 575,200 | |
| Sonoco Products Co. | | | 6,744 | | | | 398,031 | |
| Trimas Corp. | | | 5,102 | | | | 140,254 | |
| WestRock Co. | | | 7,830 | | | | 227,618 | |
| | | | | | | | 4,058,523 | |
| | | | | | | | | |
| Distributors — 0.0% | | | | | | | | |
| Weyco Group, Inc. | | | 1,043 | | | | 27,838 | |
| | | | | | | | | |
| Diversified Consumer Services — 0.9% | | | | | | | | |
| Adtalem Global Education, Inc.* | | | 5,934 | | | | 203,774 | |
| American Public Education, Inc.* | | | 1,928 | | | | 9,139 | |
| Bright Horizons Family Solutions, Inc.* | | | 1,895 | | | | 175,193 | |
| Carriage Services, Inc. | | | 2,984 | | | | 96,890 | |
| Chegg, Inc.* | | | 3,873 | | | | 34,392 | |
| European Wax Center, Inc., Class A*@ | | | 583 | | | | 10,861 | |
| Frontdoor, Inc.* | | | 4,679 | | | | 149,260 | |
| Graham Holdings Co., Class B | | | 462 | | | | 264,024 | |
| Grand Canyon Education, Inc.* | | | 3,776 | | | | 389,721 | |
| H&R Block, Inc. | | | 11,646 | | | | 371,158 | |
| Laureate Education, Inc., Class A | | | 3,916 | | | | 47,344 | |
| OneSpaWorld Holdings Ltd.* | | | 2,259 | | | | 27,334 | |
| Perdoceo Education Corp.* | | | 6,976 | | | | 85,596 | |
| Service Corp. International | | | 7,334 | | | | 473,703 | |
| Strategic Education, Inc. | | | 2,650 | | | | 179,776 | |
| Stride, Inc.* | | | 4,184 | | | | 155,770 | |
| | | | | | | | 2,673,935 | |
| | | | | | | | | |
| Diversified Telecommunication Services — 0.3% | | | | | | | | |
| Anterix, Inc.* | | | 1,066 | | | | 33,782 | |
| ATN International, Inc. | | | 2,105 | | | | 77,043 | |
| Bandwidth, Inc., Class A* | | | 766 | | | | 10,479 | |
| Cogent Communications Holdings, Inc. | | | 5,536 | | | | 372,517 | |
| Contra Communications CVR*@§¶ | | | 354 | | | | 1,080 | |
| EchoStar Corp., Class A* | | | 1,286 | | | | 22,299 | |
| IDT Corp., Class B* | | | 2,980 | | | | 77,033 | |
| Iridium Communications, Inc. | | | 4,335 | | | | 269,290 | |
| Liberty Latin America Ltd. Class A* | | | 1,600 | | | | 14,000 | |
| Liberty Latin America Ltd., Class C* | | | 12,050 | | | | 103,871 | |
| Lumen Technologies, Inc.@ | | | 11,406 | | | | 25,778 | |
| Ooma, Inc.* | | | 1,297 | | | | 19,416 | |
| | | | | | | | 1,026,588 | |
| | | | | | | | | |
| Electric Utilities — 1.2% | | | | | | | | |
| Allete, Inc. | | | 6,498 | | | | 376,689 | |
| Genie Energy Ltd. Class B | | | 3,300 | | | | 46,662 | |
| Hawaiian Electric Industries, Inc. | | | 7,162 | | | | 259,264 | |
| IDACORP, Inc. | | | 2,837 | | | | 291,076 | |
| MGE Energy, Inc. | | | 3,771 | | | | 298,324 | |
| NRG Energy, Inc. | | | 14,356 | | | | 536,771 | |
| OGE Energy Corp. | | | 10,049 | | | | 360,860 | |
| Otter Tail Corp. | | | 4,597 | | | | 362,979 | |
| Pinnacle West Capital Corp. | | | 5,960 | | | | 485,502 | |
| PNM Resources, Inc. | | | 10,204 | | | | 460,200 | |
| Portland General Electric Co. | | | 5,648 | | | | 264,496 | |
| | | | | | | | 3,742,823 | |
| | | | | | | | | |
| Electrical Equipment — 1.5% | | | | | | | | |
| Acuity Brands, Inc. | | | 2,347 | | | | 382,749 | |
| Allied Motion Technologies, Inc. | | | 1,626 | | | | 64,942 | |
| Atkore, Inc.* | | | 5,678 | | | | 885,427 | |
| Encore Wire Corp. | | | 2,341 | | | | 435,262 | |
| EnerSys | | | 4,742 | | | | 514,602 | |
| LSI Industries, Inc. | | | 3,137 | | | | 39,401 | |
| nVent Electric PLC | | | 2,150 | | | | 111,091 | |
| Plug Power, Inc.*@ | | | 1,062 | | | | 11,034 | |
| Powell Industries, Inc. | | | 1,380 | | | | 83,614 | |
| Preformed Line Products Co. | | | 668 | | | | 104,275 | |
| Regal Rexnord Corp. | | | 7,570 | | | | 1,165,023 | |
| Sensata Technologies Holding PLC | | | 10,094 | | | | 454,129 | |
The accompanying notes are an integral part of these financial statements.
SA U.S. Small Company Fund
PORTFOLIO OF INVESTMENTS — AS OF JUNE 30, 2023 (Continued)
| | | SHARES | | | VALUE† | |
| COMMON STOCKS (Continued) | | | | | | | | |
| Electrical Equipment (Continued) | | | | | | | | |
| Sunrun, Inc.* | | | 6,232 | | | $ | 111,304 | |
| Thermon Group Holdings, Inc.* | | | 3,577 | | | | 95,148 | |
| Vicor Corp.* | | | 3,445 | | | | 186,030 | |
| | | | | | | | 4,644,031 | |
| | | | | | | | | |
| Electronic Equipment, Instruments & Components — 3.8% |
| Advanced Energy Industries, Inc. | | | 4,145 | | | | 461,960 | |
| Arrow Electronics, Inc.* | | | 7,096 | | | | 1,016,360 | |
| Avnet, Inc. | | | 8,026 | | | | 404,912 | |
| Badger Meter, Inc. | | | 3,368 | | | | 496,982 | |
| Bel Fuse, Inc., Class B | | | 1,421 | | | | 81,580 | |
| Belden, Inc. | | | 4,896 | | | | 468,302 | |
| Benchmark Electronics, Inc. | | | 4,604 | | | | 118,921 | |
| Climb Global Solutions, Inc. | | | 315 | | | | 15,076 | |
| Cognex Corp. | | | 4,833 | | | | 270,745 | |
| CTS Corp. | | | 3,954 | | | | 168,559 | |
| ePlus, Inc.* | | | 3,836 | | | | 215,967 | |
| Fabrinet* | | | 4,275 | | | | 555,237 | |
| FARO Technologies, Inc.* | | | 2,298 | | | | 37,228 | |
| Flex Ltd.* | | | 26,302 | | | | 726,987 | |
| Identiv, Inc.* | | | 927 | | | | 7,796 | |
| Insight Enterprises, Inc.* | | | 3,841 | | | | 562,092 | |
| IPG Photonics Corp.* | | | 1,782 | | | | 242,031 | |
| Itron, Inc.* | | | 4,157 | | | | 299,720 | |
| Jabil, Inc. | | | 3,611 | | | | 389,735 | |
| Key Tronic Corp.* | | | 1,700 | | | | 9,639 | |
| Kimball Electronics, Inc.* | | | 2,987 | | | | 82,531 | |
| Knowles Corp.* | | | 6,624 | | | | 119,629 | |
| Littelfuse, Inc. | | | 1,865 | | | | 543,293 | |
| Methode Electronics, Inc. | | | 4,122 | | | | 138,169 | |
| NAPCO Security Technologies, Inc. | | | 5,355 | | | | 185,551 | |
| National Instruments Corp. | | | 7,611 | | | | 436,871 | |
| nLight, Inc.* | | | 1,098 | | | | 16,931 | |
| Novanta, Inc.* | | | 4,244 | | | | 781,320 | |
| OSI Systems, Inc.* | | | 1,764 | | | | 207,852 | |
| PC Connection, Inc. | | | 2,926 | | | | 131,963 | |
| Plexus Corp.* | | | 3,061 | | | | 300,713 | |
| Richardson Electronics Ltd. | | | 1,505 | | | | 24,833 | |
| Rogers Corp.* | | | 2,017 | | | | 326,613 | |
| Sanmina Corp.* | | | 6,551 | | | | 394,829 | |
| Scansource, Inc.* | | | 2,807 | | | | 82,975 | |
| TD SYNNEX Corp. | | | 3,515 | | | | 330,410 | |
| TTM Technologies, Inc.* | | | 10,405 | | | | 144,629 | |
| Vishay Intertechnology, Inc. | | | 11,850 | | | | 348,390 | |
| Vishay Precision Group, Inc.* | | | 1,694 | | | | 62,932 | |
| Vontier Corp. | | | 8,347 | | | | 268,857 | |
| | | | | | | | 11,479,120 | |
| | | | | | | | | |
| Energy Equipment & Services — 1.2% | | | | | | | | |
| Archrock, Inc. | | | 12,231 | | | | 125,368 | |
| Bristow Group, Inc.* | | | 1,579 | | | | 45,365 | |
| Cactus, Inc., Class A | | | 3,486 | | | | 147,528 | |
| ChampionX Corp. | | | 9,876 | | | | 306,551 | |
| Core Laboratories, Inc. | | | 998 | | | | 23,204 | |
| Dril-Quip, Inc.* | | | 2,081 | | | | 48,425 | |
| Expro Group Holdings NV* | | | 837 | | | | 14,832 | |
| Helix Energy Solutions Group, Inc.* | | | 8,345 | | | $ | 61,586 | |
| Helmerich & Payne, Inc. | | | 6,380 | | | | 226,171 | |
| Liberty Energy, Inc., Class A | | | 11,763 | | | | 157,271 | |
| Nabors Industries Ltd.* | | | 539 | | | | 50,143 | |
| Natural Gas Services Group, Inc.* | | | 2,179 | | | | 21,572 | |
| Newpark Resources, Inc.* | | | 5,904 | | | | 30,878 | |
| NexTier Oilfield Solutions, Inc.* | | | 17,336 | | | | 154,984 | |
| Noble Corp. PLC* | | | 2,483 | | | | 102,573 | |
| NOV, Inc. | | | 23,731 | | | | 380,645 | |
| Oceaneering International, Inc.* | | | 1,554 | | | | 29,060 | |
| Oil States International, Inc.* | | | 3,584 | | | | 26,772 | |
| Patterson-UTI Energy, Inc. | | | 10,229 | | | | 122,441 | |
| ProPetro Holding Corp.* | | | 4,527 | | | | 37,302 | |
| RPC, Inc. | | | 11,642 | | | | 83,240 | |
| SEACOR Marine Holdings, Inc.* | | | 3,233 | | | | 36,953 | |
| Select Water Solutions, Inc. | | | 3,073 | | | | 24,891 | |
| Solaris Oilfield Infrastructure, Inc., Class A | | | 1,000 | | | | 8,330 | |
| TechnipFMC PLC* | | | 23,392 | | | | 388,775 | |
| Tetra Technologies, Inc.* | | | 8,698 | | | | 29,399 | |
| Tidewater, Inc.* | | | 2,915 | | | | 161,608 | |
| Transocean Ltd.* | | | 43,549 | | | | 305,278 | |
| U.S. Silica Holdings, Inc.* | | | 5,267 | | | | 63,889 | |
| Valaris Ltd.* | | | 1,881 | | | | 118,371 | |
| Weatherford International PLC* | | | 4,378 | | | | 290,787 | |
| | | | | | | | 3,624,192 | |
| | | | | | | | | |
| Entertainment — 0.4% | | | | | | | | |
| Cinemark Holdings, Inc.*@ | | | 7,484 | | | | 123,486 | |
| Endeavor Group Holdings, Inc., Class A* | | | 3,669 | | | | 87,763 | |
| IMAX Corp.* | | | 4,117 | | | | 69,948 | |
| Liberty Braves Group, Class C* | | | 2,620 | | | | 103,804 | |
| Liberty Media Corp.-Liberty Braves, Class A* | | | 934 | | | | 38,219 | |
| Lions Gate Entertainment Corp., Class A* | | | 3,637 | | | | 32,115 | |
| Lions Gate Entertainment Corp., Class B* | | | 6,300 | | | | 52,605 | |
| Madison Square Garden Entertainment Corp.* | | | 432 | | | | 14,524 | |
| Madison Square Garden Sports Corp. | | | 404 | | | | 75,972 | |
| Marcus Corp. (The) | | | 3,100 | | | | 45,973 | |
| Playtika Holding Corp.* | | | 7,992 | | | | 92,707 | |
| Roku, Inc.* | | | 478 | | | | 30,573 | |
| Sciplay Corp., Class A* | | | 1,456 | | | | 28,654 | |
| Sphere Entertainment Co.* | | | 432 | | | | 11,832 | |
| World Wrestling Entertainment, Inc., Class A | | | 2,566 | | | | 278,334 | |
| | | | | | | | 1,086,509 | |
| | | | | | | | | |
| Financial Services — 1.5% | | | | | | | | |
| A-Mark Precious Metals, Inc. | | | 2,332 | | | | 87,298 | |
| Acacia Research Corp.* | | | 1,995 | | | | 8,299 | |
| Alerus Financial Corp. | | | 466 | | | | 8,379 | |
| AvidXchange Holdings, Inc.* | | | 1,863 | | | | 19,338 | |
| BM Technologies, Inc.* | | | 823 | | | | 2,453 | |
| Cannae Holdings, Inc.* | | | 3,828 | | | | 77,364 | |
The accompanying notes are an integral part of these financial statements.
SA U.S. Small Company Fund
PORTFOLIO OF INVESTMENTS — AS OF JUNE 30, 2023 (Continued)
| | | SHARES | | | VALUE† | |
| COMMON STOCKS (Continued) | | | | | | | | |
| Financial Services (Continued) | | | | | | | | |
| Cantaloupe, Inc.* | | | 3,505 | | | $ | 27,900 | |
| Cass Information Systems, Inc. | | | 1,788 | | | | 69,339 | |
| Equitable Holdings, Inc. | | | 3,817 | | | | 103,670 | |
| Essent Group Ltd. | | | 4,642 | | | | 217,246 | |
| Euronet Worldwide, Inc.* | | | 2,511 | | | | 294,716 | |
| EVERTEC, Inc. | | | 4,311 | | | | 158,774 | |
| Federal Agricultural Mortgage Corp., Class C | | | 1,215 | | | | 174,644 | |
| Flywire Corp.* | | | 4,301 | | | | 133,503 | |
| I3 Verticals, Inc., Class A* | | | 1,470 | | | | 33,604 | |
| International Money Express, Inc.* | | | 1,977 | | | | 48,496 | |
| Jack Henry & Associates, Inc. | | | 578 | | | | 96,717 | |
| Jackson Financial, Inc., Class A | | | 1,992 | | | | 60,975 | |
| Marqeta, Inc., Class A* | | | 3,982 | | | | 19,392 | |
| MGIC Investment Corp. | | | 11,104 | | | | 175,332 | |
| Mr Cooper Group, Inc.* | | | 4,998 | | | | 253,099 | |
| NMI Holdings, Inc., Class A* | | | 7,878 | | | | 203,410 | |
| PennyMac Financial Services, Inc. | | | 1,706 | | | | 119,949 | |
| Radian Group, Inc. | | | 7,144 | | | | 180,600 | |
| Shift4 Payments, Inc., Class A*@ | | | 2,548 | | | | 173,035 | |
| TFS Financial Corp. | | | 3,750 | | | | 47,137 | |
| Voya Financial, Inc. | | | 9,648 | | | | 691,858 | |
| Walker & Dunlop, Inc. | | | 4,099 | | | | 324,190 | |
| Waterstone Financial, Inc. | | | 2,966 | | | | 42,977 | |
| Western Union Co. (The) | | | 12,000 | | | | 140,760 | |
| WEX, Inc.* | | | 2,575 | | | | 468,830 | |
| | | | | | | | 4,463,284 | |
| | | | | | | | | |
| Food Products — 1.5% | | | | | | | | |
| Alico, Inc.@ | | | 713 | | | | 18,153 | |
| B&G Foods, Inc. | | | 8,145 | | | | 113,378 | |
| Cal-Maine Foods, Inc. | | | 5,021 | | | | 225,945 | |
| Calavo Growers, Inc. | | | 2,189 | | | | 63,525 | |
| Darling Ingredients, Inc.* | | | 13,438 | | | | 857,210 | |
| Flowers Foods, Inc. | | | 10,685 | | | | 265,843 | |
| Fresh Del Monte Produce, Inc. | | | 5,010 | | | | 128,807 | |
| Freshpet, Inc.* | | | 870 | | | | 57,255 | |
| Hain Celestial Group, Inc. (The)* | | | 2,490 | | | | 31,150 | |
| Hostess Brands, Inc.* | | | 4,664 | | | | 118,093 | |
| Ingredion, Inc. | | | 3,754 | | | | 397,736 | |
| J&J Snack Foods Corp. | | | 2,148 | | | | 340,157 | |
| John B. Sanfilippo & Son, Inc. | | | 1,112 | | | | 130,404 | |
| Lancaster Colony Corp. | | | 2,908 | | | | 584,770 | |
| Lifeway Foods, Inc.* | | | 1,756 | | | | 11,818 | |
| Limoneira Co. | | | 2,072 | | | | 32,240 | |
| Mission Produce, Inc.* | | | 1,256 | | | | 15,223 | |
| Pilgrim’s Pride Corp.* | | | 5,624 | | | | 120,860 | |
| Post Holdings, Inc.* | | | 4,776 | | | | 413,840 | |
| Seaboard Corp. | | | 42 | | | | 149,550 | |
| Seneca Foods Corp., Class A* | | | 800 | | | | 26,144 | |
| Simply Good Foods Co. (The)* | | | 4,321 | | | | 158,105 | |
| Tootsie Roll Industries, Inc. | | | 5,148 | | | | 182,291 | |
| TreeHouse Foods, Inc.* | | | 3,458 | | | | 174,214 | |
| Utz Brands, Inc.@ | | | 1,291 | | | | 21,121 | |
| Vital Farms, Inc.* | | | 2,774 | | | | 33,260 | |
| | | | | | | | 4,671,092 | |
| Gas Utilities — 0.7% | | | | | | |
| Chesapeake Utilities Corp. | | | 2,106 | | | | 250,614 | |
| National Fuel Gas Co. | | | 4,000 | | | | 205,440 | |
| New Jersey Resources Corp. | | | 9,687 | | | | 457,226 | |
| Northwest Natural Holding Co. | | | 3,354 | | | | 144,390 | |
| ONE Gas, Inc. | | | 5,011 | | | | 384,895 | |
| RGC Resources, Inc. | | | 600 | | | | 12,018 | |
| Southwest Gas Holdings, Inc. | | | 4,019 | | | | 255,809 | |
| Spire, Inc. | | | 4,808 | | | | 305,019 | |
| UGI Corp. | | | 10,146 | | | | 273,638 | |
| | | | | | | | 2,289,049 | |
| | | | | | | | | |
| Ground Transportation — 1.4% | | | | | | | | |
| ArcBest Corp. | | | 3,093 | | | | 305,588 | |
| Covenant Logistics Group, Inc. | | | 1,259 | | | | 55,182 | |
| Heartland Express, Inc. | | | 8,017 | | | | 131,559 | |
| Knight-Swift Transportation Holdings, Inc. | | | 10,458 | | | | 581,047 | |
| Landstar System, Inc. | | | 2,867 | | | | 552,012 | |
| Marten Transport Ltd. | | | 7,902 | | | | 169,893 | |
| P.A.M. Transportation Services, Inc.* | | | 6,092 | | | | 163,083 | |
| RXO, Inc.* | | | 1,530 | | | | 34,685 | |
| Saia, Inc.* | | | 3,397 | | | | 1,163,167 | |
| Schneider National, Inc., Class B | | | 1,500 | | | | 43,080 | |
| U-Haul Holding Co. | | | 9,522 | | | | 482,480 | |
| U-Haul Holding Co.@ | | | 1,058 | | | | 58,529 | |
| Universal Logistics Holdings, Inc. | | | 2,551 | | | | 73,494 | |
| Werner Enterprises, Inc. | | | 6,797 | | | | 300,291 | |
| XPO Logistics, Inc.* | | | 1,530 | | | | 90,270 | |
| | | | | | | | 4,204,360 | |
| | | | | | | | | |
| Health Care — 0.0% | | | | | | | | |
| Contra Aduro Biotech CVR*§¶ | | | 237 | | | | 588 | |
| | | | | | | | | |
| Health Care Equipment & Supplies — 2.8% | | | | | | | | |
| Achillion Pharmaceuticals, Inc.*@§¶ | | | 23,152 | | | | 6,251 | |
| Angiodynamics, Inc.* | | | 2,110 | | | | 22,007 | |
| Artivion, Inc.* | | | 5,028 | | | | 86,431 | |
| AtriCure, Inc.* | | | 3,625 | | | | 178,930 | |
| Atrion Corp. | | | 201 | | | | 113,706 | |
| Avanos Medical, Inc.* | | | 4,019 | | | | 102,726 | |
| Axogen, Inc.* | | | 2,643 | | | | 24,131 | |
| Axonics, Inc.* | | | 2,988 | | | | 150,804 | |
| CONMED Corp. | | | 2,255 | | | | 306,432 | |
| Dentsply Sirona, Inc. | | | 8,130 | | | | 325,363 | |
| Electromed, Inc.* | | | 2,175 | | | | 23,294 | |
| Embecta Corp. | | | 4,112 | | | | 88,819 | |
| Enovis Corp.* | | | 3,400 | | | | 218,008 | |
| Envista Holdings Corp.* | | | 11,739 | | | | 397,248 | |
| Figs, Inc., Class A* | | | 2,862 | | | | 23,669 | |
| Fonar Corp.* | | | 1,282 | | | | 21,922 | |
| Glaukos Corp.* | | | 3,346 | | | | 238,269 | |
| Globus Medical, Inc., Class A* | | | 5,734 | | | | 341,402 | |
| Haemonetics Corp.* | | | 5,164 | | | | 439,663 | |
| Inari Medical, Inc.* | | | 518 | | | | 30,117 | |
| Integer Holdings Corp.* | | | 3,152 | | | | 279,299 | |
| Integra LifeSciences Holdings Corp.* | | | 6,371 | | | | 262,039 | |
| iRadimed Corp. | | | 704 | | | | 33,609 | |
The accompanying notes are an integral part of these financial statements.
SA U.S. Small Company Fund
PORTFOLIO OF INVESTMENTS — AS OF JUNE 30, 2023 (Continued)
| | | SHARES | | | VALUE† | |
| COMMON STOCKS (Continued) | | | | | | |
| Health Care Equipment & Supplies (Continued) | | | | | | | | |
| Lantheus Holdings, Inc.* | | | 7,277 | | | $ | 610,686 | |
| LeMaitre Vascular, Inc. | | | 2,735 | | | | 184,011 | |
| LENSAR, Inc.* | | | 1,385 | | | | 5,886 | |
| LivaNova PLC* | | | 3,953 | | | | 203,303 | |
| Masimo Corp.* | | | 1,950 | | | | 320,872 | |
| Merit Medical Systems, Inc.* | | | 5,761 | | | | 481,850 | |
| Neogen Corp.* | | | 10,822 | | | | 235,378 | |
| NuVasive, Inc.* | | | 5,261 | | | | 218,805 | |
| Omnicell, Inc.* | | | 4,593 | | | | 338,366 | |
| OraSure Technologies, Inc.* | | | 9,521 | | | | 47,700 | |
| Orthofix Medical, Inc.* | | | 1,791 | | | | 32,345 | |
| OrthoPediatrics Corp.* | | | 1,252 | | | | 54,900 | |
| Penumbra, Inc.* | | | 2,476 | | | | 851,893 | |
| Pulmonx Corp.* | | | 667 | | | | 8,744 | |
| QuidelOrtho Corp.* | | | 446 | | | | 36,956 | |
| Semler Scientific, Inc.* | | | 300 | | | | 7,872 | |
| Shockwave Medical, Inc.* | | | 2,116 | | | | 603,928 | |
| STAAR Surgical Co.* | | | 1,276 | | | | 67,079 | |
| SurModics, Inc.* | | | 1,788 | | | | 55,982 | |
| Tactile Systems Technology, Inc.* | | | 1,239 | | | | 30,888 | |
| Tandem Diabetes Care, Inc.* | | | 1,468 | | | | 36,025 | |
| Teleflex, Inc. | | | 723 | | | | 174,988 | |
| TransMedics Group, Inc.* | | | 72 | | | | 6,047 | |
| UFP Technologies, Inc.* | | | 913 | | | | 176,985 | |
| Utah Medical Products, Inc. | | | 630 | | | | 58,716 | |
| Varex Imaging Corp.* | | | 578 | | | | 13,623 | |
| | | | | | | | 8,577,967 | |
| | | | | | | | | |
| Health Care Providers & Services — 3.5% | | | | | | | | |
| Acadia Healthcare Co., Inc.* | | | 8,805 | | | | 701,230 | |
| Addus HomeCare Corp.* | | | 1,872 | | | | 173,534 | |
| Agiliti, Inc.*@ | | | 3,373 | | | | 55,655 | |
| agilon health, Inc.*@ | | | 6,331 | | | | 109,780 | |
| Amedisys, Inc.* | | | 3,653 | | | | 334,030 | |
| AMN Healthcare Services, Inc.* | | | 5,001 | | | | 545,709 | |
| Apollo Medical Holdings, Inc.*@ | | | 4,323 | | | | 136,607 | |
| Brookdale Senior Living, Inc.* | | | 7,211 | | | | 30,430 | |
| Castle Biosciences, Inc.* | | | 1,302 | | | | 17,863 | |
| Chemed Corp. | | | 1,565 | | | | 847,714 | |
| Contra Abiomed, Inc CVR.*§¶ | | | 90 | | | | 1,054 | |
| Contra Albireo Pharma, Inc CVR.*¶§ | | | 1,018 | | | | 1,642 | |
| Corvel Corp.* | | | 2,837 | | | | 548,959 | |
| Cross Country Healthcare, Inc.* | | | 5,512 | | | | 154,777 | |
| DaVita, Inc.* | | | 8,508 | | | | 854,799 | |
| Encompass Health Corp. | | | 6,968 | | | | 471,803 | |
| Enhabit, Inc.* | | | 3,708 | | | | 42,642 | |
| Ensign Group, Inc. (The) | | | 6,774 | | | | 646,646 | |
| Enzo Biochem, Inc.* | | | 6,609 | | | | 12,161 | |
| Fulgent Genetics, Inc.* | | | 2,336 | | | | 86,502 | |
| HealthEquity, Inc.* | | | 5,161 | | | | 325,866 | |
| Henry Schein, Inc.* | | | 10,880 | | | | 882,368 | |
| Joint Corp. (The)* | | | 1,577 | | | | 21,290 | |
| ModivCare, Inc.* | | | 1,383 | | | | 62,525 | |
| National Healthcare Corp. | | | 1,582 | | | | 97,799 | |
| National Research Corp. | | | 2,987 | | | | 129,964 | |
| NeoGenomics, Inc.* | | | 5,114 | | | | 82,182 | |
| Option Care Health, Inc.* | | | 7,998 | | | | 259,855 | |
| Owens & Minor, Inc.* | | | 5,414 | | | | 103,083 | |
| Patterson Cos., Inc. | | | 6,230 | | | | 207,210 | |
| Pediatrix Medical Group, Inc.* | | | 3,540 | | | | 50,303 | |
| Pennant Group, Inc. (The)* | | | 3,997 | | | | 49,083 | |
| Premier, Inc., Class A | | | 6,565 | | | | 181,588 | |
| RadNet, Inc.* | | | 5,402 | | | | 176,213 | |
| Select Medical Holdings Corp. | | | 12,138 | | | | 386,717 | |
| Surgery Partners, Inc.* | | | 1,984 | | | | 89,260 | |
| Tenet Healthcare Corp.* | | | 11,198 | | | | 911,293 | |
| U.S. Physical Therapy, Inc. | | | 1,511 | | | | 183,420 | |
| Universal Health Services, Inc., Class B | | | 3,730 | | | | 588,482 | |
| | | | | | | | 10,562,038 | |
| | | | | | | | | |
| Health Care Technology — 0.4% | | | | | | | | |
| Allscripts Healthcare Solutions, Inc.* | | | 14,834 | | | | 186,908 | |
| American Well Corp.* | | | 12,361 | | | | 25,958 | |
| Certara, Inc.* | | | 6,275 | | | | 114,268 | |
| Computer Programs & Systems, Inc.* | | | 1,636 | | | | 40,393 | |
| Doximity, Inc., Class A*@ | | | 2,443 | | | | 83,111 | |
| Evolent Health, Inc., Class A* | | | 5,196 | | | | 157,439 | |
| HealthStream, Inc. | | | 3,803 | | | | 93,402 | |
| NextGen Healthcare, Inc.* | | | 6,391 | | | | 103,662 | |
| Phreesia, Inc.* | | | 2,105 | | | | 65,276 | |
| Schrodinger, Inc.*@ | | | 4,061 | | | | 202,725 | |
| Simulations Plus, Inc. | | | 1,668 | | | | 72,274 | |
| Teladoc Health, Inc.* | | | 2,607 | | | | 66,009 | |
| | | | | | | | 1,211,425 | |
| | | | | | | | | |
| Hotels, Restaurants & Leisure — 3.6% | | | | | | | | |
| Aramark | | | 20,945 | | | | 901,682 | |
| Bally’s Corp.* | | | 797 | | | | 12,401 | |
| Biglari Holdings, Inc., Class A* | | | 7 | | | | 6,650 | |
| Biglari Holdings, Inc., Class B* | | | 74 | | | | 14,588 | |
| BJ’s Restaurants, Inc.* | | | 2,751 | | | | 87,482 | |
| Bloomin’ Brands, Inc. | | | 8,154 | | | | 219,261 | |
| Boyd Gaming Corp. | | | 2,637 | | | | 182,929 | |
| Brinker International, Inc.* | | | 5,679 | | | | 207,851 | |
| Caesars Entertainment, Inc.* | | | 531 | | | | 27,065 | |
| Carnival Corp.*@ | | | 4,641 | | | | 87,390 | |
| Cheesecake Factory, Inc. (The)@ | | | 5,035 | | | | 174,110 | |
| Choice Hotels International, Inc.@ | | | 6,024 | | | | 707,941 | |
| Churchill Downs, Inc. | | | 7,622 | | | | 1,060,754 | |
| Chuy’s Holdings, Inc.* | | | 1,904 | | | | 77,721 | |
| Cracker Barrel Old Country Store, Inc.@ | | | 2,324 | | | | 216,550 | |
| Dave & Buster’s Entertainment, Inc.* | | | 4,530 | | | | 201,857 | |
| Denny’s Corp.* | | | 4,694 | | | | 57,830 | |
| DineEquity, Inc. | | | 1,002 | | | | 58,146 | |
| Domino’s Pizza, Inc. | | | 366 | | | | 123,338 | |
| DraftKings, Inc. Class A* | | | 4,606 | | | | 122,381 | |
| El Pollo Loco Holdings, Inc. | | | 4,284 | | | | 37,571 | |
| Everi Holdings, Inc.* | | | 4,400 | | | | 63,624 | |
| Fiesta Restaurant Group, Inc.* | | | 4,058 | | | | 32,221 | |
| Hyatt Hotels Corp., Class A | | | 811 | | | | 92,924 | |
| Inspired Entertainment, Inc.* | | | 1,305 | | | | 19,197 | |
The accompanying notes are an integral part of these financial statements.
SA U.S. Small Company Fund
PORTFOLIO OF INVESTMENTS — AS OF JUNE 30, 2023 (Continued)
| | | SHARES | | | VALUE† | |
| COMMON STOCKS (Continued) | | | | | | |
| Hotels, Restaurants & Leisure (Continued) | | | | | | | | |
| International Game Technology PLC | | | 969 | | | $ | 30,901 | |
| Jack in the Box, Inc. | | | 3,000 | | | | 292,590 | |
| Kura Sushi USA, Inc., Class A* | | | 365 | | | | 33,927 | |
| Light & Wonder, Inc., Class A* | | | 1,500 | | | | 103,140 | |
| Marriott Vacations Worldwide Corp. | | | 5,154 | | | | 632,499 | |
| Monarch Casino & Resort, Inc. | | | 1,490 | | | | 104,971 | |
| Nathan’s Famous, Inc. | | | 794 | | | | 62,361 | |
| Papa John’s International, Inc. | | | 4,290 | | | | 316,731 | |
| Penn Entertainment, Inc.*@ | | | 5,194 | | | | 124,812 | |
| Planet Fitness, Inc. Class A* | | | 8,887 | | | | 599,339 | |
| SeaWorld Entertainment, Inc.* | | | 4,795 | | | | 268,568 | |
| Shake Shack, Inc., Class A* | | | 2,266 | | | | 176,114 | |
| Six Flags Entertainment Corp.* | | | 3,483 | | | | 90,488 | |
| Texas Roadhouse, Inc. | | | 6,983 | | | | 784,051 | |
| Travel + Leisure Co. | | | 5,666 | | | | 228,566 | |
| Vail Resorts, Inc. | | | 2,071 | | | | 521,395 | |
| Wendy’s Co. (The) | | | 22,109 | | | | 480,871 | |
| Wingstop, Inc. | | | 1,665 | | | | 333,266 | |
| Wyndham Hotels & Resorts, Inc. | | | 5,481 | | | | 375,832 | |
| Wynn Resorts Ltd. | | | 4,811 | | | | 508,090 | |
| | | | | | | | 10,861,976 | |
| |
| Household Durables — 2.7% | | | | | | | | |
| Bassett Furniture Industries, Inc. | | | 1,080 | | | | 16,243 | |
| Beazer Homes USA, Inc.* | | | 1,643 | | | | 46,480 | |
| Cavco Industries, Inc.* | | | 986 | | | | 290,870 | |
| Century Communities, Inc. | | | 3,674 | | | | 281,502 | |
| Ethan Allen Interiors, Inc. | | | 2,598 | | | | 73,471 | |
| Flexsteel Industries, Inc. | | | 1,069 | | | | 21,070 | |
| GoPro, Inc., Class A* | | | 6,985 | | | | 28,918 | |
| Green Brick Partners, Inc.* | | | 4,024 | | | | 228,563 | |
| Hamilton Beach Brands Holding Co., Class A | | | 2,000 | | | | 19,320 | |
| Helen of Troy Ltd.* | | | 2,629 | | | | 283,985 | |
| Hooker Furnishings Corp. | | | 1,742 | | | | 32,506 | |
| Installed Building Products, Inc. | | | 3,050 | | | | 427,488 | |
| iRobot Corp.* | | | 3,109 | | | | 140,682 | |
| KB Home | | | 7,849 | | | | 405,872 | |
| La-Z-Boy, Inc. | | | 4,321 | | | | 123,753 | |
| Leggett & Platt, Inc. | | | 8,008 | | | | 237,197 | |
| LGI Homes, Inc.* | | | 624 | | | | 84,171 | |
| Lifetime Brands, Inc. | | | 3,200 | | | | 18,080 | |
| Lovesac Co. (The)* | | | 794 | | | | 21,398 | |
| M.D.C. Holdings, Inc. | | | 6,276 | | | | 293,529 | |
| M/I Homes, Inc.* | | | 3,074 | | | | 268,022 | |
| Meritage Homes Corp. | | | 3,491 | | | | 496,665 | |
| Mohawk Industries, Inc.* | | | 3,847 | | | | 396,857 | |
| Newell Brands, Inc. | | | 27,926 | | | | 242,956 | |
| Orleans Homebuilders, Inc.*@§ | | | 4,953 | | | | — | |
| Skyline Champion Corp.* | | | 2,566 | | | | 167,945 | |
| Sonos, Inc.* | | | 3,418 | | | | 55,816 | |
| Taylor Morrison Home Corp.* | | | 9,778 | | | | 476,873 | |
| Tempur Sealy International, Inc. | | | 19,486 | | | | 780,804 | |
| Toll Brothers, Inc. | | | 10,507 | | | | 830,789 | |
| TopBuild Corp.* | | | 3,486 | | | | 927,346 | |
| TRI Pointe Homes, Inc.* | | | 12,577 | | | | 413,280 | |
| Universal Electronics, Inc.* | | | 1,292 | | | | 12,429 | |
| VOXX International Corp.* | | | 3,284 | | | | 40,984 | |
| | | | | | | | 8,185,864 | |
| | | | | | | | | |
| Household Products — 0.3% | | | | | | | | |
| Central Garden & Pet Co.* | | | 1,247 | | | | 48,346 | |
| Central Garden & Pet Co., Class A* | | | 4,555 | | | | 166,075 | |
| Energizer Holdings, Inc. | | | 5,016 | | | | 168,437 | |
| Spectrum Brands Holdings, Inc. | | | 1,853 | | | | 144,627 | |
| WD-40 Co.@ | | | 1,589 | | | | 299,765 | |
| | | | | | | | 827,250 | |
| | | | | | | | | |
| Independent Power Producers & Energy Traders — 0.6% | | | | | | | | |
| Atlantica Sustainable Infrastructure PLC | | | 1,800 | | | | 42,192 | |
| Brookfield Renewable Corp. Class A | | | 811 | | | | 25,563 | |
| Clearway Energy, Inc., Class A | | | 3,716 | | | | 100,332 | |
| Clearway Energy, Inc., Class C | | | 9,495 | | | | 271,177 | |
| Ormat Technologies, Inc. | | | 5,451 | | | | 438,588 | |
| Sunnova Energy International, Inc.*@ | | | 8,581 | | | | 157,118 | |
| Vistra Corp. | | | 28,253 | | | | 741,641 | |
| | | | | | | | 1,776,611 | |
| | | | | | | | | |
| Insurance — 3.7% | | | | | | | | |
| Ambac Financial Group, Inc.* | | | 900 | | | | 12,816 | |
| American Equity Investment Life Holding Co. | | | 10,429 | | | | 543,455 | |
| American Financial Group, Inc. | | | 3,696 | | | | 438,900 | |
| AMERISAFE, Inc. | | | 1,961 | | | | 104,560 | |
| Argo Group International Holdings Ltd. | | | 3,856 | | | | 114,176 | |
| Assurant, Inc. | | | 4,350 | | | | 546,882 | |
| Assured Guaranty Ltd. | | | 4,657 | | | | 259,861 | |
| Axis Capital Holdings Ltd. | | | 4,830 | | | | 259,999 | |
| Brighthouse Financial, Inc.* | | | 5,115 | | | | 242,195 | |
| BRP Group, Inc., Class A* | | | 3,130 | | | | 77,561 | |
| Citizens, Inc.*@ | | | 6,126 | | | | 14,764 | |
| CNO Financial Group, Inc. | | | 10,476 | | | | 247,967 | |
| Crawford & Co., Class A | | | 5,638 | | | | 62,525 | |
| Crawford & Co., Class B | | | 3,345 | | | | 31,410 | |
| Donegal Group, Inc., Class A | | | 3,630 | | | | 52,381 | |
| Employers Holdings, Inc. | | | 2,665 | | | | 99,698 | |
| Enstar Group Ltd.* | | | 1,195 | | | | 291,867 | |
| Erie Indemnity Co., Class A | | | 612 | | | | 128,526 | |
| Everest Re Group Ltd. | | | 113 | | | | 38,630 | |
| F&G Annuities & Life, Inc.@ | | | 877 | | | | 21,732 | |
| Fidelity National Financial, Inc. | | | 11,853 | | | | 426,708 | |
| First American Financial Corp. | | | 7,508 | | | | 428,106 | |
| Genworth Financial, Inc., Class A* | | | 14,918 | | | | 74,590 | |
| Globe Life, Inc. | | | 3,866 | | | | 423,791 | |
| Hanover Insurance Group, Inc. (The) | | | 2,145 | | | | 242,449 | |
| HCI Group, Inc.@ | | | 1,239 | | | | 76,545 | |
| Horace Mann Educators Corp. | | | 4,392 | | | | 130,267 | |
| Investors Title Co. | | | 279 | | | | 40,734 | |
| James River Group Holdings Ltd. | | | 829 | | | | 15,138 | |
| Kemper Corp. | | | 5,843 | | | | 281,983 | |
| Kinsale Capital Group, Inc. | | | 808 | | | | 302,354 | |
| Lincoln National Corp. | | | 8,515 | | | | 219,346 | |
| MBIA, Inc.* | | | 6,313 | | | | 54,544 | |
The accompanying notes are an integral part of these financial statements.
SA U.S. Small Company Fund
PORTFOLIO OF INVESTMENTS — AS OF JUNE 30, 2023 (Continued)
| | | SHARES | | | VALUE† | |
| COMMON STOCKS (Continued) | | | | | | | | |
| Insurance (Continued) | | | | | | | | |
| Mercury General Corp. | | | 3,869 | | | $ | 117,115 | |
| Old Republic International Corp. | | | 20,327 | | | | 511,631 | |
| Oscar Health, Inc., Class A* | | | 3,732 | | | | 30,080 | |
| Palomar Holdings, Inc.* | | | 1,593 | | | | 92,458 | |
| Primerica, Inc. | | | 4,105 | | | | 811,805 | |
| Reinsurance Group of America, Inc. | | | 3,019 | | | | 418,705 | |
| RenaissanceRe Holdings Ltd. | | | 2,896 | | | | 540,162 | |
| RLI Corp. | | | 5,024 | | | | 685,625 | |
| Safety Insurance Group, Inc. | | | 1,656 | | | | 118,768 | |
| Selective Insurance Group, Inc. | | | 6,118 | | | | 587,022 | |
| Stewart Information Services Corp. | | | 3,069 | | | | 126,259 | |
| Trupanion, Inc.*@ | | | 335 | | | | 6,593 | |
| Unico American Corp.* | | | 1,700 | | | | 208 | |
| United Fire Group, Inc. | | | 2,400 | | | | 54,384 | |
| Universal Insurance Holdings, Inc. | | | 4,293 | | | | 66,241 | |
| Unum Group | | | 14,680 | | | | 700,236 | |
| White Mountains Insurance Group Ltd. | | | 170 | | | | 236,115 | |
| | | | | | | | 11,409,867 | |
| |
| Interactive Media & Services — 0.3% | | | | | | | | |
| Bumble, Inc., Class A* | | | 2,172 | | | | 36,446 | |
| Cargurus, Inc.* | | | 1,272 | | | | 28,785 | |
| Cars.com, Inc.* | | | 3,931 | | | | 77,913 | |
| DHI Group, Inc.* | | | 8,881 | | | | 34,014 | |
| Match Group, Inc.* | | | 1,193 | | | | 49,927 | |
| QuinStreet, Inc.* | | | 858 | | | | 7,576 | |
| Shutterstock, Inc. | | | 2,721 | | | | 132,431 | |
| TripAdvisor, Inc.* | | | 6,168 | | | | 101,710 | |
| Yelp, Inc.* | | | 4,724 | | | | 172,001 | |
| Ziff Davis, Inc.* | | | 2,996 | | | | 209,900 | |
| ZoomInfo Technologies, Inc.* | | | 2,215 | | | | 56,239 | |
| | | | | | | | 906,942 | |
| |
| IT Services — 0.8% | | | | | | | | |
| Amdocs Ltd. | | | 5,319 | | | | 525,783 | |
| Brightcove, Inc.* | | | 3,324 | | | | 13,329 | |
| Computer Task Group, Inc.* | | | 4,027 | | | | 30,646 | |
| DXC Technology Co.* | | | 11,187 | | | | 298,917 | |
| Edgio, Inc.* | | | 9,405 | | | | 6,339 | |
| Fastly, Inc., Class A* | | | 1,787 | | | | 28,181 | |
| Globant SA* | | | 1,874 | | | | 336,795 | |
| GoDaddy, Inc., Class A* | | | 8,025 | | | | 602,918 | |
| Grid Dynamics Holdings, Inc.* | | | 4,703 | | | | 43,503 | |
| Hackett Group, Inc. (The) | | | 4,098 | | | | 91,590 | |
| Information Services Group, Inc. | | | 2,180 | | | | 11,685 | |
| Kyndryl Holdings, Inc.* | | | 2,623 | | | | 34,834 | |
| Okta, Inc.* | | | 281 | | | | 19,487 | |
| Perficient, Inc.* | | | 4,602 | | | | 383,485 | |
| PFSweb, Inc. | | | 3,727 | | | | 16,846 | |
| Squarespace, Inc.* | | | 2,445 | | | | 77,115 | |
| Twilio, Inc., Class A* | | | 518 | | | | 32,955 | |
| | | | | | | | 2,554,408 | |
| |
| Leisure Equipment & Products — 0.6% | | | | | | | | |
| Acushnet Holdings Corp. | | | 541 | | | | 29,582 | |
| American Outdoor Brands, Inc.* | | | 1,946 | | | | 16,891 | |
| Brunswick Corp. | | | 4,070 | | | | 352,625 | |
| Escalade, Inc. | | | 1,950 | | | | 26,032 | |
| Funko, Inc., Class A* | | | 1,917 | | | | 20,742 | |
| Hasbro, Inc. | | | 3,528 | | | | 228,508 | |
| Johnson Outdoors, Inc., Class A | | | 1,000 | | | | 61,450 | |
| Malibu Boats, Inc., Class A* | | | 2,116 | | | | 124,125 | |
| Marine Products Corp. | | | 3,930 | | | | 66,260 | |
| MasterCraft Boat Holdings, Inc.* | | | 2,183 | | | | 66,909 | |
| Mattel, Inc.* | | | 16,916 | | | | 330,539 | |
| Polaris, Inc. | | | 3,530 | | | | 426,883 | |
| Smith & Wesson Brands, Inc. | | | 4,598 | | | | 59,958 | |
| Topgolf Callaway Brands Corp.* | | | 5,300 | | | | 105,205 | |
| | | | | | | | 1,915,709 | |
| | | | | | | | | |
| Life Sciences Tools & Services — 0.7% | | | | | | | | |
| Adaptive Biotechnologies Corp.* | | | 4,578 | | | | 30,718 | |
| Azenta, Inc.* | | | 937 | | | | 43,739 | |
| BioLife Solutions, Inc.* | | | 1,278 | | | | 28,244 | |
| Bruker Corp. | | | 5,636 | | | | 416,613 | |
| Charles River Laboratories International, Inc.* | | | 527 | | | | 110,802 | |
| CryoPort, Inc.*@ | | | 3,270 | | | | 56,407 | |
| Harvard Bioscience, Inc.* | | | 5,522 | | | | 30,316 | |
| Medpace Holdings, Inc.* | | | 2,141 | | | | 514,204 | |
| OmniAb, Inc.* | | | 8,462 | | | | 42,564 | |
| OmniAb, Inc.*§ | | | 654 | | | | — | |
| OmniAb, Inc.*§ | | | 654 | | | | — | |
| Pacific Biosciences of California, Inc.* | | | 2,709 | | | | 36,030 | |
| Repligen Corp.* | | | 4,248 | | | | 600,922 | |
| Syneos Health, Inc.* | | | 6,498 | | | | 273,826 | |
| | | | | | | | 2,184,385 | |
| | | | | | | | | |
| Machinery — 5.1% | | | | | | | | |
| AGCO Corp. | | | 5,729 | | | | 752,905 | |
| Alamo Group, Inc. | | | 1,320 | | | | 242,761 | |
| Albany International Corp., Class A | | | 3,573 | | | | 333,289 | |
| Allison Transmission Holdings, Inc. | | | 6,647 | | | | 375,290 | |
| Astec Industries, Inc. | | | 1,967 | | | | 89,380 | |
| Barnes Group, Inc. | | | 4,989 | | | | 210,486 | |
| Blue Bird Corp.* | | | 662 | | | | 14,882 | |
| Chart Industries, Inc.*@ | | | 3,344 | | | | 534,338 | |
| CIRCOR International, Inc.* | | | 2,600 | | | | 146,770 | |
| Columbus McKinnon Corp. | | | 2,642 | | | | 107,397 | |
| Commercial Vehicle Group, Inc.* | | | 3,758 | | | | 41,714 | |
| Crane Co. | | | 3,089 | | | | 275,292 | |
| Crane NXT Co. | | | 3,089 | | | | 174,343 | |
| Donaldson Co., Inc. | | | 8,206 | | | | 512,957 | |
| Douglas Dynamics, Inc. | | | 2,507 | | | | 74,909 | |
| Eastern Co. (The) | | | 1,272 | | | | 23,010 | |
| Enerpac Tool Group Corp. | | | 6,499 | | | | 175,473 | |
| EnPro Industries, Inc. | | | 2,344 | | | | 312,994 | |
| Esab Corp. | | | 418 | | | | 27,814 | |
| ESCO Technologies, Inc. | | | 2,646 | | | | 274,205 | |
| Federal Signal Corp. | | | 5,985 | | | | 383,220 | |
| Flowserve Corp. | | | 2,564 | | | | 95,253 | |
| Franklin Electric Co., Inc. | | | 5,666 | | | | 583,031 | |
| Gorman-Rupp Co. (The) | | | 3,803 | | | | 109,640 | |
The accompanying notes are an integral part of these financial statements.
SA U.S. Small Company Fund
PORTFOLIO OF INVESTMENTS — AS OF JUNE 30, 2023 (Continued)
| | | SHARES | | | VALUE† | |
| COMMON STOCKS (Continued) | | | | | | | | |
| Machinery (Continued) | | | | | | | | |
| Graco, Inc. | | | 4,051 | | | $ | 349,804 | |
| Greenbrier Cos., Inc. (The) | | | 3,984 | | | | 171,710 | |
| Helios Technologies, Inc. | | | 3,760 | | | | 248,498 | |
| Hurco Cos., Inc. | | | 1,000 | | | | 21,650 | |
| Hyster-Yale Materials Handling, Inc. | | | 165 | | | | 9,214 | |
| ITT, Inc. | | | 5,131 | | | | 478,261 | |
| John Bean Technologies Corp. | | | 3,520 | | | | 426,976 | |
| Kadant, Inc. | | | 1,660 | | | | 368,686 | |
| Kennametal, Inc. | | | 6,340 | | | | 179,993 | |
| LB Foster Co., Class A* | | | 2,165 | | | | 30,916 | |
| Lincoln Electric Holdings, Inc. | | | 3,365 | | | | 668,390 | |
| Lindsay Corp. | | | 1,209 | | | | 144,282 | |
| Manitex International, Inc.* | | | 1,300 | | | | 6,968 | |
| Manitowoc Co., Inc. (The)* | | | 3,607 | | | | 67,920 | |
| Middleby Corp. (The)* | | | 4,055 | | | | 599,451 | |
| Miller Industries, Inc. | | | 1,261 | | | | 44,728 | |
| Mueller Industries, Inc. | | | 6,958 | | | | 607,294 | |
| Mueller Water Products, Inc., Class A | | | 16,726 | | | | 271,463 | |
| Nordson Corp. | | | 628 | | | | 155,857 | |
| Omega Flex, Inc. | | | 1,002 | | | | 103,988 | |
| Oshkosh Corp. | | | 4,130 | | | | 357,617 | |
| Park-Ohio Holdings Corp. | | | 2,182 | | | | 41,458 | |
| Pentair PLC | | | 11,013 | | | | 711,440 | |
| Perma-Pipe International Holdings, Inc.* | | | 1,900 | | | | 18,069 | |
| RBC Bearings, Inc.* | | | 336 | | | | 73,070 | |
| Shyft Group, Inc. (The) | | | 3,913 | | | | 86,321 | |
| Snap-On, Inc. | | | 938 | | | | 270,322 | |
| SPX Technologies, Inc.* | | | 4,956 | | | | 421,111 | |
| Standex International Corp. | | | 1,427 | | | | 201,878 | |
| Tennant Co. | | | 2,037 | | | | 165,221 | |
| Terex Corp. | | | 6,869 | | | | 410,972 | |
| Timken Co. (The) | | | 6,902 | | | | 631,740 | |
| Titan International, Inc.* | | | 4,338 | | | | 49,800 | |
| Toro Co. (The) | | | 3,825 | | | | 388,811 | |
| Trinity Industries, Inc. | | | 4,908 | | | | 126,185 | |
| Wabash National Corp. | | | 6,446 | | | | 165,275 | |
| Watts Water Technologies, Inc., Class A | | | 3,406 | | | | 625,784 | |
| | | | | | | | 15,572,476 | |
| | | | | | | | | |
| Marine Transportation — 0.3% | | | | | | | | |
| Costamare, Inc. | | | 5,728 | | | | 55,390 | |
| Eagle Bulk Shipping, Inc.@ | | | 436 | | | | 20,945 | |
| Kirby Corp.* | | | 4,368 | | | | 336,118 | |
| Matson, Inc. | | | 5,291 | | | | 411,269 | |
| | | | | | | | 823,722 | |
| | | | | | | | | |
| Media — 1.1% | | | | | | | | |
| Altice USA, Inc., Class A* | | | 2,984 | | | | 9,012 | |
| Boston Omaha Corp., Class A* | | | 1,358 | | | | 25,558 | |
| Cable One, Inc. | | | 397 | | | | 260,861 | |
| DISH Network Corp., Class A* | | | 4,087 | | | | 26,933 | |
| Entravision Communications Corp., Class A | | | 5,678 | | | | 24,927 | |
| EW Scripps Co. (The), Class A* | | | 7,073 | | | | 64,718 | |
| Gannett Co., Inc.* | | | 1 | | | | 2 | |
| Gray Television, Inc. | | | 8,433 | | | | 66,452 | |
| iHeartMedia, Inc., Class A* | | | 2,052 | | | | 7,469 | |
| Interpublic Group of Cos., Inc. (The) | | | 3,000 | | | | 115,740 | |
| John Wiley & Sons, Inc., Class A | | | 3,247 | | | | 110,496 | |
| Liberty Broadband Corp., Class A* | | | 475 | | | | 37,872 | |
| Liberty Broadband Corp., Class C* | | | 473 | | | | 37,892 | |
| Liberty Media Corp.-Liberty Siriusxm, Class A* | | | 456 | | | | 14,961 | |
| Liberty Media Corp.-Liberty Siriusxm, Class C* | | | 416 | | | | 13,616 | |
| Magnite, Inc.* | | | 3,879 | | | | 52,948 | |
| New York Times Co. (The), Class A | | | 18,114 | | | | 713,329 | |
| News Corp., Class A | | | 19,977 | | | | 389,552 | |
| News Corp., Class B | | | 7,188 | | | | 141,747 | |
| Nexstar Media Group, Inc. Class A | | | 4,189 | | | | 697,678 | |
| Paramount Global, Class B | | | 1,375 | | | | 21,876 | |
| PubMatic, Inc., Class A* | | | 3,162 | | | | 57,801 | |
| Saga Communications, Inc., Class A | | | 664 | | | | 14,183 | |
| Scholastic Corp. | | | 3,519 | | | | 136,854 | |
| Sinclair, Inc. | | | 2,132 | | | | 29,464 | |
| TechTarget, Inc.* | | | 3,517 | | | | 109,484 | |
| Thryv Holdings, Inc.* | | | 1,938 | | | | 47,675 | |
| WideOpenWest, Inc.* | | | 4,405 | | | | 37,178 | |
| | | | | | | | 3,266,278 | |
| | | | | | | | | |
| Metals & Mining — 1.8% | | | | | | | | |
| Alcoa Corp. | | | 16,066 | | | | 545,119 | |
| Alpha Metallurgical Resources, Inc. | | | 886 | | | | 145,623 | |
| Arconic Corp.* | | | 5,198 | | | | 153,757 | |
| ATI, Inc.* | | | 14,726 | | | | 651,331 | |
| Carpenter Technology Corp. | | | 3,912 | | | | 219,581 | |
| Century Aluminum Co.* | | | 8,912 | | | | 77,713 | |
| Cleveland-Cliffs, Inc.* | | | 21,519 | | | | 360,658 | |
| Coeur Mining, Inc.* | | | 16,461 | | | | 46,749 | |
| Commercial Metals Co. | | | 13,236 | | | | 697,008 | |
| Ferroglobe PLC* | | | 10,242 | | | | 48,854 | |
| Fortitude Gold Corp. | | | 4,671 | | | | 29,334 | |
| Friedman Industries, Inc. | | | 700 | | | | 8,820 | |
| Haynes International, Inc. | | | 1,229 | | | | 62,458 | |
| Hecla Mining Co. | | | 30,869 | | | | 158,975 | |
| Kaiser Aluminum Corp. | | | 2,372 | | | | 169,930 | |
| Materion Corp. | | | 2,319 | | | | 264,830 | |
| MP Materials Corp.* | | | 6,046 | | | | 138,332 | |
| Olympic Steel, Inc. | | | 1,200 | | | | 58,800 | |
| Reliance Steel & Aluminum Co. | | | 757 | | | | 205,594 | |
| Royal Gold, Inc. | | | 4,388 | | | | 503,655 | |
| Ryerson Holding Corp. | | | 5,114 | | | | 221,845 | |
| Schnitzer Steel Industries, Inc., Class A | | | 2,809 | | | | 84,242 | |
| SunCoke Energy, Inc. | | | 8,204 | | | | 64,565 | |
| TimkenSteel Corp.* | | | 5,303 | | | | 114,386 | |
| Tredegar Corp. | | | 3,412 | | | | 22,758 | |
| United States Steel Corp. | | | 8,879 | | | | 222,064 | |
| Warrior Met Coal, Inc. | | | 738 | | | | 28,745 | |
| Worthington Industries, Inc. | | | 4,458 | | | | 309,697 | |
| | | | | | | | 5,615,423 | |
| | | | | | | | | |
| Multi-Utilities — 0.5% | | | | | | | | |
| Avista Corp. | | | 6,896 | | | | 270,806 | |
The accompanying notes are an integral part of these financial statements.
SA U.S. Small Company Fund
PORTFOLIO OF INVESTMENTS — AS OF JUNE 30, 2023 (Continued)
| | | SHARES | | | VALUE† | |
| COMMON STOCKS (Continued) | | | | | | | | |
| Multi-Utilities (Continued) | | | | | | | | |
| Black Hills Corp. | | | 6,023 | | | $ | 362,946 | |
| NiSource, Inc. | | | 18,689 | | | | 511,144 | |
| NorthWestern Corp. | | | 4,148 | | | | 235,441 | |
| Unitil Corp. | | | 1,923 | | | | 97,515 | |
| | | | | | | | 1,477,852 | |
| | | | | | | | | |
| Oil, Gas & Consumable Fuels — 3.2% | | | | | | | | |
| Adams Resources & Energy, Inc. | | | 536 | | | | 18,840 | |
| Alto Ingredients, Inc.* | | | 5,761 | | | | 16,649 | |
| Amplify Energy Corp.*@ | | | 1,867 | | | | 12,640 | |
| Antero Midstream Corp. | | | 32,353 | | | | 375,295 | |
| Antero Resources Corp.* | | | 5,180 | | | | 119,295 | |
| APA Corp. | | | 1,360 | | | | 46,471 | |
| Arch Resources, Inc. | | | 1,865 | | | | 210,297 | |
| Ardmore Shipping Corp. | | | 1,612 | | | | 19,908 | |
| Berry Corp. | | | 4,166 | | | | 28,662 | |
| California Resources Corp. | | | 3,564 | | | | 161,414 | |
| Callon Petroleum Co.* | | | 3,677 | | | | 128,952 | |
| Centrus Energy Corp. Class A* | | | 1,074 | | | | 34,970 | |
| Chesapeake Energy Corp.@ | | | 4,468 | | | | 373,882 | |
| Chord Energy Corp. | | | 804 | | | | 123,655 | |
| Civitas Resources, Inc. | | | 2,093 | | | | 145,191 | |
| Clean Energy Fuels Corp.* | | | 20,279 | | | | 100,584 | |
| CNX Resources Corp.* | | | 16,780 | | | | 297,342 | |
| Comstock Resources, Inc.@ | | | 11,934 | | | | 138,434 | |
| CONSOL Energy, Inc. | | | 2,376 | | | | 161,117 | |
| CVR Energy, Inc. | | | 1,556 | | | | 46,618 | |
| Delek US Holdings, Inc. | | | 7,082 | | | | 169,614 | |
| Denbury, Inc.* | | | 2,643 | | | | 227,985 | |
| DHT Holdings, Inc. | | | 11,638 | | | | 99,272 | |
| Dorian LPG Ltd. | | | 3,332 | | | | 85,466 | |
| DT Midstream, Inc. | | | 1,881 | | | | 93,241 | |
| Earthstone Energy, Inc., Class A* | | | 7,471 | | | | 106,761 | |
| EnLink Midstream LLC* | | | 27,038 | | | | 286,603 | |
| EQT Corp. | | | 1,580 | | | | 64,985 | |
| Equitrans Midstream Corp. | | | 22,329 | | | | 213,465 | |
| Evolution Petroleum Corp. | | | 5,356 | | | | 43,223 | |
| Green Plains, Inc.* | | | 5,096 | | | | 164,295 | |
| Gulfport Energy Corp.* | | | 944 | | | | 99,186 | |
| Hallador Energy Co.* | | | 3,193 | | | | 27,364 | |
| HF Sinclair Corp. | | | 9,611 | | | | 428,747 | |
| International Seaways, Inc. | | | 4,383 | | | | 167,606 | |
| Kosmos Energy Ltd.* | | | 25,367 | | | | 151,948 | |
| Laredo Petroleum, Inc.*@ | | | 1,191 | | | | 53,774 | |
| Magnolia Oil & Gas Corp., Class A | | | 7,613 | | | | 159,112 | |
| Matador Resources Co. | | | 10,827 | | | | 566,469 | |
| Murphy Oil Corp. | | | 13,521 | | | | 517,854 | |
| NACCO Industries, Inc., Class A | | | 1,000 | | | | 34,660 | |
| New Fortress Energy, Inc.@ | | | 3,932 | | | | 105,299 | |
| Nordic American Tankers Ltd. | | | 8,255 | | | | 30,296 | |
| Northern Oil and Gas, Inc.@ | | | 1,306 | | | | 44,822 | |
| Overseas Shipholding Group, Inc., Class A* | | | 11,837 | | | | 49,360 | |
| Ovintiv, Inc. | | | 555 | | | | 21,129 | |
| Par Pacific Holdings, Inc.* | | | 4,135 | | | | 110,032 | |
| PBF Energy, Inc., Class A | | | 10,429 | | | | 426,963 | |
| PDC Energy, Inc. | | | 8,838 | | | | 628,735 | |
| Peabody Energy Corp. | | | 3,580 | | | | 77,543 | |
| Permian Resources Corp., Class A | | | 16,144 | | | | 176,938 | |
| Range Resources Corp. | | | 10,825 | | | | 318,255 | |
| Rex American Resources Corp.* | | | 2,364 | | | | 82,291 | |
| SandRidge Energy, Inc. | | | 2,175 | | | | 33,169 | |
| Scorpio Tankers, Inc. | | | 3,855 | | | | 182,072 | |
| SFL Corp. Ltd. | | | 4,682 | | | | 43,683 | |
| Sitio Royalties Corp. | | | 3,565 | | | | 93,653 | |
| SM Energy Co. | | | 2,124 | | | | 67,182 | |
| Southwestern Energy Co.* | | | 62,679 | | | | 376,701 | |
| Talos Energy, Inc.* | | | 3,212 | | | | 44,551 | |
| Teekay Corp.* | | | 4,339 | | | | 26,208 | |
| Teekay Tankers Ltd., Class A | | | 1,880 | | | | 71,872 | |
| Texas Pacific Land Corp. | | | 126 | | | | 165,879 | |
| Vitesse Energy, Inc. | | | 2,544 | | | | 56,986 | |
| W&T Offshore, Inc.* | | | 9,305 | | | | 36,010 | |
| World Kinect Corp. | | | 4,796 | | | | 99,181 | |
| | | | | | | | 9,690,656 | |
| | | | | | | | | |
| Paper & Forest Products — 0.3% | | | | | | | | |
| Clearwater Paper Corp.* | | | 1,838 | | | | 57,566 | |
| Contra Resolute Forest Products, Inc. CVR*¶§ | | | 7,629 | | | | 8,125 | |
| Glatfelter Corp. | | | 4,665 | | | | 14,088 | |
| Louisiana-Pacific Corp. | | | 10,788 | | | | 808,884 | |
| Mercer International, Inc. | | | 7,857 | | | | 63,406 | |
| Sylvamo Corp. | | | 2,483 | | | | 100,438 | |
| | | | | | | | 1,052,507 | |
| |
| Passenger Airlines — 0.3% | | | | | | | | |
| Alaska Air Group, Inc.* | | | 9,239 | | | | 491,330 | |
| Allegiant Travel Co.* | | | 441 | | | | 55,690 | |
| American Airlines Group, Inc.* | | | 6,949 | | | | 124,665 | |
| Hawaiian Holdings, Inc.* | | | 6,255 | | | | 67,366 | |
| Skywest, Inc.* | | | 4,643 | | | | 189,063 | |
| Spirit Airlines, Inc. | | | 3,315 | | | | 56,885 | |
| | | | | | | | 984,999 | |
| | | | | | | | | |
| Personal Products — 0.8% | | | | | | | | |
| BellRing Brands, Inc.* | | | 7,482 | | | | 273,841 | |
| Coty, Inc., Class A* | | | 46,457 | | | | 570,957 | |
| Edgewell Personal Care Co. | | | 3,865 | | | | 159,663 | |
| elf Beauty, Inc.* | | | 4,063 | | | | 464,117 | |
| Herbalife Ltd.* | | | 600 | | | | 7,944 | |
| Honest Co., Inc. (The)* | | | 3,035 | | | | 5,099 | |
| Inter Parfums, Inc. | | | 3,888 | | | | 525,774 | |
| Medifast, Inc. | | | 1,490 | | | | 137,318 | |
| Natural Alternatives International, Inc.* | | | 1,000 | | | | 7,420 | |
| Nature’s Sunshine Products, Inc.* | | | 1,700 | | | | 23,205 | |
| Nu Skin Enterprises, Inc., Class A | | | 3,817 | | | | 126,724 | |
| United-Guardian, Inc. | | | 600 | | | | 5,112 | |
| USANA Health Sciences, Inc.* | | | 2,205 | | | | 139,003 | |
| | | | | | | | 2,446,177 | |
| | | | | | | | | |
| Pharmaceuticals — 0.9% | | | | | | | | |
| Amphastar Pharmaceuticals, Inc.* | | | 5,670 | | | | 325,855 | |
| ANI Pharmaceuticals, Inc.* | | | 1,669 | | | | 89,842 | |
The accompanying notes are an integral part of these financial statements.
SA U.S. Small Company Fund
PORTFOLIO OF INVESTMENTS — AS OF JUNE 30, 2023 (Continued)
| | | SHARES | | | VALUE† | |
| COMMON STOCKS (Continued) | | | | | | | | |
| Pharmaceuticals (Continued) | | | | | | | | |
| Cara Therapeutics, Inc.*@ | | | 3,972 | | | $ | 11,241 | |
| Collegium Pharmaceutical, Inc.* | | | 2,590 | | | | 55,659 | |
| Corcept Therapeutics, Inc.* | | | 7,842 | | | | 174,484 | |
| Cumberland Pharmaceuticals, Inc.* | | | 1,100 | | | | 1,617 | |
| Cymabay Therapeutics, Inc.* | | | 1,670 | | | | 18,286 | |
| Edgewise Therapeutics, Inc.*@ | | | 1,162 | | | | 9,006 | |
| Elanco Animal Health, Inc.* | | | 2,020 | | | | 20,321 | |
| Harmony Biosciences Holdings, Inc.* | | | 3,861 | | | | 135,869 | |
| Innoviva, Inc.* | | | 5,963 | | | | 75,909 | |
| Jazz Pharmaceuticals PLC* | | | 4,329 | | | | 536,666 | |
| Ligand Pharmaceuticals, Inc.* | | | 1,727 | | | | 124,517 | |
| Organon & Co. | | | 8,187 | | | | 170,371 | |
| Pacira BioSciences, Inc.* | | | 3,025 | | | | 121,212 | |
| Perrigo Co. PLC | | | 12,427 | | | | 421,897 | |
| Prestige Consumer Healthcare, Inc.* | | | 6,078 | | | | 361,216 | |
| SIGA Technologies, Inc. | | | 1,900 | | | | 9,595 | |
| Supernus Pharmaceuticals, Inc.* | | | 5,158 | | | | 155,049 | |
| Taro Pharmaceutical Industries Ltd.* | | | 438 | | | | 16,613 | |
| | | | | | | | 2,835,225 | |
| | | | | | | | | |
| Professional Services — 3.4% | | | | | | | | |
| ASGN, Inc.* | | | 5,882 | | | | 444,856 | |
| Barrett Business Services, Inc. | | | 935 | | | | 81,532 | |
| Booz Allen Hamilton Holding Corp. | | | 789 | | | | 88,052 | |
| CACI International, Inc., Class A* | | | 2,530 | | | | 862,325 | |
| CBIZ, Inc.* | | | 6,173 | | | | 328,897 | |
| Concentrix Corp. | | | 3,341 | | | | 269,786 | |
| Conduent, Inc.* | | | 5,702 | | | | 19,387 | |
| CRA International, Inc. | | | 773 | | | | 78,846 | |
| CSG Systems International, Inc. | | | 4,225 | | | | 222,826 | |
| ExlService Holdings, Inc.* | | | 3,892 | | | | 587,925 | |
| Exponent, Inc. | | | 5,886 | | | | 549,282 | |
| Forrester Research, Inc.* | | | 2,360 | | | | 68,652 | |
| Franklin Covey Co.* | | | 2,254 | | | | 98,455 | |
| FTI Consulting, Inc.* | | | 3,703 | | | | 704,311 | |
| Genpact Ltd. | | | 12,745 | | | | 478,830 | |
| Heidrick & Struggles International, Inc. | | | 1,928 | | | | 51,034 | |
| Huron Consulting Group, Inc.* | | | 2,643 | | | | 224,417 | |
| ICF International, Inc. | | | 2,012 | | | | 250,273 | |
| Insperity, Inc. | | | 4,545 | | | | 540,673 | |
| KBR, Inc. | | | 14,771 | | | | 961,001 | |
| Kelly Services, Inc., Class A | | | 3,132 | | | | 55,155 | |
| Kforce, Inc. | | | 3,397 | | | | 212,856 | |
| Korn Ferry | | | 5,760 | | | | 285,350 | |
| Manpowergroup, Inc. | | | 3,514 | | | | 279,012 | |
| Mastech Digital, Inc.* | | | 2,122 | | | | 20,965 | |
| Maximus, Inc. | | | 2,874 | | | | 242,882 | |
| NV5 Global, Inc.* | | | 1,843 | | | | 204,149 | |
| RCM Technologies, Inc.* | | | 2,995 | | | | 55,108 | |
| Resources Connection, Inc. | | | 3,396 | | | | 53,351 | |
| Robert Half International, Inc. | | | 7,950 | | | | 597,999 | |
| Science Applications International Corp. | | | 2,559 | | | | 287,836 | |
| TriNet Group, Inc.* | | | 7,048 | | | | 669,349 | |
| TrueBlue, Inc.* | | | 3,431 | | | | 60,763 | |
| TTEC Holdings, Inc. | | | 4,929 | | | | 166,797 | |
| Verra Mobility Corp.* | | | 10,023 | | | | 197,654 | |
| | | | | | | | 10,300,586 | |
| |
| Real Estate Management & Development — 0.6% | | | | | | | | |
| Cushman & Wakefield PLC* | | | 5,956 | | | | 48,720 | |
| Douglas Elliman, Inc. | | | 8,113 | | | | 18,012 | |
| Forestar Group, Inc.* | | | 3,530 | | | | 79,602 | |
| FRP Holdings, Inc.* | | | 200 | | | | 11,514 | |
| Howard Hughes Corp. (The)* | | | 1,369 | | | | 108,041 | |
| Jones Lang LaSalle, Inc.* | | | 3,879 | | | | 604,348 | |
| Kennedy-Wilson Holdings, Inc. | | | 13,722 | | | | 224,080 | |
| Marcus & Millichap, Inc. | | | 3,263 | | | | 102,817 | |
| Maui Land & Pineapple Co., Inc.* | | | 2,324 | | | | 33,094 | |
| Newmark Group, Inc., Class A | | | 11,400 | | | | 70,908 | |
| RMR Group, Inc. (The) Class A | | | 1,159 | | | | 26,854 | |
| St. Joe Co. (The) | | | 3,300 | | | | 159,522 | |
| Stratus Properties, Inc. | | | 313 | | | | 8,216 | |
| Tejon Ranch Co.* | | | 2,949 | | | | 50,752 | |
| Zillow Group, Inc., Class A* | | | 1,875 | | | | 92,250 | |
| Zillow Group, Inc., Class C* | | | 6,088 | | | | 305,983 | |
| | | | | | | | 1,944,713 | |
| | | | | | | | | |
| Semiconductors & Semiconductor Equipment — 4.0% | | | | | | | | |
| Allegro MicroSystems, Inc.* | | | 456 | | | | 20,584 | |
| Alpha & Omega Semiconductor Ltd.* | | | 2,886 | | | | 94,661 | |
| Ambarella, Inc.* | | | 2,341 | | | | 195,871 | |
| Amkor Technology, Inc. | | | 25,678 | | | | 763,920 | |
| Amtech Systems, Inc.* | | | 2,822 | | | | 26,978 | |
| Axcelis Technologies, Inc.* | | | 3,944 | | | | 723,054 | |
| AXT, Inc.* | | | 5,653 | | | | 19,446 | |
| Ceva, Inc.* | | | 3,095 | | | | 79,077 | |
| Cirrus Logic, Inc.* | | | 5,956 | | | | 482,496 | |
| Cohu, Inc.* | | | 5,114 | | | | 212,538 | |
| Diodes, Inc.* | | | 5,169 | | | | 478,081 | |
| Entegris, Inc. | | | 328 | | | | 36,349 | |
| First Solar, Inc.* | | | 6,847 | | | | 1,301,546 | |
| FormFactor, Inc.* | | | 9,854 | | | | 337,204 | |
| GSI Technology, Inc.* | | | 4,641 | | | | 25,665 | |
| Ichor Holdings Ltd.* | | | 400 | | | | 15,000 | |
| Kulicke & Soffa Industries, Inc. | | | 5,924 | | | | 352,182 | |
| Lattice Semiconductor Corp.* | | | 14,663 | | | | 1,408,674 | |
| MACOM Technology Solutions Holdings, Inc.* | | | 2,196 | | | | 143,904 | |
| Magnachip Semiconductor Corp.* | | | 4,588 | | | | 51,294 | |
| MaxLinear, Inc.* | | | 7,715 | | | | 243,485 | |
| MKS Instruments, Inc. | | | 1,144 | | | | 123,666 | |
| NVE Corp. | | | 502 | | | | 48,915 | |
| Onto Innovation, Inc.* | | | 4,376 | | | | 509,673 | |
| PDF Solutions, Inc.* | | | 4,938 | | | | 222,704 | |
| Photronics, Inc.* | | | 7,008 | | | | 180,736 | |
| Power Integrations, Inc. | | | 6,542 | | | | 619,331 | |
| Qorvo, Inc.* | | | 1,876 | | | | 191,408 | |
| Rambus, Inc.* | | | 14,241 | | | | 913,845 | |
| Semtech Corp.* | | | 7,337 | | | | 186,800 | |
| Silicon Laboratories, Inc.* | | | 3,982 | | | | 628,121 | |
| Synaptics, Inc.* | | | 5,027 | | | | 429,205 | |
The accompanying notes are an integral part of these financial statements.
SA U.S. Small Company Fund
PORTFOLIO OF INVESTMENTS — AS OF JUNE 30, 2023 (Continued)
| | | SHARES | | | VALUE† | |
| COMMON STOCKS (Continued) | | | | | | |
| Semiconductors & Semiconductor Equipment (Continued) | | | | | | | | |
| Ultra Clean Holdings, Inc.* | | | 4,298 | | | $ | 165,301 | |
| Universal Display Corp. | | | 3,037 | | | | 437,723 | |
| Veeco Instruments, Inc.* | | | 4,666 | | | | 119,823 | |
| Wolfspeed, Inc.*@ | | | 10,030 | | | | 557,568 | |
| | | | | | | | 12,346,828 | |
| | | | | | | | | |
| Software — 2.9% | | | | | | | | |
| A10 Networks, Inc. | | | 6,016 | | | | 87,773 | |
| ACI Worldwide, Inc.* | | | 12,870 | | | | 298,198 | |
| Adeia, Inc. | | | 7,577 | | | | 83,423 | |
| Agilysys, Inc.* | | | 2,848 | | | | 195,487 | |
| Alarm.com Holdings, Inc.* | | | 3,799 | | | | 196,332 | |
| Altair Engineering, Inc., Class A* | | | 3,033 | | | | 230,023 | |
| American Software, Inc., Class A | | | 4,461 | | | | 46,885 | |
| Aspen Technology, Inc.* | | | 1,995 | | | | 334,382 | |
| Bill.com Holdings, Inc.* | | | 287 | | | | 33,536 | |
| Black Knight, Inc.* | | | 540 | | | | 32,254 | |
| Blackbaud, Inc.* | | | 5,719 | | | | 407,078 | |
| Box, Inc., Class A* | | | 6,867 | | | | 201,752 | |
| Ceridian HCM Holding, Inc.* | | | 2,010 | | | | 134,610 | |
| Commvault Systems, Inc.* | | | 2,675 | | | | 194,258 | |
| Confluent, Inc., Class A* | | | 916 | | | | 32,344 | |
| Consensus Cloud Solutions, Inc.* | | | 1,449 | | | | 44,919 | |
| Digital Turbine, Inc.* | | | 635 | | | | 5,893 | |
| DocuSign, Inc.* | | | 748 | | | | 38,215 | |
| Dolby Laboratories, Inc., Class A | | | 2,281 | | | | 190,874 | |
| DoubleVerify Holdings, Inc.* | | | 6,316 | | | | 245,819 | |
| Dropbox, Inc., Class A* | | | 14,286 | | | | 381,008 | |
| Dynatrace, Inc.* | | | 7,032 | | | | 361,937 | |
| Ebix, Inc. | | | 2,155 | | | | 54,306 | |
| eGain Corp.* | | | 4,304 | | | | 32,237 | |
| EngageSmart, Inc.* | | | 593 | | | | 11,320 | |
| Envestnet, Inc.* | | | 3,097 | | | | 183,807 | |
| EverCommerce, Inc.* | | | 921 | | | | 10,905 | |
| Gen Digital, Inc. | | | 7,703 | | | | 142,891 | |
| Guidewire Software, Inc.* | | | 3,773 | | | | 287,050 | |
| InterDigital, Inc. | | | 3,064 | | | | 295,829 | |
| Jamf Holding Corp.* | | | 4,792 | | | | 93,540 | |
| JFrog Ltd.* | | | 479 | | | | 13,268 | |
| Liveramp Holdings, Inc.* | | | 8,339 | | | | 238,162 | |
| Manhattan Associates, Inc.* | | | 3,948 | | | | 789,126 | |
| MeridianLink, Inc.* | | | 2,090 | | | | 43,472 | |
| Mitek Systems, Inc.* | | | 1,166 | | | | 12,639 | |
| N-able, Inc.* | | | 8,171 | | | | 117,744 | |
| Olo, Inc., Class A* | | | 2,551 | | | | 16,479 | |
| Paylocity Holding Corp.* | | | 2,396 | | | | 442,134 | |
| PowerSchool Holdings, Inc., Class A* | | | 3,215 | | | | 61,535 | |
| Procore Technologies, Inc.* | | | 845 | | | | 54,984 | |
| Progress Software Corp. | | | 4,772 | | | | 277,253 | |
| Qualys, Inc.* | | | 4,157 | | | | 536,960 | |
| Rimini Street, Inc.* | | | 4,492 | | | | 21,517 | |
| Sapiens International Corp. NV | | | 2,496 | | | | 66,394 | |
| SentinelOne, Inc., Class A* | | | 5,750 | | | | 86,825 | |
| SolarWinds Corp.* | | | 5,202 | | | | 53,373 | |
| SPS Commerce, Inc.* | | | 2,160 | | | | 414,850 | |
| Telos Corp.* | | | 4,278 | | | | 10,952 | |
| Teradata Corp.* | | | 6,462 | | | | 345,135 | |
| UiPath, Inc., Class A* | | | 7,523 | | | | 124,656 | |
| Verint Systems, Inc.* | | | 6,847 | | | | 240,056 | |
| Vertex, Inc., Class A* | | | 1,558 | | | | 30,381 | |
| Xperi, Inc.* | | | 3,030 | | | | 39,845 | |
| Yext, Inc.* | | | 4,488 | | | | 50,759 | |
| | | | | | | | 8,977,384 | |
| | | | | | | | | |
| Specialty Retail — 3.6% | | | | | | | | |
| 1-800-Flowers.com, Inc., Class A* | | | 3,880 | | | | 30,264 | |
| Aaron’s Co. Inc. (The) | | | 4,459 | | | | 63,050 | |
| Abercrombie & Fitch Co., Class A* | | | 3,727 | | | | 140,433 | |
| Academy Sports & Outdoors, Inc. | | | 2,614 | | | | 141,287 | |
| Advance Auto Parts, Inc. | | | 4,051 | | | | 284,785 | |
| America’s Car-Mart, Inc.* | | | 822 | | | | 82,019 | |
| American Eagle Outfitters, Inc. | | | 19,472 | | | | 229,770 | |
| Asbury Automotive Group, Inc.* | | | 2,143 | | | | 515,220 | |
| AutoNation, Inc.* | | | 4,060 | | | | 668,317 | |
| Bath & Body Works, Inc. | | | 4,874 | | | | 182,775 | |
| Boot Barn Holdings, Inc.* | | | 3,866 | | | | 327,412 | |
| Buckle, Inc. (The) | | | 5,018 | | | | 173,623 | |
| Build-A-Bear Workshop, Inc. | | | 1,640 | | | | 35,129 | |
| Burlington Stores, Inc.* | | | 555 | | | | 87,352 | |
| Caleres, Inc. | | | 3,874 | | | | 92,705 | |
| CarParts.com, Inc.* | | | 2,801 | | | | 11,904 | |
| Cato Corp. (The) Class A | | | 2,638 | | | | 21,183 | |
| Chico’s FAS, Inc.* | | | 8,580 | | | | 45,903 | |
| Children’s Place, Inc. (The)*@ | | | 1,314 | | | | 30,498 | |
| Citi Trends, Inc.* | | | 818 | | | | 14,446 | |
| Conn’s, Inc.* | | | 3,722 | | | | 13,771 | |
| Container Store Group, Inc. (The)* | | | 2,100 | | | | 6,594 | |
| Destination XL Group, Inc.* | | | 3,560 | | | | 17,444 | |
| Dick’s Sporting Goods, Inc. | | | 2,101 | | | | 277,731 | |
| Duluth Holdings, Inc., Class B* | | | 1,185 | | | | 7,442 | |
| Five Below, Inc.* | | | 5,505 | | | | 1,081,953 | |
| Floor & Decor Holdings, Inc., Class A* | | | 4,489 | | | | 466,676 | |
| Foot Locker, Inc.@ | | | 5,979 | | | | 162,091 | |
| Franchise Group, Inc. | | | 1,459 | | | | 41,786 | |
| GameStop Corp., Class A* | | | 8,267 | | | | 200,475 | |
| Gap, Inc. (The) | | | 2,272 | | | | 20,289 | |
| Genesco, Inc.* | | | 1,490 | | | | 37,310 | |
| Group 1 Automotive, Inc. | | | 1,940 | | | | 500,714 | |
| Guess?, Inc. | | | 5,086 | | | | 98,923 | |
| Haverty Furniture Cos., Inc. | | | 1,983 | | | | 59,926 | |
| Hibbett, Inc. | | | 1,600 | | | | 58,064 | |
| Leslie’s, Inc.* | | | 9,429 | | | | 88,538 | |
| Lithia Motors, Inc. | | | 3,347 | | | | 1,017,856 | |
| MarineMax, Inc.* | | | 2,209 | | | | 75,459 | |
| Monro, Inc. | | | 3,090 | | | | 125,547 | |
| Murphy USA, Inc. | | | 3,083 | | | | 959,152 | |
| National Vision Holdings, Inc.* | | | 3,794 | | | | 92,156 | |
| ODP Corp. (The)* | | | 3,360 | | | | 157,315 | |
| Penske Automotive Group, Inc. | | | 1,742 | | | | 290,270 | |
| PetMed Express, Inc.@ | | | 2,360 | | | | 32,544 | |
| Rent-A-Center, Inc. | | | 6,271 | | | | 195,216 | |
| Revolve Group, Inc.*@ | | | 706 | | | | 11,578 | |
| RH* | | | 318 | | | | 104,810 | |
The accompanying notes are an integral part of these financial statements.
SA U.S. Small Company Fund
PORTFOLIO OF INVESTMENTS — AS OF JUNE 30, 2023 (Continued)
| | | SHARES | | | VALUE† | |
| COMMON STOCKS (Continued) | | | | | | | | |
| Specialty Retail (Continued) | | | | | | | | |
| Sally Beauty Holdings, Inc.* | | | 4,925 | | | $ | 60,824 | |
| Shoe Carnival, Inc. | | | 3,062 | | | | 71,896 | |
| Signet Jewelers Ltd. | | | 5,809 | | | | 379,095 | |
| Sleep Number Corp.* | | | 3,221 | | | | 87,869 | |
| Sonic Automotive, Inc., Class A | | | 3,080 | | | | 146,824 | |
| Sportsman’s Warehouse Holdings, Inc.* | | | 3,058 | | | | 17,431 | |
| Tilly’s, Inc., Class A* | | | 1,836 | | | | 12,870 | |
| Urban Outfitters, Inc.* | | | 2,086 | | | | 69,109 | |
| Victoria’s Secret & Co.* | | | 3,466 | | | | 60,412 | |
| Williams-Sonoma, Inc. | | | 4,058 | | | | 507,818 | |
| Winmark Corp. | | | 554 | | | | 184,188 | |
| Zumiez, Inc.* | | | 2,406 | | | | 40,084 | |
| | | | | | | | 11,018,125 | |
| | | | | | | | | |
| Textiles, Apparel & Luxury Goods — 1.2% | | | | | | | | |
| Capri Holdings Ltd.* | | | 8,276 | | | | 297,026 | |
| Carter’s, Inc. | | | 1,939 | | | | 140,771 | |
| Columbia Sportswear Co. | | | 4,507 | | | | 348,121 | |
| Deckers Outdoor Corp.* | | | 1,068 | | | | 563,541 | |
| Delta Apparel, Inc.* | | | 1,153 | | | | 12,083 | |
| G-III Apparel Group Ltd.* | | | 5,008 | | | | 96,504 | |
| Kontoor Brands, Inc. | | | 2,384 | | | | 100,366 | |
| Lakeland Industries, Inc. | | | 1,669 | | | | 24,017 | |
| Movado Group, Inc. | | | 2,220 | | | | 59,563 | |
| Oxford Industries, Inc. | | | 1,665 | | | | 163,869 | |
| PVH Corp. | | | 1,378 | | | | 117,089 | |
| Ralph Lauren Corp. | | | 2,279 | | | | 281,001 | |
| Rocky Brands, Inc. | | | 1,000 | | | | 21,000 | |
| Skechers U.S.A., Inc., Class A* | | | 6,530 | | | | 343,870 | |
| Steven Madden Ltd. | | | 7,918 | | | | 258,839 | |
| Superior Group of Cos., Inc. | | | 2,200 | | | | 20,548 | |
| Tapestry, Inc. | | | 18,072 | | | | 773,482 | |
| Under Armour, Inc., Class A* | | | 2,222 | | | | 16,043 | |
| Under Armour, Inc., Class C* | | | 1,318 | | | | 8,844 | |
| Unifi, Inc.* | | | 2,394 | | | | 19,319 | |
| Wolverine World Wide, Inc. | | | 5,855 | | | | 86,010 | |
| | | | | | | | 3,751,906 | |
| | | | | | | | | |
| Tobacco — 0.1% | | | | | | | | |
| Turning Point Brands, Inc. | | | 1,280 | | | | 30,733 | |
| Universal Corp. | | | 2,612 | | | | 130,443 | |
| Vector Group Ltd. | | | 12,276 | | | | 157,256 | |
| | | | | | | | 318,432 | |
| | | | | | | | | |
| Trading Companies & Distributors — 2.2% | | | | | | | | |
| Air Lease Corp. | | | 5,985 | | | | 250,472 | |
| Applied Industrial Technologies, Inc. | | | 4,375 | | | | 633,631 | |
| Beacon Roofing Supply, Inc.* | | | 7,687 | | | | 637,867 | |
| Boise Cascade Co. | | | 4,352 | | | | 393,203 | |
| Core & Main, Inc., Class A* | | | 2,355 | | | | 73,806 | |
| Distribution Solutions Group, Inc.* | | | 112 | | | | 5,831 | |
| DXP Enterprises, Inc.* | | | 2,323 | | | | 84,580 | |
| GATX Corp. | | | 3,909 | | | | 503,245 | |
| Global Industrial Co. | | | 4,722 | | | | 131,130 | |
| GMS, Inc.* | | | 2,900 | | | | 200,680 | |
| H&E Equipment Services, Inc. | | | 4,346 | | | | 198,829 | |
| Herc Holdings, Inc. | | | 4,556 | | | | 623,489 | |
| Mcgrath Rentcorp | | | 2,655 | | | | 245,534 | |
| MRC Global, Inc.* | | | 5,657 | | | | 56,966 | |
| MSC Industrial Direct Co., Inc., Class A | | | 936 | | | | 89,182 | |
| NOW, Inc.* | | | 8,751 | | | | 90,660 | |
| Rush Enterprises, Inc., Class A | | | 5,962 | | | | 362,132 | |
| SiteOne Landscape Supply, Inc.* | | | 413 | | | | 69,120 | |
| Textainer Group Holdings Ltd. | | | 4,819 | | | | 189,772 | |
| Titan Machinery, Inc.* | | | 2,515 | | | | 74,193 | |
| Triton International Ltd. | | | 7,398 | | | | 615,957 | |
| Univar Solutions, Inc.* | | | 3,220 | | | | 115,405 | |
| Veritiv Corp. | | | 1,000 | | | | 125,610 | |
| WESCO International, Inc. | | | 5,493 | | | | 983,577 | |
| Willis Lease Finance Corp.* | | | 900 | | | | 35,217 | |
| | | | | | | | 6,790,088 | |
| | | | | | | | | |
| Water Utilities — 0.5% | | | | | | | | |
| American States Water Co. | | | 4,082 | | | | 355,134 | |
| Artesian Resources Corp., Class A | | | 1,177 | | | | 55,578 | |
| California Water Service Group | | | 6,097 | | | | 314,788 | |
| Consolidated Water Co. Ltd. | | | 1,751 | | | | 42,427 | |
| Essential Utilities, Inc. | | | 6,838 | | | | 272,904 | |
| Middlesex Water Co. | | | 2,133 | | | | 172,048 | |
| Pure Cycle Corp.* | | | 1,000 | | | | 11,000 | |
| SJW Group | | | 2,989 | | | | 209,559 | |
| York Water Co. (The) | | | 1,803 | | | | 74,410 | |
| | | | | | | | 1,507,848 | |
| | | | | | | | | |
| Wireless Telecommunication Services — 0.1% | | | | | | | | |
| Gogo, Inc.* | | | 1,021 | | | | 17,367 | |
| Shenandoah Telecommunications Co. | | | 6,413 | | | | 124,605 | |
| Spok Holdings, Inc. | | | 2,839 | | | | 37,730 | |
| United States Cellular Corp.* | | | 1,551 | | | | 27,344 | |
| | | | | | | | 207,046 | |
| | | | | | | | | |
| TOTAL COMMON STOCKS | | | | | | | | |
| (Identified Cost $165,645,695) | | | | | | | 305,177,856 | |
| | | | | | | | | |
| PREFERRED STOCKS — 0.1% | | | | | | | | |
| Media — 0.0% | | | | | | | | |
| Liberty Broadband Corp. 7.000% | | | 1,225 | | | | 28,236 | |
| | | | | | | | | |
| Trading Companies & Distributors — 0.1% | | | | | | | | |
| WESCO International, Inc. 10.625%, 5 year CMT + 10.325% | | | 4,390 | | | | 117,301 | |
| TOTAL PREFERRED STOCKS | | | | | | | | |
| (Identified Cost $114,396) | | | | | | | 145,537 | |
The accompanying notes are an integral part of these financial statements.
SA U.S. Small Company Fund
PORTFOLIO OF INVESTMENTS — AS OF JUNE 30, 2023 (Continued)
| | | SHARES | | | VALUE† | |
| SHORT-TERM INVESTMENTS — 0.7% | | | | | | | | |
| Investment Company — 0.1% | | | | | | | | |
| State Street Institutional U.S. Government Money Market Fund 4.780% | | | 340,127 | | | $ | 340,127 | |
| | | | | | | | | |
| Collateral For Securities On Loan — 0.6% | | | | | | | | |
| State Street Navigator Securities Lending Government Money Market Portfolio 5.110% | | | 1,951,648 | | | | 1,951,648 | |
TOTAL SHORT-TERM INVESTMENTS
(Identified Cost $2,291,775) | | | | | | | 2,291,775 | |
Total Investments — 100.7%
(Identified Cost $168,051,866) | | | | | | | 307,615,168 | |
| Liabilities in excess of Cash and Other Assets — (0.7%) | | | | | | | (2,014,858 | ) |
| Net Assets — 100.0% | | | | | | $ | 305,600,310 | |
| * | Non-income producing security |
| @ | A portion or all of the security was held on loan. As of June 30, 2023, the fair value of the securities on loan was $7,212,085. |
| ¶ | Contingent value rights based on future performance. |
| § | Fair valued security. Security is valued using significant unobservable inputs as determined pursuant to procedures approved by the Fund’s Board of Trustees. See Note 1 |
Key to abbreviations:
CMT — Constant Maturity Treasury
CVR — Contingent Value Rights
Portfolio Sectors as of June 30, 2023
(As a percentage of long-term investments) (Unaudited)
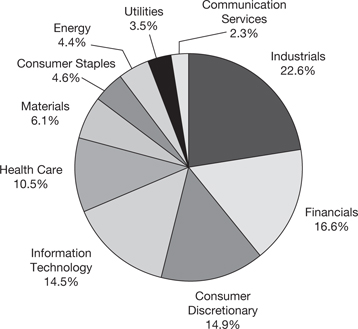
The accompanying notes are an integral part of these financial statements.
SA International Value Fund
PORTFOLIO OF INVESTMENTS — AS OF JUNE 30, 2023
| | | SHARES | | | VALUE† | |
| COMMON STOCKS — 97.8% | | | | | | | | |
| Australia — 5.9% | | | | | | | | |
| AMP Ltd. | | | 59,607 | | | $ | 44,869 | |
| Ampol Ltd. | | | 21,337 | | | | 425,557 | |
| ANZ Group Holdings Ltd. | | | 171,032 | | | | 2,701,351 | |
| Aurizon Holdings Ltd. | | | 247,637 | | | | 646,657 | |
| Bendigo & Adelaide Bank Ltd.@ | | | 20,967 | | | | 119,978 | |
| BlueScope Steel Ltd. | | | 163,249 | | | | 2,234,779 | |
| Challenger Ltd. | | | 57,064 | | | | 246,325 | |
| Cleanaway Waste Management Ltd. | | | 139,337 | | | | 240,402 | |
| Evolution Mining Ltd. | | | 217,587 | | | | 466,725 | |
| Fortescue Metals Group Ltd.@ | | | 17,284 | | | | 255,375 | |
| Harvey Norman Holdings Ltd.@ | | | 136,089 | | | | 315,482 | |
| Incitec Pivot Ltd. | | | 255,280 | | | | 465,950 | |
| Insurance Australia Group Ltd. | | | 23,277 | | | | 88,384 | |
| Lendlease Corp. Ltd.@ | | | 43,821 | | | | 226,233 | |
| National Australia Bank Ltd. | | | 258,849 | | | | 4,547,040 | |
| Newcrest Mining Ltd. | | | 80,215 | | | | 1,411,759 | |
| Northern Star Resources Ltd. | | | 104,349 | | | | 839,706 | |
| Orica Ltd. | | | 41,739 | | | | 412,340 | |
| Origin Energy Ltd. | | | 168,307 | | | | 942,910 | |
| QBE Insurance Group Ltd. | | | 41,216 | | | | 430,236 | |
| Qube Holdings Ltd. | | | 60,569 | | | | 114,992 | |
| Rio Tinto Ltd. | | | 21,996 | | | | 1,680,511 | |
| Santos Ltd. | | | 456,444 | | | | 2,286,533 | |
| Seven Group Holdings Ltd. | | | 3,940 | | | | 64,697 | |
| Sonic Healthcare Ltd. | | | 7,876 | | | | 186,621 | |
| South32 Ltd. | | | 637,438 | | | | 1,596,607 | |
| Suncorp Group Ltd. | | | 186,999 | | | | 1,680,441 | |
| Tabcorp Holdings Ltd. | | | 94,616 | | | | 69,962 | |
| TPG Telecom Ltd.@ | | | 26,524 | | | | 86,048 | |
| Treasury Wine Estates Ltd. | | | 13,295 | | | | 99,458 | |
| Viva Energy Group Ltd. ± | | | 120,061 | | | | 240,736 | |
| Westpac Banking Corp. | | | 182,943 | | | | 2,600,653 | |
| Whitehaven Coal Ltd. | | | 121,581 | | | | 543,451 | |
| Woodside Energy Group Ltd. | | | 157,968 | | | | 3,624,135 | |
| Worley Ltd. | | | 30,039 | | | | 315,966 | |
| Yancoal Australia Ltd. | | | 14,480 | | | | 44,178 | |
| | | | | | | | 32,297,047 | |
| | | | | | | | | |
| Austria — 0.1% | | | | | | | | |
| Erste Group Bank AG | | | 7,953 | | | | 278,487 | |
| Mondi PLC | | | 10,432 | | | | 158,851 | |
| | | | | | | | 437,338 | |
| | | | | | | | | |
| Belgium — 0.7% | | | | | | | | |
| Ageas SA | | | 21,755 | | | | 880,957 | |
| KBC Group NV | | | 25,395 | | | | 1,771,289 | |
| Solvay SA | | | 9,936 | | | | 1,109,154 | |
| | | | | | | | 3,761,400 | |
| | | | | | | | | |
| Bermuda — 0.0% | | | | | | | | |
| Golden Ocean Group Ltd. | | | 18,503 | | | | 139,286 | |
| | | | | | | | | |
| Canada — 9.0% | | | | | | | | |
| Agnico Eagle Mines Ltd. | | | 31,880 | | | | 1,593,362 | |
| AltaGas Ltd. | | | 24,518 | | | | 440,482 | |
| ARC Resources Ltd.@ | | | 31,547 | | | | 420,785 | |
| B2Gold Corp. | | | 22,856 | | | | 81,596 | |
| Bank of Montreal@ | | | 57,895 | | | | 5,228,497 | |
| Bank of Montreal | | | 3,141 | | | | 283,668 | |
| Bank of Nova Scotia (The)@ | | | 104,892 | | | | 5,248,796 | |
| Bank of Nova Scotia (The)@ | | | 24,894 | | | | 1,245,499 | |
| Barrick Gold Corp. | | | 65,719 | | | | 1,112,623 | |
| Barrick Gold Corp. | | | 6,619 | | | | 111,970 | |
| Brookfield Corp.@ | | | 15,086 | | | | 507,644 | |
| Canadian Imperial Bank of Commerce | | | 16,359 | | | | 698,202 | |
| Canadian Imperial Bank of Commerce | | | 79,825 | | | | 3,408,116 | |
| Cenovus Energy, Inc. | | | 41,371 | | | | 702,480 | |
| Fairfax Financial Holdings Ltd. | | | 3,439 | | | | 2,575,947 | |
| First Quantum Minerals Ltd. | | | 69,639 | | | | 1,647,470 | |
| Great-West Lifeco, Inc.@ | | | 16,930 | | | | 491,638 | |
| iA Financial Corp., Inc. | | | 15,555 | | | | 1,059,701 | |
| Imperial Oil Ltd.@ | | | 7,194 | | | | 368,045 | |
| Kinross Gold Corp. | | | 173,331 | | | | 826,912 | |
| Lundin Mining Corp. | | | 146,222 | | | | 1,145,714 | |
| Magna International, Inc.@ | | | 47,875 | | | | 2,702,065 | |
| Manulife Financial Corp. | | | 3,055 | | | | 57,745 | |
| Manulife Financial Corp. | | | 154,229 | | | | 2,916,470 | |
| MEG Energy Corp.* | | | 17,402 | | | | 275,857 | |
| Nutrien Ltd. | | | 50,591 | | | | 2,987,398 | |
| Sun Life Financial, Inc. | | | 3,972 | | | | 207,063 | |
| Suncor Energy, Inc. ¥ | | | 67,770 | | | | 1,987,954 | |
| Suncor Energy, Inc. | | | 73,497 | | | | 2,154,932 | |
| Teck Resources Ltd., Class B | | | 92,145 | | | | 3,879,304 | |
| Toronto-Dominion Bank (The) | | | 1,730 | | | | 107,228 | |
| Toronto-Dominion Bank (The)@ | | | 6,483 | | | | 402,011 | |
| Tourmaline Oil Corp.@ | | | 15,422 | | | | 726,659 | |
| West Fraser Timber Co. Ltd. | | | 13,116 | | | | 1,126,803 | |
| Whitecap Resources, Inc.@ | | | 51,254 | | | | 358,652 | |
| | | | | | | | 49,089,288 | |
| | | | | | | | | |
| China — 0.1% | | | | | | | | |
| ESR Group Ltd. ± | | | 59,000 | | | | 101,195 | |
| Prosus NV* | | | 1,797 | | | | 131,595 | |
| Xinyi Glass Holdings Ltd. | | | 23,000 | | | | 35,809 | |
| | | | | | | | 268,599 | |
| | | | | | | | | |
| Denmark — 2.1% | | | | | | | | |
| AP Moller - Maersk A/S, Class A | | | 246 | | | | 428,296 | |
| AP Moller - Maersk A/S, Class B | | | 372 | | | | 652,847 | |
| Carlsberg A/S, Class B | | | 15,826 | | | | 2,529,238 | |
| Chr Hansen Holding A/S | | | 9,378 | | | | 650,901 | |
| Danske Bank A/S* | | | 41,578 | | | | 1,011,497 | |
| Demant A/S* | | | 12,776 | | | | 540,174 | |
| DSV A/S | | | 16,777 | | | | 3,523,330 | |
| Genmab A/S* | | | 1,182 | | | | 446,920 | |
| H Lundbeck A/S | | | 21,000 | | | | 99,837 | |
| Novozymes A/S, B Shares, Class B | | | 2,800 | | | | 130,449 | |
| Pandora A/S | | | 4,717 | | | | 421,132 | |
| Rockwool International A/S, B Shares, Class B | | | 858 | | | | 221,683 | |
| Tryg A/S | | | 15,313 | | | | 331,350 | |
| Vestas Wind Systems A/S* | | | 24,212 | | | | 643,879 | |
| | | | | | | | 11,631,533 | |
The accompanying notes are an integral part of these financial statements.
SA International Value Fund
PORTFOLIO OF INVESTMENTS — AS OF JUNE 30, 2023 (Continued)
| | | SHARES | | | VALUE† | |
| COMMON STOCKS (Continued) | | | | | | | | |
| Finland — 0.9% | | | | | | | | |
| Nokia Oyj, ADR@ | | | 338,897 | | | $ | 1,409,812 | |
| Nordea Bank Abp | | | 184,120 | | | | 2,002,287 | |
| Stora Enso Oyj, R Shares | | | 77,897 | | | | 903,138 | |
| UPM-Kymmene Oyj | | | 24,633 | | | | 733,005 | |
| | | | | | | | 5,048,242 | |
| | | | | | | | | |
| France — 11.3% | | | | | | | | |
| Accor SA | | | 6,035 | | | | 224,035 | |
| Adevinta ASA* | | | 8,113 | | | | 53,212 | |
| ALD SA ± | | | 6,961 | | | | 74,477 | |
| Alstom SA@ | | | 7,849 | | | | 233,991 | |
| Amundi SA ± | | | 5,568 | | | | 328,397 | |
| Arkema SA | | | 12,548 | | | | 1,181,653 | |
| AXA SA | | | 96,903 | | | | 2,857,639 | |
| BNP Paribas SA | | | 58,992 | | | | 3,715,557 | |
| Bollore SE | | | 138,791 | | | | 864,773 | |
| Bouygues SA | | | 55,128 | | | | 1,850,389 | |
| Carrefour SA | | | 128,110 | | | | 2,426,119 | |
| Cie de Saint-Gobain | | | 92,022 | | | | 5,596,097 | |
| Cie Generale des Etablissements Michelin SCA | | | 119,912 | | | | 3,540,747 | |
| Credit Agricole SA | | | 62,747 | | | | 744,401 | |
| Danone SA | | | 5,607 | | | | 343,485 | |
| Eiffage SA | | | 10,100 | | | | 1,053,399 | |
| Engie SA | | | 170,127 | | | | 2,826,966 | |
| Forvia* | | | 4,468 | | | | 105,164 | |
| Orange SA | | | 322,578 | | | | 3,767,074 | |
| Publicis Groupe SA | | | 29,051 | | | | 2,329,984 | |
| Renault SA | | | 21,069 | | | | 886,974 | |
| Rexel SA | | | 15,388 | | | | 379,653 | |
| Sanofi | | | 38,892 | | | | 4,167,506 | |
| Societe Generale SA | | | 86,689 | | | | 2,251,363 | |
| TotalEnergies SE@ | | | 332,966 | | | | 19,093,129 | |
| Vinci SA | | | 1,446 | | | | 167,854 | |
| Vivendi SE | | | 28,695 | | | | 263,209 | |
| Worldline SA*± | | | 3,145 | | | | 114,966 | |
| | | | | | | | 61,442,213 | |
| | | | | | | | | |
| Germany — 7.1% | | | | | | | | |
| BASF SE | | | 75,282 | | | | 3,653,110 | |
| Bayer AG | | | 93,338 | | | | 5,160,763 | |
| Bayerische Motoren Werke AG | | | 40,060 | | | | 4,918,641 | |
| Commerzbank AG | | | 137,947 | | | | 1,527,857 | |
| Continental AG | | | 11,257 | | | | 848,800 | |
| Covestro AG*± | | | 22,452 | | | | 1,165,692 | |
| Daimler Truck Holding AG | | | 61,594 | | | | 2,217,976 | |
| Deutsche Bank AG | | | 46,122 | | | | 484,058 | |
| Deutsche Bank AG | | | 92,725 | | | | 976,394 | |
| E.ON SE | | | 75,215 | | | | 958,632 | |
| Evonik Industries AG | | | 12,943 | | | | 246,171 | |
| Fresenius Medical Care AG & Co. KGaA | | | 11,995 | | | | 572,903 | |
| Fresenius SE & Co. KGaA | | | 42,320 | | | | 1,171,576 | |
| Hapag-Lloyd AG ± | | | 402 | | | | 81,547 | |
| Heidelberg Materials AG | | | 25,898 | | | | 2,125,145 | |
| Mercedes-Benz Group AG | | | 122,485 | | | | 9,846,414 | |
| RWE AG | | | 24,745 | | | | 1,076,560 | |
| Siemens Energy AG* | | | 13,742 | | | | 242,624 | |
| Talanx AG | | | 5,652 | | | | 324,100 | |
| Telefonica Deutschland Holding AG | | | 136,346 | | | | 383,408 | |
| Vitesco Technologies Group AG Class A* | | | 911 | | | | 75,004 | |
| Volkswagen AG | | | 4,164 | | | | 694,741 | |
| Wacker Chemie AG | | | 1,080 | | | | 148,196 | |
| | | | | | | | 38,900,312 | |
| |
| Hong Kong — 1.8% | | | | | | | | |
| BOC Hong Kong Holdings Ltd. | | | 302,500 | | | | 924,563 | |
| Cathay Pacific Airways Ltd.@* | | | 230,363 | | | | 235,478 | |
| CK Asset Holdings Ltd. | | | 210,069 | | | | 1,163,476 | |
| CK Hutchison Holdings Ltd. | | | 344,624 | | | | 2,104,423 | |
| CK Infrastructure Holdings Ltd. | | | 24,000 | | | | 126,952 | |
| Hang Lung Properties Ltd. | | | 194,000 | | | | 299,566 | |
| Hang Seng Bank Ltd. | | | 32,600 | | | | 463,872 | |
| Henderson Land Development Co. Ltd. | | | 133,684 | | | | 397,503 | |
| MTR Corp. Ltd. | | | 74,169 | | | | 340,746 | |
| New World Development Co. Ltd. | | | 231,859 | | | | 570,475 | |
| Sun Hung Kai Properties Ltd. | | | 145,677 | | | | 1,834,906 | |
| Swire Pacific Ltd., Class A | | | 53,500 | | | | 409,989 | |
| Swire Pacific Ltd., Class B | | | 127,500 | | | | 160,595 | |
| Tsim Sha Tsui Properties Ltd.@ | | | 6,907 | | | | 18,510 | |
| WH Group Ltd. ± | | | 1,342,459 | | | | 710,976 | |
| | | | | | | | 9,762,030 | |
| |
| Ireland — 0.7% | | | | | | | | |
| AIB Group PLC | | | 31,002 | | | | 130,243 | |
| Bank of Ireland Group PLC | | | 56,367 | | | | 537,454 | |
| CRH PLC, ADR@ | | | 40,650 | | | | 2,265,425 | |
| Flutter Entertainment PLC* | | | 3,025 | | | | 606,996 | |
| | | | | | | | 3,540,118 | |
| |
| Israel — 0.4% | | | | | | | | |
| Bank Hapoalim B.M. | | | 16,762 | | | | 137,388 | |
| Bank Leumi Le-Israel BM | | | 110,944 | | | | 825,832 | |
| Delek Group Ltd. | | | 904 | | | | 102,704 | |
| Harel Insurance Investments & Financial Services Ltd. | | | 13,270 | | | | 103,253 | |
| Israel Discount Bank Ltd., Class A | | | 113,726 | | | | 564,562 | |
| Migdal Insurance & Financial Holding Ltd. | | | 22,264 | | | | 27,000 | |
| Phoenix Holdings Ltd. (The) | | | 15,023 | | | | 150,980 | |
| | | | | | | | 1,911,719 | |
| |
| Italy — 1.1% | | | | | | | | |
| Eni SpA | | | 122,576 | | | | 1,763,158 | |
| Mediobanca Banca di Credito Finanziario SpA | | | 24,500 | | | | 293,009 | |
| Telecom Italia SpA@* | | | 570,741 | | | | 160,556 | |
| UniCredit SpA | | | 163,283 | | | | 3,788,880 | |
| | | | | | | | 6,005,603 | |
The accompanying notes are an integral part of these financial statements.
SA International Value Fund
PORTFOLIO OF INVESTMENTS — AS OF JUNE 30, 2023 (Continued)
| | | SHARES | | | VALUE† | |
| COMMON STOCKS (Continued) | | | | | | | | |
| Japan — 21.0% | | | | | | | | |
| AGC, Inc.@ | | | 48,500 | | | $ | 1,735,372 | |
| Air Water, Inc. | | | 14,100 | | | | 194,798 | |
| Aisin Corp. | | | 22,500 | | | | 690,305 | |
| Alfresa Holdings Corp. | | | 7,700 | | | | 114,944 | |
| Amada Co. Ltd. | | | 37,100 | | | | 363,300 | |
| Aozora Bank Ltd.@ | | | 4,800 | | | | 88,968 | |
| Asahi Group Holdings Ltd. | | | 13,200 | | | | 509,905 | |
| Asahi Kasei Corp. | | | 191,300 | | | | 1,288,635 | |
| Bank of Kyoto Ltd. (The)@ | | | 8,000 | | | | 398,184 | |
| Bridgestone Corp.@ | | | 21,200 | | | | 865,660 | |
| Brother Industries Ltd. | | | 32,400 | | | | 471,422 | |
| Canon Marketing Japan, Inc.@ | | | 9,700 | | | | 240,324 | |
| Canon, Inc.@ | | | 33,500 | | | | 879,899 | |
| Chiba Bank Ltd. (The) | | | 63,800 | | | | 386,395 | |
| Coca-Cola Bottlers Japan Holdings, Inc.@ | | | 13,975 | | | | 147,600 | |
| COMSYS Holdings Corp. | | | 2,900 | | | | 57,168 | |
| Concordia Financial Group Ltd. | | | 111,200 | | | | 433,564 | |
| Cosmo Energy Holdings Co. Ltd. | | | 11,900 | | | | 324,107 | |
| Dai-ichi Life Holdings, Inc. | | | 77,400 | | | | 1,468,666 | |
| Daicel Corp. | | | 52,000 | | | | 463,440 | |
| Daiwa House Industry Co. Ltd. | | | 42,100 | | | | 1,106,367 | |
| Daiwa Securities Group, Inc. | | | 143,400 | | | | 735,708 | |
| DIC Corp.@ | | | 7,300 | | | | 132,093 | |
| Dowa Holdings Co. Ltd. | | | 9,600 | | | | 302,447 | |
| ENEOS Holdings, Inc. | | | 470,600 | | | | 1,612,424 | |
| Ezaki Glico Co. Ltd.@ | | | 3,000 | | | | 78,340 | |
| FUJIFILM Holdings Corp. | | | 12,300 | | | | 728,052 | |
| Fujikura Ltd. | | | 10,500 | | | | 87,503 | |
| Fukuoka Financial Group, Inc. | | | 18,000 | | | | 370,865 | |
| Hankyu Hanshin Holdings, Inc. | | | 31,900 | | | | 1,051,211 | |
| Haseko Corp. | | | 22,300 | | | | 274,007 | |
| Hino Motors Ltd.* | | | 11,600 | | | | 49,022 | |
| Hitachi Construction Machinery Co. Ltd. | | | 8,000 | | | | 223,320 | |
| Hitachi Ltd. | | | 10,400 | | | | 641,175 | |
| Honda Motor Co. Ltd. | | | 155,400 | | | | 4,675,085 | |
| House Foods Group, Inc. | | | 2,800 | | | | 62,192 | |
| Idemitsu Kosan Co. Ltd. | | | 29,400 | | | | 588,020 | |
| Iida Group Holdings Co. Ltd. | | | 36,900 | | | | 620,392 | |
| INFRONEER Holdings, Inc. | | | 12,800 | | | | 120,198 | |
| Inpex Corp.@ | | | 144,500 | | | | 1,600,270 | |
| Isetan Mitsukoshi Holdings Ltd. | | | 8,800 | | | | 89,162 | |
| Isuzu Motors Ltd. | | | 85,200 | | | | 1,027,395 | |
| ITOCHU Corp.@ | | | 18,000 | | | | 709,422 | |
| Iwatani Corp. | | | 4,900 | | | | 258,218 | |
| J. Front Retailing Co. Ltd. | | | 35,100 | | | | 335,322 | |
| Japan Post Holdings Co. Ltd. | | | 71,600 | | | | 514,317 | |
| Japan Post Insurance Co. Ltd. | | | 4,500 | | | | 67,565 | |
| JFE Holdings, Inc. | | | 50,400 | | | | 716,033 | |
| JTEKT Corp. | | | 43,200 | | | | 390,700 | |
| K’s Holdings Corp. | | | 32,000 | | | | 278,430 | |
| Kajima Corp. | | | 54,000 | | | | 812,086 | |
| Kamigumi Co. Ltd. | | | 15,700 | | | | 354,704 | |
| Kaneka Corp. | | | 16,000 | | | | 445,864 | |
| Kawasaki Heavy Industries Ltd. | | | 32,800 | | | | 835,145 | |
| Kawasaki Kisen Kaisha Ltd.@ | | | 11,100 | | | | 270,702 | |
| Kobe Steel Ltd. | | | 19,500 | | | | 178,452 | |
| Komatsu Ltd. | | | 46,800 | | | | 1,258,746 | |
| Kuraray Co. Ltd.@ | | | 76,400 | | | | 740,465 | |
| LIXIL Corp. | | | 38,200 | | | | 482,878 | |
| Mabuchi Motor Co. Ltd.@ | | | 5,100 | | | | 141,660 | |
| Makita Corp.@ | | | 7,800 | | | | 218,170 | |
| Marubeni Corp. | | | 109,400 | | | | 1,849,932 | |
| Mazda Motor Corp. | | | 65,100 | | | | 628,690 | |
| Mebuki Financial Group, Inc. | | | 83,070 | | | | 196,658 | |
| Medipal Holdings Corp. | | | 17,700 | | | | 288,386 | |
| Mitsubishi Chemical Group Corp. | | | 185,800 | | | | 1,111,491 | |
| Mitsubishi Corp. | | | 107,100 | | | | 5,143,650 | |
| Mitsubishi Electric Corp. | | | 48,300 | | | | 678,500 | |
| Mitsubishi Estate Co. Ltd. | | | 82,000 | | | | 971,759 | |
| Mitsubishi Gas Chemical Co., Inc. | | | 26,800 | | | | 388,270 | |
| Mitsubishi Heavy Industries Ltd. | | | 24,000 | | | | 1,116,213 | |
| Mitsubishi Logistics Corp. | | | 2,500 | | | | 61,489 | |
| Mitsubishi Materials Corp. | | | 21,600 | | | | 386,733 | |
| Mitsubishi Motors Corp. | | | 41,900 | | | | 145,508 | |
| Mitsubishi UFJ Financial Group, Inc. | | | 206,400 | | | | 1,523,379 | |
| Mitsubishi UFJ Financial Group, Inc., ADR@ | | | 434,108 | | | | 3,199,376 | |
| Mitsui Chemicals, Inc. | | | 47,200 | | | | 1,383,338 | |
| Mitsui Fudosan Co. Ltd. | | | 54,100 | | | | 1,072,477 | |
| Mitsui OSK Lines Ltd.@ | | | 30,300 | | | | 725,713 | |
| Mizuho Financial Group, Inc. | | | 116,740 | | | | 1,779,073 | |
| MS&AD Insurance Group Holdings, Inc. | | | 24,728 | | | | 873,307 | |
| NEC Corp. | | | 37,100 | | | | 1,790,786 | |
| NGK Insulators Ltd. | | | 30,500 | | | | 362,293 | |
| NH Foods Ltd. | | | 15,533 | | | | 419,933 | |
| Nippon Electric Glass Co. Ltd.@ | | | 2,400 | | | | 42,089 | |
| Nippon Express Holdings, Inc.@ | | | 15,900 | | | | 892,987 | |
| Nippon Steel Corp. | | | 60,327 | | | | 1,255,915 | |
| Nippon Yusen KK | | | 58,100 | | | | 1,284,445 | |
| Nissan Motor Co. Ltd. | | | 222,800 | | | | 908,216 | |
| Nisshin Seifun Group, Inc. | | | 3,900 | | | | 48,096 | |
| Niterra Co. Ltd. | | | 10,600 | | | | 211,787 | |
| Nomura Holdings, Inc. | | | 175,700 | | | | 666,295 | |
| Nomura Real Estate Holdings, Inc. | | | 23,700 | | | | 560,739 | |
| NSK Ltd. | | | 59,600 | | | | 378,925 | |
| Obayashi Corp. | | | 72,500 | | | | 625,039 | |
| Oji Holdings Corp. | | | 226,000 | | | | 842,008 | |
| Otsuka Holdings Co. Ltd.@ | | | 10,100 | | | | 368,946 | |
| Panasonic Holdings Corp. | | | 194,100 | | | | 2,358,740 | |
| Resona Holdings, Inc. | | | 184,200 | | | | 881,204 | |
| Ricoh Co. Ltd. | | | 74,900 | | | | 634,570 | |
| Rohm Co. Ltd. | | | 4,700 | | | | 440,376 | |
| Santen Pharmaceutical Co. Ltd. | | | 30,800 | | | | 261,585 | |
| SBI Holdings, Inc. | | | 20,500 | | | | 393,321 | |
| Seiko Epson Corp. | | | 37,600 | | | | 583,433 | |
| Seino Holdings Co. Ltd. | | | 20,400 | | | | 289,116 | |
| Sekisui Chemical Co. Ltd. | | | 16,000 | | | | 229,752 | |
| Sekisui House Ltd. | | | 46,000 | | | | 926,248 | |
| Sharp Corp.@* | | | 17,500 | | | | 97,497 | |
The accompanying notes are an integral part of these financial statements.
SA International Value Fund
PORTFOLIO OF INVESTMENTS — AS OF JUNE 30, 2023 (Continued)
| | | SHARES | | | VALUE† | |
| COMMON STOCKS (Continued) | | | | | | | | |
| Japan (Continued) | | | | | | | | |
| Shimizu Corp. | | | 49,600 | | | $ | 312,907 | |
| Shizuoka Financial Group, Inc. | | | 46,000 | | | | 331,224 | |
| Showa Denko KK | | | 14,000 | | | | 225,677 | |
| Sohgo Security Services Co., Ltd. | | | 12,000 | | | | 67,711 | |
| Sojitz Corp. | | | 35,820 | | | | 788,663 | |
| Stanley Electric Co. Ltd. | | | 11,500 | | | | 231,203 | |
| Subaru Corp. | | | 90,700 | | | | 1,699,034 | |
| Sumitomo Chemical Co. Ltd. | | | 300,700 | | | | 909,633 | |
| Sumitomo Corp. | | | 94,000 | | | | 1,981,039 | |
| Sumitomo Electric Industries Ltd. | | | 164,200 | | | | 1,999,372 | |
| Sumitomo Forestry Co. Ltd.@ | | | 33,800 | | | | 815,866 | |
| Sumitomo Heavy Industries Ltd.@ | | | 26,000 | | | | 619,481 | |
| Sumitomo Metal Mining Co. Ltd. | | | 35,500 | | | | 1,139,336 | |
| Sumitomo Mitsui Financial Group, Inc. | | | 71,100 | | | | 3,034,789 | |
| Sumitomo Mitsui Trust Holdings, Inc. | | | 24,900 | | | | 882,315 | |
| Sumitomo Realty & Development Co. Ltd. | | | 42,000 | | | | 1,034,173 | |
| Sumitomo Rubber Industries Ltd. | | | 42,800 | | | | 413,481 | |
| Suzuken Co. Ltd. | | | 1,100 | | | | 29,830 | |
| Suzuki Motor Corp. | | | 20,700 | | | | 746,115 | |
| Taiheiyo Cement Corp. | | | 7,500 | | | | 147,588 | |
| Taisei Corp. | | | 7,200 | | | | 250,537 | |
| Takashimaya Co. Ltd.@ | | | 5,700 | | | | 79,518 | |
| Takeda Pharmaceutical Co. Ltd. | | | 126,173 | | | | 3,958,454 | |
| TDK Corp. | | | 21,400 | | | | 825,627 | |
| Teijin Ltd. | | | 53,199 | | | | 531,455 | |
| THK Co. Ltd.@ | | | 3,200 | | | | 65,311 | |
| Toda Corp. | | | 28,000 | | | | 156,790 | |
| Tokai Carbon Co. Ltd.@ | | | 21,300 | | | | 194,556 | |
| Tokyo Tatemono Co. Ltd. | | | 37,600 | | | | 482,198 | |
| Tokyu Fudosan Holdings Corp. | | | 132,300 | | | | 754,769 | |
| Toray Industries, Inc. | | | 166,100 | | | | 921,352 | |
| Tosoh Corp. | | | 58,300 | | | | 686,453 | |
| Toyo Seikan Group Holdings Ltd. | | | 16,700 | | | | 245,011 | |
| Toyo Tire Corp.@ | | | 3,700 | | | | 48,835 | |
| Toyoda Gosei Co. Ltd. | | | 15,300 | | | | 288,621 | |
| Toyota Boshoku Corp. | | | 3,600 | | | | 64,006 | |
| Toyota Motor Corp. | | | 370,350 | | | | 5,925,035 | |
| Toyota Tsusho Corp. | | | 26,700 | | | | 1,320,983 | |
| Tsuruha Holdings, Inc.@ | | | 1,000 | | | | 74,188 | |
| Yamada Holdings Co. Ltd. | | | 93,100 | | | | 273,825 | |
| Yamaha Motor Co. Ltd.@ | | | 37,200 | | | | 1,062,673 | |
| Yamazaki Baking Co. Ltd. | | | 11,300 | | | | 152,786 | |
| Yokohama Rubber Co. Ltd. (The)@ | | | 27,600 | | | | 602,516 | |
| Z Holdings Corp. | | | 90,000 | | | | 216,057 | |
| Zeon Corp. | | | 28,500 | | | | 274,443 | |
| | | | | | | | 114,450,502 | |
| | | | | | | | | |
| Netherlands — 4.6% | | | | | | | | |
| ABN AMRO Group NV GDR ± | | | 42,957 | | | | 667,027 | |
| Aegon NV@ | | | 149,418 | | | | 754,898 | |
| Akzo Nobel NV | | | 20,561 | | | | 1,676,431 | |
| ArcelorMittal SA@ | | | 60,669 | | | | 1,658,690 | |
| ArcelorMittal SA = | | | 1,708 | | | | 46,464 | |
| ASR Nederland NV | | | 2,953 | | | | 132,888 | |
| Coca-Cola Europacific Partners PLC | | | 10,606 | | | | 682,823 | |
| Heineken NV | | | 14,477 | | | | 1,487,790 | |
| ING Groep NV | | | 253,754 | | | | 3,416,348 | |
| JDE Peet’s NV@ | | | 9,259 | | | | 275,419 | |
| Koninklijke Ahold Delhaize NV | | | 179,778 | | | | 6,132,394 | |
| Koninklijke KPN NV | | | 211,274 | | | | 753,643 | |
| Koninklijke Philips NV ¢ | | | 34,541 | | | | 746,586 | |
| Koninklijke Philips NV@ | | | 14,062 | | | | 305,005 | |
| NN Group NV@ | | | 31,090 | | | | 1,150,411 | |
| Randstad NV | | | 16,773 | | | | 884,204 | |
| Stellantis NV | | | 191,757 | | | | 3,366,757 | |
| Stellantis NV@ | | | 56,317 | | | | 987,800 | |
| | | | | | | | 25,125,578 | |
| | | | | | | | | |
| New Zealand — 0.3% | | | | | | | | |
| Auckland International Airport Ltd.* | | | 121,547 | | | | 637,774 | |
| EBOS Group Ltd.@ | | | 16,843 | | | | 379,868 | |
| Fletcher Building Ltd. | | | 87,592 | | | | 291,353 | |
| Port of Tauranga Ltd. | | | 3,033 | | | | 11,615 | |
| Ryman Healthcare Ltd.@ | | | 22,869 | | | | 92,348 | |
| Summerset Group Holdings Ltd. | | | 14,495 | | | | 85,309 | |
| | | | | | | | 1,498,267 | |
| | | | | | | | | |
| Norway — 0.8% | | | | | | | | |
| Aker ASA, A Shares | | | 2,155 | | | | 122,169 | |
| Aker BP ASA | | | 3,860 | | | | 90,552 | |
| DNB Bank ASA | | | 96,212 | | | | 1,799,000 | |
| Elkem ASA ±* | | | 36,022 | | | | 83,363 | |
| Norsk Hydro ASA | | | 88,167 | | | | 524,060 | |
| SpareBank 1 SR-Bank ASA | | | 18,440 | | | | 223,508 | |
| Storebrand ASA | | | 56,200 | | | | 438,035 | |
| Subsea 7 SA | | | 28,831 | | | | 358,991 | |
| Wallenius Wilhelmsen ASA | | | 13,553 | | | | 93,880 | |
| Yara International ASA | | | 11,049 | | | | 390,137 | |
| | | | | | | | 4,123,695 | |
| | | | | | | | | |
| Portugal — 0.0% | | | | | | | | |
| EDP Renovaveis SA@ | | | 3,173 | | | | 63,344 | |
| Galp Energia SGPS SA | | | 16,108 | | | | 188,426 | |
| | | | | | | | 251,770 | |
| | | | | | | | | |
| Singapore — 1.2% | | | | | | | | |
| City Developments Ltd. | | | 58,800 | | | | 292,174 | |
| Great Eastern Holdings Ltd. | | | 3,000 | | | | 39,175 | |
| Hafnia Ltd. | | | 12,769 | | | | 62,396 | |
| Hongkong Land Holdings Ltd. | | | 101,200 | | | | 394,680 | |
| Keppel Corp. Ltd. | | | 311,700 | | | | 1,546,515 | |
| Olam Group Ltd. | | | 94,300 | | | | 96,922 | |
| Oversea-Chinese Banking Corp. Ltd. | | | 99,449 | | | | 903,012 | |
| Seatrium Ltd.* | | | 5,948,805 | | | | 549,838 | |
| Singapore Airlines Ltd.@ | | | 195,249 | | | | 1,032,261 | |
| United Overseas Bank Ltd. | | | 35,100 | | | | 726,708 | |
| UOL Group Ltd.@ | | | 47,218 | | | | 224,149 | |
| Wilmar International Ltd. | | | 273,400 | | | | 768,205 | |
| | | | | | | | 6,636,035 | |
| | | | | | | | | |
| Spain — 2.5% | | | | | | | | |
| Banco Bilbao Vizcaya Argentaria SA | | | 228,555 | | | | 1,753,776 | |
The accompanying notes are an integral part of these financial statements.
SA International Value Fund
PORTFOLIO OF INVESTMENTS — AS OF JUNE 30, 2023 (Continued)
| | | SHARES | | | VALUE† | |
| COMMON STOCKS (Continued) | | | | | | | | |
| Spain (Continued) | | | | | | | | |
| Banco Bilbao Vizcaya Argentaria SA, ADR@ | | | 210,800 | | | $ | 1,618,944 | |
| Banco de Sabadell SA | | | 74,625 | | | | 85,828 | |
| Banco Santander SA | | | 1,654,430 | | | | 6,110,990 | |
| Banco Santander SA, ADR | | | 210,864 | | | | 782,305 | |
| CaixaBank SA | | | 146,848 | | | | 606,831 | |
| Repsol SA@ | | | 195,616 | | | | 2,845,372 | |
| Telefonica SA | | | 6,496 | | | | 26,179 | |
| | | | | | | | 13,830,225 | |
| | | | | | | | | |
| Sweden — 2.5% | | | | | | | | |
| AFRY AB | | | 3,038 | | | | 44,843 | |
| Boliden AB* | | | 30,464 | | | | 879,995 | |
| Electrolux AB, Class B | | | 16,903 | | | | 230,695 | |
| Essity AB, B Shares | | | 3,803 | | | | 101,234 | |
| Getinge AB, B Shares@ | | | 7,190 | | | | 125,963 | |
| Holmen AB, B Shares | | | 11,612 | | | | 417,093 | |
| Husqvarna AB, B Shares@ | | | 30,403 | | | | 275,239 | |
| Loomis AB | | | 8,247 | | | | 240,558 | |
| Millicom International Cellular SA, SDR* | | | 20,565 | | | | 314,328 | |
| Saab AB, Class B | | | 4,192 | | | | 226,675 | |
| Securitas AB, B Shares@ | | | 47,497 | | | | 389,564 | |
| Skandinaviska Enskilda Banken AB, Class A | | | 140,768 | | | | 1,555,119 | |
| Skanska AB, B Shares@ | | | 40,249 | | | | 564,065 | |
| SKF AB | | | 839 | | | | 14,531 | |
| SKF AB, B Shares | | | 64,782 | | | | 1,126,816 | |
| SSAB AB, A Shares | | | 29,362 | | | | 208,590 | |
| SSAB AB, B Shares | | | 84,454 | | | | 584,934 | |
| Svenska Cellulosa AB SCA, A Shares | | | 244 | | | | 3,117 | |
| Svenska Cellulosa AB SCA, B Shares@ | | | 33,674 | | | | 429,146 | |
| Svenska Handelsbanken AB, A Shares | | | 54,423 | | | | 455,857 | |
| Svenska Handelsbanken AB, B Shares@ | | | 1,918 | | | | 19,135 | |
| Swedbank AB, A Shares | | | 38,879 | | | | 655,532 | |
| Swedish Orphan Biovitrum AB* | | | 6,963 | | | | 135,834 | |
| Telefonaktiebolaget LM Ericsson, B Shares | | | 165,860 | | | | 898,245 | |
| Telia Co. AB | | | 223,825 | | | | 490,801 | |
| Trelleborg AB, B Shares | | | 31,022 | | | | 751,867 | |
| Vitrolife AB | | | 3,603 | | | | 69,953 | |
| Volvo AB, A Shares | | | 17,414 | | | | 370,712 | |
| Volvo AB, B Shares | | | 101,851 | | | | 2,105,891 | |
| Volvo Car AB, Class B@* | | | 14,136 | | | | 56,123 | |
| | | | | | | | 13,742,455 | |
| | | | | | | | | |
| Switzerland — 10.4% | | | | | | | | |
| ABB Ltd. | | | 10,562 | | | | 415,140 | |
| Alcon, Inc. µ | | | 30,384 | | | | 2,515,451 | |
| Alcon, Inc. | | | 1,965 | | | | 161,346 | |
| Baloise Holding AG | | | 6,063 | | | | 890,094 | |
| Banque Cantonale Vaudoise@ | | | 1,642 | | | | 173,364 | |
| Barry Callebaut AG | | | 187 | | | | 360,817 | |
| Cie Financiere Richemont SA, Class A | | | 36,248 | | | | 6,141,567 | |
| DSM-Firmenich AG* | | | 15,922 | | | | 1,713,433 | |
| Holcim AG* | | | 48,710 | | | | 3,276,177 | |
| Julius Baer Group Ltd. | | | 38,000 | | | | 2,391,956 | |
| Lonza Group AG | | | 2,497 | | | | 1,488,073 | |
| Novartis AG | | | 122,351 | | | | 12,302,765 | |
| Novartis AG, ADR@ | | | 20,130 | | | | 2,031,318 | |
| SIG Group AG@* | | | 33,586 | | | | 926,096 | |
| Swatch Group AG (The) µ | | | 6,226 | | | | 341,889 | |
| Swatch Group AG (The) µ | | | 1,834 | | | | 535,006 | |
| Swiss Life Holding AG | | | 4,035 | | | | 2,357,751 | |
| Swiss Prime Site AG | | | 1,574 | | | | 136,552 | |
| Swiss Re AG | | | 23,316 | | | | 2,345,537 | |
| Swisscom AG | | | 4,128 | | | | 2,572,592 | |
| UBS Group AG* | | | 270,713 | | | | 5,472,936 | |
| Zurich Insurance Group AG | | | 17,576 | | | | 8,343,715 | |
| | | | | | | | 56,893,575 | |
| | | | | | | | | |
| United Kingdom — 13.3% | | | | | | | | |
| Anglo American PLC | | | 68,697 | | | | 1,948,184 | |
| Associated British Foods PLC | | | 19,275 | | | | 487,382 | |
| Aviva PLC | | | 239,234 | | | | 1,200,724 | |
| Barclays PLC, ADR | | | 330,258 | | | | 2,595,828 | |
| Barratt Developments PLC | | | 47,310 | | | | 248,446 | |
| Bellway PLC | | | 1,481 | | | | 37,392 | |
| BP PLC | | | 299,981 | | | | 1,746,202 | |
| BP PLC, ADR | | | 98,123 | | | | 3,462,761 | |
| British American Tobacco PLC | | | 135,808 | | | | 4,498,176 | |
| BT Group PLC | | | 1,231,112 | | | | 1,912,956 | |
| Dowlais Group PLC* | | | 38,137 | | | | 61,511 | |
| DS Smith PLC | | | 127,033 | | | | 438,500 | |
| Endeavour Mining PLC | | | 18,998 | | | | 455,321 | |
| Glencore PLC | | | 645,274 | | | | 3,642,667 | |
| HSBC Holdings PLC, ADR@ | | | 201,042 | | | | 7,965,284 | |
| Investec PLC | | | 30,868 | | | | 172,804 | |
| J Sainsbury PLC | | | 422,622 | | | | 1,443,803 | |
| Kingfisher PLC | | | 420,977 | | | | 1,238,762 | |
| Legal & General Group PLC | | | 83,264 | | | | 240,359 | |
| Lloyds Banking Group PLC | | | 7,496,521 | | | | 4,150,019 | |
| Lloyds Banking Group PLC, ADR | | | 217,015 | | | | 477,433 | |
| Marks & Spencer Group PLC* | | | 24,148 | | | | 59,097 | |
| Melrose Industries PLC | | | 105,417 | | | | 677,698 | |
| NatWest Group PLC | | | 151,590 | | | | 463,586 | |
| Natwest Group PLC, ADR@ | | | 107,133 | | | | 655,654 | |
| Pearson PLC | | | 17,918 | | | | 187,053 | |
| Pearson PLC, ADR@ | | | 5,700 | | | | 59,736 | |
| Persimmon PLC | | | 11,130 | | | | 144,955 | |
| Shell PLC, ADR | | | 437,830 | | | | 26,436,175 | |
| Standard Chartered PLC | | | 199,242 | | | | 1,728,244 | |
| Taylor Wimpey PLC | | | 139,975 | | | | 182,657 | |
| Tesco PLC | | | 378,871 | | | | 1,195,216 | |
| Vodafone Group PLC | | | 2,697,977 | | | | 2,534,530 | |
| | | | | | | | 72,749,115 | |
| | | | | | | | | |
| TOTAL COMMON STOCKS | | | | | | | | |
| (Identified Cost $448,593,584) | | | | | | | 533,535,945 | |
The accompanying notes are an integral part of these financial statements.
SA International Value Fund
PORTFOLIO OF INVESTMENTS — AS OF JUNE 30, 2023 (Continued)
| | | SHARES | | | VALUE† | |
| PREFERRED STOCKS — 1.1% | | | | | | | | |
| Germany — 1.0% | | | | | | | | |
| Bayerische Motoren Werke AG, 8.216% | | | 7,858 | | | $ | 893,479 | |
| Henkel AG & Co. KGaA, 2.525% | | | 2,169 | | | | 173,393 | |
| Porsche Automobil Holding SE, 4.636% | | | 17,284 | | | | 1,040,334 | |
| Volkswagen AG, 22.618% | | | 24,782 | | | | 3,324,559 | |
| | | | | | | | 5,431,765 | |
| | | | | | | | | |
| Italy — 0.1% | | | | | | | | |
| Telecom Italia SpA, 6.500%* | | | 711,381 | | | | 193,754 | |
| TOTAL PREFERRED STOCKS | | | | | | | | |
| (Identified Cost $7,715,951) | | | | | | | 5,625,519 | |
| | | | | | | | | |
| SHORT-TERM INVESTMENTS — 7.3% | | | | | | | | |
| Investment Company — 0.0% | | | | | | | | |
| State Street Institutional U.S. Government Money Market Fund 4.780% | | | 248,934 | | | | 248,934 | |
| | | | | | | | | |
| Collateral For Securities On Loan — 7.3% | | | | | | | | |
| State Street Navigator Securities Lending Government Money Market Portfolio 5.110% | | | 39,745,759 | | | $ | 39,745,759 | |
| | | | | | | | | |
| TOTAL SHORT-TERM INVESTMENTS | | | | | | | | |
| (Identified Cost $39,994,693) | | | | | | | 39,994,693 | |
| | | | | | | | | |
| Total Investments — 106.2% | | | | | | | | |
| (Identified Cost $496,304,228) | | | | | | | 579,156,157 | |
| Liabilities in excess of Cash and Other Assets — (6.2%) | | | | | | | (33,732,519 | ) |
| Net Assets — 100.0% | | | | | | $ | 545,423,638 | |
| @ | A portion or all of the security was held on loan. As of June 30, 2023, the fair value of the securities on loan was $60,326,686. |
| ± | 144A Securities. Securities exempt from registration under Rule 144A of the Securities Act of 1933. These securities may be resold in transactions exempt from registration to qualified institutional buyers. These securities have been deemed by the Fund to be liquid and at June 30, 2023 amounted to $3,568,376 or 0.65% of the net assets of the Fund. |
| * | Non-income producing security |
| ¥ | Traded on the Canada, Toronto Stock Exchange. |
| = | Traded on the France, Euronext Paris Exchange. |
| ¢ | Traded on the Netherlands, Euronext Amsterdam Stock Market. |
| µ | Traded on the Switzerland, Swiss Exchange. |
Key to abbreviations:
ADR — American Depository Receipt
SDR — Swedish Depository Receipt
Ten largest industry holdings as of June 30, 2023
(As a percentage of net assets) (Unaudited)
| Industry | | Percentage |
| Commercial Banks | | 18.5% |
| Oil, Gas & Consumable Fuels | | 13.6% |
| Automobiles | | 7.9% |
| Insurance | | 6.4% |
| Metals & Mining | | 6.0% |
| Pharmaceuticals | | 5.2% |
| Chemicals | | 4.7% |
| Automobile Components | | 2.4% |
| Machinery | | 2.4% |
| Trading Companies & Distributors | | 2.2% |
Country weightings as of June 30, 2023
(As a percentage of long-term investments) (Unaudited)

The accompanying notes are an integral part of these financial statements.
SA International Small Company Fund
PORTFOLIO OF INVESTMENTS — AS OF JUNE 30, 2023
| | | SHARES | | | VALUE† | |
| MUTUAL FUNDS — 100.1% | | | | | | | | |
| Others — 100.1% | | | | | | | | |
| DFA International Small Company Portfolio £ | | | 13,435,985 | | | $ | 246,953,410 | |
| | | | | | | | | |
| TOTAL MUTUAL FUNDS | | | | | | | | |
| (Identified Cost $140,980,077) | | | | | | | 246,953,410 | |
| | | | | | | | | |
| Total Investments — 100.1% | | | | | | | | |
| (Identified Cost $140,980,077) | | | | | | | 246,953,410 | |
| Liabilities in excess of Cash and Other Assets — (0.1%) | | | | | | | (162,084 | ) |
| Net Assets — 100.0% | | | | | | $ | 246,791,326 | |
| £ | Please refer to the Portfolio of Investments of the DFA International Small Company Portfolio included elsewhere in this report. |
The accompanying notes are an integral part of these financial statements.
SA Emerging Markets Value Fund
PORTFOLIO OF INVESTMENTS — AS OF JUNE 30, 2023
| | | SHARES | | | VALUE† | |
| COMMON STOCKS — 97.3% | | | | | | | | |
| Belgium — 0.0% | | | | | | | | |
| Titan Cement International SA | | | 2,956 | | | $ | 55,932 | |
| | | | | | | | | |
| Brazil — 3.8% | | | | | | | | |
| Atacadao SA | | | 28,162 | | | | 65,873 | |
| Banco Bradesco SA | | | 70,133 | | | | 214,433 | |
| Banco Bradesco SA, ADR | | | 136,380 | | | | 471,875 | |
| Banco do Brasil SA | | | 51,498 | | | | 531,306 | |
| Banco Santander Brasil SA | | | 19,597 | | | | 125,361 | |
| BRF SA* | | | 45,699 | | | | 85,038 | |
| Camil Alimentos SA | | | 8,900 | | | | 13,123 | |
| Cia Brasileira de Distribuicao* | | | 20,555 | | | | 80,319 | |
| Cia Siderurgica Nacional SA | | | 34,656 | | | | 87,794 | |
| Cia Siderurgica Nacional SA, ADR | | | 17,252 | | | | 44,683 | |
| Cogna Educacao* | | | 137,975 | | | | 93,939 | |
| Cyrela Brazil Realty SA Empreendimentos e Participacoes | | | 30,113 | | | | 126,598 | |
| Dexco SA | | | 34,954 | | | | 60,955 | |
| Embraer SA* | | | 7,694 | | | | 29,791 | |
| Embraer SA, ADR* | | | 12,729 | | | | 196,790 | |
| Enauta Participacoes SA | | | 13,118 | | | | 37,643 | |
| Ez Tec Empreendimentos e Participacoes SA | | | 8,100 | | | | 31,160 | |
| Gerdau SA, ADR | | | 101,234 | | | | 528,441 | |
| GRUPO DE MODA SOMA SA | | | 32,600 | | | | 81,701 | |
| Hapvida Participacoes e Investimentos SA*± | | | 222,277 | | | | 203,328 | |
| Iochpe Maxion SA | | | 12,197 | | | | 31,816 | |
| IRB Brasil Resseguros SA* | | | 5,122 | | | | 46,586 | |
| Jalles Machado SA | | | 15,200 | | | | 23,872 | |
| JBS SA | | | 63,545 | | | | 231,714 | |
| JHSF Participacoes SA | | | 40,831 | | | | 43,405 | |
| Movida Participacoes SA | | | 18,600 | | | | 40,904 | |
| MRV Engenharia e Participacoes SA | | | 22,336 | | | | 53,972 | |
| Natura & Co. Holding SA* | | | 68,808 | | | | 240,559 | |
| Petroleo Brasileiro SA | | | 344,373 | | | | 2,380,591 | |
| Petroleo Brasileiro SA, ADR | | | 1,600 | | | | 22,128 | |
| Positivo Tecnologia SA | | | 9,100 | | | | 17,523 | |
| TIM SA | | | 62,197 | | | | 189,908 | |
| Tupy SA | | | 3,847 | | | | 21,066 | |
| Ultrapar Participacoes SA | | | 45,846 | | | | 180,868 | |
| Usinas Siderurgicas de Minas Gerais SA | | | 9,100 | | | | 13,855 | |
| Vale SA | | | 20,412 | | | | 273,768 | |
| Via S/A* | | | 96,044 | | | | 43,126 | |
| Vibra Energia SA | | | 29,109 | | | | 109,732 | |
| YDUQS Participacoes SA* | | | 12,700 | | | | 52,570 | |
| Zamp SA* | | | 22,200 | | | | 21,096 | |
| | | | | | | | 7,149,210 | |
| | | | | | | | | |
| British Virgin Islands — 0.0% | | | | | | | | |
| AsiaInfo Technologies Ltd. ± | | | 10,000 | | | | 13,910 | |
| | | | | | | | | |
| Canada — 0.0% | | | | | | | | |
| China Gold International Resources Corp. Ltd. | | | 13,700 | | | | 52,101 | |
| | | | | | | | | |
| Cayman Islands — 0.0% | | | | | | | | |
| Baozun, Inc., Class A* | | | 4,600 | | | | 6,105 | |
| Edvantage Group Holdings Ltd. | | | 32,244 | | | | 9,341 | |
| Fulgent Sun International Holding Co. Ltd. | | | 8,000 | | | | 35,447 | |
| Gourmet Master Co. Ltd. | | | 5,000 | | | | 23,038 | |
| | | | | | | | 73,931 | |
| | | | | | | | | |
| Chile — 0.6% | | | | | | | | |
| Banco de Credito e Inversiones SA | | | 363 | | | | 11,092 | |
| Banco Itau Chile SA | | | 2,264 | | | | 24,285 | |
| CAP SA | | | 4,662 | | | | 34,527 | |
| Cencosud SA | | | 98,037 | | | | 190,008 | |
| Cia Sud Americana de Vapores SA | | | 206,953 | | | | 14,055 | |
| Empresa Nacional de Telecomunicaciones SA | | | 13,467 | | | | 54,422 | |
| Empresas CMPC SA | | | 61,213 | | | | 117,119 | |
| Empresas COPEC SA | | | 28,747 | | | | 213,338 | |
| Enel Americas SA* | | | 873,666 | | | | 116,586 | |
| Falabella SA | | | 38,983 | | | | 93,597 | |
| Grupo Security SA | | | 123,808 | | | | 31,348 | |
| Inversiones Aguas Metropolitanas SA | | | 38,384 | | | | 31,358 | |
| PAZ Corp. SA | | | 9,073 | | | | 6,111 | |
| Ripley Corp. SA | | | 81,141 | | | | 15,788 | |
| Sigdo Koppers SA | | | 27,803 | | | | 42,622 | |
| SMU SA | | | 147,411 | | | | 25,924 | |
| Sociedad Matriz SAAM SA | | | 298,644 | | | | 31,833 | |
| SONDA SA | | �� | 83,103 | | | | 40,735 | |
| | | | | | | | 1,094,748 | |
| | | | | | | | | |
| China — 27.7% | | | | | | | | |
| 360 Security Technology, Inc., Class A* | | | 20,500 | | | | 35,389 | |
| 361 Degrees International Ltd.*@ | | | 71,000 | | | | 33,797 | |
| 3SBio, Inc. ± | | | 106,000 | | | | 106,460 | |
| A-Living Smart City Services Co. Ltd.*± | | | 41,000 | | | | 26,371 | |
| AAC Technologies Holdings, Inc. | | | 60,500 | | | | 142,371 | |
| Accelink Technologies Co. Ltd. Class A* | | | 7,000 | | | | 35,742 | |
| Addsino Co Ltd., Class A | | | 16,300 | | | | 22,439 | |
| Advanced Technology & Materials Co. Ltd. Class A | | | 13,900 | | | | 18,121 | |
| Agile Group Holdings Ltd.*@ | | | 131,091 | | | | 20,744 | |
| Agricultural Bank of China Ltd., H Shares | | | 1,776,000 | | | | 698,070 | |
| Alibaba Group Holding Ltd.* | | | 202,200 | | | | 2,095,283 | |
| Aluminum Corp. of China Ltd., H Shares | | | 328,000 | | | | 141,062 | |
| Angang Steel Co. Ltd., H Shares | | | 142,999 | | | | 37,410 | |
| Anhui Conch Cement Co. Ltd., H Shares | | | 104,000 | | | | 276,059 | |
| Anhui Guangxin Agrochemical Co. Ltd., Class A | | | 3,080 | | | | 11,482 | |
| Anhui Huilong Agricultural Means of Production Co. Ltd. Class A | | | 6,500 | | | | 6,496 | |
| Anhui Jinhe Industrial Co. Ltd., Class A | | | 5,000 | | | | 16,244 | |
| Anhui Truchum Advanced Materials & Technology Co. Ltd., Class A | | | 13,800 | | | | 13,526 | |
The accompanying notes are an integral part of these financial statements.
SA Emerging Markets Value Fund
PORTFOLIO OF INVESTMENTS — AS OF JUNE 30, 2023 (Continued)
| | | SHARES | | | VALUE† | |
| COMMON STOCKS (Continued) | | | | | | | | |
| China (Continued) | | | | | | | | |
| Anhui Zhongding Sealing Parts Co. Ltd., Class A | | | 13,300 | | | $ | 23,967 | |
| Asia - Potash International Investment Guangzhou Co. Ltd., Class A* | | | 4,400 | | | | 13,895 | |
| Asia Cement China Holdings Corp. | | | 40,000 | | | | 19,755 | |
| Avary Holding Shenzhen Co. Ltd., Class A | | | 12,300 | | | | 41,130 | |
| AviChina Industry & Technology Co. Ltd., H Shares @ | | | 254,000 | | | | 123,175 | |
| BAIC Motor Corp. Ltd., H Shares ± | | | 145,000 | | | | 35,158 | |
| Baidu, Inc., ADR* | | | 11,412 | | | | 1,562,417 | |
| Baidu, Inc., Class A* | | | 5,150 | | | | 87,279 | |
| Bank of Beijing Co. Ltd., Class A | | | 98,400 | | | | 62,719 | |
| Bank of Changsha Co. Ltd., Class A | | | 25,500 | | | | 27,241 | |
| Bank of Chengdu Co. Ltd., Class A* | | | 26,000 | | | | 43,703 | |
| Bank of China Ltd., H Shares | | | 5,514,902 | | | | 2,209,902 | |
| Bank of Chongqing Co. Ltd., H Shares @ | | | 46,500 | | | | 23,855 | |
| Bank of Communications Co. Ltd., H Shares | | | 529,400 | | | | 350,636 | |
| Bank of Guiyang Co. Ltd., Class A | | | 22,500 | | | | 15,983 | |
| Bank of Hangzhou Co. Ltd., Class A | | | 32,101 | | | | 51,925 | |
| Bank of Jiangsu Co. Ltd. Class A* | | | 80,100 | | | | 81,048 | |
| Bank of Nanjing Co. Ltd., Class A | | | 61,300 | | | | 67,511 | |
| Bank of Ningbo Co. Ltd., Class A | | | 38,780 | | | | 135,067 | |
| Bank of Shanghai Co. Ltd., Class A | | | 68,500 | | | | 54,223 | |
| Bank of Suzhou Co. Ltd., Class A | | | 22,220 | | | | 20,036 | |
| Baoshan Iron & Steel Co. Ltd., Class A | | | 100,300 | | | | 77,599 | |
| BBMG Corp., H Shares @ | | | 184,000 | | | | 20,194 | |
| Beijing Capital Development Co. Ltd., Class A | | | 12,200 | | | | 6,550 | |
| Beijing Capital Eco-Environment Protection Group Co. Ltd. Class A | | | 48,000 | | | | 19,031 | |
| Beijing Capital International Airport Co. Ltd., H Shares* | | | 190,000 | | | | 122,933 | |
| Beijing Dabeinong Technology Group Co. Ltd., Class A | | | 18,000 | | | | 16,355 | |
| Beijing Easpring Material Technology Co. Ltd., Class A | | | 2,700 | | | | 18,707 | |
| Beijing Energy International Holding Co. Ltd. | | | 310,000 | | | | 7,794 | |
| Beijing Enlight Media Co. Ltd., Class A | | | 11,300 | | | | 12,585 | |
| Beijing Enterprises Holdings Ltd. | | | 46,000 | | | | 166,424 | |
| Beijing Enterprises Water Group Ltd. | | | 448,000 | | | | 106,340 | |
| Beijing GeoEnviron Engineering & Technology, Inc., Class A* | | | 11,232 | | | | 14,488 | |
| Beijing Haixin Energy Technology Co. Ltd. | | | 35,800 | | | | 16,855 | |
| Beijing Jetsen Technology Co. Ltd. Class A* | | | 28,600 | | | | 24,844 | |
| Beijing Jingyuntong Technology Co. Ltd., Class A | | | 22,000 | | | | 18,323 | |
| Beijing New Building Materials PLC Class A | | | 10,000 | | | | 33,742 | |
| Beijing Orient National Communication Science & Technology Co. Ltd., Class A* | | | 8,200 | | | | 12,688 | |
| Beijing Originwater Technology Co. Ltd., Class A | | | 5,558 | | | | 4,101 | |
| Beijing Shougang Co. Ltd., Class A | | | 27,500 | | | | 13,250 | |
| Beijing Shunxin Agriculture Co. Ltd., Class A* | | | 1,300 | | | | 6,029 | |
| Beijing Sinnet Technology Co. Ltd., Class A* | | | 12,200 | | | | 18,055 | |
| Beijing SL Pharmaceutical Co. Ltd., Class A | | | 8,900 | | | | 12,362 | |
| Beijing Yanjing Brewery Co. Ltd., Class A | | | 9,600 | | | | 16,480 | |
| Beijing-Shanghai High Speed Railway Co. Ltd., Class A | | | 108,000 | | | | 78,204 | |
| BGI Genomics Co. Ltd. Class A | | | 1,800 | | | | 14,865 | |
| BOC International China Co. Ltd., Class A | | | 14,300 | | | | 20,985 | |
| BOE Technology Group Co. Ltd., Class A | | | 220,300 | | | | 124,039 | |
| Bohai Leasing Co. Ltd., Class A* | | | 64,900 | | | | 18,762 | |
| Bright Dairy & Food Co. Ltd., Class A | | | 7,700 | | | | 11,024 | |
| Brilliance China Automotive Holdings Ltd.@ | | | 178,000 | | | | 72,463 | |
| BTG Hotels Group Co. Ltd., Class A* | | | 5,700 | | | | 14,870 | |
| BYD Electronic International Co. Ltd. | | | 67,500 | | | | 204,154 | |
| C C Land Holdings Ltd. | | | 106,500 | | | | 21,746 | |
| C&D International Investment Group Ltd. | | | 28,187 | | | | 63,885 | |
| Caitong Securities Co. Ltd., Class A | | | 15,470 | | | | 15,419 | |
| CECEP Solar Energy Co. Ltd., Class A | | | 30,100 | | | | 28,094 | |
| CECEP Wind-Power Corp., Class A | | | 49,010 | | | | 24,761 | |
| Central China Management Co. Ltd. | | | 81,000 | | | | 3,876 | |
| CGN New Energy Holdings Co. Ltd.@ | | | 130,000 | | | | 36,166 | |
| Changjiang Securities Co. Ltd., Class A | | | 39,900 | | | | 31,858 | |
| Chengdu Kanghong Pharmaceutical Group Co. Ltd. Class A | | | 4,900 | | | | 12,898 | |
| Chengdu Wintrue Holding Co. Ltd., Class A | | | 8,900 | | | | 11,002 | |
| Chengtun Mining Group Co. Ltd., Class A | | | 19,700 | | | | 13,180 | |
| China Aircraft Leasing Group Holdings Ltd. | | | 16,000 | | | | 8,290 | |
| China Baoan Group Co. Ltd., Class A | | | 9,000 | | | | 14,954 | |
| China BlueChemical Ltd., H Shares | | | 192,000 | | | | 43,124 | |
| China Bohai Bank Co. Ltd., Class H*± | | | 141,000 | | | | 21,773 | |
| China CAMC Engineering Co. Ltd. Class A* | | | 20,600 | | | | 33,832 | |
| China Cinda Asset Management Co. Ltd., Class H | | | 664,000 | | | | 66,095 | |
| China Citic Bank Corp. Ltd., H Shares | | | 613,000 | | | | 287,882 | |
| China Coal Energy Co. Ltd., H Shares | | | 181,000 | | | | 134,433 | |
| China Communication Services Corp. Ltd., H Shares | | | 231,600 | | | | 114,086 | |
The accompanying notes are an integral part of these financial statements.
SA Emerging Markets Value Fund
PORTFOLIO OF INVESTMENTS — AS OF JUNE 30, 2023 (Continued)
| | | SHARES | | | VALUE† | |
| COMMON STOCKS (Continued) | | | | | | | | |
| China (Continued) | | | | | | | | |
| China Conch Environment Protection Holdings Ltd.*@ | | | 97,500 | | | $ | 28,494 | |
| China Conch Venture Holdings Ltd. | | | 91,500 | | | | 119,104 | |
| China Construction Bank Corp., H Shares* | | | 7,032,810 | | | | 4,550,325 | |
| China CSSC Holdings Ltd., Class A | | | 6,500 | | | | 29,448 | |
| China Development Bank Financial Leasing Co. Ltd., H Shares ± | | | 128,000 | | | | 16,988 | |
| China Education Group Holdings Ltd.@ | | | 30,000 | | | | 23,354 | |
| China Energy Engineering Corp. | | | 88,674 | | | | 28,565 | |
| China Energy Engineering Corp. Ltd., H Shares @ | | | 152,000 | | | | 18,622 | |
| China Everbright Bank Co. Ltd., H Shares | | | 241,000 | | | | 69,200 | |
| China Feihe Ltd. ± | | | 110,000 | | | | 61,205 | |
| China Foods Ltd. | | | 86,000 | | | | 30,401 | |
| China Galaxy Securities Co. Ltd., H Shares | | | 194,500 | | | | 103,753 | |
| China Gas Holdings Ltd. | | | 228,400 | | | | 261,453 | |
| China Great Wall Securities Co. Ltd., Class A* | | | 8,500 | | | | 9,513 | |
| China Greatwall Technology Group Co. Ltd. Class A | | | 15,387 | | | | 29,295 | |
| China High Speed Transmission Equipment Group Co. Ltd.* | | | 44,000 | | | | 13,701 | |
| China Hongqiao Group Ltd. | | | 189,000 | | | | 153,400 | |
| China Huiyuan Juice Group Ltd.*§ | | | 84,500 | | | | — | |
| China International Marine Containers Group Co. Ltd., Class H | | | 74,460 | | | | 43,235 | |
| China Jinmao Holdings Group Ltd. | | | 476,464 | | | | 69,925 | |
| China Jushi Co. Ltd., Class A | | | 22,631 | | | | 44,115 | |
| China Lesso Group Holdings Ltd. | | | 100,000 | | | | 65,595 | |
| China Lilang Ltd. | | | 31,000 | | | | 16,616 | |
| China Medical System Holdings Ltd. | | | 97,000 | | | | 157,953 | |
| China Meheco Co. Ltd., Class A | | | 13,860 | | | | 24,766 | |
| China Merchants Bank Co. Ltd., H Shares | | | 240,000 | | | | 1,090,352 | |
| China Merchants Port Holdings Co. Ltd. | | | 94,516 | | | | 133,403 | |
| China Merchants Property Operation & Service Co. Ltd. Class A* | | | 5,000 | | | | 10,359 | |
| China Merchants Securities Co. Ltd., H Shares ± | | | 19,660 | | | | 18,516 | |
| China Merchants Shekou Industrial Zone Holdings Co. Ltd., Class A | | | 22,000 | | | | 39,463 | |
| China Minsheng Banking Corp. Ltd., H Shares | | | 395,880 | | | | 146,510 | |
| China Modern Dairy Holdings Ltd.@ | | | 290,000 | | | | 30,347 | |
| China National Accord Medicines Corp. Ltd., Class A | | | 6,760 | | | | 40,584 | |
| China National Building Material Co. Ltd., H Shares | | | 396,850 | | | | 244,106 | |
| China National Medicines Corp. Ltd., Class A | | | 2,900 | | | | 15,510 | |
| China National Nuclear Power Co. Ltd., Class A | | | 101,100 | | | | 98,121 | |
| China New Higher Education Group Ltd. ± | | | 74,000 | | | | 22,004 | |
| China Nonferrous Metal Industry's Foreign Engineering and Construction Co. Ltd. Class A* | | | 15,100 | | | | 9,812 | |
| China Nonferrous Mining Corp. Ltd. | | | 27,000 | | | | 12,749 | |
| China Oil & Gas Group Ltd.* | | | 200,000 | | | | 6,126 | |
| China Oilfield Services Ltd., H Shares | | | 112,000 | | | | 115,630 | |
| China Overseas Grand Oceans Group Ltd. | | | 141,402 | | | | 66,226 | |
| China Overseas Land & Investment Ltd. | | | 279,000 | | | | 608,132 | |
| China Pacific Insurance Group Co. Ltd., H Shares | | | 162,600 | | | | 420,195 | |
| China Petroleum & Chemical Corp., H Shares | | | 1,946,400 | | | | 1,140,119 | |
| China Railway Group Ltd., H Shares | | | 291,000 | | | | 191,995 | |
| China Railway Signal & Communication Corp. Ltd. H Shares ± | | | 149,000 | | | | 56,284 | |
| China Reinsurance Group Corp., H Shares | | | 323,000 | | | | 21,847 | |
| China Renaissance Holdings Ltd. @*±<> | | | 11,300 | | | | 10,484 | |
| China Resources Cement Holdings Ltd. | | | 238,000 | | | | 98,104 | |
| China Resources Double Crane Pharmaceutical Co. Ltd., Class A | | | 6,300 | | | | 15,108 | |
| China Resources Gas Group Ltd. | | | 70,000 | | | | 239,408 | |
| China Resources Land Ltd. | | | 302,000 | | | | 1,279,530 | |
| China Resources Medical Holdings Co. Ltd. | | | 71,500 | | | | 54,839 | |
| China Resources Pharmaceutical Group Ltd. ± | | | 134,500 | | | | 117,061 | |
| China Resources Sanjiu Medical & Pharmaceutical Co. Ltd., Class A | | | 5,100 | | | | 42,589 | |
| China Risun Group Ltd. | | | 58,000 | | | | 26,942 | |
| China Sanjiang Fine Chemicals Co. Ltd.* | | | 44,000 | | | | 7,300 | |
| China Shanshui Cement Group Ltd.*@ | | | 53,000 | | | | 7,575 | |
| China Shenhua Energy Co. Ltd., H Shares | | | 293,000 | | | | 895,527 | |
| China Shineway Pharmaceutical Group Ltd. | | | 36,000 | | | | 40,567 | |
| China South City Holdings Ltd.*@ | | | 508,000 | | | | 31,766 | |
| China South Publishing & Media Group Co. Ltd., Class A | | | 11,600 | | | | 18,524 | |
| China State Construction Engineering Corp. Ltd., Class A | | | 158,300 | | | | 125,088 | |
| China State Construction International Holdings Ltd. | | | 28,000 | | | | 31,909 | |
| China Sunshine Paper Holdings Co. Ltd.* | | | 26,000 | | | | 9,091 | |
| China Taiping Insurance Holdings Co. Ltd. | | | 137,800 | | | | 143,146 | |
| China Tianrui Group Cement Co. Ltd.*@ | | | 11,000 | | | | 8,535 | |
| China Tower Corp. Ltd., Class H ± | | | 3,372,000 | | | | 374,380 | |
| China Traditional Chinese Medicine Holdings Co. Ltd. | | | 260,000 | | | | 121,108 | |
| China TransInfo Technology Co. Ltd., Class A* | | | 6,900 | | | | 12,956 | |
The accompanying notes are an integral part of these financial statements.
SA Emerging Markets Value Fund
PORTFOLIO OF INVESTMENTS — AS OF JUNE 30, 2023 (Continued)
| | | SHARES | | | VALUE† | |
| COMMON STOCKS (Continued) | | | | | | | | |
| China (Continued) | | | | | | | | |
| China Travel International Investment Hong Kong Ltd.* | | | 180,000 | | | $ | 35,145 | |
| China Vanke Co. Ltd., Class H | | | 133,972 | | | | 179,860 | |
| China Yongda Automobiles Services Holdings Ltd. | | | 84,000 | | | | 42,236 | |
| China Zheshang Bank Co. Ltd., Class H @ | | | 96,000 | | | | 31,485 | |
| Chinasoft International Ltd.* | | | 174,000 | | | | 109,472 | |
| Chinese Universe Publishing and Media Group Co. Ltd., Class A | | | 9,200 | | | | 16,870 | |
| Chongqing Changan Automobile Co. Ltd., Class A* | | | 40,430 | | | | 71,965 | |
| Chongqing Department Store Co. Ltd., Class A | | | 2,400 | | | | 10,388 | |
| Chongqing Rural Commercial Bank Co. Ltd., H Shares | | | 226,000 | | | | 79,890 | |
| Chow Tai Seng Jewellery Co. Ltd. Class A | | | 9,125 | | | | 22,335 | |
| CIFI Ever Sunshine Services Group Ltd. § | | | 18,000 | | | | 5,255 | |
| CIMC Enric Holdings Ltd. | | | 74,000 | | | | 66,105 | |
| CITIC Ltd. | | | 356,000 | | | | 424,783 | |
| CITIC Securities Co. Ltd., Class H | | | 83,950 | | | | 152,130 | |
| Citychamp Watch & Jewellery Group Ltd.* | | | 62,000 | | | | 8,703 | |
| CMGE Technology Group Ltd.* | | | 90,000 | | | | 20,100 | |
| CMOC Group Ltd. Class H | | | 66,000 | | | | 34,533 | |
| CNNC Hua Yuan Titanium Dioxide Co. Ltd., Class A | | | 21,460 | | | | 17,401 | |
| CNOOC Energy Technology & Services Ltd., Class A | | | 62,100 | | | | 26,245 | |
| CNSIG Inner Mongolia Chemical Industry Co. Ltd. | | | 13,650 | | | | 16,912 | |
| COFCO Biotechnology Co. Ltd., Class A* | | | 15,100 | | | | 16,838 | |
| COFCO Joycome Foods Ltd.@* | | | 162,000 | | | | 38,867 | |
| Concord New Energy Group Ltd. | | | 420,000 | | | | 34,839 | |
| Consun Pharmaceutical Group Ltd. | | | 23,000 | | | | 15,556 | |
| COSCO SHIPPING Development Co. Ltd., H Shares | | | 324,200 | | | | 40,132 | |
| COSCO SHIPPING Energy Transportation Co. Ltd., H Shares* | | | 62,000 | | | | 62,190 | |
| COSCO SHIPPING Holdings Co. Ltd., H Shares | | | 244,199 | | | | 220,016 | |
| COSCO SHIPPING International Hong Kong Co. Ltd. | | | 34,000 | | | | 11,064 | |
| COSCO SHIPPING Ports Ltd. | | | 156,998 | | | | 93,365 | |
| Country Garden Holdings Co. Ltd.*@ | | | 847,376 | | | | 171,941 | |
| CPMC Holdings Ltd. | | | 53,000 | | | | 26,311 | |
| CSG Holding Co. Ltd., Class A* | | | 19,500 | | | | 15,999 | |
| CSR Corp., Ltd., Class H | | | 38,000 | | | | 20,804 | |
| CSSC Hong Kong Shipping Co. Ltd. | | | 70,000 | | | | 11,613 | |
| CTS International Logistics Corp. Ltd., Class A | | | 11,000 | | | | 13,795 | |
| Daan Gene Co. Ltd., Class A | | | 9,400 | | | | 12,902 | |
| Dali Foods Group Co. Ltd. ± | | | 38,500 | | | | 17,196 | |
| Daqin Railway Co. Ltd., Class A | | | 85,800 | | | | 87,760 | |
| DBG Technology Co. Ltd.,Class A | | | 7,000 | | | | 10,311 | |
| DHC Software Co. Ltd., Class A | | | 28,100 | | | | 27,311 | |
| Dian Diagnostics Group Co. Ltd. Class A | | | 4,800 | | | | 16,936 | |
| Digital China Holdings Ltd. | | | 62,000 | | | | 24,686 | |
| Digital China Information Service Co. Ltd., Class A | | | 10,000 | | | | 16,933 | |
| Dong-E-E-Jiao Co. Ltd., Class A | | | 3,300 | | | | 24,282 | |
| Dongfang Electric Corp. Ltd. H Shares | | | 21,000 | | | | 26,853 | |
| Dongxing Securities Co. Ltd., Class A | | | 12,000 | | | | 13,249 | |
| Dongyue Group Ltd. | | | 104,000 | | | | 77,774 | |
| Dynagreen Environmental Protection Group Co. Ltd., Class H | | | 52,000 | | | | 16,656 | |
| E-Commodities Holdings Ltd. | | | 94,000 | | | | 12,596 | |
| EEKA Fashion Holdings Ltd. | | | 8,000 | | | | 10,516 | |
| Essex Bio-technology Ltd. | | | 37,000 | | | | 16,951 | |
| Eternal Asia Supply Chain Management Ltd. Class A | | | 24,300 | | | | 17,061 | |
| Everbright Securities Co. Ltd., Class H*± | | | 16,000 | | | | 10,985 | |
| Fangda Carbon New Material Co. Ltd., Class A* | | | 15,700 | | | | 13,400 | |
| Fangda Special Steel Technology Co. Ltd., Class A* | | | 19,000 | | | | 12,110 | |
| Far East Horizon Ltd.@ | | | 187,000 | | | | 147,958 | |
| FAW Jiefang Group Co. Ltd., Class A* | | | 24,100 | | | | 27,769 | |
| Fiberhome Telecommunication Technologies Co. Ltd., Class A | | | 5,800 | | | | 16,264 | |
| FIH Mobile Ltd.* | | | 203,000 | | | | 20,466 | |
| Financial Street Holdings Co. Ltd., Class A | | | 23,300 | | | | 14,498 | |
| FinVolution Group, ADR | | | 11,439 | | | | 52,619 | |
| Fosun International Ltd. | | | 195,500 | | | | 134,225 | |
| Founder Securities Co. Ltd., Class A | | | 23,800 | | | | 21,428 | |
| Foxconn Industrial Internet Co. Ltd. Class A | | | 58,500 | | | | 202,945 | |
| Fu Shou Yuan International Group Ltd. | | | 44,000 | | | | 30,265 | |
| Fufeng Group Ltd. | | | 153,000 | | | | 77,320 | |
| Fujian Funeng Co. Ltd., Class A | | | 14,100 | | | | 22,419 | |
| Fujian Sunner Development Co. Ltd., Class A | | | 9,000 | | | | 23,726 | |
| Gansu Shangfeng Cement Co. Ltd., Class A | | | 6,240 | | | | 7,843 | |
| GCL Energy Technology Co. Ltd. | | | 4,200 | | | | 7,765 | |
| GCL Technology Holdings Ltd.@ | | | 395,000 | | | | 91,239 | |
| GDS Holdings Ltd., Class A* | | | 50,000 | | | | 68,275 | |
| Geely Automobile Holdings Ltd. | | | 401,000 | | | | 489,224 | |
| GEM Co. Ltd., Class A* | | | 33,500 | | | | 31,867 | |
| Gemdale Corp., Class A | | | 19,200 | | | | 19,057 | |
| Gemdale Properties & Investment Corp. Ltd.* | | | 442,000 | | | | 25,665 | |
| Genertec Universal Medical Group Co. Ltd. ± | | | 75,500 | | | | 41,431 | |
| GF Securities Co. Ltd., Class H* | | | 64,200 | | | | 88,648 | |
| Giant Network Group Co. Ltd., Class A | | | 9,400 | | | | 23,202 | |
| GoerTek, Inc., Class A | | | 18,300 | | | | 44,717 | |
The accompanying notes are an integral part of these financial statements.
SA Emerging Markets Value Fund
PORTFOLIO OF INVESTMENTS — AS OF JUNE 30, 2023 (Continued)
| | | SHARES | | | VALUE† | |
| COMMON STOCKS (Continued) | | | | | | | | |
| China (Continued) | | | | | | | | |
| Golden Eagle Retail Group Ltd.* | | | 15,000 | | | $ | 12,481 | |
| Gotion High-tech Co. Ltd., Class A* | | | 5,100 | | | | 19,392 | |
| Grand Pharmaceutical Group Ltd. | | | 88,500 | | | | 49,920 | |
| Grandjoy Holdings Group Co. Ltd., Class A* | | | 30,000 | | | | 15,116 | |
| Greattown Holdings Ltd., Class A* | | | 34,100 | | | | 14,506 | |
| Greatview Aseptic Packaging Co. Ltd.* | | | 88,000 | | | | 24,145 | |
| Gree Electric Appliances, Inc., Class A | | | 13,800 | | | | 69,360 | |
| Greenland Hong Kong Holdings Ltd. | | | 112,000 | | | | 6,146 | |
| Greentown China Holdings Ltd. | | | 78,500 | | | | 78,640 | |
| Greentown Service Group Co. Ltd. | | | 34,000 | | | | 16,271 | |
| GRG Banking Equipment Co. Ltd., Class A | | | 12,500 | | | | 20,168 | |
| Guangdong HEC Technology Holding Co. Ltd., Class A | | | 11,800 | | | | 11,712 | |
| Guangdong Provincial Expressway Development Co. Ltd. Class A | | | 12,700 | | | | 13,707 | |
| Guangdong Tapai Group Co. Ltd., Class A | | | 9,300 | | | | 9,884 | |
| Guangdong Xinbao Electrical Appliances Holdings Co. Ltd., Class A | | | 4,200 | | | | 10,425 | |
| Guanghui Energy Co. Ltd., Class A | | | 48,700 | | | | 45,991 | |
| Guangshen Railway Co. Ltd.,Class H* | | | 82,000 | | | | 25,952 | |
| Guangxi Liugong Machinery Co. Ltd., Class A | | | 14,900 | | | | 16,204 | |
| Guangzhou Automobile Group Co. Ltd., H Shares | | | 188,000 | | | | 112,042 | |
| Guangzhou Baiyunshan Pharmaceutical Holdings Co. Ltd., Class H | | | 16,000 | | | | 48,290 | |
| Guangzhou Haige Communications Group, Inc. Co., Class A | | | 22,300 | | | | 31,743 | |
| Guangzhou Yuexiu Capital Holdings Group Co. Ltd., Class A | | | 18,042 | | | | 15,772 | |
| Guizhou Panjiang Refined Coal Co. Ltd., Class A | | | 9,269 | | | | 8,868 | |
| Guizhou Xinbang Pharmaceutical Co. Ltd. Class A | | | 32,400 | | | | 19,759 | |
| Guosen Securities Co. Ltd., Class A | | | 22,400 | | | | 26,921 | |
| Guosheng Financial Holding, Inc., Class A* | | | 14,131 | | | | 17,080 | |
| Guotai Junan Securities Co. Ltd., H Shares ± | | | 29,000 | | | | 34,011 | |
| Haier Smart Home Co. Ltd., Class A | | | 20,500 | | | | 66,263 | |
| Hainan Meilan International Airport Co. Ltd., H Shares* | | | 14,000 | | | | 17,348 | |
| Haitian International Holdings Ltd. | | | 44,000 | | | | 102,644 | |
| Haitong Securities Co. Ltd., Class H | | | 169,600 | | | | 103,890 | |
| Han's Laser Technology Industry Group Co. Ltd., Class A | | | 8,900 | | | | 32,101 | |
| Hang Zhou Great Star Industrial Co. Ltd., Class A | | | 4,400 | | | | 13,253 | |
| Hangcha Group Co. Ltd. Class A | | | 8,000 | | | | 25,936 | |
| Hangzhou Binjiang Real Estate Group Co. Ltd., Class A | | | 22,900 | | | | 27,805 | |
| Hangzhou Robam Appliances Co. Ltd. Class A | | | 2,900 | | | | 10,096 | |
| Harbin Electric Co. Ltd., H Shares | | | 16,000 | | | | 6,432 | |
| Health & Happiness H&H International Holdings Ltd. | | | 18,500 | | | | 23,798 | |
| Heilongjiang Agriculture Co. Ltd., Class A | | | 8,000 | | | | 14,681 | |
| Henan Mingtai Al Industrial Co. Ltd., Class A | | | 8,400 | | | | 16,051 | |
| Hengan International Group Co. Ltd. | | | 55,500 | | | | 233,729 | |
| Hengli Petrochemical Co. Ltd., Class A* | | | 35,500 | | | | 70,032 | |
| Hengtong Optic-electric Co. Ltd., Class A | | | 9,680 | | | | 19,536 | |
| Hengyi Petrochemical Co. Ltd., Class A | | | 25,000 | | | | 23,334 | |
| Hesteel Co. Ltd., Class A | | | 65,500 | | | | 20,378 | |
| Hi Sun Technology China Ltd.* | | | 138,000 | | | | 12,504 | |
| Holitech Technology Co. Ltd., Class A* | | | 35,900 | | | | 17,446 | |
| Hongda Xingye Co. Ltd., Class A* | | | 21,200 | | | | 6,537 | |
| Hope Education Group Co. Ltd.*@± | | | 120,000 | | | | 7,963 | |
| Hopson Development Holdings Ltd.@ | | | 92,637 | | | | 65,730 | |
| Hua Han Health Industry Holdings Ltd.@*§ | | | 504,000 | | | | — | |
| Hua Hong Semiconductor Ltd.*@± | | | 43,000 | | | | 140,480 | |
| Huafon Chemical Co. Ltd., Class A | | | 27,754 | | | | 26,210 | |
| Huafon Microfibre Shanghai Technology Co. Ltd., Class T* | | | 25,700 | | | | 12,772 | |
| Huaibei Mining Holdings Co. Ltd. Class A | | | 10,400 | | | | 16,493 | |
| Huapont Life Sciences Co. Ltd., Class A | | | 27,600 | | | | 18,998 | |
| Huatai Securities Co. Ltd., Class H ± | | | 58,600 | | | | 72,390 | |
| Huaxi Securities Co. Ltd., Class A | | | 12,600 | | | | 14,414 | |
| Huaxia Bank Co. Ltd., Class A | | | 43,300 | | | | 32,248 | |
| Huaxin Cement Co. Ltd. | | | 17,700 | | | | 15,337 | |
| Huaxin Cement Co. Ltd., Class A | | | 7,000 | | | | 11,901 | |
| Huayu Automotive Systems Co. Ltd., Class A | | | 17,500 | | | | 44,472 | |
| Hubei Biocause Pharmaceutical Co. Ltd., Class A | | | 17,600 | | | | 7,269 | |
| Hubei Jumpcan Pharmaceutical Co. Ltd., Class A* | | | 4,400 | | | | 17,590 | |
| Hubei Xingfa Chemicals Group Co. Ltd., Class A | | | 9,400 | | | | 28,754 | |
| Humanwell Healthcare Group Co. Ltd., Class A | | | 9,700 | | | | 35,974 | |
| Hunan Valin Steel Co. Ltd., Class A | | | 47,300 | | | | 31,060 | |
| Hytera Communications Corp. Ltd., Class A* | | | 23,400 | | | | 18,716 | |
| Industrial & Commercial Bank of China Ltd., H Shares | | | 4,186,000 | | | | 2,232,961 | |
| Industrial Bank Co. Ltd. Class A | | | 122,900 | | | | 264,781 | |
| Industrial Securities Co. Ltd., Class A | | | 52,910 | | | | 44,577 | |
| Infore Environment Technology Group Co. Ltd., Class A | | | 12,400 | | | | 8,621 | |
| Inner Mongolia BaoTou Steel Union Co. Ltd., Class A* | | | 169,960 | | | | 41,881 | |
| Inner Mongolia Dian Tou Energy Corp. Ltd., Class A | | | 12,000 | | | | 21,839 | |
The accompanying notes are an integral part of these financial statements.
SA Emerging Markets Value Fund
PORTFOLIO OF INVESTMENTS — AS OF JUNE 30, 2023 (Continued)
| | | SHARES | | | VALUE† | |
| COMMON STOCKS (Continued) | | | | | | | | |
| China (Continued) | | | | | | | | |
| Inner Mongolia ERDOS Resources Co. Ltd. Class A | | | 11,760 | | | $ | 14,522 | |
| Inner Mongolia Junzheng Energy & Chemical Industry Group Co. Ltd., Class A | | | 55,300 | | | | 31,213 | |
| Inner Mongolia Yitai Coal Co. Ltd. Class H | | | 9,800 | | | | 21,536 | |
| Inner Mongolia Yuan Xing Energy Co. Ltd., Class A | | | 34,700 | | | | 34,346 | |
| Intco Medical Technology Co. Ltd. Class A | | | 5,700 | | | | 17,263 | |
| JCET Group Co. Ltd., Class A | | | 12,895 | | | | 55,332 | |
| Jiangsu Changshu Rural Commercial Bank Co. Ltd., Class A | | | 20,200 | | | | 18,965 | |
| Jiangsu Eastern Shenghong Co. Ltd., Class A | | | 10,600 | | | | 17,248 | |
| Jiangsu Guotai International Group Co. Ltd., Class A | | | 10,400 | | | | 10,795 | |
| Jiangsu Jiangyin Rural Commercial Bank Co. Ltd., Class A | | | 34,700 | | | | 17,627 | |
| Jiangsu Lihua Animal Husbandry Stock Co. Ltd., Class A | | | 4,320 | | | | 10,961 | |
| Jiangsu Provincial Agricultural Reclamation and Development Corp. | | | 11,200 | | | | 17,947 | |
| Jiangsu Shagang Co. Ltd. | | | 38,000 | | | | 20,977 | |
| Jiangsu Shuangxing Color Plastic New Materials Co. Ltd., Class A | | | 10,800 | | | | 18,674 | |
| Jiangsu Yuyue Medical Equipment & Supply Co. Ltd., Class A | | | 5,600 | | | | 27,745 | |
| Jiangsu Zhangjiagang Rural Commercial Bank Co. Ltd., Class A | | | 27,840 | | | | 16,212 | |
| Jiangsu Zhongtian Technology Co. Ltd., Class A | | | 11,500 | | | | 25,188 | |
| Jiangxi Copper Co. Ltd., H Shares | | | 70,000 | | | | 107,555 | |
| Jiaozuo Wanfang Aluminum Manufacturing Co. Ltd., Class A | | | 17,100 | | | | 11,394 | |
| Jilin Aodong Pharmaceutical Group Co. Ltd., Class A* | | | 7,300 | | | | 16,119 | |
| Jingrui Holdings Ltd.*@ | | | 43,000 | | | | 466 | |
| Jinke Smart Services Group Co. Ltd., Class H @* | | | 12,000 | | | | 17,274 | |
| Jinneng Science&Technology Co. Ltd., Class A | | | 10,600 | | | | 11,805 | |
| Jizhong Energy Resources Co. Ltd., Class A | | | 21,200 | | | | 18,620 | |
| JNBY Design Ltd. | | | 16,500 | | | | 17,877 | |
| Joincare Pharmaceutical Group Industry Co. Ltd., Class A | | | 18,700 | | | | 32,720 | |
| Jointown Pharmaceutical Group Co. Ltd., Class A | | | 15,943 | | | | 22,782 | |
| Joyoung Co. Ltd. Class A | | | 1,600 | | | | 3,293 | |
| Ju Teng International Holdings Ltd. | | | 56,000 | | | | 9,076 | |
| Kingboard Holdings Ltd. | | | 71,500 | | | | 194,809 | |
| Kingboard Laminates Holdings Ltd. | | | 79,000 | | | | 74,302 | |
| Kingfa Sci & Tech Co. Ltd. Class A | | | 13,400 | | | | 16,104 | |
| Kingsoft Corp. Ltd. | | | 29,000 | | | | 114,172 | |
| Kunlun Energy Co. Ltd. | | | 354,000 | | | | 278,285 | |
| KWG Living Group Holdings Ltd.*@ | | | 65,000 | | | | 7,466 | |
| Lao Feng Xiang Co. Ltd., Class A | | | 2,700 | | | | 25,974 | |
| LB Group Co. Ltd., Class A | | | 11,200 | | | | 25,440 | |
| Lee & Man Chemical Co. Ltd. | | | 16,000 | | | | 9,658 | |
| Lee & Man Paper Manufacturing Ltd. | | | 122,000 | | | | 40,480 | |
| Legend Holdings Corp., H Shares ± | | | 38,400 | | | | 35,577 | |
| Lenovo Group Ltd. | | | 100,000 | | | | 104,262 | |
| Lens Technology Co. Ltd., Class A | | | 24,140 | | | | 39,081 | |
| Leo Group Co. Ltd., Class A* | | | 48,000 | | | | 15,198 | |
| LexinFintech Holdings Ltd., ADR* | | | 16,062 | | | | 36,782 | |
| Leyard Optoelectronic Co. Ltd., Class A | | | 20,300 | | | | 18,249 | |
| Lianhe Chemical Technology Co. Ltd. | | | 6,700 | | | | 9,648 | |
| Lingyi iTech Guangdong Co., Class A* | | | 42,800 | | | | 40,714 | |
| Livzon Pharmaceutical Group, Inc., H Shares* | | | 6,800 | | | | 23,387 | |
| Longfor Group Holdings Ltd. ± | | | 154,500 | | | | 375,406 | |
| Lonking Holdings Ltd. | | | 158,000 | | | | 26,011 | |
| Luenmei Quantum Co. Ltd., Class A | | | 13,300 | | | | 12,762 | |
| Luoniushan Co. Ltd., Class A | | | 16,000 | | | | 14,405 | |
| Luxi Chemical Group Co. Ltd., Class A | | | 8,600 | | | | 12,502 | |
| Luye Pharma Group Ltd.*@± | | | 161,500 | | | | 68,219 | |
| LVGEM China Real Estate Investment Co. Ltd.*@ | | | 72,000 | | | | 13,783 | |
| Maanshan Iron & Steel Co. Ltd., H Shares | | | 78,000 | | | | 13,737 | |
| Maccura Biotechnology Co. Ltd. Class A | | | 3,800 | | | | 7,910 | |
| Mango Excellent Media Co. Ltd. Class A | | | 11,000 | | | | 51,804 | |
| Maoyan Entertainment*@± | | | 21,200 | | | | 19,398 | |
| Meinian Onehealth Healthcare Holdings Co. Ltd., Class A* | | | 29,300 | | | | 28,679 | |
| Metallurgical Corp. of China Ltd., H Shares | | | 225,000 | | | | 55,417 | |
| Midea Real Estate Holding Ltd.@± | | | 14,000 | | | | 12,596 | |
| Ming Yang Smart Energy Group Ltd., Class A | | | 6,800 | | | | 15,802 | |
| Mingfa Group International Co. Ltd.* | | | 91,000 | | | | 2,903 | |
| Minth Group Ltd. | | | 38,000 | | | | 104,262 | |
| MLS Co. Ltd., Class A | | | 20,000 | | | | 25,330 | |
| MMG Ltd.* | | | 236,000 | | | | 68,367 | |
| Nanjing Iron & Steel Co. Ltd., Class A | | | 36,600 | | | | 16,980 | |
| Nanjing Xinjiekou Department Store Co. Ltd., Class A | | | 6,900 | | | | 7,609 | |
| NavInfo Co. Ltd., Class A* | | | 10,200 | | | | 16,260 | |
| NetDragon Websoft Holdings Ltd. | | | 25,500 | | | | 47,967 | |
| New China Life Insurance Co. Ltd., H Shares | | | 57,900 | | | | 152,582 | |
| New Hope Liuhe Co. Ltd., Class A* | | | 12,000 | | | | 19,295 | |
| Newland Digital Technology Co. Ltd., Class A | | | 10,000 | | | | 26,019 | |
| Nexteer Automotive Group Ltd. | | | 69,000 | | | | 36,015 | |
| Nine Dragons Paper Holdings Ltd.* | | | 173,000 | | | | 106,635 | |
| Ningbo Huaxiang Electronic Co. Ltd., Class A | | | 8,950 | | | | 16,510 | |
| Ningbo Joyson Electronic Corp., Class A | | | 5,200 | | | | 12,628 | |
The accompanying notes are an integral part of these financial statements.
SA Emerging Markets Value Fund
PORTFOLIO OF INVESTMENTS — AS OF JUNE 30, 2023 (Continued)
| | | SHARES | | | VALUE† | |
| COMMON STOCKS (Continued) | | | | | | | | |
| China (Continued) | | | | | | | | |
| Ningbo Zhoushan Port Co. Ltd., Class A | | | 33,200 | | | $ | 15,494 | |
| Ningxia Baofeng Energy Group Co. Ltd., Class A | | | 11,600 | | | | 20,137 | |
| Noah Holdings Ltd., ADR | | | 1,172 | | | | 16,502 | |
| Northeast Securities Co. Ltd., Class A | | | 8,500 | | | | 8,121 | |
| Offshore Oil Engineering Co. Ltd. Class A | | | 27,400 | | | | 22,066 | |
| ORG Technology Co. Ltd., Class A | | | 26,800 | | | | 16,639 | |
| Orient Securities Co. Ltd., Class H @± | | | 52,400 | | | | 28,688 | |
| Oriental Energy Co. Ltd. Class A | | | 11,300 | | | | 13,456 | |
| Oriental Pearl Group Co. Ltd., Class A | | | 10,700 | | | | 11,519 | |
| PAX Global Technology Ltd. | | | 75,000 | | | | 56,853 | |
| People's Insurance Co. Group of China Ltd. (The), H Shares | | | 305,000 | | | | 110,541 | |
| PetroChina Co. Ltd., H Shares | | | 2,014,000 | | | | 1,393,042 | |
| PICC Property & Casualty Co. Ltd., H Shares | | | 494,000 | | | | 549,099 | |
| Ping An Bank Co. Ltd., Class A | | | 108,500 | | | | 167,738 | |
| Ping An Insurance Group Co. of China Ltd., Class H | | | 381,000 | | | | 2,423,794 | |
| Pingdingshan Tianan Coal Mining Co. Ltd., Class A | | | 15,900 | | | | 16,504 | |
| Poly Property Group Co. Ltd. | | | 200,431 | | | | 44,762 | |
| Postal Savings Bank of China Co. Ltd., Class H @± | | | 571,000 | | | | 351,228 | |
| Pou Sheng International Holdings Ltd.* | | | 252,000 | | | | 18,974 | |
| Power Construction Corp. of China Ltd. Class A | | | 56,900 | | | | 44,962 | |
| Q Technology Group Co. Ltd.*@ | | | 31,000 | | | | 12,185 | |
| Qifu Technology, Inc. | | | 5,298 | | | | 91,549 | |
| Qingdao Hanhe Cable Co. Ltd., Class A | | | 35,800 | | | | 19,763 | |
| Radiance Holdings Group Co. Ltd.*@ | | | 37,000 | | | | 17,660 | |
| Red Star Macalline Group Corp. Ltd., H Shares @*± | | | 35,700 | | | | 14,123 | |
| Redco Properties Group Ltd.*@±§ | | | 80,000 | | | | 10,184 | |
| Renhe Pharmacy Co. Ltd., Class A | | | 19,700 | | | | 16,652 | |
| Rongsheng Petrochemical Co. Ltd. Class A | | | 61,100 | | | | 97,907 | |
| SAIC Motor Corp. Ltd., Class A | | | 29,700 | | | | 57,936 | |
| Sailun Group Co. Ltd., Class A | | | 13,900 | | | | 21,795 | |
| Sansteel Minguang Co. Ltd., Class A | | | 13,700 | | | | 7,959 | |
| Sansure Biotech, Inc. Class A | | | 3,333 | | | | 7,727 | |
| Sany Heavy Equipment International Holdings Co. Ltd. | | | 40,000 | | | | 52,374 | |
| Sany Heavy Industry Co. Ltd. Class A | | | 28,800 | | | | 65,933 | |
| Satellite Chemical Co. Ltd., Class A | | | 17,026 | | | | 35,064 | |
| Sealand Securities Co. Ltd., Class A | | | 24,800 | | | | 11,437 | |
| Seazen Group Ltd.*@ | | | 188,571 | | | | 36,819 | |
| Seazen Holdings Co. Ltd., Class A* | | | 13,800 | | | | 27,376 | |
| SF Holding Co. Ltd. Class A | | | 14,100 | | | | 87,523 | |
| Shaanxi Coal Industry Co. Ltd., Class A | | | 50,037 | | | | 125,298 | |
| Shan Xi Hua Yang Group New Energy Co. Ltd., Class A | | | 32,400 | | | | 35,281 | |
| Shandong Buchang Pharmaceuticals Co. Ltd., Class A | | | 9,200 | | | | 26,077 | |
| Shandong Chenming Paper Holdings Ltd., H Shares* | | | 35,250 | | | | 11,381 | |
| Shandong Hi-Speed Road & Bridge Co. Ltd. | | | 20,600 | | | | 18,206 | |
| Shandong Himile Mechanical Science & Technology Co. Ltd., Class A | | | 2,700 | | | | 13,058 | |
| Shandong Hualu Hengsheng Chemical Co. Ltd., Class A | | | 11,310 | | | | 47,690 | |
| Shandong Humon Smelting Co. Ltd., Class A* | | | 10,800 | | | | 16,191 | |
| Shandong Linglong Tyre Co. Ltd., Class A | | | 7,700 | | | | 23,554 | |
| Shandong Nanshan Aluminum Co. Ltd., Class A | | | 37,900 | | | | 15,757 | |
| Shandong Sun Paper Industry JSC Ltd., Class A | | | 16,800 | | | | 24,723 | |
| Shandong Weigao Group Medical Polymer Co. Ltd., H Shares | | | 75,200 | | | | 98,271 | |
| Shanghai AJ Group Co. Ltd., Class A | | | 16,900 | | | | 11,633 | |
| Shanghai Construction Group Co. Ltd. Class A | | | 55,900 | | | | 20,701 | |
| Shanghai Electric Group Co. Ltd., H Shares* | | | 166,000 | | | | 38,767 | |
| Shanghai Environment Group Co. Ltd., Class A | | | 11,600 | | | | 15,155 | |
| Shanghai Industrial Holdings Ltd. | | | 45,000 | | | | 65,237 | |
| Shanghai International Port Group Co. Ltd., Class A | | | 48,600 | | | | 35,125 | |
| Shanghai Jinjiang International Hotels Co. Ltd., Class A | | | 1,300 | | | | 7,577 | |
| Shanghai Lingang Holdings Corp. Ltd., Class A | | | 8,760 | | | | 14,411 | |
| Shanghai Lujiazui Finance & Trade Zone Development Co. Ltd., Class A | | | 13,500 | | | | 18,343 | |
| Shanghai Mechanical and Electrical Industry Co. Ltd., Class A | | | 7,100 | | | | 16,792 | |
| Shanghai Pharmaceuticals Holding Co. Ltd., Class H | | | 63,600 | | | | 125,966 | |
| Shanghai Pudong Development Bank Co. Ltd., Class A | | | 118,900 | | | | 118,506 | |
| Shanghai RAAS Blood Products Co. Ltd., Class A | | | 37,200 | | | | 38,460 | |
| Shanghai Tunnel Engineering Co. Ltd., Class A | | | 25,600 | | | | 21,180 | |
| Shanghai Yuyuan Tourist Mart Group Co. Ltd., Class A | | | 18,000 | | | | 16,999 | |
| Shanghai Zhangjiang High-Tech Park Development Co. Ltd., Class A | | | 7,800 | | | | 14,947 | |
| Shanxi Coking Coal Energy Group Co. Ltd., Class A | | | 39,900 | | | | 49,985 | |
| Shanxi Lu'an Environmental Energy Development Co. Ltd., Class A | | | 26,900 | | | | 60,436 | |
The accompanying notes are an integral part of these financial statements.
SA Emerging Markets Value Fund
PORTFOLIO OF INVESTMENTS — AS OF JUNE 30, 2023 (Continued)
| | | SHARES | | | VALUE† | |
| COMMON STOCKS (Continued) | | | | | | | | |
| China (Continued) | | | | | | | | |
| Shanxi Meijin Energy Co. Ltd., Class A* | | | 31,400 | | | $ | 32,593 | |
| Shanxi Securities Co. Ltd., Class A | | | 24,700 | | | | 18,974 | |
| Shanxi Taigang Stainless Steel Co. Ltd., Class A | | | 34,300 | | | | 18,274 | |
| Shenghe Resources Holding Co. Ltd., Class A* | | | 11,000 | | | | 19,489 | |
| Shengyi Technology Co. Ltd. Class A | | | 9,946 | | | | 19,443 | |
| Shenwan Hongyuan Group Co. Ltd., H Shares ± | | | 43,200 | | | | 8,270 | |
| Shenzhen Agricultural Products Group Co. Ltd., Class A | | | 15,600 | | | | 12,864 | |
| Shenzhen Airport Co. Ltd., Class A | | | 16,200 | | | | 15,500 | |
| Shenzhen Aisidi Co. Ltd., Class A | | | 14,200 | | | | 14,427 | |
| Shenzhen Huaqiang Industry Co. Ltd. Class A | | | 5,900 | | | | 9,276 | |
| Shenzhen International Holdings Ltd. | | | 107,733 | | | | 94,864 | |
| Shenzhen Investment Ltd. | | | 323,060 | | | | 57,719 | |
| Shenzhen Jinjia Group Co. Ltd., Class A* | | | 10,602 | | | | 8,786 | |
| Shenzhen Kaifa Technology Co. Ltd. Class A* | | | 5,900 | | | | 16,236 | |
| Shenzhen Kinwong Electronic Co. Ltd., Class A | | | 5,800 | | | | 20,480 | |
| Shenzhen MTC Co. Ltd., Class A | | | 42,300 | | | | 32,028 | |
| Shenzhen Neptunus Bioengineering Co. Ltd., Class A* | | | 28,200 | | | | 12,500 | |
| Shenzhen Overseas Chinese Town Co. Ltd., Class A* | | | 43,200 | | | | 26,167 | |
| Shenzhen Sunway Communication Co. Ltd. Class A | | | 4,700 | | | | 12,992 | |
| Shenzhen Tagen Group Co. Ltd., Class A | | | 25,000 | | | | 17,346 | |
| Shenzhen World Union Group, Inc., Class A* | | | 33,300 | | | | 11,736 | |
| Shenzhen Yan Tian Port Holding Co. Ltd. Class A | | | 28,200 | | | | 18,828 | |
| Shenzhen YUTO Packaging Technology Co. Ltd. Class A | | | 4,900 | | | | 16,452 | |
| Shenzhen Zhongjin Lingnan Nonfemet Co. Ltd., Class A | | | 31,900 | | | | 20,860 | |
| Shijiazhuang Changshan BeiMing Technology Co. Ltd., Class A* | | | 26,700 | | | | 29,736 | |
| Shimao Group Holdings Ltd.*§ | | | 131,000 | | | | — | |
| Shoucheng Holdings Ltd. | | | 58,400 | | | | 13,564 | |
| Shougang Fushan Resources Group Ltd. | | | 219,790 | | | | 55,256 | |
| Shui On Land Ltd. | | | 280,000 | | | | 31,802 | |
| Sichuan Development Lomon Co. Ltd., Class A | | | 13,600 | | | | 15,221 | |
| Sichuan Hebang Biotechnology Co. Ltd., Class A | | | 84,300 | | | | 28,200 | |
| Sichuan Kelun Pharmaceutical Co. Ltd., Class A | | | 12,500 | | | | 51,073 | |
| Sichuan Road & Bridge Group Co. Ltd., Class A | | | 28,840 | | | | 38,948 | |
| Sichuan Yahua Industrial Group Co. Ltd., Class A | | | 8,400 | | | | 20,560 | |
| Sino-Ocean Group Holding Ltd.*@ | | | 293,712 | | | | 16,492 | |
| Sinofert Holdings Ltd.* | | | 244,000 | | | | 29,581 | |
| Sinoma International Engineering Co., Class A | | | 14,600 | | | | 25,626 | |
| Sinoma Science & Technology Co. Ltd., Class A | | | 11,000 | | | | 31,074 | |
| Sinopec Engineering Group Co. Ltd., H Shares | | | 111,000 | | | | 49,437 | |
| Sinopec Kantons Holdings Ltd. | | | 90,000 | | | | 33,767 | |
| Sinopharm Group Co. Ltd., H Shares | | | 140,400 | | | | 438,974 | |
| Sinotrans Ltd., H Shares | | | 145,000 | | | | 51,627 | |
| Sinotruk Hong Kong Ltd. | | | 67,000 | | | | 130,135 | |
| Sinotruk Jinan Truck Co. Ltd. | | | 2,800 | | | | 6,495 | |
| Skyworth Group Ltd.@ | | | 133,484 | | | | 58,940 | |
| SOHO China Ltd.* | | | 153,500 | | | | 22,919 | |
| SooChow Securities Co. Ltd., Class A | | | 20,280 | | | | 19,375 | |
| STO Express Co. Ltd.* | | | 15,900 | | | | 23,683 | |
| Sun Art Retail Group Ltd. | | | 172,500 | | | | 44,468 | |
| Suning Universal Co. Ltd., Class A | | | 32,100 | | | | 12,064 | |
| Sunward Intelligent Equipment Co. Ltd., Class A* | | | 10,800 | | | | 9,887 | |
| Suzhou Anjie Technology Co. Ltd. | | | 10,500 | | | | 19,948 | |
| Suzhou Dongshan Precision Manufacturing Co. Ltd., Class A* | | | 10,800 | | | | 38,507 | |
| Tangshan Jidong Cement Co. Ltd., Class A | | | 10,000 | | | | 10,146 | |
| TangShan Port Group Co. Ltd., Class A | | | 55,900 | | | | 27,165 | |
| Tangshan Sanyou Chemical Industries Co. Ltd., Class A | | | 11,600 | | | | 8,703 | |
| TBEA Co. Ltd., Class A* | | | 21,000 | | | | 64,439 | |
| TCL Electronics Holdings Ltd.* | | | 99,667 | | | | 51,767 | |
| TCL Technology Group Corp., Class A* | | | 78,540 | | | | 42,600 | |
| Tencent Music Entertainment Group, ADR* | | | 18,038 | | | | 133,120 | |
| Tian Di Science & Technology Co. Ltd., Class A | | | 40,500 | | | | 32,505 | |
| Tiande Chemical Holdings Ltd. | | | 36,000 | | | | 7,856 | |
| Tiangong International Co. Ltd. | | | 100,000 | | | | 24,247 | |
| Tianjin Chase Sun Pharmaceutical Co. Ltd., Class A | | | 30,700 | | | | 22,907 | |
| Tianma Microelectronics Co. Ltd., Class A* | | | 15,500 | | | | 19,588 | |
| Tianneng Power International Ltd.@ | | | 74,000 | | | | 76,399 | |
| Tianshan Aluminum Group Co. Ltd. Class A | | | 18,200 | | | | 15,008 | |
| Tianshui Huatian Technology Co. Ltd., Class A | | | 35,100 | | | | 44,455 | |
| Titan Wind Energy Suzhou Co. Ltd., Class A* | | | 8,800 | | | | 18,450 | |
| Tomson Group Ltd. | | | 1,275 | | | | 283 | |
| Tong Ren Tang Technologies Co. Ltd., Class H | | | 41,000 | | | | 40,707 | |
| TongFu Microelectronics Co. Ltd., Class A | | | 10,100 | | | | 31,423 | |
| Tongkun Group Co. Ltd., Class A | | | 11,100 | | | | 20,247 | |
| Tongling Nonferrous Metals Group Co. Ltd., Class A | | | 49,000 | | | | 19,495 | |
The accompanying notes are an integral part of these financial statements.
SA Emerging Markets Value Fund
PORTFOLIO OF INVESTMENTS — AS OF JUNE 30, 2023 (Continued)
| | | SHARES | | | VALUE† | |
| COMMON STOCKS (Continued) | | | | | | | | |
| China (Continued) | | | | | | | | |
| Tongyu Heavy Industry Co. Ltd., Class A | | | 40,800 | | | $ | 15,671 | |
| Topsec Technologies Group, Inc., Class A* | | | 7,000 | | | | 9,347 | |
| Transfar Zhilian Co. Ltd., Class A | | | 27,553 | | | | 20,179 | |
| Trip.com Group Ltd., ADR* | | | 26,828 | | | | 938,980 | |
| Truly International Holdings Ltd. | | | 120,000 | | | | 14,089 | |
| Uni-President China Holdings Ltd. | | | 92,000 | | | | 77,489 | |
| Unisplendour Corp. Ltd., Class A | | | 13,940 | | | | 61,121 | |
| United Energy Group Ltd.* | | | 692,000 | | | | 67,116 | |
| Universal Scientific Industrial Shanghai Co. Ltd., Class A | | | 10,000 | | | | 20,595 | |
| Victory Giant Technology Huizhou Co. Ltd. Class A | | | 9,400 | | | | 31,199 | |
| Vinda International Holdings Ltd. | | | 26,000 | | | | 64,701 | |
| Vipshop Holdings Ltd., ADR* | | | 31,293 | | | | 516,335 | |
| Viva Biotech Holdings*± | | | 27,000 | | | | 5,168 | |
| Wangsu Science & Technology Co. Ltd., Class A | | | 20,900 | | | | 20,457 | |
| Wanxiang Qianchao Co. Ltd., Class A | | | 42,900 | | | | 32,187 | |
| Wasion Holdings Ltd. | | | 48,000 | | | | 19,541 | |
| Wasu Media Holding Co. Ltd. | | | 20,700 | | | | 24,792 | |
| Weibo Corp., ADR | | | 2,074 | | | | 27,190 | |
| Weichai Power Co. Ltd., H Shares | | | 151,000 | | | | 221,220 | |
| Weifu High-Technology Group Co. Ltd., Class A | | | 5,600 | | | | 12,142 | |
| Wellhope Foods Co. Ltd., Class A | | | 7,700 | | | | 9,646 | |
| West China Cement Ltd. | | | 198,000 | | | | 19,962 | |
| Western Securities Co. Ltd. Class A | | | 22,600 | | | | 19,756 | |
| Wharf Holdings Ltd. (The) | | | 70,000 | | | | 166,335 | |
| Wingtech Technology Co. Ltd., Class A | | | 3,900 | | | | 26,254 | |
| Wolong Electric Group Co. Ltd., Class A | | | 11,600 | | | | 23,331 | |
| Wuchan Zhongda Group Co. Ltd., Class A | | | 29,100 | | | | 19,790 | |
| Wuhu Token Science Co. Ltd., Class A | | | 16,000 | | | | 13,282 | |
| Wushang Group Co. Ltd. Class A | | | 12,600 | | | | 17,155 | |
| Wuxi Taiji Industry Co. Ltd., Class A* | | | 14,900 | | | | 14,892 | |
| XCMG Construction Machinery Co. Ltd., Class A | | | 47,400 | | | | 44,176 | |
| Xiamen C & D, Inc., Class A | | | 17,600 | | | | 26,434 | |
| Xiamen ITG Group Corp. Ltd., Class A | | | 17,300 | | | | 18,434 | |
| Xiamen Tungsten Co. Ltd., Class A | | | 7,300 | | | | 19,124 | |
| Xiamen Xiangyu Co. Ltd., Class A* | | | 22,200 | | | | 26,588 | |
| Xiaomi Corp., Class B*± | | | 524,800 | | | | 717,950 | |
| Xinfengming Group Co. Ltd., Class A* | | | 4,000 | | | | 6,085 | |
| Xingda International Holdings Ltd. | | | 81,992 | | | | 14,754 | |
| Xinhu Zhongbao Co. Ltd., Class A* | | | 44,900 | | | | 15,329 | |
| Xinhua Winshare Publishing and Media Co. Ltd., Class H | | | 36,000 | | | | 26,325 | |
| Xinjiang Goldwind Science & Technology Co. Ltd., H Shares* | | | 47,800 | | | | 32,757 | |
| Xinjiang Tianshan Cement Co. Ltd., Class A | | | 4,500 | | | | 5,043 | |
| Xinjiang Zhongtai Chemical Co. Ltd., Class A | | | 14,500 | | | | 12,875 | |
| Xinte Energy Co. Ltd., Class H*@ | | | 22,800 | | | | 48,300 | |
| Xinxing Ductile Iron Pipes Co. Ltd., Class A | | | 18,100 | | | | 10,166 | |
| Xinyi Energy Holdings Ltd. | | | 136,400 | | | | 44,562 | |
| Xinyu Iron & Steel Co. Ltd., Class A | | | 27,300 | | | | 13,943 | |
| XPeng, Inc., Class A*@ | | | 28,100 | | | | 179,301 | |
| Xuji Electric Co. Ltd., Class A | | | 9,300 | | | | 29,510 | |
| Yankuang Energy Group Co. Ltd., Class H @ | | | 98,000 | | | | 280,768 | |
| Yantai Changyu Pioneer Wine Co. Ltd., Class A | | | 3,700 | | | | 15,617 | |
| Yantai Jereh Oilfield Services Group Co. Ltd., Class A | | | 7,300 | | | | 25,254 | |
| YiChang HEC ChangJiang Pharmaceutical Co. Ltd., H Shares*± | | | 25,600 | | | | 22,117 | |
| Yifan Pharmaceutical Co. Ltd., Class A* | | | 7,200 | | | | 14,471 | |
| Yintai Gold Co. Ltd., Class A | | | 19,400 | | | | 31,247 | |
| Yixintang Pharmaceutical Group Co. Ltd., Class A | | | 2,800 | | | | 10,176 | |
| Yonfer Agricultural Technology Co. Ltd. | | | 6,900 | | | | 9,765 | |
| Youngor Group Co. Ltd., Class A | | | 11,500 | | | | 9,990 | |
| YTO Express Group Co. Ltd. Class A | | | 21,200 | | | | 42,493 | |
| Yunda Holding Co. Ltd., Class A | | | 16,500 | | | | 21,715 | |
| Yunnan Aluminium Co. Ltd., Class A | | | 18,200 | | | | 31,895 | |
| Yunnan Baiyao Group Co. Ltd., Class A | | | 5,460 | | | | 39,446 | |
| Yunnan Copper Co. Ltd., Class A | | | 8,100 | | | | 12,322 | |
| Yunnan Tin Co. Ltd., Class A | | | 14,600 | | | | 31,254 | |
| Zhefu Holding Group Co. Ltd., Class A | | | 16,400 | | | | 9,324 | |
| Zhejiang Century Huatong Group Co. Ltd., Class A* | | | 39,280 | | | | 41,043 | |
| Zhejiang China Commodities City Group Co. Ltd. Class A | | | 30,700 | | | | 36,050 | |
| Zhejiang Chint Electrics Co. Ltd., Class A | | | 13,100 | | | | 49,864 | |
| Zhejiang Crystal-Optech Co. Ltd., Class A | | | 12,400 | | | | 20,382 | |
| Zhejiang Dahua Technology Co. Ltd., Class A | | | 19,700 | | | | 53,562 | |
| Zhejiang Hailiang Co. Ltd., Class A | | | 19,700 | | | | 32,571 | |
| Zhejiang Hisoar Pharmaceutical Co. Ltd., Class A | | | 12,700 | | | | 15,018 | |
| Zhejiang Huace Film & Television Co. Ltd. | | | 30,500 | | | | 29,769 | |
| Zhejiang Jiahua Energy Chemical Industry Co. Ltd. Class A | | | 9,000 | | | | 11,671 | |
| Zhejiang JIULI Hi-tech Metals Co. Ltd. | | | 4,400 | | | | 10,315 | |
| Zhejiang Juhua Co. Ltd., Class A* | | | 7,900 | | | | 14,986 | |
| Zhejiang Longsheng Group Co. Ltd., Class A | | | 19,300 | | | | 24,842 | |
| Zhejiang Medicine Co. Ltd., Class A | | | 10,400 | | | | 15,677 | |
| Zhejiang NHU Co. Ltd., Class A | | | 12,240 | | | | 25,949 | |
| Zhejiang Orient Financial Holdings Group Co. Ltd., Class A | | | 17,420 | | | | 9,185 | |
| Zhejiang Orient Gene Biotech Co. Ltd., Class A | | | 2,365 | | | | 12,281 | |
| Zhejiang Runtu Co. Ltd. | | | 19,400 | | | | 17,813 | |
| Zhejiang Semir Garment Co. Ltd., Class A | | | 21,700 | | | | 18,581 | |
The accompanying notes are an integral part of these financial statements.
SA Emerging Markets Value Fund
PORTFOLIO OF INVESTMENTS — AS OF JUNE 30, 2023 (Continued)
| | | SHARES | | | VALUE† | |
| COMMON STOCKS (Continued) | | | | | | | | |
| China (Continued) | | | | | | | | |
| Zhejiang Wanfeng Auto Wheel Co. Ltd., Class A | | | 24,800 | | | $ | 23,660 | |
| Zhejiang Wanliyang Co. Ltd., Class A* | | | 11,400 | | | | 14,046 | |
| Zhejiang Xinan Chemical Industrial Group Co. Ltd., Class A | | | 14,980 | | | | 22,540 | |
| Zhengzhou Coal Mining Machinery Group Co. Ltd., H Shares | | | 21,400 | | | | 18,653 | |
| Zhongjin Gold Corp. Ltd., Class A | | | 32,000 | | | | 45,506 | |
| Zhongshan Broad Ocean Motor Co. Ltd., Class A | | | 22,200 | | | | 17,420 | |
| Zhongsheng Group Holdings Ltd. | | | 4,000 | | | | 15,288 | |
| Zhuhai Huafa Properties Co. Ltd., Class A | | | 11,600 | | | | 15,730 | |
| Zhuzhou CRRC Times Electric Co. Ltd., Class H | | | 13,500 | | | | 50,306 | |
| Zhuzhou Kibing Group Co. Ltd., Class A* | | | 10,500 | | | | 12,460 | |
| Zoomlion Heavy Industry Science & Technology Co. Ltd., H Shares* | | | 85,800 | | | | 44,345 | |
| | | | | | | | 52,607,893 | |
| | | | | | | | | |
| Colombia — 0.1% | | | | | | | | |
| Bancolombia SA | | | 5,606 | | | | 41,657 | |
| Bancolombia SA, ADR | | | 1,030 | | | | 27,480 | |
| CEMEX Latam Holdings SA*<> | | | 13,000 | | | | 10,570 | |
| Corp. Financiera Colombiana SA | | | 2,308 | | | | 8,216 | |
| Grupo Argos SA | | | 22,537 | | | | 52,132 | |
| Grupo de Inversiones Suramericana SA | | | 1,288 | | | | 11,115 | |
| | | | | | | | 151,170 | |
| | | | | | | | | |
| Czech Republic — 0.1% | | | | | | | | |
| CEZ A/S | | | 959 | | | | 39,618 | |
| Komercni Banka, A/S | | | 5,768 | | | | 175,934 | |
| Moneta Money Bank AS ± | | | 17,580 | | | | 64,395 | |
| | | | | | | | 279,947 | |
| | | | | | | | | |
| Greece — 0.5% | | | | | | | | |
| Alpha Services & Holdings SA* | | | 127,150 | | | | 208,119 | |
| Bank of Greece | | | 859 | | | | 15,747 | |
| Eurobank Ergasias Services & Holdings SA Class A* | | | 168,065 | | | | 276,739 | |
| Fourlis Holdings SA | | | 3,046 | | | | 15,489 | |
| Helleniq Energy Holdings SA | | | 5,260 | | | | 44,942 | |
| Motor Oil Hellas Corinth Refineries SA | | | 4,222 | | | | 106,884 | |
| Mytilineos SA | | | 743 | | | | 26,220 | |
| National Bank of Greece SA* | | | 30,271 | | | | 196,671 | |
| Piraeus Financial Holdings SA* | | | 10,411 | | | | 34,150 | |
| | | | | | | | 924,961 | |
| | | | | | | | | |
| Hong Kong — 0.2% | | | | | | | | |
| AAG Energy Holdings Ltd.*±<> | | | 64,000 | | | | 14,946 | |
| Alibaba Pictures Group Ltd.*@ | | | 910,000 | | | | 47,614 | |
| BOC Aviation Ltd. ± | | | 7,200 | | | | 58,208 | |
| China Zhongwang Holdings Ltd.@*§ | | | 154,000 | | | | — | |
| Comba Telecom Systems Holdings Ltd. | | | 88,000 | | | | 16,172 | |
| CTEG @*§ | | | 98,000 | | | | — | |
| Jinmao Property Services Co. Ltd. | | | 6,646 | | | | 2,756 | |
| Lumena New Materials*§ | | | 5,599 | | | | — | |
| Orient Overseas International Ltd. | | | 7,000 | | | | 93,887 | |
| Vnet Group, Inc., ADR*@ | | | 9,629 | | | | 27,924 | |
| Yuexiu Property Co. Ltd. | | | 135,006 | | | | 156,956 | |
| Yuexiu Real Estate Investment Trust @ | | | 8,369 | | | | 1,784 | |
| | | | | | | | 420,247 | |
| | | | | | | | | |
| Hungary — 0.2% | | | | | | | | |
| MOL Hungarian Oil & Gas PLC | | | 44,543 | | | | 389,860 | |
| | | | | | | | | |
| India — 17.8% | | | | | | | | |
| ACC Ltd.* | | | 6,555 | | | | 145,025 | |
| Adani Transmission Ltd.* | | | 664 | | | | 6,215 | |
| Aditya Birla Capital Ltd.* | | | 44,000 | | | | 105,071 | |
| Advanced Enzyme Technologies Ltd. | | | 3,035 | | | | 10,377 | |
| Ahluwalia Contracts India Ltd. | | | 1,765 | | | | 13,081 | |
| Alembic Pharmaceuticals Ltd. | | | 5,197 | | | | 40,284 | |
| Allcargo Logistics Ltd. | | | 4,985 | | | | 17,303 | |
| Allcargo Terminals Ltd.*<> | | | 4,985 | | | | 3,730 | |
| Amara Raja Batteries Ltd. | | | 8,020 | | | | 66,385 | |
| Ambuja Cements Ltd.* | | | 36,667 | | | | 190,674 | |
| Apar Industries Ltd. | | | 1,462 | | | | 62,018 | |
| Apollo Tyres Ltd.* | | | 31,532 | | | | 156,053 | |
| Arvind Ltd.* | | | 13,452 | | | | 21,809 | |
| Aster DM Healthcare Ltd.*± | | | 9,764 | | | | 33,385 | |
| Aurobindo Pharma Ltd. | | | 25,561 | | | | 226,520 | |
| Avanti Feeds Ltd. | | | 2,210 | | | | 10,547 | |
| Axis Bank Ltd. | | | 133,355 | | | | 1,602,967 | |
| Axis Bank Ltd., GDR | | | 12,180 | | | | 727,146 | |
| Bajaj Consumer Care Ltd. | | | 10,520 | | | | 24,750 | |
| Bajaj Holdings & Investment Ltd. | | | 2,428 | | | | 207,177 | |
| Balrampur Chini Mills Ltd. | | | 14,783 | | | | 69,332 | |
| Bandhan Bank Ltd.*± | | | 42,966 | | | | 126,903 | |
| Bank of Baroda | | | 74,524 | | | | 172,692 | |
| Bank of India | | | 26,524 | | | | 23,813 | |
| Bharat Electronics Ltd. | | | 265,086 | | | | 404,724 | |
| Bharat Heavy Electricals Ltd. | | | 96,730 | | | | 103,290 | |
| Birla Corp. Ltd. | | | 3,237 | | | | 48,928 | |
| Birlasoft Ltd. | | | 1,959 | | | | 8,558 | |
| Bombay Burmah Trading Co. | | | 684 | | | | 8,446 | |
| Camlin Fine Sciences Ltd.* | | | 4,352 | | | | 8,652 | |
| Can Fin Homes Ltd. | | | 2,104 | | | | 19,979 | |
| Canara Bank | | | 25,786 | | | | 94,926 | |
| Ceat Ltd. | | | 3,536 | | | | 89,525 | |
| Central Bank of India Ltd.* | | | 45,284 | | | | 16,008 | |
| Century Textiles & Industries Ltd. | | | 3,788 | | | | 39,768 | |
| Chambal Fertilizers and Chemicals Ltd. | | | 14,403 | | | | 47,913 | |
| Cholamandalam Financial Holdings Ltd. | | | 8,070 | | | | 88,539 | |
| CIE Automotive India Ltd. | | | 6,907 | | | | 43,318 | |
| Cipla Ltd. | | | 32,099 | | | | 396,169 | |
| City Union Bank Ltd. | | | 30,829 | | | | 47,745 | |
| Cochin Shipyard Ltd. ± | | | 3,997 | | | | 27,535 | |
| Container Corp. Of India Ltd. | | | 7,508 | | | | 60,486 | |
| Cosmo First Ltd.* | | | 1,201 | | | | 10,320 | |
| CSB Bank Ltd.* | | | 3,753 | | | | 12,947 | |
| Cyient Ltd. | | | 6,750 | | | | 123,668 | |
The accompanying notes are an integral part of these financial statements.
SA Emerging Markets Value Fund
PORTFOLIO OF INVESTMENTS — AS OF JUNE 30, 2023 (Continued)
| | | SHARES | | | VALUE† | |
| COMMON STOCKS (Continued) | | | | | | | | |
| India (Continued) | | | | | | | | |
| Dalmia Bharat Ltd. | | | 5,315 | | | $ | 140,202 | |
| DCB Bank Ltd. | | | 19,962 | | | | 29,881 | |
| DCM Shriram Ltd. | | | 2,904 | | | | 31,682 | |
| Deepak Fertilisers & Petrochemicals Corp. Ltd. | | | 4,535 | | | | 31,151 | |
| Dhampur Sugar Mills Ltd. | | | 2,664 | | | | 8,758 | |
| DLF Ltd. | | | 37,826 | | | | 226,095 | |
| eClerx Services Ltd. | | | 1,477 | | | | 29,437 | |
| EID Parry India Ltd. | | | 7,288 | | | | 41,110 | |
| Electrosteel Castings Ltd. | | | 23,821 | | | | 17,350 | |
| Engineers India Ltd. | | | 18,093 | | | | 25,363 | |
| EPL Ltd. | | | 5,342 | | | | 13,955 | |
| Equitas Small Finance Bank Ltd.*± | | | 16,074 | | | | 17,634 | |
| Exide Industries Ltd.* | | | 26,178 | | | | 75,436 | |
| FDC Ltd.* | | | 3,013 | | | | 11,422 | |
| Federal Bank Ltd. | | | 161,831 | | | | 249,050 | |
| Finolex Cables Ltd. | | | 3,726 | | | | 39,151 | |
| Finolex Industries Ltd. | | | 15,431 | | | | 32,917 | |
| Firstsource Solutions Ltd. | | | 20,730 | | | | 32,458 | |
| Fortis Healthcare Ltd.* | | | 26,126 | | | | 100,477 | |
| GAIL India Ltd. | | | 260,433 | | | | 333,493 | |
| Gateway Distriparks Ltd. | | | 25,136 | | | | 21,908 | |
| General Insurance Corp. of India*± | | | 7,543 | | | | 16,780 | |
| GHCL Ltd. | | | 5,527 | | | | 34,744 | |
| GHCL Textiles Ltd.* | | | 5,527 | | | | 4,982 | |
| Glenmark Pharmaceuticals Ltd. | | | 12,966 | | | | 107,049 | |
| Godawari Power and Ispat Ltd. | | | 2,402 | | | | 15,489 | |
| Godfrey Phillips India Ltd. | | | 794 | | | | 16,384 | |
| Godrej Industries Ltd.* | | | 1,769 | | | | 11,107 | |
| Granules India Ltd. | | | 16,905 | | | | 61,254 | |
| Grasim Industries Ltd. | | | 17,963 | | | | 379,640 | |
| Great Eastern Shipping Co. Ltd. (The) | | | 8,516 | | | | 76,610 | |
| Gujarat Alkalies & Chemicals Ltd. | | | 2,551 | | | | 21,060 | |
| Gujarat Ambuja Exports Ltd. | | | 4,383 | | | | 12,716 | |
| Gujarat Fluorochemicals Ltd. | | | 285 | | | | 10,176 | |
| Gujarat Mineral Development Corp. Ltd. | | | 5,595 | | | | 11,284 | |
| Gujarat Narmada Valley Fertilizers & Chemicals Ltd. | | | 8,633 | | | | 63,009 | |
| Gujarat Pipavav Port Ltd. | | | 19,498 | | | | 29,222 | |
| Gujarat State Fertilizers & Chemicals Ltd. | | | 11,602 | | | | 23,180 | |
| Gujarat State Petronet Ltd. | | | 23,082 | | | | 80,189 | |
| HDFC Bank Ltd. | | | 6,979 | | | | 144,686 | |
| HEG Ltd. | | | 1,254 | | | | 24,916 | |
| Hero MotoCorp Ltd. | | | 9,748 | | | | 345,188 | |
| HIL Ltd. | | | 469 | | | | 17,768 | |
| Himadri Speciality Chemical Ltd. | | | 10,592 | | | | 17,140 | |
| Hindalco Industries Ltd. | | | 162,157 | | | | 831,972 | |
| Hinduja Global Solutions Ltd. | | | 1,090 | | | | 14,389 | |
| Hindustan Aeronautics Ltd. | | | 2,011 | | | | 92,710 | |
| Housing Development Finance Corp. Ltd. | | | 54,403 | | | | 1,870,404 | |
| ICICI Bank Ltd., ADR | | | 80,109 | | | | 1,848,916 | |
| IDFC First Bank Ltd.* | | | 140,953 | | | | 136,767 | |
| IDFC Ltd. | | | 76,058 | | | | 95,031 | |
| IIFL Finance Ltd. | | | 5,565 | | | | 34,121 | |
| IIFL Securities Ltd. | | | 25,376 | | | | 18,915 | |
| India Cements Ltd. (The) | | | 14,192 | | | | 36,693 | |
| India Glycols Ltd. | | | 934 | | | | 6,979 | |
| Indiabulls Housing Finance Ltd.* | | | 31,451 | | | | 47,271 | |
| Indian Bank | | | 12,211 | | | | 43,583 | |
| Indian Overseas Bank* | | | 76,991 | | | | 22,899 | |
| Indian Railway Finance Corp. Ltd. ± | | | 47,733 | | | | 18,997 | |
| Indus Towers Ltd.* | | | 55,203 | | | | 110,290 | |
| IndusInd Bank Ltd. | | | 28,574 | | | | 479,448 | |
| Infibeam Avenues Ltd.* | | | 77,058 | | | | 14,747 | |
| Info Edge India Ltd. | | | 2,802 | | | | 153,017 | |
| IRCON International Ltd. ± | | | 18,858 | | | | 19,183 | |
| ISGEC Heavy Engineering Ltd. | | | 1,061 | | | | 8,976 | |
| Jindal Poly Films Ltd. | | | 769 | | | | 6,167 | |
| Jindal Saw Ltd. | | | 14,261 | | | | 44,416 | |
| Jindal Stainless Ltd. | | | 39,168 | | | | 158,274 | |
| Jindal Steel & Power Ltd. | | | 46,366 | | | | 328,375 | |
| JK Lakshmi Cement Ltd. | | | 4,751 | | | | 41,553 | |
| JK Paper Ltd. | | | 10,798 | | | | 42,173 | |
| JK Tyre & Industries Ltd. | | | 10,161 | | | | 29,311 | |
| JM Financial Ltd. | | | 40,467 | | | | 36,133 | |
| JSW Energy Ltd. | | | 37,575 | | | | 124,859 | |
| JSW Steel Ltd. | | | 80,442 | | | | 767,931 | |
| Jubilant Ingrevia Ltd. | | | 2,745 | | | | 14,281 | |
| Jubilant Pharmova Ltd. | | | 9,690 | | | | 47,005 | |
| Kalpataru Projects International Ltd. | | | 5,415 | | | | 35,311 | |
| Karnataka Bank Ltd. (The) | | | 29,326 | | | | 67,491 | |
| Karur Vysya Bank Ltd. (The) | | | 36,209 | | | | 54,974 | |
| Kaveri Seed Co. Ltd. | | | 2,043 | | | | 12,701 | |
| KEC International Ltd.* | | | 9,194 | | | | 61,668 | |
| KNR Constructions Ltd. | | | 3,786 | | | | 11,168 | |
| KRBL Ltd. | | | 6,141 | | | | 25,511 | |
| L&T Finance Holdings Ltd. | | | 78,972 | | | | 123,026 | |
| Larsen & Toubro Ltd. | | | 15,920 | | | | 480,300 | |
| Larsen & Toubro Ltd., GDR | | | 33,937 | | | | 1,021,504 | |
| LG Balakrishnan & Bros Ltd. | | | 1,438 | | | | 20,141 | |
| LIC Housing Finance Ltd. | | | 24,147 | | | | 115,516 | |
| LT Foods Ltd. | | | 16,533 | | | | 26,491 | |
| Lupin Ltd. | | | 15,489 | | | | 169,737 | |
| Maharashtra Seamless Ltd. | | | 3,116 | | | | 17,960 | |
| Mahindra & Mahindra Financial Services Ltd. | | | 54,856 | | | | 224,676 | |
| Mahindra & Mahindra Ltd. | | | 63,982 | | | | 1,135,569 | |
| Mahindra & Mahindra Ltd., GDR | | | 4,830 | | | | 85,491 | |
| Manappuram Finance Ltd. | | | 34,315 | | | | 55,319 | |
| Meghmani Organics Ltd. | | | 7,232 | | | | 7,894 | |
| MOIL Ltd. | | | 5,661 | | | | 11,189 | |
| Motilal Oswal Financial Services Ltd. | | | 1,768 | | | | 15,692 | |
| MRF Ltd. | | | 136 | | | | 167,442 | |
| Muthoot Finance Ltd. | | | 6,474 | | | | 97,935 | |
| Natco Pharma Ltd. | | | 1,319 | | | | 11,094 | |
| National Aluminium Co. Ltd. | | | 39,968 | | | | 40,048 | |
| Nava Ltd. | | | 6,116 | | | | 22,891 | |
| NCC Ltd. | | | 30,074 | | | | 44,651 | |
| NESCO Ltd. | | | 965 | | | | 7,399 | |
| NIIT Learning Systems Ltd.*<> | | | 2,427 | | | | 9,267 | |
The accompanying notes are an integral part of these financial statements.
SA Emerging Markets Value Fund
PORTFOLIO OF INVESTMENTS — AS OF JUNE 30, 2023 (Continued)
| | | SHARES | | | VALUE† | |
| COMMON STOCKS (Continued) | | | | | | | | |
| India (Continued) | | | | | | | | |
| NIIT Ltd.* | | | 2,427 | | | $ | 2,521 | |
| Nilkamal Ltd. | | | 322 | | | | 9,609 | |
| NMDC Ltd. | | | 47,585 | | | | 60,760 | |
| Nmdc Steel Ltd.* | | | 47,585 | | | | 25,290 | |
| NOCIL Ltd. | | | 7,374 | | | | 19,937 | |
| Oberoi Realty Ltd. | | | 9,011 | | | | 108,194 | |
| Orient Cement Ltd. | | | 6,133 | | | | 9,943 | |
| PCBL Ltd. | | | 11,386 | | | | 22,547 | |
| Petronet LNG Ltd. | | | 67,706 | | | | 184,005 | |
| Piramal Enterprises Ltd. | | | 6,545 | | | | 75,230 | |
| Piramal Pharma Ltd.* | | | 26,180 | | | | 29,487 | |
| PNB Housing Finance Ltd.*± | | | 6,492 | | | | 44,728 | |
| PNC Infratech Ltd. | | | 4,201 | | | | 16,748 | |
| Polyplex Corp. Ltd. | | | 1,545 | | | | 24,739 | |
| Power Finance Corp. Ltd. | | | 97,509 | | | | 256,205 | |
| Prestige Estates Projects Ltd. | | | 14,610 | | | | 102,073 | |
| PTC India Ltd. | | | 17,788 | | | | 25,022 | |
| Punjab National Bank | | | 115,447 | | | | 72,685 | |
| Quess Corp. Ltd. ± | | | 2,433 | | | | 13,316 | |
| Rain Industries Ltd. | | | 17,328 | | | | 34,482 | |
| Rajesh Exports Ltd. | | | 7,411 | | | | 49,415 | |
| Rallis India Ltd. | | | 3,389 | | | | 8,147 | |
| Ramco Cements Ltd. (The) | | | 8,242 | | | | 92,862 | |
| Rashtriya Chemicals & Fertilizers Ltd. | | | 16,695 | | | | 22,213 | |
| Raymond Ltd. | | | 3,276 | | | | 67,556 | |
| RBL Bank Ltd.*± | | | 23,414 | | | | 51,773 | |
| REC Ltd. | | | 124,810 | | | | 250,803 | |
| Redington Ltd. | | | 57,900 | | | | 131,276 | |
| Reliance Industries Ltd. | | | 206,554 | | | | 6,428,922 | |
| Reliance Power Ltd.* | | | 223,846 | | | | 38,610 | |
| RITES Ltd. | | | 2,755 | | | | 12,540 | |
| Samvardhana Motherson International Ltd. | | | 65,061 | | | | 67,808 | |
| Shipping Corp. of India Ltd. Spin-off Shares*§ | | | 14,166 | | | | 3,503 | |
| Shipping Corp. of India Ltd. | | | 14,166 | | | | 17,397 | |
| Shriram Finance Ltd. | | | 20,316 | | | | 430,410 | |
| Sobha Ltd. | | | 6,105 | | | | 40,000 | |
| South Indian Bank Ltd. (The)* | | | 66,795 | | | | 15,714 | |
| Star Cement Ltd.* | | | 7,280 | | | | 12,513 | |
| State Bank of India | | | 69,305 | | | | 483,527 | |
| State Bank of India, GDR | | | 8,728 | | | | 611,833 | |
| Steel Authority of India Ltd. | | | 89,762 | | | | 93,607 | |
| Strides Pharma Science Ltd.* | | | 5,470 | | | | 28,641 | |
| Sun Pharmaceutical Industries Ltd. | | | 37,178 | | | | 476,303 | |
| Sun TV Network Ltd. | | | 5,489 | | | | 29,263 | |
| Sundaram-Clayton Ltd. | | | 221 | | | | 12,621 | |
| Sunteck Realty Ltd.* | | | 5,951 | | | | 20,471 | |
| Surya Roshni Ltd. | | | 773 | | | | 8,179 | |
| Tata Chemicals Ltd. | | | 12,988 | | | | 158,550 | |
| Tata Coffee Ltd. | | | 1,997 | | | | 6,025 | |
| Tata Consumer Products Ltd. | | | 9,028 | | | | 94,664 | |
| Tata Steel Ltd. | | | 430,140 | | | | 587,249 | |
| Tata Steel Ltd., GDR | | | 6,923 | | | | 92,422 | |
| Techno Electric & Engineering Co. Ltd. | | | 2,836 | | | | 12,532 | |
| Thirumalai Chemicals Ltd. | | | 4,154 | | | | 10,084 | |
| TransIndia Realty & Logistics Parks Ltd.*<> | | | 4,985 | | | | 1,475 | |
| Tube Investments of India Ltd. | | | 732 | | | | 28,378 | |
| TV18 Broadcast Ltd.* | | | 55,772 | | | | 25,358 | |
| Uflex Ltd. | | | 3,166 | | | | 15,979 | |
| Union Bank of India Ltd.* | | | 36,541 | | | | 32,227 | |
| UPL Ltd. | | | 40,601 | | | | 340,155 | |
| Usha Martin Ltd. | | | 14,837 | | | | 48,742 | |
| UTI Asset Management Co. Ltd. | | | 947 | | | | 9,062 | |
| VA Tech Wabag Ltd.* | | | 2,558 | | | | 15,223 | |
| Vardhman Textiles Ltd.* | | | 8,165 | | | | 36,438 | |
| Varroc Engineering Ltd.*± | | | 3,632 | | | | 14,878 | |
| Vedanta Ltd. | | | 58,464 | | | | 198,084 | |
| Venky's India Ltd. | | | 673 | | | | 13,872 | |
| Voltamp Transformers Ltd. | | | 408 | | | | 20,191 | |
| Welspun Corp. Ltd. | | | 11,246 | | | | 35,779 | |
| Welspun India Ltd. | | | 30,613 | | | | 34,443 | |
| West Coast Paper Mills Ltd. | | | 3,247 | | | | 19,830 | |
| Wipro Ltd. | | | 42,908 | | | | 203,488 | |
| Wipro Ltd., ADR @ | | | 54,311 | | | | 256,348 | |
| Wockhardt Ltd.* | | | 5,344 | | | | 15,289 | |
| Yes Bank Ltd.* | | | 193,770 | | | | 38,501 | |
| Zee Entertainment Enterprises Ltd. | | | 70,032 | | | | 151,356 | |
| Zensar Technologies Ltd. | | | 5,610 | | | | 26,403 | |
| Zydus Lifesciences Ltd. | | | 13,699 | | | | 97,253 | |
| Zydus Wellness Ltd. | | | 1,266 | | | | 22,861 | |
| | | | | | | | 33,830,613 | |
| | | | | | | | | |
| Indonesia — 2.0% | | | | | | | | |
| Ace Hardware Indonesia Tbk PT* | | | 625,900 | | | | 28,180 | |
| Adaro Energy Indonesia Tbk PT | | | 1,752,200 | | | | 260,624 | |
| Aneka Tambang Tbk | | | 600,600 | | | | 78,117 | |
| Astra Agro Lestari Tbk PT | | | 61,744 | | | | 30,785 | |
| Astra International Tbk PT | | | 1,432,200 | | | | 647,201 | |
| Astra Otoparts Tbk PT | | | 19,600 | | | | 3,242 | |
| Bank Mandiri Persero Tbk PT | | | 1,357,000 | | | | 470,662 | |
| Bank Maybank Indonesia Tbk PT | | | 568,800 | | | | 9,712 | |
| Bank Negara Indonesia Persero Tbk PT | | | 458,466 | | | | 279,804 | |
| Bank OCBC Nisp Tbk PT | | | 223,000 | | | | 17,626 | |
| Bank Pan Indonesia Tbk PT | | | 399,700 | | | | 28,926 | |
| Bank Pembangunan Daerah Jawa Barat Dan Banten Tbk PT | | | 173,300 | | | | 13,640 | |
| Bank Pembangunan Daerah Jawa Timur Tbk PT | | | 403,000 | | | | 17,338 | |
| Bank Tabungan Negara Persero Tbk PT | | | 537,509 | | | | 47,324 | |
| BISI International Tbk PT | | | 94,000 | | | | 10,345 | |
| Buana Lintas Lautan Tbk PT* | | | 1,041,300 | | | | 6,876 | |
| Bukit Asam Tbk PT | | | 339,600 | | | | 60,706 | |
| Bumi Serpong Damai Tbk PT* | | | 435,700 | | | | 31,822 | |
| Ciputra Development Tbk PT | | | 924,577 | | | | 65,369 | |
| Elang Mahkota Teknologi Tbk PT | | | 999,500 | | | | 47,333 | |
| Erajaya Swasembada Tbk PT | | | 1,042,500 | | | | 33,099 | |
| Gudang Garam Tbk PT | | | 38,200 | | | | 70,387 | |
| Hanson International Tbk PT*§ | | | 5,335,700 | | | | — | |
| Harum Energy Tbk PT | | | 170,700 | | | | 16,168 | |
| Indah Kiat Pulp & Paper Tbk PT | | | 294,700 | | | | 167,080 | |
| Indika Energy Tbk PT | | | 180,500 | | | | 22,995 | |
The accompanying notes are an integral part of these financial statements.
SA Emerging Markets Value Fund
PORTFOLIO OF INVESTMENTS — AS OF JUNE 30, 2023 (Continued)
| | | SHARES | | | VALUE† | |
| COMMON STOCKS (Continued) | | | | | | | | |
| Indonesia (Continued) | | | | | | | | |
| Indo Tambangraya Megah Tbk PT | | | 52,800 | | | $ | 84,962 | |
| Indocement Tunggal Prakarsa Tbk PT | | | 78,800 | | | | 52,165 | |
| Indofood Sukses Makmur Tbk PT | | | 407,500 | | | | 199,775 | |
| Japfa Comfeed Indonesia Tbk PT | | | 567,600 | | | | 50,731 | |
| Medco Energi Internasional Tbk PT | | | 1,095,352 | | | | 65,023 | |
| Media Nusantara Citra Tbk PT* | | | 629,000 | | | | 27,270 | |
| Pabrik Kertas Tjiwi Kimia Tbk PT | | | 133,200 | | | | 54,861 | |
| Pakuwon Jati Tbk PT | | | 433,100 | | | | 14,097 | |
| Panin Financial Tbk PT | | | 1,207,600 | | | | 22,875 | |
| Perusahaan Perkebunan London Sumatra Indonesia Tbk PT | | | 296,500 | | | | 19,777 | |
| Samudera Indonesia Tbk PT | | | 670,500 | | | | 17,084 | |
| Sawit Sumbermas Sarana Tbk PT | | | 240,200 | | | | 19,386 | |
| Semen Indonesia Persero Tbk PT | | | 278,124 | | | | 112,697 | |
| Sri Rejeki Isman Tbk PT*§ | | | 996,900 | | | | — | |
| Summarecon Agung Tbk PT | | | 932,100 | | | | 41,033 | |
| Surya Citra Media Tbk PT | | | 1,943,100 | | | | 20,996 | |
| Surya Esa Perkasa Tbk PT | | | 324,100 | | | | 12,538 | |
| Surya Semesta Internusa Tbk PT* | | | 393,100 | | | | 12,428 | |
| Triputra Agro Persada PT | | | 418,500 | | | | 15,353 | |
| Tunas Baru Lampung Tbk PT | | | 363,085 | | | | 16,710 | |
| United Tractors Tbk PT | | | 182,800 | | | | 283,787 | |
| Vale Indonesia Tbk PT | | | 184,400 | | | | 77,487 | |
| XL Axiata Tbk PT | | | 522,966 | | | | 68,194 | |
| | | | | | | | 3,754,590 | |
| | | | | | | | | |
| Korea — 12.7% | | | | | | | | |
| Amorepacific Corp. | | | 139 | | | | 10,296 | |
| AMOREPACIFIC Group | | | 1,396 | | | | 27,917 | |
| Asia Paper Manufacturing Co. Ltd. | | | 567 | | | | 14,760 | |
| Binggrae Co. Ltd. | | | 417 | | | | 15,048 | |
| BNK Financial Group, Inc. | | | 20,319 | | | | 106,865 | |
| Boryung | | | 1,586 | | | | 9,882 | |
| CJ CheilJedang Corp. | | | 860 | | | | 175,896 | |
| CJ Corp. | | | 1,381 | | | | 71,584 | |
| CJ ENM Co. Ltd.* | | | 853 | | | | 40,590 | |
| CJ Logistics Corp. | | | 649 | | | | 37,630 | |
| Com2uSCorp | | | 128 | | | | 5,887 | |
| Cuckoo Homesys Co. Ltd. | | | 408 | | | | 7,277 | |
| Daehan Flour Mill Co. Ltd. | | | 157 | | | | 16,002 | |
| Daesang Corp. | | | 2,426 | | | | 31,613 | |
| Daewoo Engineering & Construction Co. Ltd.* | | | 18,960 | | | | 58,492 | |
| Daewoong Co. Ltd. | | | 1,602 | | | | 15,222 | |
| Daihan Pharmaceutical Co. Ltd. | | | 296 | | | | 6,223 | |
| Daishin Securities Co. Ltd. | | | 3,671 | | | | 37,611 | |
| Daou Data Corp. | | | 1,785 | | | | 18,288 | |
| Daou Technology, Inc. | | | 2,149 | | | | 28,623 | |
| DB Insurance Co. Ltd. | | | 2,398 | | | | 135,765 | |
| DGB Financial Group, Inc. | | | 18,216 | | | | 100,505 | |
| DI Dong Il Corp. | | | 1,505 | | | | 24,100 | |
| DL E&C Co. Ltd. | | | 3,846 | | | | 101,429 | |
| DL Holdings Co. Ltd. | | | 1,534 | | | | 48,081 | |
| Dong-A Socio Holdings Co., Ltd. | | | 150 | | | | 9,665 | |
| Dong-A ST Co. Ltd. | | | 237 | | | | 10,306 | |
| Dongkuk CM Co. Ltd.* | | | 2,159 | | | | 18,073 | |
| Dongkuk Holdings Co. Ltd. | | | 1,150 | | | | 15,204 | |
| Dongkuk Steel Mill Co. Ltd.* | | | 3,583 | | | | 29,422 | |
| Dongwha Pharm Co. Ltd. | | | 736 | | | | 5,804 | |
| Dongwon F&B Co. Ltd. | | | 640 | | | | 13,551 | |
| Dongwon Industries Co. Ltd. | | | 715 | | | | 21,081 | |
| Doosan Bobcat, Inc. | | | 4,635 | | | | 206,485 | |
| Doosan Co. Ltd. | | | 376 | | | | 25,853 | |
| DoubleUGames Co. Ltd. | | | 504 | | | | 16,122 | |
| E-MART, Inc. | | | 1,350 | | | | 78,788 | |
| Easy Holdings Co. Ltd. | | | 5,023 | | | | 12,141 | |
| ENF Technology Co. Ltd. | | | 555 | | | | 11,246 | |
| Eugene Corp. | | | 5,295 | | | | 14,025 | |
| Eugene Investment & Securities Co. Ltd. | | | 8,694 | | | | 26,063 | |
| Fila Holdings Corp. | | | 1,651 | | | | 50,120 | |
| Green Cross Corp. | | | 247 | | | | 21,520 | |
| Green Cross Holdings Corp. | | | 1,234 | | | | 13,345 | |
| GS Engineering & Construction Corp. | | | 4,411 | | | | 62,400 | |
| GS Holdings Corp. | | | 4,562 | | | | 126,890 | |
| GS Retail Co. Ltd. | | | 2,919 | | | | 50,731 | |
| Hana Financial Group, Inc. | | | 22,264 | | | | 662,352 | |
| Handsome Co. Ltd. | | | 1,312 | | | | 23,150 | |
| Hanil Holdings Co. Ltd. | | | 1,021 | | | | 9,415 | |
| Hankook Tire & Technology Co. Ltd. | | | 5,220 | | | | 136,279 | |
| Hansol Paper Co. Ltd. | | | 2,232 | | | | 18,938 | |
| Hansol Technics Co. Ltd. | | | 1,664 | | | | 10,216 | |
| Hanwha Corp. | | | 3,458 | | | | 78,600 | |
| Hanwha Galleria Corp.* | | | 4,602 | | | | 5,298 | |
| Hanwha Investment & Securities Co. Ltd.* | | | 13,449 | | | | 27,099 | |
| Hanwha Life Insurance Co. Ltd.* | | | 20,246 | | | | 39,642 | |
| Hanwha Solutions Corp.* | | | 4,080 | | | | 130,979 | |
| Harim Holdings Co. Ltd. | | | 2,243 | | | | 13,227 | |
| HD Hyundai Co. Ltd. | | | 3,291 | | | | 149,608 | |
| HD Hyundai Construction Equipment Co. Ltd. | | | 1,558 | | | | 101,451 | |
| HD Hyundai Energy Solutions Co. Ltd. | | | 362 | | | | 10,618 | |
| HD Korea Shipbuilding & Offshore Engineering Co. Ltd.* | | | 2,470 | | | | 218,385 | |
| HDC Holdings Co. Ltd. | | | 2,781 | | | | 13,571 | |
| HDC Hyundai Development Co.-Engineering & Construction | | | 2,554 | | | | 22,077 | |
| HL Mando Co. Ltd. | | | 2,177 | | | | 89,053 | |
| HMM Co. Ltd. | | | 20,919 | | | | 299,262 | |
| Hy-Lok Corp. | | | 918 | | | | 18,358 | |
| Hyosung Corp. | | | 657 | | | | 31,512 | |
| Hyosung Heavy Industries Corp.* | | | 306 | | | | 26,683 | |
| Hyundai Department Store Co. Ltd. | | | 867 | | | | 32,439 | |
| Hyundai Engineering & Construction Co. Ltd. | | | 4,831 | | | | 139,689 | |
| Hyundai Futurenet Co. Ltd. | | | 3,997 | | | | 8,812 | |
| Hyundai GF Holdings | | | 3,524 | | | | 9,735 | |
| Hyundai Glovis Co. Ltd. | | | 1,408 | | | | 211,256 | |
| Hyundai Green Food* | | | 1,871 | | | | 18,119 | |
| Hyundai Home Shopping Network Corp. | | | 716 | | | | 24,887 | |
The accompanying notes are an integral part of these financial statements.
SA Emerging Markets Value Fund
PORTFOLIO OF INVESTMENTS — AS OF JUNE 30, 2023 (Continued)
| | | SHARES | | | VALUE† | |
| COMMON STOCKS (Continued) | | | | | | | | |
| Korea (Continued) | | | | | | | | |
| Hyundai Marine & Fire Insurance Co. Ltd. | | | 4,572 | | | $ | 107,738 | |
| Hyundai Mobis Co. Ltd. | | | 3,389 | | | | 597,991 | |
| Hyundai Motor Co. | | | 8,495 | | | | 1,331,323 | |
| Hyundai Motor Securities Co. Ltd. | | | 1,658 | | | | 10,998 | |
| Hyundai Steel Co. | | | 5,647 | | | | 144,641 | |
| Hyundai Wia Corp. | | | 941 | | | | 47,848 | |
| Industrial Bank of Korea | | | 20,136 | | | | 158,013 | |
| Innocean Worldwide, Inc. | | | 407 | | | | 12,155 | |
| INTOPS Co. Ltd. | | | 1,491 | | | | 38,360 | |
| IS Dongseo Co. Ltd.* | | | 1,027 | | | | 26,033 | |
| JB Financial Group Co. Ltd. | | | 11,834 | | | | 76,070 | |
| KB Financial Group, Inc., ADR | | | 24,215 | | | | 881,426 | |
| KC Co. Ltd. | | | 887 | | | | 13,026 | |
| KC Tech Co. Ltd. | | | 463 | | | | 7,467 | |
| KCC Corp. | | | 293 | | | | 43,673 | |
| KCC Glass Corp. | | | 444 | | | | 14,978 | |
| KG Eco Technology Service Co. Ltd. | | | 1,719 | | | | 16,764 | |
| Kia Corp. | | | 21,952 | | | | 1,474,407 | |
| KISWIRE Ltd. | | | 1,165 | | | | 16,781 | |
| KIWOOM Securities Co. Ltd. | | | 1,398 | | | | 93,791 | |
| Kolon Industries, Inc. | | | 1,930 | | | | 73,163 | |
| Korea Asset In Trust Co. Ltd. | | | 5,452 | | | | 13,137 | |
| Korea Electric Terminal Co. Ltd. | | | 682 | | | | 31,418 | |
| Korea Investment Holdings Co. Ltd. | | | 2,704 | | | | 105,890 | |
| Korea Line Corp.* | | | 16,631 | | | | 25,559 | |
| Korea Petrochemical Ind Co. Ltd. | | | 144 | | | | 15,267 | |
| Korea Zinc Co. Ltd. | | | 330 | | | | 122,092 | |
| Korean Air Lines Co. Ltd. | | | 13,791 | | | | 254,856 | |
| Korean Reinsurance Co. | | | 10,794 | | | | 57,425 | |
| Kumho Petrochemical Co. Ltd. | | | 1,118 | | | | 112,593 | |
| Kwang Dong Pharmaceutical Co. Ltd. | | | 5,019 | | | | 25,216 | |
| LF Corp. | | | 1,623 | | | | 20,927 | |
| LG Corp. | | | 5,347 | | | | 357,102 | |
| LG Display Co. Ltd.* | | | 12,166 | | | | 145,514 | |
| LG Display Co. Ltd., ADR*@ | | | 22,467 | | | | 136,150 | |
| LG Electronics, Inc. | | | 10,373 | | | | 997,427 | |
| LG HelloVision Co. Ltd. | | | 4,225 | | | | 13,804 | |
| LG Uplus Corp. | | | 15,900 | | | | 129,478 | |
| Lotte Chemical Corp. | | | 1,267 | | | | 148,657 | |
| Lotte Chilsung Beverage Co. Ltd. | | | 156 | | | | 15,012 | |
| Lotte Corp. | | | 1,582 | | | | 30,016 | |
| LOTTE Fine Chemical Co. Ltd. | | | 1,517 | | | | 79,900 | |
| Lotte Shopping Co. Ltd. | | | 641 | | | | 33,372 | |
| Lotte Wellfood Co. Ltd. | | | 167 | | | | 12,852 | |
| LS Corp. | | | 1,155 | | | | 81,432 | |
| LX Hausys Ltd. | | | 728 | | | | 25,166 | |
| LX Holdings Corp. | | | 2,593 | | | | 15,586 | |
| LX International Corp. | | | 3,459 | | | | 94,636 | |
| Maeil Dairies Co. Ltd. | | | 341 | | | | 11,478 | |
| Meritz Financial Group, Inc.* | | | 4,221 | | | | 132,942 | |
| Mirae Asset Life Insurance Co. Ltd.* | | | 5,257 | | | | 14,981 | |
| Mirae Asset Securities Co. Ltd. | | | 23,824 | | | | 130,723 | |
| MK Electron Co. Ltd. | | | 1,843 | | | | 21,904 | |
| Namyang Dairy Products Co. Ltd. | | | 41 | | | | 16,647 | |
| Netmarble Corp.*± | | | 1,028 | | | | 38,307 | |
| Nexen Tire Corp. | | | 5,151 | | | | 32,290 | |
| NH Investment & Securities Co. Ltd. | | | 10,116 | | | | 73,318 | |
| NHN Corp.* | | | 2,376 | | | | 44,359 | |
| NICE Holdings Co. Ltd. | | | 708 | | | | 6,297 | |
| NongShim Co. Ltd. | | | 178 | | | | 53,765 | |
| OCI Co. Ltd.* | | | 450 | | | | 41,665 | |
| OCI Holdings Co. Ltd. | | | 995 | | | | 85,556 | |
| Orion Holdings Corp. | | | 2,572 | | | | 28,655 | |
| Ottogi Corp. | | | 93 | | | | 27,703 | |
| Pan Ocean Co. Ltd. | | | 22,750 | | | | 89,436 | |
| Partron Co. Ltd. | | | 1,897 | | | | 13,187 | |
| Poongsan Corp. | | | 1,950 | | | | 64,228 | |
| POSCO Holdings, Inc. | | | 1,386 | | | | 408,127 | |
| POSCO Holdings, Inc., ADR | | | 12,275 | | | | 907,736 | |
| Posco International Corp. | | | 4,654 | | | | 140,752 | |
| S-Oil Corp. | | | 3,390 | | | | 171,603 | |
| Samsung C&T Corp. | | | 3,893 | | | | 312,291 | |
| Samsung Card Co. Ltd. | | | 2,083 | | | | 46,872 | |
| Samsung Electronics Co. Ltd. | | | 9,536 | | | | 522,521 | |
| Samsung Electronics Co. Ltd., GDR | | | 1,132 | | | | 1,568,952 | |
| Samsung Fire & Marine Insurance Co. Ltd. | | | 2,717 | | | | 474,261 | |
| Samsung Life Insurance Co. Ltd. | | | 3,756 | | | | 191,841 | |
| Samsung SDS Co. Ltd. | | | 1,305 | | | | 121,720 | |
| Samsung Securities Co. Ltd. | | | 4,339 | | | | 118,547 | |
| Samyang Holdings Corp. | | | 409 | | | | 22,535 | |
| Sangsangin Co. Ltd.* | | | 375 | | | | 1,370 | |
| SD Biosensor, Inc. | | | 1,120 | | | | 10,395 | |
| SeAH Steel Holdings Corp. | | | 235 | | | | 37,007 | |
| Sebang Co. Ltd. | | | 1,306 | | | | 12,241 | |
| Sebang Global Battery Co. Ltd. | | | 697 | | | | 25,523 | |
| Seegene, Inc. | | | 2,156 | | | | 33,625 | |
| SGC Energy Co. Ltd. | | | 395 | | | | 7,824 | |
| Shinhan Financial Group Co. Ltd. | | | 23,813 | | | | 614,459 | |
| Shinhan Financial Group Co. Ltd., ADR | | | 5,343 | | | | 139,239 | |
| Shinsegae International, Inc. | | | 1,209 | | | | 15,626 | |
| Shinsegae, Inc. | | | 629 | | | | 85,019 | |
| Shinyoung Securities Co. Ltd. | | | 511 | | | | 21,601 | |
| SK Chemicals Co. Ltd. | | | 256 | | | | 13,639 | |
| SK Discovery Co. Ltd. | | | 1,247 | | | | 33,975 | |
| SK Gas Ltd. | | | 364 | | | | 35,332 | |
| SK Hynix, Inc. | | | 29,836 | | | | 2,608,513 | |
| SK Innovation Co. Ltd.* | | | 4,409 | | | | 530,358 | |
| SK Networks Co. Ltd. | | | 12,838 | | | | 49,495 | |
| SK Securities Co. Ltd. | | | 36,346 | | | | 18,702 | |
| SK, Inc. | | | 2,700 | | | | 304,702 | |
| SL Corp. | | | 1,820 | | | | 50,692 | |
| SNT Motiv Co. Ltd. | | | 1,086 | | | | 43,600 | |
| Songwon Industrial Co. Ltd. | | | 1,925 | | | | 29,584 | |
| Soulbrain Holdings Co. Ltd. | | | 523 | | | | 11,054 | |
| Sung Kwang Bend Co. Ltd. | | | 2,237 | | | | 25,449 | |
| Sungwoo Hitech Co. Ltd. | | | 3,959 | | | | 29,836 | |
| Sunjin Co. Ltd. | | | 941 | | | | 6,099 | |
| Taekwang Industrial Co. Ltd. | | | 36 | | | | 17,294 | |
| Taeyoung Engineering & Construction Co. Ltd. | | | 2,546 | | | | 7,787 | |
| TY Holdings Co. Ltd. | | | 2,455 | | | | 15,241 | |
The accompanying notes are an integral part of these financial statements.
SA Emerging Markets Value Fund
PORTFOLIO OF INVESTMENTS — AS OF JUNE 30, 2023 (Continued)
| | | SHARES | | | VALUE† | |
| COMMON STOCKS (Continued) | | | | | | | | |
| Korea (Continued) | | | | | | | | |
| TYM Corp. | | | 3,499 | | | $ | 20,341 | |
| Unid Co. Ltd. | | | 511 | | | | 26,100 | |
| Unidbtplus Co. Ltd* | | | 802 | | | | 4,766 | |
| Webzen, Inc. | | | 838 | | | | 8,802 | |
| Woori Financial Group, Inc. | | | 38,312 | | | | 342,806 | |
| Young Poong Corp. | | | 46 | | | | 19,969 | |
| Youngone Corp. | | | 2,083 | | | | 101,964 | |
| Youngone Holdings Co. Ltd. | | | 787 | | | | 46,169 | |
| Yuanta Securities Korea Co. Ltd. | | | 11,552 | | | | 23,496 | |
| | | | | | | | 24,217,154 | |
| | | | | | | | | |
| Malaysia — 1.6% | | | | | | | | |
| Aeon Co. M Bhd | | | 64,400 | | | | 18,075 | |
| Alliance Bank Malaysia Bhd | | | 93,200 | | | | 66,493 | |
| AMMB Holdings Bhd | | | 154,687 | | | | 119,971 | |
| Bank Islam Malaysia Bhd | | | 33,500 | | | | 13,996 | |
| Batu Kawan Bhd | | | 16,500 | | | | 73,388 | |
| Boustead Plantations Bhd | | | 55,720 | | | | 11,042 | |
| Bumi Armada Bhd* | | | 264,700 | | | | 26,654 | |
| CIMB Group Holdings Bhd | | | 502,873 | | | | 545,161 | |
| DRB-Hicom Bhd | | | 119,100 | | | | 34,193 | |
| Gamuda Bhd | | | 127,679 | | | | 120,362 | |
| Genting Bhd | | | 144,900 | | | | 126,040 | |
| Genting Malaysia Bhd | | | 182,600 | | | | 96,239 | |
| Genting Plantations Bhd | | | 7,100 | | | | 8,975 | |
| Hibiscus Petroleum Bhd | | | 140,200 | | | | 25,982 | |
| Hong Leong Financial Group Bhd | | | 17,621 | | | | 66,671 | |
| IJM Corp. Bhd | | | 250,560 | | | | 79,986 | |
| IOI Properties Group Bhd | | | 50,050 | | | | 11,474 | |
| Kossan Rubber Industries Bhd | | | 16,400 | | | | 4,533 | |
| Magnum Bhd | | | 86,961 | | | | 18,538 | |
| Mah Sing Group Bhd | | | 205,885 | | | | 27,128 | |
| Malayan Banking Bhd | | | 283,943 | | | | 524,998 | |
| Malaysia Building Society Bhd | | | 205,001 | | | | 28,549 | |
| Matrix Concepts Holdings Bhd | | | 64,200 | | | | 19,394 | |
| Mega First Corp. Bhd | | | 12,800 | | | | 8,419 | |
| MISC Bhd | | | 80,820 | | | | 123,979 | |
| MKH Bhd | | | 36,950 | | | | 9,737 | |
| Oriental Holdings Bhd | | | 25,760 | | | | 35,156 | |
| OSK Holdings Bhd | | | 74,455 | | | | 16,909 | |
| PPB Group Bhd | | | 37,500 | | | | 126,460 | |
| RHB Bank Bhd | | | 156,680 | | | | 182,276 | |
| Sarawak Oil Palms Bhd | | | 30,750 | | | | 16,141 | |
| Sime Darby Bhd | | | 293,600 | | | | 128,951 | |
| Sime Darby Property Bhd | | | 308,000 | | | | 30,684 | |
| SP Setia Bhd Group | | | 143,480 | | | | 16,753 | |
| Sunway Bhd | | | 97,497 | | | | 33,004 | |
| Ta Ann Holdings Bhd | | | 12,260 | | | | 8,773 | |
| Top Glove Corp. Bhd* | | | 84,400 | | | | 14,647 | |
| United Malacca Bhd | | | 14,600 | | | | 15,890 | |
| UOA Development Bhd | | | 14,900 | | | | 4,980 | |
| Yinson Holdings Bhd | | | 96,880 | | | | 53,136 | |
| YTL Corp. Bhd | | | 416,943 | | | | 92,902 | |
| | | | | | | | 2,986,639 | |
| Mexico — 2.8% | | | | | | | | |
| ALEATICA SAB de CV* | | | 17,691 | | | | 35,140 | |
| Alfa SAB de CV, Class A | | | 260,453 | | | | 161,138 | |
| Alpek SAB de CV | | | 27,384 | | | | 27,213 | |
| Banco del Bajio SA ± | | | 27,418 | | | | 83,758 | |
| Cemex SAB de CV* | | | 605,139 | | | | 427,773 | |
| Cemex SAB de CV, ADR* | | | 2,361 | | | | 16,716 | |
| Coca-Cola Femsa SAB de CV | | | 18,073 | | | | 150,923 | |
| Consorcio ARA SAB de CV | | | 72,788 | | | | 16,712 | |
| Controladora AXTEL SAB DE CV* | | | 260,453 | | | | 3,348 | |
| Corp. Actinver SAB de CV | | | 15,700 | | | | 12,841 | |
| El Puerto de Liverpool SAB de CV, Series C1 | | | 11,951 | | | | 72,912 | |
| Fomento Economico Mexicano SAB de CV | | | 56,916 | | | | 629,810 | |
| Genomma Lab Internacional SAB de CV, Series B | | | 44,530 | | | | 34,288 | |
| Gentera SAB de CV | | | 67,054 | | | | 71,727 | |
| Grupo Carso SAB de CV, Series A1 | | | 20,689 | | | | 149,514 | |
| Grupo Comercial Chedraui SA de CV | | | 18,270 | | | | 104,110 | |
| Grupo Financiero Banorte SAB de CV, Class O | | | 128,474 | | | | 1,056,944 | |
| Grupo Financiero Inbursa SAB de CV, Class O* | | | 90,439 | | | | 214,038 | |
| Grupo Hotelero Santa Fe SAB de CV* | | | 22,600 | | | | 5,453 | |
| Grupo Mexico SAB de CV, Series B | | | 195,137 | | | | 938,235 | |
| Grupo Televisa SAB | | | 159,243 | | | | 163,364 | |
| Grupo Traxion SAB de CV*± | | | 5,100 | | | | 9,689 | |
| Industrias CH SAB de CV, Series B* | | | 23,916 | | | | 286,288 | |
| Industrias Penoles SAB de CV* | | | 8,090 | | | | 113,389 | |
| La Comer SAB de CV | | | 21,917 | | | | 47,504 | |
| Megacable Holdings SAB de CV | | | 42,063 | | | | 97,460 | |
| Minera Frisco SAB de CV, Class A1* | | | 52,254 | | | | 8,548 | |
| Nemak SAB de CV*± | | | 122,975 | | | | 29,169 | |
| Orbia Advance Corp. SAB de CV | | | 64,269 | | | | 137,609 | |
| Organizacion Soriana SAB de CV, Class B* | | | 57,868 | | | | 96,317 | |
| Promotora y Operadora de Infraestructura SAB de CV | | | 13,054 | | | | 131,005 | |
| Promotora y Operadora de Infraestructura SAB de CV, Class L | | | 1,600 | | | | 10,282 | |
| | | | | | | | 5,343,217 | |
| | | | | | | | | |
| Philippines — 0.8% | | | | | | | | |
| ACEN Corp.* | | | 37,650 | | | | 3,676 | |
| Alliance Global Group, Inc. | | | 253,300 | | | | 61,582 | |
| Ayala Corp. | | | 10,620 | | | | 120,246 | |
| Ayala Land, Inc. | | | 38,300 | | | | 16,860 | |
| Bank of the Philippine Islands | | | 28,578 | | | | 56,328 | |
| BDO Unibank, Inc. | | | 113,780 | | | | 283,834 | |
| Belle Corp. | | | 176,000 | | | | 3,826 | |
| China Banking Corp. | | | 74,676 | | | | 40,585 | |
| Cosco Capital, Inc. | | | 257,000 | | | | 22,814 | |
| DMCI Holdings, Inc. | | | 385,900 | | | | 63,339 | |
| Filinvest Land, Inc. | | | 1,435,000 | | | | 18,198 | |
| First Philippine Holdings Corp. | | | 26,510 | | | | 29,536 | |
The accompanying notes are an integral part of these financial statements.
SA Emerging Markets Value Fund
PORTFOLIO OF INVESTMENTS — AS OF JUNE 30, 2023 (Continued)
| | | SHARES | | | VALUE† | |
| COMMON STOCKS (Continued) | | | | | | | | |
| Philippines (Continued) | | | | | | | | |
| GT Capital Holdings, Inc. | | | 3,472 | | | $ | 32,393 | |
| JG Summit Holdings, Inc. | | | 178,383 | | | | 143,645 | |
| LT Group, Inc. | | | 132,300 | | | | 22,793 | |
| Megaworld Corp. | | | 1,004,700 | | | | 36,220 | |
| Metropolitan Bank & Trust Co. | | | 133,237 | | | | 134,445 | |
| Puregold Price Club, Inc. | | | 55,500 | | | | 29,560 | |
| Rizal Commercial Banking Corp. | | | 47,790 | | | | 20,346 | |
| Robinsons Land Corp. | | | 247,455 | | | | 64,016 | |
| Robinsons Retail Holdings, Inc. | | | 31,610 | | | | 31,324 | |
| San Miguel Corp. | | | 41,650 | | | | 79,528 | |
| Security Bank Corp. | | | 37,690 | | | | 57,013 | |
| Top Frontier Investment Holdings, Inc.* | | | 4,630 | | | | 9,227 | |
| Union Bank of the Philippines | | | 42,739 | | | | 57,992 | |
| | | | | | | | 1,439,326 | |
| | | | | | | | | |
| Poland — 0.9% | | | | | | | | |
| AB SA | | | 845 | | | | 13,010 | |
| Alior Bank SA* | | | 8,160 | | | | 97,054 | |
| Amica SA | | | 306 | | | | 5,833 | |
| Asseco Poland SA | | | 4,353 | | | | 85,916 | |
| Cognor Holding SA | | | 5,564 | | | | 10,318 | |
| Cyfrowy Polsat SA | | | 17,146 | | | | 69,622 | |
| Develia SA* | | | 16,364 | | | | 17,145 | |
| Echo Investment SA | | | 1,732 | | | | 1,857 | |
| Enea SA* | | | 23,584 | | | | 37,093 | |
| Jastrzebska Spolka Weglowa SA* | | | 4,372 | | | | 43,065 | |
| KGHM Polska Miedz SA | | | 9,866 | | | | 272,738 | |
| Lubelski Wegiel Bogdanka SA | | | 1,684 | | | | 16,269 | |
| mBank SA* | | | 482 | | | | 48,141 | |
| PGE Polska Grupa Energetyczna SA* | | | 60,152 | | | | 107,405 | |
| Polski Koncern Naftowy Orlen SA | | | 45,894 | | | | 727,021 | |
| Powszechna Kasa Oszczednosci Bank Polski SA | | | 8,908 | | | | 79,200 | |
| Santander Bank Polska SA* | | | 461 | | | | 44,105 | |
| Tauron Polska Energia SA* | | | 66,763 | | | | 45,155 | |
| | | | | | | | 1,720,947 | |
| | | | | | | | | |
| Russia — 0.0% | | | | | | | | |
| Gazprom PJSC, ADR*§ | | | 162,760 | | | | — | |
| Lukoil PJSC, ADR*§ | | | 15,271 | | | | — | |
| RusHydro PJSC, ADR*§ | | | 61,905 | | | | — | |
| VTB Bank PJSC, GDR*§ | | | 92,145 | | | | — | |
| | | | | | | | — | |
| Singapore — 0.0% | | | | | | | | |
| China XLX Fertiliser Ltd. | | | 44,000 | | | | 18,811 | |
| | | | | | | | | |
| South Africa — 3.0% | | | | | | | | |
| Absa Group Ltd. | | | 55,331 | | | | 493,624 | |
| Aeci Ltd. | | | 11,902 | | | | 57,293 | |
| African Rainbow Minerals Ltd. | | | 9,314 | | | | 98,483 | |
| AngloGold Ashanti Ltd., ADR | | | 21,886 | | | | 461,576 | |
| Aspen Pharmacare Holdings Ltd. | | | 21,622 | | | | 210,944 | |
| Astral Foods Ltd. | | | 5,245 | | | | 42,704 | |
| Barloworld Ltd.@ | | | 20,449 | | | | 92,884 | |
| DataTec Ltd. | | | 21,933 | | | | 45,448 | |
| Exxaro Resources Ltd. | | | 19,227 | | | | 167,811 | |
| Foschini Group Ltd. (The) | | | 16,742 | | | | 83,633 | |
| Grindrod Ltd. | | | 33,342 | | | | 16,953 | |
| Harmony Gold Mining Co. Ltd. | | | 14,397 | | | | 60,621 | |
| Harmony Gold Mining Co. Ltd., ADR @ | | | 30,759 | | | | 129,188 | |
| Impala Platinum Holdings Ltd. | | | 72,158 | | | | 480,459 | |
| Investec Ltd. | | | 21,334 | | | | 120,174 | |
| KAP Ltd. | | | 156,089 | | | | 22,392 | |
| Lewis Group Ltd. | | | 3,337 | | | | 7,041 | |
| Life Healthcare Group Holdings Ltd. | | | 95,918 | | | | 104,728 | |
| Metair Investments Ltd.* | | | 23,331 | | | | 22,722 | |
| Momentum Metropolitan Holdings | | | 100,980 | | | | 96,896 | |
| Motus Holdings Ltd. | | | 14,664 | | | | 78,052 | |
| Mpact Ltd. | | | 15,365 | | | | 20,834 | |
| MTN Group Ltd. | | | 22,966 | | | | 168,573 | |
| Nedbank Group Ltd. | | | 26,249 | | | | 318,788 | |
| Oceana Group Ltd. | | | 7,336 | | | | 27,479 | |
| Old Mutual Ltd. | | | 313,640 | | | | 201,969 | |
| Omnia Holdings Ltd. | | | 16,030 | | | | 51,221 | |
| Pepkor Holdings Ltd. ± | | | 100,821 | | | | 88,387 | |
| Raubex Group Ltd. | | | 16,897 | | | | 23,351 | |
| Reunert Ltd. . | | | 14,953 | | | | 46,747 | |
| Royal Bafokeng Platinum Ltd. | | | 7,872 | | | | 52,227 | |
| Sappi Ltd.@ | | | 46,866 | | | | 97,137 | |
| Sasol Ltd. | | | 38,852 | | | | 481,510 | |
| Sasol Ltd., ADR. | | | 3,934 | | | | 48,703 | |
| Sibanye Stillwater Ltd. | | | 202,105 | | | | 311,406 | |
| Sibanye Stillwater Ltd., ADR @ | | | 1,610 | | | | 10,046 | |
| Standard Bank Group Ltd. | | | 60,990 | | | | 575,348 | |
| Super Group Ltd. | | | 41,508 | | | | 70,859 | |
| Telkom SA SOC Ltd.* | | | 28,405 | | | | 47,826 | |
| Thungela Resources Ltd. | | | 5,739 | | | | 45,110 | |
| Tiger Brands Ltd. | | | 8,247 | | | | 73,276 | |
| Wilson Bayly Holmes-Ovcon Ltd.* | | | 5,488 | | | | 30,465 | |
| Zeda Ltd.* | | | 20,449 | | | | 11,593 | |
| | | | | | | | 5,696,481 | |
| | | | | | | | | |
| Taiwan — 18.2% | | | | | | | | |
| Acer, Inc. | | | 187,884 | | | | 189,124 | |
| Acter Group Corp. Ltd. | | | 4,000 | | | | 19,329 | |
| Advanced International Multitech Co. Ltd. | | | 8,000 | | | | 20,421 | |
| Altek Corp. | | | 13,000 | | | | 14,234 | |
| Ambassador Hotel (The)* | | | 20,000 | | | | 33,906 | |
| AmTRAN Technology Co. Ltd. | | | 74,301 | | | | 35,070 | |
| Apex International Co. Ltd. | | | 15,000 | | | | 30,439 | |
| Arcadyan Technology Corp. | | | 11,000 | | | | 43,443 | |
| Ardentec Corp. | | | 39,092 | | | | 76,441 | |
| ASE Technology Holding Co. Ltd. | | | 233,000 | | | | 826,679 | |
| Asia Cement Corp. | | | 158,269 | | | | 225,630 | |
| Asia Optical Co., Inc. | | | 5,000 | | | | 10,323 | |
| Asia Pacific Telecom Co. Ltd.* | | | 125,842 | | | | 27,031 | |
| Asia Polymer Corp. | | | 31,602 | | | | 26,889 | |
| Asustek Computer, Inc. | | | 47,000 | | | | 474,610 | |
| AUO Corp. | | | 502,400 | | | | 300,041 | |
| Bank of Kaohsiung Co. Ltd. | | | 46,350 | | | | 18,528 | |
| Basso Industry Corp. | | | 9,000 | | | | 12,108 | |
The accompanying notes are an integral part of these financial statements.
SA Emerging Markets Value Fund
PORTFOLIO OF INVESTMENTS — AS OF JUNE 30, 2023 (Continued)
| | | SHARES | | | VALUE† | |
| COMMON STOCKS (Continued) | | | | | | | | |
| Taiwan (Continued) | | | | | | | | |
| Bioteque Corp. | | | 3,000 | | | $ | 11,029 | |
| Bizlink Holding, Inc. | | | 3,000 | | | | 31,017 | |
| Brighton-Best International Taiwan, Inc. | | | 17,000 | | | | 19,459 | |
| Capital Securities Corp. | | | 184,437 | | | | 84,388 | |
| Career Technology MFG. Co. Ltd.* | | | 20,400 | | | | 17,489 | |
| Catcher Technology Co. Ltd. | | | 43,000 | | | | 242,306 | |
| Cathay Financial Holding Co. Ltd. | | | 393,170 | | | | 544,728 | |
| Cathay Real Estate Development Co. Ltd. | | | 70,000 | | | | 36,636 | |
| Chang Hwa Commercial Bank Ltd. | | | 299,460 | | | | 179,323 | |
| Chang Wah Electromaterials, Inc. | | | 20,000 | | | | 21,962 | |
| Cheng Loong Corp. | | | 82,000 | | | | 89,650 | |
| Cheng Shin Rubber Industry Co. Ltd. | | | 131,000 | | | | 168,879 | |
| Cheng Uei Precision Industry Co. Ltd. | | | 44,543 | | | | 60,212 | |
| Chia Hsin Cement Corp. | | | 22,000 | | | | 15,187 | |
| Chin-Poon Industrial Co. Ltd. | | | 36,000 | | | | 36,295 | |
| China Airlines Ltd. | | | 278,111 | | | | 233,958 | |
| China Bills Finance Corp. | | | 89,000 | | | | 44,008 | |
| China Chemical & Pharmaceutical Co. Ltd. | | | 19,000 | | | | 16,014 | |
| China Development Financial Holding Corp.* | | | 1,154,559 | | | | 459,681 | |
| China General Plastics Corp. | | | 28,665 | | | | 21,537 | |
| China Man-Made Fiber Corp.* | | | 115,018 | | | | 30,357 | |
| China Metal Products . | | | 31,000 | | | | 36,231 | |
| China Motor Corp. | | | 22,478 | | | | 67,121 | |
| China Petrochemical Development Corp.* | | | 389,871 | | | | 122,678 | |
| China Steel Corp. | | | 913,800 | | | | 862,615 | |
| Chipbond Technology Corp. | | | 42,000 | | | | 85,094 | |
| ChipMOS Technologies, Inc. | | | 28,897 | | | | 33,866 | |
| Chun Yuan Steel Industry Co. Ltd.* | | | 30,000 | | | | 17,531 | |
| Chung-Hsin Electric & Machinery Manufacturing Corp. | | | 28,000 | | | | 123,168 | |
| Chunghwa Precision Test Tech Co. Ltd. | | | 2,000 | | | | 37,631 | |
| Clevo Co. | | | 43,000 | | | | 45,907 | |
| CMC Magnetics Corp.* | | | 87,979 | | | | 39,831 | |
| Compal Electronics, Inc. | | | 288,000 | | | | 270,481 | |
| Compeq Manufacturing Co. Ltd. | | | 109,000 | | | | 155,392 | |
| Concord Securities Co. Ltd. | | | 37,000 | | | | 16,692 | |
| Continental Holdings Corp. | | | 42,000 | | | | 38,838 | |
| Coretronic Corp. | | | 40,800 | | | | 95,894 | |
| CTBC Financial Holding Co. Ltd. | | | 1,475,280 | | | | 1,177,117 | |
| D-Link Corp.* | | | 50,640 | | | | 35,527 | |
| DA CIN Construction Co. Ltd. | | | 9,000 | | | | 9,507 | |
| Da-Li Development Co. Ltd. | | | 12,000 | | | | 12,233 | |
| Darfon Electronics Corp. | | | 17,000 | | | | 25,272 | |
| Darwin Precisions Corp.* | | | 55,000 | | | | 26,754 | |
| Depo Auto Parts Ind Co. Ltd. | | | 12,000 | | | | 45,465 | |
| Dyaco International, Inc. | | | 8,114 | | | | 10,174 | |
| Dynapack International Technology Corp. | | | 7,000 | | | | 17,801 | |
| Eastern Media International Corp.* | | | 24,300 | | | | 14,200 | |
| Edom Technology Co. Ltd. | | | 10,000 | | | | 9,055 | |
| Elitegroup Computer Systems Co. Ltd. | | | 35,877 | | | | 36,517 | |
| Ennoconn Corp. | | | 3,116 | | | | 27,314 | |
| ENNOSTAR, Inc.* | | | 36,414 | | | | 60,798 | |
| Entie Commercial Bank Co. Ltd. | | | 68,000 | | | | 33,951 | |
| Eternal Materials Co., Ltd. | | | 42,300 | | | | 43,869 | |
| Eva Airways Corp. | | | 241,478 | | | | 308,588 | |
| Everest Textile Co. Ltd.* | | | 56,568 | | | | 16,710 | |
| Evergreen International Storage & Transport Corp. | | | 54,000 | | | | 49,935 | |
| Evergreen Marine Corp. Taiwan Ltd. | | | 65,583 | | | | 196,889 | |
| EVERGREEN Steel Corp. | | | 13,000 | | | | 27,966 | |
| Everlight Chemical Industrial Corp. | | | 56,000 | | | | 39,198 | |
| Everlight Electronics Co. Ltd. | | | 40,000 | | | | 66,400 | |
| Excelsior Medical Co. Ltd. | | | 11,550 | | | | 36,974 | |
| Far Eastern Department Stores Ltd. | | | 85,220 | | | | 65,671 | |
| Far Eastern International Bank . | | | 283,151 | | | | 108,189 | |
| Far Eastern New Century Corp. | | | 266,338 | | | | 286,054 | |
| Farglory Land Development Co. Ltd. | | | 26,721 | | | | 52,336 | |
| Feng Hsin Steel Co. Ltd. | | | 14,000 | | | | 32,051 | |
| First Financial Holding Co. Ltd. | | | 561,369 | | | | 498,382 | |
| First Steamship Co. Ltd.* | | | 103,240 | | | | 29,768 | |
| Fitipower Integrated Technology, Inc. | | | 4,000 | | | | 18,366 | |
| FLEXium Interconnect, Inc. | | | 24,000 | | | | 71,358 | |
| Formosa Advanced Technologies Co. Ltd. | | | 20,000 | | | | 28,127 | |
| Formosa Chemicals & Fibre Corp. | | | 176,000 | | | | 379,187 | |
| Formosa Laboratories, Inc. | | | 8,000 | | | | 23,735 | |
| Formosa Petrochemical Corp. | | | 41,000 | | | | 110,976 | |
| Formosa Plastics Corp. | | | 183,000 | | | | 503,559 | |
| Formosa Taffeta Co. Ltd. | | | 28,000 | | | | 25,173 | |
| Formosan Rubber Group, Inc. | | | 20,080 | | | | 14,249 | |
| Formosan Union Chemical . | | | 48,179 | | | | 38,132 | |
| Foxconn Technology Co. Ltd. | | | 58,127 | | | | 103,770 | |
| Foxsemicon Integrated Technology, Inc.* | | | 1,000 | | | | 6,486 | |
| FSP Technology, Inc. | | | 8,000 | | | | 12,330 | |
| Fubon Financial Holding Co. Ltd. | | | 578,731 | | | | 1,129,793 | |
| Fulltech Fiber Glass Corp. | | | 32,249 | | | | 14,031 | |
| G Shank Enterprise Co. Ltd. | | | 10,000 | | | | 15,765 | |
| Gamania Digital Entertainment Co. Ltd. | | | 6,000 | | | | 15,778 | |
| Gemtek Technology Corp. | | | 47,000 | | | | 49,876 | |
| General Interface Solution Holding Ltd. | | | 24,000 | | | | 56,177 | |
| Getac Holdings Corp. | | | 21,000 | | | | 45,109 | |
| Giantplus Technology Co. Ltd.* | | | 37,000 | | | | 18,355 | |
| Gigabyte Technology Co., Ltd. | | | 35,000 | | | | 273,644 | |
| Global Brands Manufacture Ltd. | | | 10,000 | | | | 14,738 | |
| Global PMX Co. Ltd. | | | 2,000 | | | | 10,146 | |
| Gloria Material Technology Corp. | | | 34,392 | | | | 63,606 | |
| Goldsun Building Materials Co. Ltd. | | | 82,973 | | | | 73,264 | |
| Grand Pacific Petrochemical | | | 102,000 | | | | 63,700 | |
| Great Wall Enterprise Co. Ltd.* | | | 31,330 | | | | 53,617 | |
| Greatek Electronics, Inc. | | | 16,000 | | | | 29,386 | |
| Hannstar Board Corp. | | | 38,929 | | | | 60,060 | |
| HannStar Display Corp.* | | | 35,000 | | | | 14,778 | |
| HannsTouch Holdings Co. | | | 32,279 | | | | 10,986 | |
The accompanying notes are an integral part of these financial statements.
SA Emerging Markets Value Fund
PORTFOLIO OF INVESTMENTS — AS OF JUNE 30, 2023 (Continued)
| | | SHARES | | | VALUE† | |
| COMMON STOCKS (Continued) | | | | | | | | |
| Taiwan (Continued) | | | | | | | | |
| Hey Song Corp. | | | 18,750 | | | $ | 24,834 | |
| Highwealth Construction Corp. | | | 52,697 | | | | 72,164 | |
| Hiroca Holdings Ltd. | | | 8,000 | | | | 11,405 | |
| Ho Tung Chemical Corp. | | | 108,688 | | | | 30,920 | |
| Holy Stone Enterprise Co., Ltd. | | | 10,000 | | | | 34,516 | |
| Hon Hai Precision Industry Co. Ltd. | | | 735,068 | | | | 2,667,010 | |
| Hong Pu Real Estate Development Co. Ltd.* | | | 20,000 | | | | 17,306 | |
| Hong TAI Electric Industrial. | | | 13,000 | | | | 11,124 | |
| Hua Nan Financial Holdings Co. Ltd. | | | 473,337 | | | | 337,398 | |
| Huaku Development Co. Ltd. | | | 7,000 | | | | 20,273 | |
| Huang Hsiang Construction Corp. | | | 8,000 | | | | 10,442 | |
| Hung Ching Development & Construction Co. Ltd. | | | 20,000 | | | | 15,797 | |
| Hung Sheng Construction Ltd. | | | 50,688 | | | | 35,561 | |
| IBF Financial Holdings Co. Ltd.* | | | 125,715 | | | | 48,640 | |
| IEI Integration Corp. | | | 8,000 | | | | 23,144 | |
| Innolux Corp. | | | 595,270 | | | | 291,476 | |
| International CSRC Investment Holdings Co. | | | 58,604 | | | | 40,456 | |
| Inventec Corp. | | | 158,282 | | | | 219,550 | |
| ITEQ Corp. | | | 15,000 | | | | 33,280 | |
| Kenda Rubber Industrial Co. Ltd. | | | 33,000 | | | | 34,012 | |
| Kerry TJ Logistics Co. Ltd. | | | 9,000 | | | | 11,328 | |
| Kindom Development Co. Ltd. | | | 46,200 | | | | 44,651 | |
| King Yuan Electronics Co. Ltd. | | | 113,100 | | | | 206,993 | |
| King's Town Bank Co. Ltd. | | | 90,000 | | | | 102,731 | |
| Kinpo Electronics . | | | 138,000 | | | | 65,357 | |
| Kinsus Interconnect Technology Corp. | | | 28,000 | | | | 104,738 | |
| KS Terminals, Inc. | | | 14,000 | | | | 37,220 | |
| Kuo Yang Construction Co. Ltd.* | | | 14,000 | | | | 8,226 | |
| Kwong Lung Enterprise Co. Ltd. | | | 12,000 | | | | 21,500 | |
| L&K Engineering Co. Ltd. | | | 16,000 | | | | 31,389 | |
| Largan Precision Co. Ltd. | | | 7,000 | | | | 478,736 | |
| Lealea Enterprise Co. Ltd. | | | 80,000 | | | | 29,283 | |
| Lelon Electronics Corp. | | | 10,000 | | | | 19,939 | |
| Lien Hwa Industrial Holdings Corp. | | | 46,702 | | | | 101,668 | |
| Lingsen Precision Industries Ltd. | | | 41,000 | | | | 20,273 | |
| Lite-On Technology Corp. | | | 183,874 | | | | 611,054 | |
| Longchen Paper & Packaging Co. Ltd. | | | 92,459 | | | | 50,913 | |
| Lung Yen Life Service Corp. | | | 16,000 | | | | 18,854 | |
| Macronix International Co. Ltd. | | | 119,171 | | | | 125,123 | |
| MediaTek, Inc. | | | 2,000 | | | | 44,181 | |
| Mega Financial Holding Co. Ltd. | | | 466,371 | | | | 572,023 | |
| Mercuries & Associates Holding Ltd. | | | 42,767 | | | | 20,872 | |
| Mercuries Life Insurance Co. Ltd.* | | | 72,469 | | | | 12,681 | |
| Micro-Star International Co., Ltd. | | | 31,000 | | | | 175,681 | |
| Mirle Automation Corp. | | | 6,000 | | | | 7,330 | |
| Mitac Holdings Corp. | | | 27,637 | | | | 31,014 | |
| MOSA Industrial Corp. | | | 8,656 | | | | 8,574 | |
| MPI Corp. | | | 6,000 | | | | 33,425 | |
| Namchow Holdings Co. Ltd. | | | 7,000 | | | | 10,755 | |
| Nan Ya Plastics Corp. | | | 290,000 | | | | 675,079 | |
| Nanya Technology Corp. | | | 117,000 | | | | 265,973 | |
| O-Bank Co. Ltd. | | | 91,943 | | | | 30,112 | |
| Orient Semiconductor Electronics Ltd. | | | 42,485 | | | | 31,375 | |
| Oriental Union Chemical Corp. | | | 16,000 | | | | 11,379 | |
| Pan Jit International, Inc. | | | 13,600 | | | | 30,261 | |
| Pan-International Industrial Corp. | | | 34,380 | | | | 44,211 | |
| PChome Online, Inc. | | | 4,000 | | | | 6,614 | |
| Pegatron Corp. | | | 187,249 | | | | 449,717 | |
| Phison Electronics Corp. | | | 6,000 | | | | 79,276 | |
| Pixart Imaging, Inc. | | | 8,000 | | | | 28,127 | |
| POU Chen Corp. | | | 169,133 | | | | 171,064 | |
| Powerchip Semiconductor Manufacturing Corp. | | | 209,000 | | | | 207,695 | |
| Powertech Technology, Inc. | | | 49,000 | | | | 165,198 | |
| President Securities Corp. | | | 86,636 | | | | 48,402 | |
| Primax Electronics Ltd.* | | | 25,000 | | | | 52,818 | |
| Prince Housing & Development Corp. | | | 77,970 | | | | 30,042 | |
| Prosperity Dielectrics Co. Ltd. | | | 11,000 | | | | 15,258 | |
| Qisda Corp. | | | 139,400 | | | | 205,444 | |
| Quanta Computer, Inc. | | | 160,000 | | | | 780,876 | |
| Quanta Storage, Inc. | | | 13,000 | | | | 30,972 | |
| Radiant Opto-Electronics Corp. | | | 27,000 | | | | 95,362 | |
| Radium Life Tech Co. Ltd. | | | 101,477 | | | | 29,552 | |
| Rechi Precision Co. Ltd. | | | 16,000 | | | | 10,403 | |
| Rexon Industrial Corp. Ltd.* | | | 13,000 | | | | 14,505 | |
| Rich Development Co. Ltd. | | | 19,978 | | | | 6,543 | |
| Ritek Corp.* | | | 47,211 | | | | 14,977 | |
| Ruentex Development Co. Ltd. | | | 44,000 | | | | 50,789 | |
| Ruentex Industries Ltd. | | | 37,891 | | | | 73,240 | |
| Sampo Corp. | | | 31,600 | | | | 27,141 | |
| San Fang Chemical Industry Co. Ltd. | | | 13,000 | | | | 10,853 | |
| Sanyang Motor Co. Ltd. | | | 41,573 | | | | 119,468 | |
| Sesoda Corp. | | | 17,193 | | | | 21,392 | |
| Shanghai Commercial & Savings Bank Ltd. (The) | | | 106,618 | | | | 155,419 | |
| ShenMao Technology, Inc. | | | 10,000 | | | | 16,632 | |
| Shih Wei Navigation Co. Ltd. | | | 17,554 | | | | 12,907 | |
| Shihlin Electric & Engineering Corp. | | | 23,000 | | | | 110,405 | |
| Shin Kong Financial Holding Co. Ltd.* | | | 715,108 | | | | 204,353 | |
| Shin Zu Shing Co. Ltd. | | | 16,660 | | | | 48,357 | |
| Shinkong Insurance Co. Ltd. | | | 22,000 | | | | 36,732 | |
| Shinkong Synthetic Fibers Corp. | | | 108,151 | | | | 59,728 | |
| Sigurd Microelectronics Corp. | | | 42,694 | | | | 75,807 | |
| Simplo Technology Co. Ltd. | | | 9,000 | | | | 94,928 | |
| Sincere Navigation Corp. | | | 27,810 | | | | 17,948 | |
| Sinon Corp. | | | 37,000 | | | | 42,353 | |
| SinoPac Financial Holdings Co. Ltd. | | | 742,433 | | | | 413,595 | |
| Sirtec International Co. Ltd. | | | 12,000 | | | | 12,214 | |
| Soft-World International Corp. | | | 4,000 | | | | 12,972 | |
| St Shine Optical Co. Ltd. | | | 5,000 | | | | 37,165 | |
| Sunonwealth Electric Machine Industry Co. Ltd.* | | | 12,000 | | | | 35,833 | |
| Supreme Electronics Co. Ltd. | | | 43,121 | | | | 67,012 | |
| Syncmold Enterprise Corp. | | | 5,000 | | | | 9,665 | |
| Synnex Technology International Corp. | | | 87,300 | | | | 162,578 | |
| TA Chen Stainless Pipe Co., Ltd. | | | 87,870 | | | | 133,733 | |
| TA-I Technology Co. Ltd. | | | 6,000 | | | | 9,517 | |
The accompanying notes are an integral part of these financial statements.
SA Emerging Markets Value Fund
PORTFOLIO OF INVESTMENTS — AS OF JUNE 30, 2023 (Continued)
| | | SHARES | | | VALUE† | |
| COMMON STOCKS (Continued) | | | | | | | | |
| Taiwan (Continued) | | | | | | | | |
| TAI-TECH Advanced Electronics Co. Ltd. | | | 3,000 | | | $ | 9,392 | |
| Taichung Commercial Bank Co. Ltd. | | | 238,060 | | | | 116,185 | |
| TaiDoc Technology Corp. | | | 7,000 | | | | 41,805 | |
| Taiflex Scientific Co. Ltd. | | | 25,740 | | | | 36,158 | |
| Tainan Spinning Co. Ltd. | | | 115,427 | | | | 61,152 | |
| Taishin Financial Holding Co. Ltd. | | | 703,708 | | | | 427,044 | |
| Taiwan Business Bank | | | 369,300 | | | | 168,971 | |
| Taiwan Cement Corp. | | | 380,971 | | | | 465,442 | |
| Taiwan Cooperative Financial Holding Co. Ltd. | | | 209,706 | | | | 188,870 | |
| Taiwan Fertilizer Co. Ltd. | | | 48,000 | | | | 93,243 | |
| Taiwan FU Hsing Industrial Co. Ltd. | | | 21,000 | | | | 28,825 | |
| Taiwan Glass Industry Corp.* | | | 81,321 | | | | 50,394 | |
| Taiwan Hon Chuan Enterprise Co. Ltd. | | | 30,925 | | | | 104,756 | |
| Taiwan Navigation Co. Ltd. | | | 22,000 | | | | 21,545 | |
| Taiwan Paiho Ltd. | | | 12,000 | | | | 20,960 | |
| Taiwan PCB Techvest Co. Ltd. | | | 28,000 | | | | 35,467 | |
| Taiwan Sakura Corp. | | | 6,000 | | | | 12,291 | |
| Taiwan Shin Kong Security Co. Ltd. | | | 10,100 | | | | 13,410 | |
| Taiwan Styrene Monomer | | | 23,000 | | | | 12,222 | |
| Taiwan Surface Mounting Technology Corp. | | | 21,518 | | | | 69,436 | |
| Taiwan Union Technology Corp. | | | 19,000 | | | | 46,059 | |
| Tatung Co. Ltd.* | | | 115,000 | | | | 200,501 | |
| TCI Co. Ltd. | | | 5,000 | | | | 28,496 | |
| Teco Electric & Machinery Co. Ltd. | | | 101,000 | | | | 172,849 | |
| Test Research, Inc. | | | 11,000 | | | | 21,333 | |
| Thinking Electronic Industrial Co. Ltd. | | | 4,000 | | | | 21,192 | |
| Thye Ming Industrial Co. Ltd. | | | 8,000 | | | | 11,739 | |
| Ton Yi Industrial Corp. | | | 82,000 | | | | 52,000 | |
| Tong Hsing Electronic Industries Ltd. | | | 9,900 | | | | 58,171 | |
| Tong Yang Industry Co. Ltd. | | | 41,921 | | | | 70,935 | |
| Topco Scientific Co. Ltd. | | | 4,000 | | | | 23,439 | |
| Topkey Corp. | | | 3,000 | | | | 18,591 | |
| TPK Holding Co. Ltd. | | | 34,000 | | | | 48,362 | |
| Transcend Information, Inc. | | | 10,000 | | | | 25,173 | |
| Tripod Technology Corp. | | | 25,000 | | | | 99,135 | |
| TSRC Corp. | | | 26,000 | | | | 21,455 | |
| Tung Ho Steel Enterprise Corp. | | | 58,290 | | | | 111,360 | |
| TXC Corp. | | | 16,000 | | | | 48,188 | |
| TYC Brother Industrial Co. Ltd. | | | 21,000 | | | | 25,049 | |
| U-Ming Marine Transport Corp.* | | | 27,000 | | | | 41,006 | |
| Union Bank of Taiwan | | | 159,404 | | | | 84,194 | |
| Unitech Printed Circuit Board Corp.* | | | 71,667 | | | | 40,730 | |
| United Microelectronics Corp. | | | 499,513 | | | | 777,870 | |
| United Microelectronics Corp., ADR @ | | | 38,376 | | | | 302,787 | |
| Universal Cement Corp. | | | 46,836 | | | | 46,168 | |
| UPC Technology Corp. | | | 80,916 | | | | 38,581 | |
| USI Corp. | | | 77,130 | | | | 57,208 | |
| Wafer Works Corp. | | | 25,000 | | | | 37,968 | |
| Wah Lee Industrial Corp. | | | 21,420 | | | | 57,015 | |
| Walsin Lihwa Corp. | | | 156,211 | | | | 205,643 | |
| Walsin Technology Corp. | | | 28,000 | | | | 85,768 | |
| Walton Advanced Engineering, Inc. | | | 34,000 | | | | 15,666 | |
| Wan Hai Lines Ltd. | | | 58,000 | | | | 109,875 | |
| Wei Chuan Foods Corp. | | | 14,000 | | | | 9,125 | |
| Weikeng Industrial Co. Ltd. | | | 32,945 | | | | 35,331 | |
| Winbond Electronics Corp.* | | | 331,893 | | | | 292,522 | |
| Wisdom Marine Lines Co. Ltd. | | | 27,019 | | | | 42,336 | |
| Wistron Corp. | | | 287,431 | | | | 837,989 | |
| Wistron NeWeb Corp. | | | 6,000 | | | | 18,360 | |
| WPG Holdings Ltd. | | | 154,400 | | | | 271,177 | |
| WT Microelectronics Co. Ltd.* | | | 31,265 | | | | 68,263 | |
| Yageo Corp. | | | 21,067 | | | | 332,464 | |
| Yang Ming Marine Transport Corp.* | | | 143,000 | | | | 289,265 | |
| YC INOX Co. Ltd. | | | 27,763 | | | | 26,208 | |
| Yem Chio Co. Ltd. | | | 22,666 | | | | 11,499 | |
| Yeong Guan Energy Technology Group Co. Ltd. | | | 7,000 | | | | 16,138 | |
| YFY, Inc. | | | 110,385 | | | | 132,025 | |
| Yieh Phui Enterprise Co. Ltd. | | | 55,151 | | | | 27,802 | |
| Youngtek Electronics Corp. | | | 12,000 | | | | 25,584 | |
| Yuanta Financial Holding Co. Ltd. | | | 686,327 | | | | 509,051 | |
| Yuen Foong Yu Consumer Products Co. Ltd. | | | 15,000 | | | | 20,084 | |
| Yulon Motor Co. Ltd. | | | 54,247 | | | | 143,871 | |
| YungShin Global Holding Corp. | | | 7,000 | | | | 9,799 | |
| Zeng Hsing Industrial Co. Ltd. | | | 2,148 | | | | 7,690 | |
| Zenitron Corp. | | | 18,000 | | | | 19,997 | |
| Zhen Ding Technology Holding Ltd. | | | 62,000 | | | | 209,026 | |
| Zinwell Corp.* | | | 24,000 | | | | 16,298 | |
| ZongTai Real Estate Development Co. Ltd.* | | | 14,000 | | | | 19,464 | |
| Zyxel Group Corp. | | | 31,438 | | | | 46,938 | |
| | | | | | | | 34,556,424 | |
| Tanzania, United Republic Of — 0.0% | | | | | | | | |
| AngloGold Ashanti Ltd. | | | 4,067 | | | | 85,955 | |
| | | | | | | | | |
| Thailand — 2.1% | | | | | | | | |
| AP Thailand PCL. | | | 242,500 | | | | 78,656 | |
| Bangchak Corp. PCL. | | | 112,900 | | | | 116,228 | |
| Bangkok Bank PCL. | | | 48,500 | | | | 238,020 | |
| Bangkok Bank PCL, NVDR | | | 13,300 | | | | 59,832 | |
| Bangkok Insurance PCL. | | | 2,100 | | | | 18,006 | |
| Bangkok Land PCL. | | | 1,039,700 | | | | 24,046 | |
| Banpu PCL. | | | 429,750 | | | | 107,271 | |
| Berli Jucker PCL. | | | 64,800 | | | | 63,511 | |
| Cal-Comp Electronics Thailand PCL. | | | 310,479 | | | | 16,813 | |
| Charoen Pokphand Foods PCL. | | | 322,300 | | | | 179,081 | |
| GFPT PCL. | | | 33,300 | | | | 12,022 | |
| Indorama Ventures PCL. | | | 93,600 | | | | 90,419 | |
| IRPC PCL. | | | 633,100 | | | | 40,713 | |
| Italian-Thai Development PCL* | | | 563,700 | | | | 21,146 | |
| Kasikornbank PCL, NVDR. | | | 27,100 | | | | 98,983 | |
| Khon Kaen Sugar Industry PCL. | | | 135,600 | | | | 11,856 | |
| Kiatnakin Phatra Bank PCL. | | | 21,900 | | | | 36,907 | |
| Krung Thai Bank PCL. | | | 204,575 | | | | 111,938 | |
The accompanying notes are an integral part of these financial statements.
SA Emerging Markets Value Fund
PORTFOLIO OF INVESTMENTS — AS OF JUNE 30, 2023 (Continued)
| | | SHARES | | | VALUE† | |
| COMMON STOCKS (Continued) | | | | | | | | |
| Thailand (Continued) | | | | | | | | |
| Lanna Resources PCL. | | | 2,500 | | | $ | 1,044 | |
| LH Financial Group PCL. | | | 302,400 | | | | 9,467 | |
| Polyplex Thailand PCL. | | | 27,000 | | | | 10,509 | |
| Precious Shipping PCL. | | | 41,900 | | | | 10,991 | |
| Property Perfect PCL. | | | 1,000,115 | | | | 10,437 | |
| Pruksa Holding PCL. | | | 88,800 | | | | 31,558 | |
| PTT Exploration & Production PCL. | | | 101,100 | | | | 427,725 | |
| PTT Global Chemical PCL. | | | 116,228 | | | | 122,112 | |
| PTT PCL. | | | 883,900 | | | | 835,161 | |
| Quality Houses PCL. | | | 338,800 | | | | 21,023 | |
| Regional Container Lines PCL. | | | 17,100 | | | | 11,431 | |
| Sansiri PCL. | | | 1,106,700 | | | | 59,931 | |
| SC Asset Corp. PCL. | | | 188,600 | | | | 23,193 | |
| SCB X PCL. | | | 48,100 | | | | 144,483 | |
| Siam Cement PCL (The) | | | 31,500 | | | | 286,081 | |
| Siam City Cement PCL. | | | 4,100 | | | | 16,132 | |
| Sino-Thai Engineering & Construction PCL. | | | 70,300 | | | | 17,449 | |
| Somboon Advance Technology PCL. | | | 20,300 | | | | 10,821 | |
| SPCG PCL. | | | 37,500 | | | | 13,432 | |
| Sri Trang Agro-Industry PCL. | | | 60,900 | | | | 29,200 | |
| Sri Trang Gloves Thailand PCL. | | | 39,200 | | | | 3,339 | |
| Star Petroleum Refining PCL. | | | 80,000 | | | | 18,164 | |
| Supalai PCL. | | | 139,400 | | | | 79,421 | |
| Super Energy Corp. PCL* | | | 759,200 | | | | 11,135 | |
| Thai Oil PCL. | | | 78,877 | | | | 98,443 | |
| Thai Stanley Electric PCL, NVDR | | | 3,100 | | | | 18,886 | |
| Thai Union Group PCL, Class F | | | 210,500 | | | | 76,589 | |
| Thanachart Capital PCL. | | | 17,800 | | | | 24,977 | |
| Thitikorn PCL. | | | 10,500 | | | | 2,088 | |
| Thoresen Thai Agencies PCL. | | | 37,800 | | | | 6,983 | |
| TMBThanachart Bank PCL. | | | 1,537,072 | | | | 67,197 | |
| TPI Polene PCL. | | | 676,600 | | | | 28,052 | |
| TPI Polene Power PCL. | | | 179,000 | | | | 16,761 | |
| True Corp. PCL. | | | 596,339 | | | | 106,804 | |
| Unique Engineering & Construction PCL* | | | 54,500 | | | | 3,935 | |
| WHA Corp. PCL. | | | 253,200 | | | | 32,851 | |
| | | | | | | | 4,013,253 | |
| | | | | | | | | |
| Turkey — 0.8% | | | | | | | | |
| Akbank TAS | | | 317,936 | | | | 246,858 | |
| Anadolu Efes Biracilik Ve Malt Sanayii AS | | | 16,612 | | | | 42,366 | |
| Dogan Sirketler Grubu Holding AS | | | 84,330 | | | | 31,961 | |
| Enka Insaat ve Sanayi AS | | | 66,291 | | | | 74,658 | |
| Eregli Demir ve Celik Fabrikalari TAS* | | | 61,749 | | | | 87,154 | |
| KOC Holding AS | | | 57,667 | | | | 229,859 | |
| TAV Havalimanlari Holding AS* | | | 7,294 | | | | 26,172 | |
| Turk Hava Yollari AO* | | | 42,215 | | | | 314,305 | |
| Turkiye Garanti Bankasi AS | | | 39,578 | | | | 48,742 | |
| Turkiye Is Bankasi, Class C | | | 185,127 | | | | 100,048 | |
| Turkiye Sinai Kalkinma Bankasi AS* | | | 172,186 | | | | 29,650 | |
| Turkiye Sise ve Cam Fabrikalari AS | | | 52,572 | | | | 89,842 | |
| Turkiye Vakiflar Bankasi TAO, Class D* | | | 80,351 | | | | 30,607 | |
| Vestel Elektronik Sanayi ve Ticaret AS* | | | 6,125 | | | | 13,420 | |
| Yapi ve Kredi Bankasi AS | | | 235,205 | | | | 117,348 | |
| | | | | | | | 1,482,990 | |
| | | | | | | | | |
| United Arab Emirates — 1.4% | | | | | | | | |
| Abu Dhabi Commercial Bank PJSC | | | 191,420 | | | | 422,656 | |
| Abu Dhabi National Hotels | | | 9,880 | | | | 14,203 | |
| Agthia Group PJSC | | | 33,252 | | | | 44,903 | |
| Aldar Properties PJSC | | | 229,175 | | | | 317,588 | |
| Amanat Holdings PJSC | | | 112,633 | | | | 30,972 | |
| Dana Gas PJSC | | | 333,486 | | | | 78,083 | |
| Deyaar Development PJSC* | | | 130,763 | | | | 23,853 | |
| Dubai Investments PJSC | | | 191,176 | | | | 121,274 | |
| Dubai Islamic Bank PJSC | | | 7,056 | | | | 10,508 | |
| Emaar Development PJSC | | | 84,901 | | | | 133,604 | |
| Emaar Properties PJSC | | | 390,021 | | | | 680,652 | |
| Emirates NBD Bank PJSC | | | 145,337 | | | | 587,600 | |
| Manazel PJSC* | | | 139,614 | | | | 14,406 | |
| Multiply Group PJSC* | | | 29,828 | | | | 25,662 | |
| RAK Properties PJSC* | | | 114,134 | | | | 27,594 | |
| Ras Al Khaimah Ceramics | | | 60,539 | | | | 44,172 | |
| SHUAA Capital PSC* | | | 182,524 | | | | 18,883 | |
| | | | | | | | 2,596,613 | |
| TOTAL COMMON STOCKS | | | | | | | | |
| (Identified Cost $176,673,463) | | | | | | | 184,956,923 | |
| | | | | | | | | |
| PREFERRED STOCKS — 1.8% | | | | | | | | |
| Brazil — 1.8% | | | | | | | | |
| Banco ABC Brasil SA, 5.684% | | | 11,102 | | | | 44,216 | |
| Banco Bradesco SA, 6.128% | | | 100,741 | | | | 346,099 | |
| Banco do Estado do Rio Grande do Sul SA, Class B, 5.867% | | | 14,808 | | | | 46,389 | |
| Banco Pan SA, 3.045% | | | 20,000 | | | | 38,219 | |
| Marcopolo SA, 4.491% | | | 42,283 | | | | 46,008 | |
| Petroleo Brasileiro SA, 16.504% | | | 448,645 | | | | 2,766,903 | |
| Randon SA Implementos e Participacoes, 4.133% | | | 9,200 | | | | 23,383 | |
| Usinas Siderurgicas de Minas Gerais SA, Class A, 4.65% | | | 42,992 | | | | 63,480 | |
| | | | | | | | 3,374,697 | |
| | | | | | | | | |
| Colombia — 0.0% | | | | | | | | |
| Grupo Argos SA, 8.631% | | | 12,517 | | | | 18,032 | |
| | | | | | | | | |
| Philippines — 0.0% | | | | | | | | |
| Cebu Air, Inc., 6.000%* | | | 12,909 | | | | 8,396 | |
| | | | | | | | | |
| India — 0.0% | | | | | | | | |
| Sundaram Clayton Ltd., 9.000%* | | | 256,360 | | | | 31,406 | |
| | | | | | | | | |
TOTAL PREFERRED STOCKS
(Identified Cost $2,496,184) | | | | | | | 3,432,531 | |
The accompanying notes are an integral part of these financial statements.
SA Emerging Markets Value Fund
PORTFOLIO OF INVESTMENTS — AS OF JUNE 30, 2023 (Continued)
| | | SHARES | | | VALUE† | |
| RIGHTS AND WARRANTS — 0.0% | | | | | | | | |
| Hong Kong — 0.0% | | | | | | | | |
| China Zheshang Bank Co. Ltd. Rights 7/19/23. *<> | | | 28,800 | | | $ | 1,249 | |
| | | | | | | | | |
| TOTAL RIGHTS AND WARRANTS | | | | | | | | |
| (Identified Cost $0) | | | | | | | 1,249 | |
| | | | | | | | | |
| SHORT-TERM INVESTMENTS — 1.0% | | | | | | | | |
| Investment Company — 0.2% | | | | | | | | |
| State Street Institutional U.S. Government Money Market Fund 4.780% | | | 421,895 | | | | 421,895 | |
| | | | | | | | | |
| Collateral For Securities On Loan — 0.8% | | | | | | | | |
| State Street Navigator Securities Lending Government Money Market Portfolio 5.110% | | | 1,462,355 | | | | 1,462,355 | |
| | | | | | | | | |
| TOTAL SHORT-TERM INVESTMENTS | | | | | | | | |
| (Identified Cost $1,884,250) | | | | | | | 1,884,250 | |
| | | | | | | | | |
| Total Investments — 100.1% | | | | | | | | |
| (Identified Cost $181,053,897) | | | | | | | 190,274,953 | |
| Liabilities, Less Cash and Other Assets — (0.1%) | | | | | | | (191,632 | ) |
| Net Assets — 100.0% | | | | | | $ | 190,083,321 | |
| † | See Note 1 |
| * | Non-income producing security |
| ± | 144A Securities. Securities exempt from registration under Rule 144A of the Securities Act of 1933. These securities may be resold in transactions exempt from registration to qualified institutional buyers. These securities have been deemed by the Fund to be liquid and at June 30, 2023 amounted to $3,849,273 or 2.03% of the net assets of the Fund. |
| @ | A portion or all of the security was held on loan. As of June 30, 2023, the fair value of the securities on loan was $3,271,516. |
| <> | Fair valued security. Security is valued using significant observable inputs other than quoted prices as determined pursuant to procedures approved by the Fund’s Board of Trustees. See Note 1 |
| § | Fair valued security. Security is valued using significant unobservable inputs as determined pursuant to procedures approved by the Fund’s Board of Trustees. See Note 1 |
Key to abbreviations:
ADR — American Depository Receipt
GDR — Global Depository Receipt
NVDR — Non-Voting Depository Receipt
Ten largest industry holdings as of June 30, 2023
(As a percentage of net assets) (Unaudited)
| Industry | | Percentage |
| Commercial Banks | | | 20.8% |
| Oil, Gas & Consumable Fuels | | | 11.5% |
| Metals & Mining | | | 6.7% |
| Electronic Equipment, Instruments & Components | | | 4.6% |
| Computers & Peripherals | | | 4.3% |
| Insurance | | | 4.0% |
| Semiconductors & Semiconductor Equipment | | | 3.9% |
| Real Estate Management & Development | | | 3.7% |
| Chemicals | | | 3.5% |
| Automobiles | | | 3.4% |
Country weightings as of June 30, 2023
(As a percentage of long-term investments) (Unaudited)

The accompanying notes are an integral part of these financial statements.
SA Real Estate Securities Fund
PORTFOLIO OF INVESTMENTS — AS OF JUNE 30, 2023
| | | SHARES | | | VALUE† | |
| COMMON STOCKS — 99.3% | | | | | | | | |
| Diversified REITs — 2.1% | | | | | | | | |
| American Assets Trust, Inc. | | | 6,032 | | | $ | 115,814 | |
| Broadstone Net Lease, Inc. | | | 17,587 | | | | 271,543 | |
| CTO Realty Growth, Inc. | | | 2,292 | | | | 39,285 | |
| Empire State Realty Trust, Inc., Class A | | | 11,500 | | | | 86,135 | |
| Essential Properties Realty Trust, Inc. | | | 16,250 | | | | 382,525 | |
| Gladstone Commercial Corp.@ | | | 3,518 | | | | 43,518 | |
| Global Net Lease, Inc. | | | 8,639 | | | | 88,809 | |
| One Liberty Properties, Inc. | | | 1,802 | | | | 36,616 | |
| WP Carey, Inc. | | | 22,578 | | | | 1,525,370 | |
| | | | | | | | 2,589,615 | |
| Health Care REITs — 8.8% | | | | | | | | |
| CareTrust REIT, Inc. | | | 10,703 | | | | 212,562 | |
| Community Healthcare Trust, Inc. | | | 2,728 | | | | 90,079 | |
| Global Medical REIT, Inc. | | | 5,127 | | | | 46,810 | |
| Healthcare Realty Trust, Inc., Class A | | | 40,607 | | | | 765,848 | |
| Healthpeak Properties, Inc. | | | 58,326 | | | | 1,172,353 | |
| LTC Properties, Inc. | | | 3,972 | | | | 131,155 | |
| Medical Properties Trust, Inc.@ | | | 59,765 | | | | 553,424 | |
| National Health Investors, Inc. | | | 4,627 | | | | 242,547 | |
| Omega Healthcare Investors, Inc. | | | 24,989 | | | | 766,912 | |
| Physicians Realty Trust | | | 25,667 | | | | 359,081 | |
| Sabra Health Care REIT, Inc. | | | 25,104 | | | | 295,474 | |
| Universal Health Realty Income Trust | | | 1,452 | | | | 69,086 | |
| Ventas, Inc. | | | 42,562 | | | | 2,011,906 | |
| Welltower, Inc. | | | 52,619 | | | | 4,256,351 | |
| | | | | | | | 10,973,588 | |
| Hotel & Resort REITs — 2.9% | | | | | | | | |
| Apple Hospitality REIT, Inc. | | | 24,154 | | | | 364,967 | |
| Braemar Hotels & Resorts, Inc. | | | 5,308 | | | | 21,338 | |
| Chatham Lodging Trust | | | 5,496 | | | | 51,443 | |
| DiamondRock Hospitality Co. | | | 22,762 | | | | 182,324 | |
| Host Hotels & Resorts, Inc. | | | 75,632 | | | | 1,272,886 | |
| Park Hotels & Resorts, Inc. | | | 23,481 | | | | 301,026 | |
| Pebblebrook Hotel Trust @ | | | 13,445 | | | | 187,423 | |
| RLJ Lodging Trust | | | 16,642 | | | | 170,913 | |
| Ryman Hospitality Properties, Inc. | | | 5,617 | | | | 521,932 | |
| Service Properties Trust | | | 17,100 | | | | 148,599 | |
| Summit Hotel Properties, Inc. | | | 10,209 | | | | 66,461 | |
| Sunstone Hotel Investors, Inc. | | | 22,084 | | | | 223,490 | |
| Xenia Hotels & Resorts, Inc. | | | 13,264 | | | | 163,280 | |
| | | | | | | | 3,676,082 | |
| Industrial REITs — 13.9% | | | | | | | | |
| Americold Realty Trust, Inc. | | | 28,809 | | | | 930,531 | |
| EastGroup Properties, Inc. | | | 4,697 | | | | 815,399 | |
| First Industrial Realty Trust, Inc. | | | 14,063 | | | | 740,276 | |
| Innovative Industrial Properties, Inc. | | | 2,731 | | | | 199,390 | |
| LXP Industrial Trust | | | 29,881 | | | | 291,340 | |
| Plymouth Industrial REIT, Inc. | | | 4,574 | | | | 105,293 | |
| Prologis, Inc. | | | 97,865 | | | | 12,001,185 | |
| Rexford Industrial Realty, Inc. | | | 22,664 | | | | 1,183,514 | |
| STAG Industrial, Inc. | | | 19,127 | | | | 686,277 | |
| Terreno Realty Corp. | | | 8,376 | | | | 503,398 | |
| | | | | | | | 17,456,603 | |
| Office REITs — 4.7% | | | | | | | | |
| Alexandria Real Estate Equities, Inc. | | | 17,426 | | | | 1,977,677 | |
| Boston Properties, Inc. | | | 15,888 | | | | 914,990 | |
| Brandywine Realty Trust | | | 18,624 | | | | 86,602 | |
| City Office REIT, Inc. | | | 5,176 | | | | 28,830 | |
| Corporate Office Properties Trust | | | 11,998 | | | | 284,953 | |
| Cousins Properties, Inc. | | | 17,110 | | | | 390,108 | |
| Douglas Emmett, Inc.@ | | | 18,107 | | | | 227,605 | |
| Easterly Government Properties, Inc. | | | 9,677 | | | | 140,317 | |
| Equity Commonwealth | | | 11,816 | | | | 239,392 | |
| Highwoods Properties, Inc. | | | 11,410 | | | | 272,813 | |
| Hudson Pacific Properties, Inc. | | | 12,646 | | | | 53,366 | |
| JBG SMITH Properties | | | 11,344 | | | | 170,614 | |
| Kilroy Realty Corp. | | | 11,447 | | | | 344,440 | |
| Office Properties Income Trust | | | 3,570 | | | | 27,489 | |
| Orion Office REIT, Inc. | | | 6,753 | | | | 44,637 | |
| Paramount Group, Inc. | | | 17,848 | | | | 79,067 | |
| Piedmont Office Realty Trust, Inc., | | | | | | | | |
| Class A | | | 10,998 | | | | 79,955 | |
| SL Green Realty Corp.@ | | | 7,066 | | | | 212,333 | |
| Vornado Realty Trust | | | 18,129 | | | | 328,860 | |
| | | | | | | | 5,904,048 | |
| | | | | | | | | |
| Residential REITs — 15.8% | | | | | | | | |
| American Homes 4 Rent., Class A | | | 34,796 | | | | 1,233,518 | |
| Apartment Income REIT Corp. | | | 16,970 | | | | 612,447 | |
| Apartment Investment and Management Co., Class A | | | 15,756 | | | | 134,241 | |
| AvalonBay Communities, Inc. | | | 15,005 | | | | 2,839,996 | |
| Bluerock Homes Trust, Inc.* | | | 412 | | | | 6,650 | |
| BRT Apartments Corp. | | | 400 | | | | 7,920 | |
| Camden Property Trust | | | 10,791 | | | | 1,174,816 | |
| Centerspace | | | 1,825 | | | | 111,982 | |
| Clipper Realty, Inc. | | | 1,167 | | | | 6,617 | |
| Elme Communities | | | 10,445 | | | | 171,716 | |
| Equity LifeStyle Properties, Inc. | | | 18,811 | | | | 1,258,268 | |
| Equity Residential | | | 38,102 | | | | 2,513,589 | |
| Essex Property Trust, Inc. | | | 6,794 | | | | 1,591,834 | |
| Independence Realty Trust, Inc. | | | 24,425 | | | | 445,023 | |
| Invitation Homes, Inc. | | | 65,249 | | | | 2,244,566 | |
| Mid-America Apartment Communities, Inc. | | | 12,349 | | | | 1,875,319 | |
| NexPoint Residential Trust, Inc. | | | 2,547 | | | | 115,838 | |
| Sun Communities, Inc. | | | 13,230 | | | | 1,725,986 | |
| UDR, Inc. | | | 33,842 | | | | 1,453,852 | |
| UMH Properties, Inc. | | | 5,369 | | | | 85,797 | |
| Veris Residential, Inc.* | | | 8,319 | | | | 133,520 | |
| | | | | | | | 19,743,495 | |
| | | | | | | | | |
| Retail REITs — 13.7% | | | | | | | | |
| Acadia Realty Trust | | | 9,876 | | | | 142,116 | |
| Agree Realty Corp. | | | 9,186 | | | | 600,672 | |
| Alexander's, Inc. | | | 303 | | | | 55,710 | |
| Brixmor Property Group, Inc. | | | 32,048 | | | | 705,056 | |
| Federal Realty OP LP | | | 7,875 | | | | 762,064 | |
| Getty Realty Corp. | | | 3,812 | | | | 128,922 | |
| InvenTrust Properties Corp. | | | 6,885 | | | | 159,319 | |
| Kimco Realty Corp. | | | 65,626 | | | | 1,294,145 | |
The accompanying notes are an integral part of these financial statements.
SA Real Estate Securities Fund
PORTFOLIO OF INVESTMENTS — AS OF JUNE 30, 2023 (Continued)
| | | SHARES | | | VALUE† | |
| COMMON STOCKS (Continued) | | | | | | | | |
| Retail REITs (Continued) | | | | | | | | |
| Kite Realty Group Trust | | | 23,808 | | | $ | 531,871 | |
| Macerich Co. (The) | | | 23,319 | | | | 262,805 | |
| Necessity Retail REIT, Inc. | | | 17,263 | | | | 116,698 | |
| NETSTREIT Corp. | | | 6,691 | | | | 119,568 | |
| NNN REIT, Inc. | | | 19,374 | | | | 829,013 | |
| Phillips Edison & Co., Inc.@ | | | 12,411 | | | | 422,967 | |
| Realty Income Corp. | | | 70,499 | | | | 4,215,135 | |
| Regency Centers Corp. | | | 16,409 | | | | 1,013,584 | |
| Retail Opportunity Investments Corp. | | | 13,420 | | | | 181,304 | |
| RPT Realty | | | 8,058 | | | | 84,206 | |
| Saul Centers, Inc. | | | 1,556 | | | | 57,307 | |
| Simon Property Group, Inc. | | | 34,617 | | | | 3,997,571 | |
| SITE Centers Corp. | | | 20,184 | | | | 266,832 | |
| Spirit Realty Capital, Inc. | | | 14,821 | | | | 583,651 | |
| Tanger Factory Outlet Centers, Inc. | | | 11,333 | | | | 250,119 | |
| Urban Edge Properties | | | 12,741 | | | | 196,594 | |
| Urstadt Biddle Properties, Inc. | | | 1,000 | | | | 21,040 | |
| Urstadt Biddle Properties, Inc., Class A | | | 2,206 | | | | 46,900 | |
| Whitestone REIT | | | 6,078 | | | | 58,957 | |
| | | | | | | | 17,104,126 | |
| | | | | | | | | |
| Specialized REITs — 37.4% | | | | | | | | |
| American Tower Corp. | | | 49,450 | | | | 9,590,333 | |
| Crown Castle, Inc. | | | 45,866 | | | | 5,225,972 | |
| CubeSmart | | | 23,892 | | | | 1,067,017 | |
| Digital Realty Trust, Inc. | | | 30,839 | | | | 3,511,637 | |
| EPR Properties | | | 8,091 | | | | 378,659 | |
| Equinix, Inc. | | | 9,946 | | | | 7,797,067 | |
| Esc War Ind *§ | | | 9,141 | | | | — | |
| Extra Space Storage, Inc. | | | 14,295 | | | | 2,127,811 | |
| Four Corners Property Trust, Inc. | | | 9,280 | | | | 235,712 | |
| Gaming and Leisure Properties, Inc. | | | 27,975 | | | | 1,355,668 | |
| Global Self Storage, Inc. | | | 2,195 | | | | 11,085 | |
| Iron Mountain, Inc. | | | 31,096 | | | | 1,766,875 | |
| Lamar Advertising Co., Class A | | | 9,329 | | | | 925,903 | |
| Life Storage, Inc. | | | 9,049 | | | | 1,203,155 | |
| National Storage Affiliates Trust | | | 9,022 | | | | 314,236 | |
| Outfront Media, Inc. | | | 16,965 | | | | 266,690 | |
| Public Storage | | | 16,756 | | | | 4,890,741 | |
| SBA Communications Corp. | | | 11,650 | | | | 2,700,004 | |
| Uniti Group, Inc. | | | 20,375 | | | | 94,132 | |
| VICI Properties, Inc. | | | 107,081 | | | | 3,365,556 | |
| | | | | | | | 46,828,253 | |
| | | | | | | | | |
| TOTAL COMMON STOCKS | | | | | | | | |
| (Identified Cost $72,264,780) | | | | | | | 124,275,810 | |
| | | | | | | | | |
| SHORT-TERM INVESTMENTS — 0.8% | | | | | | | | |
| Investment Company — 0.5% | | | | | | | | |
| State Street Institutional U.S. Government Money Market Fund 4.780% | | | 653,723 | | | $ | 653,723 | |
| Collateral For Securities On Loan — 0.3% | | | | | | | | |
| State Street Navigator Securities Lending Government Money Market Portfolio 5.110% | | | 295,730 | | | | 295,730 | |
| | | | | | | | | |
| TOTAL SHORT-TERM INVESTMENTS | | | | | | | | |
| (Identified Cost $949,453) | | | | | | | 949,453 | |
| | | | | | | | | |
| Total Investments — 100.1% | | | | | | | | |
| (Identified Cost $73,214,233) | | | | | | | 125,225,263 | |
| Liabilities, Less Cash and Other Assets — (0.1%) | | | | | | | (70,515 | ) |
| Net Assets — 100.0% | | | | | | $ | 125,154,748 | |
| † | See Note 1 |
| @ | A portion or all of the security was held on loan. As of June 30, 2023, the fair value of the securities on loan was $1,649,106. |
| * | Non-income producing security |
| § | Fair valued security. Security is valued using significant unobservable inputs as determined pursuant to procedures approved by the Fund’s Board of Trustees. See Note 1 |
Key to abbreviations:
REIT — Real Estate Investment Trust
Portfolio Sectors as of June 30, 2023
(As a percentage of long-term investments) (Unaudited)

The accompanying notes are an integral part of these financial statements.
SA Worldwide Moderate Growth Fund
PORTFOLIO OF INVESTMENTS — AS OF JUNE 30, 2023
| | | SHARES | | | VALUE† | |
| MUTUAL FUNDS — 100.0% | | | | | | | | |
| Other — 100.1% | | | | | | | | |
| SA Emerging Markets Value Fund € | | | 155,612 | | | $ | 1,489,207 | |
| SA Global Fixed Income Fund € | | | 545,841 | | | | 4,650,561 | |
| SA International Value Fund € | | | 367,890 | | | | 4,491,942 | |
| SA Real Estate Securities Fund € | | | 63,048 | | | | 667,683 | |
| SA U.S. Core Market Fund € | | | 135,413 | | | | 3,738,764 | |
| SA U.S. Fixed Income Fund € | | | 210,687 | | | | 1,993,098 | |
| SA U.S. Small Company Fund € | | | 58,801 | | | | 1,489,421 | |
| SA U.S. Value Fund € | | | 198,482 | | | | 3,747,332 | |
| | | | | | | | 22,268,008 | |
| | | | | | | | | |
| TOTAL MUTUAL FUNDS | | | | | | | | |
| (Identified Cost $20,993,170) | | | | | | | 22,268,008 | |
| | | | | | | | | |
| Total Investments — 100.0% | | | | | | | | |
| (Identified Cost $20,993,170) | | | | | | | 22,268,008 | |
| Cash and Other Assets, Less Liabilities — 0.0% | | | | | | | 825 | |
| Net Assets — 100.0% | | | | | | $ | 22,268,833 | |
| † | See Note 1 |
| € | SA Worldwide Moderate Growth Fund invests substantially all of its assets in the affiliated Underlying SA Funds. |
The accompanying notes are an integral part of these financial statements.
(This page has been left blank intentionally.)
STATEMENTS OF ASSETS AND LIABILITIES — JUNE 30, 2023
| | | SA
U.S. Fixed
Income Fund | | | SA
Global Fixed
Income Fund | | | SA
U.S. Core
Market Fund | |
| ASSETS | | | | | | | | | | | | |
| Investments in unaffiliated securities, at value(1) | | $ | 406,993,780 | | | $ | 673,482,407 | | | $ | 641,149,822 | |
| Investments in affiliated securities, at value | | | — | | | | — | | | | — | |
| Cash | | | 15,625 | | | | — | | | | 376,976 | |
| Foreign currency, at value | | | — | | | | 157,537 | | | | — | |
| Receivable for investments sold | | | — | | | | 3,901,467 | | | | — | |
| Dividends and interest receivable | | | 1,595,089 | | | | 3,436,113 | | | | 356,049 | |
| Receivable for fund shares sold | | | 201,998 | | | | 439,839 | | | | 344,781 | |
| Unrealized appreciation on forward foreign currency exchange contracts (Note 1) | | | — | | | | 990,671 | | | | — | |
| Receivable from the Adviser (Note 2) | | | 11,378 | | | | — | | | | 9,689 | |
| Receivable for tax reclaims | | | — | | | | — | | | | — | |
| Prepaid expenses | | | 24,728 | | | | 26,244 | | | | 23,431 | |
| Other assets | | | — | | | | — | | | | 573 | |
| Total Assets | | | 408,842,598 | | | | 682,434,278 | | | | 642,261,321 | |
| | | | | | | | | | | | | |
| LIABILITIES | | | | | | | | | | | | |
| Payable for investments purchased | | | 1,651,012 | | | | — | | | | — | |
| Payable for fund shares redeemed | | | 454,805 | | | | 474,732 | | | | 662,863 | |
| Due to custodian bank | | | — | | | | — | | | | — | |
| Collateral for securities on loan (Note 1) | | | — | | | | 5,297,645 | | | | 314,743 | |
| Unrealized depreciation on forward foreign currency exchange contracts (Note 1) | | | — | | | | 2,838,316 | | | | — | |
| Advisory fee payable (Note 2) | | | 50,306 | | | | 138,585 | | | | 206,211 | |
| Sub-Advisory fee payable (Note 2) | | | 10,061 | | | | 16,630 | | | | 15,466 | |
| Sub-Administration fee payable (Note 2) | | | 19,112 | | | | 30,928 | | | | 26,217 | |
| Custody and accounting fees payable | | | 22,648 | | | | 44,330 | | | | 23,561 | |
| Shareholder servicing fee payable (Note 2) | | | 50,306 | | | | 83,151 | | | | 77,329 | |
| Transfer agent fee payable | | | 10,640 | | | | 11,726 | | | | 13,449 | |
| Professional fees payable | | | 31,824 | | | | 33,323 | | | | 31,823 | |
| Accrued foreign capital gains tax | | | — | | | | — | | | | — | |
| Accrued expenses and other liabilities | | | 7,737 | | | | 7,357 | | | | 13,964 | |
| Total Liabilities | | | 2,308,451 | | | | 8,976,723 | | | | 1,385,626 | |
| NET ASSETS | | $ | 406,534,147 | | | $ | 673,457,555 | | | $ | 640,875,695 | |
| NET ASSETS CONSIST OF: | | | | | | | | | | | | |
| Paid-in capital | | $ | 443,031,054 | | | $ | 755,128,904 | | | $ | 141,815,862 | |
| Total distributable earnings (loss)(2) | | | (36,496,907 | ) | | | (81,671,349 | ) | | | 499,059,833 | |
| NET ASSETS | | $ | 406,534,147 | | | $ | 673,457,555 | | | $ | 640,875,695 | |
| Shares of beneficial interest outstanding ($0.01 par value, unlimited shares authorized) | | | 42,964,537 | | | | 79,061,972 | | | | 23,211,663 | |
| Net asset value per share | | $ | 9.46 | | | $ | 8.52 | | | $ | 27.61 | |
The accompanying notes are an integral part of these financial statements.
SA
U.S. Value
Fund | | | SA
U.S. Small
Company Fund | | | SA
International
Value Fund | | | SA International
Small Company
Fund | | | SA Emerging
Markets
Value Fund | | | SA
Real Estate
Securities Fund | | | SA Worldwide
Moderate
Growth Fund | |
| | | | | | | | | | | | | | | | | | | | |
| $ | 519,815,152 | | | $ | 307,615,168 | | | $ | 579,156,157 | | | $ | 246,953,410 | | | $ | 190,274,953 | | | $ | 125,225,263 | | | $ | — | |
| | — | | | | — | | | | — | | | | — | | | | — | | | | — | | | | 22,268,008 | |
| | 412,092 | | | | 173,728 | | | | 13,841 | | | | — | | | | 31,920 | | | | 49,057 | | | | — | |
| | — | | | | — | | | | 1,369,438 | | | | — | | | | 872,052 | | | | — | | | | — | |
| | — | | | | — | | | | 1,536,336 | | | | 15,000 | | | | 179,297 | | | | — | | | | — | |
| | 460,750 | | | | 179,146 | | | | 1,189,345 | | | | — | | | | 1,586,911 | | | | 520,121 | | | | — | |
| | 202,893 | | | | 103,580 | | | | 274,846 | | | | 127,961 | | | | 191,497 | | | | 60,772 | | | | 6,750 | |
| | — | | | | — | | | | — | | | | — | | | | — | | | | — | | | | — | |
| | — | | | | — | | | | 7,900 | | | | — | | | | 31,010 | | | | 12,705 | | | | 15,911 | |
| | — | | | | — | | | | 3,083,344 | | | | — | | | | 5,838 | | | | — | | | | — | |
| | 22,915 | | | | 21,807 | | | | 22,458 | | | | 21,463 | | | | 21,667 | | | | 21,250 | | | | 23,142 | |
| | — | | | | — | | | | — | | | | — | | | | — | | | | 5,485 | | | | — | |
| | 520,913,802 | | | | 308,093,429 | | | | 586,653,665 | | | | 247,117,834 | | | | 193,195,145 | | | | 125,894,653 | | | | 22,313,811 | |
| | | | | | | | | | | | | | | | | | | | | | | | | | | |
| | | | | | | | | | | | | | | | | | | | | | | | | | | |
| | 93,138 | | | | — | | | | 506,498 | | | | — | | | | 95,670 | | | | 245,119 | | | | 5,950 | |
| | 247,530 | | | | 255,676 | | | | 492,147 | | | | 155,170 | | | | 124,646 | | | | 71,775 | | | | 800 | |
| | — | | | | — | | | | — | | | | 14,009 | | | | — | | | | — | | | | — | |
| | — | | | | 1,951,648 | | | | 39,745,759 | | | | — | | | | 1,462,355 | | | | 295,730 | | | | — | |
| | — | | | | — | | | | — | | | | — | | | | — | | | | — | | | | — | |
| | 167,540 | | | | 109,550 | | | | 199,946 | | | | 50,704 | | | | 70,429 | | | | 35,321 | | | | — | |
| | 41,885 | | | | 49,070 | | | | 88,865 | | | | — | | | | 56,343 | | | | 10,092 | | | | — | |
| | 23,749 | | | | 13,994 | | | | 23,611 | | | | 10,794 | | | | 8,070 | | | | 6,327 | | | | 998 | |
| | 21,352 | | | | 23,049 | | | | 43,786 | | | | 8,910 | | | | 84,408 | | | | 8,940 | | | | 6,288 | |
| | 62,827 | | | | 36,803 | | | | 66,649 | | | | 30,423 | | | | 23,476 | | | | 15,137 | | | | — | |
| | 12,810 | | | | 12,506 | | | | 12,799 | | | | 12,269 | | | | 11,271 | | | | 11,300 | | | | 338 | |
| | 31,823 | | | | 31,823 | | | | 31,323 | | | | 31,823 | | | | 37,288 | | | | 34,323 | | | | 28,323 | |
| | — | | | | — | | | | — | | | | — | | | | 1,104,314 | | | | — | | | | — | |
| | 13,531 | | | | 9,000 | | | | 18,644 | | | | 12,406 | | | | 33,554 | | | | 5,841 | | | | 2,281 | |
| | 716,185 | | | | 2,493,119 | | | | 41,230,027 | | | | 326,508 | | | | 3,111,824 | | | | 739,905 | | | | 44,978 | |
| $ | 520,197,617 | | | $ | 305,600,310 | | | $ | 545,423,638 | | | $ | 246,791,326 | | | $ | 190,083,321 | | | $ | 125,154,748 | | | $ | 22,268,833 | |
| $ | 313,896,699 | | | $ | 164,359,949 | | | $ | 471,604,082 | | | $ | 162,824,059 | | | $ | 192,918,991 | | | $ | 72,084,731 | | | $ | 20,559,435 | |
| | 206,300,918 | | | | 141,240,361 | | | | 73,819,556 | | | | 83,967,267 | | | | (2,835,670 | ) | | | 53,070,017 | | | | 1,709,398 | |
| $ | 520,197,617 | | | $ | 305,600,310 | | | $ | 545,423,638 | | | $ | 246,791,326 | | | $ | 190,083,321 | | | $ | 125,154,748 | | | $ | 22,268,833 | |
| | 27,553,807 | | | | 12,063,953 | | | | 44,666,615 | | | | 12,733,490 | | | | 19,873,474 | | | | 11,821,698 | | | | 2,062,375 | |
| $ | 18.88 | | | $ | 25.33 | | | $ | 12.21 | | | $ | 19.38 | | | $ | 9.56 | | | $ | 10.59 | | | $ | 10.80 | |
The accompanying notes are an integral part of these financial statements.
STATEMENTS OF ASSETS AND LIABILITIES — JUNE 30, 2023 (Continued)
| | | SA
U.S. Fixed
Income Fund | | | SA
Global Fixed
Income Fund | | | SA
U.S. Core
Market Fund | |
| Identified cost of unaffiliated investments | | $ | 411,462,180 | | | $ | 668,487,977 | | | $ | 145,160,492 | |
| Identified cost of affiliated investments | | $ | — | | | $ | — | | | $ | — | |
| Cost of foreign currency | | $ | — | | | $ | 157,595 | | | $ | — | |
| (1) Including securities on loan, at value (see Note 1) | | $ | — | | | $ | 5,146,321 | | | $ | 1,357,807 | |
| (2) Net of deferred capital gain country tax of: | | $ | — | | | $ | — | | | $ | — | |
The accompanying notes are an integral part of these financial statements.
| SA | | | SA | | | SA | | | SA International | | | SA Emerging | | | SA | | | SA Worldwide | |
| U.S. Value | | | U.S. Small | | | International | | | Small Company | | | Markets | | | Real Estate | | | Moderate | |
| Fund | | | Company Fund | | | Value Fund | | | Fund | | | Value Fund | | | Securities Fund | | | Growth Fund | |
| $ | 313,725,770 | | | $ | 168,051,866 | | | $ | 496,304,228 | | | $ | 140,980,077 | | | $ | 181,053,897 | | | $ | 73,214,233 | | | $ | — | |
| $ | — | | | $ | — | | | $ | — | | | $ | — | | | $ | — | | | $ | — | | | $ | 20,993,170 | |
| $ | — | | | $ | — | | | $ | 1,372,846 | | | $ | — | | | $ | 881,585 | | | $ | — | | | $ | — | |
| $ | 590,900 | | | $ | 7,212,085 | | | $ | 60,326,686 | | | $ | — | | | $ | 3,271,516 | | | $ | 1,649,106 | | | $ | — | |
| $ | — | | | $ | — | | | $ | — | | | $ | — | | | $ | 1,104,314 | | | $ | — | | | $ | — | |
The accompanying notes are an integral part of these financial statements.
STATEMENTS OF OPERATIONS — YEAR ENDED JUNE 30, 2023
| | | SA U.S. | | | SA Global | | | SA U.S. | |
| | | Fixed Income | | | Fixed Income | | | Core Market | |
| | | Fund | | | Fund | | | Fund | |
| INVESTMENT INCOME | | | | | | | | | | | | |
| Income: | | | | | | | | | | | | |
| Unaffiliated dividends | | $ | — | | | $ | — | | | $ | 9,679,784 | |
| Affiliated dividends | | | — | | | | — | | | | — | |
| Interest(1) | | | 12,436,191 | | | | 17,908,714 | | | | 57,638 | |
| Other income | | | — | | | | — | | | | 4,194 | |
| Taxes withheld | | | — | | | | — | | | | (1,232 | ) |
| Total Income | | | 12,436,191 | | | | 17,908,714 | | | | 9,740,384 | |
| Expenses: | | | | | | | | | | | | |
| Advisory fees (Note 2) | | | 648,984 | | | | 1,768,731 | | | | 2,416,512 | |
| Shareholder Servicing fees (Note 2) | | | 537,056 | | | | 876,664 | | | | 763,630 | |
| Administration fees (Note 2) | | | 145,136 | | | | 235,469 | | | | 193,578 | |
| Sub-Advisory fees (Note 2) | | | 129,797 | | | | 212,248 | | | | 173,882 | |
| Sub-Administration fees (Note 2) | | | 86,759 | | | | 140,730 | | | | 119,287 | |
| Trustees' fees and expenses (Note 2) | | | 37,200 | | | | 37,200 | | | | 37,200 | |
| Custody and accounting fees | | | 53,286 | | | | 145,783 | | | | 103,306 | |
| Transfer agent fees | | | 83,743 | | | | 87,753 | | | | 101,710 | |
| Professional fees* | | | 57,842 | | | | 59,342 | | | | 59,342 | |
| Registration fees | | | 44,948 | | | | 53,950 | | | | 49,773 | |
| Shareholders report printing expenses | | | 35,610 | | | | 58,638 | | | | 47,303 | |
| Insurance expenses | | | — | | | | — | | | | — | |
| Other expenses** | | | 29,693 | | | | 32,106 | | | | 105,144 | |
| Total expenses before waivers and reimbursements: | | | 1,890,054 | | | | 3,708,614 | | | | 4,170,667 | |
| Less: Fee waiver by the Adviser (Note 2) | | | (95,709 | ) | | | — | | | | (90,051 | ) |
| Net expenses | | | 1,794,345 | | | | 3,708,614 | | | | 4,080,616 | |
| Net investment income | | | 10,641,846 | | | | 14,200,100 | | | | 5,659,768 | |
| NET REALIZED AND UNREALIZED GAIN (LOSS) ON INVESTMENTS | | | | | | | | | | | | |
| Realized gain (loss) on: | | | | | | | | | | | | |
| Investments(2)^ | | | (6,535,175 | ) | | | (47,015,862 | ) | | | 34,844,575 | |
| Investments in affiliates | | | — | | | | — | | | | — | |
| Forward foreign currency exchange contracts | | | — | | | | (669,203 | ) | | | — | |
| Foreign currency transactions | | | — | | | | 95,306 | | | | — | |
| Capital gain distributions from underlying funds | | | — | | | | — | | | | 979,678 | |
| Increase (decrease) in unrealized appreciation (depreciation) on: | | | | | | | | | | | | |
| Investments(3) | | | 2,972,420 | | | | 49,481,506 | | | | 65,430,073 | |
| Investments in affiliates | | | — | | | | — | | | | — | |
| Forward foreign currency exchange contracts | | | — | | | | (8,693,629 | ) | | | — | |
| Foreign currency transactions | | | — | | | | 49,569 | | | | — | |
| Net realized and unrealized gain (loss) on investments and foreign currency transactions and translation | | | (3,562,755 | ) | | | (6,752,313 | ) | | | 101,254,326 | |
| Net increase (decrease) in net assets resulting from operations | | $ | 7,079,091 | | | $ | 7,447,787 | | | | $106,914,094 | |
| (1) | | Interest income includes security lending income of: | | $ | — | | | $ | 16,440 | | | $ | 9,310 | |
| (2) | | Net of capital gain country tax of: | | $ | — | | | $ | — | | | $ | — | |
| (3) | | Net of increase of deferred capital gain country tax accrual of: | | $ | — | | | $ | — | | | $ | — | |
| * | | Professional fees include, but are not limited to, fees associated with legal, audit and tax services. |
| ** | | Other expenses include, but are not limited to, fees associated with insurance, printing services and ReFlow. |
| ^ | | For the year ended June 30, 2023, the SA U.S. Core Market Fund, SA U.S. Value Fund, SA U.S. Small Company Fund, SA International Value Fund, and SA Real Estate Securities Fund had redemptions-in-kind of securities in the amount of $35,949,048, $32,446,948, $17,261,508, $6,034,134 and $5,078,485, respectively. Net realized gains (losses) on investments includes the realized gain on the transactions of $33,195,162, $20,073,591, $9,992,433, $2,913,679 and $2,747,290, respectively, which will not be realized by the Funds for tax purposes. |
The accompanying notes are an integral part of these financial statements.
| SA U.S. | | | SA U.S. | | | SA | | | SA International | | | SA Emerging | | | SA Real Estate | | | SA Worldwide | |
| Value | | | Small Company | | | International | | | Small Company | | | Markets Value | | | Securities | | | Moderate | |
| Fund | | | Fund | | | Value Fund | | | Fund | | | Fund | | | Fund | | | Growth Fund | |
| | | | | | | | | | | | | | | | | | | | |
| | | | | | | | | | | | | | | | | | | | |
| $ | 13,040,419 | | | $ | 4,520,258 | | | $ | 26,758,036 | | | $ | 7,264,121 | | | $ | 10,063,763 | | | $ | 4,493,809 | | | $ | — | |
| | — | | | | — | | | | — | | | | — | | | | — | | | | — | | | | 559,419 | |
| | 44,250 | | | | 40,468 | | | | 288,028 | | | | — | | | | 71,577 | | | | 16,861 | | | | — | |
| | — | | | | 33,618 | | | | — | | | | — | | | | 85 | | | | — | | | | — | |
| | — | | | | (3,870 | ) | | | (2,601,850 | ) | | | — | | | | (1,157,874 | ) | | | — | | | | — | |
| | 13,084,669 | | | | 4,590,474 | | | | 24,444,214 | | | | 7,264,121 | | | | 8,977,551 | | | | 4,510,670 | | | | 559,419 | |
| | | | | | | | | | | | | | | | | | | | | | | | | | | |
| | 2,102,507 | | | | 1,214,684 | | | | 2,418,873 | | | | 609,781 | | | | 830,829 | | | | 459,672 | | | | — | |
| | 658,926 | | | | 381,258 | | | | 676,846 | | | | 307,782 | | | | 229,721 | | | | 162,125 | | | | — | |
| | 167,953 | | | | 97,467 | | | | 164,514 | | | | 74,777 | | | | 57,966 | | | | 44,629 | | | | — | |
| | 525,627 | | | | 607,342 | | | | 1,075,055 | | | | — | | | | 664,663 | | | | 131,335 | | | | — | |
| | 103,929 | | | | 61,523 | | | | 105,932 | | | | 49,475 | | | | 36,115 | | | | 26,581 | | | | 4,494 | |
| | 37,200 | | | | 37,200 | | | | 37,200 | | | | 37,200 | | | | 37,200 | | | | 37,200 | | | | 37,200 | |
| | 73,581 | | | | 79,131 | | | | 171,416 | | | | 27,951 | | | | 269,237 | | | | 43,458 | | | | 15,492 | |
| | 97,030 | | | | 95,146 | | | | 96,831 | | | | 93,260 | | | | 85,405 | | | | 85,685 | | | | 3,580 | |
| | 59,342 | | | | 59,706 | | | | 57,342 | | | | 59,342 | | | | 92,362 | | | | 61,842 | | | | 54,341 | |
| | 47,899 | | | | 43,524 | | | | 46,331 | | | | 40,606 | | | | 41,339 | | | | 38,491 | | | | 26,094 | |
| | 42,873 | | | | 23,033 | | | | 43,757 | | | | 19,182 | | | | 14,788 | | | | 11,226 | | | | 11,934 | |
| | — | | | | — | | | | — | | | | — | | | | — | | | | — | | | | 8,462 | |
| | 104,670 | | | | 66,627 | | | | 88,600 | | | | 21,521 | | | | 110,015 | | | | 40,022 | | | | 15,095 | |
| | 4,021,537 | | | | 2,766,641 | | | | 4,982,697 | | | | 1,340,877 | | | | 2,469,640 | | | | 1,142,266 | | | | 176,692 | |
| | — | | | | (1,459 | ) | | | (64,761 | ) | | | (2,405 | ) | | | (538,756 | ) | | | (132,919 | ) | | | (176,692 | ) |
| | 4,021,537 | | | | 2,765,182 | | | | 4,917,936 | | | | 1,338,472 | | | | 1,930,884 | | | | 1,009,347 | | | | — | |
| | 9,063,132 | | | | 1,825,292 | | | | 19,526,278 | | | | 5,925,649 | | | | 7,046,667 | | | | 3,501,323 | | | | 559,419 | |
| | | | | | | | | | | | | | | | | | | | | | | | | | | |
| | | | | | | | | | | | | | | | | | | | | | | | | | | |
| | 24,829,240 | | | | 12,084,959 | | | | (257,718 | ) | | | (2,359,021 | ) | | | (1,698,433 | ) | | | 3,470,107 | | | | — | |
| | — | | | | — | | | | — | | | | — | | | | — | | | | — | | | | 740,045 | |
| | — | | | | — | | | | 1,131 | | | | — | | | | (476 | ) | | | — | | | | — | |
| | — | | | | — | | | | (71,537 | ) | | | — | | | | (145,183 | ) | | | — | | | | — | |
| | — | | | | — | | | | — | | | | 2,901,400 | | | | — | | | | — | | | | 450,834 | |
| | | | | | | | | | | | | | | | | | | | | | | | | | | |
| | 22,385,154 | | | | 29,037,209 | | | | 66,642,814 | | | | 21,341,505 | | | | 8,698,850 | | | | (13,923,863 | ) | | | — | |
| | — | | | | — | | | | — | | | | — | | | | — | | | | — | | | | 523,672 | |
| | — | | | | — | | | | — | | | | — | | | | — | | | | — | | | | — | |
| | — | | | | — | | | | 112,148 | | | | — | | | | 24,293 | | | | — | | | | — | |
| | 47,214,394 | | | | 41,122,168 | | | | 66,426,838 | | | | 21,883,884 | | | | 6,879,051 | | | | (10,453,756 | ) | | | 1,714,551 | |
| $ | 56,277,526 | | | $ | 42,947,460 | | | $ | 85,953,116 | | | $ | 27,809,533 | | | $ | 13,925,718 | | | $ | (6,952,433 | ) | | $ | 2,273,970 | |
| $ | 1,925 | | | $ | 24,730 | | | $ | 274,320 | | | $ | — | | | $ | 59,177 | | | $ | 1,333 | | | $ | — | |
| $ | — | | | $ | — | | | $ | — | | | $ | — | | | $ | 91,833 | | | $ | — | | | $ | — | |
| $ | — | | | $ | — | | | $ | — | | | $ | — | | | $ | 624,532 | | | $ | — | | | $ | — | |
The accompanying notes are an integral part of these financial statements.
STATEMENTS OF CHANGES IN NET ASSETS
| | | SA U.S. Fixed Income Fund | |
| | | Year Ended | | | Year Ended | |
| | | June 30, 2023 | | | June 30, 2022 | |
| INCREASE (DECREASE) IN NET ASSETS | | | | | | | | |
| Operations: | | | | | | | | |
| Net investment income | | $ | 10,641,846 | | | $ | 1,518,885 | |
| Net realized gain (loss) on investments and foreign currency transactions | | | (6,535,175 | ) | | | (22,778,233 | ) |
| Net increase (decrease) in unrealized appreciation (depreciation) | | | 2,972,420 | | | | (6,788,887 | ) |
| Net increase (decrease) in net assets from operations | | | 7,079,091 | | | | (28,048,235 | ) |
| | | | | | | | | |
| Distributions to shareholders: | | | | | | | | |
| Investor Class | | | (8,262,472 | ) | | | (56,146 | ) |
| Select Class(a) | | | (2,529,260 | ) | | | (1,018,043 | ) |
| Total distributions to shareholders | | | (10,791,732 | ) | | | (1,074,189 | ) |
| | | | | | | | | |
| Capital share transactions | | | | | | | | |
| Proceeds from sale of shares | | | | | | | | |
| Investor Class | | | 416,790,234 | (b) | | | 7,329,042 | |
| Select Class(a) | | | 9,346,480 | | | | 63,433,581 | |
| | | | 426,136,714 | | | | 70,762,623 | |
| Value of distributions reinvested | | | | | | | | |
| Investor Class | | | 8,174,816 | | | | 55,475 | |
| Select Class(a) | | | 2,503,640 | | | | 1,007,504 | |
| | | | 10,678,456 | | | | 1,062,979 | |
| Cost of shares redeemed | | | | | | | | |
| Investor Class | | | (74,306,097 | ) | | | (12,383,679 | ) |
| Select Class(a) | | | (414,094,652 | )(b) | | | (118,709,833 | ) |
| | | | (488,400,749 | ) | | | (131,093,512 | ) |
| Tax-free interclass conversion | | | | | | | | |
| Investor Class | | | (47,203 | ) | | | (7,640,160 | ) |
| Select Class(a) | | | 47,203 | | | | 7,640,160 | |
| | | | — | | | | — | |
| Total capital share transactions | | | (51,585,579 | ) | | | (59,267,910 | ) |
| Total increase (decrease) in net assets | | | (55,298,220 | ) | | | (88,390,334 | ) |
| | | | | | | | | |
| NET ASSETS | | | | | | | | |
| Beginning of year | | $ | 461,832,367 | | | $ | 550,222,701 | |
| End of year | | $ | 406,534,147 | | | $ | 461,832,367 | |
The accompanying notes are an integral part of these financial statements.
| SA Global Fixed Income Fund | | | SA U.S. Core Market Fund | |
| Year Ended | | | Year Ended | | | Year Ended | | | Year Ended | |
| June 30, 2023 | | | June 30, 2022 | | | June 30, 2023 | | | June 30, 2022 | |
| | | | | | | | | | | | | | | |
| | | | | | | | | | | | | | | |
| $ | 14,200,100 | | | $ | 4,501,295 | | | $ | 5,659,768 | | | $ | 4,673,402 | |
| | (47,589,759 | ) | | | (18,128,681 | ) | | | 35,824,253 | | | | 37,986,631 | |
| | 40,837,446 | | | | (46,976,847 | ) | | | 65,430,073 | | | | (122,191,294 | ) |
| | 7,447,787 | | | | (60,604,233 | ) | | | 106,914,094 | | | | (79,531,261 | ) |
| | | | | | | | | | | | | | | |
| | | | | | | | | | | | | | | |
| | (18,787,117 | ) | | | (205,761 | ) | | | (31,997,503 | ) | | | (7,761,606 | ) |
| | (3,999,164 | ) | | | (3,320,824 | ) | | | — | | | | (48,734,730 | ) |
| | (22,786,281 | ) | | | (3,526,585 | ) | | | (31,997,503 | ) | | | (56,496,336 | ) |
| | | | | | | | | | | | | | | |
| | | | | | | | | | | | | | | |
| | | | | | | | | | | | | | | |
| | 697,161,653 | (c) | | | 24,022,227 | | | | 594,629,964 | (d) | | | 10,359,708 | |
| | 19,545,558 | | | | 195,368,079 | | | | 16,838,788 | | | | 118,551,161 | |
| | 716,707,211 | | | | 219,390,306 | | | | 611,468,752 | | | | 128,910,869 | |
| | | | | | | | | | | | | | | |
| | 18,613,725 | | | | 203,470 | | | | 31,305,591 | | | | 7,492,066 | |
| | 3,964,077 | | | | 3,290,379 | | | | — | | | | 47,960,700 | |
| | 22,577,802 | | | | 3,493,849 | | | | 31,305,591 | | | | 55,452,766 | |
| | | | | | | | | | | | | | | |
| | (120,544,720 | ) | | | (12,263,989 | ) | | | (126,889,441 | ) | | | (16,882,446 | ) |
| | (678,883,998 | )(c) | | | (134,188,050 | ) | | | (534,028,957 | )(d) | | | (124,009,602 | ) |
| | (799,428,718 | ) | | | (146,452,039 | ) | | | (660,918,398 | ) | | | (140,892,048 | ) |
| | | | | | | | | | | | | | | |
| | (63,682 | ) | | | (12,596,442 | ) | | | (82,452 | ) | | | (11,224,342 | ) |
| | 63,682 | | | | 12,596,442 | | | | 82,452 | | | | 11,224,342 | |
| | — | | | | — | | | | — | | | | — | |
| | (60,143,705 | ) | | | 76,432,116 | | | | (18,144,055 | ) | | | 43,471,587 | |
| | (75,482,199 | ) | | | 12,301,298 | | | | 56,772,536 | | | | (92,556,010 | ) |
| | | | | | | | | | | | | | | |
| | | | | | | | | | | | | | | |
| $ | 748,939,754 | | | $ | 736,638,456 | | | $ | 584,103,159 | | | $ | 676,659,169 | |
| $ | 673,457,555 | | | $ | 748,939,754 | | | $ | 640,875,695 | | | $ | 584,103,159 | |
The accompanying notes are an integral part of these financial statements.
STATEMENTS OF CHANGES IN NET ASSETS (Continued)
| | | SA U.S. Fixed Income Fund | |
| | | Year Ended | | | Year Ended | |
| | | June 30, 2023 | | | June 30, 2022 | |
| CAPITAL SHARE TRANSACTIONS | | | | | | | | |
| Shares sold by subscription | | | | | | | | |
| Investor Class | | | 44,451,239 | (b) | | | 734,005 | |
| Select Class(a) | | | 984,015 | | | | 6,369,809 | |
| Shares issued for distributions reinvested | | | | | | | | |
| Investor Class | | | 869,365 | | | | 5,797 | |
| Select Class(a) | | | 264,097 | | | | 104,240 | |
| Shares redeemed | | | | | | | | |
| Investor Class | | | (7,877,726 | ) | | | (1,244,974 | ) |
| Select Class(a) | | | (44,079,131 | )(b) | | | (11,941,746 | ) |
| Tax-free interclass conversion | | | | | | | | |
| Investor Class | | | (5,011 | ) | | | (767,215 | ) |
| Select Class(a) | | | 5,000 | | | | 766,048 | |
| Net increase (decrease) in fund shares | | | (5,388,152 | ) | | | (5,974,036 | ) |
| (a) | Effective October 26, 2022, each Fund converted its Select Class shares into its Investor Class shares and all the Investor Class shares were redesignated as shares of the Fund with no name. |
| (b) | Includes automatic conversion from Select Class shares of $388,870,466 representing 41,420,313 shares into 41,490,581 Investor Class shares. |
| (c) | Includes automatic conversion from Select Class shares of $636,280,968 representing 74,708,925 shares into 74,600,310 Investor Class shares. |
| (d) | Includes automatic conversion from Select Class shares of $510,617,519 representing 20,507,057 shares into 20,412,453 Investor Class shares. |
The accompanying notes are an integral part of these financial statements.
| SA Global Fixed Income Fund | | | SA U.S. Core Market Fund | |
| Year Ended | | | Year Ended | | | Year Ended | | | Year Ended | |
| June 30, 2023 | | | June 30, 2022 | | | June 30, 2023 | | | June 30, 2022 | |
| | | | | | | | | | | |
| | | | | | | | | | | |
| | 81,782,678 | (c) | | | 2,577,623 | | | | 23,737,954 | (d) | | | 344,182 | |
| | 2,263,737 | | | | 21,073,279 | | | | 663,858 | | | | 4,005,720 | |
| | | | | | | | | | | | | | | |
| | 2,222,202 | | | | 23,334 | | | | 1,327,070 | | | | 248,246 | |
| | 460,939 | | | | 378,205 | | | | — | | | | 1,599,223 | |
| | | | | | | | | | | | | | | |
| | (14,201,099 | ) | | | (1,343,234 | ) | | | (5,012,660 | ) | | | (568,365 | ) |
| | (79,652,877 | )(c) | | | (14,718,276 | ) | | | (21,433,395 | )(d) | | | (4,183,330 | ) |
| | | | | | | | | | | | | | | |
| | (7,400 | ) | | | (1,357,999 | ) | | | (3,250 | ) | | | (372,787 | ) |
| | 7,412 | | | | 1,359,516 | | | | 3,265 | | | | 374,579 | |
| | (7,124,408 | ) | | | 7,992,448 | | | | (717,158 | ) | | | 1,447,468 | |
The accompanying notes are an integral part of these financial statements.
STATEMENTS OF CHANGES IN NET ASSETS (Continued)
| | | SA U.S. Value Fund | |
| | | Year Ended | | | Year Ended | |
| | | June 30, 2023 | | | June 30, 2022 | |
| INCREASE (DECREASE) IN NET ASSETS | | | | | | | | |
| Operations: | | | | | | | | |
| Net investment income | | $ | 9,063,132 | | | $ | 8,684,569 | |
| Net realized gain (loss) on investments and foreign currency transactions | | | 24,829,240 | | | | 38,687,383 | |
| Net increase (decrease) in unrealized appreciation (depreciation) | | | 22,385,154 | | | | (88,891,972 | ) |
| Net increase (decrease) in net assets from operations | | | 56,277,526 | | | | (41,520,020 | ) |
| | | | | | | | | |
| Distributions to shareholders: | | | | | | | | |
| Investor Class | | | (37,682,984 | ) | | | (3,097,342 | ) |
| Select Class(a) | | | — | | | | (23,772,127 | ) |
| Total distributions to shareholders | | | (37,682,984 | ) | | | (26,869,469 | ) |
| | | | | | | | | |
| Capital share transactions | | | | | | | | |
| Proceeds from sale of shares | | | | | | | | |
| Investor Class | | | 543,036,027 | (b) | | | 6,195,059 | |
| Select Class(a) | | | 13,362,519 | | | | 67,410,410 | |
| | | | 556,398,546 | | | | 73,605,469 | |
| Value of distributions reinvested | | | | | | | | |
| Investor Class | | | 37,067,906 | | | | 3,028,641 | |
| Select Class(a) | | | — | | | | 23,502,957 | |
| | | | 37,067,906 | | | | 26,531,598 | |
| Cost of shares redeemed | | | | | | | | |
| Investor Class | | | (116,735,600 | ) | | | (12,430,535 | ) |
| Select Class(a) | | | (491,721,644 | )(b) | | | (109,924,641 | ) |
| | | | (608,457,244 | ) | | | (122,355,176 | ) |
| Tax-free interclass conversion | | | | | | | | |
| Investor Class | | | (103,118 | ) | | | (9,903,669 | ) |
| Select Class(a) | | | 103,118 | | | | 9,903,669 | |
| | | | — | | | | — | |
| Total capital share transactions | | | (14,990,792 | ) | | | (22,218,109 | ) |
| Total increase (decrease) in net assets | | | 3,603,750 | | | | (90,607,598 | ) |
| | | | | | | | | |
| NET ASSETS | | | | | | | | |
| Beginning of year | | $ | 516,593,867 | | | $ | 607,201,465 | |
| End of year | | $ | 520,197,617 | | | $ | 516,593,867 | |
The accompanying notes are an integral part of these financial statements.
| SA U.S. Small Company Fund | | | SA International Value Fund | |
| Year Ended | | | Year Ended | | | Year Ended | | | Year Ended | |
| June 30, 2023 | | | June 30, 2022 | | | June 30, 2023 | | | June 30, 2022 | |
| | | | | | | | | | | |
| | | | | | | | | | | |
| $ | 1,825,292 | | | $ | 1,794,068 | | | $ | 19,526,278 | | | $ | 22,281,128 | |
| | 12,084,959 | | | | 44,369,692 | | | | (328,124 | ) | | | 31,104,267 | |
| | 29,037,209 | | | | (97,596,716 | ) | | | 66,754,962 | | | | (100,244,262 | ) |
| | 42,947,460 | | | | (51,432,956 | ) | | | 85,953,116 | | | | (46,858,867 | ) |
| | | | | | | | | | | | | | | |
| | | | | | | | | | | | | | | |
| | (9,248,061 | ) | | | (9,826,552 | ) | | | (21,242,831 | ) | | | (2,102,149 | ) |
| | — | | | | (68,069,736 | ) | | | — | | | | (17,859,233 | ) |
| | (9,248,061 | ) | | | (77,896,288 | ) | | | (21,242,831 | ) | | | (19,961,382 | ) |
| | | | | | | | | | | | | | | |
| | | | | | | | | | | | | | | |
| | | | | | | | | | | | | | | |
| | 303,499,620 | (c) | | | 3,320,503 | | | | 491,513,082 | (d) | | | 5,029,522 | |
| | 7,168,836 | | | | 39,784,901 | | | | 15,295,136 | | | | 61,305,963 | |
| | 310,668,456 | | | | 43,105,404 | | | | 506,808,218 | | | | 66,335,485 | |
| | | | | | | | | | | | | | | |
| | 9,099,972 | | | | 9,578,225 | | | | 20,986,104 | | | | 2,061,319 | |
| | — | | | | 67,289,785 | | | | — | | | | 17,683,774 | |
| | 9,099,972 | | | | 76,868,010 | | | | 20,986,104 | | | | 19,745,093 | |
| | | | | | | | | | | | | | | |
| | (61,197,619 | ) | | | (15,181,548 | ) | | | (102,241,956 | ) | | | (13,473,045 | ) |
| | (278,607,332 | )(c) | | | (115,328,413 | ) | | | (471,759,098 | )(d) | | | (129,317,851 | ) |
| | (339,804,951 | ) | | | (130,509,961 | ) | | | (574,001,054 | ) | | | (142,790,896 | ) |
| | | | | | | | | | | | | | | |
| | (14,643 | ) | | | (6,172,452 | ) | | | (77,915 | ) | | | (10,125,688 | ) |
| | 14,643 | | | | 6,172,452 | | | | 77,915 | | | | 10,125,688 | |
| | — | | | | — | | | | — | | | | — | |
| | (20,036,523 | ) | | | (10,536,547 | ) | | | (46,206,732 | ) | | | (56,710,318 | ) |
| | 13,662,876 | | | | (139,865,791 | ) | | | 18,503,553 | | | | (123,530,567 | ) |
| | | | | | | | | | | | | | | |
| | | | | | | | | | | | | | | |
| $ | 291,937,434 | | | $ | 431,803,225 | | | $ | 526,920,085 | | | $ | 650,450,652 | |
| $ | 305,600,310 | | | $ | 291,937,434 | | | $ | 545,423,638 | | | $ | 526,920,085 | |
The accompanying notes are an integral part of these financial statements.
STATEMENTS OF CHANGES IN NET ASSETS (Continued)
| | | SA U.S. Value Fund | |
| | | Year Ended | | | Year Ended | |
| | | June 30, 2023 | | | June 30, 2022 | |
| CAPITAL SHARE TRANSACTIONS | | | | | | | | |
| Shares sold by subscription | | | | | | | | |
| Investor Class | | | 28,471,484 | (b) | | | 298,775 | |
| Select Class(a) | | | 717,407 | | | | 3,279,221 | |
| Shares issued for distributions reinvested | | | | | | | | |
| Investor Class | | | 2,067,368 | | | | 148,390 | |
| Select Class(a) | | | — | | | | 1,158,352 | |
| Shares redeemed | | | | | | | | |
| Investor Class | | | (6,238,858 | ) | | | (602,545 | ) |
| Select Class(a) | | | (25,832,120 | )(b) | | | (5,338,058 | ) |
| Tax-free interclass conversion | | | | | | | | |
| Investor Class | | | (5,660 | ) | | | (477,749 | ) |
| Select Class(a) | | | 5,683 | | | | 479,735 | |
| Net increase (decrease) in fund shares | | | (814,696 | ) | | | (1,053,879 | ) |
| (a) | Effective October 26, 2022, each Fund converted its Select Class shares into its Investor Class shares and all the Investor Class shares were redesignated as shares of the Fund with no name. |
| (b) | Includes automatic conversion from Select Class shares of $469,351,404 representing 24,627,398 shares into 24,533,425 Investor Class shares. |
| (c) | Includes automatic conversion from Select Class shares of $265,166,445 representing 11,100,822 shares into 11,074,720 Investor Class shares. |
| (d) | Includes automatic conversion from Select Class shares of $452,121,916 representing 43,049,800 shares into 42,903,552 Investor Class shares. |
The accompanying notes are an integral part of these financial statements.
| SA U.S. Small Company Fund | | | SA International Value Fund | |
| Year Ended | | | Year Ended | | | Year Ended | | | Year Ended | |
| June 30, 2023 | | | June 30, 2022 | | | June 30, 2023 | | | June 30, 2022 | |
| | | | | | | | | | | | | | | |
| | | | | | | | | | | | | | | |
| | 12,650,157 | (c) | | | 110,551 | | | | 46,316,995 | (d) | | | 412,840 | |
| | 301,658 | | | | 1,382,409 | | | | 1,447,657 | | | | 5,049,471 | |
| | | | | | | | | | | | | | | |
| | 392,918 | | | | 350,594 | | | | 1,900,915 | | | | 175,282 | |
| | — | | | | 2,472,981 | | | | — | | | | 1,511,434 | |
| | | | | | | | | | | | | | | |
| | (2,519,240 | ) | | | (489,110 | ) | | | (8,776,053 | ) | | | (1,102,481 | ) |
| | (11,667,416 | )(c) | | | (3,737,136 | ) | | | (44,917,844 | )(d) | | | (10,617,507 | ) |
| | | | | | | | | | | | | | | |
| | (561 | ) | | | (198,289 | ) | | | (7,590 | ) | | | (825,371 | ) |
| | 563 | | | | 198,678 | | | | 7,620 | | | | 828,395 | |
| | (841,921 | ) | | | 90,678 | | | | (4,028,300 | ) | | | (4,567,937 | ) |
The accompanying notes are an integral part of these financial statements.
STATEMENTS OF CHANGES IN NET ASSETS (Continued)
| | | SA International Small Company Fund | |
| | | Year Ended | | | Year Ended | |
| | | June 30, 2023 | | | June 30, 2022 | |
| INCREASE (DECREASE) IN NET ASSETS | | | | | | | | |
| Operations: | | | | | | | | |
| Net investment income | | $ | 5,925,649 | | | $ | 6,455,492 | |
| Net realized gain (loss) on investments and foreign currency transactions | | | 542,379 | | | | 21,978,183 | |
| Net increase (decrease) in unrealized appreciation (depreciation) | | | 21,341,505 | | | | (88,709,234 | ) |
| Net increase (decrease) in net assets from operations | | | 27,809,533 | | | | (60,275,559 | ) |
| | | | | | | | | |
| Distributions to shareholders: | | | | | | | | |
| Investor Class | | | (13,986,010 | ) | | | (2,017,354 | ) |
| Select Class(a) | | | — | | | | (15,545,446 | ) |
| Total distributions to shareholders | | | (13,986,010 | ) | | | (17,562,800 | ) |
| | | | | | | | | |
| Capital share transactions | | | | | | | | |
| Proceeds from sale of shares | | | | | | | | |
| Investor Class | | | 217,127,428 | (b) | | | 2,585,459 | |
| Select Class(a) | | | 8,677,472 | | | | 30,708,162 | |
| | | | 225,804,900 | | | | 33,293,621 | |
| Value of distributions reinvested | | | | | | | | |
| Investor Class | | | 13,809,504 | | | | 1,968,082 | |
| Select Class(a) | | | — | | | | 15,389,047 | |
| | | | 13,809,504 | | | | 17,357,129 | |
| Cost of shares redeemed | | | | | | | | |
| Investor Class | | | (34,230,590 | ) | | | (6,938,558 | ) |
| Select Class(a) | | | (209,704,012 | )(b) | | | (63,100,951 | ) |
| | | | (243,934,602 | ) | | | (70,039,509 | ) |
| Tax-free interclass conversion | | | | | | | | |
| Investor Class | | | (50,325 | ) | | | (5,254,108 | ) |
| Select Class(a) | | | 50,325 | | | | 5,254,108 | |
| | | | — | | | | — | |
| Total capital share transactions | | | (4,320,198 | ) | | | (19,388,759 | ) |
| Total increase (decrease) in net assets | | | 9,503,325 | | | | (97,227,118 | ) |
| | | | | | | | | |
| NET ASSETS | | | | | | | | |
| Beginning of year | | $ | 237,288,001 | | | $ | 334,515,119 | |
| End of year | | $ | 246,791,326 | | | $ | 237,288,001 | |
The accompanying notes are an integral part of these financial statements.
| SA Emerging Markets Value Fund | | | SA Real Estate Securities Fund | |
| Year Ended | | | Year Ended | | | Year Ended | | | Year Ended | |
| June 30, 2023 | | | June 30, 2022 | | | June 30, 2023 | | | June 30, 2022 | |
| | | | | | | | | | | | | | | |
| | | | | | | | | | | | | | | |
| $ | 7,046,667 | | | $ | 6,852,856 | | | $ | 3,501,323 | | | $ | 2,112,730 | |
| | (1,844,092 | ) | | | 6,857,148 | | | | 3,470,107 | | | | 18,435,584 | |
| | 8,723,143 | | | | (46,844,981 | ) | | | (13,923,863 | ) | | | (28,655,541 | ) |
| | 13,925,718 | | | | (33,134,977 | ) | | | (6,952,433 | ) | | | (8,107,227 | ) |
| | | | | | | | | | | | | | | |
| | | | | | | | | | | | | | | |
| | (6,277,522 | ) | | | (597,981 | ) | | | (9,006,102 | ) | | | (1,660,952 | ) |
| | — | | | | (5,768,774 | ) | | | — | | | | (13,171,496 | ) |
| | (6,277,522 | ) | | | (6,366,755 | ) | | | (9,006,102 | ) | | | (14,832,448 | ) |
| | | | | | | | | | | | | | | |
| | | | | | | | | | | | | | | |
| | | | | | | | | | | | | | | |
| | 168,230,277 | (c) | | | 3,118,419 | | | | 128,259,038 | (d) | | | 1,386,664 | |
| | 6,640,753 | | | | 32,936,267 | | | | 3,286,284 | | | | 14,794,291 | |
| | 174,871,030 | | | | 36,054,686 | | | | 131,545,322 | | | | 16,180,955 | |
| | | | | | | | | | | | | | | |
| | 6,211,004 | | | | 588,176 | | | | 8,870,430 | | | | 1,632,976 | |
| | — | | | | 5,711,449 | | | | — | | | | 13,043,699 | |
| | 6,211,004 | | | | 6,299,625 | | | | 8,870,430 | | | | 14,676,675 | |
| | | | | | | | | | | | | | | |
| | (26,842,078 | ) | | | (3,508,739 | ) | | | (24,055,479 | ) | | | (5,982,293 | ) |
| | (158,372,192 | )(c) | | | (39,800,917 | ) | | | (116,259,928 | )(d) | | | (53,446,356 | ) |
| | (185,214,270 | ) | | | (43,309,656 | ) | | | (140,315,407 | ) | | | (59,428,649 | ) |
| | | | | | | | | | | | | | | |
| | (20,108 | ) | | | (3,065,158 | ) | | | (19,896 | ) | | | (2,839,875 | ) |
| | 20,108 | | | | 3,065,158 | | | | 19,896 | | | | 2,839,875 | |
| | — | | | | — | | | | — | | | | — | |
| | (4,132,236 | ) | | | (955,345 | ) | | | 100,345 | | | | (28,571,019 | ) |
| | 3,515,960 | | | | (40,457,077 | ) | | | (15,858,190 | ) | | | (51,510,694 | ) |
| | | | | | | | | | | | | | | |
| | | | | | | | | | | | | | | |
| $ | 186,567,361 | | | $ | 227,024,438 | | | $ | 141,012,938 | | | $ | 192,523,632 | |
| $ | 190,083,321 | | | $ | 186,567,361 | | | $ | 125,154,748 | | | $ | 141,012,938 | |
The accompanying notes are an integral part of these financial statements.
STATEMENTS OF CHANGES IN NET ASSETS (Continued)
| | | SA International Small Company Fund | |
| | | Year Ended | | | Year Ended | |
| | | June 30, 2023 | | | June 30, 2022 | |
| CAPITAL SHARE TRANSACTIONS | | | | | | | | |
| Shares sold by subscription | | | | | | | | |
| Investor Class | | | 12,318,311 | (b) | | | 111,503 | |
| Select Class(a) | | | 486,385 | | | | 1,365,813 | |
| Shares issued for distributions reinvested | | | | | | | | |
| Investor Class | | | 771,481 | | | | 86,891 | |
| Select Class(a) | | | — | | | | 684,262 | |
| Shares redeemed | | | | | | | | |
| Investor Class | | | (1,808,824 | ) | | | (300,029 | ) |
| Select Class(a) | | | (12,003,743 | )(b) | | | (2,723,548 | ) |
| Tax-free interclass conversion | | | | | | | | |
| Investor Class | | | (2,939 | ) | | | (219,455 | ) |
| Select Class(a) | | | 2,954 | | | | 220,479 | |
| Net increase (decrease) in fund shares | | | (236,375 | ) | | | (774,084 | ) |
| (a) | Effective October 26, 2022, each Fund converted its Select Class shares into its Investor Class shares and all the Investor Class shares were redesignated as shares of the Fund with no name. |
| (b) | Includes automatic conversion from Select Class shares of $200,767,508 representing 11,501,742 shares into 11,445,092 Investor Class shares. |
| (c) | Includes automatic conversion from Select Class shares of $151,215,525 representing 18,339,602 shares into 18,342,495 Investor Class shares. |
| (d) | Includes automatic conversion from Select Class shares of $110,708,321 representing 10,314,856 shares into 10,277,702 Investor Class shares. |
The accompanying notes are an integral part of these financial statements.
| SA Emerging Markets Value Fund | | | SA Real Estate Securities Fund | |
| Year Ended | | | Year Ended | | | Year Ended | | | Year Ended | |
| June 30, 2023 | | | June 30, 2022 | | | June 30, 2023 | | | June 30, 2022 | |
| | | | | | | | | | | |
| | | | | | | | | | | |
| | 20,221,150 | (c) | | | 294,891 | | | | 11,925,062 | (d) | | | 97,174 | |
| | 744,798 | | | | 3,154,411 | | | | 280,610 | | | | 1,061,174 | |
| | | | | | | | | | | | | | | |
| | 704,195 | | | | 57,834 | | | | 868,798 | | | | 114,194 | |
| | — | | | | 562,704 | | | | — | | | | 917,278 | |
| | | | | | | | | | | | | | | |
| | (2,946,143 | ) | | | (335,852 | ) | | | (2,264,555 | ) | | | (425,337 | ) |
| | (19,148,297 | )(c) | | | (3,798,621 | ) | | | (10,786,475 | )(d) | | | (3,814,937 | ) |
| | | | | | | | | | | | | | | |
| | (2,249 | ) | | | (292,199 | ) | | | (1,766 | ) | | | (200,378 | ) |
| | 2,249 | | | | 292,456 | | | | 1,772 | | | | 201,063 | |
| | (424,297 | ) | | | (64,376 | ) | | | 23,446 | | | | (2,049,769 | ) |
The accompanying notes are an integral part of these financial statements.
STATEMENTS OF CHANGES IN NET ASSETS (Continued)
| | | SA Worldwide Moderate Growth Fund | |
| | | Year Ended | | | Year Ended | |
| | | June 30, 2023 | | | June 30, 2022 | |
| INCREASE (DECREASE) IN NET ASSETS | | | | | | | | |
| Operations: | | | | | | | | |
| Net investment income | | $ | 559,419 | | | $ | 360,412 | |
| Net realized gain on investments and foreign currency transactions | | | 1,190,879 | | | | 2,038,472 | |
| Net increase (decrease) in unrealized appreciation (depreciation) | | | 523,672 | | | | (4,677,179 | ) |
| Net increase (decrease) in net assets from operations | | | 2,273,970 | | | | (2,278,295 | ) |
| Distributions to shareholders | | | (1,732,292 | ) | | | (1,168,884 | ) |
| | | | | | | | | |
| Capital share transactions | | | | | | | | |
| Proceeds from sale of shares | | | 2,163,784 | | | | 2,954,114 | |
| Value of distributions reinvested | | | 1,725,778 | | | | 1,164,151 | |
| Cost of shares redeemed | | | (5,334,057 | ) | | | (4,667,944 | ) |
| Total capital share transactions | | | (1,444,495 | ) | | | (549,679 | ) |
| Total decrease in net assets | | | (902,817 | ) | | | (3,996,858 | ) |
| | | | | | | | | |
| NET ASSETS | | | | | | | | |
| Beginning of year | | $ | 23,171,650 | | | $ | 27,168,508 | |
| End of year | | $ | 22,268,833 | | | $ | 23,171,650 | |
| | | | | | | | | |
| CAPITAL SHARE TRANSACTIONS | | | | | | | | |
| Shares sold by subscription | | | 205,027 | | | | 248,004 | |
| Shares issued for distributions reinvested | | | 172,233 | | | | 96,932 | |
| Shares redeemed | | | (501,925 | ) | | | (391,603 | ) |
| Net decrease in fund shares | | | (124,665 | ) | | | (46,667 | ) |
The accompanying notes are an integral part of these financial statements.
FINANCIAL HIGHLIGHTS
| | | SA U.S. Fixed Income Fund | |
| | | Year Ended June 30, | |
| | | 2023 | | | 2022 | | | 2021 | | | 2020 | | | 2019 | |
| Net asset value, beginning of period | | $ | 9.54 | | | $ | 10.12 | | | $ | 10.17 | | | $ | 10.16 | | | $ | 10.11 | |
| | | | | | | | | | | | | | | | | | | | | |
| Income from investment operations: | | | | | | | | | | | | | | | | | | | | |
| Net investment income (loss) | | | 0.23 | (1) | | | 0.01 | (1) | | | (0.02 | )(1)(2) | | | 0.13 | (1) | | | (0.20 | ) |
| Net realized and unrealized gain (loss) on investments | | | (0.08 | ) | | | (0.58 | ) | | | (0.03 | )(2) | | | 0.01 | | | | 0.46 | |
| Total from investment operations | | | 0.15 | | | | (0.57 | ) | | | (0.05 | ) | | | 0.14 | | | | 0.26 | |
| | | | | | | | | | | | | | | | | | | | | |
| Less distributions from: | | | | | | | | | | | | | | | | | | | | |
| Net investment income | | | (0.23 | ) | | | (0.01 | ) | | | (0.00 | )(3) | | | (0.13 | ) | | | (0.21 | ) |
| | | | | | | | | | | | | | | | | | | | | |
| Net asset value, end of period | | $ | 9.46 | | | $ | 9.54 | | | $ | 10.12 | | | $ | 10.17 | | | $ | 10.16 | |
| | | | | | | | | | | | | | | | | | | | | |
| Total return | | | 1.65 | % | | | (5.63 | )% | | | (0.48 | )% | | | 1.42 | % | | | 2.58 | % |
| Net assets, end of period (000s) | | $ | 406,534 | | | $ | 52,715 | | | $ | 68,818 | | | $ | 80,440 | | | $ | 113,430 | |
| Ratio of net expenses to average net assets | | | 0.41 | % | | | 0.63 | % | | | 0.64 | % | | | 0.63 | % | | | 0.64 | % |
| Ratio of gross expenses to average net assets | | | 0.44 | %(4) | | | 0.63 | % | | | 0.64 | % | | | 0.63 | % | | | 0.64 | % |
| Ratio of net investment income (loss) to average net assets | | | 2.46 | % | | | 0.10 | % | | | (0.15 | )% | | | 1.28 | % | | | 1.92 | % |
| Portfolio turnover rate | | | 29 | % | | | 203 | % | | | 113 | % | | | 49 | % | | | 88 | % |
| (1) | Calculated based on average shares outstanding during the year. |
| (2) | Realized and unrealized gains and losses per share in this caption are balancing amounts necessary to reconcile the change in net asset value per share for the period, and may not reconcile with the aggregate gains and losses in the Statement of Operations due to share transactions for the period. |
| (3) | Amount rounds to less than $(0.005) per share. |
| (4) | Gross expenses before waivers of expenses. |
The accompanying notes are an integral part of these financial statements.
FINANCIAL HIGHLIGHTS (Continued)
| | | SA Global Fixed Income Fund | |
| | | Year Ended June 30, | |
| | | 2023 | | | 2022 | | | 2021 | | | 2020 | | | 2019 | |
| Net asset value, beginning of period | | $ | 8.71 | | | $ | 9.44 | | | $ | 9.42 | | | $ | 9.63 | | | $ | 9.59 | |
| | | | | | | | | | | | | | | | | | | | | |
| Income from investment operations: | | | | | | | | | | | | | | | | | | | | |
| Net investment income (loss) | | | 0.17 | (1) | | | 0.03 | (1) | | | (0.03 | )(1) | | | 0.00 | (1)(2) | | | (0.09 | ) |
| Net realized and unrealized gain (loss) on investments | | | (0.08 | ) | | | (0.74 | ) | | | 0.05 | | | | 0.14 | | | | 0.46 | |
| Total from investment operations | | | 0.09 | | | | (0.71 | ) | | | 0.02 | | | | 0.14 | | | | 0.37 | |
| | | | | | | | | | | | | | | | | | | | | |
| Less distributions from: | | | | | | | | | | | | | | | | | | | | |
| Net investment income | | | (0.28 | ) | | | (0.02 | ) | | | — | | | | (0.35 | ) | | | (0.33 | ) |
| | | | | | | | | | | | | | | | | | | | | |
| Net asset value, end of period | | $ | 8.52 | | | $ | 8.71 | | | $ | 9.44 | | | $ | 9.42 | | | $ | 9.63 | |
| | | | | | | | | | | | | | | | | | | | | |
| Total return | | | 1.06 | % | | | (7.50 | )% | | | 0.21 | % | | | 1.46 | % | | | 3.90 | % |
| Net assets, end of period (000s) | | $ | 673,458 | | | $ | 80,670 | | | $ | 88,378 | | | $ | 100,567 | | | $ | 133,954 | |
| Ratio of net expenses to average net assets | | | 0.52 | % | | | 0.71 | % | | | 0.73 | % | | | 0.73 | % | | | 0.73 | % |
| Ratio of gross expenses to average net assets | | | 0.52 | % | | | 0.71 | % | | | 0.73 | % | | | 0.73 | % | | | 0.73 | % |
| Ratio of net investment income (loss) to average net assets | | | 2.01 | % | | | 0.37 | % | | | (0.30 | )% | | | 0.01 | % | | | 0.53 | % |
| Portfolio turnover rate | | | 97 | % | | | 103 | % | | | 111 | % | | | 58 | % | | | 75 | % |
| (1) | Calculated based on average shares outstanding during the year. |
| (2) | Amount rounds to less than $0.005 per share. |
The accompanying notes are an integral part of these financial statements.
FINANCIAL HIGHLIGHTS (Continued)
| | | SA U.S. Core Market Fund | |
| | | Year Ended June 30, | |
| | | 2023 | | | 2022 | | | 2021 | | | 2020 | | | 2019 | |
| Net asset value, beginning of period | | $ | 24.52 | | | $ | 30.22 | | | $ | 23.37 | | | $ | 24.79 | | | $ | 24.18 | |
| | | | | | | | | | | | | | | | | | | | | |
| Income from investment operations: | | | | | | | | | | | | | | | | | | | | |
| Net investment income | | | 0.24 | (1) | | | 0.14 | (1) | | | 0.14 | (1) | | | 0.23 | (1) | | | 0.01 | |
| Net realized and unrealized gain (loss) on investments | | | 4.23 | | | | (3.46 | ) | | | 8.87 | | | | 1.43 | | | | 1.95 | |
| Total from investment operations | | | 4.47 | | | | (3.32 | ) | | | 9.01 | | | | 1.66 | | | | 1.96 | |
| | | | | | | | | | | | | | | | | | | | | |
| Less distributions from: | | | | | | | | | | | | | | | | | | | | |
| Net investment income | | | (0.22 | ) | | | (0.11 | ) | | | (0.22 | ) | | | (0.26 | ) | | | (0.17 | ) |
| Capital gains | | | (1.16 | ) | | | (2.27 | ) | | | (1.94 | ) | | | (2.82 | ) | | | (1.18 | ) |
| Total distributions | | | (1.38 | ) | | | (2.38 | ) | | | (2.16 | ) | | | (3.08 | ) | | | (1.35 | ) |
| | | | | | | | | | | | | | | | | | | | | |
| Net asset value, end of period | | $ | 27.61 | | | $ | 24.52 | | | $ | 30.22 | | | $ | 23.37 | | | $ | 24.79 | |
| | | | | | | | | | | | | | | | | | | | | |
| Total return | | | 19.19 | % | | | (12.44 | )% | | | 39.94 | % | | | 6.31 | % | | | 9.30 | % |
| Net assets, end of period (000s) | | $ | 640,876 | | | $ | 77,555 | | | $ | 106,102 | | | $ | 112,429 | | | $ | 165,849 | |
| Ratio of net expenses to average net assets | | | 0.68 | %(3) | | | 0.86 | % | | | 0.87 | % | | | 0.88 | % | | | 0.88 | % |
| Ratio of gross expenses to average net assets | | | 0.69 | %(2)(3) | | | 0.86 | % | | | 0.87 | % | | | 0.88 | % | | | 0.88 | % |
| Ratio of net investment income to average net assets | | | 0.94 | % | | | 0.48 | % | | | 0.53 | % | | | 0.98 | % | | | 1.02 | % |
| Portfolio turnover rate | | | 3 | % | | | 9 | % | | | 1 | % | | | 3 | % | | | 4 | % |
| (1) | Calculated based on average shares outstanding during the year. |
| (2) | Gross expenses before waivers of expenses. |
| (3) | The ratio of net expenses and gross expenses to average net assets excluding ReFlow liquidity program fee were 0.66% and 0.68%, respectively. |
The accompanying notes are an integral part of these financial statements.
FINANCIAL HIGHLIGHTS (Continued)
| | | SA U.S. Value Fund | |
| | | Year Ended June 30, | |
| | | 2023 | | | 2022 | | | 2021 | | | 2020 | | | 2019 | |
| Net asset value, beginning of period | | $ | 18.28 | | | $ | 20.71 | | | $ | 14.10 | | | $ | 17.13 | | | $ | 18.39 | |
| | | | | | | | | | | | | | | | | | | | | |
| Income from investment operations: | | | | | | | | | | | | | | | | | | | | |
| Net investment income (loss) | | | 0.32 | (1) | | | 0.26 | (1) | | | 0.21 | (1) | | | 0.28 | (1) | | | (0.03 | ) |
| Net realized and unrealized gain (loss) on investments | | | 1.67 | | | | (1.80 | ) | | | 6.66 | | | | (2.39 | ) | | | 0.24 | |
| Total from investment operations | | | 1.99 | | | | (1.54 | ) | | | 6.87 | | | | (2.11 | ) | | | 0.21 | |
| | | | | | | | | | | | | | | | | | | | | |
| Less distributions from: | | | | | | | | | | | | | | | | | | | | |
| Net investment income | | | (0.33 | ) | | | (0.22 | ) | | | (0.26 | ) | | | (0.26 | ) | | | (0.19 | ) |
| Capital gains | | | (1.06 | ) | | | (0.67 | ) | | | — | | | | (0.66 | ) | | | (1.28 | ) |
| Total distributions | | | (1.39 | ) | | | (0.89 | ) | | | (0.26 | ) | | | (0.92 | ) | | | (1.47 | ) |
| | | | | | | | | | | | | | | | | | | | | |
| Net asset value, end of period | | $ | 18.88 | | | $ | 18.28 | | | $ | 20.71 | | | $ | 14.10 | | | $ | 17.13 | |
| | | | | | | | | | | | | | | | | | | | | |
| Total return | | | 11.31 | % | | | (7.88 | )% | | | 49.17 | % | | | (13.42 | )% | | | 2.43 | % |
| Net assets, end of period (000s) | | $ | 520,198 | | | $ | 59,594 | | | $ | 80,613 | | | $ | 74,571 | | | $ | 117,485 | |
| Ratio of net expenses to average net assets | | | 0.77 | %(2) | | | 0.94 | % | | | 0.95 | % | | | 0.95 | % | | | 0.96 | % |
| Ratio of gross expenses to average net assets | | | 0.77 | %(2) | | | 0.94 | % | | | 0.95 | % | | | 0.95 | % | | | 0.96 | % |
| Ratio of net investment income to average net assets | | | 1.72 | % | | | 1.26 | % | | | 1.24 | % | | | 1.71 | % | | | 1.53 | % |
| Portfolio turnover rate | | | 5 | % | | | 10 | % | | | 5 | % | | | 10 | % | | | 11 | % |
| (1) | Calculated based on average shares outstanding during the year. |
| (2) | The ratio of net expenses and gross expenses to average net assets excluding ReFlow liquidity program fee were 0.75% and 0.75%, respectively. |
The accompanying notes are an integral part of these financial statements.
FINANCIAL HIGHLIGHTS (Continued)
| | | SA U.S. Small Company Fund | |
| | | Year Ended June 30, | |
| | | 2023 | | | 2022 | | | 2021 | | | 2020 | | | 2019 | |
| Net asset value, beginning of period | | $ | 22.68 | | | $ | 33.74 | | | $ | 21.77 | | | $ | 25.46 | | | $ | 27.37 | |
| | | | | | | | | | | | | | | | | | | | | |
| Income from investment operations: | | | | | | | | | | | | | | | | | | | | |
| Net investment income | | | 0.15 | (1) | | | 0.09 | (1) | | | 0.06 | (1) | | | 0.09 | (1) | | | 0.07 | |
| Net realized and unrealized gain (loss) on investments | | | 3.25 | | | | (4.02 | ) | | | 12.60 | | | | (2.62 | ) | | | (1.27 | ) |
| Total from investment operations | | | 3.40 | | | | (3.93 | ) | | | 12.66 | | | | (2.53 | ) | | | (1.20 | ) |
| | | | | | | | | | | | | | | | | | | | | |
| Less distributions from: | | | | | | | | | | | | | | | | | | | | |
| Net investment income | | | (0.12 | ) | | | (0.07 | ) | | | (0.06 | ) | | | (0.07 | ) | | | — | |
| Capital gains | | | (0.63 | ) | | | (7.06 | ) | | | (0.63 | ) | | | (1.09 | ) | | | (0.71 | ) |
| Total distributions | | | (0.75 | ) | | | (7.13 | ) | | | (0.69 | ) | | | (1.16 | ) | | | (0.71 | ) |
| | | | | | | | | | | | | | | | | | | | | |
| Net asset value, end of period | | $ | 25.33 | | | $ | 22.68 | | | $ | 33.74 | | | $ | 21.77 | | | $ | 25.46 | |
| | | | | | | | | | | | | | | | | | | | | |
| Total return | | | 15.29 | % | | | (15.24 | )% | | | 58.84 | % | | | (10.66 | )% | | | (3.94 | )% |
| Net assets, end of period (000s) | | $ | 305,600 | | | $ | 34,945 | | | $ | 59,623 | | | $ | 55,701 | | | $ | 81,679 | |
| Ratio of net expenses to average net assets | | | 0.91 | %(3) | | | 1.09 | % | | | 1.14 | % | | | 1.14 | % | | | 1.15 | % |
| Ratio of gross expenses to average net assets | | | 0.91 | %(2)(3) | | | 1.09 | % | | | 1.14 | % | | | 1.14 | % | | | 1.15 | % |
| Ratio of net investment income to average net assets | | | 0.60 | % | | | 0.31 | % | | | 0.20 | % | | | 0.38 | % | | | 0.31 | % |
| Portfolio turnover rate | | | 8 | % | | | 7 | % | | | 7 | % | | | 14 | % | | | 12 | % |
| (1) | Calculated based on average shares outstanding during the year. |
| (2) | Gross expenses before waivers of expenses. |
| (3) | The ratio of net expenses and gross expenses to average net assets excluding ReFlow liquidity program fee were 0.90% and 0.90%, respectively. |
The accompanying notes are an integral part of these financial statements.
FINANCIAL HIGHLIGHTS (Continued)
| | | SA International Value Fund | |
| | | Year Ended June 30, | |
| | | 2023 | | | 2022 | | | 2021 | | | 2020 | | | 2019 | |
| Net asset value, beginning of period | | $ | 10.86 | | | $ | 12.25 | | | $ | 8.71 | | | $ | 10.96 | | | $ | 11.87 | |
| | | | | | | | | | | | | | | | | | | | | |
| Income from investment operations: | | | | | | | | | | | | | | | | | | | | |
| Net investment income | | | 0.41 | (1) | | | 0.41 | (1) | | | 0.28 | (1) | | | 0.19 | (1) | | | 0.13 | |
| Net realized and unrealized gain (loss) on investments | | | 1.39 | | | | (1.43 | ) | | | 3.48 | | | | (2.03 | ) | | | (0.85 | ) |
| Total from investment operations | | | 1.80 | | | | (1.02 | ) | | | 3.76 | | | | (1.84 | ) | | | (0.72 | ) |
| | | | | | | | | | | | | | | | | | | | | |
| Less distributions from: | | | | | | | | | | | | | | | | | | | | |
| Net investment income | | | (0.45 | ) | | | (0.37 | ) | | | (0.22 | ) | | | (0.41 | ) | | | (0.19 | ) |
| | | | | | | | | | | | | | | | | | | | | |
| Net asset value, end of period | | $ | 12.21 | | | $ | 10.86 | | | $ | 12.25 | | | $ | 8.71 | | | $ | 10.96 | |
| | | | | | | | | | | | | | | | | | | | | |
| Total return | | | 17.05 | % | | | (8.57 | )% | | | 43.64 | % | | | (17.62 | )% | | | (5.88 | )% |
| Net assets, end of period (000s) | | $ | 545,424 | | | $ | 56,827 | | | $ | 80,507 | | | $ | 80,664 | | | $ | 124,822 | |
| Ratio of net expenses to average net assets | | | 0.91 | %(3) | | | 1.11 | % | | | 1.11 | % | | | 1.11 | % | | | 1.12 | % |
| Ratio of gross expenses to average net assets | | | 0.93 | %(2)(3) | | | 1.11 | % | | | 1.11 | % | | | 1.11 | % | | | 1.12 | % |
| Ratio of net investment income to average net assets | | | 3.63 | % | | | 3.36 | % | | | 2.64 | % | | | 1.92 | % | | | 2.67 | % |
| Portfolio turnover rate | | | 11 | % | | | 12 | % | | | 9 | % | | | 13 | % | | | 19 | % |
| (1) | Calculated based on average shares outstanding during the year. |
| (2) | Gross expenses before waivers of expenses. |
| (3) | The ratio of net expenses and gross expenses to average net assets excluding ReFlow liquidity program fee were 0.91% and 0.92%, respectively. |
The accompanying notes are an integral part of these financial statements.
FINANCIAL HIGHLIGHTS (Continued)
| | | SA International Small Company Fund | |
| | | Year Ended June 30, | |
| | | 2023 | | | 2022 | | | 2021 | | | 2020 | | | 2019 | |
| Net asset value, beginning of period | | $ | 18.39 | | | $ | 24.44 | | | $ | 17.32 | | | $ | 19.75 | | | $ | 22.94 | |
| | | | | | | | | | | | | | | | | | | | | |
| Income from investment operations: | | | | | | | | | | | | | | | | | | | | |
| Net investment income (loss) | | | 0.45 | (1) | | | 0.44 | (1) | | | 0.24 | (1) | | | 0.31 | (1) | | | (0.21 | ) |
| Net realized and unrealized gain (loss) on investments | | | 1.64 | | | | (5.16 | ) | | | 7.31 | | | | (1.57 | ) | | | (1.80 | ) |
| Total from investment operations | | | 2.09 | | | | (4.72 | ) | | | 7.55 | | | | (1.26 | ) | | | (2.01 | ) |
| | | | | | | | | | | | | | | | | | | | | |
| Less distributions from: | | | | | | | | | | | | | | | | | | | | |
| Net investment income | | | (0.33 | ) | | | (0.57 | ) | | | (0.24 | ) | | | (0.35 | ) | | | (0.29 | ) |
| Capital gains | | | (0.77 | ) | | | (0.76 | ) | | | (0.19 | ) | | | (0.82 | ) | | | (0.89 | ) |
| Total distributions | | | (1.10 | ) | | | (1.33 | ) | | | (0.43 | ) | | | (1.17 | ) | | | (1.18 | ) |
| | | | | | | | | | | | | | | | | | | | | |
| Net asset value, end of period | | $ | 19.38 | | | $ | 18.39 | | | $ | 24.44 | | | $ | 17.32 | | | $ | 19.75 | |
| | | | | | | | | | | | | | | | | | | | | |
| Total return | | | 11.85 | % | | | (20.33 | )% | | | 43.94 | % | | | (7.26 | )% | | | (8.05 | )% |
| Net assets, end of period (000s) | | $ | 246,791 | | | $ | 26,761 | | | $ | 43,416 | | | $ | 41,203 | | | $ | 62,905 | |
| Ratio of net expenses to average net assets† | | | 0.55 | % | | | 0.74 | % | | | 0.75 | % | | | 0.75 | % | | | 0.75 | % |
| Ratio of gross expenses to average net assets† | | | 0.55 | %(2) | | | 0.74 | % | | | 0.75 | %(2) | | | 0.75 | % | | | 0.76 | %(2) |
| Ratio of net investment income to average net assets†(3) | | | 2.43 | % | | | 1.92 | % | | | 1.11 | % | | | 1.63 | % | | | 1.58 | % |
| Ratio of expenses to average net assets for the DFA Portfolio (unaudited)†(4) | | | 0.39 | % | | | 0.42 | % | | | 0.49 | % | | | 0.53 | % | | | 0.54 | % |
| Ratio of expenses to average net assets for the DFA Portfolio†(5) | | | 0.41 | % | | | 0.46 | % | | | 0.53 | % | | | 0.54 | % | | | 0.53 | % |
| Portfolio turnover rate(6) | | | 7 | % | | | 8 | % | | | 2 | % | | | 6 | % | | | 6 | % |
| † | The DFA Portfolio expenses are not included in the stated expense information of the SA International Small Co. Fund. The financial statements of the DFA International Small Company Portfolio are included elsewhere in this report. |
| (1) | Calculated based on average shares outstanding during the year. |
| (2) | Gross expenses before waivers of expenses. |
| (3) | Recognition of net investment income by the Fund is affected by the timing of the declaration of dividends by the underlying investment companies in which the Fund invests. |
| (4) | The DFA Portfolio expense ratios are as of April 30, 2023, 2022, 2021, 2020 and 2019 respectively and are unaudited. |
| (5) | The DFA Portfolio expense ratios are for the fiscal years ended October 31, 2022, 2021, 2020, 2019 and 2018 respectively. |
| (6) | The SA International Small Company Fund invests substantially all of its assets in the DFA Portfolio. Please refer to the financial statements of the DFA Portfolio included elsewhere in this report. |
The accompanying notes are an integral part of these financial statements.
FINANCIAL HIGHLIGHTS (Continued)
| | | SA Emerging Markets Value Fund | |
| | | Year Ended June 30, | |
| | | 2023 | | | 2022 | | | 2021 | | | 2020 | | | 2019 | |
| Net asset value, beginning of period | | $ | 9.20 | | | $ | 11.15 | | | $ | 7.75 | | | $ | 9.85 | | | $ | 9.93 | |
| | | | | | | | | | | | | | | | | | | | | |
| Income from investment operations: | | | | | | | | | | | | | | | | | | | | |
| Net investment income (loss) | | | 0.35 | (1) | | | 0.32 | (1) | | | 0.17 | (1) | | | 0.18 | (1) | | | (0.12 | ) |
| Net realized and unrealized gain (loss) on investments | | | 0.32 | | | | (1.97 | ) | | | 3.40 | | | | (2.07 | ) | | | 0.20 | |
| Total from investment operations | | | 0.67 | | | | (1.65 | ) | | | 3.57 | | | | (1.89 | ) | | | 0.08 | |
| | | | | | | | | | | | | | | | | | | | | |
| Less distributions from: | | | | | | | | | | | | | | | | | | | | |
| Net investment income | | | (0.31 | ) | | | (0.30 | ) | | | (0.17 | ) | | | (0.21 | ) | | | (0.16 | ) |
| | | | | | | | | | | | | | | | | | | | | |
| Net asset value, end of period | | $ | 9.56 | | | $ | 9.20 | | | $ | 11.15 | | | $ | 7.75 | | | $ | 9.85 | |
| | | | | | | | | | | | | | | | | | | | | |
| Total return | | | 7.72 | % | | | (15.07 | )% | | | 46.51 | % | | | (19.60 | )% | | | 0.97 | % |
| Net assets, end of period (000s) | | $ | 190,083 | | | $ | 17,439 | | | $ | 24,222 | | | $ | 22,078 | | | $ | 37,001 | |
| Ratio of net expenses to average net assets | | | 1.05 | % | | | 1.24 | % | | | 1.32 | % | | | 1.35 | % | | | 1.35 | % |
| Ratio of gross expenses to average net assets(2) | | | 1.34 | % | | | 1.54 | % | | | 1.61 | % | | | 1.61 | % | | | 1.62 | % |
| Ratio of net investment income to average net assets | | | 3.82 | % | | | 3.05 | % | | | 1.83 | % | | | 2.06 | % | | | 1.78 | % |
| Portfolio turnover rate | | | 12 | % | | | 19 | % | | | 22 | % | | | 22 | % | | | 12 | % |
| (1) | Calculated based on average shares outstanding during the year. |
| (2) | Gross expenses before waivers of expenses. |
The accompanying notes are an integral part of these financial statements.
FINANCIAL HIGHLIGHTS (Continued)
| | | SA Real Estate Securities Fund | |
| | | Year Ended June 30, | |
| | | 2023 | | | 2022 | | | 2021 | | | 2020 | | | 2019 | |
| Net asset value, beginning of period | | $ | 12.00 | | | $ | 13.95 | | | $ | 11.02 | | | $ | 12.43 | | | $ | 11.40 | |
| | | | | | | | | | | | | | | | | | | | | |
| Income from investment operations: | | | | | | | | | | | | | | | | | | | | |
| Net investment income (loss) | | | 0.29 | (1) | | | 0.15 | (1) | | | 0.17 | (1) | | | 0.22 | (1) | | | (0.34 | ) |
| Net realized and unrealized gain (loss) on investments | | | (0.91 | ) | | | (0.85 | ) | | | 3.20 | | | | (1.08 | ) | | | 1.79 | |
| Total from investment operations | | | (0.62 | ) | | | (0.70 | ) | | | 3.37 | | | | (0.86 | ) | | | 1.45 | |
| | | | | | | | | | | | | | | | | | | | | |
| Less distributions from: | | | | | | | | | | | | | | | | | | | | |
| Net investment income | | | (0.19 | ) | | | (0.13 | ) | | | (0.29 | ) | | | (0.15 | ) | | | (0.35 | ) |
| Capital gains | | | (0.60 | ) | | | (1.12 | ) | | | (0.15 | ) | | | (0.40 | ) | | | (0.07 | ) |
| Total distributions | | | (0.79 | ) | | | (1.25 | ) | | | (0.44 | ) | | | (0.55 | ) | | | (0.42 | ) |
| | | | | | | | | | | | | | | | | | | | | |
| Net asset value, end of period | | $ | 10.59 | | | $ | 12.00 | | | $ | 13.95 | | | $ | 11.02 | | | $ | 12.43 | |
| | | | | | | | | | | | | | | | | | | | | |
| Total return | | | (4.95 | )% | | | (6.51 | )% | | | 31.57 | % | | | (7.47 | )% | | | 13.32 | % |
| Net assets, end of period (000s) | | $ | 125,155 | | | $ | 15,527 | | | $ | 23,828 | | | $ | 24,097 | | | $ | 36,944 | |
| Ratio of net expenses to average net assets | | | 0.77 | %(3) | | | 0.95 | % | | | 0.95 | % | | | 0.95 | % | | | 0.95 | % |
| Ratio of gross expenses to average net assets(2) | | | 0.87 | %(3) | | | 1.02 | % | | | 1.05 | % | | | 1.02 | % | | | 1.04 | % |
| Ratio of net investment income to average net assets | | | 2.67 | % | | | 1.04 | % | | | 1.44 | % | | | 1.82 | % | | | 2.28 | % |
| Portfolio turnover rate | | | 2 | % | | | 2 | % | | | 4 | % | | | 3 | % | | | 6 | % |
| (1) | Calculated based on average shares outstanding during the year. |
| (2) | Gross expenses before waivers of expenses. |
| (3) | The ratio of net expenses and gross expenses to average net assets excluding ReFlow liquidity program fee were 0.76% and 0.86%, respectively. |
The accompanying notes are an integral part of these financial statements.
FINANCIAL HIGHLIGHTS (Continued)
| | | SA Worldwide Moderate Growth Fund | |
| | | Year Ended June 30, | |
| | | 2023 | | | 2022 | | | 2021 | | | 2020 | | | 2019 | |
| Net asset value, beginning of period | | $ | 10.59 | | | $ | 12.16 | | | $ | 9.54 | | | $ | 10.83 | | | $ | 11.29 | |
| | | | | | | | | | | | | | | | | | | | | |
| Income from investment operations: | | | | | | | | | | | | | | | | | | | | |
| Net investment income (loss) | | | 0.26 | (1) | | | 0.16 | (1) | | | 0.14 | (1) | | | 0.24 | (1) | | | (0.18 | ) |
| Net realized and unrealized gain (loss) on investments | | | 0.79 | | | | (1.19 | ) | | | 3.01 | | | | (0.97 | ) | | | 0.39 | |
| Total from investment operations | | | 1.05 | | | | (1.03 | ) | | | 3.15 | | | | (0.73 | ) | | | 0.21 | |
| | | | | | | | | | | | | | | | | | | | | |
| Less distributions from: | | | | | | | | | | | | | | | | | | | | |
| Net investment income | | | (0.27 | ) | | | (0.16 | ) | | | (0.20 | ) | | | (0.25 | ) | | | (0.21 | ) |
| Capital gains | | | (0.57 | ) | | | (0.38 | ) | | | (0.33 | ) | | | (0.31 | ) | | | (0.46 | ) |
| Total distributions | | | (0.84 | ) | | | (0.54 | ) | | | (0.53 | ) | | | (0.56 | ) | | | (0.67 | ) |
| | | | | | | | | | | | | | | | | | | | | |
| Net asset value, end of period | | $ | 10.80 | | | $ | 10.59 | | | $ | 12.16 | | | $ | 9.54 | | | $ | 10.83 | |
| | | | | | | | | | | | | | | | | | | | | |
| Total return | | | 10.57 | % | | | (8.97 | )% | | | 33.71 | % | | | (7.33 | )% | | | 2.53 | % |
| Net assets, end of period (000s) | | $ | 22,269 | | | $ | 23,172 | | | $ | 27,169 | | | $ | 30,464 | | | $ | 38,210 | |
| Ratio of net expenses to average net assets(2) | | | 0.00 | % | | | 0.00 | % | | | 0.00 | % | | | 0.00 | % | | | 0.00 | % |
| Ratio of gross expenses to average net assets(2)(3) | | | 0.78 | % | | | 0.67 | % | | | 0.69 | % | | | 0.54 | % | | | 0.51 | % |
| Ratio of net investment income to average net assets(2)(4) | | | 2.46 | % | | | 1.38 | % | | | 1.24 | % | | | 2.36 | % | | | 2.07 | % |
| Portfolio turnover rate | | | 115 | % | | | 25 | % | | | 11 | % | | | 23 | % | | | 14 | % |
| (1) | Calculated based on average shares outstanding during the year. |
| (2) | These ratios exclude the impact of the underlying affiliated funds as represented in the Portfolio of Investments. |
| (3) | Gross expenses before waivers of expenses. |
| (4) | Recognition of net investment income by the Fund is affected by the timing of the declaration of dividends by the underlying investment companies in which the Fund invests. |
The accompanying notes are an integral part of these financial statements.
SA FUNDS
NOTES TO FINANCIAL STATEMENTS — JUNE 30, 2023
1. Organization and Significant Accounting Policies
SA Funds — Investment Trust (the “Trust”) is a Delaware statutory trust that was organized on June 16, 1998. The Agreement and Declaration of Trust permits the Trust to offer separate portfolios (“Funds”) of shares of beneficial interest and different classes of shares of each Fund. The Trust is registered under the Investment Company Act of 1940 (the “1940 Act”), and currently offers the following ten Funds, each of which (with the exception of the SA Worldwide Moderate Growth Fund) is a diversified mutual fund as defined in the 1940 Act. Each Fund represents a distinct portfolio with its own investment objective. Refer to the Prospectus for each Fund’s investment objective:
SA U.S. Fixed Income Fund
SA Global Fixed Income Fund
SA U.S. Core Market Fund
SA U.S. Value Fund
SA U.S. Small Company Fund
SA International Value Fund
SA International Small Company Fund
SA Emerging Markets Value Fund
SA Real Estate Securities Fund
SA Worldwide Moderate Growth Fund
The SA U.S. Core Market Fund, SA U.S. Value Fund, SA U.S. Small Company Fund, SA International Value Fund, and SA International Small Company Fund commenced investment operations on August 5, 1999, the SA Global Fixed Income Fund commenced operations on July 29, 1999, the SA U.S. Fixed Income Fund, SA Emerging Markets Value Fund, and SA Real Estate Securities Fund commenced operations on April 2, 2007, and the SA Worldwide Moderate Growth Fund commenced operations on July 1, 2015.
Prior to October 26, 2022, each Fund with the exception of the SA Worldwide Moderate Growth Fund, offered Investor Class shares and Select Class shares. Effective October 26, 2022, each Fund converted its Select Class shares into its Investor Class and the Investor Class shares were redesignated as shares of the Fund with no name. The SA Worldwide Moderate Growth Fund continues to offer only a single share class.
Prior to October 26, 2022, Select Class shares were available to investors that invest through the Strategist Program of Buckingham Strategic Partners, LLC (the “Adviser” or “Buckingham”) and certain registered investment companies at the discretion of the Adviser.
The SA International Small Company Fund invests substantially all of its assets in the International Small Company Portfolio (the “DFA Portfolio”), a series of DFA Investment Dimensions Group Inc., a separate registered investment company. The DFA Portfolio has the same investment objective as SA International Small Company Fund and invests its assets in The Japanese Small Company Series, The Asia Pacific Small Company Series, The United Kingdom Small Company Series, The Continental Small Company Series and The Canadian Small Company Series, each a series of The DFA Investment Trust Company (each a “Series”), an open-end management investment company. As of June 30, 2023, the SA International Small Company Fund held approximately 2.30% of the DFA Portfolio. The SA International Small Company Fund adheres closely to the accounting for a fund-of-funds investments under the AICPA Audit and Accounting Guide for Investment Companies. The performance of the SA International Small Company Fund is directly affected by the performance of the DFA Portfolio. The financial statements of the DFA Portfolio and the Series in which it
SA FUNDS
NOTES TO FINANCIAL STATEMENTS — JUNE 30, 2023 (Continued)
invests are included elsewhere in this report and should be read in conjunction with the financial statements of the SA International Small Company Fund.
Prior to October 26, 2022, the SA Worldwide Moderate Growth Fund invested substantially all of its assets in the Select Class shares of the Underlying SA Funds. Effective October 26, 2022, purchases by the SA Worldwide Moderate Growth Fund in Underlying SA Funds receive shares of the Underlying SA Funds, which have no class designation effective October 26, 2022. The Underlying SA Funds managed by the Adviser comprise various asset categories and strategies. The Adviser has established an asset allocation target for the Fund. This target is the approximate percentage of the Fund’s assets that will be invested in equity investments and fixed income investments. Under normal market conditions, the SA Worldwide Moderate Growth Fund invests approximately 70% of its assets in equity investments and approximately 30% of its assets in fixed income investments as represented by the holdings of the Underlying SA Funds. The performance of the SA Worldwide Moderate Growth Fund is directly affected by the performance of the Underlying SA Funds. The financial statements of the Underlying SA Funds are included elsewhere in the report and should be read in conjunction with the financial statements of the SA Worldwide Moderate Growth Fund.
Use of Estimates — The Funds are investment companies that follow the investment company accounting and reporting guidance of Financial Accounting Standards Board (“FASB”) Accounting Standards Codification (“ASC”) Topic 946 Financial Services – Investment Companies.
The preparation of financial statements in accordance with accounting principles generally accepted in the United States of America requires management to make estimates and assumptions that affect the reported amounts of assets and liabilities and disclosures of contingent assets and liabilities at the date of the financial statements and the reported amounts of increases and decreases in net assets from operations during the reporting period. Actual results could differ from those estimates.
The following summarizes the significant accounting policies of the Funds:
Security Valuation — Domestic equity securities listed on an exchange or stock market for which market quotations are readily available are valued according to the official closing price, if any, or at their last reported sale price on the exchange or stock market where the security is primarily traded, or in the absence of such reported prices, at the mean between the most recent quoted bid and asked prices. Domestic equity securities traded on the over-the-counter markets are valued at the mean between the most recent quoted bid and asked prices in the absence of an official closing price or last reported sale price.
Foreign equity securities traded on a foreign exchange or over-the-counter markets are generally valued at the most recent quoted bid price in the absence of an official closing price or last reported sale price. Foreign securities quoted in foreign currencies are translated into U.S. dollars using prevailing exchange rates.
Fixed income investments are generally valued based on prices received from independent pricing services. In determining the value of a fixed income investment, pricing services may use certain information with respect to transactions in such investments, quotations from dealers, pricing matrixes, market transactions in comparable investments, various relationships observed in the market between investments and calculated yield measures.
Shares of registered open-end investment companies are valued at the investment company’s net asset value. Forward currency contracts are valued based on prices received from independent pricing services. Securities for which market quotations are not readily available, or for which available quotations appear not
SA FUNDS
NOTES TO FINANCIAL STATEMENTS — JUNE 30, 2023 (Continued)
to accurately reflect the current value of an investment, are valued at fair value as determined in good faith by the valuation designee (“Valuation Designee”) appointed by the Board of Trustees pursuant to procedures approved by the Board of Trustees. The Board of Trustees has designated the Adviser as the Valuation Designee for the Funds.
Certain Funds hold securities traded in foreign markets. Foreign securities are valued at the latest market price in the foreign market. However, if events occurring after the close of the foreign market (but before the close of regular trading on the New York Stock Exchange) are believed to materially affect the value of those securities, such securities may be valued at fair value as determined in good faith by the Valuation Designee.
Valuation of securities by the DFA Portfolio and the Series in which it invests is discussed in the “Selected Financial Statements of DFA Investment Dimensions Group Inc. – Notes to Financial Statements,” and “Selected Financial Statements of the DFA Investment Trust Company – Notes to Financial Statements,” which are included elsewhere in this report.
Fair Value Measurement — The Board has approved procedures to fair value securities and other assets of each Fund when market prices are not readily available or do not accurately reflect their current market value. The Board has designated the responsibility for applying these fair valuation methods to the Valuation Designee. For example, a Fund may fair value an asset when it is delisted or trading is halted or suspended; when it has not been traded for an extended period of time; when its primary pricing source is unavailable or other data calls the primary source’s reliability into question; or when its primary trading market is closed during regular U.S. market hours. Each Fund makes fair valuation determinations in accordance with the Trust’s Procedures for Valuing Securities and Assets, as amended. The Valuation Designee may consider various factors, including unobservable market inputs when arriving at fair value. The Valuation Designee may use, but is not limited to, techniques such as review of related or comparable assets or liabilities, related market activities, recent transactions, market multiples, book value, and other relevant information when determining fair value. The Valuation Designee regularly reviews these inputs and assumptions when reviewing fair valuations of investments held by the Funds. Fair value pricing involves subjective judgement and it is possible that the fair value determined for an asset is materially different than the value that could be realized upon the sale of that asset. The inputs or methodologies used for valuing securities are not necessarily an indication of the risk associated with investing in those securities.
The Funds value their investments based on a three-level hierarchy of inputs that establishes classification of fair value measurements for disclosure purposes. If inputs used to measure a financial instrument fall within different levels of the hierarchy, the categorization is based on the lowest level input that is significant to the valuation. The three-level hierarchy of inputs is summarized in the three broad levels below.
Level 1 – unadjusted quoted prices in active markets for identical investments.
Level 2 – significant observable inputs other than quoted prices within Level 1 (including quoted prices for similar investments, interest rates, yield curves, foreign exchange rates, put or call provisions, credit risk and default rates for similar securities).
Level 3 – significant unobservable inputs to the extent that observable inputs are not available (including the Pricing Committee’s own assumptions used to determine the fair value of investments).
SA FUNDS
NOTES TO FINANCIAL STATEMENTS — JUNE 30, 2023 (Continued)
The tables below provide a summary of the inputs as of June 30, 2023, in valuing each Fund’s investments:
| | | Investments in Securities | | | | |
| | | Unadjusted | | | | | | | | | | |
| | | Quoted Prices in | | | Significant | | | | | | | |
| | | Active Markets | | | Other | | | Significant | | | | |
| | | for Identical | | | Observable | | | Unobservable | | | Total Fair Value | |
| | | Investments | | | Inputs | | | Inputs | | | as of | |
| Description | | (Level 1) | | | (Level 2) | | | (Level 3) | | | June 30, 2023 | |
| SA U.S. Fixed Income Fund | | | | | | | | | | | | | | | | |
| Assets | | | | | | | | | | | | | | | | |
| Yankee Corporate Bonds And Notes | | $ | — | | | $ | 44,970,139 | | | $ | — | | | $ | 44,970,139 | |
| Corporate Bonds and Notes | | | — | | | | 53,515,971 | | | | — | | | | 53,515,971 | |
| U.S. Government and Agency Obligations | | | — | | | | 261,734,729 | | | | — | | | | 261,734,729 | |
| Short-Term Investments | | | 8,828,846 | | | | 37,944,095 | | | | — | | | | 46,772,941 | |
| Total Investments | | $ | 8,828,846 | | | $ | 398,164,934 | | | $ | — | | | $ | 406,993,780 | |
| SA Global Fixed Income Fund | | | | | | | | | | | | | | | | |
| Assets | | | | | | | | | | | | | | | | |
| Bonds and Notes | | $ | — | | | $ | 594,163,342 | | | $ | — | | | $ | 594,163,342 | |
| Short-Term Investments | | | 6,375,181 | | | | 72,943,884 | | | | — | | | | 79,319,065 | |
| Other Financial Instruments | | | | | | | | | | | | | | | | |
| Forward Foreign Currency Exchange Contracts | | | — | | | | 990,671 | | | | — | | | | 990,671 | |
| Total Investments | | $ | 6,375,181 | | | $ | 668,097,897 | | | $ | — | | | $ | 674,473,078 | |
| Liabilities | | | | | | | | | | | | | | | | |
| Other Financial Instruments | | | | | | | | | | | | | | | | |
| Forward Foreign Currency Exchange Contracts | | $ | — | | | $ | (2,838,316 | ) | | $ | — | | | $ | (2,838,316 | ) |
| SA U.S. Core Market Fund | | | | | | | | | | | | | | | | |
| Assets | | | | | | | | | | | | | | | | |
| Common Stocks | | $ | 616,209,748 | | | $ | — | | | $ | 4,098 | † | | $ | 616,213,846 | |
| Mutual Funds | | | 23,687,442 | | | | — | | | | — | | | | 23,687,442 | |
| Short-Term Investments | | | 1,248,534 | | | | — | | | | — | | | | 1,248,534 | |
| Total Investments | | $ | 641,145,724 | | | $ | — | | | $ | 4,098 | | | $ | 641,149,822 | |
| SA U.S. Value Fund | | | | | | | | | | | | | | | | |
| Assets | | | | | | | | | | | | | | | | |
| Common Stocks | | $ | 518,937,350 | | | $ | — | | | $ | — | | | $ | 518,937,350 | |
| Short-Term Investments | | | 877,802 | | | | — | | | | — | | | | 877,802 | |
| Total Investments | | $ | 519,815,152 | | | $ | — | | | $ | — | | | $ | 519,815,152 | |
SA FUNDS
NOTES TO FINANCIAL STATEMENTS — JUNE 30, 2023 (Continued)
| | | Investments in Securities | | | | |
| | | Unadjusted | | | | | | | | | | |
| | | Quoted Prices in | | | Significant | | | | | | | |
| | | Active Markets | | | Other | | | Significant | | | | |
| | | for Identical | | | Observable | | | Unobservable | | | Total Fair Value | |
| | | Investments | | | Inputs | | | Inputs | | | as of | |
| Description | | (Level 1) | | | (Level 2) | | | (Level 3) | | | June 30, 2023 | |
| SA U.S. Small Company Fund | | | | | | | | | | | | | | | | |
| Assets | | | | | | | | | | | | | | | | |
| Common Stocks | | $ | 305,129,667 | | | $ | — | | | $ | 48,189 | † | | $ | 305,177,856 | |
| Preferred Stocks | | | 145,537 | | | | — | | | | — | | | | 145,537 | |
| Short-Term Investments | | | 2,291,775 | | | | — | | | | — | | | | 2,291,775 | |
| Total Investments | | $ | 307,566,979 | | | $ | — | | | $ | 48,189 | | | $ | 307,615,168 | |
| SA International Value Fund | | | | | | | | | | | | | | | | |
| Assets | | | | | | | | | | | | | | | | |
| Common Stocks | | $ | 533,535,945 | | | $ | — | | | $ | — | | | $ | 533,535,945 | |
| Preferred Stocks | | | 5,625,519 | | | | — | | | | — | | | | 5,625,519 | |
| Short-Term Investments | | | 39,994,693 | | | | — | | | | — | | | | 39,994,693 | |
| Total Investments | | $ | 579,156,157 | | | $ | — | | | $ | — | | | $ | 579,156,157 | |
| SA International Small Company Fund | | | | | | | | | | | | | | | | |
| Assets | | | | | | | | | | | | | | | | |
| Mutual Funds | | $ | 246,953,410 | | | $ | — | | | $ | — | | | $ | 246,953,410 | |
| Total Investments | | $ | 246,953,410 | | | $ | — | | | $ | — | | | $ | 246,953,410 | |
| SA Emerging Markets Value Fund | | | | | | | | | | | | | | | | |
| Assets | | | | | | | | | | | | | | | | |
| Common Stocks | | $ | 184,887,509 | | | $ | 50,472 | | | $ | 18,942 | † | | $ | 184,956,923 | |
| Preferred Stocks | | | 3,432,531 | | | | — | | | | — | | | | 3,432,531 | |
| Rights and Warrants | | | — | | | | 1,249 | | | | — | | | | 1,249 | |
| Short-Term Investments | | | 1,884,250 | | | | — | | | | — | | | | 1,884,250 | |
| Total Investments | | $ | 190,204,290 | | | $ | 51,721 | | | $ | 18,942 | | | $ | 190,274,953 | |
| SA Real Estate Securities Fund | | | | | | | | | | | | | | | | |
| Assets | | | | | | | | | | | | | | | | |
| Common Stocks | | $ | 124,275,810 | | | $ | — | | | $ | 0 | † | | $ | 124,275,810 | |
| Short-Term Investments | | | 949,453 | | | | — | | | | — | | | | 949,453 | |
| Total Investments | | $ | 125,225,263 | | | $ | — | | | $ | 0 | | | $ | 125,225,263 | |
| SA Worldwide Moderate Growth Fund | | | | | | | | | | | | | | | | |
| Assets | | | | | | | | | | | | | | | | |
| Mutual Funds | | $ | 22,268,008 | | | $ | — | | | $ | — | | | $ | 22,268,008 | |
| Total Investments | | $ | 22,268,008 | | | $ | — | | | $ | — | | | $ | 22,268,008 | |
| † | Contains securities with a market value of zero. |
A reconciliation in which Level 3 inputs are used in determining fair value is presented when there are significant Level 3 assets and/or liabilities at the beginning and/or end of the period. No significant Level 3 assets and/or liabilities held at the beginning or end of the period.
SA FUNDS
NOTES TO FINANCIAL STATEMENTS — JUNE 30, 2023 (Continued)
Securities Lending – The Funds may lend any of their securities held by State Street Bank and Trust Company (“State Street”) as custodian to certain qualified broker-dealers, banks and other institutions, except those securities which the Adviser or Dimensional Fund Advisor LP (the “Sub -Adviser”) specifically identifies as not being available. Any gain or loss in the fair price of the securities loaned that might occur and any interest or dividends declared during the term of the loan would accrue to the account of the Funds. Risks of delay in recovery of the securities or even loss of rights in the collateral may occur should the borrower of the securities fail financially. Risks may also arise to the extent that the value of the collateral decreases below the value of the securities loaned.
Upon entering into a securities lending transaction, a Fund maintains cash or other securities as collateral in an amount equal to or exceeding 100% of the current fair value of the loaned securities with respect to securities of the U.S. government or its agencies or instrumentalities, a loan of sovereign debt issued by non-U.S. governments, or a loan of non-U.S. corporate debt, 102% of the current fair value of the loaned securities with respect to other U.S. securities and 105% of the current fair value of the loaned securities with respect to foreign equity securities. The fair value of the loaned security is determined at the close of each business day of the Fund and any additional required collateral is delivered to the Fund, or excess collateral is returned by the Fund, on the next business day. Any cash received as collateral is generally invested by State Street, acting in its capacity as securities lending agent (the “Agent”), in the State Street Navigator Securities Lending Government Money Market Portfolio, which is a money market fund registered under the 1940 Act. A portion of the income received on the collateral is rebated to the borrower of the securities, and the remainder is split between the Agent and each respective Fund.
As of June 30, 2023, the following Funds had securities on loan, which were collateralized by short-term investments. The value of securities on loan and the value of the related collateral were as follows:
| | | | | | | | | Value of | | | | |
| | | Value | | | Value of Cash | | | Non-Cash | | | Total | |
| | | of Securities | | | Collateral | | | Collateral* | | | Collateral | |
| SA Global Fixed Income Fund | | $ | 5,146,321 | | | $ | 5,297,645 | | | $ | — | | | $ | 5,297,645 | |
| SA U.S. Core Market Fund | | | 1,357,807 | | | | 314,743 | | | | 1,077,727 | | | | 1,392,470 | |
| SA U.S. Value Fund | | | 590,900 | | | | — | | | | 604,609 | | | | 604,609 | |
| SA U.S. Small Company Fund | | | 7,212,085 | | | | 1,951,648 | | | | 5,567,372 | | | | 7,519,020 | |
| SA International Value Fund | | | 60,326,686 | | | | 39,745,759 | | | | 22,799,654 | | | | 62,545,413 | |
| SA Emerging Markets Value Fund | | | 3,271,516 | | | | 1,462,355 | | | | 2,062,954 | | | | 3,525,309 | |
| SA Real Estate Securities Fund | | | 1,649,106 | | | | 295,730 | | | | 1,401,094 | | | | 1,696,824 | |
* The Funds cannot repledge or resell this collateral. The non-cash collateral is comprised of U.S. government securities.
SA FUNDS
NOTES TO FINANCIAL STATEMENTS — JUNE 30, 2023 (Continued)
The following table provides increased transparency about the types of collateral pledged for securities lending transactions that are accounted for as secured borrowing. Non-cash collateral is not reflected in the table because the Funds cannot repledge or resell this collateral.
| | | Remaining Contractual Maturity of the Agreements | |
| | | As of June 30, 2023 | |
| | | Overnight and | | | | | | Between | | | | | | | |
| Securities Lending Transaction(1) | | Continuous | | | <30 days | | | 30 & 90 days | | | >90 days | | | Total | |
| SA Global Fixed Income Fund | | | | | | | | | | | | | | | | | | | | |
| Government Money Market | | $ | 5,297,645 | | | $ | — | | | $ | — | | | $ | — | | | $ | 5,297,645 | |
| Total Borrowings | | $ | 5,297,645 | | | $ | — | | | $ | — | | | $ | — | | | $ | 5,297,645 | |
| Gross amount of recognized liabilities for securities lending transactions | | | | $ | 5,297,645 | |
| SA U.S. Core Market Fund | | | | | | | | | | | | | | | | | | | | |
| Government Money Market | | $ | 314,743 | | | $ | — | | | $ | — | | | $ | — | | | $ | 314,743 | |
| Total Borrowings | | $ | 314,743 | | | $ | — | | | $ | — | | | $ | — | | | $ | 314,743 | |
| Gross amount of recognized liabilities for securities lending transactions | | | | $ | 314,743 | |
| SA U.S. Small Company Fund | | | | | | | | | | | | | | | | | | | | |
| Government Money Market | | $ | 1,951,648 | | | $ | — | | | $ | — | | | $ | — | | | $ | 1,951,648 | |
| Total Borrowings | | $ | 1,951,648 | | | $ | — | | | $ | — | | | $ | — | | | $ | 1,951,648 | |
| Gross amount of recognized liabilities for securities lending transactions | | | | $ | 1,951,648 | |
| SA International Value Fund | | | | | | | | | | | | | | | | | | | | |
| Government Money Market | | $ | 39,745,759 | | | $ | — | | | $ | — | | | $ | — | | | $ | 39,745,759 | |
| Total Borrowings | | $ | 39,745,759 | | | $ | — | | | $ | — | | | $ | — | | | $ | 39,745,759 | |
| Gross amount of recognized liabilities for securities lending transactions | | | | $ | 39,745,759 | |
| SA Emerging Markets Value Fund | | | | | | | | | | | | | | | | | | | | |
| Government Money Market | | $ | 1,462,355 | | | $ | — | | | $ | — | | | $ | — | | | $ | 1,462,355 | |
| Total Borrowings | | $ | 1,462,355 | | | $ | — | | | $ | — | | | $ | — | | | $ | 1,462,355 | |
| Gross amount of recognized liabilities for securities lending transactions | | | | $ | 1,462,355 | |
| SA Real Estate Securities Fund | | | | | | | | | | | | | | | | | | | | |
| Government Money Market | | $ | 295,730 | | | $ | — | | | $ | — | | | $ | — | | | $ | 295,730 | |
| Total Borrowings | | $ | 295,730 | | | $ | — | | | $ | — | | | $ | — | | | $ | 295,730 | |
| Gross amount of recognized liabilities for securities lending transactions | | | | $ | 295,730 | |
| (1) | Amounts represent the payable for cash collateral received on securities on loan. This will generally be in the “Overnight and Continuous” column as the securities are typically callable on demand. The payable will be allocated into categories of securities based on the market value of the securities on loan. |
SA FUNDS
NOTES TO FINANCIAL STATEMENTS — JUNE 30, 2023 (Continued)
Foreign Currency Translation and Foreign Investments — The books and records of the Funds are maintained in U.S. dollars. The value of securities, currencies and other assets and liabilities denominated in currencies other than U.S. dollars are translated into U.S. dollars based upon foreign currency exchange rates prevailing at the end of the period. Purchases and sales of investment securities are translated at contractual currency exchange rates established at the time of the trade. Income and expenses are translated at prevailing exchange rates on the respective dates of such transactions.
The results of operations resulting from changes in foreign exchange rates on investments are not reported separately from fluctuations arising from changes in market prices of securities held. All such fluctuations are included with net realized and unrealized gain or loss on investments. Reported net realized foreign exchange gains or losses arise from sales of foreign currencies, currency gains or losses realized between the trade and settlement dates on securities transactions, and the difference between the amounts of dividends, interest, and foreign withholding taxes recorded on the Funds’ books and the U.S. dollar equivalent of the amounts actually received or paid. Net unrealized foreign exchange gains and losses arise from changes in the fair values of assets and liabilities, other than investments in securities at fiscal period-end, resulting from changes in exchange rates.
Investing in foreign securities may involve certain sovereign and other risks, in addition to the credit and market risks normally associated with domestic securities. Investments in foreign securities are subject to fluctuations in currency exchange rates, which may negatively affect the value of a Fund’s portfolio. Additional risks may include exposure to less developed or less efficient trading markets; social, political or economic instability; nationalization of assets, currency controls or redenomination; changes in tax policy; high transaction costs; settlement, custodial or other operation risks; and less stringent accounting, auditing, financial reporting, and legal standards and practices. As a result, foreign securities can fluctuate more widely in price, and may also be less liquid, than comparable U.S. securities.
Forward Foreign Currency Exchange Contracts — Each Fund that may invest in foreign securities may enter into forward foreign currency exchange contracts. A forward foreign currency exchange contract is an agreement between two parties to buy or sell currency at a set price on a future date. By entering into a forward contract for the purchase or sale for a fixed amount of dollars of the amount of foreign currency involved in an underlying security transaction, a Fund may be able to protect itself against a possible loss resulting from an adverse change in the relationship between the U.S. dollar and the applicable foreign currency during the period between the date the security is purchased or sold and the date on which payment is made or received.
The market value of a contract will fluctuate with changes in currency exchange rates. The contract is marked-to-market daily using the 4:00 PM Eastern Time pricing for the forward currency exchange rate, and the change in market value is recorded as unrealized appreciation (depreciation) on foreign currency and forward currency transactions in a fund’s statement of assets and liabilities. When the contract is closed, a realized gain or loss is recognized, which is equal to the difference between the value of the contract at the time it was opened and the value at the time it was closed, and recorded as realized gain (loss) on foreign currency and forward currency transactions in a fund’s statement of operations.
Forward foreign currency exchange contracts may involve risks from the potential inability of counterparties to meet the terms of their contracts and from unanticipated movements in the value of a foreign currency relative to the U.S. dollar.
SA FUNDS
NOTES TO FINANCIAL STATEMENTS — JUNE 30, 2023 (Continued)
The Funds have adopted provisions surrounding disclosures regarding derivative instruments and hedging activities which require qualitative disclosures about objectives and strategies for using derivatives, quantitative disclosures about fair value amounts of gains and losses on derivative instruments, and disclosures about currency risk-related contingent features in derivative agreements.
In order to better define its contractual rights and to secure rights that will help the SA Global Fixed Income Fund mitigate its counterparty risk, the SA Global Fixed Income Fund may enter into an International Swaps and Derivatives Association, Inc. Master Agreement (“ISDA Master Agreement”) or similar agreement with its derivative contract counterparties. An ISDA Master Agreement is a bilateral agreement between the SA Global Fixed Income Fund and a counterparty that governs over-the-counter derivatives and foreign exchange contracts and typically contains, among other things, collateral posting terms and netting provisions in the event of a default and/or termination event. Under an ISDA Master Agreement, the SA Global Fixed Income Fund may, under certain circumstances, offset with the counterparty certain derivative financial instrument’s payables and/or receivables with collateral held and/or posted and create one single net payment. The provisions of the ISDA Master Agreement typically permit a single net payment in the event of default (close-out netting) including the bankruptcy or insolvency of the counterparty. Note, however, that bankruptcy or insolvency laws of a particular jurisdiction may impose restrictions on or prohibitions against the right of offset in bankruptcy, insolvency or other events.
For financial reporting purposes, the SA Global Fixed Income Fund does not offset derivative assets and derivative liabilities that are subject to netting arrangements in its Statement of Assets and Liabilities.
The following tables, grouped into appropriate risk categories, disclose the amounts related to the Fund’s use of derivative instruments and hedging activities at June 30, 2023, on a gross basis:
| | | | | | | | | Gain or (Loss) on Derivatives | |
| | | | | | | | | Recognized in Income | |
| | | Asset Derivative | | | Liability Derivative | | | Realized | | | Change in | |
| Risk Type | | Fair Value(1) | | | Fair Value(2) | | | Gain(3) | | | Depreciation(4) | |
| Foreign currency | | $ | 990,671 | | | $ | 2,838,316 | | | $ | (669,203 | ) | | $ | (8,693,629 | ) |
| (1) | Statement of Assets and Liabilities location: Unrealized appreciation on forward foreign currency exchange contracts. |
| (2) | Statement of Assets and Liabilities location: Unrealized depreciation on forward foreign currency exchange contracts. |
| (3) Statement | of Operations location: Realized gain (loss) on: forward foreign currency exchange contracts. |
| (4) | Statement of Operations location: Increase (decrease) in unrealized appreciation (depreciation) on: forward foreign currency exchange contracts. |
Forward Currency Contracts Assets and Collateral Held by Counterparty as of June 30, 2023:
| | | Gross Amount of | | | | | | | | | | |
| | | Assets Presented | | | Financial | | | | | | | |
| | | in Statements of | | | Instruments | | | Collateral | | | | |
| Counterparty | | Assets & Liabilities | | | Available for Offset | | | Received | | | Net Amount | |
| Bank of America N.A. | | $ | 39,522 | | | $ | — | | | $ | — | | | $ | 39,522 | |
| Citibank N.A. | | | 470,345 | | | | — | | | | — | | | | 470,345 | |
| State Street Bank and Trust Co. | | | 480,804 | | | | (480,804 | ) | | | — | | | | — | |
SA FUNDS
NOTES TO FINANCIAL STATEMENTS — JUNE 30, 2023 (Continued)
Forward Currency Contracts Liabilities and Collateral Pledged as of June 30, 2023:
| | | Gross Amount | | | | | | | | | | |
| | | of Liabilities | | | | | | | | | | |
| | | Presented in | | | | | | | | | | |
| | | Statements | | | Financial | | | | | | | |
| | | of Assets | | | Instruments | | | Collateral | | | | |
| Counterparty | | & Liabilities | | | Available for Offset | | | Pledged | | | Net Amount | |
| Morgan Stanley & Co., Inc. | | $ | (559,820 | ) | | $ | — | | | $ | — | | | $ | (559,820 | ) |
| State Street Bank and Trust Co. | | | (1,356,118 | ) | | | 480,804 | | | | — | | | | (875,314 | ) |
| UBS | | | (922,378 | ) | | | — | | | | — | | | | (922,378 | ) |
For the fiscal year ended June 30, 2023, the average monthly principal amount of forward foreign currency exchange contracts was $404,175,957.
Investment Transactions, Income and Expenses — Investments in securities are accounted for as of trade date (the date the buy or sell is executed). Dividend income is recorded on the ex-dividend date. Interest income is recorded on an accrual basis and includes amortization of discounts and premiums based on the effective interest method. Gains and losses are determined on the identified cost basis, which is the same for U.S. federal income tax purposes.
The Funds characterize distributions received from mutual fund investments on the Statements of Operations using the same characterization as the distribution received.
Investment income and realized and unrealized gains(losses) on investments are allocated daily to each class of shares based on the relative proportion of net assets of each class.
Expenses directly attributable to a specific Fund are charged to the respective Fund. Expenses that cannot be attributed to a particular Fund are apportioned among the Funds evenly or based on relative net assets.
Indemnifications — Under the Trust’s organizational documents, its officers and Trustees are indemnified against certain liabilities arising out of the performance of their duties to the Funds. The Trustees are also indemnified against certain liabilities pursuant to an Indemnity Agreement between the Trust and each Trustee. In addition, in the normal course of business the Trust enters into contracts that contain a variety of representations and warranties which provide general indemnifications. The Funds’ maximum exposures under these arrangements are unknown as this would involve potential future claims against the Funds that have not yet occurred. However, the Funds expect the risk of loss to be remote.
Foreign Taxes — Each Fund may be subject to foreign taxes (a portion of which may be reclaimable) on income, corporate events, or capital gains on investments or currency repatriation. All foreign taxes are recorded in accordance with the applicable foreign tax regulations and rates that exist in the foreign markets in which the Fund invests. These foreign taxes, if any, are paid by each Fund and are disclosed in its Statement of Operations. Foreign taxes payable as of June 30, 2023, if any, are reflected in each Fund’s Statement of Assets and Liabilities. The Funds may also be subject to capital gains tax in India and potentially other foreign jurisdictions, on gains realized upon the sale of securities. Any realized losses in excess of gains in India may be carried forward to offset future gains. Funds with exposure to Indian securities and potentially other foreign jurisdictions accrue a deferred liability for unrealized gains in excess of available loss carryforwards based
SA FUNDS
NOTES TO FINANCIAL STATEMENTS — JUNE 30, 2023 (Continued)
on existing tax rates and holding periods of the securities. As of June 30, 2023, SA Emerging Markets Value Fund recorded a deferred liability for potential future India and Thailand capital gains taxes of $1,037,996 and $66,318, respectively.
Federal Income Tax — Each Fund is treated as a separate entity for U.S. federal income tax purposes. Each Fund’s policy is to comply with the requirements of Subchapter M of the Internal Revenue Code that are applicable to regulated investment companies and to distribute substantially all of the Funds’ taxable income and net capital gain to their shareholders. Therefore, no income tax provision is required.
Each Fund recognizes the tax benefits of uncertain tax positions only when the position is “more likely than not” to be sustained upon examination by the tax authorities based on the technical merits of the tax position. As of June 30, 2023, and for all open tax year, each Fund has determined that no liability for unrecognized tax benefits is required in each Fund’s financial statements related to uncertain tax positions taken on a tax return (or expected to be taken on future tax returns). Open tax years are those that remain subject to examination and are based on each tax jurisdiction’s statute of limitation. The Funds record interest and penalties, if any, on the Statements of Operations.
The Trust’s management has analyzed the Funds’ tax positions, and has concluded that no liability for unrecognized tax benefits should be recorded with respect to uncertain tax positions taken on returns filed for open tax years (2019-2021), or expected to be taken in the Funds’ 2022 tax returns.
As of June 30, 2023, for U.S. federal income tax purposes, the Funds have realized capital losses which may be carried forward indefinitely to offset future net realized gains as follows:
| | | Unlimited Short-Term | | | Unlimited Long-Term | |
| | | Losses | | | Losses | |
| SA U.S. Fixed Income Fund | | $ | (28,745,102 | ) | | $ | (3,501,799 | ) |
| SA Global Fixed Income Fund | | | (34,154,974 | ) | | | (33,380,811 | ) |
| SA International Value Fund | | | (4,944,118 | ) | | | (16,964,612 | ) |
| SA Emerging Markets Value Fund | | | — | | | | (12,217,998 | ) |
The federal income tax character of distributions paid to shareholders during the fiscal years ended June 30, 2023 and 2022 were as follows:
| | | 2023 | | | 2022 | |
| | | Ordinary | | | Long-Term | | | Ordinary | | | Long-Term | |
| | | Income | | | Capital Gain | | | Income | | | Capital Gain | |
| SA U.S. Fixed Income Fund | | $ | 10,791,732 | | | $ | — | | | $ | 1,074,189 | | | $ | — | |
| SA Global Fixed Income Fund | | | 22,786,281 | | | | — | | | | 3,526,585 | | | | — | |
| SA U.S. Core Market Fund | | | 5,200,751 | | | | 26,796,752 | | | | 4,094,947 | | | | 52,401,389 | |
| SA U.S. Value Fund | | | 9,132,478 | | | | 28,550,506 | | | | 7,725,837 | | | | 19,143,632 | |
| SA U.S. Small Company Fund | | | 1,480,401 | | | | 7,767,660 | | | | 5,318,226 | | | | 72,578,062 | |
| SA International Value Fund | | | 21,242,831 | | | | — | | | | 19,961,382 | | | | — | |
| SA International Small Company Fund | | | 4,197,396 | | | | 9,788,614 | | | | 7,983,608 | | | | 9,579,192 | |
| SA Emerging Markets Value Fund | | | 6,277,522 | | | | — | | | | 6,366,755 | | | | — | |
| SA Real Estate Securities Fund | | | 2,190,859 | | | | 6,815,243 | | | | 1,869,716 | | | | 12,962,732 | |
| SA Worldwide Moderate Growth Fund | | | 563,331 | | | | 1,168,961 | | | | 347,454 | | | | 821,430 | |
SA FUNDS
NOTES TO FINANCIAL STATEMENTS — JUNE 30, 2023 (Continued)
As of June 30, 2023, the components of distributable earnings on a federal income tax basis were:
| | | | | | Undistributed | | | Unrealized | | | Post October | | | | |
| | | Undistributed | | | Long-Term | | | Appreciation/ | | | Capital/ Late Year | | | Capital Loss | |
| | | Ordinary Income | | | Capital Gains | | | (Depreciation) | | | Ordinary Loss | | | Carryforward | |
| SA U.S. Fixed Income Fund | | $ | 259,619 | | | $ | — | | | $ | (4,509,625 | ) | | $ | — | | | $ | (32,246,901 | ) |
| SA Global Fixed Income Fund | | | — | | | | — | | | | 4,966,750 | | | | (4,972,064 | ) | | | (67,535,785 | ) |
| SA U.S. Core Market Fund | | | 2,721,812 | | | | — | | | | 496,338,021 | | | | — | | | | — | |
| SA U.S. Value Fund | | | 4,361,181 | | | | — | | | | 206,037,348 | | | | (4,097,611 | ) | | | — | |
| SA U.S. Small Company Fund | | | 663,804 | | | | 1,082,351 | | | | 139,494,206 | | | | — | | | | — | |
| SA International Value Fund | | | 13,322,962 | | | | — | | | | 82,397,336 | | | | — | | | | (21,908,730 | ) |
| SA International Small Company Fund | | | 2,436,994 | | | | 1,622,528 | | | | 79,907,745 | | | | — | | | | — | |
| SA Emerging Markets Value Fund | | | 3,834,805 | | | | — | | | | 6,656,219 | | | | — | | | | (12,217,998 | ) |
| SA Real Estate Securities Fund | | | 1,610,410 | | | | 251,995 | | | | 51,207,612 | | | | — | | | | — | |
| SA Worldwide Moderate Growth | | | 26,869 | | | | 446,278 | | | | 1,236,251 | | | | — | | | | — | |
Under current tax law, certain specified losses incurred after October 31 or December 31, as applicable, may be deferred and treated as occurring on the first day of the following taxable year. As of June 30, 2023, the SA U.S. Value Fund is deferring post-October capital losses and the SA Global Fixed Income Fund is deferring late year ordinary losses.
At June 30, 2023, the aggregate cost of investment securities, aggregate gross unrealized appreciation (depreciation) and net unrealized appreciation (depreciation) for all securities, including forward foreign currency exchange contracts, as computed on a federal income tax basis for each fund were as follows:
| | | | | | | | | | | | Net Unrealized | |
| | | | | | Unrealized | | | Unrealized | | | Appreciation | |
| | | Cost | | | Appreciation | | | Depreciation | | | (Depreciation) | |
| SA U.S. Fixed Income Fund | | $ | 411,503,405 | | | $ | 58,903 | | | $ | (4,568,528 | ) | | $ | (4,509,625 | ) |
| SA Global Fixed Income Fund | | | 668,498,562 | | | | 15,958,914 | | | | (10,992,164 | ) | | | 4,966,750 | |
| SA U.S. Core Market Fund | | | 144,811,801 | | | | 498,190,967 | | | | (1,852,946 | ) | | | 496,338,021 | |
| SA U.S. Value Fund | | | 313,777,804 | | | | 220,517,783 | | | | (14,480,435 | ) | | | 206,037,348 | |
| SA U.S. Small Company Fund | | | 168,120,962 | | | | 150,183,307 | | | | (10,689,101 | ) | | | 139,494,206 | |
| SA International Value Fund | | | 496,758,821 | | | | 120,016,516 | | | | (37,619,180 | ) | | | 82,397,336 | |
| SA International Small Company Fund | | | 167,045,665 | | | | 79,907,745 | | | | — | | | | 79,907,745 | |
| SA Emerging Markets Value Fund | | | 183,618,734 | | | | 39,286,665 | | | | (32,630,446 | ) | | | 6,656,219 | |
| SA Real Estate Securities Fund | | | 74,017,651 | | | | 54,707,139 | | | | (3,499,527 | ) | | | 51,207,612 | |
| SA Worldwide Moderate Growth Fund | | | 21,031,757 | | | | 1,261,393 | | | | (25,142 | ) | | | 1,236,251 | |
Distributions to Shareholders — Each Fund, excluding the SA Global Fixed Income Fund and the SA U.S. Fixed Income Fund, declares and pays dividends from its net investment income, if any, annually. The SA Global Fixed Income Fund and the SA U.S. Fixed Income Fund declare and pay dividends from net investment income, if any, quarterly. All of the Funds declare and pay distributions from net realized capital gains, if any, at least annually.
SA FUNDS
NOTES TO FINANCIAL STATEMENTS — JUNE 30, 2023 (Continued)
The SA Real Estate Securities Fund characterizes distributions received from REIT investments based on information provided by the REITs into the following categories: ordinary income, long-term capital gains, and return of capital. If information is not available on a timely basis from the REITs in which the Fund invests, the characterization will be estimated based on available information, which may include the previous year’s allocation. If new or additional information becomes available from one or more of those REITs at a later date, a recharacterization will be made in the following year. The Fund records any amount recharacterized as dividend income as ordinary income, any amount recharacterized as long-term capital gain as realized gain in the Statement of Operations, and any amount recharacterized as a return of capital as a reduction to the cost of investments in the Statement of Assets and Liabilities and in the Portfolio of Investments. These recharacterizations are reflected in the accompanying financial statements.
Dividends to shareholders are recorded on the ex-dividend date. Income and capital gain distributions are determined in accordance with federal income tax regulations, which may differ from generally accepted accounting principles in the U.S. These differences are primarily due to differing treatments of income and gains on various investment securities held by the Funds, timing differences and differing characterizations of distributions made by the Funds. To the extent that distributions exceed the sum of net investment income and net capital gains for federal income tax purposes, they are reported as distributions of paid-in capital. Permanent book and tax basis differences relating to shareholder distributions will result in reclassifications to paid-in capital. Temporary book and tax differences such as wash sales, passive foreign investment companies, non-REIT return of capital, and foreign currency transactions that will reverse in a subsequent period. During any particular year, a Fund’s net realized gains from investment transactions in excess of available capital loss carry forwards will be taxable to a Fund if not distributed and, therefore, will be distributed to shareholders annually.
At June 30, 2023, as a result of permanent book-to-tax differences, the following reclassifications were made on the Statements of Assets and Liabilities. These differences primarily relate to the utilization of tax-equalization adjustments and realized gains and losses on redemptions in-kind:
| | | Paid in | | | Total distributable | |
| | | Capital | | | earnings (loss) | |
| SA U.S. Core Market Fund | | $ | 33,837,965 | | | $ | (33,837,965 | ) |
| SA U.S. Value Fund | | | 20,518,453 | | | | (20,518,453 | ) |
| SA U.S. Small Company Fund | | | 11,224,073 | | | | (11,224,073 | ) |
| SA International Value Fund | | | 2,193,676 | | | | (2,193,676 | ) |
| SA International Small Company Fund | | | 84,530 | | | | (84,530 | ) |
| SA Real Estate Securities Fund | | | 2,802,442 | | | | (2,802,442 | ) |
| SA Worldwide Moderate Growth Fund | | | 152,032 | | | | (152,032 | ) |
2. Agreements and Transactions with Affiliates
The Trust has an Investment Advisory and Administrative Services Agreement with the Adviser (the “Investment Advisory Agreement”) under which the Adviser manages the investments of, and provides administrative services to, each Fund.
SA FUNDS
NOTES TO FINANCIAL STATEMENTS — JUNE 30, 2023 (Continued)
Prior to October 26, 2022, for the advisory and administrative services provided to the SA U.S. Fixed Income Fund, SA Global Fixed Income Fund, SA U.S. Core Market Fund, SA U.S. Value Fund, SA U.S. Small Company Fund, SA International Value Fund, SA International Small Company Fund, SA Emerging Markets Value Fund and SA Real Estate Securities Fund (each, an “SA Fund” and collectively, the “SA Funds”) under the Investment Advisory Agreement, the Adviser was entitled to receive from each SA Fund separate advisory fees and administrative fees computed daily and payable monthly at the annual rates set forth below:
| | | Advisory | | | Administrative | |
| Fund | | Fee | | | Fee | |
| SA U.S. Fixed Income Fund | | | 0.15 | % | | | 0.10 | % |
| SA Global Fixed Income Fund | | | 0.25 | % | | | 0.10 | % |
| SA U.S. Core Market Fund | | | 0.40 | % | | | 0.10 | % |
| SA U.S. Value Fund | | | 0.40 | % | | | 0.10 | % |
| SA U.S. Small Company Fund | | | 0.40 | % | | | 0.10 | % |
| SA International Value Fund | | | 0.45 | % | | | 0.10 | % |
| SA International Small Company Fund | | | 0.25 | % | | | 0.10 | % |
| SA Emerging Markets Value Fund | | | 0.45 | % | | | 0.10 | % |
| SA Real Estate Securities Fund | | | 0.35 | % | | | 0.10 | % |
Effective October 26, 2022, for the advisory and administrative services provided to the SA Funds under the Investment Advisory Agreement, the Adviser is entitled to receive from each SA Fund a fee computed daily and payable monthly at the annual rate set forth below:
| | | Advisory and | |
| | | Administrative | |
| Fund | | Fee | |
| SA U.S. Fixed Income Fund | | | 0.15 | % |
| SA Global Fixed Income Fund | | | 0.25 | % |
| SA U.S. Core Market Fund | | | 0.40 | % |
| SA U.S. Value Fund | | | 0.40 | % |
| SA U.S. Small Company Fund | | | 0.40 | % |
| SA International Value Fund | | | 0.45 | % |
| SA International Small Company Fund | | | 0.25 | % |
| SA Emerging Markets Value Fund | | | 0.45 | % |
| SA Real Estate Securities Fund | | | 0.35 | % |
The advisory and administration fees for the SA Worldwide Moderate Growth Fund have two components. There is no advisory or administration fee on assets invested in the Underlying SA Funds, any other investment companies advised or sub-advised by the Adviser, money market funds or held in cash or cash equivalents. The Fund is subject to an advisory fee of 0.25% and an administration fee of 0.10% on assets invested in any other investments. During the fiscal year ended June 30, 2023, the Fund did not make investments that would be subject to the advisory fee and administration fees.
SA FUNDS
NOTES TO FINANCIAL STATEMENTS — JUNE 30, 2023 (Continued)
The Trust and the Adviser have jointly entered into an Investment Sub-Advisory Agreement (the “Sub-Advisory Agreement”) with the Sub-Adviser. For the sub-advisory services provided to the Funds under the Sub-Advisory Agreement, the Sub-Adviser is entitled to a fee from each Fund computed daily and payable monthly at an annual rate based on each Fund’s average daily net assets as follows:
| | Sub-Advisory |
| | Fees |
| SA U.S. Fixed Income Fund | 0.03% |
| SA Global Fixed Income Fund | 0.03% |
| SA U.S. Core Market Fund | 0.03%* |
| SA U.S. Value Fund | 0.10% |
| SA U.S. Small Company Fund | 0.20% |
| SA International Value Fund | 0.20% |
| SA Emerging Markets Value Fund | 0.36% |
| SA Real Estate Securities Fund | 0.10% |
* The Sub-Adviser will not receive any sub-advisory fee for its sub-advisory services to the SA U.S. Core Market Fund with respect to any assets of the SA U.S. Core Market Fund invested in the U.S. Micro Cap Portfolio of the DFA Investment Dimensions Group Inc. For its management services, the Sub-Adviser receives an investment advisory fee from the U.S. Micro Cap Portfolio.
The Trust has a Shareholder Servicing Agreement with the Adviser. For the shareholder services provided to the Funds, the Adviser is entitled to a fee from each Fund computed daily and payable monthly at the annual rate of 0.15% of the average daily net assets of each Fund. Prior to October 26, 2022, for these services, the Adviser was paid a service fee that was calculated daily and paid monthly at the annual rate of 0.25% and 0.05% of the average daily net assets of each Fund’s former Investor Class and Select Class shares, respectively. There is no shareholder servicing fee on assets of the SA Worldwide Moderate Growth Fund that are invested in the Underlying SA Funds, any other investment companies advised or sub-advised by the Adviser, money market funds or held in cash or cash equivalents. The SA Worldwide Moderate Growth Fund is subject to a shareholder servicing fee of 0.25% on assets invested in any other investment. The SA Worldwide Moderate Growth Fund does not currently intend to make investments that would be subject to a shareholder servicing fee.
The Adviser has contractually agreed, pursuant to a Fee Waiver and Expense Reimbursement Letter Agreement (the “SA Funds Fee Waiver Agreement”), to waive the fees payable to it under the Investment Advisory Agreement and/or to reimburse the operating expenses allocated to an SA Fund to the extent each SA Fund’s shares’ total annual operating expenses (excluding interest, taxes, brokerage commissions, redemption liquidity service expenses, acquired fund fees and expenses, and extraordinary expenses) exceed, in the aggregate, the rate per annum, as set forth below. The SA Funds Fee Waiver Agreement will remain in effect until October 28, 2025, at which time it may be continued, modified or eliminated and net expenses will be adjusted as necessary.
SA FUNDS
NOTES TO FINANCIAL STATEMENTS — JUNE 30, 2023 (Continued)
| Fund Expense Limitation | | |
| (Shown is the resulting ratio of total annual | | Expense |
| fund operating expenses expressed as a percentage) | | Limitation |
| SA U.S. Fixed Income Fund | | 0.40% |
| SA Global Fixed Income Fund | | 0.55% |
| SA U.S. Core Market Fund | | 0.65% |
| SA U.S. Value Fund | | 0.75% |
| SA U.S. Small Company Fund | | 0.90% |
| SA International Value Fund | | 0.90% |
| SA International Small Company Fund | | 0.55% |
| SA Emerging Markets Value Fund | | 1.04% |
| SA Real Estate Securities Fund | | 0.75% |
Prior to October 26, 2022, the Adviser agreed to waive its advisory fees and/or to reimburse expenses to the extent that: (1) each Fund’s former Investor Class shares’ operating expenses (excluding interest, taxes, brokerage commissions, acquired fund fees and expenses, and extraordinary expenses) exceed, in the aggregate, the rate per annum shown in the table below; (2) each Fund’s former Select Class shares’ total annual operating expenses (excluding interest, taxes, brokerage commissions, acquired fund fees and expenses, and extraordinary expenses) were 0.20% lower than the Investor Class shares’ total annual operating expense ratio after fee waiver and/or expense reimbursement and did not exceed, in the aggregate, the rate per annum shown in the table below:
| | | Fee Cap | | Fee Cap |
| | | for Investor Class Shares | | for Select Class Shares |
| | | (Shown is the resulting ratio of total | | (Shown is the resulting ratio of total |
| | | annual fund operating expenses | | annual fund operating expenses |
| Fund | | expressed as a percentage) | | expressed as a percentage) |
| SA U.S. Fixed Income Fund | | 0.65% | | 0.45% |
| SA Global Fixed Income Fund | | 0.75% | | 0.55% |
| SA U.S. Core Market Fund | | 0.90% | | 0.70% |
| SA U.S. Value Fund | | 1.00% | | 0.80% |
| SA U.S. Small Company Fund | | 1.10% | | 0.90% |
| SA International Value Fund | | 1.15% | | 0.95% |
| SA International Small Company Fund | | 0.75% | | 0.55% |
| SA Emerging Markets Value Fund | | 1.24% | | 1.04% |
| SA Real Estate Securities Fund | | 0.95% | | 0.75% |
Trustees’ Fees and Expenses — Prior to January 1, 2023, for their services as Trustees, the Trustees of the Trust received an annual retainer fee of $118,000, as well as reimbursement for expenses incurred in connection with each meeting of the Board and its Committees. Prior to January 1, 2023, the Chairman of the Board received an annual supplemental compensation of $11,800 per year.
Effective January 1, 2023, the Trustees of the Trust receive an annual retainer fee of $122,000, as well as reimbursement for expenses incurred in connection with each meeting of the Board and its Committees.
SA FUNDS
NOTES TO FINANCIAL STATEMENTS — JUNE 30, 2023 (Continued)
Also effective January 1, 2023, the Chairman of the Board receives an annual supplemental compensation of $12,200 per year.
Sub-Administration Fees — State Street serves as sub-administrator for the Trust, pursuant to a Sub-Administration Agreement with the Trust and the Adviser. State Street receives a fee that is calculated daily and paid monthly at an annual rate based on the aggregate average daily net assets of the Trust as follows: 0.017% of the first $1.5 billion of net assets and 0.014% of net assets over $1.5 billion. The fee is then allocated to each Fund based on the relative net assets of each Fund, subject to a minimum fee of $54,000 annually per Fund.
3. Purchases and Sales of Securities
Excluding short-term investments, each Fund’s purchases and sales of securities for the fiscal year ended June 30, 2023 were as follows:
| | | Purchases | | | Sales | |
| | | U.S. | | | | | | U.S. | | | | |
| | | Government | | | Other | | | Government | | | Other | |
| SA U.S. Fixed Income Fund | | | 104,986,977 | | | | 13,374,103 | | | | 130,865,838 | | | | 107,820,128 | |
| SA Global Fixed Income Fund | | | 241,438,849 | | | | 356,717,311 | | | | 347,913,341 | | | | 503,250,756 | |
| SA U.S. Core Market Fund | | | — | | | | 16,044,839 | | | | — | | | | 20,970,087 | |
| SA U.S. Value Fund | | | — | | | | 27,237,739 | | | | — | | | | 37,087,232 | |
| SA U.S. Small Company Fund | | | — | | | | 22,727,515 | | | | — | | | | 24,755,483 | |
| SA International Value Fund | | | — | | | | 56,329,420 | | | | — | | | | 99,725,793 | |
| SA International Small Company Fund | | | — | | | | 16,562,522 | | | | — | | | | 26,306,000 | |
| SA Emerging Markets Value Fund | | | — | | | | 22,431,621 | | | | — | | | | 26,026,389 | |
| SA Real Estate Securities Fund | | | — | | | | 5,082,199 | | | | — | | | | 2,899,023 | |
| SA Worldwide Moderate Growth Fund | | | — | | | | 26,096,964 | | | | — | | | | 28,278,232 | |
4. Liquidity
Certain Funds are permitted to participate in the ReFlow liquidity program, which is designed to provide an alternative liquidity source for mutual funds experiencing net redemptions of their shares. Pursuant to the program, ReFlow Fund, LLC (“ReFlow”) provides participating mutual funds with a source of cash to meet net shareholder redemptions by standing ready each business day to purchase fund shares up to the value of the net shares redeemed by other shareholders that are to settle the next business day. Following purchases of fund shares, ReFlow then generally redeems those shares when the fund experiences net sales, at the end of a maximum holding period determined by ReFlow (currently 14 days) or at other times at ReFlow’s discretion. While ReFlow holds fund shares, it will have the same rights and privileges with respect to those shares as any other shareholder. For use of the ReFlow service, a fund pays a fee to ReFlow each time it purchases fund shares, calculated by applying to the purchase amount a fee rate determined through an automated daily auction among participating mutual funds. This fee is allocated among a fund’s share classes based on relative net assets. ReFlow’s purchases of fund shares through the liquidity program are made on an investment-blind basis without regard to the fund’s objective, policies or anticipated performance. In accordance with federal securities laws, ReFlow is prohibited from acquiring more than 3% of the outstanding voting securities of
SA FUNDS
NOTES TO FINANCIAL STATEMENTS — JUNE 30, 2023 (Continued)
a fund. ReFlow will periodically redeem its entire share position in participating Funds and request that such redemption be met in kind in accordance with the Funds’ redemption in-kind policies.
During the fiscal year ended June 30, 2023, the following Funds utilized ReFlow. The shares and amounts ReFlow subscribed to and redemptions-in-kind were as follows:
| | | Shares | | | Amount | | | | | | | |
| | | ReFlow | | | ReFlow | | | Redemptions- | | | Redemptions- | |
| Fund | | Subscribed to | | | Subscribed to | | | in-kind Shares | | | in-kind Amount | |
| SA U.S. Core Market Fund | | | 1,640,569 | | | $ | 41,628,270 | | | | (1,599,711 | ) | | $ | (40,396,056 | ) |
| SA U.S. Value Fund | | | 2,029,809 | | | | 37,940,443 | | | | (2,007,186 | ) | | | (37,281,737 | ) |
| SA U.S. Small Company Fund | | | 822,512 | | | | 20,017,320 | | | | (817,650 | ) | | | (19,770,488 | ) |
| SA International Value Fund | | | 711,795 | | | | 8,223,495 | | | | (711,795 | ) | | | (8,252,149 | ) |
| SA Real Estate Securities Fund | | | 686,121 | | | | 7,274,969 | | | | (681,319 | ) | | | (7,120,880 | ) |
5. Affiliated Ownership
The SA Worldwide Moderate Growth Fund invests in Underlying Securities and other Investment Companies, certain of which may be deemed to be under common control because of the same or affiliated investment adviser and membership in a common family of investment companies (the “Affiliated Underlying Funds”). A summary of the transactions with each Affiliated Underlying Fund during the fiscal year ended June 30, 2023 follows:
| | | | | | | | | | | | Net Realized | | | | | | | | | | | | Dividend | | | Capital Gain | |
| | | | | | | | | | | | Gain (Loss) | | | | | | | | | | | | Income | | | Distributions | |
| | | Beginning | | | | | | | | | on Sales of | | | Change in | | | | | | Shares as | | | from | | | from | |
| Affiliated | | Value as of | | | Purchases | | | | | | Affiliated | | | Unrealized | | | Ending Value | | | of | | | Affiliated | | | Affiliated | |
| Investment | | June 30, | | | at | | | Proceeds | | | Investment | | | Appreciation/ | | | as of | | | June 30, | | | Investment | | | Investment | |
| Companies | | 2022 | | | Cost | | | from Sales | | | Companies | | | Depreciation | | | June 30, 2023 | | | 2023 | | | Companies | | | Companies | |
| SA U.S. Fixed Income Fund | | $ | 2,182,837 | | | $ | 2,320,543 | | | $ | (2,493,295 | ) | | $ | (160,626 | ) | | $ | 143,639 | | | $ | 1,993,098 | | | $ | 210,687 | | | $ | 52,027 | | | $ | — | |
| SA Global Fixed Income Fund | | | 5,099,654 | | | | 5,449,257 | | | | (5,793,605 | ) | | | (545,127 | ) | | | 440,382 | | | | 4,650,561 | | | | 545,841 | | | | 155,937 | | | | — | |
| SA U.S. Core Market Fund | | | 3,807,077 | | | | 4,293,706 | | | | (4,847,940 | ) | | | 202,117 | | | | 283,804 | | | | 3,738,764 | | | | 135,413 | | | | 33,193 | | | | 171,025 | |
| SA U.S. Value Fund | | | 3,813,020 | | | | 4,511,371 | | | | (4,730,007 | ) | | | 640,732 | | | | (487,784 | ) | | | 3,747,332 | | | | 198,482 | | | | 65,592 | | | | 205,058 | |
| SA U.S. Small Company Fund | | | 1,520,559 | | | | 1,719,797 | | | | (1,934,099 | ) | | | 76,221 | | | | 106,943 | | | | 1,489,421 | | | | 58,801 | | | | 7,471 | | | | 39,200 | |
| SA International Value Fund | | | 4,525,785 | | | | 5,241,638 | | | | (5,841,008 | ) | | | 407,473 | | | | 158,054 | | | | 4,491,942 | | | | 367,890 | | | | 181,118 | | | | — | |
| SA Emerging Markets Value Fund | | | 1,548,867 | | | | 1,728,958 | | | | (1,858,609 | ) | | | 123,592 | | | | (53,601 | ) | | | 1,489,207 | | | | 155,612 | | | | 52,653 | | | | — | |
| SA Real Estate Securities Fund | | | 687,761 | | | | 831,694 | | | | (779,670 | ) | | | (4,337 | ) | | | (67,765 | ) | | | 667,683 | | | | 63,048 | | | | 11,428 | | | | 35,551 | |
| Totals | | $ | 23,185,560 | | | $ | 26,096,964 | | | $ | (28,278,233 | ) | | $ | 740,045 | | | $ | 523,672 | | | $ | 22,268,008 | | | | | | | $ | 559,419 | | | $ | 450,834 | |
6. Recent Accounting Pronouncements
In March 2020, the FASB issued Accounting Standards Update (ASU) No. 2020-04, Reference Rate Reform (Topic 848) – Facilitation of the Effects of Reference Rate Reform on Financial Reporting. In January 2021, the
SA FUNDS
NOTES TO FINANCIAL STATEMENTS — JUNE 30, 2023 (Continued)
FASB issued ASU No. 2021-01, with further amendments to Topic 848. The amendments in the ASUs provide optional temporary accounting recognition and financial reporting relief from the effect of certain types of contract modifications due to the planned discontinuation of the LIBOR and other interbank-offered based reference rates as of the end of 2021 and 2023. The ASUs are effective for certain reference rate-related contract modifications that occur during the period March 12, 2020 through December 31, 2022. Management has reviewed the requirements and believes the adoption of these ASUs will not have a material impact on the Funds financial statements.
In October 2020, the SEC adopted new regulations governing the use of derivatives by registered investment companies. Rule 18f-4 (the “Derivatives Rule”) imposes limits on the amount of derivatives contracts the Funds could enter, eliminates the asset segregation framework previously used by the Funds to comply with Section 18 of the 1940 Act, and requires funds whose use of derivatives is more than a limited specified exposure to establish and maintain a derivatives risk management program and appoint a derivatives risk manager. The Derivatives Rule became effective February 19, 2021 and the Funds began complying with the Derivatives Rule on August 19, 2022.
On December 3, 2020, the SEC adopted new Rule 2a-5 (the “Valuation Rule”) under the 1940 Act, establishing an updated regulatory framework for fund valuation. The Valuation Rule, in part, provides a framework for good faith fair value determination and permits a Board to designate fair value determinations to a fund’s investment adviser. Further, the SEC rescinded previously issued guidance on related issues. The Valuation Rule became effective on March 8, 2021 and the Funds began complying with the Valuation Rule on August 1, 2022.
In June 2022, the FASB issued ASU 2022-03 to clarify the guidance in Topic 820, Fair Value Measurement (“Topic 820”). The amendments in ASU 2022-03 affect all entities that have investments in equity securities measured at fair value that are subject to a contractual sale restriction. ASU 2022-03 (1) clarifies the guidance in Topic 820, when measuring the fair value of an equity security subject to contractual restrictions that prohibit the sale of an equity security, (2) amends a related illustrative example, and (3) introduces new disclosure requirements for equity securities subject to contractual sale restrictions that are measured at fair value in accordance with Topic 820. For public business entities, the amendments in ASU 2022-03 are effective for fiscal years beginning after December 15, 2023, and interim periods within those fiscal years. For all other entities, the amendments are effective for fiscal years beginning after December 15, 2024, and interim periods within those fiscal years. Early adoption is permitted for both interim and annual financial statements that have not yet been issued or made available for issuance. Management is currently assessing the impact of these provisions on the Funds’ financial statements.
In October 2022, the Securities and Exchange Commission (the “SEC”) adopted a final rule relating to Tailored Shareholder Reports for Mutual Funds and Exchange-Traded Funds; Fee Information in Investment Company Advertisements. The rule and form amendments will, among other things, require the Fund to transmit concise and visually engaging shareholder reports that highlight key information. The amendments will require that funds tag information in a structured data format and that certain more in-depth information be made available online and available for delivery free of charge to investors on request. The amendments became effective January 24, 2023. There is an 18-month transition period after the effective date of the amendment.
7. Consideration related to COVID-19 Pandemic
Global financial markets have experienced, and may continue to experience, significant volatility resulting from the spread of COVID-19. The COVID-19 pandemic has resulted in travel and border restrictions, quarantines,
SA FUNDS
NOTES TO FINANCIAL STATEMENTS — JUNE 30, 2023 (Continued)
supply chain disruptions, lower consumer demand, and general market uncertainty. The effects of COVID-19, including new variants of the underlying virus, have adversely affected, and may continue to adversely affect, the global economy, the economies of certain nations, and individual issuers, all of which may negatively impact the Funds’ performance.
8. Executive Order in Response to Continued Russian Federation Aggression
On April 15, 2021, President Biden issued an executive order authorizing blocking sanctions against persons operating in the technology, defense and any related materials sectors of the Russian economy. This list was expanded on February 22, 2022 and March 31, 2022 to include the financial services, aerospace, electronics and marine sectors. On April 6, 2022, President Biden further expanded upon these previously issued executive orders and announced Executive Order 14071, which prohibited new investment in and certain services to the Russian Federation in response to continued Russian Federation aggression (the “Executive Order”). Under the Executive Order, all U.S. persons are prohibited from new investment in the Russian Federation.
On February 28, 2022, Russia authorities restricted foreign investors’ ability to sell Russian securities locally on the Moscow stock exchange. On April 16, 2022, Russia enacted a law that prohibits the placement and circulation of depositary receipts (DRs) where underlying assets are Russian local shares. These events and actions by the U.S. and Russia have materially impacted the investability of Russian securities. Management has undertaken certain actions related to the Executive Order, and will continue to evaluate and determine what, if any additional actions are required to comply with the Executive Order.
9. Subsequent Events
As announced by the Trust on April 12, 2023, Focus Financial Partners, Inc. (“Focus”), the parent company of the Adviser, agreed to be acquired by Clayton, Dubilier & Rice (“CD&R”). The purchase of Focus by CD&R is anticipated to close in the third quarter of 2023 (the “Transaction”). Following the Transaction, Focus will be privately owned, and its shares will not be publicly traded. The Transaction is not expected to result in any material change in the day-to-day management of the Funds or the Adviser.
The closing of the Transaction will result in a change of control of the investment adviser to the Funds (the “Change of Control”). Consistent with the requirements of the 1940 Act, the investment advisory agreement between the investment adviser and each of the Funds (the “Advisory Agreement”) and the investment sub-advisory agreement between Dimensional Fund Advisors LP (“DFA”), the investment sub-adviser to the Funds (except the SA Worldwide Moderate Growth Fund) and the Adviser (collectively, the “Advisory Agreements”) each contain a provision that each Advisory Agreement will terminate automatically in the event of its “assignment” (as defined in the 1940 Act). The Change of Control will cause an assignment of the Advisory Agreements and result in the automatic termination of the Advisory Agreements.
At its in-person meeting on May 22, 2023, the Board, consisting solely of Trustees who are not “interested persons” of the Funds or the Adviser within the meaning of the 1940 Act (the “Independent Trustees”), approved a new investment advisory agreement between the Adviser and each of the Funds and a new sub-advisory agreement between DFA and the Adviser (together, the “New Advisory Agreements”). The New Advisory Agreements also need to be approved by shareholders of the Funds at a special meeting of shareholders. The terms and conditions of the New Advisory Agreements are identical in all material respects to the Advisory Agreements, including the rate of the investment advisory fee for the Funds.
REPORT OF INDEPENDENT REGISTERED PUBLIC ACCOUNTING FIRM
To the Shareholders and Board of Trustees of
SA Funds – Investment Trust
Opinion on the Financial Statements
We have audited the accompanying statements of assets and liabilities, including the portfolios of investments, of SA Funds – Investment Trust, comprising SA U.S. Fixed Income Fund, SA Global Fixed Income Fund, SA U.S. Core Market Fund, SA U.S. Value Fund, SA U.S. Small Company Fund, SA International Value Fund, SA International Small Company Fund, SA Emerging Markets Value Fund, SA Real Estate Securities Fund and SA Worldwide Moderate Growth Fund (the “Funds”) as of June 30, 2023, the related statements of operations for the year then ended, the statements of changes in net assets for each of the two years in the period then ended, the related notes, and the financial highlights for each of the four years in the period then ended (collectively referred to as the “financial statements”). In our opinion, the financial statements present fairly, in all material respects, the financial position of each of the Funds as of June 30, 2023, the results of their operations for the year then ended, the changes in net assets for each of the two years in the period then ended, and the financial highlights for each of the four years in the period then ended, in conformity with accounting principles generally accepted in the United States of America.
The Funds’ financial highlights for the year ended June 30, 2019 were audited by other auditors whose report dated August 27, 2019, expressed an unqualified opinion on those financial highlights.
Basis for Opinion
These financial statements are the responsibility of the Funds’ management. Our responsibility is to express an opinion on the Funds’ financial statements based on our audits. We are a public accounting firm registered with the Public Company Accounting Oversight Board (United States) (“PCAOB”) and are required to be independent with respect to the Funds in accordance with the U.S. federal securities laws and the applicable rules and regulations of the Securities and Exchange Commission and the PCAOB.
We conducted our audits in accordance with the standards of the PCAOB. Those standards require that we plan and perform the audit to obtain reasonable assurance about whether the financial statements are free of material misstatement whether due to error or fraud.
Our audits included performing procedures to assess the risks of material misstatement of the financial statements, whether due to error or fraud, and performing procedures that respond to those risks. Such procedures included examining, on a test basis, evidence regarding the amounts and disclosures in the financial statements. Our procedures included confirmation of securities owned as of June 30, 2023, by correspondence with the custodian, transfer agent and brokers; when replies were not received from brokers, we performed other auditing procedures. Our audits also included evaluating the accounting principles used and significant estimates made by management, as well as evaluating the overall presentation of the financial statements. We believe that our audits provide a reasonable basis for our opinion.
We have served as the Funds’ auditor since 2020.

COHEN & COMPANY, LTD.
Cleveland, Ohio
August 28, 2023
SA FUNDS
ADDITIONAL INFORMATION (Unaudited)
Proxy Voting Policies and Procedures
The Sub-Adviser is responsible for exercising the voting rights associated with the securities purchased and/or held by the Funds. A description of the policies and procedures that are used by the Sub-Adviser to vote proxies relating to the Funds’ portfolio securities is available without charge, upon request, by calling (844) 366-0905 and on the Securities and Exchange Commission’s website (“SEC”) at http://www.sec.gov. Information regarding how the Sub-Adviser voted these proxies during the most recent 12-month period ended June 30th is listed in the Trust’s Form N-PX, which is available after August 31st without charge, upon request, by calling the same number or visiting the SEC’s website at http://www.sec.gov.
Schedules of Portfolio Holdings
The Trust files the complete schedules of portfolio holdings for each Fund monthly on Form N-PORT. The schedules filed for the end of the first and third quarters of each fiscal year are made available to the public on the SEC’s website at www.sec.gov no later than 60 days after the relevant period. The Trust’s Form N-PORT may also be reviewed and copied at the SEC’s Public Reference Room in Washington, D.C., and information on the operation of the Public Reference Room may be obtained by calling 1-800-SEC-0330. The Trust’s most recent Form N-PORT is also available without charge, upon request, by calling 1-844-366-0905.
Semi-Annual Portfolio Schedule
The Trust files a complete schedule of portfolio holdings for each Fund for the second quarter of each fiscal year on Form N-CSR. The Trust’s Form N-CSR is available on the SEC’s website at http://www.sec.gov. Information on the operation of the Public Reference Room may be obtained by calling 1-800-SEC-0330. The Trust’s most recent Form N-CSR is also available without charge, upon request, by calling (844) 366-0905.
Additional Information
This report is prepared for the general information of shareholders and is not an offer of shares of the SA Funds. Shares are sold only through the currently effective prospectus, which must precede or accompany this report.
More information about the SA Funds is available without charge, upon request, please mail, visit the Funds’ website or call:
SA Funds – Investment Trust
c/o Buckingham Strategic Partners, LLC
8182 Maryland Ave.
Suite 500
Saint Louis, MO 63105
Toll-free: 1-844-366-0905
Website: http://www.sa-funds.com
Trustees and Officers’ Information
Information regarding the Trustees and executive officers of the Trust is listed below. The Board is responsible for managing the business and affairs of the Trust. The Board’s role in management of the Trust is oversight. As is the case with virtually all investment companies (as distinguished from operating companies), service providers to the Trust have the responsibility for the day-to-day management of the Funds. The Board’s oversight role does not make the Board a guarantor of the Funds’ investments or activities. The Trustees are experienced executives who meet periodically throughout the year to oversee each Fund’s activities, review contractual arrangements with companies that provide services to each Fund, and review each Fund’s performance. The Board is comprised entirely of Trustees who are not “interested persons” of the Trust, as such term is defined under the 1940 Act (the “Independent Trustees”).
SA FUNDS
ADDITIONAL INFORMATION (Unaudited) (Continued)
Officers of the Trust listed in the table below whose names are marked with an asterisk (*) are interested persons of the Trust (as defined by the 1940 Act) by virtue of, among other considerations, their relationships with the Adviser or its affiliated entities. Each Trustee and executive officer of the Trust oversees all Funds of the Trust.
Independent Trustees:
| | | | | | | Number of | | |
| | | Position(s) | | | | Portfolios in | | |
| | | Held with | | Principal | | Fund Complex | | Other |
| Name, Address,(1) | | Trust and Length of | | Occupation(s) | | Overseen by | | Trusteeships/ |
| and Year of Birth | | Time Served(2) | | During Past 5 Years | | Trustee | | Directorships Held |
| Bryan W. Brown Year of Birth: 1945 | | Trustee (since April 1999) Chairman (since December 2004) | | Self-Employed Management Consultant (financial and technological systems) (since 1992). | | 10 | | Director/Officer, Kilohana Martial Arts Association (since June 2018). |
| | | | | | | | | |
| Charles M. Roame Year of Birth: 1965 | | Trustee (since June 2012) | | Managing Partner, Tiburon Strategic Advisors & Tiburon CEO Summits (since April 1998). | | 10 | | Director, Edelman Financial Engines (provider of financial planning & investment advisory services) (since January 2014). Director, FacetWealth (provider of financial planning services) (since February 2018). Director, DPL Financial Partners (insurance management platform) (since February 2022). Director, Allspring Global Investments (financial services) (since May 2022). |
| | | | | | | | | |
| Harold M. Shefrin Year of Birth: 1948 | | Trustee (since April 1999) | | Faculty member, Santa Clara University (since 1978). | | 10 | | Trustee, Litman Gregory Funds Trust (11 portfolios) (since February 2005). |
| (1) | The address of each Trustee is: Buckingham Strategic Partners, LLC, 8182 Maryland Avenue, Suite 500, St. Louis, Missouri 63105. |
| (2) | Each Trustee serves for the lifetime of the Trust or until he dies, resigns, or is removed. |
The Funds’ Statement of Additional Information includes additional information about the Trustees and is available, without charge, upon request, by calling 1-844-366-0905. It is also available on the Funds’ website at: http://sa-funds.com.
SA FUNDS
ADDITIONAL INFORMATION (Unaudited) (Continued)
Officers of the Trust
| | | Position(s) | | |
| | | Held with | | |
| Name, Address(1) | | Trust and Length of | | |
| and Year of Birth | | Time Served(2) | | Principal Occupation(s) During Past 5 Years |
| Jonathan Scheid* Year of Birth: 1976 | | President and Chief Executive Officer (since June 2023). | | Managing Director, Buckingham Wealth Partners (since January 2022); Managing Director, Buckingham Strategic Partners (2019-2021); Vice President, Buckingham Strategic Partners (2018-2019). |
| | | | | |
| Dan Anderson* Year of Birth: 1976 | | Chief Financial and Accounting Officer and Treasurer (since March 2023). | | Chief Financial Officer, Buckingham Strategic Wealth, LLC and Buckingham Strategic Partners, LLC (since January 2018); Chief Financial Officer, BAM Management LLC (since January 2018). |
| | | | | |
| Jeffery Yorg* | | Chief Compliance Officer and Anti-Money Laundering Compliance Officer (since July 2021) | | Chief Compliance Officer and Associate General Counsel, Buckingham Strategic Partners, LLC (since October 2019); Chief Compliance Officer, Head of Compliance Legal and Risk, and Deputy Chief Risk Officer, Gurtin Municipal Bond Management, LLC (2014-2019). |
| | | | | |
| Marcy Tsagarakis* Year of Birth: 1971 | | Secretary (since June 2006). | | Director, Fund Administration, Buckingham Strategic Partners, LLC (since December 2018); Vice President, Fund Administration, LWI Financial Inc. (2005-2018). |
| (1) | The address of each officer is: Buckingham Strategic Partners, LLC, 8182 Maryland Avenue, Suite 500, St. Louis, Missouri 63105. |
| (2) | The Trust’s officers are appointed annually by the Board. |
SA FUNDS
ADDITIONAL INFORMATION (Unaudited) (Continued)
Board Approval of New Advisory Agreements and New Sub-Advisory Agreement
At a meeting held on May 22, 2023 (the “Special Meeting”), the Board, consisting solely of Independent Trustees, considered for approval the Interim Advisory Agreements, Interim Sub-Advisory Agreement, New Advisory Agreements and New Sub-Advisory Agreement. For purposes of this discussion, the Interim Advisory Agreements, Interim Sub-Advisory Agreement, New Advisory Agreements and New Sub-Advisory Agreement were considered at the same time.
Factors Considered in Approving the New Advisory Agreements
In connection with the Board’s review of the New Advisory Agreements, key personnel of the Adviser advised the Board about a variety of matters, including the following:
| ● | No material changes are currently contemplated and no diminution is anticipated as a result of the Transaction in the nature, quality, or extent of services currently provided to the Funds and their Shareholders, including investment management services or other shareholder services. |
| ● | All of the key investment advisory personnel of the Adviser who currently assist in the management of the Funds are expected to continue to do so after the Transaction. In addition, all of the key investment personnel of the Sub-Adviser who currently assist in the management of the Sub-Advised Funds are expected to continue to do so after the Transaction. |
| ● | The terms and conditions of the New Advisory Agreements, including each Fund’s contractual fee rate, are the same as the existing Advisory Agreements, except for the effective and termination dates and a few immaterial terms. |
| ● | In addition, the current operating expense limits for each Fund will remain in effect after the Closing Date until at least the end of the initial two-year term of the New Advisory Agreements. |
| ● | The Funds and the Funds’ shareholders will continue to receive the benefit of the strong compliance culture and financial resources of Focus following the Transaction. |
| ● | Focus has agreed that it will conduct its business, and will, to the extent within its reasonable control, cause each of its affiliates to conduct their businesses, in a manner to enable reliance upon the conditions of Section 15(f) of the 1940 Act, including not imposing any “unfair burden” on the Funds for at least two years from the Closing. |
In their deliberations, the Board considered the factors discussed below, among others. The Board relied upon the advice of legal counsel and their own business judgment in determining the material factors to be considered in evaluating the New Advisory Agreements and the weight to be given to each such factor. The conclusions reached by the Board were based on a comprehensive evaluation of all of the information provided, both in written and verbal form. The Trustees did not identify any particular factor or piece of information that was all-important or controlling, and each Trustee may have attributed different weights to the various factors:
The nature, extent and quality of the services provided and to be provided by the Adviser. The Board considered the Adviser’s favorable attributes, including its investment philosophy, investment management capabilities, experienced leadership and reputation. The Board also considered the capabilities, resources, and
SA FUNDS
ADDITIONAL INFORMATION (Unaudited) (Continued)
personnel of the Adviser, in order to determine whether the Adviser is capable of continuing to provide at least an equivalent level of investment management services currently provided to each Fund. The Board also reviewed information provided by Focus related to its business, legal and regulatory affairs. This review considered the resources available to the Adviser to provide the services specified under the New Advisory Agreements, including the supervision of the existing Sub-Adviser to the Sub-Advised Funds. In addition, the Board considered that all of the portfolio managers currently managing the Funds are expected to continue to do so following the Transaction.
Based on its review of materials prepared for the Special Meeting, the Board considered the experience and qualifications of the personnel of the Adviser who will be responsible for continuing to provide services to the Funds. The Board noted that none of the personnel responsible for servicing or managing the Funds were expected to change, and that the investment process and day-to-day operations of the Fund were not expected to change. The Board also noted the oversight role of the Adviser over the Sub-Adviser relating to portfolio construction and management, and compliance with the Funds’ investment objectives and policies, the Trust’s compliance policies and procedures, and applicable laws and regulations.
The Board concluded that the Adviser will be capable of continuing to provide investment advisory services at least equivalent to the same high quality as the investment advisory services previously provided to the Funds.
The investment performance of the Funds achieved by the Adviser. The Board considered that all of the portfolio managers and other key investment personnel currently managing the Funds are expected to continue to do so following the Transaction. The Board was provided with information describing the performance of each of the Funds for various trailing time periods, on an absolute basis as well as relative to each Fund’s benchmark index and peer group. The Board also reviewed a presentation of each Fund’s performance as compared to the Fund’s benchmark as well as against a group of other registered funds that have objectives and strategies that are similar to those of the Fund. The peer group performance was obtained from publicly available sources and measured as of each such peer group fund’s most recent fiscal year end. The Board concluded that the investment performance of the Funds remained competitive relative to their respective asset classes and investment styles. The Trustees noted that based on the information presented at the Special Meeting and its discussion with the Adviser, it believes that the Adviser is capable of generating a level of long-term investment performance that is appropriate in light of each Funds’ investment objectives, policies and strategies and competitive with many other investment companies.
The extent to which the Adviser will realize economies of scale as the Trust grows larger and whether fee levels reflect these economies of scale for the benefit of Fund shareholders. The Board evaluated potential or anticipated economies of scale in relation to the services the Adviser provides to each Fund. The Board noted that at this time, the fee structure does not account for the benefit of economies of scale because the Funds have insufficient assets for economies of scale to be realized. The Board further noted that currently, the fee structure provides for a flat percentage rate, and that once assets under management grow to substantially higher levels, economies of scale may begin to take effect and benefit the Adviser. The Board considered that at such future time, it may be appropriate for the Adviser to review the fee structure to determine whether the management fees as a percent of assets under management might be reduced. The Board acknowledged that there can be no assurance that the Funds will reach the asset levels necessary for economies of scale to take effect.
Total expenses of the Funds and competitiveness of fees to be paid to the Adviser. The Board considered that the New Advisory Agreements are the same as the existing Advisory Agreements, except for the effective and termination dates and a few immaterial terms, and that each Fund’s contractual fee rate will be identical for each Fund for the initial two-year term of the New Advisory Agreements. The Board also noted that the Adviser has contractually agreed to maintain all of the current operating expense limits pursuant to a new Fee Waiver
SA FUNDS
ADDITIONAL INFORMATION (Unaudited) (Continued)
Agreement (with identical terms to the existing Fee Waiver Agreement), which will remain in effect after the Closing Date until at least the end of the initial two-year term of the New Advisory Agreements, whereby it will waive a portion of its advisory fees so that each Fund does not exceed its operating expense limitation. The Board also reviewed information regarding management fees charged by advisers to other comparably-sized funds, which showed that the management fees charged to the Funds are competitive with the fees paid by many other comparably-sized funds. In light of these comparisons, the Board concluded that the terms of the New Advisory Agreements are fair and reasonable.
The profits to be realized by the Adviser and its affiliates, from their relationship with the Trust. The Board considered potential benefits the Adviser and its affiliates may derive from their relationship with the Funds, including compensation received by the Adviser for the provision of certain shareholder and administrative services to the Funds. The Board noted that at this time the Adviser’s compensation is not high relative to the experience of the Adviser and the nature and quality of the services performed by the Adviser. The Board considered the Adviser’s representation that it anticipates profitability for the Adviser under the New Advisory Agreements to be similar to profitability for the Adviser during recent periods. The Board noted that it would have the opportunity to give further consideration to the Adviser’s profitability with respect to the Funds at the end of the initial two-year term of the New Advisory Agreements.
Other Considerations. In approving the New Advisory Agreements, the Board considered that the Adviser will be making a commitment to the retention and recruitment of high quality personnel, and has undertaken to maintain the same level of financial, compliance and operational resources reasonably necessary to manage the Funds in a professional manner that is consistent with the best interests of the Funds and their shareholders and that has previously been provided to the Funds. The Board also considered that the Adviser has committed to the management and success of the Funds, and to employ its resources in an effort to both maintain and grow the Funds by seeking out expanded distribution opportunities where possible. The Board also considered that the Funds and their shareholders will continue to receive the benefit of the strong compliance culture and financial resources of Focus following the Transaction.
Conclusions. In approving the New Advisory Agreements, the Board concluded that the terms of the New Advisory Agreements are fair and reasonable and that approval of the New Advisory Agreements is in the best interests of each Fund and its shareholders. In reaching this determination, the Board considered that the Adviser is expected to provide a high level of service to each Fund; that it has confidence in the Adviser’s capabilities to manage the Funds consistently with their respective specified investment objective and strategies; that each Fund’s fee structure appeared to the Board to be reasonable and fair given the nature and quality of services provided; and that the benefits that will accrue to the Adviser by virtue of its relationship to the Funds are reasonable in comparison with the benefits accruing to each Fund. After this review and discussion, the Board concluded that the approval of the New Advisory Agreements for an initial two-year term was in the best interests of each Fund and its shareholders and determined to recommend that shareholders of the Funds vote to approve the New Advisory Agreements at the Special Meeting of Shareholders.
Factors Considered in Approving the Sub-Advisory Agreement
In connection with the Board’s review of the New Sub-Advisory Agreement, key personnel of the Adviser advised the Board about a variety of matters, including the following:
| ● | No material changes are currently contemplated as a result of the Transaction in the nature, quality, or extent of the sub-advisory services currently provided to the SA U.S. Fixed Income Fund, the SA |
SA FUNDS
ADDITIONAL INFORMATION (Unaudited) (Continued)
Global Fixed Income Fund, the SA U.S. Core Market Fund, the SA U.S. Value Fund, the SA U.S. Small Company Fund, the SA International Value Fund, the SA International Small Company Fund, the SA Emerging Markets Value Fund and the SA Real Estate Securities Fund (each, a “Sub-Advised Fund” and collectively, the “Sub-Advised Funds”) and their shareholders by the Sub-Adviser.
| ● | All of the current portfolio managers and other key investment personnel of the Sub-Adviser who currently assist in the management of the Sub-Advised Funds are expected to continue to do so after the Transaction. |
| ● | The terms and conditions of the New Sub-Advisory Agreement, including each Sub-Advised Fund’s contractual fee rate, will remain the same as the terms of the existing Sub-Advisory Agreement for the initial two-year term of the New Sub-Advisory Agreement. |
In their deliberations, the Board considered the factors discussed below, among others. The Independent Trustees did not identify any particular factor or piece of information that was all-important or controlling, and each Trustee may have attributed different weights to the various factors:
The nature, extent and quality of the services provided and to be provided by the Sub-Adviser. The Board considered the experience and qualifications of the key investment personnel of the Sub-Adviser, including the portfolio managers, who are responsible for providing services to the Sub-Advised Funds. The Board noted the role of the Sub-Adviser relating to portfolio construction and management, and compliance with the Sub-Advised Funds’ investment objectives and policies, the Trust’s compliance policies and procedures, and applicable laws and regulations, as well as the Sub-Adviser’s role in implementing the Board’s directives relating to the Sub-Advised Funds. The Board also noted that all of the current portfolio managers and other key investment personnel of the Sub-Adviser are expected to continue to serve in their current roles with respect to the Sub-Advised Funds following the Transaction.
Based on its consideration and review of the foregoing information, the Board concluded that the nature, extent and quality of services to be provided by the Sub-Adviser were satisfactory and that there was a reasonable basis on which to conclude that the Sub-Adviser would continue to provide high quality investment services to the Sub-Advised Funds.
The investment performance of the Sub-Advised Funds achieved by the Adviser and the Sub-Adviser. The Board considered that it is anticipated that all of the portfolio managers and other key investment personnel currently managing the Sub-Advised Funds are expected to continue to do so following the Transaction. The Board also considered its recent review of each of the Sub-Advised Funds performance for various trailing time periods, including over longer-term trailing time periods, on an absolute basis, as well as relative to each Sub-Advised Fund’s benchmark index, the Broadridge peer group and funds managed by the Sub-Adviser with comparable investment styles. The Board had concluded that the investment performance of each Sub-Advised Fund remained competitive relative to its Broadridge peer group and benchmark index. The Trustees noted that based on the information presented at the Special Meeting, as well as periodic discussions with the Sub-Adviser, they believed that the Sub-Adviser remains capable of generating a level of long-term investment performance that is appropriate in light of each Sub-Advised Fund’s investment objectives, policies and strategies and competitive with other investment companies.
The extent to which the Sub-Adviser realizes economies of scale as the Trust grows larger and whether fee levels reflect these economies of scale for the benefit of Sub-Advised Fund shareholders. The Board evaluated
SA FUNDS
ADDITIONAL INFORMATION (Unaudited) (Continued)
potential or anticipated economies of scale in relation to the services the Sub-Adviser will provide to each Fund. The Board considered historic and potential growth rates in the Sub-Advised Funds’ assets, and noted that the Funds are designed to work together as a set of asset allocation choices and that economies of scale (and other factors) are most appropriately assessed on a Trust-level and not on a Fund-by-Fund basis. The Board noted that the Sub-Advised Funds do not have sub-advisory fee breakpoints. However, the Board considered that future growth in the assets of the Sub-Advised Funds and any related economies of scale could allow the Adviser to negotiate lower fees with the Sub-Adviser, to the extent such growth were to create economies of scale. The Board also noted that it will have the opportunity to periodically re-examine whether a Fund or the Trust has achieved economies of scale, and the appropriateness of sub-advisory fees payable to the Sub-Adviser, in the future.
Total expenses of the Sub-Advised Funds and competitiveness of fees to be paid to the Sub-Adviser. The Board considered the sub-advisory fee rates charged by the Sub-Adviser, as well as the total effective management fee rate of each Sub-Advised Fund, after taking into consideration each Sub-Advised Fund’s expense limitation arrangements. The Board noted that the terms and conditions of the New Sub-Advisory Agreement, including each Sub-Advised Fund’s contractual sub-advisory fee rate, will remain the same, for an initial two-year term, as the contractual fee rate in the existing Sub-Advisory Agreement. In assessing the fees charged by the Sub-Adviser, the Board noted that the fees ranged from 3 to 36 basis points (“bps”) annually, with most of them at or below 10 bps annually, except for the SA International Value Fund (20 bps annually), the SA U.S. Small Company Fund (20 bps annually) and the SA Emerging Markets Value Fund (36 bps annually). The Board took into consideration that these fees reflected an arm’s-length negotiation between the Adviser and the Sub-Adviser, and determined that the fees were reasonable in light of the services provided to each Sub-Advised Fund.
The Board also noted that each Sub-Advised Fund’s total net expense ratio, a figure which includes all operating expenses, excluding any dividend, interest or borrowing expenses, minus any expense waivers or other reimbursements, was below the median expense ratio of its respective Broadridge peer group.
The profits to be realized by the Sub-Adviser and its affiliates, from their relationship with the Trust. The Board considered the profitability rates of the Sub-Adviser and noted that the Sub-Adviser has previously represented that it no longer accrues soft-dollar research credits and has wound down the remaining aspects of its soft-dollar program. The Board reviewed information provided by the Sub-Adviser regarding its financial stability and the profitability attributable to its agreements with the Sub-Advised Funds. After such review, the Board determined that the profitability rates of the Sub-Adviser, with respect to the New Sub-Advisory Agreements, were reasonable in consideration of the services provided to the Sub-Advised Funds.
Conclusions. In approving the New Sub-Advisory Agreements, the Board unanimously concluded that the terms of the New Sub-Advisory Agreements are fair and reasonable and that approval of the New Sub-Advisory Agreements is in the best interests of each Sub-Advised Fund and its Shareholders. In reaching this determination, the Board considered that the Sub-Adviser provided a high level of service to each Fund; that it has confidence in the Sub-Adviser’s capabilities to continue to manage the Sub-Advised Funds consistently with their respective specified investment objective, strategies and policies; that each Sub-Advised Fund’s fee structure appeared to the Board to be reasonable and fair given the nature and quality of services provided; and that the benefits that will accrue to the Sub-Adviser by virtue of its relationship to the Sub-Advised Funds are reasonable in comparison with the benefits accruing to each Sub-Advised Fund. After this review and discussion, the Board unanimously concluded that the approval of the Sub-Advisory Agreements for an initial two-year term was in the best interests of each Sub-Advised Fund and its Shareholders.
SA FUNDS
ADDITIONAL INFORMATION (Unaudited) (Continued)
Board Approval of Continuation of Investment Agreements and Sub-Advisory Agreement
At a meeting held on June 21, 2023 (the “Meeting”), the Board, consisting solely of Independent Trustees, considered the renewal for a one-year term of each of the current Investment Advisory Agreements and the Sub-Advisory Agreement (collectively, the “Advisory Agreements”).
The Board discussed the role of the Funds as asset allocation tools and as a means by which smaller retail-level investors could access the investment services offered by the Sub-Adviser. The Board also discussed the role of the Adviser in monitoring the Funds’ effectiveness in this regard and the value added by the Adviser in ensuring that the Funds provided the type of comprehensive asset allocation investment program that shareholders were expecting to receive at reasonable cost levels. The Board also discussed asset growth and economies of scale, which, together with past reductions of the Adviser’s management fees and contractual fee waiver/expense reimbursement arrangements, have resulted in fee and/or expense reductions in recent years.
Factors Considered in Approving the Advisory Agreements
In approving the renewal of the Advisory Agreements, the Board was advised by counsel to the Independent Trustees and took into account information prepared specifically in connection with its review of the Advisory Agreements at the Meeting and the telephonic meeting of the Board on May 10, 2023 (the “May 10 Telephonic Meeting”) and information furnished to the Board throughout the year. The Board also considered the items discussed with representatives of the Trust, the Adviser and the Sub-Adviser during the May 10 Telephonic Meeting. In their deliberations, the Board considered the factors discussed below, among others. The Independent Trustees did not identify any particular piece of information that was all-important or controlling, and each Trustee may have attributed different weights to the various factors:
The nature, extent and quality of the services provided and to be provided by the Adviser and the Sub-Adviser. The Board considered the experience and qualifications of the personnel at the Adviser and the Sub-Adviser who are responsible for providing services to the Funds and the compensation structures of the Adviser and the Sub-Adviser. The Board noted the oversight role of the Adviser over the Sub-Adviser relating to portfolio construction and management, compliance with the Funds’ investment objectives and policies, the Trust’s compliance policies and procedures, and applicable laws and regulations, as well as the Adviser’s role in implementing the Board’s directives relating to the Funds. The Board also noted that the Adviser has extensive experience offering asset allocation and risk diversification through investment portfolios such as the Funds. The Board further noted the Sub-Adviser’s experience and expertise in constructing portfolios that reflect diverse asset classes and risk levels, as well as the extensive industry experience of the Sub-Adviser’s personnel.
The Board then considered the resources, policies and procedures, and infrastructure of the Adviser and the Sub-Adviser devoted to ensuring compliance with applicable laws and regulations, as well as the Adviser’s and the Sub-Adviser’s commitment to those programs. The Board considered the information received regarding the Adviser’s and the Sub-Adviser’s respective compliance programs and compliance reports received during the prior year. The Board noted that there are currently no known pending regulatory issues with the SEC or other regulatory agencies involving the Adviser or Sub-Adviser other than routine examination matters.
The Board noted that the Adviser continues to provide portfolio management and reporting services, asset-class allocation, shareholder servicing and, if requested, administrative services support to investors and their financial representatives to enhance the effectiveness of the Funds as asset allocation vehicles.
SA FUNDS
ADDITIONAL INFORMATION (Unaudited) (Continued)
The investment performance of the Funds achieved by the Adviser and the Sub-Adviser. The Board reviewed the short-term and longer-term performance of each of the Funds on both an absolute basis and relative to each Fund’s benchmark index, a peer group of funds based on investment style, and comparable funds managed by the Sub-Adviser. The Board noted that it received and discussed Fund performance information on a quarterly basis throughout the year. As part of its review, the Board also reviewed a report prepared by an independent consulting firm, Broadridge Financial Solutions, Inc. (“Broadridge”), which included comparisons of the performance of each Fund to certain funds determined by Broadridge to be comparable based on investment style (the “Broadridge Peer Group”) and the Fund’s benchmark index. The Board noted that the Broadridge Peer Group, which is used for both performance and expense comparisons, was determined for each Fund based on investment style, similar expense structures and asset size (to reflect similar economies of scale), as applicable. The Board noted that in September 2022, the Select share classes for each SA fund that had a Select share class were reorganized into Investor Share classes and that Broadridge therefore transitioned using the Investor share class as the subject funds for the analysis. The Board examined the performance of each of the Funds for the 1-year, 3-year, 5-year and 10-year periods ended December 31, 2022, as applicable.
In assessing performance, the Board took into consideration that each Fund is intended to provide exposure to a particular asset class. For this reason, the Board viewed fidelity to asset class characteristics as highly important to its evaluation of the Funds. The Board noted that it looks for Fund performance to track the appropriate benchmark index(es) as closely as possible, given certain practical constraints imposed by the 1940 Act and each Fund’s investment restrictions, size and similar factors. Because the Funds are primarily asset allocation tools, the Board emphasized each Fund’s performance against its asset class benchmark index(es) and its general adherence to asset class representation, with the exception of the SA Worldwide Moderate Growth Fund, which invests in other Funds managed by the Adviser (the “Underlying Funds”) comprising various asset classes and strategies.
For the SA U.S. Fixed Income Fund, it was noted that the Fund’s gross total return performance was in the 4th (bottom) quartile of its Broadridge Peer Group for the 1-year, 3-year, 5-year and 10-year periods ended December 31, 2022. It was also noted that the Fund’s performance trailed its benchmark, the Morningstar U.S. 1-3 Yr Composite Government and Corporate Bond Index, for each period. The Board also took into consideration that the Fund’s relatively shorter duration and persistent bias toward higher quality credits contributed to its underperformance relative to its Broadridge Peer Group and benchmark during long stretches when interest rate risk was beneficial.
For the SA Global Fixed Income Fund, it was noted that the Fund’s gross total return performance was in the 2nd quartile of its Broadridge Peer Group for the 1-year period ended December 31, 2022, in the 3rd quartile for the 3-year period and in the 4th quartile for the 5-year and 10-year periods ended the same date. It was also noted that the Fund underperformed its benchmark, the Morningstar Global 1-5 Yr Treasury Bond Hedged Index, for the 1-year, 3-year, 5-year and 10-year periods. The Board took into consideration that the Fund’s relatively shorter duration contributed to its underperformance relative to its Broadridge Peer Group and benchmark during the long stretches when taking longer duration risk would have been beneficial to the Fund.
For the SA U.S. Core Market Fund, it was noted that the Fund’s gross total return performance was in the 2nd quartile of its Broadridge Peer Group for the 1-year, 5-year and 10-year periods ended December 31, 2022 and the 3rd quartile for the 3-year period ended the same date. It was also noted that the Fund’s performance outperformed its benchmark, the Morningstar U.S. Market Extended Index, for the 1-year, 3-year, 5-year and 10-year periods.
SA FUNDS
ADDITIONAL INFORMATION (Unaudited) (Continued)
For the SA U.S. Value Fund, it was noted that the Fund’s gross total return performance was in the 2nd quartile among its Broadridge Peer Group for the 1-year and 10-year periods ended December 31, 2022, the 3rd quartile for the 5-year period ended the same date and the 4th quartile for the 3-year period ended the same date. It was also noted that the Fund’s performance exceeded that of its benchmark, the Morningstar U.S. Large-Mid Cap Broad Value Index, for the 1-year period but trailed the benchmark for the 3-year, 5-year and 10-year periods.
For the SA U.S. Small Company Fund, it was noted that the Fund’s gross total return performance was in the 2nd quartile of its Broadridge Peer Group for the 1-year, 3-year, 5-year and 10-year periods ended December 31, 2022. It was also noted that the Fund’s performance exceeded that of its benchmark, the Morningstar U.S. Small Cap Extended Index, for the 1-year, 3-year, 5-year and 10-year periods.
For the SA Real Estate Securities Fund, it was noted that the Fund’s gross total return performance was in the 1st quartile of its Broadridge Peer Group for the 1-year period ended December 31, 2022 and the 3rd quartile for the 3-year, 5-year and 10-year periods ended the same date. It was also noted that the Fund’s performance exceeded that of its benchmark, the Morningstar U.S. REIT Index, for the 1-year, 3-year and 5-year periods and trailed its benchmark for the 10-year period.
For the SA International Value Fund, it was noted that the Fund’s gross total return performance was in the 1st quartile of its Broadridge Peer Group for the 1-year, 3-year and 10-year periods ended December 31, 2022 and the 2nd quartile for the 5-year period ended the same date. It was also noted that the Fund’s performance exceeded that of its benchmark, the Morningstar Developed Markets ex-US Value Target Market Exposure Index for the 1-year, 3-year, 5-year and 10-year periods.
For the SA International Small Company Fund, it was noted that the Fund invests substantially all of its assets in the International Small Company Portfolio of DFA Investment Dimensions Group Inc. It was noted that the Fund’s gross total return performance was in the 3rd quartile of its Broadridge Peer Group for the 1-year, 3-year, 5-year and 10-year periods ended December 31, 2022. It was also noted that the Fund’s performance exceeded that of its benchmark, the Morningstar Global Markets ex-US Small-Mid Cap Index, for the 1-year, 3-year, 5-year and 10-year periods.
For the SA Emerging Markets Value Fund, it was noted that the Fund’s gross total return performance was in the 1st quartile of its Broadridge Peer Group for the 1-year, 3-year and 5-year periods ended December 31, 2022 and the 4th quartile for the 10-year period ended the same date. It was also noted that the Fund’s performance exceeded that of its benchmark, the Morningstar Emerging Markets Value Target Market Exposure Index, for the 1-year and 3-year periods and trailed the benchmark for the 5-year and 10-year periods.
For the SA Worldwide Moderate Growth Fund, it was noted that the Fund’s gross total return performance was in the 1st quartile of its Broadridge Peer Group for the 1-year period ended December 31, 2022, the 2nd quartile for the 3-year period ended the same date and the 3rd quartile for the 5-year period ended the same date. It was also noted that the Fund’s performance exceeded that of its benchmark, the Morningstar U.S. Moderate Target Allocation Index, for the 1-year and 3-year periods but trailed the benchmark for the 5-year period.
The extent to which the Adviser and the Sub-Adviser realize economies of scale as the Trust grows larger and whether fee levels reflect these economies of scale for the benefit of Fund shareholders. The Board evaluated any apparent or anticipated economies of scale in relation to the services the Adviser provides to each Fund. The Board considered the Funds’ net flows and asset levels, and noted that the Funds are designed to work together as a set of asset allocation choices and that economies of scale (and other factors) are most appropriately assessed on a
SA FUNDS
ADDITIONAL INFORMATION (Unaudited) (Continued)
Trust-level and not on a Fund-by-Fund basis. The Board also noted that although the Funds do not have advisory fee breakpoints, the Adviser has contractually agreed to waive a portion of its advisory fees and/or reimburse each of the Funds for certain expenses so that each Fund does not exceed its operating expense limitation and has taken other steps to reduce Fund operating expenses.
In considering potential economies of scale, the Board noted that the Adviser is still subsidizing certain operations of the Trust through the expense limitation arrangements and that the Adviser has recouped only a portion of the amounts previously waived under these expense limitation arrangements. It was further noted that in recent years the management fees payable to the Adviser were reduced on a majority of the Funds, with additional reductions in management fees and operating expense limits for a majority of Funds applicable effective January 1, 2018, and further reductions on the SA Emerging Markets Value Fund, effective March 1, 2021 and July 1, 2021, and on the SA U.S. Small Company Fund effective July 1, 2021. The Board concluded that any economies of scale generated at current asset levels were being effectively shared with Fund shareholders.
Total expenses of the Funds and competitiveness of fees to be paid to the Adviser and the Sub-Adviser. The Board considered the gross management fee rates charged by the Adviser and the Sub-Adviser, as well as the effective management fee rates after taking into consideration the Funds’ expense limitation arrangements with the Adviser.
In considering the management fees and the total fees and expenses of each Fund, the Board reviewed a comparison of each Fund’s effective advisory fee and overall expense ratio to its respective Broadridge Peer Group. The Board considered the median of the contractual management fees and overall expense ratios of each peer group.
It was noted that each Fund’s net expense ratio, a figure that includes all of the Fund’s operating expenses, excluding any dividend, interest or borrowing expenses, minus any expense waivers or other reimbursements, was below the median expense ratio of its respective Broadridge Peer Group.
The Board noted the reduction in 2018 of annual advisory fees from 45 bps to 40 bps for each of the SA U.S. Core Market Fund, SA U.S. Value Fund and SA U.S. Small Company Fund; from 50 bps to 45 bps for the SA International Value Fund and SA Emerging Markets Value Fund; from 50 bps to 25 bps for the SA International Small Company Fund. The Board further noted the reduction of annual sub-advisory fees from 45 bps to 41 bps for the SA Emerging Markets Value Fund, effective March 1, 2021, and the reduction from 41 bps to 36 bps for the SA Emerging Markets Value Fund and from 25 bps to 20 bps for the SA U.S. Small Company Fund, each effective July 1, 2021, with additional reductions in prior years. The Board further noted the implementation of expense limitations (as a percentage of average daily net assets) until October 28, 2025 for all Funds except the SA Worldwide Moderate Growth Fund. The Board further noted that for the SA Worldwide Moderate Growth Fund, the Adviser has contractually agreed until July 1, 2025 to reimburse expenses so that the Fund’s annual operating expenses do not exceed the total annual acquired fund fees and expenses related to the Underlying Funds in which it invests.
In assessing the fees charged by the Sub-Adviser, the Board noted that the fees ranged from 0 to 36 bps annually, with most of them at or below 10 bps annually, except for the SA International Value Fund (20 bps annually), the SA U.S. Small Company Fund (20 bps annually) and the SA Emerging Markets Value Fund (36 bps annually). The Board took into consideration that these fees reflected an arm’s-length negotiation between the Adviser and the Sub-Adviser and determined that the fees were reasonable in light of the services provided to each Fund. The Board also noted the previous reduction in fees payable pursuant to the Sub-Advisory Agreement for most Funds.
SA FUNDS
ADDITIONAL INFORMATION (Unaudited) (Continued)
The profits to be realized by the Adviser, the Sub-Adviser and their respective affiliates, from their relationship with the Trust. The Board considered other benefits derived by the Adviser from its relationship with the Funds, including amounts received by the Adviser for the provision of certain shareholder and administrative services to the Funds. It was noted that the Adviser does not receive any soft dollar benefits from the Funds. The Board also considered the profitability rates of the Sub-Adviser and noted that the Sub-Adviser has previously advised that it is no longer accruing soft-dollar credits and has wound down the remaining aspects of its soft-dollar program.
The Board reviewed information provided by the Adviser and the Sub-Adviser regarding their financial stability and the profitability attributable to their respective agreements with the Funds. The Board considered the fact that the Funds were designed to operate in an integrated manner as a set of asset allocation vehicles and, for that reason, profitability of the Adviser on a Fund-by-Fund basis was not as relevant to the Board’s determinations as overall profitability of the Adviser at the Trust level. The Board also noted the difficulty of making comparisons of profitability because of differing business mixes and types of funds managed, the fact that publicly traded advisory firms for which data are available are typically much bigger than the Adviser, and the lack of an industry standard for methodology used to calculate profitability.
After such review, the Board determined that the profitability rates of the Adviser and the Sub-Adviser, with respect to the Investment Advisory Agreement and the Sub-Advisory Agreement, were not unreasonable in consideration of the services each provides to the Funds.
The Board also considered the climate in the financial services industry; the risks assumed by the Adviser and the Sub-Adviser in complying with investment restrictions, expense limitations and tax laws; the entrepreneurial risks undertaken by the Adviser in sponsoring the Trust and adding Funds to the Trust; the volatility of the financial markets and, thus, of management fee income; and the compensation of the Adviser and the Sub-Adviser and the need to provide sufficient incentives to their respective owners and employees in light of the foregoing considerations.
Conclusions. In approving the Advisory Agreements, the Board concluded that the terms of the Advisory Agreements are fair and reasonable and that approval of the Advisory Agreements is in the best interests of each Fund and its shareholders. In reaching this determination, the Board considered that the Adviser and the Sub-Adviser could be expected to provide a high level of service to each Fund; the performance of each Fund over time and in some cases for more recent periods, or, in the case of underperforming Funds, that it retained confidence in the Adviser’s and the Sub-Adviser’s capabilities to manage the Funds consistently with their respective specified investment objective and strategies; that each Fund’s fee structure appeared to the Board to be reasonable given the nature and quality of services provided; and that the benefits accruing to the Adviser and the Sub-Adviser by virtue of their relationship to the Funds were reasonable in comparison with the benefits accruing to each Fund. After this review and discussion, the Board concluded that the renewal of the Advisory Agreements for a one-year term was in the best interests of each Fund and its shareholders.
SA FUNDS
ANNUAL REPORT OF LIQUIDITY RISK MANAGEMENT PROGRAM ADMINISTRATOR
Consistent with Rule 22e-4 under the Investment Company Act of 1940 (the “Liquidity Rule”), the Funds have adopted and implemented a liquidity risk management program (the “Program”). The Program seeks to assess and manage each Fund’s liquidity risk, which is defined under the Rule as the risk that a Fund is unable to meet investor redemption requests without significantly diluting the remaining investor’s interests in the Fund. The Funds’ Board of Trustees (the “Board”) has designated Buckingham Strategic Partners LLC, the Funds’ investment adviser, as the administrator (the “Administrator”) of the Program. As part of its responsibilities, the Administrator implements and oversees the day-to-day operation of the Program. The Administrator’s process of determining the degree of liquidity of each Fund’s investments is supported by one or more third-party liquidity assessment vendors.
At a meeting of the Board of Trustees on June 21, 2023, the Board reviewed a written report (the “Report”) prepared by the Administrator addressing the operation, adequacy, and effectiveness of the Funds’ Program, including any material changes to the Program for the period May 1, 2022 through April 30, 2023 (“Reporting Period”). The Report included a summary of the oversight of the Program and the system that is used to operate the Program, and a discussion of the Funds’ investment strategies and liquidity sources, cash flow projections, borrowing arrangements, reasonably anticipated trade sizes, historical redemptions, investor concentrations, liquidity events and liquidity classifications during the Reporting Period. The Report noted that there were no material changes to the Program during the Reporting Period. The Report included the Administrator’s assessment that the Program had operated adequately and effectively in all material aspects during the Reporting Period, and that the Program’s existing controls and safeguards continue to be appropriately designed to enable the administrator to maintain compliance with the Liquidity Rule.
SA FUNDS
TAX INFORMATION NOTICE (Unaudited)
For federal income tax purposes, the following information is furnished with respect to the distributions of the Funds for the fiscal year ended June 30, 2023:
Foreign Tax Credits – For the fiscal year ended June 30, 2023, the following Funds have made an election under Internal Revenue Code Section 853 to pass through foreign taxes paid by the Fund to its shareholders, all of which represents taxes witheld.
| | | Foreign | | | Foreign | |
| | | Tax Credit | | | Source Income | |
| SA International Value Fund | | $ | 1,495,630 | | | $ | 26,758,036 | |
| SA International Small Company Fund | | | 613,858 | | | | 5,582,466 | |
| SA Emerging Markets Value Fund | | | 730,327 | | | | 10,065,710 | |
| SA Worldwide Moderate Growth Fund | | | 21,455 | | | | 233,771 | |
Capital Gain Distributions – On December 20, 2022, the following Funds declared long-term capital gain distribution.
| SA U.S. Core Market Fund | | $ | 26,796,752 | |
| SA U.S. Value Fund | | | 28,550,506 | |
| SA U.S. Small Company Fund | | | 7,767,660 | |
| SA International Small Company Fund | | | 9,788,614 | |
| SA Real Estate Securities Fund | | | 6,815,243 | |
On December 28, 2022, the SA Worldwide Moderate Growth Fund declared long-term capital gain distribution of $1,168,961.
Corporate Dividends Received Deduction – The following Funds paid distributions from ordinary income that qualify for the corporate dividends received deduction. The percentage that qualifies is noted below:
| SA U.S. Core Market Fund | | | 100.00 | % |
| SA U.S. Value Fund | | | 100.00 | % |
| SA U.S. Small Company Fund | | | 100.00 | % |
| SA International Small Company Fund | | | 0.29 | % |
| SA Worldwide Moderate Growth Fund | | | 18.15 | % |
Qualified Dividend Income – For the fiscal year ended June 30, 2023 certain dividends paid by one or more of the Funds may be designated as qualified dividend income and subject to a maximum federal income tax rate of 15% for individual shareholders (20% for individuals with taxable income exceeding $459,750 or $517,200 if married filing jointly). Complete information will be reported in conjunction with your 2023 Form 1099-DIV.
SA FUNDS
ADDITIONAL INFORMATION (Unaudited) (Continued)
Understanding Your Fund’s Expense
Shareholder Expense Example
As a mutual fund shareholder you incur ongoing costs including management fees, shareholder services fees, fees for administrative services and other Fund expenses. These costs are described in more detail in the Funds’ prospectus. The examples below are intended to help you understand your ongoing costs of investing in the Funds and help you compare these with the ongoing costs of investing in other mutual funds. The following examples are based on an investment of $1,000 made at the beginning of the period, January 1, 2023 through June 30, 2023. Expenses paid during the period in the table below are equal to the annualized net expense ratio of the Funds’ each class of shares, multiplied by the average account value over the period, multiplied by the number of days in the most recent fiscal half-year divided by the number of days in the fiscal year (to reflect the one-half-year period). Such expenses are limited by an agreement between the Fund and the Adviser and may be recovered by the Adviser under certain circumstances. You can find additional information about the Fund’s expenses, including the expense limitation agreement, in the Notes to Financial Statements section of this report and in the Fund’s current prospectus.
Actual Expenses
The table below shows the actual account values and actual Fund expenses, based on the actual performance of the Funds’ each class of shares during the period. You may use the information in this line, together with the amount you invested, to estimate the expenses you paid over the period. Simply divide your account value by $1,000 (for example $8,600 account value divided by $1,000 = 8.6) then multiply the result by the number in the first line of the table for your Fund under the heading “Expenses Paid During Period” to estimate the expenses you paid over the period.
| | | Actual Expenses | |
| | | Beginning | | | Ending | | | Annual | | | Expenses | |
| | | Account | | | Account | | | Expense | | | Paid During | |
| | | Value | | | Value | | | Ratio | | | Period | |
| SA U.S. Fixed Income Fund | | $ | 1,000 | | | $ | 1,020.90 | | | | 0.38 | % | | $ | 1.90 | |
| SA Global Fixed Income Fund | | | 1,000 | | | | 1,019.10 | | | | 0.51 | | | | 2.55 | |
| SA U.S. Core Market Fund | | | 1,000 | | | | 1,165.00 | | | | 0.68 | | | | 3.65 | |
| SA U.S. Value Fund | | | 1,000 | | | | 1,037.40 | | | | 0.77 | | | | 3.89 | |
| SA U.S. Small Company Fund | | | 1,000 | | | | 1,081.10 | | | | 0.92 | | | | 4.75 | |
| SA International Value Fund | | | 1,000 | | | | 1,093.10 | | | | 0.94 | | | | 4.88 | |
| SA International Small Company Fund | | | 1,000 | | | | 1,066.00 | | | | 0.58 | | | | 2.97 | |
| SA Emerging Markets Value Fund | | | 1,000 | | | | 1,078.90 | | | | 1.07 | | | | 5.52 | |
| SA Real Estate Securities Fund | | | 1,000 | | | | 1,026.20 | | | | 0.73 | | | | 3.67 | |
| SA Worldwide Moderate Growth Fund | | | 1,000 | | | | 1,070.40 | | | | 0.00 | | | | 0.00 | |
See Notes to financial statements
SA FUNDS
ADDITIONAL INFORMATION (Unaudited) (Continued)
Hypothetical Example for Comparison Purposes
The table below provides information about hypothetical account values and hypothetical expenses based on actual expense ratio of the Funds’ each class of shares and an assumed rate of return of 5% per year before expenses, which is not actual return of the Funds’ each class of shares. Thus, you should not use the hypothetical account values and expenses to estimate the actual ending account balance or your expenses for the period. Rather, these figures are provided to enable you to compare the ongoing costs of investing in the Fund versus other funds. To do so, compare this 5% hypothetical example with the 5% hypothetical examples that appear in the shareholder reports of the other funds.
| | | Hypothetical Expenses | |
| | | Beginning | | | Ending | | | Annual | | | Expenses | |
| | | Account | | | Account | | | Expense | | | Paid During | |
| | | Value | | | Value | | | Ratio | | | Period | |
| SA U.S. Fixed Income Fund | | $ | 1,000 | | | $ | 1,022.91 | | | | 0.38 | % | | $ | 1.91 | |
| SA Global Fixed Income Fund | | | 1,000 | | | | 1,022.27 | | | | 0.51 | | | | 2.56 | |
| SA U.S. Core Market Fund | | | 1,000 | | | | 1,021.42 | | | | 0.68 | | | | 3.41 | |
| SA U.S. Value Fund | | | 1,000 | | | | 1,020.98 | | | | 0.77 | | | | 3.86 | |
| SA U.S. Small Company Fund | | | 1,000 | | | | 1,020.23 | | | | 0.92 | | | | 4.61 | |
| SA International Value Fund | | | 1,000 | | | | 1,020.13 | | | | 0.94 | | | | 4.71 | |
| SA International Small Company Fund | | | 1,000 | | | | 1,021.92 | | | | 0.58 | | | | 2.91 | |
| SA Emerging Markets Value Fund | | | 1,000 | | | | 1,019.49 | | | | 1.07 | | | | 5.36 | |
| SA Real Estate Securities Fund | | | 1,000 | | | | 1,021.17 | | | | 0.73 | | | | 3.66 | |
| SA Worldwide Moderate Growth Fund | | | 1,000 | | | | 1,024.79 | | | | 0.00 | | | | 0.00 | |
Please note that the expenses shown in the tables are meant to highlight your ongoing costs only and do not reflect any transaction costs. Therefore, the second line of the table is useful in comparing ongoing costs only, and will not help you determine the relative total costs of investing in different funds. In addition, if these transaction costs were included, your costs would have been higher.
See Notes to financial statements
Selected Financial Statements of DFA Investment Dimensions Group Inc.
International Small Company Portfolio
TABLE OF CONTENTS
DFA INVESTMENT DIMENSIONS GROUP INC.
THE DFA INVESTMENT TRUST COMPANY
DEFINITIONS OF ABBREVIATIONS AND FOOTNOTES
Schedules of Investments/Summary Schedules of Portfolio Holdings
Investment Abbreviations
| P.L.C. | Public Limited Company |
| SA | Special Assessment |
| ST | Special Tax |
Investment Footnotes
| » | Securities that have generally been fair value factored. See Note B to Financial Statements. |
| ‡ | Calculated as a percentage of total net assets. Percentages shown parenthetically next to the category headings have been calculated as a percentage of total investments. “Other Securities” are those securities that are not among the top 50 holdings in unaffiliated issuers of the Fund or do not represent more than 1.0% of the net assets of the Fund. Some of the individual securities within this category may include Total or Partial Securities on Loan and/or Non-Income Producing Securities. |
| # | Total or Partial Securities on Loan. |
| * | Non-Income Producing Securities. |
| @ | Security purchased with cash collateral received from Securities on Loan. |
| † | See Note B to Financial Statements. |
| Ω | Rule 144A, Section 4(2), or other security that is restricted as to resale to institutional investors. This security has been deemed liquid based upon the Fund’s Liquidity Guidelines. The liquidity determination is unaudited. |
| †† | Security valued using significant unobservable inputs (Level 3). |
Financial Highlights
| (A) | Computed using average shares outstanding. |
| (B) | Represents the combined ratios for the respective portfolio and its respective pro-rata share of its Master Fund(s) and/or Underlying Fund(s). |
All Statements, Schedules and Notes to Financial Statements
| — | Amounts designated as — are either zero or rounded to zero. |
| SEC | Securities and Exchange Commission |
DFA INVESTMENT DIMENSIONS GROUP INC.
INTERNATIONAL SMALL COMPANY PORTFOLIO
DISCLOSURE OF FUND EXPENSES
(Unaudited)
The following Expense Table is shown so that you can understand the impact of fees on your investment. All mutual funds have operating expenses. As a shareholder of the fund, you incur ongoing costs, which include costs for portfolio management, administrative services, and shareholder reports, among others. Operating expenses and legal and audit services, which are deducted from a fund’s gross income, directly reduce the investment return of the fund. A fund’s expenses are expressed as a percentage of its average net assets. This figure is known as the expense ratio. The following examples are intended to help you understand the ongoing costs, in dollars, of investing in the fund and to compare these costs with those of other mutual funds. The examples are based on an investment of $1,000 made at the beginning of the period shown and held for the entire period.
The Expense Table below illustrate your fund’s costs in two ways.
Actual Fund Return
This section helps you to estimate the actual expenses after fee waivers that you paid over the period. The “Ending Account Value” shown is derived from the fund’s actual return and “Expenses Paid During Period” reflect the dollar amount that would have been paid by an investor who started with $1,000 in the fund. You may use the information here, together with the amount you invested, to estimate the expenses that you paid over the period.
To do so, simply divide your account value by $1,000 (for example, a $7,500 account value divided by $1,000 = 7.5), then multiply the result by the number given for your fund under the heading “Expenses Paid During Period.”
Hypothetical Example for Comparison Purposes
This section is intended to help you compare your fund’s costs with those of other mutual funds. The hypothetical “Ending Account Value” and “Expenses Paid During Period” are derived from the fund’s actual expense ratio and an assumed 5% annual return before expenses. In this case, because the return used is not the fund’s actual return, the results do not apply to your investment. The example is useful in making comparisons because the SEC requires all mutual funds to calculate expenses based on a 5% annual return. You can assess your fund’s costs by comparing this hypothetical example with the hypothetical examples that appear in shareholder reports of other funds.
Please note that the expenses shown in the tables are meant to highlight and help you compare ongoing costs only and do not reflect any transactional costs, if applicable. The “Annualized Expense Ratio” represents the actual expenses for the six-month period indicated.
| | | | | | Six Months Ended October 31, 2022 | |
| EXPENSE TABLE | | | | | | | | | | | | |
| |
| | | Beginning | | | Ending | | | | | | Expenses | |
| | | Account | | | Account | | | Annualized | | | Paid | |
| | | Value | | | Value | | | Expense | | | During | |
| | | 05/01/22 | | | 10/31/22 | | | Ratio(1) | | | Period (1) | |
| International Small Company Portfolio(2) | | | | | | | | | | | | | | | | |
| Actual Fund Return | | $ | 1,000.00 | | | $ | 854.20 | | | | 0.41 | % | | $ | 1.92 | |
| Hypothetical 5% Annual Return | | $ | 1,000.00 | | | $ | 1,023.14 | | | �� | 0.41 | % | | $ | 2.09 | |
| 1 | Expenses are equal to the fund’s annualized expense ratio for the six-month period, multiplied by the average account value over the period, multiplied by the number of days in the most recent six-month period (184), then divided by the number of days in the year (365) to reflect the six-month period. |
| 2 | The Portfolio is a Fund of Funds. The expenses shown reflect the direct expenses of the Fund of Funds and the Fund of Funds’ portion of the expenses of its Underlying Funds (Affiliated Investment Companies). |
DFA INVESTMENT DIMENSIONS GROUP INC.
INTERNATIONAL SMALL COMPANY PORTFOLIO
DISCLOSURE OF PORTFOLIO HOLDINGS
(Unaudited)
The SEC requires that all funds file a complete Schedule of Investments with the SEC for their first and third fiscal quarters as an exhibit to their reports on Form N-PORT. For DFA Investment Dimensions Group Inc., this would be for the fiscal quarters ending January 31 and July 31. Such Form N-PORT filing must be made within 60 days of the end of the quarter. DFA Investment Dimensions Group Inc. filed its most recent Form N-PORT with the SEC on March 27, 2023. They are available upon request, without charge, by calling collect: (512) 306-7400; by mailing a request to Dimensional Fund Advisors LP, 6300 Bee Cave Road, Building One, Austin, TX 78746; or by visiting the SEC’s website at http://www.sec.gov.
SEC regulations permit a fund to include in its reports to shareholders a “Summary Schedule of Portfolio Holdings” in lieu of a full Schedule of Investments. The Summary Schedule of Portfolio Holdings reports the fund’s 50 largest holdings in unaffiliated issuers and any investments that exceed one percent of the fund’s net assets at the end of the reporting period. The regulations also require that the Summary Schedule of Portfolio Holdings identify each category of investments that are held.
A fund is required to file a complete Schedule of Investments with the SEC on Form N-CSR within ten days after mailing the annual and semi-annual reports to shareholders. It will be available upon request, without charge, by calling collect: (512) 306-7400; by mailing a request to Dimensional Fund Advisors LP, 6300 Bee Cave Road, Building One, Austin, TX 78746; or by visiting the SEC’s website at http://www.sec.gov.
PORTFOLIO HOLDINGS
The SEC requires that all funds present their categories of portfolio holdings in a table, chart or graph format in their annual and semi-annual shareholder reports, whether or not a Schedule of Investments is used. The following table, which presents portfolio holdings as a percentage of total investments before short-term investments and collateral for loaned securities, is provided in compliance with this requirement. The categories shown below represent broad industry sectors. Each industry sector consists of one or more specific industry classifications.
The categories of industry classification for the Affiliated Investment Companies are represented in their Disclosures of Portfolio Holdings, which are included elsewhere in the report. Refer to the Schedule of Investments/ Summary Schedule of Portfolio Holdings for each of the underlying Affiliated Investment Company’s holdings, which reflect the investments by category or country.
| FUND OF FUNDS | Affiliated Investment Companies |
| International Small Company Portfolio | 100.0% |
INTERNATIONAL SMALL COMPANY PORTFOLIO
SCHEDULE OF INVESTMENTS
JUNE 30, 2023
(Unaudited)
| | | | | | Value† | |
| AFFILIATED INVESTMENT COMPANIES — (98.8%) | | | | | | | | |
| Investment in The Continental Small Company Series of | | | | | | | | |
| The DFA Investment Trust Company | | | | | | $ | 4,398,331,712 | |
| Investment in The Japanese Small Company Series of | | | | | | | | |
| The DFA Investment Trust Company | | | | | | | 2,619,809,665 | |
| Investment in The United Kingdom Small Company Series of | | | | | | | | |
| The DFA Investment Trust Company | | | | | | | 1,318,775,143 | |
| Investment in The Canadian Small Company Series of | | | | | | | | |
| The DFA Investment Trust Company | | | | | | | 1,252,771,459 | |
| Investment in The Asia Pacific Small Company Series of | | | | | | | | |
| The DFA Investment Trust Company | | | | | | | 1,053,243,257 | |
| TOTAL INVESTMENTS IN AFFILIATED | | | | | | | | |
| INVESTMENT COMPANIES | | | | | | $ | 10,642,931,236 | |
| | | Shares | | | | | |
| TEMPORARY CASH INVESTMENTS — (1.2%) | | | | | | | | |
| State Street Institutional U.S. Government Money Market Fund, 5.030% | | | | | | | | |
| (Cost $124,488,522) | | | 124,488,522 | | | | 124,488,522 | |
| | | | | | | | | |
| TOTAL INVESTMENTS — (100.0%) | | | | | | | | |
| (Cost $9,934,406,554) | | | | | | $ | 10,767,419,758 | |
As of June 30, 2023, International Small Company Portfolio had entered into the following outstanding futures contracts:
| | | | | | | | | | | | | Unrealized | |
| | | Number of | | Expiration | | Notional | | | Market | | | Appreciation | |
| Description | | Contracts | | Date | | Value | | | Value | | | (Depreciation) | |
| Long Position Contracts: | | | | | | | | | | | | | | | | |
| S&P 500® Emini Index | | 540 | | 09/15/23 | | $ | 118,390,307 | | | $ | 121,182,750 | | | $ | 2,792,443 | |
| Total Futures Contracts | | | | | | $ | 118,390,307 | | | $ | 121,182,750 | | | $ | 2,792,443 | |
Summary of the Portfolio’s investments as of June 30, 2023, based on their valuation inputs, is as follows (See Security Valuation Note):
| | | Investments in Securities (Market Value) | |
| | | Level 1 | | | Level 2 | | | Level 3 | | | Total | |
| Affiliated Investment Companies | | $ | 10,642,931,236 | | | | — | | | | — | | | $ | 10,642,931,236 | |
| Temporary Cash Investments | | | 124,488,522 | | | | — | | | | — | | | | 124,488,522 | |
| Futures Contracts** | | | 2,792,443 | | | | — | | | | — | | | | 2,792,443 | |
| TOTAL | | $ | 10,770,212,201 | | | | — | | | | — | | | $ | 10,770,212,201 | |
| ** | Valued at the unrealized appreciation/(depreciation) on the investment. |
See accompanying Notes to Financial Statements.
DFA INVESTMENT DIMENSIONS GROUP INC.
INTERNATIONAL SMALL COMPANY PORTFOLIO
SCHEDULE OF INVESTMENTS
OCTOBER 31, 2022
| | | | | | Value† | |
| AFFILIATED INVESTMENT COMPANIES — (99.3%) | | | | | | | | |
| Investment in The Continental Small Company Series of | | | | | | | | |
| The DFA Investment Trust Company | | | | | | $ | 3,721,052,938 | |
| Investment in The Japanese Small Company Series of | | | | | | | | |
| The DFA Investment Trust Company | | | | | | | 2,247,239,833 | |
| Investment in The Canadian Small Company Series of | | | | | | | | |
| The DFA Investment Trust Company | | | | | | | 1,173,860,681 | |
| Investment in The United Kingdom Small Company Series of | | | | | | | | |
| The DFA Investment Trust Company | | | | | | | 1,146,678,426 | |
| Investment in The Asia Pacific Small Company Series of | | | | | | | | |
| The DFA Investment Trust Company | | | | | | | 961,398,453 | |
| TOTAL INVESTMENTS IN AFFILIATED INVESTMENT COMPANIES | | | | | | $ | 9,250,230,331 | |
| | | | Shares | | | | | |
| TEMPORARY CASH INVESTMENTS — (0.7%) | | | | | | | | |
| State Street Institutional U.S. Government Money Market Fund, 3.010% | | | | | | | | |
| (Cost $60,673,803) | | | 60,673,803 | | | | 60,673,803 | |
| TOTAL INVESTMENTS — (100.0%) | | | | | | | | |
| (Cost $10,083,101,056) | | | | | | $ | 9,310,904,134 | |
As of October 31, 2022, International Small Company Portfolio had entered into the following outstanding futures contracts:
| | | | | | | | | | | | | Unrealized | |
| | | Number of | | Expiration | | Notional | | | Market | | | Appreciation | |
| Description | | Contracts | | Date | | Value | | | Value | | | (Depreciation) | |
| Long Position Contracts: | | | | | | | | | | | | | | | | |
| S&P 500® Emini Index | | 282 | | 12/16/22 | | $ | 52,337,807 | | | $ | 54,750,300 | | | $ | 2,412,493 | |
| Total Futures Contracts | | | | | | $ | 52,337,807 | | | $ | 54,750,300 | | | $ | 2,412,493 | |
Summary of the Portfolio’s Master Fund’s investments as of October 31, 2022, based on their valuation inputs, is as follows (see Security Valuation Note):
| | | Investments in Securities (Market Value) | |
| | | Level 1 | | | Level 2 | | | Level 3 | | | Total | |
| Affiliated Investment Companies | | $ | 9,250,230,331 | | | | — | | | | — | | | $ | 9,250,230,331 | |
| Temporary Cash Investments | | | 60,673,803 | | | | — | | | | — | | | | 60,673,803 | |
| Futures Contracts** | | | 2,412,493 | | | | — | | | | — | | | | 2,412,493 | |
| TOTAL | | $ | 9,313,316,627 | | | | — | | | | — | | | $ | 9,313,316,627 | |
| ** | Valued at the unrealized appreciation/(depreciation) on the investment. |
See accompanying Notes to Financial Statements.
DFA INVESTMENT DIMENSIONS GROUP INC.
INTERNATIONAL SMALL COMPANY PORTFOLIO
STATEMENT OF ASSETS AND LIABILITIES
JUNE 30, 2023
(Unaudited)
(Amounts in thousands, except share and per share amounts)
| ASSETS: | | | | |
| Investments in Affiliated Investment Companies at Value | | $ | 10,642,931 | |
| Temporary Cash Investments at Value & Cost | | | 124,489 | |
| Cash | | | 3,340 | |
| Receivables: | | | | |
| Dividends and Interest | | | 455 | |
| Fund Shares Sold | | | 9,369 | |
| Futures Margin Variation | | | 2,793 | |
| Prepaid Expenses and Other Assets | | | 75 | |
| Total Assets | | | 10,783,452 | |
| | | | | |
| LIABILITIES: | | | | |
| Payables: | | | | |
| Fund Shares Redeemed | | | 5,254 | |
| Due to Advisor | | | 2,206 | |
| Accrued Expenses and Other Liabilities | | | 200 | |
| Total Liabilities | | | 7,660 | |
| | | | | |
| NET ASSETS | | $ | 10,775,792 | |
| NET ASSET VALUE, OFFERING AND REDEMPTION PRICE PER SHARE: | | | | |
| Institutional Class Shares — based on net assets of $10,775,792 and shares outstanding of 586,176,744 | | $ | 18.38 | |
| NUMBER OF SHARES AUTHORIZED | | | 3,000,000,000 | |
| | | | | |
| NET ASSETS CONSIST OF: | | | | |
| Paid-In Capital | | $ | 10,073,313 | |
| Total Distributable Earnings (Loss) | | | 702,479 | |
| | | | | |
| NET ASSETS | | $ | 10,775,792 | |
See accompanying Notes to Financial Statements.
DFA INVESTMENT DIMENSIONS GROUP INC.
INTERNATIONAL SMALL COMPANY PORTFOLIO
STATEMENT OF ASSETS AND LIABILITIES
OCTOBER 31, 2022
(Amounts in thousands, except share and per share amounts)
| ASSETS: | | | | |
| Investments in Affiliated Investment Companies at Value | | $ | 9,250,230 | |
| Temporary Cash Investments at Value & Cost | | | 60,674 | |
| Segregated Cash for Futures Contracts | | | 2,820 | |
| Receivables: | | | | |
| Dividends, Interest and Tax Reclaims | | | 172 | |
| Fund Shares Sold | | | 18,258 | |
| Prepaid Expenses and Other Assets | | | 63 | |
| Total Assets | | | 9,332,217 | |
| | | | | |
| LIABILITIES: | | | | |
| Payables: | | | | |
| Fund Shares Redeemed | | | 9,425 | |
| Due to Advisor | | | 1,934 | |
| Futures Margin Variation | | | 398 | |
| Accrued Expenses and Other Liabilities | | | 365 | |
| Total Liabilities | | | 12,122 | |
| | | | | |
| NET ASSETS | | $ | 9,320,095 | |
| NET ASSET VALUE, OFFERING AND REDEMPTION PRICE PER SHARE: | | | | |
| Institutional Class Shares — based on net assets of $9,320,095 and shares outstanding of 585,184,804 | | $ | 15.93 | |
| NUMBER OF SHARES AUTHORIZED | | | 3,000,000,000 | |
| | | | | |
| NET ASSETS CONSIST OF: | | | | |
| Paid-In Capital | | $ | 10,058,928 | |
| Total Distributable Earnings (Loss) | | | (738,833 | ) |
| | | | | |
| NET ASSETS | | $ | 9,320,095 | |
See accompanying Notes to Financial Statements.
DFA INVESTMENT DIMENSIONS GROUP INC.
INTERNATIONAL SMALL COMPANY PORTFOLIO*
STATEMENT OF OPERATIONS
FOR THE YEAR ENDED OCTOBER 31, 2022
(Amounts in thousands)
| Investment Income | | | | |
| Net Investment Income Allocated from Affiliated Investment Companies: | | | | |
| Dividends (Net of Foreign Taxes Withheld of $32,864) | | $ | 351,462 | |
| Income from Securities Lending | | | 11,450 | |
| Expenses Allocated from Affiliated Investment Companies | | | (13,461 | ) |
| Total Investment Income | | | 349,451 | |
| | | | | |
| Fund Expenses | | | | |
| Investment Management Fees | | | 30,411 | |
| Accounting & Transfer Agent Fees | | | 1,604 | |
| Filing Fees | | | 216 | |
| Shareholders’ Reports | | | 584 | |
| Directors’/Trustees’ Fees & Expenses | | | 46 | |
| Professional Fees | | | 100 | |
| Other | | | 203 | |
| Total Fund Expenses | | | 33,164 | |
| Net Expenses | | | 33,164 | |
| | | | | |
| Net Investment Income (Loss) | | | 316,287 | |
| | | | | |
| Realized and Unrealized Gain (Loss) | | | | |
| Net Realized Gain (Loss) on: | | | | |
| Transactions Allocated from Affiliated Investment Company** | | | 164,767 | |
| Futures | | | (19,889 | ) |
| Change in Unrealized Appreciation (Depreciation) of: | | | | |
| Transactions Allocated from Affiliated Investment Company | | | (3,930,327 | ) |
| Futures | | | 271 | |
| | | | | |
| Net Realized and Unrealized Gain (Loss) | | | (3,785,178 | ) |
| | | | | |
| Net Increase (Decrease) in Net Assets Resulting from Operations | | $ | (3,468,891 | ) |
| * | Investment Income and Realized and Unrealized Gain (Loss) were allocated from the Portfolio’s Underlying Funds (Affiliated Investment Companies). |
| ** | Net of foreign capital gain taxes withheld of $0. |
See accompanying Notes to Financial Statements.
DFA INVESTMENT DIMENSIONS GROUP INC.
INTERNATIONAL SMALL COMPANY PORTFOLIO
STATEMENTS OF CHANGES IN NET ASSETS***
(Amounts in thousands)
| | | Year | | | Year | |
| | | Ended | | | Ended | |
| | | Oct. 31, | | | Oct. 31, | |
| | | 2022 | | | 2021 | |
| Increase (Decrease) in Net Assets | | | | | | | | |
| Operations: | | | | | | | | |
| Net Investment Income (Loss) | | $ | 316,287 | | | $ | 238,915 | |
| Net Realized Gain (Loss) on: | | | | | | | | |
| Transactions Allocated from Affiliated Investment Company*,** | | | 164,767 | | | | 837,220 | |
| Futures | | | (19,889 | ) | | | 26,350 | |
| Change in Unrealized Appreciation (Depreciation) of: | | | | | | | | |
| Transactions Allocated from Affiliated Investment Company | | | (3,930,327 | ) | | | 2,927,439 | |
| Futures | | | 271 | | | | 3,416 | |
| Net Increase (Decrease) in Net Assets Resulting from Operations | | | (3,468,891 | ) | | | 4,033,340 | |
| | | | | | | | | |
| Distributions: | | | | | | | | |
| Institutional Class Shares | | | (851,167 | ) | | | (220,133 | ) |
| | | | | | | | | |
| Capital Share Transactions (1): | | | | | | | | |
| Shares Issued | | | 2,335,205 | | | | 2,604,837 | |
| Shares Issued in Lieu of Cash Distributions | | | 834,024 | | | | 214,868 | |
| Shares Redeemed | | | (2,994,929 | ) | | | (3,315,191 | ) |
| Net Increase (Decrease) from Capital Share Transactions | | | 174,300 | | | | (495,486 | ) |
| Total Increase (Decrease) in Net Assets | | | (4,145,758 | ) | | | 3,317,721 | |
| | | | | | | | | |
| Net Assets | | | | | | | | |
| Beginning of Year | | | 13,465,853 | | | | 10,148,132 | |
| End of Year | | $ | 9,320,095 | | | $ | 13,465,853 | |
| | | | | | | | | |
| (1) Shares Issued and Redeemed: | | | | | | | | |
| Shares Issued | | | 123,348 | | | | 116,406 | |
| Shares Issued in Lieu of Cash Distributions | | | 41,490 | | | | 10,453 | |
| Shares Redeemed | | | (157,815 | ) | | | (151,391 | ) |
| Net Increase (Decrease) from Shares Issued and Redeemed | | | 7,023 | | | | (24,532 | ) |
| * | Net of foreign capital gain taxes withheld for the fiscal year ended October 31, 2022 of $0. |
| ** | Net of foreign capital gain taxes withheld for the fiscal year ended October 31, 2021 of $0. |
| *** | Investment Income and Realized and Unrealized Gain (Loss) were allocated from the Portfolio’s Master Fund (Affiliated Investment Company). |
See accompanying Notes to Financial Statements.
DFA INVESTMENT DIMENSIONS GROUP INC.
INTERNATIONAL SMALL COMPANY PORTFOLIO
FINANCIAL HIGHLIGHTS
(for a share outstanding throughout each period)
| | | Year | | | Year | | | Year | | | Year | | | Year | |
| | | Ended | | | Ended | | | Ended | | | Ended | | | Ended | |
| | | Oct. 31, | | | Oct. 31, | | | Oct. 31, | | | Oct. 31, | | | Oct. 31, | |
| | | 2022 | | | 2021 | | | 2020 | | | 2019 | | | 2018 | |
| Net Asset Value, Beginning of Year | | $ | 23.29 | | | $ | 16.84 | | | $ | 18.21 | | | $ | 18.46 | | | $ | 21.52 | |
| Income from Investment Operations | | | | | | | | | | | | | | | | | | | | |
| Net Investment Income (Loss) (A) | | | 0.54 | | | | 0.41 | | | | 0.33 | | | | 0.43 | | | | 0.46 | |
| Net Gains (Losses) on Securities (Realized and Unrealized) | | | (6.44 | ) | | | (6.42 | ) | | | (0.93 | ) | | | 0.58 | | | | (2.41 | ) |
| Total from Investment Operations | | | (5.90 | ) | | | 6.83 | | | | (0.60 | ) | | | 1.01 | | | | (1.95 | ) |
| Less Distributions | | | | | | | | | | | | | | | | | | | | |
| Net Investment Income | | | (0.67 | ) | | | (0.38 | ) | | | (0.37 | ) | | | (0.44 | ) | | | (0.44 | ) |
| Net Realized Gains | | | (0.79 | ) | | | — | | | | (0.40 | ) | | | (0.82 | ) | | | (0.67 | ) |
| Total Distributions | | | (1.46 | ) | | | (0.38 | ) | | | (0.77 | ) | | | (1.26 | ) | | | (1.11 | ) |
| Net Asset Value, End of Year | | $ | 15.93 | | | $ | 23.29 | | | $ | 16.84 | | | $ | 18.21 | | | $ | 18.46 | |
| Total Return | | | (26.55 | )% | | | 40.83 | % | | | (3.64 | )% | | | 6.44 | % | | | (9.54 | )% |
| | | | | | | | | | | | | | | | | | | | | |
| Net Assets, End of Year (thousands) | | $ | 9,320,095 | | | $ | 13,465,853 | | | $ | 10,148,132 | | | $ | 12,750,110 | | | $ | 12,656,204 | |
| Ratio of Expenses to Average Net Assets *(B) | | | 0.41 | % | | | 0.46 | % | | | 0.53 | % | | | 0.54 | % | | | 0.53 | % |
| Ratio of Expenses to Average Net Assets (Excluding Fees (Waived), (Expenses Reimbursed), and/or Previously Waived Fees Recovered by Advisor)(B) | | | 0.41 | % | | | 0.46 | % | | | 0.53 | % | | | 0.54 | % | | | 0.53 | % |
| Ratio of Net Investment Income to Average Net Assets | | | 2.79 | % | | | 1.90 | % | | | 1.96 | % | | | 2.44 | % | | | 2.18 | % |
| * The Ratio of Expenses to Average Net Assets is inclusive of acquired fund fees and expenses incurred by the Portfolio indirectly as a result of Portfolio’s investment in Underlying Funds as follows | | | 0.12 | % | | | 0.12 | % | | | 0.12 | % | | | 0.12 | % | | | 0.12 | % |
See accompanying Notes to Financial Statements.
DFA INVESTMENT DIMENSIONS GROUP INC.
NOTES TO FINANCIAL STATEMENTS
A. Organization:
DFA Investment Dimensions Group Inc. (the “Fund”) is an open-end management investment company registered under the Investment Company Act of 1940 (the “1940 Act”), whose shares are generally offered to institutional investors, retirement plans and clients of registered investment advisors. At October 31, 2022, the Fund consisted of one hundred and two operational portfolios, of which one, the International Small Company Portfolio (the “Portfolio”), is included in this report.
The International Small Company Portfolio invests in five series (“Underlying Funds”) within The DFA Investment Trust Company (“DFAITC”).
At October 31, 2022, the Portfolio was the owner of record of the following approximate percentages of the total outstanding shares of the following Underlying Funds as detailed below:
| Fund of Funds | | Underlying Funds | | Percentage
Ownership at 10/31/22 | |
| International Small Company Portfolio | The Continental Small Company Series | 86% |
| | | The Japanese Small Company Series | 89% |
| | | The United Kingdom Small Company Series | 98% |
| | | The Asia Pacific Small Company Series | 81% |
| | | The Canadian Small Company Series | 97% |
The financial statements of the Portfolio’s Underlying Funds are included elsewhere in this report and should be read in conjunction with the financial statements of the Portfolio.
B. Significant Accounting Policies:
The following significant accounting policies are in conformity with accounting principles generally accepted in the United States of America (“GAAP”). Such policies are consistently followed by the Fund in preparation of its financial statements. The preparation of financial statements in accordance with GAAP requires management to make estimates and assumptions that affect the fair value of investments, the reported amounts of assets and liabilities, the disclosure of contingent assets and liabilities at the date of the financial statements, and the reported amounts of increases and decreases in net assets from operations during the reporting period. Actual results could differ from those estimates and those differences could be material.
1. Security Valuation: The Portfolio uses a fair value hierarchy which prioritizes the inputs to valuation techniques used to measure fair value into three broad levels described below:
● Level 1 - inputs are quoted prices in active markets for identical securities (including equity securities, open-end investment companies, and futures contracts)
● Level 2 - other significant observable inputs (including quoted prices for similar securities, interest rates, prepayment speeds, credit risk, etc.)
● Level 3 - significant unobservable inputs (including the Portfolio’s own assumptions in determining the fair value of investments)
Listed derivatives, such as futures, that are actively traded are valued based on quoted prices from the exchange and are categorized as Level 1 in the hierarchy.
Shares held by the International Small Company Portfolio in other investment companies (such as the Underlying Funds) are valued at their respective daily net asset values as reported by their administrator.
The Portfolio’s investments in the Underlying Funds reflect its proportionate interest in the net assets of such corresponding Underlying Fund. These valuations are classified as Level 1 in the hierarchy.
Futures contracts held by the Portfolio are valued using the settlement price established each day on the exchange on which they are traded. These valuations are generally categorized as Level 1 in the hierarchy.
A summary of the inputs used to value the Portfolio’s investments by each major security type, industry and/or country is disclosed previously in this note. A valuation hierarchy table has been included at the end of the Summary Schedule of Portfolio Holdings/Schedule of Investments. The methodology or inputs used for valuing securities are not necessarily an indication of the risk associated with investing in those securities.
2. Deferred Compensation Plan: Each eligible Director of the Fund may elect to participate in the Fee Deferral Plan for Independent Directors and Trustees (the “Plan”). Under the Plan, effective January 1, 2002, such Directors may defer payment of all or a portion of their total fees earned as a Director. These deferred amounts may be treated as though such amounts had been invested in shares of the following funds: the U.S. Large Cap Value Portfolio, U.S. Core Equity 1 Portfolio, U.S. Large Company Portfolio, U.S. Vector Equity Portfolio, U.S. Micro Cap Portfolio, DFA International Value Portfolio, International Core Equity Portfolio, Emerging Markets Portfolio, Emerging Markets Core Equity Portfolio, DFA Inflation-Protected Securities Portfolio and/or DFA Two-Year Global Fixed Income Portfolio. Contributions made under the Plan and the change in unrealized appreciation (depreciation) and income are included in Directors’/ Trustees’ Fees & Expenses.
The Directors may receive their distributions of proceeds by one of the following methods: lump sum, annual installments over a period of agreed-upon years, or quarterly installments over a period of agreed-upon years. Each Director shall have the right in a notice of election (the “Notice”) to defer the receipt of the Director’s deferred compensation until a date specified by such Director in the Notice. The date may not be sooner than the earlier of: (i) the first business day of January following the year in which such Director ceases to be a member of the Board of Directors of the Fund; and (ii) five years following the effective date of the Director’s first deferral election. If a Director who elects to defer fees fails to designate in the Notice a time or date as of which payment of the Director’s deferred fee account shall commence, payment of such amount shall commence as of the first business day of January following the year in which the Director ceases to be a member of the Board (unless the Director files an amended Notice selecting a different distribution date).
3. Other: Security transactions are accounted for as of the trade date. Costs used in determining realized gains and losses on the sale of investment securities/affiliated investment companies and foreign currency are accounted for on the basis of identified cost. Dividend income and distributions to shareholders are recorded on the ex-dividend date. Non-cash dividend income received in the form of securities in-lieu of cash, if any, are recorded at the fair value of securities received. Distributions received on securities and from the investment in affiliated investment companies that represent a return of capital or capital gains are recorded as a reduction of cost of investments or as a realized gain, respectively. The Portfolio estimates the character of received distributions that may be considered return of capital distributions. Interest income is recorded on an accrual basis. Discount and premium on debt securities purchased are amortized over the lives of the respective securities, using the effective interest method. Expenses directly attributable to a Portfolio are directly charged. Common expenses of the Fund or the Portfolio are allocated using methods approved by the Board, generally based on average net assets.
The Portfolio recognizes its pro-rata share of net investment income and realized and unrealized gains/losses on a daily basis from its Underlying Funds within DFAITC, which are treated as partnerships for federal income tax purposes.
The Portfolio may be subject to taxes imposed by countries in which they invest, with respect to their investments in issuers existing or operating in such countries. Such taxes are generally based on income earned or repatriated and capital gains realized on the sale of such investments. The Portfolio accrues such taxes when the related income or capital gains are earned or throughout the holding period. Some countries require governmental approval for the repatriation of investment income, capital or the proceeds of sales earned by foreign investors. Additionally, if there is a deterioration in a country’s balance of payments or for other reasons, a country may impose temporary restrictions on foreign capital remittances abroad.
C. Investment Advisor and Administrator:
The Advisor, Dimensional Fund Advisors LP, provides investment management services to the Portfolio. For the year ended October 31, 2022, the Portfolio’s investment management fees were accrued daily and paid monthly to the Advisor based on an effective annual rate of 0.27% of average daily net assets.
| | | Management Fee Prior to
February 28, 2022 | | Management Fee Effective
February 28, 2022 | |
| International Small Company Portfolio | | 0.30% | | 0.25% |
Pursuant to an Amended and Restated Fee Waiver and/or Expense Assumption Agreement (The “Fee Waiver Agreement”), the Advisor has contractually agreed to waive all or a portion of its management fee and to assume the other direct expenses of a class of the Portfolio (excluding expenses incurred through its investment in other investment companies) (“Portfolio Expenses”) to the extent necessary to limit the Portfolio Expenses of a class of the Portfolio to 0.45% of the average net assets of a class of the Portfolio on an annualized basis (the “Expense Limitation Amount”). The Fee Waiver Agreement will remain in effect through February 28, 2024 and may only be terminated by the Fund’s Board of Directors prior to that date and shall continue in effect from year to year thereafter unless terminated by the Fund or the Advisor. At any time that the Portfolio Expenses of a class of the Portfolio are less than the applicable Expense Limitation Amount, the Advisor retains the right to recover fees previously waived and/or expenses previously assumed to the extent that the expense ratio following such recovery would be less than the Expense Limitation Amount that was in place when such prior year fees were waived and/or expenses assumed, and less than the current Expense Limitation Amount in place for the Portfolio. The Fund, on behalf of the Portfolio, is also not obligated to reimburse the Advisor for fees previously waived or expenses previously assumed by the Advisor more than thirty-six months before the date of recovery.
Fees Paid to Officers and Directors/Trustees:
Certain Officers and Directors of the Advisor are also Officers and Directors of the Fund; however, such Officers and Directors (with the exception of the Chief Compliance Officer (“CCO”)) receive no compensation from the Fund. For the year ended October 31, 2022, the total related amounts paid by the Fund to the CCO was $166 (in thousands). The total related amounts paid the Portfolio are included in Other Expenses on the Statement of Operations.
D. Deferred Compensation:
At October 31, 2022, the total liability for deferred compensation to Directors was $96 and is included in Accrued Expenses and Other Liabilities on the Statement of Assets and Liabilities (amounts in thousands).
E. Federal Income Taxes:
The Portfolio has qualified and intends to continue to qualify as a regulated investment company under Subchapter M of the Internal Revenue Code for federal income tax purposes and to distribute substantially all of its taxable income and net capital gains to its shareholders. Accordingly, no provision has been made for federal income taxes.
Distributions from net investment income and net realized capital gains are determined in accordance with U.S. federal income tax regulations, which may differ from those amounts determined under GAAP. These book/tax differences are either temporary or permanent in nature. To the extent that these differences are permanent, they are charged or credited to paid-in capital or distributable earnings, undistributed net investment income, accumulated net realized gains or losses, or unrealized appreciation, as appropriate, in the period that the differences arise. Accordingly, the permanent differences as of October 31, 2022, can occur as a result of realized gains on securities considered to be “passive foreign investment companies”, non-deductible expenses, realized foreign capital gains tax, the use of accumulated earnings and profits distributed to shareholders on redemptions of shares as part of the dividends paid deduction for income tax purposes, net foreign currency gains/losses, distributions received from real estate investment trusts and distribution redesignations, and were reclassified to the accounts mentioned above. These reclassifications had no effect on net assets or net asset value per share.
The tax character of dividends and distributions declared and paid during the years ended October 31, 2021 and October 31, 2022 were as follows (amounts in thousands):
| | | Net Investment Income and Short-Term Capital Gain | | | Long-Term Capital Gains | | | Tax Exempt Income | | | Total | |
| International Small Company Portfolio | | | | | | | | | | | | | | | | |
| 2021 | | $ | 220,133 | | | | — | | | | — | | | $ | 220,133 | |
| 2022 | | | 483,283 | | | $ | 367,884 | | | | — | | | | 851,167 | |
As of October 31, 2022, the following net investment income and short-term capital gains and long-term capital gains distributions designated for federal income tax purposes are due to the use of accumulated earnings and profits distributed to shareholders upon redemption of shares (amounts in thousands):
| | | Net Investment Income and Short-Term Capital Gains | | | Long-Term Capital
Gains | | | Total | |
| International Small Company Portfolio | | $ | (27,229 | ) | | | (4,799 | ) | | $ | (32,028 | ) |
| | | | | | | | | | | | | |
At October 31, 2022, the components of distributable earnings (accumulated losses) were as follows (amounts in thousands):
| | | Undistributed Net Investment Income and Short-Term Capital Gains | | | Undistributed Long-Term Capital Gains | | | Capital Loss Carryforwards | | | Unrealized Appreciation (Depreciation) | | | Total Net Distributable Earnings (Accumulated Losses) | |
| International Small Company Portfolio | | $ | 68,133 | | | $ | 121,673 | | | | — | | | $ | (928,518 | ) | | $ | (738,712 | ) |
For federal income tax purposes, the Fund measures its capital loss carryforwards annually at October 31, its fiscal year end. Capital loss carryforwards may be carried forward and applied against future capital gains. As of October 31, 2022, the Portfolio did not have any capital loss carryforwards available to offset future realized capital gains.
During the year ended October 31, 2022, the Portfolio did not use capital loss carryforwards to offset realized capital gains for federal income tax purposes.
As of October 31, 2022, the total cost and aggregate gross unrealized appreciation (depreciation) of securities for federal income tax purposes were different from amounts reported for financial reporting purposes, as follows (amounts in thousands):
| | | Federal Tax Cost | | | Unrealized Appreciation | | | Unrealized Depreciation | | | Net Unrealized Appreciation (Depreciation) | |
| International Small Company Portfolio | | $ | 10,236,196 | | | | — | | | $ | (925,265 | ) | | $ | (925,265 | ) |
The difference between GAAP-basis and tax-basis unrealized gains (losses) can occur as a result of wash sales and net mark-to-market gains (losses) on regulated futures contracts, net mark-to-market gains (losses) on foreign currency contracts, and differences in the tax treatment of passive foreign investment company investments or other investments.
ASC 740 Accounting for Uncertainty in Income Taxes sets forth a minimum threshold for financial statement recognition of the benefit of a tax position taken or expected to be taken in a tax return. Management has analyzed the Portfolio’s tax positions and has concluded that no additional provision for income tax is required in the Portfolio’s financial statements. The Portfolio is not aware of any tax positions for which it is more likely than not that the total amounts of unrecognized tax benefits will significantly change in the next twelve months. The Portfolio’s federal tax returns for the prior three fiscal years remain subject to examination by the Internal Revenue Service.
F. Financial Instruments:
In accordance with the Portfolio’s investment objective and policies, the Portfolio may invest either directly or indirectly (through its investment in a corresponding Underlying Fund), in certain financial instruments that have off-balance sheet risk in excess of the amounts recognized in the financial statements and concentrations of credit and market risk. These instruments and their significant corresponding risks are described below:
1. Foreign Market Risks: Investments in foreign markets may involve certain considerations and risks not typically associated with investments in the United States of America, including the possibility of future political and economic developments and the level of foreign governmental supervision and regulation of foreign securities markets. These
markets are generally smaller, less liquid and more volatile than the major securities markets in the United States of America. Consequently, acquisition and disposition of international securities held by the Portfolio may be inhibited.
Underlying Funds that have significant exposure to certain countries, such as the United Kingdom Small Company Series, an Underlying Fund that concentrates investments in the United Kingdom, can be expected to be impacted by the political and economic conditions within such countries. For example, there is continuing uncertainty around the future of the euro and the European Union (EU) following the United Kingdom’s (UK) exit from the EU (referred to as “Brexit”). Brexit may cause greater market volatility and illiquidity, currency fluctuations, deterioration in economic activity, a decrease in business confidence, and increased likelihood of a recession in the UK. While it is not possible to determine the precise impact these events may have on the Portfolio, the ultimate impact on the UK, EU countries, other countries or parties that transact with the UK and EU, and the broader global economy could be significant and could adversely affect the value and liquidity of the Underlying Fund’s investments.
Derivative Financial Instruments:
Summarized below are the specific types of derivative instruments used by the Portfolio.
2. Futures Contracts: The Portfolio may purchase or sell futures contracts and options on futures contracts for equity securities and indices to increase or decrease market exposure based on actual or expected cash inflows to or outflows from the Portfolio. Upon entering into a futures contract, the Portfolio deposits cash or pledges U.S. Government securities to a broker, in an amount equal to the minimum “initial margin” requirements of the exchange on which the contract is traded. Subsequent payments are received from or paid to the broker each day, based on the daily fluctuation in the market value of the contract. These receipts or payments are known as “variation margin” and are recorded daily by the Portfolio as unrealized gains or losses until the contracts are closed. When the contracts are closed, the Portfolio records a realized gain or loss, which is presented in the Statements of Operations as a net realized gain or loss on futures, equal to the difference between the value of the contract at the time it was opened and the value at the time it was closed.
Risks may arise upon entrance into futures contracts from potential imperfect price correlations between the futures contracts and the underlying securities, from the possibility of an illiquid secondary market for these instruments and from the possibility that the Portfolio could lose more than the initial margin requirements. The Portfolio entering into stock index futures is subject to equity price risk from those futures contracts.
Securities have been segregated as collateral for open futures contracts.
The average volume (based on the open positions at each fiscal month-end) of derivative activity for the year ended October 31, 2022 was as follows (amounts in thousands):
| | | Futures** | |
| International Small Company Portfolio | | $ | 98,398 | |
** Average Notional Value of futures contracts.
The following is a summary of the Portfolio’s derivative instrument holdings categorized by primary risk exposure as of October 31, 2022 (amounts in thousands):
| | | Asset Derivatives Value | |
| | | Total Value at October 31, 2022 | | | Equity
Contracts*,(1) | |
| International Small Company Portfolio | | $ | 2,412 | | | $ | 2,412 | |
(1) Presented on Statements of Assets and Liabilities as Receivables: Futures Margin Variation.
* Includes cumulative appreciation (depreciation) of futures contracts. Only current day’s margin variation is reported within the Statement of Assets and Liabilities.
The following is a summary of the realized and change in unrealized gains and losses from the Portfolio’s derivative instrument holdings categorized by primary risk exposure for the year ended October 31, 2022 (amounts in thousands):
| | | Realized Gain (Loss) on (Depreciation) on Derivatives | |
| | | Total | | | Equity Contracts(1) | |
| International Small Company Portfolio | | $ | (19,889 | ) | | $ | (19,889 | ) |
| | | Change in Unrealized Appreciation (Depreciation) on Derivatives | |
| | | Total | | | Equity Contracts(2) | |
| International Small Company Portfolio | | $ | 271 | | | $ | 271 | |
(1) Presented on Statements of Operations as Net Realized Gain (Loss) on: Futures.
(2) Presented on Statements of Operations as Change in Unrealized Appreciation (Depreciation) of: Futures.
G. Line of Credit and Interfund Lending Program:
The Fund, together with other Dimensional-advised portfolios, has entered into a $500 million uncommitted, unsecured discretionary line of credit effective April 5, 2023, with its domestic custodian bank. A line of credit with similar terms was in effect through April 5, 2023. Each portfolio is permitted to borrow, subject to its investment limitations, up to a maximum of $250 million, as long as total borrowings under the line of credit do not exceed $500 million in the aggregate. Borrowings under the line of credit are charged interest at rates agreed upon by the parties at the time of borrowing. Each portfolio is individually, and not jointly, liable for its particular advances under the line of credit. There is no commitment fee on the unused portion of the line of credit. The agreement for the discretionary line of credit may be terminated by either party at any time. The agreement for the line of credit expires on April 3, 2024.
The Fund, together with other Dimensional-advised portfolios, has also entered into an additional $700 million unsecured line of credit with its international custodian bank effective December 28, 2022. A line of credit with similar terms was in effect through December 28, 2022. Each portfolio is permitted to borrow, subject to its investment limitations, up to a maximum of the lower of one-quarter of such portfolio’s net assets or $500 million, as long as total borrowings under the line of credit do not exceed $700 million in the aggregate. Each portfolio is individually, and not jointly, liable for its particular advances under the line of credit. Borrowings under the line of credit are charged interest at rates agreed upon by the parties at the time of borrowing. There is no commitment fee on the unused portion of the line of credit. The line of credit agreement expires on December 27, 2023.
For the year ended October 31, 2022, borrowings by the following Portfolio under the lines of credit were as follows (amounts in thousands, except percentages and days):
| | | Weighted Average Interest
Rate | | | Weighted Average Loan
Balance | | | Number of Days Outstanding* | | | Interest Expense Incurred | | | Maximum
Amount Borrowed
During the Period | | | Outstanding Borrowings as of
10/31/2022 | |
| International Small Company Portfolio | | | 1.08 | % | | | 23,176 | | | 4 | | | | 3 | | | | 27,039 | | | | — | |
* Number of Days Outstanding represents the total of single or consecutive days during the year ended October 31, 2022, that the Portfolio’s available line of credit was used.
Pursuant to an exemptive order issued by the SEC (the “Order”), the Portfolio may participate in an interfund lending program among certain portfolios managed by the Advisor (portfolios that operate as feeder funds do not participate in the program). The program allows the participating portfolios to borrow money from and loan money to each other for temporary or emergency purposes, subject to the conditions in the Order. A loan can only be made through the program if the interfund loan rate on that day is more favorable to both the borrowing and lending portfolios as compared to rates available through short-term bank loans or investments in overnight repurchase agreements and money market funds,
respectively, as detailed in the Order. Further, a portfolio may participate in the program only if and to the extent that such participation is consistent with its investment objectives and limitations. Interfund loans have a maximum duration of seven days and may be called on one business day’s notice.
The Portfolio did not use the interfund lending program during the year ended October 31, 2022.
H. Indemnitees; Contractual Obligations:
Under the Fund’s organizational documents, its Officers and Directors are indemnified against certain liabilities arising out of the performance of their duties to the Fund.
In the normal course of business, the Fund enters into contracts that contain a variety of representations and warranties that provide general indemnification. The Fund’s maximum exposure under these arrangements is unknown, as this would involve future claims that may be made against the Fund and/or its affiliates that have not yet occurred. However, based on experience, the Fund expects the risk of loss to be remote.
I. Recently Issued Accounting Standards and Regulations:
In March 2020, the Financial Accounting Standards Board (FASB) issued Accounting Standards Update (ASU) No. 2020-04, Reference Rate Reform (Topic 848) – Facilitation of the Effects of Reference Rate Reform on Financial Reporting. In January 2021, the FASB issued ASU No. 2021-01, with further amendments to Topic 848. The amendments in the ASUs provide optional temporary accounting recognition and financial reporting relief from the effect of certain types of contract modifications due to the planned discontinuation of the LIBOR and other interbank-offered based reference rates as of the end of 2021 and 2023. The ASUs were effective for certain reference rate-related contract modifications that occurred during the period March 12, 2020 through December 31, 2022. Management has reviewed the requirements and determined the adoption of these ASUs will not have a material impact on the Portfolio’s financial statements.
J. Other:
As of October 31, 2022, the following number of shareholders held the following approximate percentages of the Portfolio’s outstanding shares. One or more of the shareholders may be omnibus accounts, which typically hold shares for the benefit of several other underlying investors.
| | | Number of Shareholders | | | Approximate Percentage of Outstanding Shares | |
| International Small Company Portfolio – Institutional Class Shares | | 4 | | | | 79 | % |
L. Subsequent Event Evaluations:
Management has evaluated the impact of all subsequent events on the Portfolio through the date on which the financial statements were issued and has determined that there are no subsequent events requiring recognition or disclosure in the financial statements.
Report of Independent Registered Public Accounting Firm
To the Board of Directors of DFA Investment Dimensions Group Inc. and
Shareholders of International Small Company Portfolio
Opinion on the Financial Statements
We have audited the accompanying statement of assets and liabilities, including the schedule of investments, of International Small Company Portfolio (one of the portfolios constituting DFA Investment Dimensions Group Inc., hereafter referred to as the “Portfolio”) as of October 31, 2022, the related statement of operations for the year ended October 31, 2022, the statement of changes in net assets for each of the two years in the period ended October 31, 2022, including the related notes, and the financial highlights for each of the five years in the period ended October 31, 2022 (collectively referred to as the “financial statements”). In our opinion, the financial statements present fairly, in all material respects, the financial position of the Portfolio as of October 31, 2022, the results of its operations for the year then ended, the changes in its net assets for each of the two years in the period ended October 31, 2022 and the financial highlights for each of the five years in the period ended October 31, 2022 in conformity with accounting principles generally accepted in the United States of America.
Basis for Opinion
These financial statements are the responsibility of the Portfolio’s management. Our responsibility is to express an opinion on the Portfolio’s financial statements based on our audits. We are a public accounting firm registered with the Public Company Accounting Oversight Board (United States) (PCAOB) and are required to be independent with respect to the Portfolio in accordance with the U.S. federal securities laws and the applicable rules and regulations of the Securities and Exchange Commission and the PCAOB.
We conducted our audits of these financial statements in accordance with the standards of the PCAOB. Those standards require that we plan and perform the audit to obtain reasonable assurance about whether the financial statements are free of material misstatement, whether due to error or fraud.
Our audits included performing procedures to assess the risks of material misstatement of the financial statements, whether due to error or fraud, and performing procedures that respond to those risks. Such procedures included examining, on a test basis, evidence regarding the amounts and disclosures in the financial statements. Our audits also included evaluating the accounting principles used and significant estimates made by management, as well as evaluating the overall presentation of the financial statements. Our procedures included confirmation of securities owned as of October 31, 2022 by correspondence with the broker and transfer agent of the investee funds. We believe that our audits provide a reasonable basis for our opinion.
/s/PricewaterhouseCoopers LLP
Philadelphia, Pennsylvania
December 22, 2022
We have served as the auditor of one or more investment companies in Dimensional Fund Advisors L.P. investment company group since 1981.
Selected Financial Statements of The DFA Investment Trust Company
The Japanese Small Company Series
The Asia Pacific Small Company Series
The United Kingdom Small Company Series
The Continental Small Company Series
The Canadian Small Company Series
TABLE OF CONTENTS
THE DFA INVESTMENT TRUST COMPANY
DISCLOSURE OF FUND EXPENSES
(Unaudited)
The following Expense Tables are shown so that you can understand the impact of fees on your investment. All mutual funds have operating expenses. As a shareholder of the fund, you incur ongoing costs, which include costs for portfolio management, administrative services, and shareholder reports, among others. Operating expenses and legal and audit services, which are deducted from a fund’s gross income, directly reduce the investment return of the fund. A fund’s expenses are expressed as a percentage of its average net assets. This figure is known as the expense ratio. The following examples are intended to help you understand the ongoing costs, in dollars, of investing in the fund and to compare these costs with those of other mutual funds. The examples are based on an investment of $1,000 made at the beginning of the period shown and held for the entire period.
The Expense Tables below illustrate your fund’s costs in two ways.
Actual Fund Return
This section helps you to estimate the actual expenses after fee waivers that you paid over the period. The “Ending Account Value” shown is derived from the fund’s actual return and “Expenses Paid During Period” reflect the dollar amount that would have been paid by an investor who started with $1,000 in the fund. You may use the information here, together with the amount you invested, to estimate the expenses that you paid over the period.
To do so, simply divide your account value by $1,000 (for example, a $7,500 account value divided by $1,000 = 7.5), then multiply the result by the number given for your fund under the heading “Expenses Paid During Period.”
Hypothetical Example for Comparison Purposes
This section is intended to help you compare your fund’s costs with those of other mutual funds. The hypothetical “Ending Account Value” and “Expenses Paid During Period” are derived from the fund’s actual expense ratio and an assumed 5% annual return before expenses. In this case, because the return used is not the fund’s actual return, the results do not apply to your investment. The example is useful in making comparisons because the SEC requires all mutual funds to calculate expenses based on a 5% annual return. You can assess your fund’s costs by comparing this hypothetical example with the hypothetical examples that appear in shareholder reports of other funds.
Please note that the expenses shown in the tables are meant to highlight and help you compare ongoing costs only and do not reflect any transactional costs, if applicable. The “Annualized Expense Ratio” represents the actual expenses for the six-month period indicated.
Six Months Ended October 31, 2022
EXPENSE TABLES
| | | Beginning
Account
Value
05/01/22 | | | Ending Account
Value 10/31/22 | | | Annualized
Expense Ratio(1) | | | Expenses Paid
During Period(1) | |
| The Japanese Small Company Series | | | | | | | | | | | | | | | | |
| Actual Fund Return | | $ | 1,000.00 | | | $ | 926.50 | | | | 0.12 | % | | $ | 0.58 | |
| Hypothetical 5% Annual Return | | $ | 1,000.00 | | | $ | 1,024.60 | | | | 0.12 | % | | $ | 0.61 | |
| | | | | | | | | | | | | | | | | |
| The Asia Pacific Small Company Series | | | | | | | | | | | | | | | | |
| Actual Fund Return | | $ | 1,000.00 | | | $ | 805.00 | | | | 0.12 | % | | $ | 0.55 | |
| Hypothetical 5% Annual Return | | $ | 1,000.00 | | | $ | 1,024.60 | | | | 0.12 | % | | $ | 0.61 | |
| | | | | | | | | | | | | | | | | |
| The United Kingdom Small Company Series | | | | | | | | | | | | | | | | |
| Actual Fund Return | | $ | 1,000.00 | | | $ | 812.90 | | | | 0.11 | % | | $ | 0.50 | |
| Hypothetical 5% Annual Return | | $ | 1,000.00 | | | $ | 1,024.65 | | | | 0.11 | % | | $ | 0.56 | |
| | | Beginning
Account
Value
05/01/22 | | | Ending Account
Value 10/31/22 | | | Annualized
Expense Ratio(1) | | | Expenses Paid
During Period(1) | |
| The Continental Small Company Series | | | | | | | | | | | | | | | | |
| Actual Fund Return | | $ | 1,000.00 | | | $ | 837.30 | | | | 0.13 | % | | $ | 0.60 | |
| Hypothetical 5% Annual Return | | $ | 1,000.00 | | | $ | 1,024.55 | | | | 0.13 | % | | $ | 0.66 | |
| | | | | | | | | | | | | | | | | |
| The Canadian Small Company Series | | | | | | | | | | | | | | | | |
| Actual Fund Return | | $ | 1,000.00 | | | $ | 876.80 | | | | 0.11 | % | | $ | 0.52 | |
| Hypothetical 5% Annual Return | | $ | 1,000.00 | | | $ | 1,024.65 | | | | 0.11 | % | | $ | 0.56 | |
| (1) | Expenses are equal to the fund’s annualized expense ratio for the six-month period, multiplied by the average account value over the period, multiplied by the number of days in the most recent six-month period (184), then divided by the number of days in the year (365) to reflect the six-month period. |
THE DFA INVESTMENT TRUST COMPANY
DISCLOSURE OF PORTFOLIO HOLDINGS
(Unaudited)
The SEC requires that all funds file a complete Schedule of Investments with the SEC for their first and third fiscal quarters as an exhibit to their reports on Form N-PORT. For The DFA Investment Trust Company, this would be for the fiscal quarters ending January 31 and July 31. Such Form N-PORT filing must be made within 60 days of the end of the quarter. The DFA Investment Trust Company filed its most recent Form N-PORT with the SEC on March 27, 2023. They are available upon request, without charge, by calling collect: (512) 306-7400; by mailing a request to Dimensional Fund Advisors LP, 6300 Bee Cave Road, Building One, Austin, TX 78746, or by visiting the SEC’s website at http://www.sec.gov.
SEC regulations permit a fund to include in its reports to shareholders a “Summary Schedule of Portfolio Holdings” in lieu of a full Schedule of Investments. The Summary Schedule of Portfolio Holdings reports the fund’s 50 largest holdings in unaffiliated issuers and any investments that exceed one percent of the fund’s net assets at the end of the reporting period. The regulations also require that the Summary Schedule of Portfolio Holdings identify each category of investments that are held.
A fund is required to file a complete Schedule of Investments with the SEC on Form N-CSR within ten days after mailing the annual and semi-annual reports to shareholders. It will be available upon request, without charge, by calling collect: (512) 306-7400; by mailing a request to Dimensional Fund Advisors LP, 6300 Bee Cave Road, Building One, Austin, TX 78746, or by visiting the SEC’s website at http://www.sec.gov.
PORTFOLIO HOLDINGS
The SEC requires that all funds present their categories of portfolio holdings in a table, chart or graph format in their annual and semi-annual shareholder reports, whether or not a Schedule of Investments is used. The following table, which presents portfolio holdings as a percentage of total investments before short-term investments and collateral for loaned securities, is provided in compliance with this requirement. The categories shown below represent broad industry sectors. Each industry sector consists of one or more specific industry classifications.
SERIES
| The Japanese Small Company Series | | | The Asia Pacific Small Company Series | | | The United Kingdom Small Company Series | |
| Communication Services | | 2.4 | % | | Communication Services | | 4.9 | % | | Communication Services | | 3.7 | % |
| Consumer Discretionary | | 14.7 | % | | Consumer Discretionary | | 18.9 | % | | Consumer Discretionary | | 16.8 | % |
| Consumer Staples | | 7.9 | % | | Consumer Staples | | 8.6 | % | | Consumer Staples | | 7.2 | % |
| Energy | | 0.8 | % | | Energy | | 6.3 | % | | Energy | | 4.3 | % |
| Financials | | 9.0 | % | | Financials | | 13.0 | % | | Financials | | 18.9 | % |
| Health Care | | 5.1 | % | | Health Care | | 5.7 | % | | Health Care | | 5.0 | % |
| Industrials | | 28.9 | % | | Industrials | | 11.8 | % | | Industrials | | 22.8 | % |
| Information Technology | | 15.6 | % | | Information Technology | | 7.8 | % | | Information Technology | | 8.7 | % |
| Materials | | 12.4 | % | | Materials | | 15.3 | % | | Materials | | 5.3 | % |
| Real Estate | | 1.5 | % | | Real Estate | | 6.9 | % | | Real Estate | | 3.0 | % |
| Utilities | | 1.7 | % | | Utilities | | 0.8 | % | | Utilities | | 4.3 | % |
| | | 100.0 | % | | | | 100.0 | % | | | | 100.0 | % |
| | | | | | | | | | | | | | |
| The Continental Small Company Series | | | The Canadian Small Company Series | | | | |
| Communication Services | | 4.8 | % | | Communication Services | | 1.3 | % | | | | | |
| Consumer Discretionary | | 8.4 | % | | Consumer Discretionary | | 5.5 | % | | | | | |
| Consumer Staples | | 4.3 | % | | Consumer Staples | | 4.9 | % | | | | | |
| Energy | | 4.4 | % | | Energy | | 28.7 | % | | | | | |
| Financials | | 16.6 | % | | Financials | | 9.3 | % | | | | | |
| Health Care | | 6.0 | % | | Health Care | | 1.5 | % | | | | | |
| Industrials | | 27.0 | % | | Industrials | | 11.0 | % | | | | | |
| Information Technology | | 10.2 | % | | Information Technology | | 3.3 | % | | | | | |
| Materials | | 9.1 | % | | Materials | | 23.8 | % | | | | | |
| Real Estate | | 4.9 | % | | Real Estate | | 2.6 | % | | | | | |
| Utilities | | 4.3 | % | | Utilities | | 8.1 | % | | | | | |
| | | 100.0 | % | | | | 100.0 | % | | | | | |
The Japanese Small Company Series
SUMMARY SCHEDULE OF PORTFOLIO HOLDINGS
JUNE 30, 2023
(Unaudited)
| | | | Shares | | | Value» | | | Percentage
of Net Assets‡ | |
| COMMON STOCKS — (97.8%) | | | | | | | | | | | | |
| COMMUNICATION SERVICES — (2.3%) | | | | | | | | | | | | |
| | Other Securities | | | | | | $ | 65,675,493 | | | | 2.3 | % |
| CONSUMER DISCRETIONARY — (14.0%) | | | | | | | | | | | | |
| | Resorttrust, Inc. | | | 514,664 | | | | 7,638,598 | | | | 0.3 | % |
| | Other Securities | | | | | | | 403,310,717 | | | | 13.9 | % |
| TOTAL CONSUMER DISCRETIONARY | | | | | | | 410,949,315 | | | | 14.2 | % |
| | | | | | | | | | | | | | |
| CONSUMER STAPLES — (7.7%) | | | | | | | | | | | | |
| | Nissui Corp. | | | 1,771,500 | | | | 7,956,137 | | | | 0.3 | % |
| # | Pigeon Corp. | | | 612,825 | | | | 8,460,104 | | | | 0.3 | % |
| | Other Securities | | | | | | | 210,336,697 | | | | 7.3 | % |
| TOTAL CONSUMER STAPLES | | | | | | | 226,752,938 | | | | 7.9 | % |
| | | | | | | | | | | | | | |
| ENERGY — (0.7%) | | | | | | | | | | | | |
| | Other Securities | | | | | | | 21,323,889 | | | | 0.7 | % |
| | | | | | | | | | | | | | |
| FINANCIALS — (8.6%) | | | | | | | | | | | | |
| | Gunma Bank Ltd. | | | 2,072,540 | | | | 7,602,979 | | | | 0.3 | % |
| | Hachijuni Bank Ltd. | | | 1,680,741 | | | | 7,300,758 | | | | 0.3 | % |
| | Hirogin Holdings, Inc. | | | 1,509,400 | | | | 8,562,190 | | | | 0.3 | % |
| | Iyogin Holdings, Inc. | | | 1,256,518 | | | | 7,063,789 | | | | 0.3 | % |
| | Kyushu Financial Group, Inc. | | | 1,975,137 | | | | 8,343,924 | | | | 0.3 | % |
| | Yamaguchi Financial Group, Inc. | | | 1,237,672 | | | | 8,310,924 | | | | 0.3 | % |
| | Other Securities | | | | | | | 204,394,767 | | | | 6.9 | % |
| TOTAL FINANCIALS | | | | | | | 251,579,331 | | | | 8.7 | % |
| | | | | | | | | | | | | | |
| HEALTH CARE — (4.7%) | | | | | | | | | | | | |
| | Jeol Ltd. | | | 233,500 | | | | 8,335,755 | | | | 0.3 | % |
| | Nakanishi, Inc. | | | 341,900 | | | | 7,571,287 | | | | 0.3 | % |
| | Other Securities | | | | | | | 122,488,213 | | | | 4.2 | % |
| TOTAL HEALTH CARE | | | | | | | 138,395,255 | | | | 4.8 | % |
| | | | | | | | | | | | | | |
| INDUSTRIALS — (28.8%) | | | | | | | | | | | | |
| | Daiseki Co. Ltd. | | | 286,755 | | | | 8,107,041 | | | | 0.3 | % |
| # | DMG Mori Co. Ltd. | | | 731,800 | | | | 12,722,253 | | | | 0.4 | % |
| | EXEO Group, Inc. | | | 487,700 | | | | 9,796,027 | | | | 0.3 | % |
| | Furukawa Electric Co. Ltd. | | | 418,600 | | | | 7,403,249 | | | | 0.3 | % |
| | GS Yuasa Corp. | | | 393,683 | | | | 7,723,408 | | | | 0.3 | % |
| # | Hazama Ando Corp. | | | 1,150,400 | | | | 8,604,531 | | | | 0.3 | % |
| | Inaba Denki Sangyo Co. Ltd. | | | 319,300 | | | | 7,284,899 | | | | 0.3 | % |
| | Mabuchi Motor Co. Ltd. | | | 252,834 | | | | 7,055,131 | | | | 0.3 | % |
| | Meitec Corp. | | | 478,200 | | | | 8,251,271 | | | | 0.3 | % |
| | Mirait One Corp. | | | 565,135 | | | | 7,113,722 | | | | 0.3 | % |
| | Nagase & Co. Ltd. | | | 584,600 | | | | 9,735,135 | | | | 0.3 | % |
| | Nichias Corp. | | | 378,700 | | | | 7,893,068 | | | | 0.3 | % |
| | Nikkon Holdings Co. Ltd. | | | 369,900 | | | | 7,392,695 | | | | 0.3 | % |
| # | Nisshinbo Holdings, Inc. | | | 843,080 | | | | 6,991,610 | | | | 0.2 | % |
| | OKUMA Corp. | | | 147,700 | | | $ | 7,929,844 | | | | 0.3 | % |
| | OSG Corp. | | | 526,900 | | | | 7,563,907 | | | | 0.3 | % |
| | Ushio, Inc. | | | 600,400 | | | | 8,117,400 | | | | 0.3 | % |
| | Other Securities. | | | | | | | 703,414,032 | | | | 24.1 | % |
| TOTAL INDUSTRIALS | | | | | | | 843,099,223 | | | | 29.2 | % |
The Japanese Small Company Series
continued
| | | | | | | | | Percentage | |
| | | Shares | | | Value» | | | of Net Assets‡ | |
| INFORMATION TECHNOLOGY — (15.1%) | | | | | | | | | | | | |
| Alps Alpine Co. Ltd. | | | 798,153 | | | | 7,007,707 | | | | 0.3 | % |
| Anritsu Corp. | | | 851,999 | | | | 7,276,940 | | | | 0.3 | % |
| Citizen Watch Co. Ltd. | | | 1,550,700 | | | | 9,348,449 | | | | 0.3 | % |
| Daiwabo Holdings Co. Ltd. | | | 574,800 | | | | 11,130,751 | | | | 0.4 | % |
| Dexerials Corp. | | | 345,400 | | | | 7,587,645 | | | | 0.3 | % |
| Japan Material Co. Ltd. | | | 431,700 | | | | 7,215,624 | | | | 0.3 | % |
| Macnica Holdings, Inc. | | | 283,650 | | | | 11,787,500 | | | | 0.4 | % |
| Maruwa Co. Ltd. | | | 55,400 | | | | 8,603,864 | | | | 0.3 | % |
| NET One Systems Co. Ltd. | | | 420,500 | | | | 9,237,715 | | | | 0.3 | % |
| NSD Co. Ltd. | | | 482,660 | | | | 9,703,883 | | | | 0.3 | % |
| Sanken Electric Co. Ltd. | | | 126,800 | | | | 11,962,482 | | | | 0.4 | % |
| Tokyo Seimitsu Co. Ltd. | | | 232,600 | | | | 12,879,617 | | | | 0.5 | % |
| Topcon Corp. | | | 663,300 | | | | 9,772,800 | | | | 0.3 | % |
| #Ulvac, Inc. | | | 168,700 | | | | 7,194,997 | | | | 0.3 | % |
| Other Securities | | | | | | | 311,814,628 | | | | 10.6 | % |
| TOTAL INFORMATION TECHNOLOGY | | | | | | | 442,524,602 | | | | 15.3 | % |
| | | | | | | | | | | | | |
| MATERIALS — (12.7%) | | | | | | | | | | | | |
| ADEKA Corp. | | | 507,000 | | | | 9,685,087 | | | | 0.3 | % |
| Daicel Corp. | | | 804,300 | | | | 7,198,031 | | | | 0.3 | % |
| Mitsui Mining & Smelting Co. Ltd. | | | 345,600 | | | | 7,979,177 | | | | 0.3 | % |
| Sumitomo Bakelite Co. Ltd. | | | 194,100 | | | | 8,091,310 | | | | 0.3 | % |
| Taiheiyo Cement Corp. | | | 470,191 | | | | 9,295,870 | | | | 0.3 | % |
| #Tokai Carbon Co. Ltd. | | | 948,600 | | | | 8,731,820 | | | | 0.3 | % |
| UBE Corp. | | | 611,100 | | | | 10,506,181 | | | | 0.4 | % |
| Other Securities | | | | | | | 311,804,609 | | | | 10.7 | % |
| TOTAL MATERIALS | | | | | | | 373,292,085 | | | | 12.9 | % |
| | | | | | | | | | | | | |
| REAL ESTATE — (1.4%) | | | | | | | | | | | | |
| Other Securities | | | | | | | 39,712,298 | | | | 1.4 | % |
| | | | | | | | | | | | | |
| UTILITIES — (1.8%) | | | | | | | | | | | | |
| Nippon Gas Co. Ltd. | | | 676,700 | | | | 9,526,128 | | | | 0.3 | % |
| Other Securities | | | | | | | 42,520,444 | | | | 1.5 | % |
| TOTAL UTILITIES | | | | | | | 52,046,572 | | | | 1.8 | % |
| TOTAL COMMON STOCKS | | | | | | | 2,865,351,001 | | | | 99.2 | % |
| RIGHTS/WARRANTS — (0.0%) | | | | | | | | | | | | |
| INDUSTRIALS — (0.0%) | | | | | | | | | | | | |
| Other Security | | | | | | | 128,844 | | | | 0.0 | % |
| TOTAL RIGHTS/WARRANTS | | | | | | | 128,844 | | | | 0.0 | % |
| TOTAL INVESTMENT SECURITIES | | | | | | | | | | | | |
| (Cost $2,743,323,031) | | | | | | | 2,865,479,845 | | | | | |
| | | | | | | | | | | | | |
| | | | | | Value† | | | | |
| SECURITIES LENDING COLLATERAL — (2.2%) | | | | | | | | | | | | |
| @§The DFA Short Term Investment Fund | | | 5,630,625 | | | | 65,123,811 | | | | 2.3 | % |
| TOTAL INVESTMENTS—(100.0%) | | | | | | | | | | | | |
| (Cost $2,808,446,842) | | | | | | $ | 2,930,603,656 | | | | 101.5 | % |
The Japanese Small Company Series
continued
Summary of the Series’ investments as of June 30, 2023, based on their valuation inputs, is as follows (see Security Valuation Note):
| | | Investments in Securities (Market Value) | |
| | | Level 1 | | Level 2 | | Level 3 | | Total | |
| Common Stocks | | | | | | | | | | | | |
| Communication Services | | | — | | $ | 65,675,493 | | — | | $ | 65,675,493 | |
| Consumer Discretionary | | $ | 95,195 | | | 410,854,120 | | — | | | 410,949,315 | |
| Consumer Staples | | | — | | | 226,752,938 | | — | | | 226,752,938 | |
| Energy | | | — | | | 21,323,889 | | — | | | 21,323,889 | |
| Financials | | | — | | | 251,579,331 | | — | | | 251,579,331 | |
| Health Care | | | 47,328 | | | 138,347,927 | | — | | | 138,395,255 | |
| Industrials | | | 38,879 | | | 843,060,344 | | — | | | 843,099,223 | |
| Information Technology | | | 123,781 | | | 442,400,821 | | — | | | 442,524,602 | |
| Materials | | | — | | | 373,292,085 | | — | | | 373,292,085 | |
| Real Estate | | | — | | | 39,712,298 | | — | | | 39,712,298 | |
| Utilities | | | — | | | 52,046,572 | | — | | | 52,046,572 | |
| Rights/Warrants | | | | | | | | | | | | |
| Industrials | | | — | | | 128,844 | | — | | | 128,844 | |
| Securities Lending Collateral | | | — | | | 65,123,811 | | — | | | 65,123,811 | |
| TOTAL | | $ | 305,183 | | $ | 2,930,298,473 | | — | | $ | 2,930,603,656 | |
See accompanying Notes to Financial Statements.
THE ASIA PACIFIC SMALL COMPANY SERIES
SUMMARY SCHEDULE OF PORTFOLIO HOLDINGS
JUNE 30, 2023
(Unaudited)
| | | | Shares | | | Value» | | Percentage
of Net Assets‡ | |
| COMMON STOCKS — (99.2%) | |
| AUSTRALIA — (63.7%) | |
| | AMP Ltd. | | 14,485,829 | | $ | 10,946,585 | | | 0.9 | % |
| | Ansell Ltd. | | 661,545 | | | 11,822,311 | | | 0.9 | % |
| | ARB Corp. Ltd. | | 498,463 | | | 9,563,027 | | | 0.8 | % |
| | AUB Group Ltd. | | 710,426 | | | 13,972,945 | | | 1.1 | % |
| | Bapcor Ltd. | | 2,107,733 | | | 8,378,788 | | | 0.7 | % |
| | Beach Energy Ltd. | | 9,561,631 | | | 8,620,731 | | | 0.7 | % |
| * | Bellevue Gold Ltd. | | 8,307,472 | | | 7,106,805 | | | 0.6 | % |
| | Breville Group Ltd. | | 627,990 | | | 8,394,132 | | | 0.7 | % |
| | Brickworks Ltd. | | 389,897 | | | 6,942,279 | | | 0.6 | % |
| | Corporate Travel Management Ltd. | | 729,339 | | | 8,757,763 | | | 0.7 | % |
| | CSR Ltd. | | 3,176,445 | | | 11,017,324 | | | 0.9 | % |
| * | De Grey Mining Ltd. | | 7,594,615 | | | 6,881,891 | | | 0.5 | % |
| | Downer EDI Ltd. | | 4,211,433 | | | 11,562,843 | | | 0.9 | % |
| | Eagers Automotive Ltd. | | 899,116 | | | 8,133,020 | | | 0.6 | % |
| # * | Flight Centre Travel Group Ltd. | | 841,836 | | | 10,731,823 | | | 0.9 | % |
| | Gold Road Resources Ltd. | | 7,631,631 | | | 7,645,729 | | | 0.6 | % |
| | GrainCorp Ltd., Class A | | 1,417,016 | | | 7,413,480 | | | 0.6 | % |
| | Healius Ltd. | | 3,465,521 | | | 7,379,812 | | | 0.6 | % |
| | HUB24 Ltd. | | 481,265 | | | 8,227,531 | | | 0.7 | % |
| | InvoCare Ltd. | | 908,018 | | | 7,644,514 | | | 0.6 | % |
| | IPH Ltd. | | 1,434,646 | | | 7,522,941 | | | 0.6 | % |
| | IRESS Ltd. | | 1,180,193 | | | 8,101,742 | | | 0.6 | % |
| | McMillan Shakespeare Ltd. | | 587,432 | | | 7,085,110 | | | 0.6 | % |
| | Netwealth Group Ltd. | | 750,336 | | | 6,967,198 | | | 0.6 | % |
| | nib holdings Ltd. | | 2,804,808 | | | 15,818,442 | | | 1.3 | % |
| | Nine Entertainment Co. Holdings Ltd. | | 7,131,395 | | | 9,381,973 | | | 0.7 | % |
| | Nufarm Ltd. | | 2,267,973 | | | 7,722,554 | | | 0.6 | % |
| | Orora Ltd. | | 5,280,211 | | | 11,600,954 | | | 0.9 | % |
| * | Paladin Energy Ltd. | | 16,375,142 | | | 8,053,666 | | | 0.6 | % |
| | Perpetual Ltd. | | 670,235 | | | 11,590,400 | | | 0.9 | % |
| | Perseus Mining Ltd. | | 8,455,260 | | | 9,392,751 | | | 0.7 | % |
| | Reliance Worldwide Corp. Ltd. | | 4,604,581 | | | 12,660,628 | | | 1.0 | % |
| * | Sandfire Resources Ltd. | | 3,243,721 | | | 12,880,496 | | | 1.0 | % |
| | Sims Ltd. | | 1,036,292 | | | 10,931,968 | | | 0.9 | % |
| * | Star Entertainment Group Ltd. | | 8,822,099 | | | 6,815,022 | | | 0.5 | % |
| | Super Retail Group Ltd. | | 1,057,351 | | | 8,090,108 | | | 0.6 | % |
| | Tabcorp Holdings Ltd. | | 13,920,512 | | | 10,325,589 | | | 0.8 | % |
| | Technology One Ltd. | | 706,460 | | | 7,408,071 | | | 0.6 | % |
| # * | Webjet Ltd. | | 2,404,516 | | | 11,114,553 | | | 0.9 | % |
| | Other Securities | | | | | 446,189,768 | | | 34.8 | % |
| TOTAL AUSTRALIA | | | | | 810,797,267 | | | 63.8 | % |
| | | | | | | | | | |
| CHINA — (0.1%) | |
| | Other Securities | | | | | 1,197,644 | | | 0.1 | % |
THE Asia Pacific SMALL COMPANY SERIES
continued
| | | | Shares | | | Value» | | Percentage
of Net Assets‡ | | |
| HONG KONG — (21.1%) | |
| | ASMPT Ltd. | | 1,584,800 | | $ | 15,657,113 | | | 1.2 | % | |
| | Hysan Development Co. Ltd. | | 3,175,000 | | | 7,759,142 | | | 0.6 | % | |
| | Luk Fook Holdings International Ltd. | | 3,450,000 | | | 8,857,602 | | | 0.7 | % | |
| | NWS Holdings Ltd. | | 7,045,000 | | | 8,004,122 | | | 0.6 | % | |
| | Pacific Basin Shipping Ltd. | | 27,975,000 | | | 8,535,709 | | | 0.7 | % | |
| | PCCW Ltd. | | 17,843,545 | | | 9,256,690 | | | 0.7 | % | |
| | VTech Holdings Ltd. | | 1,166,000 | | | 7,657,588 | | | 0.6 | % | |
| | Other Securities | | | | | 203,563,762 | | | 16.1 | % | |
| TOTAL HONG KONG | | | | | 269,291,728 | | | 21.2 | % | |
| | | | | | | | | | |
| NEW ZEALAND — (3.6%) | |
| | Chorus Ltd. | | 1,625,490 | | | 8,409,569 | | | 0.7 | % | |
| | Other Securities | | | | | 37,940,063 | | | 3.0 | % | |
| TOTAL NEW ZEALAND | | | | | 46,349,632 | | | 3.7 | % | |
| | | | | | | | | | |
| SINGAPORE — (10.7%) | |
| | ComfortDelGro Corp. Ltd. | | 9,307,100 | | | 7,997,031 | | | 0.6 | % | |
| | Keppel Infrastructure Trust | | 19,392,287 | | | 7,324,331 | | | 0.6 | % | |
| * | SATS Ltd. | | 3,592,367 | | | 6,872,190 | | | 0.5 | % | |
| | Other Securities | | | | | 113,792,088 | | | 9.0 | % | |
| TOTAL SINGAPORE | | | | | 135,985,640 | | | 10.7 | % | |
| TOTAL COMMON STOCKS | | | | | 1,263,621,911 | | | 99.5 | % | |
| | | | | | | | | | |
| RIGHTS/WARRANTS — (0.0%) | |
| | |
| AUSTRALIA — (0.0%) | |
| | Other Securities | | | | | 3,409 | | | 0.0 | % | |
| | | | | | | | | | | |
| HONG KONG — (0.0%) | |
| | Other Security | | | | | 6,186 | | | 0.0 | % | |
| | | | | | | | | | | |
| SINGAPORE — (0.0%) | |
| | Other Securities | | | | | 30,963 | | | 0.0 | % | |
| TOTAL RIGHTS/WARRANTS | | | | | 40,558 | | | 0.0 | % | |
| TOTAL INVESTMENT SECURITIES | | | | | | | | | |
| | (Cost $1,491,561,450) | | | | | 1,263,662,469 | | | | |
| | | | | | | | | | | |
| | | | | | | Value† | | | | |
| SECURITIES LENDING COLLATERAL — (0.8%) | | | | | | | | | |
| @§ | The DFA Short Term Investment Fund | | 885,806 | | | 10,245,234 | | | 0.8 | % | |
| TOTAL INVESTMENTS—(100.0%) | | | | | | | | | |
| | (Cost $1,501,806,514) | | | | $ | 1,273,907,703 | | | 100.3 | % | |
THE Asia Pacific SMALL COMPANY SERIES
continued
Summary of the Series’ investments as of June 30, 2023, based on their valuation inputs, is as follows (see Security Valuation Note):
| | | Investments in Securities (Market Value) | |
| | | Level 1 | | Level 2 | | | Level 3 | | | Total | |
| Common Stocks | | | | | | | | | | | | | | |
| Australia | | $ | 15,287 | | $ | 810,307,242 | | $ | 474,738 | | | $ | 810,797,267 | |
| China | | | — | | | 1,197,644 | | | — | | | | 1,197,644 | |
| Hong Kong | | | 1,069 | | | 268,981,893 | | | 308,766 | | | | 269,291,728 | |
| New Zealand | | | — | | | 46,349,632 | | | — | | | | 46,349,632 | |
| Singapore | | | 446,233 | | | 134,841,835 | | | 697,572 | | | | 135,985,640 | |
| Rights/Warrants | | | | | | | | | | | | | | |
| Australia | | | — | | | 3,409 | | | — | | | | 3,409 | |
| Hong Kong | | | — | | | 6,186 | | | — | | | | 6,186 | |
| Singapore | | | — | | | 30,963 | | | — | | | | 30,963 | |
| Securities Lending Collateral | | | — | | | 10,245,234 | | | — | | | | 10,245,234 | |
| TOTAL | | $ | 462,589 | | $ | 1,271,964,038 | | $ | 1,481,076 | ^ | | $ | 1,273,907,703 | |
| ^ | A reconciliation of Level 3 investments is presented when the Fund had a significant amount of Level 3 investments at the beginning and/or end of the reporting period in relation to net assets. |
See accompanying Notes to Financial Statements.
THE UNITED KINGDOM SMALL COMPANY SERIES
SUMMARY SCHEDULE OF PORTFOLIO HOLDINGS
JUNE 30, 2023
(Unaudited)
| | | | Shares | | | Value» | | | Percentage
of Net Assets‡ | |
| COMMON STOCKS — (99.3%) | |
| COMMUNICATION SERVICES — (3.8%) | |
| | 4imprint Group PLC | | 165,738 | | $ | 10,102,406 | | | 0.8 | % |
| | ITV PLC | | 12,266,299 | | | 10,663,179 | | | 0.8 | % |
| | Moneysupermarket.com Group PLC | | 3,209,924 | | | 11,042,559 | | | 0.8 | % |
| | Other Securities | | | | | 19,020,072 | | | 1.4 | % |
| TOTAL COMMUNICATION SERVICES | | | | | 50,828,216 | | | 3.8 | % |
| | | | | | | | | | |
| CONSUMER DISCRETIONARY — (18.8%) | |
| | Bellway PLC | | 527,051 | | | 13,326,486 | | | 1.0 | % |
| | Domino’s Pizza Group PLC. | | 3,097,499 | | | 10,861,742 | | | 0.8 | % |
| | Dunelm Group PLC | | 690,244 | | | 9,854,443 | | | 0.7 | % |
| | Games Workshop Group PLC | | 176,924 | | | 24,551,237 | | | 1.8 | % |
| | Greggs PLC | | 601,854 | | | 19,551,278 | | | 1.5 | % |
| | Inchcape PLC | | 2,122,222 | | | 21,002,551 | | | 1.6 | % |
| | Pets at Home Group PLC | | 2,837,331 | | | 13,604,701 | | | 1.0 | % |
| * | Playtech PLC. | | 1,926,086 | | | 14,428,214 | | | 1.1 | % |
| * | SSP Group PLC | | 3,417,062 | | | 10,904,647 | | | 0.8 | % |
| | Vistry Group PLC. | | 1,471,857 | | | 12,360,507 | | | 0.9 | % |
| | WH Smith PLC | | 546,871 | | | 10,782,652 | | | 0.8 | % |
| | Other Securities | | | | | 91,039,879 | | | 6.8 | % |
| TOTAL CONSUMER DISCRETIONARY | | | | | 252,268,337 | | | 18.8 | % |
| | | | | | | | | | |
| CONSUMER STAPLES — (8.3%) | |
| | Britvic PLC | | 1,626,728 | | | 17,705,255 | | | 1.3 | % |
| | Cranswick PLC | | 366,623 | | | 15,124,115 | | | 1.1 | % |
| * | Marks & Spencer Group PLC | | 8,960,994 | | | 21,965,396 | | | 1.6 | % |
| | Tate & Lyle PLC | | 2,167,560 | | | 20,006,672 | | | 1.5 | % |
| | Other Securities | | | | | 36,736,576 | | | 2.8 | % |
| TOTAL CONSUMER STAPLES | | | | | 111,538,014 | | | 8.3 | % |
| | | | | | | | | | |
| ENERGY — (3.0%) | |
| | Other Securities | | | | | 40,327,959 | | | 3.0 | % |
| | | | | | | | | | | |
| FINANCIALS — (19.6%) | |
| | Bank of Georgia Group PLC | | 269,724 | | | 10,030,228 | | | 0.8 | % |
| | Beazley PLC | | 2,938,648 | | | 22,031,612 | | | 1.7 | % |
| | Burford Capital Ltd | | 965,905 | | | 11,796,343 | | | 0.9 | % |
| | Close Brothers Group PLC. | | 881,739 | | | 9,892,172 | | | 0.7 | % |
| | Hiscox Ltd. | | 1,350,247 | | | 18,719,938 | | | 1.4 | % |
| | Lancashire Holdings Ltd | | 1,661,042 | | | 12,207,803 | | | 0.9 | % |
| | Man Group PLC | | 7,541,211 | | | 20,942,543 | | | 1.6 | % |
| | OSB Group PLC | | 2,202,114 | | | 13,478,581 | | | 1.0 | % |
| | Paragon Banking Group PLC. | | 1,921,607 | | | 12,982,150 | | | 1.0 | % |
| | Virgin Money UK PLC | | 6,577,199 | | | 12,524,353 | | | 0.9 | % |
| | Other Securities | | | | | 118,623,097 | | | 8.7 | % |
| TOTAL FINANCIALS | | | | | 263,228,820 | | | 19.6 | % |
The United Kingdom Small Company Series
continued
| | | | Shares | | | Value» | | Percentage
of Net Assets‡ | |
| HEALTH CARE — (3.8%) | |
| | CVS Group PLC | | 418,701 | | $ | 10,519,007 | | | 0.8 | % |
| * | Indivior PLC | | 759,374 | | | 17,582,530 | | | 1.3 | % |
| | Other Securities | | | | | 22,648,736 | | | 1.7 | % |
| TOTAL HEALTH CARE | | | | | 50,750,273 | | | 3.8 | % |
| | | | | | | | | | |
| INDUSTRIALS — (23.8%) | |
| | Balfour Beatty PLC | | 3,585,302 | | | 15,525,384 | | | 1.2 | % |
| | Bodycote PLC | | 1,236,656 | | | 10,086,950 | | | 0.7 | % |
| | Diploma PLC | | 423,439 | | | 16,072,376 | | | 1.2 | % |
| | Grafton Group PLC | | 1,489,341 | | | 14,790,096 | | | 1.1 | % |
| | Hays PLC | | 9,347,832 | | | 12,139,353 | | | 0.9 | % |
| | JET2 PLC | | 813,756 | | | 12,877,996 | | | 1.0 | % |
| | Pagegroup PLC | | 1,947,013 | | | 9,925,824 | | | 0.7 | % |
| | QinetiQ Group PLC | | 3,241,231 | | | 14,609,019 | | | 1.1 | % |
| | Rotork PLC | | 4,324,797 | | | 16,757,041 | | | 1.2 | % |
| | Serco Group PLC | | 5,743,194 | | | 11,362,079 | | | 0.8 | % |
| | Travis Perkins PLC | | 1,194,868 | | | 12,375,076 | | | 0.9 | % |
| | Other Securities | | | | | 173,984,127 | | | 13.1 | % |
| TOTAL INDUSTRIALS | | | | | 320,505,321 | | | 23.9 | % |
| | | | | | | | | | |
| INFORMATION TECHNOLOGY — (7.1%) | |
| | Computacenter PLC | | 497,525 | | | 14,438,141 | | | 1.1 | % |
| | Oxford Instruments PLC | | 343,024 | | | 11,876,459 | | | 0.9 | % |
| | Softcat PLC | | 677,227 | | | 12,201,537 | | | 0.9 | % |
| | Spectris PLC | | 384,491 | | | 17,567,634 | | | 1.3 | % |
| | Other Securities | | | | | 39,511,180 | | | 2.9 | % |
| TOTAL INFORMATION TECHNOLOGY | | | | | 95,594,951 | | | 7.1 | % |
| | | | | | | | | | |
| MATERIALS — (5.1%) | |
| | Hill & Smith PLC | | 546,022 | | | 10,440,965 | | | 0.8 | % |
| | Other Securities | | | | | 58,092,486 | | | 4.3 | % |
| TOTAL MATERIALS | | | | | 68,533,451 | | | 5.1 | % |
| | | | | | | | | | |
| REAL ESTATE — (2.9%) | |
| | Grainger PLC | | 4,237,552 | | | 12,218,585 | | | 0.9 | % |
| | Savills PLC | | 961,872 | | | 10,396,511 | | | 0.8 | % |
| | Other Securities | | | | | 16,087,375 | | | 1.2 | % |
| TOTAL REAL ESTATE | | | | | 38,702,471 | | | 2.9 | % |
| | | | | | | | | | |
| UTILITIES — (3.1%) | |
| | Drax Group PLC | | 2,467,126 | | | 18,178,963 | | | 1.3 | % |
| | Pennon Group PLC | | 1,371,280 | | | 12,390,225 | | | 0.9 | % |
| | Other Securities | | | | | 11,396,208 | | | 0.9 | % |
| TOTAL UTILITIES | | | | | 41,965,396 | | | 3.1 | % |
| TOTAL COMMON STOCKS | | | | | | | | | |
| (Cost $1,329,981,914) | | | | | 1,334,243,209 | | | 99.4 | % |
| | | | | | | | | | |
| | | | | | | Value† | | | | |
| SECURITIES LENDING COLLATERAL — (0.7%) | | | | | | | | | |
| @§ The DFA Short Term Investment Fund | | 756,089 | | | 8,744,924 | | | 0.6 | % |
TOTAL INVESTMENTS—(100.0%)
(Cost $1,338,726,742) | | | | $ | 1,342,988,133 | | | 100.0 | % |
The United Kingdom Small Company Series
continued
Summary of the Series’ investments as of June 30, 2023, based on their valuation inputs, is as follows (see Security Valuation Note):
| | | Investments in Securities (Market Value) | |
| | | Level 1 | | Level 2 | | Level 3 | | | Total | |
| Common Stocks | | | | | | | | | | | | | | |
| Communication Services | | $ | 20,923 | | $ | 50,807,293 | | | — | | | $ | 50,828,216 | |
| Consumer Discretionary | | | 34,023 | | | 252,234,314 | | | — | | | | 252,268,337 | |
| Consumer Staples | | | — | | | 111,538,014 | | | — | | | | 111,538,014 | |
| Energy | | | — | | | 40,327,959 | | | — | | | | 40,327,959 | |
| Financials | | | — | | | 263,228,820 | | | — | | | | 263,228,820 | |
| Health Care | | | — | | | 50,748,590 | | $ | 1,683 | | | | 50,750,273 | |
| Industrials | | | — | | | 320,505,321 | | | — | | | | 320,505,321 | |
| Information Technology | | | — | | | 95,594,951 | | | — | | | | 95,594,951 | |
| Materials | | | — | | | 68,533,451 | | | — | | | | 68,533,451 | |
| Real Estate | | | — | | | 38,702,471 | | | — | | | | 38,702,471 | |
| Utilities | | | — | | | 41,965,396 | | | — | | | | 41,965,396 | |
| Securities Lending Collateral | | | — | | | 8,744,924 | | | — | | | | 8,744,924 | |
| TOTAL | | $ | 54,946 | | $ | 1,342,931,504 | | $ | 1,683 | ^ | | $ | 1,342,988,133 | |
| ^ | A reconciliation of Level 3 investments is presented when the Fund had a significant amount of Level 3 investments at the beginning and/or end of the reporting period in relation to net assets. |
See accompanying Notes to Financial Statements.
The Continental Small Company Series
SUMMARY SCHEDULE OF PORTFOLIO HOLDINGS
JUNE 30, 2023
(Unaudited)
| | | | Shares | | | Value» | | Percentage
of Net Assets‡ | |
| COMMON STOCKS — (93.3%) | | | | | | | | | |
| AUSTRIA — (3.2%) | | | | | | | | | |
| | ANDRITZ AG | | 438,579 | | $ | 24,459,480 | | | 0.5 | % |
| # | voestalpine AG | | 615,510 | | | 22,119,142 | | | 0.4 | % |
| | Wienerberger AG | | 682,908 | | | 20,904,243 | | | 0.4 | % |
| | Other Securities | | | | | 105,981,942 | | | 2.1 | % |
| TOTAL AUSTRIA | | | | | 173,464,807 | | | 3.4 | % |
| | | | | | | | | | |
| BELGIUM — (3.8%) | | | | | | | | | |
| | Ackermans & van Haaren NV | | 171,688 | | | 28,267,937 | | | 0.6 | % |
| | Other Securities | | | | | 175,342,421 | | | 3.3 | % |
| TOTAL BELGIUM | | | | | 203,610,358 | | | 3.9 | % |
| | | | | | | | | | |
| DENMARK — (6.7%) | | | | | | | | | |
| * | Jyske Bank AS | | 437,851 | | | 33,308,384 | | | 0.7 | % |
| | Ringkjoebing Landbobank AS | | 197,625 | | | 28,328,859 | | | 0.6 | % |
| | Royal Unibrew AS | | 312,981 | | | 28,015,972 | | | 0.5 | % |
| | Sydbank AS | | 461,164 | | | 21,323,139 | | | 0.4 | % |
| | Other Securities | | | | | 251,025,600 | | | 4.8 | % |
| TOTAL DENMARK | | | | | 362,001,954 | | | 7.0 | % |
| | | | | | | | | | |
| FINLAND — (4.9%) | | | | | | | | | |
| | Huhtamaki Oyj | | 631,957 | | | 20,739,905 | | | 0.4 | % |
| | Orion Oyj, Class B | | 619,790 | | | 25,721,932 | | | 0.5 | % |
| | Valmet Oyj | | 912,291 | | | 25,394,996 | | | 0.5 | % |
| | Wartsila Oyj Abp | | 2,276,158 | | | 25,665,912 | | | 0.5 | % |
| | Other Securities | | | | | 170,641,380 | | | 3.3 | % |
| TOTAL FINLAND | | | | | 268,164,125 | | | 5.2 | % |
| | | | | | | | | | |
| FRANCE — (11.1%) | | | | | | | | | |
| | Alten SA | | 141,624 | | | 22,334,687 | | | 0.4 | % |
| | Elis SA | | 1,272,724 | | | 24,758,554 | | | 0.5 | % |
| | Rexel SA | | 1,364,288 | | | 33,716,921 | | | 0.7 | % |
| | SCOR SE | | 802,342 | | | 23,586,811 | | | 0.5 | % |
| * | SOITEC | | 136,675 | | | 23,121,937 | | | 0.5 | % |
| | Sopra Steria Group SACA | | 119,421 | | | 23,841,849 | | | 0.5 | % |
| | SPIE SA | | 871,653 | | | 28,188,471 | | | 0.6 | % |
| | Valeo SA | | 1,075,406 | | | 23,109,698 | | | 0.5 | % |
| | Other Securities | | | | | 398,801,578 | | | 7.5 | % |
| TOTAL FRANCE | | | | | 601,460,506 | | | 11.7 | % |
| | | | | | | | | | |
| GERMANY — (13.3%) | | | | | | | | | |
| | Freenet AG | | 931,981 | | | 23,404,554 | | | 0.5 | % |
| | Gerresheimer AG | | 231,069 | | | 26,012,484 | | | 0.5 | % |
| | HUGO BOSS AG | | 412,000 | | | 32,202,476 | | | 0.6 | % |
| | thyssenkrupp AG | | 2,833,923 | | | 22,196,531 | | | 0.4 | % |
| | Other Securities | | | | | 616,105,945 | | | 12.0 | % |
| TOTAL GERMANY | | | | | 719,921,990 | | | 14.0 | % |
The Continental Small Company Series
continued
| | | | Shares | | | Value» | | Percentage
of Net Assets‡ | |
| IRELAND — (1.3%) | | | | | | | | | |
| | Bank of Ireland Group PLC. | | 4,153,567 | | $ | 39,655,918 | | | 0.8 | % |
| | Other Securities | | | | | 29,563,762 | | | 0.5 | % |
| TOTAL IRELAND | | | | | 69,219,680 | | | 1.3 | % |
| | | | | | | | | | |
| ISRAEL — (2.2%) | | | | | | | | | |
| | Other Securities | | | | | 118,811,072 | | | 2.3 | % |
| | | | | | | | | | | |
| ITALY — (9.4%) | | | | | | | | | |
| | Banco BPM SpA | | 9,876,720 | | | 45,875,692 | | | 0.9 | % |
| # | BPER Banca | | 7,525,929 | | | 22,881,741 | | | 0.5 | % |
| | Brunello Cucinelli SpA | | 248,717 | | | 21,898,318 | | | 0.4 | % |
| | Italgas SpA | | 3,498,389 | | | 20,740,753 | | | 0.4 | % |
| | Leonardo SpA | | 2,654,010 | | | 30,135,966 | | | 0.6 | % |
| | Other Securities | | | | | 368,612,851 | | | 7.1 | % |
| TOTAL ITALY | | | | | 510,145,321 | | | 9.9 | % |
| | | | | | | | | | |
| NETHERLANDS — (5.2%) | | | | | | | | | |
| | Aalberts NV | | 673,240 | | | 28,351,353 | | | 0.6 | % |
| | Arcadis NV | | 526,995 | | | 22,041,187 | | | 0.4 | % |
| | ASR Nederland NV | | 586,184 | | | 26,438,938 | | | 0.5 | % |
| | BE Semiconductor Industries NV | | 392,853 | | | 42,606,537 | | | 0.8 | % |
| | Other Securities | | | | | 163,354,507 | | | 3.2 | % |
| TOTAL NETHERLANDS | | | | | 282,792,522 | | | 5.5 | % |
| | | | | | | | | | |
| NORWAY — (1.9%) | | | | | | | | | |
| | Other Securities | | | | | 103,927,251 | | | 2.0 | % |
| | | | | | | | | | | |
| PORTUGAL — (0.8%) | | | | | | | | | |
| | Other Securities | | | | | 46,372,889 | | | 0.9 | % |
| | | | | | | | | | | |
| SPAIN — (5.9%) | | | | | | | | | |
| | Banco de Sabadell SA | | 36,362,876 | | | 41,924,548 | | | 0.8 | % |
| | Bankinter SA | | 4,245,482 | | | 26,129,953 | | | 0.5 | % |
| # | Enagas SA | | 1,457,648 | | | 28,648,041 | | | 0.6 | % |
| | Other Securities | | | | | 221,770,126 | | | 4.3 | % |
| TOTAL SPAIN | | | | | 318,472,668 | | | 6.2 | % |
| | | | | | | | | | |
| SWEDEN — (5.6%) | | | | | | | | | |
| | Other Securities | | | | | 306,422,220 | | | 5.9 | % |
| | | | | | | | | | | |
| SWITZERLAND — (17.9%) | | | | | | | | | |
| | Allreal Holding AG | | 123,491 | | | 20,904,428 | | | 0.4 | % |
| | Belimo Holding AG | | 65,574 | | | 32,774,692 | | | 0.6 | % |
| | BKW AG | | 161,471 | | | 28,548,055 | | | 0.6 | % |
| | Bucher Industries AG | | 54,010 | | | 23,901,484 | | | 0.5 | % |
| * | Dufry AG | | 552,791 | | | 25,213,872 | | | 0.5 | % |
| | Flughafen Zurich AG | | 145,858 | | | 30,338,962 | | | 0.6 | % |
| Ω | Galenica AG | | 279,387 | | | 22,587,090 | | | 0.4 | % |
| | Georg Fischer AG | | 626,442 | | | 47,115,048 | | | 0.9 | % |
| | Helvetia Holding AG | | 262,788 | | | 35,616,795 | | | 0.7 | % |
| | PSP Swiss Property AG | | 337,750 | | | 37,739,167 | | | 0.7 | % |
The Continental Small Company Series
continued
| | | | Shares | | | Value» | | Percentage
of Net Assets‡ | |
| SWITZERLAND — (Continued) | | | | | | | | | |
| | Siegfried Holding AG | | 32,647 | | $ | 26,996,147 | | | 0.5 | % |
| | Temenos AG | | 299,991 | | | 23,886,967 | | | 0.5 | % |
| Ω | VAT Group AG | | 71,846 | | | 29,759,617 | | | 0.6 | % |
| | Other Securities | | | | | 582,823,989 | | | 11.3 | % |
| TOTAL SWITZERLAND | | | | | 968,206,313 | | | 18.8 | % |
| | | | | | | | | | |
| UNITED STATES — (0.1%) | | | | | | | | | |
| | Other Securities | | | | | 3,235,695 | | | 0.1 | % |
| TOTAL COMMON STOCKS | | | | | 5,056,229,371 | | | 98.1 | % |
| | | | | | | | | | |
| PREFERRED STOCKS — (0.9%) | | | | | | | | | |
| GERMANY — (0.9%) | | | | | | | | | |
| | Other Securities | | | | | 46,396,758 | | | 0.9 | % |
| | | | | | | | | | | |
| RIGHTS/WARRANTS — (0.0%) | | | | | | | | | |
| AUSTRIA — (0.0%) | | | | | | | | | |
| | Other Securities | | | | | 450,329 | | | 0.0 | % |
| | | | | | | | | | | |
| NETHERLANDS — (0.0%) | | | | | | | | | |
| | Other Security | | | | | 5,781 | | | 0.0 | % |
| | | | | | | | | | | |
| SPAIN — (0.0%) | | | | | | | | | |
| | Other Security | | | | | 259,922 | | | 0.0 | % |
| | | | | | | | | | | |
| TOTAL RIGHTS/WARRANTS | | | | | 716,032 | | | 0.0 | % |
TOTAL INVESTMENT SECURITIES
(Cost $4,300,574,398) | | | | | 5,103,342,161 | | | | |
| | | | | | | | | | |
| | | | | | | Value† | | | | |
| SECURITIES LENDING COLLATERAL — (5.8%) | | | | | | | | | |
| @§ The DFA Short Term Investment Fund | | 27,268,890 | | | 315,391,981 | | | 6.1 | % |
TOTAL INVESTMENTS—(100.0%)
(Cost $4,615,953,371) | | | | $ | 5,418,734,142 | | | 105.1 | % |
The Continental Small Company Series
continued
Summary of the Series’ investments as of June 30, 2023, based on their valuation inputs, is as follows (see Security Valuation Note):
| | | Investments in Securities (Market Value) | |
| | | Level 1 | | Level 2 | | Level 3 | | Total | |
| Common Stocks | | | | | | | | | | | | | |
| Austria | | | — | | $ | 173,464,807 | | | — | | $ | 173,464,807 | |
| Belgium | | $ | 676,194 | | | 202,934,164 | | | — | | | 203,610,358 | |
| Denmark | | | — | | | 362,001,954 | | | — | | | 362,001,954 | |
| Finland | | | — | | | 268,164,125 | | | — | | | 268,164,125 | |
| France | | | — | | | 601,460,506 | | | — | | | 601,460,506 | |
| Germany | | | — | | | 719,921,990 | | | — | | | 719,921,990 | |
| Ireland | | | — | | | 69,219,680 | | | — | | | 69,219,680 | |
| Israel | | | 631,428 | | | 118,179,644 | | | — | | | 118,811,072 | |
| Italy | | | — | | | 510,145,321 | | | — | | | 510,145,321 | |
| Netherlands | | | — | | | 282,792,522 | | | — | | | 282,792,522 | |
| Norway | | | 367,163 | | | 103,560,088 | | | — | | | 103,927,251 | |
| Portugal | | | — | | | 46,372,889 | | | — | | | 46,372,889 | |
| Spain | | | — | | | 318,472,668 | | | — | | | 318,472,668 | |
| Sweden | | | — | | | 306,422,220 | | | — | | | 306,422,220 | |
| Switzerland | | | — | | | 968,206,313 | | | — | | | 968,206,313 | |
| United States | | | — | | | 3,235,695 | | | — | | | 3,235,695 | |
| Preferred Stocks | | | | | | | | | | | | | |
| Germany | | | — | | | 46,396,758 | | | — | | | 46,396,758 | |
| Rights/Warrants | | | | | | | | | | | | | |
| Austria | | | — | | | 450,329 | | | — | | | 450,329 | |
| Netherlands | | | — | | | 5,781 | | | — | | | 5,781 | |
| Spain | | | — | | | 259,922 | | | — | | | 259,922 | |
| Securities Lending Collateral | | | — | | | 315,391,981 | | | — | | | 315,391,981 | |
| TOTAL | | $ | 1,674,785 | | $ | 5,417,059,357 | | | — | | $ | 5,418,734,142 | |
See accompanying Notes to Financial Statements.
THE CANADIAN SMALL COMPANY SERIES
SUMMARY SCHEDULE OF PORTFOLIO HOLDINGS
JUNE 30, 2023
(Unaudited)
| | | | | | | | | Percentage |
| | | Shares | | | Value» | | | of Net Assets‡ |
| COMMON STOCKS — (88.4%) | | | | | | | | | | | | |
| COMMUNICATION SERVICES — (0.9%) | | | | | | | | | | | | |
| Other Securities | | | | | | $ | 13,196,409 | | | | 1.0 | % |
| CONSUMER DISCRETIONARY — (4.8%) | | | | | | | | | | | | |
| *Aritzia, Inc. | | | 490,659 | | | | 13,622,523 | | | | 1.1 | % |
| Linamar Corp. | | | 252,633 | | | | 13,276,701 | | | | 1.0 | % |
| *Uni-Select, Inc. | | | 241,584 | | | | 8,580,130 | | | | 0.7 | % |
| Other Securities | | | | | | | 34,940,198 | | | | 2.6 | % |
| TOTAL CONSUMER DISCRETIONARY | | | | | | | 70,419,552 | | | | 5.4 | % |
| |
| CONSUMER STAPLES — (4.2%) | | | | | | | | | | | | |
| #Maple Leaf Foods, Inc. | | | 453,624 | | | | 8,861,890 | | | | 0.7 | % |
| #Premium Brands Holdings Corp. | | | 244,773 | | | | 19,313,925 | | | | 1.5 | % |
| Primo Water Corp | | | 799,922 | | | | 10,023,556 | | | | 0.8 | % |
| Other Securities | | | | | | | 23,630,536 | | | | 1.8 | % |
| TOTAL CONSUMER STAPLES | | | | | | | 61,829,907 | | | | 4.8 | % |
| |
| ENERGY — (21.5%) | | | | | | | | | | | | |
| #*Baytex Energy Corp. | | | 2,700,011 | | | | 8,804,716 | | | | 0.7 | % |
| #Birchcliff Energy Ltd. | | | 1,560,817 | | | | 9,237,068 | | | | 0.7 | % |
| Crescent Point Energy Corp | | | 2,349,740 | | | | 15,821,612 | | | | 1.2 | % |
| Crescent Point Energy Corp | | | 739,368 | | | | 4,975,947 | | | | 0.4 | % |
| #Enerplus Corp. | | | 1,253,055 | | | | 18,160,903 | | | | 1.4 | % |
| Enerplus Corp. | | | 28,353 | | | | 410,268 | | | | 0.0 | % |
| #Gibson Energy, Inc. | | | 899,205 | | | | 14,138,849 | | | | 1.1 | % |
| *MEG Energy Corp. | | | 1,420,274 | | | | 22,514,251 | | | | 1.7 | % |
| *NuVista Energy Ltd. | | | 1,051,851 | | | | 8,432,276 | | | | 0.7 | % |
| Paramount Resources Ltd., Class A | | | 487,473 | | | | 10,597,644 | | | | 0.8 | % |
| Parex Resources, Inc. | | | 727,671 | | | | 14,589,124 | | | | 1.1 | % |
| Parkland Corp. | | | 848,828 | | | | 21,144,611 | | | | 1.6 | % |
| #Peyto Exploration & Development Corp. | | | 1,064,787 | | | | 8,809,259 | | | | 0.7 | % |
| #PrairieSky Royalty Ltd. | | | 1,210,467 | | | | 21,162,042 | | | | 1.6 | % |
| Secure Energy Services, Inc. | | | 1,829,933 | | | | 8,757,708 | | | | 0.7 | % |
| Vermilion Energy, Inc. | | | 716,524 | | | | 8,935,253 | | | | 0.7 | % |
| Vermilion Energy, Inc. | | | 233,451 | | | | 2,906,465 | | | | 0.2 | % |
| Whitecap Resources, Inc. | | | 1,953,560 | | | | 13,670,129 | | | | 1.1 | % |
| Other Securities | | | | | | | 99,383,414 | | | | 7.7 | % |
| TOTAL ENERGY | | | | | | | 312,451,539 | | | | 24.1 | % |
| |
| FINANCIALS — (8.2%) | | | | | | | | | | | | |
| Canadian Western Bank | | | 499,325 | | | | 9,317,467 | | | | 0.7 | % |
| #CI Financial Corp. | | | 1,010,158 | | | | 11,468,410 | | | | 0.9 | % |
| Element Fleet Management Corp. | | | 945,377 | | | | 14,400,987 | | | | 1.1 | % |
| #Home Capital Group, Inc. | | | 284,804 | | | | 9,268,089 | | | | 0.7 | % |
| #Laurentian Bank of Canada | | | 330,400 | | | | 8,245,347 | | | | 0.7 | % |
| Onex Corp. | | | 209,947 | | | | 11,596,016 | | | | 0.9 | % |
| Other Securities | | | | | | | 55,284,239 | | | | 4.2 | % |
| TOTAL FINANCIALS | | | | | | | 119,580,555 | | | | 9.2 | % |
THE CANADIAN SMALL COMPANY SERIES
CONTINUED
| | | | | | | | | Percentage |
| | | Shares | | | Value» | | | of Net Assets‡ |
| HEALTH CARE — (2.0%) | | | | | | | | | | | | |
| *Bausch Health Cos., Inc. | | | 1,533,896 | | | $ | 12,271,168 | | | | 1.0 | % |
| *Bausch Health Cos., Inc. | | | 17,777 | | | | 142,243 | | | | 0.0 | % |
| Other Securities. | | | | | | | 16,372,772 | | | | 1.2 | % |
| TOTAL HEALTH CARE | | | | | | | 28,786,183 | | | | 2.2 | % |
| | | | | | | | | | | | | |
| INDUSTRIALS — (13.7%) | | | | | | | | | | | | |
| *ATS Corp. | | | 428,936 | | | | 19,734,780 | | | | 1.5 | % |
| *Bombardier, Inc., Class A | | | 13,989 | | | | 690,184 | | | | 0.1 | % |
| *Bombardier, Inc., Class B | | | 475,761 | | | | 23,454,954 | | | | 1.8 | % |
| Boyd Group Services, Inc. | | | 118,616 | | | | 22,630,831 | | | | 1.7 | % |
| Finning International, Inc. | | | 823,989 | | | | 25,346,331 | | | | 2.0 | % |
| Richelieu Hardware Ltd. | | | 316,493 | | | | 10,010,233 | | | | 0.8 | % |
| Russel Metals, Inc. | | | 354,503 | | | | 9,820,917 | | | | 0.8 | % |
| #SNC-Lavalin Group, Inc. | | | 978,592 | | | | 25,669,803 | | | | 2.0 | % |
| Other Securities | | | | | | | 61,328,414 | | | | 4.6 | % |
| TOTAL INDUSTRIALS | | | | | | | 198,686,447 | | | | 15.3 | % |
| | | | | | | | | | | | | |
| INFORMATION TECHNOLOGY — (3.1%) | | | | | | | | | | | | |
| # *BlackBerry Ltd. | | | 2,152,506 | | | | 11,903,358 | | | | 0.9 | % |
| *Celestica, Inc. | | | 584,405 | | | | 8,483,192 | | | | 0.7 | % |
| # *Lightspeed Commerce, Inc. | | | 579,603 | | | | 9,806,883 | | | | 0.8 | % |
| Other Securities | | | | | | | 15,244,852 | | | | 1.1 | % |
| TOTAL INFORMATION TECHNOLOGY | | | | | | | 45,438,285 | | | | 3.5 | % |
| | | | | | | | | | | | | |
| MATERIALS — (20.9%) | | | | | | | | | | | | |
| Alamos Gold, Inc., Class A | | | 2,146,839 | | | | 25,572,456 | | | | 2.0 | % |
| Alamos Gold, Inc., Class A | | | 31,783 | | | | 378,853 | | | | 0.0 | % |
| B2Gold Corp. | | | 1,419,420 | | | | 5,057,304 | | | | 0.4 | % |
| B2Gold Corp. | | | 4,573,000 | | | | 16,325,610 | | | | 1.3 | % |
| # *Capstone Copper Corp. | | | 2,311,783 | | | | 10,487,878 | | | | 0.8 | % |
| Methanex Corp. | | | 203,098 | | | | 8,392,213 | | | | 0.7 | % |
| Methanex Corp. | | | 126,782 | | | | 5,244,971 | | | | 0.4 | % |
| Osisko Gold Royalties Ltd. | | | 645,585 | | | | 9,921,956 | | | | 0.8 | % |
| Osisko Gold Royalties Ltd. | | | 278,602 | | | | 4,282,113 | | | | 0.3 | % |
| #SSR Mining, Inc. | | | 847,686 | | | | 12,023,413 | | | | 0.9 | % |
| #SSR Mining, Inc. | | | 318,436 | | | | 4,515,422 | | | | 0.4 | % |
| Stella-Jones, Inc. | | | 302,188 | | | | 15,561,627 | | | | 1.2 | % |
| Other Securities | | | | | | | 185,815,302 | | | | 14.2 | % |
| TOTAL MATERIALS | | | | | | | 303,579,118 | | | | 23.4 | % |
| | | | | | | | | | | | | |
| REAL ESTATE — (2.8%) | | | | | | | | | | | | |
| Tricon Residential, Inc. | | | 1,208,577 | | | | 10,655,731 | | | | 0.8 | % |
| Tricon Residential, Inc. | | | 182,323 | | | | 1,606,265 | | | | 0.1 | % |
| Other Securities | | | | | | | 28,668,939 | | | | 2.3 | % |
| TOTAL REAL ESTATE | | | | | | | 40,930,935 | | | | 3.2 | % |
THE CANADIAN SMALL COMPANY SERIES
CONTINUED
| | | | | | | | | Percentage |
| | | Shares | | | Value» | | | of Net Assets‡ |
| | | | |
| UTILITIES — (6.3%) | | | | | | | | | | | | |
| Atco Ltd., Class I | | | 409,045 | | | $ | 12,177,947 | | | | 0.9 | % |
| Boralex, Inc., Class A | | | 505,030 | | | | 13,750,845 | | | | 1.1 | % |
| #Capital Power Corp. | | | 687,087 | | | | 21,835,337 | | | | 1.7 | % |
| #TransAlta Corp. | | | 1,716,689 | | | | 16,068,650 | | | | 1.2 | % |
| Other Securities | | | | | | | 27,632,911 | | | | 2.2 | % |
| TOTAL UTILITIES | | | | | | | 91,465,690 | | | | 7.1 | % |
| | | | | | | | | | | | | |
| TOTAL COMMON STOCKS | | | | | | | | | | | | |
| (Cost $1,129,333,912) | | | | | | | 1,286,364,620 | | | | 99.2 | % |
| | | | | | | | | | | | | |
| | | | | | | | Value† | | | | | |
| SECURITIES LENDING COLLATERAL — (11.6%) | | | | | | | | | | | | |
| @§The DFA Short Term Investment Fund | | | 14,526,048 | | | | 168,008,274 | | | | 13.0 | % |
| | | | | | | | | | | | | |
| TOTAL INVESTMENTS—(100.0%) | | | | | | | | | | | | |
| (Cost $1,297,338,587) | | | | | | $ | 1,454,372,894 | | | | 112.2 | % |
Summary of the Series’ investments as of June 30, 2023, based on their valuation inputs, is as follows (see Security Valuation Note):
| | | Investments in Securities (Market Value) | |
| | | Level 1 | | | Level 2 | | | Level 3 | | | Total | |
| Common Stocks | | | | | | | | | | | | | | | | |
| Communication Services | | $ | 9,813,505 | | | $ | 3,382,904 | | | | — | | | $ | 13,196,409 | |
| Consumer Discretionary | | | 70,419,552 | | | | — | | | | — | | | | 70,419,552 | |
| Consumer Staples | | | 61,829,907 | | | | — | | | | — | | | | 61,829,907 | |
| Energy | | | 312,451,539 | | | | — | | | | — | | | | 312,451,539 | |
| Financials | | | 119,451,187 | | | | 129,368 | | | | — | | | | 119,580,555 | |
| Health Care | | | 28,772,374 | | | | 13,809 | | | | — | | | | 28,786,183 | |
| Industrials | | | 198,686,447 | | | | — | | | | — | | | | 198,686,447 | |
| Information Technology | | | 45,438,285 | | | | — | | | | — | | | | 45,438,285 | |
| Materials | | | 303,579,118 | | | | — | | | | — | | | | 303,579,118 | |
| Real Estate | | | 40,930,935 | | | | — | | | | — | | | | 40,930,935 | |
| Utilities | | | 91,465,690 | | | | — | | | | — | | | | 91,465,690 | |
| Securities Lending Collateral | | | — | | | | 168,008,274 | | | | — | | | | 168,008,274 | |
| TOTAL | | $ | 1,282,838,539 | | | $ | 171,534,355 | | | | — | | | $ | 1,454,372,894 | |
See accompanying Notes to Financial Statements.
THE JAPANESE SMALL COMPANY SERIES
SUMMARY SCHEDULE OF PORTFOLIO HOLDINGS
OCTOBER 31, 2022
| | | | | | | | | Percentage |
| | | Shares | | | Value» | | | of Net Assets‡ |
| COMMON STOCKS — (97.8%) | | | | | | | | | | | | |
| COMMUNICATION SERVICES — (2.4%) | | | | | | | | | | | | |
| Other Securities | | | | | | $ | 60,456,006 | | | | 2.4 | % |
| | | | | | | | | | | | | |
| CONSUMER DISCRETIONARY — (14.4%) | | | | | | | | | | | | |
| Resorttrust, Inc. | | | 521,964 | | | | 8,033,803 | | | | 0.3 | % |
| Other Securities | | | | | | | 358,737,144 | | | | 14.2 | % |
| TOTAL CONSUMER DISCRETIONARY | | | | | | | 366,770,947 | | | | 14.5 | % |
| | | | | | | | | | | | | |
| CONSUMER STAPLES — (7.8%) | | | | | | | | | | | | |
| Milbon Co. Ltd. | | | 164,552 | | | | 6,785,094 | | | | 0.3 | % |
| Nippon Suisan Kaisha Ltd. | | | 1,893,700 | | | | 6,745,679 | | | | 0.3 | % |
| Pigeon Corp. | | | 573,125 | | | | 7,507,397 | | | | 0.3 | % |
| Sapporo Holdings Ltd. | | | 385,720 | | | | 8,507,745 | | | | 0.3 | % |
| Other Securities | | | | | | | 168,517,053 | | | | 6.6 | % |
| TOTAL CONSUMER STAPLES | | | | | | | 198,062,968 | | | | 7.8 | % |
| | | | | | | | | | | | | |
| ENERGY — (0.7%) | | | | | | | | | | | | |
| Other Securities | | | | | | | 19,204,938 | | | | 0.8 | % |
| | | | | | | | | | | | | |
| FINANCIALS — (8.8%) | | | | | | | | | | | | |
| Fuyo General Lease Co. Ltd. | | | 114,800 | | | | 6,380,157 | | | | 0.3 | % |
| Hachijuni Bank Ltd. | | | 1,994,500 | | | | 6,360,770 | | | | 0.3 | % |
| Hirogin Holdings, Inc. | | | 1,534,800 | | | | 6,331,737 | | | | 0.3 | % |
| JAFCO Group Co. Ltd. | | | 588,100 | | | | 9,023,388 | | | | 0.4 | % |
| Yamaguchi Financial Group, Inc. | | | 1,237,672 | | | | 6,517,904 | | | | 0.3 | % |
| Other Securities | | | | | | | 188,749,126 | | | | 7.3 | % |
| TOTAL FINANCIALS | | | | | | | 223,363,082 | | | | 8.9 | % |
| | | | | | | | | | | | | |
| HEALTH CARE — (5.0%) | | | | | | | | | | | | |
| H.U. Group Holdings, Inc. | | | 348,800 | | | | 6,492,843 | | | | 0.3 | % |
| Nipro Corp. | | | 839,500 | | | | 6,328,382 | | | | 0.3 | % |
| Ship Healthcare Holdings, Inc. | | | 346,200 | | | | 6,639,723 | | | | 0.3 | % |
| Other Securities | | | | | | | 108,331,555 | | | | 4.2 | % |
| TOTAL HEALTH CARE | | | | | | | 127,792,503 | | | | 5.1 | % |
| | | | | | | | | | | | | |
| INDUSTRIALS — (28.2%) | | | | | | | | | | | | |
| Daiseki Co. Ltd. | | | 290,755 | | | | 8,984,172 | | | | 0.4 | % |
| DMG Mori Co. Ltd. | | | 731,800 | | | | 8,468,845 | | | | 0.3 | % |
| Fujikura Ltd. | | | 1,559,000 | | | | 9,230,804 | | | | 0.4 | % |
| Furukawa Electric Co. Ltd. | | | 424,300 | | | | 6,546,029 | | | | 0.3 | % |
| #Hazama Ando Corp. | | | 1,162,500 | | | | 6,737,422 | | | | 0.3 | % |
| Hitachi Zosen Corp. | | | 1,041,679 | | | | 6,005,282 | | | | 0.2 | % |
| Inaba Denki Sangyo Co. Ltd. | | | 322,900 | | | | 6,027,512 | | | | 0.2 | % |
| Mabuchi Motor Co. Ltd. | | | 249,034 | | | | 6,757,392 | | | | 0.3 | % |
| Meitec Corp. | | | 484,000 | | | | 8,152,392 | | | | 0.3 | % |
| Nagase & Co. Ltd. | | | 584,600 | | | | 7,964,771 | | | | 0.3 | % |
| #Nishimatsu Construction Co. Ltd. | | | 313,800 | | | | 7,640,054 | | | | 0.3 | % |
| Nisshinbo Holdings, Inc. | | | 911,180 | | | | 6,316,101 | | | | 0.3 | % |
THE JAPANESE SMALL COMPANY SERIES
CONTINUED
| | | | | | | | | Percentage |
| | | Shares | | | Value» | | | of Net Assets‡ |
| INDUSTRIALS — (Continued) | | | | | | | | | | | | |
| OSG Corp. | | | 526,900 | | | $ | 6,698,620 | | | | 0.3 | % |
| Penta-Ocean Construction Co. Ltd. | | | 1,589,800 | | | | 7,906,395 | | | | 0.3 | % |
| Ushio, Inc. | | | 622,400 | | | | 6,463,241 | | | | 0.3 | % |
| Other Securities | | | | | | | 610,194,505 | | | | 24.1 | % |
| TOTAL INDUSTRIALS | | | | | | | 720,093,537 | | | | 28.6 | % |
| | | | | | | | | | | | | |
| INFORMATION TECHNOLOGY — (15.3%) | | | | | | | | | | | | |
| Alps Alpine Co. Ltd. | | | 788,800 | | | | 6,776,241 | | | | 0.3 | % |
| Anritsu Corp. | | | 849,300 | | | | 8,548,093 | | | | 0.3 | % |
| Citizen Watch Co. Ltd. | | | 1,669,800 | | | | 7,012,673 | | | | 0.3 | % |
| Daiwabo Holdings Co. Ltd. | | | 581,600 | | | | 7,504,581 | | | | 0.3 | % |
| Dexerials Corp. | | | 345,400 | | | | 8,044,653 | | | | 0.3 | % |
| DTS Corp. | | | 254,000 | | | | 6,038,755 | | | | 0.2 | % |
| Konica Minolta, Inc. | | | 2,014,100 | | | | 6,136,873 | | | | 0.3 | % |
| Macnica Holdings, Inc. | | | 335,450 | | | | 6,709,361 | | | | 0.3 | % |
| Maruwa Co. Ltd. | | | 57,700 | | | | 6,779,271 | | | | 0.3 | % |
| NET One Systems Co. Ltd. | | | 383,900 | | | | 7,884,792 | | | | 0.3 | % |
| NSD Co. Ltd. | | | 489,360 | | | | 8,362,456 | | | | 0.3 | % |
| Tokyo Seimitsu Co. Ltd. | | | 248,700 | | | | 7,479,548 | | | | 0.3 | % |
| Topcon Corp. | | | 676,700 | | | | 7,401,971 | | | | 0.3 | % |
| Ulvac, Inc. | | | 225,700 | | | | 8,897,322 | | | | 0.4 | % |
| Other Securities | | | | | | | 285,987,560 | | | | 11.2 | % |
| TOTAL INFORMATION TECHNOLOGY | | | | | | | 389,564,150 | | | | 15.4 | % |
| | | | | | | | | | | | | |
| MATERIALS — (12.1%) | | | | | | | | | | | | |
| ADEKA Corp. | | | 508,800 | | | | 7,606,774 | | | | 0.3 | % |
| Asahi Holdings, Inc. | | | 472,200 | | | | 6,022,117 | | | | 0.2 | % |
| Daicel Corp. | | | 1,608,100 | | | | 9,175,525 | | | | 0.4 | % |
| Kureha Corp. | | | 103,950 | | | | 6,674,583 | | | | 0.3 | % |
| Mitsui Mining & Smelting Co. Ltd. | | | 366,200 | | | | 7,396,353 | | | | 0.3 | % |
| Tokai Carbon Co. Ltd. | | | 1,004,500 | | | | 6,555,281 | | | | 0.3 | % |
| UBE Corp. | | | 611,100 | | | | 7,881,843 | | | | 0.3 | % |
| Other Securities | | | | | | | 257,679,027 | | | | 10.2 | % |
| TOTAL MATERIALS | | | | | | | 308,991,503 | | | | 12.3 | % |
| | | | | | | | | | | | | |
| REAL ESTATE — (1.4%) | | | | | | | | | | | | |
| Other Securities | | | | | | | 36,414,839 | | | | 1.4 | % |
| | | | | | | | | | | | | |
| UTILITIES — (1.7%) | | | | | | | | | | | | |
| Nippon Gas Co. Ltd. | | | 684,000 | | | | 9,936,468 | | | | 0.4 | % |
| Other Securities | | | | | | | 32,350,517 | | | | 1.3 | % |
| TOTAL UTILITIES | | | | | | | 42,286,985 | | | | 1.7 | % |
| | | | | | | | | | | | | |
| TOTAL COMMON STOCKS | | | | | | | | | | | | |
| (Cost $2,854,128,543) | | | | | | | 2,493,001,458 | | | | 98.9 | % |
| | | | | | | | | | | | | |
| | | | | | | | Value† | | | | | |
| SECURITIES LENDING COLLATERAL — (2.2%) | | | | | | | | | | | | |
| @ §The DFA Short Term Investment Fund | | | 4,804,517 | | | | 55,545,021 | | | | 2.2 | % |
| TOTAL INVESTMENTS—(100.0%) | | | | | | | | | | | | |
| (Cost $2,909,692,756) | | | | | | $ | 2,548,546,479 | | | | 101.1 | % |
THE JAPANESE SMALL COMPANY SERIES
CONTINUED
Summary of the Series’ investments as of October 31, 2022, based on their valuation inputs, is as follows (see Security Valuation Note):
| | | Investments in Securities (Market Value) | |
| | | Level 1 | | | Level 2 | | | Level 3 | | | Total | |
| Common Stocks | | | | | | | | | | | | | | | | |
| Communication Services | | | — | | | $ | 60,456,006 | | | | — | | | $ | 60,456,006 | |
| Consumer Discretionary | | | — | | | | 366,770,947 | | | | — | | | | 366,770,947 | |
| Consumer Staples | | | — | | | | 198,062,968 | | | | — | | | | 198,062,968 | |
| Energy | | | — | | | | 19,204,938 | | | | — | | | | 19,204,938 | |
| Financials | | $ | 2,856,753 | | | | 220,506,329 | | | | — | | | | 223,363,082 | |
| Health Care | | | — | | | | 127,792,503 | | | | — | | | | 127,792,503 | |
| Industrials | | | — | | | | 720,093,537 | | | | — | | | | 720,093,537 | |
| Information Technology | | | — | | | | 389,564,150 | | | | — | | | | 389,564,150 | |
| Materials | | | — | | | | 308,991,503 | | | | — | | | | 308,991,503 | |
| Real Estate | | | — | | | | 36,414,839 | | | | — | | | | 36,414,839 | |
| Utilities | | | — | | | | 42,286,985 | | | | — | | | | 42,286,985 | |
| Securities Lending Collateral | | | — | | | | 55,545,021 | | | | — | | | | 55,545,021 | |
| TOTAL | | $ | 2,856,753 | | | $ | 2,545,689,726 | | | | — | | | $ | 2,548,546,479 | |
See accompanying Notes to Financial Statements.
THE ASIA PACIFIC SMALL COMPANY SERIES
SUMMARY SCHEDULE OF PORTFOLIO HOLDINGS
OCTOBER 31, 2022
| | | | | | | | | Percentage |
| | | Shares | | | Value» | | | of Net Assets‡ |
| COMMON STOCKS — (98.6%) | | | | | | | | | | | | |
| AUSTRALIA — (64.4%) | | | | | | | | | | | | |
| *AMP Ltd. | | | 12,919,775 | | | $ | 10,418,866 | | | | 0.9 | % |
| #Ansell Ltd. | | | 667,221 | | | | 12,045,403 | | | | 1.0 | % |
| #ARB Corp. Ltd. | | | 515,315 | | | | 9,567,925 | | | | 0.8 | % |
| AUB Group Ltd. | | | 762,060 | | | | 10,083,242 | | | | 0.9 | % |
| Bapcor Ltd. | | | 2,227,045 | | | | 9,417,379 | | | | 0.8 | % |
| Beach Energy Ltd. | | | 8,737,409 | | | | 8,934,529 | | | | 0.8 | % |
| #Breville Group Ltd. | | | 652,020 | | | | 8,261,901 | | | | 0.7 | % |
| Brickworks Ltd. | | | 469,394 | | | | 6,646,000 | | | | 0.6 | % |
| #Corporate Travel Management Ltd. | | | 706,149 | | | | 7,883,899 | | | | 0.7 | % |
| CSR Ltd. | | | 3,109,441 | | | | 9,211,011 | | | | 0.8 | % |
| Downer EDI Ltd. | | | 3,274,403 | | | | 9,410,422 | | | | 0.8 | % |
| Eagers Automotive Ltd. | | | 941,185 | | | | 7,461,464 | | | | 0.6 | % |
| Elders Ltd. | | | 1,009,369 | | | | 8,415,415 | | | | 0.7 | % |
| # *Flight Centre Travel Group Ltd. | | | 718,191 | | | | 7,643,947 | | | | 0.6 | % |
| #Gold Road Resources Ltd. | | | 7,605,514 | | | | 6,572,387 | | | | 0.6 | % |
| GrainCorp Ltd., Class A | | | 1,517,016 | | | | 8,155,207 | | | | 0.7 | % |
| Healius Ltd. | | | 3,665,521 | | | | 8,029,741 | | | | 0.7 | % |
| HUB24 Ltd. | | | 461,678 | | | | 7,485,853 | | | | 0.6 | % |
| #Insignia Financial Ltd. | | | 4,120,661 | | | | 8,306,842 | | | | 0.7 | % |
| IPH Ltd. | | | 1,331,405 | | | | 8,467,477 | | | | 0.7 | % |
| IRESS Ltd. | | | 1,215,703 | | | | 7,890,780 | | | | 0.7 | % |
| Lifestyle Communities Ltd. | | | 578,173 | | | | 6,490,474 | | | | 0.5 | % |
| Metcash Ltd. | | | 2,899,744 | | | | 7,612,203 | | | | 0.6 | % |
| #New Hope Corp. Ltd. | | | 2,341,365 | | | | 8,505,399 | | | | 0.7 | % |
| nib holdings Ltd. | | | 2,992,914 | | | | 12,806,819 | | | | 1.1 | % |
| Nufarm Ltd. | | | 2,098,872 | | | | 7,480,120 | | | | 0.6 | % |
| # *Omni Bridgeway Ltd. | | | 2,355,720 | | | | 6,782,068 | | | | 0.6 | % |
| Orora Ltd. | | | 5,992,474 | | | | 11,628,555 | | | | 1.0 | % |
| # *Paladin Energy Ltd. | | | 16,033,988 | | | | 8,680,653 | | | | 0.7 | % |
| #Pendal Group Ltd. | | | 2,058,779 | | | | 6,466,738 | | | | 0.5 | % |
| #Perseus Mining Ltd. | | | 8,114,950 | | | | 9,451,479 | | | | 0.8 | % |
| Premier Investments Ltd. | | | 410,666 | | | | 6,576,580 | | | | 0.6 | % |
| Reliance Worldwide Corp. Ltd. | | | 4,255,179 | | | | 8,742,677 | | | | 0.7 | % |
| Sims Ltd. | | | 1,106,977 | | | | 8,654,727 | | | | 0.7 | % |
| *Star Entertainment Group Ltd. | | | 5,751,661 | | | | 10,819,618 | | | | 0.9 | % |
| #Super Retail Group Ltd. | | | 1,057,351 | | | | 6,952,302 | | | | 0.6 | % |
| # *Syrah Resources Ltd. | | | 4,792,786 | | | | 7,321,076 | | | | 0.6 | % |
| Technology One Ltd. | | | 1,296,361 | | | | 9,972,913 | | | | 0.8 | % |
| ΩViva Energy Group Ltd. | | | 3,776,327 | | | | 6,854,919 | | | | 0.6 | % |
| # *Webjet Ltd. | | | 2,329,981 | | | | 7,868,307 | | | | 0.7 | % |
| Whitehaven Coal Ltd. | | | 3,623,702 | | | | 21,049,343 | | | | 1.8 | % |
| Other Securities | | | | | | | 417,169,018 | | | | 34.7 | % |
| TOTAL AUSTRALIA | | | | | | | 778,195,678 | | | | 65.2 | % |
| | | | | | | | | | | | | |
| CHINA — (0.1%) | | | | | | | | | | | | |
| Other Securities | | | | | | | 1,050,669 | | | | 0.1 | % |
THE ASIA PACIFIC SMALL COMPANY SERIES
CONTINUED
| | | | | | | | | Percentage |
| | | Shares | | | Value» | | | of Net Assets‡ |
| | | | |
| HONG KONG — (18.7%) | | | | | | | | | | | | |
| ASMPT Ltd. | | | 1,590,200 | | | $ | 8,746,899 | | | | 0.7 | % |
| Kerry Logistics Network Ltd. | | | 4,063,500 | | | | 6,450,213 | | | | 0.6 | % |
| Luk Fook Holdings International Ltd. | | | 3,509,000 | | | | 7,622,920 | | | | 0.6 | % |
| VTech Holdings Ltd. | | | 1,292,000 | | | | 6,877,585 | | | | 0.6 | % |
| Other Securities | | | | | | | 195,738,785 | | | | 16.4 | % |
| TOTAL HONG KONG | | | | | | | 225,436,402 | | | | 18.9 | % |
| | | | | | | | | | | | | |
| NEW ZEALAND — (4.6%) | | | | | | | | | | | | |
| Chorus Ltd. | | | 2,451,723 | | | | 11,836,205 | | | | 1.0 | % |
| *SKYCITY Entertainment Group Ltd. | | | 4,246,632 | | | | 7,159,611 | | | | 0.6 | % |
| Other Securities | | | | | | | 35,984,180 | | | | 3.0 | % |
| TOTAL NEW ZEALAND | | | | | | | 54,979,996 | | | | 4.6 | % |
| | | | | | | | | | | | | |
| SINGAPORE — (10.8%) | | | | | | | | | | | | |
| ComfortDelGro Corp. Ltd. | | | 9,120,200 | | | | 8,187,132 | | | | 0.7 | % |
| Golden Agri-Resources Ltd. | | | 31,541,800 | | | | 6,467,918 | | | | 0.5 | % |
| Keppel Infrastructure Trust | | | 18,468,846 | | | | 6,911,022 | | | | 0.6 | % |
| Other Securities | | | | | | | 109,293,171 | | | | 9.1 | % |
| TOTAL SINGAPORE | | | | | | | 130,859,243 | | | | 10.9 | % |
| TOTAL COMMON STOCKS | | | | | | | 1,190,521,988 | | | | 99.7 | % |
| RIGHTS/WARRANTS — (0.0%) | | | | | | | | | | | | |
| AUSTRALIA — (0.0%) | | | | | | | | | | | | |
| Other Securities | | | | | | | 21,319 | | | | 0.0 | % |
| HONG KONG — (0.0%) | | | | | | | | | | | | |
| Other Security | | | | | | | 5,255 | | | | 0.0 | % |
| TOTAL RIGHTS/WARRANTS. | | | | | | | 26,574 | | | | 0.0 | % |
| TOTAL INVESTMENT SECURITIES | | | | | | | | | | | | |
| (Cost $1,539,796,503) | | | | | | | 1,190,548,562 | | | | | |
| | | | | | | | | | | | | |
| | | | | | | | Value† | | | | | |
| SECURITIES LENDING COLLATERAL — (1.4%) | | | | | | | | | | | | |
| @§The DFA Short Term Investment Fund | | | 1,496,806 | | | | 17,304,573 | | | | 1.5 | % |
| TOTAL INVESTMENTS—(100.0%) | | | | | | | | | | | | |
| (Cost $1,557,108,416) | | | | | | $ | 1,207,853,135 | | | | 101.2 | % |
THE ASIA PACIFIC SMALL COMPANY SERIES
CONTINUED
Summary of the Series’ investments as of October 31, 2022, based on their valuation inputs, is as follows (see Security Valuation Note):
| | | Investments in Securities (Market Value) | |
| | | Level 1 | | | Level 2 | | | Level 3 | | | Total | |
| Common Stocks | | | | | | | | | | | | | | | | |
| Australia | | $ | 8,084 | | | $ | 777,796,648 | | | $ | 390,946 | | | $ | 778,195,678 | |
| China | | | — | | | | 1,050,669 | | | | — | | | | 1,050,669 | |
| Hong Kong | | | — | | | | 224,321,261 | | | | 1,115,141 | | | | 225,436,402 | |
| New Zealand | | | — | | | | 54,979,996 | | | | — | | | | 54,979,996 | |
| Singapore | | | 637,539 | | | | 129,841,227 | | | | 380,477 | | | | 130,859,243 | |
| Rights/Warrants | | | | | | | | | | | | | | | | |
| Australia | | | — | | | | 21,319 | | | | — | | | | 21,319 | |
| Hong Kong | | | — | | | | 5,255 | | | | — | | | | 5,255 | |
| Securities Lending Collateral | | | — | | | | 17,304,573 | | | | — | | | | 17,304,573 | |
| TOTAL | | $ | 645,623 | | | $ | 1,205,320,948 | | | | $ 1,886,564^ | | | $ | 1,207,853,135 | |
| ^ | A reconciliation of Level 3 investments is presented when the Fund had a significant amount of Level 3 investments at the beginning and/or end of the reporting period in relation to net assets. |
See accompanying Notes to Financial Statements.
THE UNITED KINGDOM SMALL COMPANY SERIES
SUMMARY SCHEDULE OF PORTFOLIO HOLDINGS
OCTOBER 31, 2022
| | | | | | | | | Percentage |
| | | Shares | | | Value» | | | of Net Assets‡ |
| COMMON STOCKS — (97.5%) | | | | | | | | | | | | |
| COMMUNICATION SERVICES — (3.6%) | | | | | | | | | | | | |
| Euromoney Institutional Investor PLC | | | 592,842 | | | $ | 9,845,186 | | | | 0.8 | % |
| Other Securities | | | | | | | 33,354,764 | | | | 2.9 | % |
| TOTAL COMMUNICATION SERVICES | | | | | | | 43,199,950 | | | | 3.7 | % |
| | | | | | | | | | | | | |
| CONSUMER DISCRETIONARY — (16.3%) | | | | | | | | | | | | |
| Bellway PLC | | | 429,828 | | | | 9,141,218 | | | | 0.8 | % |
| *Frasers Group PLC | | | 1,220,486 | | | | 9,056,198 | | | | 0.8 | % |
| Games Workshop Group PLC | | | 176,198 | | | | 12,933,595 | | | | 1.1 | % |
| Greggs PLC | | | 604,556 | | | | 14,014,474 | | | | 1.2 | % |
| Inchcape PLC | | | 2,415,336 | | | | 20,604,988 | | | | 1.8 | % |
| Pets at Home Group PLC | | | 3,042,980 | | | | 10,061,388 | | | | 0.9 | % |
| *Playtech PLC | | | 1,947,421 | | | | 11,571,872 | | | | 1.0 | % |
| #Vistry Group PLC | | | 1,228,992 | | | | 8,503,987 | | | | 0.7 | % |
| Other Securities | | | | | | | 98,610,384 | | | | 8.4 | % |
| TOTAL CONSUMER DISCRETIONARY | | | | | | | 194,498,104 | | | | 16.7 | % |
| | | | | | | | | | | | | |
| CONSUMER STAPLES — (7.0%) | | | | | | | | | | | | |
| Britvic PLC | | | 1,626,728 | | | | 13,586,475 | | | | 1.2 | % |
| Cranswick PLC | | | 365,093 | | | | 12,464,969 | | | | 1.1 | % |
| *Marks & Spencer Group PLC | | | 7,566,588 | | | | 9,163,708 | | | | 0.8 | % |
| Tate & Lyle PLC | | | 2,060,165 | | | | 16,553,803 | | | | 1.4 | % |
| Other Securities | | | | | | | 31,665,598 | | | | 2.6 | % |
| TOTAL CONSUMER STAPLES | | | | | | | 83,434,553 | | | | 7.1 | % |
| | | | | | | | | | | | | |
| ENERGY — (4.2%) | | | | | | | | | | | | |
| *Capricorn Energy PLC | | | 4,040,365 | | | | 11,477,115 | | | | 1.0 | % |
| Other Securities | | | | | | | 38,574,608 | | | | 3.3 | % |
| TOTAL ENERGY | | | | | | | 50,051,723 | | | | 4.3 | % |
| | | | | | | | | | | | | |
| FINANCIALS — (18.4%) | | | | | | | | | | | | |
| Beazley PLC | | | 3,081,626 | | | | 22,100,836 | | | | 1.9 | % |
| Close Brothers Group PLC | | | 898,617 | | | | 10,123,897 | | | | 0.9 | % |
| Hiscox Ltd. | | | 1,420,362 | | | | 14,632,152 | | | | 1.2 | % |
| Lancashire Holdings Ltd. | | | 1,670,143 | | | | 9,478,286 | | | | 0.8 | % |
| Man Group PLC | | | 7,662,342 | | | | 19,060,892 | | | | 1.6 | % |
| OSB Group PLC | | | 2,135,454 | | | | 10,176,648 | | | | 0.9 | % |
| Paragon Banking Group PLC | | | 1,934,045 | | | | 9,462,355 | | | | 0.8 | % |
| Plus500 Ltd. | | | 525,338 | | | | 10,868,092 | | | | 0.9 | % |
| ΩQuilter PLC | | | 8,070,566 | | | | 8,945,685 | | | | 0.8 | % |
| TP ICAP Group PLC | | | 4,137,686 | | | | 8,726,393 | | | | 0.7 | % |
| Virgin Money UK PLC | | | 6,368,888 | | | | 9,926,426 | | | | 0.8 | % |
| Other Securities | | | | | | | 86,017,639 | | | | 7.5 | % |
| TOTAL FINANCIALS | | | | | | | 219,519,301 | | | | 18.8 | % |
THE UNITED KINGDOM SMALL COMPANY SERIES
CONTINUED
| | | | | | | | | Percentage |
| | | Shares | | | Value» | | | of Net Assets‡ |
| | | | |
| HEALTH CARE — (4.9%) | | | | | | | | | | | | |
| CVS Group PLC | | | 413,530 | | | $ | 8,938,783 | | | | 0.8 | % |
| Indivior PLC | | | 771,895 | | | | 14,621,023 | | | | 1.2 | % |
| #Mediclinic International PLC | | | 2,400,508 | | | | 13,655,822 | | | | 1.2 | % |
| Other Securities | | | | | | | 20,957,862 | | | | 1.8 | % |
| TOTAL HEALTH CARE | | | | | | | 58,173,490 | | | | 5.0 | % |
| | | | | | | | | | | | | |
| INDUSTRIALS — (22.3%) | | | | | | | | | | | | |
| *Babcock International Group PLC | | | 2,860,700 | | | | 9,035,971 | | | | 0.8 | % |
| Balfour Beatty PLC | | | 3,610,310 | | | | 12,369,652 | | | | 1.1 | % |
| Diploma PLC | | | 427,629 | | | | 12,162,994 | | | | 1.0 | % |
| Grafton Group PLC | | | 1,499,770 | | | | 11,874,058 | | | | 1.0 | % |
| Hays PLC | | | 9,235,636 | | | | 11,644,369 | | | | 1.0 | % |
| Pagegroup PLC | | | 1,968,311 | | | | 9,493,890 | | | | 0.8 | % |
| QinetiQ Group PLC | | | 3,269,929 | | | | 13,478,205 | | | | 1.2 | % |
| Rotork PLC | | | 4,427,553 | | | | 12,977,500 | | | | 1.1 | % |
| Serco Group PLC | | | 5,072,076 | | | | 9,486,190 | | | | 0.8 | % |
| Travis Perkins PLC | | | 1,187,192 | | | | 11,189,269 | | | | 1.0 | % |
| Other Securities | | | | | | | 151,227,680 | | | | 12.9 | % |
| TOTAL INDUSTRIALS | | | | | | | 264,939,778 | | | | 22.7 | % |
| | | | | | | | | | | | | |
| INFORMATION TECHNOLOGY — (8.5%) | | | | | | | | | | | | |
| Computacenter PLC | | | 501,179 | | | | 10,398,774 | | | | 0.9 | % |
| Micro Focus International PLC | | | 1,571,570 | | | | 9,370,682 | | | | 0.8 | % |
| Softcat PLC | | | 677,739 | | | | 8,707,891 | | | | 0.7 | % |
| Spectris PLC | | | 462,131 | | | | 16,016,986 | | | | 1.4 | % |
| Spirent Communications PLC | | | 4,065,908 | | | | 12,069,222 | | | | 1.0 | % |
| Other Securities | | | | | | | 44,097,451 | | | | 3.8 | % |
| TOTAL INFORMATION TECHNOLOGY | | | | | | | 100,661,006 | | | | 8.6 | % |
| | | | | | | | | | | | | |
| MATERIALS — (5.1%) | | | | | | | | | | | | |
| Victrex PLC | | | 545,312 | | | | 10,356,993 | | | | 0.9 | % |
| Other Securities | | | | | | | 50,618,342 | | | | 4.3 | % |
| TOTAL MATERIALS | | | | | | | 60,975,335 | | | | 5.2 | % |
| | | | | | | | | | | | | |
| REAL ESTATE — (3.0%) | | | | | | | | | | | | |
| Grainger PLC | | | 4,237,552 | | | | 11,018,013 | | | | 0.9 | % |
| Savills PLC | | | 965,499 | | | | 9,122,034 | | | | 0.8 | % |
| Other Securities | | | | | | | 15,177,252 | | | | 1.3 | % |
| TOTAL REAL ESTATE | | | | | | | 35,317,299 | | | | 3.0 | % |
| | | | | | | | | | | | | |
| UTILITIES — (4.2%) | | | | | | | | | | | | |
| Centrica PLC | | | 12,351,821 | | | | 10,853,682 | | | | 0.9 | % |
| Drax Group PLC | | | 2,494,304 | | | | 14,895,027 | | | | 1.3 | % |
| Pennon Group PLC | | | 1,360,703 | | | | 13,075,947 | | | | 1.1 | % |
| Telecom Plus PLC | | | 427,882 | | | | 10,401,875 | | | | 0.9 | % |
| Other Security | | | | | | | 539,940 | | | | 0.1 | % |
| TOTAL UTILITIES | | | | | | | 49,766,471 | | | | 4.3 | % |
| TOTAL COMMON STOCKS | | | | | | | | | | | | |
| (Cost $1,400,292,665) | | | | | | | 1,160,537,010 | | | | 99.4 | % |
THE UNITED KINGDOM SMALL COMPANY SERIES
CONTINUED
| | | | | | | | | Percentage |
| | | Shares | | | Value† | | | of Net Assets‡ |
| SECURITIES LENDING COLLATERAL — (2.5%) | | | | | | | | | | | | |
| @§The DFA Short Term Investment Fund | | | 2,548,908 | | | | 29,467,920 | | | | 2.5 | % |
| TOTAL INVESTMENTS—(100.0%) | | | | | | | | | | | | |
| (Cost $1,429,768,069) | | | | | | $ | 1,190,004,930 | | | | 101.9 | % |
Summary of the Series’ investments as of October 31, 2022, based on their valuation inputs, is as follows (see Security Valuation Note):
| | | Investments in Securities (Market Value) | |
| | | Level 1 | | | Level 2 | | | Level 3 | | | Total | |
| Common Stocks | | | | | | | | | | | | | | | | |
| Communication Services | | $ | 23,016 | | | $ | 43,176,934 | | | | — | | | $ | 43,199,950 | |
| Consumer Discretionary | | | — | | | | 194,388,958 | | | $ | 109,146 | | | | 194,498,104 | |
| Consumer Staples | | | — | | | | 83,434,553 | | | | — | | | | 83,434,553 | |
| Energy | | | — | | | | 50,051,723 | | | | — | | | | 50,051,723 | |
| Financials | | | — | | | | 219,518,781 | | | | 520 | | | | 219,519,301 | |
| Health Care | | | — | | | | 58,167,401 | | | | 6,089 | | | | 58,173,490 | |
| Industrials | | | 160,252 | | | | 264,779,526 | | | | — | | | | 264,939,778 | |
| Information Technology | | | — | | | | 100,661,006 | | | | — | | | | 100,661,006 | |
| Materials | | | — | | | | 60,975,335 | | | | — | | | | 60,975,335 | |
| Real Estate | | | — | | | | 35,317,299 | | | | — | | | | 35,317,299 | |
| Utilities | | | — | | | | 49,766,471 | | | | — | | | | 49,766,471 | |
| Securities Lending Collateral | | | — | | | | 29,467,920 | | | | — | | | | 29,467,920 | |
| TOTAL | | $ | 183,268 | | | $ | 1,189,705,907 | | | | $115,755^ | | | $ | 1,190,004,930 | |
| ^ | A reconciliation of Level 3 investments is presented when the Fund had a significant amount of Level 3 investments at the beginning and/or end of the reporting period in relation to net assets. |
See accompanying Notes to Financial Statements.
THE CONTINENTAL SMALL COMPANY SERIES
SUMMARY SCHEDULE OF PORTFOLIO HOLDINGS
OCTOBER 31, 2022
| | | | | | | | | Percentage |
| | | Shares | | | Value» | | | of Net Assets‡ |
| COMMON STOCKS — (93.7%) | | | | | | | | | | | | |
| AUSTRIA — (3.1%) | | | | | | | | | | | | |
| ANDRITZ AG | | | 444,373 | | | $ | 20,652,912 | | | | 0.5 | % |
| ΩBAWAG Group AG | | | 344,403 | | | | 16,626,330 | | | | 0.4 | % |
| Other Securities | | | | | | | 104,285,328 | | | | 2.4 | % |
| TOTAL AUSTRIA | | | | | | | 141,564,570 | | | | 3.3 | % |
| | | | | | | | | | | | | |
| BELGIUM — (4.4%) | | | | | | | | | | | | |
| Ackermans & van Haaren NV | | | 172,739 | | | | 24,066,242 | | | | 0.6 | % |
| D’ieteren Group | | | 122,666 | | | | 20,415,062 | | | | 0.5 | % |
| Euronav NV | | | 1,306,429 | | | | 22,776,000 | | | | 0.5 | % |
| Other Securities | | | | | | | 132,956,790 | | | | 3.0 | % |
| TOTAL BELGIUM | | | | | | | 200,214,094 | | | | 4.6 | % |
| | | | | | | | | | | | | |
| DENMARK — (6.2%) | | | | | | | | | | | | |
| # *ISS AS | | | 927,711 | | | | 17,037,438 | | | | 0.4 | % |
| *Jyske Bank AS | | | 445,581 | | | | 24,047,629 | | | | 0.6 | % |
| Ringkjoebing Landbobank AS | | | 197,936 | | | | 21,527,994 | | | | 0.5 | % |
| Royal Unibrew AS | | | 312,072 | | | | 17,826,861 | | | | 0.4 | % |
| Topdanmark AS | | | 367,737 | | | | 16,972,205 | | | | 0.4 | % |
| Other Securities | | | | | | | 187,427,684 | | | | 4.2 | % |
| TOTAL DENMARK | | | | | | | 284,839,811 | | | | 6.5 | % |
| | | | | | | | | | | | | |
| FINLAND — (5.3%) | | | | | | | | | | | | |
| Huhtamaki Oyj | | | 643,085 | | | | 23,112,067 | | | | 0.5 | % |
| Orion Oyj, Class B | | | 676,382 | | | | 31,125,885 | | | | 0.7 | % |
| Valmet Oyj | | | 1,002,259 | | | | 22,794,608 | | | | 0.5 | % |
| Other Securities | | | | | | | 164,215,005 | | | | 3.8 | % |
| TOTAL FINLAND | | | | | | | 241,247,565 | | | | 5.5 | % |
| | | | | | | | | | | | | |
| FRANCE — (10.4%) | | | | | | | | | | | | |
| Gaztransport Et Technigaz SA | | | 161,171 | | | | 18,750,394 | | | | 0.4 | % |
| Nexans SA | | | 198,522 | | | | 18,537,701 | | | | 0.4 | % |
| Rexel SA | | | 1,687,054 | | | | 30,105,974 | | | | 0.7 | % |
| *SOITEC | | | 136,660 | | | | 17,498,496 | | | | 0.4 | % |
| SPIE SA | | | 887,677 | | | | 20,765,906 | | | | 0.5 | % |
| Other Securities | | | | | | | 368,603,169 | | | | 8.5 | % |
| TOTAL FRANCE | | | | | | | 474,261,640 | | | | 10.9 | % |
| | | | | | | | | | | | | |
| GERMANY — (13.4%) | | | | | | | | | | | | |
| *Aareal Bank AG | | | 523,741 | | | | 16,561,936 | | | | 0.4 | % |
| Aurubis AG | | | 287,683 | | | | 18,152,871 | | | | 0.4 | % |
| Freenet AG | | | 962,168 | | | | 18,912,546 | | | | 0.4 | % |
| Hugo Boss AG | | | 426,713 | | | | 19,653,270 | | | | 0.5 | % |
| K&S AG | | | 1,269,799 | | | | 28,035,878 | | | | 0.7 | % |
| Lanxess AG | | | 577,941 | | | | 19,544,674 | | | | 0.5 | % |
| Rheinmetall AG | | | 186,043 | | | | 30,241,593 | | | | 0.7 | % |
| Other Securities | | | | | | | 460,058,281 | | | | 10.5 | % |
| TOTAL GERMANY | | | | | | | 611,161,049 | | | | 14.1 | % |
THE CONTINENTAL SMALL COMPANY SERIES
CONTINUED
| | | | | | | | | Percentage |
| | | Shares | | | Value» | | | of Net Assets‡ |
| | | | |
| IRELAND — (1.5%) | | | | | | | | | | | | |
| Bank of Ireland Group PLC | | | 5,945,531 | | | $ | 42,811,519 | | | | 1.0 | % |
| Other Securities | | | | | | | 24,848,912 | | | | 0.6 | % |
| TOTAL IRELAND | | | | | | | 67,660,431 | | | | 1.6 | % |
| | | | | | | | | | | | | |
| ISRAEL — (3.6%) | | | | | | | | | | | | |
| Other Securities | | | | | | | 162,740,149 | | | | 3.7 | % |
| | | | | | | | | | | | | |
| ITALY — (8.4%) | | | | | | | | | | | | |
| Banco BPM SpA | | | 10,252,032 | | | | 31,017,683 | | | | 0.7 | % |
| Italgas SpA | | | 3,535,826 | | | | 18,217,452 | | | | 0.4 | % |
| Leonardo SpA | | | 2,965,480 | | | | 23,824,938 | | | | 0.6 | % |
| Other Securities | | | | | | | 310,831,433 | | | | 7.1 | % |
| TOTAL ITALY | | | | | | | 383,891,506 | | | | 8.8 | % |
| | | | | | | | | | | | | |
| NETHERLANDS — (5.6%) | | | | | | | | | | | | |
| Aalberts NV | | | 686,131 | | | | 23,803,028 | | | | 0.6 | % |
| Arcadis NV | | | 533,103 | | | | 18,091,946 | | | | 0.4 | % |
| ASR Nederland NV | | | 672,922 | | | | 29,630,688 | | | | 0.7 | % |
| BE Semiconductor Industries NV | | | 405,420 | | | | 20,662,135 | | | | 0.5 | % |
| #OCI NV | | | 554,235 | | | | 21,198,317 | | | | 0.5 | % |
| ΩSignify NV | | | 711,679 | | | | 19,717,182 | | | | 0.5 | % |
| Other Securities | | | | | | | 123,236,655 | | | | 2.7 | % |
| TOTAL NETHERLANDS | | | | | | | 256,339,951 | | | | 5.9 | % |
| | | | | | | | | | | | | |
| NORWAY — (2.4%) | | | | | | | | | | | | |
| Other Securities | | | | | | | 111,438,926 | | | | 2.6 | % |
| | | | | | | | | | | | | |
| PORTUGAL — (1.0%) | | | | | | | | | | | | |
| Other Securities | | | | | | | 43,915,237 | | | | 1.0 | % |
| | | | | | | | | | | | | |
| SPAIN — (5.7%) | | | | | | | | | | | | |
| Banco de Sabadell SA | | | 36,362,876 | | | | 28,610,453 | | | | 0.7 | % |
| Bankinter SA | | | 4,326,671 | | | | 26,171,851 | | | | 0.6 | % |
| #Enagas SA | | | 1,457,648 | | | | 23,663,312 | | | | 0.5 | % |
| Other Securities | | | | | | | 184,347,363 | | | | 4.2 | % |
| TOTAL SPAIN | | | | | | | 262,792,979 | | | | 6.0 | % |
| | | | | | | | | | | | | |
| SWEDEN — (5.9%) | | | | | | | | | | | | |
| Other Securities | | | | | | | 270,528,558 | | | | 6.2 | % |
| | | | | | | | | | | | | |
| SWITZERLAND — (16.5%) | | | | | | | | | | | | |
| Allreal Holding AG | | | 125,251 | | | | 17,941,765 | | | | 0.4 | % |
| Belimo Holding AG | | | 65,574 | | | | 26,708,771 | | | | 0.6 | % |
| BKW AG | | | 163,805 | | | | 19,109,935 | | | | 0.4 | % |
| Bucher Industries AG | | | 54,335 | | | | 18,319,886 | | | | 0.4 | % |
| Clariant AG | | | 1,125,574 | | | | 18,088,884 | | | | 0.4 | % |
| DKSH Holding AG | | | 235,948 | | | | 17,021,421 | | | | 0.4 | % |
| *Flughafen Zurich AG | | | 147,702 | | | | 22,913,924 | | | | 0.5 | % |
| Georg Fischer AG | | | 630,511 | | | | 34,920,705 | | | | 0.8 | % |
| Helvetia Holding AG | | | 266,750 | | | | 26,488,894 | | | | 0.6 | % |
| PSP Swiss Property AG | | | 340,600 | | | | 36,386,222 | | | | 0.8 | % |
| Siegfried Holding AG | | | 32,909 | | | | 19,590,005 | | | | 0.5 | % |
THE CONTINENTAL SMALL COMPANY SERIES
CONTINUED
| | | | | | | | | Percentage |
| | | Shares | | | Value» | | | of Net Assets‡ |
| | | | |
| SWITZERLAND — (Continued) | | | | | | | | | | | | |
| ΩVAT Group AG | | | 114,674 | | | $ | 26,180,212 | | | | 0.6 | % |
| Other Securities | | | | | | | 470,666,378 | | | | 11.0 | % |
| TOTAL SWITZERLAND | | | | | | | 754,337,002 | | | | 17.4 | % |
| | | | | | | | | | | | | |
| UNITED STATES — (0.3%) | | | | | | | | | | | | |
| Other Securities | | | | | | | 12,849,060 | | | | 0.3 | % |
| | | | | | | | | | | | | |
| TOTAL COMMON STOCKS | | | | | | | 4,279,782,528 | | | | 98.4 | % |
| | | | | | | | | | | | | |
| PREFERRED STOCKS — (0.7%) | | | | | | | | | | | | |
| GERMANY — (0.7%) | | | | | | | | | | | | |
| Other Securities | | | | | | | 33,294,751 | | | | 0.8 | % |
| TOTAL INVESTMENT SECURITIES | | | | | | | | | | | | |
| (Cost $4,398,989,975) | | | | | | | 4,313,077,279 | | | | | |
| | | | | | | | | | | | | |
| | | | | | | | Value† | | | | | |
| SECURITIES LENDING COLLATERAL — (5.6%) | | | | | | | | | | | | |
| @§The DFA Short Term Investment Fund | | | 22,188,427 | | | | 256,520,399 | | | | 5.9 | % |
| TOTAL INVESTMENTS—(100.0%) | | | | | | | | | | | | |
| (Cost $4,655,611,905) | | | | | | $ | 4,569,597,678 | | | | 105.1 | % |
THE CONTINENTAL SMALL COMPANY SERIES
CONTINUED
Summary of the Series’ investments as of October 31, 2022, based on their valuation inputs, is as follows (see Security Valuation Note):
| | | Investments in Securities (Market Value) | |
| | | Level 1 | | | Level 2 | | | Level 3 | | | Total | |
| Common Stocks | | | | | | | | | | | | | | | | |
| Austria | | $ | 376,173 | | | $ | 141,188,397 | | | | — | | | $ | 141,564,570 | |
| Belgium | | | 792,151 | | | | 199,421,943 | | | | — | | | | 200,214,094 | |
| Denmark | | | — | | | | 284,839,811 | | | | — | | | | 284,839,811 | |
| Finland | | | — | | | | 241,247,565 | | | | — | | | | 241,247,565 | |
| France | | | 127,704 | | | | 474,099,006 | | | $ | 34,930 | | | | 474,261,640 | |
| Germany | | | — | | | | 611,161,049 | | | | — | | | | 611,161,049 | |
| Ireland | | | — | | | | 67,660,431 | | | | — | | | | 67,660,431 | |
| Israel | | | 585,758 | | | | 162,154,391 | | | | — | | | | 162,740,149 | |
| Italy | | | — | | | | 383,891,506 | | | | — | | | | 383,891,506 | |
| Netherlands | | | — | | | | 256,339,951 | | | | — | | | | 256,339,951 | |
| Norway | | | 239,412 | | | | 111,199,514 | | | | — | | | | 111,438,926 | |
| Portugal | | | — | | | | 43,915,237 | | | | — | | | | 43,915,237 | |
| Spain | | | — | | | | 262,792,979 | | | | — | | | | 262,792,979 | |
| Sweden | | | 704,204 | | | | 269,824,354 | | | | — | | | | 270,528,558 | |
| Switzerland | | | — | | | | 754,337,002 | | | | — | | | | 754,337,002 | |
| United States | | | 5,487,656 | | | | 7,361,404 | | | | — | | | | 12,849,060 | |
| Preferred Stocks | | | | | | | | | | | | | | | | |
| Germany | | | — | | | | 33,294,751 | | | | — | | | | 33,294,751 | |
| Securities Lending Collateral | | | — | | | | 256,520,399 | | | | — | | | | 256,520,399 | |
| TOTAL | | $ | 8,313,058 | | | $ | 4,561,249,690 | | | | $ 34,930^ | | | $ | 4,569,597,678 | |
| ^ | A reconciliation of Level 3 investments is presented when the Fund had a significant amount of Level 3 investments at the beginning and/or end of the reporting period in relation to net assets. |
See accompanying Notes to Financial Statements.
THE CANADIAN SMALL COMPANY SERIES
SUMMARY SCHEDULE OF PORTFOLIO HOLDINGS
OCTOBER 31, 2022
| | | | | | | | | Percentage |
| | | Shares | | | Value» | | | of Net Assets‡ |
| COMMON STOCKS — (85.9%) | | | | | | | | | | | | |
| COMMUNICATION SERVICES — (1.1%) | | | | | | | | | | | | |
| Other Securities | | | | | | $ | 15,273,446 | | | | 1.2 | % |
| | | | | | | | | | | | | |
| CONSUMER DISCRETIONARY — (4.7%) | | | | | | | | | | | | |
| #*Aritzia, Inc. | | | 461,040 | | | | 17,881,861 | | | | 1.5 | % |
| Linamar Corp. | | | 255,634 | | | | 10,941,402 | | | | 0.9 | % |
| Other Securities | | | | | | | 38,001,319 | | | | 3.1 | % |
| TOTAL CONSUMER DISCRETIONARY | | | | | | | 66,824,582 | | | | 5.5 | % |
| | | | | | | | | | | | | |
| CONSUMER STAPLES — (4.2%) | | | | | | | | | | | | |
| #North West Co., Inc | | | 291,156 | | | | 7,576,232 | | | | 0.6 | % |
| #Premium Brands Holdings Corp. | | | 227,466 | | | | 13,419,050 | | | | 1.1 | % |
| Primo Water Corp. | | | 93,425 | | | | 1,363,071 | | | | 0.1 | % |
| Primo Water Corp. | | | 799,922 | | | | 11,661,064 | | | | 1.0 | % |
| Other Securities | | | | | | | 25,055,883 | | | | 2.1 | % |
| TOTAL CONSUMER STAPLES | | | | | | | 59,075,300 | | | | 4.9 | % |
| | | | | | | | | | | | | |
| ENERGY — (24.7%) | | | | | | | | | | | | |
| *Advantage Energy Ltd. | | | 1,194,867 | | | | 9,033,751 | | | | 0.7 | % |
| *Baytex Energy Corp | | | 2,341,875 | | | | 12,720,575 | | | | 1.0 | % |
| #Birchcliff Energy Ltd | | | 1,610,417 | | | | 12,518,307 | | | | 1.0 | % |
| #Crescent Point Energy Corp. | | | 2,943,000 | | | | 23,006,533 | | | | 1.9 | % |
| #Crescent Point Energy Corp. | | | 346,792 | | | | 2,715,381 | | | | 0.2 | % |
| #Enerplus Corp. | | | 1,294,755 | | | | 22,448,059 | | | | 1.9 | % |
| Enerplus Corp. | | | 28,353 | | | | 490,790 | | | | 0.0 | % |
| #Freehold Royalties Ltd. | | | 652,441 | | | | 8,117,499 | | | | 0.7 | % |
| #Gibson Energy, Inc. | | | 899,205 | | | | 15,345,922 | | | | 1.3 | % |
| #*MEG Energy Corp. | | | 2,167,763 | | | | 32,412,620 | | | | 2.7 | % |
| *NuVista Energy Ltd. | | | 1,111,528 | | | | 11,022,676 | | | | 0.9 | % |
| #Paramount Resources Ltd., Class A | | | 405,621 | | | | 8,592,673 | | | | 0.7 | % |
| Parex Resources, Inc. | | | 774,607 | | | | 11,815,124 | | | | 1.0 | % |
| Parkland Corp. | | | 836,660 | | | | 16,913,140 | | | | 1.4 | % |
| #Peyto Exploration & Development Corp. | | | 965,837 | | | | 9,017,834 | | | | 0.7 | % |
| #PrairieSky Royalty Ltd. | | | 1,182,767 | | | | 18,370,720 | | | | 1.5 | % |
| Secure Energy Services, Inc. | | | 1,849,956 | | | | 9,709,094 | | | | 0.8 | % |
| #Vermilion Energy, Inc. | | | 716,524 | | | | 16,719,858 | | | | 1.4 | % |
| Vermilion Energy, Inc. | | | 233,451 | | | | 5,441,743 | | | | 0.5 | % |
| #Whitecap Resources, Inc. | | | 2,696,209 | | | | 20,899,159 | | | | 1.7 | % |
| Other Securities | | | | | | | 81,074,025 | | | | 6.7 | % |
| TOTAL ENERGY | | | | | | | 348,385,483 | | | | 28.7 | % |
| | | | | | | | | | | | | |
| FINANCIALS — (8.0%) | | | | | | | | | | | | |
| #Canadian Western Bank | | | 498,863 | | | | 8,678,426 | | | | 0.7 | % |
| CI Financial Corp. | | | 1,010,158 | | | | 10,113,814 | | | | 0.8 | % |
| #Element Fleet Management Corp. | | | 2,180,348 | | | | 29,047,834 | | | | 2.4 | % |
| #Laurentian Bank of Canada | | | 370,975 | | | | 8,278,078 | | | | 0.7 | % |
| Other Securities | | | | | | | 56,710,772 | | | | 4.7 | % |
| TOTAL FINANCIALS | | | | | | | 112,828,924 | | | | 9.3 | % |
THE CANADIAN SMALL COMPANY SERIES
CONTINUED
| | | | | | | | | Percentage |
| | | Shares | | | Value» | | | of Net Assets‡ |
| | | | |
| HEALTH CARE — (1.3%) | | | | | | | | | | | | |
| Other Securities | | | | | | $ | 18,737,939 | | | | 1.5 | % |
| | | | | | | | | | | | | |
| INDUSTRIALS — (9.4%) | | | | | | | | | | | | |
| *ATS Automation Tooling Systems, Inc. | | | 416,536 | | | | 13,177,745 | | | | 1.1 | % |
| #*Bombardier, Inc., Class A | | | 13,989 | | | | 415,455 | | | | 0.0 | % |
| #*Bombardier, Inc., Class B | | | 435,248 | | | | 12,782,522 | | | | 1.1 | % |
| #Boyd Group Services, Inc. | | | 87,102 | | | | 12,394,461 | | | | 1.0 | % |
| Finning International, Inc. | | | 809,489 | | | | 17,213,562 | | | | 1.4 | % |
| Richelieu Hardware Ltd. | | | 316,493 | | | | 8,495,724 | | | | 0.7 | % |
| #Russel Metals, Inc. | | | 345,023 | | | | 7,146,878 | | | | 0.6 | % |
| #SNC-Lavalin Group, Inc. | | | 888,433 | | | | 15,383,811 | | | | 1.3 | % |
| Other Securities | | | | | | | 46,315,708 | | | | 3.8 | % |
| TOTAL INDUSTRIALS | | | | | | | 133,325,866 | | | | 11.0 | % |
| | | | | | | | | | | | | |
| INFORMATION TECHNOLOGY — (2.8%) | | | | | | | | | | | | |
| Other Securities | | | | | | | 39,577,541 | | | | 3.2 | % |
| | | | | | | | | | | | | |
| MATERIALS — (20.5%) | | | | | | | | | | | | |
| Alamos Gold, Inc., Class A | | | 2,191,494 | | | | 17,292,586 | | | | 1.4 | % |
| Alamos Gold, Inc., Class A | | | 23,683 | | | | 186,859 | | | | 0.0 | % |
| B2Gold Corp. | | | 523,630 | | | | 1,598,929 | | | | 0.1 | % |
| B2Gold Corp. | | | 4,206,445 | | | | 12,913,786 | | | | 1.1 | % |
| Lundin Mining Corp. | | | 1,333,672 | | | | 6,989,700 | | | | 0.6 | % |
| #Methanex Corp. | | | 214,217 | | | | 7,476,800 | | | | 0.6 | % |
| #Methanex Corp. | | | 126,782 | | | | 4,423,424 | | | | 0.4 | % |
| Pan American Silver Corp. | | | 30,283 | | | | 483,470 | | | | 0.0 | % |
| #Pan American Silver Corp. | | | 807,720 | | | | 12,907,366 | | | | 1.1 | % |
| #SSR Mining, Inc. | | | 847,686 | | | | 11,672,908 | | | | 1.0 | % |
| SSR Mining, Inc. | | | 262,936 | | | | 3,628,517 | | | | 0.3 | % |
| #Stella-Jones, Inc. | | | 312,231 | | | | 9,403,485 | | | | 0.8 | % |
| Turquoise Hill Resources Ltd. | | | 237,010 | | | | 6,662,351 | | | | 0.6 | % |
| #*Turquoise Hill Resources Ltd. | | | 259,936 | | | | 7,319,089 | | | | 0.6 | % |
| #Yamana Gold, Inc. | | | 3,875,378 | | | | 17,010,871 | | | | 1.4 | % |
| Yamana Gold, Inc. | | | 588,814 | | | | 2,579,005 | | | | 0.2 | % |
| Other Securities | | | | | | | 166,659,300 | | | | 13.6 | % |
| TOTAL MATERIALS | | | | | | | 289,208,446 | | | | 23.8 | % |
| | | | | | | | | | | | | |
| REAL ESTATE — (2.3%) | | | | | | | | | | | | |
| #Altus Group Ltd. | | | 244,093 | | | | 8,673,647 | | | | 0.7 | % |
| #Tricon Residential, Inc. | | | 1,203,306 | | | | 10,139,797 | | | | 0.8 | % |
| Tricon Residential, Inc. | | | 103,827 | | | | 875,262 | | | | 0.1 | % |
| Other Securities | | | | | | | 12,011,086 | | | | 1.0 | % |
| TOTAL REAL ESTATE | | | | | | | 31,699,792 | | | | 2.6 | % |
| | | | | | | | | | | | | |
| UTILITIES — (6.9%) | | | | | | | | | | | | |
| #Atco Ltd., Class I | | | 397,742 | | | | 12,349,607 | | | | 1.0 | % |
| #Boralex, Inc., Class A | | | 499,461 | | | | 14,162,424 | | | | 1.2 | % |
| #Brookfield Infrastructure Corp., Class A | | | 205,538 | | | | 8,868,171 | | | | 0.7 | % |
| #Capital Power Corp. | | | 724,520 | | | | 24,250,825 | | | | 2.0 | % |
| #Innergex Renewable Energy, Inc. | | | 748,951 | | | | 8,246,239 | | | | 0.7 | % |
THE CANADIAN SMALL COMPANY SERIES
CONTINUED
| | | | | | | | | Percentage |
| | | Shares | | | Value» | | | of Net Assets‡ |
| UTILITIES — (Continued) | | | | | | | | | | | | |
| TransAlta Corp. | | | 1,758,255 | | | $ | 15,487,254 | | | | 1.3 | % |
| Other Securities | | | | | | | 14,633,883 | | | | 1.2 | % |
| TOTAL UTILITIES | | | | | | | 97,998,403 | | | | 8.1 | % |
| TOTAL COMMON STOCKS | | | | | | | | | | | | |
| (Cost $1,129,103,652) | | | | | | | 1,212,935,722 | | | | 99.8 | % |
| TOTAL INVESTMENT SECURITIES | | | | | | | | | | | | |
| (Cost $1,129,103,652) | | | | | | | 1,212,935,722 | | | | | |
| | | | | | | | | | | | | |
| | | | | | | | Value† | | | | | |
| SECURITIES LENDING COLLATERAL — (14.1%) | | | | | | | | | | | | |
| @§ The DFA Short Term Investment Fund | | | 17,275,482 | | | $ | 199,721,843 | | | | 16.5 | % |
| TOTAL INVESTMENTS—(100.0%) | | | | | | | | | | | | |
| (Cost $1,328,909,530) | | | | | | $ | 1,412,657,565 | | | | 116.3 | % |
Summary of the Series’ investments as of October 31, 2022, based on their valuation inputs, is as follows (see Security Valuation Note):
| | | Investments in Securities (Market Value) | |
| | | Level 1 | | | Level 2 | | | Level 3 | | | Total | |
| Common Stocks | | | | | | | | | | | | | | | | |
| Communication Services | | $ | 11,643,215 | | | $ | 3,630,231 | | | | — | | | $ | 15,273,446 | |
| Consumer Discretionary | | | 66,824,582 | | | | — | | | | — | | | | 66,824,582 | |
| Consumer Staples | | | 59,075,300 | | | | — | | | | — | | | | 59,075,300 | |
| Energy | | | 348,385,483 | | | | — | | | | — | | | | 348,385,483 | |
| Financials | | | 112,828,924 | | | | — | | | | — | | | | 112,828,924 | |
| Health Care | | | 18,723,050 | | | | 14,889 | | | | — | | | | 18,737,939 | |
| Industrials | | | 133,325,866 | | | | — | | | | — | | | | 133,325,866 | |
| Information Technology | | | 39,577,541 | | | | — | | | | — | | | | 39,577,541 | |
| Materials | | | 289,169,935 | | | | 38,511 | | | | — | | | | 289,208,446 | |
| Real Estate | | | 31,699,792 | | | | — | | | | — | | | | 31,699,792 | |
| Utilities | | | 97,998,403 | | | | — | | | | — | | | | 97,998,403 | |
| Securities Lending Collateral | | | — | | | | 199,721,843 | | | | — | | | | 199,721,843 | |
| TOTAL | | $ | 1,209,252,091 | | | $ | 203,405,474 | | | | — | | | $ | 1,412,657,565 | |
See accompanying Notes to Financial Statements.
THE DFA INVESTMENT TRUST COMPANY
STATEMENTS OF ASSETS AND LIABILITIES
JUNE 30, 2023
(Unaudited)
(Amounts in thousands)
| | | | | | | | | The | | | | | | | |
| | | The | | | The | | | United | | | The | | | The | |
| | | Japanese | | | Asia | | | Kingdom | | | Continental | | | Canadian | |
| | | Small | | | Pacific Small | | | Small | | | Small | | | Small | |
| | | Company | | | Company | | | Company | | | Company | | | Company | |
| | | Series* | | | Series* | | | Series* | | | Series* | | | Series* | |
| ASSETS: | | | | | | | | | | | | | | | | | | | | |
| Investment Securities at Value (including $177,961, $74,527, $8,161, $293,770 and $163,463 of securities on loan, respectively) | | $ | 2,865,480 | | | $ | 1,263,662 | | | $ | 1,334,243 | | | $ | 5,103,342 | | | $ | 1,286,365 | |
| Collateral from Securities on Loan Invested in Affiliate at Value (including cost of $65,124, $10,245, $8,745, $315,379 and $168,005, respectively) | | | 65,124 | | | | 10,245 | | | | 8,745 | | | | 315,392 | | | | 168,008 | |
| Foreign Currencies at Value | | | 15,410 | | | | 2,356 | | | | 101 | | | | 13,005 | | | | 578 | |
| Cash | | | 6,638 | | | | 3,353 | | | | 2,092 | | | | 10,170 | | | | 1,902 | |
| Receivables: | | | | | | | | | | | | | | | | | | | | |
| Investment Securities Sold | | | 2,741 | | | | 921 | | | | 1,082 | | | | 2,774 | | | | 275 | |
| Dividends, Interest and Tax Reclaims | | | 5,563 | | | | 3,031 | | | | 6,126 | | | | 39,651 | | | | 7,704 | |
| Securities Lending Income | | | 187 | | | | 216 | | | | 31 | | | | 460 | | | | 141 | |
| Prepaid Expenses and Other Assets | | | 4 | | | | 3 | | | | 2 | | | | 7 | | | | 1 | |
| Total Assets | | | 2,961,147 | | | | 1,283,787 | | | | 1,352,422 | | | | 5,484,801 | | | | 1,464,974 | |
| LIABILITIES: | | | | | | | | | | | | | | | | | | | | |
| Payables: | | | | | | | | | | | | | | | | | | | | |
| Upon Return of Securities Loaned | | | 65,176 | | | | 13,509 | | | | 8,748 | | | | 325,249 | | | | 168,093 | |
| Investment Securities Purchased | | | 8,415 | | | | 42 | | | | 1,074 | | | | 5,131 | | | | 115 | |
| Due to Advisor | | | 237 | | | | 104 | | | | 111 | | | | 421 | | | | 106 | |
| Unrealized Loss on Foreign Currency Contracts | | | 3 | | | | — | | | | — | | | | — | | | | — | |
| Accrued Expenses and Other Liabilities | | | 179 | | | | 112 | | | | 71 | | | | 359 | | | | 41 | |
| Total Liabilities | | | 74,010 | | | | 13,767 | | | | 10,004 | | | | 331,160 | | | | 168,355 | |
| NET ASSETS | | $ | 2,887,137 | | | $ | 1,270,020 | | | $ | 1,342,418 | | | $ | 5,153,641 | | | $ | 1,296,619 | |
| Investment Securities at Cost | | $ | 2,743,323 | | | $ | 1,491,561 | | | $ | 1,329,982 | | | $ | 4,300,574 | | | $ | 1,129,334 | |
| Foreign Currencies at Cost | | $ | 15,387 | | | $ | 2,349 | | | $ | 99 | | | $ | 13,110 | | | $ | 578 | |
| * | See Note J in the Notes to Financial Statements for additional securities lending collateral. |
See accompanying Notes to Financial Statements.
THE DFA INVESTMENT TRUST COMPANY
STATEMENTS OF ASSETS AND LIABILITIES
OCTOBER 31, 2022
(Amounts in thousands)
| | | | | | | | | The | | | | | | | |
| | | The | | | The | | | United | | | The | | | The | |
| | | Japanese | | | Asia | | | Kingdom | | | Continental | | | Canadian | |
| | | Small | | | Pacific Small | | | Small | | | Small | | | Small | |
| | | Company | | | Company | | | Company | | | Company | | | Company | |
| | | Series* | | | Series* | | | Series* | | | Series* | | | Series* | |
| ASSETS: | | | | | | | | | | | | | | | | | | | | |
| Investment Securities at Value (including $134,496, $112,812, $27,667, $232,134 and $211,169 of securities on loan, respectively) | | $ | 2,493,001 | | | $ | 1,190,549 | | | $ | 1,160,537 | | | $ | 4,313,078 | | | $ | 1,212,936 | |
| Collateral from Securities on Loan Invested in Affiliate at Value (including cost of $55,564, $17,312, $29,475, $256,622 and $199,806) | | | 55,545 | | | | 17,305 | | | | 29,468 | | | | 256,520 | | | | 199,722 | |
| Foreign Currencies at Value | | | 174 | | | | 1,718 | | | | 1,035 | | | | 1,400 | | | | 1,520 | |
| Cash | | | 975 | | | | 210 | | | | 8 | | | | 526 | | | | — | |
| Receivables: | | | | | | | | | | | | | | | | | | | | |
| Investment Securities Sold | | | 4,450 | | | | 126 | | | | 1,867 | | | | 14,246 | | | | 22,504 | |
| Dividends, Interest and Tax Reclaims | | | 23,051 | | | | 1,315 | | | | 5,013 | | | | 28,879 | | | | 719 | |
| Securities Lending Income | | | 164 | | | | 337 | | | | 20 | | | | 375 | | | | 166 | |
| Unrealized Gain on Foreign Currency Contracts | | | 4 | | | | 5 | | | | — | | | | — | | | | — | |
| Prepaid Expenses and Other Assets | | | — | | | | — | | | | — | | | | — | | | | 1 | |
| Total Assets | | | 2,577,364 | | | | 1,211,565 | | | | 1,197,948 | | | | 4,615,024 | | | | 1,437,568 | |
| LIABILITIES: | | | | | | | | | | | | | | | | | | | | |
| Payables: | | | | | | | | | | | | | | | | | | | | |
| Due to Custodian | | | — | | | | — | | | | — | | | | — | | | | 122 | |
| Upon Return of Securities Loaned | | | 56,630 | | | | 17,192 | | | | 29,920 | | | | 267,759 | | | | 222,227 | |
| Investment Securities Purchased | | | — | | | | 148 | | | | — | | | | — | | | | — | |
| Due to Advisor | | | 215 | | | | 102 | | | | 96 | | | | 354 | | | | 100 | |
| Futures Margin Variation | | | — | | | | — | | | | — | | | | — | | | | — | |
| Unrealized Loss on Foreign Currency Contracts | | | — | | | | — | | | | — | | | | — | | | | — | |
| Accrued Expenses and Other Liabilities | | | 176 | | | | 102 | | | | 85 | | | | 338 | | | | 59 | |
| Total Liabilities | | | 57,021 | | | | 17,544 | | | | 30,101 | | | | 268,461 | | | | 222,508 | |
| NET ASSETS | | $ | 2,520,343 | | | $ | 1,194,021 | | | $ | 1,167,847 | | | $ | 4,346,563 | | | $ | 1,215,060 | |
| Investments Securities at Cost | | $ | 2,854,129 | | | $ | 1,539,797 | | | $ | 1,400,293 | | | $ | 4,398,990 | | | $ | 1,129,104 | |
| Foreign Currencies at Cost | | $ | 175 | | | $ | 1,705 | | | $ | 1,040 | | | $ | 1,406 | | | $ | 1,516 | |
| * | See Note J in the Notes to Financial Statements for additional securities lending collateral. |
See accompanying Notes to Financial Statements.
THE DFA INVESTMENT TRUST COMPANY
STATEMENTS OF OPERATIONS
FOR THE YEAR ENDED OCTOBER 31, 2022
(Amounts in thousands)
| | | The | | | The Asia | | | The United | | | The | | | The | |
| | | Japanese | | | Pacific | | | Kingdom | | | Continental | | | Canadian | |
| | | Small | | | Small | | | Small | | | Small | | | Small | |
| | | Company | | | Company | | | Company | | | Company | | | Company | |
| | | Series# | | | Series# | | | Series# | | | Series# | | | Series# | |
| Investment Income | | | | | | | | | | | | | | | | | | | | |
| Dividends (Net of Foreign Taxes Withheld of $8,447, $724, $332, $22,430 and $5,523 respectively) | | $ | 76,219 | | | $ | 63,499 | | | $ | 63,674 | | | $ | 154,725 | | | $ | 39,740 | |
| Non Cash Income | | | | | | | | | | | | | | | | | | | | |
| Income from Securities Lending | | | 1,562 | | | | 4,162 | | | | 102 | | | | 5,905 | | | | 1,683 | |
| Total Investment Income | | | 77,781 | | | | 67,661 | | | | 63,776 | | | | 160,630 | | | | 41,423 | |
| Expenses | | | | | | | | | | | | | | | | | | | | |
| Investment Management Fees | | | 2,900 | | | | 1,555 | | | | 1,523 | | | | 5,401 | | | | 1,333 | |
| Accounting & Transfer Agent Fees | | | — | | | | 4 | | | | — | | | | 8 | | | | 7 | |
| Custodian Fees | | | 419 | | | | 272 | | | | 106 | | | | 1,013 | | | | 76 | |
| Shareholders’ Reports | | | 18 | | | | 17 | | | | 17 | | | | 21 | | | | 17 | |
| Directors’/Trustees’ Fees & Expenses | | | 13 | | | | 7 | | | | 6 | | | | 21 | | | | 6 | |
| Professional Fees | | | 39 | | | | 19 | | | | 20 | | | | 144 | | | | 14 | |
| Other | | | 93 | | | | 49 | | | | 49 | | | | 180 | | | | 37 | |
| Total Expenses | | | 3,482 | | | | 1,923 | | | | 1,721 | | | | 6,788 | | | | 1,490 | |
| Fees Paid Indirectly (Note C) | | | 23 | | | | 5 | | | | 12 | | | | 29 | | | | 9 | |
| Net Expenses | | | 3,459 | | | | 1,918 | | | | 1,721 | | | | 6,759 | | | | 1,481 | |
| Net Investment Income (Loss) | | | 74,322 | | | | 65,743 | | | | 62,067 | | | | 153,871 | | | | 39,942 | |
| Realized and Unrealized Gain (Loss) | | | | | | | | | | | | | | | | | | | | |
| Net Realized Gain (Loss) on: | | | | | | | | | | | | | | | | | | | | |
| Investment Securities Sold** | | | 5,574 | | | | 33,519 | | | | (4,763 | ) | | | 53,125 | | | | 84,639 | |
| Affiliated Investment Companies Shares Sold | | | (8 | ) | | | (10 | ) | | | (3 | ) | | | (59 | ) | | | (66 | ) |
| Futures | | | — | | | | 349 | | | | — | | | | — | | | | 27 | |
| Foreign Currency Transactions | | | (5,554 | ) | | | (731 | ) | | | (1,687 | ) | | | (2,690 | ) | | | (101 | ) |
| Change in Unrealized Appreciation (Depreciation) of: | | | | | | | | | | | | | | | | | | | | |
| Investment Securities and Foreign Currency | | | (862,888 | ) | | | (565,107 | ) | | | (665,322 | ) | | | (2,054,707 | ) | | | (295,189 | ) |
| Affiliated Investment Companies Shares | | | (32 | ) | | | (12 | ) | | | (11 | ) | | | (130 | ) | | | (101 | ) |
| Translation of Foreign Currency Denominated Amounts | | | (284 | ) | | | (8 | ) | | | (66 | ) | | | (3,148 | ) | | | (9 | ) |
| Net Realized and Unrealized Gain (Loss) | | | (863,192 | ) | | | (532,000 | ) | | | (671,852 | ) | | | (2,007,609 | ) | | | (210,800 | ) |
| Net Increase (Decrease) in Net Assets Resulting from Operations | | $ | (788,870 | ) | | $ | (466,257 | ) | | $ | (609,785 | ) | | $ | (1,853,738 | ) | | $ | (170,858 | ) |
| ** | Net of foreign capital gain taxes withheld of $0, $0, $0, $0 and $0, respectively. |
| # | Portion of income is from investment in affiliated fund. |
See accompanying Notes to Financial Statements.
THE DFA INVESTMENT TRUST COMPANY
STATEMENTS OF CHANGES IN NET ASSETS
(Amounts in thousands)
| | | The Japanese Small | |
| | | Company Series | |
| | | Year | | | Year | |
| | | Ended | | | Ended | |
| | | Oct 31, | | | Oct 31, | |
| | | 2022 | | | 2021 | |
| Increase (Decrease) in Net Assets | | | | | | | | |
| Operations: | | | | | | | | |
| Net Investment Income (Loss) | | $ | 74,322 | | | $ | 67,580 | |
| Net Realized Gain (Loss) on: | | | | | | | | |
| Investment Securities Sold*,** | | | 5,574 | | | | 106,212 | |
| Affiliated Investment Companies Shares Sold | | | (8 | ) | | | 4 | |
| Foreign Currency Transactions | | | (5,554 | ) | | | (32 | ) |
| Change in Unrealized Appreciation (Depreciation) of: | | | | | | | | |
| Investment Securities and Foreign Currency | | | (862,888 | ) | | | 204,124 | |
| Affiliated Investment Companies Shares | | | (32 | ) | | | (6 | ) |
| Translation of Foreign Currency-Denominated Amounts | | | (284 | ) | | | (657 | ) |
| Net Increase (Decrease) in Net Assets Resulting from Operations | | | (788,870 | ) | | | 377,225 | |
| Transactions in Interest: | | | | | | | | |
| Contributions | | | 112,114 | | | | 441,236 | |
| Withdrawals | | | (219,045 | ) | | | (345,470 | ) |
| Net Increase (Decrease) from Transactions in Interest | | | (106,931 | ) | | | 95,766 | |
| Total Increase (Decrease) in Net Assets | | | (895,801 | ) | | | 472,991 | |
| Net Assets | | | | | | | | |
| Beginning of Year | | | 3,416,144 | | | | 2,943,153 | |
| End of Year | | $ | 2,520,343 | | | $ | 3,416,144 | |
| * | Net of foreign capital gain taxes withheld for the fiscal year ended October 31, 2022 of $0. |
| ** | Net of foreign capital gain taxes withheld for the fiscal year ended October 31, 2021 of $0. |
See accompanying Notes to Financial Statements.
THE DFA INVESTMENT TRUST COMPANY
STATEMENTS OF CHANGES IN NET ASSETS
(Amounts in thousands)
| | | The Asia Pacific Small | | | The United Kingdom Small | |
| | | Company Series | | | Company Series | |
| | | Year | | | Year | | | Year | | | Year | |
| | | Ended | | | Ended | | | Ended | | | Ended | |
| | | Oct 31, | | | Oct 31, | | | Oct 31, | | | Oct 31, | |
| | | 2022 | | | 2021 | | | 2022 | | | 2021 | |
| Increase (Decrease) in Net Assets | | | | | | | | | | | | | | | | |
| Operations: | | | | | | | | | | | | | | | | |
| Net Investment Income (Loss) | | $ | 65,743 | | | $ | 62,661 | | | $ | 62,067 | | | $ | 43,588 | |
| Net Realized Gain (Loss) on: | | | | | | | | | | | | | | | | |
| Investment Securities Sold*,** | | | 33,519 | | | | 188,465 | | | | (4,763 | ) | | | 99,258 | |
| Affiliated Investment Companies Shares Sold | | | (10 | ) | | | (3 | ) | | | (3 | ) | | | 1 | |
| Futures | | | 349 | | | | — | | | | — | | | | (120 | ) |
| Foreign Currency Transactions | | | (731 | ) | | | (238 | ) | | | (1,687 | ) | | | 291 | |
| Change in Unrealized Appreciation (Depreciation) of: | | | | | | | | | | | | | | | | |
| Investment Securities and Foreign Currency | | | (565,107 | ) | | | 322,334 | | | | (665,322 | ) | | | 602,698 | |
| Affiliated Investment Companies Shares | | | (12 | ) | | | (1 | ) | | | (11 | ) | | | (3 | ) |
| Translation of Foreign Currency-Denominated Amounts | | | (8 | ) | | | 8 | | | | (66 | ) | | | 25 | |
| Net Increase (Decrease) in Net Assets Resulting from Operations | | | (466,257 | ) | | | 573,226 | | | | (609,785 | ) | | | 745,738 | |
| Transactions in Interest: | | | | | | | | | | | | | | | | |
| Contributions | | | 49,404 | | | | 105,831 | | | | 38,338 | | | | 46,399 | |
| Withdrawals | | | (212,093 | ) | | | (383,104 | ) | | | (157,982 | ) | | | (370,643 | ) |
| Net Increase (Decrease) from Transactions in Interest | | | (162,689 | ) | | | (277,273 | ) | | | (119,644 | ) | | | (324,244 | ) |
| Total Increase (Decrease) in Net Assets | | | (628,946 | ) | | | 295,953 | | | | (729,429 | ) | | | 421,494 | |
| Net Assets | | | | | | | | | | | | | | | | |
| Beginning of Year | | | 1,822,967 | | | | 1,527,014 | | | $ | 1,897,276 | | | | 1,475,782 | |
| End of Year | | $ | 1,194,021 | | | $ | 1,822,967 | | | $ | 1,167,847 | | | $ | 1,897,276 | |
| * | Net of foreign capital gain taxes withheld for the fiscal year ended October 31, 2022 of $0, $0, $0 and $0, respectively. |
| ** | Net of foreign capital gain taxes withheld for the fiscal year ended October 31, 2021 of $0, $0, $0 and $0, respectively. |
See accompanying Notes to Financial Statements.
THE DFA INVESTMENT TRUST COMPANY
STATEMENTS OF CHANGES IN NET ASSETS
(Amounts in thousands)
| | | The Continental Small | | | The Canadian Small | |
| | | Company Series | | | Company Series | |
| | | Year | | | Year | | | Year | | | Year | |
| | | Ended | | | Ended | | | Ended | | | Ended | |
| | | Oct 31, | | | Oct 31, | | | Oct 31, | | | Oct 31, | |
| | | 2022 | | | 2021 | | | 2022 | | | 2021 | |
| Increase (Decrease) in Net Assets | | | | | | | | | | | | | | | | |
| Operations: | | | | | | | | | | | | | | | | |
| Net Investment Income (Loss) | | $ | 153,871 | | | $ | 125,991 | | | $ | 39,942 | | | $ | 24,914 | |
| Net Realized Gain (Loss) on: | | | | | | | | | | | | | | | | |
| Investment Securities Sold*,** | | | 53,125 | | | | 392,015 | | | | 84,639 | | | | 167,819 | |
| Affiliated Investment Companies Shares Sold | | | (59 | ) | | | 2 | | | | (66 | ) | | | (11 | ) |
| Futures | | | — | | | | — | | | | 27 | | | | 42 | |
| Foreign Currency Transactions | | | (2,690 | ) | | | (1,344 | ) | | | (101 | ) | | | 445 | |
| Change in Unrealized Appreciation (Depreciation) of: | | | | | | | | | | | | | | | | |
| Investment Securities and Foreign Currency | | | (2,054,707 | ) | | | 1,753,296 | | | | (295,189 | ) | | | 390,372 | |
| Affiliated Investment Companies Shares | | | (130 | ) | | | (21 | ) | | | (101 | ) | | | (6 | ) |
| Translation of Foreign Currency-Denominated Amounts | | | (3,148 | ) | | | (445 | ) | | | (9 | ) | | | 3 | |
| Net Increase (Decrease) in Net Assets Resulting from Operations | | | (1,853,738 | ) | | | 2,269,494 | | | | (170,858 | ) | | | 583,578 | |
| Transactions in Interest: | | | | | | | | | | | | | | | | |
| Contributions | | | 179,167 | | | | 513,046 | | | | 51,681 | | | | 164,451 | |
| Withdrawals | | | (517,971 | ) | | | (845,380 | ) | | | (117,171 | ) | | | (267,504 | ) |
| Net Increase (Decrease) from Transactions in Interest | | | (338,804 | ) | | | (332,334 | ) | | | (65,490 | ) | | | (103,053 | ) |
| Total Increase (Decrease) in Net Assets | | | (2,192,542 | ) | | | 1,937,160 | | | | (236,348 | ) | | | 480,525 | |
| Net Assets | | | | | | | | | | | | | | | | |
| Beginning of Year | | | 6,539,105 | | | | 4,601,945 | | | | 1,451,408 | | | | 970,883 | |
| End of Year | | $ | 4,346,563 | | | $ | 6,539,105 | | | $ | 1,215,060 | | | $ | 1,451,408 | |
| * | Net of foreign capital gain taxes withheld for the fiscal year ended October 31, 2022 of $0, $0, $0 and $0, respectively. |
| ** | Net of foreign capital gain taxes withheld for the fiscal year ended October 31, 2021 of $0, $0, $0 and $0, respectively. |
See accompanying Notes to Financial Statements.
THE DFA INVESTMENT TRUST COMPANY
FINANCIAL HIGHLIGHTS
(for a share outstanding throughout each period)
| | | The Japanese Small Company Series | | | The Asia Pacific Small Company Series | |
| | | Year | | | Year | | | Year | | | Year | | | Year | | | Year | | | Year | | | Year | | | Year | | | Year | |
| | | Ended | | | Ended | | | Ended | | | Ended | | | Ended | | | Ended | | | Ended | | | Ended | | | Ended | | | Ended | |
| | | Oct 31, | | | Oct 31, | | | Oct 31, | | | Oct 31, | | | Oct 31, | | | Oct 31, | | | Oct 31, | | | Oct 31, | | | Oct 31, | | | Oct 31, | |
| | | 2022 | | | 2021 | | | 2020 | | | 2019 | | | 2018 | | | 2022 | | | 2021 | | | 2020 | | | 2019 | | | 2018 | |
| Total Return | | | (23.60 | )% | | | 13.08 | % | | | (1.93 | )% | | | 4.47 | % | | | (7.46 | )% | | | (26.65 | )% | | | 38.31 | % | | | 0.14 | % | | | 5.27 | % | | | (8.14 | )% |
| Net Assets, End of Year (thousands) | | $ | 2,520,343 | | | $ | 3,416,144 | | | $ | 2,943,153 | | | $ | 3,748,177 | | | $ | 3,834,097 | | | $ | 1,194,021 | | | $ | 1,822,967 | | | $ | 1,527,014 | | | $ | 1,641,843 | | | $ | 1,730,371 | |
| Ratio of Expenses to Average Net Assets | | | 0.12 | % | | | 0.12 | % | | | 0.13 | % | | | 0.12 | % | | | 0.12 | % | | | 0.12 | % | | | 0.12 | % | | | 0.13 | % | | | 0.13 | % | | | 0.13 | % |
| Ratio of Expenses to Average Net Assets (Excluding Fees Paid Indirectly) | | | 0.12 | % | | | 0.12 | % | | | 0.13 | % | | | 0.12 | % | | | 0.12 | % | | | 0.12 | % | | | 0.12 | % | | | 0.13 | % | | | 0.13 | % | | | 0.13 | % |
| Ratio of Net Investment Income to Average Net Assets | | | 2.56 | % | | | 2.11 | % | | | 2.13 | % | | | 2.32 | % | | | 1.90 | % | | | 4.23 | % | | | 3.42 | % | | | 4.21 | % | | | 4.11 | % | | | 3.96 | % |
| Portfolio Turnover Rate | | | 11 | % | | | 11 | % | | | 5 | % | | | 12 | % | | | 17 | % | | | 19 | % | | | 19 | % | | | 18 | % | | | 18 | % | | | 18 | % |
See page 1-2 for the Definitions of Abbreviations and Footnotes.
| | | The United Kingdom Small Company Series | | | The Continental Small Company Series | |
| | | Year | | | Year | | | Year | | | Year | | | Year | | | Year | | | Year | | | Year | | | Year | | | Year | |
| | | Ended | | | Ended | | | Ended | | | Ended | | | Ended | | | Ended | | | Ended | | | Ended | | | Ended | | | Ended | |
| | | Oct 31, | | | Oct 31, | | | Oct 31, | | | Oct 31, | | | Oct 31, | | | Oct 31, | | | Oct 31, | | | Oct 31, | | | Oct 31, | | | Oct 31, | |
| | | 2022 | | | 2021 | | | 2020 | | | 2019 | | | 2018 | | | 2022 | | | 2021 | | | 2020 | | | 2019 | | | 2018 | |
| Total Return | | | (33.34 | )% | | | 51.93 | % | | | (14.87 | )% | | | 10.67 | % | | | (8.90 | )% | | | (29.07 | )% | | | 51.24 | % | | | (2.23 | )% | | | 8.43 | % | | | (10.78 | )% |
| Net Assets, End of Year (thousands) | | $ | 1,167,847 | | | $ | 1,897,276 | | | $ | 1,475,782 | | | $ | 2,277,451 | | | $ | 2,188,825 | | | $ | 4,346,563 | | | $ | 6,539,105 | | | $ | 4,601,945 | | | $ | 5,607,495 | | | $ | 5,422,260 | |
| Ratio of Expenses to Average Net Assets | | | 0.11 | % | | | 0.12 | % | | | 0.12 | % | | | 0.11 | % | | | 0.11 | % | | | 0.13 | % | | | 0.12 | % | | | 0.12 | % | | | 0.12 | % | | | 0.12 | % |
| Ratio of Expenses to Average Net Assets (Excluding Fees Paid Indirectly) | | | 0.11 | % | | | 0.12 | % | | | 0.12 | % | | | 0.12 | % | | | 0.11 | % | | | 0.13 | % | | | 0.12 | % | | | 0.12 | % | | | 0.13 | % | | | 0.12 | % |
| Ratio of Net Investment Income to Average Net Assets | | | 4.07 | % | | | 2.27 | % | | | 2.38 | % | | | 3.43 | % | | | 3.23 | % | | | 2.85 | % | | | 2.11 | % | | | 2.15 | % | | | 2.74 | % | | | 2.51 | % |
| Portfolio Turnover Rate | | | 14 | % | | | 12 | % | | | 9 | % | | | 18 | % | | | 14 | % | | | 11 | % | | | 17 | % | | | 8 | % | | | 17 | % | | | 15 | % |
See page 1-2 for the Definitions of Abbreviations and Footnotes.
See accompanying Notes to Financial Statements.
THE DFA INVESTMENT TRUST COMPANY
FINANCIAL HIGHLIGHTS
(for a share outstanding throughout each period)
| | | The Canadian Small Company Series | |
| | | Year | | | Year | | | Year | | | Year | | | Year | |
| | | Ended | | | Ended | | | Ended | | | Ended | | | Ended | |
| | | Oct 31, | | | Oct 31, | | | Oct 31, | | | Oct 31, | | | Oct 31, | |
| | | 2022 | | | 2021 | | | 2020 | | | 2019 | | | 2018 | |
| Total Return | | | (12.52 | )% | | | 59.72 | % | | | 6.02 | % | | | 1.00 | % | | | (10.44 | )% |
| Net Assets, End of Year (thousands) | | $ | 1,215,060 | | | $ | 1,451,408 | | | $ | 970,883 | | | $ | 1,148,615 | | | $ | 1,146,811 | |
| Ratio of Expenses to Average Net Assets | | | 0.11 | % | | | 0.12 | % | | | 0.12 | % | | | 0.12 | % | | | 0.12 | % |
| Ratio of Expenses to Average Net Assets (Excluding Fees Paid Indirectly) | | | 0.11 | % | | | 0.12 | % | | | 0.12 | % | | | 0.12 | % | | | 0.12 | % |
| Ratio of Net Investment Income to Average Net Assets | | | 3.00 | % | | | 1.90 | % | | | 2.08 | % | | | 2.37 | % | | | 2.11 | % |
| Portfolio Turnover Rate | | | 15 | % | | | 27 | % | | | 18 | % | | | 12 | % | | | 14 | % |
See page 1-2 for the Definitions of Abbreviations and Footnotes.
See accompanying Notes to Financial Statements.
THE DFA INVESTMENT TRUST COMPANY
NOTES TO FINANCIAL STATEMENTS
A. Organization:
The DFA Investment Trust Company (the “Trust��) is an open-end management investment company registered under the Investment Company Act of 1940 (the “1940 Act”), The Trust consists of ten operational portfolios, five of which, The Japanese Small Company Series, The Asia Pacific Small Company Series, The United Kingdom Small Company Series, The Continental Small Company Series and The Canadian Small Company Series are included in this section of the report (collectively, the “Series”). The remaining operational portfolios are presented in separate reports. The Series are investment companies, and accordingly, follow the accounting and reporting guidance under the Financial Accounting Standards Board (“FASB”) Accounting Standards Codification (“ASC”), Topic 946, “Financial Services-Investment Companies.”
B. Significant Accounting Policies:
The following significant accounting policies are in conformity with accounting principles generally accepted in the United States of America (“GAAP”). Such policies are consistently followed by the Trust in preparation of its financial statements. The preparation of financial statements in accordance with GAAP requires management to make estimates and assumptions that affect the fair value of investments, the reported amounts of assets and liabilities, the disclosure of contingent assets and liabilities at the date of the financial statements, and the reported amounts of increases and decreases in net assets from operations during the reporting period. Actual results could differ from those estimates and those differences could be material.
1. Security Valuation: The Series use a fair value hierarchy, which prioritizes the inputs-to-valuation techniques used to measure fair value into three broad levels described below:
• Level 1 - inputs are quoted prices in active markets for identical securities (including equity securities, open-end investment companies, and futures contracts)
• Level 2 - other significant observable inputs (including quoted prices for similar securities, interest rates, prepayment speeds, credit risk, etc.)
• Level 3 - significant unobservable inputs (including the Series’ own assumptions in determining the fair value of investments)
Securities held by the Series, including over-the-counter securities, are valued at the last quoted sale price of the day. International equity securities are subject to a fair value factor, as described later in this note. Securities held by the Series that are listed on Nasdaq are valued at the Nasdaq Official Closing Price (“NOCP”). If there is no last reported sale price or NOCP for the day, the Series value the securities at the mean between the most recent quoted bid and ask prices. Price information on listed securities is taken from the exchange where the security is primarily traded. Generally, securities issued by open-end management investment companies are valued using their respective net asset values or public offering prices, as appropriate, for purchase orders placed at the close of the New York Stock Exchange (“NYSE”). These securities are generally categorized as Level 1 in the hierarchy.
Securities for which no market quotations are readily available (including restricted securities), or for which market quotations have become unreliable, are valued in good faith at fair value in accordance with Rule 2a-5 under the 1940 Act pursuant to procedures approved by the Board of Trustees of the Trust. Fair value pricing may also be used if events that have a significant effect on the value of an investment (as determined in the discretion of Dimensional Fund Advisors LP) occur before the net asset value of the Series is calculated. When fair value pricing is used, the prices of securities used by the Series may differ from the quoted or published prices for the same securities on their primary markets or exchanges. These securities are generally categorized as Level 2 or Level 3 in the hierarchy.
The Series will also apply a fair value price in the circumstances described below. Generally, trading in foreign securities markets is completed each day at various times prior to the close of the NYSE. For example, trading in the Japanese securities markets is completed each day at the close of the Tokyo Stock Exchange (normally, 2:00 a.m. ET), which is fourteen hours before the close of the NYSE (normally, 4:00 p.m. ET) and the time that the net asset values of the Series are computed. Due to the time differences between the closings of the relevant foreign securities exchanges and the time the Series price their shares at the close of the NYSE, the Series will fair-value their foreign investments when it is determined that the market quotations for the foreign investments are either unreliable or not readily available. The fair value prices will attempt to reflect the impact of the U.S. financial markets’ perceptions and trading activities on the Series’ foreign investments since the last closing prices of the foreign investments were calculated on their primary foreign securities markets or exchanges. For these purposes, Dimensional Fund Advisors LP has determined that movements in relevant indices or other appropriate market indicators, after the close of the Tokyo Stock Exchange or the London Stock Exchange, demonstrate that market quotations may be unreliable. Fair valuation of portfolio securities may occur on a daily basis. The fair value pricing by the Series uses data furnished by an independent pricing service (and that data draws upon, among other information, the market values of foreign investments). When a Series uses fair value pricing, the values assigned to the Series’ foreign investments may not be the quoted or published prices of the investments on their primary markets or exchanges. These securities are generally categorized as Level 2 in the hierarchy.
Futures contracts held by the Series are valued using the settlement price established each day on the exchange on which they are traded. These valuations are generally categorized as Level 1 in the hierarchy.
Over-the-counter derivative contracts, which include forward currency contracts, do not require material subjectivity as pricing inputs are observed from quoted markets and are categorized as Level 2 in the hierarchy.
A summary of the inputs used to value the Series’ investments by each major security type, industry and/or country is disclosed previously in this note. Valuation hierarchy tables have been included at the end of the Summary Schedules of Portfolio Holdings. The methodology or inputs used for valuing securities are not necessarily an indication of the risk associated with investing in those securities.
2. Foreign Currency Translation: Securities and other assets and liabilities of the Series, whose values are initially expressed in foreign currencies are translated to U.S. dollars using the mean between the most recent bid and ask prices for the U.S. dollar as quoted by generally recognized reliable sources. To facilitate the translation, the Series enter into foreign currency contracts. A foreign currency contract is a spot agreement between two parties to buy and sell currencies at current market exchange rates, for settlement generally within two business days. Dividend and interest income and certain expenses are translated to U.S. dollars at the rate of exchange on their respective accrual dates. Receivables and payables denominated in foreign currencies are marked-to-market daily based on daily exchange rates and exchange gains or losses are realized upon ultimate receipt or disbursement.
The Series do not isolate the effect of foreign currency rate fluctuations when determining the realized gain or loss upon the sale or maturity of foreign currency denominated debt obligations pursuant to U.S. Federal income tax regulations; such amounts are categorized as foreign exchange gain or loss for income tax reporting purposes.
Realized gains or losses on foreign currency transactions represent net foreign exchange gains or losses from the disposition of foreign currencies, currency gains or losses realized between the trade and settlement dates of securities transactions, and the difference between amounts of interest, dividends and any foreign withholding taxes recorded on the books of the Series and the U.S. dollar equivalent amounts actually received or paid.
3. Deferred Compensation Plan: Each eligible Trustee of the Trust may elect to participate in the Fee Deferral Plan for Independent Directors and Trustees (the “Plan”). Under the Plan, effective January 1, 2002, such Trustees may defer payment of all or a portion of their total fees earned as a Trustee. These deferred amounts may be treated as though such amounts had been invested in shares of the following funds: the U.S. Large Cap Value Portfolio; U.S. Core Equity 1 Portfolio; U.S. Large Company Portfolio; U.S. Vector Equity Portfolio; U.S. Micro Cap Portfolio; DFA International Value Portfolio; International Core Equity Portfolio; Emerging Markets Portfolio; Emerging Markets Core Equity Portfolio, DFA Inflation-Protected Securities Portfolio, and/or DFA Two-Year Global Fixed Income Portfolio. Contributions made under the Plan and the change in unrealized appreciation (depreciation) and income are included in Directors’/Trustees’ Fees & Expenses.
The Trustees may receive their distributions of proceeds by one of the following methods: lump sum, annual installments over a period of agreed-upon years, or quarterly installments over a period of agreed-upon years. Each Trustee shall have the right in a notice of election (the “Notice”) to defer the receipt of the Trustee’s deferred compensation until a date specified by such Trustee in the Notice. The date may not be sooner than the earlier of: (i) the first business day of January following the year in which such Trustee ceases to be a member of the Board of Trustees of the Trust; and (ii) five years following the effective date of the Trustee’s first deferral election. If a Trustee who elects to defer fees fails to designate in the Notice a time or date as of which payment of the Trustee’s deferred fee account shall commence, payment of such amount shall commence as of the first business day of January following the year in which the Trustee ceases to be a member of the Board (unless the Trustee files an amended Notice selecting a different distribution date).
4. Other: Security transactions are accounted for as of the trade date. Costs used in determining realized gains and losses on the sale of investment securities and foreign currency are accounted for on the basis of identified cost. Dividend income and distributions to shareholders are recorded on the ex-dividend date. Non-cash dividend income received in the form of securities in-lieu of cash, if any, are recorded at the fair value of securities received. Distributions received on securities and that represent a return of capital or capital gains are recorded as a reduction of cost of investments or as a realized gain, respectively. The Series estimate the character of received distributions that may be considered return of capital distributions. Interest income is recorded on an accrual basis. Discount and premium on securities purchased are amortized over the lives of the respective securities, using the effective interest method. Expenses directly attributable to a Series are directly charged. Common expenses of the Trust or Series are allocated using methods approved by the Board of Trustees, generally based on average net assets.
The Series may be subject to taxes imposed by countries in which they invest, with respect to their investments in issuers existing or operating in such countries. Such taxes are generally based on income earned or repatriated and capital gains realized on the sale of such investments. The Series accrue such taxes when the related income or capital gains are earned or throughout the holding period. Some countries require governmental approval for the repatriation of investment income, capital or the proceeds of sales earned by foreign investors. Additionally, if there is a deterioration in a country’s balance of payments or for other reasons, a country may impose temporary restrictions on foreign capital remittances abroad.
C. Investment Advisor:
The Advisor, Dimensional Fund Advisors LP, provides investment management services to the Series. For the year ended October 31, 2022, investment management fees were accrued daily and paid monthly to the Advisor based on the following effective annual rates of average daily net assets:
| The Japanese Small Company Series | | | 0.10 | % |
| The Asia Pacific Small Company Series | | | 0.10 | % |
| The United Kingdom Small Company Series | | | 0.10 | % |
| The Continental Small Company Series | | | 0.10 | % |
| The Canadian Small Company Series | | | 0.10 | % |
Earned Income Credit:
Additionally, the Series have entered into arrangements with their custodian whereby net interest earned on uninvested cash balances was used to reduce a portion of each Series’ custody expenses. Custody expense in the accompanying financial statements is presented before reduction for credits. The impact of such credits is generally less than one basis point of each Series’ net assets. During the year ended October 31, 2022, expenses reduced were as follows (amounts in thousands):
| | | Fees Paid | |
| | | Indirectly | |
| The Japanese Small Company Series | | $ | 23 | |
| The Asia Pacific Small Company Series | | | 5 | |
| The United Kingdom Small Company Series | | | 12 | |
| The Continental Small Company Series | | | 29 | |
| The Canadian Small Company Series | | | 9 | |
Fees Paid to Officers and Directors/Trustees:
Certain Officers and Trustees of the Advisor are also Officers and Trustees of the Trust; however, such Officers and Trustees (with the exception of the Chief Compliance Officer (“CCO”)) receive no compensation from the Trust. For the year ended October 31, 2022, the total related amounts paid by the Trust to the CCO were $28 (in thousands). The total related amounts paid by each of the Series are included in Other Expenses on the Statement of Operations.
D. Deferred Compensation:
At October 31, 2022, the total liability for deferred compensation to Trustees is included in Accrued Expenses and Other Liabilities on the Statement of Assets and Liabilities as follows (amounts in thousands):
| The Japanese Small Company Series | | $ | 35 | |
| The Asia Pacific Small Company Series | | | 16 | |
| The United Kingdom Small Company Series | | | 23 | |
| The Continental Small Company Series | | | 25 | |
| The Canadian Small Company Series | | | 7 | |
E. Purchases and Sales of Securities:
For the year ended October 31, 2022, the Series’ transactions related to investment securities, other than short-term securities, in-kind redemptions and U.S. government securities (amounts in thousands), were as follows:
| | | Purchases | | | Sales | |
| The Japanese Small Company Series | | $ | 321,472 | | | $ | 359,611 | |
| The Asia Pacific Small Company Series | | | 291,315 | | | | 329,566 | |
| The United Kingdom Small Company Series | | | 224,491 | | | | 206,460 | |
| The Continental Small Company Series | | | 577,020 | | | | 760,337 | |
| The Canadian Small Company Series | | | 206,110 | | | | 202,538 | |
There were no purchases or sales of long-term U.S. government securities.
For the year ended October 31, 2022, transactions related to Affiliated Investment Companies, excluding in-kind redemptions, are presented below.
The amounts presented below may differ from the respective amounts presented in the corresponding Summary Schedule of Portfolio Holdings, Statement of Assets and Liabilities or Statement of Operations due to rounding. The amounts are as follows (amounts in thousands):
| | | | | | | | | | | | Net | | | Change in | | | | | | Shares | | | | | | | |
| | | Balance at | | | | | | | | | Realized | | | Unrealized | | | Balance at | | | as of | | | | | | | |
| | | October 31, | | | Purchases | | | Proceeds | | | Gain/(Loss) | | | Appreciation/ | | | October 31, | | | October 31, | | | Dividend | | | Capital Gain | |
| | | 2021 | | | at Cost | | | from Sales | | | on Sales | | | Depreciation | | | 2022 | | | 2022 | | | Income | | | Distributions | |
| | | | |
| The Japanese Small Company Series | | | | | | | | | | | | | | | | | | | | | |
| The DFA Short Term Investment Fund | | $ | 61,490 | | | $ | 427,535 | | | $ | 433,440 | | | $ | (8) | | | $ | (32) | | | $ | 55,545 | | | | 4,805 | | | $ | 583 | | | | — | |
| Total | | $ | 61,490 | | | $ | 427,535 | | | $ | 433,440 | | | $ | (8) | | | $ | (32) | | | $ | 55,545 | | | | 4,805 | | | $ | 583 | | | | — | |
| | | | | | | | | | | | | | | | | | | | | | | | | | | | | | | | | | | | | |
| The Asia Pacific Small Company | | | | | | | | | | | | | | | | | | | | | |
| The DFA Short Term Investment Fund | | $ | 40,607 | | | $ | 119,787 | | | $ | 143,067 | | | $ | (10) | | | $ | (12) | | | $ | 17,305 | | | | 1,497 | | | $ | 213 | | | | — | |
| Total | | $ | 40,607 | | | $ | 119,787 | | | $ | 143,067 | | | $ | (10) | | | $ | (12) | | | $ | 17,305 | | | | 1,497 | | | $ | 213 | | | | — | |
| | | | | | | | | | | | | | | | | | | | | | | | | | | | | | | | | | | | | |
| The United Kingdom Small Company Series | | | | | | | | | | | | | | | | | | | | | |
| The DFA Short Term Investment Fund | | $ | 15,631 | | | $ | 98,187 | | | $ | 84,336 | | | $ | (3) | | | $ | (11) | | | $ | 29,468 | | | | 2,549 | | | $ | 151 | | | | — | |
| Total | | $ | 15,631 | | | $ | 98,187 | | | $ | 84,336 | | | $ | (3) | | | $ | (11) | | | $ | 29,468 | | | | 2,549 | | | $ | 151 | | | | — | |
| | | | | | | | | | | | | | | | | | | | | | | | | | | | | | | | | | | | | |
| The Continental Small Company Series | | | | | | | | | | | | | | | | | | | | | |
| The DFA Short Term Investment Fund | | $ | 297,271 | | | $ | 1,289,178 | | | $ | 1,329,740 | | | $ | (59) | | | $ | (130) | | | $ | 256,520 | | | | 22,188 | | | $ | 3,144 | | | | — | |
| Total | | $ | 297,271 | | | $ | 1,289,178 | | | $ | 1,329,740 | | | $ | (59) | | | $ | (130) | | | $ | 256,520 | | | | 22,188 | | | $ | 3,144 | | | | — | |
| | | | | | | | | | | | | | | | | | | | | | | | | | | | | | | | | | | | | |
| The Canadian Small Company | | | | | | | | | | | | | | | | | | | | | |
| The DFA Short Term Investment Fund | | $ | 276,415 | | | $ | 770,364 | | | $ | 846,890 | | | $ | (66) | | | $ | (101) | | | $ | 199,722 | | | | 17,275 | | | $ | 2,371 | | | | — | |
| Total | | $ | 276,415 | | | $ | 770,364 | | | $ | 846,890 | | | $ | (66) | | | $ | (101) | | | $ | 199,722 | | | | 17,275 | | | $ | 2,371 | | | | — | |
F. Federal Income Taxes:
No provision for federal income taxes is required since the Series are treated as partnerships for federal income tax purposes. Any net investment income and realized and unrealized gains and losses have been deemed to have been “passed down” to their respective partners.
At October 31, 2022, the total cost and aggregate gross unrealized appreciation (depreciation) of securities for federal income tax purposes were different from amounts reported for financial reporting purposes, as follows (amounts in thousands):
| | | | | | | | | | | | Net | |
| | | | | | | | | | | | Unrealized | |
| | | Federal | | | Unrealized | | | Unrealized | | | Appreciation | |
| | | Tax Cost | | | Appreciation | | | (Depreciation) | | | (Depreciation) | |
| The Japanese Small Company Series | | $ | 2,969,111 | | | $ | 334,789 | | | $ | (755,354 | ) | | $ | (420,565 | ) |
| The Asia Pacific Small Company Series | | | 1,584,563 | | | | 177,560 | | | | (554,270 | ) | | | (376,710 | ) |
| The United Kingdom Small Company Series | | | 1,439,003 | | | | 187,762 | | | | (436,759 | ) | | | (248,997 | ) |
| The Continental Small Company Series | | | 4,686,399 | | | | 958,768 | | | | (1,075,569 | ) | | | (116,801 | ) |
| The Canadian Small Company Series | | | 1,365,752 | | | | 287,544 | | | | (240,639 | ) | | | 46,905 | |
The difference between GAAP-basis and tax basis unrealized gains (losses) can occur as a result of wash sales and net mark-to-market gains (losses) on regulated futures contracts, net mark-to-market gains (losses) on foreign currency contracts, and differences in the tax treatment of passive foreign investment company investments or other investments.
ASC 740 Accounting for Uncertainty in Income Taxes sets forth a minimum threshold for financial statement recognition of the benefit of a tax position taken or expected to be taken in a tax return. Management has analyzed the Series’ tax positions and has concluded that no additional provision for income tax is required in any Series’ financial statements. The Series are not aware of any tax positions for which it is more likely than not that the total amounts of unrecognized tax benefits will significantly change in the next twelve months. The Series’ federal tax returns for the prior three fiscal years remain subject to examination by the Internal Revenue Service.
G. Financial Instruments:
In accordance with the Series’ investment objectives and policies, the Series may invest in certain financial instruments that have off-balance sheet risk in excess of the amounts recognized in the financial statements and concentrations of credit and market risk. These instruments and their significant corresponding risks are described below:
1. Foreign Market Risks: Investments in foreign markets may involve certain considerations and risks not typically associated with investments in the United States of America, including the possibility of future political and economic developments and the level of foreign governmental supervision and regulation of foreign securities markets. These markets are generally smaller, less liquid and more volatile than the major securities markets in the United States of America. Consequently, acquisition and disposition of international securities held by the Series may be inhibited.
Series that have significant exposure to certain countries, such as The United Kingdom Small Company Series that concentrates investments in the United Kingdom, can be expected to be impacted by the political and economic conditions within such countries. For example, there is continuing uncertainty around the future of the euro and the European Union (EU) following the United Kingdom’s (UK) exit from the EU (referred to as “Brexit”). Brexit may cause greater market volatility and illiquidity, currency fluctuations, deterioration in economic activity, a decrease in business confidence, and increased likelihood of a recession in the UK. While it is not possible to determine the precise impact these events may have on the Series, the ultimate impact on the UK, EU countries, other countries or parties that transact with the UK and EU, and the broader global economy could be significant and could adversely affect the value and liquidity of the Series’ investments.
Derivative Financial Instruments:
Summarized below are the specific types of derivative instruments used by the Series.
2. Futures Contracts: The Series listed below may purchase or sell futures contracts and options on futures contracts for equity securities and indices to increase or decrease market exposure based on actual or expected cash inflows to or outflows from the Series. Upon entering into a futures contract, a Series deposits cash or pledges U.S. Government securities to a broker in an amount equal to the minimum “initial margin” requirements of the exchange on which the contract is traded. Subsequent payments are received from or paid to the broker each day, based on the daily fluctuation in the market value of the contract. These receipts or payments are known as “variation margin” and are recorded daily by the Series as unrealized gains or losses until the contracts are closed. When the contracts are closed, the Series records a realized gain or loss, which is presented in the Statements of Operations as a net realized gain or loss on futures, equal to the difference between the value of the contract at the time it was opened and the value at the time it was closed.
Risks may arise upon entrance into futures contracts from potential imperfect price correlations between the futures contracts and the underlying securities, from the possibility of an illiquid secondary market for these instruments and from the possibility that the Series could lose more than the initial margin requirements. A Portfolio entering into stock index futures is subject to equity price risk from those futures contracts.
Securities have been segregated as collateral for open futures contracts.
The average volume (based on the open positions at each fiscal month-end) of derivative activity for the year ended October 31, 2022 was as follows (amounts in thousands):
| | | Futures* | |
| The Canadian Small Company Series | | $ | 734 | |
* Average Notional Value of contracts.
The following is a summary of the realized and change in unrealized gains and losses from the Series’ derivative instrument holdings categorized by primary risk exposure for the year ended October 31, 2022 (amounts in thousands):
| | | Realized Gain (Loss) on | |
| | | Derivatives | |
| | | Total | | | Equity
Contracts(1) | |
| The Asia Pacific Small Company Series | | $ | 349 | | | $ | 349 | * |
| The Canadian Small Company Series | | | 27 | | | | 27 | * |
(1) Presented on Statements of Operations as Net Realized Gain (Loss) on: Futures.
| * | As of October 31, 2022, there were no futures contracts outstanding. During the year ended October 31, 2022, the Series had limited activity in futures contracts. |
H. Line of Credit and Interfund Lending Program:
The Trust, together with other Dimensional-advised portfolios, has entered into a $500 million uncommitted, unsecured discretionary line of credit effective April 5, 2023 with its domestic custodian bank. A line of credit with similar terms was in effect through April 5, 2023. Each portfolio is permitted to borrow, subject to its investment limitations, up to a maximum of $250 million, as long as total borrowings under the line of credit do not exceed $500 million in the aggregate. Borrowings under the line of credit are charged interest at rates agreed upon by the parties at the time of borrowing. Each portfolio is individually, and not jointly, liable for its particular advances under the line of credit. There is no commitment fee on the unused portion of the line of credit. The agreement for the discretionary line of credit may be terminated by either party at any time. The agreement for the line of credit expires on April 3, 2024.
The Trust, together with other Dimensional-advised portfolios, has also entered into an additional $700 million unsecured line of credit with its international custodian bank effective December 28, 2022. A line of credit with similar terms was in effect through December 28, 2022. Each portfolio is permitted to borrow, subject to its investment limitations, up to a maximum of the lower of one-quarter of such portfolio’s net assets or $500 million, as long as total borrowings under the line of credit do not exceed $700 million in the aggregate. Each portfolio is individually, and not jointly, liable for its particular advances under the line of credit. Borrowings under the line of credit are charged interest at rates agreed upon by the parties at the time of borrowing. There is no commitment fee on the unused portion of the line of credit. The agreement for the discretionary line of credit may be terminated by either party at any time. The line of credit agreement expires on December 27, 2023.
For the year ended October 31, 2022, borrowings by the following Series under the lines of credit were as follows (amounts in thousands, except percentages and days):
| | | Weighted | | | Weighted | | | Number | | | Interest | | | Maximum Amount | | | Outstanding | |
| | | Average | | | Average | | | of Days | | | Expense | | | Borrowed During | | | Borrowings as | |
| | | Interest Rate | | | Loan Balance | | | Outstanding* | | | Incurred | | | the Period | | | of 10/31/2022 | |
| The Japanese Small Company Series | | | 1.72 | % | | $ | 1,701 | | | | 18 | | | $ | 2 | | | $ | 11,233 | | | | — | |
| The Asia Pacific Small Company Series | | | 2.09 | % | | | 862 | | | | 48 | | | | 3 | | | | 15,068 | | | | — | |
| The United Kingdom Small Company Series | | | 1.03 | % | | | 913 | | | | 27 | | | | 1 | | | | 3,521 | | | | — | |
| The Continental Small Company Series | | | 2.20 | % | | | 3,006 | | | | 30 | | | | 7 | | | | 11,952 | | | | — | |
| The Canadian Small Company Series | | | 1.04 | % | | | 89 | | | | 14 | | | | — | | | | 428 | | | | — | |
| * | Number of Days Outstanding represents the total single or consecutive days during the year ended October 31, 2022, that each Series’ available line of credit was used. |
Pursuant to an exemptive order issued by the SEC (the “Order”), the Series may participate in an interfund lending program among certain portfolios managed by the Advisor (portfolios that operate as feeder funds do not participate in the program). The program allows the participating portfolios to borrow money from and loan money to each other for temporary or emergency purposes, subject to the conditions in the Order. A loan can only be made through the program if the interfund loan rate on that day is more favorable to both the borrowing and lending portfolios as compared to rates available through short-term bank loans or investments in overnight repurchase agreements and money market funds, respectively, as detailed in the Order. Further, a portfolio may participate in the program only if and to the extent that such participation is consistent with its investment objectives and limitations. Interfund loans have a maximum duration of seven days and may be called on one business day’s notice.
The Series did not use the interfund lending program during the year ended October 31, 2022.
I. Affiliated Trades:
Cross trades for the year ended October 31, 2022, if any, were executed by the Series pursuant to procedures adopted by the Board of Trustees of the Trust to ensure compliance with Rule 17a-7 under the 1940 Act. Cross trading is the buying or selling of portfolio securities between series of investment companies, or between a series of an investment company and another entity, that are or could be considered affiliates by virtue of a common investment advisor (or affiliated investment advisors), common Trustees and/or common Officers. At its regularly scheduled meetings, the CCO certifies to the Board that the 17a-7 transactions entered into by the Series complied with the Rule 17a-7 Procedures adopted by the Board of Trustees of the Trust.
For the year ended October 31, 2022, cross trades by the Series under Rule 17a-7 were as follows (amounts in thousands):
| | | | | | | | | Realized | |
| Series | | Purchases | | | Sales | | | Gain (Loss) | |
| The Japanese Small Company Series | | $ | 42,494 | | | $ | 31,791 | | | $ | (2,373 | ) |
| The Asia Pacific Small Company Series | | | 14,105 | | | | 30,116 | | | | 2,231 | |
| The United Kingdom Small Company Series | | | 32,010 | | | | 19,557 | | | | 3,055 | |
| The Continental Small Company Series | | | 31,836 | | | | 62,380 | | | | 12,864 | |
| The Canadian Small Company Series | | | 24,127 | | | | 33,685 | | | | 10,646 | |
J. Securities Lending:
As of October 31, 2022, each Series had securities on loan to brokers/dealers, for which each such Series received cash collateral. The Series also received non-cash collateral consisting of short-and/or long-term U.S. Treasuries and U.S. government agency securities as follows (amounts in thousands):
| | | Non-Cash | |
| | | Collateral | |
| | | Market Value | |
| The Japanese Small Company Series | | $ | 86,329 | |
| The Asia Pacific Small Company Series | | | 102,694 | |
| The Continental Small Company Series | | | 217 | |
| The Canadian Small Company Series | | | 22,524 | |
Each Series invests the cash collateral, as described below, and records a liability for the return of the collateral, during the period the securities are on loan. Loans of securities are expected at all times to be secured by collateral in an amount (i) equal to at least 100% of the current market value of the loaned securities with respect to securities of the U.S. government or its agencies, (ii) generally equal to 102% of the current market value of the loaned securities with respect to U.S. securities, and (iii) generally equal to 105% of the current market value of the loaned securities with respect to foreign securities. However, daily market fluctuations could cause the Series’ collateral to be lower or higher than the expected thresholds. If this were to occur, the collateral would be adjusted the next business day to ensure adequate collateralization. In the event of default or bankruptcy by the other party to the agreement, realization and/or retention of the collateral may be subject to legal proceedings. If the borrower fails to return loaned securities, cash collateral being maintained by the borrower is insufficient to cover the value of loaned securities and such collateral insufficiency is not the result of investment losses, the lending agent has agreed to pay the amount of the shortfall to the Series or, at the option of the lending agent, to replace the securities. In the event of the bankruptcy of the borrower, the Series could experience delay in recovering the loaned securities or only recover cash or a security of equivalent value.
Subject to their stated investment policies, each Series will generally invest the cash collateral received for the loaned securities in The DFA Short Term Investment Fund (the “Money Market Series”), an affiliated registered money market fund advised by the Advisor for which the Advisor receives a management fee of 0.05% of the average daily net assets of the Money Market Series. Income received from the Money Market Series is netted with fees for securities lending and collateral investment expenses and with other payments to and from borrowers of securities. The Series also may invest the cash collateral received for the loaned securities in securities of the U.S. government or its agencies, repurchase agreements collateralized by securities of the U.S. government or its agencies, and affiliated or unaffiliated money market funds that are registered or unregistered. For purposes of this paragraph, agencies include both agency debentures and agency mortgage-backed securities. Additionally, each Series will be able to terminate the loan at any time and will receive reasonable interest on the loan, as well as amounts equal to any dividends, interest or, other distributions on the loaned securities. However, dividend income received from loaned securities may not be eligible for taxation at qualified dividend income rates.
The following table reflects a breakdown of transactions accounted for as secured borrowings, the gross obligation by the type of collateral pledged, and the remaining contractual maturity of those transactions as of October 31, 2022 (amounts in thousands):
| | | Remaining Contractual Maturity of the Agreements | |
| | | As of October 31, 2022 | |
| | | Overnight and | | | <30 | | | Between | | | >90 | | | | |
| | | Continuous | | | days | | | 30 & 90 days | | | days | | | Total | |
| Securities Lending Transactions | | | | | | | | | | | | | | | | | | | | |
| The Japanese Small Company Series | | | | | | | | | | | | | | | | | | | | |
| Common Stocks | | $ | 56,630 | | | | — | | | | — | | | | — | | | $ | 56,630 | |
| The Asia Pacific Small Company Series | | | | | | | | | | | | | | | | | | | | |
| Common Stocks | | | 17,192 | | | | — | | | | — | | | | — | | | | 17,192 | |
| The United Kingdom Small Company Series | | | | | | | | | | | | | | | | | | | | |
| Common Stocks | | | 29,920 | | | | — | | | | — | | | | — | | | | 29,920 | |
| The Continental Small Company Series | | | | | | | | | | | | | | | | | | | | |
| Common Stocks, Rights/Warrants | | | 267,759 | | | | — | | | | — | | | | — | | | | 267,759 | |
| The Canadian Small Company Series | | | | | | | | | | | | | | | | | | | | |
| Common Stocks, Rights/Warrants | | | 222,227 | | | | — | | | | — | | | | — | | | | 222,227 | |
K. Indemnitees; Contractual Obligations:
Under the Trust’s organizational documents, its Officers and Trustees are indemnified against certain liabilities arising out of the performance of their duties to the Trust.
In the normal course of business, the Trust enters into contracts that contain a variety of representations and warranties that provide general indemnification. The Trust’s maximum exposure under these arrangements is unknown as this would involve future claims that may be made against the Trust and/or its affiliates that have not yet occurred. However, based on experience, the Trust expects the risk of loss to be remote.
L. Recently Issued Accounting Standards and Regulations:
In March 2020, the Financial Accounting Standards Board (FASB) issued Accounting Standards Update (ASU) No. 2020-04, Reference Rate Reform (Topic 848) – Facilitation of the Effects of Reference Rate Reform on Financial Reporting. In January 2021, the FASB issued ASU No. 2021-01, with further amendments to Topic 848. The amendments in the ASUs provide optional temporary accounting recognition and financial reporting relief from the effect of certain types of contract modifications due to the planned discontinuation of the LIBOR and other interbank-offered based reference rates as of the end of 2021 and 2023. The ASUs were effective for certain reference rate-related contract modifications that occurred during the period March 12, 2020 through December 31, 2022. Management has reviewed the requirements and determined the adoption of these ASUs will not have a material impact on the Series’ financial statements.
M. Other:
The Series and the Trust are subject to claims and suits that arise from time to time in the ordinary course of business (for example, claw back litigation against former shareholders of portfolio companies that filed for bankruptcy, such as the now ended litigation involving The Tribune Company and the ongoing litigation involving Nine West). Although management currently believes that resolving claims against the Series and the Trust, individually or in aggregate, will not have a material adverse impact on the Series’ and the Trust’s financial position, results of operations, or cash flows, these matters are subject to inherent uncertainties and management’s view of these matters may change in the future.
N. Subsequent Event Evaluations:
Management has evaluated the impact of all subsequent events on the Series through the date on which the financial statements were issued and has determined that there are no subsequent events requiring recognition or disclosure in the financial statements.
REPORT OF INDEPENDENT REGISTERED PUBLIC ACCOUNTING FIRM
To the Board of Trustees of The DFA Investment Trust Company and Shareholders of The Japanese Small Company Series, The Asia Pacific Small Company Series, The United Kingdom Small Company Series, The Continental Small Company Series and The Canadian Small Company Series
Opinions on the Financial Statements
We have audited the accompanying statements of assets and liabilities, including the summary schedules of portfolio holdings, of The Japanese Small Company Series, The Asia Pacific Small Company Series, The United Kingdom Small Company Series, The Continental Small Company Series and The Canadian Small Company Series (five of the series constituting The DFA Investment Trust Company, hereafter collectively referred to as the “Series”) as of October 31, 2022, the related statements of operations for the year ended October 31, 2022, the statements of changes in net assets for each of the two years in the period ended October 31, 2022, including the related notes, and the financial highlights for each of the five years in the period ended October 31, 2022 (collectively referred to as the “financial statements”). In our opinion, the financial statements present fairly, in all material respects, the financial position of each of the Series as of October 31, 2022, the results of each of their operations for the year then ended, the changes in each of their net assets for each of the two years in the period ended October 31, 2022, and each of the financial highlights for each of the five years in the period ended October 31, 2022 in conformity with accounting principles generally accepted in the United States of America.
Basis for Opinions
These financial statements are the responsibility of the Series’ management. Our responsibility is to express an opinion on the Series’ financial statements based on our audits. We are a public accounting firm registered with the Public Company Accounting Oversight Board (United States) (PCAOB) and are required to be independent with respect to the Series in accordance with the U.S. federal securities laws and the applicable rules and regulations of the Securities and Exchange Commission and the PCAOB.
We conducted our audits of these financial statements in accordance with the standards of the PCAOB. Those standards require that we plan and perform the audit to obtain reasonable assurance about whether the financial statements are free of material misstatement, whether due to error or fraud.
Our audits included performing procedures to assess the risks of material misstatement of the financial statements, whether due to error or fraud, and performing procedures that respond to those risks. Such procedures included examining, on a test basis, evidence regarding the amounts and disclosures in the financial statements. Our audits also included evaluating the accounting principles used and significant estimates made by management, as well as evaluating the overall presentation of the financial statements. Our procedures included confirmation of securities owned as of October 31, 2022 by correspondence with the custodian, brokers and transfer agent of the investee fund; when replies were not received from brokers, we performed other auditing procedures. We believe that our audits provide a reasonable basis for our opinions.
/s/PricewaterhouseCoopers LLP
Philadelphia, Pennsylvania
December 22, 2022
We have served as the auditor of one or more investment companies in Dimensional Fund Advisors L.P. investment company group since 1981.
FUND MANAGEMENT
(Unaudited)
Trustees/Directors
Each Board of Trustees/Directors (each, the “Board” and collectively, the “Boards”) of The DFA Investment Trust Company (“DFAITC”), DFA Investment Dimensions Group Inc. (“DFAIDG”), Dimensional Investment Group Inc. (“DIG”), Dimensional ETF Trust (!ETF Trust!), and Dimensional Emerging Markets Value Fund (“DEM”) (each, the “Fund” and collectively, the “Funds”) is responsible for establishing the Funds’ policies and for overseeing the management of the Funds. The Trustees/ Directors of the Funds, including all of the disinterested Trustees/Directors, have adopted written procedures to monitor potential conflicts of interest that might develop between portfolios of the Funds (the “Feeder Portfolios”) that invest in certain series of DFAITC or DEM (the “Master Funds”).
Each Board has four standing committees, an Audit Committee, a Nominating and Governance Committee (the “Nominating Committee”), a Mutual Funds-ETF Relations committee and an Investment Strategy Committee (the “Strategy Committee”). The Audit Committee is composed of Reena Aggarwal, George M. Constantinides, Francis A. Longstaff, Abbie J. Smith and Ingrid M. Werner. Each member of the Audit Committee is a disinterested Trustee/Director. The Audit Committee oversees the Fund’s accounting and financial reporting policies and practices the Fund’s internal controls, the Fund’s financial statements and the independent audits thereof and performs other oversight functions as requested by the Board. The Audit Committee recommends the appointment of each Fund’s independent registered certified public accounting firm and acts as a liaison between the Fund’s independent registered certified public accounting firm and the full Board. There were three Audit Committee meetings held during the fiscal year ended October 31, 2022.
Each Board’s Nominating Committee is composed of Reena Aggarwal, George M. Constantinides, Douglas W. Diamond, Francis A. Longstaff, and Heather E. Tookes. Each member of the Nominating Committee is a disinterested Trustee/Director. The Nominating Committee for each Board makes recommendations for nominations of disinterested and interested members on the Board to the disinterested Board members and to the full Board. The Nominating Committee works closely with the other disinterested Trustees to evaluate a candidate’s qualification for Board membership and the independence of such candidate from the Advisor and other principal service providers. The Nominating Committee also periodically reviews the Board governance practices, policies, procedures, and operations; reviews the membership of each committee of the Board; reviews and makes recommendations regarding the Independent Trustees’ compensation; oversees the annual self-assessment of the Board and each committee; considers and recommends to the Board, the selection of “independent legal counsel” (as that term is defined in the 1940 Act); and monitors and considers corporate governance issues that may arise from time to time. There were three Nominating Committee meetings held during the fiscal year ended October 31, 2022.
Each Board’s Strategy Committee is composed of Gerard K. O’Reilly, Douglas W. Diamond, Darrell Duffie, and Heather E. Tookes. The Strategy Committee assists the Board in carrying out its fiduciary duties with respect to the oversight of the Fund and its performance. At the request of the Board or the Advisor, the Strategy Committee (i) reviews the design of possible new series of the Fund, (ii) reviews performance of existing portfolios of the Funds and discusses and recommends possible enhancements to the portfolios’ investment strategies, (iii) reviews proposals by the Advisor to modify or enhance the investment strategies or policies of each portfolio, and (iv) considers issues relating to investment services for each portfolio of the Fund. There were four Strategy Committee meetings held during the fiscal year ended October 31, 2022.
The Mutual Funds-ETF Relations Committee is comprised of George M. Constantinides, Darrell Duffie, and Ingrid M. Werner. At the request of the Board, the Mutual Funds-ETF Relations Committee (i) reviews any newly-proposed expenses to be borne by the ETFs in the Dimensional ETF Trust (“Dimensional ETFs”), portfolios in the DFA mutual fund complex (“Fund Complex”) or changes to the existing expense allocations among the Dimensional ETFs, portfolios in the Fund Complex, and the Advisor, (ii) considers any conflicts of interest that may arise in the operations of the Dimensional ETFs and the portfolios in the Fund Complex, (iii) reviews and considers relevant information relating to the operations of the Dimensional ETFs, and (iv) considers asset flows and performance differences between the similarly managed mutual funds and ETFs of the Funds. There were two Mutual Funds-ETF Relations Committee meetings held for the Trust during the fiscal year ended October 31, 2022.
Certain biographical information for each disinterested Trustee/Director and interested Trustee/Director of the Funds is set forth in the tables below, including a description of each Trustee/Director’s experience as a Trustee/Director of the Funds and as a Director or Trustee of other funds, as well as other recent professional experience.
The statements of additional information (together, “SAI”) of the Funds include additional information about each Trustee/Director. You may obtain copies of the SAI and prospectus of each Fund advised by Dimensional Fund Advisors LP by calling collect (512) 306-7400 or by mailing a request to Dimensional Fund Advisors LP, 6300 Bee Cave Road, Building One, Austin, TX 78746. Prospectuses are also available at http://us.dimensional.com.
Disinterested Directors/Trustees
| | | | | Portfolios | Other Directorships |
| | | | | within the DFA | of Public Companies |
| Name, Address and | | Term of Office1 and | Principal Occupation During | Fund Complex2 | Held During Past |
| Year of Birth | Position | Length of Service | Past 5 Years | Overseen | 5 Years |
Reena Aggarwal c/o Dimensional Fund Advisors LP 6300 Bee Cave Road, Building One Austin, TX 78746 1957 | Director/ Trustee | Since December 2021 | Robert E. McDonough Professor of Business Administration and Finance, McDonough School of Business, Georgetown University (since 2003); Director, Georgetown Center for Financial Markets and Policy (since 2010); and Vice Provost of Faculty (2016-2020), Georgetown University. | 147 portfolios in 5 investment companies | Director, Cohen & Steers (asset management firm) (since 2017) and Director, Nuveen Churchill Direct Lending (private business development company) (since 2019). Formerly, Director, New York Life Investment Management IndexIQ (2008-2021) (22 funds); Director, REAN Cloud (technology) (2015- 2018); Director, FBR & Co. (investment banking) (2011- 2017); and Director, Brightwood Capital Advisors, L.P. (private equity) (2013-2020). |
George M. Constantinides University of Chicago Booth School of Business 5807 S. Woodlawn Avenue Chicago, IL 60637 1947 | Director/ Trustee | DFAIDG – Since 1983; DIG & DEMSince 1993; DFAITC – Since 1992; ETF Trust – Since 2020 | Leo Melamed Professor of Finance, University of Chicago Booth School of Business (since 1978). | 147 portfolios in 5 investment companies | None |
Douglas W. Diamond c/o Dimensional Fund Advisors LP 6300 Bee Cave Road, Building One Austin, TX 78746 1953 | Director/ Trustee | DFAIDG, DIG, DEM & DFAITC – Since 2017; ETF Trust – Since 2020 | Merton H. Miller Distinguished Service Professor of Finance, University of Chicago Booth School of Business (since 1979). Formerly, Visiting Scholar, Federal Reserve Bank of Richmond (1990-2019). | 147 portfolios in 5 investment companies | None |
Darrell Duffie c/o Dimensional Fund Advisors LP 6300 Bee Cave Road, Building One Austin, TX 78746 1954 | Director/ Trustee | DFAIDG, DIG, DEM & DFAITC – Since 2019; ETF Trust – Since 2020 | Adams Distinguished Professor of Management and Professor of Finance, Stanford University (since 1984) and Director, TNB Inc. (bank) (since 2020). | 147 portfolios in 5 investment companies | Formerly, Director, Moody’s Corporation (financial information and information technology) (2008-2018). |
Name, Address and Year of Birth | Position | Term of Office1 and Length of Service | Principal Occupation During Past 5 Years | Portfolios within the DFA Fund Complex2 Overseen | Other Directorships of Public Companies Held During Past 5 Years |
Francis A. Longstaff c/o Dimensional Fund Advisors LP 6300 Bee Cave Road, Building One Austin, TX 78746 1956 | Director/ Trustee | Since December 2021 | Allstate Professor of Insurance and Finance, UCLA, Anderson School of Management; Consultant, NERA Economic Consulting (since 2018); Consultant, Charles River Associates (economic consulting firm) (since 2013); Consultant, Simplex Holdings, Inc. (technology firm) (since 1998); and Expert Witness, Analysis Group (economic consulting firm) (since 2012). | 147 portfolios in 5 investment companies | None |
Abbie J. Smith University of Chicago Booth School of Business 5807 S. Woodlawn Avenue Chicago, IL 60637 1953 | Director/ Trustee | DFAIDG, DIG, DEM & DFAITC – Since 2000; ETF Trust - Since 2020 | Boris and Irene Stern Distinguished Service Professor of Accounting and James S. Ely, III Faculty Fellow, University of Chicago Booth School of Business (since 1980). | 147 portfolios in 5 investment companies | Director (since 2000) and formerly, Lead Director (2014-2017), HNI Corporation (office furniture); Director, Ryder System Inc. (transportation, logistics and supplychain management) (since 2003); and Trustee, UBS Funds (2 investment companies within the fund complex) (13 portfolios) (since 2009). |
Heather E. Tookes Yale School of Management 165 Whitney Avenue New Haven, CT 06511 1974 | Director/ Trustee | Since December 2021 | Professor of Finance, Yale School of Management (since 2004). | 147 portfolios in 5 investment companies | Director, Payoneer Inc. (digital payments) (since 2021); Director, Ariel Investments LLC (since 2017); and Director, Community Foundation of Greater New Haven (community foundation and grant-making) (since 2022). Formerly, Director, KCG Holdings (trading company) (January 2017-July 2017). |
Name, Address and Year of Birth | Position | Term of Office1 and Length of Service | Principal Occupation During Past 5 Years | Portfolios within the DFA Fund Complex2 Overseen | Other Directorships of Public Companies Held During Past 5 Years |
Ingrid M. Werner c/o Dimensional Fund Advisors LP 6300 Bee Cave Road, Building One Austin, TX 78746 1961 | Director/ Trustee | DFAIDG, DIG, DEM & DFAITC – Since 2019; ETF Trust - Since 2020 | Martin and Andrew Murrer Professor of Finance, Fisher College of Business, The Ohio State University (since 1998). Adjunct Member, the Prize Committee for the Swedish Riksbank Prize in Economic Sciences in Memory of Alfred Nobel (annual award for significant scientific research contribution) (since 2018). Director, American Finance Association (global association of academic researchers and practitioners in finance) (since January 2019). Member, Scientific Board, Leibniz Institute for Financial Research (institute supporting academic research in finance) (since 2020). Chair, Economic Advisory Committee, FINRA (since 2017). Chairman, Scientific Advisory Board, Swedish House of Finance (institute supporting academic research in finance) (since 2014). Member, Scientific Board, Danish Finance Institute (institute supporting academic research in finance) (since 2017). Fellow, Center for Analytical Finance (academic research) (since 2015). Associate Editor, Journal of Finance (since 2016). Formerly, President, Western Finance Association (global association of academic researchers and practitioners in finance) (2018-2019). Formerly, Member, Academic Board, Mistra Financial Systems (organization funding academic research on environment, governance and climate/sustainability in finance) (2016-2021). | 147 portfolios in 5 investment companies | Director, Fourth Swedish AP Fund (pension fund asset management) (since 2017). |
Interested Directors/Trustees
The following interested Directors are described as such because each is deemed to be an “interested person,” as that term is defined under the 1940 Act, due to his position with the Advisor.
Name, Address and Year of Birth | Position | Term of Office1 and Length of Service | Principal Occupation During Past 5 Years | Portfolios within the DFA Fund Complex2 Overseen | Other Directorships of Public Companies Held During Past 5 Years |
David P. Butler c/o Dimensional Fund Advisors LP 6300 Bee Cave Road, Building One, Austin, TX 78746 1964 | Director Co-Chief Executive Officer | Director since December 2021 Co-Chief Executive Officer since 2017 (DFAIDG, DIG, DEM & DFAITC); 2020 (ETF Trust) | Co-Chief Executive Officer of Dimensional Emerging Markets Value Fund (“DEM”), DFAIDG, Dimensional Investment Group Inc. (“DIG”), The DFA Investment Trust Company (“DFAITC”), Dimensional Holdings Inc., Dimensional Fund Advisors LP, Dimensional Investment LLC, and DFA Securities LLC (collectively with DEM, DFAIDG, DIG and DFAITC, the “DFA Entities”) (since 2017), DFA Canada LLC (since 2018), Dimensional Holdings LLC (since 2017), and Dimensional ETF Trust (since 2020); Chief Executive Officer of Dimensional Fund Advisors Canada ULC (since 2018); Director (since 2017) of Dimensional Holdings Inc., Dimensional Fund Advisors Canada ULC, Dimensional Japan Ltd., Dimensional Advisors Ltd., Dimensional Fund Advisors Ltd., and DFA Australia Limited; Director and Co-Chief Executive Officer (since 2017) of Dimensional Cayman Commodity Fund I Ltd.; Chief Executive Officer of Dimensional Fund Advisors Canada ULC (since 2018); Head of Global Financial Advisor Services for Dimensional Fund Advisors LP (since 2007) and Dimensional Investment LLC (since 2017); Formerly, Vice President (2007 – 2017) of all the DFA Entities; Formerly, Head of Global Advisor Services for Dimensional Investment LLC (2011-2017). | 147 portfolios in 5 investment companies | None |
Gerard K. O’Reilly c/o Dimensional Fund Advisors LP 6300 Bee Cave Road, Building One, Austin, TX 78746 1976 | Chairman and Director Co-Chief Executive Officer and Chief Investment Officer | Chairman and Director since December 2021 Co-Chief Executive Officer and Chief Investment Officer since 2017 (DFAIDG, DIG, DEM & DFAITC); 2020 (ETF Trust) | Co-Chief Executive Officer and Chief Investment Officer of the DFA Entities (since 2017) and Dimensional ETF Trust (since 2020); Co-Chief Executive Officer of Dimensional Canada LLC (since 2018); Chief Investment Officer of Dimensional Fund Advisors Canada ULC (since 2017); Director, Chief Investment Officer (since 2017) and Vice President (since 2014) of DFA Australia Limited; Chief Investment Officer (since 2018) and Vice President (since 2016) of Dimensional Japan Ltd.; Director, Co- Chief Executive Officer and Chief Investment Officer (since 2017) of Dimensional Cayman Commodity Fund I Ltd.; Director of Dimensional Funds plc (since 2014), Dimensional Fund II plc (since 2014), Dimensional Holdings Inc. (since 2017), Dimensional Advisors Ltd. (since 2017), and Dimensional Ireland Limited (since 2018). Formerly, Executive Vice President (2017) and Co-Chief Investment Officer (2014 – 2017) of the DFA Entities; Formerly, Vice President (2007 – 2017) of the DFA Entities; Formerly, Vice President and Co-Chief Investment Officer (2014 – 2017) of Dimensional Fund Advisors Canada ULC. Formerly, Director of Dimensional Fund Advisors Pte. Ltd. (2017-2018) and Dimensional Fund Advisors Ltd. (2018-2021). | 147 portfolios in 5 investment companies | None |
| 1 | Each Director/Trustee holds office for an indefinite term until his or her successor is elected and qualified. |
| 2 | Each Director/Trustee is a director or trustee of each of the five registered investment companies within the DFA Fund Complex, which include: the Fund; DIG; DFAITC; DEM; and Dimensional ETF Trust. Each disinterested Director/Trustee also serves on the Independent Review Committee of the Dimensional Funds, mutual funds registered in the provinces of Canada and managed by the Advisor’s affiliate, Dimensional Fund Advisors Canada ULC. |
Officers
Below is the name, year of birth, information regarding positions with the Funds and the principal occupation for each officer of the Funds. The address of each officer is 6300 Bee Cave Road, Building One, Austin, TX 78746. Each of the officers listed below holds the same office (except as otherwise noted) in the DFA Entities.
| | Term of Office1 | |
| Name and Year of | | and Length of | |
| Birth | Position | Service | Principal Occupation During Past 5 Years |
| Valerie A. Brown | Vice President and | Since 2001 | Vice President and Assistant Secretary of |
| 1967 | Assistant Secretary | | • all the DFA Entities (since 2001) |
| | | • DFA Australia Limited (since 2002) |
| | | • Dimensional Fund Advisors Ltd. (since 2002) |
| | | • Dimensional Cayman Commodity Fund I Ltd. (since 2010) |
| | | • Dimensional Fund Advisors Pte. Ltd. (since 2012) |
| | | • Dimensional Hong Kong Limited (since 2012) |
| | | • Dimensional ETF Trust (since 2020) |
| | | Director, Vice President and Assistant Secretary (since 2003) of |
| | | • Dimensional Fund Advisors Canada ULC |
| Ryan P. Buechner | Vice President and | Since 2019 | Vice President and Assistant Secretary of |
| 1982 | Assistant Secretary | | • DFAIDG, DIG, DFAITC and DEM (since 2019) |
| | | • Dimensional ETF Trust (since 2020) |
| | | Vice President (since January 2018) of |
| | | • Dimensional Holdings Inc. |
| | | • Dimensional Fund Advisors LP |
| | | • Dimensional Investment LLC |
| | | • DFA Securities LLC |
| Stephen A. Clark | Executive Vice | Since 2017 | Executive Vice President of |
| 1972 | President | | • all the DFA Entities (since 2017) |
| | | • Dimensional ETF Trust (since 2020) |
| | | Director and Vice President (since 2016) of |
| | | • Dimensional Japan Ltd. |
| | | Chairman (since 2018) of |
| | | • Dimensional Fund Advisors Canada ULC President and Director (since 2016) of |
| | | • Dimensional Fund Advisors Canada ULC Vice President (since 2008) and |
| | | Director (since 2016) of |
| | | • DFA Australia Limited Director (since 2016) of |
| | | • Dimensional Advisors Ltd. |
| | | • Dimensional Fund Advisors Pte. Ltd. |
| | | • Dimensional Hong Kong Limited Vice President of |
| | | • Dimensional Advisors Ltd. (since 2016) |
| | | • Dimensional Hong Kong Limited (since 2016) |
| | | • Dimensional Fund Advisors Pte. Ltd. (since 2019) Formerly, Director (2016-2021) of |
| | | • Dimensional Fund Advisors Ltd. Formerly, Vice President (2004 – 2017) of |
| | | • all the DFA Entities |
| | | Formerly, Vice President (2010 – 2016) of |
| | | • Dimensional Fund Advisors Canada ULC Formerly, Vice President (2016-2019) of |
| | | • Dimensional Fund Advisors Pte. Ltd. Formerly, Interim Chief Executive Officer |
| | | (2019-2020) of |
| | | • Dimensional Fund Advisors Pte. Ltd. |
| | | Formerly, Head of Institutional, North America (2012 – 2013) and Head of Global |
| | | Institutional Services (2014-2018) for |
| | | • Dimensional Fund Advisors LP |
| | | Term of Office1 | |
| Name and Year of | | and Length of | |
| Birth | Position | Service | Principal Occupation During Past 5 Years |
| Lisa M. Dallmer | Chief Operating Officer | Since June 2021 | Chief Operating Officer (since June 2021) of |
| 1972 | | | • the DFA Fund Complex |
| | | | Executive Vice President (since January 2020) |
| | | | • Dimensional Holdings Inc. |
| | | | • Dimensional Fund Advisors LP |
| | | | • Dimensional Investment LLC |
| | | | • DFA Securities LLC |
| | | | Chief Operating Officer (since December 2019) |
| | | | • Dimensional Holdings Inc. |
| | | | • Dimensional Fund Advisors LP |
| | | | • Dimensional Investment LLC |
| | | | • DFA Securities LLC |
| | | | Vice President (since 2020) of |
| | | | • DFA Australia Limited |
| | | | • Dimensional Advisors Ltd. |
| | | | • Dimensional Fund Advisors Canada ULC |
| | | | • Dimensional Fund Advisors Pte. Ltd. |
| | | | • Dimensional Ireland Limited |
| | | | • Dimensional Japan Ltd. |
| | | | Formerly, Vice President, Chief Financial Officer, and Treasurer |
| | | | (June 2020 – June 2021) of |
| | | | • the DFA Fund Complex |
| | | | Formerly, Senior Vice President, Business Operations |
| | | | (March 2019 – October 2019) at |
| | | | • Delphix Inc. |
| | | | Formerly, Chief Operating Officer Global Technology & Operations, Managing |
| | | | Director (2014 – 2018) of |
| | | | • BlackRock Inc. |
| Bernard J. Grzelak | Vice President | Since June 2021 | Vice President (since June 2021) of |
| 1971 | | | • the DFA Fund Complex |
| | | | Vice President, Chief Financial Officer and Treasurer (since September |
| | | | 2020) of |
| | | | • DFA Australia Limited |
| | | | • Dimensional Fund Advisors Canada ULC |
| | | | • DFA Securities LLC |
| | | | • Dimensional Advisors Ltd. |
| | | | • Dimensional Fund Advisors LP |
| | | | • Dimensional Fund Advisors Ltd. |
| | | | • Dimensional Fund Advisors Pte. Ltd. |
| | | | • Dimensional Holdings Inc. |
| | | | • Dimensional Hong Kong Limited |
| | | | • Dimensional Investment LLC |
| | | | Vice President (since March 2021) of |
| | | | • Dimensional Ireland Limited |
| | | | Formerly, Partner (2008 – 2020), Chief Operating Officer, Global Funds and |
| | | | Risk (2018 – 2020), Chief Operations Officer (2016 – 2018), and Director of |
| | | | Fund Administration (2003 – 2016) of |
| | | | • Lord Abbett & Co. LLC |
| | | | Formerly, Chief Financial Officer (2017 - 2020), and Treasurer (2003 – 2017) of |
| | | | • Lord Abbett Family of Funds |
| | | Term of Office1 | |
| Name and Year of | | and Length of | |
| Birth | Position | Service | Principal Occupation During Past 5 Years |
| Eric Hall | Vice President and | Since June 2021 | Vice President and Assistant Treasurer (since June 2021) of |
| 1978 | Assistant Treasurer | | • the DFA Fund Complex |
| | | | Formerly, Data Integrity Team Lead (December 2019 – April 2021) of |
| | | | • Clearwater Analytics |
| | | | Formerly, Assistant Vice President and Assistant Treasurer |
| | | | (March 2015 – November 2019) at |
| | | | • INVESCO, U.S. (formerly, OppenheimerFunds, Inc.) |
| Jeff J. Jeon | Vice President | Since 2004 | Vice President (since 2004) of |
| 1973 | | | • all the DFA Entities Vice President (since 2020) of |
| | | | • Dimensional ETF Trust |
| | | | Vice President and Assistant Secretary (since 2010) of |
| | | | • Dimensional Cayman Commodity Fund I Ltd. Formerly, Assistant Secretary |
| | | | (2017-2019) of |
| | | | • all the DFA Entities |
| Joy Lopez | Vice President and | Vice President | Vice President of |
| 1971 | Assistant Treasurer | since 2015 and | • all the DFA Entities (since 2015) |
| | | Assistant Treasurer | • Dimensional Fund Advisors Ltd. (since 2015) |
| | | since 2017 | • Dimensional ETF Trust (since 2020) |
| | | | • DFA Australia Limited (since 2020) |
| | | | • Dimensional Fund Advisors Canada ULC (since 2020) |
| | | | • Dimensional Ireland Limited (since 2020) |
| | | | Assistant Treasurer of |
| | | | • DFAIDG, DIG, DFAITC and DEM (since 2017) |
| | | | • Dimensional ETF Trust (since 2020) |
| Kenneth M. Manell | Vice President | Since 2010 | Vice President of |
| 1972 | | | • all the DFA Entities (since 2010) |
| | | | • Dimensional Cayman Commodity Fund I Ltd. (since 2010) |
| | | | • Dimensional ETF Trust (since 2020) |
| Jan Miller | Vice President, Chief | Since June 2021 | Vice President, Chief Financial Officer, and Treasurer (since June 2021) of |
| 1963 | Financial Officer, and | | • the DFA Fund Complex |
| | Treasurer | | Formerly, Director (May 2019 – January 2021) at |
| | | | • INVESCO, U.S. (formerly, OppenheimerFunds, Inc.) |
| | | | Formerly, Vice President and Assistant Treasurer (September 2012 – May 2019) at |
| | | | • OppenheimerFunds, Inc. |
| | | Term of Office1 | |
| Name and Year of | | and Length of | |
| Birth | Position | Service | Principal Occupation During Past 5 Years |
| Catherine L. Newell | President and General | President since | President of |
| 1964 | Counsel | 2017 and General | • DFAIDG, DIG, DFAITC and DEM (since 2017) |
| | Counsel since 2001 | • Dimensional ETF Trust (since 2020) |
| | | General Counsel of |
| | | • all the DFA Entities (since 2001) |
| | | • Dimensional Fund Advisors LP (since 2006) |
| | | • Dimensional Holdings Inc (since 2006) |
| | | • Dimensional Investment LLC (since 2009) |
| | | • DFA Canada LLC (since 2009) |
| | | • Dimensional ETF Trust (since 2020) |
| | | Executive Vice President (since 2017) of |
| | | • Dimensional Fund Advisors LP |
| | | • Dimensional Holdings Inc. |
| | | • DFA Securities LLC |
| | | • Dimensional Investment LLC |
| | | Secretary of |
| | | • Dimensional Fund Advisors LP (since 2006) |
| | | • Dimensional Holdings Inc. (since 2006) |
| | | • DFA Securities LLC (since 2006) |
| | | • Dimensional Investment LLC (since 2009) |
| | | Vice President (since 1997) and Secretary (since 2002) of |
| | | • DFA Australia Limited |
| | | • Dimensional Fund Advisors Ltd. |
| | | Vice President and Secretary of |
| | | • Dimensional Fund Advisors Canada ULC (since 2003) |
| | | • DFA Canada LLC (since 2009) |
| | | • Dimensional Cayman Commodity Fund I Ltd. (since 2010) |
| | | • Dimensional Japan Ltd. (since 2012) |
| | | • Dimensional Advisors Ltd (since 2014) |
| | | • Dimensional Fund Advisors Pte. Ltd. (since 2012) |
| | | Vice President and Assistant Secretary (since 2012) of |
| | | • Dimensional Hong Kong |
| | | Limited Director of |
| | | • Dimensional Australia Limited (since 2007) |
| | | • Dimensional Funds plc (since 2002) |
| | | • Dimensional Funds II plc (since 2006) |
| | | • Director of Dimensional Japan Ltd. (since 2012) |
| | | • Dimensional Advisors Ltd. (since 2012) |
| | | • Dimensional Fund Advisors Pte. Ltd. (since 2012) |
| | | • Dimensional Hong Kong Limited (since 2012) |
| | | • Dimensional Ireland Limited (since 2018) |
| | | Formerly, Vice President and Secretary (2010 – 2014) of |
| | | • Dimensional SmartNest (US) LLC |
| | | Formerly, Vice President (1997 – 2017) and Secretary (2000 – 2017) of |
| | | • DFAIDG, DIG, DFAITC and DEM |
| | | Formerly, Vice President of |
| | | • Dimensional Fund Advisors LP (1997 – 2017) |
| | | • Dimensional Holdings Inc. (2006 – 2017) |
| | | • DFA Securities LLC (1997 – 2017) |
| | | • Dimensional Investment LLC (2009 – 2017) Formerly, Director (2002 – 2021) of |
| | | • Dimensional Fund Advisors Ltd. |
| | | Term of Office1 | |
| Name and Year of | | and Length of | |
| Birth | Position | Service | Principal Occupation During Past 5 Years |
| Selwyn J. Notelovitz | Vice President | Since September | Vice President (since September 2021) of |
| 1961 | | 2021 | • the DFA Fund Complex |
| | | Vice President (since December 2012) and Chief Compliance Officer (since July 2020) of |
| | | • DFA Securities LLC |
| | | • Dimensional Fund Advisors LP |
| | | • Dimensional Holdings Inc. |
| | | • Dimensional Investment LLC |
| | | Chief Compliance Officer (since July 2020) of: |
| | | • DFA Australia Limited |
| | | • Dimensional Fund Advisors Ltd. |
| | | • Dimensional Fund Advisors Canada ULC |
| | | Formerly, Deputy Chief Compliance Officer (2013-2020) of: |
| | | • DFA Fund Complex |
| | | • DFA Securities LLC |
| | | • Dimensional Fund Advisors LP |
| | | • Dimensional Holdings Inc. |
| | | • Dimensional Investment LLC |
| | | Formerly, Vice President (2013-2020) of: |
| | | • DFA Fund Complex |
| | | Formerly, Director (2019-2021) of: |
| | | • Dimensional Ireland Limited |
| Carolyn L. O | Vice President and | Vice President | Vice President and Secretary of |
| 1974 | Secretary | since 2010 and | • DFAIDG, DIG, DFAITC and DEM (since 2010 and 2017, respectively) |
| | Secretary since | • Dimensional ETF Trust (since 2020) |
| | 2017 | Vice President (since 2010) and Assistant Secretary (since 2016) of |
| | | • Dimensional Fund Advisors LP |
| | | • Dimensional Holdings Inc. |
| | | • Dimensional Investment LLC Vice President of |
| | | • DFA Securities LLC (since 2010) |
| | | • Dimensional Cayman Commodity Fund I Ltd. (since 2010) |
| | | • Dimensional Fund Advisors Canada ULC (since 2016) |
| | | Assistant Secretary (since 2016) of |
| | | • DFA Securities LLC |
| Randy C. Olson | Chief Compliance | Since 2020 | Chief Compliance Officer (since 2020) |
| 1980 | Officer | | • the DFA Fund Complex |
| | | • Vice President (since 2016) of |
| | | • DFA Securities LLC |
| | | • Dimensional Fund Advisors LP |
| | | • Dimensional Holdings Inc. |
| | | • Dimensional Investment LLC |
| | | Formerly, Vice President – Senior Compliance Officer |
| | | • Dimensional Investment Advisors LP (January 2020 – August |
| | | 2020 and July 2014 – March 2017) |
| | | Formerly, Vice President – Head of Compliance & Operations Asia Ex-Japan |
| | | • Dimensional Investment Advisors LP (April 2017 – January 2020) |
| James J. Taylor | Vice President and | Since 2020 | Vice President and Assistant Treasurer (since 2020) of |
| 1983 | Assistant Treasurer | | • the DFA Fund Complex Vice President |
| | | • Dimensional Holdings Inc. (since 2016) |
| | | • Dimensional Fund Advisors LP (since 2016) |
| | | • Dimensional Investment LLC (since 2016) |
| | | • DFA Securities LLC (since 2016) |
| | | • Dimensional Fund Advisors Canada ULC (since 2020) |
| 1 | Each officer holds office for an indefinite term at the pleasure of the Board of Directors and until his or her successor is elected and qualified. |
VOTING PROXIES ON FUND PORTFOLIO SECURITIES
A description of the policies and procedures that the Fund uses in voting proxies relating to securities held in the portfolio is available (1) without charge, upon request, by calling collect: (512) 306-7400; (2) from the Advisor’s website at www.dimensional.com; and (3) on the SEC’s website at http://www.sec.gov. Information regarding how the Advisor votes these proxies is available from the EDGAR database on the SEC’s website at http://www.sec.gov and from the Advisor’s website at www.dimensional.com/us-en/who-we-are/investment-stewardship and reflects the twelve-month period beginning July 1st and ending June 30th.
Distributor for the SA Funds:
Foreside Financial Services, LLC
Three Canal Plaza, Suite 100,
Portland, ME 04101
www.foreside.com
This report is submitted for the general information of the shareholders of the SA Funds. It is not authorized for distribution to prospective investors in the SA Funds unless preceded or accompanied by an effective prospectus, which includes information regarding the SA Funds’ objectives and policies, experience of its management, and other information.
Item 1 (b)
Not applicable.
Item 2. Code of Ethics.
(a) As of the end of the period covered by this Form N-CSR, the registrant has adopted a code of ethics, as defined in Item 2(b) of Form N-CSR, that applies to the registrant’s chief executive officer and chief financial and accounting officer.
(c) During the period, the registrant’s code of ethics was not revised.
(d) The registrant has not granted any waivers from any provisions of its code of ethics during the period covered by this Form N-CSR.
(e) Not applicable.
(f) A copy of the registrant’s code of ethics is filed as Exhibit 13(a)(1) to this Form N-CSR.
Item 3. Audit Committee Financial Expert.
(a)(1) The registrant’s Board of Trustees (the “Board”) has determined that the registrant has three members serving on the registrant’s Audit Committee that possess the attributes identified in Form N-CSR to qualify as an “audit committee financial expert.”
(a)(2) The audit committee financial experts are Bryan W. Brown, Harold M. Shefrin and Charles M. Roame. Each has been deemed to be “independent” as that term is defined in Form N-CSR.
Item 4. Principal Accountant Fees and Services.
For the fiscal year June 30, 2023, Cohen & Co. (“Cohen”) serves as the independent registered public accounting firm for the registrant.
(a) Audit Fees.
For the fiscal years ended June 30, 2023 and June 30, 2022, the aggregate fees billed for professional services rendered by Cohen for the audit of the registrant’s annual financial statements or for services that are normally provided by Cohen in connection with statutory and regulatory filings or engagements were $197,500 and $182,500 respectively.
(b) Audit-Related Fees.
For the fiscal years ended June 30, 2023 and June 30, 2022, the aggregate fees billed for assurance and related services rendered by Cohen that are reasonably related to the performance of the audit or review of the registrant’s financial statements and that are not reported under Audit Fees above were $0 and $0, respectively. Services for which fees in the Audit-Related Fees category were billed include Cohen’s reasonable out-of-pocket expenses and ticket charges for booking travel related to conducting the audit.
For the twelve month periods ended June 30, 2023 and June 30, 2022, aggregate Audit-Related Fees billed by Cohen that were required to be approved by the registrant’s Audit Committee for audit-related services rendered to the registrant’s investment adviser and any entity controlling, controlled by or under common control with the investment adviser that provides ongoing services to the registrant (the “Affiliated Service Providers”) that relate directly to the operations and financial reporting of the registrant were $0 and $0, respectively.
(c) Tax Fees.
For the fiscal years ended June 30, 2023 and June 30, 2022, the aggregate fees billed for tax compliance, tax advice and tax planning by Cohen were $42,000 and $39,500, respectively. Services for which fees in the Tax Fees category are billed include Cohen’s review of the registrant’s U.S. federal income tax returns and the required state corporate income tax returns, as well as Cohen’s review of excise tax distribution calculations.
For the twelve month periods ended June 30, 2023 and June 30, 2022, the aggregate Tax Fees billed Cohen that were required to be approved by the registrant’s Audit Committee for tax compliance, tax advice and tax planning services rendered on behalf of Affiliated Service Providers that relate directly to the operations and financial reporting of the registrant were $0 and $0, respectively.
(d) All Other Fees.
For the fiscal years ended June 30, 2023 and June 30, 2022, the aggregate fees billed by Cohen to the registrant for all services other than services reported under Audit Fees, Audit-Related Fees, and Tax Fees were $7,500 and $5,900, respectively.
For the twelve month periods ended June 30, 2023 and June 30, 2022, the aggregate fees in this category billed by Cohen that were required to be approved by the registrant’s Audit Committee for services rendered on behalf of Affiliated Service Providers that relate directly to the operations and financial reporting of the registrant were $0 and $0, respectively.
(e)(1) Audit Committee’s Pre-Approval Policies and Procedures.
The registrant’s Audit Committee has the sole authority to pre-approve all audit and non-audit services to be provided by Cohen to the registrant, subject to the de minimis exceptions for non-audit services described in Section 10A(i)(1)B of the Securities Exchange Act of 1934, as amended (“Exchange Act”). Pre-approval of audit and non-audit services is not required if the engagement to render the services is entered into pursuant to pre-approval policies and procedures established by the Audit Committee. The Audit Committee has not established such policies and procedures.
(e)(2) Percentage of Services.
None of the services described in each of paragraphs (b) through (d) of this Item were approved by the registrant’s Audit Committee pursuant to paragraph (c)(7)(i)(C) of Rule 2-01 of Regulation S-X.
(f) Not applicable.
(g) For the fiscal years ended June 30, 2023 and June 30, 2022, aggregate non-audit fees billed by Cohen for services rendered to the registrant were $0 and $0, respectively.
For the twelve month periods ended June 30, 2023 and June 30, 2022, aggregate non-audit fees billed by Cohen for services rendered to the Affiliated Service Providers were $0 and $0, respectively.
(h) Not applicable.
Item 5. Audit Committee of Listed Registrants.
Not applicable to the registrant.
Item 6. Schedule of Investments.
(a)
The Japanese Small Company Series
SUMMARY SCHEDULE OF PORTFOLIO HOLDINGS
June 30, 2023
(Unaudited)
| | | | | Shares | | | Value» | | | Percentage
of Net Assets‡ | |
| COMMON STOCKS — (97.8%) |
| COMMUNICATION SERVICES — (2.3%) |
| | | Other Securities | | | | | | $ | 65,675,493 | | | | 2.3 | % |
| CONSUMER DISCRETIONARY — (14.0%) |
| | | Resorttrust, Inc. | | | 514,664 | | | | 7,638,598 | | | | 0.3 | % |
| | | Other Securities | | | | | | | 403,310,717 | | | | 13.9 | % |
| TOTAL CONSUMER DISCRETIONARY | | | | | | | 410,949,315 | | | | 14.2 | % |
| CONSUMER STAPLES — (7.7%) |
| | | Nissui Corp. | | | 1,771,500 | | | | 7,956,137 | | | | 0.3 | % |
| # | | Pigeon Corp. | | | 612,825 | | | | 8,460,104 | | | | 0.3 | % |
| | | Other Securities | | | | | | | 210,336,697 | | | | 7.3 | % |
| TOTAL CONSUMER STAPLES | | | | | | | 226,752,938 | | | | 7.9 | % |
| ENERGY — (0.7%) |
| | | Other Securities | | | | | | | 21,323,889 | | | | 0.7 | % |
| FINANCIALS — (8.6%) |
| | | Gunma Bank Ltd. | | | 2,072,540 | | | | 7,602,979 | | | | 0.3 | % |
| | | Hachijuni Bank Ltd. | | | 1,680,741 | | | | 7,300,758 | | | | 0.3 | % |
| | | Hirogin Holdings, Inc. | | | 1,509,400 | | | | 8,562,190 | | | | 0.3 | % |
| | | Iyogin Holdings, Inc. | | | 1,256,518 | | | | 7,063,789 | | | | 0.3 | % |
| | | Kyushu Financial Group, Inc. | | | 1,975,137 | | | | 8,343,924 | | | | 0.3 | % |
| | | Yamaguchi Financial Group, Inc. | | | 1,237,672 | | | | 8,310,924 | | | | 0.3 | % |
| | | Other Securities | | | | | | | 204,394,767 | | | | 6.9 | % |
| TOTAL FINANCIALS | | | | | | | 251,579,331 | | | | 8.7 | % |
| HEALTH CARE — (4.7%) |
| | | Jeol Ltd. | | | 233,500 | | | | 8,335,755 | | | | 0.3 | % |
| | | Nakanishi, Inc. | | | 341,900 | | | | 7,571,287 | | | | 0.3 | % |
| | | Other Securities | | | | | | | 122,488,213 | | | | 4.2 | % |
| TOTAL HEALTH CARE | | | | | | | 138,395,255 | | | | 4.8 | % |
| INDUSTRIALS — (28.8%) |
| | | Daiseki Co. Ltd. | | | 286,755 | | | | 8,107,041 | | | | 0.3 | % |
| # | | DMG Mori Co. Ltd. | | | 731,800 | | | | 12,722,253 | | | | 0.4 | % |
| | | EXEO Group, Inc. | | | 487,700 | | | | 9,796,027 | | | | 0.3 | % |
| | | Furukawa Electric Co. Ltd. | | | 418,600 | | | | 7,403,249 | | | | 0.3 | % |
| | | GS Yuasa Corp. | | | 393,683 | | | | 7,723,408 | | | | 0.3 | % |
| # | | Hazama Ando Corp. | | | 1,150,400 | | | | 8,604,531 | | | | 0.3 | % |
| | | Inaba Denki Sangyo Co. Ltd. | | | 319,300 | | | | 7,284,899 | | | | 0.3 | % |
| | | Mabuchi Motor Co. Ltd. | | | 252,834 | | | | 7,055,131 | | | | 0.3 | % |
| | | Meitec Corp. | | | 478,200 | | | | 8,251,271 | | | | 0.3 | % |
| | | Mirait One Corp. | | | 565,135 | | | | 7,113,722 | | | | 0.3 | % |
| | | Nagase & Co. Ltd. | | | 584,600 | | | | 9,735,135 | | | | 0.3 | % |
| | | Nichias Corp. | | | 378,700 | | | | 7,893,068 | | | | 0.3 | % |
| | | Nikkon Holdings Co. Ltd. | | | 369,900 | | | | 7,392,695 | | | | 0.3 | % |
| # | | Nisshinbo Holdings, Inc. | | | 843,080 | | | | 6,991,610 | | | | 0.2 | % |
| | | OKUMA Corp. | | | 147,700 | | | | 7,929,844 | | | | 0.3 | % |
| | | OSG Corp. | | | 526,900 | | | | 7,563,907 | | | | 0.3 | % |
| | | Ushio, Inc. | | | 600,400 | | | | 8,117,400 | | | | 0.3 | % |
| | | Other Securities | | | | | | | 703,414,032 | | | | 24.1 | % |
| TOTAL INDUSTRIALS | | | | | | | 843,099,223 | | | | 29.2 | % |
The Japanese Small Company Series
CONTINUED
| | | | | Shares | | | Value» | | | Percentage
of Net Assets‡ | |
| INFORMATION TECHNOLOGY — (15.1%) |
| | | Alps Alpine Co. Ltd. | | | 798,153 | | | $ | 7,007,707 | | | | 0.3 | % |
| | | Anritsu Corp. | | | 851,999 | | | | 7,276,940 | | | | 0.3 | % |
| | | Citizen Watch Co. Ltd. | | | 1,550,700 | | | | 9,348,449 | | | | 0.3 | % |
| | | Daiwabo Holdings Co. Ltd. | | | 574,800 | | | | 11,130,751 | | | | 0.4 | % |
| | | Dexerials Corp. | | | 345,400 | | | | 7,587,645 | | | | 0.3 | % |
| | | Japan Material Co. Ltd. | | | 431,700 | | | | 7,215,624 | | | | 0.3 | % |
| | | Macnica Holdings, Inc. | | | 283,650 | | | | 11,787,500 | | | | 0.4 | % |
| | | Maruwa Co. Ltd. | | | 55,400 | | | | 8,603,864 | | | | 0.3 | % |
| | | NET One Systems Co. Ltd. | | | 420,500 | | | | 9,237,715 | | | | 0.3 | % |
| | | NSD Co. Ltd. | | | 482,660 | | | | 9,703,883 | | | | 0.3 | % |
| | | Sanken Electric Co. Ltd. | | | 126,800 | | | | 11,962,482 | | | | 0.4 | % |
| | | Tokyo Seimitsu Co. Ltd. | | | 232,600 | | | | 12,879,617 | | | | 0.5 | % |
| | | Topcon Corp. | | | 663,300 | | | | 9,772,800 | | | | 0.3 | % |
| # | | Ulvac, Inc. | | | 168,700 | | | | 7,194,997 | | | | 0.3 | % |
| | | Other Securities | | | | | | | 311,814,628 | | | | 10.6 | % |
| TOTAL INFORMATION TECHNOLOGY | | | | | | | 442,524,602 | | | | 15.3 | % |
| MATERIALS — (12.7%) |
| | | ADEKA Corp. | | | 507,000 | | | | 9,685,087 | | | | 0.3 | % |
| | | Daicel Corp. | | | 804,300 | | | | 7,198,031 | | | | 0.3 | % |
| | | Mitsui Mining & Smelting Co. Ltd. | | | 345,600 | | | | 7,979,177 | | | | 0.3 | % |
| | | Sumitomo Bakelite Co. Ltd. | | | 194,100 | | | | 8,091,310 | | | | 0.3 | % |
| | | Taiheiyo Cement Corp. | | | 470,191 | | | | 9,295,870 | | | | 0.3 | % |
| # | | Tokai Carbon Co. Ltd. | | | 948,600 | | | | 8,731,820 | | | | 0.3 | % |
| | UBE Corp. | | | 611,100 | | | | 10,506,181 | | | | 0.4 | % |
| | | Other Securities | | | | | | | 311,804,609 | | | | 10.7 | % |
| TOTAL MATERIALS | | | | | | | 373,292,085 | | | | 12.9 | % |
| REAL ESTATE — (1.4%) |
| | | Other Securities | | | | | | | 39,712,298 | | | | 1.4 | % |
| UTILITIES — (1.8%) |
| | | Nippon Gas Co. Ltd. | | | 676,700 | | | | 9,526,128 | | | | 0.3 | % |
| | | Other Securities | | | | | | | 42,520,444 | | | | 1.5 | % |
| TOTAL UTILITIES | | | | | | | 52,046,572 | | | | 1.8 | % |
| TOTAL COMMON STOCKS | | | | | | | 2,865,351,001 | | | | 99.2 | % |
| RIGHTS/WARRANTS — (0.0%) |
| INDUSTRIALS — (0.0%) |
| | | Other Security | | | | | | | 128,844 | | | | 0.0 | % |
| TOTAL RIGHTS/WARRANTS | | | | | | | 128,844 | | | | 0.0 | % |
TOTAL INVESTMENT SECURITIES
(Cost $2,743,323,031) | | | | | | | 2,865,479,845 | | | | | |
| | | | | | | | | | | | |
| | | | | | | | Value† | | | | |
| SECURITIES LENDING COLLATERAL — (2.2%) |
| @ § | | The DFA Short Term Investment Fund | | | 5,630,625 | | | | 65,123,811 | | | | 2.3 | % |
TOTAL INVESTMENTS—(100.0%)
(Cost $2,808,446,842) | | | | | | $ | 2,930,603,656 | | | | 101.5 | % |
| » | | Securities that have been fair value factored. See Note B to Financial Statements. | | | | | | | | | | | | |
The Japanese Small Company Series
CONTINUED
| | | | | Shares | | | Value† | | | Percentage
of Net Assets‡ | |
| ‡ | | Calculated as a percentage of total net assets. Percentages shown parenthetically next to the category headings have been calculated as a percentage of total investments. “Other Securities” are those securities that are not among the top 50 holdings in unaffiliated issuers of the Fund or do not represent more than 1.0% of the net assets of the Fund. Some of the individual securities within this category may include Total or Partial Securities on Loan and/or Non-Income Producing Securities. | | | | | | | | | | | | |
| # | | Total or Partial Securities on Loan. | | | | | | | | | | | | |
| † | | See Note B to Financial Statements. | | | | | | | | | | | | |
| @ | | Security purchased with cash collateral received from Securities on Loan. | | | | | | | | | | | | |
| § | | Affiliated Fund. | | | | | | | | | | | | |
Summary of the Series’ investments as of June 30, 2023, based on their valuation inputs, is as follows (see Security Valuation Note):
| | | Investments in Securities (Market Value) | |
| | | Level 1 | | | Level 2 | | | Level 3 | | | Total | |
| Common Stocks | | | | | | | | | | | | | | | | |
| Communication Services | | | — | | | $ | 65,675,493 | | | | — | | | $ | 65,675,493 | |
| Consumer Discretionary | | $ | 95,195 | | | | 410,854,120 | | | | — | | | | 410,949,315 | |
| Consumer Staples | | | — | | | | 226,752,938 | | | | — | | | | 226,752,938 | |
| Energy | | | — | | | | 21,323,889 | | | | — | | | | 21,323,889 | |
| Financials | | | — | | | | 251,579,331 | | | | — | | | | 251,579,331 | |
| Health Care | | | 47,328 | | | | 138,347,927 | | | | — | | | | 138,395,255 | |
| Industrials | | | 38,879 | | | | 843,060,344 | | | | — | | | | 843,099,223 | |
| Information Technology | | | 123,781 | | | | 442,400,821 | | | | — | | | | 442,524,602 | |
| Materials | | | — | | | | 373,292,085 | | | | — | | | | 373,292,085 | |
| Real Estate | | | — | | | | 39,712,298 | | | | — | | | | 39,712,298 | |
| Utilities | | | — | | | | 52,046,572 | | | | — | | | | 52,046,572 | |
| Rights/Warrants | | | | | | | | | | | | | | | | |
| Industrials | | | — | | | | 128,844 | | | | — | | | | 128,844 | |
| Securities Lending Collateral | | | — | | | | 65,123,811 | | | | — | | | | 65,123,811 | |
| TOTAL | | $ | 305,183 | | | $ | 2,930,298,473 | | | | — | | | $ | 2,930,603,656 | |
The Asia Pacific Small Company Series
SUMMARY SCHEDULE OF PORTFOLIO HOLDINGS
June 30, 2023
(Unaudited)
| | | | | Shares | | | Value» | | | Percentage
of Net Assets‡ | |
| COMMON STOCKS — (99.2%) |
| AUSTRALIA — (63.7%) |
| | | AMP Ltd. | | | 14,485,829 | | | $ | 10,946,585 | | | | 0.9 | % |
| | | Ansell Ltd. | | | 661,545 | | | | 11,822,311 | | | | 0.9 | % |
| | | ARB Corp. Ltd. | | | 498,463 | | | | 9,563,027 | | | | 0.8 | % |
| | | AUB Group Ltd. | | | 710,426 | | | | 13,972,945 | | | | 1.1 | % |
| | | Bapcor Ltd. | | | 2,107,733 | | | | 8,378,788 | | | | 0.7 | % |
| | | Beach Energy Ltd. | | | 9,561,631 | | | | 8,620,731 | | | | 0.7 | % |
| * | | Bellevue Gold Ltd. | | | 8,307,472 | | | | 7,106,805 | | | | 0.6 | % |
| | | Breville Group Ltd. | | | 627,990 | | | | 8,394,132 | | | | 0.7 | % |
| | | Brickworks Ltd. | | | 389,897 | | | | 6,942,279 | | | | 0.6 | % |
| | | Corporate Travel Management Ltd. | | | 729,339 | | | | 8,757,763 | | | | 0.7 | % |
| | | CSR Ltd. | | | 3,176,445 | | | | 11,017,324 | | | | 0.9 | % |
| * | | De Grey Mining Ltd. | | | 7,594,615 | | | | 6,881,891 | | | | 0.5 | % |
| | | Downer EDI Ltd. | | | 4,211,433 | | | | 11,562,843 | | | | 0.9 | % |
| | | Eagers Automotive Ltd. | | | 899,116 | | | | 8,133,020 | | | | 0.6 | % |
| # * | | Flight Centre Travel Group Ltd. | | | 841,836 | | | | 10,731,823 | | | | 0.9 | % |
| | | Gold Road Resources Ltd. | | | 7,631,631 | | | | 7,645,729 | | | | 0.6 | % |
| | | GrainCorp Ltd., Class A | | | 1,417,016 | | | | 7,413,480 | | | | 0.6 | % |
| | | Healius Ltd. | | | 3,465,521 | | | | 7,379,812 | | | | 0.6 | % |
| | | HUB24 Ltd. | | | 481,265 | | | | 8,227,531 | | | | 0.7 | % |
| | | InvoCare Ltd. | | | 908,018 | | | | 7,644,514 | | | | 0.6 | % |
| | | IPH Ltd. | | | 1,434,646 | | | | 7,522,941 | | | | 0.6 | % |
| | | IRESS Ltd. | | | 1,180,193 | | | | 8,101,742 | | | | 0.6 | % |
| | | McMillan Shakespeare Ltd. | | | 587,432 | | | | 7,085,110 | | | | 0.6 | % |
| | | Netwealth Group Ltd. | | | 750,336 | | | | 6,967,198 | | | | 0.6 | % |
| | | nib holdings Ltd. | | | 2,804,808 | | | | 15,818,442 | | | | 1.3 | % |
| | | Nine Entertainment Co. Holdings Ltd. | | | 7,131,395 | | | | 9,381,973 | | | | 0.7 | % |
| | | Nufarm Ltd. | | | 2,267,973 | | | | 7,722,554 | | | | 0.6 | % |
| | | Orora Ltd. | | | 5,280,211 | | | | 11,600,954 | | | | 0.9 | % |
| * | | Paladin Energy Ltd. | | | 16,375,142 | | | | 8,053,666 | | | | 0.6 | % |
| | | Perpetual Ltd. | | | 670,235 | | | | 11,590,400 | | | | 0.9 | % |
| | | Perseus Mining Ltd. | | | 8,455,260 | | | | 9,392,751 | | | | 0.7 | % |
| | | Reliance Worldwide Corp. Ltd. | | | 4,604,581 | | | | 12,660,628 | | | | 1.0 | % |
| * | | Sandfire Resources Ltd. | | | 3,243,721 | | | | 12,880,496 | | | | 1.0 | % |
| | | Sims Ltd. | | | 1,036,292 | | | | 10,931,968 | | | | 0.9 | % |
| * | | Star Entertainment Group Ltd. | | | 8,822,099 | | | | 6,815,022 | | | | 0.5 | % |
| | | Super Retail Group Ltd. | | | 1,057,351 | | | | 8,090,108 | | | | 0.6 | % |
| | | Tabcorp Holdings Ltd. | | | 13,920,512 | | | | 10,325,589 | | | | 0.8 | % |
| | | Technology One Ltd. | | | 706,460 | | | | 7,408,071 | | | | 0.6 | % |
| # * | | Webjet Ltd. | | | 2,404,516 | | | | 11,114,553 | | | | 0.9 | % |
| | | Other Securities | | | | | | | 446,189,768 | | | | 34.8 | % |
| TOTAL AUSTRALIA | | | | | | | 810,797,267 | | | | 63.8 | % |
| CHINA — (0.1%) |
| | | Other Securities | | | | | | | 1,197,644 | | | | 0.1 | % |
| HONG KONG — (21.1%) |
| | | ASMPT Ltd. | | | 1,584,800 | | | | 15,657,113 | | | | 1.2 | % |
| | | Hysan Development Co. Ltd. | | | 3,175,000 | | | | 7,759,142 | | | | 0.6 | % |
| | | Luk Fook Holdings International Ltd. | | | 3,450,000 | | | | 8,857,602 | | | | 0.7 | % |
| | | NWS Holdings Ltd. | | | 7,045,000 | | | | 8,004,122 | | | | 0.6 | % |
The Asia Pacific Small Company Series
CONTINUED
| | | | | Shares | | | Value» | | | Percentage
of Net Assets‡ | |
| HONG KONG — (Continued) |
| | | Pacific Basin Shipping Ltd. | | | 27,975,000 | | | $ | 8,535,709 | | | | 0.7 | % |
| | | PCCW Ltd. | | | 17,843,545 | | | | 9,256,690 | | | | 0.7 | % |
| | | VTech Holdings Ltd. | | | 1,166,000 | | | | 7,657,588 | | | | 0.6 | % |
| | | Other Securities | | | | | | | 203,563,762 | | | | 16.1 | % |
| TOTAL HONG KONG | | | | | | | 269,291,728 | | | | 21.2 | % |
| NEW ZEALAND — (3.6%) |
| | | Chorus Ltd. | | | 1,625,490 | | | | 8,409,569 | | | | 0.7 | % |
| | | Other Securities | | | | | | | 37,940,063 | | | | 3.0 | % |
| TOTAL NEW ZEALAND | | | | | | | 46,349,632 | | | | 3.7 | % |
| SINGAPORE — (10.7%) |
| | | ComfortDelGro Corp. Ltd. | | | 9,307,100 | | | | 7,997,031 | | | | 0.6 | % |
| | | Keppel Infrastructure Trust | | | 19,392,287 | | | | 7,324,331 | | | | 0.6 | % |
| * | | SATS Ltd. | | | 3,592,367 | | | | 6,872,190 | | | | 0.5 | % |
| | | Other Securities | | | | | | | 113,792,088 | | | | 9.0 | % |
| TOTAL SINGAPORE | | | | | | | 135,985,640 | | | | 10.7 | % |
| TOTAL COMMON STOCKS | | | | | | | 1,263,621,911 | | | | 99.5 | % |
| RIGHTS/WARRANTS — (0.0%) |
| AUSTRALIA — (0.0%) |
| | | Other Securities | | | | | | | 3,409 | | | | 0.0 | % |
| HONG KONG — (0.0%) |
| | | Other Security | | | | | | | 6,186 | | | | 0.0 | % |
| SINGAPORE — (0.0%) |
| | | Other Securities | | | | | | | 30,963 | | | | 0.0 | % |
| TOTAL RIGHTS/WARRANTS | | | | | | | 40,558 | | | | 0.0 | % |
TOTAL INVESTMENT SECURITIES
(Cost $1,491,561,450) | | | | | | | 1,263,662,469 | | | | | |
| | | | | | | | | | | | | |
| | | | | | | | Value† | | | | |
| SECURITIES LENDING COLLATERAL — (0.8%) |
| @ § | | The DFA Short Term Investment Fund | | | 885,806 | | | | 10,245,234 | | | | 0.8 | % |
TOTAL INVESTMENTS—(100.0%)
(Cost $1,501,806,514) | | | | | | $ | 1,273,907,703 | | | | 100.3 | % |
| » | | Securities that have been fair value factored. See Note B to Financial Statements. | | | | | | | | | | | | |
| ‡ | | Calculated as a percentage of total net assets. Percentages shown parenthetically next to the category headings have been calculated as a percentage of total investments. “Other Securities” are those securities that are not among the top 50 holdings in unaffiliated issuers of the Fund or do not represent more than 1.0% of the net assets of the Fund. Some of the individual securities within this category may include Total or Partial Securities on Loan and/or Non-Income Producing Securities. | | | | | | | | | | | | |
The Asia Pacific Small Company Series
CONTINUED
| | | | | Shares | | | Value† | | | Percentage
of Net Assets‡ | |
| * | | Non-Income Producing Securities. | | | | | | | | | | | | |
| # | | Total or Partial Securities on Loan. | | | | | | | | | | | | |
| † | | See Note B to Financial Statements. | | | | | | | | | | | | |
| @ | | Security purchased with cash collateral received from Securities on Loan. | | | | | | | | | | | | |
| § | | Affiliated Fund. | | | | | | | | | | | | |
Summary of the Series’ investments as of June 30, 2023, based on their valuation inputs, is as follows (see Security Valuation Note):
| | | Investments in Securities (Market Value) | |
| | | Level 1 | | | Level 2 | | | Level 3 | | | Total | |
| Common Stocks | | | | | | | | | | | | | | | | |
| Australia | | $ | 15,287 | | | $ | 810,307,242 | | | $ | 474,738 | | | $ | 810,797,267 | |
| China | | | — | | | | 1,197,644 | | | | — | | | | 1,197,644 | |
| Hong Kong | | | 1,069 | | | | 268,981,893 | | | | 308,766 | | | | 269,291,728 | |
| New Zealand | | | — | | | | 46,349,632 | | | | — | | | | 46,349,632 | |
| Singapore | | | 446,233 | | | | 134,841,835 | | | | 697,572 | | | | 135,985,640 | |
| Rights/Warrants | | | | | | | | | | | | | | | | |
| Australia | | | — | | | | 3,409 | | | | — | | | | 3,409 | |
| Hong Kong | | | — | | | | 6,186 | | | | — | | | | 6,186 | |
| Singapore | | | — | | | | 30,963 | | | | — | | | | 30,963 | |
| Securities Lending Collateral | | | — | | | | 10,245,234 | | | | — | | | | 10,245,234 | |
| TOTAL | | $ | 462,589 | | | $ | 1,271,964,038 | | | $ | 1,481,076 | ^ | | $ | 1,273,907,703 | |
| ^ | A reconciliation of Level 3 investments is presented when the Fund had a significant amount of Level 3 investments at the beginning and/or end of the reporting period in relation to net assets. |
The United Kingdom Small Company Series
SUMMARY SCHEDULE OF PORTFOLIO HOLDINGS
June 30, 2023
(Unaudited)
| | | | | Shares | | | Value» | | | Percentage
of Net Assets‡ | |
| COMMON STOCKS — (99.3%) |
| COMMUNICATION SERVICES — (3.8%) |
| | | 4imprint Group PLC | | | 165,738 | | | $ | 10,102,406 | | | | 0.8 | % |
| | | ITV PLC | | | 12,266,299 | | | | 10,663,179 | | | | 0.8 | % |
| | | Moneysupermarket.com Group PLC | | | 3,209,924 | | | | 11,042,559 | | | | 0.8 | % |
| | | Other Securities | | | | | | | 19,020,072 | | | | 1.4 | % |
| TOTAL COMMUNICATION SERVICES | | | | | | | 50,828,216 | | | | 3.8 | % |
| CONSUMER DISCRETIONARY — (18.8%) |
| | | Bellway PLC | | | 527,051 | | | | 13,326,486 | | | | 1.0 | % |
| | | Domino’s Pizza Group PLC | | | 3,097,499 | | | | 10,861,742 | | | | 0.8 | % |
| | | Dunelm Group PLC | | | 690,244 | | | | 9,854,443 | | | | 0.7 | % |
| | | Games Workshop Group PLC | | | 176,924 | | | | 24,551,237 | | | | 1.8 | % |
| | | Greggs PLC | | | 601,854 | | | | 19,551,278 | | | | 1.5 | % |
| | | Inchcape PLC | | | 2,122,222 | | | | 21,002,551 | | | | 1.6 | % |
| | | Pets at Home Group PLC | | | 2,837,331 | | | | 13,604,701 | | | | 1.0 | % |
| * | | Playtech PLC | | | 1,926,086 | | | | 14,428,214 | | | | 1.1 | % |
| * | | SSP Group PLC | | | 3,417,062 | | | | 10,904,647 | | | | 0.8 | % |
| | | Vistry Group PLC | | | 1,471,857 | | | | 12,360,507 | | | | 0.9 | % |
| | | WH Smith PLC | | | 546,871 | | | | 10,782,652 | | | | 0.8 | % |
| | | Other Securities | | | | | | | 91,039,879 | | | | 6.8 | % |
| TOTAL CONSUMER DISCRETIONARY | | | | | | | 252,268,337 | | | | 18.8 | % |
| CONSUMER STAPLES — (8.3%) |
| | | Britvic PLC | | | 1,626,728 | | | | 17,705,255 | | | | 1.3 | % |
| | | Cranswick PLC | | | 366,623 | | | | 15,124,115 | | | | 1.1 | % |
| * | | Marks & Spencer Group PLC | | | 8,960,994 | | | | 21,965,396 | | | | 1.6 | % |
| | | Tate & Lyle PLC | | | 2,167,560 | | | | 20,006,672 | | | | 1.5 | % |
| | | Other Securities | | | | | | | 36,736,576 | | | | 2.8 | % |
| TOTAL CONSUMER STAPLES | | | | | | | 111,538,014 | | | | 8.3 | % |
| ENERGY — (3.0%) |
| | | Other Securities | | | | | | | 40,327,959 | | | | 3.0 | % |
| FINANCIALS — (19.6%) |
| | | Bank of Georgia Group PLC | | | 269,724 | | | | 10,030,228 | | | | 0.8 | % |
| | | Beazley PLC | | | 2,938,648 | | | | 22,031,612 | | | | 1.7 | % |
| | | Burford Capital Ltd. | | | 965,905 | | | | 11,796,343 | | | | 0.9 | % |
| | | Close Brothers Group PLC | | | 881,739 | | | | 9,892,172 | | | | 0.7 | % |
| | | Hiscox Ltd. | | | 1,350,247 | | | | 18,719,938 | | | | 1.4 | % |
| | | Lancashire Holdings Ltd. | | | 1,661,042 | | | | 12,207,803 | | | | 0.9 | % |
| | | Man Group PLC | | | 7,541,211 | | | | 20,942,543 | | | | 1.6 | % |
| | | OSB Group PLC | | | 2,202,114 | | | | 13,478,581 | | | | 1.0 | % |
| | | Paragon Banking Group PLC | | | 1,921,607 | | | | 12,982,150 | | | | 1.0 | % |
| | | Virgin Money UK PLC | | | 6,577,199 | | | | 12,524,353 | | | | 0.9 | % |
| | | Other Securities | | | | | | | 118,623,097 | | | | 8.7 | % |
| TOTAL FINANCIALS | | | | | | | 263,228,820 | | | | 19.6 | % |
| HEALTH CARE — (3.8%) |
| | | CVS Group PLC | | | 418,701 | | | | 10,519,007 | | | | 0.8 | % |
| * | | Indivior PLC | | | 759,374 | | | | 17,582,530 | | | | 1.3 | % |
The United Kingdom Small Company Series
CONTINUED
| | | Shares | | | Value» | | | Percentage
of Net Assets‡ | |
| HEALTH CARE — (Continued) |
| Other Securities | | | | | | $ | 22,648,736 | | | | 1.7 | % |
| TOTAL HEALTH CARE | | | | | | | 50,750,273 | | | | 3.8 | % |
| INDUSTRIALS — (23.8%) |
| Balfour Beatty PLC | | | 3,585,302 | | | | 15,525,384 | | | | 1.2 | % |
| Bodycote PLC | | | 1,236,656 | | | | 10,086,950 | | | | 0.7 | % |
| Diploma PLC | | | 423,439 | | | | 16,072,376 | | | | 1.2 | % |
| Grafton Group PLC | | | 1,489,341 | | | | 14,790,096 | | | | 1.1 | % |
| Hays PLC | | | 9,347,832 | | | | 12,139,353 | | | | 0.9 | % |
| JET2 PLC | | | 813,756 | | | | 12,877,996 | | | | 1.0 | % |
| Pagegroup PLC | | | 1,947,013 | | | | 9,925,824 | | | | 0.7 | % |
| QinetiQ Group PLC | | | 3,241,231 | | | | 14,609,019 | | | | 1.1 | % |
| Rotork PLC | | | 4,324,797 | | | | 16,757,041 | | | | 1.2 | % |
| Serco Group PLC | | | 5,743,194 | | | | 11,362,079 | | | | 0.8 | % |
| Travis Perkins PLC | | | 1,194,868 | | | | 12,375,076 | | | | 0.9 | % |
| Other Securities | | | | | | | 173,984,127 | | | | 13.1 | % |
| TOTAL INDUSTRIALS | | | | | | | 320,505,321 | | | | 23.9 | % |
| INFORMATION TECHNOLOGY — (7.1%) |
| Computacenter PLC | | | 497,525 | | | | 14,438,141 | | | | 1.1 | % |
| Oxford Instruments PLC | | | 343,024 | | | | 11,876,459 | | | | 0.9 | % |
| Softcat PLC | | | 677,227 | | | | 12,201,537 | | | | 0.9 | % |
| Spectris PLC | | | 384,491 | | | | 17,567,634 | | | | 1.3 | % |
| Other Securities | | | | | | | 39,511,180 | | | | 2.9 | % |
| TOTAL INFORMATION TECHNOLOGY | | | | | | | 95,594,951 | | | | 7.1 | % |
| MATERIALS — (5.1%) |
| Hill & Smith PLC | | | 546,022 | | | | 10,440,965 | | | | 0.8 | % |
| Other Securities | | | | | | | 58,092,486 | | | | 4.3 | % |
| TOTAL MATERIALS | | | | | | | 68,533,451 | | | | 5.1 | % |
| REAL ESTATE — (2.9%) |
| Grainger PLC | | | 4,237,552 | | | | 12,218,585 | | | | 0.9 | % |
| Savills PLC | | | 961,872 | | | | 10,396,511 | | | | 0.8 | % |
| Other Securities | | | | | | | 16,087,375 | | | | 1.2 | % |
| TOTAL REAL ESTATE | | | | | | | 38,702,471 | | | | 2.9 | % |
| UTILITIES — (3.1%) |
| Drax Group PLC | | | 2,467,126 | | | | 18,178,963 | | | | 1.3 | % |
| Pennon Group PLC | | | 1,371,280 | | | | 12,390,225 | | | | 0.9 | % |
| Other Securities | | | | | | | 11,396,208 | | | | 0.9 | % |
| TOTAL UTILITIES | | | | | | | 41,965,396 | | | | 3.1 | % |
TOTAL COMMON STOCKS
(Cost $1,329,981,914) | | | | | | | 1,334,243,209 | | | | 99.4 | % |
| | | | | | | | Value† | | | | |
| SECURITIES LENDING COLLATERAL — (0.7%) |
| @ § | | The DFA Short Term Investment Fund | | | 756,089 | | | | 8,744,924 | | | | 0.6 | % |
TOTAL INVESTMENTS—(100.0%)
(Cost $1,338,726,742) | | | | | | $ | 1,342,988,133 | | | | 100.0 | % |
The United Kingdom Small Company Series
CONTINUED
| | | | | Shares | | | Value† | | | Percentage
of Net Assets‡ | |
| » | | Securities that have been fair value factored. See Note B to Financial Statements. | | | | | | | | | | | | |
| ‡ | | Calculated as a percentage of total net assets. Percentages shown parenthetically next to the category headings have been calculated as a percentage of total investments. “Other Securities” are those securities that are not among the top 50 holdings in unaffiliated issuers of the Fund or do not represent more than 1.0% of the net assets of the Fund. Some of the individual securities within this category may include Total or Partial Securities on Loan and/or Non-Income Producing Securities. | | | | | | | | | | | | |
| * | | Non-Income Producing Securities. | | | | | | | | | | | | |
| † | | See Note B to Financial Statements. | | | | | | | | | | | | |
| @ | | Security purchased with cash collateral received from Securities on Loan. | | | | | | | | | | | | |
| § | | Affiliated Fund. | | | | | | | | | | | | |
Summary of the Series’ investments as of June 30, 2023, based on their valuation inputs, is as follows (see Security Valuation Note):
| | | Investments in Securities (Market Value) | |
| | | Level 1 | | | Level 2 | | | Level 3 | | | Total | |
| Common Stocks | | | | | | | | | | | | | | | | |
| Communication Services | | $ | 20,923 | | | $ | 50,807,293 | | | | — | | | $ | 50,828,216 | |
| Consumer Discretionary | | | 34,023 | | | | 252,234,314 | | | | — | | | | 252,268,337 | |
| Consumer Staples | | | — | | | | 111,538,014 | | | | — | | | | 111,538,014 | |
| Energy | | | — | | | | 40,327,959 | | | | — | | | | 40,327,959 | |
| Financials | | | — | | | | 263,228,820 | | | | — | | | | 263,228,820 | |
| Health Care | | | — | | | | 50,748,590 | | | $ | 1,683 | | | | 50,750,273 | |
| Industrials | | | — | | | | 320,505,321 | | | | — | | | | 320,505,321 | |
| Information Technology | | | — | | | | 95,594,951 | | | | — | | | | 95,594,951 | |
| Materials | | | — | | | | 68,533,451 | | | | — | | | | 68,533,451 | |
| Real Estate | | | — | | | | 38,702,471 | | | | — | | | | 38,702,471 | |
| Utilities | | | — | | | | 41,965,396 | | | | — | | | | 41,965,396 | |
| Securities Lending Collateral | | | — | | | | 8,744,924 | | | | — | | | | 8,744,924 | |
| TOTAL | | $ | 54,946 | | | $ | 1,342,931,504 | | | $ | 1,683 | ^ | | $ | 1,342,988,133 | |
| ^ | A reconciliation of Level 3 investments is presented when the Fund had a significant amount of Level 3 investments at the beginning and/or end of the reporting period in relation to net assets. |
The Continental Small Company Series
SUMMARY SCHEDULE OF PORTFOLIO HOLDINGS
June 30, 2023
(Unaudited)
| | | | | Shares | | | Value» | | | Percentage
of Net Assets‡ | |
| COMMON STOCKS — (93.3%) |
| AUSTRIA — (3.2%) |
| | | ANDRITZ AG | | | 438,579 | | | $ | 24,459,480 | | | | 0.5 | % |
| # | | voestalpine AG | | | 615,510 | | | | 22,119,142 | | | | 0.4 | % |
| | | Wienerberger AG | | | 682,908 | | | | 20,904,243 | | | | 0.4 | % |
| | | Other Securities | | | | | | | 105,981,942 | | | | 2.1 | % |
| TOTAL AUSTRIA | | | | | | | 173,464,807 | | | | 3.4 | % |
| BELGIUM — (3.8%) |
| | | Ackermans & van Haaren NV | | | 171,688 | | | | 28,267,937 | | | | 0.6 | % |
| | | Other Securities | | | | | | | 175,342,421 | | | | 3.3 | % |
| TOTAL BELGIUM | | | | | | | 203,610,358 | | | | 3.9 | % |
| DENMARK — (6.7%) |
| * | | Jyske Bank AS | | | 437,851 | | | | 33,308,384 | | | | 0.7 | % |
| | | Ringkjoebing Landbobank AS | | | 197,625 | | | | 28,328,859 | | | | 0.6 | % |
| | | Royal Unibrew AS | | | 312,981 | | | | 28,015,972 | | | | 0.5 | % |
| | | Sydbank AS | | | 461,164 | | | | 21,323,139 | | | | 0.4 | % |
| | | Other Securities | | | | | | | 251,025,600 | | | | 4.8 | % |
| TOTAL DENMARK | | | | | | | 362,001,954 | | | | 7.0 | % |
| FINLAND — (4.9%) |
| | | Huhtamaki Oyj | | | 631,957 | | | | 20,739,905 | | | | 0.4 | % |
| | | Orion Oyj, Class B | | | 619,790 | | | | 25,721,932 | | | | 0.5 | % |
| | | Valmet Oyj | | | 912,291 | | | | 25,394,996 | | | | 0.5 | % |
| | | Wartsila Oyj Abp | | | 2,276,158 | | | | 25,665,912 | | | | 0.5 | % |
| | | Other Securities | | | | | | | 170,641,380 | | | | 3.3 | % |
| TOTAL FINLAND | | | | | | | 268,164,125 | | | | 5.2 | % |
| FRANCE — (11.1%) |
| | | Alten SA | | | 141,624 | | | | 22,334,687 | | | | 0.4 | % |
| | | Elis SA | | | 1,272,724 | | | | 24,758,554 | | | | 0.5 | % |
| | | Rexel SA | | | 1,364,288 | | | | 33,716,921 | | | | 0.7 | % |
| | | SCOR SE | | | 802,342 | | | | 23,586,811 | | | | 0.5 | % |
| * | | SOITEC | | | 136,675 | | | | 23,121,937 | | | | 0.5 | % |
| | | Sopra Steria Group SACA | | | 119,421 | | | | 23,841,849 | | | | 0.5 | % |
| | | SPIE SA | | | 871,653 | | | | 28,188,471 | | | | 0.6 | % |
| | | Valeo SA | | | 1,075,406 | | | | 23,109,698 | | | | 0.5 | % |
| | | Other Securities | | | | | | | 398,801,578 | | | | 7.5 | % |
| TOTAL FRANCE | | | | | | | 601,460,506 | | | | 11.7 | % |
| GERMANY — (13.3%) |
| | | Freenet AG | | | 931,981 | | | | 23,404,554 | | | | 0.5 | % |
| | | Gerresheimer AG | | | 231,069 | | | | 26,012,484 | | | | 0.5 | % |
| | | HUGO BOSS AG | | | 412,000 | | | | 32,202,476 | | | | 0.6 | % |
| | | thyssenkrupp AG | | | 2,833,923 | | | | 22,196,531 | | | | 0.4 | % |
| | | Other Securities | | | | | | | 616,105,945 | | | | 12.0 | % |
| TOTAL GERMANY | | | | | | | 719,921,990 | | | | 14.0 | % |
| IRELAND — (1.3%) |
| | | Bank of Ireland Group PLC | | | 4,153,567 | | | | 39,655,918 | | | | 0.8 | % |
The Continental Small Company Series
CONTINUED
| | | | | Shares | | | Value» | | | Percentage
of Net Assets‡ | |
| IRELAND — (Continued) |
| | | Other Securities | | | | | | $ | 29,563,762 | | | | 0.5 | % |
| TOTAL IRELAND | | | | | | | 69,219,680 | | | | 1.3 | % |
| ISRAEL — (2.2%) |
| | | Other Securities | | | | | | | 118,811,072 | | | | 2.3 | % |
| ITALY — (9.4%) |
| | | Banco BPM SpA | | | 9,876,720 | | | | 45,875,692 | | | | 0.9 | % |
| # | | BPER Banca | | | 7,525,929 | | | | 22,881,741 | | | | 0.5 | % |
| | | Brunello Cucinelli SpA | | | 248,717 | | | | 21,898,318 | | | | 0.4 | % |
| | | Italgas SpA | | | 3,498,389 | | | | 20,740,753 | | | | 0.4 | % |
| | | Leonardo SpA | | | 2,654,010 | | | | 30,135,966 | | | | 0.6 | % |
| | | Other Securities | | | | | | | 368,612,851 | | | | 7.1 | % |
| TOTAL ITALY | | | | | | | 510,145,321 | | | | 9.9 | % |
| NETHERLANDS — (5.2%) |
| | | Aalberts NV | | | 673,240 | | | | 28,351,353 | | | | 0.6 | % |
| | | Arcadis NV | | | 526,995 | | | | 22,041,187 | | | | 0.4 | % |
| | | ASR Nederland NV | | | 586,184 | | | | 26,438,938 | | | | 0.5 | % |
| | | BE Semiconductor Industries NV | | | 392,853 | | | | 42,606,537 | | | | 0.8 | % |
| | | Other Securities | | | | | | | 163,354,507 | | | | 3.2 | % |
| TOTAL NETHERLANDS | | | | | | | 282,792,522 | | | | 5.5 | % |
| NORWAY — (1.9%) |
| | | Other Securities | | | | | | | 103,927,251 | | | | 2.0 | % |
| PORTUGAL — (0.8%) |
| | | Other Securities | | | | | | | 46,372,889 | | | | 0.9 | % |
| SPAIN — (5.9%) |
| | | Banco de Sabadell SA | | | 36,362,876 | | | | 41,924,548 | | | | 0.8 | % |
| | | Bankinter SA | | | 4,245,482 | | | | 26,129,953 | | | | 0.5 | % |
| # | | Enagas SA | | | 1,457,648 | | | | 28,648,041 | | | | 0.6 | % |
| | | Other Securities | | | | | | | 221,770,126 | | | | 4.3 | % |
| TOTAL SPAIN | | | | | | | 318,472,668 | | | | 6.2 | % |
| SWEDEN — (5.6%) |
| | | Other Securities | | | | | | | 306,422,220 | | | | 5.9 | % |
| SWITZERLAND — (17.9%) |
| | | Allreal Holding AG | | | 123,491 | | | | 20,904,428 | | | | 0.4 | % |
| | | Belimo Holding AG | | | 65,574 | | | | 32,774,692 | | | | 0.6 | % |
| | | BKW AG | | | 161,471 | | | | 28,548,055 | | | | 0.6 | % |
| | | Bucher Industries AG | | | 54,010 | | | | 23,901,484 | | | | 0.5 | % |
| * | | Dufry AG | | | 552,791 | | | | 25,213,872 | | | | 0.5 | % |
| | | Flughafen Zurich AG | | | 145,858 | | | | 30,338,962 | | | | 0.6 | % |
| Ω | | Galenica AG | | | 279,387 | | | | 22,587,090 | | | | 0.4 | % |
| | | Georg Fischer AG | | | 626,442 | | | | 47,115,048 | | | | 0.9 | % |
| | | Helvetia Holding AG | | | 262,788 | | | | 35,616,795 | | | | 0.7 | % |
| | | PSP Swiss Property AG | | | 337,750 | | | | 37,739,167 | | | | 0.7 | % |
| | | Siegfried Holding AG | | | 32,647 | | | | 26,996,147 | | | | 0.5 | % |
| | | Temenos AG | | | 299,991 | | | | 23,886,967 | | | | 0.5 | % |
| Ω | | VAT Group AG | | | 71,846 | | | | 29,759,617 | | | | 0.6 | % |
| | | Other Securities | | | | | | | 582,823,989 | | | | 11.3 | % |
| TOTAL SWITZERLAND | | | | | | | 968,206,313 | | | | 18.8 | % |
The Continental Small Company Series
CONTINUED
| | | Shares | | | Value» | | | Percentage
of Net Assets‡ | |
| UNITED STATES — (0.1%) |
| Other Securities | | | | | | $ | 3,235,695 | | | | 0.1 | % |
| TOTAL COMMON STOCKS | | | | | | | 5,056,229,371 | | | | 98.1 | % |
| PREFERRED STOCKS — (0.9%) |
| GERMANY — (0.9%) |
| Other Securities | | | | | | | 46,396,758 | | | | 0.9 | % |
| RIGHTS/WARRANTS — (0.0%) |
| AUSTRIA — (0.0%) |
| Other Securities | | | | | | | 450,329 | | | | 0.0 | % |
| NETHERLANDS — (0.0%) |
| Other Security | | | | | | | 5,781 | | | | 0.0 | % |
| SPAIN — (0.0%) |
| Other Security | | | | | | | 259,922 | | | | 0.0 | % |
| TOTAL RIGHTS/WARRANTS | | | | | | | 716,032 | | | | 0.0 | % |
TOTAL INVESTMENT SECURITIES
(Cost $4,300,574,398) | | | | | | | 5,103,342,161 | | | | | |
| | | | | | | | Value† | | | | |
| SECURITIES LENDING COLLATERAL — (5.8%) |
| @ § | | The DFA Short Term Investment Fund | | | 27,268,890 | | | | 315,391,981 | | | | 6.1 | % |
TOTAL INVESTMENTS—(100.0%)
(Cost $4,615,953,371) | | | | | | $ | 5,418,734,142 | | | | 105.1 | % |
| SA | | Special Assessment | | | | | | | | | | | | |
| » | | Securities that have been fair value factored. See Note B to Financial Statements. | | | | | | | | | | | | |
| ‡ | | Calculated as a percentage of total net assets. Percentages shown parenthetically next to the category headings have been calculated as a percentage of total investments. “Other Securities” are those securities that are not among the top 50 holdings in unaffiliated issuers of the Fund or do not represent more than 1.0% of the net assets of the Fund. Some of the individual securities within this category may include Total or Partial Securities on Loan and/or Non-Income Producing Securities. | | | | | | | | | | | | |
| # | | Total or Partial Securities on Loan. | | | | | | | | | | | | |
| * | | Non-Income Producing Securities. | | | | | | | | | | | | |
| Ω | | Rule 144A, Section 4(2), or other security that is restricted as to resale to institutional investors. This security has been deemed liquid based upon the Fund’s Liquidity Guidelines. The liquidity
determination is unaudited. | | | | | | | | | | | | |
| † | | See Note B to Financial Statements. | | | | | | | | | | | | |
| @ | | Security purchased with cash collateral received from Securities on Loan. | | | | | | | | | | | | |
| § | | Affiliated Fund. | | | | | | | | | | | | |
The Continental Small Company Series
CONTINUED
Summary of the Series’ investments as of June 30, 2023, based on their valuation inputs, is as follows (see Security Valuation Note):
| | | Investments in Securities (Market Value) | |
| | | Level 1 | | | Level 2 | | | Level 3 | | | Total | |
| Common Stocks | | | | | | | | | | | | | | | | |
| Austria | | | — | | | $ | 173,464,807 | | | | — | | | $ | 173,464,807 | |
| Belgium | | $ | 676,194 | | | | 202,934,164 | | | | — | | | | 203,610,358 | |
| Denmark | | | — | | | | 362,001,954 | | | | — | | | | 362,001,954 | |
| Finland | | | — | | | | 268,164,125 | | | | — | | | | 268,164,125 | |
| France | | | — | | | | 601,460,506 | | | | — | | | | 601,460,506 | |
| Germany | | | — | | | | 719,921,990 | | | | — | | | | 719,921,990 | |
| Ireland | | | — | | | | 69,219,680 | | | | — | | | | 69,219,680 | |
| Israel | | | 631,428 | | | | 118,179,644 | | | | — | | | | 118,811,072 | |
| Italy | | | — | | | | 510,145,321 | | | | — | | | | 510,145,321 | |
| Netherlands | | | — | | | | 282,792,522 | | | | — | | | | 282,792,522 | |
| Norway | | | 367,163 | | | | 103,560,088 | | | | — | | | | 103,927,251 | |
| Portugal | | | — | | | | 46,372,889 | | | | — | | | | 46,372,889 | |
| Spain | | | — | | | | 318,472,668 | | | | — | | | | 318,472,668 | |
| Sweden | | | — | | | | 306,422,220 | | | | — | | | | 306,422,220 | |
| Switzerland | | | — | | | | 968,206,313 | | | | — | | | | 968,206,313 | |
| United States | | | — | | | | 3,235,695 | | | | — | | | | 3,235,695 | |
| Preferred Stocks | | | | | | | | | | | | | | | | |
| Germany | | | — | | | | 46,396,758 | | | | — | | | | 46,396,758 | |
| Rights/Warrants | | | | | | | | | | | | | | | | |
| Austria | | | — | | | | 450,329 | | | | — | | | | 450,329 | |
| Netherlands | | | — | | | | 5,781 | | | | — | | | | 5,781 | |
| Spain | | | — | | | | 259,922 | | | | — | | | | 259,922 | |
| Securities Lending Collateral | | | — | | | | 315,391,981 | | | | — | | | | 315,391,981 | |
| TOTAL | | $ | 1,674,785 | | | $ | 5,417,059,357 | | | | — | | | $ | 5,418,734,142 | |
The Canadian Small Company Series
SUMMARY SCHEDULE OF PORTFOLIO HOLDINGS
June 30, 2023
(Unaudited)
| | | | | Shares | | | Value» | | | Percentage
of Net Assets‡ | |
| COMMON STOCKS — (88.4%) |
| COMMUNICATION SERVICES — (0.9%) |
| | | Other Securities | | | | | | $ | 13,196,409 | | | | 1.0 | % |
| CONSUMER DISCRETIONARY — (4.8%) |
| * | | Aritzia, Inc. | | | 490,659 | | | | 13,622,523 | | | | 1.1 | % |
| | | Linamar Corp. | | | 252,633 | | | | 13,276,701 | | | | 1.0 | % |
| * | | Uni-Select, Inc. | | | 241,584 | | | | 8,580,130 | | | | 0.7 | % |
| | | Other Securities | | | | | | | 34,940,198 | | | | 2.6 | % |
| TOTAL CONSUMER DISCRETIONARY | | | | | | | 70,419,552 | | | | 5.4 | % |
| CONSUMER STAPLES — (4.2%) |
| # | | Maple Leaf Foods, Inc. | | | 453,624 | | | | 8,861,890 | | | | 0.7 | % |
| # | | Premium Brands Holdings Corp. | | | 244,773 | | | | 19,313,925 | | | | 1.5 | % |
| | | Primo Water Corp. | | | 799,922 | | | | 10,023,556 | | | | 0.8 | % |
| | | Other Securities | | | | | | | 23,630,536 | | | | 1.8 | % |
| TOTAL CONSUMER STAPLES | | | | | | | 61,829,907 | | | | 4.8 | % |
| ENERGY — (21.5%) |
| # * | | Baytex Energy Corp. | | | 2,700,011 | | | | 8,804,716 | | | | 0.7 | % |
| # | | Birchcliff Energy Ltd. | | | 1,560,817 | | | | 9,237,068 | | | | 0.7 | % |
| | | Crescent Point Energy Corp. | | | 2,349,740 | | | | 15,821,612 | | | | 1.2 | % |
| | | Crescent Point Energy Corp. | | | 739,368 | | | | 4,975,947 | | | | 0.4 | % |
| # | | Enerplus Corp. | | | 1,253,055 | | | | 18,160,903 | | | | 1.4 | % |
| | | Enerplus Corp. | | | 28,353 | | | | 410,268 | | | | 0.0 | % |
| # | | Gibson Energy, Inc. | | | 899,205 | | | | 14,138,849 | | | | 1.1 | % |
| * | | MEG Energy Corp. | | | 1,420,274 | | | | 22,514,251 | | | | 1.7 | % |
| * | | NuVista Energy Ltd. | | | 1,051,851 | | | | 8,432,276 | | | | 0.7 | % |
| | | Paramount Resources Ltd., Class A | | | 487,473 | | | | 10,597,644 | | | | 0.8 | % |
| | | Parex Resources, Inc. | | | 727,671 | | | | 14,589,124 | | | | 1.1 | % |
| | | Parkland Corp. | | | 848,828 | | | | 21,144,611 | | | | 1.6 | % |
| # | | Peyto Exploration & Development Corp. | | | 1,064,787 | | | | 8,809,259 | | | | 0.7 | % |
| # | | PrairieSky Royalty Ltd. | | | 1,210,467 | | | | 21,162,042 | | | | 1.6 | % |
| | | Secure Energy Services, Inc. | | | 1,829,933 | | | | 8,757,708 | | | | 0.7 | % |
| | | Vermilion Energy, Inc. | | | 716,524 | | | | 8,935,253 | | | | 0.7 | % |
| | | Vermilion Energy, Inc. | | | 233,451 | | | | 2,906,465 | | | | 0.2 | % |
| | | Whitecap Resources, Inc. | | | 1,953,560 | | | | 13,670,129 | | | | 1.1 | % |
| | | Other Securities | | | | | | | 99,383,414 | | | | 7.7 | % |
| TOTAL ENERGY | | | | | | | 312,451,539 | | | | 24.1 | % |
| FINANCIALS — (8.2%) |
| | | Canadian Western Bank | | | 499,325 | | | | 9,317,467 | | | | 0.7 | % |
| # | | CI Financial Corp. | | | 1,010,158 | | | | 11,468,410 | | | | 0.9 | % |
| | | Element Fleet Management Corp. | | | 945,377 | | | | 14,400,987 | | | | 1.1 | % |
| # | | Home Capital Group, Inc. | | | 284,804 | | | | 9,268,089 | | | | 0.7 | % |
| # | | Laurentian Bank of Canada | | | 330,400 | | | | 8,245,347 | | | | 0.7 | % |
| | | Onex Corp. | | | 209,947 | | | | 11,596,016 | | | | 0.9 | % |
| | | Other Securities | | | | | | | 55,284,239 | | | | 4.2 | % |
| TOTAL FINANCIALS | | | | | | | 119,580,555 | | | | 9.2 | % |
| HEALTH CARE — (2.0%) |
| * | | Bausch Health Cos., Inc. | | | 1,533,896 | | | | 12,271,168 | | | | 1.0 | % |
| * | | Bausch Health Cos., Inc. | | | 17,777 | | | | 142,243 | | | | 0.0 | % |
The Canadian Small Company Series
CONTINUED
| | | | | Shares | | | Value» | | | Percentage
of Net Assets‡ | |
| HEALTH CARE — (Continued) |
| | | Other Securities | | | | | | $ | 16,372,772 | | | | 1.2 | % |
| TOTAL HEALTH CARE | | | | | | | 28,786,183 | | | | 2.2 | % |
| INDUSTRIALS — (13.7%) |
| * | | ATS Corp. | | | 428,936 | | | | 19,734,780 | | | | 1.5 | % |
| * | | Bombardier, Inc., Class A | | | 13,989 | | | | 690,184 | | | | 0.1 | % |
| * | | Bombardier, Inc., Class B | | | 475,761 | | | | 23,454,954 | | | | 1.8 | % |
| | | Boyd Group Services, Inc. | | | 118,616 | | | | 22,630,831 | | | | 1.7 | % |
| | | Finning International, Inc. | | | 823,989 | | | | 25,346,331 | | | | 2.0 | % |
| | | Richelieu Hardware Ltd. | | | 316,493 | | | | 10,010,233 | | | | 0.8 | % |
| | | Russel Metals, Inc. | | | 354,503 | | | | 9,820,917 | | | | 0.8 | % |
| # | | SNC-Lavalin Group, Inc. | | | 978,592 | | | | 25,669,803 | | | | 2.0 | % |
| | | Other Securities | | | | | | | 61,328,414 | | | | 4.6 | % |
| TOTAL INDUSTRIALS | | | | | | | 198,686,447 | | | | 15.3 | % |
| INFORMATION TECHNOLOGY — (3.1%) |
| # * | | BlackBerry Ltd. | | | 2,152,506 | | | | 11,903,358 | | | | 0.9 | % |
| * | | Celestica, Inc. | | | 584,405 | | | | 8,483,192 | | | | 0.7 | % |
| # * | | Lightspeed Commerce, Inc. | | | 579,603 | | | | 9,806,883 | | | | 0.8 | % |
| | | Other Securities | | | | | | | 15,244,852 | | | | 1.1 | % |
| TOTAL INFORMATION TECHNOLOGY | | | | | | | 45,438,285 | | | | 3.5 | % |
| MATERIALS — (20.9%) |
| | | Alamos Gold, Inc., Class A | | | 2,146,839 | | | | 25,572,456 | | | | 2.0 | % |
| | | Alamos Gold, Inc., Class A | | | 31,783 | | | | 378,853 | | | | 0.0 | % |
| | | B2Gold Corp. | | | 1,419,420 | | | | 5,057,304 | | | | 0.4 | % |
| | | B2Gold Corp. | | | 4,573,000 | | | | 16,325,610 | | | | 1.3 | % |
| # * | | Capstone Copper Corp. | | | 2,311,783 | | | | 10,487,878 | | | | 0.8 | % |
| | | Methanex Corp. | | | 203,098 | | | | 8,392,213 | | | | 0.7 | % |
| | | Methanex Corp. | | | 126,782 | | | | 5,244,971 | | | | 0.4 | % |
| | | Osisko Gold Royalties Ltd. | | | 645,585 | | | | 9,921,956 | | | | 0.8 | % |
| | | Osisko Gold Royalties Ltd. | | | 278,602 | | | | 4,282,113 | | | | 0.3 | % |
| # | | SSR Mining, Inc. | | | 847,686 | | | | 12,023,413 | | | | 0.9 | % |
| # | | SSR Mining, Inc. | | | 318,436 | | | | 4,515,422 | | | | 0.4 | % |
| | | Stella-Jones, Inc. | | | 302,188 | | | | 15,561,627 | | | | 1.2 | % |
| | | Other Securities | | | | | | | 185,815,302 | | | | 14.2 | % |
| TOTAL MATERIALS | | | | | | | 303,579,118 | | | | 23.4 | % |
| REAL ESTATE — (2.8%) |
| | | Tricon Residential, Inc. | | | 1,208,577 | | | | 10,655,731 | | | | 0.8 | % |
| | | Tricon Residential, Inc. | | | 182,323 | | | | 1,606,265 | | | | 0.1 | % |
| | | Other Securities | | | | | | | 28,668,939 | | | | 2.3 | % |
| TOTAL REAL ESTATE | | | | | | | 40,930,935 | | | | 3.2 | % |
| UTILITIES — (6.3%) |
| | | Atco Ltd., Class I | | | 409,045 | | | | 12,177,947 | | | | 0.9 | % |
| | | Boralex, Inc., Class A | | | 505,030 | | | | 13,750,845 | | | | 1.1 | % |
| # | | Capital Power Corp. | | | 687,087 | | | | 21,835,337 | | | | 1.7 | % |
| # | | TransAlta Corp. | | | 1,716,689 | | | | 16,068,650 | | | | 1.2 | % |
| | | Other Securities | | | | | | | 27,632,911 | | | | 2.2 | % |
| TOTAL UTILITIES | | | | | | | 91,465,690 | | | | 7.1 | % |
TOTAL COMMON STOCKS
(Cost $1,129,333,912) | | | | | | | 1,286,364,620 | | | | 99.2 | % |
The Canadian Small Company Series
CONTINUED
| | | | | Shares | | | Value† | | | Percentage
of Net Assets‡ | |
| SECURITIES LENDING COLLATERAL — (11.6%) |
| @ § | | The DFA Short Term Investment Fund | | | 14,526,048 | | | $ | 168,008,274 | | | | 13.0 | % |
TOTAL INVESTMENTS—(100.0%)
(Cost $1,297,338,587) | | | | | | $ | 1,454,372,894 | | | | 112.2 | % |
| » | | Securities that have been fair value factored. See Note B to Financial Statements. | | | | | | | | | | | | |
| ‡ | | Calculated as a percentage of total net assets. Percentages shown parenthetically next to the category headings have been calculated as a percentage of total investments. “Other Securities” are those securities that are not among the top 50 holdings in unaffiliated issuers of the Fund or do not represent more than 1.0% of the net assets of the Fund. Some of the individual securities within this category may include Total or Partial Securities on Loan and/or Non-Income Producing Securities. | | | | | | | | | | | | |
| * | | Non-Income Producing Securities. | | | | | | | | | | | | |
| # | | Total or Partial Securities on Loan. | | | | | | | | | | | | |
| † | | See Note B to Financial Statements. | | | | | | | | | | | | |
| @ | | Security purchased with cash collateral received from Securities on Loan. | | | | | | | | | | | | |
| § | | Affiliated Fund. | | | | | | | | | | | | |
Summary of the Series’ investments as of June 30, 2023, based on their valuation inputs, is as follows (see Security Valuation Note):
| | | Investments in Securities (Market Value) | |
| | | Level 1 | | | Level 2 | | | Level 3 | | | Total | |
| Common Stocks | | | | | | | | | | | | | | | | |
| Communication Services | | $ | 9,813,505 | | | $ | 3,382,904 | | | | — | | | $ | 13,196,409 | |
| Consumer Discretionary | | | 70,419,552 | | | | — | | | | — | | | | 70,419,552 | |
| Consumer Staples | | | 61,829,907 | | | | — | | | | — | | | | 61,829,907 | |
| Energy | | | 312,451,539 | | | | — | | | | — | | | | 312,451,539 | |
| Financials | | | 119,451,187 | | | | 129,368 | | | | — | | | | 119,580,555 | |
| Health Care | | | 28,772,374 | | | | 13,809 | | | | — | | | | 28,786,183 | |
| Industrials | | | 198,686,447 | | | | — | | | | — | | | | 198,686,447 | |
| Information Technology | | | 45,438,285 | | | | — | | | | — | | | | 45,438,285 | |
| Materials | | | 303,579,118 | | | | — | | | | — | | | | 303,579,118 | |
| Real Estate | | | 40,930,935 | | | | — | | | | — | | | | 40,930,935 | |
| Utilities | | | 91,465,690 | | | | — | | | | — | | | | 91,465,690 | |
| Securities Lending Collateral | | | — | | | | 168,008,274 | | | | — | | | | 168,008,274 | |
| TOTAL | | $ | 1,282,838,539 | | | $ | 171,534,355 | | | | — | | | $ | 1,454,372,894 | |
The Japanese Small Company Series
SUMMARY SCHEDULE OF PORTFOLIO HOLDINGS
October 31, 2022
| | | | | Shares | | | Value» | | | Percentage
of Net Assets‡ | |
| COMMON STOCKS — (97.8%) |
| COMMUNICATION SERVICES — (2.4%) |
| | | Other Securities | | | | | | $ | 60,456,006 | | | | 2.4 | % |
| CONSUMER DISCRETIONARY — (14.4%) |
| | | Resorttrust, Inc. | | | 521,964 | | | | 8,033,803 | | | | 0.3 | % |
| | | Other Securities | | | | | | | 358,737,144 | | | | 14.2 | % |
| TOTAL CONSUMER DISCRETIONARY | | | | | | | 366,770,947 | | | | 14.5 | % |
| CONSUMER STAPLES — (7.8%) |
| | | Milbon Co. Ltd. | | | 164,552 | | | | 6,785,094 | | | | 0.3 | % |
| | | Nippon Suisan Kaisha Ltd. | | | 1,893,700 | | | | 6,745,679 | | | | 0.3 | % |
| | | Pigeon Corp. | | | 573,125 | | | | 7,507,397 | | | | 0.3 | % |
| | | Sapporo Holdings Ltd. | | | 385,720 | | | | 8,507,745 | | | | 0.3 | % |
| | | Other Securities | | | | | | | 168,517,053 | | | | 6.6 | % |
| TOTAL CONSUMER STAPLES | | | | | | | 198,062,968 | | | | 7.8 | % |
| ENERGY — (0.7%) |
| | | Other Securities | | | | | | | 19,204,938 | | | | 0.8 | % |
| FINANCIALS — (8.8%) |
| | | Fuyo General Lease Co. Ltd. | | | 114,800 | | | | 6,380,157 | | | | 0.3 | % |
| | | Hachijuni Bank Ltd. | | | 1,994,500 | | | | 6,360,770 | | | | 0.3 | % |
| | | Hirogin Holdings, Inc. | | | 1,534,800 | | | | 6,331,737 | | | | 0.3 | % |
| | | JAFCO Group Co. Ltd. | | | 588,100 | | | | 9,023,388 | | | | 0.4 | % |
| | | Yamaguchi Financial Group, Inc. | | | 1,237,672 | | | | 6,517,904 | | | | 0.3 | % |
| | | Other Securities | | | | | | | 188,749,126 | | | | 7.3 | % |
| TOTAL FINANCIALS | | | | | | | 223,363,082 | | | | 8.9 | % |
| HEALTH CARE — (5.0%) |
| | | H.U. Group Holdings, Inc. | | | 348,800 | | | | 6,492,843 | | | | 0.3 | % |
| | | Nipro Corp. | | | 839,500 | | | | 6,328,382 | | | | 0.3 | % |
| | | Ship Healthcare Holdings, Inc. | | | 346,200 | | | | 6,639,723 | | | | 0.3 | % |
| | | Other Securities | | | | | | | 108,331,555 | | | | 4.2 | % |
| TOTAL HEALTH CARE | | | | | | | 127,792,503 | | | | 5.1 | % |
| INDUSTRIALS — (28.2%) |
| | | Daiseki Co. Ltd. | | | 290,755 | | | | 8,984,172 | | | | 0.4 | % |
| | | DMG Mori Co. Ltd. | | | 731,800 | | | | 8,468,845 | | | | 0.3 | % |
| | | Fujikura Ltd. | | | 1,559,000 | | | | 9,230,804 | | | | 0.4 | % |
| | | Furukawa Electric Co. Ltd. | | | 424,300 | | | | 6,546,029 | | | | 0.3 | % |
| # | | Hazama Ando Corp. | | | 1,162,500 | | | | 6,737,422 | | | | 0.3 | % |
| | | Hitachi Zosen Corp. | | | 1,041,679 | | | | 6,005,282 | | | | 0.2 | % |
| | | Inaba Denki Sangyo Co. Ltd. | | | 322,900 | | | | 6,027,512 | | | | 0.2 | % |
| | | Mabuchi Motor Co. Ltd. | | | 249,034 | | | | 6,757,392 | | | | 0.3 | % |
| | | Meitec Corp. | | | 484,000 | | | | 8,152,392 | | | | 0.3 | % |
| | | Nagase & Co. Ltd. | | | 584,600 | | | | 7,964,771 | | | | 0.3 | % |
| # | | Nishimatsu Construction Co. Ltd. | | | 313,800 | | | | 7,640,054 | | | | 0.3 | % |
| | | Nisshinbo Holdings, Inc. | | | 911,180 | | | | 6,316,101 | | | | 0.3 | % |
| | | OSG Corp. | | | 526,900 | | | | 6,698,620 | | | | 0.3 | % |
| | | Penta-Ocean Construction Co. Ltd. | | | 1,589,800 | | | | 7,906,395 | | | | 0.3 | % |
| | | Ushio, Inc. | | | 622,400 | | | | 6,463,241 | | | | 0.3 | % |
The Japanese Small Company Series
CONTINUED
| | | Shares | | | Value» | | | Percentage
of Net Assets‡ | |
| INDUSTRIALS — (Continued) |
| Other Securities | | | | | | $ | 610,194,505 | | | | 24.1 | % |
| TOTAL INDUSTRIALS | | | | | | | 720,093,537 | | | | 28.6 | % |
| INFORMATION TECHNOLOGY — (15.3%) |
| Alps Alpine Co. Ltd. | | | 788,800 | | | | 6,776,241 | | | | 0.3 | % |
| Anritsu Corp. | | | 849,300 | | | | 8,548,093 | | | | 0.3 | % |
| Citizen Watch Co. Ltd. | | | 1,669,800 | | | | 7,012,673 | | | | 0.3 | % |
| Daiwabo Holdings Co. Ltd. | | | 581,600 | | | | 7,504,581 | | | | 0.3 | % |
| Dexerials Corp. | | | 345,400 | | | | 8,044,653 | | | | 0.3 | % |
| DTS Corp. | | | 254,000 | | | | 6,038,755 | | | | 0.2 | % |
| Konica Minolta, Inc. | | | 2,014,100 | | | | 6,136,873 | | | | 0.3 | % |
| Macnica Holdings, Inc. | | | 335,450 | | | | 6,709,361 | | | | 0.3 | % |
| Maruwa Co. Ltd. | | | 57,700 | | | | 6,779,271 | | | | 0.3 | % |
| NET One Systems Co. Ltd. | | | 383,900 | | | | 7,884,792 | | | | 0.3 | % |
| NSD Co. Ltd. | | | 489,360 | | | | 8,362,456 | | | | 0.3 | % |
| Tokyo Seimitsu Co. Ltd. | | | 248,700 | | | | 7,479,548 | | | | 0.3 | % |
| Topcon Corp. | | | 676,700 | | | | 7,401,971 | | | | 0.3 | % |
| Ulvac, Inc. | | | 225,700 | | | | 8,897,322 | | | | 0.4 | % |
| Other Securities | | | | | | | 285,987,560 | | | | 11.2 | % |
| TOTAL INFORMATION TECHNOLOGY | | | | | | | 389,564,150 | | | | 15.4 | % |
| MATERIALS — (12.1%) |
| ADEKA Corp. | | | 508,800 | | | | 7,606,774 | | | | 0.3 | % |
| Asahi Holdings, Inc. | | | 472,200 | | | | 6,022,117 | | | | 0.2 | % |
| Daicel Corp. | | | 1,608,100 | | | | 9,175,525 | | | | 0.4 | % |
| Kureha Corp. | | | 103,950 | | | | 6,674,583 | | | | 0.3 | % |
| Mitsui Mining & Smelting Co. Ltd. | | | 366,200 | | | | 7,396,353 | | | | 0.3 | % |
| Tokai Carbon Co. Ltd. | | | 1,004,500 | | | | 6,555,281 | | | | 0.3 | % |
| UBE Corp. | | | 611,100 | | | | 7,881,843 | | | | 0.3 | % |
| Other Securities | | | | | | | 257,679,027 | | | | 10.2 | % |
| TOTAL MATERIALS | | | | | | | 308,991,503 | | | | 12.3 | % |
| REAL ESTATE — (1.4%) |
| Other Securities | | | | | | | 36,414,839 | | | | 1.4 | % |
| UTILITIES — (1.7%) |
| Nippon Gas Co. Ltd. | | | 684,000 | | | | 9,936,468 | | | | 0.4 | % |
| Other Securities | | | | | | | 32,350,517 | | | | 1.3 | % |
| TOTAL UTILITIES | | | | | | | 42,286,985 | | | | 1.7 | % |
TOTAL COMMON STOCKS
(Cost $2,854,128,543) | | | | | | | 2,493,001,458 | | | | 98.9 | % |
| | | | | | | | Value† | | | | |
| SECURITIES LENDING COLLATERAL — (2.2%) |
| @§ | | The DFA Short Term Investment Fund | | | 4,804,517 | | | | 55,545,021 | | | | 2.2 | % |
TOTAL INVESTMENTS—(100.0%)
(Cost $2,909,692,756) | | | | | | $ | 2,548,546,479 | | | | 101.1 | % |
The Japanese Small Company Series
CONTINUED
Summary of the Series’ investments as of October 31, 2022, based on their valuation inputs, is as follows (see Security Valuation Note):
| | | Investments in Securities (Market Value) | |
| | | Level 1 | | | Level 2 | | | Level 3 | | | Total | |
| Common Stocks | | | | | | | | | | | | | | | | |
| Communication Services | | | — | | | $ | 60,456,006 | | | | — | | | $ | 60,456,006 | |
| Consumer Discretionary | | | — | | | | 366,770,947 | | | | — | | | | 366,770,947 | |
| Consumer Staples | | | — | | | | 198,062,968 | | | | — | | | | 198,062,968 | |
| Energy | | | — | | | | 19,204,938 | | | | — | | | | 19,204,938 | |
| Financials | | $ | 2,856,753 | | | | 220,506,329 | | | | — | | | | 223,363,082 | |
| Health Care | | | — | | | | 127,792,503 | | | | — | | | | 127,792,503 | |
| Industrials | | | — | | | | 720,093,537 | | | | — | | | | 720,093,537 | |
| Information Technology | | | — | | | | 389,564,150 | | | | — | | | | 389,564,150 | |
| Materials | | | — | | | | 308,991,503 | | | | — | | | | 308,991,503 | |
| Real Estate | | | — | | | | 36,414,839 | | | | — | | | | 36,414,839 | |
| Utilities | | | — | | | | 42,286,985 | | | | — | | | | 42,286,985 | |
| Securities Lending Collateral | | | — | | | | 55,545,021 | | | | — | | | | 55,545,021 | |
| TOTAL | | $ | 2,856,753 | | | $ | 2,545,689,726 | | | | — | | | $ | 2,548,546,479 | |
See accompanying Notes to Financial Statements.
The Asia Pacific Small Company Series
SUMMARY SCHEDULE OF PORTFOLIO HOLDINGS
October 31, 2022
| | | | | Shares | | | Value» | | | Percentage
of Net Assets‡ | |
| COMMON STOCKS — (98.6%) |
| AUSTRALIA — (64.4%) |
| * | | AMP Ltd. | | | 12,919,775 | | | $ | 10,418,866 | | | | 0.9 | % |
| # | | Ansell Ltd. | | | 667,221 | | | | 12,045,403 | | | | 1.0 | % |
| # | | ARB Corp. Ltd. | | | 515,315 | | | | 9,567,925 | | | | 0.8 | % |
| | | AUB Group Ltd. | | | 762,060 | | | | 10,083,242 | | | | 0.9 | % |
| | | Bapcor Ltd. | | | 2,227,045 | | | | 9,417,379 | | | | 0.8 | % |
| | | Beach Energy Ltd. | | | 8,737,409 | | | | 8,934,529 | | | | 0.8 | % |
| # | | Breville Group Ltd. | | | 652,020 | | | | 8,261,901 | | | | 0.7 | % |
| | | Brickworks Ltd. | | | 469,394 | | | | 6,646,000 | | | | 0.6 | % |
| # | | Corporate Travel Management Ltd. | | | 706,149 | | | | 7,883,899 | | | | 0.7 | % |
| | | CSR Ltd. | | | 3,109,441 | | | | 9,211,011 | | | | 0.8 | % |
| | | Downer EDI Ltd. | | | 3,274,403 | | | | 9,410,422 | | | | 0.8 | % |
| | | Eagers Automotive Ltd. | | | 941,185 | | | | 7,461,464 | | | | 0.6 | % |
| | | Elders Ltd. | | | 1,009,369 | | | | 8,415,415 | | | | 0.7 | % |
| #* | | Flight Centre Travel Group Ltd. | | | 718,191 | | | | 7,643,947 | | | | 0.6 | % |
| # | | Gold Road Resources Ltd. | | | 7,605,514 | | | | 6,572,387 | | | | 0.6 | % |
| | | GrainCorp Ltd., Class A | | | 1,517,016 | | | | 8,155,207 | | | | 0.7 | % |
| | | Healius Ltd. | | | 3,665,521 | | | | 8,029,741 | | | | 0.7 | % |
| | | HUB24 Ltd. | | | 461,678 | | | | 7,485,853 | | | | 0.6 | % |
| # | | Insignia Financial Ltd. | | | 4,120,661 | | | | 8,306,842 | | | | 0.7 | % |
| | | IPH Ltd. | | | 1,331,405 | | | | 8,467,477 | | | | 0.7 | % |
| | | IRESS Ltd. | | | 1,215,703 | | | | 7,890,780 | | | | 0.7 | % |
| | | Lifestyle Communities Ltd. | | | 578,173 | | | | 6,490,474 | | | | 0.5 | % |
| | | Metcash Ltd. | | | 2,899,744 | | | | 7,612,203 | | | | 0.6 | % |
| # | | New Hope Corp. Ltd. | | | 2,341,365 | | | | 8,505,399 | | | | 0.7 | % |
| | | nib holdings Ltd. | | | 2,992,914 | | | | 12,806,819 | | | | 1.1 | % |
| | | Nufarm Ltd. | | | 2,098,872 | | | | 7,480,120 | | | | 0.6 | % |
| #* | | Omni Bridgeway Ltd. | | | 2,355,720 | | | | 6,782,068 | | | | 0.6 | % |
| | | Orora Ltd. | | | 5,992,474 | | | | 11,628,555 | | | | 1.0 | % |
| #* | | Paladin Energy Ltd. | | | 16,033,988 | | | | 8,680,653 | | | | 0.7 | % |
| # | | Pendal Group Ltd. | | | 2,058,779 | | | | 6,466,738 | | | | 0.5 | % |
| # | | Perseus Mining Ltd. | | | 8,114,950 | | | | 9,451,479 | | | | 0.8 | % |
| | | Premier Investments Ltd. | | | 410,666 | | | | 6,576,580 | | | | 0.6 | % |
| | | Reliance Worldwide Corp. Ltd. | | | 4,255,179 | | | | 8,742,677 | | | | 0.7 | % |
| | | Sims Ltd. | | | 1,106,977 | | | | 8,654,727 | | | | 0.7 | % |
| * | | Star Entertainment Group Ltd. | | | 5,751,661 | | | | 10,819,618 | | | | 0.9 | % |
| # | | Super Retail Group Ltd. | | | 1,057,351 | | | | 6,952,302 | | | | 0.6 | % |
| #* | | Syrah Resources Ltd. | | | 4,792,786 | | | | 7,321,076 | | | | 0.6 | % |
| | | Technology One Ltd. | | | 1,296,361 | | | | 9,972,913 | | | | 0.8 | % |
| Ω | | Viva Energy Group Ltd. | | | 3,776,327 | | | | 6,854,919 | | | | 0.6 | % |
| #* | | Webjet Ltd. | | | 2,329,981 | | | | 7,868,307 | | | | 0.7 | % |
| | | Whitehaven Coal Ltd. | | | 3,623,702 | | | | 21,049,343 | | | | 1.8 | % |
| | | Other Securities | | | | | | | 417,169,018 | | | | 34.7 | % |
| TOTAL AUSTRALIA | | | | | | | 778,195,678 | | | | 65.2 | % |
| CHINA — (0.1%) | | | | | | | | | | | | |
| | | Other Securities | | | | | | | 1,050,669 | | | | 0.1 | % |
| HONG KONG — (18.7%) | | | | | | | | | | | | |
| | | ASMPT Ltd. | | | 1,590,200 | | | | 8,746,899 | | | | 0.7 | % |
| | | Kerry Logistics Network Ltd. | | | 4,063,500 | | | | 6,450,213 | | | | 0.6 | % |
| | | Luk Fook Holdings International Ltd. | | | 3,509,000 | | | | 7,622,920 | | | | 0.6 | % |
| | | VTech Holdings Ltd. | | | 1,292,000 | | | | 6,877,585 | | | | 0.6 | % |
The Asia Pacific Small Company Series
CONTINUED
| | | | | Shares | | | Value» | | | Percentage
of Net Assets‡ | |
| HONG KONG — (Continued) |
| | | Other Securities | | | | | | $ | 195,738,785 | | | | 16.4 | % |
| TOTAL HONG KONG | | | | | | | 225,436,402 | | | | 18.9 | % |
| NEW ZEALAND — (4.6%) |
| | | Chorus Ltd. | | | 2,451,723 | | | | 11,836,205 | | | | 1.0 | % |
| * | | SKYCITY Entertainment Group Ltd. | | | 4,246,632 | | | | 7,159,611 | | | | 0.6 | % |
| | | Other Securities | | | | | | | 35,984,180 | | | | 3.0 | % |
| TOTAL NEW ZEALAND | | | | | | | 54,979,996 | | | | 4.6 | % |
| SINGAPORE — (10.8%) |
| | | ComfortDelGro Corp. Ltd. | | | 9,120,200 | | | | 8,187,132 | | | | 0.7 | % |
| | | Golden Agri-Resources Ltd. | | | 31,541,800 | | | | 6,467,918 | | | | 0.5 | % |
| | | Keppel Infrastructure Trust | | | 18,468,846 | | | | 6,911,022 | | | | 0.6 | % |
| | | Other Securities | | | | | | | 109,293,171 | | | | 9.1 | % |
| TOTAL SINGAPORE | | | | | | | 130,859,243 | | | | 10.9 | % |
| TOTAL COMMON STOCKS | | | | | | | 1,190,521,988 | | | | 99.7 | % |
| RIGHTS/WARRANTS — (0.0%) |
| AUSTRALIA — (0.0%) |
| | | Other Securities | | | | | | | 21,319 | | | | 0.0 | % |
| HONG KONG — (0.0%) |
| | | Other Security | | | | | | | 5,255 | | | | 0.0 | % |
| TOTAL RIGHTS/WARRANTS | | | | | | | 26,574 | | | | 0.0 | % |
TOTAL INVESTMENT SECURITIES
(Cost $1,539,796,503) | | | | | | | 1,190,548,562 | | | | | |
| | | | | | | | Value† | | | | |
| SECURITIES LENDING COLLATERAL — (1.4%) |
| @§ | | The DFA Short Term Investment Fund | | | 1,496,806 | | | | 17,304,573 | | | | 1.5 | % |
TOTAL INVESTMENTS—(100.0%)
(Cost $1,557,108,416) | | | | | | $ | 1,207,853,135 | | | | 101.2 | % |
Summary of the Series’ investments as of October 31, 2022, based on their valuation inputs, is as follows (see Security Valuation Note):
| | | Investments in Securities (Market Value) | |
| | | Level 1 | | | Level 2 | | | Level 3 | | | Total | |
| Common Stocks | | | | | | | | | | | | | | | | |
| Australia | | $ | 8,084 | | | $ | 777,796,648 | | | $ | 390,946 | | | $ | 778,195,678 | |
| China | | | — | | | | 1,050,669 | | | | — | | | | 1,050,669 | |
| Hong Kong | | | — | | | | 224,321,261 | | | | 1,115,141 | | | | 225,436,402 | |
| New Zealand | | | — | | | | 54,979,996 | | | | — | | | | 54,979,996 | |
| Singapore | | | 637,539 | | | | 129,841,227 | | | | 380,477 | | | | 130,859,243 | |
| Rights/Warrants | | | | | | | | | | | | | | | | |
| Australia | | | — | | | | 21,319 | | | | — | | | | 21,319 | |
| Hong Kong | | | — | | | | 5,255 | | | | — | | | | 5,255 | |
| Securities Lending Collateral | | | — | | | | 17,304,573 | | | | — | | | | 17,304,573 | |
| TOTAL | | $ | 645,623 | | | $ | 1,205,320,948 | | | $ | 1,886,564 | ^ | | $ | 1,207,853,135 | |
The Asia Pacific Small Company Series
CONTINUED
| ^ | A reconciliation of Level 3 investments is presented when the Fund had a significant amount of Level 3 investments at the beginning and/or end of the reporting period in relation to net assets. |
See accompanying Notes to Financial Statements.
The United Kingdom Small Company Series
SUMMARY SCHEDULE OF PORTFOLIO HOLDINGS
October 31, 2022
| | | | | Shares | | | Value» | | | Percentage
of Net Assets‡ | |
| COMMON STOCKS — (97.5%) |
| COMMUNICATION SERVICES — (3.6%) |
| | | Euromoney Institutional Investor PLC | | | 592,842 | | | $ | 9,845,186 | | | | 0.8 | % |
| | | Other Securities | | | | | | | 33,354,764 | | | | 2.9 | % |
| TOTAL COMMUNICATION SERVICES | | | | | | | 43,199,950 | | | | 3.7 | % |
| CONSUMER DISCRETIONARY — (16.3%) |
| | | Bellway PLC | | | 429,828 | | | | 9,141,218 | | | | 0.8 | % |
| * | | Frasers Group PLC | | | 1,220,486 | | | | 9,056,198 | | | | 0.8 | % |
| | | Games Workshop Group PLC | | | 176,198 | | | | 12,933,595 | | | | 1.1 | % |
| | | Greggs PLC | | | 604,556 | | | | 14,014,474 | | | | 1.2 | % |
| | | Inchcape PLC | | | 2,415,336 | | | | 20,604,988 | | | | 1.8 | % |
| | | Pets at Home Group PLC | | | 3,042,980 | | | | 10,061,388 | | | | 0.9 | % |
| * | | Playtech PLC | | | 1,947,421 | | | | 11,571,872 | | | | 1.0 | % |
| # | | Vistry Group PLC | | | 1,228,992 | | | | 8,503,987 | | | | 0.7 | % |
| | | Other Securities | | | | | | | 98,610,384 | | | | 8.4 | % |
| TOTAL CONSUMER DISCRETIONARY | | | | | | | 194,498,104 | | | | 16.7 | % |
| CONSUMER STAPLES — (7.0%) |
| | | Britvic PLC | | | 1,626,728 | | | | 13,586,475 | | | | 1.2 | % |
| | | Cranswick PLC | | | 365,093 | | | | 12,464,969 | | | | 1.1 | % |
| * | | Marks & Spencer Group PLC | | | 7,566,588 | | | | 9,163,708 | | | | 0.8 | % |
| | | Tate & Lyle PLC | | | 2,060,165 | | | | 16,553,803 | | | | 1.4 | % |
| | | Other Securities | | | | | | | 31,665,598 | | | | 2.6 | % |
| TOTAL CONSUMER STAPLES | | | | | | | 83,434,553 | | | | 7.1 | % |
| ENERGY — (4.2%) |
| * | | Capricorn Energy PLC | | | 4,040,365 | | | | 11,477,115 | | | | 1.0 | % |
| | | Other Securities | | | | | | | 38,574,608 | | | | 3.3 | % |
| TOTAL ENERGY | | | | | | | 50,051,723 | | | | 4.3 | % |
| FINANCIALS — (18.4%) |
| | | Beazley PLC | | | 3,081,626 | | | | 22,100,836 | | | | 1.9 | % |
| | | Close Brothers Group PLC | | | 898,617 | | | | 10,123,897 | | | | 0.9 | % |
| | | Hiscox Ltd. | | | 1,420,362 | | | | 14,632,152 | | | | 1.2 | % |
| | | Lancashire Holdings Ltd. | | | 1,670,143 | | | | 9,478,286 | | | | 0.8 | % |
| | | Man Group PLC | | | 7,662,342 | | | | 19,060,892 | | | | 1.6 | % |
| | | OSB Group PLC | | | 2,135,454 | | | | 10,176,648 | | | | 0.9 | % |
| | | Paragon Banking Group PLC | | | 1,934,045 | | | | 9,462,355 | | | | 0.8 | % |
| | | Plus500 Ltd. | | | 525,338 | | | | 10,868,092 | | | | 0.9 | % |
| Ω | | Quilter PLC | | | 8,070,566 | | | | 8,945,685 | | | | 0.8 | % |
| | | TP ICAP Group PLC | | | 4,137,686 | | | | 8,726,393 | | | | 0.7 | % |
| | | Virgin Money UK PLC | | | 6,368,888 | | | | 9,926,426 | | | | 0.8 | % |
| | | Other Securities | | | | | | | 86,017,639 | | | | 7.5 | % |
| TOTAL FINANCIALS | | | | | | | 219,519,301 | | | | 18.8 | % |
| HEALTH CARE — (4.9%) |
| | | CVS Group PLC | | | 413,530 | | | | 8,938,783 | | | | 0.8 | % |
| | Indivior PLC | | | 771,895 | | | | 14,621,023 | | | | 1.2 | % |
| # | | Mediclinic International PLC | | | 2,400,508 | | | | 13,655,822 | | | | 1.2 | % |
| | | Other Securities | | | | | | | 20,957,862 | | | | 1.8 | % |
| TOTAL HEALTH CARE | | | | | | | 58,173,490 | | | | 5.0 | % |
The United Kingdom Small Company Series
CONTINUED
| | | | | Shares | | | Value» | | | Percentage
of Net Assets‡ | |
| INDUSTRIALS — (22.3%) |
| * | | Babcock International Group PLC | | | 2,860,700 | | | $ | 9,035,971 | | | | 0.8 | % |
| | | Balfour Beatty PLC | | | 3,610,310 | | | | 12,369,652 | | | | 1.1 | % |
| | Diploma PLC | | | 427,629 | | | | 12,162,994 | | | | 1.0 | % |
| | | Grafton Group PLC | | | 1,499,770 | | | | 11,874,058 | | | | 1.0 | % |
| | | Hays PLC | | | 9,235,636 | | | | 11,644,369 | | | | 1.0 | % |
| | | Pagegroup PLC | | | 1,968,311 | | | | 9,493,890 | | | | 0.8 | % |
| | | QinetiQ Group PLC | | | 3,269,929 | | | | 13,478,205 | | | | 1.2 | % |
| | | Rotork PLC | | | 4,427,553 | | | | 12,977,500 | | | | 1.1 | % |
| | | Serco Group PLC | | | 5,072,076 | | | | 9,486,190 | | | | 0.8 | % |
| | | Travis Perkins PLC | | | 1,187,192 | | | | 11,189,269 | | | | 1.0 | % |
| | | Other Securities | | | | | | | 151,227,680 | | | | 12.9 | % |
| TOTAL INDUSTRIALS | | | | | | | 264,939,778 | | | | 22.7 | % |
| INFORMATION TECHNOLOGY — (8.5%) |
| | | Computacenter PLC | | | 501,179 | | | | 10,398,774 | | | | 0.9 | % |
| | | Micro Focus International PLC | | | 1,571,570 | | | | 9,370,682 | | | | 0.8 | % |
| | | Softcat PLC | | | 677,739 | | | | 8,707,891 | | | | 0.7 | % |
| | | Spectris PLC | | | 462,131 | | | | 16,016,986 | | | | 1.4 | % |
| | | Spirent Communications PLC | | | 4,065,908 | | | | 12,069,222 | | | | 1.0 | % |
| | | Other Securities | | | | | | | 44,097,451 | | | | 3.8 | % |
| TOTAL INFORMATION TECHNOLOGY | | | | | | | 100,661,006 | | | | 8.6 | % |
| MATERIALS — (5.1%) |
| | | Victrex PLC | | | 545,312 | | | | 10,356,993 | | | | 0.9 | % |
| | | Other Securities | | | | | | | 50,618,342 | | | | 4.3 | % |
| TOTAL MATERIALS | | | | | | | 60,975,335 | | | | 5.2 | % |
| REAL ESTATE — (3.0%) |
| | | Grainger PLC | | | 4,237,552 | | | | 11,018,013 | | | | 0.9 | % |
| | | Savills PLC | | | 965,499 | | | | 9,122,034 | | | | 0.8 | % |
| | | Other Securities | | | | | | | 15,177,252 | | | | 1.3 | % |
| TOTAL REAL ESTATE | | | | | | | 35,317,299 | | | | 3.0 | % |
| UTILITIES — (4.2%) |
| | | Centrica PLC | | | 12,351,821 | | | | 10,853,682 | | | | 0.9 | % |
| | | Drax Group PLC | | | 2,494,304 | | | | 14,895,027 | | | | 1.3 | % |
| | | Pennon Group PLC | | | 1,360,703 | | | | 13,075,947 | | | | 1.1 | % |
| | | Telecom Plus PLC | | | 427,882 | | | | 10,401,875 | | | | 0.9 | % |
| | | Other Security | | | | | | | 539,940 | | | | 0.1 | % |
| TOTAL UTILITIES | | | | | | | 49,766,471 | | | | 4.3 | % |
TOTAL COMMON STOCKS
(Cost $1,400,292,665) | | | | | | | 1,160,537,010 | | | | 99.4 | % |
| | | | | | | | Value† | | | | |
| SECURITIES LENDING COLLATERAL — (2.5%) |
| @§ | | The DFA Short Term Investment Fund | | | 2,548,908 | | | | 29,467,920 | | | | 2.5 | % |
TOTAL INVESTMENTS—(100.0%)
(Cost $1,429,768,069) | | | | | | $ | 1,190,004,930 | | | | 101.9 | % |
The United Kingdom Small Company Series
CONTINUED
Summary of the Series’ investments as of October 31, 2022, based on their valuation inputs, is as follows (see Security Valuation Note):
| | | Investments in Securities (Market Value) | |
| | | Level 1 | | | Level 2 | | | Level 3 | | | Total | |
| Common Stocks | | | | | | | | | | | | | | | | |
| Communication Services | | $ | 23,016 | | | $ | 43,176,934 | | | | — | | | $ | 43,199,950 | |
| Consumer Discretionary | | | — | | | | 194,388,958 | | | $ | 109,146 | | | | 194,498,104 | |
| Consumer Staples | | | — | | | | 83,434,553 | | | | — | | | | 83,434,553 | |
| Energy | | | — | | | | 50,051,723 | | | | — | | | | 50,051,723 | |
| Financials | | | — | | | | 219,518,781 | | | | 520 | | | | 219,519,301 | |
| Health Care | | | — | | | | 58,167,401 | | | | 6,089 | | | | 58,173,490 | |
| Industrials | | | 160,252 | | | | 264,779,526 | | | | — | | | | 264,939,778 | |
| Information Technology | | | — | | | | 100,661,006 | | | | — | | | | 100,661,006 | |
| Materials | | | — | | | | 60,975,335 | | | | — | | | | 60,975,335 | |
| Real Estate | | | — | | | | 35,317,299 | | | | — | | | | 35,317,299 | |
| Utilities | | | — | | | | 49,766,471 | | | | — | | | | 49,766,471 | |
| Securities Lending Collateral | | | — | | | | 29,467,920 | | | | — | | | | 29,467,920 | |
| TOTAL | | $ | 183,268 | | | $ | 1,189,705,907 | | | $ | 115,755 | ^ | | $ | 1,190,004,930 | |
| ^ | A reconciliation of Level 3 investments is presented when the Fund had a significant amount of Level 3 investments at the beginning and/or end of the reporting period in relation to net assets. |
See accompanying Notes to Financial Statements.
The Continental Small Company Series
SUMMARY SCHEDULE OF PORTFOLIO HOLDINGS
October 31, 2022
| | | | | Shares | | | Value» | | | Percentage
of Net Assets‡ | |
| COMMON STOCKS — (93.7%) |
| AUSTRIA — (3.1%) |
| | | ANDRITZ AG | | | 444,373 | | | $ | 20,652,912 | | | | 0.5 | % |
| Ω | | BAWAG Group AG | | | 344,403 | | | | 16,626,330 | | | | 0.4 | % |
| | | Other Securities | | | | | | | 104,285,328 | | | | 2.4 | % |
| TOTAL AUSTRIA | | | | | | | 141,564,570 | | | | 3.3 | % |
| BELGIUM — (4.4%) |
| | | Ackermans & van Haaren NV | | | 172,739 | | | | 24,066,242 | | | | 0.6 | % |
| | | D’ieteren Group | | | 122,666 | | | | 20,415,062 | | | | 0.5 | % |
| | | Euronav NV | | | 1,306,429 | | | | 22,776,000 | | | | 0.5 | % |
| | | Other Securities | | | | | | | 132,956,790 | | | | 3.0 | % |
| TOTAL BELGIUM | | | | | | | 200,214,094 | | | | 4.6 | % |
| DENMARK — (6.2%) |
| #* | | ISS AS | | | 927,711 | | | | 17,037,438 | | | | 0.4 | % |
| * | | Jyske Bank AS | | | 445,581 | | | | 24,047,629 | | | | 0.6 | % |
| | | Ringkjoebing Landbobank AS | | | 197,936 | | | | 21,527,994 | | | | 0.5 | % |
| | | Royal Unibrew AS | | | 312,072 | | | | 17,826,861 | | | | 0.4 | % |
| | | Topdanmark AS | | | 367,737 | | | | 16,972,205 | | | | 0.4 | % |
| | | Other Securities | | | | | | | 187,427,684 | | | | 4.2 | % |
| TOTAL DENMARK | | | | | | | 284,839,811 | | | | 6.5 | % |
| FINLAND — (5.3%) |
| | | Huhtamaki Oyj | | | 643,085 | | | | 23,112,067 | | | | 0.5 | % |
| | | Orion Oyj, Class B | | | 676,382 | | | | 31,125,885 | | | | 0.7 | % |
| | | Valmet Oyj | | | 1,002,259 | | | | 22,794,608 | | | | 0.5 | % |
| | | Other Securities | | | | | | | 164,215,005 | | | | 3.8 | % |
| TOTAL FINLAND | | | | | | | 241,247,565 | | | | 5.5 | % |
| FRANCE — (10.4%) |
| | | Gaztransport Et Technigaz SA | | | 161,171 | | | | 18,750,394 | | | | 0.4 | % |
| | | Nexans SA | | | 198,522 | | | | 18,537,701 | | | | 0.4 | % |
| | | Rexel SA | | | 1,687,054 | | | | 30,105,974 | | | | 0.7 | % |
| * | | SOITEC | | | 136,660 | | | | 17,498,496 | | | | 0.4 | % |
| | | SPIE SA | | | 887,677 | | | | 20,765,906 | | | | 0.5 | % |
| | | Other Securities | | | | | | | 368,603,169 | | | | 8.5 | % |
| TOTAL FRANCE | | | | | | | 474,261,640 | | | | 10.9 | % |
| GERMANY — (13.4%) |
| * | | Aareal Bank AG | | | 523,741 | | | | 16,561,936 | | | | 0.4 | % |
| | | Aurubis AG | | | 287,683 | | | | 18,152,871 | | | | 0.4 | % |
| | | Freenet AG | | | 962,168 | | | | 18,912,546 | | | | 0.4 | % |
| | | Hugo Boss AG | | | 426,713 | | | | 19,653,270 | | | | 0.5 | % |
| | | K&S AG | | | 1,269,799 | | | | 28,035,878 | | | | 0.7 | % |
| | | Lanxess AG | | | 577,941 | | | | 19,544,674 | | | | 0.5 | % |
| | | Rheinmetall AG | | | 186,043 | | | | 30,241,593 | | | | 0.7 | % |
| | | Other Securities | | | | | | | 460,058,281 | | | | 10.5 | % |
| TOTAL GERMANY | | | | | | | 611,161,049 | | | | 14.1 | % |
| IRELAND — (1.5%) |
| | | Bank of Ireland Group PLC | | | 5,945,531 | | | | 42,811,519 | | | | 1.0 | % |
The Continental Small Company Series
CONTINUED
| | | | | Shares | | | Value» | | | Percentage
of Net Assets‡ | |
| IRELAND — (Continued) |
| | | Other Securities | | | | | | $ | 24,848,912 | | | | 0.6 | % |
| TOTAL IRELAND | | | | | | | 67,660,431 | | | | 1.6 | % |
| ISRAEL — (3.6%) |
| | | Other Securities | | | | | | | 162,740,149 | | | | 3.7 | % |
| ITALY — (8.4%) |
| | | Banco BPM SpA | | | 10,252,032 | | | | 31,017,683 | | | | 0.7 | % |
| | | Italgas SpA | | | 3,535,826 | | | | 18,217,452 | | | | 0.4 | % |
| | | Leonardo SpA | | | 2,965,480 | | | | 23,824,938 | | | | 0.6 | % |
| | | Other Securities | | | | | | | 310,831,433 | | | | 7.1 | % |
| TOTAL ITALY | | | | �� | | | 383,891,506 | | | | 8.8 | % |
| NETHERLANDS — (5.6%) |
| | | Aalberts NV | | | 686,131 | | | | 23,803,028 | | | | 0.6 | % |
| | | Arcadis NV | | | 533,103 | | | | 18,091,946 | | | | 0.4 | % |
| | | ASR Nederland NV | | | 672,922 | | | | 29,630,688 | | | | 0.7 | % |
| | | BE Semiconductor Industries NV | | | 405,420 | | | | 20,662,135 | | | | 0.5 | % |
| # | | OCI NV | | | 554,235 | | | | 21,198,317 | | | | 0.5 | % |
| Ω | | Signify NV | | | 711,679 | | | | 19,717,182 | | | | 0.5 | % |
| | | Other Securities | | | | | | | 123,236,655 | | | | 2.7 | % |
| TOTAL NETHERLANDS | | | | | | | 256,339,951 | | | | 5.9 | % |
| NORWAY — (2.4%) |
| | | Other Securities | | | | | | | 111,438,926 | | | | 2.6 | % |
| PORTUGAL — (1.0%) |
| | | Other Securities | | | | | | | 43,915,237 | | | | 1.0 | % |
| SPAIN — (5.7%) |
| | | Banco de Sabadell SA | | | 36,362,876 | | | | 28,610,453 | | | | 0.7 | % |
| | | Bankinter SA | | | 4,326,671 | | | | 26,171,851 | | | | 0.6 | % |
| # | | Enagas SA | | | 1,457,648 | | | | 23,663,312 | | | | 0.5 | % |
| | | Other Securities | | | | | | | 184,347,363 | | | | 4.2 | % |
| TOTAL SPAIN | | | | | | | 262,792,979 | | | | 6.0 | % |
| SWEDEN — (5.9%) |
| | | Other Securities | | | | | | | 270,528,558 | | | | 6.2 | % |
| SWITZERLAND — (16.5%) |
| | | Allreal Holding AG | | | 125,251 | | | | 17,941,765 | | | | 0.4 | % |
| | | Belimo Holding AG | | | 65,574 | | | | 26,708,771 | | | | 0.6 | % |
| | | BKW AG | | | 163,805 | | | | 19,109,935 | | | | 0.4 | % |
| | | Bucher Industries AG | | | 54,335 | | | | 18,319,886 | | | | 0.4 | % |
| | | Clariant AG | | | 1,125,574 | | | | 18,088,884 | | | | 0.4 | % |
| | | DKSH Holding AG | | | 235,948 | | | | 17,021,421 | | | | 0.4 | % |
| * | | Flughafen Zurich AG | | | 147,702 | | | | 22,913,924 | | | | 0.5 | % |
| | | Georg Fischer AG | | | 630,511 | | | | 34,920,705 | | | | 0.8 | % |
| | | Helvetia Holding AG | | | 266,750 | | | | 26,488,894 | | | | 0.6 | % |
| | | PSP Swiss Property AG | | | 340,600 | | | | 36,386,222 | | | | 0.8 | % |
| | | Siegfried Holding AG | | | 32,909 | | | | 19,590,005 | | | | 0.5 | % |
| Ω | | VAT Group AG | | | 114,674 | | | | 26,180,212 | | | | 0.6 | % |
| | | Other Securities | | | | | | | 470,666,378 | | | | 11.0 | % |
| TOTAL SWITZERLAND | | | | | | | 754,337,002 | | | | 17.4 | % |
The Continental Small Company Series
CONTINUED
| | | Shares | | | Value» | | | Percentage
of Net Assets‡ | |
| UNITED STATES — (0.3%) |
| Other Securities | | | | | | $ | 12,849,060 | | | | 0.3 | % |
| TOTAL COMMON STOCKS | | | | | | | 4,279,782,528 | | | | 98.4 | % |
| PREFERRED STOCKS — (0.7%) |
| GERMANY — (0.7%) |
| Other Securities | | | | | | | 33,294,751 | | | | 0.8 | % |
TOTAL INVESTMENT SECURITIES
(Cost $4,398,989,975) | | | | | | | 4,313,077,279 | | | | | |
| | | | | | | | | | | | |
| | | | | | | | Value† | | | | |
| SECURITIES LENDING COLLATERAL — (5.6%) |
| @§ | | The DFA Short Term Investment Fund | | | 22,188,427 | | | | 256,520,399 | | | | 5.9 | % |
TOTAL INVESTMENTS—(100.0%)
(Cost $4,655,611,905) | | | | | | $ | 4,569,597,678 | | | | 105.1 | % |
Summary of the Series’ investments as of October 31, 2022, based on their valuation inputs, is as follows (see Security Valuation Note):
| | | Investments in Securities (Market Value) | |
| | | Level 1 | | | Level 2 | | | Level 3 | | | Total | |
| Common Stocks | | | | | | | | | | | | | | | | |
| Austria | | $ | 376,173 | | | $ | 141,188,397 | | | | — | | | $ | 141,564,570 | |
| Belgium | | | 792,151 | | | | 199,421,943 | | | | — | | | | 200,214,094 | |
| Denmark | | | — | | | | 284,839,811 | | | | — | | | | 284,839,811 | |
| Finland | | | — | | | | 241,247,565 | | | | — | | | | 241,247,565 | |
| France | | | 127,704 | | | | 474,099,006 | | | $ | 34,930 | | | | 474,261,640 | |
| Germany | | | — | | | | 611,161,049 | | | | — | | | | 611,161,049 | |
| Ireland | | | — | | | | 67,660,431 | | | | — | | | | 67,660,431 | |
| Israel | | | 585,758 | | | | 162,154,391 | | | | — | | | | 162,740,149 | |
| Italy | | | — | | | | 383,891,506 | | | | — | | | | 383,891,506 | |
| Netherlands | | | — | | | | 256,339,951 | | | | — | | | | 256,339,951 | |
| Norway | | | 239,412 | | | | 111,199,514 | | | | — | | | | 111,438,926 | |
| Portugal | | | — | | | | 43,915,237 | | | | — | | | | 43,915,237 | |
| Spain | | | — | | | | 262,792,979 | | | | — | | | | 262,792,979 | |
| Sweden | | | 704,204 | | | | 269,824,354 | | | | — | | | | 270,528,558 | |
| Switzerland | | | — | | | | 754,337,002 | | | | — | | | | 754,337,002 | |
| United States | | | 5,487,656 | | | | 7,361,404 | | | | — | | | | 12,849,060 | |
| Preferred Stocks | | | | | | | | | | | | | | | | |
| Germany | | | — | | | | 33,294,751 | | | | — | | | | 33,294,751 | |
| Securities Lending Collateral | | | — | | | | 256,520,399 | | | | — | | | | 256,520,399 | |
| TOTAL | | $ | 8,313,058 | | | $ | 4,561,249,690 | | | $ | 34,930 | ^ | | $ | 4,569,597,678 | |
| ^ | A reconciliation of Level 3 investments is presented when the Fund had a significant amount of Level 3 investments at the beginning and/or end of the reporting period in relation to net assets. |
See accompanying Notes to Financial Statements.
The Canadian Small Company Series
SUMMARY SCHEDULE OF PORTFOLIO HOLDINGS
October 31, 2022
| | | | | Shares | | | Value» | | | Percentage
of Net Assets‡ | |
| COMMON STOCKS — (85.9%) |
| COMMUNICATION SERVICES — (1.1%) |
| | | Other Securities | | | | | | $ | 15,273,446 | | | | 1.2 | % |
| CONSUMER DISCRETIONARY — (4.7%) |
| #* | | Aritzia, Inc. | | | 461,040 | | | | 17,881,861 | | | | 1.5 | % |
| | | Linamar Corp. | | | 255,634 | | | | 10,941,402 | | | | 0.9 | % |
| | | Other Securities | | | | | | | 38,001,319 | | | | 3.1 | % |
| TOTAL CONSUMER DISCRETIONARY | | | | | | | 66,824,582 | | | | 5.5 | % |
| CONSUMER STAPLES — (4.2%) |
| # | | North West Co., Inc. | | | 291,156 | | | | 7,576,232 | | | | 0.6 | % |
| # | | Premium Brands Holdings Corp. | | | 227,466 | | | | 13,419,050 | | | | 1.1 | % |
| | | Primo Water Corp. | | | 93,425 | | | | 1,363,071 | | | | 0.1 | % |
| | | Primo Water Corp. | | | 799,922 | | | | 11,661,064 | | | | 1.0 | % |
| | | Other Securities | | | | | | | 25,055,883 | | | | 2.1 | % |
| TOTAL CONSUMER STAPLES | | | | | | | 59,075,300 | | | | 4.9 | % |
| ENERGY — (24.7%) |
| * | | Advantage Energy Ltd. | | | 1,194,867 | | | | 9,033,751 | | | | 0.7 | % |
| * | | Baytex Energy Corp. | | | 2,341,875 | | | | 12,720,575 | | | | 1.0 | % |
| # | | Birchcliff Energy Ltd. | | | 1,610,417 | | | | 12,518,307 | | | | 1.0 | % |
| # | | Crescent Point Energy Corp. | | | 2,943,000 | | | | 23,006,533 | | | | 1.9 | % |
| # | | Crescent Point Energy Corp. | | | 346,792 | | | | 2,715,381 | | | | 0.2 | % |
| # | | Enerplus Corp. | | | 1,294,755 | | | | 22,448,059 | | | | 1.9 | % |
| | | Enerplus Corp. | | | 28,353 | | | | 490,790 | | | | 0.0 | % |
| # | | Freehold Royalties Ltd. | | | 652,441 | | | | 8,117,499 | | | | 0.7 | % |
| # | | Gibson Energy, Inc. | | | 899,205 | | | | 15,345,922 | | | | 1.3 | % |
| #* | | MEG Energy Corp. | | | 2,167,763 | | | | 32,412,620 | | | | 2.7 | % |
| * | | NuVista Energy Ltd. | | | 1,111,528 | | | | 11,022,676 | | | | 0.9 | % |
| # | | Paramount Resources Ltd., Class A | | | 405,621 | | | | 8,592,673 | | | | 0.7 | % |
| | | Parex Resources, Inc. | | | 774,607 | | | | 11,815,124 | | | | 1.0 | % |
| | | Parkland Corp. | | | 836,660 | | | | 16,913,140 | | | | 1.4 | % |
| # | | Peyto Exploration & Development Corp. | | | 965,837 | | | | 9,017,834 | | | | 0.7 | % |
| # | | PrairieSky Royalty Ltd. | | | 1,182,767 | | | | 18,370,720 | | | | 1.5 | % |
| | | Secure Energy Services, Inc. | | | 1,849,956 | | | | 9,709,094 | | | | 0.8 | % |
| # | | Vermilion Energy, Inc. | | | 716,524 | | | | 16,719,858 | | | | 1.4 | % |
| | | Vermilion Energy, Inc. | | | 233,451 | | | | 5,441,743 | | | | 0.5 | % |
| # | | Whitecap Resources, Inc. | | | 2,696,209 | | | | 20,899,159 | | | | 1.7 | % |
| | | Other Securities | | | | | | | 81,074,025 | | | | 6.7 | % |
| TOTAL ENERGY | | | | | | | 348,385,483 | | | | 28.7 | % |
| FINANCIALS — (8.0%) |
| # | | Canadian Western Bank | | | 498,863 | | | | 8,678,426 | | | | 0.7 | % |
| # | | CI Financial Corp. | | | 1,010,158 | | | | 10,113,814 | | | | 0.8 | % |
| | | Element Fleet Management Corp. | | | 2,180,348 | | | | 29,047,834 | | | | 2.4 | % |
| # | | Laurentian Bank of Canada | | | 370,975 | | | | 8,278,078 | | | | 0.7 | % |
| | | Other Securities | | | | | | | 56,710,772 | | | | 4.7 | % |
| TOTAL FINANCIALS | | | | | | | 112,828,924 | | | | 9.3 | % |
| HEALTH CARE — (1.3%) |
| | | Other Securities | | | | | | | 18,737,939 | | | | 1.5 | % |
The Canadian Small Company Series
CONTINUED
| | | | | Shares | | | Value» | | | Percentage
of Net Assets‡ | |
| INDUSTRIALS — (9.4%) |
| * | | ATS Automation Tooling Systems, Inc. | | | 416,536 | | | $ | 13,177,745 | | | | 1.1 | % |
| #* | | Bombardier, Inc., Class A | | | 13,989 | | | | 415,455 | | | | 0.0 | % |
| #* | | Bombardier, Inc., Class B | | | 435,248 | | | | 12,782,522 | | | | 1.1 | % |
| # | | Boyd Group Services, Inc. | | | 87,102 | | | | 12,394,461 | | | | 1.0 | % |
| | | Finning International, Inc. | | | 809,489 | | | | 17,213,562 | | | | 1.4 | % |
| | | Richelieu Hardware Ltd. | | | 316,493 | | | | 8,495,724 | | | | 0.7 | % |
| # | | Russel Metals, Inc. | | | 345,023 | | | | 7,146,878 | | | | 0.6 | % |
| # | | SNC-Lavalin Group, Inc. | | | 888,433 | | | | 15,383,811 | | | | 1.3 | % |
| | | Other Securities | | | | | | | 46,315,708 | | | | 3.8 | % |
| TOTAL INDUSTRIALS | | | | | | | 133,325,866 | | | | 11.0 | % |
| INFORMATION TECHNOLOGY — (2.8%) |
| | | Other Securities | | | | | | | 39,577,541 | | | | 3.2 | % |
| MATERIALS — (20.5%) |
| | | Alamos Gold, Inc., Class A | | | 2,191,494 | | | | 17,292,586 | | | | 1.4 | % |
| | | Alamos Gold, Inc., Class A | | | 23,683 | | | | 186,859 | | | | 0.0 | % |
| | | B2Gold Corp. | | | 523,630 | | | | 1,598,929 | | | | 0.1 | % |
| | | B2Gold Corp. | | | 4,206,445 | | | | 12,913,786 | | | | 1.1 | % |
| | | Lundin Mining Corp. | | | 1,333,672 | | | | 6,989,700 | | | | 0.6 | % |
| # | | Methanex Corp. | | | 214,217 | | | | 7,476,800 | | | | 0.6 | % |
| # | | Methanex Corp. | | | 126,782 | | | | 4,423,424 | | | | 0.4 | % |
| | | Pan American Silver Corp. | | | 30,283 | | | | 483,470 | | | | 0.0 | % |
| # | | Pan American Silver Corp. | | | 807,720 | | | | 12,907,366 | | | | 1.1 | % |
| # | | SSR Mining, Inc. | | | 847,686 | | | | 11,672,908 | | | | 1.0 | % |
| | | SSR Mining, Inc. | | | 262,936 | | | | 3,628,517 | | | | 0.3 | % |
| # | | Stella-Jones, Inc. | | | 312,231 | | | | 9,403,485 | | | | 0.8 | % |
| | | Turquoise Hill Resources Ltd. | | | 237,010 | | | | 6,662,351 | | | | 0.6 | % |
| #* | | Turquoise Hill Resources Ltd. | | | 259,936 | | | | 7,319,089 | | | | 0.6 | % |
| # | | Yamana Gold, Inc. | | | 3,875,378 | | | | 17,010,871 | | | | 1.4 | % |
| | | Yamana Gold, Inc. | | | 588,814 | | | | 2,579,005 | | | | 0.2 | % |
| | | Other Securities | | | | | | | 166,659,300 | | | | 13.6 | % |
| TOTAL MATERIALS | | | | | | | 289,208,446 | | | | 23.8 | % |
| REAL ESTATE — (2.3%) |
| # | | Altus Group Ltd. | | | 244,093 | | | | 8,673,647 | | | | 0.7 | % |
| # | | Tricon Residential, Inc. | | | 1,203,306 | | | | 10,139,797 | | | | 0.8 | % |
| | | Tricon Residential, Inc. | | | 103,827 | | | | 875,262 | | | | 0.1 | % |
| | | Other Securities | | | | | | | 12,011,086 | | | | 1.0 | % |
| TOTAL REAL ESTATE | | | | | | | 31,699,792 | | | | 2.6 | % |
| UTILITIES — (6.9%) |
| | | Atco Ltd., Class I | | | 397,742 | | | | 12,349,607 | | | | 1.0 | % |
| | | Boralex, Inc., Class A | | | 499,461 | | | | 14,162,424 | | | | 1.2 | % |
| # | | Brookfield Infrastructure Corp., Class A | | | 205,538 | | | | 8,868,171 | | | | 0.7 | % |
| | | Capital Power Corp. | | | 724,520 | | | | 24,250,825 | | | | 2.0 | % |
| # | | Innergex Renewable Energy, Inc. | | | 748,951 | | | | 8,246,239 | | | | 0.7 | % |
| | | TransAlta Corp. | | | 1,758,255 | | | | 15,487,254 | | | | 1.3 | % |
The Canadian Small Company Series
CONTINUED
| | | Shares | | | Value» | | | Percentage
of Net Assets‡ | |
| UTILITIES — (Continued) |
| Other Securities | | | | | | $ | 14,633,883 | | | | 1.2 | % |
| TOTAL UTILITIES | | | | | | | 97,998,403 | | | | 8.1 | % |
TOTAL COMMON STOCKS
(Cost $1,129,103,652) | | | | | | | 1,212,935,722 | | | | 99.8 | % |
TOTAL RIGHTS/WARRANTS
(Cost $) | | | | | | | 0 | | | | 0.0 | % |
TOTAL INVESTMENT SECURITIES
(Cost $1,129,103,652) | | | | | | | 1,212,935,722 | | | | | |
| | | | | | | | | | | | | | | |
| | | | | | | | Value† | | | | |
| SECURITIES LENDING COLLATERAL — (14.1%) |
| @§ | | The DFA Short Term Investment Fund | | | 17,275,482 | | | | 199,721,843 | | | | 16.5 | % |
TOTAL INVESTMENTS—(100.0%)
(Cost $1,328,909,530) | | | | | | $ | 1,412,657,565 | | | | 116.3 | % |
Summary of the Series’ investments as of October 31, 2022, based on their valuation inputs, is as follows (see Security Valuation Note):
| | | Investments in Securities (Market Value) | |
| | | Level 1 | | | Level 2 | | | Level 3 | | | Total | |
| Common Stocks | | | | | | | | | | | | | | | | |
| Communication Services | | $ | 11,643,215 | | | $ | 3,630,231 | | | | — | | | $ | 15,273,446 | |
| Consumer Discretionary | | | 66,824,582 | | | | — | | | | — | | | | 66,824,582 | |
| Consumer Staples | | | 59,075,300 | | | | — | | | | — | | | | 59,075,300 | |
| Energy | | | 348,385,483 | | | | — | | | | — | | | | 348,385,483 | |
| Financials | | | 112,828,924 | | | | — | | | | — | | | | 112,828,924 | |
| Health Care | | | 18,723,050 | | | | 14,889 | | | | — | | | | 18,737,939 | |
| Industrials | | | 133,325,866 | | | | — | | | | — | | | | 133,325,866 | |
| Information Technology | | | 39,577,541 | | | | — | | | | — | | | | 39,577,541 | |
| Materials | | | 289,169,935 | | | | 38,511 | | | | — | | | | 289,208,446 | |
| Real Estate | | | 31,699,792 | | | | — | | | | — | | | | 31,699,792 | |
| Utilities | | | 97,998,403 | | | | — | | | | — | | | | 97,998,403 | |
| Securities Lending Collateral | | | — | | | | 199,721,843 | | | | — | | | | 199,721,843 | |
| TOTAL | | $ | 1,209,252,091 | | | $ | 203,405,474 | | | | — | | | $ | 1,412,657,565 | |
See accompanying Notes to Financial Statements.
(b) Not applicable.
Item 7. Disclosure of Proxy Voting Policies and Procedures for Closed-End Management Investment Companies.
Not applicable to the registrant.
Item 8. Portfolio Managers of Closed-End Management Investment Companies.
Not applicable to the registrant.
Item 9. Purchases of Equity Securities by Closed-End Management Investment Company and Affiliated Purchasers.
Not applicable to the registrant.
Item 10. Submission of Matters to a Vote of Security Holders.
The registrant has not adopted procedures by which shareholders may recommend nominees to the registrant's Board of Trustees.
Item 11. Controls and Procedures.
(a) Within 90 days of the filing date of this Form N-CSR, Jonathan Scheid, the registrant’s President and Chief Executive Officer, and Dan Anderson, the registrant’s Treasurer and Chief Financial and Accounting Officer, reviewed the registrant’s disclosure controls and procedures (as defined in Rule 30a-3(c) under the Investment Company Act of 1940, as amended (the “1940 Act”)) and evaluated their effectiveness. Based on their review, Messrs. Scheid and Anderson determined that the disclosure controls and procedures are reasonably designed to ensure that information required to be disclosed by the registrant on Form N-CSR and Form N-PORT is accumulated and communicated to the registrant’s management to allow timely decisions regarding required disclosure.
(b) There were no changes in the registrant’s internal control over financial reporting (as defined in Rule 30a-3(d) under the 1940 Act) that occurred during the period covered by this report that has materially affected, or is reasonably likely to materially affect, the registrant’s internal control over financial reporting.
Item 12. Disclosure of Securities Lending Activities for Closed-End Management Investment Companies
Not applicable to the registrant.
Item 13. Exhibits.
(a)(1) Code of Ethics referred to in Item 2 is filed herewith.
(a)(2) The certifications required by Rule 30a-2(a) of the 1940 Act and Section 302 of the Sarbanes-Oxley Act of 2002 (“Sarbanes-Oxley Act”) are filed herewith.
(a)(3) Not applicable.
(a)(4) Not applicable.
(b) The certifications required by Rule 30a-2(b) of the 1940 Act and Section 906 of the Sarbanes-Oxley Act are filed herewith.
The certifications provided pursuant to Rule 30a-2(b) of the 1940 Act and Section 906 of the Sarbanes-Oxley Act are not deemed “filed” for purposes of Section 18 of the Securities Exchange Act of 1934, as amended (the “Exchange Act”), or otherwise subject to the liability of that section. Such certifications will not be deemed to be incorporated by reference into any filing under the Securities Act of 1933 or the Exchange Act, except to the extent that the registrant specifically incorporates them by reference.
SIGNATURES
Pursuant to the requirements of the Securities Exchange Act of 1934 and the Investment Company Act of 1940, the registrant has duly caused this report to be signed on its behalf by the undersigned, thereunto duly authorized.
SA FUNDS – INVESTMENT TRUST
| By: | /s/Jonathan Scheid | |
| | Jonathan Scheid |
| | President and Chief Executive Officer |
| | |
| Date: | September 5, 2023 |
| | |
| Pursuant to the requirements of the Securities Exchange Act of 1934 and the Investment Company Act of 1940, this report has been signed below by the following persons on behalf of the registrant and in the capacities and on the dates indicated. |
| | |
| By: | /s/Jonathan Scheid | |
| | Jonathan Scheid |
| | President and Chief Executive Officer |
| | |
| Date: | September 5, 2023 |
| | |
| By: | /s/Dan Anderson | |
| | Dan Anderson |
| | Treasurer and Chief Financial and Accounting Officer |
| | |
| Date: | September 5, 2023 |