QuickLinks -- Click here to rapidly navigate through this document
Creating Value Through Information
| The Thomson Corporation Annual Report 2003 |
| Information | Knowledge |
In a knowledge-driven economy, you need to know. Having the right information, delivered where and when you need it, has become critical to gaining competitive advantage.
We believe the most powerful solutions are those that transform information into knowledge. Our customers benefit from Thomson solutions that enable them to work more effectively and efficiently, and provide them with tools for creating new value.
To experience an interactive version of this annual report, go to www.thomson.com
The Thomson Corporation
Financial Highlights†
| | 2003 | 2002 | Change | ||||||
|---|---|---|---|---|---|---|---|---|---|
| Revenues | 7,606 | 7,444 | + 2 | % | |||||
| Adjusted EBITDA(1) | 2,064 | 1,961 | + 5 | % | |||||
| Adjusted operating profit(2) | 1,476 | 1,426 | + 4 | % | |||||
| Operating profit | 1,191 | 1,136 | + 5 | % | |||||
| Earnings attributable to common shares | 879 | 586 | +50 | % | |||||
| Earnings per common share (EPS) | $ | 1.34 | $ | 0.91 | +47 | % | |||
| Adjusted earnings from continuing operations(3) | 705 | 636 | +11 | % | |||||
| Adjusted EPS from continuing operations(3) | $ | 1.08 | $ | 0.99 | + 9 | % | |||
| Shareholders' equity | 9,200 | 8,966 | |||||||
| Net cash provided by operating activities | 1,654 | 1,691 | - 2 | % | |||||
| Free cash flow(4) | 983 | 980 | — | ||||||
Thomson Market Groups(5)
Legal & Regulatory 41% of Revenues |  |
| | 2003 | 2002 | Change | ||||
|---|---|---|---|---|---|---|---|
| Revenues | 3,142 | 2,959 | +6 | % | |||
| Adjusted EBITDA(1) | 980 | 926 | +6 | % | |||
| Adjusted operating profit(2) | 799 | 767 | +4 | % |
17,000 people in 24 countries / Thomson Legal & Regulatory provides integrated information solutions to legal, tax, accounting, intellectual property, compliance and business professionals, as well as government agencies around the world.
Learning 27% of Revenues |  |
| | 2003 | 2002 | Change | ||||
|---|---|---|---|---|---|---|---|
| Revenues | 2,052 | 2,036 | + 1 | % | |||
| Adjusted EBITDA(1) | 520 | 465 | +12 | % | |||
| Adjusted operating profit(2) | 337 | 302 | +12 | % |
9,100 people in 40 countries / Thomson Learning provides a wide range of tailored learning solutions to colleges, universities, professors, students, libraries, reference centers, government agencies, corporations and professionals globally.
Financial 20% of Revenues |  |
| | 2003 | 2002 | Change | ||||
|---|---|---|---|---|---|---|---|
| Revenues | 1,523 | 1,597 | -5 | % | |||
| Adjusted EBITDA(1) | 406 | 409 | -1 | % | |||
| Adjusted operating profit(2) | 231 | 240 | -4 | % |
7,700 people in 22 countries / Thomson Financial provides a broad range of financial products and information solutions to the global financial services industry, including brokers, financial planners and corporate executives.
Scientific & Healthcare 10% of Revenues |  |
| | 2003 | 2002 | Change | ||||
|---|---|---|---|---|---|---|---|
| Revenues | 760 | 692 | +10 | % | |||
| Adjusted EBITDA(1) | 217 | 187 | +16 | % | |||
| Adjusted operating profit(2) | 186 | 160 | +16 | % |
3,900 people in 19 countries / Thomson Scientific & Healthcare provides information and services to researchers, physicians and other professionals in the healthcare, academic, scientific, corporate and government marketplaces.
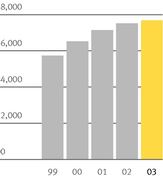
| Five-Year Revenues Five-Year CAGR 7.6% |
| 03 | 7,606 | |
| 02 | 7,444 | |
| 01 | 7,075 | |
| 00 | 6,453 | |
| 99 | 5,674 |
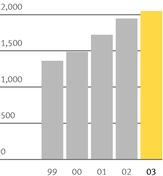
| Five-Year Adjusted EBITDA(1) Five-Year CAGR 9.6% |
| 03 | 2,064 | |
| 02 | 1,961 | |
| 01 | 1,733 | |
| 00 | 1,496 | |
| 99 | 1,371 |
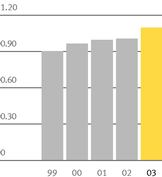
| Five-Year Adjusted EPS(3) Five-Year CAGR 5.9% |
| 03 | 1.08 | |
| 02 | 0.99 | |
| 01 | 0.98 | |
| 00 | 0.95 | |
| 99 | 0.90 |
- †
- Millions of U.S. dollars except per common share amounts. Adjusted EBITDA, Adjusted operating profit, Adjusted earnings from continuing operations, Adjusted EPS from continuing operations and Free cash flow are non-GAAP financial measures, which are reconciled to the most directly comparable GAAP financial measures within the MD&A.
- (1)
- Earnings from continuing operations before interest, taxes, depreciation and amortization, as well as restructuring charges, net other income (expense) and equity in net losses of associates, net of tax.
- (2)
- Before amortization and restructuring charges.
- (3)
- Excludes one-time items. For a full reconciliation to reported earnings, see the six-year summary on page 90.
- (4)
- Net cash provided by operating activities less net additions to property and equipment, other investing activities and dividends paid on preference shares.
- (5)
- Amounts are in millions of U.S. dollars, and represent results from ongoing businesses, which exclude businesses sold or held for sale that do not qualify as discontinued operations.
Value
At Thomson, we create value by leveraging knowledge, expertise and technology across markets that are fundamental to the global economy. We deliver solutions that put knowledge to work.
To Our Shareholders:
We are pleased to report that The Thomson Corporation made significant progress in strengthening our business, delivering solid earnings growth and securing our leadership position in our markets during 2003.
Today, Thomson is a global leader in the information services industry. The markets we serve are fundamental to the global economy and have sustainable long-term growth potential. Our customers, many of whom are professionals such as lawyers, accountants, professors, doctors, researchers and financial advisors, rely on us for vital information that helps them make informed decisions. And, with continuing advances in software technology, Thomson has the ability, more than ever before, to tailor the delivery of information to meet specific needs. Our strategy is to combine information and software tools to create solutions that help our customers be more productive and successful.
Business Highlights
In the legal market, we continue to build on the leading position of our Westlaw brand to drive growth in new areas of the business. We have acquired and developed software businesses that give Thomson the unique ability to provide law firms with new productivity tools in addition to the world-class legal research that has made West so successful. We now offer a broad range of services to help law firms manage cases, maintain accurate billing records and attract new clients as they seek to run their practices more effectively and efficiently.
At Thomson Financial, we have transformed our business model from being a supplier of numerous stand-alone products to developing integrated offerings. Thomson ONE, for example, allows us to combine our broad range of financial information, market data and software tools, and tailor these to the specific needs of investment bankers, traders, advisors and analysts. Thomson ONE performed well during its first full year on the market. We added approximately 43,000 Thomson ONE users in 2003 through contract wins and by transitioning existing customers to this new and superior product. At the beginning of 2004, we already had commitments to add approximately 40,000 more users.
Similarly, we are developing a new suite of online research products for the pharmaceutical industry that we plan to launch in 2004. This new offering leverages the benefits of our operating model by combining information from across our Scientific & Healthcare market group, as well as from Thomson Financial and outside data sources, into a single product that can be tailored to the needs of the customer. It is designed for researchers at every stage of the drug development process, and it represents an exciting opportunity to expand our presence in the pharmaceutical industry.
We also continued to leverage our technology expertise across the Company in 2003. For example, we extended the use of our Novus platform, which we developed to efficiently distribute information online around the world. We began utilizing Novus in our Legal & Regulatory market group and we are now expanding its use to our Learning and Financial groups, as well. Products representing a significant portion of our revenues will be delivered on this global online platform in the future. Leveraging resources across Thomson allows us to create better products for our customers and drive efficiencies throughout our operations.
Financial Performance
Despite challenging market conditions for some of our businesses, Thomson delivered solid earnings in 2003. Earnings per share (EPS) rose 47% to $1.34. After adjusting for discontinued operations and one-time items, which we believe is a more meaningful comparison, EPS grew 9% to $1.08 per share in 2003.
Revenues grew 2% to $7.6 billion for the year. Thomson Scientific & Healthcare and Thomson Legal & Regulatory generated revenue growth of 10% and 6%, respectively, driven by good performance in existing businesses and contributions from tactical acquisitions that have been folded into existing operations. In both market groups, we continued to see strong revenue growth from online products, as well as very high customer retention rates—over 95% in some cases.
Thomson Learning revenues increased by 1%, as growth in the higher education business was largely offset by lower revenues in our library reference and IT testing and training operations due to weak market conditions. While 2003 presented challenges for Thomson Learning, we believe our strong position in both the college textbook and e-learning markets creates excellent opportunities for future growth, as education and training increasingly become lifelong pursuits and we continue to target new markets of opportunity.
Thomson Financial performed in line with our expectations in 2003, but revenues were down 5% due to weakness in the U.S. and European financial services markets. By year end, market conditions were improving, and we expect further strengthening in 2004, particularly in the United States. This, combined with additional market share gains we expect for Thomson ONE, makes us confident that Thomson Financial will generate revenue growth in 2004.
An important financial measure for Thomson is free cash flow, which was strong again in 2003, at $983 million. This was about level with a year ago, even though our capital expenditures rose 10% and the prior year benefited from unusually strong improvement in working capital. We plan to continue to use our free cash flow to fund internal growth initiatives and acquisitions, pay an attractive dividend to shareholders and repay debt.
Creating Long-term Value
The Board of Directors and management of Thomson are firmly committed to creating long-term value for the Company's shareholders. We continue to position Thomson in highly attractive markets with excellent long-term growth potential. We are confident that our business strategies are sound and will enable us to capitalize on the growing information needs of our customers. Most important, we believe we have the management and resources necessary to execute successfully and deliver attractive returns to our shareholders.
Thomson has always been committed to good corporate governance and the highest standards of integrity in all of our business dealings. To further underscore that commitment, our Board recently conducted a thorough review of our policies; expanded guidelines defining Board duties, director independence and conflicts of interest; and instituted a code of conduct for all directors and employees that reflects our values as a corporation.
On behalf of the Board and management, we would like to express our appreciation to all of our shareholders and customers for their ongoing support as Thomson continues to evolve and grow. We would especially like to recognize the hard work and dedication of our 39,000 employees around the world, who are committed to the Company's success and to strengthening our position as a world leader in information services.

Sincerely,
 | ||
| David K.R. Thomson Chairman of the Board | Richard J. Harrington President & Chief Executive Officer |
2
The need to know
Much has been written about the information economy, and indeed more information—more data—is available than ever before. Information has become a commodity. But the market for knowledge—information analyzed and applied—is vast and growing.
In the United States, most new jobs are for knowledge workers, and that trend is becoming global. Information is the tool of their trade. They analyze and apply information to solve problems—technology problems, business problems, legal problems—for their companies and their customers. Their need to know is constant, almost insatiable.
4

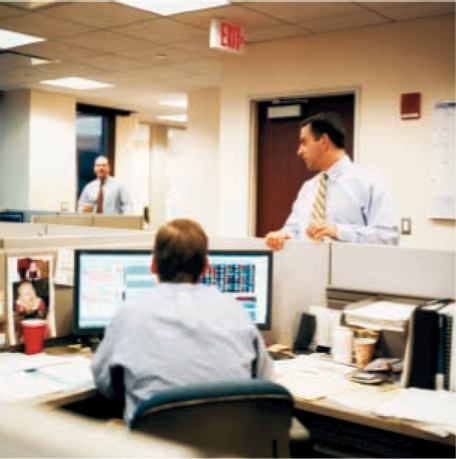
Jeff Liguori
Equity Sales Trader, America's Growth Capital
Another important trend is the increasing need for knowledge workers to do more with less. Industries such as financial services, law and accounting are consolidating; performance pressure is intense. Professionals in every industry must constantly improve their productivity.
Information that in-house research departments used to process is now being delivered directly to the desktop computers of brokers, attorneys, clinicians and corporate managers.
Customers must manage more information, and are therefore more demanding. Demanding that the information they buy is comprehensive, accurate and current. Demanding that it be delivered right now, when and where they need it, in a form they can put to immediate use.
5

Richard Klasco, MD, FACEP
Chief Medical Officer, Thomson Micromedex
Why is knowledge more valuable than information?
Information is useful only if you apply it the right way at the right time. Thomson does not just sell information: we help our customers meet their demands for knowledge and also help them apply that knowledge at the point of need.
6

To save lives, when seconds matter
Knowledge on demand has become critical in a variety of contexts. In some, it is literally a matter of life or death. Dr. Rich Klasco, chief medical officer of Thomson Micromedex, is also a practicing emergency physician. Not only does he oversee the content development of key Micromedex products, he also uses them in the E.R. at a major trauma center.
A few years ago, Rich learned an unforgettable lesson about how indispensable such solutions are. He was one of the emergency physicians on duty when several critically injured teenagers were brought in for emergency care.
"I used a Thomson solution at the bedside. The computer was right in the resuscitation room where we were caring for these kids, and the neurosurgeon and I used the DRUGDEX and EMERGINDEX information. We had all that information at our fingertips, and could make a decision in a matter of moments. That really made a difference in these kids' lives."
7

To learn to compete, just-in-time
Gregory Heeter is the U.S. director of e-learning services at Siemens ICN, the networks division of the diversified electronics and infrastructure giant. He knows that Siemens' competitiveness is closely tied to how fast employees learn the skills they need.
"Access to training needs to be immediate, as people require it. An employee may be performing his job and realize that he needs to refresh his knowledge of a software program or learn about a financial process—anything from technical to business skills.
"With the NETg e-learning platform, he can stay at his desk but switch to a different mode, access a short learning module, and update and apply his newly learned skills immediately. That is a radical departure in training delivery and has to be the way of the future. It's like just-in-time production technologies. This is just-in-time knowledge."
8

Gregory Heeter, Director, with Amy Graft, Program Manager
e-learning Services, Siemens ICN
9

What are information solutions made of?
Thomson solutions combine high-value content, software tools and Thomson expertise to help customers solve problems and capitalize on opportunities. They deliver knowledge that is in demand, on demand.
10

Susan Schway
Vice President,
Content Operations
Thomson West
Connecting the dots
Customers were at the center of product development for Westlaw Litigator. Sue Schway of West describes the process: "Litigation attorneys, who spend most of their time evaluating and investigating cases, have specialized information needs. So we asked customers who are trial lawyers, 'What specific information would be most valuable to you if we packaged it to fit into your workflow?'
"Litigators told us they need information about expert witnesses, dockets and legal briefs. We have a substantial repository of legal briefs that attorneys can search. They also need access to jury verdicts to evaluate the potential worth of a client's case. While some of this information was already available online from Westlaw, it wasn't all linked together in one place for trial lawyers to find easily.
"Using Westlaw Litigator, attorneys can now link from a brief to an expert witness or a jury verdict or a court ruling. They can find all the information they need to do their work in the most efficient way possible."
11

Craig Columbus
Senior Vice President, Market Strategist
Thomson Financial
Market intelligence in real time
Craig Columbus, market strategist for Thomson Financial and a weekly commentator on CNBC's "Power Lunch" program, describes how one of the many tools delivered by Thomson ONE helps customers boost their productivity:
"Everyone's struggling with information overload. The advantage of a Thomson ONE Company in Context report is that it's very concise yet includes a tremendous amount of information about a company based on extensive back-end calculations.
"Company in Context reports provide evaluations of publicly listed stocks on a 1 to 10 scale based on several components: earnings, fundamental factors such as profitability and debt, relative valuation, risk, price momentum and insider trading.
12

"We do the heavy lifting so our customers don't have to. From their perspective, they get the summary rating and a lot of value-added analytics so they don't have to do the calculations themselves. That's a key selling point because, in a time-managed, stressful world, we're giving them intelligence and actionable knowledge that is both concise and transparent, and we're doing it in real time."
13

William Brottmiller
Vice President, Healthcare Business Unit
Thomson Delmar Learning
Changing how people learn
Thomson Delmar Learning has been developing innovative solutions to the problems of nursing education. One such product was designed to help nurses gain a level of comfort with complex hands-on procedures.
"Our IV (intravenous) therapy product was developed in partnership with Rensselaer Polytechnic Institute, whose electronic media department has cutting-edge, three-dimensional graphic technology," explains Bill Brottmiller of Thomson Delmar Learning. "We teamed up with them to create 3-D imagery of IV therapy practice.
"With this software, a nursing student can use the mouse to experiment with the pressure it takes to push a needle into a person's blood vessel. And they can see inside the patient's arm, in a 3-D environment. Does the needle hit the right vessel? When do you stop pressing? How about choosing the drip rate of the medication—is it too fast or too slow?
14

"All this can now be done in a software environment, so that when you or your loved ones are in a hospital, the nurse who has used our products will be much more adept at performing these vital tasks."
15

What do integrated solutions integrate, and what difference does it make?
Thomson delivers integrated information solutions. Not only do these combine information, tools and expertise; they can be seamlessly integrated into the way our customers work and into the products they deliver to their own customers.
Integrating knowledge into the workflow
Dr. Steven Rosner works in a medical practice of nine specialists who recently invested in the technology necessary to network every aspect of their practice. They collect, store and track patient information digitally, which improves the productivity of the office and the care received by the patient.
16

Steven Rosner, MD
Old Hook Medical Associates
One of the most important gains is the ability to reduce errors: "My laptop and PDA (personal digital assistant) allow me to access PDR.net and mobilePDR—electronic products from Thomson PDR (Physicians' Desk Reference). One of the terrific benefits of how this has changed my practice is that I now write my prescriptions using the PDA.
"If the patient has bronchitis, for example, and you input that as the diagnosis, there's a drop-down menu for all the drugs you've chosen as preferred for bronchitis. You just highlight one of them and the computer instantly prints a prescription on a state-approved prescription blank from the printer by the nurses' station.
"The big advantage is that the computer has every drug in memory, and the computer types it for you. There's no confusion with drugs that sound alike, and there's no mistake in dosing. It's also a speed advantage. If a patient has bronchitis and all your preferred drugs are memorized, you can prescribe a cough suppressant, an antibiotic and an inhaler, all from one screen."
17

Shelly Gregory
Senior Supervisor,
Financial Planning
Chick-fil-A
Integrating knowledge into the work product
At Chick-fil-A, a highly successful U.S. food service business, the financial planning department relies on Thomson RIA's Checkpoint product for tax planning. Shelly Gregory values its constantly updated content and the new tools that have emerged from her interactions with the Thomson people who support Checkpoint.
"One feature I needed was a chart function that would enable me to simultaneously research several states' tax treatment of a certain item, like non-business income. My RIA representative and I chatted about this, and as always she listened to me. She said, "You know, that would be a great idea.'
"I didn't know that Thomson and Checkpoint were hard at work creating that very function for me, until she called three or four months ago with the usual excitement in her voice and said, "Shelly, your dream has come true. Create a Chart is coming out.' I am finding the Create a Chart function very useful in meeting my research needs."
18

19

Todd Smith
Equity Research Analyst, America's Growth Capital
20
An integrated platform
Todd Smith, an equity research analyst at America's Growth Capital, a growing full-service investment bank, calls Thomson ONE "a completely integrated platform for our research needs. Information is our business, so we want to be the first out there with news, and Thomson ONE enables us to do that.
"We can be more proactive with research by using Thomson ONE Analytics—which gives us historical pricing, EDGAR filings and the competitive data we need to provide research to our clients. It allows us to distribute our research to institutional clients, as well as track who's reading those research reports, and it helps us manage our business, from generating reports to following up.
"Thomson ONE is the first thing I turn on when I come into the office and it's the last thing I turn off when I leave."
21

22
Knowledge ![]() Value
Value
From knowledge to value creation
Thomson solutions are enabling people to make better decisions faster—anywhere, anytime. We are helping our customers find new ways to create value, enabling them to be more competitive.
As Thomson builds better solutions and develops deeper customer knowledge, we are becoming an increasingly trusted partner. Customers rely on us, not only for solutions that are already available, but to help them find ever more innovative ways to translate information into knowledge and apply it at the point of need.
Thomson has focused its business on markets that are central to economic development and growth—legal, regulatory, learning, financial, scientific and healthcare. As more people become part of the information economy, Thomson is well positioned as a leader in the business of knowledge.
To experience an interactive version of this annual report, go to www.thomson.com
23
Our Business and Markets
Thomson is a world leader in providing integrated information solutions to business and professional customers. We provide our customers with business-critical information from multiple Thomson and third-party databases, and further enhance the value of that information with analysis, insight and commentary.
We focus on four major information markets: legal & regulatory, learning, financial, and scientific & healthcare. These markets are large, global and information-dependent. They all play a vital role in the future of the global economy, so we believe Thomson is well positioned for the long term.
Many of our customers are what management guru Peter Drucker termed knowledge workers. Back in the 1950s, Drucker predicted the rise of a new kind of worker—well-educated professionals who use specialized information to perform their jobs every day. Drucker was right. The majority of new jobs in the United States today are knowledge worker jobs, and this is a growing trend in other countries as well.
Knowledge workers have a constant need for accurate, up-to-date information. And they need tools to manage this information and integrate it into their work products.
Our customers are high-end knowledge workers such as attorneys, accountants, educators, bankers, researchers, and physicians.
Our strategy capitalizes on three major forces at work in the information industry.
Too Much of a Good Thing
The first trend is theinformation explosion. It has been estimated that the amount of information online is doubling every six months. You don't have to be a mathematician to figure out that people are going to have a harder and harder time keeping up. Knowledge workers are inundated with data that they must sort through, condense and analyze in order to make informed decisions.
The Revolution Continues
A second trend fuels the information explosion: thetechnology revolution, which keeps on changing the way we work and live.
Computers made it possible to create and compile more data than ever before. Then the Internet made it possible to tap into that data anytime, from almost anywhere. The open standards movement in computing made it feasible to access and transfer information using all kinds of devices, from desktop computers to laptop computers to handheld PDAs (personal digital assistants).
And innovations in software are now making it easier to search vast seas of data, pull out the relevant bits, and bundle them together to meet the specialized information needs of different groups of knowledge workers.
24
Something New Every Day
Not so long ago, customer requests were delivered by the post office, and—if the request was urgent—answered within days. Today, scenes like the following are becoming the norm:
- •
- The phone rings on an equity sales trader's desk. A potential customer is calling for advice on which of two stocks to buy. The trader knows he has to do a comprehensive comparative analysis of the two stocks right then, while he has the customer on the phone. Fortunately, all the data and analytical tools needed for this sophisticated analysis are right in front of him. He doesn't even have to put down the receiver.
- •
- A technician is troubleshooting a problem in her company's telecommunications software. She discovers that she hasn't encountered this type of problem before and does not have the skills to solve it. So she calls up a training module on her desktop computer, spends an hour learning the needed skills from an online course, then fixes the software.
- •
- A tax specialist not only needs to stay current on changes in tax law for every state where her company operates, she also needs to keep her management informed about the impact of changes. Fortunately, the same product that provides her with constant updates on state tax law also creates the charts she needs to communicate her findings clearly and quickly.
- •
- An emergency room physician treating a critically wounded patient has to decide which drug to use and exactly how to use it. The patient's life depends on making the right decision. And it has to be made right now. It's a good thing the doctor doesn't have to leave his patient's bedside to search some of the largest drug databases in the world and retrieve definitive information within seconds.
These are all stories from Thomson customers who use Thomson products to do their jobs and add value in real time.
These stories illustrate the third trend shaping the information industry: information needs are evolving at an accelerating speed. High-end knowledge workers are confronted with new challenges every day. They must have, or be able to get, the knowledge necessary to meet these challenges as they arise.
25
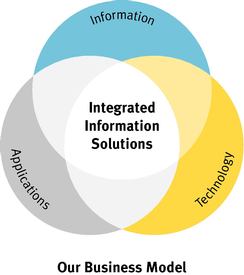
Our Business Model
To satisfy our customers' need to know, Thomson targets the sweet spot where technology, information and applications meet. We create integrated information solutions that combine exhaustive information with tools powerful enough to transform that information into value. The essentials of our business model are:
- •
- Business-critical information that is comprehensive, accurate and timely
- •
- Ease of access—making content available to individuals any way they want it delivered, right to their desktop or their PDA
- •
- Online analysis, tools and applications to raise productivity
- •
- Integration of information into total solutions that bring together Thomson data with data from third parties and the customer's own databases, as well as the tools to manage the data.
This business model allows us to become partners with our customers to help them make better decisions faster—anytime, anywhere.
Key Initiatives
Refining Our Customer Strategy
We are reinvigorating our customer strategy to ensure that we deliver the right products at the right price to meet our customers' changing needs. Across our businesses, we are:
- •
- Using market research to deepen our understanding of customer needs and work flows—as they are today and as they are evolving in response to market forces
- •
- Identifying customer sub-segments in existing markets whose needs we can meet through tailored products and services
- •
- Reframing and realigning, where necessary, to better serve our customers. For instance, Thomson Financial has completed a reorganization of its sales force to increase responsiveness
- •
- Refining our pricing models to ensure the right value/price equation for our products and services.
We are continuously soliciting customer feedback and driving "the voice of the customer" deep into all of our business processes.
Leveraging Resources across Thomson
Each quarter sees new examples of cross-business collaboration to deliver comprehensive information solutions, such as Thomson Scientific & Healthcare integrating relevant data from Thomson Financial into its comprehensive IDdb drug database, or Thomson Learning providing online training and testing resources to supplement our Westlaw and Thomson ONE products.
We are also leveraging our technology assets, such as the powerful Novus platform, to deliver products and services more efficiently and effectively.
Strengthening Our Operating Mechanisms
We have put in place enterprise-wide operating mechanisms that are designed to help Thomson achieve its strategic goals. Going forward, we expect to reap the benefits of:
- •
- A Company-wide planning process that aligns Thomson businesses with major market opportunities
- •
- Shared performance metrics to drive excellence in execution
- •
- Anew talent management process that helps develop leaders across the Company and ensures that we have the right talent in place in key positions.
26
Thomson Legal & Regulatory
Our Business and Markets
Thomson Legal & Regulatory is a world leader in providing information and software-based solutions for legal, tax, accounting, intellectual property, compliance and other business professionals, as well as government agencies. We offer our customers access to over 19,000 databases—some of the largest in the world.
While the overall market in law, tax and accounting continues to grow steadily but modestly, the demand for online products, software and services is accelerating and driving growth in our business.
As law firms continue to consolidate, demand is rising for more efficient and effective ways to manage law practices and attract new clients. The story is similar in tax and accounting, where consolidation is also the rule of the day and performance pressures remain high.
Our Business Model
In addition to delivering must-have information, we increasingly provide software, tools and services that help lawyers, accountants and other professionals work more effectively and better serve their customers.
We offer a broad range of products and services that leverage our electronic databases of legal and regulatory information. Our offerings also include non-content-based products and services, such as software to assist lawyers and accountants with practice management functions, and software that assists tax professionals with preparing and filing tax returns. And we deliver business information and news to more than 25,000 corporate customers and 100,000 professional researchers.
In the U.S. legal market, we support the attorney from the time he or she enters law school throughout every phase of a career:
- •
- Our legal textbook publishing business has over 1,400 titles and, through BAR/BRI, we provide bar examination review courses and materials.
- •
- For the practicing attorney and legal researcher, Westlaw is the number one source of authoritative information.
- •
- FindLaw offers client development services to help attorneys build their practices.
- •
- Our legal software suite brings together Elite, ProLaw, West km, and Law Manager products to help firms manage the business of law. Customers use this product suite to improve front- and back-office functions such as case management, records management and billing.
- •
- Through West LegalEdcenter, we are the top provider of online continuing legal education.
We believe that there is substantial growth opportunity in replicating this model of comprehensive legal products and services internationally. Further opportunity lies in building out elements of this model in our tax and accounting businesses.
| RICH CONTENT | TOOLS AND APPLICATIONS | |||||
High-quality, comprehensive databases of must-have information compiled and continuously updated by subject-matter experts. Examples include: Over 19,000 databases encompassing case law, statutes, citations, treatises, briefs, commentary, legal education materials and other legal information enhanced with headnotes, synopses, key numbers and other editorial enhancements; tax and accounting information, and regulatory data; business information, current and archival news; trademark search and information services. | State-of-the-art tools and software to search, compare, aggregrate, analyze, synthesize and communicate vast amounts of data; law firm management software; web-based legal directory and website creation and hosting services; tax and accounting software. | |||||
27
Key Initiatives
Growing Online Products
In 2003, revenues for many of our online products grew by double digits. To meet growing demand, we are continuing our shift to online products and services. Examples include:
- •
- Checkpoint, our online tax product, provides customers with instant access to a broad collection of databases. Checkpoint's subscriber base has been growing fast, and increased 22% in 2003.
- •
- Westlaw, our primary online platform for the legal market, offers numerous search features and navigation tools that enable customers to quickly search extensive databases for case histories, statutes, law briefs, topical commentary and many other legal matters.
Expanding Internationally
Westlaw supports customers in almost 30 countries. We are working to broaden our coverage geographically and to deepen the local content we offer. For example, Westlaw DE, based in Germany, now offers comprehensive coverage of German and European legal information.
Sub-segmenting Markets
Technology is enabling us to sub-segment our markets so that we can profitably deliver tailored products to the litigator, the real estate law specialist and many other customer segments. For example, our new Westlaw Litigator product is uniquely designed to help attorneys evaluate and investigate cases and prepare for trial.
Integrating Solutions
We continue to integrate our front- and back-office management products to provide total solutions for firms seeking to increase productivity and reduce the cost and time associated with practice management. In 2003, we acquired Elite to build out our software offerings in this area. In addition, demand for client development services has been booming; our FindLaw business grew 53% in 2003.
In the business information arena, we are in the process of migrating Dialog's content to our global Novus online platform so that we can enhance our offerings and accelerate new product development. We expect to gain further leverage as Dialog content becomes a component of solutions offered by other Thomson market groups, in addition to Legal & Regulatory.
Leveraging Our Technology
Novus, the latest generation of our global online delivery platform, allows us to seamlessly combine content from our various online services, reduce product delivery costs and decrease development time for new products. We continuously upgrade the applications and infrastructure, thereby enhancing our ability to sell and deliver products on the Internet.
| OPEN TECHNOLOGY ARCHITECTURE | MULTIPLE DELIVERY OPTIONS | POINT OF NEED | ||||||||
Open standards technology that makes it easy to integrate our content and applications with customers' information systems. | Content and tools delivered through the channel or channels preferred by the customer—e.g., print, CD-ROM, proprietary online platform, the Internet, wireless. | Solutions delivered anytime, anywhere to support the education, research, and managerial needs of lawyers, law students, law librarians, accountants, trademark professionals, consultants, government agencies and business professionals. | ||||||||
28
Thomson Learning
Our Business and Markets
Thomson Learning is one of the two global leaders in higher education, and is strongly positioned in the corporate training and testing markets. We provide a wide range of tailored learning solutions to colleges, universities, professors, students, libraries, reference centers, government agencies, corporations and professionals globally.
Favorable trends are expected to lead to long-term growth in both the higher education and lifelong learning markets:
- •
- The global demand for post-secondary education is continuing to rise, driven in part by a large wage gap between workers who hold college degrees and those who don't. This trend should accelerate as major economies around the world continue their shift to the service sector. As the service sector grows, so does the need for knowledge workers.
- •
- Education is becoming a lifelong pursuit. This is in part due to the information explosion, which requires professionals to update their education continually and to recertify periodically.
- •
- Companies have long relied on internal corporate training programs to improve employee skills. Increasingly, companies are supplementing or replacing traditional classroom learning with e-training and e-testing to provide cost- and time-efficient training on a 24/7 basis.
We believe the long-term growth prospects are excellent, although recent economic conditions have constrained spending in some areas of higher education and corporate training:
- •
- Overall, the demand for post-secondary education remains strong, although state budget issues have led to larger class sizes and some course consolidation. At the same time, distance learning is expanding access to higher education around the world, and electronic instructional materials will grow in importance.
- •
- The library reference market has also experienced budget pressures. However, this is accelerating the migration from print to electronic offerings, which affords Thomson the opportunity to supply integrated reference solutions.
- •
- Corporations are seeking to cut costs by outsourcing training programs and shifting to more cost-efficient e-learning solutions.
Our Business Model
The higher education and lifelong learning markets are changing rapidly, and we are evolving our business model to meet our customers' current and emerging needs.
While higher education instructors and students are increasingly seeking electronic resources, printed materials continue to be the most widely used learning resource:
- •
- We publish textbooks, study guides and teaching guides in both print and electronic formats. We are uniquely positioned to supplement our major textbooks with electronic teaching aids, such as online interactive information resources, to help students achieve their learning goals.
- •
- We combine primary-source research information and content from scholarly journals, and integrate them into a broad array of sophisticated reference tools used by libraries and research institutions around the world.
| RICH CONTENT | TOOLS AND APPLICATIONS | |||||
High-quality, comprehensive databases of must-have information compiled and continuously updated by subject-matter experts. Examples include: Higher Education/Reference—Textbooks and electronic course materials in the humanities, social sciences, business, economics, mathematics, sciences, modern languages and English-language training; college selection and test preparation guides; reference collections of periodicals, microfilm and encyclopedias. Lifelong Learning—Textbooks and learning materials for technology, business skills, healthcare, trades, professional and career education. | Tools to search, compare, aggregate, analyze, synthesize and communicate vast amounts of data; state-of-the-art e-learning technology; technology-based test development, delivery, and management. | |||||
29
Corporate training is undergoing a profound shift toward e-learning. This is partly driven by the demand for just-in-time training that enables employees to learn new skills at the point those skills are needed. In addition, many companies are trying to achieve economies of scale by seeking flexible training resources that meet the diverse needs of employees enterprise-wide—which frequently means worldwide. One of the strengths of our training and testing business is the breadth of our online offerings. We have a repository of more than 80,000 self-contained instruction modules to teach specific skills, and more than 3,000 e-learning courses. This breadth enables us to create flexible and personalized programs tailored to the needs of the individual student.
Key Initiatives
Migrating to Online Products
We are evolving our educational offerings to address students' evolving needs:
- •
- Through Peterson's Test Prep, we have begun providing customized lessons and exercises for college entrance exams. Our technology enables us to design individualized courses for each student, which are tailored to his or her strengths and weaknesses.
- •
- Online learning products like BCA/iLrn (Brooks/ColeAssessment) are growing in reach and impact. BCA/iLrn delivers homework tools, interactive content and links to live tutors. Students made over three million visits to the BCA/iLrn website in 2003.
Expanding Internationally
We see great opportunity to continue expanding the international reach of our products:
- •
- In 2003, Thomson NETg supported one of the largest online learning implementations in Europe when a major telecommunications company rolled out a comprehensive collection of e-learning courses and reference materials to 125,000 employees and their families.
- •
- We adapt textbooks and learning materials for international sales by translating them, where necessary, and supplementing them with local content. In 2003, approximately 60% of our non-U.S. higher education revenues came from content created in local markets.
Expanding into New Market Segments
We are enhancing our ability to provide comprehensive, must-have solutions for government and corporate customers:
- •
- We are creating solutions that help customers maintain mandatory professional certifications and licenses, and comply with government regulations.
- •
- In 2003, we began providing pre-employment screening for a major U.S. financial services corporation. We believe the corporate market for this type of e-testing will be significant.
Integrating Solutions
We are currently digitizing our microfilm collection and integrating this content with our electronic products. For example, Gale's Eighteenth Century Collections Online provides electronic access to 150,000 printed works from multiple academic disciplines. With full-text search capabilities across 33 million pages, this collection creates a new way to conduct multidisciplinary research.
| OPEN TECHNOLOGY ARCHITECTURE | MULTIPLE DELIVERY OPTIONS | POINT OF NEED | ||||||||
Open standards technology that makes it easy to integrate our content and applications with customers' information systems. | Content and tools delivered through the channel or channels preferred by the customer—e.g., print, CD-ROM, proprietary online platform, the Internet, wireless. | Solutions delivered anywhere, anytime to support the learning goals of college students, professionals and instructors; and the information needs of colleges, universities, vocational schools, libraries, research centers, corporations and government agencies. | ||||||||
30
Thomson Financial
Our Business and Markets
Thomson Financial is one of the Big Three information providers for the worldwide financial services industry. With the broadest range of products and services in the industry, as well as a growing capability to provide turnkey solutions for global firms, we help clients in more than 70 countries make better decisions and be more productive.
During 2002 and 2003, weakness in the economy strongly impacted the financial services industry. There was significant consolidation, accompanied by waves of layoffs and budget cuts among financial services firms. Demand for financial information declined as well.
However, in late 2003, the U.S. market began to turn around. The fourth quarter saw the greatest IPO volume in three years, and merger and acquisition activity increased after a two-year decline. Industry employment levels began to stabilize. While recovery in international markets lagged behind North America, many experts predict the beginnings of a turnaround in Europe during 2004.
While there have been signs of recovery in the financial services industry, financial firms remain under heavy pressure to increase productivity and lower costs. They need services tailored for the individual professional that enable him or her to increase personal productivity. More and more, our customers are demanding integrated solutions that offer advanced analytic capabilities and that can be easily integrated into their own workflows and work products.
Our Business Model
The breadth and depth of our products position us uniquely to satisfy customers' complete information needs:
- •
- We provide customers with financial information, including historical financial and economic information, broker research, earnings estimates, transaction data, insider trading information, corporate information and public disclosure documents.
- •
- We offer access to real-time information, including market data, trading information and financial news.
- •
- We make this information more valuable to our customers by providing tools that search, analyze and manipulate the data so that it can be used more effectively.
- •
- We also provide services such as the dissemination of corporate news releases, back-office data processing, transaction processing and, through our joint ventures, services that facilitate trade settlement and securities issuance.
| RICH CONTENT | TOOLS AND APPLICATIONS | |||||
High-quality, comprehensive databases of must-have information compiled and continuously updated by subject-matter experts. Examples include: Transactional data, institutional holdings data, current and historical earnings estimates, pricing information, SEC filings, real-time equity and fixed-income brokerage research, current and historical analyst forecast estimates, company accounts data, market indices, market intelligence, and corporate news and information. Industry-leading content brands include First Call, SDC, Worldscope and IFR. | Tools to search, compare, aggregrate, analyze, synthesize and communicate vast amounts of data; back-office data processing services; real-time networks for trade order indications and trade executions; performance attribution and portfolio construction tools; portfolio management and order management systems; and web-based applications providing corporate news, stock surveillance and outbound communications services. | |||||
31
Besides the comprehensiveness of our products and services, we offer customers exceptional flexibility to purchase tailored workflow products that deliver only the content and applications they need.
In 2003, we made a major step forward in choice and customization with the introduction of Thomson ONE. Thomson ONE is a flexible, open-architecture technology platform that enables easy integration and delivery of bundled products and services. It provides content both from Thomson Financial and from third parties, and combines this content with a suite of applications and tools tailored to the end-user's workflow. For example, Merrill Lynch brokers will be able to access Thomson data and tools, third-party data and their own proprietary information, seamlessly from their desktops.
Integrated information solutions currently delivered via Thomson ONE include: Thomson ONE Banker for investment banking professionals; Thomson ONE Yield and Thomson ONE Equity, targeting the needs of institutional fixed-income and equity traders; Thomson ONE Advisor, designed for retail brokerage and wealth managers; and Thomson ONE Analytics—including our popular First Call product—to meet the needs of research analysts and portfolio managers.
More than 90% of our revenues come from sales of products and services delivered electronically. Three-quarters of our revenues come from subscription-based products.
Key Initiatives
Delivering Superior Value
- •
- Helping current customers transition to Thomson ONE, which improves our service to them and optimizes our efficiency in product development and delivery
- •
- Implementing bundling strategies that leverage the full suite of Thomson Financial assets to deliver superior value and provide customer-centric alternatives to premium-price competitor products.
Expanding into New Markets
- •
- Expanding our offerings to target new markets in the institutional sales and trading, and portfolio management segments
- •
- Accelerating our growth internationally as the financial services industry begins to recover in Europe and Asia.
Enhancing the Customer Experience
In addition to enriching our line of products and services, we continue to enhance the customer's overall experience with Thomson Financial by:
- •
- Adopting a single-point-of-contact sales model across a broad range of products and services
- •
- Delivering innovative new service models that reduce the cost, time and complexity of switching from our competitors
- •
- Building out training and pilot capabilities to ensure smooth transitions to our integrated solutions
- •
- Continuing to align our product development, sales, service and administrative processes to maximize responsiveness to customer needs.
| OPEN TECHNOLOGY ARCHITECTURE | MULTIPLE DELIVERY OPTIONS | POINT OF NEED | ||||||||
Open standards technology that makes it easy to integrate our content and applications with customers' information systems. We have integrated our content and tools into a single, flexible, highly efficient technology platform—Thomson ONE. | Content and tools delivered through the channel or channels preferred by the customer—e.g., CD-ROM, proprietary online platform, the Internet, wireless. | Solutions delivered straight to the desktop to help financial professionals and corporate executives make informed, timely decisions. Our customers include investment bankers, private equity professionals, institutional traders, retail traders, investment advisors, portfolio managers, research analysts and investor relations professionals. | ||||||||
32
Thomson Scientific & Healthcare
Our Business and Markets
Thomson Scientific & Healthcare is a leading provider of integrated information solutions to researchers, physicians, and other professionals in the healthcare, academic, scientific, corporate and government marketplaces.
Our solutions assist scientists in all stages of the research and development cycle from scientific discovery to product release.
We provide physicians with critical drug and clinical information, as well as medical education, enabling them to improve the quality of care their patients receive. We also provide decision-support solutions so that healthcare managers and practitioners can more effectively manage the cost and quality of healthcare.
Scientific
The scientific information market is truly global, since researchers need to stay informed of scientific breakthroughs wherever they occur. Thus high-quality, comprehensive scientific databases have relevance worldwide.
In addition, the scientific community has been an early adopter of online information sources. Today, the top academic and corporate research libraries subscribe to electronic databases as their primary vehicle for distributing scientific and technical information. Increasingly, information is being delivered directly to the individual scientist's desktop on demand, and information solutions are becoming embedded in researchers' workflows.
Healthcare
The global healthcare information market is extremely broad. While we participate in various segments of the market, we focus on the clinical and drug information and medical education segments because we believe these areas have the greatest growth prospects.
In the United States, continued investments in scientific R&D, drug development and healthcare services are fueled by the graying of the population. As America ages, investments in drug development for chronic conditions and diseases are growing more than 10% a year. Drug development pipelines are improving in the pharmaceutical and biotechnology markets. Furthermore, the demand for healthcare services generated by the aging U.S. population increases the need for information solutions that facilitate effective and efficient healthcare delivery.
A second major market trend is the shift toward delivering information to physicians and other healthcare professionals at the point of care. For example, more and more doctors are using their PDAs to access information and tools, sometimes literally at their patients' bedsides. Consumer demand for quality healthcare, cost pressures and heightened awareness of medical errors all feed the growing demand for accurate and reliable point-of-care information.
| RICH CONTENT | TOOLS AND APPLICATIONS | |||||
High-quality, comprehensive databases of must-have information compiled and continuously updated by subject-matter experts. Examples include: Scientific—journal literature, patents, commercial news sources, company communications, patented genetic sequences. Healthcare—FDA approved drug monographs; clinical, toxicological and environmental data; poison control and emergency procedures; acute and chronic disease information; market intelligence, benchmark data and research for managing the delivery of health services; medical education materials. | Tools to search, compare, aggregrate, analyze, synthesize and communicate vast amounts of data, including decision support systems. | |||||
33
Our Business Model
Today we are uniquely positioned in the scientific and healthcare market to deliver information solutions across the value chain—from R&D information through medical reference databases to our suite of healthcare cost management solutions.
Leading Products
Web of Science reaches nearly nine million researchers globally.
Using Delphion, customers can search over 39 million patents from 70 countries and leverage unique productivity tools to track market developments and competitive activities.
More than 9,000 healthcare facilities depend on our Micromedex solutions to meet their medical reference needs.
Approximately 160,000 healthcare professionals have registered for PDR.net, which provides an online version of the PDR (Physicians' Desk Reference) and also enables handheld access through mobilePDR.
Medstat is a leading provider of decision-support systems, market intelligence and benchmark databases for managing the purchase, administration, and delivery of health services and benefits.
Physicians World and Gardiner-Caldwell deliver continuing medical education to help caregivers keep their skills up to date.
In response to our customers' evolving needs, we are accelerating the shift from stand-alone reference databases to integrated information solutions. For example, IDdb (Investigational Drugs Database) provides validated, integrated and evaluated information about the R&D portfolios of more than 9,600 organizations involved in drug development. It includes information about therapeutic patents, the pipeline status of more than 20,000 investigational drugs, searchable chemical structures and meeting reports. This comprehensive solution is currently used by 20,000 professionals in the pharmaceutical industry.
Key Initiatives
Integrating Solutions
We are increasing penetration of the hospital market by repositioning our Micromedex offering as an integrated information solution for clinical practice and clinical management support.
In the scientific market, we are enhancing our Web of Knowledge platform tools and content to strengthen our competitive advantage in the academic and government research markets.
Delivering to the Point of Care
We are continuing to develop point-of-need products and services for the clinician and researcher. In 1998, virtually no U.S. doctors used PDAs in patient care; today more than 25% do. Point-of-care solutions like mobilePDR and mobileMICROMEDEX reduce the risk of error in diagnosis and prescription by helping caregivers make more informed decisions.
Expanding into New Markets
We are developing an integrated platform that will deliver products and services tailored for customers in the pharmaceutical and biotechnology industries. This platform will seamlessly combine content and tools from our scientific and healthcare businesses, augmented by relevant products from other Thomson market groups.
| OPEN TECHNOLOGY ARCHITECTURE | MULTIPLE DELIVERY OPTIONS | POINT OF NEED | ||||||||
Open standards technology that makes it easy to integrate our content and applications with customers' information systems. | Content and tools delivered through the channel or channels preferred by the customer—e.g., print, CD-ROM, proprietary online platform, the Internet, wireless. | Solutions delivered anywhere, anytime—to the hospital to help physicians deliver better care, or to the laboratory or desktop to help the scientist conduct research. Our customers include corporations in the pharmaceutical, biotechnology, chemical and engineering industries, as well as government agencies, research libraries, universities, hospitals, poison control centers, insurance companies and health professionals. | ||||||||
34
Financial and Corporate Information
To experience an interactive version of this annual report, go to www.thomson.com
35
| 37 | Management's Discussion and Analysis | |
37 | Overview | |
39 | 2004 Financial Outlook | |
41 | Use of Non-GAAP Financial Measures | |
42 | Results of Operations | |
49 | Liquidity and Capital Resources | |
55 | Related Party Transactions | |
57 | Employee Future Benefits | |
57 | Subsequent Events | |
58 | Changes in Accounting | |
58 | Critical Accounting Policies | |
61 | Recently Issued Accounting Standards | |
63 | Additional Information | |
64 | Reconciliations | |
66 | Quarterly Information | |
68 | Selected Financial Data | |
69 | Management Report | |
70 | Auditors' Report | |
71 | Financial Statements | |
74 | Notes to Consolidated Financial Statements | |
118 | Six-Year Summary | |
120 | Board of Directors | |
122 | Senior Management | |
123 | Corporate Information |
36
Management's Discussion and Analysis
The following management's discussion and analysis should be read in conjunction with our consolidated financial statements prepared in accordance with accounting principles generally accepted in Canada, or Canadian GAAP, and the related notes to those financial statements. All dollar amounts in this discussion are in U.S. dollars unless otherwise specified. Unless otherwise indicated, references in this discussion to "we," "our" and "us" are to The Thomson Corporation and its subsidiaries. This management's discussion and analysis is dated as of February 25, 2004.
Overview
Our Business
We are a global leader in providing integrated information solutions to business and professional customers. We generate revenues by supplying our customers with business-critical information from multiple Thomson and third-party databases and further enhance the value of that information with analysis, insight and commentary. To enhance the speed and accessibility of information for our customers, we increasingly deliver information and services electronically. As we integrate critical information with analysis, tools and applications, we place greater focus on the way our customers use our content, rather than simply on selling the content itself.
As a global company, we are affected by the economic conditions and business characteristics of each market in which we operate. The development of our business is also largely driven by our customers' technological, information and other needs. In 2002 and 2003, we saw gains in strategically important areas of our businesses, such as online information, software tools and applications, and services. However, challenging global economic conditions, increasing customer pricing pressures and budget constraints, most notably in the financial, library reference and IT testing markets, affected our overall revenue growth. During the last two years, our company-wide focus on leveraging resources and driving efficiencies helped us increase our profitability. We generated strong cash flow in 2002 and 2003, reflecting our strong operating results.
In 2003, we derived approximately 64% (2002—62%) of our revenues from sales of subscription-based products, 34% (2002—36%) from books and other products and services and only 2% (2002—2%) from advertising. In 2003, we derived 81% (2002—82%) of our revenues from our operations in North America, and 55% (2002—56%) of our revenues from products and services delivered electronically. The following table summarizes selected financial information for 2003 and 2002, including certain metrics which are non-GAAP financial measures. Please see the section below entitled "Use of Non-GAAP Financial Measures" for definitions of these terms and refer to the
37
"Reconciliations" section at the end of this management's discussion and analysis for a reconciliation of these measures to the most directly comparable Canadian GAAP measures.
| | Year ended December 31 | | |||||||
|---|---|---|---|---|---|---|---|---|---|
| (millions of U.S. dollars, except per share amounts) | | ||||||||
| 2003 | 2002 | Change | |||||||
| Consolidated statement of earnings data | |||||||||
| Revenues | 7,606 | 7,444 | 2 | % | |||||
| Operating profit | 1,191 | 1,136 | 5 | % | |||||
| Earnings attributable to common shares(1) | 879 | 586 | 50 | % | |||||
| Basic and diluted earnings per common share(1) | $ | 1.34 | $ | 0.91 | 47 | % | |||
Consolidated balance sheet data | |||||||||
| Cash and cash equivalents | 683 | 709 | |||||||
| Total assets | 18,680 | 18,548 | |||||||
| Total liabilities | 9,480 | 9,582 | |||||||
| Shareholders' equity | 9,200 | 8,966 | |||||||
Other data(2) | |||||||||
| Adjusted EBITDA | 2,064 | 1,961 | 5 | % | |||||
| Adjusted earnings attributable to common shares | 705 | 636 | 11 | % | |||||
| Adjusted earnings per common share | $ | 1.08 | $ | 0.99 | 9 | % | |||
| Net debt | 3,373 | 3,573 | |||||||
| Free cash flow | 983 | 980 | |||||||
- (1)
- Results are not directly comparable due to certain one-time items. For more information, please see the "Results of Operations" section of this management's discussion and analysis.
- (2)
- Non-GAAP financial measures.
We organize our operations into four market groups that are structured on the basis of the customers they serve:
- •
- THOMSON LEGAL & REGULATORY (41% of revenues) is a leading provider of integrated information solutions to legal, tax, accounting, intellectual property, compliance and other business professionals, as well as government agencies. Major brands include Westlaw, Aranzadi, BAR/BRI, Carswell, Checkpoint, Compu-Mark, Creative Solutions, Dialog, Elite, FindLaw, GEE, IOB, Lawbook, RIA, Sweet & Maxwell and Thomson & Thomson.
- •
- THOMSON LEARNING (27% of revenues) is a leading provider of tailored learning solutions to colleges, universities, professors, students, libraries, reference centers, government agencies, corporations and professionals. Major brands include Course Technology, Delmar, Gale, Heinle, Nelson, NETg, Peterson's, Prometric, SouthWestern and Wadsworth.
- •
- THOMSON FINANCIAL (20% of revenues) is a leading provider of financial products and information solutions to the global financial services industry, including brokers, financial planners and corporate executives. Major businesses and brands include AutEx, Baseline, BETA Systems, Datastream, DigiTRADE, Disclosure, First Call, I/B/E/S, IFR, Investext, IR Channel, Thomson ONE Equity, Thomson ONE Analytics, Thomson ONE Advisor, Thomson ONE Banker, Thomson ONE Yield and Worldscope.
- •
- THOMSON SCIENTIFIC & HEALTHCARE (10% of revenues) is a leading provider of information and services to researchers, physicians and other professionals in the healthcare, academic, scientific, corporate and government marketplaces. Major businesses and information solutions include Current Drugs IDdb (Investigational Drugs Database), Derwent World Patents Index, Medstat,
38
Micromedex, PDR (Physicians' Desk Reference), Web of Science and Web of Knowledge, and continuing medical education providers Physicians World and Gardiner-Caldwell.
We also report financial results for a corporate and other reporting category, which constituted 2% of our 2003 total revenues, as well as discontinued operations. The corporate and other category principally includes corporate expenses, costs associated with our stock-related compensation and the results of Thomson Media, which is a business unit we established in 2001 to manage print-based businesses that were previously managed in our financial group.
2004 Financial Outlook
We anticipate that the current economic environment will improve in 2004, including the market for U.S. financial services. Consequently, we expect 2004 revenue growth to accelerate from the 2% increase achieved in 2003, but to remain below our long-term target of 7% to 9%. This long-term target is not an annual revenue objective, but is expected to be achieved by our portfolio of businesses over the normal business cycle. Growth is expected to be driven by continued high growth rates in the strategic areas of the business, supplemented by tactical acquisitions. Our financial group is expected to post a revenue increase in 2004, following two years of declines due to depressed market conditions.
Adjusted EBITDA margins in 2004 are expected to remain consistent with 2003 levels, reflecting continued operating improvement, offset by higher pension expense and higher expected stock-related compensation expense.
We expect to continue to generate strong free cash flow in 2004, in line with the level achieved in 2003.
Revenues
Our revenues are derived from a diverse customer base. In both 2003 and 2002, no single customer accounted for more than 2% of our total revenues.
We segment our financial results geographically by origin in our financial statements, on the basis of the location of our operations that produce the product or service. The following table presents a summary of our revenues, before intercompany eliminations, segmented geographically for the years ended December 31, 2003 and 2002:
| | Year ended December 31, 2003 | Year ended December 31, 2002 | |||||||
|---|---|---|---|---|---|---|---|---|---|
| (millions of U.S. dollars) | |||||||||
| Revenues | % | Revenues | % | ||||||
| United States | 6,131 | 79 | % | 6,092 | 80 | % | |||
| Europe | 1,093 | 14 | % | 1,017 | 14 | % | |||
| Asia-Pacific | 291 | 4 | % | 255 | 3 | % | |||
| Canada | 201 | 2 | % | 165 | 2 | % | |||
| Other countries | 69 | 1 | % | 77 | 1 | % | |||
7,785 | 100 | % | 7,606 | 100 | % | ||||
| Eliminations(1) | (179 | ) | (162 | ) | |||||
| Total | 7,606 | 7,444 | |||||||
- (1)
- Represents intercompany sales from one region to another.
In 2003, 81% of our revenues were from our operations in North America, a slight decrease from 82% in 2002. We are seeking to increase our revenues from outside North America as a percentage of
39
our overall revenues. We can modify and offer internationally many of the products and services we developed originally for customers in North America without excessive customization or translation. This represents an opportunity for us to earn incremental revenues. For example, in 1996, Westlaw only had a market presence in the United States. In 2003, Westlaw had extended its footprint to 63 countries. For some of the products and services we sell internationally, we incur additional costs to customize our products and services for the local market and this can result in lower margins if we cannot achieve adequate scale. Development of additional products and services and expansion into new geographic markets are integral parts of our growth strategy. While development and expansion present an element of risk, particularly in foreign countries where local knowledge of our products may be lacking, we believe that the quality and brand recognition of our products and services help to mitigate that risk.
We use a variety of media to deliver our products and services to our customers. Increasingly, our customers are seeking products and services delivered electronically and are migrating away from print-based products. We deliver information electronically over the Internet, through dedicated transmission lines, CDs and more recently through handheld wireless devices. We expect that electronic revenues as a percentage of our total revenues will increase slightly in 2004 compared to 2003 as we continue to emphasize electronic delivery, add solution-based and software-based acquisitions to our portfolio, and as markets outside of North America continue to incorporate technology into their workflow. In 2003, electronic revenues as a percentage of our total revenues declined slightly, primarily due to our financial group's revenue decrease and lower revenues from our e-learning businesses. Electronic delivery of our products and services improves our ability to provide additional products and services to our existing customers and to access new customers around the world. This allows us to increase our revenues and expand our margins because products and services delivered electronically generally have lower variable costs than those that are print-based.
Expenses
As an information provider, our most significant expense is labor. Our labor costs include all costs related to our employees, including salaries, bonuses, commissions, benefits and payroll taxes, but do not include costs related to our stock-related compensation. Labor represented approximately 58% of our cost of sales, selling, marketing, general and administrative expenses (operating costs) in 2003 compared to approximately 57% in 2002. No other category of expenses accounted for more than 12% of our operating costs in either 2003 or 2002.
Acquisitions and Dispositions
During 2002 and 2003, we completed a total of 57 acquisitions for an aggregate cost of approximately $500 million. These acquisitions were tactical in nature and generally related to the purchase of information, products or services that we integrated into our operations to broaden the range of our product and service offerings to better serve our customers. This is the key principle which drives our overall acquisition strategy. As alternatives to the development of new products and services, tactical acquisitions often have the advantages of faster integration into our product and service offerings and cost efficiencies. During 2002 and 2003, acquired businesses generated a significant portion of the growth in our total revenues and a lesser portion of the growth in our operating profit. Generally, the businesses that we acquired in 2002 and 2003 have initially had lower margins than our existing businesses. In 2003, our largest acquisition was Elite Information Group, a provider of practice management software to law firms that we acquired in May 2003 for $101 million. In 2004, we expect that the total amount we will spend on acquisitions will increase from the 2003 level of $211 million.
When integrating acquired businesses, we focus on eliminating cost redundancies and combining the acquired products and services with our existing offerings. We may incur costs, such as severance
40
payments to terminate employees and contract cancellation fees, when we integrate businesses. We include many of these costs in deriving our operating profit.
During 2002 and 2003, we completed a total of 19 dispositions for aggregate consideration of approximately $475 million. In 2003, we also announced the planned sale of certain businesses which we expect to complete in 2004. While a number of these businesses possessed strong brand equity, loyal customer bases and talented employees, these businesses did not provide the type of synergies that strengthen our core integrated information solutions. The more significant of these dispositions were the sale of our 20% interest in Bell Globemedia Inc., or BGM, in April 2003 for $279 million and the sale of our healthcare magazines in October 2003 for $135 million. The BGM transaction is discussed in "Related Party Transactions" below and the healthcare magazines transaction is discussed in "Discontinued Operations" below.
Seasonality
We typically derive a much greater portion of our operating profit and operating cash flow in the second half of the year. Customer buying patterns are concentrated in the second half of the year, particularly in the learning and regulatory markets, while costs are spread more evenly throughout the year. As a result, our operating margins generally increase as the year progresses. For these reasons, it may not be possible to compare the performance of our businesses quarter to consecutive quarter, and our quarterly results should be considered on the basis of results for the whole year or by comparing results in a quarter with the results in the same quarter for the previous year. While we report results quarterly, we view and manage our business from a longer-term perspective.
Use of Non-GAAP Financial Measures
In addition to the results reported in accordance with Canadian GAAP, we use non-GAAP financial measures as supplemental indicators of our operating performance and financial position. We use these non-GAAP financial measures internally for comparing actual results from one period to another, as well as for future planning purposes. We have historically reported non-GAAP financial results as we believe their use provides more insight to our results. The following discussion defines the measures that we use and explains why we believe they are useful measures of our performance, including our ability to generate cash flow:
- •
- ADJUSTED EBITDA. We define Adjusted EBITDA as earnings from continuing operations before interest, taxes, depreciation and amortization, as well as restructuring charges, net other income (expense) and equity in net losses of associates, net of tax. Among other things, Adjusted EBITDA eliminates the differences that arise between businesses due to the manner in which they were acquired or funded. In particular, Adjusted EBITDA excludes the effects of amortization of identifiable intangible assets, which is a non-cash charge arising from acquisitions accounted for under the purchase method of accounting. We also use Adjusted EBITDA margin, which we define as Adjusted EBITDA as a percentage of revenues.
- •
- ADJUSTED OPERATING PROFIT. Operating profit before amortization and restructuring charges, or Adjusted operating profit, reflects depreciation expense but eliminates the effects of restructuring charges and amortization of identifiable intangible assets. Because we do not consider these items to be operating costs, we exclude them from the measurement of our operating performance. We also use Adjusted operating profit margin, which we define as Adjusted operating profit as a percentage of revenues.
- •
- FREE CASH FLOW. We evaluate our operating performance based on free cash flow, which we define as net cash provided by operating activities less net additions to property and equipment, other investing activities and dividends paid on our preference shares. We use free cash flow as
41
- •
- ADJUSTED EARNINGS AND ADJUSTED EARNINGS PER COMMON SHARE FROM CONTINUING OPERATIONS. We measure our earnings attributable to common shares and per share amounts to adjust for non-recurring items and discontinued operations which we refer to as Adjusted earnings from continuing operations and Adjusted earnings per share from continuing operations. We use these measures to assist in comparisons from one period to another. Adjusted earnings per common share from continuing operations does not represent actual earnings per share attributable to shareholders.
- •
- NET DEBT. We measure our indebtedness including associated hedging instruments (swaps) on our debt less cash and cash equivalents. Given that we hedge some of our debt to reduce risk, we include hedging instruments as a better measure of the total obligation associated with our outstanding debt. We reduce gross indebtedness by cash and cash equivalents, on the basis that they could be used to pay down debt.
a performance measure because it represents cash available to repay debt, pay common dividends and fund new acquisitions.
These and related measures do not have any standardized meaning prescribed by Canadian GAAP, and therefore, are unlikely to be comparable with the calculation of similar measures used by other companies. You should not view these measures as alternatives to operating profit, cash flow from operations, net earnings, total debt or other measures of financial performance calculated in accordance with Canadian GAAP. We encourage you to review the reconciliation of these non-GAAP financial measures to the most directly comparable Canadian GAAP measure within this management's discussion and analysis.
Results of Operations
Consolidated Operations
Our results from continuing operations exclude businesses that we classify as discontinued operations for all periods presented in the accompanying consolidated financial statements. For more information on these businesses, please see the section below entitled "Discontinued Operations." Our market group results from continuing operations represent ongoing businesses, which exclude the results of businesses sold or held for sale that do not qualify as discontinued operations (i.e., disposals). The principal businesses included in disposals were various businesses in our financial market group. The following table sets forth our summarized results from 2003 and 2002.
| | Year ended December 31 | | |||||||
|---|---|---|---|---|---|---|---|---|---|
| (millions of U.S. dollars, except per common share amounts) | | ||||||||
| 2003 | 2002 | Change | |||||||
| Revenues | 7,606 | 7,444 | 2 | % | |||||
| Adjusted EBITDA | 2,064 | 1,961 | 5 | % | |||||
| Adjusted EBITDA margin | 27.1 | % | 26.3 | % | |||||
| Operating profit | 1,191 | 1,136 | 5 | % | |||||
| Operating profit margin | 15.7 | % | 15.3 | % | |||||
| Adjusted operating profit | 1,476 | 1,426 | 4 | % | |||||
| Adjusted operating profit margin | 19.4 | % | 19.2 | % | |||||
| Net earnings | 867 | 605 | 43 | % | |||||
| Earnings attributable to common shares | 879 | 586 | 50 | % | |||||
| Earnings per share attributable to common shares | $ | 1.34 | $ | 0.91 | 47 | % | |||
See the "Reconciliations" section for a reconciliation of the above non-GAAP financial measures to the most directly comparable Canadian GAAP measures.
42
REVENUES. The increase in revenues was primarily attributable to contributions from acquisitions and the impact of favorable foreign currency translation. Growth from certain existing businesses, notably in our legal and regulatory and scientific and healthcare businesses, was offset primarily by reduced revenues in library reference and e-testing businesses in our learning group, transaction-based products in our financial group, and the news and trademark businesses in our legal and regulatory group.
To conform to the current year's presentation, revenues and expenses for 2002 within our learning and financial groups have been increased in order to present on a gross basis certain fees charged to our customers that had previously been netted. This reclassification had no impact on Adjusted EBITDA or Adjusted operating profit, and each reclassification is discussed in more detail within the market group discussions below.
OPERATING PROFIT. Operating profit and related margin growth in 2003 reflected continued efficiency efforts across the corporation and, to a lesser extent, contributions from acquisitions and the favorable impact of foreign currency translation. Those increases were partially offset by higher depreciation expense from recent acquisitions and capital expenditures; expense in 2003 associated with our stock appreciation rights, reflecting an increase in the trading price of our common shares during the year, compared to a benefit in 2002; and higher pension expense. The increased pension expense was due to changes in assumptions and the amortization of deferred losses, as well as the effect of a one-time benefit of $32 million recognized in 2002 in connection with one of our pension plans. This benefit was recorded within corporate and other, and is discussed more fully under that section. There was no such benefit in 2003.
ADJUSTED EBITDA AND ADJUSTED OPERATING PROFIT. Adjusted EBITDA and Adjusted operating profit and related margins increased for the same reasons discussed in the "Operating profit" discussion in the immediately preceding paragraph.
DEPRECIATION AND AMORTIZATION. Depreciation in 2003 increased 10% to $588 million from $535 million in 2002. This increase reflected recent acquisitions and capital expenditures. Amortization was $285 million in 2003, essentially unchanged from $284 million in 2002, as increases due to the amortization of newly acquired assets were offset by decreases arising from the completion of amortization for certain intangible assets acquired in previous years.
NET OTHER INCOME (EXPENSE). In 2003, net other income was $74 million, compared to a net other expense of $34 million in 2002. The 2003 amount comprised primarily a gain on the sale of our 20% interest in BGM (discussed in "Related Party Transactions" below), and the receipt of $22 million in July 2003 as part of a settlement with Skillsoft PLC, a competitor of our learning group. Under the terms of the settlement, Skillsoft PLC is scheduled to pay us an additional $22 million in July 2004, which will be recognized upon receipt. In 2002, net expense was primarily comprised of charges associated with the sale or write-down of certain investments.
NET INTEREST EXPENSE AND OTHER FINANCING COSTS. Our interest expense in 2003 decreased 13% to $252 million from $291 million in 2002. This decrease reflected lower average levels of outstanding net debt in 2003.
INCOME TAXES. Our income tax expense in 2003 of $156 million represented 15.4% of our earnings from continuing operations before income taxes and our proportionate share of losses on investments accounted for using the equity method of accounting. This compares with income tax expense of $162 million in 2002 and an equivalent effective rate of 20.0%. The decrease in the effective rate largely reflected the reversal, in the fourth quarter of 2003, of contingent tax liabilities principally arising from a favorable tax settlement. After consideration of the tax settlement, as well as other tax contingencies as at December 31, 2003, we reduced our liability for tax contingencies by $64 million.
43
Excluding the effect of the adjustment to contingent tax liabilities, our income tax expense in 2003 would have been $220 million, or 21.7% of our earnings from continuing operations before income taxes and our proportionate share of losses on investments accounted for using the equity method of accounting.
Our effective income tax rate in each year was lower than the statutory corporate income tax rate in Canada of 36.6% (2002—38.6%) due principally to the lower tax rates and differing tax rules applicable to our operating and financing subsidiaries outside Canada.
The balance of our valuation allowance against our deferred tax assets at December 31, 2003 was $534 million compared to $540 million at December 31, 2002. The net movement in the valuation allowance from 2002 to 2003 primarily relates to additions from Canadian losses sustained in 2003, the reversal of prior years' contingencies and additions from foreign currency translation, offset by the change in the deferred tax liability related to the revaluation of the currency swap financial instruments, which reduced the valuation allowance requirement.
EQUITY IN NET LOSSES OF ASSOCIATES, NET OF TAX. Equity in net losses of associates, net of tax, includes our proportionate share of net losses of investments accounted for using the equity method, as well as write-downs from the reduction in carrying values of certain investments accounted for under the equity method. In 2003, equity in losses of associates, net of tax, was $13 million, compared to $101 million in 2002. The difference primarily reflects a goodwill impairment charge recorded by BGM in 2002, of which our proportionate share was $67 million, and a higher level of write-downs in 2002.
EARNINGS ATTRIBUTABLE TO COMMON SHARES AND EARNINGS PER COMMON SHARE. In 2003, earnings attributable to common shares included a gain of $21 million related to the redemption of our Series V preference shares. We redeemed those shares in April 2003 for Cdn$25.50 per share plus accrued dividends. The gain of $21 million represents a realized foreign exchange gain of $30 million, less the premium paid on redemption of $6 million, and taxes of $3 million.
Earnings attributable to common shares, which include the results of discontinued operations, were $879 million in 2003 compared to $586 million in 2002. Earnings per common share, which also include discontinued operations, were $1.34 in 2003 compared to $0.91 in 2002. These results are not directly comparable, however, because of the results of discontinued operations as well as certain one-time items. The following table presents a summary of our earnings and our earnings per common share from continuing operations for both 2003 and 2002, after adjusting for one-time items in both years.
| | Year ended December 31 | |||||||
|---|---|---|---|---|---|---|---|---|
| (millions of U.S. dollars, except per common share amounts) | ||||||||
| 2003 | 2002 | |||||||
| Earnings attributable to common shares | 879 | 586 | ||||||
| Adjustments: | ||||||||
| Net other (income) expense | (74 | ) | 34 | |||||
| Restructuring charges | — | 6 | ||||||
| Tax on above items | 8 | — | ||||||
| Net change to contingent tax liabilities | (64 | ) | — | |||||
| BGM goodwill impairment | — | 67 | ||||||
| Net gain on redemption of Series V preference shares | (21 | ) | — | |||||
| Discontinued operations | (23 | ) | (57 | ) | ||||
| Adjusted earnings from continuing operations attributable to common shares | 705 | 636 | ||||||
| Adjusted earnings per common share from continuing operations | $ | 1.08 | $ | 0.99 | ||||
44
On a comparable basis, adjusted earnings per common share from continuing operations increased 9%. This increase was primarily attributable to higher operating profit stemming from increased revenues, contributions from cost controls, acquisitions, and favorable foreign currency translation, as well as benefits from lower interest expense and improved performance of equity investees. Partially offsetting those increases were higher income taxes, higher pension costs and an expense in 2003 related to our stock appreciation rights, compared to a benefit in 2002.
Operating Results by Business Segment
Thomson Legal & Regulatory
| | Year ended December 31 | | |||||
|---|---|---|---|---|---|---|---|
| (millions of U.S. dollars) | | ||||||
| 2003 | 2002 | Change | |||||
| Revenues | 3,142 | 2,959 | 6 | % | |||
| Adjusted EBITDA | 980 | 926 | 6 | % | |||
| Adjusted EBITDA margin | 31.2 | % | 31.3 | % | |||
| Adjusted operating profit | 799 | 767 | 4 | % | |||
| Adjusted operating profit margin | 25.4 | % | 25.9 | % | |||
See the "Reconciliations" section for a reconciliation of the above non-GAAP financial measures to the most directly comparable Canadian GAAP measures.
During 2003, revenue growth from existing businesses was driven by Westlaw and Checkpoint online services and growth in FindLaw's client development services. Those increases were largely offset by decreases in the business information and news sectors, and, as expected, from lower print and CD product revenues in North America, as customers continued to migrate toward products and services delivered electronically. Elite Information Group, a provider of practice management software to law firms that we acquired in May 2003, contributed to overall revenue growth. Favorable foreign currency translation also contributed to overall revenue growth.
Although slowing somewhat, the trend toward law firm mergers continues globally. However, the overall legal information market growth remains modest but steady. We expect that customer spending on print and CD products will continue to decline, but will be more than offset by growth in spending for online products and integrated information offerings such as Westlaw Litigator. In 2003, revenue growth from Westlaw in North America occurred in all major market segments: legal, governmental, corporate and academic. Outside of North America, Westlaw revenues grew rapidly in Europe and the Asia-Pacific region.
The increases in Adjusted EBITDA and Adjusted operating profit reflected the revenue growth described above and cost management efforts within the group. Higher depreciation expense related to our global information platform and additional data center capacity. However, the related margins decreased due to the impact of increased pension costs and because recently acquired companies contributed initial margins that were lower than existing businesses. Additionally, margins decreased due to the impact of strengthening foreign currencies on our lower margin international businesses.
45
Thomson Learning
| | Year ended December 31 | | |||||
|---|---|---|---|---|---|---|---|
| (millions of U.S. dollars) | | ||||||
| 2003 | 2002 | Change | |||||
| Revenues | 2,052 | 2,036 | 1 | % | |||
| Adjusted EBITDA | 520 | 465 | 12 | % | |||
| Adjusted EBITDA margin | 25.3 | % | 22.8 | % | |||
| Adjusted operating profit | 337 | 302 | 12 | % | |||
| Adjusted operating profit margin | 16.4 | % | 14.8 | % | |||
See the "Reconciliations" section for a reconciliation of the above non-GAAP financial measures to the most directly comparable Canadian GAAP measures.
The increase in revenues during 2003 was attributable to improved performance in the Higher Education sector and favorable foreign currency translation, partially offset by decreases in revenues primarily in our library reference and e-testing businesses.
Within the Higher Education sector, strong growth came from sales to vocational and career markets as well as our international businesses. Declining demand arising from budget pressures at educational institutions continued to impact our academic group, despite a year of strong product releases. Sales of both new and updated editions of textbooks increased significantly over 2002 levels. However, those sales were offset by a decline in sales of older editions. While post-secondary education enrollment continues to increase, many public post-secondary institutions are dealing with cutbacks in state and local government funding support. While those cuts are not negatively affecting the demand for education, the underlying economic conditions have led to further tuition increases and a reduction in some course offerings. Those conditions have made students more sensitive about textbook prices, leading to reduced textbook sales.
State government cutbacks have also significantly reduced the amounts spent by libraries on reference materials. These cuts have resulted in an accelerated migration of collections to electronic products, and many libraries that had in the past purchased materials in both print and electronic formats are now choosing to purchase in electronic format only. These negative factors led to a decrease in revenues at Gale, despite strong growth in our electronic offerings.
The general economic conditions have led to reduced information technology hiring and reduced corporate spending on employee training, which have negatively impacted certification volumes at Prometric. NETg's revenues remained virtually unchanged despite the difficult economic conditions. NETg ended the year on a positive note, with orders received in December 2003 well above those of the comparable period in 2002.
While 2003 was a challenging year for our learning group due to many economic factors, we recognize that education has become a lifelong pursuit in a global knowledge-based economy, and we expect to benefit from this growing trend.
To conform to the current year's presentation, revenues and expenses for 2002 have been increased by $26 million in order to present on a gross basis certain freight and distribution fees charged to our customers that had previously been netted. This reclassification had no impact on Adjusted EBITDA or Adjusted operating profit. However, it did decrease the Adjusted EBITDA margin and Adjusted operating profit margin for 2002.
In the fourth quarter of 2003, we reduced staffing levels and consolidated office locations at several of our businesses. As a result, we recorded a $16 million charge primarily related to severance and lease termination costs. Offsetting this charge were credits of approximately $27 million, which
46
largely related to the reversal of incentive accruals which were no longer required due to the lower than expected performance in several of our learning group's businesses.
The increases in Adjusted EBITDA, Adjusted operating profit, and the related margins in 2003 largely resulted from improved efficiencies realized from combining businesses acquired in 2001 from Harcourt General, Inc., or Harcourt, with existing businesses, general cost-containment measures and the impact of the items referred to in the preceding paragraph. Additionally, 2002 results included certain non-recurring expenses related to the Harcourt acquisition. These factors were partially offset by increased depreciation due to the deployment of several projects during 2003, most notably a scheduling and registration system in our e-testing business.
Thomson Financial
| | Year ended December 31 | | |||||
|---|---|---|---|---|---|---|---|
| (millions of U.S. dollars) | | ||||||
| 2003 | 2002 | Change | |||||
| Revenues | 1,523 | 1,597 | (5 | )% | |||
| Adjusted EBITDA | 406 | 409 | (1 | )% | |||
| Adjusted EBITDA margin | 26.7 | % | 25.6 | % | |||
| Adjusted operating profit | 231 | 240 | (4 | )% | |||
| Adjusted operating profit margin | 15.2 | % | 15.0 | % | |||
See the "Reconciliations" section for a reconciliation of the above non-GAAP financial measures to the most directly comparable Canadian GAAP measures.
Revenues decreased in each of the major geographical markets served by our financial group, most notably in Europe. The decrease in revenues was primarily attributable to the difficult market conditions that prevailed in the global financial services industry, offset partially by the favorable impact of foreign currency translation. These difficult market conditions led to reduced earnings for many of our customers. Those customers responded by reducing their capital spending and budgets, which in turn led to some product cancellations, particularly from our European customers, and pressure on our pricing. Consolidation in the financial services industry has reduced the number of customers in the market, thereby intensifying competition.
However, deal activity in the fourth quarter of 2003 provided signs of improving market conditions. A high level of fourth-quarter merger and acquisition activity led to an overall increase in such activity for the year. Although initial public offering activity declined in 2003 compared to 2002, volume in the fourth quarter of 2003 was the highest in more than three years.
To conform to the current year's presentation, revenues and expenses for 2002 have been increased by $70 million in order to present on a gross basis certain stock exchange fees charged to our customers that had previously been netted. This reclassification had no impact on Adjusted EBITDA or Adjusted operating profit; however, it did decrease Adjusted EBITDA margin and Adjusted operating profit margin for 2002.
The decreases in Adjusted EBITDA and Adjusted operating profit reflected the reduced revenues, which were partially mitigated by cost-containment actions. The 2003 amounts include a net benefit of $4 million related to insurance claims for September 11, 2001 losses recorded in earlier periods. Comparability was also affected by a net benefit of $10 million recorded in the fourth quarter of 2002, which represented a $30 million reversal of bonus-related accruals and a $20 million severance charge.
Despite the decreases in Adjusted EBITDA and Adjusted operating profit, the related margins showed improvements, primarily due to the effects of leveraging initiatives, cost controls and technology platform consolidation across the businesses in our financial group.
47
Thomson Scientific & Healthcare
| | Year ended December 31 | | |||||
|---|---|---|---|---|---|---|---|
| (millions of U.S. dollars) | | ||||||
| 2003 | 2002 | Change | |||||
| Revenues | 760 | 692 | 10 | % | |||
| Adjusted EBITDA | 217 | 187 | 16 | % | |||
| Adjusted EBITDA margin | 28.6 | % | 27.0 | % | |||
| Adjusted operating profit | 186 | 160 | 16 | % | |||
| Adjusted operating profit margin | 24.5 | % | 23.1 | % | |||
See the "Reconciliations" section for a reconciliation of the above non-GAAP financial measures to the most directly comparable Canadian GAAP measures.
The increase in revenues in 2003 was attributable to growth from existing businesses, contributions from acquired companies and, to a lesser extent, favorable foreign currency translation. Growth from existing businesses was primarily due to increases in continuing medical education revenues, growth in our Web of Science and Web of Knowledge products, higher revenues from our PDR (Physicians' Desk Reference) and higher Micromedex electronic subscription revenues. These increases reflect continuing investments by our customers in basic research and drug development and the increasing demand for healthcare point-of-care and management information solutions fueled by the aging U.S. population. Revenue growth from acquisitions resulted primarily from Current Drugs, a provider of databases to the pharmaceutical and biotechnology industries acquired in August 2002; and Delphion Research Site, a patent research solution acquired in December 2002. The revenue increases were partly offset by lower sales of patent information at Derwent.
We believe that demand for scientific information will continue to grow because scientific research and development funding are considered to be necessary, not discretionary, expenditures for our customers. Within the healthcare information market, we see a continuation of the trend toward delivering information to physicians and other healthcare professionals at the point of care. We also see continued growth in the continuing medical education market because physicians must be made aware of the existence of new drugs and their benefits and risks before considering them as treatment options for their patients.
The increases in Adjusted EBITDA and Adjusted operating profit primarily resulted from these increased revenues. Corresponding margins increased as a result of cost controls.
Corporate and Other
Revenues, which relate solely to Thomson Media, remained constant at $164 million. The revenue performance reflected continued weakness in the global financial services industry and the related advertising market.
In 2003, the overall Adjusted EBITDA loss for corporate and other was $60 million, compared to a loss in 2002 of $35 million. The increased loss in 2003 was primarily attributable to a $32 million benefit recorded in 2002 in connection with one of our U.K. pension plans. Additionally, in 2003 we recognized an expense associated with our stock appreciation rights, reflecting an increase in the trading price of our common shares, compared to the recognition of a benefit in 2002.
The $32 million benefit recorded in 2002 related to a reversal of a valuation allowance against the assets of one of our U.K. pension plans. Canadian accounting principles require us to record a valuation allowance against the assets of overfunded pension plans if the assets cannot be used by us to reduce future contributions to the plans. When the values of these assets decline, the need for the valuation allowance against the assets also declines. However, we recognize the decline in the value of the assets over time, while we recognize in income immediately the reduction in the valuation
48
allowance, as computed on the measurement date of the plan. In the fourth quarter of 2002, such a situation occurred with respect to one of our U.K. pension plans due to the decline in equity markets. As such, we reversed the valuation allowance against the assets, which resulted in a pre-tax benefit of $32 million. There was no such benefit in 2003.
Effective January 1, 2003, we began expensing the fair value of all stock options issued with restatement of prior periods. Included within "Corporate and other" for 2003 were charges of $19 million (2002—$17 million), related to compensation expense associated with stock options.
Discontinued Operations
In October 2003, we sold our portfolio of healthcare magazines for $135 million and recorded the related post-tax gain of $63 million in the fourth quarter of 2003. The magazines had previously been managed within our scientific and healthcare group.
In November 2003, we expressed our intention to sell Sheshunoff Information Services Inc., a provider of critical data, compliance and management tools to financial institutions, which had been managed within Thomson Media. We are working toward completing a sale in the first half of 2004. Based on recent estimates of fair market value, we recorded a pre-tax impairment charge of $24 million relating to intangible assets in the fourth quarter of 2003 within discontinued operations.
In February 2004, we completed the sale of DBM, a provider of human resource solutions, which had been managed within our learning group. Based on the status of the negotiations at December 31, 2003, we recorded a pre-tax impairment charge of $62 million relating to intangible assets within discontinued operations.
These three businesses, along with one other small business formerly managed in our learning group that was sold in June 2003, are classified as discontinued operations within our consolidated financial statements. None of these businesses is considered fundamental to our integrated information offerings.
For more information on these discontinued operations, see Note 6 to our consolidated financial statements.
Liquidity and Capital Resources
Financial Position
At December 31, 2003, our total assets were $18,680 million, which represented a 1% increase from the December 31, 2002 total of $18,548 million. This increase was primarily due to the impact of foreign currency translation and an increase in goodwill arising from acquisitions, partly offset by the effect of depreciation and amortization and the sale of our 20% interest in BGM (discussed below in "Related Party Transactions").
49
Our total assets by market group as of December 31, 2003 and 2002 were as follows:
| | Year ended December 31, 2003 | Year ended December 31, 2002 | |||||||
|---|---|---|---|---|---|---|---|---|---|
| (millions of U.S. dollars) | Total assets | Percentage of total assets | Total assets | Percentage of total assets | |||||
| Legal & Regulatory | 7,412 | 40 | % | 7,195 | 39 | % | |||
| Learning | 5,108 | 27 | % | 5,068 | 28 | % | |||
| Financial | 2,914 | 16 | % | 3,022 | 16 | % | |||
| Scientific & Healthcare | 994 | 5 | % | 985 | 5 | % | |||
| Corporate and other | 1,988 | 11 | % | 1,902 | 10 | % | |||
| Discontinued operations | 264 | 1 | % | 376 | 2 | % | |||
| Total assets | 18,680 | 100 | % | 18,548 | 100 | % | |||
The following table presents comparative information related to total net debt, which we define as total debt, after accounting for swap arrangements, less cash and cash equivalents; shareholders' equity and the ratio of net debt to shareholders' equity:
| | As at December 31 | |||||
|---|---|---|---|---|---|---|
| (millions of U.S. dollars) | ||||||
| 2003 | 2002 | |||||
| Short-term indebtedness | 87 | 316 | ||||
| Current portion of long-term debt | 484 | 318 | ||||
| Long-term debt | 3,684 | 3,487 | ||||
| Total debt | 4,255 | 4,121 | ||||
| Swaps | (199 | ) | 161 | |||
| Total debt after swaps | 4,056 | 4,282 | ||||
| Less: | ||||||
| Cash and cash equivalents | (683 | ) | (709 | ) | ||
| Net debt | 3,373 | 3,573 | ||||
| Shareholders' equity | 9,200 | 8,966 | ||||
| Net debt/equity ratio | 0.37:1 | 0.40:1 | ||||
50
The following table displays the changes in our shareholders' equity for the year ended December 31, 2003:
| (millions of U.S. dollars) | | ||
|---|---|---|---|
| Balance at December 31, 2002 | 8,966 | ||
| Earnings attributable to common shares for the year ended December 31, 2003 | 879 | ||
| Additional paid-in capital related to stock option expense | 19 | ||
| Redemption of Series V preference shares | (332 | ) | |
| Issuance of common shares under stock incentive plan | 3 | ||
| Common share dividend payments | (658 | ) | |
| Change in cumulative translation adjustment | 323 | ||
| Balance at December 31, 2003 | 9,200 | ||
Presently, our long-term debt is rated "A3" (stable outlook) by Moody's, "A-" (stable outlook) by Standard & Poor's and "A(low)" by Dominion Bond Rating Service, or DBRS, and our commercial paper is rated "R1 (low)" by DBRS. The maturity dates for our long-term debt are well balanced with no significant concentration in any one year. You should be aware that a rating is not a recommendation to buy, sell or hold securities and may be subject to revision, suspension or withdrawal at any time by the assigning rating organization. We cannot assure you that our credit ratings will not be lowered in the future or that rating agencies will not issue adverse commentaries regarding our securities.
At December 31, 2003, the carrying amounts of our total current liabilities exceeded the carrying amounts of our total current assets because current liabilities include deferred revenue. Deferred revenue does not represent a cash obligation, however, but rather an obligation to perform services or deliver products in the future. The costs to fulfill these obligations are included in our operating costs.
Cash Flow
Our principal sources of liquidity are cash provided by our operations, borrowings under our revolving bank credit facilities and our commercial paper program, the issuance of public debt and, prior to July 2003, the reinvestment of dividends by The Woodbridge Company Limited, or Woodbridge, our principal shareholder. In July 2003, we and Woodbridge agreed to discontinue their commitment to participate in our dividend reinvestment plan. Please see "Related Party Transactions" below for more information. Our principal uses of cash have been to finance working capital and debt servicing costs, repay debt, and finance capital expenditures, acquisitions and dividend payments.
OPERATING ACTIVITIES. Cash provided by our operating activities in 2003 was $1,654 million compared to $1,691 million for 2002. The change primarily reflected the timing of accounts receivable collection and higher income tax payments in 2003 due to higher taxable earnings partially offset by a lower level of voluntary contributions to our pension plans in 2003.
INVESTING ACTIVITIES. Cash used in our investing activities in 2003 was $461 million compared to $910 million for 2002. The lower use of cash in 2003 was primarily attributable to increased proceeds from disposals of businesses and investments, most notably the disposal of our 20% interest in BGM; proceeds from the disposals of our healthcare magazine operations; and a lower level of acquisition activity in 2003. These items were partially offset by a higher level of additions to property and equipment (i.e., capital expenditures).
Capital expenditures in 2003 increased 10% to $570 million from $518 million in 2002. Higher capital expenditures in 2003 were incurred primarily at our legal and regulatory and financial groups, and primarily related to initiatives to standardize technology platforms across businesses which support
51
document storage and search and retrieval services. Additionally, our financial group incurred an increased level of capital expenditures related to the Merrill Lynch outsourcing contract.
The majority of our capital expenditures is focused on technology-related investments. We make significant investments in technology because it is essential to providing integrated information solutions to our customers and because we intend to maintain the significant competitive advantage we believe we have in this area. Our technology expenditures include spending on computer hardware, software, electronic systems, telecommunications infrastructure and digitization of content. In 2002 and 2003, our total capital expenditures were $1.1 billion, of which approximately 72% was for technology-related investments. Although we can give no assurance that investments in technology will result in an increase in our revenues or a decrease in our operating costs, we expect our technology-related investments to continue at a significant level. We expect our technology-related expenditures to increase slightly as a percentage of revenues in 2004 as we continue to migrate a number of our significant online legal and regulatory, learning and financial services onto unified technology platforms.
Other investing activities, which primarily comprise activity on acquisition and disposition-related reserves, were $83 million in 2003, compared to $166 million in 2002. The decrease reflected the completion of many post acquisition and disposal activities during the year.
FINANCING ACTIVITIES. Cash used in our financing activities was $1,228 million for the year ended December 31, 2003, compared to $614 million for the year ended December 31, 2002. The increased use of cash largely reflected higher common dividends and the redemption of our Series V preference shares. The higher common dividend payments were primarily due to a special dividend of $279 million paid in April 2003 in connection with our sale of our 20% interest in BGM, as well as the impact of Woodbridge no longer participating in our dividend reinvestment plan. For more information on these items, please see the section entitled "Related Party Transactions" below. The 2002 amounts included $437 million of proceeds from our public offering in June of that year, which is also discussed in the section entitled "Related Party Transactions" below.
The following table sets forth our common dividend activity. Prior to July 2003, reinvested dividends related primarily to Woodbridge.
| | Year ended December 31 | ||||
|---|---|---|---|---|---|
| | 2003 | 2002 | |||
| Regular dividends declared | 473 | 451 | |||
| Special dividends declared | 279 | — | |||
| Dividends reinvested | (94 | ) | (168 | ) | |
| Dividends paid | 658 | 283 | |||
The following describes our significant financing activities from each year.
In August 2003, we completed an offering of $450 million of global unsecured notes, raising approximately $445 million in net proceeds after expenses. The offering included $200 million of 4.25% notes due 2009 and $250 million of 5.25% notes due 2013. We entered into an interest rate swap related to the 4.25% notes to convert the notes from a fixed rate of interest to a floating rate of interest. We used a portion of the proceeds to redeem $250 million of preferred shares issued to a subsidiary of Woodbridge (which shares previously had been included in "Long-term debt" in our consolidated balance sheet) and used the balance of the proceeds to repay other outstanding indebtedness and for general corporate purposes. Following the completion of this offering, in September 2003 we filed a shelf registration statement covering the sale of up to $2 billion in debt securities. As of December 31, 2003, the entire amount remained available under this registration. The shelf registration is valid until October 2005.
52
In April 2003, we redeemed all 18,000,000 of our outstanding Series V preference shares for $308 million, plus $3 million of associated tax.
On June 12, 2002, our common shares were listed on the New York Stock Exchange. On June 14, 2002, we and our principal shareholder, Woodbridge, completed a public offering of 32,051,284 common shares at a price of $31.20 per share. The offering included 14,615,385 common shares newly issued by us and 17,435,899 common shares held by Woodbridge. Proceeds to us from the offering, net of the underwriting commissions and expenses, of $437 million were used for general corporate purposes, including the repayment of indebtedness. We did not receive any proceeds from the sale of common shares by Woodbridge. The expenses incurred from the offering were divided equally between us and Woodbridge, other than the underwriting commission, which was allocated based upon the proportionate share of the proceeds from the offering received by each party.
In January 2002, we issued $400 million of 5.75% notes due 2008. We used the net proceeds of $397 million from the offering primarily to repay indebtedness.
FREE CASH FLOW. The following table sets forth a calculation of our free cash flow for 2003 and 2002:
| | Year ended December 31 | ||||
|---|---|---|---|---|---|
| (millions of U.S. dollars) | |||||
| 2003 | 2002 | ||||
| Net cash provided by operating activities | 1,654 | 1,691 | |||
| Additions to property and equipment | (570 | ) | (518 | ) | |
| Other investing activities | (83 | ) | (166 | ) | |
| Dividends paid on preference shares | (11 | ) | (22 | ) | |
| Additions to property and equipment of discontinued operations | (7 | ) | (5 | ) | |
Free cash flow | 983 | 980 | |||
Our free cash flow for 2003 benefited from increased Adjusted EBITDA, lower voluntary pension contributions and lower acquisition and disposition-related reserve activity. Those items, however, were essentially offset by higher capital expenditures, higher tax payments due to higher taxable earnings and the timing of accounts receivable collection.
CREDIT FACILITIES AND COMMERCIAL PAPER PROGRAM. We maintain revolving unsecured credit facilities that we have historically used to support the issuance of commercial paper. Borrowings under our commercial paper program reduce the amount available to us under our credit facilities. In 2003, we renewed our existing credit facilities and entered into new arrangements with certain financial institutions. At December 31, 2003, our credit lines and related activity were as follows:
| (millions of U.S. dollars) Type | Credit lines | Amount drawn | Commercial paper outstanding(1) | Lines available | ||||
|---|---|---|---|---|---|---|---|---|
| Multi-year | 1,040 | (65 | ) | (76 | ) | 899 | ||
| 364-day | 520 | — | — | 520 | ||||
| Total | 1,560 | (65 | ) | (76 | ) | 1,419 | ||
- (1)
- Includes related currency swaps.
Our commercial paper program authorizes us to issue up to Cdn$1 billion.
53
Our multi-year facilities currently expire in March 2008. Of our 364-day facilities, $195 million expires in September 2004 and the remaining $325 million expires in March 2005. Although not currently anticipated, if our long-term debt rating was downgraded by Moody's or Standard & Poor's, our facility fee and borrowing costs under our existing multi-year credit facilities may increase, although availability would be unaffected. Conversely, an upgrade in our ratings may reduce our facility fees and borrowing costs.
COMMITMENTS. The following table presents a summary of our long-term debt and related currency swap instruments, as well as our off-balance sheet contractual obligations as of December 31, 2003 for the years indicated:
| (millions of U.S. dollars) | 2004 | 2005 | 2006 | 2007 | 2008 | Thereafter | Total | ||||||||
|---|---|---|---|---|---|---|---|---|---|---|---|---|---|---|---|
| Long-term debt | 484 | 316 | 432 | 635 | 771 | 1,530 | 4,168 | ||||||||
| Currency swap instruments | (9 | ) | (5 | ) | (31 | ) | (58 | ) | (45 | ) | (51 | ) | (199 | ) | |
| Hedged debt | 475 | 311 | 401 | 577 | 726 | 1,479 | 3,969 | ||||||||
| Operating lease payments | 190 | 173 | 132 | 112 | 98 | 344 | 1,049 | ||||||||
| Unconditional purchase obligations | 103 | 28 | 13 | 3 | 1 | — | 148 | ||||||||
| Capital commitments to investees | 15 | — | — | — | — | — | 15 | ||||||||
| Total | 783 | 512 | 546 | 692 | 825 | 1,823 | 5,181 | ||||||||
We have entered into operating leases in the ordinary course of business, primarily for real property and equipment. Payments for these leases are contractual obligations as scheduled per each agreement. With certain leases, we guarantee a portion of the residual value loss, if any, incurred by the lessors in disposing of the assets, or to restore a property to a specified condition after completion of the lease period. With certain real property leases, we guarantee the rental obligations of some of our subsidiaries that are tenants. We believe, based upon current facts and circumstances, that a material payment pursuant to such guarantees is remote.
We have various unconditional purchase obligations. These obligations are for materials, supplies and services incident to the ordinary conduct of business.
We have obligations to pay additional consideration for prior acquisitions, typically based upon performance measures contractually agreed to at the time of purchase. Known payments have been accrued. We do not believe that additional payments would have a material impact on our financial statements. Additionally, we have capital commitments to investees of $15 million of which $11 million is payable upon demand and $4 million is payable only upon the attainment of certain operational milestones by the investee.
In certain disposition agreements, we guarantee to the purchaser the recoverability of certain assets or limits on certain liabilities. We believe, based upon current facts and circumstances, that a material payment pursuant to such guarantees is remote. In connection with two prior dispositions, we have guaranteed certain obligations of which $29 million remain potentially outstanding at December 31, 2003. At this time, we estimate that we will incur $13 million of the remaining contingency, and we have accrued this estimate within "Accounts payable and accruals" and "Other non-current liabilities" in our consolidated balance sheet.
We guarantee certain obligations of our subsidiaries, including borrowings by our subsidiaries under our revolving credit facilities. These guarantees generally require that we maintain a minimum amount of capital and retained earnings and that our net debt-to-equity ratio not exceed 2.0:1.
Other than as described above, we do not engage in any off-balance sheet financing arrangements. In particular, we do not have any interests in unconsolidated special-purpose or structured finance entities.
54
For the foreseeable future, we believe that cash from our operations and available credit facilities are sufficient to fund our future cash dividends, debt service, projected capital expenditures and tactical acquisitions that we pursue in the normal course of business.
Market Risks
Our consolidated financial statements are expressed in U.S. dollars but a portion of our business is carried on in currencies other than U.S. dollars. Changes in the exchange rates for such currencies into U.S. dollars can affect our revenues, earnings and the carrying values of our assets and liabilities in our consolidated balance sheet, either positively or negatively. Changes in exchange rates between 2002 and 2003 increased our revenues by approximately 2%. The translation effects of changes in exchange rates in our consolidated balance sheet are recorded within the cumulative translation adjustment component of our shareholders' equity. In 2003, we recorded cumulative translation gains of $309 million, reflecting changes in exchange rates of various currencies compared to the U.S. dollar.
We use derivative instruments only to reduce our foreign currency and interest rate exposures. In particular, when we borrow money in currencies other than the U.S. dollar, we generally enter into currency swap arrangements to effectively convert our obligations into U.S. dollars. All such swap arrangements are entered into only with counterparties that are investment-grade financial institutions. At December 31, 2003, 98% of our indebtedness was denominated in U.S. dollars or had been swapped into U.S. dollar obligations.
At December 31, 2003, after taking into account interest rate swap agreements, 84% of our total debt was at fixed rates of interest and the remainder was at floating rates of interest. Based upon these levels, a 1% change in floating interest rates would increase or decrease our full-year interest expense by approximately $6 million.
Set out below are the U.S. dollar equivalents of our local currency revenues and operating profit. Based on our 2003 results of operations, a 10% change in the average exchange rate for each of these currencies into U.S. dollars would increase or decrease our full year revenues and operating profit by the following amounts:
| (millions of U.S. dollars) Currency | Revenues as reported | Impact on revenues | Operating profit as reported | Impact on operating profit | ||||
|---|---|---|---|---|---|---|---|---|
| U.S. dollar | 6,136 | — | 1,061 | — | ||||
| British pound sterling | 675 | 67 | 80 | 8 | ||||
| Euro | 223 | 22 | 13 | 1 | ||||
| Canadian dollar | 198 | 20 | 35 | 3 | ||||
| Australian dollar | 131 | 13 | 6 | 1 | ||||
| Other | 243 | 25 | (4 | ) | — | |||
| Total | 7,606 | 147 | 1,191 | 13 | ||||
In addition to exposing us to changes in foreign currency exchange rates and interest rates, operating in foreign countries subjects us to certain risks that are inherent in doing business in certain jurisdictions outside North America, including difficulties in penetrating new markets, exposure to varying legal standards in other jurisdictions and potential instability of international economies and governments.
Related Party Transactions
As at March 5, 2004, through Woodbridge and its affiliates, Kenneth R. Thomson controlled approximately 69% of our common shares.
55
In the normal course of business, a Woodbridge-owned company rents office space from one of our subsidiaries. Additionally, a number of our subsidiaries charge a Woodbridge-owned company administrative fees for various services. In 2003, the total amount charged to Woodbridge for these rentals and services was approximately $2 million. Additionally, in 2003, we paid one of our directors, Mr. J.A. Tory, $89,000 for advisory services in connection with our long-term tax and capital strategies.
The employees of Jane's Information Group, a business sold by us to Woodbridge in April 2001, continue to participate in our United States and United Kingdom pension plans. Jane's makes proportional contributions to these plans as required.
In September 2003, we redeemed $250 million of preferred shares issued by a Thomson subsidiary to a subsidiary of Woodbridge. The shares, which were originally issued in February 2001 and exchanged in February 2002 for separate preferred shares in the same face amount, paid a fixed annual dividend of 4.5% and by their original terms were redeemable at the option of either Woodbridge or us beginning February 2006 and annually thereafter. Prior to the redemption, the shares were included within "Long-term debt" in the consolidated balance sheet.
In July 2003, we announced that Woodbridge had agreed to discontinue its commitment to participate in our dividend reinvestment plan. Previously, Woodbridge had agreed to reinvest at least 50% of the quarterly dividends received by it and its subsidiaries in our common shares through June 2005. The termination of this commitment reflects our expected ability to generate sufficient cash flow for our dividends. All eligible shareholders of our company, including Woodbridge, retain the ability to reinvest their dividends in Thomson stock on a voluntary basis under the dividend reinvestment plan. However, Woodbridge has advised management that it has no current intention to voluntarily participate.
In March 2003, we sold our 20% interest in BGM to a company that is owned by the Thomson family for $279 million. In the event that BGM is subsequently sold to a third party for a gain prior to February 7, 2005, we are entitled to receive half of the gain relative to our former interest, subject to certain adjustments. If no such gains are recognized from a subsequent sale to a third party, we are not required to reimburse the former owner for any losses. Our Board of Directors appointed a committee of independent directors to review the transaction. The committee retained a financial advisor to provide an opinion to us as to the fairness of the transaction to us from a financial point of view. One of our directors is also a director of the parent company of the financial advisor, but was not a member of the committee. In connection with the sale, we paid a special dividend, equal to the proceeds received of $0.428 per common share.
In September 2002, we sold a parcel of properties located in Toronto, Ontario to Woodbridge for $15 million. In connection with this transaction, we received a report from a financial advisor providing an assessment of market values of those properties. The transaction was recorded based upon the $15 million exchanged in the transaction, and the proceeds were recorded in "Proceeds from disposals of businesses and investments" while the resulting gain of $2 million was included in "Net other income (expense)" within the consolidated financial statements. If Woodbridge sells any of the properties for a gain prior to September 30, 2005, we are entitled to receive half of the gain subject to certain adjustments. If Woodbridge does not recognize any such gains, we are not required to reimburse Woodbridge for any losses. In prior periods, we had maintained a liability of $8 million for certain of the above-noted properties that were to be contributed to BGM. During 2002, we negotiated an agreement with BGM under which we paid cash to BGM equivalent to the recorded liability, in order to relieve us of our obligation to contribute these properties. The properties were then included within the parcel of properties sold to Woodbridge.
In September 2002, we entered into an agreement with Woodbridge to reduce the cost of our directors' and officers' insurance coverage. Under the terms of the agreement, we maintain standard directors' and officers' insurance for any amount up to $15 million with a third-party insurance
56
company. A separate third-party insurer is responsible for the next $75 million of coverage. Woodbridge indemnifies this second insurer. For its agreement to indemnify the insurer, we pay Woodbridge an annual premium of $685,000, which is less than the premium that we would have paid to a third party.
In June 2002, we completed a series of transactions to assist Woodbridge in reorganizing its holding of our common shares to achieve certain Canadian tax objectives. Similar transactions were completed at the same time with certain companies affiliated with Woodbridge and a company controlled by one of our directors. We issued an aggregate of 431,503,802 common shares to members of this group of companies, and a wholly-owned subsidiary of our company acquired the same number of common shares from members of this group of companies. Immediately following the acquisition, the wholly- owned subsidiary was wound up into our company and the 431,503,802 common shares it held were cancelled. The total number of our common shares outstanding, as well as our stated capital, was the same before and after this series of transactions. Woodbridge and the other companies have reimbursed us for all costs and expenses arising from, and have agreed to indemnify us, our officers, directors and shareholders against any liabilities that may arise in connection with the series of transactions. These transactions had no economic effect, did not cause any change to our common shares or result in any other consequence to us or to our other shareholders.
In June 2002, our wholly-owned U.K. subsidiary, The Thomson Corporation PLC, redeemed its outstanding Series A ordinary shares for $0.6 million. The Series A ordinary shares were held by Woodbridge.
Employee Future Benefits
In September 2003, we contributed $50 million (2002—$107 million) to our principal qualified defined benefit pension plan in the United States. In the fourth quarter of 2003, we contributed $31 million (2002—$35 million) to various benefit plans, principally in the United Kingdom and Canada. While none of these contributions were required under the applicable funding rules and regulations governing each country, we decided to make the voluntary contributions in light of the decrease in interest rates, which increased the present value of the future pension obligations. As a result of the contribution, the fair value of the U.S. plan assets was sufficient to fund the accumulated benefit obligation on its measurement date.
We are not required to make contributions to our major pension plan, which is in the U.S., in 2004. However, from time to time, we may elect to voluntarily contribute to the plan in order to improve its funded status. Because the decision to voluntarily contribute is based on various market-related factors, including asset values and interest rates, which are used to determine the plan's funded status, we cannot predict whether, or the amount, we may elect to voluntarily contribute in 2004.
The determination of the cost and obligations associated with employee future benefits requires the use of various assumptions, including an expected rate of return on assets and a discount rate to measure obligations. We consult with our actuaries regarding the selection of these assumptions each year. Reflecting our expectation of future investment returns, we will reduce our 2004 assumption of the expected rate of return on assets available to fund obligations. Similarly, in 2004 we will lower our assumed discount rate to measure obligations to reflect lower interest rates. These assumption changes had no impact on the 2003 cost of benefits. Management currently estimates that the changes in assumptions will cause the 2004 cost of employee future benefits to increase by approximately $30 million.
Subsequent Events
In January 2004, we acquired the publishing assets of Biological Abstracts, Inc. and BIOSIS. BIOSIS offers both custom and standard information resources designed to fit the information needs of
57
researchers, students and information professionals worldwide. BIOSIS is now part of our scientific and healthcare group.
Also in January 2004, we announced that we had signed a definitive agreement to acquire the 90% of Corporate Communications Broadcast Network, or CCBN, Inc., that we did not previously own. CCBN provides web-based solutions for the investment community, offering services to enhance the way companies communicate and meet disclosure requirements, and assists investors in managing and leveraging this information. If the transaction closes as contemplated, CCBN will be a part of our financial group.
In February 2004, we completed the sale of DBM.
Changes in Accounting
Effective January 1, 2003, we began expensing the fair value of all stock options issued as allowed under Canadian Institute of Chartered Accountants, or CICA, Handbook Section 3870,Stock-Based Compensation and Other Stock-Based Payments. Prior to January 1, 2003, we used the intrinsic value-based method to account for our stock incentive plan and no compensation expense had been recognized under the plan. This change in policy has been applied retroactively for all periods. For the year ended December 31, 2002, compensation expense recorded in connection with the stock incentive plan was $17 million before income taxes. Details of the restatements made to previously reported financial statements are discussed in Note 2 to our consolidated financial statements.
In July 2001, the CICA issued Handbook Section 3062,Goodwill and Other Intangible Assets, or CICA 3062. CICA 3062, which became effective January 1, 2002, eliminates the amortization of goodwill and identifiable intangible assets with indefinite useful lives, but subjects such assets to tests for impairment based upon comparing carrying values to their fair values at least annually or when certain conditions arise. This fair value-based approach to impairment differs from the previous approach, under which impairment was determined by comparing net carrying amounts to net recoverable amounts.
The transitional provisions of CICA 3062 required that we perform an initial impairment test as of January 1, 2002. During the first quarter of 2002, as a result of that transitional impairment test and the adoption of the provisions of this new accounting standard, we recorded pretax reductions in the carrying amounts of identifiable intangible assets with indefinite useful lives of $26 million and goodwill of $50 million related to a unit in our Scientific & Healthcare group. Additionally, during the second quarter of 2002, we recorded a transitional impairment charge of $116 million in connection with the application of CICA 3062 by BGM, an equity-method investment. Those non-cash charges, which totaled $183 million after taxes, were applied to the opening balance of retained earnings as of January 1, 2002.
Critical Accounting Policies
The preparation of our financial statements requires management to make judgments, estimates and assumptions that affect the reported amounts of assets and liabilities, disclosure of contingent assets and liabilities at the date of the financial statements and the reported amount of revenues and expenses during the reporting period. Our estimates are based on historical experience and on various other assumptions that are believed to be reasonable under the circumstances. The result of our ongoing evaluation of these estimates forms the basis for making judgments about the carrying values of assets and liabilities and the reported amounts of revenues and expenses that are not readily apparent from other sources. Actual results may differ from these estimates under different assumptions.
58
Our critical accounting policies are those that we believe are the most important in portraying our financial condition and results, and require the most subjective judgment and estimates on the part of management. A summary of our significant accounting policies, including the critical accounting policies discussed below, is set forth in Note 1 to our consolidated financial statements.
Revenue Recognition
Revenues from subscription-based products, excluding software, generally are recognized ratably over the term of the subscription. Where applicable, we recognize usage fees as earned. Subscription payments received or receivable in advance of delivery of our products or services are included in our deferred revenue account on our consolidated balance sheet. As we deliver subscription-based products and services to subscribers, we recognize the proportionate share of deferred revenue in our consolidated statement of earnings and our deferred revenue account balance is reduced. Certain incremental costs that are directly related to the subscription revenue are deferred and amortized over the subscription period.
Revenues from sales of products such as books, that are separate and distinct from any other product and carry no further substantive performance obligations on our part after shipment, are recognized when delivery has occurred and significant risks and rewards of ownership have transferred to the customer, provided that the price is fixed or determinable and ultimate collection is reasonably assured. We recognize revenues from sales of discrete products net of estimated returns. Significant judgment is involved in estimating future returns. Estimates are made after taking into account historical experience and current market conditions. If future returns differ from our estimates, the impact would be recorded against future revenues and profits.
For all accounts receivable, we must make a judgment regarding the ability of our customers to pay and, accordingly, we establish an allowance for estimated losses arising from non-payment. We consider customer creditworthiness, current economic trends and our past experience when evaluating the adequacy of this allowance. If future collections differ from our estimates, our future earnings would be affected.
Capitalized Software
A significant portion of our expenditures relates to software that is developed as part of our electronic databases, delivery systems and internal infrastructures, and, to a lesser extent, software sold directly to our customers. During the software development process, our judgment is required to determine the expected period of benefit over which capitalized costs should be amortized. Due to rapidly changing technology and the uncertainty of the software development process itself, our future results could be affected if our current assessment of our various projects differs from actual performance.
Identifiable Intangible Assets and Goodwill
We account for our business acquisitions using the purchase method of accounting. We allocate the total cost of an acquisition to the underlying net assets based on their respective estimated fair values. As part of this allocation process, we must identify and attribute values and estimated lives to the intangible assets acquired. These determinations involve significant estimates and assumptions, including those with respect to future cash inflows and outflows, discount rates and asset lives, and therefore require considerable judgment. These determinations will affect the amount of amortization expense recognized in future periods.
We review the carrying values of identifiable intangible assets with indefinite lives and goodwill at least annually to assess impairment because these assets are not amortized. Additionally, we review the carrying value of any intangible asset or goodwill whenever events or changes in circumstances indicate
59
that its carrying amount may not be recoverable. Examples of such events or changes in circumstances include significant negative industry or economic trends, significant changes in the manner of our use of the acquired assets or our strategy, a significant decrease in the market value of the asset, and a significant change in legal factors or in the business climate that could affect the value of the asset.
We assess impairment by comparing the fair value of an identifiable intangible asset or goodwill with its carrying value. The determination of fair value involves significant management judgment. Impairments are expensed when incurred. Specifically, we test for impairment as follows:
IDENTIFIABLE INTANGIBLE ASSETS WITH FINITE LIVES
We compare the expected undiscounted future operating cash flows associated with the asset to its carrying value to determine if the asset is recoverable. If the expected future operating cash flows are not sufficient to recover the carrying value, we estimate the fair value of the asset. Impairment is recognized when the carrying amount of the asset is not recoverable and when the carrying value exceeds fair value.
IDENTIFIABLE INTANGIBLE ASSETS WITH INDEFINITE LIVES
We determine the fair values of our intangible assets with indefinite lives using an income approach, the relief from royalties method. Impairment is recognized when the carrying amount exceeds fair value.
GOODWILL
We test goodwill for impairment on a "reporting unit" level. A reporting unit is a group of businesses: (a) for which discrete financial information is available; and (b) that have similar economic characteristics. We test goodwill for impairment using the following two-step approach:
- •
- In the first step, we determine the fair value of each reporting unit. If the fair value of a reporting unit is less than its carrying value, this is an indicator that the goodwill assigned to that reporting unit might be impaired, which requires performance of the second step.
- •
- In the second step, we allocate the fair value of the reporting unit to the assets and liabilities of the reporting unit as if it had just been acquired in a business combination, and as if the purchase price was equivalent to the fair value of the reporting unit. The excess of the fair value of the reporting unit over the amounts assigned to its assets and liabilities is referred to as the implied fair value of goodwill. We then compare that implied fair value of the reporting unit's goodwill to the carrying value of that goodwill. If the implied fair value is less than the carrying value, we recognize an impairment loss for that excess.
We determine the fair value of our reporting units based on a combination of various techniques, including the present value of future cash flows and earnings multiples of competitors.
As the valuation of identifiable intangible assets and goodwill requires significant estimates and judgment about future performance and fair values, our future results could be affected if our current estimates of future performance and fair values change.
INVESTMENTS
We use the equity method of accounting to account for investments in businesses over which we have the ability to exercise significant influence. Under the equity method, we initially record investments at cost and subsequently adjust the carrying amounts to reflect our share of net earnings or losses of the investee companies. We reduce the carrying amounts for dividends received. We use the
60
cost method of accounting to account for investments in businesses over which we do not have the ability to exercise significant influence.
To determine whether or not we have significant influence, we consider the percentage of the investee we own, whether we have representation on the board of the investee, our voting rights, as well as any other influential relationships which may exist with respect to the investee.
We regularly review the fair value of investments to determine if an impairment that is other than temporary has occurred. Because many of the entities in which we invest are not publicly traded, the determination of fair value requires us to make estimates. To the extent that our estimates differ from actual fair value, any required change to the carrying amounts of our investments will affect future reporting periods.
Income Taxes
We are required to estimate our income taxes in each of the jurisdictions in which we operate. This includes estimating a value for our existing net operating losses based on our assessment of our ability to utilize them against future taxable income before they expire. Our assessment is based upon existing tax laws and estimates of future taxable income. If our assessment of our ability to use our net operating losses proves inaccurate in the future, we might be required to recognize more or less of the net operating losses as assets, which would decrease or increase our income tax expense in the relevant year. This would affect our earnings in that year.
Our accounting for income taxes requires us to exercise judgment for issues relating to known issues under discussion with tax authorities and transactions yet to be settled. As a result, we maintain a tax liability for contingencies and regularly assess the adequacy of this tax liability. We record liabilities for known tax contingencies when, in our judgment, it is probable that a liability has been incurred. It is reasonably possible that actual amounts payable resulting from audits by tax authorities could be materially different from the liabilities we have recorded due to the complex nature of the tax legislation that affects us.
Employee Future Benefits
The determination of the cost and obligations associated with our employee future benefits requires the use of various assumptions. We must select assumptions such as the expected return on assets available to fund pension obligations, the discount rate to measure obligations, the projected age of employees upon retirement, the expected rate of future compensation and the expected healthcare cost trend rate. These assumptions are re-evaluated each year, and variations between the actual results and the results based on our assumptions for any period will affect reported amounts in future periods. We retain an independent actuarial expert to prepare the calculations and to advise on the selection of assumptions.
Recently Issued Accounting Standards
The Accounting Standards Board and the Emerging Issues Committee, or EIC, of the CICA, have recently issued the following accounting standards that are applicable to our activities in future periods.
CICA HANDBOOK SECTION 3110, ASSET RETIREMENT OBLIGATIONS. CICA Handbook Section 3110 was issued in March 2003 and is effective for fiscal years beginning on or after January 1, 2004. The new guidance harmonizes Canadian GAAP with U.S. GAAP relative to the recognition and measurement of obligations associated with the retirement of property, plant and equipment when those obligations result from the acquisition, construction, development or normal operation of the assets.
61
The adoption of Handbook Section 3110 is not expected to have a material impact on our consolidated financial statements.
ACCOUNTING GUIDELINE ACG-13, HEDGING RELATIONSHIPS. Effective for hedging relationships in effect for fiscal years beginning on or after July 1, 2003, this Guideline was issued by the CICA in 2001 to address the identification, designation, documentation and effectiveness of hedging relationships, as well as the conditions for applying hedge accounting.
EIC ABSTRACT 128, ACCOUNTING FOR TRADING, SPECULATIVE OR NON-HEDGING DERIVATIVE FINANCIAL INSTRUMENTS. Issued in June 2002, the consensus reached in EIC Abstract 128 must be applied in all financial statements prepared for fiscal periods beginning on or after the date of implementation of AcG-13. The consensus requires that, with certain exceptions, a freestanding derivative financial instrument that does not qualify for hedge accounting under AcG-13, should be recognized in the balance sheet and measured at fair value, with changes in fair value recognized in income.
Certain derivatives previously accounted for as hedges will not qualify for this treatment under AcG-13. Therefore, in accordance with AcG-13 and EIC Abstract 128, changes in the fair value of these derivatives after January 1, 2004 will be recognized in our earnings in the period in which they occur. If AcG-13 and EIC Abstract 128 had been in effect in 2003, we would have recognized additional income of approximately $20 million associated with the changes in fair values of these derivatives. At December 31, 2003, the fair value of these derivatives was approximately $25 million in favor of the counterparties and would have been recorded in "Prepaid expenses and other current assets" and "Other non-current liabilities" in our consolidated balance sheet.
ACCOUNTING GUIDELINE ACG-15, CONSOLIDATION OF VARIABLE INTEREST ENTITIES. In June 2003, the CICA issued AcG-15, which requires the consolidation of certain entities that are subject to control on a basis other than the ownership of voting interest. This Guideline provides guidance for determining when an enterprise includes the assets, liabilities and results of operations of a variable interest entity in its consolidated financial statements. The guidance related to consolidation requirements is effective for periods beginning on or after November 1, 2004.
We are in the process of assessing the impact of AcG-15, but do not expect the adoption to have a material impact on the consolidated financial statements.
EIC ABSTRACT 141, REVENUE RECOGNITION. In December 2003, the EIC issued EIC Abstract 141, which incorporates the principles and summarizes the guidance in the U.S. Securities and Exchange Commission (SEC) Staff Accounting Bulletin (SAB) 101,Revenue Recognition in Financial Statements. The Abstract also provides interpretive guidance on the application of CICA Handbook Section 3400,Revenue. The Abstract may be applied prospectively to sales transactions recognized in 2004, or may be applied retroactively, with prior period financial statements being restated.
Because we have previously applied the provisions of SAB 101, the adoption of EIC Abstract 141 is not expected to have a material impact on our consolidated financial statements.
EIC ABSTRACT 142, REVENUE ARRANGEMENTS WITH MULTIPLE DELIVERABLES. Issued in December 2003, this Abstract addresses the accounting by vendors for arrangements in which the vendor will perform multiple revenue-generating activities. The Abstract conforms Canadian GAAP to the U.S. GAAP set forth in Emerging Issues Task Force, or EITF, Issue 00-21, also entitledRevenue Arrangements with Multiple Deliverables.
Because we have previously applied EITF Issue 00-21, the adoption of EIC Abstract 142 is not expected to have a material impact on our consolidated financial statements.
62
CICA HANDBOOK SECTION 1100, GENERALLY ACCEPTED ACCOUNTING PRINCIPLES. CICA Handbook Section 1100 was issued in October 2003, and is effective for our fiscal year beginning January 1, 2004. The Handbook Section establishes standards for financial reporting in accordance with generally accepted accounting principles and clarifies the relative authority of various accounting pronouncements and other sources within GAAP.
We are in the process of assessing the impact of this standard.
Additional Information
Disclosure Controls and Procedures
Our Chief Executive Officer and Chief Financial Officer, after evaluating the effectiveness of our disclosure controls and procedures (as defined in applicable U.S. and Canadian securities law) as of the end of the period covered by this management's discussion and analysis, have concluded that our disclosure controls and procedures are effective to ensure that all information required to be disclosed by our company in reports that it files or furnishes under the U.S. Securities Exchange Act and applicable Canadian securities law is recorded, processed, summarized and reported within the time periods specified in the rules and forms of the U.S. Securities and Exchange Commission and Canadian securities regulatory authorities.
Changes in Internal Controls over Financial Reporting
There was no change in our company's internal control over financial reporting that occurred during our last fiscal year that has materially affected, or is reasonably likely to materially affect, our internal control over financial reporting.
Share Capital
As of February 25, 2004, we had outstanding 654,608,008 common shares and 6,000,000 Series II preference shares.
Public Securities Filings
You may access other information about our company, including our annual information form and our other disclosure documents, reports, statements or other information that we file with the Canadian securities regulatory authorities through SEDAR at www.sedar.com and in the United States with the SEC at www.sec.gov.
63
Reconciliation of Adjusted EBITDA to Net Earnings and Adjusted Operating Profit to Operating Profit
| | For the year ended December 31, 2003 | |||||||||||||||||
|---|---|---|---|---|---|---|---|---|---|---|---|---|---|---|---|---|---|---|
| (millions of U.S. dollars) (unaudited) | Legal & Regulatory | Learning | Financial | Scientific & Healthcare | Corporate and other | Ongoing | Disposals | Total | ||||||||||
| Adjusted EBITDA | 980 | 520 | 406 | 217 | (60 | ) | 2,063 | 1 | 2,064 | |||||||||
| Less: | ||||||||||||||||||
| Depreciation | (181 | ) | (183 | ) | (175 | ) | (31 | ) | (18 | ) | (588 | ) | — | (588 | ) | |||
| Adjusted operating profit | 799 | 337 | 231 | 186 | (78 | ) | 1,475 | 1 | 1,476 | |||||||||
| Less: | ||||||||||||||||||
| Amortization | (106 | ) | (83 | ) | (62 | ) | (26 | ) | (8 | ) | (285 | ) | — | (285 | ) | |||
| Operating profit | 693 | 254 | 169 | 160 | (86 | ) | 1,190 | 1 | 1,191 | |||||||||
| Net other income (expense) | 74 | |||||||||||||||||
| Net interest expense and other financing costs | (252 | ) | ||||||||||||||||
| Income taxes | (156 | ) | ||||||||||||||||
| Equity in net losses of associates, net of tax | (13 | ) | ||||||||||||||||
| Earnings from continuing operations | 844 | |||||||||||||||||
| Earnings from discontinued operations, net of tax | 23 | |||||||||||||||||
| Net earnings | 867 | |||||||||||||||||
| | For the year ended December 31, 2002 | |||||||||||||||||
|---|---|---|---|---|---|---|---|---|---|---|---|---|---|---|---|---|---|---|
| | Legal & Regulatory | Learning | Financial | Scientific & Healthcare | Corporate and other | Ongoing | Disposals | Total | ||||||||||
| Adjusted EBITDA | 926 | 465 | 409 | 187 | (35 | ) | 1,952 | 9 | 1,961 | |||||||||
| Less: | ||||||||||||||||||
| Depreciation | (159 | ) | (163 | ) | (169 | ) | (27 | ) | (16 | ) | (534 | ) | (1 | ) | (535 | ) | ||
| Adjusted operating profit | 767 | 302 | 240 | 160 | (51 | ) | 1,418 | 8 | 1,426 | |||||||||
| Less: | ||||||||||||||||||
| Amortization | (91 | ) | (97 | ) | (63 | ) | (22 | ) | (11 | ) | (284 | ) | — | (284 | ) | |||
| Restructuring charges | (4 | ) | — | — | — | (2 | ) | (6 | ) | — | (6 | ) | ||||||
| Operating profit | 672 | 205 | 177 | 138 | (64 | ) | 1,128 | 8 | 1,136 | |||||||||
| Net other income (expense) | (34 | ) | ||||||||||||||||
| Net interest expense and other financing costs | (291 | ) | ||||||||||||||||
| Income taxes | (162 | ) | ||||||||||||||||
| Equity in net losses of associates, net of tax | (101 | ) | ||||||||||||||||
| Earnings from continuing operations | 548 | |||||||||||||||||
| Earnings from discontinued operations, net of tax | 57 | |||||||||||||||||
| Net earnings | 605 | |||||||||||||||||
64
Reconciliation of Adjusted EBITDA Margin and Adjusted Operating Profit Margin to Operating Profit Margin
| | For the year ended December 31, 2003 | |||||||||||||||||
|---|---|---|---|---|---|---|---|---|---|---|---|---|---|---|---|---|---|---|
| (as a percentage of revenue) (unaudited) | Legal & Regulatory | Learning | Financial | Scientific & Healthcare | Corporate and other | Ongoing | Disposals | Total | ||||||||||
| Adjusted EBITDA | 31.2 | % | 25.3 | % | 26.7 | % | 28.6 | % | (36.6 | )% | 27.1 | % | 14.3 | % | 27.1 | % | ||
| Less: | ||||||||||||||||||
| Depreciation | (5.8 | )% | (8.9 | )% | (11.5 | )% | (4.1 | )% | (11.0 | )% | (7.7 | )% | — | (7.7 | )% | |||
| Adjusted operating profit | 25.4 | % | 16.4 | % | 15.2 | % | 24.5 | % | (47.6 | )% | 19.4 | % | 14.3 | % | 19.4 | % | ||
| Less: | ||||||||||||||||||
| Amortization | (3.3 | )% | (4.0 | )% | (4.1 | )% | (3.4 | )% | (4.8 | )% | (3.7 | )% | — | (3.7 | )% | |||
| Operating profit | 22.1 | % | 12.4 | % | 11.1 | % | 21.1 | % | (52.4 | )% | 15.7 | % | 14.3 | % | 15.7 | % | ||
| | For the year ended December 31, 2002 | |||||||||||||||||
|---|---|---|---|---|---|---|---|---|---|---|---|---|---|---|---|---|---|---|
| | Legal & Regulatory | Learning | Financial | Scientific & Healthcare | Corporate and other | Ongoing | Disposals | Total | ||||||||||
| Adjusted EBITDA | 31.3 | % | 22.8 | % | 25.6 | % | 27.0 | % | (21.3 | )% | 26.4 | % | 23.7 | % | 26.3 | % | ||
| Less: | ||||||||||||||||||
| Depreciation | (5.4 | )% | (8.0 | )% | (10.6 | )% | (3.9 | )% | (9.8 | )% | (7.3 | )% | (2.6 | )% | (7.1 | )% | ||
| Adjusted operating profit | 25.9 | % | 14.8 | % | 15.0 | % | 23.1 | % | (31.1 | )% | 19.1 | % | 21.1 | % | 19.2 | % | ||
| Less: | ||||||||||||||||||
| Amortization | (3.1 | )% | (4.7 | )% | (3.9 | )% | (3.2 | )% | (6.7 | )% | (3.8 | )% | — | (3.8 | )% | |||
| Restructuring charges | (0.1 | )% | — | — | — | (1.2 | )% | (0.1 | )% | — | (0.1 | )% | ||||||
| Operating profit | 22.7 | % | 10.1 | % | 11.1 | % | 19.9 | % | (39.0 | )% | 15.2 | % | 21.1 | % | 15.3 | % | ||
Certain information in this management's discussion and analysis, particularly under the heading "2004 Financial Outlook," are forward-looking statements that are not historical facts but reflect our current expectations regarding future results. These forward-looking statements are subject to a number of risks and uncertainties that could cause actual results or events to differ materially from current expectations. Some of the factors that could cause actual results or events to differ materially from current expectations are: actions of our competitors; failure of our significant investments in technology to increase our revenues or decrease our operating costs; failure to fully derive anticipated benefits from our acquisitions; failure to develop additional products and services to meet our customers' needs, attract new customers or expand into new geographic markets; failure to meet the special challenges involved in expansion of our operations outside North America; failure to recruit and retain high-quality management and key employees; consolidation of our customers; increased self-sufficiency of our customers; increased accessibility to free or relatively inexpensive information sources; failure to maintain the availability of information obtained through licensing arrangements and changes in the terms of our licensing arrangements; changes in the general economy; inadequate protection of our intellectual property rights; an increase in our effective income tax rate; impairment of goodwill and identifiable intangible assets; and failures or disruptions of our electronic delivery systems or the Internet. Additional factors are discussed in our materials filed with the securities regulatory authorities in Canada and the United States from time to time, including our annual information form, which is contained in our current annual report on Form 40-F. We disclaim any intention or obligation to update or revise any forward-looking statements, whether as a result of new information, future events or otherwise.
65
Quarterly Information (unaudited)
The following table presents a summary of our segments and consolidated operating results for each of the eight quarters ended March 31, 2002 through December 31, 2003.
The following table includes measurements for Adjusted EBITDA and Adjusted operating profit which do not have any standardized meaning prescribed by Canadian GAAP. These measurements are used by management to evaluate performance. A further discussion of these performance measures and a reconciliation of them to our statement of earnings and retained earnings are included in Note 26 to our consolidated financial statements.
| | Quarter ended March 31 | Quarter ended June 30 | Quarter ended September 30 | Quarter ended December 31 | |||||||||||||
|---|---|---|---|---|---|---|---|---|---|---|---|---|---|---|---|---|---|
| (millions of U.S. dollars) | |||||||||||||||||
| 2003 | 2002 | 2003 | 2002 | 2003 | 2002 | 2003 | 2002 | ||||||||||
| Revenues | |||||||||||||||||
| Legal & Regulatory | 676 | 664 | 769 | 733 | 794 | 728 | 903 | 834 | |||||||||
| Learning | 327 | 328 | 397 | 388 | 714 | 705 | 614 | 615 | |||||||||
| Financial | 383 | 406 | 379 | 403 | 375 | 394 | 386 | 394 | |||||||||
| Scientific & Healthcare | 169 | 148 | 181 | 159 | 169 | 157 | 241 | 228 | |||||||||
| Corporate and other(1) | 33 | 34 | 46 | 47 | 37 | 36 | 48 | 47 | |||||||||
| Eliminations | (10 | ) | (9 | ) | (12 | ) | (12 | ) | (8 | ) | (7 | ) | (12 | ) | (14 | ) | |
| 1,578 | 1,571 | 1,760 | 1,718 | 2,081 | 2,013 | 2,180 | 2,104 | ||||||||||
| Disposals(2) | 4 | 11 | 1 | 13 | 1 | 8 | 1 | 6 | |||||||||
| 1,582 | 1,582 | 1,761 | 1,731 | 2,082 | 2,021 | 2,181 | 2,110 | ||||||||||
| Adjusted EBITDA(3) | |||||||||||||||||
| Legal & Regulatory | 151 | 137 | 244 | 226 | 262 | 233 | 323 | 330 | |||||||||
| Learning | (23 | ) | (25 | ) | 46 | 41 | 278 | 249 | 219 | 200 | |||||||
| Financial | 94 | 94 | 102 | 98 | 107 | 100 | 103 | 117 | |||||||||
| Scientific & Healthcare | 34 | 30 | 46 | 33 | 40 | 34 | 97 | 90 | |||||||||
| Corporate and other(1) | (10 | ) | (32 | ) | (13 | ) | (4 | ) | (11 | ) | (2 | ) | (26 | ) | 3 | ||
| 246 | 204 | 425 | 394 | 676 | 614 | 716 | 740 | ||||||||||
| Disposals(2) | 2 | 2 | — | 4 | (1 | ) | (1 | ) | — | 4 | |||||||
| 248 | 206 | 425 | 398 | 675 | 613 | 716 | 744 | ||||||||||
| Adjusted operating profit (loss)(3) | |||||||||||||||||
| Legal & Regulatory | 108 | 98 | 200 | 185 | 216 | 195 | 275 | 289 | |||||||||
| Learning | (57 | ) | (54 | ) | 10 | 10 | 218 | 194 | 166 | 152 | |||||||
| Financial | 49 | 55 | 60 | 57 | 63 | 53 | 59 | 75 | |||||||||
| Scientific & Healthcare | 27 | 23 | 37 | 27 | 33 | 27 | 89 | 83 | |||||||||
| Corporate and other(1) | (16 | ) | (36 | ) | (16 | ) | (7 | ) | (17 | ) | (6 | ) | (29 | ) | (2 | ) | |
| 111 | 86 | 291 | 272 | 513 | 463 | 560 | 597 | ||||||||||
| Disposals(2) | 2 | 2 | — | 3 | (1 | ) | (1 | ) | — | 4 | |||||||
| 113 | 88 | 291 | 275 | 512 | �� | 462 | 560 | 601 | |||||||||
The following table includes measurements for Adjusted earnings and Adjusted earnings per common share which do not have any standardized meaning prescribed by Canadian GAAP. These measurements are used by management to evaluate performance. A further discussion of these performance measures and a
66
reconciliation of them to our statement of earnings and retained earnings are included in this management's discussion and analysis.
| | Quarter ended March 31 | Quarter ended June 30 | Quarter ended September 30 | Quarter ended December 31 | |||||||||||||||||||||
|---|---|---|---|---|---|---|---|---|---|---|---|---|---|---|---|---|---|---|---|---|---|---|---|---|---|
| (millions of U.S. dollars, except per common share amounts) | |||||||||||||||||||||||||
| 2003 | 2002 | 2003 | 2002 | 2003 | 2002 | 2003 | 2002 | ||||||||||||||||||
| Earnings from continuing operations | 36 | (44 | ) | 108 | 80 | 295 | 248 | 405 | 264 | ||||||||||||||||
| Discontinued operations, net of tax | 11 | 11 | 8 | 13 | 12 | 11 | (8 | ) | 22 | ||||||||||||||||
| Net earnings | 47 | (33 | ) | 116 | 93 | 307 | 259 | 397 | 286 | ||||||||||||||||
| Dividends declared on preference shares | (5 | ) | (3 | ) | (2 | ) | (5 | ) | (1 | ) | (6 | ) | (1 | ) | (5 | ) | |||||||||
| Net gain on redemption of Series V preference shares | 24 | — | (3 | ) | — | — | — | — | — | ||||||||||||||||
| Earnings attributable to common shares | 66 | (36 | ) | 111 | 88 | 306 | 253 | 396 | 281 | ||||||||||||||||
| Basic and fully diluted earnings (loss) per common share(4) | |||||||||||||||||||||||||
| From continuing operations | $ | 0.08 | $ | (0.07 | ) | $ | 0.16 | $ | 0.12 | $ | 0.45 | $ | 0.37 | $ | 0.62 | $ | 0.40 | ||||||||
| From discontinued operations | 0.02 | 0.01 | 0.01 | 0.02 | 0.02 | 0.02 | (0.02 | ) | 0.03 | ||||||||||||||||
| $ | 0.10 | $ | (0.06 | ) | $ | 0.17 | $ | 0.14 | $ | 0.47 | $ | 0.39 | $ | 0.60 | $ | 0.43 | |||||||||
| Supplemental information | |||||||||||||||||||||||||
| Earnings attributable to common shares as above | 66 | (36 | ) | 111 | 88 | 306 | 253 | 396 | 281 | ||||||||||||||||
| Adjust: one-time items, net of tax, resulting from other (income) expense, restructuring charges, proportionate share of goodwill impairment recognized by equity-method investee, net gain on redemption of Series V preference shares and favorable tax settlement, net | (81 | ) | 2 | 3 | 3 | (14 | ) | 3 | (59 | ) | 99 | ||||||||||||||
| Discontinued operations | (11 | ) | (11 | ) | (8 | ) | (13 | ) | (12 | ) | (11 | ) | 8 | (22 | ) | ||||||||||
| Adjusted earnings from continuing operations | (26 | ) | (45 | ) | 106 | 78 | 280 | 245 | 345 | 358 | |||||||||||||||
| Adjusted basic and diluted earnings per common share from continuing operations | $ | (0.04 | ) | $ | (0.07 | ) | $ | 0.16 | $ | 0.12 | $ | 0.43 | $ | 0.38 | $ | 0.53 | $ | 0.55 | |||||||
- (1)
- Corporate and other includes the results of Thomson Media, a non-reportable segment, as well as corporate costs and costs associated with stock-related compensation.
- (2)
- Disposals include the results of businesses sold or held for sale that do not qualify as discontinued operations.
- (3)
- Before amortization and restructuring costs.
- (4)
- Per common share amounts for the quarter are computed independently and, due to the computation formula, the sum of the quarters may not equal the year-to-date period. Please see the section entitled "Seasonality."
67
Selected Financial Data
The following tables present selected financial data for the three most recent years and are derived from our consolidated financial statements.
| (millions of U.S. dollars, except per share amounts) For the years ended or as at December 31 | 2003 | 2002 | 2001 | ||||||
|---|---|---|---|---|---|---|---|---|---|
| Revenues | 7,606 | 7,444 | 7,075 | ||||||
| Earnings from continuing operations | 844 | 548 | 654 | ||||||
| Earnings from discontinued operations, net of tax | 23 | 57 | 115 | ||||||
| Net earnings | 867 | 605 | 769 | ||||||
| Basic and fully diluted earnings per common share | $ | 1.34 | $ | 0.91 | $ | 1.18 | |||
| Total assets | 18,680 | 18,548 | 18,650 | ||||||
| Total long-term liabilities | 6,335 | 6,377 | 6,562 | ||||||
| Total shareholders' equity | 9,200 | 8,966 | 8,225 | ||||||
| Dividends per common share—ordinary (US$) | $ | 0.725 | $ | 0.705 | $ | 0.70 | |||
| Dividends per common share—special (US$) | $ | 0.428 | — | — | |||||
| Dividends per Series II preferred share (Cdn$) | $ | 0.82 | $ | 0.73 | $ | 1.07 | |||
| Dividends per Series V preferred share (Cdn$)(1) | $ | 0.32 | $ | 1.00 | $ | 1.25 | |||
Supplemental Information (unaudited)
| (millions of U.S. dollars, except per common share amounts) For the years ended December 31 | 2003 | 2002 | 2001 | ||||||||
|---|---|---|---|---|---|---|---|---|---|---|---|
| Earnings attributable to common shares | 879 | 586 | 742 | ||||||||
| Adjustments | |||||||||||
| One time items: | |||||||||||
| Net other expense (income) | (74 | ) | 34 | (302 | ) | ||||||
| Restructuring charges | — | 6 | 30 | ||||||||
| Tax on above items | 8 | — | 66 | ||||||||
| Net change to contingent tax liabilities | (64 | ) | — | — | |||||||
| BGM goodwill impairment | — | 67 | — | ||||||||
| Net gain on redemption of Series V preference shares | (21 | ) | — | — | |||||||
| Earnings from discontinued operations, net of tax | (23 | ) | (57 | ) | (115 | ) | |||||
| Effect of new accounting standard(2) | — | — | 194 | ||||||||
| Adjusted earnings from continuing operations(3) | 705 | 636 | 615 | ||||||||
| Adjusted basic and fully diluted earnings per common share from continuing operations(3) | $ | 1.08 | $ | 0.99 | $ | 0.98 | |||||
- (1)
- Redeemed in April 2003.
- (2)
- Represents the reduction of amortization, net of tax, of identifiable intangible assets and goodwill as if the current accounting standard was in effect in 2001.
- (3)
- Non-GAAP financial measure. See the "Reconciliations" section of this management's discussion and analysis.
68
The management of The Thomson Corporation is responsible for the accompanying consolidated financial statements and other information included in the annual report. The financial statements have been prepared in conformity with Canadian generally accepted accounting principles using the best estimates and judgments of management, where appropriate. Information presented elsewhere in this annual report is consistent with that in the financial statements.
Management is also responsible for a system of internal control which is designed to provide reasonable assurance that assets are safeguarded, liabilities are recognized and that the accounting systems provide timely and accurate financial reports.
The Board of Directors is responsible for ensuring that management fulfills its responsibilities in respect of financial reporting and internal control. The Audit Committee of the Board of Directors meets periodically with management and the Corporation's independent auditors to discuss auditing matters and financial reporting issues. In addition, the Audit Committee recommends to the Board of Directors the approval of the interim and annual consolidated financial statements and the annual appointment of the independent auditors.
| ||
| Richard J. Harrington President & Chief Executive Officer | ||
| Robert D. Daleo Executive Vice President & Chief Financial Officer | ||
February 12, 2004 |
69
Auditors' Report
To the shareholders of The Thomson Corporation:
We have audited the consolidated balance sheet of The Thomson Corporation (the Corporation) as at December 31, 2003 and 2002, and the consolidated statements of earnings and retained earnings and of cash flow for each of the years in the two year period ended December 31, 2003. These consolidated financial statements are the responsibility of the Corporation's management. Our responsibility is to express an opinion on these financial statements based on our audits.
We conducted our audits in accordance with Canadian generally accepted auditing standards. Those standards require that we plan and perform an audit to obtain reasonable assurance whether the financial statements are free of material misstatement. An audit includes examining, on a test basis, evidence supporting the amounts and disclosures in the financial statements. An audit also includes assessing the accounting principles used and significant estimates made by management, as well as evaluating the overall financial statement presentation.
In our opinion, these consolidated financial statements present fairly, in all material respects, the financial position of the Corporation as at December 31, 2003 and 2002, and the results of its operations and its cash flows for each of the years in the two year period ended December 31, 2003 in accordance with Canadian generally accepted accounting principles.
PricewaterhouseCoopers LLP Chartered Accountants, Toronto, Canada | ||
February 12, 2004 |
70
Consolidated Statement of Earnings and Retained Earnings
| | Year ended December 31 | |||||||
|---|---|---|---|---|---|---|---|---|
| (millions of U.S. dollars, except per common share amounts) | 2003 | 2002 (notes 2 and 6) | ||||||
| Revenues(note 1) | 7,606 | 7,444 | ||||||
| Cost of sales, selling, marketing, general and administrative expenses(note 1) | (5,542 | ) | (5,483 | ) | ||||
| Depreciation(note 11) | (588 | ) | (535 | ) | ||||
| Amortization(note 12) | (285 | ) | (284 | ) | ||||
| Restructuring charges(note 19) | — | (6 | ) | |||||
| Operating profit | 1,191 | 1,136 | ||||||
| Net other income (expense)(note 3) | 74 | (34 | ) | |||||
| Net interest expense and other financing costs(note 4) | (252 | ) | (291 | ) | ||||
| Income taxes(note 5) | (156 | ) | (162 | ) | ||||
| Equity in net losses of associates, net of tax(note 15) | (13 | ) | (101 | ) | ||||
| Earnings from continuing operations | 844 | 548 | ||||||
| Earnings from discontinued operations, net of tax(note 6) | 23 | 57 | ||||||
| Net earnings | 867 | 605 | ||||||
| Dividends declared on preference shares(note 16) | (9 | ) | (19 | ) | ||||
| Net gain on redemption of Series V preference shares(note 16) | 21 | — | ||||||
| Earnings attributable to common shares | 879 | 586 | ||||||
| Retained earnings at beginning of year(note 2) | 6,196 | 6,244 | ||||||
| Effect of adoption of accounting standard, net of tax(note 7) | — | (183 | ) | |||||
| Deduct net gain on redemption of Series V preference shares recorded in Capital(note 16) | (21 | ) | — | |||||
| Dividends declared on common shares(note 16) | (752 | ) | (451 | ) | ||||
| Retained earnings at end of year | 6,302 | 6,196 | ||||||
Basic and diluted earnings per common share(note 8): | ||||||||
| From continuing operations | $ | 1.31 | $ | 0.83 | ||||
| From discontinued operations | $ | 0.03 | $ | 0.08 | ||||
| Basic and diluted earnings per common share | $ | 1.34 | $ | 0.91 | ||||
The related notes form an integral part of these consolidated financial statements.
71
Consolidated Balance Sheet
| | December 31 | |||||
|---|---|---|---|---|---|---|
| (millions of U.S. dollars) | 2003 | 2002 (notes 2 and 6) | ||||
| ASSETS | ||||||
| Cash and cash equivalents | 683 | 709 | ||||
| Accounts receivable, net of allowances of $345 million (2002—$369 million)(note 9) | 1,521 | 1,489 | ||||
| Inventories(note 10) | 310 | 285 | ||||
| Prepaid expenses and other current assets | 309 | 268 | ||||
| Deferred income taxes(note 5) | 185 | 218 | ||||
| Current assets of discontinued operations(note 6) | 36 | 53 | ||||
| Current assets | 3,044 | 3,022 | ||||
| Property and equipment(note 11) | 1,539 | 1,531 | ||||
| Identifiable intangible assets(note 12) | 4,467 | 4,579 | ||||
| Goodwill(note 13) | 8,155 | 7,911 | ||||
| Other non-current assets | 1,247 | 1,182 | ||||
| Non-current assets of discontinued operations(note 6) | 228 | 323 | ||||
| Total assets | 18,680 | 18,548 | ||||
| LIABILITIES AND SHAREHOLDERS' EQUITY | ||||||
| Liabilities | ||||||
| Short-term indebtedness(note 15) | 87 | 316 | ||||
| Accounts payable and accruals | 1,542 | 1,601 | ||||
| Deferred revenue | 971 | 876 | ||||
| Current portion of long-term debt(note 15) | 484 | 318 | ||||
| Current liabilities of discontinued operations(note 6) | 61 | 94 | ||||
| Current liabilities | 3,145 | 3,205 | ||||
| Long-term debt(note 15) | 3,684 | 3,487 | ||||
| Other non-current liabilities | 986 | 1,202 | ||||
| Deferred income taxes(note 5) | 1,638 | 1,656 | ||||
| Non-current liabilities of discontinued operations(note 6) | 27 | 32 | ||||
| Total liabilities | 9,480 | 9,582 | ||||
| Shareholders' equity | ||||||
| Capital(note 16) | 2,639 | 2,834 | ||||
| Cumulative translation adjustment(note 21) | 259 | (64 | ) | |||
| Retained earnings | 6,302 | 6,196 | ||||
| Total shareholders' equity | 9,200 | 8,966 | ||||
| Total liabilities and shareholders' equity | 18,680 | 18,548 | ||||
The related notes form an integral part of these consolidated financial statements.
Approved by the Board
| ||
David K.R. Thomson Director | Richard J. Harrington Director |
72
Consolidated Statement of Cash Flow
| | Year ended December 31 | |||||
|---|---|---|---|---|---|---|
| (millions of U.S. dollars) | 2003 | 2002 (notes 2 and 6) | ||||
| CASH PROVIDED BY (USED IN): | ||||||
| Operating activities | ||||||
| Earnings from continuing operations | 844 | 548 | ||||
| Add back (deduct) items not involving cash: | ||||||
| Amortization of development costs and capitalized software for sale | 38 | 46 | ||||
| Depreciation(note 11) | 588 | 535 | ||||
| Amortization(note 12) | 285 | 284 | ||||
| Net (gains) losses on disposals of businesses and investments(note 3) | (52 | ) | 34 | |||
| Deferred income taxes(note 5) | 22 | 94 | ||||
| Equity in net losses of associates, net of tax(note 15) | 13 | 101 | ||||
| Other, net | 54 | 62 | ||||
| Voluntary pension contributions | (81 | ) | (142 | ) | ||
| Changes in working capital and other items(note 23) | (93 | ) | 58 | |||
| Cash provided by operating activities—discontinued operations(note 6) | 36 | 71 | ||||
| Net cash provided by operating activities | 1,654 | 1,691 | ||||
| Investing activities | ||||||
| Acquisitions of businesses and investments, less cash therein of $25 million (2002—$15 million)(note 20) | (211 | ) | (272 | ) | ||
| Proceeds from disposals of businesses and investments(note 20) | 288 | 51 | ||||
| Additions to property and equipment, less proceeds from disposals of $6 million (2002—$8 million) | (570 | ) | (518 | ) | ||
| Other investing activities | (83 | ) | (166 | ) | ||
| Additions to property and equipment of discontinued operations(note 6) | (7 | ) | (5 | ) | ||
| Proceeds from disposals of discontinued operations | 137 | — | ||||
| Cash used in investing activities—discontinued operations(note 6) | (15 | ) | — | |||
| Net cash used in investing activities | (461 | ) | (910 | ) | ||
| Financing activities | ||||||
| Proceeds from debt(note 15) | 451 | 400 | ||||
| Repayments of debt(note 15) | (468 | ) | (540 | ) | ||
| Net repayments of short-term loan facilities | (230 | ) | (604 | ) | ||
| Proceeds from issuance of common shares(note 16) | 2 | 437 | ||||
| Redemption of Series V preference shares(note 16) | (311 | ) | — | |||
| Dividends paid on preference shares(note 16) | (11 | ) | (22 | ) | ||
| Dividends paid on common shares(note 16) | (658 | ) | (283 | ) | ||
| Other financing activities, net | (3 | ) | (2 | ) | ||
| Net cash used in financing activities | (1,228 | ) | (614 | ) | ||
| (35 | ) | 167 | ||||
| Translation adjustments | 9 | 10 | ||||
| (Decrease) increase in cash and cash equivalents | (26 | ) | 177 | |||
| Cash and cash equivalents at beginning of period | 709 | 532 | ||||
| Cash and cash equivalents at end of period | 683 | 709 | ||||
Supplemental cash flow information is provided in notes 4 and 23.
The related notes form an integral part of these consolidated financial statements.
73
Notes to Consolidated Financial Statements
(unless otherwise stated, all amounts are in millions of U.S. dollars)
Note 1: Summary of Significant Accounting Policies
Principles of Consolidation
The consolidated financial statements of The Thomson Corporation ("Thomson" or the "Company") include all controlled companies and are prepared in accordance with accounting principles generally accepted in Canada ("Canadian GAAP"). All intercompany transactions and balances are eliminated on consolidation.
Accounting Estimates
The preparation of financial statements in conformity with Canadian GAAP requires management to make estimates and assumptions that affect the reported amounts of assets and liabilities, the disclosure of contingent assets and liabilities at the date of the financial statements, and the reported amounts of revenues and expenses during the reporting period. Actual results may differ from those estimates.
Foreign Currency
Assets and liabilities of self-sustaining subsidiaries denominated in currencies other than U.S. dollars are translated at the period end rates of exchange, and the results of their operations are translated at average rates of exchange for the period. The resulting translation adjustments are accumulated in a separate component of shareholders' equity. Other currency gains or losses are included in earnings.
Revenue Recognition
Revenues are recognized, net of estimated returns, when the following four criteria are met:
- •
- persuasive evidence of an arrangement exists;
- •
- delivery has occurred;
- •
- the fee is fixed or determinable; and
- •
- collectibility is probable.
In addition to the above general principles, the Company applies the following specific revenue recognition policies:
SUBSCRIPTION-BASED PRODUCTS (EXCLUDING SOFTWARE)
Revenues from sales of subscription-based products are primarily recognized ratably over the term of the subscription. Where applicable, usage fees above a base period fee are recognized as earned. Subscription revenue received or receivable in advance of the delivery of services or publications is included in deferred revenue. Incremental costs that are directly related to the subscription revenue are deferred and amortized over the subscription period.
MULTIPLE ELEMENT ARRANGEMENTS
When a sales arrangement requires the delivery of more than one product or service, the individual deliverables are accounted for separately, if applicable criteria are met. Specifically, the revenue is allocated to each deliverable if reliable and objective evidence of fair value for each
74
deliverable is available. The amount allocated to each unit is then recognized when each unit is delivered, provided that all other relevant revenue recognition criteria are met with respect to that unit.
If, however, evidence of fair value is only available for undelivered elements, the revenue is allocated first to the undelivered items, with the remainder of the revenue being allocated to the delivered items, according to a calculation known as the residual method. Amounts allocated to delivered items are limited if there are further obligations with respect to the delivered items.
If evidence of fair value is only available for the delivered items, but not for the undelivered items, the arrangement is considered a single element arrangement and revenue is recognized as the relevant recognition criteria are met.
SOFTWARE-RELATED PRODUCTS AND SERVICES
If the four criteria of revenue recognition are met, license fees are generally recognized ratably on a straight-line basis over the license period. Alternatively, if there is neither an associated licensing period, nor future obligations, revenues are recognized upon delivery.
Certain contracts specify separate fees for software and ongoing fees for maintenance and other support. If sufficient vendor specific objective evidence of the fair value of each element of the arrangement exists, the elements of the contract are unbundled and the revenue for each element is recognized as appropriate.
OTHER SERVICE CONTRACTS
For a majority of service or consulting arrangements, revenues are recognized as services are performed based on output measures, or if no discernable pattern of revenue recognition exists, the straight-line method is utilized.
Employee Future Benefits
Net periodic pension expense for employee future benefits is actuarially determined using the projected benefit method. Determination of benefit expense requires assumptions such as the expected return on assets available to fund pension obligations, the discount rate to measure obligations, the projected age of employees upon retirement, the expected rate of future compensation and the expected healthcare cost trend rate. For the purpose of calculating expected return on plan assets, the assets are valued at fair market value. Actual results will differ from results which are estimated based on assumptions. When the cumulative difference between actual and estimated results exceeds 10% of the greater of the benefit obligation or the fair value of the plan assets, such difference is amortized into earnings over the average remaining service period of active employees. Past service costs arising from plan amendments are amortized on a straight-line basis over the average remaining service period of active employees at the date of the amendment.
Cash and Cash Equivalents
Cash and cash equivalents comprise cash on hand, demand deposits and investments with an original maturity at the date of purchase of three months or less.
Inventories
Inventories are valued at the lower of cost and net realizable value. Cost is determined using either the average cost or first-in, first-out method.
75
Long-lived Assets
Long-lived assets with finite lives are tested for impairment when events or changes in circumstances indicate that their carrying amounts may not be recoverable. When such a situation occurs, the expected future operating cash flows associated with the asset are compared to its carrying value to determine if the asset is recoverable. If the expected future operating cash flows are not sufficient to recover the asset, an estimate of the fair value of the asset is computed. Impairment of the carrying amount of a long-lived asset is recognized within operating profit of continuing or discontinued operations, as appropriate, when the carrying amount is not recoverable and is in excess of its fair value. The impairment loss recognized is equal to the excess of the carrying amount over the fair value.
Capitalized Software
Certain costs incurred in connection with the development of software to be used internally are capitalized once the applicable criteria specified in generally accepted accounting principles are met. The capitalized amounts, net of accumulated amortization, are included in "Property and equipment" in the consolidated balance sheet. The amortization expense is included within "Depreciation" in the consolidated statement of earnings and retained earnings.
In connection with the development of software that is intended to be marketed to customers, certain costs are capitalized once technological feasibility of the product is established and a market for the product has been identified. The capitalized amounts, net of accumulated amortization, are included in "Other non-current assets" in the consolidated balance sheet. The capitalized amounts are amortized over the expected period of benefit, not to exceed three years, and such amortization expense is included within "Cost of sales, selling, marketing, general and administrative expenses" in the consolidated statement of earnings and retained earnings.
Property and Equipment
Property and equipment are recorded at cost and depreciated on a straight-line basis over their estimated useful lives as follows:
| Buildings and building improvements | 5-40 years | |
| Furniture, fixtures and equipment | 3-10 years | |
| Computer hardware | 3-5 years | |
| Internal-use computer software | 3-10 years |
Identifiable Intangible Assets and Goodwill
Upon acquisition, identifiable intangible assets are recorded at fair value and, if deemed to have a finite life, are subsequently amortized over their estimated useful lives. A summary of those useful lives by category follows.
| Tradenames | 2-29 years | |
| Customer relationships | 1-40 years | |
| Databases and content | 2-29 years | |
| Publishing rights | 4-34 years | |
| Other | 2-29 years |
Goodwill represents the excess of the cost of the acquired businesses over fair values attributed to underlying net tangible assets and identifiable intangible assets.
Identifiable intangible assets with finite lives are tested for impairment as described under "Long-lived Assets" above.
76
Identifiable intangible assets with indefinite lives and goodwill are not amortized. The carrying values of identifiable intangible assets with indefinite lives and goodwill are reviewed at least annually to assess impairment. Goodwill is tested for impairment on a "reporting unit" level. A reporting unit is a group of businesses: (a) for which discrete financial information is available; and (b) that have similar economic characteristics. Goodwill is tested for impairment using the following two-step approach:
- •
- In the first step, the fair value of each reporting unit is determined. If the fair value of a reporting unit is less than its carrying value, this is an indicator that the goodwill assigned to that reporting unit might be impaired, which requires performance of the second step.
- •
- In the second step, the fair value of the reporting unit is allocated to the assets and liabilities of the reporting unit as if it had just been acquired in a business combination, and as if the purchase price was equivalent to the fair value of the reporting unit. The excess of the fair value of the reporting unit over the amounts assigned to its assets and liabilities is referred to as the implied fair value of goodwill. The implied fair value of the reporting unit's goodwill is then compared to the actual carrying value of goodwill. If the implied fair value is less than the carrying value, an impairment loss is recognized for that excess.
The fair value of the Company's reporting units are determined based on a combination of various techniques, including the present value of future cash flows and earnings multiples of competitors. Fair value of intangible assets with indefinite lives is determined using an income approach, specifically the relief from royalties method.
The carrying values of all intangible assets are reviewed for impairment whenever events or changes in circumstances indicate that their carrying amounts may not be recoverable. Impairment is determined by comparing the fair values of such assets with their carrying amounts.
Investments
The equity method of accounting is used to account for investments in businesses over which Thomson has the ability to exercise significant influence. Under the equity method, investments are initially recorded at cost and the carrying amounts are adjusted to reflect the Company's share of net earnings or losses of the investee companies, and are reduced by dividends received.
The cost method of accounting is used to account for investments in businesses over which Thomson does not have the ability to exercise significant influence.
When the estimated fair values of investments fall below their carrying values, the investments are written down when such declines are considered to be other than temporary.
Disposal of Long-lived Assets and Discontinued Operations
Long-lived assets are classified as held for sale when certain criteria are met. Assets held for sale are measured at the lower of their carrying amounts or fair values less costs to sell and are no longer depreciated. Long-lived assets held for sale are classified as discontinued operations if the operations and cash flows can be clearly distinguished, operationally and for financial reporting purposes, from the remaining operations. See Note 6 for detail on the Company's discontinued operations.
Deferred Income Taxes
Deferred income taxes are determined based on the temporary differences between the financial reporting and tax bases of assets and liabilities using the enacted or substantially enacted rates expected to apply to taxable income in the years in which those temporary differences are expected to reverse. A valuation allowance is recorded against deferred income tax assets if management determines that it is more likely than not that such deferred income tax assets will not be realized within the foreseeable
77
future. The income tax provision for the period is the tax payable for the period and the change during the period in deferred income tax assets and liabilities.
Derivative Financial Instruments
In the ordinary course of business, Thomson enters into the following types of derivative financial instruments to manage foreign currency and interest rate exposures:
- •
- foreign currency contracts to hedge currency exposures on non-U.S. dollar debt;
- •
- foreign currency contracts to hedge forecasted cash flows denominated in currencies other than the functional currency of a particular Thomson subsidiary; and
- •
- interest rate contracts to manage the fixed versus floating interest rate mix of debt. Such contracts require periodic exchange of payments without the exchange of the notional principal amount upon which the payments are based.
The Company identifies a risk management objective for each transaction. All derivatives are linked to specific assets and liabilities or to specific firm commitments or forecasted transactions. Where required, periodic assessments of each derivative's effectiveness are performed.
While the derivative financial instruments are subject to the risk of loss from changes in exchange and interest rates, these losses are offset by gains on the exposures being hedged. Gains and losses on foreign currency derivative instruments designated as hedges of existing assets and liabilities are accrued as exchange rates change, thereby offsetting gains and losses from the underlying assets and liabilities. Gains and losses on foreign exchange contracts designated as hedges for firm commitments or forecasted transactions are recorded in consolidated earnings when the related transaction is realized. The differential paid or received on interest rate swap agreements is recognized as part of net interest expense.
Stock-based Compensation Plans
Thomson has both a Stock Appreciation Rights ("SAR") plan and a stock incentive plan, which are described in Note 22.
Under the SAR plan, compensation expense is recognized as SARs change in value based on the fair market value of the Company's common stock at the end of each reporting period.
Under the stock incentive plan, Thomson may grant stock options and other equity-based awards to certain employees for up to 20,000,000 shares of common stock. The options vest over a period of four to five years. The maximum term of an option is 10 years from the date of grant. Options under the plan are granted at the closing price of the Company's common stock on the day prior to the date of grant. Effective January 1, 2003 the Company began expensing the fair value of all stock options retroactively as allowed under Canadian Institute of Chartered Accountants ("CICA") Handbook Section 3870,Stock-Based Compensation and Other Stock-Based Payments ("CICA3870"). See Note 2.
Recently Issued Accounting Standards
The Accounting Standards Board and the Emerging Issues Committee ("EIC") of the CICA have recently issued the following accounting standards that are applicable to the Company's activities in future periods.
CICA HANDBOOK SECTION 3110, ASSET RETIREMENT OBLIGATIONS. CICA Handbook Section 3110 was issued in March 2003 and is effective for fiscal years beginning on or after January 1, 2004. The new guidance harmonizes Canadian GAAP with U.S. GAAP relative to the recognition and measurement of
78
obligations associated with the retirement of property, plant and equipment when those obligations result from the acquisition, construction, development or normal operation of the assets.
The adoption of Handbook Section 3110 is not expected to have a material impact on the Company's consolidated financial statements.
ACCOUNTING GUIDELINE ACG-13, HEDGING RELATIONSHIPS. Effective for hedging relationships in effect for fiscal years beginning on or after July 1, 2003, this Guideline was issued by the CICA in 2001 to address the identification, designation, documentation and effectiveness of hedging relationships, as well as the conditions for applying hedge accounting.
EIC ABSTRACT 128, ACCOUNTING FOR TRADING, SPECULATIVE OR NON-HEDGING DERIVATIVE FINANCIAL INSTRUMENTS. Issued in June 2002, the consensus reached in EIC Abstract 128 must be applied in all financial statements prepared for fiscal periods beginning on or after the date of implementation of AcG-13. The consensus requires that, with certain exceptions, a freestanding derivative financial instrument that does not qualify for hedge accounting under AcG-13, should be recognized in the balance sheet and measured at fair value, with changes in fair value recognized in income.
Certain derivatives, previously accounted for as hedges, will not qualify for this treatment under AcG-13. Therefore, in accordance with AcG-13 and EIC Abstract 128, changes in the fair value of these derivatives after January 1, 2004 will be recognized in earnings in the period in which they occur. If AcG-13 and EIC Abstract 128 had been in effect in 2003, the Company would have recognized additional income of approximately $20 million associated with the changes in fair values of these derivatives. At December 31, 2003 the fair value of these derivatives was approximately $25 million, net, in favor of the counterparties and would have been recorded within "Prepaid expenses and other current assets" and "Other non-current liabilities" in the consolidated balance sheet.
ACCOUNTING GUIDELINE ACG-15, CONSOLIDATION OF VARIABLE INTEREST ENTITIES. In June 2003, the CICA issued AcG-15, which requires the consolidation of certain entities that are subject to control on a basis other than the ownership of voting interest. This Guideline provides guidance for determining when an enterprise includes the assets, liabilities and results of operations of a variable interest entity in its consolidated financial statements. The guidance related to consolidation requirements is effective for periods beginning on or after November 1, 2004.
The Company is in the process of assessing the impact of AcG-15, but does not expect the adoption to have a material impact on the consolidated financial statements.
EIC ABSTRACT 141, REVENUE RECOGNITION. In December 2003, the EIC issued EIC Abstract 141, which incorporates the principles and summarizes the guidance in the U.S. Securities and Exchange Commission (SEC) Staff Accounting Bulletin (SAB) 101,Revenue Recognition in Financial Statements. The Abstract also provides interpretive guidance on the application of CICA Handbook Section 3400,Revenue. The Abstract may be applied prospectively to sales transactions recognized in 2004, or may be applied retroactively, with prior period financial statements being restated.
Because the Company has previously applied the provisions of SAB 101, the adoption of EIC Abstract 141 is not expected to have a material impact on the consolidated financial statements.
EIC ABSTRACT 142, REVENUE ARRANGEMENTS WITH MULTIPLE DELIVERABLES. Issued in December 2003, this Abstract addresses the accounting by vendors for arrangements in which the vendor will perform multiple revenue-generating activities. The Abstract conforms Canadian GAAP to the U.S. GAAP set forth in Emerging Issues Task Force, or EITF, Issue 00-21, also entitledRevenue Arrangements with Multiple Deliverables.
Because the Company has previously applied EITF Issue 00-21, the adoption of EIC Abstract 142 is not expected to have a material impact on the consolidated financial statements.
79
CICA HANDBOOK SECTION 1100, GENERALLY ACCEPTED ACCOUNTING PRINCIPLES. CICA Handbook Section 1100 was issued in October 2003, and is effective for the Company's fiscal year beginning January 1, 2004. The Handbook Section establishes standards for financial reporting in accordance with generally accepted accounting principles and clarifies the relative authority of various accounting pronouncements and other sources within GAAP.
The Company is in the process of assessing the impact of this standard.
Comparative Amounts
Prior periods have been restated for discontinued operations. Additionally, where necessary, certain amounts for 2002 have been reclassified to conform to the current year's presentation. In particular, within Thomson Learning, for the year ended December 31, 2002, revenues and cost of sales, selling, marketing, general and administrative expenses were increased by $26 million to present on a gross basis certain freight and distribution costs charged to customers which had previously been netted. Additionally, within Thomson Financial, for the year ended December 31, 2002, revenues and cost of sales, selling, marketing, general and administrative expenses were increased by $70 million to present on a gross basis certain stock exchange fees charged to customers which had previously been netted. On a consolidated basis, for the year ended December 31, 2002, after eliminating intercompany revenues of $3 million, the total increase in revenues and expenses was $93 million. The revised presentation is in accordance with EIC Abstract 123,Reporting Revenue Gross as a Principal versus Net as an Agent, which addresses whether an enterprise should recognize revenue based upon the gross amount billed to the customer or the net amount retained. This reclassification had no impact on operating profit or net earnings.
Note 2: Effect of a Change in Accounting Policy
Effective January 1, 2003, the Company began expensing the fair value of all stock options issued, as allowed under CICA3870. Prior to January 1, 2003, the Company used the intrinsic value-based method to account for its stock incentive plan and no compensation expense had been recognized under the plan. This change in policy has been applied retroactively for all periods. For the year ended December 31, 2002, compensation expense recorded in connection with the stock incentive plan was $17 million before income taxes.
The following details the stock compensation related restatements made to the previously reported consolidated financial statements as restated for discontinued operations and other reclassifications:
| | Year ended December 31, 2002 | |||||
|---|---|---|---|---|---|---|
| Consolidated statement of earnings and retained earnings | ||||||
| As reported | As restated | |||||
| Operating profit | 1,153 | 1,136 | ||||
| Income taxes | 169 | 162 | ||||
| Net earnings | 615 | 605 | ||||
| Retained earnings at beginning of year | 6,253 | 6,244 | ||||
| Earnings per common share | $ | 0.93 | $ | 0.91 | ||
| | December 31, 2002 | |||
|---|---|---|---|---|
| Consolidated balance sheet | As reported | As restated | ||
| Net long-term deferred income tax liabilities | 1,668 | 1,656 | ||
| Capital | 2,803 | 2,834 | ||
| Retained earnings | 6,215 | 6,196 | ||
80
| | Year ended December 31, 2002 | |||
|---|---|---|---|---|
| Consolidated statement of cash flow | As reported | As restated | ||
| Earnings from continuing operations | 558 | 548 | ||
| Deferred income taxes | 101 | 94 | ||
| Other items not involving cash, net | 45 | 62 | ||
Other information related to the Company's stock incentive plan and stock appreciation rights plan is included in Note 22.
Note 3: Net Other Income (Expense)
During the period, Net other income (expense) includes:
| | Year ended December 31 | ||||
|---|---|---|---|---|---|
| | 2003 | 2002 | |||
| Skillsoft settlement | 22 | — | |||
| Net gains (losses) on disposals of businesses and investments | 52 | (34 | ) | ||
| Net other income (expense) | 74 | (34 | ) | ||
Skillsoft settlement
In July 2003, Thomson reached a settlement with Skillsoft PLC, a competitor of Thomson Learning, regarding the Company's claims of breach of fiduciary duty, appropriation of trade secrets and patent infringement. Under the terms of the settlement, Skillsoft PLC must pay Thomson $44 million in two equal installments, the first of which was received in July 2003. The second installment is scheduled to be received in July 2004, and will be recognized upon receipt.
Net gains (losses) on disposals of businesses and investments
The most significant item in 2003 was a $55 million gain recorded upon completion of the sale of the Company's 20% interest in Bell Globemedia Inc. ("BGM") in March 2003. See Note 24.
Note 4: Net Interest Expense and Other Financing Costs
| | Year ended December 31 | ||||
|---|---|---|---|---|---|
| | 2003 | 2002 | |||
| Interest income | 10 | 12 | |||
| Interest on short-term indebtedness | (6 | ) | (10 | ) | |
| Interest on long-term debt | (256 | ) | (293 | ) | |
| (252 | ) | (291 | ) | ||
Interest paid on short-term indebtedness and long-term debt during 2003 was $263 million (2002—$282 million) and interest received during 2003 was $12 million (2002—$11 million).
81
Note 5: Income Taxes
The components of earnings (loss) before taxes by jurisdiction are as follows:
| | Year ended December 31 | |||||
|---|---|---|---|---|---|---|
| | 2003 | 2002 | ||||
| Canada | (127 | ) | (239 | ) | ||
| U.S. and other jurisdictions | 1,140 | 1,050 | ||||
| Total earnings before taxes(1) | 1,013 | 811 | ||||
- (1)
- Represents earnings from continuing operations before equity in net losses of associates, net of tax and income taxes.
The provision for income taxes consists of:
| | Year ended December 31 | ||||
|---|---|---|---|---|---|
| | 2003 | 2002 | |||
| Canada: | |||||
| Current | 1 | 1 | |||
| Deferred | — | 1 | |||
| Total Canadian | 1 | 2 | |||
| U.S. and other jurisdictions: | |||||
| Current | 133 | 67 | |||
| Deferred | 22 | 93 | |||
| Total U.S. and other jurisdictions | 155 | 160 | |||
| Total worldwide | 156 | 162 | |||
The tax effects of the significant components of temporary differences giving rise to the Company's deferred income tax assets and liabilities at December 31 are as follows:
| | 2003 | 2002 | ||||
|---|---|---|---|---|---|---|
| Accrued expenses | 155 | 145 | ||||
| Accounts receivable allowances | 96 | 86 | ||||
| Deferred compensation | 85 | 83 | ||||
| Financial instruments | — | 64 | ||||
| Tax loss and credit carryforwards | 736 | 502 | ||||
| Other | 97 | 135 | ||||
| Total deferred tax asset | 1,169 | 1,015 | ||||
| Valuation allowance | (534 | ) | (540 | ) | ||
| Net deferred tax asset | 635 | 475 | ||||
| Intangible assets | (1,564 | ) | (1,482 | ) | ||
| Property and equipment | (244 | ) | (253 | ) | ||
| Financial instruments | (72 | ) | — | |||
| Pension | (148 | ) | (126 | ) | ||
| Other | (60 | ) | (52 | ) | ||
| Total deferred tax liability | (2,088 | ) | (1,913 | ) | ||
| Net deferred tax liability | (1,453 | ) | (1,438 | ) | ||
82
The net deferred liability of $1,453 million (2002—$1,438 million) was comprised of net current deferred tax assets of $185 million (2002—$218 million) and net long-term deferred tax liabilities of $1,638 million (2002—$1,656 million).
The net movement in the valuation allowance from 2002 to 2003 primarily relates to additions from Canadian losses sustained in 2003, the reversal of prior years' contingencies and additions from foreign currency translation, offset by the change in the deferred tax liability related to the revaluation of the currency swap financial instruments, which reduced the valuation allowance requirement.
The following is a reconciliation of income taxes calculated at the Canadian corporate tax rate of 36.6% (2002—38.6%) to the income tax provision:
| | 2003 | 2002 | ||||
|---|---|---|---|---|---|---|
| Earnings before taxes | 1,013 | 811 | ||||
| Income taxes at the Canadian corporate tax rate | 371 | 313 | ||||
| Differences attributable to: | ||||||
| Effect of income recorded at rates different than the Canadian tax rate | (173 | ) | (213 | ) | ||
| Change in valuation allowance | 33 | 78 | ||||
| Net change to contingent tax liabilities | (64 | ) | — | |||
| Other, net | (11 | ) | (16 | ) | ||
| Income tax provision on continuing operations | 156 | 162 | ||||
The Company's tax provision is impacted by the geographical mix of earnings before taxes, and also by the impact of differing tax rules applicable to the Company's operating and financing subsidiaries outside Canada. The Company maintains a tax liability for contingencies associated with known issues under discussion with tax authorities and transactions yet to be settled and regularly assesses the adequacy of this tax liability. In the fourth quarter of 2003, the Company reduced its contingent tax liabilities by a net amount of $64 million, principally arising from a favorable tax settlement.
At December 31, 2003, the Company had Canadian tax loss carryforwards of $1,335 million, and tax loss carryforwards in other jurisdictions of $383 million. If not utilized, $56 million of Canadian tax loss carryforwards will expire in 2004, with the majority of the remainder expiring between 2007 and 2010. The majority of the tax loss carryforwards from other jurisdictions may be carried forward indefinitely. The ability to realize the tax benefits of these losses is dependent upon a number of factors, including the future profitability of operations in the jurisdictions in which the tax losses arose. Additionally, the Company had other tax credit carryforwards of $32 million, which may be carried forward indefinitely, and $70 million of capital loss carryforwards that may be used only in offsetting future capital gains.
The total amount of undistributed earnings of non-Canadian subsidiaries for income tax purposes was approximately $4.8 billion at December 31, 2003. A portion of such undistributed earnings can be remitted to Canada tax free. Where tax free remittance of undistributed earnings is not possible, it is the Company's intention to reinvest such undistributed earnings and thereby indefinitely postpone their remittance. Accordingly, no provision has been made for withholding income taxes that may become payable if undistributed earnings from non-Canadian subsidiaries were distributed by those companies. The additional taxes on that portion of the undistributed earnings, which is available for dividends, are not practicably determinable.
83
Note 6: Discontinued Operations
On October 1, 2003, Thomson sold its portfolio of healthcare magazines for $135 million and recorded the related pre-tax gain on the sale of $103 million in the fourth quarter of 2003. The magazines had previously been managed within Thomson Scientific & Healthcare.
In June 2003, Thomson announced its intention to sell DBM (Drake Beam Morin), a provider of human resource solutions, which had been managed within Thomson Learning. The Company completed the sale in February 2004. Based on the status of negotiations at December 31, 2003, an impairment charge relating to goodwill of $62 million before income taxes was recorded in the fourth quarter of 2003 within discontinued operations.
In November 2003, Thomson announced its intention to sell Sheshunoff Information Services Inc. ("Sheshunoff"), a provider of critical data, compliance and management tools to financial institutions, which had been managed within Thomson Media. The Company is working toward completing a sale in the first half of 2004. Based on recent estimates of fair value, an impairment charge relating to identifiable intangible assets and goodwill of $24 million before income taxes was recorded in the fourth quarter of 2003 within discontinued operations.
These three businesses, along with one other small business from Thomson Learning, which was sold in June 2003, were classified as discontinued operations within the consolidated financial statements for all periods presented. None of these businesses is considered fundamental to the integrated information offerings of Thomson.
The carrying amounts of assets and liabilities related to these discontinued businesses as of December 31, 2003 and 2002 are as follows:
Balance Sheet—December 31, 2003
| | DBM | Healthcare Magazines | Sheshunoff | Other | Total 2003 | ||||||
|---|---|---|---|---|---|---|---|---|---|---|---|
| Current assets: | |||||||||||
| Accounts receivable, net of allowances | 30 | — | 1 | — | 31 | ||||||
| Other current assets | 3 | — | 2 | — | 5 | ||||||
| Total current assets | 33 | — | 3 | — | 36 | ||||||
| Non-current assets: | |||||||||||
| Property and equipment | 17 | — | 3 | — | 20 | ||||||
| Identifiable intangible assets | 63 | — | 38 | — | 101 | ||||||
| Goodwill | 95 | — | — | — | 95 | ||||||
| Other non-current assets | 5 | — | 7 | — | 12 | ||||||
| Total non-current assets | 180 | — | 48 | — | 228 | ||||||
| Current liabilities: | |||||||||||
| Accounts payable and accruals | 14 | — | 1 | — | 15 | ||||||
| Deferred revenue | 34 | — | 12 | — | 46 | ||||||
| Total current liabilities | 48 | — | 13 | — | 61 | ||||||
| Non-current liabilities: | |||||||||||
| Deferred income taxes | 27 | — | — | — | 27 | ||||||
| Total non-current liabilities | 27 | — | — | — | 27 | ||||||
84
Balance Sheet—December 31, 2002
| | DBM | Healthcare Magazines | Sheshunoff | Other | Total 2002 | ||||||
|---|---|---|---|---|---|---|---|---|---|---|---|
| Current assets: | |||||||||||
| Accounts receivable, net of allowances | 34 | 9 | 1 | 1 | 45 | ||||||
| Other current assets | 3 | 2 | 2 | 1 | 8 | ||||||
| Total current assets | 37 | 11 | 3 | 2 | 53 | ||||||
| Non-current assets: | |||||||||||
| Property and equipment | 11 | 1 | 4 | 1 | 17 | ||||||
| Identifiable intangible assets | 64 | 14 | 56 | — | 134 | ||||||
| Goodwill | 145 | 10 | 9 | 1 | 165 | ||||||
| Other non-current assets | 4 | 2 | 1 | — | 7 | ||||||
| Total non-current assets | 224 | 27 | 70 | 2 | 323 | ||||||
| Current liabilities: | |||||||||||
| Accounts payable and accruals | 32 | 6 | 2 | — | 40 | ||||||
| Deferred income taxes | 3 | — | — | — | 3 | ||||||
| Deferred revenue | 29 | 9 | 12 | 1 | 51 | ||||||
| Total current liabilities | 64 | 15 | 14 | 1 | 94 | ||||||
| Non-current liabilities: | |||||||||||
| Other non-current liabilities | — | 1 | — | — | 1 | ||||||
| Deferred income taxes | 31 | — | — | — | 31 | ||||||
| Total non-current liabilities | 31 | 1 | — | — | 32 | ||||||
The earnings from discontinued operations for the years ended December 31, 2003 and 2002 are summarized below:
| | Year ended December 31, 2003 | ||||||||||
|---|---|---|---|---|---|---|---|---|---|---|---|
| | DBM | Healthcare Magazines | Sheshunoff | Other | Total 2003 | ||||||
| Revenues from discontinued operations | 241 | 63 | 33 | 2 | 339 | ||||||
| Earnings (loss) from discontinued operations before income taxes | (27 | ) | 8 | (21 | ) | (1 | ) | (41 | ) | ||
| Gain on sale of discontinued operations | — | 103 | — | 5 | 108 | ||||||
| Income taxes | (10 | ) | (43 | ) | 5 | 4 | (44 | ) | |||
| Earnings (loss) from discontinued operations | (37 | ) | 68 | (16 | ) | 8 | 23 | ||||
| | Year ended December 31, 2002 | ||||||||||
|---|---|---|---|---|---|---|---|---|---|---|---|
| | DBM | Healthcare Magazines | Sheshunoff | Other | Total 2002 | ||||||
| Revenues from discontinued operations | 275 | 88 | 37 | 5 | 405 | ||||||
| Earnings from discontinued operations before income taxes | 52 | 17 | 2 | — | 71 | ||||||
| Gain on sale of discontinued operations | — | — | — | 9 | 9 | ||||||
| Income taxes | (16 | ) | (6 | ) | (1 | ) | — | (23 | ) | ||
| Earnings from discontinued operations | 36 | 11 | 1 | 9 | 57 | ||||||
85
In conjunction with the expiration of certain representations and warranty periods associated with the disposal of Thomson Newspapers, the Company adjusted its related disposal liabilities, which resulted in pre-tax gains of $5 million and $9 million of earnings from discontinued operations for the years ended December 31, 2003 and 2002, respectively. These amounts are included within "Other" above.
Note 7: Effect of Adoption of Accounting Standards on Goodwill and Other Intangible Assets
In July 2001, the CICA issued Handbook Section 3062,Goodwill and Other Intangible Assets ("CICA3062"). The transitional provisions of CICA3062 required that the Company perform an initial impairment test as of January 1, 2002. During the first quarter of 2002, as a result of that transitional impairment test and the adoption of the provisions of this new accounting standard, the Company recorded pre-tax reductions in the carrying amounts of identifiable intangible assets with indefinite useful lives of $26 million and goodwill of $50 million related to a unit in Thomson Scientific & Healthcare. Additionally, during the second quarter of 2002, the Company recorded a transitional impairment charge of $116 million in connection with the application of CICA3062 by BGM, an equity-method investment. Those non-cash charges, which totaled $183 million after taxes, were applied to the opening balance of retained earnings as of January 1, 2002.
Note 8: Earnings per Common Share
Basic earnings per common share are calculated by dividing earnings attributable to common shares by the weighted-average number of common shares outstanding during the period. Diluted earnings per common share are calculated using the weighted-average number of common shares outstanding adjusted to include the potentially dilutive effect of outstanding stock options and other securities. The Company uses the treasury stock method to calculate diluted earnings per common share.
Earnings used in determining earnings per common share from continuing operations are presented below. Earnings used in determining earnings per common share from discontinued operations are the earnings from discontinued operations as reported within the consolidated statement of earnings and retained earnings.
| | 2003 | 2002 | |||
|---|---|---|---|---|---|
| Earnings from continuing operations | 844 | 548 | |||
| Dividends declared on preference shares | (9 | ) | (19 | ) | |
| Net gain on redemption of Series V preference shares | 21 | — | |||
| Earnings from continuing operations attributable to common shares | 856 | 529 | |||
The weighted-average number of common shares outstanding, as well as a reconciliation of the weighted-average number of common shares outstanding used in the basic earnings per common share computation to the weighted-average number of common shares outstanding used in the diluted earnings per common share computation, is presented below.
| | 2003 | 2002 | ||
|---|---|---|---|---|
| Basic | 653,771,414 | 641,038,900 | ||
| Effect of stock and other incentive plans | 380,364 | 436,272 | ||
| Diluted | 654,151,778 | 641,475,172 | ||
86
Note 9: Accounts Receivable Allowances
The change in the valuation allowances for returns, billing adjustments and doubtful accounts related to accounts receivable is as follows:
| | 2003 | 2002 | |||
|---|---|---|---|---|---|
| Balance at beginning of year | 369 | 380 | |||
| Charges | 448 | 452 | |||
| Write-offs | (485 | ) | (462 | ) | |
| Other | 13 | (1 | ) | ||
| Balance at end of year | 345 | 369 | |||
Other includes additions from acquisitions, net of reductions from disposals, and the impact from foreign currency translation.
The Company is exposed to normal credit risk with respect to its accounts receivable. To mitigate this credit risk, the Company follows a program of customer credit evaluation and maintains provisions for potential credit losses. The Company has no significant exposure to any single customer.
Note 10: Inventories
Inventories consist of the following:
| | 2003 | 2002 | ||
|---|---|---|---|---|
| Raw materials | 26 | 38 | ||
| Work in process | 34 | 34 | ||
| Finished goods | 250 | 213 | ||
| 310 | 285 | |||
Note 11: Property and Equipment
Property and equipment consist of the following:
| | 2003 | 2002 | |||
|---|---|---|---|---|---|
| Land, buildings and building improvements | 494 | 473 | |||
| Furniture, fixtures and equipment | 910 | 830 | |||
| Computer hardware | 1,044 | 1,047 | |||
| Internal-use computer software | 1,408 | 1,153 | |||
| 3,856 | 3,503 | ||||
| Accumulated depreciation | (2,317 | ) | (1,972 | ) | |
| 1,539 | 1,531 | ||||
Fully depreciated assets are retained in asset and accumulated depreciation accounts until such assets are removed from service. In the case of disposals, assets and related accumulated depreciation amounts are removed from the accounts, and the net amounts, less proceeds from disposals, are included in income. The depreciation charge in 2003 was $588 million (2002—$535 million), of which $240 million (2002—$193 million) represented amortization of capitalized internal-use computer software.
87
Note 12: Identifiable Intangible Assets
The following table presents the details of identifiable intangible assets as at December 31, 2003 and 2002.
| As at December 31, 2003 | Gross identifiable intangible assets | Accumulated amortization | Net identifiable intangible assets | ||||
|---|---|---|---|---|---|---|---|
| Finite useful lives: | |||||||
| Tradenames | 342 | (91 | ) | 251 | |||
| Customer relationships | 1,707 | (466 | ) | 1,241 | |||
| Databases and content | 1,225 | (374 | ) | 851 | |||
| Publishing rights | 1,746 | (550 | ) | 1,196 | |||
| Other | 140 | (63 | ) | 77 | |||
| 5,160 | (1,544 | ) | 3,616 | ||||
| Indefinite useful lives: | |||||||
| Tradenames | 851 | 851 | |||||
| 6,011 | (1,544 | ) | 4,467 | ||||
| As at December 31, 2002 | Gross identifiable intangible assets | Accumulated amortization | Net identifiable intangible assets | ||||
|---|---|---|---|---|---|---|---|
| Finite useful lives: | |||||||
| Tradenames | 211 | (46 | ) | 165 | |||
| Customer relationships | 1,676 | (399 | ) | 1,277 | |||
| Databases and content | 1,166 | (282 | ) | 884 | |||
| Publishing rights | 1,692 | (490 | ) | 1,202 | |||
| Other | 132 | (32 | ) | 100 | |||
| 4,877 | (1,249 | ) | 3,628 | ||||
| Indefinite useful lives: | |||||||
| Tradenames | 951 | 951 | |||||
| 5,828 | (1,249 | ) | 4,579 | ||||
The amortization charge in 2003 was $285 million (2002—$284 million).
As at December 31, 2003, the weighted-average amortization life based upon the gross balance of the identifiable intangible assets with finite useful lives is approximately 18 years.
Publishing rights relate to certain historical acquisitions and are comprised of the cumulative value of tradenames, imprints and titles, databases and other intangible assets. These intangible assets are amortized over a weighted-average useful life, which approximates 30 years.
88
Note 13: Goodwill
The following table presents net goodwill by business segment for the years ended December 31, 2003 and 2002.
| | Legal & Regulatory | Learning | Financial | Scientific & Healthcare | Corporate and other | Total | |||||||
|---|---|---|---|---|---|---|---|---|---|---|---|---|---|
| Balance at December 31, 2001 | 3,078 | 2,758 | 1,557 | 294 | 54 | 7,741 | |||||||
| Acquisitions | 41 | 30 | 2 | 109 | — | 182 | |||||||
| Disposals | — | — | — | — | (2 | ) | (2 | ) | |||||
| Transfer assembled workforce, net of tax | 37 | 9 | — | — | — | 46 | |||||||
| Transitional impairment | — | — | — | (50 | ) | — | (50 | ) | |||||
| Adjusted purchase price allocations | (17 | ) | (53 | ) | (30 | ) | (11 | ) | — | (111 | ) | ||
| Translation and other, net | — | 65 | 29 | 2 | 9 | 105 | |||||||
| Balance at December 31, 2002 | 3,139 | 2,809 | 1,558 | 344 | 61 | 7,911 | |||||||
| Acquisitions | 98 | 19 | — | 2 | — | 119 | |||||||
| Disposals | (1 | ) | — | (2 | ) | — | — | (3 | ) | ||||
| Adjusted purchase price allocations | (4 | ) | (56 | ) | (16 | ) | — | — | (76 | ) | |||
| Translation and other, net | 74 | 71 | 45 | 14 | — | 204 | |||||||
| Balance at December 31, 2003 | 3,306 | 2,843 | 1,585 | 360 | 61 | 8,155 | |||||||
The adjusted purchase price allocations primarily relate to updated valuations of identifiable intangible assets for certain acquisitions, which resulted in increases of goodwill of $2 million (2002—reductions of $24 million) as well as to the adjustment of certain acquisition-related assets and liabilities, which resulted in decreases in goodwill of $78 million (2002—$87 million).
Note 14: Capitalized Software Intended to be Marketed
| | 2003 | 2002 | |||
|---|---|---|---|---|---|
| Capitalized software | 135 | 123 | |||
| Accumulated amortization | (86 | ) | (69 | ) | |
| 49 | 54 | ||||
The amortization charge in 2003 was $25 million (2002—$25 million).
Note 15: Financial Instruments
Carrying Amounts
Amounts recorded in the consolidated balance sheet are referred to as "carrying amounts" and are based on period-end exchange rates, as applicable.
For non-U.S. dollar denominated debt which is hedged into U.S. dollars by derivative contracts, the primary debt carrying amounts are reflected in "Long-term debt" in the consolidated balance sheet. The related receivables and payables arising from the translation gains and losses on the derivative contracts, which effectively offset the losses and gains on translation of the primary debt, are included within "Other non-current assets", "Prepaid expenses and other current assets", "Other non-current liabilities" and "Accounts payable and accruals" in the consolidated balance sheet, as appropriate.
Fair Values
The fair values of cash and cash equivalents, accounts receivable, short-term indebtedness and accounts payable approximate their carrying amounts because of the short-term maturity of these
89
instruments. The fair value of long-term debt, including the current portion, is estimated based on either quoted market prices for similar issues or current rates offered to Thomson for debt of the same maturity. The fair values of interest rate swaps and forward contracts are estimated based upon discounted cash flows using applicable current market rates. The fair values of the foreign exchange contracts reflect the estimated amounts at which the Company would have to settle all outstanding contracts on December 31. The fair values of publicly traded long-term investments are based on quoted market prices. The fair values of privately held long-term investments are estimated by management. The fair values represent point-in-time estimates that may not be relevant in predicting the Company's future earnings or cash flows.
Credit Risk
Thomson attempts to minimize its credit exposure on derivative contracts by entering into transactions only with counterparties that are major investment-grade international financial institutions.
The Company places its cash investments with high-quality financial institutions and limits the amount of exposure to any one institution. At December 31, 2003, a significant portion of the Company's cash was on deposit with four such institutions.
Short-term Indebtedness
Short-term indebtedness was principally comprised of $76 million (2002—$302 million) of commercial paper. At December 31, 2003, the average interest rate on this debt was 1.1% (2002—2.2%) after accounting for hedging arrangements.
90
Long-term Debt
The following is a summary of long-term debt:
| | Carrying Amount | Fair Value | ||||||||||
|---|---|---|---|---|---|---|---|---|---|---|---|---|
| As at December 31, 2003 | Primary debt instruments | Currency swap instruments | Hedged debt | Primary debt instruments | Currency swap instruments | Hedged debt | ||||||
| Bank and other | 110 | — | 110 | 110 | — | 110 | ||||||
| 9.15% Debentures, due 2004 | 191 | (9 | ) | 182 | 197 | (22 | ) | 175 | ||||
| 7.95% Debentures, due 2005 | 191 | (5 | ) | 186 | 207 | (23 | ) | 184 | ||||
| 6.20% Debentures, due 2006 | 191 | (25 | ) | 166 | 202 | (22 | ) | 180 | ||||
| 7.15% Debentures, due 2006 | 191 | (6 | ) | 185 | 208 | (25 | ) | 183 | ||||
| 6.50% Debentures, due 2007 | 191 | (11 | ) | 180 | 207 | (32 | ) | 175 | ||||
| 6.55% Medium-term notes, due 2007 | 343 | (47 | ) | 296 | 372 | (45 | ) | 327 | ||||
| 6.90% Medium-term notes, due 2008 | 305 | (45 | ) | 260 | 337 | (43 | ) | 294 | ||||
| 6.85% Medium-term notes, due 2011 | 305 | (51 | ) | 254 | 339 | (46 | ) | 293 | ||||
| 5.75% Notes, due 2008 | 400 | — | 400 | 433 | — | 433 | ||||||
| 4.25% Notes, due 2009 | 200 | — | 200 | 203 | — | 203 | ||||||
| 6.20% Notes, due 2012 | 700 | — | 700 | 771 | — | 771 | ||||||
| 5.25% Notes, due 2013 | 250 | — | 250 | 259 | — | 259 | ||||||
| Floating rate notes | 125 | — | 125 | 125 | — | 125 | ||||||
| Private placements, due 2004—2010 | 475 | — | 475 | 522 | — | 522 | ||||||
| 4,168 | (199 | ) | 3,969 | 4,492 | (258 | ) | 4,234 | |||||
| Current portion | (484 | ) | 9 | (475 | ) | |||||||
| 3,684 | (190 | ) | 3,494 | |||||||||
91
| | Carrying Amount | Fair Value | ||||||||||
|---|---|---|---|---|---|---|---|---|---|---|---|---|
| As at December 31, 2002 | Primary debt instruments | Currency swap instruments | Hedged debt | Primary debt instruments | Currency swap instruments | Hedged debt | ||||||
| Bank and other | 108 | — | 108 | 108 | — | 108 | ||||||
| 7.70% Debentures, due 2003 | 159 | 37 | 196 | 165 | 30 | 195 | ||||||
| 9.15% Debentures, due 2004 | 159 | 23 | 182 | 171 | 5 | 176 | ||||||
| 7.95% Debentures, due 2005 | 159 | 27 | 186 | 175 | 8 | 183 | ||||||
| 6.20% Debentures, due 2006 | 159 | 7 | 166 | 168 | 16 | 184 | ||||||
| 7.15% Debentures, due 2006 | 159 | 26 | 185 | 173 | 7 | 180 | ||||||
| 6.50% Debentures, due 2007 | 159 | 21 | 180 | 170 | 4 | 174 | ||||||
| 6.55% Medium-term notes, due 2007 | 285 | 11 | 296 | 307 | 25 | 332 | ||||||
| 6.90% Medium-term notes, due 2008 | 254 | 6 | 260 | 277 | 20 | 297 | ||||||
| 6.85% Medium-term notes, due 2011 | 254 | — | 254 | 272 | 21 | 293 | ||||||
| 5.75% Notes, due 2008 | 400 | — | 400 | 432 | — | 432 | ||||||
| 6.20% Notes, due 2012 | 700 | — | 700 | 759 | — | 759 | ||||||
| Floating rate notes | 125 | — | 125 | 125 | — | 125 | ||||||
| Private placements, due 2004—2010 | 475 | — | 475 | 536 | — | 536 | ||||||
| Redeemable preference shares (note 25) | 250 | — | 250 | 261 | — | 261 | ||||||
| 3,805 | 158 | 3,963 | 4,099 | 136 | 4,235 | |||||||
| Current portion | (318 | ) | (37 | ) | (355 | ) | ||||||
| 3,487 | 121 | 3,608 | ||||||||||
The floating rate notes will mature on March 22, 2004 and are subject to a one-year extension by the holders from March 22, 2004 to March 21, 2005. Interest, which is payable quarterly, is equal to U.S.$ LIBOR plus (i) 0.55% for the period from March 20, 2003 through March 21, 2004, and (ii) 0.65% for the period from March 22, 2004 through March 20, 2005. The private placements have interest rates ranging from 6.76% to 7.98%, with a weighted-average rate of 7.53% at December 31, 2003.
Bank and other debt at December 31, 2003 and 2002 was primarily denominated in foreign currencies. The debentures and medium-term notes are Canadian dollar denominated and are fully hedged into U.S. dollars. The 5.75% Notes, 4.25% Notes, 6.20% Notes, 5.25% Notes, floating rate
92
notes, private placements and redeemable preference shares are U.S. dollar denominated. The carrying amount of long-term debt, all of which is unsecured, was denominated in the following currencies:
| | Before hedging arrangements | After hedging arrangements | ||||||
|---|---|---|---|---|---|---|---|---|
| | 2003 | 2002 | 2003 | 2002 | ||||
| Canadian dollar | 1,908 | 1,747 | — | — | ||||
| U.S. dollar | 2,183 | 1,981 | 3,892 | 3,886 | ||||
| Other currencies | 77 | 77 | 77 | 77 | ||||
| 4,168 | 3,805 | 3,969 | 3,963 | |||||
Maturities of long-term debt in each of the next five years and thereafter are as follows:
| | 2004 | 2005 | 2006 | 2007 | 2008 | Thereafter | Total | |||||||
|---|---|---|---|---|---|---|---|---|---|---|---|---|---|---|
| Before hedging arrangements | 484 | 316 | 432 | 635 | 771 | 1,530 | 4,168 | |||||||
| After hedging arrangements | 475 | 311 | 401 | 577 | 726 | 1,479 | 3,969 |
At December 31, 2003, undrawn and available bank facilities amounted to $1,419 million.
In August 2003, Thomson completed an offering of $450 million of global notes. The offering included $200 million of 4.25% unsecured notes due 2009 and $250 million of 5.25% unsecured notes due 2013. The Company entered into an interest rate swap related to the 4.25% notes due 2009 to convert these notes from a fixed rate of interest to a floating rate of interest. Thomson used a portion of the proceeds to redeem $250 million of preferred shares issued to a subsidiary of Thomson's principal shareholder, The Woodbridge Company Limited ("Woodbridge") (see Note 25) and used the balance to repay other outstanding indebtedness and for general corporate purposes.
In January 2002, Thomson issued $400 million of U.S. dollar denominated principal amount unsecured notes due February 1, 2008 bearing an annual rate of interest of 5.75%, payable semi-annually. The net proceeds of $397 million were principally used to repay existing indebtedness.
Interest Rate Risk Exposures
Thomson enters into interest rate swap agreements to manage the mix of fixed and floating interest rates in its debt portfolio. The notional amount of interest rate swap agreements is used to measure interest to be paid or received and does not represent the amount of exposure to credit loss. The fair value of interest rate swap agreements as at December 31, 2003 was $49 million in favor of the counterparties (2002—$87 million in favor of the counterparties). The Company's notional amounts of interest rate swaps related to long-term debt as at December 31, 2003 are summarized as follows:
| | Maturing in: | | ||||||
|---|---|---|---|---|---|---|---|---|
| | Less than 1 year | 1 to 5 years | More than 5 years | Total | ||||
| Notional amounts of interest rate swaps | 182 | 436 | 200 | 818 | ||||
After taking account of hedging arrangements, the fixed and floating rate mix of long-term debt is as follows:
| | 2003 | Average interest rate | % Share | 2002 | Average interest rate | % Share | |||||||
|---|---|---|---|---|---|---|---|---|---|---|---|---|---|
| Total fixed | 3,421 | 6.5 | % | 86 | % | 3,871 | 6.5 | % | 98 | % | |||
| Total floating | 548 | 2.0 | % | 14 | % | 92 | 4.3 | % | 2 | % | |||
| 3,969 | 5.8 | % | 100 | % | 3,963 | 6.4 | % | 100 | % | ||||
93
Including the effect of short-term indebtedness, the proportion of fixed to floating rate debt is 84% to 16%, respectively. Floating interest rate long-term debt is LIBOR-based and, consequently, interest rates are reset periodically.
Foreign Exchange Contracts
Thomson uses foreign exchange contracts to manage foreign exchange risk. Generally, foreign exchange contracts are designated for existing assets and liabilities, firm commitments or forecasted transactions that are expected to occur in less than one year.
At December 31, 2003, the fair value of foreign exchange contracts was approximately $4 million in favor of Thomson (2002—$1 million in favor of counterparties), and consisted of foreign exchange contracts with gains of $5 million (2002—$1 million) and losses of $1 million (2002—$2 million).
Investments
At December 31, 2003, investments accounted for using the equity method had a carrying amount of $87 million (2002—$297 million, of which $202 million represented the Company's investment in BGM). These investments did not have market quotations. Losses from equity method investments were $13 million in 2003 (2002—$101 million, of which $81 million represented writedowns of investments). Of the $81 million in 2002, $67 million related to the Company's share of a writedown of goodwill recorded by BGM in the fourth quarter. During the second quarter of 2002, the Company also recorded a transitional impairment charge of $116 million for BGM in connection with the initial adoption of CICA 3062 by BGM. This amount was recorded directly to retained earnings, as it related to the initial adoption of the standard. As discussed in Note 24, in March 2003, the Company sold its interest in BGM to a company that is owned by the Thomson family.
At December 31, 2003, investments accounted for using the cost method totaled $48 million (2002—$54 million). During 2003 and 2002, Thomson determined that certain of its cost method investments had experienced losses in value that were other than temporary. A reduction in the carrying values of those investments of $4 million (2002—$54 million) for the year ended December 31, 2003 was included in "Net other income (expense)" in the consolidated statement of earnings and retained earnings.
The investments accounted for under both the equity and cost methods are included in "Other non-current assets" in the consolidated balance sheet.
94
Note 16: Capital
The change in capital, which includes stated capital and contributed surplus, is as follows:
| | Common share capital | Cumulative redeemable preference share capital | | | |||||||||
|---|---|---|---|---|---|---|---|---|---|---|---|---|---|
| | Number of shares | Stated capital | Series II | Series V | Contributed surplus | Total capital | |||||||
| Balance, December 31, 2001 | 630,740,649 | 1,756 | 110 | 332 | 14 | 2,212 | |||||||
| Common shares issued under offering | 14,615,385 | 437 | — | — | — | 437 | |||||||
| Common shares issued under Dividend Reinvestment Plan ("DRIP") | 5,771,650 | 168 | — | — | — | 168 | |||||||
| Common shares issued from stock option exercise | 22,800 | 1 | — | — | — | 1 | |||||||
| Redemption of related Thomson PLC shares | — | — | — | — | — | — | |||||||
| Redemption of Thomson PLC "A" ordinary shares | — | (1 | ) | — | — | — | (1 | ) | |||||
| Woodbridge issuance of common shares(note 25) | 431,503,802 | 1,102 | — | — | — | 1,102 | |||||||
| Woodbridge redemption of common shares(note 25) | (431,503,802 | ) | (1,102 | ) | — | — | — | (1,102 | ) | ||||
| Stock option expense(note 22) | — | — | — | — | 17 | 17 | |||||||
| Balance, December 31, 2002 | 651,150,484 | 2,361 | 110 | 332 | 31 | 2,834 | |||||||
| Redemption of Series V preference shares | — | — | — | (332 | ) | 21 | (311 | ) | |||||
| Common shares issued under DRIP | 3,344,390 | 94 | — | — | — | 94 | |||||||
| Common shares issued from stock option exercise and other employee programs | 84,423 | 3 | — | — | — | 3 | |||||||
| Stock option expense(note 22) | — | — | — | 19 | 19 | ||||||||
| Balance, December 31, 2003 | 654,579,297 | 2,458 | 110 | — | 71 | 2,639 | |||||||
Thomson Common Shares
Thomson common shares, which have no par value, are voting shares. The authorized common share capital of Thomson is an unlimited number of shares.
Holders of the common shares may participate in the DRIP under which cash dividends are automatically reinvested in new common shares having a value equal to the cash dividend. Such shares are valued at the weighted-average price at which the common shares traded on The Toronto Stock Exchange during the five trading days immediately preceding the record date for such dividend.
Public Offering of Common Shares
On June 12, 2002, the Company's common shares were listed on the New York Stock Exchange. On June 14, 2002, the Company and its principal shareholder, Woodbridge, completed a public offering of 32,051,284 common shares (the "offering") at a price of $31.20 per share. The offering included 14,615,385 common shares newly issued by the Company and 17,435,899 common shares held by Woodbridge. Proceeds to the Company from the offering, net of the underwriting commission and expenses, of $437 million were used for general corporate purposes including the repayment of
95
indebtedness. The Company did not receive any proceeds from the sale of common shares by Woodbridge. The expenses incurred from the offering were divided equally between the Company and Woodbridge, other than the underwriting commission, which was allocated among the Company and Woodbridge based upon the proportionate share of the proceeds from the offering received by each party.
Thomson PLC Common Shares
At December 31, 2001, holders of 5,574,476 Thomson common shares also held the same number of related common shares of The Thomson Corporation PLC ("Thomson PLC") with a par value of one sterling penny each. The holders of these shares had the alternative to receive their dividends in pounds sterling from Thomson PLC. During 2002, all of the related Thomson PLC shares were redeemed at par for less than $0.1 million in aggregate, concurrent with the common share issuance.
Thomson PLC "A" Ordinary Shares
During 2002, all of the Thomson PLC "A" ordinary shares were redeemed at par for $0.6 million in aggregate, concurrent with the common share issuance. In 2000, Thomson PLC issued these 10,982,764 "A" ordinary shares with a par value of four sterling pence each to Woodbridge out of 15 million shares available to be issued. See Note 25. Such shares were entitled to 5% of the votes at general meetings of the shareholders of Thomson PLC and could be redeemed by Thomson PLC at any time after January 1, 2004 at their par value. Dividends on these shares ranked pari passu with dividends on the ordinary shares of Thomson PLC and could not exceed 5% of the par value thereof, and the holder could not receive by way of payment on winding-up or return of capital an amount in excess of such par value.
Dividends
Dividends on the Thomson common shares are declared and payable in U.S. dollars. Shareholders also have the option of receiving dividends on the Thomson common shares in equivalent Canadian funds or pounds sterling. Dividends declared per common share in 2003 were $1.153 (2002—70.5 cents). Equivalent dividends of 24.1757 pence were paid per related common share of Thomson PLC up to the date of their redemption in 2002.
In the consolidated statement of cash flow, dividends paid on common shares are shown net of $19 million (2002—$19 million) reinvested in common shares issued under the DRIP and $75 million (2002—$149 million) reinvested through private placements of common shares with the Company's major shareholders. These private placements, together with the DRIP, satisfied the commitment of the Company's major shareholders to participate in the DRIP for at least 50% of the dividends declared on the Thomson common shares directly and indirectly owned by them. The Company's major shareholders acquired these common shares on the same terms and conditions under which Thomson issues common shares to shareholders participating in the DRIP. In July 2003, the Company's major shareholders agreed to discontinue such commitment. See Note 25.
Preference Share Capital
The authorized preference share capital of Thomson is an unlimited number of preference shares without par value. The directors are authorized to issue preference shares without par value in one or more series, and to determine the number of shares in, and terms attaching to, each such series.
Series II, Cumulative Redeemable Preference Shares
As at December 31, 2003 and 2002, 6,000,000 shares of Series II, Cumulative Redeemable Preference Shares were outstanding. The Series II preference shares are non-voting and are
96
redeemable at the option of Thomson for Cdn$25.00 per share, together with accrued dividends. Dividends are payable quarterly at an annual rate of 70% of the Canadian bank prime rate applied to the stated capital of such shares. The total number of authorized Series II preference shares is 6,000,000.
Series V, Cumulative Redeemable Preference Shares
As at December 31, 2002, 18,000,000 shares of Series V, Cumulative Redeemable Preference Shares were outstanding. On April 14, 2003, Thomson redeemed all of its outstanding Series V, Cumulative Redeemable Preference Shares for $308 million, which represented a price of Cdn$25.50 per share plus accrued dividends, and associated tax of $3 million.
At December 31, 2002, the shares were recorded within "Capital" within the consolidated balance sheet at their historical value of $332 million. The $21 million increase to contributed surplus represents the difference between the historical value of $332 million and the redemption amount of $308 million, which was due to exchange rate fluctuations of $30 million less the premium paid on the redemption of $6 million, and taxes of $3 million. This gain was included in the calculation of earnings attributable to common shares.
Note 17: Employee Future Benefits
Thomson sponsors both defined benefit and defined contribution employee future benefit plans covering substantially all employees. Costs for all future employee benefits are accrued over the periods in which employees earn the benefits.
Defined Benefit Plans
Thomson sponsors defined benefit plans providing pension and other post-retirement benefits to covered employees. Net periodic pension expense for employee future benefits is actuarially determined using the projected benefit method. The Company uses a measurement date of September 30th for the majority of its plans.
On December 8, 2003, the Medicare Prescription Drug, Improvement and Modernization Act of 2003 ("the Act") was signed into law in the United States. The Act introduces a prescription drug benefit under Medicare (Medicare Part D) as well as a federal subsidy to sponsors of retiree health care benefit plans that provide a benefit that is at least actuarially equivalent to Medicare Part D. As the Act was signed after the measurement date of the Company's U.S. benefit plan, no effect of the Act was reflected in the Company's financial statements. Additionally, the U.S. Financial Accounting Standards Board ("FASB") issued Staff Position No. FAS 106-1,Accounting and Disclosure Requirements Related to the Medicare Prescription Drug, Improvement and Modernization Act of 2003, which states that any measures of the accumulated projected benefit obligation or net periodic benefit cost in these financial statements or accompanying notes should not reflect the effect of the Act on the Company's U.S. plan. Further specific guidance on proper accounting for the Act is pending from the FASB and, when issued, may require financial statement issuers to restate previously reported information. While the Company's financial statements are prepared in accordance with Canadian GAAP, the Company will follow the provisions of Staff Position FAS 106-1 unless specific guidance is issued by the CICA and the approved Staff Position does not conflict with Canadian GAAP. The Company may need to amend its plan in order to benefit from the Act and is currently awaiting the issuance of specific guidelines from the U.S. Department of Health and Human Services to allow further evaluation. At this time, the Company cannot estimate the impact of the federal subsidy and a change to its plan, if any, on future expense or cash flows.
97
The following significant weighted-average assumptions were employed to determine the net periodic pension and post-retirement plans' expenses and the accrued benefit obligations:
| | Pensions | Other post-retirement plans | |||||||
|---|---|---|---|---|---|---|---|---|---|
| | 2003 | 2002 | 2003 | 2002 | |||||
| Assumptions used to determine net periodic pension expense | |||||||||
| Expected long-term rate of return on plan assets | 8.2 | % | 8.9 | % | n/a | n/a | |||
| Discount rate | 6.3 | % | 6.8 | % | 6.7 | % | 7.2 | % | |
| Rate of compensation increase | 4.7 | % | 4.9 | % | 5.2 | % | 5.6 | % | |
| Assumptions used to determine benefit obligation | |||||||||
| Discount rate | 5.8 | % | 6.3 | % | 6.1 | % | 6.7 | % | |
| Rate of compensation increase | 4.3 | % | 4.7 | % | n/a | * | 5.2 | % | |
- *
- At the end of 2003, plans consist almost entirely of retired employees.
The Company uses multiple techniques to determine its expected long-term rate of return on plan assets. These include the use of statistical models and the examination of historical returns.
The Company's net defined benefit plan (income) expense is comprised of the following elements:
| | Pensions | Other post-retirement plans | |||||||||||
|---|---|---|---|---|---|---|---|---|---|---|---|---|---|
| | Funded | Unfunded | | | |||||||||
| | 2003 | 2002 | 2003 | 2002 | 2003 | 2002 | |||||||
| Current service cost | 39 | 30 | 5 | 4 | 2 | 1 | |||||||
| Interest cost | 104 | 95 | 10 | 9 | 8 | 7 | |||||||
| Expected return on plan assets | (148 | ) | (134 | ) | — | — | — | — | |||||
| Amortization of net transition obligation | 3 | 3 | — | — | — | — | |||||||
| Amortization of net actuarial losses (gains) | 8 | (3 | ) | — | — | 1 | (1 | ) | |||||
| Amortization of prior service cost | — | — | 3 | 1 | — | — | |||||||
| Change in valuation allowance provided against accrued benefit asset | — | (32 | ) | — | — | — | — | ||||||
| Net defined benefit plan (income) expense | 6 | (41 | ) | 18 | 14 | 11 | 7 | ||||||
98
The following information summarizes activity in all of the pension and other post-retirement benefit plans for the Company:
| | Pensions | Other post-retirement plans | |||||||||||
|---|---|---|---|---|---|---|---|---|---|---|---|---|---|
| | Funded | Unfunded | | | |||||||||
| | 2003 | 2002 | 2003 | 2002 | 2003 | 2002 | |||||||
| Benefit obligation | |||||||||||||
| Beginning benefit obligation | 1,632 | 1,414 | 142 | 121 | 126 | 93 | |||||||
| Current service cost | 39 | 30 | 5 | 4 | 2 | 1 | |||||||
| Interest cost | 104 | 95 | 10 | 9 | 8 | 7 | |||||||
| Plan participants' contributions | 4 | 3 | — | — | 1 | 1 | |||||||
| Actuarial losses | 126 | 99 | 14 | 8 | 33 | 33 | |||||||
| Non-routine events | — | 2 | 5 | (2 | ) | (2 | ) | — | |||||
| Acquisitions, net | — | — | 1 | 8 | — | — | |||||||
| Benefits paid | (77 | ) | (73 | ) | (7 | ) | (6 | ) | (10 | ) | (9 | ) | |
| Translation adjustments | 86 | 62 | 3 | — | 1 | — | |||||||
| Ending benefit obligation | 1,914 | 1,632 | 173 | 142 | 159 | 126 | |||||||
| Plan assets | |||||||||||||
| Beginning fair value of plan assets | 1,532 | 1,468 | — | — | — | — | |||||||
| Actual return (loss) on plan assets | 213 | (80 | ) | — | — | — | — | ||||||
| Employer contributions | 66 | 149 | 7 | 6 | 10 | 8 | |||||||
| Plan participants' contributions | 4 | 6 | — | — | 1 | 1 | |||||||
| Benefits paid | (77 | ) | (73 | ) | (7 | ) | (6 | ) | (10 | ) | (9 | ) | |
| Acquisitions, net | 2 | — | — | — | (1 | ) | — | ||||||
| Translation adjustments | 81 | 62 | — | — | — | — | |||||||
| Ending fair value of plan assets | 1,821 | 1,532 | — | — | — | — | |||||||
| Funded status—deficit | (93 | ) | (100 | ) | (173 | ) | (142 | ) | (159 | ) | (126 | ) | |
| Unamortized net actuarial loss | 544 | 478 | 30 | 17 | 53 | 22 | |||||||
| Unamortized past service costs | 6 | 6 | 9 | 6 | — | — | |||||||
| Unamortized net transitional asset | (6 | ) | (3 | ) | — | — | — | — | |||||
| Post-measurement date activity | 26 | * | 1 | 2 | 2 | 3 | 2 | ||||||
| Accrued benefit asset (liability) | 477 | 382 | (132 | ) | (117 | ) | (103 | ) | (102 | ) | |||
- *
- Consists primarily of contributions.
The accrued benefit assets and liabilities are included within "Other non-current assets" and "Other non-current liabilities" within the consolidated balance sheet.
The unfunded pension plans referred to above consist primarily of supplemental executive retirement plans ("SERP") for eligible employees. Thomson partially funds the liabilities of these plans through insurance contracts, which are excluded from plan assets in accordance with CICA Handbook Section 3461. The cash surrender values of insurance contracts used to fund the SERPs total $33 million at December 31, 2003 and are included in "Other noncurrent assets" in the Company's consolidated balance sheet.
The benefit obligations of funded plans that had benefit obligations that exceeded plan assets at December 31, 2003 were $1,584 million (2002—$1,346 million). These plans had related fair values of plan assets of $1,467 million (2002—$1,220 million). While these plans are not considered fully funded
99
for financial reporting purposes, they are adequately funded under the applicable statutory funding rules and regulations governing the particular plans.
The average healthcare cost trend rate used was 10% for 2004, which is reduced ratably to 5% in 2009. A 1% change in the trend rate would result in an increase or decrease in the benefit obligation for post-retirement benefits of approximately 9% at December 31, 2003.
The Company's pension plan asset allocation at December 31, 2003 and 2002 is as follows:
| | Percentage of plan assets at December 31 | ||||
|---|---|---|---|---|---|
| Asset category | |||||
| 2003 | 2002 | ||||
| Equity securities | 56 | % | 45 | % | |
| Debt securities | 39 | % | 45 | % | |
| Other | 5 | % | 10 | % | |
| Total | 100 | % | 100 | % | |
As of December 31, 2003 and 2002 there were no Thomson securities held in the Company's pension plans' assets.
Plan assets are invested to satisfy the fiduciary obligation to adequately secure benefits and to minimize Thomson's long-term contributions to the plans.
In September 2003, the Company contributed $50 million (2002—$107 million) to its principal qualified defined benefit pension plan in the U.S. In the fourth quarter of 2003, the Company contributed $31 million (2002—$35 million) to various benefit plans, principally in the United Kingdom and Canada. While none of these contributions was required under the applicable funding rules and regulations governing each country, the Company decided to make the voluntary contributions in light of the decrease in interest rates, which increased the present value of the future pension obligations.
Based on regulatory requirements, the Company is not obligated to make contributions in 2004 to its major pension plan, which is in the U.S. However, from time to time, the Company may elect to voluntarily contribute to the plan in order to improve its funded status. Because the decision to voluntarily contribute is based on various market related factors, including asset values and interest rates, which are used to determine the plan's funded status, the Company cannot predict whether, nor the amount, it will elect to voluntarily contribute in 2004.
100
The benefit payments for the years ended December 31, 2003 and 2002 and the estimated payments thereafter, as assumed in the calculation of the benefit obligation as of December 31, 2003, are as follows:
Benefit Payments
| | Pensions | | |||||
|---|---|---|---|---|---|---|---|
| | Other post- retirement plans | ||||||
| | Funded | Unfunded | |||||
| 2002 | 73 | 6 | 9 | ||||
| 2003 | 77 | 7 | 10 | ||||
| Estimated future payments: | |||||||
| 2004 | 84 | 6 | 16 | ||||
| 2005 | 85 | 6 | 16 | ||||
| 2006 | 88 | 7 | 16 | ||||
| 2007 | 91 | 7 | 16 | ||||
| 2008 | 94 | 7 | 17 | ||||
| 2009 to 2013 | 510 | 57 | 84 | ||||
Defined Contribution Plans
The Company and its subsidiaries sponsor various defined contribution savings plans that have provisions for company-matching contributions. Total expense related to defined contribution plans was $64 million in 2003 (2002—$63 million).
Note 18: Contingencies, Commitments and Guarantees
Claims and Legal Actions
At December 31, 2003, certain lawsuits and other claims in the normal course of business were pending against Thomson. While the outcome of these matters is subject to future resolution, management's evaluation and analysis of such matters indicates that, individually and in the aggregate, the probable ultimate resolution of such matters will not have a material effect on the Company's consolidated financial statements.
Taxes
The Company maintains a tax liability for contingencies associated with known issues under discussion with tax authorities and transactions yet to be settled and regularly assesses the adequacy of this tax liability. The Company records liabilities for known tax contingencies when, in the Company's judgment, it is probable that a liability has been incurred.
Leases
The Company enters into operating leases in the ordinary course of business, primarily for real property and equipment. Payments for these leases are contractual obligations as scheduled per each agreement. Operating lease payments in 2003 were $204 million (2002—$215 million). The future minimum operating lease payments are $190 million in 2004, $173 million in 2005, $132 million in 2006, $112 million in 2007, $98 million in 2008 and $344 million thereafter.
With certain leases, the Company guarantees a portion of the residual value loss, if any, incurred by the lessors in disposing of the assets, or in restoring a property to a specified condition after completion of the lease period. The Company believes, based upon current facts and circumstances, that the likelihood of a material payment pursuant to such guarantees is remote.
101
Business Combinations and Investments
The Company has obligations to pay additional consideration for prior acquisitions, typically based upon performance measures contractually agreed to at the time of purchase. Known payments have been accrued. The Company does not believe that additional payments would have a material impact on the consolidated financial statements. Additionally, the Company has capital commitments of $15 million to investees of which $11 million is payable upon demand and $4 million is payable upon the attainment of certain operational milestones by the investee.
In certain disposition agreements, the Company guarantees to the purchaser the recoverability of certain assets or limits on certain liabilities. The Company believes, based upon current facts and circumstances, that a material payment pursuant to such guarantees is remote. In connection with two prior dispositions, the Company has guaranteed certain obligations of which $29 million remain potentially outstanding at December 31, 2003. At this time, Thomson estimates that it will incur $13 million of the remaining contingency, and has accrued this estimate within "Accounts payable and accruals" and "Other non-current liabilities" in the consolidated balance sheet.
Other Commitments
At December 31, 2003 the Company has various unconditional purchase obligations. These obligations are for materials, supplies and services incident to the ordinary conduct of business.
Note 19: Restructuring Charges
During the first quarter of 2002, the Company completed restructuring activities pertaining to strategic initiatives undertaken in the prior year to improve operational and administrative efficiencies within Thomson Legal & Regulatory and Thomson Media. The restructuring charges for the year ended December 31, 2002 consisted of a charge to Thomson Legal & Regulatory of $4 million and a charge to Corporate and other of $2 million.
The following table presents the activity in and balances of the restructuring liability accounts, included in "Accounts payable and accruals" and "Other non-current liabilities" in the consolidated balance sheet, from December 31, 2002 through December 31, 2003:
| Type of cost | Balance December 31, 2002 | 2003 Utilization | 2003 Other movements | Balance December 31, 2003 | ||||
|---|---|---|---|---|---|---|---|---|
| Severance | 3 | (3 | ) | — | — | |||
| Contract cancellation costs | 6 | (3 | ) | (1 | ) | 2 | ||
| Other exit costs | 1 | — | — | 1 | ||||
| 10 | (6 | ) | (1 | ) | 3 | |||
Substantially all of the restructuring charges recorded represented expected cash outlays.
102
Note 20: Acquisitions and Disposals of Businesses and Investments
During the year ended December 31, 2003, 25 businesses and two investments (2002—26 businesses and four investments) were acquired for cash consideration as follows:
| | Year ended December 31 | |||
|---|---|---|---|---|
| | 2003 | 2002 | ||
| Businesses acquired | 233 | 277 | ||
| Investments in businesses | 3 | 10 | ||
| Total acquisitions of businesses and investments | 236 | 287 | ||
All acquisitions have been accounted for using the purchase method and the results of acquired businesses are included in the consolidated financial statements from the dates of acquisition. For acquisitions made in 2003 and 2002, the majority of the acquired goodwill is not deductible for tax purposes.
The details of net assets of businesses acquired are as follows:
| | 2003 | 2002 | |||
|---|---|---|---|---|---|
| Cash and cash equivalents | 25 | 15 | |||
| Accounts receivable | 23 | 5 | |||
| Inventories | 4 | 2 | |||
| Prepaid expenses and other current assets | 5 | 8 | |||
| Property and equipment | 8 | 8 | |||
| Identifiable intangible assets | 105 | 107 | |||
| Goodwill | 119 | 182 | |||
| Other non-current assets | 6 | — | |||
| Total assets | 295 | 327 | |||
| Accounts payable and accruals | (27 | ) | (23 | ) | |
| Deferred revenue | (29 | ) | (20 | ) | |
| Other non-current liabilities | (6 | ) | (7 | ) | |
| Total liabilities | (62 | ) | (50 | ) | |
| Net assets | 233 | 277 | |||
As of December 31, 2003, the balance of the reserves for exit costs related to business acquisitions consummated during 2001 through 2003 totaled $6 million. Reserves recorded in connection with businesses acquired during the year ended December 31, 2003 were $4 million. The following table presents the activity in these acquisition reserve accounts, which are included within "Accounts payable and accruals" and "Other non-current liabilities" in the consolidated balance sheet.
| Type of cost | Balance December 31, 2002 | 2003 Utilization | 2003 Additions | Other movements | Balance December 31, 2003 | |||||
|---|---|---|---|---|---|---|---|---|---|---|
| Severance and other employee-related costs | 8 | (6 | ) | 4 | (5 | ) | 1 | |||
| Lease cancellation and idle facility costs | 11 | (2 | ) | — | (5 | ) | 4 | |||
| Other exit costs | 4 | (1 | ) | — | (2 | ) | 1 | |||
| Total | 23 | (9 | ) | 4 | (12 | ) | 6 | |||
103
The following highlights certain acquisitions, none of which was significant individually nor in the aggregate:
| Date | Company | Acquiring market group | Description | |||
|---|---|---|---|---|---|---|
| December 2003 | Quickfinder | Legal & Regulatory | A provider of tax reference materials and knowledge | |||
| July 2003 | TaxRelief | Legal & Regulatory | A provider of integrated tax compliance and ccounting software products | |||
| July 2003 | Gage | Learning | A provider of educational materials to Canadian market | |||
| May 2003 | Elite | Legal & Regulatory | A provider of integrated practice and financial management applications | |||
| December 2002 | Delphion | Scientific & Healthcare | A provider of full-text patent research information | |||
| August 2002 | Current Drugs | Scientific & Healthcare | A provider of competitor intelligence services to the pharmaceutical industry | |||
| August 2002 | Lawtel | Legal & Regulatory | AU.K.-based online legal current awareness provider |
The identifiable intangible assets acquired are summarized as follows:
| | | | Weighted-average amortization period (years) | ||||||
|---|---|---|---|---|---|---|---|---|---|
| | 2003 | 2002 | 2003 | 2002 | |||||
| Finite useful lives: | |||||||||
| Tradenames | 14 | 12 | 14 | 13 | |||||
| Customer relationships | 37 | 38 | 14 | 7 | |||||
| Databases and content | 43 | 55 | 10 | 8 | |||||
| Other | 11 | 2 | 8 | 9 | |||||
| 105 | 107 | ||||||||
Disposals
In 2003, Thomson received $288 million (2002—$51 million) cash consideration from the disposals of businesses and investments which did not qualify as discontinued operations within the following segments:
| | 2003 | 2002 | ||
|---|---|---|---|---|
| Legal & Regulatory | 4 | 2 | ||
| Learning | — | 19 | ||
| Financial | 5 | 1 | ||
| Scientific & Healthcare | — | 7 | ||
| Corporate and other | 279 | 22 | ||
| 288 | 51 | |||
The disposal within Corporate and other in 2003 is the sale of the Company's 20% interest in BGM. See Note 24.
104
Note 21: Cumulative Translation Adjustment
An analysis of the cumulative translation adjustment shown separately in shareholders' equity in the consolidated balance sheet is as follows:
| | 2003 | 2002 | |||
|---|---|---|---|---|---|
| Balance at beginning of year | (64 | ) | (231 | ) | |
| Realized from disposal of investment | 14 | — | |||
| Net translation gains | 309 | 167 | |||
| Balance at end of year | 259 | (64 | ) | ||
Note 22: Stock-based Compensation
Stock Appreciation Rights Plan
Thomson has a Stock Appreciation Rights ("SAR") plan that provides for the granting of SARs to officers and key employees. The SAR provides the holder with the opportunity to earn a cash award equal to the fair market value of the Company's common stock less the price at which the SAR was issued. Compensation expense is measured based on the market price of Thomson common stock at the end of the reporting period. The SARs outstanding under the plan have been granted at the closing price of the Company's common stock on the day prior to the date of grant, vest over a four to eight-year period, and expire five to eleven years after the grant date. The compensation expense is recognized over the applicable period. At December 31, 2003, the authorized number of SARs was 20,500,000 and there were 3,298,419 units available for grant. Thomson recognized an expense of $7 million related to the SAR plan for the year ended December 31, 2003 (2002—$9 million benefit) in the consolidated statement of earnings and retained earnings as a result of the increase (2002—decrease) in the Company's share price as compared to the prior year-end.
A summary of the status of the Thomson SAR plan as of December 31, 2003 and 2002, and changes during the years ended on those dates, is as follows:
| | 2003 | 2002 | ||||||
|---|---|---|---|---|---|---|---|---|
| | SARs | Canadian $ weighted-average exercise price | SARs | Canadian $ weighted-average exercise price | ||||
| Outstanding at beginning of year | 3,132,281 | 34.46 | 3,424,744 | 33.11 | ||||
| Granted | 192,032 | 44.32 | 165,768 | 40.69 | ||||
| Exercised | (415,798 | ) | 23.44 | (361,229 | ) | 26.09 | ||
| Forfeited | (297,347 | ) | 38.31 | (97,002 | ) | 28.56 | ||
| Outstanding at end of year | 2,611,168 | 36.51 | 3,132,281 | 34.46 | ||||
| Exercisable at end of year | 2,085,323 | 34.46 | 2,091,365 | 31.86 | ||||
The following table summarizes information on SARs outstanding at December 31, 2003:
| | SARs outstanding | SARs exercisable | ||||||||
|---|---|---|---|---|---|---|---|---|---|---|
| Canadian $ range of exercise prices | ||||||||||
| Number outstanding at 12/31/03 | Weighted-average remaining contractual life | Canadian $ weighted-average exercise price | Number exercisable at 12/31/03 | Canadian $ weighted-average exercise price | ||||||
| 16.00 - 17.25 | 6,500 | 0.9 | 16.96 | 6,500 | 16.96 | |||||
| 21.77 - 32.125 | 592,088 | 2.8 | 23.23 | 589,588 | 23.20 | |||||
| 35.00 - 44.50 | 1,712,300 | 5.5 | 38.48 | 1,310,741 | 37.13 | |||||
| 48.40 - 57.45 | 300,280 | 7.6 | 51.84 | 178,494 | 52.72 | |||||
105
Stock Incentive Plan
On January 24, 2000, the Board of Directors approved the adoption of a stock incentive plan, which authorizes the Company to grant officers and key employees stock options. Under the plan, the exercise price equals the closing market price of the Company's stock on the day prior to the date of the grant and the maximum term of an option is 10 years. In general, grants vest 25% per year from the date of issuance. Under the plan options may be granted in either Canadian dollars or U.S. dollars. As of December 31, 2003 there were 8,304,840 shares available for grant (2002—10,214,585).
A summary of the status of the options granted and exercised in Canadian dollars as of December 31, 2003 and 2002, and changes during the years ended on those dates, is as follows:
| | 2003 | 2002 | ||||||
|---|---|---|---|---|---|---|---|---|
| | Options | Canadian $ weighted-average exercise price | Options | Canadian $ weighted-average exercise price | ||||
| Outstanding at beginning of year | 7,085,813 | 49.50 | 7,127,813 | 49.56 | ||||
| Granted | 11,500 | 44.37 | 84,000 | 42.56 | ||||
| Exercised | (53,000 | ) | 41.00 | (22,800 | ) | 41.00 | ||
| Forfeited | (767,223 | ) | 50.62 | (103,200 | ) | 50.15 | ||
| Outstanding at end of year | 6,277,090 | 49.43 | 7,085,813 | 49.50 | ||||
| Exercisable at end of year | 3,734,394 | 50.22 | 2,561,339 | 50.56 | ||||
The following table summarizes information on Canadian dollar stock options outstanding at December 31, 2003:
| | Options outstanding | Options exercisable | ||||||||
|---|---|---|---|---|---|---|---|---|---|---|
| Canadian $ range of exercise prices | ||||||||||
| Number outstanding at 12/31/03 | Weighted-average remaining contractual life | Canadian $ weighted-average exercise price | Number exercisable at 12/31/03 | Canadian $ weighted-average exercise price | ||||||
| 40.69 - 44.40 | 1,564,800 | 6.2 | 41.03 | 889,000 | 41.01 | |||||
| 45.90 - 48.70 | 2,584,080 | 7.9 | 48.37 | 1,287,035 | 48.37 | |||||
| 50.25 - 57.45 | 2,128,210 | 7.0 | 56.88 | 1,558,359 | 57.00 | |||||
A summary of the status of the stock incentive plan granted and exercised in U.S. dollars as of December 31, 2003, and changes during the year ended December 31, 2003, is as follows:
| | 2003 | 2002 | ||||||
|---|---|---|---|---|---|---|---|---|
| | Options | U.S. $ weighted-average exercise price | Options | U.S. $ weighted-average exercise price | ||||
| Outstanding at beginning of year | 2,576,802 | 26.30 | — | — | ||||
| Granted | 2,689,968 | 33.42 | 2,576,802 | 26.30 | ||||
| Exercised | (1,875 | ) | 26.06 | — | — | |||
| Forfeited | (24,500 | ) | 26.06 | — | — | |||
| Outstanding at end of year | 5,240,395 | 29.96 | 2,576,802 | 26.30 | ||||
| Exercisable at end of year | 636,200 | 26.30 | — | — | ||||
106
The following table summarizes information on U.S. dollar stock options outstanding at December 31, 2003:
| | Options outstanding | Options exercisable | ||||||||
|---|---|---|---|---|---|---|---|---|---|---|
| U.S. $ range of exercise prices | Number outstanding at 12/31/03 | Weighted-average remaining contractual life | U.S. $ weighted-average exercise price | Number exercisable at 12/31/03 | U.S. $ weighted-average exercise price | |||||
| 26.06 - 29.70 | 2,470,427 | 9.0 | 26.12 | 606,200 | 26.08 | |||||
| 30.79 - 33.49 | 2,769,968 | 9.9 | 33.37 | 30,000 | 30.82 | |||||
The Company expenses the fair value of all stock options using the Black-Scholes pricing model to compute an estimate of fair value. Under this method, a fair value is determined for each option at the date of grant, and that amount is recognized as expense over the vesting period. For the year ended December 31, 2003, compensation expense recorded in connection with the stock incentive plan was $19 million (2002—$17 million) before income taxes.
Using the Black-Scholes pricing model, the weighted-average fair value of options granted was estimated to be $7.63 and $6.40 for the years ended December 31, 2003 and 2002, respectively. The Black-Scholes model was developed for use in estimating the fair value of traded options that have no vesting restrictions. In addition, the model requires the use of subjective assumptions, including expected stock price volatility. The principal assumptions used in applying the Black-Scholes option-pricing model for the years ended December 31, 2003 and 2002 were as follows:
| | 2003 | 2002 | |||
|---|---|---|---|---|---|
| Risk-free interest rate | 3.5 | % | 3.4 | % | |
| Dividend yield | 2.3 | % | 2.1 | % | |
| Volatility factor | 24.4 | % | 25.3 | % | |
| Expected life(in years) | 6 | 6 |
Note 23: Supplemental Cash Flow Information
Details of "Changes in working capital and other items" are:
| | 2003 | 2002 | |||
|---|---|---|---|---|---|
| Accounts receivable | (8 | ) | 151 | ||
| Inventories | (20 | ) | (29 | ) | |
| Prepaid expenses and other current assets | (40 | ) | 15 | ||
| Accounts payable and accruals | 5 | (34 | ) | ||
| Deferred revenue | 66 | 12 | |||
| Income taxes | (17 | ) | (1 | ) | |
| Other | (79 | ) | (56 | ) | |
| (93 | ) | 58 | |||
Income taxes paid during 2003 were $233 million (2002—$136 million). Income tax refunds received during 2003 were $18 million (2002—$64 million).
Note 24: Bell Globemedia Inc.
On March 17, 2003, the Company sold its 20% interest in Bell Globemedia Inc. ("BGM") to a company that is owned by the Thomson family for $279 million. In the event that BGM is subsequently sold to a third party for a gain prior to February 7, 2005, the Company is entitled to receive half of the gain relative to its former interest, subject to certain adjustments. If no such gains are recognized from a subsequent sale to a third party, the Company is not required to reimburse the former owner for any
107
losses. The Company's Board of Directors appointed a committee of independent directors to review the transaction. The committee retained a financial advisor to provide an opinion to the Company as to the fairness of the transaction from a financial point of view. One of the directors of the Company is also a director of the parent company of the financial advisor, but was not a member of the committee.
In connection with the sale, the Company paid a special dividend, equal to the proceeds received, of $0.428 per common share on March 17, 2003. During the fourth quarter of 2002, the Company had reduced the carrying amount of this investment by $67 million, reflecting its share of a writedown of goodwill recorded by BGM. Upon completion of the sale of the Company's interest, it recognized a gain of $55 million recorded in "Net other income (expense)" within the consolidated statement of earnings and retained earnings, largely offsetting the previous non-cash writedown.
Note 25: Related Party Transactions
As at December 31, 2003 through Woodbridge and its affiliates, Kenneth R. Thomson controlled approximately 69% of our common shares.
In the normal course of business, a Woodbridge-owned company rents office space from one of the Company's subsidiaries. Additionally, a number of the Company's subsidiaries charge a Woodbridge-owned company fees for various administrative services. In 2003, the amounts charged for these rentals and services were approximately $2 million. Additionally, in 2003, the Company paid a director, Mr. J.A. Tory, $89,000 for advisory services in connection with the Company's long-term tax and capital strategies.
The employees of Jane's Information Group, a business sold by the Company to Woodbridge in April 2001, continue to participate in the Company's United States and United Kingdom pension plans. Jane's makes proportional contributions to these plans as required.
In September 2003, the Company redeemed $250 million of preferred shares issued by a Thomson subsidiary to a subsidiary of Woodbridge. The shares, which were originally issued in February 2001 and exchanged in February 2002 for separate preferred shares in the same face amount, paid a fixed annual dividend of 4.5% and by their original term were redeemable at the option of either Woodbridge or the Company beginning February 2006 and annually thereafter. Prior to the redemption, the shares were included within "Long-term debt" in the consolidated balance sheet.
In July 2003, Thomson announced that Woodbridge had agreed to discontinue its commitment to participate in the Company's dividend reinvestment plan. Previously, Woodbridge had agreed to reinvest at least 50% of the quarterly dividends received by it and its subsidiaries in common shares through June 2005. All eligible Thomson shareholders, including Woodbridge, retain the ability to reinvest their dividends in Thomson stock on a voluntary basis under the DRIP.
In March 2003, the Company sold its 20% interest in BGM to a company that is owned by the Thomson family for $279 million. See Note 24.
In September 2002, the Company sold a parcel of properties located in Toronto, Ontario to Woodbridge for $15 million. In connection with this transaction, the Company received a report from a financial advisor providing an assessment of market values of those properties. The transaction was recorded based upon the $15 million exchanged in the transaction, and the proceeds were recorded in "Proceeds from disposals of businesses and investments" while the resulting gain of $2 million was included in "Net other income (expense)" within the consolidated financial statements. If Woodbridge sells any of the properties for a gain prior to September 30, 2005, Thomson is entitled to receive half of the gain subject to certain adjustments. If Woodbridge does not recognize any such gains, the Company is not required to reimburse Woodbridge for any losses. In prior periods, the Company had maintained a liability of $8 million for certain of the above-noted properties that were to be contributed to BGM. During 2002, the Company negotiated an agreement with BGM under which the
108
Company paid cash to BGM equivalent to the recorded liability, in order to relieve the Company of its obligation to contribute these properties. The properties were then included within the parcel of properties sold to Woodbridge.
In September 2002, the Company entered into an agreement with Woodbridge to reduce the cost of the Company's directors' and officers' insurance coverage. Under the terms of the agreement, the Company maintains standard directors' and officers' insurance for any amount up to $15 million with a third-party insurance company. A separate third-party insurer is responsible for the next $75 million of coverage. Woodbridge indemnifies this second insurer. For its agreement to indemnify the insurer, the Company pays Woodbridge an annual premium of $685,000, which is less than the premium that the Company would have paid to a third party.
In June 2002, the Company completed a series of transactions to assist Woodbridge in reorganizing its holding of the Company's common shares to achieve certain Canadian tax objectives. Similar transactions were completed at the same time with certain companies affiliated with Woodbridge and a company controlled by one of the Company's directors. The Company issued an aggregate of 431,503,802 common shares to members of this group of companies, and a wholly-owned subsidiary of the Company acquired the same number of common shares from members of this group of companies. Immediately following the acquisition, the wholly-owned subsidiary was wound up into the Company and the 431,503,802 common shares it held were cancelled. The total number of the Company's common shares outstanding, as well as the Company's stated capital, was the same before and after this series of transactions. Woodbridge and the other companies have reimbursed the Company for all costs and expenses arising from, and have agreed to indemnify the Company (and the officers, directors and shareholders of the Company and its subsidiaries) against any liabilities that may arise in connection with the series of transactions. These transactions had no economic effect, did not cause any change to the Company's common shares or result in any other consequence to the Company or to the Company's other shareholders.
In June 2002, one of the Company's wholly-owned U.K. subsidiaries, The Thomson Corporation PLC, redeemed its outstanding Series A ordinary shares for $0.6 million. The Series A ordinary shares were held by Woodbridge.
Note 26: Segment Information
Thomson is a global provider of integrated information solutions for business and professional customers. Thomson operates in four reportable market segments worldwide. The reportable segments of Thomson are strategic business groups that offer products and services to target markets. The accounting policies applied by the segments are the same as those applied by the Company. The Company's four reportable segments are:
Legal & Regulatory
Providing integrated information solutions to legal, tax, accounting, intellectual property, compliance and other business professionals, as well as government agencies.
Learning
Providing tailored learning solutions to colleges, universities, professors, students, libraries, reference centers, government agencies, corporations and professionals.
Financial
Providing financial products and information solutions to the global financial services industry, including brokers, financial planners and corporate executives.
109
Providing information and services to researchers, physicians and other professionals in the healthcare, academic, scientific, corporate and government marketplaces.
Business Segments—2003
| (millions of U.S. dollars) | Revenues | Adjusted EBITDA | Adjusted operating profit | Additions to capital assets(1) | Total assets | |||||
|---|---|---|---|---|---|---|---|---|---|---|
| Legal & Regulatory | 3,144 | 981 | 800 | 370 | 7,412 | |||||
| Learning | 2,052 | 520 | 337 | 242 | 5,108 | |||||
| Financial | 1,528 | 406 | 231 | 154 | 2,914 | |||||
| Scientific & Healthcare | 760 | 217 | 186 | 26 | 994 | |||||
| Corporate and other(2) | 164 | (60 | ) | (78 | ) | 15 | 1,988 | |||
| Eliminations | (42 | ) | — | — | — | — | ||||
| Continuing operations | 7,606 | 2,064 | 1,476 | 807 | 18,416 | |||||
| Discontinued operations | 264 | |||||||||
| Total | 18,680 | |||||||||
Business Segments—2002 | | | | | | |||||
| (millions of U.S. dollars) | Revenues | Adjusted EBITDA | Adjusted operating profit | Additions to capital assets(1) | Total assets | |||||
| Legal & Regulatory | 2,962 | 928 | 769 | 238 | 7,195 | |||||
| Learning(3) | 2,036 | 465 | 302 | 226 | 5,068 | |||||
| Financial(4) | 1,624 | 414 | 244 | 129 | 3,022 | |||||
| Scientific & Healthcare | 696 | 189 | 162 | 221 | 985 | |||||
| Corporate and other(2)(5) | 168 | (35 | ) | (51 | ) | 8 | 1,902 | |||
| Eliminations | (42 | ) | — | — | — | — | ||||
| Continuing operations | 7,444 | 1,961 | 1,426 | 822 | 18,172 | |||||
| Discontinued operations | 376 | |||||||||
| Total | 18,548 | |||||||||
110
Geographic Segments—2003
| (by country of origin) (millions of U.S. dollars) | Revenues | Capital assets(1) | Total assets | |||
|---|---|---|---|---|---|---|
| United States | 6,131 | 11,510 | 14,827 | |||
| Europe | 1,093 | 2,128 | 2,986 | |||
| Asia-Pacific | 291 | 198 | 356 | |||
| Canada | 201 | 204 | 313 | |||
| Other countries | 69 | 121 | 198 | |||
| Eliminations | (179 | ) | — | — | ||
| Total | 7,606 | 14,161 | 18,680 | |||
Geographic Segments—2002 | | | | |||
| (by country of origin) (millions of U.S. dollars) | Revenues | Capital assets(1) | Total assets | |||
| United States | 6,092 | 11,624 | 14,858 | |||
| Europe | 1,017 | 1,988 | 2,812 | |||
| Asia-Pacific | 255 | 163 | 287 | |||
| Canada | 165 | 140 | 417 | |||
| Other countries | 77 | 107 | 174 | |||
| Eliminations | (162 | ) | — | — | ||
| Total | 7,444 | 14,022 | 18,548 | |||
- (1)
- Capital assets include property and equipment, identifiable intangible assets and goodwill.
- (2)
- Corporate and other includes the results of Thomson Media, a non-reportable segment, as well as corporate costs and costs associated with the Company's stock appreciation rights. Thomson Media's results for the years ended December 31, 2003 and 2002 are as follows:
| | Year ended December 31 | |||
|---|---|---|---|---|
| (in millions of U.S. dollars) | ||||
| 2003 | 2002 | |||
| Revenues | 164 | 168 | ||
| Adjusted EBITDA | 23 | 23 | ||
| Adjusted operating profit | 19 | 18 | ||
- (3)
- For the year ended December 31, 2002, revenues and expenses within Thomson Learning were each increased by $26 million in order to present on a gross basis certain freight and distribution costs charged to customers which had previously been netted. This reclassification had no impact on Adjusted EBITDA or Adjusted operating profit. See Note 1 to the consolidated financial statements.
- (4)
- For the year ended December 31, 2002, revenues and expenses within Thomson Financial were each increased by $70 million in order to present on a gross basis certain stock exchange fees charged to customers which had previously been netted. This reclassification had no impact on Adjusted EBITDA or Adjusted operating profit. See Note 1 to the consolidated financial statements.
- (5)
- Effective January 1, 2003, the Company began expensing stock options, with restatement of prior periods. As a result of the restatement, for the year ended December 31, 2002, each of Corporate and other's Adjusted EBITDA and Adjusted operating profit reflect an additional charge of $17 million as compared to the previously reported amounts. See Note 2 to the consolidated financial statements.
111
In accordance with CICA Handbook Section 1701,Segment Disclosures, the Company discloses information about its reportable segments based upon the measures used by management in assessing the performance of those reportable segments. Adjusted EBITDA and Adjusted operating profit are used by the Company to measure its operating performance, including its ability to generate cash flow. Adjusted EBITDA is earnings from continuing operations before interest, taxes, depreciation and amortization, as well as restructuring charges, net other income (expense), and equity in net losses of associates, net of tax. Adjusted operating profit is operating profit before amortization and restructuring charges. Among other things, Adjusted EBITDA eliminates the differences that arise between businesses due to the manner in which they were acquired, or funded. In particular, Adjusted EBITDA excludes the effects of amortization of identifiable intangible assets, which is a non-cash charge arising from acquisitions accounted for under the purchase method of accounting. Adjusted operating profit reflects depreciation expense, but eliminates the effects of restructuring charges and amortization of identifiable intangible assets. Because the Company does not consider these items to be operating costs, it excludes them from the measurement of its operating performance. Adjusted EBITDA and Adjusted operating profit do not have any standardized meaning prescribed by Canadian GAAP.
The following table reconciles Adjusted EBITDA and Adjusted operating profit per the business segment information to operating profit per the consolidated statement of earnings and retained earnings.
| | For the year ended December 31 | |||||
|---|---|---|---|---|---|---|
| | 2003 | 2002 | ||||
| Adjusted EBITDA | 2,064 | 1,961 | ||||
| Less: | ||||||
| Depreciation | (588 | ) | (535 | ) | ||
| Adjusted operating profit | 1,476 | 1,426 | ||||
| Less: | ||||||
| Amortization | (285 | ) | (284 | ) | ||
| Restructuring charges | — | (6 | ) | |||
| Operating profit | 1,191 | 1,136 | ||||
112
Note 27: Reconciliation of Canadian to U.S. Generally Accepted Accounting Principles
The consolidated financial statements have been prepared in accordance with Canadian GAAP, which differ in some respects from U.S. GAAP. The following schedules present the material differences between Canadian and U.S. GAAP.
| | For the year ended December 31 | |||||||
|---|---|---|---|---|---|---|---|---|
| | 2003 | 2002 | ||||||
| Net earnings under Canadian GAAP | 867 | 605 | ||||||
| Differences in GAAP increasing (decreasing) reported earnings: | ||||||||
| Development costs | 12 | 24 | ||||||
| Pension adjustments | — | — | ||||||
| Business combinations | 15 | (4 | ) | |||||
| Related party transactions (notes 24 and 25) | (55 | ) | (2 | ) | ||||
| Derivative instruments and hedging activities | 18 | (5 | ) | |||||
| Income taxes | (11 | ) | (8 | ) | ||||
Earnings under U.S. GAAP, before cumulative effect of change in accounting principle | 846 | 610 | ||||||
| Cumulative effect of change in accounting principle, net of tax | — | (182 | ) | |||||
| Net income under U.S. GAAP | 846 | 428 | ||||||
| Other comprehensive income: | ||||||||
| Foreign currency translation | 319 | 167 | ||||||
| Minimum pension liability (net of taxes in 2003—$2 million and 2002—$3 million) | (13 | ) | (28 | ) | ||||
| Net unrealized gains (losses) on cash flow hedges (net of taxes in 2003 and 2002—$0 million) | 52 | (72 | ) | |||||
| Other comprehensive income | 358 | 67 | ||||||
| Comprehensive income | 1,204 | 495 | ||||||
| Earnings under U.S. GAAP from continuing operations, before cumulative effect of change in accounting principle | 819 | 552 | ||||||
| Cumulative effect of change in accounting principle, net of tax | — | (182 | ) | |||||
| Earnings under U.S. GAAP from discontinued operations | 27 | 58 | ||||||
| Net income under U.S. GAAP | 846 | 428 | ||||||
Basic and diluted earnings (loss) per common share, under U.S. GAAP, from: | ||||||||
| Continuing operations, before cumulative effect of change in accounting principle, net of tax | $ | 1.27 | $ | 0.83 | ||||
| Cumulative effect of change in accounting principle, net of tax | — | (0.28 | ) | |||||
| Discontinued operations, net of tax | 0.04 | 0.09 | ||||||
| Basic and diluted earnings per common share(1) | $ | 1.31 | $ | 0.64 | ||||
- (1)
- Earnings per common share is calculated after taking into account dividends declared on preference shares and the gain recognized in connection with the redemption of the Series V preference shares.
113
| | As at December 31 | |||||
|---|---|---|---|---|---|---|
| | 2003 | 2002 | ||||
| Shareholders' equity as reported under Canadian GAAP | 9,200 | 8,966 | ||||
| Differences in GAAP increasing (decreasing) reported shareholders' equity: | ||||||
| Development costs | — | (12 | ) | |||
| Business combinations | (647 | ) | (658 | ) | ||
| Minimum pension liability | (53 | ) | (38 | ) | ||
| Derivative instruments and hedging activities | (33 | ) | (103 | ) | ||
| Income taxes | 171 | 180 | ||||
| Shareholders' equity under U.S. GAAP | 8,638 | 8,335 | ||||
Descriptions of the nature of the reconciling differences are provided below:
Development Costs
Under Canadian GAAP, certain costs classified as development are deferred and amortized over their estimated useful lives. Under U.S. GAAP, all development costs are expensed as incurred.
Business Combinations
Prior to January 1, 2001, various differences existed between Canadian and U.S. GAAP for the accounting for business combinations, including the establishment of acquisition-related liabilities. The $15 million increase to income ($4 million decrease—2002) primarily relates to (i) costs that are required to be recorded as operating expenses under U.S. GAAP which, prior to January 1, 2001 were capitalized under Canadian GAAP; (ii) overall decreased amortization charges due to basis differences; and (iii) differences in gain or loss calculations on business disposals resulting from the above factors.
The $647 million decrease in Shareholders' equity as of December 31, 2003 ($658 million—December 31, 2002) primarily relates to basis differences in intangible assets and goodwill due to the factors discussed above, as well as a gain of $54 million recorded for U.S. GAAP resulting from a 1997 disposal mandated by the U.S. Department of Justice, which was required to be recorded as a reduction of goodwill under Canadian GAAP. On a U.S. GAAP basis, goodwill was $7,856 million at December 31, 2003 (2002—$7,605 million). On the same basis, identifiable intangible assets, net of accumulated amortization, were $4,113 million at December 31, 2003 (2002—$4,213 million).
Related Party Transactions
During the years ended December 31, 2003 and 2002, in accordance with Canadian GAAP, the Company recognized gains on transactions with entities associated with its controlling shareholder in its net earnings. Under U.S. GAAP, such related party gains are not recognizable in net earnings, but must be reflected as equity transactions. In 2003, the related party transaction was the sale of the Company's 20% interest in BGM to a company that is owned by the Thomson family which resulted in a gain of $55 million.
Derivative Instruments and Hedging Activities
Under Canadian GAAP, the fair values of derivative instruments are disclosed in the notes to the consolidated financial statements as at and for the year ended December 31, 2003, but not recorded in the consolidated balance sheet. Under U.S. Statement of Financial Accounting Standards ("SFAS") No. 133,Accounting for Derivative Instruments and Hedging Activities as amended by SFAS 138,Accounting for Certain Derivative Instruments and Certain Hedging Activities, all derivative instruments
114
are recognized in the balance sheet at their fair values, and changes in fair value are recognized either immediately in earnings or, if the transaction qualifies for hedge accounting, when the transaction being hedged affects earnings. Accordingly, under U.S. GAAP as at December 31, 2003, prepaid expenses and other current assets were $6 million higher (2002—unchanged), accounts payable and accruals were unchanged (2002—$4 million higher), current portion of long-term debt was unchanged (2002—$6 million higher), long-term debt was $37 million higher (2002—$31 million higher) and other non-current liabilities were $2 million higher (2002—$62 million higher) as compared to Canadian GAAP.
Income Taxes
The income tax adjustment for each period is comprised of the tax effect of the U.S. GAAP reconciling items. The adjustment to shareholders' equity relates entirely to deferred tax liabilities.
Employee Future Benefits
PENSION ADJUSTMENT
In accordance with Canadian GAAP, prior to 2002, the Company recorded a pension valuation allowance for plans that had an excess of the adjusted benefit asset over the expected future benefits, and recognized changes in the pension valuation allowance in earnings. As U.S. GAAP did not specifically address pension valuation allowances, this was not treated as a difference between Canadian and U.S. GAAP in prior periods. Due to a clarification of accounting guidance on this matter in 2002, changes in the valuation allowance must be treated as a GAAP difference. In order to reconcile earnings under Canadian GAAP to earnings under U.S. GAAP in 2002, earnings under Canadian GAAP were reduced by $22 million, representing the after-tax effect of the change in the valuation allowance. This difference was offset by the elimination of the valuation allowance for U.S. GAAP purposes, which increased earnings by $22 million.
MINIMUM PENSION LIABILITY
Certain of the Company's defined benefit pension plans have accumulated benefit obligations in excess of the fair market value of assets available to fund such obligations as of the annual measurement date for those plans. With respect to those plans, U.S. accounting standards require the recognition of an "additional minimum liability" of $53 million (2002—$38 million), with a corresponding reduction in shareholders' equity. If, at a subsequent date, the fair market value of the pension assets exceeds the accumulated benefit obligations, the equity adjustment would be reversed. This adjustment has no impact on income or cash flow. Because the concept of an additional minimum liability does not exist in Canadian GAAP, the liability and the reduction in equity resulted in a reconciling item.
The accumulated benefit obligation of funded pension plans that had accumulated benefit obligations that exceeded plan assets at December 31, 2003 was $150 million (2002—$125 million). These plans had related fair values of plan assets of $113 million (2002—$92 million).
Comprehensive Income
SFAS No. 130,Reporting Comprehensive Income, requires companies to disclose comprehensive income, which includes, in addition to net income, other comprehensive income consisting primarily of unrealized gains and losses which bypass the traditional income statement and are recorded directly into shareholders' equity on a U.S. GAAP basis. In 2003 and 2002, the components of other comprehensive income consist of unrealized gains and losses relating to the translation of foreign currency financial statements, minimum pension liabilities, hedging activity and certain investment
115
securities. Accumulated other comprehensive income as at December 31, 2003 was a gain of $194 million (2002—loss of $164 million).
Change in Accounting Principle
The cumulative effect of change in accounting principle represents the transitional impairment charge relating to adopting the U.S. GAAP equivalent of CICA 3062, SFAS 142,Goodwill and Other Intangible Assets. Under U.S. GAAP, this charge is required to be recorded net of tax as a cumulative effect of a change in accounting principle, which is a component of net income, as compared with a charge to opening retained earnings under Canadian GAAP. See Note 7.
Note 28: Subsequent Events
In January 2004, the Company acquired the publishing assets of Biological Abstracts, Inc. and BIOSIS. BIOSIS offers both custom and standard information resources designed to fit the information needs of researchers, students and information professionals worldwide. BIOSIS is now part of Thomson Scientific & Healthcare.
Also in January 2004, the Company announced that it had signed a definitive agreement to acquire the 90% of Corporate Communications Broadcast Network ("CCBN") that the Company did not previously own. CCBN provides web-based solutions for the investment community, offering services to enhance the way companies communicate and meet disclosure requirements, and assists investors in managing and leveraging this information. If the transaction closes as contemplated, CCBN will be a part of Thomson Financial.
In February 2004, the Company completed the sale of DBM.
116
Six-Year Summary
(unaudited)
The following table includes measurements for Adjusted EBITDA and Adjusted operating profit which do not have any standardized meaning prescribed by Canadian generally accepted accounting principles. These measurements are used by management to evaluate performance. A further discussion of these performance measures and a reconciliation of them to the consolidated statement of earnings and retained earnings are included in Note 26 to the consolidated financial statements.
| (millions of U.S. dollars) | 2003 | 2002 | 2001 | 2000 | 1999 | 1998 | |||||||
|---|---|---|---|---|---|---|---|---|---|---|---|---|---|
| Revenues | |||||||||||||
| Legal & Regulatory | 3,144 | 2,962 | 2,847 | 2,638 | 2,389 | 2,227 | |||||||
| Learning(1) | 2,052 | 2,036 | 1,752 | 1,429 | 1,118 | 1,082 | |||||||
| Financial(2) | 1,528 | 1,624 | 1,704 | 1,551 | 1,255 | 1,120 | |||||||
| Scientific & Healthcare | 760 | 696 | 617 | 636 | 699 | 655 | |||||||
| Corporate and other(3) | 164 | 168 | 189 | 230 | 213 | 192 | |||||||
| Eliminations | (42 | ) | (42 | ) | (34 | ) | (31 | ) | — | — | |||
| 7,606 | 7,444 | 7,075 | 6,453 | 5,674 | 5,276 | ||||||||
| Adjusted EBITDA(4) | |||||||||||||
| Legal & Regulatory | 981 | 928 | 860 | 778 | 708 | 656 | |||||||
| Learning | 520 | 465 | 385 | 345 | 258 | 250 | |||||||
| Financial | 406 | 414 | 400 | 331 | 312 | 304 | |||||||
| Scientific & Healthcare | 217 | 189 | 160 | 152 | 145 | 134 | |||||||
| Corporate and other(3) | (60 | ) | (35 | ) | (72 | ) | (110 | ) | (52 | ) | (39 | ) | |
| 2,064 | 1,961 | 1,733 | 1,496 | 1,371 | 1,305 | ||||||||
| Adjusted operating profit(5) | |||||||||||||
| Legal & Regulatory | 800 | 769 | 713 | 650 | 580 | 516 | |||||||
| Learning | 337 | 302 | 244 | 219 | 149 | 151 | |||||||
| Financial | 231 | 244 | 246 | 206 | 210 | 223 | |||||||
| Scientific & Healthcare | 186 | 162 | 136 | 124 | 107 | 97 | |||||||
| Corporate and other(3) | (78 | ) | (51 | ) | (78 | ) | (115 | ) | (58 | ) | (43 | ) | |
| 1,476 | 1,426 | 1,261 | 1,084 | 988 | 944 | ||||||||
- (1)
- For prior periods, revenues and expenses within Thomson Learning were increased in order to present on a gross basis certain freight and distribution costs charged to customers which had previously been netted. This reclassification had no impact on Adjusted EBITDA or Adjusted operating profit. See Note 1 to the consolidated financial statements.
- (2)
- For prior periods, revenues and expenses within Thomson Financial were increased in order to present on a gross basis certain stock exchange fees charged to customers which had previously been netted. This reclassification had no impact on Adjusted EBITDA or Adjusted operating profit. See Note 1 to the consolidated financial statements.
- (3)
- Corporate and other includes the results of Thomson Media, a non-reportable segment, as well as corporate costs, minority interests and costs associated with the Company's stock-related compensation expense. Effective January 1, 2003 the Company began expensing stock options with restatement of prior periods.
117
- (4)
- Adjusted EBITDA is earnings from continuing operations before interest, taxes, depreciation and amortization, as well as restructuring charges, net other income (expense) and equity in losses of associates, net of tax and, in 2000, 1999 and 1998, Year 2000 costs.
- (5)
- Adjusted operating profit excludes amortization and restructuring charges and, in 2000, 1999 and 1998, Year 2000 costs.
Prior year amounts have been restated for discontinued operations and reclassified to conform with the current year's presentation.
The following table includes measurements for Adjusted earnings and Adjusted earnings per common share which do not have any standardized meaning prescribed by Canadian generally accepted accounting principles. These measurements are used by management to evaluate performance. A further discussion of these performance measures and a reconciliation of them to the consolidated statement of earnings and retained earnings are included in the management's discussion and analysis.
| (millions of U.S. dollars, except per common share amounts) | 2003 | 2002 | 2001 | 2000 | 1999 | 1998 | |||||||||||||
|---|---|---|---|---|---|---|---|---|---|---|---|---|---|---|---|---|---|---|---|
| Earnings attributable to common shares(1) | 879 | 586 | 742 | 1,221 | 532 | 1,818 | |||||||||||||
| Basic and diluted earnings per common share(1) | $ | 1.34 | $ | 0.91 | $ | 1.18 | $ | 1.96 | $ | 0.86 | $ | 2.97 | |||||||
| Supplemental information | |||||||||||||||||||
| Earnings attributable to common shares as above | 879 | 586 | 742 | 1,221 | 532 | 1,818 | |||||||||||||
| Adjust: one-time items, net of tax, resulting from other (income) expense, restructuring charges, Year 2000 costs, and redemption of Series V preference shares | (87 | ) | 40 | (206 | ) | 2 | 52 | 90 | |||||||||||
| Proportionate share of goodwill impairment recognized by BGM | — | 67 | — | — | — | — | |||||||||||||
| One-time tax benefits | (64 | ) | — | — | (105 | ) | — | — | |||||||||||
| Earnings from discontinued operations | (23 | ) | (57 | ) | (115 | ) | (671 | ) | (142 | ) | (1,524 | ) | |||||||
| Effect of new accounting standard(2) | — | — | 194 | 146 | 114 | 111 | |||||||||||||
| Adjusted earnings from continuing operations | 705 | 636 | 615 | 593 | 556 | 495 | |||||||||||||
| Adjusted basic and diluted earnings per common share from continuing operations | $ | 1.08 | $ | 0.99 | $ | 0.98 | $ | 0.95 | $ | 0.90 | $ | 0.81 | |||||||
- (1)
- Effective January 1, 2003 the Company began expensing stock options with restatement of prior periods.
- (2)
- Under CICA 3062, goodwill and identifiable intangible assets with indefinite useful lives are no longer amortized beginning in 2002. This adjustment removes the amortization related to these assets in prior periods.
118
 David K.R. Thomson Chairman, The Thomson Corporation; Deputy Chairman, The Woodbridge Company Limited Member of Finance Committee |  W. Geoffrey Beattie Deputy Chairman, The Thomson Corporation; President, The Woodbridge Company Limited Chairman of Finance Committee; Member of Corporate Governance Committee and Human Resources Committee |  Richard J. Harrington President & Chief Executive Officer, The Thomson Corporation |  Ron D. Barbaro Corporate Director Member of Audit Committee and Corporate Governance Committee | |||
 Roger L. Martin Dean of the Joseph L. Rotman School of Management, University of Toronto Member of Audit Committee |  Vance K. Opperman President & Chief Executive Officer, Key Investment, Inc. Chairman of Audit Committee |  David H. Shaffer Chief Executive Officer, Thomson Financial |  John M. Thompson Chairman of the Board, The Toronto-Dominion Bank Chairman of Corporate Governance Committee; Member of Audit Committee |
119
 Robert D. Daleo Executive Vice President & Chief Financial Officer, The Thomson Corporation |  Steven A. Denning Managing Partner, General Atlantic Partners, LLC Chairman of Human Resources Committee |  John F. Fraser Corporate Director Member of Corporate Governance Committee |  V. Maureen Kempston Darkes Group Vice President, General Motors Corporation and President, GM Latin America, Africa and Middle East Member of Corporate Governance Committee and Human Resources Committee | |||
 Kenneth R. Thomson Chairman, The Woodbridge Company Limited |  Peter J. Thomson Deputy Chairman, The Woodbridge Company Limited |  Richard M. Thomson Retired Chairman & Chief Executive Officer, The Toronto-Dominion Bank Member of Audit Committee and Human Resources Committee |  John A. Tory President, Thomson Investments Limited Member of Finance Committee and Human Resources Committee |
120
Senior Management
 Richard J. Harrington President & Chief Executive Officer, The Thomson Corporation |  Robert C. Cullen President & Chief Executive Officer, Thomson Scientific & Healthcare |  Robert D. Daleo Executive Vice President & Chief Financial Officer, The Thomson Corporation | ||
 Brian H. Hall President & Chief Executive Officer, Thomson Legal & Regulatory |  Brian T. Martin Senior Vice President, Corporate Affairs, The Thomson Corporation |  Ronald H. Schlosser President & Chief Executive Officer, Thomson Learning | ||
 David H. Shaffer Chief Executive Officer, Thomson Financial |  James C. Smith Executive Vice President, Human Resources & Administration, The Thomson Corporation |  Deirdre Stanley Senior Vice President & General Counsel, The Thomson Corporation |
121
Corporate Information
Corporate Headquarters
Metro Center
One Station Place
Stamford, Connecticut 06902
United States
tel 203.539.8000
generalinfo@thomson.com
Stock Exchange Listings
Common shares (symbol: TOC):
- •
- Toronto Stock Exchange (TSX)
- •
- New York Stock Exchange (NYSE)
Series II preference shares (symbol: TOC.PR.B):
- •
- Toronto Stock Exchange (TSX)
Capital Stock
Shares outstanding as of December 31, 2003:
Common: 654,579,297
Series II preference: 6,000,000
Controlling shareholder: Kenneth R. Thomson
(approximately 69% of common shares)
Financial Calendar
Year end: December 31
Annual report: mailed April
Quarterly reports: mailed May/August/November to shareholders who elect to receive them by checking a box located on the annual meeting proxy card or by enrolling electronically with the registrar.
Common Share Dividends
At the discretion of the directors. Paid on March 15/June 15/September 15/December 15 or on the first business day thereafter. Declared in U.S. dollars but can be paid in Canadian dollars or U.K. pounds sterling at the holder's option (see also Note 16, page 74). Further information is available from the registrar.
122
Dividend Reinvestment Plan
Thomson has a dividend reinvestment plan under which eligible common shareholders may elect to have cash dividends reinvested in common shares. Further information is available from the registrar.
Annual Meeting of Shareholders
Wednesday, May 5, 2004, 12:00 p.m. at
Roy Thomson Hall
60 Simcoe Street
Toronto, Ontario, Canada
Transfer Agent and Registrar
Computershare Trust Company of Canada
100 University Avenue, 9th Floor
Toronto, Ontario M5J 2Y1
Canada
tel 1.800.564.6253
service@computershare.com
Auditors
PricewaterhouseCoopers LLP
Suite 3000, Box 82
Royal Trust Tower
Toronto-Dominion Centre
Toronto, Ontario M5K 1G8
Canada
Corporate Governance
A statement of our policy with respect to corporate governance is included in the management information circular enclosed with the annual report mailed to shareholders. Our corporate governance guidelines, board committee charters, code of conduct and a summary of the significant ways in which our corporate governance practices differ from those followed by U.S. domestic companies under NYSE listing standards, are available on our website.
Further Information
Please visit www.thomson.com for corporate and management news and more detailed information on individual Thomson businesses, products and services. For investor relations inquiries, call 1.800.969.9974 or e-mail: investor.relations@thomson.com.
123
Design: Aegis, Toronto
Photography: Christopher Wahl, Bill Gallery
Typesetting, prepress: Moveable Inc., Toronto
Printed in Canada
| To experience an interactive version of this annual report, go to www.thomson.com |
The Thomson Corporation
| Metro Center | Suite 2706, Toronto Dominion Bank Tower | |
| One Station Place | P.O.Box 24, Toronto-Dominion Centre | |
| Stamford, Connecticut 06902 | Toronto, Ontario M5K 1A1 | |
| United States | Canada | |
| tel 203.539.8000 | tel 416.360.8700 |