Exhibit 99.1
THOMSON REUTERS CORPORATION
MANAGEMENT’S DISCUSSION AND ANALYSIS
This management’s discussion and analysis is designed to provide you with a narrative explanation of our financial condition and results of operations through the eyes of our management. We recommend that you read this in conjunction with our interim financial statements for the three and six months ended June 30, 2011, our 2010 annual financial statements and our 2010 annual management’s discussion and analysis. We have organized our management’s discussion and analysis in the following key sections:
| · | Overview – a brief discussion of our business; |
| · | Results of Operations – a comparison of our current and prior period results; |
| · | Liquidity and Capital Resources – a discussion of our cash flow and debt; |
| · | Outlook – our current business and financial outlook for 2011; |
| · | Related Party Transactions – a discussion of transactions with our principal and controlling shareholder, The Woodbridge Company Limited (Woodbridge), and others; |
| · | Subsequent Events – a discussion of material events occurring after June 30, 2011 and through the date of this management’s discussion and analysis; |
| · | Changes in Accounting Policies – a discussion of changes in our accounting policies and recent accounting pronouncements; |
| · | Critical Accounting Estimates and Judgments – a discussion of critical estimates and judgments made by our management in applying accounting policies; |
| · | Additional Information – other required disclosures; and |
| · | Appendices – supplemental information and discussion. |
References in this discussion to “$” and “US$” are to U.S. dollars and references to “C$” are to Canadian dollars. Unless otherwise indicated or the context otherwise requires, references in this discussion to “we,” “our,” “us” and “Thomson Reuters” are to Thomson Reuters Corporation and our subsidiaries.
This management's discussion and analysis also contains forward-looking statements, which are subject to risks and uncertainties that could cause our actual results to differ materially from the forward-looking statements. Forward-looking statements include, but are not limited to, our expectations regarding:
| · | General economic conditions and market trends and their anticipated effects on our business; |
| · | Our 2011 financial outlook; |
| · | Investments that we have made and plan to make and the timing for businesses that we expect to sell; |
| · | Anticipated cost savings to be realized from our integration and legacy savings programs; and |
| · | Our liquidity and capital resources available to us to fund our ongoing operations, investments and returns to shareholders. |
For additional information related to forward-looking statements and material risks associated with them, please see the section of this management’s discussion and analysis entitled “Cautionary Note Concerning Factors That May Affect Future Results”.
This management’s discussion and analysis is dated as of July 27, 2011.
1
OVERVIEW
KEY HIGHLIGHTS
Thomson Reuters second quarter results reflected the strong growth of our Professional division and margin improvement for the company.
| · | 4% growth, before currency, in revenues from ongoing businesses (1) was led by an 8% increase from the Professional division. Markets division revenue growth of 1% was lower than anticipated. Acquisitions contributed to revenue growth; |
| · | Adjusted EBITDA and underlying operating profit margins (1) increased 380 basis points and 140 basis points, respectively, due to the benefits of scale from higher revenues, savings from efficiency and integration initiatives, timing benefits in Markets and favorable foreign currency. Adjusted EBITDA also benefited from lower integration programs expenses; and |
| · | We announced plans to sell our healthcare business and we created a new intellectual property and science segment within our Professional division. |
We also recently announced a streamlining of the organizational structure in our Markets division. The changes are intended to accelerate growth by simplifying the business and enhancing sales effectiveness while improving collaboration across our company.
Portfolio optimization
| · | We completed $0.7 billion of acquisitions in the second quarter, using proceeds from the recently completed sales of our BARBRI legal education business and Scandinavian legal, tax and accounting business; and |
| · | We expect all announced disposals to close by the end of the year. |
Integration program – We continued to make good progress in the final year of our Reuters integration program, and we achieved run-rate savings of $1.54 billion at June 30, 2011. We expect to achieve our aggregate run-rate savings target (including legacy efficiency programs) of $1.7 billion by the end of this year.
We recently reaffirmed our 2011 business outlook that we originally communicated in February. Additional information is provided in the “Outlook” section of this management’s discussion and analysis.
OUR BUSINESS AND STRATEGY
Who we are and what we do – We are the leading source of intelligent information for businesses and professionals. We combine industry expertise with innovative technology to deliver critical information to leading decision-makers. Through over 55,000 people in over 100 countries, we deliver this must-have insight to the financial, legal, tax and accounting, intellectual property and science and media markets, powered by the world’s most trusted news organization.
How we make money – We serve a wide variety of customers with a single, tested business model. We derive the majority of our revenues from selling electronic content and services to professionals, primarily on a subscription basis. Over the years, this has proven to be capital efficient and cash flow generative, and it has enabled us to maintain leading and scalable positions in our chosen markets. Within each of the markets we serve, we bring in-depth understanding of our customers’ needs, flexible technology platforms, proprietary content and scale. We believe our ability to embed our solutions into customers’ workflows is a significant competitive advantage as it leads to strong customer retention.
Our operational structure — We are organized in two divisions:
| · | Professional, which consists of our legal, tax and accounting, intellectual property and science businesses; and |
| · | Markets, which consists of our financial and media businesses. |
Professional division realignment
In the second quarter of 2011, we announced that we intend to sell our healthcare business and we realigned the structure of our Professional division.
| · | A new Intellectual Property & Science segment was formed, including the intellectual property business, formerly reported within the Legal segment, and the science business, formerly reported within the Healthcare & Science segment. The new segment is a provider of content, technology and services to governments, academia, corporations and law firms that enable the discovery, development and delivery of innovations across the world; and |
| · | The Paisley business was moved from the Tax & Accounting segment to the Legal segment. |
| (1) | Refer to Appendix A for additional information on non-IFRS financial measures. |
2
Markets division realignment
In July 2011, we announced a streamlining of the organizational structure of our Markets division which is designed to accelerate growth by simplifying the business while improving collaboration across the company. A key reason for this change was our disappointment with the division’s recent revenue growth, which resulted in part from a sales reorganization in Markets at the end of last year that did not adequately align the sales force with our business units and customers. Additionally, the recent development and marketing of Thomson Reuters Eikon has not yet adequately leveraged our capabilities across the Markets division.
Our Markets division will be organized into three units:
| · | Financial Professionals & Marketplaces: Focusing on services for professionals delivered to screens and trading marketplaces, combining the Sales & Trading and Investment & Advisory businesses; |
| · | Enterprise Solutions: Focusing on services and infrastructure for financial firms as a whole, continuing and expanding the current Enterprise unit; and |
| · | Media: Providing news and information tailored for media and business professionals. |
The combination of the three Markets financial units into two reflects our two platform strategy for the industry - Thomson Reuters Eikon for Financial Professionals & Marketplaces, and Thomson Reuters Elektron for Enterprise Solutions.
In connection with these changes, Thomson Reuters chief executive officer, Tom Glocer, has assumed more direct responsibility of the Markets division.
We believe the new Markets structure will enable us to focus on our core strengths of content, infrastructure, trading communities, distribution and joined-up workflow solutions. We expect to improve performance not only by simplifying the business through organizational change, but also by driving accountability, realigning the sales force with markets, customers and products and reassigning experienced managers from other parts of our company to key roles in the Markets division.
SEASONALITY
Our revenues and operating profits do not tend to be significantly impacted by seasonality as we record a large portion of our revenues ratably over a contract term and our costs, excluding integration programs expenses, are generally incurred evenly throughout the year. However, our non-recurring revenues can cause changes in our performance from quarter to consecutive quarter. Additionally, the release of certain print-based offerings can be seasonal as can certain product releases for the regulatory markets, which tend to be concentrated at the end of the year.
INTEGRATION PROGRAMS
In 2011, we expect to complete the integration program we commenced in 2008 as a result of the Reuters acquisition. The major initiatives associated with the program relate to:
| · | Realizing cost synergies through headcount reductions; |
| · | Retiring legacy products and systems; |
| · | Consolidating data centers; |
| · | Rolling out new strategic products; and |
| · | Capturing revenue synergies. |
3
The following chart summarizes the run-rate savings that we have achieved and the annual savings (including legacy efficiency programs) that we expect to achieve by completion of the program at the end of this year, as well as the actual and projected costs to achieve these savings levels.
| ($ millions) | Run-rate savings and One-time expenses | |
 |
* Total costs exclude $68 million of Reuters transaction-related expenses incurred in 2008.
As of June 30, 2011, we had achieved run-rate savings of $1.54 billion, which represents an increase of $40 million since March 31, 2011 and $120 million since year-end 2010. The incremental run-rate savings achieved in the second quarter of 2011 included the retirement of legacy products.
USE OF NON-IFRS FINANCIAL MEASURES
In addition to our results reported in accordance with International Financial Reporting Standards (IFRS), we use certain non-IFRS financial measures as supplemental indicators of our operating performance and financial position and for internal planning purposes. These non-IFRS measures include:
| · | Revenues from ongoing businesses; |
| · | Revenues at constant currency (before currency or revenues excluding the effects of foreign currency); |
| · | Underlying operating profit and underlying operating profit margin; |
| · | Adjusted EBITDA and adjusted EBITDA margin; |
| · | Adjusted earnings and adjusted earnings per share from continuing operations; |
| · | Net debt; |
| · | Free cash flow; and |
| · | Underlying free cash flow. |
We have historically reported non-IFRS financial measures as we believe their use provides more insight into our performance. Please see Appendix A for a description of our non-IFRS financial measures, including an explanation of why we believe they are useful measures of our performance, including our ability to generate cash flow. Non-IFRS financial measures are unaudited. See the sections entitled “Results of Operations”, “Liquidity and Capital Resources” and Appendix C for reconciliations of these non-IFRS measures to the most directly comparable IFRS measures.
4
RESULTS OF OPERATIONS
BASIS OF PRESENTATION
Within this management’s discussion and analysis, we discuss our results of operations on various bases, all of which exclude discontinued operations and include the performance of acquired businesses from the date of their purchase.
Consolidated results
We discuss our consolidated results from continuing operations as reported in our income statement. Additionally, we discuss our consolidated results on a non-IFRS basis which, among other adjustments, excludes "Other businesses", which is an aggregation of businesses that have been or are expected to be exited through sale or shut–down that could not be classified as discontinued operations. Other businesses include the healthcare business as well as other previously announced disposals.
Segment results
We changed our segment reporting in the second quarter of 2011 to reflect how we currently manage our businesses (1). We discuss the results of our four reportable segments as presented in our financial statements: Legal, Tax & Accounting, Intellectual Property & Science (which collectively comprise the Professional division) and the Markets division. We also provide information on Other businesses and Corporate expenses. Other businesses do not qualify as a component of our four reportable segments, nor as a separate reportable segment. Corporate expenses are comprised of corporate functions and certain share-based compensation costs.
See note 3 of our interim consolidated financial statements for the three and six months ended June 30, 2011 for a reconciliation of results from our reportable segments to consolidated results as reported in our income statement.
In analyzing our revenues from ongoing businesses, at both the consolidated and segment levels, we separately measure the effect of foreign currency. We measure the performance of existing businesses and the impact of acquired businesses on a constant currency basis.
CONSOLIDATED RESULTS
The following table provides a summary of our results for the periods indicated:
Three months ended June 30, | Six months ended June 30, | |||||||||||||||||||||||
| (millions of U.S. dollars, except per share amounts) | 2011 | 2010 | Change | 2011 | 2010 | Change | ||||||||||||||||||
| IFRS Financial Measures | ||||||||||||||||||||||||
| Revenues | 3,447 | 3,216 | 7 | % | 6,777 | 6,356 | 7 | % | ||||||||||||||||
| Operating profit | 833 | 435 | 91 | % | 1,229 | 756 | 63 | % | ||||||||||||||||
| Diluted earnings per share | $ | 0.67 | $ | 0.35 | 91 | % | $ | 0.97 | $ | 0.50 | 94 | % | ||||||||||||
Non-IFRS Financial Measures | ||||||||||||||||||||||||
| Revenues from ongoing businesses | 3,195 | 2,942 | 9 | % | 6,303 | 5,877 | 7 | % | ||||||||||||||||
| Underlying operating profit | 669 | 573 | 17 | % | 1,205 | 1,103 | 9 | % | ||||||||||||||||
| Underlying operating profit margin | 20.9 | % | 19.5 | % | 140 | bp | 19.1 | % | 18.8 | % | 30 | bp | ||||||||||||
| Adjusted EBITDA | 887 | 705 | 26 | % | 1,608 | 1,400 | 15 | % | ||||||||||||||||
| Adjusted EBITDA margin | 27.8 | % | 24.0 | % | 380 | bp | 25.5 | % | 23.8 | % | 170 | bp | ||||||||||||
| Adjusted earnings per share from continuing operations | $ | 0.51 | $ | 0.41 | 24 | % | $ | 0.88 | $ | 0.74 | 19 | % | ||||||||||||
bp= basis points.
Foreign currency effects. With respect to the average foreign exchange rates we use to report our results, the U.S. dollar weakened against the Euro, British pound sterling, Japanese yen and other major currencies in the second quarter of 2011 compared to the same period in 2010. Given our currency mix of revenues and expenses around the world, these fluctuations had a positive impact on the amount of our revenues in U.S. dollars and our underlying operating profit margin.
| (1) | Prior period amounts have been reclassified to reflect the current presentation. See Appendix B for restated 2010 and 2009 annual information. |
5
Revenues. The following table provides information about our revenues:
Three months ended June 30, | Percentage change: | |||||||||||||||||||||||||||
| (millions of U.S. dollars) | 2011 | 2010 | Existing businesses | Acquired businesses | Constant currency | Foreign currency | Total | |||||||||||||||||||||
| Revenues from ongoing businesses | 3,195 | 2,942 | 1 | % | 3 | % | 4 | % | 5 | % | 9 | % | ||||||||||||||||
| Other businesses | 252 | 274 | n/m | n/m | n/m | n/m | n/m | |||||||||||||||||||||
| Revenues | 3,447 | 3,216 | n/m | n/m | n/m | n/m | 7 | % | ||||||||||||||||||||
Six months ended June 30, | Percentage change: | |||||||||||||||||||||||||||
| (millions of U.S. dollars) | 2011 | 2010 | Existing businesses | Acquired businesses | Constant currency | Foreign currency | Total | |||||||||||||||||||||
| Revenues from ongoing businesses | 6,303 | 5,877 | 2 | % | 2 | % | 4 | % | 3 | % | 7 | % | ||||||||||||||||
| Other businesses | 474 | 479 | n/m | n/m | n/m | n/m | n/m | |||||||||||||||||||||
| Revenues | 6,777 | 6,356 | n/m | n/m | n/m | n/m | 7 | % | ||||||||||||||||||||
n/m = not meaningful.
Revenues from ongoing businesses increased on a constant currency basis in both the three and six-month periods, driven by contributions from our Professional division, which increased 8%, and from our Markets division’s Enterprise business, which increased 10%. Overall, the Markets division’s revenues increased 1% and 2% on a constant currency basis in the three and six-month periods, respectively. Acquisitions contributed to revenue growth in each period.
Operating profit, underlying operating profit and adjusted EBITDA. The following table provides information about our operating profit and our related non-IFRS financial measures, underlying operating profit and adjusted EBITDA:
Three months ended June 30, | Six months ended June 30, | |||||||||||||||||||||||
| (millions of U.S. dollars) | 2011 | 2010 | Change | 2011 | 2010 | Change | ||||||||||||||||||
| Operating profit | 833 | 435 | 91 | % | 1,229 | 756 | 63 | % | ||||||||||||||||
| Adjustments: | ||||||||||||||||||||||||
| Amortization of other identifiable intangible assets | 150 | 132 | 294 | 261 | ||||||||||||||||||||
| Integration programs expenses | 42 | 90 | 112 | 187 | ||||||||||||||||||||
Fair value adjustments | (8 | ) | (36 | ) | (10 | ) | (27 | ) | ||||||||||||||||
| Other operating (gains) losses, net | (286 | ) | 34 | (319 | ) | 33 | ||||||||||||||||||
| Operating profit from other businesses | (62 | ) | (82 | ) | (101 | ) | (107 | ) | ||||||||||||||||
| Underlying operating profit | 669 | 573 | 17 | % | 1,205 | 1,103 | 9 | % | ||||||||||||||||
| Adjustments: | ||||||||||||||||||||||||
| Integration programs expenses | (42 | ) | (90 | ) | (112 | ) | (187 | ) | ||||||||||||||||
| Depreciation and amortization of computer software (excluding Other businesses) | 260 | 222 | 515 | 484 | ||||||||||||||||||||
Adjusted EBITDA (1) | 887 | 705 | 26 | % | 1,608 | 1,400 | 15 | % | ||||||||||||||||
| Underlying operating profit margin | 20.9 | % | 19.5 | % | 140 | bp | 19.1 | % | 18.8 | % | 30 | bp | ||||||||||||
| Adjusted EBITDA margin | 27.8 | % | 24.0 | % | 380 | bp | 25.5 | % | 23.8 | % | 170 | bp | ||||||||||||
| (1) | See Appendix C for a reconciliation of earnings from continuing operations to adjusted EBITDA. |
bp = basis points.
Operating profit increased in both periods primarily due to gains from the sale of our BARBRI legal education business and Scandinavian legal, tax and accounting business. Higher revenues, savings from efficiency and integration initiatives, timing benefits in Markets, lower integration programs expenses and favorable foreign currency also contributed to the increases.
Underlying operating profit, which removes the impact of gains and losses and integration programs expenses, increased due to higher revenues, savings from efficiency and integration initiatives, timing benefits in Markets and favorable foreign currency. For the three-month period, the increase in underlying operating profit margin included a 40 basis point benefit from favorable currency. Adjusted EBITDA and the related margin, which include integration program expenses, also benefited from lower integration programs expenses in both periods.
The six-month period included $39 million in efficiency-related charges incurred in the first quarter of 2011.
6
Operating expenses. The following table provides information about our operating expenses:
Three months ended June 30, | Six months ended June 30, | |||||||||||||||||||||||
| (millions of U.S. dollars) | 2011 | 2010 | Change | 2011 | 2010 | Change | ||||||||||||||||||
| Operating expenses | 2,478 | 2,377 | 4 | % | 5,030 | 4,789 | 5 | % | ||||||||||||||||
| Remove: | ||||||||||||||||||||||||
Fair value adjustments (1) | 8 | 36 | 10 | 27 | ||||||||||||||||||||
| Other businesses | (178 | ) | (176 | ) | (345 | ) | (339 | ) | ||||||||||||||||
| Operating expenses, excluding fair value adjustments and Other businesses | 2,308 | 2,237 | 3 | % | 4,695 | 4,477 | 5 | % | ||||||||||||||||
| (1) | Fair value adjustments primarily represent non-cash accounting adjustments from the revaluation of embedded foreign exchange derivatives within certain customer and vendor contracts due to fluctuations in foreign exchange rates and mark-to-market adjustments from certain share-based awards. |
Operating expenses (excluding fair value adjustments and Other businesses) increased in both periods due to unfavorable foreign currency and higher staff costs. Staff costs, which include salaries, bonuses, commissions, benefits, payroll taxes and share-based compensation, increased 1% and 6% (before currency), in the three and six-month periods, respectively. The increase in the six-month period was partially due to $39 million in efficiency-related charges recorded in the first quarter of 2011. Staff costs comprised approximately 53% and 54% of operating expenses (excluding fair value adjustments and Other businesses) in the three and six-month periods of 2011, respectively, and 52% in both prior year periods.
Other highlights included the following:
| · | Favorable timing of expenses in the three and six months ended June 30, 2011 impacted our Markets division; |
| · | Savings generated from tight cost controls, efficiency and integration initiatives mitigated increases associated with recent acquisitions; and |
| · | Lower costs associated with a decrease in recoveries revenues (which are low-margin revenues we collect and pass through to a third party provider, such as stock exchange fees) were recorded in our Markets division. |
Depreciation and amortization.
Three months ended June 30, | Six months ended June 30, | |||||||||||||||||||||||
| (millions of U.S. dollars) | 2011 | 2010 | Change | 2011 | 2010 | Change | ||||||||||||||||||
| Depreciation | 110 | 105 | 5 | % | 217 | 243 | (11 | %) | ||||||||||||||||
| Amortization of computer software | 162 | 133 | 22 | % | 326 | 274 | 19 | % | ||||||||||||||||
| Amortization of other identifiable intangible assets | 150 | 132 | 14 | % | 294 | 261 | 13 | % | ||||||||||||||||
| · | Depreciation. In both 2011 periods, depreciation expense reflected capital expenditures associated with our technology investments. Depreciation expense decreased in the six-month period as certain assets acquired in the Reuters acquisition became fully depreciated. |
| · | Amortization of computer software. The increases reflected higher amortization attributable to investments in products launched in 2010 such as Thomson Reuters Eikon and WestlawNext, investments in growth initiatives and assets of newly-acquired businesses. |
| · | Amortization of other identifiable intangible assets. The increases were due to amortization from newly-acquired assets, which more than offset decreases from the completion of amortization for certain identifiable intangible assets acquired in previous years. |
Other operating gains (losses), net.
Three months ended June 30, | Six months ended June 30, | |||||||||||||||
| (millions of U.S. dollars) | 2011 | 2010 | 2011 | 2010 | ||||||||||||
| Other operating gains (losses), net | 286 | (34 | ) | 319 | (33 | ) | ||||||||||
Both the three and six months ended June 30, 2011 included approximately:
| · | $400 million of gains from the sales of the BARBRI legal education business and Scandinavian legal, tax and accounting business; |
7
| · | $44 million of losses and asset impairment charges related to other businesses that have been or are expected to be sold; |
| · | $28 million gain from the revaluation of contingent consideration associated with a prior acquisition; and |
| · | $22 million in acquisition-related costs. |
Additionally, losses of $69 million and $34 million were recorded in the three and six months ended June 30, 2011, respectively, in connection with the termination of an information technology (“IT”) outsourcing agreement. Earlier this year, we reached agreement with a vendor to terminate an IT outsourcing agreement, which had been signed by Reuters prior to the acquisition of that business. We and the vendor mutually terminated the agreement as the vendor was unable to provide certain services. We are in the process of transitioning these technology support services into existing in-house operations. For the full year, we expect to record total charges of approximately $100 million relating to this termination. The net charges represent payments that were made to the vendor in prior periods for which we will receive no future value, net of amounts that are payable by us and the vendor in connection with the termination and subsequent transition. The majority of the net charges will be non-cash and must be amortized over the transition period of the contract.
The 2010 amounts were principally comprised of a settlement in connection with a vendor dispute.
Net interest expense.
Three months ended June 30, | Six months ended June 30, | |||||||||||||||||||||||
| (millions of U.S. dollars) | 2011 | 2010 | Change | 2011 | 2010 | Change | ||||||||||||||||||
| Net interest expense | 98 | 95 | 3 | % | 199 | 188 | 6 | % | ||||||||||||||||
The increases in both periods reflected higher interest expense associated with debt securities which were refinanced from floating to fixed interest rates in the second half of 2010.
Other finance income (costs).
Three months ended June 30, | Six months ended June 30, | |||||||||||||||
| (millions of U.S. dollars) | 2011 | 2010 | 2011 | 2010 | ||||||||||||
| Other finance income (costs) | 9 | 39 | 16 | (24 | ) | |||||||||||
Other finance income (costs) include gains or losses realized from changes in foreign currency exchange rates on certain intercompany funding arrangements and gains or losses related to freestanding derivative instruments.
The six months ended June 30, 2010 also included a loss of $62 million principally representing premiums paid for the early redemption of debt securities. See “Liquidity and Capital Resources - Financing activities” for additional information.
Tax expense.
Three months ended June 30, | Six months ended June 30, | |||||||||||||||
| (millions of U.S. dollars) | 2011 | 2010 | 2011 | 2010 | ||||||||||||
| Tax expense | 174 | 79 | 226 | 110 | ||||||||||||
Tax expense reflected the mix of taxing jurisdictions in which pre-tax profits and losses were recognized. However, because the geographical mix of pre-tax profits and losses in interim periods may not be reflective of full year results, this distorts our interim period effective tax rate. The three and six months ended June 30, 2011 included a $46 million tax benefit as a result of recognizing tax losses that arose in a prior year from the sale of an investment to Woodbridge. Because Woodbridge sold its interest in that investment to a third party in April 2011, the tax losses became available to us for use for tax purposes.
Net earnings and earnings per share.
Three months ended June 30, | Six months ended June 30, | |||||||||||||||||||||||
| (millions of U.S. dollars, except per share amounts) | 2011 | 2010 | Change | 2011 | 2010 | Change | ||||||||||||||||||
| Net earnings | 572 | 297 | 93 | % | 829 | 431 | 92 | % | ||||||||||||||||
| Diluted earnings per share | $ | 0.67 | $ | 0.35 | 91 | % | $ | 0.97 | $ | 0.50 | 94 | % | ||||||||||||
Net earnings and the related per share amounts increased in both periods primarily due to gains from the sale of our BARBRI legal education business and Scandinavian legal, tax and accounting business. Higher operating profit from our Professional and Markets divisions and decreased integration programs expenses also contributed. The prior year six-month period also reflected a loss in connection with our early redemption of debt securities.
8
Adjusted earnings and adjusted earnings per share from continuing operations. The following table presents our adjusted earnings calculation:
Three months ended June 30, | Six months ended June 30, | |||||||||||||||||||||||
| (millions of U.S. dollars) | 2011 | 2010 | Change | 2011 | 2010 | Change | ||||||||||||||||||
| Earnings attributable to common shareholders | 563 | 290 | 94 | % | 813 | 417 | 95 | % | ||||||||||||||||
| Adjustments: | ||||||||||||||||||||||||
| Operating profit from Other businesses | (62 | ) | (82 | ) | (101 | ) | (107 | ) | ||||||||||||||||
| Fair value adjustments | (8 | ) | (36 | ) | (10 | ) | (27 | ) | ||||||||||||||||
| Other operating (gains) losses, net | (286 | ) | 34 | (319 | ) | 33 | ||||||||||||||||||
| Other finance (income) costs | (9 | ) | (39 | ) | (16 | ) | 24 | |||||||||||||||||
| Share of post-tax earnings in equity method investees | (2 | ) | (3 | ) | (7 | ) | (3 | ) | ||||||||||||||||
| Tax on above | 115 | 30 | 127 | 29 | ||||||||||||||||||||
| Interim period effective tax rate normalization | 15 | 7 | 5 | (11 | ) | |||||||||||||||||||
Discrete tax item (1) | (46 | ) | - | (46 | ) | - | ||||||||||||||||||
| Amortization of other identifiable intangible assets | 150 | 132 | 294 | 261 | ||||||||||||||||||||
| Discontinued operations | - | 6 | (2 | ) | 6 | |||||||||||||||||||
| Dividends declared on preference shares | (1 | ) | - | (2 | ) | (1 | ) | |||||||||||||||||
| Adjusted earnings from continuing operations | 429 | 339 | 27 | % | 736 | 621 | 19 | % | ||||||||||||||||
| Adjusted earnings per share from continuing operations | $ | 0.51 | $ | 0.41 | 24 | % | $ | 0.88 | $ | 0.74 | 19 | % | ||||||||||||
| (1) | See “Tax expense”. |
Adjusted earnings from continuing operations and the related per share amounts increased in both periods due to higher underlying operating profit and lower integration costs. Favorable foreign currency accounted for $0.03 and $0.04 of the increases in the three and six-month periods, respectively.
SEGMENT RESULTS
A discussion of the operating results of each of our reportable segments follows. By definition, results from Other businesses are excluded from our reportable segments as they do not qualify as a component of our four reportable segments, nor as a separate reportable segment. We use segment operating profit to measure the performance of our reportable segments. Our definition of segment operating profit as reflected below may not be comparable to that of other companies. We define segment operating profit as operating profit before (i) amortization of other identifiable intangible assets; (ii) other operating gains and losses; (iii) certain asset impairment charges; and (iv) corporate-related items (including corporate expenses, integration programs expenses and fair value adjustments). We use this measure for our reportable segments because we do not consider these excluded items to be controllable operating activities for purposes of assessing the current performance of our reportable segments. We also use segment operating profit margin, which we define as segment operating profit as a percentage of revenues. As a supplemental measure of segment performance, we use EBITDA and the related margin.
Professional division
Three months ended June 30, | Percentage change: | |||||||||||||||||||||||||||
| (millions of U.S. dollars) | 2011 | 2010 | Existing businesses | Acquired businesses | Constant currency | Foreign currency | Total | |||||||||||||||||||||
| Revenues | 1,306 | 1,184 | 4 | % | 4 | % | 8 | % | 2 | % | 10 | % | ||||||||||||||||
| Segment operating profit | 343 | 311 | 10 | % | ||||||||||||||||||||||||
| Segment operating profit margin | 26.3 | % | 26.3 | % | - | |||||||||||||||||||||||
| EBITDA | 457 | 413 | 11 | % | ||||||||||||||||||||||||
| EBITDA margin | 35.0 | % | 34.9 | % | 10 | bp | ||||||||||||||||||||||
9
Six months ended June 30, | Percentage change: | |||||||||||||||||||||||||||
| (millions of U.S. dollars) | 2011 | 2010 | Existing businesses | Acquired businesses | Constant currency | Foreign currency | Total | |||||||||||||||||||||
| Revenues | 2,551 | 2,329 | 4 | % | 4 | % | 8 | % | 2 | % | 10 | % | ||||||||||||||||
| Segment operating profit | 624 | 580 | 8 | % | ||||||||||||||||||||||||
| Segment operating profit margin | 24.5 | % | 24.9 | % | (40 | )bp | ||||||||||||||||||||||
| EBITDA | 846 | 780 | 8 | % | ||||||||||||||||||||||||
| EBITDA margin | 33.2 | % | 33.5 | % | (30 | )bp | ||||||||||||||||||||||
bp = basis points.
Revenues increased on a constant currency basis in both the three and six-month periods reflecting growth from existing businesses in each segment and the benefit of acquisitions. The following chart illustrates the Professional division’s revenue growth trend.
Professional Division
Revenue Growth Rate
(% change before currency)
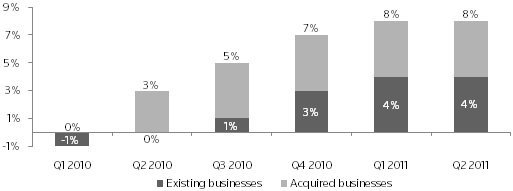
The Professional division’s accelerating revenue growth trend has been driven by three factors:
| · | New product offerings, such as WestlawNext, which has been sold to over 24,000 customers since its launch in February 2010, and the ONESOURCE global tax workstation; |
| · | Improving conditions in various legal services markets; and |
| · | Acquisition and expansion into higher-growth geographic areas (such as Latin America) and adjacent customer segments, such as governance, risk and compliance. |
| o | The Professional division completed foundational acquisitions in Latin America and is combining acquired products and services with technology to deliver new electronic solutions, such as Revista Online in Brazil. |
| o | In governance, risk and compliance, the Professional division completed the acquisitions of Complinet in 2010 and World-Check in May 2011. |
We expect these trends to continue through the second half of this year.
EBITDA and segment operating profit increased in both the three and six-month periods due to the benefits of scale from higher revenues and savings from efficiency initiatives. EBITDA margin was largely unchanged in the three month period as the benefits of scale from higher revenues and savings from efficiency initiatives were offset by the dilutive effect from acquisitions. EBITDA margin declined in the six-month period as these factors were further offset by an $11 million efficiency-related charge incurred in the first quarter of 2011. Acquisitions negatively impacted the division’s segment operating profit margin by 140 basis points in the three-month period and by 110 basis points in the six-month period. Segment operating profit margin for the division also absorbed the impact of depreciation and amortization related to growth investments in both periods.
10
Legal
Three months ended June 30, | Percentage change: | |||||||||||||||||||||||||||
| (millions of U.S. dollars) | 2011 | 2010 | Existing businesses | Acquired businesses | Constant currency | Foreign currency | Total | |||||||||||||||||||||
| Revenues | 843 | 761 | 3 | % | 6 | % | 9 | % | 2 | % | 11 | % | ||||||||||||||||
| Segment operating profit | 236 | 220 | 7 | % | ||||||||||||||||||||||||
| Segment operating profit margin | 28.0 | % | 28.9 | % | (90 | )bp | ||||||||||||||||||||||
| EBITDA | 314 | 287 | 9 | % | ||||||||||||||||||||||||
| EBITDA margin | 37.2 | % | 37.7 | % | (50 | )bp | ||||||||||||||||||||||
Six months ended June 30, | Percentage change: | |||||||||||||||||||||||||||
| (millions of U.S. dollars) | 2011 | 2010 | Existing businesses | Acquired businesses | Constant currency | Foreign currency | Total | |||||||||||||||||||||
| Revenues | 1,631 | 1,470 | 3 | % | 7 | % | 10 | % | 1 | % | 11 | % | ||||||||||||||||
| Segment operating profit | 422 | 402 | 5 | % | ||||||||||||||||||||||||
| Segment operating profit margin | 25.9 | % | 27.3 | % | (140 | )bp | ||||||||||||||||||||||
| EBITDA | 572 | 533 | 7 | % | ||||||||||||||||||||||||
| EBITDA margin | 35.1 | % | 36.3 | % | (120 | )bp | ||||||||||||||||||||||
bp = basis points.
The Legal segment is organized around the following lines of business:
| · | U.S. Law Firm Solutions - these include businesses such as Westlaw, FindLaw and Elite that sell products and services to large, medium and small law firms; |
| · | Corporate, Government & Academic and Risk & Compliance - these businesses serve general counsels/corporate legal departments, government customers and law schools as well as support the regulatory needs of our customers; and |
| · | Global Businesses - these are our legal businesses in Latin America, Asia and other countries outside of the United States. |
Revenues increased on a constant currency basis in both the three and six-month periods reflecting contributions from existing and acquired businesses. Recent acquisitions include World-Check, acquired in May 2011, and Revista dos Tribunais, Canada Law Book, Complinet, Pangea3 and Serengeti, all acquired in 2010.
For the three months ended June 30, 2011:
| · | U.S. Law Firm Solutions revenues increased 2% (1% from existing businesses), led by a 12% increase (11% from existing businesses) in Business of Law (FindLaw and Elite) offset by a 2% decline in research-related revenues; |
| · | Corporate, Government & Academic and Risk & Compliance revenues increased 16% (5% from existing businesses), and included contributions from the recently acquired World-Check business; and |
| · | Global Businesses revenues increased 19% (5% from existing businesses), primarily due to acquisitions in Latin America and Canada. |
For the six months ended June 30, 2011, U.S. Law Firm Solutions, Corporate, Government & Academic and Risk & Compliance and Global Businesses revenues increased 3%, 15% and 22%, respectively.
EBITDA and segment operating profit increased in both the three and six-month periods due to the benefits of scale from higher revenues and savings from efficiency initiatives. The related margins declined due to the dilutive effects from acquisitions. Segment operating profit margin also included the impact of amortization and depreciation from growth investments.
11
Tax & Accounting
Three months ended June 30, | Percentage change: | |||||||||||||||||||||||||||
| (millions of U.S. dollars) | 2011 | 2010 | Existing businesses | Acquired businesses | Constant currency | Foreign currency | Total | |||||||||||||||||||||
| Revenues | 252 | 226 | 7 | % | 3 | % | 10 | % | 2 | % | 12 | % | ||||||||||||||||
| Segment operating profit | 50 | 35 | 43 | % | ||||||||||||||||||||||||
| Segment operating profit margin | 19.8 | % | 15.5 | % | 430 | bp | ||||||||||||||||||||||
| EBITDA | 72 | 56 | 29 | % | ||||||||||||||||||||||||
| EBITDA margin | 28.6 | % | 24.8 | % | 380 | bp | ||||||||||||||||||||||
Six months ended June 30, | Percentage change: | |||||||||||||||||||||||||||
| (millions of U.S. dollars) | 2011 | 2010 | Existing businesses | Acquired businesses | Constant currency | Foreign currency | Total | |||||||||||||||||||||
| Revenues | 508 | 470 | 5 | % | 2 | % | 7 | % | 1 | % | 8 | % | ||||||||||||||||
| Segment operating profit | 93 | 72 | 29 | % | ||||||||||||||||||||||||
| Segment operating profit margin | 18.3 | % | 15.3 | % | 300 | bp | ||||||||||||||||||||||
| EBITDA | 137 | 113 | 21 | % | ||||||||||||||||||||||||
| EBITDA margin | 27.0 | % | 24.0 | % | 300 | bp | ||||||||||||||||||||||
bp = basis points.
The Tax & Accounting segment is organized around the following lines of business:
| · | Professional – these are integrated solutions for operations of small, medium and large accounting firms, including tax return preparation and filing; |
| · | Corporate – these are software and services for corporate tax departments, legal, bank and trust customers, including compliance and reporting solutions; and |
| · | Knowledge Solutions – these offerings provide expert guidance and research as well as education for tax and accounting professionals. |
Revenues increased on a constant currency basis in both the three and six-month periods reflecting contributions from existing and acquired business, including Mastersaf, a Brazilian provider of tax and accounting solutions, acquired in May 2011.
For the three months ended June 30, 2011:
| · | Professional tax business revenues increased 13% driven by electronic filing of tax returns; |
| · | Corporate revenues increased 5%, led by income tax provision and indirect tax offerings; and |
| · | Knowledge Solutions revenues increased 7%, led by Checkpoint. |
For the six months ended June 30, 2011, Professional, Corporate and Knowledge Solutions revenues increased 10%, 3% and 6%, respectively.
EBITDA, segment operating profit and the related margins increased in both the three and six-month periods due to the benefits of scale from higher revenues and savings from efficiency initiatives. Segment operating profit in the three-month period also benefited from the completion of amortization charges related to prior acquisitions.
Intellectual Property & Science
Three months ended June 30, | Percentage change: | |||||||||||||||||||||||||||
| (millions of U.S. dollars) | 2011 | 2010 | Existing businesses | Acquired businesses | Constant currency | Foreign currency | Total | |||||||||||||||||||||
| Revenues | 211 | 197 | 2 | % | 2 | % | 4 | % | 3 | % | 7 | % | ||||||||||||||||
| Segment operating profit | 57 | 56 | 2 | % | ||||||||||||||||||||||||
| Segment operating profit margin | 27.0 | % | 28.4 | % | (140 | )bp | ||||||||||||||||||||||
| EBITDA | 71 | 70 | 1 | % | ||||||||||||||||||||||||
| EBITDA margin | 33.6 | % | 35.5 | % | (190 | )bp | ||||||||||||||||||||||
12
Six months ended June 30, | Percentage change: | |||||||||||||||||||||||||||
| (millions of U.S. dollars) | 2011 | 2010 | Existing businesses | Acquired businesses | Constant currency | Foreign currency | Total | |||||||||||||||||||||
| Revenues | 412 | 389 | 3 | % | 1 | % | 4 | % | 2 | % | 6 | % | ||||||||||||||||
| Segment operating profit | 109 | 106 | 3 | % | ||||||||||||||||||||||||
| Segment operating profit margin | 26.5 | % | 27.2 | % | (70 | )bp | ||||||||||||||||||||||
| EBITDA | 137 | 134 | 2 | % | ||||||||||||||||||||||||
| EBITDA margin | 33.3 | % | 34.4 | % | (110 | )bp | ||||||||||||||||||||||
bp = basis points.
The Intellectual Property & Science segment is organized around the following lines of business:
| · | Scientific & Scholarly Research (SSR) – these solutions support scholars and researchers and include offerings such as the Thomson Reuters Web of Knowledge database; |
| · | Life Sciences – these solutions provide content and analytics to pharmaceutical, biotechnology and other life sciences companies to improve research and development productivity and lower the cost and time of bringing a product to market; and |
| · | Intellectual Property Solutions (IP Solutions) – these solutions support business professionals and attorneys through the entire intellectual property lifecycle from ideation and maintenance to protection and commercialization. |
Revenues increased on a constant currency basis in both the three and six-month periods reflecting contributions from both existing and acquired businesses.
For the three months ended June 30, 2011:
| · | SSR revenues increased 5%, led by Web of Knowledge subscriptions; |
| · | Life Sciences revenues increased 11% (4% from existing businesses) due to strong demand for biology and disease analytics products and contributions from our 2010 acquisition of GeneGo; and |
| · | IP Solutions revenues increased 2%, led by growth in Patents and Services. |
For the six months ended June 30, 2011, SSR, Life Sciences and IP Solutions revenues increased 2%, 14% and 4%, respectively.
EBITDA and segment operating profit margins declined in the three and six-month periods primarily due to investments in content and technology initiatives.
Markets division
Three months ended June 30, | Percentage change: | |||||||||||||||||||||||||||
| (millions of U.S. dollars) | 2011 | 2010 | Existing businesses | Acquired businesses | Constant currency | Foreign currency | Total | |||||||||||||||||||||
| Sales & Trading | 940 | 868 | (1 | %) | 2 | % | 1 | % | 7 | % | 8 | % | ||||||||||||||||
| Investment & Advisory | 558 | 550 | (2 | %) | - | (2 | %) | 3 | % | 1 | % | |||||||||||||||||
| Enterprise | 312 | 265 | 10 | % | - | 10 | % | 8 | % | 18 | % | |||||||||||||||||
| Media | 84 | 79 | (1 | %) | - | (1 | %) | 7 | % | 6 | % | |||||||||||||||||
| Revenues | 1,894 | 1,762 | - | 1 | % | 1 | % | 6 | % | 7 | % | |||||||||||||||||
| Segment operating profit | 388 | 312 | 24 | % | ||||||||||||||||||||||||
| Segment operating profit margin | 20.5 | % | 17.7 | % | 280 | bp | ||||||||||||||||||||||
| EBITDA | 532 | 427 | 25 | % | ||||||||||||||||||||||||
| EBITDA margin | 28.1 | % | 24.2 | % | 390 | bp | ||||||||||||||||||||||
13
Six months ended June 30, | Percentage change: | |||||||||||||||||||||||||||
| (millions of U.S. dollars) | 2011 | 2010 | Existing businesses | Acquired businesses | Constant currency | Foreign Currency | Total | |||||||||||||||||||||
| Sales & Trading | 1,867 | 1,758 | (1 | %) | 3 | % | 2 | % | 4 | % | 6 | % | ||||||||||||||||
| Investment & Advisory | 1,118 | 1,109 | (2 | %) | - | (2 | %) | 3 | % | 1 | % | |||||||||||||||||
| Enterprise | 608 | 528 | 10 | % | - | 10 | % | 5 | % | 15 | % | |||||||||||||||||
| Media | 166 | 159 | - | - | - | 4 | % | 4 | % | |||||||||||||||||||
| Revenues | 3,759 | 3,554 | 1 | % | 1 | % | 2 | % | 4 | % | 6 | % | ||||||||||||||||
| Segment operating profit | 718 | 630 | 14 | % | ||||||||||||||||||||||||
| Segment operating profit margin | 19.1 | % | 17.7 | % | 140 | bp | ||||||||||||||||||||||
| EBITDA | 1,003 | 902 | 11 | % | ||||||||||||||||||||||||
| EBITDA margin | 26.7 | % | 25.4 | % | 130 | bp | ||||||||||||||||||||||
bp = basis points.
Revenues increased on a constant currency basis in both the three and six-month periods. Excluding recoveries revenues, which are low-margin fees, revenue growth was 2% and 3% for the three and six-month periods, respectively.
In 2011, revenue growth was led by Enterprise, Commodities & Energy and Tradeweb. Enterprise benefited from demand for the Thomson Reuters Elektron data distribution platform. These increases were partially offset by lower revenues from Investment Management and Exchange Traded Instruments.
By revenue type:
| · | Subscription revenues, which comprised 77% of Markets revenues, increased 1% and 2% in the three and six-month periods, respectively, and included the benefit of a price increase. The division continues to experience strong demand for Thomson Reuters Elektron, our low-latency data distribution platform and it continues to make progress with the rollout of Thomson Reuters Eikon, our next generation desktop platform. Thomson Reuters Eikon has been sold or migrated to over 28,000 desktops since its launch in September 2010 and Thomson Reuters Elektron has twelve hosting centers around the world. |
| · | Transaction revenues increased 7% and 11% in the three and six-month periods, respectively, driven by our change in ownership of Tradeweb, which we fully consolidate in our results since obtaining a controlling interest in that entity in the fourth quarter of 2010; |
| · | Recoveries revenues (low-margin revenues that we collect and largely pass-through to a third party provider, such as stock exchange fees) declined 6% in both the three and six-month periods, as exchanges continue to move clients to a direct bill model; and |
| · | Outright revenues, which represented a small portion of Markets revenues, increased 19% and 11%, in the three and six-month periods, respectively. |
By geographic area, revenues in Asia increased 5%, Europe, Middle East and Africa (EMEA) increased 2% and Americas declined 1% in the three-month period. Revenue growth was positive across these major geographic areas for the six-month period.
The following provides additional information regarding the Markets division’s businesses, on a constant currency basis:
| · | Sales & Trading revenues increased in the three-month period primarily from Tradeweb, driven by both a 7% increase in its existing business and the change in ownership of Tradeweb. Our Trading Marketplaces businesses, comprised of Tradeweb and Foreign Exchange matching and dealing solutions, increased 10%. Recoveries declined 10%. Excluding recoveries, Sales & Trading revenues increased 4%. Commodities & Energy revenues increased 5%, primarily due to our 2010 acquisition of Point Carbon. Treasury revenues were unchanged, as growth was impacted by 2010 cancellations. Exchange Traded Instruments revenues decreased 7%, due to our decision to shut down certain low-margin legacy products as part of our integration and the continued reduction of recoveries revenues. |
| · | Investment & Advisory revenues decreased in the three-month period, as higher revenues from Corporate customers, Investment Banking and Wealth Management were more than offset by weak performance in Investment Management, which declined 8%. The decline in Investment Management was attributable to its U.S. business, with the European business flat and the Asia business returning to consistent sales growth. Improving performance in Investment Management is a key objective of the recent reorganization of the Markets division described in the section entitled “Markets division realignment”. |
14
| · | Enterprise revenues increased in the three-month period driven by continued demand for its data distribution platform, Thomson Reuters Elektron. Enterprise Real Time Solutions revenues increased 9%, as customers continued to invest in low-latency data feeds and hosting solutions. Platform revenues increased 15%, driven by recurring and outright products. Content revenues increased 20%, driven by growth in pricing and reference data. Revenues from Omgeo, our trade processing joint venture with The Depository Trade & Clearing Corporation, declined 3%, driven by lower equity volumes. |
| · | Media revenues decreased as a result of lower online sales. News Agency revenues were unchanged due to tight customer budgets. Consumer revenues declined 3% from lower online sales, primarily in EMEA and the Americas. |
Markets overall revenue dynamics for the first half of 2011 were similar to those in the second quarter of 2011. Media revenues were unchanged for the six-month period compared to the prior year, as a result of a stronger performance in the U.S. consumer business.
EBITDA, segment operating profit and the related margins increased in both the three and six-month periods due to favorable currency, savings from integration and efficiency initiatives and timing of expenses. The six-month period also reflected a $28 million efficiency-related charge recorded in the first quarter of 2011.
In addition, operating profit reflected the impact of higher depreciation and amortization charges attributable to products launched in the latter part of 2010 such as Thomson Reuters Eikon. These increases were partially offset by a lessening impact from assets acquired in the Reuters acquisition that are now fully depreciated. The decrease in Reuters-related expense was more pronounced in the first quarter of this year, as we began to experience this declining effect in the second quarter of last year.
We believe the Markets division’s margins in the second quarter of 2011 represent a high point for the year.
Corporate expenses
Three months ended June 30, | Six months ended June 30, | |||||||||||||||||||||||
| (millions of U.S. dollars) | 2011 | 2010 | $ Change | 2011 | 2010 | $ Change | ||||||||||||||||||
| Corporate expenses | 62 | 50 | 12 | 137 | 107 | 30 | ||||||||||||||||||
Corporate expenses were higher in both periods due to higher technology and consulting costs as well as unfavorable foreign currency. The six-month period also reflected unfavorable timing of expenses.
Other businesses
We provide information on the performance of Other businesses separately from our reportable segments, as these businesses are no longer fundamental to our strategy and will be sold or shut-down. The results in this category are not comparable from period to period, as the composition of businesses changes as businesses are identified for sale or shut-down. Further fluctuations are caused by the timing of the sales or shut-downs.
Three months ended June 30, | Six months ended June 30, | |||||||||||||||
| (millions of U.S. dollars) | 2011 | 2010 | 2011 | 2010 | ||||||||||||
| Revenues | 252 | 274 | 474 | 479 | ||||||||||||
| Operating profit | 62 | 82 | 101 | 107 | ||||||||||||
The more significant businesses included in this category for the periods presented were:
| Business | Status | Former Segment | Description | |||
| BARBRI | Sold in the second quarter of 2011 | Legal | A provider of bar exam preparatory workshops, courses, software, lectures and other tools in the U.S. | |||
| Healthcare | Held for sale | Healthcare & Science | A provider of data, analytics and performance benchmarking solutions and services to companies, government agencies and healthcare professionals | |||
| Enterprise Risk | Held for sale | Markets | A provider of risk management solutions to financial institutions, including banks, broker-dealers and hedge funds |
15
LIQUIDITY AND CAPITAL RESOURCES
At June 30, 2011, we had a strong liquidity position with:
| · | Approximately $0.7 billion of cash on hand; and |
| · | Access to a committed, but undrawn $2.5 billion syndicated credit facility. |
We repaid $593 million in debt securities (after swaps) upon their maturity in July 2011 (see “Subsequent Events”) and we have no scheduled maturities of long-term debt until 2013.
Our business generates significant free cash flow attributable to our strong business model and diversified customer base. In 2011, we expect to increase free cash flow compared to 2010 as a period of heavy investment relating to the launch of new products and the Reuters integration program comes to an end. We believe that cash on hand, cash provided by our operations, our commercial paper program and available credit facility will be sufficient to fund our cash dividends, debt service, capital expenditures, acquisitions in the normal course of business and any opportunistic share repurchases. We also expect net after-tax proceeds in excess of $2.0 billion from divestitures to be a source of liquidity in 2011.
FINANCIAL POSITION
Our total assets were $36.0 billion at June 30, 2011 compared to $35.5 billion at December 31, 2010. Increases from changes in foreign currency exchange rates, additions from newly acquired businesses and capital expenditures more than offset the effects of divestitures, depreciation and amortization.
Net Debt
The following table presents information related to our net debt as of the dates indicated:
| As at | ||||||||
(millions of U.S. dollars) | June 30, 2011 | December 31, 2010 | ||||||
| Current indebtedness | 634 | 645 | ||||||
| Long-term indebtedness | 6,955 | 6,873 | ||||||
| Total debt | 7,589 | 7,518 | ||||||
| Swaps | (397 | ) | (296 | ) | ||||
| Total debt after swaps | 7,192 | 7,222 | ||||||
| Remove fair value adjustments for hedges | (20 | ) | (31 | ) | ||||
| Remove transaction costs and discounts included in the carrying value of debt | 57 | 62 | ||||||
| Less: cash and cash equivalents | (713 | ) | (864 | ) | ||||
| Net debt | 6,516 | 6,389 | ||||||
Our net debt position increased due to lower cash and cash equivalents balances. See the section entitled “Cash Flow” for additional information.
Total Equity
The following table shows the changes in our total equity:
| (millions of U.S. dollars) | ||||
| Balance at December 31, 2010 | 19,675 | |||
| Net earnings | 829 | |||
| Share issuances | 122 | |||
| Effect of share-based compensation plans on paid in capital | 1 | |||
| Dividends declared on common shares | (518 | ) | ||
| Dividends declared on preference shares | (2 | ) | ||
| Unrecognized net income on cash flow hedges | 8 | |||
| Change in foreign currency translation adjustment | 410 | |||
| Net actuarial losses on defined benefit pension plans, net of tax | (3 | ) | ||
| Distributions to non-controlling interests | (19 | ) | ||
| Balance at June 30, 2011 | 20,503 | |||
16
Additional Information on Liquidity
The maturity dates for our long-term debt are well balanced with no significant concentration in any one year. At June 30, 2011, the average maturity for our long-term debt was approximately eight years at an average interest rate (after swaps) under 6%.
At June 30, 2011, the carrying amounts (excluding balances held for sale) of our total current liabilities exceeded the carrying amounts of our total current assets principally because current liabilities include deferred revenue. Deferred revenue does not represent a cash obligation, but rather an obligation to perform services or deliver products in the future. The costs to fulfill these obligations are included in our operating expenses.
We monitor the financial strength of financial institutions with which we have banking and other commercial relationships, including those that hold our cash and cash equivalents as well as those which are counterparties to derivative financial instruments and other arrangements.
Guarantees
We guarantee certain obligations of our subsidiaries, including borrowings by our subsidiaries under our revolving credit facility. Under our revolving credit facility discussed below, we must maintain a ratio of net debt as of the last day of each fiscal quarter to EBITDA as defined in the credit facility agreement (earnings before interest, income taxes, depreciation and amortization and other modifications described in the credit facility agreement) for the last four quarters ended of not more than 4.5:1. We were in compliance with this covenant at June 30, 2011.
RATINGS OF DEBT SECURITIES
Our access to financing depends on, among other things, suitable market conditions and the maintenance of suitable long-term credit ratings. Our credit ratings may be adversely affected by various factors, including increased debt levels, decreased earnings, declines in customer demand, increased competition, a further deterioration in general economic and business conditions and adverse publicity. Any downgrades in our credit ratings may impede our access to the debt markets or raise our borrowing rates.
The following table sets forth the credit ratings that we have received from rating agencies in respect of our outstanding securities as of the date of this management's discussion and analysis:
| Moody’s | Standard & Poor’s | DBRS Limited | Fitch | |||||
| Long-term debt | Baa1 | A- | A (low) | A- | ||||
| Commercial paper | - | A-1 (low) | R-1 (low) | F2 | ||||
| Trend/Outlook | Stable | Stable | Stable | Stable |
There have been no changes in our credit ratings since March 1, 2011, the date of our 2010 annual management’s discussion and analysis, and we are not aware of any changes being contemplated by these rating agencies.
These credit ratings are not recommendations to purchase, hold, or sell securities and do not address the market price or suitability of a specific security for a particular investor. Credit ratings may not reflect the potential impact of all risks on the value of securities. We cannot assure you that our credit ratings will not be lowered in the future or that rating agencies will not issue adverse commentaries regarding our securities.
CASH FLOW
Our principal sources of liquidity are cash on hand, cash provided by our operations, our commercial paper program and our available credit facility, as well as the issuance of public debt. We also expect proceeds from divestitures to be a source of liquidity in 2011. Our principal uses of cash have been for debt servicing costs, debt repayments, dividend payments, capital expenditures and acquisitions. Additionally, we have occasionally used cash to repurchase outstanding shares in open market transactions.
17
Summary of Statement of Cash Flow
The following table presents summary cash flow information for the periods presented:
Three months ended June 30, | Six months ended June 30, | |||||||||||||||||||||||
| (millions of U.S. dollars) | 2011 | 2010 | Change | 2011 | 2010 | Change | ||||||||||||||||||
Cash provided by operating activities (1) | 879 | 889 | (10 | ) | 1,079 | 1,193 | (114 | ) | ||||||||||||||||
Cash used in investing activities (1) | (404 | ) | (656 | ) | 252 | (681 | ) | (1,015 | ) | 334 | ||||||||||||||
| Cash used in financing activities | (374 | ) | (541 | ) | 167 | (554 | ) | (759 | ) | 205 | ||||||||||||||
| Translation adjustments on cash and cash equivalents | 1 | (12 | ) | 13 | 5 | (22 | ) | 27 | ||||||||||||||||
| Increase (decrease) in cash and cash equivalents | 102 | (320 | ) | 422 | (151 | ) | (603 | ) | 452 | |||||||||||||||
| Cash and cash equivalents at beginning of period | 611 | 828 | (217 | ) | 864 | 1,111 | (247 | ) | ||||||||||||||||
| Cash and cash equivalents at end of period | 713 | 508 | 205 | 713 | 508 | 205 | ||||||||||||||||||
| (1) | Certain prior period amounts have been revised in the consolidated statement of cash flow. Specifically, capital expenditures now include only cash payments, whereas previously they also included accruals relating to capital expenditures. The revision had no impact on prior periods’ increase or decrease in cash and cash equivalents, financial position or results of operations. See note 1 of our interim financial statements for the three and six months ended June 30, 2011 for additional information. |
Key highlights:
| · | $0.6 billion of free cash flow generated in the six months ended June 30, 2011; |
| · | $0.5 billion in proceeds realized from the recent disposal of non-core businesses; and |
| · | $0.7 billion re-invested through acquisitions this year. |
Operating activities. Cash provided by operating activities was largely unchanged for the three-month period as higher tax payments offset increases in EBITDA. The decrease for the six-month period was due to an unfavorable change in working capital, which provided a timing benefit in the fourth quarter of 2010 as well as higher tax payments.
Investing activities. Cash used in investing activities decreased in both the three and six-month periods as higher proceeds from the disposal of businesses more than offset higher spending on acquisitions.
Our investing activity included the following:
| · | Acquisition spending directed at broadening our product and service offerings in higher growth market segments and executing our globalization strategy, particularly in rapidly developing economies. |
| The following provides a brief description of major acquisitions completed during the periods presented: |
| Date | Company | Acquiring segment | Description | |||
| May 2011 | Mastersaf | Tax & Accounting | A Brazilian provider of tax and accounting solutions | |||
| May 2011 | World-Check | Legal | A provider of financial crime and corruption prevention information | |||
| June 2010 | Complinet | Legal | A provider of global compliance information solutions for financial services institutions and their advisors | |||
| June 2010 | Point Carbon | Markets | A provider of essential trading analytics, news and content for the energy and environmental markets | |||
| May 2010 | Revista dos Tribunais | Legal | A Brazilian legal publisher |
| · | $0.5 billion in proceeds realized from the disposal of our BARBRI legal education business and Scandinavian legal, tax and accounting business in the second quarter of 2011; and |
| · | Capital expenditures of $247 million (2010: $249 million) and $541 million (2010: $558 million) in the three and six months ended June 30, 2011, respectively, were largely unchanged compared to the prior year periods (1). Within our Markets division, we continued to invest in Thomson Reuters Eikon, with future releases targeted to our buy-side customers, as well as expansion of Thomson Reuters Elektron. Within our Professional division, we invested to extend product platforms in new markets and to integrate recent acquisitions. We also continued to invest in infrastructure technology to drive efficiencies across our businesses. |
| (1) | Capital expenditures including accrued amounts were $233 million (2010: $248 million) and $451 million (2010: $462 million) for the three and six months ended June 30, 2011, respectively. The amounts reported on our consolidated statement of cash flow are different due to the timing of cash payments for capital expenditures. |
Financing activities. Cash used in financing activities decreased in both the three and six-month periods, reflecting lower net outflows from debt-related activities.
18
| · | In March 2010, we issued $500 million principal amount of 5.85% notes due 2040. The net proceeds from this issuance were used to repurchase $432 million principal amount of notes as part of the tender for our $700 million principal amount of outstanding 6.20% notes due 2012. In April 2010, we completed the redemption of the remaining notes which were not tendered. |
The following table sets forth dividend information for the periods presented:
Three months ended June 30, | Six months ended June 30, | |||||||||||||||
| (millions of U.S. dollars) | 2011 | 2010 | 2011 | 2010 | ||||||||||||
| Dividends declared | 259 | 242 | 518 | 483 | ||||||||||||
| Dividends reinvested | (11 | ) | (10 | ) | (53 | ) | (20 | ) | ||||||||
| Dividends paid | 248 | 232 | 465 | 463 | ||||||||||||
In February 2011, our board of directors approved a $0.08 per share increase in the annualized dividend to $1.24 per common share.
For the six months ended June 30, 2011, the increase in dividends reinvested in shares reflects higher reinvestment by Woodbridge in the first quarter of 2011.
Free cash flow and underlying free cash flow. The following table sets forth calculations of our free cash flow and underlying free cash flow for the periods presented:
Three months ended June 30, | Six months ended June 30, | |||||||||||||||
| (millions of U.S. dollars) | 2011 | 2010 | 2011 | 2010 | ||||||||||||
Net cash provided by operating activities (1) | 879 | 889 | 1,079 | 1,193 | ||||||||||||
Capital expenditures, less proceeds from disposals (1) | (247 | ) | (249 | ) | (541 | ) | (558 | ) | ||||||||
| Other investing activities | 2 | 4 | 37 | 3 | ||||||||||||
| Dividends paid on preference shares | (1 | ) | - | (2 | ) | (1 | ) | |||||||||
Free cash flow (1) | 633 | 644 | 573 | 637 | ||||||||||||
Integration programs costs (2) | 67 | 107 | 140 | 221 | ||||||||||||
Underlying free cash flow (1) | 700 | 751 | 713 | 858 | ||||||||||||
| (1) | There was no impact on free cash flow or underlying free cash flow as a result of the revision of prior period amounts for “Net cash provided by operating activities” and “Capital expenditures, less proceeds from disposals”. See “Summary of Statement of Cash Flow”. |
| (2) | Free cash flow includes one-time cash costs associated with our integration programs. We remove these costs to derive our underlying free cash flow. |
Free cash flow and underlying free cash flow declined in the three-month period as higher tax payments offset increases in EBITDA. Free cash flow and underlying free cash flow decreased in the six-month period due to an unfavorable change in working capital, which provided a timing benefit in the fourth quarter of 2010, as well as higher tax payments. Free cash flow was lower in each period despite lower integration programs costs.
Credit facility and commercial paper program. We have a $2.5 billion unsecured revolving credit facility which we may utilize to provide liquidity in connection with our commercial paper program and for general corporate purposes. The credit facility currently expires in August 2012, but we may request an extension of the maturity date under certain circumstances for up to two additional one-year periods, which the applicable lenders may accept or decline in their sole discretion. We may also request an increase, subject to approval by applicable lenders, in the amount of the lenders’ commitments up to a maximum amount of $3.0 billion. As of June 30, 2011, we had no borrowings under the credit facility and no commercial paper outstanding.
Based on our current credit rating, the cost of borrowing under the agreement is priced at LIBOR plus 19 basis points (or plus 24 basis points on all borrowings when line utilization exceeds 50%). If our long-term debt rating was downgraded by Moody’s or Standard & Poor’s, our facility fee and borrowing costs may increase, although availability would be unaffected. Conversely, an upgrade in our ratings may reduce our credit facility fees and borrowing costs. The facility contains certain customary affirmative and negative covenants, each with customary exceptions. The financial covenant related to this facility is described in the “Financial Position” subsection above. We monitor the lenders that are party to our facility and believe they continue to be able to lend to us.
Normal course issuer bid (NCIB). We may buy back shares (and subsequently cancel them) from time to time as part of our capital management strategy. In May 2011, we renewed our NCIB share repurchase facility for an additional 12-month period. Under the NCIB, up to 15 million common shares (representing less than 2% of the total outstanding shares) may be repurchased in open market transactions on the TSX or the NYSE between May 13, 2011 and May 12, 2012.
19
OFF-BALANCE SHEET ARRANGEMENTS, COMMITMENTS AND CONTRACTUAL OBLIGATIONS
For a summary of our other off-balance sheet arrangements, commitments and contractual obligations please see our 2010 annual management’s discussion and analysis. There were no material changes to these arrangements, commitments and contractual obligations outside the ordinary course of business during the three months ended June 30, 2011.
CONTINGENCIES
Lawsuits and Legal Claims
In November 2009, the European Commission initiated an investigation relating to our use of our company’s Reuters Instrument Codes (RIC symbols). RIC symbols help financial professionals retrieve news and information on financial instruments (such as prices and other data on stocks, bonds, currencies and commodities). We are fully cooperating with the investigation. We do not believe that we have engaged in any anti-competitive activity related to RIC symbols.
In addition to the matter described above, we have engaged in various legal proceedings and claims that have arisen in the ordinary course of business. The outcome of all of the proceedings and claims against us, including the matter described above, is subject to future resolution, including the uncertainties of litigation. Based on information currently known to us and after consultation with outside legal counsel, management believes that the probable ultimate resolution of any such proceedings and claims, individually or in the aggregate, will not have a material adverse effect on our financial condition, taken as a whole.
Uncertain Tax Positions
We are subject to taxation in numerous jurisdictions. There are many transactions and calculations during the course of business for which the ultimate tax determination is uncertain. We maintain provisions for uncertain tax positions that we believe appropriately reflect our risk. These provisions are made using the best estimate of the amount expected to be paid based on a qualitative assessment of all relevant factors. We review the adequacy of these provisions at the end of the reporting period. The IRS has challenged certain positions taken on our tax returns for the years 2006 and 2007. It is possible that at some future date, liabilities in excess of our provisions could result from audits by, or litigation with, the IRS or other relevant taxing authorities. Management believes that such additional liabilities would not have a material adverse impact on our financial condition taken as a whole.
20
OUTLOOK
The information in this section is forward-looking and should be read in conjunction with the section below entitled “Cautionary Note Concerning Factors That May Affect Future Results”.
We recently reaffirmed our business outlook for 2011 that was first communicated in February.
The following table sets forth our current 2011 outlook, the material assumptions related to our outlook and the material risk factors that may cause actual performance to differ materially from our current expectations.
Our 2011 outlook excludes businesses which have been or are expected to be exited through sale or shut–down, as well as the impact of changes in foreign currency exchange rates.
| 2011 Outlook | Material assumptions | Material risk factors | ||
| Revenues expected to grow mid-single digits | — New products gain momentum, driving positive net sales and our markets continue to recover — Positive global GDP growth, led by rapidly developing economies — Continued increase in the number of professionals around the world and their demand for high quality information and services — Successful execution of ongoing product release programs, globalization strategy and other growth initiatives | — Uneven economic recovery across the markets we serve may result in reduced spending levels by our customers — Demand for our products and services could be reduced by changes in customer buying patterns, competitive pressures or service or product issues — Implementation of regulatory reform, including Dodd-Frank legislation and similar financial services laws around the world, may limit business opportunities for our customers, lowering their demand for our products and services — As government stimulus programs unwind, global economic recovery slows or reverts to recession | ||
| Adjusted EBITDA margin expected to increase by at least 300 basis points | — Revenues expected to grow mid-single digits in 2011 — Business mix within our Professional division continues to shift to an increasing percentage of software and solutions which have lower initial margins compared to print and non-subscription based businesses Revenues from higher-margin print and non-subscription-based businesses remain comparable to 2010 levels — Integration programs completed at an in-period cost of $200 million — Realization of expected benefits and savings from our integration program and efficiency initiatives | — See risk factors above related to revenue outlook — Revenues from higher margin print and non-subscription based businesses may be lower than expected — The costs of required investments exceed expectations or actual returns are below expectations — See the risk factors below related to integration program savings | ||
| Underlying operating profit margin expected to increase by at least 100 basis points | — Adjusted EBITDA margin to increase by at least 300 basis points in 2011 — The expected underlying operating profit margin increase reflects the absorbing of an anticipated 70 basis point impact from higher depreciation and amortization related to prior years’ investments in recently launched products | — See risk factors above related to Adjusted EBITDA margin — 2011 capital expenditures may be higher than currently expected, resulting in higher in-period depreciation and amortization of computer software charges |
21
| Outlook | Material assumptions | Material risk factors | ||
| Free cash flow expected to increase 20% to 25% | — Revenues expected to grow mid-single digits in 2011 — Adjusted EBITDA margin to increase by at least 300 basis points in 2011 — Capital expenditures decline as a percentage of revenues to between 7.5% to 8.0% of revenues in 2011 | — See risk factors above related to revenue outlook and adjusted EBITDA margin — Higher capital expenditures than currently expected | ||
| Achieve integration program run-rate savings of $1.7 billion at an in-period cost of approximately $200 million | — We will have the ability to execute our integration plan as currently anticipated | — Benefits may not be achieved to the extent, or within the time period, currently expected — The timing and amount of costs incurred in 2011 may vary from current expectations |
Additionally, in 2011, we expect that: our depreciation and amortization of computer software will represent 8% to 8.5% of revenues; interest expense to be $400 to $425 million, assuming no significant change in our level of indebtedness; Core corporate expenses increase to approximately $290 million, reflecting higher healthcare costs; and our effective tax rate (as a percentage of post-amortization earnings) to be in a range of 20% to 22%, assuming no changes in current tax laws or treaties to which we are subject.
22
RELATED PARTY TRANSACTIONS
As of July 26, 2011, Woodbridge beneficially owned approximately 55% of our shares.
TRANSACTIONS WITH WOODBRIDGE
From time to time, in the normal course of business, Woodbridge and certain of its affiliates purchase some of our product and service offerings. These transactions are negotiated at arm’s length on standard terms, including price, and are not significant to our results of operations or financial condition either individually or in the aggregate.
In the normal course of business, certain of our subsidiaries charge a Woodbridge owned company fees for various administrative services. The total amount charged to Woodbridge for these services in 2010 was approximately $126,000.
We purchase property and casualty insurance from third party insurers and retain the first $500,000 of each and every claim under the programs via our captive insurance subsidiary. Woodbridge is included in these programs and pays us a premium commensurate with its exposures. Premiums relating to 2010 were $67,000, which would approximate the premium charged by a third party insurer for such coverage.
We maintained an agreement with Woodbridge until April 17, 2008 (the closing date of the Reuters acquisition) under which Woodbridge agreed to indemnify up to $100 million of liabilities incurred either by our current and former directors and officers or by our company in providing indemnification to these individuals on substantially the same terms and conditions as would apply under an arm’s length, commercial arrangement. We were required to pay Woodbridge an annual fee of $750,000, which was less than the premium that would have been paid for commercial insurance. In 2008, we replaced this agreement with a conventional insurance agreement. We are entitled to seek indemnification from Woodbridge for any claims arising from events prior to April 17, 2008, so long as the claims are made before April 17, 2014.
TRANSACTIONS WITH AFFILIATES AND JOINT VENTURES
From time to time, we enter into transactions in connection with our investments in affiliates and joint ventures. These transactions typically involve providing or receiving services and are entered into in the normal course of business and on an arm’s length basis.
We and The Depository Trust & Clearing Corporation (DTCC) each have a 50% interest in Omgeo, a provider of trade management services. Omgeo pays us for use of a facility and technology and other services which were valued at approximately $5 million for the six months ended June 30, 2011.
We and Shin Nippon Hoki Shuppan K.K. each own 50% of Westlaw Japan K.K., a provider of legal information and solutions to the Japanese legal market. We provide the joint venture with technology and other services, which were valued at approximately $800,000 for the six months ended June 30, 2011.
In connection with the 2008 acquisition of Reuters, we assumed a lease agreement with 3XSQ Associates, an entity now owned by Thomson Reuters and Rudin Times Square Associates LLC that was formed to build and operate the 3 Times Square property and building in New York, New York that now serves as our corporate headquarters. We follow the equity method of accounting for our investment in 3XSQ Associates. The lease provides us with over 690,000 square feet of office space until 2021 and includes provisions to terminate portions early and various renewal options. Our costs under this lease arrangement for rent, taxes and other expenses were approximately $18 million for the six months ended June 30, 2011.
OTHER TRANSACTIONS
In February 2010, we acquired Super Lawyers from an entity controlled by Vance Opperman, one of our directors, for approximately $15 million. The acquisition helped expand FindLaw’s product offerings. Mr. Opperman’s son was the CEO of the acquired business and agreed to stay on with the business through a transition period which concluded in the third quarter of 2010. Our board of directors reviewed and approved the transaction. Mr. Opperman refrained from deliberating and voting on the matter.
In October 2010, we acquired Serengeti, a provider of electronic billing and matter management systems for corporate legal departments. As a result of a prior investment in a venture lending firm, Peter Thomson, one of our directors, may have the right to receive 10% of the purchase consideration paid by our company. Mr. Thomson did not participate in negotiations related to the acquisition of Serengeti and refrained from deliberating and voting on the acquisition.
23
SUBSEQUENT EVENTS
ACQUISITIONS
In July 2011, we acquired Manatron, a provider of property tax automation and land registry software for governments and municipalities. At this time, an independent valuation, which is required to complete the accounting for the acquisition, is in process. Therefore, it is impractical to provide further disclosures in accordance with IFRS 3, Business Combinations. Once this is completed, we will allocate the fair value to the individual assets and liabilities acquired.
REPAYMENT OF DEBT MATURITIES
In July 2011, we repaid our C$600 million principal amount of 5.25% notes upon their maturity for $593 million after giving effect to debt-related swap agreements. The repayment was funded with commercial paper and other available resources.
MARKETS DIVISION REALIGNMENT
In July 2011, we announced a streamlining of the organizational structure of our Markets division. See “Our operational structure – Markets division realignment” for additional information.
CHANGES IN ACCOUNTING POLICIES
Please refer to the “Changes in Accounting Policies” section of our 2010 annual management’s discussion and analysis, which is contained in our 2010 annual report, as well as note 2 of our interim financial statements for the six months ended June 30, 2011, for information regarding changes in accounting policies.
CRITICAL ACCOUNTING ESTIMATES AND JUDGMENTS
The preparation of financial statements requires management to make estimates and judgments about the future. Estimates and judgments are continually evaluated and are based on historical experience and other factors, including expectations of future events that are believed to be reasonable under the circumstances. Please refer to the “Critical Accounting Estimates and Judgments” section of our 2010 annual management’s discussion and analysis, which is contained in our 2010 annual report, for additional information. Since the date of our 2010 annual management’s discussion and analysis, there have not been any significant changes to our critical accounting estimates and judgments.
24
ADDITIONAL INFORMATION
DISCLOSURE CONTROLS AND PROCEDURES
Our Chief Executive Officer and Chief Financial Officer, after evaluating the effectiveness of our disclosure controls and procedures (as defined in applicable U.S. and Canadian securities law) as of the end of the period covered by this management’s discussion and analysis, have concluded that our disclosure controls and procedures are effective to ensure that all information that we are required to disclose in reports that we file or furnish under the U.S. Securities Exchange Act and applicable Canadian securities law is (i) recorded, processed, summarized and reported within the time periods specified in the rules and forms of the SEC and Canadian securities regulatory authorities and (ii) accumulated and communicated to our management, including our Chief Executive Officer and Chief Financial Officer, to allow timely decisions regarding required disclosure.
INTERNAL CONTROL OVER FINANCIAL REPORTING
Our management is responsible for establishing and maintaining adequate internal control over financial reporting to provide reasonable assurance regarding the reliability of financial reporting and the preparation of financial statements for external purposes in accordance with IFRS. In 2011, we expect to complete the integration program we commenced in 2008 as a result of the Reuters acquisition. Our current integration efforts include a phased implementation of order-to-cash (OTC) applications and related workflow processes in our Markets division. Key elements of the OTC solutions are order management, billing, cash management and collections functionality. We continue to modify the design and documentation of the related internal control processes and procedures as the regional phased implementation progresses.
Except as described above, there was no change in our internal control over financial reporting during the last fiscal quarter that materially affected, or is reasonably likely to materially affect, our internal control over financial reporting.
SHARE CAPITAL
As of July 26, 2011, we had outstanding 836,797,696 common shares, 6,000,000 Series II preference shares, 13,119,981 stock options and a total of 7,944,518 time-based restricted share units and performance restricted share units. We have also issued a Thomson Reuters Founders Share which enables Thomson Reuters Founders Share Company to exercise extraordinary voting power to safeguard the Thomson Reuters Trust Principles.
PUBLIC SECURITIES FILINGS AND REGULATORY ANNOUNCEMENTS
You may access other information about our company, including our 2010 annual report (which contains information required in an annual information form) and our other disclosure documents, reports, statements or other information that we file with the Canadian securities regulatory authorities through SEDAR at www.sedar.com and in the United States with the SEC at www.sec.gov.
CAUTIONARY NOTE CONCERNING FACTORS THAT MAY AFFECT FUTURE RESULTS
Certain statements in this management’s discussion and analysis, including, but not limited to statements in the ”Outlook” section are forward-looking. These forward-looking statements are based on certain assumptions and reflect our company’s current expectations. As a result, forward-looking statements are subject to a number of risks and uncertainties that could cause actual results or events to differ materially from current expectations. Certain factors that could cause actual results or events to differ materially from current expectations are discussed in the “Outlook“ section above. Additional factors are discussed in the “Risk Factors” section of our 2010 annual report and in materials that we from time to time file with, or furnish to, the Canadian securities regulatory authorities and the U.S. Securities and Exchange Commission. There is no assurance that any forward-looking statement will materialize. Our outlook is provided for the purpose of providing information about current expectations for 2011. This information may not be appropriate for other purposes. You are cautioned not to place undue reliance on forward-looking statements, which reflect our expectations only as of the date of this management’s discussion and analysis. Except as may be required by applicable law, we disclaim any obligation to update or revise any forward-looking statements.
25
APPENDIX A
NON-IFRS FINANCIAL MEASURES
The following table sets forth our non-IFRS financial measures, including an explanation of why we believe they are useful measures of our performance. Reconciliations for the most directly comparable IFRS measure are reflected in our management’s discussion and analysis.
| Non-IFRS Financial Measure | How We Define It | Why We Use It and Why It Is Useful to Investors | Most Directly Comparable IFRS Measure/Reconciliation | |||
| Revenues from ongoing businesses | Revenues from reportable segments less eliminations. | Provides a measure of our ability to grow our ongoing businesses over the long term. | Revenues | |||
| Revenues at constant currency (before currency or revenues excluding the effects of foreign currency) | Revenues applying the same foreign currency exchange rates for the current and equivalent prior period. To calculate the foreign currency impact between periods, we convert the current and equivalent prior period’s local currency revenues using the same foreign currency exchange rate. | Provides a measure of underlying business trends, without distortion from the effect of foreign currency movements during the period. Our reporting currency is the U.S. dollar. However, we conduct a significant amount of our activities in currencies other than the U.S. dollar. We manage our operating segments on a constant currency basis, and we manage currency exchange risk at the corporate level. | Revenues | |||
| Underlying operating profit and underlying operating profit margin | Operating profit from reportable segments and corporate expenses. The related margin is expressed as a percentage of revenues from ongoing businesses. | Provides a basis to evaluate operating profitability and performance trends, excluding the impact of items which distort the performance of our operations. | Operating profit | |||
| Adjusted EBITDA and adjusted EBITDA margin | Underlying operating profit excluding the related depreciation and amortization of computer software, but including integration programs expenses. The related margin is expressed as a percentage of revenues from ongoing businesses. | Provides a measure commonly reported and widely used by investors as an indicator of a company’s operating performance and ability to incur and service debt, and as a valuation metric. | Earnings from continuing operations |
26
| Non-IFRS Financial Measure | How We Define It | Why We Use It and Why It Is Useful to Investors | Most Directly Comparable IFRS Measure/Reconciliation | |||
| Adjusted earnings and adjusted earnings per share from continuing operations | Earnings attributable to common shareholders and per share excluding the pre-tax impacts of amortization of other identifiable intangible assets and the post-tax impacts of fair value adjustments, other operating gains and losses, impairment charges, the results of Other businesses, other net finance costs or income, our share of post-tax earnings or losses in equity method investees, discontinued operations and other items affecting comparability. We also deduct dividends declared on preference shares. This measure is calculated using diluted weighted average shares. In interim periods, we also adjust our reported earnings and earnings per share to reflect a normalized effective tax rate. Specifically, the normalized effective rate is computed as the estimated full-year effective tax rate applied to adjusted pre-tax earnings of the interim period. The reported effective tax rate is based on separate annual effective income tax rates for each taxing jurisdiction that are applied to each interim period’s pre-tax income. | Provides a more comparable basis to analyze earnings and is also a measure commonly used by shareholders to measure our performance. Because the geographical mix of pre-tax profits and losses in interim periods distorts the reported effective tax rate within an interim period, we believe that using the expected full-year effective tax rate provides more comparability among interim periods. The adjustment to normalize the effective tax rate reallocates estimated full-year income taxes between interim periods, but has no effect on full year tax expense or on cash taxes paid. | Earnings attributable to common shareholders and earnings per share attributable to common shareholders |
27
| Non-IFRS Financial Measure | How We Define It | Why We Use It and Why It Is Useful to Investors | Most Directly Comparable IFRS Measure/Reconciliation | |||
| Net debt | Total indebtedness, including the associated fair value of hedging instruments (swaps) on our debt, but excluding unamortized transaction costs and premiums or discounts associated with our debt, less cash and cash equivalents. | Provides a measure of indebtedness in excess of the current cash available to pay down debt. Given that we hedge some of our debt to reduce risk, we include hedging instruments as we believe it provides a better measure of the total obligation associated with our outstanding debt. However, because we intend to hold our debt and related hedges to maturity, we do not consider certain components of the associated fair value of hedges in our measurements. We reduce gross indebtedness by cash and cash equivalents on the basis that they could be used to pay down debt. | Total debt (current indebtedness plus long-term indebtedness) | |||
| Free cash flow | Net cash provided by operating activities less capital expenditures, other investing activities and dividends paid on our preference shares. | Helps assess our ability, over the long term, to create value for our shareholders as it represents cash available to repay debt, pay common dividends and fund share repurchases and new acquisitions. | Net cash provided by operating activities | |||
| Underlying free cash flow | Free cash flow excluding one-time cash costs associated with integration programs. | Provides a supplemental measure of our ability, over the long term, to create value for our shareholders because it represents free cash flow generated by our operations excluding certain unusual items. | Net cash provided by operating activities |
28
APPENDIX B
SUPPLEMENTAL FINANCIAL INFORMATION:
REALIGNMENT OF REPORTABLE SEGMENTS - RESTATED FINANCIAL INFORMATION FOR THE YEARS ENDED DECEMBER 31, 2010 AND 2009
In the second quarter of 2011, we announced that we intend to sell our healthcare business and we realigned the structure of our Professional division. As a result, we changed our segment reporting to reflect how we currently manage our businesses.
| · | A new Intellectual Property & Science segment was formed, including the intellectual property business, formerly reported within the Legal segment, and the science business, formerly reported within the Healthcare & Science segment; |
| · | The Paisley business was moved from the Tax & Accounting segment to the Legal segment; and |
| · | An “Other businesses” category was created to aggregate businesses that have been or are expected to be exited through sale or shut–down that did not qualify for discontinued operations classification. This category includes the healthcare business formerly reported within the Healthcare & Science segment as well as other previously announced disposals. |
The following tables provide our segment information and non-IFRS financial measures reflecting the new organizational structure for the years ended December 31, 2010 and 2009.
Division and business segment information
Year ended December 31, | Change | |||||||||||||||
| (millions of U.S. dollars) | 2010 | 2009 | Total | Existing businesses | ||||||||||||
| Revenues | ||||||||||||||||
| Legal | 3,157 | 3,057 | 3 | % | - | |||||||||||
| Tax & Accounting | 1,006 | 932 | 8 | % | 3 | % | ||||||||||
| Intellectual Property & Science | 789 | 756 | 4 | % | 2 | % | ||||||||||
| Professional division | 4,952 | 4,745 | 4 | % | 1 | % | ||||||||||
| Sales & Trading | 3,543 | 3,621 | (2 | %) | (3 | %) | ||||||||||
| Investment & Advisory | 2,208 | 2,296 | (4 | %) | (5 | %) | ||||||||||
| Enterprise | 1,093 | 1,021 | 7 | % | 7 | % | ||||||||||
| Media | 324 | 331 | (2 | %) | (3 | %) | ||||||||||
| Markets division | 7,168 | 7,269 | (1 | %) | (2 | %) | ||||||||||
| Reportable segments | 12,120 | 12,014 | 1 | % | (1 | %) | ||||||||||
| Eliminations | (12 | ) | (11 | ) | ||||||||||||
| Revenues from ongoing businesses | 12,108 | 12,003 | 1 | % | (1 | %) | ||||||||||
| Before currency | 1 | % | ||||||||||||||
Other businesses (1) | 962 | 994 | ||||||||||||||
| Consolidated revenues | 13,070 | 12,997 | 1 | % | ||||||||||||
| Operating profit | ||||||||||||||||
| Legal | 892 | 954 | (6 | %) | ||||||||||||
| Tax & Accounting | 223 | 217 | 3 | % | ||||||||||||
| Intellectual Property & Science | 209 | 218 | (4 | %) | ||||||||||||
| Professional division | 1,324 | 1,389 | (5 | %) | ||||||||||||
| Markets division | 1,281 | 1,404 | (9 | %) | ||||||||||||
| Total segment operating profit | 2,605 | 2,793 | (7 | %) | ||||||||||||
Corporate expenses (2) | (249 | ) | (253 | ) | ||||||||||||
| Underlying operating profit | 2,356 | 2,540 | (7 | %) | ||||||||||||
Other businesses (1) | 204 | 201 | ||||||||||||||
Integration programs expenses (2) | (463 | ) | (506 | ) | ||||||||||||
Fair value adjustments (2) | (117 | ) | (170 | ) | ||||||||||||
| Amortization of other identifiable intangible assets | (545 | ) | (499 | ) | ||||||||||||
| Other operating (losses) gains, net | (16 | ) | 9 | |||||||||||||
| Consolidated operating profit | 1,419 | 1,575 | (10 | %) | ||||||||||||
29
Reconciliation of operating profit to underlying operating profit and adjusted EBITDA
Year ended December 31, | ||||||||||||
| (millions of U.S. dollars) | 2010 | 2009 | Change | |||||||||
| Operating profit | 1,419 | 1,575 | (10 | %) | ||||||||
| Adjustments: | ||||||||||||
| Amortization of other identifiable intangible assets | 545 | 499 | ||||||||||
| Integration programs expenses | 463 | 506 | ||||||||||
| Fair value adjustments | 117 | 170 | ||||||||||
| Other operating losses (gains), net | 16 | (9 | ) | |||||||||
Operating profit from Other businesses (1) | (204 | ) | (201 | ) | ||||||||
| Underlying operating profit | 2,356 | 2,540 | (7 | %) | ||||||||
| Adjustments: | ||||||||||||
| Integration programs expenses | (463 | ) | (506 | ) | ||||||||
Depreciation and amortization of computer software (excluding Other businesses (1)) | 959 | 985 | ||||||||||
| Adjusted EBITDA | 2,852 | 3,019 | (6 | %) | ||||||||
| Underlying operating profit margin | 19.5 | % | 21.2 | % | (170 | ) bp | ||||||
| Adjusted EBITDA margin | 23.6 | % | 25.2 | % | (160 | ) bp | ||||||
bp = basis points.
Reconciliation of earnings attributable to common shareholders to adjusted earnings from continuing operations
Year ended December 31, | ||||||||||||
| (millions of U.S. dollars, except per share amounts) | 2010 | 2009 | Change | |||||||||
| Earnings attributable to common shareholders | 909 | 844 | 8 | % | ||||||||
| Adjustments: | ||||||||||||
Operating profit from Other businesses (1) | (204 | ) | (201 | ) | ||||||||
| Fair value adjustments | 117 | 170 | ||||||||||
| Other operating losses (gains), net | 16 | (9 | ) | |||||||||
| Other finance (income) costs | (28 | ) | 242 | |||||||||
| Other non-operating charge | - | 385 | ||||||||||
| Share of post tax earnings in equity method investees | (8 | ) | (7 | ) | ||||||||
| Tax on above items | 9 | 10 | ||||||||||
| Amortization of other identifiable intangible assets | 545 | 499 | ||||||||||
| Discrete tax items | (47 | ) | (531 | ) | ||||||||
| Discontinued operations | - | (23 | ) | |||||||||
| Dividends declared on preference shares | (3 | ) | (2 | ) | ||||||||
| Adjusted earnings from continuing operations | 1,306 | 1,377 | (5 | %) | ||||||||
| Adjusted earnings per share from continuing operations | $ | 1.56 | $ | 1.65 | (5 | %) | ||||||
30
Reconciliation of earnings from continuing operations to adjusted EBITDA
Year ended December 31, | ||||||||||||
| (millions of U.S. dollars) | 2010 | 2009 | Change | |||||||||
| Earnings from continuing operations | 933 | 844 | 11 | % | ||||||||
| Adjustments: | ||||||||||||
| Tax expense (benefit) | 139 | (299 | ) | |||||||||
| Other finance (income) cost, net | (28 | ) | 242 | |||||||||
| Net interest expense | 383 | 410 | ||||||||||
| Amortization of other identifiable intangible assets | 545 | 499 | ||||||||||
| Amortization of computer software | 572 | 548 | ||||||||||
| Depreciation | 457 | 509 | ||||||||||
| EBITDA | 3,001 | 2,753 | 9 | % | ||||||||
| Adjustments: | ||||||||||||
| Share of post tax earnings in equity method investees | (8 | ) | (7 | ) | ||||||||
| Other non-operating charge | - | 385 | ||||||||||
| Other operating losses (gains), net | 16 | (9 | ) | |||||||||
| Fair value adjustments | 117 | 170 | ||||||||||
EBITDA from Other businesses (1) | (274 | ) | (273 | ) | ||||||||
| Adjusted EBITDA | 2,852 | 3,019 | (6 | %) | ||||||||
| Adjusted EBITDA margin | 23.6 | % | 25.2 | % | (160 | ) bp | ||||||
bp = basis points
Reconciliation of underlying operating profit to adjusted EBITDA by division and business segment
| Year ended December 31, 2010 | Year ended December 31, 2009 | |||||||||||||||||||||||
Underlying Operating profit | Add: Depreciation and amortization of computer software ** | Adjusted EBITDA | Underlying Operating profit | Add: Depreciation and amortization of computer software ** | Adjusted EBITDA | |||||||||||||||||||
| Legal | 892 | 269 | 1,161 | 954 | 243 | 1,197 | ||||||||||||||||||
| Tax & Accounting | 223 | 84 | 307 | 217 | 67 | 284 | ||||||||||||||||||
| Intellectual Property & Science | 209 | 54 | 263 | 218 | 51 | 269 | ||||||||||||||||||
| Professional division | 1,324 | 407 | 1,731 | 1,389 | 361 | 1,750 | ||||||||||||||||||
| Markets division | 1,281 | 527 | 1,808 | 1,404 | 597 | 2,001 | ||||||||||||||||||
| Corporate expenses | (249 | ) | 25 | (224 | ) | (253 | ) | 27 | (226 | ) | ||||||||||||||
| Integration programs expenses | na | na | (463 | ) | na | na | (506 | ) | ||||||||||||||||
| Total | 2,356 | 959 | 2,852 | 2,540 | 985 | 3,019 | ||||||||||||||||||
na = not applicable
** excludes Other businesses (1)
______________________________________________
| (1) | Other businesses are businesses that have been or are expected to be exited through sale or shut-down that did not qualify for discontinued operations classification. The more significant businesses in this category include: BARBRI (legal education provider, sold in the second quarter 2011); Enterprise Risk (risk management solutions provider to financial institutions); and Healthcare (data, analytics and performance benchmarking solutions provider). |
| Year ended December 31, | ||||||||
| (millions of U.S. dollars) | 2010 | 2009 | ||||||
| Revenues | 962 | 994 | ||||||
| Operating profit | 204 | 201 | ||||||
| Depreciation and amortization of computer software | 70 | 72 | ||||||
| EBITDA | 274 | 273 | ||||||
| (2) | Corporate expense includes corporate functions and certain share-based compensation costs. We previously reported a “Corporate & Other” category, which also included integration programs expenses and fair value adjustments. These items are now reported separately. |
31
APPENDIX C
RECONCILIATION OF EARNINGS FROM CONTINUING OPERATIONS TO ADJUSTED EBITDA
The following schedule provides a reconciliation of earnings from continuing operations, which is the most directly comparable IFRS measure, to adjusted EBITDA, for the periods presented. See Appendix A for additional information.
Three months ended June 30, | Six months ended June 30, | |||||||||||||||||||||||
| (millions of U.S. dollars) | 2011 | 2010 | Change | 2011 | 2010 | Change | ||||||||||||||||||
| Earnings from continuing operations | 572 | 303 | 89 | % | 827 | 437 | 89 | % | ||||||||||||||||
| Adjustments: | ||||||||||||||||||||||||
| Tax expense | 174 | 79 | 226 | 110 | ||||||||||||||||||||
| Other finance (income) cost, net | (9 | ) | (39 | ) | (16 | ) | 24 | |||||||||||||||||
| Net interest expense | 98 | 95 | 199 | 188 | ||||||||||||||||||||
| Amortization of other identifiable intangible assets | 150 | 132 | 294 | 261 | ||||||||||||||||||||
| Amortization of computer software | 162 | 133 | 326 | 274 | ||||||||||||||||||||
| Depreciation | 110 | 105 | 217 | 243 | ||||||||||||||||||||
| EBITDA | 1,257 | 808 | 56 | % | 2,073 | 1,537 | 35 | % | ||||||||||||||||
| Adjustments: | ||||||||||||||||||||||||
| Share of post tax earnings in equity method investees | (2 | ) | (3 | ) | (7 | ) | (3 | ) | ||||||||||||||||
| Other operating (gains)losses, net | (286 | ) | 34 | (319 | ) | 33 | ||||||||||||||||||
| Fair value adjustments | (8 | ) | (36 | ) | (10 | ) | (27 | ) | ||||||||||||||||
EBITDA from Other businesses (1) | (74 | ) | (98 | ) | (129 | ) | (140 | ) | ||||||||||||||||
| Adjusted EBITDA | 887 | 705 | 26 | % | 1,608 | 1,400 | 15 | % | ||||||||||||||||
| Adjusted EBITDA margin | 27.8 | % | 24.0 | % | 380 | bp | 25.5 | % | 23.8 | % | 170 | bp | ||||||||||||
bp = basis points
RECONCILIATION OF UNDERLYING OPERATING PROFIT TO ADJUSTED EBITDA BY DIVISION AND BUSINESS SEGMENT
Three months ended June 30, 2011 | Three months ended June 30, 2010 | |||||||||||||||||||||||
Underlying Operating profit | Add: Depreciation and amortization of computer software ** | Adjusted EBITDA | Underlying Operating profit | Add: Depreciation and amortization of computer software ** | Adjusted EBITDA | |||||||||||||||||||
| Legal | 236 | 78 | 314 | 220 | 67 | 287 | ||||||||||||||||||
| Tax & Accounting | 50 | 22 | 72 | 35 | 21 | 56 | ||||||||||||||||||
| Intellectual Property & Science | 57 | 14 | 71 | 56 | 14 | 70 | ||||||||||||||||||
| Professional division | 343 | 114 | 457 | 311 | 102 | 413 | ||||||||||||||||||
| Markets division | 388 | 144 | 532 | 312 | 115 | 427 | ||||||||||||||||||
| Corporate expenses | (62 | ) | 2 | (60 | ) | (50 | ) | 5 | (45 | ) | ||||||||||||||
| Integration programs expenses | na | na | (42 | ) | na | na | (90 | ) | ||||||||||||||||
| Total | 669 | 260 | 887 | 573 | 222 | 705 | ||||||||||||||||||
na = not applicable
** excludes Other businesses (1)
32
RECONCILIATION OF UNDERLYING OPERATING PROFIT TO ADJUSTED EBITDA BY DIVISION AND BUSINESS SEGMENT (CONTINUED)
Six months ended June 30, 2011 | Six months ended June 30, 2010 | |||||||||||||||||||||||
Underlying operating profit | Add: Depreciation and amortization of computer software ** | Adjusted EBITDA | Underlying Operating profit | Add: Depreciation and amortization of computer software ** | Adjusted EBITDA | |||||||||||||||||||
| Legal | 422 | 150 | 572 | 402 | 131 | 533 | ||||||||||||||||||
| Tax & Accounting | 93 | 44 | 137 | 72 | 41 | 113 | ||||||||||||||||||
| Intellectual Property & Science | 109 | 28 | 137 | 106 | 28 | 134 | ||||||||||||||||||
| Professional division | 624 | 222 | 846 | 580 | 200 | 780 | ||||||||||||||||||
| Markets division | 718 | 285 | 1,003 | 630 | 272 | 902 | ||||||||||||||||||
| Corporate expenses | (137 | ) | 8 | (129 | ) | (107 | ) | 12 | (95 | ) | ||||||||||||||
| Integration programs expenses | na | na | (112 | ) | na | na | (187 | ) | ||||||||||||||||
| Total | 1,205 | 515 | 1,608 | 1,103 | 484 | 1,400 | ||||||||||||||||||
na = not applicable
** excludes Other businesses (1)
______________________________________________
| (1) | Other businesses are businesses that have been or are expected to be exited through sale or shut-down. The more significant businesses in this category include: BARBRI (legal education provider, sold in the second quarter 2011); Enterprise Risk (risk management solutions provider to financial institutions); and Healthcare (data, analytics and performance benchmarking solutions provider). |
Three months ended June 30, | Six months ended June 30, | |||||||||||||||
| (millions of U.S. dollars) | 2011 | 2010 | 2011 | 2010 | ||||||||||||
| Revenues | 252 | 274 | 474 | 479 | ||||||||||||
| Operating profit | 62 | 82 | 101 | 107 | ||||||||||||
| Depreciation and amortization of computer software | 12 | 16 | 28 | 33 | ||||||||||||
| EBITDA | 74 | 98 | 129 | 140 | ||||||||||||
33
APPENDIX D
QUARTERLY INFORMATION (UNAUDITED)
The following table presents a summary of our consolidated operating results for the eight most recent quarters.
Quarter ended March 31, | Quarter ended June 30, | Quarter ended September 30, | Quarter ended December 31, | |||||||||||||||||||||||||||||
| (millions of U.S. dollars, except per share amounts) | 2011 | 2010 | 2011 | 2010 | 2010 | 2009 | 2010 | 2009 | ||||||||||||||||||||||||
| Revenues | 3,330 | 3,140 | 3,447 | 3,216 | 3,256 | 3,216 | 3,458 | 3,357 | ||||||||||||||||||||||||
| Operating profit | 396 | 321 | 833 | 435 | 356 | 378 | 307 | 346 | ||||||||||||||||||||||||
| Earnings from continuing operations | 255 | 134 | 572 | 303 | 271 | 156 | 225 | 176 | ||||||||||||||||||||||||
| Earnings (loss) from discontinued operations, net of tax | 2 | - | - | (6 | ) | 6 | 11 | - | 6 | |||||||||||||||||||||||
| Net earnings | 257 | 134 | 572 | 297 | 277 | 167 | 225 | 182 | ||||||||||||||||||||||||
| Earnings attributable to common shares | 250 | 127 | 563 | 290 | 268 | 162 | 224 | 177 | ||||||||||||||||||||||||
| Dividends declared on preference shares | (1 | ) | (1 | ) | (1 | ) | - | (1 | ) | (1 | ) | (1 | ) | - | ||||||||||||||||||
| Basic earnings per share | ||||||||||||||||||||||||||||||||
| From continuing operations | $ | 0.30 | $ | 0.15 | $ | 0.67 | $ | 0.36 | $ | 0.31 | $ | 0.18 | $ | 0.27 | $ | 0.21 | ||||||||||||||||
| From discontinued operations | - | - | - | (0.01 | ) | 0.01 | 0.01 | - | - | |||||||||||||||||||||||
| $ | 0.30 | $ | 0.15 | $ | 0.67 | $ | 0.35 | $ | 0.32 | $ | 0.19 | $ | 0.27 | $ | 0.21 | |||||||||||||||||
| Diluted earnings per share | ||||||||||||||||||||||||||||||||
| From continuing operations | $ | 0.30 | $ | 0.15 | $ | 0.67 | $ | 0.36 | $ | 0.31 | $ | 0.18 | $ | 0.27 | $ | 0.21 | ||||||||||||||||
| From discontinued operations | - | - | - | (0.01 | ) | 0.01 | 0.01 | - | - | |||||||||||||||||||||||
| $ | 0.30 | $ | 0.15 | $ | 0.67 | $ | 0.35 | $ | 0.32 | $ | 0.19 | $ | 0.27 | $ | 0.21 | |||||||||||||||||
Our revenues and operating profits do not tend to be significantly impacted by seasonality as we record a large portion of our revenues ratably over a contract term and our costs, excluding integration programs expenses, are generally incurred evenly throughout the year. However, our non-recurring revenues can cause changes in our performance from quarter to consecutive quarter. Additionally, the release of certain print-based offerings can be seasonal as can certain product releases for the regulatory markets, which tend to be concentrated at the end of the year.
Results for all periods presented reflect both the expenses and savings benefits of the integration programs we commenced in 2008 related to the Reuters acquisition and which we expect to complete by the end of this year.
Revenue growth continued to accelerate through the first half of 2011, benefiting from 2010 investment in new products and acquisitions and improved legal services markets. In the second quarter of 2011, revenues also included a significant benefit from foreign currency and operating profit included approximately $400 million in gains from the disposal of certain non-core businesses. We expect to record total charges of approximately $100 million in 2011 relating to the termination of a vendor agreement; $69 million in charges were included in the second quarter of 2011. Integration programs expenses have declined through the first half of 2011 as this program begins to wind down.
Significant acceleration in our revenue trends began in the latter part of 2010 as the impacts from negative net sales in 2009 on our subscription revenues lessened and as we benefited from positive net sales throughout 2010, with a return to year-over-year revenue growth (before currency) in the third quarter of 2010. High-margin, non-subscription and print-related revenues declined in our Professional division through most of 2010. However, print attrition in particular returned to historic levels (and remains stable in 2011) and higher transaction levels were experienced in selected areas in both our Professional and Markets divisions as economic recovery continued. The return to revenue growth in the latter half of 2010 contributed to higher operating profit, however, continued investment in new product launches and the dilutive impacts of several acquisitions, particularly in our Legal segment, held back near term operating profit growth. Net earnings were also affected by a $62 million loss associated with our early redemption of debt securities in the first quarter of 2010.
In 2009, our results were adversely affected by the global economic recession including a change in the mix of revenues, as higher-margin print-based and non-subscription revenues decreased, while other lower-margin but higher growth businesses expanded.
34