
EXHIBIT 99.1
Management’s Discussion and Analysis
This management’s discussion and analysis is designed to provide you with a narrative explanation through the eyes of our management of our financial condition and results of operations. We recommend that you read this in conjunction with our consolidated interim financial statements for the three months ended March 31, 2016, our 2015 annual consolidated financial statements and our 2015 annual management’s discussion and analysis. This management’s discussion and analysis contains forward-looking statements, which are subject to risks and uncertainties that could cause our actual results to differ materially from the forward-looking statements. Forward-looking statements include, but are not limited to, our 2016 outlook and our expectations related to general economic conditions and market trends and their anticipated effects on our business segments. For additional information related to forward-looking statements and material risks associated with them, please see the “Cautionary Note Concerning Factors That May Affect Future Results” section of this management’s discussion and analysis. This management’s discussion and analysis is dated as of April 25, 2016.
We have organized our management’s discussion and analysis in the following key sections:
• | Executive Summary – a brief overview of our business and key financial highlights | 2 | ||||
• | Results of Operations – a comparison of our current and prior-year period results | 5 | ||||
• | Liquidity and Capital Resources – a discussion of our cash flow and debt | 13 | ||||
• | Outlook – our current financial outlook for 2016 | 18 | ||||
• | Related Party Transactions – a discussion of transactions with our principal and controlling shareholder, The Woodbridge Company Limited (Woodbridge), and others | 20 | ||||
• | Subsequent Events – a discussion of material events occurring after March 31, 2016 and through the date of this management’s discussion and analysis | 20 | ||||
• | Changes in Accounting Policies – a discussion of changes in our accounting policies and recent accounting pronouncements | 20 | ||||
• | Critical Accounting Estimates and Judgments – a discussion of critical estimates and judgments made by our management in applying accounting policies | 20 | ||||
• | Additional Information – other required disclosures | 20 | ||||
• | Appendix – supplemental information and discussion | 22 | ||||
To help you understand this management’s discussion and analysis:
| Ø | We prepare our consolidated financial statements in accordance with International Financial Reporting Standards (IFRS), as issued by the International Accounting Standards Board (IASB). This management’s discussion and analysis also includes certain non-IFRS financial measures which we use as supplemental indicators of our operating performance and financial position as well as for internal planning purposes. These non-IFRS measures do not have any standardized meanings prescribed by IFRS and therefore are unlikely to be comparable to the calculation of similar measures used by other companies, and should not be viewed as alternatives to measures of financial performance calculated in accordance with IFRS. Non-IFRS financial measures are defined and reconciled to the most directly comparable IFRS measures in Appendix A. |
| Ø | Our consolidated financial statements are reflected in U.S. dollars. References in this discussion to “$” and “US$” are to U.S. dollars. References to “bp” means “basis points” and “n/a” and “n/m” refer to “not applicable” and “not meaningful”, respectively. One basis point is equal to 1/100th of 1%, so “100 bp” is equivalent to 1%. Unless otherwise indicated or the context otherwise requires, references in this discussion to “we,” “our,” “us” and “Thomson Reuters” are to Thomson Reuters Corporation and our subsidiaries. |
| Ø | We refer to our performance before the impact of foreign currency (or at “constant currency”), which means that we apply the same foreign currency exchange rates for the current and equivalent prior period. We believe this provides the best basis to measure the performance of our business as it removes distortion from the effects of foreign currency movements during the period. |
| Ø | When we refer to “net sales” of a business, we are referring to its new sales less cancellations. |
Page 1
Our company
We are a leading source of news and information for professional markets. Our customers rely on us to deliver the intelligence, technology and expertise they need to find trusted answers. We have operated in more than 100 countries for more than 100 years.
Exponential growth in the volume of data, the impact of technology and an increasingly complex legal and regulatory environment create challenges for our customers as well as opportunities for our businesses. We believe that the credibility of our news organization, our in-depth understanding of our customers’ needs, our proprietary content and flexible technology platforms all enable our customers to operate more efficiently, reduce costs and help them manage growing compliance requirements.
We derive the majority of our revenues from selling solutions to our customers, primarily electronically and on a subscription basis. We believe our ability to embed our solutions into customers’ workflows is a significant competitive advantage as it leads to strong customer retention. Over the years, this has proven to be capital efficient and cash flow generative, and it has enabled us to maintain leading and scalable positions in our chosen market segments.
We are organized in three business units supported by a corporate center:
 | Financial & Risk, a provider of critical news, information and analytics, enabling transactions and connecting communities of trading, investment, financial and corporate professionals. Financial & Risk also provides regulatory and operational risk management solutions. | |
| Legal, a provider of critical online and print information, decision tools, software and services that support legal, investigation, business and government professionals around the world. | |
| Tax & Accounting, a provider of integrated tax compliance and accounting information, software and services for professionals in accounting firms, corporations, law firms and government. | |


We also operate:
| • | A Global Growth Organization (GGO), which works across our business units to combine our global capabilities and to expand our local presence and development in countries and regions where we believe the greatest growth opportunities exist. GGO supports our businesses in: Latin America, China, India, the Middle East, Africa, the Association of Southeast Asian Nations, North Asia, Russia and countries comprising the Commonwealth of Independent States and Turkey. We include the results of GGO within our business units. |
| • | Reuters, which is a leading provider of real-time, high-impact, multimedia news and information services to newspapers, television and cable networks, radio stations and websites around the globe. |
Discontinued operations:
We are pursuing the sale of our Intellectual Property & Science business. Intellectual Property & Science is a provider of comprehensive intellectual property and scientific information, decision support tools and services that enable the lifecycle of innovation for governments, academia, publishers, corporations and law firms to discover, protect and commercialize new ideas and brands. We currently expect the sale to close in the second half of 2016.
Intellectual Property & Science is classified as a discontinued operation for 2016 reporting purposes. To facilitate a comparison with our 2016 results, prior-year period amounts in this management’s discussion and analysis have been restated to conform to the current period’s presentation. See the “Results of Discontinued Operations” section of this management’s discussion and analysis for additional information.
Page 2
Key Financial Highlights
First quarter results from continuing operations:
| CHANGE | ||||||||||||||
Non-IFRS Financial Measures(1) (millions of U.S. dollars, except per share amounts and margins) | 2016 | 2015 | TOTAL | CONSTANT CURRENCY | ||||||||||
Revenues | 2,793 | 2,821 | (1%) | 1% | ||||||||||
Adjusted EBITDA | 748 | 734 | 2% | 1% | ||||||||||
Adjusted EBITDA margin | 26.8% | 26.0% | 80bp | 10bp | ||||||||||
Underlying operating profit | 498 | 461 | 8% | 6% | ||||||||||
Underlying operating profit margin | 17.8% | 16.3% | 150bp | 80bp | ||||||||||
Adjusted earnings per share (adjusted EPS) | $0.48 | $0.39 | 23% | 21% | ||||||||||
Our first quarter results were consistent with our expectations and we reaffirmed our full-year business outlook. Our first quarter performance reflected our progress toward our 2016 priorities to accelerate revenue growth from our existing businesses and improve profitability, while maintaining a consistent capital strategy.
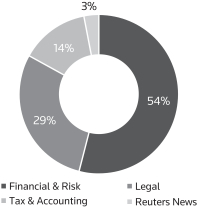
In constant currency, our revenues increased 1%, as combined growth of 4% from the Legal and Tax & Accounting businesses more than offset an expected decline in Financial & Risk due to a decline in recoveries revenues. Excluding the decline in recoveries revenues, consolidated revenues grew 2% over the prior-year period, also in constant currency.
| FIRST QUARTER 2016 REVENUES | ||
• Financial & Risk’s revenues declined 1%, driven by an expected decline in recoveries revenues and the ongoing commercial pricing adjustments related to the migration of remaining legacy foreign exchange and buy-side customers onto new products on Financial & Risk’s unified platform. Excluding these declines, Financial & Risk’s revenues grew approximately 2%.
• Legal’s revenues increased 2%, as growth in the Legal Solutions and U.S. online legal information businesses more than offset a decline in U.S. print.
• Tax & Accounting’s revenues grew 8% driven by strong growth in its Corporate and Professional businesses. |
|
In constant currency, adjusted EBITDA, underlying operating profit and the related margins all increased as higher revenues offset a modest increase in operating expenses, which reflected our investments in growth businesses and initiatives to transform our company into a more integrated enterprise. Adjusted EPS increased primarily due to higher underlying operating profit and a lower number of outstanding shares. Foreign currency had a $0.01 favorable impact on adjusted EPS. Additionally, we returned nearly $0.7 billion to shareholders through dividends and share repurchases.
In 2016, we are executing on the following key priorities to accelerate growth and profitability:
 | Accelerating Revenue Growth. We are using cost savings generated by our efficiency initiatives to fund and accelerate investments in high growth market segments, including Legal Software and Solutions, Global Trade Management, Global Tax and Risk Solutions. Additionally, we are deploying a common go-to-market strategy across our company to further improve customer retention and drive new sales. | |
| Improving profitability. We continue to transform our company from a portfolio of individual businesses into a more integrated enterprise through investments which drive scale, including further consolidation of platforms. We believe these efforts will grow revenues, expand margins and increase adjusted EPS. | |
| Consistent Capital Strategy. We continue to focus on growing revenues and free cash flow. This will allow us to execute our consistent capital strategy, which balances reinvestment in our core businesses with return of capital to our shareholders through dividends and share repurchases. Additionally, we plan to use the proceeds from the expected sale of Intellectual Property & Science for general corporate purposes, including investing in the core business, repaying debt and repurchasing common shares. | |


| (1) | Refer to Appendix A for additional information on non-IFRS financial measures. |
Page 3
2016 Outlook:
We recently reaffirmed our 2016 full-year business outlook that we originally communicated in February 2016. For 2016, we continue to expect low single digit revenue growth (between 2% and 3% growth excluding Financial & Risk’s recoveries revenues), adjusted EBITDA margin between 27.3% and 28.3%, underlying operating profit margin between 18.4% and 19.4%, and free cash flow between $1.7 billion and $1.9 billion.
Our 2016 outlook:
| • | Assumes constant currency rates relative to 2015; |
| • | Excludes the Intellectual Property & Science business, which has been classified as a discontinued operation, except for free cash flow; and |
| • | Does not factor in the impact of any other acquisitions or divestitures that may occur during the year. |
Additional information is provided in the “Outlook” section of this management’s discussion and analysis. The information in this section is forward-looking and should also be read in conjunction with the section of this management’s discussion and analysis entitled “Cautionary Note Concerning Factors That May Affect Future Results”.
Seasonality
Our revenues and operating profit on a consolidated basis do not tend to be significantly impacted by seasonality as we record a large portion of our revenues ratably over a contract term and our costs are generally incurred evenly throughout the year. However, our non-recurring revenues can cause changes in our performance from quarter to consecutive quarter. Additionally, the release of certain print-based offerings can be seasonal as can certain product releases for the regulatory markets, which tend to be concentrated at the end of the year. Our quarterly performance may also be impacted by volatile foreign currency exchange rates. As a consequence, the results of certain of our segments can be impacted by seasonality to a greater extent than our consolidated revenues and operating profit.
Use of non-IFRS financial measures
In addition to our results reported in accordance with IFRS, we use certain non-IFRS financial measures as supplemental indicators of our operating performance and financial position, as well as for internal planning purposes. We report non-IFRS financial measures as we believe their use provides more insight into and understanding of our performance. These non-IFRS financial measures include:
| • | Underlying operating profit and the related margin; |
| • | Adjusted EBITDA and the related margin; |
| • | Adjusted EBITDA less capital expenditures and the related margin; |
| • | Adjusted earnings and adjusted earnings per share (adjusted EPS); |
| • | Net debt; and |
| • | Free cash flow. |
Changes before the impact of foreign currency or at “constant currency”:In order to provide better comparability of our business trends from period to period, we also report changes in our revenues, underlying operating profit, operating expenses, adjusted EBITDA, margins, and adjusted EPS excluding the effects of foreign currency movements.
See Appendix A of this management’s discussion and analysis for a description of our non-IFRS financial measures, including an explanation of why we believe they are useful measures of our performance, including our ability to generate cash flow. Refer to the sections of this management’s discussion and analysis entitled “Results of Operations-Continuing Operations”, “Liquidity and Capital Resources” and Appendix B for reconciliations of these non-IFRS financial measures to the most directly comparable IFRS financial measures.
Page 4
RESULTS OF OPERATIONS – CONTINUING OPERATIONS
Basis of presentation
In this section of our management’s discussion and analysis, we discuss our results from continuing operations on both an IFRS and non-IFRS basis. Both bases exclude the results of our Intellectual Property & Science business, which is reported as a discontinued operation, and include the results of acquired businesses from the date of purchase. We discuss the results of our Intellectual Property & Science business within the “Results of Discontinued Operations” section of this management’s discussion and analysis.
Consolidated results
| THREE MONTHS ENDED MARCH 31, | CHANGE | |||||||||||||||
| (millions of U.S. dollars, except per share amounts and margins) | 2016 | 2015 | TOTAL | CONSTANT CURRENCY | ||||||||||||
IFRS Financial Measures | ||||||||||||||||
Revenues | 2,793 | 2,821 | (1%) | |||||||||||||
Operating profit | 310 | 362 | (14%) | |||||||||||||
Diluted earnings per share from continuing operations | $0.26 | $0.33 | (21%) | |||||||||||||
Non-IFRS Financial Measures | ||||||||||||||||
Revenues | 2,793 | 2,821 | (1%) | 1% | ||||||||||||
Adjusted EBITDA | 748 | 734 | 2% | 1% | ||||||||||||
Adjusted EBITDA margin | 26.8% | 26.0% | 80bp | 10bp | ||||||||||||
Adjusted EBITDA less capital expenditures | 515 | 444 | 16% | |||||||||||||
Adjusted EBITDA less capital expenditures margin | 18.4% | 15.7% | 270bp | |||||||||||||
Underlying operating profit | 498 | 461 | 8% | 6% | ||||||||||||
Underlying operating profit margin | 17.8% | 16.3% | 150bp | 80bp | ||||||||||||
Adjusted EPS | $0.48 | $0.39 | 23% | 21% | ||||||||||||
Foreign currency effects
With respect to the significant foreign currencies that we transact in, the U.S. dollar strengthened against the Euro, the British pound sterling and the Canadian dollar, but weakened against the Japanese yen in the first quarter of 2016 compared to the same period in 2015. Given our currency mix of revenues and expenses around the world, these fluctuations had a negative impact on our revenues, but had a positive impact on our adjusted EBITDA and underlying operating profit margins.
Revenues
The decrease in total revenues was due to the impact of foreign currency. Revenues increased on a constant currency basis as combined growth of 4% from our Legal and Tax & Accounting segments was partially offset by a 1% decline in our Financial & Risk segment, due to an expected decline in recoveries revenues. Excluding the decline in recoveries revenues, consolidated revenues grew 2% over the prior-year period, also in constant currency.
Revenues from GGO, which comprise approximately 9% of our total revenues, increased 2% on a constant currency basis. Excluding the decline in recoveries revenues and ongoing commercial pricing adjustments related to the migration of certain customers to new platforms, revenues increased 7% on a constant currency basis.
Page 5
Operating profit, underlying operating profit, adjusted EBITDA and adjusted EBITDA less capital expenditures
| THREE MONTHS ENDED MARCH 31, | CHANGE | |||||||||||||||
| (millions of U.S. dollars, except margins) | 2016 | 2015 | TOTAL | CONSTANT CURRENCY | ||||||||||||
Operating profit | 310 | 362 | (14%) | |||||||||||||
Adjustments to remove: | ||||||||||||||||
Amortization of other identifiable intangible assets | 128 | 140 | ||||||||||||||
Fair value adjustments | 64 | (53) | ||||||||||||||
Other operating (gains) losses, net | (4) | 12 | ||||||||||||||
Underlying operating profit | 498 | 461 | 8% | 6% | ||||||||||||
Remove: depreciation and amortization of computer software | 250 | 273 | ||||||||||||||
Adjusted EBITDA(1) | 748 | 734 | 2% | 1% | ||||||||||||
Deduct: capital expenditures, less proceeds from disposals | 233 | 290 | ||||||||||||||
Adjusted EBITDA less capital expenditures(1) | 515 | 444 | 16% | |||||||||||||
Underlying operating profit margin | 17.8% | 16.3% | 150bp | 80bp | ||||||||||||
Adjusted EBITDA margin | 26.8% | 26.0% | 80bp | 10bp | ||||||||||||
Adjusted EBITDA less capital expenditures margin | 18.4% | 15.7% | 270bp | |||||||||||||
| (1) | See Appendix B for a reconciliation of earnings from continuing operations to adjusted EBITDA and adjusted EBITDA less capital expenditures. |
Operating profit decreased primarily due to unfavorable fair value adjustments associated with embedded derivatives within certain customer contracts, due to fluctuations in foreign exchange rates.
Adjusted EBITDA, underlying operating profit and the related margins increased, despite the negative impact of currency on revenues. On a constant currency basis, adjusted EBITDA and the related margins also increased, but to a lesser extent, as the impact of higher revenues more than offset a modest increase in operating expenses. The increases in underlying operating profit and the related margin reflected the same factors which impacted adjusted EBITDA, as well as lower depreciation and amortization expense.
Adjusted EBITDA less capital expenditures and the related margin increased due to higher adjusted EBITDA and lower capital expenditures, which were timing related.
Operating expenses
| THREE MONTHS ENDED MARCH 31, | CHANGE | |||||||||||||||
| (millions of U.S. dollars) | 2016 | 2015 | TOTAL | CONSTANT CURRENCY | ||||||||||||
Operating expenses | 2,109 | 2,034 | 4% | |||||||||||||
Remove fair value adjustments(1) | (64) | 53 | ||||||||||||||
Operating expenses, excluding fair value adjustments | 2,045 | 2,087 | (2%) | 1% | ||||||||||||
| (1) | Fair value adjustments primarily represent mark-to market impacts on embedded derivatives within certain customer contracts due to fluctuations in foreign exchange rates, as well as mark-to-market impacts on certain share-based awards, due to changes in our share price. |
Operating expenses increased largely due to the impact of fluctuations in foreign exchange rates on embedded derivatives. On a constant currency basis, operating expenses excluding fair value adjustments, increased modestly. The increase reflected higher investments in growth businesses and initiatives to transform our company into a more integrated enterprise, partly offset by lower expenses in our Financial & Risk segment. Financial & Risk segment operating expenses declined due to cost savings from earlier efficiency initiatives and lower costs related to the decline in recoveries revenues.
Page 6
Depreciation and amortization
| THREE MONTHS ENDED MARCH 31, | ||||||||||||
| (millions of U.S. dollars) | 2016 | 2015 | CHANGE | |||||||||
Depreciation | 81 | 93 | (13%) | |||||||||
Amortization of computer software | 169 | 180 | (6%) | |||||||||
Subtotal | 250 | 273 | (8%) | |||||||||
Amortization of other identifiable intangible assets | 128 | 140 | (9%) | |||||||||
| • | Depreciation and amortization of computer software on a combined basis decreased due to the impact of foreign currency and the completion of depreciation and amortization of assets acquired or developed in previous years, partly offset by higher expenses associated with capital spending on product development and infrastructure initiatives. |
| • | Amortization of other identifiable intangible assets decreased due to the impact of foreign currency and the completion of amortization for certain identifiable intangible assets acquired in previous years. |
Net interest expense
| THREE MONTHS ENDED MARCH 31, | ||||||||||||
| (millions of U.S. dollars) | 2016 | 2015 | CHANGE | |||||||||
Net interest expense | 93 | 105 | (11%) | |||||||||
The decrease in net interest expense was primarily due to lower interest on our term debt obligations, which reflected the repayment of notes in July 2015, and an interest benefit associated with the release of certain sales tax liabilities. These decreases were partly offset by higher interest on commercial paper borrowings. As substantially all of our long-term debt obligations paid interest at fixed rates (after swaps), the net interest expense on the balance of our term debt was essentially unchanged.
Other finance (costs) income
| THREE MONTHS ENDED MARCH 31, | ||||||||
| (millions of U.S. dollars) | 2016 | 2015 | ||||||
Other finance (costs) income | (34) | 44 | ||||||
Other finance (costs) income included net losses in the first quarter of 2016 (2015 – net gains) related to foreign exchange contracts, partly offset by lower net losses realized from changes in foreign currency exchange rates on certain intercompany funding arrangements.
Tax (benefit) expense
| THREE MONTHS ENDED MARCH 31, | ||||||||
| (millions of U.S. dollars) | 2016 | 2015 | ||||||
Tax (benefit) expense | (26) | 25 | ||||||
The tax (benefit) expense in each period reflected the mix of taxing jurisdictions in which pre-tax profits and losses were recognized. Because the geographical mix of pre-tax profits and losses in interim periods may be different from that for the full-year, tax expense or benefit in interim periods is not necessarily indicative of tax expense for the full-year.
Page 7
Additionally, the comparability of our tax (benefit) expense was impacted by various transactions and accounting adjustments during each period. The following table sets forth certain components within income tax (benefit) expense that impact comparability from period to period, including tax (benefit) expense associated with items that are removed from adjusted earnings:
| TAX (BENEFIT) EXPENSE | THREE MONTHS ENDED MARCH 31, | |||||||
| (millions of U.S. dollars) | 2016 | 2015 | ||||||
Tax items impacting comparability: | ||||||||
Corporate tax rates(1) | - | (1) | ||||||
Other tax adjustments(2) | (7) | (5) | ||||||
Subtotal | (7) | (6) | ||||||
Tax related to: | ||||||||
Fair value adjustments | (20) | 16 | ||||||
Other items | (5) | (2) | ||||||
Subtotal | (25) | 14 | ||||||
Total | (32) | 8 | ||||||
| (1) | Relates to the net changes of deferred tax liabilities due to changes in U.S. state apportionment factors and changes in corporate tax rates that were substantively enacted in certain jurisdictions. |
| (2) | Relates primarily to changes in the recognition of deferred tax assets in various jurisdictions due to earlier acquisitions, assumptions regarding future profitability, and adjustments for indefinite-lived assets and liabilities that are not expected to reverse. |
Because the items described above impact the comparability of our tax expense for each period, we remove them from our calculation of adjusted earnings, along with the pre-tax items to which they relate.
The computation of our adjusted tax expense is set forth below:
| THREE MONTHS ENDED MARCH 31, | ||||||||
| (millions of U.S. dollars) | 2016 | 2015 | ||||||
Tax (benefit) expense | (26) | 25 | ||||||
Remove: Items from above impacting comparability | 32 | (8) | ||||||
Other adjustments: | ||||||||
Interim period effective tax rate normalization(1) | 5 | (1) | ||||||
Tax charge amortization(2) | 16 | 16 | ||||||
Total tax expense on adjusted earnings | 27 | 32 | ||||||
| (1) | Adjustment to reflect income taxes based on estimated full-year effective tax rate. Reported earnings or loss for interim periods reflect income taxes based on the estimated effective tax rates of each of the jurisdictions in which we operate. The adjustment reallocates estimated full-year income taxes between interim periods, but has no effect on full-year income taxes. |
| (2) | In 2013, we recorded $442 million of deferred tax charges associated with the consolidation of the ownership and management of our technology and content assets. Within our tax expense on adjusted earnings, we amortize these deferred charges on a straight-line basis over seven years. We believe this treatment more appropriately reflects our tax position because these charges are expected to be paid over seven years from the date of the original transaction, in varying annual amounts, in conjunction with the repayments of interest-bearing notes that were issued as consideration in the original transactions. |
Earnings and earnings per share from continuing operations
| THREE MONTHS ENDED MARCH 31, | ||||||||||||
| (millions of U.S. dollars, except per share amounts)) | 2016 | 2015 | CHANGE | |||||||||
Earnings from continuing operations | 210 | 280 | (25%) | |||||||||
Diluted earnings per share from continuing operations | $ | 0.26 | $ | 0.33 | (21%) | |||||||
Earnings from continuing operations and the related per share amount decreased due to lower operating profit and higher net financing costs, partly offset by a tax benefit in the current period.
Page 8
Adjusted earnings and adjusted EPS
| THREE MONTHS ENDED MARCH 31, | CHANGE | |||||||||||||||||
| (millions of U.S. dollars, except per share amounts and share data) | 2016 | 2015 | TOTAL | CONSTANT CURRENCY | ||||||||||||||
Earnings attributable to common shareholders | 262 | 305 | (14%) | |||||||||||||||
Adjustments to remove: | ||||||||||||||||||
Fair value adjustments | 64 | (53) | ||||||||||||||||
Other operating (gains) losses, net | (4) | 12 | ||||||||||||||||
Other finance costs (income) | 34 | (44) | ||||||||||||||||
Share of post-tax earnings in equity method investments | (1) | (4) | ||||||||||||||||
Tax on above items(1) | (25) | 14 | ||||||||||||||||
Tax items impacting comparability(1) | (7) | (6) | ||||||||||||||||
Amortization of other identifiable intangible assets | 128 | 140 | ||||||||||||||||
Earnings from discontinued operations, net of tax | (62) | (40) | ||||||||||||||||
Interim period effective tax rate normalization(1) | (5) | 1 | ||||||||||||||||
Tax charge amortization(1) | (16) | (16) | ||||||||||||||||
Dividends declared on preference shares | (1) | (1) | ||||||||||||||||
Adjusted earnings | 367 | 308 | 19% | |||||||||||||||
Adjusted EPS | $0.48 | $0.39 | 23% | 21% | ||||||||||||||
Diluted weighted-average common shares (millions) | 762.2 | 797.6 | ||||||||||||||||
| (1) | See the “Tax expense” section above for additional information. |
Adjusted earnings and the related per share amount increased primarily due to higher underlying operating profit. Additionally, adjusted EPS benefited from lower outstanding common shares due to share repurchases (see the “Liquidity and Capital Resources – Share Repurchases” section of this management’s discussion and analysis for additional information).
Segment results
We discuss the results of our three reportable segments as presented in our consolidated interim financial statements for the three months ended March 31, 2016: Financial & Risk, Legal and Tax & Accounting. The operating results of Intellectual Property & Science, which was previously a reportable segment, are reported as a discontinued operation, except for the West IP business, which we will retain as part of the Legal segment. Prior-year period amounts have been restated to conform to the current year’s presentation.
We also report “Corporate & Other”, which includes expenses for corporate functions, shared costs previously allocated to Intellectual Property & Science, and the results of the Reuters News business. Neither Corporate & Other nor the Reuters News business qualify as a component of another reportable segment nor as a separate reportable segment.
See note 3 of our consolidated interim financial statements for the three months ended March 31, 2016 which includes a reconciliation of results from our reportable segments to consolidated results as reported in our consolidated income statement.
We assess the performance of our reportable segments as follows:
Segment operating profit and segment operating profit margin
| • | Segment operating profit represents operating profit before (i) amortization of other identifiable intangible assets; (ii) other operating gains and losses; (iii) certain asset impairment charges; (iv) corporate-related items; and (v) fair value adjustments. |
| • | We do not consider these excluded items to be controllable operating activities for purposes of assessing the current performance of our reportable segments. |
| • | Each segment includes an allocation of centralized support services such as technology, editorial, real estate and certain global transaction processing functions based on usage or other applicable measures. |
| • | We also use segment operating profit margin, which we define as segment operating profit as a percentage of revenues. |
Page 9
EBITDA and EBITDA margin
| • | As a supplemental measure of segment operating performance, we add back depreciation and amortization of computer software to segment operating profit to arrive at each segment’s EBITDA and the related margin as a percentage of revenues. See Appendix B of this management’s discussion and analysis for additional information. |
Our definitions of segment operating profit, segment operating profit margin, EBITDA and EBITDA margin may not be comparable to that of other companies.
Financial & Risk
| THREE MONTHS ENDED MARCH 31, | ||||||||||||
| (millions of U.S. dollars, except margins) | 2016 | 2015 | CHANGE | |||||||||
Revenues | 1,509 | 1,552 | (3%) | |||||||||
Revenue change at constant currency | (1%) | |||||||||||
EBITDA | 437 | 401 | 9% | |||||||||
EBITDA margin | 29.0% | 25.8% | 320bp | |||||||||
Segment operating profit | 295 | 241 | 22% | |||||||||
Segment operating profit margin | 19.5% | 15.5% | 400bp | |||||||||
Revenues on a constant currency basis decreased due to the expected decline in recoveries revenues and commercial pricing adjustments related to the migration of remaining foreign exchange and buy-side customers onto new products on Financial & Risk’s unified platform. Financial & Risk expects to complete the remaining commercial price adjustments on its legacy foreign exchange products in the second half of the year. Excluding the decline in recoveries revenues and the impact of the commercial pricing adjustments, Financial & Risk’s revenues increased approximately 2%, driven by the impact of positive net sales from 2015 and an annual price increase.
By geographic area, Financial & Risk’s revenues in the Americas and Asia Pacific increased 1% and 3%, respectively, while its revenues in Europe, Middle East and Africa (EMEA) decreased 3%.
For the eighth consecutive quarter, net sales were positive overall. Net sales were positive in the Americas and Asia, but negative in EMEA.
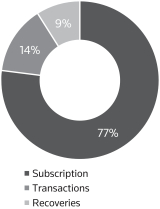
Results by type were as follows:
• Subscription revenues increased 1% driven by growth in feeds and Risk products, which reflected the benefit of the 2016 annual price increase and the impact of positive net sales from 2015. These factors were partly offset by the commercial pricing adjustments on Financial & Risk’s remaining legacy foreign exchange products;
• Transactions revenues decreased 1% due to lower foreign exchange volumes; and
• Recoveries revenues, which Financial & Risk collects from customers and largely passes through to a third party provider, such as stock exchange fees, decreased 13%, as expected. The decline in these low-margin recoveries revenues reflected a small number of third-party information providers increasingly moving to direct billing arrangements with their customers. As a result, we continue to expect recoveries revenue will decrease by about $100 million for the full year. We do not expect an impact on Financial & Risk’s EBITDA and segment operating profit, or on our consolidated adjusted EBITDA, underlying operating profit and free cash flow, since the recoveries revenues that Financial & Risk collects from its customers are largely passed on to our third party information providers. | FIRST QUARTER 2016 REVENUES BY TYPE | |
| ||
EBITDA, segment operating profit and the related margins increased primarily due to lower expenses from earlier efficiency initiatives, including platform consolidations completed in 2015. Foreign exchange benefited EBITDA and segment operating profit margins by 60bp and 20bp, respectively. The increases in segment operating profit and the related margin also benefited from lower depreciation and amortization expense.
For the full year of 2016, we expect Financial & Risk’s EBITDA margin to improve over the prior-year period, but to a lesser extent than experienced in the first quarter.
Page 10
Legal
| THREE MONTHS ENDED MARCH 31, | ||||||||||||
| (millions of U.S. dollars, except margins) | 2016 | 2015 | CHANGE | |||||||||
Revenues | 822 | 824 | - | |||||||||
Revenue change at constant currency | 2% | |||||||||||
EBITDA | 298 | 286 | 4% | |||||||||
EBITDA margin | 36.3% | 34.7% | 160bp | |||||||||
Segment operating profit | 238 | 219 | 9% | |||||||||
Segment operating profit margin | 29.0% | 26.6% | 240bp | |||||||||
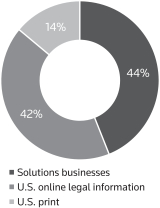
Revenues increased on a constant currency basis as 3% growth in subscription revenues (74% of Legal’s business) more than offset a 1% decline in transaction revenues (12% of Legal’s business) and a 3% decline in U.S. print revenues (14% of Legal’s business). Excluding U.S. print, Legal’s revenues increased 3%.
Results by line of business were as follows:
• Solutions businesses revenues include non U.S. legal information and global software and services businesses. Solutions businesses revenues increased 3%, driven by growth in Legal Enterprise Solutions (Elite and Serengeti), U.K. Practical Law and international businesses, partly offset by a decline in Findlaw transaction revenues. We expect the Solutions businesses to grow in the mid-single digit range for the full year in 2016;
• U.S. online legal information revenues increased 2%, due to growth in U.S. Practical Law and the impact of improved net sales and higher retention rates at Westlaw. This was the fifth consecutive quarter of positive growth for this business; and
• U.S. print revenues decreased 3% due to timing. However, for the full year 2016, we expect the U.S. print business to decline at a comparable rate to 2015, which experienced a 6% decline. | FIRST QUARTER 2016 REVENUES BY LINE OF BUSINESS | |
|
The increases in EBITDA, segment operating profit and the related margins benefited from foreign exchange, which impacted EBITDA and segment operating profit margins each by 120bp, compared to the prior-year period. On a constant currency basis, EBITDA, segment operating profit and the related margins increased as well, but to a lesser extent, primarily due to the impact of higher revenues. The increases in segment operating profit and the related margin also benefited from lower depreciation and amortization expense.
Tax & Accounting
| THREE MONTHS ENDED MARCH 31, | ||||||||||||
| (millions of U.S. dollars, except margins) | 2016 | 2015 | CHANGE | |||||||||
Revenues | 389 | 373 | 4% | |||||||||
Revenue change at constant currency | 8% | |||||||||||
EBITDA | 114 | 126 | (10%) | |||||||||
EBITDA margin | 29.3% | 33.8% | (450)bp | |||||||||
Segment operating profit | 83 | 98 | (15%) | |||||||||
Segment operating profit margin | 21.3% | 26.3% | (500)bp | |||||||||
Revenues increased on a constant currency basis driven by an 11% increase in recurring revenues (82% of our Tax & Accounting business), partly offset by a 3% decrease in transaction revenues.
Page 11
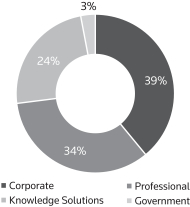
Results by line of business were as follows:
• Corporate includes revenues from a suite of global and local tax compliance, workflow and data management software and services. Corporate revenues increased 17%, primarily from ONESOURCE software and services and strong growth in solutions revenues in Latin America;
• Professional includes revenues from tax, accounting, audit, payroll, document management, client portals and practice management applications and services. Professional revenues increased 5%, primarily from the CS Professional Suite and Enterprise Suite solutions for accounting firms;
• Knowledge Solutions includes revenues from information, research, workflow tools and certified professional education. Knowledge Solutions revenues increased 1%, as growth in the U.S. Checkpoint business was partly offset by lower print revenues; and
• Governmentincludes revenues from integrated property tax management and land registry solutions. Government revenues, which represent a relatively small revenue base, decreased 7%. Revenues for the Government business are less predictable in nature, and growth rates can vary significantly from period to period. | FIRST QUARTER 2016 REVENUES BY LINE OF BUSINESS | |
| ||
EBITDA, segment operating profit and the related margins decreased as the favorable impact of higher revenues was more than offset by higher expenses, which included higher investments in growth businesses and severance charges. Additionally, the prior period benefited from lower than expected bonus and commission costs. Foreign exchange benefited EBITDA and segment operating profit margins by 130bp and 120bp, respectively, compared to the prior-year period.
Tax & Accounting is a seasonal business with a significant percentage of its operating profit historically generated in the fourth quarter. Small movements in the timing of revenues and expenses can impact quarterly margins. Full-year margins are more reflective of the segment’s performance.
Corporate & Other
| THREE MONTHS ENDED MARCH 31, | ||||||||
| (millions of U.S. dollars) | 2016 | 2015 | ||||||
Revenues – Reuters News | 75 | 74 | ||||||
Reuters News | (2) | (3) | ||||||
Core corporate expenses | (116) | (94) | ||||||
Total | (118) | (97) | ||||||
Revenues from Reuters News increased despite an unfavorable impact from foreign currency. Revenues increased 4% in constant currency driven by content marketing and broadcast solutions revenues.
The increase in core corporate expenses was primarily due to investment initiatives to transform our company into a more integrated enterprise. For the full year, we expect core corporate expenses to be in the range of $375 million to $400 million.
Page 12
RESULTS OF DISCONTINUED OPERATIONS
We are pursuing the sale of our Intellectual Property & Science business in order to focus on opportunities at the intersection of global commerce and regulation. We currently expect to close the transaction in the second half of 2016.
Intellectual Property & Science is reported as a discontinued operation, and prior-year period results have been restated to conform to the current year’s presentation. Intellectual Property & Science reported the following results for the three months ended March 31, 2016 and 2015:
| THREE MONTHS ENDED MARCH 31, | ||||||||
| (millions of U.S. dollars) | 2016 | 2015 | ||||||
Earnings from discontinued operations, net of tax | 62 | 40 | ||||||
The first quarter of 2016 includes a $19 million tax benefit that reflects our estimate of the net deferred tax asset we expect to realize in connection with the planned sale of our Intellectual Property & Science business. The current and deferred tax consequences of the divestiture could vary significantly depending on the ultimate structure of the transaction.
Additionally, the increase in earnings from discontinued operations, net of tax, was due to the impact of higher revenues, which grew 4% in the first quarter. See note 9 of our consolidated interim financial statements for the three months ended March 31, 2016.
LIQUIDITY AND CAPITAL RESOURCES
Our disciplined capital strategy is aligned with our business strategy and remains focused on:
| • | Driving revenue growth from our existing businesses, rather than from acquisitions; |
| • | Delivering consistent free cash flow growth; |
| • | Balancing cash generated between reinvestment in the business and returns to shareholders; and |
| • | Maintaining a strong balance sheet, solid credit ratings and ample financial flexibility to support the execution of our business strategy. |
We have launched a process to sell our Intellectual Property & Science business and we currently expect to close the transaction in the second half of 2016. While the amount of proceeds from the sale is uncertain, we intend to use them for general corporate purposes, including investing in our core business, repaying debt and repurchasing common shares. We plan to utilize sale proceeds in a manner that will enable us to continue to maintain our net debt to EBITDA(1) leverage target of 2.5:1.
| (1) | For purposes of this calculation, EBITDA is defined as adjusted EBITDA including the results of Intellectual Property & Science. |
Our principal sources of liquidity are cash on hand, cash provided by our operations, our $2.0 billion commercial paper programs and our $2.5 billion credit facility. From time to time, we also issue debt securities. Our principal uses of cash are for debt repayments, debt servicing costs, dividend payments, capital expenditures, share repurchases and acquisitions. We believe that our existing sources of liquidity will be sufficient to fund our expected cash requirements in the normal course of business for the next 12 months.
Cash flow
Summary of consolidated statement of cash flow
| THREE MONTHS ENDED MARCH 31, | ||||||||||||
| (millions of U.S. dollars) | 2016 | 2015 | $ CHANGE | |||||||||
Net cash provided by operating activities | 458 | 244 | 214 | |||||||||
Net cash used in investing activities | (269) | (309) | 40 | |||||||||
Net cash used in financing activities | (248) | (173) | (75) | |||||||||
Decrease in cash and bank overdrafts | (59) | (238) | 179 | |||||||||
Translation adjustments | 4 | (12) | 16 | |||||||||
Cash and bank overdrafts at beginning of period | 922 | 1,015 | (93) | |||||||||
Cash and bank overdrafts at end of period | 867 | 765 | 102 | |||||||||
Cash and bank overdrafts at end of period comprised of: | ||||||||||||
Cash and cash equivalents | 869 | 769 | 100 | |||||||||
Bank overdrafts | (2) | (4) | 2 | |||||||||
Page 13
Operating activities. The increase in net cash provided by operating activities was primarily due to favorable movements in working capital, lower tax payments and higher adjusted EBITDA.
Investing activities.The decrease in net cash used in investing activities was primarily attributable to lower capital expenditures due to timing, partly offset by higher acquisition spending. In the first quarter of 2016, acquisition spending was $46 million compared to $8 million in the prior-year period.
Financing activities.The increase in net cash used in financing activities was primarily attributable to higher share repurchases. We returned $0.7 billion (2015 – $0.6 billion) to our shareholders through dividends and share repurchases in the first quarter of 2016.
Additional information about our debt, dividends and share repurchases is as follows:
| • | Commercial paper programs. Our $2.0 billion commercial paper programs provide cost-effective and flexible short-term funding. Issuances of commercial paper reached a peak of $1.5 billion during the first quarter of 2016, all of which remained outstanding at March 31, 2016. |
| • | Credit facility. We have a $2.5 billion syndicated credit facility agreement which matures in May 2018. The facility may be utilized to provide liquidity for general corporate purposes (including support for our commercial paper programs). There were no borrowings under the credit facility in the first quarter of 2016. |
We may request an increase, subject to approval by applicable lenders, in the lenders’ commitments up to a maximum amount of $3.0 billion.
Based on our current credit ratings, the cost of borrowing under the agreement is priced at LIBOR/EURIBOR plus 100 basis points. If our long-term debt rating were downgraded by Moody’s or Standard & Poor’s, our facility fee and borrowing costs may increase, although availability would be unaffected. Conversely, an upgrade in our ratings may reduce our facility fee and borrowing costs. We monitor the lenders that are party to our facility and believe they continue to be able to lend to us.
We guarantee borrowings by our subsidiaries under the credit facility. We must also maintain a ratio of net debt as of the last day of each fiscal quarter to EBITDA as defined in the credit agreement (earnings before interest, income taxes, depreciation and amortization and other modifications described in the credit agreement) for the last four quarters ended of not more than 4.5:1. We were in compliance with this covenant at March 31, 2016.
| • | Debt shelf prospectus. In March 2016, we filed a debt shelf prospectus under which we may issue up to $3.0 billion principal amount of debt securities from time to time through April 2018. No debt securities have been issued under this prospectus as of the date of this management’s discussion and analysis. |
| • | Credit ratings. Our access to financing depends on, among other things, suitable market conditions and the maintenance of suitable long-term credit ratings. Our credit ratings may be adversely affected by various factors, including increased debt levels, decreased earnings, declines in customer demand, increased competition, a further deterioration in general economic and business conditions and adverse publicity. Any downgrades in our credit ratings may impede our access to the debt markets or result in significantly higher borrowing rates. |
The following table sets forth the credit ratings that we have received from rating agencies in respect of our outstanding securities as of the date of this management’s discussion and analysis:
| MOODY’S | STANDARD & POOR’S | DBRS LIMITED | FITCH | |||||
Long-term debt | Baa2 | BBB+ | BBB (high) | BBB+ | ||||
Commercial paper | P-2 | A-2 | R-2 (high) | F2 | ||||
Trend/Outlook | Stable | Stable | Stable | Stable | ||||
These credit ratings are not recommendations to purchase, hold, or sell securities and do not address the market price or suitability of a specific security for a particular investor. Credit ratings may not reflect the potential impact of all risks on the value of securities. We cannot assure you that our credit ratings will not be lowered in the future or that rating agencies will not issue adverse commentaries regarding our securities.
Page 14
| • | Dividends.In February 2016, we announced a $0.02 per share increase in the annualized dividend rate to $1.36 per common share. Dividends paid on our common shares were as follows for the periods presented: |
| THREE MONTHS ENDED MARCH 31, | ||||||||
| (millions of U.S. dollars) | 2016 | 2015 | ||||||
Dividends declared | 258 | 266 | ||||||
Dividends reinvested | (9) | (8) | ||||||
Dividends paid | 249 | 258 | ||||||
| • | Share repurchases. We may buy back shares (and subsequently cancel them) from time to time as part of our capital strategy. In February 2016, we announced that we plan to repurchase up to $1.5 billion of our common shares. As of March 31, 2016, we repurchased 6.9 million common shares for a cost of $260 million under this buyback program. |
Under our normal course issuer bid (NCIB) as amended in February 2016, we may repurchase up to 39.2 million common shares. Under the NCIB, we may repurchase these shares between May 28, 2015 and May 27, 2016 in open market transactions on the TSX, the New York Stock Exchange (NYSE) and/or other exchanges and alternative trading systems, if eligible, or by such other means as may be permitted by the TSX and/or NYSE or under applicable law, including private agreement purchases if we receive an issuer bid exemption order from applicable securities regulatory authorities in Canada for such purchases. In the first quarter of 2016, we privately repurchased 1.5 million common shares at a discount to the then-prevailing market price. We intend to renew our NCIB in May 2016 for an additional 12 month period.
Details of share repurchases were as follows:
| THREE MONTHS ENDED MARCH 31, | ||||||||
| 2016 | 2015 | |||||||
Share repurchases (millions of U.S. dollars) | 432 | 348 | ||||||
Shares repurchased (millions) | 11.7 | 8.8 | ||||||
Share repurchases – average price per share | 36.99 | 39.74 | ||||||
Decisions regarding any future repurchases will be based on the timing of the sale of the Intellectual Property & Science business in addition to other factors, such as market conditions, share price and other opportunities to invest capital for growth. We may elect to suspend or discontinue our share repurchases at any time, in accordance with applicable laws. From time to time when we do not possess material nonpublic information about ourselves or our securities, we may enter into a pre-defined plan with our broker to allow for the repurchase of shares at times when we ordinarily would not be active in the market due to our own internal trading blackout periods, insider trading rules or otherwise. Any such plans entered into with our broker will be adopted in accordance with applicable Canadian securities laws and the requirements of Rule 10b5-1 under the U.S. Securities Exchange Act of 1934, as amended. We entered into such plans with our broker on March 31, 2016 and on December 31, 2015. As a result, we recorded a $90 million liability in “Other financial liabilities” within current liabilities at March 31, 2016 ($165 million at December 31, 2015) with a corresponding amount recorded in equity in the consolidated statement of financial position in both periods.
Free cash flow
| THREE MONTHS ENDED MARCH 31, | ||||||||
| (millions of U.S. dollars) | 2016 | 2015 | ||||||
Net cash provided by operating activities | 458 | 244 | ||||||
Capital expenditures, less proceeds from disposals | (233) | (290) | ||||||
Other investing activities | 19 | 2 | ||||||
Dividends paid on preference shares | (1) | (1) | ||||||
Dividends paid to non-controlling interests | (9) | (7) | ||||||
Capital expenditures from discontinued operations | (11) | (13) | ||||||
Free cash flow | 223 | (65) | ||||||
Page 15
Free cash flow is historically the lowest in the first quarter of the year and is not indicative of our full-year expectation of between $1.7 billion and $1.9 billion. The improvement in free cash flow in the first quarter of 2016 was primarily due to higher cash from operating activities and lower capital expenditures, which were timing related.
Financial position
Our total assets were $29.0 billion at March 31, 2016, a slight decrease from $29.1 billion at December 31, 2015 as depreciation of fixed assets, amortization of computer software and other identifiable intangible assets were offset by capital expenditures and changes in foreign currency.
As at March 31, 2016, the carrying amounts of our total current liabilities exceeded the carrying amounts of our total current assets principally because current liabilities include deferred revenue, which arises from the sale of information and services delivered electronically on a subscription basis, for which many customers pay in advance. The cash received from these advance payments is used to currently fund the operating, investing and financing activities of our business. However, for accounting purposes, these advance payments must be deferred and recognized over the term of the subscription. As such, we typically reflect a negative working capital position in our consolidated statement of financial position. In the ordinary course of business, deferred revenue does not represent a cash obligation, but rather an obligation to perform services or deliver products. Therefore, we believe that our negative working capital position as at March 31, 2016, was not indicative of a liquidity issue, but rather an outcome of the required accounting for our business model.
Additionally, as at March 31, 2016, our current liabilities included commercial paper borrowings and term debt maturing in less than 12 months. As previously stated in this “Liquidity and Capital Resources” section, we believe our existing sources of liquidity will be sufficient to fund our expected cash requirements in the normal course of business for the next 12 months.
Net debt(1)
| MARCH 31, | DECEMBER 31, | |||||||
| (millions of U.S. dollars) | 2016 | 2015 | ||||||
Current indebtedness | 2,543 | 1,555 | ||||||
Long-term indebtedness | 6,379 | 6,829 | ||||||
Total debt | 8,922 | 8,384 | ||||||
Swaps | 290 | 370 | ||||||
Total debt after swaps | 9,212 | 8,754 | ||||||
Remove fair value adjustments for hedges(2) | 9 | 26 | ||||||
Total debt after currency hedging arrangements | 9,221 | 8,780 | ||||||
Remove transaction costs and discounts included in the carrying value of debt | 65 | 67 | ||||||
Less: cash and cash equivalents(3) | (869) | (926) | ||||||
Net debt | 8,417 | 7,921 | ||||||
| (1) | Net debt is a non-IFRS financial measure, which we define in Appendix A. |
| (2) | Represents the interest-related fair value component of hedging instruments that are removed to reflect net cash outflow upon maturity. |
| (3) | Includes cash and cash equivalents of $97 million and $106 million at March 31, 2016 and December 31, 2015, respectively, held in subsidiaries, which have regulatory restrictions, contractual restrictions or operate in countries where exchange controls and other legal restrictions apply and are therefore not available for general use by our company. |
The maturity dates for our debt are well balanced with no significant concentration in any one year. Our next scheduled term debt maturity occurs in May 2016. At March 31, 2016, the average maturity of our term debt was approximately eight years at an average interest rate (after swaps) of less than 5%.
Additional information
| • | We monitor the financial strength of financial institutions with which we have banking and other commercial relationships, including those that hold our cash and cash equivalents, as well as those which are counterparties to derivative financial instruments and other arrangements; and |
| • | We expect to continue to have access to funds held by our subsidiaries outside the U.S. in a tax efficient manner to meet our liquidity requirements. |
Page 16
Off-balance sheet arrangements, commitments and contractual obligations
For a summary of our other off-balance sheet arrangements, commitments and contractual obligations please see our 2015 annual management’s discussion and analysis. There were no material changes to these arrangements, commitments and contractual obligations during the three months ended March 31, 2016.
Contingencies
Lawsuits and legal claims
We are engaged in various legal proceedings, claims, audits and investigations that have arisen in the ordinary course of business. These matters include, but are not limited to, antitrust/competition claims, intellectual property infringement claims, employment matters and commercial matters. The outcome of all of the matters against us is subject to future resolution, including the uncertainties of litigation. Based on information currently known to us and after consultation with outside legal counsel, management believes that the ultimate resolution of any such matters, individually or in the aggregate, will not have a material adverse impact on our financial condition taken as a whole.
Uncertain tax positions
We are subject to taxation in numerous jurisdictions and we are routinely under audit by many different taxing authorities in the ordinary course of business. There are many transactions and calculations during the course of business for which the ultimate tax determination is uncertain, as taxing authorities may challenge some of our positions and propose adjustments or changes to our tax filings. As a result, we maintain provisions for uncertain tax positions that we believe appropriately reflect our risk. These provisions are made using our best estimate of the amount expected to be paid based on a qualitative assessment of all relevant factors. We review the adequacy of these provisions at the end of each reporting period and adjust them based on changing facts and circumstances. Due to the uncertainty associated with tax audits, it is possible that at some future date, liabilities resulting from such audits or related litigation could vary significantly from our provisions. However, based on currently enacted legislation, information currently known to us and after consultation with outside tax advisors, management believes that the ultimate resolution of any such matters, individually or in the aggregate, will not have a material adverse impact on our financial condition taken as a whole.
For additional information, please see the “Risk Factors” section of our 2015 annual report, which contains further information on risks related to tax matters.
Page 17
The information in this section is forward-looking and should be read in conjunction with the section below entitled “Cautionary Note Concerning Factors That May Affect Future Results”.
We recently reaffirmed our business outlook for 2016 that was first communicated in February.
Our 2016 outlook:
| • | Assumes constant currency rates relative to 2015; |
| • | Excludes the Intellectual Property & Science business, which has been classified as a discontinued operation, except for free cash flow; and |
| • | Does not factor in the impact of any other acquisitions or divestitures that may occur during the year. |
The following table sets forth our current 2016 financial outlook, the material assumptions related to our financial outlook and the material risks that may cause actual performance to differ materially from our current expectations.
REVENUES TO GROW LOW SINGLE DIGITS REVENUES, EXCLUDING FINANCIAL & RISK’S RECOVERIES REVENUES TO GROW 2% TO 3% | ||
Material assumptions | Material risks | |
• Gross domestic product (GDP) growth in most of the countries where we operate
• Continued increase in the number of professionals around the world and their demand for high quality information and workflow solutions
• The successful execution of sales initiatives, ongoing product release programs and our globalization strategy
• The sale of our Intellectual Property & Science business in the second half of 2016 | • Uneven economic growth, recession or volatile currency movements across the markets we serve may result in reduced spending levels by our customers
• Demand for our products and services could be reduced by changes in customer buying patterns, competitive pressures or our inability to execute on key product or customer support initiatives
• Implementation of regulatory reform around the world, including financial services laws, may limit business opportunities for our customers, lowering their demand for our products and services
• Pressure on our customers, in developed markets in particular, may constrain the number of professionals employed due to regulatory and economic uncertainty
• Competitive pricing actions could impact our revenues
• Price adjustments related to the migration of remaining Financial & Risk customers onto new products on its unified platform could be more severe or last longer than expected
• Global market conditions could depress transaction volumes in our Financial & Risk business
• We may be unable to sell all or parts of our Intellectual Property & Science business or it may take longer than we expect
| |
ADJUSTED EBITDA MARGIN EXPECTED TO BE BETWEEN 27.3% and 28.3% | ||
Material assumptions | Material risks | |
• Revenues, excluding Financial & Risk’s recoveries revenues, expected to grow 2% to 3%
• Business mix continues to shift to higher-growth, but lower margin offerings
• Execution of transformation and efficiency initiatives
• Continue to invest in growth markets and customer service
• The sale of our Intellectual Property & Science business in the second half of 2016 and the elimination of shared costs in line with our estimates | • Refer to the risks above related to the revenue outlook
• Revenues from higher margin businesses may be lower than expected; conversely, revenues from low-margin businesses (including recoveries) could be higher than expected
• The costs of required investments, including those in growth markets, exceed expectations or actual returns are below expectations
• Acquisition and disposal activity may dilute margins
• Efficiency initiatives may cost more than expected, be delayed or may not produce the expected level of savings
• We are unable to sell all or parts of our Intellectual Property & Science business or it may take longer than we expect; our estimates regarding the elimination of shared costs may be inaccurate
| |
Page 18
UNDERLYING OPERATING PROFIT MARGIN EXPECTED TO BE BETWEEN 18.4% AND 19.4% | ||
Material assumptions | Material risks | |
• Adjusted EBITDA margin expected to be between 27.3% and 28.3%
• Depreciation and software amortization expense expected to be approximately 9% of revenues
• Capital expenditures expected to be approximately 8% of revenues
• The sale of our Intellectual Property & Science business in the second half of 2016 | • Refer to the risks above related to adjusted EBITDA margin outlook
• Capital expenditures may be higher than currently expected, resulting in higher in-period depreciation and amortization
• Obsolescence of technology may require accelerated amortization or impairment of certain assets
• We are unable to sell all or parts of our Intellectual Property & Science business or it may take longer than we expect; our estimates regarding the elimination of shared costs may be inaccurate
| |
FREE CASH FLOW IS EXPECTED TO BE BETWEEN $1.7 BILLION AND $1.9 BILLION | ||
Material assumptions | Material risks | |
• Revenues, excluding Financial & Risk’s recoveries revenues, expected to grow 2% to 3%
• Adjusted EBITDA margin expected to be between 27.3% and 28.3%
• Capital expenditures expected to be approximately 8% of revenues
• The sale of our Intellectual Property & Science business in the second half of 2016 and our estimates regarding cash flows to be eliminated | • Refer to the risks above related to the revenue outlook and adjusted EBITDA margin outlook
• A weaker macroeconomic environment could negatively impact working capital performance
• Capital expenditures may be higher than currently expected resulting in higher cash outflows
• The timing and amount of tax payments to governments may differ from our expectations
• We are unable to sell all or parts of our Intellectual Property & Science business or it may take longer than we expect; our estimates regarding cash flows to be eliminated may be inaccurate
| |
Additionally, in 2016, we expect interest expense to be between $420 million and $460 million. We expect our 2016 effective tax rate (as a percentage of post-amortization adjusted earnings) to be between 10% and 13%, assuming no material changes in current tax laws or treaties to which we are subject.
Page 19
As of April 25, 2016, Woodbridge beneficially owned approximately 60% of our shares.
In January 2016, we sold a Canadian wholly owned subsidiary to a company affiliated with Woodbridge for $16 million. The subsidiary’s assets consisted of accumulated losses that management did not expect to utilize against future taxable income prior to their expiry. As such, no tax benefit for the losses had been recognized in our consolidated financial statements. Under Canadian law, certain losses may only be transferred to related companies, such as those affiliated with Woodbridge. We recorded a gain of $16 million within “Other operating gains (losses), net” within the consolidated income statement. In connection with this transaction, our board of directors’ Corporate Governance Committee obtained an independent fairness opinion. We utilized the independent fairness opinion to determine that the negotiated price between us and the purchaser was reasonable. After receiving the recommendation of the Corporate Governance Committee, the board of directors approved the transaction. Directors who were not considered independent because of their positions with Woodbridge refrained from deliberating and voting on the matter at both the committee and board meetings.
Except for the above transaction, there were no new significant related party transactions during the first quarter of 2016. Please refer to the “Related Party Transactions” section of our 2015 annual management’s discussion and analysis, which is contained in our 2015 annual report, as well as note 29 of our 2015 annual consolidated financial statements for information regarding related party transactions.
There were no material events occurring after March 31, 2016 through the date of this management’s discussion and analysis.
CHANGES IN ACCOUNTING POLICIES
Please refer to the “Changes in Accounting Policies” section of our 2015 annual management’s discussion and analysis, which is contained in our 2015 annual report, as well as note 2 of our consolidated interim financial statements for the three months ended March 31, 2016, for information regarding changes in accounting policies.
CRITICAL ACCOUNTING ESTIMATES AND JUDGMENTS
The preparation of financial statements requires management to make estimates and judgments about the future. Estimates and judgments are continually evaluated and are based on historical experience and other factors, including expectations of future events that are believed to be reasonable under the circumstances. Please refer to the “Critical Accounting Estimates and Judgments” section of our 2015 annual management’s discussion and analysis, which is contained in our 2015 annual report, for additional information. Since the date of our 2015 annual management’s discussion and analysis, there have not been any significant changes to our critical accounting estimates and judgments.
Disclosure controls and procedures
Our Chief Executive Officer and Chief Financial Officer, after evaluating the effectiveness of our disclosure controls and procedures (as defined in applicable U.S. and Canadian securities law) as of the end of the period covered by this management’s discussion and analysis, have concluded that our disclosure controls and procedures were effective to ensure that all information that we are required to disclose in reports that we file or furnish under the U.S. Securities Exchange Act and applicable Canadian securities law is (i) recorded, processed, summarized and reported within the time periods specified in the rules and forms of the SEC and Canadian securities regulatory authorities and (ii) accumulated and communicated to our management, including our Chief Executive Officer and Chief Financial Officer, to allow timely decisions regarding required disclosure.
Internal control over financial reporting
Our management is responsible for establishing and maintaining adequate internal control over financial reporting to provide reasonable assurance regarding the reliability of financial reporting and the preparation of financial statements for external purposes in accordance with IFRS.
Page 20
We are engaged in the following long-term efficiency initiatives which impact our financial reporting:
| • | We are enhancing our order-to-cash (OTC) applications and related workflow processes in phases over multiple years. Key elements of the OTC solutions are order management, billing, cash management and collections functionality. We expect to reduce the number of applications and to streamline processes across our organization through this initiative. |
| • | We are automating manual processes and updating workflows associated with intercompany revenue and cost allocation. |
As we are implementing these initiatives in phases over an extended period, the nature and extent of activity will vary by quarter. In certain quarters, we may have limited or no activity.
As these initiatives could result in material changes to our internal control over financial reporting depending on the nature and volume of work completed, we will continue to modify the design and documentation of the related internal control processes and procedures, as necessary. Except as described above, there was no change in our internal control over financial reporting during the first quarter of 2016 that materially affected, or is reasonably likely to materially affect, our internal control over financial reporting.
Share capital
As of April 25, 2016, we had outstanding 752,425,068 common shares, 6,000,000 Series II preference shares, 11,029,606 stock options and a total of 7,414,911 time-based restricted share units and performance restricted share units. We have also issued a Thomson Reuters Founders Share which enables Thomson Reuters Founders Share Company to exercise extraordinary voting power to safeguard the Thomson Reuters Trust Principles.
Public securities filings and regulatory announcements
You may access other information about our company, including our 2015 annual report (which contains information required in an annual information form) and our other disclosure documents, reports, statements or other information that we file with the Canadian securities regulatory authorities through SEDAR atwww.sedar.com and in the United States with the SEC atwww.sec.gov.
Cautionary note concerning factors that may affect future results
Certain statements in this management’s discussion and analysis are forward-looking, including, but not limited to, statements about our 2016 expectations in the “Overview” and “Outlook” sections and statements regarding timing and the use of proceeds from a sale of our Intellectual Property & Science business, our expectation of 2016 core corporate expenses, and 2016 opportunities and challenges for our business segments (notably, statements regarding Financial & Risk’s recoveries revenues, commercial pricing adjustments and EBITDA margin, and the Legal segment’s Solutions and U.S. print revenue performance). The words “expect”, “target” and “will” and similar expressions identify forward-looking statements. These forward-looking statements are based on certain assumptions and reflect our company’s current expectations. As a result, forward-looking statements are subject to a number of risks and uncertainties that could cause actual results or events to differ materially from current expectations. Certain factors that could cause actual results or events to differ materially from current expectations are discussed in the “Outlook” section above. Additional factors are discussed in the “Risk Factors” section of this annual report and in materials that we from time to time file with, or furnish to, the Canadian securities regulatory authorities and the U.S. Securities and Exchange Commission. There is no assurance that any forward-looking statement will materialize. Our outlook is provided for the purpose of providing information about current expectations for 2016. This information may not be appropriate for other purposes. You are cautioned not to place undue reliance on forward-looking statements, which reflect our expectations only as of the date of this management’s discussion and analysis. Except as may be required by applicable law, we disclaim any obligation to update or revise any forward-looking statements.
Page 21
Non-IFRS financial measures
We use non-IFRS financial measures as supplemental indicators of our operating performance and financial position. Additionally, we use non-IFRS measures as performance metrics as the basis for management incentive programs. These measures do not have any standardized meanings prescribed by IFRS and therefore are unlikely to be comparable to the calculation of similar measures used by other companies. Except for free cash flow, all our non-IFRS measures exclude the results of our Intellectual Property & Science business, which is reported as a discontinued operation.
The following table sets forth our non-IFRS financial measures, including an explanation of why we believe they are useful measures of our performance. Reconciliations for the most directly comparable IFRS measure are reflected in our management’s discussion and analysis.
| HOW WE DEFINE IT | WHY WE USE IT AND WHY IT IS USEFUL TO INVESTORS | MOST DIRECTLY COMPARABLE IFRS MEASURE / RECONCILIATION | ||
Underlying operating profit and the related margin | ||||
Operating profit from reportable segments and Corporate & Other. The related margin is expressed as a percentage of revenues. | Provides a basis to evaluate operating profitability and performance trends, excluding the impact of items which distort the performance of our operations. | Operating profit | ||
Adjusted EBITDA and the related margin | ||||
Underlying operating profit excluding the related depreciation and amortization of computer software. The related margin is expressed as a percentage of revenues. | Provides a measure commonly reported and widely used by investors as an indicator of a company’s operating performance and ability to incur and service debt, and as a valuation metric. | Earnings (loss) from continuing operations | ||
Adjusted EBITDA less capital expenditures and the related margin | ||||
Adjusted EBITDA less capital expenditures, less proceeds from disposals. The related margin is expressed as a percentage of revenues. | Provides a basis for evaluating the operating profitability and capital intensity of a business in a single measure. This measure captures investments regardless of whether they are expensed or capitalized. | Earnings (loss) from continuing operations | ||
Adjusted earnings and adjusted EPS | ||||
Earnings (loss) attributable to common shareholders and per share: • excluding the pre-tax impacts of amortization of other identifiable intangible assets; and • the post-tax impacts of fair value adjustments, other operating gains and losses, certain impairment charges, other net finance costs or income, our share of post-tax earnings or losses in equity method investments, discontinued operations and other items affecting comparability. • We also deduct dividends declared on preference shares; and | Provides a more comparable basis to analyze earnings and is also a measure commonly used by shareholders to measure our performance. | Earnings (loss) attributable to common shareholders and earnings (loss) per share attributable to common shareholders | ||
amortization of the tax charges associated with the consolidation of ownership and management of technology and content assets. For the non-IFRS measure, the majority of the charges are amortized over seven years, the period over which the tax is expected to be paid.
Adjusted EPS is calculated using diluted weighted-average shares. | We believe this treatment more accurately reflects our tax position because the tax liability is associated with ongoing tax implications from the consolidation of these assets.
| |||
Page 22
| HOW WE DEFINE IT | WHY WE USE IT AND WHY IT IS USEFUL TO INVESTORS | MOST DIRECTLY COMPARABLE RECONCILIATION | ||
Adjusted earnings and adjusted EPS (continued) | ||||
In interim periods, we also adjust our reported earnings and earnings per share to reflect a normalized effective tax rate. Specifically, the normalized effective rate is computed as the estimated full-year effective tax rate applied to adjusted pre-tax earnings of the interim period. The reported effective tax rate is based on separate annual effective income tax rates for each taxing jurisdiction that are applied to each interim period’s pre-tax income. | Because the geographical mix of pre-tax profits and losses in interim periods may be different from that for the full-year, our effective tax rate computed in accordance with IFRS may be more volatile by quarter. Therefore, we believe that using the expected full-year effective tax rate provides more comparability among interim periods. The adjustment to normalize the effective tax rate reallocates estimated full-year income taxes between interim periods, but has no effect on full-year tax expense or on cash taxes paid. | |||
Net debt | ||||
Total indebtedness, including the associated fair value of hedging instruments, but excluding the associated unamortized transaction costs and premiums or discounts and the interest-related fair value component of hedging instruments, less cash and cash equivalents. | Provides a commonly used measure of a company’s leverage.
Given that we hedge some of our debt to reduce risk, we include hedging instruments as we believe it provides a better measure of the total obligation associated with our outstanding debt. However, because we intend to hold our debt and related hedges to maturity, we do not consider the interest components of the associated fair value of hedges in our measurements. We reduce gross indebtedness by cash and cash equivalents. | Total debt (current indebtedness plus long-term indebtedness) | ||
Free cash flow (includes free cash flow from continuing and discontinued operations) | ||||
Net cash provided by operating activities, and other investing activities, less capital expenditures, dividends paid on our preference shares, and dividends paid to non-controlling interests. | Helps assess our ability, over the long term, to create value for our shareholders as it represents cash available to repay debt, pay common dividends and fund share repurchases and new acquisitions. | Net cash provided by operating activities | ||
Changes before the impact of foreign currency or at “constant currency” | ||||
Applicable measures where changes are reported before the impact of foreign currency or at “constant currency”
IFRS Measures: • Revenues • Operating expenses
Non-IFRS Measures: • Underlying operating profit • Underlying operating profit margin • Adjusted EBITDA • Adjusted EBITDA margin • Adjusted EPS | Provides better comparability of business trends from period to period.
Our reporting currency is the U.S. dollar. However, we conduct a significant amount of our activities in currencies other than the U.S. dollar. We measure our performance before the impact of foreign currency (or at “constant currency”), which means that we apply the same foreign currency exchange rates for the current and equivalent prior period. To calculate the foreign currency impact between periods, we convert the current and equivalent prior period’s local currency results using the same foreign currency exchange rate. | For each non-IFRS measure, refer to the definitions above for most directly comparable IFRS measure. | ||
Page 23
APPENDIX B
This appendix provides reconciliations that are not presented elsewhere in this management’s discussion and analysis for certain non-IFRS measures to the most directly comparable IFRS measure for the three months ended March 31, 2016 and 2015.
Reconciliation of earnings from continuing operations to adjusted EBITDA and adjusted EBITDA less capital expenditures
| THREE MONTHS ENDED MARCH 31, | ||||||||||||
| (millions of U.S. dollars, except margins) | 2016 | 2015 | CHANGE | |||||||||
Earnings from continuing operations | 210 | 280 | (25%) | |||||||||
Adjustments to remove: | ||||||||||||
Tax (benefit) expense | (26) | 25 | ||||||||||
Other finance costs (income) | 34 | (44) | ||||||||||
Net interest expense | 93 | 105 | ||||||||||
Amortization of other identifiable intangible assets | 128 | 140 | ||||||||||
Amortization of computer software | 169 | 180 | ||||||||||
Depreciation | 81 | 93 | ||||||||||
EBITDA | 689 | 779 | ||||||||||
Adjustments to remove: | ||||||||||||
Share of post-tax earnings in equity method investments | (1) | (4) | ||||||||||
Other operating (gains) losses, net | (4) | 12 | ||||||||||
Fair value adjustments | 64 | (53) | ||||||||||
Adjusted EBITDA | 748 | 734 | 2% | |||||||||
Deduct: Capital expenditures, less proceeds from disposals | 233 | 290 | ||||||||||
Adjusted EBITDA less capital expenditures | 515 | 444 | 16% | |||||||||
Adjusted EBITDA margin | 26.8% | 26.0% | 80bp | |||||||||
Adjusted EBITDA less capital expenditures margin | 18.4% | 15.7% | 270bp | |||||||||
Reconciliation of underlying operating profit to adjusted EBITDA by segment
| THREE MONTHS ENDED MARCH 31, 2016 | THREE MONTHS ENDED MARCH 31, 2015 | |||||||||||||||||||||||||
| (millions of U.S. dollars) | Underlying operating | Add: Depreciation and | Adjusted EBITDA | Underlying operating | Add: Depreciation and | Adjusted EBITDA | ||||||||||||||||||||
Financial & Risk | 295 | 142 | 437 | 241 | 160 | 401 | ||||||||||||||||||||
Legal | 238 | 60 | 298 | 219 | 67 | 286 | ||||||||||||||||||||
Tax & Accounting | 83 | 31 | 114 | 98 | 28 | 126 | ||||||||||||||||||||
Corporate & Other (includes Reuters News) | (118) | 17 | (101) | (97) | 18 | (79) | ||||||||||||||||||||
Total | 498 | 250 | 748 | 461 | 273 | 734 | ||||||||||||||||||||
Page 24
Reconciliation of changes in consolidated revenues, operating expenses, adjusted EBITDA, underlying operating profit and the related margins, and adjusted EPS, excluding the effects of foreign currency
| THREE MONTHS ENDED MARCH 31, | CHANGE | |||||||||||||||||||
| (millions of U.S. dollars) | 2016 | 2015 | Total | Foreign currency | Constant currency | |||||||||||||||
Revenues | ||||||||||||||||||||
Financial & Risk | 1,509 | 1,552 | (3%) | (2%) | (1%) | |||||||||||||||
Legal | 822 | 824 | - | (2%) | 2% | |||||||||||||||
Tax & Accounting | 389 | 373 | 4% | (4%) | 8% | |||||||||||||||
Corporate & Other | 75 | 74 | 1% | (3%) | 4% | |||||||||||||||
Eliminations | (2) | (2) | ||||||||||||||||||
Consolidated revenues | 2,793 | 2,821 | (1%) | (2%) | 1% | |||||||||||||||
| THREE MONTHS ENDED MARCH 31, | CHANGE | |||||||||||||||||||||||
| (millions of U.S. dollars) | 2016 | 2015 | Total | Foreign currency | Fair value adjustments | Constant currency | ||||||||||||||||||
Consolidated results | ||||||||||||||||||||||||
Operating expenses | 2,109 | 2,034 | 4% | (3%) | 6% | 1% | ||||||||||||||||||
Adjusted EBITDA | 748 | 734 | 2% | 1% | n/a | 1% | ||||||||||||||||||
Adjusted EBITDA margin | 26.8% | 26.0% | 80bp | 70bp | n/a | 10bp | ||||||||||||||||||
Underlying operating profit | 498 | 461 | 8% | 2% | n/a | 6% | ||||||||||||||||||
Underlying operating profit margin | 17.8% | 16.3% | 150bp | 70bp | n/a | 80bp | ||||||||||||||||||
Adjusted EPS | $0.48 | $0.39 | 23% | 2% | n/a | 21% | ||||||||||||||||||
Page 25
APPENDIX C
Quarterly information (unaudited)
The following table presents a summary of our consolidated operating results for the eight most recent quarters.
| QUARTER ENDED MARCH 31, | QUARTER ENDED JUNE 30, | QUARTER ENDED SEPTEMBER 30, | QUARTER ENDED DECEMBER 31, | |||||||||||||||||||||||||||||
| (millions of U.S. dollars, except per share amounts) | 2016 | 2015 | 2015 | 2014 | 2015 | 2014 | 2015 | 2014 | ||||||||||||||||||||||||
Revenues | 2,793 | 2,821 | 2,802 | 2,922 | 2,747 | 2,873 | 2,887 | 2,955 | ||||||||||||||||||||||||
Operating profit | 310 | 362 | 341 | 316 | 359 | 408 | 424 | 1,264 | ||||||||||||||||||||||||
Earnings from continuing operations | 210 | 280 | 221 | 200 | 237 | 193 | 348 | 1,087 | ||||||||||||||||||||||||
Earnings from discontinued operations, net of tax | 62 | 40 | 60 | 60 | 56 | 57 | 69 | 70 | ||||||||||||||||||||||||
Net earnings | 272 | 320 | 281 | 260 | 293 | 250 | 417 | 1,157 | ||||||||||||||||||||||||
Earnings attributable to common shareholders | 262 | 305 | 262 | 249 | 280 | 231 | 408 | 1,147 | ||||||||||||||||||||||||
Dividends declared on preference shares | (1) | (1) | - | - | (1) | (1) | - | (1) | ||||||||||||||||||||||||
Basic earnings per share | ||||||||||||||||||||||||||||||||
From continuing operations | $0.26 | $0.33 | $0.26 | $0.23 | $0.29 | $0.22 | $0.44 | $1.35 | ||||||||||||||||||||||||
From discontinued operations | 0.08 | 0.05 | 0.07 | 0.08 | 0.07 | 0.07 | 0.09 | 0.08 | ||||||||||||||||||||||||
| $0.34 | $0.38 | $0.33 | $0.31 | $0.36 | $0.29 | $0.53 | $1.43 | |||||||||||||||||||||||||
Diluted earnings per share | ||||||||||||||||||||||||||||||||
From continuing operations | $0.26 | $0.33 | $0.26 | $0.23 | $0.29 | $0.21 | $0.44 | $1.34 | ||||||||||||||||||||||||
From discontinued operations | 0.08 | 0.05 | 0.07 | 0.08 | 0.07 | 0.07 | 0.09 | 0.09 | ||||||||||||||||||||||||
| $0.34 | $0.38 | $0.33 | $0.31 | $0.36 | $0.28 | $0.53 | $1.43 | |||||||||||||||||||||||||
Our revenues and operating profit on a consolidated basis do not tend to be significantly impacted by seasonality as we record a large portion of our revenues ratably over a contract term and our costs are generally incurred evenly throughout the year. However, our non-recurring revenues can cause changes in our performance from quarter to consecutive quarter. Additionally, the release of certain print-based offerings can be seasonal as can certain product releases for the regulatory markets, which tend to be concentrated at the end of the year. Our quarterly performance may also be impacted by volatile foreign currency exchange rates. As a consequence, the results of certain of our segments can be impacted by seasonality to a greater extent than our consolidated revenues and operating profit.
Revenues—In all periods, the revenue declines were attributable to the negative impact of foreign currency.
On a constant currency basis, revenues for all quarters grew by low single digits as combined growth from our Legal, Tax & Accounting segments was offset by our Financial & Risk segment. Financial & Risk’s revenue performance declined slightly in the first quarter of 2016, increased slightly in second quarter of 2015, and was essentially unchanged for each remaining quarter. The segment’s revenue performance over all periods reflected the positive impacts of improving net sales and annual price increases balanced against declines in recoveries revenues and the negative impact of commercial pricing adjustments associated with the migration of certain customers to new products. Acquisitions did not have a meaningful impact on revenue performance over the last four quarters.
Operating profit—Operating profit decreased in the first quarter of 2016 and the third quarter of 2015 due to the unfavorable impact of fair value adjustments associated with foreign currency embedded derivatives in certain customer contracts. The significant decrease in operating profit in the fourth quarter of 2015 was primarily due to a $931 million gain recorded in the prior-year period from the release of accumulated foreign currency translation adjustments from shareholders’ equity. The gain was triggered by the loss of control of a subsidiary, which involved the settlement of an intercompany loan that had been considered permanent.
Net earnings—Net earnings declined in the first quarter of 2016 and the fourth quarter of 2015 due to lower operating profit. Net earnings increased in the remaining quarters. Net earnings increased in the third quarter of 2015, despite lower operating profit, due to lower net financing costs and income tax expense.
Page 26