Exhibit 16(c)(2)
| Dragon Pharmaceutical Inc. | |
| Discussion Notes Preliminary [Subject to Review of Final Definitive Agreement] | |
Private andConfidential
March 2010
DRAFT
![]()
| Contents | |
Section
| 1. | Introduction |
| 2. | Dragon Pharmaceutical Overview |
| 3. | Fairness Assessment |
Appendix
| A. | WACC Analysis |
| B. | Overview of Selected Comparable Companies |
| C. | Case Study – Management Buyout |
| 2 | DRAFT | |
| Preliminary [Subject to Review of Final Definitive Agreement] |
| Section 1 | |
| Introduction | |
| Canaccord’s Mandate | |
Canaccord has been engaged by the Special Committee of the Board of Directors (the “Special Committee”) of Dragon Pharmaceutical Inc. (“Dragon”, or the “Company”) to provide an opinion as to the fairness (the “Fairness Opinion”), from a financial point of view, of the consideration paid to Dragon shareholders, by Mr.
Yanlin Han, Chairman and CEO of the Company (the “Transaction”)[Canaccord’s role in providing the Fairness Opinion does not include the preparation of a formal valuation (asdefined in Multilateral Instrument 61-101Protection of Minority Security Holders in Special Transactions)ofthe shares of Dragon]
This presentation is not intended to be made public and is strictly for the internal use of the Company and the Special Committee
Canaccord will provide the Fairness Opinion letter for inclusion in any disclosure documents to be disseminated to the shareholders of Dragon subject to Canaccord’s approval
The enclosed analysis is based on the closing share price of Dragon as at January 22, 2010
All figures in US dollars unless otherwise stipulated
Foreign exchange
US$/C$ = 0.9474
US$/RMB = 0.1464
| 4 | DRAFT | |
| Preliminary [Subject to Review of Final Definitive Agreement] |
| Foreword | |
Canaccord has used publicly available information as the basis for evaluating the Transaction as well as information provided by the Company in response to requested due diligence materials
We have reviewed:
Financial models and budgets provided by management
Copies of all minutes and resolutions of the shareholders and board of directors for the last five years
Publicly available documents filed on SEDAR
Notes from meeting with management
Certain documents as requested in our due diligence checklist
Proposal in a letter dated January 15, 2010 by Yanlin Han, Chairman and CEO of Dragon
Draft Agreement and Plan of Merger dated March 17, 2010
Historical market prices and valuation multiples for the common shares of Dragon
Prices and multiples with publicly available financial data concerning certain publicly traded companies that Canaccord considered to be relevant for purposes of its analysis;
Certain other documents filed by Dragon that Canaccord considered to be relevant
In addition, a certificate of representation as to certain factual matters and the completeness and accuracy of the information upon which the fairness opinion is based, addressed to Canaccord and dated the date provided by senior officers of Dragon will be obtained prior to delivery of a formal fairness opinion by Canaccord
| 5 | DRAFT | |
| Preliminary [Subject to Review of Final Definitive Agreement] |
| Transaction Overview | |
| Structure | • | As announced on January 22, 2010, Dragon received a letter dated January 15, 2010 in which Mr. Yanlin Han, Chairman and CEO of the Company has made a non-binding proposal to acquire all of the common shares of Dragon (the “Shares”) for US$0.80 per Share. Mr. Han is the largest shareholder of the Company owning 37.95% of the total outstanding shares of the Company |
| • | Since the announcement and following further discussions with Mr. Han, the Board has indicated that Mr. Han has increased hisoffer from US$0.80 to US$82 per share | |
| Consideration | • | Holders of the Shares will receive $0.82 per share |
| Lock-up Agreements/BoardRecommendation | • | On March 3, 2010, the Board preliminary approved the offer price of US$0.82 |
| Management | • | N/A |
| Non-Solicitation andSuperior Proposal | • | Deal structure allows for superior proposal |
| • | Satisfactory of due diligence | |
| • | Negotiation of definitive transaction documents | |
| Conditions | • | Requisite financing commitments |
| • | Receipt of Shareholders approval | |
| Timing | • | Execution of Agreement and Plan of Merger on March 24-26, 2010 |
| Break Fee | • | $1,000,000 payable by the Company with a superior offer, otherwise termination fee of $400,000 |
Source: Letter dated January 15, 2010 by Yanlin Han, Minutes of the Meeting of the Board on March 3, 2010 and draft Agreement and Plan of Merger dated March 17, 2010
| 6 | DRAFT | |
| Preliminary [Subject to Review of Final Definitive Agreement] |
| Section 2 | |
| Dragon Pharmaceutical Overview | |
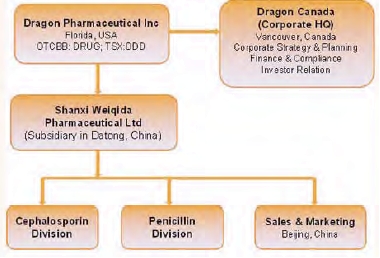
| Dragon Pharmaceutical – Corporate Profile | |
Dragon Pharmaceutical Inc. (Ticker: OTCBB: DRUG, TSX: DDD, BBSE: DRP) is an international pharmaceutical company
Produces and supplies a broad line of high-quality antibiotic products covering intermediates, active pharmaceutical ingredients and formulation drugs
Third largest manufacturer and the largest exporter of 7ACA in China and supplying 30% of its production to the international market
First manufacturer and remains the market leader for Clavulanic Acid with a market share of 80% in China and 30% in India
Business strategy is to focus on antibiotic product lines, currently on Cephalosporin group and Penicillin group
Product strategy is to integrate product lines from intermediates to Active Pharmaceutical Ingredients (API) to formulated products to maximize market dominating position, while developing new pipelines within the product lines horizontally to leverage the current resources for future growth
| Company Statistics | |||||
| Ticker | TSX:DDD | OTCBB:DRUG | |||
| Offer Price (Jan. 22, 2010) - US$ | $ | 0.80 | |||
| 52 Week High/Low - US$ | $ | 0.75 | $ | 0.32 | |
| Shares Out (M) Basic | 67.1 | ||||
| Implied Market Capitalization - US$M | $ | 53.7 | |||
| Cash - US$M | $ | 6.7 | |||
| Total Debt - US$M | $ | 46.2 | |||
| Enterprise Value - US$M | $ | 93.2 | |||
| OTCBB - Average Daily Volume (3 Months) | 20,000 | ||||
| TSX - Average Daily Volume (3 Months) | 15,000 | ||||
| Organization |
Source: Company Reports
| 8 | DRAFT | |
| Preliminary [Subject to Review of Final Definitive Agreement] |
| Dragon Pharmaceutical – Relocation/Expansion Plans | |
Production facilities are reaching full utilization rate and may not meet the expected increase demand from its customers
Due to the local government’s urban planning, there is no space for expansion in the current plant and surrounding areas
To encourage the Company to relocate, local government will designate a new campus with 300,000 square metres and grant a subsidy of $38.2 million
7ACA and Clavulanic Acid accounts for 50% of the total current sales
Required capex for the expansion plans is expected to be approximately US$100 million
| Capacity Expansion and Capex Plans | ||||||||||
| Capacity | Required | |||||||||
| Current | Post Exp. | Change | Capex (US$) | |||||||
| Product (tons) | ||||||||||
| Cephalosporin Division | ||||||||||
| 7-ACA | 780 | 1,200 | 53.8 | % | $ | 13.5 | ||||
| Crude Bulk API | 500 | 1,000 | 100.0 | % | $ | 3.0 | ||||
| Sterilized Bulk API | 300 | 600 | 100.0 | % | $ | 2.8 | ||||
| $ | 19.3 | |||||||||
| Penicillin Division | ||||||||||
| Clavulanic Acid | 78 | 300 | 284.6 | % | $ | 15.7 | ||||
| Penicillin G | 0 | 1,500 | $ | 11.4 | ||||||
| Amoxicillan API and | 0 | 500 | $ | 4.4 | ||||||
| Sterilized Bulk API | 0 | 200 | ||||||||
| $ | 31.4 | |||||||||
| Utilities | $ | 39.3 | ||||||||
| Admin & Logistics | $ | 6.5 | ||||||||
| Land | $ | 3.4 | ||||||||
| Total | $ | 99.9 | ||||||||
Source: Company Management Report on Business Expansion and Equity Financing
| 9 | DRAFT | |
| Preliminary [Subject to Review of Final Definitive Agreement] |
| Dragon Pharmaceutical – Income Statement | |
| FYE Dec. 31 - (US$ in thousands) | 2008A | 2009E | 2010E | 2011E | 2012E | 2013E | |||||||
| Sales | 151,900 | 167,000 | 206,234 | 268,103 | 307,392 | 348,188 | |||||||
| Cost of Sales | 127,400 | 136,200 | 167,619 | 211,756 | 241,844 | 270,731 | |||||||
| Gross Profit | 24,500 | 30,800 | 38,615 | 56,347 | 65,548 | 77,457 | |||||||
| Selling expense | 4,007 | 7,000 | 8,249 | 12,065 | 13,833 | 15,668 | |||||||
| G & A | 10,890 | 8,658 | 10,312 | 16,086 | 18,444 | 20,891 | |||||||
| Income from Operations | 9,603 | 15,143 | 20,054 | 28,196 | 33,272 | 40,898 | |||||||
| Interest expense | 3,626 | 4,500 | 5,500 | 9,000 | 7,500 | 4,500 | |||||||
| Other expense (income) | -893 | -523 | 0 | 0 | 0 | 0 | |||||||
| Income from Cont. Ops. B4 Taxes | 6,870 | 11,166 | 14,554 | 19,196 | 25,772 | 36,398 | |||||||
| Taxes | 896 | 2,665 | 3,638 | 4,799 | 6,443 | 9,099 | |||||||
| Net Income | 5,974 | 8,500 | 10,915 | 14,397 | 19,329 | 27,298 | |||||||
| EPS | |||||||||||||
| Basic | 0.09 | 0.13 | 0.16 | 0.21 | 0.29 | 0.41 | |||||||
| FD | 0.08 | 0.11 | 0.14 | 0.19 | 0.25 | 0.36 | |||||||
| Shares Outstanding | |||||||||||||
| Basic | 67,066 | 67,066 | 67,066 | 67,066 | 67,066 | 67,066 | |||||||
| FD | 76,826 | 76,826 | 76,826 | 76,826 | 76,826 | 76,826 | |||||||
| Sales Growth | 77.0 | % | 9.9 | % | 23.5 | % | 30.0 | % | 14.7 | % | 13.3 | % | |
| % Sales | 100.0 | % | 100.0 | % | 100.0 | % | 100.0 | % | 100.0 | % | 100.0 | % | |
| Cost of Sales | 83.9 | % | 81.6 | % | 81.3 | % | 79.0 | % | 78.7 | % | 77.8 | % | |
| Gross margin | 16.1 | % | 18.4 | % | 18.7 | % | 21.0 | % | 21.3 | % | 22.2 | % | |
| Selling Expense | 2.6 | % | 4.2 | % | 4.0 | % | 4.5 | % | 4.5 | % | 4.5 | % | |
| G & A | 7.2 | % | 5.2 | % | 5.0 | % | 6.0 | % | 6.0 | % | 6.0 | % | |
| Interest | 2.4 | % | 2.7 | % | 2.7 | % | 3.4 | % | 2.4 | % | 1.3 | % | |
| Effective Tax Rate | 13.0 | % | 23.9 | % | 25.0 | % | 25.0 | % | 25.0 | % | 25.0 | % | |
Source: Prepared by Company Management
| 10 | DRAFT | |
| Preliminary [Subject to Review of Final Definitive Agreement] |
| Dragon Pharmaceutical – Balance Sheet | |
| FYE Dec. 31 - (US$ in thousands) | 2008A | 2009E | 2010E | 2011E | 2012E | 2013E | |||||||
| CURRENT ASSETS | |||||||||||||
| Cash | 1,964 | 4,570 | 3,542 | 4,542 | 5,016 | 6,192 | |||||||
| Restricted Cash | 2,923 | 2,900 | 2,900 | 0 | 0 | 0 | |||||||
| Accounts Receivable Net | 10,499 | 15,613 | 22,036 | 28,794 | 33,013 | 38,394 | |||||||
| Inventories Net | 25,761 | 18,284 | 24,753 | 34,113 | 42,207 | 47,248 | |||||||
| Prepaid Expenses | 5,738 | 5,000 | 5,000 | 8,000 | 10,000 | 10,000 | |||||||
| Deferred Income Tax Assets | 1,315 | 0 | 0 | 0 | 0 | 0 | |||||||
| TOTAL CURRENT ASSETS | 48,200 | 46,368 | 58,230 | 75,449 | 90,235 | 101,835 | |||||||
| PROPERTY AND EQUIPMENT, NET | 94,565 | 113,863 | 146,511 | 146,259 | 139,557 | 131,655 | |||||||
| OTHER ASSETS | |||||||||||||
| Intangible Assets, Net | 1,503 | 5,471 | 5,319 | 5,167 | 5,015 | 4,863 | |||||||
| Investment - cost | 15 | 15 | 15 | 15 | 15 | 15 | |||||||
| Other Assets | 4,046 | 0 | 0 | 0 | 0 | 0 | |||||||
| TOTAL OTHER ASSETS | 5,564 | 5,486 | 5,334 | 5,182 | 5,030 | 4,878 | |||||||
| TOTAL ASSETS | 148,329 | 165,717 | 210,075 | 226,889 | 234,822 | 238,367 | |||||||
| CURRENT LIABILITIES | |||||||||||||
| Accounts Payable | 17,142 | 17,100 | 20,973 | 26,415 | 30,124 | 33,686 | |||||||
| Other Payables & Accrued Expenses | 26,280 | 42,567 | 56,336 | 20,012 | 19,106 | 20,992 | |||||||
| Loans Payable - short-term | 20,870 | 15,000 | 25,000 | 40,000 | 30,000 | 15,000 | |||||||
| Notes Payable | 5,902 | 2,500 | 2,500 | 0 | 0 | 0 | |||||||
| TOTAL CURRENT LIABILITIES | 70,194 | 77,167 | 104,809 | 86,427 | 79,230 | 69,677 | |||||||
| LONG-TERM LIABILITIES | |||||||||||||
| Loans Payable - long-term | 20,965 | 25,000 | 30,000 | 50,000 | 45,000 | 30,000 | |||||||
| TOTAL LONG-TERM LIABILITIES | 20,965 | 25,000 | 30,000 | 50,000 | 45,000 | 30,000 | |||||||
| TOTAL LIABILITIES | 91,159 | 102,167 | 134,809 | 136,427 | 124,230 | 99,677 | |||||||
| Capital | 49,136 | 49,136 | 49,136 | 49,136 | 49,136 | 49,136 | |||||||
| Retained earnings & reserves | 600 | 9,100 | 20,016 | 34,413 | 53,742 | 81,040 | |||||||
| Acc. other comprehensive income | 7,434 | 5,314 | 6,114 | 6,914 | 7,714 | 8,514 | |||||||
| TOTAL EQUITY | 57,170 | 63,550 | 75,265 | 90,463 | 110,592 | 138,690 | |||||||
| TOTAL EQUITY AND LIABILITIES | 148,329 | 165,717 | 210,075 | 226,889 | 234,822 | 238,367 | |||||||
Source: Prepared by Company Management
| 11 | DRAFT | |
| Preliminary [Subject to Review of Final Definitive Agreement] |
| Dragon Pharmaceutical – Cash Flow Statement | |
| FYE Dec. 31 - (US$ in thousands) | 2008A | 2009E | 2010E | 2011E | 2012E | 2013E | |||||||
| Net Profit from Cont. Operations | 5,974 | 8,500 | 10,915 | 14,397 | 19,329 | 27,298 | |||||||
| Add: | |||||||||||||
| Depreciation and Amortization | 8,032 | 8,702 | 14,352 | 17,252 | 18,702 | 19,902 | |||||||
| Other Non-Cash Items | 616 | 267 | 267 | 267 | 290 | 314 | |||||||
| Accreted interest | 56 | 0 | 0 | 0 | 0 | 0 | |||||||
| Stock based compensation expense | 154 | 500 | 500 | 500 | 500 | 500 | |||||||
| Government grant recognition | -43 | -233 | -233 | -233 | -210 | -186 | |||||||
| Loss on disposal of assets | -54 | 0 | 0 | 0 | 0 | 0 | |||||||
| Deferred income tax expenses | 503 | 0 | 0 | 0 | 0 | 0 | |||||||
| Chgs. in Operat. Assets and Liabilities | 0 | 0 | 0 | 0 | 0 | 0 | |||||||
| Accounts Receivable | 523 | -5,114 | -6,423 | -6,758 | -4,220 | -5,381 | |||||||
| Inventory | -6,147 | 7,477 | -6,468 | -9,360 | -8,094 | -5,041 | |||||||
| Prepaid Expenses | -1,932 | 738 | 0 | -3,000 | -2,000 | 0 | |||||||
| Accounts Payable | 7,086 | -42 | 3,874 | 5,442 | 3,709 | 3,561 | |||||||
| Notes Payable | 5,745 | -3,402 | 0 | -2,500 | 0 | 0 | |||||||
| Restricted Cash | -2,877 | 23 | 0 | 2,900 | 0 | 0 | |||||||
| Other Payables and Accrued Expense | -2,198 | -238 | 2,502 | 909 | 1,804 | 2,072 | |||||||
| Cash Provided by Continuing Op. | 14,822 | 16,910 | 19,019 | 19,549 | 29,522 | 42,724 | |||||||
| Cash Provided by (Used in) Disc. Op. | 923 | 0 | 0 | 0 | 0 | 0 | |||||||
| OPERATING. CASH IN/ (OUT) | 15,745 | 16,910 | 19,019 | 19,549 | 29,522 | 42,724 | |||||||
| Purchase/Deposit of Fixed Assets | -23,472 | -18,968 | -63,348 | -50,848 | -14,348 | -11,848 | |||||||
| Proceeds/Deposit on Disp. of Assets | 4,945 | 1,899 | 31,300 | 0 | 0 | 0 | |||||||
| Cash provided by (used in) cont .ops. | -18,527 | -17,069 | -32,048 | -50,848 | -14,348 | -11,848 | |||||||
| Cash provided by (used in) disc. Ops. | 1,580 | 0 | 0 | 0 | 0 | 0 | |||||||
| INV. CASH INFLOW / (OUTFLOW) | -16,947 | -17,069 | -32,048 | -50,848 | -14,348 | -11,848 | |||||||
| Repayment of Long-Term AP | -1,527 | 0 | 0 | 0 | 0 | 0 | |||||||
| Proceeds /(Repay of) Non-Int. Loans | -3,640 | 4,300 | -3,300 | -3,000 | 0 | 0 | |||||||
| Proceeds from Loans/ Repayment(ne | 3,126 | -1,835 | 15,000 | 35,000 | -15,000 | -30,000 | |||||||
| Proceeds from Common Shares Issue | 0 | 0 | 0 | 0 | 0 | 0 | |||||||
| Proceeds from Ex. of Stock Options | 167 | 0 | 0 | 0 | 0 | 0 | |||||||
| FINANCING CASH IN/ (OUT) | -1,874 | 2,465 | 11,700 | 32,000 | -15,000 | -30,000 | |||||||
| EFFECT OF EXCHANGE RATE CHANGE | 304 | 300 | 300 | 300 | 300 | 300 | |||||||
| NET INCREASE IN CASH | -2,772 | 2,606 | -1,029 | 1,001 | 474 | 1,176 | |||||||
| CASH AT THE BEGINNING | 4,736 | 1,964 | 4,570 | 3,542 | 4,542 | 5,016 | |||||||
| CASH AT THE END | 1,964 | 4,570 | 3,542 | 4,542 | 5,016 | 6,192 | |||||||
Source: Prepared by Company Management
| 12 | DRAFT | |
| Preliminary [Subject to Review of Final Definitive Agreement] |
| Dragon Pharmaceutical - Shareholder Analysis | |
| Dragon Pharmaceutical Shareholders | ||
| Common Shareholders | Share Position (000s) | % of Basic |
| I. Shares Held By Officers and Directors | ||
| Han, Yanlin (Chairman and CEO) | 25,454 | 38% |
| Weng, Zhanguo (Director) | 8,987 | 13% |
| Liu, Xuemei (Director) | 4,493 | 7% |
| Sun, Yiu Kwong (Director) | 700 | 1% |
| Wick, Alexander (Director) | 500 | 1% |
| Total Shares Held Officers and Directors | 40,134 | 60% |
| II. Major Shareholders | ||
| Qingming, Liu | 6,000 | 9% |
| Bright Faith Overseas Ltd. | 3,497 | 5% |
| Total Shares Held By Major Shareholders | 9,497 | 14% |
| III. Others | 17,436 | 26% |
| IV. Total Common Shareholders | 67,066 | 100% |
| TSX Net House Summary - 6 Months |
![]()
Source: Company Reports, ThomsonOne, CapitalIQ
| 13 | DRAFT | |
| Preliminary [Subject to Review of Final Definitive Agreement] |
| Dragon Pharmaceutical - Shareholder Analysis | |
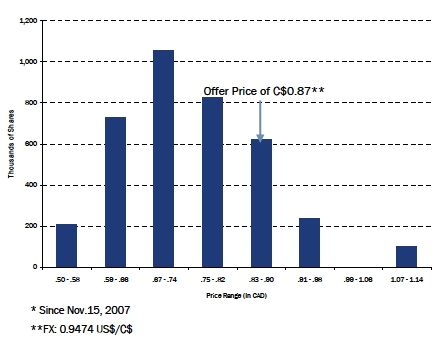
| TSX – Analysis of Share Trading Price* |
| OTCBB - Analysis of Share Trading Price* |
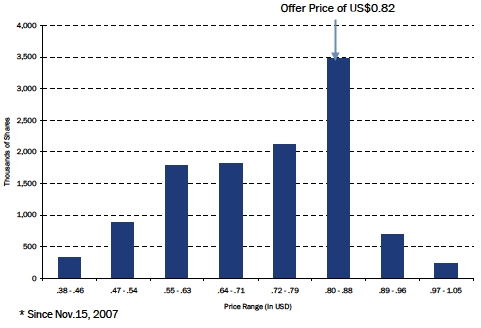
One turn of the public float takes 2.2 years
75% of the public float trades on the OTCBB, 25% on the TSX
Source: Company Reports, ThomsonOne, CapitalIQ
| 14 | DRAFT | |
| Preliminary [Subject to Review of Final Definitive Agreement] |
| Dragon Pharmaceutical- Timeline of Events | |
| TSX Price Volume Chart for the Last Two Years |
| Label | Dates | Key Events |
| 1 | 31-Mar-08 | Announces FYE 2007 Results |
| 2 | 14-May-08 | Announces Q1/08 Results |
| 3 | 14-Aug-08 | Announces Q2/08 Results |
| 4 | 14-Nov-08 | Announces Q3/08 Results |
| 5 | 31-Mar-09 | Announces FYE 2008 Results |
| 6 | 19-May-09 | Annouces Q1/09 Results |
| 7 | 17-Aug-09 | Reports Q2/09 Results |
| 8 | 16-Nov-09 | Reports Q3/09 Results |
| 9 | 22-Jan-10 | Receives Acquisition Proposal |
| From Yanlin Han |
![]()
Note: As at January 28, 2010
| 15 | DRAFT | |
| Preliminary [Subject to Review of Final Definitive Agreement] |
| Dragon Pharmaceutical – Management & Board | |
Yanlin Han –Chairman& CEO
Mr. Han serves as Chairman of the Board of Oriental Wave, responsible for the overall strategic planning and direction of Oriental Wave. Mr. Han has over 20 years of experience in the pharmaceutical industry. Mr. Han has been the Chairman of the Board at Shanxi Tongling Pharmaceutical Company since 1994 and Aurobindo Tongling (Datong) Pharmaceutical Company since 2000.
Garry Wong – CFO
Mr. Wong served as Executive Assistant to President and Chief Executive Officer of Dragon Pharmaceutical Inc., from February 2002 to January 2005. Before joining Dragon, Mr. Wong was a team member of the Global Mergers and Acquisitions Group at Nortel Networks since 1996. He managed and executed transactions consisted of acquisitions, divestitures, equity investments, spin-offs, public market listing and joint ventures and occurred in Europe, North America, Asia and the Middle East.
MaggieDeng – COO
Ms. Deng has over 10 years of experience working in or with public companies as investment banker, mainly on IPOs and secondary offering for Chinese companies on domestic stock exchange as well as international ones. Ms. Deng served as senior manager of China International Capital Corporation, from 1998 to 2001. She served as Chief Operating Officer of Dragon Pharmaceuticals Inc., prior to reverse merger with Oriental Wave Holding Ltd. She moved to Canada in 2001 and served as Assistant to President in a start-up biotech company in Vancouver.
Heinz Frey –Director
Heinz Frey has been the Chief Executive Officer of MANEF GmbH since August 1998. Dr. Frey serves as the President of Tranzcom China Security Networks Inc. Dr. Frey has 30 years of experience in the telecommunication industry, security manufacturing and service industry. He has experience in the management of various sizes of companies with global presence, financing and controlling of international companies, leading development, production, sales and finance departments .. He served as a Director of UBS (Union Bank of Switzerland) . He served as a Director of Pacific Link Mining Corp. since December 11, 2001.
Jin Li –Director
Jin Li serves as a Senior Advisor of Phycos International Co., Ltd. Mr. Li has been Vice President of Technology Exchange Ltd since November 2003. Prior to Phycos, he served as a Partner at the international law firm, Linklaters from 2002 to November 2003. He has ten years of experience in international IPOs, M&A and business transactions. Mr. Li studied biochemistry at Peking University in China in 1989 and received Master of Science degree in Biochemistry from the University of Michigan and doctoral degree from Law School of University of Columbia and in 1994 he received his Juris Doctor degree from Columbia University Law School in the United States.
XuemeiLiu –Director
Xuemei Liu served as Vice General Manager of Beijing Chemical Baifeng Investment Corporation Futures Broker Company from 1996 to 1999. Ms. Liu serves as Chairman of Beijing Yongfeng Industrial Group Company Ltd., which engages in a wide range of investment projects in real estate development, coal trading and media and publishing industry. He serves as Chairman of Tera Science & Technology Development Co. Ltd.
Source: Company Reports
| 16 | DRAFT | |
| Preliminary [Subject to Review of Final Definitive Agreement] |
| Dragon Pharmaceutical – Management & Board | |
Zhanguo,Weng –Director
Mr. Weng has over 25 years of experience in pharmaceutical industry including being the General Manager for Shanxi Tongzhen Pharmaceutical Co. Ltd. from August 1997 to January 2002 and Superintendent for Datong No.2 Pharmaceutical Factory from June 1992 to August 1997. Mr. Weng serves as Director of Oriental Wave and Shanxi Qianyuan Pharmaceutical Company.
AlexanderWick –Director
Dr. Wick served in leading positions in the pharmaceutical research departments of F. Hoffmann -La Roche in the United States and Switzerland and Synthelabo in France (Director of Chemical Research and Development) for over 25 years in the field of antibiotics, prostaglandius, vitamins, cardiovascular CNS and AIDS. In 1995, he created the fine chemicals company Sylachim S.A., a 100% subsidiary of Synthelabo, active in chemical intermediates and API's for the world's largest pharmaceutical companies (turnover of over 100 million Euros) and was its President until its acquisition by the German conglomerate mg Technologies (Dynamit -Nobel GmbH) in 2001.
Yiu Kwong Sun, M.D. –Director
Yiu Kwong Sun, M.D serves as an Administration Partner of United Medical Practice, which manages a large network of medical facilities throughout Hong Kong and Macau. Dr. Sun has been Chairman of the Dr. Sun Medical Centre Limited since 1995, which has been operating a network of medical centers in Hong Kong and China for the past 20 years. He has been an Independent Director of Dragon Pharmaceutical Inc. since November 1999. Dr. Sun has been a Member of the Dr. Cheng Yu Tung Fellowship Committee of Management of the University of Hong Kong Faculty of Medicine since 1997. He is a Founding Fellow of the Hong Kong College of Family Physicians and a Fellow of the Hong Kong Academy of Medicine. Dr. Sun was graduated from the University of Hong Kong Faculty of Medicine in 1967.
Kin Kwong Mak –Director
Kin Kwong Mak, Peter has been Chief Financial Officer of A-Power Energy Generation Systems, Ltd. since May 26, 2009. Mr. Mak is the founded Venfund Investment Management Ltd. in 2001 and serves as its Managing Director. Mr. Mak served as Chief Financial Officer of New Dragon Asia Corp. from November 8, 2004 to February 2009. He served as a Managing Partner of Arthur Andersen Southern China from 1992 to 2001 and a Partner of Arthur Andersen Worldwide with a particular focus since 1985 on serving clients in Mainland China. Mr. Mak has been an Independent Director of Dragon Pharmaceutical Inc. since September 30, 2005. He has been Director of Network CN, Inc. since September 1, 2007. He has been an Independent Director of China Grentech Corp. Ltd. since November 2004 and Huabao International Holdings Ltd. since March 29, 2004. He has been an Independent Director of Trina Solar Ltd., (Alternate Name, Changzhou Trina Solar Energy Co.) since December 18, 2006 and China Security & Surveillance Technology In c. since October 25, 2007.
Source: Company Reports
| 17 | DRAFT | |
| Preliminary [Subject to Review of Final Definitive Agreement] |
| Section 3 | |
| Fairness Assessment | |
| Transaction Proposal | |
| News Release Dated January 22, 2010 |
DRAGON PHARMACEUTICALINC ("DDD-T;DRUG-L") -Receives Acquisition ProposalFrom Yanlin Han
Dragon Pharmaceutical Inc. ("Dragon Pharma" or the "Company") announced that in a letter dated January 15, 2010, Mr. Yanlin Han, Chairman and CEO of the Company, has made a non-binding proposal to acquire all of the outstanding shares of Dragon Pharma for a price of $0.80 per share. Dragon's common stock quoted on OTCBB and traded on Toronto Stock Exchange closed at $0.60 per share and at CAD $0.63 per share, respectively, on January 22, 2010.
Mr. Han is the largest shareholder of the Company owning 37.95% of the total outstanding shares. Mr. Han's letter indicates that his proposal is conditioned upon satisfactory completion of due diligence, negotiation of definitive transaction documents, receipt of the requisite financing commitments and receipt of necessary board approval. The Board of Directors of the Company has established a special committee of independent directors consisting of Peter Mak, Chairman, and Drs. Li and Frey to act on behalf of Dragon Pharma with respect to consideration of the proposal and other strategic alternatives.
The process of considering the proposal is only in its initial stages and consequently no decision has been made by the special committee of the Board in respect of Dragon Pharma's response, if any, to the proposal. Shareholders are not being asked to take any action with respect to the proposal at this time. There can be no assurance that the proposed transaction or any other transaction will be acted upon, approved or completed.
Subsequent to the announcement of January 22, 2010, the offer price has been increased from US$0.80 to US$0.82
| Premiums at Offer Price of US$0.82 | |||||
| TSX (C$) | OTCBB (US$) | ||||
| PricingPeriod | VWAP | Implied Premium* | VWAP | Implied Premium | |
| Jan. 21/10 | $0.63 | 37.4% | $0.60 | 36.7% | |
| 5-Day | $0.63 | 37.2% | $0.60 | 37.4% | |
| 10-Day | $0.67 | 30.2% | $0.63 | 29.7% | |
| 15-Day | $0.67 | 28.8% | $0.63 | 29.3% | |
| 20-Day | $0.67 | 29.0% | $0.63 | 30.6% | |
| 30-Day | $0.68 | 27.1% | $0.62 | 32.0% | |
| 40-Day | $0.68 | 27.3% | $0.62 | 31.6% | |
| 60-Day | $0.69 | 25.4% | $0.64 | 27.9% | |
| 90-Day | $0.69 | 24.9% | $0.66 | 24.1% | |
| 120-Day | $0.69 | 26.2% | $0.66 | 25.0% | |
| *FX: 0.9474 US$/C$ | |||||
| Price/Volume Since Announcement* | |||
| TSX (C$) | OTCBB (US$) | ||
| Total Volume | 355,196 | 753,524 | |
| Avg Daily Volume | 14,800 | 21,529 | |
| VWAP | $0.69 | $0.69 | |
| Days Traded | 24 | 35 | |
| High Close | 0.77 | 0.74 | |
| Low Close | 0.61 | 0.66 | |
| *as at March 19, 2010 | |||
| 19 | DRAFT | |
| Preliminary [Subject to Review of Final Definitive Agreement] |
| Valuation Methodology | |
Three valuation methodologies may be used to assess value of the common shares of Dragon under our review:
| 1. | Comparable Company Analysis |
Canaccord reviewed trading multiples EV to EBITDA and Price to Earnings
| 2. | Discounted Cash Flow |
The discounted cash flow (DCF) methodology reflects growth prospects and risks inherent in the business by taking into account the amount, timing and relative certainty of projected free cash flows expected to be generated
| 3. | Precedent Transactions Analysis |
Canaccord reviewed applicable multiples for precedent transactions, as well as premiums paid to pre-announcement trading prices on comparable transactions
| 20 | DRAFT | |
| Preliminary [Subject to Review of Final Definitive Agreement] |
| Comparable Company Analysis – Selection of Peers | |
In consultation with management, we considered the following companies listed on the Hong Kong Stock Exchange as the Primary Peer Group
The United Laboratories (SEHK:3933)
China Pharmaceutical Group (SEHK:1093)
Dawnrays Pharmaceutical Holdings (SEHK: 2348)
We considered the following companies as the Secondary Peer Group, and although they do not focus on the same business as Dragon, they are in the pharmaceutical sector with a presence in China and are publicly listed on a North American stock exchange
Simcere Pharmaceutical Group (NYSE:SCR)
Tongjitang Chinese Medicines (NYSE:TCM)
Tianyin Pharmaceutical (AMEX:TPI)
We reviewed TSX listed Chinese companies but did not consider as appropriate for this analysis as their business were not similar to that of Dragon
| 21 | DRAFT | |
| Preliminary [Subject to Review of Final Definitive Agreement] |
| Comparable Company Analysis – Other Considerations | |
Dragon’s stock price should not warrant the same multiple or premium over its peers Shares should trade a discount relative to its peers based on the following factors:
Illiquid stock, resulting in higher cost of capital
Certain Officers and Directors have significant control
Private company valuation
Small public float
Analysis indicate that this can result in a discount of 20-40% of the valuation*
Negative working capital
Higher leverage
Higher financing risks
Limited ability to access capital markets
No research coverage
No equity offering since its RTO
Small company risk
Peers have larger product mix
To reflect the above factors, we discount the implied valuation by 30% - 35% (“Company Discount”)
*Source: Marketability and Value: Measuring the Illiquidity Discount,Aswath Damodaran,Stern School ofBusiness,July 2005
| 22 | DRAFT | |
| Preliminary [Subject to Review of Final Definitive Agreement] |
| Comparable Company Analysis – Company Statistics | |
| Peer Group Analysis – Company Statistics | ||||||||||||||
| Share | Market | Net Debt/ | LTM(2) | Sales | Public | Shares | Daily Tading | |||||||
| Currency | Exch. | Price(1) | $ | Cap. | Ebitda | Sales | Ebitda | Margin | Growth(3) | Float | Out | Vol(4) | % of S/O | |
| HK Listed Chinese Pharma | ||||||||||||||
| The United Laboratories Ltd. | HKD | SEHK | $4.08 | HKD | 4,896 | 2.7x | 3,860 | 742 | 19.2% | 29.7% | 99.0% | 1,200.0 | 4.6 | 0.4% |
| China Pharmaceutical Group Ltd. | HKD | SEHK | $4.18 | HKD | 6,416 | 0.1x | 6,853 | 1,642 | 24.0% | 25.0% | 49.0% | 1,535.0 | 9.6 | 0.6% |
| Dawnrays Pharmaceutical Holdings Ltd. | HKD | SEHK | $1.42 | HKD | 1,117 | -0.3x | 987 | 154 | 15.6% | 8.9% | 47.3% | 786.4 | 1.1 | 0.1% |
| Average | 4,143 | 3,900 | 846 | 19.6% | ||||||||||
| Median | 4,896 | 3,860 | 742 | 19.2% | ||||||||||
| US Listed Chinese Pharmas | ||||||||||||||
| Tianyin Pharmaceutical Co., Inc. | USD | AMEX | $3.89 | USD | 101 | -1.1x | 47 | 11 | 23.6% | 47.1% | 52.6% | 25.8 | 0.3 | 1.0% |
| Simcere Pharmaceutical Group. | USD | NYSE | $8.38 | USD | 476 | -1.1x | 260 | 42 | 16.3% | 33.1% | 33.6% | 56.8 | 0.2 | 0.3% |
| Tongjitang Chinese Medicines Co. | USD | NYSE | $3.75 | USD | 107 | -4.5x | 65 | 7 | 10.6% | 9.2% | 12.2% | 28.6 | 0.0 | 0.1% |
| Average | 228 | 163 | 16.8% | |||||||||||
| Median | 107 | 163 | 16.3% | |||||||||||
| TSX Listed Chinese Companies | ||||||||||||||
| Asia Bio-Chem Group Corp. | CAD | TSXV | $1.36 | CAD | 104 | 7.3x | 87 | 4 | 4.5% | 15.7% | 53.4% | 76.8 | 0.1 | 0.1% |
| Changfeng Energy Inc. | CAD | TSXV | $0.34 | CAD | 22 | 4.2x | 16 | 3 | 21.2% | n/a | 97.8% | 66.0 | 0.0 | 0.0% |
| GLG Life Tech Corporation | CAD | TSX | $8.00 | CAD | 195 | -37.9x | 33 | -1 | n/m | 179.6% | 74.6% | 24.3 | 0.1 | 0.2% |
| Hanfeng Evergreen Inc. | CAD | TSX | $7.34 | CAD | 453 | -1.3x | 280 | 43 | 15.4% | 187.1% | 60.3% | 61.8 | 0.2 | 0.3% |
| Hanwei Energy Services Corp. | CAD | TSX | $0.70 | CAD | 43 | 4.6x | 90 | 10 | 10.7% | 81.2% | 70.4% | 60.9 | 0.1 | 0.2% |
| Migao Corporation | CAD | TSX | $7.10 | CAD | 370 | 0.2x | 322 | 60 | 18.5% | 76.6% | 64.8% | 52.1 | 0.2 | 0.4% |
| Neo Material Technologies Inc | CAD | TSX | $4.25 | CAD | 510 | -2.1x | 171 | 20 | 11.9% | 3.8% | 79.4% | 120.1 | 0.6 | 0.5% |
| Zungui Haixi Corporation | CAD | TSXV | $3.20 | CAD | 160 | -0.7x | 139 | 32 | 23.1% | n/a | 26.5% | 50.0 | 0.1 | 0.1% |
| Zongshen PEM Power Systems Inc. | CAD | TSX | $1.40 | CAD | 90 | 57.8x | 44 | -1 | n/m | n/a | 51.0% | 63.9 | 0.1 | 0.1% |
| Average | 216 | 131 | 25 | 15.0% | ||||||||||
| Median | 160 | 90 | 20 | 15.4% | ||||||||||
| Dragon Pharmaceutical Inc.* | USD | OTCBB | $0.60 | USD | 40 | 1.7x | 155 | 23 | 14.7% | 62.9% | 22.4% | 67.1 | 0.0 | 0.0% |
| Dragon Pharmaceutical Inc.** | USD | OTCBB | $0.80 | USD | 54 | 1.7x | 155 | 23 | 14.7% | 62.9% | 22.4% | 67.1 | 0.0 | 0.0% |
Notes
(1) Prices as at January 22, 2010
(2) LTM - Last 12 months
(3) Sales Growth - 3 Year CAGR
(4) Average daily volume last 12 months
*Priced as at Jan.22, 2010
**Priced based on the Proposed Offer
Source: Capital IQ, Company Reports
| 23 | DRAFT | |
| Preliminary [Subject to Review of Final Definitive Agreement] |
| Comparable Company Analysis – Valuation Multiples | |
PrimaryPeer Group
The average LTM EBITDA and earnings multiple is 7x and 12x respectively
SecondaryPeer Group
The average LTM EBITDA and earnings multiple is 10x and 17x
Primary +SecondaryGrp.
The average LTM EBITDA and earnings multiple is 8x and 15x respectively
| Peer Group Analysis – Valuation Multiples | ||||||||||||||||||
| Share | Market | EV/Sales(2) | EV/Ebitda(2) | P/E(2) | P/BV | |||||||||||||
| Currency | Exch. | Price(1) | $ | Cap. | LTM | 2009E | 2010E | 2011E | LTM | 2009E | 2010E | 2011E | LTM | 2009E | 2010E | 2011E | ||
| HK Listed Chinese Pharma | ||||||||||||||||||
| The United Laboratories Ltd. | HKD | SEHK | $4.08 | HKD | 4,896 | 1.8x | 1.6x | 1.5x | 1.4x | 9.3x | 7.2x | 6.5x | 5.8x | 18.5x | 9.5x | 7.7x | 7.7x | 1.8x |
| China Pharmaceutical Group Ltd. | HKD | SEHK | $4.18 | HKD | 6,416 | 1.0x | 0.9x | 0.9x | 0.9x | 4.0x | 3.9x | 4.4x | 4.9x | 6.8x | 6.4x | 7.7x | 10.9x | 1.4x |
| Dawnrays Pharmaceutical Holdings Ltd. | HKD | SEHK | $1.42 | HKD | 1,117 | 1.1x | n/a | n/a | n/a | 7.0x | n/a | n/a | n/a | 10.7x | n/a | n/a | n/a | 1.7x |
| Average | 4,143 | 1.3x | 1.3x | 1.2x | 1.1x | 6.8x | 5.6x | 5.4x | 5.3x | 12.0x | 8.0x | 7.7x | 9.3x | 1.6x | ||||
| Median | 4,896 | 1.1x | 1.3x | 1.2x | 1.1x | 7.0x | 5.6x | 5.4x | 5.3x | 10.7x | 8.0x | 7.7x | 9.3x | 1.7x | ||||
| US Listed Chinese Pharmas | ||||||||||||||||||
| Tianyin Pharmaceutical Co., Inc. | USD | AMEX | $3.89 | USD | 101 | 1.9x | n/a | n/a | n/a | 8.0x | n/a | n/a | n/a | 12.0x | n/a | n/a | n/a | 2.0x |
| Simcere Pharmaceutical Group. | USD | NYSE | $8.38 | USD | 476 | 1.6x | 1.6x | 1.3x | 1.2x | 10.1x | 10.2x | 8.4x | 7.1x | 22.1x | 22.1x | 17.9x | 15.0x | 1.6x |
| Tongjitang Chinese Medicines Co. | USD | NYSE | $3.75 | USD | 107 | 1.2x | 1.1x | 1.0x | n/a | 11.0x | n/a | n/a | n/a | n/m | n/m | n/m | n/a | 0.8x |
| Average | 292 | 1.6x | 1.3x | 1.1x | 1.2x | 9.7x | 10.2x | 8.4x | 7.1x | 17.0x | 22.1x | 17.9x | 15.0 | 1.5x | ||||
| Median | 292 | 1.6x | 1.3x | 1.1x | 1.2x | 10.1x | 10.2x | 8.4x | 7.1x | 17.0x | 22.1x | 17.9x | 15.0x | 1.6x | ||||
| TSX Listed Chinese Companies | ||||||||||||||||||
| Asia Bio-Chem Group Corp. | CAD | TSXV | $1.36 | CAD | 104 | 1.5x | 1.4x | 0.5x | 0.5x | n/m | 18.8x | 3.7x | 3.5x | n/m | 34.0x | 4.6x | 3.9x | 1.4x |
| Changfeng Energy Inc. | CAD | TSXV | $0.34 | CAD | 22 | 2.2x | 2.1x | 1.2x | n/a | 10.6x | 8.8x | 4.0x | n/a | 20.0x | 16.8x | 3.7x | n/m | 2.4x |
| GLG Life Tech Corporation | CAD | TSX | $8.00 | CAD | 195 | 7.2x | 5.2x | 2.8x | 1.6x | n/m | 28.0x | 11.9x | 6.1x | n/m | n/m | 25.2x | 12.4x | 1.5x |
| Hanfeng Evergreen Inc. | CAD | TSX | $7.34 | CAD | 453 | 1.4x | 1.2x | 1.0x | 0.7x | 9.2x | 8.3x | 7.4x | 5.1x | 11.5x | 12.7x | 10.5x | 7.4x | 1.7x |
| Hanwei Energy Services Corp. | CAD | TSX | $0.70 | CAD | 43 | 1.0x | 1.2x | 0.7x | 0.5x | 9.1x | 8.3x | 4.1x | n/a | 22.8x | 17.5x | 4.3x | 2.5x | 0.4x |
| Migao Corporation | CAD | TSX | $7.10 | CAD | 370 | 1.2x | 1.5x | 1.3x | 1.1x | 6.4x | 8.1x | 6.9x | 5.5x | 6.7x | 9.5x | 8.5x | 7.4x | 1.5x |
| Neo Material Technologies Inc | CAD | TSX | $4.25 | CAD | 510 | 2.7x | 2.6x | 1.8x | 1.6x | 22.9x | 14.5x | 7.8x | 6.4x | n/m | 29.5x | 13.1x | 10.4x | 2.5x |
| Zungui Haixi Corporation | CAD | TSXV | $3.20 | CAD | 160 | 1.0x | n/a | n/a | n/a | n/m | n/a | n/a | n/a | n/a | n/a | n/a | n/a | n/a |
| Zongshen PEM Power Systems Inc. | CAD | TSX | $1.40 | CAD | 90 | 1.2x | 2.0x | 1.1x | n/a | n/m | n/a | 6.6x | 1.8x | n/m | n/m | 20.0x | 10.0x | 2.0x |
| Average | 216 | 2.2x | 2.1x | 1.3x | 1.0x | 11.6x | 13.5x | 6.5x | 4.7x | 15.2x | 20.0x | 11.2x | 7.7x | 1.7x | ||||
| Median | 160 | 1.4x | 1.8x | 1.1x | 0.9x | 9.2x | 8.8x | 6.7x | 5.3x | 15.7x | 17.1x | 9.5x | 7.4x | 1.6x | ||||
| Dragon Pharmaceutical Inc.* | USD | OTCBB | $0.60 | USD | 40 | 0.5x | 0.4x | 0.4x | 0.3x | 3.5x | 4.5x | 3.4x | 2.3x | 6.2x | 5.8x | 4.2x | 3.2x | 0.6x |
| Dragon Pharmaceutical Inc.** | USD | OTCBB | $0.80 | USD | 54 | 0.6x | 0.5x | 0.5x | 0.3x | 4.1x | 5.3x | 3.9x | 2.7x | 8.3x | 7.7x | 5.6x | 4.3x | 0.9x |
Notes
(1) Prices as at January 22, 2010
(2) Estimates based on average of consensus street estimates
*Priced as at Jan.22, 2010
**Priced based on the Proposed Offer
Source: Capital IQ, Company Reports
| 24 | DRAFT | |
| Preliminary [Subject to Review of Final Definitive Agreement] |
| Comparable Company Analysis – Valuation Analysis of LTM | |
| Applying Price to Earnings and EV/EBITDA |
EV/EBITDA
Applying a 6-7x multiple to Dragon’s LTM EBITDA and Company Discount of 30-35% we arrive at a valuation ofUS$0.75 to $1.04 per share of Dragon
P/E
Applying a 11-12x multiple to Dragon’s LTM earnings and Company Discount of 30-35% we arrive at a valuation ofUS$0.68 to $0.80 per share of Dragon
| US$ in thousands | |||||||
| Low | High | ||||||
| EBITDA | 22,800 | 22,800 | |||||
| Multiple | 6.0 | x | 7.0 | x | |||
| Enterprise Value | 136,800 | 159,600 | |||||
| Less: Debt | 46,245 | 46,245 | |||||
| Add: Cash | 6,675 | 6,675 | |||||
| Add: Non-Cash Working Capital (Deficit) | -17,224 | -17,224 | |||||
| Equity Value | 80,006 | 102,806 | |||||
| Less: Company Discount | 35.0 | % | 30.0 | % | |||
| Net Equity Value | 52,004 | 71,964 | |||||
| Shares Outstanding (FD include ITM Options) | 69,056 | 69,056 | |||||
| Net Equity Value/Share | $ | 0.75 | $ | 1.04 |
| Low | High | ||||||
| Net Income | 6,580 | 6,580 | |||||
| Multiple | 11.0 | x | 12.0 | x | |||
| Equity Value | 72,380 | 78,960 | |||||
| Less: Company Discount | 35.0 | % | 30.0 | % | |||
| Net Equity Value | 47,047 | 55,272 | |||||
| Shares Outstanding (FD include ITM Options) | 69,056 | 69,056 | |||||
| Net Equity Value/Share | $ | 0.68 | $ | 0.80 |
| 25 | DRAFT | |
| Preliminary [Subject to Review of Final Definitive Agreement] |
| Comparable Company Analysis – Valuation Analysis of 2009E | |
| Applying Price to Earnings and EV/EBITDA |
EV/EBITDA
Applying a 5-6x multiple to Dragon’s 2009E EBITDA and Company Discount of 30-35%, we arrive at a valuation ofUS$0.60 to $1.07 per share of Dragon
P/E
Applying a 9-10x multiple to Dragon’s 2009E earnings and Company Discount of 30-35% we arrive at a valuation ofUS$0.71 to $0.88 per share of Dragon
| Low | High | ||||||
| EBITDA | 24,200 | 27,000 | |||||
| Multiple | 5.0 | x | 6.0 | x | |||
| Enterprise Value | 121,000 | 162,000 | |||||
| Less: Debt | 46,245 | 46,245 | |||||
| Add: Cash | 6,675 | 6,675 | |||||
| Add: Non-Cash Working Capital (Deficit) | -17,224 | -17,224 | |||||
| Equity Value | 64,206 | 105,206 | |||||
| Less: Company Discount | 35.0 | % | 30.0 | % | |||
| Net Equity Value | 41,734 | 73,644 | |||||
| Shares Outstanding (FD include ITM Options) | 69,056 | 69,056 | |||||
| Net Equity Value/Share | $ | 0.60 | $ | 1.07 |
| Low | High | ||||||
| Net Income | 8,400 | 8,700 | |||||
| Multiple | 9.0 | x | 10.0 | x | |||
| Equity Value | 75,600 | 87,000 | |||||
| Less: Company Discount | 35.0 | % | 30.0 | % | |||
| Net Equity Value | 49,140 | 60,900 | |||||
| Shares Outstanding (FD include ITM Options) | 69,056 | 69,056 | |||||
| Net Equity Value/Share | $ | 0.71 | $ | 0.88 |
| 26 | DRAFT | |
| Preliminary [Subject to Review of Final Definitive Agreement] |
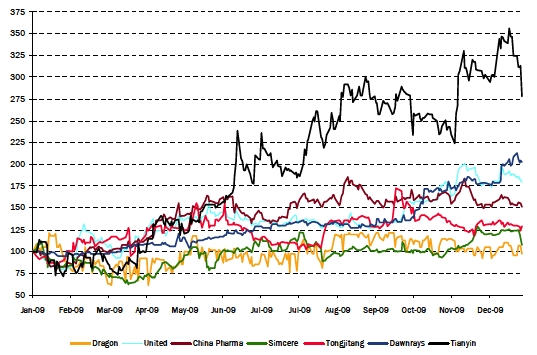
| Comparable Company Analysis - Relative Performance | |
Since the start of 2009, Dragon’s stock has underperformed its peers
The performance of Dragon’s stock was flat for the last 2 years relative to its peers
| Chart - Relative Price Performance Since Jan. ‘09 |
| Annual Returns | |||
| Company | 2008 | 2009 | 2010YTD* |
| The United Laboratories Ltd. | -56% | 101% | -1% |
| China Pharmaceutical Group Ltd. | -7% | 58% | -3% |
| Dawnrays Pharmaceutical Holdings Lt | -13% | 79% | 14% |
| Simcere Pharmaceutical Group. | -48% | 29% | -9% |
| Tongjitang Chinese Medicines Co. | -70% | 27% | -1% |
| Tianyin Pharmaceutical Co., Inc. | n/a | 223% | -7% |
| Average | -39% | 86% | -1% |
| Dragon Pharmaceutical Inc. | -12% | -2% | 2% |
| *YTD to Jan. 22/10 | |||
Source: Capital IQ
| 27 | DRAFT | |
| Preliminary [Subject to Review of Final Definitive Agreement] |
| DCF Analysis - I | |
Utilized the financial projections provided by management
Projections based on a capex of US$100 million over 2 years, a large proportion financed by debt (100%) and government incentives
| DCF Model | |||||||||||||||
| FYE Dec. 31 - (US$ in thousands) | 2008A | 2009E | 2010E | 2011E | 2012E | 2013E | |||||||||
| EBITDA | 17,635 | 25,000 | 34,406 | 45,448 | 51,974 | 60,800 | |||||||||
| Depreciation and Amortization | 8,032 | 8,702 | 14,352 | 17,252 | 18,702 | 19,902 | |||||||||
| EBIT | 9,603 | 16,298 | 20,054 | 28,196 | 33,272 | 40,898 | |||||||||
| Income Taxes | 25.0% | 2,401 | 4,074 | 5,013 | 7,049 | 8,318 | 10,224 | ||||||||
| Unlevered Net Income | 7,202 | 12,223 | 15,040 | 21,147 | 24,954 | 30,673 | |||||||||
| Plus: Depreciation & Amortization | 8,032 | 8,702 | 14,352 | 17,252 | 18,702 | 19,902 | |||||||||
| Plus: Decrease/(Increase) in W/C | 3,077 | -2,542 | -11,215 | -18,375 | -12,802 | -9,059 | |||||||||
| Less: Capital Expenditures | 18,527 | 17,069 | 32,048 | 50,848 | 14,348 | 11,848 | |||||||||
| Unlevered Free Cash Flow | -216 | 1,314 | -13,871 | -30,823 | 16,506 | 29,668 | |||||||||
| Terminal Multiple of 2013E EBITDA | 4.0x | 243,199 | |||||||||||||
| Nominal Cash Flows | -13,871 | -30,823 | 16,506 | 272,867 | |||||||||||
| Discount Rate | 20.0% | 0.8333 | 0.6944 | 0.5787 | 0.4823 | ||||||||||
| Present Value of Cash Flows | -11,559 | -21,405 | 9,552 | 131,591 | |||||||||||
| VALUATION CALCULATION: | |||||||||||||||
| Enterprise Value | 108,179 | ||||||||||||||
| Less: Debt | 46,245 | ||||||||||||||
| Add: Cash | 6,675 | ||||||||||||||
| Add: Non-Cash Working Capital (Deficit) | -17,224 | ||||||||||||||
| Equity Value | 51,385 | ||||||||||||||
| Shares Outstanding (FD include ITM Options) | 69,056 | ||||||||||||||
| Equity Value/Share at WACC of 20% | $0.74 | ||||||||||||||
| Equity Value/Share at WACC of 15% | $1.08 | ||||||||||||||
| Sensitivity | |||||
| Terminal EBITDA Multiple | |||||
| 3.0x | 3.5x | 4.0x | 4.5x | 5.0x | |
| 11.0% | $0.83 | $1.12 | $1.41 | $1.70 | $1.99 |
| 12.0% | $0.76 | $1.04 | $1.32 | $1.60 | $1.88 |
| 13.0% | $0.70 | $0.97 | $1.24 | $1.51 | $1.78 |
| 14.0% | $0.64 | $0.90 | $1.16 | $1.42 | $1.68 |
| 15.0% | $0.58 | $0.83 | $1.08 | $1.33 | $1.59 |
| 16.0% | $0.52 | $0.77 | $1.01 | $1.25 | $1.49 |
| 17.0% | $0.47 | $0.70 | $0.94 | $1.17 | $1.41 |
| 18.0% | $0.42 | $0.64 | $0.87 | $1.10 | $1.32 |
| 19.0% | $0.37 | $0.59 | $0.81 | $1.03 | $1.24 |
| 20.0% | $0.32 | $0.53 | $0.74 | $0.96 | $1.17 |
Key Assumptions
Used a weighted average cost of capital in the range of 15% - 20% (see Appendix A for Analysis)
Use terminal EBITDA multiple of 4x
Valuation
We arrive at a valuation of$0.74 to $1.08 per Share
| 28 | DRAFT | |
| Preliminary [Subject to Review of Final Definitive Agreement] |
| DCF Analysis - II | |
Utilized the financial projections provided by management
Projections based on a capex of US$100 million over 2 years, a large proportion financed by debt (100%) and government incentives
| DCF Model | |||||||||||||||
| FYE Dec. 31 - (US$ in thousands) | 2008A | 2009E | 2010E | 2011E | 2012E | 2013E | |||||||||
| EBITDA | 17,635 | 25,000 | 34,406 | 45,448 | 51,974 | 60,800 | |||||||||
| Depreciation and Amortization | 8,032 | 8,702 | 14,352 | 17,252 | 18,702 | 19,902 | |||||||||
| EBIT | 9,603 | 16,298 | 20,054 | 28,196 | 33,272 | 40,898 | |||||||||
| Income Taxes | 25.0% | 2,401 | 4,074 | 5,013 | 7,049 | 8,318 | 10,224 | ||||||||
| Unlevered Net Income | 7,202 | 12,223 | 15,040 | 21,147 | 24,954 | 30,673 | |||||||||
| Plus: Depreciation & Amortization | 8,032 | 8,702 | 14,352 | 17,252 | 18,702 | 19,902 | |||||||||
| Plus: Decrease/(Increase) in W/C | 3,077 | -2,542 | -11,215 | -18,375 | -12,802 | -9,059 | |||||||||
| Less: Capital Expenditures | 18,527 | 17,069 | 32,048 | 50,848 | 14,348 | 11,848 | |||||||||
| Unlevered Free Cash Flow | -216 | 1,314 | -13,871 | -30,823 | 16,506 | 29,668 | |||||||||
| Growth in Perpetuity | 3.0% | 179,752 | |||||||||||||
| Nominal Cash Flows | -13,871 | -30,823 | 16,506 | 209,420 | |||||||||||
| Discount Rate | 20.0% | 0.8333 | 0.6944 | 0.5787 | 0.4823 | ||||||||||
| Present Value of Cash Flows | -11,559 | -21,405 | 9,552 | 100,993 | |||||||||||
| VALUATION CALCULATION: | |||||||||||||||
| Enterprise Value | 77,582 | ||||||||||||||
| Less: Debt | 46,245 | ||||||||||||||
| Add: Cash | 6,675 | ||||||||||||||
| Add: Non-Cash Working Capital (Deficit) | -17,224 | ||||||||||||||
| Equity Value | 20,788 | ||||||||||||||
| Discount | 35.0% | ||||||||||||||
| 52,459 | |||||||||||||||
| Shares Outstanding (FD include ITM Options) | 69,056 | ||||||||||||||
| Equity Value/Share Using WACC of 20% | $0.30 | ||||||||||||||
| Equity Value/Share Using WACC of 15% | $1.18 | ||||||||||||||
| Sensitivity | ||||
| Growth in Perpetuity | ||||
| 3.0% | 4.0% | 5.0% | ||
| Discount Rate | 11.0% | $2.74 | $3.30 | $4.04 |
| 12.0% | $2.21 | $2.63 | $3.18 | |
| 13.0% | $1.79 | $2.12 | $2.54 | |
| 14.0% | $1.46 | $1.72 | $2.04 | |
| 15.0% | $1.18 | $1.39 | $1.65 | |
| 16.0% | $0.94 | $1.12 | $1.33 | |
| 17.0% | $0.75 | $0.89 | $1.06 | |
| 18.0% | $0.58 | $0.70 | $0.84 | |
| 19.0% | $0.43 | $0.54 | $0.66 | |
| 20.0% | $0.30 | $0.39 | $0.50 | |
Key Assumptions
Used a weighted average cost of capital in the range of 15% - 20% (see Appendix A for Analysis)
Use growth in perpetuity of 3% - 5%
Valuation
We arrive at a valuation of$0.50 to $1.18 per Share
| 29 | DRAFT | |
| Preliminary [Subject to Review of Final Definitive Agreement] |
| Precedent Transactions | |
We reviewed relevant transactions (going private, LBO, MBO and majority shareholder purchasing remaining shares) in the healthcare sector
Premiums paid for the last 30 days prior to the announcement
Median - 28%
Average - 37%
Applying a 28 to 37% premium to the 30 day VWAP of Dragon’s shares of US$0.62, we arrive at a valuation ofUS$0.79 to $0.85
| Recent Precedent Transactions in the Healthcare |
| Implied Equity Value/ | Implied Enterprise Value/ | Imp. Eq./ | Offer Premium | ||||||||||||
| Gross | Implied | ||||||||||||||
| Announce | Trans. | Equity | Book | Net | |||||||||||
| Buyer | Target | Date | Close | Date Value* | Value | Value | Net Inc. | Implied EV | EBIT | EBITDA | Revenue | Income | One Day | 5 days | 30 days |
| Private Equity | Goldshield Group plc | Sep-09 | Dec-09 | 257.0 | 290.0 | n/m | 10.3x | 228.4 | 6.0x | 5.0x | 1.4x | 10.3x | 3.6% | 8.3% | 24.4% |
| Chairman & CEO | Life Sciences Research, Inc. | Mar-09 | Nov-09 | 177.7 | 113.5 | n/m | 17.8x | 158.0 | 5.7x | 4.2x | 0.8x | 17.8x | 73.5% | 36.4% | 28.8% |
| Novartis AG | Speedel Holding AG | Jul-08 | Sep-08 | 381.8 | 989.1 | 36.6x | n/m | 956.5 | n/m | n/m | 126.3x | n/m | 93.7% | 107.0% | 67.9% |
| Chairman & CEO | Tongjitang Chinese Medicines | Mar-08 | Cancelled** | 363.9 | 340.9 | 2.0x | 14.2x | 251.4 | 14.8x | 12.9x | 3.0x | 14.2x | 54.5% | 38.2% | 26.2% |
| General Atlantic LL | Emdeon Inc. | Sep-06 | Nov-06 | 1,200.0 | 2,307.7 | n/a | n/a | 2,307.7 | n/a | n/a | n/a | n/a | n/m | n/m | n/m |
| Private Equity | Pronova BioPharma ASA | Apr-05 | Apr-05 | 43.2 | 221.5 | n/a | n/a | 221.5 | n/a | n/a | n/a | n/a | n/m | n/m | n/m |
| Private Equity | Warner Chilcott Holdings | Oct-04 | Jan-05 | 3,168.6 | 2,976.9 | 2.6x | 24.1x | 2,982.3 | 16.2x | 12.2x | 6.4x | 24.1x | n/m | n/m | n/m |
| Private Equity | Talecris Biotherapeutics | Dec-04 | Apr-05 | 590.0 | 588.9 | n/a | n/a | 648.9 | n/a | n/a | n/a | n/a | n/m | n/m | n/m |
| *Consideration100% cash | |||||||||||||||
| **Cancelled due to inability to get funding | |||||||||||||||
| High | 2,976.9 | 36.6x | 24.1x | 2,982.3 | 16.2x | 12.9x | 126.3x | 24.1x | 93.7% | 107.0% | 67.9% | ||||
| Median | 464.9 | 2.6x | 16.0x | 450.1 | 10.4x | 8.6x | 3.0x | 16.0x | 64.0% | 37.3% | 27.5% | ||||
| Low | 113.5 | 2.0x | 10.3x | 158.0 | 5.7x | 4.2x | 0.8x | 10.3x | 3.6% | 8.3% | 24.4% | ||||
| Average | 978.6 | 13.7x | 16.6x | 969.3 | 10.7x | 8.6x | 27.6x | 16.6x | 56.3% | 47.5% | 36.8% | ||||
Source: Capital IQ
| 30 | DRAFT | |
| Preliminary [Subject to Review of Final Definitive Agreement] |
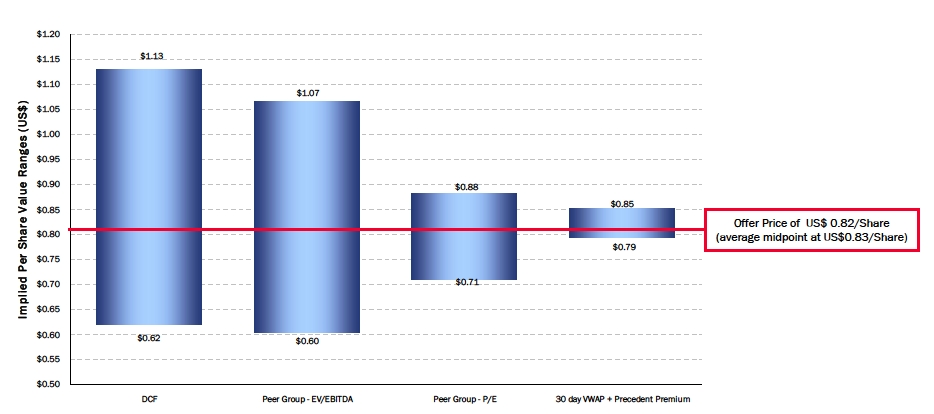
| Dragon Value Summary – Based on LTM Financials | |
Implied transaction price of US$0.82 per common share is within the valuation methodologies used to value Dragon
| Dragon Implied Value Summary |
![]()
| 31 | DRAFT | |
| Preliminary [Subject to Review of Final Definitive Agreement] |
| Dragon Value Summary – Based on 2009E Financials | |
Implied transaction price of US$0.82 per common share is within the valuation methodologies used to value Dragon
| Dragon Implied Value Summary |
| 32 | DRAFT | |
| Preliminary [Subject to Review of Final Definitive Agreement] |
| Other considerations of the Transaction | |
Strategy and management forecasts require funding of US$100 million of capex
Relocation and expansion plans of production facilities
Limited ability to access the capital markets since becoming public through a RTO
Limited likelihood of a competitive offer
Management advised that the Company has conducted investor road shows in the last few years prior to the announcement which we would consider as a market check
Significant control position of Mr. Han and certain Officers/Directors
| 33 | DRAFT | |
| Preliminary [Subject to Review of Final Definitive Agreement] |
| Conclusion | |
It is Canaccord’s opinion, based upon the preceding analysis, assumptions and other relevant factors that the consideration paid for the Transaction is fair, from a financial point of view, to the stakeholders of Dragon
| 34 | DRAFT | |
| Preliminary [Subject to Review of Final Definitive Agreement] |
| Appendix A | |
| Weighted Average Cost of Capital Analysis | |
| WACC Analysis | |
| (USD in millions) | |
| ASSUMPTIONS | |
| Tax Rate | 25.0% |
| Risk-Free Rate of Return (Rf) | 3.6% |
| Market Risk Premium (Rm - Rf) | 6.5% |
| Size Premium | 15.0% |
| OTCBB: DRUG D/(D+P+E) | 53.5% |
| OTCBB: DRUG D/E | 114.9% |
| OTCBB: DRUG Cost of Debt (Rd) | 8.0% |
| OTCBB: DRUG Cost of Preferred (Rp) | 0.0% |
| OTCBB: DRUG Tax Rate | 25.0% |
| WACC | |
| Market Risk Premium (Rm - Rf) | 6.5% |
| Multiplied by: OTCBB: DRUG Levered Beta | 1.895 |
| Adjusted Market Risk Premium | 12.3% |
| Add: Risk-Free Rate of Return (Rf) | 3.6% |
| Add: Size Premium | 15.0% |
| Cost of Equity | 30.9% |
| Multiplied by: OTCBB: DRUG E/(D+P+E) | 46.5% |
| Cost of Equity Portion | 14.4% |
| OTCBB: DRUG Cost of Debt (Rd) | 8.0% |
| OTCBB: DRUG Tax Rate | 25.0% |
| After-Tax Cost of Debt | 6.0% |
| Multiplied by: OTCBB: DRUG D/(D+P+E) | 53.5% |
| Cost of Debt Portion | 3.2% |
| OTCBB: DRUG Cost of Preferred (Rp) | 0.0% |
| Multiplied by: OTCBB: DRUG P/(D+P+E) | 0.0% |
| Cost of Preferred Portion | 0.0% |
| WACC | 17.6% |
| BETA CALCULATION | ||||||
| Levered | Total | Mkt. Val. | Debt/ | Unlevered | ||
| Ticker | Name | Beta | Debt | Equity | Equity | Beta |
| SEHK:3933 | The United Laboratories Ltd. | 1.439 | 301.8 | 602.6 | 50.1% | 1.046 |
| SEHK:1093 | China Pharmaceutical Group Ltd. | 1.369 | 219.9 | 784.7 | 28.0% | 1.131 |
| SEHK:2348 | Dawnrays Pharmaceutical Holdings Ltd. | 0.509 | 4.1 | 138.7 | 3.0% | 0.498 |
| SCR | Simcere Pharmaceutical Group. | 1.545 | 10.0 | 466.1 | 2.1% | 1.521 |
| TCM | Tongjitang Chinese Medicines Co. | 1.016 | 19.8 | 106.6 | 18.6% | 0.892 |
| Average | 1.176 | 1.018 | ||||
| Average Unlevered Beta for Comps | 1.018 | |||||
| OTCBB: DRUG D/E | 114.9 | |||||
| OTCBB: DRUG Tax Rate | 25.0 | |||||
| OTCBB: DRUG Levered Beta | 1.895 | |||||
Used a weighted average cost of capital in the range of 15% - 20%
| 36 | DRAFT | |
| Preliminary [Subject to Review of Final Definitive Agreement] |
| Appendix B | |
| Overview of Selected Comparable Companies | |
| The United Laboratories (SEHK:3933) | |
| Corporate Overview |
Engages in the research and development, manufacture, and distribution of pharmaceutical products in Hong Kong and the People’s Republic of China.
Offers bulk medicines, capsules, chemical preparations, and biological products. The company’s finished products include antibiotics, antiallergics, vitamins, and antiinfectives.
intermediates include aminopenicillin acid, aminocephalosporanic acid, and T-octylammonium clavulanate; and APIs include penicillins, cephalosporins, and¦Â -lactamase inhibitors and compounds.
Products are used in various therapeutic categories, such as antibiotics, antipyretic analgesics, antihistamines, antivirals, and cardiovascular medicines.
It distributes its products in Asia, Europe, South America, and Africa.
Founded in 1990 and is headquartered in Yuen Long, Hong Kong.
| Major Shareholders – Top 10 | |
| Holder | % Of CSO |
| Capital Research and Management Company | 4.9 |
| Standard Life Investments Limited | 1.7 |
| Choy, Kam Lok (Executive Chairman) | 0.8 |
| Schroder Investment Management Limited | 0.4 |
| Nordea Invest Fund Management A/s | 0.2 |
| Union Investment Luxembourg SA | 0.2 |
| DBS Asset Management Ltd. | 0.2 |
| Nuveen Asset Management | 0.1 |
| Wei, Peng (General Manager and Executive Director) | 0.1 |
| JPMorgan Asset Management Holdings Inc. | 0.1 |
| Street Research | |||
| Firm Name | Rating | Tgt Px* | Date |
| Morgan Stanley | Equalwt/Attractive | 5.00 | 12/16/09 |
| E2 Capital | buy | 5.04 | 11/20/09 |
| OSK (Asia) Securities | neutral | 3.00 | 09/22/09 |
| Core Pacific | buy | 3.20 | 03/25/09 |
| Sun Hung Kai Securities | buy | 4.10 | 02/12/09 |
| Capital Securities Corp | buy | 4.80 | 08/18/08 |
| *HKD | |||
| Source: Bloomberg | |||
| 38 | DRAFT | |
| Preliminary [Subject to Review of Final Definitive Agreement] |
| China Pharmaceutical Group Ltd. (SEHK:1093) | |
| Corporate Overview |
Engages in the manufacture and sale of intermediaries and bulk drugs.
Primarily offers vitamin C series, penicillin series, and cephalosporin series, as well as provides finished drugs, including antibiotics.
Also provides pharmaceutical research and development services and offers sewage treatment services.
Principally markets its products and services in the People’s Republic of China, the other parts of Asia, Europe, and the Americas.
Based in Wanchai, Hong Kong
| Major Shareholders – Top 10 | |
| Holder | % Of CSO |
| Massive Giant Group Ltd. | 51.043 |
| Dr. Jens Ehrhardt Kapital AG | 1.533 |
| Dimensional Fund Advisors LP | 1.214 |
| Martin Currie Investment Management Limited | 0.974 |
| Principal Global Investors, LLC | 0.837 |
| Harvest Fund Management Co. Ltd. | 0.717 |
| Jyske Invest International | 0.425 |
| Deutsche Asset Management Group | 0.408 |
| HSBC Global Asset Management (UK) Limited | 0.391 |
| Mediolanum Gestione Fondi SGR p.A. | 0.334 |
| Street Research | |||
| Firm Name | Rating | Tgt Px* | Date |
| Shenyin Wanguo | outperform | n/a | 01/26/10 |
| BofAML | neutral | 4.80 | 01/19/10 |
| Goldman Sachs | neutral/neutral | 4.90 | 12/17/09 |
| Morgan Stanley | Equalwt/Attractive | 5.00 | 12/16/09 |
| DBS Vickers | hold | 4.80 | 12/15/09 |
| China International Capital Corphold | 12/04/09 | ||
| Guotai Junan | neutral | 5.00 | 09/13/09 |
| Everbright Securities Co., Ltd | buy | 5.70 | 09/09/09 |
| *HKD | |||
| Source: Bloomberg | |||
| 39 | DRAFT | |
| Preliminary [Subject to Review of Final Definitive Agreement] |
| Dawnrays Pharmaceutical Holdings (SEHK:2348) | |
| Corporate Overview |
Develops, manufactures, and sells pharmaceutical products and intermediates in Mainland China.
Offers non-patented chemical medicines, including cephalosporin in bulk medicine and powder for injection, tablets, capsules, granules, and midbody, as well as their intermediate pharmaceuticals and system specific medicines.
Bulk medicine products include cefoperazone sodium sterile (crystallization), ceftriaxone sodium sterile, cefotaxime sodium sterile, ceftazidime sterile, ceftazidime sterile (with sodium carbonate), cefuroxime sodium sterile, cefepime sterile, cefixme, sulbactam sodium sterile, cefoperazone sodium and sulbactam sodium sterile (crystallization), cefoperazone, ceftriaxone sodium crude, cefotaxime acid, sparfloxacin lactate, cetirizine hydrochloride, amlodipine besylate, and anhydrous sodium carbonate sterile.
Preparations comprise cefoperazone sodium, cefoperazone sodium and sulbactam sodium, ceftriaxone sodium, cefotaxime sodium, cefradine, and ceftazidime for injection, as well as other antibacterial series, including sparfloxacin lactate tablet and clindamycin hydrochloride capsule.
Founded in 1995 and headquartered in Hong Kong.
| Major Shareholders | |
| Holder | % Of CSO |
| Fortune United Group | 43.5 |
| Tung Li Ming | 8.39 |
| Toyo International Investments | 7.63 |
| Dimensional Fund Advisors | 0.23 |
| Yi Gao | 0.11 |
| Schoellerbank Investmentn Advisors | 0.08 |
| Source: Bloomberg | |
| 40 | DRAFT | |
| Preliminary [Subject to Review of Final Definitive Agreement] |
| Simcere Pharmaceutical Group (NYSE:SCR) | |
| Corporate Overview |
Engages in the research, development, manufacture, distribution, and marketing of branded generic pharmaceutical products in the People’s Republic of China.
Principal products include prescription edaravone injection for the treatment of strokes and generic diclofenac sodium, an anti-inflammatory pain reliever and analgesic drug to treat rheumatoid arthritis and osteoarthritis
Products also comprise sustained release implants under for the treatment of cancer; edaravone injection for the treatment of strokes; anti-diarrhea pharmaceutical; cefaclor in dry suspension antibiotics for the treatment of infections; and a herbal medicine used for the treatment of coughs.
Also, distributes prescription pharmaceuticals manufactured by independent third parties,
Manufactures and sells 45 pharmaceuticals products and distributes 3 additional pharmaceuticals that are manufactured by independent third parties under the company’s brand names.
Founded in 1995; headquartered in Nanjing, PRC.
| Major Shareholders – Top 10 | |
| Holder | % Of CSO |
| New Good Management Limited | 39.3 |
| Beijing Hony Future Investment Advisor Ltd. | 15.8 |
| TrustBridge Partners | 10.4 |
| Wellington Management Company L.L.P. | 6.7 |
| Genesis Investment Management, LLP | 3.9 |
| Goldman Sachs Group, Investment Banking and Securities Investments | 2.5 |
| Ivy Investment Management Company | 1.0 |
| Ren, Jinsheng (Co-Founder, Chairman of the Board and CEO) | 0.9 |
| T. Rowe Price Group, Inc. (NasdaqGS:TROW) | 0.8 |
| Royce & Associates, LLC | 0.6 |
| Street Research | |||
| Firm Name | Rating | Tgt Px* | Date |
| Oppenheimer & Co | market perform | $9.00 | 01/21/10 |
| Goldman Sachs | neutral/neutral | $8.30 | 12/17/09 |
| Morgan Stanley | Underwt/Attractive | $5.60 | 12/16/09 |
| Susquehanna Financial Group Positive | $11.00 | 11/30/09 | |
| Piper Jaffray | neutral | $10.00 | 11/30/09 |
| BofAML | neutral | $8.00 | 08/18/09 |
| *US$ | |||
| Source: Bloomberg | |||
| 41 | DRAFT | |
| Preliminary [Subject to Review of Final Definitive Agreement] |
| Tongjitang Chinese Medicines Co. (NYSE:TCM) | |
| Corporate Overview |
Engages in the development, manufacture, marketing, and sale of Chinese medicines, nutritional products, and Tibetan recipe-originated plant-based medicines in the People’s Republic of China.
Also involves in the wholesale and retail of medicines.
Treatment of osteoporosis, osteoarthritis, ischemic bone necrosis, and bone fractures;
Treatment of insomnia; and moisturizing and anti- itching capsules for the treatment of inflammatory skin conditions.
Also produces and sells such products for the treatment of vertigo and treatment of upper respiratory infections; and ulcers; and to improve memory, breathing, hearing, and general malaise; treatment of stroke and coronary artery disease;
Founded in 1995; headquartered in Shenzhen, PRC
| Major Shareholders – Top 10 | |
| Holder | % Of CSO |
| Wang, Xiaochun (Chairman and Chief Executive Officer) | 46.1 |
| Fosun Industrial Co., Ltd. | 29.0 |
| Samtung Investment Limited | 7.3 |
| Merrill Lynch & Co. Inc., Asset Management Arm | 6.5 |
| Wang, Shaolan (Former Chief Financial Officer and Director) | 5.1 |
| Merrill Lynch Ventures | 2.2 |
| Wellington Management Company L.L.P. | 1.8 |
| Renaissance Technologies Corp. | 0.9 |
| The Bank of Nova Scotia, Banking and Trust Investments | 0.5 |
| Absolute Asia Asset Management Limited | 0.4 |
![]()
| Street Research | |||
| Firm Name | Rating | Tgt Px | Date |
| Oppenheimer & Co | market perform | n/a | 10/29/09 |
| Credit Suisse | neutral | $4.30 | 08/18/08 |
| *US$ | |||
| Source: Bloomberg | |||
| 42 | DRAFT | |
| Preliminary [Subject to Review of Final Definitive Agreement] |
| Tianyin Pharmaceutical Co. (AMEX:TPI) | |
| Corporate Overview |
Engages in the development, manufacture, marketing, and sale of modernized traditional Chinese medicines and other pharmaceuticals in the People’s Republic of China.
Products are intended to address various medical needs in the therapeutic areas spanning internal medicines, gynecology, hepatology, otolaryngology, urology, neurology, gastroenterology, orthopedics, dermatology, and pediatrics.
Manufactures a portfolio of 39 modernized traditional Chinese medicines and pharmaceuticals, and has a pipeline of 17 products, which are pending regulatory approvals with the China State Food and Drug Administration.
Founded in 1994 and is based in Chengdu, the People’s Republic of China.
| Major Shareholders – Top 10 | |
| Holder | % Of CSO |
| Lor, Stewart Shiang (Director) | 47.0 |
| Pope Asset Management, LLC | 7.5 |
| Whitebox Advisors, LLC | 1.2 |
| Tripoint Capital Advisors, | 1.2 |
| Keane Capital Management, Inc. | 1.0 |
| Parr Financial Group LLC | 0.4 |
| Wells, William P. | 0.4 |
| The Oxford Asset Management Co Ltd | 0.3 |
| Bogle Investment Management, L.P. | 0.2 |
| Invesco Ltd. (OTCPK:IVZ) | 0.2 |
| 43 | DRAFT | |
| Preliminary [Subject to Review of Final Definitive Agreement] |
| Appendix C | |
| Case Study – Management Buyout | |
| Life Sciences Research – Going Private Transaction | |
| Corporate Overview |
Life Sciences Research (“LSR”) is a global contract research organization, or CRO, providing product development services to the pharmaceutical, agrochemical and biotechnology industries
LSR brings leading technology and capability to support its clients in non-clinical safety testing of new compounds in early stage development and assessment
| Transaction Overview |
On March 3, 2009, the Chairman and CEO of LSR made an offer to acquire all of the outstanding shares of LSR at $7.50/share
Owned 17% of the shares outstanding prior to the Offer
Subsequently, during the “market check process”, the Offer was increased to $8.50/share and accepted by the Special Committee and shareholders
| Corporate Statistics | |||
| NYSE (formerly listed) | LSR | ||
| Offer Price | $8.50 | ||
| 52 Week High | $9.78 | ||
| 52 Week Low | $4.78 | ||
| Shares Out | 13.9 | ||
| Market Cap. | $118.1 | ||
| Cash | $39.4 | ||
| Total Debt | $74.1 | ||
| EV | $152.8 | ||
| Valuation | 2007A | 2008A | LTM |
| Sales | 236.8 | 242.4 | 194.0 |
| EBITDA | 41.4 | 46.6 | 33.5 |
| Earnings | -14.0 | 10.4 | 5.4 |
| EV/Sales | 0.6x | 0.6x | 0.8x |
| EV/EBITDA | 3.7x | 3.3x | 4.6x |
| P/E | n/m | 11.4x | 21.9x |
| Offer Premium Analysis | ||
| Initial | Final | |
| Offer Price | $7.50 | $8.50 |
| Premium to closing price prior to Initial Offer | 56.6% | 77.5% |
| Premium to the 10 day average closing price prior to Initial Offer | 27.3% | 44.3% |
| 45 | DRAFT | |
| Preliminary [Subject to Review of Final Definitive Agreement] |
| Life Sciences Research – Share Price Performance and Developments | |
| Price Performance |

| Developments in the last 12 months |
| Label | Date | |
| 1 | Mar-2/09 | Announces 2008 YE Results |
| 2 | Mar-3/09 | Andrew Baker presents to the Board and a non-binding Offer of $7.50/share |
| 3 | Apr-30/09 | Announces Q2 results |
| 4 | July-7/09 | Financial advisor delivers to the Special Committee the Fairness Opinion |
| 5 | July-9/09 | Enters definitive merger agreement to be acquired at $8.50/share |
| 6 | July-30/09 | Announces Q2 results |
| 7 | Aug-11/09 | Files Preliminary Proxy Statement |
| 8 | Oct-28/09 | Files Final Proxy Statement |
| 9 | Nov. 5/09 | Announces Q3 results |
| 10 | Nov. 23/09 | Shareholders approve the going private transaction |
| 46 | DRAFT | |
| Preliminary [Subject to Review of Final Definitive Agreement] |
| Disclosures | |
Canaccord Adams is the business name used by certain subsidiaries of Canaccord Financial Inc., including Canaccord Adams Inc., Canaccord Adams Limited, and Canaccord Adams, a division of Canaccord Financial Ltd. Canaccord Financial Inc. is listed on the TSX and AIM.
Research Policy: Decisions regarding initiation and termination of research coverage will be made exclusively by research management. Investment banking is not able to request or have input into specific company coverage decisions. It is, however, our general practice to continue to provide coverage for companies for which we act as lead or co-manager in an equity offering.
The information contained in this document has been compiled by Canaccord Adams from sources believed to be reliable, but no representation or warranty, express or implied, is made by Canaccord Adams, its affiliates or any other person as to its accuracy, completeness or correctness. All estimates, opinions and other information contained in this document constitute Canaccord Adams’ judgment as of the date of this document, are subject to change without notice and are provided in good faith but without legal responsibility or liability.
Canaccord Adams and its affiliates may choose to provide specific disclosures of the subject companies by reference, as well as its policies and procedures regarding the dissemination of investment research. To access this material or for more information, please send a request to Canaccord Adams Research, Attn: Disclosures, P.O. Box 10337 Pacific Centre, 2200-609 Granville Street, Vancouver, BC, Canada V7Y 1H2 or disclosures@canaccord. com.
Canaccord Adams and its affiliates may have a relationship with the company that is contained herein and may trade in any of the securities mentioned herein either for their own account or the accounts of their customers. Accordingly, Canaccord Adams or their affiliates may at any time have a long or short position in any such securities, related securities or in options, futures or other derivative instruments based thereon.
This document is provided for informational purposes only and does not constitute an offer or solicitation to buy or sell any securities discussed herein in any jurisdiction where such offer or solicitation would be prohibited. As a result, the securities discussed in this document may not be eligible for sale in some jurisdictions. This document is not, and under no circumstances should be construed as, a solicitation to act as a securities broker or dealer in any jurisdiction by any person or company that is not legally permitted to carry on the business of a securities broker or dealer in that jurisdiction. Investors should obtain advice based on their own individual circumstances before making an investment decision. To the fullest extent permitted by law, neither Canaccord Adams, nor its affiliates nor any other person accepts any liability whatsoever for any direct or consequential loss arising from any use of the information contained in this document.
ForCanadian Residents: This document has been approved by Canaccord Financial Ltd., which accepts responsibility for this report and its dissemination in Canada. Canadian clients wishing to effect transactions in any security discussed should do so through a qualified salesperson of Canaccord Adams in their particular jurisdiction.
For UnitedKingdom Residents: This material is not for distribution in the United Kingdom to retail customers, as defined under the rules of the Financial Services Authority. Canaccord Adams Limited accepts responsibility for this presentation and its dissemination in the United Kingdom. The information contained in this presentation is only intended for distribution in the UK to persons who qualify as professional clients or eligible counterparties as defined under the rules of the Financial Services Authority. This publication is not directed at private individuals in the United Kingdom or Continental Europe, and has not been approved by an authorised person for the purposes of section 21 of the Financial Services and Markets Act 2000, as amended. Within the United Kingdom, it is directed only at persons falling within Article 19 (Investment Professionals) or Article 49 (High Net Worth Companies) of the Financial Services and Markets Act 2000 (Financial Promotio ns) Order 2005. Any other person or persons who receive a copy of this presentation should not act upon it and Canaccord Adams accepts no liability or responsibility whatsoever for any actions taken by such persons in reliance on this publication. The distribution of this publication in jurisdictions other than the United Kingdom may be restricted by law and, therefore, persons into whose possession this publication comes should inform themselves about and observe any such restrictions. Any failure to comply with such restrictions may constitute a violation of the securities laws of any such jurisdictions.
Thispublicationis a briefsummaryand does notpurporttocontainallavailable informationon thesubjects covered. Further informationisavailableonrequest.
Copyright © Canaccord Adams, a division of Canaccord Financial Ltd., 2009. Member IIROC/CIPF.
Copyright © Canaccord Adams Limited, 2009. Member LSE, Authorized and Regulated by the Financial Services Authority.
Copyright © Canaccord Adams Inc., 2009. Member FINRA/SIPC.
All rights reserved. All material presented in this document, unless specifically indicated otherwise, is under copyright to Canaccord Adams, a division of Canaccord Financial Ltd., Canaccord Adams Limited, and Canaccord Adams Inc. None of the material, nor its content, nor any copy of it, may be altered in any way, or transmitted to or distributed to any other party, without the prior express written permission of the entities listed above.
| 47 | DRAFT | |
| Preliminary [Subject to Review of Final Definitive Agreement] |