1 INVESTOR PRESENTATIONNovember2022 |
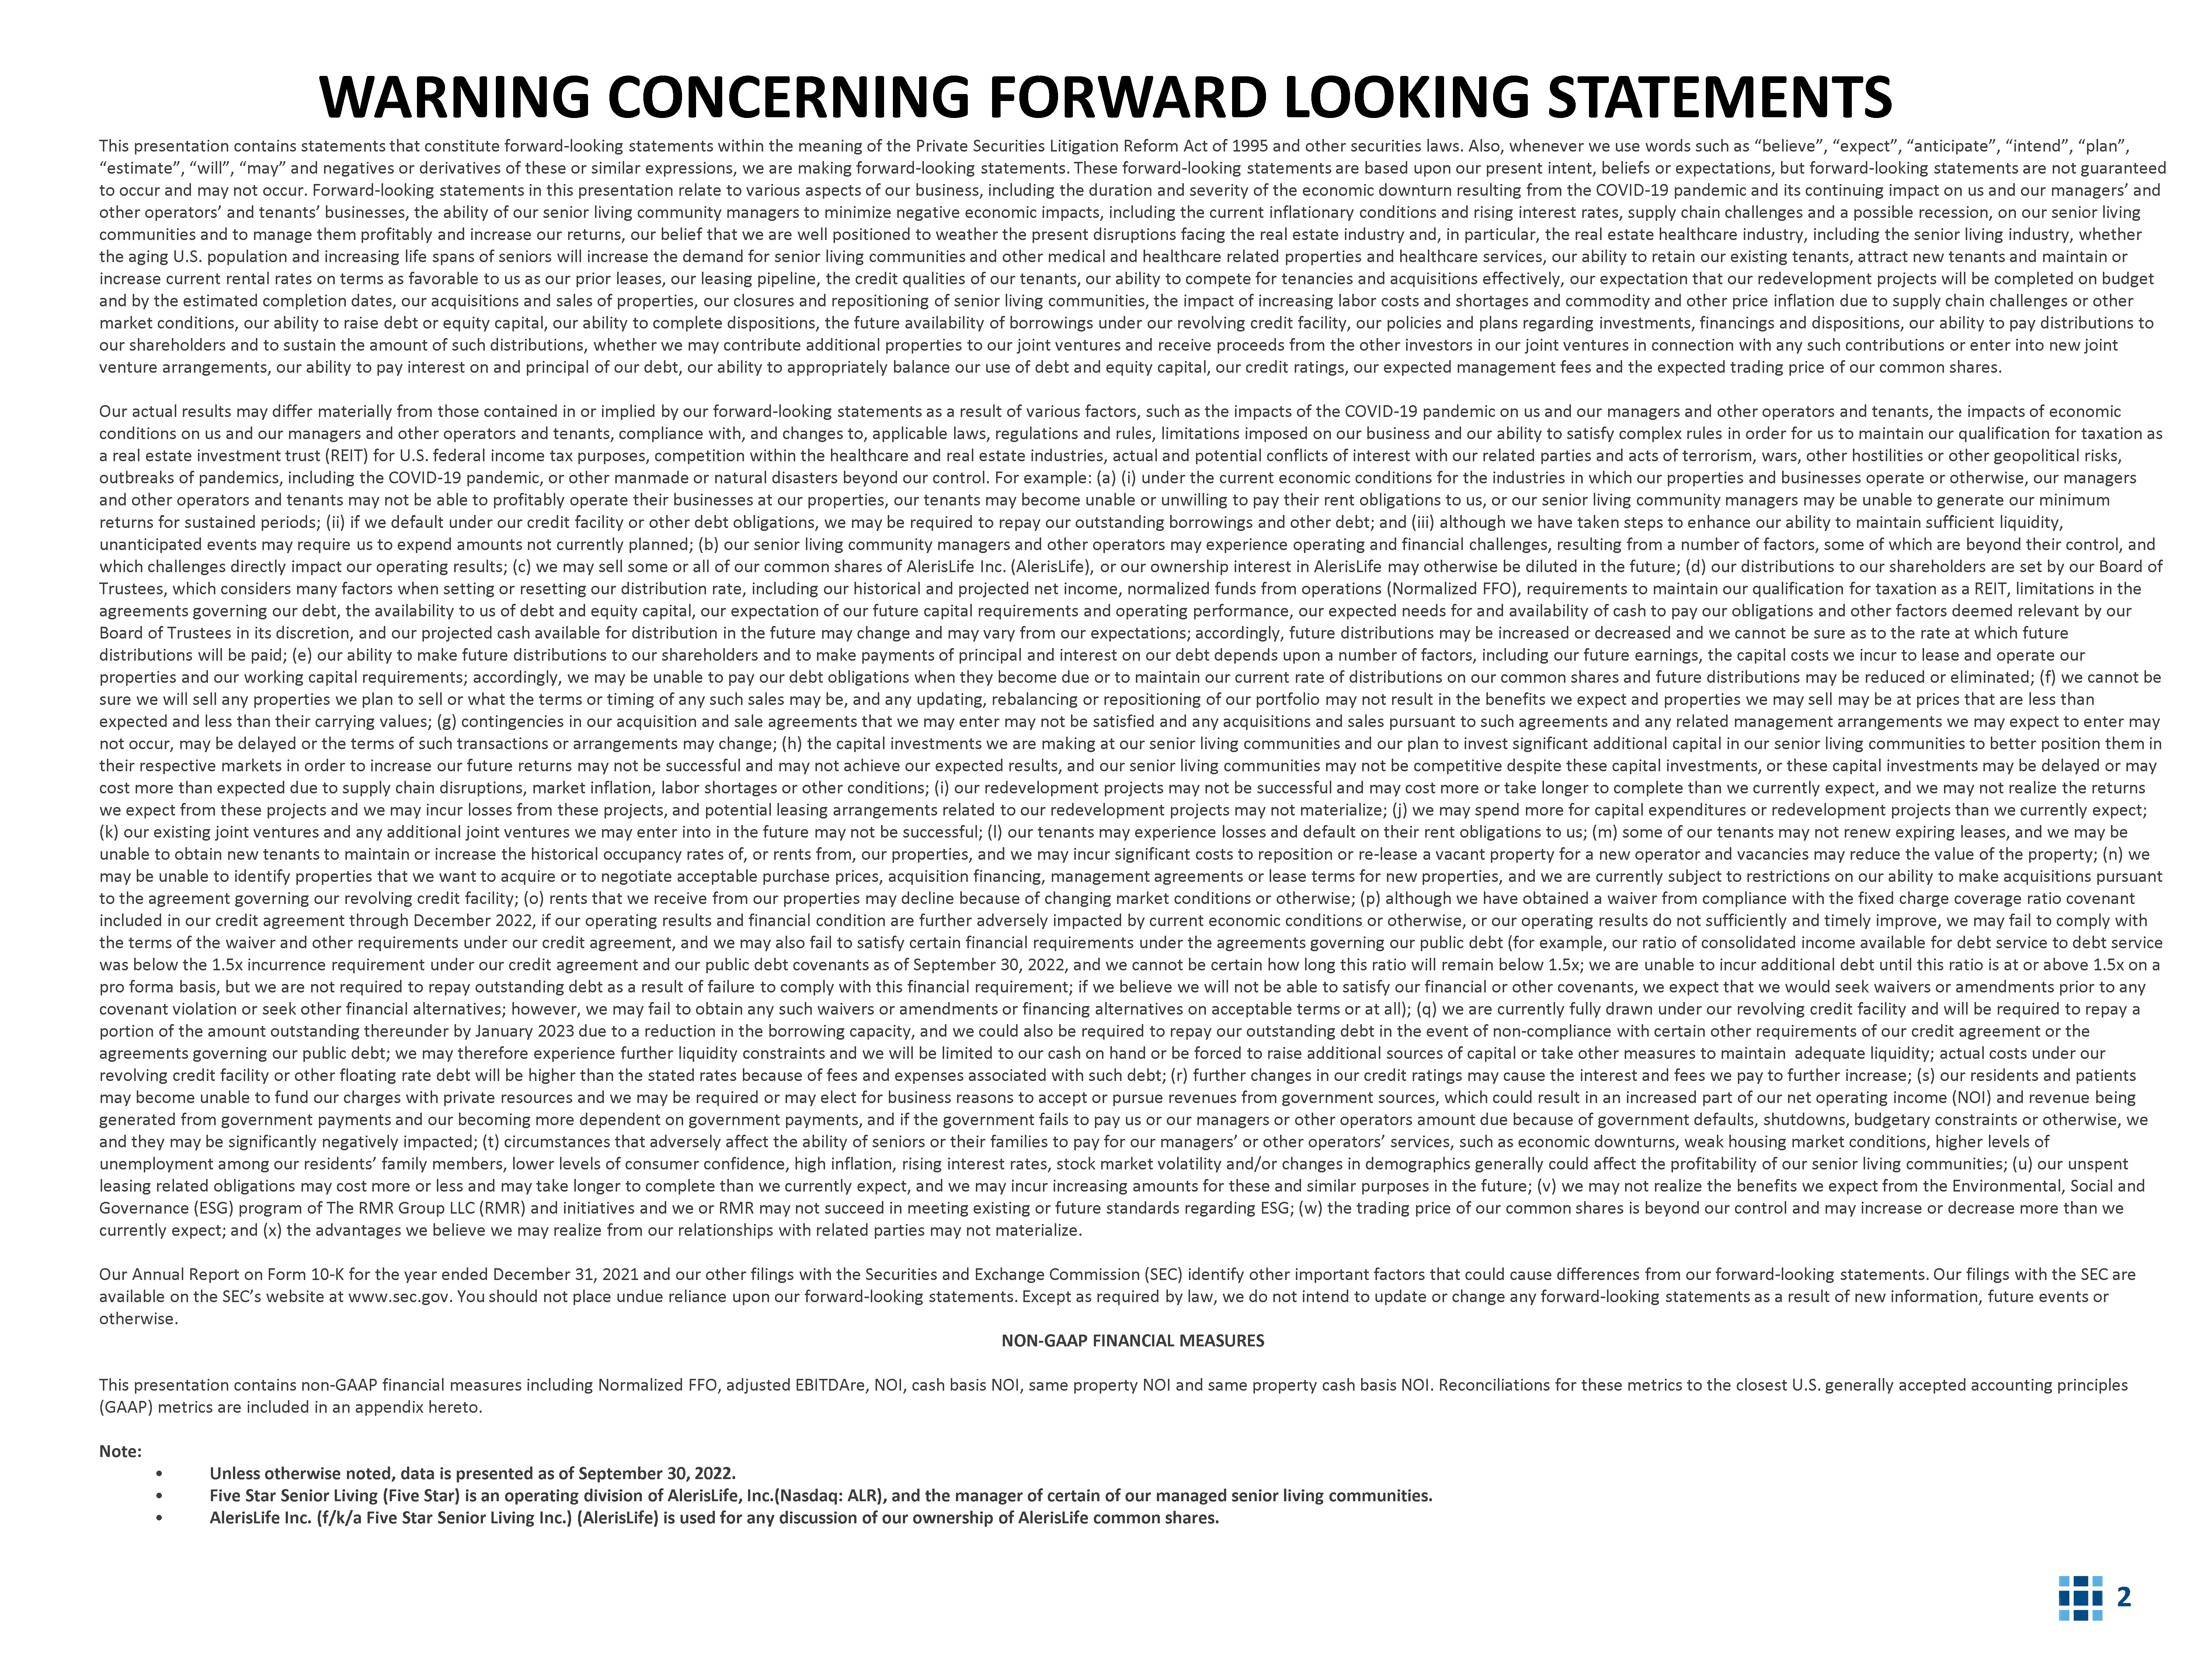
2 WARNING CONCERNING FORWARD LOOKING STATEMENTSThis presentation contains statements that constitute forward-looking statements within the meaning of the Private Securities Litigation Reform Act of 1995 and other securities laws. Also, whenever we use words such as “believe”, “expect”, “anticipate”,“intend”, “plan”, “estimate”, “will”, “may” and negatives or derivatives of these or similar expressions, we are making forward-looking statements. These forward-looking statements are based upon our present intent, beliefs or expectations, but forward-looking statements are not guaranteed to occur and may not occur. Forward-looking statements in this presentation relate to various aspects of our business, includingthe duration and severity of the economic downturn resulting from the COVID-19 pandemic and its continuing impact on us and our managers’ and other operators’ and tenants’ businesses, the ability of our senior living community managers to minimize negative economic impacts, including the current inflationary conditions andrising interest rates,supply chain challengesand a possible recession, on our senior living communities and to manage them profitably and increase our returns, our belief that we are well positioned to weather the present disruptions facing the real estate industry and, in particular,the real estate healthcare industry, including the senior living industry,whether the aging U.S. population and increasing life spans of seniors will increase the demand for senior living communities and other medical and healthcare related properties and healthcare services, our ability to retain our existing tenants, attract new tenants and maintain or increase current rental rates on terms as favorable to us as our prior leases, our leasing pipeline, the credit qualities of ourtenants, our ability to compete for tenancies and acquisitions effectively, our expectation that our redevelopment projects will be completed on budget and by the estimated completion dates, our acquisitions and sales of properties, our closures and repositioning of senior livingcommunities, the impact of increasing labor costs and shortages and commodity and other price inflation due to supply chain challenges or other market conditions, our ability to raise debt or equity capital, our ability to complete dispositions, the future availabilityofborrowings under our revolving credit facility, our policies and plans regarding investments, financings and dispositions, our ability to pay distributions to our shareholders and to sustain the amount of such distributions, whether we may contribute additional properties to our joint ventures and receive proceeds from the other investors in our joint ventures in connection with any such contributions or enter into new joint venture arrangements, our ability to pay interest on and principal of our debt, our ability to appropriately balance our use of debt and equity capital, our credit ratings, our expected management fees and the expected trading price of our common shares. Our actual results may differ materially from those contained in or implied by our forward-looking statements as a result of various factors, such as the impacts of the COVID-19 pandemic on us and our managers and other operators and tenants, the impacts of economic conditions on us and our managers and other operators and tenants, compliance with, and changes to, applicable laws, regulationsand rules, limitations imposed on our business and our ability to satisfy complex rules in order for us to maintain our qualification for taxation as a real estate investment trust (REIT) for U.S. federal income tax purposes, competition within the healthcare and real estateindustries, actual and potential conflicts of interest with our related parties and acts of terrorism, wars, other hostilities or other geopolitical risks, outbreaks of pandemics, including the COVID-19 pandemic, or other manmade or natural disasters beyond our control. For example: (a) (i) under the current economic conditions for the industries in which our properties and businesses operateor otherwise, our managers and other operators and tenants may not be able to profitably operate their businesses at our properties, our tenants may becomeunable or unwilling to pay their rent obligations to us, or our senior living community managers may be unable to generate our minimum returns for sustained periods; (ii) if we default under our credit facility or other debt obligations, we may be required to repay our outstanding borrowings and other debt; and (iii) although we have taken steps to enhance our ability to maintain sufficient liquidity, unanticipated events may require us to expend amounts not currently planned; (b) our senior living community managers and other operators may experience operating and financial challenges, resulting from a number of factors, some of which are beyond their control, and which challenges directly impact our operating results; (c) we may sell some or all of our common sharesof AlerisLifeInc. (AlerisLife), or our ownership interest in AlerisLife may otherwise be diluted in the future; (d) our distributions to our shareholders are set by our Board of Trustees, which considers many factors when setting or resetting our distribution rate, including our historical and projected net income, normalized funds from operations (Normalized FFO), requirements to maintain our qualification for taxation as a REIT,limitations in the agreements governing our debt, the availability to us of debt and equity capital, our expectation of our future capital requirements and operating performance, our expected needs for and availability of cash to pay our obligations and other factors deemed relevant by our Board of Trustees in its discretion, and our projected cash available for distribution in the future may change and may vary from our expectations; accordingly, future distributions may be increased or decreased and we cannot be sure as to the rate at which future distributions will be paid; (e) our ability to make future distributions to our shareholders and to make payments of principal and interest on our debt depends upon a number of factors, including our future earnings, the capital costs we incur to lease andoperate our properties and our working capital requirements; accordingly, we may be unable to pay our debt obligations when they become due or to maintain our current rate of distributions on our common shares and future distributions may be reduced or eliminated; (f)we cannot be sure we will sell any properties we plan to sell or what the terms or timing of any such sales may be, and any updating, rebalancing or repositioning of our portfolio may not result in the benefits we expect and properties we may sell may be at prices thatare less than expected and less than their carrying values; (g) contingencies in our acquisition and sale agreements that we may enter may notbe satisfied and any acquisitions and sales pursuant to such agreements and any related management arrangements we may expectto enter may not occur, may be delayed or the terms of such transactions or arrangements may change; (h) the capital investments we are making at our senior living communities and our plan to invest significant additional capital in our senior living communities to better position them in their respective markets in order to increase our future returns may not be successful and may not achieve our expected results,and our senior living communities may not be competitive despite these capital investments, or these capital investments may bedelayed or may cost more than expected due to supply chain disruptions, market inflation, labor shortages or other conditions; (i) our redevelopment projects may not be successful and may cost more or take longer to complete than we currently expect, andwemay not realize the returns we expect from these projects and we may incur losses from these projects, and potential leasing arrangements related to our redevelopment projects may not materialize; (j) we may spend more for capital expenditures or redevelopment projects than we currently expect; (k) our existing joint ventures and any additional joint ventures we may enter into in the future may not be successful; (l) ourtenants may experience losses and default on their rent obligations to us; (m) some of our tenants may not renew expiring leases, and we may be unable to obtain new tenants to maintain or increase the historical occupancy rates of, or rents from, our properties, and wemay incur significant costs to reposition or re-lease a vacant property for a new operator and vacancies may reduce the value of the property; (n) we may be unable to identify properties that we want to acquire or to negotiate acceptable purchase prices, acquisition financing, management agreements or lease terms for new properties, and we are currently subject to restrictions on our ability to make acquisitions pursuant to the agreement governing our revolving credit facility; (o) rents that we receive from our properties may decline because of changing market conditions or otherwise; (p) although we have obtained a waiver from compliance with the fixed charge coverageratio covenant included in our credit agreement through December 2022, if our operating results and financial condition are further adversely impacted by current economic conditions or otherwise, or our operating results do not sufficiently and timely improve, we may fail to comply with the terms of the waiver and other requirements under our credit agreement, and we may also fail to satisfy certain financial requirements under the agreements governing our public debt (for example, our ratio of consolidated income available for debt service to debt service was below the 1.5x incurrence requirement under our credit agreement and our public debt covenants as of September30, 2022, and we cannot be certain how long this ratio will remain below 1.5x; we are unable to incur additional debt until this ratio is at or above 1.5x on a pro forma basis, but we are not required to repay outstanding debt as a result of failure to comply with this financial requirement; if we believe we will not be able to satisfy our financial or other covenants, we expect that we would seek waivers or amendments prior to any covenant violation or seek other financial alternatives; however, we may fail to obtain any such waivers or amendments or financing alternatives on acceptable terms or at all); (q) we are currently fully drawn under our revolving credit facility and will be required to repay a portion of the amount outstanding thereunder by January 2023 due to a reduction in the borrowing capacity, and we could also be required to repay our outstanding debt in the event of non-compliance with certain other requirements of our credit agreement or the agreements governing our public debt; we may therefore experience further liquidity constraints and we will be limited to our cash on hand or be forced to raise additional sources of capital or take other measures to maintain adequate liquidity; actual costs under our revolving credit facility or other floating rate debt will be higher than the stated rates because of fees and expenses associated with such debt; (r) further changes in our credit ratings may cause the interest and fees we pay to further increase; (s) ourresidents and patients may become unable to fund our charges with private resources and we may be required or may elect for business reasons to accept or pursue revenues from government sources, which could result in an increased part of our net operating income (NOI) and revenue being generated from government payments and our becoming more dependent on government payments, and if the government fails to payusor our managers or other operators amount due because of government defaults, shutdowns, budgetary constraints or otherwise, weand they may be significantly negatively impacted; (t) circumstances that adversely affect the ability of seniors or their families to pay for our managers’ or other operators’ services, such as economic downturns, weak housing market conditions, higherlevels of unemployment among our residents’ family members, lower levels of consumer confidence, high inflation, rising interest rates, stock market volatility and/or changes in demographics generally could affect the profitability of our senior living communities; (u) our unspent leasing related obligations may cost more or less and may take longer to complete than we currently expect, and we may incur increasing amounts for these and similar purposes in the future; (v) we may not realize the benefits we expect from the Environmental, Social and Governance (ESG) program of The RMR Group LLC (RMR) and initiatives and we or RMR may not succeed in meeting existing or future standards regarding ESG; (w) the trading price of our common shares is beyond our control and may increase or decrease more thanwe currently expect; and (x) the advantages we believe we may realize from our relationships with related parties may not materialize. Our Annual Report on Form 10-K for the year ended December 31, 2021and our other filings with the Securities and Exchange Commission (SEC) identify other important factors that could cause differences from our forward-looking statements. Our filings with the SEC are available on the SEC’s website at www.sec.gov. You should not place undue reliance upon our forward-looking statements. Except as required by law, we do not intend to update or change any forward-looking statements as a result of new information, future events or otherwise.NON-GAAP FINANCIAL MEASURESThis presentation contains non-GAAP financial measures including Normalized FFO, adjusted EBITDAre, NOI, cash basis NOI, same property NOI and same property cash basis NOI. Reconciliations for these metrics to the closest U.S. generally accepted accounting principles (GAAP) metrics are included in an appendix hereto.Note: •Unless otherwise noted, data is presented as of September30, 2022.•Five Star Senior Living(Five Star) is an operating division of AlerisLife, Inc.(Nasdaq: ALR), and themanager of certain of our managed senior living communities.•AlerisLife Inc. (f/k/a Five Star Senior Living Inc.) (AlerisLife) is used for any discussion of our ownership of AlerisLife common shares. |
3 REASONS TO INVEST IN DHC An institutional quality portfoliothat is diversified across the healthcare spectrum, and seeks long-term stable growth.Predominantly private pay assets with limited exposure to government reimbursement programs such as Medicare and Medicaid.Long-term, positive healthcare demographics that offer potential for improved industry fundamentals.Diversified tenant credit profile with almost 500 tenants in the Office Portfolio segment.Strong management platformwith efficiency advantages.Deep valuation disconnect, which creates an attractive buying opportunity. |
4 DHC seeks to capitalize on the healthcare demands of an aging U.S. population. A WELL POSITIONED NATIONAL HEALTHCARE REIT379Healthcare Related Properties(1)$7.0BInvestment Portfolio(1)8.8M sfMedical Office & Life Science Space(1)27,404Senior Living Community UnitsFocused growthWell-located medical office and life science buildings, and private pay senior living communities in diverse markets.Scale and diversityWith an approximately$7billion national investment portfolio and almost 500 medical office and life science tenants, DHC is well scaled with strong credit diversity. 1.Excludes unconsolidated joint ventures. |
5 PORTFOLIO PROFILEDHC’s historically opportunistic approach to investing in quality healthcare related properties has created a portfolio that is broadly diversified with national scale. Asset Class By NOI(1)(2)(based on Q32022same propertyNOI)379properties located in 36 states and Washington, D.C.(1) Medical Office51%Independent Living17%Life Science16%Assisted Living8%Wellness Centers6%Skilled Nursing Facilities2%Geographic Diversification By Holdings FL10%WI4%CA9%VA4%TX9%IL4%GA6%IN4%MD5%26 Other States + D.C.41%NC4%Total100%Geographic Diversification By Gross Book Value Of Real Estate Assets(1)1.Excludes unconsolidated joint ventures.2.Senior living communities are categorized by the type of living units which constitute a majority of the living units at the community.# of PropertyHoldings MA |
6 HIGH QUALITY MEDICAL OFFICE AND LIFE SCIENCE PORTFOLIOAlmost500 tenants with same property occupancy of 90.2%atSeptember30, 2022.(1)(2) Maryland Heights, MOTenant: Magellan HealthSquare feet: 232,5211.Excludes unconsolidated joint ventures.2.Occupancy data is as of September 30, 2022and includes space that is leased but is not occupied or is being offered for sublease by tenants and space being fitted out for occupancy.Grafton, WITenant: Advocate Aurora HealthSquare feet: 35,677Mason, OHTenant: AtriCureSquare feet: 95,780Washington, DCMulti-tenant MOBSquare feet: 137,977San Diego, CAMulti-tenant Life ScienceSquare feet: 185,979 |
7 OFFICE PORTFOLIO1.Excludes unconsolidated joint ventures.2.Includes both medical office and life science properties. Based on Q3 2022 NOI. See Appendix for the calculation of NOI and areconciliation of net income (loss) determined in accordance with GAAP to that amount.3.Annualized rental income is based on rents pursuant to existing leases as of September30, 2022. Annualized rental income includes estimated percentage rents, straight line rent adjustments and estimated recurring expense reimbursements for certain net and modified gross leases and excludes lease valueamortization at certain of our medical office and life science properties.4.Medical office and life science same property occupancy data is as of September30, 2022 and includes space that is leased but is not occupied or is being offered for sublease by tenants and space being fitted out for occupancy.5.Medical office building geographic exposure data is on a square foot basis and is as of September30, 2022, and includes (i) out of service assets undergoing redevelopment, (ii) space that is leased but is not occupied or is being offered for sublease by tenants and (iii) space being fitted out for occupancy.6.Average remaining lease term is weighted by annualized rental income, as of September30, 2022.TENANTS INCLUDEOffice Portfolio Segment(1)(2)As of September30, 2022(1):•Our same property Office Portfolio occupancy was 90.2%(4).•Geographically diversified Medical Office Building portfolio with no market exposure greater than 11%(5).•Well laddered lease expiration schedule.•Weighted average remaining lease term is 5.8years(6).Medical Office & Life Science Annualized Rental Income Expiring(1)(3) Life Science32.5%Other17.3%Patient Care50.2% 2%7%13%8%11%10%12%5%32%0%10%20%30%40%50%202220232024202520262027202820292030+ |
8 02.557.51012.5 1Q05 3Q05 1Q06 3Q06 1Q07 3Q07 1Q08 3Q08 1Q09 3Q09 1Q10 3Q10 1Q11 3Q11 1Q12 3Q12 1Q13 3Q13 1Q14 3Q14 1Q15 3Q15 1Q16 3Q16 1Q17 3Q17 1Q18 3Q18 1Q19 3Q19 1Q20 3Q20 1Q21 3Q21 1Q22 3Q22 Billions ($)MEDICAL OFFICE AND LIFE SCIENCE DYNAMICSStrong demographic tailwinds driving healthcarereal estate demand.•Between 2022and 2030, more than 20% (or the equivalent of 10,000 Baby Boomers per day) of the total U.S. population will reach the age of 65.(1)•Physician and clinical services spending is projected to grow at an average rate of 5.4% per year and reach $1.2 trillion by 2027.•The demand for life science innovation is rapidly growing. Real estate is becoming a key component for collaborative R&D environments such as incubator spaces in innovation clusters.(3)•Many life science tenants were labeled “essential” and continuedoccupying space during the pandemic, insulating the industry from work-from-home trends.(4)•Venture capital funding to the life science industry has surged over the past few years, driving employment growth and increased attention from new investors. Venture capitalfunding is up 15.8% CAGR since 2005.(3)1.Source: U.S. Census Bureau.2.Source: Centers for Medicare & Medicaid Services, Office of the Actuary, September 2018.3.Source: Bloomberg, as of October 24, 2022. Note: Quarterly VC funding includes venture capital transactions where at least one entity involved is a biotechnology, healthcare-products or pharmaceutical company.4.Source: Newmark Knight Frank, 2020 Life Sciences Overview.Life Science VC Funding(3) $200 $400 $600 $800 $1,000 $1,20020202021202220232024202520262027Billions ($)Outpatient Services Expenditures (2) |
9 OFFICE PORTFOLIO -THIRDQUARTER UPDATEFor the quarter endedSeptember30, 2022, our Office Portfolio segment represented67% of same property cash basis NOI.1.Represents estimated square footage upon project completion.2.Project costs include estimated construction costs and leasing capital up to stabilization, $ in millions.3.$ in millions.4.Estimated completion date can depend on various factors, including when lease agreements are signed with tenants. Therefore, theactual completion date may vary.Rendering of 1415 West 3rd St.Tempe, AZ ProjectLocationType of PropertySquare Feet(1)Estimated Project Costs(2)Total Costs Incurred as of September30, 2022(3)Estimated Completion Date(4)101 West Ponce De Leon AvenueDecatur, GAMedical Office112,440$8.6 $ 7.9 Q420221415 West 3rd StreetTempe, AZLife Science82,257$11.0 $1. 9 Q1202310030 North MacArthur BoulevardIrving, TXMedical Office94,137$3.5 $2.0 Q1 2023100 Hampshire StreetMansfield, MALife Science124,803$21.2 $0.2 Q420232141 K Street NWWashington, D.C.Medical Office82,592$56.5 $ 1.2 Q1 2025•During the third quarter, we executed new and renewal leases totaling more than 220 thousand square feet, with an average roll-up in rents of 2.4% and a weighted average lease term of 5.8 years. •Our leasing pipeline contains potential new and renewal transactions of more than 1.2 millionsquare feet of space, an increase of over 40% from the second quarter. On a square footage basis, approximately 67% of the leasing pipeline is for new tenants that could absorb vacant space.•As ofthe end ofthe thirdquarter, over 90% of our leases have expense recovery structures, where much of our operating expense increases can be passed back to tenants. |
10 SummaryWe own a 10% equity interest in the two-building life science complex located at 11 Fan Pier Blvd. and 50 Northern Ave. in Boston, MA.Size1.1 million sfOccupancy100%WALT6.3yearsDHC Ownership10%DHC Carrying Value$108.4 millionProperty Valuation$1.7billionDebt$620 millionINVESTMENTS IN UNCONSOLIDATED JOINT VENTURES SummaryWe own a 20% equity interest in 10 medical office and life science properties.Size1.1 million sfOccupancy97%WALT6.1yearsDHC Ownership20%DHC Carrying Value$51.1 millionProperty Valuation$703 millionDebt$457million 8631 & 8635 West Third StreetLos Angeles, CATotal SF: 330,892 4770 Regent BoulevardIrving, TXTotal SF: 116,948 Vertex PharmaceuticalsBoston, MATotal SF: 1,134,479 30 New Crossing RoadReading, MA Total SF: 33,600330 Baker AveConcord, MATotal SF: 49,250Boston Seaport JV(1)Life Science / Medical Office JV(1)1.Unless otherwise noted, data as of September30, 2022.2.As of December 23, 2021.3.As of January 28, 2022.(2)(3) |
11 SENIOR LIVING PORTFOLIO The Palms at Lake SpiveyOperator: Five Star Senior LivingJonesboro, GA200 UnitsFive Star Premier ResidencesOperator: Five Star Senior LivingPompano Beach, FL170 UnitsOaks at StockbridgeOperator: Oaks-CaravitaSenior CareStockbridge, GA61 UnitsAmber RidgeOperator: Cedarhurst Senior LivingMoline, IL87 Units Granite Gate Senior LivingOperator: Five Star Senior LivingPrescott, AZ123 Units The Bungalows at RiverchaseOperator: Phoenix Senior LivingHoover, AL36Units |
12 RESTRUCTURED SHOP SEGMENTDHC's SHOP segment contains 227communities with over 25,000 units with a diverse group of best-in-class operators.(1)Unit MixUnit Mix107OtherOperator Communities120 Five Star Managed Communities ManagerLocationNumber of CommunitiesNumber of UnitsCedarhurst Senior LivingIL/WI13785Charter Senior LivingFL/MD/TN/VA17976IntegraCareSenior LivingPA2143Life Care ServicesDE3517Navion Senior SolutionsSC5235Northstar Senior LivingAZ/CA7418Oaks-Caravita Senior CareGA/SC261,415Omega Senior LivingNE169Phoenix Senior LivingAL/AR/KY/MO/NC/SC231,462Stellar Senior LivingCO/TX/WY101,169Subtotal OtherOperator1077,189Five Star Senior LivingNational12017,889Total SHOP22725,078Same PropertyQ32022 Highlights:•120 communities with approximately 18,000 living units managed by Five Star, an operating division of AlerisLife.•Occupancy grew 120 basis points from the second quarter to 75.3%. Rate also increased as historical concessions continue to burn off, and new concessions have been reduced to one month, in most cases.•Operating expenses were negatively impacted by Hurricane Ian, which drove a $3.8 million increase in same property costs from the second quarter. •While total wages and benefits remain a challenge due to accessibility and wage inflation, AlerisLife has reduced turnover, the average time-to-fill positions, and the number of open positions this quarter. OtherOperator Q32022 Highlights:•107communities with approximately 7,200 units managed by 10 operators.•Occupancy in the third quarter was 73.2%, an increase of 80 basis points from the second quarter and an increase of 660 basis points year-over-year. •The decrease in NOI from the second quarter is largely attributable to just five communities with a high percentage of skilled nursing. These communities had higher agency usage during the quarter, and are working to reduce contract labor moving forward. IL8%AL56%MC17%SNF19% IL55%AL36%MC9%1. Excludes properties classified as closed. |
SENIOR LIVING PORTFOLIO OVERVIEW Current Portfolio (as of September30, 2022) Five Star Managed -SHOP IL, AL, MC 120 17,889 Various OtherOperators -SHOP IL, AL, MC, SNF, CCRC 107 7,189 SHOP Segment IL, AL, MC, SNF, CCRC 227 25,078 NNN Subtotal IL, AL, MC, SNF, CCRC 30 2,326 SHOP Occupancy is Beginning to Recover. SHOP monthly occupancy hit a pandemic low in February 2021. •Indexed occupancy increased throughout 2021 despite COVID-19 variants. •Following the announcement of our plan to transition communities from Five Star to otherthird party operators, disruption related to employee turnover as a result of the announcement lead to modest underperformance in occupancy growth compared to the industry average. •Five Star and our other operators have accelerated occupancy growth in recent months and have outperformed the industry benchmark on an indexed basis. Indexed Occupancy Since March 2021 (2) Excludes properties classified as closed. Source: National Investment Center for Seniors Housing & Care (NIC), as of September2022. |
14 CURRENT ENVIRONMENT & FUTURE DEMOGRAPHICSLong-Term IndustryDemographics Remain Compelling•Senior living demographic of 80+ population is projected to grow over 30% in the next five years.•National healthcare spending is projected to grow at an average rate of 5.7% per year and reach $6.0 trillion by 2027(2).1.Source: U.S. Census Bureau. 2.Source: Centers for Medicare & Medicaid Services, www.cms.gov ..3.Source: NIC Map © Data Service, as of Q32022. For more information on the NIC MAP © Data Service, please visit www.nic.org/NIC-map ..Primary & Secondary Market Senior Living Supply: Units Started as a % of Inventory(3)Favorable Supply Trends in the Wake ofCOVID-19•Primary & secondary market senior living unit construction continues to moderate.•Inventory growth is now just 1.4% year-over-year, and new starts as a percentage of inventory are at their lowest level since 2009. •Independent living supply growth remains more measured than assisted living. Independent living supply growth was 1.2% as of 3Q22 compared to assisted living of 1.5% 05101520252005200620072008200920102011201220132014201520162017201820192020 2021E 2022E 2023E 2024E 2025E 2026E 2027E 2028E 2029E 2030E MillionsAge 80+ Population Growth (1)2015-2020CAGR: 1.7%2021-2030CAGR: 4.2% 1.4%0.0%1.0%2.0%3.0%4.0%5.0% 2008Q1 2008Q3 2009Q1 2009Q3 2010Q1 2010Q3 2011Q1 2011Q3 2012Q1 2012Q3 2013Q1 2013Q3 2014Q1 2014Q3 2015Q1 2015Q3 2016Q1 2016Q3 2017Q1 2017Q3 2018Q1 2018Q3 2019Q1 2019Q3 2020Q1 2020Q3 2021Q1 2021Q3 2022Q1 2022Q3 |
1.Werepaid$10.3millionofthisdebtinOctober2022. Public Debt: Active public bond issuer with over $2.3 billion outstanding. Agency Market (Fannie Mae and Freddie Mac): Offers attractively priced capital for financing senior housing assets. Traditional mortgages opportunities through existing JV partners. $114 $586 <$1 <$1 $11 $16 $2 $2 <$1 <$1 $8 0 250 500 750 1,000 1,250 2022 2023 2024 2025 2026 2027 2028 2029 2030 Thereafter $ Millions Floating Rate Debt Unsecured Fixed Rate Debt Secured Fixed Rate Debt (1) (2) (3) Debt Maturity Schedule (as of September30, 2022, $ in millions) |
16 STRONG MANAGEMENT PLATFORM ADVANTAGES Financial Services:Real Estate Services:Business Services:AccountingAcquisitions/ DispositionsAdministrationCapital MarketsAsset ManagementHuman ResourcesCompliance/ AuditConstruction/DevelopmentInformation Technology (IT)Finance/ PlanningEngineeringInvestor RelationsTreasuryLeasingMarketingTaxProperty ManagementLegal/Risk Management RMR’s Operations Include: Over38,000Combined Employees 2,100Properties Approximately $12.2Billion in Total Consolidated Annual Revenues Combined RMR Managed Companies: Office Industrial Government Medical Office Life Sciences Senior Living Hotels RetailTHE RMR GROUP LLC(1) Over$37Billion in AUM Over600CRE Professionals More than 30Real Estate Offices Throughout the U.S.(1)As of September30, 2022. DHC IS MANAGED BY THE RMR GROUP, AN ALTERNATIVE ASSET MANAGER. NATIONAL MULTI-SECTOR INVESTMENT PLATFORM |
THE RMR GROUPA WINNING TRADITIONEPA’S ENERGY STARPartner of the Year 2019 -2022. 70 properties with EPAENERGY STAR certifications60 properties withBOMAdesignations. Ranked #1 for portfolio with most designations56 properties with LEEDdesignations SUSTAINABILITYBoston Globe’sTop Places to Work; 2020 & 2021 Women on Boards; Winning Organization 2020 Fortune Magazine’s Fastest Growing Companies ranked 75th2019 RMR RECOGNITIONin RetailReal Estate Ownershipin Hotel Real Estate Ownershipin Senior Living Real Estate Ownershipin OfficeReal Estate Ownershipin IndustrialReal Estate OwnershipSenior LivingOperator(1)HotelOperator #7#8#8#13#4#5#3 17TruckStop Operator#3 Note: Real estate ownership rankings for Retail, Hotel, Office and Industrial utilize property count rankings generated from Real Capital Analytics as of June 30, 2022. Senior Living Real Estate Ownership and Senior Living Operator rankings are sourced from the 2021 ASHA 50 annual publication as of September 30, 2021. Hotel Operator rankings sourced from STR Inc. as of June 30, 2021.(1)AlerisLife Inc., formerly Five Star Senior Living Inc., was ranked 4th in the 2021 Argentum 50 annual publication. However, adjusting the ranking for units that transitioned to other operators in 2021, AlerisLife Inc. would have ranked 7th. |
18 (1) As of September30, 2022.DHC BENEFITS FROM RELATIONSHIP WITH THE RMR GROUPRMR provides DHC with scale and efficiencies.•DHC has no employees; RMR provides all services.•RMR’s acquisitions team sees a substantial number of properties marketed for sale in every market across the United States.•RMR attracts very strong real estate professionals (acquisitions, asset management, property management, finance, accounting, etc.) because of the size of the portfolios for which they will be responsible.•RMR provides job growth opportunities for employees, which is a benefit when hiring.•RMR property management employees focus only on assets managed by RMR, with no conflicting responsibilities for other owners.•DHC benefits from the scale of a $37.3 billion platform(1). Examples:◦Centralized procurement. ◦Centralized services. ◦Banking and capital markets. |
19 SUPPORTED BY RMR'S PERSONNEL INVESTMENTS •RMR continues to invest in personnel overseeing the asset management, development and project management functions. •Since 2016, RMR has added 25 positions to the Senior Living and Office & Industrial Asset Management teams, while it has also added 11 positions to the Development and Project management teams.•This personnel investment comes at no additional cost to DHC pursuant to its management agreement with RMR. 1.9%2.6%3.4%5.0%6.0%6.6%6.7%7.3%8.2%9.0%9.0%13.5%13.6%14.0%14.2%20.6%0.0%10.0%20.0%30.0%DHCWELLVTRPEAKOHIHTAHRNHIDOCSBRAMPWGMRECHCTCTRELTCGBCSDHC’s G&A as a percent of total revenues compares favorably to its peer group(1):(1) Source: S&P Global Market Intelligence and company filings. Data is as of the most recently reported quarter. |
20 MANAGEMENT AGREEMENT PROVIDES FOR ALIGNMENT OF INTERESTSRMR base management fee tied to DHC share price performance•Consists of an annual fee based on 50 bps of the lower of: (1) DHC’s historical cost of real estate, or (2) DHC’s total market capitalization.•There is no incentive for RMR to complete any transaction that could reduce DHC’s share price.RMR incentive fees are contingent on total shareholder return outperformance•Equal to 12% of value generated by DHC in excess of the benchmark index total returns (MSCI U.S. REIT/Health Care REIT Index)(1)per share over a three year period, subject to a cap (1.5% of equity market cap).•Outperformance must be positive: it can’t be the best of the worst.•Shareholders keep 100% of benchmark returns and at least 88% of returns in excess of the benchmark. Other fees•Property management fee: consists of an annual fee based on 3.0% of rents collected at DHC’s medical office, life science and active adult properties.•Construction supervision fee based on project costs. Alignment of InterestsIf DHC’s total market cap exceeds historical cost of real estate, base fee is paid on assets.If DHC’s total market cap is less than historical cost of real estate, base fee fluctuates with share price. Incentive fee structure keeps RMR focused on increasing total shareholder return. Members of RMR senior management are holders of DHC shares, some subject to long term lock up agreements.DHC shareholders have visibility into publicly traded RMR.DHC benefits from RMR’s national footprint and economies of scale of $37.3billion(2) platform.1.On October 1, 2021, DHC announced that it had amended its business management agreement effective August 1, 2021 with The RMRGroup LLC to replace the benchmark index used in the calculation of incentive management fees. For periods beginning on and after August 1, 2021, the MSCI U.S. REIT/Health Care REIT Index replaces the discontinued SNL U.S. REIT Healthcare Index and is used to calculate benchmark returns per share for purposes of determining anyincentive management fee payable by DHC to The RMR Group LLC. For periods prior to August 1, 2021, the SNL U.S. REIT Healthcare Index continues to be used.2. Data as of September 30, 2022. |
APPENDIX Muse at Torrey PinesSan Diego, CA |
22 For the Three Months Ended September30, For the NineMonths Ended September30, (Dollars in thousands, except per share data) 2022 2021 2022 2021 Rental income $63,960 $101,403 $191,767 $306,555 Residents fees and services 258,960 236,013 754,914 739,926 Total revenues 322,920 337,416 946,681 1,046,481 Net (loss) income (81,492) (88,004) 49,548 (186,832) Net (loss) income attributable to common shareholders $(81,492) $(89,343) $49,548 $(191,070) NOI(2) $33,824 $71,343 $122,777 $228,385 NOI margin % 10.5% 21.1% 13.0% 21.8% Adjusted EBITDAre(3) $35,782 $63,080 $122,654 $224,072 Normalized FFO attributable to common shareholders $(14,167) $(9,449) $(46,463) $8,589 Per share data: Common dividend $0.01 $0.01 $0.03 $0.03 Normalized FFO attributable to common shareholders(4) $(0.06) $(0.04) $(0.20) $0.04 1. SeeDefinitionsofCertainNon-GAAPFinancialMeasuresintheappendixforadescriptionofwhywebelievetheyareappropriatesupplementalmeasuresandadescriptionofhowweusethesemeasures. FINANCIAL SUMMARY(1) |
CALCULATION AND RECONCILIATION OF NOI AND CASH BASIS NOI(1) (Dollars in thousands)For the Three Months Ended9/30/20226/30/20223/31/202212/31/20219/30/2021 Calculation of NOI and Cash Basis NOI: Revenues:Rental income$63,960$62,522$65,285$102,034 $ 101,403 Residents fees and services258,960250,506245,448234,697 236,013 Total revenues322,920313,028310,733336,731 337,416 Property operating expenses(289,096)(266,066)(268,742)(273,716) (266,073 ) NOI33,82446,96241,99163,015 71,343 Non-cash straight line rent adjustments included in rental income(2,738)(2,710)(1,745)(2,042) (1,679) Lease value amortization included in rental income4257105(1,648) (1,848) Non-cash amortization included in property operating expenses(199)(199)(199)(200) (199) Cash Basis NOI$30,929$44,110$40,152$59,125 $ 67,617 Reconciliation of Net Income (Loss) to NOI and Cash Basis NOI: Net (loss) income$(81,492)$(109,383)$240,423$366,758 $ (88,004) Equity in earnings of investees(2,127)(3,204)(3,354)——Income tax expense(benefit)13(640)1,472406 595 Loss on modification or early extinguishment of debt—29,560483— — Interest expense46,93655,97557,13163,518 64,493 Interest and other income(4,099)(2,266)(395)(786) (976) Losses on equity investments, net2,67410,1578,55315,289 14,755 Loss (gain) on sale of properties5,044686(327,794)(461,434) (200) Acquisition and certain other transaction related costs2896099282,327 3,108 General and administrative6,1797,2077,2858,549 8,870 Depreciation and amortization60,40758,26157,25968,388 68,702 NOI33,82446,96241,99163,015 71,343 Non-cash straight line rent adjustments included in rental income(2,738)(2,710)(1,745)(2,042) (1,679) Lease value amortization included in rental income4257105(1,648) (1,848) Non-cash amortization included in property operating expenses(199)(199)(199)(200) (199) Cash Basis NOI$30,929$44,110$40,152$59,125 $ 67,617 23 1.SeeDefinitionsofCertainNon-GAAPFinancialMeasuresinappendixforadefinitionofNOI,CashBasisNOI,SamePropertyNOIandSamePropertyCashBasisNOI,adescriptionofwhywebelievetheyareappropriatesupplementalmeasuresandadescriptionofhowweusethesemeasures. |
CALCULATION AND RECONCILIATION OFSAME PROPERTY NOI AND SAME PROPERTY CASH BASIS NOI AND CASH BASIS NOI(1)24 1.SeeDefinitionsofCertainNon-GAAPFinancialMeasuresinappendixforadefinitionofNOI,CashBasisNOI,SamePropertyNOIandSamePropertyCashBasisNOI,adescriptionofwhywebelievetheyareappropriatesupplementalmeasuresandadescriptionofhowweusethesemeasures. For the Three Months EndedCalculation of NOI and Cash Basis NOI:9/30/20226/30/20223/31/202212/31/20219/30/2021Rental income / residents fees and services$322,920$313,028$310,733$336,731$337,416Property operating expenses(289,096)(266,066)(268,742)(273,716)(266,073)NOI$33,824$46,962$41,991$63,015$71,343NOI$33,824$46,962$41,991$63,015$71,343Less:Non-cash straight line rent adjustments included in rental income2,7382,7101,7452,0421,679Lease value amortization included in rental income(42)(57)(105)1,6481,848Non-cash amortization included in property operating expenses199199199200199Cash Basis NOI$30,929$44,110$40,152$59,125$67,617Reconciliation of NOI to Same Property NOI:NOI$33,824$46,962$41,991$63,015$71,343Less:NOI of properties not included in same property results(8,690)(4,527)(5,802)19,69126,518Same Property NOI$42,514$51,489$47,793$43,324$44,825Reconciliation of Same Property NOI to Same Property Cash Basis NOI:Same Property NOI$42,514$51,489$47,793$43,324$44,825Less:Non-cash straight line rent adjustments included in rental income6799921,4001,445820Lease value amortization included in rental income(42)(57)(115)(127)(119)Non-cash amortization included in property operating expenses2091351729898Same Property Cash Basis NOI$41,668$50,419$46,336$41,908$44,026(Dollars in thousands) |
(Dollars in thousands)For the Three Months Ended9/30/20226/30/20223/31/202212/31/20219/30/2021Net (loss) income$(81,492)$(109,383)$240,423$366,758$(88,004)Interest expense46,93655,97557,13163,51864,493Income tax expense(benefit)13(640)1,472406595Depreciation and amortization60,40758,26157,25968,38868,702EBITDA 25,8644,213356,285499,07045,786Loss (gain) on sale of properties5,044686(327,794)(461,434)(200)Equity in earnings of unconsolidated joint ventures(2,127)(3,204)(3,354)——Share of EBITDArefrom unconsolidated joint ventures 3,730 5,7095,232384—Adjustments to reflect our share of EBITDAreattributable to an equity method investment(1,358)(1,446)(1,816)(2,468)(2,345)EBITDAre31,1535,95828,55335,55243,241General and administrative expense paid in common shares472665315315742Acquisition and certain other transaction related costs2896099282,3273,108Loss on modification or early extinguishment of debt—29,560483——Losses on equity securities, net2,67410,1578,55315,28914,755Adjustments to reflect our share of Adjusted EBITDAreattributable to an equity method investment1,1941,026653921,234Adjusted EBITDAre$35,782$47,975$38,897$53,875$63,0801.SeeDefinitionsofCertainNon-GAAPFinancialMeasuresintheappendixforadefinitionofEBITDA,EBITDAreandAdjustedEBITDAreandadescriptionofwhywebelievetheyareappropriatesupplementalmeasures.CALCULATION AND RECONCILIATION OF EBITDA, EBITDAre, AND ADJUSTED EBITDAre(1)25 |
1.SeeDefinitionsofCertainNon-GAAPFinancialMeasuresintheappendixforadefinitionofFFOattributabletocommonshareholdersandNormalizedFFOattributabletocommonshareholders,adescriptionofwhywebelievetheyareappropriatesupplementalmeasuresandadescriptionofhowweusethesemeasures.CALCULATION AND RECONCILIATION OF FFO AND NORMALIZED FFO ATTRIBUTABLE TO COMMON SHAREHOLDERS(1)26 For the Three Months Ended(Amounts in thousands, except per share data)9/30/20226/30/20223/31/202212/31/20219/30/2021Net (loss) income attributable to common shareholders$(81,492)$(109,383)$240,423$365,585$(89,343)Depreciation and amortization60,40758,26157,25968,38868,702Loss (gain) on sale of properties5,044686(327,794)(461,434)(200)Losses on equity securities, net2,67410,1578,55315,28914,755FFO adjustments attributable to noncontrolling interest———(4,763)(5,273)Equity in earnings of unconsolidated joint ventures(2,127)(3,204)(3,354)——Share of FFO from unconsolidated joint ventures2,1373,7043,675273—Adjustments to reflect our share of FFO attributable to an equity method investment(1,639)(1,466)(1,932)(2,608)(2,440)FFO attributable to common shareholders(14,996)(41,245)(23,170)(19,270)(13,799)Acquisition and certain other transaction related costs2896099282,3273,108Loss on modification or early extinguishment of debt—29,560483——Adjustments to reflect our share of Normalized FFO attributable to an equity method investment540681(142)4481,242Normalized FFO attributable to common shareholders$ (14,167)$(10,395)$(21,901)$(16,495)$(9,449)Weighted average common shares outstanding (basic)238,344238,197238,149238,149238,008Weighted average common shares outstanding (diluted)238,344238,197238,198238,149238,008 Per Common Share Data (basic and diluted): Net (loss) income attributable to common shareholders$(0.34)$(0.46)$1.01$1.54$(0.38)FFO attributable to common shareholders$(0.06)$(0.17)$(0.10) $ (0.08) $(0.06)Normalized FFO attributable to common shareholders$(0.06)$(0.04)$(0.09) $ (0.07) $(0.04) |
DEFINITIONS OF CERTAIN NON-GAAP FINANCIAL MEASURESNon-GAAP Financial Measures We present certain "non-GAAP financial measures" within the meaning of applicable rules of the SEC, including net operating income, or NOI, Cash Basis NOI, earnings before interest, income tax, depreciation and amortization, or EBITDA, EBITDA for real estate, or EBITDAre, Adjusted EBITDAre, funds from operations attributable to common shareholders, or FFO attributable to common shareholders, and normalized funds from operations attributable to common shareholders, or Normalized FFO attributable to common shareholders. These measures do not represent cash generated by operating activities in accordance with GAAP and should not be considered alternatives to net income (loss) or net income (loss) attributable to common shareholders as indicators of our operating performance or as measures of our liquidity. These measures should be considered in conjunction with net income (loss) and net income (loss) attributable to common shareholders as presented in our condensed consolidated statements of comprehensive income (loss). We consider these non-GAAP measures to be appropriate supplemental measures of operating performance for a REIT, along with net income (loss) and net income (loss) attributable to common shareholders. We believe these measures provide useful information to investors because by excluding the effects of certain historical amounts, such as depreciation and amortization, they may facilitate a comparison of our operating performance between periods and with other REITs and, in the case of NOI, Cash Basis NOI, reflecting only those income and expense items that are generated and incurred at the property level may help both investors and management to understand the operations of our properties. NOI, Cash Basis NOI, Same Property NOI and Same Property Cash Basis NOI The calculations of NOI, Cash Basis NOI, same property NOI and same property cash basis NOI exclude certain components of net income (loss) in order to provide results that are more closely related to our property level results of operations. We calculate NOI, Cash Basis NOI, same property NOI and same property cash basis NOI as shown in this appendix. We define NOI as income from our real estate less our property operating expenses. NOI excludes amortization of capitalized tenant improvement costs and leasing commissions that we record as depreciation and amortization. We define Cash Basis NOI as NOI excluding non-cash straight line rent adjustments, lease value amortization, lease termination fee amortization, if any, and non-cash amortization included in property operating expenses. We calculate same property NOI and same property cash basis NOI in the same manner that we calculate the corresponding NOI and cash basis NOI amounts, except that we only include same properties in calculating same property NOI and same property cash basis NOI. We use NOI, Cash Basis NOI, same property NOI and same property cash basis NOI to evaluate individual and company wide property level performance. Other real estate companies and REITs may calculate NOI, Cash Basis NOI, same property NOI and same property cash basis NOI differently than we do. EBITDA, EBITDAre and Adjusted EBITDAre We calculate EBITDA, EBITDAre and Adjusted EBITDAre as shown in this appendix. EBITDAre is calculated on the basis defined by the National Association of Real Estate Investment Trusts, or Nareit, which is EBITDA, excluding gains or losses on the sale of properties, equity in earnings of unconsolidated joint ventures, impairment of assets, if any, including adjustments to reflect our proportionate share of EBITDAre of our equity method investment in AlerisLife and our proportionate share of EBITDAre from our unconsolidated joint ventures as well as certain other adjustments currently not applicable to us. In calculating Adjusted EBITDAre, we adjust for the items shown in the appendix. Other real estate companies and REITs may calculate EBITDA, EBITDAre and Adjusted EBITDAre differently than we do. FFO and Normalized FFO Attributable to Common Shareholders We calculate FFO attributable to common shareholders and Normalized FFO attributable to common shareholders as shown in this appendix. FFO attributable to common shareholders is calculated on the basis defined by Nareit, which is net income (loss) attributable to common shareholders, calculated in accordance with GAAP, excluding any gain or loss on sale of properties, equity in earnings of unconsolidated joint ventures, loss on impairment of real estate assets, gains or losses on equity securities, net, if any, including adjustments to reflect our proportionate share of FFO of our equity method investment in AlerisLife and our proportionate share of FFO from our unconsolidated joint ventures, plus real estate depreciation and amortization of consolidated properties and minus FFO adjustments attributable to noncontrolling interest, as well as certain other adjustments currently not applicable to us. In calculating Normalized FFO attributable to common shareholders, we adjust for the items shown in this appendix. FFO attributable to common shareholders and Normalized FFO attributable to common shareholders are among the factors considered by our Board of Trustees when determining the amount of distributions to our shareholders. Other factors include, but are not limited to, requirements to maintain our qualification for taxation as a REIT, limitations in the agreements governing our debt, the availability to us of debt and equity capital, our expectation of our future capital requirements and operating performance, and our expected needs for and availability of cash to pay our obligations. Other real estate companies and REITs may calculate FFO attributable to common shareholders and Normalized FFO attributable to common shareholders differently than we do. |