SECURITIES AND EXCHANGE COMMISSION
Washington, D.C. 20549
_____________________________________________________________________________________________
FORM 10-K
☒ ANNUAL REPORT PURSUANT TO SECTION 13 OR 15(d) OF THE SECURITIES EXCHANGE ACT OF 1934
For the fiscal year ended: December 31, 2024
OR
☐ TRANSITION REPORT PURSUANT TO SECTION 13 OR 15(d) OF THE SECURITIES EXCHANGE ACT OF 1934
For the transition period from to
_____________________________________________________________________________________________
Commission File No.: 1-36691
Booking Holdings Inc.
(Exact name of Registrant as specified in its charter)
| | | | | |
| Delaware | 06-1528493 |
| (State or other jurisdiction of incorporation or organization) | (I.R.S. Employer Identification Number) |
800 Connecticut Avenue
Norwalk, Connecticut 06854
(address of principal executive offices)
Registrant's telephone number, including area code: (203) 299-8000
_____________________________________________________________________________________________
Securities Registered Pursuant to Section 12(b) of the Act:
| | | | | | | | | | | | | | | |
| Title of Each Class: | | Trading Symbol | | Name of Each Exchange on which Registered: | |
| Common Stock par value $0.008 per share | | BKNG | | The NASDAQ Global Select Market | |
| | | | | |
| | | | | |
| | | | | |
| 0.100% Senior Notes Due 2025 | | BKNG 25 | | The NASDAQ Stock Market LLC | |
| 4.000% Senior Notes Due 2026 | | BKNG 26 | | The NASDAQ Stock Market LLC | |
| 1.800% Senior Notes Due 2027 | | BKNG 27 | | The NASDAQ Stock Market LLC | |
| 0.500% Senior Notes Due 2028 | | BKNG 28 | | The NASDAQ Stock Market LLC | |
| 3.625% Senior Notes Due 2028 | | BKNG 28A | | The NASDAQ Stock Market LLC | |
| 4.250% Senior Notes Due 2029 | | BKNG 29 | | The NASDAQ Stock Market LLC | |
| 3.500% Senior Notes Due 2029 | | BKNG 29A | | The NASDAQ Stock Market LLC | |
| 4.500% Senior Notes Due 2031 | | BKNG 31 | | The NASDAQ Stock Market LLC | |
| 3.625% Senior Notes Due 2032 | | BKNG 32 | | The NASDAQ Stock Market LLC | |
| 3.250% Senior Notes Due 2032 | | BKNG 32A | | The NASDAQ Stock Market LLC | |
| 4.125% Senior Notes Due 2033 | | BKNG 33 | | The NASDAQ Stock Market LLC | |
| 4.750% Senior Notes Due 2034 | | BKNG 34 | | The NASDAQ Stock Market LLC | |
| 3.750% Senior Notes Due 2036 | | BKNG 36 | | The NASDAQ Stock Market LLC | |
| 3.750% Senior Notes Due 2037 | | BKNG 37 | | The NASDAQ Stock Market LLC | |
| 4.000% Senior Notes Due 2044 | | BKNG 44 | | The NASDAQ Stock Market LLC | |
| 3.875% Senior Notes Due 2045 | | BKNG 45 | | The NASDAQ Stock Market LLC | |
Securities Registered Pursuant to Section 12(g) of the Act: None.
_____________________________________________________________________________________________
Indicate by check mark if the registrant is a well-known seasoned issuer, as defined in Rule 405 of the Securities Act. Yes ☒ No ☐
Indicate by check mark if the registrant is not required to file reports pursuant to Section 13 or Section 15(d) of the Act. Yes ☐ No ☒
Indicate by check mark whether the registrant (1) has filed all reports required to be filed by Section 13 or 15(d) of the Securities Exchange Act of 1934 during the preceding 12 months (or for such shorter period that the registrant was required to file such reports), and (2) has been subject to such filing requirements for the past 90 days. Yes ☒ No ☐
Indicate by check mark whether the registrant has submitted electronically every Interactive Data File required to be submitted pursuant to Rule 405 of Regulation S-T (§232.405 of this chapter) during the preceding 12 months (or for such shorter period that the registrant was required to submit such files). Yes ☒ No ☐
Indicate by check mark whether the registrant is a large accelerated filer, an accelerated filer, a non-accelerated filer, a smaller reporting company or an emerging growth company. See the definitions of "large accelerated filer," "accelerated filer," "smaller reporting company," and "emerging growth company" in Rule 12b-2 of the Exchange Act: | | | | | | | | | | | | | | | | | |
| Large accelerated filer | ☒ | Accelerated filer | ☐ | Non-accelerated filer | ☐ |
| Smaller reporting company | ☐ | Emerging growth company | ☐ | | |
If an emerging growth company, indicate by check mark if the registrant has elected not to use the extended transition period for complying with any new or revised financial accounting standards provided pursuant to Section 13(a) of the Exchange Act. ☐
Indicate by check mark whether the registrant has filed a report on and attestation to its management's assessment of the effectiveness of its internal control over financial reporting under Section 404(b) of the Sarbanes-Oxley Act (15 U.S.C. 7262(b)) by the registered public accounting firm that prepared or
issued its audit report. ☒
If securities are registered pursuant to Section 12(b) of the Act, indicate by check mark whether the financial statements of the registrant included in the filing reflect the correction of an error to previously issued financial statements. ☐
Indicate by check mark whether any of those error corrections are restatements that required a recovery analysis of incentive-based compensation received by any of the registrant's executive officers during the relevant recovery period pursuant to §240.10D-1(b). ☐
Indicate by check mark whether the registrant is a shell company (as defined in Rule 12b-2 of the Act). Yes ☐ No ☒
The aggregate market value of common stock held by non-affiliates of Booking Holdings Inc. at June 30, 2024 was approximately $133.1 billion based upon the closing price reported for such date on the NASDAQ Global Select Market. For purposes of this disclosure, shares of common stock held by executive officers and directors of Booking Holdings Inc. on June 30, 2024 have been excluded because such persons may be deemed to be affiliates of Booking Holdings Inc. This determination of affiliate status is not necessarily a conclusive determination for other purposes.
The number of outstanding shares of Booking Holdings Inc.'s common stock was 32,815,201 at February 13, 2025.
DOCUMENTS INCORPORATED BY REFERENCE
The information required by Part III of this Annual Report on Form 10-K, to the extent not set forth in this Form 10-K, is incorporated herein by reference from Booking Holdings Inc.'s definitive proxy statement relating to its annual meeting of stockholders to be held on June 3, 2025, to be filed with the Securities and Exchange Commission within 120 days after the end of Booking Holdings Inc.'s fiscal year ended December 31, 2024.
Booking Holdings Inc. Annual Report on Form 10-K for the Year Ended December 31, 2024 Index
Special Note Regarding Forward-Looking Statements
This Annual Report on Form 10-K, including "Management's Discussion and Analysis of Financial Condition and Results of Operation" in Part II, Item 7, and the documents incorporated by reference contain forward-looking statements. These statements reflect our views regarding current expectations and projections about future events and conditions and are based on currently available information. They are not guarantees of future performance and are subject to risks, uncertainties, and assumptions that are difficult to predict, including the Risk Factors identified in Part I, Item 1A of this Annual Report. Our actual results could differ materially from those expressed or implied in any such statements. Expressions of future goals and expectations and similar expressions, including "may," "will," "should," "could," "aims," "seeks," "expects," "plans," "anticipates," "intends," "believes," "estimates," "predicts," "potential," "targets," and "continue," reflecting something other than historical fact are intended to identify forward-looking statements. Unless required by law, we undertake no obligation to update publicly any forward-looking statements, whether as a result of new information, future events, or otherwise. However, readers should carefully review the reports and documents we file or furnish from time to time with the Securities and Exchange Commission (the "SEC" or the "Commission").
PART I
Item 1. Business
Our mission is to make it easier for everyone to experience the world. We aim to provide consumers with a best-in-class experience offering the travel choices they want, with tailored planning, payment, language, and other options, seamlessly connecting them with our travel service provider partners. We offer these services through five primary consumer-facing brands: Booking.com, Priceline, Agoda, KAYAK, and OpenTable:
| | | | | | | | | | | | | | | | | | | | |
| Accommodations | Ground Transportation | Flights | Activities | Restaurants | Meta Search |
| Booking.com | ☑ | ☑ | ☑ | ☑ | | |
| Priceline | ☑ | ☑ | ☑ | ☑ | | |
| agoda | ☑ | ☑ | ☑ | ☑ | | |
| KAYAK | | | | | | ☑ |
| OpenTable | | | | | ☑ | |
We are proud that, despite ongoing challenges to our global community such as the wars in Ukraine and the Middle East and the impact of inflation, we continued our efforts to make our brands the most trusted and convenient platforms for consumers and partners, including:
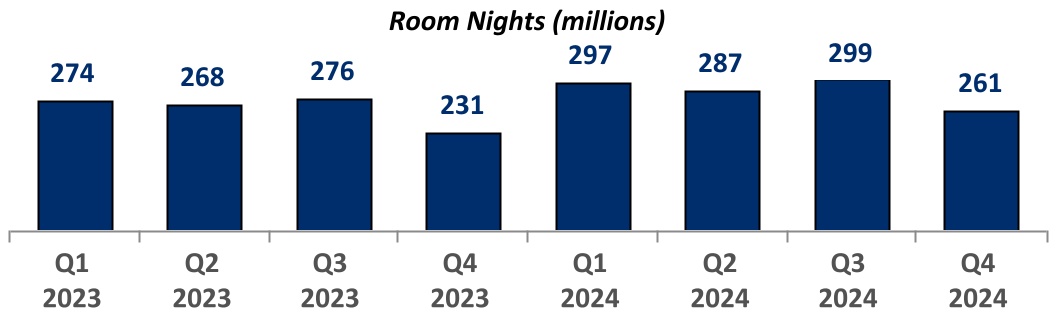
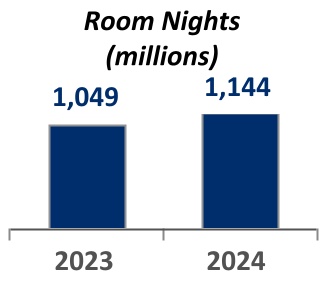
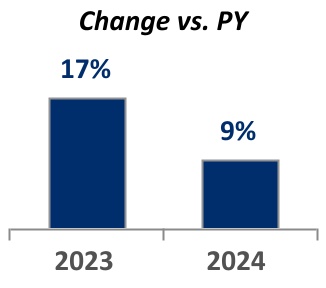
•achieving record annual room nights in 2024;
•continuing to increase brand awareness in key markets such as the U.S., including through high-profile sponsorships in the U.S.;
•growing our alternative accommodations offering;
•improving our loyalty programs, particularly by expanding the Genius program at Booking.com into more travel verticals;
•further integrating generative artificial intelligence ("Gen AI") technology into our offerings to add value for consumers and partners;
•using Gen AI to drive efficiencies in our operations;
•seeking to more effectively manage operating expenses to increase organizational agility and create more capacity for reinvestment, with plans to continue expense reduction in 2025;
•improving and expanding our flight offering at Booking.com and Agoda, and offering more opportunities for consumers to discover and book Connected Trips; and
•increasing adoption of our payments platform and capabilities.
Our common stock is listed on the NASDAQ Global Select Market under the symbol "BKNG." We refer to our company and all of our subsidiaries and brands collectively as "Booking Holdings," the "Company," "we," "our," or "us."
Our Business Model
We derive substantially all of our revenues from providing online travel reservation services, which facilitate online travel purchases by travelers from travel service providers (which we generally refer to as "consumers" and "partners," respectively). We also earn revenues from advertising services, restaurant reservation and management services, travel-related insurance offerings, and other services.
For the year ended December 31, 2024, we had revenues of $23.7 billion, which we classify as "merchant" revenues, "agency" revenues, and "advertising and other" revenues.
•Merchant revenues are derived from transactions where we facilitate payments from travelers for the services provided, generally at the time of booking. These include transactions where travelers book accommodation, rental car, airline reservations, and other travel related services. Merchant revenues include travel reservation commissions and transaction net revenues (i.e., the amount charged to travelers, including the contra-revenue impact of merchandising, less the amount owed to travel service providers); revenues from facilitation of payments such as credit card processing rebates and customer processing fees; and ancillary fees, including travel-related insurance revenues. The majority of our merchant revenue is from Booking.com's accommodation reservations.
•Agency revenues are derived from travel-related transactions where we do not facilitate payments from travelers for the services provided. Agency revenues consist almost entirely of travel reservation commissions from our reservation services. Substantially all of our agency revenue is from Booking.com's accommodation reservations.
•Advertising and other revenues are derived primarily from (a) revenues earned by KAYAK for sending referrals to online travel companies ("OTCs") and travel service providers and for advertising placements on our platforms and (b) revenues earned by OpenTable for its restaurant reservation services and subscription fees for restaurant management services.
Our Strategy
We aim to demonstrate global leadership in online travel bookings and related services by:
•making it easy for people to find, book, pay for, and experience travel;
•providing consumers with the most comprehensive choices and value on any device;
•offering platforms, tools, and insights to our business partners to drive mutual growth; and
•operating our business sustainably and supporting sustainable travel choices by our consumers and partners.
We focus on relentless innovation and execution and a commitment to serve both consumers and partners with unmatched service and best-in-class technology. We believe that global travel bookings will generally continue to grow while shifting from traditional offline methods to online channels like ours. We expect to benefit from this growth in travel and the continued shift to online channels as we work to expand our service offerings and increase our presence in key geographies. In particular, we seek to (a) leverage technology to provide consumers with the best experience, (b) partner with travel service providers and restaurants to our mutual benefit, (c) operate multiple brands that collaborate with each other, and (d) invest in profitable and sustainable growth.
Provide the best consumer experience. We endeavor to provide consumers with: (a) personalized and easy-to-use online travel services; (b) a comprehensive selection of travel and payment options; (c) informative and useful content; (d) excellent customer service; and (e) value through competitive prices and loyalty programs.
We continue to innovate to meet the needs of our consumers and partners through intuitive, easy-to-use websites and mobile apps. An increasing percentage of our room nights are booked on our mobile apps. We believe that the growth of our payments capabilities across the Company removes friction from the booking process and delivers additional value for travelers and partners. We continue to execute against our long-term strategy to create an ideal traveler experience, offering our customers relevant options and connections at the times and in the language they want them, making trips booked with us seamless, easy, and valuable. We refer to this as the "Connected Trip." The goal of our Connected Trip vision is to offer a differentiated and personalized online travel planning, booking, payment, and in-trip experience for each trip, enhanced by a robust loyalty program that provides value to travelers and partners across all trips. In the near term, we are focused on providing consumers the ability to build a complete travel itinerary by enabling them to travel to their destination by flight or rental car, make a reservation with one of our accommodation partners, and experience an attraction while on their trip. We continue to grow our Connected Trip verticals, including 38% year-over-year flight ticket growth in 2024. We have also launched consumer-facing Gen AI capabilities, including a trip planner, an AI assistant to answer consumer queries, and a price comparison tool. We believe Gen AI has the potential to enhance our Connected Trip offering. We strive to provide excellent customer service, including through call centers and online platforms and the use of virtual assistants.
Partner with travel service providers and restaurants. We aim to establish mutually beneficial relationships with our partners around the world. We believe they benefit from participating in our services by increasing their distribution channels, demand, profile and reputation, and inventory utilization in an efficient and cost-effective manner. They also benefit from our
trusted brands and marketing efforts, expertise in offering an excellent consumer experience, and ability to offer their inventory in markets and to consumers that they may otherwise be unable or unlikely to reach, for instance due to language or payments services we can offer on their behalf.
Operate multiple brands. Our brands allow us to offer numerous services, appeal to different consumers, pursue distinct marketing and business strategies, encourage experimentation and innovation, and focus on specific markets or geographies. We continue to optimize collaboration among our brands to provide consumers with comprehensive and value-oriented services, share resources and technological innovations, and co-develop new services. We invest to support growth by our brands, whether through increased marketing, geographic expansion, technological innovation, or increased access to travel service offerings.
Invest in profitable and sustainable growth. We seek to offer online services that meet the needs and the expectations of consumers and partners and that we believe will result in mutual long-term profitability and growth. We have made significant investments in people, technology, marketing, and added or expanded travel offerings. In 2024, we continued our investments in Gen AI to benefit internal productivity and improve the consumer and partner experience. We also regularly evaluate and may pursue potential strategic acquisitions, partnerships, joint ventures, or investments as part of our long-term business strategy.
Service Offerings
Booking.com. Booking.com is the world's leading brand for booking online accommodation reservations, based on room nights booked, with operations worldwide and headquarters in the Netherlands. At December 31, 2024, Booking.com offered accommodation reservation services for approximately 4.0 million properties in over 220 countries and territories and in over 40 languages, consisting of approximately 500,000 hotels, motels, and resorts and approximately 3.5 million homes, apartments, and other unique places to stay.
In 2024, globally Booking.com offered flights in over 55 markets and in-destination tours and activities in 1,700 cities, as well as rental car reservation services in over 42,000 locations and ground transportation services at approximately 1,900 airports.
Priceline. Priceline is a leader in discount travel reservations, primarily in North America, with headquarters in Norwalk, Connecticut. Priceline offers online accommodation, flight, and rental car reservation services, as well as vacation packages, cruises, activity, and hotel distribution services for partners and affiliates.
Agoda. Agoda is a leading online accommodation reservation service catering primarily to consumers in the Asia-Pacific region, with headquarters in Singapore. Agoda also offers flight, ground transportation, and activities reservation services.
KAYAK. KAYAK, headquartered in Stamford, Connecticut, provides online meta-search services that allow consumers to easily search and compare travel itineraries and prices from hundreds of online travel platforms at once. KAYAK offers its services in over 60 countries and territories.
OpenTable. OpenTable is a leading brand for booking online restaurant reservations. With significant operations in San Francisco, California, OpenTable provides online restaurant reservation services to consumers and reservation management services to restaurants, primarily in the United States.
Marketing and Brand Awareness
We have established widely used and recognized e-commerce brands through marketing campaigns and strategic use of performance marketing spend. We invest in marketing and other brand building to preserve and enhance consumer awareness of our brands.
Competition
We compete globally with both online and traditional travel and restaurant reservation and related services. The markets for the services we offer are intensely competitive and constantly evolving. Current and new competitors launch new services at a relatively low cost. Some of our current and potential competitors include the largest global technology companies, which have significantly more customers or users, consumer data, and resources than we do, and may be able to leverage other aspects of their businesses (e.g., search or mobile device businesses, or Gen AI capabilities) to compete more effectively with us. For example, Google's online travel offerings have grown rapidly in this area by linking travel search services to its dominant search functionality through flight, hotel, and alternative accommodations meta-search products, and by integrating such products into its Google Maps app.
We currently, or may in the future, compete with a variety of companies, including:
•online travel or restaurant reservation services and meta-search services;
•large online search, social media, and marketplace companies;
•travel service providers (e.g., accommodations, rental car companies, or airlines);
•traditional travel agencies, travel management companies, wholesalers, tour operators, and financial institutions;
•companies offering software solutions and technology services to travel service providers; and
•companies offering AI agents powered by Gen AI via leveraging e.g., virtual assistants.
For more information regarding current and potential competitors and the competitive nature of the markets in which we operate, see Part I, Item 1A, Risk Factors - "Intense competition could reduce our market share and harm our financial performance."
Government Regulation
Our business is affected by regulations of governments and regulatory authorities around the world, many of which are evolving and subject to revised and novel interpretations. Violations of laws or regulations could result in fines, penalties, and criminal sanctions against us, our officers or employees, and prohibitions on how or where we conduct our business. Even if we are compliant, doing business in certain jurisdictions or violations of these laws and regulations by the parties with which we conduct business risks harming our reputation and brands. Regulations that may impact us include:
•Data Protection and Privacy: We have policies and a governance framework to comply with privacy laws that apply to our business, meet evolving stakeholder expectations, and support innovation and growth. Regulations such as the EU's General Data Protection Regulation ("GDPR"), the California Consumer Privacy Act (the "CCPA") and other comprehensive state consumer privacy laws impose significant compliance obligations and costs. Other jurisdictions have adopted or may adopt similar data protection regulations. Some of these laws afford consumers a private right of action against companies like ours for certain statutory violations.
•Competition, Consumer Protection and Online Commerce: Competition and consumer protection authorities are increasingly focused on large technology companies and the regulation of digital platforms. The Digital Markets Act ("DMA") and Digital Services Act ("DSA") give EU regulators more instruments to investigate and regulate digital businesses and impose rules and requirements on online platforms, including those designated as "gatekeepers" under the DMA, with separate rules for "Very Large Online Platforms" ("VLOPs") under the DSA. The European Commission has designated the Company as a gatekeeper under the DMA for the service provided through Booking.com and Booking.com as a VLOP under the DSA.
•Regulation of the Travel Industry: Our business is impacted by travel-related regulations such as local regulation of alternative accommodations or measures to address the issues of "overtourism" and the impact of tourism on the climate. Further, some parts of our business are already subject to certain requirements of the EU Package Travel Directive (the "Package Directive"), and as our offerings continue to diversify and expand, we may become subject to additional requirements of the Package Directive or other regulations.
•Payments: As we expand our payments services to consumers and business partners in different geographies, we are subject to additional regulations, such as local financial services or export control regulations and license requirements, which has resulted in increased compliance costs and complexities, including those associated with the implementation of new or advanced internal controls. We are also subject to payment card association rules and obligations under our contracts with payment card processors, including the Payment Card Industry Data Security Standard, compliance with which is complex and costly.
For further discussion of these regulations and how other global regulations may impact our business, see Part I, Item 1A, Risk Factors - "Information Security, Cybersecurity, and Data Privacy Risks" and "Legal, Regulatory, Compliance, and Reputational Risks."
Technology
Our business is supported by multiple systems and platforms designed with an emphasis on scalability, performance, redundancy, and security. Our systems connect us with vendors and partners. We are modernizing our technology by building new applications with modern development tools and application programming interfaces, and we increasingly rely upon public cloud infrastructure. Our applications utilize digital certificates and other security technologies to help us conduct secure communications and transactions, as appropriate. The systems infrastructure and web and database servers of our worldwide operations are hosted in data centers in Europe, Asia, and North America, and each provides services and support typical of hosted data centers. See Part I, Item 1A, Risk Factors - "Information Security, Cybersecurity, and Data Privacy Risks."
Intellectual Property
The protection of our intellectual property is important to our success. We rely on intellectual property such as trademarks, copyrights, patents, and trade secrets to support our business as well as domain names or other intangible rights or property secured through purchase, licensing, or other agreements with employees, travel service providers, vendors, and other parties. We have filed applications for protection of certain aspects of our intellectual property in the United States and other jurisdictions, and we hold patents in several jurisdictions. See Part I, Item 1A, Risk Factors - "We face risks related to our intellectual property."
Seasonality and Other Timing Factors
In 2024, our gross bookings were generally similar in the first three quarters of the year and higher than in the fourth quarter. We generally recognize our marketing activities as the expense is incurred, which is typically in the quarter when the gross bookings for the associated reservations are recognized. However, we would generally recognize revenue from these bookings when the travel begins (at "check-in"), and accommodation check-ins in Europe and North America are generally highest in the third quarter during those regions' peak summer travel season and lowest in the first quarter. As a result of this timing difference between when we record marketing expenses and when we recognize associated revenues, we typically experience our highest levels of profitability in the third quarter and our lowest level of profitability in the first quarter. In addition to the typical seasonality effects on our business, our quarterly results and quarterly year-over-year growth rates can be impacted by:
•The length of the booking window (the average time between the booking of a travel reservation and when the travel begins), which impacts the relationship between our gross bookings (recognized at the time of booking) and our revenues (recognized at the time of check-in). In 2024, the booking window was generally longer than we experienced in 2023 as an increased percentage of bookings were made for travel that was to occur further out from the time of booking;
•The level of acceleration or deceleration in the gross bookings growth rate. For example, our operating margins are typically negatively impacted in the near term from gross bookings and related variable marketing expense growth acceleration, as revenue growth is typically less impacted by accelerating gross bookings growth in the near term. Any such acceleration would positively impact revenue growth in subsequent periods as a portion of the revenue recognized from such gross bookings will occur in future quarters. Conversely, in periods where our gross bookings growth rate substantially decelerates, our operating margins typically benefit; and
•The date on which certain holidays (e.g., Easter or Ramadan) fall.
Human Capital Resources
Our employees are fundamental to delivering on our mission to make it easier for everyone to experience the world. Our goal is to attract, develop, and retain highly-skilled talent and to foster opportunities for colleagues to grow and develop their careers. We seek to attract the best and most innovative talent from a wide range of sources to achieve our long-term strategic goals. By cultivating a diverse leadership and workforce that reflects the broad spectrum of people we work with throughout the world, we gain valuable insights from a wide range of backgrounds and experiences that help us understand the needs of our global consumers and partners. We are committed to engaging with our employees across our Company and maintaining a productive workforce that is proud to work for Booking Holdings.
Our Board of Directors and the Talent and Compensation Committee have oversight of our human capital management. As a result of our operating structure with multiple distinct brands, our approach to human capital management can vary by brand.
Workforce
As of December 31, 2024, we employed approximately 24,300 employees, of which approximately 3,100 were based in the United States and approximately 21,200 outside the United States. We retain independent contractors to support certain functions, but approximately 99% of our employees are full-time employees.
We operate in over 220 countries and in over 40 languages globally, and believe that a diverse workforce operating in an inclusive environment has been a part of our success and will help us achieve our long-term strategic goals. Given the broad geographical nature of our business and workforce, we are committed to creating workplaces that embrace the cultures and practices of our employees and we prohibit unlawful discrimination of any type.
As of December 31, 2024, approximately 46% of our employees were women, approximately 26% of our technology positions were filled by women, and approximately 34% of leadership (which includes vice presidents and above for all brands except Booking.com, which includes senior directors and above due to a greater number of employees) were women.
Gender Diversity of Employees (as of December 31, 2024)
While a significant percentage of our workforce is located in jurisdictions that may present challenges to tracking certain employee demographics for legal reasons, we seek other ways to assess our employees' experience. For example, all of our brands include questions in annual employee engagement surveys to gauge our inclusivity progress. We also publish our consolidated EEO-1 report for employees in the United States, although as of December 31, 2024, this represented only approximately 13% of our workforce.
Attraction, Development, and Retention
It is critical for our business that we attract and retain the top talent in our industry. We believe that we offer a rich culture where employees feel empowered to do their best work with opportunities to grow as well as competitive compensation and benefits. We are focused on our employees' engagement and mental well-being, career satisfaction, development, and succession planning. We offer tailored learning opportunities to enable employees to upskill while at work and drive career conversations between employees and their managers, as well as succession planning.
We measure organizational culture and engagement so we can be responsive to our employees' needs. We regularly connect with our employees through engagement and quick pulse surveys to request feedback, and the results of these efforts
are shared with senior management. We believe that the results of our 2024 engagement surveys broadly demonstrate an engaged workforce.
Employee Relations
Although we have works councils or employee representatives in certain countries, our U.S. employees are not represented by a labor union or covered by a collective bargaining agreement. We work collaboratively with works councils, employee representatives, and other organizations in relevant jurisdictions. We have never had a work stoppage and we consider our relations with our employees to be good.
Company Websites
We maintain websites with the addresses www.bookingholdings.com, www.booking.com, www.priceline.com, www.agoda.com, www.kayak.com, and www.opentable.com, among others. We are not including the information contained on our websites as a part of, or incorporating it by reference into, this Annual Report on Form 10-K. We make available free of charge through the www.bookingholdings.com website our Annual Reports on Form 10-K, Quarterly Reports on Form 10-Q and Current Reports on Form 8-K, and amendments to these reports filed or furnished pursuant to Section 13(a) or 15(d) of the Securities Exchange Act of 1934, as amended (the "Exchange Act"), as soon as reasonably practicable after we electronically file or furnish such material with the SEC. These reports and other information are also available, free of charge, at www.sec.gov. In addition, the Company's Code of Conduct is available through the www.bookingholdings.com website and any amendments to or waivers of the Code of Conduct will be disclosed on that website.
Item 1A. Risk Factors
Our business and financial results are subject to risks and uncertainties, which could adversely affect our business, results of operations, financial condition, and cash flows.
The risk factors section should be carefully considered in full, in addition to other information appearing in this Form 10-K, including Part II, Item 7, Management's Discussion and Analysis of Financial Condition and Results of Operations and our consolidated financial statements and related notes. The following is only a summary of the principal risks that make an investment in our securities speculative or risky.
Risk Factors Summary
Industry and Business Risks
•Adverse changes in market conditions for travel services;
•The effects of competition;
•Our ability to successfully manage growth and expand our global business;
•Adverse changes in third-party relationships;
•Our performance marketing efficiency and the effectiveness of our marketing efforts;
•Our ability to respond to and keep up with rapid technological or other market changes;
•The development and use of generative AI ("Gen AI");
•Our ability to attract and retain qualified personnel;
•Operational and technological infrastructure risks;
Information Security, Cybersecurity, and Data Privacy Risks
•Data privacy and cyberattack risks;
•IT systems-related failures or security breaches;
Tax Risks
•Risks related to exposure to additional tax liabilities and maintaining tax benefits;
Legal, Regulatory, Compliance, and Reputational Risks
•Legal and regulatory risks;
•Risks associated with the facilitation of payments;
Financial Risks
•Fluctuations in foreign currency exchange rates and other risks associated with doing business in multiple currencies and jurisdictions;
•Risks of increased debt levels and stock price volatility; and
•Success of investments and acquisitions, including integration of acquired businesses.
Industry and Business Risks
Declines or disruptions in the travel industry could adversely affect our business and financial performance.
Our financial results depend upon sales of travel services, which can fluctuate based on consumer discretionary spending levels. Demand for and sales of travel services often decline during periods of perceived or actual adverse economic conditions and times of political or economic uncertainty. Economic and political uncertainty can negatively impact transaction growth rates, cancellation rates, and accommodation average daily rates ("ADRs"). While lower occupancy rates can increase distribution of accommodation reservations through third-party intermediaries such as us, if there are lower ADRs, it generally has a negative effect on our revenues and results of operations.
Macroeconomic uncertainties have led to significant volatility in currency exchange rates, stock markets, and oil prices, which can impact consumer travel behavior. The uncertainty of macroeconomic factors and their impact on consumer behavior makes it difficult to forecast industry and consumer trends and their potential impact on our business, which could adversely affect our ability to effectively manage our business and adversely affect our results of operations.
Other events beyond our control such as pandemics, terrorist attacks, natural disasters, wars and regional hostilities, travel-related accidents, or increased focus on the environmental impact of travel may disrupt or limit the ability or willingness of travelers to visit certain locations, or result in declines in demand for our travel offerings. Responses to such events by governments or global organizations could restrict travel in ways that could impact our ability to conduct our business. Because these events and their impacts are largely unpredictable, they can dramatically and suddenly affect travel behavior by consumers, demand for and provision of our services, and relationships with travel service providers and other partners, any of which can adversely affect our business and results of operations.
Intense competition could reduce our market share and harm our financial performance.
We compete globally with online and traditional travel and restaurant reservation and related services. The markets for the services we offer are intensely competitive and constantly evolving. Current and new competitors launch new services at a relatively low cost. Some of our current and potential competitors include the largest global technology companies, which have significantly more consumers, consumer data, and resources than we do, and may be able to leverage other aspects of their businesses (e.g., search or mobile device businesses or Gen AI and similar or related capabilities) to compete with us. For example, Google's online travel offerings have grown rapidly by linking travel search services to its dominant search functionality through flight, hotel, and alternative accommodations meta-search products, and integrating such products into Google Maps. Similarly, several companies developing Gen AI-powered platforms have used travel search and reservation capabilities to illustrate the possible use cases for this technology. The structure of the travel industry or consumer preferences could also change in ways that disadvantage us and benefit competitors or new entrants. If we are unable to successfully adapt to such changes, our ability to compete, and our business and results of operations, would be adversely affected.
We currently, or may in the future, compete with companies that provide a variety of products and services, including:
•online platforms, including accommodation and alternative accommodation search or reservation services, travel meta-search, and large online companies including in search, social media, marketplace, Gen AI, and ride-sharing;
•travel service providers (e.g., accommodations, rental car companies, or airlines), which may offer lower prices on their direct channel than they provide to us;
•traditional travel agencies, travel management companies, wholesalers, and tour operators;
•companies offering software solutions and technology services to travel service providers, including global distribution systems ("GDSs") and hospitality software and payments platforms; and
•companies offering AI agents powered by Gen AI that can perform or facilitate travel-related services, such as virtual assistants.
Some of our current and potential competitors may have greater resources or stronger competitive positions in certain geographic regions than we do. For example, some of our competitors may be domiciled in different countries and subject to political, legal, and regulatory regimes that enable them to compete more effectively than us.
The market for accommodations covers a wide range of property types including alternative accommodations, and companies like Airbnb and Vrbo (owned by Expedia) compete directly with our accommodations businesses. Meta-search services may lower the cost for new companies to enter the market by providing a distribution channel without the cost of promoting the new entrant's brand and also compete directly with us for customers. They may also evolve into more traditional online travel companies ("OTCs") by offering consumers the ability to make travel reservations directly. Moreover, some of our competitors and potential competitors offer a variety of online services, many of which are used by consumers more frequently than online travel services or have created "super-apps" where consumers can use such various services without leaving the company's app. A competitor that has established other, more frequent online or app-based interactions with consumers may be
able to more easily or cost-effectively acquire customers for its online travel services than we can. Some competitors include private equity-funded platforms, which can more easily withstand significant losses for an extended period of time while building market share through heavy marketing and/or discounting of their services. In addition, competitors may more effectively invest in online marketing channels, which could hinder growth of our services if they are more successful at promoting their platform than us.
For many consumers, the price of a travel service is the primary factor determining whether to book a reservation. In some cases, our competitors are willing to make little or no profit on a transaction or offer travel services at a loss in order to gain market share. In certain markets, we may need to provide discounts or other incentives in order to be competitive, which may make it difficult for us to maintain or grow market share, maintain historical profit margins, and may also result in lower ADRs and lower revenues as a percentage of gross bookings. Consolidation among travel service providers or the development of alternative offerings as a result of Gen AI could result in lower OTC commission rates, increased discounting, and greater incentives for consumers to join closed-user groups as such travel service providers expand their offerings. If we are unable to effectively offer competitive prices, our revenues, market share, business, and results of operations could be materially adversely affected.
We face risks related to the growth rate and the global expansion of our business.
We have significant operations in countries outside the United States and derive a substantial portion of our gross bookings from these countries. Our OTC operations outside of the United States historically had achieved significant year-over-year growth in their gross bookings, though growth rates have generally declined over time as the absolute level of our gross bookings increased and online travel growth rates declined. Other factors may also slow the growth rates of our businesses outside of the United States, including economic conditions, strengthening of the U.S. Dollar versus other currencies, declines in ADRs, increases in cancellations, adverse changes in travel market conditions, and competition. Any decline in the growth rates of our businesses could negatively impact our revenue and earnings growth rates and as a consequence our stock price.
We are also subject to risks related to expanding our business internationally. International markets may have strong local competitors with an established brand and travel service provider or restaurant relationships making expansion in that market difficult or costly. Certain markets in which we operate have unique localized preferences or lower operating margins, or from time to time have experienced declining or no growth. Scaling and growing our business in such markets could require significant investment, which could have a negative impact on our profit margins. In some markets such as China, local requirements may restrict participation by foreign businesses, making our entry into and expansion in those markets costly, difficult, or impossible. If we are unsuccessful in expanding in new and existing markets and managing that expansion, our business and results of operations could be adversely affected.
We believe that the breadth, variety, and quality of accommodations on our platforms helps drive our growth. The growth rate of the number of accommodations on our platforms may vary in part due to removing accommodations from time to time. Many newer accommodations we offer may have fewer rooms or higher credit risk and may appeal to a smaller subset of consumers (e.g., hostels and bed and breakfasts). If occupancy rates increase, accommodation providers often limit their offerings to OTCs. Also, certain jurisdictions have instituted regulations intended to address the issues of "overtourism" and the impact of tourism on climate, including by restricting accommodation offerings near popular tourist destinations. As a result, we may experience constraints on the number of listings or available accommodation room nights or decreased demand, which could negatively impact our business growth rate and results of operations.
We are dependent on travel service providers, restaurants, search platforms, and other third parties.
We rely on providers of accommodations, rental cars, and airline tickets, and on restaurants, to make their services available to consumers for reservation through us. Our arrangements with travel service providers generally do not require them to make available any specific quantity of reservations, or to make reservations available in any geographic area, for any particular route, or at any particular price. Similarly, our arrangements with restaurants generally do not require them to provide all of their available tables and reservations to customers through us. Our arrangements with OTCs and travel service providers to provide pricing, schedules, availability, and other information in connection with Kayak's meta-search services are non-exclusive and can be terminated with little notice. A significant reduction on the part of any of our major travel service providers, or restaurants, for a sustained period of time or their complete withdrawal from our services, including due to a provider's bankruptcy or closure, could have an adverse effect on our business, advertising revenue, market share, and results of operations. Further, as consolidation among travel service providers increases, or if Gen AI better enables, or offers alternatives for travel service providers to reach consumers, the potential adverse effect of a decision by a significant travel service provider to withdraw from or reduce its participation in our services also increases.
We rely upon Google and other search and meta-search services to generate a significant portion of traffic to our platforms, principally through pay-per-click marketing campaigns. The pricing and operating dynamics on these platforms can change rapidly. If the logic determining placement and display of results of a consumer's search changes, the placement of links to our platforms can be negatively affected and our costs to improve or maintain our placement can increase. A decline or slowing growth in travel search traffic also negatively impacts our ability to efficiently generate traffic to our platforms through
performance marketing on general search platforms, which could have an adverse effect on our business and results of operations.
We rely on various third-party distribution channels (i.e., marketing affiliates) to distribute accommodation, rental car, and airline ticket reservations. If distribution through such third parties declines, our business, market share, and results of operations could be adversely affected.
We offer a range of insurance products related to our travel offerings, primarily through third-party insurance providers. Our business and reputation may be adversely affected if such providers no longer make such offerings available to us on economically reasonable terms or at all.
We face risks related to the growth of our alternative accommodations business.
Our alternative accommodations business faces risks relating to claims of liability, regulatory developments, and continued growth and profitability. Because alternative accommodations are often either a single unit or a small collection of independent units, and may have additional costs to be offered on our platforms, these properties generally represent more limited booking opportunities and lower profit margins than hotels, motels, and resorts. Further, alternative accommodations may be subject to increased seasonality or may not be available at peak times due to use by property owners. To the extent alternative accommodations represent an increasing percentage of the properties we add to our platforms, we expect that our room-night growth rate and property growth rate will continue to diverge over time, and the number of reservations per property will likely continue to decrease.
Alternative accommodations are subject to claims of liability based on injury, death, discrimination, or criminal activities occurring at these properties. We have no control over the actions of our consumers, property owners, and other third parties during a stay, and cannot guarantee the safety of such individuals. We have not in the past and may not in the future undertake to systematically verify the safety, quality, and legal compliance of our alternative accommodation listings. We rely on property owners to disclose information relating to their listings and such information may be inaccurate or incomplete. Moreover, Booking.com facilitates the provision of partner liability insurance that may protect alternative accommodation partners against liability claims, lawsuits by third parties for bodily injury, or personal property damage that occur during a stay at a partner property. This partner liability insurance, if applicable to the claim, may provide partners with up to $1.0 million equivalent (policy limit) of third party liability coverage related to the underlying claim, though the Company could be required to pay amounts in excess of the policy limit. Any resulting complaints or claims could result in negative publicity and increased costs, which could adversely affect our reputation, business, and results of operations.
Alternative accommodation regulation is new and evolving, and laws, regulations, or property association rules could impose obligations on property owners and managers that limit or negatively affect their ability to rent their properties. For example, in conjunction with the Digital Services Act ("DSA"), the European Commission (the "EC") has adopted a short-term rental regulation that imposes new obligations around property owner registration, property verification, and enforcement of local registration schemes. Some jurisdictions have adopted or are considering restrictions on the ability to offer alternative accommodation properties or that require online platforms, owners, or managers to obtain a license to rent or list alternative accommodations. From time to time, we have been and are subject to inquiries related to compliance with alternative accommodation legal requirements that have resulted in fines and could result in additional fines, adversely affect our reputation, or require modifications to our business operations. Legal requirements applicable to alternative accommodations are evolving and can be inconsistent among individual localities, and we are unable to predict what effect they may have on our business. This dynamic regulatory environment requires us to expend significant time and resources and could negatively impact our alternative accommodation reservation business.
We face risks relating to our marketing efforts.
We invest considerable resources in the establishment and maintenance of our brands, marketing and other brand building efforts to preserve and enhance consumer awareness of our brands, and to attract and retain customers. Performance marketing costs to grow traffic to our platforms are variable because they are dependent on others' marketing spend in the same channels. If we are unable to maintain or enhance consumer awareness and acceptance of our brands or if such efforts are not cost-effective, our business, market share, and results of operations could be materially adversely affected.
Our marketing efficiency, expressed as marketing expense as a percentage of gross bookings, and performance marketing return on investment ("ROIs") are impacted by a number of factors that are subject to variability and are in some cases outside of our control, including ADRs, costs per click, cancellation rates, foreign currency exchange rates, our ability to convert traffic to booking customers, and the timing and effectiveness of our brand marketing campaigns. Marketing efficiency can also be impacted by the extent to which consumers come directly to our platforms for bookings. If our marketing efforts are less effective at generating new bookings, our marketing efficiency could deteriorate and our margins, revenues, and earnings growth could be adversely affected. For example, competition for desired rankings in search results and/or a decline in ad clicks by consumers could increase our costs-per-click and negatively impact our marketing efficiency. At times we may pursue a strategy of increasing marketing ROIs, which could negatively affect our gross bookings and revenue growth rates. Pursuing a strategy of improving performance marketing ROIs along with factors such as competitors' actions in the bidding environment, the amount of
marketing invested by these channels to generate demand, and overall marketing platform traffic growth trends, may also impact our gross bookings and revenue growth rates. Negative trends in our marketing efficiency, performance marketing ROIs, or consumer shopping activity could negatively impact our business, market share, and results of operations.
We may not be able to keep up with rapid technological or other market changes.
We compete in markets characterized by rapidly changing technology, evolving industry standards, consolidation, frequent service developments, and changing consumer preferences. In addition, these market characteristics are heightened by the progress of technology adoption in various markets, including the continuing adoption of online commerce in certain geographies and the growth of mobile e-commerce transactions. We may not be able to keep up with these rapid changes.
Our long-term strategy to build the Connected Trip will require increased investments that could have an adverse impact on our results of operations until we achieve the expected return on these investments. The development of the Connected Trip is subject to uncertainties, including further development of the verticals and technological capabilities (which may include developing and integrating technologies like Gen AI) necessary for the Connected Trip experience, the ability to collect, store, and use customer data in a compliant and integrated fashion, and the attraction and retention of employees dedicated to this effort. It may take longer than we expect to realize the Connected Trip vision or it may not achieve the expected return on investment. These efforts may also not be successful in improving the travel experience or retaining and attracting new customers. Further, regulatory restrictions may impact our ability to commercialize the Connected Trip or expose us to unanticipated liabilities. With any technical innovation such as the Connected Trip effort, there could be vulnerabilities and other technical failures, which could result in lost business, harm to our brand or reputation, consumer complaints, and other adverse consequences, any of which could adversely affect our business and results of operations.
In the future the competitive pressure to innovate could encompass a wider range of services and technologies, and our ability to keep pace may slow. Other companies, including emerging start-ups or large technology companies utilizing proprietary Gen AI or similar capabilities, may be able to innovate and focus on developing a new product or service faster than we can or may foresee consumer need for new services or technologies before we do. In addition, the widespread adoption of new technologies, such as Gen AI and machine learning, could influence how customers search for and book travel, render our existing technology obsolete, require us to modify or adapt our services or infrastructure, which could adversely affect our results of operations or financial condition.
Consumers increasingly use mobile devices and apps to make online travel bookings. The revenues earned on a mobile transaction may be less than a desktop transaction due to different purchasing patterns. To the extent mobile devices or platforms enable users to block advertising content, our advertising revenue and ability to market our brands may also be negatively affected. If we are unable to attract consumers to our mobile platforms, or app store providers like Google and Apple use their app distribution, mobile operating, or payment platforms to favor competing services to ours, we could lose market share and our business, future growth, and results of operations could be adversely affected.
Our ability to offer a variety of appropriate payment solutions is an important part of our value proposition for our partners and consumers. If we are unable to offer consumers their preferred method of payment, it would limit our growth opportunities and our business and results of operations could be harmed.
The development and use of Gen AI may result in reputational harm or legal liability and may adversely affect our business, financial condition, and results of operations.
We are seeking to incorporate Gen AI in our business, including for internal productivity purposes and in consumer- and partner-facing initiatives such as AI travel assistants, price comparison tools, and as part of enhancing the development of our Connected Trip vision. Our evolving efforts to utilize Gen AI may increase risks related to harmful content, inaccuracies, bias or discrimination, intellectual property infringement or misappropriation, data privacy, cybersecurity, or other issues. In some instances we may make use of third-party foundational models that have been pre-trained on data which may be insufficient, erroneous, stale, contain biased information, or infringe intellectual property rights. Our implementation of AI systems could result in legal liability, regulatory action, brand, reputational, or competitive harm, or subject us to new regulatory frameworks (such as the European Union Artificial Intelligence Act). Such risks are heightened if we or third-party developers or vendors lack sufficient responsible AI development or governance practices. If we enable or offer Gen AI solutions that have unintended consequences, are contrary to responsible AI policies and practices, or are otherwise controversial because of their impact on human rights, privacy, employment, or other social, economic, or political issues, our reputation, competitive position, business, financial condition, and results of operations may be adversely affected.
Our Gen AI initiatives will require increased investment in infrastructure and headcount. If our Gen AI investments are not successful or our competitors are better at the deployment of Gen AI technologies longer-term, our business and financial performance could be harmed.
We rely on the performance of highly skilled employees; and, if we are unable to retain or motivate key employees or hire, retain, and motivate well-qualified employees, our business would be harmed.
Our performance relies on the talents and efforts of highly skilled individuals. Our future success depends on our continuing to attract and retain a highly skilled workforce. Our ability to attract and retain talent could be negatively impacted by factors such as the recently announced organizational changes, including an expected workforce reduction, and our hybrid work environment.
Competition for well-qualified employees, especially software engineers and other technology professionals, is intense and costly. In addition, our customer service resources (including outsource arrangements) may be unable to provide adequate customer service support. Our success has led to increased efforts by our competitors and others to hire our employees. These difficulties may be amplified by increased ability to work remotely, evolving restrictions on immigration or availability of visas or work permits for skilled technology workers, requirements of applicable collective bargaining agreements, and laws in certain jurisdictions that make recruiting senior talent more difficult, such as the reductions in the partial tax exemption that benefits certain non-Dutch citizens working in the Netherlands. These factors combined with inflationary pressure on compensation has caused our personnel expenses to attract and retain key talent to increase, which may adversely affect our results of operations. If we do not succeed in attracting and retaining well-qualified employees, our business, ability to grow and innovate, competitive position, reputation, and results of operations would be adversely affected.
Impairments of goodwill, long-term investments, and long-lived assets, increases in provisions for expected credit losses on receivables from and cash advances made to our travel service provider and restaurant partners, and increases in cash outlays to refund consumers for prepaid reservations have a negative impact on our results of operations.
We have recorded and may in the future record impairments of goodwill, long-term investments, or long-lived assets. Future events and changing market conditions may result in the need to recognize goodwill, investment, or asset impairment charges, which could have a material adverse effect on our results of operations.
Any significant increase in our provision for expected credit losses and any significant increase in cash outlays to refund consumers could have a corresponding adverse effect on our results of operations and related cash flows. We could experience a high level of cancellations of existing reservations which could result in higher than normal cash outlays to refund consumers for prepaid reservations. In some instances, where we had agreed to provide free cancellations to consumers for non-refundable reservations, we did not estimate a recovery of prepayments already made to travel service providers. We may also offer cancellable room rates on behalf of a partner to provide flexibility to our consumers even if the partner has not provided a cancellable room rate, which could have a negative impact on our revenues if we are unable to facilitate booking from another consumer.
We face risks related to our operational and technological infrastructures.
Our financial results depend on the successful execution of our operating plans. We previously announced our intention to implement certain organizational changes, including modernizing processes and systems, an expected workforce reduction, optimizing procurement, and seeking real estate savings (the "Transformation Program"). There are no assurances that we will achieve the estimated cost savings goals, realize the expected benefits from the Transformation Program, or manage the Transformation Program effectively. We may also incur significant charges related to the Transformation Program, which could reduce our profitability in the periods such charges are incurred. Our inability to generate anticipated cost savings, successfully implement our strategies, or efficiently manage our operating plans for the Transformation Program could negatively affect our business and results of operations.
Historically, our brands operated on a largely independent basis and many of them focused on particular services or geographies. We continue to optimize collaboration among our brands. As we manage this shift, in addition to managing changes in our workforce we may find it difficult to maintain the beneficial aspects of our corporate culture at our brands and throughout the organization. Any future expansion or shift increases the complexity of our business and places additional strain on our management, operations, technical performance, financial resources, and administrative, legal, tax, internal controls, and financial reporting functions. Our employees and outsourced resources, systems, procedures, and controls may not be adequate to support and effectively manage such changes and increased complexity, or could result in disruption of our service or customer support, especially as we have employees and outsourced resources around the world and we increase the number and variety of our products and payment systems.
In addition, we are conducting a multi-year phased migration to integrate and upgrade certain systems and processes. The implementation of new information technology, payment, enterprise resource planning, or other systems is disruptive and costly and may not be successful, which could adversely affect our business and results of operations. Any failure to implement or adapt to new technologies in a timely manner or at all could adversely affect our ability to compete, increase our consumer acquisition costs, or otherwise adversely affect our business, brands, market share, reputation, or results of operations.
Investments in new business strategies and acquisitions could disrupt our ongoing business and present risks not originally contemplated.
We have invested and in the future may invest in new business strategies and acquisitions of complementary businesses. Such endeavors may not be successful, such as our agreement to acquire European-based flights booking provider Etraveli Group that was terminated after the EC blocked the transaction in 2023. Additionally, such ventures may involve significant risks and uncertainties, including diversion of management's attention from current operations, greater than expected liabilities and expenses, increased regulatory scrutiny, failing to obtain required regulatory approvals on a timely basis or at all, the imposition of conditions that could delay or prevent us from completing a transaction or limit our ability to realize the anticipated benefits of a transaction, inadequate return on capital, new risks with which we are not familiar, legal and compliance obligations that previously did not apply to us, integration risks, and unidentified issues not discovered in our evaluations of those strategies and acquisitions. We may issue shares of our common stock in these transactions, which could result in dilution to our stockholders. Entering new businesses involves risks and costs that could have an adverse effect on our business, reputation, results of operations, profit margins, cash flows or financial condition, as well as on our ability to achieve the expected benefits of any such investments or acquisitions. In addition, we may decide to make minority investments, including through joint ventures, in which we have limited or no management or operational control. The controlling person in such a case may have interests that are inconsistent with ours, and decisions of the company or venture in which we invested may result in harm to our reputation or business or adversely affect the value of our investment.
We may not be able to successfully integrate acquired businesses or manage the operation of our internal businesses.
The integration of acquired businesses requires significant time and resources, and we may not manage these processes successfully. In addition to acquired businesses, we may integrate or manage differently certain of our internal businesses, integrate certain functions across our businesses, and restructure or cease operating certain assets or businesses, and we may do so in the future, including through divestitures. These actions are complex, costly, and create a variety of risks, including:
•disruption or harm to the businesses involved, or to our other businesses, including the need for management to spend time and attention on them;
•difficulty managing different company cultures, systems, processes, and human resource policies and practices, or implementing and maintaining effective internal controls, procedures, and policies;
•challenges retaining key personnel; and
•loss of travel service providers, restaurants, or other partners.
We may not successfully integrate companies or achieve the strategic, financial, or operating objectives of an acquisition or integration, any of which could adversely affect our business, results of operations, or financial condition.
Information Security, Cybersecurity, and Data Privacy Risks
Our processing, storage, use, and disclosure of personal data exposes us to risks of data breaches and could give rise to liabilities and/or damage our reputation.
We depend on software and computing infrastructure (including open source software) for the operation of our business. If threat actors such as cyber-criminals, hackers, or state-sponsored organizations are able to circumvent, interrupt, or adversely affect our security measures, including as a result of our own acts or omissions, it could result in a compromise or breach of consumer, partner, or employee data. Data security is essential to maintaining consumer and partner confidence in our services and the uninterrupted availability of our web and mobile platforms is essential for our business. Consumers may provide us with their personal identity data and payment information, which in turn attracts attention from threat actors. With cyberattacks evolving and increasing in frequency and sophistication, we may not be able to successfully defend against determined adversaries. In addition, our security policies and controls may not keep pace with the innovation of our offerings and technological advances of threat actors, such as leveraging AI. We have experienced and responded to cyberattacks, which we believe have not had a material impact on the integrity of our systems or the security of data we maintain.
Vulnerabilities in our consumer and partner systems could and have resulted in unauthorized access to personal and confidential data, such as the inadvertent disclosure of data to third-party partners that may be undetected for a period of time. These risks are likely to increase as we expand our offerings, integrate our products and services, incorporate AI, and store and process more data. The disclosure of sensitive Company, consumer, or other information through our systems or by our workforce or other parties could lead to information loss, reputational harm, monetary damages, regulatory penalties, or loss of a competitive advantage. We expend significant resources to protect against security breaches and to maintain or increase our systems' security. Security breaches could result in negative publicity, damage our reputation, expose us to risk of loss or litigation and liability, subject us to regulatory penalties and sanctions, or cause consumers to lose confidence in us and choose to use the services of our competitors, any of which would have an adverse effect on our brands, market share, results of operations, and financial condition. Our efforts to protect information from unauthorized access have and could in the future result in the rejection or delay of legitimate attempts to book reservations through our services, which could result in lost
business. Additionally, our consumers' personal data has in the past and could in the future be affected by inadvertent disclosure to, or security breaches at, third parties upon which we rely. For example, we are currently assessing an inadvertent personal customer data disclosure to a limited number of marketing partners that was recently discovered by Booking.com. We have contracts that include confidentiality provisions with such partners and at this time do not believe the information was exposed beyond such partners, but are continuing to assess this matter.
We receive and store a large volume of personally identifiable data and payment information. The handling and storage of such data, as well as privacy rights of consumers, are subject to complex and evolving laws and regulations in numerous jurisdictions. While we invest significant resources to comply with regulations such as the European Union's (the "EU") General Data Protection Regulation (the "GDPR"), the California Consumer Privacy Act (the "CCPA"), the Personal Information Protection Law in the People's Republic of China, the Digital Personal Data Protection Act in India, and the EU Digital Markets Act ("DMA"), they are complex, subject to uncertain interpretation, and impose significant compliance obligations and costs on us. For example, under the GDPR violations could result in fines of up to 20 million Euros or up to 4% of the annual global revenues of the infringer, whichever is greater. In many cases, these laws apply not only to third-party transactions, but also to transfers of information between us and our subsidiaries, including employee information. These laws and their interpretations continue to develop and may be inconsistent from jurisdiction to jurisdiction. Some of these regulations, such as the CCPA, give consumers a private right of action against companies for alleged violations. Non-compliance with these laws could result in negative publicity, damage to our reputation, significant penalties, or other legal liability. If laws or regulations are expanded to require changes in our business practices, or interpreted in ways that negatively affect our business, our results of operations, financial condition, or competitive position could be adversely affected.
Cyberattacks, system vulnerabilities, or inadequate system capacity could lead to sustained service outages, data loss, reduced revenue, increased costs, liability claims, or harm to our competitive position.
If our systems cannot cope with the level of demand required to service our consumers and partners, we could experience unanticipated disruptions in service, slower response times, decreased customer service and customer satisfaction, and delays in the introduction of new services. We are dependent on the internet, connectivity, and mobile systems throughout the world. Disruptions in internet access could materially adversely affect our business and results of operations. While we maintain redundant systems and hosting services, they may not be sufficient to prevent interruptions. Moreover, while we maintain insurance policies to protect against potential losses caused by security breaches, our insurance policies may not be adequate to reimburse us for all losses caused by security breaches.
We have computer hardware for operating our services located in hosting facilities around the world. Although we have disaster recovery plans, these systems and operations are vulnerable to damage or interruption and they may not cover us in every region. If such events were to occur, we may not be able to recover our back-up systems immediately and it could result in lengthy interruptions or delays in our services. Any system failure that causes an interruption or delay in service could impair our reputation, damage our brands, increase customer service costs, or result in lost business, any of which could adversely affect our business and results of operations. We seek to improve the reliability and redundancy of our systems, however, these steps are expensive, may reduce our margins, and may not be successful in reducing the frequency or duration of unscheduled downtime.
We have experienced targeted and organized malware, phishing, and account takeover attacks, and may in the future experience these and other forms of attack such as ransomware, SQL injection (where a third party attempts to insert malicious code into our software through data entry fields in our websites in order to gain control of the system), and attempts to use our websites as a platform to launch a denial-of-service attack on another party. Our existing security measures have not always been, and in the future may not be, successful in preventing attacks on our systems. For instance, we have incurred costs related to customer reimbursement and customer service, reputational harm, and lost revenue from fictitious listings and account takeovers. Our existing IT business continuity and disaster recovery practices are less effective against certain types of attacks, which could result in interruption of our services, data exposure, and/or an extortion attempt. Reductions in the availability and response time of our online services could cause loss of substantial business volumes and measures we may take to divert suspect traffic could result in the diversion of bona fide customers. These issues are more difficult to manage during any expansion of the number of places where we operate and the variety of services we offer, and as the tools and techniques used in such attacks, such as Gen AI or similar technologies, become more advanced. We use advanced technology to identify cybersecurity threats; however, cyberattacks may go undetected for a period of time resulting in harm to our computer systems and the loss of data. This could result in regulatory fines, loss of consumers or partners, and reputational harm, among other costs. Successful attacks could result in significant interruptions to our operations, severe damage to our information technology infrastructure, negative publicity, reputational harm, and/or prevent consumers from using our services during the attack, any of which could cause consumers to use the services of our competitors, which would have a negative effect on the value of our brands, market share, business, and results of operations.
We use both internally-developed and third-party systems to operate our services, including transaction processing, order management, and financial and accounting systems. If the number of consumers using our services increases substantially, or if critical third-party systems stop operating as designed, we may need to repair, expand, replace, or upgrade our systems or infrastructure. If we are unable to meet demand in a timely manner, it could have a negative impact on our business. Many of our processes and systems are highly automated and involve multiple inputs from various IT systems, which can
mitigate the risk of human error but can also make testing, troubleshooting, and auditing more difficult. As a result, it may be difficult to quickly detect and correct errors embedded in these processes or systems.
Our business relies on a global supply chain of third party services providers and we are exposed to risks because we rely on the resilience, security, and legal compliance of their products and services.
We rely on third-party computer systems and third-party service providers, including GDSs and computerized central reservation systems of the accommodation, rental car, and airline industries in connection with providing some of our services. Any damage to, breach of, or interruption in these third-party services and systems or deterioration in their performance could prevent us from booking related reservations and have an adverse effect on our business, brands, and results of operations. Third party business partners, service providers, and consultants may be given access to our computer networks. A cyberattack against one of these third parties that compromises their credentials may result in unauthorized access to our systems and data, resulting in a cyberattack against us. Furthermore, our agreements with some third-party service providers do not provide recourse for service interruptions, and such service interruptions could have a negative impact on our business and results of operations.
Any publicized privacy and security problems could negatively affect consumers' willingness to use our services. Some of our business is conducted with third-party marketing affiliates, which may generate travel reservations through our infrastructure or through other systems. A security breach at any third party that we conduct business with could be perceived by consumers as a security breach of our systems and could result in negative publicity, subject us to notification requirements, damage our reputation, expose us to risk of loss or litigation, and subject us to regulatory penalties and sanctions, even if we had no direct involvement in the breach. In addition, such third parties may not comply with applicable disclosure or confidentiality requirements, or with parameters within which we permit them to process data, which could expose us to liability.
We depend upon various third parties to process payments, including credit cards, or to provide credit card numbers for payment for our merchant transactions. If any such third party were compromised or ceased or suspended operations, our cash flows could be disrupted or we may not be able to generate merchant transactions (and related revenues) for a period of time and this could have a negative effect on our revenues, business, reputation, and results of operations and, in certain cases (such as insolvency of a partner), the loss of the total transaction value.
Tax Risks
We may have exposure to additional tax liabilities.
As an international business providing services around the world, we are subject to various taxes. Although we believe that our tax filing positions are reasonable and comply with applicable law, we regularly review them and we may change our positions or determine that previous positions should be amended, either of which could result in additional tax liabilities. The final determination of tax audits or disputes may be different from what is reflected in our historical tax provisions and accruals. We have been audited in many taxing jurisdictions. If audits find that additional taxes are due, we may be subject to incremental tax liabilities, possibly including interest and penalties, which could have a material adverse effect on our results of operations, financial condition, and cash flows. An unfavorable outcome or settlement of pending litigation or audit proceedings could encourage the commencement of additional litigation, audit proceedings, or other regulatory inquiries.
Governments have sought to increase tax revenues, which has contributed to an increase in audit activity, more aggressive positions taken by tax authorities, more time and difficulty to resolve audits or disputes, and an increase in new tax legislation. Additional taxes or other assessments may be in excess of our current tax provisions or may require us to modify our business practices in order to reduce our exposure to additional taxes going forward, any of which could have a material adverse effect on our business, results of operations, and financial condition.
The U.S.'s Tax Cuts and Jobs Act (the "Tax Act") introduced a tax on 50% of global intangible low-taxed income ("GILTI"), which is income determined to be in excess of a specified routine rate of return on qualifying business assets. The Tax Act further introduced a base erosion and anti-abuse tax ("BEAT") aimed at preventing the erosion of the U.S. tax base and a new tax deduction with respect to certain foreign-derived intangible income. If we are unable to operate our business so that BEAT does not impact us, our effective tax rate, results of operations and cash flows would be adversely affected. The interpretation and implementation of the Tax Act have had and could have a negative impact on our results of operations and cash flows. In addition, the U.S.'s Inflation Reduction Act includes a 15% corporate minimum tax on book income and a 1% excise tax on stock repurchases. The interpretation and implementation of these provisions could have a negative impact on our results of operations and cash flows. Increases in the U.S. corporate income tax rate, increasing the percentage of GILTI subject to tax in the U.S., or other changes to U.S. federal tax laws could have a negative impact on our results of operations and cash flows.
Certain countries have unilaterally introduced a digital services tax to address the issue of multinational businesses carrying on business in their jurisdiction without a physical presence and therefore generally not being subject to income tax in those jurisdictions. These digital services taxes are calculated as a percentage of revenue rather than income or profits. The interpretation and implementation of the various, and at times inconsistent, digital services taxes could adversely impact our
results of operations and cash flows. Further, digital services taxes may not apply to our competitors, which could harm our business and competitive position.
Additionally, there have been significant changes made and proposed to international tax laws that increase the complexity, burden, and cost of tax compliance. The Organisation for Economic Co-operation and Development ("OECD") is focused on tax reform to ensure international tax standards keep pace with changes in global business practices, which could result in tax changes. We continue to monitor the impact of the OECD's tax reform initiatives as countries implement legislation and the OECD provides additional guidance. The implementation of these rules could have a negative impact on our results of operations or cash flows.
Due to the scale of our business activities outside of the U.S., changes in U.S. or international taxation of our activities, such as new definitions of permanent establishment, new nexus and profit allocation rules, or the combined effect of tax laws in multiple jurisdictions, may increase our worldwide effective tax rate, increase the complexity and costs associated with tax compliance, and adversely affect our cash flows and results of operations.
We are also subject to other non-income-based taxes, such as value-added, payroll, sales, use, excise, net worth, property, hotel occupancy, and goods and services. We refer generally to taxes on travel transactions (e.g., value-added taxes, sales taxes, excise taxes, hotel occupancy taxes, etc.) as "travel transaction taxes." Changing value-added tax regulation such as the VAT in the digital age proposal in the EU could increase complexity and costs associated with compliance. Additionally, from time to time, we are under audit or investigation by tax authorities or involved in legal proceedings related to these non-income-based taxes or we may revise our tax positions, which may result in additional non-income-based tax liabilities.
A number of jurisdictions in the U.S. have initiated lawsuits or other proceedings against OTCs, including us, related to, among other things, the payment of certain travel transaction taxes that could include historical taxes that are claimed to be owed, interest, penalties, punitive damages, and/or attorney's fees and costs. Additional jurisdictions may assert that we are subject to travel transaction taxes and could seek to collect such taxes, either retroactively, prospectively, or both. We continue to defend against these lawsuits and, where appropriate, intend to continue to assert that we should not be subject to such taxes. Although we believe we do not owe the taxes claimed in these lawsuits, litigation is uncertain, and if there was an adverse outcome in these lawsuits or similar litigation in other jurisdictions, it could result in liabilities for past and/or future bookings, and it could have an adverse effect on our business, reputation, profit margins, and results of operations. Jurisdictions could also seek to amend their tax statutes in order to collect travel transaction taxes from us on a prospective basis.
Additionally, jurisdictions have initiated, and may in the future initiate, legal proceedings against us and other OTCs related to the payment of certain travel transaction taxes (including historical or prospective taxes, interest, penalties, punitive damages, and/or attorney's fees and costs). Although we believe we do not owe the taxes claimed, litigation is uncertain and an adverse outcome could result in liabilities for past and/or future bookings, which could adversely affect our business, profit margins, and results of operations.
We may not be able to maintain our "Innovation Box Tax" benefit.
The Netherlands corporate income tax law provides that income generated from qualifying innovative activities is taxed at the rate of 9% ("Innovation Box Tax") rather than the Dutch statutory rate of 25.8%. A portion of Booking.com's earnings historically has qualified for Innovation Box Tax treatment.
In order to be eligible for Innovation Box Tax treatment, Booking.com must, among other things, apply for and obtain a research and development ("R&D") certificate from a Dutch governmental agency every six months confirming that the activities that Booking.com intends to be engaged in over the subsequent six-month period are "innovative." The R&D certificate is current but should Booking.com fail to secure such a certificate in any future period - for example, because the governmental agency does not view Booking.com's new or anticipated activities as innovative, the Innovation Box Tax benefit may be reduced or eliminated. Booking.com intends to apply for continued Innovation Box Tax treatment for future periods. However, Booking.com's application may not be accepted, or, if accepted, the amount of qualifying earnings may be reduced.
The loss or reduction of the Innovation Box Tax benefit could substantially increase our effective tax rate and adversely impact our results of operations and cash flows.
Legal, Regulatory, Compliance, and Reputational Risks
Our business is subject to various competition, consumer protection, and online commerce laws and regulations around the world, and as the size of our business grows, scrutiny of our business by legislators and regulators in these areas may intensify.
We are subject to competition and consumer protection laws and regulations around the world. These laws and regulations evolve, and their interpretation, application, and enforcement can also change, be unpredictable, or be affected by changing political or social pressures. As we expand our business into new areas, including building the Connected Trip vision, we may become subject to additional laws and regulations. We have been the subject of investigations or inquiries by national
competition authorities ("NCAs") and other governmental authorities. For example, we are involved in investigations related to whether certain of Booking.com's contractual parity arrangements with accommodation providers are anti-competitive because they require partners to provide Booking.com with rates, conditions, and availability at least as favorable as those offered to other OTCs or by the partner itself. In July 2024, the Comisión Nacional de los Mercados y la Competencia (the "CNMC") in Spain notified Booking.com of its decision to impose a fine and to restrict certain business practices based on the allegation that certain practices by Booking.com may produce adverse effects for hotels and other OTCs. Booking.com does not agree with the rationale stated in the decision and certain of the restrictions imposed, and has filed an appeal. In September 2017 the Swiss Price Surveillance Office opened an investigation that may require Booking.com to reduce its commissions in Switzerland. To resolve and close certain of these investigations, we have made commitments regarding future business practices or activities, such as agreeing to narrow the scope of our parity arrangements. While we believe that we are complying with the commitments we have made, investigating authorities or third parties may determine otherwise and decide to pursue legal action to compel compliance or seek other remedies. We cooperate with regulators but we are unable to predict what, if any, effect any investigations or their resolution, including the effect of any commitments we might make, will have on our business, industry practices, or online commerce more generally. An unfavorable outcome in an investigation could encourage additional regulatory inquiries that could become widespread over time, significantly increasing the potential financial and reputational impact on the Company. Additionally, these types of investigations can result and have resulted in the assessment of fines, private litigation, and negative publicity.
We have also been involved in investigations or inquiries involving consumer protection matters and we have previously made voluntary commitments to consumer authorities to resolve investigations or inquiries that have included showing prices inclusive of all mandatory taxes and charges, providing information about the effect of money earned on search result rankings, displaying certain sustainability-related information about accommodations, making adjustments to how discounts and statements concerning popularity or availability are shown to consumers, and displaying additional customer service details. To the extent that these or any other investigations or inquiries result in additional commitments, changes to our business practices, negative publicity, fines, damages from private litigation, or other remedies, it could have a material adverse effect on our business, financial condition, and results of operations.
There is significant legislative and public focus on the technology industry, especially as technology companies become larger. In some instances countries have passed legislation that goes further to restrict business activities than actions taken by NCAs or other regulatory authorities. The EU's Platform to Business Regulation regulates the relationship between online platforms such as Booking.com and European business users of online platforms. The DMA and DSA give regulators in the EU more instruments to investigate and regulate digital businesses and impose additional rules and requirements on platforms designated as "gatekeepers" under the DMA and online platforms more generally, with separate rules for "Very Large Online Platforms" ("VLOPs") under the DSA. As a result of our designation as a gatekeeper under the DMA and Booking.com's designation as a VLOP under the DSA, we are subject to additional rules and regulations that may not be applicable to our competitors. For example, Booking.com has implemented changes to address the DMA prohibition on parity arrangements in the European Economic Area and the requirements regarding the usage of data across services, which could adversely impact our business. As a gatekeeper, we also established an independent compliance function to monitor compliance with the DMA. Under the DSA, as a VLOP, Booking.com is required to collect more information from partners, which could disincentivize certain partners from using our services. Booking.com is also subject to additional scrutiny, obligations, and costs, such as payment of an annual supervisory fee, annual risk assessments and independent audits, and establishing an independent compliance function. The DMA and DSA each have significant penalties for non-compliance, and could lead to private litigation. Our compliance costs have increased in connection with becoming subject to the DMA and DSA, each of which remains subject to further interpretation and regulatory engagement, and could require additional changes to our products, business practices, and compliance activities in the future.
The EC designates VLOPs based on a platform's number of EU "monthly active recipients" ("MARs"). The EC requires counting users who display and to whom information was displayed (e.g., partners and consumers), even if a user does not make a transaction on the platform. The assessment of MARs and any other similarly published information by our brands represents an estimate based on the data available to us and limited guidance, and is subject to limitations. Any such estimate is published solely as required by applicable rules or regulations, may be inaccurate, and should not be used for any other purpose.
New state and federal laws and regulations could impact our services, require us to change our business practices, and impose additional complexity and costs. As market conditions change as a result of investigations, litigation, legislation, changing public perception of the industry, or political or social pressure, we may decide to modify our business practices beyond what is required, the full effects of which may not be known when making the decision, but which could harm our competitive position and adversely affect our business and results of operations.
With additional attention on the size of travel or technology companies generally, our size and market share may negatively affect our ability to obtain regulatory approval of proposed acquisitions or other opportunities, our ability to expand into complementary businesses, or our latitude in dealing with travel service providers (such as by limiting our ability to provide discounts, rebates, or incentives or to exercise contractual rights), any of which could adversely affect our business, results of operations, or ability to grow and compete.
Another area of potential regulatory inquiry involves contractual online search term bidding restrictions where one contracting party agrees not to bid on certain key search terms related to the other party (e.g., such other party's name). In some of our contracts, we or the other party have agreed to bidding restrictions. If bidding restrictions are held to be illegal or otherwise unenforceable or if we remove them from all of our contracts, it could negatively impact our performance marketing efficiency, business, and results of operations.
Regulatory and legal requirements and uncertainties could subject us to business constraints, increased compliance costs and complexities, or otherwise harm our business.
Legal requirements of governments and regulatory authorities, many of which are evolving and subject to revised interpretations, impact our ability to provide our services and can result in private litigation. For example, we currently offer optional rental car-related insurance products to customers protecting them against accidental damage to their rental vehicles, optional room and flight cancellation insurance products, and we intend to offer additional trip-related insurance products in the future, which subjects us to insurance distribution regulations and related increased compliance costs and complexities, any of which could negatively impact our business and results of operations. Increases in the number or complexity of the laws and regulations applicable to us and our businesses could increase our compliance costs and burdens and negatively affect our business and results of operations.
Laws in some countries relating to data localization, registration as a travel agent, and other local requirements could, if applicable to us, adversely affect our ability to conduct business in those countries. For example, in the EU and the United Kingdom (the "UK"), the Package Travel Directive and other local laws governing the sale of travel services (the "Package Directive") set out broad requirements such as local registration, certain mandatory financial guarantees, disclosure requirements, and other rules regulating the provision of single travel sales, travel packages, and linked travel arrangements, and certain liability for performance of the services. Some parts of our business are already subject to the broad scope of the Package Directive, and as our offerings continue to diversify and expand, we may become subject to additional requirements. Compliance with this directive could be costly and complex and, as a result of its requirements, we could choose to limit offerings that would otherwise be beneficial for the business. Further, the Package Directive is under legislative reform, and changes to its interpretation could be costly or complex, which may adversely affect our business, results of operations, and ability to grow and compete.
The implementation of unfavorable regulations or unfavorable interpretations of existing regulations by judicial or regulatory bodies could require us to incur significant compliance costs, cause the development of the affected markets to become impractical and otherwise have a material adverse effect on our business and results of operations. For example, Turkish courts have ruled that Booking.com is subject to certain registration requirements in order to offer domestic accommodations to Turkish residents. If the appeal of this decision is not successful, Booking.com would be subject to Turkish registration requirements in order to resume offering domestic accommodations to Turkish residents, which would continue to negatively impact our business.
Compliance with the legal requirements of multiple jurisdictions increases our cost of doing business. These laws and regulations, which sometimes conflict, include the U.S. Foreign Corrupt Practices Act, the UK Bribery Act, the DSA and DMA, and local laws prohibiting corrupt payments to governmental officials or third parties, data privacy requirements, emerging regulations governing the development, marketing, and use of AI, labor relations laws, non-discrimination, human rights or anti-human trafficking laws, tax laws, anti-trust or competition laws, U.S., EU, or U.N. sanctioned country or sanctioned persons mandates, and consumer protection laws. Violations of these laws and regulations have resulted and in the future could result in fines, penalties, and criminal sanctions against us, our officers, or our employees and prohibitions on how or where we conduct business. Violations could delay or prevent potential acquisitions and could materially damage our reputation, brands, global expansion efforts, ability to attract and retain employees and business partners, business, and operating results. Even if we comply with these laws and regulations, doing business in certain jurisdictions or violations of these laws and regulations by the parties with which we conduct business could harm our reputation and brands, which could adversely affect our results of operations and stock price. In addition, if these restrictions are not applicable to competitors, it may provide them a competitive advantage. Additionally, our employees in certain countries in Europe are represented by works councils and/or trade unions. We are required to consult with works councils on certain matters such as restructurings (such as our Transformation Program), acquisitions and divestitures, and other matters that could impact our labor force. Consultation may not be completed on terms satisfactory to us and could result in increases in our cost of labor, diversion of management's attention away from operating our business, delays in certain initiatives, and expose us to claims and litigation. We are also subject to a variety of other regulatory, legal, and public policy risks and challenges in managing an organization operating in various countries, including:
•additional complexity to comply with regulations in multiple jurisdictions, as well as overlapping or inconsistent legal regimes, in particular with respect to tax, labor, consumer protection, AI, digital content, advertising, promotions, privacy, sustainability, and competition laws;
•difficulties in transferring funds from or converting currencies in certain countries; and
•changes in social or political conditions or policies relating to a wide range of topics.
We have made efforts and expect to make further efforts to integrate access to travel services across our various brands. These changes add complexity to legal and tax compliance and our internal controls, and our size and operating history may increase the likelihood that we will be subject to regulatory scrutiny or audits by tax authorities.
There are various risks associated with the facilitation of payments, including risks related to fraud, compliance with evolving rules and regulations, and reliance on third parties.
Our results have been and will likely continue to be negatively impacted by consumer purchases made using fraudulent payment cards, claims the consumer did not authorize the purchase, or consumers who have closed bank accounts or have insufficient funds in their bank accounts to satisfy payments. We may be held liable for fraudulent transactions on our platforms, as well as other payment disputes. Accordingly, we calculate and record an allowance for resulting chargebacks. If we are unable to successfully implement and evolve measures to detect and reduce the risk of fraud on our platforms, our business, profit margins, results of operations, and financial condition could be materially adversely affected.
We process many of our transactions on a merchant basis where we facilitate payments from travelers through payment cards and other payment methods. While processing transactions on a merchant basis allows us to offer a variety of payment methods and flexible transaction terms, we incur additional payment processing costs (which are typically higher for foreign currency transactions) and other costs related to these transactions, such as costs related to fraudulent payments and transactions and fraud detection. These costs may increase as we expand our payments services to consumers and partners, and our results of operations and profit margins could be materially adversely affected.
As a greater percentage of our transactions involve us processing payments, our global systems and processes must be managed on a larger scale, which adds complexity, administrative burdens and costs, and increases the demands on our systems and controls, which could adversely affect our results of operations. In addition, as our payment processing activities develop or expand into different geographies, we expect to be subject to additional regulations, including financial services and export controls regulations, which we expect to result in increased compliance costs and complexities, including those associated with the implementation of new or advanced internal controls. Compliance with and implementation of the EU's Payment Services Directive 2 and similar or successor legislation such as the EU's Payment Services Directive 3 and Payment Services Regulations may be difficult to adhere to in a timely manner, result in increased compliance costs, and be administratively burdensome, any of which could negatively impact our business and results of operations.
Regulators (or we) may determine, and in some cases are likely to determine, that certain aspects of our business are subject to laws that govern payments activities, such as money transmission and online payments processing, which could require us to obtain licenses to continue to operate in certain jurisdictions or result in modification or interruption of our business plans, which would negatively impact our business and results of operations. Certain of our subsidiaries that may provide payment services in support of our brands are subject to licensing and regulations that impose notice and approval obligations on investors that seek indirect or direct ownership, in the aggregate, of 10% or more of our outstanding shares. Regulations relating to operational resilience, including the EU's Digital Operations Resilience Act, banking (including consumer protection), privacy, and security of our processes also apply to us. Further, our payments systems are susceptible to illegal and improper uses, including money laundering, terrorist financing, fraudulent sales of goods or services, and transactions by or with sanctioned parties. We have invested and will need to continue to invest substantial resources to comply with applicable laws and regulations, and failure to maintain compliance with applicable licensing, payment services, customer fund safeguarding, or related regulations could lead to fines, which could be significant, or require us to modify or interrupt our business practices, plans, or operations, any of which could negatively impact our business, results of operations, and profit margins.
We are also subject to payment card association rules and obligations under our contracts with the card schemes and our payment card processors, and indirectly to the rules of payment systems in respect of credit (i.e., account to account) transfers. The rules of the card schemes and payment systems are often updated or interpreted in different ways, and we may need to adjust our systems and/or processes to comply with any updated obligations. If we fail to comply with such obligations, we may be fined, required to pay additional processing fees, lose our ability to accept certain credit and debit card payments from our customers, or facilitate other types of online payments, any of which would negatively impact our business, operating results, and profit margins. Under card association rules, including the Payment Card Industry Data Security Standard (the "Standard"), if information is compromised, we could be liable to payment card issuers for associated expenses and penalties, and in some cases, we could be restricted in our ability to accept payment cards. Under certain circumstances in our agreements with the card schemes and in relation to the Standard, we are also subject to periodic audits, self-assessments, and other assessments of our compliance with the rules and obligations of the payment card associations and the Standard, which could result in additional expenses and administrative burdens. In addition, if we fail to follow payment card industry security standards, even if no consumer information is compromised, we could incur significant fines or experience a significant increase in payment card transaction costs. Compliance with the Standard may not prevent all security incidents.
We rely on banks, card schemes, and other payment processors to execute certain components of the payments process. For inbound payments, we pay these third parties interchange and other processing and gateway fees to facilitate payments from consumers to travel service providers. If we are unable to maintain our relationships with these third parties on favorable terms, fees are increased, or if we provide security, our profit margin, business, and results of operations could be harmed. Additionally, if these third parties experience service disruptions or if they cease operations, consumers and travel
service providers could have difficulty making or receiving payments, which could adversely impact our reputation, business, and results of operations.
In addition, in the event that one of our major travel service providers declares bankruptcy or otherwise ceases or limits operations, we could experience an increase in chargebacks from customers with travel reservations with such travel service provider and we could experience financial loss from certain prepayments made to such travel service provider if we are not able to recover the prepayments.
We face risks related to our intellectual property.
We regard our intellectual property as important to our success, and we rely on intellectual property such as trademarks, copyrights, patents, and trade secrets to support our business as well as domain names or other intangible rights or property secured through purchase, licensing or other agreements with our employees, travel service providers, partners, and other parties. We have filed applications for protection of certain aspects of our intellectual property in the U.S. and other jurisdictions, and we currently hold a number of issued patents in several jurisdictions. In the future we may acquire additional intellectual property portfolios, which could require significant cash expenditures. We have licensed in the past, and may license in the future, certain of our proprietary rights, such as trademarks or copyrighted material, to third parties, and these licensees may take actions that diminish the value of our proprietary rights or harm our reputation. We also have procured various intellectual property licenses from third parties. Additionally, we periodically use open source software in connection with our software development, which use could subject us to claims of ownership from other parties of what we believe to be open source software or non-compliance with open source licensing terms, or require us to disclose our proprietary source code. Further, there is uncertainty about the validity and enforceability of intellectual property rights related to our use of Gen AI. Effective intellectual property protection may not be available in every country in which our services are made available, particularly in certain jurisdictions in which we operate in which theft of intellectual property may be more prevalent. We may be required to expend significant time and resources to prevent infringement or to enforce our intellectual property rights.
We endeavor to defend our intellectual property rights diligently, but intellectual property litigation is expensive and time-consuming, and may divert managerial attention and resources from our business objectives. We may not be able to successfully defend our intellectual property rights or our intellectual property rights may not be sufficient to effectively protect our business, which could adversely affect our business, brands, and results of operations.
From time to time, in the ordinary course of our business, we may be subject to legal proceedings and claims relating to the intellectual property rights of others, and we expect that third parties will continue to assert intellectual property claims against us. Successful infringement claims against us could result in a significant monetary liability and/or prevent us from operating our business, or require us to change business practices or develop non-infringing alternatives, which could require significant effort and expense. In addition, resolution of claims may require us to obtain licenses to intellectual property rights belonging to third parties, which may be expensive to procure, or require us to cease using those rights altogether. Any of these events could have an adverse effect on our business, results of operations, and financial condition.
We face risks relating to our environmental, social, and governance ("ESG") objectives, including climate-related commitments we have made that require us to invest effort, resources, and management time, and failing to meet those objectives may adversely impact our reputation, employee retention, and willingness of customers and partners to do business with us.
In response to focus by our investors and other stakeholders, we made climate-related commitments and issued a Climate Action Plan. We continue to evaluate these commitments, including those related to offering more sustainable trip options as well as ESG disclosures that may be required in certain jurisdictions. Our ability to do so is subject to risks including: (1) the availability and cost of limiting or offsetting our use of carbon-based energy sources and technologies, (2) evolving regulatory requirements affecting ESG standards and disclosures, (3) our ability to work with partners and providers that can meet our sustainability and other standards, (4) the availability of vendor or other third-party data, (5) the impact of our organic growth and acquisitions or dispositions of businesses or operations on our ESG goals, and (6) customers' actual demand for ESG-oriented product offerings, which may be more expensive and less available than other options. We may need to invest significant effort and resources relating to required ESG disclosures, and inconsistent and uncertain regulations may lead us to revise or discontinue our commitments or how we measure and report ESG data. In addition, regulatory developments regarding sustainability labeling have resulted and could result in further changes to, or the discontinuation of, ESG programs or objectives.
If our ESG practices and disclosures do not meet evolving investor or other stakeholder expectations or regulatory requirements, then our reputation, ability to attract or retain employees, and our attractiveness as an investment or business partner could be negatively impacted. Similarly, our failure or perceived failure to pursue or fulfill our ESG-related objectives or to satisfy increasingly broad reporting obligations could expose us to government enforcement actions, private litigation, and actions by stockholders or stakeholders, and adversely impact our business, brands, or reputation.
Regulations and policies impacting the way corporations use cookies and other online tracking technologies could negatively impact the way we do business.
There are several privacy-driven initiatives that are changing the collection and use of consumer data in the digital marketing ecosystem. These include: requirements by browsers such as Safari and Google Chrome to require opt-in consent for third-party cookies; restrictions on the use of the identifier for advertisers (such as the Apple "IDFA") by mobile device manufacturers; Apple's iCloud+ Private Relay (which hides a user's IP address from websites that the user accesses in favor of other IP addresses provided by Apple's partners); and the adoption of regulations that govern the use of cookies. For example, in the EU, the ePrivacy Directive regulates the use of cookies and similar technologies, including limitations on the use of data and guidelines for enabling users to accept or reject cookies. Authorities may assert, and in some cases are likely to determine, that our collection, use, or management of customer and other data is inconsistent with laws and regulations, including laws that apply to cookies or similar technology, and there may be significant penalties for non-compliance. In the EU, the ePrivacy Directive is implemented in national laws as a result of which different interpretations and requirements apply on a country by country basis. EU regulators continue to issue guidance concerning the ePrivacy Directive's requirements regarding the use of cookies and similar technologies and may impose specific measures which could impact our use of such technologies. In addition, the ePrivacy Directive and national implementation laws impose additional limitations on the use of data across messaging products and include significant penalties for non-compliance. In the U.S., disclosure requirements and limitations may apply to the use of certain cookies and other online tracking technologies deemed to be sales of personal information under the CCPA or other state laws. If these initiatives or regulations impair our ability to serve customers or if we are less effective than our competitors in addressing these issues, our ability to improve performance on our platforms, business, market share, and results of operations could be adversely affected. Further, failure or perceived failure to comply with evolving privacy regulations, guidance, and interpretations could result in significant fines, government enforcement actions, private litigation, and harm to our business, results of operations, or reputation.
Financial Risks
Our liquidity, credit ratings, and ongoing access to capital could be materially and negatively affected by global financial conditions and events.
Our continued access to sources of liquidity depends on multiple factors, including global economic conditions, the condition of global financial markets, the availability of sufficient amounts of financing, our ability to meet debt covenant requirements, our operating performance, and our credit ratings. Increased volatility in financial and securities markets will generally make access to capital less certain. Further, if our credit ratings were to be downgraded or if financing sources were to ascribe higher risk to our rating levels, our industry or us, our access to capital and the cost of any financing would be negatively impacted. We currently have $2 billion available under our revolving credit facility, which contains certain financial covenants that we need to comply with in order to access such liquidity. There can be no assurance that we will be able to meet the covenant requirements at any particular time. The lenders have the right to require repayment of any amounts borrowed under the facility if we are not in compliance.
There is no guarantee that additional debt financing will be available in the future on commercially reasonable terms or at all, in which case we may need to seek other sources of funding. In addition, the terms of future debt agreements could include more restrictive covenants, which could restrict our business operations.
We are exposed to fluctuations in foreign currency exchange rates.
We conduct a substantial majority of our business outside the U.S. but we report our results in U.S. Dollars. As a result, we face exposure to movements in foreign currency exchange rates as the financial results of our businesses outside of the U.S. are translated from local currency (principally Euros and British Pounds Sterling) into U.S. Dollars. When the U.S. Dollar strengthens against other currencies in which we transact, our foreign-currency-denominated net assets, gross bookings, revenues, operating expenses, and net income are lower as expressed in U.S. Dollars. When the U.S. Dollar weakens against other currencies in which we transact, our foreign-currency-denominated net assets, gross bookings, revenues, operating expenses, and net income are higher as expressed in U.S. Dollars. Foreign currency exchange rate fluctuations on transactions denominated in currencies other than the functional currency result in gains and losses that are reflected in our financial results.
Significant fluctuations in foreign currency exchange rates can affect consumer travel behavior. Consumers traveling from a country whose currency has weakened against other currencies may book lower ADR accommodations, choose to shorten or cancel their international travel plans, or choose to travel domestically rather than internationally, any of which could adversely affect our gross bookings, revenues, and results of operations.
Our stock price is highly volatile.
The market price of our common stock is highly volatile and subject to fluctuations in response to factors such as:
•financial or operating results that vary from expectations, changes in expectations as to our future financial or operating performance, or changes in our capital structure;
•worldwide political and economic conditions, including the effects of inflation, changes in interest rates, market volatility, or fluctuations in foreign currency exchange rates, particularly between the U.S. Dollar and the Euro;
•occurrence of a significant security breach or business interruption;
•impact of our share repurchase and dividend programs;
•changes in market valuations of other technology, e-commerce, or travel companies, or announcements of significant business or operational changes by us or our competitors;
•initiation of significant litigation or regulatory proceedings against us or adverse developments in pending proceedings;
•lack of success in expanding our business; and
•additions or departures of key personnel.
Sales of a substantial number of shares of our common stock could adversely affect the market price of our common stock by introducing a large number of sellers or short sellers to the market. In addition, fluctuations in our stock price and our price-to-earnings multiple may have made or may make our stock attractive to momentum, hedge, or day-trading investors ,which could exacerbate price fluctuations.
The market for technology stocks or the stock market in general has experienced extreme price and volume fluctuations, which has caused, and may cause in the future, a decrease in the market price of our common stock due to a number of factors, many of which are out of our control. To the extent that the public's perception of the prospects of technology, e-commerce, or travel companies is negative, our stock price could decline, regardless of our operating results or financial performance.
In the past, we have been a defendant in securities class action litigation. If our stock price declines or is volatile, it could increase the chances that we become the target of securities class action litigation, which could result in substantial costs and divert management's attention and resources, either of which could adversely affect our business, financial condition, and results of operations.
We face increased risks if the level of our debt increases.
We have a substantial amount of outstanding indebtedness and we may incur substantial additional indebtedness in the future. Our outstanding indebtedness and any additional indebtedness we incur may have significant consequences, which may be amplified if our cash flow and earnings decrease, and could include:
•requiring the dedication of a portion of our cash flow from operations to service our indebtedness, thereby reducing the amount of cash flow available for other purposes;
•increased vulnerability to downturns in our business, competitive pressures, and adverse changes in general economic and industry conditions, and less flexibility when planning for or reacting to changes in our business and industry; and
•decreased or lost ability to obtain additional financing on terms acceptable to us.
Our ability to make payments of principal and interest on our indebtedness depends upon our future performance, which is subject to many factors beyond our control. Further, we may not have access to equity or debt markets or other sources of financing, or such financing may not be available to us on commercially reasonable terms, to repay or refinance our debt as it comes due or, in the case of our convertible notes, upon conversion. Our ability to make share repurchases and the payment of dividends rely on our access to capital, which depends on cash flow generated by our business and the availability of financing.
The value of our investments could decline, which could adversely affect our financial condition and results of operations.
We maintain an investment portfolio, which typically includes marketable debt securities and equity securities of publicly-traded companies, the values of which are subject to market price volatility, and investments in private entities. Credit losses, impairments, and changes in the fair values of our investments could be volatile and they have had, and are likely to continue to have, a significant impact on our quarterly net income (or loss).
Our investments in private entities are inherently risky in that such companies are typically at an early stage of development, may have no or limited revenues, may not be or ever become profitable, may not be able to secure additional funding, or their technologies, services, or products may not be successfully developed or introduced to the market. Further, our ability to liquidate any such investments is typically dependent on a liquidity event as no public market exists for such securities. Valuations of privately-held entities are inherently complex and uncertain due to the lack of a liquid market for such securities. If we determine that any of our equity investments in such companies have experienced a decline in value, we are required to recognize the change in the Consolidated Statements of Operations. For investments classified as debt securities, any decline in value attributed to credit losses is also recognized in the Consolidated Statements of Operations. We could lose the full amount of any of our investments, and impairment of our investments have previously and could in the future have a material adverse effect on our financial condition and results of operations.
Item 1B. Unresolved Staff Comments
None.
Item 1C. Cybersecurity
We are dedicated to managing cybersecurity, privacy, and data protection and security risks. We employ various tools, processes, technologies, and controls to identify and manage such risks.
Identifying, assessing, and managing cybersecurity risk is generally integrated into our overall risk management processes. The Company's internal audit function, with primary oversight by the Audit Committee, assesses key risks facing the organization, which are reviewed and discussed by the Company's management-level risk committee (a multi-disciplinary committee including representation from senior management in the finance, internal audit, and legal functions, among others). The risk committee is tasked with ensuring risks, including those related to cybersecurity, are managed and aligning strategic objectives with an appropriate level of risk tolerance.
The Cyber Risk Management Policy (the "Policy") establishes the framework for our cybersecurity risk management and governance. Our security teams operationalize the Policy across the Company and conduct cyber risk identification, assessment, management, and reporting. Our privacy teams are responsible for identifying, assessing, managing, and reporting on data protection risks. We leverage the National Institute of Standards and Technology (NIST) frameworks for cybersecurity and privacy. We annually measure our security and privacy program maturity against the NIST frameworks, and engage a third-party every other year to assess the current state against these frameworks. The results of these assessments are discussed with the Board and the Cybersecurity Subcommittee of the Audit Committee.
As part of the Company's risk management strategy, we require that all employees complete regular data security and privacy trainings, and conduct phishing tests and specialized training such as secure coding training for our developers.
Our security teams have established procedures for identifying, assessing, and managing, cybersecurity incidents. A cross-functional working group of security, privacy, and legal personnel review potentially significant incidents. If an incident could be deemed material, it is escalated, and we consult with outside counsel as appropriate.
Our internal audit function performs its own cybersecurity and privacy audits and reviews certain related practices as part of their assessment of our internal control over financial reporting. From time to time we have taken steps to improve our practices and remedy deficiencies that have been identified. Our enterprise-wide information security program is also independently assessed every other year by a third party as part of our enterprise risk management, and the Cybersecurity Subcommittee reviews the findings.
We rely on certain third-party computer systems and third-party service providers, including global distribution systems ("GDSs") and computerized central travel reservation systems in connection with providing some of our services. We also depend upon various third parties to process payments for certain transactions. These third-party business partners, service providers, and consultants need to access our customer and other data, and connect to our computer networks. We define confidentiality, security, and privacy requirements through our contracting processes and perform third-party cyber risk assessments to monitor such third parties as needed.
Although we expend significant resources to protect against security breaches, our existing security measures have not been and may not be successful in preventing all attacks. We have experienced cybersecurity incidents and threats, including malware, phishing, account takeover attacks, denial-of-service attacks, and inadvertent disclosures of data. We do not believe these cybersecurity incidents have had a material adverse effect on our Company, including our business strategy, results of operations, or financial condition. However, the cybersecurity threat environment is increasingly challenging, and we, along with the entire digital ecosystem, face a constant and increasing threat. For further discussion, see Part I, Item 1A, Risk Factors - "Information Security, Cybersecurity, and Data Privacy Risks."
Governance
The Board and Audit Committee are responsible for oversight related to cybersecurity, privacy, and data protection and security. The Cybersecurity Subcommittee of the Audit Committee oversees management's efforts and processes to identify, assess, and manage significant cybersecurity and privacy risks and regulatory developments in this area. The cybersecurity and privacy leaders meet with the Cybersecurity Subcommittee to discuss the Company's cybersecurity and data protection risk exposures, including steps management has taken to assess and manage such exposures and their potential impact on the Company's business, operations, and reputation. The Cybersecurity Subcommittee reports periodically on these matters to the Audit Committee and the Board.
The individuals serving in the roles of chief security officer and chief privacy officer have enterprise-wide responsibility for assessing and managing cybersecurity, data protection and security, and privacy risks, respectively. These leaders collectively have over 25 years of relevant work experience in public companies and extensive industry expertise.
Item 2. Properties
We lease office space facilities for our corporate headquarters in Norwalk, Connecticut, United States of America. We lease additional space, including office space and data center facilities in various locations around the world, to support our operations, the largest being the headquarters of our Booking.com business in Amsterdam, Netherlands.
We believe that our existing facilities are adequate to meet our current requirements, and that suitable additional or substitute space will be available as needed to accommodate any further expansion of operations.
Item 3. Legal Proceedings
A description of any material legal proceedings to which we are a party is included in Note 16 to our Consolidated Financial Statements included in this Annual Report on Form 10-K for the year ended December 31, 2024, and is incorporated into this Item 3 by reference.
Item 4. Mine Safety Disclosures
Not applicable.
PART II
Item 5. Market for Registrant's Common Equity, Related Stockholder Matters and Issuer Purchases of Equity Securities
Common Stock
Our common stock is quoted on the NASDAQ Global Select Market under the symbol "BKNG."
Holders
At February 13, 2025, there were approximately 111 shareholders of record of Booking Holdings Inc.'s common stock.
Dividend Policy
On January 25, 2024, our Board of Directors (the "Board") adopted a dividend policy pursuant to which we intend to pay quarterly cash dividends on our common stock. Declaration of dividends pursuant to the policy will be subject to the Board's consideration of, among other things, our financial performance, cash flows, capital needs, and liquidity.
Pursuant to the dividend policy, cash dividends of $1.2 billion were paid during the year ended December 31, 2024 and in February 2025, the Board declared a cash dividend of $9.60 per share of common stock, payable on March 31, 2025 to stockholders of record as of the close of business on March 7, 2025.
Performance Measurement Comparison
The following graph shows the total stockholder return through December 31, 2024 of an investment of $100 in cash on December 31, 2019 for our common stock and an investment of $100 in cash on December 31, 2019 for (i) the NASDAQ Composite Index, (ii) the Standard and Poor's 500 Index, and (iii) the Research Data Group ("RDG") Internet Composite Index. The RDG Internet Composite Index is an index of stocks representing the internet industry, including internet software and service companies and e-commerce companies. Historic stock performance is not necessarily indicative of future stock price performance. All values assume reinvestment of the full amount of all dividends and are calculated as of the last day of each month:
| | | | | | | | | | | | | | | | | | | | | | | | | | |
Measurement Point
December 31 | | Booking Holdings Inc. | | NASDAQ
Composite Index | | S&P 500
Index | | RDG Internet
Composite |
| | | | | | | | |
| 2019 | | 100.00 | | | 100.00 | | | 100.00 | | | 100.00 | |
| 2020 | | 108.45 | | | 144.92 | | | 118.40 | | | 137.32 | |
| 2021 | | 116.82 | | | 177.06 | | | 152.39 | | | 134.41 | |
| 2022 | | 98.13 | | | 119.45 | | | 124.79 | | | 81.50 | |
| 2023 | | 172.72 | | | 172.77 | | | 157.59 | | | 118.93 | |
| 2024 | | 244.06 | | | 223.87 | | | 197.02 | | | 158.48 | |
Issuer Purchases of Equity Securities
The following table sets forth information relating to repurchases of our equity securities during the three months ended December 31, 2024 (in billions, except share and per share data):
ISSUER PURCHASES OF EQUITY SECURITIES
| | | | | | | | | | | | | | | | | | | | | | | | | | | | | | | | |
| Period | | Total Number
of Shares
(or Units)
Purchased | | Average Price Paid per Share (or Unit) (1) | | Total Number of
Shares (or Units)
Purchased as Part of
Publicly Announced
Plans or Programs | | Maximum Number (or
Approximate Dollar Value)
of Shares (or Units)
that May Yet Be
Purchased Under the
Plans or Programs | | |
| October 1, 2024 – | | 106,814 | | (2) | $ | 4,306 | | | 106,814 | | | $ | 8.3 | | | (2) |
| October 31, 2024 | | 100 | | (3) | $ | 4,367 | | | N/A | | N/A | | |
| | | | | | | | | | |
| November 1, 2024 – | | 68,062 | | (2) | $ | 4,995 | | | 68,062 | | | $ | 8.0 | | | (2) |
| November 30, 2024 | | 3,151 | | (3) | $ | 4,912 | | | N/A | | N/A | | |
| | | | | | | | | | |
| December 1, 2024 – | | 61,465 | | (2) | $ | 5,127 | | | 61,465 | | | $ | 7.7 | | | (2) |
| December 31, 2024 | | 251 | | (3) | $ | 5,100 | | | N/A | | N/A | | |
| Total | | 239,843 | | | | | 236,341 | | | $ | 7.7 | | | |
(1) These amounts exclude the 1% excise tax mandated by the Inflation Reduction Act on share repurchases.
(2) Pursuant to a stock repurchase program announced on February 23, 2023, whereby we were authorized to repurchase up to $20 billion of our common stock.
(3) Pursuant to a general authorization, not publicly announced, whereby we are authorized to repurchase shares of our common stock to satisfy employee withholding tax obligations related to stock-based compensation. The table above does not include adjustments during the three months ended December 31, 2024 to previously withheld share amounts (reduction of 40 shares) that reflect changes to the estimates of employee tax withholding obligations.
Item 6. [Reserved]
Item 7. Management's Discussion and Analysis of Financial Condition and Results of Operations
The following discussion should be read in conjunction with our Consolidated Financial Statements and accompanying notes.
We evaluate certain operating and financial measures on both an as-reported and constant-currency basis. We calculate constant currency based on the predominant transactional currency in each country, converting our current year results in currencies other than U.S. Dollars using the corresponding prior year monthly average exchange rates.
Overview
Our mission is to make it easier for everyone to experience the world. We aim to provide consumers with a best-in-class experience offering the travel choices they want, with tailored planning, payment, language, and other options, seamlessly connecting them with our travel service provider partners. We offer these services through five primary consumer-facing brands: Booking.com, Priceline, Agoda, KAYAK, and OpenTable. See Notes 1 and 17 to our Consolidated Financial Statements for information on our operating segments and revenue by geographic area.
We derive substantially all of our revenues from enabling consumers to make travel service reservations. We also earn revenues from advertising services, restaurant reservation and management services, travel-related insurance offerings, and other services.
Trends
Our global room nights in 2024 increased 9% year-over-year driven primarily by healthy travel demand in Europe and Asia. We saw the booking window expand in 2024 compared to 2023, which benefited year-over-year room night growth.
Our global room nights in the fourth quarter of 2024 were 13% higher than the fourth quarter of 2023 which was negatively impacted by the Israel-Hamas war. When excluding room nights from bookers in Israel in each comparable period, our overall room nights in the fourth quarter of 2024 increased 12% year-over-year. When excluding room nights from bookers in Israel in each comparable period, our overall room nights for the full year 2024 increased 9% year-over-year.
Quarterly Room Nights and Change versus the prior year
Full Year Room Nights and Change versus the prior year
The cancellation rate in 2024 was in line with the prior year. Because we recognize revenues from bookings when the traveler checks in, our reported revenues are not at risk of being reversed due to cancellations. Increases in cancellation rates can negatively impact our marketing efficiency as a result of incurring performance marketing expenses at the time a booking is made even though that booking could be canceled in the future if it was booked under a flexible cancellation policy.
In 2024, our global average daily rates ("ADRs") on a constant currency basis were about in line with the prior year. Our global ADRs were negatively impacted by a higher mix of room nights from Asia, which is a lower ADR region. Excluding the changes in regional mix, our global ADRs on a constant currency basis increased year-over-year by about 1%. It is difficult to predict what the trend in industry ADRs will be in the future.
We focus on relentless innovation to grow our business by providing a best-in-class user experience with intuitive, easy-to-use online platforms that aim to exceed the expectations of consumers. We have a long-term strategy to create an ideal traveler experience, offering our customers relevant options and connections at the times and in the language they want them, making trips booked with us seamless, easy, and valuable. We refer to this as the "Connected Trip." The goal of our Connected Trip vision is to offer a differentiated and personalized online travel planning, booking, payment, and in-trip experience for each trip, enhanced by a robust loyalty program that provides value to travelers and partners across all trips. We believe these efforts will help improve traveler loyalty, frequency, and mix of direct bookings over time. We believe these improvements will benefit revenue growth and marketing efficiency in the future, however, to the extent our non-accommodation services have lower margins and increase as a percentage of our total business, our operating margins may be negatively affected.
Our mobile app is an important platform for experiencing the Connected Trip since the app travels with the traveler. The mix of our room nights booked on a mobile app in 2024 was a low-fifties percentage, up from a high-forties percentage in 2023. The significant majority of room nights booked on our mobile apps are direct, and we continue to see favorable repeat direct booking behavior from consumers in our mobile apps, which allow us more opportunities to engage directly with consumers. The revenues earned on a transaction on a mobile app may be less than a typical desktop transaction as we see different consumer purchasing patterns across devices. For example, accommodation reservations made on a mobile app typically are for shorter lengths of stay and have lower accommodation ADRs.
As part of our strategy to provide more payment options to consumers and travel service providers, increase the number and variety of our accommodations, and enable our long-term Connected Trip strategy, Booking.com increasingly processes transactions on a merchant basis, where it facilitates payments from travelers for the services provided. This allows Booking.com to process transactions for travel service providers and to increase its ability to offer secure and flexible transaction terms to consumers, such as the form and timing of payment. We believe that expanding these types of service offerings will benefit consumers and travel service providers, as well as our gross bookings, room night, and earnings growth rates. However, this results in additional expenses for personnel, payment processing, chargebacks (including those related to fraud), and other expenses related to these transactions, which are recorded in "Personnel" expenses and "Sales and other expenses" in our Consolidated Statements of Operations, as well as associated incremental revenues (e.g., payment card rebates), which are recorded in "Merchant revenues." To the extent more of our business is generated on a merchant basis, we incur a greater level of these merchant-related expenses, which negatively impacts our operating margins despite increases in associated incremental revenues. In 2024, the incremental revenues from facilitating payments were greater than the associated incremental variable expenses. The mix of our total gross bookings generated on a merchant basis was 63% in 2024, an increase from 54% in 2023.
We have established widely-used and recognized brands through marketing and promotional campaigns. Our total marketing expenses, which are comprised of performance and brand marketing expenses that are substantially variable in nature, were $7.3 billion in 2024, up 7% versus 2023 as a result of the year-over-year growth in travel demand and our efforts to invest in marketing. Our performance marketing expenses, which represent a substantial majority of our marketing expenses, are primarily related to the use of online search engines (primarily Google), affiliate marketing, meta-search, and social media channels to generate traffic to our platforms. Our brand marketing expenses are primarily related to costs associated with producing and airing digital branding and television advertising.
Marketing efficiency, expressed as marketing expenses as a percentage of gross bookings, and performance marketing returns on investment ("ROIs") are impacted by a number of factors that are in some cases outside of our control. Such factors include ADRs, costs per click, cancellation rates, foreign currency exchange rates, our ability to convert paid traffic to booking customers, and the timing and effectiveness of our brand marketing campaigns. In recent years, we observed periods of stable or increasing ROIs. Although it is difficult to predict how ROIs will change in the future, ROIs could be negatively impacted by increased levels of competition and other factors. When evaluating our performance marketing spend, we typically consider several factors for each channel, such as the customer experience on the advertising platform, the incremental traffic we receive, and anticipated repeat rates. Marketing efficiency can also be impacted by the extent to which consumers come directly to our platforms for bookings. The mix of our total room nights booked by consumers coming directly to our platforms was a mid-fifties percentage in 2024, and was a higher percentage of room nights if we exclude the room nights booked through affiliate programs (i.e., business-to-business). Both of these percentages increased year-over-year, which benefited our marketing efficiency versus 2023. See Part I, Item 1A, Risk Factors - "We face risks relating to our marketing efforts" and "We are dependent on travel service providers, restaurants, search platforms, and other third parties."
Booking.com had approximately 4.0 million total properties on its website at December 31, 2024, representing an increase from approximately 3.4 million total properties at December 31, 2023. At December 31, 2024, the total properties on Booking.com's website consisted of approximately 3.5 million alternative accommodation properties (including homes, apartments, and other unique places to stay) and approximately 500,000 hotels, motels, and resorts.
The mix of Booking.com's room nights booked for alternative accommodation properties in 2024 was approximately 35%, up versus approximately 33% in 2023. We have observed a longer-term trend of an increasing mix of room nights booked for alternative accommodation properties as consumer demand for these types of properties has grown, and as we have increased the number and variety of these properties on Booking.com. We may experience lower profit margins due to additional costs, such as increased customer service or certain partner related costs, related to offering alternative accommodations. As our alternative accommodation business has grown, these different characteristics have negatively impacted our profit margins and this trend may continue.
Although we believe that providing an extensive collection of properties, excellent customer service, and an intuitive, easy-to-use consumer experience are important factors influencing a consumer's decision to make a reservation, for many consumers, the price of the travel service is the primary factor determining whether to book. Discounting and couponing (i.e., merchandising) occurs across the major regions in which we operate, particularly in Asia. In some cases, our competitors are willing to make little or no profit on a transaction or offer travel services at a loss in order to gain market share. As a result, it is important to offer travel services at a competitive price, whether through discounts, coupons, closed-user group rates or loyalty programs, increased flexibility in cancellation policies, or otherwise. These initiatives have resulted and, in the future, may result in lower ADRs and lower revenues as a percentage of gross bookings.
Over the long term, we intend to continue to invest in marketing and promotion, technology, and personnel, as well as exploring strategic alternatives such as acquisitions, within parameters consistent with efforts to improve long-term operating results. To create room for these investments, we intend to continue to look for ways to optimize our expenses.
In November 2024, we announced our intention to implement certain organizational changes, including modernizing processes and systems, initiating an expected workforce reduction, optimizing procurement, and seeking real estate savings (the "Transformation Program"). We believe it is important to make these organizational changes in order to drive further expense efficiency, create room for reinvestment in projects and initiatives that will support the growth of our business over the long run, and further improve our organizational agility. We expect the Transformation Program to ultimately deliver about $400 to $450 million in annual run rate savings over the next three years as compared to our 2024 expense base. We are in the early stages of this program and we expect the majority of the run rate savings to be achieved after 2025. We expect that restructuring costs and accelerated investments related to the Transformation Program will be incurred in the next two to three years and are estimated to be, in the aggregate, approximately one times the expected annual run rate savings.
Many taxing authorities seek to increase tax revenues and have targeted large multinational technology companies in these efforts. Many jurisdictions have implemented or are considering the adoption of a digital services tax or similar tax that imposes a tax on revenues earned from digital advertisements or the use of online platforms, even when there is no physical presence in the jurisdiction. Rates for these taxes range from 1.5% to 10% of revenues deemed generated in the jurisdiction. We record the applicable digital services taxes in "Sales and other expenses" in the Consolidated Statements of Operations. For more information, see Part I, Item 1A, Risk Factors - "We may have exposure to additional tax liabilities."
Increased regulatory focus on large technology companies could result in increased compliance costs or otherwise adversely affect our business. For example, the European Commission designated the Company as a gatekeeper under the Digital Markets Act in 2024 and Booking.com as a "Very Large Online Platform" under the Digital Services Act in 2023. As a result of these designations, we are subject to additional rules and regulations that may not be applicable to our competitors. For more information, see Part I, Item 1A, Risk Factors - "Our business is subject to various competition, consumer protection, and online commerce laws and regulations around the world, and as the size of our business grows, scrutiny of our business by legislators and regulators in these areas may intensify" and Note 16 to our Consolidated Financial Statements.
Our businesses outside of the U.S. represent a substantial majority of our financial results, but because we report our results in U.S. Dollars, we face exposure to movements in foreign currency exchange rates as the financial results and the financial condition of our businesses outside of the U.S. are translated from local currency (principally Euros and British Pounds Sterling) into U.S. Dollars. See Note 17 to our Consolidated Financial Statements for information related to revenues by geographic area. As a result of movements in foreign currency exchange rates, both the absolute amounts of and percentage changes in our foreign-currency-denominated net assets, gross bookings, revenues, operating expenses, and net income as expressed in U.S. Dollars are affected. Our total revenues increased by approximately 11% in 2024 as compared to 2023, but without the impact of changes in foreign currency exchange rates our total revenues increased year-over-year on a constant-currency basis by approximately 12%. Since our expenses are generally denominated in foreign currencies on a basis similar to our revenues, our operating margins have not been significantly impacted by currency fluctuations.
We generally enter into derivative instruments to minimize the impact of foreign currency exchange rate fluctuations, such as foreign currency exchange derivative contracts to hedge our exposure to the impact of movements in foreign currency exchange rates on our transactional balances denominated in currencies other than the functional currency. See Note 6 to our Consolidated Financial Statements for additional information. We designate certain portions of the aggregate principal value of our Euro-denominated debt as a hedge of the foreign currency exposure of the net investment in certain Euro functional currency subsidiaries. Foreign currency transaction gains or losses on the Euro-denominated debt that is not designated as a hedging instrument for accounting purposes are recognized in "Other income (expense), net" in the Consolidated Statements of Operations (see Notes 12 and 18 to our Consolidated Financial Statements). Such foreign currency transaction gains or losses are dependent on the amount of net assets of the Euro functional currency subsidiaries, the amount of the Euro-denominated debt that is designated as a hedge, and fluctuations in foreign currency exchange rates. For more information, see Part I, Item 1A, Risk Factors - "We are exposed to fluctuations in foreign currency exchange rates."
Outlook
For the first quarter of 2025, we expect:
•the year-over-year growth in room nights will be between 5% and 7%;
•the year-over-year growth in gross bookings will be between 5% and 7%;
•the year-over-year growth in revenues will be between 2% and 4%; and
•operating income will be lower than the first quarter of 2024, due in part to the negative impact from the shift in Easter timing versus last year, as well as the negative impact from year-over-year changes in foreign currency exchange rates. Excluding these impacts, we expect operating income will be slightly higher than the first quarter of 2024.
For the full year 2025, we expect:
•the year-over-year growth in gross bookings will be in a mid single digit percentage range;
•the year-over-year growth in revenues will be in a mid single digit percentage range; and
•operating income will be higher than in 2024.
Critical Accounting Estimates
Management's Discussion and Analysis of Financial Condition and Results of Operations is based upon our Consolidated Financial Statements, which have been prepared in accordance with accounting principles generally accepted in the United States of America ("U.S. GAAP"). Our significant accounting policies and estimates are more fully described in Note 2 to our Consolidated Financial Statements. Certain of our accounting estimates are important to our financial position and results of operations and require us to make difficult and subjective judgments, often as a result of the need to make estimates of matters that are inherently uncertain. We use our judgment to determine the appropriate assumptions to be used in the determination of certain estimates and evaluate our estimates on an ongoing basis. Estimates are based on historical experience, terms of existing contracts, our observance of trends in the travel industry, and on other assumptions that we believe to be reasonable under the circumstances. Our actual results may differ from these estimates under different assumptions or conditions. Matters that involve significant estimates and judgments of management include the valuation of investments in private entities, income taxes, and contingencies.
Valuation of Investments in Private Entities
See Notes 2, 5, and 6 to our Consolidated Financial Statements for additional information related to the investments in private entities and information on fair value measurements, including the three levels of inputs to the valuation techniques used to measure fair value. When inputs that are observable, either directly or indirectly (observable market data), are available at the measurement date and are not significantly adjusted using unobservable inputs, the observable inputs would be classified as Level 2 inputs. When little or no market data is available, the fair value of these investments are measured using unobservable inputs ("Level 3 inputs").
Our investments measured using Level 3 inputs primarily consist of investments in privately-held entities that were classified as either debt securities or equity securities without readily determinable fair values. Fair values of privately held securities are estimated using a variety of valuation methodologies, including both market and income approaches. We use valuation techniques appropriate for the type of investment and the information available about the investee as of the valuation date to determine fair value. Recent financing transactions in the investee are generally considered the best indication of the enterprise value and therefore used as a basis to estimate fair value. However, based on a number of factors, such as the proximity to the valuation date or the volume or other terms of these financing transactions, we may also use other valuation techniques to supplement this data, including the income approach. When a financing transaction occurs and represents fair value, we also use the calibration process, as appropriate, when estimating fair value on subsequent measurement dates. Calibration is the process of using observed transactions in the investee company's own instruments to ensure that the valuation techniques that will be employed to value the investee company investment on subsequent measurement dates begin with assumptions that are consistent with the original observed transaction as well as any more recent observed transactions in the instruments issued by the investee company.
Our investments in equity securities of private entities at December 31, 2024 and 2023, includes $51 million originally invested in Yanolja Co., Ltd. ("Yanolja"). Certain observable transactions subsequent to our original investment resulted in an adjusted carrying value of $306 million for the investment as of December 31, 2021. As of June 30, 2023 and 2022, we evaluated our investment in Yanolja for impairment using a combination of the market approach and the income approach in estimating the fair value of our investment as of those dates, and recognized impairment charges of $24 million and $184 million during the years ended December 31, 2023 and 2022, respectively (see Note 6 to our Consolidated Financial Statements). The carrying value of our investment in Yanolja was $98 million as of December 31, 2024 and 2023, respectively.
The market approach estimates value using prices and other relevant information generated by market transactions involving identical or comparable companies. The income approach estimates value based on the expectation of future cash flows that a company will generate. These future cash flows are discounted to their present values using a discount rate based on a company's weighted-average cost of capital adjusted to reflect the risks inherent in its cash flows. The key unobservable inputs and ranges used for the June 2023 impairment evaluation include the weighted average cost of capital of 10.5%-14.5% and a terminal earnings before interest, taxes, depreciation, and amortization ("EBITDA") multiple of 14x-16x. The key unobservable inputs and ranges used for the June 2022 impairment evaluation include, for the market approach, percentage decrease in the calibrated EBITDA multiple (36%) and for the income approach, the weighted average cost of capital of 10%-14% and the terminal EBITDA multiple of 14x-16x. Significant changes in any of these inputs would result in significantly different fair value measurements. A change in the assumption used for EBITDA multiples would result in a directionally similar change in the fair value and a change in the assumption used for weighted average cost of capital would result in a directionally opposite change in the fair value.
The determination of the fair values of investments where we are a minority shareholder and have access to limited information from the investee reflects numerous assumptions that are subject to various risks and uncertainties, including regarding the investee's expected growth rates and operating margin, as well as other matters outside of our control, such as discount rates and market comparables. It requires significant judgments and estimates and actual results could be materially different than those judgments and estimates utilized in the fair value estimate. Future events and changing market conditions may lead us to re-evaluate the assumptions reflected in the valuation, which may result in a need to recognize additional impairment charges.
Income Taxes
We determine our tax expense based on income and statutory tax rates applicable in the jurisdictions in which we operate. Due to the complex and dynamic nature of tax legislation, significant judgment is required in computing our tax expense and determining our tax positions. The U.S. Tax Cuts and Jobs Act (the "Tax Act") enacted in December 2017 made significant changes to U.S. federal tax law, including a one-time deemed repatriation tax imposed on accumulated unremitted international earnings, to be paid over eight years. We do not intend to indefinitely reinvest our international earnings that were subject to U.S. taxation pursuant to the mandatory deemed repatriation or subject to U.S. taxation as global intangible low-taxed income ("GILTI").
We regularly review our deferred tax assets for recoverability considering historical profitability, projected future taxable income, the expected timing of the reversals of temporary differences, and tax planning strategies and record valuation allowances as required.
We are subject to ongoing tax examinations and assessments, and face challenges regarding the amount of taxes due from time to time. These challenges include questions regarding the timing and amount of deductions on our tax returns. Although we believe that our tax filing positions are reasonable and comply with applicable law, we regularly review our tax filing positions, especially in light of tax law or business practice changes, and we may change our positions or determine that previous positions should be amended, either of which could result in changes to our tax liabilities. The final determination of tax audits or tax disputes may be different from what is reflected in our historical income tax provisions and accruals.
The evaluation of tax positions and recognition of income tax benefits require significant judgment and we consult with external tax and legal counsel as appropriate. We consider the technical merits of our tax positions along with the applicable tax statutes, related interpretations and precedents, and our expectation of the outcome of proceedings (or negotiations) with tax authorities. We recognize liabilities when we believe that uncertain positions may not be fully sustained upon audit by the tax authorities, including any related appeals or litigation processes. Liabilities recognized for uncertain tax positions are based on a two-step approach for recognition and measurement. First, we evaluate the tax position for recognition by determining if the weight of available evidence indicates it is more likely than not that the position will be sustained based on its technical merits. Second, we measure the tax benefit as the largest amount that is more than 50% likely of being realized upon ultimate settlement. Interest and penalties attributable to uncertain tax positions, if any, are recognized as a component of income tax expense. The tax benefits ultimately realized by us may be different than what is recorded in the financial statements due to future events such as our settling a matter with tax authorities or our success in sustaining our tax positions.
See Notes 15 and 16 to our Consolidated Financial Statements for additional information.
Contingencies
Loss contingencies (other than income tax-related contingencies disclosed above) arise from actual or possible claims and assessments and pending or threatened litigation that may be brought against us. Based on our assessment of loss contingencies at each balance sheet date, a loss is recorded in the financial statements if it is probable that an asset has been impaired or a liability has been incurred and the amount of the loss can be reasonably estimated. If the amount of the loss cannot be reasonably estimated, we disclose information about the contingency in the financial statements. We also disclose information in our financial statements about reasonably possible loss contingencies.
The determination of whether a loss is probable and whether the amount of the loss can be reasonably estimated requires significant judgment and evaluation of all the underlying facts and circumstances including judgments about the potential actions of third-party claimants, regulatory authorities, and courts. Claims, assessments, and litigations involve significant uncertainties such as the complexity of the facts, the legal theories involved, the nature of the claims, the judgment of the courts, the applicable methodology for determining potential damages, and, in the case of class actions, whether a class action can be certified and the extent to which members of a class would or would not file a claim.
On a quarterly basis, we update our analysis and estimates considering available information, including the impact of negotiations, settlements, rulings, and advice of legal counsel. Changes in our assessment of whether a loss is probable, our estimate of the loss, or our determination of whether the amount of loss can be reasonably estimated could have a material impact on our results of operations and financial position. Changes in our assumptions regarding a particular matter or the effectiveness of our strategies related to legal and other proceedings could also have a material impact on our results of operations and financial position. For all loss contingencies, until a matter is finally resolved, there may be an exposure to loss in excess of the liability accrued for the matter and such amounts could be material.
See Note 16 to our Consolidated Financial Statements for additional information regarding certain contingencies.
Recent Accounting Pronouncements
See Note 2 to our Consolidated Financial Statements, which is incorporated into this Item 7 by reference.
Results of Operations
Year Ended December 31, 2024 compared to Year Ended December 31, 2023
Operating and Statistical Metrics
Our financial results are driven by certain operating metrics that encompass the booking and other business activity generated by our travel and travel-related services. Reservations of room nights, rental car days, and airline tickets capture the volume of units booked through our online travel companies' ("OTC") brands by our customers. Gross bookings is an operating and statistical metric that captures the total dollar value, generally inclusive of taxes and fees, of all travel services booked through our OTC brands by our customers, net of cancellations. Our non-OTC brands (KAYAK and OpenTable) have different business metrics from those of our OTC brands, so search queries through KAYAK and restaurant reservations through OpenTable do not contribute to our gross bookings.
Room nights, rental car days, and airline tickets reserved through our services for the years ended December 31, 2024 and 2023 were as follows:
| | | | | | | | | | | | | | | | | | | | |
| | Year Ended December 31, | | Increase (Decrease) |
| (in millions) | | 2024 | | 2023 | |
| Room nights | | 1,144 | | 1049 | | 9.1 | % |
| Rental car days | | 83 | | 74 | | 12.3 | % |
| Airline tickets | | 49 | | 36 | | 38.1 | % |
Room nights reserved through our services increased in 2024 compared to 2023, driven primarily by increased travel demand in Europe and Asia. Rental car days reserved through our services increased in 2024 compared to 2023, driven primarily by year-over-year growth in rental car days reserved on Booking.com. Airline tickets reserved through our services increased in 2024 compared to 2023, driven primarily by the expansion of flight offerings at Booking.com and Agoda.
Gross bookings resulting from reservations of room nights, rental car days, and airline tickets made through our merchant and agency categories for the years ended December 31, 2024 and 2023 were as follows (numbers may not total due to rounding):
| | | | | | | | | | | | | | | | | | | | |
| | Year Ended December 31, | | Increase (Decrease) |
| (in millions) | | 2024 | | 2023 | |
| Merchant gross bookings | | $ | 104,182 | | | $ | 81,721 | | | 27.5 | % |
| Agency gross bookings | | 61,398 | | | 68,906 | | | (10.9) | % |
| | | | | | |
| Total gross bookings | | $ | 165,580 | | | $ | 150,627 | | | 9.9 | % |
Merchant gross bookings increased and agency gross bookings decreased in 2024 compared to 2023, due primarily to the ongoing shift from agency to merchant bookings at Booking.com. The year-over-year increase in merchant gross bookings in 2024 was also due to strong growth in gross bookings from merchant accommodation reservation services at Agoda and merchant flight reservation services at Booking.com and Agoda.
The year-over-year increase in total gross bookings in 2024 was due primarily to the increase in room nights and the positive impact from year-over-year growth in flight gross bookings, partially offset by a negative impact of foreign exchange rate fluctuations.
Flight gross bookings increased 28% year-over-year in 2024, due to airline ticket growth, partially offset by lower airline ticket prices. Rental car gross bookings increased 7% year-over-year in 2024, due primarily to rental car days growth, partially offset by lower average daily car rental prices.
Revenues
Online travel reservation services
Substantially all of our revenues are generated by providing online travel reservation services, which facilitate online travel purchases by travelers from travel service providers.
Revenues from online travel reservation services are classified into two categories:
•Merchant. Merchant revenues are derived from travel-related transactions where we facilitate payments from travelers for the services provided, generally at the time of booking. These include transactions where travelers book accommodation, rental car, airline reservations, and other travel related services. The majority of our merchant revenues are from Booking.com's accommodation reservations. Merchant revenues include:
◦travel reservation commissions and transaction net revenues (i.e., the amount charged to travelers, including the contra-revenue impact of merchandising, less the amount owed to travel service providers) in connection with our merchant reservation services;
◦revenues from facilitating payments, such as credit card processing rebates and customer processing fees; and
◦ancillary fees, including travel-related insurance revenues.
•Agency. Agency revenues are derived from travel-related transactions where we do not facilitate payments from travelers for the services provided. Agency revenues consist almost entirely of travel reservation commissions from our accommodation, rental car, and airline reservation services. Substantially all of our agency revenues are from Booking.com's accommodation reservations.
Advertising and other revenues
Advertising and other revenues are derived primarily from:
•revenues earned by KAYAK for (a) sending referrals to OTCs and travel service providers and (b) advertising placements on its platforms; and
•revenues earned by OpenTable for (a) restaurant reservation services (fees paid by restaurants for diners seated through OpenTable's online reservation service) and (b) subscription fees for restaurant management services.
| | | | | | | | | | | | | | | | | | | | |
| | Year Ended December 31, | | Increase (Decrease) |
| (in millions) | | 2024 | | 2023 | |
| Merchant revenues | | $ | 14,142 | | | $ | 10,936 | | | 29.3 | % |
| Agency revenues | | 8,524 | | | 9,414 | | | (9.5) | % |
| Advertising and other revenues | | 1,073 | | | 1,015 | | | 5.7 | % |
| Total revenues | | $ | 23,739 | | | $ | 21,365 | | | 11.1 | % |
| % of Total gross bookings | | 14.3 | % | | 14.2 | % | | |
Merchant revenues increased while agency revenues decreased in 2024 compared to 2023 due primarily to the ongoing shift from agency to merchant revenues at Booking.com. The year-over-year increase in merchant revenues in 2024 was also due to strong growth in revenues from merchant accommodation reservation services at Agoda. Advertising and other revenues increased in 2024 compared to 2023 due to growth in advertising revenues at Booking.com and growth at OpenTable.
Total revenues as a percentage of gross bookings was 14.3% in 2024, up from 14.2% in 2023 due to an increase in revenues related to facilitating payments, mostly offset by an increase in the mix of flight gross bookings, which have lower revenues as a percentage of gross bookings.
Operating Expenses
Marketing Expenses
| | | | | | | | | | | | | | | | | | | | |
| | Year Ended December 31, | | Increase (Decrease) |
| (in millions) | | 2024 | | 2023 | |
| Marketing expenses | | $ | 7,278 | | | $ | 6,773 | | | 7.5 | % |
| % of Total gross bookings | | 4.4 | % | | 4.5 | % | | |
| % of Total revenues | | 30.7 | % | | 31.7 | % | | |
Marketing expenses consist primarily of the costs of:
•search engine keyword purchases;
•affiliate programs;
•referrals from meta-search websites;
•other performance-based marketing, including social media marketing; and
•offline and online brand marketing.
Our marketing expenses, which are substantially variable in nature, increased year-over-year in 2024, to help drive additional gross bookings and revenues. Marketing expenses as a percentage of total gross bookings in 2024 were lower than in 2023 due to an increase in the share of room nights booked by consumers coming directly to our platforms, lower brand marketing expenses, and higher performance marketing ROIs, partially offset by increased spend in social media channels.
Sales and Other Expenses
| | | | | | | | | | | | | | | | | | | | |
| | Year Ended December 31, | | Increase (Decrease) |
| (in millions) | | 2024 | | 2023 | |
| Sales and other expenses | | $ | 3,120 | | | $ | 2,744 | | | 13.7 | % |
| % of Total gross bookings | | 1.9 | % | | 1.8 | % | | |
| % of Total revenues | | 13.1 | % | | 12.8 | % | | |
Sales and other expenses consist primarily of:
•credit card and other payment processing fees associated with merchant transactions;
•fees paid to third parties that provide call center and other customer services;
•digital services taxes and other similar taxes;
•chargeback provisions and fraud prevention expenses associated with merchant transactions;
•provisions for expected credit losses, mostly related to accommodation commission receivables; and
•customer relations costs.
Sales and other expenses, which are substantially variable in nature, increased year-over-year in 2024 due primarily to an increase in merchant transaction costs of $242 million and an increase in digital services taxes and other similar taxes of $74 million. Merchant transactions increased year-over-year in 2024 due primarily to the ongoing shift from agency to merchant transactions at Booking.com. Digital services taxes and other similar taxes in 2024 were impacted by an accrual of $17 million related to Canadian digital services taxes related to the years ended December 31, 2023 and 2022 that were enacted in 2024 with retrospective effect. Sales and other expenses as a percentage of total revenues in 2024 were higher than in 2023 due primarily to the impact of increased merchant transactions, which grew faster than total revenue.
Personnel
| | | | | | | | | | | | | | | | | | | | |
| | Year Ended December 31, | | Increase (Decrease) |
| (in millions) | | 2024 | | 2023 | |
| Personnel | | $ | 3,354 | | | $ | 3,294 | | | 1.8 | % |
| % of Total revenues | | 14.1 | % | | 15.4 | % | | |
Personnel expenses consist primarily of:
•salaries, bonuses, and stock-based compensation;
•employee health and other benefits; and
•payroll taxes.
Personnel expenses increased year-over-year in 2024 due to increases in salary expense of $163 million, as well as increases in employee health and other benefits expense and stock-based compensation expense. The year-over-year increase in personnel expenses in 2024 was partially offset by an accrual of $276 million related to the Netherlands pension fund matter in 2023. The year-over-year increase in personnel expenses was impacted by a 3% increase in employee headcount from approximately 23,600 as of December 31, 2023 to 24,300 as of December 31, 2024.
General and Administrative | | | | | | | | | | | | | | | | | | | | |
| | Year Ended December 31, | | Increase (Decrease) |
| (in millions) | | 2024 | | 2023 | |
| General and administrative | | $ | 1,036 | | | $ | 1,555 | | | (33.4) | % |
| % of Total revenues | | 4.4 | % | | 7.3 | % | | |
General and administrative expenses consist primarily of:
•fees for certain outside professionals;
•occupancy and office expenses;
•personnel-related expenses such as travel, relocation, recruiting, and training expenses; and
•certain travel transaction taxes.
General and administrative expenses decreased year-over-year in 2024 due to the accrual of a loss of $530 million related to a draft decision by the Spanish competition authority in 2023, which was subsequently reduced by $78 million in 2024 when the decision was finalized. In addition, the year-over-year decrease in general and administrative expenses in 2024 was due to the termination fee of $90 million related to the acquisition agreement for the Etraveli Group in 2023 as well as the settlement of certain indirect tax matters of $62 million in 2023. The year-over-year decrease in general and administrative expenses in 2024 was partially offset by additional expenses of $337 million related to the settlement agreement with the Italian Tax Authorities in 2024.
Information Technology
| | | | | | | | | | | | | | | | | | | | |
| | Year Ended December 31, | | Increase (Decrease) |
| (in millions) | | 2024 | | 2023 | |
| Information technology | | $ | 771 | | | $ | 655 | | | 17.8 | % |
| % of Total revenues | | 3.2 | % | | 3.1 | % | | |
Information technology expenses consist primarily of:
•software license and system maintenance fees;
•cloud computing costs and outsourced data center costs;
•payments to contractors; and
•data communications and other expenses associated with operating our services.
Information technology expenses increased year-over-year in 2024 due to an increase in expenses related to cloud computing costs and outsourced data center costs, as well as software license and system maintenance fees.
Depreciation and Amortization
| | | | | | | | | | | | | | | | | | | | |
| | Year Ended December 31, | | Increase (Decrease) |
| (in millions) | | 2024 | | 2023 | |
| Depreciation and amortization | | $ | 591 | | | $ | 504 | | | 17.3 | % |
| % of Total revenues | | 2.5 | % | | 2.4 | % | | |
Depreciation and amortization expenses consist of:
•amortization of intangible assets with determinable lives;
•amortization of internally-developed and purchased software;
•depreciation of computer equipment; and
•depreciation of leasehold improvements, furniture and fixtures, and office equipment.
Depreciation and amortization expenses increased year-over-year in 2024 due primarily to increased depreciation of computer equipment, as well as amortization expense related to internally-developed and purchased software.
Transformation Costs | | | | | | | | | | | | | | | | | | | | |
| | Year Ended December 31, | | Increase (Decrease) |
| (in millions) | | 2024 | | 2023 | |
| Transformation costs | | $ | 34 | | | $ | — | | | * |
| % of Total revenues | | 0.1 | % | | —% | | |
| | | | | | |
| | | | | | |
* Not meaningful
See "–Trends" above for additional information on the Transformation Program that we announced in November 2024. For the year ended December 31, 2024, the program related costs, which primarily consist of professional fees, are recorded in "Transformation costs" in the Consolidated Statement of Operations. See Note 20 to our Consolidated Financial Statements.
Other Operating Expenses | | | | | | | | | | | | | | | | | | | | |
| | Year Ended December 31, | | Increase (Decrease) |
| (in millions) | | 2024 | | 2023 | |
| | | | | | |
| | | | | | |
| Other operating expenses | | $ | — | | | $ | 5 | | | * |
| | | | | | |
* Not meaningful
Interest Expense and Interest and Dividend Income
The following table presents the changes in interest expense and interest and dividend income for the years ended December 31, 2024 and 2023:
| | | | | | | | | | | | | | | | | | | | |
| | Year Ended December 31, | | Increase (Decrease) |
| (in millions) | | 2024 | | 2023 | |
| Interest expense | | $ | (1,295) | | | $ | (897) | | | 44.3 | % |
| Interest and dividend income | | 1,114 | | | 1,020 | | | 9.2 | % |
Interest expense increased for the year ended December 31, 2024, compared to the year ended December 31, 2023, primarily due to the amortization of debt discount related to convertible senior notes due May 2025 (see Note 12 to our Consolidated Financial Statements) and the senior notes issued in 2023 and 2024. Interest and dividend income increased for the year ended December 31, 2024, compared to the year ended December 31, 2023, primarily due to higher money market fund investment balances.
Other Income (Expense), Net
The following table sets forth the composition of "Other income (expense), net" for the years ended December 31, 2024 and 2023: | | | | | | | | | | | | | | |
| | Year Ended December 31, |
| (in millions) | | 2024 | | 2023 |
| Foreign currency transaction gains (losses) | | $ | 383 | | | $ | (348) | |
| Net gains (losses) on equity securities | | 63 | | | (131) | |
| | | | |
| | | | |
| Loss related to the conversion option on convertible senior notes | | (517) | | | — | |
| Other | | (11) | | | 2 | |
| Other income (expense), net | | $ | (82) | | | $ | (477) | |
Foreign currency transaction gains (losses) for the year ended December 31, 2024 includes gains of $526 million related to our Euro-denominated debt and accrued interest that were not designated as net investment hedges and losses of $156 million on derivative contracts. Foreign currency transaction gains (losses) for the year ended December 31, 2023 includes losses of $163 million related to our Euro-denominated debt and accrued interest that were not designated as net investment hedges and losses of $106 million on derivative contracts.
See Notes 5 and 6 to our Consolidated Financial Statements for additional information related to net gains (losses) on equity securities.
See Note 12 to our Consolidated Financial Statements for additional information on the loss related to the conversion option on convertible senior notes.
Income Taxes
| | | | | | | | | | | | | | | | | | | | |
| | Year Ended December 31, | | Increase (Decrease) |
| (in millions) | | 2024 | | 2023 | |
| Income tax expense | | $ | 1,410 | | | $ | 1,192 | | | 18.3 | % |
| % of Income before income taxes | | 19.3 | % | | 21.8 | % | | |
Our 2024 effective tax rate differs from the U.S. federal statutory tax rate of 21%, primarily due to the benefit of the Netherlands Innovation Box Tax (as defined below) and a reduction to the Company's 2018 federal one-time deemed repatriation liability, pursuant to the U.S. Tax Cuts and Jobs Act ("Tax Act"), resulting from a recent U.S. Tax Court decision in Varian Medical Systems, Inc. vs. Commissioner, partially offset by higher international tax rates, non-deductible expenses related to the convertible senior notes and certain other non-deductible expenses, unrecognized tax benefits, and U.S. federal tax associated with the Company's international earnings. Our 2023 effective tax rate differs from the U.S. federal statutory tax rate of 21%, primarily due to higher international tax rates, non-deductible fines, certain other non-deductible expenses, and U.S. federal tax associated with the Company's international earnings, partially offset by the benefit of the Netherlands Innovation Box Tax.
Our effective tax rate was lower for the year ended December 31, 2024, compared to the year ended December 31, 2023, primarily due to a reduction to the Company's 2018 federal one-time deemed repatriation liability, pursuant to the Tax Act, resulting from a recent U.S. Tax Court decision in Varian Medical Systems, Inc. vs. Commissioner, and lower non-deductible fines, partially offset by higher unrecognized tax benefits, non-deductible expenses related to the convertible senior notes, and a decrease in the benefit of the Netherlands Innovation Box Tax.
Under Dutch corporate income tax law, income generated from qualifying innovative activities is taxed at a rate of 9% ("Netherlands Innovation Box Tax") rather than the Dutch statutory rate of 25.8%. A portion of Booking.com's earnings during the years ended December 31, 2024 and 2023 qualified for Innovation Box Tax treatment, which had a significant beneficial impact on our effective tax rates for these periods. For more information, see Part I, Item 1A, Risk Factors - "We may not be able to maintain our 'Innovation Box Tax' benefit."
Results of Operations
Year Ended December 31, 2023 compared to Year Ended December 31, 2022
For a comparison of our results of operations for the fiscal years ended December 31, 2023 and 2022, see Part II, Item 7. Management's Discussion and Analysis of Financial Condition and Results of Operations, of our Annual Report on Form 10-K for the fiscal year ended December 31, 2023, filed with the SEC on February 22, 2024.
Liquidity and Capital Resources
Our primary source of funds for operations is the cash flow that we generate from operations. We use our cash for a variety of needs, including ongoing investments in our business, share repurchases, dividends, repayment of debt, and capital expenditures. Our continued access to sources of liquidity depends on multiple factors. See Part I, Item 1A, Risk Factors - "Our liquidity, credit ratings, and ongoing access to capital could be materially and negatively affected by global financial conditions and events." Our financial results and prospects are almost entirely dependent on facilitating the sale of travel-related services. Marketing expenses and personnel expenses are the most significant operating expenses for our business. See our Consolidated Statements of Operations and "Trends" and "Results of Operations" above for additional information on marketing expenses and personnel expenses, including stock-based compensation expenses.
We believe that our existing cash balances, liquid resources, and access to capital markets will be sufficient to fund our operating activities, capital expenditures, and other obligations through at least the next twelve months.
Cash, cash equivalents, and investments
At December 31, 2024, we had $16.7 billion in cash, cash equivalents, and investments, of which approximately $9.6 billion is held by our international subsidiaries. Cash, cash equivalents, and long-term investments held by our international subsidiaries are denominated primarily in Euros, U.S. Dollars, and British Pounds Sterling. Our investment policy seeks to preserve capital and maintain sufficient liquidity to meet operational and other needs of the business. See Notes 5 and 6 to our Consolidated Financial Statements for additional information.
Deferred merchant bookings
Deferred merchant bookings of $4.0 billion at December 31, 2024 includes cash payments received from travelers in advance of us completing our performance obligations and are comprised principally of amounts estimated to be payable to travel service providers as well as our estimated future revenues for our commission or margin and fees. The amounts are mostly subject to refunds for cancellations.
Debt
Our revolving credit facility extends a revolving line of credit up to $2 billion to us. We are in compliance with the maximum leverage ratio covenant under the facility, which is a condition to our ability to borrow.
In 2024, we issued senior notes with varying maturities for aggregate cash proceeds of $4.8 billion. The proceeds from the issuance of these senior notes are available for general corporate purposes, including to repurchase shares of our common stock and to redeem or repay outstanding indebtedness. During the year ended December 31, 2024, we paid $1.1 billion on the maturity of the Senior Notes due September 2024.
As of November 1, 2024, holders of our convertible senior notes due in May 2025 ("May 2025 Notes") are entitled to repayment of the principal amount of the notes in cash, and if they exercise their option to convert, the note holders are entitled to cash payment for the conversion premium, which is the conversion value in excess of the principal amount, settled at maturity. During the year ended December 31, 2024, we paid $198 million in aggregate upon the conversion of the May 2025 Notes at the note holders' option.
The total outstanding senior notes at December 31, 2024 had cumulative interest to maturity (based on coupon interest rates) of $4.5 billion, with $546 million payable within the next twelve months.
See Note 12 to our Consolidated Financial Statements for additional information related to our debt arrangements, including principal amounts, interest rates, and maturity dates.
Share repurchases and dividends
See Note 13 to our Consolidated Financial Statements for additional information related to our stock repurchases, authorization limits, and excise taxes. During the year ended December 31, 2024, we repurchased shares of our common stock for an aggregate cost of $6.5 billion, including $345 million to repurchase shares of our common stock withheld to satisfy employee withholding tax obligations related to stock-based compensation. As of December 31, 2024, we recorded an estimated excise tax liability of $56 million for share repurchases in 2024. During the year ended December 31, 2024, we remitted excise taxes of $96 million for our share repurchases in 2023. We expect to complete the share repurchases under the remaining authorization of $7.7 billion of the program authorized by our Board of Directors ("the Board") in 2023 by the end of 2026, assuming no major downturn in the travel market. In January 2025, our Board authorized a program to repurchase up to an additional $20 billion of our common stock.
During the year ended December 31, 2024, we paid cash dividends of $1.2 billion. In February 2025, the Board declared a cash dividend of $9.60 per share of common stock, payable on March 31, 2025 to stockholders of record as of the close of business on March 7, 2025.
Commitments, contingencies, and other
At December 31, 2024, we had, in the aggregate, $986 million of non-cancellable purchase obligations individually greater than $10 million, of which $208 million is payable within the next twelve months. Such purchase obligations relate to agreements to purchase goods and services that are enforceable and legally binding, that specify all significant terms, including the quantities to be purchased, price provisions, and the approximate timing of the transaction.
At December 31, 2024, we had lease obligations of $756 million, of which $169 million is payable within the next twelve months. See Note 10 to our Consolidated Financial Statements for additional information.
At December 31, 2024, we had a remaining transition tax liability of $487 million as a result of the Tax Act, which included $257 million reported as "Long-term U.S. transition tax liability" and $230 million included in "Accrued expenses and other current liabilities" in the Consolidated Balance Sheet. This liability will be paid over the next two years. Due to a recent U.S. Tax Court decision in Varian Medical Systems, Inc. vs. Commissioner, a portion of our total transition tax liability may be refunded. In accordance with the Tax Act, generally, future repatriation of our international cash will not be subject to a U.S. federal income tax liability as a dividend, but will be subject to U.S. state income taxes and international withholding taxes, which have been accrued by us.
See Note 16 to our Consolidated Financial Statements for information related to the $650 million standby letters of credit and bank guarantees issued on our behalf at December 31, 2024.
See Note 16 to our Consolidated Financial Statements and Part I, Item IA, Risk Factors - "We may have exposure to additional tax liabilities." for information related to certain tax assessments and other tax matters.
See Note 16 to our Consolidated Financial Statements and Part I, Item IA, Risk Factors - "Our business is subject to various competition, consumer protection, and online commerce laws and regulations around the world, and as the size of our business grows, scrutiny of our business by legislators and regulators in these areas may intensify" for information related to certain regulatory matters, and our other contingent liabilities.
See "–Trends" above for information on the Transformation Program that we announced in November 2024 to implement certain organizational changes, including the estimated annual run rate savings and restructuring costs and accelerated investments required for the program.
Cash Flow Analysis
Year Ended December 31, 2024 compared to Year Ended December 31, 2023
See our Consolidated Statements of Cash Flows for additional information related to our cash flows.
The following table summarizes our cash flows for the years ended December 31, 2024 and 2023:
| | | | | | | | | | | | | | | | |
| | Year Ended December 31, |
| (in millions) | | 2024 | | 2023 | | |
| Net cash provided by operating activities | | $ | 8,323 | | | $ | 7,344 | | | |
| Net cash provided by investing activities | | 129 | | | 1,486 | | | |
| Net cash used in financing activities | | (4,204) | | | (8,909) | | | |
| | | | | | |
Net cash provided by operating activities for the year ended December 31, 2024 resulted from net income of $5.9 billion, a favorable net impact from adjustments for non-cash and other items of $2.1 billion, and a favorable net change in working capital and other assets and liabilities of $367 million. Non-cash and other items were principally associated with the loss related to the conversion option on convertible senior notes, stock-based compensation expense, depreciation and amortization, unrealized foreign currency transaction gains related to Euro-denominated debt, provision for expected credit losses and chargebacks, and operating lease amortization. For the year ended December 31, 2024, deferred merchant bookings and other current liabilities increased by $1.4 billion and accounts receivable increased by $506 million, primarily due to higher business volumes, partially offset by faster accounts receivable collections in 2024. Merchant revenues increased while agency revenues decreased for the year ended December 31, 2024 compared to the year ended December 31, 2023 due to the ongoing shift from agency to merchant revenues at Booking.com.
Net cash provided by operating activities for the year ended December 31, 2023 resulted from net income of $4.3 billion, a favorable net impact from adjustments for non-cash and other items of $1.3 billion, and a favorable net change in working capital and other assets and liabilities of $1.7 billion. Non-cash and other items were principally associated with stock-based compensation expense, depreciation and amortization, deferred income tax benefit, provision for expected credit losses and chargebacks, unrealized foreign currency transaction losses related to Euro-denominated debt, and operating lease amortization. For the year ended December 31, 2023, deferred merchant bookings and other current liabilities increased by $2.7 billion and accounts receivable increased by $1.3 billion, primarily due to increases in business volumes. During the year ended December 31, 2023, the Company accrued a loss of $530 million related to a draft decision by the Spanish competition authority and a loss of $276 million related to the Netherlands pension fund matter. The related liabilities are included in "Accrued expenses and other current liabilities" in the Consolidated Balance Sheet as of December 31, 2023. See Note 16 to our Consolidated Financial Statements for additional information.
Net cash provided by investing activities for the year ended December 31, 2024 resulted mainly from proceeds from the maturity of investments of $590 million, partially offset with additions to property and equipment of $429 million. Net cash provided by investing activities for the year ended December 31, 2023 principally resulted from proceeds from the sale and maturity of investments of $1.8 billion, partially offset with additions to property and equipment of $345 million.
Net cash used in financing activities for the year ended December 31, 2024 resulted mainly from payments for the repurchase of common stock of $6.5 billion, payments on the maturity and conversion of debt of $1.3 billion, and dividends of $1.2 billion, partially offset with proceeds from the issuance of long-term debt of $4.8 billion. Net cash used in financing activities for the year ended December 31, 2023 principally resulted from payments for the repurchase of common stock of $10.4 billion and payment on the maturity of debt of $500 million, partially offset with proceeds from the issuance of long-term debt of $1.9 billion.
Year Ended December 31, 2023 compared to Year Ended December 31, 2022
For a comparison of our cash flow activities for the fiscal years ended December 31, 2023 and 2022, see Cash Flow Analysis in Part II, Item 7. Management's Discussion and Analysis of Financial Condition and Results of Operations, of our Annual Report on Form 10-K for the fiscal year ended December 31, 2023, filed with the SEC on February 22, 2024.
Item 7A. Quantitative and Qualitative Disclosures About Market Risk
We have exposure to several types of market risk, including changes in interest rates, foreign currency exchange rates, and equity prices.
We manage our exposure to interest rate risk and foreign currency risk through internally established policies and procedures and, when deemed appropriate, through the use of derivative financial instruments. We use foreign currency exchange derivative contracts to manage short-term foreign currency risk.
The objective of our policies is to mitigate potential income statement, cash flow, and fair value exposures resulting from possible future adverse fluctuations in rates. We evaluate our exposure to market risk by assessing the anticipated near-term and long-term fluctuations in interest rates and foreign currency exchange rates. This evaluation includes the review of leading market indicators, discussions with financial analysts and investment bankers regarding current and future economic conditions, and the review of market projections as to expected future rates. We utilize this information to determine our own investment strategies as well as to determine if the use of derivative financial instruments is appropriate to mitigate any potential future market exposure that we may face. Our policy does not allow speculation in derivative instruments for profit or, except in certain limited situations, execution of derivative instrument contracts for which there are no underlying exposures. We do not use financial instruments for trading purposes and are not a party to any leveraged derivatives. To the extent that changes in interest rates and foreign currency exchange rates affect general economic conditions, we would also be affected by such changes.
See Note 12 to our Consolidated Financial Statements for information about our convertible senior notes due in May 2025 ("May 2025 Notes") and other debt. Excluding the effect on the fair value of our convertible senior notes, a hypothetical 100 basis point (1.0%) decrease in interest rates would have resulted in an increase in the estimated fair value of our nonconvertible debt of approximately $930 million and $612 million at December 31, 2024 and 2023, respectively. Our convertible senior notes are more sensitive to the equity market price volatility of our shares than changes in interest rates. The fair value of the convertible senior notes will likely increase as the market price of our shares increases and will likely decrease as the market price of our shares falls. The May 2025 Notes are currently convertible at the option of the holder. As of November 1, 2024, at maturity, the note holders are entitled to repayment of the principal amount of the May 2025 Notes in cash, and if they exercise their option to convert, they are entitled to cash payment for the conversion premium, which is the conversion value in excess of the principal amount. During the year ended December 31, 2024, we paid $198 million in aggregate upon the conversion of the May 2025 Notes at the note holders' option.
We face exposure to movements in foreign currency exchange rates as the financial results and the financial condition of our businesses outside of the U.S., which represent a substantial majority of our financial results, are translated from local currencies (principally Euros and British Pounds Sterling) into U.S. Dollars. For example, our total gross bookings increased by 10% in 2024 as compared to 2023, but without the impact of changes in foreign currency exchange rates our total gross bookings increased year-over-year on a constant-currency basis by approximately 11%. Our total revenues increased by 11% in 2024 as compared to 2023, but without the impact of changes in foreign currency exchange rates, our total revenues increased year-over-year on a constant-currency basis by approximately 12%. See Notes 6, 12, and 18 to our Consolidated Financial Statements and Part II, Item 7. Management's Discussion and Analysis of Financial Condition and Results of Operations for additional information about foreign currency transaction gains and losses, changes in foreign currency exchange rates, the impact of such changes on the increase in our revenues and operating margins, our use of foreign currency exchange derivatives, and our designation of certain portions of our Euro-denominated debt as a hedge of the foreign currency exposure of the net investment in certain Euro functional currency subsidiaries. We generally enter into foreign currency exchange derivatives to hedge our exposure to the impact of movements in foreign currency exchange rates on our transactional balances denominated in currencies other than the functional currency. We will continue to evaluate the use of derivative instruments in the future. We also designate certain portions of the aggregate principal value of our Euro-denominated debt as a hedge of the foreign currency exposure of the net investment in certain Euro functional currency subsidiaries. Foreign currency transaction gains or losses are dependent on the amount of net assets of the Euro functional currency subsidiaries, the amount of the Euro-denominated debt that is designated as a hedge, and fluctuations in foreign currency exchange rates.
See Notes 5 and 6 to our Consolidated Financial Statements for information about our investments in equity securities of publicly-traded companies and private entities. We are exposed to equity price risk as it relates to changes in fair values of these investments. Our investments in private entities are measured at cost less impairment, if any. Such investments are also required to be measured at fair value as of the date of certain observable transactions for the identical or a similar investment of the same issuer. A hypothetical 10% decrease in the fair values at December 31, 2024 and 2023 of our investments in equity securities of publicly-traded companies and private entities would have resulted in a loss, before tax, of approximately $55 million and $45 million, respectively, being recognized in net income.
Item 8. Financial Statements and Supplementary Data
The following Consolidated Financial Statements of the Company and the report of our independent registered public accounting firm are filed as part of this Annual Report on Form 10-K (See Part IV, Item 15, Exhibits and Financial Statement Schedules): Consolidated Balance Sheets at December 31, 2024 and 2023; Consolidated Statements of Operations, Consolidated Statements of Comprehensive Income, Consolidated Statements of Changes in Stockholders' (Deficit) Equity, and Consolidated Statements of Cash Flows for the years ended December 31, 2024, 2023, and 2022; Notes to our Consolidated Financial Statements; and Report of Independent Registered Public Accounting Firm.
Item 9. Changes in and Disagreements with Accountants on Accounting and Financial Disclosure
None.
Item 9A. Controls and Procedures
Disclosure Controls and Procedures. Under the supervision and with the participation of our management, including our principal executive officer and our principal financial officer, we conducted an evaluation of our disclosure controls and procedures, as defined under Exchange Act Rule 13a-15(e). Based on this evaluation, our principal executive officer and our principal financial officer concluded that our disclosure controls and procedures were effective as of the end of the period covered by this Annual Report on Form 10-K.
Management's Report on Internal Control Over Financial Reporting. Our management is responsible for establishing and maintaining adequate internal control over financial reporting, as defined in Exchange Act Rule 13a-15(f). Under the supervision and with the participation of our management, including our principal executive officer and principal financial officer, we conducted an evaluation of the effectiveness of our internal control over financial reporting based on the framework in the Internal Control - Integrated Framework (2013) issued by the Committee of Sponsoring Organizations of the Treadway Commission.
Based on our evaluation, our management concluded that our internal control over financial reporting was effective as of December 31, 2024. Our independent registered public accounting firm also attested to and reported on the effectiveness of internal control over financial reporting.
Because of its inherent limitations, internal control over financial reporting may not prevent or detect misstatements. Projections of any evaluation of effectiveness to future periods are subject to the risk that controls may become inadequate because of changes in conditions or that the degree of compliance with the policies or procedures may deteriorate.
Changes in Internal Controls. We continue to monitor changes related to the ongoing implementation of the integration and upgrade of financial systems and processes to determine the impact on internal control over financial reporting (as such term is defined in Exchange Act Rule 13a-15(f)). No change in our internal control over financial reporting occurred during the three months ended December 31, 2024 that materially affected, or is reasonably likely to materially affect, our internal control over financial reporting.
REPORT OF INDEPENDENT REGISTERED PUBLIC ACCOUNTING FIRM
To the Board of Directors and Stockholders of Booking Holdings Inc.
Opinion on Internal Control over Financial Reporting
We have audited the internal control over financial reporting of Booking Holdings Inc. and subsidiaries (the "Company") as of December 31, 2024, based on criteria established in Internal Control - Integrated Framework (2013) issued by the Committee of Sponsoring Organizations of the Treadway Commission (COSO). In our opinion, the Company maintained, in all material respects, effective internal control over financial reporting as of December 31, 2024, based on criteria established in Internal Control - Integrated Framework (2013) issued by COSO.
We have also audited, in accordance with the standards of the Public Company Accounting Oversight Board (United States) (PCAOB), the consolidated financial statements as of and for the year ended December 31, 2024, of the Company and our report dated February 20, 2025, expressed an unqualified opinion on those financial statements.
Basis for Opinion
The Company’s management is responsible for maintaining effective internal control over financial reporting and for its assessment of the effectiveness of internal control over financial reporting, included in the accompanying "Management's Report on Internal Control Over Financial Reporting". Our responsibility is to express an opinion on the Company’s internal control over financial reporting based on our audit. We are a public accounting firm registered with the PCAOB and are required to be independent with respect to the Company in accordance with the U.S. federal securities laws and the applicable rules and regulations of the Securities and Exchange Commission and the PCAOB.
We conducted our audit in accordance with the standards of the PCAOB. Those standards require that we plan and perform the audit to obtain reasonable assurance about whether effective internal control over financial reporting was maintained in all material respects. Our audit included obtaining an understanding of internal control over financial reporting, assessing the risk that a material weakness exists, testing and evaluating the design and operating effectiveness of internal control based on the assessed risk, and performing such other procedures as we considered necessary in the circumstances. We believe that our audit provides a reasonable basis for our opinion.
Definition and Limitations of Internal Control over Financial Reporting
A company's internal control over financial reporting is a process designed to provide reasonable assurance regarding the reliability of financial reporting and the preparation of financial statements for external purposes in accordance with generally accepted accounting principles. A company's internal control over financial reporting includes those policies and procedures that (1) pertain to the maintenance of records that, in reasonable detail, accurately and fairly reflect the transactions and dispositions of the assets of the company; (2) provide reasonable assurance that transactions are recorded as necessary to permit preparation of financial statements in accordance with generally accepted accounting principles, and that receipts and expenditures of the company are being made only in accordance with authorizations of management and directors of the company; and (3) provide reasonable assurance regarding prevention or timely detection of unauthorized acquisition, use, or disposition of the company’s assets that could have a material effect on the financial statements.
Because of its inherent limitations, internal control over financial reporting may not prevent or detect misstatements. Also, projections of any evaluation of effectiveness to future periods are subject to the risk that controls may become inadequate because of changes in conditions, or that the degree of compliance with the policies or procedures may deteriorate.
/s/ DELOITTE & TOUCHE LLP
Stamford, Connecticut
February 20, 2025
Item 9B. Other Information
Disclosure pursuant to Section 219 of the Iran Threat Reduction and Syria Human Rights Act of 2012 and 13(r) of the Exchange Act
As previously reported in the Quarterly Report on Form 10-Q filed with the SEC on August 1, 2024, the following activities are disclosed as required by Section 219 of the Iran Threat Reduction and Syria Human Rights Act of 2012 and Section 13(r) of the Securities Exchange Act of 1934, as amended. The Company has determined that a limited number of bookings were made through Agoda at accommodations in Iran that were ultimately owned or controlled by the Government of Iran and covered by the travel exemption in applicable U.S. sanctions regulations, as well as one booking at a property that may be owned by a party blocked pursuant to Executive Order No. 13224, for which the travel exemption is not available (the Company has notified, and intends to cooperate with, relevant authorities regarding this booking). The bookings resulted in gross revenues of approximately $1,000 and no net profit. Agoda does not intend to continue these activities or transactions.
Rule 10b5-1 Trading Plans
On December 9, 2024, Glenn D. Fogel, Director, Chief Executive Officer, and President, adopted a trading plan intended to satisfy the affirmative defense of Rule 10b5-1(c) to sell a designated percentage of the net number of the shares resulting from the vesting of his Performance Share Units and Restricted Stock Units. The trading plan will be effective on May 15, 2025 and end on April 15, 2026.
On November 26, 2024, Peter J. Millones, Executive Vice President and General Counsel, adopted a trading plan intended to satisfy the affirmative defense of Rule 10b5-1(c) for the sale of up to 6,502 shares of the Company's common stock with sales starting on May 26, 2026 and ending on May 31, 2027.
Item 9C. Disclosure Regarding Foreign Jurisdictions that Prevent Inspections
None.
PART III
Item 10. Directors, Executive Officers and Corporate Governance
Information required by Part III, Item 10 will be included in our Proxy Statement relating to our 2025 annual meeting of stockholders to be filed with the Securities and Exchange Commission within 120 days after the end of our fiscal year ended December 31, 2024, and is incorporated herein by reference.
The Company has adopted an insider trading policy which governs transactions in our securities by the Company's directors, officers, employees, contractors, and consultants, as well as by the Company itself. The Company believes that its insider trading policy is reasonably designed to promote compliance with insider trading laws, rules and regulations, and listing standards applicable to the Company. A copy of the Company's insider trading policy is filed with this Annual Report on Form 10-K as Exhibit 19.1.
Item 11. Executive Compensation
Information required by Part III, Item 11 will be included in our Proxy Statement relating to our 2025 annual meeting of stockholders to be filed with the Securities and Exchange Commission within 120 days after the end of our fiscal year ended December 31, 2024, and is incorporated herein by reference.
Item 12. Security Ownership of Certain Beneficial Owners and Management and Related Stockholder Matters
Information required by Part III, Item 12 will be included in our Proxy Statement relating to our 2025 annual meeting of stockholders to be filed with the Securities and Exchange Commission within 120 days after the end of our fiscal year ended December 31, 2024, and is incorporated herein by reference.
Item 13. Certain Relationships and Related Transactions, and Director Independence
Information required by Part III, Item 13 will be included in our Proxy Statement relating to our 2025 annual meeting of stockholders to be filed with the Securities and Exchange Commission within 120 days after the end of our fiscal year ended December 31, 2024, and is incorporated herein by reference.
Item 14. Principal Accountant Fees and Services
Information required by Part III, Item 14 will be included in our Proxy Statement relating to our 2025 annual meeting of stockholders to be filed with the Securities and Exchange Commission within 120 days after the end of our fiscal year ended December 31, 2024, and is incorporated herein by reference.
PART IV
Item 15. Exhibits and Financial Statement Schedules.
(a) List of Documents Filed as a Part of this Annual Report on Form 10-K:
The following Consolidated Financial Statements of the Company and the report of our independent registered public accounting firm are filed as part of this Annual Report on Form 10-K: Consolidated Balance Sheets at December 31, 2024 and 2023; Consolidated Statements of Operations, Consolidated Statements of Comprehensive Income, Consolidated Statements of Changes in Stockholders' (Deficit) Equity, and Consolidated Statements of Cash Flows for the years ended December 31, 2024, 2023, and 2022; Notes to our Consolidated Financial Statements; Report of Independent Registered Public Accounting Firm; and Schedule I - Condensed Financial Information of Parent (Booking Holdings Inc.).
Other financial statement schedules have been omitted because they are not applicable, not material or the required information is shown in the Consolidated Financial Statements or the notes thereto.
(b) Exhibits
In reviewing the agreements included as exhibits to this Annual Report on Form 10-K, please remember they are included to provide you with information regarding their terms and are not intended to provide any other factual or disclosure information about the Company or the other parties to the agreements. Some agreements contain representations and warranties by each of the parties to the applicable agreement. These representations and warranties have been made solely for the benefit of the other parties to the applicable agreement and:
•should not be treated as categorical statements of fact, but rather as a way of allocating the risk to one of the parties if those statements prove to be inaccurate;
•may have been qualified by disclosures that were made to the other party in connection with the negotiation of the applicable agreement, which disclosures are not necessarily reflected in the agreement;
•may apply standards of materiality in a way that is different from what may be viewed as material to you or other investors; and
•were made only as of the date of the applicable agreement or such other date or dates as may be specified in the agreement and are subject to more recent developments.
Accordingly, these representations and warranties may not describe the actual state of affairs as of the date they were made or at any other time. Additional information about the Company may be found elsewhere in this Annual Report on Form 10‑K and the Company's other public filings, which are available without charge through the SEC's website at http://www.sec.gov.
| | | | | |
| Exhibit Number | Description |
| Restated Certificate of Incorporation of the Company. |
| Certificate of Amendment of the Restated Certificate of Incorporation, dated as of June 4, 2021. |
| Amended and Restated By-Laws of Booking Holdings Inc., dated as of June 4, 2021. |
| 4.1 | Reference is hereby made to Exhibits 3.1, 3.2, and 3.3. |
| Specimen Certificate for the Company's Common Stock. |
| Indenture, dated as of September 23, 2014, between the Company and Deutsche Bank Trust Company Americas, as Trustee. |
| Indenture, dated as of August 8, 2017, between the Company and U.S. Bank National Association, as trustee. |
| Form of 1.800% Senior Note due 2027. |
| Officers' Certificate, dated March 3, 2015, for the 1.800% Senior Notes due 2027. |
| Form of 3.650% Senior Note due 2025. |
| Officers' Certificate, dated March 13, 2015, for the 3.650% Senior Notes due 2025. |
| Form of 3.600% Senior Note due 2026. |
| Officers' Certificate, dated May 23, 2016, for the 3.600% Senior Notes due 2026. |
| Form of 3.550% Senior Note due 2028. |
| Officers' Certificate, dated August 15, 2017, with respect to the 3.550% Senior Notes due 2028. |
| | | | | |
| Exhibit Number | Description |
| Description of the Company's Common Stock Registered Pursuant to Section 12 of the Securities Exchange Act of 1934. |
| Description of the Company's 2.375% Senior Notes due 2024 Registered Pursuant to Section 12 of the Securities Exchange Act of 1934. |
| Description of the Company's 1.800% Senior Notes due 2027 Registered Pursuant to Section 12 of the Securities Exchange Act of 1934. |
| Description of the Company's 0.100% Senior Notes due 2025 Registered Pursuant to Section 12 of the Securities Exchange Act of 1934. |
| |
| |
| Description of the Company's 0.500% Senior Notes due 2028 Registered Pursuant to Section 12 of the Securities Exchange Act of 1934. |
| Form of 4.625% Senior Note due 2030. |
| Officers' Certificate, dated April 13, 2020, with respect to the 4.625% Senior Notes due 2030. |
| Form of 0.750% Convertible Senior Note due 2025. |
| Indenture, dated as of April 14, 2020, between Booking Holdings Inc. and U.S. Bank National Association, as trustee. |
| Form of 0.100% Senior Note due 2025. |
| Officers' Certificate, dated March 8, 2021, with respect to the 0.100% Senior Notes due 2025. |
| Form of 0.500% Senior Note due 2028. |
| Officers' Certificate, dated March 8, 2021, with respect to the 0.500% Senior Notes due 2028. |
| Form of 4.000% Senior Note due 2026. |
| Officers' Certificate, dated November 15, 2022, with respect to the 4.000% Senior Notes due 2026. |
| Form of 4.250% Senior Note due 2029. |
| Officers' Certificate, dated November 15, 2022, with respect to the 4.250% Senior Notes due 2029. |
| Form of 4.500% Senior Note due 2031. |
| Officers' Certificate, dated November 15, 2022, with respect to the 4.500% Senior Notes due 2031. |
| Form of 4.750% Senior Note due 2034. |
| Officers' Certificate, dated November 15, 2022, with respect to the 4.750% Senior Notes due 2034. |
| Description of the Company's 4.000% Senior Notes due 2026 Registered Pursuant to Section 12 of the Securities Exchange Act of 1934. |
| Description of the Company's 4.250% Senior Notes due 2029 Registered Pursuant to Section 12 of the Securities Exchange Act of 1934. |
| Description of the Company's 4.500% Senior Notes due 2031 Registered Pursuant to Section 12 of the Securities Exchange Act of 1934. |
| Description of the Company's 4.750% Senior Notes due 2034 Registered Pursuant to Section 12 of the Securities Exchange Act of 1934. |
| Form of 3.625% Senior Note due 2028. |
| Officers' Certificate, dated May 12, 2023, with respect to the 3.625% Senior Notes due 2028. |
| Form of 4.125% Senior Note due 2033. |
| Officers' Certificate, dated May 12, 2023, with respect to the 4.125% Senior Notes due 2033. |
| Agency Agreement, dated as of May 12, 2023, by and between Booking Holdings Inc., as issuer, Elavon Financial Services DAC, UK Branch, as paying agent, and U.S. Bank Trust Company, National Association, as transfer agent, registrar, and trustee. |
| Description of the Company's 3.625% Senior Notes due 2028 Registered Pursuant to Section 12 of the Securities Exchange Act of 1934. |
| Description of the Company's 4.125% Senior Notes due 2033 Registered Pursuant to Section 12 of the Securities Exchange Act of 1934. |
| Form of 3.500% Senior Note due 2029. |
| Officers' Certificate, dated March 1, 2024, with respect to the 3.500% Senior Notes due 2029. |
| Form of 3.625% Senior Note due 2032. |
| Officers' Certificate, dated March 1, 2024, with respect to the 3.625% Senior Notes due 2032. |
| Form of 3.750% Senior Note due 2036. |
| Officers' Certificate, dated March 1, 2024, with respect to the 3.750% Senior Notes due 2036. |
| Form of 4.000% Senior Note due 2044. |
| Officers' Certificate, dated March 1, 2024, with respect to the 4.000% Senior Notes due 2044. |
| | | | | |
| Exhibit Number | Description |
| Agency Agreement, dated as of March 1, 2024, by and between Booking Holdings Inc., as issuer, Elavon Financial Services DAC, UK Branch, as paying agent, and U.S. Bank Trust Company, National Association, as transfer agent, registrar, and trustee. |
| Form of 3.250% Senior Notes due 2032. |
| Officers' Certificate, dated November 21, 2024, with respect to the 3.250% Senior Notes due 2032. |
| Form of 3.750% Senior Notes due 2037. |
| Officers' Certificate, dated November 21, 2024, with respect to the 3.750% Senior Notes due 2037. |
| Form of 3.875% Senior Notes due 2045. |
| Officers' Certificate, dated November 21, 2024, with respect to the 3.875% Senior Notes due 2045. |
| Agency Agreement, dated as of November 21, 2024, by and between Booking Holdings Inc., as issuer, and U.S. Bank Trust Company, National Association, as paying agent, transfer agent, registrar, and trustee. |
| Description of the Company's 3.500% Senior Notes due 2029 Registered Pursuant to Section 12 of the
Securities Exchange Act of 1934.
|
| Description of the Company's 3.625% Senior Notes due 2032 Registered Pursuant to Section 12 of the
Securities Exchange Act of 1934.
|
| Description of the Company's 3.750% Senior Notes due 2036 Registered Pursuant to Section 12 of the
Securities Exchange Act of 1934.
|
| Description of the Company's 4.000% Senior Notes due 2044 Registered Pursuant to Section 12 of the
Securities Exchange Act of 1934.
|
| Description of the Company's 3.250% Senior Notes due 2032 Registered Pursuant to Section 12 of the
Securities Exchange Act of 1934.
|
| Description of the Company's 3.750% Senior Notes due 2037 Registered Pursuant to Section 12 of the
Securities Exchange Act of 1934.
|
| Description of the Company's 3.875% Senior Notes due 2045 Registered Pursuant to Section 12 of the
Securities Exchange Act of 1934.
|
| Booking Holdings Inc. 1999 Omnibus Plan (as amended and restated effective June 3, 2021). |
| Form of Restricted Stock Unit Agreement for awards under the 1999 Omnibus Plan to non-employee directors. |
| Form of Restricted Stock Unit Agreement for awards under the 1999 Omnibus Plan. |
| |
| |
| Form of Performance Share Unit Agreement under the Company's 1999 Omnibus Plan. |
| Amended and Restated KAYAK Software Corporation 2012 Equity Incentive Plan. |
| OpenTable, Inc. Amended and Restated 2009 Equity Incentive Award Plan. |
| Buuteeq, Inc. Amended and Restated 2010 Stock Plan. |
| Amended and Restated Rocket Travel, Inc. 2012 Stock Incentive Plan. |
| Amended and Restated Annual Bonus Plan. |
| Form of Non-Competition and Non-Solicitation Agreement. |
| Second Amended and Restated Employment Agreement, dated April 21, 2015, by and between the Company and Peter J. Millones. |
| Employment Agreement, dated December 15, 2016, by and between the Company and Glenn D. Fogel. |
| Non-Competition and Non-Solicitation Agreement, dated December 15, 2016, by and between the Company and Glenn D. Fogel. |
| Employee Confidentiality and Assignment Agreement, dated December 15, 2016, by and between the Company and Glenn D. Fogel. |
| Employment Agreement, dated January 19, 2018, between the Company and David I. Goulden. |
| Non-Competition and Non-Solicitation Agreement, dated March 1, 2018, between the Company and David I. Goulden. |
| Employee Confidentiality and Assignment Agreement, dated January 19, 2018, between the Company and David I. Goulden. |
| Credit Agreement, dated as of August 14, 2019, among the Company, the lenders from time to time party thereto, and JPMorgan Chase Bank, N.A., as Administrative Agent. |
| Letter Agreement, dated October 24, 2019, by and between the Company and Glenn D. Fogel. |
| | | | | |
| Exhibit Number | Description |
| Form of Employee Confidentiality and Assignment Agreement. |
| Amendment No. 1, dated as of April 7, 2020, to the Credit Agreement, dated as of August 14, 2019, by and among the Company, the lenders from time to time party thereto, and JPMorgan Chase Bank, N.A., as administrative agent. |
| Amendment No. 2, dated as of October 28, 2020, to the Credit Agreement, dated as of August 14, 2019, by and among the Company, the lenders from time to time party thereto, and JPMorgan Chase Bank, N.A., as administrative agent. |
| Letter Amendment to 2018 PSU Award and 2019 PSU Award Agreements with Glenn D. Fogel dated January 28, 2021. |
| Letter Amendment to 2018 PSU Award and 2019 PSU Award Agreements with David I. Goulden dated January 28, 2021. |
| Letter Amendment to 2018 PSU Award and 2019 PSU Award Agreements with Peter J. Millones dated January 28, 2021. |
| Letter Agreement, dated July 31, 2021, by and between the Company and Paulo Pisano. |
| Amendment No. 3, dated as of December 22, 2021, to the Credit Agreement, dated as of August 14, 2019, by and among the Company, the lenders from time to time party thereto, and JPMorgan Chase Bank, N.A., as administrative agent. |
| Agreement for the Sale and Purchase of the Booking Campus in Amsterdam, the Netherlands, dated as of December 14, 2022, by and among Booking.com Real Estate Amsterdam B.V., as the Seller, D-IE WIIS Oosterdok Coöperatief U.A., as the Purchaser, and Booking.com Holding B.V., as the Guarantor. |
| Amendment No. 4, dated as of January 6, 2023, to the Credit Agreement, dated as of August 14, 2019, by and among the Company, the lenders from time to time party thereto, and JPMorgan Chase Bank, N.A., as administrative agent. |
| Form of Performance Share Unit Agreement under the Company's 1999 Omnibus Plan. |
| Form of Restricted Stock Unit Agreement under the Company's 1999 Omnibus Plan. |
| Letter Agreement, dated February 23, 2023, by and between the Company and David I. Goulden. |
| Credit Agreement, dated as of May 17, 2023, among the Company, the lenders from time to time party thereto, and JPMorgan Chase Bank, N.A. as Administrative Agent. |
| Employment Agreement, dated December 4, 2019, by and between Booking.com International BV and Paulo Pisano. |
| Description of Termination Pay Policy, effective as of April 5, 2023. |
| Employment Agreement, dated December 1, 2023, by and between the Company and Ewout Steenbergen. |
| Form of Restricted Stock Unit Agreement under the Company's 1999 Omnibus Plan. |
| Non-Competition and Non-Solicitation Agreement, dated December 1, 2023, by and between the Company and Ewout L. Steenbergen. |
| Employee Confidentiality and Assignment Agreement, dated December 4, 2023, by and between the Company and Ewout L. Steenbergen. |
| Letter Agreement Amendment, dated January 18, 2024 by and between the Company and David I. Goulden. |
| Letter Agreement Amendment, dated April 4, 2024 by and between the Company and David I. Goulden. |
| Additional Letter Agreement, dated December 18, 2024, by and between the Company and David I. Goulden. |
| Booking Holdings Inc. Insider Trading Policies and Procedures |
| List of Subsidiaries. |
| Consent of Deloitte & Touche LLP. |
| Power of Attorney (included in the Signature Page). |
| Certification of Glenn D. Fogel, pursuant to Section 302 of the Sarbanes-Oxley Act of 2002. |
| Certification of Ewout L. Steenbergen, pursuant to Section 302 of the Sarbanes-Oxley Act of 2002. |
| Certification of Glenn D. Fogel, pursuant to Section 906 of the Sarbanes-Oxley Act of 2002 (Subsections (a) and (b) of Section 1350, Chapter 63 of Title 18, United States Code). |
| Certification of Ewout L. Steenbergen, pursuant to Section 906 of the Sarbanes-Oxley Act of 2002 (Subsections (a) and (b) of Section 1350, Chapter 63 of Title 18, United States Code). |
| Booking Holdings Inc. Financial Restatement Recovery Policy. |
| | | | | |
| Exhibit Number | Description |
| 101.INS | XBRL Instance Document - the instance document does not appear in the Interactive Data File because its XBRL tags are embedded within the inline XBRL document. |
| 104 | Cover Page Interactive Data File - the cover page from this Annual Report on Form 10-K for the year ended December 31, 2024, formatted in Inline XBRL (included in Exhibit 101). |
____________________________
+ Indicates a management contract or compensatory plan or arrangement.
* Schedules or similar attachments have been omitted pursuant to Item 601(a)(5) of Regulation S-K. The Company hereby undertakes to furnish copies of any of the omitted schedules or similar attachments upon request by the Securities and Exchange Commission.
| | | | | |
| |
| (a) | Previously filed as an exhibit to the Current Report on Form 8-K filed on February 21, 2018 (File No. 1-36691). |
| (b) | Previously filed as an exhibit to the Current Report on Form 8-K filed on June 4, 2021 (File No. 1-36691). |
| (c) | Previously filed as an exhibit to Amendment No. 2 to Registration Statement on Form S-1 filed on March 18, 1999 (File No. 333-69657). |
| (d) | Previously filed as an exhibit to the Current Report on Form 8-K filed on November 25, 2015 (File No. 1-36691). |
| (e) | Previously filed as an exhibit to the Registration Statement on Form S-3 filed on August 8, 2017 (File No. 333-219800). |
| (f) | Previously filed as an exhibit to the Current Report on Form 8-K filed on March 2, 2015 (File No. 1-36691). |
| (g) | Previously filed as an exhibit to the Current Report on Form 8-K filed on March 4, 2015 (File No. 1-36691). |
| (h) | Previously filed as an exhibit to the Current Report on Form 8-K filed on March 12, 2015 (File No. 1-36691). |
| (i) | Previously filed as an exhibit to the Current Report on Form 8-K filed on March 13, 2015 (File No. 1-36691). |
| (j) | Previously filed as an exhibit to the Current Report on Form 8-K filed on May 23, 2016 (File No. 1-36691). |
| (k) | Previously filed as an exhibit to our Current Report on Form 8-K filed on August 15, 2017 (File No. 1-36691). |
| (l) | Previously filed as an exhibit to our Current Report on Form 8-K filed on March 8, 2021 (File No. 1-36691). |
| |
| (m) | Previously filed as an exhibit to the Current Report on Form 8‑K filed on March 9, 2011 (File No. 0-25581). |
| (n) | Previously filed as an exhibit to the Current Report on Form 8‑K filed on March 3, 2017 (File No. 1-36691). |
| (o) | Previously filed as an exhibit to the Registration Statement on Form S-8 filed on June 13, 2014 (File No. 333-196756). |
| |
| (p) | Previously filed as an exhibit to the Annual Report on Form 10-K filed for the year ended December 31, 2015 (File No. 1-36691). |
| |
| (q) | Previously filed as an exhibit to the Current Report on Form 8-K filed on March 4, 2013 (File No. 0-25581). |
| (r) | Previously filed as an exhibit to our Current Report on Form 8-K filed on April 24, 2015 (File No. 1-36691). |
| (s) | Previously filed as an exhibit to the Current Report on Form 8-K filed on December 16, 2016 (File No. 1-36691). |
| (t) | Previously filed as an exhibit to the Current Report on Form 8-K filed on January 22, 2018 (File No. 1-36691). |
| (u) | Previously filed as an exhibit to the Current Report on Form 8-K filed on August 14, 2019 (File No. 1-36691). |
| (v) | Previously filed as an exhibit to the Quarterly Report on Form 10-Q filed on May 9, 2019 (File No. 1-36691). |
| (w) | Previously filed as an exhibit to the Current Report on Form 8-K filed on April 8, 2020 (File No. 1-36691). |
| (x) | Previously filed as an exhibit to the Current Report on Form 8-K filed on April 14, 2020 (File No. 1-36691). |
| |
| (y) | Previously filed as an exhibit to the Current Report on Form 8-K filed on October 30, 2020 (File No. 1-36691). |
| (z) | Previously filed as an exhibit to the Annual Report on Form 10-K filed on February 26, 2020 (File No. 1-36691). |
| (aa) | Previously filed as an exhibit to the Quarterly Report on Form 10-Q filed on May 7, 2020 (File No. 1-36691) |
| (bb) | Previously filed as an exhibit to the Current Report on Form 8-K filed on July 17, 2020 (File No. 1-36691) |
| (cc) | Previously filed as an exhibit to the Current Report on Form 8-K filed on January 29, 2021 (File No. 1-36691) |
| (dd) | Previously filed as an exhibit to the Quarterly Report on Form 10-Q filed on November 3, 2021 (File No. 1-36691) |
| (ee) | Previously filed as an exhibit to the Annual Report on Form 10-K filed on February 23, 2022 (File No. 1-36691). |
| (ff) | Previously filed as an exhibit to the Current Report on Form 8-K filed on November 15, 2022 (File No. 1-36691). |
| (gg) | Previously filed as an exhibit to the Current Report on Form 8-K filed on October 25, 2019 (File No. 1-36691). |
| (hh) | Previously filed as an exhibit to the Current Report on Form 8-K filed on December 19, 2022 (File No. 1-36691). |
| (ii) | Previously filed as an exhibit to the Annual Report on Form 10-K filed on February 23, 2023 (File No. 1-36691). |
| (jj) | Previously filed as an exhibit to the Current Report on Form 8-K filed on May 12, 2023 (File No. 1-36691). |
| (kk) | Previously filed as an exhibit to the Quarterly Report on Form 10-Q filed on May 4, 2023 (File No. 1-36691). |
| | | | | |
| (ll) | Previously filed as an exhibit to the Current Report on Form 8-K filed on February 23, 2023 (File No. 1-36691). |
| (mm) | Previously filed as an exhibit to the Current Report on Form 8-K filed on May 19, 2023 (File No. 1-36691). |
| (nn) | Previously filed as an exhibit to the Quarterly Report on Form 10-Q filed on August 3, 2023 (File No. 1-36691). |
| (oo) | Previously filed as an exhibit to the Current Report on Form 8-K filed on April 11, 2023 (File No. 1-36691). |
| (pp) | Previously filed as an exhibit to the Current Report on Form 8-K filed on December 13, 2023 (File No. 1-36691). |
| (qq) | This document is being furnished in accordance with SEC Release Nos. 33‑8212 and 34‑47551. |
| (rr) | Previously filed as an exhibit to the Annual Report on Form 10-K filed on February 22, 2024 (File No. 1-36691). |
| (ss) | Previously filed as an exhibit to the Current Report on Form 8-K filed on March 1, 2024 (File No. 1-36691). |
| (tt) | Previously filed as an exhibit to the Current Report on Form 8-K filed on November 21, 2024 (File No. 1-36691). |
| (uu) | Previously filed as an exhibit to the Current Report on Form 8-K filed on January 19, 2024 (File No. 1-36691). |
| (vv) | Previously filed as an exhibit to the Current Report on Form 8-K filed on April 5, 2024 (File No. 1-36691). |
| (ww) | Previously filed as an exhibit to the Current Report on Form 8-K filed on December 18, 2024 (File No. 1-36691) |
| (xx) | Previously filed as an exhibit to the Current Report on Form 8-K filed on April 22, 2024 (File No. 1-36691). |
Item 16. Form 10-K Summary.
None.
Signatures
Pursuant to the requirements of Section 13 or 15(d) of the Securities Exchange Act of 1934, the registrant has duly caused this report to be signed on its behalf by the undersigned, thereunto duly authorized.
| | | | | | | | | | | |
| | BOOKING HOLDINGS INC. |
| | | | |
| | By: | /s/ Glenn D. Fogel |
| | | Name: | Glenn D. Fogel |
| | | Title: | Chief Executive Officer and President |
| | | Date: | February 20, 2025 |
Power of Attorney
KNOW ALL PERSONS BY THESE PRESENTS, that each person whose signature appears below constitutes and appoints Glenn D. Fogel, Ewout L. Steenbergen, and Peter J. Millones, and each of them severally, his or her true and lawful attorney-in-fact with power of substitution and resubstitution to sign in his or her name, place and stead, in any and all capacities, to do any and all things and execute any and all instruments that such attorney may deem necessary or advisable under the Securities Exchange Act of 1934 and any rules, regulations and requirements of the Securities and Exchange Commission in connection with this Annual Report on Form 10-K and any and all amendments hereto, as fully and for all intents and purposes as he or she might do or could do in person, and hereby ratifies and confirms all said attorneys-in-fact and agents, each acting alone, and his or her substitute or substitutes, may lawfully do or cause to be done by virtue hereof.
Pursuant to the requirements of the Securities Exchange Act of 1934, this report has been signed below by the following persons on behalf of the registrant and in the capacities and on the dates indicated.
| | | | | | | | | | | | | | |
| Signature | | Title | | Date |
| | | | | |
| | | | | |
| /s/ Robert J. Mylod Jr. | | Director, Chair of the Board | | February 20, 2025 |
| Robert J. Mylod Jr. | | | | |
| | | | |
| /s/ Glenn D. Fogel | | Director, Chief Executive Officer and President | | February 20, 2025 |
| Glenn D. Fogel | | | | |
| | | | |
| /s/ Ewout L. Steenbergen | | Executive Vice President and Chief Financial | | February 20, 2025 |
| Ewout L. Steenbergen | | Officer (Principal Financial Officer) | | |
| | | | |
| /s/ Susana D'Emic | | Chief Accounting Officer and Controller | | February 20, 2025 |
| Susana D'Emic | | (Principal Accounting Officer) | | |
| | | | |
| /s/ Mirian Graddick-Weir | | Director | | February 20, 2025 |
| Mirian Graddick-Weir | | | | |
| | | | | |
| /s/ Kelly Grier | | Director | | February 20, 2025 |
| Kelly Grier | | | | |
| | | | |
| | | | |
| /s/ Wei Hopeman | | Director | | February 20, 2025 |
| Wei Hopeman | | | | |
| | | | | |
| | | | |
| | | | |
| | | | |
| /s/ Charles H. Noski | | Director | | February 20, 2025 |
| Charles H. Noski | | | | |
| | | | |
| /s/ Larry Quinlan | | Director | | February 20, 2025 |
| Larry Quinlan | | | | |
| | | | |
| | | | |
| | | | |
| | | | |
| /s/ Nicholas J. Read | | Director | | February 20, 2025 |
| Nicholas J. Read | | | | |
| | | | |
| /s/ Thomas E. Rothman | | Director | | February 20, 2025 |
| Thomas E. Rothman | | | | |
| | | | |
| /s/ Sumit Singh | | Director | | February 20, 2025 |
| Sumit Singh | | | | |
| | | | |
| /s/ Lynn Vojvodich Radakovich | | Director | | February 20, 2025 |
| Lynn Vojvodich Radakovich | | | | |
| | | | |
| /s/ Vanessa A. Wittman | | Director | | February 20, 2025 |
| Vanessa A. Wittman | | | | |
INDEX TO CONSOLIDATED FINANCIAL STATEMENTS
| | | | | |
| | Page No. |
| | |
| Report of Independent Registered Public Accounting Firm (PCAOB ID: 34) | |
| | |
| Consolidated Balance Sheets at December 31, 2024 and 2023 | |
| | |
| Consolidated Statements of Operations for the years ended December 31, 2024, 2023, and 2022 | |
| | |
| Consolidated Statements of Comprehensive Income for the years ended December 31, 2024, 2023, and 2022 | |
| |
| Consolidated Statements of Changes in Stockholders' (Deficit) Equity for the years ended December 31, 2024, 2023, and 2022 | |
| | |
| Consolidated Statements of Cash Flows for the years ended December 31, 2024, 2023, and 2022 | |
| | |
| Notes to Consolidated Financial Statements | |
REPORT OF INDEPENDENT REGISTERED PUBLIC ACCOUNTING FIRM
To the Board of Directors and Stockholders of Booking Holdings Inc.
Opinion on the Financial Statements
We have audited the accompanying consolidated balance sheets of Booking Holdings Inc. and subsidiaries (the "Company") as of December 31, 2024 and 2023, the related consolidated statements of operations, comprehensive income, changes in stockholders' (deficit) equity, and cash flows for each of the three years in the period ended December 31, 2024, and the related notes and the schedule listed in the Index at Item 15 (collectively referred to as the "financial statements"). In our opinion, the financial statements present fairly, in all material respects, the financial position of the Company as of December 31, 2024 and 2023, and the results of its operations and its cash flows, for each of the three years in the period ended December 31, 2024, in conformity with accounting principles generally accepted in the United States of America.
We have also audited, in accordance with the standards of the Public Company Accounting Oversight Board (United States) (PCAOB), the Company's internal control over financial reporting as of December 31, 2024, based on criteria established in Internal Control - Integrated Framework (2013) issued by the Committee of Sponsoring Organizations of the Treadway Commission and our report dated February 20, 2025, expressed an unqualified opinion on the Company's internal control over financial reporting.
Basis for Opinion
These financial statements are the responsibility of the Company's management. Our responsibility is to express an opinion on the Company's financial statements based on our audits. We are a public accounting firm registered with the PCAOB and are required to be independent with respect to the Company in accordance with the U.S. federal securities laws and the applicable rules and regulations of the Securities and Exchange Commission and the PCAOB.
We conducted our audits in accordance with the standards of the PCAOB. Those standards require that we plan and perform the audit to obtain reasonable assurance about whether the financial statements are free of material misstatement, whether due to error or fraud. Our audits included performing procedures to assess the risks of material misstatement of the financial statements, whether due to error or fraud, and performing procedures that respond to those risks. Such procedures included examining, on a test basis, evidence regarding the amounts and disclosures in the financial statements. Our audits also included evaluating the accounting principles used and significant estimates made by management, as well as evaluating the overall presentation of the financial statements. We believe that our audits provide a reasonable basis for our opinion.
Critical Audit Matter
The critical audit matter communicated below is a matter arising from the current-period audit of the financial statements that was communicated or required to be communicated to the audit committee and that (1) relates to accounts or disclosures that are material to the financial statements and (2) involved our especially challenging, subjective, or complex judgments. The communication of critical audit matters does not alter in any way our opinion on the financial statements, taken as a whole, and we are not, by communicating the critical audit matter below, providing a separate opinion on the critical audit matter or on the accounts or disclosures to which it relates.
Revenues - Refer to Notes 2 and 3 to the financial statements
Critical Audit Matter Description
Substantially all of the Company’s revenues are generated by providing online travel reservation services, which principally allow travelers to book travel reservations with travel service providers through the Company’s platforms. Revenues consist of a significant volume of low-dollar transactions utilizing multiple custom systems.
We identified revenues as a critical audit matter as the majority of the processes to calculate and record revenue are highly automated, rely on a number of custom systems, and involve interfacing significant volumes of data across multiple systems. Given the complex information technology (IT) environment, this required the involvement of professionals with expertise in IT to identify, test, and evaluate the revenue data flows, the revenue systems and the automated controls.
How the Critical Audit Matter Was Addressed in the Audit
Our audit procedures related to the Company's revenue transactions included the following, among others:
•With the assistance of our IT specialists, we:
–Identified the systems used to calculate and record revenue transactions.
–Tested the general IT controls over each of these systems, including testing of user access controls, change management controls, and IT operations controls.
–Performed testing of system interface controls and automated controls within the relevant revenue streams.
•We tested business process controls to reconcile the various systems to the Company's general ledgers.
•We performed detail transaction testing by agreeing the amounts recognized to source documents and testing the mathematical accuracy of the recorded revenue.
/s/ DELOITTE & TOUCHE LLP
Stamford, Connecticut
February 20, 2025
We have served as the Company’s auditor since 1997.
Booking Holdings Inc.
CONSOLIDATED BALANCE SHEETS
(In millions, except share and per share data)
| | | | | | | | | | | | | | |
| | | December 31, |
| | | 2024 | | 2023 |
| ASSETS | | | | |
| Current assets: | | | | |
| Cash and cash equivalents | | $ | 16,164 | | | $ | 12,107 | |
Short-term investments (Available-for-sale debt securities: Amortized cost of $580 at December 31, 2023) | | — | | | 576 | |
| Accounts receivable, net (Allowance for expected credit losses of $146 and $137, respectively) | | 3,199 | | | 3,253 | |
| Prepaid expenses, net | | 587 | | | 644 | |
| Other current assets | | 541 | | | 454 | |
| Total current assets | | 20,491 | | | 17,034 | |
| Property and equipment, net | | 832 | | | 784 | |
| Operating lease assets | | 559 | | | 705 | |
| Intangible assets, net | | 1,382 | | | 1,613 | |
| Goodwill | | 2,799 | | | 2,826 | |
| Long-term investments | | 536 | | | 440 | |
| Other assets, net | | 1,109 | | | 940 | |
| Total assets | | $ | 27,708 | | | $ | 24,342 | |
| LIABILITIES AND STOCKHOLDERS' DEFICIT | | | | |
| Current liabilities: | | | | |
| Accounts payable | | $ | 3,824 | | | $ | 3,374 | |
| Accrued expenses and other current liabilities | | 6,047 | | | 4,741 | |
| Deferred merchant bookings | | 4,031 | | | 3,254 | |
| Short-term debt | | 1,745 | | | 1,961 | |
| Total current liabilities | | 15,647 | | | 13,330 | |
| Deferred income taxes | | 289 | | | 258 | |
| Operating lease liabilities | | 483 | | | 599 | |
| Long-term U.S. transition tax liability | | 257 | | | 515 | |
| Other long-term liabilities | | 199 | | | 161 | |
| Long-term debt | | 14,853 | | | 12,223 | |
| Total liabilities | | 31,728 | | | 27,086 | |
| Commitments and contingencies (see Note 16) | | | | |
| | | | |
| Stockholders' deficit: | | | | |
Common stock, $0.008 par value, Authorized shares: 1,000,000,000 Issued shares: 64,276,130 and 64,048,000, respectively | | — | | | — | |
| Treasury stock: 31,329,265 and 29,650,351 shares, respectively | | (47,877) | | | (41,426) | |
| Additional paid-in capital | | 7,707 | | | 7,175 | |
| Retained earnings | | 36,525 | | | 31,830 | |
| Accumulated other comprehensive loss | | (375) | | | (323) | |
| Total stockholders' deficit | | (4,020) | | | (2,744) | |
| Total liabilities and stockholders' deficit | | $ | 27,708 | | | $ | 24,342 | |
See Notes to Consolidated Financial Statements.
Booking Holdings Inc.
CONSOLIDATED STATEMENTS OF OPERATIONS
(In millions, except share and per share data)
| | | | | | | | | | | | | | | | | | | | |
| | Year Ended December 31, |
| | 2024 | | 2023 | | 2022 |
| Merchant revenues | | $ | 14,142 | | | $ | 10,936 | | | $ | 7,193 | |
| Agency revenues | | 8,524 | | | 9,414 | | | 9,003 | |
| Advertising and other revenues | | 1,073 | | | 1,015 | | | 894 | |
| Total revenues | | 23,739 | | | 21,365 | | | 17,090 | |
| Operating expenses: | | | | | | |
| Marketing expenses | | 7,278 | | | 6,773 | | | 5,993 | |
| Sales and other expenses | | 3,120 | | | 2,744 | | | 1,986 | |
| Personnel, including stock-based compensation of $599, $530, and $404, respectively | | 3,354 | | | 3,294 | | | 2,465 | |
| General and administrative | | 1,036 | | | 1,555 | | | 766 | |
| Information technology | | 771 | | | 655 | | | 526 | |
| Depreciation and amortization | | 591 | | | 504 | | | 451 | |
| Transformation costs | | 34 | | | — | | | — | |
| Other operating expenses | | — | | | 5 | | | (199) | |
| | | | | | |
| Total operating expenses | | 16,184 | | | 15,530 | | | 11,988 | |
| Operating income | | 7,555 | | | 5,835 | | | 5,102 | |
| | | | | | |
| Interest expense | | (1,295) | | | (897) | | | (391) | |
| Interest and dividend income | | 1,114 | | | 1,020 | | | 219 | |
| Other income (expense), net | | (82) | | | (477) | | | (1,007) | |
| | | | | | |
| Income before income taxes | | 7,292 | | | 5,481 | | | 3,923 | |
| Income tax expense | | 1,410 | | | 1,192 | | | 865 | |
| Net income | | $ | 5,882 | | | $ | 4,289 | | | $ | 3,058 | |
| | | | | | |
| | | | | | |
| | | | | | |
| | | | | | |
| Net income applicable to common stockholders per basic common share | | $ | 174.96 | | | $ | 118.67 | | | $ | 76.70 | |
| Weighted-average number of basic common shares outstanding (in 000's) | | 33,622 | | | 36,140 | | | 39,872 | |
| Net income applicable to common stockholders per diluted common share | | $ | 172.69 | | | $ | 117.40 | | | $ | 76.35 | |
| Weighted-average number of diluted common shares outstanding (in 000's) | | 34,064 | | | 36,530 | | | 40,052 | |
See Notes to Consolidated Financial Statements.
Booking Holdings Inc.
CONSOLIDATED STATEMENTS OF COMPREHENSIVE INCOME
(In millions)
| | | | | | | | | | | | | | | | | | | | |
| | Year Ended December 31, |
| | 2024 | | 2023 | | 2022 |
| Net income | | $ | 5,882 | | | $ | 4,289 | | | $ | 3,058 | |
| | | | | | |
| | | | | | |
| | | | | | |
| | | | | | |
Other comprehensive loss, net of tax (1) | | (52) | | | (56) | | | (123) | |
| Comprehensive income | | $ | 5,830 | | | $ | 4,233 | | | $ | 2,935 | |
(1) Primarily consists of foreign currency translation adjustments (see Note 14).
See Notes to Consolidated Financial Statements.
Booking Holdings Inc.
CONSOLIDATED STATEMENTS OF CHANGES IN STOCKHOLDERS' (DEFICIT) EQUITY
FOR THE YEARS ENDED DECEMBER 31, 2024, 2023, and 2022
(In millions, except share data)
| | | | | | | | | | | | | | | | | | | | | | | | | | | | | | | | | | | | | | | | | | | | | | | | | | |
| | | Common Stock | | Treasury Stock | | Additional Paid-in Capital | | Retained Earnings | | Accumulated Other Comprehensive Loss | | Total |
| | | Shares
(in 000's) | | Amount | | Shares
(in 000's) | | Amount | | | | |
| Balance, December 31, 2021 | | 63,584 | | | $ | — | | | (22,518) | | | $ | (24,290) | | | $ | 6,159 | | | $ | 24,453 | | | $ | (144) | | | $ | 6,178 | |
| Cumulative effect of adoption of accounting standards update | | — | | | — | | | — | | | — | | | (96) | | | 30 | | | — | | | (66) | |
| Net income | | — | | | — | | | — | | | — | | | — | | | 3,058 | | | — | | | 3,058 | |
| | | | | | | | | | | | | | | | |
| Other comprehensive loss, net of tax | | — | | | — | | | — | | | — | | | — | | | — | | | (123) | | | (123) | |
| | | | | | | | | | | | | | | | |
| | | | | | | | | | | | | | | | |
| | | | | | | | | | | | | | | | |
| | | | | | | | | | | | | | | | |
| Exercise of stock options and vesting of restricted stock units and performance share units | | 197 | | | — | | | — | | | — | | | 7 | | | — | | | — | | | 7 | |
| Repurchase of common stock | | — | | | — | | | (3,400) | | | (6,693) | | | — | | | — | | | — | | | (6,693) | |
| Stock-based compensation | | — | | | — | | | — | | | — | | | 421 | | | — | | | — | | | 421 | |
| | | | | | | | | | | | | | | | |
| Balance, December 31, 2022 | | 63,781 | | | $ | — | | | (25,918) | | | $ | (30,983) | | | $ | 6,491 | | | $ | 27,541 | | | $ | (267) | | | $ | 2,782 | |
| | | | | | | | | | | | | | | | |
| Net income | | — | | | — | | | — | | | — | | | — | | | 4,289 | | | — | | | 4,289 | |
| | | | | | | | | | | | | | | | |
| Other comprehensive loss, net of tax | | — | | | — | | | — | | | — | | | — | | | — | | | (56) | | | (56) | |
| | | | | | | | | | | | | | | | |
| | | | | | | | | | | | | | | | |
| | | | | | | | | | | | | | | | |
| | | | | | | | | | | | | | | | |
| Exercise of stock options and vesting of restricted stock units and performance share units | | 267 | | | — | | | — | | | — | | | 134 | | | — | | | — | | | 134 | |
| Repurchase of common stock | | — | | | — | | | (3,732) | | | (10,443) | | | — | | | — | | | — | | | (10,443) | |
| Stock-based compensation | | — | | | — | | | — | | | — | | | 550 | | | — | | | — | | | 550 | |
| | | | | | | | | | | | | | | | |
| Balance, December 31, 2023 | | 64,048 | | | $ | — | | | (29,650) | | | $ | (41,426) | | | $ | 7,175 | | | $ | 31,830 | | | $ | (323) | | | $ | (2,744) | |
| | | | | | | | | | | | | | | | |
| Net income | | — | | | — | | | — | | | — | | | — | | | 5,882 | | | — | | | 5,882 | |
| | | | | | | | | | | | | | | | |
| Other comprehensive loss, net of tax | | — | | | — | | | — | | | — | | | — | | | — | | | (52) | | | (52) | |
| | | | | | | | | | | | | | | | |
| | | | | | | | | | | | | | | | |
| | | | | | | | | | | | | | | | |
| Conversion of debt | | — | | | — | | | — | | | — | | | (102) | | | — | | | — | | | (102) | |
| Exercise of stock options and vesting of restricted stock units and performance share units | | 228 | | | — | | | — | | | — | | | 14 | | | — | | | — | | | 14 | |
| Repurchase of common stock | | — | | | — | | | (1,679) | | | (6,451) | | | — | | | — | | | — | | | (6,451) | |
| Dividends | | — | | | — | | | — | | | — | | | — | | | (1,187) | | | — | | | (1,187) | |
| Stock-based compensation | | — | | | — | | | — | | | — | | | 620 | | | — | | | — | | | 620 | |
| | | | | | | | | | | | | | | | |
| Balance, December 31, 2024 | | 64,276 | | | $ | — | | | (31,329) | | | $ | (47,877) | | | $ | 7,707 | | | $ | 36,525 | | | $ | (375) | | | $ | (4,020) | |
See Notes to Consolidated Financial Statements.
Booking Holdings Inc.
CONSOLIDATED STATEMENTS OF CASH FLOWS
(In millions)
| | | | | | | | | | | | | | | | | | | | |
| | | Year Ended December 31, |
| | | 2024 | | 2023 | | 2022 |
| OPERATING ACTIVITIES: | | | | | | |
| Net income | | $ | 5,882 | | | $ | 4,289 | | | $ | 3,058 | |
| Adjustments to reconcile net income to net cash provided by operating activities: | | | | | | |
| Depreciation and amortization | | 591 | | | 504 | | | 451 | |
| Provision for expected credit losses and chargebacks | | 412 | | | 330 | | | 232 | |
| Deferred income tax expense (benefit) | | 98 | | | (478) | | | (257) | |
| Net (gains) losses on equity securities | | (63) | | | 131 | | | 963 | |
| Stock-based compensation expense | | 599 | | | 530 | | | 404 | |
| Operating lease amortization | | 160 | | | 161 | | | 156 | |
| | | | | | |
| Unrealized foreign currency transaction (gains) losses related to Euro-denominated debt | | (526) | | | 163 | | | (46) | |
| | | | | | |
| | | | | | |
| | | | | | |
| Loss related to the conversion option on convertible senior notes | | 796 | | | — | | | — | |
| Gain on sale and leaseback transaction | | — | | | — | | | (240) | |
| Other | | 7 | | | 5 | | | 38 | |
| Changes in assets and liabilities: | | | | | | |
| Accounts receivable | | (506) | | | (1,330) | | | (1,228) | |
| Prepaid expenses and other current assets | | (12) | | | 155 | | | (217) | |
| Deferred merchant bookings and other current liabilities | | 1,361 | | | 2,742 | | | 3,718 | |
| | | | | | |
| Other | | (476) | | | 142 | | | (478) | |
| Net cash provided by operating activities | | 8,323 | | | 7,344 | | | 6,554 | |
| INVESTING ACTIVITIES: | | | | | | |
| Purchase of investments | | (33) | | | (12) | | | (768) | |
| Proceeds from sale and maturity of investments | | 590 | | | 1,840 | | | 32 | |
| Additions to property and equipment | | (429) | | | (345) | | | (368) | |
| | | | | | |
| | | | | | |
| | | | | | |
| | | | | | |
| Proceeds from sale and leaseback transaction | | — | | | — | | | 601 | |
| Other investing activities | | 1 | | | 3 | | | (15) | |
| Net cash provided by (used in) investing activities | | 129 | | | 1,486 | | | (518) | |
| FINANCING ACTIVITIES: | | | | | | |
| | | | | | |
| | | | | | |
| | | | | | |
| | | | | | |
| Proceeds from the issuance of long-term debt | | 4,836 | | | 1,893 | | | 3,621 | |
| | | | | | |
| | | | | | |
| Payments on maturity and conversion of debt | | (1,312) | | | (500) | | | (1,880) | |
| Payments for repurchase of common stock | | (6,509) | | | (10,377) | | | (6,621) | |
| | | | | | |
| Dividends paid | | (1,174) | | | — | | | — | |
| Proceeds from exercise of stock options | | 14 | | | 134 | | | 7 | |
| Other financing activities | | (59) | | | (59) | | | (24) | |
| Net cash used in financing activities | | (4,204) | | | (8,909) | | | (4,897) | |
| Effect of exchange rate changes on cash and cash equivalents and restricted cash and cash equivalents | | (190) | | | (37) | | | (40) | |
| Net increase (decrease) in cash and cash equivalents and restricted cash and cash equivalents | | 4,058 | | | (116) | | | 1,099 | |
| Total cash and cash equivalents and restricted cash and cash equivalents, beginning of period | | 12,135 | | | 12,251 | | | 11,152 | |
| Total cash and cash equivalents and restricted cash and cash equivalents, end of period | | $ | 16,193 | | | $ | 12,135 | | | $ | 12,251 | |
| | | | | | |
| | | | | | |
| | | | | | |
| | | | | | |
| | | | | | |
See Notes to Consolidated Financial Statements.
Booking Holdings Inc.
NOTES TO CONSOLIDATED FINANCIAL STATEMENTS
1. BUSINESS DESCRIPTION
Booking Holdings Inc. ("Booking Holdings" or the "Company") seeks to make it easier for everyone to experience the world by providing consumers, travel service providers, and restaurants with leading travel and restaurant online reservation and related services. The Company offers its services through five primary consumer-facing brands: Booking.com, Priceline, Agoda, KAYAK, and OpenTable, which allow consumers to: book a broad array of accommodations (including hotels, motels, resorts, homes, apartments, bed and breakfasts, hostels, and other alternative and traditional accommodations properties) and a flight to their destinations; make a car rental reservation or arrange for an airport taxi; make a dinner reservation; or book a vacation package, tour, activity, or cruise. Consumers can also use the Company's meta-search services to easily compare travel reservation information, such as flight, hotel, and rental car reservations from hundreds of online travel platforms at once. In addition, the Company offers other services to consumers, travel service providers and restaurants, such as travel-related insurance products and restaurant management services.
2. SUMMARY OF SIGNIFICANT ACCOUNTING POLICIES
Basis of Presentation
The Company's Consolidated Financial Statements include the accounts of the Company and its wholly-owned subsidiaries, including acquired businesses from the dates of acquisition. All intercompany accounts and transactions have been eliminated in consolidation.
Use of Estimates
The preparation of financial statements in conformity with accounting principles generally accepted in the United States of America ("U.S. GAAP") requires management to make estimates and assumptions that affect the amounts reported in the financial statements and footnotes thereto. Actual results may differ significantly from those estimates. The estimates underlying the Company's Consolidated Financial Statements relate to, among other things, the valuation of goodwill and other long-lived tangible and intangible assets, the valuation of investments in private entities, income taxes, contingencies, stock-based compensation, the allowance for expected credit losses (also referred to as provision for bad debts or provision for uncollectible accounts), chargeback provisions, and the accrual of obligations for consumer incentive programs.
Fair Value
Fair value is the price that would be received to sell an asset or paid to transfer a liability in an orderly transaction between market participants at the measurement date.
There are three levels of inputs to valuation techniques used to measure fair value:
Level 1: Quoted prices in active markets that are accessible by the Company at the measurement date for identical assets and liabilities.
Level 2: Inputs that are observable, either directly or indirectly. Such prices may be based upon quoted prices for identical or comparable securities in active markets or inputs not quoted on active markets, but corroborated by market data.
Level 3: Unobservable inputs are used when little or no market data is available.
Cash and Cash Equivalents
Cash and cash equivalents consists primarily of cash and highly liquid investment grade securities with an original maturity of three months or less. See Note 19 for information related to restricted cash and cash equivalents.
Investments
Debt Securities
The Company has classified its investments in debt securities as available-for-sale securities. The aggregate unrealized gains and losses on available-for-sale debt securities, net of tax, are included in "Accumulated other comprehensive loss" in the Consolidated Balance Sheets. If the amortized cost basis of an available-for-sale security exceeds its fair value and if the Company has the intention to sell the security or it is more likely than not that the Company will be required to sell the security before recovery of the amortized cost basis, an impairment is recognized in the Consolidated Statements of Operations. If the Company does not have the intention to sell the security and it is not more likely than not that the Company will be required to sell the security before recovery of the amortized cost basis and the Company determines that the decline in fair value below the amortized cost basis of an available-for-sale security is entirely or partially due to credit-related factors, the credit loss is measured and recognized as an allowance for expected credit losses along with the related expense in the Consolidated Statements of Operations. The allowance is measured as the amount by which the debt security's amortized cost basis exceeds the Company's best estimate of the present value of cash flows expected to be collected.
The Company's investments in marketable debt securities are recognized based on the trade date. The cost of marketable debt securities sold is determined using a first-in and first-out method. The Company's investments in debt securities are assessed for classification in the Consolidated Balance Sheets as short-term or long-term at the individual security level. Classification as short-term or long-term is based on the maturities of the securities, as applicable, and the Company's expectations regarding the timing of sales and redemptions.
Equity Securities
Equity securities are reported as "Long-term investments" in the Consolidated Balance Sheets and include equity investments with readily determinable fair values and equity investments without readily determinable fair values. Equity investments with readily determinable fair values are reported at estimated fair value with changes in fair value recognized in "Other income (expense), net" in the Consolidated Statements of Operations. The Company holds investments in equity securities of private entities, over which the Company does not have the ability to exercise significant influence or control. These investments, which do not have readily determinable fair values, are measured at cost less impairment, if any. Such investments are also required to be measured at fair value as of the date of certain observable transactions for the identical or a similar investment of the same issuer.
Accounts Receivable from Customers and Allowance for Expected Credit Losses
Accounts receivable is reported net of expected credit losses. The Company estimates lifetime expected credit losses upon recognition of the financial assets. The Company identifies the relevant risk characteristics of its customers and the related receivables and prepayments, which include the following: size, type (alternative accommodations vs. hotels) or geographic location of the customer, or a combination of these characteristics. Receivables with similar risk characteristics have been grouped into pools. For each pool, the Company considers the historical credit loss experience, current economic conditions, supportable forecasts of future economic conditions, and any recoveries in assessing the lifetime expected credit losses. Other key factors that influence the expected credit loss analysis include customer demographics, payment terms offered in the normal course of business to customers, the nature of competition, and industry-specific factors that could impact the Company's receivables. Additionally, external data and macroeconomic conditions are considered. This is assessed at each balance sheet date based on the Company's specific facts and circumstances.
Property and Equipment, Net
Property and equipment are stated at cost less accumulated depreciation. Depreciation is computed on a straight-line basis over the estimated useful lives of the assets or, when applicable, the lease term related to leasehold improvements, whichever is shorter.
Website Costs and Internal-use Software
Acquisition costs and certain direct development costs associated with website and internal-use software are capitalized and include external direct costs of services and payroll costs for employees devoting time to the software projects principally related to platform development, including support systems, software coding, designing system interfaces, and installation and testing of the software. These costs are recorded as property and equipment and are generally amortized beginning when the asset is substantially ready for use. Costs incurred for enhancements that are expected to result in additional features or functionalities are capitalized and amortized over the estimated useful life of the enhancements. Costs incurred during the preliminary project stage, as well as maintenance and training costs, are expensed as incurred.
Cloud Computing Arrangements
The Company utilizes various third-party computer systems and third-party service providers, including global distribution systems and computerized central reservation systems of the accommodation, rental car, and airline industries in connection with providing some of its services. The Company uses both internally-developed systems and third-party systems to operate its services, including transaction processing, order management, and financial and accounting systems. Implementation costs incurred in a hosting arrangement that is a service contract are capitalized and amortized over the term of the hosting arrangement. The capitalized implementation costs are reported as "Prepaid expenses, net" or "Other assets, net" in the Company's Consolidated Balance Sheets, as appropriate. The related amortization expenses are reported in "Information technology" expenses in the Company's Consolidated Statements of Operations.
Leases
The Company determines if an arrangement is a lease, or contains a lease, when a contract is signed. The Company determines if a lease is an operating or finance lease and records a lease asset and a lease liability upon lease commencement, which is the date when the underlying asset is made available for use by the lessor. The Company has operating leases for office space and data centers. For office space and data centers, the Company has elected to combine the fixed payments to lease the asset and any fixed non-lease payments (such as maintenance or utility charges) when determining its lease payments. The Company's finance leases are mainly for computer equipment.
The Company uses its incremental borrowing rate as its discount rate to determine the present value of its remaining lease payments to calculate its lease assets and lease liabilities because the rate implicit in the lease is not readily determinable. The incremental borrowing rate approximates the rate the Company would pay to borrow in the currency of the lease payments on a collateralized basis for the weighted-average life of the lease. Operating lease assets also include any prepaid lease payments and lease incentives received prior to lease commencement.
The Company recognizes operating lease costs and the amortization of finance lease assets on a straight-line basis over the lease term. The interest component of a finance lease is recognized using the effective interest method over the lease term. Certain of the Company's lease agreements include rent payments which are adjusted periodically based on an index or rate. Any change in payments due to such adjustments are recognized as variable lease expense as they are incurred. Variable lease expense also includes costs for property taxes, insurance, and services provided by the lessor which are charged based on usage or performance (such as maintenance or utility charges).
Most leases have one or more options to renew beyond their initial term. The exercise of renewal options, mainly for office space and data centers, is at the Company's discretion and are included in the determination of the lease term for accounting purposes if they are reasonably certain to be exercised.
Business Combinations, Goodwill, and Intangible Assets
The Company accounts for acquired businesses using the acquisition method of accounting. The consideration transferred is allocated to the assets acquired and liabilities assumed based on their respective values at the acquisition date. The excess of the consideration transferred over the net of the amounts allocated to the identifiable assets acquired and liabilities assumed is recognized as goodwill. The Company generally recognizes and measures contract assets and contract liabilities in a business combination at amounts consistent with those recorded by the acquired business.
Goodwill is assigned to reporting units that are expected to benefit from the synergies of the business combination. Goodwill is not subject to amortization and is tested for impairment on an annual basis and between annual tests if an event occurs or circumstances change that would more likely than not reduce the fair value of a reporting unit below its carrying amount. The Company tests goodwill at a reporting unit level. The fair value of the reporting unit is compared to its carrying value, including goodwill. Fair values are determined using a combination of standard valuation techniques, including an income approach (discounted cash flows) and market approaches (e.g., earnings before interest, taxes, depreciation, and amortization ("EBITDA") multiples of comparable publicly traded companies) and based on market participant assumptions. A goodwill impairment loss is measured at the amount by which a reporting unit's carrying amount exceeds its fair value, not to exceed the carrying amount of goodwill. See Note 11 for additional information.
Intangible assets are carried at cost and amortized on a straight-line basis over their estimated useful lives.
Impairment of Long-lived Assets
The Company reviews long-lived assets, including intangible assets and operating lease assets, whenever events or changes in circumstances indicate that the carrying amount of the asset may not be recoverable. The assessment of possible impairment is based upon the Company's ability to recover the carrying value of the assets from the estimated undiscounted future net cash flows, before interest and taxes, of the related asset group. The amount of impairment loss, if any, is measured as the excess of the carrying value of the asset over the present value of estimated future cash flows, using a discount rate commensurate with the risks involved and based on assumptions representative of market participants.
Foreign Currency Translation
The functional currency of the Company's subsidiaries is generally the respective local currency. For operations outside of the U.S., assets and liabilities are translated into U.S. Dollars at the rate of exchange existing at the balance sheet date. Income statement amounts are translated at monthly average exchange rates applicable for the period. Translation gains and losses are included as a component of "Accumulated other comprehensive loss" in the Company's Consolidated Balance Sheets. Foreign currency transaction gains and losses are included in "Other income (expense), net" in the Company's Consolidated Statements of Operations.
Derivatives
As a result of the Company's operations outside of the U.S., it is exposed to various market risks that may affect its consolidated results of operations, cash flows, and financial position. These market risks include, but are not limited to, fluctuations in foreign currency exchange rates. For the Company's operations outside of the U.S., the primary foreign currency exposures are in Euros and British Pounds Sterling, the currencies in which the Company conducts a significant portion of its business activities. As a result, the Company faces exposure to adverse movements in foreign currency exchange rates as the financial results of its operations outside of the U.S. are translated from local currencies into U.S. Dollars upon consolidation. Additionally, foreign currency exchange rate fluctuations on transactions denominated in currencies other than the functional currency of an entity result in gains and losses that are reflected in net income.
The Company may enter into derivative instruments to hedge certain net exposures of nonfunctional currency denominated assets and liabilities, even though it does not elect to apply hedge accounting or hedge accounting does not apply. These contracts are generally short-term in duration. Certain of the Company's derivative instruments have master netting arrangements, which reduce credit risk by permitting net settlement of transactions with the same counterparty. The Company is exposed to the risk that counterparties to derivative instruments may fail to meet their contractual obligations. The Company regularly reviews its credit exposure and assesses the creditworthiness of its counterparties. The Company reports the fair value of its derivative assets and liabilities on a gross basis in the Consolidated Balance Sheets in "Other current assets" and "Accrued expenses and other current liabilities," respectively. Unless designated as hedges for accounting purposes, gains and losses resulting from changes in the fair value of derivative instruments are recognized in "Other income (expense), net" in the Consolidated Statements of Operations in the period that the changes occur and are classified within "Net cash provided by operating activities" or "Net cash used in financing activities," as appropriate, in the Consolidated Statements of Cash Flows. See Note 6 for additional information related to these derivative instruments.
Contractual terms of debt arrangements, including embedded features such as conversion options, are evaluated and reassessed at each balance sheet date to determine whether they must be accounted for separately from the debt contract as derivative instruments under ASC 815. Embedded derivatives are measured at fair value, with changes in fair value recognized in the Consolidated Statement of Operations.
Non-derivative Instrument Designated as Net Investment Hedge
The foreign currency transaction gains or losses on the Company's Euro-denominated debt are measured based upon changes in spot rates. The foreign currency transaction gains or losses on the Euro-denominated debt that is designated as a hedging instrument for accounting purposes are recorded in "Accumulated other comprehensive loss" in the Consolidated Balance Sheets. The foreign currency transaction gains or losses on the Euro-denominated debt that is not designated as a hedging instrument are recognized in "Other income (expense), net" in the Consolidated Statements of Operations. See Notes 12 and 14 for additional information related to the net investment hedge.
Revenue Recognition
Online travel reservation services
Substantially all of the Company's revenues are generated by providing online travel reservation services, which principally allows travelers to book travel reservations with travel service providers through the Company's platforms. While the Company generally refers to a consumer that books travel reservation services on the Company's platforms as its customer, for accounting purposes, the Company's customers are the travel service providers and, in certain merchant transactions, the travelers. The Company's contracts with travel service providers give them the ability to market their reservation availability without transferring to the Company the responsibility to deliver the travel services. Therefore, the Company's revenues are presented on a net basis in the Consolidated Statements of Operations. These contracts include payment terms and establish the consideration to which the Company is entitled, which includes either a commission or a margin on the travel transaction. Revenue is measured based on the expected consideration specified in the contract with the travel service provider, considering the effects of factors such as discounts and other sales incentives. Estimates for sales incentives are based on historical experience, current trends, and forecasts, as applicable. Local occupancy taxes, general excise taxes, value-added taxes, sales taxes, and other similar taxes ("travel transaction taxes"), if any, collected from travelers are reported on a net basis in revenues in the Consolidated Statements of Operations.
Revenues for online travel reservation services are recognized at a point in time when the Company has completed its post-booking services and the travelers begin using the arranged travel services. These revenues are classified into two categories:
•Merchant revenues are derived from travel-related transactions where the Company facilitates payments from travelers for the services provided, generally at the time of booking. These include transactions where travelers book accommodation, rental car, airline reservations, and other travel related services. Merchant revenues include travel reservation commissions and transaction net revenues (i.e., the amount charged to travelers, including the contra-revenue impact of merchandising, less the amount owed to travel service providers) in connection with the Company's merchant reservation services; revenues from facilitating payments, such as credit card processing rebates and customer processing fees; and ancillary fees, including travel-related insurance revenues.
•Agency revenues are derived from the Company's commissions on travel-related transactions where the Company does not facilitate payments from travelers for the services provided.
Advertising and Other Revenues
Advertising and other revenues are derived primarily from revenues earned by KAYAK and OpenTable. KAYAK recognizes advertising revenue primarily by sending referrals to online travel companies ("OTCs") and travel service providers and from advertising placements on its platforms. Revenue related to referrals is recognized when a consumer clicks on a referral placement or upon completion of the travel. Revenue for advertising placements is recognized based upon when a consumer clicks on an advertisement or when KAYAK displays an advertisement. OpenTable recognizes revenues for restaurant reservation services (fees paid by restaurants when diners are seated through its online reservation service) and subscription fees for restaurant management services on a straight-line basis over the contractual period in accordance with how the service is provided.
Consumer Incentive Programs
The Company provides various consumer incentive programs such as referral bonuses, rebates, credits, and discounts. In addition, the Company offers loyalty programs where participating consumers may be awarded loyalty points on current transactions that can be redeemed in the future. The estimated value of the incentives granted and the loyalty points expected to be redeemed is generally recognized as a reduction of revenue at the time they are granted.
Deferred Merchant Bookings
Cash payments received from travelers in advance of the Company completing its performance obligations are included in "Deferred merchant bookings" in the Company's Consolidated Balance Sheets and are comprised principally of amounts estimated to be payable to travel service providers as well as the Company's estimated future revenue for its commission or margin and fees. The amounts are mostly subject to refunds for cancellations. The Company expects to complete its performance obligations generally within one year from the reservation date. The increase in the Deferred Merchant Booking balance during the year ended December 31, 2024 was principally due to the increase in business volumes.
Marketing Expenses
The Company's advertising expenses are reported in "Marketing expenses" in the Consolidated Statements of Operations. Marketing expenses consist of performance marketing expenses and brand marketing expenses. These expenses consist primarily of the costs of: (1) search engine keyword purchases; (2) affiliate programs; (3) referrals from meta-search websites; (4) other performance-based marketing, including social media marketing; and (5) offline and online brand marketing. Performance marketing expenses are expenses generally measured by return on investment or an increase in bookings over a specified time period and are recognized as incurred. Brand marketing expenses are expenses incurred to build brand awareness over a specified time period. These expenses consist primarily of television advertising and online video and display advertising (including the airing of the Company's television advertising online), as well as other marketing expenses such as public relations and sponsorships. Brand marketing expenses are generally recognized as incurred with the exception of advertising production costs, which are deferred and expensed the first time the advertisement is displayed or broadcast.
Sales and Other Expenses
Sales and other expenses are generally variable in nature and consist primarily of: (1) credit card and other payment processing fees associated with merchant transactions; (2) fees paid to third parties that provide call center and other customer services; (3) digital services taxes and other similar taxes (4) chargeback provisions and fraud prevention expenses associated with merchant transactions; (5) provisions for expected credit losses, mostly related to accommodation commission receivables; and (6) customer relations costs.
Personnel Expenses
Personnel expenses consist of compensation to the Company's personnel, including salaries, bonuses, and stock-based compensation, payroll taxes, and employee health and other benefits.
Stock-Based Compensation
Stock-based compensation expense related to performance share units, restricted stock units and stock options is recognized based on fair value on a straight-line basis over the respective requisite service periods and forfeitures are accounted for when they occur. The fair value on the grant date of performance share units and restricted stock units is determined based on the number of units granted and the quoted price of the Company's common stock. For performance share units with market conditions, the effect of the market condition is also considered in the determination of fair value on the grant date using Monte Carlo simulations. The fair value of employee stock options is determined using the Black-Scholes model.
The Company records stock-based compensation expense for performance-based awards using its estimate of the probable outcome at the end of the performance period (i.e., the estimated performance against the performance targets or performance goals, as applicable). The Company periodically adjusts the cumulative stock-based compensation expense recorded when the probable outcome for these performance-based awards is updated based upon changes in actual and forecasted operating results or expected achievement of performance goals, as applicable.
The benefits of tax deductions in excess of recognized compensation costs are recognized in the Consolidated Statements of Operations as a discrete item when an option exercise or a vesting and release of shares occurs. Excess tax benefits are presented as operating cash flows and cash payments for employee statutory tax withholding related to vested stock awards are presented as financing cash flows in the Consolidated Statements of Cash Flows.
General and Administrative Expenses
General and administrative expenses consist primarily of fees for certain outside professionals, occupancy and office expenses, personnel-related expenses such as travel, relocation, recruiting, and training expenses, and certain travel transaction taxes.
Information Technology Expenses
Information technology expenses consist primarily of: (1) software license and system maintenance fees; (2) cloud computing costs and outsourced data center costs; (3) payments to contractors; and (4) data communications and other expenses associated with operating the Company's services.
Restructuring and Other Exit Costs
The Company records employee severance and other termination costs that meet the requirements for recognition in accordance with the relevant guidance of Accounting Standards Codification ("ASC") 420, Exit or Disposal Cost Obligations, or ASC 712, Compensation - Nonretirement Postemployment Benefits, as applicable. For involuntary termination benefits that are not provided under the terms of an ongoing benefit arrangement, the liability for the current fair value of expected future costs associated with a management-approved restructuring plan is recognized in the period in which the plan is communicated to the employees and the plan is not expected to change significantly. For ongoing benefit arrangements, inclusive of statutory requirements, employee termination costs are accrued when the existing situation or set of circumstances indicates that an obligation has been incurred, it is probable the benefits will be paid, and the amount can be reasonably estimated. Termination benefits associated with voluntary leaver schemes are recorded when the employee irrevocably accepts the offer and the amount can be reasonably estimated.
Income Taxes
The Company accounts for income taxes under the asset and liability method. The Company records the estimated future tax effects of temporary differences between the tax bases of assets and liabilities and amounts reported in the Consolidated Balance Sheets, as well as operating loss and tax credit carryforwards. Deferred taxes are classified as non-current in the Consolidated Balance Sheets.
The Company records deferred tax assets to the extent it believes these assets will more likely than not be realized. The Company regularly reviews its deferred tax assets for recoverability considering historical profitability, projected future taxable income, the expected timing of the reversals of existing temporary differences, the carryforward periods available for tax reporting purposes, and tax planning strategies. A valuation allowance is provided when it is more likely than not that some portion or all of a deferred tax asset will not be realized. The ultimate realization of deferred tax assets depends on the generation of future taxable income during the period in which related temporary differences become deductible. In determining the future tax consequences of events that have been recognized in the financial statements or tax returns, significant judgments, estimates, and interpretation of statutes are required.
Deferred taxes are measured using the enacted tax rates expected to apply to taxable income in the years in which those temporary differences are expected to be recovered or settled. The effect on deferred taxes of a change in tax rates is recognized in income in the period that includes the enactment date of such change.
The Company recognizes liabilities when it believes that uncertain positions may not be fully sustained upon audit by the tax authorities. Liabilities recognized for uncertain tax positions are based on a two-step approach for recognition and measurement. First, the Company evaluates the tax position for recognition by determining if the weight of available evidence indicates it is more likely than not that the position will be sustained on audit based on its technical merits. Second, the Company measures the tax benefit as the largest amount that is more than 50% likely of being realized upon ultimate settlement. Interest and penalties attributable to uncertain tax positions, if any, are recognized as a component of income tax expense.
The Company accounts for taxes on global intangible low-taxed income ("GILTI") introduced by the U.S. Tax Cuts and Jobs Act (the "Tax Act") as period costs. See Note 15 for further details related to income taxes.
Contingencies
Loss contingencies (other than income tax-related contingencies) arise from actual or possible claims and assessments and pending or threatened litigation that may be brought against the Company by individuals, governments or other entities. Based on the Company's assessment of loss contingencies at each balance sheet date, a loss is recorded in the financial statements if it is probable that an asset has been impaired or a liability has been incurred and the amount of the loss can be reasonably estimated.
Reclassification
Certain amounts from prior periods have been reclassified to conform to the current period presentation. These include the reclassification in the Consolidated Balance Sheet as of December 31, 2023 of certain liabilities aggregating $106 million from "Accounts payable" to "Accrued expenses and other current liabilities" to better reflect the progress of the underlying transactions in the procure-to-pay process.
Recent Accounting Pronouncements Adopted
Accounting for Convertible Instruments and Contracts in an Entity's Own Equity
On January 1, 2022, the Company adopted the accounting standards update relating to convertible instruments and contracts in an entity's own equity. Under the updated guidance, upon the initial recognition of convertible debt, the Company presents the entire amount attributable to the debt as a liability. The initial carrying amount of the convertible debt liability is reduced by any direct and incremental issuance costs paid to third parties that are associated with the convertible debt issuance. In calculating diluted earnings per share, the accounting standards update also requires the use of the if-converted method for the Company's convertible debt. See Note 8 for additional information on net income per share calculations.
The Company adopted the accounting standards update on a modified retrospective basis applied to the 0.75% convertible senior notes due in May 2025 (see Note 12) resulting in an increase of $30 million to "Retained earnings" as of January 1, 2022. The significant corresponding balance sheet changes as of that date were an increase of $86 million to "Long-term debt" and decreases of $96 million to "Additional paid-in capital" and $21 million to "Deferred income taxes."
Improvements to Reportable Segment Disclosures
In fiscal 2024, the Company adopted the accounting standards update that requires additional reportable segment disclosures, including segment revenues, significant expenses, and segment profit or loss. See Note 17.
Other Recent Accounting Pronouncements
Expense Disaggregation Disclosures
In November 2024, the Financial Accounting Standards Board ("FASB") issued an accounting standards update that requires the Company to disclose additional information about certain expense categories in the notes to financial statements at interim and annual reporting periods. The update is effective for annual financial statements beginning with the fiscal year 2027 and interim financial statements in the fiscal year 2028 onwards. The Company is currently evaluating the impact of the accounting standards update on its Consolidated Financial Statements.
Improvements to Income Tax Disclosures
In December 2023, the FASB issued an accounting standards update related to income taxes that requires additional disclosures on the rate reconciliation and taxes paid. The update requires disclosure of additional categories of information in the tax rate reconciliation table about federal, state and foreign income taxes and more details about certain items that meet a quantitative threshold. Income taxes paid (net of refunds received) are required to be disclosed disaggregated by federal (national), state and foreign taxes and also by jurisdiction based on a quantitative threshold. The update is effective for annual financial statements beginning with the fiscal year 2025. In preparation for the adoption of the update, the Company is currently evaluating the impact to its Consolidated Financial Statements and establishing the related processes and internal controls.
3. REVENUES
Disaggregation of Revenues
Revenues by Type of Service
Approximately 89% of the Company's revenues for the years ended December 31, 2024, 2023, and 2022 relate to online accommodation reservation services. Revenues from all other sources of online travel reservation services and advertising and other revenues each individually represent less than 10% of the Company's total revenues for each year. The majority of the Company's merchant revenues and substantially all of its agency revenues are from Booking.com's accommodation reservations.
Revenues by Geographic Area
See Note 17 for the information related to revenues by geographic area.
Consumer Incentive Programs
At December 31, 2024 and 2023, liabilities of $150 million and $149 million, respectively, were included in "Accrued expenses and other current liabilities" in the Consolidated Balance Sheets for incentives granted to consumers, including credits, loyalty programs, and discounts.
4. STOCK-BASED COMPENSATION
The Company's 1999 Omnibus Plan, as amended and restated effective June 3, 2021, (the "1999 Plan") is the primary stock compensation plan from which broad-based employee, non-employee director, and consultant equity awards may be made. At December 31, 2024, there were approximately 828,000 shares of common stock available for future grants under the 1999 Plan.
Stock-based compensation issued under the plans generally consists of restricted stock units, performance share units, and stock options. Performance share units and restricted stock units are payable in shares of the Company's common stock upon vesting. The Company issues shares of its common stock upon the exercise of stock options. The tax benefit related to stock-based compensation was $58 million, $52 million, and $40 million for the years ended December 31, 2024, 2023, and 2022, respectively.
Restricted Stock Units and Performance Share Units
The Company makes broad-based grants of restricted stock units that generally vest during a period of one- to three-years, subject to certain exceptions for terminations other than for "cause," for "good reason," or on account of death or disability. The Company grants performance share units to executives and certain other employees, which generally vest at the end of a three-year period (with the exception of certain shorter-term performance share units), subject to certain exceptions for terminations other than for "cause," for "good reason," or on account of death or disability. The number of shares that ultimately vest depends on achieving certain performance metrics, performance goals, stock price increase and/or relative total shareholder return, as applicable, by the end of the performance period, assuming there is no accelerated vesting for, among other things, a termination of employment under certain circumstances.
Restricted stock units and performance share units granted by the Company during the years ended December 31, 2024, 2023, and 2022 had an aggregate grant-date fair value of $635 million, $586 million, and $490 million, respectively. Restricted stock units and performance share units that vested during the years ended December 31, 2024, 2023, and 2022 had an aggregate fair value at vesting of $778 million, $459 million, and $400 million, respectively. At December 31, 2024, there was $713 million of estimated total future stock-based compensation expense related to unvested restricted stock units and performance share units to be recognized over a weighted-average period of 1.8 years.
The following table summarizes the activity in restricted stock units and performance share units for employees and non-employee directors during the year ended December 31, 2024:
| | | | | | | | | | | | | | | | | | | | | | | | | | |
| | Restricted Stock Units | | Performance Share Units |
| | Shares | | Weighted-average Grant-date Fair Value | | Shares | | Weighted-average Grant-date Fair Value |
Unvested at December 31, 2023 (1) | | 291,404 | | $ | 2,404 | | | 233,026 | | $ | 2,467 | |
| | | | | | | | |
Granted (2) | | 143,377 | | $ | 3,530 | | | 35,301 | | $ | 3,660 | |
| Vested | | (140,299) | | $ | 2,335 | | | (78,692) | | $ | 2,450 | |
Performance shares adjustment (3) | | | | | | 16,113 | | $ | 3,688 | |
| Forfeited | | (15,759) | | $ | 2,830 | | | (5,594) | | $ | 2,617 | |
| Unvested at December 31, 2024 | | 278,723 | | $ | 2,994 | | | 200,154 | | $ | 2,779 | |
(1) Excludes 4,399 performance share units awarded during the year ended December 31, 2022 for which the grant date under ASC 718, Compensation - Stock Compensation, was not established as of December 31, 2023. Among other conditions, for the grant date to be established, a mutual understanding is required to be reached between the Company and the employee of the key terms and conditions of the award, including the performance targets. The performance targets for each of the annual performance periods under the award are set at the beginning of the respective year.
(2) Includes 4,399 performance share units awarded during the year ended December 31, 2022 for which the grant date under ASC 718 was established during the year ended December 31, 2024.
(3) Probable outcome for performance-based awards is updated based upon changes in actual and forecasted operating results or expected achievement of performance goals, as applicable, and the impact of modifications, if any.
Stock Options
The following table summarizes the activity in stock options during the year ended December 31, 2024:
| | | | | | | | | | | | | | | | | | | | | | | | | | | | | |
| Employee Stock Options | | Number of Shares | | Weighted-average
Exercise Price | | Aggregate
Intrinsic Value (in millions) | | Weighted-average Remaining Contractual Term
(in years) |
| Balance, December 31, 2023 | | 25,523 | | | $ | 1,411 | | | $ | 55 | | | 6.4 |
| | | | | | | | | |
| Exercised | | (9,834) | | | $ | 1,411 | | | | | |
| | | | | | | | |
| | | | | | | | | |
| Balance, December 31, 2024 | | 15,689 | | | $ | 1,411 | | | $ | 56 | | | 5.4 |
| Exercisable at December 31, 2024 | | 15,689 | | | $ | 1,411 | | | $ | 56 | | | 5.4 |
The aggregate intrinsic value of employee stock options exercised during the years ended December 31, 2024 and 2023 was $24 million and $124 million, respectively. No stock options were granted to the executive officers of the Company.
5. INVESTMENTS
The following table summarizes the Company's investments by major security type at December 31, 2024 and 2023:
| | | | | | | | | | | | | | | | | | | | | | | | | | |
| (in millions) | | Cost | | Gross
Unrealized Gains /Upward Adjustments | | Gross
Unrealized Losses /Downward Adjustments | | Carrying Value |
| December 31, 2024 | | | | | | | | |
| | | | | | | | |
| | | | | | | | |
| | | | | | | | |
| | | | | | | | |
| | | | | | | | |
| | | | | | | | |
| | | | | | | | |
| | | | | | | | |
| Long-term investments: | | | | | | | | |
| | | | | | | | |
| | | | | | | | |
| | | | | | | | |
| | | | | | | | |
| | | | | | | | |
| | | | | | | | |
| Equity securities with readily determinable fair values | | $ | 715 | | | $ | — | | | $ | (324) | | | $ | 391 | |
| Equity securities of private entities | | 111 | | | 259 | | | (225) | | | 145 | |
| | | | | | | | |
| Total long-term investments | | $ | 826 | | | $ | 259 | | | $ | (549) | | | $ | 536 | |
| | | | | | | | |
| December 31, 2023 | | | | | | | | |
| Short-term investments: | | | | | | | | |
| Debt securities: | | | | | | | | |
| International government securities | | $ | 63 | | | $ | — | | | $ | — | | | $ | 63 | |
U.S. government securities (1) | | 152 | | | — | | | (1) | | | 151 | |
| Corporate debt securities | | 365 | | | — | | | (3) | | | 362 | |
| | | | | | | | |
| Total short-term investments | | $ | 580 | | | $ | — | | | $ | (4) | | | $ | 576 | |
| | | | | | | | |
| Long-term investments: | | | | | | | | |
| | | | | | | | |
| | | | | | | | |
| | | | | | | | |
| | | | | | | | |
| | | | | | | | |
| | | | | | | | |
| Equity securities with readily determinable fair values | | $ | 715 | | | $ | — | | | $ | (404) | | | $ | 311 | |
| Equity securities of private entities | | 78 | | | 259 | | | (208) | | | 129 | |
| | | | | | | | |
| Total long-term investments | | $ | 793 | | | $ | 259 | | | $ | (612) | | | $ | 440 | |
(1) Includes investments in U.S. municipal bonds.
The Company's investment policy seeks to preserve capital and maintain sufficient liquidity to meet operational and other needs of the business. The Company's investments in available-for-sale debt securities at December 31, 2023 had investment grade credit quality ratings and the investments in international government securities principally included debt securities issued by the governments of Germany, France, Norway, Canada, and Sweden.
Equity securities with readily determinable fair values include the Company's investments in Grab Holdings Limited ("Grab") and DiDi Global Inc. ("DiDi"), with fair values of $200 million and $179 million, respectively, at December 31, 2024 and $143 million and $155 million, respectively, at December 31, 2023. During the year ended December 31, 2023, the Company sold its entire investment in Meituan for $1.7 billion, resulting in a loss of $149 million included in "Other income (expense), net" in the Consolidated Statement of Operations for the year ended December 31, 2023. The cost basis of the Company's investment in Meituan was $450 million. Equity securities with readily determinable fair values are included in "Long-term investments" in the Consolidated Balance Sheets. Net unrealized gains (losses) related to these investments included in "Other income (expense), net" in the Consolidated Statements of Operations for the years ended December 31, 2024, 2023, and 2022 were as follows:
| | | | | | | | | | | | | | | | | | | | |
| | Year Ended December 31, |
| (in millions) | | 2024 | | 2023 | | 2022 |
| | | | | | |
| Grab | | $ | 57 | | | $ | 7 | | | $ | (165) | |
| DiDi | | 24 | | | 30 | | | (70) | |
| Meituan | | — | | | — | | | (526) | |
The Company's investments in equity securities of private entities at December 31, 2024 and 2023, includes $51 million originally invested in Yanolja Co., Ltd. ("Yanolja"). Certain observable transactions subsequent to the Company's original investment resulted in an adjusted carrying value of $306 million for the investment as of December 31, 2021. The Company evaluated its investment in Yanolja for impairment as of June 30, 2023 and 2022 and recognized impairment charges of $24 million and $184 million during the years ended December 31, 2023 and 2022, respectively (see Note 6). The carrying value of the Company's investment in Yanolja was $98 million as of December 31, 2024 and 2023.
6. FAIR VALUE MEASUREMENTS
Financial assets and liabilities measured at fair value on a recurring basis at December 31, 2024 and 2023 and nonrecurring basis, as applicable, are categorized below based on the level of inputs to the valuation techniques used to measure fair value (see Note 2):
| | | | | | | | | | | | | | | | | | | | | | | | | | |
| (in millions) | | Level 1 | | Level 2 | | Level 3 | | Total |
| December 31, 2024 | | | | | | | | |
| Recurring fair value measurements | | | | | | | | |
| ASSETS: | | | | | | | | |
| Cash equivalents and restricted cash equivalents: | | | | | | | | |
| Money market fund investments | | $ | 14,806 | | | $ | — | | | $ | — | | | $ | 14,806 | |
| | | | | | | | |
| | | | | | | | |
| | | | | | | | |
| | | | | | | | |
| Certificates of deposit | | 120 | | | — | | | — | | | 120 | |
| | | | | | | | |
| | | | | | | | |
| | | | | | | | |
| | | | | | | | |
| | | | | | | | |
| | | | | | | | |
| | | | | | | | |
| Long-term investments: | | | | | | | | |
| | | | | | | | |
| | | | | | | | |
| | | | | | | | |
| | | | | | | | |
| Equity securities | | 391 | | | — | | | — | | | 391 | |
| Derivatives: | | | | | | | | |
| Foreign currency exchange derivatives | | — | | | 70 | | | — | | | 70 | |
| | | | | | | | |
| | | | | | | | |
| LIABILITIES: | | | | | | | | |
| Derivatives: | | | | | | | | |
| Foreign currency exchange derivatives | | $ | — | | | $ | 93 | | | $ | — | | | $ | 93 | |
| Embedded derivative liability | | — | | | 1,300 | | | — | | | 1,300 | |
| | | | | | | | |
| | | | | | | | |
| | | | | | | | |
| | | | | | | | |
| | | | | | | | |
| | | | | | | | |
| December 31, 2023 | | | | | | | | |
| Recurring fair value measurements | | | | | | | | |
| ASSETS: | | | | | | | | |
| Cash equivalents and restricted cash equivalents: | | | | | | | | |
| Money market fund investments | | $ | 10,871 | | | $ | — | | | $ | — | | | $ | 10,871 | |
| | | | | | | | |
| | | | | | | | |
| | | | | | | | |
| | | | | | | | |
| Certificates of deposit | | 97 | | | — | | | — | | | 97 | |
| Short-term investments: | | | | | | | | |
| International government securities | | — | | | 63 | | | — | | | 63 | |
| U.S. government securities | | — | | | 151 | | | — | | | 151 | |
| Corporate debt securities | | — | | | 362 | | | — | | | 362 | |
| | | | | | | | |
| | | | | | | | |
| | | | | | | | |
| Long-term investments: | | | | | | | | |
| | | | | | | | |
| | | | | | | | |
| | | | | | | | |
| | | | | | | | |
| Equity securities | | 311 | | | — | | | — | | | 311 | |
| Derivatives: | | | | | | | | |
| Foreign currency exchange derivatives | | — | | | 62 | | | — | | | 62 | |
| | | | | | | | |
| | | | | | | | |
| LIABILITIES: | | | | | | | | |
| Derivatives: | | | | | | | | |
| Foreign currency exchange derivatives | | $ | — | | | $ | 36 | | | $ | — | | | $ | 36 | |
| | | | | | | | |
| Nonrecurring fair value measurements | | | | | | | | |
Investment in equity securities of a private entity (1) | | $ | — | | | $ | — | | | $ | 98 | | | $ | 98 | |
| | | | | | | | |
| | | | | | | | |
(1) During the year ended December 31, 2023, the investment in Yanolja was written down to its estimated fair value.
Investments
See Note 5 for additional information related to the Company's investments.
The Company's investments in debt securities are measured using "Level 2" inputs as the Company has access to quoted prices for identical or comparable securities, but does not have visibility into the volume and frequency of trading for these investments. A market approach is used for recurring fair value measurements and the valuation techniques use inputs that are observable, or can be corroborated by observable data, in an active marketplace.
The Company's investments measured using Level 3 inputs primarily consist of investments in privately-held entities. Fair values of these securities are estimated using a variety of valuation methodologies, including both the market and income approaches. The Company uses valuation techniques appropriate for the type of investment and the information available about the investee as of the valuation date to determine fair value. Recent financing transactions in the investee are generally considered the best indication of the enterprise value and therefore used as a basis to estimate fair value. However, based on a number of factors, such as the proximity in timing to the valuation date or the volume or other terms of these financing transactions, the Company may also use other valuation techniques to supplement this data, including the income approach. When a financing transaction occurs and represents fair value, the Company also uses the calibration process, as appropriate, when estimating fair value on subsequent measurement dates. Calibration is the process of using observed transactions in the investee company's own instruments to ensure that the valuation techniques that will be employed to value the investee company investment on subsequent measurement dates begin with assumptions that are consistent with the original observed transaction as well as any more recent observed transactions in the instruments issued by the investee company.
As of June 30, 2023 and 2022, the Company evaluated its investment in Yanolja for impairment using a combination of the market approach and the income approach in estimating the fair value of the investment as of those dates, and recognized impairment charges. The market approach estimates value using prices and other relevant information generated by market transactions involving comparable companies. The income approach estimates value based on the expectation of future cash flows that a company will generate. These future cash flows are discounted to their present values using a discount rate based on a company's weighted-average cost of capital adjusted to reflect the risks inherent in its cash flows. The key unobservable inputs and ranges used for the June 2023 impairment evaluation, primarily using the income approach, include the weighted average cost of capital (10.5%-14.5%) and the terminal EBITDA multiple (14x-16x). The key unobservable inputs and ranges used for the June 2022 impairment evaluation include, for the market approach, percentage decrease in the calibrated EBITDA multiple (36%) and for the income approach, the weighted average cost of capital (10%-14%) and the terminal EBITDA multiple (14x-16x). Significant changes in any of these inputs in isolation would result in significantly different fair value measurements. A change in the assumption used for EBITDA multiples would result in a directionally similar change in the fair value, and a change in the assumption used for weighted average cost of capital would result in a directionally opposite change in the fair value.
The determination of the fair values of investments, where the Company is a minority shareholder and has access to limited information from the investee, reflects numerous assumptions that are subject to various risks and uncertainties, including key assumptions regarding the investee's expected growth rates and operating margin, as well as other key assumptions with respect to matters outside of the Company's control, such as discount rates and market comparables. It requires significant judgments and estimates and actual results could be materially different than those judgments and estimates utilized in the fair value measurement. Future events and changing market conditions may lead the Company to re-evaluate the assumptions reflected in the valuation which may result in a need to recognize additional impairment charges.
Derivatives
In the normal course of business, the Company is exposed to the impact of foreign currency fluctuations. The Company mitigates these risks by following established risk management policies and procedures, including the use of derivatives. The Company enters into foreign currency exchange contracts to hedge its exposure to the impact of movements in foreign currency exchange rates on its transactional balances denominated in currencies other than the functional currency. The Company does not use derivatives for trading or speculative purposes.
The Company's derivative instruments are valued using pricing models. Pricing models take into account the contract terms as well as multiple inputs where applicable, such as interest rate yield curves, option volatility, and foreign currency exchange rates. The valuation of derivatives is considered "Level 2" fair value measurement. The Company's derivative instruments are typically short-term in nature. The Company reports the fair values of its derivative assets and liabilities on a gross basis in the Consolidated Balance Sheets in "Other current assets" and "Accrued expenses and other current liabilities," respectively.
See Note 12 for information on the embedded derivative liability related to the convertible senior notes due in May 2025.
As of December 31, 2024 and 2023, the Company did not designate any derivatives as hedges for accounting purposes. Gains and losses resulting from changes in the fair values of derivative instruments are recognized in "Other income (expense), net" in the Consolidated Statements of Operations in the period that the changes occur and cash flow impacts, if any, are classified within "Net cash provided by operating activities" or "Net cash used in financing activities," as appropriate, in the Consolidated Statements of Cash Flows.
For the Company's foreign currency exchange derivatives outstanding as of December 31, 2024 and 2023, the notional amounts of the foreign currency purchases were $8.2 billion and $4.9 billion, respectively, and the notional amounts of the foreign currency sales were $5.5 billion and $4.2 billion, respectively. The notional amount of a foreign currency exchange derivative contract is the contracted amount of foreign currency to be exchanged and is not recorded in the balance sheet.
The effect of foreign currency exchange derivatives recorded in "Other income (expense), net" in the Consolidated Statements of Operations for the years ended December 31, 2024, 2023, and 2022 is as follows:
| | | | | | | | | | | | | | | | | | | | |
| | Year Ended December 31, |
| (in millions) | | 2024 | | 2023 | | 2022 |
| Losses on foreign currency exchange derivatives | | $ | (156) | | | $ | (106) | | | $ | (52) | |
Other Financial Assets and Liabilities
At December 31, 2024 and 2023, the Company's cash consisted of bank deposits. Cash equivalents principally include money market fund investments and certificates of deposit and their carrying value generally approximates the fair value as they are readily convertible to known amounts of cash. Other financial assets and liabilities, including restricted cash, accounts payable, accrued expenses, and deferred merchant bookings, are carried at cost which approximates their fair values because of the short-term nature of these items. Accounts receivable and other financial assets measured at amortized cost are carried at cost less an allowance for expected credit losses to present the net amount expected to be collected (see Note 7). See Note 12 for the estimated fair value of the Company's outstanding senior notes, including the estimated fair value of the Company's convertible senior notes.
7. ACCOUNTS RECEIVABLE AND OTHER FINANCIAL ASSETS
Accounts receivable in the Consolidated Balance Sheets at December 31, 2024 and 2023 includes receivables from customers of $2.0 billion and $1.9 billion, respectively, and receivables from payment processors and networks of $1.2 billion and $1.3 billion, respectively. The remaining balance principally relates to receivables from marketing affiliates. The Company's receivables are short-term in nature. The amounts mentioned above are stated on a gross basis, before deducting the allowance for expected credit losses.
Significant judgments and assumptions are required to estimate the allowance for expected credit losses and such assumptions may change in future periods, particularly the assumptions related to the business prospects and financial condition of customers and marketing affiliates, including macroeconomic conditions, inflationary pressures, and the Company's ability to collect the receivable or recover prepayments.
The following table summarizes the activity of the allowance for expected credit losses on receivables:
| | | | | | | | | | | | | | | | | | | | |
| | | Year Ended December 31, |
| (in millions) | | 2024 | | 2023 | | 2022 |
| Balance, beginning of year | | $ | 137 | | | $ | 117 | | | $ | 101 | |
| Provision charged to earnings | | 222 | | | 169 | | | 130 | |
| Write-offs and other adjustments | | (213) | | | (149) | | | (114) | |
| | | | | | |
| | | | | | |
| Balance, end of year | | $ | 146 | | | $ | 137 | | | $ | 117 | |
8. NET INCOME PER SHARE
The Company computes basic net income per share by dividing net income applicable to common stockholders by the weighted-average number of common shares outstanding during the period. Diluted net income per share is based upon the weighted-average number of common and common equivalent shares outstanding during the period. Only dilutive common equivalent shares that decrease the net income per share are included in the computation of diluted net income per share.
Common equivalent shares related to stock options, restricted stock units, and performance share units are calculated using the treasury stock method. Performance share units are included in the weighted-average common equivalent shares based on the number of shares that would be issued if the end of the reporting period were the end of the performance period, if the result would be dilutive.
See Note 12 for information on the convertible senior notes due in May 2025. For periods prior to the date of the Company's irrevocable election to settle the conversion premium in cash, the Company used the if-converted method to calculate the dilutive effect of the convertible senior notes.
A reconciliation of the weighted-average number of shares outstanding used in calculating diluted net income per share is as follows:
| | | | | | | | | | | | | | | | | | | | |
| | | Year Ended December 31, |
| (in thousands) | | 2024 | | 2023 | | 2022 |
| Weighted-average number of basic common shares outstanding | | 33,622 | | | 36,140 | | | 39,872 | |
| Weighted-average dilutive stock options, restricted stock units, and performance share units | | 242 | | | 228 | | | 151 | |
| Assumed conversion of convertible senior notes | | 200 | | | 162 | | | 29 | |
| Weighted-average number of diluted common and common equivalent shares outstanding | | 34,064 | | | 36,530 | | | 40,052 | |
| | | | | | |
9. PROPERTY AND EQUIPMENT, NET
Property and equipment, net at December 31, 2024 and 2023 consist of the following:
| | | | | | | | | | | | | | | | | | | | |
| | December 31, | | Estimated
Useful Lives
(years) |
| (in millions) | | 2024 | | 2023 | |
| Capitalized software | | $ | 1,249 | | | $ | 1,096 | | | 1 to 7 years |
| Computer equipment | | 694 | | | 608 | | | 2 to 5 years |
| Leasehold improvements | | 216 | | | 228 | | | Up to 15 years |
| Office equipment, furniture, and fixtures | | 65 | | | 71 | | | 1 to 10 years |
| | | | | | |
| | | | | | |
| Total | | 2,224 | | | 2,003 | | | |
| Less: Accumulated depreciation | | (1,392) | | | (1,219) | | | |
| Property and equipment, net | | $ | 832 | | | $ | 784 | | | |
Depreciation expense was $370 million, $282 million, and $227 million for the years ended December 31, 2024, 2023, and 2022, respectively. Additions to capitalized software during the years ended December 31, 2024, 2023, and 2022 were $212 million, $229 million, and $217 million, respectively.
10. LEASES
The Company has operating and finance leases for office space, data centers, and computer equipment.
The Company recognized the following related to its leases in its Consolidated Balance Sheets:
| | | | | | | | | | | | | | | | | | | | | | |
| | Classification in Consolidated Balance Sheets | | December 31, | | |
| (in millions) | | | 2024 | | 2023 | | |
| Operating lease assets | | Operating lease assets | | $ | 559 | | | $ | 705 | | | |
| Operating lease liabilities: | | | | | | | | |
| Current operating lease liabilities | | Accrued expenses and other current liabilities | | $ | 122 | | | $ | 152 | | | |
| Non-current operating lease liabilities | | Operating lease liabilities | | 483 | | | 599 | | | |
| Total operating lease liabilities | | | | $ | 605 | | | $ | 751 | | | |
| | | | | | | | | | | | | | | | | | | | |
| | | | |
| | | | | | |
| Finance lease assets | | Property and equipment, net | | $ | 35 | | | $ | 70 | |
| Finance lease liabilities: | | | | | | |
| Current finance lease liabilities | | Accrued expenses and other current liabilities | | $ | 26 | | | $ | 34 | |
| Non-current finance lease liabilities | | Other long-term liabilities | | 7 | | | 34 | |
| Total finance lease liabilities | | | | $ | 33 | | | $ | 68 | |
The Company recognized the following costs related to its leases in its Consolidated Statements of Operations: | | | | | | | | | | | | | | | | | | | | | | | | | | |
| | | | Year Ended December 31, |
| (in millions) | | Classification in Consolidated Statements of Operations | | 2024 | | 2023 | | 2022 |
| | | | | | | | |
| Finance lease cost | | Depreciation and amortization | | $ | 37 | | | $ | 28 | | | $ | 9 | |
| | | | | | | | |
| Operating lease cost | | General and administrative and Information technology | | 174 | | | 180 | | | 160 | |
| Variable lease cost | | General and administrative and Information technology | | 78 | | | 82 | | | 45 | |
| Other | | | | 4 | | | (4) | | | (5) | |
| Total lease cost | | $ | 293 | | | $ | 286 | | | $ | 209 | |
As of December 31, 2024, the future lease payments for operating and finance leases are as follows:
| | | | | | | | | | | | | | |
| (in millions) | | Operating Leases | | Finance Leases |
| 2025 | | $ | 142 | | | $ | 27 | |
| 2026 | | 99 | | | 7 | |
| 2027 | | 80 | | | — | |
| 2028 | | 60 | | | — | |
| 2029 | | 50 | | | — | |
| Thereafter | | 291 | | | — | |
| Total future lease payments | | 722 | | | 34 | |
| Less: Imputed interest | | (117) | | | (1) | |
| Total lease liabilities | | $ | 605 | | | $ | 33 | |
Supplemental cash flow information related to operating and finance leases is as follows:
| | | | | | | | | | | | | | | | | | | | |
| | Year Ended December 31, |
| (in millions) | | 2024 | | 2023 | | 2022 |
| Cash paid for amounts included in the measurement of lease liabilities: | | | | | | |
| Operating cash flows from operating leases | | $ | 184 | | | $ | 172 | | | $ | 175 | |
| | | | | | |
| Financing cash flows from finance leases | | 36 | | | 31 | | | 9 | |
| Operating lease assets obtained in exchange for new operating lease liabilities | | 75 | | | 200 | | | 392 | |
| Finance lease assets obtained in exchange for new finance lease liabilities | | 2 | | | 44 | | | 50 | |
"Operating lease amortization" presented in the operating activities section of the Consolidated Statements of Cash Flows reflects the portion of the operating lease cost from the amortization of the operating lease assets.
At December 31, 2024 and 2023 the weighted-average lease term and discount rate for operating and finance leases are as follows:
| | | | | | | | | | | | | | |
| | December 31, |
| (in millions) | | 2024 | | 2023 |
| Operating leases: | | | | |
| Weighted-average remaining lease term | | 9.2 years | | 8.7 years |
| Weighted-average discount rate | | 3.9 | % | | 4.0 | % |
| Finance leases: | | | | |
| Weighted-average remaining lease term | | 1.2 years | | 2.1 years |
| Weighted-average discount rate | | 3.5 | % | | 3.1 | % |
In 2022, the Company entered into a sale and leaseback transaction whereby the Company transferred ownership of Booking.com's headquarters building in the Netherlands and related land lease rights to a subsidiary of Deka Immobilien Investment GmbH for an aggregate consideration of approximately $601 million. The Company concurrently entered into an agreement to lease the building from the purchaser for an initial term of 16.5 years, with up to five renewal options of five years each. The initial annual base rent under the lease was $26 million, which will increase annually based on the consumer price index, subject to a specified ceiling. The lease commenced in December 2022 and has been classified by the Company as an operating lease. The Company recognized a gain of $240 million on the sale and leaseback transaction, which was recorded in "Other operating expenses" in the Consolidated Statement of Operations for the year ended December 31, 2022.
11. GOODWILL AND INTANGIBLE ASSETS
A substantial portion of the Company's intangible assets and goodwill relates to the acquisitions of KAYAK, OpenTable, and Getaroom.
Goodwill
The changes in the balance of goodwill for the years ended December 31, 2024 and 2023 consist of the following:
| | | | | | | | | | | | | | |
| | Year Ended December 31, |
| (in millions) | | 2024 | | 2023 |
| Balance, beginning of year | | $ | 2,826 | | | $ | 2,807 | |
| | | | |
| | | | |
| Foreign currency translation adjustments | | (27) | | | 19 | |
Balance, end of year (1) | | $ | 2,799 | | | $ | 2,826 | |
(1) The balance of goodwill as of December 31, 2024 and 2023 is stated net of cumulative impairment charges of $2 billion.
At September 30, 2024, the Company performed its annual goodwill impairment test and concluded that there was no impairment of goodwill.
Intangible Assets
The Company's intangible assets consist of the following:
| | | | | | | | | | | | | | | | | | | | | | | | | | | | | | | | | | | | | | | | | | | | |
| | | December 31, 2024 | | December 31, 2023 | | |
| (in millions) | | Gross Carrying
Amount | | Accumulated
Amortization | | Net Carrying
Amount | | Gross Carrying
Amount | | Accumulated
Amortization | | Net Carrying
Amount | | Amortization Period |
| Trade names | | $ | 1,802 | | | $ | (1,000) | | | $ | 802 | | | $ | 1,812 | | | $ | (911) | | | $ | 901 | | | 3 - 20 years |
| Supply and distribution agreements | | 1,377 | | | (830) | | | 547 | | | 1,402 | | | (759) | | | 643 | | | 3 - 20 years |
| | | | | | | | | | | | | | |
| | | | | | | | | | | | | | |
| Other intangible assets | | 326 | | | (293) | | | 33 | | | 330 | | | (261) | | | 69 | | | Up to 20 years |
| Total intangible assets | | $ | 3,505 | | | $ | (2,123) | | | $ | 1,382 | | | $ | 3,544 | | | $ | (1,931) | | | $ | 1,613 | | | |
Amortization expense for intangible assets was $221 million, $222 million, and $224 million for the years ended December 31, 2024, 2023, and 2022, respectively.
The estimated future annual amortization expense for the Company's intangible assets at December 31, 2024 is as follows:
| | | | | | | | |
| (in millions) | | |
| 2025 | | $ | 213 | |
| 2026 | | 179 | |
| 2027 | | 168 | |
| 2028 | | 168 | |
| 2029 | | 159 | |
| Thereafter | | 495 | |
| | |
12. DEBT
Revolving Credit Facility
In May 2023, the Company entered into a five-year unsecured revolving credit facility with a group of lenders. The revolving credit facility extends a revolving line of credit of up to $2 billion to the Company and provides for the issuance of up to $80 million of letters of credit, as well as up to $100 million of borrowings on same-day notice, referred to as swingline loans. Other than the swingline loans, which are available only in U.S. Dollars, the revolving loans and the letters of credit are available in U.S. Dollars, Euros, Pounds Sterling, and any other currency agreed to by the administrative agent and each of the lenders. The revolving credit facility contains a maximum leverage ratio covenant, compliance with which is a condition to the Company's ability to borrow. In May 2024, the Company extended the maturity date of the revolving credit facility from May 2028 to May 2029 pursuant to an extension request under the credit agreement.
Borrowings under the revolving credit facility will bear interest at a rate determined by reference to benchmark rates plus an applicable spread (ranging from 0% to 1.375%) based on the Company's leverage or credit rating at the time of the borrowing. Undrawn balances available under the revolving credit facility are subject to commitment fees at the applicable rate determined by reference to the Company's leverage or credit rating. At December 31, 2024 and 2023, there were no borrowings outstanding and $26 million and $18 million, respectively, of letters of credit issued under the revolving credit facility.
Outstanding Debt
Outstanding debt consists of the following:
| | | | | | | | | | | | | | | | | | | | | | | | | | |
| | December 31, 2024 | | December 31, 2023 |
| (in millions) | | Outstanding Principal Amount | | Carrying Value (1) | | Outstanding Principal Amount | | Carrying Value (1) |
| | | | | | | | |
| | | | | | | | |
2.375% (€1 Billion) Senior Notes due September 2024 (2) | | $ | — | | | $ | — | | | $ | 1,105 | | | $ | 1,104 | |
| | | | | | | | |
| | | | | | | | |
| | | | | | | | |
| | | | | | | | |
3.65% Senior Notes due March 2025 (3) | | 500 | | | 500 | | | 500 | | | 499 | |
0.1% (€950 Million) Senior Notes due March 2025 (3) | | 984 | | | 984 | | | 1,050 | | | 1,048 | |
0.75% Convertible Senior Notes due May 2025 (2)(3) | | 784 | | | 261 | | | 862 | | | 857 | |
| 3.6% Senior Notes due June 2026 | | 1,000 | | | 999 | | | 1,000 | | | 998 | |
| 4.0% (€750 Million) Senior Notes due November 2026 | | 777 | | | 775 | | | 828 | | | 825 | |
| 1.8% (€1 Billion) Senior Notes due March 2027 | | 1,035 | | | 1,034 | | | 1,105 | | | 1,103 | |
| 3.55% Senior Notes due March 2028 | | 500 | | | 499 | | | 500 | | | 499 | |
| 0.5% (€750 Million) Senior Notes due March 2028 | | 777 | | | 774 | | | 828 | | | 825 | |
| 3.625% (€500 Million) Senior Notes due November 2028 | | 518 | | | 516 | | | 552 | | | 549 | |
| 3.5% (€500 Million) Senior Notes due March 2029 | | 518 | | | 516 | | | — | | | — | |
| 4.25% (€750 Million) Senior Notes due May 2029 | | 777 | | | 772 | | | 828 | | | 823 | |
| 4.625% Senior Notes due April 2030 | | 1,500 | | | 1,494 | | | 1,500 | | | 1,492 | |
| 4.5% (€1 Billion) Senior Notes due November 2031 | | 1,035 | | | 1,030 | | | 1,105 | | | 1,098 | |
| 3.625% (€650 Million) Senior Notes due March 2032 | | 673 | | | 669 | | | — | | | — | |
| 3.25% (€600 Million) Senior Notes due November 2032 | | 621 | | | 614 | | | — | | | — | |
| 4.125% (€1.25 Billion) Senior Notes due May 2033 | | 1,294 | | | 1,282 | | | 1,381 | | | 1,367 | |
| 4.75% (€1 Billion) Senior Notes due November 2034 | | 1,035 | | | 1,028 | | | 1,105 | | | 1,097 | |
| 3.75% (€850 Million) Senior Notes due March 2036 | | 880 | | | 866 | | | — | | | — | |
| 3.75% (€500 Million) Senior Notes due November 2037 | | 518 | | | 514 | | | — | | | — | |
| 4.0% (€750 Million) Senior Notes due March 2044 | | 777 | | | 762 | | | — | | | — | |
| 3.875% (€700 Million) Senior Notes due March 2045 | | 725 | | | 709 | | | — | | | — | |
| Total outstanding debt | | $ | 17,228 | | | $ | 16,598 | | | $ | 14,249 | | | $ | 14,184 | |
| Short-term debt | | 2,268 | | | 1,745 | | | 1,967 | | | 1,961 | |
| Long-term debt | | $ | 14,960 | | | $ | 14,853 | | | $ | 12,282 | | | $ | 12,223 | |
(1) The carrying values differ from the outstanding principal amounts due to unamortized debt discounts and debt issuance costs of $630 million and $65 million as of December 31, 2024 and 2023, respectively.
(2) Included in "Short-term debt" in the Consolidated Balance Sheet as of December 31, 2023.
(3) Included in "Short-term debt" in the Consolidated Balance Sheet as of December 31, 2024.
Fair Value of Debt
At December 31, 2024 and 2023, the estimated fair value of the outstanding debt was approximately $18.8 billion and $15.2 billion, respectively, and was considered a "Level 2" fair value measurement (see Note 2). The fair values were estimated based upon actual trades at the end of the reporting period or the most recent trade available as well as the Company's stock price at the end of the reporting period. The estimated fair value of the Company's debt in excess of the outstanding principal amount at December 31, 2024 and 2023 primarily relates to the conversion premium, which is the conversion value in excess of the principal amount, on the convertible senior notes due in May 2025.
Convertible Senior Notes
In April 2020, the Company issued $863 million aggregate principal amount of convertible senior notes due in May 2025 with an interest rate of 0.75% (the "May 2025 Notes"). The May 2025 Notes are convertible, subject to certain conditions, into the Company's common stock at a current conversion price of $1,869.86 per share. The May 2025 Notes were convertible, at the option of the holder, prior to November 1, 2024, upon the occurrence of specific events, including but not limited to a change in control, or if the closing sales price of the Company's common stock for at least 20 trading days in the period of 30 consecutive trading days ending on the last trading day of the immediately preceding calendar quarter was more than 130% of the conversion price in effect for the notes on the last trading day of the immediately preceding quarter. In the event that all or substantially all of the Company's common stock is acquired on or prior to the maturity of the May 2025 Notes in a transaction in which the consideration paid to holders of the Company's common stock consists of all or substantially all cash, the Company would be required to make additional payments in the form of shares of common stock to the holders of the May 2025 Notes in an aggregate value ranging from $0 to $235 million depending upon the date of the transaction and the then current stock price of the Company. Starting on November 1, 2024, holders have the right to convert all or any portion of the May 2025 Notes, regardless of the Company's stock price. The May 2025 Notes may not be redeemed by the Company prior to maturity. The holders may require the Company to repurchase the May 2025 Notes for cash in certain circumstances. Interest on the May 2025 Notes is payable on May 1 and November 1 of each year. Prior to November 2024, if the note holders exercised their option to convert, the Company delivered cash to repay the principal amount of the May 2025 Notes and had the option to deliver shares of the Company's common stock or cash, to satisfy the conversion premium. As of November 1, 2024, note holders are entitled to repayment of the principal amount of the May 2025 Notes in cash, and if they exercise their option to convert, the note holders are entitled to cash payment for the conversion premium, settled at maturity. Based on the closing sales prices of the Company's common stock for the prescribed measurement periods, the May 2025 Notes were convertible at the option of the holder starting the second calendar quarter of 2023 until November 1, 2024, when they became convertible regardless of the Company's stock price. The May 2025 Notes are classified as "Short-term debt" in the Consolidated Balance Sheets as of December 31, 2024 and 2023. At December 31, 2024 and 2023, the estimated fair value of the May 2025 Notes was $2.1 billion and $1.6 billion, respectively, and was considered a "Level 2" fair value measurement (see Note 2). For the years ended December 31, 2023, and 2022, the weighted-average effective interest rate related to the May 2025 Notes was 1.2%. During the year ended December 31, 2024, the Company paid $198 million in aggregate upon the conversion of the May 2025 Notes at the holders' option, to repay the principal amount of $78 million due upon conversion and an additional $120 million conversion premium.
Upon issuance and subsequent balance sheet-date reassessments through September 30, 2024, the conversion option on the May 2025 Notes qualified for the equity scope exception under ASC 815 Derivatives and Hedging ("ASC 815") because the Company had the option to deliver either cash or shares of the Company's common stock to satisfy the conversion premium. Under such exception, the conversion option is not required to be accounted for as a separate instrument. On November 1, 2024, the Company irrevocably elected to settle the conversion premium in cash. Upon that election, the conversion option no longer qualified for the exception and was deemed to be an embedded derivative which required bifurcation from the debt contract. Upon bifurcation of the conversion option, the Company recorded an embedded derivative liability at fair value of $1.2 billion, a debt discount of $783 million reducing the carrying value of the May 2025 Notes to zero, and a loss of $428 million. The debt discount is amortized over the remaining term of the May 2025 Notes using the straight-line method. The fair value of the embedded derivative liability (considered a "Level 2" fair value measurement; see Note 2), was $1.3 billion at December 31, 2024 and is included in "Accrued expenses and other current liabilities" in the Consolidated Balance Sheet. The unamortized debt discount and debt issuance costs was $523 million at December 31, 2024.
The Company recognized the following charges related to the conversion option on the May 2025 Notes in its Consolidated Statement of Operations:
| | | | | | | | | | | | | | | | | | |
| (in millions) | | Classification in Consolidated Statements of Operations | | Year Ended | | | | |
| | December 31, 2024 | | | | |
| Change in fair value of the embedded derivative, including loss on bifurcation | | Other income (expense), net | | $ | 517 | | | | | |
| Amortization of debt discount | | Interest expense | | 261 | | | | | |
| Other | | Other income (expense), net | | 18 | | | | | |
| Total charges | | $ | 796 | | | | | |
Nonconvertible Senior Notes
The following table summarizes the information related to nonconvertible senior notes outstanding at December 31, 2024:
| | | | | | | | | | | | | | | | | | | | |
| Nonconvertible Senior Notes | | Date of Issuance | | Effective Interest Rate (1) | | Timing of Interest Payments |
| | | | | | |
| | | | | | |
| 3.65% Senior Notes due March 2025 | | March 2015 | | 3.76 | % | | Semi-annually in March and September |
| 0.1% Senior Notes due March 2025 | | March 2021 | | 0.30 | % | | Annually in March |
| 3.6% Senior Notes due June 2026 | | May 2016 | | 3.70 | % | | Semi-annually in June and December |
| 4.0% Senior Notes due November 2026 | | November 2022 | | 4.08 | % | | Annually in November |
| 1.8% Senior Notes due March 2027 | | March 2015 | | 1.86 | % | | Annually in March |
| 3.55% Senior Notes due March 2028 | | August 2017 | | 3.63 | % | | Semi-annually in March and September |
| 0.5% Senior Notes due March 2028 | | March 2021 | | 0.63 | % | | Annually in March |
| 3.625% Senior Notes due November 2028 | | May 2023 | | 3.74 | % | | Annually in November |
| 3.5% Senior Notes due March 2029 | | March 2024 | | 3.61 | % | | Annually in March |
| 4.25% Senior Notes due May 2029 | | November 2022 | | 4.35 | % | | Annually in May |
| 4.625% Senior Notes due April 2030 | | April 2020 | | 4.72 | % | | Semi-annually in April and October |
| 4.5% Senior Notes due November 2031 | | November 2022 | | 4.57 | % | | Annually in November |
| 3.625% Senior Notes due March 2032 | | March 2024 | | 3.71 | % | | Annually in March |
| 3.25% Senior Notes due November 2032 | | November 2024 | | 3.41 | % | | Annually in November |
| 4.125% Senior Notes due May 2033 | | May 2023 | | 4.26 | % | | Annually in May |
| 4.75% Senior Notes due November 2034 | | November 2022 | | 4.81 | % | | Annually in November |
| 3.75% Senior Notes due March 2036 | | March 2024 | | 3.92 | % | | Annually in March |
| 3.75% Senior Notes due November 2037 | | November 2024 | | 3.81 | % | | Annually in November |
| 4.0% Senior Notes due March 2044 | | March 2024 | | 4.15 | % | | Annually in March |
| 3.875% Senior Notes due March 2045 | | November 2024 | | 4.03 | % | | Annually in March |
(1) Represents the coupon interest rate adjusted for deferred debt issuance costs, premiums or discounts existing at the origination of the debt.
In 2024, the Company issued senior notes with varying maturities for aggregate cash proceeds of $4.8 billion. The proceeds from the issuance of the senior notes issued in 2024 are available for general corporate purposes, including to repurchase shares of the Company's common stock and to redeem or repay outstanding indebtedness.
In 2024, the Company paid $1.1 billion on the maturity of the Senior Notes due September 2024. In 2023, the Company paid $500 million on the maturity of Senior Notes due March 2023. In 2022, the Company paid $778 million and $1.1 billion on the maturity of Senior Notes due November 2022 and March 2022, respectively. In addition, the Company paid the applicable accrued and unpaid interest relating to these senior notes.
Interest expense related to nonconvertible senior notes consists primarily of coupon interest expense of $527 million, $409 million, and $241 million for the years ended December 31, 2024, 2023, and 2022, respectively. Debt discount and debt issuance costs for such notes are amortized using the effective interest rate method over the period from the origination date through the stated maturity date. "Interest expense" in the Consolidated Statements of Operations also includes interest expense related to the Company's cash management activities (with related income recorded in "Other income (expense), net" in the Consolidated Statements of Operations).
Each of the Company's senior notes are unsecured and rank equally in right of payment with all of the Company's other senior unsecured notes.
The Company designates certain portions of the aggregate principal value of the Euro-denominated debt as a hedge of the foreign currency exposure of the net investment in certain Euro functional currency subsidiaries. For the years ended December 31, 2024 and 2023, the carrying value of the portion of Euro-denominated debt, designated as a net investment hedge, ranged from $2.3 billion to $5.3 billion and from $3.1 billion to $8.4 billion, respectively. The foreign currency transaction gains or losses on the Euro-denominated debt that is designated as a hedging instrument for accounting purposes are recorded in "Accumulated other comprehensive loss" in the Consolidated Balance Sheets. The foreign currency transaction gains or losses on the Euro-denominated debt that is not designated as a hedging instrument are recognized in "Other income (expense), net" in the Consolidated Statements of Operations.
13. TREASURY STOCK AND DIVIDENDS
At December 31, 2024 and 2023, the Company had a total remaining authorization of $7.7 billion and $13.7 billion, respectively, related to a program authorized by the Company's Board of Directors ("the Board") in 2023 to repurchase up to $20 billion of the Company's common stock. The Company expects to complete the share repurchases under the remaining authorization by the end of 2026, assuming no major downturn in the travel market. In January 2025, the Board authorized a program to repurchase up to an additional $20 billion of the Company's common stock. Additionally, the Board has given the Company the general authorization to repurchase shares of its common stock withheld to satisfy employee withholding tax obligations related to stock-based compensation.
The following table summarizes the Company's stock repurchase activities during the years ended December 31, 2024, 2023, and 2022:
| | | | | | | | | | | | | | | | | | | | | | | | | | | | | | | | | | | | | | |
| | Year Ended December 31, |
| (in millions, except for shares, which are reflected in thousands) | | 2024 | | 2023 | | 2022 |
| Shares | | Amount | | Shares | | Amount | | Shares | | Amount |
| Authorized stock repurchase programs | | 1,581 | | | $ | 6,104 | | | 3,660 | | | $ | 10,249 | | | 3,320 | | | $ | 6,526 | |
| General authorization for shares withheld on stock award vesting | | 98 | | | 347 | | | 72 | | | 194 | | | 80 | | | 167 | |
| Total | | 1,679 | | $ | 6,451 | | | 3,732 | | $ | 10,443 | | | 3,400 | | | $ | 6,693 | |
| | | | | | | | | | | | |
| | | | | | | | | | | | |
Stock repurchases of $20 million in December 2024 were settled in January 2025. Stock repurchases of $40 million in December 2023 were settled in January 2024. For the years ended December 31, 2024, 2023, and 2022, the Company remitted employee withholding taxes of $345 million, $194 million, and $165 million, respectively, to the tax authorities, which is different from the aggregate cost of the shares withheld for taxes for each year due to the timing in remitting the taxes. The cash remitted to the tax authorities is included in financing activities in the Consolidated Statements of Cash Flows.
Effective January 1, 2023, the Inflation Reduction Act of 2022 has mandated a 1% excise tax on share repurchases. Excise tax obligations that result from the Company's share repurchases are accounted for as a cost of the treasury stock transaction. As of December 31, 2024 and 2023, the Company recorded estimated liabilities of $56 million and $96 million, respectively, related to excise taxes on share repurchases, which are included in "Accrued expenses and other current liabilities" in the Consolidated Balance Sheets. During the year ended December 31, 2024, the Company remitted excise taxes of $96 million to the tax authorities, which is included in financing activities in the Consolidated Statement of Cash Flows.
During 2024, the Board adopted a dividend policy pursuant to which the Company pays quarterly cash dividends on its common stock. Declaration of dividends will be subject to the Board's consideration of, among other things, the Company's financial performance, cash flows, capital needs, and liquidity. During the year ended December 31, 2024, the Board declared quarterly cash dividends of $8.75 per share of common stock and the Company paid cash dividends of $1.2 billion in total. In February 2025, the Board declared a cash dividend of $9.60 per share of common stock, payable on March 31, 2025 to stockholders of record as of the close of business on March 7, 2025.
14. CHANGES IN ACCUMULATED OTHER COMPREHENSIVE LOSS BY COMPONENT
The table below presents the changes in the balances of accumulated other comprehensive loss ("AOCI") by component for the years ended December 31, 2024, 2023, and 2022:
| | | | | | | | | | | | | | | | | | | | | | | | | | | | | | | | | | | | | | | | | | | | | | | | | | | | | | | | | | | | | | |
| (in millions) | | Foreign currency translation adjustments | | | | Net unrealized gains (losses) on available-for-sale securities | | Total AOCI, net of tax |
| Foreign currency translation | | Net investment hedges (1) | | Total, net of tax | | | | | | | | Before tax | | Tax | | Total, net of tax | |
| Before tax | | Tax (2) | | Before tax | | Tax | | | | |
| Balance, December 31, 2021 | | $ | (276) | | | $ | 67 | | | $ | 91 | | | $ | (28) | | | $ | (146) | | | | | | | | | $ | 3 | | | $ | (1) | | | $ | 2 | | | $ | (144) | |
| | | | | | | | | | | | | | | | | | | | | | | | |
| | | | | | | | | | | | | | | | | | | | | | | | |
| | | | | | | | | | | | | | | | | | | | | | | | |
| Other comprehensive (loss) income ("OCI") for the period | | (303) | | | 26 | | | 219 | | | (53) | | | (111) | | | | | | | | | (16) | | | 4 | | | (12) | | | (123) | |
| | | | | | | | | | | | | | | | | | | | | | | | |
| Balance, December 31, 2022 | | $ | (579) | | | $ | 93 | | | $ | 310 | | | $ | (81) | | | $ | (257) | | | | | | | | | $ | (13) | | | $ | 3 | | | $ | (10) | | | $ | (267) | |
| | | | | | | | | | | | | | | | | | | | | | | | |
| | | | | | | | | | | | | | | | | | | | | | | | |
| | | | | | | | | | | | | | | | | | | | | | | | |
| OCI for the period | | 42 | | | 1 | | | (139) | | | 33 | | | (63) | | | | | | | | | 9 | | | (2) | | | 7 | | | (56) | |
| | | | | | | | | | | | | | | | | | | | | | | | |
| Balance, December 31, 2023 | | $ | (537) | | | $ | 94 | | | $ | 171 | | | $ | (48) | | | $ | (320) | | | | | | | | | $ | (4) | | | $ | 1 | | | $ | (3) | | | $ | (323) | |
| | | | | | | | | | | | | | | | | | | | | | | | |
| | | | | | | | | | | | | | | | | | | | | | | | |
| | | | | | | | | | | | | | | | | | | | | | | | |
| OCI for the period | | (232) | | | 36 | | | 185 | | | (44) | | | (55) | | | | | | | | | 4 | | | (1) | | | 3 | | | (52) | |
| | | | | | | | | | | | | | | | | | | | | | | | |
| Balance, December 31, 2024 | | $ | (769) | | | $ | 130 | | | $ | 356 | | | $ | (92) | | | $ | (375) | | | | | | | | | $ | — | | | $ | — | | | $ | — | | | $ | (375) | |
(1) Net investment hedges balance at December 31, 2024 and earlier dates presented above, includes accumulated net losses from fair value adjustments of $35 million ($53 million before tax) associated with previously settled derivatives that were designated as net investment hedges. The remaining balances relate to foreign currency transaction gains (losses) and related tax benefits (expenses) associated with the Company's Euro-denominated debt that is designated as a hedge of the foreign currency exposure of the net investment in certain Euro functional currency subsidiaries (see Notes 2 and 12).
(2) The tax benefits relate to foreign currency translation adjustments to the Company's one-time deemed repatriation tax liability recorded at December 31, 2017 and foreign earnings for periods after December 31, 2017 that are subject to U.S. federal and state income tax, resulting from the enactment of the Tax Act.
15. INCOME TAXES
The composition of pre-tax income (loss) for the years ended December 31, 2024, 2023, and 2022 is as follows:
| | | | | | | | | | | | | | | | | | | | |
| | Year Ended December 31, |
| (in millions) | | 2024 | | 2023 | | 2022 |
| International | | $ | 8,029 | | | $ | 6,119 | | | $ | 4,717 | |
| U.S. | | (737) | | | (638) | | | (794) | |
| Total | | $ | 7,292 | | | $ | 5,481 | | | $ | 3,923 | |
Provision for Income Taxes
The composition of income tax expense for the years ended December 31, 2024, 2023, and 2022 is as follows:
| | | | | | | | | | | | | | | | | | | | |
| | Year Ended December 31, |
| (in millions) | | 2024 | | 2023 | | 2022 |
| Current income tax expense (benefit): | | | | | | |
| International | | $ | 1,545 | | | $ | 1,371 | | | $ | 1,145 | |
| U.S. Federal | | (235) | | | 291 | | | (8) | |
| U.S. State | | 2 | | | 8 | | | (15) | |
| Current income tax expense (benefit): | | 1,312 | | | 1,670 | | | 1,122 | |
| Deferred income tax expense (benefit): | | | | | | |
| International | | 25 | | | (47) | | | (61) | |
| U.S. Federal | | 51 | | | (411) | | | (172) | |
| U.S. State | | 22 | | | (20) | | | (24) | |
| Deferred income tax expense (benefit) | | 98 | | | (478) | | | (257) | |
| Income tax expense | | $ | 1,410 | | | $ | 1,192 | | | $ | 865 | |
Income tax liabilities of $905 million and $1.0 billion are included in "Accrued expenses and other current liabilities" in the Consolidated Balance Sheets at December 31, 2024 and 2023, respectively.
U.S. Tax Reform
In December 2017, the Tax Act was enacted into law in the U.S. The Tax Act made significant changes to U.S. federal tax law, including a one-time deemed repatriation tax on accumulated unremitted international earnings, to be paid over eight years. In 2024, the Company reduced its income tax expense that was recorded during the year ended December 31, 2018 by $416 million relating to its federal one-time deemed repatriation liability. The reduction in expense resulted from a recent U.S. Tax Court decision in Varian Medical Systems, Inc. vs. Commissioner. Under the Tax Act, the Company's future cash generated by the Company's international operations can generally be repatriated without further U.S. federal income tax, but will be subject to U.S. state income taxes and international withholding taxes, which have been accrued by the Company. The Tax Act also introduced in 2018 a tax on 50% of GILTI, which is income determined to be in excess of a specified routine rate of return, and a base erosion and anti-abuse tax ("BEAT") aimed at preventing the erosion of the U.S. tax base. The Company has adopted an accounting policy to treat taxes on GILTI as period costs.
Several countries outside the U.S. have adopted rules, effective January 1, 2024, that impose a 15% minimum global tax. This is in response to the framework set forth by the Organisation for Economic Co-operation and Development with respect to its base erosion and profit shifting project. The impact of these rules have been reflected in our 2024 income tax expense.
Deferred Income Taxes
The Company utilized $309 million of its U.S. NOLs to reduce its U.S. federal tax liability for the deemed repatriation tax. After utilization of available NOLs, at December 31, 2024, the Company had U.S. federal NOLs of $462 million, the majority of which do not have an expiration date, and U.S. state NOLs of $370 million, which mainly begin to expire in years ending December 31, 2032 and forward. In addition, at December 31, 2024, the Company had $796 million of non-U.S. NOLs, the majority of which do not have an expiration date, and $51 million of U.S. research tax credit and foreign tax credit carryforwards available to reduce future tax liabilities.
The utilization of these NOLs and credits is dependent upon the Company's ability to generate sufficient future taxable income and the tax laws in the jurisdictions where the losses were generated. The Company periodically evaluates the likelihood of the realization of deferred tax assets, and reduces the carrying amount of these deferred tax assets by a valuation allowance to the extent it believes a portion will not be realized. The Company considers many factors when assessing the likelihood of future realization of the deferred tax assets, including its recent cumulative earnings experience by taxing jurisdiction, expectations of future income, tax planning strategies, the carryforward periods available for tax reporting purposes and other relevant factors.
The tax effects of temporary differences that give rise to significant portions of deferred tax assets and liabilities at December 31, 2024 and 2023 are as follows:
| | | | | | | | | | | | | | |
| | December 31, |
| (in millions) | | 2024 | | 2023 |
| Deferred tax assets: | | | | |
| Net operating loss carryforward — U.S. | | $ | 117 | | | $ | 89 | |
| Net operating loss carryforward — International | | 156 | | | 200 | |
| Accrued expenses | | 83 | | | 70 | |
| Stock-based compensation | | 55 | | | 47 | |
| Unrealized losses on investments | | 67 | | | 83 | |
| Foreign currency translation adjustments | | 103 | | | 66 | |
| Tax credits | | 45 | | | 39 | |
| | | | |
| | | | |
| | | | |
| Operating lease liabilities | | 22 | | | 20 | |
| Property and equipment | | 234 | | | 195 | |
| Embedded derivative liability | | 123 | | | — | |
| Other | | — | | | 16 | |
| Total deferred tax assets | | 1,005 | | | 825 | |
| Valuation allowance on deferred tax assets | | (111) | | | (114) | |
| Deferred tax assets, net | | 894 | | | 711 | |
| Deferred tax liabilities: | | | | |
| Debt discount on convertible notes | | (123) | | | — | |
| Intangible assets and other | | (110) | | | (140) | |
| Euro-denominated debt | | (144) | | | (11) | |
| | | | |
| | | | |
| | | | |
| Operating lease assets | | (22) | | | (19) | |
| Installment sale liability | | (118) | | | (118) | |
| | | | |
| Other | | (4) | | | (6) | |
| Deferred tax liabilities | | (521) | | | (294) | |
Net deferred tax assets (1) | | $ | 373 | | | $ | 417 | |
(1) Includes deferred tax assets of $662 million and $675 million at December 31, 2024 and 2023, respectively, included in "Other assets, net" in the Consolidated Balance Sheets.
The valuation allowance on deferred tax assets at December 31, 2024 includes $31 million related to international operations and $80 million primarily related to certain unrealized losses on equity securities. The valuation allowance on deferred tax assets at December 31, 2023 includes $30 million related to international operations and $84 million primarily related to certain unrealized losses on equity securities. The decrease in the valuation allowance is primarily related to deferred tax assets generated from certain unrealized losses on equity securities.
The Company does not intend to indefinitely reinvest its international earnings that were subject to U.S. taxation pursuant to the mandatory deemed repatriation or subject to U.S. taxation as GILTI.
Reconciliation of U.S. Federal Statutory Income Tax Rate to Effective Income Tax Rate
A significant portion of the Company's taxable earnings is generated in the Netherlands. According to Dutch corporate income tax law, income generated from qualifying innovative activities is taxed at a rate of 9% ("Innovation Box Tax") rather than the Dutch statutory rate of 25.8%. A portion of Booking.com's earnings during the years ended December 31, 2024, 2023, and 2022 qualified for Innovation Box Tax treatment, which had a significant beneficial impact on the Company's effective tax rate for those years.
The effective income tax rate of the Company is different from the amount computed using the expected U.S. statutory federal rate of 21% for the years ended December 31, 2024, 2023, and 2022 as a result of the following items:
| | | | | | | | | | | | | | | | | | | | |
| | Year Ended December 31, |
| (in millions) | | 2024 | | 2023 | | 2022 |
| Income tax expense at U.S. federal statutory rate | | $ | 1,531 | | | $ | 1,151 | | | $ | 824 | |
| Adjustment due to: | | | | | | |
| Foreign rate differential | | 386 | | | 307 | | | 264 | |
| Innovation Box Tax benefit | | (607) | | | (544) | | | (452) | |
| | | | | | |
| Stock-based compensation | | 73 | | | 59 | | | 42 | |
| Federal GILTI | | 82 | | | 24 | | | 10 | |
| State income tax benefit | | 19 | | | (9) | | | (31) | |
| Valuation allowance | | (5) | | | (4) | | | 87 | |
| Uncertain tax positions | | 189 | | | 14 | | | 72 | |
| Fines and penalties | | — | | | 144 | | | 2 | |
| Loss related to the conversion option on convertible senior notes | | 167 | | | — | | | — | |
| Tax Act - U.S. transition tax | | (416) | | | 1 | | | — | |
| Other | | (9) | | | 49 | | | 47 | |
| Income tax expense | | $ | 1,410 | | | $ | 1,192 | | | $ | 865 | |
Uncertain Tax Positions
The following is a reconciliation of the total beginning and ending amount of unrecognized tax benefits:
| | | | | | | | | | | | | | | | | | | | |
| | Year Ended December 31, |
| (in millions) | | 2024 | | 2023 | | 2022 |
| Unrecognized tax benefit — January 1 | | $ | 67 | | | $ | 184 | | | $ | 120 | |
| Gross increases — tax positions in current period | | 5 | | | 16 | | | 3 | |
| Gross increases — tax positions in prior periods | | 193 | | | 22 | | | 94 | |
| Gross decreases — tax positions in prior periods | | (4) | | | (5) | | | (33) | |
| Reduction due to lapse in statute of limitations | | — | | | (3) | | | — | |
| Reduction due to settlements during the current period | | (1) | | | (147) | | | — | |
| Unrecognized tax benefit — December 31 | | $ | 260 | | | $ | 67 | | | $ | 184 | |
The increase in unrecognized tax benefits during the year ended December 31, 2024 primarily relates to certain 2018 U.S. federal taxes that are impacted by the recent U.S. Tax Court decision in Varian Medical Systems, Inc. vs. Commissioner. The majority of unrecognized tax benefits are included in "Other assets, net" in the Consolidated Balance Sheet as of December 31, 2024. The amount of unrecognized tax benefits, if recognized, that would affect the effective tax rate are $236 million as of December 31, 2024. It is reasonably possible that the balance of gross unrecognized tax benefits could change over the next 12 months. As of December 31, 2024 and 2023, total gross interest and penalties accrued was $6 million and $7 million, respectively. See Note 16 for more information regarding tax contingencies.
The Company's major taxing jurisdictions include: the Netherlands, U.S., Singapore, and the United Kingdom (the "UK"). The statutes of limitations that remain open related to these major tax jurisdictions are: the Company's Netherlands returns for 2019 and forward, U.S. federal returns for 2018, as well as 2021 and forward, Singapore returns from 2019 and forward, and UK returns for 2021 and forward.
16. COMMITMENTS AND CONTINGENCIES
Competition and Consumer Protection Reviews
Online travel platforms have been the subject of investigations or inquiries by national competition authorities ("NCAs") or other governmental authorities regarding competition law matters, consumer protection issues, and other areas. The Company is and has been involved in many such investigations. For example, the Company is involved in investigations related to whether Booking.com's contractual parity arrangements with accommodation providers are anti-competitive because they require partners to provide Booking.com with rates, conditions, and availability at least as favorable as those offered to other OTCs or by the partner itself. To resolve certain of the parity-related investigations, the Company has from time to time made commitments regarding future business practices or activities, such as agreeing to narrow the scope of its parity clauses. Some of these investigations have resulted in fines and the Company could incur additional fines and/or be restricted in certain of its business practices in the future.
In 2024, the Comisión Nacional de los Mercados y la Competencia in Spain (the "CNMC") imposed a fine of 413 million Euros and decided to restrict certain of Booking.com's business practices such as those relating to parity provisions and the ranking criteria that Booking.com can use to determine how to rank hotels in its display to customers. Booking.com does not agree with the rationale stated in the decision and the restrictions imposed, and has filed an appeal. Although the Company disagrees with the rationale stated in the decision, the Company accrued a loss of 486 million Euros ($530 million) during the year ended December 31, 2023 (reflecting the initial fine amount in the CNMC's draft decision). As of June 30, 2024, to align with the CNMC's reduced final fine, the Company recorded a decrease of 72 million Euros ($78 million) in its accrual. The initial accrual and subsequent decrease are reflected in "General and administrative" expenses in the Consolidated Statements of Operations. The related liability is included in "Accrued expenses and other current liabilities" in the Consolidated Balance Sheets as of December 31, 2024 and 2023.
In September 2017, the Swiss Price Surveillance Office (the "Swiss PSO") opened an investigation into the level of commissions of Booking.com in Switzerland. Booking.com anticipates a negative decision ordering a reduction of commission in Switzerland. The exact scope, impact, and timing of its effects will depend on the order. Booking.com does not agree with the rationale underlying this expected negative decision and the restrictions expected to be imposed, and is continuing to engage with the Swiss PSO prior to the order being finalized. If the order were to become final, Booking.com plans to challenge aspects of it. In July 2023, the Polish Office of Competition and Consumer Protection opened an investigation into Booking.com's identification of private and professional hosts and its messaging in relation to obligations owed to consumers, and the investigation is ongoing. In 2024, the Italian Competition Authority (the "AGCM") investigated certain Booking.com business practices relating to hotels and other online travel agencies. Booking.com resolved the investigation by making certain commitments to the AGCM regarding its future business practices. If any of the investigations were to find that Booking.com practices violated the respective laws, or as part of a negotiated resolution, Booking.com may face significant fines, restrictions on its business practices, and/or be required to make other commitments.
The Company is and has been involved in investigations or inquiries by NCAs or other governmental authorities involving consumer protection matters. The Company has previously made certain voluntary commitments to authorities to resolve investigations or inquiries that have included showing prices inclusive of all mandatory taxes and charges, providing information about the effect of money earned on search result rankings on or before the search results page, adjusting how discounts and statements concerning popularity or availability are shown, and displaying additional customer service details. It is possible new jurisdictions could negotiate with the Company to implement changes to its business. The Company is unable to predict what, if any, effect any future such commitments will have on its business. To the extent that investigations or inquiries result in additional commitments, fines, damages, or other remedies, the Company's business, financial condition, and results of operations could be harmed.
The Company is unable to predict how any current or future investigations or litigation may be resolved or the long-term impact of any such resolution on its business. For example, competition and consumer-law-related investigations, legislation, or issues could result in private litigation and the Company is currently involved in such litigation. More immediate results could include, among other things, the imposition of fines, payment of damages, commitments to change certain business practices, or reputational damage, any of which could harm the Company's business, results of operations, brands, or competitive position.
Tax Matters
Between December 2018 and August 2021, the Italian tax authorities issued assessments on Booking.com's Italian subsidiary totaling approximately 251 million Euros ($260 million) for the tax years 2013 through 2018, asserting that its transfer pricing policies were inadequate. The Company believes Booking.com has been and continues to be in compliance with Italian tax law. In September 2020, the Italian tax authorities approved the opening of a mutual agreement procedure ("MAP") between Italy and the Netherlands for the 2013 tax year and the Italian tax authorities subsequently approved the inclusion of the tax years 2014 through 2018 in the MAP. Based on the Company's expectation that the Italian assessments for 2013 through 2018, and any transfer pricing assessments received for subsequent open years, will be settled through the MAP process, and after considering potential resolution amounts, 33 million Euros ($34 million) have been reflected in net unrecognized tax benefits, the majority of which is recorded to "Other assets, net" in the Consolidated Balance Sheets at December 31, 2024 and 2023. This unrecognized tax benefit is partially offset by a deferred income tax benefit of 15 million Euros ($16 million). As of December 31, 2024, the Company made prepayments of 74 million Euros ($77 million) to the Italian tax authorities to forestall collection enforcement pending the appeal phase of the case. The payments do not constitute an admission that the Company owes the taxes and will be refunded (with interest) to the Company to the extent that the Company prevails. The payments are included in "Other assets, net" in the Consolidated Balance Sheets at December 31, 2024 and 2023.
In June 2024, the Guardia di Finanza ("GdF") of Rome issued a tax audit report to Booking.com, proposing a tax assessment to the Italian Tax Authorities ("ITA") of 396 million Euros ($410 million), excluding penalties and interest, for June 2017 through December 2023. The GdF alleged that a 2017 law (the "STR Law") obliged Booking.com to withhold and remit 21% of the total transaction value for the income tax liabilities of certain short-term rental partners in Italy for the period under audit. While the Company believes that Booking.com has been and continues to be in compliance with Italian tax laws, in November 2024, the Company entered into a settlement agreement with the ITA without admitting liability and paid 313 million Euros ($332 million) to resolve the matter. The settlement is reflected in "General and administrative" expenses in the Consolidated Statement of Operations for the year ended December 31, 2024.
The Company is also involved in other tax-related audits, investigations, and litigation relating to income taxes, value-added taxes, travel transaction taxes (e.g., hotel occupancy taxes), withholding taxes, and other taxes.
Any taxes or assessments in excess of the Company's tax provisions, including the resolution of any tax proceedings or litigation, could have a material adverse impact on the Company's results of operations, cash flows, and financial condition. In some cases, assessments may be significantly in excess of the Company's tax provisions, particularly in instances where the Company does not agree with the tax authority's assessment of how the tax laws may apply to the Company's business.
Other Matters
Beginning in 2014, Booking.com B.V. received several letters from the Netherlands Pension Fund for the Travel Industry (Reiswerk) ("BPF") claiming that it was required to participate in the mandatory pension scheme of the BPF with retroactive effect to 1999, which has a higher contribution rate than the pension scheme in which it is currently participating. BPF instituted legal proceedings and in 2016 the District Court of Amsterdam rejected all of BPF's claims. BPF appealed the decision to the Court of Appeal, and, in May 2019, the Court of Appeal also rejected all of BPF's claims, in each case by ruling that Booking did not meet the definition of a travel intermediary for purposes of the mandatory pension scheme. BPF then appealed to the Netherlands Supreme Court. In April 2021, the Supreme Court overturned the previous decision of the Court of Appeal and held that Booking.com B.V. met the definition of a travel intermediary for the purposes of the mandatory pension scheme. The Supreme Court ruled only on the qualification of Booking.com B.V. as a travel intermediary for the purposes of the mandatory pension scheme and did not rule on the various other defenses brought forward by the Company against BPF's claims. The Supreme Court referred the matter to another Court of Appeal to assess the other defenses brought forward by the Company. In January 2024, that Court of Appeal ruled that Booking.com B.V. is required to participate in the mandatory pension scheme of the BPF with retroactive effect to 1999. The Company has filed an appeal of the decision to the Netherlands Supreme Court. Although the Company disagrees with the decision, it accrued a loss of 253 million Euros ($276 million), included in "Personnel" expenses in the Consolidated Statement of Operations for the year ended December 31, 2023. During the year ended December 31, 2024, the Company recorded additional estimated expenses of 72 million Euros ($77 million) included in "Personnel" expenses in the Consolidated Statements of Operations. The related liability is included in "Accrued expenses and other current liabilities" in the Consolidated Balance Sheets as of December 31, 2024 and 2023. On a go-forward basis, Booking.com B.V. expects to begin paying pension premiums to the BPF scheme or to increase contributions to the benefit of employees under its existing pension scheme.
From time to time, the Company notifies the competent data protection authority, such as the Dutch data protection authority in accordance with its obligations under the General Data Protection Regulation, of certain data security incidents. Should, for example, the Dutch data protection authority decide these incidents were the result of inadequate technical and organizational security measures or practices, it may impose a fine or require other commitments.
The Company has been, is currently, and expects to continue to be, subject to legal proceedings and claims in the ordinary course of business, including claims of alleged infringement of third-party intellectual property rights. Such claims could result in the expenditure of significant financial and managerial resources, divert management's attention, and adversely affect the Company's business, reputation, results of operations, and cash flows.
The Company accrues for certain other legal contingencies where it is probable that a loss has been incurred and the amount can be reasonably estimated. Such accrued amounts are not material to the Company's balance sheets and provisions recorded have not been material to the Company's results of operations or cash flows.
Other Contractual Obligations and Contingencies
The Company had $650 million and $533 million of standby letters of credit and bank guarantees issued on behalf of the Company as of December 31, 2024 and 2023, respectively, including those issued under the revolving credit facility. These were obtained primarily for regulatory purposes. See Note 12 for information related to letters of credit issued under the revolving credit facility.
Booking.com offers partner liability insurance that provides protection to certain accommodation partners ("home partners") in instances where a reservation has been made via Booking.com. The partner liability insurance may provide those home partners (both owners and property managers) coverage up to $1 million equivalent per occurrence, subject to limitations and exclusions, against third-party lawsuits claims for bodily injury, or third party personal property damage that occurred during a stay booked through Booking.com. Booking.com retains certain financial risks related to this insurance offering, which is underwritten by third party insurance companies.
17. SEGMENT REPORTING AND GEOGRAPHIC INFORMATION
See Note 1 for a description of the Company's business. The Company's portfolio of brands is organized into four operating segments. The Company determined its operating segments based on how its chief operating decision maker ("CODM"), who is the Chief Executive Officer and President, manages the business, makes operating decisions, and evaluates operating performance. The operating segments are aggregated into one reportable segment based on the similarity in economic characteristics, other qualitative factors, and the objectives and principles of ASC 280, Segment Reporting.
The CODM reviews revenues and an adjusted measure of earnings before interest, taxes, depreciation, and amortization less additions to property and equipment ("Adjusted EBITDA less Capex") for each operating segment. The following table presents information for the Company's reportable segment. Other segment items include operating expenses such as general and administrative and information technology. See Note 2 for additional information on these expenses.
| | | | | | | | | | | | | | | | | | | | |
| | Year Ended December 31, |
| (in millions) | | 2024 | | 2023 | | 2022 |
| Total revenues | | $ | 23,739 | | | $ | 21,365 | | | $ | 17,090 | |
| Marketing expenses | | 7,278 | | | 6,773 | | | 5,993 | |
| Sales and other expenses | | 3,104 | | | 2,744 | | | 1,986 | |
| Personnel expenses | | 3,133 | | | 2,818 | | | 2,310 | |
| Other segment items | | 2,045 | | | 2,010 | | | 1,694 | |
| Segment Adjusted EBITDA less Capex | | $ | 8,179 | | | $ | 7,020 | | | $ | 5,107 | |
Decisions to allocate resources to each operating segment are made predominantly through the budgeting and forecasting process. The CODM reviews budget-to-actual variances for revenues and Adjusted EBITDA less Capex to assess performance of the operating segments. The information is also used as a basis for determining compensation for certain employees. Estimates and judgments are made in allocating certain revenues and Adjusted EBITDA less Capex to operating segments due to the integrated nature of the operating segments in the underlying transactions. The allocation process is consistent with the manner in which the CODM assesses the performance of the operating segments. Information on segment assets is not presented as depreciation and amortization is not included in measuring Adjusted EBITDA less Capex.
The following table presents the reconciliation of the Company's segment Adjusted EBITDA less Capex to Income before income taxes:
| | | | | | | | | | | | | | | | | | | | |
| | Year Ended December 31, |
| (in millions) | | 2024 | | 2023 | | 2022 |
| | | | | | |
| | | | | | |
| Segment Adjusted EBITDA less Capex | | $ | 8,179 | | | $ | 7,020 | | | $ | 5,107 | |
| | | | | | |
| Additions to property and equipment | | 445 | | | 395 | | | 435 | |
Accruals related to the Netherlands pension fund matter (1) | | — | | | (276) | | | — | |
Accruals related to fine imposed by the Spanish Competition authority (1) | | 78 | | | (530) | | | — | |
Accruals related to settlements of indirect tax matters (1) | | (337) | | | (62) | | | (46) | |
Termination fee related to an acquisition agreement (2) | | — | | | (90) | | | — | |
Depreciation and amortization (3) | | (591) | | | (504) | | | (451) | |
Transformation costs (4) | | (34) | | | — | | | — | |
Loss on assets classified as held for sale (5) | | — | | | — | | | (36) | |
Gain on sale and leaseback transaction (5) | | — | | | — | | | 240 | |
Interest expense (3) | | (1,295) | | | (897) | | | (391) | |
Interest and dividend income (3) | | 1,114 | | | 1,020 | | | 219 | |
| | | | | | |
Net gains (losses) on equity securities (6) | | 63 | | | (131) | | | (963) | |
Foreign currency transaction gains (losses) on the remeasurement of certain Euro-denominated debt and accrued interest and debt-related foreign currency derivative instruments (6) | | 539 | | | (163) | | | 56 | |
Loss related to the conversion option on convertible senior notes (7) | | (535) | | | — | | | — | |
Other (8) | | (334) | | | (301) | | | (247) | |
| Income before income taxes | | $ | 7,292 | | | $ | 5,481 | | | $ | 3,923 | |
| | | | | | |
| | | | | | |
(1) See Note 16 for additional information.
(2) See Note 22 for additional information.
(3) See Consolidated Statements of Operations.
(4) See Note 20 for additional information.
(5) See Note 21 for additional information.
(6) See Note 18 for additional information.
(7) See Note 12 for additional information.
(8) Primarily consists of the expenses of corporate headquarters and certain other functional departments.
Stock-based compensation included in the determination of segment Adjusted EBITDA less Capex was $522 million, $447 million, and $347 million for the years ended December 31, 2024, 2023, and 2022, respectively.
Geographic Information
The Company's revenues from its businesses outside of the U.S. consists of the results of Booking.com and Agoda in their entirety and the results of the KAYAK and OpenTable businesses located outside of the U.S. This classification is independent of where the consumer resides, where the consumer is physically located while using the Company's services, or the location of the travel service provider or restaurant. For example, a reservation made through Booking.com at a hotel in New York by a consumer in the U.S. is part of the results of the Company's businesses outside of the U.S. The Company's geographic information on revenues for the years ended December 31, 2024, 2023, and 2022 is as follows:
| | | | | | | | | | | | | | | | | | | | | | | |
| | | | | | | |
| (in millions) | | U.S. | | | | | Outside of the U.S. (1) | | Total
Company |
| December 31, 2024 | | $ | 2,485 | | | | | | $ | 21,254 | | | $ | 23,739 | |
| December 31, 2023 | | 2,327 | | | | | | 19,038 | | | 21,365 | |
| December 31, 2022 | | 2,205 | | | | | | 14,885 | | | 17,090 | |
(1) Includes $18.6 billion, $17.0 billion, and $13.4 billion for the years ended December 31, 2024, 2023, and 2022, respectively, attributed to an entity domiciled in the Netherlands.
The following table presents information on the Company's property and equipment (excluding capitalized software) and operating lease assets based on location of the assets at December 31, 2024 and 2023:
| | | | | | | | | | | | | | | | | | | | | | | | | | | | | | | | |
| | U.S. | | Outside of the U.S. | | Total
Company |
| (in millions) | | | The Netherlands | | United Kingdom | | Other | |
| December 31, 2024 | | $ | 129 | | | $ | 405 | | | $ | 168 | | | $ | 243 | | | $ | 945 | |
| December 31, 2023 | | 127 | | | 476 | | | 209 | | | 229 | | | 1,041 | |
| | | | | | | | | | |
18. OTHER INCOME (EXPENSE), NET
The components of other income (expense), net included the following:
| | | | | | | | | | | | | | | | | | | | |
| | Year Ended December 31, |
| (in millions) | | 2024 | | 2023 | | 2022 |
Foreign currency transaction gains (losses) (1) | | $ | 383 | | | $ | (348) | | | $ | (43) | |
Net gains (losses) on equity securities (2) | | 63 | | | (131) | | | (963) | |
| | | | | | |
| | | | | | |
| | | | | | |
Loss related to the conversion option on convertible senior notes (3) | | (517) | | | — | | | — | |
| Other | | (11) | | | 2 | | | (1) | |
| Other income (expense), net | | $ | (82) | | | $ | (477) | | | $ | (1,007) | |
(1) Foreign currency transaction gains (losses) include gains of $526 million, losses of $163 million, and gains of $46 million for the years ended December 31, 2024, 2023, and 2022, respectively, related to Euro-denominated debt and accrued interest that were not designated as net investment hedges (see Note 12).
(2) See Note 5 for additional information related to net gains (losses) on equity securities.
(3) See Note 12 for additional information.
19. SUPPLEMENTAL CASH FLOW INFORMATION
As of December 31, 2024 and December 31, 2023, cash and cash equivalents reported in the Consolidated Balance Sheets differ from the amounts of total cash and cash equivalents and restricted cash and cash equivalents as shown in the Consolidated Statements of Cash Flows due to restricted cash and cash equivalents, which are included in "Other current assets" in the Consolidated Balance Sheets, primarily related to the Company's travel-related insurance business.
Noncash investing activity related to additions to property and equipment, including stock-based compensation and accrued liabilities, was $55 million, $50 million, and $48 million for the years ended December 31, 2024, 2023, and 2022, respectively. See Note 13 for additional information on noncash financing activity related to the excise tax on share repurchases.
During the years ended December 31, 2024, 2023, and 2022, the Company made income tax payments of $1.9 billion, $1.8 billion, and $600 million, respectively, and interest payments of $953 million, $842 million, and $380 million, respectively.
20. TRANSFORMATION COSTS
In November 2024, the Company announced its intention to implement certain organizational changes that are expected to improve operating expense efficiency, increase organizational agility, free up resources that can be reinvested into further improving its offering to travelers and partners, and better position the Company for the long term (the "Transformation Program"). The Company currently expects that restructuring costs and accelerated investments related to the Transformation Program will be incurred in the next two to three years and anticipates these costs to primarily relate to expected workforce reductions, technology investments, and professional fees. The details of the Transformation Program are not yet final and remain subject to consultation with works councils, employee representative bodies, and other relevant organizations, legal requirements in multiple jurisdictions, and the Company completing its analysis of overall Transformation Program costs. For the year ended December 31, 2024, the Transformation Program related costs are recorded in "Transformation costs" in the Consolidated Statement of Operations and primarily consist of professional fees.
21. OTHER OPERATING EXPENSES
During the year ended December 31, 2022, the Company transferred certain customer service operations of Booking.com to Majorel Group Luxembourg S.A. resulting in a loss of $41 million included in "Other operating expenses" in the Consolidated Statement of Operations for the year ended December 31, 2022.
See Note 10 for information on the gain recognized during the year ended December 31, 2022 related to the sale and leaseback transaction for the Booking.com's headquarters building in the Netherlands.
22. OTHER
Terminated Acquisition
In November 2021, the Company entered into an agreement to acquire global flight booking provider Etraveli Group. The completion of the acquisition was subject to certain closing conditions, including regulatory approvals. In September 2023, the European Commission announced its decision to prohibit the acquisition and consequently a termination fee of 85 million Euros ($90 million) was paid by the Company in October 2023 and is recorded in "General and administrative" expenses in the Consolidated Statement of Operations for the year ended December 31, 2023.
Benefit Plans
The Company maintains a defined contribution 401(k) savings plan covering certain U.S. employees and participates in certain defined contribution plans outside of the U.S. for which it provides contributions for eligible employees. The Company's contributions to the defined contribution plans during the years ended December 31, 2024, 2023, and 2022 were $59 million, $55 million, and $40 million, respectively. See Note 16 for information on accruals related to the Netherlands pension fund matter.
Accrued expenses and other current liabilities
Included in "Accrued expenses and other current liabilities" in the Consolidated Balance Sheets at December 31, 2024 and 2023 are accrued liabilities of $597 million and $587 million, respectively, related to marketing expenses and $611 million and $634 million, respectively, related to personnel expenses. In addition, "Accrued expenses and other current liabilities" in the Consolidated Balance Sheets at December 31, 2024 and 2023 include accruals of $336 million and $276 million, respectively, related to the Netherlands pension fund matter (see Note 16).
Booking Holdings Inc.
Schedule I - Condensed Financial Information of Parent (Booking Holdings Inc.)
CONDENSED BALANCE SHEETS
(In millions)
| | | | | | | | | | | | | | |
| | | December 31, |
| | | 2024 | | 2023 |
| ASSETS | | | | |
| Current assets: | | | | |
| Cash and cash equivalents | | $ | 4,173 | | | $ | 1,752 | |
| Receivables from subsidiaries | | 296 | | | 106 | |
| Other current assets | | 18 | | | 22 | |
| Total current assets | | 4,487 | | | 1,880 | |
| Loans receivable from subsidiaries | | 982 | | | 1,119 | |
| Investment in subsidiaries | | 10,586 | | | 10,294 | |
| Other assets | | 52 | | | 29 | |
| Total assets | | $ | 16,107 | | | $ | 13,322 | |
| LIABILITIES AND STOCKHOLDERS' DEFICIT | | | | |
| Current liabilities: | | | | |
| | | | |
| Payables to subsidiaries | | $ | 23 | | | $ | 19 | |
| Accrued expenses and other current liabilities | | 1,674 | | | 336 | |
| Short-term debt | | 1,745 | | | 1,961 | |
| Total current liabilities | | 3,442 | | | 2,316 | |
| Loans payable to subsidiaries | | 1,533 | | | 1,404 | |
| Other long-term liabilities | | 299 | | | 123 | |
| Long-term debt | | 14,853 | | | 12,223 | |
| Total liabilities | | 20,127 | | | 16,066 | |
| Commitments and contingencies | | | | |
| | | | |
| | | | |
| Total stockholders' deficit | | (4,020) | | | (2,744) | |
| Total liabilities and stockholders' deficit | | $ | 16,107 | | | $ | 13,322 | |
See Notes to Condensed Financial Statements.
Booking Holdings Inc.
Schedule I - Condensed Financial Information of Parent (Booking Holdings Inc.)
CONDENSED STATEMENTS OF OPERATIONS AND COMPREHENSIVE INCOME
(In millions)
| | | | | | | | | | | | | | | | | | | | |
| | Year Ended December 31, |
| | 2024 | | 2023 | | 2022 |
| Revenues | | $ | — | | | $ | — | | | $ | — | |
| Operating expenses | | 341 | | | 299 | | | 225 | |
| Operating loss | | (341) | | | (299) | | | (225) | |
| Interest expense | | (880) | | | (495) | | | (284) | |
| Interest and dividend income | | 200 | | | 166 | | | 58 | |
| Other income (expense), net | | 4 | | | (166) | | | 58 | |
| Equity in earnings (losses) of subsidiaries, net of tax | | 7,061 | | | 5,074 | | | 3,442 | |
| Income before income taxes | | 6,044 | | | 4,280 | | | 3,049 | |
| Income tax expense (benefit) | | 162 | | | (9) | | | (9) | |
| Net income | | $ | 5,882 | | | $ | 4,289 | | | $ | 3,058 | |
| | | | | | |
| | | | | | |
| | | | | | |
| Other comprehensive loss, net of tax | | (52) | | | (56) | | | (123) | |
| Comprehensive income | | $ | 5,830 | | | $ | 4,233 | | | $ | 2,935 | |
See Notes to Condensed Financial Statements
Booking Holdings Inc.
Schedule I - Condensed Financial Information of Parent (Booking Holdings Inc.)
CONDENSED STATEMENTS OF CASH FLOWS
(In millions)
| | | | | | | | | | | | | | | | | | | | |
| | | Year Ended December 31, |
| | | 2024 | | 2023 | | 2022 |
| OPERATING ACTIVITIES: | | | | | | |
| Net cash provided by operating activities | | $ | 6,414 | | | $ | 6,464 | | | $ | 3,695 | |
| INVESTING ACTIVITIES: | | | | | | |
| | | | | | |
| Proceeds from internal transfers of subsidiaries | | — | | | — | | | 174 | |
| | | | | | |
| | | | | | |
| Dividends received | | 139 | | | 107 | | | 3,087 | |
| Other investing activities | | (37) | | | (128) | | | (102) | |
| Net cash provided by (used in) investing activities | | 102 | | | (21) | | | 3,159 | |
| FINANCING ACTIVITIES: | | | | | | |
| | | | | | |
| | | | | | |
| Proceeds from the issuance of long-term debt | | 4,836 | | | 1,893 | | | 3,621 | |
| | | | | | |
| Payments on maturity and conversion of debt | | (1,312) | | | (500) | | | (1,880) | |
| | | | | | |
| Payments for repurchase of common stock | | (6,509) | | | (10,377) | | | (6,621) | |
| Dividends paid | | (1,174) | | | — | | | — | |
| Proceeds from exercise of stock options | | 14 | | | 134 | | | 7 | |
| Other financing activities | | 50 | | | 49 | | | 47 | |
| Net cash used in financing activities | | (4,095) | | | (8,801) | | | (4,826) | |
| | | | | | |
| Net increase (decrease) in cash and cash equivalents | | 2,421 | | | (2,358) | | | 2,028 | |
| Total cash and cash equivalents, beginning of period | | 1,752 | | | 4,110 | | | 2,082 | |
| Total cash and cash equivalents, end of period | | $ | 4,173 | | | $ | 1,752 | | | $ | 4,110 | |
See Notes to Condensed Financial Statements.
Booking Holdings Inc.
Schedule I - Condensed Financial Information of Parent (Booking Holdings Inc.)
NOTES TO CONDENSED FINANCIAL STATEMENTS
1. BASIS OF PRESENTATION
These condensed parent company-only financial statements of Booking Holdings Inc. (the "Parent"), are prepared on a "parent company-only" basis and have been derived from and should be read in conjunction with the consolidated financial statements and related notes of Booking Holdings Inc. and subsidiaries included in Part IV, Item 15 of this Annual Report on Form 10-K (the "Consolidated Financial Statements"). Under a parent company-only presentation, investments in the parent's subsidiaries are accounted for under the equity method of accounting. Certain information and footnote disclosures normally included in financial statements prepared in accordance with U.S. GAAP have been condensed or omitted.
2. DEBT
See Note 12 to the Consolidated Financial Statements for additional information on the Parent's revolving credit facility and outstanding debt.
3. DIVIDENDS FROM SUBSIDIARIES
Cash dividends paid to the Parent by the subsidiaries were $7.2 billion, $7.3 billion, and $7.3 billion for the years ended December 31, 2024 and 2023, and 2022, respectively, and are classified within "Net cash provided by operating activities" or "Net cash provided by (used in) investing activities," as appropriate, in the Condensed Statements of Cash Flows.
4. GUARANTEES
The Parent had $721 million and $389 million of guarantees issued on behalf of the Parent's subsidiaries as of December 31, 2024 and 2023, respectively, which are primarily related to arrangements with payment processors and networks.