[GRAPHIC]
[LOGO]
Goldman, Sachs & Co.
7th Annual Internet Conference
May 24, 2006
CONFIDENTIAL INFORMATION • Property of priceline.com incorporated. All Rights Reserved. 5.23.06
Priceline.com would like to remind you that this presentation contains forward looking statements, which are made pursuant to the Safe Harbor provisions of the Private Securities Litigation Reform Act of 1995. These forward-looking statements are not guarantees of future performance and are subject to certain risks, uncertainties and assumptions that are difficult to predict; therefore, actual results may differ materially from those expressed, implied or forecasted in any such forward-looking statements.
Expressions of future goals and similar expressions reflecting something other than historical fact are intended to identify forward looking statements. For a list of factors that could cause Priceline.com’s actual results to differ materially from those described in the forward-looking statements, please refer to the risk factors in Priceline.com’s most recent filings with the Securities and Exchange Commission. Unless required by law, Priceline.com undertakes no obligation to update publicly any forward-looking statements, whether as a result of new information, future events or otherwise.
This presentation should be read in conjunction with priceline.com’s audited financial statements and the notes thereto filed with the Securities and Exchange Commission on Form 10-K and quarterly financial statements filed with the Securities and Exchange Commission on Form 10-Q.
2
Mission
• To be the leading online travel business for value-conscious leisure travelers in North America
• To be the leading European online hotel reservation service for leisure and unmanaged business travel
3
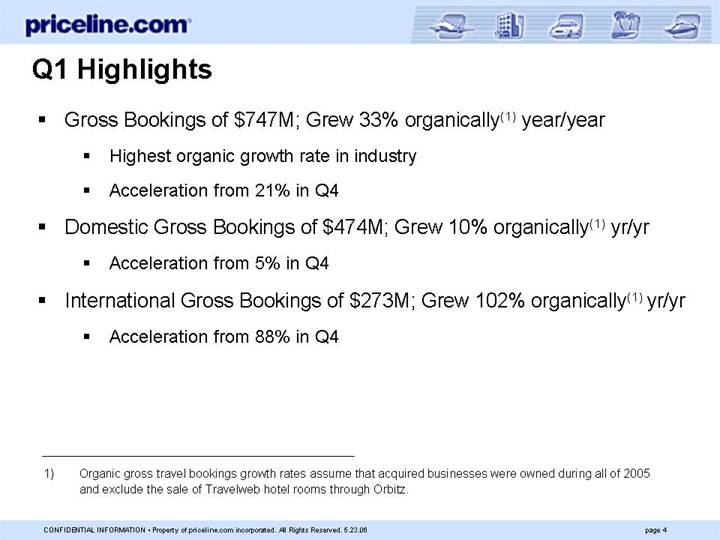
Q1 Highlights
• Gross Bookings of $747M; Grew 33% organically(1) year/year
• Highest organic growth rate in industry
• Acceleration from 21% in Q4
• Domestic Gross Bookings of $474M; Grew 10% organically(1) yr/yr
• Acceleration from 5% in Q4
• International Gross Bookings of $273M; Grew 102% organically(1) yr/yr
• Acceleration from 88% in Q4
(1) Organic gross travel bookings growth rates assume that acquired businesses were owned during all of 2005 and exclude the sale of Travelweb hotel rooms through Orbitz.
4
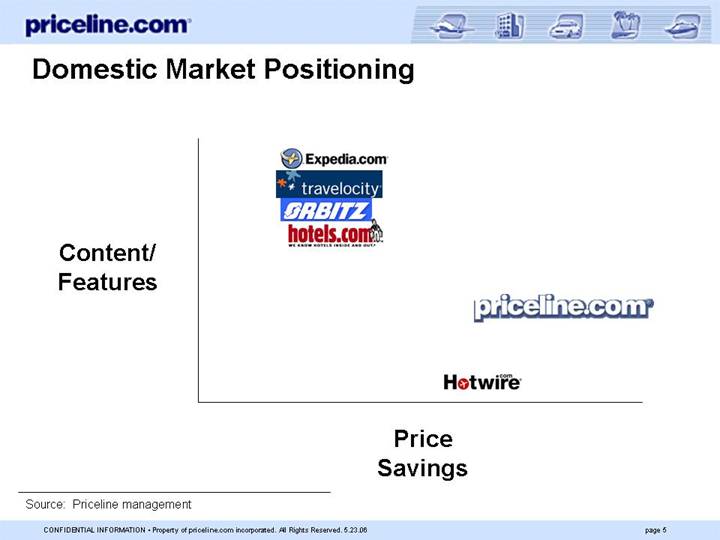
Domestic Market Positioning
[CHART]
Source: Priceline management
5
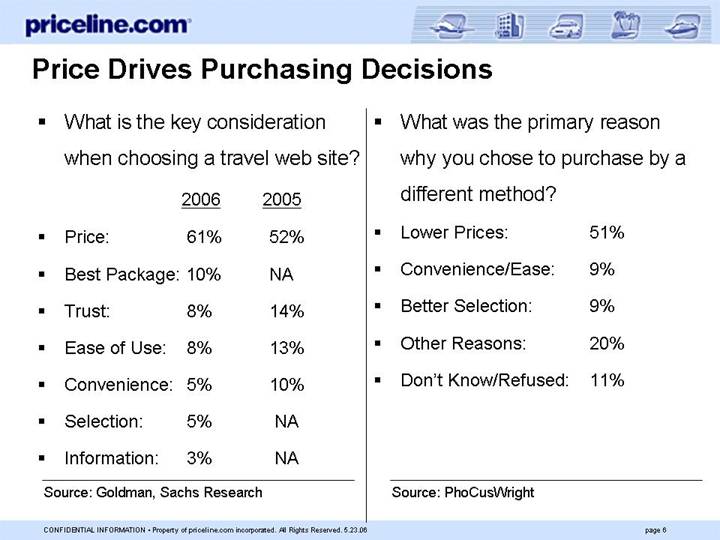
Price Drives Purchasing Decisions
• What is the key consideration when choosing a travel web site?
| | | 2006 | | 2005 | |
• | Price: | | 61 | % | 52 | % |
| | | | | | |
• | Best Package: | | 10 | % | NA | |
| | | | | | |
• | Trust: | | 8 | % | 14 | % |
| | | | | | |
• | Ease of Use: | | 8 | % | 13 | % |
| | | | | | |
• | Convenience: | | 5 | % | 10 | % |
| | | | | | |
• | Selection: | | 5 | % | NA | |
| | | | | | |
• | Information: | | 3 | % | NA | |
Source: Goldman, Sachs Research
• What was the primary reason why you chose to purchase by a different method?
• | Lower Prices: | | 51 | % | | |
| | | | | | |
• | Convenience/Ease: | | 9 | % | | |
| | | | | | |
• | Better Selection: | | 9 | % | | |
| | | | | | |
• | Other Reasons: | | 20 | % | | |
| | | | | | |
• | Don’t Know/Refused: | | 11 | % | | |
Source: PhoCusWright
6
More Ways to Save - Air
[GRAPHIC]
7
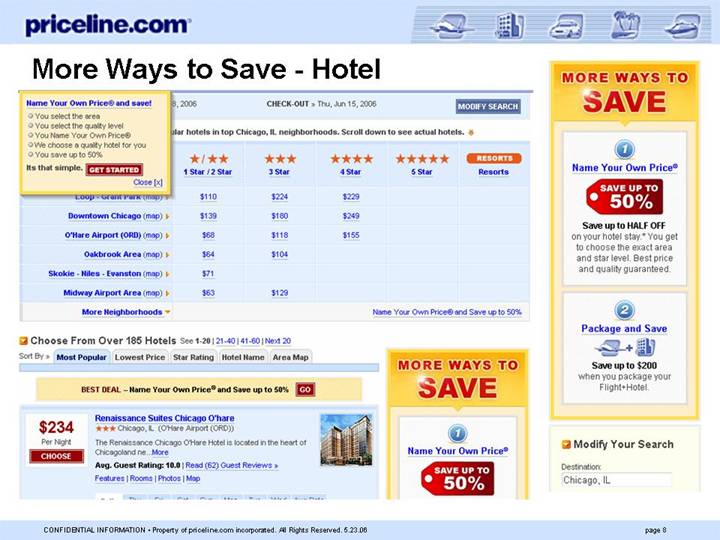
More Ways to Save - Hotel
[GRAPHIC]
8
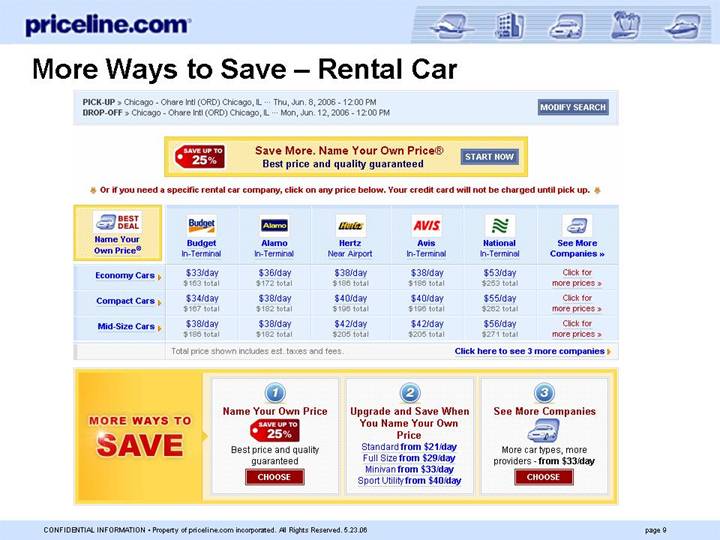
More Ways to Save – Rental Car
[GRAPHIC]
9
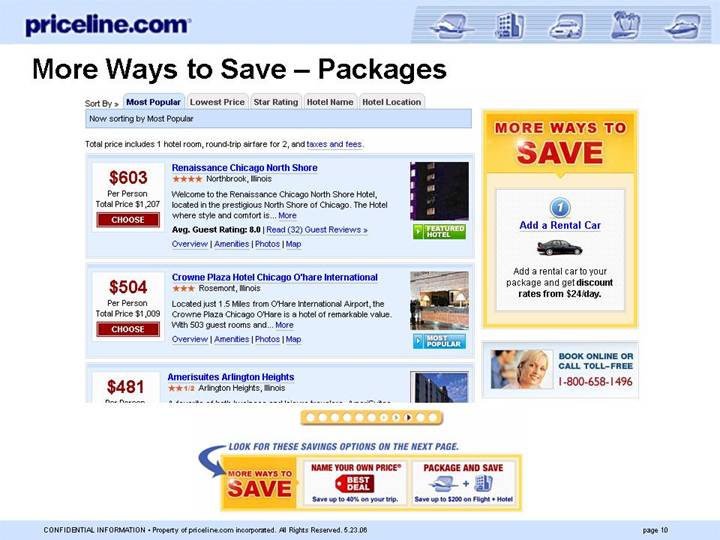
More Ways to Save – Packages
[GRAPHIC]
10
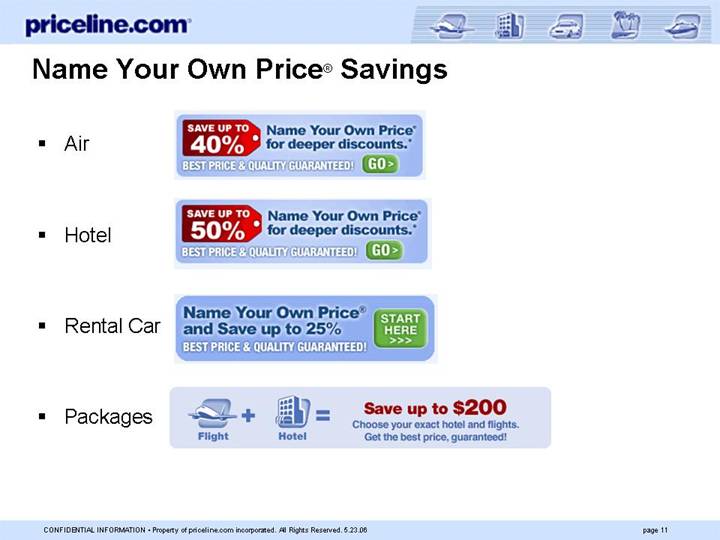
Name Your Own Price® Savings
• | Air | [GRAPHIC] |
| | |
• | Hotel | [GRAPHIC] |
| | |
• | Rental Car | [GRAPHIC] |
| | |
• | Packages | [GRAPHIC] |
11
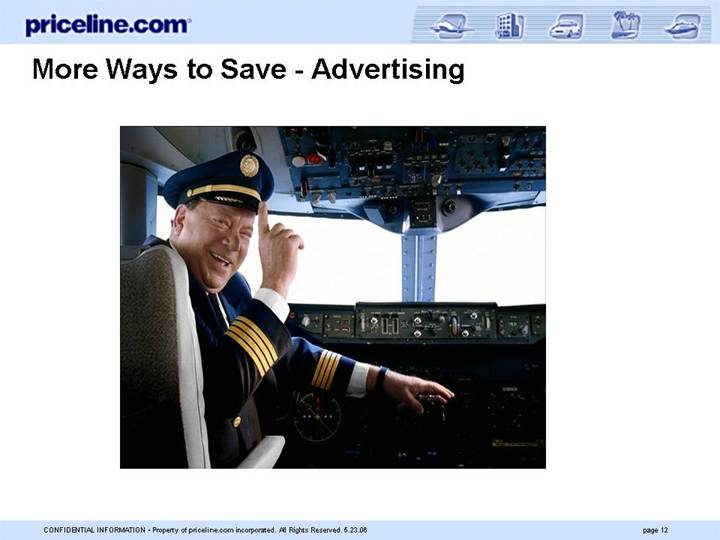
More Ways to Save - Advertising
[GRAPHIC]
12
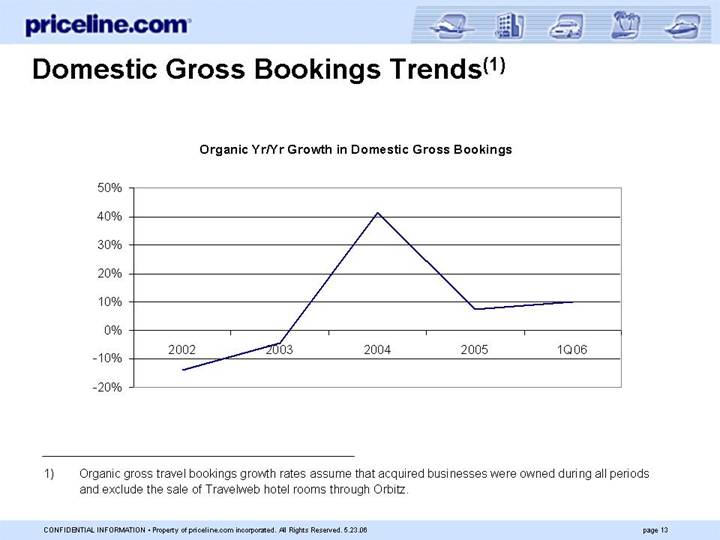
Domestic Gross Bookings Trends(1)
Organic Yr/Yr Growth in Domestic Gross Bookings
[CHART]
(1) Organic gross travel bookings growth rates assume that acquired businesses were owned during all periods and exclude the sale of Travelweb hotel rooms through Orbitz.
13
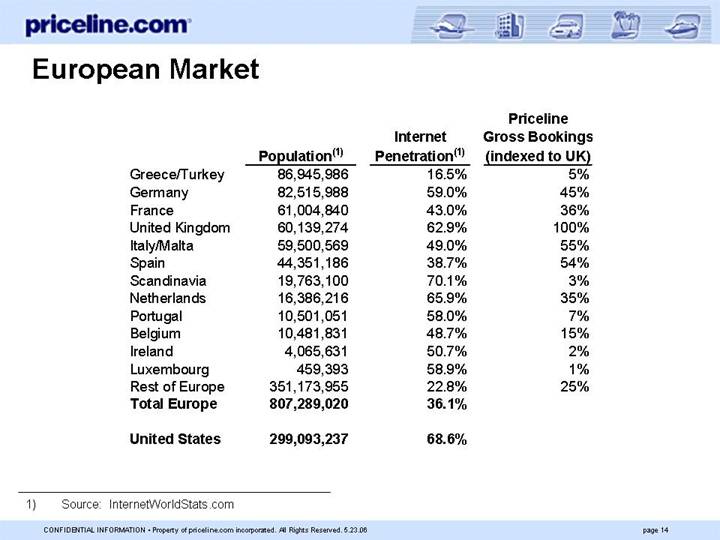
European Market
| | | | | | Priceline | |
| | | | Internet | | Gross Bookings | |
| | Population(1) | | Penetration(1) | | (indexed to UK) | |
Greece/Turkey | | 86,945,986 | | 16.5 | % | 5 | % |
Germany | | 82,515,988 | | 59.0 | % | 45 | % |
France | | 61,004,840 | | 43.0 | % | 36 | % |
United Kingdom | | 60,139,274 | | 62.9 | % | 100 | % |
Italy/Malta | | 59,500,569 | | 49.0 | % | 55 | % |
Spain | | 44,351,186 | | 38.7 | % | 54 | % |
Scandinavia | | 19,763,100 | | 70.1 | % | 3 | % |
Netherlands | | 16,386,216 | | 65.9 | % | 35 | % |
Portugal | | 10,501,051 | | 58.0 | % | 7 | % |
Belgium | | 10,481,831 | | 48.7 | % | 15 | % |
Ireland | | 4,065,631 | | 50.7 | % | 2 | % |
Luxembourg | | 459,393 | | 58.9 | % | 1 | % |
Rest of Europe | | 351,173,955 | | 22.8 | % | 25 | % |
Total Europe | | 807,289,020 | | 36.1 | % | | |
| | | | | | | |
United States | | 299,093,237 | | 68.6 | % | | |
(1) Source: InternetWorldStats.com
14
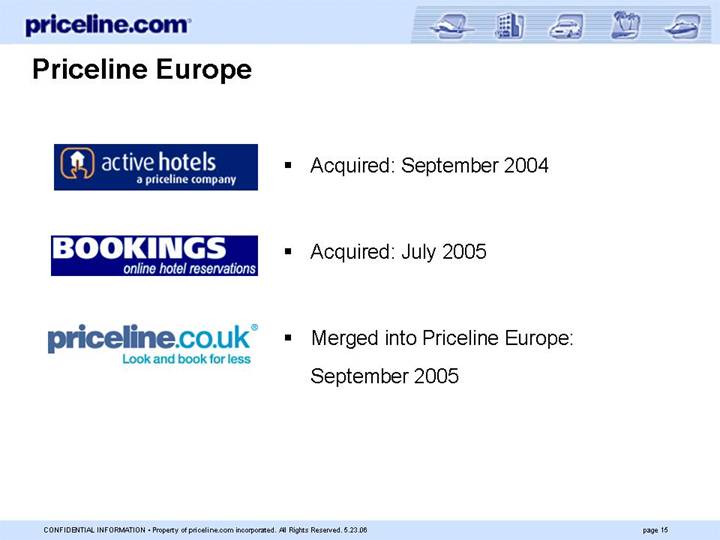
Priceline Europe
[LOGO] | • | Acquired: September 2004 |
| | |
[LOGO] | • | Acquired: July 2005 |
| | |
[LOGO] | • | Merged into Priceline Europe: September 2005 |
15
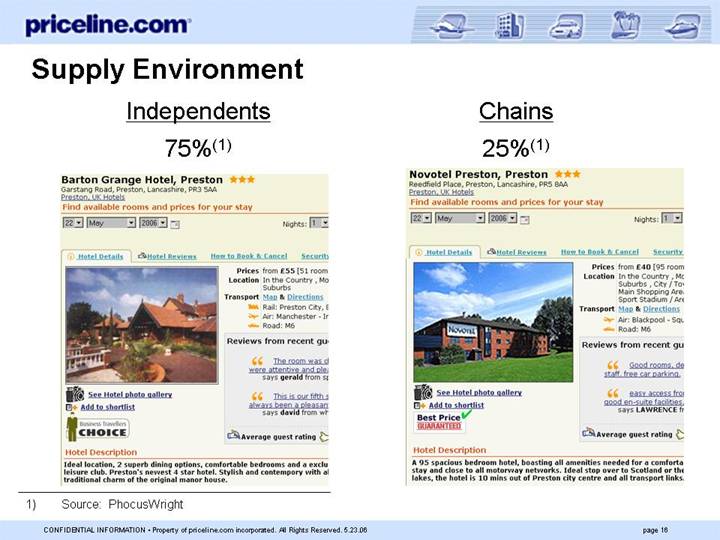
Supply Environment
Independents | | Chains |
| | |
75%(1) | | 25%(1) |
| | |
[GRAPHIC] | | [GRAPHIC] |
(1) Source: PhocusWright
16
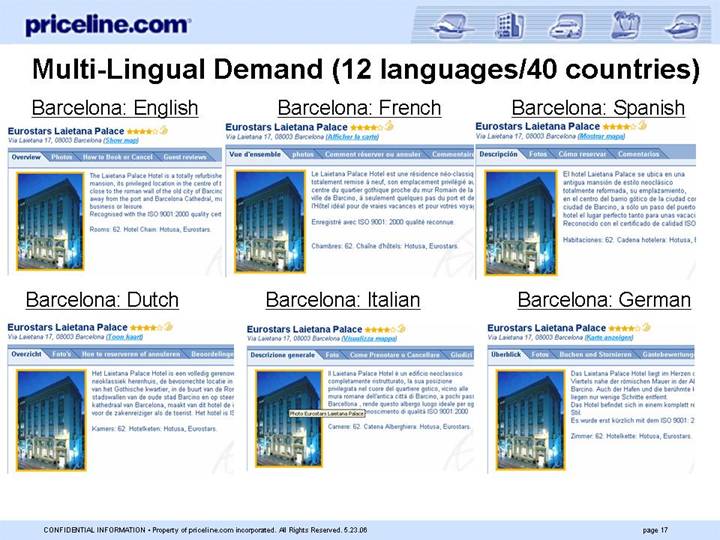
Multi-Lingual Demand (12 languages/40 countries)
Barcelona: English | | Barcelona: French | | Barcelona: Spanish |
| | | | |
[GRAPHIC] | | [GRAPHIC] | | [GRAPHIC] |
| | | | |
Barcelona: Dutch | | Barcelona: Italian | | Barcelona: German |
| | | | |
[GRAPHIC] | | [GRAPHIC] | | [GRAPHIC] |
17
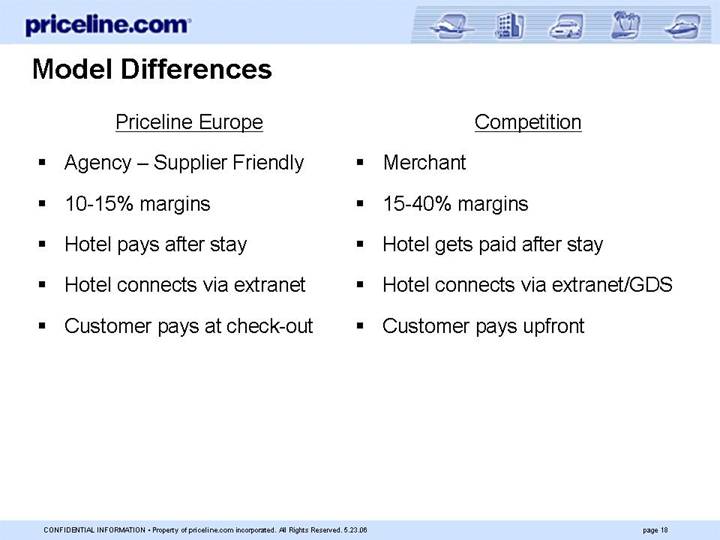
Model Differences
Priceline Europe
• Agency – Supplier Friendly
• 10-15% margins
• Hotel pays after stay
• Hotel connects via extranet
• Customer pays at check-out
Competition
• Merchant
• 15-40% margins
• Hotel gets paid after stay
• Hotel connects via extranet/GDS
• Customer pays upfront
18
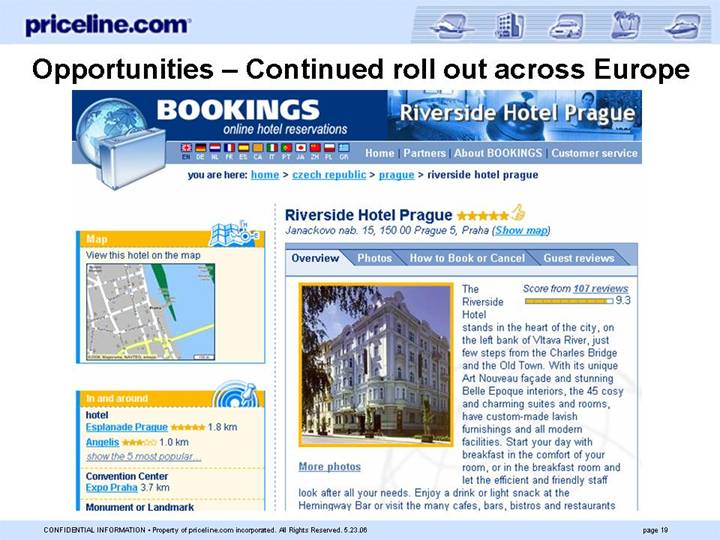
Opportunities – Continued roll out across Europe
[GRAPHIC]
19
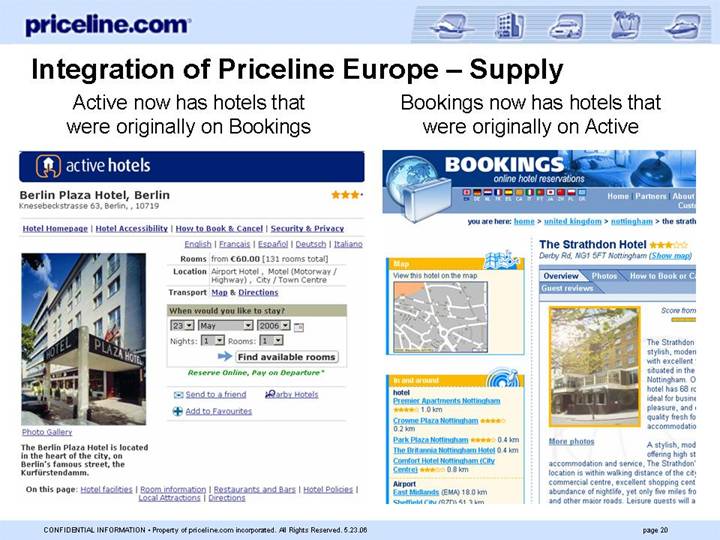
Integration of Priceline Europe – Supply
Active now has hotels that | | Bookings now has hotels that |
were originally on Bookings | | were originally on Active |
| | |
[GRAPHIC] | | [GRAPHIC] |
20
Integration of Priceline Europe – Demand
Eastbound | | Westbound |
| | |
[GRAPHIC] | | [GRAPHIC] |
21
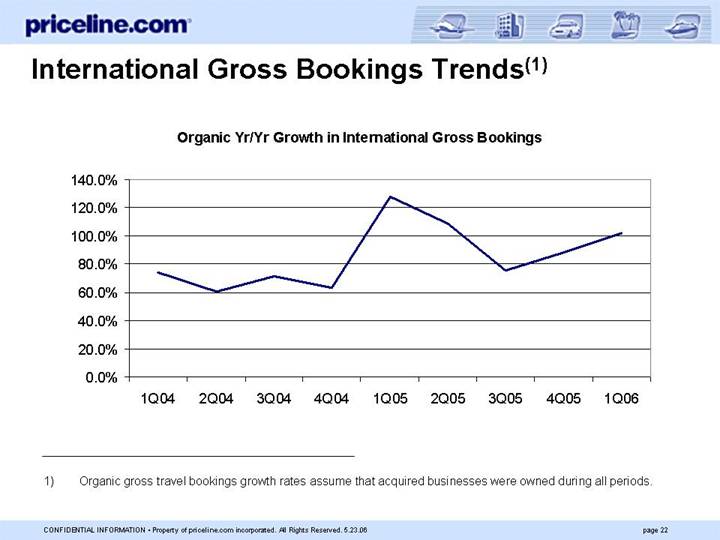
International Gross Bookings Trends(1)
Organic Yr/Yr Growth in International Gross Bookings
[CHART]
(1) Organic gross travel bookings growth rates assume that acquired businesses were owned during all periods.
22