


Searchable text section of graphics shown above
[GRAPHIC]
Forward Looking Information
This presentation includes forward-looking statements regarding future events and the future financial performance of TC PipeLines, LP. Words such as “believes”, “expects”, “intends”, “forecasts”, “projects”, and similar expressions, identify forward-looking statements. All forward-looking statements are based on the Partnership’s current beliefs as well as assumptions made by and information currently available to the Partnership. These statements reflect the Partnership’s current views with respect to future events. Important factors that could cause actual results to materially differ from the Partnership’s current expectations include regulatory decisions, particularly those of the Federal Energy Regulatory Commission, majority control of the Northern Border Pipeline management committee by affiliates of ONEOK, Inc., Northern Border Pipeline’s ability to recontract available capacity, the failure of a shipper on either one of the Partnership’s pipelines to perform its contractual obligations, cost of acquisitions, future demand for natural gas, overcapacity in the industry, and other risks inherent in the transportation of natural gas as discussed in the Partnership’s filings with the Securities and Exchange Commission, including the Partnership’s Annual Report on Form 10-K for the year ended December 31, 2004.
2
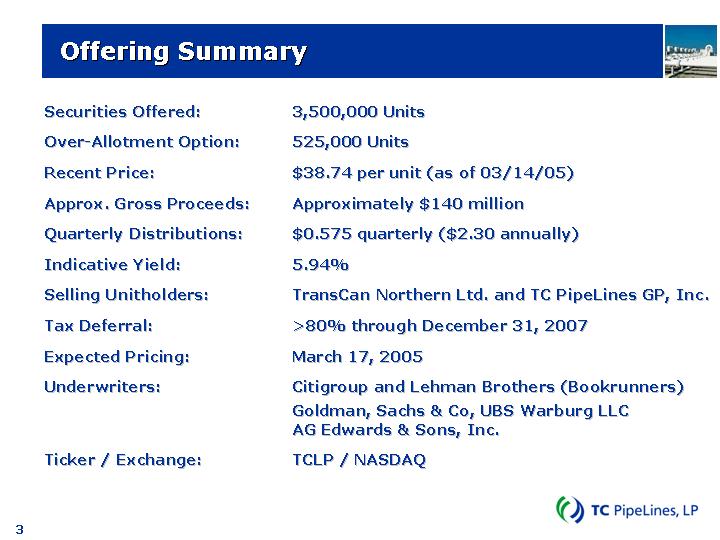
Offering Summary
Securities Offered: |
| 3,500,000 Units |
|
|
|
Over-Allotment Option: |
| 525,000 Units |
|
|
|
Recent Price: |
| $38.74 per unit (as of 03/14/05) |
|
|
|
Approx. Gross Proceeds: |
| Approximately $140 million |
|
|
|
Quarterly Distributions: |
| $0.575 quarterly ($2.30 annually) |
|
|
|
Indicative Yield: |
| 5.94% |
|
|
|
Selling Unitholders: |
| TransCan Northern Ltd. and TC PipeLines GP, Inc. |
|
|
|
Tax Deferral: |
| >80% through December 31, 2007 |
|
|
|
Expected Pricing: |
| March 17, 2005 |
|
|
|
Underwriters: |
| Citigroup and Lehman Brothers (Bookrunners) |
|
| Goldman, Sachs & Co, UBS Warburg LLC |
|
| AG Edwards & Sons, Inc. |
|
|
|
Ticker / Exchange: |
| TCLP / NASDAQ |
3
Management Team
Ron Turner
President and Chief Executive Officer
Russell Girling
Chief Financial Officer
Max Feldman
Vice-President
4
Investment Highlights
• Strategically located, FERC-regulated natural gas pipelines
• Compelling natural gas supply / demand fundamentals
• Stable, fee-based cash flows
• Track record of growing cash distributions and attractive returns
• Conservative cash distribution coverage
• Strong and balanced financial position
• Seasoned management team with average industry experience of 28 years
• Strong stewardship from TransCanada, one of the largest natural gas pipeline companies in North America
5
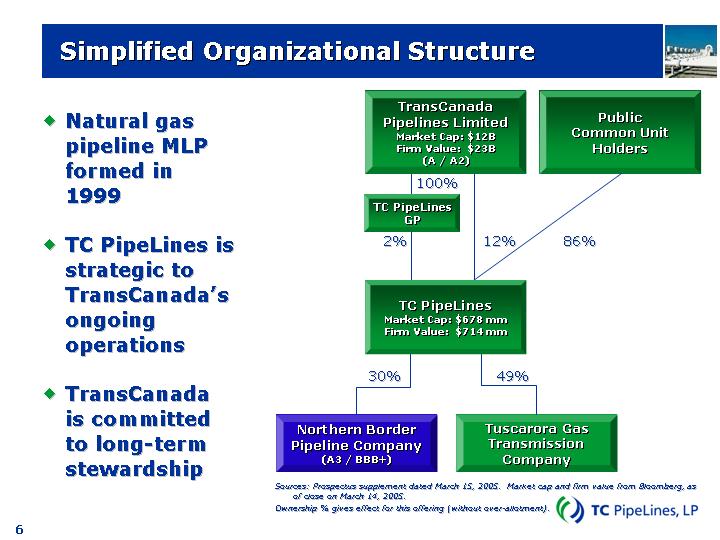
Simplified Organizational Structure
• Natural gas pipeline MLP formed in 1999
• TC PipeLines is strategic to TransCanada’s ongoing operations
• TransCanada is committed to long-term stewardship
[CHART]
Sources: Prospectus supplement dated March 15, 2005. Market cap and firm value from Bloomberg, as of close on March 14, 2005.
Ownership % gives effect for this offering (without over-allotment).
6
Partnership Business Strategies
• Working with our partners, maximize utilization and expand our pipeline assets to meet market demand while conducting safe and efficient operations
• Maintain a strong and balanced financial position
• Prudently invest in pipelines that are underpinned by strong fundamentals and provide stable cash flows
• Leverage TransCanada’s expertise and position in the gas transmission industry
7
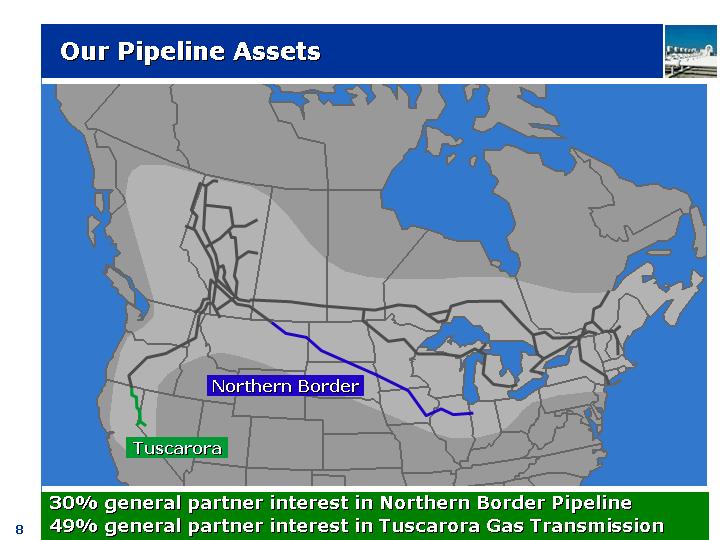
Our Pipeline Assets
[GRAPHIC]
30% general partner interest in Northern Border Pipeline
49% general partner interest in Tuscarora Gas Transmission
8
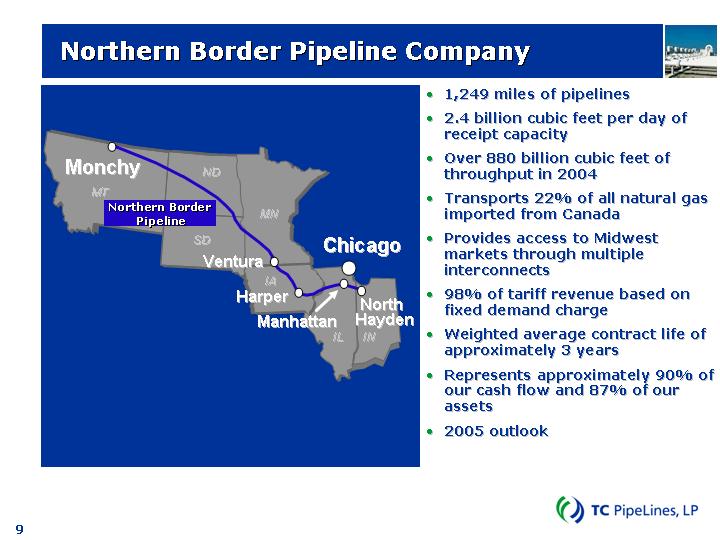
Northern Border Pipeline Company
[GRAPHIC]
• 1,249 miles of pipelines
• 2.4 billion cubic feet per day of receipt capacity
• Over 880 billion cubic feet of throughput in 2004
• Transports 22% of all natural gas imported from Canada
• Provides access to Midwest markets through multiple interconnects
• 98% of tariff revenue based on fixed demand charge
• Weighted average contract life of approximately 3 years
• Represents approximately 90% of our cash flow and 87% of our assets
• 2005 outlook
9
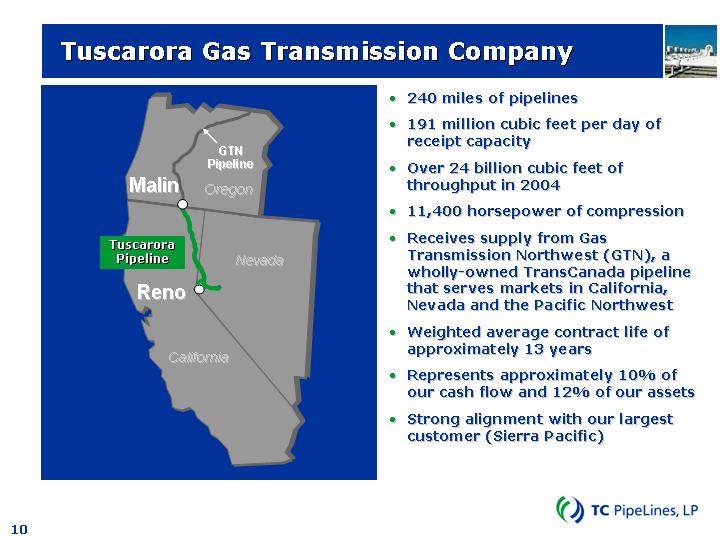
Tuscarora Gas Transmission Company
[GRAPHIC]
• 240 miles of pipelines
• 191 million cubic feet per day of receipt capacity
• Over 24 billion cubic feet of throughput in 2004
• 11,400 horsepower of compression
• Receives supply from Gas Transmission Northwest (GTN), a wholly-owned TransCanada pipeline that serves markets in California, Nevada and the Pacific Northwest
• Weighted average contract life of approximately 13 years
• Represents approximately 10% of our cash flow and 12% of our assets
• Strong alignment with our largest customer (Sierra Pacific)
10
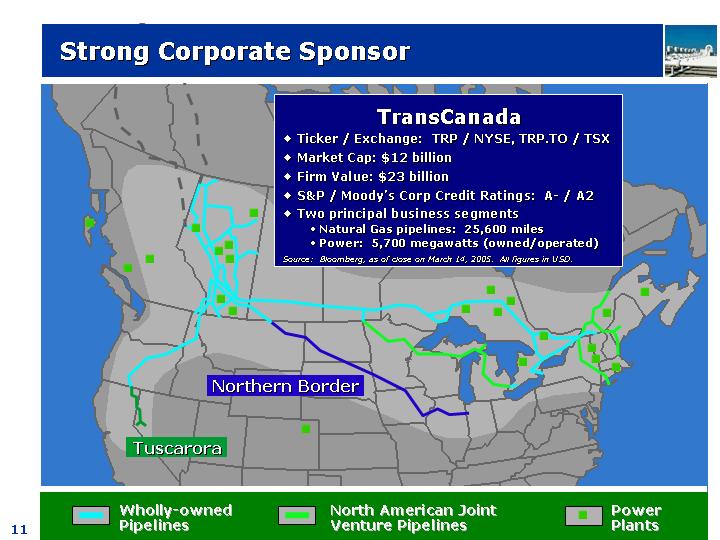
Strong Corporate Sponsor
TransCanada
• Ticker / Exchange: TRP / NYSE, TRP.TO / TSX
• Market Cap: $12 billion
• Firm Value: $23 billion
• S&P / Moody’s Corp Credit Ratings: A- / A2
• Two principal business segments
• Natural Gas pipelines: 25,600 miles
• Power: 5,700 megawatts (owned/operated)
Source: Bloomberg, as of close on March 14, 2005. All figures in USD.
[GRAPHIC]
11
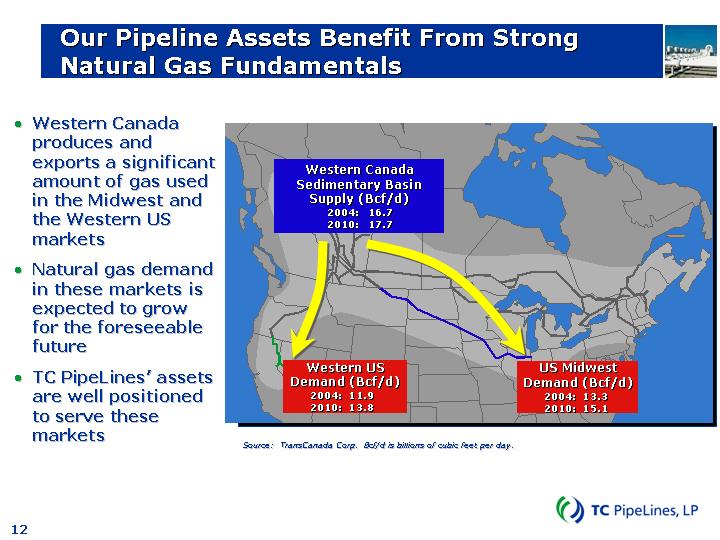
Our Pipeline Assets Benefit From Strong Natural Gas Fundamentals
• Western Canada produces and exports a significant amount of gas used in the Midwest and the Western US markets
• Natural gas demand in these markets is expected to grow for the foreseeable future
• TC PipeLines’ assets are well positioned to serve these markets
[GRAPHIC]
Source: TransCanada Corp. Bcf/d is billions of cubic feet per day.
12
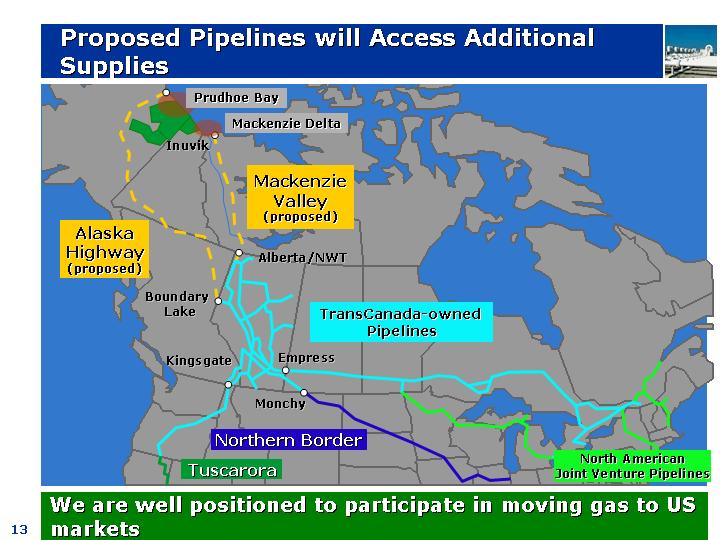
Proposed Pipelines will Access Additional Supplies
[GRAPHIC]
We are well positioned to participate in moving gas to US markets
13
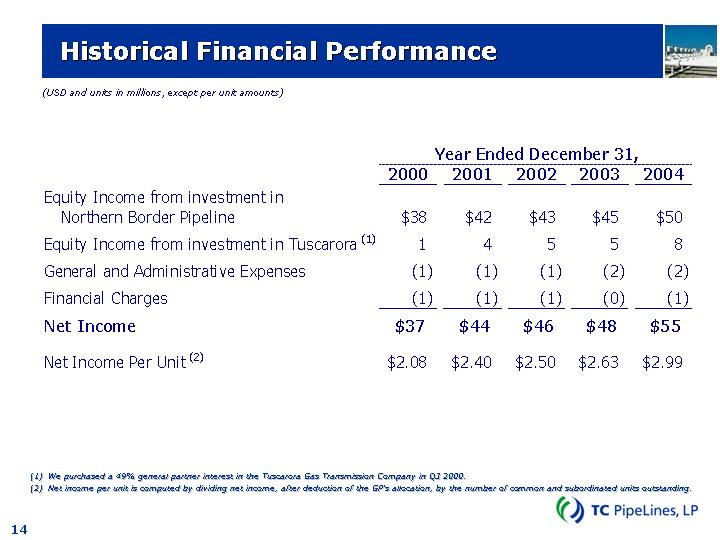
Historical Financial Performance
(USD and units in millions, except per unit amounts)
|
| Year Ended December 31, |
| |||||||||||||
|
| 2000 |
| 2001 |
| 2002 |
| 2003 |
| 2004 |
| |||||
Equity Income from investment in Northern Border Pipeline |
| $ | 38 |
| $ | 42 |
| $ | 43 |
| $ | 45 |
| $ | 50 |
|
Equity Income from investment in Tuscarora (1) |
| 1 |
| 4 |
| 5 |
| 5 |
| 8 |
| |||||
General and Administrative Expenses |
| (1 | ) | (1 | ) | (1 | ) | (2 | ) | (2 | ) | |||||
Financial Charges |
| (1 | ) | (1 | ) | (1 | ) | (0 | ) | (1 | ) | |||||
Net Income |
| $ | 37 |
| $ | 44 |
| $ | 46 |
| $ | 48 |
| $ | 55 |
|
|
|
|
|
|
|
|
|
|
|
|
| |||||
Net Income Per Unit (2) |
| $ | 2.08 |
| $ | 2.40 |
| $ | 2.50 |
| $ | 2.63 |
| $ | 2.99 |
|
(1) We purchased a 49% general partner interest in the Tuscarora Gas Transmission Company in Q3 2000.
(2) Net income per unit is computed by dividing net income, after deduction of the GP’s allocation, by the number of common and subordinated units outstanding.
14
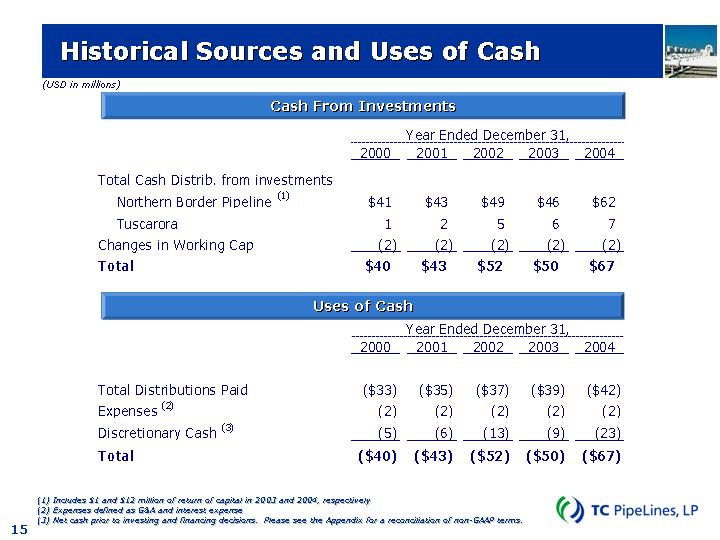
Historical Sources and Uses of Cash
(USD in millions)
Cash From Investments
|
| Year Ended December 31, |
| |||||||||||||
|
| 2000 |
| 2001 |
| 2002 |
| 2003 |
| 2004 |
| |||||
|
|
|
|
|
|
|
|
|
|
|
| |||||
Total Cash Distrib. from investments |
|
|
|
|
|
|
|
|
|
|
| |||||
Northern Border Pipeline (1) |
| $ | 41 |
| $ | 43 |
| $ | 49 |
| $ | 46 |
| $ | 62 |
|
Tuscarora |
| 1 |
| 2 |
| 5 |
| 6 |
| 7 |
| |||||
Changes in Working Cap |
| (2 | ) | (2 | ) | (2 | ) | (2 | ) | (2 | ) | |||||
Total |
| $ | 40 |
| $ | 43 |
| $ | 52 |
| $ | 50 |
| $ | 67 |
|
Uses of Cash
|
| Year Ended December 31, |
| |||||||||||||
|
| 2000 |
| 2001 |
| 2002 |
| 2003 |
| 2004 |
| |||||
|
|
|
|
|
|
|
|
|
|
|
| |||||
Total Distributions Paid |
| $ | (33 | ) | $ | (35 | ) | $ | (37 | ) | $ | (39 | ) | $ | (42 | ) |
Expenses (2) |
| (2 | ) | (2 | ) | (2 | ) | (2 | ) | (2 | ) | |||||
Discretionary Cash (3) |
| (5 | ) | (6 | ) | (13 | ) | (9 | ) | (23 | ) | |||||
Total |
| $ | (40 | ) | $ | (43 | ) | $ | (52 | ) | $ | (50 | ) | $ | (67 | ) |
(1) Includes $1 and $12 million of return of capital in 2003 and 2004, respectively
(2) Expenses defined as G&A and interest expense
(3) Net cash prior to investing and financing decisions. Please see the Appendix for a reconciliation of non-GAAP terms.
15
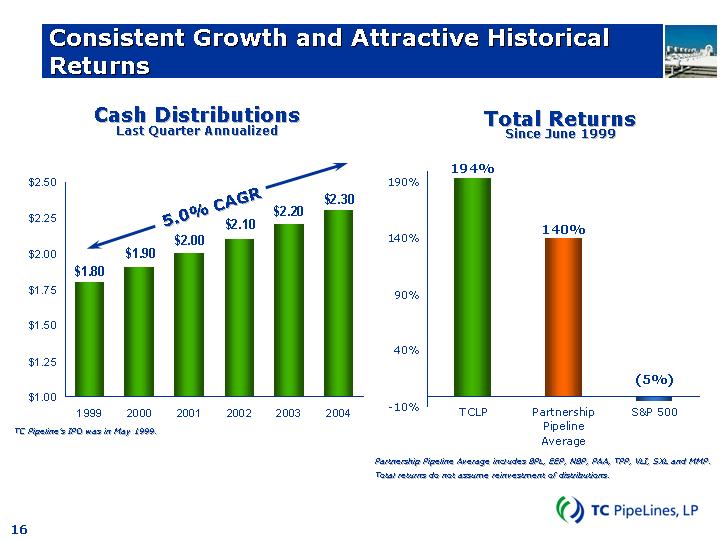
Consistent Growth and Attractive Historical Returns
Cash Distributions
Last Quarter Annualized
[CHART]
TC Pipeline’s IPO was in May 1999.
Total Returns
Since June 1999
[CHART]
Partnership Pipeline Average includes BPL, EEP, NBP, PAA, TPP, VLI, SXL and MMP.
Total returns do not assume reinvestment of distributions.
16
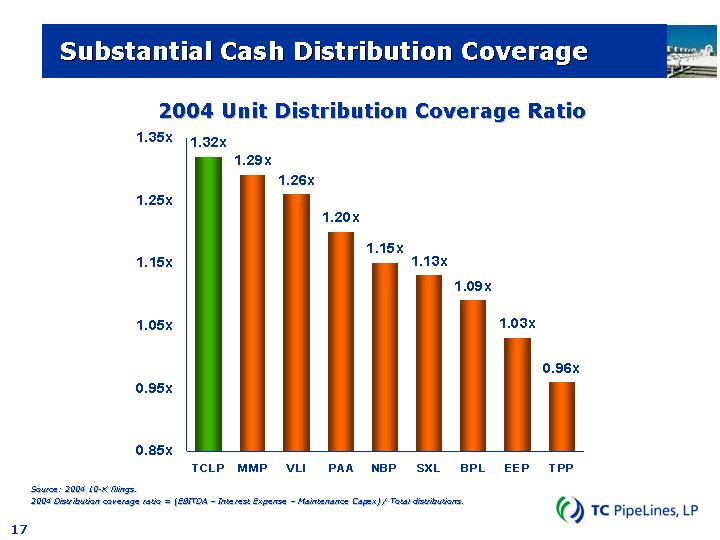
Substantial Cash Distribution Coverage
2004 Unit Distribution Coverage Ratio
[CHART]
Source: 2004 10-K filings.
2004 Distribution coverage ratio = (EBITDA – Interest Expense – Maintenance Capex) / Total distributions.
17
Investment Highlights
• Strategically located, FERC-regulated natural gas pipelines
• Compelling natural gas supply / demand fundamentals
• Stable, fee-based cash flows
• Track record of growing cash distributions and attractive returns
• Conservative cash distribution coverage
• Strong and balanced financial position
• Seasoned management team with average industry experience of 28 years
• Strong stewardship from TransCanada, one of the largest natural gas pipeline companies in North America
18
Non-GAAP Financial Measure
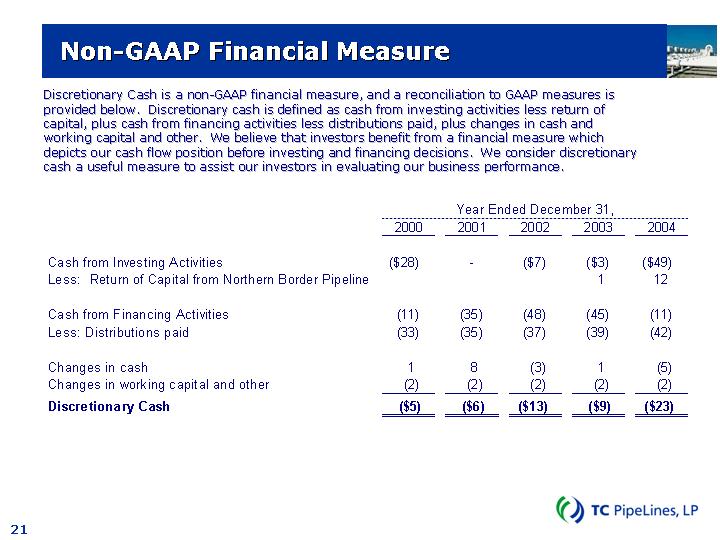
Discretionary Cash is a non-GAAP financial measure, and a reconciliation to GAAP measures is provided below. Discretionary cash is defined as cash from investing activities less return of capital, plus cash from financing activities less distributions paid, plus changes in cash and working capital and other. We believe that investors benefit from a financial measure which depicts our cash flow position before investing and financing decisions. We consider discretionary cash a useful measure to assist our investors in evaluating our business performance.
|
| Year Ended December 31, |
| |||||||||||||
|
| 2000 |
| 2001 |
| 2002 |
| 2003 |
| 2004 |
| |||||
|
|
|
|
|
|
|
|
|
|
|
| |||||
Cash from Investing Activities |
| $ | (28 | ) | — |
| $ | (7 | ) | $ | (3 | ) | $ | (49 | ) | |
Less: Return of Capital from Northern Border Pipeline |
|
|
|
|
|
|
| 1 |
| 12 |
| |||||
|
|
|
|
|
|
|
|
|
|
|
| |||||
Cash from Financing Activities |
| (11 | ) | (35 | ) | (48 | ) | (45 | ) | (11 | ) | |||||
Less: Distributions paid |
| (33 | ) | (35 | ) | (37 | ) | (39 | ) | (42 | ) | |||||
|
|
|
|
|
|
|
|
|
|
|
| |||||
Changes in cash |
| 1 |
| 8 |
| (3 | ) | 1 |
| (5 | ) | |||||
Changes in working capital and other |
| (2 | ) | (2 | ) | (2 | ) | (2 | ) | (2 | ) | |||||
Discretionary Cash |
| $ | (5 | ) | $ | (6 | ) | $ | (13 | ) | $ | (9 | ) | $ | (23 | ) |
21
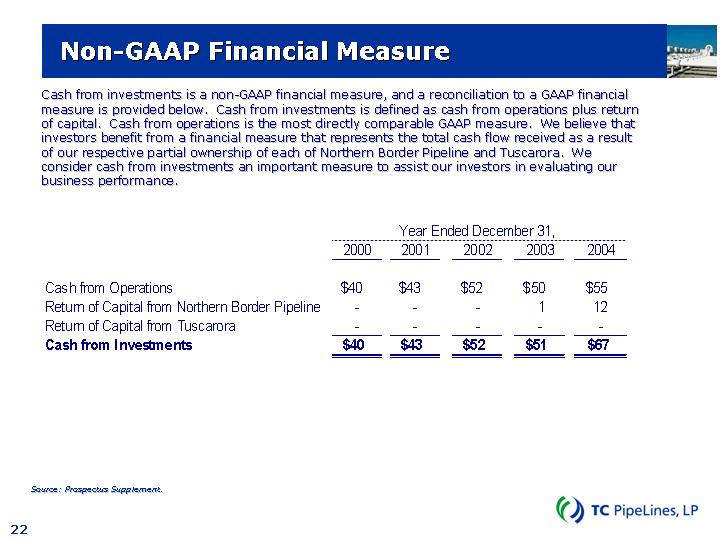
Cash from investments is a non-GAAP financial measure, and a reconciliation to a GAAP financial measure is provided below. Cash from investments is defined as cash from operations plus return of capital. Cash from operations is the most directly comparable GAAP measure. We believe that investors benefit from a financial measure that represents the total cash flow received as a result of our respective partial ownership of each of Northern Border Pipeline and Tuscarora. We consider cash from investments an important measure to assist our investors in evaluating our business performance.
|
| Year Ended December 31, |
| |||||||||||||
|
| 2000 |
| 2001 |
| 2002 |
| 2003 |
| 2004 |
| |||||
|
|
|
|
|
|
|
|
|
|
|
| |||||
Cash from Operations |
| $ | 40 |
| $ | 43 |
| $ | 52 |
| $ | 50 |
| $ | 55 |
|
Return of Capital from Northern Border Pipeline |
| — |
| — |
| — |
| 1 |
| 12 |
| |||||
Return of Capital from Tuscarora |
| — |
| — |
| — |
| — |
| — |
| |||||
Cash from Investments |
| $ | 40 |
| $ | 43 |
| $ | 52 |
| $ | 51 |
| $ | 67 |
|
Source: Prospectus Supplement.
22