Exhibit 13
Dear Stockholder:
I am pleased to be able to present a summary of what was accomplished during 2007. This past year can be viewed as a period of building and positioning for the future of the company. Many of the endeavors and accomplishments of last year were undertaken with the goal of building and maximizing long-term value to the stockholders. We are satisfied that these achievements will accomplish that in a timely fashion.
We continue to take advantage of any viable opportunities as they are presented. Throughout the past year, several opportunities arose that fit well within our strategic plan. These opportunities included property acquisition, branch development and increased staff in various markets. As always, considerable additional expenses are to be expected during a transition or growth stage. Although this was the case for 2007, our expectations are already beginning to be achieved.
We opened two new branches during the year. Our eco-friendly building in Starkville, Mississippi was opened, and our staff there now offers full service banking to an expanding market. We purchased property and remodeled a building in Collinsville, Mississippi. This branch offers our services to a growing community in Lauderdale County. We hired and trained staff for two additional branches in Meridian, Mississippi, which were fully operational in early 2008. We increased our lending staff at several existing locations during the year. As this staff makes additional loans, this additional payroll expense will become a revenue enhancement. I fully understand what factors caused the company’s net earnings position for 2007; and, while I would certainly have been pleased with better results, I am not discouraged due to the previously mentioned opportunities. We simply experienced some growth pains that have to be endured to achieve the desired long-term value for the stockholders.
We will continue to follow our strategic plan for growth. In so doing, we are constantly evaluating opportunities and ways to leverage our healthy capital position into increased revenues and maximized values for you. During this time of economic uncertainties, we will stay the course with sound, prudent business decisions as we carry our type of customer- friendly banking into new markets.
We continually appreciate the support of a dedicated group of stockholders, customers and employees. Considering the company’s accomplishments during 2007, we are motivated and ready for 2008.
As always, thank you for your interest and support in a great company!
Sincerely,

Greg L. McKee
President & CEO
CITIZENS HOLDING COMPANY
AND SUBSIDIARY
Philadelphia, Mississippi
Consolidated Financial Statements
Years Ended December 31, 2007, 2006 and 2005
CONTENTS
| | |
| |
Report of Independent Registered Public Accounting Firm | | 1 |
| |
Management’s Assessment of Internal Control over Financial Reporting | | 3 |
| |
Consolidated Financial Statements | | |
| |
Consolidated Balance Sheets | | 4 |
| |
Consolidated Statements of Income | | 5 |
| |
Consolidated Statements of Comprehensive Income | | 6 |
| |
Consolidated Statements of Changes in Stockholders’ Equity | | 7 |
| |
Consolidated Statements of Cash Flows | | 8 – 9 |
| |
Notes to Consolidated Financial Statements | | 10 – 42 |

REPORT OF INDEPENDENT REGISTERED PUBLIC ACCOUNTING FIRM
March 10, 2008
To the Board of Directors & Stockholders
Citizens Holding Company
Philadelphia, Mississippi
We have audited the consolidated balance sheets of Citizens Holding Company and Subsidiary (the “Company”) as of December 31, 2007 and 2006, and the related consolidated statements of income, comprehensive income, changes in stockholders’ equity and cash flows for each of the three years in the period ended December 31, 2007. We also have audited the Company’s internal control over financial reporting as of December 31, 2007, based on criteria established inInternal Control — Integrated Frameworkissued by the Committee of Sponsoring Organizations of the Treadway Commission (“COSO”).The Company’s management is responsible for these financial statements, for maintaining effective internal control over financial reporting and for its assessment of the effectiveness of internal control over financial reporting included in the accompanying Management’s Assessment of Internal Control over Financial Reporting. Our responsibility is to express an opinion on these financial statements and an opinion on the Company’s internal control over financial reporting based on our audits.
We conducted our audits in accordance with the standards of the Public Company Accounting Oversight Board (United States). Those standards require that we plan and perform the audits to obtain reasonable assurance about whether the financial statements are free of material misstatement and whether effective internal control over financial reporting was maintained in all material respects. Our audits of the financial statements included examining, on a test basis, evidence supporting the amounts and disclosures in the financial statements, assessing the accounting principles used and significant estimates made by management, and evaluating the overall financial statement presentation. Our audit of internal control over financial reporting included obtaining an understanding of internal control over financial reporting, assessing the risk that a material weakness exists, and testing and evaluating the design and operating effectiveness of internal control based on the assessed risk. Our audits also included performing such other procedures as we considered necessary in the circumstances. We believe that our audits provide a reasonable basis for our opinions.
A company’s internal control over financial reporting is a process designed to provide reasonable assurance regarding the reliability of financial reporting and the preparation of financial
1
To the Board of Directors and Stockholders
Citizens Holding Company
Page Two
statements for external purposes in accordance with accounting principles generally accepted in the United States of America. A company’s internal control over financial reporting includes those policies and procedures that (1) pertain to the maintenance of records that, in reasonable detail, accurately and fairly reflect the transactions and dispositions of the assets of the company; (2) provide reasonable assurance that transactions are recorded as necessary to permit preparation of financial statements in accordance with accounting principles generally accepted in the United States, and that receipts and expenditures of the company are being made only in accordance with authorizations of management and directors of the company; and (3) provide reasonable assurance regarding prevention or timely detection of unauthorized acquisition, use, or disposition of the company’s assets that could have a material effect on the financial statements.
Because of its inherent limitations, internal control over financial reporting may not prevent or detect misstatements. Also, projections of any evaluation of effectiveness to future periods are subject to the risk that controls may become inadequate because of changes in conditions, or that the degree of compliance with the policies or procedures may deteriorate.
In our opinion, the consolidated financial statements referred to above present fairly, in all material respects, the financial position of the Company as of December 31, 2007 and 2006, and the results of their operations and their cash flows for each of the three years in the period ended December 31, 2007, in conformity with accounting principles generally accepted in the United States of America. Also in our opinion, the Company maintained in all material respects, effective internal control over financial reporting as of December 31, 2007, based on criteria established inInternal Control — Integrated Frameworkissued by COSO.
HORNE LLP

Jackson, Mississippi
2
Citizens Holding Company
Philadelphia, MS 39350
MANAGEMENT’S ASSESSMENT OF INTERNAL CONTROL OVER FINANCIAL REPORTING
Management of Citizens Holding Company (the “Company”) is responsible for establishing and maintaining adequate internal control over financial reporting. Internal control over financial reporting is a process designed under the supervision of the Company’s principal executive and principal financial officers to provide reasonable assurance regarding the reliability of financial reporting and the preparation of the Company’s financial statements for external purposes in accordance with accounting principles generally accepted in the United States of America.
Management, under the direction of the chief executive officer and chief financial officer, assessed the Company’s internal control over financial reporting as of December 31, 2007 based on the criteria for effective internal control over financial reporting established inInternal Control — Integrated Frameworkissued by the Committee of Sponsoring Organizations of the Treadway Commission. Based on this assessment, management believes that, as of December 31, 2007, the Company maintained effective internal control over financial reporting.
The Company’s internal control over financial reporting includes policies and procedures that (1) pertain to the maintenance of records that in reasonable detail accurately and fairly reflect the transactions and dispositions of the assets of the Company, (2) provide reasonable assurance that transactions are recorded as necessary to permit preparation of financial statements in accordance with generally accepted accounting principles and that receipts and expenditures of the Company are being made only in accordance with authorizations of management and directors of the Company, and (3) provide reasonable assurance regarding prevention or timely detection of unauthorized acquisition, use or disposition of the Company’s assets that could have a material effect on the financial statements.
Because of its inherent limitations, internal control over financial reporting may not prevent or detect misstatements. Projections of any evaluation of effectiveness to future periods are subject to risk that controls may become inadequate because of changes in conditions, or that the degree of compliance with the policies or procedures may deteriorate.
HORNE LLP, the Company’s Independent Registered Public Accounting Firm, has audited the Company’s internal control over financial reporting as of December 31, 2007, as stated in their report, beginning on page 1, which expresses an unqualified opinion on the Company’s internal control over financial reporting as of December 31, 2007.
| | | | |
 | | | |  |
| | |
| Greg L. McKee | | | | Robert T. Smith |
| President and Chief Executive Officer | | | | Treasurer and Chief Financial Officer |
March 7, 2008
3
CITIZENS HOLDING COMPANY AND SUBSIDIARY
Consolidated Balance Sheets
December 31, 2007 and 2006
| | | | | | | | |
| ASSETS | | 2007 | | | 2006 | |
Cash and due from banks | | $ | 18,622,058 | | | $ | 15,449,434 | |
Interest bearing deposits with other banks | | | 612,938 | | | | 396,811 | |
Federal funds sold | | | 900,000 | | | | 15,200,000 | |
Securities available for sale, at fair value (amortized cost of $245,410,195 in 2007 and $175,450,210 in 2006) | | | 244,720,367 | | | | 174,617,149 | |
Loans, net of allowance for loan losses of | | | | | | | | |
$3,967,951 in 2007 and $3,712,375 in 2006 | | | 368,025,286 | | | | 369,280,664 | |
Bank premises, furniture, fixtures and equipment, net | | | 14,288,797 | | | | 12,106,456 | |
Real estate acquired by foreclosure | | | 2,046,584 | | | | 2,707,885 | |
Accrued interest receivable | | | 5,210,201 | | | | 5,015,574 | |
Cash value of life insurance | | | 17,693,476 | | | | 16,846,557 | |
Intangible assets | | | 4,215,070 | | | | 4,752,573 | |
Other assets | | | 4,568,854 | | | | 4,824,393 | |
| | | | | | | | |
Total assets | | $ | 680,903,631 | | | $ | 621,197,496 | |
| | | | | | | | |
| | |
LIABILITIES AND STOCKHOLDERS’ EQUITY | | | | | | | | |
Deposits | | | | | | | | |
Non-interest bearing deposits | | $ | 78,224,936 | | | $ | 82,867,220 | |
Interest bearing time deposits | | | 399,007,368 | | | | 388,980,036 | |
| | | | | | | | |
Total deposits | | | 477,232,304 | | | | 471,847,256 | |
Federal funds purchased | | | 4,200,000 | | | | — | |
Sweep account liability | | | 74,963,424 | | | | 12,767,483 | |
Federal Home Loan Bank advances | | | 49,400,000 | | | | 59,400,000 | |
Accrued interest payable | | | 1,915,232 | | | | 1,153,890 | |
Deferred compensation payable | | | 2,989,940 | | | | 2,699,783 | |
Other liabilities | | | 2,011,299 | | | | 2,181,742 | |
| | | | | | | | |
Total liabilities | | | 612,712,199 | | | | 550,050,154 | |
| | | | | | | | |
Commitments and contingencies | | | — | | | | — | |
Minority interest | | | — | | | | 1,482,069 | |
| | | | | | | | |
Stockholders’ equity | | | | | | | | |
Common stock, $0.20 par value, authorized 22,500,000 shares; 4,863,242 shares issued at 2007 and 5,020,228 at 2006 | | | 972,648 | | | | 1,004,046 | |
Additional paid-in capital | | | 3,979,717 | | | | 3,886,830 | |
Accumulated other comprehensive loss, net of taxes of $257,306 in 2007 and $304,082 in 2006 | | | (432,522 | ) | | | (511,161 | ) |
Retained earnings | | | 63,671,589 | | | | 65,285,558 | |
| | | | | | | | |
Total stockholders’ equity | | | 68,191,432 | | | | 69,665,273 | |
| | | | | | | | |
Total liabilities and stockholders’ equity | | $ | 680,903,631 | | | $ | 621,197,496 | |
| | | | | | | | |
The accompanying notes are an integral part of these financial statements.
4
CITIZENS HOLDING COMPANY AND SUBSIDIARY
Consolidated Statements of Income
Years Ended December 31, 2007, 2006 and 2005
| | | | | | | | | | | | |
| | | 2007 | | | 2006 | | | 2005 | |
Interest income | | | | | | | | | | | | |
Interest and fees on loans | | $ | 28,981,941 | | | $ | 28,914,226 | | | $ | 26,435,191 | |
Interest on securities | | | | | | | | | | | | |
Taxable | | | 4,927,774 | | | | 3,651,802 | | | | 3,022,520 | |
Non-taxable | | | 3,169,536 | | | | 3,514,524 | | | | 3,406,130 | |
Other | | | 1,020,601 | | | | 406,842 | | | | 179,863 | |
| | | | | | | | | | | | |
Total interest income | | | 38,099,852 | | | | 36,487,394 | | | | 33,043,704 | |
| | | | | | | | | | | | |
Interest expense | | | | | | | | | | | | |
Deposits | | | 12,814,534 | | | | 10,314,943 | | | | 7,431,479 | |
Other borrowed funds | | | 3,948,220 | | | | 2,866,762 | | | | 2,415,801 | |
| | | | | | | | | | | | |
Total interest expense | | | 16,762,754 | | | | 13,181,705 | | | | 9,847,280 | |
| | | | | | | | | | | | |
Net interest income | | | 21,337,098 | | | | 23,305,689 | | | | 23,196,424 | |
Provision for loan losses | | | (784,120 | ) | | | 360,910 | | | | (1,084,326 | ) |
| | | | | | | | | | | | |
Net interest income after provision for loan losses | | | 20,552,978 | | | | 23,666,599 | | | | 22,112,098 | |
| | | | | | | | | | | | |
Non-interest income | | | | | | | | | | | | |
Service charges on deposit accounts | | | 3,859,598 | | | | 3,816,473 | | | | 3,556,824 | |
Other service charges and fees | | | 763,079 | | | | 567,320 | | | | 585,288 | |
Net gains (losses) on securities sales | | | 29,339 | | | | (12,318 | ) | | | — | |
Other income | | | 3,126,633 | | | | 1,816,046 | | | | 1,594,811 | |
| | | | | | | | | | | | |
Total non-interest income | | | 7,778,649 | | | | 6,187,521 | | | | 5,736,923 | |
| | | | | | | | | | | | |
Non-interest expense | | | | | | | | | | | | |
Salaries and employee benefits | | | 10,539,810 | | | | 9,980,336 | | | | 9,523,367 | |
Occupancy expense | | | 1,688,809 | | | | 1,395,498 | | | | 1,163,219 | |
Equipment expense | | | 1,528,841 | | | | 1,614,969 | | | | 1,739,751 | |
Earnings applicable to minority interest | | | — | | | | 185,409 | | | | 198,872 | |
Other expense | | | 5,691,823 | | | | 5,446,971 | | | | 4,891,696 | |
| | | | | | | | | | | | |
Total non-interest expense | | | 19,449,283 | | | | 18,623,183 | | | | 17,516,905 | |
| | | | | | | | | | | | |
Income before income taxes | | | 8,882,344 | | | | 11,230,937 | | | | 10,332,116 | |
Income tax expense | | | 1,968,110 | | | | 2,836,413 | | | | 2,365,984 | |
| | | | | | | | | | | | |
Net income | | $ | 6,914,234 | | | $ | 8,394,524 | | | $ | 7,966,132 | |
| | | | | | | | | | | | |
Net income per share – basic | | $ | 1.41 | | | $ | 1.67 | | | $ | 1.59 | |
| | | | | | | | | | | | |
Net income per share – diluted | | $ | 1.39 | | | $ | 1.65 | | | $ | 1.57 | |
| | | | | | | | | | | | |
Average shares outstanding | | | | | | | | | | | | |
Basic | | | 4,913,946 | | | | 5,016,257 | | | | 5,006,493 | |
| | | | | | | | | | | | |
Diluted | | | 4,964,475 | | | | 5,080,755 | | | | 5,066,165 | |
| | | | | | | | | | | | |
The accompanying notes are an integral part of these financial statements.
5
CITIZENS HOLDING COMPANY AND SUBSIDIARY
Consolidated Statements of Comprehensive Income
Years Ended December 31, 2007, 2006 and 2005
| | | | | | | | | | | | |
| | | 2007 | | | 2006 | | | 2005 | |
Net income | | $ | 6,914,234 | | | $ | 8,394,524 | | | $ | 7,966,132 | |
| | | | | | | | | | | | |
Other comprehensive income (loss) | | | | | | | | | | | | |
Unrealized holding gains (losses) during year | | | 172,573 | | | | 729,836 | | | | (2,196,048 | ) |
Income tax effect | | | (64,369 | ) | | | (272,229 | ) | | | 798,637 | |
| | | | | | | | | | | | |
Net unrealized gains (losses) | | | 108,204 | | | | 457,607 | | | | (1,397,411 | ) |
| | | | | | | | | | | | |
Reclassification adjustment for (gains) losses included in net income | | | (29,339 | ) | | | 12,318 | | | | — | |
Income tax effect | | | 10,943 | | | | (4,594 | ) | | | — | |
| | | | | | | | | | | | |
Net (gains) losses included in net income | | | (18,396 | ) | | | 7,724 | | | | — | |
| | | | | | | | | | | | |
Change in minority interest in net unrealized gains (losses) | | | (11,169 | ) | | | (9,950 | ) | | | 30,948 | |
| | | | | | | | | | | | |
Total other comprehensive income (loss) | | | 78,639 | | | | 455,381 | | | | (1,366,463 | ) |
| | | | | | | | | | | | |
Comprehensive income | | $ | 6,992,873 | | | $ | 8,849,905 | | | $ | 6,599,669 | |
| | | | | | | | | | | | |
The accompanying notes are an integral part of these financial statements.
6
CITIZENS HOLDING COMPANY AND SUBSIDIARY
Consolidated Statements of Changes in Stockholders’ Equity
Years Ended December 31, 2007, 2006 and 2005
| | | | | | | | | | | | | | | | | | | | | | |
| | | Number
of Shares
Issued | | | Common
Stock | | | Additional
Paid-In
Capital | | Accumulated
Other
Comprehensive
Income (Loss) | | | Retained
Earnings | | | Total | |
Balance, December 31, 2004 | | 5,000,278 | | | $ | 1,000,056 | | | $ | 3,150,246 | | $ | 399,921 | | | $ | 55,641,002 | | | $ | 60,191,225 | |
Net income | | — | | | | — | | | | — | | | — | | | | 7,966,132 | | | | 7,966,132 | |
Dividends paid ($0.65 per share) | | — | | | | — | | | | — | | | — | | | | (3,254,591 | ) | | | (3,254,591 | ) |
Options exercised, net of tax benefit of $106,792 | | 9,000 | | | | 1,800 | | | | 236,002 | | | — | | | | — | | | | 237,802 | |
Other comprehensive loss, net | | — | | | | — | | | | — | | | (1,366,463 | ) | | | — | | | | (1,366,463 | ) |
| | | | | | | | | | | | | | | | | | | | | | |
Balance, December 31, 2005 | | 5,009,278 | | | | 1,001,856 | | | | 3,386,248 | | | (966,542 | ) | | | 60,352,543 | | | | 63,774,105 | |
Net income | | — | | | | — | | | | — | | | — | | | | 8,394,524 | | | | 8,394,524 | |
Dividends paid ($0.69 per share) | | — | | | | — | | | | — | | | — | | | | (3,461,509 | ) | | | (3,461,509 | ) |
Options exercised, net of tax benefit of $12,287 | | 10,950 | | | | 2,190 | | | | 196,421 | | | — | | | | — | | | | 198,611 | |
Stock compensation expense | | — | | | | — | | | | 304,161 | | | — | | | | — | | | | 304,161 | |
Other comprehensive loss, net | | — | | | | — | | | | — | | | 455,381 | | | | — | | | | 455,381 | |
| | | | | | | | | | | | | | | | | | | | | | |
Balance, December 31, 2006 | | 5,020,228 | | | | 1,004,046 | | | | 3,886,830 | | | (511,161 | ) | | | 65,285,558 | | | | 69,665,273 | |
Net income | | — | | | | — | | | | — | | | — | | | | 6,914,234 | | | | 6,914,234 | |
Dividends paid ($0.73 per share) | | — | | | | — | | | | — | | | — | | | | (3,576,655 | ) | | | (3,576,655 | ) |
Options exercised, net of tax benefit of $10,927 | | 3,200 | | | | 640 | | | | 25,915 | | | — | | | | — | | | | 26,555 | |
Shares repurchased | | (160,186 | ) | | | (32,038 | ) | | | — | | | — | | | | (3,450,115 | ) | | | (3,482,153 | ) |
Increase investment in subsidiary | | — | | | | — | | | | — | | | — | | | | (1,501,433 | ) | | | (1,501,433 | ) |
Stock compensation expense | | — | | | | — | | | | 66,972 | | | — | | | | — | | | | 66,972 | |
Other comprehensive income, net | | — | | | | — | | | | — | | | 78,639 | | | | — | | | | 78,639 | |
| | | | | | | | | | | | | | | | | | | | | | |
Balance, December 31, 2007 | | 4,863,242 | | | $ | 972,648 | | | $ | 3,979,717 | | $ | (432,522 | ) | | $ | 63,671,589 | | | $ | 68,191,432 | |
| | | | | | | | | | | | | | | | | | | | | | |
The accompanying notes are an integral part of these financial statements.
7
CITIZENS HOLDING COMPANY AND SUBSIDIARY
Consolidated Statements of Cash Flows
Years Ended December 31, 2007, 2006 and 2005
| | | | | | | | | | | | |
| | | 2007 | | | 2006 | | | 2005 | |
Cash flows from operating activities | | | | | | | | | | | | |
Net income | | $ | 6,914,234 | | | $ | 8,394,524 | | | $ | 7,966,132 | |
Adjustments to reconcile net income to net cash provided by operating activities | | | | | | | | | | | | |
Depreciation | | | 1,068,377 | | | | 950,340 | | | | 1,024,320 | |
Amortization of intangibles | | | 537,503 | | | | 537,503 | | | | 537,503 | |
Amortization of premiums and accretion of discounts on investment securities | | | 461,914 | | | | 697,003 | | | | 1,182,298 | |
Stock compensation expense | | | 41,994 | | | | 304,161 | | | | — | |
Provision for loan losses | | | 784,120 | | | | (360,910 | ) | | | 1,084,326 | |
Realized investment securities (gains) losses | | | (29,339 | ) | | | 12,318 | | | | — | |
Deferred income tax benefit | | | (286,890 | ) | | | (169,994 | ) | | | (310,432 | ) |
Net earnings applicable to minority interest | | | — | | | | 108,975 | | | | 198,872 | |
Earnings from equity investment | | | (112,330 | ) | | | (102,411 | ) | | | (131,664 | ) |
Increase in accrued interest receivable | | | (194,627 | ) | | | (320,427 | ) | | | (309,255 | ) |
Increase in cash value of life insurance | | | (846,919 | ) | | | (800,884 | ) | | | (540,844 | ) |
Increase in accrued interest payable | | | 761,342 | | | | 355,223 | | | | 178,077 | |
Increase in deferred compensation liability | | | 290,157 | | | | 333,191 | | | | 209,551 | |
Net change in other operating assets and liabilities | | | 284,641 | | | | 3,627,264 | | | | 2,212,319 | |
| | | | | | | | | | | | |
Net cash provided by operating activities | | | 9,674,177 | | | | 13,565,876 | | | | 13,301,203 | |
| | | | | | | | | | | | |
Cash flows from investing activities | | | | | | | | | | | | |
Proceeds from maturities of securities available-for-sale | | | 15,130,290 | | | | 15,451,326 | | | | 37,496,514 | |
Proceeds from sales of securities available-for-sale | | | 22,916,630 | | | | 18,132,710 | | | | — | |
Purchases of securities available-for-sale | | | (53,312,896 | ) | | | (38,846,962 | ) | | | (51,638,423 | ) |
Purchases of bank premises, furniture, fixtures and equipment | | | (3,250,718 | ) | | | (3,162,581 | ) | | | (1,146,322 | ) |
Proceeds from sale of real estate acquired by foreclosure | | | 2,263,187 | | | | 691,132 | | | | 2,043,687 | |
Net (increase) decrease in interest bearing deposits with other banks | | | (216,127 | ) | | | (83,986 | ) | | | 505,891 | |
Net (increase) decrease in loans | | | (1,130,628 | ) | | | 5,620,592 | | | | (13,412,543 | ) |
Net decrease (increase) in federal funds sold | | | 14,300,000 | | | | (15,200,000 | ) | | | 11,000,000 | |
Cash paid for acquisition of subsidiary stock | | | (2,994,671 | ) | | | — | | | | — | |
Net decrease in other securities | | | 7,229,658 | | | | — | | | | — | |
| | | | | | | | | | | | |
Net cash provided (used) by investing activities | | | 934,725 | | | | (17,397,769 | ) | | | (15,151,196 | ) |
| | | | | | | | | | | | |
8
CITIZENS HOLDING COMPANY AND SUBSIDIARY
Consolidated Statements of Cash Flows
Years Ended December 31, 2007, 2006 and 2005
Page 2 of 2
| | | | | | | | | | | | |
| | | 2007 | | | 2006 | | | 2005 | |
Cash flows from financing activities | | | | | | | | | | | | |
Net increase in deposits | | $ | 5,385,048 | | | $ | (1,964,978 | ) | | $ | (651,511 | ) |
Net increase (decrease) in federal funds purchased | | | 4,200,000 | | | | (1,600,000 | ) | | | 1,600,000 | |
Proceeds from exercise of stock options | | | 26,555 | | | | 186,324 | | | | 131,610 | |
Excess tax benefits on stock option exercises | | | 10,927 | | | | 27,108 | | | | — | |
Repurchase of company stock | | | (3,482,153 | ) | | | — | | | | — | |
Dividends paid to stockholders | | | (3,576,655 | ) | | | (3,461,509 | ) | | | (3,254,591 | ) |
Federal Home Loan Bank advance proceeds | | | — | | | | 15,000,000 | | | | 25,000,000 | |
Federal Home Loan Bank advance payments | | | (10,000,000 | ) | | | (15,648,818 | ) | | | (11,069,748 | ) |
| | | | | | | | | | | | |
Net cash (used) provided by financing activities | | | (7,436,278 | ) | | | (7,461,873 | ) | | | 11,755,760 | |
| | | | | | | | | | | | |
Net increase (decrease) in cash and due from banks | | | 3,172,624 | | | | (11,293,766 | ) | | | 9,905,767 | |
Cash and due from banks, beginning of year | | | 15,449,434 | | | | 26,743,200 | | | | 16,837,433 | |
| | | | | | | | | | | | |
Cash and due from banks, end of year | | $ | 18,622,058 | | | $ | 15,449,434 | | | $ | 26,743,200 | |
| | | | | | | | | | | | |
Supplemental disclosures of cash flow Information | | | | | | | | | | | | |
Cash paid for Interest | | $ | 16,001,411 | | | $ | 12,826,482 | | | $ | 9,669,203 | |
| | | | | | | | | | | | |
Income taxes | | $ | 1,967,770 | | | $ | 4,711,328 | | | $ | 786,026 | |
| | | | | | | | | | | | |
Non-cash disclosures | | | | | | | | | | | | |
Real estate acquired by foreclosure | | $ | 1,601,886 | | | $ | 480,646 | | | $ | 2,232,018 | |
| | | | | | | | | | | | |
Unrealized gain (loss) on investments | | $ | 172,573 | | | $ | 729,836 | | | $ | (2,196,048 | ) |
| | | | | | | | | | | | |
The accompanying notes are an integral part of these financial statements.
9
CITIZENS HOLDING COMPANY AND SUBSIDIARY
Years Ended December 31, 2007, 2006 and 2005
NOTES TO CONSOLIDATED FINANCIAL STATEMENTS
| Note 1. | Summary of Significant Accounting Policies |
Basis of Financial Statement Presentation
The accounting policies of Citizens Holding Company and subsidiary conform to accounting principles generally accepted in the United States of America and to general practices within the banking industry. The consolidated financial statements of Citizens Holding Company include the accounts of its wholly-owned subsidiary, The Citizens Bank of Philadelphia, Mississippi (collectively referred to as the “Company”). All significant intercompany transactions have been eliminated in consolidation. As the result of a 1-for-1,000 reverse stock split on January 2, 2007, Citizens Holding Company became the sole owner of The Citizens Bank of Philadelphia, Mississippi.
Nature of Business
The Citizens Bank of Philadelphia, Mississippi (the “Bank”) operates under a state bank charter and provides general banking services. As a state bank, the Bank is subject to regulations of the Mississippi Department of Banking and Consumer Finance and the Federal Deposit Insurance Corporation. Citizens Holding Company is subject to the regulations of the Federal Reserve. The area served by the Bank is Neshoba County, Mississippi and the immediately surrounding areas. Services are provided at several branch offices.
Estimates
The preparation of financial statements in conformity with accounting principles generally accepted in the United States of America requires management to make estimates and assumptions that affect the reported amounts of assets and liabilities and disclosure of contingent assets and liabilities at the date of the financial statements and the reported amounts of revenues and expenses during the reporting period. Actual results could differ from those estimates.
Estimates that are particularly susceptible to significant change relate to the determination of the allowance for loan losses and the valuation of real estate acquired in connection with foreclosures or in satisfaction of loans. In connection with the determination of the allowance for loan losses and valuation of foreclosed real estate, management obtains independent appraisals for significant properties.
While management uses available information to recognize losses on loans and foreclosed real estate, future additions to the allowance or adjustments to the valuation may be necessary based on changes in local economic conditions. In addition, regulatory agencies, as an integral part of their examination process, periodically review the Company’s allowance for loan losses and valuations of foreclosed real estate. Such agencies may require the Company to recognize additions to the allowance or to make adjustments to the valuation based on their judgments about information available to them at the time of their examination. Because of these factors, it is reasonably possible that the allowance for loan losses and valuation of foreclosed real estate may change materially in the near term.
10
CITIZENS HOLDING COMPANY AND SUBSIDIARY
Years Ended December 31, 2007, 2006, and 2005
NOTES TO CONSOLIDATED FINANCIAL STATEMENTS
Cash and Due from Banks
For the purpose of reporting cash flows, cash and due from banks include cash on hand and demand deposits. Cash flows from loans originated by the Company, deposits, and federal funds purchased and sold are reported net in the statement of cash flows. The Company is required to maintain average reserve balances with the Federal Reserve Bank based on a percentage of deposits. The average reserve required by the Federal Reserve Bank at December 31, 2007 and 2006 was $749,000 and $812,000, respectively.
Interest-bearing deposits with other banks mature within one year and are carried at cost.
At December 31, 2007 and 2006, the Company had deposits in financial institutions in excess of federally insured limits. Management monitors the soundness of the financial institutions and believes there is minimal risk.
Investment Securities
In accordance with Financial Accounting Standards Board (“FASB”) Statement of Financial Accounting Standards (“SFAS”) No. 115,Accounting for Certain Investments in Debt and Equity Securities, securities are classified as “available-for-sale,” “held-to-maturity” or “trading”. Fair values for securities are based on quoted market prices where available. If quoted market prices are not available, fair values are based on quoted market prices of comparable instruments. Gains or losses on the sale of securities are determined using the specific identification method. Currently, the Company has no held-to-maturity or trading securities.
Securities Available-for-Sale
Securities available-for-sale are reported at fair value with unrealized gains and losses reported as a separate component of stockholders’ equity. Securities that are held for indefinite periods of time or used as part of the Company’s asset/liability management strategy and that may be sold in response to interest rate changes, changes in prepayment risk, the need to increase regulatory capital and other similar factors are classified as available-for-sale.
Realized gains or losses, determined on the basis of the cost of specific securities sold, are included in earnings. The amortization of premiums and accretion of discounts are recognized in interest income.
11
CITIZENS HOLDING COMPANY AND SUBSIDIARY
Years Ended December 31, 2007, 2006, and 2005
NOTES TO CONSOLIDATED FINANCIAL STATEMENTS
Loans and Allowance for Loan Losses
Loans receivable that management has the intent and ability to hold for the foreseeable future or until maturity or payoff are reported at the principal amount outstanding, net of unearned discounts and unearned finance charges. The Company has no loans held-for-sale.
Loan origination and commitment fees and direct loan origination costs attributable to loans held with a maturity of more than one year are not significant and are, therefore, recognized as income or expense, as applicable in the period received or incurred.
Unearned discounts on installment loans are recognized as income over the terms of the loans by a method that approximates the interest method. Unearned finance charges and interest on commercial loans are recognized based on the principal amount outstanding. For all other loans, interest is accrued daily on the outstanding balances. For impaired loans, interest is discontinued on a loan when management believes, after considering collection efforts and other factors, that the borrower’s financial condition is such that collection of interest is doubtful. Cash collections on impaired loans are credited to the loan receivable balance, and no interest income is recognized on those loans until the principal balance has been collected. The Company generally discontinues the accrual of interest income when a loan becomes 90 days past due as to principal or interest; however, management may elect to continue the accrual when the estimated net realizable value of collateral is sufficient to cover the principal balance and the accrued interest. Interest income on other nonaccrual loans is recognized only to the extent of interest payments. Upon discontinuance of the accrual of interest on a loan, any previously accrued but unpaid interest is reversed against interest income.
A loan is impaired when management determines that it is probable the Company will be unable to collect all contractual principal and interest payments due in accordance with the terms of the loan agreement. Impaired loans are measured based on the present value of expected future cash flows discounted at the loan’s effective interest rate or, as a practical expedient, at the loan’s observable market price or the fair value of the collateral if the loan is collateral dependent. The amount of impairment, if any, and any subsequent changes are included in the allowance for loan losses.
12
CITIZENS HOLDING COMPANY AND SUBSIDIARY
Years Ended December 31, 2007, 2006, and 2005
NOTES TO CONSOLIDATED FINANCIAL STATEMENTS
The allowance for loan losses is established through a provision for loan losses charged against net income. Loans determined to be uncollectible are charged against the allowance for loan losses, and subsequent recoveries, if any, are credited to the allowance. The allowance represents an amount, which, in management’s judgment, will be adequate to absorb estimated probable losses on existing loans that may become uncollectible. Management’s judgment in determining the adequacy of the allowance is based on evaluations of the collectability of loans and prior loss experience. These evaluations take into consideration such factors as changes in the nature and volume of the loan portfolio, review of specific problem loans, the Company’s past loan loss experience, adverse situations that may affect the borrowers’ ability to pay, the estimated value of any underlying collateral, current economic conditions, and other relevant factors.
The allowance consists of specific, general and unallocated components. The specific component relates to loans that are classified as either doubtful, substandard or special mention, as well as loans considered impaired. For such loans that are also classified as impaired, a specific allowance is established when the discounted cash flows (or collateral value or observable market price) of the impaired loan is lower than the carrying value of that loan. The general component covers non-classified loans and is based on historical loss experience adjusted for qualitative and other factors. An unallocated component is maintained to address uncertainties that could affect management’s estimate of probable losses. The unallocated component of the allowance reflects the margin of imprecision inherent in the underlying assumptions used in the methodologies for estimating specific and general losses in the portfolio.
Large groups of small-balance homogenous loans are collectively evaluated for impairment. Accordingly, the Company does not separately identify individual consumer and residential loans for impairment disclosures.
Bank Premises, Furniture, Fixtures and Equipment
The Company’s premises, furniture, fixtures and equipment are stated at cost less accumulated depreciation computed primarily by straight-line methods over the estimated useful lives of the assets. Costs of major additions and improvements are capitalized. Expenditures for maintenance and repairs are charged to expense as incurred.
Real Estate Acquired by Foreclosure
Real estate acquired by foreclosure consists of properties repossessed by the Company on foreclosed loans. These assets are stated at the lower of the outstanding loan amount (including accrued interest, if any) or fair value at the date acquired less estimated costs to sell. Losses arising from the acquisition of such property are charged against the allowance for loan losses. Declines in value resulting from subsequent revaluation of the property or losses resulting from disposition of such property are expensed. Revenue and expenses from operations of other real estate owned are reflected as other income (expense).
13
CITIZENS HOLDING COMPANY AND SUBSIDIARY
Years Ended December 31, 2007, 2006, and 2005
NOTES TO CONSOLIDATED FINANCIAL STATEMENTS
Cash Value of Life Insurance
The Company has purchased life insurance contracts on certain employees and directors. Certain of such policies were acquired pursuant to “split-dollar” arrangements with employees. Several of these policies were subsequently converted to bank owned policies and the remainder of each policy was surrendered for cash. The cash surrender value of the remaining “split-dollar” policies as well as other Company owned policies is carried at the actual cash surrender value of the policy at the balance sheet date.
Intangible Assets
Intangible assets include core deposits purchased and goodwill. Core deposit intangibles are amortized on a straight-line basis over their estimated economic lives ranging from 5 to 10 years. Goodwill and other intangible assets with indefinite lives are not amortized, but are tested at least annually for impairment. Fair values are determined based on market valuation multiples for the Company and comparable businesses based on the assets and cash flow of the Bank, the Company’s only reportable segment. If impairment has occurred, the goodwill or other intangible asset is reduced to its estimated fair value through a charge to expense.
Investment – Insurance Company
The Company accounts for its investment in New South Life Insurance Company (“New South”), a 25% owned affiliate, using the equity method of accounting. The Company’s share of the net income of New South is recognized as income in the Company’s income statement and added to the investment account, and dividends received from New South are used to reduce the investment account. New South has not paid dividends.
The fiscal year of New South ends on November 30, and the Company follows the practice of recognizing the net income of New South on that basis.
The investment in New South, which is included in other assets, totaled $2,035,526 and $1,924,196 at December 31, 2007 and 2006, respectively. Income from the investment for the years ended December 31, 2007, 2006, and 2005 included in other income totaled $112,330, $102,411 and $131,664, respectively.
Trust Assets
Assets held by the Trust Department of the Company in fiduciary or agency capacities are not assets of the Company and are not included in the consolidated financial statements.
14
CITIZENS HOLDING COMPANY AND SUBSIDIARY
Years Ended December 31, 2007, 2006, and 2005
NOTES TO CONSOLIDATED FINANCIAL STATEMENTS
Income Taxes
Provisions for income taxes are based on taxes payable or refundable for the current year and deferred taxes on temporary differences between the tax bases of assets and liabilities and their reported amounts in the consolidated financial statements. Deferred tax assets and liabilities are included in the financial statements at currently enacted income tax rates applicable to the period in which the deferred tax assets and liabilities are expected to be realized or settled as described in SFAS No. 109,Accounting for Income Taxes. As changes in tax laws or rates are enacted, deferred tax assets and liabilities are adjusted through the provision for income taxes. Deferred tax assets are reduced by a valuation allowance when, in the opinion of management, it is more likely than not that some portion or all of the deferred tax assets will not be realized.
Comprehensive Income
Comprehensive income includes net earnings reported in the statements of income and changes in unrealized gain (loss) on securities available-for-sale reported as a component of stockholders’ equity. Unrealized gain (loss) on securities available-for-sale, net of related income taxes, is the only component of accumulated other comprehensive income for the Company.
Net Income Per Share
Basic net income per share is computed by dividing net income by the weighted average number of common shares outstanding during the year. Diluted net income per share is based on the weighted average number of shares of common stock outstanding for the periods, including the dilutive effect of the Company’s outstanding stock options. The effect of the dilutive shares for the years 2007, 2006 and 2005 is illustrated in the following table.
| | | | | | | | | |
| | | 2007 | | 2006 | | 2005 |
Basic weighted average shares outstanding | | | 4,913,946 | | | 5,016,257 | | | 5,006,493 |
Dilutive effect of stock options | | | 50,529 | | | 64,498 | | | 59,672 |
| | | | | | | | | |
Dilutive weighted average shares outstanding | | | 4,964,475 | | | 5,080,755 | | | 5,066,165 |
| | | | | | | | | |
Net income | | $ | 6,914,234 | | $ | 8,394,524 | | $ | 7,966,132 |
| | | | | | | | | |
Net income per share-basic | | $ | 1.41 | | $ | 1.67 | | $ | 1.59 |
Net income per share-diluted | | $ | 1.39 | | $ | 1.65 | | $ | 1.57 |
15
CITIZENS HOLDING COMPANY AND SUBSIDIARY
Years Ended December 31, 2007, 2006, and 2005
NOTES TO CONSOLIDATED FINANCIAL STATEMENTS
Stock-Based Compensation
At December 31, 2007, the Corporation had two stock-based compensation plans, which are the 1999 Employees’ Long-Term Incentive Plan and the 1999 Directors’ Stock Compensation Plan. Effective January 1, 2006, the Corporation began accounting for these plans under the recognition and measurement principles of fair value set forth in SFAS No. 123R,Share-Based Payment, (“SFAS No. 123R”) and the Securities and Exchange Commission Staff Accounting Bulletin 107 (“SAB 107”). SAB 107 provides guidance related to share-based payment transactions, including valuation methods (including assumptions such as expected volatility and expected term), the classification of compensation expense, non-GAAP financial measures, first time adoption of SFAS No. 123R in an interim period and disclosure in Management’s Discussion and Analysis subsequent to the adoption of SFAS No. 123R. Effective January 1, 2006, the Company adopted SFAS No. 123R using the modified prospective transition method. Under that method of transition, compensation cost recognized in 2006 includes: (a) compensation cost for all share-based payments granted prior to, but not yet vested as of January 1, 2006, based on the grant date fair value estimated in accordance with the original provisions of SFAS No. 123, and (b) compensation cost for all share-based payments granted subsequent to January 1, 2006, based on the grant-date fair value estimated in accordance with the provisions of SFAS No. 123R. At the date of adoption, there were no unvested share-based payments outstanding. Also, given the limited historical amount of forfeited options, the Company has not reduced compensation expense for estimated forfeitures. The adoption of SFAS No. 123R increased stock compensation expense by $304,161 in 2006.
Prior to January 1, 2006, the Corporation accounted for options in accordance with Accounting Principles Board (“APB”) Opinion No. 25, which results in no compensation cost recognized for grants prior to December 31, 2005. Accordingly, no compensation expense was recognized for stock options granted if the option price is not less than the fair market value of the underlying stock at the grant date. For the year ended December 31, 2005, no stock based compensation expense was included in the determination of net income as all options granted during the years had an exercise price equal to the market value of the stock on the date of grant.
16
CITIZENS HOLDING COMPANY AND SUBSIDIARY
Years Ended December 31, 2007, 2006, and 2005
NOTES TO CONSOLIDATED FINANCIAL STATEMENTS
If compensation expense been determined on the basis of fair value pursuant to SFAS No. 123R, net income and earnings per share would have been reduced as follows:
| | | | |
| | | 2005 | |
Net income | | | | |
As reported | | $ | 7,966,132 | |
Stock based employee compensation expense included in reported net income | | | — | |
Less stock based compensation expense determined under fair value method for all stock options, net of related income tax benefit | | | (55,340 | ) |
| | | | |
Pro forma net income | | $ | 7,910,792 | |
| | | | |
| |
| | | 2005 | |
Basic earnings per share | | | | |
As reported | | $ | 1.59 | |
Pro forma | | $ | 1.58 | |
Diluted earnings per share | | | | |
As reported | | $ | 1.57 | |
Pro forma | | $ | 1.56 | |
The fair value of each option is estimated on the grant date using the Black-Scholes option pricing model. The following weighted average assumptions were made in estimating fair values:
| | | | | | | | | |
Assumption | | 2007 | | | 2006 | | | 2005 | |
Dividend yield | | 3.3 | % | | 2.9 | % | | 3.0 | % |
Risk-free interest rate | | 4.76 | % | | 4.65 | % | | 4.0 | % |
Expected life | | 5.3 years | | | 5.3 years | | | 7 years | |
Expected volatility | | 34.88 | % | | 28.86 | % | | 5.36 | % |
Forfeitures | | 0 | % | | 0 | % | | 0 | % |
17
CITIZENS HOLDING COMPANY AND SUBSIDIARY
Years Ended December 31, 2007, 2006, and 2005
NOTES TO CONSOLIDATED FINANCIAL STATEMENTS
Advertising Costs
Advertising costs are charged to expense when incurred. Advertising expense was $551,998, $482,540 and $495,579 for the years ended December 31, 2007, 2006 and 2005, respectively.
Fair Value of Financial Instruments
SFAS No. 107,Disclosures about Fair Value of Financial Instruments (“SFAS No. 107”), requires disclosure of financial instruments’ fair values, as well as the methodology and significant assumptions used in estimating fair values. These requirements have been incorporated in Note 1. In cases where quoted market prices are not available, fair values are based on estimates using present value or other valuation techniques. Those techniques are significantly affected by the assumptions used, including the discount rate and estimates of future cash flows. In that regard, the derived fair value estimates cannot be substantiated by comparison to independent markets and, in many cases, could not be realized in immediate settlement of the instrument. SFAS No. 107 excludes certain financial instruments from its disclosure requirements. Accordingly, the aggregate fair value amounts presented do not represent the underlying value of the Company and may not be indicative of amounts that might ultimately be realized upon disposition or settlement of those assets and liabilities.
Recent Accounting Pronouncements
In July 2006, the Financial Accounting Standards Board (“FASB”) issued FASB Interpretation No. 48,Accounting for Uncertainty in Income Taxes—an interpretation of FASB Statement No. 109 (“FIN 48”), which clarifies the accounting and disclosure for uncertainty in tax positions, as defined. FIN 48 seeks to reduce the diversity in practice associated with certain aspects of the recognition and measurement related to accounting for income taxes. This interpretation was adopted effective January 1, 2007, and did not have a material impact on results of operation or financial position.
In September 2006, the FASB issued SFAS No. 157,Fair Value Measurements (“SFAS No. 157”). SFAS No. 157 enhances existing guidance for measuring assets and liabilities using fair value. Prior to the issuance of SFAS No. 157, guidance for applying fair value was incorporated in several accounting pronouncements. SFAS No. 157 provides a single definition of fair value, together with a framework for measuring it, and requires additional disclosure about the use of fair value to measure assets and liabilities. SFAS No. 157 also emphasizes that fair value is a market-based measurement, not an entity-specific measurement, and sets out a fair value hierarchy with the highest priority being quoted prices in active markets. Under SFAS No. 157, fair value measurements are disclosed by level within that hierarchy. While SFAS No. 157 does not add any new fair value measurements, it does change current practice. Changes to practice include: (1) a requirement for an entity to include its own credit standing in the measurement of its liabilities; (2) a modification of the transaction price presumption; (3) a prohibition on the use
18
CITIZENS HOLDING COMPANY AND SUBSIDIARY
Years Ended December 31, 2007, 2006, and 2005
NOTES TO CONSOLIDATED FINANCIAL STATEMENTS
of block discounts when valuing large blocks of securities for broker-dealers and investment companies; and (4) a requirement to adjust the value of restricted stock for the effect of the restriction even if the restriction lapses within one year. SFAS No. 157 is effective for financial statements issued for fiscal years beginning after November 15, 2007, and interim periods within
those fiscal years. The Company does not expect the adoption of SFAS No. 157 to have a material effect on the Company’s financial condition or results of operations.
In February 2007, the FASB issued SFAS No. 159,Establishing the Fair Value Option for Financial Assets and Liabilities (“SFAS No. 159”). The FASB has issued SFAS No. 159 to permit all entities to choose to elect, at specified election dates, to measure eligible financial instruments at fair value. An entity shall report unrealized gains and losses on items for which the fair value option has been elected in earnings at each subsequent reporting date, and recognize upfront costs and fees related to those items in earnings as incurred and not deferred. SFAS No. 159 applies to fiscal years beginning after November 15, 2007, with early adoption permitted for an entity that has also elected to apply the provisions of SFAS No. 157,Fair Value Measurements. An entity is prohibited from retrospectively applying SFAS No. 159, unless it chooses early adoption. SFAS No. 159 also applies to eligible items existing at November 15, 2007 (or early adoption date). The Company does not expect the adoption of SFAS No. 159 to have a material effect on the Company’s financial condition or results of operations.
In December 2007, the FASB issued Statement No. 141(R),Business Combinations (“Statement 141R”) which replaces Statement No. 141,Business Combinations (“Statement 141”). Statement 141R retains the fundamental requirements in Statement 141 that the acquisition method of accounting (formerly referred to as purchase method) be used for all business combinations and that an acquirer be identified for each business combination. Statement 141R defines the acquirer as the entity that obtains control of one or more businesses in the business combination and establishes the acquisition date as of the date that the acquirer achieves control. Statement 141R requires an acquirer to recognize the assets acquired, the liabilities assumed, and any noncontrolling interest in the acquiree at the acquisition date, measured at their fair values. Statement 141R requires the acquirer to acquisition related costs and restructuring costs separately from the business combination as period expense. This Statement is effective for business combinations for which the acquisition date is on or after the beginning of the first annual reporting period beginning on or after December 15, 2008. The adoption of this statement will impact the accounting and reporting of acquisitions after January 1, 2008.
19
CITIZENS HOLDING COMPANY AND SUBSIDIARY
Years Ended December 31, 2007, 2006, and 2005
NOTES TO CONSOLIDATED FINANCIAL STATEMENTS
In December 2007, the FASB issued Statement No. 160,Noncontrolling Interest in Consolidated Financial Statements – an Amendment to ARB No 51 (“Statement 160”). Statement 160 establishes new accounting and reporting standards that require the ownership interests in the subsidiaries held by parties other than the parent be clearly identified, labeled and presented in the consolidated statement of financial position within equity, but separate from the parent’s equity. Statement 160 also requires the amount of consolidated net income attributable to the parent and to the noncontrolling interest be clearly identified and presented on the face of the consolidated statement of income. In addition, when a subsidiary is deconsolidated, any retained noncontrolling equity investment in the former subsidiary shall be initially measured at fair value, with the gain or loss on the deconsolidation of the subsidiary measured using the fair value of any noncontrolling equity investment rather than the carrying amount of that retained investment. Statement 160 also clarifies that changes in a parent’s ownership in a subsidiary that do not result in deconsolidation are equity transactions if the parent retains its controlling financial interest. Statement 160 also includes expanded disclosure requirements regarding the interests of the parent and it noncontrolling interest. Statement 160 is effective for fiscal years, and interim periods within those fiscal years, beginning on or after December 15, 2008. Early adoption is prohibited. The Company is currently in the process of evaluating the impact of adopting Statement 160 on its financial statements.
Reclassifications
Certain information for 2006 and 2005 has been reclassified to conform to the financial presentation for 2007. Such reclassifications are not considered material and had no effect on net income or stockholders’ equity.
20
CITIZENS HOLDING COMPANY AND SUBSIDIARY
Years Ended December 31, 2007, 2006, and 2005
NOTES TO CONSOLIDATED FINANCIAL STATEMENTS
In 2002, the Company acquired CB&T Capital Corporation, a one-bank holding company, whose wholly-owned subsidiary was Citizens Bank & Trust Company in Louisville, Mississippi. In addition to the intangible assets related to the purchase of CB&T Capital Corporation, the Company recorded intangible assets from the purchase of branches located in Kosciusko, Scooba, Forest and Decatur, Mississippi along with the purchase of Three D Mortgage Company. The following table details the goodwill associated with each purchase, which is no longer being amortized.
| | | | | | | | | |
Purchase | | Total | | Life to Date
Amortization | | Unamortized |
Kosciusko Branch | | $ | 605,122 | | $ | 309,285 | | $ | 295,837 |
Scooba Branch | | | 400,000 | | | 180,000 | | | 220,000 |
Three D Mortgage Company | | | 76,408 | | | 10,188 | | | 66,220 |
CB&T Capital Corporation | | | 2,567,600 | | | — | | | 2,567,600 |
| | | | | | | | | |
Total goodwill | | $ | 3,649,130 | | $ | 499,473 | | $ | 3,149,657 |
| | | | | | | | | |
The Company has also allocated intangible assets to be recognized as core deposit intangibles on the acquisition of the Forest and Decatur branches and the CB&T Capital Corporation acquisition. These transactions are detailed in the following table.
| | | | | | | | | | | | |
Purchase | | Total | | Current
Amortization
Per Year | | Life to Date
Amortization | | Unamortized |
Decatur and Forest branches | | $ | 2,487,574 | | $ | 352,812 | | $ | 2,237,879 | | $ | 249,695 |
CB&T Capital Corporation | | | 1,846,909 | | | 184,691 | | | 1,031,191 | | | 815,718 |
| | | | | | | | | | | | |
Total core deposit intangible | | $ | 4,334,483 | | $ | 537,503 | | $ | 3,269,070 | | $ | 1,065,413 |
| | | | | | | | | | | | |
Total amortization expense related to all intangible assets for the years ended December 31, 2007, 2006 and 2005 was $537,503, $537,503 and $537,503, respectively. Estimated amortization expense attributable to core deposit intangible assets for the next five years is detailed in the table below. The Company has not added any intangibles during the last three years.
| | | |
Year Ending December 31, | | Amount |
2008 | | $ | 434,386 |
2009 | | | 184,691 |
2010 | | | 184,691 |
2011 | | | 184,691 |
2012 | | | 76,954 |
21
CITIZENS HOLDING COMPANY AND SUBSIDIARY
Years Ended December 31, 2007, 2006, and 2005
NOTES TO CONSOLIDATED FINANCIAL STATEMENTS
| Note 3. | Investment Securities |
The amortized cost and fair value of investment securities at December 31, 2007 and 2006 are as follows:
| | | | | | | | | | | | |
2007 | | Amortized Cost | | Gross
Unrealized
Gains | | Gross
Unrealized
Losses | | Fair Value |
Securities available-for-sale | | | | | | | | | | | | |
Obligations of U.S. Government agencies | | $ | 26,765,446 | | $ | 276,179 | | $ | — | | $ | 27,041,625 |
Mortgage-backed securities | | | 68,642,027 | | | 161,228 | | | 334,015 | | | 68,469,240 |
Other investments | | | 150,002,722 | | | 537,537 | | | 1,330,757 | | | 149,209,502 |
| | | | | | | | | | | | |
Total | | $ | 245,410,195 | | $ | 974,944 | | $ | 1,664,772 | | $ | 244,720,367 |
| | | | | | | | | | | | |
| | | | | | | | | | | | |
2006 | | Amortized Cost | | Gross
Unrealized
Gains | | Gross
Unrealized
Losses | | Fair Value |
Securities available-for-sale | | | | | | | | | | | | |
Obligations of U.S. Government agencies | | $ | 11,935,669 | | $ | 21,078 | | $ | 243,627 | | $ | 11,713,120 |
Mortgage-backed securities | | | 69,853,177 | | | 29,971 | | | 938,531 | | | 68,944,617 |
Other investments | | | 93,661,364 | | | 1,043,934 | | | 745,886 | | | 93,959,412 |
| | | | | | | | | | | | |
Total | | $ | 175,450,210 | | $ | 1,094,983 | | $ | 1,928,044 | | $ | 174,617,149 |
| | | | | | | | | | | | |
The following table shows the gross unrealized losses and fair value of the Company’s investments with unrealized losses that are not deemed to be other-than-temporarily impaired (in thousands), aggregated by investment category and length of time that individual securities have been in a continuous unrealized loss position, at December 31, 2007 and 2006, in thousands.
22
CITIZENS HOLDING COMPANY AND SUBSIDIARY
Years Ended December 31, 2007, 2006, and 2005
NOTES TO CONSOLIDATED FINANCIAL STATEMENTS
| | | | | | | | | | | | | | | | | | |
December 31, 2007 | | Less than 12 months | | 12 months or more | | Total |
Description of Securities | | Fair
Value | | Unrealized
Losses | | Fair
Value | | Unrealized
Losses | | Fair
Value | | Unrealized
Losses |
Obligations of U. S. Government agencies | | $ | — | | $ | — | | $ | — | | $ | — | | $ | — | | $ | — |
Mortgage-backed securities | | | 7,683 | | | 37 | | | 34,923 | | | 297 | | | 42,606 | | | 334 |
Other investments | | | 11,857 | | | 334 | | | 28,659 | | | 997 | | | 40,516 | | | 1,331 |
| | | | | | | | | | | | | | | | | | |
Total | | $ | 19,540 | | $ | 371 | | $ | 63,582 | | $ | 1,294 | | $ | 83,122 | | $ | 1,665 |
| | | | | | | | | | | | | | | | | | |
| | | | | | | | | | | | | | | | | | |
December 31, 2006 | | Less than 12 months | | 12 months or more | | Total |
Description of Securities | | Fair
Value | | Unrealized
Losses | | Fair
Value | | Unrealized
Losses | | Fair Value | | Unrealized
Losses |
Obligations of U. S. Government agencies | | $ | — | | $ | — | | $ | 10,761 | | $ | 244 | | $ | 10,761 | | $ | 244 |
Mortgage-backed securities | | | 24,310 | | | 164 | | | 38,475 | | | 774 | | | 62,785 | | | 938 |
Other investments | | | 7,085 | | | 164 | | | 26,070 | | | 582 | | | 33,155 | | | 746 |
| | | | | | | | | | | | | | | | | | |
Total | | $ | 31,395 | | $ | 328 | | $ | 75,306 | | $ | 1,600 | | $ | 106,701 | | $ | 1,928 |
| | | | | | | | | | | | | | | | | | |
Mortgage-backed Securities. The unrealized losses on the Company’s investment in mortgage-backed securities were caused by interest rate increases. The contractual cash flows of these investments are guaranteed either by the full faith and credit of the United States or by an agency of the United States Government and it is not expected that the securities would be settled at a price less than the amortized cost of the Company’s investment. Because the decline in fair value is attributable to changes in interest rates and not credit quality and because the Company has the ability and intent to hold these investments until a recovery of fair value, which may be maturity, the Company does not consider these investments to be other-than-temporarily impaired at December 31, 2007 or 2006.
Other investments. The Company’s unrealized loss on other investments relates to state, county and municipal bonds that have seen a decline in value due to changes in interest rates. It is not expected that these securities would be settled at a price less than amortized cost of the Company’s investment. Because the decline in fair value is attributable to changes in interest rates and not credit quality and because the Company has the ability and intent to hold these investments until a recovery of fair value, which may be at maturity, the Company does not consider these investments to be other-than-temporarily impaired at December 31, 2007 or 2006.
23
CITIZENS HOLDING COMPANY AND SUBSIDIARY
Years Ended December 31, 2007, 2006, and 2005
NOTES TO CONSOLIDATED FINANCIAL STATEMENTS
The amortized cost and estimated fair value of securities at December 31, 2007, by contractual maturity, are shown below. Expected maturities will differ from contractual maturities because borrowers may have the right to call or prepay obligations with or without call or prepayment penalties.
| | | | | |
| | | Amortized
Cost | | Fair Value |
Securities available-for-sale | | | | | |
Due in one year or less | | $ | 74,293,984 | | 74,295,674 |
Due after one year through five years | | | 11,584,994 | | 11,659,854 |
Due after five years through ten years | | | 32,128,595 | | 32,250,254 |
Due after ten years | | | 127,402,622 | | 126,514,585 |
| | | | | |
Total | | $ | 245,410,195 | | 244,720,367 |
| | | | | |
Investment securities with carrying values of $110,510,441 and $107,357,331 at December 31, 2007 and 2006, respectively, were pledged as collateral for public deposits.
Gross realized gains and losses are included in other income. Total gross realized gains and gross realized losses from the sale of investment securities for each of the years ended December 31 were:
| | | | | | | | | | | |
| | | 2007 | | | 2006 | | | 2005 |
Gross realized gains | | $ | 192,197 | | | $ | 12,917 | | | $ | — |
Gross realized losses | | | (162,858 | ) | | | (25,235 | ) | | | — |
| | | | | | | | | | | |
| | $ | 29,339 | | | $ | (12,318 | ) | | $ | — |
| | | | | | | | | | | |
| Note 4. | Federal Home Loan Bank Stock |
The Company, as a member of the Federal Home Loan Bank of Dallas (“FHLB”) system, owns stock in such organization. No ready market exists for the stock, and it has no quoted market value. The Company’s investment in the FHLB is carried at cost of $2,592,400 and $3,301,100 at December 31, 2007 and 2006, respectively, and is included in other investments.
24
CITIZENS HOLDING COMPANY AND SUBSIDIARY
Years Ended December 31, 2007, 2006, and 2005
NOTES TO CONSOLIDATED FINANCIAL STATEMENTS
The composition of net loans at December 31, 2007 and 2006 is as follows:
| | | | | | | | |
| | | 2007 | | | 2006 | |
| | | (In Thousands) | |
Commercial, financial and agricultural loans | | $ | 177,822 | | | $ | 186,202 | |
Real estate – construction loans | | | 18,820 | | | | 11,047 | |
Real estate – mortgage loans | | | 119,172 | | | | 115,203 | |
Consumer loans | | | 56,680 | | | | 61,572 | |
| | | | | | | | |
| | | 372,494 | | | | 374,024 | |
Unearned discount | | | (501 | ) | | | (1,031 | ) |
Allowance for loan losses | | | (3,968 | ) | | | (3,712 | ) |
| | | | | | | | |
Loans, net | | $ | 368,025 | | | $ | 369,281 | |
| | | | | | | | |
Loans are made principally to customers in the Company’s trade area. The Company’s lending policy provides that loans collateralized by real estate are normally made with loan-to-loan value ratios of 80 percent or less. Commercial loans are typically collateralized by property, equipment, inventories and/or receivables with loan-to-value ratios from 50 percent to 80 percent. Real estate mortgage loans are collateralized by personal residences with loan-to-value ratios of 80 percent or less. Consumer loans are typically collateralized by real estate, vehicles and other consumer durable goods. Approximately $50.7 million and $58.4 million of the loans outstanding at December 31, 2007 and 2006, respectively, were variable rate loans.
25
CITIZENS HOLDING COMPANY AND SUBSIDIARY
Years Ended December 31, 2007, 2006, and 2005
NOTES TO CONSOLIDATED FINANCIAL STATEMENTS
Changes in the allowance for loan losses at December 31, 2007, 2006 and 2005 are as follows:
| | | | | | | | | | | | |
| | | 2007 | | | 2006 | | | 2005 | |
Balance, beginning | | $ | 3,712,375 | | | $ | 4,561,817 | | | $ | 4,720,875 | |
Provision for loan losses | | | 784,120 | | | | (360,910 | ) | | | 1,084,326 | |
Loans charged off | | | (886,798 | ) | | | (780,040 | ) | | | (1,567,186 | ) |
Recoveries of loans previously charged off | | | 358,254 | | | | 291,508 | | | | 323,802 | |
| | | | | | | | | | | | |
Balance, end of year | | $ | 3,967,951 | | | $ | 3,712,375 | | | $ | 4,561,817 | |
| | | | | | | | | | | | |
Loans on nonaccrual (impaired) status were $1,441,251, $1,628,651 and $4,346,512 at December 31, 2007, 2006 and 2005, respectively. Allowance for loan losses attributable to the entire balance of nonaccrual (impaired) loans totaled $149,972 and $491,301 at December 31, 2007 and 2006, respectively. Interest income forgone on loans classified as nonaccrual (impaired) during the years ended December 31, 2007, 2006 and 2005 was $102,452, $122,706 and $348,804, respectively.
| Note 6. | Bank Premises, Furniture, Fixtures and Equipment |
Bank premises, furniture, fixtures and equipment consist of the following at December 31, 2007 and 2006:
| | | | | | |
| | | 2007 | | 2006 |
Land and buildings | | $ | 15,977,762 | | $ | 13,635,092 |
Furniture, fixtures and equipment | | | 10,666,590 | | | 9,758,542 |
| | | | | | |
| | | 26,644,352 | | | 23,393,634 |
Less accumulated depreciation | | | 12,355,555 | | | 11,287,178 |
| | | | | | |
Total | | $ | 14,288,797 | | $ | 12,106,456 |
| | | | | | |
Depreciation expense for the years ended December 31, 2007, 2006 and 2005 was $1,068,377, $950,340 and $1,024,320, respectively.
26
CITIZENS HOLDING COMPANY AND SUBSIDIARY
Years Ended December 31, 2007, 2006, and 2005
NOTES TO CONSOLIDATED FINANCIAL STATEMENTS
The composition of deposits is as follows:
| | | | | | |
| | | 2007 | | 2006 |
Non-interest bearing | | $ | 78,224,936 | | $ | 82,867,220 |
NOW and money market accounts | | | 144,302,273 | | | 152,988,036 |
Savings deposits | | | 29,763,885 | | | 32,636,927 |
Time certificates, $100,000 or more | | | 101,806,688 | | | 76,352,424 |
Other time certificates | | | 123,134,522 | | | 127,002,649 |
| | | | | | |
Total | | $ | 477,232,304 | | $ | 471,847,256 |
| | | | | | |
The scheduled maturities of certificates of deposit at December 31, 2007 are as follows:
| | | |
Year Ending December 31, | | Amount |
2008 | | $ | 207,764,513 |
2009 | | | 10,946,552 |
2010 | | | 6,104,161 |
2011 | | | 77,634 |
2012 | | | 48,350 |
| | | |
| | $ | 224,941,210 |
| | | |
Interest expense for certificates of deposit over $100,000 was approximately $4,193,000, $2,902,000 and $2,074,000 for the years ended December 31, 2007, 2006 and 2005, respectively.
27
CITIZENS HOLDING COMPANY AND SUBSIDIARY
Years Ended December 31, 2007, 2006, and 2005
NOTES TO CONSOLIDATED FINANCIAL STATEMENTS
| Note 8. | Federal Home Loan Bank Advances |
Pursuant to collateral agreements with the FHLB, advances are collateralized by all the Company’s stock, FHLB securities ($2,592,400 included in securities available-for-sale at December 31, 2007) and qualifying first mortgage and other loans. As of December 31, 2007, the balance in qualifying first mortgage and other loans was $121,841,868. At December 31, 2007, advances from the FHLB, along with their rate and maturity date, consist of the following:
| | | | | | | | |
Advance Amount at
December 31, | | Interest Rate | | Final Maturity |
2007 | | 2006 | | |
| $ | — | | $ | 10,000,000 | | 5.37 | | May 25, 2007 |
| | 5,000,000 | | | 5,000,000 | | 5.46 | | February 26, 2008 |
| | 5,000,000 | | | 5,000,000 | | 5.66 | | April 28, 2008 |
| | 15,000,000 | | | 15,000,000 | | 4.50 | | June 23, 2008 |
| | 3,000,000 | | | 3,000,000 | | 5.24 | | April 20, 2009 |
| | 2,000,000 | | | 2,000,000 | | 5.29 | | April 20, 2009 |
| | 2,000,000 | | | 2,000,000 | | 4.47 | | September 7, 2010 |
| | 2,000,000 | | | 2,000,000 | | 4.88 | | August 22, 2011 |
| | 1,000,000 | | | 1,000,000 | | 4.76 | | August 29, 2011 |
| | 900,000 | | | 900,000 | | 4.43 | | September 19, 2011 |
| | 10,000,000 | | | 10,000,000 | | 3.66 | | June 17, 2013 |
| | 3,500,000 | | | 3,500,000 | | 4.67 | | December 16, 2014 |
| | | | | | | | | |
| | $49,400,000 | | $ | 59,400,000 | | | | |
| | | | | | | | | |
The scheduled payments for the next five years are as follows:
| | | |
Year Due | | Payment |
2008 | | $ | 25,000,000 |
2009 | | | 5,000,000 |
2010 | | | 2,000,000 |
2011 | | | 3,900,000 |
2012 | | | — |
Thereafter | | | 13,500,000 |
| | | |
| | $ | 49,400,000 |
| | | |
28
CITIZENS HOLDING COMPANY AND SUBSIDIARY
Years Ended December 31, 2007, 2006, and 2005
NOTES TO CONSOLIDATED FINANCIAL STATEMENTS
| Note 9. | Other Income and Other Expense |
The following is a detail of the major income classifications that are included in other income under non-interest income on the income statement.
| | | | | | | | | |
Other Income | | 2007 | | 2006 | | 2005 |
BOLI Insurance | | $ | 714,601 | | $ | 553,477 | | $ | 485,890 |
Mortgage Loan Origination Fees | | | 319,044 | | | 407,426 | | | 380,049 |
Other Income | | | 2,092,988 | | | 855,143 | | | 728,872 |
| | | | | | | | | |
Total Other Income | | $ | 3,126,633 | | $ | 1,816,046 | | $ | 1,594,811 |
| | | | | | | | | |
The following is a detail of the major expense classifications that comprise the other expense line item in the income statement.
| | | | | | | | | |
Other Expense | | 2007 | | 2006 | | 2005 |
Intangible Amortization | | $ | 537,503 | | $ | 537,503 | | $ | 537,503 |
Advertising | | | 551,998 | | | 482,540 | | | 495,579 |
Office Supplies | | | 576,358 | | | 515,958 | | | 559,442 |
Legal and Audit Fees | | | 350,971 | | | 452,064 | | | 404,183 |
Telephone Expense | | | 418,681 | | | 377,716 | | | 398,435 |
Other Expenses | | | 3,256,312 | | | 3,081,190 | | | 2,496,554 |
| | | | | | | | | |
Total Other Expense | | $ | 5,691,823 | | $ | 5,446,971 | | $ | 4,891,696 |
| | | | | | | | | |
The consolidated provision for income taxes consists of the following:
| | | | | | | | | | | | |
| | | 2007 | | | 2006 | | | 2005 | |
Currently payable | | | | | | | | | | | | |
Federal | | $ | 1,971,014 | | | $ | 2,559,846 | | | $ | 2,250,896 | |
State | | | 308,964 | | | | 446,561 | | | | 425,520 | |
| | | | | | | | | | | | |
| | | 2,279,978 | | | | 3,006,407 | | | | 2,676,416 | |
Deferred tax benefit | | | (311,868 | ) | | | (169,994 | ) | | | (310,432 | ) |
| | | | | | | | | | | | |
Income tax expense | | $ | 1,968,110 | | | $ | 2,836,413 | | | $ | 2,365,984 | |
| | | | | | | | | | | | |
29
CITIZENS HOLDING COMPANY AND SUBSIDIARY
Years Ended December 31, 2007, 2006, and 2005
NOTES TO CONSOLIDATED FINANCIAL STATEMENTS
The differences between income taxes calculated at the federal statutory rate and income tax expense were as follows:
| | | | | | | | | | | | |
| | | 2007 | | | 2006 | | | 2005 | |
Federal taxes based on statutory rate | | $ | 3,019,997 | | | $ | 3,818,519 | | | $ | 3,512,919 | |
State income taxes, net of federal benefit | | | 203,916 | | | | 294,730 | | | | 280,843 | |
Tax-exempt investment interest | | | (940,489 | ) | | | (1,070,432 | ) | | | (1,067,853 | ) |
Other, net | | | (315,314 | ) | | | (206,404 | ) | | | (359,925 | ) |
| | | | | | | | | | | | |
Income tax expense | | $ | 1,968,110 | | | $ | 2,836,413 | | | $ | 2,365,984 | |
| | | | | | | | | | | | |
At December 31, 2007 and 2006, net deferred tax assets consist of the following:
| | | | | | |
| | | 2007 | | 2006 |
Deferred tax assets | | | | | | |
Allowance for loan losses | | $ | 1,480,046 | | $ | 1,384,716 |
Deferred compensation liability | | | 1,115,247 | | | 1,007,020 |
Unrealized loss on available-for-sale securities | | | 257,306 | | | 310,732 |
Intangible assets | | | 127,201 | | | — |
Other | | | 72,191 | | | 67,728 |
| | | | | | |
Total | | | 3,051,991 | | | 2,770,196 |
Deferred tax liabilities | | | | | | |
Premises and equipment | | | 1,030,258 | | | 507,826 |
Intangible assets | | | — | | | 13,713 |
Other | | | 790,975 | | | 717,424 |
| | | | | | |
Total | | | 1,821,233 | | | 1,238,963 |
| | | | | | |
Net deferred tax asset | | $ | 1,230,758 | | $ | 1,531,233 |
| | | | | | |
The net deferred tax asset of $1,230,758 and $1,531,233 at December 31, 2007 and 2006, respectively, is included in other assets. The Company has evaluated the need for a valuation allowance related to the above deferred tax assets and, based on the weight of the available evidence, has determined that it is more likely than not that all deferred tax assets will be realized.
30
CITIZENS HOLDING COMPANY AND SUBSIDIARY
Years Ended December 31, 2007, 2006, and 2005
NOTES TO CONSOLIDATED FINANCIAL STATEMENTS
FASB Interpretation 48, “Accounting for Income Tax Uncertainties” (“FIN 48”), was issued in June 2006 and defines the threshold for recognizing the benefits of tax return positions in the financial statements as “more-likely-than-not” to be sustained by the taxing authority. FIN 48 also provides guidance on the derecognition, measurement and classification for income tax uncertainties, along with any related interest and penalties, and includes guidance concerning accounting for income tax uncertainties in interim periods. The Company adopted the provisions of FIN 48, on January 1, 2007, and determined that were was no need to make an adjustment to retained earnings upon adoption of FIN 48. As of December 31, 2007, the Company has no unrecognized tax benefits related to federal and state income tax matters. If ultimately recognized, the Company does not anticipate any material increase in the effective tax rate during 2007 relative to any tax positions taken prior to January 1, 2007. As of December 31, 2007, the Company has not accrued for interest and penalties related to uncertain tax positions. It is the Company’s policy to recognize interest and/or penalties related to income tax matters in income tax expense.
The Company and its subsidiaries file a consolidated U. S. federal income tax return. The Company is currently open to audit under the statute of limitations by the Internal Revenue Service for the years ended December 31, 2004 through 2007. The Company and its subsidiaries; state income tax returns are open to audit under the statute of limitations for the year ended December 31, 2004 through 2007.
31
CITIZENS HOLDING COMPANY AND SUBSIDIARY
Years Ended December 31, 2007, 2006, and 2005
NOTES TO CONSOLIDATED FINANCIAL STATEMENTS
| Note 11. | Summarized Financial Information of Citizens Holding Company |
Summarized financial information of Citizens Holding Company, parent company only, at December 31, 2007 and 2006, and for the years ended December 31, 2007, 2006 and 2005, is as follows:
Balance Sheets
December 31, 2007 and 2006
| | | | | | |
| | | 2007 | | 2006 |
Assets | | | | | | |
Cash (1) | | $ | 955,232 | | $ | 1,783,950 |
Investment in bank subsidiary (1) | | | 67,157,467 | | | 67,830,998 |
Other assets (1) | | | 78,733 | | | 53,925 |
| | | | | | |
Total assets | | $ | 68,191,432 | | $ | 69,668,873 |
| | | | | | |
Liabilities | | | | | | |
Other liabilities | | $ | — | | $ | 3,600 |
Stockholders’ equity | | | 68,191,432 | | | 69,665,273 |
| | | | | | |
Total liabilities and stockholders’ equity | | $ | 68,191,432 | | $ | 69,668,873 |
| | | | | | |
| (1) | Eliminates in consolidation. |
32
CITIZENS HOLDING COMPANY AND SUBSIDIARY
Years Ended December 31, 2007, 2006, and 2005
NOTES TO CONSOLIDATED FINANCIAL STATEMENTS
Income Statements
Years Ended December 31, 2007, 2006 and 2005
| | | | | | | | | | | | |
| | | 2007 | | | 2006 | | | 2005 | |
Interest income | | $ | 8,889 | | | $ | 13,577 | | | $ | 30,359 | |
| | | | | | | | | | | | |
Other income | | | | | | | | | | | | |
Dividends from bank subsidiary (1) | | | 6,251,760 | | | | 3,498,167 | | | | 3,265,783 | |
Equity in undistributed earnings of bank subsidiary (1) | | | 749,262 | | | | 4,987,588 | | | | 4,717,327 | |
| | | | | | | | | | | | |
Total other income | | | 7,009,911 | | | | 8,485,755 | | | | 7,983,110 | |
| | | | | | | | | | | | |
Other expense | | | 147,302 | | | | 158,733 | | | | 58,468 | |
| | | | | | | | | | | | |
Income before income taxes | | | 6,862,609 | | | | 8,340,599 | | | | 7,955,001 | |
Income tax expense (benefit) | | | (51,625 | ) | | | (53,925 | ) | | | (11,131 | ) |
| | | | | | | | | | | | |
Net income | | $ | 6,914,234 | | | $ | 8,394,524 | | | $ | 7,966,132 | |
| | | | | | | | | | | | |
| (1) | Eliminates in consolidation. |
Statements of Cash Flows
Years Ended December 31, 2007, 2006 and 2005
| | | | | | | | | | | | |
| | | 2007 | | | 2006 | | | 2005 | |
Cash flows from operating activities | | | | | | | | | | | | |
Net income | | $ | 6,914,234 | | | $ | 8,394,524 | | | $ | 7,966,132 | |
Adjustments to reconcile net income to net cash provided by operating activities | | | | | | | | | | | | |
Equity in undistributed earnings of Bank | | | (749,263 | ) | | | (4,987,588 | ) | | | (4,717,327 | ) |
Decrease in other assets | | | 42,164 | | | | 11,836 | | | | 13,961 | |
(Decrease) increase in other liabilities | | | (3,600 | ) | | | 1,200 | | | | (36,603 | ) |
| | | | | | | | | | | | |
Net cash provided by operating activities | | | 6,203,535 | | | | 3,419,972 | | | | 3,226,163 | |
| | | | | | | | | | | | |
Cash flows from investing activities | | | | | | | | | | | | |
Other | | | — | | | | — | | | | 300,890 | |
| | | | | | | | | | | | |
Net cash provided by investing activities | | | — | | | | — | | | | 300,890 | |
| | | | | | | | | | | | |
33
CITIZENS HOLDING COMPANY AND SUBSIDIARY
Years Ended December 31, 2007, 2006, and 2005
NOTES TO CONSOLIDATED FINANCIAL STATEMENTS
| | | | | | | | | | | | |
| | | 2007 | | | 2006 | | | 2005 | |
Cash flows from financing activities | | | | | | | | | | | | |
Dividends paid to stockholders | | $ | (3,576,655 | ) | | $ | (3,461,509 | ) | | $ | (3,254,591 | ) |
Proceeds from exercise of stock options | | | 26,555 | | | | 311,160 | | | | 131,595 | |
| | | | | | | | | | | | |
Net cash used by financing activities | | | (3,482,153 | ) | | | (3,150,349 | ) | | | (3,122,996 | ) |
| | | | | | | | | | | | |
Net increase in cash | | | (828,718 | ) | | | 269,623 | | | | 404,057 | |
| | | | | | | | | | | | |
Cash, beginning of year | | | 1,783,950 | | | | 1,514,327 | | | | 1,110,270 | |
| | | | | | | | | | | | |
Cash, end of year | | $ | 955,232 | | | $ | 1,783,950 | | | $ | 1,514,327 | |
| | | | | | | | | | | | |
The Bank is required to obtain approval from state regulators before paying dividends. The Bank paid dividends of $6,251,760, $3,498,167 and $3,265,783 to the Citizens Holding Company during the years ended December 31, 2007, 2006 and 2005, respectively.
| Note 12. | Related Party Transactions |
The Company had, and may be expected to have in the future, banking transactions in the ordinary course of business with directors, significant stockholders, principal officers, their immediate families, and affiliated companies in which they are principal stockholders (commonly referred to as related parties). In management’s opinion, such loans are made on substantially the same terms, including interest rates and collateral, as those prevailing at the time for comparable transactions with unrelated parties, and do not involve more than the normal risk of collectibility at the time of the transaction.
The balance of loans made to related parties at December 31, 2007 and 2006 was $309,044 and $336,995, respectively. Advances to related parties during the year ended December 31, 2007 and 2006 totaled $241,864 and $193,308, respectively. Payments received from related parties during the year ended December 31, 2007 and 2006 totaled $269,815 and $212,011.
Deposits from related parties at December 31, 2007 and 2006 approximated $3,239,609 and $2,649,575, respectively.
34
CITIZENS HOLDING COMPANY AND SUBSIDIARY
Years Ended December 31, 2007, 2006, and 2005
NOTES TO CONSOLIDATED FINANCIAL STATEMENTS
| Note 13. | Off-Balance Sheet Financial Instruments, Commitments and Contingencies and Concentrations of Risks |
Commitments to Extend Credit
In the ordinary course of business, the Company makes various commitments and incurs certain contingent liabilities to fulfill the financing needs of its customers. These commitments and contingent liabilities include commitments to extend credit and issue standby letters of credit. They involve, to varying degrees, elements of credit risk in excess of the amount recognized in the balance sheets. The Company’s exposure to credit loss in the event of nonperformance by the other party to the financial instrument for commitments to extend credit and standby letters of credit is represented by the contractual amount of those instruments. At December 31, 2007 and 2006, commitments related to unused lines of credit were $27,293,147 and $22,150,442, respectively, and standby letters of credit were $437,918 and $955,218, respectively. The fair value of such commitments is not materially different than stated values. As some of these commitments are expected to expire without being drawn upon, the total commitment amount does not necessarily represent future cash requirements. The Company applies the same credit policies and standards as it does in the lending process when making these commitments. The collateral obtained is based upon the assessed credit worthiness of the borrower. Collateral held varies, but may include accounts receivable, crops, livestock, inventory, property and equipment, residential real estate and income-producing commercial properties.
Interest Rate Risk
The Company is principally engaged in providing short-term and medium-term installment, commercial and agricultural loans with interest rates that are fixed or fluctuate with the prime lending rate. These assets are primarily funded through short-term demand deposits and long-term certificates of deposit with variable and fixed rates. Accordingly, the Company is exposed to interest rate risk because, in changing interest rate environments, interest rate adjustments on assets and liabilities may not occur at the same time or in the same amount. The Company manages the overall rate sensitivity and mix of its asset and liability portfolio and attempts to minimize the effects that interest rate fluctuations will have on its net interest margin.
Legal Proceedings
The Company is party to lawsuits and other claims that arise in the ordinary course of business. The lawsuits assert claims related to the general business activities of the Company. The cases are being vigorously contested. In the regular course of business, management evaluates estimated losses or costs related to litigation, and provision is made for anticipated losses whenever management believes that such losses are probable and can be reasonably estimated. While management believes that the final resolution of pending legal proceedings will not have a material impact on the Company’s financial position or results of operations, the final resolution of such proceedings could have such a material adverse effect.
35
CITIZENS HOLDING COMPANY AND SUBSIDIARY
Years Ended December 31, 2007, 2006, and 2005
NOTES TO CONSOLIDATED FINANCIAL STATEMENTS
Concentration of Risk
The Company makes agricultural, agribusiness, commercial, residential and consumer loans primarily in eastern central Mississippi. A substantial portion of the Company’s customers’ abilities to honor their contracts is dependent on the business and agricultural economy in that area.
Although the Company’s loan portfolio is diversified, there is a relationship in this region between the agricultural economy and the economic performance of loans made to nonagricultural customers. The Company’s lending policies for agricultural and nonagricultural customers require loans to be well-collateralized and supported by cash flows. Collateral for agricultural loans includes equipment, crops, livestock, and land. Credit losses from loans related to the agricultural economy are consistent with credit losses experienced in the portfolio as a whole. The concentration of credit in the regional agricultural economy is taken into consideration by management in determining the allowance for loan losses. See Note 5 for a summary of loans by type.
The nature of the Company’s business requires that it maintain amounts due from banks, which at times may exceed federally insured limits. The Company has not experienced any losses in such accounts.
| Note 14. | Lease Commitment and Total Rental Expense |
The Company has operating leases under noncancellable operating lease agreements for banking facilities and equipment. Future minimum rental payments due under the leases are as follows:
| | | |
Years Ending December 31, | | Amounts |
2008 | | $ | 153,534 |
2009 | | | 151,531 |
2010 | | | 151,531 |
2011 | | | 142,816 |
2012 | | | 125,600 |
| | | |
| | $ | 725,012 |
| | | |
The total rental expense included in the income statements for the years ended December 31, 2007, 2006 and 2005 is $75,926, $65,625, and $63,398, respectively.
36
CITIZENS HOLDING COMPANY AND SUBSIDIARY
Years Ended December 31, 2007, 2006, and 2005
NOTES TO CONSOLIDATED FINANCIAL STATEMENTS
The Company provides its employees with a profit sharing and savings plan, which allows employees to direct a percentage of their compensation into a tax deferred retirement account, subject to statutory limitations. To encourage participation, the Company provides a 100 percent matching contribution for up to 6 percent of each participant’s compensation, plus discretionary non-matching contributions. Employees are eligible after one year of service. For 2007, 2006 and 2005, the Company’s contributions were $558,340, $523,270 and $516,555, respectively.
Deferred Compensation Plans
The Company provides a deferred compensation plan covering its directors. Participants in the deferred compensation plan can defer a portion of their compensation for payment after attaining age 70. Life insurance contracts have been purchased which may be used to fund payments under the plan. Net expenses related to this plan were $127,577, $192,651 and $144,158 for the plan years ended December 31, 2007, 2006 and 2005, respectively.
The Company has also entered into deferred compensation arrangements with certain officers that provide for payments to such officers or their survivors after retirement. Life insurance policies have been purchased which may be used to fund payments under these arrangements. The obligations of the Company under both the directors and officers deferred compensation arrangements are on a systematic basis over the remaining expected service period of the individual directors and officers.
| Note 16. | Regulatory Matters |
The Company (on a consolidated basis) and the Bank are subject to various regulatory capital requirements administered by federal banking agencies. Failure to meet the minimum regulatory capital requirements can initiate certain mandatory, and possible additional discretionary actions by regulators that, if undertaken, could have a direct material affect on the Company.
37
CITIZENS HOLDING COMPANY AND SUBSIDIARY
Years Ended December 31, 2007, 2006, and 2005
NOTES TO CONSOLIDATED FINANCIAL STATEMENTS
Under the regulatory capital adequacy guidelines and the regulatory framework for prompt corrective action, the Company must meet specific capital guidelines involving quantitative measures of the Company’s assets, liabilities and certain off-balance sheet items as calculated under regulatory accounting practices. The Company’s capital amounts and classification under the prompt corrective action guidelines are also subject to qualitative judgments by the regulators about components, risk weightings, and other factors. Quantitative measures established by regulation to ensure capital adequacy require the Company to maintain minimum amounts and ratios of total capital and Tier I capital to risk-weighted assets (as defined in the regulations) and Tier I capital to average assets (as defined in the regulations). Management believes, as of December 31, 2007, that the Company and the Bank meet all capital adequacy requirements to which they are subject.
As of December 31, 2007 and 2006, the most recent regulatory notification categorized the Bank as well capitalized. There have been no conditions or events that would cause changes to the capital structure of the Company since this notification. To continue to be categorized as well capitalized under the regulatory framework for prompt corrective action, the Company would have to maintain minimum total risk-based, Tier I risk-based, and Tier I leverage ratios as disclosed below, in comparison with actual capital amounts and ratios:
| | | | | | | | | | | | | | | | | | |
| | | Actual | | | For Capital
Adequacy Purposes | | | To Be Well
Capitalized under Prompt
Corrective Action Provisions | |
| | | Amount | | Ratio | | | Amount | | Ratio | | | Amount | | Ratio | |
As of December 31, 2007 | | | | | | | | | | | | | | | | | | |
Total Capital (to Risk-Weighted Assets) | | | | | | | | | | | | | | | | | | |
Citizens Holding Company | | $ | 68,376,835 | | 17.06 | % | | $ | 32,066,762 | | 8 | % | | $ | N/A | | — | |
Citizens Bank | | | 67,342,869 | | 16.80 | | | | 32,058,795 | | 8 | | | | 40,073,493 | | 10 | % |
Tier I Capital (to Risk-Weighted Assets) | | | | | | | | | | | | | | | | | | |
Citizens Holding Company | | | 64,408,884 | | 16.07 | | | | 16,033,381 | | 4 | | | | N/A | | — | |
Citizens Bank | | | 63,374,918 | | 15.81 | | | | 16,029,397 | | 4 | | | | 24,044,096 | | 6 | |
Tier I Capital (to Average Assets) | | | | | | | | | | | | | | | | | | |
Citizens Holding Company | | | 64,408,884 | | 9.98 | | | | 25,820,254 | | 4 | | | | N/A | | — | |
Citizens Bank | | | 63,374,918 | | 9.79 | | | | 25,894,058 | | 4 | | | | 32,367,573 | | 5 | |
38
CITIZENS HOLDING COMPANY AND SUBSIDIARY
Years Ended December 31, 2007, 2006, and 2005
NOTES TO CONSOLIDATED FINANCIAL STATEMENTS
| | | | | | | | | | | | | | | | | | |
| | | Actual | | | For Capital
Adequacy Purposes | | | To Be Well
Capitalized under Prompt
Corrective Action Provisions | |
| | | Amount | | Ratio | | | Amount | | Ratio | | | Amount | | Ratio | |
As of December 31, 2006 | | | | | | | | | | | | | | | | | | |
Total Capital (to Risk-Weighted Assets) | | | | | | | | | | | | | | | | | | |
Citizens Holding Company | | $ | 70,618,305 | | 18.32 | % | | $ | 30,829,550 | | 8 | % | | $ | N/A | | — | |
Citizens Bank | | | 68,795,198 | | 17.85 | | | | 30,825,236 | | 8 | | | | 38,531,545 | | 10 | % |
Tier I Capital (to Risk-Weighted Assets) | | | | | | | | | | | | | | | | | | |
Citizens Holding Company | | | 66,905,930 | | 17.36 | | | | 15,414,775 | | 4 | | | | N/A | | — | |
Citizens Bank | | | 65,082,824 | | 16.89 | | | | 15,412,618 | | 4 | | | | 23,118,927 | | 6 | |
Tier I Capital (to Average Assets) | | | | | | | | | | | | | | | | | | |
Citizens Holding Company | | | 66,905,930 | | 11.30 | | | | 23,683,458 | | 4 | | | | N/A | | — | |
Citizens Bank | | | 65,082,824 | | 11.00 | | | | 23,670,190 | | 4 | | | | 29,587,738 | | 5 | |
| Note 17. | Fair Values of Financial Instruments |
The following represents the carrying value and estimated fair value of the Company’s financial instruments at December 31, 2007 and 2006:
| | | | | | | | | | | | |
| | | 2007 | | 2006 |
| | | Carrying
Amount | | Fair Value | | Carrying
Amount | | Fair Value |
Financial assets | | | | | | | | | | | | |
Cash and due from banks | | $ | 18,622,058 | | $ | 18,622,058 | | $ | 15,449,434 | | $ | 15,449,434 |
Interest bearing deposits with banks | | | 612,938 | | | 612,938 | | | 396,811 | | | 396,811 |
Federal funds sold | | | 900,000 | | | 900,000 | | | 15,200,000 | | | 15,200,000 |
Securities available-for-sale | | | 244,720,367 | | | 244,720,367 | | | 174,617,419 | | | 174,617,419 |
Net loans | | | 368,025,286 | | | 367,012,621 | | | 369,280,664 | | | 368,758,573 |
Accrued interest receivable | | | 5,210,201 | | | 5,210,201 | | | 5,015,574 | | | 5,015,574 |
Financial liabilities | | | | | | | | | | | | |
Deposits | | $ | 477,232,304 | | $ | 477,627,672 | | $ | 471,847,256 | | $ | 472,088,286 |
Federal Home Loan Bank advances | | | 49,400,000 | | | 49,418,909 | | | 59,400,000 | | | 58,410,468 |
Accrued interest payable | | | 1,915,232 | | | 1,915,232 | | | 1,153,890 | | | 1,153,890 |
Federal funds purchased | | | 4,200,000 | | | 4,200,000 | | | — | | | — |
Sweep account liability | | | 74,963,424 | | | 74,963,424 | | | 12,767,483 | | | 12,767,483 |
The fair value estimates, methods and assumptions used by the Company in estimating its fair value disclosures for financial instruments were:
39
CITIZENS HOLDING COMPANY AND SUBSIDIARY
Years Ended December 31, 2007, 2006, and 2005
NOTES TO CONSOLIDATED FINANCIAL STATEMENTS
Cash and Due from Banks and Interest Bearing Deposits with Banks
The carrying amounts reported in the balance sheet for these instruments approximate those assets’ fair values because of their immediate and shorter-term maturities.
Securities Available-for-Sale
Fair values for investment securities are based on quoted market prices, where available. If quoted market prices are not available, fair values are based on quoted market prices of comparable instruments.
Net Loans
For variable-rate loans that reprice frequently and with no significant change in credit risk, fair values are based on carrying values. The fair values for other loans (i.e., commercial real estate and rental property mortgage loans, commercial and industrial loans, financial institution loans, and agricultural loans) are estimated using discounted cash flow analyses, using interest rates currently being offered for loans with similar terms to borrowers of similar credit quality. The carrying amount of accrued interest receivable approximates its fair value.
Federal Funds Sold and Purchased; Sweep Account Liability
Due to the short term nature of these instruments, the carrying amount is equal to the fair value.
Deposits
The fair values for demand deposits, NOW and money market accounts and savings accounts are, by definition, equal to the amount payable on demand at the reporting date (i.e., their carrying amounts). The carrying amounts for variable-rate, fixed-term money market accounts and time deposits approximate their fair values at the reporting date. Fair values for fixed-rate time deposits are estimated using a discounted cash flow calculation that applies interest rates currently being offered on certificates to a schedule of aggregated expected monthly maturities on time deposits. The carrying amount of accrued interest payable approximates its fair value.
Federal Home Loan Bank Borrowings
The fair value of the portion of FHLB advances that matures within 90 days approximates its fair value. For longer term maturities, the fair value is based on discounted cash flow analysis.
Off-Balance Sheet Instruments
The fair value of commitments to extend credit and letters of credit are estimated using fees currently charged to enter into similar agreements. The fees associated with these financial instruments are not material.
40
CITIZENS HOLDING COMPANY AND SUBSIDIARY
Years Ended December 31, 2007, 2006, and 2005
NOTES TO CONSOLIDATED FINANCIAL STATEMENTS
The Company has a directors’ stock compensation plan and employees’ long-term incentive plan. Under the directors’ plan, the Company may grant options for up to 210,000 shares of common stock. The price of each option is equal to the market price determined as of the option grant date. Options granted are exercisable after 6 months and expire after 10 years. Under the employees’ incentive plan, the Company may grant options for up to 7 percent of the total number of shares of common stock, which may be issued and outstanding. Incentive options must be granted within 10 years of the adoption of the plan and expire no later than 10 years from the grant date. The exercise price is equal to the market price of the Company’s stock on the date of grant.
Following is a summary of the status of the plans for the years ending December 31, 2007, 2006 and 2005:
| | | | | | | | | | | | |
| | | Directors’ Plan | | Employees’ Plan |
| | | Number
of
Shares | | | Weighted
Average
Exercise
Price | | Number
of
Shares | | | Weighted
Average
Exercise
Price |
Outstanding at January 1, 2005 | | 77,850 | | | $ | 13.95 | | 136,150 | | | $ | 16.43 |
Granted | | 12,000 | | | | 20.00 | | 43,500 | | | | 21.05 |
Exercised | | (6,000 | ) | | | 14.66 | | (3,000 | ) | | | 14.55 |
Forfeited | | — | | | | — | | (4,450 | ) | | | 17.24 |
| | | | | | | | | | | | |
Outstanding at December 31, 2005 | | 83,850 | | | $ | 14.77 | | 172,200 | | | $ | 17.60 |
Granted | | 12,000 | | | | 23.70 | | 40,500 | | | | 23.46 |
Exercised | | (4,500 | ) | | | 17.88 | | (6,450 | ) | | | 16.41 |
Forfeited | | (1,500 | ) | | | 22.25 | | (9,450 | ) | | | 19.68 |
| | | | | | | | | | | | |
Outstanding at December 31, 2006 | | 89,850 | | | $ | 15.68 | | 196,800 | | | $ | 17.60 |
Granted | | 13,500 | | | | 22.00 | | — | | | | — |
Exercised | | (2,700 | ) | | | 7.15 | | (500 | ) | | | 14.50 |
Forfeited | | — | | | | — | | (4,000 | ) | | | 20.22 |
| | | | | | | | | | | | |
Outstanding at December 31, 2007 | | 100,650 | | | $ | 16.76 | | 192,300 | | | $ | 17.55 |
| | | | | | | | | | | | |
Options exercisable at: | | | | | | | | | | | | |
December 31, 2007 | | 100,650 | | | $ | 16.76 | | 192,300 | | | $ | 17.55 |
| | | | | | | | | | | | |
Weighted average fair value of Options granted during years ended | | | | | | | | | | | | |
December 31, 2005 | | | | | $ | 1.48 | | | | | $ | 1.56 |
| | | | | | | | | | | | |
December 31, 2006 | | | | | $ | 6.10 | | | | | $ | 5.87 |
| | | | | | | | | | | | |
December 31, 2006 | | | | | $ | 6.23 | | | | | $ | — |
| | | | | | | | | | | | |
41
CITIZENS HOLDING COMPANY AND SUBSIDIARY
Years Ended December 31, 2007, 2006, and 2005
NOTES TO CONSOLIDATED FINANCIAL STATEMENTS
The following table presents the outstanding stock options granted in relation to the option price and the weighted average maturity.
| | | | | | | |
Range of Exercise Prices | | Options
Outstanding | | Weighted
Average Price | | Weighted Average
Life Remaining |
$7.15 to $10.00 | | 12,150 | | $ | 7.30 | | 1 years, 2 months |
$10.01 to $15.00 | | 107,300 | | | 13.39 | | 4 years, 1 month |
$15.01 to $20.00 | | 24,000 | | | 18.20 | | 6 years, 4 months |
$20.01 to $22.50 | | 99,000 | | | 21.61 | | 7 years, 1 months |
$22.51 and above | | 50,500 | | | 23.52 | | 8 years, 3 months |
| | | | | | | |
Total | | 292,950 | | $ | 18.06 | | 5 years, 10 months |
| | | | | | | |
The intrinsic value of options granted under the Directors’ Plan at December 31, 2007 was $328,010 and the intrinsic value of the Employees’ Plan at December 31, 2007 was $344,356 for a total intrinsic value at December 31, 2007 of $672,366. Additionally, the total intrinsic value of options exercised during 2007 and 2006 was $32,040 and $93,843, respectively. There was no unrecognized stock-based compensation expense at December 31, 2007.
42
Management’s Discussion and Analysis of Financial Condition and Results of Operations as of December 31, 2007, 2006 and 2005
OVERVIEW
The following information discusses the financial condition and results of operations of Citizens Holding Company (the “Company”) as of December 31, 2007, 2006 and 2005. In this discussion, all references to the activities, operations or financial performance of the Company reflect the Company’s activities, operations and financial performance through its wholly-owned subsidiary, The Citizens Bank of Philadelphia, Mississippi (the “Bank”), unless otherwise specifically noted.
Over the past three years, the Company has experienced growth in total assets and deposits as management has capitalized on opportunities for organic growth within our market area. Total assets increased over the three-year period by $93.7 million. In the three year period, earnings increased in 2005 and 2006 before decreasing in 2007. Higher costs for deposits and lower loan spreads from increased market competition caused the Company’s net interest margin to compress in 2007. Even during this time of shrinking margins, management believes it has made appropriate provisions for loan losses although the improving loan portfolio quality has required smaller or negative provisions for loan losses.
During 2007, the Company’s assets grew to $680,903,631, or 9.6%, from 2006, loans decreased to $368,025,286, or 0.3%, and deposits increased $5,385,048, or 1.1%. Loans decreased in 2007 due to the repayment of several large loans in the portfolio. At the same time that demand and savings accounts decreased, certificates of deposit increased. Certificates of deposit ended 2007 at $224,941,210, or 10.6%, higher than 2006. Demand, NOW, savings and money market accounts decreased $16,201,089, or 6.0%, to $252,291,094 at December 31, 2007.
During 2006, the Company’s assets grew to $621,197,496, or 1.0%, from 2005, loans decreased to $369,280,664, or 1.5%, and deposits decreased $1,964,978, or 0.4%. Loans decreased in 2006 due to the repayment of loans related to Hurricane Katrina rebuilding contracts that were made in the fourth quarter of 2005 and repaid in the first quarter of 2006 when the contracts were completed. Decreases in savings accounts and certificates of deposit were the primary reason for the decrease in deposits as they ended 2006 at $2,051,725, or 0.9%, lower than 2005. Demand, NOW and money market accounts grew $86,747, or 0.04%, to $235,855,256 at December 31, 2006.
In 2005, the Company experienced growth in its assets and loans as compared to 2004 although the growth rate was less than in 2004. The Company’s assets grew to $607,709,136, or 3.5%, from 2004, loans increased to $374,964,316, or 2.8%, and deposits decreased $651,511, or 0.1%. Loans increased in 2005 due to the Hurricane Katrina rebuilding contracts. The decrease in savings accounts and certificates of deposit were the primary reason for the decrease in deposits as they ended 2005 at $9,731,729, or 3.9% lower than 2004. Demand, NOW and money market accounts grew $9,080,209, or 4.0% to $235,768,509, at December 31, 2005 compared to the balance at December 31, 2004.
In 2007, the Company’s net income after taxes decreased to $6,914,234, a decrease of $1,480,290 over 2006. The increase in the rates paid on deposits was a major cause of the decrease along with the additional costs related to the branch expansion expenses recorded in the fourth quarter. Net income for 2007 produced, on a fully diluted basis, earnings per share of $1.39 compared to $1.65 in 2006 and $1.57 for 2005.
43
In 2006, the Company’s net income after taxes increased to $8,394,524, an increase of $428,392 over 2005. The increase in the rates paid on deposits was offset by a negative provision for loan losses, which was due to an improvement in the credit quality of the loan portfolio.
The Company’s net income after taxes for 2005 increased 5.6% to $7,966,132, an increase of $420,047 over 2004. Interest rates continued to rise in 2005, resulting in a higher cost of investible funds for the Company. This increase was offset by a corresponding increase in interest rates on loans and investments.
The Company’s Return on Average Assets (“ROA”) was 1.08% in 2007, compared to 1.39% in 2006 and 1.35% in 2005. Its Return on Average Equity (“ROE”) was 10.26% in 2007, 12.59% in 2006 and 12.63% in 2005. During these periods, leverage capital ratios (the ratio of equity to average total assets) increased from 10.11% in 2005 to 11.30% in 2006 before decreasing to 9.98% in 2007. The decrease in ROE was the result of the Company’s capital growing at a faster rate than its net income. The decrease in ROA was also a result of the Company’s assets growing at a faster rate than its net income. The Company to increase the annual dividend payout rate to approximately 51.77% of 2007 earnings per share, as compared to 41.3% in 2006 and 40.9% in 2005. Even though the dividend payout ratio has increased, the leverage capital ratio was 9.98% in 2007, which is well above the regulatory requirement of 5% to be considered “well capitalized” under applicable Federal Deposit Insurance Corporation (the “FDIC”) guidelines for the Bank.
CRITICAL ACCOUNTING POLICIES
The preparation of financial statements in conformity with accounting principles generally accepted in the United States of America requires management to make estimates and assumptions that affect the reported amounts of assets and liabilities and disclosure of contingent assets and liabilities at the date of the financial statements and the reported amounts of revenues and expenses during the reporting period. Actual results could differ from those estimates.
The critical accounting policy most important to the presentation of our financial statements relates to the allowance for loan loss and the related provision for loan losses. The allowance for loan losses is available to absorb probable credit losses inherent in the entire loan portfolio. The appropriate level of the allowance is based on a quarterly analysis of the loan portfolio and represents an amount that management deems adequate to provide for inherent losses, including collective impairment as recognized under Financial Accounting Standards Board (“FASB”) Statement of Financial Accounting Standard (“SFAS”) No. 5, “Accounting for Contingencies”. The collective impairment is calculated based on loans grouped by grade. Another component of the allowance is losses on loans assessed as impaired under FASB Statement 114, “Accounting by Creditors for Impairment of a Loan” (“SFAS No. 114”). The balance of these loans determined to be impaired under SFAS No. 114 and their related allowance is included in management’s estimation and analysis of the allowance for loan losses. For a discussion of other considerations in establishing the allowance for loan losses and our loan policies and procedures for addressing credit risk, please refer to the disclosures in this Item under the heading “Provision for Loan Losses and Asset Quality.”
44
Prior to the adoption of FASB SFAS No. 123 (revised 2004), “Share-Based Payment” (“SFAS No. 123R”, effective January 1, 2006), the Company accounted for stock options in accordance with Accounting Principles Board Opinion No. 25, “Accounting for Stock Issued to Employees” (“APB No. 25”). APB No. 25 did not require the Company to recognize compensation expense for stock options granted to employees if the option price was not less than the fair market value of the underlying stock at the grant date. Accordingly, the Company did not recognize compensation expense for the 55,500 and 57,000 options granted to employees and directors for 2005 and 2004, respectively. If the Company had applied the provisions of SFAS No. 123R for the options granted, the Company would have reported compensation expense of $55,340 and $201,610 for 2005 and 2004, respectively, with the decrease in volatility of our stock price used in calculating compensation expense being the primary reason for the decrease in expense from 2004 to 2005.
Generally, all options granted to employees and directors fully vest six months and one day after the date of grant, rather than vesting in tranches over a specified period. Effective January 1, 2006, the Company adopted SFAS No. 123R using the modified prospective transition method. Under that method of transition, compensation cost recognized in 2006 includes: (a) compensation cost for all share-based payments granted prior to, but not yet vested as of January 1, 2006, based on the grant date fair value estimated in accordance with the original provisions of SFAS No. 123; and (b) compensation cost for all share-based payments granted subsequent to January 1, 2006, based on the grant-date fair value estimated in accordance with the provisions of SFAS No. 123R. At the date of adoption, there were no unvested share-based payments outstanding. Also, given the limited historical amount of forfeited options, the Company has not reduced compensation expense for estimated forfeitures. The Company did not change the amount or terms of any outstanding option arrangements in anticipation of the adoption of SFAS No. 123R.
The Company utilizes the Black-Scholes valuation model to determine the fair value of stock options. The Black-Scholes model requires the use of certain assumptions, including the volatility of the Company’s stock price (the Company has used the historical volatility in prior periods to determine the estimated compensation expense), the expected life of the option, the expected dividend rate and the discount rate. The Company does not currently expect to change the model or its methods for determining the assumptions underlying the valuation of future stock option grants. For more information on the Company’s stock options and the assumptions used to calculate the expense of such options, please refer to Note 1, “Summary of Significant Accounting Policies,” and Note 18, “Stock Options” to the Company’s Consolidated Financial Statements included in this Annual Report.
Please refer to Note 1, “Summary of Significant Accounting Policies,” to the Consolidated Financial Statements of the Company included in this Annual Report for a detailed discussion of recent accounting pronouncements affecting the Company.
45
DISCLOSURE REGARDING FORWARD-LOOKING STATEMENTS
In addition to historical information, this report contains statements which constitute forward-looking statements and information which are based on management’s beliefs, plans, expectations, assumptions and on information currently available to management. The words “may,” “should,” “expect,” “anticipate,” “intend,” “plan,” “continue,” “believe,” “seek,” “estimate,” and similar expressions used in this report that do not relate to historical facts are intended to identify forward-looking statements. The Company notes that a variety of factors could cause its actual results or experience to differ materially from the anticipated results or other expectations described or implied by such forward-looking statements. The risks and uncertainties that may affect the operation, performance, development and results of the business of the Company and the Bank, include, but are not limited to, the following:
| | • | | the risk of adverse changes in business conditions in the banking industry generally and in the specific markets in which the Company operates; |
| | • | | changes in the legislative and regulatory environment that negatively impact the Company and the Bank through increased operating expenses; |
| | • | | increased competition from other financial institutions; |
| | • | | the impact of technological advances; |
| | • | | expectations about the movement of interest rates, including actions that may be taken by the Federal Reserve Board in response to changing economic conditions; |
| | • | | changes in asset quality and loan demand; |
| | • | | expectations about overall economic strength and the performance of the economy in the Company’s market area; and |
| | • | | other risks detailed from time to time in the Company’s filings with the Securities and Exchange Commission. |
The Company undertakes no obligation to update or revise any forward-looking statements subsequent to the date on which they are made.
46
SELECTED FINANCIAL DATA
The following selected financial data has been taken from the Company’s Consolidated Financial Statements and related notes included in this Annual Report and should be read in conjunction with such consolidated financial statements and related notes. Dollar references in all of the following tables are in thousands except for per share data.
The major components of the Company’s operating results for the past five years are summarized in Table 1—Five Year Financial Summary of Consolidated Statements and Related Statistics.
TABLE 1 – FIVE YEAR SUMMARY OF CONSOLIDATED STATEMENTS AND RELATED STATISTICS
| | | | | | | | | | | | | | | | | | | | |
| | | 2007 | | | 2006 | | | 2005 | | | 2004 | | | 2003 | |
Summary of Earnings | | | | | | | | | | | | | | | | | | | | |
| | | | | |
Total Interest Income | | $ | 38,100 | | | $ | 36,487 | | | $ | 33,044 | | | $ | 29,972 | | | $ | 29,725 | |
Total Interest Expense | | | 16,763 | | | | 13,181 | | | | 9,847 | | | | 7,537 | | | | 8,188 | |
Provision for loan losses | | | 784 | | | | (361 | ) | | | 1,084 | | | | 1,067 | | | | 2,003 | |
Non-interest income | | | 7,779 | | | | 6,187 | | | | 5,737 | | | | 5,574 | | | | 5,324 | |
Non-interest expense | | | 19,449 | | | | 18,623 | | | | 17,517 | | | | 16,713 | | | | 15,042 | |
Income tax expense | | | 1,968 | | | | 2,836 | | | | 2,366 | | | | 2,683 | | | | 2,845 | |
Net Income | | | 6,914 | | | | 8,395 | | | | 7,966 | | | | 7,546 | | | | 6,971 | |
Per Share Data | | | | | | | | | | | | | | | | | | | | |
Earnings-basic | | $ | 1.41 | | | $ | 1.67 | | | $ | 1.59 | | | $ | 1.51 | | | $ | 1.40 | |
Earnings-diluted | | | 1.39 | | | | 1.65 | | | | 1.57 | | | | 1.49 | | | | 1.39 | |
Cash dividends | | | 0.73 | | | | 0.69 | | | | 0.65 | | | | 0.60 | | | | 0.57 | |
Book value at year end | | | 14.02 | | | | 13.88 | | | | 12.73 | | | | 12.04 | | | | 11.35 | |
| | | | | |
Selected Year End Actual Balances | | | | | | | | | | | | | | | | | | | | |
| | | | | |
Loans, net of unearned income | | $ | 371,993 | | | $ | 372,993 | | | $ | 379,526 | | | $ | 369,589 | | | $ | 357,064 | |
Allowance for loan losses | | | 3,968 | | | | 3,712 | | | | 4,562 | | | | 4,721 | | | | 5,127 | |
Securities available for sale | | | 244,720 | | | | 174,617 | | | | 162,203 | | | | 151,716 | | | | 143,181 | |
Earning assets | | | 613,756 | | | | 552,843 | | | | 542,441 | | | | 525,155 | | | | 493,209 | |
Total assets | | | 680,904 | | | | 621,197 | | | | 614,827 | | | | 587,239 | | | | 550,761 | |
Deposits | | | 477,232 | | | | 471,847 | | | | 473,812 | | | | 474,464 | | | | 438,697 | |
Long term borrowings | | | 49,400 | | | | 59,400 | | | | 60,049 | | | | 46,119 | | | | 47,637 | |
Shareholders’ equity | | | 68,191 | | | | 69,665 | | | | 63,774 | | | | 60,191 | | | | 56,502 | |
| | | | | |
Selected Year End Average Balances | | | | | | | | | | | | | | | | | | | | |
| | | | | |
Loans, net of unearned income | | $ | 358,178 | | | $ | 373,729 | | | $ | 371,925 | | | $ | 364,922 | | | $ | 337,763 | |
Allowance for loan losses | | | 3,688 | | | | 4,162 | | | | 4,646 | | | | 5,532 | | | | 4,495 | |
Securities available for sale | | | 201,620 | | | | 160,537 | | | | 156,333 | | | | 142,994 | | | | 164,371 | |
Earning assets | | | 575,262 | | | | 527,891 | | | | 528,562 | | | | 506,898 | | | | 499,726 | |
Total assets | | | 639,305 | | | | 604,137 | | | | 591,872 | | | | 565,892 | | | | 549,520 | |
Deposits | | | 480,191 | | | | 469,460 | | | | 464,629 | | | | 457,510 | | | | 447,188 | |
Long term borrowings | | | 54,634 | | | | 59,608 | | | | 54,823 | | | | 41,607 | | | | 35,314 | |
Shareholders’ equity | | | 67,377 | | | | 66,685 | | | | 63,068 | | | | 58,750 | | | | 56,121 | |
| | | | | |
Selected Ratios | | | | | | | | | | | | | | | | | | | | |
| | | | | |
Return on average assets | | | 1.08 | % | | | 1.39 | % | | | 1.35 | % | | | 1.33 | % | | | 1.27 | % |
Return on average equity | | | 10.26 | % | | | 12.59 | % | | | 12.63 | % | | | 12.84 | % | | | 12.42 | % |
Dividend payout ratio | | | 51.77 | % | | | 41.32 | % | | | 40.86 | % | | | 39.71 | % | | | 40.71 | % |
Equity to year end assets | | | 10.01 | % | | | 11.21 | % | | | 10.49 | % | | | 10.25 | % | | | 10.26 | % |
Total risk-based capital to risk-adjusted assets | | | 17.06 | % | | | 17.73 | % | | | 16.20 | % | | | 15.35 | % | | | 14.94 | % |
Leverage capital ratio | | | 9.98 | % | | | 11.30 | % | | | 10.11 | % | | | 9.72 | % | | | 9.11 | % |
Efficiency ratio | | | 64.41 | % | | | 60.05 | % | | | 58.14 | % | | | 57.65 | % | | | 54.45 | % |
47
NET OPERATING INCOME
Net operating income for 2007 decreased 17.6% to $6,914,234, or $1.41 per share-basic and $1.39 per share-diluted, from the $8,394,524, or $1.67 per share basic and $1.65 per share diluted for 2006. The provision for loan losses for 2007 was $784,120 compared to the negative provision of $360,910 in 2006. Non-interest income increased $1,591,128, or 25.8%, and non-interest expense increased $826,100, or 4.4%, in 2007. Non-interest income for 2007 increased due to an increase in dividends from investments related to a commercial sweep account program and non-interest expense increased mainly due to an increase in salaries and benefits. This increase in salaries and benefits is related to our new branches in Lauderdale and Oktibbeha counties and normal raises for our existing officers and employees.
Net operating income for 2006 increased 5.4% to $8,394,524, or $1.67 per share-basic and $1.65 per share-diluted, from the $7,966,132, $1.59 per share basic and $1.57 per share diluted for 2005. The provision for possible loan losses for the year ended 2006 was a negative provision of $360,910 compared to the provision of $1,084,326 in 2005. This negative provision was the result of improved loan quality, favorable loss experience and a decrease in loans outstanding. Non-interest income increased $450,598 thousand, or 7.8%, and non-interest expense increased $1,106,278, or 6.3%, for 2006.
Net operating income for 2005 increased 5.6% to $7,966,132, or $1.59 per share-basic and $1.57 per share-diluted. The provision for possible loan losses for 2005 was $1,084,326, an increase of $16,883, or 1.6% from 2004. Non-interest income in 2005 increased $162,292, or 2.9%, over 2004 non-interest income due to an increase in service charges and other fees received. Non-interest expense increased $803,949, or 4.8% when compared to the same period in 2004. This increase was due mainly to a $916,301, or 10.6% in salaries and benefits paid.
NET INTEREST INCOME
Net interest income is the most significant component of the Company’s earnings. Net interest income is the difference between interest and fees realized on earning assets, primarily loans and securities, and interest paid on deposits and other borrowed funds. The net interest margin is this difference expressed as a percentage of average earning assets. Net interest income is affected by several factors, including the volume of earning assets and liabilities, the mix of earning assets and liabilities, and interest rates. The discussion below is presented on a tax equivalent basis which management believes to be the best way to analyze net interest income.
Net interest income on a tax equivalent basis was $23,766,000, $24,506,000 and $24,373,000 for the years 2007, 2006 and 2005, respectively. Net interest margin was 4.34%, 4.55% and 4.61% for the same periods. During 2007, the yields on interest earning assets rose less than the rates paid on interest bearing deposits. The largest increase in rates paid was in the rates paid on certificates of
48
deposit. For the year ended December 31, 2007, the average yield on earnings assets was 7.15%, an increase of 18 basis points compared to the average yield at December 31, 2006. The average rate paid on interest-bearing liabilities was 3.38%, an increase of 40 basis points compared to the average rate at December 31, 2006. The volume of earning assets increased 1.4% while the volume of interest-bearing liabilities increased 3.0% in 2007.
For the year ended December 31, 2006, the average yield on earnings assets was 6.97%, an increase of 51 basis points compared to the average yield at December 31, 2005. The average rate paid on interest-bearing liabilities was 2.98%, an increase of 66 basis points compared to the average rate at December 31, 2005. The effect of increases in rates on net interest margin was offset partially by changes in volume. The volume of earning assets increased 2.1% while the volume of interest-bearing liabilities increased 0.3% in 2006.
During 2005, the rates on interest earning assets and interest bearing liabilities both rose such that the net interest margin in 2005 was unchanged from 2004. Both volume and rates increased on both interest bearing assets and liabilities. For the year ended December 31, 2005, the average yield on earnings assets was 6.46%, an increase of 37 basis points compared to the average yield at December 31, 2004. The average rate paid on interest-bearing liabilities was 2.22%, an increase of 46 basis points compared to the average rate at December 31, 2004. The volume of earning assets increased 4.6% while the volume of interest-bearing liabilities increased 3.2% in 2005.
During this three-year period, loan demand has remained steady and has allowed the Company to continue to invest its available funds in loans. Loans generally provide the Company with yields that are greater than the yields on typical investment securities.
During 2003, the Company purchased $11.4 million of additional bank-owned life insurance. The income received by the Company on these policies increased the Company’s total investment to approximately $16.0 million at December 31, 2005, $16.8 million at December 31, 2006 and $17.7 million at December 2007. The additional purchases were made to provide a future funding source for certain of the Company’s deferred compensation arrangements. Such insurance also offers more attractive yields than other investment securities.
Table 2 – Average Balance Sheets and Interest Rates sets forth average balance sheet data, including all major categories of interest-earning assets and interest-bearing liabilities, together with the interest earned or interest paid and the average yield or average rate paid on each such category for the fiscal years ended December 31, 2007, 2006 and 2005.
49
TABLE 2 – AVERAGE BALANCE SHEETS AND INTEREST RATES
| | | | | | | | | | | | | | | | | | | | | | | | | | | |
| | | Average Balance | | Income/Expense | | Average Yield/Rate | |
| | | 2007 | | 2006 | | 2005 | | 2007 | | 2006 | | 2005 | | 2007 | | | 2006 | | | 2005 | |
Loans: | | | | | | | | | | | | | | | | | | | | | | | | | | | |
Loans, net of unearned income | | $ | 357,323 | | $ | 372,691 | | $ | 370,982 | | $ | 28,985 | | $ | 28,920 | | $ | 25,435 | | 8.11 | % | | 7.76 | % | | 7.13 | % |
Investment Securities | | | | | | | | | | | | | | | | | | | | | | | | | | | |
Taxable | | | 93,594 | | | 74,846 | | | 71,916 | | | 4,928 | | | 3,652 | | | 3,023 | | 5.27 | % | | 4.88 | % | | 4.20 | % |
Tax-exempt | | | 76,803 | | | 84,019 | | | 80,728 | | | 4,247 | | | 4,709 | | | 4,564 | | 5.53 | % | | 5.60 | % | | 5.65 | % |
| | | | | | | | | | | | | | | | | | | | | | | | | | | |
Total Investment Securities | | | 170,397 | | | 158,865 | | | 152,644 | | | 9,175 | | | 8,361 | | | 7,587 | | 5.38 | % | | 5.26 | % | | 4.97 | % |
Federal Funds Sold and Other | | | 19,976 | | | 8,825 | | | 5,891 | | | 1,021 | | | 407 | | | 180 | | 5.11 | % | | 4.61 | % | | 3.06 | % |
| | | | | | | | | | | | | | | | | | | | | | | | | | | |
Total Interest Earning Assets | | | 547,696 | | | 540,381 | | | 529,517 | | | 39,181 | | | 37,688 | | | 34,202 | | 7.15 | % | | 6.97 | % | | 6.46 | % |
| | | | | | | | | | | | | | | | | | | | | | | | | | | |
Non-Earning Assets | | | 91,609 | | | 63,756 | | | 62,355 | | | | | | | | | | | | | | | | | | |
| | | | | | | | | | | | | | | | | | | | | | | | | | | |
Total Assets | | $ | 639,305 | | $ | 604,137 | | $ | 591,872 | | | | | | | | | | | | | | | | | | |
| | | | | | | | | | | | | | | | | | | | | | | | | | | |
Deposits: | | | | | | | | | | | | | | | | | | | | | | | | | | | |
Interest-bearing Demand | | | | | | | | | | | | | | | | | | | | | | | | | | | |
Deposits | | $ | 149,111 | | $ | 144,348 | | $ | 144,134 | | $ | 2,805 | | $ | 2,528 | | $ | 2,098 | | 1.88 | % | | 1.75 | % | | 1.46 | % |
Savings | | | 30,775 | | | 34,288 | | | 35,494 | | | 262 | | | 313 | | | 301 | | 0.85 | % | | 0.85 | % | | 0.89 | % |
Time | | | 220,364 | | | 202,792 | | | 204,265 | | | 9,724 | | | 7,474 | | | 5,014 | | 4.41 | % | | 3.69 | % | | 2.45 | % |
| | | | | | | | | | | | | | | | | | | | | | | | | | | |
Total Deposits | | | 400,250 | | | 381,428 | | | 383,893 | | | 12,791 | | | 10,315 | | | 7,413 | | 3.20 | % | | 2.70 | % | | 1.93 | % |
Borrowed Funds | | | | | | | | | | | | | | | | | | | | | | | | | | | |
Short-term Borrowings | | | 1,892 | | | 1,106 | | | 2,344 | | | 96 | | | 60 | | | 84 | | 5.07 | % | | 5.34 | % | | 3.58 | % |
Long-term Borrowings | | | 53,482 | | | 59,607 | | | 54,823 | | | 2,534 | | | 2,807 | | | 2,332 | | 4.74 | % | | 4.64 | % | | 4.25 | % |
| | | | | | | | | | | | | | | | | | | | | | | | | | | |
Total Borrowed Funds | | | 55,374 | | | 60,713 | | | 57,167 | | | 2,630 | | | 2,867 | | | 2,416 | | 4.75 | % | | 4.72 | % | | 4.23 | % |
| | | | | | | | | | | | | | | | | | | | | | | | | | | |
Total Interest-Bearing Liabilities | | | 455,624 | | | 442,141 | | | 441,060 | | | 15,421 | | | 13,182 | | | 9,829 | | 3.38 | % | | 2.97 | % | | 2.22 | % |
Non-Interest Bearing Liabilities | | | | | | | | | | | | | | | | | | | | | | | | | | | |
Demand Deposits | | | 79,187 | | | 87,396 | | | 80,737 | | | | | | | | | | | | | | | | | | |
Other Liabilities | | | 37,117 | | | 7,935 | | | 7,007 | | | | | | | | | | | | | | | | | | |
Shareholders’ Equity | | | 67,377 | | | 66,665 | | | 63,068 | | | | | | | | | | | | | | | | | | |
| | | | | | | | | | | | | | | | | | | | | | | | | | | |
Total Liabilities and Shareholders’ Equity | | $ | 639,305 | | $ | 604,137 | | $ | 591,872 | | | | | | | | | | | | | | | | | | |
| | | | | | | | | | | | | | | | | | | | | | | | | | | |
Interest Rate Spread | | | | | | | | | | | | | | | | | | | | 3.77 | % | | 4.00 | % | | 4.24 | % |
| | | | | | | | | | | | | | | | | | | | | | | | | | | |
Net Interest Margin | | | | | | | | | | | $ | 23,760 | | $ | 24,506 | | $ | 24,373 | | 4.34 | % | | 4.55 | % | | 4.61 | % |
| | | | | | | | | | | | | | | | | | | | | | | | | | | |
Less Tax Equivalent Adjustment | | | | | | | | | | | | 1,081 | | | 1,201 | | | 1,177 | | | | | | | | | |
| | | | | | | | | | | | | | | | | | | | | | | | | | | |
Net Interest Income | | | | | | | | | | | $ | 22,679 | | $ | 23,305 | | $ | 23,196 | | | | | | | | | |
| | | | | | | | | | | | | | | | | | | | | | | | | | | |
50
Table 3 – Net Average Interest Earning Assets illustrates net interest earning assets and liabilities for 2007, 2006, and 2005.
TABLE 3 – NET AVERAGE INTEREST EARNING ASSETS
| | | | | | | | | |
| | | 2007 | | 2006 | | 2005 |
Average interest earning assets | | $ | 547,696 | | $ | 540,381 | | $ | 529,517 |
Average interest bearing liabilities | | | 455,624 | | | 442,141 | | | 441,614 |
| | | | | | | | | |
Net average interest earning assets | | $ | 92,072 | | $ | 98,240 | | $ | 87,903 |
| | | | | | | | | |
Table 4 – Volume/Rate Analysis depicts the effect on interest income and interest expense of changes in volume and changes in rate from 2005 through 2007. Variances which were attributable to both volume and rate are allocated proportionately between rate and volume using the absolute values of each for a basis for the allocation. Non-accruing loans are included in the average loan balances used in determining the yields. Interest income on tax-exempt securities and loans has been adjusted to a tax equivalent basis using a federal income tax rate of 34%.
TABLE 4 – VOLUME/RATE ANALYSIS
| | | | | | | | | | | | | | | | | | | | | | | | |
| | | 2007 Change from 2006 | | | 2006 Change from 2005 | |
| | | Volume | | | Rate | | | Total | | | Volume | | | Rate | | | Total | |
INTEREST INCOME | | | | | | | | | | | | | | | | | | | | | | | | |
Loans | | $ | (1,246 | ) | | $ | 1,311 | | | $ | 65 | | | $ | 133 | | | $ | 2,352 | | | $ | 2,485 | |
Taxable Securities | | | 988 | | | | 288 | | | | 1,276 | | | | 143 | | | | 486 | | | | 629 | |
Non-Taxable Securities | | | (399 | ) | | | (63 | ) | | | (462 | ) | | | 184 | | | | (39 | ) | | | 145 | |
Federal Funds Sold and Other | | | 570 | | | | 44 | | | | 614 | | | | 135 | | | | 92 | | | | 227 | |
| | | | | | | | | | | | | | | | | | | | | | | | |
TOTAL INTEREST INCOME | | $ | (87 | ) | | $ | 1,580 | | | $ | 1,493 | | | $ | 595 | | | $ | 2,891 | | | $ | 3,486 | |
| | | | | | | | | | | | | | | | | | | | | | | | |
| | | | | | |
INTEREST EXPENSE | | | | | | | | | | | | | | | | | | | | | | | | |
Interest-bearing demand deposits | | $ | 90 | | | $ | 187 | | | | 277 | | | $ | 4 | | | $ | 426 | | | | 430 | |
Savings Deposits | | | (30 | ) | | | (21 | ) | | | (51 | ) | | | (10 | ) | | | 1 | | | | (9 | ) |
Time Deposits | | | 775 | | | | 1,475 | | | | 2,250 | | | | (54 | ) | | | 2,514 | | | | 2,460 | |
Short-term borrowings | | | 40 | | | | (4 | ) | | | 36 | | | | (67 | ) | | | 43 | | | | (24 | ) |
Long-term borrowings | | | (290 | ) | | | 17 | | | | (273 | ) | | | 225 | | | | 250 | | | | 475 | |
| | | | | | | | | | | | | | | | | | | | | | | | |
TOTAL INTEREST EXPENSE | | $ | 585 | | | $ | 1,654 | | | | 2,239 | | | $ | 98 | | | $ | 3,234 | | | | 3,332 | |
| | | | | | | | | | | | | | | | | | | | | | | | |
NET INTEREST INCOME | | $ | (672 | ) | | $ | (74 | ) | | $ | (746 | ) | | $ | 693 | | | $ | 6,125 | | | $ | 6,818 | |
| | | | | | | | | | | | | | | | | | | | | | | | |
LOANS
The loan portfolio constitutes the major earning asset of the Company and, in the opinion of management, offers the best alternative for maximizing net interest margin. The Company’s loan personnel have the authority to extend credit under guidelines established and approved by the Board of Directors. Any aggregate credit that exceeds the authority of the loan officer is forwarded to the Board’s loan committee for approval. The loan committee is composed of various directors, including the Chairman of the Board. All aggregate credits which exceed the loan committee’s lending authority are presented to the full Board of Directors for ultimate
51
approval or denial. The loan committee not only acts as an approval body to ensure consistent application of the Company’s loan policy but also provides valuable insight through communication and pooling of knowledge, judgment, and experience of its members.
The Company has stated in its Loan Policy the following objectives for its loan portfolio:
| | • | | to make loans after sound and thorough credit analysis; |
| | • | | to properly document all loans; |
| | • | | to eliminate loans from the portfolio that are under-priced, high risk or difficult and costly to administer; |
| | • | | to seek good relationships with the customer; |
| | • | | to avoid undue concentrations of loans; and |
| | • | | to keep non-accrual loans to a minimum by aggressive collection policies. |
Loan demand has weakened in the Company’s market area over the past three years. In general, the change in loan demand experienced in 2007 and 2006 was due to a lack of growth in the market area served by the Company and increased competition from other financial institutions for the available loans. The impact on the housing market caused by the opening of a casino on the nearby Choctaw Indian Reservation in 1995 is beginning to show less of an impact in the area. The impact on the loan portfolio attributable to Hurricane Katrina rebuilding contracts has also lessened, as these loans were repaid in early 2006 as the rebuilding contracts were completed. Real estate mortgage loans originated by the Company increased by 3.5%, or $3,968,856, in 2007, by 26.7%, or $24,250,834, in 2006, and by 1.7%, or $1,550,809, in 2005 compared to the prior year. The growth in mortgage loans in 2007 was the result of normal growth in our market area. Most of the increase in mortgage loans during 2006 is the result of 1-to-4 family rental property being reclassified from commercial loans to residential real estate. Prior to 2006, 1-to-4 family rental housing had been classified as commercial real estate instead of 1-to-4 family mortgages due to the business nature of the property. After a review of our collateral as part of its normal collateral verification process, The Federal Home Loan Bank of Dallas (“FHLB”) advised that 1-to-4 family rental property should be classified as 1-to-4 family mortgages. This reclassification affected approximately $20 million in commercial real estate loans.
Commercial and agricultural loans declined $8,415,346, or 4.5% in 2007, and $27,241,284, or 12.8%, in 2006 and increased $12,019,676, or 6.0%, in 2005. Several large loans paid off in 2007, which were not replaced with other loans or renewals. The decrease in 2006 in this category of loans is a result of a transfer of loans from being classified as commercial loans to mortgage loans and reflected in the increase noted above. Commercial and agricultural loans are the largest segment of the loan portfolio and, by nature, bear a higher degree of risk. Management believes the lending practices, policies, and procedures applicable to this loan category are adequate to manage any risk represented by the growth of the loans in this category.
52
Consumer loans declined $4,857,228, or 7.9% in 2007, declined $6,140,000, or 9.1%, in 2006 and increased $1,046,248, or 1.6%, in 2005, compared to the prior year. The Company believes that changes in consumer purchasing habits and the increase in loan sources have affected the growth of this segment of loans. Sustained low unemployment may also have lessened the dependence on consumer loans for some purchases.
Table 5 – Loans Outstanding reflects outstanding balances by loan type for the past five years. Additional loan information is presented in Note 5, “Loans,” to the Company’s Consolidated Financial Statements included in this Annual Report.
TABLE 5 – LOANS OUTSTANDING
| | | | | | | | | | | | | | | |
| | | AT DECEMBER 31, |
| | | 2007 | | 2006 | | 2005 | | 2004 | | 2003 |
Commercial, financial and agricultural | | $ | 177,787 | | $ | 186,202 | | $ | 213,444 | | $ | 201,424 | | $ | 186,950 |
Real estate – construction | | | 18,821 | | | 11,047 | | | 8,779 | | | 10,706 | | | 15,409 |
Real estate – mortgage | | | 119,172 | | | 115,203 | | | 90,952 | | | 92,503 | | | 92,412 |
Consumer | | | 56,714 | | | 61,572 | | | 67,712 | | | 66,666 | | | 64,309 |
| | | | | | | | | | | | | | | |
TOTAL LOANS | | $ | 372,494 | | $ | 374,024 | | $ | 380,887 | | $ | 371,299 | | $ | 359,080 |
| | | | | | | | | | | | | | | |
Table 6 – Loan Liquidity and Sensitivity to Changes in Interest Rates reflects the maturity schedule or repricing frequency of all loans. Also presented are fixed and variable rate loans maturing after one year for all loans.
TABLE 6 – LOAN LIQUIDITY
LOAN MATURITIES AT DECEMBER 31, 2007
| | | | | | | | | | | | |
| | | 1 YEAR
OR LESS | | 1 - 5
YEARS | | OVER 5
YEARS | | Total |
Commercial, financial and agricultural | | $ | 88,549 | | $ | 76,003 | | $ | 13,235 | | $ | 177,787 |
Real estate – construction | | | 16,281 | | | 2,540 | | | | | $ | 18,821 |
Real estate – mortgage | | | 20,233 | | | 73,599 | | | 25,340 | | $ | 119,172 |
Consumer | | | 25,867 | | | 27,565 | | | 3,282 | | $ | 56,714 |
| | | | | | | | | | | | |
Total loans | | $ | 150,930 | | $ | 179,707 | | $ | 41,857 | | $ | 372,494 |
| | | | | | | | | | | | |
SENSITIVITY TO CHANGES IN INTEREST RATES
| | | | | | |
| | | 1 – 5
YEARS | | OVER 5
YEARS |
Fixed rates | | $ | 175,513 | | $ | 33,989 |
Variable rates | | | 4,194 | | | 7,868 |
| | | | | | |
Total loans | | $ | 179,707 | | $ | 41,857 |
| | | | | | |
Each loan the Company makes either has a stated maturity as to when the loan is to be repaid or is subject to an agreement between the Company and the customer governing its progressive reduction. The Company’s policy is that every loan is to be repaid by its stated maturity and not carried as a continuing debt. Generally, the Company requires that principal reductions on a loan must have begun prior to the second renewal date of the loan.
53
PROVISION FOR LOAN LOSSES AND ASSET QUALITY
The allowance for loan losses represents an amount which in management’s judgment will be adequate to absorb estimated probable losses within the existing loan portfolio. Loans that management determines to be uncollectible are charged against the allowance for loan losses, and subsequent recoveries, if any, are credited to the allowance. Management’s judgment in determining the adequacy of the allowance is based on evaluations of the collectibility of specific loans and prior loss experience. Other factors considered by management include specific economic events, general economic conditions and trends, and loan portfolio mix and growth. The allowance for loan losses is subject to close regulatory review from the FDIC and the Mississippi Department of Banking and Consumer Finance and is also a factor in each agency’s determination of our capital adequacy. The estimation of losses in our loan portfolio is susceptible to changes resulting from changes in the financial condition of individual borrowers and economic conditions in the Company’s market area.
The allowance for loan losses is established through a provision for loan losses charged against net income. This expense is determined by a number of factors, including historical loan losses, assessment of specific credit weaknesses within the portfolio, assessment of the prevailing economic climate, and other factors that may affect the overall condition of the loan portfolio. Management utilized these factors to determine the provision for loan losses for each of 2005, 2006 and 2007. The ratio of net loans charged off to average loans was 0.15% in 2007, 0.13% in 2006 and 0.33% in 2005. These percentages are representative of normal loan charge-offs and are not the result of an economic downturn in any particular segment of the Company’s market. Management evaluates the adequacy of the allowance for loan loss on a monthly basis and makes adjustments to the allowance based on this analysis.
The provision for loan losses in 2007 was $784,120 compared to a negative provision of $360,910 in 2006 and a provision of $1,084,326 in 2005. The Company uses a model that takes into account historical charge-offs and recoveries and applies that to certain loan segments of our portfolio. At the end of 2007, the total allowance for loan losses was $3,967,951, an amount that management believes to be sufficient to cover estimated probable losses in the loan portfolio.
Activity in the allowance for loan losses is reflected in Table 7 – Analysis of Allowance for Loan Losses. The Company’s policy is to charge-off loans when in management’s opinion the loan is deemed uncollectible. Even after it is charged off, however, the Company makes concerted efforts to maximize recovery of such loan.
TABLE 7 – ANALYSIS OF ALLOWANCE FOR LOAN LOSSES
| | | | | | | | | | | | | | | | | | | | |
| | | 2007 | | | 2006 | | | 2005 | | | 2004 | | | 2003 | |
BALANCE AT BEGINNING OF YEAR | | $ | 3,712 | | | $ | 4,562 | | | $ | 4,721 | | | $ | 5,127 | | | $ | 4,222 | |
| | | | | |
LOANS CHARGED-OFF | | | | | | | | | | | | | | | | | | | | |
Commercial, financial and agricultural | | | 404 | | | | 101 | | | | 861 | | | | 1,394 | | | | 700 | |
Real estate – construction | | | — | | | | 72 | | | | — | | | | — | | | | — | |
Real estate – mortgage | | | 211 | | | | 30 | | | | 64 | | | | 15 | | | | 145 | |
Consumer | | | 272 | | | | 577 | | | | 642 | | | | 390 | | | | 555 | |
TOTAL CHARGE-OFFS | | | 887 | | | | 780 | | | | 1,567 | | | | 1,799 | | | | 1,400 | |
| | | | | | | | | | | | | | | | | | | | |
| | | | | |
CHARGE-OFFS RECOVERED | | | | | | | | | | | | | | | | | | | | |
Commercial, financial and agricultural | | | 36 | | | | 37 | | | | 189 | | | | 144 | | | | 65 | |
Real estate – construction | | | — | | | | — | | | | — | | | | — | | | | — | |
Real estate – mortgage | | | 63 | | | | — | | | | 2 | | | | 11 | | | | 2 | |
Consumer | | | 259 | | | | 254 | | | | 133 | | | | 171 | | | | 235 | |
| | | | | | | | | | | | | | | | | | | | |
TOTAL RECOVERIES | | | 358 | | | | 291 | | | | 324 | | | | 326 | | | | 302 | |
| | | | | | | | | | | | | | | | | | | | |
Net loans charged-off | | | 529 | | | | 489 | | | | 1,243 | | | | 1,473 | | | | 1,098 | |
Additions charged to operating expense | | | 784 | | | | (361 | ) | | | 1,084 | | | | 1,067 | | | | 2,003 | |
| | | | | | | | | | | | | | | | | | | | |
BALANCE AT END OF YEAR | | $ | 3,967 | | | $ | 3,712 | | | $ | 4,562 | | | $ | 4,721 | | | $ | 5,127 | |
| | | | | | | | | | | | | | | | | | | | |
| | | | | |
Loans, net of unearned, at year end | | $ | 371,993 | | | $ | 372,993 | | | $ | 379,526 | | | $ | 369,589 | | | $ | 357,064 | |
| | | | | |
Ratio of allowance to loans at year end | | | 1.07 | % | | | 1.00 | % | | | 1.20 | % | | | 1.28 | % | | | 1.44 | % |
| | | | | |
Average loans – net of unearned | | $ | 358,178 | | | $ | 373,729 | | | $ | 371,925 | | | $ | 364,922 | | | $ | 337,763 | |
| | | | | |
Ratio of net loans charged-off to average loans | | | 0.15 | % | | | 0.13 | % | | | 0.33 | % | | | 0.40 | % | | | 0.33 | % |
54
ALLOCATION OF ALLOWANCE FOR LOAN LOSSES
| | | | | | | | | | | | | | | |
| | | AT DECEMBER 31, |
| | | 2007 | | 2006 | | 2005 | | 2004 | | 2003 |
Commercial, financial and agricultural | | $ | 2,080 | | $ | 1,163 | | $ | 1,713 | | $ | 1,872 | | $ | 2,300 |
Real estate – construction | | | 160 | | | 200 | | | 300 | | | 300 | | | 300 |
Real estate – mortgage | | | 517 | | | 900 | | | 900 | | | 900 | | | 900 |
Consumer | | | 1,211 | | | 1,350 | | | 1,550 | | | 1,550 | | | 1,550 |
Unallocated | | | — | | | 99 | | | 99 | | | 99 | | | 77 |
| | | | | | | | | | | | | | | |
Total | | $ | 3,968 | | $ | 3,712 | | $ | 4,562 | | $ | 4,721 | | $ | 5,127 |
| | | | | | | | | | | | | | | |
COMPOSITION OF LOAN PORTFOLIO BY TYPE
| | | | | | | | | | | | | | | |
| | | AT DECEMBER 31, | |
| | | 2007 | | | 2006 | | | 2005 | | | 2004 | | | 2003 | |
Commercial, financial and agricultural | | 47.72 | % | | 49.79 | % | | 56.04 | % | | 54.25 | % | | 52.06 | % |
Real estate – construction | | 5.05 | % | | 2.95 | % | | 2.30 | % | | 2.88 | % | | 4.29 | % |
Real estate – mortgage | | 31.99 | % | | 30.80 | % | | 23.88 | % | | 24.91 | % | | 25.74 | % |
Consumer | | 15.24 | % | | 16.46 | % | | 17.78 | % | | 17.96 | % | | 17.91 | % |
| | | | | | | | | | | | | | | |
| | 100.00 | % | | 100.00 | % | | 100.00 | % | | 100.00 | % | | 100.00 | % |
| | | | | | | | | | | | | | | |
After peaking in 2005, loan balances outstanding have declined in the last two years, as our credit standards have tightened and loan demand has decreased. The table above illustrates that while we had growth in the mortgage real estate and construction real estate categories, we have shown declines in the other categories. The most significant portion of the growth occurred in the mortgage real estate category, primarily on account of the reclassification of certain loans into the mortgage real estate category, as discussed above. Notwithstanding this growth, a larger portion of the allowance for loan losses is allocated to commercial, financial and agricultural loans and consumer loans. This reflects the higher risks associated with commercial and consumer lending as compared to real estate mortgages and construction loans.
55
Non-performing assets and the relative percentages of such assets to loan balances are presented in Table 8 – Non-performing Assets. Non-performing loans include non-accrual loans, loans delinquent 90 days or more based on contractual terms and troubled debt restructurings (within the meaning of FASB Statement 15, “ Accounting by Debtors and Creditors for Troubled Debt Restructurings”). Management classifies loans as non-accrual when it believes that collection of interest is doubtful. This typically occurs when payments are past due over 90 days, unless the loans are well secured and in the process of collection. Another measurement of asset quality is other real estate owned (OREO), which represents properties acquired by the Company through foreclosure following loan defaults by customers; the percentage of OREO to total loans at December 31, 2007 was 0.55% compared to 0.73% in 2006. OREO decreased in 2007 due to the sale of several parcels that were in other real estate.
Loans on non-accrual status amounted to $1,441,251 in 2007 as compared to $1,628,651 in 2006 and $4,346,512 in 2005. Interest income forgone on loans classified as non-accrual in 2007 was $102,452 as compared to $122,706 in 2006 and $348,804 in 2005. Upon the classification of a loan as non-accrual, all interest accrued on the loan prior to the time it is classified as non-accrual is reversed and interest accruals are suspended until such time that the loan is in compliance with its terms and/or deemed collectable.
TABLE 8 – NON-PERFORMING ASSETS
| | | | | | | | | | | | | | | | | | | | |
| | | AS OF DECEMBER 31, | |
| | | 2007 | | | 2006 | | | 2005 | | | 2004 | | | 2003 | |
PRINCIPAL BALANCE | | | | | | | | | | | | | | | | | | | | |
Non-accrual | | $ | 1,441 | | | $ | 1,629 | | | $ | 4,347 | | | $ | 3,146 | | | $ | 1,503 | |
Accruing loans 90 days or more past due | | | 526 | | | | 1,355 | | | | 911 | | | | 904 | | | | 4,396 | |
Troubled debt restructuring | | | — | | | | — | | | | — | | | | — | | | | — | |
| | | | | | | | | | | | | | | | | | | | |
TOTAL LOANS | | $ | 1,967 | | | $ | 2,984 | | | $ | 5,258 | | | $ | 4,050 | | | $ | 5,899 | |
| | | | | | | | | | | | | | | | | | | | |
TOTAL NON-PERFORMING LOANS | | $ | 1,967 | | | $ | 2,984 | | | $ | 5,258 | | | $ | 4,050 | | | $ | 5,899 | |
| | | | | | | | | | | | | | | | | | | | |
Income on non-accrual loans not recorded | | $ | 102 | | | $ | 123 | | | $ | 349 | | | $ | 229 | | | $ | 169 | |
Non-performing as a percent of loans | | | 0.53 | % | | | 0.80 | % | | | 1.39 | % | | | 1.10 | % | | | 1.65 | % |
Other real estate owned | | $ | 2,047 | | | $ | 2,708 | | | $ | 2,975 | | | $ | 2,787 | | | $ | 695 | |
OREO as a percent of loans | | | 0.55 | % | | | 0.73 | % | | | 0.78 | % | | | 0.75 | % | | | 0.19 | % |
Allowance as a percent of non-performing loans | | | 201.73 | % | | | 124.40 | % | | | 86.76 | % | | | 116.57 | % | | | 86.91 | % |
SFAS Nos. 114 and 118, “Accounting by Creditors for Impairment of a Loan,” was effective January 1, 1995. These statements changed the methods of estimating the loan loss allowance for problem loans. In general, when management determines that principal and interest due under the contractual terms of a loan are not fully collectible, management must value the loan using discounted future expected cash flows. Management considers the Company’s nonaccrual loans as being impaired under FASB 114 and 118. The balances of nonaccrual (impaired) loans for the years 2007, 2006, 2005 were $1,441,251, $1,628,651 and $4,346,512, respectively.
56
Management monitors any loans which are classified under FDIC regulations as loss, doubtful or substandard, even if management has not classified the loans as non-performing or impaired. In addition to loans classified for regulatory purposes, management also designates certain loans for internal monitoring purposes in a “watch” category. Loans may be placed on management’s watch list as a result of delinquent status, management’s concern about the borrower’s financial condition or the value of the collateral securing the loan, a substandard classification during regulatory examinations, or simply as a result of management’s desire to monitor more closely a borrower’s financial condition and performance. Watch category loans may include loans that are still performing and accruing interest and may be current under the terms of the loan agreement but about which management has a significant degree of concern about the borrowers’ ability to continue to perform according to the terms of the loan agreement. Watch category loans may also include credits, which, although adequately secured and performing, reflect a past delinquency problem or unfavorable financial trends exhibited by the borrower. Loss exposure on these loans is typically evaluated based primarily upon the estimated liquidation value of the collateral securing the loan.
At December 31, 2007, loans totaling $12,966,807 were included on the watch list of the Company compared to $16,238,723 at December 31, 2006. The majority of these loans are real estate loans that, although adequately collateralized, have experienced frequent delinquencies in scheduled payments. The inclusion of loans on this list does not indicate a greater risk of loss; rather it indicates that the loan possesses one of the several characteristics described above warranting increased oversight by management.
SECURITIES
At December 31, 2007, the Company classified all of its securities as available-for-sale.
Securities available-for-sale are reported at fair value, with unrealized gains and losses included as a separate component of equity, net of tax. The Company does not hold any securities classified as held to maturity or held for trading purposes.
Table 9 – Securities and Securities Maturity Schedule summarizes the carrying value of securities from 2005 through 2007 and the maturity distribution at December 31, 2007, by classification.
TABLE 9 – SECURITIES
| | | | | | | | | |
| | | 2007 | | 2006 | | 2005 |
SECURITIES AVAILABLE FOR SALE | | | | | | | | | |
U. S. Government Agencies | | $ | 95,511 | | $ | 0 | | $ | 2,003 |
State, County and Municipal Obligations | | | 77,072 | | | 11,713 | | | 11,972 |
Other Securities | | | 72,137 | | | 93,959 | | | 98,076 |
| | | | | | | | | |
TOTAL SECURITIES AVAILABLE FOR SALE | | $ | 244,720 | | $ | 174,617 | | $ | 169,321 |
| | | | | | | | | |
57
SECURITIES MATURITY SCHEDULE
| | | | | | | | | | | | | | | | | | | | | | | | |
| | | 1 year or less | | | 1 to 5 years | | | 5 to 10 years | | | over 10 years | |
| | | Actual
Balance | | Average
Yield | | | Actual
Balance | | Average
Yield | | | Actual
Balance | | Average
Yield | | | Actual
Balance | | Average
Yield | |
AVAILABLE-FOR-SALE | | | | | | | | | | | | | | | | | | | | | | | | |
U. S. Government Agencies (1) | | $ | 0 | | 0.00 | % | | $ | 831 | | 5.42 | % | | $ | 10,002 | | 5.50 | % | | $ | 84,678 | | 5.57 | % |
State, County and Municipal (2) | | | 2,158 | | 5.34 | % | | | 10,829 | | 5.93 | % | | | 22,248 | | 6.08 | % | | | 41,837 | | 5.94 | % |
Other Securities | | | 72,137 | | 4.26 | % | | | 0 | | 0.00 | % | | | 0 | | 0.00 | % | | | 0 | | 0.00 | % |
| | | | | | | | | | | | | | | | | | | | | | | | |
TOTAL AVAILABLE-FOR-SALE | | $ | 74,295 | | 4.29 | % | | $ | 11,660 | | 5.89 | % | | $ | 32,250 | | 5.90 | % | | $ | 126,515 | | 5.69 | % |
| | | | | | | | | | | | | | | | | | | | | | | | |
| (1) | The maturities for the mortgage backed securities included in this line item are based on final maturity. |
| (2) | Average rates were calculated on tax equivalent basis using a marginal federal income tax rate of 34% and a state tax rate of 5%. |
The change in the carrying value of the available-for-sale portfolio is due to market value fluctuations resulting from the changing interest rate environment during 2007. This change is not used in the Tier 1 capital calculation.
As the above table illustrates, during the last three years, the Company shifted its investment mix away from lower-yielding U. S. Treasury securities into higher-yielding mortgage-backed securities issued by the Government National Mortgage Agency (“GNMA”) and other agencies of the federal government and higher-yielding securities issued by state and local entities. This move was done mainly to maintain a higher yield on investment securities than the Company could have attained with U. S. Treasury instruments. Also during 2007, the Company reduced its Federal Funds Sold by $14,300,000 and invested these funds in higher yielding securities
DEPOSITS
The Company offers a wide variety of deposit services to individual and commercial customers, such as non-interest-bearing and interest-bearing checking accounts, savings accounts, money market deposit accounts, and certificates of deposit. The deposit base is the Company’s major funding source for earning assets. Time deposits increased in 2007, as the Company began to aggressively price time deposits to maintain its market share. During this time all other segments of deposits declined.
A three-year schedule of deposits by type and maturities of time deposits greater than $100,000 is presented in Table 10 – Deposit Information.
58
TABLE 10 – DEPOSIT INFORMATION
| | | | | | | | | | | | | | | | | | |
| | | 2007 | | | 2006 | | | 2005 | |
| | | Average
Balance | | Average
Rate | | | Average
Balance | | Average
Rate | | | Average
Balance | | Average
Rate | |
Noninterest-bearing | | $ | 78,225 | | | | | $ | 87,396 | | | | | $ | 80,183 | | | |
Interest-bearing demand | | | 149,111 | | 1.89 | % | | | 144,348 | | 1.75 | % | | | 144,134 | | 1.46 | % |
Savings | | | 29,764 | | 0.85 | % | | | 34,924 | | 0.85 | % | | | 36,048 | | 0.83 | % |
Certificates of deposit | | | 224,941 | | 4.41 | % | | | 202,792 | | 3.69 | % | | | 204,265 | | 2.45 | % |
| | | | | | | | | | | | | | | | | | |
| | $ | 482,041 | | 2.70 | % | | $ | 469,460 | | 2.20 | % | | $ | 464,630 | | 1.59 | % |
| | | | | | | | | | | | | | | | | | |
MATURITY RANGES OF TIME CERTIFICATES OF DEPOSIT OF $100,000 OR MORE,
| | | |
| | | AS OF DECEMBER 31, 2007 |
3 months or less | | $ | 39,123 |
3 through 6 months | | | 26,291 |
6 through 12 months | | | 33,835 |
over 12 months | | | 2,557 |
| | | |
| | $ | 101,806 |
| | | |
The Company in its normal course of business will acquire large certificates of deposit, generally from public entities, with a variety of maturities. These funds are acquired on a bid basis and are considered to be part of the deposit base of the Company.
BORROWINGS
Aside from the core deposit base and large denomination certificates of deposit mentioned above, the remaining funding sources utilized by the Company include short-term and long-term borrowings. Short-term borrowings consist of Federal Funds Purchased from other financial institutions on an overnight basis and short-term advances from the FHLB. Long-term borrowings are advances from the FHLB with an initial maturity of greater than one year.
TABLE 11 - SHORT-TERM BORROWINGS
| | | | | | | | | | | | |
| | | AS OF DECEMBER 31, | |
| | | 2007 | | | 2006 | | | 2005 | |
Short-term borrowings | | | | | | | | | | | | |
Year-end balance | | $ | 79,163 | | | $ | 12,767 | | | $ | 1,600 | |
Weighted average rate | | | 3.96 | % | | | 4.71 | % | | | 4.20 | % |
| | | |
Maximum month-end balance | | $ | 79,163 | | | $ | 50,682 | | | $ | 12,600 | |
| | | |
Year to date average balance | | $ | 31,916 | | | $ | 20,796 | | | $ | 2,344 | |
Weighted average rate | | | 4.43 | % | | | 4.55 | % | | | 3.54 | % |
59
The Company borrows funds for short periods from the FHLB as an alternative to Federal Funds Purchased. The Company foresees short-term borrowings to be a continued source of liquidity and likely will continue to use these borrowings as a method to fund short-term needs. At December 31, 2007, the Company had the capacity to borrow up to $139,341,868 from the FHLB and other financial institutions in the form of Federal Funds Purchased. The Company generally will use these types of borrowings if loan demand is greater than the growth in deposits. In 2007, the Company decreased its borrowings from the FHLB by $10,000,000 and increased its Federal Funds Purchased by $4,200,000. In 2007, the sweep account liability increased to $74,963,424 from $12,195,941, an increase of $62,195,941, or 510%. This increase was the result of both additional accounts being opened and increased balances in the existing accounts.
The Company at the end of 2007 had long-term debt in the amount of $49,400,000 to the FHLB for advances and $1,018,273 payable to the State of Mississippi for advances under the Mississippi Agribusiness Enterprise Loan Program. This program provides interest-free loans to banks to fund loans to qualifying farmers. Farmers that qualify for the program receive 20% of their loan at zero interest. When the loan is repaid, the State of Mississippi receives 20% of the principal payment, which is equal to the amount advanced by the state; the Company retains the balance of the principal payment. The remaining maturity schedule of the long-term debt at December 31, 2007 is listed below.
| | | |
| | | 2007 |
Less than one year | | $ | 25,010 |
One year to three years | | | 11,008 |
Over three years | | | 14,400 |
| | | |
Total Long-term borrowings | | $ | 50,418 |
| | | |
NON-INTEREST INCOME AND EXPENSE
Table 12 – Non-interest Income and Expense illustrates the Company’s non-interest income and expense from 2005 through 2007 and percentage changes between such years.
TABLE 12 - NON-INTEREST INCOME & EXPENSE
| | | | | | | | | | | | | | | |
| | | 2007 | | %
CHANGE
FROM
‘06 | | | 2006 | | %
CHANGE
FROM
‘05 | | | 2005 |
NON-INTEREST INCOME | | | | | | | | | | | | | | | |
Service charges on deposit accounts | | $ | 3,860 | | 1.15 | % | | $ | 3,816 | | 7.28 | % | | $ | 3,557 |
Other operating income | | | 3,919 | | 65.22 | % | | | 2,372 | | 8.81 | % | | | 2,180 |
| | | | | | | | | | | | | | | |
TOTAL NON-INTEREST INCOME | | $ | 7,779 | | 25.71 | % | | $ | 6,188 | | 7.86 | % | | $ | 5,737 |
| | | | | | | | | | | | | | | |
NON-INTEREST EXPENSE | | | | | | | | | | | | | | | |
Salaries and employee benefits | | $ | 10,540 | | 5.61 | % | | $ | 9,980 | | 4.80 | % | | $ | 9,523 |
Occupancy expense, including equipment | | | 3,217 | | 6.88 | % | | | 3,010 | | 3.69 | % | | | 2,903 |
Other operating expense | | | 5,692 | | 1.05 | % | | | 5,633 | | 10.65 | % | | | 5,091 |
| | | | | | | | | | | | | | | |
TOTAL NON-INTEREST EXPENSE | | $ | 19,449 | | 4.44 | % | | $ | 18,623 | | 6.31 | % | | $ | 17,517 |
| | | | | | | | | | | | | | | |
60
Non-interest income typically consists of service charges on checking accounts, including debit card fees, and other financial services. With continued pressure on interest rates, the Company has sought to increase its non-interest income through the expansion of fee income and the development of new services. Currently, the Company’s main sources of non-interest income are service charges on checking accounts, safe deposit box rentals, credit life insurance premiums, title insurance service fees and income contributions from the Company’s credit life insurance subsidiary.
During 2007, non-interest income increased $1,591,128, or 25.7%, when compared to year of 2006. Service charge income from checking accounts and an increase in dividends received from our sweep program assets were the main sources of this increase.
During 2006, non-interest income increased $450,598, or 7.9%, when compared to year of 2005. Service charge income from checking accounts was the main source of this increase.
Non-interest expenses consist of salaries and benefits, occupancy expense and other overhead expenses incurred by the Company in the transaction of its business. In 2007, non-interest expense increased $826,100, or 4.4%, to $19,449,283. Included in this was an increase in salaries and benefits in the amount of $559,474, or 5.6%.
In 2006, non-interest expenses increased $1,106,278, or 6.3%, to $18,623,183. The main reason for this increase was a $456,969 increase in salaries and benefits. The remainder of the increase is the result of increased costs in losses on fraudulent checks and charged off checking accounts, building repair costs and normal other expense increases as a result of growth and inflation.
In 2007, the Company’s efficiency ratio was 64.41%, compared to 60.05% in 2006 and 58.14% in 2005. The efficiency ratio is calculated to measure the cost of generating one dollar of revenue. This ratio is designed to reflect the percentage of one dollar which must be expended to generate one dollar of revenue. The efficiency ratio is calculated by dividing non-interest expense by the sum of net interest income, on a fully tax equivalent basis, and non-interest income. The increase in the efficiency ratio over the past three years reflects increases in non-interest expense associated with managing the growth in assets during the period.
INCOME TAXES
The Company records a provision for income taxes currently payable, along with a provision for deferred taxes to be realized in the future. Such deferred taxes arise from differences in timing of certain items for financial statement reporting rather than income tax reporting. The deferred tax amount of $1,230,758 is considered realizable without the use of extraordinary tax planning strategies.
The Company’s effective tax rate was 22.15%, 25.26% and 22.90% in 2007, 2006 and 2005, respectively. The major difference between the effective tax rate applied to the Company’s financial statement income and the federal statutory rate of 34% is interest on tax-exempt securities and loans. Further tax information is disclosed in Note 10, “Income Taxes” to the Company’s Consolidated Financial Statements included in this Annual Report.
61
LIQUIDITY AND RATE SENSITIVITY
Liquidity management is the process by which the Company ensures that adequate liquid funds are available to meet its financial commitments on a timely basis. These commitments include honoring withdrawals by depositors, funding credit obligations to borrowers, servicing long-term obligations, making shareholder dividend payments, paying operating expenses, funding capital expenditures and maintaining reserve requirements.
The Company’s predominant sources of funding include: core deposits (consisting of both commercial and individual deposits), proceeds from maturities of securities, repayments of loan principal and interest, Federal Funds Purchased, and short-term and long-term borrowing from the FHLB. In 2007, the Company experienced an increase in deposits and a smaller decline in loans outstanding. Since deposits increased and loans declined, the Company’s dependence on long and short term borrowings to fund loan and security growth was reduced. As a result, the Company was able to reduce its balances in FHLB advances by $10 million. The Company relies upon non-core sources of funding, such as Federal Funds Purchased and short and long term borrowings from the FHLB, when deposit growth is not adequate to meet its short term needs. While the strategy of using these wholesale funding sources is adequate to cover liquidity deficiencies in the short term, the Company’s goal is to increase core deposits as a source of long term funding. Management does not intend to rely on borrowings from the FHLB as the first choice as a source of funds but prefers to increase core deposits through increased competition for available deposits. Management believes that core deposits can be increased by offering more competitive rates and superior service to our customers.
The deposit base is diversified between individual and commercial accounts, which the Company believes helps it avoid dependence on large concentrations of funds. The Company does not solicit certificates of deposit from brokers. The primary sources of liquidity on the asset side of the balance sheet are federal funds sold and securities classified as available-for-sale. The entire investment securities portfolio is classified in the available-for-sale category, and is available to be sold, should liquidity needs arise. Management, through its Asset Liability Committee (“ALCO”), and the Board review the Company’s liquidity position on a monthly basis. At December 31, 2007, both the ALCO and the Board determined that the Company’s liquidity position was adequate.
Table 13 – Funding Uses and Sources details the main components of cash flows for 2007 and 2006.
TABLE 13 - FUNDING USES AND SOURCES
| | | | | | | | | | | | | | | | | | | | |
| | | 2007 | | | 2006 | |
| | | Average
Balance | | Increase/(decrease) | | | Average
Balance | | Increase/(decrease) | |
| | | | Amount | | | Percent | | | | Amount | | | Percent | |
FUNDING USES | | | | | | | | | | | | | | | | | | | | |
Loans, net of unearned income | | $ | 357,323 | | $ | (12,244 | ) | | -3.31 | % | | $ | 369,567 | | $ | (2,358 | ) | | -0.63 | % |
Taxable securities | | | 93,594 | | | 20,424 | | | 27.91 | % | | | 73,170 | | | 1,562 | | | 2.18 | % |
Tax-exempt securities | | | 76,803 | | | (6,691 | ) | | -8.01 | % | | | 83,494 | | | 2,360 | | | 2.91 | % |
Federal funds sold and other | | | 19,976 | | | 11,151 | | | 126.36 | % | | | 8,825 | | | 2,934 | | | 49.80 | % |
| | | | | | | | | | | | | | | | | | | | |
TOTAL USES | | $ | 547,696 | | $ | 12,640 | | | 2.36 | % | | $ | 535,056 | | $ | 4,498 | | | 0.85 | % |
| | | | | | | | | | | | | | | | | | | | |
| | | | | | |
FUNDING SOURCES | | | | | | | | | | | | | | | | | | | | |
Noninterest-bearing deposits | | $ | 79,187 | | $ | (8,209 | ) | | -9.39 | % | | $ | 87,396 | | $ | 7,213 | | | 9.00 | % |
Interest-bearing demand and savings deposits | | | 179,886 | | | 614 | | | 0.34 | % | | | 179,272 | | | (909 | ) | | -0.50 | % |
Time Deposits | | | 220,364 | | | 17,572 | | | 8.67 | % | | | 202,792 | | | (1,473 | ) | | -0.72 | % |
Short-term borrowings | | | 1,892 | | | 786 | | | 71.07 | % | | | 1,106 | | | (1,238 | ) | | -52.82 | % |
Long-term debt | | | 53,482 | | | (6,126 | ) | | -10.28 | % | | | 59,608 | | | 4,785 | | | 8.73 | % |
| | | | | | | | | | | | | | | | | | | | |
TOTAL SOURCES | | $ | 534,811 | | $ | 4,637 | | | 0.87 | % | | $ | 530,174 | | $ | 8,378 | | | 1.61 | % |
| | | | | | | | | | | | | | | | | | | | |
62
The Company’s liquidity depends substantially on the ability of the Bank to transfer funds to the Company in the form of dividends. The information under the heading “Market Price and Dividend Information” in this Annual Report discusses federal and state statutory and regulatory restrictions on the ability of the Bank to transfer funds to the Company in the form of dividends.
CAPITAL RESOURCES
The Company and Bank are subject to various regulatory capital guidelines as required by federal and state banking agencies. These guidelines define the various components of core capital and assign risk weights to various categories of assets.
The Federal Deposit Insurance Corporation Improvement Act of 1991 (“FDICIA”) required federal regulatory agencies to define capital tiers. These tiers are: well capitalized, adequately capitalized, undercapitalized, significantly undercapitalized, and critically undercapitalized. Under FDICIA, a “well-capitalized” institution must achieve a Tier 1 risk-based capital ratio of at least 6.00%, a total capital ratio of at least 10.00%, a leverage ratio of at least 5.00% and not be under a capital directive order. These ratios generally measure the percentage of a bank’s capital to all or certain categories of assets. Failure to meet capital requirements can initiate regulatory action that could have a direct material effect on the Company’s financial statements. If a bank is only adequately capitalized, regulatory approval is required before the bank may accept brokered deposits. If undercapitalized, capital distributions, asset growth, and expansion are limited, and the institution is required to submit a capital restoration plan.
During 2007, total capital decreased due to the implementation of a stock repurchase program and an increase in the ownership of the Company’s subsidiary. The Company put a plan in place to purchase up to 250,000 shares of its stock on the open market. During 2007, this plan purchased 160,186 at a total cost of $3,482,153. Also during 2007, the Company increased its ownership in The Citizens Bank of Philadelphia to 100% at a net cost of $1,501,433. This decrease in capital was partially offset by earnings that were in excess of dividends.
Management believes the Company and the Bank meet all the capital requirements to be well-capitalized under the guidelines established by FDICIA as of December 31, 2007, as noted below in Table 14 – Capital Ratios. To be classified as well-capitalized, the Company and Bank must maintain the ratios described above.
63
TABLE 14 - CAPITAL RATIOS
| | | | | | | | | | | | |
| | | At December 31, | |
| | | 2007 | | | 2006 | | | 2005 | |
Tier 1 capital | | | | | | | | | | | | |
Shareholders’ equity | | $ | 68,191 | | | $ | 69,665 | | | $ | 63,774 | |
Less: Intangibles | | | (4,215 | ) | | | (4,753 | ) | | | (5,290 | ) |
Add/less: Unrealized loss/(gain) on securities | | | 433 | | | | 511 | | | | 966 | |
Add: Minority interest in equity accounts of unconsolidated subsidiaries | | | — | | | | 1,482 | | | | 1,358 | |
| | | | | | | | | | | | |
TOTAL TIER 1 CAPITAL | | $ | 64,409 | | | $ | 66,905 | | | $ | 60,808 | |
| | | | | | | | | | | | |
Total capital | | | | | | | | | | | | |
Tier 1 capital | | $ | 64,409 | | | $ | 66,905 | | | $ | 60,808 | |
Allowable allowance for loan losses | | | 3,968 | | | | 3,712 | | | | 4,562 | |
| | | | | | | | | | | | |
TOTAL CAPITAL | | $ | 68,377 | | | $ | 70,617 | | | $ | 65,370 | |
| | | | | | | | | | | | |
RISK WEIGHTED ASSETS | | $ | 400,835 | | | $ | 398,397 | | | $ | 403,497 | |
| | | | | | | | | | | | |
AVERAGE ASSETS (FOURTH QUARTER) | | $ | 645,506 | | | $ | 592,086 | | | $ | 601,607 | |
| | | | | | | | | | | | |
RISK BASED RATIOS | | | | | | | | | | | | |
TIER 1 | | | 16.07 | % | | | 16.79 | % | | | 15.07 | % |
| | | | | | | | | | | | |
TOTAL CAPITAL | | | 17.06 | % | | | 17.73 | % | | | 16.20 | % |
| | | | | | | | | | | | |
LEVERAGE RATIOS | | | 9.98 | % | | | 11.30 | % | | | 10.11 | % |
| | | | | | | | | | | | |
Management’s strategy with respect to capital levels is to maintain a sufficient amount of capital to allow the Company to respond to growth and acquisition opportunities in our service area. Over the past three years, the Company has been able to increase the amount of its capital, through retention of earnings, while still increasing the dividend payout ratio to approximately 51.77 % of earnings per share. The Company does not currently have any commitments for capital expenditures that would require the Company to raise additional capital by means other than retained earnings. The Company does not plan to change this strategy unless needed to support future acquisition activity.
OFF-BALANCE SHEET ARRANGEMENTS
In the ordinary course of business, the Company makes various commitments and incurs certain contingent liabilities to fulfill the financing needs of its customers. These commitments and contingent liabilities include commitments to extend credit and issue standby letters of credit. These off-balance sheet arrangements are further detailed in Note 13, “Off-Balance Sheet Financial Instruments, Commitments and Contingencies and Concentration of Risks,” in the notes to the Company’s Consolidated Financial Statements included in this Annual Report.
64
CONTRACTUAL OBLIGATIONS
The following table summarizes the contractual obligations of the Company as of December 31, 2007. (amounts in thousands)
| | | | | | | | | | | | | | | |
| | | | | Payments Due by Period |
| Contractual Obligations | | Total | | Less than
1 year | | 1-3
Years | | 3-5
Years | | Over 5
Years |
Long-term Debt | | $ | 49,400 | | $ | 25,000 | | $ | 7,000 | | $ | 3,900 | | $ | 13,500 |
Operating Leases | | | 725 | | | 154 | | | 303 | | | 268 | | | — |
Other Long-term Liabilities | | | 1,018 | | | 10 | | | 108 | | | 900 | | | — |
| | | | | | | | | | | | | | | |
Total | | $ | 51,143 | | $ | 25,164 | | $ | 7,411 | | $ | 5,068 | | $ | 13,500 |
| | | | | | | | | | | | | | | |
Long-term debt obligations represent borrowings from the FHLB that have an original maturity in excess of one (1) year. Operating leases are primarily for a lease on one of the Bank’s branches and other leases for mailing equipment. The branch lease is for 60 months and the equipment leases are for various terms. The other long-term liabilities are those obligations of the Company under the Agribusiness Enterprise Loan Program of the State of Mississippi.
Quantitative and Qualitative Disclosures about Market Risk
OVERVIEW
The definition of market risk is the possibility of loss that could result from adverse changes in market prices or interest rates. The Company has taken steps to assess the amount of risk that is associated with its asset and liability structure. The Company measures the potential risk on a regular basis and makes changes to its strategies to manage these risks. The Board of Directors reviews important policy limits each month, with a more detailed risk analysis completed on a quarterly basis. These measurement tools are important in allowing the Company to manage market risk and to plan effective strategies to respond to any adverse changes in risk. The Company does not participate in some of the financial instruments that are inherently subject to substantial market risk. All of the financial instruments entered into by the Company are for purposes other than trading.
MARKET/INTEREST RATE RISK MANAGEMENT
Interest rate risk is the primary market risk that management must address. Interest rate risk is the exposure of Company earnings and capital to changes in interest rates. All financial institutions assume interest rate risk as an integral part of normal operations.
The primary purpose in managing interest rate risk is to effectively invest capital and preserve the value created by the core banking business of the Company. The Company utilizes an investment portfolio to manage the interest rate risk naturally created through its business activities. The process of managing interest rate risk generally involves both reducing the exposure of the Company’s net interest margin to swings in interest rates and concurrently ensuring that there is sufficient capital and liquidity to support balance sheet growth. The Company uses a quarterly interest rate risk report to evaluate its exposure to interest rate risk, project earnings and manage the composition of the balance sheet and its growth. This report utilizes an immediate 200 basis point rate movement up and down and measures the effect this change has on earnings and the value of equity.
65
In addition to the quarterly interest rate risk report, the Company employs a number of tools to measure interest rate risk. One tool is static gap analysis, which matches assets with specified maturities to liabilities with corresponding maturities. Although management believes that this does not provide a complete picture of the Company’s exposure to interest rate risk, it does highlight significant short-term repricing volume mismatches. The following table presents the Company’s rate sensitivity static gap analysis at December 31, 2007 ($ in thousands):
| | | | | | | | |
| | | Interest Sensitive Within | |
| | | 90 days | | | One year | |
Total rate sensitive assets | | $ | 178,311 | | | $ | 84,151 | |
Total rate sensitive liabilities | | | 344,175 | | | | 146,479 | |
| | | | | | | | |
Net gap | | $ | (165,864 | ) | | $ | (62,328 | ) |
| | | | | | | | |
The analysis shows a negative gap position over the next three- and twelve –month periods which indicates that the Company would benefit somewhat from a decrease in market interest rates. Although rate increases would be detrimental to the interest rate risk of the Company, management believes there is adequate flexibility to alter the overall rate sensitivity structure as necessary to minimize exposure to these changes.
Management believes that static gap analysis does not fully capture the impact of interest rate movements on interest sensitive assets and liabilities. Thus, the Company also measures interest rate risk by analyzing interest rate sensitivity and the rate sensitivity gap. Table 15 - Interest Rate Sensitivity provides additional information about the financial instruments that are sensitive to changes in interest rates. This tabular disclosure is limited by its failure to depict accurately the effect on assumptions of significant changes in the economy or interest rates or changes in management’s expectations or intentions relating to the Company’s financial statements. The information in the interest rate sensitivity table below reflects contractual interest rate pricing dates and contractual maturity dates. For indeterminate maturity deposit products (money market, NOW and savings accounts), the tables present principal cash flows in the shortest term. Although these deposits may not reprice within this time frame, the depositors of such funds have the ability to reprice. Weighted average floating rates are based on the rate for that product as of December 31, 2007 and 2006.
TABLE 15 – INTEREST RATE SENSITIVITY AS OF DECEMBER 31, 2007
| | | | | | | | | | | | | | | | | | | | | | | | | | | | | | | |
| | | 2008 | | | 2009 | | | 2010 | | | 2011 | | | 2012 | | | Thereafter | | | Carrying
Value | | | Fair Value |
Loans | | | | | | | | | | | | | | | | | | | | | | | | | | | | | | | |
Fixed Rate | | $ | 139,042 | | | $ | 44,119 | | | $ | 48,148 | | | $ | 42,734 | | | $ | 7,160 | | | $ | 28,427 | | | $ | 309,630 | | | $ | 308,618 |
Average Int Rate | | | 7.84 | % | | | 7.32 | % | | | 7.56 | % | | | 8.26 | % | | | 7.41 | % | | | 7.38 | % | | | 7.73 | % | | | |
Floating Rate | | $ | 35,072 | | | $ | 3,171 | | | $ | 2,333 | | | $ | 2,548 | | | $ | 671 | | | $ | 14,600 | | | $ | 58,395 | | | $ | 58,395 |
Average Int Rate | | | 8.24 | % | | | 8.45 | % | | | 7.99 | % | | | 8.68 | % | | | 8.47 | % | | | 8.66 | % | | | 8.37 | % | | | |
Investment securities | | | | | | | | | | | | | | | | | | | | | | | | | | | | | | | |
Fixed Rate | | $ | 74,295 | | | $ | 1,593 | | | $ | 2,121 | | | $ | 7,731 | | | $ | 4,998 | | | $ | 153,982 | | | $ | 244,720 | | | $ | 244,720 |
Average Int Rate | | | 4.31 | % | | | 5.87 | % | | | 6.31 | % | | | 5.11 | % | | | 6.01 | % | | | 5.76 | % | | | 5.31 | % | | | |
Floating Rate | | | | | | | | | | | | | | | | | | | | | | | | | | | | | | | |
Average Int Rate | | | | | | | | | | | | | | | | | | | | | | | | | | | | | | | |
Other earning assets | | | | | | | | | | | | | | | | | | | | | | | | | | | | | | | |
Fixed Rate | | | | | | | | | | | | | | | | | | | | | | | | | | | | | | | |
Average Int Rate | | | | | | | | | | | | | | | | | | | | | | | | | | | | | | | |
Floating Rate | | | | | | | | | | | | | | | | | | | | | | | | | | | | | | | |
Average Int Rate | | | | | | | | | | | | | | | | | | | | | | | | | | | | | | | |
Interest-bearing deposits | | | | | | | | | | | | | | | | | | | | | | | | | | | | | | | |
Fixed Rate | | $ | 373,216 | | | $ | 4,474 | | | $ | 866 | | | $ | 56 | | | | | | | | | | | $ | 378,612 | | | $ | 379,008 |
Average Int Rate | | | 3.25 | % | | | 4.06 | % | | | 3.89 | % | | | 5.34 | % | | | | | | | | | | | 3.26 | % | | | |
Floating Rate | | $ | 9,064 | | | $ | 6,023 | | | $ | 5,238 | | | $ | 22 | | | $ | 48 | | | | | | | $ | 20,395 | | | $ | 20,395 |
Average Int Rate | | | 3.92 | % | | | 3.53 | % | | | 3.54 | % | | | 3.54 | % | | | 3.54 | % | | | | | | | 3.71 | % | | | |
Other int-bearing Liabilities | | | | | | | | | | | | | | | | | | | | | | | | | | | | | | | |
Fixed Rate | | $ | 25,000 | | | $ | 5,000 | | | $ | 2,000 | | | $ | 3,900 | | | $ | 0 | | | $ | 13,500 | | | $ | 49,400 | | | $ | 49,419 |
Average Int Rate | | | 4.92 | % | | | 5.26 | % | | | 4.47 | % | | | 4.75 | % | | | 0.00 | % | | | 3.92 | % | | | 4.65 | % | | | |
Floating Rate | | | | | | | | | | | | | | | | | | | | | | | | | | | | | | | |
Average Int Rate | | | | | | | | | | | | | | | | | | | | | | | | | | | | | | | |
66
AS OF DECEMBER 31, 2006
| | | | | | | | | | | | | | | | | | | | | | | | | | | | | | | |
| | | 2007 | | | 2008 | | | 2009 | | | 2010 | | | 2011 | | | Thereafter | | | Carrying
Value | | | Fair Value |
Loans | | | | | | | | | | | | | | | | | | | | | | | | | | | | | | | |
Fixed Rate | | $ | 93,932 | | | $ | 41,597 | | | $ | 44,024 | | | $ | 48,114 | | | $ | 42,585 | | | $ | 34,609 | | | $ | 304,861 | | | $ | 368,759 |
Average Int Rate | | | 8.09 | % | | | 7.29 | % | | | 7.33 | % | | | 7.57 | % | | | 8.28 | % | | | 7.59 | % | | | 7.76 | % | | | |
Floating Rate | | $ | 19,040 | | | $ | 16,031 | | | $ | 3,171 | | | $ | 2,333 | | | $ | 2,548 | | | $ | 15,271 | | | $ | 58,394 | | | $ | 58,394 |
Average Int Rate | | | 8.89 | % | | | 7.47 | % | | | 8.44 | % | | | 7.99 | % | | | 8.68 | % | | | 8.68 | % | | | 8.37 | % | | | |
Investment securities | | | | | | | | | | | | | | | | | | | | | | | | | | | | | | | |
Fixed Rate | | $ | 1,417 | | | $ | 2,173 | | | $ | 3,200 | | | $ | 6,820 | | | $ | 6,737 | | | $ | 137,259 | | | $ | 157,606 | | | $ | 157,606 |
Average Int Rate | | | 5.91 | % | | | 5.35 | % | | | 5.22 | % | | | 5.21 | % | | | 5.73 | % | | | 5.80 | % | | | 5.76 | % | | | |
Floating Rate | | | | | | | | | | | | | | | | | | | | | | | | | | | | | | | |
Average Int Rate | | | | | | | | | | | | | | | | | | | | | | | | | | | | | | | |
Other earning assets | | | | | | | | | | | | | | | | | | | | | | | | | | | | | | | |
Fixed Rate | | | | | | | | | | | | | | | | | | | | | | | | | | | | | | | |
Average Int Rate | | | | | | | | | | | | | | | | | | | | | | | | | | | | | | | |
Floating Rate | | | | | | | | | | | | | | | | | | | | | | | | | | | | | | | |
Average Int Rate | | | | | | | | | | | | | | | | | | | | | | | | | | | | | | | |
Interest-bearing deposits | | | | | | | | | | | | | | | | | | | | | | | | | | | | | | | |
Fixed Rate | | $ | 344,640 | | | $ | 23,621 | | | $ | 196 | | | $ | 168 | | | | | | | | | | | $ | 368,625 | | | $ | 368,915 |
Average Int Rate | | | 1.85 | % | | | 4.06 | % | | | 4.28 | % | | | 4.49 | % | | | | | | | | | | | 1.99 | % | | | |
Floating Rate | | $ | 8,902 | | | $ | 7,421 | | | $ | 3,942 | | | $ | 20 | | | $ | 21 | | | | | | | $ | 20,306 | | | $ | 20,306 |
Average Int Rate | | | 3.54 | % | | | 3.54 | % | | | 3.54 | % | | | 3.54 | % | | | 3.54 | % | | | | | | | 3.54 | % | | | |
Other int-bearing Liabilities | | | | | | | | | | | | | | | | | | | | | | | | | | | | | | | |
Fixed Rate | | $ | 10,000 | | | $ | 25,000 | | | $ | 5,000 | | | $ | 2,000 | | | $ | 3,900 | | | $ | 13,500 | | | $ | 59,400 | | | $ | 58,410 |
Average Int Rate | | | 5.37 | % | | | 4.92 | % | | | 5.26 | % | | | 4.47 | % | | | 4.75 | % | | | 3.92 | % | | | 4.77 | % | | | |
Floating Rate | | | | | | | | | | | | | | | | | | | | | | | | | | | | | | | |
Average Int Rate | | | | | | | | | | | | | | | | | | | | | | | | | | | | | | | |
67
Rate sensitivity gap analysis is another tool management uses to measure interest rate risk. The rate sensitivity gap is the difference between the repricing of interest earning assets and the repricing of interest bearing liabilities within certain defined time frames. The Company’s interest rate sensitivity position is influenced by the distribution of interest earning assets and interest-bearing liabilities among the maturity categories. Table 16—Rate Sensitivity Gap reflects interest earning assets and interest-bearing liabilities by maturity distribution as of December 31, 2007. Product lines repricing in time periods predetermined by contractual agreements are included in the respective maturity categories.
TABLE 16 – RATE SENSITIVITY GAP AT DECEMBER 31, 2007
| | | | | | | | | | | | | | | | | | | |
| | | 1 - 90 Days | | | 91 - 365
Days | | | 1 - 5 Years | | | Over 5
years | | | Total |
INTEREST EARNING ASSETS | | | | | | | | | | | | | | | | | | | |
Loans | | $ | 89,263 | | | $ | 71,344 | | | $ | 172,997 | | | $ | 32,500 | | | $ | 366,104 |
Investment securities | | | 87,535 | | | | 12,807 | | | | 43,820 | | | | 97,466 | | | | 241,628 |
Federal Home Loan Bank Account | | | 613 | | | | — | | | | — | | | | — | | | | 613 |
Federal Funds Sold | | | 900 | | | | — | | | | — | | | | — | | | | 900 |
| | | | | | | | | | | | | | | | | | | |
TOTAL INTEREST BEARING ASSETS | | $ | 178,311 | | | $ | 84,151 | | | $ | 216,817 | | | $ | 129,966 | | | $ | 609,245 |
| | | | | | | | | | | | | | | | | | | |
INTEREST BEARING LIABILITIES | | | | | | | | | | | | | | | | | | | |
Interest bearing demand deposits | | $ | 130,868 | | | $ | — | | | $ | — | | | $ | — | | | $ | 130,868 |
Savings and Money Market deposits | | | 43,199 | | | | — | | | | — | | | | — | | | | 43,199 |
Time deposits | | | 81,735 | | | | 126,479 | | | | 16,727 | | | | — | | | | 224,941 |
Federal Funds Purchased | | | 4,200 | | | | — | | | | — | | | | — | | | | 4,200 |
Short term borrowings | | | 79,163 | | | | — | | | | — | | | | — | | | | 79,163 |
Long term borrowings | | | 5,010 | | | | 20,000 | | | | 11,908 | | | | 13,500 | | | | 50,418 |
| | | | | | | | | | | | | | | | | | | |
TOTAL INTEREST BEARING LIABILITIES | | $ | 344,175 | | | $ | 146,479 | | | $ | 28,635 | | | $ | 13,500 | | | $ | 532,789 |
| | | | | | | | | | | | | | | | | | | |
| | | | | |
Rate sensitive gap | | $ | (165,864 | ) | | $ | (62,328 | ) | | $ | 188,182 | | | $ | 116,466 | | | $ | 76,456 |
Rate sensitive cumulative gap | | | (165,864 | ) | | | (228,192 | ) | | | (40,010 | ) | | | 76,456 | | | | |
Cumulative gap as a percentage of total earning assets | | | -27.22 | % | | | -37.45 | % | | | -6.57 | % | | | 12.55 | % | | | |
The purpose of the above table is to measure interest rate risk utilizing the repricing intervals of interest sensitive assets and liabilities. Rate sensitive gaps constantly change as funds are acquired and invested and as rates change. Rising interest rates are likely to increase net interest income in a positive gap position while falling interest rates are beneficial in a negative gap position.
The above rate sensitivity analysis places interest-bearing demand and savings deposits in the shortest maturity category because these liabilities do not have defined maturities. If these deposits were placed in a maturity distribution representative of the Company’s deposit base history, the shortfall of the negative rate sensitive gap position would be reduced in the 1-to-90 day time frame.
68
The rate sensitivity gap table illustrates that the Company had a large negative cumulative gap position for the one-year period ending December 31, 2007. This negative gap position was mainly due to: (1) the interest-bearing and savings deposits being classified in the 1-90 day category; (2) approximately 92.6% of certificates of deposit maturing during the next twelve months; and (3) a significant portion of the Company’s loans maturing after one year.
The interest rate sensitivity and rate sensitivity gap tables, taken together, indicate that the Company continues to be in a liability sensitive position when evaluating the maturities of interest bearing items. Thus a decline in the interest rate environment would enhance earnings, while an increase in interest rates would have the opposite effect on corporate earnings. The Company has attempted to mitigate the impact of its interest rate position by increasing the amount of its variable rate loans and also by structuring deposit rates to entice customers to shortened the maturities of their time deposits. The effect of any changes in interest rates on the Company would be mitigated by the fact that interest-bearing demand and savings deposits may not be immediately affected by changes in general interest rates.
Although short and medium term interest rates decreased in 2007 in connection with decreases in the target Federal Funds rate by the Federal Reserve Bank, the effect on the Company was marginal due to the lateness in the year of the reductions. The Company’s net interest margin in 2007 was 4.34% and in 2006 was 4.55%.
69
Quarterly Financial Trends
| | | | | | | | | | | | | | | | |
| | | 2007 | |
| | | First
Quarter | | | Second
Quarter | | | Third
Quarter | | | Fourth
Quarter | |
Interest Income | | $ | 9,445 | | | $ | 9,560 | | | $ | 9,620 | | | $ | 9,475 | |
Interest Expense | | | 3,935 | | | | 4,179 | | | | 4,242 | | | | 4,407 | |
| | | | | | | | | | | | | | | | |
Net Interest Income | | | 5,510 | | | | 5,381 | | | | 5,378 | | | | 5,068 | |
Provision for Loan Losses | | | 77 | | | | 80 | | | | 396 | | | | 231 | |
Non-interest Income | | | 1,639 | | | | 1,908 | | | | 2,023 | | | | 2,208 | |
Non-interest Expense | | | 4,544 | | | | 4,717 | | | | 4,895 | | | | 5,293 | |
Income Taxes | | | 638 | | | | 632 | | | | 362 | | | | 336 | |
| | | | | | | | | | | | | | | | |
Net Income | | $ | 1,890 | | | $ | 1,860 | | | $ | 1,748 | | | $ | 1,416 | |
| | | | | | | | | | | | | | | | |
Per common share: | | | | | | | | | | | | | | | | |
Basic | | $ | 0.38 | | | $ | 0.38 | | | $ | 0.36 | | | $ | 0.29 | |
Diluted | | $ | 0.37 | | | $ | 0.37 | | | $ | 0.36 | | | $ | 0.29 | |
| | | | | | | | | | | | | | | | |
Cash Dividends | | $ | 0.18 | | | $ | 0.18 | | | $ | 0.18 | | | $ | 0.19 | |
| |
| | | 2006 | |
| | | First
Quarter | | | Second
Quarter | | | Third
Quarter | | | Fourth
Quarter | |
Interest Income | | $ | 8,660 | | | $ | 9,162 | | | $ | 9,265 | | | $ | 9,400 | |
Interest Expense | | | 2,965 | | | | 3,283 | | | | 3,425 | | | | 3,508 | |
| | | | | | | | | | | | | | | | |
Net Interest Income | | | 5,695 | | | | 5,879 | | | | 5,840 | | | | 5,892 | |
Provision for Loan Losses | | | (129 | ) | | | (63 | ) | | | (111 | ) | | | (58 | ) |
Non-interest Income | | | 1,400 | | | | 1,664 | | | | 1,582 | | | | 1,541 | |
Non-interest Expense | | | 4,643 | | | | 4,724 | | | | 4,657 | | | | 4,599 | |
Income Taxes | | | 656 | | | | 771 | | | | 751 | | | | 658 | |
| | | | | | | | | | | | | | | | |
Net Income | | $ | 1,925 | | | $ | 2,111 | | | $ | 2,125 | | | $ | 2,234 | |
| | | | | | | | | | | | | | | | |
Per common share: | | | | | | | | | | | | | | | | |
Basic | | $ | 0.38 | | | $ | 0.42 | | | $ | 0.42 | | | $ | 0.44 | |
Diluted | | $ | 0.38 | | | $ | 0.42 | | | $ | 0.42 | | | $ | 0.44 | |
| | | | | | | | | | | | | | | | |
Cash Dividends | | $ | 0.17 | | | $ | 0.17 | | | $ | 0.17 | | | $ | 0.18 | |
70
Market Price and Dividend Information
MARKET PRICE
On November 16, 2006, the Company’s common stock began trading on The NASDAQ Global Market (“NASDAQ”) under the symbol “CIZN”. Prior to that date, the stock was traded on the American Stock Exchange (“AMEX”) under the symbol “CIZ”. The stock began trading on the AMEX on October 19, 1999 and prior to that date was sold in private transactions between parties. On December 31, 2007, the common stock’s closing price on NASDAQ was $18.22. The following table sets forth the high and low sales prices for the common stock as reported on NASDAQ or AMEX, as applicable, as well as the dividends declared, in each quarter in the past two fiscal years.
| | | | | | | | | |
2006 | | High | | Low | | Dividends Declared
(per common share) |
January - March | | $ | 24.20 | | $ | 22.25 | | $ | 0.17 |
April - June | | | 24.00 | | | 22.15 | | | 0.17 |
July - September | | | 22.75 | | | 21.40 | | | 0.17 |
October - December | | | 22.75 | | | 21.32 | | | 0.18 |
| | | |
2007 | | High | | Low | | Dividends Declared
(per common share) |
January - March | | $ | 22.50 | | $ | 20.77 | | $ | 0.18 |
April - June | | | 22.95 | | | 20.00 | | | 0.18 |
July - September | | | 23.00 | | | 19.10 | | | 0.18 |
October - December | | | 22.00 | | | 18.00 | | | 0.19 |
On March 7, 2008, shares of our common stock were held of record by approximately 466 shareholders.
DIVIDENDS
Dividends totaled $0.73 per share for 2007 compared to $0.69 per share for 2006, an increase of 5.8%.
If funds are available, the Company typically declares dividends on a quarterly basis in March, June, September and December with payment following at the end of the month in which the dividend was declared. Funds for the payment by the Company of cash dividends are obtained from dividends, loans or advances received by the Company from the Bank. Accordingly, the declaration and payment of dividends by the Company depend upon the Bank’s earnings and financial condition, general economic conditions, compliance with regulatory requirements, and other factors. The Bank must also receive the approval of the Mississippi Department of Banking and Consumer Finance prior to the payment of a dividend.
71
STOCK PERFORMANCE GRAPH
The following performance graph compares the performance of the Company’s common stock to the AMEX Market Index, the NASDAQ Market Index and to a peer group of 49 other regional bank holding companies for the Company’s reporting period. The graph assumes that the value of the investment in the Company’s common stock and each index was $100 at December 31, 2002 and that all dividends were reinvested.
Although the Company’s stock currently trades on the NASDAQ, this graph reflects a comparison to the AMEX Market Index in addition to the NASDAQ Market Index. This is due to the fact that the Company did not transfer the listing of its common stock to NASDAQ until November 2006. Thus, our stock has traded on both indexes during the period of this graph and we believe it is more appropriate to compare our stock’s performance to both the AMEX Market Index and the NASDAQ Market Index.
Performance Graph
December 31, 2002—December 31, 2007
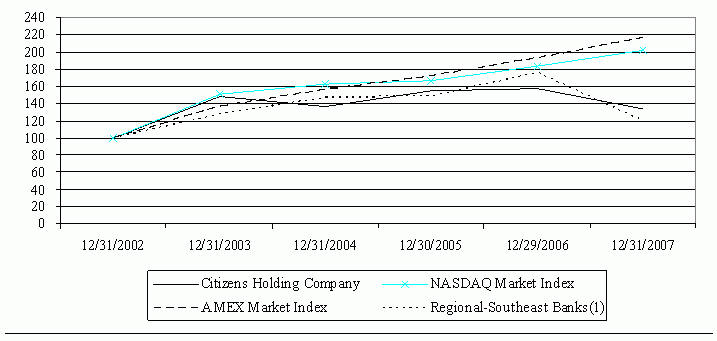
| | | | | | | | | | | | |
| | | 12/31/2002 | | 12/31/2003 | | 12/31/2004 | | 12/30/2005 | | 12/29/2006 | | 12/31/2007 |
Citizens Holding Company | | 100.00 | | 147.57 | | 136.20 | | 154.30 | | 157.69 | | 133.12 |
AMEX Market Index | | 100.00 | | 136.11 | | 155.86 | | 171.89 | | 192.45 | | 216.06 |
NASDAQ Market Index | | 100.00 | | 150.36 | | 163.00 | | 166.58 | | 183.68 | | 201.91 |
Regional-Southeast Banks | | 100.00 | | 127.68 | | 146.81 | | 148.65 | | 175.16 | | 119.72 |
(1) | The bank holding companies included in the peer group are as follows: Appalachian Bancshares, Auburn National Banc Inc., Bancorpsouth Inc., Banctrust Financial Group, Bank of the Ozarks Inc., Beach First National Bankshares, Britton & Koontz Capital Corporation, Cadence Financial Corp., Capitalsouth Bancorp, Cardinal Financial Corp., Centerstate Banks of Florida, Citizens First Corp., Colonial Bancgroup |
72
CLA, Community National Bank Lake, Community Trust Bancorp Inc., Crescent Banking Company, Eastern Virginia Bankshares, Farmers Capital Bank Corporation, Fauquier Bancshares Inc., First Advantage Bancorp, First Bancshares Inc. (Mississippi), First Financial Service Corp, First Horizon National, First M&F Corporation, FNB Corporation (Florida), FNB Corporation (Virginia), FPB Bancorp Inc, Green Bancshares, Inc., Hancock Holding Co., Heritage Financial Group, Iberiabank Corporation, Midsouth Bancorp Inc, NB&T Financial Group, Nexity Financial Corp, Pinnacle Financial Partners, Porter Bancorp, Inc., Premier Financial Bancorp, Regions Financial Corp., Renasant Corporation, Republic Bancorp Inc. CLA, S.Y. Bancorp Inc., Security Bank Corp, Simmons First National Corp., Southcoast Financial Corp, Superior Bancorp, Tennessee Commerce Banc, Trustmark Corp., United Security Bancshares, and Whitney Holding Corporation.
Source: Hemscott, Richmond Virginia
There can be no assurance that the Company’s common stock performance will continue in the future with the same or similar trends depicted in the performance graph above. The Company does not and will not make or endorse any predictions as to future stock performance.
73
THE CITIZENS BANK OFFICERS
| | | | |
Greg McKee President and CEO Danny Hicks Senior Vice President Robert T. Smith Senior Vice President and CFO Erdis Chaney Vice President & Senior Deposit Officer Tim Lofton Vice President and CIO Randy Cheatham Vice President Mike Guthrie Vice President and Senior Credit Officer Murray Johnson Vice President Jackie Hester Vice President and Marketing Kaye Johnson Vice President Stanley Salter Vice President Darrell Bates Vice President Jean T. Fulton Vice President and Internal Auditor Gayle Sharp Vice President Brad Copeland Vice President Mark Majure Vice President Vicki Brown Vice President and Compliance Officer Mark Taylor Vice-President and Human Resources Bob Posey Vice President Sommer Vick Assistant Vice President Carolyn K. McKee Student Loan Officer Beth Branning Assistant Vice President Tommy Jackson Assistant Vice President Pat Stokes Assistant Cashier | | Adriana Burt Assistant Cashier Mitch Peden Data Processing Officer Tammy Pope Accounting Officer Mark Flake Data Processing Officer Barbara Lewis Assistant Cashier Greg Jackson Accounting Officer Patsy Smith Assistant Cashier Ashley Peebles Assistant Cashier Deborah Ladd Item Processing Officer Linda Goforth Electronic Banking Officer Patti Rickles ACH Officer Juane Kirkland Security Officer Carthage Branch Mike Brooks President Billy Cook Vice President Margaret Thompson Assistant Cashier Sebastopol Branch Linda Bennett President Connie Comans Assistant Cashier Union Branch Robert C. Palmer, Jr. President Karen Foster Assistant Vice President Kosciusko Branch Charlie Hudson President David Blair Vice President Joanne Sanders Assistant Cashier | | Scooba and DeKalb Branches Fran Knight President Meridian Branch Charles Young President Vikki Gunter Assistant Vice President Forest Branch Richard Latham Vice President Dymple Winstead Assistant Vice President Decatur Branch Ken Jones Vice President Louisville Branch Terry Woods President Marion Gardner Assistant Cashier Bruce Lee Assistant Vice President Starkville Branch Stan Acy Vice-President Charlie Douglas Vice-President Rhonda Edmondson Assistant Cashier Collinsville Branch Mike Shelby Vice-President Meridian Mid-Town Jackie Long Vice-President Frances Garrett Assistant Vice President Meridian Broadmoor Camp Keith Assistant Cashier Mortgage Loan Department Linda Stribling Mortgage Loan Officer |
74
BOARD OF DIRECTORS
| | |
Don Fulton President & General Manager Nemanco, Inc. | | William M. Mars Retired Attorney Mars, Mars, Mars & Chalmers |
| |
Donald L. Kilgore Attorney General Mississippi Band of Choctaw Indians | | Greg L. McKee President & CEO Citizens Holding Company and The Citizens Bank |
| |
David A. King Proprietor Philadelphia Motor Company | | David P. Webb Attorney Baker, Donelson, Bearman, Caldwell & Berkowitz, PC |
| |
Herbert A. King Civil Engineer King Engineering Associates, Inc. | | A. T. Williams Certified Public Accountant A. T. Williams, CPA |
| |
Adam Mars Business Manager Mars, Mars, Mars & Chalmers | | Terrell E. Winstead Chief Financial Officer Molpus Woodlands Group |
CITIZENS HOLDING COMPANY OFFICERS
William M. Mars
Chairman
Greg L. McKee
President and CEO
Carolyn K. McKee
Secretary
Robert T. Smith
Treasurer and Chief Financial Officer
75
BANKING LOCATIONS
| | | | |
Philadelphia Main Office 521 Main Street Philadelphia, MS 39350 601.656.4692 | | Collinsville Branch 9065 Collinsville Road Collinsville, MS 39325 601.626.7608 | | Decatur Branch 15330 Hwy 15 South Decatur, MS 39327 601.635.2321 |
| | |
Westside Branch 912 West Beacon Street Philadelphia, MS 39350 601.656.4978 | | Madden Branch Highway 488 Madden, MS 39109 601.267.7366 | | Forest Branch 247 Woodland Drive North Forest, MS 39074 601.469.3424 |
| | |
Northside Branch 802 Pecan Avenue Philadelphia, MS 39350 601.656.4977 | | Sebastopol Branch 24 Pine Street Sebastopol, MS 39359 601.625.7447 | | Louisville Branch l00 East Main Street Louisville, MS 39339 662.773.6261 |
| | |
Eastside Branch 585 East Main Street Philadelphia, MS 39350 601.656.4976 | | DeKalb Branch Corner of Main & Bell St. DeKalb, MS 39328 601.743.2115 | | Noxapater Branch 45 East Main Street Noxapater, MS 39346 662.724.4261 |
| | |
Pearl River Branch 110 Choctaw Town Center Philadelphia, MS 39350 601.656.4971 | | Kosciusko Branch 775 North Jackson Street Kosciusko, MS 39090 662.289.4356 | | Industrial Branch 803 South Church Street Louisville, MS 39339 662.773.6261 |
| | |
Union Branch 502 Bank Street Union, MS 39365 601.774.9231 | | Scooba Branch 1048 Johnson Street Scooba, MS 39358 662.476.8431 | | Meridian Mid-Town 905 22nd Avenue Meridian, MS 39301 601.482.8858 |
| | |
Carthage Main Office 219 West Main Street Carthage, MS 39051 601.257.4525 | | Meridian Eastgate 1825 Hwy 39 North Meridian, MS 39301 601.693.8367 | | Meridian Broadmoor 5015 Highway 493 Meridian. MS 39305 601.581.1541 |
| | |
Starkville Branch 201 Highway 12 Starkville, MS 39759 662.323.1420 | | Phone Teller 1.800.397.0344 | | Internet Banking http://www.thecitizensbankphila.com |
76
FINANCIAL INFORMATION
CORPORATE HEADQUARTERS
521 Main Street
P.O. Box 209
Philadelphia, MS 39350
601.656.4692
ANNUAL STOCKHOLDER MEETING
The Annual Stockholder meeting of the Citizens Holding Company, Inc. will be held Tuesday, April 22, 2008, at 4:30P.M. in the lobby of the main office of The Citizens Bank, 521 Main Street, Philadelphia, Mississippi.
STOCK REGISTRAR AND TRANSFER AGENT
American Stock Transfer & Trust Company
59 Maiden Lane
New York, NY 10038
FORM 10-K
The Corporation’s most recent Annual Report on Form 10-K, filed with the Securities and Exchange Commission, is available without charge to stockholder’s upon request to the Treasurer of the Citizens Holding Company.
FINANCIAL CONTACT
Robert T. Smith
Treasurer and Chief Financial Officer
P.O. 209
Philadelphia, Mississippi 39350
Additional information can be obtained from our corporate website at www.citizensholdingcompany.com
77