Exhibit 13 – 2023 Annual Report to Shareholders
CITIZENS HOLDING COMPANY
Philadelphia, Mississippi
Consolidated Financial Statements
As of December 31, 2023 and 2022 and for the
Years Ended December 31, 2023, 2022 and 2021
CONTENTS
| | |
Report of Independent Registered Public Accounting Firm (Horne LLP, Memphis, TN PCAOB ID #: 171) | 1-2 |
| | |
Management’s Assessment of Internal Control over Financial Reporting | 3 – 4 |
| | |
| | |
Consolidated Financial Statements | |
| | |
Consolidated Statements of Financial Condition | 5 |
| | |
Consolidated Statements of Income | 6 |
| | |
Consolidated Statements of Comprehensive Income (Loss) | 7 |
| | |
Consolidated Statements of Changes in Shareholders’ Equity | 8 |
| | |
Consolidated Statements of Cash Flows | 9 – 10 |
| | |
Notes to Consolidated Financial Statements | 11 – 65 |
| | |

REPORT OF INDEPENDENT REGISTERED PUBLIC ACCOUNTING FIRM
To the Shareholders and the Board of Directors of Citizens Holding Company
Opinion on the Financial Statements
We have audited the accompanying consolidated statements of financial condition of Citizens Holding Company and Subsidiary (the "Company") as of December 31, 2023 and 2022, the related consolidated statements of income, comprehensive (loss) income, changes in shareholders' equity, and cash flows for each of the three years in the period ended December 31, 2023, and the related notes to the consolidated financial statements (collectively, referred to as the "financial statements"). In our opinion, the financial statements present fairly, in all material respects, the financial position of the Company as of December 31, 2023 and 2022, and the results of its operations and its cash flows for each of the three years in the period ended December 31, 2023, in conformity with accounting principles generally accepted in the United States of America.
Basis for Opinion
These financial statements are the responsibility of the Company's management. Our responsibility is to express an opinion on the Company's financial statements based on our audits. We are a public accounting firm registered with the Public Company Accounting Oversight Board (United States) ("PCAOB") and are required to be independent with respect to the Company in accordance with U.S. federal securities laws and the applicable rules and regulations of the Securities and Exchange Commission and the PCAOB.
We conducted our audits in accordance with the standards of the PCAOB. Those standards require that we plan and perform the audit to obtain reasonable assurance about whether the financial statements are free of material misstatement, whether due to error or fraud. The Company is not required to have, nor were we engaged to perform, an audit of its internal control over financial reporting in accordance with PCAOB standards. As part of our audit, we are required to obtain an understanding of internal control over financial reporting but not for the purpose of expressing an opinion on the effectiveness of the Company's internal control over financial reporting in accordance with PCAOB standards. Accordingly, we express no such opinion.
Our audits included performing procedures to assess the risks of material misstatement of the financial statements, whether due to error or fraud, and performing procedures that respond to those risks. Such procedures included examining, on a test basis, evidence regarding the amounts and disclosures in the financial statements. Our audits also included evaluating the accounting principles used and significant estimates made by management, as well as evaluating the overall presentation of the financial statements. We believe that our audits provide a reasonable basis for our opinion.
Adoption of Accounting Pronouncements
As discussed in Note 1 to the financial statements, the Company has changed its method of accounting for the allowance for credit losses ("ACL") in 2023 due to the adoption of ASC 326.
Critical Audit Matter
The critical audit matter communicated below is a matter arising from the current period audit of the financial statements that was communicated to the audit committee and that: (1) relate to accounts or disclosures that are material to the financial statements and (2) involved especially challenging, subjective, or complex judgments. The communication of this critical audit matter does not alter in any way our opinion on the financial statements, taken as a whole, and we are not, by communicating the critical audit matter below, providing separate opinions on the critical audit matter or on the accounts or disclosures to which it relates.
Allowance for Credit Losses - Loans
Description of the Matter
As described in Notes 1 and 5 to the financial statements, the Company's ACL is a valuation allowance that reflects the Company's best estimate of expected credit losses inherent within the Company's loans held for investment portfolio and is maintained at a level believed adequate by management to absorb credit losses inherent in the entire loan portfolio in accordance with Accounting Standards Codification ASC 326: Financial Instruments – Credit Losses. The ACL is measured over the contractual life of loans held for investment and is estimated using relevant available information relating to past events, current conditions, and reasonable and supportable forecasts, as well as qualitative adjustments. The ACL was $6,551,000 at December 31, 2023.
The Company's measurement of expected credit losses of loans on a pool basis when the loans share similar risk characteristics is based off historical data that is adjusted, as necessary, for both internal and external qualitative factors where there are differences in the historical loss data used by the Company and current or projected future conditions. Consideration of the relevant qualitative factors are used to bring the ACL to the level management believes is appropriate based on factors that are otherwise unaccounted for in the quantitative process. The ACL also includes reserves for loans evaluated on an individual basis. Management applies judgment in the determination of the qualitative factors and reserves assigned on an individual basis to estimate the ACL.
The ACL was identified by us as a critical audit matter because of the extent of auditor judgment applied and significant audit effort to evaluate the significant subjective and complex judgments made by management including the judgment required in evaluating management's determination of the qualitative factors.
How We Addressed the Matter in Our Audit
The primary audit procedures we performed in response to this critical audit matter included:
| | ● | Obtained an understanding of the Company's process for establishing the ACL, including determination of the qualitative factors and reserve assumptions for loans evaluated on an individual basis, and evaluated the process utilized by management to challenge the model results and determine the best estimate of the ACL as of the statement of financial condition date. |
| | ● | Assessed reasonableness of model methodology and key modeling assumptions, as well as the appropriateness of management's qualitative framework, and reserve assumptions for loans evaluated on an individual basis. |
| | ● | Performed specific substantive tests of the model utilized, qualitative factors and the reserve assumptions for loans evaluated on an individual basis. We evaluated if qualitative factors were applied based on a comprehensive framework and compared the adjustments utilized by management to both internal portfolio metrics and external macroeconomic data (as applicable) to support adjustments and evaluate trends in such adjustments. Within our reserve testing for loans evaluated on an individual basis, we evaluated management's assumptions, including collateral valuations. In addition, we evaluated the Company's estimate of the overall ACL giving consideration to the Company's borrowers, loan portfolio, and macroeconomic trends, independently obtained and compared such information to comparable financial institutions and considered whether new or contrary information existed. |
/s/ HORNE LLP
We have served as the Company's auditor since 1998.
Memphis, Tennessee
March 29, 2024

Report on Management’s Assessment of Internal Control over Financial Reporting
Citizens Holding Company (the “Company”) is responsible for the preparation, integrity and fair presentation of the consolidated financial statements included in this annual report. The consolidated financial statements and notes included in this annual report have been prepared in conformity with accounting principles generally accepted in the United States and necessarily include some amounts that are based on management’s best estimates and judgments.
Management of the Company is responsible for establishing and maintaining effective internal control over financial reporting designed to provide reasonable assurance regarding the reliability of financial reporting and the preparation of financial statements for external purposes in accordance with accounting principles generally accepted in the United States. The Company’s internal control over financial reporting includes those policies and procedures that: (1) pertain to the maintenance of records that, in reasonable detail, accurately and fairly reflect the transactions and dispositions of the assets of the Company; (2) provide reasonable assurance that transactions are recorded as necessary to permit preparation of financial statements in accordance with accounting principles generally accepted in the United States of America and that receipts and expenditures of the Company are being made only in accordance with authorizations of management and directors of the Company; and (3) provide reasonable assurance regarding prevention or timely detection of unauthorized acquisition, use or disposition of the Company’s assets that could have a material effect on the financial statements.
The system of internal control over financial reporting as it relates to the financial statements is evaluated for effectiveness by management and tested for reliability through a program of internal audits. Actions are taken to correct potential deficiencies as they are identified. Any system of internal control, no matter how well designed, has inherent limitations, including the possibility that a control can be circumvented or overridden, and misstatements due to error or fraud may occur and not be detected. Also, because of changes in conditions, internal control effectiveness may vary over time. Accordingly, even an effective system of internal control will provide only reasonable assurance with respect to financial statement preparation.
Citizens Holding Company
Page Two
Management, with the participation of the Company’s principal executive officer and principal financial officer, conducted an assessment of the effectiveness of the Company’s system of internal control over financial reporting as of December 31, 2023, based on criteria for effective internal control over financial reporting described in the “Internal Control – Integrated Framework,” (2013) issued by the Committee of Sponsoring Organizations of the Treadway Commission. Based on this assessment, management has concluded that, as of December 31, 2023, the Company’s system of internal control over financial reporting was effective.


| Stacy Brantley | Phillip R. Branch |
| Chief Executive Officer | Treasurer and Chief Financial Officer |
March 16, 2023
CITIZENS HOLDING COMPANY
Consolidated Statements of Financial Condition
December 31, 2023 and 2022
(in thousands, except share data)
| | | 2023 | | | 2022 | |
| ASSETS | | | | | | | | |
Cash and due from banks | | $ | 14,553 | | | $ | 26,948 | |
Interest bearing deposits with other banks | | | 79,923 | | | | 1,646 | |
Cash and cash equivalents | | | 94,476 | | | | 28,594 | |
Securities available-for-sale, at fair value | | | 177,795 | | | | 201,322 | |
Investment securities held-to-maturity, at amortized cost | | | 387,799 | | | | 406,590 | |
Loans held for investment ("LHFI"), net | | | 640,945 | | | | 585,316 | |
Less allowance for credit losses, LHFI | | | 6,551 | | | | 5,264 | |
Net LHFI | | | 634,394 | | | | 580,052 | |
Bank premises, furniture, fixtures and equipment, net | | | 27,073 | | | | 27,705 | |
Other real estate owned, net | | | 1,234 | | | | 1,179 | |
Accrued interest receivable | | | 5,231 | | | | 4,864 | |
Cash surrender value of life insurance | | | 26,284 | | | | 25,724 | |
Deferred tax assets, net | | | 28,008 | | | | 29,574 | |
Identifiable intangible assets, net | | | 13,331 | | | | 13,442 | |
Other assets | | | 8,972 | | | | 4,682 | |
| | | | | | | | | |
Total assets | | $ | 1,404,597 | | | $ | 1,323,728 | |
| | | | | | | | | |
LIABILITIES AND SHAREHOLDERS' EQUITY | | | | | | | | |
Deposits | | | | | | | | |
Non-interest bearing deposits | | $ | 264,528 | | | $ | 299,112 | |
Interest bearing deposits | | | 905,549 | | | | 827,290 | |
| | | | | | | | | |
Total deposits | | | 1,170,077 | | | | 1,126,402 | |
| | | | | | | | | |
Short-term borrowings | | | 158,086 | | | | 127,574 | |
Borrowings on secured line of credit | | | 18,000 | | | | 18,000 | |
Accrued interest payable | | | 1,243 | | | | 732 | |
Deferred compensation payable | | | 9,929 | | | | 9,868 | |
Other liabilities | | | 4,489 | | | | 2,127 | |
| | | | | | | | | |
Total liabilities | | | 1,361,824 | | | | 1,284,703 | |
| | | | | | | | | |
Shareholders' equity | | | | | | | | |
Common stock, $.20 par value, authorized 22,500,000 shares; 5,616,438 shares issued and outstanding at December 31, 2023 and 5,603,570 shares issued and outstanding at December 31, 2022 | | | 1,123 | | | | 1,122 | |
Additional paid-in capital | | | 18,585 | | | | 18,448 | |
Accumulated other comprehensive loss, net of tax benefit of $25,362 in 2023 and $29,355 in 2022 | | | (76,289 | ) | | | (83,070 | ) |
Retained earnings | | | 99,354 | | | | 102,525 | |
| | | | | | | | | |
Total shareholders' equity | | | 42,773 | | | | 39,025 | |
| | | | | | | | | |
Total liabilities and shareholders' equity | | $ | 1,404,597 | | | $ | 1,323,728 | |
The accompanying notes are an integral part of these statements.
CITIZENS HOLDING COMPANY
Consolidated Statements of Income
Years Ended December 31, 2023, 2022, and 2021
(in thousands, except share and per share data)
| | | 2023 | | | 2022 | | | 2021 | |
Interest income | | | | | | | | | | | | |
Interest and fees on loans | | $ | 32,777 | | | $ | 27,198 | | | $ | 31,207 | |
Interest on securities | | | | | | | | | | | | |
Taxable | | | 8,957 | | | | 8,075 | | | | 4,440 | |
Non-taxable | | | 4,184 | | | | 4,040 | | | | 2,800 | |
Other interest | | | 3,366 | | | | 388 | | | | 62 | |
Total interest income | | | 49,284 | | | | 39,701 | | | | 38,509 | |
| | | | | | | | | | | | | |
Interest expense | | | | | | | | | | | | |
Deposits | | | 12,254 | | | | 2,538 | | | | 4,260 | |
Other borrowed funds | | | 7,152 | | | | 2,254 | | | | 755 | |
Total interest expense | | | 19,406 | | | | 4,792 | | | | 5,015 | |
Net interest income | | | 29,878 | | | | 34,909 | | | | 33,494 | |
| | | | | | | | | | | | | |
Provision for credit losses | | | 669 | | | | 124 | | | | 1,409 | |
Net interest income after provision for credit losses | | | 29,209 | | | | 34,785 | | | | 32,085 | |
| | | | | | | | | | | | | |
Non-interest income | | | | | | | | | | | | |
Service charges on deposit accounts | | | 3,788 | | | | 3,896 | | | | 3,499 | |
Other service charges and fees | | | 4,449 | | | | 4,268 | | | | 4,281 | |
Net (losses) gains on sales of securities | | | (1,986 | ) | | | - | | | | 1,378 | |
Other income | | | 2,497 | | | | 2,721 | | | | 3,030 | |
Total non-interest income | | | 8,748 | | | | 10,885 | | | | 12,188 | |
| | | | | | | | | | | | | |
Non-interest expense | | | | | | | | | | | | |
Salaries and employee benefits | | | 18,583 | | | | 17,649 | | | | 18,460 | |
Occupancy expense | | | 3,143 | | | | 3,195 | | | | 3,193 | |
Equipment expense | | | 4,692 | | | | 4,216 | | | | 3,942 | |
Write down on other real estate | | | - | | | | 42 | | | | 914 | |
Other expense | | | 9,759 | | | | 9,067 | | | | 8,839 | |
Total non-interest expense | | | 36,177 | | | | 34,169 | | | | 35,348 | |
| | | | | | | | | | | | | |
Income before income taxes | | | 1,780 | | | | 11,501 | | | | 8,925 | |
Income tax (benefit) expense | | | (74 | ) | | | 1,881 | | | | 1,431 | |
Net income | | $ | 1,854 | | | $ | 9,620 | | | $ | 7,494 | |
Net income per share – basic | | $ | 0.33 | | | $ | 1.72 | | | $ | 1.34 | |
Net income per share – diluted | | $ | 0.33 | | | $ | 1.72 | | | $ | 1.34 | |
Weighted average shares outstanding | | | | | | | | | | | | |
Basic | | | 5,600,964 | | | | 5,592,668 | | | | 5,584,396 | |
Diluted | | | 5,600,964 | | | | 5,592,668 | | | | 5,584,483 | |
The accompanying notes are an integral part of these statements.
CITIZENS HOLDING COMPANY
Consolidated Statements of Comprehensive (Loss) Income
Years Ended December 31, 2023, 2022, and 2021
(in thousands)
| | | 2023 | | | 2022 | | | 2021 | |
Net income | | $ | 1,854 | | | $ | 9,620 | | | $ | 7,494 | |
| | | | | | | | | | | | | |
Other comprehensive income (loss) | | | | | | | | | | | | |
| | | | | | | | | | | | | |
Securities available-for-sale | | | | | | | | | | | | |
Unrealized holding gains (losses) during the period | | | 7,340 | | | | (96,677 | ) | | | (22,608 | ) |
Income tax effect | | | (1,831 | ) | | | 24,121 | | | | 5,641 | |
Net unrealized gains (losses) | | | 5,509 | | | | (72,556 | ) | | | (16,967 | ) |
| | | | | | | | | | | | | |
Amortization of net unrealized losses on securities transferred from AFS to HTM | | | 4,546 | | | | 1,707 | | | | - | |
Income tax effect | | | (1,134 | ) | | | (426 | ) | | | - | |
Net unrealized losses amortized on securities transferred from AFS to HTM | | | 3,412 | | | | 1,281 | | | | - | |
| | | | | | | | | | | | | |
Derivative Instruments | | | | | | | | | | | | |
Unrealized holding losses during the period | | | (866 | ) | | | - | | | | - | |
Income tax effect | | | 215 | | | | - | | | | - | |
Net unrealized losses | | | (651 | ) | | | - | | | | - | |
| | | | | | | | | | | | | |
Reclassification adjustment for (losses) gains included in net income | | | (1,984 | ) | | | - | | | | 1,378 | |
Income tax effect | | | 495 | | | | - | | | | (344 | ) |
Net (losses) gains included in net income | | | (1,489 | ) | | | - | | | | 1,034 | |
| | | | | | | | | | | | | |
| | | | | | | | | | | | | |
Total other comprehensive income (loss) | | | 6,781 | | | | (71,275 | ) | | | (15,933 | ) |
| | | | | | | | | | | | | |
Comprehensive income (loss) | | $ | 8,635 | | | $ | (61,655 | ) | | $ | (8,439 | ) |
The accompanying notes are an integral part of these statements.
CITIZENS HOLDING COMPANY
Consolidated Statements of Changes in Shareholders' Equity
Years Ended December 31, 2023, 2022, and 2021
(in thousands, except share data)
| | | | | | | | | | | | | | | Accumulated | | | | | | | | | |
| | | Number | | | | | | | Additional | | | Other | | | | | | | | | |
| | | of Shares | | | Common | | | Paid-In | | | Comprehensive | | | Retained | | | | | |
| | | Issued | | | Stock | | | Capital | | | (Loss) Income | | | Earnings | | | Total | |
Balance, January 1, 2021 | | | 5,587,070 | | | | 1,118 | | | | 18,134 | | | | 4,138 | | | | 96,158 | | | $ | 119,548 | |
Net income | | | - | | | | - | | | | - | | | | - | | | | 7,494 | | | | 7,494 | |
Dividends paid ($0.96 per share) | | | - | | | | - | | | | - | | | | - | | | | (5,370 | ) | | | (5,370 | ) |
Restricted stock granted | | | 8,250 | | | | 2 | | | | (2 | ) | | | - | | | | - | | | | - | |
Stock compensation expense | | | - | | | | - | | | | 161 | | | | - | | | | - | | | | 161 | |
Other comprehensive loss, net | | | - | | | | - | | | | - | | | | (15,933 | ) | | | - | | | | (15,933 | ) |
Balance, December 31, 2021 | | | 5,595,320 | | | | 1,120 | | | | 18,293 | | | | (11,795 | ) | | | 98,282 | | | | 105,900 | |
Net income | | | - | | | | - | | | | - | | | | - | | | | 9,620 | | | | 9,620 | |
Dividends paid ($0.96 per share) | | | - | | | | - | | | | - | | | | - | | | | (5,377 | ) | | | (5,377 | ) |
Restricted stock granted | | | 8,250 | | | | 2 | | | | (2 | ) | | | - | | | | - | | | | - | |
Stock compensation expense | | | - | | | | - | | | | 157 | | | | - | | | | - | | | | 157 | |
Other comprehensive loss, net | | | - | | | | - | | | | - | | | | (71,275 | ) | | | - | | | | (71,275 | ) |
Balance, December 31, 2022 | | | 5,603,570 | | | | 1,122 | | | | 18,448 | | | | (83,070 | ) | | | 102,525 | | | | 39,025 | |
FASB ASU 2016-13 adoption adjustment | | | - | | | | - | | | | - | | | | - | | | | (983 | ) | | | (983 | ) |
Net income | | | - | | | | - | | | | - | | | | - | | | | 1,854 | | | | 1,854 | |
Dividends paid ($0.72 per share) | | | - | | | | - | | | | - | | | | - | | | | (4,042 | ) | | | (4,042 | ) |
Restricted stock granted | | | 12,868 | | | | 1 | | | | (1 | ) | | | - | | | | - | | | | - | |
Stock compensation expense | | | - | | | | - | | | | 138 | | | | - | | | | - | | | | 138 | |
Other comprehensive income, net | | | - | | | | - | | | | - | | | | 6,781 | | | | - | | | | 6,781 | |
Balance, December 31, 2023 | | | 5,616,438 | | | $ | 1,123 | | | $ | 18,585 | | | $ | (76,289 | ) | | $ | 99,354 | | | $ | 42,773 | |
The accompanying notes are an integral part of these statements.
CITIZENS HOLDING COMPANY
Consolidated Statements of Cash Flows
Years Ended December 31, 2023, 2022, and 2021
1 of 2
(in thousands)
| | | 2023 | | | 2022 | | | 2021 | |
Cash flows from operating activities | | | | | | | | | | | | |
Net income | | $ | 1,854 | | | $ | 9,620 | | | $ | 7,494 | |
Adjustments to reconcile net income to net cash provided by operating activities | | | | | | | | | | | | |
Depreciation and amortization | | | 1,437 | | | | 1,275 | | | | 1,173 | |
Amortization of premiums and accretion of discounts on investment securities, net | | | 2,777 | | | | 3,247 | | | | 6,629 | |
Stock compensation expense | | | 138 | | | | 157 | | | | 161 | |
Provision for credit losses | | | 669 | | | | 124 | | | | 1,409 | |
Loss (gain) on sale of securities | | | 1,986 | | | | - | | | | (1,378 | ) |
Gain from death benefit proceeds on BOLI | | | - | | | | (192 | ) | | | (357 | ) |
(Gain) loss on sale of fixed assets | | | (279 | ) | | | (322 | ) | | | 13 | |
Impairment loss on fixed assets | | | - | | | | 208 | | | | - | |
Net gain on sale of other real estate owned | | | - | | | | (27 | ) | | | (323 | ) |
Deferred income tax expense | | | (362 | ) | | | 401 | | | | 566 | |
Writedown on other real estate owned | | | - | | | | 42 | | | | 914 | |
(Increase) decrease in accrued interest receivable | | | (366 | ) | | | (694 | ) | | | 1,812 | |
Increase in cash surrender value life insurance | | | (560 | ) | | | (665 | ) | | | (670 | ) |
Increase (decrease) in accrued interest payable | | | 511 | | | | 403 | | | | (194 | ) |
Increase (decrease) in deferred compensation liability | | | 61 | | | | 325 | | | | (122 | ) |
Net change in other operating assets and liabilities | | | (2,343 | ) | | | (142 | ) | | | 364 | |
| | | | | | | | | | | | | |
Net cash provided by operating activities | | | 5,523 | | | | 13,760 | | | | 17,491 | |
| | | | | | | | | | | | | |
Cash flows from investing activities | | | | | | | | | | | | |
Proceeds from calls, paydowns and maturities of securities available-for-sale | | $ | 11,332 | | | $ | 39,399 | | | $ | 150,879 | |
Proceeds from calls, paydowns and maturities of securities held-to-maturity | | | 21,377 | | | | 8,371 | | | | - | |
Proceeds from sales of securities available-for-sale | | | 14,748 | | | | - | | | | 500,685 | |
Purchases of investment securities available-for-sale | | | - | | | | (122,120 | ) | | | (631,131 | ) |
Proceeds from sale of FHLB stock | | | - | | | | - | | | | 4,447 | |
Death benefit proceeds from bank-owned life insurance | | | - | | | | 812 | | | | 1,162 | |
Purchases of bank premises, furniture, fixtures and equipment | | | (718 | ) | | | (2,642 | ) | | | (2,599 | ) |
CITIZENS HOLDING COMPANY
Consolidated Statements of Cash Flows
Years Ended December 31, 2023, 2022, and 2021
2 of 2
(in thousands)
| | | 2023 | | | 2022 | | | 2021 | |
Proceeds from sales of bank premises, furniture, fixtures and equipment | | | 207 | | | | 546 | | | | 492 | |
Proceeds from sale of other real estate owned | | | 324 | | | | 1,331 | | | | 3,257 | |
Purchases of FHLB stock | | | (317 | ) | | | (880 | ) | | | (4,103 | ) |
Net change in loans | | | (56,739 | ) | | | (13,166 | ) | | | 75,527 | |
| | | | | | | | | | | | | |
Net cash (used in) provided by investing activities | | | (9,786 | ) | | | (88,349 | ) | | | 98,616 | |
| | | | | | | | | | | | | |
Cash flows from financing activities | | | | | | | | | | | | |
Net change in deposits | | $ | 43,675 | | | $ | 14,510 | | | $ | 16,703 | |
Net increase (decrease) in securities sold under agreement to repurchase | | | 30,512 | | | | 14,814 | | | | (83,512 | ) |
Proceeds from borrowings on secured line of credit | | | - | | | | - | | | | 18,000 | |
Dividends paid to shareholders | | | (4,042 | ) | | | (5,377 | ) | | | (5,370 | ) |
Net decrease in FHLB advances | | | - | | | | - | | | | (25,000 | ) |
| | | | | | | | | | | | | |
Net cash provided by (used in) financing activities | | | 70,145 | | | | 23,947 | | | | (79,179 | ) |
| | | | | | | | | | | | | |
Net increase (decrease) in cash and due from banks | | | 65,882 | | | | (50,642 | ) | | | 36,928 | |
| | | | | | | | | | | | | |
Cash and cash equivalents, beginning of year | | | 28,594 | | | | 79,236 | | | | 42,308 | |
| | | | | | | | | | | | | |
Cash and cash equivalents, end of year | | $ | 94,476 | | | $ | 28,594 | | | $ | 79,236 | |
| | | | | | | | | | | | | |
Supplemental disclosures of cash flow information | | | | | | | | | | | | |
Cash paid for | | | | | | | | | | | | |
Interest | | $ | 18,895 | | | $ | 4,388 | | | $ | 5,209 | |
Income taxes | | $ | 1,950 | | | $ | 1,490 | | | $ | 515 | |
| | | | | | | | | | | | | |
Noncash disclosures | | | | | | | | | | | | |
Real estate acquired by foreclosure | | $ | 286 | | | $ | 49 | | | $ | 3,250 | |
The accompanying notes are an integral part of these financial statements.
Note 1. Nature of Business and Summary of Significant Accounting Policies
(in thousands, except share and per share data)
Nature of Business
Citizens Holding Company (referred to herein as the “Holding Company”) owns and operates The Citizens Bank of Philadelphia (the “Bank”). In addition to full service commercial banking, the Bank offers title insurance services through its affiliate, Title Services LLC. During 2022, Title Services LLC ceased operations. As a state bank, the Bank is subject to regulations of the Mississippi Department of Banking and Consumer Finance and the Federal Deposit Insurance Company. The Company is also subject to the regulations of the Federal Reserve. The area served by the Bank is east central Mississippi, along with southern and northern counties of Mississippi and their surrounding areas. Services are provided at multiple branch offices.
Basis of Financial Statement Presentation
The accounting policies of the Company and its subsidiary conform to generally accepted accounting principles (“GAAP”) in the United States of America and to general practices within the banking industry. The consolidated financial statements of the Company include the accounts of the Bank and its affiliate (collectively, the “Company”). All significant intercompany transactions have been eliminated in consolidation.
Segment Reporting
We have determined that all of our lending divisions meet the aggregation criteria of Accounting Standards Codification (“ASC”) 280, Segment Reporting, since all offer similar products and services, operate with similar processes, have similar customers and are collectively reviewed by the chief operating decision maker. No other services are material for presentation as a separate segment.
Estimates
The preparation of financial statements in conformity with GAAP requires management to make estimates and assumptions that affect the reported amounts of assets and liabilities and disclosure of contingent assets and liabilities at the date of the financial statements and the reported amounts of revenues and expenses during the reporting period. Actual results could differ from those estimates.
Estimates that are particularly susceptible to significant change relate to the determination of the allowance for credit losses (“ACL”) and the valuation of real estate acquired in connection with foreclosures or in satisfaction of loans. In connection with the determination of the ACL and valuation of foreclosed real estate, management obtains independent appraisals for significant properties.
While management uses available information to recognize losses on loans and to value foreclosed real estate, future additions to the allowance or adjustments to the valuation may be necessary based on changes in local economic conditions. In addition, regulatory agencies, as an integral part of their examination process, periodically review the Company’s ACL and valuations of foreclosed real estate. Such agencies may require the Company to recognize additions to the allowance or to make adjustments to the valuation based on their judgments about information available to them at the time of their examination. Due to these factors, it is reasonably possible that the ACL and valuation of foreclosed real estate may change materially in the near term.
Note 1. Continued
Cash, Due from Banks and Interest Bearing Deposits with Other Banks
For the purpose of reporting cash flows, cash and due from banks includes cash on hand and demand deposits. The Company is required to maintain average reserve balances with the Federal Reserve Bank based on a percentage of deposits. Effective March 26, 2021, the Federal Reserve reduced reserve requirement ratios to zero percent, eliminating the reserve requirements for all depository institutions.
Interest-bearing deposits with other banks mature within one year and are carried at cost.
Investment Securities
In accordance with the investments topic of the ASC, securities are classified as “available-for-sale (“AFS”)”, “held-to-maturity (“HTM”)” or “trading”. Fair values for securities are based on quoted market prices where available. If quoted market prices are not available, fair values are based on quoted market prices of comparable instruments. Gains or losses on the sale of securities are determined using the specific identification method. Currently, the Company has no trading securities.
Securities Available-for-Sale
Securities that are held for indefinite periods of time or used as part of the Company’s asset/liability management strategy and that may be sold in response to interest rate changes, changes in prepayment risk, the need to increase regulatory capital and other similar factors are classified as AFS. Securities available-for-sale are reported at fair value, with unrealized gains and losses reported, net of related income tax effect, as a separate component of shareholders’ equity.
The Company also evaluates available-for-sale investment securities in an unrealized loss position on a quarterly basis. If the Company intends to sell the security or it is more likely than not that it will be required to sell before recovery, the entire unrealized loss is recorded as a loss within noninterest income in the Consolidated Statements of Income with a corresponding adjustment to the amortized cost basis of the security. If the Company does not intend to sell the security and it is not more likely than not that it will be required to sell the security before recovery of its amortized cost basis, the Company evaluates if any of the unrealized loss is related to a potential credit loss. The amount, if any, related to credit loss is recognized in earnings as a provision for credit loss (“PCL”) and a corresponding ACL is established; each is calculated as the difference between the estimate of discounted future cash flows and the amortized cost basis of the security. A number of qualitative and quantitative factors, including the financial condition of the underlying issuer, current and projected deferrals or defaults and credit ratings by nationally recognized statistical rating agencies are considered by management in the estimate of the discounted future cash flows. The remaining difference between the fair value and the amortized cost basis of the security is considered the amount related to other market factors and is recognized in other comprehensive income, net of applicable taxes.
Note 1. Continued
Securities Held-to-Maturity
HTM securities are carried at amortized cost and represent those securities that the Company both intends and has the ability to hold to maturity.
The Company evaluates its ACL on the held-to-maturity investment portfolio on a quarterly basis in accordance with Financial Accounting Standards Board (“FASB”) ASC 326, “Financial Instruments - Credit Losses (“ASC 326”; ASC 326 is also referred to as “CECL”). Expected credit losses on debt securities classified as held-to-maturity are measured on a collective basis by major security type. The estimates of expected credit losses are based on historical default rates, investment grades, current conditions, and reasonable and supportable forecasts about the future. The allowance is increased through PCL and decreased by charge-offs, net of recoveries of amounts previously charged-off.
LHFI and Allowance for Credit Losses
LHFI are loans receivable that management has the intent and ability to hold for the foreseeable future or until maturity or payoff are reported at the principal amount outstanding, net of unearned income and an ACL. The Company has no loans held-for-sale.
Unearned origination fees include deferred fees net of deferred direct incremental loan origination cost. Unearned origination fees attributable to loans held with a maturity of more than one year is recognized as income or expense over the life of the loan.
Unearned discounts on installment loans are recognized as income over the terms of the loans by a method that approximates the interest method. Unearned origination fees and interest on commercial loans are recognized based on the principal amount outstanding. For all other loans, interest is accrued daily on the outstanding balances. For nonperforming loans, interest is discontinued on a loan when management believes, after considering collection efforts and other factors, that the borrower’s financial condition is such that collection of interest is doubtful. Cash collections on these loans are credited to the loan receivable balance, and no interest income is recognized on those loans until the principal balance has been collected. The Company generally discontinues the accrual of interest income when a loan becomes 90 days past due as to principal or interest; however, management may elect to continue the accrual when the estimated net realizable value of collateral is sufficient to cover the principal balance and the accrued interest. Interest income on other nonaccrual loans is recognized only to the extent of interest payments.
Upon discontinuance of the accrual of interest on a loan, any previously accrued but unpaid interest is reversed against interest income.
Note 1. Continued
Loans are considered past due if the required principal and interest payments have not been received as of the date such payments were due. Generally, the recognition of interest on mortgage and commercial and industrial loans is discontinued at the time the loan is 90 days past due unless the credit is well-secured and in process of collection. Consumer and other retail loans are typically charged-off no later than the time the loan is 120 days past due. In all cases, loans are placed on nonaccrual status or charged-off at an earlier date if collection of principal or interest is considered doubtful. Loans may be placed on nonaccrual regardless of whether or not such loans are considered past due. All interest accrued for the current year, but not collected, for loans that are placed on nonaccrual or charged-off is reversed against interest income, the amount of which was immaterial for the years ended December 31, 2023, 2022 and 2021. The interest on these loans is accounted for on the cash-basis or cost-recovery method, until qualifying for return to accrual. Interest income recognized on nonaccrual loans was immaterial for the year ended December 31, 2023. Loans are returned to accrual status when all the principal and interest amounts contractually due are brought current and future payments are reasonably assured.
The ACL is an estimate of expected losses inherent within the Company’s loans held for investment portfolio and is maintained at a level believed adequate by management to absorb credit losses inherent in the entire loan portfolio in accordance with ASC 326. Management evaluates the adequacy of the ACL on a quarterly basis. Expected credit loss inherent in non-cancellable off-balance-sheet credit exposures is accounted for as a separate liability in the Consolidated Statements of Financial Condition. The ACL for loans held for investment, as reported in the Company’s Consolidated Statements of Financial Condition, is adjusted by a PCL, which is reported in earnings, and reduced by net charge-offs. Loan losses are charged against the ACL when management believes the uncollectability of a loan balance is confirmed. Subsequent recoveries, if any, are credited to the allowance.
The credit loss estimation process involves procedures to appropriately consider the unique characteristics of the Company’s loan portfolio segments. Credit quality is assessed and monitored by evaluating various attributes, and the results of those evaluations are utilized in underwriting new loans and in the Company’s process for the estimation of expected credit losses. Credit quality monitoring procedures and indicators can include an assessment of problem loans, the types of loans, historical loss experience, new lending products, emerging credit trends, changes in the size and character of loan categories and other factors, including the Company’s risk rating system, regulatory guidance and economic conditions, such as the unemployment rate and GDP growth in the markets in which the Company operates, as well as trends in the market values of underlying collateral securing loans, all as determined based on input from management, loan review staff and other sources. This evaluation is complex and inherently subjective, as it requires estimates by management that are inherently uncertain and therefore susceptible to significant revision as more information becomes available. In future periods, evaluations of the overall loan portfolio, in light of the factors and forecasts then prevailing, may result in significant changes in the ACL and PCL in those future periods.
The methodology for estimating the amount of expected credit losses reported in the ACL has two basic components: first, a collective or pooled component for estimating expected credit losses for pools of loans that share similar risk characteristics; and second, an asset-specific component involving individual loans that do not share risk characteristics with other loans and the measurement of expected credit losses for such individual loans.
Note 1. Continued
Loans Evaluated on a Collective (Pool) Basis
The ACL for loans that share similar risk characteristics with other loans is calculated on a collective or pool basis, where such loans are segregated into loan portfolio segments based upon similarity of credit risk. The Company’s primary loan portfolio segments are as follows:
Real Estate – Land Development and Construction - The Company’s construction loan portfolio consists of loans for the construction of single family residential properties, multi-family properties and commercial projects. Maturities for construction loans generally range from 6 to 12 months for residential properties and from 24 to 36 months for non-residential and multi-family properties. The source of repayment of a construction loan comes from the sale or lease of newly-constructed property, although often construction loans are repaid with the proceeds of a commercial real estate loan that the Company makes to the owner or lessor of the newly-constructed property.
Real Estate - Farmland - are “owner-occupied” loans in which the owner develops a property with the intention of locating its farming operations there. Payments on these loans are dependent on the successful development and management of the business as well as the borrower’s ability to generate sufficient operating revenue to repay the loan. In some instances, in addition to the mortgage on the underlying real estate of the business, farmland loans are secured by other non-real estate collateral, such as equipment or other assets used in the business. In addition to owner-occupied commercial real estate loans, the Company offers loans in which the owner develops a property where the source of repayment of the loan will come from the sale or lease of the developed property. These loans are referred to as “non-owner occupied” farmland loans.
Real Estate - 1-4 Family Mortgage - This segment of the Company’s loan portfolio includes loans secured by first or second liens on residential real estate in which the property is the principal residence of the borrower, as well as loans secured by residential real estate in which the property is rented to tenants or is otherwise not the principal residence of the borrower. Loans for the preparation of residential real property prior to construction are also included in this segment. Finally, this segment includes home equity loans or lines of credit and term loans secured by first and second mortgages on the residences of borrowers who elect to use the accumulated equity in their homes for purchases, refinances, home improvements, education and other personal expenditures. The Company attempts to minimize the risk associated with residential real estate loans by scrutinizing the financial condition of the borrower; typically, the maximum loan-to-value ratio is also limited.
Real Estate - Commercial Real Estate - are “owner-occupied” loans in which the owner develops a property with the intention of locating its business there. Payments on these loans are dependent on the successful development and management of the business as well as the borrower’s ability to generate sufficient operating revenue to repay the loan. In some instances, in addition to the mortgage on the underlying real estate of the business, commercial real estate loans are secured by other non-real estate collateral, such as equipment or other assets used in the business. In addition to owner-occupied commercial real estate loans, the Company offers loans in which the owner develops a property where the source of repayment of the loan will come from the sale or lease of the developed property, for example, retail shopping centers, hotels and storage facilities. These loans are referred to as “non-owner occupied” commercial real estate loans. The Company also offers commercial real estate loans to developers of commercial properties for purposes of site acquisition and preparation and other development prior to actual construction (referred to as “commercial land development loans”). Non-owner occupied commercial real estate loans and commercial land development loans are dependent on the successful completion of the project and may be affected by adverse conditions in the real estate market or the economy as a whole.
Note 1. Continued
Business Loans - Commercial and Industrial Loans - Commercial loans are customarily granted to established local business customers in the Company’s market area on a collateralized basis to meet their credit needs. Maturities are typically short term in nature and are commensurate with the secondary source of repayment that serves as the Company’s collateral. Although commercial loans may be collateralized by equipment or other business assets, the repayment of this type of loan depends primarily on the creditworthiness and projected cash flow of the borrower (and any guarantors). Thus, the chief considerations when assessing the risk of a commercial loan are the local business borrower’s ability to sell its products/services, thereby generating sufficient operating revenue to repay the Company under the agreed upon terms and conditions, and the general business conditions of the local economy or other market that the business serves.
Business Loans – Farm Production and Other Farm Loans - Farm Production and Other Farm loans are customarily granted to established local farming customers in the Company’s market area on a collateralized basis to meet their credit needs. Maturities are typically short term in nature and are commensurate with the secondary source of repayment that serves as the Company’s collateral. Although farm loans may be collateralized by equipment or other business assets, the repayment of this type of loan depends primarily on the creditworthiness and projected cash flow of the borrower (and any guarantors). Thus, the chief considerations when assessing the risk of a commercial loan are the local business borrower’s ability to sell its products/services, thereby generating sufficient operating revenue to repay the Company under the agreed upon terms and conditions, and the general business conditions of the local economy or other market that the business serves.
Consumer Loans and Credit Cards - Installment loans to individuals are granted to individuals for the purchase of personal goods. Loss or decline of income by the borrower due to unplanned occurrences represents the primary risk of default to the Company. In the event of default, a shortfall in the value of the collateral may pose a loss in this loan category. Before granting a consumer loan, the Company assesses the applicant’s credit history and ability to meet existing and proposed debt obligations. Although the applicant’s creditworthiness is the primary consideration, the underwriting process also includes a comparison of the value of the collateral, if any, to the proposed loan amount. The Company obtains a lien against the collateral securing the loan and holds title until the loan is repaid in full.
In determining the ACL on loans evaluated on a collective basis, the Company categorizes loan pools based on loan type and/or risk rating. The Company uses four CECL models: (1) a loss rate model, based on CRE price index, real GDP, and U.S. unemployment for Real Estate – Land Development and Construction, Farmland, 1-4 Family Mortgages, and Commercial Real Estate, (2) a loss rate model, based on U.S. unemployment and nominal GDP for Commercial and Industrial Loans and Farm Production and Other Farm Loans, (3) a loss rate model, based on Moody’s Expected Consumer Credit Loss Model for Consumer Loans, and (4) a WARM model, based on company loss history for Credit Cards and Overdrafts.
Note 1. Continued
The historical loss rates calculated as described above are adjusted, as necessary, for both internal and external qualitative factors where there are differences in the historical loss data of the Company and current or projected future conditions. Internal factors include lending expertise, risk tolerance measured through lending policy requirements, and quality of the loan review system. External factors include current and reasonable and supportable forecasted economic conditions, impact of competition and changes in collateral values. These factors are used to adjust the historical loss rates (as described above) to ensure that they reflect management’s expectation of future conditions based on a reasonable and supportable forecast period. To the extent the lives of the loans in the portfolio extend beyond the period for which a reasonable and supportable forecast can be made, the Company uses a reversion period of four quarters and reverts to the historical mean on a straight-line basis over the remaining life of the loans.
Loans Evaluated on an Individual Basis
For loans that do not share similar risk characteristics with other loans, an individual analysis is performed to determine the expected credit loss. If the respective loan is collateral dependent (that is, when the borrower is experiencing financial difficulty and repayment is expected to be provided substantially through the operation or sale of the collateral), the expected credit loss is measured as the difference between the amortized cost basis of the loan and the fair value of the collateral. The fair value of collateral is initially based on external appraisals. Generally, collateral values for loans for which measurement of expected losses is dependent on the fair value of such collateral are updated every twelve months, either from external third parties or in-house certified appraisers. Third-party appraisals are obtained from a pre-approved list of independent, local appraisal firms. The fair value of the collateral derived from external appraisal is then adjusted for the estimated cost to sell if repayment or satisfaction of a loan is dependent on the sale (rather than only on the operation) of the collateral. Other acceptable methods for determining the expected credit losses for individually evaluated loans (typically used when the loan is not collateral dependent) is a discounted cash flow approach or, if applicable, an observable market price. Once the expected credit loss amount is determined, an allowance equal to such expected credit loss is included in the ACL.
The Company considers the loans disclosed as individually evaluated in Note 5, “Allowance for credit losses (“ACL”) and LHFI” as collateral dependent with the type of collateral being real estate.
The Company maintains a separate ACL on unfunded loan commitments, which is included in the “Other liabilities” line item on the Consolidated Statements of Financial Condition. Changes in such allowance are recorded in the “Other noninterest expense” line item on the Consolidated Statements of Income. Management estimates the amount of expected losses on unfunded loan commitments by calculating a likelihood of funding over the contractual period for exposures that are not unconditionally cancellable by the Company and applying the loss factors used in the ACL on loans methodology described above to unfunded commitments for each loan type. No credit loss estimate is reported for off-balance-sheet credit exposures that are unconditionally cancellable by the Company.
Note 1. Continued
Prior to the adoption of ASC 326 on January 1, 2023, the allowance was calculated under the guidance on collective impairment as recognized under ASC 450, “Contingencies.” Collective impairment was calculated based on loans grouped by grade. Another component of the allowance was losses on loans assessed as impaired under ASC 310, “Receivables” (“ASC 310”). The balance of these loans and their related allowance was included in management’s estimation and analysis of the ACL.
Bank Premises, Furniture, Fixtures and Equipment
The Company’s premises, furniture, fixtures and equipment are stated at cost less accumulated depreciation computed by straight-line methods over the estimated useful lives of the assets, which range from three to forty years. Costs of major additions and improvements are capitalized. Expenditures for maintenance and repairs are charged to expense as incurred.
Leases
Accounting Standards Update (“ASU”) 2016-02, “Leases (Topic 842),” became effective for the Company on January 1, 2020. The Company adopted FASB ASC Topic 842 utilizing the modified retrospective transition approach prescribed by ASU 2018-11, “Leases (Topic 842): Targeted Improvements”. The Company did not elect to adopt the package of practical expedients, which includes reassessing whether any expired or existing contracts are or contain leases, reassessing the lease classification and reassessing initial direct costs. Also, the Company did not elect to adopt the hindsight practical expedient therefore maintaining the lease terms previously determined under FASB ASC Topic 840, “Leases”. The Company made an accounting policy election to not recognize short-term leases (12 months or less) on the Statements of Financial Condition. The Company accounts for the lease and nonlease components separately as such amounts are readily determinable.
Once the Company identifies and determines certain contracts are leases according to FASB ASC Topic 842, the Company classifies it as an operating or a finance lease and recognizes a right-of-use asset and a lease liability at the lease commencement date. The lease liability represents the present value of the lease payments that remain unpaid as of the commencement date and the right-of-use asset is the initial lease liability recognized for the lease plus any lease payments made to the lessor at or before the commencement date as well as any initial direct costs less any lease incentives received.
The Company’s operating leases primarily consist of building and land leases. The Company recognizes lease rent expense on a straight-line basis over the term of the lease contract and records it as noninterest expense in occupancy expense. The Company’s amortization of the right-of-use asset is the difference between the straight-line lease expense and the interest expense recognized on the lease liability during the period. The Company’s lease liabilities are measured as the present value of the remaining lease payments throughout the lease term.
Note 1. Continued
In order to calculate its right-of-use assets and lease liabilities, FASB ASC Topic 842 requires the Company to use the rate of interest implicit in the lease when readily determinable. If the rate implicit in the lease is not readily determinable, the Company is required to use its incremental borrowing rate, which is the rate of interest the Company would have to pay to borrow on a collateralized basis over a similar term in a similar economic environment. Since the implicit interest rate for most of its building and land leases were not readily determinable, the Company used its incremental borrowing rate.
The Company’s short-term leases primarily include automated teller machines. For short-term leases, the Company recognizes lease expense on a straight-line basis over the lease term. As previously stated, the Company has elected not to include short-term leases on its statement of financial condition.
Other Real Estate Owned
Other real estate owned (“OREO”) consists of properties repossessed by the Company on foreclosed loans. These assets are stated at fair value at the date acquired less estimated costs to sell. Losses arising from the acquisition of such property are charged against the ACL. Declines in value resulting from subsequent revaluation of the property or losses resulting from disposition of such property are expensed as incurred. Revenue and expenses from operations of OREO are reflected as other income (expense).
Cash Surrender Value of Life Insurance
The Company has purchased life insurance contracts on certain employees and directors. Certain of such policies were acquired to fund deferred compensation arrangements with employees and directors. The cash surrender value of the Company owned policies is carried at the actual cash surrender value of the policy at the statement of financial condition date. Changes in the value of the policies are classified in non-interest income.
Intangible Assets
Intangible assets include core deposits purchased and goodwill. Core deposit intangibles are amortized on a straight-line basis over their estimated economic lives ranging from 5 to 10 years. Goodwill and other intangible assets with indefinite lives are not amortized but are tested at least annually for impairment. Fair values are determined based on market valuation multiples for the Company and comparable businesses based on the assets and cash flow of the Bank, the Company’s only reportable segment. If impairment has occurred, the goodwill or other intangible asset is reduced to its estimated fair value through a charge to expense.
Income Taxes
Provisions for income taxes are based on taxes payable or refundable for the current year and the changes in deferred tax assets and liabilities, excluding components of other comprehensive income. Deferred tax assets and liabilities are included in the financial statements at currently enacted income tax rates applicable to the period in which the deferred tax assets and liabilities are expected to be realized or settled. As changes in tax laws or rates are enacted, deferred tax assets and liabilities are adjusted through the provision for income taxes. Deferred tax assets are reduced by a valuation allowance when, in the opinion of management, it is more likely than not that some portion or all of the deferred tax assets will not be realized.
Note 1. Continued
Fair Value Measurements:
ASC 820, “Fair Value Measurements and Disclosures,” provides guidance for using fair value to measure assets and liabilities and also establishes a fair value hierarchy that prioritizes the inputs to valuation techniques used to measure fair value into three broad levels. The fair value hierarchy gives the highest priority to a valuation based on quoted prices in active markets for identical assets and liabilities (Level 1), moderate priority to a valuation based on quoted prices in active markets for similar assets and liabilities and/or based on assumptions that are observable in the market (Level 2), and the lowest priority to a valuation based on assumptions that are not observable in the market (Level 3). See Note 19, “Fair Value Measurements,” for further details regarding the Company’s methods and assumptions used to estimate the fair values of the Company’s financial assets and liabilities.
Derivative Instruments and Hedging Activities
The Company utilizes derivative financial instruments as part of its ongoing efforts to manage its interest rate risk exposure as well as to meet the needs of its customers. Derivative financial instruments are included in the Consolidated Statements of Financial Condition line item “Other assets” or “Other liabilities” at fair value in accordance with ASC 815.
Fair value hedges are utilized to mitigate the exposure to future interest rate risk. For the Company’s derivatives designated as fair value hedges, the gain or loss on the derivative instrument as well as the offsetting loss or gain on the hedged liability attributable to the hedged risk are recognized in current earnings. The gain or loss on the derivative instrument is presented on the same line item as the earnings effect of the hedged item.
Comprehensive Income (Loss)
Comprehensive income (loss) includes net earnings reported in the consolidated statements of income, changes in unrealized gain (loss) on securities available-for-sale and the amount of unrealized losses recorded upon the transfer of AFS securities to HTM securities, net of amortization, reported as a component of shareholders’ equity. Unrealized gain (loss) on AFS securities, net of related income taxes, and unrealized losses from the transfer of AFS securities to HTM securities are the primary components of accumulated other comprehensive income (loss) for the Company.
Net Income Per Share
Net income per share-basic is computed by dividing net income by the weighted average number of common shares outstanding during the year. Net income per share-diluted is based on the weighted average number of shares of common stock outstanding for the periods, including the dilutive effect of the Company’s outstanding stock options and restricted stock grants. The effect of the dilutive shares for the years 2023, 2022 and 2021 is illustrated in the following table.
Note 1. Continued
| | | 2023 | | | 2022 | | | 2021 | |
| | | | | | | | | | | | | |
Basic weighted average shares outstanding | | | 5,600,964 | | | | 5,592,668 | | | | 5,584,396 | |
Dilutive effect of stock options | | | - | | | | - | | | | 87 | |
| | | | | | | | | | | | | |
Dilutive weighted average shares outstanding | | | 5,600,964 | | | | 5,592,668 | | | | 5,584,483 | |
| | | | | | | | | | | | | |
Net income | | $ | 1,854 | | | $ | 9,620 | | | $ | 7,494 | |
| | | | | | | | | | | | | |
Net income per share-basic | | $ | 0.33 | | | $ | 1.72 | | | $ | 1.34 | |
Net income per share-diluted | | $ | 0.33 | | | $ | 1.72 | | | $ | 1.34 | |
Advertising Costs
Advertising costs are charged to expense when incurred. Advertising expense was $566, $610 and $573 for the years ended December 31, 2023, 2022 and 2021, respectively.
Securities Sold Under Agreements to Repurchase
Securities sold under agreements to repurchase are accounted for as collateralized financing transactions and are recorded at the amounts at which the securities were sold. Securities, generally United States Government, federal agency and state county municipal securities, pledged as collateral under these financing arrangements cannot be sold or re-pledged by the secured party.
Reclassifications
Certain information for 2022 has been reclassified to conform to the financial presentation for 2023. Such reclassifications had no effect on net income or shareholders’ equity.
Stock-Based Compensation
At December 31, 2023, the Company had outstanding grants under two stock-based compensation plans, which are the 1999 Directors’ Stock Compensation Plan and the 2013 Incentive Compensation Plan. Compensation expense for option grants and restricted stock awards is determined based on the estimated fair value of the stock options and restricted stock on the applicable grant or award date. The Company has elected to account for forfeitures in compensation cost when they occur as permitted under the guidance in ASC 718, “Compensation - Stock Compensation” (“ASC 718”). Expense associated with the Company’s stock-based compensation is included under the line item “Salaries and employee benefits” on the Consolidated Statements of Income. The Company recognizes compensation expense for all share-based payments to employees in accordance with ASC 718.
Note 1. Continued
Impact of Recently-Issued Accounting Standards and Pronouncements:
In June 2016, the Financial Accounting Standards Board (“FASB”) issued Accounting Standards Update (“ASU”) 2016-13, “Financial Instruments - Credit Losses (Topic 326): Measurement of Credit Losses on Financial Instruments” (“ASU 2016-13”). This update to ASC 326, Financial Instruments - Credit Losses, significantly changed the way entities recognize impairment on many financial assets by requiring immediate recognition of estimated credit losses expected to occur over the asset’s remaining life. FASB describes this impairment recognition model as the current expected credit loss model and believes the CECL model will result in more timely recognition of credit losses since the CECL model incorporates expected credit losses versus incurred credit losses. The scope of FASB’s CECL model includes loans, held-to-maturity debt instruments, lease receivables, loan commitments and financial guarantees that are not accounted for at fair value. Additionally, ASU 2016-13 amended the accounting for credit losses on available-for-sale securities and purchased financial assets with credit deterioration. In the remainder of these Notes to Consolidated Financial Statements, references to “CECL” or to “FASB ASU 2016-13” shall mean the accounting standards and principles set forth in ASC 326 after giving effect to ASU 2016-13 and the clarifications thereto discussed in the next paragraph.
The Company adopted ASU 2016-13 and all related subsequent amendments thereto effective January 1, 2023 using the modified retrospective approach for all financial assets measured at amortized cost and off-balance sheet credit exposures. To implement CECL, entities are required to apply a cumulative-effect adjustment to retained earnings as of the beginning of the fiscal year of adoption. The Company recorded a one-time cumulative-effect adjustment as disclosed in the table below.
| | | December 31, 2022 | | | Impact of FASB ASU | | | January 1, 2023 | |
| | | (as reported) | | | 2016-13 Adoption | | | (adjusted) | |
Assets: | | | | | | | | | | | | |
ACL | | $ | (5,264 | ) | | $ | (634 | ) | | $ | (5,898 | ) |
Deferred tax assets, net | | | 29,574 | | | | 327 | | | | 29,901 | |
Liabilities: | | | | | | | | | | | | |
ACL on off-balance sheet exposures | | | - | | | | 677 | 2 | | | 677 | |
Shareholders' equity: | | | | | | | | | | | | |
Retained earnings | | $ | 102,525 | | | $ | (984 | ) | | $ | 101,541 | |
| 2 | The allowance for credit losses on unfunded loan commitments is included in "Other liabilities" in the accompanying consolidated balance sheet. The related provision for credit losses on unfunded loan commitments is included in "Provision for credit losses" in the accompanying consolidated statements of income for the three and nine months ended December 31, 2023. |
Additionally, the Company made an accounting policy election to exclude accrued interest receivable from the amortized cost basis of loans and thus the measurement of the ACL in the Company’s loan portfolio. Accrued interest receivable on loans is reported as a component of accrued interest receivable on the Consolidated Statements of Financial Condition and totaled $2,397 and $1,981 at December 31, 2023 and December 31, 2022, respectively, and is excluded from estimated credit losses.
Note 2. Investment Securities
(in thousands)
The amortized cost and estimated fair value of securities available-for-sale and the corresponding amounts of gross unrealized gains and losses recognized in accumulated other comprehensive (loss) income at December 31, 2023 and 2022 were as follows:
| | | | | | | Gross | | | Gross | | | | | |
| | | Amortized | | | Unrealized | | | Unrealized | | | | | |
2023 | | Cost | | | Gains | | | Losses | | | Fair Value | |
Securities available-for-sale | | | | | | | | | | | | | | | | |
Mortgage-backed securities | | $ | 94,255 | | | $ | - | | | $ | 9,883 | | | $ | 84,372 | |
State, County, Municipals | | | 118,815 | | | | 2 | | | | 25,839 | | | | 92,978 | |
Other securities | | | 500 | | | | - | | | | 55 | | | | 445 | |
Total | | $ | 213,570 | | | $ | 2 | | | $ | 35,777 | | | $ | 177,795 | |
| | | | | | | Gross | | | Gross | | | | | |
| | | Amortized | | | Unrealized | | | Unrealized | | | | | |
2022 | | Cost | | | Gains | | | Losses | | | Fair Value | |
Securities available-for-sale | | | | | | | | | | | | | | | | |
Mortgage-backed securities | | $ | 107,055 | | | $ | - | | | $ | 10,083 | | | $ | 96,972 | |
State, County, Municipals | | | 134,906 | | | | - | | | | 30,993 | | | | 103,913 | |
Other securities | | | 500 | | | | - | | | | 63 | | | | 437 | |
Total | | $ | 242,461 | | | $ | - | | | $ | 41,139 | | | $ | 201,322 | |
The amortized cost and estimated fair value of securities HTM and the corresponding amounts of gross unrealized gains and losses at December 31, 2023 were as follows:
| | | | | | | Gross | | | Gross | | | | | |
| | | Amortized | | | Unrealized | | | Unrealized | | | | | |
2023 | | Cost | | | Gains | | | Losses | | | Fair Value | |
Securities held-to-maturity | | | | | | | | | | | | | | | | |
Obligations of U.S. Government agencies | | $ | 4,065 | | | $ | - | | | $ | 375 | | | $ | 3,690 | |
Mortgage-backed securities | | | 290,803 | | | | - | | | | 29,011 | | | | 261,792 | |
State, County, Municipals | | | 92,931 | | | | 33 | | | | 3,028 | | | | 89,936 | |
Total | | $ | 387,799 | | | $ | 33 | | | $ | 32,414 | | | $ | 355,418 | |
Note 2. Continued
The amortized cost and estimated fair value of securities HTM and the corresponding amounts of gross unrealized gains and losses at December 31, 2022 were as follows:
| | | | | | | Gross | | | Gross | | | | | |
| | | Amortized | | | Unrealized | | | Unrealized | | | | | |
2022 | | Cost | | | Gains | | | Losses | | | Fair Value | |
Securities held-to-maturity | | | | | | | | | | | | | | | | |
Obligations of U.S. Government agencies | | $ | 4,002 | | | $ | - | | | $ | 367 | | | $ | 3,635 | |
Mortgage-backed securities | | | 309,748 | | | | - | | | | 24,654 | | | | 285,094 | |
State, County, Municipals | | | 92,840 | | | | - | | | | 6,277 | | | | 86,563 | |
Total | | $ | 406,590 | | | $ | - | | | $ | 31,298 | | | $ | 375,292 | |
The following tables show the gross unrealized losses and fair value of the Company’s investments classified as AFS and HTM investments with unrealized losses aggregated by investment category and length of time that individual securities have been in a continuous unrealized loss position, at December 31, 2023 and 2022.
A summary of unrealized loss information for AFS and HTM securities, categorized by security type follows:
December 31, 2023 | |
Available-for-sale | | Less than 12 months | | | 12 months or more | | | Total | |
| | | | | | | Unrealized | | | | | | | Unrealized | | | | | | | Unrealized | |
Description of Securities | | Fair Value | | | Losses | | | Fair Value | | | Losses | | | Fair Value | | | Losses | |
| | | | | | | | | | | | | | | | | | | | | | | | | |
Mortgage backed securities | | $ | 3,330 | | | $ | 28 | | | $ | 78,553 | | | $ | 9,855 | | | $ | 81,883 | | | $ | 9,883 | |
State, County, Municipal | | | 1,282 | | | | 5 | | | | 91,197 | | | | 25,834 | | | | 92,479 | | | | 25,839 | |
Other securities | | | - | | | | - | | | | 445 | | | | 55 | | | | 445 | | | | 55 | |
| | | | | | | | | | | | | | | | | | | | | | | | | |
Total | | $ | 4,612 | | | $ | 33 | | | $ | 170,195 | | | $ | 35,744 | | | $ | 174,807 | | | $ | 35,777 | |
Held-to-maturity | | Less than 12 months | | | 12 months or more | | | Total | |
| | | | | | | Unrealized | | | | | | | Unrealized | | | | | | | Unrealized | |
Description of Securities | | Fair Value | | | Losses | | | Fair Value | | | Losses | | | Fair Value | | | Losses | |
| | | | | | | | | | | | | | | | | | | | | | | | | |
Obligations of U.S. Government agencies | | $ | - | | | $ | - | | | $ | 3,690 | | | $ | 375 | | | $ | 3,690 | | | $ | 375 | |
Mortgage backed securities | | | - | | | | - | | | | 261,791 | | | | 29,011 | | | | 261,791 | | | | 29,011 | |
State, County, Municipal | | | - | | | | - | | | | 86,390 | | | | 3,028 | | | | 86,390 | | | | 3,028 | |
| | | | | | | | | | | | | | | | | | | | | | | | | |
Total | | $ | - | | | $ | - | | | $ | 351,871 | | | $ | 32,414 | | | $ | 351,871 | | | $ | 32,414 | |
Note 2. Continued
December 31, 2022 | |
Available-for-sale | | Less than 12 months | | | 12 months or more | | | Total | |
| | | | | | | Unrealized | | | | | | | Unrealized | | | | | | | Unrealized | |
Description of Securities | | Fair Value | | | Losses | | | Fair Value | | | Losses | | | Fair Value | | | Losses | |
| | | | | | | | | | | | | | | | | | | | | | | | | |
Mortgage backed securities | | $ | 70,652 | | | $ | 3,838 | | | $ | 26,320 | | | $ | 6,245 | | | $ | 96,972 | | | $ | 10,083 | |
State, County, Municipal | | | 45,200 | | | | 9,027 | | | | 58,713 | | | | 21,966 | | | | 103,913 | | | | 30,993 | |
Other securities | | | - | | | | - | | | | 437 | | | | 63 | | | | 437 | | | | 63 | |
| | | | | | | | | | | | | | | | | | | | | | | | | |
Total | | $ | 115,852 | | | $ | 12,865 | | | $ | 85,470 | | | $ | 28,274 | | | $ | 201,322 | | | $ | 41,139 | |
Held-to-maturity | | Less than 12 months | | | 12 months or more | | | Total | |
| | | | | | | Unrealized | | | | | | | Unrealized | | | | | | | Unrealized | |
Description of Securities | | Fair Value | | | Losses | | | Fair Value | | | Losses | | | Fair Value | | | Losses | |
| | | | | | | | | | | | | | | | | | | | | | | | | |
Obligations of U.S. Government agencies | | $ | - | | | $ | - | | | $ | 3,635 | | | $ | 367 | | | $ | 3,635 | | | $ | 367 | |
Mortgage backed securities | | | 17,882 | | | | 1,333 | | | | 267,212 | | | | 23,321 | | | | 285,094 | | | | 24,654 | |
State, County, Municipal | | | 15,059 | | | | 781 | | | | 71,504 | | | | 5,496 | | | | 86,563 | | | | 6,277 | |
| | | | | | | | | | | | | | | | | | | | | | | | | |
Total | | $ | 32,941 | | | $ | 2,114 | | | $ | 342,351 | | | $ | 29,184 | | | $ | 375,292 | | | $ | 31,298 | |
The unrealized losses shown above are due to increases in market rates over the yields available at the time of purchase of the underlying securities and not credit quality. The Company does not intend to sell any of the securities in an unrealized loss position, and it is more likely than not that the Company will not be required to sell any such security prior to the recovery of its amortized cost basis, which may be at maturity.
The amortized cost and estimated fair value of securities at December 31, 2023, by contractual maturity and investment type, are shown below. Expected maturities will differ from contractual maturities because borrowers may have the right to call or prepay obligations with or without call or prepayment penalties.
| | | Available-for-sale | | | Held-to-maturity | |
| | | Amortized Cost | | | Fair Value | | | Amortized Cost | | | Fair Value | |
December 31, 2023 | | | | | | | | | | | | | | | | |
Due in one year or less | | $ | 500 | | | $ | 445 | | | $ | - | | | $ | - | |
Due after one year through five years | | | 2,880 | | | | 2,797 | | | | - | | | | - | |
Due after five years through ten years | | | 5,547 | | | | 5,284 | | | | - | | | | - | |
Due after ten years | | | 110,388 | | | | 84,897 | | | | 96,996 | | | | 93,626 | |
Residential mortgage backed securities | | | 81,820 | | | | 72,305 | | | | 232,902 | | | | 211,313 | |
Commercial mortgage backed securities | | | 12,435 | | | | 12,067 | | | | 57,901 | | | | 50,479 | |
| | | | | | | | | | | | | | | | | |
Total | | $ | 213,570 | | | $ | 177,795 | | | $ | 387,799 | | | $ | 355,418 | |
Note 2. Continued
| | | Available-for-sale | | | Held-to-maturity | |
| | | Amortized Cost | | | Fair Value | | | Amortized Cost | | | Fair Value | |
December 31, 2022 | | | | | | | | | | | | | | | | |
Due in one year or less | | $ | 721 | | | $ | 657 | | | $ | - | | | $ | - | |
Due after one year through five years | | | 3,152 | | | | 3,042 | | | | - | | | | - | |
Due after five years through ten years | | | 5,275 | | | | 4,853 | | | | - | | | | - | |
Due after ten years | | | 126,258 | | | | 95,798 | | | | 96,842 | | | | 90,198 | |
Residential mortgage backed securities | | | 94,226 | | | | 84,481 | | | | 250,615 | | | | 230,771 | |
Commercial mortgage backed securities | | | 12,829 | | | | 12,491 | | | | 59,133 | | | | 54,323 | |
| | | | | | | | | | | | | | | | | |
Total | | $ | 242,461 | | | $ | 201,322 | | | $ | 406,590 | | | $ | 375,292 | |
Investment securities with carrying amounts of $532,768 and $462,954 at December 31, 2023 and December 31, 2022, respectively, were pledged as collateral for public deposits and securities sold under agreement to repurchase.
Gross realized gains and losses are included in net (losses) gains on sales of securities in the Consolidated Statements of Income. Total gross realized gains and gross realized losses from the sale of investment securities for each of the years ended December 31 were:
| | | 2023 | | | 2022 | | | 2021 | |
Gross realized gains | | $ | - | | | $ | - | | | $ | 4,257 | |
Gross realized losses | | | (1,986 | ) | | | - | | | | (2,879 | ) |
| | | | | | | | | | | | | |
Net realized (losses) gains | | $ | (1,986 | ) | | $ | - | | | $ | 1,378 | |
Note 3. Federal Home Loan Bank Stock
(in thousands)
The Company, as a member of the Federal Home Loan Bank of Dallas (“FHLB”) system, owns stock in the organization. No ready market exists for the stock, and it has no quoted market value. The Company’s investment in the FHLB is carried at cost of $2,199 and $1,786 at December 31, 2023 and December 31, 2022, respectively, and is included in “Other Assets” in the Consolidated Statements of Financial Condition. The Company purchased stock in 2023 and 2022 at the par value of $100 per share.
Note 4. Loans
(In Thousands, Except Number of Loans)
The composition of LHFI, net at December 31, 2023 and 2022 is as follows:
| | | 2023 | | | 2022 | |
Real Estate: | | | | | | | | |
Land Development and Construction | | $ | 66,942 | | | $ | 52,731 | |
Farmland | | | 10,825 | | | | 11,437 | |
1-4 Family Mortgages | | | 95,161 | | | | 92,148 | |
Commercial Real Estate | | | 358,226 | | | | 316,541 | |
Total Real Estate Loans | | | 531,154 | | | | 472,857 | |
| | | | | | | | | |
Business Loans: | | | | | | | | |
Commercial and Industrial Loans | | | 93,060 | | | | 96,500 | |
Farm Production and Other Farm Loans | | | 424 | | | | 504 | |
Total Business Loans | | | 93,484 | | | | 97,004 | |
| | | | | | | | | |
Consumer Loans: | | | | | | | | |
Credit Cards | | | 3,377 | | | | 2,738 | |
Other Consumer Loans | | | 14,013 | | | | 12,992 | |
Total Consumer Loans | | | 17,390 | | | | 15,730 | |
| | | | | | | | | |
| | | | | | | | | |
Total Gross Loans | | | 642,028 | | | | 585,591 | |
| | | | | | | | | |
Unearned Origination Fees | | | (1,083 | ) | | | (275 | ) |
Allowance for Loan Losses | | | (6,551 | ) | | | (5,264 | ) |
| | | | | | | | | |
| | | | | | | | | |
Loans, net | | $ | 634,394 | | | $ | 580,052 | |
The Company has certain lending policies and procedures in place that are designed to maximize loan income within an acceptable level of risk. Management reviews these policies and procedures and submits them to the Company’s Board of Directors for its approval when needed, but no less frequently than annually. A reporting system supplements the review process by providing management with frequent reports related to loan production, loan quality, concentrations of credit, loan delinquencies and non-performing and potential problem loans. Diversification in the loan portfolio is a means of managing risk associated with fluctuations in economic conditions.
The Company maintains an independent loan review department that reviews and validates the credit risk program on a periodic basis. Results of this review are presented to management with quarterly reports made to the board of directors. The loan review process complements and reinforces the risk identification and assessment decisions made by the lenders and credit personnel, as well as the Company’s policies and procedures.
Note 4. Continued
Loans are made principally to customers in the Company’s market. The Company’s lending policy provides that loans collateralized by real estate are normally made with loan-to-value (“LTV”) ratios of 80 percent or less. Commercial loans are typically collateralized by property, equipment, inventories or receivables with LTV ratios from 50 percent to 80 percent. Residential real estate mortgage loans are collateralized by personal residences with LTV ratios of 80 percent or less. Consumer loans are typically collateralized by real estate, vehicles and other consumer durable goods. Approximately $152,262 and $104,261 of the loans outstanding at December 31, 2023 and 2022, respectively, were variable rate loans.
In the ordinary course of business, the Company has granted loans to certain directors, significant shareholders and their affiliates (collectively referred to as “related parties”). These loans were made on substantially the same terms, including interest rates and collateral, as those prevailing at the time for comparable transactions with other unaffiliated persons and do not involve more than normal risk of collectability. Activity in related party loans during 2023 is presented in the following table.
Balance outstanding at December 31, 2022 | | $ | 923 | |
| | | | | |
Principal additions | | | 584 | |
| | | | | |
Principal reductions | | | (45 | ) |
| | | | | |
Balance outstanding at December 31, 2023 | | $ | 1,462 | |
In addition to the loans outstanding above, the Company has an outstanding letter of credit with one of the Company’s directors with availability of $2,275 at December 31, 2022. The letter of credit was not drawn on during 2022 or 2023 and is no longer oultstanding at December 31, 2023. The letter of credit was made on substantially the same terms as comparable transactions with other unaffiliated persons.
Loans are considered to be past due if the required principal and interest payments have not been received as of the date such payments were due. Loans are placed on non-accrual status, when, in management’s opinion, the borrower may be unable to meet payment obligations as they become due, as well as when required by regulatory provisions. Loans may be placed on non-accrual status regardless of whether such loans are considered past due. When interest accruals are discontinued, all unpaid accrued interest is reversed. Interest income is subsequently recognized only to the extent cash payments are received in excess of principal due. Loans are returned to accrual status when all the principal and interest amounts contractually due are brought current and future payments are reasonably assured.
Note 4. Continued
Nonaccrual and Past Due LHFI
The amortized cost basis of period-end, nonaccrual and past due LHFI, segregated by class, were as follows:
| | | Nonaccrual With No Allowance for Credit Loss | | | Nonaccrual | | | Loans Past Due 90 Days or More Still Accruing | |
December 31, 2023 | | | | | | | | | | | | |
Loans secured by real estate: | | | | | | | | | | | | |
Land Development and Construction | | $ | - | | | $ | - | | | $ | - | |
Farmland | | | - | | | | 95 | | | | - | |
1-4 Family Mortgages | | | - | | | | 1,670 | | | | - | |
Commercial Real Estate | | | 399 | | | | 504 | | | | - | |
Total Real Estate Loans | | | 399 | | | | 2,269 | | | | - | |
Business Loans: | | | | | | | | | | | | |
Commercial and Industrial Loans | | | 124 | | | | 267 | | | | 4 | |
Farm Production and Other Farm Loans | | | - | | | | - | | | | - | |
Total Business Loans | | | 124 | | | | 267 | | | | - | |
Consumer Loans: | | | | | | | | | | | | |
Other Consumer Loans | | | - | | | | 40 | | | | - | |
Credit Cards | | | - | | | | - | | | | 12 | |
Total Consumer Loans | | | - | | | | 40 | | | | 12 | |
Total | | $ | 523 | | | $ | 2,576 | | | $ | 16 | |
Note 4. Continued
The following disclosures are presented under GAAP in effect prior to the adoption of CECL. The Company has included these disclosures to address the applicable prior period.
| | | Nonaccrual | | | Loans Past Due 90 Days or More Still Accruing | |
December 31, 2022 | | | | | | | | |
Loans secured by real estate: | | | | | | | | |
Land Development and Construction | | $ | - | | | $ | 4 | |
Farmland | | | 117 | | | | - | |
1-4 Family Mortgages | | | 1,720 | | | | - | |
Commercial Real Estate | | | 846 | | | | 95 | |
Total Real Estate Loans | | | 2,683 | | | | 99 | |
Business Loans: | | | | | | | | |
Commercial and Industrial Loans | | | 281 | | | | - | |
Farm Production and Other Farm Loans | | | - | | | | - | |
Total Business Loans | | | 281 | | | | - | |
Consumer Loans: | | | | | | | | |
Other Consumer Loans | | | 24 | | | | - | |
Credit Cards | | | - | | | | 12 | |
Total Consumer Loans | | | 24 | | | | 12 | |
Total | | $ | 2,988 | | | $ | 111 | |
In the event that non-accrual loans had performed in accordance with their original terms, the Company would have recognized additional interest income of approximately $431, $354 and $281 in 2023, 2022 and 2021, respectively.
Note 4. Continued
An aging analysis of past due loans, segregated by class of loans, as of December 31, 2023 is as follows:
December 31, 2023 | | 30 - 89 Days Past Due | | | Greater Than 89 Days Past Due | | | Total Past Due | | | Current Loans | | | Total | |
Loans secured by real estate: | | | | | | | | | | | | | | | | | | | | |
Land Development and Construction | | $ | 32 | | | $ | - | | | $ | 32 | | | $ | 66,910 | | | $ | 66,942 | |
Farmland | | | 90 | | | | - | | | | 90 | | | | 10,735 | | | | 10,825 | |
1-4 Family Mortgages | | | 1,024 | | | | 179 | | | | 1,203 | | | | 93,958 | | | | 95,161 | |
Commercial Real Estate | | | 1,080 | | | | 67 | | | | 1,147 | | | | 357,079 | | | | 358,226 | |
Total Real Estate Loans | | | 2,226 | | | | 246 | | | | 2,472 | | | | 528,682 | | | | 531,154 | |
Business Loans: | | | | | | | | | | | | | | | | | | | | |
Commercial and Industrial Loans | | | 54 | | | | 270 | | | | 324 | | | | 92,736 | | | | 93,060 | |
Farm Production and Other Farm Loans | | | - | | | | - | | | | - | | | | 424 | | | | 424 | |
Total Business Loans | | | 54 | | | | 270 | | | | 324 | | | | 93,160 | | | | 93,484 | |
Consumer Loans: | | | | | | | | | | | | | | | | | | | | |
Credit Cards | | | 65 | | | | 12 | | | | 77 | | | | 3,300 | | | | 3,377 | |
Other Consumer Loans | | | 116 | | | | - | | | | 116 | | | | 13,897 | | | | 14,013 | |
Total Consumer Loans | | | 181 | | | | 12 | | | | 193 | | | | 17,197 | | | | 17,390 | |
Total | | $ | 2,461 | | | $ | 528 | | | $ | 2,989 | | | $ | 639,039 | | | $ | 642,028 | |
An aging analysis of past due loans, segregated by class of loans, as of December 31, 2022 is as follows:
December 31, 2022 | | 30 - 89 Days Past Due | | | Greater Than 89 Days Past Due | | | Total Past Due | | | Current Loans | | | Total | |
Loans secured by real estate: | | | | | | | | | | | | | | | | | | | | |
Land Development and Construction | | $ | - | | | $ | 4 | | | $ | 4 | | | $ | 52,727 | | | $ | 52,731 | |
Farmland | | | 38 | | | | 30 | | | | 68 | | | | 11,369 | | | | 11,437 | |
1-4 Family Mortgages | | | 1,799 | | | | 439 | | | | 2,238 | | | | 89,910 | | | | 92,148 | |
Commercial Real Estate | | | 933 | | | | 486 | | | | 1,419 | | | | 315,122 | | | | 316,541 | |
Total Real Estate Loans | | | 2,770 | | | | 959 | | | | 3,729 | | | | 469,128 | | | | 472,857 | |
Business Loans: | | | | | | | | | | | | | | | | | | | | |
Commercial and Industrial Loans | | | 109 | | | | 277 | | | | 386 | | | | 96,114 | | | | 96,500 | |
Farm Production and Other Farm Loans | | | 4 | | | | - | | | | 4 | | | | 500 | | | | 504 | |
Total Business Loans | | | 113 | | | | 277 | | | | 390 | | | | 96,614 | | | | 97,004 | |
Consumer Loans: | | | | | | | | | | | | | | | | | | | | |
Credit Cards | | | 56 | | | | 12 | | | | 89 | | | | 2,649 | | | | 2,738 | |
Other Consumer Loans | | | 66 | | | | 23 | | | | 68 | | | | 12,924 | | | | 12,992 | |
Total Consumer Loans | | | 122 | | | | 35 | | | | 157 | | | | 15,573 | | | | 15,730 | |
Total | | $ | 3,005 | | | $ | 1,271 | | | $ | 4,276 | | | $ | 581,315 | | | $ | 585,591 | |
Note 4. Continued
Prior to the adoption of FASB ASC Topic 326, the Company’s individually evaluated impaired LHFI included all commercial substandard relationships of $100 or more, which were specifically reviewed for impairment and deemed impaired, and all LHFI classified as troubled-debt restructurings (“TDRs”) in accordance with FASB ASC Subtopic 310-10-50-20 “Impaired Loans.” Once a LHFI was deemed to be impaired, the full difference between book value and the most likely estimate of the collateral’s net realizable value was charged off or a specific reserve was established.
$124 of interest income was recognized in the income statement on impaired LHFI for the periods ended December 31, 2023. The amount was immaterial for the period ended December 31, 2022.
The following disclosures are presented under GAAP in effect prior to the adoption of CECL that are no longer applicable or required. The Company has included these disclosures to address the applicable prior periods.
Loans formerly accounted for under FASB ASC 310-20, “Nonrefundable Fees and Other Cost” (“ASC 310-20”), and which are impaired loans recognized in conformity with ASC 310, “Receivables” (“ASC 310”), segregated by class, were as follows as of December 31, 2022:
| | | | | | | Recorded | | | Recorded | | | | | | | | | | | | | |
| | | Unpaid | | | Investment | | | Investment | | | Total | | | | | | | Average | |
| | | Principal | | | With No | | | With | | | Recorded | | | Related | | | Recorded | |
2022 | | Balance | | | Allowance | | | Allowance | | | Investment | | | Allowance | | | Investment | |
Real Estate: | | | | | | | | | | | | | | | | | | | | | | | | |
| | | | | | | | | | | | | | | | | | | | | | | | | |
Land Development and Construction | | $ | - | | | $ | - | | | $ | - | | | $ | - | | | $ | - | | | $ | 86 | |
Farmland | | | 30 | | | | 30 | | | | - | | | | 30 | | | | - | | | | 32 | |
1-4 Family Mortgages | | | 190 | | | | 190 | | | | - | | | | 190 | | | | - | | | | 479 | |
Commercial Real Estate | | | 3,023 | | | | 795 | | | | 2,066 | | | | 2,861 | | | | 116 | | | | 1,996 | |
Total Real Estate Loans | | | 3,243 | | | | 1,015 | | | | 2,066 | | | | 3,081 | | | | 116 | | | | 2,593 | |
| | | | | | | | | | | | | | | | | | | | | | | | | |
Business: | | | | | | | | | | | | | | | | | | | | | | | | |
Commercial and Industrial | | | 304 | | | | 196 | | | | - | | | | 196 | | | | - | | | | 214 | |
Total Business Loans | | | 304 | | | | 196 | | | | - | | | | 196 | | | | - | | | | 214 | |
| | | | | | | | | | | | | | | | | | | | | | | | | |
Total Loans | | $ | 3,547 | | | $ | 1,211 | | | $ | 2,066 | | | $ | 3,277 | | | $ | 116 | | | $ | 2,807 | |
Note 4. Continued
Loan Modifications
The Company adopted ASU 2022-02, Financial Instruments-Credit Losses (Topic 326): Troubled Debt Restructurings and Vintage Disclosures on January 1, 2023. The amendments in this ASU were applied prospectively, and therefore, loan modification and charge off information is provided only for those items occurring after the January 1, 2023 adoption date.
Based on the guidance in ASU 2022-02, a loan modification or refinancing results in a new loan if the terms of the new loan are at least as favorable to the lender as the terms with customers with similar collection risks that are not refinancing or restructuring their loans and the modification to the terms of the loans are more than minor. If a loan modification or refinancing does not result in a new loan, it is classified as a loan modification. There are additional disclosures for the modification of loans with borrowers experiencing financial difficulty that results in a direct change in the timing or amount of contractual cash flows. The disclosures are applicable to situations where there is principal forgiveness, interest rate reductions, other-than-insignificant payment delays, term extensions or a combination of any of these terms. If the Company modifies any loans to borrowers in financial distress that involves principal forgiveness, the amount of principal forgiven is charged off against the ACL.
The Company had no loan modifications to borrowers experiencing financial difficulties in 2023.
At December 31, 2023, LHFI classified as modified loans totaled $2,224. At December 31, 2023, modified loans were primarily comprised of interest rate concessions. The Company had $-0- in unused commitments on modified loans at December 31, 2023.
The allocated ACL attributable to modified loans was $142 at December 31, 2023. The Company had no commitments to lend additional funds on these loans as of December 31, 2023.
There were no loans modified within the last twelve months for which there was a payment default during the twelve months ended December 31, 2023.
At December 31, 2023 and December 31, 2022, the amortized cost of loans secured by Real Estate – 1-4 Family Mortgage in the process of foreclosure was $-0- and $-0-, respectively.
Note 4. Continued
Collateral-Dependent Loans
The following tables present the amortized cost basis of collateral-dependent loans by class of loans and collateral type as of December 31, 2023:
December 31, 2023 | | Stocks | | | Inventory | | | Real Estate | | | Receivables | | | Total | |
Loans secured by real estate: | | | | | | | | | | | | | | | | | | | | |
Land Development and Construction | | $ | - | | | $ | - | | | $ | - | | | $ | - | | | $ | - | |
1-4 Family Mortgages | | | - | | | | - | | | | 81 | | | | - | | | | 81 | |
Commercial Real Estate | | | - | | | | - | | | | 2,399 | | | | - | | | | 2,399 | |
Total Real Estate Loans | | | - | | | | - | | | | 2,480 | | | | - | | | | 2,480 | |
Business Loans: | | | | | | | | | | | | | | | | | | | | |
Commercial and Industrial Loans | | | 1,280 | | | | 92 | | | | - | | | | 32 | | | | 1,404 | |
Farm Production and Other Farm Loans | | | - | | | | - | | | | - | | | | - | | | | - | |
Total Business Loans | | | 1,280 | | | | 92 | | | | - | | | | 32 | | | | 1,404 | |
| | | | | | | | | | | | | | | | | | | | | |
Total | | $ | 1,280 | | | $ | 92 | | | $ | 2,480 | | | $ | 32 | | | $ | 3,884 | |
A loan is collateral dependent when the borrower is experiencing financial difficulty and repayment of the loan is expected to be provided substantially through the sale of the collateral. The following provides a qualitative description by class of loan of the collateral that secures the Company’s collateral-dependent LHFI:
| | ● | Loans secured by real estate – Loans within these loan classes are secured by liens on real estate properties. There have been no significant changes to the collateral that secures these financial assets during the period. |
| | ● | Business loans – Loans within this loan class are primarily secured by inventory, accounts receivables, equipment and other non-real estate collateral. There have been no significant changes to the collateral that secures these financial assets during the period. |
Note 4. Continued
The Company utilizes a risk grading matrix to assign a risk grade to each of its loans when originated and is updated as factors related to the strength of the loan changes. Loans are graded on a scale of 1 to 9. A description of the general characteristics of the 9 risk grades is as follows.
Grade 1. MINIMAL RISK - These loans are without loss exposure to the Company. This classification is reserved for only the best, well secured loans to borrowers with significant capital strength, low leverage, stable earnings and growth and other readily available financing alternatives. This type of loan would also include loans secured by a program of the government.
Grade 2. MODEST RISK - These loans include borrowers with solid credit quality and moderate risk of loss. These loans may be fully secured by certificates of deposit with another reputable financial institution, or secured by readily marketable securities with acceptable margins.
Grade 3. AVERAGE RISK - This is the rating assigned to most of the loans held by the Company. This includes loans with average loss exposure and average overall quality. These loans should liquidate through possessing adequate collateral and adequate earnings of the borrower. In addition, these loans are properly documented and are in accordance with all aspects of the current loan policy.
Grade 4. ACCEPTABLE RISK - Borrower generates sufficient cash flow to fund debt service but most working asset and capital expansion needs are provided from external sources. Profitability and key statement of balance sheet ratios are usually close to peers but one or more may not align with peers.
Grade 5. MANAGEMENT ATTENTION - Borrower has potential weaknesses resulting from performance trends or management concerns. The financial condition of the borrower has taken a negative turn and may be temporarily strained. Cash flow is weak but cash reserves remain adequate to meet debt service. Management weakness is evident.
Grade 6. OTHER LOANS ESPECIALLY MENTIONED (“OLEM”) - Loans in this category are fundamentally sound but possess some weaknesses. OLEM loans have weaknesses, which may, if not checked or corrected, weaken the asset or inadequately protect the Bank's credit position at some future date. These loans have an identifiable weakness in credit, collateral, or repayment ability but there is no expectation of loss.
Grade 7. SUBSTANDARD ASSETS - Assets classified as substandard are inadequately protected by the current net worth and paying capacity of the obligor or of the collateral pledged, if any. Assets classified as substandard must have a well-defined weakness based upon objective evidence. Assets classified as substandard are characterized by the distinct possibility that the insured institution will sustain some loss if the deficiencies are not corrected. The possibility that liquidation would not be timely requires a substandard classification even if there is little likelihood of total loss.
Note 4. Continued
Grade 8. DOUBTFUL - A loan classified as doubtful has all the weaknesses of a substandard classification and the added characteristic that the weakness makes collection or liquidation in full, on the basis of currently existing facts, conditions, and values, highly questionable or improbable. The possibility of loss is extremely high, but because of certain important and reasonable specific pending factors that may work to the advantage and strengthening of the asset, its classification as an estimated loss is deferred until its more exact status may be determined. A doubtful classification could reflect the fact that the primary source of repayment is gone and serious doubt exists as to the quality of a secondary source of repayment.
Grade 9. LOSS - Loans classified loss are considered uncollectible and of such little value that their continuance as bankable assets is not warranted. This classification does not mean that the asset has absolutely no recovery or salvage value, but rather it is not practical or desirable to defer writing off this basically worthless asset even though partial recovery may occur in the future. Also included in this classification is the defined loss portion of loans rated substandard assets and doubtful assets.
These internally assigned grades are updated on a continual basis throughout the course of the year and represent management’s most updated judgment regarding grades at December 31, 2023.
Note 4. Continued
The following table details the amortized cost basis of LHFI, segregated by loan origination year, grade and class, as of December 31, 2023:
Term Loans Amortized Cost Basis by Origination Year | | | | | | | | | | | | | | | | | | | | | |
December 31, 2023 | | 2023 | | | 2022 | | | 2021 | | | 2020 | | | 2019 | | | Prior | | | Revolving Loans | | | Total Loans | |
Loans secured by real estate: | | | | | | | | | | | | | | | | | | | | | | | | | | | | | | | | |
Land Development and Construction | | | | | | | | | | | | | | | | | | | | | | | | | | | | | | | | |
Satisfactory - Categories 1-4 | | $ | 23,439 | | | $ | 3,514 | | | $ | 1,173 | | | $ | 13,160 | | | $ | 860 | | | $ | 226 | | | $ | 23,282 | | | $ | 65,654 | |
Special Mention - Category 5 & 6 | | | - | | | | 348 | | | | 679 | | | | - | | | | - | | | | - | | | | - | | | | 1,027 | |
Substandard - Category 7 | | | - | | | | 261 | | | | - | | | | - | | | | - | | | | - | | | | - | | | | 261 | |
Doubtful - Category 8 | | | - | | | | - | | | | - | | | | - | | | | - | | | | - | | | | - | | | | - | |
Loss 9 | | | - | | | | - | | | | - | | | | - | | | | - | | | | - | | | | - | | | | - | |
Total Land Development and Construction | | | 23,439 | | | | 4,123 | | | | 1,852 | | | | 13,160 | | | | 860 | | | | 226 | | | | 23,282 | | | | 66,942 | |
| | | | | | | | | | | | | | | | | | | | | | | | | | | | | | | | | |
Farmland | | | | | | | | | | | | | | | | | | | | | | | | | | | | | | | | |
Satisfactory - Categories 1-4 | | | 1,929 | | | | 1,520 | | | | 1,143 | | | | 1,395 | | | | 3,003 | | | | 492 | | | | 995 | | | | 10,477 | |
Special Mention - Category 5 & 6 | | | - | | | | - | | | | 80 | | | | - | | | | 129 | | | | 37 | | | | - | | | | 246 | |
Substandard - Category 7 | | | - | | | | 32 | | | | 6 | | | | 4 | | | | 17 | | | | 43 | | | | - | | | | 102 | |
Doubtful - Category 8 | | | - | | | | - | | | | - | | | | - | | | | - | | | | - | | | | - | | | | - | |
Loss 9 | | | - | | | | - | | | | - | | | | - | | | | - | | | | - | | | | - | | | | - | |
Total Farmland | | | 1,929 | | | | 1,552 | | | | 1,229 | | | | 1,399 | | | | 3,149 | | | | 572 | | | | 995 | | | | 10,825 | |
| | | | | | | | | | | | | | | | | | | | | | | | | | | | | | | | | |
1-4 Family Mortgages | | | | | | | | | | | | | | | | | | | | | | | | | | | | | | | | |
Satisfactory - Categories 1-4 | | | 14,355 | | | | 18,980 | | | | 11,305 | | | | 10,988 | | | | 9,353 | | | | 5,163 | | | | 19,976 | | | | 90,120 | |
Special Mention - Category 5 & 6 | | | 497 | | | | 184 | | | | 93 | | | | 464 | | | | 296 | | | | 157 | | | | 76 | | | | 1,767 | |
Substandard - Category 7 | | | 275 | | | | 34 | | | | 274 | | | | 262 | | | | 79 | | | | 1,918 | | | | 351 | | | | 3,193 | |
Doubtful - Category 8 | | | - | | | | - | | | | - | | | | - | | | | - | | | | - | | | | - | | | | - | |
Loss 9 | | | - | | | | - | | | | - | | | | - | | | | 81 | | | | - | | | | - | | | | 81 | |
Total 1-4 Family Mortgages | | | 15,127 | | | | 19,198 | | | | 11,672 | | | | 11,714 | | | | 9,809 | | | | 7,238 | | | | 20,403 | | | | 95,161 | |
| | | | | | | | | | | | | | | | | | | | | | | | | | | | | | | | | |
Commercial Real Estate | | | | | | | | | | | | | | | | | | | | | | | | | | | | | | | | |
Satisfactory - Categories 1-4 | | | 82,361 | | | | 51,185 | | | | 58,021 | | | | 52,120 | | | | 24,368 | | | | 29,836 | | | | 17,920 | | | | 315,811 | |
Special Mention - Category 5 & 6 | | | 9,172 | | | | 2,414 | | | | 2,193 | | | | 917 | | | | 4,481 | | | | 288 | | | | 3,855 | | | | 23,320 | |
Substandard - Category 7 | | | - | | | | 67 | | | | 3,636 | | | | - | | | | 264 | | | | 15,128 | | | | - | | | | 19,095 | |
Doubtful - Category 8 | | | - | | | | - | | | | - | | | | - | | | | - | | | | - | | | | - | | | | - | |
Loss 9 | | | - | | | | - | | | | - | | | | - | | | | - | | | | - | | | | - | | | | - | |
Total Commercial Real Estate | | | 91,533 | | | | 53,666 | | | | 63,850 | | | | 53,037 | | | | 29,113 | | | | 45,252 | | | | 21,775 | | | | 358,226 | |
Total Real Estate Loans | | | 132,028 | | | | 78,539 | | | | 78,603 | | | | 79,310 | | | | 42,931 | | | | 53,288 | | | | 66,455 | | | | 531,154 | |
Business Loans: | | | | | | | | | | | | | | | | | | | | | | | | | | | | | | | | |
Commercial and Industrial Loans | | | | | | | | | | | | | | | | | | | | | | | | | | | | | | | | |
Satisfactory - Categories 1-4 | | | 28,036 | | | | 18,428 | | | | 4,415 | | | | 14,052 | | | | 5,988 | | | | 7,390 | | | | 10,136 | | | | 88,445 | |
Special Mention - Category 5 & 6 | | | 23 | | | | 116 | | | | - | | | | 246 | | | | - | | | | 441 | | | | 2,141 | | | | 2,967 | |
Substandard - Category 7 | | | - | | | | 16 | | | | 83 | | | | - | | | | 4 | | | | 720 | | | | 825 | | | | 1,648 | |
Doubtful - Category 8 | | | - | | | | - | | | | - | | | | - | | | | - | | | | - | | | | - | | | | - | |
Loss 9 | | | - | | | | - | | | | - | | | | - | | | | - | | | | - | | | | - | | | | - | |
Total Commercial & Industrial | | | 28,059 | | | | 18,560 | | | | 4,498 | | | | 14,298 | | | | 5,992 | | | | 8,551 | | | | 13,102 | | | | 93,060 | |
| | | | | | | | | | | | | | | | | | | | | | | | | | | | | | | | | |
Farm Production and Other Farm Loans | | | | | | | | | | | | | | | | | | | | | | | | | | | | | | | | |
Satisfactory - Categories 1-4 | | | 109 | | | | 162 | | | | - | | | | - | | | | - | | | | 91 | | | | 62 | | | | 424 | |
Special Mention - Category 5 & 6 | | | - | | | | - | | | | - | | | | - | | | | - | | | | - | | | | - | | | | - | |
Substandard - Category 7 | | | - | | | | - | | | | - | | | | - | | | | - | | | | - | | | | - | | | | - | |
Doubtful - Category 8 | | | - | | | | - | | | | - | | | | - | | | | - | | | | - | | | | - | | | | - | |
Loss 9 | | | - | | | | - | | | | - | | | | - | | | | - | | | | - | | | | - | | | | - | |
Total Farm Production & Other Farm | | | 109 | | | | 162 | | | | - | | | | - | | | | - | | | | 91 | | | | 62 | | | | 424 | |
Total Business Loans | | | 28,168 | | | | 18,722 | | | | 4,498 | | | | 14,298 | | | | 5,992 | | | | 8,642 | | | | 13,164 | | | | 93,484 | |
Consumer Loans: | | | | | | | | | | | | | | | | | | | | | | | | | | | | | | | | |
Satisfactory - Categories 1-4 | | | 7,368 | | | | 3,071 | | | | 1,188 | | | | 586 | | | | 836 | | | | 185 | | | | 367 | | | | 13,601 | |
Special Mention - Category 5 & 6 | | | 2 | | | | - | | | | - | | | | - | | | | 3 | | | | - | | | | - | | | | 5 | |
Substandard - Category 7 | | | 337 | | | | 37 | | | | 31 | | | | - | | | | - | | | | - | | | | - | | | | 405 | |
Doubtful - Category 8 | | | - | | | | - | | | | - | | | | - | | | | - | | | | - | | | | - | | | | - | |
Loss 9 | | | 2 | | | | - | | | | - | | | | - | | | | - | | | | - | | | | - | | | | 2 | |
Total Consumer Loans | | | 7,709 | | | | 3,108 | | | | 1,219 | | | | 586 | | | | 839 | | | | 185 | | | | 367 | | | | 14,013 | |
| | | | | | | | | | | | | | | | | | | | | | | | | | | | | | | | | |
Credit Cards | | | | | | | | | | | | | | | | | | | | | | | | | | | | | | | | |
Performing | | | - | | | | - | | | | - | | | | - | | | | - | | | | - | | | | 3,365 | | | | 3,365 | |
Nonperforming | | | - | | | | - | | | | - | | | | - | | | | - | | | | - | | | | 12 | | | | 12 | |
Total Credit Card | | | - | | | | - | | | | - | | | | - | | | | - | | | | - | | | | 3,377 | | | | 3,377 | |
Gross LHFI | | $ | 167,905 | | | $ | 100,369 | | | $ | 84,320 | | | $ | 94,194 | | | $ | 49,762 | | | $ | 62,115 | | | $ | 83,363 | | | $ | 642,028 | |
Less Unearned Origination Fees | | | | | | | | | | | | | | | | | | | | | | | | | | | | | | | (1,083 | ) |
Less ACL | | | | | | | | | | | | | | | | | | | | | | | | | | | | | | | (6,551 | ) |
Net LHFI | | | | | | | | | | | | | | | | | | | | | | | | | | | | | | $ | 634,394 | |
Note 4. Continued
There were no revolving loans converted to term loans during the year ended December 31, 2023.
The following disclosures are presented under GAAP in effect prior to the adoption of CECL. The Company has included these disclosures to address the applicable prior period.
A discussion of the Company’s policies regarding internal risk-rating of loans is discussed above and is applicable to these tables. The following table presents the Company’s loan portfolio by internal risk-rating grades as of December 31, 2022:
| | | | | | | Special | | | | | | | | | | | | | | | | | |
| | | Satisfactory | | | Mention | | | Substandard | | | Doubtful | | | Loss | | | Total | |
| | | 1,2,3,4 | | | 5,6 | | | 7 | | | 8 | | | 9 | | | Loans | |
Real Estate: | | | | | | | | | | | | | | | | | | | | | | | | |
Land Development and Construction | | $ | 50,015 | | | $ | 2,427 | | | $ | 289 | | | $ | - | | | $ | - | | | $ | 52,731 | |
Farmland | | | 10,832 | | | | 269 | | | | 336 | | | | - | | | | - | | | | 11,437 | |
1-4 Family Mortgages | | | 85,861 | | | | 1,816 | | | | 4,471 | | | | - | | | | - | | | | 92,148 | |
Commercial Real Estate | | | 274,901 | | | | 7,975 | | | | 33,665 | | | | - | | | | - | | | | 316,541 | |
Total Real Estate Loans | | | 421,609 | | | | 12,487 | | | | 38,761 | | | | - | | | | - | | | | 472,857 | |
| | | | | | | | | | | | | | | | | | | | | | | | | |
Business Loans: | | | | | | | | | | | | | | | | | | | | | | | | |
Commercial and Industrial Loans | | | 91,016 | | | | 4,902 | | | | 577 | | | | - | | | | 5 | | | | 96,500 | |
Farm Production and Other Farm Loans | | | 491 | | | | - | | | | 13 | | | | - | | | | - | | | | 504 | |
Total Business Loans | | | 91,507 | | | | 4,902 | | | | 590 | | | | - | | | | 5 | | | | 97,004 | |
| | | | | | | | | | | | | | | | | | | | | | | | | |
Consumer Loans: | | | | | | | | | | | | | | | | | | | | | | | | |
Credit Cards | | | 2,670 | | | | - | | | | 68 | | | | - | | | | - | | | | 2,738 | |
Other Consumer Loans | | | 12,934 | | | | 7 | | | | 51 | | | | - | | | | - | | | | 12,992 | |
Total Consumer Loans | | | 15,604 | | | | 7 | | | | 119 | | | | - | | | | - | | | | 15,730 | |
| | | | | | | | | | | | | | | | | | | | | | | | | |
| | | | | | | | | | | | | | | | | | | | | | | | | |
Total Loans | | $ | 528,720 | | | $ | 17,396 | | | $ | 39,470 | | | $ | - | | | $ | 5 | | | $ | 585,591 | |
Note 5. ACL on LHFI
(in thousands)
The Company’s ACL methodology for LHFI is based upon guidance within ASC Subtopic 326-20 as well as applicable regulatory guidance. The ACL is a valuation account that is deducted from the loans’ amortized cost basis to present the net amount expected to be collected on the loans. Credit quality within the LHFI portfolio is regularly monitored by Management and is reflected within the ACL for loans. The ACL is an estimate of expected losses inherent within the Company’s existing LHFI portfolio. The ACL for LHFI is adjusted through the PCL, LHFI and reduced by the charge off of loan amounts, net of recoveries.
The methodology for estimating the amount of expected credit losses reported in the ACL has two basic components: a collective, or pooled, component for estimated expected credit losses for pools of loans that share similar risk characteristics, and an asset-specific component involving individual loans that do not share risk characteristics with other loans and the measurement of expected credit losses for such individual loans. In estimating the ACL for the collective component, loans are segregated into loan pools based on loan product types and similar risk characteristics.
Note 5. Continued
The loans secured by real estate segment includes loans for both commercial and residential properties. The underwriting process for these loans includes analysis of the financial position and strength of both the borrower and guarantor, experience with similar projects in the past, market demand and prospects for successful completion of the proposed project within the established budget and schedule, values of underlying collateral, availability of permanent financing, maximum loan-to-value ratios, minimum equity requirements, acceptable amortization periods and minimum debt service coverage requirements, based on property type. The borrower’s financial strength and capacity to repay their obligations remain the primary focus of underwriting. Financial strength is evaluated based upon analytical tools that consider historical and projected cash flows and performance in addition to a financial analysis of any proposed project. Additional support offered by guarantors is also considered. Ultimate repayment of these loans is sensitive to interest rate changes, general economic conditions, liquidity and availability of long-term financing.
The business loan segment includes loans within the Company’s geographic markets made to many types of businesses for various purposes, such as short term working capital loans that are usually secured by accounts receivable and inventory and term financing for equipment and fixed asset purchases that are secured by those assets. The Company’s credit underwriting process for commercial and industrial loans includes analysis of historical and projected cash flows and performance, evaluation of financial strength of both borrowers and guarantors as reflected in current and detailed financial information and evaluation of underlying collateral to support the credit.
The consumer LHFI portfolio segment is comprised of loans that are centrally underwritten based on a credit scoring system as well as an evaluation of the borrower’s repayment capacity, credit, and collateral. Property appraisals are obtained to assist in evaluating collateral. Loan-to value and debt-to-income ratios, loan amount, and lien position are also considered in assessing whether to originate a loan. These borrowers are particularly susceptible to downturns in economic trends such as conditions that negatively affect housing prices and demand and levels of unemployment.
The following table provides a description of each of the Company’s portfolio segments, loan classes, loan pools and the ACL methodology and loss drivers:
Portfolio Segment | Loan Class | Methodology | Loss Drivers |
Loans secured by real estate | | | |
| | Land Development and Construction | Loss Rate | CRE Price Index, Real GDP, US Unemployment |
| | Farmland | Loss Rate | CRE Price Index, Real GDP, US Unemployment |
| | 1-4 Family Mortgages | Loss Rate | CRE Price Index, Real GDP, US Unemployment |
| | Commercial Real Estate | Loss Rate | CRE Price Index, Real GDP, US Unemployment |
| | | | |
Business loans | | | |
| | Commercial and Industrial Loans | Loss Rate | US Unemployment, Nominal GDP |
| | Farm Production and Other Farm Loans | Loss Rate | US Unemployment, Nominal GDP |
| | | | |
Consumer loans | | | |
| | Consumer Loans | Loss Rate | Moody's Expected Consumer Credit Loss Model |
| | Credit Cards | WARM | Company loss history |
| | Overdraft | WARM | Company loss history |
Note 5. Continued
The Loss Rate model is designed to operate at the portfolio segment level. These segments are relatively homogenous groups of loans with similar characteristics. Based on the average inputs of each segment, the model then calculates both quarterly and lifetime loss rates for the entire segment by loan. The lifetime loss rate is then multiplied by the amortized cost of each loan within a class to get a quantitative reserve.
The Company chose the Weighted Average Remaining Maturity (“WARM”) method for two loan classes that are relatively non-complex. The WARM methodology factors in the remaining life of each applicable loan class that must be calculated to be used within the quantitative model.
The Company determined that reasonable and supportable forecasts could be made for a twelve-month period for all of its loan pools. To the extent the lives of the loans in the LHFI portfolio extend beyond this forecast period, the Company uses a reversion period of four quarters and reverts to the historical mean on a straight-line basis over the remaining life of the loans. The econometric models currently in production reflect segment or pool level sensitivities of probability of default to changes in macroeconomic variables. By measuring the relationship between defaults and changes in the economy, the quantitative reserve incorporates reasonable and supportable forecasts of future conditions that will affect the value of its assets, as required by FASB ASC Topic 326.
In addition to the items mentioned above, the Company incorporates qualitative factors into the ACL methodology, including the following:
| | ● | Risk tolerance measured through lending policy requirements |
| | ● | Quality of the loan review system |
| | ● | Changes in collateral valuations |
| | ● | External factors within the Company’s operating region, including economic conditions |
The qualitative reserve is calculated by taking the quantitative reserve rate and multiplying this rate by the qualitative factor (“Q-factor”) scalar. The Q-factor scalar takes the average of all the Q-factors selected for a specific loan class. Each Q-factor is given a rating between 0 to 100 basis points (“bps”), with the 0 being no risk to 100 bps being the highest risk impact. Each Q-factor is evaluated and adjusted quarterly using both internal and external reports and data.
Note 5. Continued
The following table details activity in the ACL by portfolio segment for the twelve months ended December 31, 2023:
| | | Real | | | Business | | | | | | | | | |
| | | Estate | | | Loans | | | Consumer | | | Total | |
Beginning Balance, January 1, 2023 | | $ | 4,154 | | | $ | 713 | | | $ | 397 | | | $ | 5,264 | |
FASB ASU 2016-13 adoption adjustment | | | 665 | | | | 56 | | | | (86 | ) | | | 635 | |
PCL | | | 626 | | | | (189 | ) | | | 27 | | | | 464 | |
Chargeoffs | | | 22 | | | | 83 | | | | 148 | | | | 253 | |
Recoveries | | | 218 | | | | 39 | | | | 184 | | | | 441 | |
Net recoveries | | | (196 | ) | | | 44 | | | | (36 | ) | | | (188 | ) |
Ending Balance December 31, 2023 | | $ | 5,641 | | | $ | 536 | | | $ | 374 | | | $ | 6,551 | |
Period end allowance allocated to: | | | | | | | | | | | | | | | | |
Loans individually evaluated for impairment | | $ | 56 | | | $ | - | | | $ | 86 | | | $ | 142 | |
Loans collectively evaluated for impairment | | | 5,585 | | | | 536 | | | | 288 | | | | 6,409 | |
Ending Balance, December 31, 2023 | | $ | 5,641 | | | $ | 536 | | | $ | 374 | | | $ | 6,551 | |
December 31, 2023 | | | | | | | | | | | | | | | | |
Loans individually evaluated for specific impairment | | $ | 2,399 | | | $ | 1,404 | | | $ | 224 | | | $ | 4,027 | |
Loans collectively evaluated for general impairment | | | 528,755 | | | | 92,080 | | | | 17,166 | | | | 638,001 | |
| | | $ | 531,154 | | | $ | 93,484 | | | $ | 17,390 | | | $ | 642,028 | |
The following table details activity in the ACL by portfolio segment, based on the Company’s former allowance methodology prior to the adoption of ASC 326, for the twelve months ended December 31, 2022:
| | | Real | | | Business | | | | | | | | | |
| | | Estate | | | Loans | | | Consumer | | | Total | |
Beginning Balance, January 1, 2022 | | $ | 3,622 | | | $ | 645 | | | $ | 246 | | | $ | 4,513 | |
PCL | | | 279 | | | | 96 | | | | (251 | ) | | | 124 | |
Chargeoffs | | | 8 | | | | 61 | | | | 110 | | | | 179 | |
Recoveries | | | 261 | | | | 33 | | | | 512 | | | | 806 | |
Net chargeoffs (recoveries) | | | (253 | ) | | | 28 | | | | (402 | ) | | | (627 | ) |
Ending Balance December 31, 2022 | | $ | 4,154 | | | $ | 713 | | | $ | 397 | | | $ | 5,264 | |
Period end allowance allocated to: | | | | | | | | | | | | | | | | |
Loans individually evaluated for impairment | | $ | 116 | | | $ | - | | | $ | - | | | $ | 116 | |
Loans collectively evaluated for impairment | | | 4,038 | | | | 713 | | | | 397 | | | | 5,148 | |
Ending Balance, December 31, 2022 | | $ | 4,154 | | | $ | 713 | | | $ | 397 | | | $ | 5,264 | |
December 31, 2022 | | | | | | | | | | | | | | | | |
Loans individually evaluated for specific impairment | | $ | 3,081 | | | $ | 196 | | | $ | - | | | $ | 3,277 | |
Loans collectively evaluated for general impairment | | | 469,776 | | | | 96,808 | | | | 15,730 | | | | 582,314 | |
| | | $ | 472,857 | | | $ | 97,004 | | | $ | 15,730 | | | $ | 585,591 | |
The Company recorded a PCL of $669 during 2023, as compared to a PCL of $124 recorded in 2022. The Company’s ACL model considers economic projections, primarily the national unemployment rate, recessionary risks, gross domestic product (GDP) and commercial real estate (CRE) price fluctuations.
Note 5. Continued
The following table represents gross charge-offs by year of origination for the date presented:
| | | | | | | | | | | | | | | | | | | | | | | | | | | Revolving | | | Total Charge- | |
| | | 2023 | | | 2022 | | | 2021 | | | 2020 | | | 2019 | | | Prior | | | Loans | | | Offs | |
Gross Charge-Offs | | | | | | | | | | | | | | | | | | | | | | | | | | | | | | | | |
December 31, 2023 | | | | | | | | | | | | | | | | | | | | | | | | | | | | | | | | |
Loans secured by real estate: | | | | | | | | | | | | | | | | | | | | | | | | | | | | | | | | |
Commercial Real Estate | | $ | - | | | $ | - | | | $ | - | | | $ | - | | | $ | 5 | | | $ | 17 | | | $ | - | | | $ | 22 | |
Total Real Estate Loans | | | - | | | | - | | | | - | | | | - | | | | 5 | | | | 17 | | | | - | | | | 22 | |
| | | | | | | | | | | | | | | | | | | | | | | | | | | | | | | | | |
Business Loans | | | | | | | | | | | | | | | | | | | | | | | | | | | | | | | | |
Commercial and Industrial Loans | | | 5 | | | | - | | | | - | | | | - | | | | - | | | | 78 | | | | - | | | | 83 | |
Total Business Loans | | | 5 | | | | - | | | | - | | | | - | | | | - | | | | 78 | | | | - | | | | 83 | |
| | | | | | | | | | | | | | | | | | | | | | | | | | | | | | | | | |
Total Consumer Loans | | | 12 | | | | 28 | | | | 6 | | | | 4 | | | | - | | | | - | | | | - | | | | 50 | |
| | | | | | | | | | | | | | | | | | | | | | | | | | | | | | | | | |
Total Credit Card | | | - | | | | - | | | | - | | | | - | | | | - | | | | - | | | | 98 | | | | 98 | |
| | | | | | | | | | | | | | | | | | | | | | | | | | | | | | | | | |
Total gross charge-offs | | $ | 17 | | | $ | 28 | | | $ | 6 | | | $ | 4 | | | $ | 5 | | | $ | 95 | | | $ | 98 | | | $ | 253 | |
ACL for Off-Balance Sheet Credit Exposure
The Company maintains a separate ACL for Off-Balance Sheet Credit Exposure, which is included in the “Other liabilities” line item on the Consolidated Statements of Financial Condition. The Company estimates the amount of expected losses on off-balance sheet credit exposure by calculating a likelihood of funding over the contractual period for exposures that are not unconditionally cancellable by the Company and applying the loss factors used in the ACL on loans methodology described above to unfunded commitments for each loan type. No credit loss estimate is reported for off-balance-sheet credit exposures that are unconditionally cancellable by the Company.
The following table provides a roll-forward of the ACL for off-balance sheet credit exposure for the period presented:
| | | For the Twelve Months | |
| | | Ended December 31, | |
| | | 2023 | |
ACL for off-balance sheet credit exposure: | | | | |
Beginning balance | | $ | - | |
FASB ASU 2016-13 adoption adjustment | | | 677 | |
PCL for off-balance sheet credit exposure | | | 205 | |
Ending Balance | | $ | 882 | |
The Company recorded a PCL for off-balance sheet credit exposure for the twelve months ended December 31, 2023 of $205. The Company’s ACL model considers economic projections, primarily the national unemployment rate, recessionary risks, GDP and CRE price fluctuations. The provision during the year was primarily driven by increased recessionary risk due to inflationary pressures partially offset by a decrease in unfunded loan commitments.
Note 6. Derivative Instruments
The Company uses certain derivative instruments to meet the needs of customers as well as to manage the interest rate risk associated with certain transactions.
Derivatives designated as fair value hedges
Fair value hedges protect against changes in the fair value of an asset, liability, or firm commitment. The Company enters into interest rate swap agreements to manage interest rate exposure on certain of the Company’s fixed-rate investment portfolio. The agreements convert the fixed interest rates to variable interest rates.
The following table provides a summary of the Company's derivatives designated as fair value hedges as of the dates presented:
| | Statement of Financial | | December 31,2023 | | | December 31, 2022 | |
| | Condition Location | | Notional Amount | | | Fair Value | | | Notional Amount | | | Fair Value | |
Derivative Assets: | | | | | | | | | | | | | | | | | |
Interest rate swaps | Other Assets | | $ | 66,600 | | | $ | 865 | | | $ | - | | | $ | - | |
The following table presents the effects of the Company’s fair value hedge relationships on the Consolidated Statements of Income for the periods presented:
| | | | Amount of Gain (Loss) Recognized in Income | |
| | Income Statement | | Twelve Months Ended December 31, | |
| | Location | | 2023 | | | 2022 | |
Derivative assets: | | | | | | | | | |
Interest rate swaps - investment securities | Interest Income | | $ | 286 | | | $ | - | |
Derivative assets - hedged items: | | | | | | | | | |
Interest rate swaps - investment securities | Interest Income | | $ | (286 | ) | | $ | - | |
Note 7. Bank Premises, Furniture, Fixtures and Equipment
(in thousands)
Bank premises, furniture, fixtures and equipment consist of the following at December 31, 2023 and December 31, 2022:
| | | 2023 | | | 2022 | |
Land and buildings | | $ | 35,304 | | | $ | 35,120 | |
Furniture, fixtures and equipment | | | 7,921 | | | | 8,522 | |
| | | | 43,225 | | | | 43,642 | |
Less accumulated depreciation | | | 16,152 | | | | 15,937 | |
| | | | | | | | | |
Total | | $ | 27,073 | | | $ | 27,705 | |
Note 7. Continued
Depreciation expense for the years ended December 31, 2023, 2022 and 2021, respectively, was $1,328, $1,166, and $1,064.
The Company leases certain premises and equipment under operating leases. At December 31, 2023, the Company had lease liabilities and right-of-use (“ROU”) assets totaling $490 related to these leases. Lease liabilities and ROU assets are reflected in other liabilities and other assets, respectively. For the year ended December 31, 2023, the weighted average remaining lease term for operating leases was 4.2 years and the weighted average discount rate used in the measurement of operating lease liabilities was 1.45%.
Lease costs for the twelve months ended December 31 were:
| | | December 31, 2023 | | | December 31, 2022 | |
(in thousands) | | | | | | | | |
Operating lease cost | | $ | 163 | | | $ | 144 | |
| | | $ | 163 | | | $ | 144 | |
There were no sale and leaseback transactions, leverage leases or lease transactions with related parties during the year ended December 31, 2023 and 2022.
A maturity analysis of operating lease liabilities and reconciliation of the undiscounted cash flows to the total operating lease liability is as follows:
| | | December 31, 2023 | |
| | | | | |
Lease payments due: | | | | |
Within one year | | $ | 124 | |
After one year but within two years | | $ | 124 | |
After two years but within three years | | | 124 | |
After three year but within four years | | | 124 | |
After four years but within five years | | | 30 | |
After five years | | | - | |
Total undiscounted cash flows | | | 525 | |
Discount on cash flows | | | (35 | ) |
Total lease liability | | $ | 490 | |
Note 8. Goodwill and Other Intangible Assets
(in thousands)
Changes in the carrying amount of goodwill during the years ended December 31 were as follows
| | | Total | |
Balance at December 31, 2021 | | $ | 13,030 | |
Addition to goodwill from acquisition | | | - | |
Balance at December 31, 2022 | | | 13,030 | |
Addition to goodwill from acquisition | | | - | |
Balance at December 31, 2023 | | $ | 13,030 | |
There were no changes to goodwill during the year ended December 31, 2023. The Company performed a goodwill impairment test for 2023 and concluded that no impairment charge was required.
The following table provides a summary of finite-lived intangible assets as of the dates presented:
| | | 2023 | | | 2022 | |
Core deposit intangible | | $ | 412 | | | $ | 521 | |
Accumulated amortization | | | (111 | ) | | | (109 | ) |
Total finite-lived intangible assets | | $ | 301 | | | $ | 412 | |
Core deposit intangible amortization expense for the years ended December 31, 2023, 2022 and 2021 was $109, $109 and $109, respectively. The estimated amortization expense of finite-lived intangible assets for the five succeeding fiscal years is summarized as follows:
Year Ending | | | | |
December 31, | | Amount | |
2024 | | | 111 | |
2025 | | | 111 | |
2026 | | | 79 | |
| | | $ | 301 | |
Note 9. Deposits
(in thousands)
The composition of deposits as of December 31, 2023 and December 31, 2022 is as follows:
| | | 2023 | | | 2022 | |
Non-interest bearing | | $ | 264,528 | | | $ | 299,112 | |
NOW and money market accounts | | | 546,329 | | | | 515,337 | |
Savings deposits | | | 112,693 | | | | 133,030 | |
Time deposits, $250,000 or more | | | 59,226 | | | | 44,370 | |
Other time deposits | | | 187,301 | | | | 134,553 | |
Total | | $ | 1,170,077 | | | $ | 1,126,402 | |
The scheduled maturities of time deposits at December 31, 2023 are as follows:
Year Ending | | | | |
December 31, | | Amount | |
2024 | | $ | 194,894 | |
2025 | | | 16,844 | |
2026 | | | 17,230 | |
2027 | | | 13,312 | |
2028 and thereafter | | | 4,247 | |
| | | $ | 246,527 | |
Note 10. Short-Term Borrowings
(in thousands)
Short-term borrowings as of December 31 are summarized as follows:
| | | 2023 | | | 2022 | |
Securities sold under agreements to repurchase | | $ | 158,086 | | | $ | 127,574 | |
Federal funds purchased | | | - | | | | - | |
Federal Home Loan Bank short-term advances | | | - | | | | - | |
Total short-term borrowings | | $ | 158,086 | | | $ | 127,574 | |
Securities sold under agreements to repurchase (“repurchase agreements”) represent funds received from customers, generally on an overnight or continuous basis, which are collateralized by investment securities owned or, at times, borrowed and re-hypothecated by the Company. The securities used as collateral consist primarily of U.S. Government agency mortgage-backed securities, U.S. Government agency collateralized mortgage obligations, obligations of U.S. Government agencies, and obligations of states and political subdivisions. All securities are maintained by the Company’s safekeeping agents. These securities are reviewed by the Company on a daily basis, and the Company may be required to provide additional collateral due to changes in the fair market value of these securities. The terms of the Company’s repurchase agreements are continuous but may be canceled at any time by the Company or the customer.
Note 10. Continued
Federal funds purchased are short term borrowings, generally overnight borrowings, between financial institutions that are generally used to maintain reserve requirements at the Federal Reserve Bank or elsewhere.
FHLB short-term advances are borrowings with original maturities of less than one year. Interest is payable monthly. Pursuant to collateral agreements with the FHLB, advances are collateralized by all of the Bank’s FHLB stock and qualifying first mortgages and other loans. As of December 31, 2023 and 2022, the balance in qualifying first mortgages and other loans was $179,107 and $160,488 respectively.
The average balances and cost of funds of short-term borrowings for the years ending December 31 are summarized as follows:
| | | Average Balances | | | Cost of Funds | |
| | | 2023 | | | 2022 | | | 2023 | | | 2022 | |
Securities sold under agreements to repurchase | | $ | 144,729 | | | $ | 113,893 | | | | 3.76 | % | | | 1.06 | % |
Federal funds purchased | | | 826 | | | | 779 | | | | 5.34 | % | | | 2.70 | % |
Federal Home Loan Bank short-term advances | | | 1,940 | | | | 7,111 | | | | 4.76 | % | | | 1.50 | % |
Total short-term borrowings | | $ | 147,495 | | | $ | 121,783 | | | | 3.78 | % | | | 1.10 | % |
Note 11. Long-Term Debt
(in thousands)
Long-term debt as of December 31, 2023 and 2022 is summarized as follows:
| | | 2023 | | | 2022 | |
Secured line of credit | | $ | 18,000 | | | $ | 18,000 | |
Total long-term debt | | $ | 18,000 | | | $ | 18,000 | |
Secured line of credit
On June 9, 2021, the Company obtained a secured revolving line of credit (“Line”) in the amount of $20,000 with First Horizon Bank. The proceeds of the Line were used to enhance the Bank’s capital structure. The Line bears interest at a floating interest rate linked to WSJ Prime Rate with an initial interest rate of 8.50%, which is payable quarterly on the first day of each calendar quarter, commencing on July 1, 2022, with the final installment of interest being due and payable concurrently on the same date that the principal balance is due. The Line also bears an unused line fee at a rate equal to 0.25%, applied to the unused balance of the Line. The Line is fully secured by the common stock of the Bank. The Line matures on June 9, 2024, at which time all unpaid interest and principal is due and payable. As of September 30, 2023 the Company did not meet the Return on Average Assets covenant set forth in the applicable loan agreement of 50 basis points on a rolling four quarter basis. The Company failed the return on average assets covenant with a four quarter rolling average of 47 basis points. The loan agreement does not provide a grace or cure period for the default, which would constitute a default in 2023.
Note 11. Continued
However, the Company met all other requirements set forth in the agreement as of December 31, 2023.
The aggregate stated maturities of long-term debt outstanding at December 31, 2023, are summarized as follows:
Year Ending | | | | |
December 31, | | Amount | |
2024 | | $ | 18,000 | |
Thereafter | | | - | |
| | | $ | 18,000 | |
Note 12. Other Income and Other Expense
(in thousands)
The following is a detail of the major income classifications that are included in other income under non-interest income on the income statement for the year ended December 31:
Other Income | | 2023 | | | 2022 | | | 2021 | |
| | | | | | | | | | | | | |
BOLI insurance | | $ | 483 | | | $ | 444 | | | $ | 517 | |
Mortgage loan origination income | | | 306 | | | | 652 | | | | 1,305 | |
Other income | | | 1,708 | | | | 1,625 | | | | 1,208 | |
| | | | | | | | | | | | | |
Total Other income | | $ | 2,497 | | | $ | 2,721 | | | $ | 3,030 | |
The following is a detail of the major expense classifications that comprise the other expense line item in the income statement for the years ended December 31:
Other Expense | | 2023 | | | 2022 | | | 2021 | |
| | | | | | | | | | | | | |
Advertising | | $ | 566 | | | $ | 610 | | | $ | 573 | |
Office supplies | | | 1,020 | | | | 1,016 | | | | 1,007 | |
Professional fees | | | 1,137 | | | | 1,144 | | | | 1,039 | |
FDIC and state assessment | | | 934 | | | | 830 | | | | 879 | |
Technology expense | | | 438 | | | | 441 | | | | 520 | |
Postage and freight | | | 584 | | | | 588 | | | | 618 | |
Loan collection expense | | | 73 | | | | 28 | | | | 89 | |
Other losses | | | 524 | | | | 442 | | | | 295 | |
Debit card/ATM expense | | | 890 | | | | 799 | | | | 733 | |
Other expenses | | | 3,593 | | | | 3,169 | | | | 3,086 | |
| | | | | | | | | | | | | |
Total Other Expense | | $ | 9,759 | | | $ | 9,067 | | | $ | 8,839 | |
Note 13. Income Taxes
(in thousands)
Income tax expense consists of the following:
| | | 2023 | | | 2022 | | | 2021 | |
Current payable | | | | | | | | | | | | |
Federal | | $ | 73 | | | $ | 993 | | | $ | 525 | |
State | | | 215 | | | | 487 | | | | 340 | |
| | | | 288 | | | | 1,480 | | | | 865 | |
| | | | | | | | | | | | | |
Deferred tax (benefit) expense | | | (362 | ) | | | 401 | | | | 566 | |
| | | | | | | | | | | | | |
Income tax (benefit) expense | | $ | (74 | ) | | $ | 1,881 | | | $ | 1,431 | |
The differences between income taxes calculated at the federal statutory rate and income tax expense were as follows:
| | | 2023 | | | 2022 | | | 2021 | |
Federal taxes based on statutory rate | | $ | 374 | | | $ | 2,415 | | | $ | 1,874 | |
State income taxes, net of federal benefit | | | 159 | | | | 384 | | | | 336 | |
Tax-exempt investment interest | | | (543 | ) | | | (836 | ) | | | (593 | ) |
Income related to bank-owned life insurance | | | (165 | ) | | | (159 | ) | | | (218 | ) |
Other, net | | | 101 | | | | 77 | | | | 32 | |
| | | | | | | | | | | | | |
Income tax (benefit) expense | | $ | (74 | ) | | $ | 1,881 | | | $ | 1,431 | |
Note 13. Continued
At December 31, 2023 and December 31, 2022, net deferred tax assets consisted of the following:
| | | 2023 | | | 2022 | |
Deferred tax assets | | | | | | | | |
ACL | | $ | 1,854 | | | $ | 1,313 | |
Deferred compensation liability | | | 2,503 | | | | 2,491 | |
Other real estate owned | | | 251 | | | | 261 | |
Unrealized loss on securities available-for-sale | | | 25,146 | | | | 27,617 | |
Other | | | 488 | | | | 51 | |
Total | | | 30,242 | | | | 31,733 | |
Deferred tax liabilities | | | | | | | | |
Premises and equipment | | | 1,941 | | | | 1,908 | |
Core deposit intangible | | | 75 | | | | 102 | |
Other | | | 218 | | | | 147 | |
Total | | | 2,234 | | | | 2,159 | |
Net deferred tax asset | | $ | 28,008 | | | $ | 29,574 | |
The Company has evaluated the need for a valuation allowance related to the above deferred tax assets and, based on the weight of the available evidence, has determined that it is more likely than not that all deferred tax assets will be realized.
As of December 31, 2023, the Company has no unrecognized tax benefits related to federal and state income tax matters. As of December 31, 2023, the Company has not accrued for interest and penalties related to uncertain tax positions. It is the Company’s policy to recognize interest or penalties related to income tax matters in income tax expense.
The Company and the Bank file a consolidated United States federal income tax return. The Company is currently open to audit under the statute of limitations by the Internal Revenue Service for the years ended December 31, 2021 through 2023. The Company and Bank’s state income tax returns are open to audit under the statute of limitations for the years ended December 31, 2021 through 2023.
The Company acquired federal net operating losses as part of an acquisition, with varying expiration periods. The federal net operating losses (“NOLs”) acquired were $2,302. The Company utilized the remaining $447 of the NOLs in 2022. No NOLs remained in 2023.
Note 14. Summarized Financial Information of Citizens Holding Company
Summarized financial information of Citizens Holding Company, excluding the Bank, at December 31, 2023 and December 31, 2022, and for the years ended December 31, 2023, 2022 and 2021, is as follows:
Balance Sheets
December 31, 2023 and 2022
| | | 2023 | | | 2022 | |
Assets | | | | | | | | |
Cash (1) | | $ | 234 | | | $ | 526 | |
Investment in bank subsidiary (1) | | | 60,061 | | | | 56,373 | |
Other assets (1) | | | 478 | | | | 444 | |
Total assets | | $ | 60,773 | | | $ | 57,343 | |
| | | | | | | | | |
Liabilities | | | | | | | | |
Secured line of credit | | $ | 18,000 | | | $ | 18,000 | |
Accrued interest payable | | | - | | | | 318 | |
Total liabilities | | $ | 18,000 | | | $ | 18,318 | |
| | | | | | | | | |
Shareholders’ equity | | | 42,773 | | | | 39,025 | |
Total liabilities and shareholders’ equity | | $ | 60,773 | | | $ | 57,343 | |
(1) | Fully or partially eliminates in consolidation. |
Income Statements
Years Ended December 31, 2023, 2022 and 2021
| | | 2023 | | | 2022 | | | 2021 | |
Interest income(1) | | $ | - | | | $ | - | | | $ | 1 | |
| | | | | | | | | | | | | |
Other income | | | | | | | | | | | | |
Dividends from bank subsidiary(1) | | | 5,383 | | | | 6,128 | | | | 4,104 | |
Equity in undistributed earnings of bank subsidiary(1) | | | (2,110 | ) | | | 4,546 | | | | 3,995 | |
Other income | | | 7 | | | | 21 | | | | - | |
Total other income | | | 3,280 | | | | 10,695 | | | | 8,099 | |
Other expense | | | 1,872 | | | | 1,417 | | | | 820 | |
Income before income taxes | | | 1,408 | | | | 9,278 | | | | 7,280 | |
Income tax benefit | | | (446 | ) | | | (342 | ) | | | (214 | ) |
Net income | | $ | 1,854 | | | $ | 9,620 | | | $ | 7,494 | |
| | (1) | Eliminates in consolidation. |
Note 14. Continued
Statements of Cash Flows
Years Ended December 31, 2023, 2022 and 2021
| | | 2023 | | | 2022 | | | 2021 | |
Cash flows from operating activities | | | | | | | | | | | | |
Net income | | $ | 1,854 | | | $ | 9,620 | | | $ | 7,494 | |
Adjustments to reconcile net income to net cash provided by operating activities | | | | | | | | | | | | |
Equity in undistributed loss (earnings) of the Bank | | | 2,109 | | | | (4,546 | ) | | | (3,995 | ) |
(Gain) on sale of real estate acquired in foreclosure | | | (21 | ) | | | - | | | | - | |
Writedown on Other Real Estate | | | 37 | | | | - | | | | - | |
Stock compensation expense | | | 140 | | | | 157 | | | | 161 | |
Increase in other assets | | | (32 | ) | | | (94 | ) | | | (60 | ) |
Increase (decrease) in other liabilities | | | (320 | ) | | | 318 | | | | - | |
Net cash provided by operating activities | | | 3,767 | | | | 5,455 | | | | 3,600 | |
| | | | | | | | | | | | | |
Cash flows from investing activities | | | | | | | | | | | | |
Decrease (increase) in ownership in subsidiary | | $ | - | | | $ | 38 | | | $ | (18,000 | ) |
Increase in other real estate owned | | | (38 | ) | | | (38 | ) | | | - | |
Proceeds from sale of other real estate owned | | | 21 | | | | 21 | | | | - | |
Net cash (used in) provided by investing activities | | | (17 | ) | | | 21 | | | | (18,000 | ) |
| | | | | | | | | | | | | |
Cash flows from financing activities | | | | | | | | | | | | |
Dividends paid to shareholders | | $ | (4,042 | ) | | $ | (5,377 | ) | | $ | (5,370 | ) |
Proceeds from borrowings on secured line of credit | | | - | | | | - | | | | 18,000 | |
Net cash (used in) provided by financing activities | | | (4,042 | ) | | | (5,377 | ) | | | 12,630 | |
Net (decrease) increase in cash | | | (292 | ) | | | 99 | | | | (1,770 | ) |
Cash, beginning of year | | | 526 | | | | 427 | | | | 2,197 | |
Cash, end of year | | $ | 234 | | | $ | 526 | | | $ | 427 | |
The Bank is required to obtain approval from state regulators before paying dividends.
Note 15. Related Party Transactions
(in thousands)
The Company had, and may have in the future, banking transactions in the ordinary course of business with directors, significant shareholders, principal officers, their immediate families, and affiliated companies in which they are principal shareholders (commonly referred to as related parties). In management’s opinion, such loans are made on substantially the same terms, including interest rates and collateral, as those prevailing at the time for comparable transactions with unrelated parties, and do not involve more than the normal risk of collectability at the time of the transaction.
Activity in related party loans is detailed in tabular form in Note 4 of the notes to the Financial Statements.
Deposits from related parties at December 31, 2023 and December 31, 2022 approximated $172,597 and $157,642, respectively.
The Company and its subsidiary have business dealings with companies owned by directors and beneficial shareholders of the Company. One director is a partner of the law firm that provides general counsel to the Company. Legal and other fees paid to this law firm for the years ended December 31, 2023, 2022, and 2021 were $62, $49, and $128, respectively. Additionally, one director is associated with a business which provides insurance to the Company in which the amounts paid for this service in 2023, 2022, and 2021 were $265, $273, and $280, respectively.
Note 16. Off-Balance Sheet Financial Instruments, Commitments and Contingencies and Concentrations of Risks
(in thousands)
Commitments to Extend Credit
In the ordinary course of business, the Company makes various commitments and incurs certain contingent liabilities to fulfill the financing needs of its customers. These commitments and contingent liabilities include commitments to extend credit and issue standby letters of credit. They involve, to varying degrees, elements of credit risk in excess of the amount recognized in the statements of financial condition. The Company’s exposure to credit loss in the event of nonperformance by the other party to the financial instrument for commitments to extend credit and standby letters of credit is represented by the contractual amount of those instruments. At December 31, 2023 and December 31, 2022, commitments related to unused lines of credit were $99,369 and $75,602, respectively, and standby letters of credit were $16,089 and $5,438, respectively. The fair value of such commitments is not materially different than stated values. As some of these commitments are expected to expire without being drawn upon, the total commitment amount does not necessarily represent future cash requirements. The Company applies the same credit policies and standards as it does in the lending process when making these commitments. The collateral obtained is based upon the assessed credit worthiness of the borrower. Collateral held varies, but may include accounts receivable, crops, livestock, inventory, property and equipment, residential real estate and income-producing commercial properties.
Note 16: Continued
Interest Rate Risk
The Company is principally engaged in providing short-term and medium-term installment, commercial and agricultural loans with interest rates that are fixed or fluctuate with the prime lending rate. These assets are primarily funded through short-term demand deposits and long-term certificates of deposit with variable and fixed rates. Accordingly, the Company is exposed to interest rate risk because in changing interest rate environments interest rate adjustments on assets and liabilities may not occur at the same time or in the same amount.
Legal Proceedings
We are a party to various legal proceedings such as claims and lawsuits arising in the course of our normal business activities. Although the ultimate outcome of all claims and lawsuits outstanding as of December 31, 2023 cannot be ascertained at this time, it is the opinion of management that these matters, when resolved, will not have a material adverse effect on our business, results of operations or financial condition.
Concentration of Risk
The Company makes commercial, residential and consumer loans throughout the state of Mississippi. A substantial portion of the customers’ abilities to honor their contracts is dependent on their business and the agricultural economy in the state.
Although the Company’s loan portfolio is diversified, there is a relationship in this state and our operating regions between the agricultural economy and the economic performance of loans made to nonagricultural customers. The Company’s lending policies for agricultural and nonagricultural customers require loans to be well-collateralized and supported by cash flows. Credit losses from loans related to the agricultural economy are consistent with credit losses experienced in the portfolio as a whole. The concentration of credit in the regional agricultural economy is taken into consideration by management in determining the ACL. See Note 4 for a summary of loans by type.
Note 17. Benefit Plans
(in thousands)
The Company provides its employees with a profit sharing and savings plan, which allows employees to direct a percentage of their compensation into a tax deferred retirement account, subject to statutory limitations. To encourage participation, the Company provides a 50 percent matching contribution for up to a maximum of 3 percent of each participant’s compensation, plus discretionary non-matching contributions. Employees are eligible after one year of service. For 2023, 2022 and 2021, the Company’s contributions were $720, $696 and $720, respectively.
Note 17. Continued
Deferred Compensation Plans
The Company provides a deferred compensation plan covering its directors. Participants in the deferred compensation plan can defer a portion of their compensation for payment after attaining age 70. Life insurance contracts have been purchased which may be used to fund payments under the plan. Expenses related to this plan were $174, $162 and $146 for the plan years ended December 31, 2023, 2022 and 2021, respectively.
The Company has also entered into deferred compensation arrangements with certain officers that provide for payments to such officers or their survivors after retirement. Life insurance policies have been purchased that may be used to fund all or a portion of the payments under these arrangements. The obligations of the Company under both the directors and officers deferred compensation arrangements are expensed on a systematic basis over the remaining expected service period of the individual directors and officers. Expenses related to this plan were $940, $725 and $788 for the plan years ended December 31, 2023, 2022 and 2021, respectively.
Note 18. Regulatory Matters
(in thousands)
The Company (on a consolidated basis) and the Bank are subject to various regulatory capital requirements administered by federal banking agencies. Failure to meet the minimum regulatory capital requirements can initiate certain mandatory and possible additional discretionary actions by regulators that, if undertaken, could have a direct material adverse effect on the Company.
Under the regulatory capital adequacy guidelines and the regulatory framework for prompt corrective action, the Company must meet specific capital guidelines involving quantitative measures of the Company’s assets, liabilities and certain off-balance sheet items as calculated under regulatory accounting practices. The Company’s capital amounts and classification under the prompt corrective action guidelines are also subject to qualitative judgments by the regulators about components, risk weightings, and other factors. Quantitative measures established by regulation to ensure capital adequacy require the Company to maintain minimum amounts and ratios of total capital and Tier I capital to risk-weighted assets (as defined in the regulations) and Tier I capital to average assets (as defined in the regulations). Management believes, as of December 31, 2023, that the Company and the Bank meet all capital adequacy requirements to which they are subject.
The Federal Reserve Bank (“FRB”), Federal Deposit Insurance Corporation (“FDIC”) and other federal banking agencies have established risk-based capital adequacy guidelines. These guidelines are intended to provide a measure of a bank’s capital adequacy that reflects the degree of risk associated with a bank’s operations.
A banking organization’s risk-based capital ratios are obtained by dividing its qualifying capital by its total risk-adjusted assets and off-balance sheet items. Since December 31, 1992, the federal banking agencies have required a minimum ratio of qualifying total capital to risk-adjusted assets and off-balance sheet items of 8%, and a minimum ratio of Tier 1 capital to risk-adjusted assets and off-balance sheet items of 4%.
Note 18. Continued
The Dodd-Frank Act requires the FRB, the Office of the Comptroller of the Currency (“OCC”) and the FDIC to adopt regulations imposing a continuing “floor” on the risk based capital requirements. In December 2010, the Basel Committee released a final framework for a strengthened set of capital requirements, known as "Basel III". In July 2013, each of the U.S. federal banking agencies adopted final rules relevant to us: (1) the Basel III regulatory capital reforms; and (2) the "standardized approach of Basel II for non-core banks and bank holding companies, such as the Bank and the Company. The capital framework under Basel III will replace the existing regulatory capital rules for all banks, savings associations and U.S. bank holding companies with greater than $500 million in total assets, and all savings and loan holding companies.
Beginning January 1, 2015, the Bank began to comply with the Basel III rules, which became effective on January 1, 2020. Among other things, the Basel III rules impact regulatory capital ratios of banking organizations in the following manner:
| | ● | Create a new requirement to maintain a ratio of common equity Tier 1 capital to total risk-weighted assets of not less than 4.5%; |
| | ● | Increase the minimum leverage ratio to 4% for all banking organizations (currently 3% for certain banking organizations); |
| | ● | Increase the minimum Tier 1 risk-based capital ratio from 4% to 6%; and |
| | ● | Maintain the minimum total risk-based capital ratio at 8%. |
In addition, the Basel III rules will subject a banking organization to certain limitations on capital distributions and discretionary bonus payments to executive officers if the organization did not maintain a capital conservation buffer of common equity Tier 1 capital in an amount greater than 2.5% of its total risk-weighted assets. The capital conservation buffer increases the minimum common equity Tier 1 capital ratio to 7%, the minimum Tier 1 risk-based capital ratio to 8.5% and the minimum total risk-based capital ratio to 10.5% for banking organizations seeking to avoid the limitations on capital distributions and discretionary bonus payments to executive officers.
The Basel III rules also changed the capital categories for insured depository institutions for purposes of prompt corrective action. Under the rules, to be well capitalized, an insured depository institution must maintain a minimum common equity Tier 1 capital ratio of at least 6.5%, a Tier 1 risk-based capital ratio of at least 8%, a total risk-based capital ratio of at least 10.0%, and a leverage capital ratio of at least 5%. In addition, the Basel III rules established more conservative standards for including an instrument in regulatory capital and imposed certain deductions from and adjustments to the measure of common equity Tier 1 capital.
Note 18. Continued
As of December 31, 2023 and 2022, the most recent regulatory notification categorized the Bank as well capitalized. There have been no conditions or events that would cause changes to the capital structure of the Company since this notification. To continue to be categorized as well capitalized under the regulatory framework for prompt corrective action, the Company would have to maintain minimum total risk-based, Tier I risk-based, and Tier I leverage ratios as disclosed below, in comparison with actual capital amounts and ratios:
| | | | | | | | | | | | | | | | | | | Minimum Capital | |
| | | | | | | | | | | Minimum Capital | | | Requirement to be | |
| | | | | | | | | | | Requirement to be | | | Adequately | |
| | | Actual | | | Well Capitalized | | | Capitalized | |
| | | Amount | | | Ratio | | | Amount | | | Ratio | | | Amount | | | Ratio | |
December 31, 2023 | | | | | | | | | | | | | | | | | | | | | | | | |
Citizens Holding Company | | | | | | | | | | | | | | | | | | | | | | | | |
Tier 1 leverage ratio | | $ | 106,544 | | | | 7.43 | % | | $ | 71,680 | | | | 5.00 | % | | $ | 57,344 | | | | 4.00 | % |
Common Equity tier 1 capital ratio | | | 106,544 | | | | 7.43 | % | | | 93,185 | | | | 6.50 | % | | | 64,512 | | | | 4.50 | % |
Tier 1 risk-based capital ratio | | | 106,544 | | | | 11.95 | % | | | 71,353 | | | | 8.00 | % | | | 53,515 | | | | 6.00 | % |
Total risk-based capital ratio | | | 113,239 | | | | 12.70 | % | | | 89,192 | | | | 10.00 | % | | | 71,353 | | | | 8.00 | % |
The Citizens Bank of Philadelphia | | | | | | | | | | | | | | | | | | | | | | | | |
Tier 1 leverage ratio | | $ | 123,832 | | | | 8.64 | % | | $ | 71,653 | | | | 5.00 | % | | $ | 57,322 | | | | 4.00 | % |
Common Equity tier 1 capital ratio | | | 123,832 | | | | 8.64 | % | | | 93,149 | | | | 6.50 | % | | | 64,488 | | | | 4.50 | % |
Tier 1 risk-based capital ratio | | | 123,832 | | | | 13.89 | % | | | 71,315 | | | | 8.00 | % | | | 53,486 | | | | 6.00 | % |
Total risk-based capital ratio | | | 130,526 | | | | 14.64 | % | | | 89,144 | | | | 10.00 | % | | | 71,315 | | | | 8.00 | % |
| | | | | | | | | | | | | | | | | | | | | | | | | |
December 31, 2022 | | | | | | | | | | | | | | | | | | | | | | | | |
Citizens Holding Company | | | | | | | | | | | | | | | | | | | | | | | | |
Tier 1 leverage ratio | | $ | 108,756 | | | | 7.96 | % | | $ | 68,352 | | | | 5.00 | % | | $ | 54,682 | | | | 4.00 | % |
Common Equity tier 1 capital ratio | | | 108,756 | | | | 13.19 | % | | | 88,858 | | | | 6.50 | % | | | 61,517 | | | | 4.50 | % |
Tier 1 risk-based capital ratio | | | 108,756 | | | | 13.19 | % | | | 65,951 | | | | 8.00 | % | | | 49,463 | | | | 6.00 | % |
Total risk-based capital ratio | | | 114,020 | | | | 13.83 | % | | | 82,438 | | | | 10.00 | % | | | 65,951 | | | | 8.00 | % |
The Citizens Bank of Philadelphia | | | | | | | | | | | | | | | | | | | | | | | | |
Tier 1 leverage ratio | | $ | 126,105 | | | | 9.23 | % | | $ | 68,333 | | | | 5.00 | % | | $ | 54,667 | | | | 4.00 | % |
Common Equity tier 1 capital ratio | | | 126,105 | | | | 15.34 | % | | | 88,833 | | | | 6.50 | % | | | 61,500 | | | | 4.50 | % |
Tier 1 risk-based capital ratio | | | 126,105 | | | | 15.34 | % | | | 65,759 | | | | 8.00 | % | | | 49,320 | | | | 6.00 | % |
Total risk-based capital ratio | | | 131,370 | | | | 15.98 | % | | | 82,199 | | | | 10.00 | % | | | 65,759 | | | | 8.00 | % |
Note 19. Fair Values of Financial Instruments
(in thousands)
Under the authoritative guidance on fair value measurements, fair value is the price that would be received to sell an asset or paid to transfer a liability in an orderly transaction between market participants at the measurement date. In determining fair value, the Company uses various methods including market, income and cost approaches. Based on these approaches, the Company often utilizes certain assumptions about risk and or the risks inherent in the inputs to the valuation technique. These inputs can be readily observable, market corroborated, or generally unobservable inputs. The Company utilizes valuation techniques that maximize the use of observable inputs and minimize the use of unobservable inputs. Based on the observability of the inputs used in the valuation techniques, the Company is required to provide the following information according to the fair value hierarchy. The fair value hierarchy ranks the quality and reliability of the information used to determine fair values. Financial assets and liabilities carried at fair value will be classified and disclosed in one of the three following categories:
| | Level 1 | Quoted prices in active markets for identical assets or liabilities; |
| | | |
| | Level 2 | Quoted prices in active markets for similar assets and liabilities and inputs that are observable for the asset or liability; or |
| | | |
| | Level 3 | Unobservable inputs, such as discounted cash flow models or valuations. |
The determination of where assets and liabilities fall within this hierarchy is based upon the lowest level of input that is significant to the fair value measurement. The Company used the following methods and assumptions to estimate the fair value of financial instruments that are measured at fair value on a recurring basis:
Investment Securities
The fair values of debt securities available for sale are determined by third party matrix pricing, which is a mathematical technique widely used in the industry to value debt securities without relying exclusively on quoted prices for the specific securities but rather by relying on the securities’ relationship to other benchmark quoted securities (Level 2 inputs).
Derivative Instruments
Most of the Company’s derivative contracts are actively traded in over-the-counter markets and are valued using discounted cash flow models which incorporate observable market based inputs including current market interest rates, credit spreads, and other factors. Such instruments are categorized within Level 2 of the fair value hierarchy and include interest rate swaps. The Company’s interest rate lock commitments are valued using current market prices for mortgage-backed securities with similar characteristics, adjusted for certain factors including servicing and risk.
The following table presents investment securities that are measured at fair value on a recurring basis as of December 31, 2023:
| | | Quoted Prices | | | | | | | | | | | | | |
| | | in Active | | | Significant | | | | | | | | | |
| | | Markets for | | | Other | | | Significant | | | | | |
| | | Identical | | | Observable | | | Unobservable | | | | | |
| | | Assets | | | Inputs | | | Inputs | | | | | |
| | | (Level 1) | | | (Level 2) | | | (Level 3) | | | Totals | |
Derivative instruments | | $ | - | | | $ | 865 | | | $ | - | | | $ | 865 | |
Securities available for sale | | | | | | | | | | | | | | | | |
Mortgage-backed securities | | | - | | | | 84,372 | | | | - | | | | 84,372 | |
State, County, Municipals | | | - | | | | 92,978 | | | | - | | | | 92,978 | |
Other securities | | | - | | | | 445 | | | | - | | | | 445 | |
| | | $ | - | | | $ | 178,660 | | | $ | - | | | $ | 178,660 | |
The following table presents investment securities that are measured at fair value on a recurring basis as of December 31, 2022:
| | | Quoted Prices | | | | | | | | | | | | | |
| | | in Active | | | Significant | | | | | | | | | |
| | | Markets for | | | Other | | | Significant | | | | | |
| | | Identical | | | Observable | | | Unobservable | | | | | |
| | | Assets | | | Inputs | | | Inputs | | | | | |
| | | (Level 1) | | | (Level 2) | | | (Level 3) | | | Totals | |
Securities available for sale | | | | | | | | | | | | | | | | |
Mortgage-backed securities | | | - | | | | 96,972 | | | | - | | | | 96,972 | |
State, County, Municipals | | | - | | | | 103,913 | | | | - | | | | 103,913 | |
Other securities | | | - | | | | 437 | | | | - | | | | 437 | |
| | | $ | - | | | $ | 201,322 | | | $ | - | | | $ | 201,322 | |
Note 19. Continued
Individually Evaluated Loans
For loans that do not share similar risk characteristics with other loans, an individual analysis is performed to determine the expected credit loss. If the respective loan is collateral dependent (that is, when the borrower is experiencing financial difficulty and repayment is expected to be provided substantially through the operation or sale of the collateral), the expected credit loss is measured as the difference between the amortized cost basis of the loan and the fair value of the collateral. The fair value of collateral is initially based on external appraisals. Generally, collateral values for loans for which measurement of expected losses is dependent on the fair value of such collateral are updated every twelve months, either from external third parties or in-house certified appraisers. Third-party appraisals are obtained from a pre-approved list of independent, local appraisal firms. The fair value of the collateral derived from external appraisal is then adjusted for the estimated cost to sell if repayment or satisfaction of a loan is dependent on the sale (rather than only on the operation) of the collateral. Other acceptable methods for determining the expected credit losses for individually evaluated loans (typically used when the loan is not collateral dependent) is a discounted cash flow approach or, if applicable, an observable market price. Once the expected credit loss amount is determined, an allowance equal to such expected credit loss is included in the ACL. Since not all valuation inputs are observable, these nonrecurring fair value determinations are classified as Level 3. Individually evaluated loans are reviewed and evaluated on at least a quarterly basis for additional impairment and adjusted accordingly, based on the same factors previously identified.
Other real estate owned
OREO is primarily comprised of real estate acquired in partial or full satisfaction of loans. OREO is recorded at its estimated fair value less estimated selling and closing costs at the date of transfer, with any excess of the related loan balance over the fair value less expected selling costs charged to the ACL. Subsequent changes in fair value are reported as adjustments to the carrying amount and are recorded against earnings. The Company outsources the valuation of OREO with material balances to third party appraisers. The Company reviews the third-party appraisal for appropriateness and adjusts the value downward to consider selling and closing costs, which typically approximate 25% of the appraised value. Given that fair value, when recorded, is determined based on appraisals by qualified licensed appraisers and adjusted for management’s estimates of costs to sell, values for OREO are classified as Level 3.
Note 19. Continued
The following table presents assets measured at fair value on a nonrecurring basis during December 31, 2023 and 2022 and were still held at those respective dates:
| | | Quoted Prices | | | | | | | | | | | | | |
| | | in Active | | | Significant | | | | | | | | | |
| | | Markets for | | | Other | | | Significant | | | | | |
| | | Identical | | | Observable | | | Unobservable | | | | | |
| | | Assets | | | Inputs | | | Inputs | | | | | |
| | | (Level 1) | | | (Level 2) | | | (Level 3) | | | Totals | |
December 31, 2023 | | | | | | | | | | | | | | | | |
Loans individually evaluated for impairment | | $ | - | | | $ | - | | | $ | 2,082 | | | $ | 2,082 | |
Other real estate owned | | | - | | | | - | | | | 260 | | | | 260 | |
| | | $ | - | | | $ | - | | | $ | 2,342 | | | $ | 2,342 | |
| | | | | | | | | | | | | | | | | |
December 31, 2022 | | | | | | | | | | | | | | | | |
Loans individually evaluated for impairment | | $ | - | | | $ | - | | | $ | 2,074 | | | $ | 2,074 | |
| | | | | | | | | | | | | | | | | |
Total | | $ | - | | | $ | - | | | $ | 2,074 | | | $ | 2,074 | |
Individually evaluated loans with a carrying value of $2,224 and $2,190 had an allocated ACL of $142 and $116 at December 31, 2023 and December 31, 2022, respectively. The allocated allowance is based on the carrying value of the impaired loan and the fair value of the underlying collateral less estimated costs to sell.
After monitoring the carrying amounts for subsequent declines or impairment after foreclosure, management determined that a fair value adjustments to OREO in the amount of $0 and $-0- was necessary and recorded during the year ended December 31, 2023 and December 31, 2022, respectively.
Note 19. Continued
The following represents the carrying value and estimated fair value of the Company’s financial instruments at December 31, 2023 and December 31, 2022:
| | | | | | | Quoted Prices | | | | | | | | | | | | | |
| | | | | | | in Active | | | Significant | | | | | | | | | |
| | | | | | | Markets for | | | Other | | | Significant | | | Total | |
| | | Carrying | | | Identical | | | Observable | | | Unobservable | | | Fair | |
| | | Value | | | Assets | | | Inputs | | | Inputs | | | Value | |
2023 | | | | | | (Level 1) | | | (Level 2) | | | (Level 3) | | | | | |
Financial assets | | | | | | | | | | | | | | | | | | | | |
Cash and due from banks | | $ | 14,553 | | | $ | 14,553 | | | $ | - | | | $ | - | | | $ | 14,553 | |
Interest bearing deposits with banks | | | 79,923 | | | | 79,923 | | | | - | | | | - | | | | 79,923 | |
Securities held-to-maturity | | | 387,799 | | | | - | | | | 355,418 | | | | - | | | | 355,418 | |
Securities available-for-sale | | | 177,795 | | | | - | | | | 177,795 | | | | - | | | | 177,795 | |
Net LHFI | | | 634,394 | | | | - | | | | - | | | | 606,273 | | | | 606,273 | |
Derivative instruments | | | 865 | | | | - | | | | 865 | | | | - | | | | 865 | |
Financial liabilities | | | | | | | | | | | | | | | | | | | | |
Deposits | | | 1,170,077 | | | | 923,551 | | | | 221,882 | | | | - | | | | 1,145,433 | |
Short-term borrowings | | | 158,086 | | | | 158,086 | | | | - | | | | - | | | | 158,086 | |
Borrowings on secured line of credit | | | 18,000 | | | | 18,000 | | | | - | | | | - | | | | 18,000 | |
| | | | | | | Quoted Prices | | | | | | | | | | | | | |
| | | | | | | in Active | | | Significant | | | | | | | | | |
| | | | | | | Markets for | | | Other | | | Significant | | | Total | |
| | | Carrying | | | Identical | | | Observable | | | Unobservable | | | Fair | |
| | | Value | | | Assets | | | Inputs | | | Inputs | | | Value | |
2022 | | | | | | (Level 1) | | | (Level 2) | | | (Level 3) | | | | | |
Financial assets | | | | | | | | | | | | | | | | | | | | |
Cash and due from banks | | $ | 26,948 | | | $ | 26,948 | | | $ | - | | | $ | - | | | $ | 26,948 | |
Interest bearing deposits with banks | | | 1,646 | | | | 1,646 | | | | - | | | | - | | | | 1,646 | |
Securities held-to-maturity | | | 406,590 | | | | - | | | | 375,292 | | | | - | | | | 375,292 | |
Securities available-for-sale | | | 201,322 | | | | - | | | | 201,322 | | | | - | | | | 201,322 | |
Net loans | | | 580,052 | | | | - | | | | - | | | | 541,173 | | | | 541,173 | |
Financial liabilities | | | | | | | | | | | | | | | | | | | | |
Deposits | | | 1,126,402 | | | | 947,479 | | | | 178,902 | | | | - | | | | 1,126,381 | |
Short-term Borrowings | | | 127,574 | | | | 127,574 | | | | - | | | | - | | | | 127,574 | |
Borrowings on secured line of credit | | | 18,000 | | | | 18,000 | | | | - | | | | - | | | | 18,000 | |
Note 20. Stock Based Compensation
(in thousands, except share data)
The Company has a directors’ stock compensation plan and had an employees’ long-term incentive plan. Under the directors’ plan, the Company may grant options for up to 210,000 shares of common stock. The price of each option is equal to the market price determined as of the option grant date. Options granted are exercisable after six months and expire after 10 years. The employee plan expired on April 13, 2009, no options have been granted since this date and all previously granted options either expired or were exercised as of December 31, 2023. The options previously granted under the employee plan expire 10 years from the grant date. The exercise price is equal to the market price of the Company’s stock on the date of grant.
The fair value of each option granted is estimated on the date of the grant using the Black-Sholes option-pricing model. No options were granted in 2023 or 2022, therefore no calculations were required in 2023 or 2022 to determine fair values.
The Company has adopted the 2013 Incentive Compensation Plan (the “2013 Plan”), which the Company has used for all equity grants after the adoption and approval of the 2013 Plan.
During 2023, the Company’s directors received restricted stock grants totaling 9,000 shares of common stock at a then market value of $12.48 per share and in 2022 received 8,250 shares of common stock at a then market value of $19.05 per share. The Chief Executive Officer (“CEO) also received restricted stock grants totaling 3,868 common stock at a then market value of $15.51. These grants vest over a one-year period during which time the recipients have rights to vote the shares and to receive dividends. The grant date fair value of these shares granted in 2023 was $138 and will be recognized ratably over the one-year vesting period. The grant date fair value of the shares granted in 2022 was $157 and was recognized ratably over the one-year vesting period.
During 2023 and 2022, the Company recorded expense of $138 and $157 related to all of the restricted shares.
At December 31, 2023, there were 9,000 shares non-vested with $52 in unrecognized stock-based compensation expense related to the 2013 Plan.
Note 20. Continued
Following is a summary of the status of the stock options remaining under the plans for the years ending December 31, 2023, 2022 and 2021:
| | | Directors’ Plan | |
| | | | | | | Weighted | |
| | | Number | | | Average | |
| | | of | | | Exercise | |
| | | Shares | | | Price | |
Outstanding at January 1, 2021 | | | 19,500 | | | $ | 19.42 | |
Granted | | | - | | | | - | |
Exercised | | | - | | | | - | |
Expired | | | (10,500 | ) | | | 20.02 | |
| | | | | | | | | |
Outstanding at December 31, 2021 | | | 9,000 | | | $ | 18.76 | |
Granted | | | - | | | | - | |
Exercised | | | - | | | | - | |
Expired | | | (9,000 | ) | | | 18.76 | |
| | | | | | | | | |
Outstanding at December 31, 2022 | | | - | | | $ | - | |
Granted | | | - | | | | - | |
Exercised | | | - | | | | - | |
Expired | | | - | | | | - | |
| | | | | | | | | |
Outstanding at December 31, 2023 | | | - | | | $ | - | |
| | | | | | | | | |
Options exercisable at: | | | | | | | | |
December 31, 2023 | | | - | | | $ | - | |
Note 20. Continued
The intrinsic value of options outstanding under the Directors’ Plan at December 31, 2023 was $-0-. Additionally, the total intrinsic value of options exercised during 2023 and 2022 was $-0- and $-0-, respectively.
There were no options granted during 2023 or 2022 under the 2013 Plan.
Note 21. Subsequent Events
Sale Leaseback
The Company executed a sale leaseback of three separate locations on January 16, 2024. The Company recognized a net gain of $4,535 in January 2024 related to the sales.
These leases will be recognized as operating leases and will be accounted for in 2024.
Revolving Credit Line
Due to not meeting the Return on Average Assets covenant set forth in our revolving line of credit agreement with First Horizon, the Company was in violation of the agreement as of December 31, 2023. The Company obtained a waiver of the debt covenant in January 2024, however, First Horizon did not waive its rights regarding any future covenant breaches. As part of the waiver agreement, in January 2024, the Company deposited $1,800 with First Horizon, and the line of credit was reduced to $18,000.
Other Subsequent Events
The Company has evaluated, for consideration of recognition or disclosure, subsequent events that have occurred through the date of issuance of its financial statements, and has determined that no other significant events occurred after December 31, 2023 but prior to the issuance of these financial statements that would have a material impact on its Consolidated Financial Statements.
Management’s Discussion and Analysis of Financial Condition and Results of Operations as of December 31, 2023, 2022 and 2021
(in thousands)
OVERVIEW
The following information discusses the financial condition and results of operations of Citizens Holding Company (the “Company”) as of December 31, 2023, 2022 and 2021. In this discussion, all references to the activities, operations or financial performance of the Company reflect the Company’s activities, operations and financial performance through its wholly-owned subsidiary, The Citizens Bank of Philadelphia, Mississippi (the “Bank”), unless otherwise specifically noted. The Company’s financial statements and accompanying notes should be read in conjunction with this Management’s Discussion and Analysis.
Net income for the year ended December 31, 2023 was $1,854, a decrease of ($7,766), or (80.73%) compared to $9,620 at December 31, 2022. Net income decreased year-over-year primarily due to the interest rate increases by the Federal Reserve Bank during 2022 and 2023, which in turn caused deposits to reprice higher.
The Company continued to maintain and expand customer relationships as reflected by the deposit growth of $43,675, or 3.88%, to $1,170,077 at December 31, 2023 compared to $1,126,402 at December 31, 2022. The deposit increase was primarily driven by Negotiable Order of Withdrawal (“NOW”) and Money Market (“MMDA”) accounts which grew $30,992, or 6.01%, when compared to December 31, 2022.
The actions taken to mitigate the economic impact of the COVID-19 pandemic during 2020 and 2021, including but not limited to the Paycheck Protection Program, the Federal Reserve Bank (“FRB”) slashing rates to 0 bps immediately, multiple rounds of economic stimulus in the trillions of dollars all while limiting the amount of economic output that could occur caught up with the economy in 2022 and early 2023 causing record levels of inflation across the globe. While inflation started to subside throughout 2023, it still remains elevated above the FRB’s 2% target. Throughout 2022 and 2023, the FRB hiked the federal funds rate by 525 bps in addition to methodically shrinking its balance sheet in an effort to slow the economy and ultimately inflation. Since the latter part of 2023, the FRB has been on pause to assess the impact of their efforts to slow the economy. As we head into 2024, the FRB and the markets have forecasted rate cuts sometime in 2024, likely the second half of the year. While the interest rate outlook remains uncertain, the Company’s balance sheet is well positioned for falling rates and would benefit if the FRB does in fact cut rates.
The housing market came to a halt in the fourth quarter of 2022 and there was minimal housing activity in 2023 as well due to a lack of supply coupled with the fact that many homeowners refinanced their homes at much lower rates causing home selling to slow to historic lows. However, the commercial real estate market remained modestly robust throughout 2023 and heading into 2024. We were able to grow loans year over year, primarily in the land development and construction and commercial real estate categories. As we head into 2024, the Company’s pipeline remains positive and the economic outlook would be favorable in the Company’s operating markets should the forecasts hold true.
Additionally, deposit competition remains elevated but there are signs of softening in certain markets. This drove up funding costs in 2023 but as we head into 2024, the Company saw margin expansion in late 2023 and we expect that trend to continue in 2024 due to the FRB pausing rate hikes and our focus on higher yielding assets, primarily loans.
The Company and Bank remain well capitalized with all capital ratios above the regulatory requirements. The Bank’s leverage capital ratio decreased from 9.23% at December 31, 2022 to 8.64% at December 31, 2023. The Tier 1 capital ratio for the Company and Bank was 7.43% and 8.64%, respectively, at December 31, 2023.
The Company’s return on average assets (“ROA”) was 0.14% in 2023, compared to 0.72% in 2022 and 0.53% in 2021. The Company’s return on average equity (“ROE”) was 4.89% in 2023, 15.30% in 2022 and 6.74% in 2021. During the 2021 to 2023 period, the Company’s leverage capital ratios (the ratio of equity to average total assets) were 7.80% in 2021, 7.96% in 2022, and 7.43% in 2023. The ROE in 2022, 2021 and 2020 is a function of the level of net income and equity balances during those years. The changes in ROA were also a result of the Company’s net income in those years and also affected by the change in total assets during these time periods. The Company set the annual dividend payout rate to approximately 218.18% of 2023 earnings per share, as compared to 55.81% in 2022 and 71.64% in 2021.
Management has continued its practice of maintaining excess funding capacity to provide the Company with adequate liquidity for its ongoing operations. In this regard, the Company benefits from its strong deposit base and its access to funding from a variety of external funding sources such as federal funds lines and FHLB advances. Liquidity is discussed in more detail under the heading, Liquidity and Rate Sensitivity. The Company’s only commitment at December 31, 2023 that would require a material expenditure of capital resources is the outstanding $18,000 FHN secured line of credit balance.
The Company is not aware of any developments that would have a material impact on its revenues or net income outside of the recessionary risks inherent entering 2024. Interest rates are currently projected to go down in the second half of 2024. As previously mentioned, the Company’s liability-sensitive balance sheet is well-positioned for rate cuts, should they materialize. Also, the Company works to be proactive in monitoring the recessionary risks and impacts to its employees, customers and communities. Although the ultimate outcome cannot be accurately predicted at this point, the Company believes that it is well-capitalized and has the financial stability to continue to serve its customers and communities.
CRITICAL ACCOUNTING POLICIES
The preparation of financial statements in conformity with accounting principles generally accepted in the United States of America requires management to make estimates and assumptions that affect the reported amounts of assets and liabilities and disclosure of contingent assets and liabilities at the date of the financial statements and the reported amounts of revenues and expenses during the reporting period. Actual results could differ from those estimates.
Allowance for Credit Losses
Described more fully in our audited financial statements in Part I of this annual report, especially Note 1, Impact of Recently-Issued Accounting Standards and Pronouncements and Note 5, ACL on LHFI, on January 1, 2023, the Company adopted ASC 326. This standard replaced the incurred loss methodology with an expected loss methodology that is referred to as the current expected credit loss (“CECL”) methodology. CECL requires an estimate of credit losses for the remaining estimated life of the financial asset using historical experience, current conditions, and reasonable and supportable forecasts and generally applies to financial assets measured at amortized cost, including loan receivables and held-to-maturity debt securities, and some off-balance sheet credit exposures such as unfunded commitments to extend credit.
Please refer to Note 1, “Nature of Business and Summary of Significant Accounting Policies,” to the Consolidated Financial Statements of the Company included in this Annual Report for a detailed discussion of other significant accounting policies affecting the Company.
DISCLOSURE REGARDING FORWARD-LOOKING STATEMENTS
In addition to historical information, this report contains statements that constitute forward-looking statements within the meaning of Section 27A of the Securities Act of 1933, as amended, and Section 21E of the Securities Exchange Act of 1934, as amended, that are based on management’s beliefs, plans, expectations, assumptions and on information currently available to management. The words “may,” “should,” “expect,” “anticipate,” “intend,” “plan,” “continue,” “believe,” “seek,” “estimate” and similar expressions used in this report that do not relate to historical facts are intended to identify forward-looking statements. These statements appear in a number of places in this report, including, but not limited to, statements found in Item 1, “Business,” and in Item 7, “Management’s Discussion and Analysis of Financial Condition and Results of Operations.” Citizens Holding Company (the “Company”) notes that a variety of factors could cause its actual results or experience to differ materially from the anticipated results or other expectations described or implied by such forward-looking statements. The risks and uncertainties that may affect the operation, performance, development and results of the business of the Company and the Company’s wholly-owned subsidiary, The Citizens Bank of Philadelphia, Mississippi (the “Bank”), include, but are not limited to, the following:
● | expectations about the movement of interest rates, including actions that may be taken by the Federal Reserve Board in response to changing economic conditions; |
● | adverse changes in asset quality and loan demand, and the potential insufficiency of the ACL and our ability to foreclose on delinquent mortgages; |
● | the risk of adverse changes in business conditions in the banking industry generally and in the specific markets in which the Company operates; |
● | natural disasters, civil unrest, epidemics and other catastrophic events in the Company’s geographic area; |
● | the impact of increasing inflation rates on the general economic, market or business conditions; |
● | extensive regulation, changes in the legislative and regulatory environment that negatively impact the Company and the Bank through increased operating expenses and the potential for regulatory enforcement actions, claims, or litigation; |
● | increased competition from other financial institutions, in particular with respect to deposits, and the risk of failure to achieve our business strategies; |
● | events affecting our business operations, including the effectiveness of our risk management framework, the accuracy of our estimates, our reliance on third party vendors, the risk of security breaches and potential fraud, and the impact of technological advances; |
● | climate change and societal responses to climate change could adversely affect the Company’s business and results of operations, including indirectly through impact to its customers; |
● | our ability to maintain sufficient capital and to raise additional capital when needed; |
● | our ability to maintain adequate liquidity to conduct business and meet our obligations; |
● | events affecting our ability to compete effectively and achieve our strategies, such as the risk of failure to achieve the revenue increases expected to result from our acquisitions, branch additions and in new product and service offerings, our ability to control expenses and our ability to attract and retain skilled people; |
● | events that adversely affect our reputation, and the resulting potential adverse impact on our business operations; |
● | increased cybersecurity risk, including network breaches, business disruptions or financial losses; |
● | risks arising from owning our common stock, such as the volatility and trading volume, our ability to pay dividends, the regulatory limitations on stock ownership, and provisions in our governing documents that may make it more difficult for another party to obtain control of us; |
● | risks associated with national and global events, such as the conflict between Russia and Ukraine and supply chain disruptions; |
● | risks associated with the failures of Silicon Valley Bank, Signature Bank and First Republic Bank, which have resulted in significant market volatility and less confidence in depository institutions; |
● | internal and external factors affecting net interest margin; and |
● | other risks detailed from time-to-time in the Company’s filings with the Securities and Exchange Commission. |
The Company undertakes no obligation to update or revise any forward-looking statements subsequent to the date on which they are made.
NET INCOME
Net income for 2023 decreased by (80.73%) to $1,854 or $0.33 per share-basic and -diluted, from $9,620 or $1.72 per share-basic and -diluted for 2022. The PCL for 2023 was $669 as compared to $124 in 2022. The increase in the provision is mainly attributed to the fact that the Company was in a smaller net recovery position for the year ended December 31, 2023 partially offset with increases in qualitative factors due to the FRB’s restrictive monetary policy coupled with recessionary risks for the near future. Noninterest income decreased by $151, or (1.39%), and non-interest expense increased by $3,994 or 11.69%, in 2023. Non-interest income for 2023 decreased primarily as a result of a decrease in the net gains on sales of securities partially offset by increased interchange fees and overdraft fees. Non-interest expenses increased mainly due to an increase in salaries and employee benefits and a net loss on securities sold.
Net income for 2022 increased by 28.37% to $9,620 or $1.72 per share-basic and -diluted, from $7,494 or $1.34 per share-basic and -diluted for 2021. The PCL for 2022 was $124 as compared to $1,409 in 2021. The decrease in the provision is mainly attributed to the fact that the Company was in a large net recovery position for the year ended December 31, 2022 partially offset with increases in qualitative factors due to the FRB’s restrictive monetary policy coupled with recessionary risks for the near future. Noninterest income decreased by $1,304, or (10.70%), and non-interest expense decreased by $1,180 or (3.34%), in 2022. Non-interest income for 2022 decreased primarily as a result of a decrease in the net gains on sales of securities partially offset by increased interchange fees and overdraft fees. Noninterest expense decreased mainly due to a decrease in salaries and benefits and write-downs of OREO partially offset by the continued investment in customer facing and internal technology.
NET INTEREST INCOME
Net interest income is the most significant component of the Company’s earnings. Net interest income is the difference between interest and fees realized on earning assets, primarily loans and securities, and interest paid on deposits and other borrowed funds. The net interest margin is this difference expressed as a percentage of average earning assets. Net interest income is affected by several factors, including the volume of earning assets and liabilities, the mix of earning assets and liabilities, and interest rates. The discussion below is presented on a tax equivalent basis which management believes to be the best way to analyze net interest income.
Net interest income on a tax equivalent basis was $31,186, $36,049 and $34,340 for the years 2023, 2022 and 2021, respectively. Net interest margin was 2.45%, 2.80% and 2.60% for the same periods. In 2023 as compared to 2022, interest-bearing assets increased by $97,998, or 8.22% and interest-bearing liabilities increased by $108,771, or 11.18%. For the year ended December 31, 2023, the average yield on earnings assets was 3.97%, an increase of 80 basis points compared to the average yield at December 31, 2022. The average rate paid on interest-bearing liabilities in 2023 was 1.90%, an increase of 141 basis point compared to the average rate at December 31, 2022.
During 2022 as compared to 2021, interest-bearing assets decreased by $81,283, or (6.38%) and interest-bearing liabilities increased by $29,324, or 2.39%. For the year ended December 31, 2022, the average yield on earnings assets was 3.17%, an increase of 19 basis points compared to the average yield at December 31, 2021. The average rate paid on interest-bearing liabilities was 0.49%, a decrease of 1 basis point compared to the average rate at December 31, 2021.
During this three-year period, loans outstanding increased in 2022 and 2023. In 2021 loans decreased significantly due to increased competition and stagnant loan demand due to the continued effects of the pandemic. Loans generally provide the Company with yields that are greater than the yields on typical investment securities. Additionally, the taxable securities yield drove a majority of the increase in the interest earning assets yield with the yield increasing significantly due to rate increases during 2023 which drove decreased prepayments on mortgage-backed securities.
Table 1 – Average Balance Sheets and Interest Rates sets forth average balance sheet data, including all major categories of interest-earning assets and interest-bearing liabilities, together with the interest earned or interest paid and the average yield or average rate paid on each such category for the years ended December 31, 2023, 2022 and 2021.
TABLE 1 – AVERAGE BALANCE SHEETS AND INTEREST RATES
(in thousands)
| | | Average Balance | | | Income/Expense | | | Average Yield/Rate | |
| | | 2023 | | | 2022 | | | 2021 | | | 2023 | | | 2022 | | | 2021 | | | 2023 | | | 2022 | | | 2021 | |
Loans: | | | | | | | | | | | | | | | | | | | | | | | | | | | | | | | | | | | | |
Loans, net of unearned(1) | | $ | 587,785 | | | $ | 586,435 | | | $ | 628,618 | | | $ | 33,101 | | | $ | 27,311 | | | $ | 31,327 | | | | 5.63 | % | | | 4.66 | % | | | 4.98 | % |
| | | | | | | | | | | | | | | | | | | | | | | | | | | | | | | | | | | | | |
Investment Securities | | | | | | | | | | | | | | | | | | | | | | | | | | | | | | | | | | | | |
Taxable | | | 432,029 | | | | 465,386 | | | | 496,946 | | | | 10,287 | | | | 8,066 | | | | 4,441 | | | | 2.38 | % | | | 1.73 | % | | | 0.89 | % |
Tax-exempt | | | 199,661 | | | | 210,895 | | | | 148,977 | | | | 4,184 | | | | 5,059 | | | | 3,498 | | | | 2.10 | % | | | 2.40 | % | | | 2.35 | % |
Total Investment Securities | | | 631,690 | | | | 676,281 | | | | 645,923 | | | | 14,471 | | | | 13,125 | | | | 7,939 | | | | 2.29 | % | | | 1.94 | % | | | 1.23 | % |
| | | | | | | | | | | | | | | | | | | | | | | | | | | | | | | | | | | | | |
Federal Funds Sold and Other | | | 55,366 | | | | 23,574 | | | | 44,451 | | | | 2,981 | | | | 370 | | | | 55 | | | | 5.38 | % | | | 1.57 | % | | | 0.12 | % |
| | | | | | | | | | | | | | | | | | | | | | | | | | | | | | | | | | | | | |
Total Interest Earning Assets(1)(2) | | | 1,274,841 | | | | 1,286,290 | | | | 1,318,992 | | | | 50,553 | | | | 40,806 | | | | 39,321 | | | | 3.97 | % | | | 3.17 | % | | | 2.98 | % |
| | | | | | | | | | | | | | | | | | | | | | | | | | | | | | | | | | | | | |
Non-Earning Assets | | | 78,466 | | | | 56,944 | | | | 93,090 | | | | | | | | | | | | | | | | | | | | | | | | | |
| | | | | | | | | | | | | | | | | | | | | | | | | | | | | | | | | | | | | |
Total Assets | | $ | 1,353,307 | | | $ | 1,343,234 | | | $ | 1,412,082 | | | | | | | | | | | | | | | | | | | | | | | | | |
| | | | | | | | | | | | | | | | | | | | | | | | | | | | | | | | | | | | | |
Deposits: | | | | | | | | | | | | | | | | | | | | | | | | | | | | | | | | | | | | |
Interest-bearing Demand | | | | | | | | | | | | | | | | | | | | | | | | | | | | | | | | | | | | |
Deposits (3) | | $ | 520,486 | | | $ | 486,636 | | | $ | 487,894 | | | $ | 6,369 | | | $ | 929 | | | $ | 1,324 | | | | 1.22 | % | | | 0.19 | % | | | 0.27 | % |
Savings | | | 120,300 | | | | 133,739 | | | | 118,063 | | | | 348 | | | | 133 | | | | 120 | | | | 0.29 | % | | | 0.10 | % | | | 0.10 | % |
Time | | | 212,655 | | | | 202,315 | | | | 245,886 | | | | 5,498 | | | | 1,442 | | | | 2,783 | | | | 2.59 | % | | | 0.71 | % | | | 1.13 | % |
Total Deposits | | | 853,441 | | | | 822,690 | | | | 851,843 | | | | 12,215 | | | | 2,504 | | | | 4,227 | | | | 1.43 | % | | | 0.30 | % | | | 0.50 | % |
| | | | | | | | | | | | | | | | | | | | | | | | | | | | | | | | | | | | | |
Borrowed Funds | | | | | | | | | | | | | | | | | | | | | | | | | | | | | | | | | | | | |
Short-term Borrowings | | | 147,496 | | | | 121,783 | | | | 135,282 | | | | 5,651 | | | | 1,338 | | | | 401 | | | | 3.83 | % | | | 1.10 | % | | | 0.30 | % |
Long-term Borrowings | | | 18,000 | | | | 18,000 | | | | 9,692 | | | | 1,501 | | | | 915 | | | | 353 | | | | 8.34 | % | | | 5.08 | % | | | 3.64 | % |
Total Borrowed Funds | | | 165,496 | | | | 139,783 | | | | 144,974 | | | | 7,152 | | | | 2,253 | | | | 754 | | | | 4.32 | % | | | 1.61 | % | | | 0.52 | % |
Total Interest-Bearing | | | | | | | | | | | | | | | | | | | | | | | | | | | | | | | | | | | | |
Liabilities (3) | | | 1,018,937 | | | | 962,473 | | | | 996,817 | | | | 19,367 | | | | 4,757 | | | | 4,981 | | | | 1.90 | % | | | 0.49 | % | | | 0.50 | % |
| | | | | | | | | | | | | | | | | | | | | | | | | | | | | | | | | | | | | |
Non-Interest Bearing Liabilities | | | | | | | | | | | | | | | | | | | | | | | | | | | | | | | | | | | | |
Demand Deposits | | | 281,820 | | | | 305,247 | | | | 289,883 | | | | | | | | | | | | | | | | | | | | | | | | | |
Other Liabilities | | | 11,651 | | | | 12,624 | | | | 14,193 | | | | | | | | | | | | | | | | | | | | | | | | | |
Shareholders' Equity | | | 40,899 | | | | 62,890 | | | | 111,189 | | | | | | | | | | | | | | | | | | | | | | | | | |
Total Liabilities and | | | | | | | | | | | | | | | | | | | | | | | | | | | | | | | | | | | | |
Shareholders' Equity | | $ | 1,353,307 | | | $ | 1,343,234 | | | $ | 1,412,082 | | | | | | | | | | | | | | | | | | | | | | | | | |
| | | | | | | | | | | | | | | | | | | | | | | | | | | | | | | | | | | | | |
Interest Rate Spread | | | | | | | | | | | | | | | | | | | | | | | | | | | 2.07 | % | | | 2.68 | % | | | 2.48 | % |
| | | | | | | | | | | | | | | | | | | | | | | | | | | | | | | | | | | | | |
Net Interest Margin | | | | | | | | | | | | | | $ | 31,186 | | | $ | 36,049 | | | $ | 34,340 | | | | 2.45 | % | | | 2.80 | % | | | 2.60 | % |
| | | | | | | | | | | | | | | | | | | | | | | | | | | | | | | | | | | | | |
Less | | | | | | | | | | | | | | | | | | | | | | | | | | | | | | | | | | | | |
Tax Equivalent Adjustment | | | | | | | | | | | | | | | 1,308 | | | | 1,140 | | | | 846 | | | | | | | | | | | | | |
| | | | | | | | | | | | | | | | | | | | | | | | | | | | | | | | | | | | | |
Net Interest Income | | | | | | | | | | | | | | $ | 29,878 | | | $ | 34,909 | | | $ | 33,494 | | | | | | | | | | | | | |
(1) | Overdrafts on demand deposit accounts are not included in the average volume calculation as they are not considered interest earning assets by the Company. They are included in the “Non-Earning Assets” balance above. |
(2) | Earning Assets in Table 1 does not include the dividend paying stock of the Federal Home Loan Bank. |
(3) | Demand deposits are not included in the average volume calculation as they are not interest bearing liabilities. They are included within the non-interest bearing liabilities section above. |
Table 2 – Net Average Interest Earning Assets illustrates net interest earning assets and liabilities for 2023, 2022, and 2021.
TABLE 2 – NET AVERAGE INTEREST EARNING ASSETS
(in thousands)
| | | 2023 | | | 2022 | | | 2021 | |
| | | | | | | | | | | | | |
Average interest earning assets | | $ | 1,274,841 | | | $ | 1,286,290 | | | $ | 1,318,992 | |
Average interest bearing liabilities | | | 1,018,937 | | | | 962,473 | | | | 996,817 | |
| | | | | | | | | | | | | |
Net average interest earning assets | | $ | 255,904 | | | $ | 323,817 | | | $ | 322,175 | |
Table 3 – Volume/Rate Analysis depicts the effect on interest income and interest expense of changes in volume and changes in rate from 2021 through 2023. Variances, which were attributable to both volume and rate, are allocated proportionately between rate and volume using the absolute values of each for a basis for the allocation. Non-accruing loans are included in the average loan balances used in determining the yields. Interest income on tax‑exempt securities and loans has been adjusted to a tax equivalent basis using a federal income tax rate of 21% and a state tax rate of 5% in 2023 and 2022, respectively.
TABLE 3 – VOLUME/RATE ANALYSIS
| | | | | | | (in thousands) | | | | | | | | | | | | | |
| | | 2023 Change from 2022 | | | 2022 Change from 2021 | |
| | | Volume | | | Rate | | | Total | | | Volume | | | Rate | | | Total | |
INTEREST INCOME | | | | | | | | | | | | | | | | | | | | | | | | |
| | | | | | | | | | | | | | | | | | | | | | | | | |
Loans | | $ | 63 | | | $ | 5,727 | | | $ | 5,790 | | | $ | (2,102 | ) | | $ | (1,914 | ) | | $ | (4,016 | ) |
Taxable securities | | | (578 | ) | | | 2,799 | | | | 2,221 | | | | (282 | ) | | | 3,907 | | | | 3,625 | |
Non-Taxable securities | | | (269 | ) | | | (606 | ) | | | (875 | ) | | | 1,454 | | | | 107 | | | | 1,561 | |
Federal funds sold and other | | | 499 | | | | 2,112 | | | | 2,611 | | | | (26 | ) | | | 341 | | | | 315 | |
| | | | | | | | | | | | | | | | | | | | | | | | | |
TOTAL INTEREST INCOME | | $ | (286 | ) | | $ | 10,033 | | | $ | 9,747 | | | $ | (956 | ) | | $ | 2,441 | | | $ | 1,485 | |
| | | | | | | | | | | | | | | | | | | | | | | | | |
INTEREST EXPENSE | | | | | | | | | | | | | | | | | | | | | | | | |
| | | | | | | | | | | | | | | | | | | | | | | | | |
Interest-bearing demand deposits | | $ | 65 | | | $ | 5,375 | | | $ | 5,440 | | | $ | (3 | ) | | $ | (392 | ) | | $ | (395 | ) |
Savings deposits | | | (13 | ) | | | 228 | | | | 215 | | | | 16 | | | | (3 | ) | | | 13 | |
Time deposits | | | 74 | | | | 3,982 | | | | 4,056 | | | | (493 | ) | | | (848 | ) | | | (1,341 | ) |
Short-term borrowings | | | 283 | | | | 4,030 | | | | 4,313 | | | | (40 | ) | | | 977 | | | | 937 | |
Long-term borrowings | | | - | | | | 586 | | | | 586 | | | | 303 | | | | 259 | | | | 562 | |
| | | | | | | | | | | | | | | | | | | | | | | | | |
TOTAL INTEREST EXPENSE | | $ | 407 | | | $ | 14,203 | | | $ | 14,610 | | | $ | (218 | ) | | $ | (6 | ) | | $ | (224 | ) |
| | | | | | | | | | | | | | | | | | | | | | | | | |
| | | | | | | | | | | | | | | | | | | | | | | | | |
NET INTEREST INCOME | | $ | (693 | ) | | $ | (4,170 | ) | | $ | (4,863 | ) | | $ | (738 | ) | | $ | 2,447 | | | $ | 1,709 | |
LOANS
The loan portfolio constitutes the major earning asset of the Company and, in the opinion of management, offers the best alternative for maximizing net interest margin. The Company’s loan personnel have the authority to extend credit under guidelines established and approved by the Board of Directors. Any aggregate credit that exceeds the authority of the loan officer is forwarded to the Board’s loan committee for approval. The loan committee is composed of certain directors, including the Chairman of the Board of Directors. All aggregate loans that exceed the loan committee’s lending authority are presented to the full Board of Directors for ultimate approval or denial. The loan committee not only acts as an approval body to ensure consistent application of the Company’s loan policy but also provides valuable insight through communication and pooling of knowledge, judgment, and experience of its members.
The Company has stated in its loan policy the following objectives for its loan portfolio:
| | ● | to make loans after sound and thorough credit analysis; |
| | ● | to properly document all loans; |
| | ● | to eliminate loans from the portfolio that are underpriced, high risk or difficult and costly to administer; |
| | ● | to seek good relationships with the customer; |
| | ● | to avoid undue concentrations of loans; and |
| | ● | to keep non-accrual loans to a minimum by aggressive collection policies. |
Loan demand in some of the Company’s market was robust but remained stagnant in other markets. The Company continues to face intense competition with aggressive loan terms for available loans from other financial institutions. However, the Company had positive loan growth for 2023 with loans outstanding increasing year-over-year. A majority of the increase in loans is in the commercial, financial and agricultural segment, with an increase in loans of $37,437, or 8.80%, in 2023. Commercial, financial and agricultural loans are the largest segment of the loan portfolio and, by nature, bear a higher degree of risk. Management believes the lending practices, policies and procedures applicable to this loan category are adequate to manage any risk represented by the current demand and terms of this loan segment.
Real estate mortgage loans originated by the Company increased by 3.41%, or $3,130 in 2023 and decreased by (6.70%), or $6,602, in 2022, and decreased by (16.21%), or $19,059, in 2021 when compared to the prior years. The increase in 2023 reflects the impact of more steady rate increases as opposed to a large spike in the prior year and the decrease in 2022 and 2021 reflects the weakness in some of the Company’s local housing markets coupled with increased competition in the mortgage market.
Real estate construction loans increased by $14,210, or 26.95% in 2023 to $66.941 when compared to the $52,731 at December 31, 2022 and decreased by $19,167, or (26.66%) when compared to 2021. Of the overall increase for 2023, a number of large construction projects were completed during the year and refinanced to other loan types. Real estate construction loans are usually short term in nature and are dependent on construction activity in the Company’s service area. Demand has started to recover for construction loans during the 2023 fiscal year despite the recessionary concerns.
Consumer loans increased by $1,660 or 10.55% in 2023 and increased by $1,781 or 12.77% in 2022, and increased by $201 or 1.46% in 2021, compared to the prior years. The Company believes inflation pressure, supply chain issues and the spend down of consumer savings has caused consumer spending to start to pick up.
Table 4 – Loans Outstanding reflects outstanding balances by loan type for the past five years. Additional loan information is presented in Note 4, “Loans,” to the Company’s Consolidated Financial Statements included in this Annual Report.
TABLE 4 – LOANS OUTSTANDING
(in thousands)
| | | AT DECEMBER 31, | |
| | | 2023 | | | 2022 | | | 2021 | | | 2020 | | | 2019 | |
| | | | | | | | | | | | | | | | | | | | | |
Commercial, financial and agricultural | | $ | 462,644 | | | $ | 425,207 | | | $ | 387,475 | | | $ | 472,093 | | | $ | 357,781 | |
Real estate - construction | | | 66,941 | | | | 52,731 | | | | 71,898 | | | | 48,831 | | | | 81,197 | |
Real estate - mortgage | | | 95,053 | | | | 91,923 | | | | 98,525 | | | | 117,584 | | | | 122,014 | |
Consumer | | | 17,390 | | | | 15,730 | | | | 13,949 | | | | 13,748 | | | | 16,075 | |
| | | | | | | | | | | | | | | | | | | | | |
TOTAL LOANS | | $ | 642,028 | | | $ | 585,591 | | | $ | 571,847 | | | $ | 652,256 | | | $ | 577,067 | |
Table 5 – Loan Liquidity and Sensitivity to Changes in Interest Rates reflects the maturity schedule or repricing frequency of all loans. Also presented are fixed and variable rate loans maturing after one year.
TABLE 5 – LOAN LIQUIDITY
LOAN MATURITIES AT DECEMBER 31, 2023 | |
| | | | | | | | | | | | | | | | | | | | | |
| | | 1 YEAR | | | 1 - 5 | | | 5 - 15 | | | AFTER 15 | | | | | |
| | | OR LESS | | | YEARS | | | YEARS | | | YEARS | | | Total | |
| | | | | | | | | | | | | | | | | | | | | |
Commercial, financial and agricultural | | $ | 101,917 | | | $ | 295,399 | | | $ | 42,205 | | | $ | 23,123 | | | $ | 462,644 | |
Real estate - construction | | | 29,203 | | | | 35,913 | | | | 1,825 | | | | - | | | $ | 66,941 | |
Real estate - mortgage | | | 15,460 | | | | 64,274 | | | | 14,055 | | | | 1,264.00 | | | $ | 95,053 | |
Consumer | | | 7,413 | | | | 9,261 | | | | 716 | | | | - | | | $ | 17,390 | |
| | | | | | | | | | | | | | | | | | | | | |
Total loans | | $ | 153,993 | | | $ | 404,847 | | | $ | 58,801 | | | $ | 24,387 | | | $ | 642,028 | |
SENSITIVITY TO CHANGES IN INTEREST RATES | |
| | | | | | | | | |
| | | 1 - 5 | | | OVER 5 | |
| | | YEARS | | | YEARS | |
| | | | | | | | | |
Fixed rates | | $ | 457,762 | | | $ | 32,004 | |
Variable rates | | | 101,078 | | | | 51,184 | |
| | | | | | | | | |
Total loans | | $ | 558,840 | | | $ | 83,188 | |
Each loan the Company makes either has a stated maturity as to when the loan is to be repaid or is subject to an agreement between the Company and the customer governing its progressive reduction. The Company’s policy is that every loan is to be repaid by its stated maturity and not carried as a continuing debt. Generally, the Company requires that principal reductions on a loan must have begun prior to the second renewal date of the loan.
PROVISION FOR CREDIT LOSSES AND ASSET QUALITY
The ACL represents an amount that in management’s judgment will be adequate to absorb estimated probable losses within the existing loan portfolio. Loans that management determines to be uncollectible are charged against the ACL, and subsequent recoveries, if any, are credited to the allowance. Management’s judgment in determining the adequacy of the allowance is based on evaluations of the collectability of specific loans and prior loss experience. Other factors considered by management include specific economic events, general economic conditions and trends, and loan portfolio mix and growth. The allowance for credit losses is subject to close regulatory review from the FDIC and the Mississippi Department of Banking and Consumer Finance and is also a factor in each agency’s determination of the Company’s capital adequacy. The estimation of losses in the Company’s loan portfolio is susceptible to changes resulting from changes in the financial condition of individual borrowers and economic conditions in the Company’s market area.
The ACL is established through a PCL charged against net income. This expense is determined by a number of factors, including historical loan losses, assessment of specific credit weaknesses within the portfolio, assessment of the prevailing economic climate, and other factors that may affect the overall condition of the loan portfolio. Management utilized these factors to determine the PCL for each of 2023, 2022 and 2021. The ratio of net loans charged off (recovered) to average loans was (0.03%) in 2023, (0.11%) in 2022 and 0.26% in 2021. Management evaluates the adequacy of the ACL on a monthly basis and makes adjustments to the allowance based on this analysis.
The PCL in 2023 was an expense of $669 compared to $124 in 2022 and $1,409 in 2021. The change in the provision for all three years was mainly due to management’s assessment of inherent losses in the loan portfolio, including the impact caused by current local and national economic conditions. The provision for off-balance sheet credit exposure during the year was primarily driven by increased recessionary risk due to inflationary pressures partially offset by a decrease in unfunded loan commitments. The Company uses a model that takes into account historical charge-offs and recoveries and applies that to certain loan segments of the Company’s portfolio. The current year’s higher provision is mainly attributed to higher interest rates on new loans and the current economic climate. At the end of 2023, the total ACL was $6,133, an amount that management believes to be sufficient to cover estimated probable losses in the loan portfolio.
Activity in the ACL is reflected in Table 6 – Analysis of Allowance for Credit Losses. The Company’s policy is to charge-off loans when in management’s opinion the loan is deemed uncollectible. Even after it is charged off, however, the Company makes concerted efforts to maximize recovery of such loan.
TABLE 6 – ANALYSIS OF ALLOWANCE FOR LOAN LOSSES
| (in thousands except for percentage amounts) |
| | | 2023 | | | 2022 | | | 2021 | | | 2020 | | | 2019 | |
| | | | | | | | | | | | | | | | | | | | | |
BALANCE AT BEGINNING OF YEAR | | $ | 5,264 | | | $ | 4,513 | | | $ | 4,735 | | | $ | 3,755 | | | $ | 3,372 | |
| | | | | | | | | | | | | | | | | | | | | |
CECL Adjustment | | $ | 635 | | | | | | | | | | | | | | | | | |
| | | | | | | | | | | | | | | | | | | | | |
LOANS CHARGED-OFF | | | | | | | | | | | | | | | | | | | | |
| | | | | | | | | | | | | | | | | | | | | |
Commercial, financial and agricultural | | | 83 | | | | 65 | | | | 775 | | | | 272 | | | | 176 | |
Real estate - construction | | | 2 | | | | - | | | | 36 | | | | 37 | | | | - | |
Real estate - mortgage | | | 20 | | | | 4 | | | | - | | | | 304 | | | | 46 | |
Consumer | | | 148 | | | | 110 | | | | 1,327 | | | | 104 | | | | 138 | |
| | | | | | | | | | | | | | | | | | | | | |
TOTAL CHARGE-OFFS | | | 253 | | | | 179 | | | | 2,138 | | | | 717 | | | | 360 | |
| | | | | | | | | | | | | | | | | | | | | |
CHARGE-OFFS RECOVERED | | | | | | | | | | | | | | | | | | | | |
| | | | | | | | | | | | | | | | | | | | | |
Commercial, financial and agricultural | | | 261 | | | | 205 | | | | 67 | | | | 65 | | | | 91 | |
Real estate - construction | | | 8 | | | | 14 | | | | 9 | | | | 43 | | | | 18 | |
Real estate - mortgage | | | 106 | | | | 75 | | | | 76 | | | | 61 | | | | 14 | |
Consumer | | | 66 | | | | 512 | | | | 355 | | | | 43 | | | | 47 | |
| | | | | | | | | | | | | | | | | | | | | |
TOTAL RECOVERIES | | | 441 | | | | 806 | | | | 507 | | | | 212 | | | | 170 | |
| | | | | | | | | | | | | | | | | | | | | |
| | | | | | | | | | | | | | | | | | | | | |
Net loans charged-off | | | (188 | ) | | | (627 | ) | | | 1,631 | | | | 505 | | | | 190 | |
Additions charged to operating expense | | | 464 | | | | 124 | | | | 1,409 | | | | 1,485 | | | | 573 | |
| | | | | | | | | | | | | | | | | | | | | |
| | | | | | | | | | | | | | | | | | | | | |
BALANCE AT END OF YEAR | | $ | 6,551 | | | $ | 5,264 | | | $ | 4,513 | | | $ | 4,735 | | | $ | 3,755 | |
| | | | | | | | | | | | | | | | | | | | | |
| | | | | | | | | | | | | | | | | | | | | |
Loans, net of unearned, at year end | | $ | 642,028 | | | $ | 585,591 | | | $ | 571,847 | | | $ | 652,256 | | | $ | 577,067 | |
| | | | | | | | | | | | | | | | | | | | | |
Ratio of allowance to loans at year end | | | 1.02 | % | | | 0.90 | % | | | 0.79 | % | | | 0.73 | % | | | 0.65 | % |
| | | | | | | | | | | | | | | | | | | | | |
Average loans - net of unearned | | $ | 588,382 | | | $ | 587,034 | | | $ | 629,186 | | | $ | 622,805 | | | $ | 561,483 | |
| | | | | | | | | | | | | | | | | | | | | |
Ratio of net loans charged-off to average loans | | | -0.03 | % | | | -0.11 | % | | | 0.26 | % | | | 0.08 | % | | | 0.03 | % |
ALLOCATION OF ALLOWANCE FOR LOAN LOSSES | |
| (in thousands) |
| | | AT DECEMBER 31, | |
| | | 2023 | | | 2022 | | | 2021 | | | 2020 | | | 2019 | |
| | | | | | | | | | | | | | | | | | | | | |
Commercial, financial and agricultural | | $ | 3,444 | | | $ | 4,275 | | | $ | 3,760 | | | $ | 3,354 | | | $ | 3,672 | |
Real estate - construction | | | 515 | | | | 478 | | | | 464 | | | | 267 | | | | 192 | |
Real estate - mortgage | | | 2,293 | | | | 865 | | | | 794 | | | | 653 | | | | 566 | |
Consumer | | | 299 | | | | 397 | | | | 246 | | | | 239 | | | | 305 | |
| | | | | | | | | | | | | | | | | | | | | |
Total | | $ | 6,551 | | | $ | 6,015 | | | $ | 5,264 | | | $ | 4,513 | | | $ | 4,735 | |
COMPOSITION OF LOAN PORTFOLIO BY TYPE | |
| | | | | | | | | | | | | | | | | | | | | |
| | | AT DECEMBER 31, | |
| | | 2023 | | | 2022 | | | 2021 | | | 2020 | | | 2019 | |
| | | | | | | | | | | | | | | | | | | | | |
Commercial, financial and agricultural | | | 72.06 | % | | | 72.61 | % | | | 67.76 | % | | | 72.38 | % | | | 62.00 | % |
Real estate - construction | | | 10.43 | % | | | 9.00 | % | | | 12.57 | % | | | 7.49 | % | | | 14.07 | % |
Real estate - mortgage | | | 14.81 | % | | | 15.70 | % | | | 17.23 | % | | | 18.03 | % | | | 21.14 | % |
Consumer | | | 2.71 | % | | | 2.69 | % | | | 2.44 | % | | | 2.11 | % | | | 2.79 | % |
| | | | | | | | | | | | | | | | | | | | | |
| | | | 100.00 | % | | | 100.00 | % | | | 100.00 | % | | | 100.00 | % | | | 100.00 | % |
Loan balances outstanding, as illustrated in Table 4, increased in 2023 as a result of the increased demand in our high growth markets. All loan segments except commercial, financial and agricultural decreased in 2022 except for a slight increase in consumer loans. The ACL is allocated to the various categories based on the historical loss percentage for each segment of loan and any specific reserves that might be assigned to those loans.
Non-performing assets and the relative percentages of such assets to loan balances are presented in Table 7 – Non-performing Assets. Non-performing loans include non-accrual loans, loans delinquent 90 days or more based on contractual terms and troubled debt restructurings. Management classifies loans as non-accrual when it believes that collection of interest is doubtful. This typically occurs when payments are past due over 90 days, unless the loans are well secured and in the process of collection. Another measurement of asset quality is OREO, which represents properties acquired by the Company through foreclosure following loan defaults by customers. The percentage of OREO to total loans at December 31, 2023 was 0.19% compared to 0.20% in 2022. OREO decreased in 2023 and in 2022 due to sales of several parcels in both 2023 and 2022 partially offset by foreclosures. The Company also had OREO write-downs of $42 for 2022 and $914 for 2021.
Loans on non-accrual status amounted to $2,576 in 2023 as compared to $2,988 in 2022 and $3,826 in 2021. Interest income forgone on loans classified as non-accrual in 2023 was $431 as compared to $354 in 2022 and $281 in 2021. Upon the classification of a loan as non-accrual, all interest accrued on the loan prior to the time it is classified as non-accrual is reversed and interest accruals are suspended until such time that the loan is in compliance with its terms and deemed collectable.
TABLE 7 – NON-PERFORMING ASSETS
(in thousands, except percentages)
| | | As of December 31, | |
| | | 2023 | | | 2022 | | | 2021 | | | 2020 | | | 2019 | |
PRINCIPAL BALANCE | | | | | | | | | | | | | | | | | | | | |
| | | | | | | | | | | | | | | | | | | | | |
Non-accrual | | $ | 2,576 | | | $ | 2,988 | | | $ | 3,826 | | | $ | 8,484 | | | $ | 12,026 | |
Accruing loans 90 days or more past due | | | 16 | | | | 111 | | | | 154 | | | | 14 | | | | 274 | |
Loan modifications | | | 2,000 | | | | 2,182 | | | | 213 | | | | 2,113 | | | | 2,495 | |
| | | | | | | | | | | | | | | | | | | | | |
TOTAL NON-PERFORMING LOANS | | $ | 4,592 | | | $ | 5,281 | | | $ | 4,193 | | | $ | 10,611 | | | $ | 14,795 | |
| | | | | | | | | | | | | | | | | | | | | |
| | | | | | | | | | | | | | | | | | | | | |
Income on non-accrual loans not recorded | | $ | 431 | | | $ | 354 | | | $ | 281 | | | $ | 383 | | | $ | 555 | |
| | | | | | | | | | | | | | | | | | | | | |
Non-performing as a percent of loans | | | 0.72 | % | | | 0.90 | % | | | 0.73 | % | | | 1.63 | % | | | 2.56 | % |
| | | | | | | | | | | | | | | | | | | | | |
Non-accrual as a percent of loans | | | 0.40 | % | | | 0.51 | % | | | 0.67 | % | | | 1.30 | % | | | 2.08 | % |
| | | | | | | | | | | | | | | | | | | | | |
Other real estate owned | | $ | 1,234 | | | $ | 1,179 | | | $ | 2,475 | | | $ | 3,073 | | | $ | 3,552 | |
| | | | | | | | | | | | | | | | | | | | | |
OREO as a percent of loans | | | 0.19 | % | | | 0.20 | % | | | 0.43 | % | | | 0.47 | % | | | 0.62 | % |
| | | | | | | | | | | | | | | | | | | | | |
Allowance as a percent of non-performing loans | | | 142.66 | % | | | 99.68 | % | | | 107.63 | % | | | 44.62 | % | | | 25.38 | % |
| | | | | | | | | | | | | | | | | | | | | |
Allowance as a percent of non-accrual loans | | | 254.31 | % | | | 176.17 | % | | | 117.96 | % | | | 55.81 | % | | | 31.22 | % |
In June 2016, the Financial Accounting Standards Board (“FASB”) issued Accounting Standards Update (“ASU”) 2016-13, “Financial Instruments - Credit Losses (Topic 326): Measurement of Credit Losses on Financial Instruments” (“ASU 2016-13”). This update to Accounting Standards Codification Topic (“ASC”) 326, Financial Instruments - Credit Losses (“ASC 326”), significantly changed the way entities recognize impairment on many financial assets by requiring immediate recognition of estimated credit losses expected to occur over the asset’s remaining life. FASB describes this impairment recognition model as the current expected credit loss (“CECL”) model and believes the CECL model will result in more timely recognition of credit losses since the CECL model incorporates expected credit losses versus incurred credit losses. The balances of impaired loans for the years 2023, 2022 and 2021 were $4,027, $3,277 and $2,334, respectively.
This table details the impaired loans by category as of December 31, 2023, 2022 and 2021.
| | | AT DECEMBER 31, | |
| | | 2023 | | | 2022 | | | 2021 | |
| | | | | | | | | | | | | |
Commercial, financial and agricultural | | $ | 1,404 | | | $ | 3,088 | | | $ | 1,396 | |
Real estate - construction | | | 2,399 | | | | - | | | | 171 | |
Real estate - mortgage | | | 224 | | | | 189 | | | | 767 | |
| | | | | | | | | | | | | |
Total loans | | $ | 4,027 | | | $ | 3,277 | | | $ | 2,334 | |
Management monitors any loans that are classified under FDIC regulations as loss, doubtful or substandard, even if management has not classified the loans as non-performing or impaired. In addition to loans classified for regulatory purposes, management also designates certain loans for internal monitoring purposes in a “watch” category. Loans may be placed on management’s watch list as a result of delinquent status, management’s concern about the borrower’s financial condition or the value of the collateral securing the loan, a substandard classification during regulatory examinations, or simply as a result of management’s desire to monitor more closely a borrower’s financial condition and performance. Watch category loans may include loans that are still performing and accruing interest and may be current under the terms of the loan agreement but which management has a significant degree of concern about the borrowers’ ability to continue to perform according to the terms of the loan agreement. Watch category loans may also include loans, which, although adequately secured and performing, reflect a past delinquency problem or unfavorable financial trends exhibited by the borrower. Loss exposure on these loans is typically evaluated based primarily upon the estimated liquidation value of the collateral securing the loan.
At December 31, 2023, loans totaling $24,451 were included on the Company’s watch list compared to $39,451 at December 31, 2022. The majority of these loans are real estate loans that, although adequately collateralized, have experienced frequent delinquencies in scheduled payments. The inclusion of loans on this list does not indicate a greater risk of loss; rather it indicates that the loan possesses one of the several characteristics described above warranting increased oversight by management.
SECURITIES
At December 31, 2023, the Company classified its securities as AFS or HTM. AFS securities are reported at fair value, with unrealized gains and losses included as a separate component of equity, net of tax. HTM securities are reported at book value. The Company does not hold any securities classified as held for trading purposes.
Table 8 – Securities and Securities Maturity Schedule summarizes the amortized cost of securities from 2021 through 2023 and the maturity distribution at December 31, 2023, by classification.
TABLE 8 – SECURITIES
(in thousands) | |
| | | 2023 | | | 2022 | | | 2021 | |
SECURITIES AVAILABLE-FOR-SALE | | | | | | | | | | | | |
U. S. Government Agencies | | $ | - | | | $ | - | | | $ | 4,969 | |
Mortgage Backed Securities | | | 94,255 | | | | 107,055 | | | | 411,729 | |
State, County and Municipal Obligations | | | 118,815 | | | | 134,906 | | | | 230,359 | |
Other Securities | | | 500 | | | | 500 | | | | 500 | |
| | | | | | | | | | | | | |
TOTAL SECURITIES AVAILABLE-FOR-SALE | | $ | 213,570 | | | $ | 242,461 | | | $ | 647,557 | |
| | | 2023 | | | 2022 | | | 2021 | |
SECURITIES HELD-TO-MATURITY | | | | | | | | | | | | |
U. S. Government Agencies | | $ | 4,065 | | | $ | 4,002 | | | $ | - | |
Mortgage Backed Securities | | | 290,802 | | | | 309,748 | | | | - | |
State, County and Municipal Obligations | | | 92,932 | | | | 92,840 | | | | - | |
| | | | | | | | | | | | | |
TOTAL SECURITIES HELD-TO-MATURITY | | $ | 387,799 | | | $ | 406,590 | | | $ | - | |
SECURITIES MATURITY SCHEDULE
| | | 1 year or less | | | 1 to 5 years | | | 5 to 10 years | | | over 10 years | |
| | | Actual | | | Average | | | Actual | | | Average | | | Actual | | | Average | | | Actual | | | Average | |
| | | Balance | | | Yield | | | Balance | | | Yield | | | Balance | | | Yield | | | Balance | | | Yield | |
AVAILABLE-FOR-SALE | | | | | | | | | | | | | | | | | | | | | | | | | | | | | | | | |
Mortgage Backed Securities(1) | | $ | 6,823 | | | | 4.11 | % | | $ | - | | | | 0.00 | % | | $ | 19,026 | | | | 2.97 | % | | $ | 68,406 | | | | 2.70 | % |
State, County and Municipal(2) | | | - | | | | 0.00 | % | | | 2,880 | | | | 3.03 | % | | | 5,547 | | | | 2.70 | % | | | 110,388 | | | | 2.15 | % |
Other Securities | | | 500 | | | | 0.00 | % | | | - | | | | 0.00 | % | | | - | | | | 0.00 | % | | | - | | | | 0.00 | % |
| | | | | | | | | | | | | | | | | | | | | | | | | | | | | | | | | |
TOTAL AVAILABLE-FOR-SALE | | $ | 7,323 | | | | 3.83 | % | | $ | 2,880 | | | | 3.03 | % | | $ | 24,573 | | | | 2.91 | % | | $ | 178,794 | | | | 2.36 | % |
HELD-TO-MATURITY | | | | | | | | | | | | | | | | | | | | | | | | | | | | | | | | |
U. S. Government Agencies(1) | | $ | - | | | | 0.00 | % | | $ | - | | | | 0.00 | % | | $ | - | | | | 0.00 | % | | $ | 4,065 | | | | 3.68 | % |
Mortgage Backed Securities(1) | | | - | | | | 0.00 | % | | | - | | | | 0.00 | % | | | 18,726 | | | | 3.60 | % | | | 272,076 | | | | 3.34 | % |
State, County and Municipal(2) | | | - | | | | 0.00 | % | | | - | | | | 0.00 | % | | | - | | | | 0.00 | % | | | 92,932 | | | | 3.81 | % |
| | | | | | | | | | | | | | | | | | | | | | | | | | | | | | | | | |
TOTAL HELD-TO-MATURITY | | $ | - | | | | 0.00 | % | | $ | - | | | | 0.00 | % | | $ | 18,726 | | | | 0.00 | % | | $ | 369,073 | | | | 3.46 | % |
(1) | The maturities for the mortgage backed securities included in this line item are based on final maturity. |
(2) | Average yields were calculated on tax equivalent basis using a marginal federal income tax rate of 21% and a state tax rate of 5%. |
The change in the carrying value of the securities portfolio is due to market value fluctuations resulting from the changing interest rate environment during 2023. This change is not used in the Tier 1 capital calculation.
As detailed in Table 8, the security portfolio decreased $47,561 or (7.33%) in 2023, increased $1,495 or 0.23% in 2022 and decreased $25,669 or (3.81%) in 2021. The Company strives to maximize the yields on its portfolio while balancing pledging needs and managing risk. The Company seeks to invest most of its funds not needed for loan demand or the reduction of other borrowings in higher yielding securities and not in the lower yielding federal funds sold.
DEPOSITS
The Company offers a wide variety of deposit services to individual and commercial customers, such as non-interest-bearing and interest-bearing checking accounts, savings accounts, money market deposit accounts and time deposits. The deposit base is the Company’s major funding source for earning assets. Time deposits increased in 2023 as a result of customers repositioning their deposits in anticipation of rate increases. Time deposits decreased in 2022 compared to 2021 due to a deposit special the Company issued during the first half of 2021.
A three-year schedule of average deposits by type and maturities of time deposits greater than $250 is presented in Table 9 – Deposit Information.
TABLE 9 – DEPOSIT INFORMATION
(in thousands, except percentages)
| | | 2023 | | | 2022 | | | 2021 | | | | | |
| | | Average | | | Average | | | Average | | | Average | | | Average | | | Average | |
| | | Balance | | | Rate | | | Balance | | | Rate | | | Balance | | | Rate | |
| | | | | | | | | | | | | | | | | | | | | | | | | |
Noninterest-bearing | | $ | 281,820 | | | | | | | $ | 305,247 | | | | | | | $ | 289,883 | | | | | |
Interest-bearing demand | | | 520,486 | | | | 1.22 | % | | | 486,636 | | | | 0.19 | % | | | 487,894 | | | | 0.27 | % |
Savings | | | 120,300 | | | | 0.29 | % | | | 133,739 | | | | 0.10 | % | | | 118,063 | | | | 0.10 | % |
Time deposits | | | 212,655 | | | | 2.59 | % | | | 202,315 | | | | 0.71 | % | | | 245,886 | | | | 1.13 | % |
| | | | | | | | | | | | | | | | | | | | | | | | | |
| | | $ | 1,135,261 | | | | 1.43 | % | | $ | 1,127,937 | | | | 0.30 | % | | $ | 1,141,726 | | | | 0.50 | % |
MATURITY RANGES OF TIME DEPOSITS
OF $250 OR MORE
| | | AS OF DECEMBER 31, 2023 | |
| | | | | |
3 months or less | | $ | 13,329 | |
3 through 12 months | | | 40,592 | |
1 year to 3 years | | | 3,397 | |
over 3 years | | | 1,908 | |
| | | | | |
| | | $ | 59,226 | |
The Company, in its normal course of business, will acquire large time deposits, generally from public entities, with a variety of maturities. These funds are acquired on a bid basis and are considered to be part of the deposit base of the Company.
BORROWINGS
Aside from the core deposit base and large denomination time deposits mentioned above, the remaining funding sources utilized by the Company include short-term and long-term borrowings. Short-term borrowings consist of Federal Funds Purchased from other financial institutions on an overnight basis, short-term advances from the FHLB and securities sold under agreement to repurchase. Long-term borrowings are advances from the FHLB with an initial maturity of greater than one year and the FHN secured line of credit.
TABLE 10 ‑ SHORT‑TERM BORROWINGS
(in thousands)
| | | As of December 31, | |
| | | 2023 | | | 2022 | | | 2021 | |
Short-term borrowings | | | | | | | | | | | | |
Year-end balance | | $ | 158,086 | | | $ | 127,574 | | | $ | 112,760 | |
Weighted average rate | | | 3.58 | % | | | 1.05 | % | | | 0.36 | % |
| | | | | | | | | | | | | |
Maximum month-end balance | | $ | 182,489 | | | $ | 161,319 | | | $ | 219,876 | |
| | | | | | | | | | | | | |
Year to date average balance | | $ | 147,496 | | | $ | 121,783 | | | $ | 135,282 | |
Weighted average rate | | | 3.83 | % | | | 1.10 | % | | | 0.30 | % |
The Company borrows funds for short periods from the FHLB as an alternative to Federal Funds Purchased. The Company foresees short-term borrowings to be a continued source of liquidity and likely will continue to use these borrowings as a method to fund short-term needs. At December 31, 2023, the Company had the capacity to borrow up to $179,000 from the FHLB and other financial institutions in the form of Federal Funds Purchased. The Company generally will use these types of borrowings if loan demand is greater than the growth in deposits. At December 31, 2023 the Company had borrowed $-0- from the FHLB and $-0- in Federal Funds Purchased. At December 31, 2022, the Company had borrowed $-0- from the FHLB and $-0- in Federal Funds Purchased. In 2023, the balances in Securities Sold Under Agreement to Repurchase increased $30,512, or 23.92%, to $158,086 from 2022. In 2022, these balances decreased to $127,574, an increase of $14,814, or 13.14%, from 2021.
| | | (in thousands) | |
| | | 2023 | |
Less than one year | | $ | 18,000 | |
One year to three years | | | - | |
Over three years | | | - | |
| | | | | |
Total long-term borrowings | | $ | 18,000 | |
At the end of 2023, the Company had $-0- in long-term debt to the FHLB for advances. The Company did have long-term debt of $18,000 outstanding and an additional $2,000 available balance at December 31, 2023 to FHN through a secured line of credit. See Note 11 for details of the long-term debt.
NON-INTEREST INCOME AND EXPENSE
Table 11 - Non-Interest Income and Expense illustrates the Company’s non-interest income and expense from 2021 through 2023 and percentage changes between such years.
TABLE 11 ‑ NON-INTEREST INCOME & EXPENSE
(in thousands)
| | | | | | | % CHANGE | | | | | | | % CHANGE | | | | | |
| | | 2023 | | | FROM '22 | | | 2022 | | | FROM '21 | | | 2021 | |
| | | | | | | | | | | | | | | | | | | | | |
NON-INTEREST INCOME | | | | | | | | | | | | | | | | | | | | |
Service charges on deposit accounts | | $ | 3,788 | | | | -2.77 | % | | $ | 3,896 | | | | 11.35 | % | | $ | 3,499 | |
Other operating income | | | 4,960 | | | | -29.03 | % | | | 6,989 | | | | -19.56 | % | | | 8,689 | |
| | | | | | | | | | | | | | | | | | | | | |
TOTAL NON-INTEREST INCOME | | $ | 8,748 | | | | -19.63 | % | | $ | 10,885 | | | | -10.69 | % | | $ | 12,188 | |
| | | | | | | | | | | | | | | | | | | | | |
NON-INTEREST EXPENSE | | | | | | | | | | | | | | | | | | | | |
Salaries and employee benefits | | $ | 18,583 | | | | 5.29 | % | | $ | 17,649 | | | | -4.39 | % | | $ | 18,460 | |
Occupancy expense, including equipment | | | 7,835 | | | | 5.72 | % | | | 7,411 | | | | 3.87 | % | | | 7,135 | |
Other operating expense | | | 9,759 | | | | 7.14 | % | | | 9,109 | | | | -6.60 | % | | | 9,753 | |
| | | | | | | | | | | | | | | | | | | | | |
TOTAL NON-INTEREST EXPENSE | | $ | 36,177 | | | | 5.88 | % | | $ | 34,169 | | | | -3.34 | % | | $ | 35,348 | |
Non-interest income typically consists of service charges on checking accounts, including debit card fees, and other financial services. With continued pressure on interest rates, the Company has sought to increase its non-interest income through the expansion of fee income and the development of new services. Currently, the Company’s main sources of non-interest income are service charges on checking accounts, interchange fees, safe deposit box rentals, mortgage loan origination income, credit life insurance premiums and title insurance service fees.
During 2023 as compared to 2022, non-interest income decreased by ($2,137), or (19.63%). The decrease in other operating income mainly attributed to the loss on securities during the year in addition to decreases in service charges on deposit accounts, primarily interchange fees and overdraft fees.
During 2022 as compared to 2021, non-interest income decreased by ($1,303), or (10.70%). The decrease in other operating income mainly attributed to decreases in net gains on sales of securities, partially offset by an increase in service charges on deposit accounts, primarily interchange fees and overdraft fees.
Non-interest expenses consist of salaries and benefits, occupancy expense and other overhead expenses incurred by the Company in the transaction of its business. In 2023 as compared to 2022, non-interest expense increased by $2,008, or 5.88%, to $36,177. Included in this increase was an increase in salaries and benefits in the amount of $934, or 5.29% and other expense in the amount of $650 or 7.14%. This increase is primarily driven by the additional overhead acquired during the year.
Non-interest expenses consist of salaries and benefits, occupancy expense and other overhead expenses incurred by the Company in the transaction of its business. In 2022 as compared to 2021, non-interest expense decreased by ($1,179), or (3.34%), to $34,169. Included in this increase was a decrease in salaries and benefits in the amount of ($811), or (4.39%) and other expense in the amount of ($645) or (6.61%). Write-downs on OREO of $42, a decrease of $872 from 2021 of $914 makes up a majority of the increase in other expense. Occupancy expense increased in 2022 compared to 2021 for $276, or 3.87% to $7,411 from $7,135.
In 2023, the Company’s efficiency ratio was 93.95%, compared to 78.24% in 2022 and 78.29% in 2021. The efficiency ratio is calculated to measure the cost of generating one dollar of revenue. The efficiency ratio is calculated by dividing non-interest expense by the sum of net interest income, on a fully tax equivalent basis, and non-interest income.
INCOME TAXES
The Company records a provision for income taxes currently payable, along with a provision for deferred taxes to be realized in the future. Such deferred taxes arise from differences in timing of certain items for financial statement reporting rather than income tax reporting. The deferred tax amount of $28,008 is considered realizable and no valuation allowance is considered necessary.
The Company’s effective tax rate was (4.16%), 16.36% and 16.03% in 2023, 2022 and 2021, respectively. The major difference between the effective tax rate applied to the Company’s financial statement income and the federal statutory rate of 21% in 2023, 2022 and 2021, respectively, is interest on tax-exempt securities and loans. Further tax information is disclosed in Note 13, “Income Taxes” to the Company’s Consolidated Financial Statements included in this Annual Report.
LIQUIDITY AND RATE SENSITIVITY
Liquidity management is the process by which the Company ensures that adequate liquid funds are available to meet its financial commitments on a timely basis. These commitments include honoring withdrawals by depositors, funding credit obligations to borrowers, servicing long-term obligations, making shareholder dividend payments, paying operating expenses, funding capital expenditures and maintaining reserve requirements.
The Company’s predominant sources of funding include: core deposits (consisting of both commercial and individual deposits); proceeds from maturities of securities; repayments of loan principal and interest; commercial repurchase agreements; Federal Funds Purchased; and short-term and long-term borrowings from the FHLB. In both 2023 and 2022, the Company experienced an increase in deposits and repurchase agreements in excess of the increase in loans outstanding. The increase in investment securities is mainly the result of the need to invest excess funds outside of new loans. The Company relies upon non-core sources of funding, such as commercial repurchase agreements, Federal Funds Purchased and short and long-term borrowings from the FHLB, when deposit growth is not adequate to meet its short-term needs. While the strategy of using these wholesale funding sources is adequate to cover liquidity deficiencies in the short term, the Company’s goal is to increase core deposits as a source of long-term funding. Management does not intend to rely on borrowings from the FHLB as the first choice as a source of funds but prefers to increase core deposits through increased competition for available deposits. Management believes that core deposits will increase by offering competitive rates and superior service to the Bank’s customers.
When the Company has more funds than it needs for its short-term liquidity needs, the Company increases its investment portfolio, increases the balances in interest bearing due from bank accounts or sells federal funds. It is management’s policy to maintain an adequate portion of its portfolio of assets and liabilities on a short-term basis to ensure rate flexibility and to meet loan funding and liquidity needs. When deposits decline or do not grow sufficiently to fund loan demand, management will seek funding either through federal funds purchased or advances from the FHLB.
The Company had $-0- of FHLB advances outstanding at year end of 2023 and 2022. The Company will continue to use advances if they are needed to maintain the Company’s liquidity position.
The deposit base is diversified between individual and commercial accounts, which the Company believes helps it avoid dependence on large concentrations of funds. The primary sources of liquidity on the asset side of the balance sheet are interest bearing deposits with other banks and securities classified as AFS. $177,787 of the total investment securities of $565,594 is classified in the AFS category at December 31, 2023, and any securities not pledged are available to be sold, should liquidity needs arise. Management, through its Asset Liability Committee (“ALCO”), and the Board review the Company’s liquidity position monthly. At December 31, 2023, both the ALCO and the Board of Directors determined that the Company’s liquidity position was adequate.
Table 12 - Funding Uses and Sources details the main components of cash flows for 2023 and 2022.
TABLE 12 – FUNDING USES AND SOURCES
(in thousands)
| | | | | | | 2023 | | | | | | | | | | | 2022 | | | | | |
| | | | | | | | | | | | | | | | | | | | | | | | | |
| | | Average | | | Increase/(decrease) | | | Average | | | Increase/(decrease) | |
| | | Balance | | | Amount | | | Percent | | | Balance | | | Amount | | | Percent | |
FUNDING USES | | | | | | | | | | | | | | | | | | | | | | | | |
| | | | | | | | | | | | | | | | | | | | | | | | | |
Loans, net of unearned income | | $ | 587,785 | | | $ | 1,350 | | | | 0.23 | % | | $ | 586,435 | | | $ | (42,183 | ) | | | -7.19 | % |
Taxable securities | | | 432,029 | | | | (33,357 | ) | | | -7.17 | % | | | 465,386 | | | | (31,560 | ) | | | -6.78 | % |
Tax-exempt securities | | | 199,661 | | | | (11,234 | ) | | | -5.33 | % | | | 210,895 | | | | 61,918 | | | | 29.36 | % |
Federal funds sold and other | | | 55,366 | | | | 31,792 | | | | 134.86 | % | | | 23,574 | | | | (20,877 | ) | | | -88.56 | % |
| | | | | | | | | | | | | | | | | | | | | | | | | |
TOTAL USES | | $ | 1,274,841 | | | $ | (11,449 | ) | | | -0.89 | % | | $ | 1,286,290 | | | | (32,702 | ) | | | -2.54 | % |
| | | | | | | | | | | | | | | | | | | | | | | | | |
FUNDING SOURCES | | | | | | | | | | | | | | | | | | | | | | | | |
| | | | | | | | | | | | | | | | | | | | | | | | | |
Noninterest-bearing deposits | | $ | 281,820 | | | $ | (23,427 | ) | | | -7.67 | % | | $ | 305,247 | | | | 15,364 | | | | 5.03 | % |
Interest-bearing demand and savings deposits | | | 640,786 | | | | 20,411 | | | | 3.29 | % | | | 620,375 | | | | 14,418 | | | | 2.32 | % |
Time deposits | | | 212,655 | | | | 10,340 | | | | 5.11 | % | | | 202,315 | | | | (43,571 | ) | | | -21.54 | % |
Short-term borrowings | | | 147,495 | | | | 25,712 | | | | 21.11 | % | | | 121,783 | | | | 111,466 | | | | 91.53 | % |
Long-term borrowings | | | 18,000 | | | | - | | | | 0.00 | % | | | 18,000 | | | | 18,000 | | | | 100.00 | % |
| | | | | | | | | | | | | | | | | | | | | | | | | |
TOTAL SOURCES | | $ | 1,300,756 | | | $ | 33,036 | | | | 2.61 | % | | $ | 1,267,720 | | | $ | 115,677 | | | | 9.12 | % |
The Company’s liquidity depends substantially on the ability of the Bank to transfer funds to the Company in the form of dividends. The Company manages the overall rate sensitivity and mix of its asset and liability portfolio and attempts to minimize the effects that interest rate fluctuations will have on its net interest margin. The information under the heading “Market Price and Dividend Information” in this Annual Report discusses federal and state statutory and regulatory restrictions on the ability of the Bank to transfer funds to the Company in the form of dividends.
CAPITAL RESOURCES
As a small bank holding company, the Company is not subject to reporting regulatory capital. However, the Bank is subject to various regulatory capital guidelines as required by federal and state banking agencies. These guidelines define the various components of core capital and assign risk weights to various categories of assets.
The Federal Deposit Insurance Corporation Improvement Act of 1991, as amended (“FDICIA”), required federal regulatory agencies to define capital tiers. These tiers are: well capitalized, adequately capitalized, undercapitalized, significantly undercapitalized, and critically undercapitalized. Under FDICIA, a “well-capitalized” institution must achieve a Tier 1 risk-based capital ratio of at least 6.00%, a total capital ratio of at least 10.00%, a leverage ratio of at least 5.00% and not be under a capital directive order. These ratios generally measure the percentage of a bank’s capital to all or certain categories of assets. Failure to meet capital requirements can initiate regulatory action that could have a direct material effect on the Bank’s financial statements and ultimately the Company. If a bank is only adequately capitalized, regulatory approval is required before the bank may accept brokered deposits. If undercapitalized, capital distributions, asset growth, and expansion are limited, and the institution is required to submit a capital restoration plan.
During 2023 as compared to 2022, total risk-based capital decreased due to decreased earnings.
Management believes the Company and the Bank meet all the capital requirements to be well-capitalized under the guidelines established by FDICIA as of December 31, 2023, as noted below in Table 13 - Capital Ratios. To be classified as well-capitalized, the
Bank must maintain the ratios described above.
TABLE 13 – CAPITAL RATIOS
(in thousands, except percentage amounts)
| | | At December 31, | |
The Bank | | 2023 | | | 2022 | | | 2021 | |
Tier 1 capital | | | | | | | | | | | | |
Shareholders' equity | | $ | 60,061 | | | $ | 56,374 | | | $ | 123,140 | |
Less: Intangibles | | | (13,256 | ) | | | (13,340 | ) | | | (13,420 | ) |
Less: DTA related to NOLs | | | - | | | | - | | | | (94 | ) |
Add/less: Unrealized loss/(gain) on securities | | | 77,027 | | | | 83,071 | | | | 11,795 | |
| | | | | | | | | | | | | |
TOTAL TIER 1 CAPITAL | | $ | 123,832 | | | $ | 126,105 | | | $ | 121,421 | |
| | | | | | | | | | | | | |
Total capital | | | | | | | | | | | | |
Tier 1 capital | | $ | 123,832 | | | $ | 126,105 | | | $ | 121,421 | |
Allowable allowance for credit losses | | | 6,695 | | | | 5,264 | | | | 4,513 | |
| | | | | | | | | | | | | |
TOTAL CAPITAL | | $ | 130,527 | | | $ | 131,369 | | | $ | 125,934 | |
| | | | | | | | | | | | | |
| | | | | | | | | | | | | |
RISK WEIGHTED ASSETS | | $ | 898,698 | | | $ | 824,382 | | | $ | 791,170 | |
| | | | | | | | | | | | | |
| | | | | | | | | | | | | |
AVERAGE ASSETS (FOURTH QUARTER) | | $ | 1,433,061 | | | $ | 1,367,042 | | | $ | 1,335,515 | |
| | | | | | | | | | | | | |
| | | | | | | | | | | | | |
TIER 1 LEVERAGE RATIO | | | 8.64 | % | | | 9.22 | % | | | 9.09 | % |
| | | | | | | | | | | | | |
COMMON EQUITY TIER 1 CAPITAL RATIO | | | 13.78 | % | | | 15.30 | % | | | 15.35 | % |
| | | | | | | | | | | | | |
TIER 1 RISK-BASED CAPITAL RATIO | | | 13.78 | % | | | 15.30 | % | | | 15.35 | % |
| | | | | | | | | | | | | |
TOTAL RISK-BASED CAPITAL RATIO | | | 14.52 | % | | | 15.94 | % | | | 15.92 | % |
| | | At December 31, | |
Citizens Holding Company | | 2023 | | | 2022 | | | 2021 | |
Tier 1 capital | | | | | | | | | | | | |
Shareholders' equity | | $ | 42,773 | | | $ | 39,025 | | | $ | 105,900 | |
Less: Intangibles | | | (13,256 | ) | | | (13,340 | ) | | | (13,420 | ) |
Less: DTA related to NOLs | | | - | | | | - | | | | (94 | ) |
Add/less: Unrealized loss/(gain) on securities | | | 77,027 | | | | 83,071 | | | | 11,795 | |
| | | | | | | | | | | | | |
TOTAL TIER 1 CAPITAL | | $ | 106,544 | | | $ | 108,756 | | | $ | 104,181 | |
| | | | | | | | | | | | | |
Total capital | | | | | | | | | | | | |
Tier 1 capital | | $ | 106,544 | | | $ | 108,756 | | | $ | 104,181 | |
Allowable allowance for credit losses | | | 6,695 | | | | 5,264 | | | | 4,513 | |
| | | | | | | | | | | | | |
TOTAL CAPITAL | | $ | 113,239 | | | $ | 114,020 | | | $ | 108,694 | |
| | | | | | | | | | | | | |
| | | | | | | | | | | | | |
RISK WEIGHTED ASSETS | | $ | 891,916 | | | $ | 824,382 | | | $ | 791,529 | |
| | | | | | | | | | | | | |
| | | | | | | | | | | | | |
AVERAGE ASSETS (FOURTH QUARTER) | | $ | 1,433,608 | | | $ | 1,367,042 | | | $ | 1,335,780 | |
| | | | | | | | | | | | | |
| | | | | | | | | | | | | |
TIER 1 LEVERAGE RATIO | | | 7.43 | % | | | 7.96 | % | | | 7.80 | % |
| | | | | | | | | | | | | |
COMMON EQUITY TIER 1 CAPITAL RATIO | | | 11.95 | % | | | 13.19 | % | | | 13.16 | % |
| | | | | | | | | | | | | |
TIER 1 RISK-BASED CAPITAL RATIO | | | 11.95 | % | | | 13.19 | % | | | 13.16 | % |
| | | | | | | | | | | | | |
TOTAL RISK-BASED CAPITAL RATIO | | | 12.70 | % | | | 13.83 | % | | | 13.73 | % |
Management’s strategy with respect to capital levels is to maintain a sufficient amount of capital to allow the Company to respond to growth and acquisition opportunities in the Bank’s service area. Over the past three years, the Company has been able to increase the amount of its capital, through retention of earnings, while still maintaining a reasonable dividend payout ratio, which is 218.02%, 56% and 71% in years ending 2023, 2022, 2021, respectively. The Company does have the secured line of credit commitment due in 2024 that will require the Company to make strategic decisions in regards to refinancing the line of credit or raising additional capital to pay off the debt. The Company is currently weighing a variety of options in regards to the upcoming commitment.
OFF-BALANCE SHEET ARRANGEMENTS
In the ordinary course of business, the Company makes various commitments and incurs certain contingent liabilities to fulfill the financing needs of its customers. These commitments and contingent liabilities include commitments to extend credit and issue standby letters of credit. These off-balance sheet arrangements are further detailed in Note 15, “Off-Balance Sheet Financial Instruments, Commitments and Contingencies and Concentrations of Risks,” in the notes to the Company’s Consolidated Financial Statements included in this Annual Report.
CONTRACTUAL OBLIGATIONS
Long-term debt obligations represent borrowings from the FHLB that have an original maturity in excess of one year along with the secured line of credit described in Note 10. The only other significant obligations, other than obligations under deposit contracts and short-term borrowings, were for operating leases for banking facilities. Operating leases are primarily for the lease of branches, ATM machines and other necessary equipment. The equipment leases are for various terms.
QUANTITATIVE AND QUALITATIVE DISCLOSURES ABOUT MARKET RISK
OVERVIEW
The definition of market risk is the possibility of loss that could result from adverse changes in market prices or interest rates. The Company has taken steps to assess the amount of risk that is associated with its asset and liability structure. The Company measures the potential risk on a regular basis and makes changes to its strategies to manage these risks. The Board of Directors reviews important policy limits each month, with a more detailed risk analysis completed on a quarterly basis. These measurement tools are important in allowing the Company to manage market risk and to plan effective strategies to respond to any adverse changes in risk. The Company does not participate in some of the financial instruments that are inherently subject to substantial market risk. All of the financial instruments entered into by the Company are for purposes other than trading. All information presented in this report are denominated in U.S. dollars.
MARKET/INTEREST RATE RISK MANAGEMENT
Interest rate risk is the primary market risk that management must address. Interest rate risk is the exposure of Company earnings and capital to changes in interest rates. All financial institutions assume interest rate risk as an integral part of normal operations.
The primary purpose in managing interest rate risk is to effectively invest capital and preserve the value created by the core banking business of the Company. The Company utilizes an investment portfolio to manage the interest rate risk naturally created through its business activities. The process of managing interest rate risk generally involves both reducing the exposure of the Company’s net interest margin to swings in interest rates and concurrently ensuring that there is sufficient capital and liquidity to support balance sheet growth. The Company uses a quarterly interest rate risk report to evaluate its exposure to interest rate risk, project earnings and manage the composition of the balance sheet and its growth.
In addition to the quarterly interest rate risk report, the Company employs a number of tools to measure interest rate risk. One tool is static gap analysis, which matches assets with specified maturities to liabilities with corresponding maturities. Although management believes that this does not provide a complete picture of the Company’s exposure to interest rate risk, it does highlight significant short-term repricing volume mismatches. The following table presents the Company’s rate sensitivity static gap analysis at December 31, 2023 ($ in thousands):
| | | Interest Sensitive Within | |
| | | 90 days | | | One year | |
| | | | | | | | | |
Total rate sensitive assets | | $ | 210,852 | | | $ | 177,187 | |
Total rate sensitive liabilities | | | 473,917 | | | | 145,011 | |
| | | | | | | | | |
Net gap | | $ | (263,065 | ) | | $ | 32,176 | |
The analysis shows a negative gap position over the next three-month period, which would typically indicate that the Company would benefit somewhat from a decrease in market interest rates in the very short term. Management believes the Company is well positioned from an interest rate risk perspective for downward rate movements, but will continue to focus on the risk of higher rates for longer.
Management believes that static gap analysis does not fully capture the impact of interest rate movements on interest sensitive assets and liabilities. Thus, the Company also measures interest rate risk by analyzing interest rate sensitivity and the rate sensitivity gap. Table 14 - Interest Rate Sensitivity provides additional information about the financial instruments that are sensitive to changes in interest rates. This tabular disclosure is limited by its failure to depict accurately the effect on assumptions of significant changes in the economy or interest rates or changes in management’s expectations or intentions relating to the Company’s financial statements. The information in the interest rate sensitivity table below reflects contractual interest rate pricing dates and contractual maturity dates. For indeterminate maturity deposit products (money market, NOW and savings accounts), the tables present the majority of principal cash flows in the shortest term. Although these deposits may not reprice within this time frame, the depositors of such funds have the ability to reprice. Weighted average floating rates are based on the rate for that product as of December 31, 2023 and December 31, 2022.
TABLE 14 - INTEREST RATE SENSITIVITY
AS OF DECEMBER 31, 2023
(in thousands)
| | | | | | | | | | | | | | | | | | | | | | | | | | | Carrying | | | Fair | |
| | | 2024 | | | 2025 | | | 2026 | | | 2027 | | | 2028 | | | Thereafter | | | Value | | | Value | |
Loans | | | | | | | | | | | | | | | | | | | | | | | | | | | | | | | | |
Fixed Rate | | $ | 120,456 | | | $ | 92,873 | | | $ | 73,558 | | | $ | 85,585 | | | $ | 85,290 | | | $ | 32,004 | | | $ | 489,766 | | | $ | 454,011 | |
Average Int Rate | | | 7.08 | % | | | 8.07 | % | | | 7.61 | % | | | 5.36 | % | | | 7.63 | % | | | 6.61 | % | | | 7.11 | % | | | | |
Floating Rate | | $ | 33,538 | | | $ | 7,807 | | | $ | 6,733 | | | $ | 28,156 | | | $ | 24,845 | | | $ | 51,183 | | | $ | 152,262 | | | $ | 152,262 | |
Average Int Rate | | | 5.44 | % | | | 5.33 | % | | | 6.15 | % | | | 7.85 | % | | | 8.18 | % | | | 8.54 | % | | | 7.40 | % | | | | |
Investment securities | | | | | | | | | | | | | | | | | | | | | | | | | | | | | | | | |
Fixed Rate | | $ | 6,767 | | | $ | 1,468 | | | $ | 821 | | | $ | 135 | | | $ | 374 | | | $ | 556,029 | | | $ | 565,594 | | | $ | 533,213 | |
Average Int Rate | | | 4.11 | % | | | 3.84 | % | | | 3.15 | % | | | 2.63 | % | | | 4.63 | % | | | 2.96 | % | | | 2.98 | % | | | | |
Floating Rate | | | | | | | | | | | | | | | | | | | | | | | | | | | | | | | | |
Average Int Rate | | | | | | | | | | | | | | | | | | | | | | | | | | | | | | | | |
Other earning assets | | | | | | | | | | | | | | | | | | | | | | | | | | | | | | | | |
Fixed Rate | | | | | | | | | | | | | | | | | | | | | | | | | | | | | | | | |
Average Int Rate | | | | | | | | | | | | | | | | | | | | | | | | | | | | | | | | |
Floating Rate | | $ | 79,923 | | | | | | | | | | | | | | | | | | | | | | | $ | 79,923 | | | $ | 79,923 | |
Average Int Rate | | | 5.38 | % | | | | | | | | | | | | | | | | | | | | | | | 5.38 | % | | | | |
| | | | | | | | | | | | | | | | | | | | | | | | | | | | | | | | | |
Interest-bearing deposits | | | | | | | | | | | | | | | | | | | | | | | | | | | | | | | | |
Fixed Rate | | $ | 747,533 | | | $ | 16,844 | | | $ | 2,697 | | | $ | 2,901 | | | $ | 4,247 | | | | | | | $ | 774,222 | | | $ | 774,222 | |
Average Int Rate | | | 0.29 | % | | | 0.81 | % | | | 0.80 | % | | | 0.86 | % | | | 1.58 | % | | | | | | | 0.31 | % | | | | |
Floating Rate | | $ | 131,327 | | | | | | | | | | | | | | | | | | | | | | | $ | 131,327 | | | $ | 131,327 | |
Average Int Rate | | | 4.73 | % | | | | | | | | | | | | | | | | | | | | | | | 4.73 | % | | | | |
Other int-bearing | | | | | | | | | | | | | | | | | | | | | | | | | | | | | | | | |
liabilities | | | | | | | | | | | | | | | | | | | | | | | | | | | | | | | | |
Fixed Rate | | | | | | | | | | $ | 14,533 | | | $ | 10,411 | | | | | | | | | | | $ | 24,944 | | | $ | 28,230 | |
Average Int Rate | | | | | | | | | | | 4.80 | % | | | 4.68 | % | | | | | | | | | | | 4.75 | % | | | | |
Floating Rate | | $ | 158,086 | | | | | | | | | | | | | | | | | | | | | | | $ | 158,086 | | | $ | 158,086 | |
Average Int Rate | | | 3.76 | % | | | | | | | | | | | | | | | | | | | | | | | 3.76 | % | | | | |
AS OF DECEMBER 31, 2022
(in thousands)
| | | | | | | | | | | | | | | | | | | | | | | | | | | Carrying | | | Fair | |
| | | 2023 | | | 2024 | | | 2025 | | | 2026 | | | 2027 | | | Thereafter | | | Value | | | Value | |
Loans | | | | | | | | | | | | | | | | | | | | | | | | | | | | | | | | |
Fixed Rate | | $ | 102,366 | | | $ | 64,629 | | | $ | 94,071 | | | $ | 78,136 | | | $ | 86,960 | | | $ | 55,169 | | | $ | 481,330 | | | $ | 436,912 | |
Average Int Rate | | | 4.82 | % | | | 5.15 | % | | | 4.49 | % | | | 4.34 | % | | | 4.40 | % | | | 4.29 | % | | | 0.00 | % | | | | |
Floating Rate | | $ | 6,308 | | | $ | 28,622 | | | $ | 1,430 | | | $ | 7,637 | | | $ | 6,905 | | | $ | 53,358 | | | $ | 104,261 | | | $ | 104,261 | |
Average Int Rate | | | 6.82 | % | | | 6.84 | % | | | 6.42 | % | | | 7.23 | % | | | 5.95 | % | | | 5.32 | % | | | 0.00 | % | | | | |
Investment securities | | | | | | | | | | | | | | | | | | | | | | | | | | | | | | | | |
Fixed Rate | | $ | 657 | | | $ | 6,893 | | | | 2,180 | | | $ | 832 | | | $ | 140 | | | $ | 638,284 | | | $ | 648,987 | | | $ | 576,614 | |
Average Int Rate | | | 1.82 | % | | | 4.12 | % | | | 0.04 | | | | 3.61 | % | | | 2.75 | % | | | 3.36 | % | | | 0.00 | % | | | | |
Floating Rate | | | | | | | | | | | | | | | | | | | | | | | | | | | | | | | | |
Average Int Rate | | | | | | | | | | | | | | | | | | | | | | | | | | | | | | | | |
Other earning assets | | | | | | | | | | | | | | | | | | | | | | | | | | | | | | | | |
Fixed Rate | | | | | | | | | | | | | | | | | | | | | | | | | | | | | | | | |
Average Int Rate | | | | | | | | | | | | | | | | | | | | | | | | | | | | | | | | |
Floating Rate | | $ | 1,646 | | | | | | | | | | | | | | | | | | | | | | | $ | 1,646 | | | $ | 1,646 | |
Average Int Rate | | | 1.57 | % | | | | | | | | | | | | | | | | | | | | | | | 1.57 | % | | | | |
| | | | | | | | | | | | | | | | | | | | | | | | | | | | | | | | | |
Interest-bearing deposits | | | | | | | | | | | | | | | | | | | | | | | | | | | | | | | | |
Fixed Rate | | $ | 756,606 | | | $ | 52,258 | | | $ | 12,101 | | | $ | 3,340 | | | $ | 2,985 | | | | | | | $ | 827,290 | | | $ | 827,269 | |
Average Int Rate | | | 0.29 | % | | | 1.96 | % | | | 0.43 | % | | | 0.49 | % | | | 0.63 | % | | | | | | | 0.00 | % | | | | |
Floating Rate | | | | | | | | | | | | | | | | | | | | | | | | | | | | | | | | |
Average Int Rate | | | | | | | | | | | | | | | | | | | | | | | | | | | | | | | | |
Other int-bearing | | | | | | | | | | | | | | | | | | | | | | | | | | | | | | | | |
liabilities | | | | | | | | | | | | | | | | | | | | | | | | | | | | | | | | |
Fixed Rate | | | | | | | | | | | | | | | | | | | | | | | | | | | | | | | | |
Average Int Rate | | | | | | | | | | | | | | | | | | | | | | | | | | | | | | | | |
Floating Rate | | $ | 145,574 | | | | | | | | | | | | | | | | | | | | | | | $ | 145,574 | | | $ | 145,574 | |
Average Int Rate | | | 1.61 | % | | | | | | | | | | | | | | | | | | | | | | | 1.61 | % | | | | |
Rate sensitivity gap analysis is another tool management uses to measure interest rate risk. The rate sensitivity gap is the difference between the repricing of interest-earning assets and the repricing of interest-bearing liabilities within certain defined time frames. The Company’s interest rate sensitivity position is influenced by the distribution of interest-earning assets and interest-bearing liabilities among the maturity categories. Table 15 - Rate Sensitivity Gap reflects interest-earning assets and interest-bearing liabilities by maturity distribution as of December 31, 2023. Product lines repricing in time periods predetermined by contractual agreements are included in the respective maturity categories.
TABLE 15 ‑ RATE SENSITIVITY GAP AT DECEMBER 31, 2023
(in thousands, except percentage amounts)
| | | 1 - 90 | | | 91 - 365 | | | 1 - 5 | | | Over | | | | | |
| | | Days | | | Days | | | Years | | | 5 years | | | Total | |
| | | | | | | | | | | | | | | | | | | | | |
INTEREST EARNING ASSETS | | | | | | | | | | | | | | | | | | | | |
| | | | | | | | | | | | | | | | | | | | | |
Loans | | $ | 118,666 | | | $ | 141,058 | | | $ | 369,860 | | | $ | 11,731 | | | $ | 641,315 | |
Investment securities | | | 12,263 | | | | 36,129 | | | | 136,693 | | | | 484,386 | | | | 669,471 | |
Interest bearing deposits with other banks | | | 79,923 | | | | - | | | | - | | | | - | | | | 79,923 | |
| | | | | | | | | | | | | | | | | | | | | |
TOTAL INTEREST BEARING ASSETS | | $ | 210,852 | | | $ | 177,187 | | | $ | 506,553 | | | $ | 496,117 | | | $ | 1,390,709 | |
| | | | | | | | | | | | | | | | | | | | | |
| | | | | | | | | | | | | | | | | | | | | |
INTEREST BEARING LIABILITIES | | | | | | | | | | | | | | | | | | | | |
| | | | | | | | | | | | | | | | | | | | | |
Interest bearing demand deposits | | $ | 189,908 | | | $ | - | | | $ | 129,325 | | | $ | 161,657 | | | $ | 480,890 | |
Savings and Money Market deposits | | | 57,930 | | | | - | | | | 91,967 | | | | 27,695 | | | | 177,592 | |
Time deposits | | | 49,993 | | | | 145,011 | | | | 51,837 | | | | 102 | | | | 246,943 | |
Short term borrowings | | | 158,086 | | | | - | | | | - | | | | - | | | | 158,086 | |
Long term borrowings | | | 18,000 | | | | - | | | | - | | | | - | | | | 18,000 | |
| | | | | | | | | | | | | | | | | | | | | |
TOTAL INTEREST BEARING LIABILITIES | | $ | 473,917 | | | $ | 145,011 | | | $ | 273,129 | | | $ | 189,454 | | | $ | 1,081,511 | |
| | | | | | | | | | | | | | | | | | | | | |
| | | | | | | | | | | | | | | | | | | | | |
Rate sensitive gap | | $ | (263,065 | ) | | $ | 32,176 | | | $ | 233,424 | | | $ | 306,663 | | | $ | 309,198 | |
Rate sensitive cumulative gap | | | (263,065 | ) | | | (230,889 | ) | | | 2,535 | | | | 309,198 | | | | - | |
Cumulative gap as a percentage of total earning assets | | | -18.92 | % | | | -16.60 | % | | | 0.18 | % | | | 22.23 | % | | | | |
The purpose of the above table is to measure interest rate risk utilizing the repricing intervals of interest sensitive assets and liabilities. Rate sensitive gaps constantly change as funds are acquired and invested and as rates change. Rising interest rates are likely to increase net interest income in a positive gap position while falling interest rates are beneficial in a negative gap position.
The above rate sensitivity analysis places interest-bearing demand and savings deposits in the shortest maturity category because these liabilities do not have defined maturities. If these deposits were placed in a maturity distribution representative of the Company’s deposit base history, the shortfall of the negative rate sensitive gap position would be reduced in the 1-to-90 day time frame. It is the goal of the Company to achieve a cumulative gap ratio of plus or minus 15% for all periods under one year, with maximum acceptable limits of plus or minus 20%. Quarterly, management discusses with the ALCO and the board of directors the gap position in relation to the established goals, highlights any reasons for variances from the goals and suggests changes to better align the Company’s position with the established goals. When reviewing the Company’s position, impacting factors and suggested changes, the board of directors also considers other corporate objectives, including increasing core deposits and increasing profitability, before implementing changes intended to align the Company’s position with the established goals. While the board of directors continues to closely monitor the Company’s negative gap position, at this time, management does not anticipate making any significant changes to the Company’s operating practices in order to mitigate the negative gap position.
The rate sensitivity gap table illustrates that the Company had a large negative cumulative gap position for the 1 to 90-day period as of December 31, 2022. This negative gap position was mainly due to: (1) a significant amount of non-maturity deposits classified within that period and (2) approximately 20.23% of certificates of deposit maturing during that period.
The interest rate sensitivity and rate sensitivity gap tables, taken together, indicate that the Company to be in a liability sensitive position when evaluating the maturities of interest-bearing items. Thus, an increase in the interest rate environment would have a negative impact to earnings, while a decrease in interest rates would have the opposite effect on the Company’s earnings. At the current stage of the economy with interest rates having increased quicker than any time in the past few decades and inflation pressure starting to subside, the Company foresees interest rates will remain fairly flat in the coming year. During 2023, the Company raised interest bearing asset rates but was unable to hold interest bearing liabilities low. However, the Company expects to see margin expansion as deposit costs will likely lower in 2024.
The COVID-19 pandemic during 2020 and 2021 required some quick actions by the FRB to attempt to limit the recessionary impact of the pandemic. As a result of the actions taken during those years, the FRB had to reverse course in 2022 and 2023 in a significant way to reduce the money supply in the economy and take a more restrictive stance. Market interest rates have increased 100 bps during 2023, which is the fastest rate increases on a percentage basis in decades. At the beginning of 2023, the ten-year Treasury yield was 3.88%. As of December 31, 2023, the ten-year Treasury yield was 3.86%. The movement in the short-term interest rates impact the Company’s decisions in regards to pricing the Company’s products and services. The short-term interest rates have had an impact on the Company’s earnings as we were able to reprice a majority of our interest-bearing assets while holding deposit costs down for most of 2022. The Company is focused on positioning the balance sheet to become more rate neutral to interest rates due to the expectation of relatively flat interest rates in the coming year as the data is showing the FRB’s aggressive actions have helped reduce inflation.
Market Price and Dividend Information
MARKET PRICE INFORMATION
The Company’s common stock trades on the OTCQX Best Market (“OTCQX”) under the symbol “CIZN”. On February 28, 2024, the common stock’s closing price on OTCQX was $7.78.
On February 28, 2024, shares of the Company’s common stock were held of record by approximately 456 shareholders.
DIVIDENDS
Dividends totaled $0.72 and $0.96 per share for 2023 and 2022.
If funds are available, the Board of Directors of the Company typically declares dividends on a quarterly basis in March, June, September and December with payment following at the end of the month in which the dividend was declared. Funds for the payment by the Company of cash dividends are obtained from dividends, loans or advances received by the Company from the Bank. Accordingly, the declaration and payment of dividends by the Company depend upon the Bank’s earnings and financial condition, general economic conditions, compliance with regulatory requirements, and other factors. The Bank must also receive the approval of the Mississippi Department of Banking and Consumer Finance prior to the payment of a dividend.
STOCK PERFORMANCE GRAPH
The following graph shows a comparison of the cumulative total stockholder return on our common stock with the cumulative total returns of the NASDAQ Composite Index and the S&P 500 Regional Banks index. The S&P 500 Regional Banks index replaces the Morningstar Regional Banks Index in this analysis and going forward, as Morningstar has changed its methodology for its index. The graph tracks the performance of a $100 investment in our common stock and in each of the indexes during the last five fiscal years ended December 31, 2023. Data for the NASDAQ Composite Index and S&P 500 Regional Banks index assume reinvestment of dividends. Stockholder returns over the indicated period are based on historical data and should not be considered indicative of future stockholder returns.
Performance Graph
December 31, 2018 - December 31, 2023
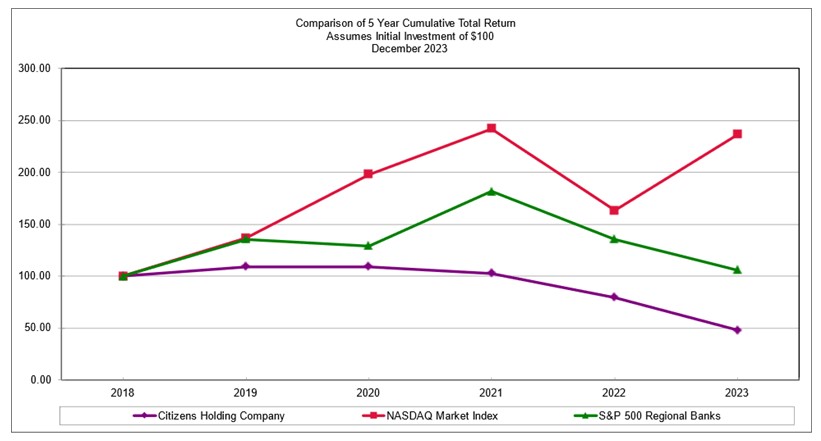
| | | 2018 | | | 2019 | | | 2020 | | | 2021 | | | 2022 | | | 2023 | |
| | | | | | | | | | | | | | | | | | | | | | | | | |
| | | | | | | | | | | | | | | | | | | | | | | | | |
Citizens Holding Company | | | 100.00 | | | | 109.16 | | | | 109.16 | | | | 102.82 | | | | 79.62 | | | | 48.03 | |
NASDAQ Market Index | | | 100.00 | | | | 136.69 | | | | 198.10 | | | | 242.03 | | | | 163.28 | | | | 236.17 | |
S&P 500 Regional Banks | | | 100.00 | | | | 135.42 | | | | 129.28 | | | | 181.68 | | | | 135.32 | | | | 106.07 | |
There can be no assurance that the Company’s common stock performance will continue in the future with the same or similar trends depicted in the performance graph above. The Company does not and will not make or endorse any predictions as to future stock performance.
THE CITIZENS BANK OFFICERS
| Stacy M. Brantley | Pam Lewis |
| President and CEO | Assistant Vice President, Collections Manager |
| | |
| Phillip R. Branch | Sandra Curties |
| Senior Vice President, CFO | Assistant Vice President, Teller Administrator |
| | |
| Mark Taylor | Temika Triplett |
| Senior Vice President, COO, Trust Officer | Assistant Vice President, Electronic Services Officer |
| | |
| Liz Owen | Greg Jackson |
| Senior Vice President, Director of | Accounting Officer |
| Human Resources, Chief Risk Officer | |
| | Reaghan Jenkins |
| Ledale Reynolds | Accounting Officer |
| Senior Vice President and CIO | |
| | Deborah Ladd |
| Joshua Sullivan | Item Processing Officer |
| Senior Vice President, Senior Credit Officer | |
| | Pam Garrett |
| Jackie Hester | Assistant Vice President, IT Project Manager |
| Vice President, Marketing Officer | |
| | Stacy Chisolm |
| Jean Fulton | IT Service Desk Manager |
| Vice President, Internal Auditor | |
| | Debra Yates |
| Mark Majure | Executive Assistant to the President/CEO |
| Vice President, Loan Review Officer | |
| | Shirley McDaniel |
| Bob Posey | Loan Processing Officer |
| Vice President, Loan Officer | |
| | Westside Branch |
| Stacy Arnold | |
| Vice President, Compliance Officer | Brice Richardson |
| | Vice President, Branch Manager |
| Ashley Peebles | |
| Vice President, Director of Deposit Services | Eastside Branch |
| | |
| Jamie Shotts | Brad Copeland |
| Vice President, Appraisal Review Officer | Vice President, Branch Manager |
| | |
| Sommer Vick | Carthage Branch |
| Vice President, Controller | |
| | Billy Cook |
| Mitch Peden | Vice President, Loan Officer |
| Vice President, Information Services Manager | |
| | Tonya J. Dorman |
| Scott Lewis | Deposit Operations Officer |
| Vice President, Information Secuirty Officer | |
| | Sebastopol Branch |
| Sam Mars | |
| Vice President, Regional Commercial Banker | Connie Comans |
| | President, Loan Officer |
| Shon Kirkland | |
| Assistant Vice President, Security Officer, Facilities Manager | Dekalb & Scooba Branch |
| | |
| Charles Wilkerson | Reginald Moore |
| Assistant Vice President, Loan Operations Officer | Assistant Vice President, Branch Manager |
| | |
| Grant Comans | Jan White |
| Assistant Vice President, Branch Manager | Assistant Vice President, Branch Operations Officer |
| Decatur Branch | Tammy McAlpin |
| | Commercial Loan, Portfolio Manager |
| Susan Brown | |
| Assistant Vice President, Deposit Operations Officer | Biloxi Cedar Lake Branch |
| | |
| Kosciusko Branch | Travis Moore |
| | Vice President, Regional Commercial Lender |
| Teresa Patterson | |
| Vice President, Branch Manager | Katie Hancock |
| | Vice President, Branch Manager |
| Meridian Eastgate Branch | |
| | Tabbetha Calvert |
| James V. Hines | Vice President, BSA Officer |
| Vice President, Loan Officer | |
| | Oxford Branch |
| Tammara Hopson | |
| Deposit Operations Officer | Corey Addy |
| | Oxford City President |
| Forest Branch | |
| | Marion Boyd |
| Lawanda McCaughn | Senior Vice President, Chief Business Development Officer |
| Deposit Operations Officer | |
| | Charles Larry Veasey |
| Louisville, Industrial & Noxapater Branch | Vice President, Regional Commercial Lender |
| | |
| Bruce Lee | Angela Ducote |
| Market President, Loan Officer | Assistant Vice President, Consumer Banker |
| | |
| Lynn Graham | Rose Alderson |
| Assistant Vice President, Branch Operations Officer | Branch Operations and Retail Banking Officer |
| | |
| Collinsville Branch | Pascagoula Branch |
| | |
| Mike Shelby | Greg Cronin |
| Vice President, Branch Manager | Regional President, Coastal-South Mississippi |
| | |
| Starkville Branch | Ford Kinsey |
| | Senior Vice President, Chief Credit Officer |
| Lee Burrell | |
| Vice President, Regional Commercial Lender | Amber Thomas |
| | Vice President, Commercial Banker |
| Rhonda Edmonson | |
| Assistant Vice President, Branch Manager | Theresa Jenkins |
| | Assistant Vice President, Branch Manager |
| Flowood Branch | |
| | Ocean Springs Branch |
| George Gammon III | |
| Regional President, North-West Mississippi | Reagan Bridley |
| | Vice President, Commercial Banker |
| Warner Cannada | |
| Vice President, Regional Commercial Banker | Sharon Wetzel |
| | Vice President, Information Technology Officer |
| Monica L. Hammack | |
| Assistant Vice President, Branch Manager | Melissa Cooper |
| | Assistant Vice President |
| Hattiesburg Branch | |
| | Mortgage Loan Division |
| Chad Hill | |
| Vice President, Branch Manager | Tom Graham |
| | Vice President, Mortage Loan Officer, Gulfport |
| Ridgeland branch | |
| | Charlene DeWeese |
| Daniel Webb | Assistant Vice President, Mortgage Loan Officer, Philadelphia Annex |
| Assistant Vice President, Loan Officer | |
| | Tammy Warren |
| | Assistant Vice President, Mortgage Loan Officer, Biloxi Cedar Lake Branch |
BOARD OF DIRECTORS
| Stacy M. Brantley | Craig Dungan, MD |
| President & Chief Executive Officer | Physician |
| Citizens Holding Company and The Citizens Bank | Meridian Gastroenterology PLLC |
| | |
| Donald L. Kilgore | Greg L. McKee |
| General Counsel | Retired President & Chief Executive Officer |
| to Tribal Chief Cyrus Ben | Citizens Holding Company and The Citizens Bank |
| | |
| David A. King | David P. Webb |
| Proprietor | Attorney |
| Philadelphia Motor Company | Baker, Donelson, Bearman, Caldwell & |
| | Berkowitz, PC |
| Herbert A. King | |
| Civil Engineer | Jane Crosswhite |
| King Engineering Associates, Inc. | Executive Vice President |
| | Williams Brothers Inc. |
| Adam Mars | |
| Business Manager | Terrell E. Winstead |
| Mars, Mars & Mars | Executive Vice President |
| | Molpus Woodlands Group |
| Gregory E. Cronin | |
| Gulf Coast President | Jason Voyles |
| Citizens Holding Company and The Citizens Bank | President & Chief Executive Officer |
| | Spectrum Capital, LLC |
CITIZENS HOLDING COMPANY OFFICERS
Herbert A. King
Chairman
Stacy M. Brantley
President and Chief Executive Officer
Mark Taylor
Secretary
Phillip R. Branch
Treasurer and Chief Financial Officer
BANKING LOCATIONS
| Philadelphia Main Office | Collinsville Branch | Decatur Branch |
| 521 Main Street | 9065 Collinsville Road | 15330 Hwy 15 South |
| Philadelphia, MS 39350 | Collinsville, MS 39325 | Decatur, MS 39327 |
| 601.656.4692 | 601.626.7608 | 601.635.2321 |
| | | |
| Westside Branch | Flowood Branch | Forest Branch |
| 912 West Beacon Street | 2845 Lakeland Drive | 247 Woodland Drive North |
| Philadelphia, MS 39350 | Flowood, MS 39232 | Forest, MS 39074 |
| 601.656.4692 | 601.992.7688 | 601.469.3424 |
| | | |
| Ridgeland Branch | Sebastopol Branch | Louisville-Main Branch |
| 320 Highway 51 North | 24 Pine Street | 906 South Columbus Avenue |
| Ridgeland, MS 39157 | Sebastopol, MS 39359 | Louisville, MS 39339 |
| 601.519.4020 | 601.625.7447 | 662.773.6261 |
| | | |
| Eastside Branch | DeKalb Branch | Noxapater Branch |
| 599 East Main Street | 176 Main Avenue | 45 East Main Street |
| Philadelphia, MS 39350 | DeKalb, MS 39328 | Noxapater, MS 39346 |
| 601.656.4692 | 601.743.2115 | 662.724.4261 |
| | | |
| Union Branch | Kosciusko Branch | Louisville-Industrial Branch |
| 502 Bank Street | 775 North Jackson Street | 1760 South Church Avenue |
| Union, MS 39365 | Kosciusko, MS 39090 | Louisville, MS 39339 |
| 601.656.4879 | 662.289.4356 | 662.773.6261 |
| | | |
| Starkville Branch | Scooba Branch | Biloxi Lemoyne Boulevard |
| 201 Highway 12 West | 27597 Highway 16 East | 15309 Lemoyne Boulevard |
| Starkville, MS 39759 | Scooba, MS 39358 | Biloxi, MS 39532 |
| 662.323.1420 | 662.476.8431 | 228.207.2343 |
| | | |
| Carthage Main Office | Meridian Eastgate | Ocean Springs Branch |
| 301 West Main Street | 1825 Hwy 39 North | 2702 Bienville Blvd |
| Carthage, MS 39051 | Meridian, MS 39301 | Ocean Springs, MS 39564 |
| 601.257.4525 | 601.693.8367 | 228.875.3933 |
| | | |
| Biloxi Cedar Lakes | Hattiesburg Branch | Pascagoula Branch |
| 1830 Popps Ferry Road | 6222 Highway 98 | 1519 Jackson Ave |
| Biloxi, MS 39532 | Hattiesburg, MS 39402 | Pascagoula, MS 39567 |
| 228.594.6913 | 601.264.4425 | |
| | | |
| Oxford Branch | Gulfport Branch | |
| 902 Sisk Avenue, Ste E | 12008 Hwy 49 | |
| Oxford, MS 38655 | Gulfport, MS 39503 | |
BANKING LOCATIONS - Continued
Phone Teller
1.800.397.0344
Internet and Mobile Banking
http.//www.thecitizensbankphila.com
FINANCIAL INFORMATION
CORPORATE HEADQUARTERS
521 Main Street
P.O. Box 209
Philadelphia, MS 39350
601.656.4692
ANNUAL SHAREHOLDER MEETING
The Annual Shareholder meeting of the Citizens Holding Company, Inc. will be held Tuesday, April 23, 2024, at 4:30 P.M. in the lobby of the main office of The Citizens Bank, 521 Main Street, Philadelphia, Mississippi.
STOCK REGISTRAR AND TRANSFER AGENT
American Stock Transfer & Trust Company
59 Maiden Lane
New York, NY 10038
FORM 10-K
The Company’s most recent Annual Report on Form 10-K, filed with the Securities and Exchange Commission, is available without charge to shareholders upon request to the Treasurer of the Citizens Holding Company.
FINANCIAL CONTACT
Phillip R. Branch
Treasurer and Chief Financial Officer
P.O. Box 209
Philadelphia, Mississippi 39350
Additional information can be obtained from the Company’s website at https://www.thecitizensbankphila.com/investor-relations/.