UNITED STATES
SECURITIES AND EXCHANGE COMMISSION
Washington, D.C. 20549
FORM N-CSR
CERTIFIED SHAREHOLDER REPORT
OF
REGISTERED MANAGEMENT INVESTMENT COMPANIES
| Investment Company Act file number: | 811-834 |
| Name of Registrant: | Vanguard Windsor Funds |
| Address of Registrant: | P.O. Box 2600 |
| Valley Forge, PA 19482 | |
| Name and address of agent for service: | Heidi Stam, Esquire |
| P.O. Box 876 | |
| Valley Forge, PA 19482 | |
| Registrant’s telephone number, including area code: | (610) 669-1000 |
| Date of fiscal year end: | October 31 |
| Date of reporting period: | November 1, 2008 – October 31, 2009 |
| Item 1: Reports to Shareholders |
![]()
| Vanguard Windsor™ Fund |
| Annual Report |
| October 31, 2009 |
> Vanguard Windsor Fund returned about 18% for the 12 months ended
October 31, 2009, substantially ahead of its benchmark and the average
return of peer funds for the period.
> The fund’s results for the fiscal year covered two very different market
environments—a period of dramatic declines followed by one of equally
dramatic gains.
> Health care and information technology sectors were major contributors
to the fund’s performance.
| Contents | |
| Your Fund’s Total Returns | 1 |
| President’s Letter | 2 |
| Advisors’ Report | 8 |
| Results of Proxy Voting | 12 |
| Fund Profile | 14 |
| Performance Summary | 15 |
| Financial Statements | 17 |
| Your Fund’s After-Tax Returns | 31 |
| About Your Fund’s Expenses | 32 |
| Glossary | 34 |
Please note: The opinions expressed in this report are just that—informed opinions. They should not be considered promises or advice.
Also, please keep in mind that the information and opinions cover the period through the date on the front of this report. Of course, the
risks of investing in your fund are spelled out in the prospectus.
Cover photograph: Veronica Coia.
Your Fund’s Total Returns
| Fiscal Year Ended October 31, 2009 | ||
| Ticker | Total | |
| Symbol | Returns | |
| Vanguard Windsor Fund | ||
| Investor Shares | VWNDX | 18.22% |
| Admiral™ Shares1 | VWNEX | 18.38 |
| Russell 1000 Value Index | 4.78 | |
| Multi-Cap Value Funds Average2 | 12.87 |
| Your Fund’s Performance at a Glance | ||||
| October 31, 2008–October 31, 2009 | ||||
| Distributions Per Share | ||||
| Starting | Ending | Income | Capital | |
| Share Price | Share Price | Dividends | Gains | |
| Vanguard Windsor Fund | ||||
| Investor Shares | $9.51 | $10.97 | $0.223 | $0.000 |
| Admiral Shares | 32.08 | 37.01 | 0.791 | 0.000 |
1 A lower-cost class of shares available to many longtime shareholders and to those with significant investments in the fund.
2 Derived from data provided by Lipper Inc.
1

President’s Letter
Dear Shareholder,
Vanguard Windsor Fund returned about 18% for the fiscal year ended October 31, 2009. In a period of strong broad-market gains, the fund’s return far surpassed that of its benchmark index, the Russell 1000 Value Index, and the average return for peer mutual funds.
The fund’s excellent 12-month return gives little hint of the two very different stock markets Windsor experienced during the year. As we reported to you earlier, the fund returned about –2% for the first six months of the period amid even steeper declines for its benchmark and peer-group average. In the robust market upswing that characterized the second half of the fiscal year, the fund’s 20% return helped it maintain its lead over its comparative standards for the full 12 months.
If you own shares of the Windsor Fund in a taxable account, you may wish to review the fund’s after-tax returns presented later in this report.
A vicious bear market quickly turned bullish
A year ago, the global financial system stood on the brink of collapse as the expanding U.S. credit crisis precipitated the deepest worldwide recession since World War II. Since then, markets have pulled back from the depths and, in fact, have rallied impressively. Although U.S. unemployment has risen to double digits
2
and signs of a robust recovery are hard to find, the global economy has begun to revive. For the first time in more than a year, U.S. gross domestic product registered growth, as reported by the Commerce Department for the third quarter of calendar 2009.
U.S. stocks recorded positive returns for the fiscal year ended October 31, as the market’s losses during the first four months of the period—marking the final plunge of a historic bear market—were erased by a remarkable rally beginning in March. Global stocks did even better, thanks to some renewed strength in developed markets and a powerful upswing in emerging markets that
actually had some prognosticators worrying about a new asset bubble. Reminders of the markets’ travails are nevertheless apparent in the index returns for the past three years, where negative figures are the rule. Even the five-year returns for U.S. stocks as of October 31 were barely positive, further evidence of the long-term damage done by the collapse of the real estate bubble.
The bond market experienced an equally dramatic turnaround
The stock market’s rapid fall and recovery were matched by an equally dramatic turnaround in the bond market. At the end of 2008, as the credit markets virtually shut down, risk-averse investors flocked to
| Market Barometer | |||
| Average Annual Total Returns | |||
| Periods Ended October 31, 2009 | |||
| One Year | Three Years | Five Years | |
| Stocks | |||
| Russell 1000 Index (Large-caps) | 11.20% | –6.84% | 0.71% |
| Russell 2000 Index (Small-caps) | 6.46 | –8.51 | 0.59 |
| Dow Jones U.S. Total Stock Market Index | 11.34 | –6.55 | 1.06 |
| MSCI All Country World Index ex USA (International) | 34.79 | –2.49 | 7.58 |
| Bonds | |||
| Barclays Capital U.S. Aggregate Bond Index | |||
| (Broad taxable market) | 13.79% | 6.35% | 5.05% |
| Barclays Capital Municipal Bond Index | 13.60 | 4.17 | 4.15 |
| Citigroup 3-Month Treasury Bill Index | 0.28 | 2.50 | 2.94 |
| CPI | |||
| Consumer Price Index | –0.18% | 2.32% | 2.52% |
3
U.S. Treasury bonds. The effect was to widen the difference between the lower yields of Treasuries and the higher yields of corporate bonds to a margin not seen since the Great Depression.
Central banks around the world responded to the economic slowdown by lowering interest rates and implementing other aggressive stimulus programs. Meanwhile, governments boosted spending in hopes of reversing the recessionary tide. As fears of a worldwide depression eased, investors’ appetite for risk returned to more normal levels. The receding pessimism raised demand for corporate bonds, raising their
prices and bringing down their yields. Over the past 12 months, both taxable and municipal bonds returned more than 13%.
However, the Fed’s easy-money campaign had a predictable effect on short-term savings vehicles such as money market funds, whose yields track prevailing short-term rates. In December 2008, the Fed reduced its target for the federal funds rate, a benchmark for the interest rates paid by money market instruments and other very short-term securities, to between 0% and 0.25%. The Fed has said it expects to maintain its target at this level “for an extended period.”
| Expense Ratios1 | |||
| Your Fund Compared With Its Peer Group | |||
| Multi-Cap | |||
| Investor | Admiral | Value Funds | |
| Shares | Shares | Average | |
| Windsor Fund | 0.37% | 0.25% | 1.27% |
1 The fund expense ratios shown are from the prospectus dated February 27, 2009, and represent estimated costs for the current fiscal year
based on the fund’s net assets as of the prospectus date. For the fiscal year ended October 31, 2009, the fund’s expense ratios were 0.33%
for Investor Shares and 0.20% for Admiral Shares. The peer-group expense ratio is derived from data provided by Lipper Inc. and captures
information through year-end 2008.
4
Health care mergers provided gains for Windsor
Windsor Fund’s strong double-digit gain for the 2009 fiscal year contrasts with the deep double-digit decline that the fund (and virtually all stock mutual funds) posted for fiscal 2008. The fund’s holdings in the health care, information technology, consumer discretionary, and energy sectors—responsible for almost half its loss a year earlier—accounted for most of its gain in fiscal 2009.
Significant contributors to return in the health care sector included the stocks of two pharmaceutical companies that are being absorbed by rivals. One deal involves
Pfizer, the world’s largest drug maker by revenue, which acquired Wyeth. The other is Merck’s merger with Schering-Plough (completed just after the end of the fiscal year), which created the world’s second-largest producer of prescription medicines, behind Pfizer.
Matching the health care sector’s contribution were the fund’s information technology stocks, especially those of electronic and communications equipment companies. Other bright spots were a variety of companies in the consumer discretionary and energy sectors, ranging from apparel retailers and Virgin Media, which provides Internet, TV, and telephone
| Total Returns | |
| Ten Years Ended October 31, 2009 | |
| Average | |
| Annual Return | |
| Windsor Fund Investor Shares | 2.85% |
| Russell 1000 Value Index | 1.70 |
| Multi-Cap Value Funds Average1 | 2.07 |
The figures shown represent past performance, which is not a guarantee of future results. (Current performance
may be lower or higher than the performance data cited. For performance data current to the most recent month-
end, visit our website at www.vanguard.com/performance.) Note, too, that both investment returns and principal
value can fluctuate widely, so an investor’s shares, when sold, could be worth more or less than their original cost.
1 Derived from data provided by Lipper Inc.
5
services in the United Kingdom, to Newfield Exploration, an independent oil and gas company.
Returns for Windsor’s financial holdings, which accounted for almost one-fifth of the fund’s assets on average, diverged widely. The stocks of investment-oriented companies, such as Goldman Sachs and Ameriprise Financial, boosted the fund’s returns. Pulling almost as forcefully in the opposite direction were holdings in commercial banks and behemoth diversified institutions, such as Citigroup. The pushes and pulls netted out to a small gain from this sector.
Among other sectors, the only significant negative returns came from the fund’s industrial holdings, primarily Delta Air Lines shares. Delta is combining with Northwest Airlines to create the world’s largest commercial air carrier.
Earlier-year results will weigh on longer-term performance
Windsor Fund’s 18% gain for fiscal 2009 contrasts sharply with its –44% return for fiscal 2008. A roller-coaster ride isn’t unusual for Windsor because of its focus on out-of-favor companies that the fund’s advisors believe have unrecognized merit, and its willingness to make large commitments to these stocks. But the plunge in fiscal 2008 was atypically severe, resulting largely from the market chaos that pulled most stock investments down (the broad market fell by about 36% over the period).
Such a severe decline will continue to weigh on the fund’s long-term performance record for years to come, even if the markets continue to improve and Windsor does well. It’s a subtlety to keep in mind as you evaluate the past performance of Windsor and other funds.
Still, as you can see in the table on page 5, Windsor’s excellent performance over the past 12 months has helped to offset the impact of the prior year’s stock market slide. For the ten years ended October 31, the fund’s average annual return outpaced both that of its benchmark index and the average return of peer funds. I am confident in the abilities of our advisors to continue to do well for the fund and its investors.
The lesson that can be learned from an unusually challenging time
The past year’s market tumult—a sharp decline followed by a strong upswing—has provided a powerful, if not entirely welcome, lesson in the critical importance of balance, diversification, and a commitment to a long-term plan. When the stock market tumbled in late 2008 and early 2009, the diversification benefits of a bond allocation became crystal-clear. During the past six months, the stock market’s powerful rally has underscored the benefit of sticking with your long-term plan through the inevitable moments of anxiety and doubt.
6
Where do we go from here? Although at this point it seems as if the worst is behind us, the financial markets’ short-term direction is impossible to forecast with accuracy. The best response to this uncertainty is, again, a plan that is based on reasonable expectations about long-term return and risk, and that you can stick with through periods of market turmoil. Vanguard Windsor Fund can play an important role in such a plan.
Thank you for your confidence in Vanguard.
Sincerely,

F. William McNabb III
President and Chief Executive Officer
November 11, 2009
Advisors’ Report
For the fiscal year ended October 31, 2009, the Investor Shares of Vanguard Windsor Fund returned 18.22%, while the Admiral Shares returned 18.38%. Your fund is managed by two independent advisors, a strategy that enhances the fund’s diversification by providing exposure to distinct, yet complementary, investment approaches. It is not uncommon for different advisors to have different views about individual securities or the broader investment environment.
The advisors, the percentage and amount of fund assets that each manages, and brief descriptions of their investment strategies are presented in the table below. The advisors have also prepared a discussion of the investment environment that existed during the fiscal year and of how the portfolio positioning reflects this assessment. These reports were prepared on November 11, 2009.
Wellington Management Company, LLP
Portfolio Manager:
James N. Mordy, Senior Vice President
and Equity Portfolio Manager
Performance has been strong over the past year, as we were well-positioned for the improvement in investor psychology that stemmed from stabilization in the economy and some healing in the credit markets. Many of our value stocks, which investors deemed “too risky” last year and thus avoided at all costs, have rebounded strongly over the past 12 months.
| Vanguard Windsor Fund Investment Advisors | |||
| Fund Assets Managed | |||
| Investment Advisor | % | $ Million | Investment Strategy |
| Wellington Management | 67 | 7,909 | An opportunistic, contrarian investment approach that |
| Company, LLP | seeks to identify significantly undervalued securities | ||
| using bottom-up fundamental analysis. As part of its | |||
| long-term strategy, the advisor seeks to take | |||
| advantage of short- and intermediate-term market- | |||
| price dislocations that result from the market’s | |||
| shorter-term focus. | |||
| AllianceBernstein L.P. | 31 | 3,641 | A value focus that couples rigorous fundamental |
| company research with quantitative risk controls to | |||
| capture value opportunities. | |||
| Cash Investments | 2 | 262 | These short-term reserves are invested by Vanguard |
| in equity index products to simulate investment in | |||
| stocks. Each advisor also may maintain a modest | |||
| cash position. | |||
8
We also benefited from increasing exposure to the more-cyclical sectors of the market, particularly during the first half of the fiscal year. We currently have 79% of our portfolio invested in energy, materials, consumer discretionary, information technology, financials, and industrials, which together accounted for about 69% of the S&P 500 Index and 73% of the Russell 1000 Value Index.
Looking across sectors, our outperformance has been fairly broad-based. Health care has been our best sector. We held large positions in both Schering-Plough and Wyeth at the time those companies were targeted for mergers with Merck and Pfizer, respectively. Although health care stocks in general have lagged the overall market, we continue to have a slight overweighting in them as we anticipate some improvement in valuations once the dust settles around industry reform.
The most challenging sector over the past year has been financials, where we benefited from strong stock selection. Our preference for companies with capital-markets exposure rather than a commercial banking focus paid off, because Goldman Sachs was a big winner. When the banks raised equity last spring to satisfy their requirements for exiting TARP (the U.S. Treasury’s Troubled Asset Relief Program), we were able to make significant purchases at very attractive prices.
In the energy sector, Newfield Exploration’s progress in key producing areas has begun to win over some skeptical investors. We
also benefited from an overweighted position and good stock selection in materials, where our chemical and mining names led the way. Consumer discretionary stocks generally rebounded from depressed levels; thus, our overweighted exposure to the sector provided a tailwind. Our stake in U.K. cable operator Virgin Media was a standout for the year, as the company’s fundamentals improved and its debt burden eased. We underperformed in the industrial sector primarily because of the 35% drop in Delta Air Lines shares. All the airlines have shown remarkable discipline in reducing capacity, but this recession hit travel demand much harder than any before.
During the year, we were net buyers in (by order of significance) the financial, energy, materials, utilities, and industrial sectors. We were net sellers in the health care, consumer staples, consumer discretionary, and information technology sectors. Among our more recent purchases were banking companies Bank of America and Wells Fargo, pharmaceutical makers Daiichi Sankyo and Merck, agribusiness leader Bunge, and industrial companies Boeing and Textron. During the first half of the year we increased our exposure to the more cyclical sectors of the market. In comparison with the S&P 500 Index, our largest overweightings are in the consumer discretionary, financial, and materials sectors. Our largest underweightings remain in consumer staples, technology, and telecommunication services.
The U.S. recession appeared to have ended in mid-summer, as evidenced by a solid advance in third-quarter gross
9
domestic product (GDP). Companies that cut back strongly during the crisis have enjoyed remarkable productivity as conditions stabilized. This helped lift corporate profits and fuel the post-March recovery in the equity markets. If inventories merely stop declining—let alone start to be replenished—it would provide another meaningful boost to overall GDP growth. Monthly job losses have slowed, and we believe we could see employment growth early next year.
Despite the improving job picture, we anticipate that U.S. GDP growth will taper off to the 2.5% range next year because consumers will remain reluctant to spend. While we do not anticipate any significant change in Federal Reserve policy over the next six months, equity markets may face some headwinds from any rise in Treasury or mortgage rates as the Fed winds down its purchase programs. We believe our portfolio continues to offer compelling value. Based on analysts’ consensus expectations, our stocks continue to sell at a discount to the price/earnings ratios of both the S&P 500 and Russell 1000 Value Indexes, yet have superior earnings growth prospects over the next five years.
AllianceBernstein L.P.
Portfolio Managers:
Joseph G. Paul, Chief Investment Officer
of North American Value Equities and
Co-Chief Investment Officer of
U.S. Large-Cap Value Equities
David Yuen, Co-Chief Investment Officer
of U.S. Large-Cap Value Equities and
Director of Research—U.S. Value Equities
At the height of the global credit crisis a year ago, we repositioned our U.S. value portfolio away from risks that could not be forecast—that is, companies and industries facing possible government intervention or requiring access to elusive capital. Fortunately, value opportunities were abundant, enabling us to shift the portfolio to stocks that offered better risk/ reward profiles. This strategy has worked over the past 12 months, producing solid outperformance that was driven by both stock and sector selection.
As fears of doomsday scenarios recede, investors are turning their attention to the more fundamental—and analyzable—issues facing individual companies on the road to earnings recovery. This
10
normalization process takes time and is never smooth. Indeed, uncertainties about future earnings remain high, causing wide disparity in stock valuations. As we see it, research will be critical to help us sift through the investment conundrums facing companies as they pull out of recession. This is where our large global research effort has historically given us an edge.
Our research continues to uncover large return potential among value stocks across sectors. Over the past couple of quarters, our transactions have mostly reflected shifting value opportunities within cyclical businesses. Early in the year, we had emphasized companies with strong balance sheets (mostly in technology), firms aggressively cutting costs in response to the economic slump (notably in media and retail), and financial companies poised to benefit from the eventual normalization of the capital markets (insurers and former investment banks). Many of these holdings outperformed in the rally that began in March, and we began trimming them.
Starting in the second calendar quarter, we increased the portfolio’s exposure to a broad array of economically sensitive sectors. In particular, these included industrial-commodities and capital-equipment companies that our research found
significantly undervalued relative to their earnings potential under more normal business conditions. Caterpillar and Ingersoll-Rand, for example, fit the latter category. Both companies enjoy significant stable revenue sources, and our analysis indicates that their cyclical businesses should bounce back sooner and more strongly than is reflected in their current stock prices.
In the energy sector, since early this year we have steadily trimmed positions in large integrated companies as per-barrel oil prices normalized from recession lows to the mid-$70s range much more quickly than we had anticipated. However, our analysts have uncovered some compelling opportunities in the sector laggards. Valero Energy, for example, has suffered because of its exposure to both a sharp decline in diesel fuel demand and an extreme abnormality in the pricing of heavy crude oil. We expect the company to benefit disproportionately on even modest corrections in these market trends.
As anxiety dissipates and corporate profitability gets back on track, we believe that our research-driven approach can continue to deliver very competitive performance as the value cycle, still in its infancy, unfolds.
11
Results of Proxy Voting
At a special meeting of shareholders on July 2, 2009, fund shareholders approved the following two proposals:
Proposal 1—Elect trustees for each fund.*
The individuals listed in the table below were elected as trustees for each fund. All trustees with the exception of Messrs. McNabb and Volanakis (both of whom already served as directors of The Vanguard Group, Inc.) served as trustees to the funds prior to the shareholder meeting.
| Percentage | |||
| Trustee | For | Withheld | For |
| John J. Brennan | 1,462,617,078 | 41,395,188 | 97.2% |
| Charles D. Ellis | 1,458,717,131 | 45,295,136 | 97.0% |
| Emerson U. Fullwood | 1,462,442,012 | 41,570,254 | 97.2% |
| Rajiv L. Gupta | 1,460,115,928 | 43,896,339 | 97.1% |
| Amy Gutmann | 1,463,668,659 | 40,343,607 | 97.3% |
| JoAnn Heffernan Heisen | 1,461,679,414 | 42,332,852 | 97.2% |
| F. William McNabb III | 1,464,260,763 | 39,751,504 | 97.4% |
| André F. Perold | 1,459,755,929 | 44,256,337 | 97.1% |
| Alfred M. Rankin, Jr. | 1,461,179,223 | 42,833,043 | 97.2% |
| Peter F. Volanakis | 1,464,881,112 | 39,131,154 | 97.4% |
| * Results are for all funds within the same trust. |
Proposal 2—Update and standardize the funds’ fundamental policies regarding:
(a) Purchasing and selling real estate.
(b) Issuing senior securities.
(c) Borrowing money.
(d) Making loans.
(e) Purchasing and selling commodities.
(f) Concentrating investments in a particular industry or group of industries.
(g) Eliminating outdated fundamental investment policies not required by law.
The revised fundamental policies are clearly stated and simple, yet comprehensive, making oversight and compliance more efficient than under the former policies. The revised fundamental policies will allow the funds to respond more quickly to regulatory and market changes, while avoiding the costs and delays associated with successive shareholder meetings.
| Broker | Percentage | ||||
| Vanguard Fund | For | Abstain | Against | Non-Votes | For |
| Windsor Fund | |||||
| 2a | 591,976,834 | 12,012,414 | 30,298,706 | 16,146,865 | 91.0% |
| 2b | 590,999,439 | 13,072,969 | 30,215,545 | 16,146,866 | 90.9% |
| 2c | 585,308,550 | 13,121,695 | 35,857,706 | 16,146,868 | 90.0% |
| 2d | 586,552,119 | 12,915,618 | 34,820,214 | 16,146,868 | 90.2% |
| 2e | 588,761,329 | 12,383,944 | 33,142,682 | 16,146,865 | 90.5% |
| 2f | 589,794,808 | 13,263,025 | 31,230,121 | 16,146,865 | 90.7% |
| 2g | 594,936,766 | 12,615,999 | 26,735,187 | 16,146,868 | 91.5% |
12
Fund shareholders did not approve this proposal:
Proposal 3—Institute procedures to prevent holding investments in companies that, in the judgment of the board, substantially contribute to genocide or crimes against humanity, the most egregious violations of human rights.
The trustees recommended a vote against the proposal because it called for procedures that duplicate existing practices and procedures of the Vanguard funds.
| Broker | Percentage | ||||
| Vanguard Fund | For | Abstain | Against | Non-Votes | For |
| Windsor Fund | 62,897,474 | 23,504,407 | 547,886,058 | 16,146,880 | 9.7% |
13
Windsor Fund
Fund Profile
As of October 31, 2009
| Portfolio Characteristics | |||
| Comparative | Broad | ||
| Fund | Index1 | Index2 | |
| Number of Stocks | 166 | 674 | 4,310 |
| Median Market Cap | $20.4B | $30.1B | $28.3B |
| Price/Earnings Ratio | 122.7x | 34.4x | 30.3x |
| Price/Book Ratio | 1.6x | 1.5x | 2.1x |
| Yield3 | 2.4% | 1.9% | |
| Investor Shares | 1.3% | ||
| Admiral Shares | 1.4% | ||
| Return on Equity | 16.9% | 16.8% | 19.4% |
| Earnings Growth Rate | 3.8% | 2.5% | 9.3% |
| Foreign Holdings | 12.4% | 0.0% | 0.0% |
| Turnover Rate | 61% | — | — |
| Expense Ratio4 | — | — | |
| Investor Shares | 0.37% | ||
| Admiral Shares | 0.25% | ||
| Short-Term Reserves | 0.9% | — | — |
| Sector Diversification (% of equity exposure) | |||
| Comparative | Broad | ||
| Fund | Index1 | Index2 | |
| Consumer Discretionary 14.3% | 9.3% | 10.0% | |
| Consumer Staples | 7.1 | 5.7 | 10.3 |
| Energy | 14.7 | 19.5 | 11.6 |
| Financials | 20.4 | 25.0 | 16.3 |
| Health Care | 11.5 | 8.9 | 11.9 |
| Industrials | 9.5 | 10.4 | 10.4 |
| Information Technology | 13.7 | 5.0 | 19.1 |
| Materials | 5.0 | 3.8 | 3.8 |
| Telecommunication | |||
| Services | 2.2 | 5.5 | 2.8 |
| Utilities | 1.6 | 6.9 | 3.8 |
| Volatility Measures5 | ||
| Fund Versus | Fund Versus | |
| Comparative Index1 | Broad Index2 | |
| R-Squared | 0.95 | 0.96 |
| Beta | 1.03 | 1.08 |
| Ten Largest Holdings6 (% of total net assets) | ||
| Wells Fargo & Co. | diversified banks | 2.6% |
| ACE Ltd. | property and | |
| casualty insurance | 2.6 | |
| Pfizer Inc. | pharmaceuticals | 2.5 |
| Cisco Systems Inc. | communications | |
| equipment | 2.1 | |
| Goldman Sachs Group Inc. | investment banking | |
| and brokerage | 2.0 | |
| Comcast Corp. | cable and satellite | 2.0 |
| JPMorgan Chase & Co. | diversified financial | |
| services | 1.9 | |
| Arrow Electronics Inc. | technology | |
| distributors | 1.7 | |
| Bank of America Corp. | diversified financial | |
| services | 1.7 | |
| Merck & Co. Inc. | pharmaceuticals | 1.5 |
| Top Ten | 20.6% | |
Investment Focus
1 Russell 1000 Value Index.
2 Dow Jones U.S. Total Stock Market Index.
3 30-day SEC yield for the fund; annualized dividend yield for the indexes. See the Glossary.
4 The expense ratios shown are from the prospectus dated February 27, 2009, and represent estimated costs for the current fiscal year based
on the fund’s net assets as of the prospectus date. For the fiscal year ended October 31, 2009, the fund’s expense ratios were 0.33% for
Investor Shares and 0.20% for Admiral shares.
5 For an explanation of R-squared, beta, and other terms used here, see the Glossary.
6 The holdings listed exclude any temporary cash investments and equity index products.
14
Windsor Fund
Performance Summary
All of the returns in this report represent past performance, which is not a guarantee of future results that may be achieved by the fund. (Current performance may be lower or higher than the performance data cited. For performance data current to the most recent month-end, visit our website at www.vanguard.com/performance.) Note, too, that both investment returns and principal value can fluctuate widely, so an investor’s shares, when sold, could be worth more or less than their original cost. The returns shown do not reflect taxes that a shareholder would pay on fund distributions or on the sale of fund shares.
Cumulative Performance: October 31, 1999–October 31, 2009
Initial Investment of $10,000
| Average Annual Total Returns | Final Value | |||
| Periods Ended October 31, 2009 | of a $10,000 | |||
| One Year | Five Years | Ten Years | Investment | |
| Windsor Fund Investor Shares1 | 18.22% | –0.83% | 2.85% | $13,250 |
| Dow Jones U.S. Total Stock Market Index | 11.34 | 1.06 | 0.06 | 10,056 |
| Russell 1000 Value Index | 4.78 | –0.05 | 1.70 | 11,839 |
| Multi-Cap Value Funds Average2 | 12.87 | –0.19 | 2.07 | 12,278 |
| Final Value | ||||
| Since | of a $100,000 | |||
| One Year | Five Years | Inception3 | Investment | |
| Windsor Fund Admiral Shares | 18.38% | –0.73% | 1.85% | $115,717 |
| Dow Jones U.S. Total Stock Market Index | 11.34 | 1.06 | 2.19 | 118,874 |
| Russell 1000 Value Index | 4.78 | –0.05 | 2.56 | 122,354 |
1 Total returns do not include the account service fee that may be applicable to certain accounts with balances below $10,000.
2 Derived from data provided by Lipper Inc.
3 Performance for the fund’s Admiral Shares and comparative standards is calculated since the Admiral Shares’ inception: November 12, 2001.
15
Windsor Fund
Fiscal-Year Total Returns (%): October 31, 1999–October 31, 2009
Average Annual Total Returns: Periods Ended September 30, 2009
This table presents average annual total returns through the latest calendar quarter—rather than through the end of the fiscal period. Securities and Exchange Commission rules require that we provide this information.
| Inception Date | One Year | Five Years | Ten Years | |
| Investor Shares1 | 10/23/1958 | 1.15% | 0.26% | 3.61% |
| Admiral Shares | 11/12/2001 | 1.32 | 0.38 | 2.342 |
1 Total returns do not include the account service fee that may be applicable to certain accounts with balances below $10,000.
2 Return since inception.
Note: See Financial Highlights tables for dividend and capital gains information.
16
Windsor Fund
Financial Statements
Statement of Net Assets
As of October 31, 2009
The fund reports a complete list of its holdings in regulatory filings four times in each fiscal year, at the quarter-ends. For the second and fourth fiscal quarters, the lists appear in the fund’s semiannual and annual reports to shareholders. For the first and third fiscal quarters, the fund files the lists with the Securities and Exchange Commission on Form N-Q. Shareholders can look up the fund’s Forms N-Q on the SEC’s website at www.sec.gov. Forms N-Q may also be reviewed and copied at the SEC’s Public Reference Room (see the back cover of this report for further information).
| Market | |||
| Value• | |||
| Shares | ($000) | ||
| Common Stocks (98.6%)1 | |||
| Consumer Discretionary (14.1%) | |||
| Virgin Media Inc. | 12,254,600 | 171,197 | |
| Home Depot Inc. | 6,509,400 | 163,321 | |
| Comcast Corp. | 9,215,800 | 129,206 | |
| 2 | Buck Holdings LP Private | ||
| Placement Shares | 89,488,365 | 124,541 | |
| 3 | MDC Holdings Inc. | 3,302,226 | 107,719 |
| TJX Cos. Inc. | 2,787,000 | 104,094 | |
| Comcast Corp. Class A | 7,093,500 | 102,856 | |
| * | Toll Brothers Inc. | 5,808,800 | 100,608 |
| VF Corp. | 1,352,300 | 96,067 | |
| Staples Inc. | 3,349,000 | 72,673 | |
| Time Warner Inc. | 2,191,700 | 66,014 | |
| News Corp. Class A | 5,420,000 | 62,438 | |
| * | Viacom Inc. Class B | 1,844,400 | 50,887 |
| Time Warner Cable Inc. | 1,243,400 | 49,040 | |
| Lowe’s Cos. Inc. | 2,211,300 | 43,275 | |
| CBS Corp. Class B | 2,983,300 | 35,113 | |
| Macy’s Inc. | 1,367,900 | 24,034 | |
| * | NVR Inc. | 32,904 | 21,791 |
| Whirlpool Corp. | 281,200 | 20,131 | |
| DR Horton Inc. | 1,810,295 | 19,841 | |
| Ltd Brands Inc. | 1,077,472 | 18,964 | |
| * | Office Depot Inc. | 3,038,600 | 18,384 |
| JC Penney Co. Inc. | 546,600 | 18,109 | |
| Harley-Davidson Inc. | 650,000 | 16,198 | |
| Black & Decker Corp. | 244,700 | 11,555 | |
| Pulte Homes Inc. | 1,140,665 | 10,277 | |
| * | TRW Automotive | ||
| Holdings Corp. | 549,700 | 8,603 | |
| 1,666,936 | |||
| Consumer Staples (6.9%) | |||
| Japan Tobacco Inc. | 41,723 | 117,054 | |
| Bunge Ltd. | 1,800,900 | 102,759 | |
| Unilever NV | 2,849,956 | 87,816 | |
| * | BRF—Brasil Foods | ||
| SA ADR | 1,544,300 | 74,698 | |
| Market | |||
| Value• | |||
| Shares | ($000) | ||
| Kroger Co. | 3,217,000 | 74,409 | |
| BRF—Brasil Foods SA | 1,977,700 | 47,680 | |
| Procter & Gamble Co. | 729,900 | 42,334 | |
| Wal-Mart Stores Inc. | 764,400 | 37,976 | |
| Archer-Daniels- | |||
| Midland Co. | 1,221,603 | 36,795 | |
| Altria Group Inc. | 1,902,100 | 34,447 | |
| Kraft Foods Inc. | 1,191,200 | 32,782 | |
| Coca-Cola Enterprises Inc. | 1,325,100 | 25,270 | |
| SUPERVALU Inc. | 1,349,800 | 21,421 | |
| * | Constellation Brands Inc. | ||
| Class A | 1,250,000 | 19,775 | |
| * | Dean Foods Co. | 975,000 | 17,774 |
| * | Smithfield Foods Inc. | 1,150,400 | 15,346 |
| Sara Lee Corp. | 987,400 | 11,148 | |
| Tyson Foods Inc. Class A | 750,000 | 9,390 | |
| 808,874 | |||
| Energy (14.4%) | |||
| Apache Corp. | 1,833,943 | 172,611 | |
| * | Newfield Exploration Co. | 3,937,200 | 161,504 |
| Baker Hughes Inc. | 3,412,200 | 143,551 | |
| Noble Energy Inc. | 1,999,800 | 131,247 | |
| Exxon Mobil Corp. | 1,643,400 | 117,782 | |
| ConocoPhillips | 2,221,000 | 111,450 | |
| Canadian Natural | |||
| Resources Ltd. | 1,520,200 | 98,311 | |
| BP PLC ADR | 1,636,600 | 92,664 | |
| * | Southwestern Energy Co. | 1,588,300 | 69,218 |
| Total SA ADR | 978,700 | 58,791 | |
| Halliburton Co. | 1,987,000 | 58,040 | |
| Devon Energy Corp. | 845,732 | 54,727 | |
| Chevron Corp. | 711,600 | 54,466 | |
| Valero Energy Corp. | 2,780,695 | 50,331 | |
| Petroleo Brasileiro | |||
| SA ADR | 1,239,400 | 49,725 | |
| Consol Energy Inc. | 1,065,000 | 45,593 | |
| Peabody Energy Corp. | 1,112,300 | 44,036 | |
17
| Windsor Fund | |||
| Market | |||
| Value• | |||
| Shares | ($000) | ||
| Occidental | |||
| Petroleum Corp. | 578,500 | 43,897 | |
| EOG Resources Inc. | 384,400 | 31,390 | |
| Nexen Inc. | 1,450,000 | 31,131 | |
| * | Weatherford | ||
| International Ltd. | 1,569,200 | 27,508 | |
| Cimarex Energy Co. | 542,110 | 21,229 | |
| ENSCO International Inc. | 425,000 | 19,461 | |
| Rowan Cos. Inc. | 490,000 | 11,392 | |
| 1,700,055 | |||
| Exchange-Traded Funds (1.0%) | |||
| ^,4 | Vanguard Value ETF | 1,689,100 | 75,773 |
| 4 | Vanguard Total Stock | ||
| Market ETF | 892,000 | 46,545 | |
| 122,318 | |||
| Financials (19.9%) | |||
| Wells Fargo & Co. | 11,181,100 | 307,704 | |
| ACE Ltd. | 5,964,600 | 306,342 | |
| Goldman Sachs | |||
| Group Inc. | 1,400,100 | 238,255 | |
| JPMorgan Chase & Co. | 5,492,350 | 229,415 | |
| Bank of America Corp. | 13,904,700 | 202,730 | |
| Ameriprise Financial Inc. | 4,611,400 | 159,877 | |
| US Bancorp | 5,967,300 | 138,561 | |
| * | TD Ameritrade | ||
| Holding Corp. | 5,510,700 | 106,356 | |
| Principal Financial | |||
| Group Inc. | 3,781,100 | 94,679 | |
| Invesco Ltd. | 3,851,754 | 81,465 | |
| Unum Group | 3,677,915 | 73,374 | |
| PartnerRe Ltd. | 881,500 | 67,417 | |
| Morgan Stanley | 1,338,200 | 42,983 | |
| MetLife Inc. | 1,208,300 | 41,118 | |
| Travelers Cos. Inc. | 815,700 | 40,614 | |
| Deutsche Bank AG | 541,427 | 38,782 | |
| Allstate Corp. | 1,212,566 | 35,856 | |
| XL Capital Ltd. Class A | 2,128,900 | 34,935 | |
| * | UBS AG | 1,856,200 | 30,952 |
| Lincoln National Corp. | 1,104,600 | 26,323 | |
| Citigroup Inc. | 6,200,000 | 25,358 | |
| BB&T Corp. | 1,009,600 | 24,140 | |
| 2,347,236 | |||
| Health Care (11.2%) | |||
| Pfizer Inc. | 17,566,100 | 299,151 | |
| Merck & Co. Inc. | 5,833,700 | 180,436 | |
| Covidien PLC | 2,629,475 | 110,753 | |
| Cardinal Health Inc. | 3,736,500 | 105,892 | |
| Schering-Plough Corp. | 3,684,409 | 103,900 | |
| Daiichi Sankyo Co. Ltd. | 5,061,600 | 98,882 | |
| CIGNA Corp. | 3,068,000 | 85,413 | |
| UnitedHealth Group Inc. | 3,291,300 | 85,409 | |
| Market | |||
| Value• | |||
| Shares | ($000) | ||
| Medtronic Inc. | 2,304,300 | 82,264 | |
| * | Amgen Inc. | 1,286,300 | 69,113 |
| * | Genzyme Corp. | 1,075,600 | 54,425 |
| GlaxoSmithKline PLC ADR | 435,000 | 17,905 | |
| Aetna Inc. | 650,000 | 16,920 | |
| * | Laboratory Corp. of | ||
| America Holdings | 179,600 | 12,373 | |
| 1,322,836 | |||
| Industrials (9.3%) | |||
| * | Delta Air Lines Inc. | 21,941,300 | 156,661 |
| Pentair Inc. | 4,357,500 | 126,803 | |
| Textron Inc. | 5,264,700 | 93,606 | |
| General Electric Co. | 6,285,200 | 89,627 | |
| Deere & Co. | 1,803,300 | 82,140 | |
| Boeing Co. | 1,675,000 | 80,065 | |
| Dover Corp. | 1,952,900 | 73,585 | |
| FedEx Corp. | 912,300 | 66,315 | |
| Waste Management Inc. | 2,026,100 | 60,540 | |
| JB Hunt Transport | |||
| Services Inc. | 1,789,500 | 53,792 | |
| Northrop Grumman Corp. | 967,000 | 48,476 | |
| Ingersoll-Rand PLC | 1,495,000 | 47,227 | |
| Caterpillar Inc. | 538,000 | 29,622 | |
| * | Thomas & Betts Corp. | 641,600 | 21,949 |
| Masco Corp. | 1,600,000 | 18,800 | |
| SPX Corp. | 318,992 | 16,837 | |
| * | Cooper Industries PLC | ||
| Class A | 393,115 | 15,210 | |
| * | Hertz Global Holdings Inc. | 1,394,700 | 12,985 |
| 1,094,240 | |||
| Information Technology (13.3%) | |||
| * | Cisco Systems Inc. | 10,814,500 | 247,111 |
| *,3 | Arrow Electronics Inc. | 8,119,350 | 205,744 |
| Microsoft Corp. | 6,005,000 | 166,519 | |
| Hewlett-Packard Co. | 3,189,600 | 151,378 | |
| Corning Inc. | 8,172,700 | 119,403 | |
| Accenture PLC Class A | 2,891,400 | 107,213 | |
| * | Flextronics | ||
| International Ltd. | 12,023,400 | 77,912 | |
| Texas Instruments Inc. | 3,073,200 | 72,067 | |
| * | Lam Research Corp. | 2,055,700 | 69,318 |
| * | Symantec Corp. | 2,968,000 | 52,177 |
| Tyco Electronics Ltd. | 2,396,665 | 50,929 | |
| Motorola Inc. | 4,584,000 | 39,285 | |
| * | Dell Inc. | 2,600,000 | 37,674 |
| Nokia Oyj ADR | 2,607,900 | 32,886 | |
| * | Computer Sciences Corp. | 474,100 | 24,042 |
| * | SAIC Inc. | 1,333,600 | 23,618 |
| International Business | |||
| Machines Corp. | 151,500 | 18,272 | |
| Seagate Technology | 1,276,700 | 17,810 | |
18
| Windsor Fund | |||
| Market | |||
| Value• | |||
| Shares | ($000) | ||
| * | Electronic Arts Inc. | 950,000 | 17,328 |
| * | Teradyne Inc. | 2,000,000 | 16,740 |
| * | Micron Technology Inc. | 2,300,000 | 15,617 |
| * | Western Digital Corp. | 330,431 | 11,129 |
| 1,574,172 | |||
| Materials (4.9%) | |||
| * | Owens-Illinois Inc. | 3,389,300 | 108,051 |
| Rexam PLC | 22,720,880 | 102,885 | |
| HeidelbergCement AG | 1,404,404 | 84,004 | |
| Agrium Inc. | 1,398,700 | 65,669 | |
| * | Vale SA Class B ADR | 2,134,400 | 54,406 |
| EI du Pont | |||
| de Nemours & Co. | 1,636,900 | 52,086 | |
| Yara International ASA | 1,217,300 | 40,240 | |
| Mosaic Co. | 860,200 | 40,197 | |
| AK Steel Holding Corp. | 875,000 | 13,886 | |
| Eastman Chemical Co. | 168,000 | 8,822 | |
| Dow Chemical Co. | 226,993 | 5,330 | |
| 575,576 | |||
| Telecommunication Services (2.1%) | |||
| AT&T Inc. | 5,588,417 | 143,455 | |
| * | Sprint Nextel Corp. | 15,347,998 | 45,430 |
| Verizon | |||
| Communications Inc. | 1,208,200 | 35,751 | |
| Vodafone Group PLC ADR | 1,206,000 | 26,761 | |
| 251,397 | |||
| Utilities (1.5%) | |||
| Allegheny Energy Inc. | 3,023,000 | 68,985 | |
| PG&E Corp. | 1,077,000 | 44,039 | |
| NiSource Inc. | 1,700,200 | 21,967 | |
| Pepco Holdings Inc. | 1,250,000 | 18,662 | |
| Northeast Utilities | 691,500 | 15,939 | |
| * | RRI Energy Inc. | 1,958,842 | 10,323 |
| 179,915 | |||
| Total Common Stocks | |||
| (Cost $11,646,286) | 11,643,555 | ||
| Temporary Cash Investments (2.2%)1 | |||
| Money Market Fund (1.5%) | |||
| 5,6 | Vanguard Market | ||
| Liquidity Fund, 0.225% | 175,160,757 | 175,161 | |
| Face | Market | |
| Amount | Value• | |
| ($000) | ($000) | |
| Repurchase Agreement (0.5%) | ||
| Bank America, N.A. | ||
| 0.080%, 11/2/09 | ||
| (Dated 10/30/09, | ||
| Repurchase Value | ||
| $54,500,000, collateralized | ||
| by Government | ||
| National Mortgage Assn. | ||
| 5.000%, 8/15/39) | 54,500 | 54,500 |
U.S. Government and Agency Obligations (0.2%)
| 7,8 Federal Home Loan Bank | ||
| Discount Notes, 0.275%, | ||
| 2/19/10 | 30,000 | 29,990 |
| Total Temporary Cash Investments | ||
| (Cost $259,636) | 259,651 | |
| Total Investments (100.8%) | ||
| (Cost $11,905,922) | 11,903,206 | |
| Other Assets and Liabilities (–0.8%) | ||
| Other Assets | 157,808 | |
| Liabilities6 | (248,800) | |
| (90,992) | ||
| Net Assets (100%) | 11,812,214 | |
19
Windsor Fund
| At October 31, 2009, net assets consisted of: | |
| Amount | |
| ($000) | |
| Paid-in Capital | 16,414,393 |
| Undistributed Net Investment Income | 21,120 |
| Accumulated Net Realized Losses | (4,620,802) |
| Unrealized Appreciation (Depreciation) | |
| Investment Securities | (2,716) |
| Futures Contracts | 221 |
| Foreign Currencies | (2) |
| Net Assets | 11,812,214 |
| Investor Shares—Net Assets | |
| Applicable to 693,890,470 outstanding | |
| $.001 par value shares of beneficial | |
| interest (unlimited authorization) | 7,609,710 |
| Net Asset Value Per Share— | |
| Investor Shares | $10.97 |
| Admiral Shares—Net Assets | |
| Applicable to 113,544,450 outstanding | |
| $.001 par value shares of beneficial | |
| interest (unlimited authorization) | 4,202,504 |
| Net Asset Value Per Share— | |
| Admiral Shares | $37.01 |
• See Note A in Notes to Financial Statements.
* Non-income-producing security.
^ Part of security position is on loan to broker-dealers. The total value of securities on loan is $8,152,000.
1 The fund invests a portion of its cash reserves in equity markets through the use of index futures contracts. After giving effect to futures
investments, the fund’s effective common stock and temporary cash investment positions represent 99.8% and 1.0%, respectively, of net
assets.
2 Restricted security represents 1.1% of net assets.
3 Considered an affiliated company of the fund as the fund owns more than 5% of the outstanding voting securities of such company.
4 Considered an affiliated company of the fund as the issuer is another member of The Vanguard Group.
5 Affiliated money market fund available only to Vanguard funds and certain trusts and accounts managed by Vanguard. Rate shown is
the 7-day yield.
6 Includes $9,870,000 of collateral received for securities on loan.
7 Securities with a value of $29,990,000 have been segregated as initial margin for open futures contracts.
8 The issuer operates under a congressional charter; its securities are not backed by the full faith and credit of the U.S. government.
ADR—American Depositary Receipt.
See accompanying Notes, which are an integral part of the Financial Statements.
20
Windsor Fund
Statement of Operations
| Year Ended | |
| October 31, 2009 | |
| ($000) | |
| Investment Income | |
| Income | |
| Dividends1,2 | 249,484 |
| Interest2 | 2,536 |
| Security Lending | 1,618 |
| Total Income | 253,638 |
| Expenses | |
| Investment Advisory Fees—Note B | |
| Basic Fee | 13,438 |
| Performance Adjustment | (5,030) |
| The Vanguard Group—Note C | |
| Management and Administrative—Investor Shares | 14,219 |
| Management and Administrative—Admiral Shares | 3,961 |
| Marketing and Distribution—Investor Shares | 1,772 |
| Marketing and Distribution—Admiral Shares | 1,022 |
| Custodian Fees | 175 |
| Auditing Fees | 26 |
| Shareholders’ Reports and Proxies—Investor Shares | 401 |
| Shareholders’ Reports and Proxies—Admiral Shares | 69 |
| Trustees’ Fees and Expenses | 22 |
| Total Expenses | 30,075 |
| Expenses Paid Indirectly | (1,218) |
| Net Expenses | 28,857 |
| Net Investment Income | 224,781 |
| Realized Net Gain (Loss) | |
| Investment Securities Sold2 | (2,135,423) |
| Futures Contracts | 1,459 |
| Foreign Currencies | 512 |
| Realized Net Gain (Loss) | (2,133,452) |
| Change in Unrealized Appreciation (Depreciation) | |
| Investment Securities | 3,654,791 |
| Futures Contracts | 25,573 |
| Foreign Currencies | (533) |
| Change in Unrealized Appreciation (Depreciation) | 3,679,831 |
| Net Increase (Decrease) in Net Assets Resulting from Operations | 1,771,160 |
1 Dividends are net of foreign withholding taxes of $3,840,000.
2 Dividend income, interest income, and realized net gain (loss) from affiliated companies of the fund were $6,446,000, $1,867,000, and
($81,374,000), respectively.
See accompanying Notes, which are an integral part of the Financial Statements.
21
Windsor Fund
Statement of Changes in Net Assets
| Year Ended October 31, | ||
| 2009 | 2008 | |
| ($000) | ($000) | |
| Increase (Decrease) in Net Assets | ||
| Operations | ||
| Net Investment Income | 224,781 | 361,217 |
| Realized Net Gain (Loss) | (2,133,452) | (2,377,257) |
| Change in Unrealized Appreciation (Depreciation) | 3,679,831 | (7,824,625) |
| Net Increase (Decrease) in Net Assets Resulting from Operations | 1,771,160 | (9,840,665) |
| Distributions | ||
| Net Investment Income | ||
| Investor Shares | (159,222) | (218,586) |
| Admiral Shares | (101,534) | (157,337) |
| Realized Capital Gain1 | ||
| Investor Shares | — | (1,480,134) |
| Admiral Shares | — | (995,876) |
| Total Distributions | (260,756) | (2,851,933) |
| Capital Share Transactions | ||
| Investor Shares | (413,053) | 137,492 |
| Admiral Shares | (1,049,588) | 60,195 |
| Net Increase (Decrease) from Capital Share Transactions | (1,462,641) | 197,687 |
| Total Increase (Decrease) | 47,763 | (12,494,911) |
| Net Assets | ||
| Beginning of Period | 11,764,451 | 24,259,362 |
| End of Period2 | 11,812,214 | 11,764,451 |
1 Includes fiscal 2008 short-term gain distributions totaling $223,640,000. Short-term gain distributions are treated as ordinary income
dividends for tax purposes.
2 Net Assets—End of Period includes undistributed net investment income of $21,120,000 and $56,583,000.
See accompanying Notes, which are an integral part of the Financial Statements.
22
Windsor Fund
Financial Highlights
| Investor Shares | |||||
| For a Share Outstanding | Year Ended October 31, | ||||
| Throughout Each Period | 2009 | 2008 | 2007 | 2006 | 2005 |
| Net Asset Value, Beginning of Period | $9.51 | $19.52 | $19.27 | $17.81 | $16.75 |
| Investment Operations | |||||
| Net Investment Income | .197 | .279 | .298 | .277 | .265 |
| Net Realized and Unrealized Gain (Loss) | |||||
| on Investments | 1.486 | (7.985) | 1.782 | 3.007 | 1.163 |
| Total from Investment Operations | 1.683 | (7.706) | 2.080 | 3.284 | 1.428 |
| Distributions | |||||
| Dividends from Net Investment Income | (.223) | (.289) | (.301) | (.265) | (.280) |
| Distributions from Realized Capital Gains | — | (2.015) | (1.529) | (1.559) | (.088) |
| Total Distributions | (.223) | (2.304) | (1.830) | (1.824) | (.368) |
| Net Asset Value, End of Period | $10.97 | $9.51 | $19.52 | $19.27 | $17.81 |
| Total Return1 | 18.22% | –43.88% | 11.24% | 19.72% | 8.54% |
| Ratios/Supplemental Data | |||||
| Net Assets, End of Period (Millions) | $7,610 | $7,041 | $14,490 | $14,140 | $12,871 |
| Ratio of Total Expenses to | |||||
| Average Net Assets2 | 0.33% | 0.30% | 0.31% | 0.36% | 0.37% |
| Ratio of Net Investment Income to | |||||
| Average Net Assets | 2.03% | 1.91% | 1.50% | 1.50% | 1.47% |
| Portfolio Turnover Rate | 61%3 | 55% | 40% | 38% | 32% |
1 Total returns do not include the account service fee that may be applicable to certain accounts with balances below $10,000.
2 Includes performance-based investment advisory fee increases (decreases) of (0.05%), (0.03%), (0.01%), 0.02%, and 0.04%.
3 Excludes the value of portfolio securities received or delivered as a result of in-kind purchases or redemptions of the fund’s capital shares.
See accompanying Notes, which are an integral part of the Financial Statements.
23
Windsor Fund
Financial Highlights
| Admiral Shares | |||||
| For a Share Outstanding | Year Ended October 31, | ||||
| Throughout Each Period | 2009 | 2008 | 2007 | 2006 | 2005 |
| Net Asset Value, Beginning of Period | $32.08 | $65.90 | $65.04 | $60.12 | $56.56 |
| Investment Operations | |||||
| Net Investment Income | .701 | .999 | 1.085 | 1.000 | .968 |
| Net Realized and Unrealized Gain (Loss) | |||||
| on Investments | 5.020 | (26.974) | 6.019 | 10.150 | 3.896 |
| Total from Investment Operations | 5.721 | (25.975) | 7.104 | 11.150 | 4.864 |
| Distributions | |||||
| Dividends from Net Investment Income | (.791) | (1.047) | (1.085) | (.970) | (1.007) |
| Distributions from Realized Capital Gains | — | (6.798) | (5.159) | (5.260) | (.297) |
| Total Distributions | (.791) | (7.845) | (6.244) | (6.230) | (1.304) |
| Net Asset Value, End of Period | $37.01 | $32.08 | $65.90 | $65.04 | $60.12 |
| Total Return | 18.38% | –43.85% | 11.38% | 19.85% | 8.62% |
| Ratios/Supplemental Data | |||||
| Net Assets, End of Period (Millions) | $4,203 | $4,723 | $9,770 | $8,987 | $7,551 |
| Ratio of Total Expenses to | |||||
| Average Net Assets1 | 0.20% | 0.17% | 0.19% | 0.25% | 0.27% |
| Ratio of Net Investment Income to | |||||
| Average Net Assets | 2.16% | 2.04% | 1.62% | 1.61% | 1.57% |
| Portfolio Turnover Rate | 61%2 | 55% | 40% | 38% | 32% |
1 Includes performance-based investment advisory fee increases (decreases) of (0.05%), (0.03%), (0.01%), 0.02%, and 0.04%.
2 Excludes the value of portfolio securities received or delivered as a result of in-kind purchases or redemptions of the fund’s capital shares.
See accompanying Notes, which are an integral part of the Financial Statements.
24
Windsor Fund
Notes to Financial Statements
Vanguard Windsor Fund is registered under the Investment Company Act of 1940 as an open-end investment company, or mutual fund. The fund offers two classes of shares: Investor Shares and Admiral Shares. Investor Shares are available to any investor who meets the fund’s minimum purchase requirements. Admiral Shares are designed for investors who meet certain administrative, service, tenure, and account-size criteria.
A. The following significant accounting policies conform to generally accepted accounting principles for U.S. mutual funds. The fund consistently follows such policies in preparing its financial statements.
1. Security Valuation: Securities are valued as of the close of trading on the New York Stock Exchange (generally 4 p.m., Eastern time) on the valuation date. Equity securities are valued at the latest quoted sales prices or official closing prices taken from the primary market in which each security trades; such securities not traded on the valuation date are valued at the mean of the latest quoted bid and asked prices. Securities for which market quotations are not readily available, or whose values have been affected by events occurring before the fund’s pricing time but after the close of the securities’ primary markets, are valued at their fair values calculated according to procedures adopted by the board of trustees. These procedures include obtaining quotations from an independent pricing service, monitoring news to identify significant market- or security-specific events, and evaluating changes in the values of foreign market proxies (for example, ADRs, futures contracts, or exchange-traded funds), between the time the foreign markets close and the fund’s pricing time. When fair-value pricing is employed, the prices of securities used by a fund to calculate its net asset value may differ from quoted or published prices for the same securities. Investments in Vanguard Market Liquidity Fund are valued at that fund’s net asset value. Temporary cash investments acquired over 60 days to maturity are valued using the latest bid prices or using valuations based on a matrix system (which considers such factors as security prices, yields, maturities, and ratings), both as furnished by independent pricing services. Other temporary cash investments are valued at amortized cost, which approximates market value.
2. Foreign Currency: Securities and other assets and liabilities denominated in foreign currencies are translated into U.S. dollars using exchange rates obtained from an independent third party as of the fund’s pricing time on the valuation date. Realized gains (losses) and unrealized appreciation (depreciation) on investment securities include the effects of changes in exchange rates since the securities were purchased, combined with the effects of changes in security prices. Fluctuations in the value of other assets and liabilities resulting from changes in exchange rates are recorded as unrealized foreign currency gains (losses) until the assets or liabilities are settled in cash, at which time they are recorded as realized foreign currency gains (losses).
3. Futures Contracts: The fund uses index futures contracts to a limited extent, with the objective of maintaining full exposure to the stock market while maintaining liquidity. The fund may purchase or sell futures contracts to achieve a desired level of investment, whether to accommodate portfolio turnover or cash flows from capital share transactions. The primary risks associated with the use of futures contracts are imperfect correlation between changes in market values of stocks held by the fund and the prices of futures contracts, and the possibility of an illiquid market.
Futures contracts are valued at their quoted daily settlement prices. The aggregate principal amounts of the contracts are not recorded in the Statement of Net Assets. Fluctuations in the value of the contracts are recorded in the Statement of Net Assets as an asset (liability) and in the Statement of Operations as unrealized appreciation (depreciation) until the contracts are closed, when they are recorded as realized futures gains (losses).
25
Windsor Fund
4. Repurchase Agreements: The fund may invest in repurchase agreements. Securities pledged as collateral for repurchase agreements are held by a custodian bank until the agreements mature. Each agreement requires that the market value of the collateral be sufficient to cover payments of interest and principal; however, in the event of default or bankruptcy by the other party to the agreement, retention of the collateral may be subject to legal proceedings.
5. Federal Income Taxes: The fund intends to continue to qualify as a regulated investment company and distribute all of its taxable income. Management has analyzed the fund’s tax positions taken for all open federal income tax years (October 31, 2006–2009), and has concluded that no provision for federal income tax is required in the fund’s financial statements.
6. Distributions: Distributions to shareholders are recorded on the ex-dividend date.
7. Security Lending: The fund may lend its securities to qualified institutional borrowers to earn additional income. Security loans are required to be secured at all times by collateral at least equal to the market value of securities loaned. The fund invests cash collateral received in Vanguard Market Liquidity Fund, and records a liability for the return of the collateral, during the period the securities are on loan. Security lending income represents the income earned on investing cash collateral, less expenses associated with the loan.
8. Other: Dividend income is recorded on the ex-dividend date. Interest income includes income distributions received from Vanguard Market Liquidity Fund and is accrued daily. Security transactions are accounted for on the date securities are bought or sold. Costs used to determine realized gains (losses) on the sale of investment securities are those of the specific securities sold.
Each class of shares has equal rights as to assets and earnings, except that each class separately bears certain class-specific expenses related to maintenance of shareholder accounts (included in Management and Administrative expenses), shareholder reporting, and proxies. Marketing and distribution expenses are allocated to each class of shares based on a method approved by the board of trustees. Income, other non-class-specific expenses, and gains and losses on investments are allocated to each class of shares based on its relative net assets.
B. AllianceBernstein L.P. and Wellington Management Company, LLP, each provide investment advisory services to a portion of the fund for a fee calculated at an annual percentage rate of average net assets managed by the advisor. The basic fees of each advisor are subject to quarterly adjustments based on performance for the preceding three years relative to a designated market index: for AllianceBernstein L.P., the Russell 1000 Value Index; and for Wellington Management Company, LLP, the S&P 500 Index.
The Vanguard Group manages the cash reserves of the fund on an at-cost basis.
For the year ended October 31, 2009, the aggregate investment advisory fee represented an effective annual basic rate of 0.12% of the fund’s average net assets, before a decrease of $5,030,000 (0.05%) based on performance.
C. The Vanguard Group furnishes at cost corporate management, administrative, marketing, and distribution services. The costs of such services are allocated to the fund under methods approved by the board of trustees. The fund has committed to provide up to 0.40% of its net assets in capital contributions to Vanguard. At October 31, 2009, the fund had contributed capital of $2,554,000 to Vanguard (included in Other Assets), representing 0.02% of the fund’s net assets and 1.02% of Vanguard’s capitalization. The fund’s trustees and officers are also directors and officers of Vanguard.
26
Windsor Fund
D. The fund has asked its investment advisors to direct certain security trades, subject to obtaining the best price and execution, to brokers who have agreed to rebate to the fund part of the commissions generated. Such rebates are used solely to reduce the fund’s management and administrative expenses. For the year ended October 31, 2009, these arrangements reduced the fund’s expenses by $1,218,000 (an annual rate of 0.01% of average net assets).
E. Various inputs may be used to determine the value of the fund’s investments. These inputs are summarized in three broad levels for financial statement purposes. The inputs or methodologies used to value securities are not necessarily an indication of the risk associated with investing in those securities.
Level 1—Quoted prices in active markets for identical securities.
Level 2—Other significant observable inputs (including quoted prices for similar securities, interest
rates, prepayment speeds, credit risk, etc.).
Level 3—Significant unobservable inputs (including the fund’s own assumptions used to determine
the fair value of investments).
The following table summarizes the fund’s investments as of October 31, 2009, based on the inputs used to value them:
| Level 1 | Level 2 | Level 3 | |
| Investments | ($000) | ($000) | ($000) |
| Common Stocks | 10,957,180 | 561,834 | 124,541 |
| Temporary Cash Investments | 175,161 | 84,490 | — |
| Futures Contracts—Liabilities1 | (3,807) | — | — |
| Total | 11,128,534 | 646,324 | 124,541 |
| 1 Represents variation margin on the last day of the reporting period. |
The following table summarizes changes in investments valued based on Level 3 inputs during the year ended October 31, 2009:
| Investments in | |
| Common Stocks | |
| ($000) | |
| Amount Valued Based on Level 3 Inputs | |
| Balance as of October 31, 2008 | 94,849 |
| Change in Unrealized Appreciation (Depreciation) | 29,692 |
| Balance as of October 31, 2009 | 124,541 |
27
Windsor Fund
F. At October 31, 2009, the aggregate settlement value of open futures contracts and the related unrealized appreciation (depreciation) were:
| ($000) | ||||
| Number of | Aggregate | Unrealized | ||
| Long (Short) | Settlement | Appreciation | ||
| Futures Contracts | Expiration | Contracts | Value | (Depreciation) |
| S&P 500 Index | December 2009 | 488 | 126,026 | 638 |
| S&P MidCap 400 Index | December 2009 | 37 | 12,162 | (417) |
Unrealized appreciation (depreciation) on open futures contracts is required to be treated as realized gain (loss) for tax purposes.
G. Distributions are determined on a tax basis and may differ from net investment income and realized capital gains for financial reporting purposes. Differences may be permanent or temporary. Permanent differences are reclassified among capital accounts in the financial statements to reflect their tax character. Temporary differences arise when certain items of income, expense, gain, or loss are recognized in different periods for financial statement and tax purposes; these differences will reverse at some time in the future. Differences in classification may also result from the treatment of short-term gains as ordinary income for tax purposes.
During the year ended October 31, 2009, the fund realized net foreign currency gains of $512,000, which increased distributable net income for tax purposes; accordingly, such gains have been reclassified from accumulated net realized losses to undistributed net investment income.
During the year ended October 31, 2009, the fund realized $106,065,000 of net capital gains resulting from in-kind redemptions—in which shareholders exchanged fund shares for securities held by the fund rather than for cash. Because such gains are not taxable to the fund, and are not distributed to shareholders, they have been reclassified from accumulated net realized losses to paid-in capital.
For tax purposes, at October 31, 2009, the fund had $51,434,000 of ordinary income available for distribution. The fund had available capital loss carryforwards totaling $4,613,757,000 to offset future net capital gains of $2,383,312,000 through October 31, 2016, and $2,230,445,000 through October 31, 2017.
At October 31, 2009, the cost of investment securities for tax purposes was $11,912,652,000. Net unrealized depreciation of investment securities for tax purposes was $9,446,000, consisting of unrealized gains of $1,514,672,000 on securities that had risen in value since their purchase and $1,524,118,000 in unrealized losses on securities that had fallen in value since their purchase.
H. During the year ended October 31, 2009, the fund purchased $6,348,339,000 of investment securities and sold $7,609,225,000 of investment securities, other than temporary cash investments.
28
Windsor Fund
I. Certain of the fund’s investments are in companies that are considered to be affiliated companies of the fund because the fund owns more than 5% of the outstanding voting securities of the company. Transactions during the period in securities of these companies were as follows:
| Current Period Transactions | |||||
| Oct. 31, 2008 | Proceeds from | Oct. 31, 2009 | |||
| Market | Purchases | Securities | Dividend | Market | |
| Value | at Cost | Sold | Income | Value | |
| ($000) | ($000) | ($000) | ($000) | ($000) | |
| Arrow Electronics Inc. | 148,768 | 15,943 | 23,344 | — | 205,744 |
| Delta Air Lines Inc. | 318,614 | 21,664 | 73,255 | — | NA1 |
| MDC Holdings Inc. | 93,126 | 29,604 | 12,760 | 3,153 | 107,719 |
| 560,508 | 3,153 | 313,463 | |||
| 1 | Not applicable—At October 31, 2009, the security was still held but the issuer was no longer an affiliated company of the fund. |
| J. | Capital share transactions for each class of shares were: |
| Year Ended October 31, | ||||
| 2009 | 2008 | |||
| Amount | Shares | Amount | Shares | |
| ($000) | (000) | ($000) | (000) | |
| Investor Shares | ||||
| Issued | 837,675 | 92,979 | 1,320,658 | 96,832 |
| Issued in Lieu of Cash Distributions | 155,346 | 17,218 | 1,656,282 | 108,083 |
| Redeemed | (1,406,074) | (157,026) | (2,839,448) | (206,467) |
| Net Increase (Decrease)—Investor Shares | (413,053) | (46,829) | 137,492 | (1,552) |
| Admiral Shares | ||||
| Issued | 291,226 | 9,177 | 397,018 | 8,532 |
| Issued in Lieu of Cash Distributions | 91,474 | 3,020 | 1,059,372 | 20,503 |
| Redeemed | (1,432,288) | (45,863) | (1,396,195) | (30,080) |
| Net Increase (Decrease)—Admiral Shares | (1,049,588) | (33,666) | 60,195 | (1,045) |
K. In preparing the financial statements as of October 31, 2009, management considered the impact of subsequent events occurring through December 8, 2009, for potential recognition or disclosure in these financial statements.
29
Report of Independent Registered Public Accounting Firm
To the Trustees of Vanguard Windsor Funds and the Shareholders of Vanguard Windsor Fund:
In our opinion, the accompanying statement of net assets and the related statements of operations and of changes in net assets and the financial highlights present fairly, in all material respects, the financial position of Vanguard Windsor Fund (the “Fund”) at October 31, 2009, the results of its operations for the year then ended, the changes in its net assets for each of the two years in the period then ended and the financial highlights for each of the five years in the period then ended, in conformity with accounting principles generally accepted in the United States of America. These financial statements and financial highlights (hereafter referred to as “financial statements”) are the responsibility of the Fund’s management; our responsibility is to express an opinion on these financial statements based on our audits. We conducted our audits of these financial statements in accordance with the standards of the Public Company Accounting Oversight Board (United States). Those standards require that we plan and perform the audit to obtain reasonable assurance about whether the financial statements are free of material misstatement. An audit includes examining, on a test basis, evidence supporting the amounts and disclosures in the financial statements, assessing the accounting principles used and significant estimates made by management, and evaluating the overall financial statement presentation. We believe that our audits, which included confirmation of securities at October 31, 2009 by correspondence with the custodians and brokers and by agreement to the underlying ownership records of Vanguard Market Liquidity Fund, provide a reasonable basis for our opinion.
PricewaterhouseCoopers LLP
Philadelphia, Pennsylvania
December 8, 2009
Special 2009 tax information (unaudited) for Vanguard Windsor Fund
This information for the fiscal year ended October 31, 2009, is included pursuant to provisions of the Internal Revenue Code.
The fund distributed $260,756,000 of qualified dividend income to shareholders during the fiscal year.
For corporate shareholders, 87.0% of investment income (dividend income plus short-term gains, if any) qualifies for the dividends-received deduction.
30
Your Fund’s After-Tax Returns
This table presents returns for your fund both before and after taxes. The after-tax returns are shown in two ways: (1) assuming that an investor owned the fund during the entire period and paid taxes on the fund’s distributions, and (2) assuming that an investor paid taxes on the fund’s distributions and sold all shares at the end of each period.
Calculations are based on the highest individual federal income tax and capital gains tax rates in effect at the times of the distributions and the hypothetical sales. State and local taxes were not considered. After-tax returns reflect any qualified dividend income, using actual prior-year figures and estimates for 2009. (In the example, returns after the sale of fund shares may be higher than those assuming no sale. This occurs when the sale would have produced a capital loss. The calculation assumes that the investor received a tax deduction for the loss.)
The table shows returns for Investor Shares only; returns for other share classes will differ. Please note that your actual after-tax returns will depend on your tax situation and may differ from those shown. Also note that if you own the fund in a tax-deferred account, such as an individual retirement account or a 401(k) plan, this information does not apply to you. Such accounts are not subject to current taxes.
Finally, keep in mind that a fund’s performance—whether before or after taxes—does not guarantee future results.
| Average Annual Total Returns: Windsor Fund Investor Shares1 | |||
| Periods Ended October 31, 2009 | |||
| One | Five | Ten | |
| Year | Years | Years | |
| Returns Before Taxes | 18.22% | –0.83% | 2.85% |
| Returns After Taxes on Distributions | 17.79 | –2.00 | 1.45 |
| Returns After Taxes on Distributions and Sale of Fund Shares | 12.26 | –0.53 | 2.18 |
1 Total returns do not include the account service fee that may be applicable to certain accounts with balances below $10,000.
31
About Your Fund’s Expenses
As a shareholder of the fund, you incur ongoing costs, which include costs for portfolio management, administrative services, and shareholder reports (like this one), among others. Operating expenses, which are deducted from a fund’s gross income, directly reduce the investment return of the fund.
A fund’s expenses are expressed as a percentage of its average net assets. This figure is known as the expense ratio. The following examples are intended to help you understand the ongoing costs (in dollars) of investing in your fund and to compare these costs with those of other mutual funds. The examples are based on an investment of $1,000 made at the beginning of the period shown and held for the entire period.
The accompanying table illustrates your fund’s costs in two ways:
• Based on actual fund return. This section helps you to estimate the actual expenses that you paid
over the period. The “Ending Account Value” shown is derived from the fund’s actual return, and the
third column shows the dollar amount that would have been paid by an investor who started with
$1,000 in the fund. You may use the information here, together with the amount you invested, to
estimate the expenses that you paid over the period.
To do so, simply divide your account value by $1,000 (for example, an $8,600 account value divided by
$1,000 = 8.6), then multiply the result by the number given for your fund under the heading “Expenses
Paid During Period.”
• Based on hypothetical 5% yearly return. This section is intended to help you compare your fund’s
costs with those of other mutual funds. It assumes that the fund had a yearly return of 5% before
expenses, but that the expense ratio is unchanged. In this case—because the return used is not the
fund’s actual return—the results do not apply to your investment. The example is useful in making
comparisons because the Securities and Exchange Commission requires all mutual funds to calculate
expenses based on a 5% return. You can assess your fund’s costs by comparing this hypothetical
example with the hypothetical examples that appear in shareholder reports of other funds.
| Six Months Ended October 31, 2009 | |||
| Beginning | Ending | Expenses | |
| Account Value | Account Value | Paid During | |
| Windsor Fund | 4/30/2009 | 10/31/2009 | Period1 |
| Based on Actual Fund Return | |||
| Investor Shares | $1,000.00 | $1,204.99 | $1.83 |
| Admiral Shares | 1,000.00 | 1,205.04 | 1.17 |
| Based on Hypothetical 5% Yearly Return | |||
| Investor Shares | $1,000.00 | $1,023.54 | $1.68 |
| Admiral Shares | 1,000.00 | 1,024.15 | 1.07 |
Note that the expenses shown in the table are meant to highlight and help you compare ongoing costs only and do not reflect transaction costs incurred by the fund for buying and selling securities. Further, the expenses do not include the account service fee described in the prospectus. If such a fee were applied to your account, your costs would be higher. Your fund does not charge transaction fees, such as purchase or redemption fees, nor does it carry a “sales load.”
The calculations assume no shares were bought or sold during the period. Your actual costs may have been higher or lower, depending on the amount of your investment and the timing of any purchases or redemptions.
You can find more information about the fund’s expenses, including annual expense ratios, in the Financial Statements section of this report. For additional information on operating expenses and other shareholder costs, please refer to your fund’s current prospectus.
33
Glossary
Beta. A measure of the magnitude of a fund’s past share-price fluctuations in relation to the ups and downs of a given market index. The index is assigned a beta of 1.00. Compared with a given index, a fund with a beta of 1.20 typically would have seen its share price rise or fall by 12% when the index rose or fell by 10%. For this report, beta is based on returns over the past 36 months for both the fund and the index. Note that a fund’s beta should be reviewed in conjunction with its R-squared (see definition). The lower the R-squared, the less correlation there is between the fund and the index, and the less reliable beta is as an indicator of volatility.
Earnings Growth Rate. The average annual rate of growth in earnings over the past five years for the stocks now in a fund.
Equity Exposure. A measure that reflects a fund’s investments in stocks and stock futures. Any holdings in short-term reserves are excluded.
Expense Ratio. The percentage of a fund’s average net assets used to pay its annual administrative and advisory expenses. These expenses directly reduce returns to investors.
Foreign Holdings. The percentage of a fund represented by stocks or depositary receipts of companies based outside the United States.
Inception Date. The date on which the assets of a fund (or one of its share classes) are first invested in accordance with the fund’s investment objective. For funds with a subscription period, the inception date is the day after that period ends. Investment performance is measured from the inception date.
Median Market Cap. An indicator of the size of companies in which a fund invests; the midpoint of market capitalization (market price x shares outstanding) of a fund’s stocks, weighted by the proportion of the fund’s assets invested in each stock. Stocks representing half of the fund’s assets have market capitalizations above the median, and the rest are below it.
Price/Book Ratio. The share price of a stock divided by its net worth, or book value, per share. For a fund, the weighted average price/book ratio of the stocks it holds.
Price/Earnings Ratio. The ratio of a stock’s current price to its per-share earnings over the past year. For a fund, the weighted average P/E of the stocks it holds. P/E is an indicator of market expectations about corporate prospects; the higher the P/E, the greater the expectations for a company’s future growth.
R-Squared. A measure of how much of a fund’s past returns can be explained by the returns from the market in general, as measured by a given index. If a fund’s total returns were precisely synchronized with an index’s returns, its R-squared would be 1.00. If the fund’s returns bore no relationship to the index’s returns, its R-squared would be 0. For this report, R-squared is based on returns over the past 36 months for both the fund and the index.
Return on Equity. The annual average rate of return generated by a company during the past five years for each dollar of shareholder’s equity (net income divided by shareholder’s equity). For a fund, the weighted average return on equity for the companies whose stocks it holds.
Short-Term Reserves. The percentage of a fund invested in highly liquid, short-term securities that can be readily converted to cash.
34
Turnover Rate. An indication of the fund’s trading activity. Funds with high turnover rates incur higher transaction costs and may be more likely to distribute capital gains (which may be taxable to investors). The turnover rate excludes in-kind transactions, which have minimal impact on costs.
Yield. A fund’s 30-day SEC yield is derived using a formula specified by the U.S. Securities and Exchange Commission. Under the formula, data related to the fund’s security holdings in the previous 30 days are used to calculate the fund’s hypothetical net income for that period, which is then annualized and divided by the fund’s estimated average net assets over the calculation period. For the purposes of this calculation, a security’s income is based on its current market yield to maturity (in the case of bonds) or its projected dividend yield (for stocks). Because the SEC yield represents hypothetical annualized income, it will differ—at times significantly—from the fund’s actual experience. As a result, the fund’s income distributions may be higher or lower than implied by the SEC yield.
35
The People Who Govern Your Fund
The trustees of your mutual fund are there to see that the fund is operated and managed in your best interests since, as a shareholder, you are a part owner of the fund. Your fund’s trustees also serve on the board of directors of The Vanguard Group, Inc., which is owned by the Vanguard funds and provides services to them on an at-cost basis.
A majority of Vanguard’s board members are independent, meaning that they have no affiliation with Vanguard or the funds they oversee, apart from the sizable personal investments they have made as private individuals. The independent board members have distinguished backgrounds in business, academia, and public service. Each of the trustees and executive officers oversees 156 Vanguard funds.
The following table provides information for each trustee and executive officer of the fund. More information about the trustees is in the Statement of Additional Information, which can be obtained, without charge, by contacting Vanguard at 800-662-7447, or online at www.vanguard.com.
| Interested Trustees | Emerson U. Fullwood |
| Born 1948. Trustee Since January 2008. Principal | |
| John J. Brennan1 | Occupation(s) During the Past Five Years: Executive |
| Born 1954. Trustee Since May 1987. Chairman of | Chief Staff and Marketing Officer for North America |
| the Board. Principal Occupation(s) During the Past | and Corporate Vice President (retired 2008) of Xerox |
| Five Years: Chairman of the Board and Director/Trustee | Corporation (photocopiers and printers); Director of |
| of The Vanguard Group, Inc., and of each of the | SPX Corporation (multi-industry manufacturing), the |
| investment companies served by The Vanguard Group; | United Way of Rochester, the Boy Scouts of America, |
| Chief Executive Officer (1996–2008) and President | Amerigroup Corporation (direct health and medical |
| (1989–2008) of The Vanguard Group and of each of the | insurance carriers), and Monroe Community College |
| investment companies served by The Vanguard Group; | Foundation. |
| Chairman of the Financial Accounting Foundation; | |
| Governor of the Financial Industry Regulatory Authority | Rajiv L. Gupta |
| (FINRA); Director of United Way of Southeastern | Born 1945. Trustee Since December 2001.2 Principal |
| Pennsylvania. | Occupation(s) During the Past Five Years: Chairman |
| and Chief Executive Officer (retired 2009) and President | |
| F. William McNabb III1 | (2006–2008) of Rohm and Haas Co. (chemicals); Board |
| Born 1957. Trustee Since July 2009. Principal | Member of American Chemistry Council; Director of |
| Occupation(s) During the Past Five Years: Director of | Tyco International, Ltd. (diversified manufacturing and |
| The Vanguard Group, Inc., since 2008; Chief Executive | services) and Hewlett-Packard Co. (electronic computer |
| Officer and President of The Vanguard Group and of | manufacturing); Trustee of The Conference Board. |
| each of the investment companies served by The | |
| Vanguard Group since 2008; Director of Vanguard | Amy Gutmann |
| Marketing Corporation; Managing Director of The | Born 1949. Trustee Since June 2006. Principal |
| Vanguard Group (1995–2008). | Occupation(s) During the Past Five Years: President of |
| the University of Pennsylvania; Christopher H. Browne | |
| Distinguished Professor of Political Science in the School | |
| Independent Trustees | of Arts and Sciences with secondary appointments |
| at the Annenberg School for Communication and the | |
| Charles D. Ellis | Graduate School of Education of the University of |
| Born 1937. Trustee Since January 2001. Principal | Pennsylvania; Director of Carnegie Corporation of |
| Occupation(s) During the Past Five Years: Applecore | New York, Schuylkill River Development Corporation, |
| Partners (pro bono ventures in education); Senior | and Greater Philadelphia Chamber of Commerce; |
| Advisor to Greenwich Associates (international business | Trustee of the National Constitution Center. |
| strategy consulting); Successor Trustee of Yale University; | |
| Overseer of the Stern School of Business at New York | |
| University; Trustee of the Whitehead Institute for | |
| Biomedical Research. |
| JoAnn Heffernan Heisen | Executive Officers | |
| Born 1950. Trustee Since July 1998. Principal | ||
| Occupation(s) During the Past Five Years: Corporate | Thomas J. Higgins1 | |
| Vice President and Chief Global Diversity Officer since | Born 1957. Chief Financial Officer Since September | |
| 2006 (retired 2008) and Member of the Executive | 2008. Principal Occupation(s) During the Past Five | |
| Committee (retired 2008) of Johnson & Johnson | Years: Principal of The Vanguard Group, Inc.; Chief | |
| (pharmaceuticals/consumer products); Vice President | Financial Officer of each of the investment companies | |
| and Chief Information Officer of Johnson & Johnson | served by The Vanguard Group since 2008; Treasurer | |
| (1997–2005); Director of the University Medical Center | of each of the investment companies served by The | |
| at Princeton and Women’s Research and Education | Vanguard Group (1998–2008). | |
| Institute; Member of the Advisory Board of the Maxwell | ||
| School of Citizenship and Public Affairs at Syracuse | ||
| University. | Kathryn J. Hyatt1 | |
| Born 1955. Treasurer Since November 2008. Principal | ||
| Occupation(s) During the Past Five Years: Principal of | ||
| F. Joseph Loughrey | The Vanguard Group, Inc.; Treasurer of each of the | |
| Born 1949. Trustee Since October 2009. Principal | investment companies served by The Vanguard | |
| Occupation(s) During the Past Five Years: President and | Group since 2008; Assistant Treasurer of each of the | |
| Chief Operating Officer since 2005 (retired 2009) and | investment companies served by The Vanguard Group | |
| Vice Chairman of the Board (2008–2009) of Cummins | (1988–2008). | |
| Inc. (industrial machinery); Director of SKF AB (industrial | ||
| machinery), Hillenbrand, Inc. (specialized consumer | ||
| services), Sauer-Danfoss Inc. (machinery), the Lumina | Heidi Stam1 | |
| Foundation for Education, and the Columbus Community | Born 1956. Secretary Since July 2005. Principal | |
| Education Coalition; Chairman of the Advisory Council | Occupation(s) During the Past Five Years: Managing | |
| for the College of Arts and Letters at the University of | Director of The Vanguard Group, Inc., since 2006; | |
| Notre Dame. | General Counsel of The Vanguard Group since 2005; | |
| Secretary of The Vanguard Group and of each of the | ||
| investment companies served by The Vanguard Group | ||
| André F. Perold | since 2005; Director and Senior Vice President of | |
| Born 1952. Trustee Since December 2004. Principal | Vanguard Marketing Corporation since 2005; Principal | |
| Occupation(s) During the Past Five Years: George Gund | of The Vanguard Group (1997–2006). | |
| Professor of Finance and Banking, Harvard Business | ||
| School; Chair of the Investment Committee of HighVista | ||
| Strategies LLC (private investment firm). | Vanguard Senior Management Team | |
| Alfred M. Rankin, Jr. | R. Gregory Barton | Michael S. Miller |
| Born 1941. Trustee Since January 1993. Principal | Mortimer J. Buckley | James M. Norris |
| Occupation(s) During the Past Five Years: Chairman, | Kathleen C. Gubanich | Glenn W. Reed |
| President, and Chief Executive Officer of NACCO | Paul A. Heller | George U. Sauter |
| Industries, Inc. (forklift trucks/housewares/lignite); | ||
| Director of Goodrich Corporation (industrial products/ | ||
| aircraft systems and services); Deputy Chairman of | ||
| the Federal Reserve Bank of Cleveland; Trustee of | ||
| University Hospitals of Cleveland, The Cleveland | Founder | |
| Museum of Art, and Case Western Reserve University. | John C. Bogle | |
| Chairman and Chief Executive Officer, 1974–1996 | ||
| Peter F. Volanakis | ||
| Born 1955. Trustee Since July 2009. Principal | ||
| Occupation(s) During the Past Five Years: President | ||
| since 2007 and Chief Operating Officer since 2005 | ||
| of Corning Incorporated (communications equipment); | ||
| President of Corning Technologies (2001–2005); Director | ||
| of Corning Incorporated and Dow Corning; Trustee of | ||
| the Corning Incorporated Foundation and the Corning | ||
| Museum of Glass; Overseer of the Amos Tuck School | ||
| of Business Administration at Dartmouth College. | ||
1 These individuals are “interested persons” as defined in the Investment Company Act of 1940.
2 December 2002 for Vanguard Equity Income Fund, Vanguard Growth Equity Fund, the Vanguard Municipal Bond Funds, and the Vanguard
State Tax-Exempt Funds.

P.O. Box 2600
Valley Forge, PA 19482-2600
Connect with Vanguard® > www.vanguard.com
| Fund Information > 800-662-7447 | All comparative mutual fund data are from Lipper Inc. |
| or Morningstar, Inc., unless otherwise noted. | |
| Direct Investor Account Services > 800-662-2739 | |
| Institutional Investor Services > 800-523-1036 | You can obtain a free copy of Vanguard’s proxy voting |
| guidelines by visiting our website, www.vanguard.com, | |
| Text Telephone for People | and searching for “proxy voting guidelines,” or by |
| With Hearing Impairment > 800-749-7273 | calling Vanguard at 800-662-2739. The guidelines are |
| also available from the SEC’s website, www.sec.gov. | |
| In addition, you may obtain a free report on how your | |
| fund voted the proxies for securities it owned during | |
| the 12 months ended June 30. To get the report, visit | |
| This material may be used in conjunction | either www.vanguard.com or www.sec.gov. |
| with the offering of shares of any Vanguard | |
| fund only if preceded or accompanied by | |
| the fund’s current prospectus. | You can review and copy information about your fund |
| at the SEC’s Public Reference Room in Washington, D.C. | |
| To find out more about this public service, call the SEC | |
| at 202-551-8090. Information about your fund is also | |
| available on the SEC’s website, and you can receive | |
| copies of this information, for a fee, by sending a | |
| request in either of two ways: via e-mail addressed to | |
| publicinfo@sec.gov or via regular mail addressed to the | |
| Public Reference Section, Securities and Exchange | |
| Commission, Washington, DC 20549-1520. | |
| © 2009 The Vanguard Group, Inc. | |
| All rights reserved. | |
| Vanguard Marketing Corporation, Distributor. | |
| Q220 122009 | |
![]()
| Vanguard Windsor™ II Fund |
| Annual Report |
| October 31, 2009 |

> For the 12 months ended October 31, 2009, Vanguard Windsor II Fund returned
about 12% for both Investor and Admiral Shares, handily outperforming its
comparative standards.
> Except for financials, all of the business sectors in the fund advanced for
the year.
> Information technology and industrial stocks—two of the fund’s largest
sectors—contributed significantly to its success.
| Contents | |
| Your Fund’s Total Returns | 1 |
| President’s Letter | 2 |
| Advisors’ Report | 8 |
| Results of Proxy Voting | 14 |
| Fund Profile | 15 |
| Performance Summary | 16 |
| Financial Statements | 18 |
| Your Fund’s After-Tax Returns | 33 |
| About Your Fund’s Expenses | 34 |
| Glossary | 36 |
Please note: The opinions expressed in this report are just that—informed opinions. They should not be considered promises or advice.
Also, please keep in mind that the information and opinions cover the period through the date on the front of this report. Of course, the
risks of investing in your fund are spelled out in the prospectus.
Cover photograph: Veronica Coia.
Your Fund’s Total Returns
| Fiscal Year Ended October 31, 2009 | ||
| Ticker | Total | |
| Symbol | Returns | |
| Vanguard Windsor II Fund | ||
| Investor Shares | VWNFX | 11.96% |
| Admiral™ Shares1 | VWNAX | 12.09 |
| Russell 1000 Value Index | 4.78 | |
| Large-Cap Value Funds Average2 | 8.88 |
| Your Fund’s Performance at a Glance | ||||
| October 31, 2008–October 31, 2009 | ||||
| Distributions Per Share | ||||
| Starting | Ending | Income | Capital | |
| Share Price | Share Price | Dividends | Gains | |
| Vanguard Windsor II Fund | ||||
| Investor Shares | $20.56 | $22.22 | $0.670 | $0.000 |
| Admiral Shares | 36.51 | 39.46 | 1.226 | 0.000 |
1 A lower-cost class of shares available to many longtime shareholders and to those with significant investments in the fund.
2 Derived from data provided by Lipper Inc.
1

President’s Letter
Dear Shareholder,
Powered by the stock market rally that began in March, Vanguard Windsor II Fund returned 11.96% for Investor Shares and 12.09% for Admiral Shares for the fiscal year ended October 31, 2009. This performance is especially welcome coming on the heels of the severe 2008 bear market. The fund’s return surpassed that of its benchmark index and the average result of peer funds.
When investors became more confident about credit markets and the economy, they regained their appetite for riskier stocks and bonds. As a result, many of the stocks that fueled the equity rally were those that had been hardest-hit during the bear market—including riskier companies with weaker balance sheets and earnings outlooks.
This environment created headwinds for high-quality, value-oriented investment strategies. Still, your fund’s talented advisors were able to deliver superior returns. An outsized investment in information technology and astute stock selection in most sectors—especially industrials—contributed to the fund’s success on both an absolute and a relative basis.
2
If you hold shares in a taxable account, you may wish to review the table and discussion on after-tax returns for the fiscal year later in this report.
A vicious bear market quickly turned bullish
A year ago, the global financial system stood on the brink of collapse as the expanding U.S. credit crisis precipitated the deepest worldwide recession since World War II. Since then, markets have pulled back from the depths and, in fact, have rallied impressively. Although U.S. unemployment has risen to double digits and signs of a robust recovery are hard to find, the global economy has begun to revive. For the first time in more than a year, U.S. gross domestic product
registered growth, as reported by the Commerce Department for the third quarter of calendar 2009.
U.S. stocks recorded positive returns for the fiscal year ended October 31 as the market’s losses during the first four months of the period—marking the final plunge of a historic bear market—were erased by a remarkable rally beginning in March. Global stocks did even better, thanks to some renewed strength in developed markets and a powerful upswing in emerging markets that actually had some prognosticators worrying about a new asset bubble. Reminders of the markets’ travails are nevertheless apparent in the index returns for the past three years, where negative figures are the rule. Even the five-year returns for U.S. stocks
| Market Barometer | |||
| Average Annual Total Returns | |||
| Periods Ended October 31, 2009 | |||
| One Year | Three Years | Five Years | |
| Stocks | |||
| Russell 1000 Index (Large-caps) | 11.20% | –6.84% | 0.71% |
| Russell 2000 Index (Small-caps) | 6.46 | –8.51 | 0.59 |
| Dow Jones U.S. Total Stock Market Index | 11.34 | –6.55 | 1.06 |
| MSCI All Country World Index ex USA (International) | 34.79 | –2.49 | 7.58 |
| Bonds | |||
| Barclays Capital U.S. Aggregate Bond Index | |||
| (Broad taxable market) | 13.79% | 6.35% | 5.05% |
| Barclays Capital Municipal Bond Index | 13.60 | 4.17 | 4.15 |
| Citigroup 3-Month Treasury Bill Index | 0.28 | 2.50 | 2.94 |
| CPI | |||
| Consumer Price Index | –0.18% | 2.32% | 2.52% |
3
as of October 31 are barely positive, further evidence of the long-term damage done by the collapse of the real estate bubble.
The bond market experienced an equally dramatic turnaround
The stock market’s rapid fall and recovery were matched by an equally dramatic turnaround in the bond market. At the end of 2008, as the credit markets virtually shut down, risk-averse investors flocked to U.S. Treasury bonds. The effect was to widen the difference between the lower yields of Treasuries and the higher yields of corporate bonds to a margin not seen since the Great Depression.
Central banks around the world responded to the economic slowdown by lowering interest rates and implementing other aggressive stimulus programs. Meanwhile, governments boosted spending in hopes of reversing the recessionary tide. As fears of a worldwide depression eased, investors’ appetite for risk returned to more normal levels. The receding pessimism raised demand for corporate bonds, lifting their prices and bringing down their yields. Over the past 12 months, both taxable and municipal bonds returned more than 13%.
However, the Fed’s easy-money campaign had a predictable effect on short-term savings vehicles such as money market funds, whose yields track prevailing short-
| Expense Ratios1 | |||
| Your Fund Compared With Its Peer Group | |||
| Large-Cap | |||
| Investor | Admiral | Value Funds | |
| Shares | Shares | Average | |
| Windsor II Fund | 0.39% | 0.29% | 1.25% |
1 The fund expense ratios shown are from the prospectus dated February 27, 2009, and represent estimated costs for the current fiscal year
based on the fund’s net assets as of the prospectus date. For the fiscal year ended October 31, 2009, the fund’s expense ratios were 0.38%
for Investor Shares and 0.27% for Admiral Shares. The peer-group expense ratio is derived from data provided by Lipper Inc. and captures
information through year-end 2008.
4
term rates. In December 2008, the Fed reduced its target for the federal funds rate, a benchmark for the interest rates paid by money market instruments and other very short-term securities, to between 0% and 0.25%. The Fed has said it expects to maintain its target at this level “for an extended period.”
The markets’ steep sell-off created exceptional opportunities
During the bear market that began late in 2007 and continued into March 2009, investors punished many stocks almost indiscriminately. Yet, amid the rubble, attractive opportunities emerged, and your fund’s advisors proved adept at identifying some of them. The fund’s information technology holdings are a good example.
Technology companies are not often regarded as value stocks. Normally, they tend to be considered expensive based on their historically high price-to-earnings and price-to-book-value ratios and low dividend yields. This is evident in the very low representation of tech stocks in the fund’s benchmark, the Russell 1000 Value Index. Not long ago, your fund’s exposure to technology companies was modest at most.
But not much has been “normal” in the markets over the last year. In the quest for underappreciated stocks with solid balance sheets and stable-to-improving earnings growth prospects, the advisors selectively added tech stocks to the fund’s holdings. With these purchases—and the overall
| Total Returns | |
| Ten Years Ended October 31, 2009 | |
| Average | |
| Annual Return | |
| Windsor II Fund Investor Shares | 2.96% |
| Russell 1000 Value Index | 1.70 |
| Large-Cap Value Funds Average1 | 0.10 |
The figures shown represent past performance, which is not a guarantee of future results. (Current performance may be lower or higher than the performance data cited. For performance data current to the most recent month-end, visit our website at www.vanguard.com/performance.) Note, too, that both investment returns and principal value can fluctuate widely, so an investor’s shares, when sold, could be worth more or less than their original cost.
1 Derived from data provided by Lipper Inc.
5
performance of the portfolio—the information technology sector grew to represent almost 15% of Windsor II’s assets by October 31 (more than double the level of three years ago). Tech stocks—including top-ten holdings International Business Machines and Microsoft—added about 5 percentage points to the fund’s return and helped it outpace the benchmark index.
The fund’s above-benchmark investment in industrials also lifted performance. With the economy stabilizing and business activity accelerating, the stock prices of companies such as Illinois Tool Works, electrical-products manufacturer Cooper Industries, and aerospace and defense contractors Honeywell International and ITT gained ground. Still, they remained below October 2007 price levels, as this sector was hit hard by the recession.
In contrast to information technology and industrial stocks, financials continued to disappoint. The advisors have been underweighted in this sector for more than three years, which has helped the fund to sidestep some of the damage from the subprime mortgage and credit crisis. Still, the fund’s financial services holdings had their share of challenges, and declined roughly in line with those of the benchmark.
For more on the fund’s positioning and performance during the year, please see the Advisors’ Report that follows this letter.
A word on expenses
The fund’s expense ratios have risen over the past fiscal year. The explanation is twofold.
First, the fund’s average net assets, the asset base used in calculating the expense ratio, declined from the average level in the prior fiscal year. With a smaller denominator, the fund’s fixed expenses have accounted for a modestly higher percentage of fund assets. Second, the Vanguard funds’ contracts with external advisors typically include breakpoint pricing. As assets rise above a breakpoint threshold, advisory fees are paid at a lower rate. When assets fall, as they have during fiscal 2009, a smaller portion of assets is subject to the lower rate, causing the overall rate to increase.
Over time, breakpoint pricing has helped shareholders benefit from the economies of scale produced by growth in the fund’s assets.
Ten-year performance well ahead of the pack
Bolstered by fiscal-year 2009 results, the Windsor II Fund has put some distance between its long-term performance and that of its comparative standards. For the ten years ended October 31, the fund’s 2.96% average annual return was more than a percentage point higher than the comparable return of its benchmark and almost three percentage points above the peer group’s average annual return. Windsor II’s low costs help shareholders
6
keep more of the fund’s return, an advantage that can compound over time and helps differentiate the fund from its peers.
The fund’s ten-year returns may appear uninspiring, but they reflect a decade in which equities have struggled across the board, enduring not one but two major bear markets. For perspective, the broad U.S. stock market was essentially flat over the same period: The Dow Jones U.S. Total Stock Market Index returned 0.06% per year.
Timeless principles work well in today’s changeable markets
Over the last two years, stocks have taken investors on a roller-coaster ride. After soaring to record highs in October 2007, the U.S. stock market in 2008 suffered its worst calendar year since the 1930s, then turned around this past spring. Investors were given a strong dose of reality—not only by the volatile stock market but also by the demise of some major financial institutions and the persistence of the longest recession in seven decades.
What lessons did we learn? We were reminded that diversification, balance, and a long-term view, while not failsafe, are important principles in good times and bad. Although diversification didn’t immunize investors from the market declines, it certainly insulated them from the worst of it. And patience is often rewarded: Many investors who did not panic and sell out as stocks sank have recovered a substantial share of their paper losses.
Now that the economy and the markets have pulled back from the brink, it’s a good time to reevaluate your long-term investment objectives, time frame, and risk tolerance, and to make sure your investments are appropriately diversified. Vanguard Windsor II Fund can play a valuable role in such a portfolio, by providing low-cost exposure to large-cap value stocks selected by an experienced and complementary team of managers.
Thank you for entrusting your assets to Vanguard.
Sincerely,

F. William McNabb III
President and Chief Executive Officer
November 12, 2009
7
Advisors’ Report
For the fiscal year ended October 31, 2009, Vanguard Windsor II Fund returned about 12%. Your fund is managed by five advisors. This provides exposure to distinct, yet complementary, investment approaches, enhancing the fund’s diversification. It is not uncommon for different advisors to have different views about individual securities or the broader investment environment.
The advisors, the percentage and dollar amount of fund assets each manages, and brief descriptions of their investment strategies are presented in the table below. The advisors also have provided a
discussion of the investment environment that existed during the fiscal year and of how portfolio positioning reflects this assessment. These comments were prepared on November 16, 2009.
Barrow, Hanley, Mewhinney &
Strauss, Inc.
Portfolio Manager:
James P. Barrow, Founding Partner
While this shareholder letter is a bit easier to write than last year’s, as the fund has a positive return, concern remains about the economy. We look back to where things were and get depressed. It seems that a
| Vanguard Windsor II Fund Investment Advisors | |||
| Fund Assets Managed | |||
| Investment Advisor | % | $ Million | Investment Strategy |
| Barrow, Hanley, Mewhinney | 69 | 22,374 | Conducts fundamental research on individual stocks |
| & Strauss, Inc. | exhibiting traditional value characteristics: price/earnings | ||
| and price/book ratios below the broad market average | |||
| and dividend yields above the broad market average. | |||
| Lazard Asset Management LLC | 18 | 5,884 | Employs a relative-value approach that seeks a |
| combination of attractive valuation and high financial | |||
| productivity. The process is research-driven, relying | |||
| upon bottom-up stock analysis performed by the firm’s | |||
| global sector analysts. | |||
| Hotchkis and Wiley | 5 | 1,699 | Uses a disciplined investment approach, focusing on |
| Capital Management, LLC | such investment parameters as a company’s tangible | ||
| assets, sustainable cash flow, and potential for | |||
| improving business performance. | |||
| Armstrong Shaw Associates Inc. | 4 | 1,419 | Uses a bottom-up approach, employing fundamental |
| and qualitative criteria to identify individual companies | |||
| for potential investment. | |||
| Vanguard Quantitative | 2 | 608 | Employs a quantitative fundamental management |
| Equity Group | approach, using models that assess valuation, market | ||
| sentiment, earnings quality and growth, and manage- | |||
| ment decisions of companies versus their peers. | |||
| Cash Investments | 2 | 771 | These short-term reserves are invested by Vanguard |
| in equity index products to simulate investment in | |||
| stocks. Each advisor may also maintain a modest | |||
| cash position. | |||
8
decline in housing values has an emotional impact. The pervasive flight from the U.S. dollar and into gold and other commodities is a real concern, as it surely appears to be a bubble and, like most speculations, can create significant financial dislocation. Exposure and losses seem to show up in the most unlikely places. We suspect that a significant percentage of the interest in commodities is prompted by the leverage inherent in the contracts, which can be especially tempting to hedge fund managers who stand to earn outsized profits when their leveraged investments pay off.
Our banking system continues to try to “right-size” its balance sheet, which means loans will be hard to get. The interesting part of this is that the bond market is willing to make loans, setting up the conundrum that Wall Street can get liquidity while Main Street cannot. The stingy mood of bankers makes the unemployment rate stubborn, as more employment opportunities rest in small and medium-sized companies. Now what happens?
We are not too concerned with the level of the stock market when we see the mountain of cash on the sidelines earning almost nothing. Until short-term interest rates go up and liquidity declines, we feel the momentum is to the upside.
The Federal Reserve Board is not likely to increase interest rates for some time, as Washington is focused on employment and mid-term elections are only 12 months off. With absolute levels of interest near zero, banks should be able to “earn their
way” out of a problematic loan portfolio. Our portfolio’s health care holdings should begin to perform once the debate in Washington is resolved. Industrial earnings should soar with the combination of falling unit labor costs, increasing volumes, and strong productivity.
In the past year, we have included in our list of holdings some rather unusual “value” names such as Microsoft, Intel, and Quest Diagnostics. While these are generally viewed as growth stocks, at the time of purchase their price/earnings ratios were compressed by market worries.
We liked their upside potential, sound business plans, and strong balance sheets, and look forward to the time when these companies no longer qualify for inclusion in the fund’s holdings.
The portfolio continues to exhibit traditional value characteristics: a price/earnings ratio lower than the market’s, a price/book value ratio lower than the market’s, and a dividend yield higher than the market’s. We feel we can achieve adequate diversification in our part of the fund with 45–50 stocks. Our turnover is low by industry standards, but, we feel, adequate.
Lazard Asset Management LLC
Portfolio Managers:
Andrew Lacey, Deputy Chairman
Christopher Blake, Managing Director
Stocks rebounded strongly in March 2009 as investors became less worried about systemic risk and more optimistic about the economy, the housing market,
9
and corporate profitability—factors that appeared to temporarily outweigh concerns over the rising jobless rate and weak consumer spending. The S&P 500 Index returned roughly 55% after the March trough, but stocks remain well below the peak reached in October 2007. The market ended October on a negative note, showing signs of fatigue.
Nearly all sectors had positive 12-month returns, with information technology in the lead as strong cash positions and resilient profitability, particularly among large-cap technology companies, attracted investors. The consumer discretionary sector was one of the hardest-hit early in the period, but rebounded strongly as investors’ optimism grew. Materials stocks gained with higher demand from the emerging markets, which displayed resilience amid the global recession. More defensive sectors, such as consumer staples, health care, and telecom services, lagged during the market rebound and underperformed for the year.
The financial sector was the worst performer, despite normalization in the credit markets and an improving economic outlook. Still, our portfolio benefited from strong stock selection in this sector. Our largest financial position, JPMorgan Chase, performed well compared with the overall group. With its strong balance sheet and market leadership, we believe JPMorgan Chase is well-positioned for the return of a more normal operating environment.
Ameriprise Financial experienced weakness late in 2008 because of investors’ concern about the capital ratios of life insurers, but has performed well since then. We continue to own Ameriprise for several reasons: It is better capitalized than its peers; it has a diversified business model; its management is focused on cost-cutting and revenue enhancement; its financial advisory business gained market share during the downturn; and we believe the recent purchase of Columbia Asset Management will enhance its asset management business.
We also had good stock selection in the energy sector. BJ Services rose sharply following a takeover offer from Baker Hughes. And shares of coal producer Massey Energy rose after the company reported better-than-expected earnings following aggressive cost-cutting and closures of higher-cost mines in view of weak demand. In the health care sector, Wyeth shares performed well after a takeover offer from Pfizer.
Conversely, stock selection in the information technology and consumer discretionary sectors detracted from our performance. Shares of Comcast recently declined as a result of concerns about its potential purchase of assets of NBC Universal. We believe this acquisition makes sense if the price is appropriate. We continue to view Comcast favorably, owing to its stable cable business, revenue growth, and strong cash flow generation. We also believe that Comcast currently trades at a discount relative to its peers.
10
Although conditions for investing are substantially better than they were a year ago, uncertainty continues to cloud the outlook. This environment demands that managers rely on forward-looking, fundamental research to make investment decisions. As we move toward a new economic backdrop and the era of disinflation fades into history, we believe that our focus on robust cash flow, strong balance sheets, and the resulting operational flexibility can continue to deliver strong results.
Hotchkis and Wiley Capital
Management, LLC
Portfolio Managers:
George H. Davis, Jr.,
Chief Executive Officer
Sheldon J. Lieberman, Principal
Equity markets have taken investors on a turbulent ride over the past 12 months. A vicious period finally reversed in early March 2009 as stocks recovered with a stunning rally. The S&P 500’s combined return for the second and third calendar quarters of 2009 represented the best back-to-back quarterly performance for the index since 1975—a welcome relief for weary equity investors.
Positive stock selection in eight of the ten market sectors—especially health care, industrials, and materials—was the primary contributor to our success over the past year. The largest individual contributors were two companies that were acquired, Schering-Plough and Rohm & Haas. In contrast, our underweighting
in telecommunications hurt performance as the index’s sector posted a strong advance. Though they have rebounded recently, some of our largest individual detractors were in the financial sector: Citigroup, Bank of America, and KeyCorp had double-digit losses for the year.
Our commitment to “value” is unwavering. In times of stress it is critical to continually evaluate financial strength. Companies must be strong enough to survive big storms and make it to the other side of tough business cycles. In our opinion, the portfolio is positioned in companies that will survive, and indeed thrive again. The prospect of recovery is becoming more visible. We think our portfolio is attractively balanced between two groups of industries and companies: those that are likely to benefit from an economic recovery and others that are more steady and stable with extremely strong balance sheets.
Armstrong Shaw Associates Inc.
Portfolio Manager:
Jeffrey M. Shaw, Chairman and
Chief Investment Officer
The past year encompassed two very different market environments. Late 2008 and early 2009 were marked by turmoil in the equity and credit markets, massive deleveraging, and plunging asset prices. Since March 9, equities have rallied sharply as the economy stabilized and many companies that were near death survived. Our portion of the Windsor II portfolio performed well, and benefited from our
11
significantly underweighted position in financials—the worst-performing index sector—and our sizable overweighting in technology, the best-performing index sector. Stock selection in financials and industrials also helped our relative performance.
In our portfolio, the top-performing sectors were information technology, materials, and industrials—all with double-digit advances. Wyndham Worldwide, which more than doubled, was our top performer, followed by Morgan Stanley and Wells Fargo. In industrials, the index sector declined while our holdings had a double-digit gain—led by several high-quality companies that included ABB, CSX, ITT, and Rockwell Collins. We purchased these stocks during the market sell-off, and they delivered strong returns as investors began to anticipate an economic recovery. Hurting performance were our weak relative returns in energy and health care.
Although the recovery may be slower than has been normal, and the employment news may not get better soon, there are many pockets of opportunity in the market, particularly in two broad groups of stocks. First, we like companies with good balance sheets and global franchises that are levered to an economic recovery, including Hewlett-Packard, Transocean, and United Technologies. We favor companies with increasing exposure to emerging markets, where we expect growth to be at least twice that of the United States over the next five years.
Secondly, we like high-quality, large-capitalization companies that possess steady cash flows and were left behind in the market’s most recent rally, such as Abbott Labs, Amgen, and CVS Caremark. These companies trade at compelling valuations, 10–11 times projected 2010 earnings per share, yet they have solid free cash flow and growth attributes.
The rally that started in March rewarded the weakest companies the most as the worst-case economic scenario was taken off the table. However, as the rally matures, we believe leadership will switch to higher-quality, better-managed companies with strong balance sheets that can build their earnings and cash flow. This should benefit our portfolio of industry-leading companies trading at attractive earnings valuations.
Vanguard Quantitative Equity Group
Portfolio Manager:
James D. Troyer, CFA, Principal
Our quantitative approach to selecting stocks is based on computer models with five components: valuation, earnings quality, earnings growth, management decisions, and market sentiment. Valuation measures the price we would pay for a company’s earnings or cash flow. By itself, valuation can be a powerful investment tool, but our research tells us that other models can help to improve upon a valuation signal.
12
Our quality score separates inexpensive stocks that deserve their low valuation because of poor margins from their more profitable peers. Similarly, our growth indicator differentiates between companies with poor growth prospects and those with more attractive prospects. Since actions often speak louder than words, another score evaluates executive decision-making, including decisions about issuing stock, raising debt, and making capital investments. Finally, our sentiment score measures the market’s overall view of the company’s value, because news about a company is usually quickly reflected in the stock price. We combine the five components into an overall score, with each indicator helping to verify the others.
This fundamental analysis helps us to single out companies with key attributes including low price/earnings or price/cash-flow ratios, growth rates near the market’s, and higher return on equity. Our research shows that a strategy focused on these attributes is likely to be successful in the long term, but may not work in some periods, such as the past fiscal year. Early in the year, panicked investors heading for the exits drove down all stocks, regardless of individual characteristics. In March, as the survival of near-death companies seemed more likely, these firms’ stocks roared back to life. Unfortunately, they had attributes that our model does not seek, such as losses, low margins, negative market sentiment, and low growth. Value-oriented stocks, which we prefer, were particularly out of favor.
Although we are disappointed that our performance was not more robust, we are not surprised. All investment styles endure periods of relative under- or overperformance. There are parallels to the Internet boom that began in the late 1990s—a “melt-up” as opposed to the recent meltdown. Back then, a very few factors dominated performance: Having little or no earnings was acceptable if a company had an Internet-related story line. But our model rejected many stocks that did not pass our earnings and quality tests, and our portfolios lagged. Last year, the dominant factor was the credit crisis. In such environments, when one or two factors dominate investors’ decision-making, our process will suffer.
Specific examples of our disappointments last year included some holdings in the energy and financial sectors. Our positions in Devon Energy, an independent oil and gas exploration company, and in Bank of America lost ground for the period.
In contrast, we had our greatest successes in the consumer discretionary and information technology sectors. Ford Motor soared, albeit from a low starting point. And in tech stocks, some of our best performers were Computer Sciences, which provides services that include business process outsourcing, and Intel.
In the long run, we believe the market will reward portfolios with attractive profiles such as ours. We thank you for your investment and look forward to the coming year.
13
Results of Proxy Voting
At a special meeting of shareholders on July 2, 2009, fund shareholders approved the following two proposals:
Proposal 1—Elect trustees for each fund.*
The individuals listed in the table below were elected as trustees for each fund. All trustees with the exception of Messrs. McNabb and Volanakis (both of whom already served as directors of The Vanguard Group, Inc.) served as trustees to the funds prior to the shareholder meeting.
| Percentage | |||
| Trustee | For | Withheld | For |
| John J. Brennan | 1,462,617,078 | 41,395,188 | 97.2% |
| Charles D. Ellis | 1,458,717,131 | 45,295,136 | 97.0% |
| Emerson U. Fullwood | 1,462,442,012 | 41,570,254 | 97.2% |
| Rajiv L. Gupta | 1,460,115,928 | 43,896,339 | 97.1% |
| Amy Gutmann | 1,463,668,659 | 40,343,607 | 97.3% |
| JoAnn Heffernan Heisen | 1,461,679,414 | 42,332,852 | 97.2% |
| F. William McNabb III | 1,464,260,763 | 39,751,504 | 97.4% |
| André F. Perold | 1,459,755,929 | 44,256,337 | 97.1% |
| Alfred M. Rankin, Jr. | 1,461,179,223 | 42,833,043 | 97.2% |
| Peter F. Volanakis | 1,464,881,112 | 39,131,154 | 97.4% |
| * Results are for all funds within the same trust. |
Proposal 2—Update and standardize the funds’ fundamental policies regarding:
(a) Purchasing and selling real estate.
(b) Issuing senior securities.
(c) Borrowing money.
(d) Making loans.
(e) Purchasing and selling commodities.
(f) Concentrating investments in a particular industry or group of industries.
(g) Eliminating outdated fundamental investment policies not required by law.
The revised fundamental policies are clearly stated and simple, yet comprehensive, making oversight and compliance more efficient than under the former policies. The revised fundamental policies will allow the funds to respond more quickly to regulatory and market changes, while avoiding the costs and delays associated with successive shareholder meetings.
| Broker | Percentage | ||||
| Vanguard Fund | For | Abstain | Against | Non-Votes | For |
| Windsor II Fund | |||||
| 2a | 777,186,280 | 14,023,991 | 24,795,542 | 37,571,634 | 91.1% |
| 2b | 774,442,220 | 16,012,659 | 25,550,928 | 37,571,639 | 90.7% |
| 2c | 757,734,429 | 15,655,158 | 42,616,226 | 37,571,634 | 88.8% |
| 2d | 768,579,658 | 16,037,876 | 31,388,282 | 37,571,631 | 90.0% |
| 2e | 769,863,470 | 15,350,994 | 30,791,352 | 37,571,632 | 90.2% |
| 2f | 772,406,246 | 15,458,422 | 28,141,146 | 37,571,634 | 90.5% |
| 2g | 782,735,917 | 14,666,451 | 18,601,768 | 37,573,311 | 91.7% |
14
Windsor II Fund
Fund Profile
As of October 31, 2009
| Portfolio Characteristics | |||
| Comparative | Broad | ||
| Fund | Index1 | Index2 | |
| Number of Stocks | 236 | 674 | 4,310 |
| Median Market Cap | $40.7B | $30.1B | $28.3B |
| Price/Earnings Ratio | 21.1x | 34.4x | 30.3x |
| Price/Book Ratio | 1.9x | 1.5x | 2.1x |
| Yield3 | 2.4% | 1.9% | |
| Investor Shares | 2.1% | ||
| Admiral Shares | 2.3% | ||
| Return on Equity | 19.6% | 16.8% | 19.4% |
| Earnings Growth Rate | 6.4% | 2.5% | 9.3% |
| Foreign Holdings | 8.4% | 0.0% | 0.0% |
| Turnover Rate | 41% | — | — |
| Expense Ratio4 | — | — | |
| Investor Shares | 0.39% | ||
| Admiral Shares | 0.29% | ||
| Short-Term Reserves | 2.4% | — | — |
| Sector Diversification (% of equity exposure) | |||
| Comparative | Broad | ||
| Fund | Index1 | Index2 | |
| Consumer Discretionary | 6.0% | 9.3% | 10.0% |
| Consumer Staples | 11.1 | 5.7 | 10.3 |
| Energy | 12.3 | 19.5 | 11.6 |
| Financials | 17.2 | 25.0 | 16.3 |
| Health Care | 13.1 | 8.9 | 11.9 |
| Industrials | 13.7 | 10.4 | 10.4 |
| Information Technology | 15.8 | 5.0 | 19.1 |
| Materials | 2.6 | 3.8 | 3.8 |
| Telecommunication | |||
| Services | 2.3 | 5.5 | 2.8 |
| Utilities | 5.9 | 6.9 | 3.8 |
| Volatility Measures5 | ||
| Fund Versus | Fund Versus | |
| Comparative Index1 | Broad Index2 | |
| R-Squared | 0.97 | 0.96 |
| Beta | 0.95 | 0.99 |
| Ten Largest Holdings6 (% of total net assets) | ||
| JPMorgan Chase & Co. | diversified financial | |
| services | 3.2% | |
| International Business | computer | |
| Machines Corp. | hardware | 3.1 |
| ConocoPhillips | integrated oil | |
| and gas | 3.1 | |
| Pfizer Inc. | pharmaceuticals | 3.0 |
| Microsoft Corp. | systems software | 2.9 |
| Hewlett-Packard Co. | computer hardware | 2.8 |
| Wells Fargo & Co. | diversified banks | 2.7 |
| Bristol-Myers Squibb Co. | pharmaceuticals | 2.5 |
| Imperial Tobacco Group | ||
| PLC ADR | tobacco | 2.5 |
| Philip Morris | ||
| International Inc. | tobacco | 2.4 |
| Top Ten | 28.2% | |
Investment Focus
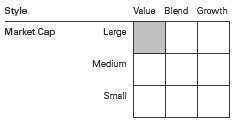
1 Russell 1000 Value Index.
2 Dow Jones U.S. Total Stock Market Index.
3 30-day SEC yield for the fund; annualized dividend yield for the indexes. See the Glossary.
4 The expense ratios shown are from the prospectus dated February 27, 2009, and represent estimated costs for the current fiscal year
based on the fund’s net assets as of the prospectus date. For the fiscal year ended October 31, 2009, the expense ratios were 0.38% for
Investor Shares and 0.27% for Admiral Shares.
5 For an explanation of R-squared, beta, and other terms used here, see the Glossary.
6 The holdings listed exclude any temporary cash investments and equity index products.
15
Windsor II Fund
Performance Summary
All of the returns in this report represent past performance, which is not a guarantee of future results that may be achieved by the fund. (Current performance may be lower or higher than the performance data cited. For performance data current to the most recent month-end, visit our website at www.vanguard.com/performance.) Note, too, that both investment returns and principal value can fluctuate widely, so an investor’s shares, when sold, could be worth more or less than their original cost. The returns shown do not reflect taxes that a shareholder would pay on fund distributions or on the sale of fund shares.
Cumulative Performance: October 31, 1999–October 31, 2009
Initial Investment of $10,000
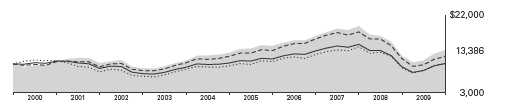
| Average Annual Total Returns | Final Value | |||
| Periods Ended October 31, 2009 | of a $10,000 | |||
| One Year | Five Years | Ten Years | Investment | |
| Windsor II Fund Investor Shares1 | 11.96% | 1.02% | 2.96% | $13,386 |
| Dow Jones U.S. Total Stock Market Index | 11.34 | 1.06 | 0.06 | 10,056 |
| Russell 1000 Value Index | 4.78 | –0.05 | 1.70 | 11,839 |
| Large-Cap Value Funds Average2 | 8.88 | –0.26 | 0.10 | 10,102 |
| Final Value | ||||
| Since | of a $100,000 | |||
| One Year | Five Years | Inception3 | Investment | |
| Windsor II Fund Admiral Shares | 12.09% | 1.14% | 1.80% | $116,304 |
| Dow Jones U.S. Total Stock Market Index | 11.34 | 1.06 | 0.80 | 106,957 |
| Russell 1000 Value Index | 4.78 | –0.05 | 1.30 | 111,532 |
1 Total returns do not include the account service fee that may be applicable to certain accounts with balances below $10,000.
2 Derived from data provided by Lipper Inc.
3 Performance for the fund’s Admiral Shares and comparative standards is calculated since the Admiral Shares’ inception: May 14, 2001.
16
Windsor II Fund
Fiscal-Year Total Returns (%): October 31, 1999–October 31, 2009
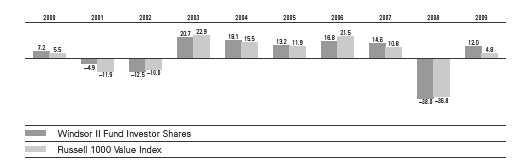
Average Annual Total Returns: Periods Ended September 30, 2009
This table presents average annual total returns through the latest calendar quarter—rather than through the end of the fiscal period. Securities and Exchange Commission rules require that we provide this information.
| Inception Date | One Year | Five Years | Ten Years | |
| Investor Shares1 | 6/24/1985 | –6.55% | 1.46% | 3.30% |
| Admiral Shares | 5/14/2001 | –6.47 | 1.56 | 1.942 |
1 Total returns do not include the account service fee that may be applicable to certain accounts with balances below $10,000.
2 Return since inception.
Note: See Financial Highlights tables for dividend and capital gains information.
17
Windsor II Fund
Financial Statements
Statement of Net Assets
As of October 31, 2009
The fund reports a complete list of its holdings in regulatory filings four times in each fiscal year, at the quarter-ends. For the second and fourth fiscal quarters, the lists appear in the fund’s semiannual and annual reports to shareholders. For the first and third fiscal quarters, the fund files the lists with the Securities and Exchange Commission on Form N-Q. Shareholders can look up the fund’s Forms N-Q on the SEC’s website at www.sec.gov. Forms N-Q may also be reviewed and copied at the SEC’s Public Reference Room (see the back cover of this report for further information).
| Market | |||
| Value• | |||
| Shares | ($000) | ||
| Common Stocks (95.4%)1 | |||
| Consumer Discretionary (5.6%) | |||
| 2 | Wyndham | ||
| Worldwide Corp. | 18,797,969 | 320,505 | |
| Carnival Corp. | 9,561,800 | 278,440 | |
| Comcast Corp. | 19,692,298 | 276,086 | |
| CBS Corp. Class B | 16,425,800 | 193,332 | |
| 2 | Service Corp. | ||
| International | 25,080,100 | 172,300 | |
| Mattel Inc. | 6,553,998 | 124,067 | |
| McDonald’s Corp. | 1,754,500 | 102,831 | |
| JC Penney Co. Inc. | 2,486,320 | 82,372 | |
| Family Dollar Stores Inc. | 2,570,700 | 72,751 | |
| * | Starbucks Corp. | 2,631,900 | 49,954 |
| Home Depot Inc. | 1,514,124 | 37,989 | |
| Lowe’s Cos. Inc. | 1,780,500 | 34,844 | |
| Time Warner Cable Inc. | 655,813 | 25,865 | |
| Ltd Brands Inc. | 1,159,300 | 20,404 | |
| Gap Inc. | 799,877 | 17,069 | |
| * | Interpublic Group | ||
| of Cos. Inc. | 2,443,700 | 14,711 | |
| Time Warner Inc. | 191,399 | 5,765 | |
| * | Ford Motor Co. | 498,600 | 3,490 |
| Comcast Corp. Class A | 201,300 | 2,919 | |
| Darden Restaurants Inc. | 93,000 | 2,819 | |
| Walt Disney Co. | 99,612 | 2,726 | |
| DR Horton Inc. | 224,400 | 2,460 | |
| Ross Stores Inc. | 49,100 | 2,161 | |
| * | DISH Network Corp. | ||
| Class A | 675 | 12 | |
| 1,845,872 | |||
| Consumer Staples (10.5%) | |||
| Imperial Tobacco Group | |||
| PLC ADR | 13,840,000 | 809,363 | |
| Philip Morris | |||
| International Inc. | 16,792,100 | 795,274 | |
| Diageo PLC ADR | 8,768,500 | 570,128 | |
| Altria Group Inc. | 14,545,275 | 263,415 | |
| Walgreen Co. | 5,588,139 | 211,399 | |
| Sysco Corp. | 5,586,189 | 147,755 | |
| Molson Coors Brewing Co. | |||
| Class B | 2,907,500 | 142,380 | |
| Wal-Mart Stores Inc. | 2,686,400 | 133,460 | |
| Kimberly-Clark Corp. | 1,799,177 | 110,038 | |
| CVS Caremark Corp. | 1,610,580 | 56,853 | |
| Kraft Foods Inc. | 1,978,001 | 54,435 | |
| PepsiCo Inc. | 794,600 | 48,113 | |
| Safeway Inc. | 1,925,500 | 42,996 | |
| Lorillard Inc. | 238,000 | 18,497 | |
| Coca-Cola Co. | 104,086 | 5,549 | |
| General Mills Inc. | 68,369 | 4,507 | |
| Procter & Gamble Co. | 69,420 | 4,026 | |
| * | Dr Pepper Snapple | ||
| Group Inc. | 146,600 | 3,996 | |
| Tyson Foods Inc. Class A | 313,639 | 3,927 | |
| Coca-Cola Enterprises Inc. | 203,237 | 3,876 | |
| Archer-Daniels-Midland Co. 48,737 | 1,468 | ||
| Reynolds American Inc. | 25,900 | 1,256 | |
| 3,432,711 | |||
| Energy (11.6%) | |||
| ConocoPhillips | 20,020,026 | 1,004,605 | |
| Occidental | |||
| Petroleum Corp. | 9,606,591 | 728,948 | |
| BP PLC ADR | 11,156,300 | 631,670 | |
| 2 | Spectra Energy Corp. | 32,337,100 | 618,285 |
| Chevron Corp. | 3,183,099 | 243,634 | |
| Royal Dutch Shell | |||
| PLC ADR | 1,295,700 | 75,358 | |
| Apache Corp. | 751,961 | 70,775 | |
| Halliburton Co. | 2,245,700 | 65,597 | |
| Devon Energy Corp. | 872,840 | 56,482 | |
| Valero Energy Corp. | 3,089,300 | 55,916 | |
| EOG Resources Inc. | 683,275 | 55,796 | |
| El Paso Corp. | 5,097,950 | 50,011 | |
| Exxon Mobil Corp. | 670,799 | 48,076 | |
| Massey Energy Co. | 1,468,285 | 42,712 | |
| * | Transocean Ltd. | 445,600 | 37,390 |
| * | National Oilwell Varco Inc. | 109,849 | 4,503 |
| Noble Corp. | 95,300 | 3,883 | |
| * | Newfield Exploration Co. | 75,400 | 3,093 |
18
Windsor II Fund
| Market | ||||
| Value• | ||||
| Shares | ($000) | |||
| Chesapeake Energy Corp. | 90,400 | 2,215 | ||
| Murphy Oil Corp. | 12,500 | 764 | ||
| * | Pride International Inc. | 17,835 | 527 | |
| 3,800,240 | ||||
| Exchange-Traded Funds (0.9%) | ||||
| 3 | Vanguard Total Stock | |||
| Market ETF | 3,197,800 | 166,861 | ||
| ^,3 | Vanguard Value ETF | 2,511,200 | 112,653 | |
| 279,514 | ||||
| Financials (16.4%) | ||||
| JPMorgan Chase & Co. | 25,177,968 | 1,051,684 | ||
| Wells Fargo & Co. | 32,509,797 | 894,670 | ||
| PNC Financial Services | ||||
| Group Inc. | 12,464,113 | 609,994 | ||
| American Express Co. | 17,035,000 | 593,499 | ||
| Bank of America Corp. | 35,183,362 | 512,973 | ||
| Capital One | ||||
| Financial Corp. | 9,531,200 | 348,842 | ||
| XL Capital Ltd. Class A | 14,555,700 | 238,859 | ||
| * | SLM Corp. | 21,128,300 | 204,944 | |
| Citigroup Inc. | 35,014,026 | 143,207 | ||
| Travelers Cos. Inc. | 2,284,548 | 113,748 | ||
| Ameriprise Financial Inc. | 2,859,900 | 99,153 | ||
| Morgan Stanley | 2,305,985 | 74,068 | ||
| PartnerRe Ltd. | 762,000 | 58,278 | ||
| Public Storage | 788,729 | 58,050 | ||
| MetLife Inc. | 1,661,396 | 56,537 | ||
| Charles Schwab Corp. | 3,017,000 | 52,315 | ||
| ACE Ltd. | 717,080 | 36,829 | ||
| Bank of New York | ||||
| Mellon Corp. | 1,041,333 | 27,762 | ||
| Allstate Corp. | 896,900 | 26,521 | ||
| * | Genworth Financial Inc. | |||
| Class A | 2,243,000 | 23,821 | ||
| Prudential Financial Inc. | 394,000 | 17,821 | ||
| KeyCorp | 2,606,182 | 14,047 | ||
| Goldman Sachs Group Inc. | 77,679 | 13,219 | ||
| SunTrust Banks Inc. | 455,900 | 8,712 | ||
| Comerica Inc. | 302,600 | 8,397 | ||
| US Bancorp | 297,949 | 6,918 | ||
| Aflac Inc. | 140,269 | 5,820 | ||
| Chubb Corp. | 114,299 | 5,546 | ||
| State Street Corp. | 102,000 | 4,282 | ||
| Unum Group | 211,461 | 4,219 | ||
| New York Community | ||||
| Bancorp Inc. | 366,539 | 3,955 | ||
| Hudson City Bancorp Inc. | 296,113 | 3,891 | ||
| Torchmark Corp. | 94,104 | 3,821 | ||
| American Financial | ||||
| Group Inc. | 150,662 | 3,706 | ||
| Simon Property Group Inc. | 44,898 | 3,048 | ||
| BOK Financial Corp. | 68,500 | 2,943 | ||
| Federated Investors Inc. | ||||
| Class B | 106,200 | 2,788 | ||
| * | Progressive Corp. | 158,100 | 2,530 | |
| Annaly Capital | ||||
| Management Inc. | 108,307 | 1,831 | ||
| Plum Creek Timber Co. Inc. | 43,039 | 1,347 | ||
| ProLogis | 116,664 | 1,322 | ||
| Host Hotels & Resorts Inc. | 106,938 | 1,081 | ||
| Hospitality Properties Trust | 52,442 | 1,013 | ||
| * | St Joe Co. | 33,400 | 800 | |
| Discover Financial Services | 56,300 | 796 | ||
| Rayonier Inc. | 14,010 | 540 | ||
| Vornado Realty Trust | 8,598 | 512 | ||
| Boston Properties Inc. | 7,700 | 468 | ||
| * | Jefferies Group Inc. | 16,400 | 428 | |
| HCP Inc. | 12,200 | 361 | ||
| Equity Residential | 11,615 | 335 | ||
| Everest Re Group Ltd. | 2,800 | 245 | ||
| HCC Insurance | ||||
| Holdings Inc. | 6,200 | 164 | ||
| Ventas Inc. | 2,600 | 104 | ||
| *,4 | Washington Mutual Inc. | 5,856,328 | 59 | |
| AvalonBay | ||||
| Communities Inc. | 800 | 55 | ||
| 5,352,878 | ||||
| Health Care (12.4%) | ||||
| Pfizer Inc. | 57,819,568 | 984,667 | ||
| Bristol-Myers Squibb Co. | 38,164,957 | 831,996 | ||
| 2 | Quest Diagnostics Inc. | 9,593,300 | 536,553 | |
| Baxter International Inc. | 6,645,400 | 359,250 | ||
| * | WellPoint Inc. | 6,773,400 | 316,724 | |
| Johnson & Johnson | 4,747,800 | 280,358 | ||
| UnitedHealth Group Inc. | 3,799,501 | 98,597 | ||
| * | Amgen Inc. | 1,691,210 | 90,869 | |
| Merck & Co. Inc. | 2,461,300 | 76,128 | ||
| Medtronic Inc. | 1,837,700 | 65,606 | ||
| * | Gilead Sciences Inc. | 1,450,600 | 61,723 | |
| Eli Lilly & Co. | 1,625,100 | 55,270 | ||
| Abbott Laboratories | 959,500 | 48,522 | ||
| Becton Dickinson and Co. | 709,700 | 48,515 | ||
| * | Thermo Fisher | |||
| Scientific Inc. | 998,300 | 44,923 | ||
| Covidien PLC | 985,900 | 41,526 | ||
| * | Talecris Biotherapeutics | |||
| Holdings Corp. | 2,002,929 | 40,179 | ||
| * | CareFusion Corp. | 1,510,014 | 33,779 | |
| Schering-Plough Corp. | 607,300 | 17,126 | ||
| * | Zimmer Holdings Inc. | 246,300 | 12,948 | |
| * | Forest Laboratories Inc. | 166,562 | 4,609 | |
| CIGNA Corp. | 159,301 | 4,435 | ||
| AmerisourceBergen Corp. | ||||
| Class A | 196,690 | 4,357 | ||
| * | Mylan Inc. | 220,592 | 3,582 | |
| * | Community Health | |||
| Systems Inc. | 91,191 | 2,852 | ||
| * | Hospira Inc. | 10,300 | 460 | |
| 4,065,554 | ||||
19
Windsor II Fund
| Market | |||
| Value• | |||
| Shares | ($000) | ||
| Industrials (13.0%) | |||
| Raytheon Co. | 16,172,100 | 732,273 | |
| Honeywell | |||
| International Inc. | 16,773,347 | 601,995 | |
| 2 | ITT Corp. | 11,021,220 | 558,776 |
| *,2 | Cooper Industries PLC | ||
| Class A | 13,760,600 | 532,398 | |
| General Electric Co. | 35,320,504 | 503,670 | |
| Illinois Tool Works Inc. | 10,048,500 | 461,427 | |
| Emerson Electric Co. | 2,556,600 | 96,512 | |
| Dover Corp. | 2,329,900 | 87,791 | |
| Norfolk Southern Corp. | 1,436,500 | 66,970 | |
| * | Corrections Corp. | ||
| of America | 2,631,800 | 63,005 | |
| Parker Hannifin Corp. | 1,133,600 | 60,036 | |
| Republic Services Inc. | |||
| Class A | 2,247,400 | 58,230 | |
| United Technologies Corp. | 903,060 | 55,493 | |
| Rockwell Collins Inc. | 856,460 | 43,148 | |
| Northrop Grumman Corp. | 793,276 | 39,767 | |
| CSX Corp. | 872,530 | 36,803 | |
| PACCAR Inc. | 952,400 | 35,629 | |
| Tyco International Ltd. | 1,053,007 | 35,328 | |
| United Parcel Service Inc. | |||
| Class B | 616,480 | 33,093 | |
| FedEx Corp. | 445,500 | 32,383 | |
| Cummins Inc. | 746,800 | 32,157 | |
| Lockheed Martin Corp. | 438,000 | 30,130 | |
| * | Empresa Brasileira | ||
| de Aeronautica SA ADR | 1,021,100 | 20,677 | |
| Boeing Co. | 219,700 | 10,502 | |
| 3M Co. | 127,126 | 9,353 | |
| Goodrich Corp. | 75,061 | 4,080 | |
| * | URS Corp. | 100,748 | 3,915 |
| Joy Global Inc. | 76,055 | 3,834 | |
| RR Donnelley & Sons Co. | 133,800 | 2,687 | |
| * | Hertz Global Holdings Inc. | 147,400 | 1,372 |
| Caterpillar Inc. | 10,100 | 556 | |
| Pitney Bowes Inc. | 9,300 | 228 | |
| 4,254,218 | |||
| Information Technology (14.9%) | |||
| International Business | |||
| Machines Corp. | 8,514,850 | 1,026,976 | |
| Microsoft Corp. | 34,344,000 | 952,359 | |
| Hewlett-Packard Co. | 19,103,550 | 906,654 | |
| Intel Corp. | 35,840,700 | 684,916 | |
| Nokia Oyj ADR | 43,239,900 | 545,255 | |
| Oracle Corp. | 8,074,760 | 170,377 | |
| * | Cisco Systems Inc. | 7,131,660 | 162,958 |
| * | eBay Inc. | 4,698,200 | 104,629 |
| * | Symantec Corp. | 4,734,600 | 83,234 |
| CA Inc. | 2,937,128 | 61,445 | |
| * | Google Inc. Class A | 111,420 | 59,735 |
| Applied Materials Inc. | 4,478,100 | 54,633 | |
| Tyco Electronics Ltd. | 1,796,775 | 38,181 | |
| Accenture PLC Class A | 235,000 | 8,714 | |
| * | Computer Sciences Corp. | 89,191 | 4,523 |
| Seagate Technology | 270,244 | 3,770 | |
| Xilinx Inc. | 173,000 | 3,763 | |
| Motorola Inc. | 300,700 | 2,577 | |
| * | LSI Corp. | 463,900 | 2,375 |
| * | Micron Technology Inc. | 109,500 | 744 |
| 4,877,818 | |||
| Materials (2.4%) | |||
| EI du Pont de Nemours | |||
| & Co. | 11,018,420 | 350,606 | |
| Ball Corp. | 2,690,173 | 132,706 | |
| Air Products | |||
| & Chemicals Inc. | 989,700 | 76,336 | |
| Mosaic Co. | 1,370,700 | 64,053 | |
| Newmont Mining Corp. | 1,272,300 | 55,294 | |
| Praxair Inc. | 408,180 | 32,426 | |
| Agrium Inc. | 663,280 | 31,141 | |
| PPG Industries Inc. | 422,200 | 23,825 | |
| Alcoa Inc. | 660,000 | 8,197 | |
| * | Pactiv Corp. | 147,400 | 3,403 |
| Walter Energy Inc. | 43,200 | 2,527 | |
| * | Owens-Illinois Inc. | 52,000 | 1,658 |
| Lubrizol Corp. | 8,800 | 586 | |
| MeadWestvaco Corp. | 6,600 | 151 | |
| 782,909 | |||
| Telecommunication Services (2.1%) | |||
| AT&T Inc. | 13,328,116 | 342,133 | |
| Verizon | |||
| Communications Inc. | 10,151,654 | 300,387 | |
| Vodafone Group | |||
| PLC ADR | 2,370,800 | 52,608 | |
| Qwest Communications | |||
| International Inc. | 1,109,600 | 3,983 | |
| Windstream Corp. | 248,300 | 2,394 | |
| 701,505 | |||
| Utilities (5.6%) | |||
| Dominion Resources Inc. | 12,684,594 | 432,418 | |
| Duke Energy Corp. | 24,025,400 | 380,082 | |
| 2 | Constellation Energy | ||
| Group Inc. | 11,031,200 | 341,085 | |
| 2 | CenterPoint Energy Inc. | 24,112,500 | 303,817 |
| Entergy Corp. | 2,448,100 | 187,818 | |
| Exelon Corp. | 1,700,697 | 79,865 | |
| American Electric | |||
| Power Co. Inc. | 1,524,700 | 46,076 | |
| FPL Group Inc. | 575,995 | 28,281 | |
| Edison International | 761,300 | 24,225 | |
| PG&E Corp. | 131,967 | 5,396 | |
| Public Service Enterprise | |||
| Group Inc. | 180,093 | 5,367 | |
| * | NRG Energy Inc. | 182,500 | 4,196 |
| CMS Energy Corp. | 260,900 | 3,470 | |
| * | AES Corp. | 227,800 | 2,977 |
20
Windsor II Fund
| Market | ||
| Value• | ||
| Shares | ($000) | |
| NSTAR | 62,700 | 1,941 |
| NiSource Inc. | 47,400 | 612 |
| 1,847,626 | ||
| Total Common Stocks | ||
| (Cost $31,566,243) | 31,240,845 | |
| Temporary Cash Investments (3.9%)1 | ||
| Money Market Fund (3.7%) | ||
| 5,6 Vanguard Market | ||
| Liquidity Fund, | ||
| 0.225% | 1,230,193,000 | 1,230,193 |
| Face | ||
| Amount | ||
| ($000) | ||
| U.S. Government and Agency Obligations (0.2%) | ||
| 7,8 Federal Home Loan Bank | ||
| Discount Notes, | ||
| 0.275%, 2/19/10 | 63,500 | 63,480 |
| Total Temporary Cash Investments | ||
| (Cost $1,293,640) | 1,293,673 | |
| Total Investments (99.3%) | ||
| (Cost $32,859,883) | 32,534,518 | |
| Other Assets and Liabilities (0.7%) | ||
| Other Assets | 585,906 | |
| Liabilities6 | (365,031) | |
| 220,875 | ||
| Net Assets (100%) | 32,755,393 | |
| Market | |
| Value• | |
| ($000) | |
| Statement of Assets and Liabilities | |
| Assets | |
| Investments in Securities, at Value | 32,534,518 |
| Receivables for Investment | |
| Securities Sold | 511,388 |
| Other Assets | 74,518 |
| Total Assets | 33,120,424 |
| Liabilities | |
| Payables for Investment | |
| Securities Purchased | 232,362 |
| Other Liabilities | 132,669 |
| Total Liabilities | 365,031 |
| Net Assets | 32,755,393 |
21
Windsor II Fund
| At October 31, 2009, net assets consisted of: | |
| Amount | |
| ($000) | |
| Paid-in Capital | 37,963,420 |
| Undistributed Net Investment Income | 167,862 |
| Accumulated Net Realized Losses | (5,048,833) |
| Unrealized Appreciation (Depreciation) | |
| Investment Securities | (325,365) |
| Futures Contracts | (1,691) |
| Net Assets | 32,755,393 |
| Investor Shares—Net Assets | |
| Applicable to 931,236,816 outstanding | |
| $.001 par value shares of beneficial | |
| interest (unlimited authorization) | 20,695,353 |
| Net Asset Value Per Share— | |
| Investor Shares | $22.22 |
| Admiral Shares—Net Assets | |
| Applicable to 305,657,973 outstanding | |
| $.001 par value shares of beneficial | |
| interest (unlimited authorization) | 12,060,040 |
| Net Asset Value Per Share— | |
| Admiral Shares | $39.46 |
• See Note A in Notes to Financial Statements.
* Non-income-producing security.
^ Part of security position is on loan to broker-dealers. The total value of securities on loan is $13,528,000.
1 The fund invests a portion of its cash reserves in equity markets through the use of index futures contracts. After giving effect to futures
investments, the fund’s effective common stock and temporary cash investment positions represent 96.8% and 2.5%, respectively, of
net assets.
2 Considered an affiliated company of the fund as the fund owns more than 5% of the outstanding voting securities of such company.
3 Considered an affiliated company of the fund as the issuer is another member of The Vanguard Group.
4 Restricted security represents 0.0% of net assets.
5 Affiliated money market fund available only to Vanguard funds and certain trusts and accounts managed by Vanguard. Rate shown is the
7-day yield.
6 Includes $14,609,000 of collateral received for securities on loan.
7 The issuer operates under a congressional charter; its securities are not backed by the full faith and credit of the U.S. government.
8 Securities with a value of $63,480,000 have been segregated as initial margin for open futures contracts.
ADR—American Depositary Receipt.
See accompanying Notes, which are an integral part of the Financial Statements.
22
Windsor II Fund
Statement of Operations
| Year Ended | |
| October 31, 2009 | |
| ($000) | |
| Investment Income | |
| Income | |
| Dividends1,2 | 928,762 |
| Interest2 | 7,932 |
| Security Lending | 28,474 |
| Total Income | 965,168 |
| Expenses | |
| Investment Advisory Fees—Note B | |
| Basic Fee | 41,325 |
| Performance Adjustment | (2,736) |
| The Vanguard Group—Note C | |
| Management and Administrative—Investor Shares | 38,134 |
| Management and Administrative—Admiral Shares | 11,584 |
| Marketing and Distribution—Investor Shares | 4,928 |
| Marketing and Distribution—Admiral Shares | 2,812 |
| Custodian Fees | 418 |
| Auditing Fees | 28 |
| Shareholders’ Reports and Proxies—Investor Shares | 1,315 |
| Shareholders’ Reports and Proxies—Admiral Shares | 181 |
| Trustees’ Fees and Expenses | 57 |
| Total Expenses | 98,046 |
| Expenses Paid Indirectly | (2,749) |
| Net Expenses | 95,297 |
| Net Investment Income | 869,871 |
| Realized Net Gain (Loss) | |
| Investment Securities Sold2 | (1,483,919) |
| Futures Contracts | 78,462 |
| Realized Net Gain (Loss) | (1,405,457) |
| Change in Unrealized Appreciation (Depreciation) | |
| Investment Securities | 3,973,419 |
| Futures Contracts | 8,097 |
| Change in Unrealized Appreciation (Depreciation) | 3,981,516 |
| Net Increase (Decrease) in Net Assets Resulting from Operations | 3,445,930 |
1 Dividends are net of foreign withholding taxes of $2,227,000.
2 Dividend income, interest income, and realized net gain (loss) from affiliated companies of the fund were $102,991,000, $7,233,000, and
$60,881,000, respectively.
See accompanying Notes, which are an integral part of the Financial Statements.
23
Windsor II Fund
Statement of Changes in Net Assets
| Year Ended October 31, | ||
| 2009 | 2008 | |
| ($000) | ($000) | |
| Increase (Decrease) in Net Assets | ||
| Operations | ||
| Net Investment Income | 869,871 | 1,184,198 |
| Realized Net Gain (Loss) | (1,405,457) | (3,600,882) |
| Change in Unrealized Appreciation (Depreciation) | 3,981,516 | (17,372,691) |
| Net Increase (Decrease) in Net Assets Resulting from Operations | 3,445,930 | (19,789,375) |
| Distributions | ||
| Net Investment Income | ||
| Investor Shares | (629,788) | (736,648) |
| Admiral Shares | (381,680) | (463,178) |
| Realized Capital Gain1 | ||
| Investor Shares | — | (3,062,841) |
| Admiral Shares | — | (1,864,749) |
| Total Distributions | (1,011,468) | (6,127,416) |
| Capital Share Transactions | ||
| Investor Shares | (286,176) | 1,720,177 |
| Admiral Shares | (404,419) | 1,136,517 |
| Net Increase (Decrease) from Capital Share Transactions | (690,595) | 2,856,694 |
| Total Increase (Decrease) | 1,743,867 | (23,060,097) |
| Net Assets | ||
| Beginning of Period | 31,011,526 | 54,071,623 |
| End of Period2 | 32,755,393 | 31,011,526 |
1 Includes fiscal 2008 short-term gain distributions totaling $731,863,000. Short-term gain distributions are treated as ordinary income
dividends for tax purposes.
2 Net Assets—End of Period includes undistributed net investment income of $167,862,000 and $309,459,000.
See accompanying Notes, which are an integral part of the Financial Statements.
24
Windsor II Fund
Financial Highlights
| Investor Shares | |||||
| For a Share Outstanding | Year Ended October 31, | ||||
| Throughout Each Period | 2009 | 2008 | 2007 | 2006 | 2005 |
| Net Asset Value, Beginning of Period | $20.56 | $37.84 | $35.14 | $31.61 | $28.49 |
| Investment Operations | |||||
| Net Investment Income | .580 | .777 | .803 | .760 | .650 |
| Net Realized and Unrealized Gain (Loss) | |||||
| on Investments | 1.750 | (13.804) | 4.145 | 4.368 | 3.100 |
| Total from Investment Operations | 2.330 | (13.027) | 4.948 | 5.128 | 3.750 |
| Distributions | |||||
| Dividends from Net Investment Income | (.670) | (.799) | (.790) | (.720) | (.630) |
| Distributions from Realized Capital Gains | — | (3.454) | (1.458) | (.878) | — |
| Total Distributions | (.670) | (4.253) | (2.248) | (1.598) | (.630) |
| Net Asset Value, End of Period | $22.22 | $20.56 | $37.84 | $35.14 | $31.61 |
| Total Return1 | 11.96% | –38.02% | 14.62% | 16.85% | 13.22% |
| Ratios/Supplemental Data | |||||
| Net Assets, End of Period (Millions) | $20,695 | $19,400 | $33,821 | $30,790 | $28,199 |
| Ratio of Total Expenses to | |||||
| Average Net Assets2 | 0.38% | 0.32% | 0.33% | 0.34% | 0.35% |
| Ratio of Net Investment Income to | |||||
| Average Net Assets | 2.96% | 2.66% | 2.19% | 2.28% | 2.14% |
| Portfolio Turnover Rate | 41% | 37% | 51% | 34% | 28% |
1 Total returns do not include the account service fee that may be applicable to certain accounts with balances below $10,000.
2 Includes performance-based investment advisory fee increases (decreases) of (0.01%), (0.01%), 0.01%, 0.01%, and 0.01%.
See accompanying Notes, which are an integral part of the Financial Statements.
25
Windsor II Fund
Financial Highlights
| Admiral Shares | |||||
| For a Share Outstanding | Year Ended October 31, | ||||
| Throughout Each Period | 2009 | 2008 | 2007 | 2006 | 2005 |
| Net Asset Value, Beginning of Period | $36.51 | $67.18 | $62.41 | $56.13 | $50.59 |
| Investment Operations | |||||
| Net Investment Income | 1.064 | 1.431 | 1.491 | 1.402 | 1.224 |
| Net Realized and Unrealized Gain (Loss) | |||||
| on Investments | 3.112 | (24.497) | 7.348 | 7.782 | 5.493 |
| Total from Investment Operations | 4.176 | (23.066) | 8.839 | 9.184 | 6.717 |
| Distributions | |||||
| Dividends from Net Investment Income | (1.226) | (1.473) | (1.481) | (1.346) | (1.177) |
| Distributions from Realized Capital Gains | — | (6.131) | (2.588) | (1.558) | — |
| Total Distributions | (1.226) | (7.604) | (4.069) | (2.904) | (1.177) |
| Net Asset Value, End of Period | $39.46 | $36.51 | $67.18 | $62.41 | $56.13 |
| Total Return | 12.09% | –37.94% | 14.71% | 17.01% | 13.34% |
| Ratios/Supplemental Data | |||||
| Net Assets, End of Period (Millions) | $12,060 | $11,611 | $20,250 | $15,934 | $11,992 |
| Ratio of Total Expenses to | |||||
| Average Net Assets1 | 0.27% | 0.22% | 0.23% | 0.23% | 0.22% |
| Ratio of Net Investment Income to | |||||
| Average Net Assets | 3.07% | 2.76% | 2.29% | 2.39% | 2.25% |
| Portfolio Turnover Rate | 41% | 37% | 51% | 34% | 28% |
1 Includes performance-based investment advisory fee increases (decreases) of (0.01%), (0.01%), 0.01%, 0.01%, and 0.01%.
See accompanying Notes, which are an integral part of the Financial Statements.
26
Windsor II Fund
Notes to Financial Statements
Vanguard Windsor II Fund is registered under the Investment Company Act of 1940 as an open-end investment company, or mutual fund. The fund offers two classes of shares: Investor Shares and Admiral Shares. Investor Shares are available to any investor who meets the fund’s minimum purchase requirements. Admiral Shares are designed for investors who meet certain administrative, service, tenure, and account-size criteria.
A. The following significant accounting policies conform to generally accepted accounting principles for U.S. mutual funds. The fund consistently follows such policies in preparing its financial statements.
1. Security Valuation: Securities are valued as of the close of trading on the New York Stock Exchange (generally 4 p.m., Eastern time) on the valuation date. Equity securities are valued at the latest quoted sales prices or official closing prices taken from the primary market in which each security trades; such securities not traded on the valuation date are valued at the mean of the latest quoted bid and asked prices. Securities for which market quotations are not readily available, or whose values have been affected by events occurring before the fund’s pricing time but after the close of the securities’ primary markets, are valued at their fair values calculated according to procedures adopted by the board of trustees. These procedures include obtaining quotations from an independent pricing service, monitoring news to identify significant market- or security-specific events, and evaluating changes in the values of foreign market proxies (for example, ADRs, futures contracts, or exchange-traded funds), between the time the foreign markets close and the fund’s pricing time. When fair-value pricing is employed, the prices of securities used by a fund to calculate its net asset value may differ from quoted or published prices for the same securities. Investments in Vanguard Market Liquidity Fund are valued at that fund’s net asset value. Temporary cash investments acquired over 60 days to maturity are valued using the latest bid prices or using valuations based on a matrix system (which considers such factors as security prices, yields, maturities, and ratings), both as furnished by independent pricing services. Other temporary cash investments are valued at amortized cost, which approximates market value.
2. Futures Contracts: The fund uses index futures contracts to a limited extent, with the objective of maintaining full exposure to the stock market while maintaining liquidity. The fund may purchase or sell futures contracts to achieve a desired level of investment, whether to accommodate portfolio turnover or cash flows from capital share transactions. The primary risks associated with the use of futures contracts are imperfect correlation between changes in market values of stocks held by the fund and the prices of futures contracts, and the possibility of an illiquid market.
Futures contracts are valued at their quoted daily settlement prices. The aggregate principal amounts of the contracts are not recorded in the Statement of Net Assets. Fluctuations in the value of the contracts are recorded in the Statement of Net Assets as an asset (liability) and in the Statement of Operations as unrealized appreciation (depreciation) until the contracts are closed, when they are recorded as realized futures gains (losses).
3. Federal Income Taxes: The fund intends to continue to qualify as a regulated investment company and distribute all of its taxable income. Management has analyzed the fund’s tax positions taken for all open federal income tax years (October 31, 2006–2009), and has concluded that no provision for federal income tax is required in the fund’s financial statements.
4. Distributions: Distributions to shareholders are recorded on the ex-dividend date.
27
Windsor II Fund
5. Security Lending: The fund may lend its securities to qualified institutional borrowers to earn additional income. Security loans are required to be secured at all times by collateral at least equal to the market value of securities loaned. The fund invests cash collateral received in Vanguard Market Liquidity Fund, and records a liability for the return of the collateral, during the period the securities are on loan. Security lending income represents the income earned on investing cash collateral, less expenses associated with the loan.
6. Other: Dividend income is recorded on the ex-dividend date. Interest income includes income distributions received from Vanguard Market Liquidity Fund and is accrued daily. Security transactions are accounted for on the date securities are bought or sold. Costs used to determine realized gains (losses) on the sale of investment securities are those of the specific securities sold.
Each class of shares has equal rights as to assets and earnings, except that each class separately bears certain class-specific expenses related to maintenance of shareholder accounts (included in Management and Administrative expenses), shareholder reporting, and proxies. Marketing and distribution expenses are allocated to each class of shares based on a method approved by the board of trustees. Income, other non-class-specific expenses, and gains and losses on investments are allocated to each class of shares based on its relative net assets.
B. Armstrong Shaw Associates Inc.; Barrow, Hanley, Mewhinney & Strauss, Inc.; Hotchkis and Wiley Capital Management, LLC; and Lazard Asset Management LLC each provide investment advisory services to a portion of the fund for a fee calculated at an annual percentage rate of average net assets managed by the advisor. The basic fee of Armstrong Shaw Associates Inc. is subject to quarterly adjustments based on performance since January 31, 2006, relative to the Russell 1000 Value Index. The basic fee of Barrow, Hanley, Mewhinney & Strauss, Inc., is subject to quarterly adjustments based on performance for the preceding three years relative to the MSCI US Prime Market 750 Index. The basic fee of Hotchkis and Wiley Capital Management, LLC, is subject to quarterly adjustments based on performance for the preceding five years relative to the MSCI US Investa ble Market 2500 Index. The basic fee of Lazard Asset Management LLC is subject to quarterly adjustments based on performance since January 31, 2007, relative to the S&P 500 Index.
The Vanguard Group provides investment advisory services to a portion of the fund on an at-cost basis; the fund paid Vanguard advisory fees of $978,000 for the year ended October 31, 2009.
For the year ended October 31, 2009, the aggregate investment advisory fee represented an effective annual basic rate of 0.14% of the fund’s average net assets, before a decrease of $2,736,000 (0.01%) based on performance.
C. The Vanguard Group furnishes at cost corporate management, administrative, marketing, and distribution services. The costs of such services are allocated to the fund under methods approved by the board of trustees. The fund has committed to provide up to 0.40% of its net assets in capital contributions to Vanguard. At October 31, 2009, the fund had contributed capital of $6,929,000 to Vanguard (included in Other Assets), representing 0.02% of the fund’s net assets and 2.77% of Vanguard’s capitalization. The fund’s trustees and officers are also directors and officers of Vanguard.
D. The fund has asked its investment advisors to direct certain security trades, subject to obtaining the best price and execution, to brokers who have agreed to rebate to the fund part of the commissions generated. Such rebates are used solely to reduce the fund’s management and administrative expenses. For the year ended October 31, 2009, these arrangements reduced the fund’s expenses by $2,749,000 (an annual rate of 0.01% of average net assets).
28
Windsor II Fund
E. Various inputs may be used to determine the value of the fund’s investments. These inputs are summarized in three broad levels for financial statement purposes. The inputs or methodologies used to value securities are not necessarily an indication of the risk associated with investing in those securities.
Level 1—Quoted prices in active markets for identical securities.
Level 2—Other significant observable inputs (including quoted prices for similar securities, interest
rates, prepayment speeds, credit risk, etc.).
Level 3—Significant unobservable inputs (including the fund’s own assumptions used to determine the
fair value of investments).
The following table summarizes the fund’s investments as of October 31, 2009, based on the inputs used to value them:
| Level 1 | Level 2 | Level 3 | |
| Investments | ($000) | ($000) | ($000) |
| Common Stocks | 31,240,786 | — | 59 |
| Temporary Cash Investments | 1,230,193 | 63,480 | — |
| Futures Contracts—Liabilities1 | (11,939) | — | — |
| Total | 32,459,040 | 63,480 | 59 |
1 Represents variation margin on the last day of the reporting period.
The following table summarizes changes in investments valued based on Level 3 inputs during the year ended October 31, 2009:
| Investments in | |
| Common Stocks | |
| Amount Valued Based on Level 3 Inputs | ($000) |
| Balance as of October 31, 2008 | — |
| Transfers into Level 3 | 59 |
| Balance as of October 31, 2009 | 59 |
F. At October 31, 2009, the aggregate settlement value of open futures contracts and the related unrealized appreciation (depreciation) were:
| ($000) | ||||
| Number of | Aggregate | Unrealized | ||
| Long (Short) | Settlement | Appreciation | ||
| Futures Contracts | Expiration | Contracts | Value | (Depreciation) |
| S&P 500 Index | December 2009 | 1,230 | 317,648 | 635 |
| E-mini S&P 500 Index | December 2009 | 3,225 | 166,571 | (2,326) |
Unrealized appreciation (depreciation) on open futures contracts is required to be treated as realized gain (loss) for tax purposes.
29
Windsor II Fund
G. Distributions are determined on a tax basis and may differ from net investment income and realized capital gains for financial reporting purposes. Differences may be permanent or temporary. Permanent differences are reclassified among capital accounts in the financial statements to reflect their tax character. Temporary differences arise when certain items of income, expense, gain, or loss are recognized in different periods for financial statement and tax purposes; these differences will reverse at some time in the future. Differences in classification may also result from the treatment of short-term gains as ordinary income for tax purposes.
For tax purposes, at October 31, 2009, the fund had $236,796,000 of ordinary income available for distribution. The fund had available capital loss carryforwards totaling $5,023,219,000 to offset future net capital gains of $3,383,640,000 through October 31, 2016, and $1,639,579,000 through October 31, 2017.
At October 31, 2009, the cost of investment securities for tax purposes was $32,887,774,000. Net unrealized depreciation of investment securities for tax purposes was $353,256,000, consisting of unrealized gains of $5,410,353,000 on securities that had risen in value since their purchase and $5,763,609,000 in unrealized losses on securities that had fallen in value since their purchase.
H. During the year ended October 31, 2009, the fund purchased $11,415,946,000 of investment securities and sold $12,493,449,000 of investment securities, other than temporary cash investments.
I. Capital share transactions for each class of shares were:
| Year Ended October 31, | ||||
| 2009 | 2008 | |||
| Amount | Shares | Amount | Shares | |
| ($000) | (000) | ($000) | (000) | |
| Investor Shares | ||||
| Issued | 2,238,808 | 120,849 | 3,499,635 | 123,646 |
| Issued in Lieu of Cash Distributions | 611,735 | 32,569 | 3,715,460 | 121,524 |
| Redeemed | (3,136,719) | (165,583) | (5,494,918) | (195,573) |
| Net Increase (Decrease)—Investor Shares | (286,176) | (12,165) | 1,720,177 | 49,597 |
| Admiral Shares | ||||
| Issued | 1,115,935 | 33,223 | 2,041,071 | 39,062 |
| Issued in Lieu of Cash Distributions | 354,517 | 10,636 | 2,193,289 | 40,423 |
| Redeemed | (1,874,871) | (56,220) | (3,097,843) | (62,881) |
| Net Increase (Decrease)—Admiral Shares | (404,419) | (12,361) | 1,136,517 | 16,604 |
30
Windsor II Fund
J. Certain of the fund’s investments are in companies that are considered to be affiliated companies of the fund because the fund owns more than 5% of the outstanding voting securities of the company. Transactions during the period in securities of these companies were as follows:
| Current Period Transactions | |||||
| Oct. 31, 2008 | Proceeds from | Oct. 31, 2009 | |||
| Market | Purchases | Securities | Dividend | Market | |
| Value | at Cost | Sold | Income | Value | |
| ($000) | ($000) | ($000) | ($000) | ($000) | |
| CenterPoint Energy Inc. | 215,552 | 65,637 | 7,896 | 15,601 | 303,817 |
| Constellation Energy Group Inc. | NA1 | 176,004 | — | 9,386 | 341,085 |
| Cooper Industries PLC Class A2 | 393,823 | 113,515 | 116,971 | 15,488 | 532,398 |
| ITT Corp. | 406,361 | 77,711 | — | 8,447 | 558,776 |
| Quest Diagnostics Inc. | NA1 | 191,809 | 59,748 | 3,602 | 536,553 |
| Service Corp. International | 173,053 | — | — | 4,013 | 172,300 |
| Sherwin-Williams Co. | 402,433 | — | 386,164 | 4,194 | — |
| Spectra Energy Corp. | 625,076 | — | — | 32,337 | 618,285 |
| Wyndham Worldwide Corp. | 145,592 | 8,120 | 2,213 | 2,999 | 320,505 |
| 2,361,890 | 96,067 | 3,383,719 | |||
1 Not applicable—At October 31, 2008, the issuer was not an affiliated company of the fund.
2 Cooper Industries Inc. Class A changed its name to Cooper Industries PLC Class A in September 2009.
K. In preparing the financial statements as of October 31, 2009, management considered the impact of subsequent events occurring through December 8, 2009, for potential recognition or disclosure in these financial statements.
31
Report of Independent Registered
Public Accounting Firm
To the Trustees of Vanguard Windsor Funds and the Shareholders of Vanguard Windsor II Fund:
In our opinion, the accompanying statement of net assets and statement of assets and liabilities, and the related statements of operations and of changes in net assets and the financial highlights present fairly, in all material respects, the financial position of Vanguard Windsor II Fund (the “Fund”) at October 31, 2009, the results of its operations for the year then ended, the changes in its net assets for each of the two years in the period then ended and the financial highlights for each of the five years in the period then ended, in conformity with accounting principles generally accepted in the United States of America. These financial statements and financial highlights (hereafter referred to as “financial statements”) are the responsibility of the Fund’s management; our responsibility is to express an opinion on these financial statements based on our audits. We conducted our audits of these financial statements in accordance with the standards of the Public Company Accounting Oversight Board (United States). Those standards require that we plan and perform the audit to obtain reasonable assurance about whether the financial statements are free of material misstatement. An audit includes examining, on a test basis, evidence supporting the amounts and disclosures in the financial statements, assessing the accounting principles used and significant estimates made by management, and evaluating the overall financial statement presentation. We believe that our audits, which included confirmation of securities at October 31, 2009 by correspondence with the custodian and broker and by agreement to the underlying ownership records of Vanguard Market Liquidity Fund, provide a reasonable basis for our opinion.
PricewaterhouseCoopers LLP
Philadelphia, Pennsylvania
December 8, 2009

Special 2009 tax information (unaudited) for Vanguard Windsor II Fund
This information for the fiscal year ended October 31, 2009, is included pursuant to provisions of the Internal Revenue Code.
The fund distributed $1,011,468,000 of qualified dividend income to shareholders during the fiscal year.
For corporate shareholders, 94.5% of investment income (dividend income plus short-term gains, if any) qualifies for the dividends-received deduction.
32
Your Fund’s After-Tax Returns
This table presents returns for your fund both before and after taxes. The after-tax returns are shown in two ways: (1) assuming that an investor owned the fund during the entire period and paid taxes on the fund’s distributions, and (2) assuming that an investor paid taxes on the fund’s distributions and sold all shares at the end of each period.
Calculations are based on the highest individual federal income tax and capital gains tax rates in effect at the times of the distributions and the hypothetical sales. State and local taxes were not considered. After-tax returns reflect any qualified dividend income, using actual prior-year figures and estimates for 2009. (In the example, returns after the sale of fund shares may be higher than those assuming no sale. This occurs when the sale would have produced a capital loss. The calculation assumes that the investor received a tax deduction for the loss.)
The table shows returns for Investor Shares only; returns for other share classes will differ. Please note that your actual after-tax returns will depend on your tax situation and may differ from those shown. Also note that if you own the fund in a tax-deferred account, such as an individual retirement account or a 401(k) plan, this information does not apply to you. Such accounts are not subject to current taxes.
Finally, keep in mind that a fund’s performance—whether before or after taxes—does not guarantee future results.
Average Annual Total Returns: Windsor II Fund Investor Shares1
Periods Ended October 31, 2009
| One | Five | Ten | |
| Year | Years | Years | |
| Returns Before Taxes | 11.96% | 1.02% | 2.96% |
| Returns After Taxes on Distributions | 11.37 | 0.08 | 1.79 |
| Returns After Taxes on Distributions and Sale of Fund Shares | 8.37 | 0.96 | 2.23 |
1 Total returns do not include the account service fee that may be applicable to certain accounts with balances below $10,000.
33
About Your Fund’s Expenses
As a shareholder of the fund, you incur ongoing costs, which include costs for portfolio management, administrative services, and shareholder reports (like this one), among others. Operating expenses, which are deducted from a fund’s gross income, directly reduce the investment return of the fund.
A fund’s expenses are expressed as a percentage of its average net assets. This figure is known as the expense ratio. The following examples are intended to help you understand the ongoing costs (in dollars) of investing in your fund and to compare these costs with those of other mutual funds. The examples are based on an investment of $1,000 made at the beginning of the period shown and held for the entire period.
The accompanying table illustrates your fund’s costs in two ways:
• Based on actual fund return. This section helps you to estimate the actual expenses that you
paid over the period. The “Ending Account Value” shown is derived from the fund’s actual return, and
the third column shows the dollar amount that would have been paid by an investor who started with
$1,000 in the fund. You may use the information here, together with the amount you invested, to
estimate the expenses that you paid over the period.
To do so, simply divide your account value by $1,000 (for example, an $8,600 account value divided by
$1,000 = 8.6), then multiply the result by the number given for your fund under the heading “Expenses
Paid During Period.”
• Based on hypothetical 5% yearly return. This section is intended to help you compare your fund’s
costs with those of other mutual funds. It assumes that the fund had a yearly return of 5% before
expenses, but that the expense ratio is unchanged. In this case—because the return used is not the
fund’s actual return—the results do not apply to your investment. The example is useful in making
comparisons because the Securities and Exchange Commission requires all mutual funds to calculate
expenses based on a 5% return. You can assess your fund’s costs by comparing this hypothetical
example with the hypothetical examples that appear in shareholder reports of other funds.
| Six Months Ended October 31, 2009 | |||
| Beginning | Ending | Expenses | |
| Account Value | Account Value | Paid During | |
| Windsor II Fund | 4/30/2009 | 10/31/2009 | Period1 |
| Based on Actual Fund Return | |||
| Investor Shares | $1,000.00 | $1,235.81 | $2.03 |
| Admiral Shares | 1,000.00 | 1,236.42 | 1.41 |
| Based on Hypothetical 5% Yearly Return | |||
| Investor Shares | $1,000.00 | $1,023.39 | $1.84 |
| Admiral Shares | 1,000.00 | 1,023.95 | 1.28 |
1 The calculations are based on expenses incurred in the most recent six-month period. The fund’s annualized six-month expense ratios for
that period are 0.36% for Investor Shares and 0.25% for Admiral Shares. The dollar amounts shown as “Expenses Paid” are equal to the
annualized expense ratio multiplied by the average account value over the period, multiplied by the number of days in the most recent
six-month period, then divided by the number of days in the most recent 12-month period.
34
Note that the expenses shown in the table are meant to highlight and help you compare ongoing costs only and do not reflect transaction costs incurred by the fund for buying and selling securities. Further, the expenses do not include the account service fee described in the prospectus. If such a fee were applied to your account, your costs would be higher. Your fund does not charge transaction fees, such as purchase or redemption fees, nor does it carry a “sales load.”
The calculations assume no shares were bought or sold during the period. Your actual costs may have been higher or lower, depending on the amount of your investment and the timing of any purchases or redemptions.
You can find more information about the fund’s expenses, including annual expense ratios, in the Financial Statements section of this report. For additional information on operating expenses and other shareholder costs, please refer to your fund’s current prospectus.
35
Glossary
Beta. A measure of the magnitude of a fund’s past share-price fluctuations in relation to the ups and downs of a given market index. The index is assigned a beta of 1.00. Compared with a given index, a fund with a beta of 1.20 typically would have seen its share price rise or fall by 12% when the index rose or fell by 10%. For this report, beta is based on returns over the past 36 months for both the fund and the index. Note that a fund’s beta should be reviewed in conjunction with its R-squared (see definition). The lower the R-squared, the less correlation there is between the fund and the index, and the less reliable beta is as an indicator of volatility.
Earnings Growth Rate. The average annual rate of growth in earnings over the past five years for the stocks now in a fund.
Equity Exposure. A measure that reflects a fund’s investments in stocks and stock futures. Any holdings in short-term reserves are excluded.
Expense Ratio. The percentage of a fund’s average net assets used to pay its annual administrative and advisory expenses. These expenses directly reduce returns to investors.
Foreign Holdings. The percentage of a fund represented by stocks or depositary receipts of companies based outside the United States.
Inception Date. The date on which the assets of a fund (or one of its share classes) are first invested in accordance with the fund’s investment objective. For funds with a subscription period, the inception date is the day after that period ends. Investment performance is measured from the inception date.
Median Market Cap. An indicator of the size of companies in which a fund invests; the midpoint of market capitalization (market price x shares outstanding) of a fund’s stocks, weighted by the proportion of the fund’s assets invested in each stock. Stocks representing half of the fund’s assets have market capitalizations above the median, and the rest are below it.
Price/Book Ratio. The share price of a stock divided by its net worth, or book value, per share. For a fund, the weighted average price/book ratio of the stocks it holds.
Price/Earnings Ratio. The ratio of a stock’s current price to its per-share earnings over the past year. For a fund, the weighted average P/E of the stocks it holds. P/E is an indicator of market expectations about corporate prospects; the higher the P/E, the greater the expectations for a company’s future growth.
R-Squared. A measure of how much of a fund’s past returns can be explained by the returns from the market in general, as measured by a given index. If a fund’s total returns were precisely synchronized with an index’s returns, its R-squared would be 1.00. If the fund’s returns bore no relationship to the index’s returns, its R-squared would be 0. For this report, R-squared is based on returns over the past 36 months for both the fund and the index.
Return on Equity. The annual average rate of return generated by a company during the past five years for each dollar of shareholder’s equity (net income divided by shareholder’s equity). For a fund, the weighted average return on equity for the companies whose stocks it holds.
Short-Term Reserves. The percentage of a fund invested in highly liquid, short-term securities that can be readily converted to cash.
36
Turnover Rate. An indication of the fund’s trading activity. Funds with high turnover rates incur higher transaction costs and may be more likely to distribute capital gains (which may be taxable to investors). The turnover rate excludes in-kind transactions, which have minimal impact on costs.
Yield. A fund’s 30-day SEC yield is derived using a formula specified by the U.S. Securities and Exchange Commission. Under the formula, data related to the fund’s security holdings in the previous 30 days are used to calculate the fund’s hypothetical net income for that period, which is then annualized and divided by the fund’s estimated average net assets over the calculation period. For the purposes of this calculation, a security’s income is based on its current market yield to maturity (in the case of bonds) or its projected dividend yield (for stocks). Because the SEC yield represents hypothetical annualized income, it will differ—at times significantly—from the fund’s actual experience. As a result, the fund’s income distributions may be higher or lower than implied by the SEC yield.
37
This page intentionally left blank.
This page intentionally left blank.
The People Who Govern Your Fund
The trustees of your mutual fund are there to see that the fund is operated and managed in your best interests since, as a shareholder, you are a part owner of the fund. Your fund’s trustees also serve on the board of directors of The Vanguard Group, Inc., which is owned by the Vanguard funds and provides services to them on an at-cost basis.
A majority of Vanguard’s board members are independent, meaning that they have no affiliation with Vanguard or the funds they oversee, apart from the sizable personal investments they have made as private individuals. The independent board members have distinguished backgrounds in business, academia, and public service. Each of the trustees and executive officers oversees 156 Vanguard funds.
The following table provides information for each trustee and executive officer of the fund. More information about the trustees is in the Statement of Additional Information, which can be obtained, without charge, by contacting Vanguard at 800-662-7447, or online at www.vanguard.com.
| Interested Trustees | Emerson U. Fullwood |
| Born 1948. Trustee Since January 2008. Principal | |
| John J. Brennan1 | Occupation(s) During the Past Five Years: Executive |
| Born 1954. Trustee Since May 1987. Chairman of | Chief Staff and Marketing Officer for North America |
| the Board. Principal Occupation(s) During the Past | and Corporate Vice President (retired 2008) of Xerox |
| Five Years: Chairman of the Board and Director/Trustee | Corporation (photocopiers and printers); Director of |
| of The Vanguard Group, Inc., and of each of the | SPX Corporation (multi-industry manufacturing), the |
| investment companies served by The Vanguard Group; | United Way of Rochester, the Boy Scouts of America, |
| Chief Executive Officer (1996–2008) and President | Amerigroup Corporation (direct health and medical |
| (1989–2008) of The Vanguard Group and of each of the | insurance carriers), and Monroe Community College |
| investment companies served by The Vanguard Group; | Foundation. |
| Chairman of the Financial Accounting Foundation; | |
| Governor of the Financial Industry Regulatory Authority | Rajiv L. Gupta |
| (FINRA); Director of United Way of Southeastern | Born 1945. Trustee Since December 2001.2 Principal |
| Pennsylvania. | Occupation(s) During the Past Five Years: Chairman |
| and Chief Executive Officer (retired 2009) and President | |
| F. William McNabb III1 | (2006–2008) of Rohm and Haas Co. (chemicals); Board |
| Born 1957. Trustee Since July 2009. Principal | Member of American Chemistry Council; Director of |
| Occupation(s) During the Past Five Years: Director of | Tyco International, Ltd. (diversified manufacturing and |
| The Vanguard Group, Inc., since 2008; Chief Executive | services) and Hewlett-Packard Co. (electronic computer |
| Officer and President of The Vanguard Group and of | manufacturing); Trustee of The Conference Board. |
| each of the investment companies served by The | |
| Vanguard Group since 2008; Director of Vanguard | Amy Gutmann |
| Marketing Corporation; Managing Director of The | Born 1949. Trustee Since June 2006. Principal |
| Vanguard Group (1995–2008). | Occupation(s) During the Past Five Years: President of |
| the University of Pennsylvania; Christopher H. Browne | |
| Distinguished Professor of Political Science in the School | |
| Independent Trustees | of Arts and Sciences with secondary appointments |
| at the Annenberg School for Communication and the | |
| Charles D. Ellis | Graduate School of Education of the University of |
| Born 1937. Trustee Since January 2001. Principal | Pennsylvania; Director of Carnegie Corporation of |
| Occupation(s) During the Past Five Years: Applecore | New York, Schuylkill River Development Corporation, |
| Partners (pro bono ventures in education); Senior | and Greater Philadelphia Chamber of Commerce; |
| Advisor to Greenwich Associates (international business | Trustee of the National Constitution Center. |
| strategy consulting); Successor Trustee of Yale University; | |
| Overseer of the Stern School of Business at New York | |
| University; Trustee of the Whitehead Institute for | |
| Biomedical Research. |
| JoAnn Heffernan Heisen | Executive Officers | |
| Born 1950. Trustee Since July 1998. Principal | ||
| Occupation(s) During the Past Five Years: Corporate | Thomas J. Higgins1 | |
| Vice President and Chief Global Diversity Officer since | Born 1957. Chief Financial Officer Since September | |
| 2006 (retired 2008) and Member of the Executive | 2008. Principal Occupation(s) During the Past Five | |
| Committee (retired 2008) of Johnson & Johnson | Years: Principal of The Vanguard Group, Inc.; Chief | |
| (pharmaceuticals/consumer products); Vice President | Financial Officer of each of the investment companies | |
| and Chief Information Officer of Johnson & Johnson | served by The Vanguard Group since 2008; Treasurer | |
| (1997–2005); Director of the University Medical Center | of each of the investment companies served by The | |
| at Princeton and Women’s Research and Education | Vanguard Group (1998–2008). | |
| Institute; Member of the Advisory Board of the Maxwell | ||
| School of Citizenship and Public Affairs at Syracuse | ||
| University. | Kathryn J. Hyatt1 | |
| Born 1955. Treasurer Since November 2008. Principal | ||
| Occupation(s) During the Past Five Years: Principal of | ||
| F. Joseph Loughrey | The Vanguard Group, Inc.; Treasurer of each of the | |
| Born 1949. Trustee Since October 2009. Principal | investment companies served by The Vanguard | |
| Occupation(s) During the Past Five Years: President and | Group since 2008; Assistant Treasurer of each of the | |
| Chief Operating Officer since 2005 (retired 2009) and | investment companies served by The Vanguard Group | |
| Vice Chairman of the Board (2008–2009) of Cummins | (1988–2008). | |
| Inc. (industrial machinery); Director of SKF AB (industrial | ||
| machinery), Hillenbrand, Inc. (specialized consumer | ||
| services), Sauer-Danfoss Inc. (machinery), the Lumina | Heidi Stam1 | |
| Foundation for Education, and the Columbus Community | Born 1956. Secretary Since July 2005. Principal | |
| Education Coalition; Chairman of the Advisory Council | Occupation(s) During the Past Five Years: Managing | |
| for the College of Arts and Letters at the University of | Director of The Vanguard Group, Inc., since 2006; | |
| Notre Dame. | General Counsel of The Vanguard Group since 2005; | |
| Secretary of The Vanguard Group and of each of the | ||
| investment companies served by The Vanguard Group | ||
| André F. Perold | since 2005; Director and Senior Vice President of | |
| Born 1952. Trustee Since December 2004. Principal | Vanguard Marketing Corporation since 2005; Principal | |
| Occupation(s) During the Past Five Years: George Gund | of The Vanguard Group (1997–2006). | |
| Professor of Finance and Banking, Harvard Business | ||
| School; Chair of the Investment Committee of HighVista | ||
| Strategies LLC (private investment firm). | Vanguard Senior Management Team | |
| Alfred M. Rankin, Jr. | R. Gregory Barton | Michael S. Miller |
| Born 1941. Trustee Since January 1993. Principal | Mortimer J. Buckley | James M. Norris |
| Occupation(s) During the Past Five Years: Chairman, | Kathleen C. Gubanich | Glenn W. Reed |
| President, and Chief Executive Officer of NACCO | Paul A. Heller | George U. Sauter |
| Industries, Inc. (forklift trucks/housewares/lignite); | ||
| Director of Goodrich Corporation (industrial products/ | ||
| aircraft systems and services); Deputy Chairman of | ||
| the Federal Reserve Bank of Cleveland; Trustee of | ||
| University Hospitals of Cleveland, The Cleveland | Founder | |
| Museum of Art, and Case Western Reserve University. | John C. Bogle | |
| Chairman and Chief Executive Officer, 1974–1996 | ||
| Peter F. Volanakis | ||
| Born 1955. Trustee Since July 2009. Principal | ||
| Occupation(s) During the Past Five Years: President | ||
| since 2007 and Chief Operating Officer since 2005 | ||
| of Corning Incorporated (communications equipment); | ||
| President of Corning Technologies (2001–2005); Director | ||
| of Corning Incorporated and Dow Corning; Trustee of | ||
| the Corning Incorporated Foundation and the Corning | ||
| Museum of Glass; Overseer of the Amos Tuck School | ||
| of Business Administration at Dartmouth College. | ||
1 These individuals are “interested persons” as defined in the Investment Company Act of 1940.
2 December 2002 for Vanguard Equity Income Fund, Vanguard Growth Equity Fund, the Vanguard Municipal Bond Funds, and the Vanguard
State Tax-Exempt Funds.

P.O. Box 2600
Valley Forge, PA 19482-2600
Connect with Vanguard® > www.vanguard.com
| Fund Information > 800-662-7447 | All comparative mutual fund data are from Lipper Inc. |
| or Morningstar, Inc., unless otherwise noted. | |
| Direct Investor Account Services > 800-662-2739 | |
| Institutional Investor Services > 800-523-1036 | You can obtain a free copy of Vanguard’s proxy voting |
| guidelines by visiting our website, www.vanguard.com, | |
| Text Telephone for People | and searching for “proxy voting guidelines,” or by |
| With Hearing Impairment > 800-749-7273 | calling Vanguard at 800-662-2739. The guidelines are |
| also available from the SEC’s website, www.sec.gov. | |
| In addition, you may obtain a free report on how your | |
| fund voted the proxies for securities it owned during | |
| the 12 months ended June 30. To get the report, visit | |
| This material may be used in conjunction | either www.vanguard.com or www.sec.gov. |
| with the offering of shares of any Vanguard | |
| fund only if preceded or accompanied by | |
| the fund’s current prospectus. | You can review and copy information about your fund |
| at the SEC’s Public Reference Room in Washington, D.C. | |
| CFA® is a trademark owned by CFA Institute. | To find out more about this public service, call the SEC |
| at 202-551-8090. Information about your fund is also | |
| available on the SEC’s website, and you can receive | |
| copies of this information, for a fee, by sending a | |
| request in either of two ways: via e-mail addressed to | |
| publicinfo@sec.gov or via regular mail addressed to the | |
| Public Reference Section, Securities and Exchange | |
| Commission, Washington, DC 20549-1520. | |
| © 2009 The Vanguard Group, Inc. | |
| All rights reserved. | |
| Vanguard Marketing Corporation, Distributor. | |
| Q730 122009 | |
Item 2: Code of Ethics. The Registrant has adopted a code of ethics that applies to the Registrant’s principal executive officer, principal financial officer, principal accounting officer or controller or persons performing similar functions. The Code of Ethics was amended during the reporting period covered by this report to make certain technical, non-material changes.
Item 3: Audit Committee Financial Expert. The following members of the Audit Committee have been determined by the Registrant’s Board of Trustees to be Audit Committee Financial Experts serving on its Audit Committee, and to be independent: Charles D. Ellis, Rajiv L. Gupta, JoAnn Heffernan Heisen, André F. Perold, and Alfred M. Rankin, Jr.
Item 4: Principal Accountant Fees and Services.
(a) Audit Fees.
Audit Fees of the Registrant
Fiscal Year Ended October 31, 2009: $54,000
Fiscal Year Ended October 31, 2008: $54,000
Aggregate Audit Fees of Registered Investment Companies in the Vanguard Group.
Fiscal Year Ended October 31, 2009: $3,354,640
Fiscal Year Ended October 31, 2008: $3,055,590
(b) Audit-Related Fees.
Fiscal Year Ended October 31, 2009: $876,210
Fiscal Year Ended October 31, 2008: $626,240
Includes fees billed in connection with assurance and related services provided to the Registrant, The Vanguard Group, Inc., Vanguard Marketing Corporation, and other registered investment companies in the Vanguard Group.
(c) Tax Fees.
Fiscal Year Ended October 31, 2009: $423,070
Fiscal Year Ended October 31, 2008: $230,400
Includes fees billed in connection with tax compliance, planning and advice services provided to the Registrant, The Vanguard Group, Inc., Vanguard Marketing Corporation, and other registered investment companies in the Vanguard Group and related to income and excise taxes.
(d) All Other Fees.
Fiscal Year Ended October 31, 2009: $0
Fiscal Year Ended October 31, 2008: $0
Includes fees billed for services related to risk management and privacy matters. Services were provided to the Registrant, The Vanguard Group, Inc., Vanguard Marketing Corporation, and other registered investment companies in the Vanguard Group.
(e) (1) Pre-Approval Policies. The policy of the Registrant’s Audit Committee is to consider and, if appropriate, approve before the principal accountant is engaged for such services, all specific audit and non-audit services provided to: (1) the Registrant; (2) The Vanguard Group, Inc.; (3) other entities controlled by The Vanguard Group, Inc. that provide ongoing services to the Registrant; and (4) other registered investment companies in the Vanguard Group. In making a determination, the Audit Committee considers whether the services are consistent with maintaining the principal accountant’s independence.
In the event of a contingency situation in which the principal accountant is needed to provide services in between scheduled Audit Committee meetings, the Chairman of the Audit Committee would be called on to consider and, if appropriate, pre-approve audit or permitted non-audit services in an amount sufficient to complete services through the next Audit Committee meeting, and to determine if such services would be consistent with maintaining the accountant’s independence. At the next scheduled Audit Committee meeting, services and fees would be presented to the Audit Committee for formal consideration, and, if appropriate, approval by the entire Audit Committee. The Audit Committee would again consider whether such services and fees are consistent with maintaining the principal accountant’s independence.
The Registrant’s Audit Committee is informed at least annually of all audit and non-audit services provided by the principal accountant to the Vanguard complex, whether such services are provided to: (1) the Registrant; (2) The Vanguard Group, Inc.; (3) other entities controlled by The Vanguard Group, Inc. that provide ongoing services to the Registrant; or (4) other registered investment companies in the Vanguard Group.
(2) No percentage of the principal accountant’s fees or services were approved pursuant to the waiver provision of paragraph (c)(7)(i)(C) of Rule 2-01 of Regulation S-X.
(f) For the most recent fiscal year, over 50% of the hours worked under the principal accountant’s engagement were not performed by persons other than full-time, permanent employees of the principal accountant.
(g) Aggregate Non-Audit Fees.
Fiscal Year Ended October 31, 2009: $423,070
Fiscal Year Ended October 31, 2008: $230,400
Includes fees billed for non-audit services provided to the Registrant, The Vanguard Group, Inc., Vanguard Marketing Corporation, and other registered investment companies in the Vanguard Group.
(h) For the most recent fiscal year, the Audit Committee has determined that the provision of all non-audit services was consistent with maintaining the principal accountant’s independence.
Item 5: Not Applicable.
Item 6: Not Applicable.
Item 7: Not Applicable.
Item 8: Not Applicable.
Item 9: Not Applicable.
Item 10: Not Applicable.
Item 11: Controls and Procedures.
(a) Disclosure Controls and Procedures. The Principal Executive and Financial Officers concluded that the Registrant's Disclosure Controls and Procedures are effective based on their evaluation of the Disclosure Controls and Procedures as of a date within 90 days of the filing date of this report.
(b) Internal Control Over Financial Reporting. There were no significant changes in Registrant’s Internal Control Over Financial Reporting or in other factors that could significantly affect this control subsequent to the date of the evaluation, including any corrective actions with regard to significant deficiencies and material weaknesses.
Item 12: Exhibits.
(a) Code of Ethics.
(b) Certifications.
Pursuant to the requirements of the Securities Exchange Act of 1934 and the Investment Company Act of 1940, the registrant has duly caused this report to be signed on its behalf by the undersigned, thereunto duly authorized.
| VANGUARD WINDSOR FUNDS | |
| BY: | /s/ F. WILLIAM MCNABB III* |
| F. WILLIAM MCNABB III | |
| CHIEF EXECUTIVE OFFICER | |
| Date: December 18, 2009 | |
Pursuant to the requirements of the Securities Exchange Act of 1934 and the Investment Company Act of 1940, this report has been signed below by the following persons on behalf of the registrant and in the capacities and on the dates indicated.
| VANGUARD WINDSOR FUNDS | |
| BY: | /s/ F. WILLIAM MCNABB III* |
| F. WILLIAM MCNABB III | |
| CHIEF EXECUTIVE OFFICER | |
| Date: December 18, 2009 | |
| VANGUARD WINDSOR FUNDS | |
| BY: | /s/ THOMAS J. HIGGINS* |
| THOMAS J. HIGGINS | |
| CHIEF FINANCIAL OFFICER | |
| Date: December 18, 2009 | |
* By: /s/ Heidi Stam
Heidi Stam, pursuant to a Power of Attorney filed on July 24, 2009, see file Number
2-88373, and a Power of Attorney filed on October 16, 2009, see File Number 2-52698,
both Incorporated by Reference.