UNITED STATES
SECURITIES AND EXCHANGE COMMISSION
Washington, D.C. 20549
FORM N-CSR
CERTIFIED SHAREHOLDER REPORT
OF
REGISTERED MANAGEMENT INVESTMENT COMPANIES
Investment Company Act file number: 811-00834
Name of Registrant: Vanguard Windsor Funds
Address of Registrant:
P.O. Box 2600
Valley Forge, PA 19482
Name and address of agent for service:
Heidi Stam, Esquire
P.O. Box 876
Valley Forge, PA 19482
Registrant’s telephone number, including area code: (610) 669-1000
Date of fiscal year end: October 31
Date of reporting period: November 1, 2013 – April 30, 2014
Item 1: Reports to Shareholders

|
| Semiannual Report | April 30, 2014 |
| Vanguard Windsor™ Fund |
| |
 |
Vanguard’s Principles for Investing Success
We want to give you the best chance of investment success. These principles,
grounded in Vanguard’s research and experience, can put you on the right path.
Goals. Create clear, appropriate investment goals.
Balance. Develop a suitable asset allocation using broadly diversified funds.
Cost. Minimize cost.
Discipline. Maintain perspective and long-term discipline.
A single theme unites these principles: Focus on the things you can control.
We believe there is no wiser course for any investor.
| |
| Contents | |
| Your Fund’s Total Returns. | 1 |
| Chairman’s Letter. | 2 |
| Advisors’ Report. | 7 |
| Fund Profile. | 11 |
| Performance Summary. | 13 |
| Financial Statements. | 14 |
| About Your Fund’s Expenses. | 26 |
| Trustees Approve Advisory Arrangements. | 28 |
| Glossary. | 30 |
Please note: The opinions expressed in this report are just that—informed opinions. They should not be considered promises or advice. Also, please keep in mind that the information and opinions cover the period through the date on the front of this report. Of course, the risks of investing in your fund are spelled out in the prospectus.
See the Glossary for definitions of investment terms used in this report.
About the cover: The ship’s wheel represents leadership and guidance, essential qualities in navigating difficult seas. This one is a replica based on an 18th-century British vessel. The HMSVanguard, another ship of that era, served as the flagship for British Admiral Horatio Nelson when he defeated a French fleet at the Battle of the Nile.
Your Fund’s Total Returns
| |
| Six Months Ended April 30, 2014 | |
| | Total |
| | Returns |
| Vanguard Windsor Fund | |
| Investor Shares | 8.75% |
| Admiral™ Shares | 8.81 |
| Russell 1000 Value Index | 9.61 |
| Multi-Cap Value Funds Average | 8.03 |
| Multi-Cap Value Funds Average: Derived from data provided by Lipper, a Thomson Reuters Company. | |
| Admiral Shares carry lower expenses and are available to investors who meet certain account-balance requirements. | |
| | | | |
| Your Fund’s Performance at a Glance | | | | |
| October 31, 2013, Through April 30, 2014 | | | | |
| | | | Distributions Per Share |
| | Starting | Ending | Income | Capital |
| | Share Price | Share Price | Dividends | Gains |
| Vanguard Windsor Fund | | | | |
| Investor Shares | $19.50 | $21.08 | $0.121 | $0.000 |
| Admiral Shares | 65.81 | 71.14 | 0.447 | 0.000 |
1

Chairman’s Letter
Dear Shareholder,
Value stocks handily outperformed their growth counterparts in the six months ended April 30, 2014. In this environment, Vanguard Windsor Fund returned 8.75% for Investor Shares and 8.81% for the lower-cost Admiral Shares.
The fund’s results were modestly ahead of the average return of peer funds, but they lagged the benchmark, the Russell 1000 Value Index. Keep in mind that, on average, your fund’s holdings have a lower market capitalization than the index, which places more emphasis on the market’s largest-cap stocks.
In other periods, including the fiscal year ended October 31, 2013, this divergence has worked in the fund’s favor and contributed to its notable besting of the index.
Recent progress has been sporadic,
but stocks continued to climb
For the half year ended April 30, U.S. stocks
returned almost 8%, notwithstanding the patches of turbulence the market has encountered in the new year. Technology stocks, for example, turned in a rocky performance amid concerns about pricey valuations. Weak economic data from China and the conflict in Ukraine also unsettled investors.
Global economic and political shifts, of course, are as inevitable as they are unpredictable. Broad diversification remains
2
the best way of managing the risks they pose to your portfolio. As Joe Davis, our chief economist, noted recently, “Having a broader portfolio tends to moderate those individual issues and that’s always, I think, a valuable starting point for investors.”
International stocks, in aggregate, returned nearly 3%, with the developed markets of Europe faring the best. The developed markets of the Pacific region and emerging markets, where China’s weakness was felt most, had negative returns.
Despite low yields, the bond market
experienced a surprising rally
Bonds continued to emerge from the
struggles that marked much of 2013, when the market was roiled by worries about the
prospect that the Federal Reserve would reduce its stimulative bond-buying. In January, however, when the reduction actually began, investors seemed to take the news in stride.
The broad U.S. taxable bond market returned 1.74%. The yield of the 10-year Treasury note ended the six months at 2.69%, up from 2.54% on October 31 but down from nearly 3% on December 31. (Bond prices and yields move in opposite directions.)
Municipal bonds returned 4.08% for the six months. Money market funds and savings accounts posted paltry returns as the Fed’s target for short-term interest rates remained at 0%–0.25%.
| | | |
| Market Barometer | | | |
| |
| | | | Total Returns |
| | | Periods Ended April 30, 2014 |
| | Six | One | Five Years |
| | Months | Year | (Annualized) |
| Stocks | | | |
| Russell 1000 Index (Large-caps) | 8.25% | 20.81% | 19.52% |
| Russell 2000 Index (Small-caps) | 3.08 | 20.50 | 19.84 |
| Russell 3000 Index (Broad U.S. market) | 7.83 | 20.78 | 19.54 |
| FTSE All-World ex US Index (International) | 2.84 | 9.77 | 13.22 |
| |
| Bonds | | | |
| Barclays U.S. Aggregate Bond Index (Broad taxable market) | 1.74% | -0.26% | 4.88% |
| Barclays Municipal Bond Index (Broad tax-exempt market) | 4.08 | 0.50 | 5.54 |
| Citigroup Three-Month U.S. Treasury Bill Index | 0.00 | 0.04 | 0.08 |
| |
| CPI | | | |
| Consumer Price Index | 1.51% | 1.95% | 2.14% |
3
International bond markets (as measured by the Barclays Global Aggregate Index ex USD) returned 2.33%.
The Windsor Fund’s advisors
stay true to their strategies
As I mentioned, value stocks outshone
growth stocks for the six-month period. (Value stocks tend to sell at relatively low prices in relation to their earnings or book value, whereas growth stocks typically have higher valuations because of the earnings and revenue potential of the underlying companies.)
For much of 2013, growth stocks—especially those of certain biotechnology and information technology firms—notched robust advances. But the arrival of 2014 seemed to mark a shift among investors
toward value stocks. That move may have been prompted by concerns about pricey valuations for those high-flying biotech and IT stocks. The Russell 1000 Value Index returned 9.61% for the six months compared with 6.95% for the Russell 1000 Growth Index.
The periodic alternating of leadership between growth and value, with one style of investing outperforming the other for a time, can affect your fund’s results relative to the broad market indexes typically quoted in investment commentary. (You can read more about the performance of growth versus value stocks in the accompanying text box.) But these shifts don’t alter the strategies of the Windsor Fund’s advisors. Both Wellington Management Company and Pzena Investment Management take
| | | |
| Expense Ratios | | | |
| Your Fund Compared With Its Peer Group | | | |
| | Investor | Admiral | Peer Group |
| | Shares | Shares | Average |
| Windsor Fund | 0.37% | 0.27% | 1.24% |
The fund expense ratios shown are from the prospectus dated February 26, 2014, and represent estimated costs for the current fiscal year. For the six months ended April 30, 2014, the fund’s annualized expense ratios were 0.37% for Investor Shares and 0.27% for Admiral Shares. The peer-group expense ratio is derived from data provided by Lipper, a Thomson Reuters Company, and captures information through year-end 2013.
Peer group: Multi-Cap Value Funds.
4
a long-term, patient approach to investing. And neither is afraid of being out of step with the latest Wall Street fashion, or even the more narrowly defined characteristics of a value-oriented benchmark index.
For example, as of April 30, information technology stocks accounted for about 18% of fund assets compared with about 9% for the Russell 1000 Value Index. The fund’s allocation to IT stocks, as well as
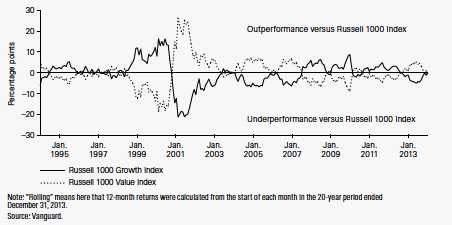
Growth stocks versus value stocks: A case for both
Growth and value stocks typically take turns outperforming each other. The chart here shows how they have switched off during the past 20 years in leading or lagging a broad market average.
These two styles of investing are typically considered complementary—when growth is performing well, value typically isn’t, and vice versa. Very generally speaking, growth stocks represent companies that are expected to expand their businesses at a rapid pace, while value stocks typically represent more established, slower-growing companies.
Which does better in the long run? Neither. Vanguard research has shown that there is no significant long-term difference in the risk/reward characteristics of growth and value stocks. But, because their performance can vary considerably over shorter time periods, a truly diversified portfolio should have exposure to both.
Rolling 12-month return differences, 1994–2013
5
the advisors’ choices among them, served it well in the fiscal half year. The Windsor Fund had strong results among semiconductor stocks and shares of established tech giants.
Technology stocks were once almost exclusively the domain of growth-style investors. But valuations have declined for the shares of some older firms as the industry has matured. Value investors have increasingly turned to parts of the sector that are considered inexpensive relative to earnings and other metrics.
Some of the fund’s retailer holdings stumbled, contributing to its below-benchmark results for the period. You can find more information about the Windsor Fund’s performance and positioning in the Advisors’ Report that follows this letter.
The power of compounding
can put time on your side
The purpose of my letter to you is, of
course, to report on how your fund fared over the past half year. Although it’s important to be aware of how your fund is doing in the latest market environment, short-term performance isn’t what matters most. The focus on the preceding six months shouldn’t distract investors from the long-term commitment they need to help achieve their goals.
To be sure, there are many aspects of investing success that you can’t control, overall market performance being the obvious example. But you can control
how long you invest, and that’s important because it allows you to harness the power of compounding—the snowball effect that occurs when your earnings generate even more earnings. As Benjamin Franklin put it, “Money makes money.”
A simple example illustrates the benefits of compounding that can potentially result from investing and then reinvesting your money over the long haul. Suppose you were able to put away $10,000 and earn 6% a year (keep in mind this is hypothetical; actual returns would probably be different, and certainly a lot less predictable).
If you kept reinvesting the earnings (again assuming a hypothetical 6% yearly return), after ten years you would have almost $18,000. After 30 years, you would have more than $57,000.
Compounding can make a real difference in your account balance over time, particularly when combined with Vanguard’s low expense ratios—which allow you to keep more of the return on your investment.
As always, thank you for entrusting your assets to Vanguard.
Sincerely,

F. William McNabb III
Chairman and Chief Executive Officer
May 12, 2014
6
Advisors’ Report
For the fiscal half year ended April 30, 2014, the Investor Shares of Vanguard Windsor Fund returned 8.75% and the lower-cost Admiral Shares returned 8.81%. Your fund is managed by two independent advisors, a strategy that enhances the fund’s diversification by providing exposure to distinct yet complementary investment approaches. It is not uncommon for different advisors to have different views about individual securities or the broader investment environment.
The advisors, the percentage and amount of fund assets that each manages, and brief descriptions of their investment strategies are presented in the table below. The advisors have also prepared
a discussion of the investment environment that existed during the period and of how their portfolio positioning reflects this assessment. These reports were prepared on May 16, 2014.
Wellington Management Company, llp
Portfolio Manager:
James N. Mordy, Senior Vice President
and Equity Portfolio Manager
Although equity markets continued to gain over the past six months, investors have become more cautious recently, perceiving a number of risks and challenges. In the United States, the Federal Reserve has been tapering its monthly bond purchases
| | | |
| Vanguard Windsor Fund Investment Advisors | |
| |
| | Fund Assets Managed | |
| Investment Advisor | % | $ Million | Investment Strategy |
| Wellington Management | 70 | 12,230 | Seeks to provide long-term total returns above both the |
| Company, LLP | | | S&P 500 and value-oriented indexes over a complete |
| | | | market cycle through bottom-up, fundamentally driven |
| | | | stock selection focused on undervalued securities. |
| Pzena Investment Management, | 29 | 5,035 | Uses a fundamental, bottom-up, deep-value-oriented |
| LLC | | | investment strategy. Seeks to buy good businesses at |
| | | | low prices, focusing exclusively on companies that are |
| | | | underperforming their historically demonstrated |
| | | | earnings power. |
| Cash Investments | 1 | 217 | These short-term reserves are invested by Vanguard in |
| | | | equity index products to simulate investment in stocks. |
| | | | Each advisor also may maintain a modest cash |
| | | | position. |
7
since the beginning of the year, and first-quarter GDP growth was reduced to almost zero by severe winter weather. Globally, events in Ukraine have raised geopolitical tensions, and further slowing in China and some emerging markets could weigh on the pace of economic recovery.
As these factors increased uncertainty among investors, the yield of the 10-year U.S. Treasury bond dropped 40 basis points from year-end 2013, contrary to our expectations. The S&P 500 Index returned 8.36% for the half year, but two of the more defensive industry sectors, utilities and health care, led the gain.
Our performance across the ten major sectors was mixed. Once again, we had outstanding results in information technology. We remain significantly overweight in the semiconductor industry and enjoyed returns of 40% to 60% in NXP Semiconductors, Avago Technologies, and Skyworks Solutions. Each of these companies is outgrowing the overall chip market because of new emerging opportunities or gains within existing end-markets such as smartphones. Although investors are recognizing these very favorable fundamentals more than they did when we bought the stocks, we still see further upside and maintain our overweight position.
We also benefited from owning no stocks in telecommunications services, the S&P 500 Index’s worst-performing sector for the period.
Materials was another source of favorable relative returns. Our chemical holdings, Dow Chemical and LyondellBasell Industries, each returned more than 25%. While both companies benefited from low-cost U.S. natural gas, they have also increased their earnings power through growth initiatives and restructuring moves, and returned significant excess capital to shareholders.
Our worst relative sector was industrials. American Airlines was one of our better stocks, returning almost 55%, but this was more than offset by several other holdings. We believed KBR would win contracts for engineering and construction work on major liquefied natural gas and petrochemical projects. Instead, new orders disappointed, 2013 earnings fell short, guidance was slashed for 2014, and the company’s CEO announced his planned departure. We sold the stock because we don’t see fundamentals improving any time soon.
Eaton, Rexel SA, and AB SKF stocks lagged as the pace of recovery in Europe and in global commercial construction proceeded slowly. We still own these stocks and are encouraged by recent data.
We also lagged in health care. Despite owning several strong outperformers, including AstraZeneca, Mylan, Eli Lilly, and Teva, we missed big gains for Merck, which we sold earlier last year. And our large holding in Bristol-Myers Squibb returned –3% for the six months. We remain confident that Bristol will be a
8
leader in immuno-oncology, and we anticipate new data later this month from recent patient trials.
Cobalt International Energy and GNC Holdings also detracted from returns. Cobalt finished 2013 on a weak note, with disappointing results at an important well. The stock sells at a significant discount to the value of already discovered oil and gas resources, and undrilled inventory offers rich potential. GNC, a retailer of health and wellness products, was hurt by the severe winter, media reports questioning the value of multivitamins and fish oil, and some product discontinuations. We continue to own both companies.
Although first-quarter GDP was a major disappointment, more recent data look healthier. We acknowledge a number of key risks to the continued global recovery, but events would have to deteriorate further to threaten our base case for economic growth. We remain overweighted in the more cyclical sectors relative to the S&P 500 Index, although slightly less so than we were six months ago.
During the half year, we favored the energy, financial, and health care sectors for net new purchases and were net sellers in materials, information technology, and industrials. Our largest new purchase was Cameco. Although the uranium market is oversupplied, we anticipate much higher prices in a few years. By that time, several Japanese nuclear plants will have restarted and China will be building many new plants to help improve air quality.
Pzena Investment Management, LLC
Portfolio Managers:
Richard Pzena, Managing Principal
and co-Chief Investment Officer
John P. Goetz, Managing Principal
and co-Chief Investment Officer
Antonio DeSpirito, Managing Principal
Our performance for the six months was driven in large part by our significant exposure to technology, financial, and energy stocks. In technology, the valuation spread has been very wide between mature enterprise suppliers such as Hewlett-Packard and Oracle and the internet services and software subsectors (Facebook, LinkedIn, Twitter, Salesforce.com, etc.). Our portfolio was focused on the mature suppliers.
Hewlett-Packard was the largest contributor, boosted by improved operating performance and cash flows. We still hold it in our portfolio because the stock is trading at just 7.3 times our estimate of normalized earnings.
The bulk of our exposure to energy was in integrated oil companies, which are trading near the lowest level of their 60-year valuation range as measured by price to book. Royal Dutch Shell performed solidly. Its recent earnings release came in well ahead of the market’s expectations, with strength in exploration and production and in refining operations and with cash
9
flow at a six-year high. The shares trade at about 6.8 times our normal earnings estimate.
In financials, we have invested in insurance companies and wealth managers, as well as banks that were at the epicenter of the global financial crisis. We are now five years past the crisis, and banks have largely fixed their problems; both capital and liquidity are at record levels. Franchises are intact, profitability has partly rebounded, and adjustment to the immense regulatory changes is progressing. However, banks’ share prices have not fully recognized these achievements.
Our financial holdings performed generally in line with the sector. However, Willis Group lagged as it missed on its quarterly earnings results when operating margins compressed and revenue did not grow as expected. The company has responded by cutting costs, and we believe normal earnings are achievable. The stock trades at about 9.3 times our normal earnings estimate.
The consumer discretionary and materials and processing sectors detracted from performance. Office-supply store Staples lagged most over the period, as recent weaker-than-expected revenues and earnings weighed on its shares. We expect industry revenues to remain weak. However, we also see cost-cutting opportunities through retail square footage reduction and potential market share gain as the newly merged Office Depot/Office Max reduces its footprint. At about 7.8 times price/normalized earnings, Staples remains attractive.
Our portfolio is positioned in a number of high-quality but nicely discounted cyclical stocks. Our largest exposures are predominantly in financials, old-line technology, and energy. High-dividend-paying companies with less cyclical earnings profiles (such as utilities, REITs, and pharmaceuticals) outperformed recently as rates fell. However, they trade at premium valuations and thus have little representation among our deep-value holdings. We expect the portfolio to benefit as this valuation gap normalizes over time.
10
Windsor Fund
Fund Profile
As of April 30, 2014
| | |
| Share-Class Characteristics | |
| | Investor | Admiral |
| | Shares | Shares |
| Ticker Symbol | VWNDX | VWNEX |
| Expense Ratio1 | 0.37% | 0.27% |
| 30-Day SEC Yield | 1.35% | 1.45% |
| | | |
| Portfolio Characteristics | | |
| | | | DJ |
| | | | U.S. |
| | | Russell | Total |
| | | 1000 | Market |
| | | Value | FA |
| | Fund | Index | Index |
| Number of Stocks | 138 | 669 | 3,664 |
| Median Market Cap | $30.2B | $54.8B | $47.3B |
| Price/Earnings Ratio | 17.1x | 17.0x | 19.7x |
| Price/Book Ratio | 1.9x | 1.8x | 2.6x |
| Return on Equity | 14.1% | 13.4% | 17.4% |
| Earnings Growth | | | |
| Rate | 10.5% | 8.9% | 12.4% |
| Dividend Yield | 1.8% | 2.3% | 1.9% |
| Foreign Holdings | 14.7% | 0.0% | 0.0% |
| Turnover Rate | | | |
| (Annualized) | 37% | — | — |
| Short-Term Reserves | 1.4% | — | — |
| | |
| Volatility Measures | | |
| | Russell | DJ |
| | 1000 | U.S. Total |
| | Value | Market |
| | Index | FA Index |
| R-Squared | 0.96 | 0.97 |
| Beta | 1.08 | 1.10 |
These measures show the degree and timing of the fund’s fluctuations compared with the indexes over 36 months.
| | |
| Ten Largest Holdings (% of total net assets) |
| Wells Fargo & Co. | Diversified Banks | 2.1% |
| American International | | |
| Group Inc. | Multi-line Insurance | 2.1 |
| Citigroup Inc. | Diversified Banks | 2.0 |
| MetLife Inc. | Life & Health | |
| | Insurance | 1.9 |
| NXP Semiconductor NV | Semiconductors | 1.8 |
| Baker Hughes Inc. | Oil & Gas Equipment | |
| | & Services | 1.8 |
| Eaton Corp. plc | Electrical | |
| | Components & | |
| | Equipment | 1.7 |
| Avago Technologies Ltd. Semiconductors | 1.6 |
| Ameriprise Financial Inc. Asset Management | |
| | & Custody Banks | 1.5 |
| Arrow Electronics Inc. | Technology | |
| | Distributors | 1.5 |
| Top Ten | | 18.0% |
The holdings listed exclude any temporary cash investments and equity index products.
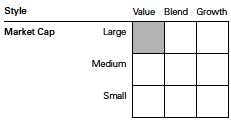
Investment Focus
1 The expense ratios shown are from the prospectus dated February 26, 2014, and represent estimated costs for the current fiscal year. For the six months ended April 30, 2014, the annualized expense ratios were 0.37% for Investor Shares and 0.27% for Admiral Shares.
11
Windsor Fund
| | | |
| Sector Diversification (% of equity exposure) |
| | | | DJ |
| | | | U.S. |
| | | Russell | Total |
| | | 1000 | Market |
| | | Value | FA |
| | Fund | Index | Index |
| Consumer | | | |
| Discretionary | 9.7% | 6.3% | 12.6% |
| Consumer Staples | 4.5 | 5.9 | 8.6 |
| Energy | 14.7 | 15.2 | 9.9 |
| Financials | 25.4 | 28.3 | 17.3 |
| Health Care | 14.1 | 13.3 | 12.8 |
| Industrials | 10.0 | 10.2 | 11.6 |
| Information | | | |
| Technology | 17.7 | 9.1 | 17.9 |
| Materials | 2.6 | 2.9 | 3.9 |
| Telecommunication | | | |
| Services | 0.0 | 2.5 | 2.2 |
| Utilities | 1.3 | 6.3 | 3.2 |
12
Windsor Fund
Performance Summary
All of the returns in this report represent past performance, which is not a guarantee of future results that may be achieved by the fund. (Current performance may be lower or higher than the performance data cited. For performance data current to the most recent month-end, visit our website at vanguard.com/performance.) Note, too, that both investment returns and principal value can fluctuate widely, so an investor’s shares, when sold, could be worth more or less than their original cost. The returns shown do not reflect taxes that a shareholder would pay on fund distributions or on the sale of fund shares.
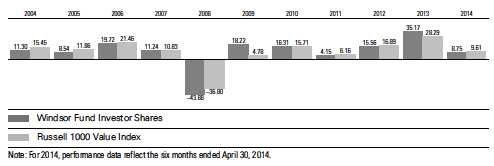
Fiscal-Year Total Returns (%): October 31, 2003, Through April 30, 2014
Average Annual Total Returns: Periods Ended March 31, 2014
This table presents returns through the latest calendar quarter—rather than through the end of the fiscal period.
Securities and Exchange Commission rules require that we provide this information.
| | | | |
| | Inception | One | Five | Ten |
| | Date | Year | Years | Years |
| Investor Shares | 10/23/1958 | 25.98% | 22.73% | 7.14% |
| Admiral Shares | 11/12/2001 | 26.10 | 22.85 | 7.26 |
See Financial Highlights for dividend and capital gains information.
13
Windsor Fund
Financial Statements (unaudited)
Statement of Net Assets
As of April 30, 2014
The fund reports a complete list of its holdings in regulatory filings four times in each fiscal year, at the quarter-ends. For the second and fourth fiscal quarters, the lists appear in the fund’s semiannual and annual reports to shareholders. For the first and third fiscal quarters, the fund files the lists with the Securities and Exchange Commission on Form N-Q. Shareholders can look up the fund’s Forms N-Q on the SEC’s website at sec.gov. Forms N-Q may also be reviewed and copied at the SEC’s Public Reference Room (see the back cover of this report for further information).
| | | |
| | | | Market |
| | | | Value |
| | | Shares | ($000) |
| Common Stocks (97.4%)1 | | |
| Consumer Discretionary (9.4%) | |
| | Newell Rubbermaid Inc. | 5,029,600 | 151,441 |
| | Lowe’s Cos. Inc. | 3,238,100 | 148,661 |
| | Nordstrom Inc. | 2,413,100 | 147,875 |
| | Lennar Corp. Class A | 3,783,190 | 145,993 |
| * | Toll Brothers Inc. | 3,762,000 | 128,811 |
| | Omnicom Group Inc. | 1,759,100 | 119,056 |
| | GNC Holdings Inc. | | |
| | Class A | 2,601,800 | 117,081 |
| | Ford Motor Co. | 6,076,400 | 98,134 |
| * | TRW Automotive | | |
| | Holdings Corp. | 1,216,900 | 97,778 |
| | Staples Inc. | 7,100,921 | 88,762 |
| | General Motors Co. | 2,546,225 | 87,794 |
| * | News Corp. Class A | 4,426,075 | 75,332 |
| | Kohl’s Corp. | 1,303,475 | 71,417 |
| | Comcast Corp. | 1,215,700 | 62,037 |
| | TJX Cos. Inc. | 812,600 | 47,277 |
| | Delphi Automotive plc | 470,825 | 31,470 |
| * | News Corp. Class B | 1,469,052 | 24,298 |
| | | | 1,643,217 |
| Consumer Staples (4.3%) | | |
| | Ingredion Inc. | 2,335,200 | 164,515 |
| | CVS Caremark Corp. | 1,684,100 | 122,468 |
| | Diageo plc | 3,916,623 | 120,006 |
| | Japan Tobacco Inc. | 3,576,000 | 117,538 |
| | Wal-Mart Stores Inc. | 1,321,900 | 105,368 |
| | BRF SA ADR | 3,487,882 | 78,826 |
| | Molson Coors Brewing | | |
| | Co. Class B | 761,800 | 45,685 |
| | | | 754,406 |
| Energy (14.3%) | | |
| | Baker Hughes Inc. | 4,461,675 | 311,871 |
| | Royal Dutch Shell | | |
| | plc ADR | 2,748,192 | 216,393 |
| | BP plc ADR | 4,170,900 | 211,131 |
| | Pioneer Natural | | |
| | Resources Co. | 988,700 | 191,086 |
| | | |
| | | | Market |
| | | | Value |
| | | Shares | ($000) |
| * | Cobalt International | | |
| | Energy Inc. | 10,199,800 | 183,596 |
| | Halliburton Co. | 2,743,900 | 173,058 |
| | Canadian Natural | | |
| | Resources Ltd. | 4,035,600 | 164,531 |
| | Exxon Mobil Corp. | 1,552,175 | 158,958 |
| * | Southwestern Energy Co. | 3,187,600 | 152,622 |
| | Cameco Corp. | 7,137,400 | 151,955 |
| | National Oilwell Varco Inc. | 1,669,400 | 131,098 |
| | Anadarko Petroleum Corp. | 1,137,900 | 112,675 |
| | Chevron Corp. | 785,600 | 98,609 |
| | Apache Corp. | 942,350 | 81,796 |
| * | Concho Resources Inc. | 625,500 | 81,597 |
| | Valero Energy Corp. | 1,326,600 | 75,842 |
| | | | 2,496,818 |
| Financials (24.8%) | | |
| | Wells Fargo & Co. | 7,460,100 | 370,319 |
| | American International | | |
| | Group Inc. | 6,912,800 | 367,277 |
| | Citigroup Inc. | 7,269,275 | 348,271 |
| | MetLife Inc. | 6,310,525 | 330,356 |
| | Ameriprise Financial Inc. | 2,320,300 | 259,015 |
| | Unum Group | 6,648,800 | 220,873 |
| | Bank of America Corp. | 12,963,300 | 196,264 |
| | PNC Financial Services | | |
| | Group Inc. | 1,865,650 | 156,789 |
| | XL Group plc Class A | 4,754,500 | 149,054 |
| | Public Storage | 781,200 | 137,108 |
| | Weyerhaeuser Co. | 4,500,100 | 134,328 |
| | JPMorgan Chase & Co. | 2,110,150 | 118,126 |
| | Principal Financial | | |
| | Group Inc. | 2,509,200 | 117,531 |
| | UBS AG | 5,113,675 | 106,927 |
| | Goldman Sachs Group Inc. | 638,050 | 101,973 |
| | Morgan Stanley | 3,274,691 | 101,286 |
| | State Street Corp. | 1,527,775 | 98,633 |
| * | Voya Financial Inc. | 2,725,700 | 96,463 |
| | Willis Group Holdings plc | 2,345,200 | 96,130 |
| | Julius Baer Group Ltd. | 1,834,033 | 85,907 |
| | Axis Capital Holdings Ltd. | 1,602,221 | 73,302 |
14
Windsor Fund
| | | |
| | | | Market |
| | | | Value |
| | | Shares | ($000) |
| | IntercontinentalExchange | | |
| | Group Inc. | 327,800 | 67,015 |
| | Zions Bancorporation | 2,315,246 | 66,957 |
| | ACE Ltd. | 574,100 | 58,742 |
| | Comerica Inc. | 1,132,600 | 54,637 |
| * | Genworth Financial Inc. | | |
| | Class A | 2,832,750 | 50,565 |
| | Invesco Ltd. | 1,409,850 | 49,641 |
| | Hartford Financial | | |
| | Services Group Inc. | 1,382,425 | 49,588 |
| | Franklin Resources Inc. | 918,225 | 48,069 |
| | Regions Financial Corp. | 4,739,400 | 48,058 |
| | KeyCorp | 3,482,075 | 47,495 |
| | Fifth Third Bancorp | 2,283,800 | 47,069 |
| | Allstate Corp. | 824,000 | 46,927 |
| | SL Green Realty Corp. | 149,777 | 15,683 |
| * | Santander Consumer | | |
| | USA Holdings Inc. | 533,561 | 12,133 |
| | | | 4,328,511 |
| Health Care (13.7%) | | |
| | Bristol-Myers Squibb Co. | 4,729,700 | 236,911 |
| | UnitedHealth Group Inc. | 2,825,500 | 212,025 |
| | Roche Holding AG | 696,237 | 204,239 |
| | Eli Lilly & Co. | 3,069,875 | 181,430 |
| | Aetna Inc. | 2,274,456 | 162,510 |
| | AstraZeneca plc ADR | 1,964,400 | 155,286 |
| | Medtronic Inc. | 2,634,500 | 154,961 |
| * | Express Scripts | | |
| | Holding Co. | 2,109,200 | 140,430 |
| | Sanofi | 1,253,448 | 135,274 |
| | Covidien plc | 1,861,000 | 132,596 |
| | Johnson & Johnson | 1,018,700 | 103,184 |
| | Abbott Laboratories | 2,532,575 | 98,112 |
| * | Mylan Inc. | 1,852,500 | 94,070 |
| | Becton Dickinson and Co. | 820,275 | 92,716 |
| | Teva Pharmaceutical | | |
| | Industries Ltd. ADR | 1,839,000 | 89,853 |
| | Cigna Corp. | 891,700 | 71,372 |
| | McKesson Corp. | 408,900 | 69,182 |
| * | Laboratory Corp. of | | |
| | America Holdings | 446,125 | 44,032 |
| | Quest Diagnostics Inc. | 417,100 | 23,328 |
| | | | 2,401,511 |
| Industrials (9.7%) | | |
| | Eaton Corp. plc | 4,116,600 | 299,030 |
| | Rexel SA | 6,080,379 | 153,512 |
| | Dover Corp. | 1,761,800 | 152,220 |
| | Chicago Bridge & Iron | | |
| | Co. NV | 1,703,700 | 136,415 |
| * | Hertz Global Holdings Inc. | 4,142,900 | 117,948 |
| | SKF AB | 4,523,777 | 117,474 |
| * | American Airlines | | |
| | Group Inc. | 3,318,500 | 116,380 |
| | Norfolk Southern Corp. | 1,229,600 | 116,234 |
| | | |
| | | | Market |
| | | | Value |
| | | Shares | ($000) |
| * | Sensata Technologies | | |
| | Holding NV | 2,600,600 | 110,447 |
| | Honeywell | | |
| | International Inc. | 1,045,300 | 97,108 |
| | Masco Corp. | 3,732,548 | 74,987 |
| | Parker Hannifin Corp. | 575,825 | 73,061 |
| | Pentair Ltd. | 723,500 | 53,749 |
| | General Dynamics Corp. | 352,825 | 38,617 |
| | L-3 Communications | | |
| | Holdings Inc. | 320,175 | 36,939 |
| | | | 1,694,121 |
| Information Technology (17.2%) | |
| * | NXP Semiconductor NV | 5,277,200 | 314,627 |
| | Avago Technologies | | |
| | Ltd. Class A | 4,301,200 | 273,126 |
| * | Arrow Electronics Inc. | 4,504,850 | 255,650 |
| | Hewlett-Packard Co. | 7,036,825 | 232,637 |
| | Cisco Systems Inc. | 9,348,075 | 216,034 |
| * | Skyworks Solutions Inc. | 4,454,900 | 182,874 |
| | SanDisk Corp. | 1,989,800 | 169,073 |
| * | Lam Research Corp. | 2,686,300 | 154,758 |
| | Oracle Corp. | 3,769,900 | 154,114 |
| * | Check Point Software | | |
| | Technologies Ltd. | 2,401,200 | 153,821 |
| * | Teradata Corp. | 3,325,500 | 151,177 |
| | Maxim Integrated | | |
| | Products Inc. | 3,586,200 | 116,336 |
| | Apple Inc. | 186,400 | 109,993 |
| | Microsoft Corp. | 2,556,500 | 103,283 |
| | Analog Devices Inc. | 1,996,800 | 102,416 |
| | Accenture plc Class A | 1,119,100 | 89,774 |
| | Intel Corp. | 2,832,275 | 75,593 |
| | Corning Inc. | 3,546,575 | 74,159 |
| | TE Connectivity Ltd. | 865,010 | 51,018 |
| * | Knowles Corp. | 880,900 | 24,604 |
| | Activision Blizzard Inc. | 27,200 | 544 |
| | | | 3,005,611 |
| Materials (2.5%) | | |
| | Celanese Corp. Class A | 2,236,500 | 137,388 |
| | LyondellBasell Industries | | |
| | NV Class A | 1,337,400 | 123,709 |
| * | Owens-Illinois Inc. | 2,391,300 | 75,996 |
| | International Paper Co. | 1,488,300 | 69,429 |
| | Dow Chemical Co. | 612,000 | 30,539 |
| | | | 437,061 |
| Other (0.3%) | | |
| 2 | Vanguard Value ETF | 703,525 | 55,424 |
| |
| Utilities (1.2%) | | |
| | PG&E Corp. | 2,544,700 | 115,987 |
| | Entergy Corp. | 1,307,873 | 94,821 |
| | FirstEnergy Corp. | 189,186 | 6,385 |
| | | | 217,193 |
| Total Common Stocks | | |
| (Cost $12,782,650) | | 17,033,873 |
15
Windsor Fund
| | | |
| | | | Market |
| | | | Value |
| | | Shares | ($000) |
| Temporary Cash Investments (2.3%)1 | |
| Money Market Fund (1.3%) | | |
| 3 | Vanguard Market Liquidity | |
| | Fund, 0.124% | 229,523,000 | 229,523 |
| |
| | | Face | |
| | | Amount | |
| | | ($000) | |
| Repurchase Agreement (0.9%) | |
| | Bank of America Securities, | |
| | LLC 0.050%, 5/1/14 (Dated | |
| | 4/30/14, Repurchase | | |
| | Value $162,300,000, | | |
| | collateralized by Federal | |
| | Home Loan Mortgage | | |
| | Corp. 2.480%–4.000%, | | |
| | 12/1/33–11/1/43, and | | |
| | Federal National Mortgage | |
| | Assn. 1.830%–6.019%, | |
| | 7/1/21–11/1/43, with a | | |
| | value of $165,546,000) | 162,300 | 162,300 |
| |
| U.S. Government and Agency Obligations (0.1%) |
| 4,5 | Federal Home Loan | | |
| | Bank Discount Notes, | | |
| | 0.075%, 6/24/14 | 10,000 | 9,999 |
| 4 | Federal Home Loan | | |
| | Bank Discount Notes, | | |
| | 0.093%, 7/18/14 | 700 | 700 |
| | | | 10,699 |
| Total Temporary Cash Investments | |
| (Cost $402,521) | | 402,522 |
| Total Investments (99.7%) | | |
| (Cost $13,185,171) | | 17,436,395 |
| |
| | Market |
| | Value |
| | ($000) |
| Other Assets and Liabilities (0.3%) | |
| Other Assets | 205,617 |
| Liabilities | (159,674) |
| | 45,943 |
| Net Assets (100%) | 17,482,338 |
| |
| |
| At April 30, 2014, net assets consisted of: |
| | Amount |
| | ($000) |
| Paid-in Capital | 13,116,245 |
| Undistributed Net Investment Income | 46,191 |
| Accumulated Net Realized Gains | 66,093 |
| Unrealized Appreciation (Depreciation) | |
| Investment Securities | 4,251,224 |
| Futures Contracts | 2,516 |
| Foreign Currencies | 69 |
| Net Assets | 17,482,338 |
| |
| Investor Shares—Net Assets | |
| Applicable to 345,186,431 outstanding | |
| $.001 par value shares of beneficial | |
| interest (unlimited authorization) | 7,277,693 |
| Net Asset Value Per Share— | |
| Investor Shares | $21.08 |
| |
| Admiral Shares—Net Assets | |
| Applicable to 143,447,641 outstanding | |
| $.001 par value shares of beneficial | |
| interest (unlimited authorization) | 10,204,645 |
| Net Asset Value Per Share— | |
| Admiral Shares | $71.14 |
See Note A in Notes to Financial Statements.
* Non-income-producing security.
1 The fund invests a portion of its cash reserves in equity markets through the use of index futures contracts. After giving effect to futures
investments, the fund’s effective common stock and temporary cash investment positions represent 98.4% and 1.3%, respectively, of
net assets.
2 Considered an affiliated company of the fund as the issuer is another member of The Vanguard Group.
3 Affiliated money market fund available only to Vanguard funds and certain trusts and accounts managed by Vanguard. Rate shown is the
7-day yield.
4 The issuer operates under a congressional charter; its securities are generally neither guaranteed by the U.S. Treasury nor backed by the
full faith and credit of the U.S. government.
5 Securities with a value of $7,699,000 have been segregated as initial margin for open futures contracts.
ADR—American Depositary Receipt.
See accompanying Notes, which are an integral part of the Financial Statements.
16
Windsor Fund
| |
| Statement of Operations | |
| |
| | Six Months Ended |
| | April 30, 2014 |
| | ($000) |
| Investment Income | |
| Income | |
| Dividends1,2 | 136,227 |
| Interest2 | 241 |
| Securities Lending | 379 |
| Total Income | 136,847 |
| Expenses | |
| Investment Advisory Fees—Note B | |
| Basic Fee | 10,785 |
| Performance Adjustment | 1,219 |
| The Vanguard Group—Note C | |
| Management and Administrative—Investor Shares | 7,537 |
| Management and Administrative—Admiral Shares | 5,523 |
| Marketing and Distribution—Investor Shares | 570 |
| Marketing and Distribution—Admiral Shares | 671 |
| Custodian Fees | 98 |
| Shareholders’ Reports—Investor Shares | 10 |
| Shareholders’ Reports—Admiral Shares | 8 |
| Trustees’ Fees and Expenses | 13 |
| Total Expenses | 26,434 |
| Expenses Paid Indirectly | (99) |
| Net Expenses | 26,335 |
| Net Investment Income | 110,512 |
| Realized Net Gain (Loss) | |
| Investment Securities Sold2 | 825,481 |
| Futures Contracts | 25,007 |
| Foreign Currencies | (250) |
| Realized Net Gain (Loss) | 850,238 |
| Change in Unrealized Appreciation (Depreciation) | |
| Investment Securities | 465,176 |
| Futures Contracts | (7,142) |
| Foreign Currencies | (15) |
| Change in Unrealized Appreciation (Depreciation) | 458,019 |
| Net Increase (Decrease) in Net Assets Resulting from Operations | 1,418,769 |
1 Dividends are net of foreign withholding taxes of $2,274,000.
2 Dividend income, interest income, and realized net gain (loss) from affiliated companies of the fund were $649,000, $201,000, and
$17,300,000, respectively.
See accompanying Notes, which are an integral part of the Financial Statements.
17
Windsor Fund
| | |
| Statement of Changes in Net Assets | | |
| |
| | Six Months Ended | Year Ended |
| | April 30, | October 31, |
| | 2014 | 2013 |
| | ($000) | ($000) |
| Increase (Decrease) in Net Assets | | |
| Operations | | |
| Net Investment Income | 110,512 | 221,195 |
| Realized Net Gain (Loss) | 850,238 | 1,394,140 |
| Change in Unrealized Appreciation (Depreciation) | 458,019 | 2,680,607 |
| Net Increase (Decrease) in Net Assets Resulting from Operations | 1,418,769 | 4,295,942 |
| Distributions | | |
| Net Investment Income | | |
| Investor Shares | (42,804) | (110,032) |
| Admiral Shares | (63,225) | (110,078) |
| Realized Capital Gain | | |
| Investor Shares | — | — |
| Admiral Shares | — | — |
| Total Distributions | (106,029) | (220,110) |
| Capital Share Transactions | | |
| Investor Shares | (406,449) | (1,629,460) |
| Admiral Shares | 305,385 | 1,318,490 |
| Net Increase (Decrease) from Capital Share Transactions | (101,064) | (310,970) |
| Total Increase (Decrease) | 1,211,676 | 3,764,862 |
| Net Assets | | |
| Beginning of Period | 16,270,662 | 12,505,800 |
| End of Period1 | 17,482,338 | 16,270,662 |
| 1 Net Assets—End of Period includes undistributed net investment income of $46,191,000 and $41,958,000. |
See accompanying Notes, which are an integral part of the Financial Statements.
18
Windsor Fund
Financial Highlights
| | | | | | |
| Investor Shares | | | | | | |
| Six Months | | | | | |
| | Ended | | | | | |
| For a Share Outstanding | April 30, | | | Year Ended October 31, |
| Throughout Each Period | 2014 | 2013 | 2012 | 2011 | 2010 | 2009 |
| Net Asset Value, Beginning of Period | $19.50 | $14.66 | $12.92 | $12.56 | $10.97 | $9.51 |
| Investment Operations | | | | | | |
| Net Investment Income | .127 | .255 | .252 | .184 | .1901 | .197 |
| Net Realized and Unrealized Gain (Loss) | | | | | | |
| on Investments | 1.574 | 4.839 | 1.729 | .346 | 1.586 | 1.486 |
| Total from Investment Operations | 1.701 | 5.094 | 1.981 | .530 | 1.776 | 1.683 |
| Distributions | | | | | | |
| Dividends from Net Investment Income | (.121) | (. 254) | (. 241) | (.170) | (.186) | (. 223) |
| Distributions from Realized Capital Gains — | — | — | — | — | — |
| Total Distributions | (.121) | (. 254) | (. 241) | (.170) | (.186) | (. 223) |
| Net Asset Value, End of Period | $21.08 | $19.50 | $14.66 | $12.92 | $12.56 | $10.97 |
| |
| Total Return2 | 8.75% | 35.17% | 15.56% | 4.15% | 16.31% | 18.22% |
| |
| Ratios/Supplemental Data | | | | | | |
| Net Assets, End of Period (Millions) | $7,278 | $7,126 | $6,711 | $6,736 | $7,999 | $7,610 |
| Ratio of Total Expenses to | | | | | | |
| Average Net Assets3 | 0.37% | 0.37% | 0.35% | 0.39% | 0.33% | 0.33% |
| Ratio of Net Investment Income to | | | | | | |
| Average Net Assets | 1.28% | 1.49% | 1.80% | 1.34% | 1.59%1 | 2.03% |
| Portfolio Turnover Rate | 37% | 40% | 68% | 49% | 50% | 61%4 |
The expense ratio, net income ratio, and turnover rate for the current period have been annualized.
1 Net investment income per share and the ratio of net investment income to average net assets include $.036 and 0.29%, respectively,
resulting from a cash payment received in connection with the merger of Schering-Plough Corp. and Merck & Co. in November 2009.
2 Total returns do not include account service fees that may have applied in the periods shown. Fund prospectuses provide information about
any applicable account service fees.
3 Includes performance-based investment advisory fee increases (decreases) of 0.01%, 0.02%, (0.01%), 0.03%, (0.03%), and (0.05%).
4 Excludes the value of portfolio securities received or delivered as a result of in-kind purchases or redemptions of the fund’s capital shares.
See accompanying Notes, which are an integral part of the Financial Statements.
19
Windsor Fund
Financial Highlights
| | | | | | |
| Admiral Shares | | | | | | |
| Six Months | | | | | |
| | Ended | | | | | |
| For a Share Outstanding | April 30, | | | Year Ended October 31, |
| Throughout Each Period | 2014 | 2013 | 2012 | 2011 | 2010 | 2009 |
| Net Asset Value, Beginning of Period | $65.81 | $49.47 | $43.59 | $42.37 | $37.01 | $32.08 |
| Investment Operations | | | | | | |
| Net Investment Income | . 465 | . 924 | . 900 | . 664 | . 6851 | .701 |
| Net Realized and Unrealized Gain (Loss) | | | | | | |
| on Investments | 5.312 | 16.329 | 5.844 | 1.171 | 5.348 | 5.020 |
| Total from Investment Operations | 5.777 | 17.253 | 6.744 | 1.835 | 6.033 | 5.721 |
| Distributions | | | | | | |
| Dividends from Net Investment Income | (. 447) | (. 913) | (. 864) | (. 615) | (. 673) | (.791) |
| Distributions from Realized Capital Gains — | — | — | — | — | — |
| Total Distributions | (. 447) | (. 913) | (. 864) | (. 615) | (. 673) | (.791) |
| Net Asset Value, End of Period | $71.14 | $65.81 | $49.47 | $43.59 | $42.37 | $37.01 |
| |
| Total Return | 8.81% | 35.32% | 15.71% | 4.26% | 16.44% | 18.38% |
| |
| Ratios/Supplemental Data | | | | | | |
| Net Assets, End of Period (Millions) | $10,205 | $9,144 | $5,795 | $4,994 | $4,680 | $4,203 |
| Ratio of Total Expenses to | | | | | | |
| Average Net Assets2 | 0.27% | 0.27% | 0.25% | 0.29% | 0.22% | 0.20% |
| Ratio of Net Investment Income to | | | | | | |
| Average Net Assets | 1.38% | 1.59% | 1.90% | 1.44% | 1.70%1 | 2.16% |
| Portfolio Turnover Rate | 37% | 40% | 68% | 49% | 50% | 61%3 |
The expense ratio, net income ratio, and turnover rate for the current period have been annualized.
1 Net investment income per share and the ratio of net investment income to average net assets include $.120 and 0.29%, respectively,
resulting from a cash payment received in connection with the merger of Schering-Plough Corp. and Merck & Co. in November 2009.
2 Includes performance-based investment advisory fee increases (decreases) of 0.01%, 0.02%, (0.01%), 0.03%, (0.03%), and (0.05%).
3 Excludes the value of portfolio securities received or delivered as a result of in-kind purchases or redemptions of the fund’s capital shares.
See accompanying Notes, which are an integral part of the Financial Statements.
20
Windsor Fund
Notes to Financial Statements
Vanguard Windsor Fund is registered under the Investment Company Act of 1940 as an open-end investment company, or mutual fund. The fund offers two classes of shares: Investor Shares and Admiral Shares. Investor Shares are available to any investor who meets the fund’s minimum purchase requirements. Admiral Shares are designed for investors who meet certain administrative, service, and account-size criteria.
A. The following significant accounting policies conform to generally accepted accounting principles for U.S. investment companies. The fund consistently follows such policies in preparing its financial statements.
1. Security Valuation: Securities are valued as of the close of trading on the New York Stock Exchange (generally 4 p.m., Eastern time) on the valuation date. Equity securities are valued at the latest quoted sales prices or official closing prices taken from the primary market in which each security trades; such securities not traded on the valuation date are valued at the mean of the latest quoted bid and asked prices. Securities for which market quotations are not readily available, or whose values have been affected by events occurring before the fund’s pricing time but after the close of the securities’ primary markets, are valued at their fair values calculated according to procedures adopted by the board of trustees. These procedures include obtaining quotations from an independent pricing service, monitoring news to identify significant market- or security-specific events, and evaluating changes in the values of foreign market proxies (for example, ADRs, futures contracts, or exchange-traded funds), between the time the foreign markets close and the fund’s pricing time. When fair-value pricing is employed, the prices of securities used by a fund to calculate its net asset value may differ from quoted or published prices for the same securities. Investments in Vanguard Market Liquidity Fund are valued at that fund’s net asset value. Temporary cash investments acquired over 60 days to maturity are valued using the latest bid prices or using valuations based on a matrix system (which considers such factors as security prices, yields, maturities, and ratings), both as furnished by independent pricing services. Other temporary cash investments are valued at amortized cost, which approximates market value.
2. Foreign Currency: Securities and other assets and liabilities denominated in foreign currencies are translated into U.S. dollars using exchange rates obtained from an independent third party as of the fund’s pricing time on the valuation date. Realized gains (losses) and unrealized appreciation (depreciation) on investment securities include the effects of changes in exchange rates since the securities were purchased, combined with the effects of changes in security prices. Fluctuations in the value of other assets and liabilities resulting from changes in exchange rates are recorded as unrealized foreign currency gains (losses) until the assets or liabilities are settled in cash, at which time they are recorded as realized foreign currency gains (losses).
3. Futures Contracts: The fund uses index futures contracts to a limited extent, with the objective of maintaining full exposure to the stock market while maintaining liquidity. The fund may purchase or sell futures contracts to achieve a desired level of investment, whether to accommodate portfolio turnover or cash flows from capital share transactions. The primary risks associated with the use of futures contracts are imperfect correlation between changes in market values of stocks held by the fund and the prices of futures contracts, and the possibility of an illiquid market. Counterparty risk involving futures is mitigated because a regulated clearinghouse is the counterparty instead of the clearing broker. To further mitigate counterparty risk, the fund trades futures contracts on an exchange, monitors the financial strength of its clearing brokers and clearinghouse, and has entered into clearing agreements with its clearing brokers. The clearinghouse imposes initial margin requirements to secure the fund’s performance and requires daily settlement of variation margin representing changes in the market value of each contract.
21
Windsor Fund
Futures contracts are valued at their quoted daily settlement prices. The aggregate notional amounts of the contracts are not recorded in the Statement of Net Assets. Fluctuations in the value of the contracts are recorded in the Statement of Net Assets as an asset (liability) and in the Statement of Operations as unrealized appreciation (depreciation) until the contracts are closed, when they are recorded as realized futures gains (losses).
During the six months ended April 30, 2014, the fund’s average investments in long and short futures contracts represented 1% and 0% of net assets, respectively, based on quarterly average aggregate settlement values.
4. Repurchase Agreements: The fund enters into repurchase agreements with institutional counterparties. Securities pledged as collateral to the fund under repurchase agreements are held by a custodian bank until the agreements mature. Each agreement requires that the market value of the collateral be sufficient to cover payments of interest and principal. The fund further mitigates its counterparty risk by entering into repurchase agreements only with a diverse group of prequalified counterparties, monitoring their financial strength, and entering into master repurchase agreements with its counterparties. The master repurchase agreements provide that, in the event of a counterparty’s default (including bankruptcy), the fund may terminate any repurchase agreements with that counterparty, determine the net amount owed, and sell or retain the collateral up to the net amount owed to the fund. Such action may be subject to legal proceedings, which may delay or limit the disposition of collateral.
5. Federal Income Taxes: The fund intends to continue to qualify as a regulated investment company and distribute all of its taxable income. Management has analyzed the fund’s tax positions taken for all open federal income tax years (October 31, 2010–2013), and for the period ended April 30, 2014, and has concluded that no provision for federal income tax is required in the fund’s financial statements.
6. Distributions: Distributions to shareholders are recorded on the ex-dividend date.
7. Securities Lending: To earn additional income, the fund lends its securities to qualified institutional borrowers. Security loans are required to be secured at all times by collateral in an amount at least equal to the market value of securities loaned. Daily market fluctuations could cause the value of loaned securities to be more or less than the value of the collateral received. When this occurs, the collateral is adjusted and settled on the next business day. The fund further mitigates its counterparty risk by entering into securities lending transactions only with a diverse group of prequalified counterparties, monitoring their financial strength, and entering into master securities lending agreements with its counterparties. The master securities lending agreements provide that, in the event of a counterparty’s default (including bankruptcy), the fund may terminate any loans with that borrower, determine the net amount owed, and sell or retain the collateral up to the net amount owed to the fund; however, such actions may be subject to legal proceedings. While collateral mitigates counterparty risk, in the absence of a default the fund may experience delays and costs in recovering the securities loaned. The fund invests cash collateral received in Vanguard Market Liquidity Fund, and records a liability in the Statement of Net Assets for the return of the collateral, during the period the securities are on loan. Securities lending income represents fees charged to borrowers plus income earned on invested cash collateral, less expenses associated with the loan.
8. Credit Facility: The fund and certain other funds managed by The Vanguard Group participate in a $2.89 billion committed credit facility provided by a syndicate of lenders pursuant to a credit agreement that may be renewed annually; each fund is individually liable for its borrowings, if any, under the credit facility. Borrowings may be utilized for temporary and emergency purposes, and are subject to the fund’s regulatory and contractual borrowing restrictions. The participating funds are
22
Windsor Fund
charged administrative fees and an annual commitment fee of 0.06% of the undrawn amount of the facility; these fees are allocated to the funds based on a method approved by the fund’s board of trustees and included in Management and Administrative expenses on the fund’s Statement of Operations. Any borrowings under this facility bear interest at a rate equal to the higher of the federal funds rate or LIBOR reference rate plus an agreed-upon spread.
The fund had no borrowings outstanding at April 30, 2014, or at any time during the period then ended.
9. Other: Dividend income is recorded on the ex-dividend date. Interest income includes income distributions received from Vanguard Market Liquidity Fund and is accrued daily. Premiums and discounts on debt securities purchased are amortized and accreted, respectively, to interest income over the lives of the respective securities. Security transactions are accounted for on the date securities are bought or sold. Costs used to determine realized gains (losses) on the sale of investment securities are those of the specific securities sold.
Each class of shares has equal rights as to assets and earnings, except that each class separately bears certain class-specific expenses related to maintenance of shareholder accounts (included in Management and Administrative expenses) and shareholder reporting. Marketing and distribution expenses are allocated to each class of shares based on a method approved by the board of trustees. Income, other non-class-specific expenses, and gains and losses on investments are allocated to each class of shares based on its relative net assets.
B. Wellington Management Company, LLP, and Pzena Investment Management, LLC, each provide investment advisory services to a portion of the fund for a fee calculated at an annual percentage rate of average net assets managed by the advisor. The basic fee of Wellington Management Company, LLP, is subject to quarterly adjustments based on performance for the preceding three years relative to the S&P 500 Index. The basic fee of Pzena Investment Management, LLC, is subject to quarterly adjustments based on performance since October 31, 2012, relative to the Russell 1000 Value Index.
The Vanguard Group manages the cash reserves of the fund on an at-cost basis.
For the six months ended April 30, 2014, the aggregate investment advisory fee represented an effective annual basic rate of 0.13% of the fund’s average net assets, before an increase of $1,219,000 (0.01%) based on performance.
C. The Vanguard Group furnishes at cost corporate management, administrative, marketing, and distribution services. The costs of such services are allocated to the fund based on methods approved by the board of trustees. The fund has committed to provide up to 0.40% of its net assets in capital contributions to Vanguard. At April 30, 2014, the fund had contributed capital of $1,860,000 to Vanguard (included in Other Assets), representing 0.01% of the fund’s net assets and 0.74% of Vanguard’s capitalization. The fund’s trustees and officers are also directors and officers of Vanguard.
D. The fund has asked its investment advisors to direct certain security trades, subject to obtaining the best price and execution, to brokers who have agreed to rebate to the fund part of the commissions generated. Such rebates are used solely to reduce the fund’s management and administrative expenses. For the six months ended April 30, 2014, these arrangements reduced the fund’s expenses by $99,000 (an annual rate of 0.00% of average net assets).
E. Various inputs may be used to determine the value of the fund’s investments. These inputs are summarized in three broad levels for financial statement purposes. The inputs or methodologies used to value securities are not necessarily an indication of the risk associated with investing in those securities.
23
Windsor Fund
Level 1—Quoted prices in active markets for identical securities.
Level 2—Other significant observable inputs (including quoted prices for similar securities, interest
rates, prepayment speeds, credit risk, etc.).
Level 3—Significant unobservable inputs (including the fund’s own assumptions used to determine
the fair value of investments).
The following table summarizes the market value of the fund’s investments as of April 30, 2014,
based on the inputs used to value them:
| | | |
| | Level 1 | Level 2 | Level 3 |
| Investments | ($000) | ($000) | ($000) |
| Common Stocks | 16,099,924 | 933,949 | — |
| Temporary Cash Investments | 229,523 | 172,999 | — |
| Futures Contracts—Assets1 | 532 | — | — |
| Total | 16,329,979 | 1,106,948 | — |
| 1 Represents variation margin on the last day of the reporting period. | | | |
F. At April 30, 2014, the aggregate settlement value of open futures contracts and the related unrealized appreciation (depreciation) were:
| | | | |
| | | | | ($000) |
| | | | Aggregate | |
| | | Number of | Settlement | Unrealized |
| | | Long (Short) | Value | Appreciation |
| Futures Contracts | Expiration | Contracts | Long (Short) | (Depreciation) |
| S&P 500 Index | June 2014 | 313 | 146,946 | 2,364 |
| E-mini S&P 500 Index | June 2014 | 180 | 16,901 | 152 |
| | | | | 2,516 |
Unrealized appreciation (depreciation) on open futures contracts is required to be treated as realized gain (loss) for tax purposes.
G. Distributions are determined on a tax basis and may differ from net investment income and realized capital gains for financial reporting purposes. Differences may be permanent or temporary. Permanent differences are reclassified among capital accounts in the financial statements to reflect their tax character. Temporary differences arise when certain items of income, expense, gain, or loss are recognized in different periods for financial statement and tax purposes. These differences will reverse at some time in the future. Differences in classification may also result from the treatment of short-term gains as ordinary income for tax purposes.
During the six months ended April 30, 2014, the fund realized net foreign currency losses of $250,000, which decreased distributable net income for tax purposes; accordingly, such losses have been reclassified from accumulated net realized gains to undistributed net investment income.
The fund’s tax-basis capital gains and losses are determined only at the end of each fiscal year. For tax purposes, at October 31, 2013, the fund had available capital losses totaling $774,686,000 to offset future net capital gains through October 31, 2017. The fund will use these capital losses to offset net taxable capital gains, if any, realized during the year ending October 31, 2014; should the fund realize net capital losses for the year, the losses will be added to the loss carryforward balance above.
24
Windsor Fund
At April 30, 2014, the cost of investment securities for tax purposes was $13,185,171,000. Net unrealized appreciation of investment securities for tax purposes was $4,251,224,000, consisting of unrealized gains of $4,403,579,000 on securities that had risen in value since their purchase and $152,355,000 in unrealized losses on securities that had fallen in value since their purchase.
H. During the six months ended April 30, 2014, the fund purchased $3,018,295,000 of investment securities and sold $3,033,108,000 of investment securities, other than temporary cash investments.
I. Capital share transactions for each class of shares were:
| | | | |
| | Six Months Ended | | Year Ended |
| | | April 30, 2014 | October 31, 2013 |
| | Amount | Shares | Amount | Shares |
| | ($000) | (000) | ($000) | (000) |
| Investor Shares | | | | |
| Issued | 268,136 | 13,230 | 628,746 | 36,860 |
| Issued in Lieu of Cash Distributions | 41,789 | 2,067 | 107,480 | 6,843 |
| Redeemed | (716,374) | (35,530) | (2,365,686) | (135,989) |
| Net Increase (Decrease)—Investor Shares | (406,449) | (20,233) | (1,629,460) | (92,286) |
| Admiral Shares | | | | |
| Issued | 726,980 | 10,666 | 1,967,049 | 33,059 |
| Issued in Lieu of Cash Distributions | 58,252 | 854 | 100,424 | 1,885 |
| Redeemed | (479,847) | (7,025) | (748,983) | (13,120) |
| Net Increase (Decrease)—Admiral Shares | 305,385 | 4,495 | 1,318,490 | 21,824 |
J. Management has determined that no material events or transactions occurred subsequent to April 30, 2014, that would require recognition or disclosure in these financial statements.
25
About Your Fund’s Expenses
As a shareholder of the fund, you incur ongoing costs, which include costs for portfolio management, administrative services, and shareholder reports (like this one), among others. Operating expenses, which are deducted from a fund’s gross income, directly reduce the investment return of the fund.
A fund’s expenses are expressed as a percentage of its average net assets. This figure is known as the expense ratio. The following examples are intended to help you understand the ongoing costs (in dollars) of investing in your fund and to compare these costs with those of other mutual funds. The examples are based on an investment of $1,000 made at the beginning of the period shown and held for the entire period.
The accompanying table illustrates your fund’s costs in two ways:
• Based on actual fund return. This section helps you to estimate the actual expenses that you paid over the period. The ”Ending Account Value“ shown is derived from the fund‘s actual return, and the third column shows the dollar amount that would have been paid by an investor who started with $1,000 in the fund. You may use the information here, together with the amount you invested, to estimate the expenses that you paid over the period.
To do so, simply divide your account value by $1,000 (for example, an $8,600 account value divided by $1,000 = 8.6), then multiply the result by the number given for your fund under the heading ”Expenses Paid During Period.“
• Based on hypothetical 5% yearly return. This section is intended to help you compare your fund‘s costs with those of other mutual funds. It assumes that the fund had a yearly return of 5% before expenses, but that the expense ratio is unchanged. In this case—because the return used is not the fund’s actual return—the results do not apply to your investment. The example is useful in making comparisons because the Securities and Exchange Commission requires all mutual funds to calculate expenses based on a 5% return. You can assess your fund’s costs by comparing this hypothetical example with the hypothetical examples that appear in shareholder reports of other funds.
Note that the expenses shown in the table are meant to highlight and help you compare ongoing costs only and do not reflect transaction costs incurred by the fund for buying and selling securities. Further, the expenses do not include any purchase, redemption, or account service fees described in the fund prospectus. If such fees were applied to your account, your costs would be higher. Your fund does not carry a “sales load.”
The calculations assume no shares were bought or sold during the period. Your actual costs may have been higher or lower, depending on the amount of your investment and the timing of any purchases or redemptions.
You can find more information about the fund’s expenses, including annual expense ratios, in the Financial Statements section of this report. For additional information on operating expenses and other shareholder costs, please refer to your fund’s current prospectus.
26
| | | |
| Six Months Ended April 30, 2014 | | | |
| | Beginning | Ending | Expenses |
| | Account Value | Account Value | Paid During |
| Windsor Fund | 10/31/2013 | 4/30/2014 | Period |
| Based on Actual Fund Return | | | |
| Investor Shares | $1,000.00 | $1,087.49 | $1.92 |
| Admiral Shares | 1,000.00 | 1,088.08 | 1.40 |
| Based on Hypothetical 5% Yearly Return | | | |
| Investor Shares | $1,000.00 | $1,022.96 | $1.86 |
| Admiral Shares | 1,000.00 | 1,023.46 | 1.35 |
The calculations are based on expenses incurred in the most recent six-month period. The fund’s annualized six-month expense ratios for that period are 0.37% for Investor Shares and 0.27% for Admiral Shares. The dollar amounts shown as “Expenses Paid” are equal to the annualized expense ratio multiplied by the average account value over the period, multiplied by the number of days in the most recent six-month period, then divided by the number of days in the most recent 12-month period.
27
Trustees Approve Advisory Arrangements
The board of trustees of Vanguard Windsor Fund has renewed the fund’s investment advisory arrangements with Pzena Investment Management, LLC (Pzena), and Wellington Management Company, LLP (Wellington Management). The board determined that renewing the fund’s advisory arrangements was in the best interests of the fund and its shareholders.
The board based its decision upon an evaluation of each advisor’s investment staff, portfolio management process, and performance. The trustees considered the factors discussed below, among others. However, no single factor determined whether the board approved the arrangements. Rather, it was the totality of the circumstances that drove the board’s decision.
Nature, extent, and quality of services
The board considered the quality of the fund’s investment management services over both the short
and long term, and took into account the organizational depth and stability of each advisor. The board noted the following:
Pzena. Founded in 1995, Pzena is a global investment management firm that employs a classic value investment approach. Pzena seeks to buy good businesses at low prices, focusing exclusively on companies that are underperforming their historically demonstrated earnings power. Pzena conducts intensive fundamental research, buying companies only when the problems are judged to be temporary, management has a viable strategy to generate earnings recovery, and there is meaningful downside protection in case earnings do not recover. Pzena has advised a portion of the fund since 2012.
Wellington Management. Founded in 1928, Wellington Management is among the nation’s oldest and most respected institutional investment managers. Using a bottom-up, fundamentally driven approach, Wellington Management invests in out-of-favor stocks that offer the combination of attractive valuations and underappreciated longer-term earnings growth projections. The advisor has the ability to seek undervalued stocks across the capitalization spectrum. The research-intensive approach is supported by the team’s deep and tenured analytical staff, which may also leverage the advisor’s global industry research capabilities. Wellington Management has advised the fund since its inception in 1958.
The board concluded that the advisor’s experience, stability, depth, and performance, among other factors, warranted approval of the advisory arrangements.
Investment performance
The board considered the short- and long-term performance of the fund and each advisor, including
any periods of outperformance or underperformance relative to a benchmark index and peer group. The board concluded that the performance was such that the advisory arrangements should continue. Information about the fund’s most recent performance can be found in the Performance Summary section of this report.
Cost
The board concluded that the fund’s expense ratio was well below the average expense ratio charged
by funds in its peer group and that the fund’s advisory fee rate was also well below the peer-group average. Information about the fund’s expenses appears in the About Your Fund’s Expenses section of this report as well as in the Financial Statements section, which also includes information about the fund’s advisory fee rate.
28
The board did not consider profitability of Pzena and Wellington Management in determining whether to approve the advisory fees, because the firms are independent of Vanguard and the advisory fees are the result of arm’s length negotiations.
The benefit of economies of scale
The board concluded that the fund’s shareholders will benefit from economies of scale because of
breakpoints in the advisory fee schedules for Pzena and Wellington Management. The breakpoints reduce the effective rate of the fees as the fund’s assets managed by each advisor increase.
The board will consider whether to renew the advisory arrangements again after a one-year period.
29
Glossary
30-Day SEC Yield. A fund’s 30-day SEC yield is derived using a formula specified by the U.S. Securities and Exchange Commission. Under the formula, data related to the fund’s security holdings in the previous 30 days are used to calculate the fund’s hypothetical net income for that period, which is then annualized and divided by the fund’s estimated average net assets over the calculation period. For the purposes of this calculation, a security’s income is based on its current market yield to maturity (for bonds), its actual income (for asset-backed securities), or its projected dividend yield (for stocks). Because the SEC yield represents hypothetical annualized income, it will differ—at times significantly—from the fund’s actual experience. As a result, the fund’s income distributions may be higher or lower than implied by the SEC yield.
Beta. A measure of the magnitude of a fund’s past share-price fluctuations in relation to the ups and downs of a given market index. The index is assigned a beta of 1.00. Compared with a given index, a fund with a beta of 1.20 typically would have seen its share price rise or fall by 12% when the index rose or fell by 10%. For this report, beta is based on returns over the past 36 months for both the fund and the index. Note that a fund’s beta should be reviewed in conjunction with its R-squared (see definition). The lower the R-squared, the less correlation there is between the fund and the index, and the less reliable beta is as an indicator of volatility.
Dividend Yield. Dividend income earned by stocks, expressed as a percentage of the aggregate market value (or of net asset value, for a fund). The yield is determined by dividing the amount of the annual dividends by the aggregate value (or net asset value) at the end of the period. For a fund, the dividend yield is based solely on stock holdings and does not include any income produced by other investments.
Earnings Growth Rate. The average annual rate of growth in earnings over the past five years for the stocks now in a fund.
Equity Exposure. A measure that reflects a fund’s investments in stocks and stock futures. Any holdings in short-term reserves are excluded.
Expense Ratio. A fund’s total annual operating expenses expressed as a percentage of the fund’s average net assets. The expense ratio includes management and administrative expenses, but does not include the transaction costs of buying and selling portfolio securities.
Foreign Holdings. The percentage of a fund represented by securities or depositary receipts of companies based outside the United States.
Inception Date. The date on which the assets of a fund (or one of its share classes) are first invested in accordance with the fund’s investment objective. For funds with a subscription period, the inception date is the day after that period ends. Investment performance is measured from the inception date.
Median Market Cap. An indicator of the size of companies in which a fund invests; the midpoint of market capitalization (market price x shares outstanding) of a fund’s stocks, weighted by the proportion of the fund’s assets invested in each stock. Stocks representing half of the fund’s assets have market capitalizations above the median, and the rest are below it.
Price/Book Ratio. The share price of a stock divided by its net worth, or book value, per share. For a fund, the weighted average price/book ratio of the stocks it holds.
30
Price/Earnings Ratio. The ratio of a stock’s current price to its per-share earnings over the past year. For a fund, the weighted average P/E of the stocks it holds. P/E is an indicator of market expectations about corporate prospects; the higher the P/E, the greater the expectations for a company’s future growth.
R-Squared. A measure of how much of a fund’s past returns can be explained by the returns from the market in general, as measured by a given index. If a fund’s total returns were precisely synchronized with an index’s returns, its R-squared would be 1.00. If the fund’s returns bore no relationship to the index’s returns, its R-squared would be 0. For this report, R-squared is based on returns over the past 36 months for both the fund and the index.
Return on Equity. The annual average rate of return generated by a company during the past five years for each dollar of shareholder’s equity (net income divided by shareholder’s equity). For a fund, the weighted average return on equity for the companies whose stocks it holds.
Short-Term Reserves. The percentage of a fund invested in highly liquid, short-term securities that can be readily converted to cash.
Turnover Rate. An indication of the fund’s trading activity. Funds with high turnover rates incur higher transaction costs and may be more likely to distribute capital gains (which may be taxable to investors). The turnover rate excludes in-kind transactions, which have minimal impact on costs.
31
The People Who Govern Your Fund
The trustees of your mutual fund are there to see that the fund is operated and managed in your best interests since, as a shareholder, you are a part owner of the fund. Your fund’s trustees also serve on the board of directors of The Vanguard Group, Inc., which is owned by the Vanguard funds and provides services to them on an at-cost basis.
A majority of Vanguard’s board members are independent, meaning that they have no affiliation with Vanguard or the funds they oversee, apart from the sizable personal investments they have made as private individuals. The independent board members have distinguished backgrounds in business, academia, and public service. Each of the trustees and executive officers oversees 178 Vanguard funds.
The following table provides information for each trustee and executive officer of the fund. More information about the trustees is in the Statement of Additional Information, which can be obtained, without charge, by contacting Vanguard at 800-662-7447, or online at vanguard.com.
| |
| InterestedTrustee1 | and Delphi Automotive LLP (automotive components); |
| | Senior Advisor at New Mountain Capital. |
| F. William McNabb III | |
| Born 1957. Trustee Since July 2009. Chairman of the | Amy Gutmann |
| Board. Principal Occupation(s) During the Past Five | Born 1949. Trustee Since June 2006. Principal |
| Years: Chairman of the Board of The Vanguard Group, | Occupation(s) During the Past Five Years: President of |
| Inc., and of each of the investment companies served | the University of Pennsylvania; Christopher H. Browne |
| by The Vanguard Group, since January 2010; Director | Distinguished Professor of Political Science, School of |
| of The Vanguard Group since 2008; Chief Executive | Arts and Sciences, and Professor of Communication, |
| Officer and President of The Vanguard Group, and of | Annenberg School for Communication, with secondary |
| each of the investment companies served by The | faculty appointments in the Department of Philosophy, |
| Vanguard Group, since 2008; Director of Vanguard | School of Arts and Sciences, and at the Graduate |
| Marketing Corporation; Managing Director of The | School of Education, University of Pennsylvania; |
| Vanguard Group (1995–2008). | Trustee of the National Constitution Center; Chair |
| | of the Presidential Commission for the Study of |
| | Bioethical Issues. |
| IndependentTrustees | |
| | |
| Emerson U. Fullwood | JoAnn Heffernan Heisen |
| Born 1948. Trustee Since January 2008. Principal | Born 1950. Trustee Since July 1998. Principal |
| Occupation(s) During the Past Five Years: Executive | Occupation(s) During the Past Five Years: Corporate |
| Chief Staff and Marketing Officer for North America | Vice President and Chief Global Diversity Officer |
| and Corporate Vice President (retired 2008) of Xerox | (retired 2008) and Member of the Executive |
| Corporation (document management products and | Committee (1997–2008) of Johnson & Johnson |
| services); Executive in Residence and 2009–2010 | (pharmaceuticals/medical devices/consumer |
| Distinguished Minett Professor at the Rochester | products); Director of Skytop Lodge Corporation |
| Institute of Technology; Director of SPX Corporation | (hotels), the University Medical Center at Princeton, |
| (multi-industry manufacturing), the United Way of | the Robert Wood Johnson Foundation, and the Center |
| Rochester, Amerigroup Corporation (managed health | for Talent Innovation; Member of the Advisory Board |
| care), the University of Rochester Medical Center, | of the Maxwell School of Citizenship and Public Affairs |
| Monroe Community College Foundation, and North | at Syracuse University. |
| Carolina A&T University. | |
| | F. Joseph Loughrey |
| Rajiv L. Gupta | Born 1949. Trustee Since October 2009. Principal |
| Born 1945. Trustee Since December 2001.2 | Occupation(s) During the Past Five Years: President |
| Principal Occupation(s) During the Past Five Years: | and Chief Operating Officer (retired 2009) of Cummins |
| Chairman and Chief Executive Officer (retired 2009) | Inc. (industrial machinery); Chairman of the Board |
| and President (2006–2008) of Rohm and Haas Co. | of Hillenbrand, Inc. (specialized consumer services), |
| (chemicals); Director of Tyco International, Ltd. | and of Oxfam America; Director of SKF AB (industrial |
| (diversified manufacturing and services), Hewlett- | machinery), Hyster-Yale Materials Handling, Inc. |
| Packard Co. (electronic computer manufacturing), | (forklift trucks), the Lumina Foundation for Education, |
| | |
| and the V Foundation for Cancer Research; Member | Executive Officers | |
| of the Advisory Council for the College of Arts and | | |
| Letters and of the Advisory Board to the Kellogg | Glenn Booraem | |
| Institute for International Studies, both at the | Born 1967. Controller Since July 2010. Principal |
| University of Notre Dame. | Occupation(s) During the Past Five Years: Principal |
| | of The Vanguard Group, Inc.; Controller of each of |
| Mark Loughridge | the investment companies served by The Vanguard |
| Born 1953. Trustee Since March 2012. Principal | Group; Assistant Controller of each of the investment |
| Occupation(s) During the Past Five Years: Senior Vice | companies served by The Vanguard Group (2001–2010). |
| President and Chief Financial Officer (retired 2013) | | |
| at IBM (information technology services); Fiduciary | Thomas J. Higgins | |
| Member of IBM’s Retirement Plan Committee (2004– | Born 1957. Chief Financial Officer Since September |
| 2013); Member of the Council on Chicago Booth. | 2008. Principal Occupation(s) During the Past Five |
| | Years: Principal of The Vanguard Group, Inc.; Chief |
| Scott C. Malpass | Financial Officer of each of the investment companies |
| Born 1962. Trustee Since March 2012. Principal | served by The Vanguard Group; Treasurer of each of |
| Occupation(s) During the Past Five Years: Chief | the investment companies served by The Vanguard |
| Investment Officer and Vice President at the University | Group (1998–2008). | |
| of Notre Dame; Assistant Professor of Finance at the | | |
| Mendoza College of Business at Notre Dame; Member | Kathryn J. Hyatt | |
| of the Notre Dame 403(b) Investment Committee; | Born 1955. Treasurer Since November 2008. Principal |
| Board Member of TIFF Advisory Services, Inc. | Occupation(s) During the Past Five Years: Principal of |
| (investment advisor); Member of the Investment | The Vanguard Group, Inc.; Treasurer of each of the |
| Advisory Committees of the Financial Industry | investment companies served by The Vanguard |
| Regulatory Authority (FINRA) and of Major League | Group; Assistant Treasurer of each of the investment |
| Baseball. | companies served by The Vanguard Group (1988–2008). |
| |
| André F. Perold | Heidi Stam | |
| Born 1952. Trustee Since December 2004. Principal | Born 1956. Secretary Since July 2005. Principal |
| Occupation(s) During the Past Five Years: George | Occupation(s) During the Past Five Years: Managing |
| Gund Professor of Finance and Banking, Emeritus | Director of The Vanguard Group, Inc.; General Counsel |
| at the Harvard Business School (retired 2011); | of The Vanguard Group; Secretary of The Vanguard |
| Chief Investment Officer and Managing Partner of | Group and of each of the investment companies |
| HighVista Strategies LLC (private investment firm); | served by The Vanguard Group; Director and Senior |
| Director of Rand Merchant Bank; Overseer of the | Vice President of Vanguard Marketing Corporation. |
| Museum of Fine Arts Boston. | | |
| | Vanguard Senior ManagementTeam |
| Alfred M. Rankin, Jr. | | |
| Born 1941. Trustee Since January 1993. Principal | Mortimer J. Buckley | Chris D. McIsaac |
| Occupation(s) During the Past Five Years: Chairman, | Kathleen C. Gubanich | Michael S. Miller |
| President, and Chief Executive Officer of NACCO | Paul A. Heller | James M. Norris |
| Industries, Inc. (housewares/lignite), and of Hyster- | Martha G. King | Glenn W. Reed |
| Yale Materials Handling, Inc. (forklift trucks); Chairman | John T. Marcante | |
| of the Board of University Hospitals of Cleveland. | | |
| |
| Peter F. Volanakis | Chairman Emeritus and Senior Advisor |
| Born 1955. Trustee Since July 2009. Principal | | |
| Occupation(s) During the Past Five Years: President | John J. Brennan | |
| and Chief Operating Officer (retired 2010) of Corning | Chairman, 1996–2009 | |
| Incorporated (communications equipment); Trustee of | Chief Executive Officer and President, 1996–2008 |
| Colby-Sawyer College; Member of the Advisory Board | | |
| of the Norris Cotton Cancer Center and of the Advisory | Founder | |
| Board of the Parthenon Group (strategy consulting). | | |
| | John C. Bogle | |
| | Chairman and Chief Executive Officer, 1974–1996 |
1 Mr. McNabb is considered an “interested person,” as defined in the Investment Company Act of 1940, because he is an officer of the Vanguard funds.
2 December 2002 for Vanguard Equity Income Fund, the Vanguard Municipal Bond Funds, and the Vanguard State Tax-Exempt Funds.
|  |
| | P.O. Box 2600 |
| | Valley Forge, PA 19482-2600 |
| Connect with Vanguard® > vanguard.com | |
| | |
Fund Information > 800-662-7447
Direct Investor Account Services > 800-662-2739
Institutional Investor Services > 800-523-1036
Text Telephone for People
With Hearing Impairment > 800-749-7273
This material may be used in conjunction
with the offering of shares of any Vanguard
fund only if preceded or accompanied by
the fund’s current prospectus.
All comparative mutual fund data are from Lipper, a
Thomson Reuters Company, or Morningstar, Inc., unless
otherwise noted.
You can obtain a free copy of Vanguard’s proxy voting
guidelines by visiting vanguard.com/proxyreporting or by
calling Vanguard at 800-662-2739. The guidelines are
also available from the SEC’s website, sec.gov. In
addition, you may obtain a free report on how your fund
voted the proxies for securities it owned during the 12
months ended June 30. To get the report, visit either
vanguard.com/proxyreporting or sec.gov.
You can review and copy information about your fund at
the SEC’s Public Reference Room in Washington, D.C. To
find out more about this public service, call the SEC at
202-551-8090. Information about your fund is also
available on the SEC’s website, and you can receive
copies of this information, for a fee, by sending a
request in either of two ways: via e-mail addressed to
publicinfo@sec.gov or via regular mail addressed to the
Public Reference Section, Securities and Exchange
Commission, Washington, DC 20549-1520. | |
| © 2014 The Vanguard Group, Inc.
All rights reserved.
Vanguard Marketing Corporation, Distributor.
Q222 062014 |

|
| Semiannual Report | April 30, 2014 |
| Vanguard Windsor™ II Fund |
|
 |
Vanguard’s Principles for Investing Success
We want to give you the best chance of investment success. These principles,
grounded in Vanguard’s research and experience, can put you on the right path.
Goals. Create clear, appropriate investment goals.
Balance. Develop a suitable asset allocation using broadly diversified funds.
Cost. Minimize cost.
Discipline. Maintain perspective and long-term discipline.
A single theme unites these principles: Focus on the things you can control.
We believe there is no wiser course for any investor.
| |
| Contents | |
| Your Fund’s Total Returns. | 1 |
| Chairman’s Letter. | 2 |
| Advisors’ Report. | 8 |
| Fund Profile. | 12 |
| Performance Summary. | 14 |
| Financial Statements. | 15 |
| About Your Fund’s Expenses. | 29 |
| Trustees Approve Advisory Arrangements. | 31 |
| Glossary. | 33 |
Please note: The opinions expressed in this report are just that—informed opinions. They should not be considered promises or advice. Also, please keep in mind that the information and opinions cover the period through the date on the front of this report. Of course, the risks of investing in your fund are spelled out in the prospectus.
See the Glossary for definitions of investment terms used in this report.
About the cover: The ship’s wheel represents leadership and guidance, essential qualities in navigating difficult seas. This one is a replica based on an 18th-century British vessel. The HMSVanguard, another ship of that era, served as the flagship for British Admiral Horatio Nelson when he defeated a French fleet at the Battle of the Nile.
Your Fund’s Total Returns
| |
| Six Months Ended April 30, 2014 | |
| | Total |
| | Returns |
| Vanguard Windsor II Fund | |
| Investor Shares | 8.83% |
| Admiral™ Shares | 8.88 |
| Russell 1000 Value Index | 9.61 |
| Large-Cap Value Funds Average | 8.35 |
| Large-Cap Value Funds Average: Derived from data provided by Lipper, a Thomson Reuters Company. |
| Admiral Shares carry lower expenses and are available to investors who meet certain account-balance requirements. |
| | | | |
| Your Fund’s Performance at a Glance | | | | |
| October 31, 2013, Through April 30, 2014 | | | | |
| | | | Distributions Per Share |
| | Starting | Ending | Income | Capital |
| | Share Price | Share Price | Dividends | Gains |
| Vanguard Windsor II Fund | | | | |
| Investor Shares | $36.19 | $38.11 | $0.385 | $0.797 |
| Admiral Shares | 64.23 | 67.64 | 0.711 | 1.414 |
1

Chairman’s Letter
Dear Shareholder,
Large-capitalization value stocks emerged as market leaders over the six months ended April 30, 2014, as investors placed more emphasis on company fundamentals and shifted away from industries where stock valuations had reached heady levels.
Although it generally benefited from this trend, Vanguard Windsor II Fund trailed its benchmark. For the half year, it returned almost 9%, compared with nearly 10% for the Russell 1000 Value Index. The fund’s outcome was slightly ahead of the average return of competing large-cap value funds.
On a separate note, I would like to inform you that in March, we announced a new investment advisory arrangement for Windsor II. Hotchkis and Wiley Capital Management is now managing about 11% of the fund’s assets. This includes the portion previously managed by Armstrong Shaw Associates, which is no longer an advisor to the fund. Barrow, Hanley, Mewhinney & Strauss continues to manage about 60% of the fund’s assets, Lazard Asset Management about 16%, and Sanders Capital about 10%. Vanguard Equity Investment Group manages the remainder.
2
Recent progress has been sporadic, but stocks continued to climb
For the six months, U.S. stocks returned almost 8%, notwithstanding the patches of turbulence the market has encountered in 2014. Technology stocks, for example, turned in a rocky performance amid concerns about pricey valuations. Weak economic data from China and the conflict in Ukraine also unsettled investors.
Global economic and political developments are, of course, as inevitable as they are unpredictable. Broad diversification remains the best way of managing the risks they pose to your portfolio. As Joe Davis, our chief economist, noted recently, “Having a
broader portfolio tends to moderate those individual issues, and that’s always, I think, a valuable starting point for investors.”
International stocks, in aggregate, returned nearly 3%, with the developed markets of Europe faring the best. The developed markets of the Pacific region and emerging markets, where China’s weakness was felt most, had negative returns.
Despite low yields, the bond market experienced a surprising rally
Bonds continued to emerge from the struggles that marked much of 2013, when the market was roiled by the prospect that the Federal Reserve would
| | | |
| Market Barometer | | | |
| |
| | | | Total Returns |
| | | Periods Ended April 30, 2014 |
| | Six | One | Five Years |
| | Months | Year | (Annualized) |
| Stocks | | | |
| Russell 1000 Index (Large-caps) | 8.25% | 20.81% | 19.52% |
| Russell 2000 Index (Small-caps) | 3.08 | 20.50 | 19.84 |
| Russell 3000 Index (Broad U.S. market) | 7.83 | 20.78 | 19.54 |
| FTSE All-World ex US Index (International) | 2.84 | 9.77 | 13.22 |
| |
| Bonds | | | |
| Barclays U.S. Aggregate Bond Index (Broad taxable market) | 1.74% | -0.26% | 4.88% |
| Barclays Municipal Bond Index (Broad tax-exempt market) | 4.08 | 0.50 | 5.54 |
| Citigroup Three-Month U.S. Treasury Bill Index | 0.00 | 0.04 | 0.08 |
| |
| CPI | | | |
| Consumer Price Index | 1.51% | 1.95% | 2.14% |
3
reduce its stimulative bond-buying. In January, however, when the reduction actually began, investors seemed to take the news in stride.
The broad U.S. taxable bond market returned 1.74%. The yield of the 10-year Treasury note ended the six months at 2.69%, up from 2.54% on October 31 but down from nearly 3% on December 31. (Bond prices and yields move in opposite directions.)
Municipal bonds returned 4.08% for the six months. Money market and savings accounts posted paltry returns as the Fed’s target for short-term interest rates remained at 0%–0.25%.
International bond markets (as measured by the Barclays Global Aggregate Index ex USD) returned 2.33%.
The fund’s performance was solid, but not without its weak spots
The financial markets move in cycles, with stocks of different characteristics and cap weightings phasing in and out of favor. Vanguard Windsor II Fund, since its founding nearly 30 years ago, has followed a path to solid long-term results through this shifting terrain.
Its five advisors concentrate on finding well-managed, quality companies that they believe are not fully valued by the market. All five take a bottom-up approach to stock
| | | |
| Expense Ratios | | | |
| Your Fund Compared With Its Peer Group | | | |
| | Investor | Admiral | Peer Group |
| | Shares | Shares | Average |
| Windsor II Fund | 0.36% | 0.28% | 1.14% |
The fund expense ratios shown are from the prospectus dated February 26, 2014, and represent estimated costs for the current fiscal year. For the six months ended April 30, 2014, the fund’s annualized expense ratios were 0.36% for Investor Shares and 0.28% for Admiral Shares. The peer-group expense ratio is derived from data provided by Lipper, a Thomson Reuters Company, and captures information through year-end 2013.
Peer group: Large-Cap Value Funds.
4
selection, meaning they look for attractive companies selling at discounted prices before they consider the state of the economy or the direction of the stock market. Using sophisticated strategies
designed to rule out stocks with weak prospects for recovery, they ultimately land on companies with short-term challenges but promising long-term outlooks.
Growth stocks versus value stocks: A case for both
Growth and value stocks typically take turns outperforming each other. The chart here shows how they have switched off during the past 20 years in leading or lagging a broad market average.
These two styles of investing are typically considered complementary—when growth is performing well, value typically isn’t, and vice versa. Very generally speaking, growth stocks represent companies that are expected to expand their businesses at a rapid pace, while value stocks typically represent more established, slower-growing companies.
Which does better in the long run? Neither. Vanguard research has shown that there is no significant long-term difference in the risk/reward characteristics of growth and value stocks. But, because their performance can vary considerably over shorter time periods, a truly diversified portfolio should have exposure to both.
Rolling 12-month return differences, 1994–2013
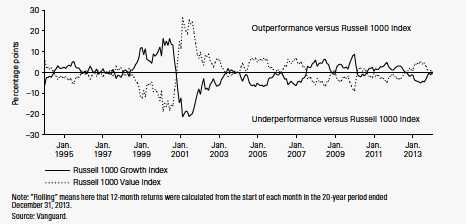
5
For the fiscal half year, a small stake in telecommunication services produced the fund’s only negative sector return. In the nine other sectors, performance versus the benchmark ranged across the spectrum.
The financial sector, the fund’s largest, was a bright spot. Within the insurance industry, the fund held some leaders and avoided a few laggards. Bank and asset manager stocks offset weakness in consumer finance and diversified financial services. Overall, the sector performed well as the economic recovery lurched forward.
Results were mixed in health care, the fund’s second-largest sector. Although those stocks generated a respectable return of about 10%, the gain fell short of the benchmark’s result of nearly 13%. In the pharmaceutical industry, the fund was stung by the investments it held as well as some that it didn’t. It partly closed the gap with a strong showing in managed health care.
The advisors’ stock choices in industrials, particularly in aerospace and defense, affected performance most positively.
Although the United States has cut its defense budget, companies with strong international sales and the latest technology thrived over the half year. Windsor II had significantly greater exposure than its benchmark to such firms.
It had a rougher time in energy. Shares of companies that focus on oil and gas drilling, equipment, and services suffered as a result of uncertainty about the direction of oil prices. At the same time, the fund had no holdings in one of the largest integrated oil and gas corporations, whose performance was boosted by the increased demand for natural gas during the harsh U.S. winter.
You can find more information on the fund’s positioning and performance in the Advisors’ Report that follows this letter.
The power of compounding can put time on your side
The purpose of my letter to you is, of course, to report on how your fund fared over the past half year. Although it’s important to be aware of how your fund is doing in the latest market environment, short-term performance isn’t what matters
6
most. The focus on the preceding six months shouldn’t distract investors from the long-term commitment they need to help achieve their goals.
To be sure, there are many aspects of investing success that you can’t control, overall market performance being the obvious example. But you can control how long you invest, and that’s important because it allows you to harness the power of compounding—the snowball effect that occurs when your earnings generate even more earnings. As Benjamin Franklin put it, “Money makes money.”
A simple example illustrates the benefits of compounding that can potentially result from investing and then reinvesting your money over the long haul. Suppose you were able to put away $10,000 and earn 6% a year (keep in mind this is hypothetical; actual returns would probably be different, and certainly a lot less predictable).
If you kept reinvesting the earnings (again, assuming a hypothetical 6% yearly return), after ten years you would have almost $18,000. After 30 years, you would have more than $57,000.
Compounding can make a real difference in your account balance over time, particularly when combined with Vanguard’s low expense ratios, which allow you to keep more of the return on your investment.
As always, thank you for entrusting your assets to Vanguard.
Sincerely,

F. William McNabb III
Chairman and Chief Executive Officer
May 12, 2014
7
Advisors’ Report
For the six months ended April 30, 2014, Vanguard Windsor II Fund returned 8.83% for Investor Shares and 8.88% for Admiral Shares. Your fund is managed by five independent advisors, a strategy that enhances its diversification by providing
exposure to distinct yet complementary investment approaches. It’s not uncommon for different advisors to have different views about individual securities or the broader investment environment. The table below lists the advisors, the amount and
| | | |
| Vanguard Windsor II Fund Investment Advisors | |
| |
| | Fund Assets Managed | |
| Investment Advisor | % | $ Million | Investment Strategy |
| Barrow, Hanley, Mewhinney & | 61 | 29,710 | Conducts fundamental research on individual stocks |
| Strauss, LLC | | | exhibiting traditional value characteristics: |
| | | | price/earnings and price/book ratios below the broad |
| | | | market average and dividend yields above the broad |
| | | | market average. |
| Lazard Asset Management LLC | 16 | 7,966 | Employs a relative-value approach that seeks a |
| | | | combination of attractive valuation and high financial |
| | | | productivity. The process is research-driven, relying |
| | | | upon bottom-up stock analysis performed by the firm’s |
| | | | global sector analysts. |
| Hotchkis and Wiley Capital | 11 | 5,554 | Uses a disciplined investment approach, focusing on |
| Management, LLC | | | such investment parameters as a company’s tangible |
| | | | assets, sustainable cash flow, and potential for |
| | | | improving business performance. |
| Sanders Capital, LLC | 10 | 4,904 | Employs a traditional, bottom-up, fundamental research |
| | | | approach to identifying securities that are undervalued |
| | | | relative to their expected total return. |
| Vanguard Equity Investment | 0 | 228 | Employs a quantitative fundamental management |
| Group | | | approach, using models that assess valuation, market |
| | | | sentiment, earnings quality and growth, and |
| | | | management decisions of companies versus their |
| | | | peers. |
| Cash Investments | 2 | 369 | These short-term reserves are invested by Vanguard in |
| | | | equity index products to simulate investment in stocks. |
| | | | Each advisor may also maintain a modest cash |
| | | | position. |
8
percentage of fund assets each manages, and brief descriptions of their investment strategies. The advisors have provided the following assessment of the investment environment during the past six months and the notable successes and shortfalls in their portfolios. These comments were prepared on May 16, 2014.
Barrow, Hanley, Mewhinney & Strauss, LLC
Portfolio Manager:
James P. Barrow, Executive Director
Associate Portfolio Managers: Jeff Fahrenbruch, CFA, Managing Director David Ganucheau, CFA, Managing Director
Fund returns weren’t far from the benchmark index and were consistent with the recovering and then rising equity market of the past five years. In our last report, we cautioned about seeing signs of “dot-com disease,” and, in fact, in the last month or so we have seen some highfliers subjected to significant price declines. Price and earnings do matter. This correction would have grown into a broader market sell-off were the Federal Reserve not so accommodative. Low interest rates have forced some investors to eschew bonds for stocks and others to take on credit risk to achieve higher returns. This will work as long as the economy is expanding.
Having more than 15% of the portfolio in underperforming, non-U.S., nonbench-mark holdings has hindered our relative performance. We expect that to reverse because of improving European economies and the resurgent euro and British pound.
Lazard Asset Management LLC
Portfolio Managers:
Andrew Lacey, Deputy Chairman
Christopher Blake, Managing Director
The Standard & Poor’s 500 Index rose 8.36% over the period. During the last two months of 2013, the market weighed the prospect of improving economic conditions against the likelihood that the Federal Reserve would soon begin tapering its bond-buying program. Ultimately, investors cheered the Fed’s December announcement that it would reduce its monthly bond purchases by $10 billion. This decision underscored Fed officials’ belief that the country’s economic recovery was sustainable.
Stocks were somewhat volatile in the first quarter of 2014, as many investors became concerned that the Fed might begin to raise interest rates sooner than previously expected. However, Chair Janet Yellen reassured markets that the Fed intended to keep rates low until the U.S. economy was stronger. Economic reports were mixed in the first quarter, but stronger data in April supported the view that the earlier weakness was largely due to severe winter weather.
9
Our portfolio benefited from stock selection in the consumer discretionary sector, where Advance Auto Parts and Expedia were top contributors. Selection in consumer staples also helped returns; standouts included Molson Coors and CVS. We sold our CVS holdings in April.
Stock picks in health care and energy hurt performance. In health care, the largest detractors included Zoetis and CareFusion; in energy, they included Transocean and Anadarko Petroleum. We sold our Anadarko holdings in December.
Sanders Capital, LLC
Portfolio Managers:
Lewis A. Sanders, CFA,
Chief Executive Officer and Co-Chief Investment Officer
John P. Mahedy, CPA,
Director of Research and Co-Chief Investment Officer
Investment opportunity in equities remains good, despite recent gains. The improved financial state of U.S. households, corporations, and banks should soon translate to faster economic growth. Our recent home-builder purchases reflect this outlook. Our investments in banks and insurers are also positioned to benefit from such growth, as well as from the normalization of interest rates that will eventually follow.
Although our information technology holdings are based on new product innovation, stronger growth will be a plus.
Our investments in health care companies, which have performed well, remain attractive and offer ballast should the economy not respond as expected.
We have reduced our investments in the energy sector, which have been lackluster, because we believe that oil may be moving from shortage to surplus. Any resulting decline in the real price of oil will help economic growth and should benefit equities broadly.
Hotchkis and Wiley Capital
Management, LLC
Portfolio Managers:
George H. Davis, Jr.,
Chief Executive Officer
Sheldon J. Lieberman, Principal
U.S. equities gained during the six months. Value stocks outperformed growth stocks, and large-capitalization stocks outperformed small-caps. Positive earnings surprises outpaced negative ones by about a 3:1 margin in the past couple of quarters, and we view that as the primary impetus behind the market’s appreciation. Data on consumer spending, consumer confidence, manufacturing, and employment have been decidedly positive, but the pace of improvement has decelerated. Recent housing data have been more mixed—home prices rose, but sales declined.
Our outlook remains tempered after the rise in equity valuations over the past several years. But we continue to identify attractive value opportunities on a selective
10
basis, as demonstrated by the portfolio’s considerable valuation discount to the overall market.
Stock selection was positive or neutral in eight of ten sectors over the six months, led by technology, utilities, and industrials. The top individual contributors were all technology companies: Hewlett-Packard (hardware), Corning (electronic components), and Oracle (software). An overweight allocation to the consumer discretionary sector and stock selection in energy hurt performance. The largest individual detractors were Cobalt International Energy, Target, and Citigroup.
Vanguard Equity Investment Group
Portfolio Managers:
James D. Troyer, CFA, Principal
James P. Stetler, Principal
Michael R. Roach, CFA
For the half year, the fund’s benchmark, the Russell 1000 Value Index, returned 9.61%. Overall, equities continued to produce robust returns. As measured by other Russell indexes, the broad U.S. equity market was up 7.83%, large-cap stocks gained 8.25%, and small-caps rose 3.08%. Value-oriented equities returned 9.24%, outpacing growth stocks, which returned 6.49%. Results were best in information technology and utilities. Telecommunication services and consumer discretionary companies lagged.
Stock selection helped most in energy and IT, where overweight allocations to Ultra Petroleum (+62%), Helmerich & Payne (+42%), Hewlett-Packard (+37%), and Western Digital (+28%) contributed most. Stock picks in the telecom and consumer discretionary sectors—specifically, overweight allocations to Best Buy (–38%), Staples (–25%), and Verizon (–5%)—detracted.
11
Windsor II Fund
Fund Profile
As of April 30, 2014
| | |
| Share-Class Characteristics | |
| | Investor | Admiral |
| | Shares | Shares |
| Ticker Symbol | VWNFX | VWNAX |
| Expense Ratio1 | 0.36% | 0.28% |
| 30-Day SEC Yield | 2.14% | 2.22% |
| | | |
| Portfolio Characteristics | | |
| | | | DJ |
| | | | U.S. |
| | | Russell | Total |
| | | 1000 | Market |
| | | Value | FA |
| | Fund | Index | Index |
| Number of Stocks | 267 | 669 | 3,664 |
| Median Market Cap | $73.1B | $54.8B | $47.3B |
| Price/Earnings Ratio | 15.8x | 17.0x | 19.7x |
| Price/Book Ratio | 2.0x | 1.8x | 2.6x |
| Return on Equity | 17.0% | 13.4% | 17.4% |
| Earnings Growth | | | |
| Rate | 10.1% | 8.9% | 12.4% |
| Dividend Yield | 2.6% | 2.3% | 1.9% |
| Foreign Holdings | 10.4% | 0.0% | 0.0% |
| Turnover Rate | | | |
| (Annualized) | 33% | — | — |
| Short-Term Reserves | 2.6% | — | — |
| | |
| Volatility Measures | | |
| | Russell | DJ |
| | 1000 | U.S. Total |
| | Value | Market |
| | Index | FA Index |
| R-Squared | 0.98 | 0.97 |
| Beta | 0.94 | 0.94 |
These measures show the degree and timing of the fund’s fluctuations compared with the indexes over 36 months.
| | |
| Ten Largest Holdings (% of total net assets) |
| Pfizer Inc. | Pharmaceuticals | 2.8% |
| Microsoft Corp. | Systems Software | 2.7 |
| JPMorgan Chase & Co. | Diversified Banks | 2.6 |
| Wells Fargo & Co. | Diversified Banks | 2.5 |
| Johnson & Johnson | Pharmaceuticals | 2.4 |
| Sanofi | Pharmaceuticals | 2.4 |
| Philip Morris | | |
| International Inc. | Tobacco | 2.3 |
| Medtronic Inc. | Health Care | |
| | Equipment | 2.2 |
| Intel Corp. | Semiconductors | 2.2 |
| American Express Co. | Consumer Finance | 2.1 |
| Top Ten | | 24.2% |
The holdings listed exclude any temporary cash investments and equity index products.
Investment Focus
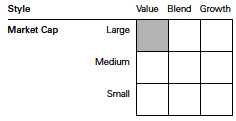
1 The expense ratios shown are from the prospectus dated February 26, 2014, and represent estimated costs for the current fiscal year. For the six months ended April 30, 2014, the annualized expense ratios were 0.36% for Investor Shares and 0.28% for Admiral Shares.
12
Windsor II Fund
| | | |
| Sector Diversification (% of equity exposure) |
| | | | DJ |
| | | | U.S. |
| | | Russell | Total |
| | | 1000 | Market |
| | | Value | FA |
| | Fund | Index | Index |
| Consumer | | | |
| Discretionary | 8.8% | 6.3% | 12.6% |
| Consumer Staples | 10.0 | 5.9 | 8.6 |
| Energy | 12.0 | 15.2 | 9.9 |
| Financials | 21.4 | 28.3 | 17.3 |
| Health Care | 17.2 | 13.3 | 12.8 |
| Industrials | 9.5 | 10.2 | 11.6 |
| Information | | | |
| Technology | 12.4 | 9.1 | 17.9 |
| Materials | 1.6 | 2.9 | 3.9 |
| Telecommunication | | | |
| Services | 2.8 | 2.5 | 2.2 |
| Utilities | 4.3 | 6.3 | 3.2 |
13
Windsor II Fund
Performance Summary
All of the returns in this report represent past performance, which is not a guarantee of future results that may be achieved by the fund. (Current performance may be lower or higher than the performance data cited. For performance data current to the most recent month-end, visit our website at vanguard.com/performance.) Note, too, that both investment returns and principal value can fluctuate widely, so an investor’s shares, when sold, could be worth more or less than their original cost. The returns shown do not reflect taxes that a shareholder would pay on fund distributions or on the sale of fund shares.
Fiscal-Year Total Returns (%): October 31, 2003, Through April 30, 2014
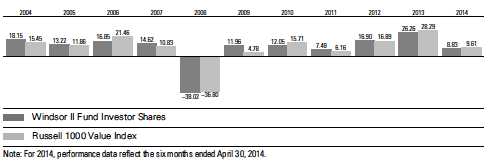
Average Annual Total Returns: Periods Ended March 31, 2014
This table presents returns through the latest calendar quarter—rather than through the end of the fiscal period.
Securities and Exchange Commission rules require that we provide this information.
| | | | |
| | Inception | One | Five | Ten |
| | Date | Year | Years | Years |
| Investor Shares | 6/24/1985 | 21.89% | 21.07% | 7.67% |
| Admiral Shares | 5/14/2001 | 21.99 | 21.17 | 7.78 |
See Financial Highlights for dividend and capital gains information.
14
Windsor II Fund
Financial Statements (unaudited)
Statement of Net Assets
As of April 30, 2014
The fund reports a complete list of its holdings in regulatory filings four times in each fiscal year, at the quarter-ends. For the second and fourth fiscal quarters, the lists appear in the fund’s semiannual and annual reports to shareholders. For the first and third fiscal quarters, the fund files the lists with the Securities and Exchange Commission on Form N-Q. Shareholders can look up the fund’s Forms N-Q on the SEC’s website at sec.gov. Forms N-Q may also be reviewed and copied at the SEC’s Public Reference Room (see the back cover of this report for further information).
| | | |
| | | | Market |
| | | | Value |
| | | Shares | ($000) |
| Common Stocks (97.2%)1 | | |
| Consumer Discretionary (8.5%) | |
| | Target Corp. | 13,422,800 | 828,858 |
| | Ford Motor Co. | 41,156,100 | 664,671 |
| | Advance Auto Parts Inc. | 2,931,860 | 355,605 |
| | Viacom Inc. Class B | 3,338,500 | 283,706 |
| | Comcast Corp. | 3,652,149 | 186,369 |
| | Omnicom Group Inc. | 2,301,650 | 155,776 |
| | Carnival Corp. | 3,771,957 | 148,276 |
| | Delphi Automotive plc | 1,767,004 | 118,107 |
| | Johnson Controls Inc. | 2,401,800 | 108,417 |
| | Genuine Parts Co. | 1,177,000 | 102,540 |
| | Renault SA | 944,271 | 92,322 |
| | Dick’s Sporting | | |
| | Goods Inc. | 1,634,950 | 86,096 |
| | Macy’s Inc. | 1,495,400 | 85,881 |
| | General Motors Co. | 2,451,500 | 84,528 |
| | DR Horton Inc. | 3,755,600 | 83,675 |
| | Time Warner Cable Inc. | 521,600 | 73,786 |
| | Interpublic Group | | |
| | of Cos. Inc. | 3,782,100 | 65,884 |
| | Expedia Inc. | 799,663 | 56,768 |
| * | Bed Bath & Beyond Inc. | 864,582 | 53,716 |
| * | Volkswagen AG | 198,467 | 53,219 |
| | Hyundai Motor Co. | 222,182 | 49,539 |
| * | Norwegian Cruise | | |
| | Line Holdings Ltd. | 1,479,100 | 48,470 |
| | Kohl’s Corp. | 834,300 | 45,711 |
| * | Volkswagen AG | | |
| | Preference Shares | 161,020 | 43,528 |
| | McDonald’s Corp. | 406,500 | 41,211 |
| | Lowe’s Cos. Inc. | 877,300 | 40,277 |
| *,^ | Honda Motor Co. | | |
| | Ltd. ADR | 1,173,800 | 39,088 |
| *,^ | JC Penney Co. Inc. | 4,531,200 | 38,606 |
| | Time Warner Inc. | 435,399 | 28,937 |
| | Nordstrom Inc. | 440,600 | 27,000 |
| | | |
| | | | Market |
| | | | Value |
| | | Shares | ($000) |
| * | Meritage Homes Corp. | 681,300 | 26,285 |
| | Ryland Group Inc. | 676,045 | 25,953 |
| | Best Buy Co. Inc. | 51,000 | 1,322 |
| | Whirlpool Corp. | 7,000 | 1,074 |
| | Royal Caribbean Cruises Ltd. | 19,400 | 1,031 |
| | GameStop Corp. Class A | 16,700 | 663 |
| * | News Corp. Class B | 38,000 | 628 |
| | Newell Rubbermaid Inc. | 11,100 | 334 |
| * | Liberty Media Corp. Class A | 500 | 65 |
| * | News Corp. Class A | 2,700 | 46 |
| | | | 4,147,968 |
| Consumer Staples (9.7%) | | |
| | Philip Morris | | |
| | International Inc. | 12,963,353 | 1,107,459 |
| | Wal-Mart Stores Inc. | 11,832,705 | 943,185 |
| | Imperial Tobacco | | |
| | Group plc ADR | 8,734,425 | 761,554 |
| | Diageo plc ADR | 5,253,620 | 645,039 |
| | Altria Group Inc. | 12,376,332 | 496,415 |
| | Molson Coors | | |
| | Brewing Co. Class B | 6,086,380 | 365,000 |
| | Sysco Corp. | 5,088,856 | 185,387 |
| | Kellogg Co. | 1,484,300 | 99,196 |
| | Mondelez International | | |
| | Inc. Class A | 1,942,161 | 69,238 |
| | PepsiCo Inc. | 334,900 | 28,765 |
| | Procter & Gamble Co. | 52,390 | 4,325 |
| | CVS Caremark Corp. | 44,300 | 3,221 |
| | Kimberly-Clark Corp. | 19,700 | 2,211 |
| | Archer-Daniels-Midland Co. | 43,300 | 1,893 |
| | Kraft Foods Group Inc. | 32,700 | 1,859 |
| | Kroger Co. | 35,700 | 1,644 |
| | Tyson Foods Inc. Class A | 36,500 | 1,532 |
| | Bunge Ltd. | 17,900 | 1,426 |
| | Coca-Cola Co. | 34,100 | 1,391 |
| | Walgreen Co. | 8,700 | 591 |
15
Windsor II Fund
| | | |
| | | | Market |
| | | | Value |
| | | Shares | ($000) |
| | Dr Pepper Snapple | | |
| | Group Inc. | 6,200 | 344 |
| | Herbalife Ltd. | 2,500 | 150 |
| | | | 4,721,825 |
| Energy (11.6%) | | |
| | ConocoPhillips | 11,930,289 | 886,540 |
| | Occidental | | |
| | Petroleum Corp. | 8,245,207 | 789,479 |
| | BP plc ADR | 15,549,869 | 787,134 |
| | Phillips 66 | 9,414,426 | 783,469 |
| ^ | Seadrill Ltd. | 10,969,707 | 386,353 |
| | Marathon | | |
| | Petroleum Corp. | 3,879,498 | 360,599 |
| | Apache Corp. | 2,753,100 | 238,969 |
| | Royal Dutch Shell | | |
| | plc ADR | 2,701,446 | 212,712 |
| | Transocean Ltd. | 3,819,085 | 164,488 |
| | CONSOL Energy Inc. | 3,677,620 | 163,691 |
| | Devon Energy Corp. | 2,216,150 | 155,130 |
| | Chevron Corp. | 1,218,699 | 152,971 |
| * | Cobalt International | | |
| | Energy Inc. | 7,439,100 | 133,904 |
| | HollyFrontier Corp. | 1,985,900 | 104,438 |
| | Marathon Oil Corp. | 2,278,400 | 82,364 |
| | Valero Energy Corp. | 1,273,600 | 72,812 |
| | Total SA ADR | 981,200 | 69,901 |
| | Murphy Oil Corp. | 888,600 | 56,364 |
| * | Kosmos Energy Ltd. | 1,364,100 | 14,896 |
| | Gazprom OAO ADR | 1,553,600 | 11,228 |
| | Exxon Mobil Corp. | 94,882 | 9,717 |
| | Ensco plc Class A | 184,586 | 9,312 |
| | Helmerich & Payne Inc. | 14,200 | 1,543 |
| *,^ | SandRidge Energy Inc. | 177,100 | 1,215 |
| | Plains GP Holdings | | |
| | LP Class A | 42,300 | 1,166 |
| | Hess Corp. | 8,125 | 724 |
| * | Newfield Exploration Co. | 4,700 | 159 |
| | | | 5,651,278 |
| Financials (20.8%) | | |
| | JPMorgan Chase & Co. | 22,550,309 | 1,262,366 |
| | Wells Fargo & Co. | 24,435,073 | 1,212,957 |
| | American Express Co. | 11,639,796 | 1,017,667 |
| | Citigroup Inc. | 20,757,444 | 994,489 |
| | PNC Financial | | |
| | Services Group Inc. | 11,148,368 | 936,909 |
| | Bank of America Corp. | 55,919,526 | 846,622 |
| | Capital One | | |
| | Financial Corp. | 10,282,638 | 759,887 |
| | SLM Corp. | 15,720,252 | 404,797 |
| | XL Group plc Class A | 12,711,132 | 398,494 |
| | American International | | |
| | Group Inc. | 4,382,200 | 232,826 |
| | Morgan Stanley | 5,965,900 | 184,525 |
| | | |
| | | | Market |
| | | | Value |
| | | Shares | ($000) |
| | Lincoln National Corp. | 3,288,461 | 159,523 |
| | MetLife Inc. | 2,923,300 | 153,035 |
| | SunTrust Banks Inc. | 3,974,467 | 152,063 |
| | IntercontinentalExchange | | |
| | Group Inc. | 701,100 | 143,333 |
| | Corrections Corp. | | |
| | of America | 4,270,434 | 140,070 |
| | Regions Financial Corp. | 13,188,800 | 133,734 |
| | Hartford Financial | | |
| | Services Group Inc. | 3,678,900 | 131,962 |
| | Barclays plc | 27,072,645 | 115,603 |
| | BNP Paribas SA | 1,523,400 | 114,477 |
| | Allstate Corp. | 1,951,500 | 111,138 |
| | Goldman Sachs Group Inc. | 664,979 | 106,277 |
| | Unum Group | 2,463,100 | 81,824 |
| *,^ | Ally Financial Inc. | 3,235,600 | 78,140 |
| | Bank of New York | | |
| | Mellon Corp. | 1,666,300 | 56,438 |
| | Nordea Bank AB | 3,482,300 | 50,461 |
| | Prudential Financial Inc. | 520,837 | 42,021 |
| * | Voya Financial Inc. | 1,111,600 | 39,340 |
| | Lexington Realty Trust | 3,118,190 | 33,552 |
| | Travelers Cos. Inc. | 22,300 | 2,020 |
| | Fifth Third Bancorp | 75,200 | 1,550 |
| | KeyCorp | 107,600 | 1,468 |
| | Everest Re Group Ltd. | 8,500 | 1,343 |
| | RenaissanceRe | | |
| | Holdings Ltd. | 12,800 | 1,295 |
| | Axis Capital Holdings Ltd. | 27,200 | 1,244 |
| | Assurant Inc. | 18,100 | 1,220 |
| | Legg Mason Inc. | 24,900 | 1,168 |
| | Validus Holdings Ltd. | 31,100 | 1,153 |
| | US Bancorp | 27,149 | 1,107 |
| | Simon Property Group Inc. | 6,100 | 1,057 |
| | Public Storage | 5,700 | 1,000 |
| | Host Hotels & Resorts Inc. | 46,200 | 991 |
| | State Street Corp. | 15,325 | 989 |
| | ACE Ltd. | 9,300 | 952 |
| | Ventas Inc. | 12,000 | 793 |
| | BlackRock Inc. | 2,600 | 783 |
| | Kimco Realty Corp. | 34,000 | 779 |
| | SL Green Realty Corp. | 7,100 | 743 |
| | UDR Inc. | 28,200 | 729 |
| | Hospitality Properties Trust | 23,900 | 718 |
| | WP Carey Inc. | 10,600 | 652 |
| | Brixmor Property Group Inc. | 25,600 | 562 |
| | Weingarten Realty Investors | 17,900 | 558 |
| | Chubb Corp. | 3,500 | 322 |
| | Vornado Realty Trust | 2,700 | 277 |
| | Comerica Inc. | 4,900 | 236 |
| | Plum Creek Timber Co. Inc. | 1,300 | 57 |
| | | | 10,120,296 |
16
Windsor II Fund
| | | |
| | | | Market |
| | | | Value |
| | | Shares | ($000) |
| Health Care (16.7%) | | |
| | Pfizer Inc. | 42,961,681 | 1,343,842 |
| | Johnson & Johnson | 11,533,750 | 1,168,254 |
| | Medtronic Inc. | 18,303,600 | 1,076,618 |
| ^ | Sanofi ADR | 18,904,300 | 1,017,051 |
| | WellPoint Inc. | 9,372,907 | 943,664 |
| | Merck & Co. Inc. | 10,320,700 | 604,380 |
| | UnitedHealth Group Inc. | 4,770,900 | 358,008 |
| | Zoetis Inc. | 10,753,890 | 325,413 |
| | Baxter International Inc. | 3,370,600 | 245,346 |
| * | CareFusion Corp. | 4,284,945 | 167,370 |
| | Sanofi | 1,296,300 | 139,898 |
| | Eli Lilly & Co. | 2,223,900 | 131,433 |
| | McKesson Corp. | 689,612 | 116,676 |
| | St. Jude Medical Inc. | 1,738,716 | 110,356 |
| | Aetna Inc. | 1,452,600 | 103,788 |
| | Humana Inc. | 626,400 | 68,748 |
| | Novartis AG ADR | 639,400 | 55,590 |
| * | Express Scripts | | |
| | Holding Co. | 702,000 | 46,739 |
| | AbbVie Inc. | 678,827 | 35,353 |
| | Zimmer Holdings Inc. | 284,900 | 27,578 |
| | Covidien plc | 379,400 | 27,032 |
| | Quest Diagnostics Inc. | 477,400 | 26,701 |
| | Cardinal Health Inc. | 24,300 | 1,689 |
| * | Charles River Laboratories | |
| | International Inc. | 13,850 | 744 |
| | Cigna Corp. | 7,600 | 608 |
| * | Quintiles Transnational | | |
| | Holdings Inc. | 8,600 | 405 |
| * | Endo Health Solutions Inc. 6,400 | 403 |
| * | Covance Inc. | 2,900 | 256 |
| | Bristol-Myers Squibb Co. | 5,053 | 253 |
| | | | 8,144,196 |
| Industrials (9.2%) | | |
| | General Dynamics Corp. | 7,589,060 | 830,623 |
| | Honeywell | | |
| | International Inc. | 8,715,561 | 809,676 |
| | Raytheon Co. | 8,165,556 | 779,647 |
| | Emerson Electric Co. | 11,191,300 | 763,023 |
| 2 | Xylem Inc. | 9,674,199 | 363,653 |
| | Tyco International Ltd. | 3,119,997 | 127,608 |
| | Cummins Inc. | 635,500 | 95,865 |
| | General Electric Co. | 3,458,304 | 92,994 |
| | Terex Corp. | 1,950,900 | 84,455 |
| | Stanley Black & | | |
| | Decker Inc. | 935,600 | 80,359 |
| | Republic Services Inc. | | |
| | Class A | 2,120,200 | 74,398 |
| | Boeing Co. | 556,000 | 71,735 |
| * | American Airlines | | |
| | Group Inc. | 1,530,100 | 53,661 |
| | | |
| | | | Market |
| | | | Value |
| | | Shares | ($000) |
| | PACCAR Inc. | 827,700 | 52,956 |
| | Caterpillar Inc. | 434,500 | 45,796 |
| | Joy Global Inc. | 648,300 | 39,144 |
| | Lockheed Martin Corp. | 184,700 | 30,317 |
| | Northrop Grumman Corp. | 240,376 | 29,208 |
| | FedEx Corp. | 192,700 | 26,255 |
| | Embraer SA ADR | 747,100 | 25,700 |
| ^ | CNH Industrial NV | 1,179,900 | 13,675 |
| | United Parcel Service | | |
| | Inc. Class B | 22,400 | 2,206 |
| | L-3 Communications | | |
| | Holdings Inc. | 12,300 | 1,419 |
| | IDEX Corp. | 15,800 | 1,178 |
| * | Spirit AeroSystems | | |
| | Holdings Inc. Class A | 33,400 | 1,003 |
| | Manpowergroup Inc. | 7,600 | 618 |
| | 3M Co. | 3,200 | 445 |
| | Pentair Ltd. | 4,800 | 357 |
| | Dover Corp. | 2,300 | 199 |
| | | | 4,498,173 |
| Information Technology (12.0%) | |
| | Microsoft Corp. | 32,748,945 | 1,323,057 |
| | Intel Corp. | 39,278,600 | 1,048,346 |
| | Oracle Corp. | 19,840,780 | 811,091 |
| | Apple Inc. | 856,818 | 505,600 |
| | Corning Inc. | 14,441,900 | 301,980 |
| | Cisco Systems Inc. | 12,790,200 | 295,582 |
| | Hewlett-Packard Co. | 6,012,750 | 198,782 |
| | International Business | | |
| | Machines Corp. | 893,625 | 175,571 |
| | Samsung Electronics | | |
| | Co. Ltd. | 133,900 | 174,600 |
| | Visa Inc. Class A | 760,700 | 154,125 |
| | EMC Corp. | 5,817,500 | 150,092 |
| | QUALCOMM Inc. | 1,522,400 | 119,828 |
| | Xerox Corp. | 8,430,761 | 101,928 |
| * | Check Point Software | | |
| | Technologies Ltd. | 1,334,600 | 85,494 |
| * | Teradyne Inc. | 3,542,300 | 62,592 |
| * | Citrix Systems Inc. | 1,044,700 | 61,961 |
| | SanDisk Corp. | 695,900 | 59,131 |
| * | Google Inc. Class A | 92,325 | 49,383 |
| * | Google Inc. | 92,325 | 48,624 |
| | Maxim Integrated | | |
| | Products Inc. | 1,278,000 | 41,458 |
| | Texas Instruments Inc. | 632,200 | 28,733 |
| | TE Connectivity Ltd. | 445,875 | 26,298 |
| * | Vantiv Inc. Class A | 118,414 | 3,641 |
| | Western Digital Corp. | 18,500 | 1,630 |
| | Seagate Technology plc | 28,550 | 1,501 |
| | Computer Sciences Corp. | 22,500 | 1,332 |
| | Harris Corp. | 18,100 | 1,331 |
17
Windsor II Fund
| | | |
| | | | Market |
| | | | Value |
| | | Shares | ($000) |
| | Applied Materials Inc. | 55,900 | 1,065 |
| * | ON Semiconductor Corp. | 84,500 | 795 |
| | Leidos Holdings Inc. | 5,600 | 209 |
| | Marvell Technology | | |
| | Group Ltd. | 6,200 | 98 |
| * | Flextronics International Ltd. | 8,400 | 76 |
| | | | 5,835,934 |
| Materials (1.6%) | | |
| | EI du Pont de | | |
| | Nemours & Co. | 5,337,588 | 359,326 |
| | Eastman Chemical Co. | 1,697,670 | 147,986 |
| | International Paper Co. | 2,257,000 | 105,289 |
| * | Owens-Illinois Inc. | 1,912,700 | 60,785 |
| | US Silica Holdings Inc. | 936,900 | 42,320 |
| | Carpenter | | |
| | Technology Corp. | 635,000 | 39,878 |
| | Dow Chemical Co. | 52,400 | 2,615 |
| | LyondellBasell Industries | | |
| | NV Class A | 24,820 | 2,296 |
| | Westlake Chemical Corp. | 19,000 | 1,353 |
| | Packaging Corp. of America | 18,800 | 1,253 |
| | Avery Dennison Corp. | 24,000 | 1,168 |
| | United States Steel Corp. | 24,500 | 637 |
| | | | 764,906 |
| Other (0.3%) | | |
| 3 | Vanguard Value ETF | 1,261,200 | 99,358 |
| | SPDR S&P 500 ETF Trust | 255,130 | 48,074 |
| | | | 147,432 |
| Telecommunication Services (2.7%) | |
| | Verizon Communications | | |
| | Inc. | 12,571,509 | 587,467 |
| | AT&T Inc. | 16,300,207 | 581,917 |
| * | Vodafone Group plc | | |
| | ADR | 3,788,836 | 143,824 |
| | | | 1,313,208 |
| Utilities (4.1%) | | |
| | Public Service Enterprise | | |
| | Group Inc. | 19,448,858 | 796,820 |
| 2 | CenterPoint Energy Inc. | 25,726,413 | 636,986 |
| | Entergy Corp. | 5,433,478 | 393,927 |
| | NRG Energy Inc. | 2,473,800 | 80,943 |
| | Exelon Corp. | 2,038,000 | 71,391 |
| | Edison International | 663,800 | 37,545 |
| | American Electric | | |
| | Power Co. Inc. | 34,400 | 1,851 |
| | Ameren Corp. | 35,200 | 1,454 |
| | MDU Resources | | |
| | Group Inc. | 36,700 | 1,300 |
| | Duke Energy Corp. | 9,900 | 737 |
| | Dominion Resources Inc. | 6,300 | 457 |
| | Westar Energy Inc. Class A | 9,500 | 341 |
| | | |
| | | | Market |
| | | | Value |
| | | Shares | ($000) |
| | OGE Energy Corp. | 9,000 | 336 |
| | AES Corp. | 15,700 | 227 |
| | Wisconsin Energy Corp. | 3,100 | 150 |
| | | | 2,024,465 |
| Total Common Stocks | | |
| (Cost $34,157,130) | | 47,369,681 |
| Temporary Cash Investments (3.9%)1 | |
| Money Market Fund (3.9%) | | |
| 4,5 | Vanguard Market | | |
| | Liquidity Fund, | | |
| | 0.124% | 1,886,153,779 | 1,886,154 |
| |
| | | Face | |
| | | Amount | |
| | | ($000) | |
| U.S. Government and Agency Obligations (0.0%) |
| 6 | Federal Home Loan | | |
| | Bank Discount Notes, | | |
| | 0.060%, 5/7/14 | 100 | 100 |
| 6,7 | Federal Home Loan | | |
| | Bank Discount Notes, | | |
| | 0.035%, 6/4/14 | 200 | 200 |
| 6 | Federal Home Loan | | |
| | Bank Discount Notes, | | |
| | 0.080%, 6/6/14 | 600 | 600 |
| 6,7 | Federal Home Loan | | |
| | Bank Discount Notes, | | |
| | 0.074%, 6/18/14 | 17,500 | 17,497 |
| | | | 18,397 |
| Total Temporary Cash Investments | |
| (Cost $1,904,552) | | 1,904,551 |
| Total Investments (101.1%) | | |
| (Cost $36,061,682) | | 49,274,232 |
| Other Assets and Liabilities (-1.1%) | |
| Other Assets | | 306,587 |
| Liabilities5 | | (850,083) |
| | | | (543,496) |
| Net Assets (100%) | | 48,730,736 |
18
Windsor II Fund
| |
| At April 30, 2014, net assets consisted of: |
| | Amount |
| | ($000) |
| Paid-in Capital | 33,112,928 |
| Undistributed Net Investment Income | 297,192 |
| Accumulated Net Realized Gains | 2,105,539 |
| Unrealized Appreciation (Depreciation) | |
| Investment Securities | 13,212,550 |
| Futures Contracts | 2,527 |
| Net Assets | 48,730,736 |
| |
| Investor Shares—Net Assets | |
| Applicable to 479,296,663 outstanding | |
| $.001 par value shares of beneficial | |
| interest (unlimited authorization) | 18,265,649 |
| Net Asset Value Per Share— | |
| Investor Shares | $38.11 |
| |
| Admiral Shares—Net Assets | |
| Applicable to 450,394,735 outstanding | |
| $.001 par value shares of beneficial | |
| interest (unlimited authorization) | 30,465,087 |
| Net Asset Value Per Share— | |
| Admiral Shares | $67.64 |
See Note A in Notes to Financial Statements.
* Non-income-producing security.
^ Includes partial security positions on loan to broker-dealers. The total value of securities on loan is $355,419,000.
1 The fund invests a portion of its cash reserves in equity markets through the use of index futures contracts. After giving effect to futures
investments, the fund’s effective common stock and temporary cash investment positions represent 97.8% and 3.3%, respectively,
of net assets.
2 Considered an affiliated company of the fund as the fund owns more than 5% of the outstanding voting securities of such company.
3 Considered an affiliated company of the fund as the issuer is another member of The Vanguard Group.
4 Affiliated money market fund available only to Vanguard funds and certain trusts and accounts managed by Vanguard. Rate shown is
the 7-day yield.
5 Includes $364,001,000 of collateral received for securities on loan.
6 The issuer operates under a congressional charter; its securities are generally neither guaranteed by the U.S. Treasury nor backed by
the full faith and credit of the U.S. government.
7 Securities with a value of $12,498,000 have been segregated as initial margin for open futures contracts.
ADR—American Depositary Receipt.
See accompanying Notes, which are an integral part of the Financial Statements.
19
Windsor II Fund
| |
| Statement of Operations | |
| |
| | Six Months Ended |
| | April 30, 2014 |
| | ($000) |
| Investment Income | |
| Income | |
| Dividends1,2 | 620,192 |
| Interest2 | 754 |
| Securities Lending | 666 |
| Total Income | 621,612 |
| Expenses | |
| Investment Advisory Fees—Note B | |
| Basic Fee | 33,558 |
| Performance Adjustment | (204) |
| The Vanguard Group—Note C | |
| Management and Administrative—Investor Shares | 17,908 |
| Management and Administrative—Admiral Shares | 17,611 |
| Marketing and Distribution—Investor Shares | 1,442 |
| Marketing and Distribution—Admiral Shares | 2,285 |
| Custodian Fees | 197 |
| Shareholders’ Reports—Investor Shares | 63 |
| Shareholders’ Reports—Admiral Shares | 72 |
| Trustees’ Fees and Expenses | 36 |
| Total Expenses | 72,968 |
| Expenses Paid Indirectly | (736) |
| Net Expenses | 72,232 |
| Net Investment Income | 549,380 |
| Realized Net Gain (Loss) | |
| Investment Securities Sold2 | 2,093,592 |
| Futures Contracts | 23,054 |
| Foreign Currencies | 50 |
| Realized Net Gain (Loss) | 2,116,696 |
| Change in Unrealized Appreciation (Depreciation) | |
| Investment Securities | 1,341,942 |
| Futures Contracts | (7,743) |
| Foreign Currencies | (2) |
| Change in Unrealized Appreciation (Depreciation) | 1,334,197 |
| Net Increase (Decrease) in Net Assets Resulting from Operations | 4,000,273 |
1 Dividends are net of foreign withholding taxes of $1,376,000.
2 Dividend income, interest income, and realized net gain (loss) from affiliated companies of the fund were $14,468,000, $746,000, and
$64,185,000, respectively.
See accompanying Notes, which are an integral part of the Financial Statements.
20
Windsor II Fund
| | |
| Statement of Changes in Net Assets | | |
| |
| | Six Months Ended | Year Ended |
| | April 30, | October 31, |
| | 2014 | 2013 |
| | ($000) | ($000) |
| Increase (Decrease) in Net Assets | | |
| Operations | | |
| Net Investment Income | 549,380 | 952,078 |
| Realized Net Gain (Loss) | 2,116,696 | 2,974,152 |
| Change in Unrealized Appreciation (Depreciation) | 1,334,197 | 5,704,925 |
| Net Increase (Decrease) in Net Assets Resulting from Operations | 4,000,273 | 9,631,155 |
| Distributions | | |
| Net Investment Income | | |
| Investor Shares | (186,328) | (420,360) |
| Admiral Shares | (308,509) | (507,947) |
| Realized Capital Gain | | |
| Investor Shares | (385,723) | — |
| Admiral Shares | (613,547) | — |
| Total Distributions | (1,494,107) | (928,307) |
| Capital Share Transactions | | |
| Investor Shares | (721,864) | (4,141,562) |
| Admiral Shares | 1,319,616 | 3,777,991 |
| Net Increase (Decrease) from Capital Share Transactions | 597,752 | (363,571) |
| Total Increase (Decrease) | 3,103,918 | 8,339,277 |
| Net Assets | | |
| Beginning of Period | 45,626,818 | 37,287,541 |
| End of Period1 | 48,730,736 | 45,626,818 |
| 1 Net Assets—End of Period includes undistributed net investment income of $297,192,000 and $242,599,000. |
See accompanying Notes, which are an integral part of the Financial Statements.
21
Windsor II Fund
Financial Highlights
| | | | | | |
| Investor Shares | | | | | | |
| Six Months | | | | | |
| | Ended | | | | | |
| For a Share Outstanding | April 30, | | | Year Ended October 31, |
| Throughout Each Period | 2014 | 2013 | 2012 | 2011 | 2010 | 2009 |
| Net Asset Value, Beginning of Period | $36.19 | $29.33 | $25.68 | $24.37 | $22.22 | $20.56 |
| Investment Operations | | | | | | |
| Net Investment Income | .424 | .740 | .644 | .557 | .495 | .580 |
| Net Realized and Unrealized Gain (Loss) | | | | | | |
| on Investments | 2.678 | 6.842 | 3.627 | 1.276 | 2.151 | 1.750 |
| Total from Investment Operations | 3.102 | 7.582 | 4.271 | 1.833 | 2.646 | 2.330 |
| Distributions | | | | | | |
| Dividends from Net Investment Income | (.385) | (.722) | (.621) | (.523) | (.496) | (.670) |
| Distributions from Realized Capital Gains | (.797) | — | — | — | — | — |
| Total Distributions | (1.182) | (.722) | (.621) | (.523) | (.496) | (.670) |
| Net Asset Value, End of Period | $38.11 | $36.19 | $29.33 | $25.68 | $24.37 | $22.22 |
| |
| Total Return1 | 8.83% | 26.26% | 16.90% | 7.48% | 12.05% | 11.96% |
| |
| Ratios/Supplemental Data | | | | | | |
| Net Assets, End of Period (Millions) | $18,266 | $18,034 | $18,255 | $19,010 | $20,921 | $20,695 |
| Ratio of Total Expenses to | | | | | | |
| Average Net Assets2 | 0.36% | 0.36% | 0.35% | 0.35% | 0.35% | 0.38% |
| Ratio of Net Investment Income to | | | | | | |
| Average Net Assets | 2.21% | 2.25% | 2.30% | 2.11% | 2.08% | 2.96% |
| Portfolio Turnover Rate | 33% | 27% | 22% | 23% | 29% | 41% |
The expense ratio, net income ratio, and turnover rate for the current period have been annualized.
1 Total returns do not include account service fees that may have applied in the periods shown. Fund prospectuses provide information about
any applicable account service fees.
2 Includes performance-based investment advisory fee increases (decreases) of 0.00%, (0.01%), (0.02%), (0.01%), (0.01%), and (0.01%).
See accompanying Notes, which are an integral part of the Financial Statements.
22
Windsor II Fund
Financial Highlights
| | | | | | |
| Admiral Shares | | | | | | |
| Six Months | | | | | |
| | Ended | | | | | |
| For a Share Outstanding | April 30, | | | Year Ended October 31, |
| Throughout Each Period | 2014 | 2013 | 2012 | 2011 | 2010 | 2009 |
| Net Asset Value, Beginning of Period | $64.23 | $52.06 | $45.59 | $43.26 | $39.46 | $36.51 |
| Investment Operations | | | | | | |
| Net Investment Income | .782 | 1.366 | 1.188 | 1.025 | .914 | 1.064 |
| Net Realized and Unrealized Gain (Loss) | | | | | | |
| on Investments | 4.753 | 12.134 | 6.424 | 2.264 | 3.811 | 3.112 |
| Total from Investment Operations | 5.535 | 13.500 | 7.612 | 3.289 | 4.725 | 4.176 |
| Distributions | | | | | | |
| Dividends from Net Investment Income | (.711) | (1.330) | (1.142) | (.959) | (.925) | (1.226) |
| Distributions from Realized Capital Gains | (1.414) | — | — | — | — | — |
| Total Distributions | (2.125) | (1.330) | (1.142) | (.959) | (.925) | (1.226) |
| Net Asset Value, End of Period | $67.64 | $64.23 | $52.06 | $45.59 | $43.26 | $39.46 |
| |
| Total Return | 8.88% | 26.36% | 16.98% | 7.56% | 12.12% | 12.09% |
| |
| Ratios/Supplemental Data | | | | | | |
| Net Assets, End of Period (Millions) | $30,465 | $27,593 | $19,032 | $14,771 | $13,381 | $12,060 |
| Ratio of Total Expenses to | | | | | | |
| Average Net Assets1 | 0.28% | 0.28% | 0.27% | 0.27% | 0.27% | 0.27% |
| Ratio of Net Investment Income to | | | | | | |
| Average Net Assets | 2.29% | 2.33% | 2.38% | 2.19% | 2.16% | 3.07% |
| Portfolio Turnover Rate | 33% | 27% | 22% | 23% | 29% | 41% |
The expense ratio, net income ratio, and turnover rate for the current period have been annualized.
1 Includes performance-based investment advisory fee increases (decreases) of 0.00%, (0.01%), (0.02%), (0.01%), (0.01%) and (0.01%).
See accompanying Notes, which are an integral part of the Financial Statements.
23
Windsor II Fund
Notes to Financial Statements
Vanguard Windsor II Fund is registered under the Investment Company Act of 1940 as an open-end investment company, or mutual fund. The fund offers two classes of shares: Investor Shares and Admiral Shares. Investor Shares are available to any investor who meets the fund’s minimum purchase requirements. Admiral Shares, are designed for investors who meet certain administrative, service, and account-size criteria.
A. The following significant accounting policies conform to generally accepted accounting principles for U.S. investment companies. The fund consistently follows such policies in preparing its financial statements.
1. Security Valuation: Securities are valued as of the close of trading on the New York Stock Exchange (generally 4 p.m., Eastern time) on the valuation date. Equity securities are valued at the latest quoted sales prices or official closing prices taken from the primary market in which each security trades; such securities not traded on the valuation date are valued at the mean of the latest quoted bid and asked prices. Securities for which market quotations are not readily available, or whose values have been affected by events occurring before the fund’s pricing time but after the close of the securities’ primary markets, are valued at their fair values calculated according to procedures adopted by the board of trustees. These procedures include obtaining quotations from an independent pricing service, monitoring news to identify significant market- or security-specific events, and evaluating changes in the values of foreign market proxies (for example, ADRs, futures contracts, or exchange-traded funds), between the time the foreign markets close and the fund’s pricing time. When fair-value pricing is employed, the prices of securities used by a fund to calculate its net asset value may differ from quoted or published prices for the same securities. Investments in Vanguard Market Liquidity Fund are valued at that fund’s net asset value. Temporary cash investments acquired over 60 days to maturity are valued using the latest bid prices or using valuations based on a matrix system (which considers such factors as security prices, yields, maturities, and ratings), both as furnished by independent pricing services. Other temporary cash investments are valued at amortized cost, which approximates market value.
2. Foreign Currency: Securities and other assets and liabilities denominated in foreign currencies are translated into U.S. dollars using exchange rates obtained from an independent third party as of the fund’s pricing time on the valuation date. Realized gains (losses) and unrealized appreciation (depreciation) on investment securities include the effects of changes in exchange rates since the securities were purchased, combined with the effects of changes in security prices. Fluctuations in the value of other assets and liabilities resulting from changes in exchange rates are recorded as unrealized foreign currency gains (losses) until the assets or liabilities are settled in cash, at which time they are recorded as realized foreign currency gains (losses).
3. Futures Contracts: The fund uses index futures contracts to a limited extent, with the objective of maintaining full exposure to the stock market while maintaining liquidity. The fund may purchase or sell futures contracts to achieve a desired level of investment, whether to accommodate portfolio turnover or cash flows from capital share transactions. The primary risks associated with the use of futures contracts are imperfect correlation between changes in market values of stocks held by the fund and the prices of futures contracts, and the possibility of an illiquid market. Counterparty risk involving futures is mitigated because a regulated clearinghouse is the counterparty instead of the clearing broker. To further mitigate counterparty risk, the fund trades futures contracts on an exchange, monitors the financial strength of its clearing brokers and clearinghouse, and has entered into clearing agreements with its clearing brokers. The clearinghouse imposes initial margin requirements to secure the fund’s performance and requires daily settlement of variation margin representing changes in the market value of each contract.
24
Windsor II Fund
Futures contracts are valued at their quoted daily settlement prices. The aggregate notional amounts of the contracts are not recorded in the Statement of Net Assets. Fluctuations in the value of the contracts are recorded in the Statement of Net Assets as an asset (liability) and in the Statement of Operations as unrealized appreciation (depreciation) until the contracts are closed, when they are recorded as realized futures gains (losses).
During the six months ended April 30, 2014, the fund’s average investments in long and short futures contracts represented less than 1% and 0% of net assets, respectively, based on quarterly average aggregate settlement values.
4. Federal Income Taxes: The fund intends to continue to qualify as a regulated investment company and distribute all of its taxable income. Management has analyzed the fund’s tax positions taken for all open federal income tax years (October 31, 2010–2013), and for the period ended April 30, 2014, and has concluded that no provision for federal income tax is required in the fund’s financial statements.
5. Distributions: Distributions to shareholders are recorded on the ex-dividend date.
6. Securities Lending: To earn additional income, the fund lends its securities to qualified institutional borrowers. Security loans are required to be secured at all times by collateral in an amount at least equal to the market value of securities loaned. Daily market fluctuations could cause the value of loaned securities to be more or less than the value of the collateral received. When this occurs, the collateral is adjusted and settled on the next business day. The fund further mitigates its counterparty risk by entering into securities lending transactions only with a diverse group of prequalified counter-parties, monitoring their financial strength, and entering into master securities lending agreements with its counterparties. The master securities lending agreements provide that, in the event of a counterparty’s default (including bankruptcy), the fund may terminate any loans with that borrower, determine the net amount owed, and sell or retain the collateral up to the net amount owed to the fund; however, such actions may be subject to legal proceedings. While collateral mitigates counter-party risk, in the absence of a default the fund may experience delays and costs in recovering the securities loaned. The fund invests cash collateral received in Vanguard Market Liquidity Fund, and records a liability in the Statement of Net Assets for the return of the collateral, during the period the securities are on loan. Securities lending income represents fees charged to borrowers plus income earned on invested cash collateral, less expenses associated with the loan.
7. Credit Facility: The fund and certain other funds managed by The Vanguard Group participate in a $2.89 billion committed credit facility provided by a syndicate of lenders pursuant to a credit agreement that may be renewed annually; each fund is individually liable for its borrowings, if any, under the credit facility. Borrowings may be utilized for temporary and emergency purposes, and are subject to the fund’s regulatory and contractual borrowing restrictions. The participating funds are charged administrative fees and an annual commitment fee of 0.06% of the undrawn amount of the facility; these fees are allocated to the funds based on a method approved by the fund’s board of trustees and included in Management and Administrative expenses on the fund’s Statement of Operations. Any borrowings under this facility bear interest at a rate equal to the higher of the federal funds rate or LIBOR reference rate plus an agreed-upon spread.
The fund had no borrowings outstanding at April 30, 2014, or at any time during the period then ended.
8. Other: Dividend income is recorded on the ex-dividend date. Interest income includes income distributions received from Vanguard Market Liquidity Fund and is accrued daily. Premiums and discounts on debt securities purchased are amortized and accreted, respectively, to interest income
25
Windsor II Fund
over the lives of the respective securities. Security transactions are accounted for on the date securities are bought or sold. Costs used to determine realized gains (losses) on the sale of investment securities are those of the specific securities sold.
Each class of shares has equal rights as to assets and earnings, except that each class separately bears certain class-specific expenses related to maintenance of shareholder accounts (included in Management and Administrative expenses) and shareholder reporting. Marketing and distribution expenses are allocated to each class of shares based on a method approved by the board of trustees. Income, other non-class-specific expenses, and gains and losses on investments are allocated to each class of shares based on its relative net assets.
B. Barrow, Hanley, Mewhinney & Strauss, LLC; Lazard Asset Management LLC; Hotchkis and Wiley Capital Management, LLC; and Sanders Capital, LLC, each provide investment advisory services to a portion of the fund for a fee calculated at an annual percentage rate of average net assets managed by the advisor. The basic fee of Barrow, Hanley, Mewhinney & Strauss, LLC, is subject to quarterly adjustments based on performance for the preceding three years relative to the MSCI US Prime Market 750 Index. The basic fee of Lazard Asset Management LLC is subject to quarterly adjustments based on performance for the preceding three years relative to the S&P 500 Index. The basic fee of Hotchkis and Wiley Capital Management, LLC, is subject to quarterly adjustments based on performance for the preceding five years relative to the MSCI US Investable Market 2500 Index. The basic fee of Sanders Capital, LLC, is subject to quarterly adjustments based on performance since January 31, 2010, relative to the Russell 3000 Index. Until February 2014, a portion of the fund was managed by Armstrong Shaw Associates Inc. The basic fee paid to Armstrong Shaw Associates Inc. was subject to quarterly adjustments based on performance for the preceding five years relative to the Russell 1000 Value Index.
The Vanguard Group provides investment advisory services to a portion of the fund on an at-cost basis; the fund paid Vanguard advisory fees of $139,000 for the six months ended April 30, 2014.
For the six months ended April 30, 2014, the aggregate investment advisory fee represented an effective annual basic rate of 0.14% of the fund’s average net assets, before a decrease of $204,000 (0.00%) based on performance.
C. The Vanguard Group furnishes at cost corporate management, administrative, marketing, and distribution services. The costs of such services are allocated to the fund based on methods approved by the board of trustees. The fund has committed to provide up to 0.40% of its net assets in capital contributions to Vanguard. At April 30, 2014, the fund had contributed capital of $5,142,000 to Vanguard (included in Other Assets), representing 0.01% of the fund’s net assets and 2.06% of Vanguard’s capitalization. The fund’s trustees and officers are also directors and officers of Vanguard.
D. The fund has asked its investment advisors to direct certain security trades, subject to obtaining the best price and execution, to brokers who have agreed to rebate to the fund part of the commissions generated. Such rebates are used solely to reduce the fund’s management and administrative expenses. For the six months ended April 30, 2014, these arrangements reduced the fund’s expenses by $736,000 (an annual rate of 0.00% of average net assets).
E. Various inputs may be used to determine the value of the fund’s investments. These inputs are summarized in three broad levels for financial statement purposes. The inputs or methodologies used to value securities are not necessarily an indication of the risk associated with investing in those securities.
26
Windsor II Fund
Level 1—Quoted prices in active markets for identical securities.
Level 2—Other significant observable inputs (including quoted prices for similar securities, interest rates, prepayment speeds, credit risk, etc.).
Level 3—Significant unobservable inputs (including the fund’s own assumptions used to determine the fair value of investments).
The following table summarizes the market value of the fund’s investments as of April 30, 2014, based on the inputs used to value them:
| | | |
| | Level 1 | Level 2 | Level 3 |
| Investments | ($000) | ($000) | ($000) |
| Common Stocks | 46,524,805 | 844,876 | — |
| Temporary Cash Investments | 1,886,154 | 18,397 | — |
| Futures Contracts—Assets1 | 865 | — | — |
| Total | 48,411,824 | 863,273 | — |
| 1 Represents variation margin on the last day of the reporting period. |
F. At April 30, 2014, the aggregate settlement value of open futures contracts and the related unrealized appreciation (depreciation) were:
| | | | |
| | | | | ($000) |
| | | | Aggregate | |
| | | Number of | Settlement | Unrealized |
| | | Long (Short) | Value | Appreciation |
| Futures Contracts | Expiration | Contracts | Long (Short) | (Depreciation) |
| E-mini S&P 500 Index | June 2014 | 1,632 | 153,237 | 1,085 |
| S&P 500 Index | June 2014 | 241 | 113,143 | 1,442 |
| | | | | 2,527 |
Unrealized appreciation (depreciation) on open futures contracts is required to be treated as realized gain (loss) for tax purposes.
G. Distributions are determined on a tax basis and may differ from net investment income and realized capital gains for financial reporting purposes. Differences may be permanent or temporary. Permanent differences are reclassified among capital accounts in the financial statements to reflect their tax character. Temporary differences arise when certain items of income, expense, gain, or loss are recognized in different periods for financial statement and tax purposes. These differences will reverse at some time in the future. Differences in classification may also result from the treatment of short-term gains as ordinary income for tax purposes. The fund’s tax-basis capital gains and losses are determined only at the end of each fiscal year.
During the six months ended April 30, 2014, the fund realized net foreign currency gains of $50,000, which increased distributable net income for tax purposes; accordingly, such gains have been reclassified from accumulated net realized gains to undistributed net investment income.
At April 30, 2014, the cost of investment securities for tax purposes was $36,061,682,000. Net unrealized appreciation of investment securities for tax purposes was $13,212,550,000, consisting of unrealized gains of $15,501,618,000 on securities that had risen in value since their purchase and $2,289,068,000 in unrealized losses on securities that had fallen in value since their purchase.
27
Windsor II Fund
H. During the six months ended April 30, 2014, the fund purchased $7,594,540,000 of investment securities and sold $7,747,155,000 of investment securities, other than temporary cash investments.
I. Capital share transactions for each class of shares were:
| | | | |
| | Six Months Ended | | Year Ended |
| | | April 30, 2014 | October 31, 2013 |
| | Amount | Shares | Amount | Shares |
| | ($000) | (000) | ($000) | (000) |
| Investor Shares | | | | |
| Issued | 488,074 | 13,252 | 1,115,392 | 34,532 |
| Issued in Lieu of Cash Distributions | 559,534 | 15,846 | 410,628 | 13,200 |
| Redeemed | (1,769,472) | (48,184) | (5,667,582) | (171,744) |
| Net Increase (Decrease)—Investor Shares | (721,864) | (19,086) | (4,141,562) | (124,012) |
| Admiral Shares | | | | |
| Issued | 1,893,370 | 28,986 | 5,688,923 | 96,894 |
| Issued in Lieu of Cash Distributions | 881,157 | 14,063 | 480,666 | 8,664 |
| Redeemed | (1,454,911) | (22,265) | (2,391,598) | (41,495) |
| Net Increase (Decrease) —Admiral Shares | 1,319,616 | 20,784 | 3,777,991 | 64,063 |
J. Certain of the fund’s investments are in companies that are considered to be affiliated companies of the fund because the fund owns more than 5% of the outstanding voting securities of the company. Transactions during the period in securities of these companies were as follows:
| | | | | |
| | | | Current Period Transactions | |
| | October 31, 2013 | | Proceeds from | | April 30, 2014 |
| | Market | Purchases | Securities | Dividend | Market |
| | Value | at Cost | Sold | Income | Value |
| | ($000) | ($000) | ($000) | ($000) | ($000) |
| CenterPoint Energy Inc. | 633,335 | — | 435 | 11,452 | 636,986 |
| Xylem Inc. | 333,760 | — | — | 1,238 | 363,653 |
| | 967,095 | | | 12,690 | 1,000,639 |
K. Management has determined that no material events or transactions occurred subsequent to April 30, 2014, that would require recognition or disclosure in these financial statements.
28
About Your Fund’s Expenses
As a shareholder of the fund, you incur ongoing costs, which include costs for portfolio management, administrative services, and shareholder reports (like this one), among others. Operating expenses, which are deducted from a fund’s gross income, directly reduce the investment return of the fund.
A fund’s expenses are expressed as a percentage of its average net assets. This figure is known as the expense ratio. The following examples are intended to help you understand the ongoing costs (in dollars) of investing in your fund and to compare these costs with those of other mutual funds. The examples are based on an investment of $1,000 made at the beginning of the period shown and held for the entire period.
The accompanying table illustrates your fund’s costs in two ways:
• Based on actual fund return. This section helps you to estimate the actual expenses that you paid over the period. The ”Ending Account Value“ shown is derived from the fund‘s actual return, and the third column shows the dollar amount that would have been paid by an investor who started with $1,000 in the fund. You may use the information here, together with the amount you invested, to estimate the expenses that you paid over the period.
To do so, simply divide your account value by $1,000 (for example, an $8,600 account value divided by $1,000 = 8.6), then multiply the result by the number given for your fund under the heading ”Expenses Paid During Period.“
• Based on hypothetical 5% yearly return. This section is intended to help you compare your fund‘s costs with those of other mutual funds. It assumes that the fund had a yearly return of 5% before expenses, but that the expense ratio is unchanged. In this case—because the return used is not the fund’s actual return—the results do not apply to your investment. The example is useful in making comparisons because the Securities and Exchange Commission requires all mutual funds to calculate expenses based on a 5% return. You can assess your fund’s costs by comparing this hypothetical example with the hypothetical examples that appear in shareholder reports of other funds.
Note that the expenses shown in the table are meant to highlight and help you compare ongoing costs only and do not reflect transaction costs incurred by the fund for buying and selling securities. Further, the expenses do not include any purchase, redemption, or account service fees described in the fund prospectus. If such fees were applied to your account, your costs would be higher. Your fund does not carry a “sales load.”
The calculations assume no shares were bought or sold during the period. Your actual costs may have been higher or lower, depending on the amount of your investment and the timing of any purchases or redemptions.
You can find more information about the fund’s expenses, including annual expense ratios, in the Financial Statements section of this report. For additional information on operating expenses and other shareholder costs, please refer to your fund’s current prospectus.
29
| | | |
| Six Months Ended April 30, 2014 | | | |
| | Beginning | Ending | Expenses |
| | Account Value | Account Value | Paid During |
| Windsor II Fund | 10/31/2013 | 4/30/2014 | Period |
| Based on Actual Fund Return | | | |
| Investor Shares | $1,000.00 | $1,088.30 | $1.86 |
| Admiral Shares | 1,000.00 | 1,088.80 | 1.45 |
| Based on Hypothetical 5% Yearly Return | | | |
| Investor Shares | $1,000.00 | $1,023.01 | $1.81 |
| Admiral Shares | 1,000.00 | 1,023.41 | 1.40 |
The calculations are based on expenses incurred in the most recent six-month period. The fund’s annualized six-month expense ratios for that period are 0.36% for Investor Shares and 0.28% for Admiral Shares. The dollar amounts shown as “Expenses Paid” are equal to the annualized expense ratio multiplied by the average account value over the period, multiplied by the number of days in the most recent six-month period, then divided by the number of days in the most recent 12-month period.
30
Trustees Approve Advisory Arrangements
The board of trustees of Vanguard Windsor II Fund has renewed the fund’s investment advisory arrangements with Barrow, Hanley, Mewhinney & Strauss, LLC (Barrow Hanley); Hotchkis and Wiley Capital Management, LLC (Hotchkis and Wiley); Lazard Asset Management LLC (Lazard); Sanders Capital, LLC (Sanders Capital); and The Vanguard Group, Inc. (Vanguard) (through its Equity Investment Group). The board determined renewing the fund’s advisory arrangements was in the best interests of the fund and its shareholders. Please note that in February, the fund’s trustees modified its investment advisory arrangements: Armstrong Shaw Associates Inc. no longer serves as one of the fund’s advisors.
The board based its decision upon an evaluation of each advisor’s investment staff, portfolio management process, and performance. The trustees considered the factors discussed below, among others. However, no single factor determined whether the board approved the arrangements. Rather, it was the totality of the circumstances that drove the board’s decision.
Nature, extent, and quality of services
The board considered the quality of the fund’s investment management services over both the shortand long term, and took into account the organizational depth and stability of each advisor. The board noted the following:
Barrow Hanley. Founded in 1979, Barrow Hanley is known for its commitment to value investing. A subsidiary of Old Mutual Asset Managers, Barrow Hanley remains independently managed. Using a combination of in-depth fundamental research and valuation forecasts, Barrow Hanley seeks stocks offering strong fundamentals and price appreciation potential, with below-average price/earnings ratios and price/book value ratios, and above-average current yields. Barrow Hanley has advised the fund since the fund’s inception in 1985.
Hotchkis and Wiley. Founded in 1980, Hotchkis and Wiley is a value-oriented firm that invests mainly in mid- and large-cap stocks with value-oriented characteristics. Hotchkis and Wiley follows a disciplined investment approach, focusing on such investment parameters as a company’s tangible assets, sustainable cash flow, and potential for improving business performance. Hotchkis and Wiley has managed a portion of the fund since 2003.
Lazard. Lazard provides investment management services for clients around the world in a variety of investment mandates, including international equities, domestic equities, and fixed income securities. The investment team at Lazard employs a bottom-up stock-selection process to identify stocks with sustainable financial productivity and attractive valuations. The investment process incorporates three types of research: financial screening, fundamental analysis, and accounting validation. Lazard is a subsidiary of Lazard Ltd and has managed a portion of the fund since 2007.
Sanders Capital. Founded in 2009, Sanders Capital employs a traditional bottom-up, fundamental research driven approach to identify securities that are undervalued relative to their expected total return. Sanders Capital has managed a portion of the fund since 2010.
Vanguard. Vanguard has been managing investments for more than three decades. The Equity Investment Group adheres to a sound, disciplined investment management process; the team has considerable experience, stability, and depth. Vanguard has managed a portion of the fund since 1991.
The board concluded that each advisor’s experience, stability, depth, and performance, among other factors, warranted continuation of the advisory arrangements.
31
Investment performance
The board considered the short- and long-term performance of the fund and each advisor, including any periods of outperformance or underperformance relative to a benchmark index and peer group. The board concluded that the performance was such that the advisory arrangement should continue. Information about the fund’s most recent performance can be found in the Performance Summary section of this report.
Cost
The board concluded that the fund’s expense ratio was well below the average expense ratio charged by funds in its peer group and that the fund’s advisory fee rate was also well below the peer-group average. Information about the fund’s expenses appears in the About Your Fund’s Expenses section of this report as well as in the Financial Statements section, which also includes information about the fund’s advisory fee rate.
The board did not consider profitability of Barrow Hanley, Hotchkis and Wiley, Lazard, or Sanders Capital in determining whether to approve the advisory fees, because the firms are independent of Vanguard and the advisory fees are the result of arm’s-length negotiations. The board does not conduct a profitability analysis of Vanguard because of Vanguard’s unique “at-cost” structure. Unlike most other mutual fund management companies, Vanguard is owned by the funds it oversees, and produces “profits” only in the form of reduced expenses for fund shareholders.
The benefit of economies of scale
The board concluded that the fund’s shareholders benefit from economies of scale because of breakpoints in the advisory fee schedules for Barrow Hanley, Hotchkis and Wiley, Lazard, and Sanders Capital. The breakpoints reduce the effective rate of the fees as the fund’s assets managed by each advisor increase.
The board also concluded that the fund’s at-cost arrangement with Vanguard ensures that the fund will realize economies of scale as it grows, with the cost to shareholders declining as the fund’s assets managed by Vanguard increase.
The board will consider whether to renew the advisory arrangements again after a one-year period.
32
Glossary
30-Day SEC Yield. A fund’s 30-day SEC yield is derived using a formula specified by the U.S. Securities and Exchange Commission. Under the formula, data related to the fund’s security holdings in the previous 30 days are used to calculate the fund’s hypothetical net income for that period, which is then annualized and divided by the fund’s estimated average net assets over the calculation period. For the purposes of this calculation, a security’s income is based on its current market yield to maturity (for bonds), its actual income (for asset-backed securities), or its projected dividend yield (for stocks). Because the SEC yield represents hypothetical annualized income, it will differ—at times significantly—from the fund’s actual experience. As a result, the fund’s income distributions may be higher or lower than implied by the SEC yield.
Beta. A measure of the magnitude of a fund’s past share-price fluctuations in relation to the ups and downs of a given market index. The index is assigned a beta of 1.00. Compared with a given index, a fund with a beta of 1.20 typically would have seen its share price rise or fall by 12% when the index rose or fell by 10%. For this report, beta is based on returns over the past 36 months for both the fund and the index. Note that a fund’s beta should be reviewed in conjunction with its R-squared (see definition). The lower the R-squared, the less correlation there is between the fund and the index, and the less reliable beta is as an indicator of volatility.
Dividend Yield. Dividend income earned by stocks, expressed as a percentage of the aggregate market value (or of net asset value, for a fund). The yield is determined by dividing the amount of the annual dividends by the aggregate value (or net asset value) at the end of the period. For a fund, the dividend yield is based solely on stock holdings and does not include any income produced by other investments.
Earnings Growth Rate. The average annual rate of growth in earnings over the past five years for the stocks now in a fund.
Equity Exposure. A measure that reflects a fund’s investments in stocks and stock futures. Any holdings in short-term reserves are excluded.
Expense Ratio. A fund’s total annual operating expenses expressed as a percentage of the fund’s average net assets. The expense ratio includes management and administrative expenses, but does not include the transaction costs of buying and selling portfolio securities.
Foreign Holdings. The percentage of a fund represented by securities or depositary receipts of companies based outside the United States.
Inception Date. The date on which the assets of a fund (or one of its share classes) are first invested in accordance with the fund’s investment objective. For funds with a subscription period, the inception date is the day after that period ends. Investment performance is measured from the inception date.
Median Market Cap. An indicator of the size of companies in which a fund invests; the midpoint of market capitalization (market price x shares outstanding) of a fund’s stocks, weighted by the proportion of the fund’s assets invested in each stock. Stocks representing half of the fund’s assets have market capitalizations above the median, and the rest are below it.
Price/Book Ratio. The share price of a stock divided by its net worth, or book value, per share. For a fund, the weighted average price/book ratio of the stocks it holds.
33
Price/Earnings Ratio. The ratio of a stock’s current price to its per-share earnings over the past year. For a fund, the weighted average P/E of the stocks it holds. P/E is an indicator of market expectations about corporate prospects; the higher the P/E, the greater the expectations for a company’s future growth.
R-Squared. A measure of how much of a fund’s past returns can be explained by the returns from the market in general, as measured by a given index. If a fund’s total returns were precisely synchronized with an index’s returns, its R-squared would be 1.00. If the fund’s returns bore no relationship to the index’s returns, its R-squared would be 0. For this report, R-squared is based on returns over the past 36 months for both the fund and the index.
Return on Equity. The annual average rate of return generated by a company during the past five years for each dollar of shareholder’s equity (net income divided by shareholder’s equity). For a fund, the weighted average return on equity for the companies whose stocks it holds.
Short-Term Reserves. The percentage of a fund invested in highly liquid, short-term securities that can be readily converted to cash.
Turnover Rate. An indication of the fund’s trading activity. Funds with high turnover rates incur higher transaction costs and may be more likely to distribute capital gains (which may be taxable to investors). The turnover rate excludes in-kind transactions, which have minimal impact on costs.
34
This page intentionally left blank.
The People Who Govern Your Fund
The trustees of your mutual fund are there to see that the fund is operated and managed in your best interests since, as a shareholder, you are a part owner of the fund. Your fund’s trustees also serve on the board of directors of The Vanguard Group, Inc., which is owned by the Vanguard funds and provides services to them on an at-cost basis.
A majority of Vanguard’s board members are independent, meaning that they have no affiliation with Vanguard or the funds they oversee, apart from the sizable personal investments they have made as private individuals. The independent board members have distinguished backgrounds in business, academia, and public service. Each of the trustees and executive officers oversees 178 Vanguard funds.
The following table provides information for each trustee and executive officer of the fund. More information about the trustees is in the Statement of Additional Information, which can be obtained, without charge, by contacting Vanguard at 800-662-7447, or online at vanguard.com.
| |
| InterestedTrustee1 | and Delphi Automotive LLP (automotive components); |
| | Senior Advisor at New Mountain Capital. |
| F. William McNabb III | |
| Born 1957. Trustee Since July 2009. Chairman of the | Amy Gutmann |
| Board. Principal Occupation(s) During the Past Five | Born 1949. Trustee Since June 2006. Principal |
| Years: Chairman of the Board of The Vanguard Group, | Occupation(s) During the Past Five Years: President of |
| Inc., and of each of the investment companies served | the University of Pennsylvania; Christopher H. Browne |
| by The Vanguard Group, since January 2010; Director | Distinguished Professor of Political Science, School of |
| of The Vanguard Group since 2008; Chief Executive | Arts and Sciences, and Professor of Communication, |
| Officer and President of The Vanguard Group, and of | Annenberg School for Communication, with secondary |
| each of the investment companies served by The | faculty appointments in the Department of Philosophy, |
| Vanguard Group, since 2008; Director of Vanguard | School of Arts and Sciences, and at the Graduate |
| Marketing Corporation; Managing Director of The | School of Education, University of Pennsylvania; |
| Vanguard Group (1995–2008). | Trustee of the National Constitution Center; Chair |
| | of the Presidential Commission for the Study of |
| IndependentTrustees | Bioethical Issues. |
| |
| Emerson U. Fullwood | JoAnn Heffernan Heisen |
| Born 1948. Trustee Since January 2008. Principal | Born 1950. Trustee Since July 1998. Principal |
| Occupation(s) During the Past Five Years: Executive | Occupation(s) During the Past Five Years: Corporate |
| Chief Staff and Marketing Officer for North America | Vice President and Chief Global Diversity Officer |
| and Corporate Vice President (retired 2008) of Xerox | (retired 2008) and Member of the Executive |
| Corporation (document management products and | Committee (1997–2008) of Johnson & Johnson |
| services); Executive in Residence and 2009–2010 | (pharmaceuticals/medical devices/consumer |
| Distinguished Minett Professor at the Rochester | products); Director of Skytop Lodge Corporation |
| Institute of Technology; Director of SPX Corporation | (hotels), the University Medical Center at Princeton, |
| (multi-industry manufacturing), the United Way of | the Robert Wood Johnson Foundation, and the Center |
| Rochester, Amerigroup Corporation (managed health | for Talent Innovation; Member of the Advisory Board |
| care), the University of Rochester Medical Center, | of the Maxwell School of Citizenship and Public Affairs |
| Monroe Community College Foundation, and North | at Syracuse University. |
| Carolina A&T University. | |
| F. Joseph Loughrey |
| Rajiv L. Gupta | Born 1949. Trustee Since October 2009. Principal |
| Born 1945. Trustee Since December 2001.2 | Occupation(s) During the Past Five Years: President |
| Principal Occupation(s) During the Past Five Years: | and Chief Operating Officer (retired 2009) of Cummins |
| Chairman and Chief Executive Officer (retired 2009) | Inc. (industrial machinery); Chairman of the Board |
| and President (2006–2008) of Rohm and Haas Co. | of Hillenbrand, Inc. (specialized consumer services), |
| (chemicals); Director of Tyco International, Ltd. | and of Oxfam America; Director of SKF AB (industrial |
| (diversified manufacturing and services), Hewlett- | machinery), Hyster-Yale Materials Handling, Inc. |
| Packard Co. (electronic computer manufacturing), | (forklift trucks), the Lumina Foundation for Education, |
| | |
| and the V Foundation for Cancer Research; Member | Executive Officers | |
| of the Advisory Council for the College of Arts and | | |
| Letters and of the Advisory Board to the Kellogg | Glenn Booraem | |
| Institute for International Studies, both at the | Born 1967. Controller Since July 2010. Principal |
| University of Notre Dame. | Occupation(s) During the Past Five Years: Principal |
| | of The Vanguard Group, Inc.; Controller of each of |
| Mark Loughridge | the investment companies served by The Vanguard |
| Born 1953. Trustee Since March 2012. Principal | Group; Assistant Controller of each of the investment |
| Occupation(s) During the Past Five Years: Senior Vice | companies served by The Vanguard Group (2001–2010). |
| President and Chief Financial Officer (retired 2013) | | |
| at IBM (information technology services); Fiduciary | Thomas J. Higgins | |
| Member of IBM’s Retirement Plan Committee (2004– | Born 1957. Chief Financial Officer Since September |
| 2013); Member of the Council on Chicago Booth. | 2008. Principal Occupation(s) During the Past Five |
| | Years: Principal of The Vanguard Group, Inc.; Chief |
| Scott C. Malpass | Financial Officer of each of the investment companies |
| Born 1962. Trustee Since March 2012. Principal | served by The Vanguard Group; Treasurer of each of |
| Occupation(s) During the Past Five Years: Chief | the investment companies served by The Vanguard |
| Investment Officer and Vice President at the University | Group (1998–2008). | |
| of Notre Dame; Assistant Professor of Finance at the | | |
| Mendoza College of Business at Notre Dame; Member | Kathryn J. Hyatt | |
| of the Notre Dame 403(b) Investment Committee; | Born 1955. Treasurer Since November 2008. Principal |
| Board Member of TIFF Advisory Services, Inc. | Occupation(s) During the Past Five Years: Principal of |
| (investment advisor); Member of the Investment | The Vanguard Group, Inc.; Treasurer of each of the |
| Advisory Committees of the Financial Industry | investment companies served by The Vanguard |
| Regulatory Authority (FINRA) and of Major League | Group; Assistant Treasurer of each of the investment |
| Baseball. | companies served by The Vanguard Group (1988–2008). |
| |
| André F. Perold | Heidi Stam | |
| Born 1952. Trustee Since December 2004. Principal | Born 1956. Secretary Since July 2005. Principal |
| Occupation(s) During the Past Five Years: George | Occupation(s) During the Past Five Years: Managing |
| Gund Professor of Finance and Banking, Emeritus | Director of The Vanguard Group, Inc.; General Counsel |
| at the Harvard Business School (retired 2011); | of The Vanguard Group; Secretary of The Vanguard |
| Chief Investment Officer and Managing Partner of | Group and of each of the investment companies |
| HighVista Strategies LLC (private investment firm); | served by The Vanguard Group; Director and Senior |
| Director of Rand Merchant Bank; Overseer of the | Vice President of Vanguard Marketing Corporation. |
| Museum of Fine Arts Boston. | | |
| |
| Alfred M. Rankin, Jr. | Vanguard Senior ManagementTeam |
| Born 1941. Trustee Since January 1993. Principal | Mortimer J. Buckley | Chris D. McIsaac |
| Occupation(s) During the Past Five Years: Chairman, | Kathleen C. Gubanich | Michael S. Miller |
| President, and Chief Executive Officer of NACCO | Paul A. Heller | James M. Norris |
| Industries, Inc. (housewares/lignite), and of Hyster- | Martha G. King | Glenn W. Reed |
| Yale Materials Handling, Inc. (forklift trucks); Chairman | John T. Marcante | |
| of the Board of University Hospitals of Cleveland. | | |
| |
| Chairman Emeritus and Senior Advisor |
| Peter F. Volanakis | |
| Born 1955. Trustee Since July 2009. Principal | John J. Brennan | |
| Occupation(s) During the Past Five Years: President | Chairman, 1996–2009 | |
| and Chief Operating Officer (retired 2010) of Corning | Chief Executive Officer and President, 1996–2008 |
| Incorporated (communications equipment); Trustee of | | |
| Colby-Sawyer College; Member of the Advisory Board | Founder | |
| of the Norris Cotton Cancer Center and of the Advisory | John C. Bogle | |
| Board of the Parthenon Group (strategy consulting). | Chairman and Chief Executive Officer, 1974–1996 |
| | |
1 Mr. McNabb is considered an “interested person,” as defined in the Investment Company Act of 1940, because he is an officer of the
Vanguard funds.
2 December 2002 for Vanguard Equity Income Fund, the Vanguard Municipal Bond Funds, and the Vanguard State Tax-Exempt Funds.
|  |
| P.O. Box 2600
Valley Forge, PA 19482-2600 |
Connect with Vanguard® > vanguard.com | |
| |
| Fund Information > 800-662-7447 | CFA® is a trademark owned by CFA Institute. |
| Direct Investor Account Services > 800-662-2739 | |
| Institutional Investor Services > 800-523-1036 | |
| Text Telephone for People | |
| With Hearing Impairment > 800-749-7273 | |
| |
| This material may be used in conjunction | |
| with the offering of shares of any Vanguard | |
| fund only if preceded or accompanied by | |
| the fund’s current prospectus. | |
| |
| All comparative mutual fund data are from Lipper, a | |
| Thomson Reuters Company, or Morningstar, Inc., unless | |
| otherwise noted. | |
| |
| You can obtain a free copy of Vanguard’s proxy voting | |
| guidelines by visiting vanguard.com/proxyreporting or by | |
| calling Vanguard at 800-662-2739. The guidelines are | |
| also available from the SEC’s website, sec.gov. In | |
| addition, you may obtain a free report on how your fund | |
| voted the proxies for securities it owned during the 12 | |
| months ended June 30. To get the report, visit either | |
| vanguard.com/proxyreporting or sec.gov. | |
| |
| You can review and copy information about your fund at | |
| the SEC’s Public Reference Room in Washington, D.C. To | |
| find out more about this public service, call the SEC at | |
| 202-551-8090. Information about your fund is also | |
| available on the SEC’s website, and you can receive | |
| copies of this information, for a fee, by sending a | |
| request in either of two ways: via e-mail addressed to | |
| publicinfo@sec.gov or via regular mail addressed to the | |
| Public Reference Section, Securities and Exchange | |
| Commission, Washington, DC 20549-1520. | |
| | © 2014 The Vanguard Group, Inc. |
| | All rights reserved. |
| | Vanguard Marketing Corporation, Distributor. |
| |
| | Q732 062014 |
Item 2: Code of Ethics.
Not Applicable.
Item 3:
Not Applicable.
Item 4: Principal Accountant Fees and Services.
Not. Applicable.
Item 5: Audit Committee of Listed Registrants.
Not Applicable.
Item 6: Investments.
Not Applicable.
Item 7: Disclosure of Proxy Voting Policies and Procedures for Closed-End Management Investment Companies.
Not Applicable.
Item 8: Portfolio Managers of Closed-End Management Investment Companies.
Not Applicable.
Item 9: Purchase of Equity Securities by Closed-End Management Investment Company and Affiliated Purchasers.
Not Applicable.
Item 10: Submission of Matters to a Vote of Security Holders.
Not Applicable.
Item 11: Controls and Procedures.
(a) Disclosure Controls and Procedures. The Principal Executive and Financial Officers concluded that the Registrant’s Disclosure Controls and Procedures are effective based on their evaluation of the Disclosure Controls and Procedures as of a date within 90 days of the filing date of this report.
(b) Internal Control Over Financial Reporting. There were no significant changes in Registrant’s Internal Control Over Financial Reporting or in other factors that could significantly affect this control subsequent to the date of the evaluation, including any corrective actions with regard to significant deficiencies and material weaknesses.
Item 12: Exhibits.
(a) Certifications.
Pursuant to the requirements of the Securities Exchange Act of 1934 and the Investment Company Act of 1940, the registrant has duly caused this report to be signed on its behalf by the undersigned, thereunto duly authorized.
| |
| | VANGUARD WINDSOR FUNDS |
| |
| By: | /s/ F. WILLIAM MCNABB III* |
| | F. WILLIAM MCNABB III |
| | CHIEF EXECUTIVE OFFICER |
| |
| Date: June 19, 2014 |
Pursuant to the requirements of the Securities Exchange Act of 1934 and the Investment Company Act of 1940, this report has been signed below by the following persons on behalf of the registrant and in the capacities and on the dates indicated.
| |
| | VANGUARD WINDSOR FUNDS |
| |
| By: | /s/ F. WILLIAM MCNABB III* |
| | F. WILLIAM MCNABB III |
| | CHIEF EXECUTIVE OFFICER |
| |
| Date: June 19, 2014 |
| |
| | VANGUARD WINDSOR FUNDS |
| |
| By: | /s/ THOMAS J. HIGGINS* |
| | THOMAS J. HIGGINS |
| | CHIEF FINANCIAL OFFICER |
| |
| Date: June 19, 2014 |
* By: /s/ Heidi Stam
Heidi Stam, pursuant to a Power of Attorney filed on April 22, 2014 see file Number 2-17620, Incorporated by Reference.