Exhibit 99.1
Introduction
Life Time Fitness, Inc. (“Life Time Fitness”, “Life Time” or the “Company”) operates high-end fitness clubs that offer premium services and amenities in suburban locations with attractive demographics. The Company designs, builds and operates sports, athletic, professional fitness and family recreation clubs complete with cafes, spas and child centers. The Company helps organizations, communities and individuals achieve their total health objectives, athletic aspirations and fitness goals by engaging in their areas of interest, or discovering new passions, both inside and outside of Life Time’s distinctive clubs, the majority of which operate 24 hours a day, seven days a week. As of April 30, 2015, the Company operated 114 clubs under the LIFE TIME FITNESS® and LIFE TIME ATHLETIC® brands primarily in suburban locations in 32 major markets in the United States and Canada. In the latest twelve month trailing period ending March 31, 2015, Life Time generated revenue, Adjusted EBITDA, and Run-Rate Adjusted EBITDA(1) of $1,310 million, $406 million and $455 million, respectively.(2)
Transaction overview
On March 16, 2015, Life Time Fitness entered into a definitive agreement to be acquired by affiliates of Leonard Green & Partners, L.P. (together with its affiliates, “LGP”) and TPG Capital (together with its affiliates, “TPG”; TPG together with LGP, the “Sponsors”), together with an affiliate of LNK Partners and Life Time’s Founder, Chairman, President and CEO Bahram Akradi, in a transaction valued at approximately $4.2 billion (the “Transaction”).
The Company’s Board of Directors unanimously approved the merger agreement, and Life Time’s shareholders are expected to vote on the Transaction at the special meeting of shareholders held on June 4, 2015. The merger is expected to close on June 10, 2015, subject to customary closing conditions.
In support of the Transaction, the Company expects to obtain a new $250 million Senior Secured Revolving Credit Facility (unfunded at close), $1,100 million Senior Secured Term Loan and $600 million Senior Unsecured Notes.
The Transaction contemplates the sale leaseback of 29 owned clubs with the expectation of closing simultaneously with the closing of the acquisition of the Company. The sale leaseback transactions are expected to raise approximately $900 million in proceeds.
Proceeds from the Transaction will be used to: (i) pay the merger consideration to Life Time’s shareholders, (ii) repay certain existing Life Time debt and (iii) pay fees and expenses associated with the Transaction.
(1) Run-Rate Adjusted EBITDA includes ~$48.7mm of incremental EBITDA contribution from clubs opened in 2013-2015 YTD that are not yet at maturity
(2) Does not give effect to $59.4mm of incremental rent expense which would result from the expected sale leaseback transactions
| | | | |
| | | | | |
 | | | | 1
|
Transaction overview
The following table sets forth the estimated sources and uses of funds relating to the Transaction:
| | | | | | |
| ($ in millions) | | | | | | |
| Sources |
Senior secured revolving credit facility ($250mm facility) | | | | $0 | | |
Excess cash on balance sheet | | | | 8 | | |
New senior secured term loan | | | | 1,100 | | |
New senior unsecured notes | | | | 600 | | |
Rolled existing mortgage debt | | | | 261 | | |
Rolled capital and financing leases and other debt | | | | 62 | | |
Sale leaseback proceeds | | | | 900 | | |
Shareholders’ equity | | | | 1,295 | | |
Total sources | | | | $4,226 | | |
| | | | | | |
| | | | | | | |
| Uses |
Purchase equity | | | | $2,816 | | |
Refinance existing debt | | | | 937 | | |
Rolled existing mortgage debt | | | | 261 | | |
Rolled capital and financing leases and other debt | | | | 62 | | |
Fees, expenses & OID | | | | 150 | | |
| | | | | | |
| | | | | | |
| | | | | | |
| | | | | | |
Total uses | | | | $4,226 | | |
| | | | | | | | | | | | | | | | | | | | |
| Pro forma capitalization |
| | | | | | | | | As of LTM 3/31/2015 and pro forma for sale leaseback |
| | | | | | % | | | Adj. pro forma | | | Adj. pro forma | | | Run-Rate Adj. | | Run-Rate Adj. |
| | | Pro forma | | | Cap | | | EBITDA | | | EBITDAR(1) | | | pro forma EBITDA(2) | | pro forma EBITDAR(1)(2) |
Cash and cash equivalents | | | $8 | | | | | | | | | | | | | | | | | |
Senior secured revolving credit facility ($250mm facility) | | | 0 | | | | 0.0 | % | | | | | | | | | | | | |
New senior secured term loan | | | 1,100 | | | | 33.2 | % | | | | | | | | | | | | |
Existing mortgage debt | | | 261 | | | | 7.9 | % | | | | | | | | | | | | |
Rolled capital and financing leases and other debt | | | 62 | | | | 1.9 | % | | | | | | | | | | | | |
Total secured debt | | | $1,423 | | | | 42.9 | % | | | 4.1x | | | | 4.9x | | | 3.6x | | 4.4x |
New senior unsecured notes | | | 600 | | | | 18.1 | % | | | | | | | | | | | | |
Total debt | | | $2,023 | | | | 61.0 | % | | | 5.8x | | | | 6.3x | | | 5.1x | | 5.7x |
Net debt | | | 2,016 | | | | 60.8 | % | | | 5.8x | | | | | | | 5.1x | | |
Shareholders’ equity | | | 1,295 | | | | 39.0 | % | | | 3.7x | | | | | | | 3.3x | | |
Total capitalization | | | $3,318 | | | | 100.0 | % | | | 9.6x | | | | | | | 8.4x | | |
Financial statistics: | | | | | | | | | | | | | | | | | | | | |
LTM 3/31/2015 Adj. pro forma EBITDA | | | | | | | | | | | $347 | | | | | | | | | |
LTM 3/31/2015 Adj. pro forma EBITDAR | | | | | | | | | | | 439 | | | | | | | | | |
LTM 3/31/2015 Run-Rate Adj. pro forma EBITDA | | | | | | | | | | | | | | | | | | $395 | | |
LTM 3/31/2015 Run-Rate Adj. pro forma EBITDAR | | | | | | | | | | | | | | | | | | 488 | | |
Interest expense, net | | | | | | | | | | | 115 | | | | | | | 115 | | |
Maintenance and corporate capital expenditures | | | | | | | | | | | 93 | | | | | | | 93 | | |
Credit statistics: | | | | | | | | | | | | | | | | | | | | |
Adj. EBITDA / interest expense, net | | | | | | | | | | | 3.0x | | | | | | | 3.4x | | |
(Adj. EBITDA - maintenance and corporate capital expenditures) / interest expense | | | | 2.2x | | | | | | | 2.6x | | |
(1) Rent expense capitalized at 8x for lease adjusted leverage levels
(2) Run-Rate Adjusted EBITDA includes $48.7mm of incremental EBITDA contribution from clubs opened in 2013-2015 YTD that are not yet at maturity
| | | | |
| | | | | |
| | | | 2
|
Company overview
| | |
Life Time, the Healthy Way of Life Company, is a premier operator of high-end fitness clubs that offers premium services and amenities in suburban locations with attractive demographics. The Company helps organizations, communities and individuals achieve their total health objectives, athletic aspirations and fitness goals by engaging in their areas of interest, or discovering new passions, both inside and outside of Life Time’s distinctive, resort-like sports, professional fitness, family recreation and spa destinations, the majority of which operate 24 hours a day, seven days a week. The Healthy Way of Life approach focuses on providing an end-to-end fitness and well-being offering. As of April 30, 2015, the Company operated 114 clubs under the LIFE TIME FITNESS® and LIFE TIME ATHLETIC® brands primarily in suburban locations in 32 major markets in the United States and Canada. | | 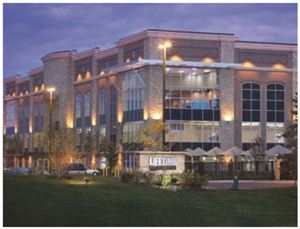
|
Life Time programs include a wide range of interest areas, such as group fitness, yoga, swimming, running, racquetball, squash, tennis, pilates, martial arts, kids’ activities and camps, adult activities and leagues, rock climbing, cycling, basketball, personal training, weight loss and nutrition initiatives and spa, medi-spa and chiropractic services. The Company believes the breadth of its programs differentiates Life Time from other fitness club operators who usually have narrower offerings of either only general fitness equipment or specialized class formats. The Company offers best-in-class programming along with a trained and certified team of Life Time employees to lead each program. Given the large size of each club, Life Time has the flexibility to develop programs to address changes in fitness trends over time.
Offerings also include a proprietary line of nutritional products and supplements and an award-winning magazine, Experience Life®. The Company also operates an Athletic Events division which offers more than 75 events each year, including running, cycling and triathlon events from entry-level to ultra-endurance. Additionally, at various clubs, a portfolio of health programs and assessments are offered to members, employees of corporate clients, and members of partner health insurance companies, with the goal of further extending the Healthy Way of Life products, programs, services and brand.
Life Time clubs generally combine modern architecture and decor with best-in-class amenities. Most of the current large format clubs are freestanding buildings designed with open architecture and naturally illuminated atriums that create a spacious, inviting atmosphere. With finishes such as limestone floors, wood lockers and granite countertops, clubs are carefully designed to create an appealing and luxurious environment that attracts and retains members and encourages them to visit the clubs. Clubs are regularly updated and refurbished to maintain a high-quality experience. Life Time’s commitment to quality and detail provides a similar look and feel at each of the large format clubs.
Diversified portfolio in attractive markets
Life Time clubs are strategically located in upscale markets in suburban locations. The portfolio is well diversified across 32 markets in 25 states and one Canadian province. 93 of Life Time’s 114 clubs are large format clubs that contributed 94% of total 2014 revenue and 97% of total 2014 club-level EBITDA. Among these 93 clubs, 68 are considered to be current model design targeting 6,500 to 10,500 memberships. These offer, on average, approximately 114,000 square feet of space and generally include an outdoor aquatics park, larger indoor aquatics area, larger gymnasium, up to three additional studios and enhanced spa and cafe spaces. The Company has a diversified national presence, with Minnesota (20% of clubs) and Texas (16% of clubs) having the highest concentration by state. Over the last three years, the Company has expanded into higher density, affluent markets on the East and West coasts (opening a club in Westchester, New York in Q1 ’14 and a club in Laguna Niguel, California in Q2 ’14). The clubs located in coastal markets have attractive demographics, lower attrition rates and higher average revenue per membership. In addition to generating higher dues, the Company believes these locations will generate higher ancillary spending from members and lead to attractive returns on investment.
| | | | |
| | | | | |
| | | | 3
|
Historical financial summary
The following table sets forth summary historical financial results of the Company for the five fiscal years ended December 31 and the last twelve month period ended March 31, 2015.
| | | | | | | | | | | | | | | | | | | | | | | | |
($’s in millions, except average monthly dues) | | 2010 | | | 2011 | | | 2012 | | | 2013 | | | 2014 | | | LTM 3/31/2015 | |
Operating metrics: | | | | | | | | | | | | | | | | | | | | | | | | |
| | | | | | |
Access memberships | | | 612,556 | | | | 676,054 | | | | 682,621 | | | | 678,619 | | | | 683,530 | | | | 711,181 | |
| | | | | | |
Average access membership monthly dues | | | $82.82 | | | | $84.63 | | | | $87.86 | | | | $94.93 | | | | $99.09 | | | | $101.10 | |
| | | | | | |
Twelve month access membership attrition | | | 32.5% | | | | 31.0% | | | | 32.3% | | | | 34.0% | | | | 33.4% | | | | 32.4% | |
| | | | | | |
Number of clubs | | | 89 | | | | 101 | | | | 105 | | | | 108 | | | | 113 | | | | 114 | |
| | | | | | |
Financial metrics: | | | | | | | | | | | | | | | | | | | | | | | | |
| | | | | | |
Membership dues | | | $603 | | | | $663 | | | | $728 | | | | $767 | | | | $811 | | | | $822 | |
| | | | | | |
Enrollment fees | | | 24 | | | | 18 | | | | 15 | | | | 14 | | | | 12 | | | | 12 | |
| | | | | | |
In-center revenue(1) | | | 266 | | | | 308 | | | | 348 | | | | 376 | | | | 411 | | | | 419 | |
| | | | | | |
Other revenue | | | 19 | | | | 23 | | | | 36 | | | | 50 | | | | 57 | | | | 57 | |
| | | | |
| | | | | | |
Total revenue | | | $913 | | | | $1,014 | | | | $1,127 | | | | $1,206 | | | | $1,291 | | | | $1,310 | |
| | | | | | |
% yoy growth(2) | | | 9.1% | | | | 11.0% | | | | 11.2% | | | | 7.0% | | | | 7.0% | | | | 6.1% | |
| | | | | | |
Same-center revenue growth – clubs open > 1yr(2) | | | 5.0% | | | | 5.1% | | | | 4.3% | | | | 4.0% | | | | 0.2% | | | | 0.2% | |
| | | | | | |
Same-center revenue growth – clubs open > 3yrs(2) | | | 2.3% | | | | 4.3% | | | | 3.7% | | | | 3.2% | | | | (0.3)% | | | | (0.6)% | |
| | | | | | |
Adjusted EBITDA | | | $279 | | | | $304 | | | | $349 | | | | $371 | | | | $402 | | | | $406 | |
| | | | | | |
% margin | | | 30.5% | | | | 30.0% | | | | 31.0% | | | | 30.8% | | | | 31.2% | | | | 31.0% | |
| | | | | | |
Maintenance and corporate capital expenditures | | | (34) | | | | (51) | | | | (81) | | | | (85) | | | | (93) | | | | (93) | |
| | | | | | |
Change in working capital(3) | | | 17 | | | | (4) | | | | 9 | | | | 21 | | | | (5) | | | | 1 | |
| | | | |
| | | | | | |
Free cash flow before growth capital expenditures | | | $262 | | | | $249 | | | | $278 | | | | $307 | | | | $305 | | | | $314 | |
| | | | | | |
Growth capital expenditures | | | (112) | | | | (113) | | | | (152) | | | | (280) | | | | (322) | | | | (326) | |
| | | | |
| | | | | | |
Free cash flow after growth capital expenditures | | | $150 | | | | $136 | | | | $126 | | | | $27 | | | | ($17) | | | | ($12) | |
(1) In-center revenue includes revenue generated at Life Time clubs from fees for personal training, group fitness and other member activities, sales of products and services offered at Life Time spas and cafes, tennis and renting space in certain clubs
(2) LTM 3/31/2015 numbers reflect Q1 2015 results for same center revenue growth and total revenue growth
(3) Working capital is calculated as the sum of accounts receivable, net, center operating supplies and inventories, prepaid expenses and other current assets, current deferred membership origination costs and long-term deferred membership origination costs less the sum of accounts payable, construction accounts payable, accrued expenses, current deferred revenue and long-term deferred revenue
| | | | |
| | | | | |
| | | | 4
|
| | | | | | | | | | |
| Performance by club designation(1)(2) |
| | | # of clubs | | LTM 3/31/2015 revenue | | LTM 3/31/2015 access | | | | |
| | | | | per access membership | | membership attrition | | | | Higher tier clubs have higher average revenue per access membership and lower attrition |
| | | | | | | | | |
Diamond/Onyx | | 21 | | $2,848 | | 28.4% | | – – | |
| | | | | | | | | |
Platinum/Gold/Bronze | | 70 | | 1,583 | | 33.5% | | | |
| | | | | | | | | | |
Total clubs | | 91 | | $1,795 | | 32.6% | | | | |
(1) Excludes acquired clubs
(2) Excludes Raleigh, NC, which opened in March 2015
| | | | |
| | | | | |
| | | | 5
|
 Attractive and consistent new unit economics
Life Time has a successful track record of identifying attractive new club locations and deploying capital effectively. The Company has historically generated a consistent and strong return on investment across the club base. The Company expects to continue to prudently expand the club base through new club development in partnership with real estate developers. The chart below illustrates the historical average club performance of owned clubs from 2007 to 2012.
|
| Historical average club performance(1) (clubs opened from 2007 to 2012) |
| | | | | | | | | | | | | | | | | | | | | | | | | | | | | | | | | | |
| | | Average | | | | | | | | | | | | | | | | | | | | Growth Rates | | | | |
| | | Invested Capital | | | Year 0 | | | Year 1 | | | Year 2 | | | Year 3 | | | | | Year 1 | | | Year 2 | | | Year 3 | |
| | | | | | | | | |
Revenue | | | | | | | $5.9 | | | | $12.0 | | | | $13.2 | | | �� | $13.6 | | | | | | 104.7% | | | | 9.9% | | | | 2.7% | |
| | | | | | | | | |
Club-level EBITDA | | | | | | | 0.7 | | | | 4.7 | | | | 5.8 | | | | 6.1 | | | | | | 584.6% | | | | 24.0% | | | | 4.8% | |
| | | | | | | | | |
Unlevered ROIC(2) | | | $35.4 | | | | 1.9% | | | | 13.2% | | | | 16.4% | | | | 17.2% | | | | | | | | | | | | | | | |
| | | | | | | | | |
Margins | | | | | | | | | | | | | | | | | | | | | | | | | | | | | | | | | | |
| | | | | | | | | |
Club-level EBITDA | | | | | | | 11.6% | | | | 38.9% | | | | 43.9% | | | | 44.8% | | | | | | | | | | | | | | | |
(1) Represents 30 clubs (27 clubs for Year 3 data). Excludes the Omaha club, which was sold in a sale leaseback transaction after opening, and acquired clubs
(2) Calculated as average club-level EBITDA / average invested capital
|
| Year 2 performance by vintage (all numbers are class average)(1) |
| | | | | | | | | | | | |
| ($ in millions, except sq. ft.) | | Year 2 |
| | | Number of clubs | | | | Invested | | | | | | |
Vintage | | opened | | Sq. ft. | | capital | | Revenue | | Club-level EBITDA | | ROIC |
FY 2007(1) | | 7 | | 113,482 | | $32 | | $12 | | $6 | | 18.1% |
FY 2008 | | 11 | | 116,050 | | 35 | | 12 | | 5 | | 14.1% |
FY 2009 | | 3 | | 112,110 | | 33 | | 14 | | 6 | | 18.2% |
FY 2010 | | 3 | | 117,801 | | 36 | | 13 | | 6 | | 15.2% |
FY 2011 | | 3 | | 122,502 | | 48 | | 20 | | 9 | | 19.0% |
FY 2012 | | 3 | | 125,988 | | 35 | | 15 | | 6 | | 17.1% |
Average(1) | | 30 | | 117,989 | | $35 | | $13 | | $6 | | 16.4% |
(1) Represents 30 clubs (27 clubs for Year 3 data). Excludes the Omaha club, which was sold in a sale leaseback transaction after opening, and acquired clubs
All but one of the mature clubs built by the Company are cash flow positive with an average club-level EBITDA of $4.7 million and an average club-level EBITDA margin of 42.9%. Of Life Time’s 104 mature clubs that have been built or acquired, 99 clubs (95%) generated positive club-level EBITDA in 2014. In addition, the Company has never closed a club due to underperformance.
2014 club-level EBITDA for mature clubs (n = 104)
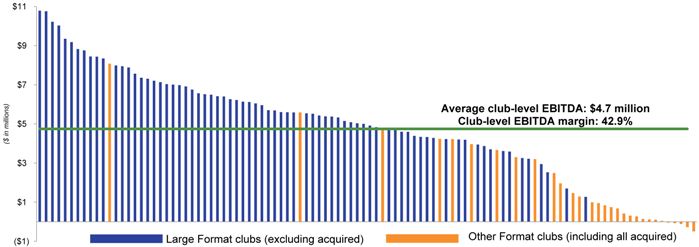
Note: As of 4/30/2015, the Company has built 82 clubs which are now mature (all but one are club-level EBITDA positive) and acquired 22 clubs that are now mature (18 are club-level EBITDA positive). 10 clubs are recently opened and still ramping. The five clubs with negative club-level EBITDA represent just 1.4% of total square footage and include four clubs acquired in 2011 and one non-typical club built by the company and opened in FY ’10.
$11 $9 $7 millions) $5 in $ ( $3 $1 ($1) Large Format clubs (excluding acquired) Other Format clubs (including all acquired) Average club-level EBITDA: $4.7 million Club-level EBITDA margin: 42.9%
| | | | |
| | | | | |
| | | | 6
|
 Large EBITDA tailwind of ~$49mm from recently opened clubs and ~$35mm from capital already invested in unopened clubs
Life Time clubs typically experience significant EBITDA ramp up in their first two full calendar years of operations as membership count and average revenue per access membership are increased and opening-related costs (such as advertising and marketing expense) are reduced. The Company’s recently opened mature clubs (30 clubs opened from 2007 to 2012) on average generated an ROIC of 16.4% in their second full calendar year of operations(1)(2). Assuming that Life Time’s eleven most recently opened clubs will operate comparably (since the average of these clubs with respect to club membership level and size, membership dues and demographic and geographic areas is similar), and applying a 16.4% ROIC to the capital invested, these clubs would generate incremental EBITDA of $48.7 million, once these clubs reach maturity.
| | | | | | | | | | | | | | | | | | | | | | |
| ($ in millions) | | | | Invested capital | | | | | | | | | | | | |
| | | | | | | | | | | |
Club opening year | | # of clubs | | | | Total | | Average | | | | | | | | Year 2
ROIC(2) | | | | Proj mature
EBITDA | | |
| | | | | | | | | | | |
FY 2013 | | 3 | | | | $128.9 | | $43.0 | | | | | | | | 16.4% | | | | $21.1 | | |
| | | | | | | | | | | |
FY 2014 | | 6 | | | | 255.5 | | 42.6 | | | | | | | | 16.4% | | | | 41.9 | | |
| | | | | | | | | | | |
YTD 2015(3) | | 2 | | | | 83.5 | | 41.7 | | | | | | | | 16.4% | | | | 13.7 | | |
| | | | | | | | | | | |
Total (Ramping clubs) | | 11 | | | | $467.8 | | $42.5 | | | | | | | | 16.4% | | | | $76.7 | | |
| | | | | | | | |
| | | | | | Less: LTM 3/31/15A EBITDA | | | | | | | | (28.0) | | |
| | | | | | | | | | | |
| | | | | | | | | | | | | | | | | | | | | | |
| | | | | | | | |
| | | | | | Incremental ramping EBITDA contribution | | | | | | | | $48.7 | | |
| | | | | | | | | | | | | | |
(1) Excludes the Omaha club, which was sold in a sale leaseback transaction after opening, and acquired clubs
(2) ROIC calculated as Average EBITDA / Average Invested Capital
(3) YTD 2015 represents the Raleigh club that opened in March 2015 and the Roseville club that opened in early May 2015
| | | | |
| | | | | |
| | | | 7
|
For the ten Life Time clubs currently under development, if the same 16.4% ROIC is applied to the estimated capital already invested in these clubs at closing (as of June 30, 2015), the incremental EBITDA that would be generated at maturity would be approximately $35 million.
| | | | | | | | | | | | | | | | | | | | |
| ($ in millions) | | | | | | | | | Capital invested | |
| | | Projected opening | | | | | | | As of | | | | | | As of | |
Club | | date | | Owned vs leased | | Sq. ft. | | | 3/31/2015 | | | Proj Q2 ‘15 | | | 6/30/15E | |
| | | | | | |
Westwood, MA | | Jul-15 | | Fee-Owned | | | 128,000 | | | | $35.9 | | | | $7.5 | | | | $43.4 | |
| | | | | | |
Ajax, ON | | Jul-15 | | Fee-Owned | | | 128,000 | | | | 31.4 | | | | 15.9 | | | | 47.3 | |
| | | | | | |
Mt. Laurel, NJ | | Nov-15 | | Fee-Owned | | | 103,772 | | | | 21.7 | | | | 10.5 | | | | 32.2 | |
| | | | | | |
Westbury, NY | | Nov-15 | | Ground Leased | | | 126,515 | | | | 19.3 | | | | 9.3 | | | | 28.6 | |
| | | | | | |
Vaughan, ON | | May-16 | | Fee-Owned | | | 128,079 | | | | 13.9 | | | | 9.0 | | | | 22.9 | |
| | | | | | |
Framingham, MA | | Jun-16 | | Ground Leased | | | 128,079 | | | | 2.1 | | | | 12.3 | | | �� | 14.4 | |
| | | | | | |
Gaithersburg, MD | | Jul-16 | | Fee-Owned | | | 128,079 | | | | 11.4 | | | | -- | | | | 11.4 | |
| | | | | | |
Ft. Washington, PA | | 2016 | | Fee-Owned | | | 112,000 | | | | 4.6 | | | | -- | | | | 4.6 | |
| | | | | | |
Folsom, CA | | 2016 | | Fee-Owned | | | na(1) | | | | 5.9 | | | | -- | | | | 5.9 | |
| | | | | | |
King of Prussia, PA | | 2017 | | Fee-Owned | | | 136,000 | | | | 0.6 | | | | -- | | | | 0.6 | |
| | | | | | |
Total(2) | | | | | | | | | | | $146.6 | | | | $64.5 | | | | $211.1 | |
| | | | |
Assumed 16.4% historical average ROIC | | | | | | | | | | | | | | | 16.4% | |
| | | | | | |
| | | | | | | | | | | | | | | | | | | | |
| | | |
Implied EBITDA from investment in unopened clubs | | | | | | | | | | | | $34.6 | |
Note: Expected capital investment projections are as of 3/31/15
(1) Only purchase of land approved at this time
(2) Excludes Northbrook club, which is expected to open in 2016, as it is not expected to have any capital investment prior to closing
| | | | |
| | | | | |
| | | | 8
|
 Highly valuable asset base with strong collateral coverage
The Company’s lenders will benefit from significant collateral coverage due to owned real estate. Pro forma for the expected sale leaseback transactions, Life Time will own 56 of its locations through fee-owned and ground-leased structures, of which the majority will be unencumbered. Pro forma for the expected sale leaseback transactions, the total gross book value of this owned club real estate is approximately $1.4 billion, and the appraised value is approximately $1.9 billion. This provides lenders collateral coverage on the term loan of 1.0x to 1.5x the loan amount.
| | | | | | | | | | |
($ in millions) | | Gross book value(1) | | | | | Appraised value(1) | |
| |
| | | |
Pro forma value of real estate | | | $1,357 | | | | | | $1,946 | |
Less: existing mortgage notes | | | (261) | | | | | | (261) | |
Remaining real estate collateral | | | $1,096 | | | | | | $1,685 | |
Term loan | | | $1,100 | | | | | | $1,100 | |
Term loan collateral coverage | | | 1.0x | | | | | | 1.5x | |
(1) Pro forma for the expected sale leaseback transactions
| | | | |
| | | | | |
| | | | 9
|
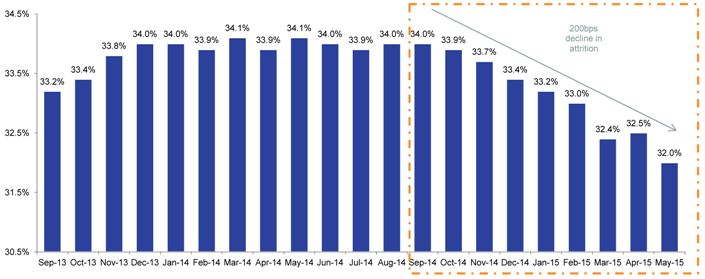
Access membership attrition rate has seen a 200 basis point improvement since September 2014. The Company typically has visibility into attrition two months in advance, as customers formally have to give advanced notice for a termination. The decline in attrition is a leading indicator that the Company’s pricing and retention initiatives are having a positive impact on operating metrics.
Access membership rolling twelve month attrition
The decline in attrition has helped drive seven consecutive months of year-over-year growth in access memberships.
Year-over-Year growth in month-end access memberships
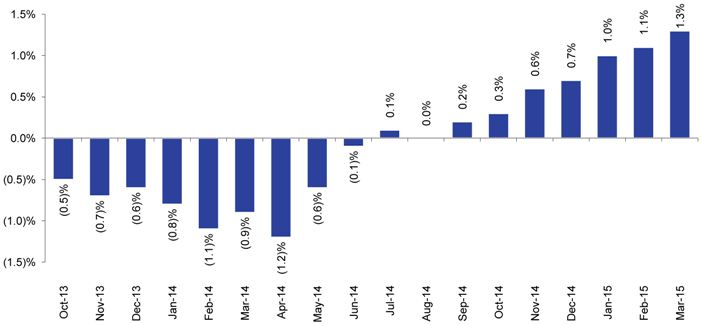
34.5% 34.1% 34.1% 200bps 34.0% 34.0% 34.0% 34.0% 34.0% decline in 33.9% 33.9% 33.9% 33.9% 33.8% attrition 33.7% 33.5% 33.4% 33.4% 33.2% 33.2% 33.0% 32.5% 32.5% 32.4% 32.0% 31.5% 30.5% Sep-13 Oct-13 Nov-13 Dec-13 Jan-14 Feb-14 Mar-14 Apr-14 May-14 Jun-14 Jul-14 Aug-14 Sep-14 Oct-14 Nov-14 Dec-14 Jan-15 Feb-15 Mar-15 Apr-15 May-15 (1. 5)% 0)% (1. (0. 5)% 0. 0. 1. 1. 0% 5% 0% 5% Oct-13 (0.5)% Nov-13 (0.7)% Dec-13 (0.6)% Jan-14 (0.8)% Feb-14 (1.1)% Mar-14 (0.9)% Apr-14 (1.2)% May-14 (0.6)% Jun-14 (0.1)% Jul-14 0.1% Aug-14 0.0% Sep-14 0.2% Oct-14 0.3% Nov-14 0.6% Dec-14 0.7% Jan-15 1.0% Feb-15 1.1% Mar-15 1.3%
| | | | |
| | | | | |
| | | | 10
|
Pro forma Adjusted EBITDA reconciliation
| | | | | | | | | | | | | | | | | | | | | | | | | | | | |
| | | | | | | | | | | | | | Three months ended | | | | | Twelve months | |
| | | Year ended December 31, | | | | | March 31, | | | | | ended | |
($ in millions) | | 2012 | | | 2013 | | | 2014 | | | | | 2014 | | | 2015 | | | | | March 31, 2015 | |
| | | | | | | | |
Net income | | | $111 | | | | $121 | | | | $114 | | | | | | $28 | | | | $25 | | | | | | $111 | |
| | | | | | | | |
Adjustments: | | | | | | | | | | | | | | | | | | | | | | | | | | | | |
| | | | | | | | |
Interest expense, net | | | 31 | | | | 31 | | | | 42 | | | | | | 9 | | | | 11 | | | | | | 44 | |
| | | | | | | | |
Taxes | | | 72 | | | | 78 | | | | 74 | | | | | | 18 | | | | 16 | | | | | | 72 | |
| | | | | | | | |
Depreciation and amortization | | | 118 | | | | 122 | | | | 144 | | | | | | 33 | | | | 39 | | | | | | 150 | |
| | | | | | | | |
EBITDA | | | $332 | | | | $352 | | | | $374 | | | | | | $88 | | | | $91 | | | | | | $377 | |
| | | | | | | | |
Share-based compensation(1) | | | 15 | | | | 12 | | | | 13 | | | | | | 3 | | | | 3 | | | | | | 13 | |
| | | | | | | | |
Non-recurring expenses(2) | | | -- | | | | -- | | | | 8 | | | | | | -- | | | | 2 | | | | | | 10 | |
| | | | | | | | |
Pre-opening expenses(3) | | | 3 | | | | 7 | | | | 7 | | | | | | 3 | | | | 3 | | | | | | 7 | |
| | | | | | | | |
Adjusted EBITDA | | | $349 | | | | $371 | | | | $402 | | | | | | $95 | | | | $99 | | | | | | $406 | |
| | | | | | | | |
Adjusted EBITDA % | | | 31.0% | | | | 30.7% | | | | 31.2% | | | | | | 30.3% | | | | 29.7% | | | | | | 31.0% | |
| | | | | | | | |
Ramping EBITDA contribution(4) | | | | | | | | | | | | | | | | | | | | | | | | | | | 49 | |
| | | | | | | | |
Sale leaseback rent expense | | | | | | | | | | | | | | | | | | | | | | | | | | | (59) | |
| | | | | | | | |
Run-Rate Adjusted pro forma EBITDA | | | | | | | | | | | | | | | | | | | | | | | | | | | $395 | |
| | | | | | | | |
Run-Rate Adjusted pro forma EBITDA % | | | | | | | | | | | | | | | | | | | | | | | | | | | 30.2% | |
| | | | | | | | |
Total rent expense | | | | | | | | | | | | | | | | | | | | | | | | | | | 92 | |
| | | | | | | | |
Run-Rate Adjusted pro forma EBITDAR | | | | | | | | | | | | | | | | | | | | | | | | | | | $488 | |
| | | | | | | | |
Run-Rate Adjusted pro forma EBITDAR % | | | | | | | | | | | | | | | | | | | | | | | | | | | 37.2% | |
| (1) | Adds back share-based compensation on the basis that it is non-cash in nature |
| (2) | Represents non-recurring legal expenses of $4.7mm in both the 2014 and LTM 3/31/2015 time periods associated with TCPA settlement, and $3.5mm in the 2014 period and $5.5mm in the LTM 3/31/2015 period of costs associated with the exploration of conversion of real estate assets into a REIT and other strategic alternatives |
| (3) | Represents expenses associated with new clubs before their opening date |
| (4) | Adds the estimated incremental EBITDA contribution at maturity from clubs opened in 2013-2015 YTD that are not yet at maturity |
| | | | |
| | | | | |
| | | | 11
|