Zazove Convertible
Securities Fund, Inc.
Annual Report
December 31, 2020
ZAZOVE CONVERTIBLE SECURITIES FUND, INC.
TABLE OF CONTENTS
| | Page |
| HISTORICAL RETURNS (UNAUDITED) | 1-2 |
| REPORT OF INDEPENDENT REGISTERED PUBLIC ACCOUNTING FIRM | 3 |
| FINANCIAL STATEMENTS: | |
| Statement of Assets and Liabilities | 4 |
| Schedule of Investments | 5-8 |
| Statement of Operations | 9 |
| Statements of Changes in Net Assets | 10 |
| Statement of Cash Flows | 11 |
| Notes to Financial Statements | 12-21 |
| Financial Highlights | 22 |
| PROXY VOTING POLICIES, DIVIDEND REINVESTMENT PLAN AND | |
| TAX INFORMATION (UNAUDITED) | 23 |
| FUND EXPENSES (UNAUDITED) | 24 |
| INVESTMENT ADVISORY AGREEMENT APPROVAL (UNAUDITED) | 25 |
| DIRECTORS AND OFFICERS (UNAUDITED) | 26 |
Zazove Convertible Securities Fund, Inc.
Relative Historical Returns (Unaudited)
For the Periods Ended December 31, 2020
Average Annualized Returns
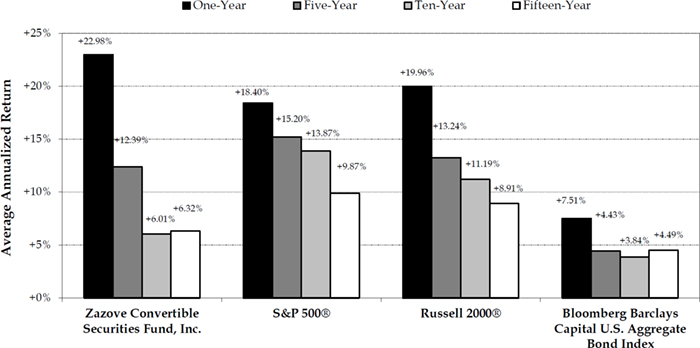
The returns for Zazove Convertible Securities Fund, Inc. are presented after all fees and expenses. The returns of the S&P 500®, the Russell 2000® Index and the Bloomberg Barclays Capital U.S. Aggregate Bond Index are presented after the reinvestment of dividends and interest. Past results are not a guarantee of future performance.
Zazove Convertible Securities Fund, Inc.
Relative Historical Returns (Unaudited)
For the Period Ended December 31, 2020
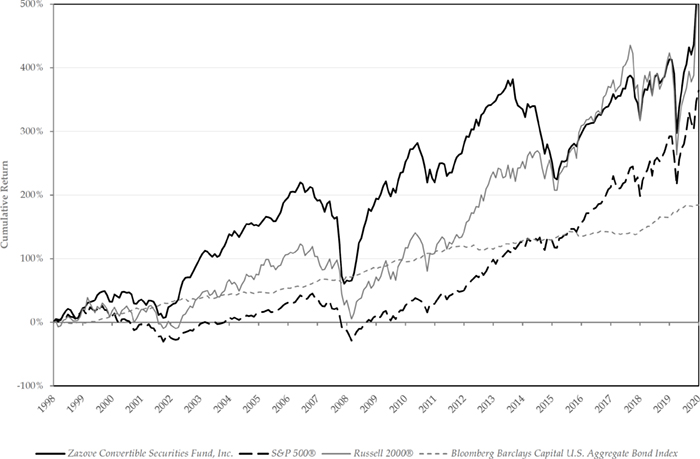
The returns for Zazove Convertible Securities Fund, Inc. are presented after all fees and expenses. The returns of the S&P 500®, the Russell 2000® Index and the Bloomberg Barclays Capital U.S. Aggregate Bond Index are presented after the reinvestment of dividends and interest. Past results are not a guarantee of future performance.
 | Deloitte & Touch LLP 111 South Wacker Drive Chicago, IL 60606-4301 USA |
| | Tel: +1 312 486 1000 |
| | Fax: +1 312 486 1486 |
| | www.deloitte.com |
REPORT OF INDEPENDENT REGISTERED PUBLIC ACCOUNTING FIRM
To the shareholders and the Board of Directors of Zazove Convertible Securities Fund, Inc.
Opinion on the Financial Statements and Financial Highlights
We have audited the accompanying statement of assets and liabilities of Zazove Convertible Securities Fund, Inc. (the “Fund”), including the schedule of investments, as of December 31, 2020, the related statements of operations and cash flows for the year then ended, the statements of changes in net assets for each of the two years in the period then ended, the financial highlights for each of the five years in the period then ended, and the related notes. In our opinion, the financial statements and financial highlights present fairly, in all material respects, the financial position of the Fund as of December 31, 2020, and the results of its operations and its cash flows for the year then ended, the changes in its net assets for each of the two years in the period then ended, and the financial highlights for each of the five years in the period then ended in conformity with accounting principles generally accepted in the United States of America.
Basis for Opinion
These financial statements and financial highlights are the responsibility of the Fund’s management. Our responsibility is to express an opinion on the Fund’s financial statements and financial highlights based on our audits. We are a public accounting firm registered with the Public Company Accounting Oversight Board (United States) (PCAOB) and are required to be independent with respect to the Fund in accordance with the U.S. federal securities laws and the applicable rules and regulations of the Securities and Exchange Commission and the PCAOB.
We conducted our audits in accordance with the standards of the PCAOB. Those standards require that we plan and perform the audit to obtain reasonable assurance about whether the financial statements and financial highlights are free of material misstatement, whether due to error or fraud. The Fund is not required to have, nor were we engaged to perform, an audit of its internal control over financial reporting. As part of our audits we are required to obtain an understanding of internal control over financial reporting but not for the purpose of expressing an opinion on the effectiveness of the Fund’s internal control over financial reporting. Accordingly, we express no such opinion.
Our audits included performing procedures to assess the risks of material misstatement of the financial statements and financial highlights, whether due to error or fraud, and performing procedures that respond to those risks. Such procedures included examining, on a test basis, evidence regarding the amounts and disclosures in the financial statements and financial highlights. Our audits also included evaluating the accounting principles used and significant estimates made by management, as well as evaluating the overall presentation of the financial statements and financial highlights. Our procedures included confirmation of securities owned as of December 31, 2020, by correspondence with the custodian and brokers; when replies were not received from brokers, we performed other auditing procedures. We believe that our audits provide a reasonable basis for our opinion.

February 22, 2021
We have served as the auditor of one or more Zazove investment companies since 2002.
ZAZOVE CONVERTIBLE SECURITIES FUND, INC.
STATEMENT OF ASSETS AND LIABILITIES
DECEMBER 31, 2020
| ASSETS | | | |
| | | | |
| Investments, at fair value (cost $40,587,717) | | $ | 44,703,169 | |
| Cash and cash equivalents | | | 3,329,365 | |
| Receivables: | | | | |
| Interest | | | 116,284 | |
| Dividends | | | 26,198 | |
| Securities sold | | | 60,248 | |
| Other assets | | | 1,004 | |
| | | | | |
| Total assets | | | 48,236,268 | |
| | | | | |
| LIABILITIES | | | | |
| Payables: | | | | |
| Capital shares redeemed | | $ | 1,215,593 | |
| Transfer agency fees | | | 7,125 | |
| Custody fees | | | 650 | |
| Professional fees | | | 28,706 | |
| Other | | | 4,583 | |
| | | | | |
| Total liabilities | | | 1,256,657 | |
| | | | | |
| NET ASSETS | | $ | 46,979,611 | |
| | | | | |
| ANALYSIS OF NET ASSETS: | | | | |
| Common stock ($.01 par value; 25,000,000 shares authorized; 2,209,026 shares issued and outstanding) | | $ | 22,090 | |
| Paid-in surplus | | | 42,668,911 | |
| Distributable earnings | | | 4,288,610 | |
| | | | | |
| NET ASSETS | | $ | 46,979,611 | |
| | | | | |
| NET ASSET VALUE PER SHARE (based on 2,209,026 shares outstanding) | | $ | 21.27 | |
See notes to financial statements.
ZAZOVE CONVERTIBLE SECURITIES FUND, INC.
SCHEDULE OF INVESTMENTS
DECEMBER 31, 2020
| | | Principal/ Shares/ Contracts | | | Fair Value | |
| INVESTMENTS - 95% | | | | | | |
| Convertible Preferred Stock - 9% | | | | | | | | |
| United States - 9% | | | | | | | | |
| Blueknight Energy Partners 11.000% | | | 80,000 | | | $ | 547,200 | |
| Braemar Hotels & Resorts 1.375% | | | 74,003 | | | | 1,198,109 | |
| Cowen Group, Inc. 5.625% | | | 920 | | | | 1,036,720 | |
| Stanley Black & Decker Inc. 5.000% | | | 1,060 | | | | 1,317,050 | |
| | | | | | | | | |
| Total Convertible Preferred Stock (cost $3,362,733) | | | | | | | 4,099,079 | |
| | | | | | | | | |
| Convertible Bonds - 74% | | | | | | | | |
| Bermuda - 1% | | | | | | | | |
| Teekay (144A) 5.000% Due 01-15-23 (b) | | | 586,000 | | | | 527,400 | |
| | | | | | | | | |
| Canada - 4% | | | | | | | | |
| Colliers International Group (144A) 4.000% Due 06-01-25 (b) | | | 340,000 | | | | 588,200 | |
| First Majestic Silver 1.875% Due 03-01-23 | | | 500,000 | | | | 743,750 | |
| Pretium Resources 2.250% Due 03-15-22 | | | 380,000 | | | | 408,500 | |
| | | | | | | | | |
| Total Canada | | | | | | | 1,740,450 | |
| | | | | | | | | |
| China - 2% | | | | | | | | |
| Pinduoduo 0.000% Due 12-01-25 | | | 700,000 | | | | 865,900 | |
| | | | | | | | | |
| France - 3% | | | | | | | | |
| Vinci S.A. (Reg S) 0.375% Due 02-16-22 (a) | | | 1,200,000 | | | | 1,359,000 | |
| | | | | | | | | |
| Germany - 2% | | | | | | | | |
| Deutsche Bank AG London (JPM) 1.000% Due 05-01-23 | | | 780,000 | | | | 904,800 | |
| | | | | | | | | |
| India - 1% | | | | | | | | |
| Bharti Airtel Limited (144A) 1.500% Due 02-17-25 (b) | | | 400,000 | | | | 469,000 | |
| | | | | | | | | |
| Netherlands - 2% | | | | | | | | |
| Qiagen N.V. (Reg S) 1.000% Due 11-13-24 (a) | | | 600,000 | | | | 772,500 | |
| | | | | | | | | |
| United Kingdom - 4% | | | | | | | | |
| Barclays Bank PLC (MSFT) 0.000% Due 02-04-25 (c) | | | 1,410,000 | | | | 1,792,533 | |
| | | | | | | | | |
| See notes to financial statements. | (continued) |
ZAZOVE CONVERTIBLE SECURITIES FUND, INC.
SCHEDULE OF INVESTMENTS
DECEMBER 31, 2020
| | | Principal/ Shares/ Contracts | | | Fair Value | |
| INVESTMENTS - 95% | | | | | | |
| Convertible Bonds - 73% | | | | | | | | |
| Switzerland - 3% | | | | | | | | |
| Credit Suisse AG London (Siemens) (144A) 0.125% Due 03-25-24 (b) | | | 1,050,000 | | | $ | 1,442,805 | |
| | | | | | | | | |
| United States - 52% | | | | | | | | |
| Air Transport Services Group 1.125% Due 10-15-24 | | | 590,000 | | | | 695,094 | |
| Akamai Tech 0.375% Due 09-01-27 | | | 850,000 | | | | 949,450 | |
| Atlanticus Holdings 5.875% Due 11-30-35 | | | 700,000 | | | | 752,500 | |
| Atlas Air Worldwide Holdings, Inc. 1.875% Due 06-01-24 | | | 820,000 | | | | 938,900 | |
| BofA Finance (CHTR) 0.125% Due 09-01-22 | | | 800,000 | | | | 945,200 | |
| Burlington Stores (144A) 2.250% Due 04-15-25 (b) | | | 610,000 | | | | 846,009 | |
| CNX Resources (144A) 2.250% Due 05-01-26 (b) | | | 470,000 | | | | 534,625 | |
| CONMED CorpoRATION 2.625% Due 02-01-24 | | | 500,000 | | | | 698,750 | |
| CyberArk Software 0.000% Due 11-15-24 | | | 400,000 | | | | 488,000 | |
| Flexion Therapeutics 3.375% Due 05-01-24 | | | 1,100,000 | | | | 981,750 | |
| HC2 Holdings (144A-Seasoned) 7.500% Due 06-01-22 (b) | | | 750,000 | | | | 748,082 | |
| Helix Energy Solutions Group 6.750% Due 02-15-26 | | | 675,000 | | | | 707,906 | |
| Hope Bancorp 2.000% Due 05-15-38 | | | 570,000 | | | | 530,813 | |
| Insmed 1.750% Due 01-15-25 | | | 260,000 | | | | 294,125 | |
| Jazz Investments I (144A) 2.000% Due 06-15-26 (b) | | | 600,000 | | | | 784,950 | |
| JPMorgan Chase Bank (Reg S) 0.000% Due 08-07-22 (a) | | | 1,100,000 | | | | 1,457,500 | |
| JPMorgan Chase Bank NA (144A - Seasoned) 0.125% Due 01-01-23 (b) | | | 1,300,000 | | | | 1,508,780 | |
| KBR 2.500% Due 11-01-23 | | | 490,000 | | | | 670,565 | |
| Lending Tree (144A) 0.500% Due 07-15-25 (b) | | | 410,000 | | | | 401,308 | |
| Liberty Media (LSXMA) 1.375% Due 10-15-23 | | | 1,425,000 | | | | 1,802,625 | |
| Lumentum Holdings 0.500% Due 12-15-26 | | | 400,000 | | | | 489,760 | |
| Middleby (144A) 1.000% Due 09-01-25 (b) | | | 720,000 | | | | 880,632 | |
| ON Semiconductor Corporation 1.625% Due 10-15-23 | | | 400,000 | | | | 677,150 | |
| Pebblebrook Hotel Trust 1.750% Due 12-15-26 | | | 810,000 | | | | 863,663 | |
| Royal Caribbean Cruises (144A) 4.250% Due 06-15-23 (b) | | | 700,000 | | | | 932,750 | |
| Silicon Laboratories (144A) 0.625% Due 06-15-25 (b) | | | 490,000 | | | | 620,156 | |
| Smart Global Holdings (144A) 2.250% Due 02-15-26 (b) | | | 830,000 | | | | 945,204 | |
| Southwest Airlines 1.250% Due 05-01-25 | | | 530,000 | | | | 774,595 | |
| Splunk (144A) 1.125% Due 06-15-27 (b) | | | 700,000 | | | | 731,938 | |
| Stride (144A) 1.125% Due 09-01-27 (b) | | | 290,000 | | | | 237,510 | |
| See notes to financial statements. | (continued) |
ZAZOVE CONVERTIBLE SECURITIES FUND, INC.
SCHEDULE OF INVESTMENTS
DECEMBER 31, 2020
| | | Principal/ Shares/ Contracts | | | Fair Value | |
| INVESTMENTS - 95% | | | | | | |
| Convertible Bonds - 73% | | | | | | | | |
| United States - 52% | | | | | | | | |
| Theravance Biopharma 3.250% Due 11-01-23 | | | 100,000 | | | $ | 95,000 | |
| Varex Imaging (144A) 4.000% Due 06-01-25 (b) | | | 540,000 | | | | 573,412 | |
| | | | | | | | | |
| Total United States | | | | | | | 24,558,702 | |
| | | | | | | | | |
| Total Convertible Bonds (cost $30,432,857) | | | | | | | 34,433,090 | |
| | | | | | | | | |
| Common Stock - 6% | | | | | | | | |
| China - 0% | | | | | | | | |
| Emerald Plantation Holdings | | | 180,362 | | | | 5,411 | |
| | | | | | | | | |
| Common Stock - 6% | | | | | | | | |
| United States - 6% | | | | | | | | |
| Clear Channel Holdings, Inc (c) | | | 285,000 | | | | 470,250 | |
| Cumulus Media, Inc. (c) | | | 190,500 | | | | 1,656,397 | |
| Emmis Communication (c) | | | 199,730 | | | | 391,471 | |
| Urban One, Inc. (c) | | | 398,875 | | | | 466,684 | |
| | | | | | | | | |
| Total United States | | | | | | | 2,984,802 | |
| | | | | | | | | |
| Total Common Stock (cost $4,228,624) | | | | | | | 2,990,213 | |
| | | | | | | | | |
| Mutual Funds - 0% | | | | | | | | |
| United States - 0% | | | | | | | | |
| Kayne Anderson MLP Investment Company | | | 21,958 | | | | 126,258 | |
| | | | | | | | | |
| Total Mutual Funds (cost $105,600) | | | | | | | 126,258 | |
| See notes to financial statements. | (continued) |
ZAZOVE CONVERTIBLE SECURITIES FUND, INC.
SCHEDULE OF INVESTMENTS
DECEMBER 31, 2020
| | | Principal/ Shares/ Contracts | | | Fair Value | |
| INVESTMENTS - 95% | | | | | | |
| Warrants - 6% | | | | | | |
| United States - 6% | | | | | | | | |
| Ashland Global Holdings, Inc., $1,000 strike price, expire 3-31-29 (c) | | | 2,260 | | | $ | 26,220 | |
| Avaya Holdings, $25.55 strike price, expire 12-15-22 (c) | | | 45,995 | | | | 160,982 | |
| CuriosityStream, $11.50 strike price, expire 10-14-25 (c) | | | 350,860 | | | | 928,025 | |
| Hostess Brands, $11.50 strike price, expire 11-14-21 (c) | | | 450,200 | | | | 711,316 | |
| LF Capital Acquisition, $11.50 strike price, expire 6-27-23 (c) | | | 56,827 | | | | 111,665 | |
| US Ecology, $58.67 strike price, expire 10-17-23 (c) | | | 62,000 | | | | 427,180 | |
| Verra Mobility, $11.50 strike price, expire 10-17-23 (c) | | | 170,000 | | | | 680,000 | |
| | | | | | | | | |
| Total United States | | | | | | | 3,045,388 | |
| | | | | | | | | |
| Total Warrants (cost $2,449,036) | | | | | | | 3,045,388 | |
| | | | | | | | | |
| Escrow - 0% | | | | | | | | |
| China - 0% | | | | | | | | |
| Sino Forest Corporation escrow | | | 1,180,000 | | | | 2,950 | |
| | | | | | | | | |
| Georgia - 0% | | | | | | | | |
| MIG LLC escrow | | | 5,158,766 | | | | 6,191 | |
| | | | | | | | | |
| Total Escrow (cost $8,867) | | | | | | | 9,141 | |
| | | | | | | | | |
| TOTAL INVESTMENTS (cost $40,587,717) | | | | | | $ | 44,703,169 | |
| (a) | Reg S securities are those offered and sold outside of the United States and thus are exempt from registration under Regulation S of the U.S. Securities Act of 1933. These securities are subject to restrictions on their sale. |
| (b) | 144A securities are those which are exempt from registration under Rule 144A of the U.S. Securities Act of 1933. These securities are subject to contractual or legal restrictions on their sale. |
| (c) | Non-income producing securities. |
Percentages are based upon the fair value as a percent of net assets as of December 31, 2020.
| See notes to financial statements. | (concluded) |
ZAZOVE CONVERTIBLE SECURITIES FUND, INC.
STATEMENT OF OPERATIONS
YEAR ENDED DECEMBER 31, 2020
| INVESTMENT INCOME: | | | | |
| Interest | | $ | 734,793 | |
| Amortization/accretion of investment securities | | | (1,042,496 | ) |
| Net interest expense | | | (307,703 | ) |
| Dividends | | | 245,236 | |
| Other | | | 1,671 | |
| | | | | |
| Total investment income | | | (60,796 | ) |
| | | | | |
| EXPENSES: | | | | |
| Management fees | | | 589,889 | |
| Transfer agency fees | | | 130,888 | |
| Professional fees | | | 68,874 | |
| Margin interest | | | 58,928 | |
| Director fees | | | 19,500 | |
| Custody fees | | | 15,070 | |
| Insurance expense | | | 4,921 | |
| Other | | | 9,162 | |
| | | | | |
| Total expenses | | | 897,232 | |
| | | | | |
| NET INVESTMENT LOSS | | | (958,028 | ) |
| NET REALIZED AND UNREALIZED GAIN (LOSS) ON INVESTMENTS AND SECURITIES SOLD SHORT: | | | | |
| Net realized gain on investments | | | 5,653,061 | |
| Net realized loss on securities sold short | | | (283,990 | ) |
| Net change in unrealized appreciation of investments and securities sold short | | | 4,368,896 | |
| | | | | |
| Net realized and unrealized gain from investments and securities sold short | | | 9,737,967 | |
| | | | | |
| NET INCREASE IN NET ASSETS RESULTING FROM OPERATIONS | | $ | 8,779,939 | |
See notes to financial statements.
ZAZOVE CONVERTIBLE SECURITIES FUND, INC.
STATEMENTS OF CHANGES IN NET ASSETS
YEARS ENDED DECEMBER 31, 2020 AND 2019
| | | 2020 | | | 2019 | |
| NET INCREASE IN NET ASSETS RESULTING FROM: | | | | | | | | |
| | | | | | | | | |
| OPERATIONS: | | | | | | | | |
| Net investment loss | | $ | (958,028 | ) | | $ | (338,434 | ) |
| Net realized gain on investments and securities sold short | | | 5,369,071 | | | | 1,759,511 | |
| Net change in unrealized appreciation of investments and securities sold short | | | 4,368,896 | | | | 6,963,897 | |
| | | | | | | | | |
| Net increase in net assets resulting from operations | | | 8,779,939 | | | | 8,384,974 | |
| | | | | | | | | |
| DISTRIBUTIONS TO SHAREHOLDERS: | | | | | | | | |
| From net investment income and net capital gains | | | (4,416,936 | ) | | | (1,484,430 | ) |
| Return of capital | | | 0 | | | | (1,313,853 | ) |
| | | | | | | | | |
| Net decrease in net assets resulting from distributions to shareholders | | | (4,416,936 | ) | | | (2,798,283 | ) |
| | | | | | | | | |
| CAPITAL SHARE TRANSACTIONS: | | | | | | | | |
| Proceeds from shares sold | | | 904,809 | | | | 299,885 | |
| Reinvestment of distributions | | | 4,250,449 | | | | 2,684,616 | |
| Payments for shares redeemed | | | (3,344,996 | ) | | | (7,538,317 | ) |
| | | | | | | | | |
| Net increase (decrease) in net assets resulting from | | | | | | | | |
| capital share transactions | | | 1,810,262 | | | | (4,553,816 | ) |
| | | | | | | | | |
| NET INCREASE IN NET ASSETS | | | 6,173,265 | | | | 1,032,875 | |
| | | | | | | | | |
| NET ASSETS- Beginning of the year | | | 40,806,346 | | | | 39,773,471 | |
| | | | | | | | | |
| NET ASSETS - End of period | | $ | 46,979,611 | | | $ | 40,806,346 | |
See notes to financial statements.
ZAZOVE CONVERTIBLE SECURITIES FUND, INC.
STATEMENT OF CASH FLOWS
YEAR ENDED DECEMBER 31, 2020
| CASH FLOWS FROM OPERATING ACTIVITIES: | | | |
| Net increase in net assets resulting from operations | | $ | 8,779,939 | |
| Adjustments to reconcile net increase in net assets | | | | |
| resulting from operations to net cash provided by operating activities: | | | | |
| Net change in unrealized appreciation of investments and securities sold short | | | (4,368,896 | ) |
| Net realized gain on investments and securities sold short | | | (5,369,071 | ) |
| Net amortization and accretion | | | 1,042,496 | |
| Purchases of investment securities | | | (87,757,775 | ) |
| Proceeds from sale of investment securities | | | 93,948,360 | |
| Purchases of securities sold short | | | (7,788,472 | ) |
| Proceeds from sale of securities sold short | | | 7,183,252 | |
| Changes in assets and liabilities: | | | | |
| Increase in receivables | | | (4,191 | ) |
| Decrease in due to broker | | | (160,785 | ) |
| Decrease in payables | | | (32,921 | ) |
| | | | | |
| Net cash provided by operating activities | | | 5,471,936 | |
| | | | | |
| CASH FLOWS FROM FINANCING ACTIVITIES: | | | | |
| Proceeds from shares sold | | | 907,809 | |
| Payments for shares redeemed | | | (2,884,970 | ) |
| Payments for distributions to shareholders | | | (166,487 | ) |
| | | | | |
| Net cash used in financing activities | | | (2,143,648 | ) |
| | | | | |
| NET INCREASE IN CASH AND CASH EQUIVALENTS | | | 3,328,288 | |
| | | | | |
| CASH AND CASH EQUIVALENTS—Beginning of year | | | 1,077 | |
| | | | | |
| CASH AND CASH EQUIVALENTS—End of year | | $ | 3,329,365 | |
| | | | | |
| SUPPLEMENTAL DISCLOSURES OF CASH FLOW INFORMATION: | | | | |
| Cash paid during the period for interest | | $ | 58,928 | |
See notes to financial statements.
ZAZOVE CONVERTIBLE SECURITIES FUND, INC.
NOTES TO FINANCIAL STATEMENTS
YEAR ENDED DECEMBER 31, 2020
Zazove Convertible Securities Fund, Inc., a Maryland corporation (the “Fund”) is registered under the Investment Company Act of 1940 as a diversified investment company that operates as a closed-end interval fund. The Fund’s investment objective is to realize long-term growth, current income and the preservation of capital. The Fund pursues this objective primarily through investing in a portfolio of convertible securities. The convertible strategy focuses primarily on opportunities in the United States of America, although the Fund may hold foreign securities. Zazove Associates, L.L.C. is the Fund’s investment advisor (the “Investment Advisor”). The Fund initially acquired its portfolio pursuant to a merger whereby Zazove Convertible Fund, L.P., a Delaware limited partnership registered under the Investment Company Act of 1940, was merged into the Fund on January 1, 1999.
| 2. | SIGNIFICANT ACCOUNTING POLICIES |
Basis of Presentation—The Fund’s financial statements have been prepared in accordance with accounting principles generally accepted in the United States of America and are stated in United States dollars. The Fund is an investment company and follows accounting and reporting guidance within Financial Accounting Standards Board ("FASB") Accounting Standard Codification ("ASC") Topic 946, Financial Services – Investment Companies. The following is a summary of the significant accounting and reporting policies used in preparing the financial statements.
Use of Estimates—The preparation of financial statements requires the Fund’s management to make estimates and assumptions that affect the reported amounts of assets and liabilities and disclosure of contingent assets and liabilities at the date of the financial statements and the reported amounts of increases and decreases in net assets from operations during the reporting period. Actual results could differ from those estimates.
Valuation of Investments—The valuation of the Fund's investments is in accordance with policies and procedures adopted by and under the supervision of the Board of Directors. Investments are recorded at fair value.
Common stock, certain convertible preferred securities and certain derivatives that are traded on national securities exchanges are valued at the last reported sales price or, if there are no sales, at the mean between the bid and ask prices. Common stock, certain convertible preferred securities and certain derivatives traded over the counter are valued at the average of the highest current independent bid and lowest current independent offer reported upon the close of trading on that day.
Convertible bond securities, corporate bond securities, certain convertible preferred securities and certain derivatives are valued at the mid-point of independent bid and offer quotes received from dealers or brokers who make markets in such securities.
Securities for which market quotations are not available are valued at fair value as determined in good faith by the Investment Advisor with the oversight of the Board of Directors pursuant to Board of Directors’ approved procedures. In such cases, fair value is derived based on all relevant facts and circumstances including, among other things, fixed income and option pricing models, enterprise valuation analysis, comparable security analysis and conversion value.
Cash and Cash Equivalents—Cash and cash equivalents represents cash held by the Fund’s custodian in the amount of $3,329,365. Since the Fund does not clear its own investment transactions, it has established an account with a third-party custodian (UMB Bank, N.A.) for this purpose.
Investment Transactions and Income—Security transactions are recorded on the trade date. Realized gains or losses from sales of securities (including securities sold short) are determined on an identified cost basis. Dividend income and expense is recognized on the ex-dividend date. Interest income and expense are recognized on the accrual basis. Bond discount is accreted and bond premium is amortized over the expected maturity of each applicable security using the effective interest method, as long as the collectability is not in doubt and the security is performing in accordance with its contractual terms.
Indemnifications—Under the Fund’s organizational documents, the Fund is obligated to indemnify its directors, officers and Investment Advisor against certain liabilities relating to the business or activities undertaken by them on behalf of the Fund. In addition, in the normal course of business, the Fund enters into contracts that provide for general indemnification to other parties. The Fund’s maximum exposure under these arrangements is unknown as this would involve future claims that may be made against the Fund that have not yet occurred. However, the Fund has not had prior claims or losses pursuant to these indemnification provisions and expects the risk of loss to be remote.
Recent Accounting Pronouncements—In August 2018, the FASB issued ASU 2018-13, Fair Value Measurement (Topic 820) - Disclosure Framework - Changes to the Disclosure Requirements for Fair Value Measurement (“ASU 2018-13”). The primary focus of ASU 2018-13 is to improve the effectiveness of the disclosure requirements for fair value measurements. The changes affect all companies that are required to include fair value measurement disclosures. In general, the amendments in ASU 2018-13 are effective for all entities for fiscal years and interim periods within those fiscal years, beginning after December 15, 2019. The Fund adopted ASU 2018-13 as of January 1, 2020, with no material impact on its financial statements.
In October 2020, FASB issued ASU No. 2020-08, Codification Improvements to Subtopic 310-20, Receivables—Nonrefundable Fees and Other Costs (“ASU 2020-08”). ASU 2020-08 was issued to clarify how to amortize premiums for debt securities where there are bonds with multiple call dates. The amendments are effective for fiscal years, and interim periods within those fiscal years, beginning after December 15, 2020. Management is currently evaluating the impact of this guidance, if any, within the Funds' financial statements.
| 3. | FAIR VALUE MEASUREMENTS |
FASB ASC Topic 820, Fair Value Measurement (“Topic 820”), defines fair value, establishes a framework for measuring fair value and expands disclosures about fair value measurements.
Various inputs are used to determine the value of the Fund’s investments. These inputs are summarized in the three broad levels listed below:
| ● | Level 1 – quoted prices in active markets for identical securities |
| ● | Level 2 – other significant observable inputs (including quoted prices for similar securities, interest rates, prepayment speeds, credit risk, etc.) |
| ● | Level 3 – significant unobservable inputs (including the Fund’s own assumptions in determining the fair value of investments) |
The inputs or methodologies used for valuing securities are not necessarily an indication of the risk associated with investing in those securities.
The following table summarizes the inputs used to value the Fund’s investments as of December 31, 2020:
| | | Level 1 | | | Level 2 | | | Level 3 | | | Total | |
| Convertible Preferred Stock | | $ | 0 | | | $ | 4,099,079 | | | $ | 0 | | | $ | 4,099,079 | |
| Convertible Bonds | | | 0 | | | | 34,433,090 | | | | 0 | | | | 34,433,090 | |
| Common Stock | | | 2,984,802 | | | | 5,411 | | | | 0 | | | | 2,990,213 | |
| Mutual Funds | | | 126,258 | | | | 0 | | | | 0 | | | | 126,258 | |
| Warrants | | | 3,019,168 | | | | 0 | | | | 26,220 | | | | 3,045,388 | |
| Escrow | | | 0 | | | | 0 | | | | 9,141 | | | | 9,141 | |
| Total Investments | | $ | 6,130,228 | | | $ | 38,537,580 | | | $ | 35,361 | | | $ | 44,703,169 | |
The following table summarizes the Fund’s common stock industry concentrations as of December 31, 2020:
| | | Level 1 | | | Level 2 | | | Level 3 | | | Total | |
| Advertising | | $ | 470,250 | | | $ | 0 | | | $ | 0 | | | $ | 470,250 | |
| Cable & Satellite TV | | | 2,047,868 | | | | 0 | | | | 0 | | | | 2,047,868 | |
| Forestry/Paper | | | 0 | | | | 5,411 | | | | 0 | | | | 5,411 | |
| Media Content | | | 466,684 | | | | 0 | | | | 0 | | | | 466,684 | |
| Total Common Stock | | $ | 2,984,802 | | | $ | 5,411 | | | $ | 0 | | | $ | 2,990,213 | |
The following is a reconciliation of Level 3 assets for which significant unobservable inputs were used to determine fair value:
| | | Warrants | | | Escrow | |
| Balance as of December 31, 2019 | | $ | 11,604 | | | $ | 9,301 | |
| Realized gain (loss) | | | 0 | | | | 0 | |
| Net change in appreciation (depreciation) | | | 14,616 | | | | (160 | ) |
| Purchases | | | 0 | | | | 0 | |
| Sales/return of capital | | | 0 | | | | 0 | |
| Transfers into Level 3 | | | 0 | | | | 0 | |
| Transfers out of Level 3 | | | 0 | | | | 0 | |
| | | | | | | | | |
| Balance as of December 31, 2020 | | $ | 26,220 | | | $ | 9,141 | |
For the year ended December 31, 2020, the net change in appreciation (depreciation) included in net assets related to Level 3 investments still held at the reporting date are as follows:
| | | Warrants | | | Escrow | |
| | | $ | 14,616 | | | $ | (160 | ) |
Topic 820 requires the following disclosures about fair value measurements of assets and liabilities classified as Level 3 within the fair value hierarchy: quantitative information about the significant unobservable inputs used in a fair value measurement.
The following table presents the quantitative information about the significant unobservable inputs and valuation techniques utilized to determine the fair value of the Fund's Level 3 investments as of December 31, 2020. The table includes Level 3 investments with values derived from third parties. Such investments may be based on broker/dealer quotes for which there is a lack of transparency as to inputs used to develop the valuations. The quantitative detail of these unobservable inputs is neither provided nor reasonably available to the Fund.
Description
Assets: | | Fair Value as of
December 31, 2020 | | | Valuation
Technique | | Unobservable
Inputs | | Amount/
Range | |
| Warrant | | $ | 26,220 | | | Discount to Black-Scholes pricing model | | Liquidity discount | | | 50 | % |
| Escrow | | $ | 9,141 | | | Broker quote | | | | | | |
The significant unobservable input used in the fair value measurement of the Fund's Level 3 warrants is a liquidity discount. A significant increase or decrease in the unobservable input for this Level 3 investment would result in a significant decrease or increase in the fair value measurement.
| 4. | DERIVATIVES AND HEDGING |
The Fund follows the provisions of FASB ASC Topic 815, Derivatives and Hedging (“Topic 815”), which requires qualitative disclosures about objectives and strategies for using derivatives, quantitative disclosures about fair value amounts of gains and losses on derivative instruments and disclosures about credit risk related to contingent features in derivative agreements.
As of and for the year ended December 31, 2020, the Fund held warrants which are considered derivative instruments under Topic 815. Warrants are convertible at the holder's option into a fixed number of shares of the issuer's common stock upon payment of the exercise price and are treated as convertible securities by the Fund. Warrants held by the Fund were either purchased or received pursuant to a restructuring or exchange transaction. Equity price is the primary risk exposure of warrants. The fair value of warrants as of December 31, 2020 was $3,045,388 and is included in investments on the statement of assets and liabilities.
During the year ended December 31, 2020, the Fund held call options which are considered derivative instruments under Topic 815. Call options are an agreement that gives the Fund the right (but not the obligation) to buy a common stock, bond, commodity or other instrument at a specified price within a specified time period. Equity price is the primary risk exposure of call options. As of December 31, 2020, the Fund did not hold call options.
Realized gains and losses on derivative instruments are included in net realized gain on investments on the statement of operations. Change in unrealized appreciation (depreciation) on derivative instruments is included in net change in unrealized depreciation of investments and securities sold short on the statement of operations.
The following table summarizes the net realized gain (loss) and net change in unrealized appreciation (depreciation) on derivative instruments for the year ended December 31, 2020:
| Derivative | | Net Realized
Gain (Loss) | | | Change in Net
Unrealized Appreciation
(Depreciation) | |
| Warrants | | $ | 12,632 | | | $ | 272,387 | |
| Call options | | | (36,013 | ) | | | 198,502 | |
| | | | | | | | | |
| | | $ | (23,381 | ) | | $ | 470,889 | |
The following table summarizes transactions in derivative contracts for the year ended December 31, 2020:
| | | | Warrants | | | Call
Options | |
| Held as of December 31, 2019 | | | | 927,590 | | | | (715 | ) |
| Purchased | | | | 472,127 | | | | 1,288 | |
| Sold/exercised | | | | (261,575 | ) | | | (573 | ) |
| | | | | | | | | | |
| Held as of December 31, 2020 | | | | 1,138,142 | | | | 0 | |
FASB ASU No. 2011-11, Balance Sheet (Topic 210): Disclosures about Offsetting Assets and Liabilities (“ASU 2011-11”), requires entities to disclose both gross and net information for recognized derivative instruments and financial instruments that are either offset in the statement of assets and liabilities or subject to an enforceable master netting arrangement or similar agreement. ASU No. 2013-01, Clarifying the Scope of Disclosures about Offsetting Assets and Liabilities (“ASU 2013-01”), clarifies that the scope of ASU 2011-11 applies to derivatives accounted for in accordance with ASC Topic 815, Derivatives and Hedging, including bifurcated embedded derivatives, repurchase agreements and reverse repurchase agreements, and securities borrowing and securities lending transactions. As of and for the year ended December 31, 2020, the Fund did not hold any derivative instruments that would require disclosure under ASU 2013-01.
| 5. | CAPITAL SHARE TRANSACTIONS |
The Fund is authorized to issue up to 25,000,000 shares of common stock, $0.01 par value. Shareholders are entitled to one vote per share on all corporate issues put to vote of the shareholders, although the Fund does not contemplate holding annual meetings to elect directors or for any other purpose.
Upon approval of the Board of Directors, shares may be purchased as of the first business day of each month at the then net asset value per share. All subscription funds received after the first business day of the month will be tracked as subscriptions received in advance until the beginning of the following month, at which time shares will be issued and the subscription will be recorded as a component of net assets.
On a quarterly basis, the Fund will offer to repurchase no less than 5% and no more than 25% of the Fund’s outstanding shares at the then net asset value per share. Notice of the terms and conditions of each quarterly repurchase offer are sent to the shareholders in advance of the offer. On November 17, 2020, the Fund offered to repurchase shares as of December 31, 2020, which are reflected as capital shares redeemed on the statement of assets and liabilities. The Fund may impose a 2% fee on the redemption of fund shares held for less than one year. This fee is intended to compensate the Fund for expenses related to such redemption. Shares are redeemed by treating the shares first acquired by a shareholder as being redeemed prior to shares acquired by such shareholders thereafter. There were no redemption fees charged during 2020.
Distributions from the Fund are recorded on the ex-distribution date. All ordinary and capital gain distributions are automatically reinvested in shares at the net asset value on the ex-distribution date unless Shareholders elect in writing to receive such distributions in cash.
In the case of the termination of the Fund, distributions to the shareholders will be made in proportion to their respective share ownership after the payment of all Fund creditors.
| Changes in Shares Outstanding | 2020 | | 2019 |
| Shares sold | 51,153 | | 15,837 |
| Shares issued from reinvestment of distributions | 210,836 | | 143,179 |
| Shares redeemed | (185,036) | | (396,279) |
| Net increase (decrease) | 76,953 | | (237,263) |
| Shares outstanding at the beginning of year | 2,132,073 | | 2,369,336 |
| Shares outstanding at the end of year | 2,209,026 | | 2,132,073 |
| 6. | MANAGEMENT AGREEMENT AND OTHER TRANSACTIONS WITH AFFILIATES |
Zazove Associates, L.L.C. has been engaged as the Fund’s Investment Advisor and fund accountant. Pursuant to the terms of an Investment Advisory Agreement, Zazove Associates, L.L.C. receives management fees based on the following management fee schedule. Management fees are computed and paid on a monthly basis based on the net assets of the Fund as of the beginning of the month.
| Net Assets | First $20,000,000 in Net Assets | Net Assets in Excess of $20,000,000 |
| Annual management fee rate | 2.00% | 1.00% |
As of December 31, 2020, certain employees and affiliates of the Investment Advisor held 15.43% of the outstanding shares of the Fund.
Transactions with related parties were conducted on terms equivalent to those prevailing in an arm’s length transaction.
The Fund bears all normal direct costs and expenses of its operations including: management fees; brokerage commissions; custodian fees; transfer agency fees; legal, audit, accounting and tax preparation expenses; applicable state taxes and other operating expenses such as regulatory filing fees and costs for communications with shareholders. The custodian fees and transfer agent fees are paid to UMB Bank, N.A.
The overall responsibility for the management and operation of the Fund is vested in the Board of Directors (the “Board”). The Board consists of four directors: Gene T. Pretti, Andrew J. Goodwin III, Jack L. Hansen, and Peter A. Lechman. Each of the three directors who are not affiliated with the Investment Advisor received $6,500 for their service to the Fund during 2020.
Gene T. Pretti, President, and Steven M. Kleiman, Secretary and Treasurer, are the principal officers of the Fund and are responsible for the day-to-day supervision of the business and affairs of the Fund. Steven M. Kleiman is the Fund’s Chief Compliance Officer and is responsible for administering the Fund’s compliance policies and procedures. Except for certain actions requiring the approval of the shareholders or the Board of Directors, the principal officers of the Fund have the power and authority to take all actions deemed necessary and appropriate to pursue the Fund’s objective.
Shareholders in the Fund will be unable to exercise any management functions. There will not be any shareholder vote unless required by the Investment Company Act of 1940.
FASB ASC Topic 740, Income Taxes (“Topic 740”), provides guidance for how uncertain tax positions should be recognized, measured, presented and disclosed in the financial statements. Topic 740 prescribes the minimum recognition threshold a tax position must meet in connection with accounting for uncertainties in income tax positions taken or expected to be taken by an entity before being measured and recognized in the financial statements. Topic 740 requires the evaluation of tax positions taken in the course of preparing the Fund’s tax returns to determine whether the tax positions are “more-likely-than-not” of being sustained by the applicable tax authority. Tax benefits of positions not deemed to meet the more-likely-than-not threshold would be recorded as a tax expense in the current year. The Fund has not taken any tax positions that do not meet the more-likely-than-not threshold. The tax years 2017 – 2020 remain subject to examination by the Internal Revenue Service.
It is the Fund’s policy to meet the requirements for qualification as a registered investment company as defined in Subchapter M of the Internal Revenue Code and to distribute substantially all of its taxable income and capital gains to the Fund’s shareholders. Therefore, no provision for federal income taxes has been made.
The amount of distributions from net investment income and net realized capital gain are determined in accordance with federal income tax regulations, which may differ from accounting principles generally accepted in the United States. Book to tax differences are primarily attributable to tax rules regarding contingent payment debt instruments and market discount bonds. To the extent these book to tax differences are permanent in nature, such amounts are reclassified among paid-in surplus, accumulated undistributed net realized gain (loss) on investments and accumulated net investment income (loss). Accordingly, at December 31, 2020, reclassifications were recorded to increase accumulated undistributed net investment income by $882,789 and decrease accumulated net realized gain on investments and securities sold short by $882,789.
At December 31, 2020, the Fund had undistributed short term capital gains of $69,346 and no undistributed ordinary income or undistributed long term capital gains for federal income tax purposes.
At December 31, 2020, the cost and related gross unrealized appreciation and depreciation for federal income tax purposes are as follows:
| Cost of investments on Statement of Assets and Liabilities | | $ | 40,587,717 | |
| Amortization and accretion cost adjustments not included in tax cost basis | | | (105,031 | ) |
| | | | | |
| Cost of investments for tax purposes | | $ | 40,482,686 | |
| | | | | |
| Gross tax unrealized appreciation | | $ | 6,730,509 | |
| Gross tax unrealized depreciation | | | (2,510,027 | ) |
| | | | | |
| Net tax unrealized depreciation on investments | | $ | 4,220,482 | |
| 8. | DISTRIBUTIONS TO SHAREHOLDERS |
On August 3, 2020, the Fund’s directors declared a dividend payable December 1, 2020 to shareholders of record on November 16, 2020. The December 1, 2020 dividend payment was $2.15 per share. The December 1, 2019 dividend payment was $1.38 per share.
The character of distributions paid during the years ended December 31, 2020 and 2019 for federal income tax purposes were as follows.
| | | 2020 | | | 2019 | |
| | | | | | | |
| Distributions paid from net investment income and short-term capital gains | | $ | 4,416,936 | | | $ | 1,484,430 | |
| Distributions paid from long term capital gains | | | 0 | | | | 0 | |
| Return of capital | | | 0 | | | | 1,313,853 | |
| Total distributions paid | | $ | 4,416,936 | | | $ | 2,798,283 | |
| 9. | INVESTMENT TRANSACTIONS |
For the year ended December 31, 2020, the cost of purchases and proceeds from sales of investments were $87,757,776 and $93,918,198, respectively and the cost of purchases and proceeds from sales of securities sold short were $7,788,472 and $7,183,252, respectively. There were no purchases or sales of long-term U.S. government securities.
| 10. | OFF-BALANCE-SHEET AND CONCENTRATION OF RISKS |
At December 31, 2020, the Fund’s investments by industry concentrations (as a percentage of net assets) were as follows:
| Banking | 13.2% |
| Media Content | 6.8% |
| Software/Services | 6.4% |
| Cable & Satellite TV | 6.4% |
| Air Transportation | 5.1% |
| Electronics | 4.8% |
| Machinery | 4.7% |
| Pharmaceuticals | 4.6% |
| REITs | 4.4% |
| Medical Products | 4.4% |
| Specialty Retail | 3.6% |
| Diversified Capital Goods | 3.1% |
| Building & Construction | 2.9% |
| Cons/Comm/Lease Financing | 2.5% |
| Metals/Mining Excluding Steel | 2.5% |
| Brokerage | 2.2% |
| Recreation & Travel | 2.0% |
| Investments & Misc Financial Services | 1.6% |
| Food - Wholesale | 1.5% |
| Oil Field Equipment & Services | 1.5% |
| Aerospace/Defense | 1.4% |
| RealEstate Dev & Mgt | 1.3% |
| Gas Distribution | 1.2% |
| Energy - Exploration & Production | 1.1% |
| Transport Infrastructure/Services | 1.1% |
| Tech Hardware & Equipment | 1.0% |
| Advertising | 1.0% |
| Telecom - Wireless | 1.0% |
| Chemicals | 1.0% |
| Support-Services | 0.5% |
| Mutual Funds | 0.3% |
| Misc. Financial | 0.2% |
| Media - Diversified | 0.0% |
| Forestry/Paper | 0.0% |
During the year ended December 31, 2020, the Fund engaged in the short sale of securities. Securities sold short represent obligations of the Fund that result in off-balance-sheet risk as the ultimate obligation may exceed the amount shown in the accompanying financial statements due to increases in the market values of these securities. These short positions are generally hedged positions against portfolio holdings and, as a result, any increase in the Fund’s obligation related to these short positions will generally be offset by gains in the related long positions.
In accordance with FASB ASC Topic 855, Subsequent Events, management has evaluated the impact of all subsequent events on the Fund through the date the financial statements were issued.
Management has determined that there are no material events that would require disclosure in the Fund’s financial statements.
* * * * * *
ZAZOVE CONVERTIBLE SECURITIES FUND, INC.
FINANCIAL HIGHLIGHTS
FIVE-YEAR PERIOD ENDED DECEMBER 31, 2020
| | | 2020 | | | 2019 | | | 2018 | | | 2017 | | | 2016 | |
| | | | | | | | | | | | | | | | |
| NET ASSET VALUE—Beginning of year | | $ | 19.14 | | | $ | 16.79 | | | $ | 18.76 | | | $ | 16.69 | | | $ | 14.93 | |
| | | | | | | | | | | | | | | | | | | | | |
| INCOME FROM INVESTMENT OPERATIONS: | | | | | | | | | | | | | | | | | | | | |
| Net investment income (loss) (a) | | | (0.45 | ) | | | (0.15 | ) | | | (0.13 | ) | | | (0.18 | ) | | | (0.03 | ) |
| Net realized and unrealized gains or losses on investments | | | 4.73 | | | | 3.88 | | | | (0.97 | ) | | | 2.30 | | | | 1.92 | |
| | | | | | | | | | | | | | | | | | | | | |
| Total from investment operations | | | 4.28 | | | | 3.73 | | | | (1.10 | ) | | | 2.12 | | | | 1.89 | |
| | | | | | | | | | | | | | | | | | | | | |
| Less distributions to shareholders: | | | | | | | | | | | | | | | | | | | | |
| From net investment income and net capital gains | | | (2.15 | ) | | | (0.73 | ) | | | (0.85 | ) | | | (0.00 | )* | | | (0.13 | ) |
| Return of capital | | | 0.00 | | | | (0.65 | ) | | | (0.02 | ) | | | (0.05 | ) | | | 0.00 | |
| | | | | | | | | | | | | | | | | | | | | |
| Total distributions to shareholders | | | (2.15 | ) | | | (1.38 | ) | | | (0.87 | ) | | | (0.05 | ) | | | (0.13 | ) |
| | | | | | | | | | | | | | | | | | | | | |
| NET ASSET VALUE—End of year | | $ | 21.27 | | | $ | 19.14 | | | $ | 16.79 | | | $ | 18.76 | | | $ | 16.69 | |
| | | | | | | | | | | | | | | | | | | | | |
| | | | | | | | | | | | | | | | | | | | | |
| TOTAL RETURN (b) | | | 22.98 | % | | | 22.39 | % | | | (6.13 | )% | | | 12.71 | % | | | 12.68 | % |
| | | | | | | | | | | | | | | | | | | | | |
| RATIOS/SUPPLEMENTAL DATA: | | | | | | | | | | | | | | | | | | | | |
| Net assets—end of year | | $ | 46,979,611 | | | $ | 40,806,346 | | | $ | 39,773,471 | | | $ | 54,342,928 | | | $ | 53,825,244 | |
| Ratio of expenses to average net assets (c) | | | 2.25 | % | | | 2.36 | % | | | 2.47 | % | | | 2.42 | % | | | 2.18 | % |
| Ratio of net investment income (loss) to average net assets | | | (2.41 | )% | | | (0.81 | )% | | | (0.68 | )% | | | (1.04 | )% | | | (0.21 | )% |
| Portfolio turnover rate | | | 234 | % | | | 127 | % | | | 182 | % | | | 132 | % | | | 126 | % |
| (a) | Net investment income (loss) calculated based on average shares method. |
| (b) | Total return assumes reinvestment of all dividends and distributions. |
| (c) | Ratio of expenses to average net assets is determined including margin interest. The ratio excluding margin interest, which is a cost of capital, was 2.11%, 2.19%, 2.26%, 2.22% and 2.09% for the years ended December 31, 2020, 2019, 2018, 2017 and 2016, respectively. |
| (*) | Distribution is less than $0.005 per share. |
See notes to financial statements.
ZAZOVE CONVERTIBLE SECURITIES FUND, INC.
PROXY VOTING POLICIES (UNAUDITED)
A description of the policies and procedures that the Fund uses to determine how to vote proxies relating to portfolio securities is available (i) without charge, upon request, by calling 847.239.7100 and (ii) on the Commission's website at http://www.sec.gov.
DIVIDEND REINVESTMENT PLAN (UNAUDITED)
Distributions from the Fund are recorded on the ex-distribution date. Pursuant to the Fund's Dividend Reinvestment Plan ("DRIP"), all ordinary and capital gain distributions are reinvested in Shares at the then prevailing net asset value. Each Shareholder is automatically included in the DRIP unless the Fund receives a written request from the Shareholder to receive such distributions in cash, or cash and stock. In order to determine the number of shares to be received by each Shareholder that participates in the DRIP, the aggregate ordinary and capital gain distribution allocated to the Shareholder that is to be reinvested is divided by the Fund's Net Asset Value per share immediately after giving effect to the aggregate amount of the dividend distribution declared by the Fund. For federal income tax purposes, dividends paid by the Fund are taxable whether received in cash or reinvested in additional Shares pursuant to the DRIP. There are no fees, commissions or expenses associated with participation in the DRIP and Shareholders may elect to terminate their participation in the DRIP by written request to the Fund. Additional information regarding the Dividend Reinvestment Plan may be obtained by contacting the Investment Advisor at 847.239.7100.
TAX INFORMATION (UNAUDITED)
For corporate shareholders, 5.30% of the distributions qualify for the dividends received deduction.
Certain dividends paid by the Fund may be subject to a maximum tax rate of 15%, as provided for by the Jobs and Growth Tax Relief Reconciliation Act of 2003. For the year ended December 31, 2020, 5.42% of dividends paid from net investment income from the Fund is designated as qualified dividend income.
ZAZOVE CONVERTIBLE SECURITIES FUND, INC.
FUND EXPENSES (UNAUDITED)
A shareholder of the Fund incurs two types of costs: (1) transaction costs, such as redemption fees which may apply to shares held for less than one year, and (2) ongoing costs, including investment advisory fees, transfer agent fees, and other Fund expenses. The examples below are intended to help shareholders understand the ongoing costs (in dollars) of investing in the Fund and to compare these costs with the ongoing costs of investing in other funds.
Actual Expenses
The following table provides information about actual account values and actual fund expenses for shareholders. The table shows the expenses that a shareholder would have paid on a $1,000 investment in the Fund from July 1, 2020 to December 31, 2020 as well as how much a $1,000 investment would be worth at the close of the period, assuming actual fund returns and expenses. A shareholder can estimate expenses incurred for the period by dividing the account value at December 31, 2020 by $1,000 and multiplying the results by the number in the Expenses Paid During the Period row as shown below.
| Beginning Account Value | | $ | 1,000.00 | |
| Ending Account Value | | $ | 1,279.96 | |
| Expenses Paid During Period* | | $ | 12.47 | |
| Annualized Expense Ratio | | | 2.18 | % |
Hypothetical Example for Comparison Purposes
The following table provides information about a hypothetical account value and hypothetical expenses for the period July 1, 2020 to December 31, 2020 based upon the Fund’s actual expense ratio and an assumed rate of return of 5% per year before expenses, which is not the Fund’s actual return. The hypothetical account value and expenses may not be used to estimate the actual ending account balance or expenses shareholders paid for the period. Shareholders may use this information to compare the ongoing costs of investing in the Fund and other funds. To do so, compare this 5% hypothetical example with the 5% hypothetical examples that appear in the shareholder reports of the other funds.
Please note that the expenses shown in the table are meant to highlight your ongoing costs only and do not reflect any transaction costs, such as redemption fees. Therefore, the third line of the table is useful in comparing ongoing costs only, and will not help you determine the relative total costs of owning different funds. In addition, if these transaction costs were included, your costs would have been higher.
| Beginning Account Value | | $ | 1,000.00 | |
| Ending Account Value | | $ | 1,014.20 | |
| Expenses Paid During Period* | | $ | 11.01 | |
| Annualized Expense Ratio | | | 2.18 | % |
| * | Expenses are equal to the Fund’s annualized expense ratio, multiplied by the average account value over the period, multiplied by 184 (the number of days in the most recent fiscal half-year) divided by 366 (to reflect the one-half year period). For this purpose, margin interest is treated as an expense as opposed to a cost of capital. |
ZAZOVE CONVERTIBLE SECURITIES FUND, INC.
INVESTMENT ADVISORY AGREEMENT APPROVAL (UNAUDITED)
Both the Investment Company Act of 1940 and the terms of the Fund's investment advisory agreement require that the investment advisory agreement between the Fund and its investment adviser be approved annually both by a majority of the Board and by a majority of the independent Directors.
On December 10, 2020, the Board of Directors, including the independent Directors (referred to collectively as the “Directors”) unanimously determined that the terms of the investment advisory agreement are fair and reasonable and approved the continuance of the investment advisory contract as being in the best interests of the Fund and its shareholders. In approving the investment advisory agreement, the Directors reviewed the statutory and regulatory requirements for approval and disclosure of investment advisory agreements.
The Directors evaluated, among other things, the items set forth below, and, after considering all factors together, determined, in the exercise of its business judgment, that approval of the investment advisory agreement was in the best interests of the Fund and its shareholders. The following summary provides more detail on certain matters considered by the Directors.
Nature, Extent and Quality of the Services Provided.
The Directors considered the roles and responsibilities of the Investment Advisor. The Directors discussed with the Investment Advisor the systems and resources utilized in managing the Fund and providing additional services including, accounting, legal, administrative, marketing and client service. The Directors determined that the nature, extent and quality of the services provided by the Investment Advisor support its decision to approve the investment advisory contract.
Performance, fees and expenses of the Fund.
The Directors compared the Fund’s performance to its peers in the open-end convertible fund universe. In addition, on a regular basis, the Directors review the Fund’s performance verses appropriate market indices. When considering the Fund’s performance, the Directors discussed with the Investment Advisor the performance goals and the actual results achieved in managing the Fund with an emphasis placed on long-term returns. The Directors discussed with the Investment Advisor the level of advisory fees for the Fund relative to other products advised by the adviser and the level of Fund expenses, including advisory fees, relative to comparable funds in the marketplace. The Directors reviewed not only the advisory fees but also other fees and expenses incurred by the Fund and the Fund's overall expense ratio. The Directors determined that the performance, fees and expenses of the Fund support its decision to approve the investment advisory contract.
Investment Adviser's Expenses in Providing the Service and Profitability.
The Directors discussed the substantial resources that the Investment Advisor utilizes in performing its services for the Fund as well as the profitability of the Fund as compared to other products managed by the Investment Advisor. The Directors determined that the analysis of the investment adviser's expenses and profitability support its decision to approve the investment advisory contract.
Economies of Scale.
The Directors considered the size of the Fund, the breakpoints in the management fee structure and how it relates to the Fund's expense ratio. The Directors determined that its review of the actual and potential economies of scale of the Fund support its decision to approve the investment advisory contract.
DIRECTORS AND OFFICERS (UNAUDITED)
| Name, Address and Age | Position(s) held
with the Fund | Term of Office and Length of Time Served | Principal Occupation(s) | Number of Portfolios in Fund Complex Overseen by Director | Other Directorships Held by Director |
Gene T. Pretti 1001 Tahoe Blvd. Incline Village, NV 89451 Age: 59 | Director President | Term:Indefinite1 Time served:2 27 years | CEO and senior portfolio manager Zazove Associates, LLC | Not Applicable | Not Applicable |
Steven M. Kleiman 520 Lake Cook Rd., Suite 178 Deerfield, IL 60015 Age: 59 | Secretary Treasurer | Time served:2 25 years | Executive Partner and general counsel Zazove Associates, LLC | Not Applicable | Not Applicable |
Andrew J. Goodwin, III 1201 Cromwell Ct. Alpharetta, GA 30022 Age: 77 | Director | Term: Indefinite Time served:2 27 years | Investment advisor Optimum Investment Advisors | Not Applicable | Not Applicable |
Jack L. Hansen 3600 Minnesota Drive, Ste 325 Edina , MN 55435 Age: 60 | Director | Term: Indefinite Time served:2 27 years | Portfolio manager The Clifton Group | Not Applicable | Not Applicable |
Peter A. Lechman 914 Wagner Road Glenview, IL 60025 Age: 57 | Director | Term: Indefinite Time served:2 27 years | Physician at Northwestern Memorial | Not Applicable | Not Applicable |
| 1 | “Interested person” as defined in the Investment Company Act of 1940, as amended. |
| 2 | Includes time served as Director General Partner with Zazove Convertible Fund, L.P., the predecessor to the Fund. |
ZAZOVE CONVERTIBLE SECURITIES FUND, INC.
| DIRECTORS | Andrew J. Goodwin, III Jack L. Hansen Peter A. Lechman Gene T. Pretti |
| | |
| OFFICERS | Gene T. Pretti Steven M. Kleiman |
| | |
| INVESTMENT ADVISOR | Zazove Associates, LLC 1001 Tahoe Blvd. Incline Village, NV 89451 |
| | |
| CUSTODIAN | UMB Bank N.A. 928 Grand Avenue Kansas City, MO 64106 |
| | |
INDEPENDENT REGISTERED PUBLIC ACCOUNTING FIRM | Deloitte & Touche LLP 111 S. Wacker Drive Chicago, IL 60606 |
| | |
DIVIDEND-DISBURSING AND TRANSFER AGENT | UMB Fund Services, Inc. 235 W. Galena Street Milwaukee, WI 53212 |