Exhibit 2

Exhibit 2 CEMEX 2010 FIRST QUARTER RESULTS Stock Listing Information NYSE (ADS) Ticker: CX MEXICAN STOCK EXCHANGE Ticker: CEMEXCPO Ratio of CEMEXCPO TO CX = 10:1 Investor Relations In the United States 1 877 7CX NYSE In Mexico 52 (81) 8888 4292 E-Mail ir@cemex.com
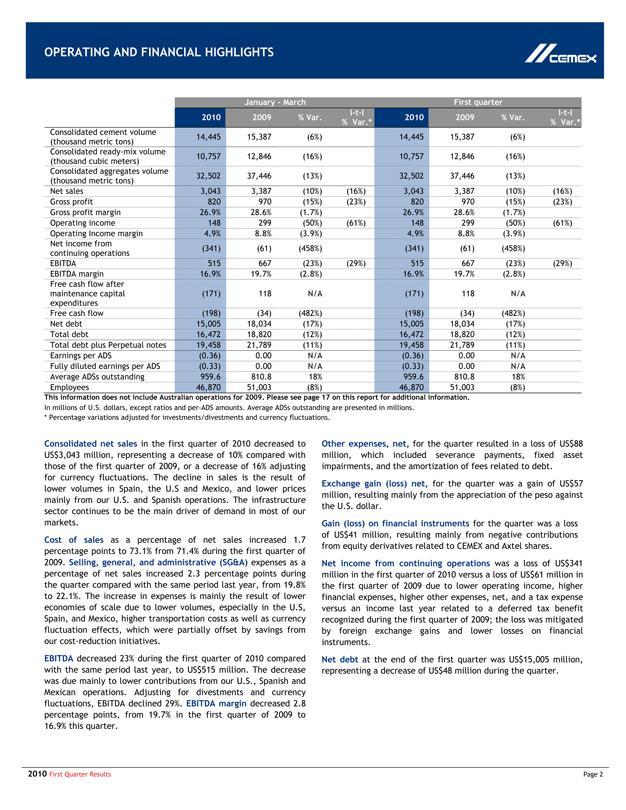
OPERATING AND FINANCIAL HIGHLIGHTS CEMEX January—March First quarter 2010 2009 % Var. l-t-l % Var.* 2010 2009 % Var. l-t-l % Var.* Consolidated cement volume (thousand metric tons) 14,445 15,387 (6%) 14,445 15,387 (6%) Consolidated ready-mix volume (thousand cubic meters) 10,757 12,846 (16%) 10,757 12,846 (16%) Consolidated aggregates volume (thousand metric tons) 32,502 37,446 (13%) 32,502 37,446 (13%) Net sales 3,043 3,387 (10%) (16%) 3,043 3,387 (10%) (16%) Gross profit 820 970 (15%) (23%) 820 970 (15%) (23%) Gross profit margin 26.9% 28.6% (1.7%) 26.9% 28.6% (1.7%) Operating income 148 299 (50%) (61%) 148 299 (50%) (61%) Operating Income margin 4.9% 8.8% (3.9%) 4.9% 8.8% (3.9%) Net income from continuing operations (341) (61) (458%) (341) (61) (458%) EBITDA 515 667 (23%) (29%) 515 667 (23%) (29%) EBITDA margin 16.9% 19.7% (2.8%) 16.9% 19.7% (2.8%) Free cash flow after maintenance capital expenditures (171) 118 N/A (171) 118 N/A Free cash flow (198) (34) (482%) (198) (34) (482%) Net debt 15,005 18,034 (17%) 15,005 18,034 (17%) Total debt 16,472 18,820 (12%) 16,472 18,820 (12%) Total debt plus Perpetual notes 19,458 21,789 (11%) 19,458 21,789 (11%) Earnings per ADS (0.36) 0.00 N/A (0.36) 0.00 N/A Fully diluted earnings per ADS (0.33) 0.00 N/A (0.33) 0.00 N/A Average ADSs outstanding 959.6 810.8 18% 959.6 810.8 18% Employees 46,870 51,003 (8%) 46,870 51,003 (8%) This information does not include Australian operations for 2009. Please see page 17 on this report for additional information. In millions of U.S. dollars, except ratios and per-ADS amounts. Average ADSs outstanding are presented in millions. * Percentage variations adjusted for investments/divestments and currency fluctuations. Consolidated net sales in the first quarter of 2010 decreased to US$3,043 million, representing a decrease of 10% compared with those of the first quarter of 2009, or a decrease of 16% adjusting for currency fluctuations. The decline in sales is the result of lower volumes in Spain, the U.S and Mexico, and lower prices mainly from our U.S. and Spanish operations. The infrastructure sector continues to be the main driver of demand in most of our markets. Cost of sales as a percentage of net sales increased 1.7 percentage points to 73.1% from 71.4% during the first quarter of 2009. Selling, general, and administrative (SG&A) expenses as a percentage of net sales increased 2.3 percentage points during the quarter compared with the same period last year, from 19.8% to 22.1%. The increase in expenses is mainly the result of lower economies of scale due to lower volumes, especially in the U.S, Spain, and Mexico, higher transportation costs as well as currency fluctuation effects, which were partially offset by savings from our cost-reduction initiatives. EBITDA decreased 23% during the first quarter of 2010 compared with the same period last year, to US$515 million. The decrease was due mainly to lower contributions from our U.S., Spanish and Mexican operations. Adjusting for divestments and currency fluctuations, EBITDA declined 29%. EBITDA margin decreased 2.8 percentage points, from 19.7% in the first quarter of 2009 to 16.9% this quarter. Other expenses, net, for the quarter resulted in a loss of US$88 million, which included severance payments, fixed asset impairments, and the amortization of fees related to debt. Exchange gain (loss) net, for the quarter was a gain of US$57 million, resulting mainly from the appreciation of the peso against the U.S. dollar. Gain (loss) on financial instruments for the quarter was a loss of US$41 million, resulting mainly from negative contributions from equity derivatives related to CEMEX and Axtel shares. Net income from continuing operations was a loss of US$341 million in the first quarter of 2010 versus a loss of US$61 million in the first quarter of 2009 due to lower operating income, higher financial expenses, higher other expenses, net, and a tax expense versus an income last year related to a deferred tax benefit recognized during the first quarter of 2009; the loss was mitigated by foreign exchange gains and lower losses on financial instruments. Net debt at the end of the first quarter was US$15,005 million, representing a decrease of US$48 million during the quarter. 2010 First Quarter Results Page 2
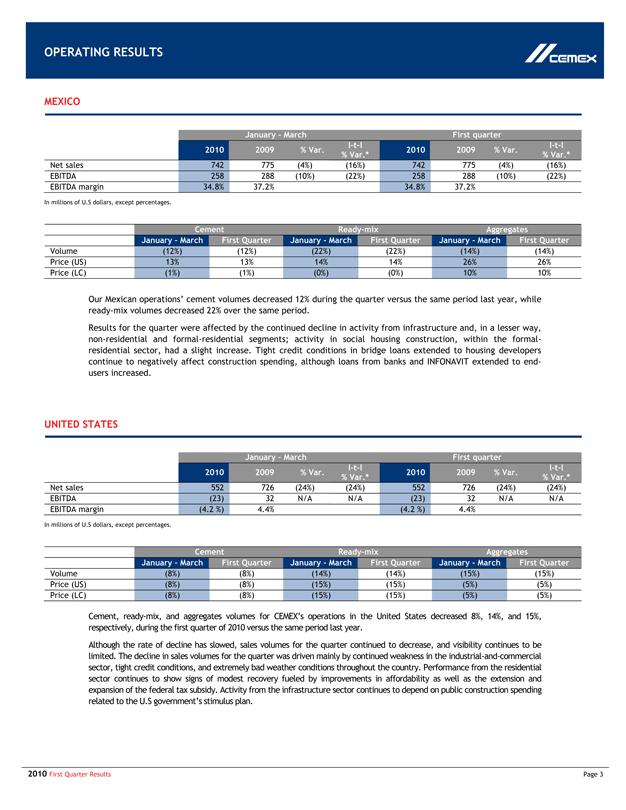
OPERATING RESULTS CEMEX MEXICO January – March First quarter 2010 2009 % Var. l-t-l % Var.* 2010 2009 % Var. l-t-l % Var.* Net sales 742 775 (4%) (16%) 742 775 (4%) (16%) EBITDA 258 288 (10%) (22%) 258 288 (10%) (22%) EBITDA margin 34.8% 37.2% 34.8% 37.2% In millions of U.S dollars, except percentages. Cement Ready-mix Aggregates January – March First Quarter January—March First Quarter January—March First Quarter Volume (12%) (12%) (22%) (22%) (14%) (14%) Price (US) 13% 13% 14% 14% 26% 26% Price (LC) (1%) (1%) (0%) (0%) 10% 10% Our Mexican operations’ cement volumes decreased 12% during the quarter versus the same period last year, while ready-mix volumes decreased 22% over the same period. Results for the quarter were affected by the continued decline in activity from infrastructure and, in a lesser way, non-residential and formal-residential segments; activity in social housing construction, within the formal-residential sector, had a slight increase. Tight credit conditions in bridge loans extended to housing developers continue to negatively affect construction spending, although loans from banks and INFONAVIT extended to end-users increased. UNITED STATES January – March First quarter 2010 2009 % Var. l-t-l % Var.* 2010 2009 % Var. l-t-l % Var.* Net sales 552 726 (24%) (24%) 552 726 (24%) (24%) EBITDA (23) 32 N/A N/A (23) 32 N/A N/A EBITDA margin (4.2 %) 4.4% (4.2 %) 4.4% In millions of U.S dollars, except percentages. Cement Ready-mix Aggregates January – March First Quarter January—March First Quarter January—March First Quarter Volume (8%) (8%) (14%) (14%) (15%) (15%) Price (US) (8%) (8%) (15%) (15%) (5%) (5%) Price (LC) (8%) (8%) (15%) (15%) (5%) (5%) Cement, ready-mix, and aggregates volumes for CEMEX’s operations in the United States decreased 8%, 14%, and 15%, respectively, during the first quarter of 2010 versus the same period last year. Although the rate of decline has slowed, sales volumes for the quarter continued to decrease, and visibility continues to be limited. The decline in sales volumes for the quarter was driven mainly by continued weakness in the industrial-and-commercial sector, tight credit conditions, and extremely bad weather conditions throughout the country. Performance from the residential sector continues to show signs of modest recovery fueled by improvements in affordability as well as the extension and expansion of the federal tax subsidy. Activity from the infrastructure sector continues to depend on public construction spending related to the U.S government’s stimulus plan. 2010 First Quarter Results Page 3
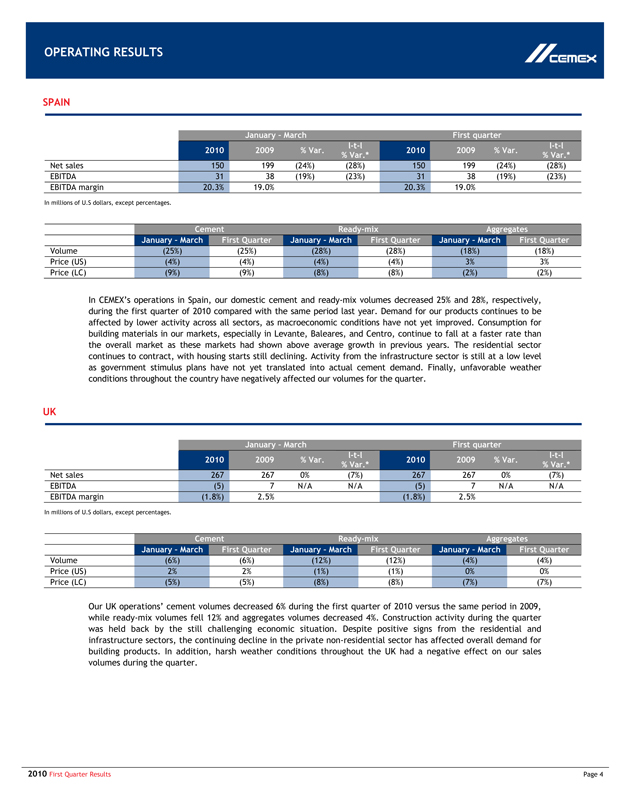
OPERATING RESULTS CEMEX SPAIN January – March First quarter 2010 2009 % Var. l-t-l % Var.* 2010 2009 % Var. l-t-l % Var.* Net sales 150 199 (24%) (28%) 150 199 (24%) (28%) EBITDA 31 38 (19%) (23%) 31 38 (19%) (23%) EBITDA margin 20.3% 19.0% 20.3% 19.0% In millions of U.S dollars, except percentages. Cement Ready-mix Aggregates January – March First Quarter January – March First Quarter January – March First Quarter Volume (25%) (25%) (28%) (28%) (18%) (18%) Price (US) (4%) (4%) (4%) (4%) 3% 3% Price (LC) (9%) (9%) (8%) (8%) (2%) (2%) In CEMEX’s operations in Spain, our domestic cement and ready-mix volumes decreased 25% and 28%, respectively, during the first quarter of 2010 compared with the same period last year. Demand for our products continues to be affected by lower activity across all sectors, as macroeconomic conditions have not yet improved. Consumption for building materials in our markets, especially in Levante, Baleares, and Centro, continue to fall at a faster rate than the overall market as these markets had shown above average growth in previous years. The residential sector continues to contract, with housing starts still declining. Activity from the infrastructure sector is still at a low level as government stimulus plans have not yet translated into actual cement demand. Finally, unfavorable weather conditions throughout the country have negatively affected our volumes for the quarter. UK January – March First quarter 2010 2009 % Var. l-t-l % Var.* 2010 2009 % Var. l-t-l % Var.* Net sales 267 267 0% (7%) 267 267 0% (7%) EBITDA (5) 7 N/A N/A (5) 7 N/A N/A EBITDA margin (1.8%) 2.5% (1.8%) 2.5% In millions of U.S dollars, except percentages. Cement Ready-mix Aggregates January – March First Quarter January – March First Quarter January – March First Quarter Volume (6%) (6%) (12%) (12%) (4%) (4%) Price (US) 2% 2% (1%) (1%) 0% 0% Price (LC) (5%) (5%) (8%) (8%) (7%) (7%) Our UK operations’ cement volumes decreased 6% during the first quarter of 2010 versus the same period in 2009, while ready-mix volumes fell 12% and aggregates volumes decreased 4%. Construction activity during the quarter was held back by the still challenging economic situation. Despite positive signs from the residential and infrastructure sectors, the continuing decline in the private non-residential sector has affected overall demand for building products. In addition, harsh weather conditions throughout the UK had a negative effect on our sales volumes during the quarter. 2010 First Quarter Results Page 4
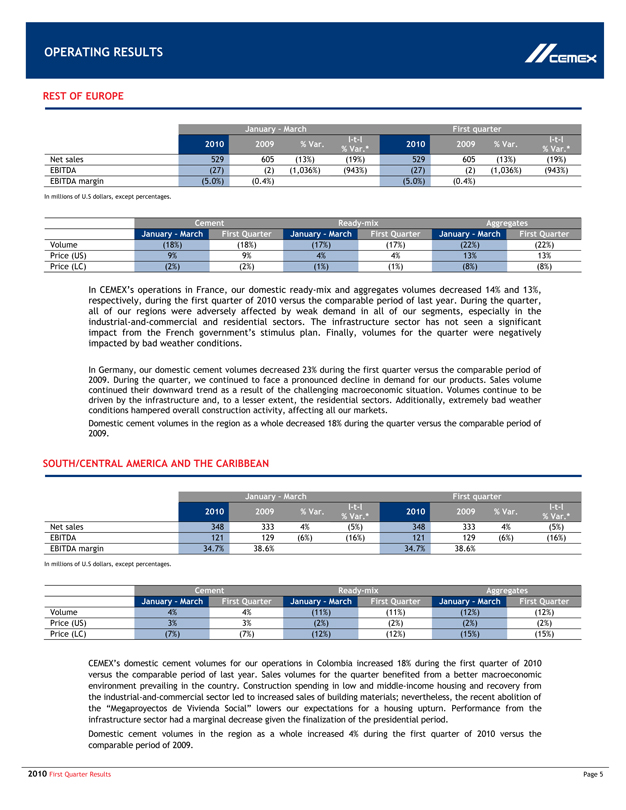
OPERATING RESULTS CEMEX REST OF EUROPE January – March First quarter 2010 2009 % Var. l-t-l % Var.* 2010 2009 % Var. l-t-l % Var.* Net sales 529 605 (13%) (19%) 529 605 (13%) (19%) EBITDA (27) (2) (1,036%) (943%) (27) (2) (1,036%) (943%) EBITDA margin (5.0%) (0.4%) (5.0%) (0.4%) In millions of U.S dollars, except percentages. Cement Ready-mix Aggregates January – March First Quarter January – March First Quarter January – March First Quarter Volume (18%) (18%) (17%) (17%) (22%) (22%) Price (US) 9% 9% 4% 4% 13% 13% Price (LC) (2%) (2%) (1%) (1%) (8%) (8%) In CEMEX’s operations in France, our domestic ready-mix and aggregates volumes decreased 14% and 13%, respectively, during the first quarter of 2010 versus the comparable period of last year. During the quarter, all of our regions were adversely affected by weak demand in all of our segments, especially in the industrial-and-commercial and residential sectors. The infrastructure sector has not seen a significant impact from the French government’s stimulus plan. Finally, volumes for the quarter were negatively impacted by bad weather conditions. In Germany, our domestic cement volumes decreased 23% during the first quarter versus the comparable period of 2009. During the quarter, we continued to face a pronounced decline in demand for our products. Sales volume continued their downward trend as a result of the challenging macroeconomic situation. Volumes continue to be driven by the infrastructure and, to a lesser extent, the residential sectors. Additionally, extremely bad weather conditions hampered overall construction activity, affecting all our markets. Domestic cement volumes in the region as a whole decreased 18% during the quarter versus the comparable period of 2009. SOUTH/CENTRAL AMERICA AND THE CARIBBEAN January – March First quarter 2010 2009 % Var. l-t-l % Var.* 2010 2009 % Var. l-t-l % Var.* Net sales 348 333 4% (5%) 348 333 4% (5%) EBITDA 121 129 (6%) (16%) 121 129 (6%) (16%) EBITDA margin 34.7% 38.6% 34.7% 38.6% In millions of U.S dollars, except percentages. Cement Ready-mix Aggregates January – March First Quarter January – March First Quarter January – March First Quarter Volume 4% 4% (11%) (11%) (12%) (12%) Price (US) 3% 3% (2%) (2%) (2%) (2%) Price (LC) (7%) (7%) (12%) (12%) (15%) (15%) CEMEX’s domestic cement volumes for our operations in Colombia increased 18% during the first quarter of 2010 versus the comparable period of last year. Sales volumes for the quarter benefited from a better macroeconomic environment prevailing in the country. Construction spending in low and middle-income housing and recovery from the industrial-and-commercial sector led to increased sales of building materials; nevertheless, the recent abolition of the “Megaproyectos de Vivienda Social” lowers our expectations for a housing upturn. Performance from the infrastructure sector had a marginal decrease given the finalization of the presidential period. Domestic cement volumes in the region as a whole increased 4% during the first quarter of 2010 versus the comparable period of 2009. 2010 First Quarter Results Page 5
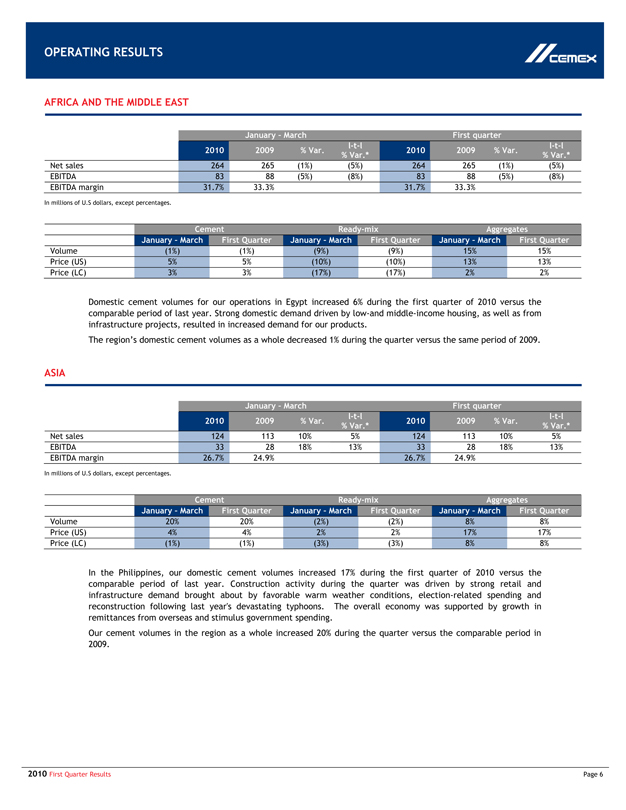
OPERATING RESULTS CEMEX AFRICA AND THE MIDDLE EAST January – March First quarter 2010 2009 % Var. l-t-l % Var.* 2010 2009 % Var. l-t-l % Var.* Net sales 264 265 (1%) (5%) 264 265 (1%) (5%) EBITDA 83 88 (5%) (8%) 83 88 (5%) (8%) EBITDA margin 31.7% 33.3% 31.7% 33.3% In millions of U.S dollars, except percentages. Cement Ready-mix Aggregates January – March First Quarter January – March First Quarter January – March First Quarter Volume (1%) (1%) (9%) (9%) 15% 15% Price (US) 5% 5% (10%) (10%) 13% 13% Price (LC) 3% 3% (17%) (17%) 2% 2% Domestic cement volumes for our operations in Egypt increased 6% during the first quarter of 2010 versus the comparable period of last year. Strong domestic demand driven by low-and middle-income housing, as well as from infrastructure projects, resulted in increased demand for our products. The region’s domestic cement volumes as a whole decreased 1% during the quarter versus the same period of 2009. ASIA January – March First quarter 2010 2009 % Var. l-t-l % Var.* 2010 2009 % Var. l-t-l % Var.* Net sales 124 113 10% 5% 124 113 10% 5% EBITDA 33 28 18% 13% 33 28 18% 13% EBITDA margin 26.7% 24.9% 26.7% 24.9% In millions of U.S dollars, except percentages. Cement Ready-mix Aggregates January – March First Quarter January – March First Quarter January – March First Quarter Volume 20% 20% (2%) (2%) 8% 8% Price (US) 4% 4% 2% 2% 17% 17% Price (LC) (1%) (1%) (3%) (3%) 8% 8% In the Philippines, our domestic cement volumes increased 17% during the first quarter of 2010 versus the comparable period of last year. Construction activity during the quarter was driven by strong retail and infrastructure demand brought about by favorable warm weather conditions, election-related spending and reconstruction following last year’s devastating typhoons. The overall economy was supported by growth in remittances from overseas and stimulus government spending. Our cement volumes in the region as a whole increased 20% during the quarter versus the comparable period in 2009. 2010 First Quarter Results Page 6
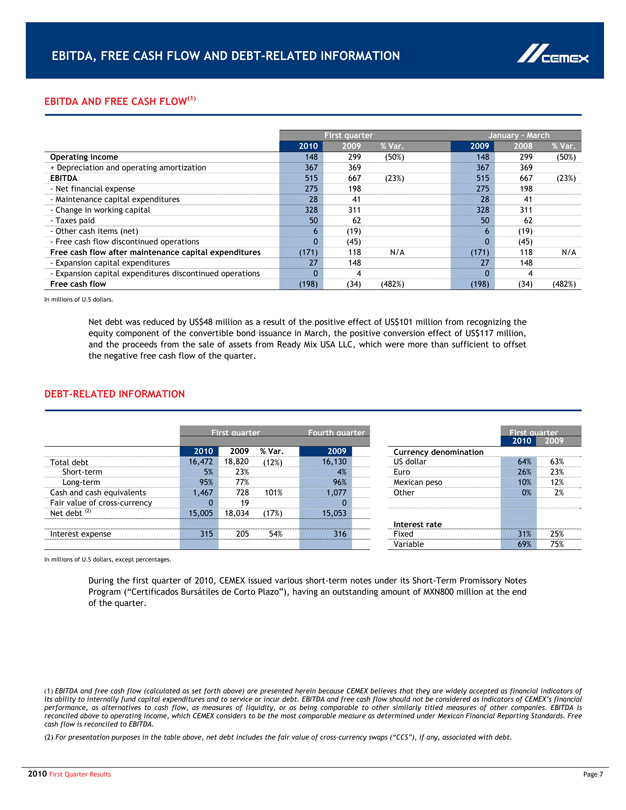
EBITDA, FREE CASH FLOW AND DEBT-RELATED INFORMATION CEMEX EBITDA AND FREE CASH FLOW( ) First quarter January – March 2010 2009 % Var. 2009 2008 % Var. Operating income 148 299 (50%) 148 299 (50%) + Depreciation and operating amortization 367 369 367 369 EBITDA 515 667 (23%) 515 667 (23%)—Net financial expense 275 198 275 198—Maintenance capital expenditures 28 41 28 41—Change in working capital 328 311 328 311—Taxes paid 50 62 50 62—Other cash items (net) 6 (19) 6 (19)—Free cash flow discontinued operations 0 (45) 0 (45) Free cash flow after maintenance capital expenditures (171) 118 N/A (171) 118 N/A—Expansion capital expenditures 27 148 27 148—Expansion capital expenditures discontinued operations 0 4 0 4 Free cash flow (198) (34) (482%) (198) (34) (482%) In millions of U.S dollars. Net debt was reduced by US$48 million as a result of the positive effect of US$101 million from recognizing the equity component of the convertible bond issuance in March, the positive conversion effect of US$117 million, and the proceeds from the sale of assets from Ready Mix USA LLC, which were more than sufficient to offset the negative free cash flow of the quarter. DEBT-RELATED INFORMATION First quarter Fourth quarter First quarter 2010 2009 2010 2009 % Var. 2009 Currency denomination Total debt 16,472 18,820X (12%) 16,130 US dollar 64% 63% Short-term 5% 23% 4% Euro 26% 23% Long-term 95% 77% 96% Mexican peso 10% 12% Cash and cash equivalents 1,467 728 101% 1,077 Other 0% 2% Fair value of cross-currency swaps (2) 0 19 0 Net debt (2) 15,005 18,034 (17%) 15,053 Interest rate Interest expense 315 205 54% 316 Fixed 31% 25% Variable 69% 75% In millions of U.S dollars, except percentages. During the first quarter of 2010, CEMEX issued various short-term notes under its Short-Term Promissory Notes Program (“Certificados Bursátiles de Corto Plazo”), having an outstanding amount of MXN800 million at the end of the quarter. ( ) EBITDA and free cash flow (calculated as set forth above) are presented herein because CEMEX believes that they are widely accepted as financial indicators of its ability to internally fund capital expenditures and to service or incur debt. EBITDA and free cash flow should not be considered as indicators of CEMEX’s financial performance, as alternatives to cash flow, as measures of liquidity, or as being comparable to other similarly titled measures of other companies. EBITDA is reconciled above to operating income, which CEMEX considers to be the most comparable measure as determined under Mexican Financial Reporting Standards. Free cash flow is reconciled to EBITDA. (2) For presentation purposes in the table above, net debt includes the fair value of cross-currency swaps (“CCS”), if any, associated with debt. 2010 First Quarter Results Page 7
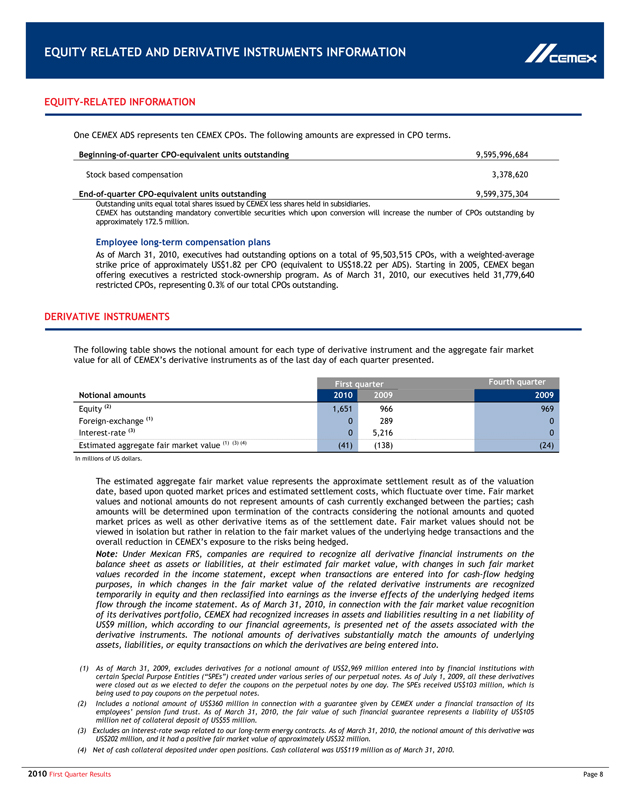
EQUITY RELATED AND DERIVATIVE INSTRUMENTS INFORMATION Equity-Related InformationOne CEMEX ADS represents ten CEMEX CPOs. The following amounts are expressed in CPO terms. Beginning-of-quarter CPO-equivalent units outstanding9,595,996,684 Stock based compensation3,378,620End-of-quarter CPO-equivalent units outstanding9,599,375,304Outstanding units equal total shares issued by CEMEX less shares held in subsidiaries. CEMEX has outstanding mandatory convertible securities which upon conversion will increase the number of CPOs outstanding by approximately 172.5 million. Employee long-term compensation plans As of March 31, 2010, executives had outstanding options on a total of 95,503,515 CPOs, with a weighted-average strike price of approximately US$1.82 per CPO (equivalent to US$18.22 per ADS). Starting in 2005, CEMEX began offering executives a restricted stock-ownership program. As of March 31, 2010, our executives held 31,779,640 restricted CPOs, representing 0.3% of our total CPOs outstanding. Derivative InstrumentsThe following table shows the notional amount for each type of derivative instrument and the aggregate fair market value for all of CEMEX’s derivative instruments as of the last day of each quarter presented.First quarterFourth quarterNotional amounts 201020092009Equity (2)1,651966969Foreign-exchange (1) 02890Interest-rate (3)05,2160Estimated aggregate fair market value (1) (3) (4)(41)(138)(24)In millions of US dollars. The estimated aggregate fair market value represents the approximate settlement result as of the valuation date, based upon quoted market prices and estimated settlement costs, which fluctuate over time. Fair market values and notional amounts do not represent amounts of cash currently exchanged between the parties; cash amounts will be determined upon termination of the contracts considering the notional amounts and quoted market prices as well as other derivative items as of the settlement date. Fair market values should not be viewed in isolation but rather in relation to the fair market values of the underlying hedge transactions and the overall reduction in CEMEX’s exposure to the risks being hedged. Note: Under Mexican FRS, companies are required to recognize all derivative financial instruments on the balance sheet as assets or liabilities, at their estimated fair market value, with changes in such fair market values recorded in the income statement, except when transactions are entered into for cash-flow hedging purposes, in which changes in the fair market value of the related derivative instruments are recognized temporarily in equity and then reclassified into earnings as the inverse effects of the underlying hedged items flow through the income statement. As of March 31, 2010, in connection with the fair market value recognition of its derivatives portfolio, CEMEX had recognized increases in assets and liabilities resulting in a net liability of US$9 million, which according to our financial agreements, is presented net of the assets associated with the derivative instruments. The notional amounts of derivatives substantially match the amounts of underlying assets, liabilities, or equity transactions on which the derivatives are being entered into. (1) As of March 31, 2009, excludes derivatives for a notional amount of US$2,969 million entered into by financial institutions with certain Special Purpose Entities (“SPEs”) created under various series of our perpetual notes. As of July 1, 2009, all these derivatives were closed out as we elected to defer the coupons on the perpetual notes by one day. The SPEs received US$103 million, which is being used to pay coupons on the perpetual notes. (2) Includes a notional amount of US$360 million in connection with a guarantee given by CEMEX under a financial transaction of its employees’ pension fund trust. As of March 31, 2010, the fair value of such financial guarantee represents a liability of US$105 million net of collateral deposit of US$55 million. (3) Excludes an interest-rate swap related to our long-term energy contracts. As of March 31, 2010, the notional amount of this derivative was US$202 million, and it had a positive fair market value of approximately US$32 million. (4) Net of cash collateral deposited under open positions. Cash collateral was US$119 million as of March 31, 2010. CEMEX 2010 First Quarter Results Page 8
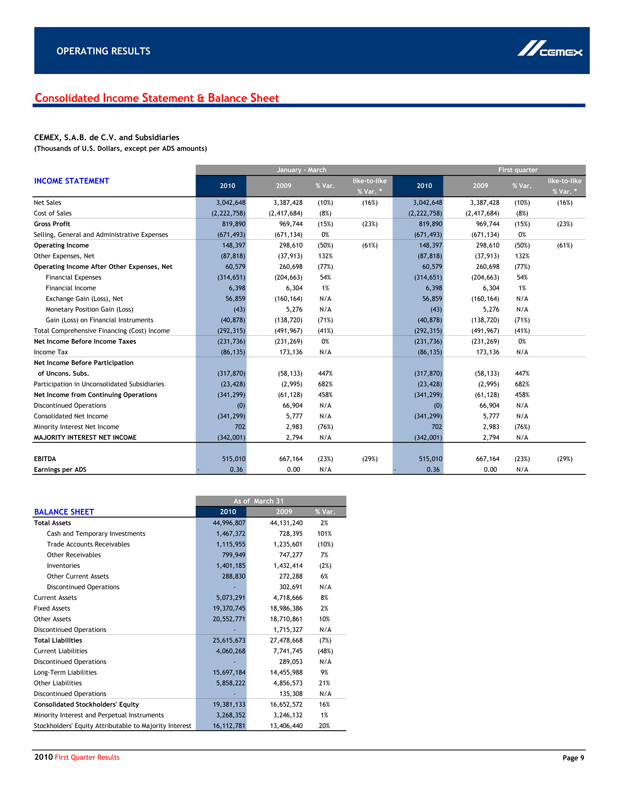
OPERATING RESULTS Consolidated Income Statement & Balance Sheet CEMEX, S.A.B. de C.V. and Subsidiaries (Thousands of U.S. Dollars, except per ADS amounts) January—March First quarter INCOME STATEMENT 2010 2009 % Var. like-to-like 2010 2009 % Var. like-to-like % Var. * % Var. * Net Sales 3,042,648 3,387,428 (10%) (16%) 3,042,648 3,387,428 (10%) (16%) Cost of Sales (2,222,758) (2,417,684) (8%) (2,222,758) (2,417,684) (8%) Gross Profit 819,890 969,744 (15%) (23%) 819,890 969,744 (15%) (23%) Selling, General and Administrative Expenses (671,493) (671,134) 0% (671,493) (671,134) 0% Operating Income 148,397 298,610 (50%) (61%) 148,397 298,610 (50%) (61%) Other Expenses, Net (87,818) (37,913) 132% (87,818) (37,913) 132% Operating Income After Other Expenses, Net 60,579 260,698 (77%) 60,579 260,698 (77%) Financial Expenses (314,651) (204,663) 54% (314,651) (204,663) 54% Financial Income 6,398 6,304 1% 6,398 6,304 1% Exchange Gain (Loss), Net 56,859 (160,164) N/A 56,859 (160,164) N/A Monetary Position Gain (Loss) (43) 5,276 N/A (43) 5,276 N/A Gain (Loss) on Financial Instruments (40,878) (138,720) (71%) (40,878) (138,720) (71%) Total Comprehensive Financing (Cost) Income (292,315) (491,967) (41%) (292,315) (491,967) (41%) Net Income Before Income Taxes (231,736) (231,269) 0% (231,736) (231,269) 0% Income Tax (86,135) 173,136 N/A (86,135) 173,136 N/A Net Income Before Participation of Uncons. Subs. (317,870) (58,133) 447% (317,870) (58,133) 447% Participation in Unconsolidated Subsidiaries (23,428) (2,995) 682% (23,428) (2,995) 682% Net Income from Continuing Operations (341,299) (61,128) 458% (341,299) (61,128) 458% Discontinued Operations (0) 66,904 N/A (0) 66,904 N/A Consolidated Net Income (341,299) 5,777 N/A (341,299) 5,777 N/A Minority Interest Net Income 702 2,983 (76%) 702 2,983 (76%) MAJORITY INTEREST NET INCOME (342,001) 2,794 N/A (342,001) 2,794 N/A EBITDA 515,010 667,164 (23%) (29%) 515,010 667,164 (23%) (29%) Earnings per ADS -0.36 0.00 N/A -0.36 0.00 N/A As of March 31 BALANCE SHEET 2010 2009 % Var. Total Assets 44,996,807 44,131,240 2% Cash and Temporary Investments 1,467,372 728,395 101% Trade Accounts Receivables 1,115,955 1,235,601 (10%) Other Receivables 799,949 747,277 7% Inventories 1,401,185 1,432,414 (2%) Other Current Assets 288,830 272,288 6% Discontinued Operations—302,691 N/A Current Assets 5,073,291 4,718,666 8% Fixed Assets 19,370,745 18,986,386 2% Other Assets 20,552,771 18,710,861 10% Discontinued Operations—1,715,327 N/A Total Liabilities 25,615,673 27,478,668 (7%) Current Liabilities 4,060,268 7,741,745 (48%) Discontinued Operations—289,053 N/A Long-Term Liabilities 15,697,184 14,455,988 9% Other Liabilities 5,858,222 4,856,573 21% Discontinued Operations—135,308 N/A Consolidated Stockholders’ Equity 19,381,133 16,652,572 16% Minority Interest and Perpetual Instruments 3,268,352 3,246,132 1% Stockholders’ Equity Attributable to Majority Interest 16,112,781 13,406,440 20% 2010 First Quarter Results Page 9
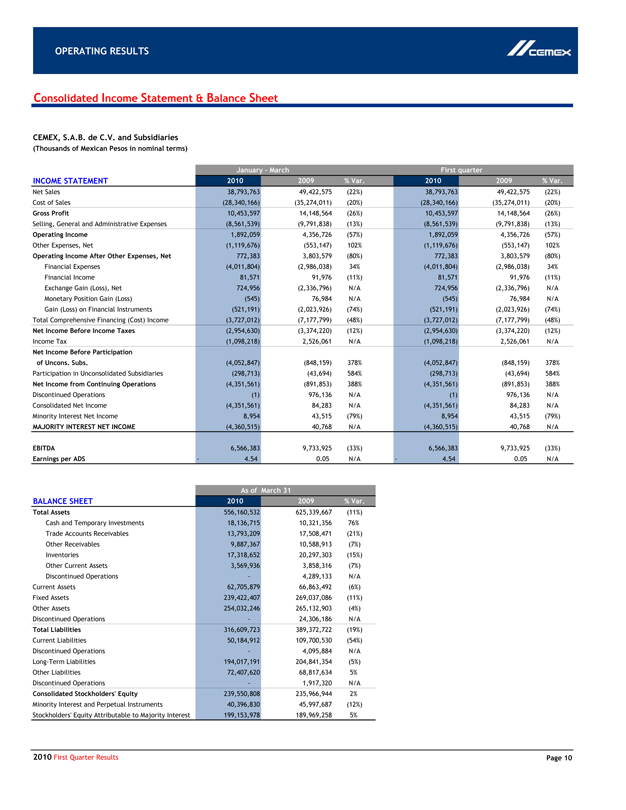
OPERATING RESULTS Consolidated Income Statement & Balance Sheet CEMEX, S.A.B. de C.V. and Subsidiaries (Thousands of Mexican Pesos in nominal terms) January—March First quarter INCOME STATEMENT 2010 2009 % Var. 2010 2009 % Var. Net Sales 38,793,763 49,422,575 (22%) 38,793,763 49,422,575 (22%) Cost of Sales (28,340,166) (35,274,011) (20%) (28,340,166) (35,274,011) (20%) Gross Profit 10,453,597 14,148,564 (26%) 10,453,597 14,148,564 (26%) Selling, General and Administrative Expenses (8,561,539) (9,791,838) (13%) (8,561,539) (9,791,838) (13%) Operating Income 1,892,059 4,356,726 (57%) 1,892,059 4,356,726 (57%) Other Expenses, Net (1,119,676) (553,147) 102% (1,119,676) (553,147) 102% Operating Income After Other Expenses, Net 772,383 3,803,579 (80%) 772,383 3,803,579 (80%) Financial Expenses (4,011,804) (2,986,038) 34% (4,011,804) (2,986,038) 34% Financial Income 81,571 91,976 (11%) 81,571 91,976 (11%) Exchange Gain (Loss), Net 724,956 (2,336,796) N/A 724,956 (2,336,796) N/A Monetary Position Gain (Loss) (545) 76,984 N/A (545) 76,984 N/A Gain (Loss) on Financial Instruments (521,191) (2,023,926) (74%) (521,191) (2,023,926) (74%) Total Comprehensive Financing (Cost) Income (3,727,012) (7,177,799) (48%) (3,727,012) (7,177,799) (48%) Net Income Before Income Taxes (2,954,630) (3,374,220) (12%) (2,954,630) (3,374,220) (12%) Income Tax (1,098,218) 2,526,061 N/A (1,098,218) 2,526,061 N/A Net Income Before Participation of Uncons. Subs. (4,052,847) (848,159) 378% (4,052,847) (848,159) 378% Participation in Unconsolidated Subsidiaries (298,713) (43,694) 584% (298,713) (43,694) 584% Net Income from Continuing Operations (4,351,561) (891,853) 388% (4,351,561) (891,853) 388% Discontinued Operations (1) 976,136 N/A (1) 976,136 N/A Consolidated Net Income (4,351,561) 84,283 N/A (4,351,561) 84,283 N/A Minority Interest Net Income 8,954 43,515 (79%) 8,954 43,515 (79%) MAJORITY INTEREST NET INCOME (4,360,515) 40,768 N/A (4,360,515) 40,768 N/A EBITDA 6,566,383 9,733,925 (33%) 6,566,383 9,733,925 (33%) Earnings per ADS -4.54 0.05 N/A -4.54 0.05 N/A As of March 31 BALANCE SHEET 2010 2009 % Var. Total Assets 556,160,532 625,339,667 (11%) Cash and Temporary Investments 18,136,715 10,321,356 76% Trade Accounts Receivables 13,793,209 17,508,471 (21%) Other Receivables 9,887,367 10,588,913 (7%) Inventories 17,318,652 20,297,303 (15%) Other Current Assets 3,569,936 3,858,316 (7%) Discontinued Operations—4,289,133 N/A Current Assets 62,705,879 66,863,492 (6%) Fixed Assets 239,422,407 269,037,086 (11%) Other Assets 254,032,246 265,132,903 (4%) Discontinued Operations—24,306,186 N/A Total Liabilities 316,609,723 389,372,722 (19%) Current Liabilities 50,184,912 109,700,530 (54%) Discontinued Operations—4,095,884 N/A Long-Term Liabilities 194,017,191 204,841,354 (5%) Other Liabilities 72,407,620 68,817,634 5% Discontinued Operations—1,917,320 N/A Consolidated Stockholders’ Equity 239,550,808 235,966,944 2% Minority Interest and Perpetual Instruments 40,396,830 45,997,687 (12%) Stockholders’ Equity Attributable to Majority Interest 199,153,978 189,969,258 5% 2010 First Quarter Results Page 10
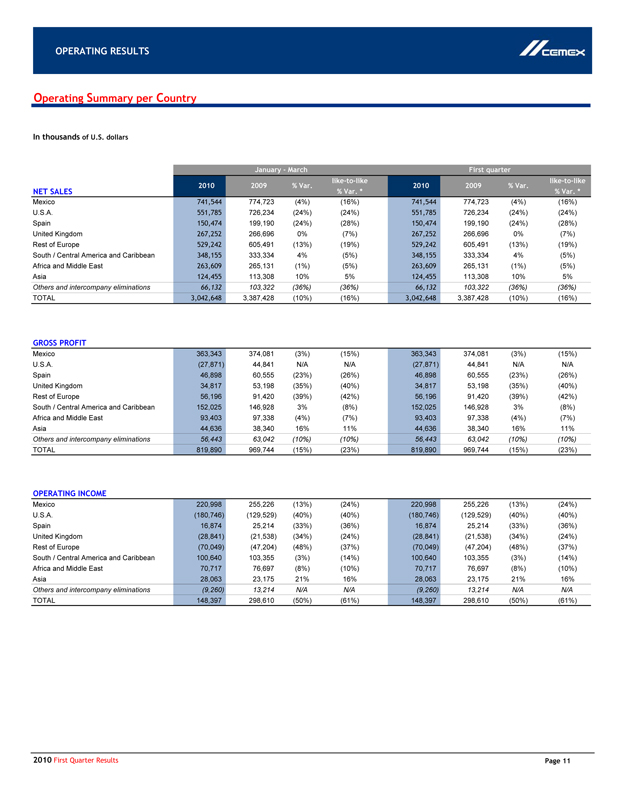
OPERATING RESULTS Operating Summary per Country In thousands of U.S. dollars January—March First quarter 2010 2009 % Var. like-to-like 2010 2009 % Var. like-to-like NET SALES % Var. * % Var. * Mexico 741,544 774,723 (4%) (16%) 741,544 774,723 (4%) (16%) U.S.A. 551,785 726,234 (24%) (24%) 551,785 726,234 (24%) (24%) Spain 150,474 199,190 (24%) (28%) 150,474 199,190 (24%) (28%) United Kingdom 267,252 266,696 0% (7%) 267,252 266,696 0% (7%) Rest of Europe 529,242 605,491 (13%) (19%) 529,242 605,491 (13%) (19%) South / Central America and Caribbean 348,155 333,334 4% (5%) 348,155 333,334 4% (5%) Africa and Middle East 263,609 265,131 (1%) (5%) 263,609 265,131 (1%) (5%) Asia 124,455 113,308 10% 5% 124,455 113,308 10% 5% Others and intercompany eliminations 66,132 103,322 (36%) (36%) 66,132 103,322 (36%) (36%) TOTAL 3,042,648 3,387,428 (10%) (16%) 3,042,648 3,387,428 (10%) (16%) GROSS PROFIT Mexico 363,343 374,081 (3%) (15%) 363,343 374,081 (3%) (15%) U.S.A. (27,871) 44,841 N/A N/A (27,871) 44,841 N/A N/A Spain 46,898 60,555 (23%) (26%) 46,898 60,555 (23%) (26%) United Kingdom 34,817 53,198 (35%) (40%) 34,817 53,198 (35%) (40%) Rest of Europe 56,196 91,420 (39%) (42%) 56,196 91,420 (39%) (42%) South / Central America and Caribbean 152,025 146,928 3% (8%) 152,025 146,928 3% (8%) Africa and Middle East 93,403 97,338 (4%) (7%) 93,403 97,338 (4%) (7%) Asia 44,636 38,340 16% 11% 44,636 38,340 16% 11% Others and intercompany eliminations 56,443 63,042 (10%) (10%) 56,443 63,042 (10%) (10%) TOTAL 819,890 969,744 (15%) (23%) 819,890 969,744 (15%) (23%) OPERATING INCOME Mexico 220,998 255,226 (13%) (24%) 220,998 255,226 (13%) (24%) U.S.A. (180,746) (129,529) (40%) (40%) (180,746) (129,529) (40%) (40%) Spain 16,874 25,214 (33%) (36%) 16,874 25,214 (33%) (36%) United Kingdom (28,841) (21,538) (34%) (24%) (28,841) (21,538) (34%) (24%) Rest of Europe (70,049) (47,204) (48%) (37%) (70,049) (47,204) (48%) (37%) South / Central America and Caribbean 100,640 103,355 (3%) (14%) 100,640 103,355 (3%) (14%) Africa and Middle East 70,717 76,697 (8%) (10%) 70,717 76,697 (8%) (10%) Asia 28,063 23,175 21% 16% 28,063 23,175 21% 16% Others and intercompany eliminations (9,260) 13,214 N/A N/A (9,260) 13,214 N/A N/A TOTAL 148,397 298,610 (50%) (61%) 148,397 298,610 (50%) (61%) 2010 First Quarter Results Page 11
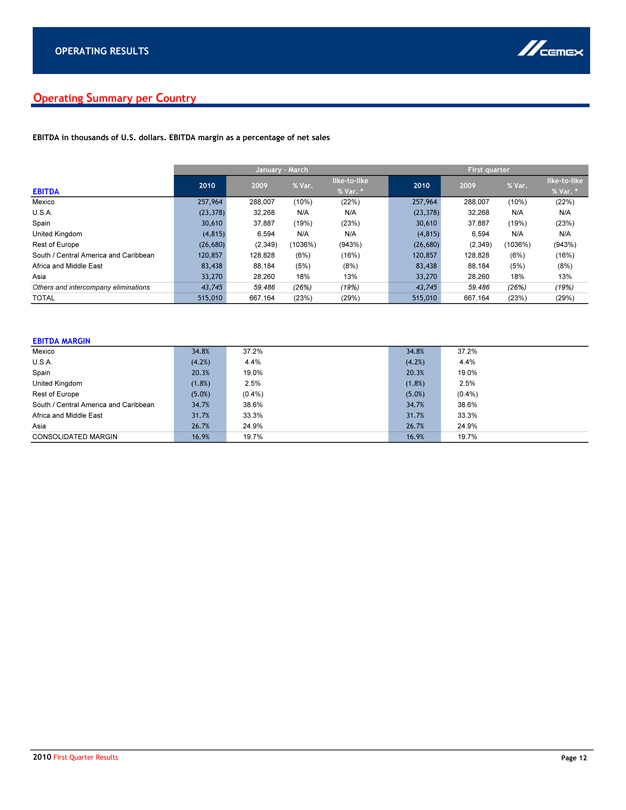
OPERATING RESULTS Operating Summary per Country EBITDA in thousands of U.S. dollars. EBITDA margin as a percentage of net sales January—March First quarter 2010 2009 % Var. like-to-like 2010 2009 % Var. like-to-like EBITDA % Var. * % Var. * Mexico 257,964 288,007 (10%) (22%) 257,964 288,007 (10%) (22%) U.S.A. (23,378) 32,268 N/A N/A (23,378) 32,268 N/A N/A Spain 30,610 37,887 (19%) (23%) 30,610 37,887 (19%) (23%) United Kingdom (4,815) 6,594 N/A N/A (4,815) 6,594 N/A N/A Rest of Europe (26,680) (2,349) (1036%) (943%) (26,680) (2,349) (1036%) (943%) South / Central America and Caribbean 120,857 128,828 (6%) (16%) 120,857 128,828 (6%) (16%) Africa and Middle East 83,438 88,184 (5%) (8%) 83,438 88,184 (5%) (8%) Asia 33,270 28,260 18% 13% 33,270 28,260 18% 13% Others and intercompany eliminations 43,745 59,486 (26%) (19%) 43,745 59,486 (26%) (19%) TOTAL 515,010 667,164 (23%) (29%) 515,010 667,164 (23%) (29%) EBITDA MARGIN Mexico 34.8% 37.2% 34.8% 37.2% U.S.A. (4.2%) 4.4% (4.2%) 4.4% Spain 20.3% 19.0% 20.3% 19.0% United Kingdom (1.8%) 2.5% (1.8%) 2.5% Rest of Europe (5.0%) (0.4%) (5.0%) (0.4%) South / Central America and Caribbean 34.7% 38.6% 34.7% 38.6% Africa and Middle East 31.7% 33.3% 31.7% 33.3% Asia 26.7% 24.9% 26.7% 24.9% CONSOLIDATED MARGIN 16.9% 19.7% 16.9% 19.7% 2010 First Quarter Results Page 12 OTHER ACTIVITIES
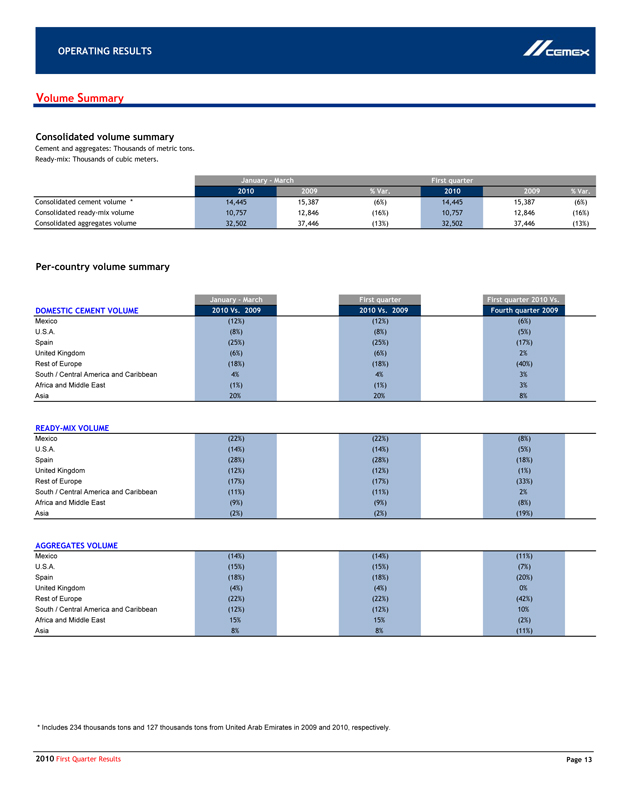
OPERATING RESULTS Volume Summary Consolidated volume summary Cement and aggregates: Thousands of metric tons. Ready-mix: Thousands of cubic meters. January—March First quarter 2010 2009 % Var. 2010 2009 % Var. Consolidated cement volume * 14,445 15,387 (6%) 14,445 15,387 (6%) Consolidated ready-mix volume 10,757 12,846 (16%) 10,757 12,846 (16%) Consolidated aggregates volume 32,502 37,446 (13%) 32,502 37,446 (13%) Per-country volume summary January—March First quarter First quarter 2010 Vs. DOMESTIC CEMENT VOLUME 2010 Vs. 2009 2010 Vs. 2009 Fourth quarter 2009 Mexico (12%) (12%) (6%) U.S.A. (8%) (8%) (5%) Spain (25%) (25%) (17%) United Kingdom (6%) (6%) 2% Rest of Europe (18%) (18%) (40%) South / Central America and Caribbean 4% 4% 3% Africa and Middle East (1%) (1%) 3% Asia 20% 20% 8% READY-MIX VOLUME Mexico (22%) (22%) (8%) U.S.A. (14%) (14%) (5%) Spain (28%) (28%) (18%) United Kingdom (12%) (12%) (1%) Rest of Europe (17%) (17%) (33%) South / Central America and Caribbean (11%) (11%) 2% Africa and Middle East (9%) (9%) (8%) Asia (2%) (2%) (19%) AGGREGATES VOLUME Mexico (14%) (14%) (11%) U.S.A. (15%) (15%) (7%) Spain (18%) (18%) (20%) United Kingdom (4%) (4%) 0% Rest of Europe (22%) (22%) (42%) South / Central America and Caribbean (12%) (12%) 10% Africa and Middle East 15% 15% (2%) Asia 8% 8% (11%) * Includes 234 thousands tons and 127 thousands tons from United Arab Emirates in 2009 and 2010, respectively. 2010 First Quarter Results Page 13
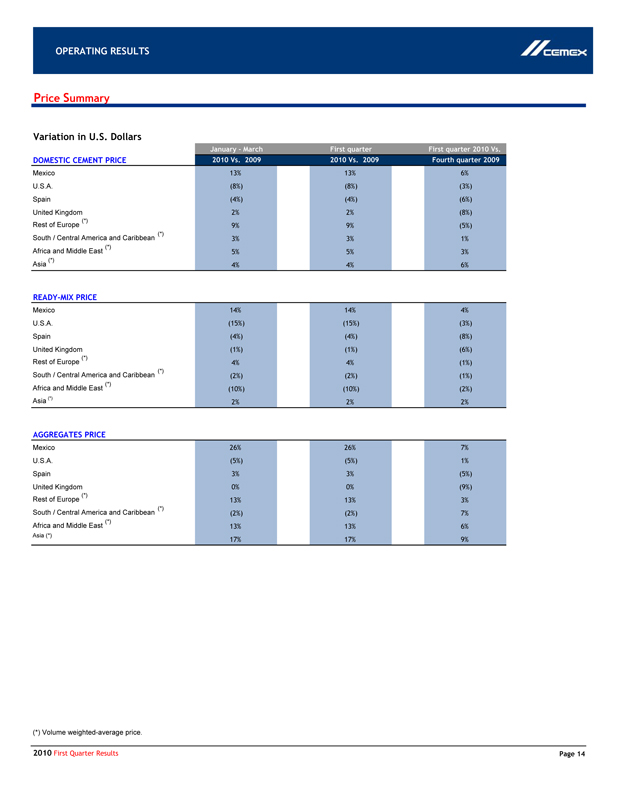
OPERATING RESULTS Price Summary Variation in U.S. Dollars January—March First quarter First quarter 2010 Vs. DOMESTIC CEMENT PRICE 2010 Vs. 2009 2010 Vs. 2009 Fourth quarter 2009 Mexico 13% 13% 6% U.S.A. (8%) (8%) (3%) Spain (4%) (4%) (6%) United Kingdom 2% 2% (8%) Rest of Europe (*) 9% 9% (5%) South / Central America and Caribbean (*) 3% 3% 1% Africa and Middle East (*) 5% 5% 3% Asia (*) 4% 4% 6% READY-MIX PRICE Mexico 14% 14% 4% U.S.A. (15%) (15%) (3%) Spain (4%) (4%) (8%) United Kingdom (1%) (1%) (6%) Rest of Europe (*) 4% 4% (1%) South / Central America and Caribbean (*) (2%) (2%) (1%) Africa and Middle East (*) (10%) (10%) (2%) Asia (*) 2% 2% 2% AGGREGATES PRICE Mexico 26% 26% 7% U.S.A. (5%) (5%) 1% Spain 3% 3% (5%) United Kingdom 0% 0% (9%) Rest of Europe (*) 13% 13% 3% South / Central America and Caribbean (*) (2%) (2%) 7% Africa and Middle East (*) 13% 13% 6% Asia (*) 17% 17% 9% (*) Volume weighted-average price. 2010 First Quarter Results Page 14
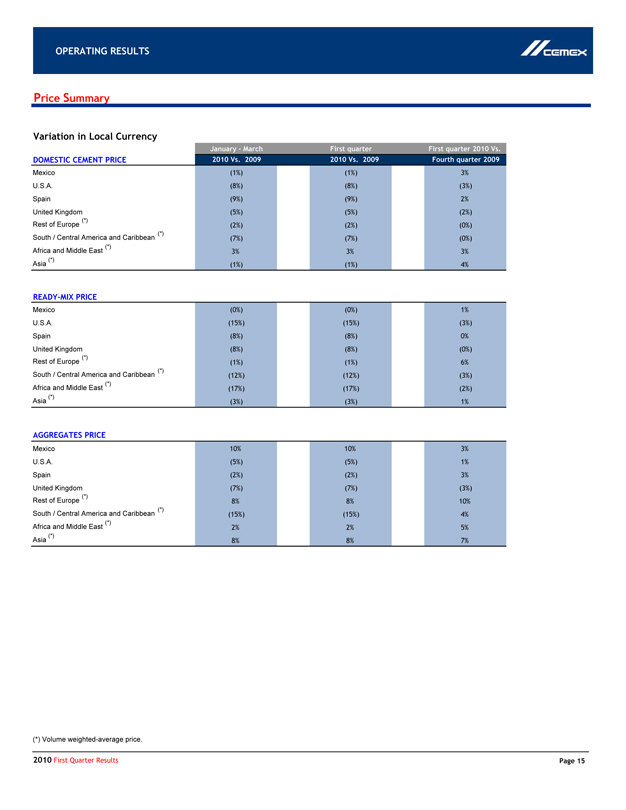
OPERATING RESULTS Price Summary Variation in Local Currency January—March First quarter First quarter 2010 Vs. DOMESTIC CEMENT PRICE 2010 Vs. 2009 2010 Vs. 2009 Fourth quarter 2009 Mexico (1%) (1%) 3% U.S.A. (8%) (8%) (3%) Spain (9%) (9%) 2% United Kingdom (5%) (5%) (2%) Rest of Europe (*) (2%) (2%) (0%) South / Central America and Caribbean (*) (7%) (7%) (0%) Africa and Middle East (*) 3% 3% 3% Asia (*) (1%) (1%) 4% READY-MIX PRICE Mexico (0%) (0%) 1% U.S.A. (15%) (15%) (3%) Spain (8%) (8%) 0% United Kingdom (8%) (8%) (0%) Rest of Europe (*) (1%) (1%) 6% South / Central America and Caribbean (*) (12%) (12%) (3%) Africa and Middle East (*) (17%) (17%) (2%) Asia (*) (3%) (3%) 1% AGGREGATES PRICE Mexico 10% 10% 3% U.S.A. (5%) (5%) 1% Spain (2%) (2%) 3% United Kingdom (7%) (7%) (3%) Rest of Europe (*) 8% 8% 10% South / Central America and Caribbean (*) (15%) (15%) 4% Africa and Middle East (*) 2% 2% 5% Asia (*) 8% 8% 7% (*) Volume weighted-average price. 2010 First Quarter Results Page 15
CEMEX announces senior management changes On February 9, 2010, CEMEX announced changes to its senior management team. Fernando A. Gonzalez has been appointed Executive Vice President, Planning & Finance. Mr. Gonzalez, who has served CEMEX in a variety of executive capacities since 1989 and has been a member of the Company’s Executive Committee since 2003, will be responsible for all corporate strategic and developmental functions, including the Company’s relationships with capital markets. CEMEX also announced the retirement of Hector Medina, Executive Vice President of Finance and Legal, and Armando J. Garcia, Executive Vice President of Technology, Energy and Sustainability. Mr. Medina and Mr. Garcia each participated in an early retirement program for senior executives. Mr. Garcia remains a member of the Company’s Board of Directors, on which he has served since 1983. As a result of these changes, the following executives report to Lorenzo H. Zambrano, CEMEX Chairman and CEO: Francisco Garza, President, Americas; Fernando A. Gonzalez, Executive Vice President, Planning & Finance; Juan Romero, President, Europe, Middle East, Africa & Asia; Victor Romo, Executive Vice President, Administration. CEMEX received US$100 million in cash proceeds from joint venture asset sale in the U.S. On February 22, 2010, CEMEX announced that its 49.9% owned Ready Mix USA LLC joint venture has completed the sale of 12 active quarries and certain other assets to SPO Partners & Co. for US$420 million. The active quarries, which consist of 2 granite quarries in Georgia, 9 limestone quarries in Tennessee, and 1 limestone quarry in Virginia, are operated by Ready Mix USA LLC and were deemed non strategic by CEMEX and Ready Mix USA LLC, its joint venture partner. The proceeds from the sale were partly used to reduce debt held by Ready Mix USA LLC, and to effect a cash distribution of approximately US$100 million to each joint venture partner, including CEMEX. CEMEX, which does not consolidate the results of Ready Mix USA LLC, expects to use its cash proceeds from this divestment to reduce outstanding debt and to enhance its liquidity position. CEMEX announces closing of offering of convertible subordinated notes On March 30, 2010, CEMEX announced the closing of an offering of US$715 million aggregate principal amount of 4.875% convertible subordinated Notes due 2015 (the “Notes”). The aggregate principal amount of the Notes issued reflects the full exercise of the US$65 million over-allotment option granted to the initial purchasers with respect to the Notes. In connection with the offering of the Notes, CEMEX entered into a capped call transaction with an affiliate of one of the initial purchasers. This transaction is expected to generally reduce the potential cost to CEMEX upon future conversion of the Notes. CEMEX used a portion of the net proceeds from the offering of the Notes to fund the purchase of the capped call transaction, and intends to use the remaining net proceeds for general corporate purposes and to repay indebtedness, including Certificados Bursatiles maturing through March 2011 and indebtedness under CEMEX’s Financing Agreement, as amended. The Notes and the capped call transaction, as well as CEMEX’s ADSs and, or CPOs, underlying such securities, have not been registered under the U.S. Securities Act of 1933 (the “Securities Act”) or any applicable state securities laws. The Notes were offered only to qualified institutional buyers pursuant to Rule 144A promulgated under the Securities Act. Unless so registered, the Notes and the securities issuable upon conversion may not be offered or sold in the United States except pursuant to an exemption from the registration requirements of the Securities Act and applicable state securities laws. 2010 First Quarter Results Page 16
OTHER INFORMATION Sale of our Australian assets In connection with the aforementioned sale of our Australian assets on October 1, 2009, our balance sheet as of March 31, 2009, includes the assets and liabilities associated to our Australian operations reclassified to the single lines items “Assets from discontinued operations” and “Liabilities from discontinued operations, respectively. Likewise, our income statements for the three-month periods ended March 31, 2009, presented elsewhere in this quarterly report, include the reclassification line-by-line of CEMEX Australia’s results of operations, net of income tax, for the three-month period to a single line item “Discontinued operations” before net income. According to MFRS, during the fourth quarter of 2009, “Discontinued operations” includes the result on the sale of our Australian assets representing a loss, net of income tax, of approximately US$446 million. This loss represents the difference between the selling price of approximately US$1.7 billion and the carrying amount of the net assets, including foreign currency translation effects accrued in equity. Selected condensed financial information of balance sheet as of September 30, 2009 and of income statement for CEMEX Australia for the nine-month period ended September 30, 2009 and the three-month period ended March 31, 2009, is as follows: Millions pesos September 30, 2009 March 31, 2009 Net sales MXN 13,015 MXN 3,979 Operating income MXN 1,198 MXN 395 Total assets MXN 28,595 Total liabilities MXN 6,013 Net total assets MXN 22,582 Mexican Tax Reform 2010 During November 2009 the Mexican Congress approved a new tax law which was enacted and published in the Daily Gazette on December 7, 2009 and effective as of January 1, 2010. The tax reform includes changes to the tax consolidation regime that will require the Company to determine its taxable income under the Mexican Income Tax Law (Ley del Impuesto Sobre la Renta) as though the tax consolidation provisions did not exist from 1999 forward. These changes also require that companies pay taxes on intercompany dividends (specifically, dividends paid from profits not taxed in the past), certain other special tax items, and operating losses generated by members of the consolidated tax group not recovered by the individual company generating such losses within the succeeding 10-year period (regarding losses from the sale of shares, losses incurred through 2001 were not required to be amortized against earnings nor were they to be reversed in regards with their effects on the consolidation; losses incurred after 2001 and through 2007 could be amortized within a five year period, and those for 2008 and forward within ten years, provided that if it was not done, their effects on the amortization would be reversed). This tax reform increase the statutory income tax rate from 28% to 30% for the year 2010 to 2012, 29% for 2013, and 28% for 2014 and future years. These changes to the tax law require that in 2010 CEMEX will be required to pay (at the new, 30% tax rate) 25% of the tax that results from eliminating the tax consolidation effects for the period from 1999 to 2004. The remaining 75% shall be paid as follows: 25% on 2011, 20% on 2012, 15% on 2013 and 15% on 2014. With respect to the consolidation effects originating after 2004, these are required to be taken into account during the sixth fiscal year following their origination and will be payable over the succeeding five years in the same proportions (25%, 25%, 20%, 15%, and 15%). Applicable taxes payable as a result of this change to the tax law will be increased by inflation adjustments as required by the Mexican Income Tax Law. Pursuant to the changes in the Mexican Tax Law dealing with tax consolidation, CEMEX estimates that the nominal value of the tax payments that will be payable in connection with such changes will be as shown in the table below and totaling approximately US$799 million. According to Mexican FRS, this amount was recognized by CEMEX as a Tax Payable on its balance sheet, against a corresponding deferred tax asset for approximately US$628 million for future tax benefits that CEMEX is expected to realize in connection with the payment of this new tax liability, and approximately US$171 million against retained earnings from previous years. The realization of this tax asset will be subject to future earnings paid in the companies that have generated tax losses in the past within the Mexico consolidated tax group as well as other limitations that currently exist, or in the future may exist, in the Mexican tax law. Tax Liability Amortization Schedule: US$ Millions 2010 US$30 2011 US$44 2012 US$54 2013 US$54 2014 US$98 2015 US$156 2016 US$136 2017 US$100 2018 US$79 2019 US$48 TOTAL US$799 Effects of the nationalization of CEMEX Venezuela on our financial statements Our consolidated balance sheets as of March 31, 2010 and 2009, presented elsewhere in this quarterly report, include within “Other assets” our net investment in our confiscated Venezuelan assets as of the same dates. Our net investment in our Venezuelan assets as of March 31, 2010 and 2009 is as follows: March 31, 2010 March 31, 2009 Net total assets MXN6,459 MXN7,419 2010 First Quarter Results Page 17
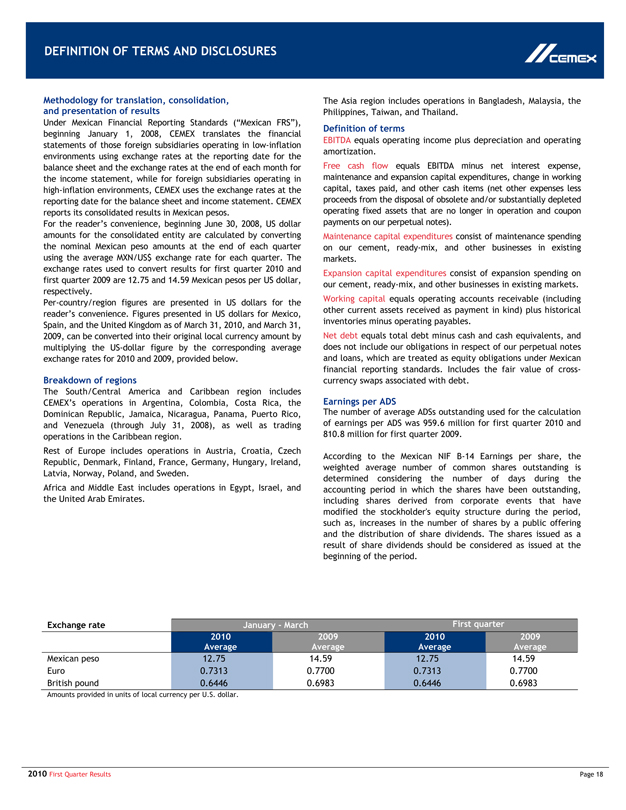
DEFINITION OF TERMS AND DISCLOSURES CEMEX Methodology for translation, consolidation, and presentation of results Under Mexican Financial Reporting Standards (“Mexican FRS”), beginning January 1, 2008, CEMEX translates the financial statements of those foreign subsidiaries operating in low-inflation environments using exchange rates at the reporting date for the balance sheet and the exchange rates at the end of each month for the income statement, while for foreign subsidiaries operating in high-inflation environments, CEMEX uses the exchange rates at the reporting date for the balance sheet and income statement. CEMEX reports its consolidated results in Mexican pesos. For the reader’s convenience, beginning June 30, 2008, US dollar amounts for the consolidated entity are calculated by converting the nominal Mexican peso amounts at the end of each quarter using the average MXN/US$ exchange rate for each quarter. The exchange rates used to convert results for first quarter 2010 and first quarter 2009 are 12.75 and 14.59 Mexican pesos per US dollar, respectively. Per-country/region figures are presented in US dollars for the reader’s convenience. Figures presented in US dollars for Mexico, Spain, and the United Kingdom as of March 31, 2010, and March 31, 2009, can be converted into their original local currency amount by multiplying the US-dollar figure by the corresponding average exchange rates for 2010 and 2009, provided below. Breakdown of regions The South/Central America and Caribbean region includes CEMEX’s operations in Argentina, Colombia, Costa Rica, the Dominican Republic, Jamaica, Nicaragua, Panama, Puerto Rico, and Venezuela (through July 31, 2008), as well as trading operations in the Caribbean region. Rest of Europe includes operations in Austria, Croatia, Czech Republic, Denmark, Finland, France, Germany, Hungary, Ireland, Latvia, Norway, Poland, and Sweden. Africa and Middle East includes operations in Egypt, Israel, and the United Arab Emirates. The Asia region includes operations in Bangladesh, Malaysia, the Philippines, Taiwan, and Thailand. Definition of terms EBITDA equals operating income plus depreciation and operating amortization. Free cash flow equals EBITDA minus net interest expense, maintenance and expansion capital expenditures, change in working capital, taxes paid, and other cash items (net other expenses less proceeds from the disposal of obsolete and/or substantially depleted operating fixed assets that are no longer in operation and coupon payments on our perpetual notes). Maintenance capital expenditures consist of maintenance spending on our cement, ready-mix, and other businesses in existing markets. Expansion capital expenditures consist of expansion spending on our cement, ready-mix, and other businesses in existing markets. Working capital equals operating accounts receivable (including other current assets received as payment in kind) plus historical inventories minus operating payables. Net debt equals total debt minus cash and cash equivalents, and does not include our obligations in respect of our perpetual notes and loans, which are treated as equity obligations under Mexican financial reporting standards. Includes the fair value of cross-currency swaps associated with debt. Earnings per ADS The number of average ADSs outstanding used for the calculation of earnings per ADS was 959.6 million for first quarter 2010 and 810.8 million for first quarter 2009. According to the Mexican NIF B-14 Earnings per share, the weighted average number of common shares outstanding is determined considering the number of days during the accounting period in which the shares have been outstanding, including shares derived from corporate events that have modified the stockholder’s equity structure during the period, such as, increases in the number of shares by a public offering and the distribution of share dividends. The shares issued as a result of share dividends should be considered as issued at the beginning of the period. Exchange rate January—March First quarter 2010 Average 2009 Average 2010 Average 2009 Average Mexican peso 12.75 14.59 12.75 14.59 Euro 0.7313 0.7700 0.7313 0.7700 British pound 0.6446 0.6983 0.6446 0.6983 Amounts provided in units of local currency per U.S. dollar. 2010 First Quarter Results Page 18