Exhibit 2
Exhibit 2 2019 FOURTH QUARTER RESULTS Stock Listing Information NYSE (ADS) Ticker: CX Mexican Stock Exchange Ticker: CEMEXCPO Ratio of CEMEXCPO to CX = 10:1 Investor Relations In the United States: + 1 877 7CX NYSE In Mexico + 52 (81) 8888 4292E-Mail: ir@cemex.com
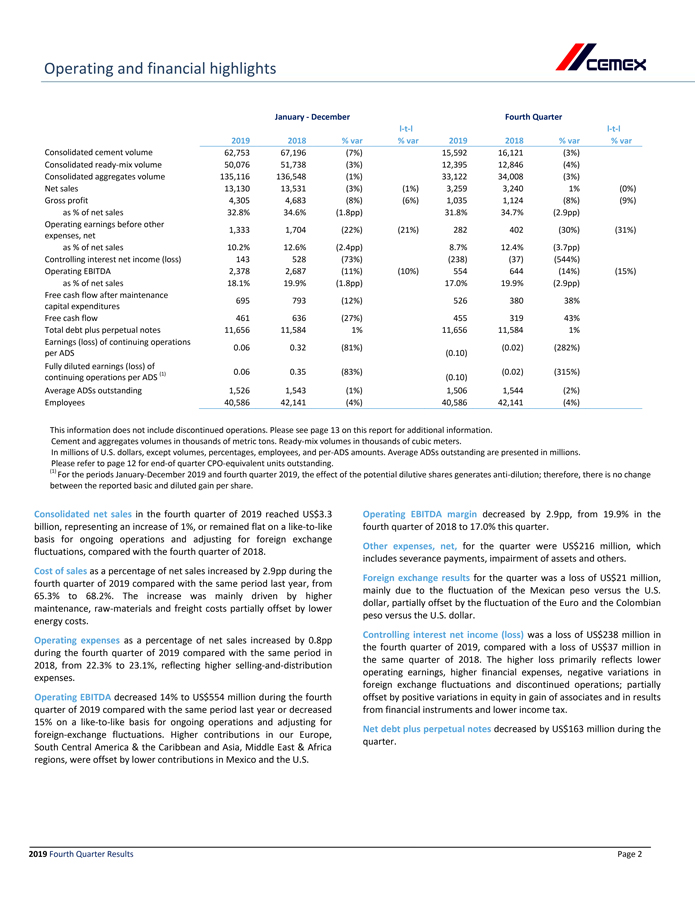
Operating and financial highlights January—December Fourth Quarterl-t-ll-t-l 2019 2018 % var% var20192018% var% var Consolidated cement volume 62,753 67,196 (7%)15,592 16,121 (3%) Consolidatedready-mix volume 50,076 51,738 (3%)12,395 12,846 (4%) Consolidated aggregates volume 135,116 136,548 (1%)33,122 34,008 (3%) Net sales 13,130 13,531 (3%)(1%)3,259 3,240 1%(0%) Gross profit 4,305 4,683 (8%)(6%)1,035 1,124 (8%)(9%) as % of net sales 32.8% 34.6%(1.8pp)31.8%34.7%(2.9pp) Operating earnings before other expenses, net 1,333 1,704 (22%)(21%)282 402 (30%)(31%) as % of net sales 10.2% 12.6%(2.4pp)8.7%12.4%(3.7pp) Controlling interest net income (loss) 143 528 (73%)(238)(37)(544%) Operating EBITDA 2,378 2,687 (11%)(10%)554 644 (14%)(15%) as % of net sales 18.1% 19.9%(1.8pp)17.0%19.9%(2.9pp) Free cash flow after maintenance capital expenditures 695 793 (12%)526 380 38% Free cash flow 461 636 (27%) 455 319 43% Total debt plus perpetual notes 11,656 11,584 1%11,656 11,584 1% Earnings (loss) of continuing operations per ADS 0.06 0.32 (81%) (0.10) (0.02)(282%) Fully diluted earnings (loss) of continuing operations per ADS (1) 0.06 0.35 (83%) (0.10) (0.02)(315%) Average ADSs outstanding 1,526 1,543 (1%)1,506 1,544 (2%) Employees 40,586 42,141 (4%) 40,586 42,141 (4%) This information does not include discontinued operations. Please see page 13 on this report for additional information. Cement and aggregates volumes in thousands of metric tons.Ready-mix volumes in thousands of cubic meters. In millions of U.S. dollars, except volumes, percentages, employees, andper-ADS amounts. Average ADSs outstanding are presented in millions. Please refer to page 12 forend-of quarterCPO-equivalent units outstanding. (1) For the periods January-December 2019 and fourth quarter 2019, the effect of the potential dilutive shares generates anti-dilution; therefore, there is no change between the reported basic and diluted gain per share. Consolidated net sales in the fourth quarter of 2019 reached US$3.3 billion, representing an increase of 1%, or remained flat on alike-to-like basis for ongoing operations and adjusting for foreign exchange fluctuations, compared with the fourth quarter of 2018. Cost of sales as a percentage of net sales increased by 2.9pp during the fourth quarter of 2019 compared with the same period last year, from 65.3% to 68.2%. The increase was mainly driven by higher maintenance,raw-materials and freight costs partially offset by lower energy costs. Operating expenses as a percentage of net sales increased by 0.8pp during the fourth quarter of 2019 compared with the same period in 2018, from 22.3% to 23.1%, reflecting higherselling-and-distribution expenses. Operating EBITDA decreased 14% to US$554 million during the fourth quarter of 2019 compared with the same period last year or decreased 15% on alike-to-like basis for ongoing operations and adjusting for foreign-exchange fluctuations. Higher contributions in our Europe, South Central America & the Caribbean and Asia, Middle East & Africa regions, were offset by lower contributions in Mexico and the U.S. Operating EBITDA margin decreased by 2.9pp, from 19.9% in the fourth quarter of 2018 to 17.0% this quarter. Other expenses, net, for the quarter were US$216 million, which includes severance payments, impairment of assets and others. Foreign exchange results for the quarter was a loss of US$21 million, mainly due to the fluctuation of the Mexican peso versus the U.S. dollar, partially offset by the fluctuation of the Euro and the Colombian peso versus the U.S. dollar. Controlling interest net income (loss) was a loss of US$238 million in the fourth quarter of 2019, compared with a loss of US$37 million in the same quarter of 2018. The higher loss primarily reflects lower operating earnings, higher financial expenses, negative variations in foreign exchange fluctuations and discontinued operations; partially offset by positive variations in equity in gain of associates and in results from financial instruments and lower income tax. Net debt plus perpetual notes decreased by US$163 million during the quarter. 2019 Fourth Quarter Results Page 2
Operating results
Mexico
January—December Fourth Quarter
2019 2018 %varl-t-l % var20192018%varl-t-l % var
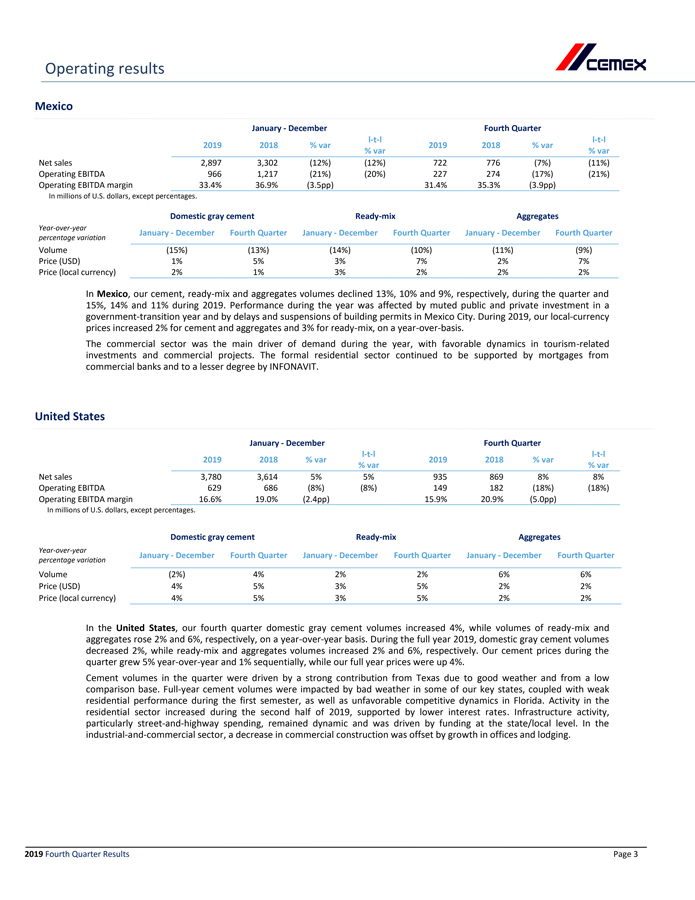
Net sales 2,897 3,302 (12%)(12%)722 776 (7%)(11%)
Operating EBITDA 966 1,217 (21%)(20%)227 274 (17%)(21%)
Operating EBITDA margin 33.4% 36.9%(3.5pp) 31.4%35.3%(3.9pp)
In millions of U.S. dollars, except percentages.
In Mexico, our cement,ready-mix and aggregates volumes declined 13%, 10% and 9%, respectively, during the quarter and 15%, 14% and 11% during 2019. Performance during the year was affected by muted public and private investment in a government-transition year and by delays and suspensions of building permits in Mexico City. During 2019, our local-currency prices increased 2% for cement and aggregates and 3% forready-mix, on a year-over-basis.
The commercial sector was the main driver of demand during the year, with favorable dynamics in tourism-related investments and commercial projects. The formal residential sector continued to be supported by mortgages from commercial banks and to a lesser degree by INFONAVIT.
United States
January—December Fourth Quarter
2019 2018 %varl-t-l % var20192018%varl-t-l % var
Net sales 3,780 3,614 5%5%935 869 8%8%
Operating EBITDA 629 686 (8%)(8%)149 182 (18%)(18%)
Operating EBITDA margin 16.6% 19.0%(2.4pp) 15.9%20.9%(5.0pp)
In millions of U.S. dollars, except percentages.
Domestic graycement Ready-mix Aggregates
Year-over-year percentage variation January—December Fourth QuarterJanuary—DecemberFourth QuarterJanuary—DecemberFourth Quarter
Volume (2%) 4%2%2%6%6%
Price (USD) 4% 5%3%5%2%2%
Price (local currency) 4% 5%3%5%2%2%
In the United States, our fourth quarter domestic gray cement volumes increased 4%, while volumes ofready-mix and aggregates rose 2% and 6%, respectively, on a year-over-year basis. During the full year 2019, domestic gray cement volumes decreased 2%, whileready-mix and aggregates volumes increased 2% and 6%, respectively. Our cement prices during the quarter grew 5% year-over-year and 1% sequentially, while our full year prices were up 4%.
Cement volumes in the quarter were driven by a strong contribution from Texas due to good weather and from a low comparison base. Full-year cement volumes were impacted by bad weather in some of our key states, coupled with weak residential performance during the first semester, as well as unfavorable competitive dynamics in Florida. Activity in the residential sector increased during the second half of 2019, supported by lower interest rates. Infrastructure activity, particularlystreet-and-highway spending, remained dynamic and was driven by funding at the state/local level. In theindustrial-and-commercial sector, a decrease in commercial construction was offset by growth in offices and lodging.
2019 Fourth Quarter Results Page 3
Operating results South, Central America and the Caribbean
January—December Fourth Quarter
2019 2018 %varl-t-l % var20192018%varl-t-l % var
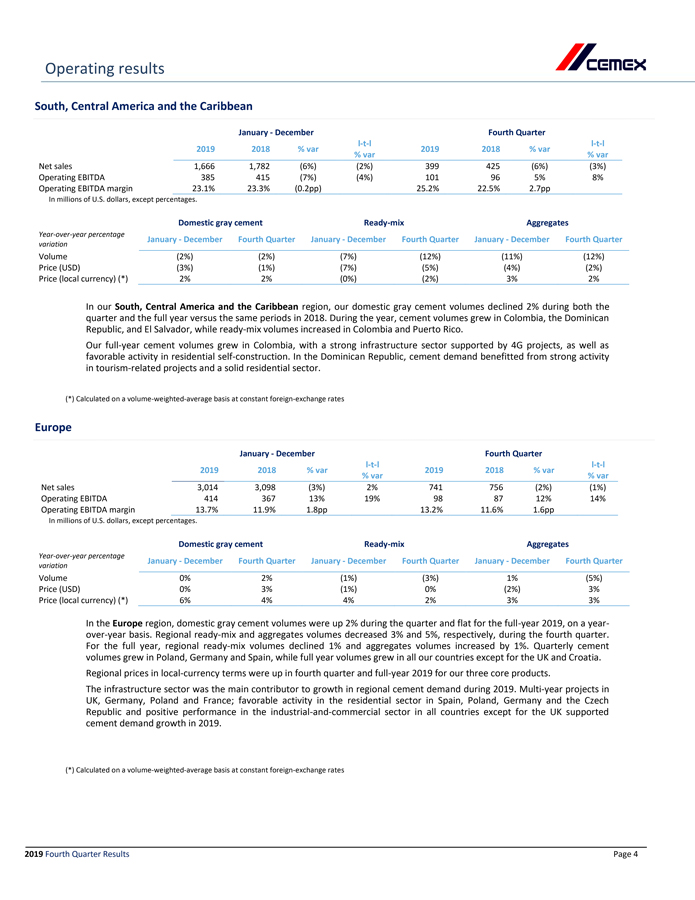
Net sales 1,666 1,782 (6%)(2%)399 425 (6%)(3%)
Operating EBITDA 385 415 (7%)(4%)101 96 5%8%
Operating EBITDA margin 23.1% 23.3%(0.2pp) 25.2%22.5%2.7pp
In millions of U.S. dollars, except percentages.
Domestic graycement Ready-mix Aggregates
Year-over-year percentage variation January—December Fourth QuarterJanuary—DecemberFourth QuarterJanuary—DecemberFourth Quarter
Volume (2%) (2%)(7%)(12%)(11%)(12%)
Price (USD) (3%) (1%)(7%)(5%)(4%)(2%)
Price (local currency) (*) 2% 2%(0%)(2%)3%2%
In our South, Central America and the Caribbean region, our domestic gray cement volumes declined 2% during both the quarter and the full year versus the same periods in 2018. During the year, cement volumes grew in Colombia, the Dominican Republic, and El Salvador, whileready-mix volumes increased in Colombia and Puerto Rico.
Our full-year cement volumes grew in Colombia, with a strong infrastructure sector supported by 4G projects, as well as favorable activity in residential self-construction. In the Dominican Republic, cement demand benefitted from strong activity in tourism-related projects and a solid residential sector.
(*) Calculated on a volume-weighted-average basis at constant foreign-exchange rates
Europe
January—December Fourth Quarter
2019 2018 %varl-t-l % var20192018%varl-t-l % var
Net sales 3,014 3,098 (3%)2%741 756 (2%)(1%)
Operating EBITDA 414 367 13%19%98 87 12%14%
Operating EBITDA margin 13.7% 11.9%1.8pp 13.2%11.6%1.6pp
In millions of U.S. dollars, except percentages.
Domestic graycement Ready-mix Aggregates
Year-over-year percentage variation January—December Fourth QuarterJanuary—DecemberFourth QuarterJanuary—DecemberFourth Quarter
Volume 0% 2%(1%)(3%)1%(5%)
Price (USD) 0% 3%(1%)0%(2%)3%
Price (local currency) (*) 6% 4%4%2%3%3%
In the Europe region, domestic gray cement volumes were up 2% during the quarter and flat for the full-year 2019, on a year-over-year basis. Regionalready-mix and aggregates volumes decreased 3% and 5%, respectively, during the fourth quarter. For the full year, regionalready-mix volumes declined 1% and aggregates volumes increased by 1%. Quarterly cement volumes grew in Poland, Germany and Spain, while full year volumes grew in all our countries except for the UK and Croatia.
Regional prices in local-currency terms were up in fourth quarter and full-year 2019 for our three core products.
The infrastructure sector was the main contributor to growth in regional cement demand during 2019. Multi-year projects in UK, Germany, Poland and France; favorable activity in the residential sector in Spain, Poland, Germany and the Czech Republic and positive performance in theindustrial-and-commercial sector in all countries except for the UK supported cement demand growth in 2019.
(*) Calculated on a volume-weighted-average basis at constant foreign-exchange rates
2019 Fourth Quarter Results Page 4
Operating results Asia, Middle East and Africa
January—December Fourth Quarter
2019 2018 %varl-t-l % var20192018%varl-t-l % var
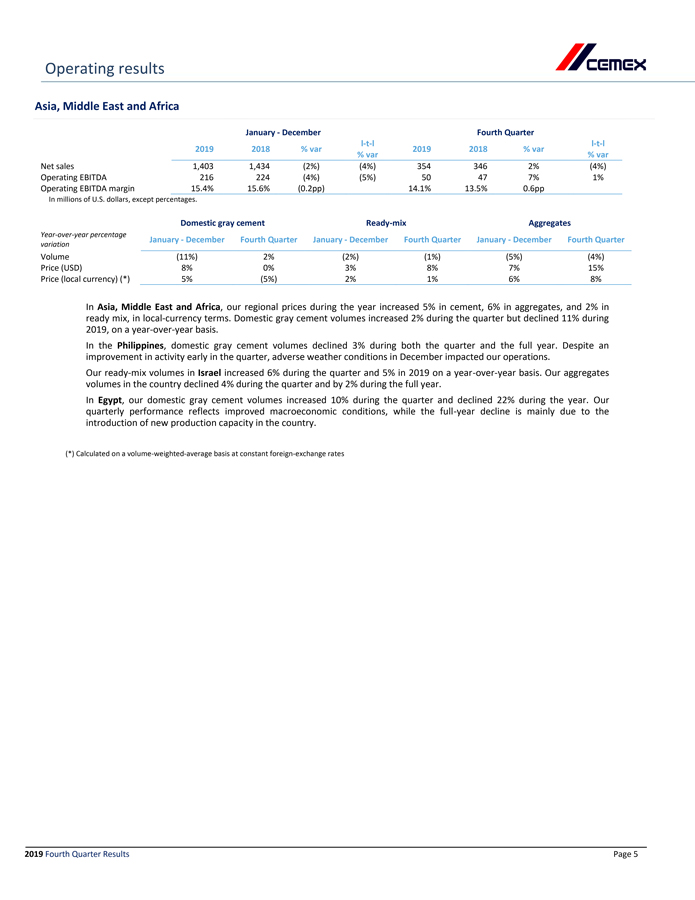
Net sales 1,403 1,434 (2%)(4%)354 346 2%(4%)
Operating EBITDA 216 224 (4%)(5%)50 47 7%1%
Operating EBITDA margin 15.4% 15.6%(0.2pp) 14.1%13.5%0.6pp
In millions of U.S. dollars, except percentages.
Domestic graycement Ready-mix Aggregates
Year-over-year percentage variation January—December Fourth QuarterJanuary—DecemberFourth QuarterJanuary—DecemberFourth Quarter
Volume (11%) 2%(2%)(1%)(5%)(4%)
Price (USD) 8% 0%3%8%7%15%
Price (local currency) (*) 5% (5%)2%1%6%8%
In Asia, Middle East and Africa, our regional prices during the year increased 5% in cement, 6% in aggregates, and 2% in ready mix, in local-currency terms. Domestic gray cement volumes increased 2% during the quarter but declined 11% during 2019, on a year-over-year basis.
In the Philippines, domestic gray cement volumes declined 3% during both the quarter and the full year. Despite an improvement in activity early in the quarter, adverse weather conditions in December impacted our operations.
Ourready-mix volumes in Israel increased 6% during the quarter and 5% in 2019 on a year-over-year basis. Our aggregates volumes in the country declined 4% during the quarter and by 2% during the full year.
In Egypt, our domestic gray cement volumes increased 10% during the quarter and declined 22% during the year. Our quarterly performance reflects improved macroeconomic conditions, while the full-year decline is mainly due to the introduction of new production capacity in the country.
(*) Calculated on a volume-weighted-average basis at constant foreign-exchange rates
2019 Fourth Quarter Results Page 5
Operating EBITDA and free cash flow
January—December Fourth Quarter
2019 2018% var20192018% var
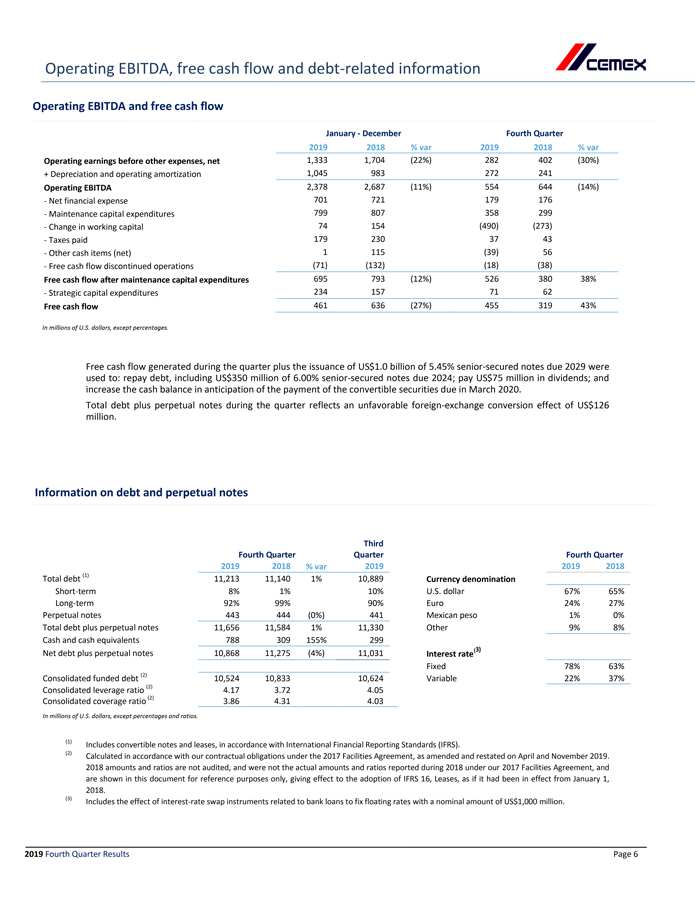
Operating earnings before other expenses, net 1,333 1,704(22%)282402(30%)
+ Depreciation and operating amortization 1,045 983 272241
Operating EBITDA 2,378 2,687(11%)554644(14%)
- Net financial expense 701 721179176
- Maintenance capital expenditures 799 807358299
- Change in working capital 74 154(490)(273)
- Taxes paid 179 2303743
- Other cash items (net) 1 115(39)56
- Free cash flow discontinued operations (71) (132) (18) (38)
Free cash flow after maintenance capital expenditures 695 793(12%)52638038%
- Strategic capital expenditures 234 1577162
Free cash flow 461 636(27%)45531943%
In millions of U.S. dollars, except percentages.
Free cash flow generated during the quarter plus the issuance of US$1.0 billion of 5.45% senior-secured notes due 2029 were used to: repay debt, including US$350 million of 6.00% senior-secured notes due 2024; pay US$75 million in dividends; and increase the cash balance in anticipation of the payment of the convertible securities due in March 2020.
Total debt plus perpetual notes during the quarter reflects an unfavorable foreign-exchange conversion effect of US$126 million.
Information on debt and perpetual notes
Third Quarter
Fourth Quarter Fourth Quarter
2019 2018% var20192019 2018
Total debt (1) 11,213 11,140 1%10,889 Currency denomination
Short-term 8%1%10%U.S. dollar67%65%
Long-term 92%99%90%Euro24%27%
Perpetual notes 443 444 (0%)441 Mexican peso1%0%
Total debt plus perpetual notes 11,656 11,584 1%11,330 Other9%8%
Cash and cash equivalents 788 309 155%299
Net debt plus perpetual notes 10,868 11,275 (4%)11,031 Interest rate(3)
Fixed 78%63%
Consolidated funded debt (2) 10,524 10,833 10,624 Variable22%37%
Consolidated leverage ratio (2) 4.17 3.72 4.05
Consolidated coverage ratio (2) 3.86 4.31 4.03
In millions of U.S. dollars, except percentages and ratios.
(1) Includes convertible notes and leases, in accordance with International Financial Reporting Standards (IFRS).
(2) Calculated in accordance with our contractual obligations under the 2017 Facilities Agreement, as amended and restated on April and November 2019. 2018 amounts and ratios are not audited, and were not the actual amounts and ratios reported during 2018 under our 2017 Facilities Agreement, and are shown in this document for reference purposes only, giving effect to the adoption of IFRS 16, Leases, as if it had been in effect from January 1, 2018.
(3) Includes the effect of interest-rate swap instruments related to bank loans to fix floating rates with a nominal amount of US$1,000 million.
2019 Fourth Quarter Results Page 6
Operating results Consolidated Income Statement & Balance Sheet
CEMEX, S.A.B. de C.V. and Subsidiaries
(Thousands of U.S. dollars, except per ADS amounts)
January—December Fourth Quarter
like-to-likelike-to-like
INCOME STATEMENT 2019 2018% var% var20192018% var% var
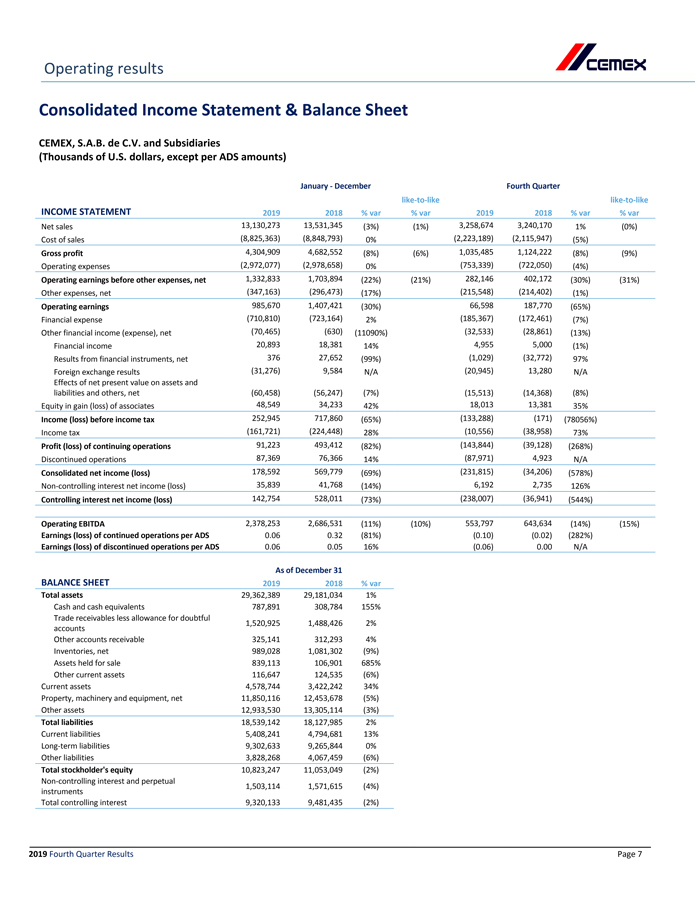
Net sales 13,130,273 13,531,345(3%)(1%)3,258,6743,240,1701%(0%)
Cost of sales (8,825,363) (8,848,793)0% (2,223,189)(2,115,947)(5%)
Gross profit 4,304,909 4,682,552(8%)(6%)1,035,4851,124,222(8%)(9%)
Operating expenses (2,972,077) (2,978,658)0% (753,339)(722,050)(4%)
Operating earnings before other expenses, net 1,332,833 1,703,894(22%)(21%)282,146402,172(30%)(31%)
Other expenses, net (347,163) (296,473)(17%) (215,548)(214,402)(1%)
Operating earnings 985,670 1,407,421(30%)66,598187,770(65%)
Financial expense (710,810) (723,164)2%(185,367)(172,461)(7%)
Other financial income (expense), net (70,465) (630)(11090%)(32,533)(28,861)(13%)
Financial income 20,89318,38114%4,9555,000(1%)
Results from financial instruments, net 37627,652(99%)(1,029)(32,772)97%
Foreign exchange results (31,276)9,584N/A(20,945)13,280N/A
Effects of net present value on assets and liabilities and others, net (60,458)(56,247)(7%)(15,513)(14,368)(8%)
Equity in gain (loss) of associates 48,549 34,23342% 18,013 13,38135%
Income (loss) before income tax 252,945 717,860(65%)(133,288)(171)(78056%)
Income tax (161,721) (224,448)28% (10,556)(38,958)73%
Profit (loss) of continuing operations 91,223 493,412(82%)(143,844)(39,128)(268%)
Discontinued operations 87,369 76,36614% (87,971)4,923N/A
Consolidated net income (loss) 178,592 569,779(69%)(231,815)(34,206)(578%)
Non-controlling interest net income (loss) 35,839 41,768(14%) 6,1922,735126%
Controlling interest net income (loss) 142,754 528,011(73%) (238,007)(36,941)(544%)
Operating EBITDA 2,378,253 2,686,531(11%)(10%)553,797643,634(14%)(15%)
Earnings (loss) of continued operations per ADS 0.06 0.32(81%)(0.10)(0.02)(282%)
Earnings (loss) of discontinued operations per ADS 0.06 0.0516% (0.06)0.00N/A
As of December 31
BALANCE SHEET 2019 2018% var
Total assets 29,362,389 29,181,0341%
Cash and cash equivalents 787,891308,784155%
Trade receivables less allowance for doubtful accounts 1,520,9251,488,4262%
Other accounts receivable 325,141312,2934%
Inventories, net 989,0281,081,302(9%)
Assets held for sale 839,113106,901685%
Other current assets 116,647124,535(6%)
Current assets 4,578,744 3,422,24234%
Property, machinery and equipment, net 11,850,116 12,453,678(5%)
Other assets 12,933,530 13,305,114(3%)
Total liabilities 18,539,142 18,127,9852%
Current liabilities 5,408,241 4,794,68113%
Long-term liabilities 9,302,633 9,265,8440%
Other liabilities 3,828,268 4,067,459(6%)
Total stockholder’s equity 10,823,247 11,053,049(2%)
Non-controlling interest and perpetual instruments 1,503,114 1,571,615(4%)
Total controlling interest 9,320,133 9,481,435(2%)
2019 Fourth Quarter Results Page 7
Operating results Operating Summary per Country
In thousands of U.S. dollars
January—December Fourth Quarter
like-to-likelike-to-like
NET SALES 2019 2018% var% var20192018% var% var
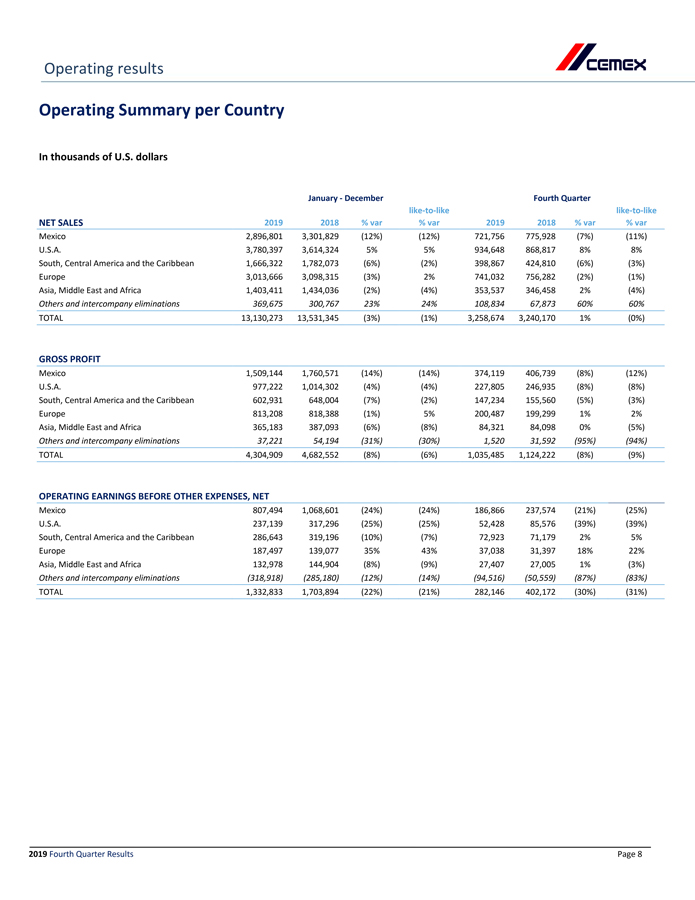
Mexico 2,896,801 3,301,829 (12%)(12%)721,756 775,928 (7%)(11%)
U.S.A. 3,780,397 3,614,324 5%5%934,648 868,817 8%8%
South, Central America and the Caribbean 1,666,322 1,782,073 (6%)(2%)398,867 424,810 (6%)(3%)
Europe 3,013,666 3,098,315 (3%)2%741,032 756,282 (2%)(1%)
Asia, Middle East and Africa 1,403,411 1,434,036 (2%)(4%)353,537 346,458 2%(4%)
Others and intercompany eliminations 369,675 300,767 23%24%108,834 67,873 60%60%
TOTAL 13,130,273 13,531,345 (3%)(1%)3,258,674 3,240,170 1%(0%)
GROSS PROFIT
Mexico 1,509,144 1,760,571 (14%)(14%)374,119 406,739 (8%)(12%)
U.S.A. 977,222 1,014,302 (4%)(4%)227,805 246,935 (8%)(8%)
South, Central America and the Caribbean 602,931 648,004 (7%)(2%)147,234 155,560 (5%)(3%)
Europe 813,208 818,388 (1%)5%200,487 199,299 1%2%
Asia, Middle East and Africa 365,183 387,093 (6%)(8%)84,321 84,098 0%(5%)
Others and intercompany eliminations 37,221 54,194 (31%)(30%)1,520 31,592 (95%)(94%)
TOTAL 4,304,909 4,682,552 (8%)(6%)1,035,485 1,124,222 (8%)(9%)
OPERATING EARNINGS BEFORE OTHER EXPENSES, NET
Mexico 807,494 1,068,601 (24%)(24%)186,866 237,574 (21%)(25%)
U.S.A. 237,139 317,296 (25%)(25%)52,428 85,576 (39%)(39%)
South, Central America and the Caribbean 286,643 319,196 (10%)(7%)72,923 71,179 2%5%
Europe 187,497 139,077 35%43%37,038 31,397 18%22%
Asia, Middle East and Africa 132,978 144,904 (8%)(9%)27,407 27,005 1%(3%)
Others and intercompany eliminations (318,918) (285,180)(12%)(14%)(94,516)(50,559)(87%)(83%)
TOTAL 1,332,833 1,703,894 (22%)(21%)282,146 402,172 (30%)(31%)
2019 Fourth Quarter Results Page 8
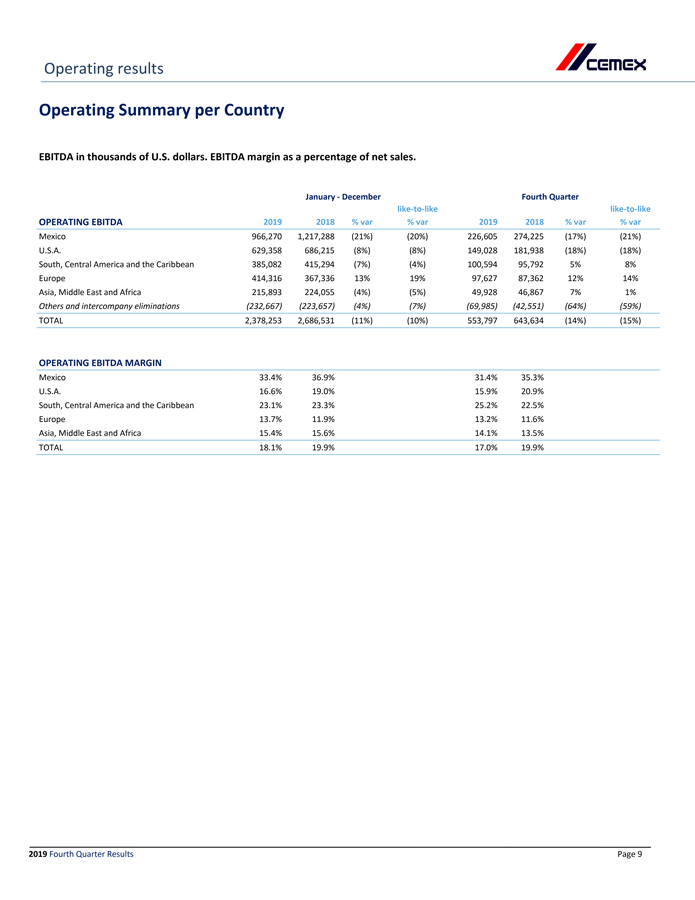
Operating results Operating Summary per Country
EBITDA in thousands of U.S. dollars. EBITDA margin as a percentage of net sales.
January—December Fourth Quarter
like-to-likelike-to-like
OPERATING EBITDA 2019 2018% var% var20192018% var% var
Mexico 966,270 1,217,288 (21%)(20%)226,605 274,225 (17%)(21%)
U.S.A. 629,358 686,215 (8%)(8%)149,028 181,938 (18%)(18%)
South, Central America and the Caribbean 385,082 415,294 (7%)(4%)100,594 95,792 5%8%
Europe 414,316 367,336 13%19%97,627 87,362 12%14%
Asia, Middle East and Africa 215,893 224,055 (4%)(5%)49,928 46,867 7%1%
Others and intercompany eliminations (232,667) (223,657)(4%)(7%)(69,985)(42,551)(64%)(59%)
TOTAL 2,378,253 2,686,531 (11%)(10%)553,797 643,634 (14%)(15%)
OPERATING EBITDA MARGIN
Mexico 33.4% 36.9% 31.4%35.3%
U.S.A. 16.6% 19.0%15.9% 20.9%
South, Central America and the Caribbean 23.1% 23.3%25.2% 22.5%
Europe 13.7% 11.9%13.2% 11.6%
Asia, Middle East and Africa 15.4% 15.6% 14.1%13.5%
TOTAL 18.1% 19.9% 17.0%19.9%
2019
Fourth Quarter Results
P
age 9
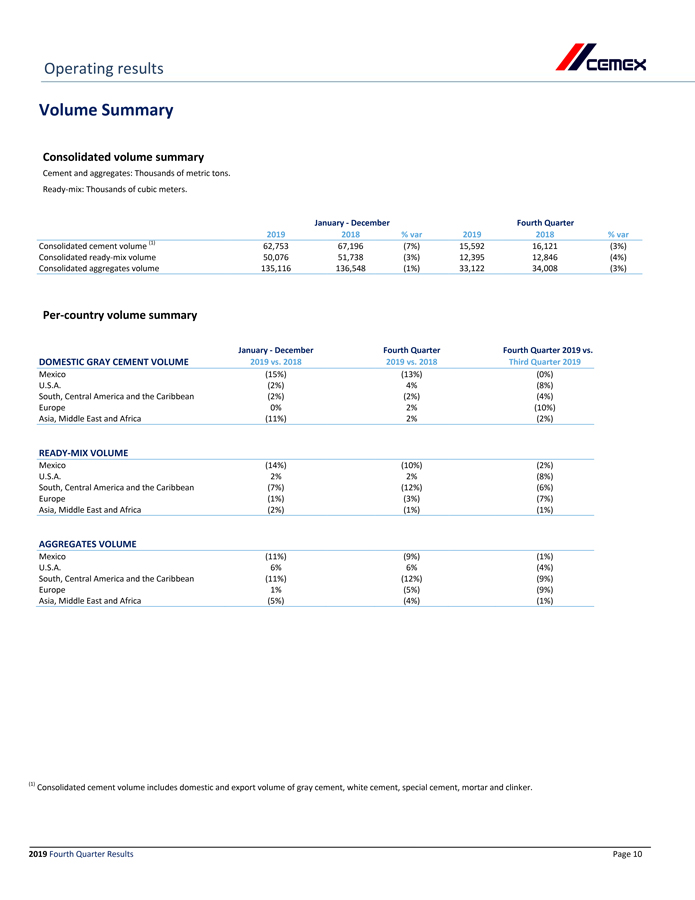
Operating results Volume Summary
Consolidated volume summary
Cement and aggregates: Thousands of metric tons.
Ready-mix: Thousands of cubic meters.
January—December Fourth Quarter
2019 2018 % var20192018% var
Consolidated cement volume (1) 62,753 67,196(7%)15,59216,121(3%)
Consolidatedready-mix volume 50,076 51,738(3%)12,39512,846(4%)
Consolidated aggregates volume 135,116 136,548(1%)33,12234,008(3%)
Per-country volume summary
January—December Fourth QuarterFourth Quarter 2019 vs.
DOMESTIC GRAY CEMENT VOLUME 2019 vs. 2018 2019 vs. 2018Third Quarter 2019
Mexico (15%) (13%) (0%)
U.S.A. (2%) 4%(8%)
South, Central America and the Caribbean (2%) (2%)(4%)
Europe 0% 2%(10%)
Asia, Middle East and Africa (11%) 2% (2%)
READY-MIX VOLUME
Mexico (14%) (10%) (2%)
U.S.A. 2% 2%(8%)
South, Central America and the Caribbean (7%) (12%)(6%)
Europe (1%) (3%)(7%)
Asia, Middle East and Africa (2%) (1%) (1%)
AGGREGATES VOLUME
Mexico (11%) (9%) (1%)
U.S.A. 6% 6%(4%)
South, Central America and the Caribbean (11%) (12%)(9%)
Europe 1% (5%)(9%)
Asia, Middle East and Africa (5%) (4%) (1%)
(1) Consolidated cement volume includes domestic and export volume of gray cement, white cement, special cement, mortar and clinker.
2019
Fourth Quarter Results
P
age 10
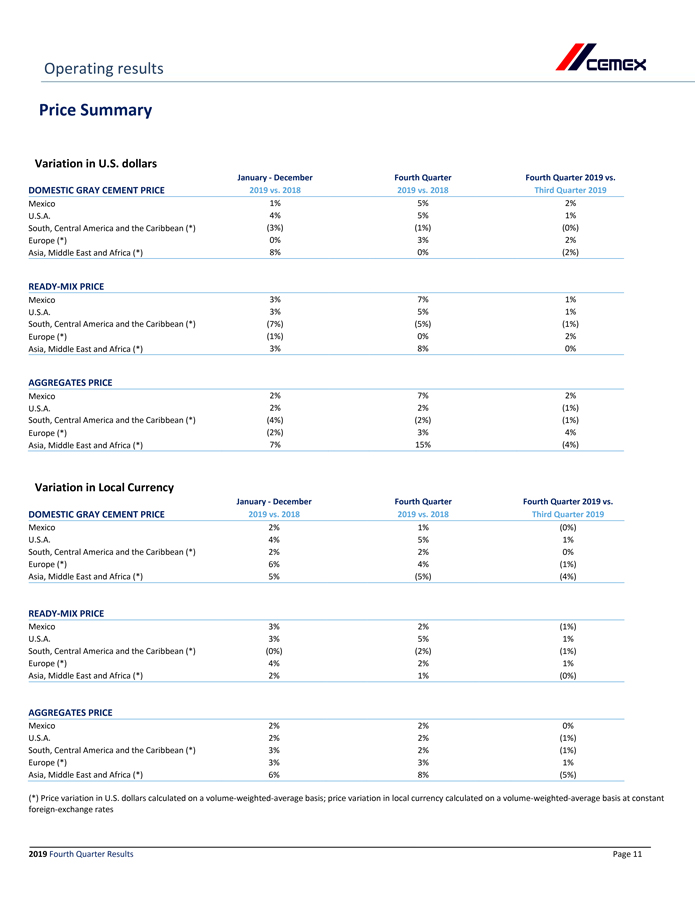
Operating results
Price Summary
Variation in U.S. dollars
January—December Fourth QuarterFourth Quarter 2019 vs.
DOMESTIC GRAY CEMENT PRICE 2019 vs. 2018 2019 vs. 2018Third Quarter 2019
Mexico 1% 5% 2%
U.S.A. 4% 5%1%
South, Central America and the Caribbean (*) (3%) (1%)(0%)
Europe (*) 0% 3%2%
Asia, Middle East and Africa (*) 8% 0% (2%)
READY-MIX PRICE
Mexico 3% 7% 1%
U.S.A. 3% 5%1%
South, Central America and the Caribbean (*) (7%) (5%)(1%)
Europe (*) (1%) 0%2%
Asia, Middle East and Africa (*) 3% 8% 0%
AGGREGATES PRICE
Mexico 2% 7% 2%
U.S.A. 2% 2%(1%)
South, Central America and the Caribbean (*) (4%) (2%)(1%)
Europe (*) (2%) 3%4%
Asia, Middle East and Africa (*) 7% 15% (4%)
Variation in Local Currency
January—December Fourth QuarterFourth Quarter 2019 vs.
DOMESTIC GRAY CEMENT PRICE 2019 vs. 2018 2019 vs. 2018Third Quarter 2019
Mexico 2% 1% (0%)
U.S.A. 4% 5%1%
South, Central America and the Caribbean (*) 2% 2%0%
Europe (*) 6% 4%(1%)
Asia, Middle East and Africa (*) 5% (5%) (4%)
READY-MIX PRICE
Mexico 3% 2% (1%)
U.S.A. 3% 5%1%
South, Central America and the Caribbean (*) (0%) (2%)(1%)
Europe (*) 4% 2%1%
Asia, Middle East and Africa (*) 2% 1% (0%)
AGGREGATES PRICE
Mexico 2% 2% 0%
U.S.A. 2% 2%(1%)
South, Central America and the Caribbean (*) 3% 2%(1%)
Europe (*) 3% 3%1%
Asia, Middle East and Africa (*) 6% 8% (5%)
(*) Price variation in U.S. dollars calculated on a volume-weighted-average basis; price variation in local currency calculated on a volume-weighted-average basis at constant foreign-exchange rates
2019
Fourth Quarter Results
P
age 11
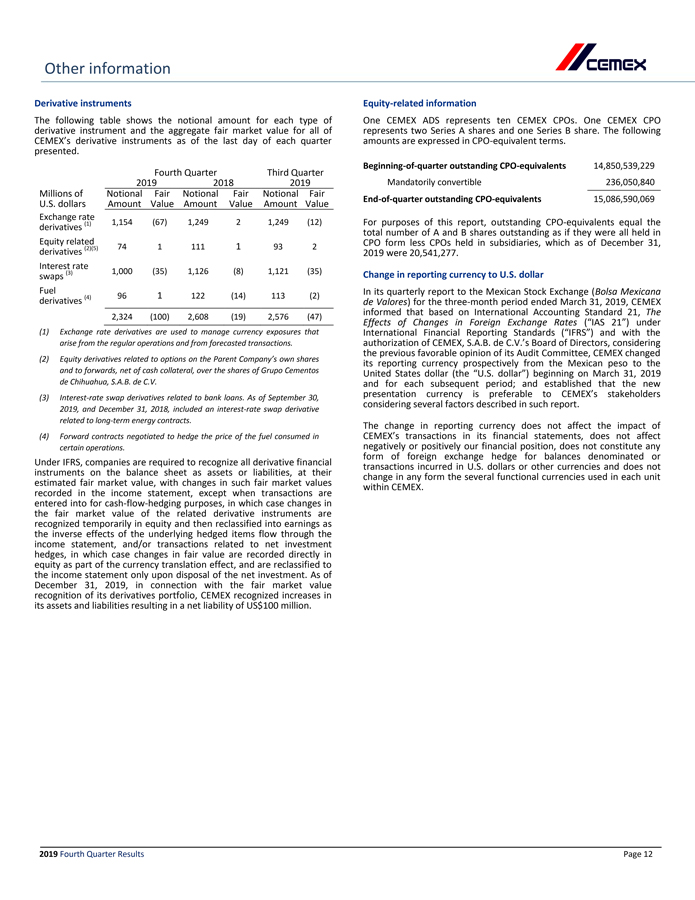
Other information Derivative instruments
The following table shows the notional amount for each type of derivative instrument and the aggregate fair market value for all of CEMEX’s derivative instruments as of the last day of each quarter presented. Fourth Quarter Third Quarter 2019 2018 2019 Millions of U.S. dollars Notional Amount Fair Value Notional Amount Fair Value Notional Amount Fair Value Exchange rate derivatives (1) 1,154 (67) 1,249 2 1,249 (12) Equity related derivatives (2)(5) 74 1 111 1 93 2 Interest rate swaps (3) 1,000 (35) 1,126 (8) 1,121 (35) Fuel derivatives (4) 96 1 122 (14) 113 (2) 2,324 (100) 2,608 (19) 2,576 (47)
(1) Exchange rate derivatives are used to manage currency exposures that arise from the regular operations and from forecasted transactions.
(2) Equity derivatives related to options on the Parent Company’s own shares and to forwards, net of cash collateral, over the shares of Grupo Cementos de Chihuahua, S.A.B. de C.V.
(3) Interest-rate swap derivatives related to bank loans. As of September 30, 2019, and December 31, 2018, included an interest-rate swap derivative related to long-term energy contracts.
(4) Forward contracts negotiated to hedge the price of the fuel consumed in certain operations.
Under IFRS, companies are required to recognize all derivative financial instruments on the balance sheet as assets or liabilities, at their estimated fair market value, with changes in such fair market values recorded in the income statement, except when transactions are entered into for cash-flow-hedging purposes, in which case changes in the fair market value of the related derivative instruments are recognized temporarily in equity and then reclassified into earnings as the inverse effects of the underlying hedged items flow through the income statement, and/or transactions related to net investment hedges, in which case changes in fair value are recorded directly in equity as part of the currency translation effect, and are reclassified to the income statement only upon disposal of the net investment. As of December 31, 2019, in connection with the fair market value recognition of its derivatives portfolio, CEMEX recognized increases in its assets and liabilities resulting in a net liability of US$100 million.
Equity-related information
One CEMEX ADS represents ten CEMEX CPOs. One CEMEX CPO represents two Series A shares and one Series B share. The following amounts are expressed inCPO-equivalent terms.
Beginning-of-quarter outstandingCPO-equivalents
14,850,539,229
Mandatorily convertible
236,050,840
End-of-quarter outstandingCPO-equivalents
15,086,590,069
For purposes of this report, outstandingCPO-equivalents equal the total number of A and B shares outstanding as if they were all held in CPO form less CPOs held in subsidiaries, which as of December 31, 2019 were 20,541,277.
Change in reporting currency to U.S. dollar
In its quarterly report to the Mexican Stock Exchange (Bolsa Mexicana de Valores) for the three-month period ended March 31, 2019, CEMEX informed that based on International Accounting Standard 21, The Effects of Changes in Foreign Exchange Rates (“IAS 21”) under International Financial Reporting Standards (“IFRS”) and with the authorization of CEMEX, S.A.B. de C.V.’s Board of Directors, considering the previous favorable opinion of its Audit Committee, CEMEX changed its reporting currency prospectively from the Mexican peso to the United States dollar (the “U.S. dollar”) beginning on March 31, 2019 and for each subsequent period; and established that the new presentation currency is preferable to CEMEX’s stakeholders considering several factors described in such report.
The change in reporting currency does not affect the impact of CEMEX’s transactions in its financial statements, does not affect negatively or positively our financial position, does not constitute any form of foreign exchange hedge for balances denominated or transactions incurred in U.S. dollars or other currencies and does not change in any form the several functional currencies used in each unit within CEMEX. 2019 Fourth Quarter Results Page 12
Other information Newly issued IFRS effective in 2019
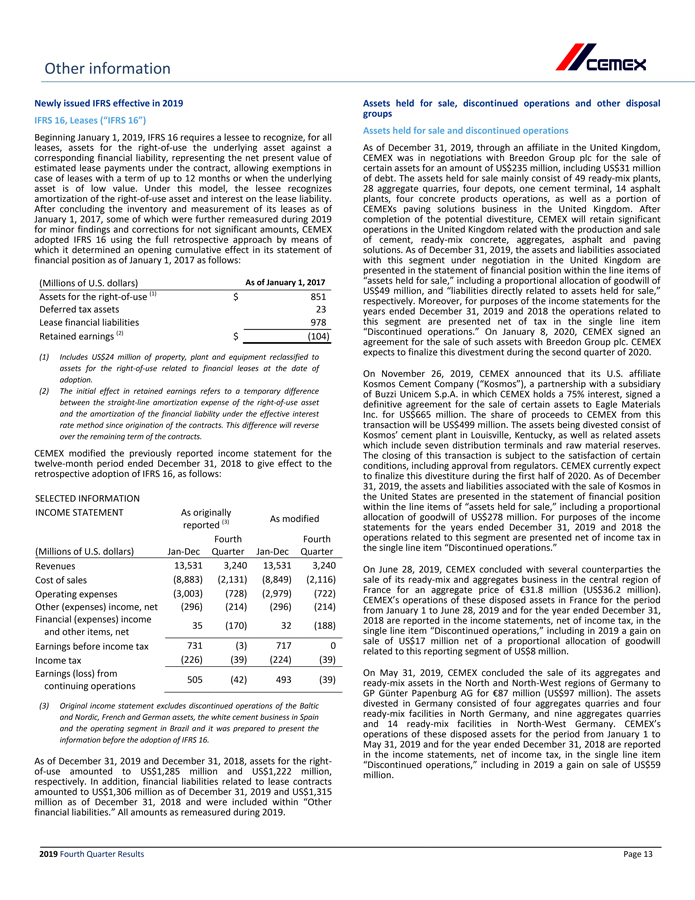
IFRS 16, Leases (“IFRS 16”)
Beginning January 1, 2019, IFRS 16 requires a lessee to recognize, for all leases, assets for theright-of-use the underlying asset against a corresponding financial liability, representing the net present value of estimated lease payments under the contract, allowing exemptions in case of leases with a term of up to 12 months or when the underlying asset is of low value. Under this model, the lessee recognizes amortization of theright-of-use asset and interest on the lease liability. After concluding the inventory and measurement of its leases as of January 1, 2017, some of which were further remeasured during 2019 for minor findings and corrections for not significant amounts, CEMEX adopted IFRS 16 using the full retrospective approach by means of which it determined an opening cumulative effect in its statement of financial position as of January 1, 2017 as follows:
(Millions of U.S. dollars) As of January 1, 2017
Assets for theright-of-use (1) $851
Deferred tax assets 23
Lease financial liabilities 978
Retained earnings (2) $(104)
(1) Includes US$24 million of property, plant and equipment reclassified to assets for theright-of-use related to financial leases at the date of adoption.
(2) The initial effect in retained earnings refers to a temporary difference between the straight-line amortization expense of theright-of-use asset and the amortization of the financial liability under the effective interest rate method since origination of the contracts. This difference will reverse over the remaining term of the contracts.
CEMEX modified the previously reported income statement for the twelve-month period ended December 31, 2018 to give effect to the retrospective adoption of IFRS 16, as follows:
SELECTED INFORMATION
INCOME STATEMENT As originally reported (3) As modified
(Millions of U.S.dollars) Jan-Dec FourthQuarterJan-DecFourth Quarter
Revenues 13,531 3,24013,5313,240
Cost of sales (8,883) (2,131)(8,849)(2,116)
Operating expenses (3,003) (728)(2,979)(722)
Other (expenses) income, net (296) (214)(296)(214)
Financial (expenses) income and other items, net 35 (170)32(188)
Earnings before income tax 731 (3)7170
Income tax (226) (39)(224)(39)
Earnings (loss) from continuing operations 505 (42)493(39)
(3) Original income statement excludes discontinued operations of the Baltic and Nordic, French and German assets, the white cement business in Spain and the operating segment in Brazil and it was prepared to present the information before the adoption of IFRS 16.
As of December 31, 2019 and December 31, 2018, assets for theright-of-use amounted to US$1,285 million and US$1,222 million, respectively. In addition, financial liabilities related to lease contracts amounted to US$1,306 million as of December 31, 2019 and US$1,315 million as of December 31, 2018 and were included within “Other financial liabilities.” All amounts as remeasured during 2019.
Assets held for sale, discontinued operations and other disposal groups
Assets held for sale and discontinued operations
As of December 31, 2019, through an affiliate in the United Kingdom, CEMEX was in negotiations with Breedon Group plc for the sale of certain assets for an amount of US$235 million, including US$31 million of debt. The assets held for sale mainly consist of 49ready-mix plants, 28 aggregate quarries, four depots, one cement terminal, 14 asphalt plants, four concrete products operations, as well as a portion of CEMEXs paving solutions business in the United Kingdom. After completion of the potential divestiture, CEMEX will retain significant operations in the United Kingdom related with the production and sale of cement,ready-mix concrete, aggregates, asphalt and paving solutions. As of December 31, 2019, the assets and liabilities associated with this segment under negotiation in the United Kingdom are presented in the statement of financial position within the line items of “assets held for sale,” including a proportional allocation of goodwill of US$49 million, and “liabilities directly related to assets held for sale,” respectively. Moreover, for purposes of the income statements for the years ended December 31, 2019 and 2018 the operations related to this segment are presented net of tax in the single line item “Discontinued operations.” On January 8, 2020, CEMEX signed an agreement for the sale of such assets with Breedon Group plc. CEMEX expects to finalize this divestment during the second quarter of 2020.
On November 26, 2019, CEMEX announced that its U.S. affiliate Kosmos Cement Company (“Kosmos”), a partnership with a subsidiary of Buzzi Unicem S.p.A. in which CEMEX holds a 75% interest, signed a definitive agreement for the sale of certain assets to Eagle Materials Inc. for US$665 million. The share of proceeds to CEMEX from this transaction will be US$499 million. The assets being divested consist of Kosmos’ cement plant in Louisville, Kentucky, as well as related assets which include seven distribution terminals and raw material reserves. The closing of this transaction is subject to the satisfaction of certain conditions, including approval from regulators. CEMEX currently expect to finalize this divestiture during the first half of 2020. As of December 31, 2019, the assets and liabilities associated with the sale of Kosmos in the United States are presented in the statement of financial position within the line items of “assets held for sale,” including a proportional allocation of goodwill of US$278 million. For purposes of the income statements for the years ended December 31, 2019 and 2018 the operations related to this segment are presented net of income tax in the single line item “Discontinued operations.”
On June 28, 2019, CEMEX concluded with several counterparties the sale of itsready-mix and aggregates business in the central region of France for an aggregate price of €31.8 million (US$36.2 million). CEMEX’s operations of these disposed assets in France for the period from January 1 to June 28, 2019 and for the year ended December 31, 2018 are reported in the income statements, net of income tax, in the single line item “Discontinued operations,” including in 2019 a gain on sale of US$17 million net of a proportional allocation of goodwill related to this reporting segment of US$8 million.
On May 31, 2019, CEMEX concluded the sale of its aggregates andready-mix assets in the North and North-West regions of Germany to GP Günter Papenburg AG for €87 million (US$97 million). The assets divested in Germany consisted of four aggregates quarries and fourready-mix facilities in North Germany, and nine aggregates quarries and 14ready-mix facilities in North-West Germany. CEMEX’s operations of these disposed assets for the period from January 1 to May 31, 2019 and for the year ended December 31, 2018 are reported in the income statements, net of income tax, in the single line item “Discontinued operations,” including in 2019 a gain on sale of US$59 million.
2019 Fourth Quarter Results Page 13
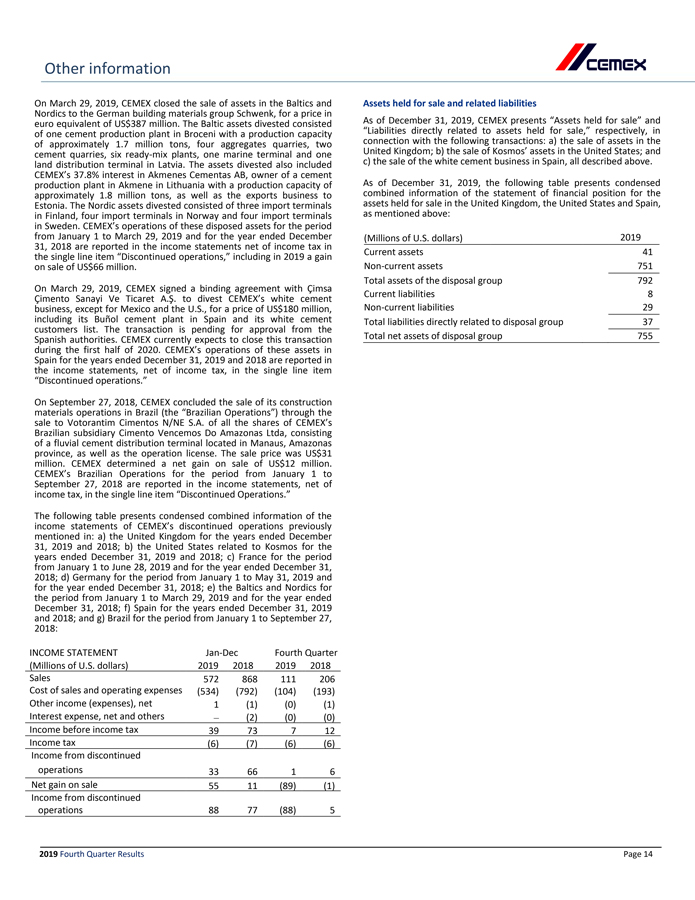
On March 29, 2019, CEMEX closed the sale of assets in the Baltics and Nordics to the German building materials group Schwenk, for a price in euro equivalent of US$387 million. The Baltic assets divested consisted of one cement production plant in Broceni with a production capacity of approximately 1.7 million tons, four aggregates quarries, two cement quarries, sixready-mix plants, one marine terminal and one land distribution terminal in Latvia. The assets divested also included CEMEX’s 37.8% interest in Akmenes Cementas AB, owner of a cement production plant in Akmene in Lithuania with a production capacity of approximately 1.8 million tons, as well as the exports business to Estonia. The Nordic assets divested consisted of three import terminals in Finland, four import terminals in Norway and four import terminals in Sweden. CEMEX’s operations of these disposed assets for the period from January 1 to March 29, 2019 and for the year ended December 31, 2018 are reported in the income statements net of income tax in the single line item “Discontinued operations,” including in 2019 a gain on sale of US$66 million.
On March 29, 2019, CEMEX signed a binding agreement with Çimsa Çimento Sanayi Ve Ticaret A.Ş. to divest CEMEX’s white cement business, except for Mexico and the U.S., for a price of US$180 million, including its Buñol cement plant in Spain and its white cement customers list. The transaction is pending for approval from the Spanish authorities. CEMEX currently expects to close this transaction during the first half of 2020. CEMEX’s operations of these assets in Spain for the years ended December 31, 2019 and 2018 are reported in the income statements, net of income tax, in the single line item “Discontinued operations.”
On September 27, 2018, CEMEX concluded the sale of its construction materials operations in Brazil (the “Brazilian Operations”) through the sale to Votorantim Cimentos N/NE S.A. of all the shares of CEMEX’s Brazilian subsidiary Cimento Vencemos Do Amazonas Ltda, consisting of a fluvial cement distribution terminal located in Manaus, Amazonas province, as well as the operation license. The sale price was US$31 million. CEMEX determined a net gain on sale of US$12 million. CEMEX’s Brazilian Operations for the period from January 1 to September 27, 2018 are reported in the income statements, net of income tax, in the single line item “Discontinued Operations.”
The following table presents condensed combined information of the income statements of CEMEX’s discontinued operations previously mentioned in: a) the United Kingdom for the years ended December 31, 2019 and 2018; b) the United States related to Kosmos for the years ended December 31, 2019 and 2018; c) France for the period from January 1 to June 28, 2019 and for the year ended December 31, 2018; d) Germany for the period from January 1 to May 31, 2019 and for the year ended December 31, 2018; e) the Baltics and Nordics for the period from January 1 to March 29, 2019 and for the year ended December 31, 2018; f) Spain for the years ended December 31, 2019 and 2018; and g) Brazil for the period from January 1 to September 27, 2018:
INCOMESTATEMENT Jan-Dec Fourth Quarter
(Millions of U.S. dollars) 2019 201820192018
Sales 572 868111206
Cost of sales and operating expenses (534) (792)(104)(193)
Other income (expenses), net 1 (1)(0)(1)
Interest expense, net and others – (2)(0)(0)
Income before income tax 39 73712
Income tax (6) (7)(6)(6)
Income from discontinued operations 33 66 16
Net gain on sale 55 11(89)(1)
Income from discontinued operations 88 77 (88)5
Assets held for sale and related liabilities
As of December 31, 2019, CEMEX presents “Assets held for sale” and “Liabilities directly related to assets held for sale,” respectively, in connection with the following transactions: a) the sale of assets in the United Kingdom; b) the sale of Kosmos’ assets in the United States; and c) the sale of the white cement business in Spain, all described above.
As of December 31, 2019, the following table presents condensed combined information of the statement of financial position for the assets held for sale in the United Kingdom, the United States and Spain, as mentioned above:
(Millions of U.S. dollars) 2019
Current assets 41
Non-current assets 751
Total assets of the disposal group 792
Current liabilities 8
Non-current liabilities 29
Total liabilities directly related to disposal group 37
Total net assets of disposal group 755
2019
Fourth Quarter Results
P
age 14
Methodology for translation, consolidation, and presentation of results
Under IFRS, CEMEX translates the financial statements of foreign subsidiaries using exchange rates at the reporting date for the balance sheet and the exchange rates at the end of each month for the income statement. Beginning on March 31, 2019 and for each subsequent period CEMEX reports its consolidated results in U.S. dollars.
Breakdown of regions
The South, Central America and the Caribbean region includes CEMEX’s operations in Argentina, Bahamas, Colombia, Costa Rica, the Dominican Republic, El Salvador, Guatemala, Guyana, Haiti, Jamaica, Trinidad & Tobago, Barbados, Nicaragua, Panama, Peru, and Puerto Rico, as well as trading operations in the Caribbean region.
Europe includes operations in Spain, Croatia, the Czech Republic, France, Germany, Poland, and the United Kingdom.
The Asia, Middle East and Africa region includes operations in the United Arab Emirates, Egypt, Israel and the Philippines.
Definition of terms
Free cash flow equals operating EBITDA minus net interest expense, maintenance and strategic capital expenditures, change in working capital, taxes paid, and other cash items (net other expenses less proceeds from the disposal of obsolete and/or substantially depleted operating fixed assets that are no longer in operation and coupon payments on our perpetual notes).
l-t-l (like to like) on alike-to-like basis adjusting for currency fluctuations and for investments/divestments when applicable.
Maintenance capital expenditures equals investments incurred for the purpose of ensuring the company’s operational continuity. These include capital expenditures on projects required to replace obsolete assets or maintain current operational levels, and mandatory capital expenditures, which are projects required to comply with governmental regulations or company policies.
Net debt equals total debt (debt plus convertible bonds and financial leases) minus cash and cash equivalents.
Operating EBITDA equals operating earnings before other expenses, net, plus depreciation and operating amortization.
pp equals percentage points
Prices all references to pricing initiatives, price increases or decreases, refer to our prices for our products
Strategic capital expenditures equals investments incurred with the purpose of increasing the company’s profitability. These include capital expenditures on projects designed to increase profitability by expanding capacity, and margin improvement capital expenditures, which are projects designed to increase profitability by reducing costs.
Working capital equals operating accounts receivable (including other current assets received as payment in kind) plus historical inventories minus operating payables.
% var percentage variation
Earnings per ADS
Please refer to page 2 for the number of average ADSs outstanding used for the calculation of earnings per ADS.
According to the IAS 33 Earnings per share, the weighted-average number of common shares outstanding is determined considering the number of days during the accounting period in which the shares have been outstanding, including shares derived from corporate events that have modified the stockholder’s equity structure during the period, such as increases in the number of shares by a public offering and the distribution of shares from stock dividends or recapitalizations of retained earnings and the potential diluted shares (Stock options, Restricted Stock Options and Mandatory Convertible Shares). The shares issued because of share dividends, recapitalizations and potential diluted shares are considered as issued at the beginning of the period.
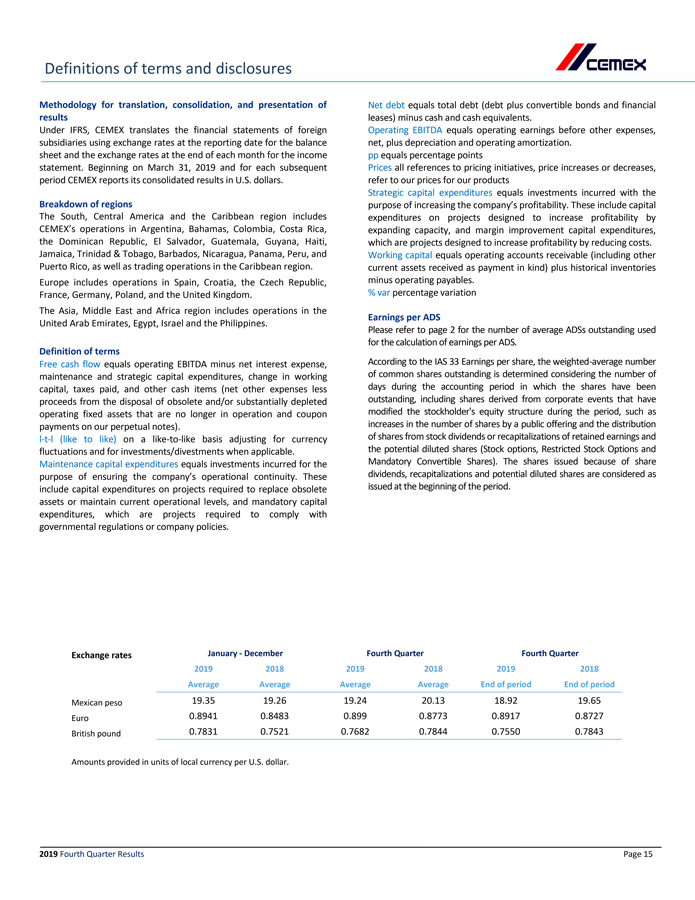
Exchange rates January—December Fourth QuarterFourth Quarter
2019 2018 2019201820192018
Average Average AverageAverageEnd of periodEnd of period
Mexican peso 19.35 19.2619.2420.1318.9219.65
Euro 0.8941 0.84830.8990.87730.89170.8727
British pound 0.7831 0.75210.76820.78440.75500.7843
Amounts provided in units of local currency per U.S. dollar.
2019 Fourth Quarter Results Page 15