Exhibit 3 Fourth Quarter 2021 Results SPLIT AIRPORT, CROATIA
Except as the context otherwise may require, references in this presentation to “CEMEX,” “we,” “us” or “our” refer to CEMEX, S.A.B. de C.V. and its consolidated entities. This presentation contains forward-looking statements within the meaning of the U.S. federal securities laws. We intend these forward-looking statements to be covered by the safe harbor provisions for forward-looking statements within the meaning of the U.S. federal securities laws. In some cases, these statements can be identified by the use of forward-looking words such as “may,” “assume,” “might,” “should,” “could,” “continue,” “would,” “can,” “consider,” “anticipate,” “estimate,” “expect,” “envision,” “plan,” “believe,” “foresee,” “predict,” “potential,” “target,” “strategy,” “intend,” “aimed” or other similar words. These forward-looking statements reflect, as of the date such forward-looking statements are made, unless otherwise indicated, our current expectations and projections about future events based on our knowledge of present facts and circumstances and assumptions about future events. These statements necessarily involve risks and uncertainties that could cause actual results to differ materially from our expectations. Some of the risks, uncertainties and other important factors that could cause results to differ, or that otherwise could have an impact on us or our consolidated entities, include, but are not limited to: the impact of pandemics, epidemics or outbreaks of infectious diseases and the response of governments and other third parties, including with respect to the novel strain of the coronavirus identified in China in late 2019 and its variants (“COVID-19”), which have affected and may continue to adversely affect, among other matters, the ability of our operating facilities to operate at full or any capacity, supply chains, international operations, availability of liquidity, investor confidence and consumer spending, as well as availability of, and demand for, our products and services; the cyclical activity of the construction sector; our exposure to other sectors that impact our and our clients’ businesses, such as, but not limited to, the energy sector; availability of raw materials and related fluctuating prices; competition in the markets in which we offer our products and services; general political, social, health, economic and business conditions in the markets in which we operate or that affect our operations and any significant economic, health, political or social developments in those markets, as well as any inherent risks to international operations; the regulatory environment, including environmental, energy, tax, antitrust, and acquisition-related rules and regulations; our ability to satisfy our obligations under our material debt agreements, the indentures that govern our outstanding notes and our other debt instruments and financial obligations, including our subordinated notes with no fixed maturity; the availability of short-term credit lines or working capital facilities, which can assist us in connection with market cycles; the impact of our below investment grade debt rating on our cost of capital and on the cost of the products and services we purchase; loss of reputation of our brands; our ability to consummate asset sales, fully integrate newly acquired businesses, achieve cost-savings from our cost-reduction initiatives, implement our pricing initiatives for our products and generally meet our “Operation Resilience” strategy’s goals; the increasing reliance on information technology infrastructure for our sales, invoicing, procurement, financial statements and other processes that can adversely affect our sales and operations in the event that the infrastructure does not work as intended, experiences technical difficulties or is subjected to cyber-attacks; changes in the economy that affect demand for consumer goods, consequently affecting demand for our products and services; weather conditions, including but not limited to, excessive rain and snow, and disasters such as earthquakes and floods; trade barriers, including tariffs or import taxes and changes in existing trade policies or changes to, or withdrawals from, free trade agreements, including the United States-Mexico-Canada Agreement; terrorist and organized criminal activities as well as geopolitical events; declarations of insolvency or bankruptcy, or becoming subject to similar proceedings; natural disasters and other unforeseen events (including global health hazards such as COVID-19); and the other risks and uncertainties described in our public filings. Readers are urged to read this presentation and carefully consider the risks, uncertainties and other factors that affect our business and operations. The information contained in this presentation is subject to change without notice, and we are not obligated to publicly update or revise forward-looking statements after the date hereof or to reflect the occurrence of anticipated or unanticipated events or circumstances. Readers should review future reports filed by us with the U.S. Securities and Exchange Commission and the Mexican Stock Exchange (Bolsa Mexicana de Valores). This presentation also includes statistical data regarding the production, distribution, marketing and sale of cement, ready mix concrete, clinker, aggregates and urbanization solutions. Unless the context indicates otherwise, all references to pricing initiatives, price increases or decreases, refer to CEMEX’s prices for CEMEX’s products. We generated some of this data internally, and some was obtained from independent industry publications and reports that we believe to be reliable sources. We have not independently verified this data nor sought the consent of any organizations to refer to their reports in this presentation. UNLESS OTHERWISE NOTED, ALL FIGURES ARE PRESENTED IN DOLLARS, BASED ON INTERNATIONAL FINANCIAL REPORTING STANDARDS, AS APPLICABLE Copyright CEMEX, S.A.B. de C.V. and its subsidiaries
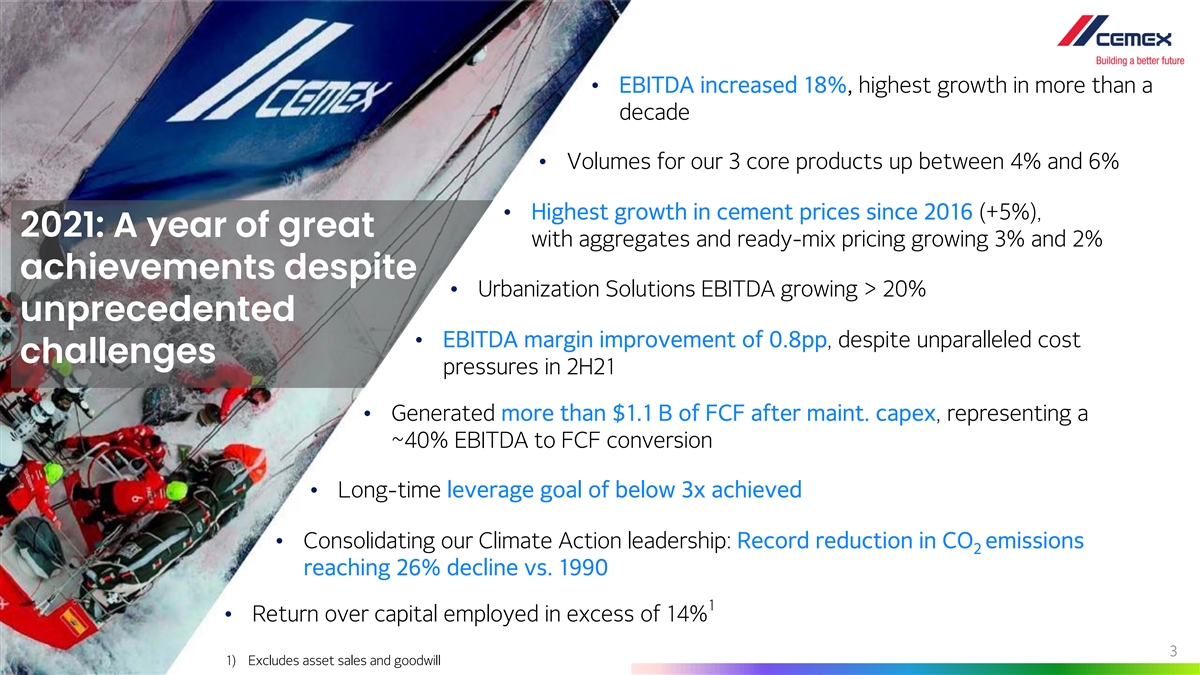
• EBITDA increased 18%, highest growth in more than a decade • Volumes for our 3 core products up between 4% and 6% • Highest growth in cement prices since 2016 (+5%), 2021: A year of great with aggregates and ready-mix pricing growing 3% and 2% achievements despite • Urbanization Solutions EBITDA growing > 20% unprecedented • EBITDA margin improvement of 0.8pp, despite unparalleled cost challenges pressures in 2H21 • Generated more than $1.1 B of FCF after maint. capex, representing a ~40% EBITDA to FCF conversion • Long-time leverage goal of below 3x achieved • Consolidating our Climate Action leadership: Record reduction in CO emissions 2 reaching 26% decline vs. 1990 1 • Return over capital employed in excess of 14% 3 1) Excludes asset sales and goodwill
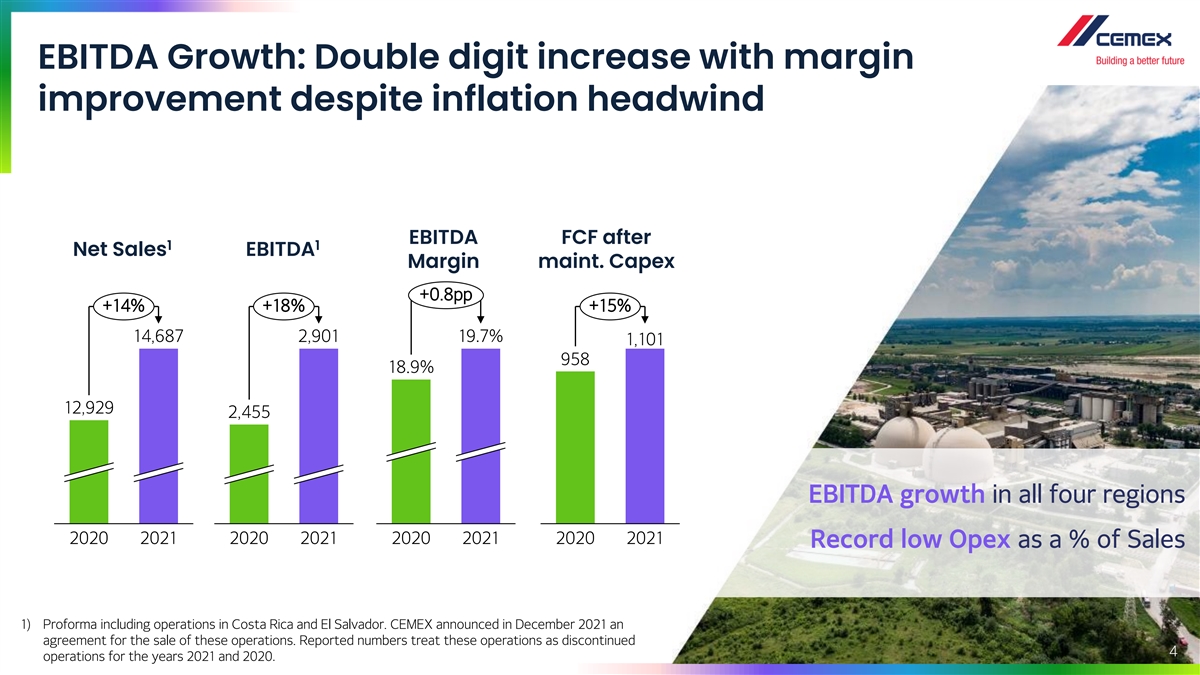
EBITDA Growth: Double digit increase with margin improvement despite inflation headwind EBITDA FCF after 1 1 Net Sales EBITDA Margin maint. Capex +0.8pp +14% +18% +15% 14,687 2,901 19.7% 1,101 958 18.9% 12,929 2,455 EBITDA growth in all four regions 2020 2021 2020 2021 2020 2021 2020 2021 Record low Opex as a % of Sales 1) Proforma including operations in Costa Rica and El Salvador. CEMEX announced in December 2021 an agreement for the sale of these operations. Reported numbers treat these operations as discontinued 4 operations for the years 2021 and 2020.
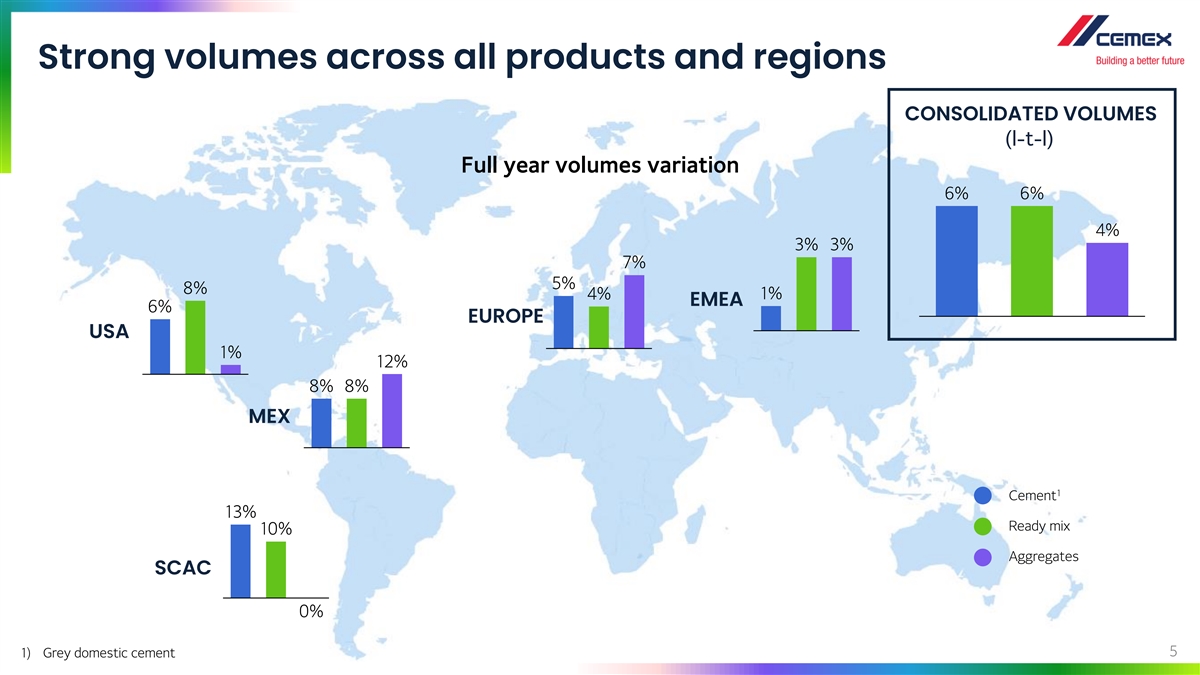
Strong volumes across all products and regions CONSOLIDATED VOLUMES (l-t-l) Full year volumes variation 6% 6% 4% 3% 3% 7% 5% 8% 4% 1% EMEA 6% EUROPE USA 1% 12% 8% 8% MEX 1 Cement 13% Ready mix 10% Aggregates SCAC 0% 5 1) Grey domestic cement
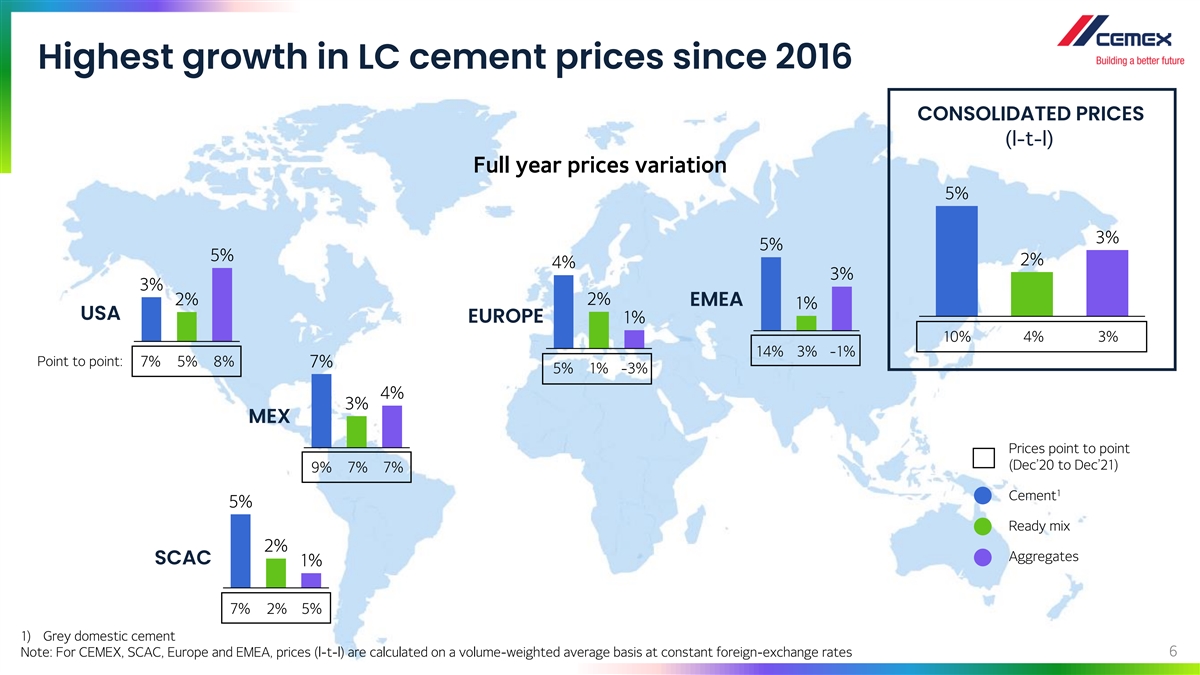
Highest growth in LC cement prices since 2016 CONSOLIDATED PRICES (l-t-l) Full year prices variation 5% 3% 5% 5% 2% 4% 3% 3% 2% 2% EMEA 1% USA EUROPE 1% 10% 4% 3% 14% 3% -1% Point to point: 7% 5% 8% 7% 5% 1% -3% 4% 3% MEX Prices point to point (Dec’20 to Dec’21) 9% 7% 7% 1 Cement 5% Ready mix 2% Aggregates SCAC 1% 7% 2% 5% 1) Grey domestic cement 6 Note: For CEMEX, SCAC, Europe and EMEA, prices (l-t-l) are calculated on a volume-weighted average basis at constant foreign-exchange rates
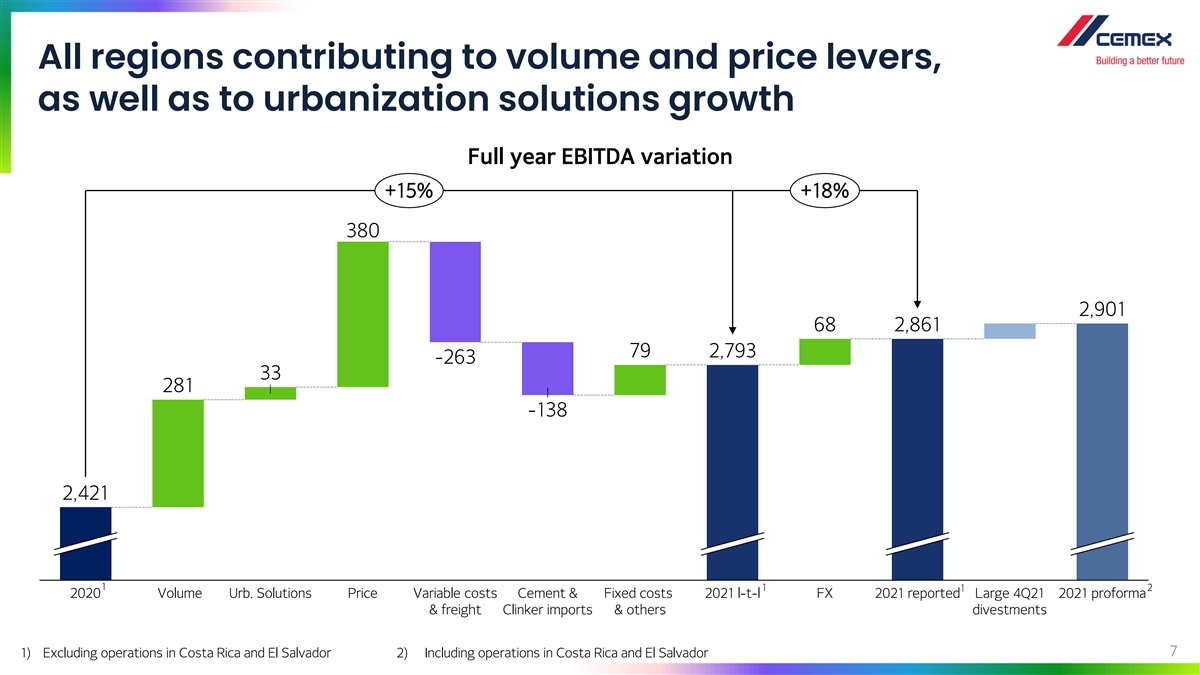
All regions contributing to volume and price levers, as well as to urbanization solutions growth Full year EBITDA variation +15% +18% 380 2,901 68 2,861 79 2,793 -263 33 281 -138 2,421 1 1 1 2 2020 Volume Urb. Solutions Price Variable costs Cement & Fixed costs 2021 l-t-l FX 2021 reported Large 4Q21 2021 proforma & freight Clinker imports & others divestments 7 1) Excluding operations in Costa Rica and El Salvador 2) Including operations in Costa Rica and El Salvador
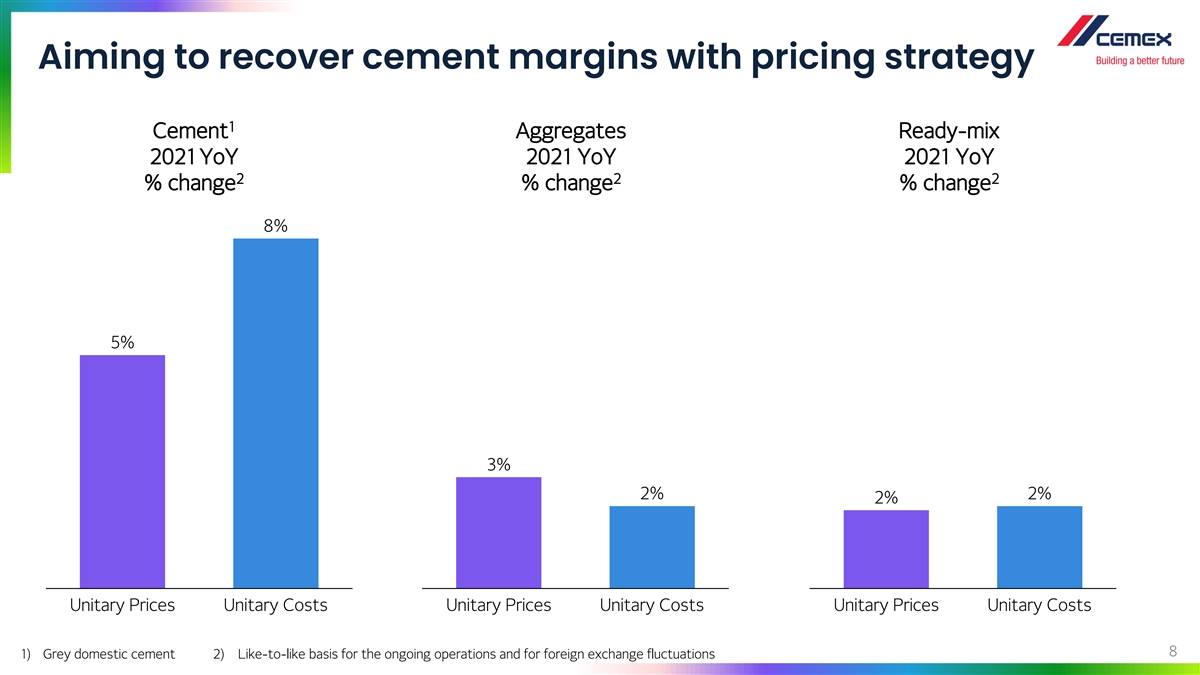
Aiming to recover cement margins with pricing strategy 1 Cement Aggregates Ready-mix 2021 YoY 2021 YoY 2021 YoY 2 2 2 % change % change % change 8% 5% 3% 2% 2% 2% Unitary Prices Unitary Costs Unitary Prices Unitary Costs Unitary Prices Unitary Costs 8 1) Grey domestic cement 2) Like-to-like basis for the ongoing operations and for foreign exchange fluctuations
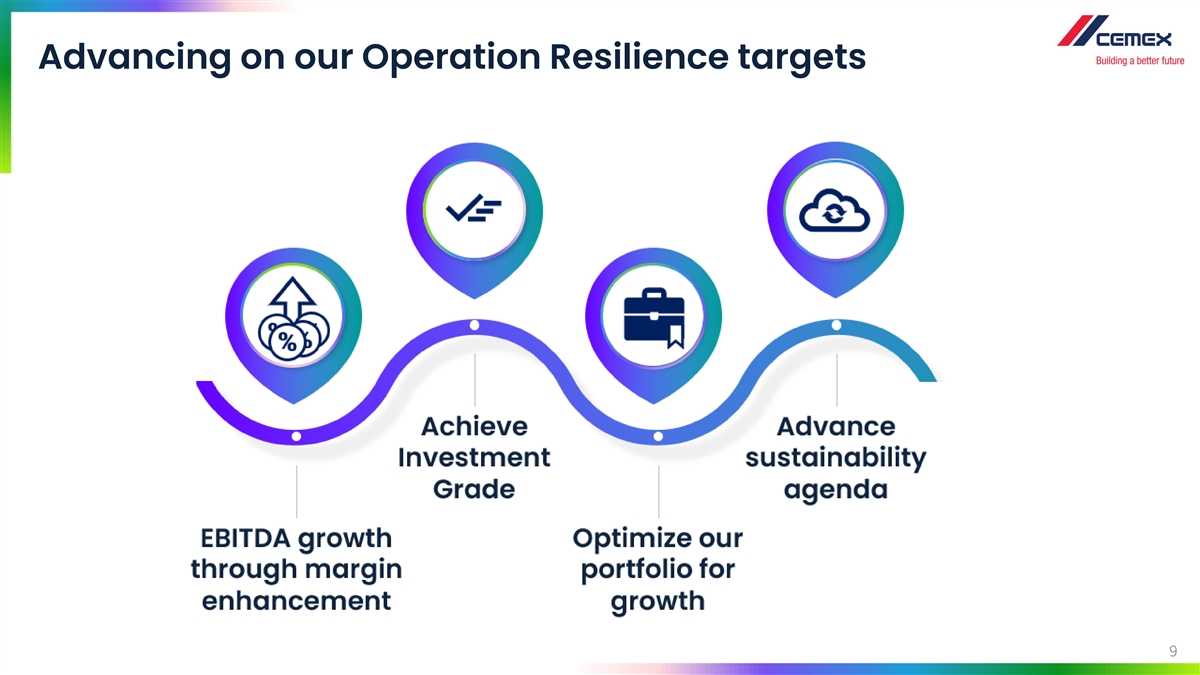
Advancing on our Operation Resilience targets 9
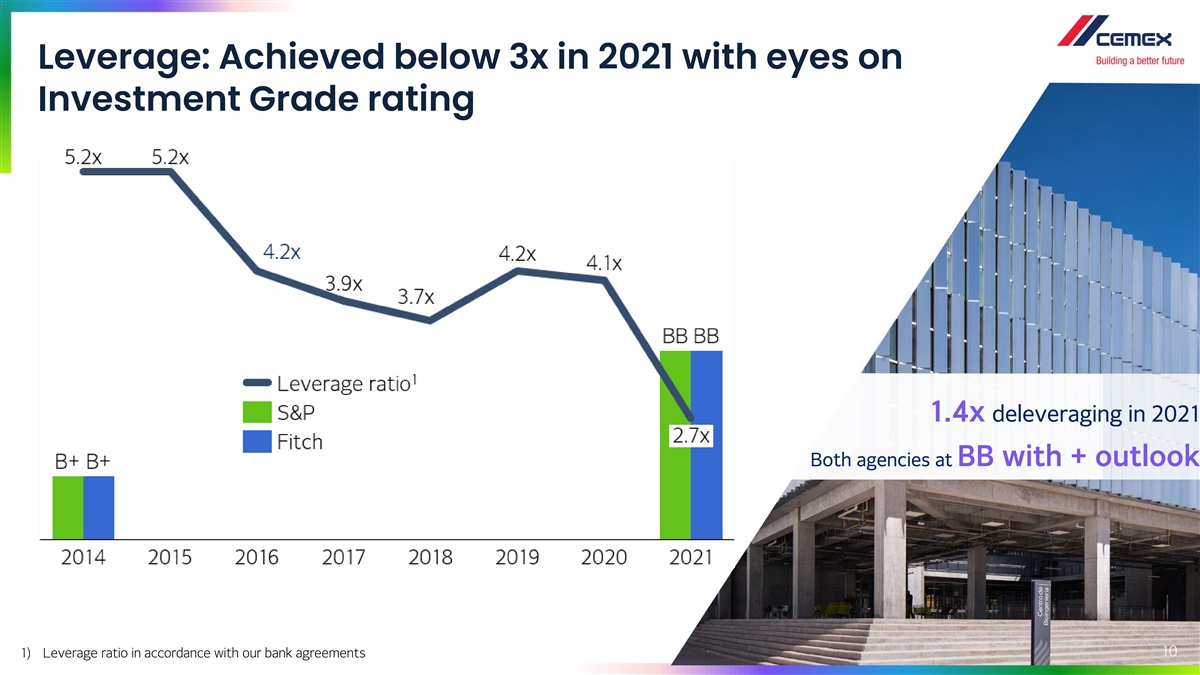
Leverage: Achieved below 3x in 2021 with eyes on Investment Grade rating 1.4x deleveraging in 2021 Both agencies at BB with + outlook 10 1) Leverage ratio in accordance with our bank agreements

Optimize portfolio for growth: Robust pipeline across core businesses and supporting CO agenda 2 bolt-on investments to be deployed in 2022 ~$900 M and beyond Growth investment strategy paying off, with incremental EBITDA of: in 2021 expected in 2022 $100 M $100 M $380 M in strategic capex in 2021, highest in a decade Portfolio rebalancing examples Accelerating growth Investments Divestments investments in 2022 • RMX in San Antonio, TX • Costa Rica & El Salvador • AGG in Paris, France • White CEM in Spain • Madrid/Baleares, Spain • RMX/AGG in southeast France Will continue to pursue opportunistic divestments 11
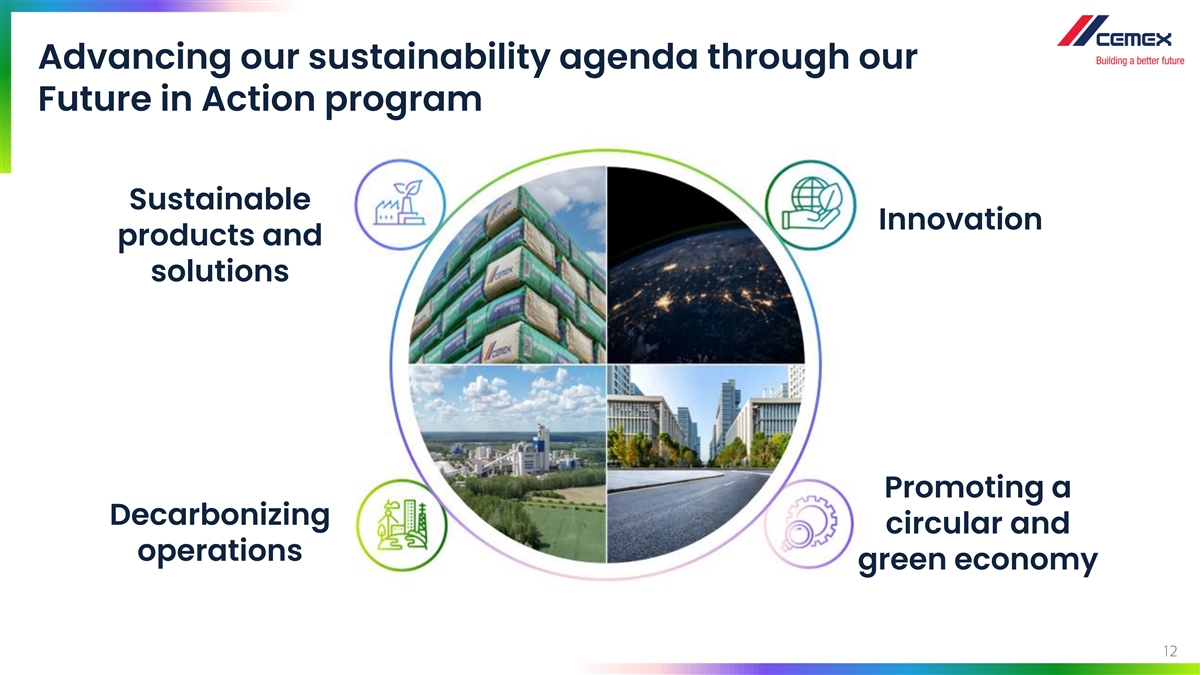
Advancing our sustainability agenda through our Future in Action program Sustainable Innovation products and solutions Promoting a Decarbonizing circular and operations green economy 12

Sustainable products and solutions 1 UK HS2 Mexico-Queretaro Highway • High speed rail in UK, largest• Concrete highway in Mexico infrastructure project in Europe• Vertua concrete • Vertua concrete• 35,000 m3 Poland P180 La Marseillaise Since launch, Vertua cement • Office building in Warsaw • 30-Storey skyscraper in Marseille volumes have grown ~50% • Vertua concrete • Vertua concrete • 3,500 m3 • 20,000 m3 Vertua® : The industry-first green cement and concrete. Vertua Cement Offering Reduction in kg CO /ton 2 Ground-breaking solution for 3D printing using Thermal Water conventional management efficiency ready-mix 13 1) Photo: Colne Valley Viaduct concepts created for HS2 by Grimshaw Architects
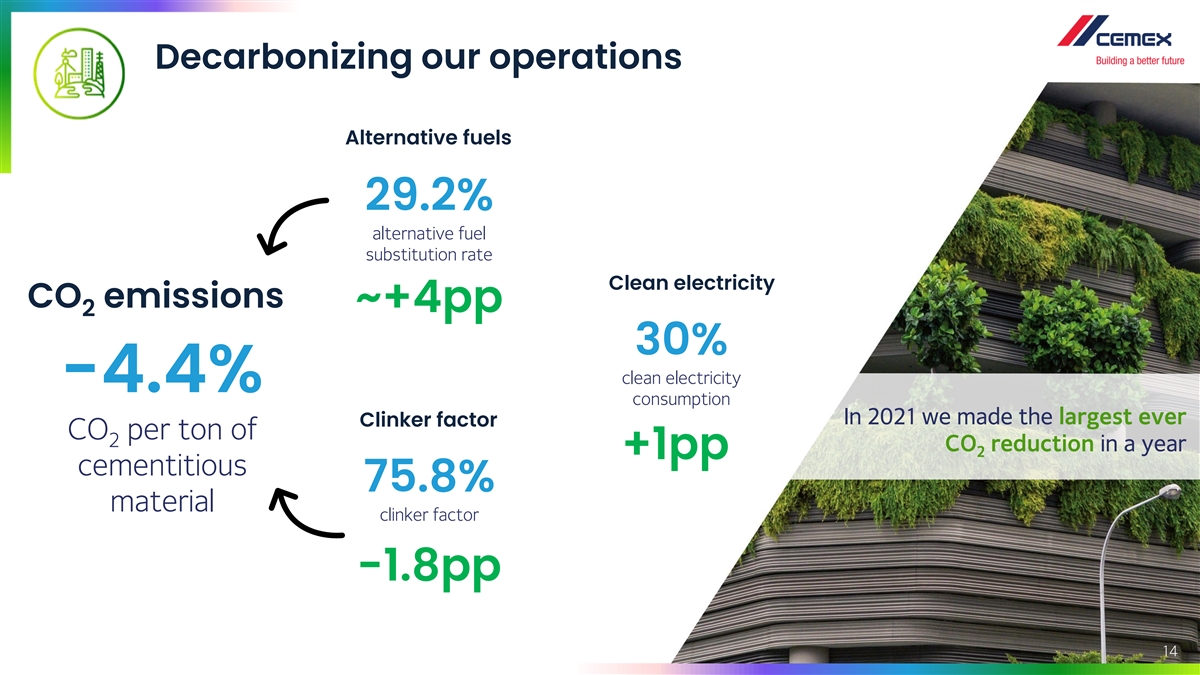
Decarbonizing our operations Alternative fuels 29.2% alternative fuel substitution rate Clean electricity CO emissions ~+4pp 2 30% clean electricity -4.4% consumption In 2021 we made the largest ever Clinker factor CO per ton of 2 CO reduction in a year 2 +1pp cementitious 75.8% material clinker factor -1.8pp 14
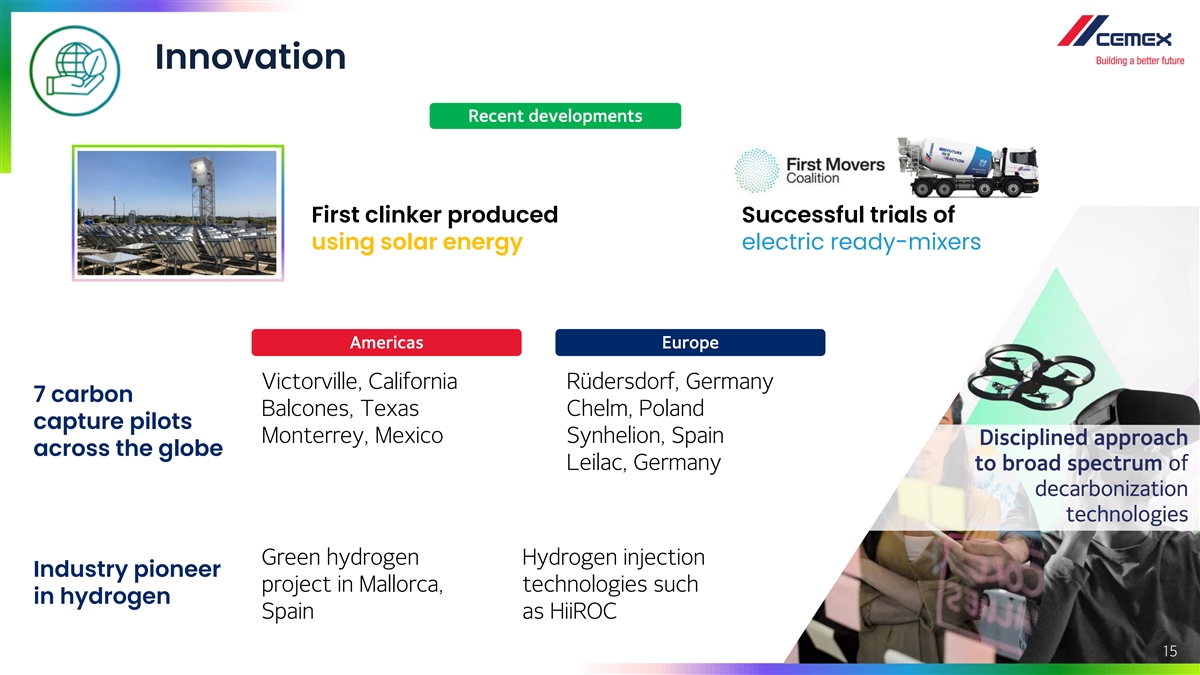
Innovation Recent developments First clinker produced Successful trials of using solar energy electric ready-mixers Americas Europe Victorville, California Rüdersdorf, Germany 7 carbon Balcones, Texas Chelm, Poland capture pilots Monterrey, Mexico Synhelion, Spain Disciplined approach across the globe Leilac, Germany to broad spectrum of decarbonization technologies Green hydrogen Hydrogen injection Industry pioneer project in Mallorca, technologies such in hydrogen Spain as HiiROC 15
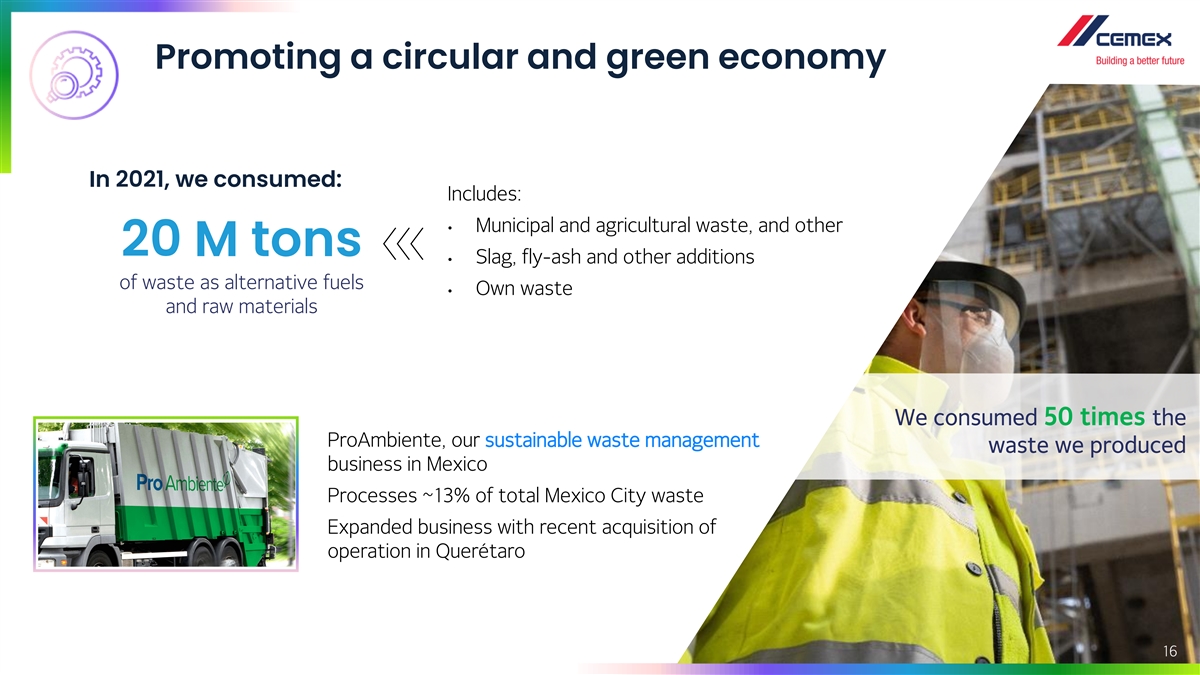
Promoting a circular and green economy In 2021, we consumed: Includes: • Municipal and agricultural waste, and other 20 M tons • Slag, fly-ash and other additions of waste as alternative fuels • Own waste and raw materials We consumed 50 times the ProAmbiente, our sustainable waste management waste we produced business in Mexico Processes ~13% of total Mexico City waste Expanded business with recent acquisition of operation in Querétaro 16
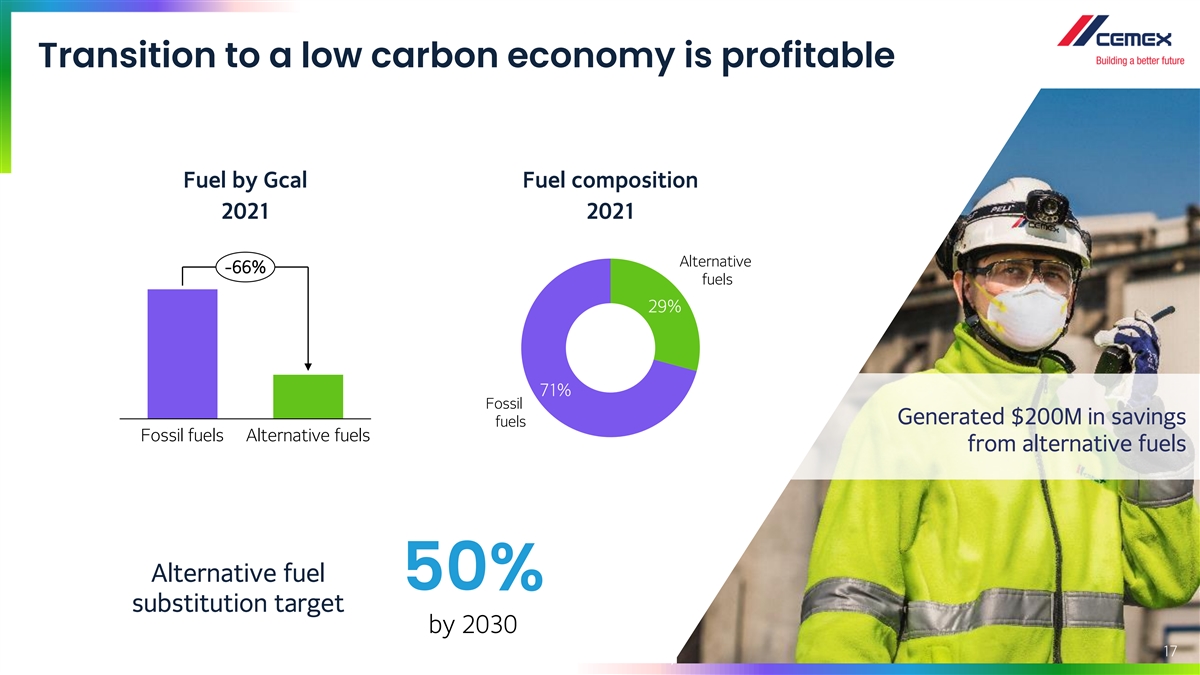
Transition to a low carbon economy is profitable Fuel by Gcal Fuel composition 2021 2021 Alternative -66% fuels 29% 71% Fossil Generated $200M in savings fuels Fossil fuels Alternative fuels from alternative fuels Alternative fuel 50% substitution target by 2030 17
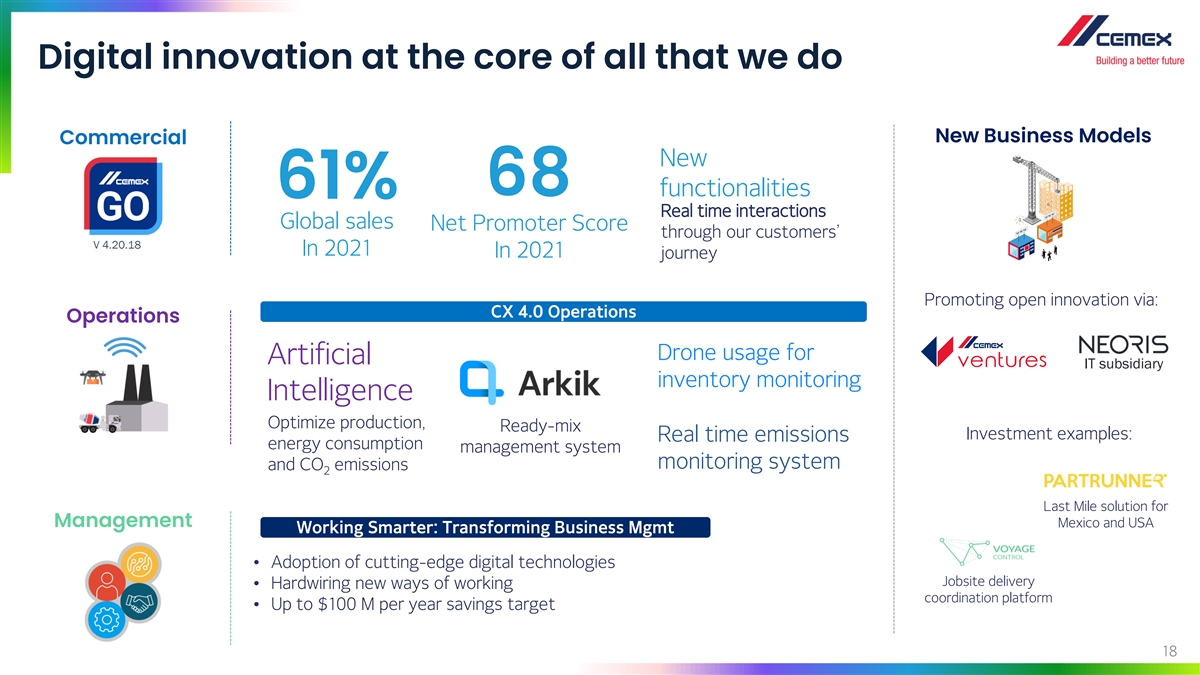
Digital innovation at the core of all that we do New Business Models Commercial New 68 functionalities 61% Real time interactions Global sales Net Promoter Score through our customers’ V 4.20.18 In 2021 In 2021 journey Promoting open innovation via: CX 4.0 Operations Operations Drone usage for Artificial IT subsidiary inventory monitoring Intelligence Optimize production, Ready-mix Investment examples: Real time emissions energy consumption management system monitoring system and CO emissions 2 Last Mile solution for Management Mexico and USA Working Smarter: Transforming Business Mgmt • Adoption of cutting-edge digital technologies Jobsite delivery • Hardwiring new ways of working coordination platform • Up to $100 M per year savings target 18
Regional Highlights BIOENGINEERING CENTER, MEXICO
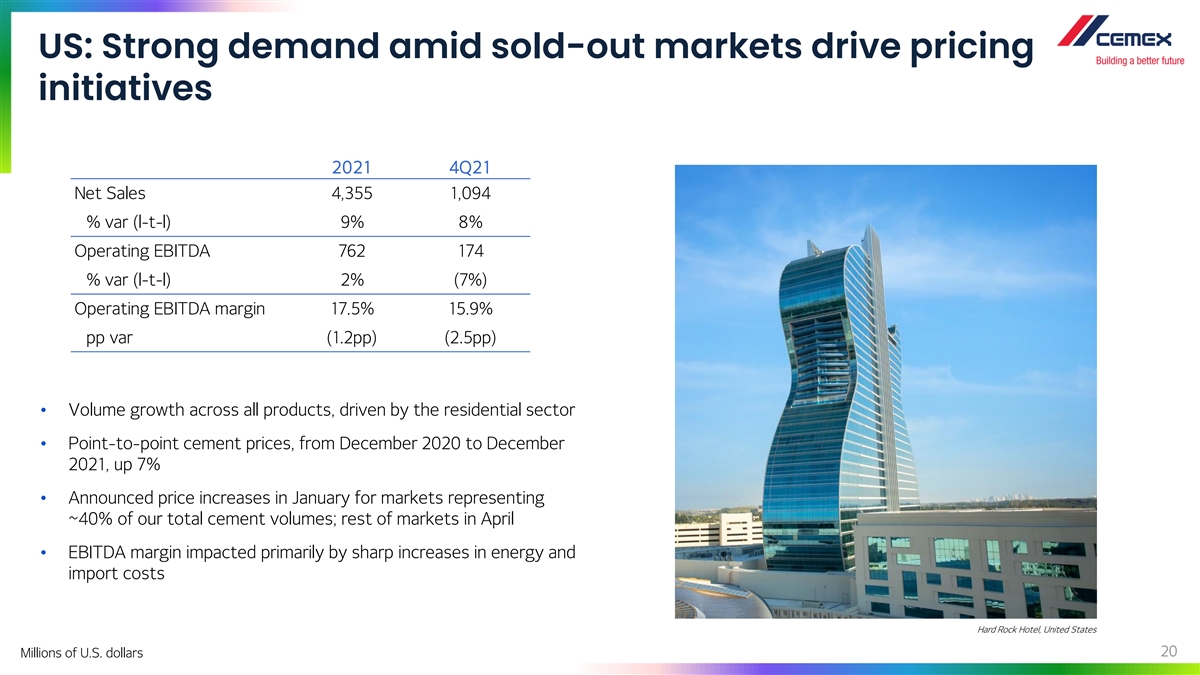
US: Strong demand amid sold-out markets drive pricing initiatives 2021 4Q21 Net Sales 4,355 1,094 % var (l-t-l) 9% 8% Operating EBITDA 762 174 % var (l-t-l) 2% (7%) Operating EBITDA margin 17.5% 15.9% pp var (1.2pp) (2.5pp) • Volume growth across all products, driven by the residential sector • Point-to-point cement prices, from December 2020 to December 2021, up 7% • Announced price increases in January for markets representing ~40% of our total cement volumes; rest of markets in April • EBITDA margin impacted primarily by sharp increases in energy and import costs Hard Rock Hotel, United States 20 Millions of U.S. dollars
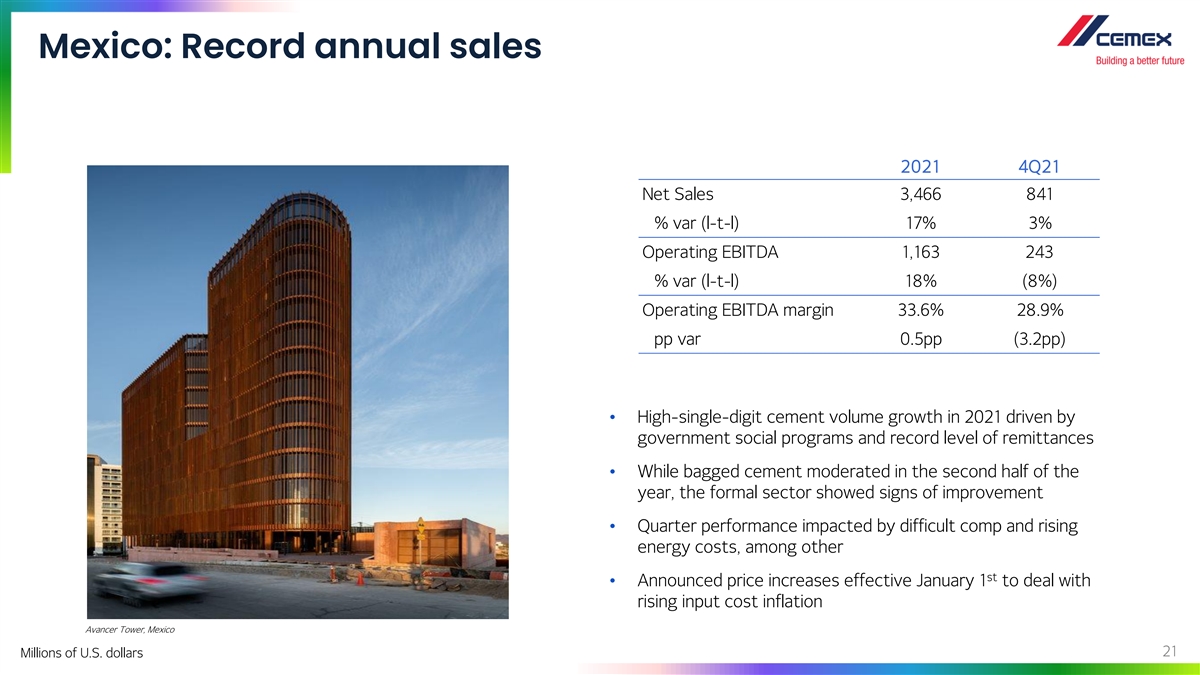
Mexico: Record annual sales 2021 4Q21 Net Sales 3,466 841 % var (l-t-l) 17% 3% Operating EBITDA 1,163 243 % var (l-t-l) 18% (8%) Operating EBITDA margin 33.6% 28.9% pp var 0.5pp (3.2pp) • High-single-digit cement volume growth in 2021 driven by government social programs and record level of remittances • While bagged cement moderated in the second half of the year, the formal sector showed signs of improvement • Quarter performance impacted by difficult comp and rising energy costs, among other st • Announced price increases effective January 1 to deal with rising input cost inflation Avancer Tower, Mexico 21 Millions of U.S. dollars
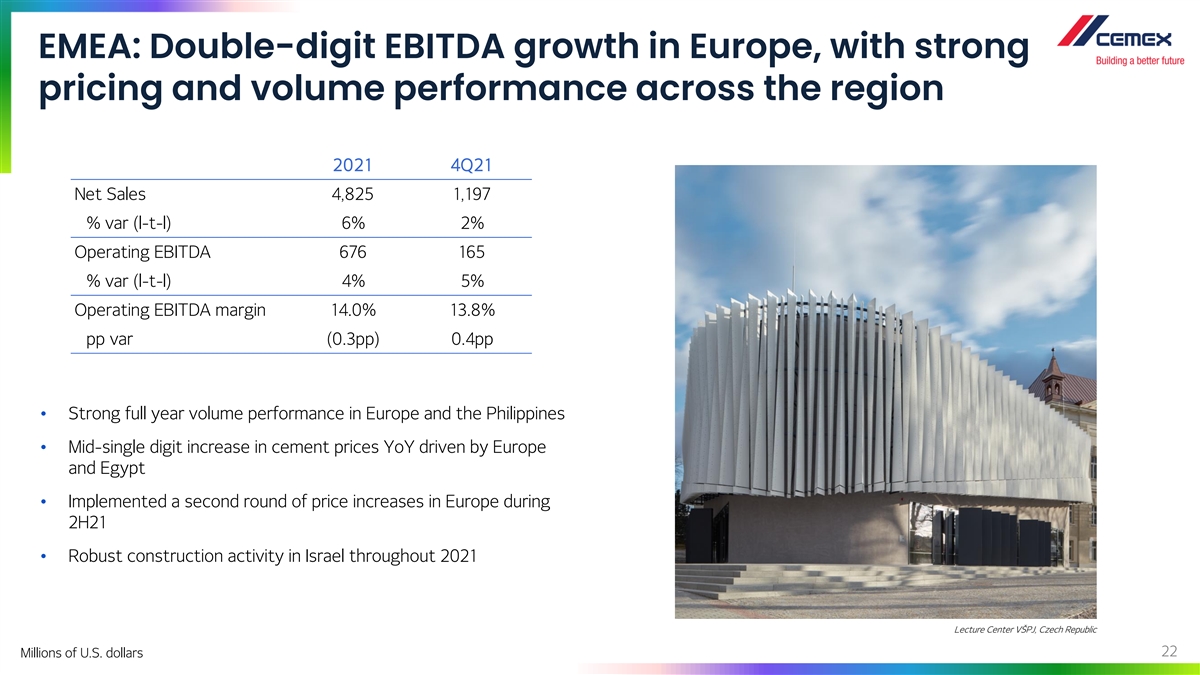
EMEA: Double-digit EBITDA growth in Europe, with strong pricing and volume performance across the region 2021 4Q21 Net Sales 4,825 1,197 % var (l-t-l) 6% 2% Operating EBITDA 676 165 % var (l-t-l) 4% 5% Operating EBITDA margin 14.0% 13.8% pp var (0.3pp) 0.4pp • Strong full year volume performance in Europe and the Philippines • Mid-single digit increase in cement prices YoY driven by Europe and Egypt • Implemented a second round of price increases in Europe during 2H21 • Robust construction activity in Israel throughout 2021 Lecture Center VŠPJ, Czech Republic 22 Millions of U.S. dollars

SCAC: Strong volume performance and improved pricing led to double-digit growth in sales 2021 4Q21 Net Sales 1,567 391 % var (l-t-l) 18% 6% Operating EBITDA 421 99 % var (l-t-l) 25% 3% Operating EBITDA margin 26.9% 25.4% pp var 1.8pp 0.1pp • Full-year cement volumes up 13% despite disruptions in some markets. Cement volumes above pre-pandemic levels • Strong supply-demand dynamics led to favorable pricing. Cement prices up 8% in 4Q21 in LC • Region with highest FY EBITDA margin expansion on the back of volume, prices and cost control initiatives • Announced price increases in most of our markets to deal with cost pressures Atrio Tower, Colombia 23 Millions of U.S. dollars
Financial Developments EC RESIDENCE, COSTA RICA
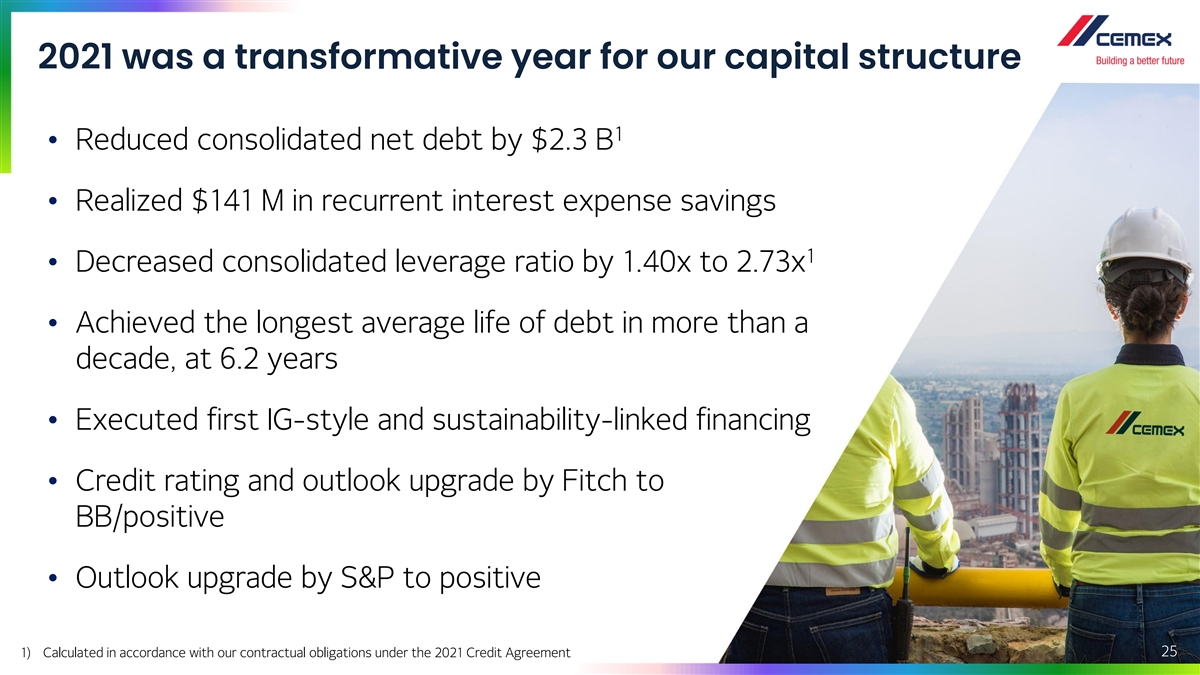
2021 was a transformative year for our capital structure 1 • Reduced consolidated net debt by $2.3 B • Realized $141 M in recurrent interest expense savings 1 • Decreased consolidated leverage ratio by 1.40x to 2.73x • Achieved the longest average life of debt in more than a decade, at 6.2 years • Executed first IG-style and sustainability-linked financing • Credit rating and outlook upgrade by Fitch to BB/positive • Outlook upgrade by S&P to positive 25 1) Calculated in accordance with our contractual obligations under the 2021 Credit Agreement
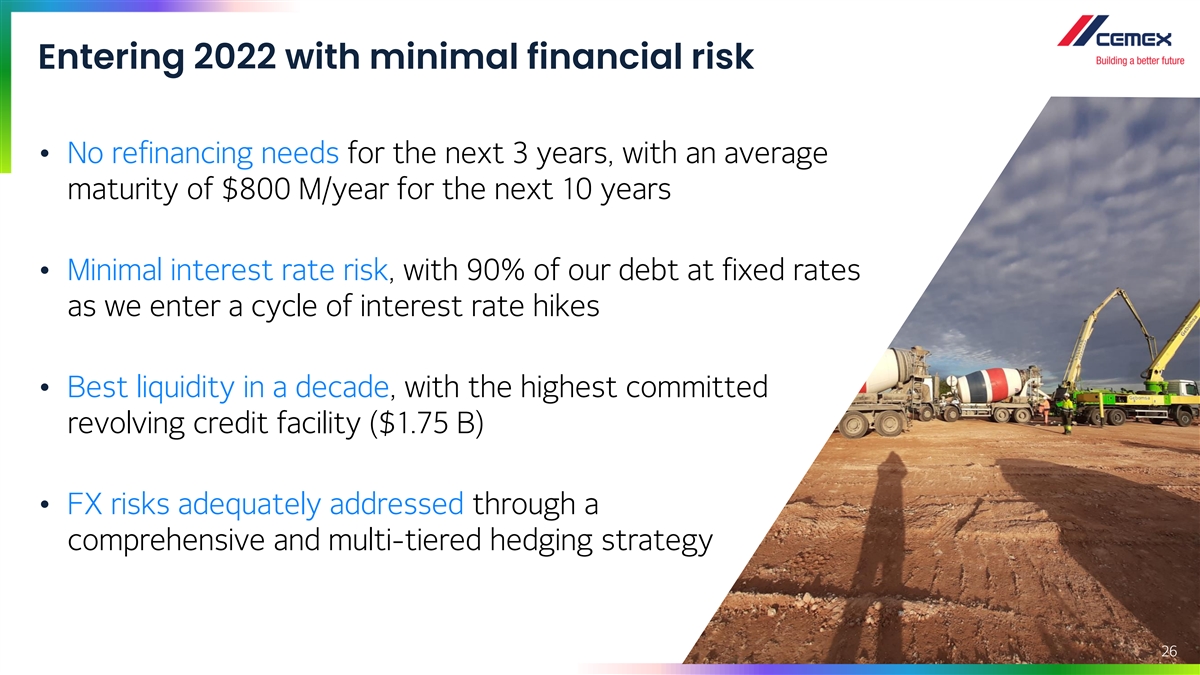
Entering 2022 with minimal financial risk • No refinancing needs for the next 3 years, with an average maturity of $800 M/year for the next 10 years • Minimal interest rate risk, with 90% of our debt at fixed rates as we enter a cycle of interest rate hikes • Best liquidity in a decade, with the highest committed revolving credit facility ($1.75 B) • FX risks adequately addressed through a comprehensive and multi-tiered hedging strategy 26
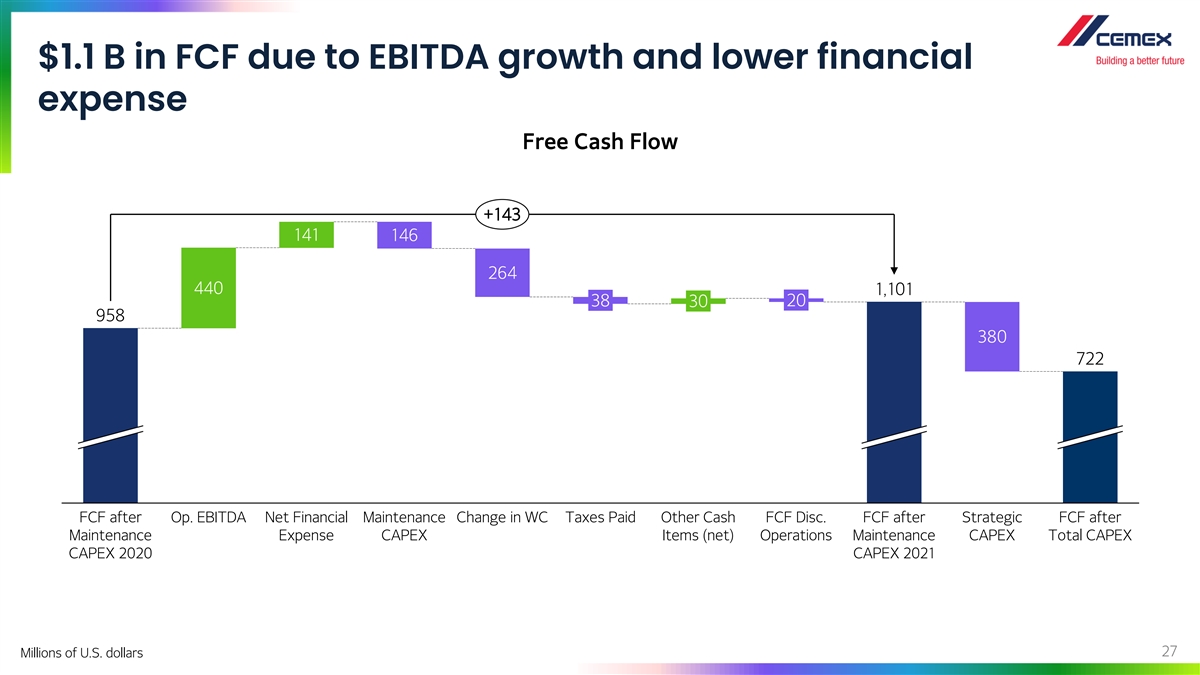
$1.1 B in FCF due to EBITDA growth and lower financial expense Free Cash Flow +143 141 146 264 440 1,101 20 38 30 958 380 722 FCF after Op. EBITDA Net Financial Maintenance Change in WC Taxes Paid Other Cash FCF Disc. FCF after Strategic FCF after Maintenance Expense CAPEX Items (net) Operations Maintenance CAPEX Total CAPEX CAPEX 2020 CAPEX 2021 27 Millions of U.S. dollars
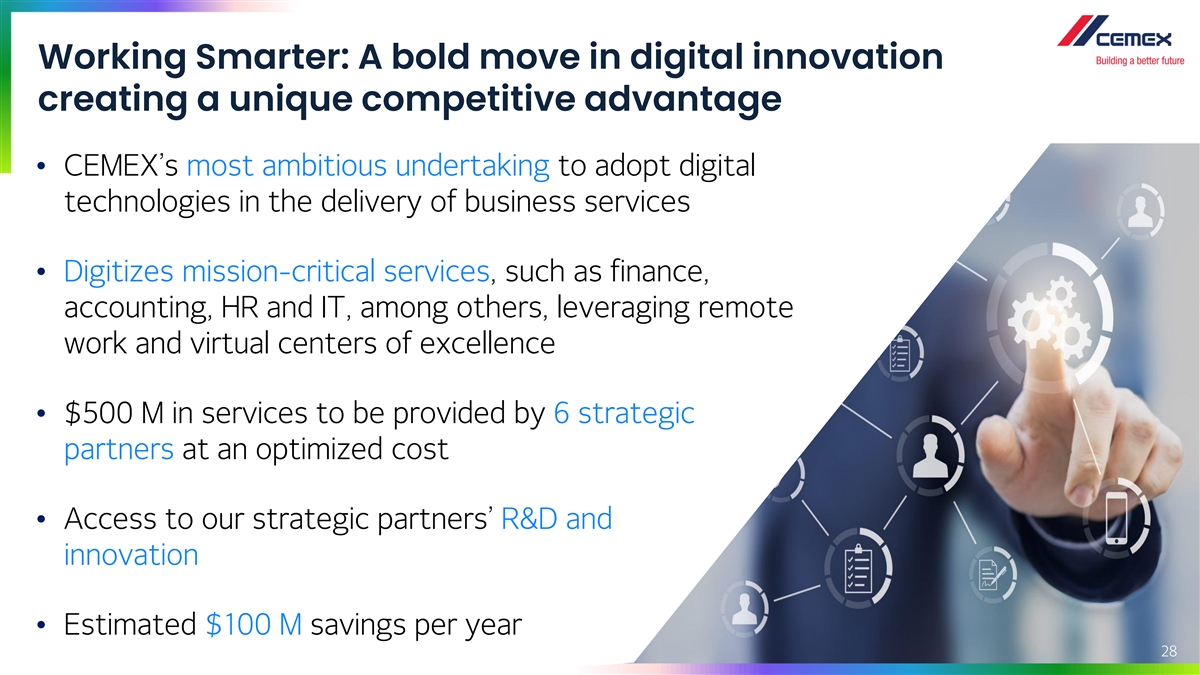
Working Smarter: A bold move in digital innovation creating a unique competitive advantage • CEMEX’s most ambitious undertaking to adopt digital technologies in the delivery of business services • Digitizes mission-critical services, such as finance, accounting, HR and IT, among others, leveraging remote work and virtual centers of excellence • $500 M in services to be provided by 6 strategic partners at an optimized cost • Access to our strategic partners’ R&D and innovation • Estimated $100 M savings per year 28
2022 Outlook INTERNATIONAL MUSEUM OF THE BAROQUE, MEXICO
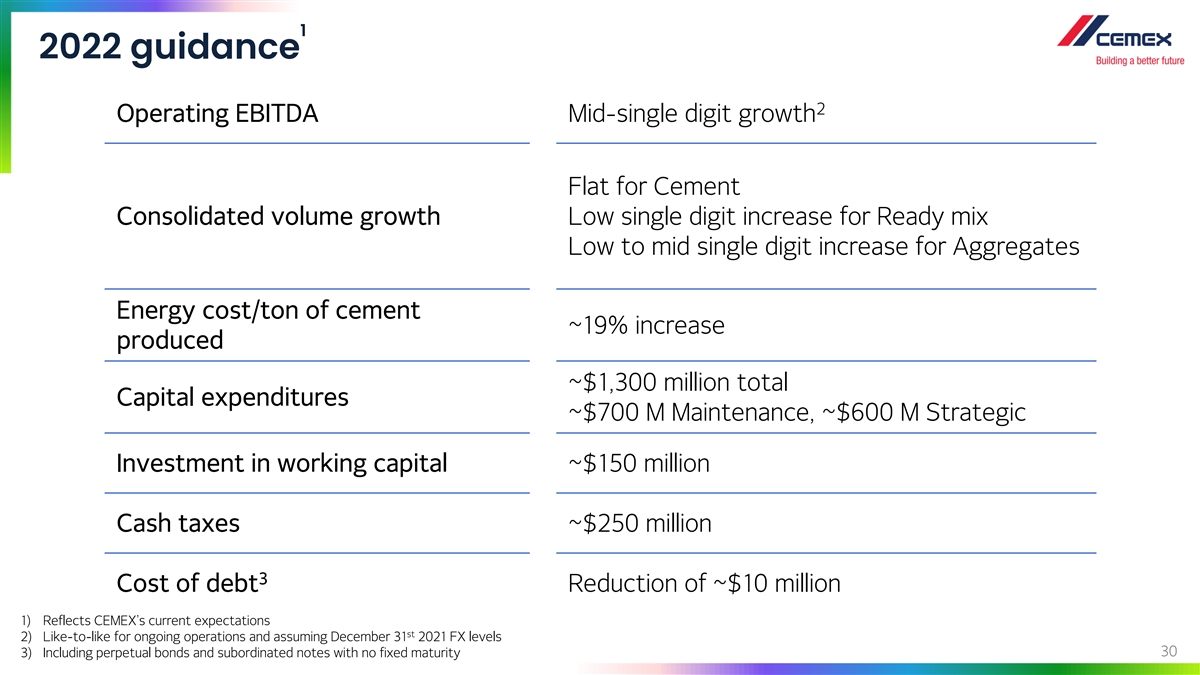
1 2022 guidance 2 Operating EBITDA Mid-single digit growth Flat for Cement Consolidated volume growth Low single digit increase for Ready mix Low to mid single digit increase for Aggregates Energy cost/ton of cement ~19% increase produced ~$1,300 million total Capital expenditures ~$700 M Maintenance, ~$600 M Strategic Investment in working capital ~$150 million Cash taxes ~$250 million 3 Cost of debt Reduction of ~$10 million 1) Reflects CEMEX’s current expectations st 2) Like-to-like for ongoing operations and assuming December 31 2021 FX levels 30 3) Including perpetual bonds and subordinated notes with no fixed maturity
Appendix OYAMEL RESIDENCE, MEXICO
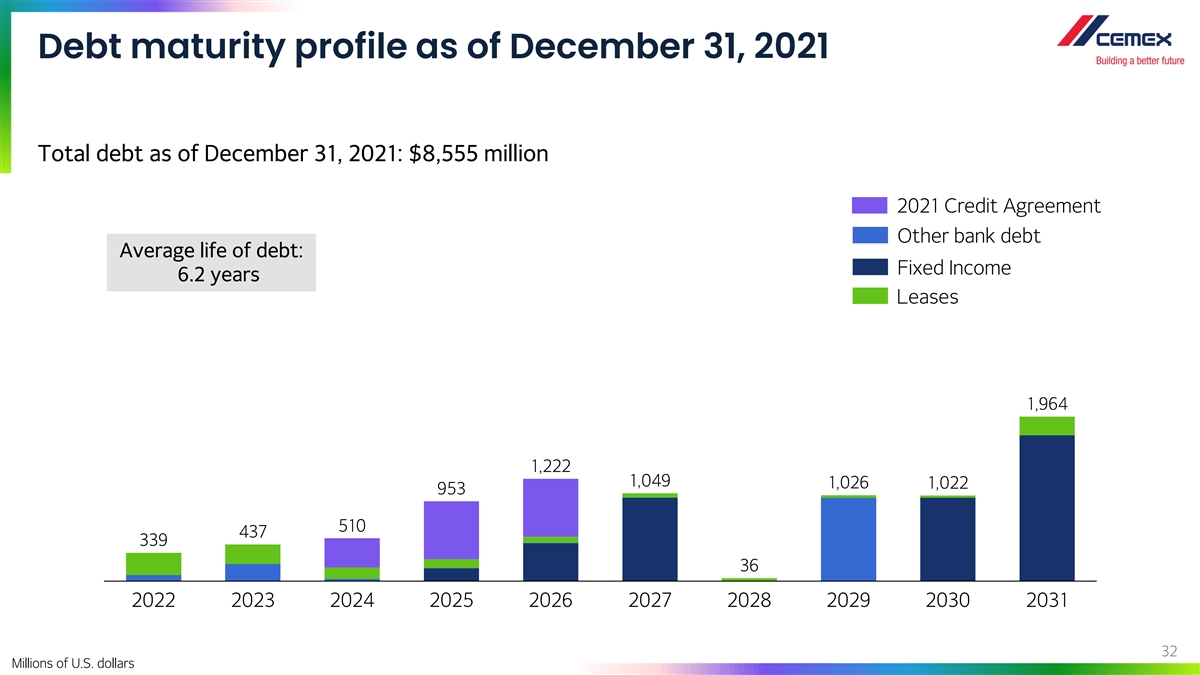
Debt maturity profile as of December 31, 2021 Total debt as of December 31, 2021: $8,555 million 2021 Credit Agreement Other bank debt Average life of debt: Fixed Income 6.2 years Leases 1,964 1,222 1,049 1,026 1,022 953 510 437 339 36 2022 2023 2024 2025 2026 2027 2028 2029 2030 2031 32 Millions of U.S. dollars
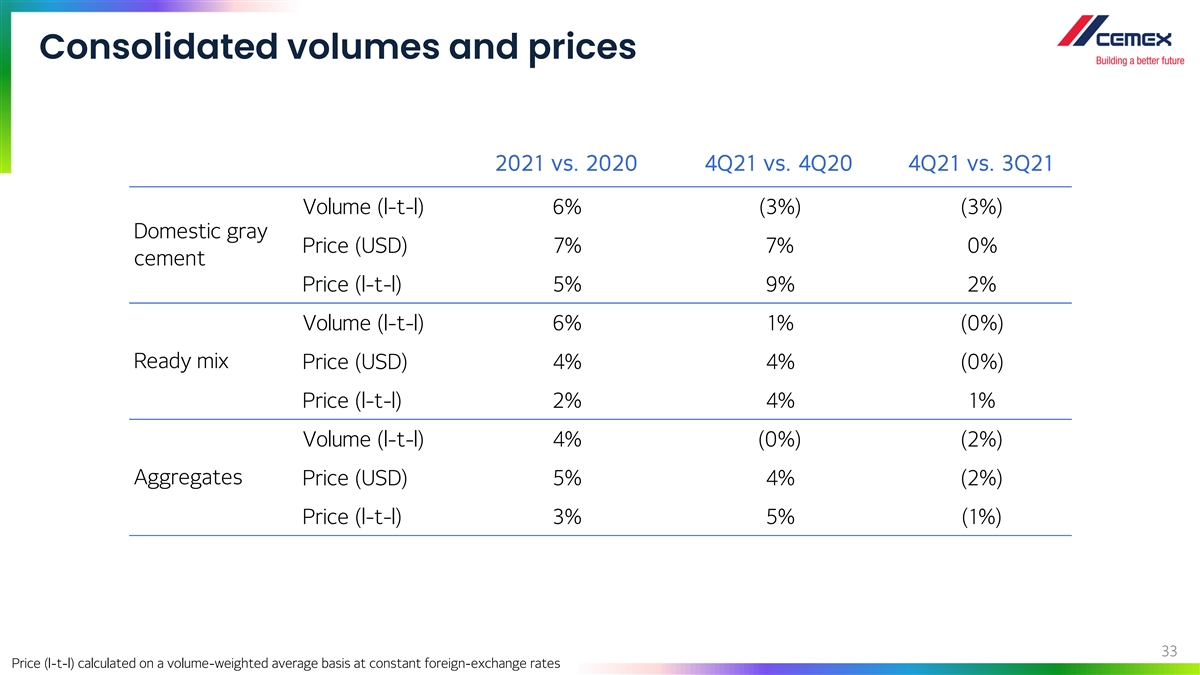
Consolidated volumes and prices 2021 vs. 2020 4Q21 vs. 4Q20 4Q21 vs. 3Q21 Volume (l-t-l) 6% (3%) (3%) Domestic gray Price (USD) 7% 7% 0% cement Price (l-t-l) 5% 9% 2% Volume (l-t-l) 6% 1% (0%) Ready mix Price (USD) 4% 4% (0%) Price (l-t-l) 2% 4% 1% Volume (l-t-l) 4% (0%) (2%) Aggregates Price (USD) 5% 4% (2%) Price (l-t-l) 3% 5% (1%) 33 Price (l-t-l) calculated on a volume-weighted average basis at constant foreign-exchange rates
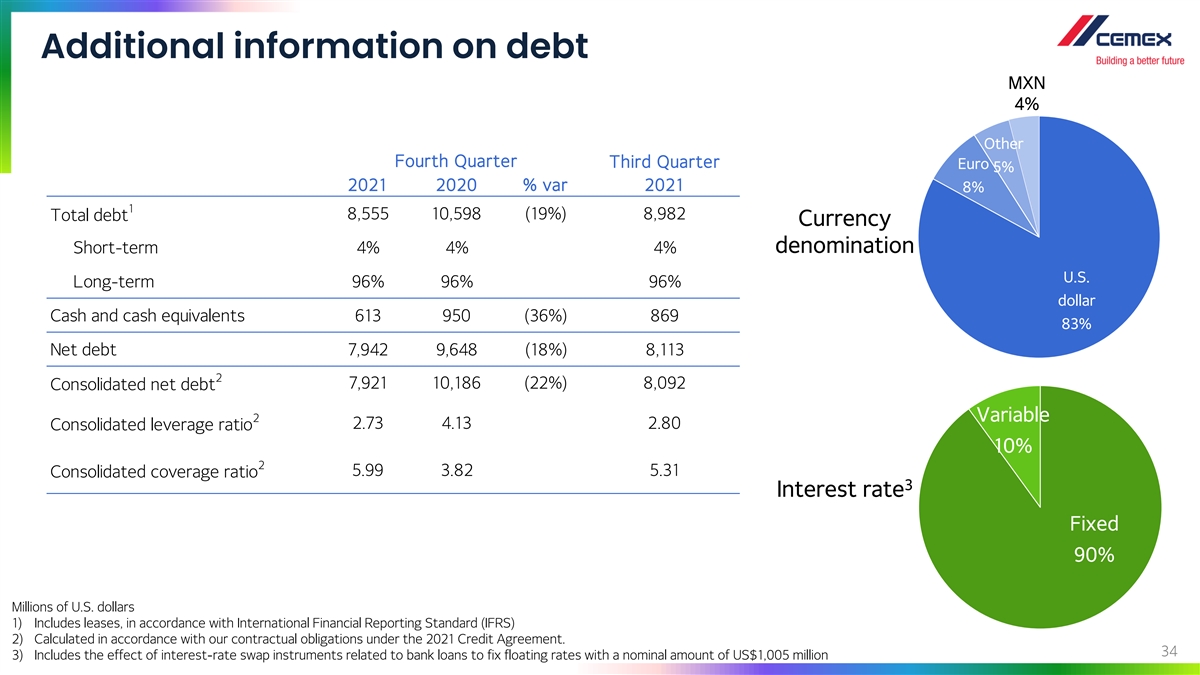
Additional information on debt MXN 4% Other Fourth Quarter Third Quarter Euro 5% 2021 2020 % var 2021 8% 1 8,555 10,598 (19%) 8,982 Total debt Currency Short-term 4% 4% 4% denomination U.S. Long-term 96% 96% 96% dollar Cash and cash equivalents 613 950 (36%) 869 83% Net debt 7,942 9,648 (18%) 8,113 2 7,921 10,186 (22%) 8,092 Consolidated net debt 2 Variable 2.73 4.13 2.80 Consolidated leverage ratio 10% 2 5.99 3.82 5.31 Consolidated coverage ratio 3 Interest rate Fixed 90% Millions of U.S. dollars 1) Includes leases, in accordance with International Financial Reporting Standard (IFRS) 2) Calculated in accordance with our contractual obligations under the 2021 Credit Agreement. 34 3) Includes the effect of interest-rate swap instruments related to bank loans to fix floating rates with a nominal amount of US$1,005 million

Additional information on debt 1 Total debt by instrument Fourth Quarter Third Quarter 2021 2021 % of total % of total 18% Fixed Income 5,330 62% 5,569 62% 2021 Credit Agreement 1,728 20% 1,957 22% 1 1,497 18% 1,457 16% Others 20% Total Debt 8,555 8,982 62% Millions of U.S. dollars 35 1) Includes leases, in accordance with IFRS
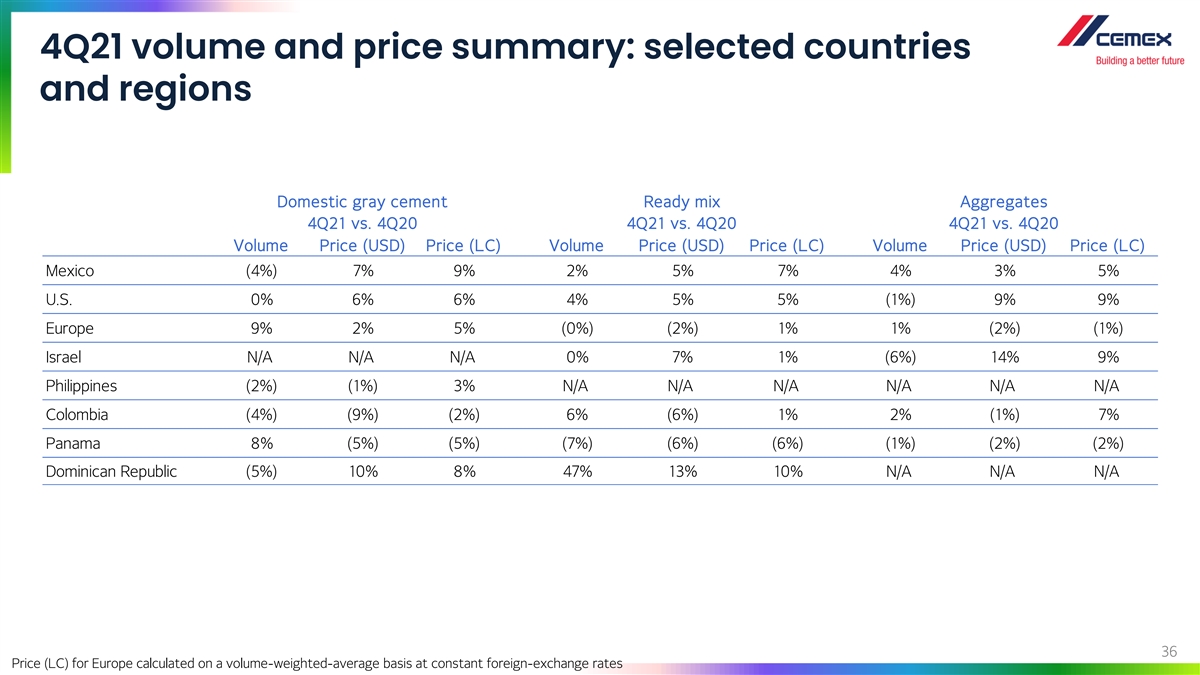
4Q21 volume and price summary: selected countries and regions Domestic gray cement Ready mix Aggregates 4Q21 vs. 4Q20 4Q21 vs. 4Q20 4Q21 vs. 4Q20 Volume Price (USD) Price (LC) Volume Price (USD) Price (LC) Volume Price (USD) Price (LC) Mexico (4%) 7% 9% 2% 5% 7% 4% 3% 5% U.S. 0% 6% 6% 4% 5% 5% (1%) 9% 9% Europe 9% 2% 5% (0%) (2%) 1% 1% (2%) (1%) Israel N/A N/A N/A 0% 7% 1% (6%) 14% 9% Philippines (2%) (1%) 3% N/A N/A N/A N/A N/A N/A Colombia (4%) (9%) (2%) 6% (6%) 1% 2% (1%) 7% Panama 8% (5%) (5%) (7%) (6%) (6%) (1%) (2%) (2%) Dominican Republic (5%) 10% 8% 47% 13% 10% N/A N/A N/A 36 Price (LC) for Europe calculated on a volume-weighted-average basis at constant foreign-exchange rates
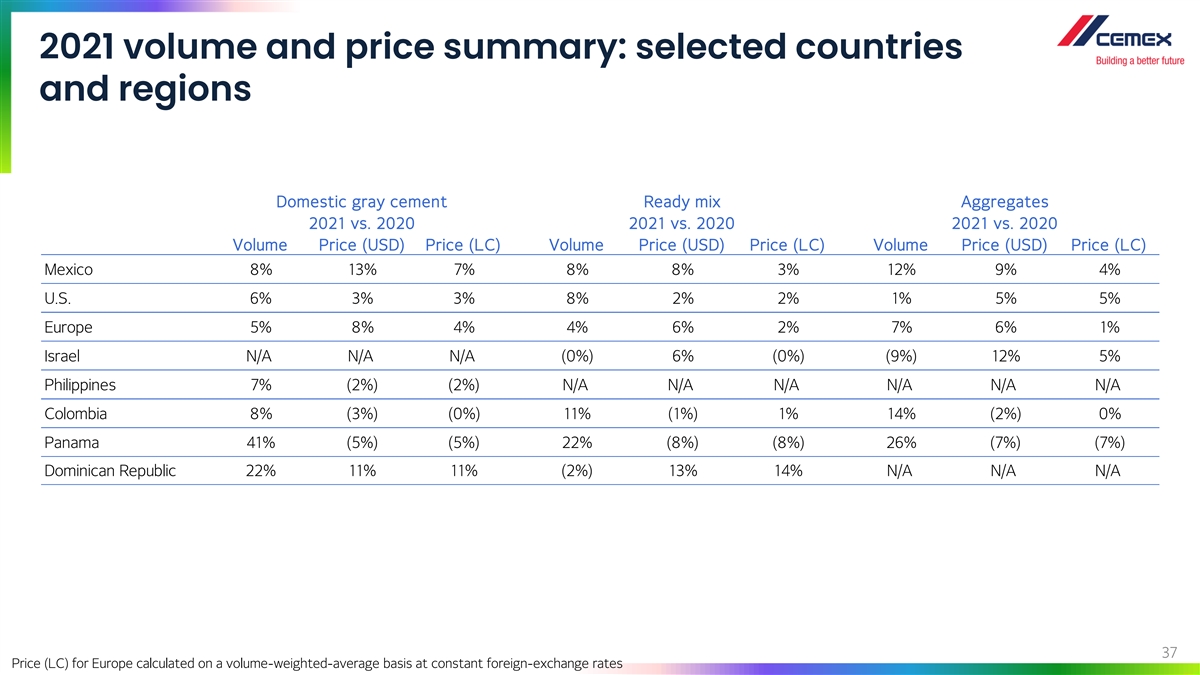
2021 volume and price summary: selected countries and regions Domestic gray cement Ready mix Aggregates 2021 vs. 2020 2021 vs. 2020 2021 vs. 2020 Volume Price (USD) Price (LC) Volume Price (USD) Price (LC) Volume Price (USD) Price (LC) Mexico 8% 13% 7% 8% 8% 3% 12% 9% 4% U.S. 6% 3% 3% 8% 2% 2% 1% 5% 5% Europe 5% 8% 4% 4% 6% 2% 7% 6% 1% Israel N/A N/A N/A (0%) 6% (0%) (9%) 12% 5% Philippines 7% (2%) (2%) N/A N/A N/A N/A N/A N/A Colombia 8% (3%) (0%) 11% (1%) 1% 14% (2%) 0% Panama 41% (5%) (5%) 22% (8%) (8%) 26% (7%) (7%) Dominican Republic 22% 11% 11% (2%) 13% 14% N/A N/A N/A 37 Price (LC) for Europe calculated on a volume-weighted-average basis at constant foreign-exchange rates
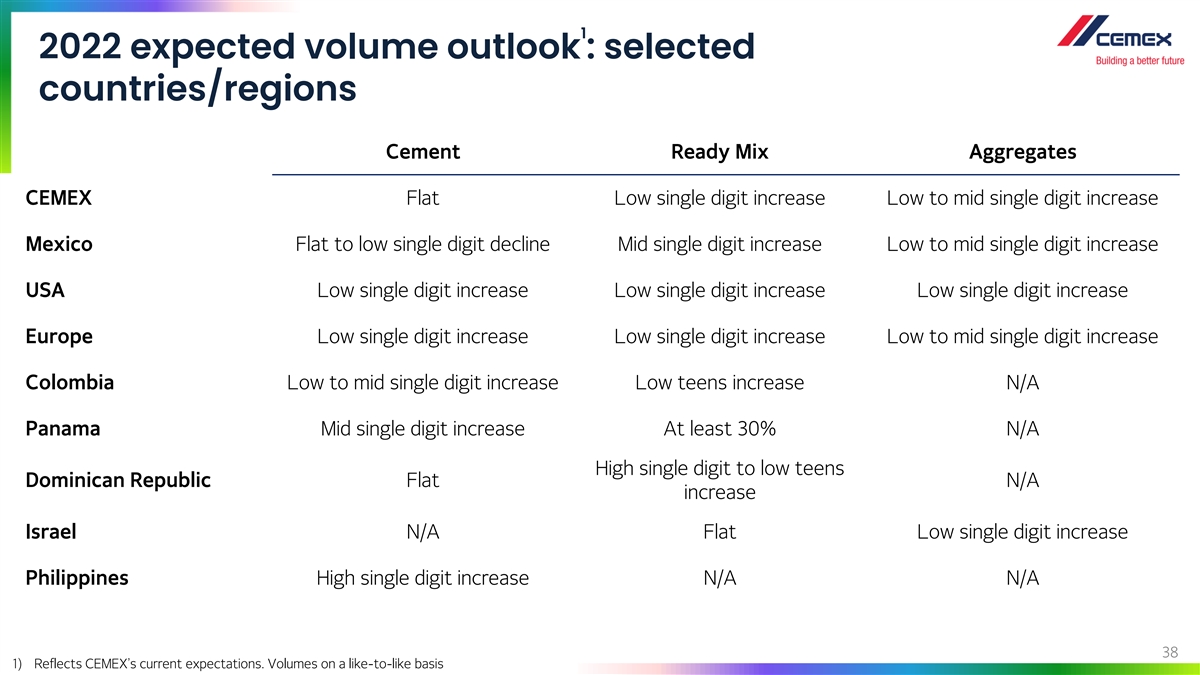
1 2022 expected volume outlook : selected countries/regions Cement Ready Mix Aggregates CEMEX Flat Low single digit increase Low to mid single digit increase Mexico Flat to low single digit decline Mid single digit increase Low to mid single digit increase USA Low single digit increase Low single digit increase Low single digit increase Europe Low single digit increase Low single digit increase Low to mid single digit increase Colombia Low to mid single digit increase Low teens increase N/A Panama Mid single digit increase At least 30% N/A High single digit to low teens Dominican Republic Flat N/A increase Israel N/A Flat Low single digit increase Philippines High single digit increase N/A N/A 38 1) Reflects CEMEX’s current expectations. Volumes on a like-to-like basis
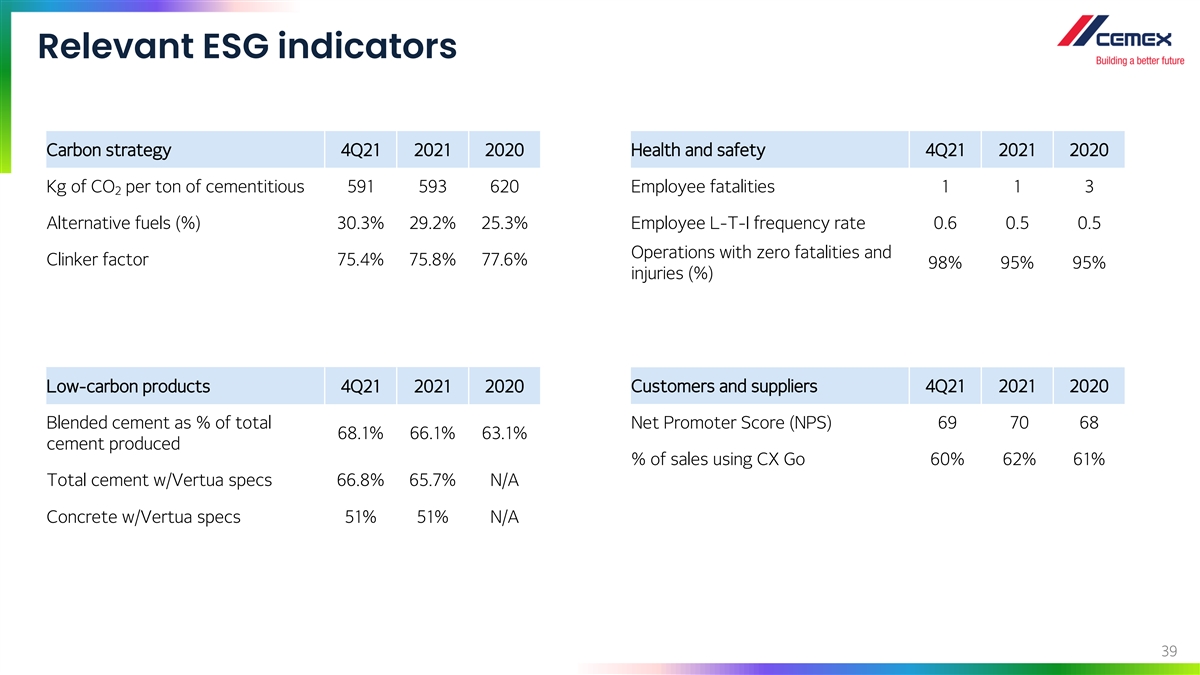
Relevant ESG indicators Carbon strategy 4Q21 2021 2020 Health and safety 4Q21 2021 2020 Kg of CO per ton of cementitious 591 593 620 Employee fatalities 1 1 3 2 Alternative fuels (%) 30.3% 29.2% 25.3% Employee L-T-I frequency rate 0.6 0.5 0.5 Operations with zero fatalities and Clinker factor 75.4% 75.8% 77.6% 98% 95% 95% injuries (%) Low-carbon products 4Q21 2021 2020 Customers and suppliers 4Q21 2021 2020 Blended cement as % of total Net Promoter Score (NPS) 69 70 68 68.1% 66.1% 63.1% cement produced % of sales using CX Go 60% 62% 61% Total cement w/Vertua specs 66.8% 65.7% N/A Concrete w/Vertua specs 51% 51% N/A 39
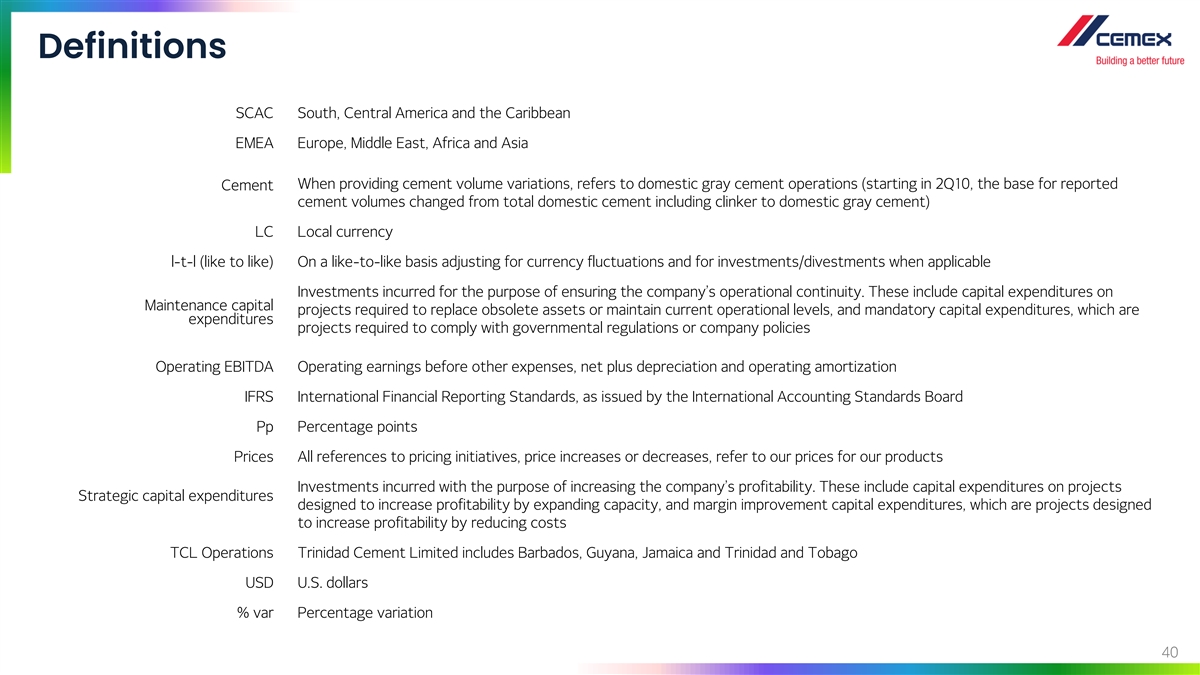
Definitions SCAC South, Central America and the Caribbean EMEA Europe, Middle East, Africa and Asia When providing cement volume variations, refers to domestic gray cement operations (starting in 2Q10, the base for reported Cement cement volumes changed from total domestic cement including clinker to domestic gray cement) LC Local currency l-t-l (like to like) On a like-to-like basis adjusting for currency fluctuations and for investments/divestments when applicable Investments incurred for the purpose of ensuring the company’s operational continuity. These include capital expenditures on Maintenance capital projects required to replace obsolete assets or maintain current operational levels, and mandatory capital expenditures, which are expenditures projects required to comply with governmental regulations or company policies Operating EBITDA Operating earnings before other expenses, net plus depreciation and operating amortization IFRS International Financial Reporting Standards, as issued by the International Accounting Standards Board Pp Percentage points Prices All references to pricing initiatives, price increases or decreases, refer to our prices for our products Investments incurred with the purpose of increasing the company’s profitability. These include capital expenditures on projects Strategic capital expenditures designed to increase profitability by expanding capacity, and margin improvement capital expenditures, which are projects designed to increase profitability by reducing costs TCL Operations Trinidad Cement Limited includes Barbados, Guyana, Jamaica and Trinidad and Tobago USD U.S. dollars % var Percentage variation 40
Contact Information Investors Stock Information Relations NYSE (ADS): CX In the United States +1 877 7CX NYSE Mexican Stock Exchange: CEMEXCPO In Mexico +52 81 8888 4292 Ratio of CEMEXCPO to CX: ir@cemex.com 10 to 1