Table of Contents
UNITED STATES SECURITIES AND EXCHANGE COMMISSION
Washington, D.C. 20549
FORM 10-K
| þ | Annual report pursuant to Section 13 or 15(d) of the Securities Exchange Act of 1934 |
For the Fiscal Year Ended December 27, 2008
or
| o | Transition report pursuant to Section 13 or 15(d) of the Securities Exchange Act of 1934 (No Fee Required) |
For the transition period from to
Commission file number 333-80361-01
Bottling Group, LLC
(Exact name of Registrant as Specified in its Charter)
| Organized in Delaware | 13-4042452 | |
| (State or other Jurisdiction of Incorporation or Organization) | (I.R.S. Employer Identification No.) | |
| One Pepsi Way, Somers, New York | 10589 | |
| (Address of Principal Executive Offices) | (Zip code) |
Registrant’s telephone number, including area code: (914) 767-6000
Securities registered pursuant to Section 12(b) of the Act: None
Securities registered pursuant to Section 12(b) of the Act: None
Securities registered pursuant to Section 12(g) of the Act: None
Indicate by check mark if the registrant is a well-known seasoned issuer, as defined in Rule 405 of the Securities Act. Yesþ Noo
Indicate by check mark if the registrant is not required to file reports pursuant to Section 13 or Section 15(d) of the Act. Yeso Noþ
Indicate by check mark whether the registrant: (1) has filed all reports required to be filed by Section 13 or 15(d) of the Securities Exchange Act of 1934 during the preceding 12 months (or for such shorter period that the registrant was required to file such reports) and (2) has been subject to such filing requirements for the past 90 days. Yesþ Noo
Indicate by check mark if disclosure of delinquent filers pursuant to Item 405 of Regulation S-K is not contained herein, and will not be contained, to the best of registrant’s knowledge, in definitive proxy or information statements incorporated by reference in Part III of this Form 10-K or any amendment to this Form 10-K.þ
Indicate by check mark whether the registrant is a large accelerated filer, an accelerated filer, a non-accelerated filer, or a smaller reporting company. See the definitions of “large accelerated filer,” “accelerated filer” and “smaller reporting company” in Rule 12b-2 of the Exchange Act. (Check one):
| Large accelerated filero | Accelerated filero | Non-accelerated filer þ (Do not check if a smaller reporting company) | Smaller reporting companyo |
Indicate by check mark whether the registrant is a shell company (as defined in Rule 12b-2 of the Exchange Act). Yeso Noþ
The aggregate market value of Bottling Group, LLC Capital Stock held by non-affiliates of Bottling Group, LLC as of June 13, 2008 was $0.
| Table of Contents | ||
| 1 | ||||
| 8 | ||||
| 12 | ||||
| 12 | ||||
| 12 | ||||
| 12 | ||||
| 13 | ||||
| 14 | ||||
| 15 | ||||
| 69 | ||||
| 69 | ||||
| 69 | ||||
| 69 | ||||
| 70 | ||||
| 71 | ||||
| 72 | ||||
| 98 | ||||
| 98 | ||||
| 100 | ||||
| 101 | ||||
| S-1 | ||||
| F-1 | ||||
| E-1 |
Table of Contents
PART I
ITEM 1. BUSINESS
Introduction
Bottling Group, LLC (“Bottling LLC”) is the principal operating subsidiary of The Pepsi Bottling Group, Inc. (“PBG”) and consists of substantially all of the operations and assets of PBG. Bottling LLC, which is fully consolidated by PBG, consists of bottling operations located in the United States, Canada, Spain, Greece, Russia, Turkey and Mexico. Prior to its formation, Bottling LLC was an operating unit of PepsiCo, Inc. (“PepsiCo”). When used in this Report, “Bottling LLC,” “we,” “us,” “our” and the “Company” each refers to Bottling Group, LLC and, where appropriate, its subsidiaries.
PBG was incorporated in Delaware in January, 1999, as a wholly owned subsidiary of PepsiCo to effect the separation of most of PepsiCo’s company-owned bottling businesses. PBG became a publicly traded company on March 31, 1999. As of January 23, 2009, PepsiCo’s ownership represented 33.1% of the outstanding common stock and 100% of the outstanding Class B common stock, together representing 40.2% of the voting power of all classes of PBG’s voting stock.
PepsiCo and PBG contributed bottling businesses and assets used in the bottling business to Bottling LLC in connection with the formation of Bottling LLC. As result of the contributions of assets and other subsequent transactions, PBG owns 93.4% of Bottling LLC and PepsiCo owns the remaining 6.6% as of December 27, 2008.
We operate in one industry, carbonated soft drinks and other ready-to-drink beverages, and all of our segments derive revenue from these products. We conduct business in all or a portion of the United States, Mexico, Canada, Spain, Russia, Greece and Turkey. Bottling LLC manages and reports operating results through three reportable segments: U.S. & Canada, Europe (which includes Spain, Russia, Greece and Turkey) and Mexico. Operationally, the Company is organized along geographic lines with specific regional management teams having responsibility for the financial results in each reportable segment.
In 2008, approximately 75% of our net revenues were generated in the U.S. & Canada, 15% of our net revenues were generated in Europe, and the remaining 10% of our net revenues were generated in Mexico. See “Management’s Discussion and Analysis of Financial Condition and Results of Operations” and Note 13 in the Notes to Consolidated Financial Statements for additional information regarding the business and operating results of our reportable segments.
Principal Products
We are the world’s largest manufacturer, seller and distributor of Pepsi-Cola beverages. In addition, in some of our territories we have the right to manufacture, sell and distribute soft drink products of companies other than PepsiCo, including Dr Pepper, Crush and Squirt. We also have the right in some of our territories to manufacture, sell and distribute beverages under trademarks that we own, including Electropura, e-pura and Garci Crespo. The majority of our volume is derived from brands licensed from PepsiCo or PepsiCo joint ventures.
We have the exclusive right to manufacture, sell and distribute Pepsi-Cola beverages in all or a portion of 42 states and the District of Columbia in the United States, nine Canadian provinces, Spain, Greece, Russia, Turkey and 23 states in Mexico.
In 2008, approximately 74% of our sales volume in the U.S. & Canada was derived from carbonated soft drinks and the remaining 26% was derived from non-carbonated beverages, 69% of our sales volume in Europe was derived from carbonated soft drinks and the remaining 31% was derived from non-carbonated beverages, and 52% of our Mexico sales volume was derived from carbonated soft drinks and the remaining 48% was derived from non-carbonated beverages. Our principal beverage brands include the following:
| U.S. & Canada | ||||
| Pepsi | Sierra Mist | Lipton | ||
| Diet Pepsi | Sierra Mist Free | SoBe | ||
| Diet Pepsi Max | Aquafina | SoBe No Fear | ||
| Wild Cherry Pepsi | Aquafina FlavorSplash | SoBe Life Water | ||
| Pepsi Lime | G2 from Gatorade | Starbucks Frappuccino® | ||
| Pepsi ONE | Propel | Dole | ||
| Mountain Dew | Crush | Muscle Milk | ||
| Diet Mountain Dew | Tropicana juice drinks | |||
| AMP | Mug Root Beer | |||
| Mountain Dew Code Red | Trademark Dr Pepper | |||
1
Table of Contents
| Europe | ||||
| Pepsi | Tropicana | Fruko | ||
| Pepsi Light | Aqua Minerale | Yedigun | ||
| Pepsi Max | Mirinda | Tamek | ||
| 7UP | IVI | Lipton | ||
| KAS | Fiesta | |||
Mexico | ||||
| Pepsi | Mirinda | Electropura | ||
| Pepsi Light | Manzanita Sol | e-pura | ||
| 7UP | Squirt | Jarritos | ||
| KAS | Garci Crespo | |||
| Belight | Aguas Frescas | |||
No individual customer accounted for 10% or more of our total revenues in 2008, although sales to Wal-Mart Stores, Inc. and its affiliated companies were 9.9% of our revenues in 2008, primarily as a result of transactions in the U.S. & Canada segment. We have an extensive direct store distribution system in the United States, Canada and Mexico. In Europe, we use a combination of direct store distribution and distribution through wholesalers, depending on local marketplace considerations.
Raw Materials and Other Supplies
We purchase the concentrates to manufacture Pepsi-Cola beverages and other beverage products from PepsiCo and other beverage companies.
In addition to concentrates, we purchase various ingredients, packaging materials and energy such as sweeteners, glass and plastic bottles, cans, closures, syrup containers, other packaging materials, carbon dioxide, some finished goods, electricity, natural gas and motor fuel. We generally purchase our raw materials, other than concentrates, from multiple suppliers. PepsiCo acts as our agent for the purchase of such raw materials in the United States and Canada and, with respect to some of our raw materials, in certain of our international markets. The Pepsi beverage agreements, as described below, provide that, with respect to the beverage products of PepsiCo, all authorized containers, closures, cases, cartons and other packages and labels may be purchased only from manufacturers approved by PepsiCo. There are no materials or supplies used by PBG that are currently in short supply. The supply or cost of specific materials could be adversely affected by various factors, including price changes, economic conditions, strikes, weather conditions and governmental controls.
Franchise and Venture Agreements
We conduct our business primarily under agreements with PepsiCo. Although Bottling LLC is not a direct party to these agreements as the principal operating subsidiary of PBG, Bottling LLC enjoys certain rights and is subject to certain obligations as described below. These agreements give us the exclusive right to market, distribute, and produce beverage products of PepsiCo in authorized containers and to use the related trade names and trademarks in specified territories.
Set forth below is a description of the Pepsi beverage agreements and other bottling agreements from which we benefit and under which we are obligated as the principal operating subsidiary.
Terms of the Master Bottling Agreement.The Master Bottling Agreement under which we manufacture, package, sell and distribute the cola beverages bearing the Pepsi-Cola and Pepsi trademarks in the United States was entered into in March of 1999. The Master Bottling Agreement gives us the exclusive and perpetual right to distribute cola beverages for sale in specified territories in authorized containers of the nature currently used by us. The Master Bottling Agreement provides that we will purchase our entire requirements of concentrates for the cola beverages from PepsiCo at prices, and on terms and conditions, determined from time to time by PepsiCo. PepsiCo may determine from time to time what types of containers to authorize for use by us. PepsiCo has no rights under the Master Bottling Agreement with respect to the prices at which we sell our products.
Under the Master Bottling Agreement we are obligated to:
(1) maintain such plant and equipment, staff, distribution facilities and vending equipment that are capable of manufacturing, packaging, and distributing the cola beverages in sufficient quantities to fully meet the demand for these beverages in our territories;
2
Table of Contents
(2) undertake adequate quality control measures prescribed by PepsiCo;
(3) push vigorously the sale of the cola beverages in our territories;
(4) increase and fully meet the demand for the cola beverages in our territories;
(5) use all approved means and spend such funds on advertising and other forms of marketing beverages as may be reasonably required to push vigorously the sale of cola beverages in our territories; and
(6) maintain such financial capacity as may be reasonably necessary to assure performance under the Master Bottling Agreement by us.
The Master Bottling Agreement requires us to meet annually with PepsiCo to discuss plans for the ensuing year and the following two years. At such meetings, we are obligated to present plans that set out in reasonable detail our marketing plan, our management plan and advertising plan with respect to the cola beverages for the year. We must also present a financial plan showing that we have the financial capacity to perform our duties and obligations under the Master Bottling Agreement for that year, as well as sales, marketing, advertising and capital expenditure plans for the two years following such year. PepsiCo has the right to approve such plans, which approval shall not be unreasonably withheld. In 2008, PepsiCo approved our plans.
If we carry out our annual plan in all material respects, we will be deemed to have satisfied our obligations to push vigorously the sale of the cola beverages, increase and fully meet the demand for the cola beverages in our territories and maintain the financial capacity required under the Master Bottling Agreement. Failure to present a plan or carry out approved plans in all material respects would constitute an event of default that, if not cured within 120 days of notice of the failure, would give PepsiCo the right to terminate the Master Bottling Agreement.
If we present a plan that PepsiCo does not approve, such failure shall constitute a primary consideration for determining whether we have satisfied our obligations to maintain our financial capacity, push vigorously the sale of the cola beverages and increase and fully meet the demand for the cola beverages in our territories.
If we fail to carry out our annual plan in all material respects in any segment of our territory, whether defined geographically or by type of market or outlet, and if such failure is not cured within six months of notice of the failure, PepsiCo may reduce the territory covered by the Master Bottling Agreement by eliminating the territory, market or outlet with respect to which such failure has occurred.
PepsiCo has no obligation to participate with us in advertising and marketing spending, but it may contribute to such expenditures and undertake independent advertising and marketing activities, as well as cooperative advertising and sales promotion programs that would require our cooperation and support. Although PepsiCo has advised us that it intends to continue to provide cooperative advertising funds, it is not obligated to do so under the Master Bottling Agreement.
The Master Bottling Agreement provides that PepsiCo may in its sole discretion reformulate any of the cola beverages or discontinue them, with some limitations, so long as all cola beverages are not discontinued. PepsiCo may also introduce new beverages under the Pepsi-Cola trademarks or any modification thereof. When that occurs, we are obligated to manufacture, package, distribute and sell such new beverages with the same obligations as then exist with respect to other cola beverages. We are prohibited from producing or handling cola products, other than those of PepsiCo, or products or packages that imitate, infringe or cause confusion with the products, containers or trademarks of PepsiCo. The Master Bottling Agreement also imposes requirements with respect to the use of PepsiCo’s trademarks, authorized containers, packaging and labeling.
If we acquire control, directly or indirectly, of any bottler of cola beverages, we must cause the acquired bottler to amend its bottling appointments for the cola beverages to conform to the terms of the Master Bottling Agreement. Under the Master Bottling Agreement, PepsiCo has agreed not to withhold approval for any acquisition of rights to manufacture and sell Pepsi trademarked cola beverages within a specific area — currently representing approximately 10.63% of PepsiCo’s U.S. bottling system in terms of volume — if we have successfully negotiated the acquisition and, in PepsiCo’s reasonable judgment, satisfactorily performed our obligations under the Master Bottling Agreement. We have agreed not to acquire or attempt to acquire any rights to manufacture and sell Pepsi trademarked cola beverages outside of that specific area without PepsiCo’s prior written approval.
3
Table of Contents
The Master Bottling Agreement is perpetual, but may be terminated by PepsiCo in the event of our default. Events of default include:
| (1) | PBG’s insolvency, bankruptcy, dissolution, receivership or the like; | ||
| (2) | any disposition of any voting securities of one of our bottling subsidiaries or substantially all of our bottling assets without the consent of PepsiCo; | ||
| (3) | PBG’s entry into any business other than the business of manufacturing, selling or distributing non-alcoholic beverages or any business which is directly related and incidental to such beverage business; and | ||
| (4) | any material breach under the contract that remains uncured for 120 days after notice by PepsiCo. |
An event of default will also occur if any person or affiliated group acquires any contract, option, conversion privilege, or other right to acquire, directly or indirectly, beneficial ownership of more than 15% of any class or series of PBG’s voting securities without the consent of PepsiCo. As of February 13, 2009, to our knowledge, no shareholder of PBG, other than PepsiCo, held more than 5% of PBG’s common stock.
We are prohibited from assigning, transferring or pledging the Master Bottling Agreement, or any interest therein, whether voluntarily, or by operation of law, including by merger or liquidation, without the prior consent of PepsiCo.
The Master Bottling Agreement was entered into by PBG in the context of our separation from PepsiCo and, therefore, its provisions were not the result of arm’s-length negotiations. Consequently, the agreement contains provisions that are less favorable to us than the exclusive bottling appointments for cola beverages currently in effect for independent bottlers in the United States.
Terms of the Non-Cola Bottling Agreements.The beverage products covered by the non-cola bottling agreements are beverages licensed to PBG by PepsiCo, including Mountain Dew, Aquafina, Sierra Mist, Diet Mountain Dew, Mug Root Beer and Mountain Dew Code Red. The non-cola bottling agreements contain provisions that are similar to those contained in the Master Bottling Agreement with respect to pricing, territorial restrictions, authorized containers, planning, quality control, transfer restrictions, term and related matters. PBG’s non-cola bottling agreements will terminate if PepsiCo terminates PBG’s Master Bottling Agreement. The exclusivity provisions contained in the non-cola bottling agreements would prevent us from manufacturing, selling or distributing beverage products that imitate, infringe upon, or cause confusion with, the beverage products covered by the non-cola bottling agreements. PepsiCo may also elect to discontinue the manufacture, sale or distribution of a non-cola beverage and terminate the applicable non-cola bottling agreement upon six months notice to us.
Terms of Certain Distribution Agreements.PBG also has agreements with PepsiCo granting us exclusive rights to distribute AMP and Dole in all of PBG’s territories, SoBe in certain specified territories and Gatorade and G2 in certain specified channels. The distribution agreements contain provisions generally similar to those in the Master Bottling Agreement as to use of trademarks, trade names, approved containers and labels and causes for termination. PBG also has the right to sell Tropicana juice drinks in the United States and Canada, Tropicana juices in Russia and Spain, and Gatorade in Spain, Greece and Russia and in certain limited channels of distribution in the United States and Canada. Some of these beverage agreements have limited terms and, in most instances, prohibit us from dealing in similar beverage products.
Terms of the Master Syrup Agreement.The Master Syrup Agreement grants PBG the exclusive right to manufacture, sell and distribute fountain syrup to local customers in PBG’s territories. We have agreed to act as a manufacturing and delivery agent for national accounts within PBG’s territories that specifically request direct delivery without using a middleman. In addition, PepsiCo may appoint PBG to manufacture and deliver fountain syrup to national accounts that elect delivery through independent distributors. Under the Master Syrup Agreement, PBG has the exclusive right to service fountain equipment for all of the national account customers within our territories. The Master Syrup Agreement provides that the determination of whether an account is local or national is at the sole discretion of PepsiCo.
The Master Syrup Agreement contains provisions that are similar to those contained in the Master Bottling Agreement with respect to concentrate pricing, territorial restrictions with respect to local customers and national customers electing direct-to-store delivery only, planning, quality control, transfer restrictions and related matters. The Master Syrup Agreement had an initial term of five years which expired in 2004 and was renewed for an additional five-year period. The Master Syrup Agreement will automatically renew for additional five-year periods, unless PepsiCo terminates it for cause. PepsiCo has the right to terminate the Master Syrup Agreement without cause at any time upon twenty-four months notice. In the event PepsiCo terminates the Master Syrup Agreement without cause, PepsiCo is required to pay PBG the fair market value of PBG’s rights thereunder.
4
Table of Contents
Our Master Syrup Agreement will terminate if PepsiCo terminates our Master Bottling Agreement.
Terms of Other U.S. Bottling Agreements.The bottling agreements between PBG and other licensors of beverage products, including Dr Pepper Snapple Group for Dr Pepper, Crush, Schweppes, Canada Dry, Hawaiian Punch and Squirt, the Pepsi/Lipton Tea Partnership for Lipton Brisk and Lipton Iced Tea, and the North American Coffee Partnership for Starbucks Frappuccino®, contain provisions generally similar to those in the Master Bottling Agreement as to use of trademarks, trade names, approved containers and labels, sales of imitations and causes for termination. Some of these beverage agreements have limited terms and, in most instances, prohibit us from dealing in similar beverage products.
Terms of the Country-Specific Bottling Agreements.The country-specific bottling agreements contain provisions generally similar to those contained in the Master Bottling Agreement and the non-cola bottling agreements and, in Canada, the Master Syrup Agreement with respect to authorized containers, planning, quality control, transfer restrictions, term, causes for termination and related matters. These bottling agreements differ from the Master Bottling Agreement because, except for Canada, they include both fountain syrup and non-fountain beverages. Certain of these bottling agreements contain provisions that have been modified to reflect the laws and regulations of the applicable country. For example, the bottling agreements in Spain do not contain a restriction on the sale and shipment of Pepsi-Cola beverages into our territory by others in response to unsolicited orders. In addition, in Mexico and Turkey we are restricted in our ability to manufacture, sell and distribute beverages sold under non-PepsiCo trademarks.
Terms of the Russia Venture Agreement.In 2007, PBG together with PepsiCo formed PR Beverages Limited (“PR Beverages”), a venture that enables us to strategically invest in Russia to accelerate our growth. PBG contributed its business in Russia to PR Beverages, and PepsiCo entered into bottling agreements with PR Beverages for PepsiCo beverage products sold in Russia on the same terms as in effect for PBG immediately prior to the venture. PepsiCo also granted PR Beverages an exclusive license to manufacture and sell the concentrate for such products.
Terms of Russia Snack Food Distribution Agreement.Effective January 2009, PR Beverages entered into an agreement with Frito-Lay Manufacturing, LLC (“FLM”), a wholly owned subsidiary of PepsiCo, pursuant to which PR Beverages purchases Frito-Lay snack products from FLM for sale and distribution in the Russian Federation. This agreement provides FLM access to the infrastructure of PBG’s distribution network in Russia and allows PBG to more effectively utilize some of its distribution network assets. This agreement replaced a similar agreement, which expired on December 31, 2008.
Seasonality
Sales of our products are seasonal, particularly in our Europe segment, where sales volumes tend to be more sensitive to weather conditions. Our peak season across all of our segments is the warm summer months beginning in May and ending in September. In 2008, approximately 50% of our volume was generated during the second and third quarters and approximately 80% of cash flow from operations was generated in the third and fourth quarters.
Competition
The carbonated soft drink market and the non-carbonated beverage market are highly competitive. Our competitors in these markets include bottlers and distributors of nationally advertised and marketed products, bottlers and distributors of regionally advertised and marketed products, as well as bottlers of private label soft drinks sold in chain stores. Among our major competitors are bottlers that distribute products from The Coca-Cola Company including Coca-Cola Enterprises Inc., Coca-Cola Hellenic Bottling Company S.A., Coca-Cola FEMSA S.A. de C.V. and Coca-Cola Bottling Co. Consolidated. Our market share for carbonated soft drinks sold under trademarks owned by PepsiCo in our U.S. territories ranges from approximately 21% to approximately 41%. Our market share for carbonated soft drinks sold under trademarks owned by PepsiCo for each country outside the United States in which we do business is as follows: Canada 44%; Russia 21%; Turkey 17%; Spain 10% and Greece 10% (including market share for our IVI brand). In addition, market share for our territories and the territories of other Pepsi bottlers in Mexico is 18% for carbonated soft drinks sold under trademarks owned by PepsiCo. All market share figures are based on generally available data published by third parties. Actions by our major competitors and others in the beverage industry, as well as the general economic environment, could have an impact on our future market share.
We compete primarily on the basis of advertising and marketing programs to create brand awareness, price and promotions, retail space management, customer service, consumer points of access, new products, packaging innovations and distribution methods. We believe that brand recognition, market place pricing, consumer value, customer service, availability and consumer and customer goodwill are primary factors affecting our competitive position.
5
Table of Contents
Governmental Regulation Applicable to Bottling LLC
Our operations and properties are subject to regulation by various federal, state and local governmental entities and agencies in the United States as well as foreign governmental entities and agencies in Canada, Spain, Greece, Russia, Turkey and Mexico. As a producer of food products, we are subject to production, packaging, quality, labeling and distribution standards in each of the countries where we have operations, including, in the United States, those of the Federal Food, Drug and Cosmetic Act and the Public Health Security and Bioterrorism Preparedness and Response Act. The operations of our production and distribution facilities are subject to laws and regulations relating to the protection of our employees’ health and safety and the environment in the countries in which we do business. In the United States, we are subject to the laws and regulations of various governmental entities, including the Department of Labor, the Environmental Protection Agency and the Department of Transportation, and various federal, state and local occupational, labor and employment and environmental laws. These laws and regulations include the Occupational Safety and Health Act, the Clean Air Act, the Clean Water Act, the Resource Conservation and Recovery Act, the Comprehensive Environmental Response, Compensation and Liability Act, the Superfund Amendments and Reauthorization Act, the Federal Motor Carrier Safety Act and the Fair Labor Standards Act.
We believe that our current legal, operational and environmental compliance programs are adequate and that we are in substantial compliance with applicable laws and regulations of the countries in which we do business. We do not anticipate making any material expenditures in connection with environmental remediation and compliance. However, compliance with, or any violation of, future laws or regulations could require material expenditures by us or otherwise have a material adverse effect on our business, financial condition or results of operations.
Bottle and Can Legislation.Legislation has been enacted in certain U.S. states and Canadian provinces where we operate that generally prohibits the sale of certain beverages in non-refillable containers unless a deposit or levy is charged for the container. These include California, Connecticut, Delaware, Hawaii, Iowa, Maine, Massachusetts, Michigan, New York, Oregon, West Virginia, British Columbia, Alberta, Saskatchewan, Manitoba, New Brunswick, Nova Scotia and Quebec. Legislation prohibited the sale of carbonated beverages in non-refillable containers in Prince Edwards Islands in 2007, but this law was repealed in May 2008.
Massachusetts and Michigan have statutes that require us to pay all or a portion of unclaimed container deposits to the state and Connecticut has enacted a similar statute effective in 2009. Hawaii and California impose a levy on beverage containers to fund a waste recovery system.
In addition to the Canadian deposit legislation described above, Ontario, Canada currently has a regulation requiring that at least 30% of all soft drinks sold in Ontario be bottled in refillable containers.
The European Commission issued a packaging and packing waste directive that was incorporated into the national legislation of most member states. This has resulted in targets being set for the recovery and recycling of household, commercial and industrial packaging waste and imposes substantial responsibilities upon bottlers and retailers for implementation. Similar legislation has been enacted in Turkey.
Mexico adopted legislation regulating the disposal of solid waste products. In response to this legislation, PBG Mexico maintains agreements with local and federal Mexican governmental authorities as well as with civil associations, which require PBG Mexico, and other participating bottlers, to provide for collection and recycling of certain minimum amounts of plastic bottles.
We are not aware of similar material legislation being enacted in any other areas served by us. The recent economic downturn has resulted in reduced tax revenue for many states and has increased the need for some states to identify new revenue sources. Some states may pursue additional revenue through new or amended bottle and can legislation. We are unable to predict, however, whether such legislation will be enacted or what impact its enactment would have on our business, financial condition or results of operations.
Soft Drink Excise Tax Legislation.Specific soft drink excise taxes have been in place in certain states for several years. The states in which we operate that currently impose such a tax are West Virginia and Arkansas and, with respect to fountain syrup only, Washington.
Value-added taxes on soft drinks vary in our territories located in Canada, Spain, Greece, Russia, Turkey and Mexico, but are consistent with the value-added tax rate for other consumer products. In addition, there is a special consumption tax applicable to cola products in Turkey. In Mexico, bottled water in containers over 10.1 liters are exempt from value-added tax, and we obtained a tax exemption for containers holding less than 10.1 liters of water. The tax exemption currently also applies to non-carbonated soft drinks.
6
Table of Contents
We are not aware of any material soft drink taxes that have been enacted in any other market served by us. The recent economic downturn has resulted in reduced tax revenue for many states and has increased the need for some states to identify new revenue sources. Some states may pursue additional revenue through new or amended soft drink or similar excise tax legislation. We are unable to predict, however, whether such legislation will be enacted or what impact its enactment would have on our business, financial condition or results of operations.
Trade Regulation.As a manufacturer, seller and distributor of bottled and canned soft drink products of PepsiCo and other soft drink manufacturers in exclusive territories in the United States and internationally, we are subject to antitrust and competition laws. Under the Soft Drink Interbrand Competition Act, soft drink bottlers operating in the United States, such as us, may have an exclusive right to manufacture, distribute and sell a soft drink product in a geographic territory if the soft drink product is in substantial and effective competition with other products of the same class in the same market or markets. We believe that there is such substantial and effective competition in each of the exclusive geographic territories in which we operate.
School Sales Legislation; Industry Guidelines.In 2004, the U.S. Congress passed the Child Nutrition Act, which required school districts to implement a school wellness policy by July 2006. In May 2006, members of the American Beverage Association, the Alliance for a Healthier Generation, the American Heart Association and The William J. Clinton Foundation entered into a memorandum of understanding that sets forth standards for what beverages can be sold in elementary, middle and high schools in the United States (the “ABA Policy”). Also, the beverage associations in the European Union and Canada have recently issued guidelines relating to the sale of beverages in schools. We intend to comply fully with the ABA Policy and these guidelines. In addition, legislation has been proposed in Mexico that would restrict the sale of certain high-calorie products, including soft drinks, in schools and that would require these products to include a label that warns consumers that consumption abuse may lead to obesity.
California Carcinogen and Reproductive Toxin Legislation.A California law requires that any person who exposes another to a carcinogen or a reproductive toxin must provide a warning to that effect. Because the law does not define quantitative thresholds below which a warning is not required, virtually all manufacturers of food products are confronted with the possibility of having to provide warnings due to the presence of trace amounts of defined substances. Regulations implementing the law exempt manufacturers from providing the required warning if it can be demonstrated that the defined substances occur naturally in the product or are present in municipal water used to manufacture the product. We have assessed the impact of the law and its implementing regulations on our beverage products and have concluded that none of our products currently requires a warning under the law. We cannot predict whether or to what extent food industry efforts to minimize the law’s impact on food products will succeed. We also cannot predict what impact, either in terms of direct costs or diminished sales, imposition of the law may have.
Mexican Water Regulation.In Mexico, we pump water from our own wells and we purchase water directly from municipal water companies pursuant to concessions obtained from the Mexican government on a plant-by-plant basis. The concessions are generally for ten-year terms and can generally be renewed by us prior to expiration with minimal cost and effort. Our concessions may be terminated if, among other things, (a) we use materially more water than permitted by the concession, (b) we use materially less water than required by the concession, (c) we fail to pay for the rights for water usage or (d) we carry out, without governmental authorization, any material construction on or improvement to, our wells. Our concessions generally satisfy our current water requirements and we believe that we are generally in compliance in all material respects with the terms of our existing concessions.
Employees
As of December 27, 2008, we employed approximately 66,800 workers, of whom approximately 32,700 were employed in the United States. Approximately 8,700 of our workers in the United States are union members and approximately 16,200 of our workers outside the United States are union members. We consider relations with our employees to be good and have not experienced significant interruptions of operations due to labor disagreements.
Available Information
PBG has made available, free of charge, the following governance materials on its website atwww.pbg.comunder Investor Relations — Company Information — Corporate Governance: PBG’s Certificate of Incorporation, PBG’s Bylaws, PBG’s Corporate Governance Principles and Practices, PBG’s Worldwide Code of Conduct (including any amendment thereto), PBG’s Director Independence Policy, PBG’s Audit and Affiliated Transactions Committee Charter, PBG’s Compensation and Management Development Committee Charter, PBG’s Nominating and Corporate Governance Committee Charter, PBG’s Disclosure Committee Charter and PBG’s Policy and Procedures Governing Related-Person Transactions. These governance materials are available in print, free of charge, to any PBG shareholder upon request.
7
Table of Contents
Financial Information on Industry Segments and Geographic Areas
We operate in one industry, carbonated soft drinks and other ready-to-drink beverages, and all of our segments derive revenue from these products. We have three reportable segments: U.S. & Canada, Europe (which includes Spain, Russia, Greece and Turkey) and Mexico. Operationally, the Company is organized along geographic lines with specific regional management teams having responsibility for the financial results in each reportable segment.
For additional information, see Note 13 in the Notes to Consolidated Financial Statements included in Item 7 below.
ITEM 1A. RISK FACTORS
Our business and operations entail a variety of risks and uncertainties, including those described below.
We may not be able to respond successfully to consumer trends related to carbonated and non-carbonated beverages.
Consumer trends with respect to the products we sell are subject to change. Consumers are seeking increased variety in their beverages, and there is a growing interest among the public regarding the ingredients in our products, the attributes of those ingredients and health and wellness issues generally. This interest has resulted in a decline in consumer demand for carbonated soft drinks and an increase in consumer demand for products associated with health and wellness, such as water, enhanced water, teas and certain other non-carbonated beverages. Consumer preferences may change due to a variety of other factors, including the aging of the general population, changes in social trends, the real or perceived impact the manufacturing of our products has on the environment, changes in consumer demographics, changes in travel, vacation or leisure activity patterns or a downturn in economic conditions. Any of these changes may reduce consumers’ demand for our products. For example, the recent downturn in economic conditions has adversely impacted sales of certain of our higher margin products, including our products sold for immediate consumption in restaurants.
Because we rely mainly on PepsiCo to provide us with the products we sell, if PepsiCo fails to develop innovative products and packaging that respond to consumer trends, we could be put at a competitive disadvantage in the marketplace and our business and financial results could be adversely affected. In addition, PepsiCo is under no obligation to provide us distribution rights to all of its products in all of the channels in which we operate. If we are unable to enter into agreements with PepsiCo to distribute innovative products in all of these channels or otherwise gain broad access to products that respond to consumer trends, we could be put at a competitive disadvantage in the marketplace and our business and financial results could be adversely affected.
We may not be able to respond successfully to the demands of our largest customers.
Our retail customers are consolidating, leaving fewer customers with greater overall purchasing power and, consequently, greater influence over our pricing, promotions and distribution methods. Because we do not operate in all markets in which these customers operate, we must rely on PepsiCo and other Pepsi bottlers to service such customers outside of our markets. The inability of PepsiCo or Pepsi bottlers as a whole, to meet the product, packaging and service demands of our largest customers could lead to a loss or decrease in business from such customers and have a material adverse effect on our business and financial results.
Our business requires a significant supply of raw materials and energy, the limited availability or increased costs of which could adversely affect our business and financial results.
The production and distribution of our beverage products is highly dependent on certain ingredients, packaging materials, other raw materials, and energy. To produce our products, we require significant amounts of ingredients, such as beverage concentrate and high fructose corn syrup, as well as access to significant amounts of water. We also require significant amounts of packaging materials, such as aluminum and plastic bottle components, such as resin (a petroleum-based product). In addition, we use a significant amount of electricity, natural gas, motor fuel and other energy sources to operate our fleet of trucks and our bottling plants.
If the suppliers of our ingredients, packaging materials, other raw materials or energy are impacted by an increased demand for their products, business downturn, weather conditions (including those related to climate change), natural disasters, governmental regulation, terrorism, strikes or other events, and we are not able to effectively obtain the products from another supplier, we could incur an interruption in the supply of such products or increased costs of such products. Any sustained interruption in the supply of our ingredients, packaging materials, other raw materials or energy, or increased costs thereof, could have a material adverse effect on our business and financial results.
8
Table of Contents
The prices of some of our ingredients, packaging materials, other raw materials and energy, including high fructose corn syrup and motor fuel, are experiencing unprecedented volatility, which can unpredictably and substantially increase our costs. We have implemented a hedging strategy to better predict our costs of some of these products. In a volatile market, however, such strategy includes a risk that, during a particular period of time, market prices fall below our hedged price and we pay higher than market prices for certain products. As a result, under certain circumstances, our hedging strategy may increase our overall costs.
If there is a significant or sustained increase in the costs of our ingredients, packaging materials, other raw materials or energy, and we are unable to pass the increased costs on to our customers in the form of higher prices, there could be a material adverse effect on our business and financial results.
Changes in the legal and regulatory environment, including those related to climate change, could increase our costs or liabilities or impact the sale of our products.
Our operations and properties are subject to regulation by various federal, state and local governmental entities and agencies as well as foreign governmental entities. Such regulations relate to, among other things, food and drug laws, competition laws, labor laws, taxation requirements (including soft drink or similar excise taxes), bottle and can legislation (see above under “Governmental Regulation Applicable to Bottling LLC”), accounting standards and environmental laws.
There is also a growing consensus that emissions of greenhouse gases are linked to global climate change, which may result in more regional, federal and/or global legal and regulatory requirements to reduce or mitigate the effects of greenhouse gases. Until any such requirements come into effect, it is difficult to predict their impact on our business or financial results, including any impact on our supply chain costs. In the interim, we are working to improve our systems to record baseline data and monitor our greenhouse gas emissions and, during the process of developing our business strategies, we consider the impact our plans may have on the environment.
We cannot assure you that we have been or will at all times be in compliance with all regulatory requirements or that we will not incur material costs or liabilities in connection with existing or new regulatory requirements, including those related to climate change.
PepsiCo’s equity ownership of PBG could affect matters concerning us.
As of January 23, 2009, PepsiCo owned approximately 40.2% of the combined voting power of PBG’s voting stock (with the balance owned by the public). PepsiCo will be able to significantly affect the outcome of PBG’s shareholder votes, thereby affecting matters concerning us.
Because we depend upon PepsiCo to provide us with concentrate, certain funding and various services, changes in our relationship with PepsiCo could adversely affect our business and financial results.
We conduct our business primarily under beverage agreements with PepsiCo. If our beverage agreements with PepsiCo are terminated for any reason, it would have a material adverse effect on our business and financial results. These agreements provide that we must purchase all of the concentrate for such beverages at prices and on other terms which are set by PepsiCo in its sole discretion. Any significant concentrate price increases could materially affect our business and financial results.
PepsiCo has also traditionally provided bottler incentives and funding to its bottling operations. PepsiCo does not have to maintain or continue these incentives or funding. Termination or decreases in bottler incentives or funding levels could materially affect our business and financial results.
Under our shared services agreement, we obtain various services from PepsiCo, including procurement of raw materials and certain administrative services. If any of the services under the shared services agreement were terminated, we would have to obtain such services on our own. This could result in a disruption of such services, and we might not be able to obtain these services on terms, including cost, that are as favorable as those we receive through PepsiCo.
9
Table of Contents
We may have potential conflicts of interest with PepsiCo, which could result in PepsiCo’s objectives being favored over our objectives.
Our past and ongoing relationship with PepsiCo could give rise to conflicts of interests. In addition, two members of PBG’s Board of Directors are executive officers of PepsiCo, and one of the three Managing Directors of Bottling LLC is an officer of PepsiCo, a situation which may create conflicts of interest.
These potential conflicts include balancing the objectives of increasing sales volume of PepsiCo beverages and maintaining or increasing our profitability. Other possible conflicts could relate to the nature, quality and pricing of services or products provided to us by PepsiCo or by us to PepsiCo.
Conflicts could also arise in the context of our potential acquisition of bottling territories and/or assets from PepsiCo or other independent Pepsi bottlers. Under our Master Bottling Agreement with PepsiCo, we must obtain PepsiCo’s approval to acquire any independent Pepsi bottler. PepsiCo has agreed not to withhold approval for any acquisition within agreed-upon U.S. territories if we have successfully negotiated the acquisition and, in PepsiCo’s reasonable judgment, satisfactorily performed our obligations under the Master Bottling Agreement. We have agreed not to attempt to acquire any independent Pepsi bottler outside of those agreed-upon territories without PepsiCo’s prior written approval.
Our acquisition strategy may be limited by our ability to successfully integrate acquired businesses into ours or our failure to realize our expected return on acquired businesses.
We intend to continue to pursue acquisitions of bottling assets and territories from PepsiCo’s independent bottlers. The success of our acquisition strategy may be limited because of unforeseen costs and complexities. We may not be able to acquire, integrate successfully or manage profitably additional businesses without substantial costs, delays or other difficulties. Unforeseen costs and complexities may also prevent us from realizing our expected rate of return on an acquired business. Any of the foregoing could have a material adverse effect on our business and financial results.
We may not be able to compete successfully within the highly competitive carbonated and non-carbonated beverage markets.
The carbonated and non-carbonated beverage markets are highly competitive. Competitive pressures in our markets could cause us to reduce prices or forego price increases required to off-set increased costs of raw materials and fuel, increase capital and other expenditures, or lose market share, any of which could have a material adverse effect on our business and financial results.
If we are unable to fund our substantial capital requirements, it could cause us to reduce our planned capital expenditures and could result in a material adverse effect on our business and financial results.
We require substantial capital expenditures to implement our business plans. If we do not have sufficient funds or if we are unable to obtain financing in the amounts desired or on acceptable terms, we may have to reduce our planned capital expenditures, which could have a material adverse effect on our business and financial results.
The level of our indebtedness could adversely affect our financial health.
The level of our indebtedness requires us to dedicate a substantial portion of our cash flow from operations to payments on our debt. This could limit our flexibility in planning for, or reacting to, changes in our business and place us at a competitive disadvantage compared to competitors that have less debt. Our indebtedness also exposes us to interest rate fluctuations, because the interest on some of our indebtedness is at variable rates, and makes us vulnerable to general adverse economic and industry conditions. All of the above could make it more difficult for us, or make us unable to satisfy our obligations with respect to all or a portion of such indebtedness and could limit our ability to obtain additional financing for future working capital expenditures, strategic acquisitions and other general corporate requirements.
We are unable to predict the impact of the recent downturn in the credit markets and the resulting costs or constraints in obtaining financing on our business and financial results.
Our principal sources of cash come from our operating activities and the issuance of debt and bank borrowings. The recent and extraordinary disruption in the credit markets has had a significant adverse impact on a number of financial institutions and has affected the cost of capital available to us. At this point in time, our liquidity has not been materially impacted by the current credit environment and management does not expect that it will be materially impacted in the near future. We will continue to closely
10
Table of Contents
monitor our liquidity and the credit markets. The recent economic downturn has also had an adverse impact on some of our customers and suppliers. We will continue to closely monitor the credit worthiness of our customers and suppliers and adjust our allowance for doubtful accounts, as appropriate. We cannot predict with any certainty the impact to us of any further disruption in the credit environment or any resulting material impact on our liquidity, future financing costs or financial results.
Our foreign operations are subject to social, political and economic risks and may be adversely affected by foreign currency fluctuations.
In the fiscal year ended December 27, 2008, approximately 34% of our net revenues were generated in territories outside the United States. Social, economic and political developments in our international markets (including Russia, Mexico, Canada, Spain, Turkey and Greece) may adversely affect our business and financial results. These developments may lead to new product pricing, tax or other policies and monetary fluctuations that may adversely impact our business and financial results. The overall risks to our international businesses also include changes in foreign governmental policies. In addition, we are expanding our investment and sales and marketing efforts in certain emerging markets, such as Russia. Expanding our business into emerging markets may present additional risks beyond those associated with more developed international markets. For example, Russia has been a significant source of our profit growth, but is now experiencing an economic downturn, which if sustained may have a material adverse impact on our business and financial results. Additionally, our cost of goods, our results of operations and the value of our foreign assets are affected by fluctuations in foreign currency exchange rates. For example, the recent weakening of foreign currencies negatively impacted our earnings in 2008 compared with the prior year.
If we are unable to maintain brand image and product quality, or if we encounter other product issues such as product recalls, our business may suffer.
Maintaining a good reputation globally is critical to our success. If we fail to maintain high standards for product quality, or if we fail to maintain high ethical, social and environmental standards for all of our operations and activities, our reputation could be jeopardized. In addition, we may be liable if the consumption of any of our products causes injury or illness, and we may be required to recall products if they become contaminated or are damaged or mislabeled. A significant product liability or other product-related legal judgment against us or a widespread recall of our products could have a material adverse effect on our business and financial results.
Our success depends on key members of our management, the loss of whom could disrupt our business operations.
Our success depends largely on the efforts and abilities of key management employees. Key management employees are not parties to employment agreements with us. The loss of the services of key personnel could have a material adverse effect on our business and financial results.
If we are unable to renew collective bargaining agreements on satisfactory terms, or if we experience strikes, work stoppages or labor unrest, our business may suffer.
Approximately 31% of our U.S. and Canadian employees are covered by collective bargaining agreements. These agreements generally expire at various dates over the next five years. Our inability to successfully renegotiate these agreements could cause work stoppages and interruptions, which may adversely impact our operating results. The terms and conditions of existing or renegotiated agreements could also increase our costs or otherwise affect our ability to increase our operational efficiency.
Benefits cost increases could reduce our profitability or cash flow.
Our profitability and cash flow is substantially affected by the costs of pension, postretirement medical and employee medical and other benefits. Recently, these costs have increased significantly due to factors such as declines in investment returns on pension assets, changes in discount rates used to calculate pension and related liabilities, and increases in health care costs. Although we actively seek to control increases, there can be no assurance that we will succeed in limiting future cost increases, and continued upward pressure in these costs could have a material adverse affect on our business and financial performance.
Our failure to effectively manage our information technology infrastructure could disrupt our operations and negatively impact our business.
We rely on information technology systems to process, transmit, store and protect electronic information. Additionally, a significant portion of the communications between our personnel, customers, and suppliers depends on information technology. If we do not effectively manage our information technology infrastructure, we could be subject to transaction errors, processing inefficiencies, the loss of customers, business disruptions and data security breaches.
11
Table of Contents
Adverse weather conditions could reduce the demand for our products.
Demand for our products is influenced to some extent by the weather conditions in the markets in which we operate. Weather conditions in these markets, such as unseasonably cool temperatures, could have a material adverse effect on our sales volume and financial results.
Catastrophic events in the markets in which we operate could have a material adverse effect on our financial condition.
Natural disasters, terrorism, pandemic, strikes or other catastrophic events could impair our ability to manufacture or sell our products. Failure to take adequate steps to mitigate the likelihood or potential impact of such events, or to manage such events effectively if they occur, could adversely affect our sales volume, cost of raw materials, earnings and financial results.
ITEM 1B. UNRESOLVED STAFF COMMENTS
None.
ITEM 2. PROPERTIES
Our corporate headquarters is located in leased property in Somers, New York. In addition, we have a total of 591 manufacturing and distribution facilities, as follows:
| U.S. & Canada | Europe | Mexico | ||||||||||
Manufacturing Facilities | ||||||||||||
| Owned | 51 | 14 | 22 | |||||||||
| Leased | 2 | — | 3 | |||||||||
| Other | 4 | — | — | |||||||||
| Total | 57 | 14 | 25 | |||||||||
Distribution Facilities | ||||||||||||
| Owned | 222 | 12 | 84 | |||||||||
| Leased | 49 | 48 | 80 | |||||||||
| Total | 271 | 60 | 164 | |||||||||
We also own or lease and operate approximately 38,500 vehicles, including delivery trucks, delivery and transport tractors and trailers and other trucks and vans used in the sale and distribution of our beverage products. We also own more than two million coolers, soft drink dispensing fountains and vending machines.
With a few exceptions, leases of plants in the U.S. & Canada are on a long-term basis, expiring at various times, with options to renew for additional periods. Our leased facilities in Europe and Mexico are generally leased for varying and usually shorter periods, with or without renewal options. We believe that our properties are in good operating condition and are adequate to serve our current operational needs.
ITEM 3. LEGAL PROCEEDINGS
From time to time we are a party to various litigation proceedings arising in the ordinary course of our business, none of which, in the opinion of management, is likely to have a material adverse effect on our financial condition or results of operations.
ITEM 4. SUBMISSION OF MATTERS TO A VOTE OF SECURITY HOLDERS
None.
12
Table of Contents
PART II
ITEM 5. MARKET FOR REGISTRANT’S COMMON EQUITY, RELATED STOCKHOLDER MATTERS AND ISSUER PURCHASES OF EQUITY SECURITIES
There is no established public trading market for the ownership of Bottling LLC.
13
Table of Contents
ITEM 6. SELECTED FINANCIAL DATA
SELECTED FINANCIAL AND OPERATING DATA
in millions
in millions
| Fiscal years ended | 2008(1) | 2007(2) | 2006(3)(4) | 2005(3)(5) | 2004 | |||||||||||||||
Statement of Operations Data: | ||||||||||||||||||||
| Net revenues | $ | 13,796 | $ | 13,591 | $ | 12,730 | $ | 11,885 | $ | 10,906 | ||||||||||
| Cost of sales | 7,586 | 7,370 | 6,900 | 6,345 | 5,656 | |||||||||||||||
| Gross profit | 6,210 | 6,221 | 5,830 | 5,540 | 5,250 | |||||||||||||||
| Selling, delivery and administrative expenses | 5,171 | 5,167 | 4,842 | 4,533 | 4,285 | |||||||||||||||
| Impairment charges | 412 | — | — | — | — | |||||||||||||||
| Operating income | 627 | 1,054 | 988 | 1,007 | 965 | |||||||||||||||
| Interest expense | 244 | 232 | 227 | 187 | 166 | |||||||||||||||
| Interest income | 162 | 222 | 174 | 77 | 34 | |||||||||||||||
| Other non-operating expenses (income), net | 24 | (5 | ) | 10 | 1 | 1 | ||||||||||||||
| Minority interest | 24 | 28 | (2 | ) | 1 | — | ||||||||||||||
| Income before income taxes | 497 | 1,021 | 927 | 895 | 832 | |||||||||||||||
Income tax (benefit) expense(6)(7)(8) | (39 | ) | 27 | 3 | 24 | 3 | ||||||||||||||
| Net income | $ | 536 | $ | 994 | $ | 924 | $ | 871 | $ | 829 | ||||||||||
Balance Sheet Data (at period end): | ||||||||||||||||||||
| Total assets | $ | 16,495 | $ | 16,712 | $ | 14,955 | $ | 13,745 | $ | 12,724 | ||||||||||
| Long-term debt | $ | 3,789 | $ | 3,776 | $ | 3,759 | $ | 2,943 | $ | 3,495 | ||||||||||
| Minority interest | $ | 672 | $ | 379 | $ | 18 | $ | 3 | $ | 3 | ||||||||||
Accumulated other comprehensive loss(9) | $ | (1,373 | ) | $ | (189 | ) | $ | (589 | ) | $ | (395 | ) | $ | (447 | ) | |||||
| Owners’ equity | $ | 7,534 | $ | 9,229 | $ | 8,092 | $ | 7,581 | $ | 6,620 | ||||||||||
| (1) | Our fiscal year 2008 results include a $412 million non-cash impairment charge related primarily to distribution rights and product brands in Mexico and an $83 million pre-tax charge related to restructuring charges. See Items Affecting Comparability of Our Financial Results in Item 7. | |
| (2) | Our fiscal year 2007 results include a $30 million pre-tax charge related to restructuring charges and a $23 million pre-tax charge related to our asset disposal plan. See Items Affecting Comparability of Our Financial Results in Item 7. | |
| (3) | In 2007, we made a classification correction for certain miscellaneous costs incurred from product losses in the trade. Approximately $90 million and $92 million of costs incurred, which were incorrectly included in selling, delivery and administrative expenses, were reclassified to cost of sales in our Consolidated Statements of Operations for the years ended 2006 and 2005, respectively. We have not reclassified these expenses for the 2004 fiscal year. | |
| (4) | In fiscal year 2006, we adopted Statement of Financial Accounting Standards (“SFAS”) No. 123 (revised 2004), “Share-Based Payment” resulting in a $65 million decrease in operating income. Results for prior periods have not been restated as provided for under the modified prospective approach. | |
| (5) | Our fiscal year 2005 results include an extra week of activity. The pre-tax income generated from the extra week was spent back in strategic initiatives within our selling, delivery and administrative expenses and, accordingly, had no impact on our net income. | |
| (6) | Our fiscal year 2007 results include a net non-cash benefit of $13 million due to tax law changes in Canada and Mexico. See Items Affecting Comparability of Our Financial Results in Item 7. | |
| (7) | Our fiscal year 2006 results include a tax benefit of $12 million from tax law changes in Canada, Turkey, and in certain U.S. jurisdictions. See Items Affecting Comparability of Our Financial Results in Item 7. | |
| (8) | Our fiscal year 2004 results include Mexico tax law change benefit of $26 million. | |
| (9) | In fiscal year 2006, we adopted SFAS No. 158, “Employers’ Accounting for Defined Benefit Pension and Other Postretirement Plans” and recorded a $278 million loss, net of taxes, to accumulated other comprehensive loss. |
14
Table of Contents
ITEM 7. MANAGEMENT’S DISCUSSION AND ANALYSIS OF FINANCIAL CONDITION AND RESULTS OF OPERATIONS
TABLE OF CONTENTS
MANAGEMENT’S FINANCIAL REVIEW
| Our Business | 16 | |||
| Critical Accounting Policies | 17 | |||
| Other Intangible Assets net, and Goodwill | 17 | |||
| Pension and Postretirement Medical Benefit Plans | 18 | |||
| Income Taxes | 21 | |||
| Relationship with PepsiCo | 21 | |||
| Items Affecting Comparability of Our Financial Results | 22 | |||
| Financial Performance Summary and Worldwide Financial Highlights for Fiscal Year 2008 | 24 | |||
| Results of Operations by Segment | 24 | |||
| Liquidity and Financial Condition | 30 | |||
| Market Risks and Cautionary Statements | 33 |
AUDITED CONSOLIDATED FINANCIAL STATEMENTS
| Consolidated Statements of Operations | 36 | |||
| Consolidated Statements of Cash Flows | 37 | |||
| Consolidated Balance Sheets | 38 | |||
| Consolidated Statements of Changes in Owners’ Equity | 39 | |||
| Notes to Consolidated Financial Statements | 40 | |||
| Note 1 - Basis of Presentation | 40 | |||
| Note 2 - Summary of Significant Accounting Policies | 40 | |||
| Note 3 - Share-Based Compensation | 44 | |||
| Note 4 - Balance Sheet Details | 46 | |||
| Note 5 - Other Intangible Assets net, and Goodwill | 48 | |||
| Note 6 - Investment in Noncontrolled Affiliate | 50 | |||
| Note 7 - Fair Value Measurements | 50 | |||
| Note 8 - Short-term Borrowings and Long-term Debt | 51 | |||
| Note 9 - Leases | 52 | |||
| Note 10 - Financial Instruments and Risk Management | 52 | |||
| Note 11 - Pension and Postretirement Medical Benefit Plans | 54 | |||
| Note 12 - Income Taxes | 59 | |||
| Note 13 - Segment Information | 62 | |||
| Note 14 - Related Party Transactions | 63 | |||
| Note 15 - Restructuring Charges | 66 | |||
| Note 16 - Accumulated Other Comprehensive Loss | 66 | |||
| Note 17 - Supplemental Cash Flow Information | 67 | |||
| Note 18 - Contingencies | 67 | |||
| Note 19 - Selected Quarterly Financial Data | 67 | |||
| Note 20 - Subsequent Event | 67 | |||
| Report of Independent Registered Public Accounting Firm | 68 |
15
Table of Contents
MANAGEMENT’S FINANCIAL REVIEW
Tabular dollars in millions
OUR BUSINESS
Bottling Group, LLC (referred to as “Bottling LLC,” “we,” “our,” “us” and the “Company”) is the principal operating subsidiary of The Pepsi Bottling Group, Inc. (“PBG”) and consists of substantially all of the operations and the assets of PBG. PBG is the world’s largest manufacturer, seller and distributor of Pepsi-Cola beverages.
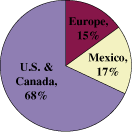
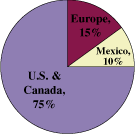
We have the exclusive right to manufacture, sell and distribute Pepsi-Cola beverages in all or a portion of the U.S., Mexico, Canada, Spain, Russia, Greece and Turkey. Bottling LLC manages and reports operating results through three reportable segments: U.S. & Canada, Europe (which includes Spain, Russia, Greece and Turkey) and Mexico. As shown in the graph below, the U.S. & Canada segment is the dominant driver of our results, generating 68 percent of our volume and 75 percent of our net revenues.
| Volume | Revenue | |||
| Total: 1.6 Billion Raw Cases | Total: $13.8 Billion | |||
 |  |
The majority of our volume is derived from brands licensed from PepsiCo, Inc. (“PepsiCo”) or PepsiCo joint ventures. These brands are some of the most recognized in the world and consist of carbonated soft drinks (“CSDs”) and non-carbonated beverages. Our CSDs include brands such as Pepsi-Cola, Diet Pepsi, Diet Pepsi Max, Mountain Dew and Sierra Mist. Our non-carbonated beverages portfolio includes brands with Starbucks Frapuccino in the ready-to-drink coffee category; Mountain Dew Amp and SoBe Adrenaline Rush in the energy drink category; SoBe and Tropicana in the juice and juice drinks category; Aquafina in the water category; and Lipton Iced Tea in the tea category. We continue to strengthen our powerful portfolio highlighted by our focus on the hydration category with SoBe Life Water, Propel fitness water and G2 in the U.S. In some of our territories we have the right to manufacture, sell and distribute soft drink products of companies other than PepsiCo, including Dr Pepper, Crush and Squirt. We also have the right in some of our territories to manufacture, sell and distribute beverages under brands that we own, including Electropura, e-pura and Garci Crespo. See Part I, Item 1 of this report for a listing of our principal products by segment.
We sell our products through cold-drink and take-home channels. Our cold-drink channel consists of chilled products sold in the retail and foodservice channels. We earn the highest profit margins on a per-case basis in the cold-drink channel. Our take-home channel consists of unchilled products that are sold in the retail, mass merchandiser and club store channels for at-home consumption.
Our products are brought to market primarily through direct store delivery (“DSD”) or third-party distribution, including foodservice and vending distribution networks. The hallmarks of the Company’s DSD system are customer service, speed to market, flexibility and reach. These are all critical factors in bringing new products to market, adding accounts to our existing base and meeting increasingly diverse volume demands.
Our customers range from large format accounts, including large chain foodstores, supercenters, mass merchandisers, chain drug stores, club stores and military bases, to small independently owned shops and foodservice businesses. Changing consumer shopping trends and “on-the-go” lifestyles are shifting more of our volume to fast-growing channels such as supercenters, club and dollar stores. Retail consolidation continues to increase the strategic significance of our large-volume customers. In 2008, sales to our top five retail customers represented approximately 19 percent of our net revenues.
Bottling LLC’s focus is on superior sales execution, customer service, merchandising and operating excellence. Our goal is to help our customers grow their beverage business by making our portfolio of brands readily available to consumers at every shopping occasion, using proven methods to grow not only PepsiCo brand sales, but the overall beverage category. Our objective is to ensure we have the right product in the right package to satisfy the ever changing needs of today’s consumers.
16
Table of Contents
We measure our sales in terms of physical cases sold to our customers. Each package, as sold to our customers, regardless of configuration or number of units within a package, represents one physical case. Our net price and gross margin on a per-case basis are impacted by how much we charge for the product, the mix of brands and packages we sell, and the channels through which the product is sold. For example, we realize a higher net revenue and gross margin per case on a 20-ounce chilled bottle sold in a convenience store than on a 2-liter unchilled bottle sold in a grocery store.
Our financial success is dependent on a number of factors, including: our strong partnership with PepsiCo, the customer relationships we cultivate, the pricing we achieve in the marketplace, our market execution, our ability to meet changing consumer preferences and the efficiencies we achieve in manufacturing and distributing our products. Key indicators of our financial success are: the number of physical cases we sell, the net price and gross margin we achieve on a per-case basis, our overall cost productivity which reflects how well we manage our raw material, manufacturing, distribution and other overhead costs, and cash and capital management.
The discussion and analysis throughout Management’s Financial Review should be read in conjunction with the Consolidated Financial Statements and the related accompanying notes.The preparation of our Consolidated Financial Statements in conformity with accounting principles generally accepted in the United States of America (“U.S. GAAP”) requires us to make estimates and assumptions that affect the reported amounts in our Consolidated Financial Statements and the related accompanying notes, including various claims and contingencies related to lawsuits, taxes, environmental and other matters arising from the normal course of business. We apply our best judgment, our knowledge of existing facts and circumstances and actions that we may undertake in the future, in determining the estimates that affect our Consolidated Financial Statements. We evaluate our estimates on an on-going basis using our historical experience as well as other factors we believe appropriate under the circumstances, such as current economic conditions, and adjust or revise our estimates as circumstances change. As future events and their effect cannot be determined with precision, actual results may differ from these estimates.
CRITICAL ACCOUNTING POLICIES
Significant accounting policies are discussed in Note 2 in the Notes to Consolidated Financial Statements. Management believes the following policies, which require the use of estimates, assumptions and the application of judgment, to be the most critical to the portrayal of Bottling LLC’s results of operations and financial condition. We applied our critical accounting policies and estimation methods consistently in all material respects and have discussed the selection of these policies and related disclosures with the Audit and Affiliated Transactions Committee of PBG’s Board of Directors.
Other Intangible Assets, net and Goodwill
Our intangible assets consist primarily of franchise rights, distribution rights, licensing rights, brands and goodwill and principally arise from the allocation of the purchase price of businesses acquired. These intangible assets, other than goodwill, are classified as either finite-lived intangibles or indefinite-lived intangibles.
The classification of intangibles and the determination of the appropriate useful life require substantial judgment. The determination of the expected life depends upon the use and underlying characteristics of the intangible asset. In our evaluation of the expected life of these intangible assets, we consider the nature and terms of the underlying agreements; our intent and ability to use the specific asset; the age and market position of the products within the territories in which we are entitled to sell; the historical and projected growth of those products; and costs, if any, to renew the related agreement.
Intangible assets that are determined to have a finite life are amortized over their expected useful life, which generally ranges from five to twenty years. For intangible assets with finite lives, evaluations for impairment are performed only if facts and circumstances indicate that the carrying value may not be recoverable.
Goodwill and other intangible assets with indefinite lives are not amortized; however, they are evaluated for impairment at least annually or more frequently if facts and circumstances indicate that the assets may be impaired. Prior to 2008, the Company completed this test in the fourth quarter. During 2008, the Company changed its impairment testing of goodwill and intangible assets with indefinite useful lives to the third quarter, with the exception of Mexico’s intangible assets. Impairment testing of Mexico’s intangible assets with indefinite useful lives was completed in the fourth quarter to coincide with the completion of our strategic review of the business.
We evaluate goodwill for impairment at the reporting unit level, which we determined to be the countries in which we operate. We evaluate goodwill for impairment by comparing the fair value of the reporting unit, as determined by its discounted cash flows, with its carrying value. If the carrying value of a reporting unit exceeds its fair value, we compare the implied fair value of the reporting unit’s goodwill with its carrying amount to measure the amount of impairment loss.
17
Table of Contents
We evaluate other intangible assets with indefinite useful lives for impairment by comparing the fair values of the assets with their carrying values. The fair value of our franchise rights, distribution rights and licensing rights is measured using a multi-period excess earnings method that is based upon estimated discounted future cash flows. The fair value of our brands is measured using a multi-period royalty savings method, which reflects the savings realized by owning the brand and, therefore, not requiring payment of third party royalty fees.
Considerable management judgment is necessary to estimate discounted future cash flows in conducting an impairment analysis for goodwill and other intangible assets. The cash flows may be impacted by future actions taken by us and our competitors and the volatility of macroeconomic conditions in the markets in which we conduct business. Assumptions used in our impairment analysis, such as forecasted growth rates, cost of capital and additional risk premiums used in the valuations, are based on the best available market information and are consistent with our long-term strategic plans. An inability to achieve strategic business plan targets in a reporting unit, a change in our discount rate or other assumptions could have a significant impact on the fair value of our reporting units and other intangible assets, which could then result in a material non-cash impairment charge to our results of operations. The recent volatility in the global macroeconomic conditions has had a negative impact on our business results. If this volatility continues to persist into the future, the fair value of our intangible assets could be adversely impacted.
As a result of the 2008 impairment test for goodwill and other intangible assets with indefinite lives, the Company recorded a $412 million non-cash impairment charge relating primarily to distribution rights and brands for the Electropura water business in Mexico. The impairment charge relating to these intangible assets was based upon the findings of an extensive strategic review and the finalization of restructuring plans for our Mexican business. In light of the weakening macroeconomic conditions and our outlook for the business in Mexico, we lowered our expectation of the future performance, which reduced the value of these intangible assets and triggered the impairment charge. After recording the above mentioned impairment charge, Mexico’s remaining net book value of goodwill and other intangible assets is approximately $367 million.
For further information about our goodwill and other intangible assets see Note 5 in the Notes to Consolidated Financial Statements.
Pension and Postretirement Medical Benefit Plans
We participate in PBG sponsored pension and other postretirement medical benefit plans in various forms in the United States and similar pension plans in our international locations, covering employees who meet specified eligibility requirements. The assets, liabilities and expenses associated with our international plans were not significant to our worldwide results of operations or financial position, and accordingly, assumptions, expenses, sensitivity analyses and other data regarding these plans are not included in any of the discussions provided below.
In the U.S., the non-contributory defined benefit pension plans provide benefits to certain full-time salaried and hourly employees. Benefits are generally based on years of service and compensation, or stated amounts for each year of service. Effective January 1, 2007, newly hired salaried and non-union hourly employees are not eligible to participate in these plans. Additionally, effective April 1, 2009, benefits from these plans will no longer continue to accrue for certain salaried and non-union employees that do not meet age and service requirements. The impact of these plan changes will significantly reduce the Company’s future long-term pension obligation, pension expense and cash contributions to the plans. Employees not eligible to participate in these plans or employees whose benefits will be discontinued will receive additional Company retirement contributions under PBG’s defined contribution plans.
Substantially all of our U.S. employees meeting age and service requirements are eligible to participate in PBG’s postretirement medical benefit plans.
Assumptions
Effective for the 2008 fiscal year, the Company adopted the measurement date provisions of Statement of Financial Accounting Standards (“SFAS”) No. 158, “Employers’ Accounting for Defined Benefit Pension and Other Postretirement Plans” (“SFAS 158”). As a result of adopting SFAS 158, the Company’s measurement date for plan assets and benefit obligations was changed from September 30 to its fiscal year end.
The determination of pension and postretirement medical plan obligations and related expenses requires the use of assumptions to estimate the amount of benefits that employees earn while working, as well as the present value of those benefit obligations. Significant assumptions include discount rate; expected return on plan assets; certain employee-related factors such as retirement age, mortality, and turnover; rate of salary increases for plans where benefits are based on earnings; and for retiree medical plans, health care cost trend rates.
18
Table of Contents
On an annual basis we evaluate these assumptions, which are based upon historical experience of the plans and management’s best judgment regarding future expectations. These assumptions may differ materially from actual results due to changing market and economic conditions. A change in the assumptions or economic events outside our control could have a material impact on the measurement of our pension and postretirement medical benefit expenses and obligations as well as related funding requirements.
The discount rates used in calculating the present value of our pension and postretirement medical benefit plan obligations are developed based on a yield curve that is comprised of high-quality, non-callable corporate bonds. These bonds are rated Aa or better by Moody’s; have a principal amount of at least $250 million; are denominated in U.S. dollars; and have maturity dates ranging from six months to thirty years, which matches the timing of our expected benefit payments.
The expected rate of return on plan assets for a given fiscal year is based upon actual historical returns and the long-term outlook on asset classes in the pension plans’ investment portfolio. In connection with the pension plan design change we changed our asset allocation targets. The current target asset allocation for the U.S. pension plans is 65 percent equity investments, of which approximately half is to be invested in domestic equities and half is to be invested in foreign equities. The remaining 35 percent is to be invested primarily in long-term corporate bonds. Based on the revised asset allocation, historical returns and estimated future outlook of the pension plans’ portfolio, we changed the 2009 estimated long-term rate of return on plan assets assumption from 8.5 percent to 8.0 percent.
Differences between the assumed rate of return and actual rate of return on plan assets are deferred in accumulated other comprehensive loss in equity and amortized to earnings utilizing the market-related value method. Under this method, differences between the assumed rate of return and actual rate of return from any one year will be recognized over a five year period to determine the market related value.
Other gains and losses resulting from changes in actuarial assumptions and from differences between assumed and actual experience are determined at each measurement date and deferred in accumulated other comprehensive loss in equity. To the extent the amount of all unrecognized gains and losses exceeds 10 percent of the larger of the benefit obligation or plan assets, such amount is amortized to earnings over the average remaining service period of active participants.
The cost or benefit from benefit plan changes is also deferred in accumulated other comprehensive loss in equity and amortized to earnings on a straight-line basis over the average remaining service period of the employees expected to receive benefits.
Net unrecognized losses and unamortized prior service costs relating to the pension and postretirement plans in the United States, totaled $969 million and $449 million at December 27, 2008 and December 29, 2007, respectively.
The following tables provide the weighted-average assumptions for our 2009 and 2008 pension and postretirement medical plans’ expense:
| 2009 | 2008 | |||||||
Pension | ||||||||
| Discount rate | 6.20 | % | 6.70 | % | ||||
| Expected rate of return on plan assets (net of administrative expenses) | 8.00 | % | 8.50 | % | ||||
| Rate of compensation increase | 3.53 | % | 3.56 | % | ||||
| 2009 | 2008 | |||||||
Postretirement | ||||||||
| Discount rate | 6.50 | % | 6.35 | % | ||||
| Rate of compensation increase | 3.53 | % | 3.56 | % | ||||
| Health care cost trend rate | 8.75 | % | 9.50 | % | ||||
19
Table of Contents
During 2008, our ongoing defined benefit pension and postretirement medical plan expenses totaled $87 million, which excludes one-time charges of approximately $27 million associated with restructuring actions and our pension plan design change. In 2009, these expenses are expected to increase by approximately $11 million to $98 million as a result of the following factors:
| • | A decrease in our weighted-average discount rate for our pension expense from 6.70 percent to 6.20 percent, reflecting decreases in the yields of long-term corporate bonds comprising the yield curve. This change in assumption will increase our 2009 pension expense by approximately $18 million. | ||
| • | Asset losses during 2008 will increase our pension expense by $20 million. | ||
| • | A decrease in the rate of return on plan asset assumption from 8.5 percent to 8.0 percent, due to revised asset allocation, historical trends and our projected long-term outlook. This change in assumption will increase our 2009 pension expense by approximately $8 million. | ||
| • | The pension design change, which will freeze benefits of certain salaried and non-union hourly employees, will decrease our 2009 pension expense by approximately $20 million. | ||
| • | Additional expected contributions to the pension trust will decrease 2009 pension expense by $11 million. | ||
| • | Other factors, including improved health care claim experience, will decrease our 2009 defined benefit pension and postretirement medical expenses by approximately $4 million. |
In addition, we expect our defined contribution plan expense will increase by $10 million to $15 million due to additional contributions to this plan for employees impacted by the pension design change.
Sensitivity Analysis
It is unlikely that in any given year the actual rate of return will be the same as the assumed long-term rate of return. The following table provides a summary for the last three years of actual rates of return versus expected long-term rates of return for our pension plan assets:
| 2008 | 2007 | 2006 | ||||||||||
| Expected rates of return on plan assets (net of administrative expenses) | 8.50 | % | 8.50 | % | 8.50 | % | ||||||
| Actual rates of return on plan assets (net of administrative expenses) | (28.50 | )% | 12.64 | % | 9.74 | % | ||||||
Sensitivity of changes in key assumptions for our pension and postretirement plans’ expense in 2009 are as follows:
| • | Discount rate — A 25 basis point change in the discount rate would increase or decrease the 2009 expense for the pension and postretirement medical benefit plans by approximately $9 million. | ||
| • | Expected rate of return on plan assets — A 25 basis point change in the expected return on plan assets would increase or decrease the 2009 expense for the pension plans by approximately $4 million. The postretirement medical benefit plans have no expected return on plan assets as they are funded from the general assets of the Company as the payments come due. | ||
| • | Contribution to the plan — A $20 million decrease in planned contributions to the plan for 2009 will increase our pension expense by $1 million. |
Funding
We make contributions to the pension trust to provide plan benefits for certain pension plans. Generally, we do not fund the pension plans if current contributions would not be tax deductible. Effective in 2008, under the Pension Protection Act, funding requirements are more stringent and require companies to make minimum contributions equal to their service cost plus amortization of their deficit over a seven year period. Failure to achieve appropriate funded levels will result in restrictions on employee benefits. Failure to contribute the minimum required contributions will result in excise taxes for the Company and reporting to the regulatory agencies. During 2008, the Company contributed $85 million to PBG’s pension trusts. The Company expects to contribute an additional $150 million to PBG’s pension trusts in 2009, of which approximately $54 million is to satisfy minimum funding requirements. These amounts exclude $23 million and $35 million of contributions to the unfunded plans for the years ended December 27, 2008 and December 26, 2009, respectively.
For further information about PBG’s pension and postretirement plans see Note 11 in the Notes to Consolidated Financial Statements.
20
Table of Contents
Income Taxes
We are a limited liability company, classified as a partnership for U.S. tax purposes and, as such, generally will pay limited U.S. federal, state and local income taxes. Our federal and state distributive shares of income, deductions and credits are allocated to our owners based on their percentage of ownership. However, certain domestic and foreign affiliates pay taxes in their respective jurisdictions and record related deferred income tax assets and liabilities.
Our effective tax rate is based on pre-tax income, statutory tax rates, tax laws and regulations and tax planning strategies available to us in the various jurisdictions in which we operate. Significant management judgment is required in evaluating our tax positions and in determining our effective tax rate.
Our deferred tax assets and liabilities reflect our best estimate of the tax benefits and costs we expect to realize in the future. We establish valuation allowances to reduce our deferred tax assets to an amount that will more likely than not be realized.
As required under the provisions of Financial Accounting Standards Board (“FASB”) Interpretation No. 48, “Accounting for Uncertainty in Income Taxes” (“FIN 48”), which we adopted as of the beginning of fiscal year 2007, we recognize the impact of our tax positions in our financial statements if those positions will more likely than not be sustained on audit, based on the technical merits of the position. A number of years may elapse before an uncertain tax position for which we have established a tax reserve is audited and finally resolved, and the number of years for which we have audits that are open varies depending on the tax jurisdiction. While it is often difficult to predict the final outcome or the timing of the resolution of an audit, we believe that our reserves for uncertain tax benefits reflect the outcome of tax positions that is more likely than not to occur. Nevertheless, it is possible that tax authorities may disagree with our tax positions, which could have a significant impact on our results of operations, financial position and cash flows. The resolution of a tax position could be recognized as an adjustment to our provision for income taxes and our deferred taxes in the period of resolution, and may also require a use of cash.
For further information about our income taxes see “Income Tax Expense” in the Results of Operations and Note 12 in the Notes to Consolidated Financial Statements.
RELATIONSHIP WITH PEPSICO
PepsiCo is a related party due to the nature of our franchise relationship and its ownership interest in our company. More than 80 percent of our volume is derived from the sale of PepsiCo brands. At December 27, 2008, PepsiCo owned 6.6 percent of our equity and 40 percent of PR Beverages Limited (“PR Beverages”), a consolidated venture for our Russian operations. We fully consolidate the results of PR Beverages and present PepsiCo’s share as minority interest in our Consolidated Financial Statements.
On March 1, 2007, together with PepsiCo, we formed PR Beverages, a venture that enables us to strategically invest in Russia to accelerate our growth. PBG contributed its business in Russia to PR Beverages, and PepsiCo entered into bottling agreements with PR Beverages for PepsiCo beverage products sold in Russia on the same terms as in effect for PBG immediately prior to the venture. PR Beverages has an exclusive license to manufacture and sell PepsiCo concentrate for such products. Increases in gross profit and operating income resulting from the consolidation of the venture are offset by minority interest expense related to PepsiCo’s share. Minority interest expense is recorded below operating income.
Our business is conducted primarily under beverage agreements between PBG and PepsiCo, including a master bottling agreement, non-cola bottling agreements, distribution agreements and a master syrup agreement. These agreements provide PepsiCo with the ability, at its sole discretion, to establish prices, and other terms and conditions for our purchase of concentrates and finished products from PepsiCo. PepsiCo provides us with bottler funding to support a variety of trade and consumer programs such as consumer incentives, advertising support, new product support and vending and cooler equipment placement. The nature and type of programs, as well as the level of funding, vary annually. Additionally, under a shared services agreement, we obtain various services from PepsiCo, which include services for information technology maintenance and the procurement of raw materials. We also provide services to PepsiCo, including facility and credit and collection support. Although we are not a direct party to these contracts, as the principal operating subsidiary of PBG, we derive direct benefit from them.
Because we depend on PepsiCo to provide us with concentrate which we use in the production of CSDs and non-carbonated beverages, bottler incentives and various services, changes in our and PBG’s relationship with PepsiCo could have a material adverse effect on our business and financial results.
For further information about our relationship with PepsiCo and its affiliates see Note 14 in the Notes to Consolidated Financial Statements.
21
Table of Contents
ITEMS AFFECTING COMPARABILITY OF OUR FINANCIAL RESULTS
The year-over-year comparisons of our financial results are affected by the following items included in our reported results:
| December | December | December | ||||||||||
| Income/(Expense) | 27, 2008 | 29, 2007 | 30, 2006 | |||||||||
Gross Profit | ||||||||||||
| PR Beverages | $ | — | $ | 29 | $ | — | ||||||
Operating Income | ||||||||||||
| Impairment Charges | $ | (412 | ) | $ | — | $ | — | |||||
| 2008 Restructuring Charges | (83 | ) | — | — | ||||||||
| 2007 Restructuring Charges | (3 | ) | (30 | ) | — | |||||||
| Asset Disposal Charges | (2 | ) | (23 | ) | — | |||||||
| PR Beverages | — | 29 | — | |||||||||
Total Operating Income Impact | $ | (500 | ) | $ | (24 | ) | $ | — | ||||
Net Income | ||||||||||||
| Impairment Charges | $ | (297 | ) | $ | — | $ | — | |||||
| 2008 Restructuring Charges | (83 | ) | — | — | ||||||||
| 2007 Restructuring Charges | (3 | ) | (30 | ) | — | |||||||
| Asset Disposal Charges | (2 | ) | (23 | ) | — | |||||||
| Tax Law Changes | — | 13 | 12 | |||||||||
Total Net Income Impact | $ | (385 | ) | $ | (40 | ) | $ | 12 | ||||
Items impacting comparability described below are shown in the year the action was initiated.
2008 Items
Impairment Charges
During the fourth quarter of 2008, the Company recorded a $412 million non-cash impairment charge relating primarily to distribution rights and brands for the Electropura water business in Mexico. For further information about the impairment charges, see section entitled “Other Intangible Assets, net and Goodwill,” in our Critical Accounting Policies.
2008 Restructuring Charges
In the fourth quarter of 2008, we announced a restructuring program to enhance the Company’s operating capabilities in each of our reportable segments. The program’s key objectives are to strengthen customer service and selling effectiveness; simplify decision making and streamline the organization; drive greater cost productivity to adapt to current macroeconomic challenges; and rationalize the Company’s supply chain infrastructure. We anticipate the program to be substantially complete by the end of 2009 and the program is expected to result in annual pre-tax savings of approximately $150 million to $160 million.
The Company expects to record pre-tax charges of $140 million to $170 million over the course of the restructuring program, which is primarily for severance and related benefits, pension and other employee-related costs and other charges, including employee relocation and asset disposal costs. As part of the restructuring program, approximately 3,150 positions will be eliminated including 750 positions in the U.S. & Canada, 200 positions in Europe and 2,200 positions in Mexico. The Company will also close four facilities in the U.S., as well as three plants and approximately 30 distribution centers in Mexico. The program will also include the elimination of approximately 700 routes in Mexico. In addition, PBG will modify its U.S. defined benefit pension plans, which will generate long-term savings and significantly reduce future financial obligations.
During 2008, the Company incurred pre-tax charges of $83 million, of which $53 million was recorded in the U.S. & Canada segment, $27 million was recorded in our Europe segment and the remaining $3 million was recorded in the Mexico segment. All of these charges were recorded in selling, delivery and administrative expenses. During 2008 we eliminated approximately 1,050 positions across all reportable segments and closed three facilities in the U.S. and two plants in Mexico and eliminated 126 routes in Mexico.
22
Table of Contents
The Company expects about $130 million in pre-tax cash expenditures from these restructuring actions, of which $13 million was paid in the fourth quarter of 2008, with the balance expected to occur in 2009 and 2010.
For further information about our restructuring charges, see Note 15 in the Notes to Consolidated Financial Statements.
2007 Items
2007 Restructuring Charges
In the third quarter of 2007, we announced a restructuring program to realign the Company’s organization to adapt to changes in the marketplace, improve operating efficiencies and enhance the growth potential of the Company’s product portfolio. We substantially completed the organizational realignment during the first quarter of 2008, which resulted in the elimination of approximately 800 positions. Annual cost savings from this restructuring program are approximately $30 million. Over the course of the program we incurred a pre-tax charge of approximately $29 million. During 2007, we recorded pre-tax charges of $26 million, of which $18 million was recorded in the U.S. & Canada segment and the remaining $8 million was recorded in the Europe segment. During the first half of 2008, we recorded an additional $3 million of pre-tax charges primarily relating to relocation expenses in our U.S. & Canada segment. We made approximately $30 million of after-tax cash payments associated with these restructuring charges.
In the fourth quarter of 2007, we implemented and completed an additional phase of restructuring actions to improve operating efficiencies. In addition to the amounts discussed above, we recorded a pre-tax charge of approximately $4 million in selling, delivery and administrative expenses, primarily related to employee termination costs in Mexico, where an additional 800 positions were eliminated as a result of this phase of the restructuring. Annual cost savings from this restructuring program are approximately $7 million.
Asset Disposal Charges
In the fourth quarter of 2007, we adopted a Full Service Vending (“FSV”) Rationalization plan to rationalize our vending asset base in our U.S. & Canada segment by disposing of older underperforming assets and redeploying certain assets to higher return accounts. Our FSV business portfolio consists of accounts where we stock and service vending equipment. This plan, which we completed in the second quarter of 2008, was part of the Company’s broader initiative to improve operating income margins of our FSV business.
Over the course of the FSV Rationalization plan, we incurred a pre-tax asset disposal charge of approximately $25 million, the majority of which was non-cash. The charge included costs associated with the removal of these assets from service, disposal costs and redeployment expenses. Of this amount, we recorded a pre-tax charge of approximately $23 million in 2007, with the remainder being recorded in 2008. This charge is recorded in selling, delivery and administrative expenses.
PR Beverages
For further information about PR Beverages see “Relationship with PepsiCo.”
Tax Law Changes
During 2007, tax law changes were enacted in Canada and Mexico which required us to re-measure our deferred tax assets and liabilities. The impact of the reduction in tax rates in Canada was partially offset by the tax law changes in Mexico which decreased our income tax expense on a net basis. Net income increased approximately $13 million as a result of these tax law changes.
2006 Items
Tax Law Changes
During 2006, tax law changes were enacted in Canada, Turkey and in various state jurisdictions in the United States which decreased our income tax expense by approximately $12 million.
23
Table of Contents
FINANCIAL PERFORMANCE SUMMARY AND WORLDWIDE FINANCIAL HIGHLIGHTS FOR FISCAL YEAR 2008
| December | December | Fiscal Year | ||||||||||
| 27, 2008 | 29, 2007 | % Change | ||||||||||
Net Revenues | $ | 13,796 | $ | 13,591 | 2 | % | ||||||
Cost of Sales | $ | 7,586 | $ | 7,370 | 3 | % | ||||||
Gross Profit | $ | 6,210 | $ | 6,221 | — | % | ||||||
Selling, Delivery and Administrative Expenses | $ | 5,171 | $ | 5,167 | — | % | ||||||
Operating Income | $ | 627 | $ | 1,054 | (41 | )% | ||||||
Net Income | $ | 536 | $ | 994 | (46 | )% | ||||||
Volume —Decrease of four percent versus the prior year driven by declines in each of our segments due to the soft economic conditions globally which have negatively impacted the liquid refreshment beverage category.
Net Revenues —Increase of two percent versus the prior year is driven by strong increases in net price per case in each of our segments, partially offset by volume declines. Net price per case increased six percent due primarily to rate increases and includes one percentage point of growth from foreign currency.
Cost of Sales —Increase of three percent versus the prior year due to rising raw material costs partially offset by volume declines. Cost of sales per case increased seven percent, which includes one percentage point from foreign currency. Increase in costs of sales per case was driven by plastic bottle components, sweetener and concentrate.
Gross Profit —Growth was flat driven by rate increases offset by volume declines and higher raw material costs. Rate gains more than offset higher raw material costs driving a four percent increase in gross profit per case.
Selling, Delivery and Administrative (“SD&A”) Expenses —Flat results versus the prior year include one percentage point of growth relating to restructuring and asset disposal charges taken in the current and prior year. The remaining one percentage point improvement in SD&A expenses was driven by lower operating costs due to decreases in volume and continued cost and productivity improvements across all our segments, partially offset by the negative impact from strengthening foreign currencies during the first half of the year.
Operating Income —Decrease of 41 percent versus the prior year was driven primarily by the impairment, restructuring and asset disposal charges taken in the current and prior year, which together contributed 42 percentage points to the operating income decline for the year. The remaining one percentage point of growth in operating income was driven by increases in Europe and the U.S. & Canada. During 2008, we captured over $170 million of productivity gains reflecting an increased focus on cost containment across all of our businesses. Savings include productivity from manufacturing and logistics coupled with reduced headcount and decreased discretionary spending. Operating income growth includes one percentage point of growth from foreign currency translation.
Net Income— Net income for the year of $536 million includes a net after-tax charge of $385 million from impairment and asset disposal charges, and restructuring initiatives discussed above. These items contributed 35 percentage points to our net income decline. The remaining 11 percent decline reflects lower interest income generated from loans made to PBG, higher interest expense on third party loans, the negative impact of foreign currency transactional expenses and higher effective taxes. For 2007, net income of $994 million included a net after-tax charge of $40 million from restructuring charges, asset disposal charges and tax items.
RESULTS OF OPERATIONS BY SEGMENT
Except where noted, tables and discussion are presented as compared to the prior fiscal year. Growth rates are rounded to the nearest whole percentage.
Volume
2008 vs. 2007
| U.S. & | ||||||||||||||||
| Worldwide | Canada | Europe | Mexico | |||||||||||||
| Total Volume Change | (4 | )% | (4 | )% | (3 | )% | (5 | )% | ||||||||
24
Table of Contents
U.S. & Canada
In our U.S. & Canada segment, volume decreased four percent due to declining consumer confidence and spending, which has negatively impacted the liquid refreshment beverage category. Cold-drink and take-home channels both declined by four percent versus last year. The decline in the take-home channel was driven primarily by our large format stores, which was impacted by the overall declines in the liquid refreshment beverage category as well as pricing actions taken to improve profitability in our take-home packages including our unflavored water business. Decline in the cold-drink channel was driven by our foodservice channel, including restaurants, travel and leisure and workplace, which has been particularly impacted by the economic downturn in the United States.
Europe
In our Europe segment, volume declined by three percent resulting from a soft volume performance in the second half of the year. Results reflect overall weak macroeconomic environments throughout Europe with high single digit declines in Spain and flat volume growth in Russia. Despite the slowing growth in Russia, we showed improvements in our energy and tea categories, partially offset by declines in the CSD category. In Spain, there were declines across all channels due to a weakening economy and our continued focus on improving revenue and gross profit growth.
Mexico
In our Mexico segment, volume decreased five percent driven by slower economic growth coupled with pricing actions taken by the Company to drive improved margins across its portfolio. This drove single digit declines in our jug water and multi-serve packages, which was partially offset by one percent improvement in our bottled water package.
2007 vs. 2006
| U.S. & | ||||||||||||||||
| Worldwide | Canada | Europe | Mexico | |||||||||||||
| Base volume | — | % | — | % | 4 | % | (2 | )% | ||||||||
| Acquisitions | 1 | — | — | 3 | ||||||||||||
| Total Volume Change | 1 | % | — | % | 4 | % | 1 | % | ||||||||
U.S. & Canada
In our U.S. & Canada segment, volume was unchanged, driven primarily by flat volume in the U.S. Our performance in the U.S. reflected growth in the take-home channel of approximately one percent, driven primarily by growth in supercenters, wholesale clubs and mass merchandisers. This growth was offset by a decline of three percent in the cold-drink channel, as a result of declines in our small format and foodservice channels. From a brand perspective, our U.S. non-carbonated portfolio increased six percent, reflecting significant increases in Trademark Lipton and water, coupled with strong growth in energy drinks. The growth in our U.S. non-carbonated portfolio was offset by declines in our CSD portfolio of three percent, driven primarily by declines in Trademark Pepsi.
In Canada, volume grew two percent, driven primarily by three percent growth in the cold-drink channel and two percent growth in the take-home channel. From a brand perspective, our non-carbonated portfolio increased 13 percent, reflecting a 12 percent increase in Trademark Lipton and a five percent increase in water.
Europe
In our Europe segment, overall volume grew four percent. This growth was driven primarily by 17 percent growth in Russia, partially offset by declines of eight percent in Spain and two percent in Turkey. Volume increases in Russia were strong in all channels, led by growth of 40 percent in our non-carbonated portfolio.
Mexico
In our Mexico segment, overall volume increased one percent, driven primarily by acquisitions, partially offset by a decrease of two percent in base business volume. This decrease was primarily attributable to four percent declines in both CSD and jug water volumes, mitigated by nine percent growth in bottled water and greater than 40 percent growth in non-carbonated beverages.
25
Table of Contents
Net Revenues
2008 vs. 2007
| U.S. & | ||||||||||||||||
| Worldwide | Canada | Europe | Mexico | |||||||||||||
| 2008 Net revenues | $ | 13,796 | $ | 10,300 | $ | 2,115 | $ | 1,381 | ||||||||
| 2007 Net revenues | $ | 13,591 | $ | 10,336 | $ | 1,872 | $ | 1,383 | ||||||||
% Impact of: | ||||||||||||||||
| Volume | (4 | )% | (4 | )% | (3 | )% | (5 | )% | ||||||||
| Net price per case (rate/mix) | 5 | 4 | 10 | 6 | ||||||||||||
| Currency translation | 1 | — | 6 | (1 | ) | |||||||||||
| Total Net Revenues Change | 2 | % | — | % | 13 | % | — | % | ||||||||
U.S. & Canada
In our U.S. & Canada segment, net revenues were flat versus the prior year driven by net price per case improvement offset by volume declines. The four percent improvement in net price per case was primarily driven by rate increases taken to offset rising raw material costs and to improve profitability in our take-home packages including our unflavored water business.
Europe
In our Europe segment, growth in net revenues for the year reflects an increase in net price per case and the positive impact of foreign currency translation, partially offset by volume declines. Net revenue per case grew in every country in Europe led by double-digit growth in Russia and Turkey due mainly to rate increases.
Mexico
In our Mexico segment, net revenues were flat versus the prior year reflecting increases in net price per case offset by declines in volume and the negative impact of foreign currency translation. Growth in net price per case was primarily due to rate increases taken within our multi-serve CSDs, jugs and bottled water packages.
2007 vs. 2006
| U.S. & | ||||||||||||||||
| Worldwide | Canada | Europe | Mexico | |||||||||||||
| 2007 Net revenues | $ | 13,591 | $ | 10,336 | $ | 1,872 | $ | 1,383 | ||||||||
| 2006 Net revenues | $ | 12,730 | $ | 9,910 | $ | 1,534 | $ | 1,286 | ||||||||
% Impact of: | ||||||||||||||||
| Volume | — | % | — | % | 4 | % | (2 | )% | ||||||||
| Net price per case (rate/mix) | 4 | 4 | 9 | 7 | ||||||||||||
| Acquisitions | 1 | — | — | 3 | ||||||||||||
| Currency translation | 2 | — | 9 | — | ||||||||||||
| Total Net Revenues Change | 7 | % | 4 | % | 22 | % | 8 | % | ||||||||
U.S. & Canada
In our U.S. & Canada segment, four percent growth in net revenues was driven mainly by increases in net price per case as a result of rate gains. The favorable impact of Canada’s foreign currency translation added slightly less than one percentage point of growth to the segment’s four percent increase. In the U.S., we achieved revenue growth as a result of a net price per case improvement of four percent.
Europe
In our Europe segment, 22 percent growth in net revenues reflected exceptionally strong increases in net price per case, strong volume growth in Russia and the positive impact of foreign currency translation. Growth in net revenues in Europe was mainly driven by a 44 percent increase in Russia.
26
Table of Contents
Mexico
In our Mexico segment, eight percent growth in net revenues reflected strong increases in net price per case, and the impact of acquisitions, partially offset by declines in base business volume.
Operating Income
2008 vs. 2007
| U.S. & | ||||||||||||||||
| Worldwide | Canada | Europe | Mexico | |||||||||||||
| 2008 Operating income | $ | 627 | $ | 864 | $ | 101 | $ | (338 | ) | |||||||
| 2007 Operating income | $ | 1,054 | $ | 876 | $ | 106 | $ | 72 | ||||||||
% Impact of: | ||||||||||||||||
| Operations | 1 | % | 1 | % | 2 | % | (3 | )% | ||||||||
| Currency translation | 1 | — | 12 | 2 | ||||||||||||
| Impairment charges | (39 | ) | — | (3 | ) | (571 | ) | |||||||||
| 2008 Restructuring charges | (8 | ) | (6 | ) | (25 | ) | (4 | ) | ||||||||
| 2007 Restructuring charges | 3 | 2 | 8 | 4 | ||||||||||||
| Asset disposal charges | 2 | 2 | — | — | ||||||||||||
| Total Operating Income Change | (41 | )%* | (1 | )% | (5 | )%* | (572 | )% | ||||||||
| * | Does not add due to rounding to the whole percentage. |
U.S. & Canada
In our U.S. & Canada segment, operating income was $864 million in 2008, decreasing one percent versus the prior year. Restructuring and asset disposal charges taken in the current and prior year together contributed a decrease of two percentage points to the operating income decline. The remaining one percentage point of growth includes increases in gross profit per case and lower operating costs, partially offset by lower volume in the United States.
Gross profit per case improved two percent versus the prior year in our U.S. & Canada segment. This includes growth in net revenue per case, which was offset by a six percent increase in cost of sales per case. Growth in cost of sales per case includes higher concentrate, sweetener and packaging costs.
SD&A expenses improved three percent versus the prior year in our U.S. & Canada segment due to lower volume and pension costs and cost productivity initiatives. These productivity initiatives reflect a combination of headcount savings, reduced discretionary spending and leveraged manufacturing and logistics benefits. Results also include one percentage point of growth due to restructuring and asset disposal charges taken in the current and prior year.
Europe
In our Europe segment, operating income was $101 million in 2008, decreasing five percent versus the prior year. The net impact of restructuring and impairment charges contributed 20 percentage points to the decline for the year. The remaining 14 percentage point increase in operating income growth for the year reflects improvements in gross profit per case and the positive impact from foreign currency translation, partially offset by higher SD&A expenses.
Gross profit per case in Europe increased 16 percent versus the prior year due to net price per case increases and foreign currency translation, partially offset by higher sweetener and packaging costs. Foreign currency contributed six percentage points of growth to gross profit for the year.
SD&A expenses in Europe increased 16 percent due to additional operating costs associated with our investments in Europe coupled with charges in Russia due to softening volume and weakening economic conditions in the fourth quarter. Foreign currency contributed five percentage points to SD&A growth. Restructuring charges taken in the current and prior year contributed approximately two percentage points of growth to SD&A expenses for the year.
Mexico
In our Mexico segment, we had an operating loss of $338 million in 2008 driven primarily by impairment and restructuring charges taken in the current and prior years. The remaining one percent decrease in operating income growth for the year was driven by volume declines, partially offset by increases in gross profit per case and the positive impact from foreign currency translation.
27
Table of Contents
Gross profit per case improved six percent versus the prior year driven by improvements in net revenue per case, as we continue to improve our segment profitability in our jug water and multi-serve packages. Cost of sales per case in Mexico increased by five percent due primarily to rising packaging costs.
SD&A remained flat versus the prior year driven by lower volume and reduced operating costs as we focus on route productivity, partially offset by cost inflation.
2007 vs. 2006
| U.S. & | ||||||||||||||||
| Worldwide | Canada | Europe | Mexico | |||||||||||||
| 2007 Operating income | $ | 1,054 | $ | 876 | $ | 106 | $ | 72 | ||||||||
| 2006 Operating income | $ | 988 | $ | 849 | $ | 57 | $ | 82 | ||||||||
% Impact of: | ||||||||||||||||
| Operations | 8 | % | 8 | % | 41 | % | (11 | )% | ||||||||
| Currency translation | 1 | 1 | 11 | 1 | ||||||||||||
| PR Beverages | 3 | — | 50 | — | ||||||||||||
| 2007 Restructuring | (3 | ) | (2 | ) | (15 | ) | (4 | ) | ||||||||
| Asset disposal charges | (2 | ) | (3 | ) | — | — | ||||||||||
| Acquisitions | — | — | — | 2 | ||||||||||||
| Total Operating Income Change | 7 | % | 3 | %* | 86 | %* | (13 | )%* | ||||||||
| * | Does not add due to rounding to the whole percentage. |
U.S. & Canada
In our U.S. & Canada segment, operating income increased three percent versus the prior year. Growth in operating income includes a five percentage point negative impact from restructuring and asset disposal charges. The remaining nine percentage point improvement in operating income growth was the result of increases in gross profit coupled with cost productivity improvements. These improvements were partially offset by higher SD&A expenses.
Gross profit for our U.S. & Canada segment increased three percent driven by net price per case improvement, which was partially offset by a five percent increase in cost of sales. Increases in cost of sales are primarily due to growth in cost of sales per case resulting from higher concentrate and sweetener costs and a one percentage point negative impact from foreign currency translation.
SD&A in the U.S. & Canada segment increased three percent driven primarily by strategic initiatives in connection with the hydration category, partially offset by cost productivity improvements.
Europe
In our Europe segment, operating income increased 86 percent versus the prior year. Operating income growth includes 35 percentage points of growth from the consolidation of PR Beverages and restructuring charges taken during the year. The remaining 52 percentage points of growth reflect strong increases in volume, gross profit per case, cost productivity improvements and an 11 percentage point positive impact of foreign currency translation. This growth was partially offset by higher operating expenses in Russia.
Gross profit per case in Europe grew 26 percent versus the prior year. This growth was driven by improvements in net revenue per case partially offset by a 16 percent increase in cost of sales. Increases in cost of sales reflected a nine percentage point impact from foreign currency translation, cost per case increases resulting from higher raw material costs, shifts in package mix and strong volume growth. These increases were partially offset by a three percentage point impact from consolidating PR Beverages in our financial results.
SD&A costs in Europe increased 25 percent versus the prior year, which includes a nine percentage point negative impact from foreign currency translation. The remaining increase in SD&A costs is due to higher operating expenses in Russia due to its growth during the year.
Mexico
In our Mexico segment, operating income decreased 13 percent as a result of declines in base business volume and higher SD&A expenses. Restructuring charges and the impact of acquisitions together contributed a two percentage point impact to the operating income decline for the year.
28
Table of Contents
Gross profit per case in Mexico grew five percent versus the prior year due primarily to increases in net revenue per case partially offset by a nine percent increase in cost of sales. Increase in cost of sales reflects cost per case increases resulting from significantly higher sweetener costs and the impact of acquisitions, partially offset by base volume declines.
SD&A expenses in Mexico grew eight percent versus the prior year, which includes three percentage points of growth from acquisitions. The remaining growth is driven by higher operating expenses versus the prior year.
Interest Expense
2008 vs. 2007
Interest expense increased by $12 million largely due to higher average debt balances throughout the year and our treasury rate locks that were settled in the fourth quarter. These increases were partially offset by lower effective interest rates from interest rate swaps which convert our fixed-rate debt to variable-rate debt.
2007 vs. 2006
Interest expense increased by $5 million largely due to higher effective interest rates.
Interest Income
2008 vs. 2007
Interest income decreased by $60 million largely due to lower effective interest rates on loans made to PBG.
2007 vs. 2006
Interest income increased by $48 million largely due to additional loans made to PBG.
Other Non-Operating Expenses (Income), net
2008 vs. 2007
Other net non-operating expenses were $24 million in 2008 as compared to $5 million of net non-operating income in 2007. Foreign currency transactional losses in 2008 resulted primarily from our U.S. dollar and euro purchases in Mexico and Russia, reflecting the impact of the weakening peso and ruble during the second half of 2008.
2007 vs. 2006
Other net non-operating income was $5 million in 2007 as compared to $10 million of net non-operating expenses in 2006. Income in 2007 was primarily a result of foreign exchange gains due to the strength of the Canadian dollar, Turkish lira, Russian ruble and euro. The expense position in 2006 was primarily a result of foreign exchange losses associated with the devaluation of the Turkish lira.
Minority Interest
2008 vs. 2007
The $4 million decrease versus the prior year was primarily driven by lower minority interest from the PR Beverages venture.
2007 vs. 2006
In 2007, minority interest primarily reflects PepsiCo’s 40 percent ownership in the PR Beverages venture formed in 2007. Minority interest activity in 2006 was not material to our results of operations.
Income Tax Expense
Bottling LLC is a limited liability company, classified as a partnership for U.S. tax purposes and, as such, generally will pay limited U.S. federal, state and local income taxes. The federal and state distributive shares of income, deductions and credits of Bottling LLC are allocated to Bottling LLC’s owners based on their percentage of ownership in Bottling LLC. However, certain domestic and foreign affiliates pay taxes in their respective jurisdictions. Such amounts are reflected in our Consolidated Statements of Operations.
29
Table of Contents
2008 vs. 2007
Our effective tax rate was a benefit of 7.7 percent in 2008 and an expense of 2.7 percent in 2007, respectively. The decrease in our effective tax rate is due primarily to the year-over-year comparability associated with the following:
| • | In 2008, we had pre-tax impairment charges related primarily to Mexico as well as pre-tax restructuring charges which resulted in a tax provision benefit of $115 million. The net impact of these items decreased our effective tax rate by 15.4 percentage points. | ||
| • | In 2007, we had tax law changes that reduced our deferred income tax provision by $13 million, coupled with valuation allowance reversals of $11 million. These items decreased our effective tax rate by 2.4 percentage points. |
2007 vs. 2006
Our effective tax rates for 2007 and 2006 were 2.7 percent and 0.3 percent, respectively. The increase in our effective tax rate is due primarily to the year-over-year comparability associated with the reversal of valuation allowances in Spain, Russia and Turkey in 2006. The tax law changes enacted in 2007 and 2006 that required us to re-measure our deferred taxes had approximately the same impact in both years.
LIQUIDITY AND FINANCIAL CONDITION
Cash Flows
2008 vs. 2007
Bottling LLC generated $1,473 million of net cash from operations, a decrease of $505 million from 2007. The decrease in net cash provided by operations was driven primarily by lower interest income received from PBG, timing of accounts payable disbursements and higher payments related to promotional activities.
Net cash used for investments was $1,543 million, a decrease of $73 million from 2007. The decrease in cash used for investments primarily reflects $1,027 million of proceeds from collection of notes receivable from PBG and lower capital expenditures, partially offset by $742 million of payments associated with our investment in JSC Lebedyansky, and payments for acquisitions of Lane Affiliated Companies, Inc. and Sobol-Aqua JSC.
Net cash provided by financing activities was $454 million, an increase of $826 million as compared to a use of cash of $372 million in 2007. The increase in cash from financing primarily reflects proceeds from the issuance of $1.3 billion in senior notes to partially pre-fund the February 2009 bond maturity of $1.3 billion. Also reflected in financing activities was $308 million of cash received from PepsiCo for their proportional share in the acquisition of JSC Lebedyansky and Sobol-Aqua JSC by PR Beverages. These increases were partially offset by higher distributions to Bottling LLC’s owners.
2007 vs. 2006
Net cash provided by operations increased by $451 million to $1,978 million in 2007. Increases in net cash provided by operations were driven by higher cash profits coupled with increased interest income from PBG and favorable working capital.
Net cash used for investments increased by $122 million to $1,616 million, driven by higher capital spending due to strategic investments in the U.S. and Russia, including the building of new plants in Las Vegas and Moscow and additional dedicated water lines in the U.S. The increase was partially offset by a lower increase in notes receivable from PBG.
Net cash used for financing increased by $433 million to $372 million, driven primarily by lower net proceeds from long-term debt.
Capital Expenditures
Our business requires substantial infrastructure investments to maintain our existing level of operations and to fund investments targeted at growing our business. Capital expenditures included in our cash flows from investing activities totaled $755 million, $854 million and $721 million during 2008, 2007 and 2006, respectively. Capital expenditures decreased $99 million in 2008 as a result of lower investments due to the economic slowdown, primarily in the United States.
30
Table of Contents
Liquidity and Capital Resources
Our principal sources of cash include cash from our operating activities and the issuance of debt and bank borrowings. We believe that these cash inflows will be sufficient for the foreseeable future to fund capital expenditures, benefit plan contributions, acquisitions and working capital requirements for PBG and us.
The recent and extraordinary disruption in the world credit markets in 2008 had a significant adverse impact on a number of financial institutions. At this point in time, the Company’s liquidity has not been materially impacted by the current credit environment and management does not expect that it will be materially impacted in the near-future. Management will continue to closely monitor the Company’s liquidity and the credit markets. However, management cannot predict with any certainty the impact to the Company of any further disruption in the credit environment.
Acquisitions and Investments
We completed a joint acquisition with PepsiCo of Russia’s leading branded juice company JSC Lebedyansky (“Lebedyansky”) for approximately $1.8 billion. Lebedyansky was acquired 58.3 percent by PepsiCo and 41.7 percent by PR Beverages, our Russian venture with PepsiCo. We have recorded an equity investment for PR Beverages’ share in Lebedyansky. In addition, we have recorded minority interest for PepsiCo’s proportional contribution to PR Beverages relating to Lebedyansky.
During 2008, we acquired Lane Affiliated Companies, Inc. (“Lane”), a Pepsi-Cola franchise bottler which serves portions of Colorado, Arizona and New Mexico. In addition, we acquired Sobol-Aqua JSC (“Sobol”), a company that manufactures Sobol brands and co-packs various Pepsi products in Siberia and Eastern Russia. The total cost of acquisitions during 2008 was approximately $257 million.
Additionally during 2008, PBG acquired Pepsi-Cola Batavia Bottling Corp, which was contributed to Bottling LLC. This Pepsi-Cola franchise bottler serves certain New York counties in whole or in part.
Long-Term Debt Activities
During the fourth quarter, we issued $1.3 billion in senior notes with a coupon rate of 6.95 percent, maturing in 2014. A portion of this debt was used to repay our senior notes due in 2009 at their maturity on February 17, 2009. In the interim, these proceeds were placed in short-term investments. In addition, we used a portion of the proceeds to finance the Lane acquisition and repay PBG’s short-term commercial paper debt, a portion of which was used to finance the acquisition of Lebedyansky.
In addition, during the first quarter of 2009 we issued an additional $750 million in senior notes, with a coupon rate of 5.125 percent, maturing in 2019. The net proceeds of the offering, together with a portion of the proceeds from the offering of our senior notes issued in the fourth quarter of 2008, were used to repay our senior notes due in 2009, at their scheduled maturity on February 17, 2009. Any excess proceeds of this offering will be used for general corporate purposes. The next significant scheduled debt maturity is not until 2012.
Short-Term Debt Activities
At December 27, 2008, we had available bank credit lines of approximately $772 million, of which the majority was uncommitted. These lines were primarily used to support the general operating needs of our international locations. As of year-end 2008, we had $103 million outstanding under these lines of credit at a weighted-average interest rate of 10.0 percent. As of year-end 2007, we had available short-term bank credit lines of approximately $748 million, of which $190 million was outstanding at a weighted-average interest rate of 5.3 percent.
Our peak borrowing timeframe varies with our working capital requirements and the seasonality of our business. Additionally, throughout the year, we may have further short-term borrowing requirements driven by other operational needs of our business. During 2008, borrowings from our line of credit facilities peaked at $484 million, reflecting payments for working capital requirements.
Debt Covenants and Credit Ratings
Certain of our senior notes have redemption features and non-financial covenants that will, among other things, limit our ability to create or assume liens, enter into sale and lease-back transactions, engage in mergers or consolidations and transfer or lease all or substantially all of our assets. Additionally, certain of our senior notes have financial covenants. These requirements are not, and it is not anticipated they will become, restrictive to our liquidity or capital resources. We are in compliance with all debt covenants. For a discussion of our covenants, see Note 8 in the Notes to Consolidated Financial Statements.
31
Table of Contents
Our credit ratings are periodically reviewed by rating agencies. Currently our long-term ratings from Moody’s and Standard and Poor’s are A2 and A, respectively. Changes in our operating results or financial position could impact the ratings assigned by the various agencies resulting in higher or lower borrowing costs.
Pensions
During 2009, we expect to contribute $185 million to fund PBG’s U.S. pension and postretirement plans. For further information about our pension and postretirement plan funding see section entitled “Pension and Postretirement Medical Benefit Plans” in our Critical Accounting Policies.
Contractual Obligations
The following table summarizes our contractual obligations as of December 27, 2008:
| Payments Due by Period | |||||||||||||||||||||
| 2010- | 2012- | 2014 and | |||||||||||||||||||
| Total | 2009 | 2011 | 2013 | beyond | |||||||||||||||||
Contractual Obligations | |||||||||||||||||||||
Long-term debt obligations(1) | $ | 5,086 | $ | 1,301 | $ | 35 | $ | 1,400 | $ | 2,350 | |||||||||||
Capital lease obligations(2) | 9 | 4 | 3 | — | 2 | ||||||||||||||||
Operating leases(2) | 279 | 58 | 69 | 34 | 118 | ||||||||||||||||
Interest obligations(3) | 1,203 | 237 | 420 | 376 | 170 | ||||||||||||||||
| Purchase obligations: | |||||||||||||||||||||
Raw material obligations(4) | 821 | 718 | 100 | — | 3 | ||||||||||||||||
Capital expenditure obligations(5) | 33 | 33 | — | — | — | ||||||||||||||||
Other obligations(6) | 324 | 135 | 113 | 38 | 38 | ||||||||||||||||
Other long-term liabilities(7) | 7 | 2 | 3 | 1 | 1 | ||||||||||||||||
| $ | 7,762 | $ | 2,488 | $ | 743 | $ | 1,849 | $ | 2,682 | ||||||||||||
| (1) | See Note 8 in the Notes to Consolidated Financial Statements for additional information relating to our long-term debt obligations. | |
| (2) | Lease obligation balances include imputed interest. See Note 9 in the Notes to Consolidated Financial Statements for additional information relating to our lease obligations. | |
| (3) | Represents interest payment obligations related to our long-term fixed-rate debt as specified in the applicable debt agreements. A portion of our long-term debt has variable interest rates due to either existing swap agreements or interest arrangements. We have estimated our variable interest payment obligations by using the interest rate forward curve where practical. Given uncertainties in future interest rates we have not included the beneficial impact of interest rate swaps after the year 2010. | |
| (4) | Represents obligations to purchase raw materials pursuant to contracts entered into by PepsiCo on our behalf and international agreements to purchase raw materials. | |
| (5) | Represents commitments to suppliers under capital expenditure related contracts or purchase orders. | |
| (6) | Represents legally binding agreements to purchase goods or services that specify all significant terms, including: fixed or minimum quantities, price arrangements and timing of payments. If applicable, penalty, notice, or minimum purchase amount is used in the calculation. Balances also include non-cancelable customer contracts for sports marketing arrangements. | |
| (7) | Primarily represents non-compete contracts that resulted from business acquisitions. The non-current portion of unrecognized tax benefits recorded on the balance sheet as of December 27, 2008 is not included in the table. There was no current portion of unrecognized tax benefits as of December 27, 2008. For additional information about our income taxes see Note 12 in the Notes to Consolidated Financial Statements. |
This table excludes our pension and postretirement liabilities recorded on the balance sheet. For a discussion of our future pension contributions, as well as expected pension and postretirement benefit payments see Note 11 in the Notes to Consolidated Financial Statements.
Off-Balance Sheet Arrangements
For information about our off-balance sheet arrangements see Note 14 in the Notes to our Consolidated Financial Statements regarding certain guarantees we made to our parent, PBG.
32
Table of Contents
MARKET RISKS AND CAUTIONARY STATEMENTS
Quantitative and Qualitative Disclosures about Market Risk
In the normal course of business, our financial position is routinely subject to a variety of risks. These risks include changes in the price of commodities purchased and used in our business, interest rates on outstanding debt and currency movements impacting our non-U.S. dollar denominated assets and liabilities. We are also subject to the risks associated with the business environment in which we operate. We regularly assess all of these risks and have strategies in place to reduce the adverse effects of these exposures.
Our objective in managing our exposure to fluctuations in commodity prices, interest rates and foreign currency exchange rates is to minimize the volatility of earnings and cash flows associated with changes in the applicable rates and prices. To achieve this objective, we have derivative instruments to hedge against the risk of adverse movements in commodity prices, interest rates and foreign currency. We monitor our counterparty credit risk on an ongoing basis. Our corporate policy prohibits the use of derivative instruments for trading or speculative purposes, and we have procedures in place to monitor and control their use. See Note 10 in the Notes to Consolidated Financial Statements for additional information relating to our derivative instruments.
A sensitivity analysis has been prepared to determine the effects that market risk exposures may have on our financial instruments. These sensitivity analyses evaluate the effect of hypothetical changes in commodity prices, interest rates and foreign currency exchange rates and changes in PBG’s stock price on our unfunded deferred compensation liability. Information provided by these sensitivity analyses does not necessarily represent the actual changes in fair value that we would incur under normal market conditions because, due to practical limitations, all variables other than the specific market risk factor were held constant. As a result, the reported changes in the values of some financial instruments that are affected by the sensitivity analyses are not matched with the offsetting changes in the values of the items that those instruments are designed to finance or hedge.
Commodity Price Risk
We are subject to market risks with respect to commodities because our ability to recover increased costs through higher pricing may be limited by the competitive business environment in which we operate. We use future and option contracts to hedge the risk of adverse movements in commodity prices related primarily to anticipated purchases of raw materials and energy used in our operations. With respect to commodity price risk, we currently have various contracts outstanding for commodity purchases in 2009 and 2010, which establish our purchase prices within defined ranges. We estimate that a 10 percent decrease in commodity prices with all other variables held constant would have resulted in a change in the fair value of our financial instruments of $14 million and $7 million at December 27, 2008 and December 29, 2007, respectively.
Interest Rate Risk
Interest rate risk is inherent to both fixed and floating rate debt. We effectively converted $1.1 billion of our senior notes to floating-rate debt through the use of interest rate swaps. Changes in interest rates on our interest rate swaps and other variable debt would change our interest expense. We estimate that a 50 basis point increase in interest rates on our variable rate debt and cash equivalents, with all other variables held constant, would have resulted in an increase to net interest expense of $2 million and $2 million in fiscal years 2008 and 2007, respectively.
Foreign Currency Exchange Rate Risk
In 2008, approximately 34 percent of our net revenues were generated from outside the United States. Social, economic and political conditions in these international markets may adversely affect our results of operations, financial condition and cash flows. The overall risks to our international businesses include changes in foreign governmental policies and other social, political or economic developments. These developments may lead to new product pricing, tax or other policies and monetary fluctuations that may adversely impact our business. In addition, our results of operations and the value of our foreign assets and liabilities are affected by fluctuations in foreign currency exchange rates.
As currency exchange rates change, translation of the statements of operations of our businesses outside the U.S. into U.S. dollars affects year-over-year comparability. We generally have not hedged against these types of currency risks because cash flows from our international operations have been reinvested locally. We have foreign currency transactional risks in certain of our international territories for transactions that are denominated in currencies that are different from their functional currency. We have entered into forward exchange contracts to hedge portions of our forecasted U.S. dollar cash flows in these international territories. A 10 percent weaker U.S. dollar against the applicable foreign currency, with all other variables held constant, would result in a change in the fair value of these contracts of $5 million and $6 million at December 27, 2008 and December 29, 2007, respectively.
33
Table of Contents
In 2007, we entered into forward exchange contracts to economically hedge a portion of intercompany receivable balances that are denominated in Mexican pesos. A 10 percent weaker U.S. dollar versus the Mexican peso, with all other variables held constant, would result in a change of $4 million and $9 million in the fair value of these contracts at December 27, 2008 and December 29, 2007, respectively.
Unfunded Deferred Compensation Liability
Our unfunded deferred compensation liability is subject to changes in PBG’s stock price, as well as price changes in certain other equity and fixed-income investments. Employee investment elections include PBG stock and a variety of other equity and fixed-income investment options. Since the plan is unfunded, employees’ deferred compensation amounts are not directly invested in these investment vehicles. Instead, we track the performance of each employee’s investment selections and adjust the employee’s deferred compensation account accordingly. The adjustments to the employees’ accounts increases or decreases the deferred compensation liability reflected on our Consolidated Balance Sheet with an offsetting increase or decrease to our selling, delivery and administrative expenses in our Consolidated Statements of Operations. We use prepaid forward contracts to hedge the portion of our deferred compensation liability that is based on PBG’s stock price. Therefore, changes in compensation expense as a result of changes in PBG’s stock price are substantially offset by the changes in the fair value of these contracts. We estimate that a 10 percent unfavorable change in the year-end stock price would have reduced the fair value from these forward contract commitments by $1 million and $2 million at December 27, 2008 and December 29, 2007, respectively.
Cautionary Statements
Except for the historical information and discussions contained herein, statements contained in this annual report on Form 10-K may constitute forward-looking statements as defined by the Private Securities Litigation Reform Act of 1995. These forward-looking statements are based on currently available competitive, financial and economic data and our operating plans. These statements involve a number of risks, uncertainties and other factors that could cause actual results to be materially different. Among the events and uncertainties that could adversely affect future periods are:
| • | changes in our relationship with PepsiCo; | |
| • | PepsiCo’s ability to affect matters concerning us through its equity ownership of PBG and Bottling LLC, representation on PBG’s Board and approval rights under our Master Bottling Agreement; | |
| • | material changes in expected levels of bottler incentive payments from PepsiCo; | |
| • | restrictions imposed by PepsiCo on our raw material suppliers that could increase our costs; | |
| • | material changes from expectations in the cost or availability of ingredients, packaging materials, other raw materials or energy; | |
| • | limitations on the availability of water or obtaining water rights; | |
| • | an inability to achieve strategic business plan targets that could result in a non-cash intangible asset impairment charge; | |
| • | an inability to achieve cost savings; | |
| • | material changes in capital investment for infrastructure and an inability to achieve the expected timing for returns on cold-drink equipment and related infrastructure expenditures; | |
| • | decreased demand for our product resulting from changes in consumers’ preferences; | |
| • | an inability to achieve volume growth through product and packaging initiatives; | |
| • | impact of competitive activities on our business; | |
| • | impact of customer consolidations on our business; | |
| • | unfavorable weather conditions in our markets; | |
| • | an inability to successfully integrate acquired businesses or to meet projections for performance in newly acquired territories; | |
| • | loss of business from a significant customer; | |
| • | loss of key members of management; | |
| • | failure or inability to comply with laws and regulations; | |
| • | litigation, other claims and negative publicity relating to alleged unhealthy properties or environmental impact of our products; | |
| • | changes in laws and regulations governing the manufacture and sale of food and beverages, the environment, transportation, employee safety, labor and government contracts; |
34
Table of Contents
| • | changes in accounting standards and taxation requirements (including unfavorable outcomes from audits performed by various tax authorities); | |
| • | an increase in costs of pension, medical and other employee benefit costs; | |
| • | unfavorable market performance of assets in PBG’s pension plans or material changes in key assumptions used to calculate the liability of PBG’s pension plans, such as discount rate; | |
| • | unforeseen social, economic and political changes; | |
| • | possible recalls of our products; | |
| • | interruptions of operations due to labor disagreements; | |
| • | limitations on our ability to invest in our business as a result of our repayment obligations under our existing indebtedness; | |
| • | changes in our debt ratings, an increase in financing costs or limitations on our ability to obtain credit; and | |
| • | material changes in expected interest and currency exchange rates. |
35
Table of Contents
Bottling Group, LLC
Consolidated Statements of Operations
in millions
Consolidated Statements of Operations
in millions
Fiscal years ended December 27, 2008, December 29, 2007 and December 30, 2006
| 2008 | 2007 | 2006 | ||||||||||
Net Revenues | $ | 13,796 | $ | 13,591 | $ | 12,730 | ||||||
| Cost of sales | 7,586 | 7,370 | 6,900 | |||||||||
Gross Profit | 6,210 | 6,221 | 5,830 | |||||||||
| Selling, delivery and administrative expenses | 5,171 | 5,167 | 4,842 | |||||||||
| Impairment charges | 412 | — | — | |||||||||
Operating Income | 627 | 1,054 | 988 | |||||||||
| Interest expense | 244 | 232 | 227 | |||||||||
| Interest income | 162 | 222 | 174 | |||||||||
| Other non-operating expenses (income), net | 24 | (5 | ) | 10 | ||||||||
| Minority interest expense (income) | 24 | 28 | (2 | ) | ||||||||
Income Before Income Taxes | 497 | 1,021 | 927 | |||||||||
| Income tax (benefit) expense | (39 | ) | 27 | 3 | ||||||||
Net Income | $ | 536 | $ | 994 | $ | 924 | ||||||
See accompanying notes to Consolidated Financial Statements.
36
Table of Contents
Bottling Group, LLC
Consolidated Statements of Cash Flows
in millions
Consolidated Statements of Cash Flows
in millions
Fiscal years ended December 27, 2008, December 29, 2007 and December 30, 2006
| 2008 | 2007 | 2006 | ||||||||||
Cash Flows—Operations | ||||||||||||
| Net income | $ | 536 | $ | 994 | $ | 924 | ||||||
| Adjustments to reconcile net income to net cash provided by operations: | ||||||||||||
| Depreciation and amortization | 672 | 668 | 648 | |||||||||
| Deferred income taxes | (87 | ) | (8 | ) | (41 | ) | ||||||
| Stock-based compensation | 56 | 61 | 65 | |||||||||
| Impairment charges | 412 | — | — | |||||||||
| Defined benefit pension and postretirement expenses | 114 | 121 | 119 | |||||||||
| Minority interest expense (income) | 24 | 28 | (2 | ) | ||||||||
| Other non-cash charges and credits | 95 | 78 | 68 | |||||||||
| Changes in operating working capital, excluding effects of acquisitions: | ||||||||||||
| Accounts receivable, net | 40 | (110 | ) | (120 | ) | |||||||
| Inventories | 3 | (19 | ) | (57 | ) | |||||||
| Prepaid expenses and other current assets | (96 | ) | 116 | (75 | ) | |||||||
| Accounts payable and other current liabilities | (136 | ) | 187 | 87 | ||||||||
| Income taxes payable | 18 | 5 | 25 | |||||||||
| Net change in operating working capital | (171 | ) | 179 | (140 | ) | |||||||
| Pension contributions to funded plans | (85 | ) | (70 | ) | (68 | ) | ||||||
| Other, net | (93 | ) | (73 | ) | (46 | ) | ||||||
Net Cash Provided by Operations | 1,473 | 1,978 | 1,527 | |||||||||
Cash Flows—Investments | ||||||||||||
| Capital expenditures | (755 | ) | (854 | ) | (721 | ) | ||||||
| Acquisitions, net of cash acquired | (257 | ) | (49 | ) | (33 | ) | ||||||
| Investments in noncontrolled affiliates | (742 | ) | — | — | ||||||||
| Proceeds from sale of property, plant and equipment | 24 | 14 | 18 | |||||||||
| Increase in notes receivable from PBG, net | (839 | ) | (733 | ) | (763 | ) | ||||||
| Proceeds from collection of notes receivable from PBG | 1,027 | — | — | |||||||||
| Other investing activities, net | (1 | ) | 6 | 5 | ||||||||
Net Cash Used for Investments | (1,543 | ) | (1,616 | ) | (1,494 | ) | ||||||
Cash Flows—Financing | ||||||||||||
| Short-term borrowings, net—three months or less | (58 | ) | (40 | ) | 133 | |||||||
| Proceeds from short-term borrowings — more than three months | 117 | 167 | 96 | |||||||||
| Payments of short-term borrowings — more than three months | (91 | ) | (211 | ) | (74 | ) | ||||||
| Proceeds from issuances of long-term debt | 1,290 | 24 | 793 | |||||||||
| Payments of long-term debt | (9 | ) | (41 | ) | (603 | ) | ||||||
| Contributions from minority interest holder | 308 | — | — | |||||||||
| Distributions to owners | (1,102 | ) | (271 | ) | (284 | ) | ||||||
| Other financing activities, net | (1 | ) | — | — | ||||||||
Net Cash Provided by (Used for) Financing | 454 | (372 | ) | 61 | ||||||||
Effect of Exchange Rate Changes on Cash and Cash Equivalents | (57 | ) | 28 | 1 | ||||||||
Net Increase in Cash and Cash Equivalents | 327 | 18 | 95 | |||||||||
Cash and Cash Equivalents—Beginning of Year | 459 | 441 | 346 | |||||||||
Cash and Cash Equivalents—End of Year | $ | 786 | $ | 459 | $ | 441 | ||||||
See accompanying notes to Consolidated Financial Statements.
37
Table of Contents
Bottling Group, LLC
Consolidated Balance Sheets
in millions
Consolidated Balance Sheets
in millions
December 27, 2008 and December 29, 2007
| 2008 | 2007 | |||||||
ASSETS | ||||||||
Current Assets | ||||||||
| Cash and cash equivalents | $ | 786 | $ | 459 | ||||
| Accounts receivable, net | 1,371 | 1,520 | ||||||
| Inventories | 528 | 577 | ||||||
| Prepaid expenses and other current assets | 337 | 308 | ||||||
Total Current Assets | 3,022 | 2,864 | ||||||
| Property, plant and equipment, net | 3,869 | 4,071 | ||||||
| Other intangible assets, net | 3,751 | 4,181 | ||||||
| Goodwill | 1,434 | 1,533 | ||||||
| Investments in noncontrolled affiliates | 619 | — | ||||||
| Notes receivable from PBG | 3,692 | 3,880 | ||||||
| Other assets | 108 | 183 | ||||||
Total Assets | $ | 16,495 | $ | 16,712 | ||||
LIABILITIES AND OWNERS’ EQUITY | ||||||||
Current Liabilities | ||||||||
| Accounts payable and other current liabilities | $ | 1,529 | $ | 1,829 | ||||
| Short-term borrowings | 103 | 190 | ||||||
| Current maturities of long-term debt | 1,305 | 6 | ||||||
Total Current Liabilities | 2,937 | 2,025 | ||||||
| Long-term debt | 3,789 | 3,776 | ||||||
| Other liabilities | 1,284 | 832 | ||||||
| Deferred income taxes | 279 | 471 | ||||||
| Minority interest | 672 | 379 | ||||||
Total Liabilities | 8,961 | 7,483 | ||||||
Owners’ Equity | ||||||||
| Owners’ net investment | 8,907 | 9,418 | ||||||
| Accumulated other comprehensive loss | (1,373 | ) | (189 | ) | ||||
Total Owners’ Equity | 7,534 | 9,229 | ||||||
Total Liabilities and Owners’ Equity | $ | 16,495 | $ | 16,712 | ||||
See accompanying notes to Consolidated Financial Statements.
38
Table of Contents
Bottling Group, LLC
Consolidated Statements of Changes in Owners’ Equity
in millions
Consolidated Statements of Changes in Owners’ Equity
in millions
December 27, 2008, December 29, 2007 and December 30, 2006
| Accumulated | ||||||||||||||||||||
| Owners’ | Other | |||||||||||||||||||
| Net | Deferred | Comprehensive | Comprehensive | |||||||||||||||||
| Investment | Compensation | Loss | Total | Income (Loss) | ||||||||||||||||
Balance at December 31, 2005 | $ | 7,990 | $ | (14 | ) | $ | (395 | ) | $ | 7,581 | ||||||||||
| Comprehensive income: | ||||||||||||||||||||
| Net income | 924 | — | — | 924 | $ | 924 | ||||||||||||||
| Net currency translation adjustment | — | — | 26 | 26 | 26 | |||||||||||||||
| Minimum pension liability adjustment | — | — | 48 | 48 | 48 | |||||||||||||||
| Cash flow hedge adjustment (net of tax of $(3)) | — | — | 10 | 10 | 10 | |||||||||||||||
| Total comprehensive income | $ | 1,008 | ||||||||||||||||||
| FAS 158 - pension liability adjustment (net of tax of $4 ) | — | — | (278 | ) | (278 | ) | ||||||||||||||
| Cash distributions to owners | (284 | ) | — | — | (284 | ) | ||||||||||||||
| Stock compensation | 51 | 14 | — | 65 | ||||||||||||||||
Balance at December 30, 2006 | 8,681 | — | (589 | ) | 8,092 | |||||||||||||||
| Comprehensive income: | ||||||||||||||||||||
| Net income | 994 | — | — | 994 | $ | 994 | ||||||||||||||
| Net currency translation adjustment | — | — | 235 | 235 | 235 | |||||||||||||||
| Pension and postretirement medical benefit plans adjustment (net of tax of $(3)) | — | — | 163 | 163 | 163 | |||||||||||||||
| Cash flow hedge adjustment (net of tax of $2) | — | — | 2 | 2 | 2 | |||||||||||||||
| Total comprehensive income | $ | 1,394 | ||||||||||||||||||
| Impact from adopting FIN 48 | (45 | ) | — | — | (45 | ) | ||||||||||||||
| Cash distributions to owners | (271 | ) | — | — | (271 | ) | ||||||||||||||
| Stock compensation | 59 | — | — | 59 | ||||||||||||||||
Balance at December 29, 2007 | 9,418 | — | (189 | ) | 9,229 | |||||||||||||||
| Comprehensive income (loss): | ||||||||||||||||||||
| Net income | 536 | — | — | 536 | $ | 536 | ||||||||||||||
| Net currency translation adjustment | — | — | (593 | ) | (593 | ) | (593 | ) | ||||||||||||
| Pension and postretirement medical benefit plans adjustment (net of tax of $2) | — | — | (562 | ) | (562 | ) | (562 | ) | ||||||||||||
| Cash flow hedge adjustment (net of tax of $(3)) | — | — | (64 | ) | (64 | ) | (64 | ) | ||||||||||||
| Total comprehensive loss | $ | (683 | ) | |||||||||||||||||
| FAS 158 - measurement date adjustment (net of tax of $0) | (27 | ) | — | 35 | 8 | |||||||||||||||
| Cash distributions to owners | (1,102 | ) | — | — | (1,102 | ) | ||||||||||||||
| Non-cash contributions from owners | 26 | — | — | 26 | ||||||||||||||||
| Stock compensation | 56 | — | — | 56 | ||||||||||||||||
Balance at December 27, 2008 | $ | 8,907 | $ | — | $ | (1,373 | ) | $ | 7,534 | |||||||||||
See accompanying notes to Consolidated Financial Statements.
39
Table of Contents
NOTES TO CONSOLIDATED FINANCIAL STATEMENTS
Tabular dollars in millions
Note 1—Basis of Presentation
Bottling Group, LLC (referred to as “Bottling LLC,” “we,” “our,” “us” and the “Company”) is the principal operating subsidiary of The Pepsi Bottling Group, Inc. (“PBG”) and consists of substantially all of the operations and the assets of PBG. PBG is the world’s largest manufacturer, seller and distributor of Pepsi-Cola beverages. We have the exclusive right to manufacture, sell and distribute Pepsi-Cola beverages in all or a portion of the U.S., Mexico, Canada, Spain, Russia, Greece and Turkey.
In conjunction with PBG’s initial public offering and other subsequent transactions, PBG and PepsiCo, Inc. (“PepsiCo”) contributed bottling businesses and assets used in the bottling businesses to Bottling LLC. As a result of the contribution of these assets, PBG owns 93.4 percent of Bottling LLC and PepsiCo owns the remaining 6.6 percent as of December 27, 2008. PepsiCo also owns 40 percent of PR Beverages Limited (“PR Beverages”), a consolidated venture for our Russian operations, which was formed on March 1, 2007.
Note 2—Summary of Significant Accounting Policies
The preparation of our consolidated financial statements in conformity with accounting principles generally accepted in the United States of America (“U.S. GAAP”) often requires management to make judgments, estimates and assumptions that affect a number of amounts included in our financial statements and related disclosures. We evaluate our estimates on an on-going basis using our historical experience as well as other factors we believe appropriate under the circumstances, such as current economic conditions, and adjust or revise our estimates as circumstances change. As future events and their effect cannot be determined with precision, actual results may differ from these estimates.
Basis of Consolidation —We consolidate in our financial statements entities in which we have a controlling financial interest, as well as variable interest entities where we are the primary beneficiary. Minority interest in earnings and ownership has been recorded for the percentage of these entities not owned by Bottling LLC. We have eliminated all intercompany accounts and transactions in consolidation.
Fiscal Year —Our U.S. and Canadian operations report using a fiscal year that consists of 52 weeks, ending on the last Saturday in December. Every five or six years a 53rd week is added. Fiscal years 2008, 2007 and 2006 consisted of 52 weeks. Our remaining countries report on a calendar-year basis. Accordingly, we recognize our quarterly business results as outlined below:
| Quarter | U.S. & Canada | Mexico & Europe | ||
| First Quarter | 12 weeks | January and February | ||
| Second Quarter | 12 weeks | March, April and May | ||
| Third Quarter | 12 weeks | June, July and August | ||
| Fourth Quarter | 16 weeks | September, October, November and December |
Revenue Recognition —Revenue, net of sales returns, is recognized when our products are delivered to customers in accordance with the written sales terms. We offer certain sales incentives on a local and national level through various customer trade agreements designed to enhance the growth of our revenue. Customer trade agreements are accounted for as a reduction to our revenues.
Customer trade agreements with our customers include payments for in-store displays, volume rebates, featured advertising and other growth incentives. A number of our customer trade agreements are based on quarterly and annual targets that generally do not exceed one year. Amounts recognized in our financial statements are based on amounts estimated to be paid to our customers depending upon current performance, historical experience, forecasted volume and other performance criteria.
Advertising and Marketing Costs —We are involved in a variety of programs to promote our products. We include advertising and marketing costs in selling, delivery and administrative expenses. Advertising and marketing costs were $437 million, $424 million and $403 million in 2008, 2007 and 2006, respectively, before bottler incentives received from PepsiCo and other brand owners.
40
Table of Contents
Bottler Incentives —PepsiCo and other brand owners, at their discretion, provide us with various forms of bottler incentives. These incentives cover a variety of initiatives, including direct marketplace support and advertising support. We classify bottler incentives as follows:
| • | Direct marketplace support represents PepsiCo’s and other brand owners’ agreed-upon funding to assist us in offering sales and promotional discounts to retailers and is generally recorded as an adjustment to cost of sales. If the direct marketplace support is a reimbursement for a specific, incremental and identifiable program, the funding is recorded as an offset to the cost of the program either in net revenues or selling, delivery and administrative expenses. | ||
| • | Advertising support represents agreed-upon funding to assist us with the cost of media time and promotional materials and is generally recorded as an adjustment to cost of sales. Advertising support that represents reimbursement for a specific, incremental and identifiable media cost, is recorded as a reduction to advertising and marketing expenses within selling, delivery and administrative expenses. |
Total bottler incentives recognized as adjustments to net revenues, cost of sales and selling, delivery and administrative expenses in our Consolidated Statements of Operations were as follows:
| Fiscal Year Ended | ||||||||||||
| 2008 | 2007 | 2006 | ||||||||||
| Net revenues | $ | 93 | $ | 66 | $ | 67 | ||||||
| Cost of sales | 586 | 626 | 612 | |||||||||
| Selling, delivery and administrative expenses | 57 | 67 | 70 | |||||||||
| Total bottler incentives | $ | 736 | $ | 759 | $ | 749 | ||||||
Share-Based Compensation— The Company grants a combination of PBG stock option awards and PBG restricted stock units to our middle and senior management. See Note 3 for further discussion on our share-based compensation.
Shipping and Handling Costs— Our shipping and handling costs reported in the Consolidated Statements of Operations are recorded primarily within selling, delivery and administrative expenses. Such costs recorded within selling, delivery and administrative expenses totaled $1.7 billion in 2008, 2007 and 2006.
Foreign Currency Gains and Losses and Currency Translation —We translate the balance sheets of our foreign subsidiaries at the exchange rates in effect at the balance sheet date, while we translate the statements of operations at the average rates of exchange during the year. The resulting translation adjustments of our foreign subsidiaries are included in accumulated other comprehensive loss on our Consolidated Balance Sheets. Transactional gains and losses arising from the impact of currency exchange rate fluctuations on transactions in foreign currency that is different from the local functional currency are included in other non-operating expenses (income), net in our Consolidated Statements of Operations.
Pension and Postretirement Medical Benefit Plans —We participate in PBG sponsored pension and other postretirement medical benefit plans in various forms in the U.S. and other similar plans in our international locations, covering employees who meet specified eligibility requirements.
On December 30, 2006, we adopted the funded status provision of Statement of Financial Accounting Standards (“SFAS”) No. 158, “Employers’ Accounting for Defined Benefit Pension and Other Postretirement Plans” (“SFAS 158”), which requires that we recognize the overfunded or underfunded status of each of the pension and other postretirement plans. In addition, on December 30, 2007, we adopted the measurement date provisions of SFAS 158, which requires that our assumptions used to measure our annual pension and postretirement medical expenses be determined as of the year-end balance sheet date and all plan assets and liabilities be reported as of that date. For fiscal years ended 2007 and prior, the majority of the pension and other postretirement plans used a September 30 measurement date and all plan assets and obligations were generally reported as of that date. As part of measuring the plan assets and benefit obligations on December 30, 2007, we adjusted our opening balances of retained earnings and accumulated other comprehensive loss for the change in net periodic benefit cost and fair value, respectively, from the previously used September 30 measurement date. The adoption of the measurement date provisions resulted in a net decrease in the pension and other postretirement medical benefit plans liability of $9 million, a net decrease in retained earnings of $27 million and a net decrease in accumulated other comprehensive loss of $35 million. There was no impact on our results of operations.
The determination of pension and postretirement medical plan obligations and related expenses requires the use of assumptions to estimate the amount of benefits that employees earn while working, as well as the present value of those benefit obligations. Significant assumptions include discount rate; expected rate of return on plan assets;
41
Table of Contents
certain employee-related factors such as retirement age, mortality, and turnover; rate of salary increases for plans where benefits are based on earnings; and for retiree medical plans, health care cost trend rates. We evaluate these assumptions on an annual basis at each measurement date based upon historical experience of the plans and management’s best judgment regarding future expectations.
Differences between the assumed rate of return and actual return of plan assets are deferred in accumulated other comprehensive loss in equity and amortized to earnings utilizing the market-related value method. Under this method, differences between the assumed rate of return and actual rate of return from any one year will be recognized over a five year period in the market related value.
Other gains and losses resulting from changes in actuarial assumptions and from differences between assumed and actual experience are determined at each measurement date and deferred in accumulated other comprehensive loss in equity. To the extent the amount of all unrecognized gains and losses exceeds 10 percent of the larger of the benefit obligation or plan assets, such amount is amortized to earnings over the average remaining service period of active participants.
The cost or benefit from benefit plan changes is also deferred in accumulated other comprehensive loss in equity and amortized to earnings on a straight-line basis over the average remaining service period of the employees expected to receive benefits.
See Note 11 for further discussion on pension and postretirement medical benefit plans.
Income Taxes— We are a limited liability company, classified as a partnership for U.S. tax purposes and, as such, generally will pay limited U.S. federal, state and local income taxes. Our federal and state distributive shares of income, deductions and credits are allocated to our owners based on their percentage of ownership. However, certain domestic and foreign affiliates pay taxes in their respective jurisdictions and record related deferred income tax assets and liabilities. Our effective tax rate is based on pre-tax income, statutory tax rates, tax laws and regulations and tax planning strategies available to us in the various jurisdictions in which we operate.
Our deferred tax assets and liabilities reflect our best estimate of the tax benefits and costs we expect to realize in the future. We establish valuation allowances to reduce our deferred tax assets to an amount that will more likely than not be realized.
As required under the provisions of Financial Accounting Standards Board (“FASB”) Interpretation No. 48, “Accounting for Uncertainty in Income Taxes” (“FIN 48”), which we adopted as of the beginning of fiscal year 2007, we recognize the impact of our tax positions in our financial statements if those positions will more likely than not be sustained on audit, based on the technical merit of the position.
Significant management judgment is required in evaluating our tax positions and in determining our effective tax rate.
See Note 12 for further discussion on our income taxes.
Cash and Cash Equivalents —Cash and cash equivalents include all highly liquid investments with original maturities not exceeding three months at the time of purchase. The fair value of our cash and cash equivalents approximate the amounts shown on our Consolidated Balance Sheets due to their short-term nature.
Allowance for Doubtful Accounts —A portion of our accounts receivable will not be collected due to non-payment, bankruptcies and sales returns. Our accounting policy for the provision for doubtful accounts requires reserving an amount based on the evaluation of the aging of accounts receivable, sales return trend analysis, detailed analysis of high-risk customers’ accounts, and the overall market and economic conditions of our customers.
Inventories —We value our inventories at the lower of cost or net realizable value. The cost of our inventory is generally computed on the first-in, first-out method.
Property, Plant and Equipment —We record property, plant and equipment (“PP&E”) at cost, except for PP&E that has been impaired, for which we write down the carrying amount to estimated fair market value, which then becomes the new cost basis.
Other Intangible Assets, net and Goodwill —Goodwill and other intangible assets with indefinite useful lives are not amortized; however, they are evaluated for impairment at least annually, or more frequently if facts and circumstances indicate that the assets may be impaired.
Intangible assets that are determined to have a finite life are amortized on a straight-line basis over the period in which we expect to receive economic benefit, which generally ranges from five to twenty years, and are evaluated for impairment only if facts and circumstances indicate that the carrying value of the asset may not be recoverable.
42
Table of Contents
The determination of the expected life depends upon the use and the underlying characteristics of the intangible asset. In our evaluation of the expected life of these intangible assets, we consider the nature and terms of the underlying agreements; our intent and ability to use the specific asset; the age and market position of the products within the territories in which we are entitled to sell; the historical and projected growth of those products; and costs, if any, to renew the related agreement.
If the carrying value is not recoverable, impairment is measured as the amount by which the carrying value exceeds its fair value. Initial fair value is generally based on either appraised value or other valuation techniques.
See Note 5 for further discussion on our goodwill and other intangible assets.
Minority Interest —Minority interest is recorded for the entities that we consolidate but are not wholly owned by Bottling LLC. Minority interest recorded in our Consolidated Financial Statements is primarily comprised of PepsiCo’s share of the consolidated net income and net assets of the PR Beverages venture. At December 27, 2008, PepsiCo owned 40 percent of the PR Beverages venture.
Financial Instruments and Risk Management —We use derivative instruments to hedge against the risk of adverse movements associated with commodity prices, interest rates and foreign currency. Our policy prohibits the use of derivative instruments for trading or speculative purposes, and we have procedures in place to monitor and control their use.
All derivative instruments are recorded at fair value as either assets or liabilities in our Consolidated Balance Sheets. Derivative instruments are generally designated and accounted for as either a hedge of a recognized asset or liability (“fair value hedge”) or a hedge of a forecasted transaction (“cash flow hedge”). The derivative’s gain or loss recognized in earnings is recorded consistent with the expense classification of the underlying hedged item.
If a fair value or cash flow hedge were to cease to qualify for hedge accounting or were terminated, it would continue to be carried on the balance sheet at fair value until settled, but hedge accounting would be discontinued prospectively. If the underlying hedged transaction ceases to exist, any associated amounts reported in accumulated other comprehensive loss are reclassified to earnings at that time.
We also may enter into a derivative instrument for which hedge accounting is not required because it is entered into to offset changes in the fair value of an underlying transaction recognized in earnings (“economic hedge”). These instruments are reflected in the Consolidated Balance Sheets at fair value with changes in fair value recognized in earnings.
Commitments and Contingencies —We are subject to various claims and contingencies related to lawsuits, environmental and other matters arising out of the normal course of business. Liabilities related to commitments and contingencies are recognized when a loss is probable and reasonably estimable.
New Accounting Standards
SFAS No. 157
In September 2006, the FASB issued SFAS No. 157, “Fair Value Measurements” (“SFAS 157”), which establishes a framework for reporting fair value and expands disclosures about fair value measurements. The Company adopted SFAS 157 as it applies to financial assets and liabilities in our first quarter of 2008. The adoption of these provisions did not have a material impact on our Consolidated Financial Statements. For further information about the fair value measurements of our financial assets and liabilities, see Note 7.
In February 2008, the FASB issued FASB Staff Position No. FAS 157-2, “Effective Date of FASB Statement No. 157” (“FSP 157-2”). FSP 157-2 delays the effective date of SFAS 157 for nonfinancial assets and nonfinancial liabilities, except for certain items that are recognized or disclosed at fair value in the financial statements on a recurring basis (at least annually). FSP 157-2 will become effective beginning with our first quarter of 2009 and will not have a material impact on our Consolidated Financial Statements.
SFAS No. 141(R)
In December 2007, the FASB issued SFAS No. 141(revised 2007), “Business Combinations” (“SFAS 141(R)”), which addresses the recognition and accounting for identifiable assets acquired, liabilities assumed, and noncontrolling interest in business combinations. Certain costs, which were previously capitalized as a component of goodwill, such as acquisition closing costs, post acquisition restructuring charges and changes to tax liabilities and valuation allowances after the measurement period, will now be expensed. SFAS 141(R) also establishes expanded disclosure requirements for business combinations. SFAS 141(R) will become effective for new transactions closing in our 2009 fiscal year.
43
Table of Contents
SFAS No. 160
In December 2007, the FASB issued SFAS No. 160, “Noncontrolling Interests in Consolidated Financial Statements, an amendment of ARB No. 51” (“SFAS 160”), which addresses the accounting and reporting framework for minority interests by a parent company. SFAS 160 also addresses disclosure requirements to distinguish between interests of the parent and interests of the noncontrolling owners of a subsidiary. SFAS 160 will become effective beginning with our first quarter of 2009. We will be reporting minority interest as a component of equity in our Consolidated Balance Sheets and below income tax expense in our Consolidated Statement of Operations. As minority interest will be recorded below income tax expense, it will have an impact to our total effective tax rate, but our total taxes will not change. For comparability, we will be retrospectively applying the presentation of our prior year balances in our Consolidated Financial Statements.
SFAS No. 161
In March 2008, the FASB issued SFAS No. 161, “Disclosures about Derivative Instruments and Hedging Activities, an amendment of FASB Statement No. 133” (“SFAS 161”), which requires enhanced disclosures for derivative and hedging activities. SFAS 161 will become effective beginning with our first quarter of 2009.
EITF Issue No. 07-1
In December 2007, the FASB ratified its Emerging Issues Task Force’s (“EITF”) Consensus for Issue No. 07-1, “Accounting for Collaborative Arrangements” (“EITF 07-1”), which defines collaborative arrangements and establishes reporting requirements for transactions between participants in a collaborative arrangement and between participants in the arrangement and third parties. EITF 07-1 will become effective beginning with our first quarter of 2009. We do not believe this standard will have a material impact on our Consolidated Financial Statements.
Note 3—Share-Based Compensation
Accounting for Share-Based Compensation
Effective January 1, 2006, the Company adopted SFAS No. 123 (revised 2004), “Share-Based Payment” (“SFAS 123(R)”). Among its provisions, SFAS 123(R) requires the Company to recognize compensation expense for equity awards over the vesting period based on their grant-date fair value. The Company adopted SFAS 123(R) in using the modified prospective approach. Under this transition method, the measurement and our method of amortization of costs for share-based payments granted prior to, but not vested as of January 1, 2006, would be based on the same estimate of the grant-date fair value and the same amortization method that was previously used in our SFAS 123 pro forma disclosure. Results for prior periods have not been restated as provided for under the modified prospective approach. For equity awards granted after the date of adoption, we amortize share-based compensation expense on a straight-line basis over the vesting term.
Compensation expense is recognized only for share-based payments expected to vest. We estimate forfeitures, both at the date of grant as well as throughout the vesting period, based on our historical experience and future expectations. Prior to the adoption of SFAS 123(R), the effect of forfeitures on the pro forma expense amounts was recognized based on estimated forfeitures.
Total share-based compensation expense recognized in the Consolidated Statements of Operations for the years ended 2008, 2007 and 2006 was $56 million, $61 million and $65 million, respectively.
Share-Based Long-Term Incentive Compensation Plans
Prior to 2006, we granted non-qualified PBG stock options to certain employees, including middle and senior management under PBG’s share-based long-term incentive compensation plans (“incentive plans”). Additionally, we granted PBG restricted stock units to certain senior executives.
Beginning in 2006, we grant a mix of PBG stock options and PBG restricted stock units to middle and senior management employees under PBG’s incentive plan.
Shares of PBG stock available for future issuance to Bottling LLC’s employees under the existing plans were 16.2 million at December 27, 2008.
44
Table of Contents
The fair value of PBG stock options was estimated at the date of grant using the Black-Scholes-Merton option-valuation model. The table below outlines the weighted-average assumptions for options granted during years ended December 27, 2008, December 29, 2007 and December 30, 2006:
| 2008 | 2007 | 2006 | ||||||||||
| Risk-free interest rate | 2.8 | % | 4.5 | % | 4.7 | % | ||||||
| Expected term (in years) | 5.3 | 5.6 | 5.7 | |||||||||
| Expected volatility | 24 | % | 25 | % | 27 | % | ||||||
| Expected dividend yield | 2.0 | % | 1.8 | % | 1.5 | % | ||||||
The risk-free interest rate is based on the implied yield available on U.S. Treasury zero-coupon issues with an equivalent remaining expected term. The expected term of the options represents the estimated period of time employees will retain their vested stocks until exercise. Due to the lack of historical experience in stock option exercises, we estimate expected term utilizing a combination of the simplified method as prescribed by the United States Securities and Exchange Commission’s Staff Accounting Bulletin No. 110 and historical experience of similar awards, giving consideration to the contractual terms, vesting schedules and expectations of future employee behavior. Expected stock price volatility is based on a combination of historical volatility of PBG’s stock and the implied volatility of its traded options. The expected dividend yield is management’s long-term estimate of PBG’s annual dividends to be paid as a percentage of share price.
The fair value of restricted stock units is based on the fair value of PBG stock on the date of grant.
We receive a tax deduction for certain stock option exercises when the options are exercised, generally for the excess of the stock price over the exercise price of the options. Additionally, we receive a tax deduction for certain restricted stock units equal to the fair market value of PBG’s stock at the date the restricted stock units are converted to PBG stock. SFAS 123(R) requires that benefits received from tax deductions resulting from the grant-date fair value of equity awards be reported as operating cash inflows in our Consolidated Statement of Cash Flows. Benefits from tax deductions in excess of the grant-date fair value from equity awards are treated as financing cash inflows in our Consolidated Statement of Cash Flows. For the year ended December 27, 2008, the tax benefits from equity awards did not have a significant impact on our Consolidated Financial Statements.
As of December 27, 2008, there was approximately $75 million of total unrecognized compensation cost related to nonvested share-based compensation arrangements granted under the incentive plans. That cost is expected to be recognized over a weighted-average period of 2.0 years.
Stock Options
PBG stock options expire after 10 years and generally vest ratably over three years.
The following table summarizes option activity for Bottling LLC employees during the year ended December 27, 2008:
| Weighted- | Weighted- | |||||||||||||||
| Average | Average | |||||||||||||||
| Exercise | Remaining | Aggregate | ||||||||||||||
| Shares | Price | Contractual | Intrinsic | |||||||||||||
| (in millions) | per Share | Term (years) | Value | |||||||||||||
Outstanding at December 29, 2007 | 26.5 | $ | 25.32 | 5.9 | $ | 388 | ||||||||||
| Granted | 3.6 | $ | 33.69 | |||||||||||||
| Exercised | (1.9 | ) | $ | 21.75 | ||||||||||||
| Forfeited | (0.7 | ) | $ | 28.39 | ||||||||||||
Outstanding at December 27, 2008 | 27.5 | $ | 26.59 | 5.5 | $ | 33 | ||||||||||
Vested or expected to vest at December 27, 2008 | 27.1 | $ | 26.50 | 5.4 | $ | 33 | ||||||||||
Exercisable at December 27, 2008 | 21.0 | $ | 24.89 | 4.5 | $ | 33 | ||||||||||
The aggregate intrinsic value in the table above is before income taxes, based on PBG’s closing stock price of $22.00 and $39.96 as of the last business day of the period ended December 27, 2008 and December 29, 2007, respectively.
For the years ended December 27, 2008, December 29, 2007 and December 30, 2006, the weighted-average grant-date fair value of PBG stock options granted was $7.09, $8.18 and $8.75, respectively. The total intrinsic value of PBG stock options exercised during the years ended December 27, 2008, December 29, 2007 and December 30, 2006 was $21 million, $99 million and $113 million, respectively.
45
Table of Contents
Restricted Stock Units
PBG restricted stock units granted to employees generally vest over three years. In addition, restricted stock unit awards to certain senior executives contain vesting provisions that are contingent upon the achievement of pre-established performance targets. All restricted stock unit awards are settled in shares of PBG common stock.
The following table summarizes restricted stock unit activity for Bottling LLC employees during the year ended December 27, 2008:
| Weighted- | ||||||||||||||||
| Weighted- | Average | |||||||||||||||
| Average | Remaining | Aggregate | ||||||||||||||
| Shares | Grant-Date | Contractual | Intrinsic | |||||||||||||
| (in thousands) | Fair Value | Term (years) | Value | |||||||||||||
Outstanding at December 29, 2007 | 2,339 | $ | 30.04 | 1.7 | $ | 93 | ||||||||||
| Granted | 1,305 | $ | 35.34 | |||||||||||||
| Converted | (160 | ) | $ | 30.10 | ||||||||||||
| Forfeited | (182 | ) | $ | 31.61 | ||||||||||||
Outstanding at December 27, 2008 | 3,302 | $ | 32.04 | 1.3 | $ | 73 | ||||||||||
Vested or expected to vest at December 27, 2008 | 2,775 | $ | 32.34 | 1.4 | $ | 61 | ||||||||||
Convertible at December 27, 2008 | 139 | $ | 29.39 | — | $ | 3 | ||||||||||
For the years ended December 27, 2008, December 29, 2007 and December 30, 2006, the weighted-average grant-date fair value of PBG restricted stock units granted was $35.34, $31.01 and $29.52, respectively. The total intrinsic value of restricted stock units converted during the year ended December 27, 2008 was $4 million. No PBG restricted stock units were converted during fiscal years 2007 and 2006.
Note 4—Balance Sheet Details
| 2008 | 2007 | |||||||
Accounts Receivable, net | ||||||||
| Trade accounts receivable | $ | 1,208 | $ | 1,319 | ||||
| Allowance for doubtful accounts | (71 | ) | (54 | ) | ||||
| Accounts receivable from PepsiCo | 154 | 188 | ||||||
| Other receivables | 80 | 67 | ||||||
| $ | 1,371 | $ | 1,520 | |||||
Inventories | ||||||||
| Raw materials and supplies | $ | 185 | $ | 195 | ||||
| Finished goods | 343 | 382 | ||||||
| $ | 528 | $ | 577 | |||||
Prepaid Expenses and Other Current Assets | ||||||||
| Prepaid expenses | $ | 187 | $ | 244 | ||||
| Accrued interest receivable from PBG | 118 | 12 | ||||||
| Other current assets | 32 | 52 | ||||||
| $ | 337 | $ | 308 | |||||
46
Table of Contents
| 2008 | 2007 | |||||||
Property, Plant and Equipment, net | ||||||||
| Land | $ | 300 | $ | 320 | ||||
| Buildings and improvements | 1,542 | 1,484 | ||||||
| Manufacturing and distribution equipment | 3,999 | 4,091 | ||||||
| Marketing equipment | 2,246 | 2,389 | ||||||
| Capital leases | 23 | 36 | ||||||
| Other | 139 | 154 | ||||||
| 8,249 | 8,474 | |||||||
| Accumulated depreciation | (4,380 | ) | (4,403 | ) | ||||
| $ | 3,869 | $ | 4,071 | |||||
Capital leases primarily represent manufacturing and distribution equipment and other equipment.
We calculate depreciation on a straight-line basis over the estimated lives of the assets as follows:
| Buildings and improvements | 20-33 years | |||
| Manufacturing and distribution equipment | 2-15 years | |||
| Marketing equipment | 2-7 years | |||
Industrial Revenue Bonds
Pursuant to the terms of an industrial revenue bond, we transferred title of certain fixed assets with a net book value of $72 million to a state governmental authority in the U.S. to receive a property tax abatement. The title to these assets will revert back to us upon retirement or cancellation of the bond. These fixed assets are still recognized in the Company’s Consolidated Balance Sheet as all risks and rewards remain with the Company.
| 2008 | 2007 | |||||||
Accounts Payable and Other Current Liabilities | ||||||||
| Accounts payable | $ | 444 | $ | 615 | ||||
| Accounts payable to PepsiCo | 217 | 255 | ||||||
| Trade incentives | 189 | 235 | ||||||
| Accrued compensation and benefits | 240 | 276 | ||||||
| Other accrued taxes | 128 | 139 | ||||||
| Accrued interest | 62 | 47 | ||||||
| Other current liabilities | 249 | 262 | ||||||
| $ | 1,529 | $ | 1,829 | |||||
47
Table of Contents
Note 5—Other Intangible Assets, net and Goodwill
The components of other intangible assets are as follows:
| 2008 | 2007 | |||||||
| Intangibles subject to amortization: | ||||||||
| Gross carrying amount: | ||||||||
| Customer relationships and lists | $ | 45 | $ | 54 | ||||
| Franchise and distribution rights | 41 | 46 | ||||||
| Other identified intangibles | 34 | 30 | ||||||
| 120 | 130 | |||||||
| Accumulated amortization: | ||||||||
| Customer relationships and lists | (15 | ) | (15 | ) | ||||
| Franchise and distribution rights | (31 | ) | (31 | ) | ||||
| Other identified intangibles | (21 | ) | (17 | ) | ||||
| (67 | ) | (63 | ) | |||||
| Intangibles subject to amortization, net | 53 | 67 | ||||||
| Intangibles not subject to amortization: | ||||||||
| Carrying amount: | ||||||||
| Franchise rights | 3,244 | 3,235 | ||||||
| Licensing rights | 315 | 315 | ||||||
| Distribution rights | 49 | 294 | ||||||
| Brands | 39 | 213 | ||||||
| Other identified intangibles | 51 | 57 | ||||||
| Intangibles not subject to amortization | 3,698 | 4,114 | ||||||
| Total other intangible assets, net | $ | 3,751 | $ | 4,181 | ||||
During the first quarter of 2008, PBG acquired Pepsi-Cola Batavia Bottling Corp, which was contributed to Bottling LLC. This Pepsi-Cola franchise bottler serves certain New York counties in whole or in part. As a result of the acquisition, we recorded approximately $19 million of non-amortizable franchise rights and $4 million of non-compete agreements.
During the first quarter of 2008, we acquired distribution rights for SoBe brands in portions of Arizona and Texas and recorded approximately $6 million of non-amortizable distribution rights.
During the fourth quarter of 2008, we acquired Lane Affiliated Companies, Inc. (“Lane”). This Pepsi-Cola franchise bottler serves portions of Colorado, Arizona and New Mexico. As a result of the acquisition, we recorded approximately $176 million of non-amortizable franchise rights.
During the first quarter of 2007, we acquired from Nor-Cal Beverage Company, Inc., franchise and bottling rights for select Cadbury Schweppes brands in the Northern California region. As a result of the acquisition, we recorded approximately $50 million of non-amortizable franchise rights.
As a result of the formation of the PR Beverages venture in the second quarter of 2007, we recorded licensing rights valued at $315 million, representing the fair value of the exclusive license and related rights granted by PepsiCo to PR Beverages to manufacture and sell the concentrate for PepsiCo beverage products sold in Russia. The licensing rights have an indefinite useful life and are not subject to amortization. For further discussion on the PR Beverages venture see Note 14.
Intangible Asset Amortization
Intangible asset amortization expense was $9 million, $10 million and $12 million in 2008, 2007 and 2006, respectively. Amortization expense for each of the next five years is estimated to be approximately $7 million or less.
48
Table of Contents
Goodwill
The changes in the carrying value of goodwill by reportable segment for the years ended December 29, 2007 and December 27, 2008 are as follows:
| U.S. & | ||||||||||||||||
| Canada | Europe | Mexico | Total | |||||||||||||
Balance at December 30, 2006 | $ | 1,229 | $ | 16 | $ | 245 | $ | 1,490 | ||||||||
| Purchase price allocations | 1 | — | (16 | ) | (15 | ) | ||||||||||
| Impact of foreign currency translation and other | 60 | 1 | (3 | ) | 58 | |||||||||||
Balance at December 29, 2007 | 1,290 | 17 | 226 | 1,533 | ||||||||||||
| Purchase price allocations | 20 | 13 | (6 | ) | 27 | |||||||||||
| Impact of foreign currency translation and other | (75 | ) | (4 | ) | (47 | ) | (126 | ) | ||||||||
Balance at December 27, 2008 | $ | 1,235 | $ | 26 | $ | 173 | $ | 1,434 | ||||||||
During 2008, the purchase price allocations in the U.S. & Canada segment primarily relate to goodwill allocations resulting from the Lane acquisition discussed above. In the Europe segment, the purchase price allocations primarily relate to Russia’s purchase of Sobol-Aqua JSC (“Sobol”) in the second quarter of 2008. Sobol manufactures its brands and co-packs various Pepsi products in Siberia and Eastern Russia.
During 2008 and 2007, the purchase price allocations in the Mexico segment primarily relate to goodwill allocations resulting from changes in taxes associated with prior year acquisitions.
Annual Impairment Testing
The Company completes its impairment testing of goodwill in accordance with SFAS No. 142, “Goodwill and Other Intangible Assets” annually, or more frequently as indicators warrant. Goodwill and intangible assets with indefinite lives are not amortized; however, they are evaluated for impairment at least annually or more frequently if facts and circumstances indicate that the assets may be impaired. In previous years the Company completed this test in the fourth quarter using a measurement date of third quarter-end. During the second quarter ended June 14, 2008, the Company changed its impairment testing of goodwill to the third quarter, using a measurement date at the beginning of the third quarter. With the exception of Mexico’s intangible assets, the Company has also changed its impairment testing of intangible assets with indefinite useful lives to the third quarter, using a measurement date at the beginning of the third quarter. Impairment testing of Mexico’s intangible assets with indefinite useful lives was completed in the fourth quarter to coincide with the completion of the strategic review of the business.
As a result of this testing, the Company recorded a $412 million non-cash impairment charge ($297 million net of tax). The impairment charge relates primarily to distribution rights and brands for Electropura water business in Mexico. The impairment charge relating to these intangible assets was determined based upon the findings of an extensive strategic review and the finalization of certain restructuring plans for our Mexican business. In light of weakening macroeconomic conditions and our outlook for the business in Mexico, we lowered our expectations of the future performance, which reduced the value of these intangible assets and triggered an impairment charge. The fair value of our franchise rights and distribution rights was estimated using a multi-period excess earnings method that is based upon estimated discounted future cash flows. The fair value of our brands was estimated using a multi-period royalty savings method, which reflects the savings realized by owning the brand and, therefore, not having to pay a royalty fee to a third party.
49
Table of Contents
Note 6—Investment in Noncontrolled Affiliate
During the second half of 2008, together with PepsiCo, we completed a joint acquisition of JSC Lebedyansky (“Lebedyansky”) for approximately $1.8 billion. The acquisition does not include the company’s baby food and mineral water businesses, which were spun off to shareholders in a separate transaction prior to our acquisition. Lebedyansky was acquired 58.3 percent by PepsiCo and 41.7 percent by PR Beverages, our Russian venture with PepsiCo. We and PepsiCo have an ownership interest in PR Beverages of 60 percent and 40 percent, respectively. As a result, PepsiCo and we have acquired a 75 percent and 25 percent economic stake in Lebedyansky, respectively.
We have recorded an equity investment for PR Beverages’ share in Lebedyansky. In addition, we have recorded a minority interest contribution for PepsiCo’s proportional contribution to PR Beverages relating to Lebedyansky.
Note 7—Fair Value Measurements
We adopted SFAS 157 at the beginning of fiscal 2008 for all financial instruments valued on a recurring basis, at least annually. The standard defines fair value as the price that would be received to sell an asset or paid to transfer a liability in an orderly transaction between market participants at the measurement date. It also establishes a three-level fair value hierarchy that prioritizes the inputs used to measure fair value. The three levels of the hierarchy are defined as follows:
Level 1- Unadjusted quoted prices in active markets for identical assets or liabilities.
Level 2- Observable inputs other than quoted prices included in Level 1, such as quoted prices for identical assets or liabilities in non-active markets, quoted prices for similar assets or liabilities in active markets and inputs other than quoted prices that are observable for substantially the full term of the asset or liability.
Level 3- Unobservable inputs reflecting management’s own assumptions about the input used in pricing the asset or liability.
If the inputs used to measure the financial instruments fall within different levels of the hierarchy, the categorization is based on the lowest level input that is significant to the fair value measurement of the instrument.
The following table summarizes the financial assets and liabilities we measure at fair value on a recurring basis as of December 27, 2008:
| Level 2 | ||||
Financial Assets: | ||||
Foreign currency forward contracts(1) | $ | 13 | ||
Prepaid forward contracts(2) | 13 | |||
Interest rate swaps(3) | 8 | |||
| $ | 34 | |||
Financial Liabilities: | ||||
Commodity contracts(1) | $ | 57 | ||
Foreign currency contracts(1) | 6 | |||
Interest rate swaps(3) | 1 | |||
| $ | 64 | |||
| (1) | Based primarily on the forward rates of the specific indices upon which contract settlement is based. | |
| (2) | Based primarily on the value of PBG’s stock price. | |
| (3) | Based primarily on the London Inter-Bank Offer Rate (“LIBOR”) index. |
50
Table of Contents
Note 8—Short-Term Borrowings and Long-Term Debt
| 2008 | 2007 | |||||||
Short-term borrowings | ||||||||
| Current maturities of long-term debt | $ | 1,305 | $ | 6 | ||||
| Other short-term borrowings | 103 | 190 | ||||||
| $ | 1,408 | $ | 196 | |||||
Long-term debt | ||||||||
5.63% (5.2% effective rate)(2)(3) senior notes due 2009 | $ | 1,300 | $ | 1,300 | ||||
4.63% (4.6% effective rate) (3) senior notes due 2012 | 1,000 | 1,000 | ||||||
| 5.00% (5.2% effective rate) senior notes due 2013 | 400 | 400 | ||||||
6.95% (7.4% effective rate)(4) senior notes due 2014 | 1,300 | — | ||||||
| 4.13% (4.4% effective rate) senior notes due 2015 | 250 | 250 | ||||||
5.50% (5.3% effective rate)(2) senior notes due 2016 | 800 | 800 | ||||||
| Capital lease obligations (Note 9) | 8 | 9 | ||||||
| Other (average rate 14.73%) | 36 | 28 | ||||||
| 5,094 | 3,787 | |||||||
SFAS 133 adjustment(1) | 6 | — | ||||||
| Unamortized discount, net | (6 | ) | (5 | ) | ||||
| Current maturities of long-term debt | (1,305 | ) | (6 | ) | ||||
| $ | 3,789 | $ | 3,776 | |||||
| (1) | In accordance with the requirements of SFAS No. 133, “Accounting for Derivative Instruments and Hedging Activities” (“SFAS 133”), the portion of our fixed-rate debt obligations that is hedged is reflected in our Consolidated Balance Sheets as an amount equal to the sum of the debt’s carrying value plus a SFAS 133 fair value adjustment, representing changes recorded in the fair value of the hedged debt obligations attributable to movements in market interest rates. | |
| (2) | Effective interest rates include the impact of the gain/loss realized on swap instruments and represent the rates that were achieved in 2008. | |
| (3) | These notes are guaranteed by PepsiCo. | |
| (4) | Effective interest rate excludes the impact of the loss realized on Treasury Rate Locks in 2008. |
Aggregate Maturities — Long-Term Debt
Aggregate maturities of long-term debt as of December 27, 2008 are as follows: 2009: $1,301 million, 2010: $28 million, 2011: $7 million, 2012: $1,000 million, 2013: $400 million, 2014 and thereafter: $2,350 million. The maturities of long-term debt do not include the capital lease obligations, the non-cash impact of the SFAS 133 adjustment and the interest effect of the unamortized discount.
On October 24, 2008 we issued $1.3 billion of 6.95 percent senior notes due 2014 (the “Notes”). The Notes were guaranteed by PepsiCo on February 17, 2009. A portion of this debt was used to repay our senior notes due in 2009 at their maturity on February 17, 2009. In the interim, these proceeds were placed in short-term investments. In addition, we used a portion of the proceeds to finance the Lane acquisition and to repay PBG’s short-term commercial paper debt, a portion of which was used to finance the acquisition of Lebedyansky.
2008 Short-Term Debt Activities
We had available bank credit lines of approximately $772 million at year-end 2008, of which the majority was uncommitted. These lines were primarily used to support the general operating needs of our international locations. As of year-end 2008, we had $103 million outstanding under these lines of credit at a weighted-average interest rate of 10.0 percent. As of year-end 2007, we had available short-term bank credit lines of approximately $748 million with $190 million outstanding at a weighted-average interest rate of 5.3 percent.
Debt Covenants
Certain of our senior notes have redemption features and non-financial covenants that will, among other things, limit our ability to create or assume liens, enter into sale and lease-back transactions, engage in mergers or consolidations and transfer or lease all or substantially all of our assets. Additionally, our new secured debt should not be greater than 10 percent of our net tangible assets. Net tangible assets are defined as total assets less current liabilities and net intangible assets.
As of December 27, 2008 we were in compliance with all debt covenants.
51
Table of Contents
Interest Payments
Amounts paid to third parties for interest, net of settlements from our interest rate swaps, were $216 million, $227 million and $213 million in 2008, 2007 and 2006, respectively.
Letters of Credit, Bank Guarantees and Surety Bonds
At December 27, 2008, we had outstanding letters of credit, bank guarantees and surety bonds from financial institutions valued at $50 million.
Note 9—Leases
We have non-cancelable commitments under both capital and long-term operating leases, principally for real estate and office equipment. Certain of our operating leases for real estate contain escalation clauses, holiday rent allowances and other rent incentives. We recognize rent expense on our operating leases, including these allowances and incentives, on a straight-line basis over the lease term. Capital and operating lease commitments expire at various dates through 2072. Most leases require payment of related executory costs, which include property taxes, maintenance and insurance.
The cost of real estate and office equipment under capital leases is included in the Consolidated Balance Sheets as property, plant and equipment. Amortization of assets under capital leases is included in depreciation expense.
Capital lease additions totaled $4 million, $7 million and $33 million for 2008, 2007 and 2006, respectively. Included in the 2006 additions was a $25 million capital lease agreement with PepsiCo to lease vending equipment. In 2007, we repaid this lease obligation with PepsiCo.
The future minimum lease payments by year and in the aggregate, under capital leases and non-cancelable operating leases consisted of the following at December 27, 2008:
| Leases | ||||||||
| Capital | Operating | |||||||
| 2009 | $ | 4 | $ | 58 | ||||
| 2010 | 2 | 43 | ||||||
| 2011 | 1 | 26 | ||||||
| 2012 | — | 20 | ||||||
| 2013 | — | 14 | ||||||
| Thereafter | 2 | 118 | ||||||
| $ | 9 | $ | 279 | |||||
| Less: Amount representing interest | 1 | |||||||
| Present value of net minimum lease payments | 8 | |||||||
| Less: current portion of net minimum lease payments | 3 | |||||||
| Long-term portion of net minimum lease payments | $ | 5 | ||||||
Components of Net Rental Expense Under Operating Leases
| 2008 | 2007 | 2006 | ||||||||||
| Minimum rentals | $ | 121 | $ | 114 | $ | 99 | ||||||
| Sublease rental income | (1 | ) | (2 | ) | (3 | ) | ||||||
| Net Rental Expense | $ | 120 | $ | 112 | $ | 96 | ||||||
Note 10—Financial Instruments and Risk Management
We are subject to the risk of loss arising from adverse changes in commodity prices, foreign currency exchange rates, interest rates, and PBG’s stock price. In the normal course of business, we manage these risks through a variety of strategies, including the use of derivatives. Certain of these derivatives are designated as either cash flow or fair value hedges.
52
Table of Contents
Cash Flow Hedges
We are subject to market risk with respect to the cost of commodities because our ability to recover increased costs through higher pricing may be limited by the competitive business environment in which we operate. We use future and option contracts to hedge the risk of adverse movements in commodity prices related primarily to anticipated purchases of raw materials and energy used in our operations. These contracts generally range from one to 24 months in duration and qualify for cash flow hedge accounting treatment. At December 27, 2008 the fair value of our commodity contracts was a $57 million net loss, of which $48 million and $9 million was recorded in other current liabilities and other liabilities, respectively, in our Consolidated Balance Sheets. In 2008, $48 million of a net loss was recognized in accumulated other comprehensive loss (“AOCL”). Additionally, in 2008, $14 million of a net gain was reclassified into earnings in selling, delivery and administrative expenses for our commodity contracts.
We are subject to foreign currency transactional risks in certain of our international territories for transactions that are denominated in currencies that are different from their functional currency. We enter into forward exchange contracts to hedge portions of our forecasted U.S. dollar purchases in our foreign businesses. These contracts generally range from one to 12 months in duration and qualify for cash flow hedge accounting treatment. At December 27, 2008, the fair value of our foreign exchange contracts was a $4 million gain recorded in other current assets in our Consolidated Balance Sheets. In 2008, $11 million of a gain was recognized in AOCL and $2 million of a loss was reclassified into earnings in cost of goods sold for our foreign exchange contracts.
For these cash flow hedges, the effective portion of the change in the fair value of a derivative instrument is deferred in AOCL until the underlying hedged item is recognized in earnings. The ineffective portion of a fair value change on a qualifying cash flow hedge is recognized in earnings immediately and is recorded consistent with the expense classification of the underlying hedged item.
We have also entered into treasury rate lock agreements to hedge against adverse interest rate changes on certain debt financing arrangements, which qualify for cash flow hedge accounting. Gains and losses that are considered effective are deferred in AOCL and amortized to interest expense over the duration of the debt term.
In 2008, we recognized a $20 million loss in AOCL for treasury rate locks that settled in the fourth quarter. Additionally, in 2008, we reclassified from AOCL $7 million of a loss to interest expense from our treasury rate locks that previously settled.
The following summarizes activity in AOCL related to derivatives designated as cash flow hedges held by the Company during the applicable periods:
| Before Taxes | Taxes | Net of Taxes | ||||||||||
Accumulated net gains as of December 31, 2005 | $ | 5 | $ | 2 | $ | 7 | ||||||
| Net changes in the fair value of cash flow hedges | 14 | (2 | ) | 12 | ||||||||
| Net gains reclassified from AOCL into earnings | (1 | ) | (1 | ) | (2 | ) | ||||||
Accumulated net gains as of December 30, 2006 | 18 | (1 | ) | 17 | ||||||||
| Net changes in the fair value of cash flow hedges | (4 | ) | 3 | (1 | ) | |||||||
| Net losses reclassified from AOCL into earnings | 4 | (1 | ) | 3 | ||||||||
Accumulated net gains as of December 29, 2007 | 18 | 1 | 19 | |||||||||
| Net changes in the fair value of cash flow hedges | (57 | ) | (2 | ) | (59 | ) | ||||||
| Net gains reclassified from AOCL into earnings | (4 | ) | (1 | ) | (5 | ) | ||||||
Accumulated net losses as of December 27, 2008 | $ | (43 | ) | $ | (2 | ) | $ | (45 | ) | |||
Assuming no change in the commodity prices and foreign currency rates as measured on December 27, 2008, $47 million of unrealized losses will be recognized in earnings over the next 24 months. During 2008 we recognized $8 million of ineffectiveness for the treasury locks that were settled in the fourth quarter. The ineffective portion of the change in fair value of our other contracts was not material to our results of operations in 2008, 2007 or 2006.
Fair Value Hedges
We finance a portion of our operations through fixed-rate debt instruments. We effectively converted $1.1 billion of our senior notes to floating-rate debt through the use of interest rate swaps with the objective of reducing our overall borrowing costs. These interest rate swaps meet the criteria for fair value hedge accounting and are 100 percent effective in eliminating the market rate risk inherent in our long-term debt. Accordingly, any gain or loss associated with these swaps is fully offset by the opposite market impact on the related debt. During 2008, the fair value of the interest rate swaps increased to a net asset of $6.1 million at December 27, 2008 from a liability of $0.3 million at December 29, 2007. The fair value of our swaps was recorded in other assets and other liabilities in our Consolidated Balance Sheets.
53
Table of Contents
Foreign Currency Hedges
We entered into forward exchange contracts to economically hedge a portion of our intercompany receivable balances that are denominated in Mexican pesos. At December 27, 2008, the fair value of these contracts was $9 million and was classified in other current assets in our Consolidated Balance Sheet. The earnings impact from these instruments is classified in other non-operating expenses (income), net in the Consolidated Statements of Operations.
Unfunded Deferred Compensation Liability
Our unfunded deferred compensation liability is subject to changes in PBG’s stock price as well as price changes in other equity and fixed-income investments. Participating employees in our deferred compensation program can elect to defer all or a portion of their compensation to be paid out on a future date or dates. As part of the deferral process, employees select from phantom investment options that determine the earnings on the deferred compensation liability and the amount that they will ultimately receive. Employee investment elections include PBG stock and a variety of other equity and fixed-income investment options.
Since the plan is unfunded, employees’ deferred compensation amounts are not directly invested in these investment vehicles. Instead, we track the performance of each employee’s investment selections and adjust his or her deferred compensation account accordingly. The adjustments to employees’ accounts increases or decreases the deferred compensation liability reflected on our Consolidated Balance Sheets with an offsetting increase or decrease to our selling, delivery and administrative expenses.
We use prepaid forward contracts to hedge the portion of our deferred compensation liability that is based on PBG’s stock price. At December 27, 2008, we had a prepaid forward contract for 585,000 shares at a price of $22.00, which was accounted for as an economic hedge. This contract requires cash settlement and has a fair value at December 27, 2008, of $13 million recorded in prepaid expenses and other current assets in our Consolidated Balance Sheet. The fair value of this contract changes based on the change in PBG’s stock price compared with the contract exercise price. We recognized an expense of $10 million and income of $5 million in 2008 and 2007, respectively, resulting from the change in fair value of these prepaid forward contracts. The earnings impact from these instruments is recorded in selling, delivery and administrative expenses.
Other Financial Assets and Liabilities
Financial assets with carrying values approximating fair value include cash and cash equivalents and accounts receivable. Financial liabilities with carrying values approximating fair value include accounts payable and other accrued liabilities and short-term debt. The carrying value of these financial assets and liabilities approximates fair value due to their short maturities and since interest rates approximate current market rates for short-term debt.
Long-term debt, which includes the current maturities of long-term debt, at December 27, 2008, had a carrying value and fair value of $5.1 billion and $5.3 billion, respectively, and at December 29, 2007, had a carrying value and fair value of $3.8 billion. The fair value is based on interest rates that are currently available to us for issuance of debt with similar terms and remaining maturities.
Note 11—Pension and Postretirement Medical Benefit Plans
Employee Benefit Plans
We participate in PBG sponsored pension and other postretirement medical benefit plans in various forms in the United States and other similar pension plans in our international locations, covering employees who meet specified eligibility requirements. The assets, liabilities and expense associated with our international plans were not significant to our results of operations and are not included in the tables and discussion presented below.
Defined Benefit Pension Plans
In the U.S. we participate in non-contributory defined benefit pension plans for certain full-time salaried and hourly employees. Benefits are generally based on years of service and compensation, or stated amounts for each year of service. Effective January 1, 2007, newly hired salaried and non-union hourly employees are not eligible to participate in these plans. Additionally, effective April 1, 2009, we will no longer continue to accrue benefits for certain of our salaried and non-union employees that do not meet age and service requirements.
54
Table of Contents
Postretirement Medical Plans
PBG’s postretirement medical plans provide medical and life insurance benefits principally to U.S. retirees and their dependents. Employees are eligible for benefits if they meet age and service requirements. The plans are not funded and since 1993 have included retiree cost sharing.
Defined Contribution Benefits
Nearly all of our U.S. employees are eligible to participate in PBG’s defined contribution plans, which are voluntary defined contribution savings plans. We make matching contributions to the defined contribution savings plans on behalf of participants eligible to receive such contributions. Additionally, employees not eligible to participate in the defined benefit pension plans and employees whose benefits will be discontinued will receive additional Company retirement contributions under PBG’s defined contribution plans. Defined contribution expense was $29 million, $27 million and $22 million in 2008, 2007 and 2006, respectively.
Components of Net Pension Expense and Other Amounts Recognized in Other Comprehensive Loss (Income)
| Pension | ||||||||||||
| 2008 | 2007 | 2006 | ||||||||||
Net Pension Expense | ||||||||||||
| Service cost | $ | 51 | $ | 55 | $ | 53 | ||||||
| Interest cost | 100 | 90 | 82 | |||||||||
| Expected return on plan assets — (income) | (116 | ) | (102 | ) | (94 | ) | ||||||
| Amortization of net loss | 15 | 38 | 38 | |||||||||
| Amortization of prior service amendments | 7 | 7 | 9 | |||||||||
| Curtailment charge | 20 | — | — | |||||||||
| Special termination benefits | 7 | 4 | — | |||||||||
| Net pension expense for the defined benefit plans | 84 | 92 | 88 | |||||||||
Other Comprehensive Loss (Income) | ||||||||||||
| Prior service cost arising during the year | 14 | 8 | N/A | |||||||||
| Net loss (gain) arising during the year | 619 | (114 | ) | N/A | ||||||||
| Amortization of net loss | (15 | ) | (38 | ) | N/A | |||||||
Amortization of prior service amendments(1) | (27 | ) | (7 | ) | N/A | |||||||
| Total recognized in other comprehensive loss (income) | 591 | (151 | ) | N/A | ||||||||
| Total recognized in net pension expense and other comprehensive loss (income) | $ | 675 | $ | (59 | ) | $ | 88 | |||||
| (1) | 2008 includes curtailment charge of $20 million. |
Components of Postretirement Medical Expense and Other Amounts Recognized in Other Comprehensive Loss (Income)
| Postretirement | ||||||||||||
| 2008 | 2007 | 2006 | ||||||||||
Net Postretirement Expense | ||||||||||||
| Service cost | $ | 5 | $ | 5 | $ | 4 | ||||||
| Interest cost | 21 | 20 | 20 | |||||||||
| Amortization of net loss | 3 | 4 | 7 | |||||||||
| Special termination benefits | 1 | ��� | — | |||||||||
| Net postretirement expense | 30 | 29 | 31 | |||||||||
Other Comprehensive Loss (Income) | ||||||||||||
| Net (gain) arising during the year | (30 | ) | (4 | ) | N/A | |||||||
| Amortization of net loss | (3 | ) | (4 | ) | N/A | |||||||
| Total recognized in other comprehensive loss (income) | (33 | ) | (8 | ) | N/A | |||||||
| Total recognized in net postretirement expense and other comprehensive loss (income) | $ | (3 | ) | $ | 21 | $ | 31 | |||||
55
Table of Contents
Changes in Benefit Obligations
| Pension | Postretirement | |||||||||||||||
| 2008 | 2007 | 2008 | 2007 | |||||||||||||
| Obligation at beginning of year | $ | 1,585 | $ | 1,539 | $ | 353 | $ | 354 | ||||||||
| SFAS 158 adoption | (53 | ) | — | (5 | ) | — | ||||||||||
| Service cost | 51 | 55 | 5 | 5 | ||||||||||||
| Interest cost | 100 | 90 | 21 | 20 | ||||||||||||
| Plan amendments | 14 | 8 | — | — | ||||||||||||
| Plan curtailment | (50 | ) | — | — | — | |||||||||||
| Actuarial (gain) loss | 141 | (53 | ) | (30 | ) | (4 | ) | |||||||||
| Benefit payments | (69 | ) | (57 | ) | (19 | ) | (23 | ) | ||||||||
| Special termination benefits | 7 | 4 | 1 | — | ||||||||||||
| Adjustment for Medicare subsidy | — | — | 1 | 1 | ||||||||||||
| Transfers | (2 | ) | (1 | ) | — | — | ||||||||||
| Obligation at end of year | $ | 1,724 | $ | 1,585 | $ | 327 | $ | 353 | ||||||||
Changes in the Fair Value of Plan Assets
| Pension | Postretirement | |||||||||||||||
| 2008 | 2007 | 2008 | 2007 | |||||||||||||
| Fair value of plan assets at beginning of year | $ | 1,455 | $ | 1,289 | $ | — | $ | — | ||||||||
| SFAS 158 adoption | (17 | ) | — | — | — | |||||||||||
| Actual return on plan assets | (412 | ) | 163 | — | — | |||||||||||
| Transfers | (2 | ) | (1 | ) | — | — | ||||||||||
| Employer contributions | 90 | 61 | 18 | 22 | ||||||||||||
| Adjustment for Medicare subsidy | — | — | 1 | 1 | ||||||||||||
| Benefit payments | (69 | ) | (57 | ) | (19 | ) | (23 | ) | ||||||||
| Fair value of plan assets at end of year | $ | 1,045 | $ | 1,455 | $ | — | $ | — | ||||||||
Amounts Included in AOCL
| Pension | Postretirement | |||||||||||||||
| 2008 | 2007 | 2008 | 2007 | |||||||||||||
| Prior service cost | $ | 38 | $ | 48 | $ | 3 | $ | 3 | ||||||||
| Net loss | 879 | 308 | 49 | 90 | ||||||||||||
| Total | $ | 917 | $ | 356 | $ | 52 | $ | 93 | ||||||||
Estimated Gross Amounts in AOCL to be Amortized in 2009
| Pension | Postretirement | |||||||
| Prior service cost | $ | 6 | $ | — | ||||
| Net loss | $ | 35 | $ | 1 | ||||
The accumulated benefit obligations for all U.S. pension plans were $1,636 million and $1,458 million at December 27, 2008 and December 29, 2007, respectively.
56
Table of Contents
Selected Information for Plans with Liabilities in Excess of Plan Assets
| Pension | Postretirement | |||||||||||||||
| 2008 | 2007(1) | 2008 | 2007(1) | |||||||||||||
| Projected benefit obligation | $ | 1,724 | $ | 777 | $ | 327 | $ | 353 | ||||||||
| Accumulated benefit obligation | $ | 1,636 | $ | 649 | $ | 327 | $ | 353 | ||||||||
Fair value of plan assets(1) | $ | 1,045 | $ | 598 | $ | — | $ | — | ||||||||
| (1) | 2007 balances were measured on September 30, 2007. Fair value of plan assets for 2007 includes fourth quarter employer contributions. |
Reconciliation of Funded Status
| Pension | Postretirement | |||||||||||||||
| 2008 | 2007 | 2008 | 2007 | |||||||||||||
| Funded status at measurement date | $ | (679 | ) | $ | (130 | ) | $ | (327 | ) | $ | (353 | ) | ||||
| Fourth quarter employer contributions/payments | N/A | 23 | N/A | 4 | ||||||||||||
| Funded status at end of year | $ | (679 | ) | $ | (107 | ) | $ | (327 | ) | $ | (349 | ) | ||||
Amounts Recognized | ||||||||||||||||
| Other assets | $ | — | $ | 69 | $ | — | $ | — | ||||||||
| Accounts payable and other current liabilities | (10 | ) | (5 | ) | (24 | ) | (26 | ) | ||||||||
Other liabilities | (669 | ) | (171 | ) | (303 | ) | (323 | ) | ||||||||
| Total net liabilities | (679 | ) | (107 | ) | (327 | ) | (349 | ) | ||||||||
| Accumulated other comprehensive loss | 917 | 356 | 52 | 93 | ||||||||||||
| Net amount recognized | $ | 238 | $ | 249 | $ | (275 | ) | $ | (256 | ) | ||||||
Weighted Average Assumptions
| Pension | Postretirement | |||||||||||||||||||||||
| 2008 | 2007 | 2006 | 2008 | 2007 | 2006 | |||||||||||||||||||
| Expense discount rate | 6.70 | % | 6.00 | % | 5.80 | % | 6.35 | % | 5.80 | % | 5.55 | % | ||||||||||||
| Liability discount rate | 6.20 | % | 6.35 | % | 6.00 | % | 6.50 | % | 6.20 | % | 5.80 | % | ||||||||||||
Expected rate of return on plan assets(1) | 8.50 | % | 8.50 | % | 8.50 | % | N/A | N/A | N/A | |||||||||||||||
| Expense rate of compensation increase | 3.56 | % | 3.55 | % | 3.53 | % | 3.56 | % | 3.55 | % | 3.53 | % | ||||||||||||
| Liability rate of compensation increase | 3.53 | % | 3.56 | % | 3.55 | % | 3.53 | % | 3.56 | % | 3.55 | % | ||||||||||||
| (1) | Expected rate of return on plan assets is presented after administration expenses. |
The expected rate of return on plan assets for a given fiscal year is based upon actual historical returns and the long-term outlook on asset classes in the pension plans’ investment portfolio.
Funding and Plan Assets
| Allocation Percentage | ||||||||||||
| Target | Actual | Actual | ||||||||||
| 2009 | 2008 | 2007 | ||||||||||
Asset Category | ||||||||||||
| Equity securities | 65 | % | 60 | % | 75 | % | ||||||
| Debt securities | 35 | % | 40 | % | 25 | % | ||||||
The table above shows the target allocation for 2009 and the actual allocation as of December 27, 2008 and December 29, 2007. Target allocations of PBG sponsored pension plans’ assets reflect the long-term nature of our pension liabilities. The target allocation for 2009 has been changed in the first quarter of 2009 from 75 percent equity and 25 percent fixed income to 65 percent equity and 35 percent fixed income. None of the current assets are invested directly in equity or debt instruments issued by Bottling LLC, PBG, PepsiCo or any bottling affiliates of PepsiCo, although it is possible that insignificant indirect investments exist through our broad market indices. PBG sponsored pension plans’ equity investments are currently diversified across all areas of the equity market (i.e., large, mid and small capitalization stocks as well as international equities). PBG sponsored pension plans’ fixed income investments are also currently diversified and consist of both corporate and U.S. government bonds. The pension plans currently do not invest directly in any derivative investments. The pension plans’ assets are held in a pension trust account at PBG’s trustee’s bank.
57
Table of Contents
PBG’s pension investment policy and strategy are mandated by PBG’s Pension Investment Committee (“PIC”) and are overseen by the PBG Board of Directors’ Compensation and Management Development Committee. The plan assets are invested using a combination of enhanced and passive indexing strategies. The performance of the plan assets is benchmarked against market indices and reviewed by the PIC. Changes in investment strategies, asset allocations and specific investments are approved by the PIC prior to execution.
Health Care Cost Trend Rates
We have assumed an average increase of 8.75 percent in 2009 in the cost of postretirement medical benefits for employees who retired before cost sharing was introduced. This average increase is then projected to decline gradually to five percent in 2015 and thereafter.
Assumed health care cost trend rates have an impact on the amounts reported for postretirement medical plans. A one-percentage point change in assumed health care costs would have the following impact:
| 1% Increase | 1% Decrease | |||||||
| Effect on total fiscal year 2008 service and interest cost components | $ | — | $ | — | ||||
| Effect on total fiscal year 2008 postretirement benefit obligation | $ | 6 | $ | (5 | ) | |||
Pension and Postretirement Cash Flow
We do not fund PBG sponsored pension plan and postretirement medical plans when contributions would not be tax deductible or when benefits would be taxable to the employee before receipt. Of the total pension liabilities at December 27, 2008, $72 million relates to pension plans not funded due to these unfavorable tax consequences.
| Pension | Postretirement | |||||||
Employer Contributions | ||||||||
| 2007 | $ | 74 | $ | 21 | ||||
| 2008 | $ | 90 | $ | 18 | ||||
| 2009 (expected) | $ | 160 | $ | 25 | ||||
Expected Benefits
The expected benefit payments to be made from PBG sponsored pension and postretirement medical plans (with and without the prescription drug subsidy provided by the Medicare Prescription Drug, Improvement and Modernization Act of 2003) to our participants over the next ten years are as follows:
| Postretirement | ||||||||||||
| Including Medicare | Excluding Medicare | |||||||||||
| Pension | Subsidy | Subsidy | ||||||||||
Expected Benefit Payments | ||||||||||||
| 2009 | $ | 80 | $ | 25 | $ | 26 | ||||||
| 2010 | $ | 73 | $ | 25 | $ | 26 | ||||||
| 2011 | $ | 80 | $ | 26 | $ | 27 | ||||||
| 2012 | $ | 88 | $ | 27 | $ | 28 | ||||||
| 2013 | $ | 96 | $ | 27 | $ | 28 | ||||||
| 2014 to 2018 | $ | 627 | $ | 141 | $ | 146 | ||||||
58
Table of Contents
Note 12—Income Taxes
The details of our income tax provision are set forth below:
| 2008 | 2007 | 2006 | ||||||||||
| Current: | ||||||||||||
| Federal | $ | 7 | $ | 6 | $ | 6 | ||||||
| Foreign | 43 | 24 | 36 | |||||||||
| State | (2 | ) | 5 | 2 | ||||||||
| 48 | 35 | 44 | ||||||||||
| Deferred: | ||||||||||||
| Federal | 12 | (17 | ) | (5 | ) | |||||||
| Foreign | (96 | ) | 6 | (36 | ) | |||||||
| State | (3 | ) | 3 | — | ||||||||
| (87 | ) | (8 | ) | (41 | ) | |||||||
| $ | (39 | ) | $ | 27 | $ | 3 | ||||||
In 2008, our tax provision includes the following significant items:
| • | Tax impact from impairment charge — During 2008, we recorded a deferred tax benefit of $115 million associated with the impairment charges primarily related to our business in Mexico. |
In 2007, our tax provision included higher taxes on higher international earnings as well as the following significant items:
| • | Valuation allowances — During 2007, we reversed valuation allowances resulting in an $11 million tax benefit. These reversals were due to improved profitability trends in Russia. | ||
| • | Tax rate changes — During 2007, changes to the income tax laws in Canada and Mexico were enacted. These law changes required us to re-measure our net deferred tax liabilities which resulted in a net decrease to our income tax expense of approximately $13 million. |
In 2006, our tax provision included increased taxes on non-U.S. earnings and the following significant items:
| • | Valuation allowances — During 2006, we reversed valuation allowances resulting in a $34 million tax benefit. These reversals were due to improved profitability trends and certain restructurings in Spain, Russia and Turkey. | ||
| • | Tax rate changes — During 2006, changes to the income tax laws in Canada, Turkey and certain jurisdictions within the U.S. were enacted. These law changes enabled us to re-measure our net deferred tax liabilities using lower tax rates which decreased our income tax expense by approximately $12 million. |
Our U.S. and foreign income before income taxes is set forth below:
| 2008 | 2007 | 2006 | ||||||||||
| U.S. | $ | 651 | $ | 787 | $ | 731 | ||||||
| Foreign | (154 | ) | 234 | 196 | ||||||||
| $ | 497 | $ | 1,021 | $ | 927 | |||||||
59
Table of Contents
Below is the reconciliation of our income tax rate from the U.S. federal statutory rate to our effective tax rate:
| 2008 | 2007 | 2006 | ||||||||||
| Income taxes computed at the U.S. federal statutory rate | 35.0 | % | 35.0 | % | 35.0 | % | ||||||
| Income taxable to owners | (46.3 | ) | (26.6 | ) | (31.4 | ) | ||||||
| State income tax, net of federal tax benefit | (0.8 | ) | 0.7 | 3.1 | ||||||||
| Impact of foreign results | (10.1 | ) | (2.8 | ) | (1.3 | ) | ||||||
| Change in valuation allowances, net | 0.5 | (2.4 | ) | (5.5 | ) | |||||||
| Nondeductible expenses | 6.6 | 1.9 | 1.4 | |||||||||
| Other, net | 1.2 | (1.8 | ) | 0.4 | ||||||||
| Impairment charges | 5.8 | — | — | |||||||||
| Tax rate change charge (benefit) | 0.4 | (1.3 | ) | (1.4 | ) | |||||||
| Total effective income tax rate | (7.7 | )% | 2.7 | % | 0.3 | % | ||||||
The 2008 percentages above are impacted by the pre-tax impact of impairment and restructuring charges.
The details of our 2008 and 2007 deferred tax liabilities (assets) are set forth below:
| 2008 | 2007 | |||||||
| Intangible assets and property, plant and equipment | $ | 288 | $ | 438 | ||||
| Investment | 305 | 178 | ||||||
| Other | 12 | 15 | ||||||
| Gross deferred tax liabilities | 605 | 631 | ||||||
| Net operating loss carryforwards | (433 | ) | (354 | ) | ||||
| Employee benefit obligations | (41 | ) | (30 | ) | ||||
| Various liabilities and other | (114 | ) | (100 | ) | ||||
| Gross deferred tax assets | (588 | ) | (484 | ) | ||||
| Deferred tax asset valuation allowance | 214 | 240 | ||||||
| Net deferred tax assets | (374 | ) | (244 | ) | ||||
| Net deferred tax liability | $ | 231 | $ | 387 | ||||
Classification within the Consolidated Balance Sheets | ||||||||
| Prepaid expenses and other current assets | $ | (51 | ) | $ | (86 | ) | ||
| Accounts payable and other current liabilities | 3 | 2 | ||||||
| Deferred income taxes | 279 | 471 | ||||||
| $ | 231 | $ | 387 | |||||
We have net operating loss carryforwards (“NOLs”) totaling $1,548 million at December 27, 2008, which resulted in deferred tax assets of $433 million and which may be available to reduce future taxes in the U.S., Spain, Greece, Turkey, Russia and Mexico. Of these NOLs, $11 million expire in 2009; $525 million expire at various times between 2010 and 2028; and $1,012 million have an indefinite life. At December 27, 2008, we have tax credit carryforwards in Mexico of $34 million, which expire at various times between 2009 and 2017.
We establish valuation allowances on our deferred tax assets, including NOLs and tax credits, when the amount of expected future taxable income is not likely to support the use of the deduction or credit. Our valuation allowances, which reduce deferred tax assets to an amount that will more likely than not be realized, were $214 million at December 27, 2008. Our valuation allowance decreased $26 million in 2008 and increased $51 million in 2007.
Deferred taxes have not been recognized on the excess of the amount for financial reporting purposes over the tax basis of investments in foreign subsidiaries that are expected to be permanent in duration. This amount becomes taxable upon a repatriation of assets from the subsidiary or a sale or liquidation of the subsidiary. The amount of such temporary difference totaled approximately $1,048 million at December 27, 2008 and $1,113 million at December 29, 2007, respectively. Determination of the amount of unrecognized deferred income taxes related to this temporary difference is not practicable.
Income taxes receivable from taxing authorities were $12 million and $17 million at December 27, 2008 and December 29, 2007, respectively. Such amounts are recorded within prepaid expenses and other current assets in our Consolidated Balance Sheets. Income taxes payable to taxing authorities were $13 million and $19 million at December 27, 2008 and December 29, 2007, respectively. Such amounts are recorded within accounts payable and other current liabilities in our Consolidated Balance Sheets.
60
Table of Contents
Income taxes receivable from PepsiCo were $1 million and $7 million at December 27, 2008 and December 29, 2007, respectively. Such amounts are recorded within accounts receivable in our Consolidated Balance Sheets. Amounts paid to taxing authorities and PepsiCo for income taxes were $30 million, $29 million and $19 million in 2008, 2007 and 2006, respectively.
We file annual income tax returns in the U.S. federal jurisdiction, various U.S. state and local jurisdictions, and in various foreign jurisdictions. Our tax filings are subject to review by various tax authorities who may disagree with our positions.
A number of years may elapse before an uncertain tax position, for which we have established tax reserves, is audited and finally resolved. While it is often difficult to predict the final outcome or the timing of the resolution of an audit, we believe that our reserves for uncertain tax benefits reflect the outcome of tax positions that is more likely than not to occur. We adjust these reserves, as well as the related interest and penalties, in light of changing facts and circumstances. The resolution of a matter could be recognized as an adjustment to our provision for income taxes and our deferred taxes in the period of resolution, and may also require a use of cash.
Our major taxing jurisdictions include Mexico, Canada and Russia. The following table summarizes the years that remain subject to examination and the years currently under audit by major tax jurisdictions:
| Years subject to | ||||||||
| Jurisdiction | examination | Years under audit | ||||||
| Mexico | 2002-2007 | 2002-2003 | ||||||
| Canada | 2006-2007 | 2006 | ||||||
| Russia | 2005-2007 | 2005-2007 | ||||||
We currently have on-going income tax audits in our major tax jurisdictions, where issues such as deductibility of certain expenses have been raised. In Canada, income tax audits have been completed for all tax years through 2005. We are in agreement with the audit results except for one matter which we continue to dispute for our 1999 through 2005 tax years.
We believe that it is reasonably possible that our worldwide reserves for uncertain tax benefits could decrease in the range of $10 million to $50 million within the next twelve months as a result of the completion of the audits in various jurisdictions and the expiration of statute of limitations. The reductions in our tax reserves can result in a combination of additional tax payments, the adjustment of certain deferred taxes or the recognition of tax benefits in our income statement. In the event that we cannot reach settlement of some of these audits, our tax reserves may increase, although we cannot estimate such potential increases at this time.
61
Table of Contents
Below is a reconciliation of the beginning and ending amount of our reserves for income taxes, as well as the related amount of interest and penalties, which are recorded in our Consolidated Balance Sheets.
| 2008 | 2007 | |||||||
Reserves (excluding interest and penalties) | ||||||||
Balance at beginning of year | $ | 87 | $ | 82 | ||||
| Increases due to tax positions related to prior years | 3 | 4 | ||||||
| Increases due to tax positions related to the current year | 9 | 9 | ||||||
| Decreases due to tax positions related to prior years | (4 | ) | (5 | ) | ||||
| Decreases due to settlements with taxing authorities | — | (2 | ) | |||||
| Decreases due to lapse of statute of limitations | (5 | ) | (9 | ) | ||||
| Currency translation adjustment | (19 | ) | 8 | |||||
Balance at end of year | $ | 71 | $ | 87 | ||||
Classification of reserves within the Consolidated Balance Sheets | ||||||||
| Other liabilities | $ | 68 | $ | 84 | ||||
| Deferred income taxes | 3 | 3 | ||||||
Total amount of reserves recognized | $ | 71 | $ | 87 | ||||
Of the $71 million of 2008 income tax reserves above, approximately $70 million would impact our effective tax rate over time, if recognized.
| 2008 | 2007 | |||||||
Interest and penalties accrued | $ | 45 | $ | 38 | ||||
We recognized $14 million of expense and $0.3 million of expense, net of reversals, during the fiscal years 2008 and 2007, respectively, for interest and penalties related to income tax reserves in the income tax expense line of our Consolidated Statements of Operations.
Note 13—Segment Information
We operate in one industry, carbonated soft drinks and other ready-to-drink beverages, and all of our segments derive revenue from these products. Bottling LLC has three reportable segments - U.S. & Canada, Europe (which includes Spain, Russia, Greece and Turkey) and Mexico.
Operationally, the Company is organized along geographic lines with specific regional management teams having responsibility for the financial results in each reportable segment. We evaluate the performance of these segments based on operating income or loss. Operating income or loss is exclusive of net interest expense, minority interest, foreign exchange gains and losses and income taxes.
| Net Revenues | ||||||||||||
| 2008 | 2007 | 2006 | ||||||||||
| U.S. & Canada | $ | 10,300 | $ | 10,336 | $ | 9,910 | ||||||
| Europe | 2,115 | 1,872 | 1,534 | |||||||||
| Mexico | 1,381 | 1,383 | 1,286 | |||||||||
| Worldwide net revenues | $ | 13,796 | $ | 13,591 | $ | 12,730 | ||||||
Net revenues in the U.S. were $9,097 million, $9,202 million and $8,901 million in 2008, 2007 and 2006, respectively. In 2008, 2007 and 2006, the Company did not have one individual customer that represented 10 percent of total revenues, although sales to Wal-Mart Stores, Inc. and its affiliated companies were 9.9 percent of our revenues in 2008, primarily as a result of transactions in the U.S. & Canada segment.
62
Table of Contents
| Operating Income (Loss) | ||||||||||||
| 2008 | 2007 | 2006 | ||||||||||
| U.S. & Canada | $ | 864 | $ | 876 | $ | 849 | ||||||
| Europe | 101 | 106 | 57 | |||||||||
| Mexico | (338 | ) | 72 | 82 | ||||||||
| Worldwide operating income | 627 | 1,054 | 988 | |||||||||
| Interest expense | 244 | 232 | 227 | |||||||||
| Interest income | 162 | 222 | 174 | |||||||||
| Other non-operating expenses (income), net | 24 | (5 | ) | 10 | ||||||||
| Minority interest | 24 | 28 | (2 | ) | ||||||||
| Income before income taxes | $ | 497 | $ | 1,021 | $ | 927 | ||||||
| Total Assets | Long-Lived Assets(1) | |||||||||||||||||||||||
| 2008 | 2007 | 2006 | 2008 | 2007 | 2006 | |||||||||||||||||||
| U.S. & Canada | $ | 13,328 | $ | 13,334 | $ | 12,072 | $ | 11,098 | $ | 11,391 | $ | 10,267 | ||||||||||||
Europe(2) | 2,222 | 1,671 | 1,072 | 1,630 | 1,014 | 554 | ||||||||||||||||||
| Mexico | 945 | 1,707 | 1,811 | 745 | 1,443 | 1,474 | ||||||||||||||||||
| Worldwide total | $ | 16,495 | $ | 16,712 | $ | 14,955 | $ | 13,473 | $ | 13,848 | $ | 12,295 | ||||||||||||
| (1) | Long-lived assets represent property, plant and equipment, other intangible assets, net, goodwill, investments in noncontrolled affiliates, notes receivable from PBG and other assets. | |
| (2) | Long-lived assets include an equity method investment in Lebedyansky with a net book value of $617 million as of December 27, 2008. |
Long-lived assets in the U.S. were $10,100 million, $10,138 million and $9,224 million in 2008, 2007 and 2006, respectively. Long-lived assets in Russia were $1,290 million, $626 million and $213 million in 2008, 2007 and 2006, respectively.
| Capital Expenditures | Depreciation and Amortization | |||||||||||||||||||||||
| 2008 | 2007 | 2006 | 2008 | 2007 | 2006 | |||||||||||||||||||
| U.S. & Canada | $ | 523 | $ | 626 | $ | 554 | $ | 498 | $ | 509 | $ | 513 | ||||||||||||
| Europe | 147 | 146 | 99 | 86 | 72 | 52 | ||||||||||||||||||
| Mexico | 85 | 82 | 68 | 88 | 87 | 83 | ||||||||||||||||||
| Worldwide total | $ | 755 | $ | 854 | $ | 721 | $ | 672 | $ | 668 | $ | 648 | ||||||||||||
Note 14—Related Party Transactions
PepsiCo is a related party due to the nature of our franchise relationship and its ownership interest in our Company. PBG has entered into a number of agreements with PepsiCo. Although we are not a direct party to these contracts, as the principal operating subsidiary of PBG, we derive direct benefit from them. The most significant agreements that govern our relationship with PepsiCo consist of:
| (1) | Master Bottling Agreement for cola beverages bearing the Pepsi-Cola and Pepsi trademarks in the U.S.; bottling agreements and distribution agreements for non-cola beverages; and a master fountain syrup agreement in the U.S.; | ||
| (2) | Agreements similar to the Master Bottling Agreement and the non-cola agreement for each country in which we operate, as well as a fountain syrup agreement for Canada; | ||
| (3) | A shared services agreement where we obtain various services from PepsiCo and provide services to PepsiCo; | ||
| (4) | Russia Venture Agreement related to the formation of PR Beverages; | ||
| (5) | Russia Snack Food Distribution Agreement pursuant to which our PR Beverages venture purchases snack food products from Frito-Lay, Inc. (“Frito”) a subsidiary of PepsiCo, for sale and distribution in the Russian Federation; and | ||
| (6) | Transition agreements that provide certain indemnities to the parties, and provide for the allocation of tax and other assets, liabilities and obligations arising from periods prior to the initial public offering. |
63
Table of Contents
The Master Bottling Agreement provides that we will purchase our entire requirements of concentrates for the cola beverages from PepsiCo at prices and on terms and conditions determined from time to time by PepsiCo. Additionally, we review our annual marketing, advertising, management and financial plans each year with PepsiCo for its approval. If we fail to submit these plans, or if we fail to carry them out in all material respects, PepsiCo can terminate our beverage agreements. If our beverage agreements with PepsiCo are terminated for this or for any other reason, it would have a material adverse effect on our business and financial results.
On March 1, 2007, together with PepsiCo, we formed PR Beverages, a venture that enables us to strategically invest in Russia to accelerate our growth. Bottling LLC contributed its business in Russia to PR Beverages, and PepsiCo entered into bottling agreements with PR Beverages for PepsiCo beverage products sold in Russia on the same terms as in effect for Bottling LLC immediately prior to the venture. PR Beverages has an exclusive license to manufacture and sell PepsiCo concentrate for such products. PR Beverages has contracted with a PepsiCo subsidiary to manufacture such concentrate.
The following income (expense) amounts are considered related party transactions as a result of our relationship with PepsiCo and its affiliates:
| 2008 | 2007 | 2006 | ||||||||||
| Net revenues: | ||||||||||||
Bottler incentives and other arrangements(a) | $ | 93 | $ | 66 | $ | 67 | ||||||
| Cost of sales: | ||||||||||||
Purchases of concentrate and finished products, and royalty fees(b) | $ | (3,451 | ) | $ | (3,406 | ) | $ | (3,227 | ) | |||
Bottler incentives and other arrangements(a) | 542 | 582 | 570 | |||||||||
| Total cost of sales | $ | (2,909 | ) | $ | (2,824 | ) | $ | (2,657 | ) | |||
| Selling, delivery and administrative expenses: | ||||||||||||
Bottler incentives and other arrangements(a) | $ | 56 | $ | 66 | $ | 69 | ||||||
Fountain service fee(c) | 187 | 188 | 178 | |||||||||
Frito-Lay purchases(d) | (355 | ) | (270 | ) | (198 | ) | ||||||
Shared services:(e) | ||||||||||||
| Shared services expense | (52 | ) | (57 | ) | (61 | ) | ||||||
| Shared services revenue | 7 | 8 | 8 | |||||||||
| Net shared services | (45 | ) | (49 | ) | (53 | ) | ||||||
| Total selling, delivery and administrative expenses | $ | (157 | ) | $ | (65 | ) | $ | (4 | ) | |||
Income tax benefit:(f) | $ | 1 | $ | 7 | $ | 6 | ||||||
(a) Bottler Incentives and Other Arrangements —In order to promote PepsiCo beverages, PepsiCo, at its discretion, provides us with various forms of bottler incentives. These incentives cover a variety of initiatives, including direct marketplace support and advertising support. We record most of these incentives as an adjustment to cost of sales unless the incentive is for reimbursement of a specific, incremental and identifiable cost. Under these conditions, the incentive would be recorded as an offset against the related costs, either in net revenues or selling, delivery and administrative expenses. Changes in our bottler incentives and funding levels could materially affect our business and financial results.
(b) Purchases of Concentrate and Finished Product —As part of our franchise relationship, we purchase concentrate from PepsiCo, pay royalties and produce or distribute other products through various arrangements with PepsiCo or PepsiCo joint ventures. The prices we pay for concentrate, finished goods and royalties are generally determined by PepsiCo at its sole discretion. Concentrate prices are typically determined annually. Effective January 2009, PepsiCo increased the price of U.S. concentrate by four percent. Significant changes in the amount we pay PepsiCo for concentrate, finished goods and royalties could materially affect our business and financial results. These amounts are reflected in cost of sales in our Consolidated Statements of Operations.
(c) Fountain Service Fee —We manufacture and distribute fountain products and provide fountain equipment service to PepsiCo customers in some territories in accordance with the Pepsi beverage agreements. Fees received from PepsiCo for these transactions offset the cost to provide these services. The fees and costs for these services are recorded in selling, delivery and administrative expenses in our Consolidated Statements of Operations.
(d) Frito-Lay Purchases —We purchase snack food products from Frito for sale and distribution in Russia primarily to accommodate PepsiCo with the infrastructure of our distribution network. Frito would otherwise be required to source third-party distribution services to reach their customers in Russia. We make payments to PepsiCo for the cost of these snack products and retain a minimal net fee based on the gross sales price of the products. Payments for the purchase of snack products are reflected in selling, delivery and administrative expenses in our Consolidated Statements of Operations.
64
Table of Contents
(e) Shared Services —We provide to and receive various services from PepsiCo and PepsiCo affiliates pursuant to a shared services agreement and other arrangements. In the absence of these agreements, we would have to obtain such services on our own. We might not be able to obtain these services on terms, including cost, which are as favorable as those we receive from PepsiCo. Total expenses incurred and income generated is reflected in selling, delivery and administrative expenses in our Consolidated Statements of Operations.
(f) Income Tax Benefit- Includes settlements under the tax separation agreement with PepsiCo.
Other Related Party Transactions
There are certain manufacturing cooperatives whose assets, liabilities and results of operations are consolidated in our financial statements. Concentrate purchases from PepsiCo by these cooperatives, not included in the table above, for the years ended 2008, 2007 and 2006 were $140 million, $143 million and $72 million, respectively. We also have equity investments in certain other manufacturing cooperatives. Total purchases of finished goods from these cooperatives, not included in the table above, for the years ended 2008, 2007 and 2006 were $61 million, $66 million and $71 million, respectively. These manufacturing cooperatives purchase concentrate from PepsiCo for certain of its finished goods sold to the Company.
As of December 27, 2008 and December 29, 2007, the receivables from PepsiCo and its affiliates were $154 million and $188 million, respectively. Our receivables from PepsiCo are shown as part of accounts receivable in our Consolidated Financial Statements. As of December 27, 2008 and December 29, 2007, the payables to PepsiCo and its affiliates were $217 million and $255 million, respectively. Our payables to PepsiCo are shown as part of accounts payable and other current liabilities in our Consolidated Financial Statements.
As a result of the formation of PR Beverages, PepsiCo has agreed to contribute $83 million plus accrued interest to the venture in the form of property, plant and equipment. PepsiCo has contributed $49 million in regards to this note. The remaining balance to be contributed to the venture is $39 million as of December 27, 2008.
PBG is a related party, as we are the principal operating subsidiary of PBG and we make up substantially all of the operations and assets of PBG. At December 27, 2008, PBG owned approximately 93.4 percent of our equity.
We guarantee that we will distribute pro rata to PBG and PepsiCo sufficient cash such that the aggregate cash distributed to PBG will enable PBG to repay amounts borrowed from us to fund their cash needs. During 2008 and 2007, we made cash distributions to PBG and PepsiCo totaling $1,102 million and $271 million, respectively.
Throughout 2008 we loaned $839 million to PBG, net of repayments, through a series of 1-year notes with interest rates ranging from 2.5 percent to 4.5 percent. In addition, at the end of the year PBG repaid $1,027 million of intercompany loans owed to us. The resulting net decrease in the notes receivable from PBG in 2008 was $188 million. During 2007, we loaned PBG $733 million, net of repayments. Total intercompany loans owed to us from PBG at December 27, 2008 and December 29, 2007, were $3,692 million and $3,880 million, respectively. The loan proceeds were used by PBG to pay for interest, taxes, dividends, share repurchases and acquisitions. Accrued interest receivable from PBG on these notes totaled $118 million and $12 million at December 27, 2008 and December 29, 2007, respectively, and is included in prepaid expenses and other current assets in our Consolidated Balance Sheets.
Total interest income recognized in our Consolidated Statements of Operations relating to outstanding loans with PBG was $140 million, $199 million and $149 million, in 2008, 2007 and 2006, respectively.
Beginning in 2002, PBG provides insurance and risk management services to us pursuant to a contractual agreement. Total premiums paid to PBG during each of the years 2008 and 2007 were $113 million.
PBG has a committed credit facility of $1.1 billion and an uncommitted credit facility of $500 million. Both of these credit facilities are guaranteed by the Company and will be used to support PBG’s commercial paper program and our working capital requirements. PBG had $0 and $50 million of outstanding commercial paper at December 27, 2008 and December 29, 2007, respectively.
In March 1999, PBG issued $1 billion of 7 percent senior notes due 2029, which are guaranteed by us.
One of our managing directors is an officer of PepsiCo and the other managing directors and officers are employees of PBG.
65
Table of Contents
Note 15—Restructuring Charges
On November 18, 2008, we announced a restructuring program to enhance the Company’s operating capabilities in each of our reporting segments with the objective to strengthen customer service and selling effectiveness; simplify decision making and streamline the organization; drive greater cost productivity to adapt to current macroeconomic challenges; and rationalize the Company’s supply chain infrastructure. As part of the restructuring program, approximately 3,150 positions will be eliminated across all reporting segments, four facilities will be closed in the U.S., three plants and about 30 distribution centers will be closed in Mexico and about 700 routes will be eliminated in Mexico. In addition, PBG will modify its U. S. defined benefit pension plans, which will generate long-term savings and significantly reduce future financial obligations.
The Company expects to record pre-tax charges of $140 million to $170 million over the course of the restructuring program which is primarily for severance and related benefits, pension and other employee-related costs and other charges, including employee relocation and asset disposal costs. During 2008, we eliminated approximately 1,050 positions across all reporting segments and closed three facilities in the U.S., two plants in Mexico and eliminated 126 routes in Mexico. As of December 27, 2008, the Company incurred a pre-tax charge of approximately $83 million, which was recorded in selling, delivery and administrative expenses. The remaining costs are expected to be incurred in fiscal year 2009.
The Company expects about $130 million in pre-tax cash expenditures from these restructuring actions, of which $13 million was recognized in the fourth quarter of 2008, with the balance expected to occur in 2009 and 2010. This includes $2 million of employee benefit payments pursuant to existing unfunded termination indemnity plans. These benefit payments have been accrued for in previous periods, and therefore, are not included in our estimated cost for this program and are not included in the tables below. The following table summarizes the pre-tax costs associated with the restructuring program by reportable segment for the year ended December 27, 2008:
| U.S. & | ||||||||||||||||
| Worldwide | Canada | Mexico | Europe | |||||||||||||
| Costs incurred through December 27, 2008 | $ | 83 | $ | 53 | $ | 3 | $ | 27 | ||||||||
| Costs expected to be incurred through December 26, 2009 | 57-87 | 36-47 | 20-35 | 1-5 | ||||||||||||
| Total costs expected to be incurred | $ | 140-$170 | $ | 89-$100 | $ | 23-$38 | $ | 28-$32 | ||||||||
The following table summarizes the nature of and activity related to pre-tax costs and cash payments associated with the restructuring program for the year ended December 27, 2008:
| Asset | ||||||||||||||||
| Pension & | Disposal, | |||||||||||||||
| Severance | Other | Employee | ||||||||||||||
| & Related | Related | Relocation | ||||||||||||||
| Total | Benefits | Costs | & Other | |||||||||||||
| Costs accrued | $ | 83 | $ | 47 | $ | 29 | $ | 7 | ||||||||
| Cash payments | (11 | ) | (10 | ) | — | (1 | ) | |||||||||
| Non-cash settlements | (30 | ) | (1 | ) | (23 | ) | (6 | ) | ||||||||
| Remaining costs accrued at December 27, 2008 | $ | 42 | $ | 36 | $ | 6 | $ | — | ||||||||
Note 16—Accumulated Other Comprehensive Loss
The year-end balances related to each component of AOCL were as follows:
| 2008 | 2007 | 2006 | ||||||||||
| Net currency translation adjustment | $ | (351 | ) | $ | 242 | $ | 7 | |||||
Cash flow hedge adjustment(1) | (45 | ) | 19 | 17 | ||||||||
| Minimum pension liability adjustment | — | — | (335 | ) | ||||||||
Adoption of SFAS 158(2) | — | — | (278 | ) | ||||||||
Pension and postretirement medical benefit plans adjustment(3) | (977 | ) | (450 | ) | — | |||||||
| Accumulated other comprehensive loss | $ | (1,373 | ) | $ | (189 | ) | $ | (589 | ) | |||
| (1) | Net of taxes of $(2) million in 2008, $1 million in 2007 and $(1) million in 2006. | |
| (2) | Net of taxes of $4 million in 2006. | |
| (3) | Net of taxes of $4 million in 2008 and $1 million in 2007. |
66
Table of Contents
Note 17—Supplemental Cash Flow Information
The table below presents the Company’s supplemental cash flow information:
| 2008 | 2007 | 2006 | ||||||||||
Non-cash investing and financing activities: | ||||||||||||
| (Decrease) increase in accounts payable related to capital expenditures | $ | (67) | $ | 15 | $ | 7 | ||||||
| Acquisition of intangible asset | $ | — | $ | 315 | $ | — | ||||||
| Contribution of acquired entity by PBG | $ | 26 | $ | — | $ | — | ||||||
| Liabilities assumed in conjunction with acquisition of bottlers | $ | 17 | $ | 1 | $ | 20 | ||||||
| Capital-in-kind contributions | $ | 34 | $ | 15 | $ | — | ||||||
| Share compensation | $ | 4 | $ | — | $ | — | ||||||
Note 18—Contingencies
We are subject to various claims and contingencies related to lawsuits, environmental and other matters arising out of the normal course of business. We believe that the ultimate liability arising from such claims or contingencies, if any, in excess of amounts already recognized is not likely to have a material adverse effect on our results of operations, financial position or liquidity.
Note 19—Selected Quarterly Financial Data (unaudited)
Quarter to quarter comparisons of our financial results are impacted by our fiscal year cycle and the seasonality of our business. The seasonality of our operating results arises from higher sales in the second and third quarters versus the first and fourth quarters of the year, combined with the impact of fixed costs, such as depreciation and interest, which are not significantly impacted by business seasonality.
| First | Second | Third | Fourth | |||||||||||||||||
| Quarter | Quarter | Quarter | Quarter | Full Year | ||||||||||||||||
2008(1) | ||||||||||||||||||||
| Net revenues | $ | 2,651 | $ | 3,522 | $ | 3,814 | $ | 3,809 | $ | 13,796 | ||||||||||
| Gross profit | $ | 1,169 | $ | 1,606 | $ | 1,737 | $ | 1,698 | $ | 6,210 | ||||||||||
| Operating income (loss) | $ | 106 | $ | 343 | $ | 453 | $ | (275 | ) | $ | 627 | |||||||||
| Net income (loss) | $ | 98 | $ | 297 | $ | 384 | $ | (243 | ) | $ | 536 | |||||||||
| First | Second | Third | Fourth | |||||||||||||||||
| Quarter | Quarter | Quarter | Quarter | Full Year | ||||||||||||||||
2007(1) | ||||||||||||||||||||
| Net revenues | $ | 2,466 | $ | 3,360 | $ | 3,729 | $ | 4,036 | $ | 13,591 | ||||||||||
| Gross profit | $ | 1,123 | $ | 1,535 | $ | 1,726 | $ | 1,837 | $ | 6,221 | ||||||||||
| Operating income | $ | 119 | $ | 320 | $ | 430 | $ | 185 | $ | 1,054 | ||||||||||
| Net income | $ | 102 | $ | 301 | $ | 401 | $ | 190 | $ | 994 | ||||||||||
| (1) | For additional unaudited information see “Items affecting comparability of our financial results” in Management’s Financial Review in Item 7. |
Note 20—Subsequent Event
On January 14, 2009, the Company issued an additional $750 million in senior notes, with a coupon rate of 5.125 percent, maturing in 2019. The net proceeds of the offering, together with a portion of the proceeds from the offering of our senior notes issued in the fourth quarter of 2008, were used to repay our senior notes due in 2009, at their scheduled maturity on February 17, 2009. Any excess proceeds of this offering will be used for general corporate purposes. The next significant scheduled debt maturity is not until 2012.
67
Table of Contents
REPORT OF INDEPENDENT REGISTERED PUBLIC ACCOUNTING FIRM
The Owners of
Bottling Group, LLC
Somers, New York
Bottling Group, LLC
Somers, New York
We have audited the accompanying consolidated balance sheets of Bottling Group, LLC and subsidiaries (the “Company”) as of December 27, 2008 and December 29, 2007, and the related consolidated statements of operations, changes in owners’ equity, and cash flows for each of the three years in the period ended December 27, 2008. Our audits also included the financial statement schedule listed in the Index at Item 15. These financial statements and financial statement schedule are the responsibility of the Company’s management. Our responsibility is to express an opinion on the financial statements and financial statement schedule based on our audits.
We conducted our audits in accordance with the standards of the Public Company Accounting Oversight Board (United States). Those standards require that we plan and perform the audit to obtain reasonable assurance about whether the financial statements are free of material misstatement. The Company is not required to have, nor were we engaged to perform, an audit of its internal control over financial reporting. Our audits included consideration of internal control over financial reporting as a basis for designing audit procedures that are appropriate in the circumstances, but not for the purpose of expressing an opinion on the effectiveness of the Company’s internal control over financial reporting. Accordingly, we express no such opinion. An audit also includes examining, on a test basis, evidence supporting the amounts and disclosures in the financial statements, assessing the accounting principles used and significant estimates made by management, as well as evaluating the overall financial statement presentation. We believe that our audits provide a reasonable basis for our opinion.
In our opinion, such consolidated financial statements present fairly, in all material respects, the financial position of the Company as of December 27, 2008 and December 29, 2007, and the results of their operations and their cash flows for each of the three years in the period ended December 27, 2008, in conformity with accounting principles generally accepted in the United States of America. Also, in our opinion, such financial statement schedule, when considered in relation to the basic consolidated financial statements taken as a whole, presents fairly in all material respects the information set forth therein.
As discussed in Note 2 to the consolidated financial statements, effective December 30, 2007 and December 30, 2006, the Company adopted Statement of Financial Accounting Standards No. 158, “Employers’ Accounting for Defined Benefit Pension and Other Postretirement Plans — an amendment of FASB Statements No. 87, 88, 106, and 132(R),” related to the measurement date provision and the requirement to recognize the funded status of a benefit plan, respectively.
As discussed in Note 2 to the consolidated financial statements, effective December 31, 2006, the Company adopted Financial Accounting Standards Board Interpretation No. 48, “Accounting for Uncertainty in Income Taxes—an interpretation of FASB Statement No. 109.”
/s/ Deloitte & Touche LLP
New York, New York
February 20, 2009
New York, New York
February 20, 2009
68
Table of Contents
ITEM 7A. QUANTITATIVE AND QUALITATIVE DISCLOSURES ABOUT MARKET RISK
Included in Item 7, Management’s Financial Review — Market Risks and Cautionary Statements.
ITEM 8. FINANCIAL STATEMENTS AND SUPPLEMENTARY DATA
Included in Item 7, Management’s Financial Review — Financial Statements.
PBG’s Annual Report on Form 10-K for the fiscal year ended December 27, 2008 is attached hereto as Exhibit 99.1 as required by the SEC as a result of our guarantee of up to $1,000,000,000 aggregate principal amount of PBG’s 7% Senior Notes due in 2029.
PepsiCo’s consolidated financial statements and notes thereto included in PepsiCo’s Annual Report on Form 10-K for the fiscal year ended December 27, 2008 filed with the Securities and Exchange Commission (“SEC”) on February 19, 2009, and any amendments to such financial information filed with the SEC, are incorporated herein by reference as required by the SEC as a result of PepsiCo’s guarantee of up to $1,300,000,000 aggregate principal amount of our 6.95% Senior Notes due 2014. Such financial information of PepsiCo was prepared by management of PepsiCo and was subject to PepsiCo’s internal control over financial reporting. We did not have any responsibility for the preparation of, and have not independently reviewed this financial information of PepsiCo and it was not subject to our financial controls or procedures. This financial information should be viewed accordingly.
ITEM 9. CHANGES IN AND DISAGREEMENTS WITH ACCOUNTANTS ON ACCOUNTING AND FINANCIAL DISCLOSURE
None.
ITEM 9A(T). CONTROLS AND PROCEDURES
Evaluation of Disclosure Controls and Procedures
Bottling LLC’s management carried out an evaluation, as required by Rule 13a-15(b) of the Securities Exchange Act of 1934 (the “Exchange Act”), with the participation of our Principal Executive Officer and our Principal Financial Officer, of the effectiveness of our disclosure controls and procedures, as of the end of our last fiscal quarter. Based upon this evaluation, the Principal Executive Officer and the Principal Financial Officer concluded that our disclosure controls and procedures were effective, as of the end of the period covered by this Annual Report on Form 10-K, such that the information relating to Bottling LLC and its consolidated subsidiaries required to be disclosed in our Exchange Act reports filed with the SEC (i) is recorded, processed, summarized and reported within the time periods specified in SEC rules and forms, and (ii) is accumulated and communicated to Bottling LLC’s management, including our Principal Executive Officer and Principal Financial Officer, as appropriate to allow timely decisions regarding required disclosure.
Management’s Annual Report on Internal Control Over Financial Reporting
Bottling LLC’s management is responsible for establishing and maintaining adequate internal control over financial reporting for Bottling LLC. Internal control over financial reporting is a process designed to provide reasonable assurance regarding the reliability of financial reporting and the preparation of financial statements in accordance with generally accepted accounting principles and includes those policies and procedures that (1) pertain to the maintenance of records that, in reasonable detail, accurately and fairly reflect the transactions and dispositions of Bottling LLC’s assets, (2) provide reasonable assurance that transactions are recorded as necessary to permit preparation of financial statements in accordance with generally accepted accounting principles, and that Bottling LLC’s receipts and expenditures are being made only in accordance with authorizations of Bottling LLC’s management and Managing Directors, and (3) provide reasonable assurance regarding prevention or timely detection of unauthorized acquisition, use, or disposition of Bottling LLC’s assets that could have a material effect on the financial statements.
As required by Section 404 of the Sarbanes-Oxley Act of 2002 and the related rule of the SEC, management assessed the effectiveness of Bottling LLC’s internal control over financial reporting using the Internal Control-Integrated Framework developed by the Committee of Sponsoring Organizations of the Treadway Commission.
69
Table of Contents
Based on this assessment, management concluded that Bottling LLC’s internal control over financial reporting was effective as of December 27, 2008. Management has not identified any material weaknesses in Bottling LLC’s internal control over financial reporting as of December 27, 2008.
This Annual Report on Form 10-K does not include an attestation report of Bottling LLC’s independent registered public accounting firm regarding internal control over financial reporting. Management’s report was not subject to attestation by Bottling LLC’s independent registered public accounting firm pursuant to temporary rules of the SEC that permit Bottling LLC to provide only management’s report in this Annual Report on Form 10-K.
Changes in Internal Control Over Financial Reporting
In addition, Bottling LLC’s management also carried out an evaluation, as required by Rule 13a-15(d) of the Exchange Act, with the participation of our Principal Executive Officer and our Principal Financial Officer, of changes in Bottling LLC’s internal control over financial reporting. Based on this evaluation, the Principal Executive Officer and the Principal Financial Officer concluded that there were no changes in our internal control over financial reporting that occurred during our last fiscal quarter that have materially affected, or are reasonably likely to materially affect, our internal control over financial reporting.
ITEM 9B. OTHER INFORMATION
None.
70
Table of Contents
PART III
ITEM 10. DIRECTORS, EXECUTIVE OFFICERS AND CORPORATE GOVERNANCE
The name, age and background of each of Bottling LLC’s Managing Directors is set forth below. Managing Directors are elected by a majority of members of Bottling LLC and their terms of office continue until their successors are appointed and qualified or until their earlier resignation or removal, death or disability. There are no family relationships among our Managing Directors.
Thomas M. Lardieri, 48, was appointed Managing Director of Bottling LLC in June 2007. He has also served as PBG’s Vice President and Controller since June 2007. Previously, Mr. Lardieri, a 19-year Pepsi veteran, had served as Vice President, Risk Management and General Auditor of PepsiCo since June 2001. Mr. Lardieri joined PepsiCo’s international beverage division in 1988 where he held a variety of accounting positions.
Marie T. Gallagher, 49, was appointed Managing Director of Bottling LLC in December 2007. She has also served as Vice President and Assistant Controller of PepsiCo since 2005. Prior to joining PepsiCo in 2005, Ms. Gallagher served as the Assistant Controller at Altria Corporate Services, Inc. since 1992. Prior to that, Ms. Gallagher was a Senior Manager at PricewaterhouseCoopers LLP.
Steven M. Rapp, 55, was appointed Managing Director of Bottling LLC in January 2005. He has also served as PBG’s Senior Vice President, General Counsel and Secretary since January 2005. Mr. Rapp previously served as Vice President, Deputy General Counsel and Assistant Secretary from 1999 through 2004. Mr. Rapp joined PepsiCo as a corporate attorney in 1986 and was appointed Division Counsel of Pepsi-Cola Company in 1994.
The name, age and background of each of Bottling LLC’s executive officers who held office as of February 6, 2009 is set forth below. Executive Officers are elected by our Managing Directors, and their terms of office continue until their successors are appointed and qualified or until their earlier resignation or removal. There are no family relationships among our executive officers.
Eric J. Foss, 50, is the Principal Executive Officer of Bottling LLC. He is also PBG’s Chairman and Chief Executive Officer and a member of PBG’s Board of Directors. Mr. Foss served as PBG’s President and Chief Executive Officer from July 2006 to October 2008. Previously, Mr. Foss served as PBG’s Chief Operating Officer from September 2005 to July 2006 and President of PBG North America from September 2001 to September 2005. Prior to that, Mr. Foss was the Executive Vice President and General Manager of PBG North America from August 2000 to September 2001. From October 1999 until August 2000, he served as PBG’s Senior Vice President, U.S. Sales and Field Operations, and prior to that, he was our Senior Vice President, Sales and Field Marketing, since March 1999. Mr. Foss joined the Pepsi-Cola Company in 1982 where he held a variety of field and headquarters-based sales, marketing and general management positions. From 1994 to 1996, Mr. Foss was General Manager of Pepsi-Cola North America’s Great West Business Unit. In 1996, Mr. Foss was named General Manager for the Central Europe Region for PCI, a position he held until joining PBG in March 1999. Mr. Foss is also a director of UDR, Inc. and on the Industry Affairs Council of the Grocery Manufacturers of America.
Alfred H. Drewes, 53, is the Principal Financial Officer of Bottling LLC. He is also PBG’s Senior Vice President and Chief Financial Officer. Previously, Mr. Drewes served as Senior Vice President and Chief Financial Officer of Pepsi-Cola International (“PCI”). Mr. Drewes joined PepsiCo in 1982 as a financial analyst in New Jersey. During the next nine years, he rose through increasingly responsible finance positions within Pepsi-Cola North America in field operations and headquarters. In 1991, Mr. Drewes joined PCI as Vice President of Manufacturing Operations, with responsibility for the global concentrate supply organization. In 1994, he was appointed Vice President of Business Planning and New Business Development and, in 1996, relocated to London as the Vice President and Chief Financial Officer of the Europe and Sub-Saharan Africa Business Unit of PCI. Mr. Drewes is also a director of the Meredith Corporation.
Thomas M. Lardieri, 48, is the Principal Accounting Officer of Bottling LLC.
Bottling LLC has not adopted a Code of Ethics because PBG’s Worldwide Code of Conduct applies to all of our officers and employees, including our Principal Executive Officer, Principal Financial Officer and Principal Accounting Officer. A copy of PBG’s Worldwide Code of Conduct is available upon request without charge by writing to Bottling Group, LLC at One Pepsi Way, Somers, New York 10589, Attention: Investor Relations.
71
Table of Contents
ITEM 11. EXECUTIVE COMPENSATION
Compensation Discussion and Analysis (CD&A)
What are the highlights of PBG’s 2008 executive compensation program as described in this CD&A?
| • | PBG provides compensation and benefits to the executive officers of Bottling LLC | ||
| • | The primary objectives of PBG’s compensation program are to attract, retain, and motivate talented and diverse domestic and international executives | ||
| • | PBG provides executive officers with the following types of compensation: base salary, short-term performance-based cash incentives, and long-term performance-based equity incentive awards | ||
| • | PBG believes that to appropriately motivate senior executives to achieve and sustain the long-term growth of PBG, a majority of their compensation should be tied to PBG’s performance | ||
| • | PBG uses equity-based compensation as a means to align the interests of their executives with those of their shareholders | ||
| • | PBG believes the design of its executive compensation program drives performance in a financially responsible way that is sensitive to the dilutive impact on their shareholders | ||
| • | PBG generally targets total compensation within the third quartile of companies within its peer group of companies which was changed slightly in 2008 | ||
| • | In early 2008, consistent with this philosophy, PBG granted a special, one-time performance-based equity award (the “Strategic Leadership Award”) to select senior executives linking their long-term compensation with PBG’s strategic imperatives and reinforcing continuity within the senior leadership team of PBG | ||
| • | In early 2008, PBG added an individual non-financial performance component to the annual performance-based cash incentive program for senior executives to reinforce the importance of their individual contribution to certain non-financial objectives of PBG | ||
| • | The challenging worldwide economic environment resulted in PBG performance in 2008 that was significantly below target. Our management nevertheless delivered solid year-over-year financial results. Based on these results, the Committee determined it appropriate to award a discretionary bonus amount to each of the Named Executive Officers. The total bonus payout for each of the Named Executive Officers was significantly below target | ||
| • | PBG has never backdated or re-priced equity awards and does not time its equity award grants relative to the release of material non-public information | ||
| • | Executive officers of Bottling LLC do not have employment, severance or change-in-control agreements | ||
| • | PBG does not provide any gross-ups for potential excise taxes that may be incurred in connection with a change-in-control of PBG | ||
| • | PBG has a long-standing policy in place to recoup compensation from an executive who has engaged in misconduct | ||
| • | Bottling LLC executives participate in the same group benefit programs, at the same levels, as all PBG employees |
Who oversees PBG’s executive compensation program?
The Compensation and Management Development Committee of PBG’s Board of Directors (the “Committee”), which is comprised solely of independent, non-management directors oversees the executive compensation program for its Chairman and Chief Executive Officer who is also our Principal Executive Officer (“PEO”), its Chief Financial Officer, who also serves as our Principal Financial Officer (“PFO”), and the other named executive officer who appears in the tables below (collectively, the “Named Executive Officers”).
72
Table of Contents
What are the objectives of PBG’s executive compensation program?
The objectives of PBG’s executive compensation program are to:
| • | Provide a total compensation program that is appropriately competitive within its industry and to reinforce its short-term and long-term business objectives by: |
| § | motivating and rewarding key executives for achieving and exceeding PBG’s business objectives; | ||
| § | providing financial consequences to key executives for failing to achieve PBG’s business objectives; and | ||
| § | attracting and retaining key executives through meaningful wealth-creation opportunities; |
| • | Align the interests of their shareholders and executives by placing particular emphasis on performance-based and equity-based compensation; | ||
| • | Maintain a financially responsible program that is appropriate within PBG’s financial structure and sensitive to the dilutive impact on their shareholders; and | ||
| • | Establish and maintain PBG’s program in accordance with all applicable laws and regulations, as well as with corporate governance best practices. |
How does PBG achieve its objectives?
PBG achieves its objectives through the use of various executive compensation elements that drive both short-term and long-term performance, deliver to their executives fixed pay as well as variable, performance-based pay, and provide significant personal exposure to PBG common stock. In 2008, the principal elements of executive compensation were base salary, an annual performance-based cash incentive (variable, short-term pay), and long-term incentive awards in the form of stock options and RSUs (variable, long-term pay). These three elements of executive compensation are referred to as “total compensation.”
| Objective | ||||||||||||||||||||||||
| Alignment with | ||||||||||||||||||||||||
| Element of Total | Form of | Motivation | Shareholder | |||||||||||||||||||||
| Compensation | Compensation | Attraction | Short-Term | Long-Term | Interests | Retention | ||||||||||||||||||
| Base Salary | Cash | ü | ü | ü | ||||||||||||||||||||
| Annual Performance-Based Cash Incentive | Cash | ü | ü | ü | ü | |||||||||||||||||||
| Long-Term | Stock Options | ü | ü | ü | ü | |||||||||||||||||||
| Performance-Based | RSUs | |||||||||||||||||||||||
| Equity Incentive | ||||||||||||||||||||||||
Why does PBG choose to pay a mix of cash and equity-based compensation?
PBG views the combination of cash and equity-based compensation as an important tool in achieving the objectives of its program. The Committee periodically reviews the mix of cash and equity-based compensation provided under the program to ensure that the mix is appropriate in light of market trends and PBG’s primary business objectives.
PBG pays base salary in cash so that their executives have a steady, liquid source of compensation.
PBG pays the annual incentive in cash because the annual incentive is tied to the achievement of its short-term (i.e., annual) business objectives, and PBG believes a cash bonus is the strongest way to motivate and reward the achievement of these objectives.
Finally, PBG pays its long-term incentive in the form of PBG equity because its long-term incentive is tied to its long-term business objectives, and PBG believes the market value of PBG equity is a strong indicator of whether PBG is achieving its long-term business objectives.
73
Table of Contents
For 2008, our Named Executive Officers’ percentage of cash (based on base salary and target payout of the short-term cash incentive) versus equity-based pay (based on the grant date fair value of the annual 2008 equity awards and the annualized grant date fair value (one-fourth) of the one-time Strategic Leadership Award for Mr. Drewes), was approximately as follows:
Chairman and CEO | Other Named Executive Officers (Average) | |
 |  |
Why is the compensation of our Named Executive Officers largely performance-based compensation rather than fixed?
Consistent with the objectives of its program, PBG utilizes the performance-based elements of its program to reinforce its short-term and long-term business objectives and to align shareholder and executive interests. PBG believes that to appropriately motivate its senior executives to achieve their business objectives, a majority of their compensation should be tied to the performance of PBG. Thus, PBG links the level of compensation to the achievement of its business objectives. As a result of this link, for years when PBG achieves above-target performance, executives will be paid above-target compensation, and for years when PBG achieves below-target performance, executives will be paid below-target compensation.
PBG also believes that the more influence an executive has over company performance, the more the executive’s compensation should be tied to their performance results. Thus, the more senior the executive, the greater the percentage of his or her total compensation that is performance-based.
When looking at the three elements of total compensation, PBG views base salary as fixed pay (i.e., once established, it is not performance-based) and the annual incentive and long-term incentive as performance-based pay. With respect to the cash-based, annual incentive, PBG’s intent is to emphasize its performance in a given year. As a result of a design change approved by the Committee in 2008, PBG links eighty percent of the annual incentive to the achievement of annual performance measures (such as year-over-year profit and volume growth) and twenty percent of the incentive to the achievement of individual non-financial performance measures (such as employee and customer satisfaction survey scores). With respect to PBG equity-based, long-term incentive, PBG views the market value of its common stock as the primary performance measure. This is especially true in the case of stock options, which have no value to the executive unless the market value of PBG common stock goes up after the grant date. In the case of other equity-based awards to our PEO and PFO, such as RSUs, that have value to the executive even if the market value of PBG common stock goes down after the grant date, PBG typically includes a second performance component — such as a specific earnings per share performance target — that must be satisfied in order for the executive to vest in the award. In addition, PBG may grant supplemental, performance-based equity awards to executives in order to link long-term compensation with its strategic imperatives and to reinforce continuity within their senior leadership team, as they did with the 2008 Strategic Leadership Awards.
74
Table of Contents
The percentage of our Named Executive Officers’ 2008 total target compensation that was performance-based (based on base salary, target payout of the short-term cash incentive, the grant date fair value of the annual 2008 equity awards and the annualized grant date fair value (one-fourth) of the one-time Strategic Leadership Award for Mr. Drewes) was approximately as follows:
| Chairman and CEO | Other Named Executive Officers (Average) | |
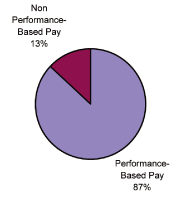 | 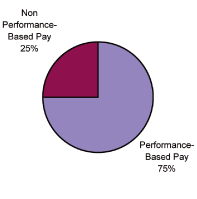 |
Why does PBG use earnings per share, volume and cash flow as the financial criteria for its performance-based compensation?
In selecting the criteria on which to base the performance targets underlying short-term and long-term incentive pay, the Committee chooses criteria that are leading indicators of PBG’s success, important to PBG’s shareholders and external market professionals, and relevant to their executives whose performance PBG strives to motivate towards the achievement of particular targets.
For PBG’s business and industry, the Committee believes the most relevant financial criteria on which to evaluate PBG’s success are comparable (or operational) earnings per share (“EPS”), profit, volume of product sold, and operating free cash flow (as defined in PBG’s earnings releases). The Committee views EPS as the best composite indicator of PBG’s operational performance. The Committee, therefore, emphasizes comparable EPS in establishing performance targets for the Named Executive Officers. In evaluating PBG’s performance against such EPS targets, the Committee considers the impact of unusual events on PBG’s reported EPS results (e.g., acquisitions, changes in accounting practices, share repurchases, etc.) and adjusts the reported results for purposes of determining the extent to which the comparable EPS targets were or were not achieved. The comparable EPS performance targets and results utilized by the Committee under PBG’s compensation program are generally consistent with PBG’s publicly disclosed EPS guidance and results.
Short-Term Incentive. Under PBG’s short-term incentive program, the Committee establishes performance targets that are designed to motivate executives to achieve short-term business targets. Therefore, for the executives leading PBG’s geographic business units, the Committee links the payment of 80% of the executives’ annual bonus to the achievement of year-over-year profit and volume growth targets, which are set at levels specifically chosen for each geographic territory. The Committee believes tying a substantial portion of these executives’ annual bonuses to local profit and volume growth is the best way to motivate executives to achieve business success within the regions they manage. Beginning in 2008, 20% of our PEO’s and PFO’s annual bonus is tied to individual non-financial goals which are qualitative and specific to the executive’s area of responsibility. The Committee implemented these goals to reinforce the importance of certain non-financial business objectives.
For our PEO and PFO, the Committee establishes a table of EPS targets that, depending on the level of EPS achieved by PBG during the year, establishes the maximum bonus payable to each executive for that year. No bonus is payable if comparable EPS is below a certain level. The Committee then uses its discretion to determine the actual bonus paid to each executive, which is never greater, and is typically much less, than the maximum bonus payable. In exercising this discretion, the Committee refers to a separately established comparable EPS or net operating profit before taxes (“NOPBT”) target, as well as volume and operating free cash flow targets, and individual non-financial targets, all of which the Committee approves at the beginning of the year. For Named Executive Officers with worldwide responsibilities, the financial targets are typically consistent with PBG’s EPS, volume and operating free cash flow guidance provided to external market professionals at the beginning of the year. For Named Executive Officers with responsibility over one of PBG’s operating segments outside the United States, these targets are typically consistent with the PBG’s internal operating plans for the particular segment.
As a result of the 2008 introduction of individual non-financial targets for certain members of PBG’s senior management, the
75
Table of Contents
Committee’s discretion is also guided by the PEO’s evaluation of the PFO’s performance against these targets. In addition, consistent with past practice, the Committee separately considers the performance of our PEO and is guided by reference to certain pre-established non-financial targets specific to our PEO (often related to strategic planning, organizational capabilities and/or executive development).
Notably, in establishing the actual bonus paid for each Named Executive Officer (within the limit of the maximum bonus payable), the Committee refers to the above financial and non-financial targets, but reserves the right to pay a bonus at the level it deems appropriate based on the performance of the Company and each executive. The performance targets established by the Committee with respect to the 2008 bonus are more fully described at page 82.
Long-Term Incentive. The Committee provides the long-term incentive in the form of an equity-based award because it believes the price of PBG common stock is a strong indicator of whether PBG is meeting its long-term objectives. The Committee, therefore, believes it important that each executive, in particular senior executives, have personal financial exposure to the performance of PBG common stock. Such exposure results in a link between PBG shareholder and executive interests and motivates PBG executives to achieve and sustain the long-term growth of PBG. Consequently, PBG is committed to paying a significant portion of executive compensation in the form of PBG equity. PBG is deliberate, however, in its use of equity compensation to avoid an inappropriate dilution of PBG’s current shareholders.
As a way of ensuring executives remain motivated and to bolster the retention of executives, the Committee does not provide for immediate vesting of long-term incentive awards. Instead, consistent with the three-year time frame with respect to which PBG establishes its strategic plans, the Committee typically provides for a three-year vesting period for equity-based awards. Executives must remain an employee of PBG through the vesting date to vest in the award. For equity-based awards that have no intrinsic value to the executive on the grant date, such as stock options, the Committee typically provides for staged vesting of such awards over the three-year vesting period (e.g., one-third vesting each year). For equity-based awards that have value to the executive on the grant date, such as RSUs, the Committee typically provides for vesting of the award only at the end of the three-year period.
Typically, for awards to our PEO and PFO that have actual value on the grant date (such as RSUs), the Committee also establishes a comparable EPS performance target for the year in which the award is granted. The achievement of this EPS target is a prerequisite to vesting in the award at the end of the three-year vesting period. The Committee believes such an additional performance element is appropriate to ensure that the executives do not obtain significant compensation if PBG’s performance in the year of grant is significantly below the EPS target. As the long-term incentive is designed to reinforce long-term business objectives, however, the Committee typically establishes this one-year EPS performance target at a lower level than PBG’s external guidance. The Committee does so to ensure that executives only lose the RSUs granted in that year if PBG misses its EPS target to such an extent as to indicate that a performance issue exists that is unlikely to be resolved in the near term. The implementation of this additional EPS performance target also ensures that the compensation paid through the long-term incentive is deductible to PBG (see “Deductibility of Compensation Expenses” below).
Why does PBG provide perquisites as an element of compensation?
Certain perquisites provided to senior executives are services or benefits designed to ensure that executives are fully focused on their responsibilities to PBG. For example, PBG makes annual physicals available to senior executives so that they can efficiently address this important personal issue and, therefore, maximize their productivity at work. Other perquisites, such as PBG’s company car program, simply represent PBG’s choice on how to deliver fixed pay to executives.
PBG also provides certain specific perquisites to senior executives who move to and work in international locations. Such perquisites are provided based on local and competitive practices. Perquisites such as housing allowances are typical in the international arena.
For certain limited perquisites, PBG reimburses (or grosses-up) the executive for the tax liability resulting from the income imputed to the executive in connection with the perquisite. PBG does so because it does not want the provision of such perquisites to result in a financial penalty to the executive or potentially discourage the executive from taking advantage of the perquisite. For example, PBG provides a gross-up to an executive with respect to his or her annual physical and benefits provided under the Company car program. PBG does not, however, gross-up perquisites with respect to which PBG does not have an interest in encouraging, such as their executives’ limited personal use of corporate transportation.
In 2008, limited perquisites were provided to our Named Executive Officers, consistent with PBG’s practice described above. These perquisites are described in more detail in the footnotes to the Summary Compensation Table.
76
Table of Contents
What other forms of compensation does PBG provide to employees, including the Named Executive Officers, and why are they provided?
PBG provides a number of other employee benefits to its employees, including the Named Executive Officers, that are generally comparable to those benefits provided at similarly sized companies. Such benefits enhance PBG’s reputation as an employer of choice and thereby serve the objectives of its compensation program to attract, retain and motivate executives.
Pension.During 2008, PBG maintained a qualified defined benefit pension plan for essentially all U.S. salaried and hourly non-union employees hired before January 1, 2007 and a non-qualified defined benefit pension plan (the “Excess Plan”) for such employees with annual compensation or pension benefits in excess of the limits imposed by the IRS. The Excess Plan provides for a benefit under the same benefit formula as provided under the qualified plan, but without regard to the IRS limits. The terms of these plans are essentially the same for all participating employees and are described in the Narrative to the Pension Benefits Table. Our Named Executive Officers have accrued pension benefits under these plans.
PBG does not provide any specially enhanced pension plan formulas or provisions that are limited to their Named Executive Officers.
Effective April 1, 2009, PBG amended its qualified and non-qualified defined benefit pension plans to cease all future accruals for salaried and non-union U.S. hourly employees with the exception of employees who, on March 31, 2009 (i) met a Rule of 65 (combined age and years of service equal to or greater than 65) or (ii) were at least age 50 with five years of service. The Named Executive Officers satisfy the Rule of 65 and will continue to accrue pension benefits.
401(k) Savings Plan.Our Named Executive Officers participate in the same 401(k) savings program PBG provides to other U.S. employees. This program includes a PBG match. PBG does not provide any special 401(k) benefits to our Named Executive Officers.
In general, salaried and non-union U.S. hourly employees hired on or after January 1, 2007 are eligible to receive a PBG company retirement contribution (“CRC”) under the 401(k) plan equal to 2% of eligible compensation (annual pay and bonus). Effective April 1, 2009, salaried and non-union U.S. hourly employees who ceased to accrue a benefit under the defined benefit pension plans will be eligible to receive the CRC, and the CRC for all eligible employees with ten or more years of service will be 3% of eligible compensation.
Deferred Income Program.PBG also maintains an Executive Income Deferral Program (the “Deferral Program”), through which all PBG executives, including the Named Executive Officers, paid in U.S. dollars, may elect to defer their base salary and/or their annual cash bonus. PBG makes the Deferral Program available to executives so they have the opportunity to defer their cash compensation without regard to the limit imposed by the IRS for amounts that may be deferred under the 401(k) plan. The material terms of the Deferral Program are described in the Narrative to the Nonqualified Deferred Compensation Table.
Health and Welfare Benefits.PBG also provides other benefits such as medical, dental, life insurance, and long-term disability coverage, on the same terms and conditions, to all employees, including the Named Executive Officers.
What policies and practices does PBG utilize in designing its executive compensation program and setting target levels of total compensation?
The Committee has established several policies and practices that govern the design and structure of PBG’s executive compensation program.
Process of Designing the Executive Compensation Program.Each year, the Committee reviews the PBG executive compensation program and establishes the target compensation level for the Named Executive Officers who appear in the tables below. For a description of this process, see the section entitled “Corporate Governance — Process of Designing the Executive Compensation Program” in PBG’s Proxy Statement.
Target Compensation-Use of Peer Group Data.In establishing the target total compensation for the Named Executive Officers, the Committee considers the competitive labor market, as determined by looking at PBG’s peer group of companies and other compensation survey data. The Committee believes that the total compensation paid to our executive officers generally should be targeted within the third quartile (i.e., which for 2008 was defined as the average of the 50th and 75th percentile) of the total compensation opportunities of executive officers at comparable companies. The Committee believes that this target is appropriately competitive and provides a total compensation opportunity that will be effective in attracting, retaining and motivating the leaders we need to be successful.
77
Table of Contents
For positions with respect to which there is widespread, publicly available compensation data (e.g. PEO), PBG establishes the third quartile based on compensation data of PBG’s peer group companies. PBG’s peer group is made up of comparably sized companies, each of which is a PBG competitor, customer or peer from the consumer goods or services industry. PBG’s peer group companies are generally world-class, industry leading companies with superior brands and/or products. The Committee, with the assistance of PBG’s senior management and the Committee’s independent compensation consultant, periodically reviews PBG’s peer group to ensure the peer group is an appropriate measure of the competitive labor market for senior executives. In January 2008, after review and discussion with the Committee’s independent compensation consultant and senior management, the Committee approved changes to PBG’s peer group of companies and this peer group was used for purposes of determining the PEO’s target total compensation. The peer group was modified to put greater focus on companies that do not require the development of big innovation platforms and are not as globally oriented. Specifically, the peer group of companies was changed as follows:
| Deleted | Added | |
| Colgate-Palmolive Company | ConAgra Foods, Inc. | |
| Kimberly-Clark Corporation | Newell Rubbermaid Inc. | |
| Staples, Inc. | Sysco Corporation | |
| Yum! Brands, Inc. |
PBG’s current peer group includes:
| Anheuser-Busch Companies, Inc | H.J. Heinz Company | |
| Aramark Corporation | Hershey Foods Corporation | |
| Campbell Soup Company | Kellogg Company | |
| Clorox Company, Inc. | Newell Rubbermaid Inc. | |
| Coca-Cola Enterprises Inc. | PepsiAmericas, Inc. | |
| ConAgra Foods, Inc. | Sara Lee Corporation | |
| Dean Foods Company | Supervalu Inc. | |
| FedEx Corporation | Sysco Corporation | |
| General Mills, Inc. |
Comparative financial measures and number of employees for the 2008 peer group are shown below:
| Peer Group* | PBG* | ||||||||||||||||
| 75th | PBG | Percent | |||||||||||||||
| Median | Percentile | Data | Rank | ||||||||||||||
| Revenue | $ | 11,799 | $ | 17,748 | $ | 13,591 | 68 | % | |||||||||
| Net Income | $ | 604 | $ | 1,027 | $ | 532 | 48 | % | |||||||||
| Market Capitalization | $ | 12,128 | $ | 19,052 | $ | 8,839 | 26 | % | |||||||||
| Number of Employees | 27,497 | 51,175 | 69,100 | 85 | % | ||||||||||||
| * | Dollars are in millions. Based on information as of December 31, 2007. |
For senior executive positions for which peer group data is not consistently publicly available (e.g., a general manager with specific geographic responsibilities), the Committee establishes the third quartile based on available peer group data and other compensation survey data from nationally-recognized human resources consulting firms.
Based on the peer group and other survey data, the Committee establishes the third quartile for target total compensation for each executive, as well as for various elements of total compensation, including base pay, total annual cash (base pay and target annual incentive) and total compensation (total annual cash and long-term incentive). The Committee then establishes the midpoint of the third quartile as its “market target.”
78
Table of Contents
Establishing Target Compensation; Role of the PEO.The Committee does not formulaically set the target total compensation for our Named Executive Officers at the market target. In determining the appropriate target total compensation for each executive, the Committee reviews each individual separately and considers a variety of factors in establishing his or her target compensation. These factors may include the executive’s time in position, unique contribution or value to PBG, recent performance, and whether there is a particular need to strengthen the retention aspects of the executive’s compensation. For a senior executive recently promoted into a new position, his or her total compensation will often fall below the targeted third quartile. In such cases, the Committee may establish a multi-year plan to raise the executive’s total compensation to the market target and, during such time, the executive’s compensation increases will often be greater than those of other senior executives.
In establishing the target total compensation for the PEO, the Committee, together with PBG’s Nominating and Corporate Governance Committee, formally advises the PBG Board of Directors on the annual individual performance of the PEO and the Committee considers recommendations from its independent compensation consultant regarding his compensation. The PEO is not involved in determining his compensation level and he is not present during the executive session during which the Committee evaluates the performance of the PEO against pre-established qualitative and quantitative targets. The Committee, however, does request that the PEO provide it with a self-evaluation of his performance against the pre-established targets prior to such executive session.
In establishing the target total compensation for Named Executive Officers other than the PEO, the Committee, with the assistance of the PEO and its independent compensation consultant, evaluates each executive’s performance and considers other individual factors such as those referenced above.
Use of Tally Sheets.The Committee annually reviews a tally sheet of our PEO’s and PFO’s compensation. This tally sheet includes detailed data for each of the following compensation elements and includes a narrative description of the material terms of any relevant plan, program or award:
| • | Annual direct compensation: Information regarding base salary, annual incentive, and long-term incentive for the past three years; | ||
| • | Equity awards: Detailed chart of information regarding all PBG equity-based awards, whether vested, unvested, exercised or unexercised, including total pre-tax value to the executive and holdings relative to the executive’s Stock Ownership Guidelines (discussed below); | ||
| • | Perquisites: Line item summary showing the value of each perquisite as well as the value of the tax gross-up, if any; | ||
| • | Pension / Deferred Compensation: Value of pension plan benefits (qualified plan, non-qualified plan and total) and value of defined-contribution plan accounts (401(k) and deferred compensation), including the year-over-year change in value in those accounts; | ||
| • | Life Insurance Benefits (expressed as multiple of cash compensation as well as actual dollar value); | ||
| • | Description of all compensation and benefits payable upon a termination of employment. |
The Committee reviews the information presented in the tally sheet to ensure that it is fully informed of all the compensation and benefits the executive has received as a PBG employee. The Committee does not, however, specifically use the tally sheet or wealth accumulation analysis in determining the executive’s target compensation for a given year.
Form of Equity-Based Compensation.Under PBG’s program, each executive annually receives an equity-based, long-term incentive award. The PBG shareholder-approved Amended and Restated 2004 Long-Term Incentive Plan (the “LTIP”) authorizes the Committee to grant equity-based awards in various forms, including stock options, restricted stock, and RSUs. The Committee selects the form of equity award based on its determination as to which form most effectively achieves the objectives of PBG’s program. While the amount of the award varies based on the level of executive, the form of the annual award has historically been the same for all PBG executives regardless of level.
The Committee periodically considers various forms of equity-based awards based on an analysis of market trends as well as their respective tax, accounting and share usage characteristics. The Committee has determined that a mix of forms is appropriate and that the annual long-term incentive award shall be in the form of 50% stock options and 50% RSUs (based on grant date fair value).
The Committee believes this mix of forms is the most appropriate approach for PBG because of the balanced impact this mix has when viewed in light of several of the objectives of PBG’s executive compensation program, including motivating and retaining a high-performing executive population, aligning the interests of PBG shareholders and executives, and creating a program that is financially appropriate for PBG and sensitive to the dilutive impact on shareholders.
79
Table of Contents
Equity Award Grant Practices.PBG has a consistent practice with respect to the granting of stock options and other equity-based awards, which the Committee established early in PBG’s history and which belies any concern regarding the timing or pricing of such awards, in particular stock options.
Timing of Grants. Executives receive equity-based awards under three scenarios. First, all executives annually receive an award, which has always been comprised, entirely or in part, of stock options. Under PBG’s long-established practice, the Committee approves this annual award at its first meeting of the calendar year (around February 1) and establishes the grant date of the award as March 1. March 1 was selected because it aligns with several other PBG human resources processes for employees generally, including the end of the annual performance review process and the effective date of base salary increases.
Second, individuals who become an executive of PBG for the first time within six months after the March 1 date are eligible for an equity award equal to 50% of the annual award. This pro-rated award is granted to all new executives on the same, fixed date of September 1.
Finally, senior executives may, on rare occasion, receive an additional equity-based award when they are first hired by PBG, when they are promoted to a new position, or when there is a special consideration related to an executive that the Committee seeks to address. In all cases of these awards, the grant date occurs after the award is approved.
Pricing of Stock Options. Throughout PBG’s history, the exercise price of stock options has been equal to the fair market value of PBG common stock on the grant date. PBG has never backdated or repriced stock options. PBG defines “Fair Market Value” in the LTIP as the average of the high and low sales prices of PBG common stock as recorded on the NYSE on the grant date, rounded up to the nearest penny. PBG believes its stock option pricing methodology is an accurate representation of the fair market value of PBG common stock on the grant date even though PBG’s methodology is different from that selected by the SEC (i.e., the closing price on the grant date).
What are some other policies and practices that govern the design and structure of PBG’s compensation program?
Stock Ownership Guidelines.To achieve PBG’s program objective of aligning PBG shareholder and executive interests, the Committee believes that PBG’s business leaders must have significant personal financial exposure to PBG common stock. The Committee, therefore, has established stock ownership guidelines for PBG’s key senior executives and directors. These guidelines are described in PBG’s Proxy Statement.
Trading Windows / Trading Plans / Hedging.PBG restricts the ability of certain employees to freely trade in PBG common stock because of their periodic access to material non-public information regarding PBG. As discussed in the corporate Governance section of PBG’s Proxy Statement, under PBG’s Insider Trading Policy, all of PBG’s key executives are permitted to purchase and sell PBG common stock and exercise PBG stock options only during limited quarterly trading windows. PBG’s senior executives, including our PEO and our PFO are generally required to conduct all stock sales and stock option exercises pursuant to written trading plans that are intended to satisfy the requirements of Rule 10b5-1 of the Securities Exchange Act. In addition, under the PBG Worldwide Code of Conduct, all employees, including our Named Executive Officers, are prohibited from hedging against or speculating in the potential changes in the value of PBG common stock.
Compensation Recovery for Misconduct.While we believe our executives conduct PBG business with the highest integrity and in full compliance with the PBG Worldwide Code of Conduct, the Committee believes it appropriate to ensure that PBG’s compensation plans and agreements provide for financial penalties to an executive who engages in fraudulent or other inappropriate conduct. Therefore, the Committee has included as a term of all equity-based awards that in the event the Committee determines that an executive has engaged in “Misconduct” (which is defined in the LTIP to include, among other things, a violation of the Code of Conduct), then all of the executive’s then outstanding equity-based awards shall be immediately forfeited and the Committee, in its discretion, may require the executive to repay to PBG all gains realized by the executive in connection with any PBG equity-based award (e.g., through option exercises or the vesting of RSUs) during the twelve-month period preceding the date the Misconduct occurred. This latter concept of repayment is commonly referred to as a “claw back” provision.
Similarly, in the event of termination of employment for cause, PBG may cancel all or a portion of an executive’s annual cash incentive or require reimbursement from the executive to the extent such amount has been paid.
As a majority of the compensation paid to an executive at the vice president level or higher is performance-based, the Committee believes its approach to compensation recovery through the LTIP and annual incentive is the most direct and appropriate for PBG.
Employment / Severance Agreements.Neither our PEO nor any other Named Executive Officer has (or ever has had) an individual employment or severance agreement with PBG or the Company entitling him to base salary, cash bonus, perquisites, or new equity grants following termination of employment.
80
Table of Contents
Indeed, as a matter of policy and practice, PBG does not generally enter into any individual agreements with executives. There are limited exceptions to this policy. First, in connection with the involuntary termination of an executive, PBG has, in light of the circumstances of the specific situation, entered into appropriate severance or settlement agreements. Second, in the case of an executive’s retirement, PBG has, on rare occasion, entered into a short-term consulting arrangement with the retired executive to ensure a proper transfer of the business knowledge the retired executive possesses. Finally, PBG’s standard long-term incentive award agreement that applies to all executives typically provides for the accelerated vesting of outstanding, unvested awards in the case of the executive’s approved transfer to PepsiCo, death, disability or retirement subject to satisfaction of any applicable performance-based vesting condition in the case of approved transfer or retirement. With respect to our PEO and other Named Executive Officers, the value of these benefits is summarized in the Narrative and accompanying tables entitled Potential Payments Upon Termination or Change In Control.
Approved Transfers To / From PepsiCo.PBG maintains a policy intended to facilitate the transfer of employees between PBG and PepsiCo. The two companies may, on a limited and mutually agreed basis, exchange employees who are considered necessary or useful to the other’s business (“Approved Transfers”). Certain of PBG’s benefit and compensation programs (as well as PepsiCo’s) are designed to prevent an Approved Transfer’s loss of compensation and benefits that would otherwise occur upon termination of his or her employment from the transferring company. For example, at the receiving company, Approved Transfers receive pension plan service credit for all years of service with the transferring company. Also, upon transfer, Approved Transfers generally vest in their transferring company equity awards rather than forfeit them as would otherwise be the case upon a termination of employment.
Two of our Named Executive Officers, Mr. Drewes and Mr. Lardieri are Approved Transfers from PepsiCo. As discussed in the footnotes to the Pension Benefits Table, Mr. Drewes and Mr. Lardieri will be eligible for pension benefits attributable to service both at PepsiCo prior to transfer and at the Company. The Potential Payments Upon Termination or Change In Control section sets forth in more detail the various compensation and benefits available to Approved Transfers.
Change in Control Protections.PBG was created in 1999 via an initial public offering by PepsiCo, and PepsiCo holds approximately 40% of the voting power of PBG common stock. As such, an acquisition of PBG can only practically occur with PepsiCo’s consent. Given this protection against a non-PepsiCo approved acquisition, the only change in control protection PBG provides through its executive compensation program is a term of the LTIP, which provides for the accelerated vesting of all outstanding, unvested equity-based awards at the time of a change in control of PBG. With respect to our PEO and other Named Executive Officers, the events that constitute a change in control and the value of change in control benefits provided under the LTIP are summarized in the Narrative and accompanying tables entitled Potential Payments Upon Termination or Change In Control. PBG does not gross-up any executive for potential excise taxes that may be incurred in connection with a change in control.
Deductibility of Compensation Expenses.Pursuant to Section 162(m) of the Internal Revenue Code (“Section 162(m)”), certain compensation paid to the PEO and other Named Executive Officers in excess of $1 million is not tax deductible, except to the extent such excess compensation is performance-based. The Committee has and will continue to carefully consider the impact of Section 162(m) when establishing the target compensation for executive officers. For 2008, PBG believes that substantially all of the compensation paid to executive officers satisfies the requirements for deductibility under Section 162(m).
As one of PBG’s primary program objectives, however, the Committee seeks to design the executive compensation program in a manner that furthers the best interests of PBG and its shareholders. In certain cases, the Committee may determine that the amount of tax deductions lost is insignificant when compared to the potential opportunity a compensation program provides for creating shareholder value. The Committee, therefore, retains the ability to pay appropriate compensation to executive officers, even though such compensation is non-deductible.
What compensation actions were taken in 2008 and why were they taken?
In January 2008, the Committee took action with respect to each element of total compensation (annual base salary, short-term cash incentive and long-term equity incentive award) for senior executives of PBG who appear in the PBG Proxy Statement including our PEO and our PFO following the principles, practices and processes described above. The PEO’s and PFO’s 2008 target total compensation did not exceed the market target based on the data considered by the Committee in January 2008.
Base Salary.In accordance with PBG’s practices with respect to individual raises, the level of annual merit increase in the base salary for each Named Executive Officer in 2008 took into consideration the performance of PBG and the executive, any increase in the executive’s responsibilities, and with respect to the PEO and PFO, an analysis of whether the executive’s base salary was within the third quartile of PBG’s peer group. The Committee determined that each of the PEO and PFO had performed well with respect to his role and responsibilities and the average merit increase in the annual rate of base salary for our Named Executive Officers receiving a merit increase was 6.6%. The Committee approved a more substantial increase in the annual salary for our PEO (11.1%) in order to bring his compensation closer to the targeted third quartile.
81
Table of Contents
Annual Cash Incentive Award. The Committee established the 2008 annual incentive targets for our executives in January 2008 with a potential payout range from 0 to 200% of target. At such time, the Committee determined that an increase in Mr. Foss’ annual incentive target, from 140% to 150% of base pay, was appropriate in light of his position and responsibilities and as measured against the targeted third quartile of total compensation of CEOs within the peer group.
Actual Annual Cash Incentive Awards.In February 2009, the Committee determined that PBG’s 2008 comparable EPS performance of $2.25, which was in excess of the $1.75 target, resulted in a maximum bonus of $5 million payable to our PEO and PFO under Section 162(m). The Committee then reviewed PBG’s 2008 performance against the pre-established EPS/NOPBT, volume and operating free cash flow targets which the Committee uses to guide its negative discretion in determining the actual bonus payable to each senior executive.
Ø Financial Performance Targets and Results.The overall achievement of financial targets is used to determine 80% of the actual bonus payout for our PEO and PFO and 100% for Mr. Lardieri, with each measure separately weighted. Each financial measure for each of the Named Executive Officers was worldwide in scope and each target was consistent with the Company’s external guidance at the start of 2008.
| Worldwide Measure | Weighting* | Target | Actual Result | |||||||||
| EPS (comparable) | 40 | % | $ | 2.37 | $ | 2.25 | ||||||
| Volume Growth v. Prior Year | 24 | % | 2.8 | % | -4.0 | % | ||||||
| Operating Free Cash Flow | 16 | % | $635 million | $526 million | ||||||||
| * | The weighting for Mr. Lardieri was 50%, 30% and 20% for EPS, Volume Growth and Operating Free Cash Flow, respectively. |
At its meeting in February 2009, the Committee certified the Actual Results shown in the tables above. The Committee determined that PBG’s performance against the worldwide measures resulted in a financial target bonus score of 12% for Messrs. Foss, Drewes and Lardieri. Following this determination, the Committee reviewed and discussed PBG’s overall operating performance during 2008. The Committee noted the PBG’s year-over-year performance, in particular comparable EPS and operating profit growth, which PBG achieved despite the economic downturn and adverse market conditions. In light of these factors, the Committee determined to exercise its discretion and award Messrs. Foss, Drewes and Lardieri a financial target bonus score of 50%.
ØNon-Financial Performance Targets and Results.The overall achievement of individual non-financial targets is used to determine 20% of the actual bonus payout for our PEO and PFO. The Committee reviewed and concurred in the assessment of our PEO with respect to the performance of our PFO against the pre-established non-financial goals. The goals were similar to the qualitative measures used by the Committee to evaluate the performance of the PEO, such as development of strategic plans. The Committee determined that a 50% payout based on non-financial measures was appropriate for our PFO.
The Committee then determined that Mr. Foss had performed well against his pre-established non-financial measures. In particular, the Committee noted that Mr. Foss had been successful in developing PBG’s global growth strategy with the acquisition of Lebedyansky in Russia and in expanding the PBG’s product portfolio with new products, such as Crush and Muscle Milk. The Committee also noted that during 2008, Mr. Foss was successful in further strengthening organization capability through greater employee engagement and improved executive representation of minorities. The Committee determined that an 80% payout based on non-financial measures was appropriate for Mr. Foss.
82
Table of Contents
For 2008, the annual incentive targets and actual payout amounts for each of the Named Executive Officers were as follows:
| 2008 Annual Cash Incentive Awards | |||||||||||||||||
| Target | 2008 Award | ||||||||||||||||
| Named Executive Officer | (% of Salary) | Target ($) | (% of Target) | 2008 Award ($) | |||||||||||||
| Eric J. Foss | 150 | % | 1,500,000 | 56 | % | 840,000 | |||||||||||
| Alfred H. Drewes | 85 | % | 408,000 | 50 | % | 204,000 | |||||||||||
| Thomas M. Lardieri | 65 | % | 211,250 | 50 | % | 105,630 | |||||||||||
The Committee believes the 2008 actual awards reflected PBG’s overall operating performance in 2008 and each individual’s contribution to such performance and were consistent with its policy to link pay to performance.
Long-Term Incentive.All of the 2008 stock option and RSU awards to our Named Executive Officers are reflected in the Grants of Plan-Based Awards Table and their terms and conditions are set out in the Narrative to the Summary Compensation Table and Grants of Plan-Based Awards Table.
Strategic Leadership Awards. During 2008, the Committee approved the Strategic Leadership Award, a special, one-time performance-based RSU award for certain senior executives other than the PEO. The Committee awarded the Strategic Leadership Award to Mr. Drewes and the other senior executives in order to emphasize the linkage between long-term compensation and the Company’s strategic imperatives and to reinforce continuity within the Company’s senior leadership team over the next four years.
The Committee established the target value of each executive’s Strategic Leadership Award at either $1,000,000 or $1,500,000 based on the executive’s scope of responsibilities and contribution to PBG. The Committee made vesting of the Strategic Leadership Award contingent upon PBG’s achievement of 2008 and 2009 comparable EPS performance targets of at least $0.75 in each year as well as the executive’s continued employment with the Company through the end of 2011. In February 2009, the Committee certified that the 2008 EPS performance target was met. Provided the 2009 EPS target and service vesting condition are satisfied, each executive is eligible to receive RSUs with a value up to 150% of his target value, with the final value of the award determined by the Committee at the beginning of 2010. The threshold, target and maximum values for each Named Executive Officer are set forth in the Grant of Plan-Based Awards Table. The final value will be determined by the Committee based on its own evaluation as well as the PEO’s assessment of PBG’s performance in 2008 and 2009 against performance criteria established for each of 2008 and 2009. The performance criteria for 2008 were: (i) increased distribution and market share of specified products within PBG’s brand portfolio; (ii) improved customer satisfaction, as measured by an external survey, and execution at point of sale; (iii) year-over-year improvement in the cost of making our products (i.e., operational efficiency); and (iv) year-over-year improvement in the Company’s internal employee satisfaction survey. The specific target levels for each of the above referenced criteria have not been externally communicated and involve confidential, commercial information, disclosure of which could result in competitive harm to the Company. The targets for each criteria are set at levels intended to incent the achievement of both short-term and long-term growth in these key strategic areas. To achieve target performance, the executive team must drive broad-based effort and contribution from the geographical and functional teams throughout PBG. The targets, individually and together, are designed to be challenging to attain and achievement of the targets requires performance beyond our normal operating plan expectations for each year of the performance period.
Annual Equity Award.Consistent with its established practice, the Committee approved the 2008 long-term incentive awards for each of the Named Executive Officers after reviewing comparative market data for total compensation, including data related to what portion of total compensation was paid in the form of long-term incentive. The Committee also considered each executive’s role and level of responsibility within PBG. Mr. Foss received a long-term equity incentive award with a present value of approximately $5,000,000. The Committee determined this award was appropriate in light of his position and responsibilities and as measured against the targeted third quartile of total compensation of CEOs within the peer group. Mr. Drewes received a long-term equity incentive award with a present value of approximately $1,000,000 and Mr. Lardieri was granted a long-term equity incentive award with a present value of approximately $575,000. These awards included the same terms and conditions as the awards to all other executives, except that consistent with its practice, the Committee made the vesting of the RSU award granted to our PFO and PEO subject to the achievement of a 2008 comparable PBG EPS performance target of $0.75. In February 2009, the Committee determined that the 2008 EPS target had been satisfied, such that our PEO and PFO will vest in his annual 2008 RSU award if he remains employed by the Company through March 1, 2011.
83
Table of Contents
Supplemental Stock Option Award for the PEO.In October 2008, after consultation with the independent compensation consultant, the Committee awarded Mr. Foss a supplemental long-term equity incentive award comprised of 400,000 stock options to recognize his appointment as Chairman of the Board of Directors of PBG and to bring Mr. Foss’ target total compensation (including the annualized value of promotional awards) closer to the peer group market target.
What noteworthy executive compensation actions took place during the first quarter of 2009 and why were such actions taken?
In February 2009, in response to the challenging global economic conditions, the Committee determined that the total target compensation for each Named Executive Officer would not increase from 2008 levels. Specifically, the Committee determined to freeze salaries at 2008 levels and determined that there would be no change to the bonus target or the annual equity award value for any of the Named Executive Officers. The Committee also reviewed the current design of the annual long-term incentive program, noting that all outstanding stock options held by the Named Executive Officers are “out-of the money”. The Committee determined that the design remained consistent with the primary objectives of attracting, retaining and motivating a talented and diverse group of executives and concluded that no design change was appropriate at this time.
84
Table of Contents
2008 Summary Compensation Table
| Change in | ||||||||||||||||||||||||||||||||
| Pension Value | ||||||||||||||||||||||||||||||||
| Non-Equity | and | |||||||||||||||||||||||||||||||
| Incentive | Nonqualified | |||||||||||||||||||||||||||||||
| Plan | Deferred | |||||||||||||||||||||||||||||||
| Stock | Option | Compen- | Compensation | All Other | ||||||||||||||||||||||||||||
| Name and Principal | Salary | Awards | Awards | sation | Earnings | Compensation | Total | |||||||||||||||||||||||||
| Position | Year | ($) | ($)(1) | ($)(1) | ($) | ($)(2)(3) | ($)(4) | ($) | ||||||||||||||||||||||||
Eric J. Foss | 2008 | 984,615 | 2,383,547 | 1,934,908 | 840,000 | 1,166,000 | 191,748 | (5) | 7,500,818 | |||||||||||||||||||||||
| Principal Executive Officer | 2007 | 892,308 | 1,584,557 | 1,893,158 | 1,805,580 | 594,000 | 66,680 | 6,836,283 | ||||||||||||||||||||||||
| 2006 | 754,500 | 975,979 | 2,025,066 | 1,289,000 | 387,000 | 64,513 | 5,496,058 | |||||||||||||||||||||||||
Alfred H. Drewes | 2008 | 476,154 | 841,694 | 444,431 | 204,000 | 505,000 | 50,669 | (6) | 2,521,948 | |||||||||||||||||||||||
| Principal Financial Officer | 2007 | 451,154 | 304,747 | 664,901 | 551,120 | 222,000 | 81,884 | 2,275,806 | ||||||||||||||||||||||||
| 2006 | 425,385 | 139,141 | 899,853 | 456,150 | 180,000 | 69,442 | 2,169,971 | |||||||||||||||||||||||||
Thomas M. Lardieri | 2008 | 323,462 | 162,331 | 48,920 | 105,630 | 159,000 | 41,617 | (7) | 840,960 | |||||||||||||||||||||||
| Principal Accounting Officer | 2007 | 182,942 | 48,361 | 0 | 170,200 | 54,000 | 16,441 | 471,944 | ||||||||||||||||||||||||
| 2006 | — | — | — | — | — | — | — | |||||||||||||||||||||||||
| 1. | The amount included in this column is the compensation cost recognized by PBG in fiscal year 2008 related to the executive’s outstanding equity awards that were unvested for all or any part of 2008, calculated in accordance with SFAS 123R without regard to forfeiture estimates. This amount encompasses equity awards that were granted in 2005, 2006, 2007 and 2008 and was determined using the assumptions set forth in Note 3, Share-Based Compensation, to Bottling LLC’s Annual Report on Form 10-K for the fiscal year ended December 27, 2008 (for 2008, 2007, 2006 awards) and Note 3, Share-Based Compensation, to Bottling LLC’s Annual Report on Form 10-K for the fiscal year ended December 29, 2007 (for 2005 awards). As of the end of PBG’s fiscal year, the market price of PBG’s common stock was below the exercise price of the option awards. Therefore, all of the option awards are “out of the money” and have no intrinsic value to the executive. | |
| 2. | No executive earned above-market or preferential earnings on deferred compensation in 2008 and, therefore, no such earnings are reported in this column. Consequently, this amount reflects only the aggregate change in 2008 in the actuarial present value of the executive’s accumulated benefit under all PBG-sponsored defined benefit pension plans in which the executive participates. The executive participates in such plans on the same terms as all other eligible employees. | |
| 3. | This amount was calculated based on the material assumptions set forth in Note 11, Pension and Postretirement Medical Benefit Plans, to Bottling LLC’s Annual Report on Form 10-K for the fiscal year ended December 27, 2008 and Note 9, Pension and Postretirement Medical Benefit Plans, to Bottling LLC’s Annual Report on Form 10-K for the fiscal year ended December 29, 2007, except for the generally applicable assumptions regarding retirement age and pre-retirement mortality. During 2008, PBG changed its measurement date from September 30 to the fiscal year-end. Consequently, we have used an annualized approach adjusting the 15 month period to a 12 month period, consistent with SEC guidance, in determining the change in pension value. | |
| 4. | The amount in this column reflects the actual cost of perquisites and personal benefits provided by PBG to each of the Named Executive Officers as well as the reimbursements paid by PBG to the executive for his tax liability related to certain of these PBG provided benefits and the dollar value of life insurance premiums paid by PBG for the benefit of the Named Executive Officers each on the same terms and conditions as all other eligible employees. The particular benefits provided to each Named Executive Officer are described below in footnotes 5, 6, and 7. In addition, PBG purchases club memberships, season tickets and passes to various sporting events and other venues for purposes of business entertainment. On limited occasions, employees (including one or more of the Named Executive Officers) may use such memberships, tickets or passes for personal use. There is no incremental cost to the Company in such circumstances. Therefore, no cost of such memberships, tickets and passes is reflected in the “All Other Compensation” column. | |
| 5. | This amount includes: $160,425, which equals the total cost of all perquisites and personal benefits provided by PBG to Mr. Foss, including a car allowance, financial advisory services, personal use of corporate transportation, nominal recognition awards and nominal personal expenses incurred in connection with a PBG Board of Directors’ meeting. The value of Mr. Foss’ personal use of the PBG-leased aircraft is $128,225 and represents the aggregate incremental cost to the Company. For this purpose, the Company has calculated the aggregate incremental cost based on the actual variable operating costs that were incurred as a result of Mr. Foss’ use of the aircraft, which includes an hourly occupied rate, fuel rate and other flight specific fees. Mr. Foss is responsible for all taxes associated with any personal use of corporate transportation. |
85
Table of Contents
| The amount shown in the above table also includes: (i) $17,629, which equals all tax reimbursements paid to Mr. Foss for the tax liability related to PBG provided perquisites and personal benefits, including his car allowance, financial advisory services, nominal recognition awards and nominal personal expenses incurred in connection with a PBG Board of Directors’ meeting; (ii) a standard PBG matching contribution of $9,038 to Mr. Foss’ 401(k) account; and (iii) $4,656, which represents the dollar value of life insurance premiums paid by PBG for the benefit of Mr. Foss. | ||
| 6. | This amount includes: (i) $25,896, which equals the total cost of all perquisites and personal benefits provided by PBG to Mr. Drewes, including a car allowance, financial advisory services and a nominal recognition award; (ii) $13,489, which equals all tax reimbursements paid to Mr. Drewes for the tax liability related to PBG provided perquisites and personal benefits, including his car allowance, financial advisory services and a nominal recognition award; (iii) a standard PBG matching contribution of $9,200 to Mr. Drewes’ 401(k) account; and (iv) $2,084, which represents the dollar value of life insurance premiums paid by PBG for the benefit of Mr. Drewes. | |
| 7. | This amount includes: (i) $24,856, which equals the total cost of all perquisites and personal benefits provided by PBG to Mr. Lardieri, including a company car and related car expenses, a service award and a nominal recognition award; (ii) $7,227, which equals all tax reimbursements paid to Mr. Lardieri for the tax liability related to PBG provided perquisites and personal benefits, including a company car and related car expenses and a nominal recognition award; (iii) a standard PBG matching contribution of $8,781 to Mr. Laridieri’s 401(k) account; and (iv) $753, which represents the dollar value of life insurance premiums paid by PBG for the benefit of Mr. Lardieri. |
Grants of Plan-Based Awards In Fiscal Year 2008
| All Other | |||||||||||||||||||||||||||||||||||||||||||||||||
| Option | |||||||||||||||||||||||||||||||||||||||||||||||||
| Awards: | |||||||||||||||||||||||||||||||||||||||||||||||||
| Number | Grant | ||||||||||||||||||||||||||||||||||||||||||||||||
| of | Exercise | Date Fair | |||||||||||||||||||||||||||||||||||||||||||||||
| Estimated Possible Payouts Under | Estimated Future Payouts Under | Securities | or Base | Closing | Value of | ||||||||||||||||||||||||||||||||||||||||||||
| Non-Equity Incentive Plan Awards(1) | Equity Incentive Plan Awards(2)(3) | Under- | Price of | Market | Stock and | ||||||||||||||||||||||||||||||||||||||||||||
| Date of | Thres- | Thres- | lying | Option | Price on | Option | |||||||||||||||||||||||||||||||||||||||||||
| Grant | Board | hold | Target | Maximum | hold | Target | Maximum | Options | Awards | Grant | Awards | ||||||||||||||||||||||||||||||||||||||
| Name | Date | Action | ($) | ($) | ($) | (#) | (#) | (#) | (#) | ($/Sh) | Date ($) | ($)(4) | |||||||||||||||||||||||||||||||||||||
Eric J. Foss Non-Equity | — | — | 0 | 1,500,000 | 3,000,000 | ||||||||||||||||||||||||||||||||||||||||||||
| RSUs | 03/01/2008 | 01/25/2008 | 72,823 | 2,500,014 | |||||||||||||||||||||||||||||||||||||||||||||
| Options | 03/01/2008 | 01/25/2008 | 218,468 | 34.33 | 34.01 | 1,542,384 | |||||||||||||||||||||||||||||||||||||||||||
| Options | 10/02/2008 | 10/02/2008 | 400,000 | 28.90 | 28.49 | 2,760,000 | |||||||||||||||||||||||||||||||||||||||||||
Alfred H. Drewes | |||||||||||||||||||||||||||||||||||||||||||||||||
| Non-Equity | — | — | 0 | 408,000 | 816,000 | ||||||||||||||||||||||||||||||||||||||||||||
| SLA RSUs | 01/01/2008 | 10/11/2007 | 0 | 37,765 | 56,648 | 1,500,026 | |||||||||||||||||||||||||||||||||||||||||||
| RSUs | 03/01/2008 | 01/25/2008 | 14,565 | 500,016 | |||||||||||||||||||||||||||||||||||||||||||||
| Options | 03/01/2008 | 01/25/2008 | 43,694 | 34.33 | 34.01 | 308,480 | |||||||||||||||||||||||||||||||||||||||||||
Thomas M. Lardieri Non-Equity | — | — | 0 | 211,250 | 422,500 | ||||||||||||||||||||||||||||||||||||||||||||
| RSUs | 03/01/2008 | 01/25/2008 | 8,375 | 287,514 | |||||||||||||||||||||||||||||||||||||||||||||
| Options | 03/01/2008 | 01/25/2008 | 25,124 | 34.33 | 34.01 | 177,375 | |||||||||||||||||||||||||||||||||||||||||||
| 1. | Amounts shown reflect the threshold, target and maximum payout amounts under PBG’s annual incentive program which is administered under the PBG shareholder-approved 2005 Executive Incentive Compensation Plan (“EICP”). The target amount is equal to a percentage of each executive’s salary, which for 2008 ranged from 65% to 150%, depending on the executive’s role and level of responsibility. The maximum amount equals 200% of the target amount. The actual payout amount is contingent upon achievement of certain financial and non-financial performance goals. Please refer to the narrative below for more detail regarding each executive’s target amount, the specific performance criteria used to determine the actual payout and how such payout is typically the result of the Committee’s exercise of negative discretion with respect to separate maximum payout amounts established for purposes of Section 162(m). | |
| 2. | In addition to the 2008 annual RSU awards, this column reflects a special award of performance-based RSUs (Strategic Leadership Award or SLA RSUs) granted to Mr. Drewes. Please refer to the narrative below for more detail regarding the Strategic Leadership Award. |
86
Table of Contents
| 3. | The 2008 stock option awards and RSU awards, including the Strategic Leadership Award, were made under the LTIP, which was approved by PBG shareholders in 2008. | |
| 4. | The assumptions used in calculating the SFAS 123R grant date fair value of the option awards and stock awards are set forth in Note 3, Share-Based Compensation, to Bottling LLC’s Annual Report on Form 10-K for the fiscal year ended December 27, 2008. As of the end of PBG’s fiscal year, the market price of PBG’s common stock was below the exercise price of the option awards. Therefore, all of the option awards are “out of the money” and have no intrinsic value to the executive. |
Narrative to the Summary Compensation Table and Grants of Plan-Based Awards Table
Salary. The 2008 annual salary of each Named Executive Officer is set forth in the “Salary” column of the Summary Compensation Table. Compensation levels for each of the Named Executive Officers are at the discretion of the Committee. There are no written or unwritten employment agreements with any Named Executive Officer. A salary increase or decrease for a Named Executive Officer may be approved by the Committee at any time in the Committee’s sole discretion. Typically, the Committee considers salary increases for each of the Named Executive Officers based on considerations such as the performance of PBG and the executive, any increase in the executive’s responsibilities and the executive’s salary level relative to similarly situated executives at peer group companies.
Stock Awards. Awards of RSUs are made under the LTIP at the discretion of the Committee. The annual RSU awards were approved by the Committee in January 2008, with a grant date of March 1, 2008, to all executives of PBG, including the Named Executive Officers. The number of RSUs awarded was determined based on an award value established by the Committee for each executive. The actual number of RSUs awarded was calculated by dividing the respective award value by the “Fair Market Value” of a share of PBG common stock on the grant date, rounded up to the next whole share. The LTIP defines Fair Market Value as the average of the high and low sales price for PBG common stock as reported on the NYSE on the grant date.
Vesting of the annual RSUs awarded to certain of the Named Executive Officers in 2008, specifically our Principal Executive Officer and Principal Financial Officer, was made subject to the achievement of a pre-established PBG EPS performance goal as well as continued employment for three years. In February 2009, the Committee determined that this PBG EPS goal was met. Thus, the RSUs will fully vest after three years provided the Principal Executive Officer and Principal Financial Officer remains continuously employed through the third anniversary of the grant date.
Mr. Drewes also received an additional, special award of performance-based RSUs (Strategic Leadership Award) in January 2008. This Strategic Leadership Award will vest only if pre-established PBG EPS targets and performance criteria are met in both 2008 and 2009 and the executive remains employed through January 1, 2012. Provided the pre-established PBG EPS targets are satisfied, Mr. Drewes will be eligible to receive a maximum award equal to 150% of the award value. The actual value of the award (from 0 — 150% of the award value) will be determined by the Committee based on achievement of the performance criteria.
All RSUs are credited with dividend equivalents in the form of additional RSUs at the same time and in the same amount as dividends are paid to shareholders of PBG. If the underlying RSUs do not vest, no dividend equivalents are paid. RSUs are paid out in shares of PBG common stock upon vesting. With the exception of the Strategic Leadership Award, vesting of the RSUs in the event of death, disability, retirement, or Approved Transfer is the same as described below for stock options; provided, however, that accelerated vesting in the case of retirement or Approved Transfer to PepsiCo is subject to satisfaction of any performance-based condition. The Strategic Leadership Award does not vest upon retirement or Approved Transfer to PepsiCo. All RSUs vest and are paid out upon the occurrence of a “Change In Control” as defined under the LTIP (“CIC”), as more fully discussed in the narrative and accompanying tables entitled Potential Payments Upon Termination or Change In Control. RSUs and shares received upon certain prior payouts of RSUs are subject to forfeiture in the event an executive engages in Misconduct.
Option Awards.Stock option awards are made under the LTIP at the discretion of the Committee. The annual stock option awards were approved by the Committee in January 2008, with a grant date of March 1, 2008, to all executives of PBG, including the Named Executive Officers. The exercise price was equal to the Fair Market Value of a share of PBG common stock on the grant date, rounded to the nearest penny. The stock options have a term of ten years and no dividends or dividend rights are payable with respect to the stock options. The 2008 stock option awards for all executives, including the Named Executive Officers, become exercisable in one-third increments, on the first, second and third anniversary of the grant date provided the executive is actively employed on each such date.
However, the vesting is accelerated in the event of death, disability, retirement, a CIC or Approved Transfer to PepsiCo. In the event of death or Approved Transfer to PepsiCo, unvested stock options fully vest immediately. In the event of retirement or disability, unvested stock options immediately vest in proportion to the number of months of active employment during the vesting period over the total number of
87
Table of Contents
months in such period. In the event of death, disability, retirement or an Approved Transfer to PepsiCo, the vested options remain exercisable for their original ten-year term, provided that in the case of an Approved Transfer, the Named Executive Officer remains actively employed at PepsiCo. In the event of a subsequent termination of employment from PepsiCo, the Named Executive Officer must exercise vested stock options within 90 calendar days of termination or the stock options are automatically cancelled. Vesting is also accelerated upon the occurrence of a CIC as more fully discussed in the narrative and accompanying tables entitled Potential Payments Upon Termination or Change In Control. Stock option awards, including certain gains on previously exercised stock options, are subject to forfeiture in the event an executive engages in Misconduct.
In October 2008, the Committee approved a supplemental stock option award for Mr. Foss as a result of his appointment to the position of Chairman of the Board of Directors of PBG. This supplemental award will vest on October 2, 2013 provided Mr. Foss is actively employed on such date and is subject to the same accelerated vesting and exercise provisions described above.
Non-Equity Incentive Plan Compensation. The 2008 annual, performance-based cash bonuses paid to the Named Executive Officers are shown in the “Non-Equity Incentive Plan Compensation” column of the Summary Compensation Table and the threshold, target and maximum bonus amounts payable to each Named Executive Officer are shown in the Grants of Plan-Based Awards Table. These award amounts were approved by the Committee and were paid under the EICP, which was approved by PBG shareholders in 2005 in order to ensure that PBG may recognize a tax deduction with respect to such awards under Section 162(m) of the Code. The threshold, target and maximum payout amounts are shown in the “Estimated Possible Payouts Under Non-Equity Incentive Plan Awards” column in the Grants of Plan-Based Awards Table. The pre-established performance criteria, actual performance and each Named Executive Officer’s target and actual payout amounts are discussed in detail in the CD&A.
Change in Pension Value and Nonqualified Deferred Compensation Earnings.The material terms of the pension plans governing the pension benefits provided to the Named Executive Officers are more fully discussed in the narrative accompanying the Pension Benefits Table. The material terms of the non-qualified elective deferred compensation plan are more fully discussed in the narrative accompanying the Nonqualified Deferred Compensation Table.
All Other Compensation. The perquisites, tax reimbursements and all other compensation paid to or on behalf of the Named Executive Officers during 2008 are described fully in the footnotes to the Summary Compensation Table.
Proportion of Salary to Total Compensation. As noted in the CD&A, PBG believes that the total compensation of our business leaders should be closely tied to the performance of PBG. Therefore, the percentage of total compensation that is fixed generally decreases as the level of the executive increases. This is reflected in the ratio of salary in proportion to total compensation for each Named Executive Officer. In 2008, Mr. Foss’ ratio of salary in proportion to total compensation shown in the Summary Compensation Table was 13%, and the ratio for Messrs. Drewes and Lardieri was approximately 19% and 38%, respectively.
88
Table of Contents
Outstanding Equity Awards At 2008 Fiscal Year-End
| Option Awards | Stock Awards | ||||||||||||||||||||||||||||||||||||||||
| Incentive Equity | |||||||||||||||||||||||||||||||||||||||||
| Equity | Plan | ||||||||||||||||||||||||||||||||||||||||
| Incentive | Awards: | ||||||||||||||||||||||||||||||||||||||||
| Market | Plan | Market or | |||||||||||||||||||||||||||||||||||||||
| Value of | Awards: | Payout | |||||||||||||||||||||||||||||||||||||||
| Shares | Number of | Value of | |||||||||||||||||||||||||||||||||||||||
| or Units | Unearned | Unearned | |||||||||||||||||||||||||||||||||||||||
| Number of | Number of | Number of | of | Shares, | Shares, | ||||||||||||||||||||||||||||||||||||
| Securities | Securities | Shares or | Stock | Units or | Units or | ||||||||||||||||||||||||||||||||||||
| Underlying | Underlying | Units of | That | Other | Other | ||||||||||||||||||||||||||||||||||||
| Unexercised | Unexercised | Option | Stock That | Have | Rights That | Rights That | |||||||||||||||||||||||||||||||||||
| Stock | Options | Options | Exercise | Option | Have | Not | Have Not | Have Not | |||||||||||||||||||||||||||||||||
| Option | (#)(26) | (#)(26) | Price | Expiration | Stock Award | Not Vested | Vested | Vested | Vested | ||||||||||||||||||||||||||||||||
| Name | Grant Date | Exercisable | Unexercisable | ($) | Date | Grant Date | (#) | ($)(26) | (#) | ($)(26) | |||||||||||||||||||||||||||||||
| E. Foss | 03/01/2002 | (1) | 145,743 | 0 | 25.25 | 03/29/2012 | 10/07/2005 | (10) | 125,718 | 2,765,796 | |||||||||||||||||||||||||||||||
| 03/01/2003 | (2) | 223,404 | 0 | 23.50 | 03/29/2013 | 03/01/2006 | (11) | 35,627 | (17) | 783,794 | |||||||||||||||||||||||||||||||
| 03/01/2004 | (3) | 182,373 | 0 | 29.50 | 03/29/2014 | 03/01/2007 | (12) | 66,846 | (18) | 1,470,612 | |||||||||||||||||||||||||||||||
| 03/01/2005 | (4) | 212,389 | 0 | 28.25 | 02/28/2015 | 03/01/2008 | (13) | 73,998 | (19) | 1,627,956 | |||||||||||||||||||||||||||||||
| 03/01/2006 | (5) | 67,530 | 34,789 | 29.32 | 02/29/2016 | ||||||||||||||||||||||||||||||||||||
| 07/24/2006 | (6) | 0 | 200,000 | 33.77 | 07/23/2016 | ||||||||||||||||||||||||||||||||||||
| 03/01/2007 | (7) | 64,181 | 130,309 | 30.85 | 02/28/2017 | ||||||||||||||||||||||||||||||||||||
| 03/01/2008 | (8) | 0 | 218,468 | 34.33 | 02/28/2018 | ||||||||||||||||||||||||||||||||||||
| 10/02/2008 | (9) | 0 | 400,000 | 28.90 | 10/01/2018 | ||||||||||||||||||||||||||||||||||||
| A. Drewes | 03/01/2003 | (2) | 127,660 | 0 | 23.50 | 03/29/2013 | 03/01/2006 | (11) | 17,813 | (20) | 391,886 | ||||||||||||||||||||||||||||||
| 03/01/2004 | (3) | 104,407 | 0 | 29.50 | 03/29/2014 | 03/01/2007 | (12) | 16,712 | (21) | 367,664 | |||||||||||||||||||||||||||||||
| 03/01/2005 | (4) | 113,274 | 0 | 28.25 | 02/28/2015 | 01/01/2008 | (14) | 38,374 | (25) | 844,228 | |||||||||||||||||||||||||||||||
| 03/01/2006 | (5) | 33,765 | 17,395 | 29.32 | 02/29/2016 | 03/01/2008 | (13) | 14,800 | (22) | 325,600 | |||||||||||||||||||||||||||||||
| 03/01/2007 | (7) | 16,045 | 32,578 | 30.85 | 02/28/2017 | ||||||||||||||||||||||||||||||||||||
| 03/01/2008 | (8) | 0 | 43,694 | 34.33 | 02/28/2018 | ||||||||||||||||||||||||||||||||||||
| T. Lardieri | 03/01/2008 | (8) | 0 | 25,124 | 34.33 | 02/28/2018 | 06/01/2007 | (15) | 7,324 | (23) | 161,128 | ||||||||||||||||||||||||||||||
| 03/01/2008 | (16) | 8,510 | (24) | 187,220 | |||||||||||||||||||||||||||||||||||||
| 1. | The vesting schedule with respect to this 2002 stock option award is as follows: 25% of the options vested and became exercisable on March 30, 2003; 25% of the options vested and became exercisable on March 30, 2004; and the remaining 50% of the options vested and became exercisable on March 30, 2005. | |
| 2. | The vesting schedule with respect to this 2003 stock option award is as follows: 25% of the options vested and became exercisable on March 30, 2004; 25% of the options vested and became exercisable on March 30, 2005; and the remaining 50% of the options vested and became exercisable on March 30, 2006. | |
| 3. | The vesting schedule with respect to this 2004 stock option award is as follows: 25% of the options vested and became exercisable on March 30, 2005; 25% of the options vested and became exercisable on March 30, 2006; and the remaining 50% of the options vested and became exercisable on March 30, 2007. | |
| 4. | The vesting schedule with respect to this 2005 stock option award is as follows: 25% of the options vested and became exercisable on March 30, 2006; 25% of the options vested and became exercisable on March 30, 2007; and the remaining 50% of the options vest and become exercisable on March 30, 2008, provided the executive remains employed through such date. | |
| 5. | The vesting schedule with respect to this 2006 stock option award is as follows: 33% of the options vested and became exercisable on March 1, 2007; 33% of the options vest and become exercisable on March 1, 2008; and the remaining 34% of the options vest and become exercisable on March 1, 2009, provided the executive remains employed through the applicable vesting dates. | |
| 6. | This stock option award was granted to Mr. Foss in recognition of his role and responsibilities as President and Chief Executive Officer of PBG. The award fully vests and becomes exercisable on July 24, 2011, provided Mr. Foss remains employed through such date. | |
| 7. | The vesting schedule with respect to this 2007 stock option award is as follows: 33% of the options vest and become exercisable on March 1, 2008; 33% of the options vest and become exercisable on March 1, 2009; and the remaining 34% of the options vest and become exercisable on March 1, 2010, provided the executive remains employed through the applicable vesting dates. |
89
Table of Contents
| 8. | The vesting schedule with respect to this 2008 stock option award is as follows: 33% of the options vest and become exercisable on March 1, 2009; 33% of the options vest and become exercisable on March 1, 2010; and the remaining 34% of the options vest and become exercisable on March 1, 2011, provided the executive remains employed through the applicable vesting dates. | |
| 9. | This stock option award was granted to Mr. Foss in recognition of his new role and responsibilities as Chairman of the Board of Directors of PBG. The award fully vests and becomes exercisable on October 2, 2013, provided Mr. Foss remains employed through October 2, 2013. | |
| 10. | Since the pre-established PBG earnings per share performance target was met, these RSUs fully vest on October 7, 2010, provided the executive remains employed through October 7, 2010. | |
| 11. | Since the pre-established PBG earnings per share performance target was met, these RSUs fully vest on March 1, 2009, provided the executive remains employed through March 1, 2009. | |
| 12. | Since the pre-established PBG earnings per share performance target was met, these RSUs fully vest on March 1, 2010, provided the executive remains employed through March 1, 2010. | |
| 13. | Since the pre-established PBG earnings per share performance target was met, these RSUs fully vest on March 1, 2011, provided the executive remains employed through March 1, 2011. | |
| 14. | The vesting of this RSU award is contingent upon the satisfaction of a pre-established 2008 and 2009 PBG earnings per share performance target, achievement of specific performance criteria and continued employment through January 1, 2012. | |
| 15. | These RSUs fully vest on June 1, 2010, provided the executive remains employed through June 1, 2010. | |
| 16. | These RSUs fully vest on March 1, 2011, provided the executive remains employed through March 1, 2011. | |
| 17. | This amount includes 1,521 RSUs accumulated as a result of dividend equivalents credited to the executive at the same time and in the same amount as dividends were paid to shareholders of PBG common stock in accordance with the governing RSU agreement. | |
| 18. | This amount includes 2,016 RSUs accumulated as a result of dividend equivalents credited to the executive at the same time and in the same amount as dividends were paid to shareholders of PBG common stock in accordance with the governing RSU agreement. | |
| 19. | This amount includes 1,175 RSUs accumulated as a result of dividend equivalents credited to the executive at the same time and in the same amount as dividends were paid to shareholders of PBG common stock in accordance with the governing RSU agreement. | |
| 20. | This amount includes 760 RSUs accumulated as a result of dividend equivalents credited to the executive at the same time and in the same amount as dividends were paid to shareholders of PBG common stock in accordance with the governing RSU agreement. | |
| 21. | This amount includes 504 RSUs accumulated as a result of dividend equivalents credited to the executive at the same time and in the same amount as dividends were paid to shareholders of PBG common stock in accordance with the governing RSU agreement. | |
| 22. | This amount includes 235 RSUs accumulated as a result of dividend equivalents credited to the executive at the same time and in the same amount as dividends were paid to shareholders of PBG common stock in accordance with the governing RSU agreement. | |
| 23. | This amount includes 199 RSUs accumulated as a result of dividend equivalents credited to the executive at the same time and in the same amount as dividends were paid to shareholders of PBG common stock in accordance with the governing RSU agreement. | |
| 24. | This amount includes 135 RSUs accumulated as a result of dividend equivalents credited to the executive at the same time and in the same amount as dividends were paid to shareholders of PBG common stock in accordance with the governing RSU agreement. | |
| 25. | This amount includes 609 RSUs accumulated as a result of dividend equivalents credited to the executive at the same time and in the same amount as dividends were paid to shareholders of PBG common stock in accordance with the governing RSU agreement. | |
| 26. | The closing price for a share of PBG common stock on December 26, 2008, the last trading day of PBG’s fiscal year, was $22.00. This price is below the exercise price of the option awards. Therefore, all of the option awards are “out of the money” and have no intrinsic value to the executive. |
90
Table of Contents
Option Exercises and Stock Vested In Fiscal Year 2008
| Option Awards | Stock Awards | ||||||||||||||||
| Number of Shares | Value Realized | Number of Shares | Value Realized | ||||||||||||||
| Name | Acquired on Exercise (#) | on Exercise ($) | Acquired on Vesting (#) | on Vesting ($) | |||||||||||||
| Eric J. Foss | 0 | 0 | 0 | 0 | |||||||||||||
| Alfred H. Drewes | 0 | 0 | 0 | 0 | |||||||||||||
| Thomas M. Lardieri | 0 | 0 | 0 | 0 | |||||||||||||
Pension Benefits for the 2008 Fiscal Year
| Number of Years | Present Value of | Payments During | ||||||||||||||
| Credited Service | Accumulated Benefit | Last Fiscal Year | ||||||||||||||
| Name | Plan Name | (#)(1) | ($)(2) | ($) | ||||||||||||
| Eric J. Foss | PBG Salaried Employees Retirement Plan | 26.6 | 462,000 | 0 | ||||||||||||
| PBG Pension Equalization Plan | 26.6 | 3,626,000 | 0 | |||||||||||||
| Alfred H. Drewes | PBG Salaried Employees Retirement Plan | 26.6 | (3) | 565,000 | 0 | |||||||||||
| PBG Pension Equalization Plan | 26.6 | (3) | 1,887,000 | 0 | ||||||||||||
| Thomas M. Lardieri | PBG Salaried Employees Retirement Plan | 20.0 | (4) | 308,000 | 0 | |||||||||||
| PBG Pension Equalization Plan | 20.0 | (4) | 438,000 | 0 | ||||||||||||
| 1. | The number of years of service shown for each executive includes service with PepsiCo, PBG’s parent company prior to March 31, 1999, at which time PBG became a separate, publicly traded company. The executive’s service with PepsiCo prior to March 31, 1999 has not been separately identified and the benefit attributable to such service has not been separately quantified for such period. Any benefit amount attributable to the executive’s service with PepsiCo after March 31, 1999 has been separately identified and quantified. In this regard, periods of PepsiCo service that Mr. Drewes and Mr. Lardieri accrued after PBG became a separate company have been separately identified and quantified in footnotes 3 (for Mr. Drewes) and 4 (for Mr. Lardieri). PBG’s policy for granting extra years of credited service is discussed in more detail in the CD&A and in the Narrative to the Pension Benefits Table. | |
| 2. | The material assumptions used to quantify the present value of the accumulated benefit for each executive are set forth in Note 11, Pension and Postretirement Medical Benefit Plans, to Bottling LLC’s Annual Report on Form 10-K for the fiscal year ended December 27, 2008, except for the generally applicable assumptions regarding retirement age and pre-retirement mortality. | |
| 3. | Mr. Drewes transferred from PepsiCo on June 25, 2001. The years of credited service shown above include all prior PepsiCo service. However, only the portion of the pension benefit attributable to Mr. Drewes’ PepsiCo service that accrued after March 31, 1999 (two years of service) has been separately quantified as follows: $33,000 under the PBG Salaried Employees Retirement Plan and $120,000 under the PBG Pension Equalization Plan. PepsiCo transferred to the PBG Salaried Employees Retirement Plan an amount equal to the present value of Mr. Drewes’ pension benefit under the PepsiCo Salaried Employees Retirement Plan at the time Mr. Drewes transferred to PBG. | |
| 4. | Mr. Lardieri transferred from PepsiCo on June 1, 2007. The years of credited service shown above include all prior PepsiCo service. However, only the portion of the pension benefit attributable to Mr. Lardieri’s PepsiCo service that accrued after March 31, 1999 (eight years of service) has been separately quantified as follows: $101,000 under the PBG Salaried Employees Retirement Plan and $148,000 under the PBG Pension Equalization Plan. PepsiCo transferred to the PBG Salaried Employees Retirement Plan an amount equal to the present value of Mr. Lardieri’s pension benefit under the PepsiCo Salaried Employees Retirement Plan at the time Mr. Lardieri transferred to PBG. |
91
Table of Contents
Narrative to the Pension Benefits Table
This narrative describes the terms of the PBG Salaried Employees Retirement Plan (“Salaried Plan”) and the Pension Equalization Plan (“PEP”) in effect during 2008. The narrative does not describe certain changes to the Salaried Plan and the PEP that became effective during 2009, which are discussed in the CD&A.
The PBG Salaried Employees Retirement Plan. The Salaried Plan, a tax qualified defined benefit pension plan, generally covers salaried employees in the U.S. hired by PBG or PepsiCo in the case of an Approved Transfer before January 1, 2007, who have completed one year of service. Eligible employees hired after January 1, 2007 participate in a defined contribution plan and receive an annual employer contribution of two percent of eligible pay. All of our Named Executive Officers were hired before January 1, 2007.
Benefits are payable under the Salaried Plan to participants with five or more years of service commencing on the later of age 65 or retirement. Benefits are determined based on a participant’s earnings (which generally include base pay or salary, regular bonuses, and short term disability pay; and exclude income resulting from equity awards, extraordinary bonuses, fringe benefits, and earnings that exceed the applicable dollar limit of Section 401(a)(17) of the Code) and credited service (generally, service as an eligible employee). The primary purpose of the Salaried Plan is to provide retirement income to eligible employees.
The annual retirement benefit formula for a participant with at least five years of service on December 31, 1999 is (a) 3% of the participant’s average earnings in the five consecutive calendar years in which earnings were the highest for each year of credited service up to ten years, plus (b) an additional 1% of such average earnings for each year of credited service in excess of ten years, minus (c) 0.43% of average earnings up to the Social Security covered compensation multiplied by years of credited service up to 35 years (“Basic Formula”). If a participant did not have five years of service on December 31, 1999, the retirement benefit formula is 1% of the participant’s average earnings in the five consecutive calendar years in which earnings were the highest for each year of credited service (“Primary Formula”).
A participant who has attained age 55 and completed ten years of vesting service may retire and begin receiving early retirement benefits. If the participant retires before age 62, benefits are reduced by 1/3 of 1% for each month (4% for each year) of payment before age 62.
Retirees have several payment options under the Salaried Plan. With the exception of the single lump sum payment option, each payment form provides monthly retirement income for the life of the retiree. Survivor options provide for continuing payments in full or part for the life of a contingent annuitant and, if selected, the survivor option reduces the benefit payable to the participant during his or her lifetime.
A participant with five or more years of service who terminates employment prior to attaining age 55 and completing ten years of service is entitled to a deferred vested benefit. The deferred vested benefit of a participant entitled to a benefit under the Basic Formula described above is equal to the Basic Formula amount calculated based on projected service to age 65 prorated by a fraction, the numerator of which is the participant’s credited service at termination of employment and the denominator of which is the participant’s potential credited service had the participant remained employed to age 65. The deferred vested benefit of a participant entitled to a benefit under the Primary Formula described above is the Primary Formula amount, determined based on earnings and credited service as of the date employment terminates. Deferred vested benefits are payable commencing at age 65. However, a participant may elect to commence benefits as early as age 55 on an actuarially reduced basis to reflect the longer payment period. Deferred vested benefits are payable in the form of a single life annuity or a joint and survivor annuity with the participant’s spouse as co-annuitant.
The Salaried Plan also provides survivor spouse benefits in the event of a participant’s death prior to commencement of benefits under the Salaried Plan. After a participant’s benefits have commenced, any survivor benefits are determined by the form of payment elected by the participant.
The Salaried Plan provides extra years of credited service for participants who become totally and permanently disabled after completing at least ten years of vesting service, and with respect to pre-participation service in connection with specified events such as plan mergers, acquired groups of employees, designated employees who transfer to PBG from PepsiCo, and other special circumstances. Salaried Plan benefits are generally offset by any other qualified plan benefit the participant is entitled to under a plan maintained or contributed to by PBG.
The PBG Pension Equalization Plan.The PEP is an unfunded nonqualified defined benefit pension plan designed to provide (i) additional benefits to participants whose Salaried Plan benefits are limited due to the annual compensation limit in Section 401(a)(17) of the Code
92
Table of Contents
and the annual benefit limit in Section 415 of the Code, and (ii) a subsidized 50% joint and survivor annuity for certain retirement eligible employees based on the Salaried Plan’s benefit formula using the participant’s total compensation including earnings that otherwise would be used to determine benefits payable under the Salaried Plan. Generally, for benefits accrued and vested prior to January 1, 2005 (“grandfathered PEP benefits”), a participant’s PEP benefit is payable under the same terms and conditions of the Salaried Plan, which include various actuarially equivalent forms as elected by participants, including lump sums. In addition, if the lump sum value of the grandfathered PEP benefit does not exceed $10,000, the benefit is paid as a single lump sum. Benefits accrued or vested on or after January 1, 2005 are payable as a lump sum at termination of employment; provided that a PEP participant who attained age 50 on or before January 1, 2009 was provided a one-time opportunity to elect to receive such benefits in the form of an annuity commencing on retirement. The PEP benefit, calculated under the terms of the plan in effect at fiscal year end, is equal to the Salaried Plan benefit, as determined without regard to the Code’s annual compensation limit and the annual benefit limit, less the actual benefit payable under the Salaried Plan. However, the PEP benefit of a participant who had eligible earnings in 1988 in excess of $75,000, including Mr. Drewes, is payable as a subsidized 50% joint and survivor annuity benefit. The subsidized 50% joint and survivor benefit pays an unreduced benefit for the lifetime of the participant and 50% of that benefit amount to the surviving spouse upon the death of the participant.
Nonqualified Deferred Compensation for the 2008 Fiscal Year
| Aggregate | ||||||||||||||||||||
| Executive | Company | Aggregate Earnings | Withdrawals/ | Aggregate | ||||||||||||||||
| Contributions | Contributions | in Last FY | Distributions | Balance at | ||||||||||||||||
| Name | in Last FY ($) | in Last FY ($) | ($) | ($) | Last FYE ($)(5) | |||||||||||||||
| Eric J. Foss | 902,790 | 0 | (1,316,342 | ) | 0 | 1,889,821 | (1) | |||||||||||||
| Alfred H. Drewes | 536,817 | 0 | (505,210 | ) | 0 | 2,098,835 | (2) | |||||||||||||
| Thomas M. Lardieri | 64,692 | (3) | 0 | (21,214 | ) | 0 | 72,843 | (4) | ||||||||||||
| 1. | $1,965,025 of Mr. Foss’ aggregate balance was previously reported as compensation in Summary Compensation Tables for prior years. | |
| 2. | $675,899 of Mr. Drewes’ aggregate balance was previously reported as compensation in Summary Compensation Tables for prior years. | |
| 3. | $64,692 is reported as compensation in the “Salary” column of the Summary Compensation Table to this Executive Compensation section. | |
| 4. | $31,500 of Mr. Lardieri’s aggregate balance was previously reported as compensation in Summary Compensation Tables for prior years. This amount also includes an additional $2,423 that was inadvertently omitted from the total reflected in the “Executive Contributions in Last FY” column of the Nonqualified Deferred Compensation Table in last year’s Executive Compensation section of Bottling LLC’s Annual Report on Form 10-K for the fiscal year ended December 29, 2007 due to a reporting error by the third party administrator for the nonqualified deferred compensation plan. | |
| 5. | The amount reflected in this column for Mr. Drewes includes compensation deferred by the Named Executive Officer over the entirety of his career at both PepsiCo and PBG. |
Narrative to the Nonqualified Deferred Compensation Table
The Deferral Program is the only nonqualified elective deferred compensation program sponsored by PBG. The Deferral Program is administered by the Committee. All PBG executives on the U.S. payroll, including our Named Executive Officers, are eligible to participate in the Deferral Program. The Deferral Program allows executives to defer receipt of compensation in excess of compensation limits imposed by the Internal Revenue Code under PBG’s 401(k) plan and to defer federal and state income tax on the deferred amounts, including earnings, until such time as the deferred amounts are paid out. PBG makes no contributions to the Deferral Program on behalf of executives. The Deferral Program is unfunded and the executive’s deferrals under the Deferral Program are at all times subject to the claims of PBG’s general creditors.
93
Table of Contents
The terms and conditions of the Deferral Program vary with respect to deferrals made or vested on and after January 1, 2005. Such deferrals are subject to the requirements of Section 409A of the Code (“409A”) which became effective on such date. Deferrals made or vested before January 1, 2005 are not subject to the requirements of 409A (“grandfathered deferrals”).
Deferrals of Base Salary and Annual Non-Equity Incentive Award.Executives may irrevocably elect to defer up to 80% of their annual base salary and 100% of their annual non-equity incentive award (“Bonus”). In addition to elective deferrals, the Committee may mandate deferral of a portion of an executive’s base salary in excess of one million dollars.
Phantom Investment Options.Executives select the phantom investment option(s) from those available under the terms of the Deferral Program. The phantom investment options available under the Deferral Program are a subset of the funds available under PBG’s 401(k) plan. Consequently, amounts deferred under the Deferral Program are subject to the same investment gains and losses during the deferral period as experienced by the participants in PBG’s 401(k) plan. Executives may change investment option elections and transfer balances between investment options on a daily basis.
The phantom investment options currently available under the Deferral Program and their 2008 rates of return are:
| PHANTOM FUND | FYE RETURN RATE (%) | |||
| The Phantom PBG Stock Fund | (41.00 | ) | ||
| The Phantom Security Plus Fund | 4.19 | |||
| The Phantom Bond Index Fund | 5.46 | |||
| The Phantom Total U.S. Equity Index Fund | (37.01 | ) | ||
| The Phantom Large Cap Equity Index Fund | (36.93 | ) | ||
| The Phantom Mid Cap Equity Index Fund | (36.09 | ) | ||
| The Phantom Small Cap Equity Index Fund | (33.66 | ) | ||
| The Phantom International Equity Index Fund | (43.26 | ) | ||
Time and Form of Payment.Prior to deferral, executives are required to elect a specific payment date or payment event as well as the form of payment (lump sum or quarterly, semi-annual, or annual installments for a period of up to twenty years). The Committee selects the time and form of payment for mandatory deferrals. Executives with grandfathered deferrals are required to elect a specific payment date or event prior to deferral, but may elect the form of payment at a later date nearer to the payment date (not later than December 31 of the calendar year preceding the year of the scheduled payment and at least six months in advance of the scheduled payment date).
Deferral Periods.Salary and Bonus deferrals are subject to minimum and maximum deferral periods. The minimum deferral period for salary deferrals is one year after the end of the applicable base salary year. The minimum deferral period for Bonus deferrals is two years after the Bonus payout would have been made but for the deferral.
Distribution Rules.In general, deferrals are paid out in accordance with the executive’s deferral election, subject to the minimum deferral periods. The Deferral Program provides that, notwithstanding the minimum deferral periods or the executive’s time and form of payment elections, deferrals will automatically be paid out in a lump sum in the event of death, disability or a separation from service for reasons other than retirement (unless installment payments have already begun in which case they would continue to be paid without acceleration). Generally, payment will be made three months after the end of the quarter in which the separation from service occurred. However, special rules apply for “key employees,” as defined under 409A (which would encompass all Named Executive Officers). In the event of a separation from service, the Named Executive Officers may not receive a distribution for at least six months following separation from service. This six month rule does not apply in the event of the Named Executive Officer’s death or disability.
Generally, payment of grandfathered deferrals is made in the form of a lump sum in the event of voluntary termination of employment or termination of employment as a result of misconduct but only after the minimum deferral periods have been satisfied. If the executive’s balance is greater than $25,000, the executive will be paid out in a lump sum a year after their last day of employment. However, special distribution rules apply when an executive separates from service after reaching retirement eligibility (age 55 with ten years of service). In such case, payment is made in the time and form elected by the executive.
Deferral Extensions (Second-Look Elections).In general, executives may extend their original deferral period by making a subsequent deferral election. This modification of an original deferral election is often referred to as a “second-look” election. More stringent requirements apply to second-look elections related to deferrals subject to 409A since 409A requires that any second-look
94
Table of Contents
election must be made at least 12 months prior to the originally scheduled payout date and the second-look election must provide for a deferral period of at least five years from the originally scheduled payment date. Grandfathered deferrals may also be extended at the election of the executive provided the election is made no later than December 31 of the year preceding the originally scheduled payout date and at least six months in advance of the originally scheduled payout date and is for a minimum deferral of at least two years from the originally scheduled payment date.
Hardship Withdrawals.Accelerated distribution is only permissible upon the executive’s showing of severe, extraordinary and unforeseen financial hardship.
Potential Payments Upon Termination or Change In Control
The terms and conditions of PBG’s compensation and benefit programs govern all payments to all eligible employees, including the Named Executive Officers. Neither PBG nor the Company have any separate written or unwritten agreement with any Named Executive Officer regarding payment of any kind at, following or in connection with termination of employment for any reason including, without limitation, retirement, an Approved Transfer to PepsiCo, a change in responsibilities, or upon a change in control of PBG (collectively, “Termination”). As such, the Named Executive Officers are not entitled to any payment outside the written terms of the LTIP or the PBG-sponsored (i) qualified and nonqualified pension plans, (ii) qualified and nonqualified defined contribution plans, (iii) non-U.S. pension and severance plans, or (iv) employee welfare benefit plans. None of PBG’s compensation or benefit programs provide for any perquisites or tax reimbursements by PBG upon Termination.
This narrative and the accompanying tables are intended to show the value of all potential payments that would be payable, under the terms of the plans in effect on December 26, 2008, to the Named Executive Officers upon any event of Termination to the extent that the Termination would result in a payment or benefit that is not generally available to all salaried employees of PBG and that is incremental to, or an enhancement of, the payments and benefits described or shown in any preceding narrative or table in this Executive Compensation section.
Nonqualified Pension Benefits. The PEP benefits accrued and vested before 2005 would provide a deferred vested pension benefit, payable as an annual annuity for the life of the executive or as a joint and survivor annuity with the executive’s spouse commencing at the same time and in the same form as the qualified plan benefit. An unreduced benefit would commence at age 65; actuarially reduced benefits may be elected as early as age 55. PEP benefits accrued or vested after 2004 are generally payable in a single lump sum payment on termination of employment (six months following termination in the case of key employees). The deferred vested PEP benefit is significantly less than the benefit that would be payable to the executive had he remained employed until age 55 and is significantly less than the benefit valued in the Pension Benefits Table, which was calculated assuming the executive works until age 62, the earliest age at which unreduced benefits are available to a plan participant. No pension benefit would be payable in an enhanced form or in an amount in excess of the value shown in the Pension Benefits Table except in the event of death. Therefore, we have not separately quantified pension benefits payable upon any event of Termination other than death under the terms of the PEP in effect on December 26, 2008.
Death. Under the terms of the PEP, a pre-retirement survivor spouse benefit would be payable with respect to pre-2005 accrued and vested PEP benefits, payable in the form of an annuity for the life of the surviving spouse. Surviving spouse benefits for post-2004 accrued and vested PEP benefits are payable in a single lump sum payment.
The table below reflects the PEP pension benefit that would be payable to the surviving spouse of each Named Executive Officer in the event of the executive’s death on December 26, 2008. To the extent the Named Executive Officer continues active service, the amounts shown below generally will increase year over year based on increases in eligible pay and service credit. The payments would be in lieu of the benefit valued in the Pension Benefits Table.
| Death | |||||||||||||
| Name | Plan Name | Annual Annuity | Lump Sum | ||||||||||
| Eric J. Foss | PBG Pension Equalization Plan | $ | 34,000 | $ | 3,239,000 | ||||||||
| Alfred H. Drewes | PBG Pension Equalization Plan | 16,000 | 1,199,000 | ||||||||||
| Thomas M. Lardieri | PBG Pension Equalization Plan | N/A | 624,000 | ||||||||||
95
Table of Contents
LTIP. The LTIP’s provisions apply to all PBG equity awards made to employees of PBG, including the Named Executive Officers, and, with few exceptions, the terms of the individual LTIP agreements provide for accelerated vesting of stock options and RSUs upon death, disability, retirement and Approved Transfer to PepsiCo. This accelerated vesting is pro-rata or 100% depending on the triggering event as more fully described below. The payments that would result from each triggering event are quantified for each Named Executive Officer in the table below. The amounts were calculated based on the closing market price of PBG common stock on December 26, 2008, the last trading day of PBG’s fiscal 2008, and reflect the incremental value to the executive that would result from the accelerated vesting of unvested equity awards.
Disability. In the event of the Disability of a Named Executive Officer, a pro-rata number of stock options vest in proportion to the executive’s active employment during the vesting period. The stock options would remain exercisable for the remainder of their original ten-year term. RSUs vest in the same pro-rata manner and would be paid out immediately upon vesting.
Death.In the event of the death of a Named Executive Officer, all unvested stock options vest automatically and remain exercisable by the executive’s estate for the remainder of their original ten-year term. In general, RSUs similarly vest automatically and are immediately paid out in shares of PBG common stock to the executive’s legal representative or heir. This automatic vesting does not apply to the October 7, 2005 RSU award granted to Mr. Foss as reflected in the Outstanding Equity Awards Table, and the special award of performance-based RSUs (Strategic Leadership Award) granted to Mr. Drewes on January 1, 2008 as reflected in the Grants of Plan-Based Awards Table, that instead provide for pro-rata vesting upon the death of the executive. The pro-rata number of RSUs that would vest is in proportion to the executive’s active employment during the vesting period.
Retirement. In general, if a Named Executive Officer retires (generally, after attaining age 55 with ten or more years of service), a pro-rata number of stock options and RSUs would vest in proportion to executive’s active employment during the vesting period subject to achievement of any applicable performance-based vesting condition. Certain RSU awards to the Named Executive Officer contain different retirement provisions. In particular, the October 7, 2005 RSU award granted to Mr. Foss as reflected in the Outstanding Equity Awards Table, and the special award of performance-based RSUs (Strategic Leadership Award) granted to Mr. Drewes on January 1, 2008 as reflected in the Grants of Plan-Based Awards Table, do not provide for accelerated vesting and payout upon retirement. Since no Named Executive Officer was eligible for early or normal retirement during 2008, there is no quantification of vesting or payout based upon such occurrence.
Approved Transfer to PepsiCo. In general, if a Named Executive Officer transfers to PepsiCo with the approval of the PBG, all stock options and RSUs would fully vest on the date of transfer subject to achievement of any applicable performance-based vesting condition. The stock options would remain exercisable for the remainder of their original ten-year term provided the Named Executive Officer remains actively employed at PepsiCo. In the event of termination from PepsiCo during the original term, the Named Executive Officer would have a limited number of days from the date of termination to exercise his stock options or they would be automatically cancelled. Generally, RSUs would vest and be paid out immediately upon an Approved Transfer to PepsiCo subject to achievement of any applicable performance-based vesting condition. However, the October 7, 2005 RSU award granted to Mr. Foss as reflected in the Outstanding Equity Awards Table, and the special award of performance-based RSUs (Strategic Leadership Award) granted to Mr. Drewes on January 1, 2008 as reflected in the Grants of Plan-Based Awards Table, do not provide for accelerated vesting and payout upon Approved Transfer.
Change in Control. The LTIP change in control provisions apply to PBG equity awards made to all employees, including the Named Executive Officers. The LTIP defines a CIC in the context of two circumstances, one related to a change in control of PBG and the other related to a change in control of PepsiCo.
A CIC of the PBG occurs if: (i) any person or entity, other than PepsiCo, becomes a beneficial owner of 50% or more of the combined voting power of PBG’s outstanding securities entitled to vote for directors; (ii) 50% of the directors (other than directors approved by a majority of the PBG’s directors or by PepsiCo) change in any consecutive two-year period; (iii) PBG is merged into or consolidated with an entity, other than PepsiCo, and is not the surviving company, unless PBG’s shareholders before and after the merger or consolidation continue to hold 50% or more of the voting power of the surviving entity’s outstanding securities; (iv) there is a disposition of all or substantially all of PBG’s assets, other than to PepsiCo or an entity approved by PepsiCo; or (v) any event or circumstance that is intended to effect a change in control of PBG results in any one of the events set forth in (i) through (iv).
A CIC of PepsiCo occurs if: (i) any person or entity acquires 20% or more of the outstanding voting securities of PepsiCo; (ii) 50% of the directors (other than directors approved by a majority of the PepsiCo directors) change in any consecutive two-year period; (iii) PepsiCo shareholders approve, and there is completed, a merger or consolidation with another entity, and PepsiCo is not the surviving company; or, if after such transaction, the other entity owns, directly or indirectly, 50% or more of PepsiCo’s
96
Table of Contents
outstanding voting securities; (iv) PepsiCo shareholders approve a plan of complete liquidation of PepsiCo or the disposition of all or substantially all of PepsiCo’s assets; or (v) any event or circumstance that is intended to effect a change in control of PepsiCo results in any one of the events set forth in (i) through (iv).
In general, in the event of a CIC of PBG or PepsiCo, all unvested PBG stock options immediately vest and are exercisable during their original term. RSUs immediately vest in the event of a CIC of PBG or PepsiCo and are payable upon vesting.
The following table reflects the incremental value the executive would receive as a result of accelerated vesting of unvested stock options and RSUs had a triggering event occurred on December 26, 2008. The value was calculated using the closing market price of a share of PBG common stock on December 26, 2008, the last trading day of PBG’s fiscal 2008.
| Approved Transfer | Change | |||||||||||||||
| to | In | |||||||||||||||
| Name | Disability | Death | PepsiCo | Control | ||||||||||||
| Eric J. Foss | $ | 3,836,177 | $ | 5,666,101 | $ | 3,882,352 | $ | 6,648,148 | ||||||||
| Alfred H. Drewes | 882,373 | 1,291,910 | 1,085,159 | 1,929,391 | ||||||||||||
| Thomas M. Lardieri | 133,338 | 348,342 | 348,342 | 348,342 | ||||||||||||
Nonqualified Deferred Compensation Plan.The Named Executive Officers’ deferred compensation balances under the Deferral Program and a description of the Deferral Program’s payment provisions are set forth in the Nonqualified Deferred Compensation Table and accompanying narrative. No triggering event would serve to enhance such amounts. However, under the terms of the Deferral Program, the deferred compensation balances set forth in the Nonqualified Deferred Compensation Table would be payable in the form of a lump sum in the event of death or separation from service for reasons other than retirement notwithstanding the Named Executive Officer’s election as to time and form of payment.
Severance. Neither PBG nor the Company has any agreement to provide any form of severance payment to a Named Executive Officer.
Benefits Generally Available to All Salaried Employees. There are a number of employee benefits generally available to all salaried employees upon termination of employment. In accordance with SEC guidelines, these benefits are not discussed above since they do not discriminate in scope, terms or operation in favor of the Company’s executive officers. These include tax-qualified retirement benefits, life insurance, long-term disability, retiree medical, health care continuation coverage mandated by the Consolidated Omnibus Budget Reconciliation Act of 1986 (“COBRA”).
Compensation of Managing Directors. Individuals do not receive additional compensation or benefits for serving as Managing Directors of Bottling LLC.
Compensation Committee Interlocks and Insider Participation.Bottling LLC does not have a compensation committee because our executive compensation program is overseen by the Compensation and Management Development Committee of PBG’s Board of Directors. During fiscal year 2008, the following individuals served as members of PBG’s Compensation and Management Development Committee: Linda G. Alvarado, Barry H. Beracha, Ira D. Hall, Susan D. Kronick, Blythe J. McGarvie, John A. Quelch and Javier G. Teruel. None of these individuals has ever served as an officer or employee of PBG, Bottling LLC or any of its subsidiaries. Ms. Alvarado has an indirect business relationship with PBG as described below under “Relationships and Transactions with Management and Others.” PBG’s Compensation and Management Development Committee members have no interlocking relationships requiring disclosure under the rules of the SEC.
97
Table of Contents
ITEM 12. SECURITY OWNERSHIP OF CERTAIN BENEFICIAL OWNERS AND MANAGEMENT AND RELATED STOCKHOLDER MATTERS
PBG holds 93.4% and PepsiCo holds 6.6% of the ownership of Bottling LLC. PBG’s address is One Pepsi Way, Somers, New York 10589 and PepsiCo’s address is 700 Anderson Hill Road, Purchase, New York 10577.
ITEM 13. CERTAIN RELATIONSHIPS AND RELATED TRANSACTIONS, AND DIRECTOR INDEPENDENCE
Although Bottling LLC may not be a direct party to the following transactions, as the principal operating subsidiary of PBG, it derives certain benefits from them. Accordingly, set forth below is information relating to certain transactions between PBG and PepsiCo. In addition, set forth below is information relating to certain transactions between Bottling LLC and PBG (“PBG/Bottling LLC Transactions”) and certain transactions with management and others.
Stock Ownership and Director Relationships with PepsiCo.PBG was initially incorporated in January 1999 as a wholly owned subsidiary of PepsiCo to effect the separation of most of PepsiCo’s company-owned bottling businesses. PBG became a publicly traded company on March 31, 1999. As of January 23, 2009, PepsiCo’s ownership represented 33.1% of PBG’s outstanding common stock and 100% of PBG’s outstanding Class B common stock, together representing 40.2% of the voting power of all classes of PBG’s voting stock. PepsiCo also owns approximately 6.6% of the equity of Bottling LLC. In addition, Marie T. Gallagher, a Managing Director of Bottling LLC, is an officer of PepsiCo.
Agreements and Transactions with PepsiCo and Affiliates.PBG and PepsiCo (and certain of its affiliates) have entered into transactions and agreements with one another, incident to their respective businesses, and PBG and PepsiCo are expected to enter into material transactions and agreements from time to time in the future. As used in this section, “PBG” includes PBG and its subsidiaries.
Material agreements and transactions between PBG and PepsiCo (and certain of its affiliates) during 2008 are described below.
Beverage Agreements and Purchases of Concentrates and Finished Products. PBG purchases concentrates from PepsiCo and manufactures, packages, distributes and sells carbonated and non-carbonated beverages under license agreements with PepsiCo. These agreements give PBG the right to manufacture, sell and distribute beverage products of PepsiCo in both bottles and cans and fountain syrup in specified territories. The agreements also provide PepsiCo with the ability to set prices of such concentrates, as well as the terms of payment and other terms and conditions under which PBG purchases such concentrates. In addition, PBG bottles water under the Aquafina trademark pursuant to an agreement with PepsiCo, which provides for the payment of a royalty fee to PepsiCo. In certain instances, PBG purchases finished beverage products from PepsiCo. During 2008, total payments by PBG to PepsiCo for concentrates, royalties and finished beverage products were approximately $2.9 billion.
There are certain manufacturing cooperatives whose assets, liabilities and results of operations are consolidated in our financial statements. Concentrate purchases from PepsiCo by these cooperatives for the years ended 2008, 2007 and 2006 were $140 million, $143 million and $72 million, respectively.
Transactions with Joint Ventures in which PepsiCo holds an equity interest.PBG purchases tea concentrate and finished beverage products from the Pepsi/Lipton Tea Partnership, a joint venture of Pepsi-Cola North America, a division of PepsiCo, and Lipton. During 2008, total amounts paid or payable to PepsiCo for the benefit of the Pepsi/Lipton Tea Partnership were approximately $279 million.
PBG purchases finished beverage products from the North American Coffee Partnership, a joint venture of Pepsi-Cola North America and Starbucks in which PepsiCo has a 50% interest. During 2008, amounts paid or payable to the North American Coffee Partnership by PBG were approximately $278 million.
Under tax sharing arrangements we have with PepsiCo and PepsiCo joint ventures, we received approximately $1 million in tax related benefits in 2008.
As a result of the formation of PR Beverages, PepsiCo has agreed to contribute $83 million plus accrued interest to the venture in the form of property, plant and equipment. During 2008, PepsiCo has contributed $34 million in regards to this note.
98
Table of Contents
During the second half of 2008, together with PepsiCo, we completed a joint acquisition of JSC Lebedyansky (“Lebedyansky”) for approximately $1.8 billion. Lebedyansky was acquired 58.3 percent by PepsiCo and 41.7 percent by PR Beverages, our Russian venture with PepsiCo. We and PepsiCo have an ownership interest in PR Beverages of 60 percent and 40 percent, respectively. As a result, PepsiCo and we have acquired a 75 percent and 25 percent economic stake in Lebedyansky, respectively.
Purchase of Frito-Lay Snack Food Products.Pursuant to a Distribution Agreement between PR Beverages and Frito-Lay Manufacturing, LLC, a wholly-owned subsidiary of PepsiCo, PR Beverages purchases snack food products from Frito-Lay Manufacturing for sale and distribution through Russia. In 2008, amounts paid or payable by PR Beverages to Frito-Lay Manufacturing were approximately $355 million.
Shared Services. PepsiCo provides various services to PBG pursuant to a shared services agreement and other arrangements, including information technology maintenance and the procurement of raw materials. During 2008, amounts paid or payable to PepsiCo for these services totaled approximately $52 million.
Pursuant to the shared services agreement and other arrangements, PBG provides various services to PepsiCo, including credit and collection, international tax and supplier services. During 2008, payments to PBG from PepsiCo for these services totaled approximately $3 million.
Rental Payments.Amounts paid or payable by PepsiCo to PBG for rental of office space at certain PBG facilities were approximately $4 million in 2008.
National Fountain Services. PBG provides certain manufacturing, delivery and equipment maintenance services to PepsiCo’s national fountain customers in specified territories. In 2008, net amounts paid or payable by PepsiCo to PBG for these services were approximately $187 million.
Bottler Incentives. PepsiCo provides PBG with marketing support in the form of bottler incentives. The level of this support is negotiated annually and can be increased or decreased at the discretion of PepsiCo. These bottler incentives are intended to cover a variety of programs and initiatives, including direct marketplace support (including point-of-sale materials) and advertising support. For 2008, total bottler incentives received from PepsiCo, including media costs shared by PepsiCo, were approximately $691 million.
PepsiCo Guarantees. The $1.0 billion of 4.63% senior notes due November 2012 issued by us on November 15, 2002 and the $1.3 billion of 6.95% senior notes due February 2014 issued by us on October 24, 2008 are guaranteed by PepsiCo in accordance with the terms set forth in the related indentures.
PBG/Bottling LLC Transactions.PBG is considered a related party, as we are the principal operating subsidiary of PBG and we make up substantially all of the operations and assets of PBG. At December 27, 2008, PBG owned approximately 93.4% of our equity.
PBG provides insurance and risk management services to us pursuant to a contractual agreement. Total premiums paid to PBG during 2008 were $113 million.
On March 8, 1999, PBG issued $1 billion of 7% senior notes due 2029, which are guaranteed by us.
PBG has a $1.2 billion commercial paper program that is supported by a $1.1 billion committed credit facility and an uncommitted credit facility of $500 million. Both of these credit facilities are guaranteed by us. At December 27, 2008, PBG had no outstanding commercial paper.
Throughout 2008 we loaned $839 million to PBG, net of repayments through a series of 1-year notes with interest rates ranging from approximately 2.5% to 4.5%. In addition, at the end of the year PBG repaid $1,027 million of the outstanding intercompany loans owed to us. The resulting net decrease in the notes receivable from PBG in 2008 was $188 million. Total intercompany loans owed to us from PBG at December 27, 2008 were $3,692 million. The proceeds were used by PBG to pay for interest, taxes, dividends and share repurchases. Accrued interest receivable from PBG on these notes totaled $118 million at December 27, 2008.
99
Table of Contents
Bottling LLC Distribution.We guarantee that to the extent there is available cash, we will distribute pro rata to PBG and PepsiCo sufficient cash such that the aggregate cash distributed to PBG will enable PBG to pay its taxes, share repurchases, dividends and make interest payments for its internal and external debt. During 2008, in accordance with our Limited Liability Company Agreement we made cash distributions to PepsiCo in the amount of $73 million and to PBG in the amount of $1,029 million.
Relationships and Transactions with Management and Others.One of our Managing Directors is an employee and officer of PepsiCo and the other Managing Directors and officers are employees of PBG. Linda G. Alvarado, a member of PBG’s Board of Directors, together with certain of her family members, wholly own interests in several YUM Brands franchise restaurant companies that purchase beverage products from PBG. In 2008, the total amount of these purchases was approximately $593,000.
ITEM 14. PRINCIPAL ACCOUNTANT FEES AND SERVICES
INDEPENDENT ACCOUNTANTS FEES AND SERVICES
Deloitte & Touche LLP has served as our independent registered public accounting firm since June 2005. In addition to retaining independent accountants to audit our consolidated financial statements for 2008, we and our affiliates retained Deloitte & Touche LLP, as well as other accounting firms, to provide various services in 2008. The aggregate fees billed for professional services by Deloitte & Touche LLP in 2008 and 2007 were as follows:
Audit and Non-Audit Fees
(in millions)
(in millions)
| 2008 | 2007 | |||||||
Audit Fees(1) | $ | 5.8 | $ | 5.6 | ||||
Audit-Related Fees(2) | $ | 0.8 | $ | 0.7 | ||||
Tax Fees(3) | $ | 0.4 | $ | 0.3 | ||||
| All Other Fees | $ | 0.0 | $ | 0.0 | ||||
| Total | $ | 7.0 | $ | 6.6 | ||||
| (1) | Represents fees for the audit of our consolidated financial statements, audit of internal controls, the reviews of interim financial statements included in our Forms 10-Q and all statutory audits. | |
| (2) | Represents fees primarily related to audits of employee benefit plans and other audit-related services. | |
| (3) | Represents fees primarily related to assistance with tax compliance matters. |
Pre-Approval Policies and Procedures.We have a policy that defines audit, audit-related and non-audit services to be provided to us by our independent registered public accounting firm and requires such services to be pre-approved by PBG’s Audit and Affiliated Transactions Committee. In accordance with our policy and applicable SEC rules and regulations, the Committee or its Chairperson pre-approves such services provided to us. Pre-approval is detailed as to the particular service or category of services. If the services are required prior to a regularly scheduled Committee meeting, the Committee Chairperson is authorized to approve such services, provided that they are consistent with our policy and applicable SEC rules and regulations, and that the full Committee is advised of such services at the next regularly scheduled Committee meeting. The independent accountants and management periodically report to the Committee regarding the extent of the services provided by the independent accountants in accordance with this pre-approval, and the fees for the services performed to date. PBG’s Audit and Affiliated Transactions Committee pre-approved all audit and non-audit fees of Deloitte & Touche LLP billed for fiscal years 2008 and 2007.
100
Table of Contents
PART IV
ITEM 15. EXHIBITS AND FINANCIAL STATEMENT SCHEDULES
(a) 1. Financial Statements. The following consolidated financial statements of Bottling LLC and its subsidiaries are included herein:
Consolidated Statements of Operations — Fiscal years ended December 27, 2008, December 29, 2007 and December 30, 2006.
Consolidated Statements of Cash Flows — Fiscal years ended December 27, 2008, December 29, 2007 and December 30, 2006.
Consolidated Balance Sheets — December 27, 2008 and December 29, 2007.
Consolidated Statements of Changes in Owners’ Equity — Fiscal years ended December 27, 2008, December 29, 2007 and December 30, 2006.
Notes to Consolidated Financial Statements.
Report of Independent Registered Public Accounting Firm
2. Financial Statement Schedules. The following financial statement schedule of Bottling LLC and its subsidiaries is included in this Report on the page indicated:
| Page | ||||
| Schedule II — Valuation and Qualifying Accounts for the fiscal years ended December 27, 2008, December 29, 2007 and December 30, 2006 | F-2 | |||
3. Exhibits
See Index to Exhibits on pages E-1 - E-2.
101
Table of Contents
SIGNATURES
Pursuant to the requirements of Section 13 of the Securities Exchange Act of 1934, Bottling Group, LLC has duly caused this report to be signed on its behalf by the undersigned, thereunto duly authorized.
Dated: February 19, 2009
| Bottling Group, LLC | ||||
| /s/ Eric J. Foss | ||||
| Eric J. Foss | ||||
| Principal Executive Officer | ||||
Pursuant to the requirements of the Securities Exchange Act of 1934, this report has been signed below by the following persons on behalf of Bottling Group, LLC and in the capacities and on the dates indicated.
| SIGNATURE | TITLE | DATE | ||
| /s/ Eric J. Foss | Principal Executive Officer | February 19, 2009 | ||
| Eric J. Foss | ||||
| /s/ Alfred H. Drewes | Principal Financial Officer | February 19, 2009 | ||
| Alfred H. Drewes | ||||
| /s/ Thomas M. Lardieri | Principal Accounting Officer and | February 19, 2009 | ||
| Thomas M. Lardieri | Managing Director | |||
| /s/ Steven M. Rapp | Managing Director | February 19, 2009 | ||
| Steven M. Rapp | ||||
| /s/ Marie T. Gallagher | Managing Director | February 19, 2009 | ||
| Marie T. Gallagher | ||||
S - 1
Table of Contents
INDEX TO FINANCIAL STATEMENT SCHEDULES
| Page | ||||
| Schedule II — Valuation and Qualifying Accounts for the fiscal years ended December 27, 2008, December 29, 2007 and December 30, 2006 | F-2 | |||
F - 1
Table of Contents
SCHEDULE II — VALUATION AND QUALIFYING ACCOUNTS BOTTLING GROUP, LLC
| Balance At | Charges to | Accounts | Foreign | Balance At | ||||||||||||||||||||
| Beginning | Cost and | Written | Currency | End Of | ||||||||||||||||||||
| In millions | Of Period | Expenses | Acquisitions | Off | Translation | Period | ||||||||||||||||||
Fiscal Year Ended December 27, 2008 | ||||||||||||||||||||||||
| Allowance for losses on trade accounts receivable | $ | 54 | $ | 30 | $ | — | $ | (9 | ) | $ | (4 | ) | $ | 71 | ||||||||||
Fiscal Year Ended December 29, 2007 | ||||||||||||||||||||||||
| Allowance for losses on trade accounts receivable | $ | 50 | $ | 11 | $ | — | $ | (10 | ) | $ | 3 | $ | 54 | |||||||||||
Fiscal Year Ended December 30, 2006 | ||||||||||||||||||||||||
| Allowance for losses on trade accounts receivable | $ | 51 | $ | 5 | $ | — | $ | (7 | ) | $ | 1 | $ | 50 | |||||||||||
F - 2
Table of Contents
INDEX TO EXHIBITS
| EXHIBIT NO. | DESCRIPTION OF EXHIBIT | |
3.1 | Articles of Formation of Bottling LLC, which is incorporated herein by reference to Exhibit 3.4 to Bottling LLC’s Registration Statement on Form S-4 (Registration No. 333-80361). | |
3.2 | Amended and Restated Limited Liability Company Agreement of Bottling LLC, which is incorporated herein by reference to Exhibit 3.5 to Bottling LLC’s Registration Statement on Form S-4 (Registration No. 333-80361). | |
3.3 | Amendment No. 1 to Bottling LLC’s Amended and Restated Limited Liability Company Agreement, which is incorporated herein by reference to Exhibit 3.3 to Bottling LLC’s Quarterly Report on Form 10-Q for the quarter ended June 14, 2008. | |
4.1 | Indenture dated as of March 8, 1999 by and among PBG, as obligor, Bottling LLC, as guarantor, and The Chase Manhattan Bank, as trustee, relating to $1,000,000,000 7% Series B Senior Notes due 2029, which is incorporated herein by reference to Exhibit 10.14 to PBG’s Registration Statement on Form S-1 (Registration No. 333-70291). | |
4.2 | Indenture dated as of November 15, 2002 among Bottling LLC, PepsiCo, Inc., as guarantor, and JPMorgan Chase Bank, as trustee, relating to $1,000,000,000 4 5/8% Senior Notes due November 15, 2012, which is incorporated herein by reference to Exhibit 4.8 to PBG’s Annual Report on Form 10-K for the year ended December 28, 2002. | |
4.3 | Registration Rights Agreement dated as of November 7, 2002 relating to the $1,000,000,000 4 5/8% Senior Notes due November 15, 2012, which is incorporated herein by reference to Exhibit 4.8 to Bottling LLC’s Annual Report on Form 10-K for the year ended December 28, 2002. | |
4.4 | Indenture, dated as of June 10, 2003 by and between Bottling LLC, as obligor, and JPMorgan Chase Bank, as trustee, relating to $250,000,000 4 1/8% Senior Notes due June 15, 2015, which is incorporated herein by reference to Exhibit 4.1 to Bottling LLC’s registration statement on Form S-4 (Registration No. 333-106285). | |
4.5 | Registration Rights Agreement dated June 10, 2003 by and among Bottling LLC, J.P. Morgan Securities Inc., Lehman Brothers Inc., Banc of America Securities LLC, Citigroup Global Markets Inc, Credit Suisse First Boston LLC, Deutsche Bank Securities Inc., Blaylock & Partners, L.P. and Fleet Securities, Inc, relating to $250,000,000 4 1/8% Senior Notes due June 15, 2015, which is incorporated herein by reference to Exhibit 4.3 to Bottling LLC’s registration statement on Form S-4 (Registration No. 333-106285). | |
4.6 | Indenture, dated as of October 1, 2003, by and between Bottling LLC, as obligor, and JPMorgan Chase Bank, as trustee, which is incorporated herein by reference to Exhibit 4.1 to Bottling LLC’s Current Report on Form 8-K dated October 3, 2003. | |
4.7 | Form of Note for the $400,000,000 5.00% Senior Notes due November 15, 2013, which is incorporated herein by reference to Exhibit 4.1 to Bottling LLC’s Current Report on Form 8-K dated November 13, 2003. | |
4.8 | Indenture, dated as of March 30, 2006, by and between Bottling LLC, as obligor, and JPMorgan Chase Bank, N.A., as trustee, which is incorporated herein by reference to Exhibit 4.1 to PBG’s Quarterly Report on Form 10-Q for the quarter ended March 25, 2006. | |
4.9 | Form of Note for the $800,000,000 5 1/2% Senior Notes due April 1, 2016, which is incorporated herein by reference to Exhibit 4.2 to PBG’s Quarterly Report on Form 10-Q for the quarter ended March 25, 2006. | |
4.10 | Indenture, dated as of October 24, 2008, by and among Bottling LLC, as obligor, PepsiCo, Inc., as guarantor, and The Bank of New York Mellon, as trustee, relating to $1,300,000,000 6.95% Senior Notes due March 15, 2014, which is incorporated herein by reference to Exhibit 4.1 to Bottling LLC’s Current Report on Form 8-K dated October 21, 2008. | |
4.11 | Form of Note for the $1,300,000,000 6.95% Senior Notes due March 15, 2014, which is incorporated herein by reference to Exhibit 4.2 to Bottling LLC’s Current Report on Form 8-K dated October 21, 2008. | |
4.12 | Form of Note for the $750,000,000 5.125% Senior Notes due January 15, 2019, which is incorporated herein by reference to Exhibit 4.1 to Bottling LLC’s Current Report on Form 8-K dated January 14, 2009. | |
E - 1
Table of Contents
| EXHIBIT NO. | DESCRIPTION OF EXHIBIT | |
10.1 | Private Limited Company Agreement of PR Beverages Limited dated as of March 1, 2007 among PBG Beverages Ireland Limited, PepsiCo (Ireland), Limited and PR Beverages Limited, which is incorporated herein by reference to Exhibit 10.1 to PBG’s Quarterly Report on Form 10-Q for the quarter ended March 24, 2007. | |
10.2 | U.S. $1,200,000,000 First Amended and Restated Credit Agreement dated as of October 19, 2007 among The Pepsi Bottling Group, Inc., as borrower; Bottling Group, LLC, as guarantor; Citigroup Global Markets Inc. and HSBC Securities (USA) Inc., as joint lead arrangers and book managers; Citibank, N.A., as agent; HSBC Bank USA, N.A., as syndication agent; and certain other banks identified in the First Amended and Restated Credit Agreement, which is incorporated herein by reference to Exhibit 10.1 to PBG’s Current Report on Form 8-K dated October 19, 2007 and filed October 25, 2007. | |
10.3 | Insurance Policy between Bottling LLC and Woodlands Insurance Company, Inc., which is incorporated herein by reference to Exhibit 10.1 to Bottling LLC’s Quarterly Report on Form 10-Q for the quarter ended June 14, 2008. | |
10.4 | Form of Promissory Note between The Pepsi Bottling Group, Inc. and Bottling LLC, which is incorporated herein by reference to Exhibit 10.2 to Bottling LLC’s Quarterly Report on Form 10-Q for the quarter ended June 14, 2008. | |
10.5* | Distribution Agreement between PepsiCo Holdings LLC and Frito-Lay Manufacturing LLC effective as of January 1, 2009. | |
12* | Computation of Ratio of Earnings to Fixed Charges. | |
21* | Subsidiaries of Bottling LLC. | |
23.1* | Consent of Deloitte & Touche LLP. | |
23.2* | Consent of Deloitte & Touche LLP, independent registered public accounting firm of The Pepsi Bottling Group, Inc. | |
23.3* | Consent of KPMG LLP, independent registered public accounting firm of PepsiCo, Inc. | |
31.1* | Certification by the Principal Executive Officer pursuant to Section 302 of the Sarbanes-Oxley Act of 2002. | |
31.2* | Certification by the Principal Financial Officer pursuant to Section 302 of the Sarbanes-Oxley Act of 2002. | |
32.1* | Certification by the Principal Executive Officer pursuant to Section 906 of the Sarbanes-Oxley Act of 2002. | |
32.2* | Certification by the Principal Financial Officer pursuant to Section 906 of the Sarbanes-Oxley Act of 2002. | |
99.1* | The Pepsi Bottling Group, Inc.’s Annual Report on Form 10-K for the fiscal year ended December 27, 2008. | |
99.2 | PepsiCo, Inc.’s consolidated financial statements and notes thereto included in PepsiCo’s Annual Report on Form 10-K for the fiscal year ended December 27, 2008, which are incorporated herein by reference to PepsiCo, Inc.’s Annual Report on Form 10-K for the year ended December 27, 2008. | |
| * | Filed herewith |
E - 2